UNITED STATES
SECURITIES AND EXCHANGE COMMISSION
Washington, D.C. 20549
FORM N-CSR
CERTIFIED SHAREHOLDER REPORT OF REGISTERED
MANAGEMENT INVESTMENT COMPANIES
Investment Company Act file number: 811-05075
Thrivent Mutual Funds
(Exact name of registrant as specified in charter)
625 Fourth Avenue South
Minneapolis, Minnesota 55415
(Address of principal executive offices) (Zip code)
Michael W. Kremenak
Secretary and Chief Legal Officer
625 Fourth Avenue South
Minneapolis, Minnesota 55415
(Name and address of agent for service)
Registrant’s telephone number, including area code: (612) 844-4198
Date of fiscal year end: December 31
Date of reporting period: December 31, 2016
| Item 1. | Report to Stockholders |

TABLEOF CONTENTS
Dear Shareholder:
In the past, my letters have often focused on the performance and rankings of our Funds, but this time I thought it would be a good opportunity to give a more personal perspective on the work we do here at Thrivent Asset Management in managing the assets you have entrusted to us. That is not to say that I do not continue to be proud of the performance of our Funds. Our investment team of more than 100 investment professionals continues to work tirelessly to help you be wise with money and achieve your investment goals. I encourage you to take the time to read this annual report, including the discussion of the performance of each of the Funds by the individual portfolio managers.
Mentioning the hard work of our investment team brings to mind a phrase from “The Thrivent Way,” which is Thrivent Financial’s statement of our mission and of who we are as an organization. Every person in our organization is aligned around the principles embodied in The Thrivent Way, which permeates the work we do every day. You can find the full text of The Thrivent Way on Thrivent’s website at Thrivent.com/about-us/what-makes-us-different. The last line of The Thrivent Way states that we will “live balanced and generous lives.” I’ll admit that the first time I read a draft of that statement I thought to myself, “Do people really want an investment manager who leads a balanced life? Or would they rather have a manager who lives a painfully unbalanced life in single-minded pursuit of investment returns?”
I am happy to say that in my experience, our investment professionals do as well as anyone in our organization at living The Thrivent Way, including leading balanced and generous lives. And I think that you, our shareholders, may be better off because of it. At Thrivent, we don’t seek to make a quick buck by doing a lot of short-term trading. We are investors, not traders. If there’s one characteristic that defines our investment approach, I would say it is that we take a long-term view of the markets and of our performance. As an organization that’s been around for more than 100 years, the concept of taking a long-term approach is ingrained in our DNA.
A second characteristic of our investment approach is that we are disciplined. We won’t stray from the investment objectives of the products you invest in. You can count on us to manage your money the way we said we would. People who live balanced and generous lives are, in my opinion, better suited to take such a long-term, disciplined view and less likely to sacrifice long-term results or style consistency for short-term gains. And I believe that our approach has contributed to our investment results.
But living balanced and generous lives doesn’t mean we don’t work hard. Quite the opposite. I’ve worked with numerous money management firms over the course of my career and have never met investment professionals who were more diligent and dedicated than our team at Thrivent. That reminds me of a personal anecdote, if you’ll indulge me. Last summer I was driving home from work one day and the famous Harry Chapin song Cat’s in the Cradle came on. I heard a verse that made me think of my two boys:
My son turned 10 just the other day.
He said, “Thanks for the ball, Dad, come on let’s play.
Can you teach me to throw?” I said, “Not today,
I got a lot to do.” He said, “That’s OK.’”
Admittedly, I started to tear up a little thinking about how my boys would be grown before I knew it. And I naturally had a feeling come over me, wondering if I, too, sometimes prioritized work over family too often. But then it occurred to me—I had left work a little early that day to coach my son’s baseball practice. And he was, in fact, 10 years old. But this little story made me think about how living The Thrivent Way has helped me lead a balanced life for the benefit of my wife and children.
Living a balanced life also doesn’t mean never staying late at the office, never coming in early, or never working over the weekend. I honestly believe that the best work I’ve done for Thrivent in my nearly 11 years here has been done outside normal working hours, often at my home. It’s the new ideas you may not have the time to consider during the workday that you may wish to ponder on your own time. Or the transaction that just needs some extra effort to get across the finish line. And I believe it’s good for children to see a parent working hard, going to work early, or staying late into the evening from time to time. Being a good steward of God’s gifts means not only being wise with money, but working hard and doing our best to make the most of all of the talents that God has given us as individuals.
In many communications you receive from Thrivent, we will mention that our mission is to help people be wise with money and live generously. It’s not just a motto or a slogan; it’s a description of who we are. I had the privilege of observing some focus groups a couple months ago in which we asked folks about their investment needs, concerns and preferences. In one of the sessions, we asked a group of people who were unfamiliar with Thrivent whether they would be interested in working with an organization that had our investment capabilities and had a mission such as ours. One participant said, “I would love to, but I don’t believe such an organization could exist.” Well, here we are. And the more than 100 investment professionals at Thrivent Asset Management are working hard every day to help you meet your financial goals—and to do our best to see that all of us are able to be wise with money and live balanced and generous lives. That’s The Thrivent Way.
Sincerely,

David S. Royal
President
Thrivent Mutual Funds
2
Dear Shareholder:
During a historic year that culminated in the election of a new president, the stock market experienced strong performance, spurred by falling unemployment and a rebound in oil prices after a rocky start to the year.
Although the economy was still hampered by softness in the labor market and productivity growth, the Federal Reserve finally demonstrated enough confidence in it to raise interest rates in December by 0.25%, to the 0.50% to 0.75% range. It was the first Fed rate hike since December 2015.
Economic Review
Gross domestic product (GDP), which is the broadest measure of economic output, grew at a seasonally adjusted annual rate of 1.4% in the second quarter and 3.5% in the third quarter, according to the U.S. Commerce Department, although we believe the 3.5% third quarter rate is somewhat misleading. Net trade added 0.8%, but that was driven by a surge in soybean exports due to a drought in South America. In addition, an inventory build-up added 0.6%. Neither development is considered to be sustainable.
Unemployment reached a nine-year low of 4.6% in November, and closed the year at 4.7%, according to the U.S. Department of Labor. The economy has experienced 75 consecutive months of job growth through December, with a total of 2.2 million new nonfarm jobs added in 2016. However, the Labor Force Participation Rate for those in their prime working years (ages 25 to 54) remains at a low level of about 81.5%, which is about 1.5% below the pre-recession level.
After a summer swoon, retail sales were solid to close out the final months of 2016. Year-over-year, retail and food services sales were up 3.8% through November, according to the U.S. Commerce Department.
The other big economic story for 2016 was the improving oil market. After dropping to a low of $26.21 per barrel (West Texas Intermediate crude) on February 11, oil prices rebounded through the remainder of the year. Oil closed the year at $53.72 per barrel—a 45% increase for the year.
Market Review
The S&P 500 Index finished 2016 with a gain of 9.54% for the year, as it moved up from 2,043.94 to 2,238.83. The real annual return for the S&P, including dividends and distributions, was 11.96%. The Nasdaq also had a solid year, finishing 2016 at 5,383.12 after ending 2015 at 5,007.41—an increase of 7.50%.
Leading sectors of the S&P 500 for 2016 included energy, telecommunications and financials, which all gained more than 20% for the year, followed by industrials, materials, utilities, and information technology, all with double-digit gains. The only loser for 2016 was health care, which was down 2.7% for the year after a 4% drop in December. (S&P sector indexes reflect the composite performance of the stocks that comprise each of the 11 industrial sector groupings of the S&P 500 Index.)
International stocks remained sluggish as the tepid economy brought on by the Great Recession still lingered. For the year, the MSCI EAFE Index, which tracks developed markets in Europe, Australasia and the Far East, dropped 1.88%.
In the fixed-income market, higher risk assets continued their multi-year run of exceptional relative performance, with the lowest quality sector of the market, CCC-rated bonds, up nearly 30% on a total return basis. Longer-maturity U.S. Treasury bond prices soared more than 20% early in the year, only to give up those price gains near the end of the year. Interest rates in the U.S. market were among the lowest in history, with market rates on 10-year U.S. Treasuries sinking to a historical low of 1.32% in July. But rates rebounded in the second half, closing the year at 2.45%.
Our Outlook
While a strengthening U.S. dollar will make U.S. exporters less competitive abroad, we believe the U.S. stock market remains the best relative investment opportunity in the world for 2017. Asia continues to be relatively unattractive entering 2017; Europe, including the U.K., retains significant potential, even though it may be less resilient to political and international trade challenges.
In the fixed-income market, we expect interest rates to continue rising modestly. As in 2016, we expect the market will be bumpy in 2017. Thus, we recommend caution in terms of duration, with a preference for shorter-term maturities.
We continue to have modest expectations for the economy in 2017. The consensus estimate for real GDP growth in 2017 is 2.3%, according to Blue Chip Economic Indicators (based on a monthly survey of more than 50 leading economists). Our expectation for growth is slightly lower than the consensus. Although we are not projecting a recession in the near term, we believe the risk of recession in the next 12 months remains elevated.
As always, thank you for the trust you have placed in our entire team of professionals at Thrivent Mutual Funds.
Sincerely,

Russell W. Swansen
Chief Investment Officer
Thrivent Mutual Funds
3
THRIVENT GROWTHAND INCOME PLUS FUND
Stephen D. Lowe, CFA, John T. Groton, CFA, Mark L. Simenstad, CFA, Noah J. Monsen, CFA, Reginald L. Pfeifer, CFA, Portfolio Co-Managers
Thrivent Growth and Income Plus Fund seeks long-term capital growth and income.
The Fund invests in debt securities and equity securities. The value of the Fund is influenced by factors impacting the overall market, certain asset classes, certain investment styles, and specific issuers. The Fund may incur losses due to incorrect assessments of investments by its investment adviser. Bond prices generally fall as interest rates rise. Credit risk is the risk that an issuer of a debt security may not pay its debt, and high yield securities are subject to increased credit risk as well as liquidity risk. Leveraged loans, REITs, preferred securities, sovereign debt, and mortgage-related and other asset-backed securities are subject to additional risks. Foreign investments involve additional risks, including currency fluctuations, liquidity, political, economic and market instability, and different legal and accounting standards; these risks are magnified for investments in emerging markets. An ETF is subject to additional fees and expenses, tracking error, and the risks of the underlying investments that it holds. The use of derivatives (such as futures and swaps) involves additional risks and transaction costs, which could leave the Fund in a worse position than if it had not used these instruments.
How did the Fund perform during the 12-month period ended December 31, 2016?
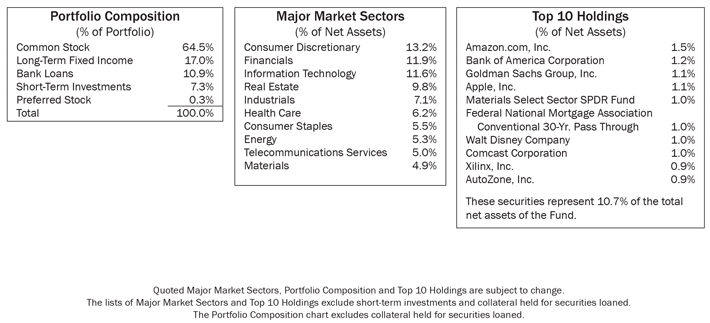
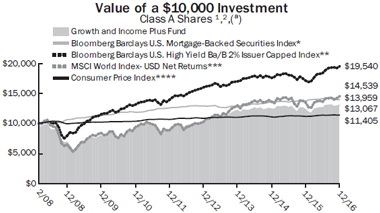
Thrivent Growth and Income Plus Fund earned a return of 6.29%, compared with the median return of its peer group, the Lipper Mixed-Asset Target Allocation Growth Funds category, of 6.70%. The Fund’s market benchmarks, the MSCI World Index-USD Net Returns, the Bloomberg Barclays U.S. Mortgage-Backed Securities Index, and the Bloomberg Barclays U.S. High Yield Ba/B 2% Issuer Capped Index, returned 7.51%, 1.67% and 14.09%, respectively. The Fund’s fourth market benchmark, the U.S. High Yield Loan Index, was decommissioned by Bloomberg Barclays effective September 30, 2016.
What factors affected the Fund’s performance?
Stock and bond markets turned in solid results in 2016 as the economy accelerated, oil prices rebounded, unemployment fell to a nine-year low, and interest rates and inflation both remained modest. Those conditions proved especially fertile for small-company stocks and high-yield bonds, both of which typically do best when economic conditions are favorable. The Fund raised its allocation to equities to 66% by year-end from 62.7% at the start the year, with all the increase allocated to domestic equities. The remainder of the Fund was invested in fixed-income securities.
Within the equity sleeve, small-cap and mid-cap stocks substantially outperformed large-cap stocks. All three groups posted positive results but lagged benchmark returns. Energy stocks were among the top performers. Real estate investment trusts (REITs), telecommunication services shares and utilities stocks delivered strong absolute and relative performances, while health care and consumer discretionary stocks detracted from returns. International stock holdings posted a modestly negative return, with losses concentrated in the U.K. following its vote to exit the European Union.
In the fixed-income sleeve, alternative investments—a group that included closed-end funds, exchange-traded funds and preferred shares—turned in the best returns, earning about 26% before expenses. Securitized assets—mostly mortgage-backed securities—were the weakest performers but still earned about 4.5% before expenses.
The Fund underperformed its peer group largely by virtue of having a larger allocation to international equities, which dramatically underperformed domestic equities and the fixed-income market. Derivatives, in the form of futures contracts traded on major exchanges, were used in both the equity and fixed-income segments of the Fund. Equity futures were used to tactically adjust exposure to various market segments while minimizing transaction costs. Fixed-income futures were used to adjust duration, or sensitivity to interest rates, within the Fund’s fixed-income sleeve. The Fund had a cash position in excess of 5% of assets at various times due to large inflows that took some time to put to work. Cash levels were below 5% at year-end.
What is your outlook?
We anticipate the U.S. economy will continue to grow at a modest pace in 2017, with interest rates and inflation likely to rise modestly as well. To minimize the negative impact of rising rates on our fixed-income portfolio, we may modestly shorten its duration. Overall, we are cautious on the outlook for fixed income and do not expect returns matching those from 2016.
In the equity markets, concerns about high valuations and the sustainability of corporate profit growth are being compounded by the political uncertainty associated with a new administration in Washington. Still, the administration’s pledges to invest in infrastructure, reduce or improve regulations, and simplify and overhaul the tax code could eventually benefit the economy. That could boost demand for energy, material, industrial and financial stocks. The outlook for international equities is mixed, weighed down by what we expect will be flat-to-negative economic growth in Japan, slow growth in Europe and slowing growth in China—all exacerbated by a strong U.S. dollar.
Quoted Fund performance is for Class A shares and does not reflect a sales charge.
The returns shown do not reflect taxes a shareholder would pay on distributions or redemptions.
4
Average Annual Total Returns1,2
As of December 31, 2016
| | | | | | | | | | | | |
Class A3 | | 1-Year | | | 5 Years | | | From
Inception
2/29/2008 | |
without sales charge | | | 6.29% | | | | 7.87% | | | | 3.61% | |
with sales charge | | | 1.51% | | | | 6.88% | | | | 3.07% | |
| | | |
Class S | | 1-Year | | | 5 Years | | | From
Inception
2/29/2008 | |
Net Asset Value | | | 6.67% | | | | 8.25% | | | | 3.98% | |
| 1 | Past performance is not an indication of future results. Average annual total returns represent past performance and reflect changes in share prices, the reinvestment of all dividends and capital gains, and the effects of compounding. The prospectus contains more complete information on the investment objectives, risks, charges and expenses of the investment company, which investors should read and consider carefully before investing. To obtain a prospectus, contact a registered representative or visit ThriventFunds.com. At various times, the Fund’s adviser waived its management fee and/or reimbursed Fund expenses. Had the adviser not done so, the Fund’s total returns would have been lower. The returns shown do not reflect taxes a shareholder would pay on distributions or redemptions. Total investment return and principal value of your investment will fluctuate, and your shares, when redeemed, may be worth more or less than their original cost. Current performance may be higher or lower than the performance data quoted. Call 800-THRIVENT (847-4836) or visit ThriventFunds.com for performance results current to the most recent month-end. |
| 2 | As you compare performance, please note that the Fund’s performance reflects the maximum 4.5% sales charge and the reinvestment of all dividends and capital gains, and the effect of compounding. The index results shown do not reflect any sales charges. Unless otherwise noted, the index results shown do not reflect deductions for fees, expenses, or taxes. Index results shown reflect reinvestment of dividends. It is not possible to invest directly into an index. |
| 3 | Class A performance with sales charge reflects the maximum sales charge of 4.5%. |
| (a) | Performance of other classes will be greater or less than the line shown based on the differences in loads and fees paid by shareholders investing in the different classes. |
| * | The Bloomberg Barclays U.S. Mortgage-Backed Securities Index (MBS) is formed by grouping the universe of over 600,000 individual fixed-rate U.S. government agency MBS pools into approximately 3,500 generic types of securities. |
| ** | The Bloomberg Barclays U.S. High Yield Ba/B 2% Issuer Capped Index covers the USD denominated, non-investment grade, Ba or B rated, fixed-rate, taxable corporate bond market. The index limits issuer exposures to a maximum 2%, redistributing excess market value index-wide on a pro-rata basis. |
| *** | The MSCI World Index—USD Net Returns is an index that represents large and mid-cap stock performance across developed market countries throughout the world. The performance of the Index reflects dividends reinvested after the deduction of withholding taxes. |
| **** | The Consumer Price Index is an inflationary indicator that measures the change in the cost of a fixed basket of products and services, including housing, electricity, food and transportation. |
5
THRIVENT DIVERSIFIED INCOME PLUS FUND
Mark L. Simenstad, CFA, Stephen D. Lowe, CFA, John T. Groton, CFA, Noah J. Monsen, CFA, Reginald L. Pfeifer, CFA, Portfolio Co-Managers
Thrivent Diversified Income Plus Fund seeks to maximize income while maintaining prospects for capital appreciation.
The Fund invests in debt securities and equity securities. The value of the Fund is influenced by factors impacting the overall market, certain asset classes, certain investment styles, and specific issuers. The Fund may incur losses due to incorrect assessments of investments by its investment adviser. Bond prices generally fall as interest rates rise. Credit risk is the risk that an issuer of a debt security may not pay its debt, and high yield securities are subject to increased credit risk as well as liquidity risk. Leveraged loans, REITs, preferred securities, sovereign debt, and mortgage-related and other asset-backed securities are subject to additional risks. Foreign investments involve additional risks, including currency fluctuations, liquidity, political, economic and market instability, and different legal and accounting standards; these risks are magnified for investments in emerging markets. An ETF is subject to additional fees and expenses, tracking error, and the risks of the underlying investments that it holds. The use of derivatives (such as futures and swaps) involves additional risks and transaction costs, which could leave the Fund in a worse position than if it had not used these instruments.
How did the Fund perform during the 12-month period ended December 31, 2016?
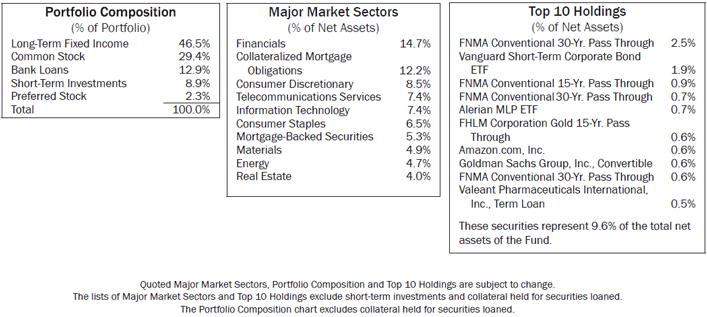
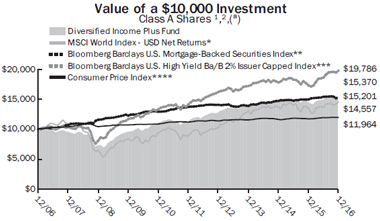
Thrivent Diversified Income Plus Fund earned a return of 6.70%, compared with the median return of its peer group, the Lipper Mixed-Asset Target Allocation Conservative Funds category, of 5.26%. The Fund’s market benchmarks, the MSCI World Index-USD Net Returns, the Bloomberg Barclays U.S. Mortgage-Backed Securities Index, and the Bloomberg Barclays U.S. High Yield Ba/B 2% Issuer Capped Index, returned 7.51%, 1.67% and 14.09%, respectively. The Fund’s fourth market benchmark, the U.S. High Yield Loan Index, was decommissioned by Bloomberg Barclays effective September 30, 2016.
What factors affected the Fund’s performance?
Stock and bond markets posted solid returns in 2016 as the economy accelerated, oil prices rebounded, unemployment fell to a nine-year low, and interest rates and inflation both remained modest. Those conditions proved especially fertile for small-company stocks and high-yield bonds, both of which tend to do best when economic conditions are improving.
The Fund allocated about 27% of its portfolio to equities and the remainder to fixed-income securities. Alternative investments, including closed-end funds, exchange-traded funds and preferred shares, turned in the best returns within the fixed-income sleeve, earning about 14% before expenses. High-yield bonds and leveraged loans earned about 11.8% and 10.5%, respectively. Investment-grade corporate bonds were the weakest performers, earning about 3%.
Within the equity sleeve, small-cap and mid-cap stocks substantially outperformed large-cap stocks. All three groups posted positive returns but lagged their respective indexes. Energy stocks were among the top performers. Yield-sensitive real estate investment trusts (REITs), telecommunication services and utilities stocks delivered strong absolute and relative performances, while health care and consumer discretionary stocks detracted from returns. International stocks posted a modestly negative return, with losses concentrated in the U.K. after its vote to exit the European Union.
The Fund outperformed its peer group largely due to the strong performance of its fixed-income sleeve. Fixed-income holdings included an overweighted allocation to “spread” products, including corporate bonds and alternatives, which significantly outperformed Treasuries. Derivatives, in the form of futures contracts traded on major exchanges, were used in both the equity and fixed-income segments of the Fund. Equity futures were used to tactically adjust exposure to various market segments while minimizing transaction costs. Fixed-income futures were used to adjust duration, or sensitivity to interest rates, within the Fund’s fixed-income sleeve.
What is your outlook?
We anticipate the U.S. economy will continue to grow at a modest pace in 2017, with interest rates and inflation likely to rise modestly as well. To minimize the negative impact of rising rates on the Fund’s fixed-income sleeve, we may shorten its overall duration. Overall, we are cautious on the outlook for fixed income and consider it unlikely to deliver gains in 2017 on the order of those we saw in 2016.
In the equity markets, concerns about high valuations and the sustainability of corporate profits are compounded by the political uncertainty associated with a new administration in Washington. Still, the administration’s pledges to invest in infrastructure, reduce or improve regulations, and simplify and overhaul the tax code could eventually benefit the economy. That could boost demand for energy, material, industrial and financial stocks.
The outlook for international equities is mixed, owing largely to what we believe will be flat-to-negative economic growth in Japan, slow growth in Europe, and slowing growth in China—all exacerbated by a strong U.S. dollar.
Quoted Fund performance is for Class A shares and does not reflect a sales charge.
The returns shown do not reflect taxes a shareholder would pay on distributions or redemptions.
6
Average Annual Total Returns1,2
As of December 31, 2016
| | | | | | | | | | | | |
Class A3 | | 1-Year | | | 5 Years | | | 10 Years | |
without sales charge | | | 6.70% | | | | 6.69% | | | | 4.87% | |
with sales charge | | | 1.90% | | | | 5.72% | | | | 4.39% | |
| | | |
Class S | | 1-Year | | | 5 Years | | | 10 Years | |
Net Asset Value | | | 6.91% | | | | 6.98% | | | | 5.21% | |
| 1 | Past performance is not an indication of future results. Average annual total returns represent past performance and reflect changes in share prices, the reinvestment of all dividends and capital gains, and the effects of compounding. The prospectus contains more complete information on the investment objectives, risks, charges and expenses of the investment company, which investors should read and consider carefully before investing. To obtain a prospectus, contact a registered representative or visit ThriventFunds.com. At various times, the Fund’s adviser waived its management fee and/or reimbursed Fund expenses. Had the adviser not done so, the Fund’s total returns would have been lower. The returns shown do not reflect taxes a shareholder would pay on distributions or redemptions. Total investment return and principal value of your investment will fluctuate, and your shares, when redeemed, may be worth more or less than their original cost. Current performance may be higher or lower than the performance data quoted. Call 800-THRIVENT (847-4836) or visit ThriventFunds.com for performance results current to the most recent month-end. |
| 2 | As you compare performance, please note that the Fund’s performance reflects the maximum 4.5% sales charge and the reinvestment of all dividends and capital gains, and the effect of compounding. The index results shown do not reflect any sales charges. Unless otherwise noted, the index results shown do not reflect deductions for fees, expenses, or taxes. Index results shown reflect reinvestment of dividends. It is not possible to invest directly into an index. |
| 3 | Class A performance with sales charge reflects the maximum sales charge of 4.5%. |
| (a) | Performance of other classes will be greater or less than the line shown based on the differences in loads and fees paid by shareholders investing in the different classes. |
| * | The MSCI World Index—USD Net Returns is an index that represents large and mid-cap stock performance across developed market countries throughout the world. The performance of the Index reflects dividends reinvested after the deduction of withholding taxes. |
| ** | The Bloomberg Barclays U.S. Mortgage-Backed Securities Index (MBS) is formed by grouping the universe of over 600,000 individual fixed-rate U.S. government agency MBS pools into approximately 3,500 generic types of securities. |
| *** | The Bloomberg Barclays U.S. High Yield Ba/B 2% Issuer Capped Index covers the USD denominated, non-investment grade, Ba or B rated, fixed-rate, taxable corporate bond market. The index limits issuer exposures to a maximum 2%, redistributing excess market value index-wide on a pro-rata basis. |
| **** | The Consumer Price Index is an inflationary indicator that measures the change in the cost of a fixed basket of products and services, including housing, electricity, food and transportation. |
7
SHAREHOLDER EXPENSE EXAMPLE
(unaudited)
As a shareholder of a Fund, you incur, depending on the Fund and share class, two types of costs: (1) transaction costs, including sales charges (loads) on purchase payments; and (2) ongoing costs, including management fees, distribution (12b-1) fees and other Fund expenses. This Example is intended to help you understand your ongoing costs (in dollars) of investing in your Fund and to compare these costs with the ongoing costs of investing in other mutual funds. The Example is based on an investment of $1,000 invested at the beginning of the period and held for the entire period from July 1, 2016 through December 31, 2016.
Actual Expenses
In the table below, the first section, labeled “Actual,” provides information about actual account values and actual expenses. You may use the information in this section, together with the amount you invested, to estimate the expenses that you paid over the period. Simply divide your account value by $1,000 (for example, an $8,600 account value divided by $1,000 = 8.6), then multiply the result by the number from the appropriate Class line under the heading entitled “Expenses Paid During Period” to estimate the expenses you paid. A small account fee of $12 may be charged to Class A shareholder accounts if the value falls to an amount of $2,000 or less, in the case of a non-qualified account, and $1,000 or less, in the case of a qualified account. This fee is not included in the table below. If it were and you were assessed such a fee, the expenses you paid during the period would have been higher and the ending account value would have been lower.
Hypothetical Example for Comparison Purposes
In the table below, the second section, labeled “Hypothetical,” provides information about hypothetical account values and hypothetical expenses based on the Fund’s actual expense ratio and an assumed rate of return of 5% per year before expenses, which is not the Fund’s actual return. The hypothetical account values and expenses may not be used to estimate the actual ending account balance or expenses you paid for the period. You may use this information to compare the ongoing costs of investing in the Fund and other funds. To do so, compare this 5% hypothetical example with the 5% hypothetical examples that appear in the shareholder reports of the other funds. A small account fee of $12 may be charged to Class A shareholder accounts if the value falls to an amount of $2,000 or less, in the case of a non-qualified account, and $1,000 or less, in the case of a qualified account. This fee is not included in the table below. If it were and you were assessed such a fee, the expenses you paid during the period would have been higher and the ending account value would have been lower.
Please note that the expenses shown in the table are meant to highlight your ongoing costs only and do not reflect any transactional costs, such as sales charges (loads). Therefore, the second section of the table is useful in comparing ongoing costs only, and will not help you determine the relative total costs of owning different funds. In addition, if these transactional costs were included, your costs would have been higher.
| | | | | | | | | | | | | | | | |
| | | Beginning
Account
Value
7/1/2016 | | | Ending
Account
Value
12/31/2016 | | | Expenses
Paid
During
Period
7/1/2016-
12/31/2016* | | | Annualized
Expense
Ratio | |
Thrivent Growth and Income Plus Fund | | | | | | | | | | | | | | | | |
Actual | | | | | | | | | | | | | | | | |
Class A | | $ | 1,000 | | | $ | 1,039 | | | $ | 5.64 | | | | 1.10 | % |
Class S | | $ | 1,000 | | | $ | 1,040 | | | $ | 4.15 | | | | 0.81 | % |
Hypothetical** | | | | | | | | | | | | | | | | |
Class A | | $ | 1,000 | | | $ | 1,020 | | | $ | 5.58 | | | | 1.10 | % |
Class S | | $ | 1,000 | | | $ | 1,021 | | | $ | 4.11 | | | | 0.81 | % |
Thrivent Diversified Income Plus Fund | | | | | | | | | | | | | | | | |
Actual | | | | | | | | | | | | | | | | |
Class A | | $ | 1,000 | | | $ | 1,035 | | | $ | 4.96 | | | | 0.97 | % |
Class S | | $ | 1,000 | | | $ | 1,037 | | | $ | 3.57 | | | | 0.70 | % |
Hypothetical** | | | | | | | | | | | | | | | | |
Class A | | $ | 1,000 | | | $ | 1,020 | | | $ | 4.92 | | | | 0.97 | % |
Class S | | $ | 1,000 | | | $ | 1,022 | | | $ | 3.55 | | | | 0.70 | % |
| * | Expenses are equal to the Fund’s annualized expense ratio, multiplied by the average account value over the period, multiplied by 184/366 to reflect the one-half year period. |
| ** | Assuming 5% annualized total return before expenses. |
8

Report of Independent Registered Public Accounting Firm
To the Board of Trustees and Shareholders of Thrivent Diversified Income Plus Fund and Thrivent Growth and Income Plus Fund:
In our opinion, the accompanying statements of assets and liabilities, including the summary schedules of investments of Thrivent Diversified Income Plus Fund and Thrivent Growth and Income Plus Fund (constituting part of the Thrivent Mutual Funds) (hereafter referred to as the “Funds”), and the related statements of operations and of changes in net assets and the financial highlights present fairly, in all material respects, the financial position of the Funds as of December 31, 2016, the results of each of their operations for the year then ended, the changes in each of their net assets for each of the two years in the period then ended and their financial highlights for each of the five years in the period then ended, in conformity with accounting principles generally accepted in the United States of America. These financial statements and financial highlights (hereafter referred to as “financial statements”) are the responsibility of the Funds’ management. Our responsibility is to express an opinion on these financial statements based on our audits. We conducted our audits of these financial statements in accordance with the standards of the Public Company Accounting Oversight Board (United States). Those standards require that we plan and perform the audit to obtain reasonable assurance about whether the financial statements are free of material misstatement. An audit includes examining, on a test basis, evidence supporting the amounts and disclosures in the financial statements, assessing the accounting principles used and significant estimates made by management, and evaluating the overall financial statement presentation. We believe that our audits, which included confirmation of securities as of December 31, 2016 by correspondence with the custodian, agent banks, transfer agent and brokers provide a reasonable basis for our opinion.

February 20, 2017
PricewaterhouseCoopers LLP, 45 South Seventh Street, Suite 3400, Minneapolis, MN 55402
T: (612) 596 6000, F: (612) 373 7160, www.pwc.com/us
9
GROWTHAND INCOME PLUS FUND
Summary Schedule of Investments as of December 31, 2016
| | | | | | | | | | | | |
Principal Amount | | | Bank Loans (11.4%) | | Value | | | % of Net
Assets | |
| | Basic Materials (0.7%) | |
| | | | Other Securities^ | | $ | 532,544 | | | | 0.7 | % |
| | | | | | | | | | | | |
| | | | Total | | | 532,544 | | | | | |
| | | | | | | | | | | | |
|
| | Capital Goods (0.7%) | |
| | | | Other Securities^ | | | 537,024 | | | | 0.7 | % |
| | | | | | | | | | | | |
| | | | Total | | | 537,024 | | | | | |
| | | | | | | | | | | | |
|
| | Communications Services (3.2%) | |
| | | | Other Securities^ | | | 2,476,782 | | | | 3.2 | % |
| | | | | | | | | | | | |
| | | | Total | | | 2,476,782 | | | | | |
| | | | | | | | | | | | |
|
| | Consumer Cyclical (2.1%) | |
| | | | Other Securities^ | | | 1,630,154 | | | | 2.1 | % |
| | | | | | | | | | | | |
| | | | Total | | | 1,630,154 | | | | | |
| | | | | | | | | | | | |
|
| | Consumer Non-Cyclical (1.7%) | |
| | | | Valeant Pharmaceuticals International, Inc., Term Loan | | | | | | | | |
| $ | 335,069 | | | 5.500%, 4/1/2022a,b,c | | | 335,133 | | | | 0.4 | % |
| | | | Other Securities^ | | | 979,607 | | | | 1.3 | % |
| | | | | | | | | | | | |
| | | | Total | | | 1,314,740 | | | | | |
| | | | | | | | | | | | |
|
| | Energy (0.5%) | |
| | | | Other Securities^ | | | 370,976 | | | | 0.5 | % |
| | | | | | | | | | | | |
| | | | Total | | | 370,976 | | | | | |
| | | | | | | | | | | | |
|
| | Financials (0.7%) | |
| | | | Other Securities^ | | | 565,718 | | | | 0.7 | % |
| | | | | | | | | | | | |
| | | | Total | | | 565,718 | | | | | |
| | | | | | | | | | | | |
|
| | Technology (1.4%) | |
| | | | Other Securities^ | | | 1,065,338 | | | | 1.4 | % |
| | | | | | | | | | | | |
| | | | Total | | | 1,065,338 | | | | | |
| | | | | | | | | | | | |
|
| | Transportation (0.2%) | |
| | | | Other Securities^ | | | 159,124 | | | | 0.2 | % |
| | | | | | | | | | | | |
| | | | Total | | | 159,124 | | | | | |
| | | | | | | | | | | | |
|
| | Utilities (0.2%) | |
| | | | Other Securities^ | | | 181,859 | | | | 0.2 | % |
| | | | | | | | | | | | |
| | | | Total | | | 181,859 | | | | | |
| | | | | | | | | | | | |
| | | | Total Bank Loans (cost $8,797,620) | | | 8,834,259 | | | | | |
| | | | | | | | | | | | |
| | | |
Shares | | | Common Stock (63.2%) | | | | | | |
| | Consumer Discretionary (10.2%) | |
| | 1,530 | | | Amazon.com, Inc.d | | | 1,147,301 | | | | 1.5 | % |
| | 870 | | | AutoZone, Inc.d | | | 687,117 | | | | 0.9 | % |
| | 11,028 | | | Comcast Corporation | | | 761,483 | | | | 1.0 | % |
| | 10,600 | | | Honda Motor Company, Ltd. | | | 309,470 | | | | 0.4 | % |
| | 12,950 | | | NIKE, Inc. | | | 658,249 | | | | 0.9 | % |
| | 7,370 | | | Walt Disney Company | | | 768,101 | | | | 1.0 | % |
| | | | Other Securities^ | | | 3,542,982 | | | | 4.5 | % |
| | | | | | | | | | | | |
| | | | Total | | | 7,874,703 | | | | | |
| | | | | | | | | | | | |
|
| | Consumer Staples (2.9%) | |
| | 5,240 | | | Philip Morris International, Inc. | | | 479,408 | | | | 0.6 | % |
| | 4,030 | | | Walgreens Boots Alliance, Inc. | | | 333,523 | | | | 0.4 | % |
| | | | Other Securities^ | | | 1,447,391 | | | | 1.9 | % |
| | | | | | | | | | | | |
| | | | Total | | | 2,260,322 | | | | | |
| | | | | | | | | | | | |
|
| | Energy (4.1%) | |
| | 90,291 | | | BP plc | | | 565,535 | | | | 0.7 | % |
| | 2,900 | | | Concho Resources, Inc.d | | | 384,540 | | | | 0.5 | % |
| | 6,880 | | | Devon Energy Corporation | | | 314,210 | | | | 0.4 | % |
| | 7,280 | | | Halliburton Company | | | 393,775 | | | | 0.5 | % |
| | 2,320 | | | Pioneer Natural Resources Company | | | 417,762 | | | | 0.5 | % |
| | | | Other Securities^ | | | 1,130,053 | | | | 1.5 | % |
| | | | | | | | | | | | |
| | | | Total | | | 3,205,875 | | | | | |
| | | | | | | | | | | | |
|
| | Financials (9.3%) | |
| | 42,790 | | | Bank of America Corporation | | | 945,659 | | | | 1.2 | % |
| | 3,670 | | | Goldman Sachs Group, Inc. | | | 878,781 | | | | 1.1 | % |
| | 14,730 | | | Synchrony Financial | | | 534,257 | | | | 0.7 | % |
| | | | Other Securities^ | | | 4,845,832 | | | | 6.3 | % |
| | | | | | | | | | | | |
| | | | Total | | | 7,204,529 | | | | | |
| | | | | | | | | | | | |
|
| | Health Care (6.1%) | |
| | 1,850 | | | Allergan plcd | | | 388,518 | | | | 0.5 | % |
| | 8,330 | | | Bristol-Myers Squibb Company | | | 486,805 | | | | 0.6 | % |
| | 5,260 | | | Celgene Corporationd | | | 608,845 | | | | 0.8 | % |
| | 8,240 | | | Medtronic plc | | | 586,935 | | | | 0.8 | % |
| | 11,660 | | | Merck & Company, Inc. | | | 686,424 | | | | 0.9 | % |
| | 6,218 | | | Novartis AG | | | 452,195 | | | | 0.6 | % |
| | | | Other Securities^ | | | 1,551,205 | | | | 1.9 | % |
| | | | | | | | | | | | |
| | | | Total | | | 4,760,927 | | | | | |
| | | | | | | | | | | | |
|
| | Industrials (7.1%) | |
| | 2,040 | | | Acuity Brands, Inc. | | | 470,954 | | | | 0.6 | % |
| | 4,260 | | | Illinois Tool Works, Inc. | | | 521,680 | | | | 0.7 | % |
| | 8,730 | | | Jacobs Engineering Group, Inc.d | | | 497,610 | | | | 0.6 | % |
| | 6,060 | | | Union Pacific Corporation | | | 628,301 | | | | 0.8 | % |
| | | | Other Securities^ | | | 3,416,296 | | | | 4.4 | % |
| | | | | | | | | | | | |
| | | | Total | | | 5,534,841 | | | | | |
| | | | | | | | | | | | |
|
| | Information Technology (9.4%) | |
| | 720 | | | Alphabet, Inc., Class Ad | | | 570,564 | | | | 0.7 | % |
| | 381 | | | Alphabet, Inc., Class Cd | | | 294,063 | | | | 0.4 | % |
| | 7,310 | | | Apple, Inc. | | | 846,644 | | | | 1.1 | % |
| | 4,780 | | | Facebook, Inc.d | | | 549,939 | | | | 0.7 | % |
| | 8,520 | | | Microsoft Corporation | | | 529,433 | | | | 0.7 | % |
| | 2,770 | | | Palo Alto Networks, Inc.d | | | 346,388 | | | | 0.5 | % |
| | 12,010 | | | PayPal Holdings, Inc.d | | | 474,035 | | | | 0.6 | % |
| | 4,310 | | | Salesforce.com, Inc.d | | | 295,063 | | | | 0.4 | % |
| | 5,090 | | | Vantiv, Inc.d | | | 303,466 | | | | 0.4 | % |
| | 8,650 | | | Visa, Inc. | | | 674,873 | | | | 0.9 | % |
| | 11,840 | | | Xilinx, Inc. | | | 714,781 | | | | 0.9 | % |
| | | | Other Securities^ | | | 1,681,864 | | | | 2.1 | % |
| | | | | | | | | | | | |
| | | | Total | | | 7,281,113 | | | | | |
| | | | | | | | | | | | |
|
| | Materials (2.6%) | |
| | 17,720 | | | BHP Billiton, Ltd. | | | 317,452 | | | | 0.4 | % |
| | | | Other Securities^ | | | 1,693,799 | | | | 2.2 | % |
| | | | | | | | | | | | |
| | | | Total | | | 2,011,251 | | | | | |
| | | | | | | | | | | | |
|
| | Real Estate (9.6%) | |
| | 2,892 | | | Alexandria Real Estate Equities, Inc. | | | 321,388 | | | | 0.4 | % |
| | 12,380 | | | Duke Realty Corporation | | | 328,813 | | | | 0.4 | % |
| | 1,368 | | | Public Storage, Inc. | | | 305,748 | | | | 0.4 | % |
| | 3,009 | | | Simon Property Group, Inc. | | | 534,609 | | | | 0.7 | % |
| | | | Other Securities^ | | | 5,955,844 | | | | 7.7 | % |
| | | | | | | | | | | | |
| | | | Total | | | 7,446,402 | | | | | |
| | | | | | | | | | | | |
The accompanying Notes to Financial Statements are an integral part of this schedule.
10
GROWTHAND INCOME PLUS FUND
Summary Schedule of Investments as of December 31, 2016
| | | | | | | | | | | | |
Shares | | | Common Stock (63.2%) | | Value | | | % of Net
Assets | |
| | Telecommunications Services (0.9%) | | | | | | | | |
| | | | Other Securities^ | | $ | 732,637 | | | | 0.9 | % |
| | | | | | | | | | | | |
| | | | Total | | | 732,637 | | | | | |
| | | | | | | | | | | | |
| | |
| | Utilities (1.0%) | | | | | | | | |
| | | | Other Securities^ | | | 735,030 | | | | 1.0 | % |
| | | | | | | | | | | | |
| | | | Total | | | 735,030 | | | | | |
| | | | | | | | | | | | |
| | | | Total Common Stock (cost $46,316,324) | | | 49,047,630 | | | | | |
| | | | | | | | | | | | |
| | | |
Principal Amount | | | Long-Term Fixed Income (17.7%) | | | | | | |
| | Asset-Backed Securities (0.1%) | | | | | | | | |
| | | | Other Securities^ | | | 95,508 | | | | 0.1 | % |
| | | | | | | | | | | | |
| | | | Total | | | 95,508 | | | | | |
| | | | | | | | | | | | |
| | |
| | Basic Materials (0.4%) | | | | | | | | |
| | | | Other Securities^ | | | 302,487 | | | | 0.4 | % |
| | | | | | | | | | | | |
| | | | Total | | | 302,487 | | | | | |
| | | | | | | | | | | | |
| | |
| | Capital Goods (0.5%) | | | | | | | | |
| | | | Other Securities^ | | | 380,840 | | | | 0.5 | % |
| | | | | | | | | | | | |
| | | | Total | | | 380,840 | | | | | |
| | | | | | | | | | | | |
| | |
| | Collateralized Mortgage Obligations (2.0%) | | | | | | | | |
| | | | Alternative Loan Trust | | | | | | | | |
| | 131,568 | | | 5.500%, 10/25/2035, Series 2005-47CB, Class A7 | | | 112,183 | | | | 0.1 | % |
| | | | CHL Mortgage Pass-Through Trust | | | | | | | | |
| | 70,078 | | | 2.919%, 1/25/2036, Series 2005-31, Class 4A2 | | | 62,432 | | | | 0.1 | % |
| | | | Countrywide Home Loan Mortgage Pass Through Trust | | | | | | | | |
| | 105,751 | | | 3.155%, 11/25/2035, Series 2005-22, Class 2A1 | | | 86,712 | | | | 0.1 | % |
| | | | Other Securities^ | | | 1,307,269 | | | | 1.7 | % |
| | | | | | | | | | | | |
| | | | Total | | | 1,568,596 | | | | | |
| | | | | | | | | | | | |
| | |
| | Communications Services (0.9%) | | | | | | | | |
| | | | Other Securities^ | | | 715,513 | | | | 0.9 | % |
| | | | | | | | | | | | |
| | | | Total | | | 715,513 | | | | | |
| | | | | | | | | | | | |
| | |
| | Consumer Cyclical (0.9%) | | | | | | | | |
| | | | Other Securities^ | | | 673,617 | | | | 0.9 | % |
| | | | | | | | | | | | |
| | | | Total | | | 673,617 | | | | | |
| | | | | | | | | | | | |
| | |
| | Consumer Non-Cyclical (0.9%) | | | | | | | | |
| | | | Other Securities^ | | | 703,514 | | | | 0.9 | % |
| | | | | | | | | | | | |
| | | | Total | | | 703,514 | | | | | |
| | | | | | | | | | | | |
| | |
| | Energy (0.7%) | | | | | | | | |
| | | | Other Securities^ | | | 556,435 | | | | 0.7 | % |
| | | | | | | | | | | | |
| | | | Total | | | 556,435 | | | | | |
| | | | | | | | | | | | |
| | |
| | Financials (1.9%) | | | | | | | | |
| | | | Bank of America Corporation | | | | | | | | |
| | 80,000 | | | 1.700% - 8.000%, 5/2/2017 - 5/l/2018e,f | | | 81,543 | | | | 0.2 | % |
| | | | Goldman Sachs Group, Inc. | | | | | | | | |
| | 40,000 | | | 2.042% - 7.500%, 1/31/2019 - 11/29/2023e | | | 41,448 | | | | <0.1 | % |
| | | | Goldman Sachs Group, Inc., Convertible | | | | | | | | |
| | 375,000 | | | 0.500%, 9/24/2022 | | | 414,202 | | | | 0.6 | % |
| | | | Other Securities^ | | | 922,229 | | | | 1.1 | % |
| | | | | | | | | | | | |
| | | | Total | | | 1,459,422 | | | | | |
| | | | | | | | | | | | |
| | |
| | Foreign Government (3.9%) | | | | | | | | |
| | | | Other Securities^ | | | 3,001,836 | | | | 3.9 | % |
| | | | | | | | | | | | |
| | | | Total | | | 3,001,836 | | | | | |
| | | | | | | | | | | | |
| | |
| | Mortgage-Backed Securities (3.9%) | | | | | | | | |
| | | | Federal National Mortgage Association Conventional 15-Yr. Pass Through | | | | | | | | |
| | 600,000 | | | 2.500%, 1/1/2032c | | | 600,660 | | | | 0.8 | % |
| | | | Federal National Mortgage Association Conventional 30-Yr. Pass Through | | | | | | | | |
| | 450,000 | | | 3.000%, 1/1/2047c | | | 446,715 | | | | 0.6 | % |
| | 780,000 | | | 3.500%, 1/1/2047c | | | 798,954 | | | | 1.0 | % |
| | 475,000 | | | 4.000%, 1/1/2047c | | | 499,130 | | | | 0.6 | % |
| | 250,000 | | | 4.500%, 1/1/2047c | | | 268,800 | | | | 0.4 | % |
| | | | Other Securities^ | | | 413,895 | | | | 0.5 | % |
| | | | | | | | | | | | |
| | | | Total | | | 3,028,154 | | | | | |
| | | | | | | | | | | | |
| | |
| | Technology (0.8%) | | | | | | | | |
| | | | Apple, Inc. | | | | | | | | |
| | 10,000 | | | 1.202%, 5/6/2020e | | | 9,992 | | | | <0.1 | % |
| | | | Other Securities^ | | | 565,630 | | | | 0.8 | % |
| | | | | | | | | | | | |
| | | | Total | | | 575,622 | | | | | |
| | | | | | | | | | | | |
| | |
| | Transportation (0.1%) | | | | | | | | |
| | | | Other Securities^ | | | 99,240 | | | | 0.1 | % |
| | | | | | | | | | | | |
| | | | Total | | | 99,240 | | | | | |
| | | | | | | | | | | | |
| | |
| | U.S. Government and Agencies (0.2%) | | | | | | | | |
| | | | Other Securities^ | | | 144,111 | | | | 0.2 | % |
| | | | | | | | | | | | |
| | | | Total | | | 144,111 | | | | | |
| | | | | | | | | | | | |
| | |
| | Utilities (0.5%) | | | | | | | | |
| | | | Other Securities^ | | | 418,134 | | | | 0.5 | % |
| | | | | | | | | | | | |
| | | | Total | | | 418,134 | | | | | |
| | | | | | | | | | | | |
| | | | Total Long-Term Fixed Income (cost $13,685,563) | | | 13,723,029 | | | | | |
| | | | | | | | | | | | |
| | | |
Shares | | | Registered Investment Companies (3.8%) | | | | | | |
| | Equity Funds/ETFs (1.9%) | | | | | | | | |
| | 16,150 | | | Materials Select Sector SPDR Fund | | | 802,655 | | | | 1.0 | % |
| | 10,710 | | | Utilities Select Sector SPDR Fund | | | 520,185 | | | | 0.7 | % |
| | | | Other Securities^ | | | 172,651 | | | | 0.2 | % |
| | | | | | | | | | | | |
| | | | Total | | | 1,495,491 | | | | | |
| | | | | | | | | | | | |
| | |
| | Fixed Income Funds/ETFs (1.9%) | | | | | | | | |
| | 14,214 | | | iShares S&P U.S. Preferred Stock Index Fund | | | 528,903 | | | | 0.7 | % |
| | | | Other Securities^ | | | 975,453 | | | | 1.2 | % |
| | | | | | | | | | | | |
| | | | Total | | | 1,504,356 | | | | | |
| | | | | | | | | | | | |
| | | | Total Registered Investment Companies (cost $3,040,332) | | | 2,999,847 | | | | | |
| | | | | | | | | | | | |
The accompanying Notes to Financial Statements are an integral part of this schedule.
11
GROWTHAND INCOME PLUS FUND
Summary Schedule of Investments as of December 31, 2016
| | | | | | | | | | | | |
Shares | | | Preferred Stock (0.3%) | | Value | | | % of Net
Assets | |
| | Consumer Staples (<0.1%) | | | | | | | | |
| | | | Other Securities^ | | $ | 15,951 | | | | <0.1 | % |
| | | | | | | | | | | | |
| | | | Total | | | 15,951 | | | | | |
| | | | | | | | | | | | |
| | |
| | Energy (<0.1%) | | | | | | | | |
| | | | Other Securities^ | | | 7,544 | | | | <0.1 | % |
| | | | | | | | | | | | |
| | | | Total | | | 7,544 | | | | | |
| | | | | | | | | | | | |
| | |
| | Health Care (0.1%) | | | | | | | | |
| | | | Other Securities^ | | | 64,706 | | | | 0.1 | % |
| | | | | | | | | | | | |
| | | | Total | | | 64,706 | | | | | |
| | | | | | | | | | | | |
| | |
| | Real Estate (0.2%) | | | | | | | | |
| | | | Other Securities^ | | | 156,750 | | | | 0.2 | % |
| | | | | | | | | | | | |
| | | | Total | | | 156,750 | | | | | |
| | | | | | | | | | | | |
| | | | Total Preferred Stock (cost $246,664) | | | 244,951 | | | | | |
| | | | | | | | | | | | |
| | | |
Shares or Principal Amount | | | Short-Term Investments (7.6%)g | | | | | | |
| | | | Thrivent Core Short-Term Reserve Fund | | | | | | | | |
| | 558,711 | | | 0.910% | | | 5,587,115 | | | | 7.2 | % |
| | | | Other Securities^ | | | 299,934 | | | | 0.4 | % |
| | | | | | | | | | | | |
| | | | Total Short-Term Investments (cost $5,887,047) | | | 5,887,049 | | | | | |
| | | | | | | | | | | | |
| | | | Total Investments (cost $77,973,550) 104.0% | | $ | 80,736,765 | | | | | |
| | | | | | | | | | | | |
| | | | Other Assets and Liabilities, Net (4.0%) | | | (3,140,917 | ) | | | | |
| | | | | | | | | | | | |
| | | | Total Net Assets 100.0% | | $ | 77,595,848 | | | | | |
| | | | | | | | | | | | |
| ^ | The Summary Schedule of Investments shows the 50 largest holdings in unaffiliated issuers, any holding or issuer that exceeds 1% of net assets and all affiliated holdings as of the report date. The remaining securities held are grouped by category as “Other securities”. |
| a | All or a portion of the loan is unfunded. |
| b | The stated interest rate represents the weighted average of all contracts within the bank loan facility. |
| c | Denotes investments purchased on a when-issued or delayed delivery basis. |
| d | Non-income producing security. |
| e | Denotes variable rate securities. Variable rate securities are securities whose yields vary with a designated market index or market rate. The rate shown is as of December 31, 2016. |
| f | Denotes perpetual securities. Perpetual securities pay an indefinite stream of interest and have no contractual maturity date. Date shown, if applicable, is next call date. |
| g | The interest rate shown reflects the yield, coupon rate or the discount rate at the date of purchase. |
Growth and Income Plus Fund held restricted securities as of December 31, 2016. Restricted securities are investment securities which cannot be offered for public sale without first being registered under the Securities Act of 1933. As of December 31, 2016, the value of these investments was $159,752 or 0.2% of total net assets.
Definitions:
| | | | |
| ETF | | - | | Exchange Traded Fund. |
Unrealized Appreciation (Depreciation)
Gross unrealized appreciation and depreciation of investments, based on cost for federal income tax purposes, were as follows:
| | | | |
Gross unrealized appreciation | | $ | 4,828,688 | |
Gross unrealized depreciation | | | (2,295,575 | ) |
| | | | |
Net unrealized appreciation (depreciation) | | $ | 2,533,113 | |
Cost for federal income tax purposes | | $ | 78,203,652 | |
The accompanying Notes to Financial Statements are an integral part of this schedule.
12
GROWTHAND INCOME PLUS FUND
Summary Schedule of Investments as of December 31, 2016
Fair Valuation Measurements
The following table is a summary of the inputs used, as of December 31, 2016, in valuing Growth and Income Plus Fund’s assets carried at fair value.
| | | | | | | | | | | | | | | | |
Investments in Securities | | Total | | | Level 1 | | | Level 2 | | | Level 3 | |
Bank Loans | | | | | | | | | | | | | | | | |
Basic Materials | | | 532,544 | | | | — | | | | 532,544 | | | | — | |
Capital Goods | | | 537,024 | | | | — | | | | 309,211 | | | | 227,813 | |
Communications Services | | | 2,476,782 | | | | — | | | | 2,185,401 | | | | 291,381 | |
Consumer Cyclical | | | 1,630,154 | | | | — | | | | 1,554,216 | | | | 75,938 | |
Consumer Non-Cyclical | | | 1,314,740 | | | | — | | | | 1,314,740 | | | | — | |
Energy | | | 370,976 | | | | — | | | | 271,679 | | | | 99,297 | |
Financials | | | 565,718 | | | | — | | | | 565,718 | | | | — | |
Technology | | | 1,065,338 | | | | — | | | | 1,065,338 | | | | — | |
Transportation | | | 159,124 | | | | — | | | | 159,124 | | | | — | |
Utilities | | | 181,859 | | | | — | | | | 106,578 | | | | 75,281 | |
Common Stock | | | | | | | | | | | | | | | | |
Consumer Discretionary | | | 7,874,703 | | | | 6,009,534 | | | | 1,865,169 | | | | — | |
Consumer Staples | | | 2,260,322 | | | | 1,186,834 | | | | 1,073,488 | | | | — | |
Energy | | | 3,205,875 | | | | 1,854,755 | | | | 1,351,068 | | | | 52 | |
Financials | | | 7,204,529 | | | | 4,094,474 | | | | 3,110,055 | | | | — | |
Health Care | | | 4,760,927 | | | | 3,610,674 | | | | 1,150,253 | | | | — | |
Industrials | | | 5,534,841 | | | | 3,206,924 | | | | 2,327,917 | | | | — | |
Information Technology | | | 7,281,113 | | | | 6,827,659 | | | | 453,454 | | | | — | |
Materials | | | 2,011,251 | | | | 600,595 | | | | 1,410,656 | | | | — | |
Real Estate | | | 7,446,402 | | | | 6,892,577 | | | | 553,825 | | | | — | |
Telecommunications Services | | | 732,637 | | | | 214,904 | | | | 517,733 | | | | — | |
Utilities | | | 735,030 | | | | 429,789 | | | | 305,241 | | | | — | |
Long-Term Fixed Income | | | | | | | | | | | | | | | | |
Asset-Backed Securities | | | 95,508 | | | | — | | | | 95,508 | | | | — | |
Basic Materials | | | 302,487 | | | | — | | | | 302,487 | | | | — | |
Capital Goods | | | 380,840 | | | | — | | | | 380,840 | | | | — | |
Collateralized Mortgage Obligations | | | 1,568,596 | | | | — | | | | 1,568,596 | | | | — | |
Communications Services | | | 715,513 | | | | — | | | | 715,513 | | | | — | |
Consumer Cyclical | | | 673,617 | | | | — | | | | 673,617 | | | | — | |
Consumer Non-Cyclical | | | 703,514 | | | | — | | | | 703,514 | | | | — | |
Energy | | | 556,435 | | | | — | | | | 556,435 | | | | — | |
Financials | | | 1,459,422 | | | | — | | | | 1,045,220 | | | | 414,202 | |
Foreign Government | | | 3,001,836 | | | | — | | | | 3,001,836 | | | | — | |
Mortgage-Backed Securities | | | 3,028,154 | | | | — | | | | 3,028,154 | | | | — | |
Technology | | | 575,622 | | | | — | | | | 575,622 | | | | — | |
Transportation | | | 99,240 | | | | — | | | | 99,240 | | | | — | |
U.S. Government and Agencies | | | 144,111 | | | | — | | | | 144,111 | | | | — | |
Utilities | | | 418,134 | | | | — | | | | 418,134 | | | | — | |
Registered Investment Companies | | | | | | | | | | | | | | | | |
Equity Funds/ETFs | | | 1,495,491 | | | | 1,495,491 | | | | — | | | | — | |
Fixed Income Funds/ETFs | | | 1,504,356 | | | | 1,504,356 | | | | — | | | | — | |
Preferred Stock | | | | | | | | | | | | | | | | |
Consumer Staples | | | 15,951 | | | | — | | | | 15,951 | | | | — | |
Energy | | | 7,544 | | | | — | | | | — | | | | 7,544 | |
Health Care | | | 64,706 | | | | 64,706 | | | | — | | | | — | |
Real Estate | | | 156,750 | | | | 156,750 | | | | — | | | | — | |
Short-Term Investments | | | 299,934 | | | | — | | | | 299,934 | | | | — | |
| | | | | | | | | | | | | | | | |
Subtotal Investments in Securities | | $ | 75,149,650 | | | $ | 38,150,022 | | | $ | 35,808,120 | | | $ | 1,191,508 | |
| | | | | | | | | | | | | | | | |
Other Investments* | | Total | | | | |
Short-Term Investments | | | 5,587,115 | | |
| | | | | |
Subtotal Other Investments | | $ | 5,587,115 | | |
| | | | | |
Total Investments at Value | | $ | 80,736,765 | | |
| | | | | |
| * | Certain investments are measured at fair value using a net asset value per share that is not publicly available (practical expedient). According to disclosure requirements of Accounting Standards Codification (ASC) 820, Fair Value Measurement, securities valued using the practical expedient are not classified in the fair value hierarchy. The fair value amounts presented in this table are intended to permit reconciliation of the fair value hierarchy to the amounts presented in the Statement of Assets and Liabilities. |
The accompanying Notes to Financial Statements are an integral part of this schedule.
13
GROWTHAND INCOME PLUS FUND
Summary Schedule of Investments as of December 31, 2016
| | | | | | | | | | | | | | | | |
Other Financial Instruments | | Total | | | Level 1 | | | Level 2 | | | Level 3 | |
Asset Derivatives | | | | | | | | | | | | | | | | |
Futures Contracts | | | 19,716 | | | | 19,716 | | | | — | | | | — | |
| | | | | | | | | | | | | | | | |
Total Asset Derivatives | | $ | 19,716 | | | $ | 19,716 | | | $ | — | | | $ | — | |
| | | | | | | | | | | | | | | | |
Liability Derivatives | | | | | | | | | | | | | | | | |
Futures Contracts | | | 15,146 | | | | 15,146 | | | | — | | | | — | |
| | | | | | | | | | | | | | | | |
Total Liability Derivatives | | $ | 15,146 | | | $ | 15,146 | | | $ | — | | | $ | — | |
| | | | | | | | | | | | | | | | |
There were no significant transfers between Levels during the period ended December 31, 2016. Transfers between Levels are identified as of the end of the period.
The following table presents Growth and Income Plus Fund’s futures contracts held as of December 31, 2016. Investments and/or cash totaling $299,934 were pledged as the initial margin deposit for these contracts.
| | | | | | | | | | | | | | | | | | | | |
Futures Contracts | | Number of
Contracts
Long/(Short) | | | Expiration
Date | | | Notional
Principal
Amount | | | Value | | | Unrealized
Gain/(Loss) | |
CBOT 10-Yr. U.S. Treasury Note | | | 4 | | | | March 2017 | | | $ | 499,466 | | | $ | 497,125 | | | ($ | 2,341 | ) |
CBOT 2-Yr. U.S. Treasury Note | | | (16 | ) | | | March 2017 | | | | (3,467,951 | ) | | | (3,467,000 | ) | | | 951 | |
CBOT 5-Yr. U.S. Treasury Note | | | 7 | | | | March 2017 | | | | 824,928 | | | | 823,648 | | | | (1,280 | ) |
CBOT U.S. Long Bond | | | 1 | | | | March 2017 | | | | 152,503 | | | | 150,656 | | | | (1,847 | ) |
CME E-mini S&P 500 Index | | | 7 | | | | March 2017 | | | | 789,920 | | | | 782,670 | | | | (7,250 | ) |
CME S&P 500 Index | | | (5 | ) | | | March 2017 | | | | (2,813,104 | ) | | | (2,795,250 | ) | | | 17,854 | |
CME Ultra Long Term U.S. Treasury Bond | | | 2 | | | | March 2017 | | | | 322,928 | | | | 320,500 | | | | (2,428 | ) |
Ultra 10-Yr. U.S. Treasury Note | | | (1 | ) | | | March 2017 | | | | (134,973 | ) | | | (134,062 | ) | | | 911 | |
Total Futures Contracts | | | | | | | | | | | | | | | | | | $ | 4,570 | |
The following table summarizes the fair value and Statement of Assets and Liabilities location, as of December 31, 2016, for Growth and Income Plus Fund’s investments in financial derivative instruments by primary risk exposure as discussed under item (2) Significant Accounting Policies of the Notes to Financial Statements.
| | | | | | |
Derivatives by risk category | | Statement of Assets and Liabilities Location | | Fair Value | |
Asset Derivatives | | | | | | |
Interest Rate Contracts | | | | | | |
Futures* | | Net Assets - Net unrealized appreciation/(depreciation) on Futures contracts | | $ | 1,862 | |
Total Interest Rate Contracts | | | 1,862 | |
Equity Contracts | | | | | | |
Futures* | | Net Assets - Net unrealized appreciation/(depreciation) on Futures contracts | | | 17,854 | |
Total Equity Contracts | | | | | 17,854 | |
| | | | | | |
Total Asset Derivatives | | | | $ | 19,716 | |
| | | | | | |
Liability Derivatives | | | | | | |
Interest Rate Contracts | | | | | | |
Futures* | | Net Assets - Net unrealized appreciation/(depreciation) on Futures contracts | | | 7,896 | |
Total Interest Rate Contracts | | | 7,896 | |
Equity Contracts | | | | | | |
Futures* | | Net Assets - Net unrealized appreciation/(depreciation) on Futures contracts | | | 7,250 | |
Total Equity Contracts | | | | | 7,250 | |
| | | | | | |
Total Liability Derivatives | | | | $ | 15,146 | |
| | | | | | |
| * | Includes cumulative appreciation/depreciation of futures contracts as reported in the Schedule of Investments. Only current day’s variation margin is reported within the Statement of Assets and Liabilities. |
The accompanying Notes to Financial Statements are an integral part of this schedule.
14
GROWTHAND INCOME PLUS FUND
Summary Schedule of Investments as of December 31, 2016
The following table summarizes the net realized gains/(losses) and Statement of Operations location, for the period ended December 31, 2016, for Growth and Income Plus Fund’s investments in financial derivative instruments by primary risk exposure.
| | | | | | |
Derivatives by risk category | | Statement of Operations Location | | Realized Gains/(Losses)
recognized in Income | |
Interest Rate Contracts | | | | | | |
Futures | | Net realized gains/(losses) on Futures contracts | | | 66,505 | |
Total Interest Rate Contracts | | | | | 66,505 | |
Equity Contracts | | | | | | |
Futures | | Net realized gains/(losses) on Futures contracts | | | (65,722 | ) |
Total Equity Contracts | | | | | (65,722 | ) |
Credit Contracts | | | | | | |
Credit Default Swaps | | Net realized gains/(losses) on Swap agreements | | | 415 | |
Total Credit Contracts | | | | | 415 | |
| | | | | | |
Total | | | | $ | 1,198 | |
| | | | | | |
The following table summarizes the change in net unrealized appreciation/(depreciation) and Statement of Operations location, for the period ended December 31, 2016, for Growth and Income Plus Fund’s investments in financial derivative instruments by primary risk exposure.
| | | | | | |
Derivatives by risk category | | Statement of Operations Location | | Change in unrealized
appreciation/(depreciation)
recognized in Income | |
Interest Rate Contracts | | | | | | |
Futures | | Change in net unrealized appreciation/(depreciation) on Futures contracts | | | (14,185 | ) |
Total Interest Rate Contracts | | | | | (14,185 | ) |
Equity Contracts | | | | | | |
Futures | | Change in net unrealized appreciation/(depreciation) on Futures contracts | | | 13,469 | |
Total Equity Contracts | | | | | 13,469 | |
Credit Contracts | | | | | | |
Credit Default Swaps | | Change in net unrealized appreciation/(depreciation) on Swap agreements | | | (5,862 | ) |
Total Credit Contracts | | | | | (5,862 | ) |
| | | | | | |
Total | | | | ($ | 6,578 | ) |
| | | | | | |
The following table presents Growth and Income Plus Fund’s average volume of derivative activity during the period ended December 31, 2016.
| | | | | | | | | | | | | | | | |
Derivative Risk Category | | Futures
(Notional)* | | | Futures
(Percentage of
Average Net Assets) | | | Swaps
(Notional)* | | | Swaps
(Percentage of
Average Net Assets) | |
Equity Contracts | | $ | 1,625,621 | | | | 2.2 | % | | | N/A | | | | N/A | |
Interest Rate | | | | | | | | | | | | | | | | |
Contracts | | | 4,479,531 | | | | 6.0 | | | | N/A | | | | N/A | |
Credit Contracts | | | N/A | | | | N/A | | | $ | 1,223 | | | | <0.1 | % |
| * | Notional amount represents long or short, or both, derivative positions held by the Fund. |
Investment in Affiliates
Affiliated issuers, as defined under the Investment Company Act of 1940, include those in which the Fund’s holdings of an issuer represent 5% or more of the outstanding voting securities of an issuer, any affiliated mutual fund, or a company which is under common ownership or control with the Fund. The Fund owns shares of Thrivent Core Short-Term Reserve Fund primarily to serve as a cash sweep vehicle for the Fund. Thrivent Core Short-Term Reserve Fund is established for the sole use of affiliated funds.
A summary of transactions for the fiscal year to date, in Growth and Income Plus Fund, is as follows:
| | | | | | | | | | | | | | | | | | | | | | | | |
Fund | | Value
December 31,
2015 | | | Gross
Purchases | | | Gross
Sales | | | Shares Held at
December 31,
2016 | | | Value
December 31,
2016 | | | Income Earned
January 1, 2016 -
December 31, 2016 | |
Cash Management Trust-Short Term Investment | | $ | 4,226,851 | | | $ | 8,198,280 | | | $ | 12,425,131 | | | | — | | | $ | — | | | $ | 4,077 | |
Core Short-Term Reserve | | | — | | | | 27,333,830 | | | | 21,746,715 | | | | 558,712 | | | | 5,587,115 | | | | 21,428 | |
Total Value and Income Earned | | $ | 4,226,851 | | | | | | | | | | | | | | | $ | 5,587,115 | | | $ | 25,505 | |
The accompanying Notes to Financial Statements are an integral part of this schedule.
15
DIVERSIFIED INCOME PLUS FUND
Summary Schedule of Investments as of December 31, 2016
| | | | | | | | | | | | |
Principal Amount | | | Bank Loans (13.6%) | | Value | | | % of Net
Assets | |
| | Basic Materials (0.8%) | | | | | | | | |
| | | | Ineos US Finance, LLC, Term Loan | | | | | | | | |
| | $2,090,257 | | | 3.750%, 12/15/2020a | | $ | 2,098,973 | | | | 0.3 | % |
| | | | Other Securities^ | | | 4,034,264 | | | | 0.5 | % |
| | | | | | | | | | | | |
| | | | Total | | | 6,133,237 | | | | | |
| | | | | | | | | | | | |
| | |
| | Capital Goods (0.7%) | | | | | | | | |
| | | | Cortes NP Acquisition Corporation, Term Loan | | | | | | | | |
| | 2,565,000 | | | 6.000%, 11/30/2023a | | | 2,597,062 | | | | 0.3 | % |
| | | | Other Securities^ | | | 2,958,907 | | | | 0.4 | % |
| | | | | | | | | | | | |
| | | | Total | | | 5,555,969 | | | | | |
| | | | | | | | | | | | |
| | |
| | Communications Services (3.7%) | | | | | | | | |
| | | | NEP/NCP Holdco, Inc., Term Loan | | | | | | | | |
| | 2,030,914 | | | 4.250%, 1/22/2020a | | | 2,035,992 | | | | 0.3 | % |
| | | | Other Securities^ | | | 25,759,512 | | | | 3.4 | % |
| | | | | | | | | | | | |
| | | | Total | | | 27,795,504 | | | | | |
| | | | | | | | | | | | |
| | |
| | Consumer Cyclical (2.1%) | | | | | | | | |
| | | | Other Securities^ | | | 15,455,830 | | | | 2.1 | % |
| | | | | | | | | | | | |
| | | | Total | | | 15,455,830 | | | | | |
| | | | | | | | | | | | |
| | |
| | Consumer Non-Cyclical (2.3%) | | | | | | | | |
| | | | Valeant Pharmaceuticals International, Inc., Term Loan | | | | | | | | |
| | 3,851,292 | | | 5.500%, 4/1/2022a,b,c | | | 3,852,023 | | | | 0.5 | % |
| | | | Other Securities^ | | | 13,311,576 | | | | 1.8 | % |
| | | | | | | | | | | | |
| | | | Total | | | 17,163,599 | | | | | |
| | | | | | | | | | | | |
| | |
| | Energy (0.6%) | | | | | | | | |
| | | | Other Securities^ | | | 4,730,891 | | | | 0.6 | % |
| | | | | | | | | | | | |
| | | | Total | | | 4,730,891 | | | | | |
| | | | | | | | | | | | |
| | |
| | Financials (1.0%) | | | | | | | | |
| | | | Other Securities^ | | | 7,562,255 | | | | 1.0 | % |
| | | | | | | | | | | | |
| | | | Total | | | 7,562,255 | | | | | |
| | | | | | | | | | | | |
| | |
| | Technology (1.8%) | | | | | | | | |
| | | | First Data Corporation, Term Loan | | | | | | | | |
| | 2,569,014 | | | 3.756%, 3/24/2021a | | | 2,597,915 | | | | 0.4 | % |
| | | | ON Semiconductor Corporation, Term Loan | | | | | | | | |
| | 2,309,212 | | | 4.020%, 3/31/2023a | | | 2,337,246 | | | | 0.3 | % |
| | | | Western Digital Corporation, Term Loan | | | | | | | | |
| | 1,965,125 | | | 4.520%, 4/29/2023a | | | 1,995,211 | | | | 0.3 | % |
| | | | Other Securities^ | | | 6,169,755 | | | | 0.8 | % |
| | | | | | | | | | | | |
| | | | Total | | | 13,100,127 | | | | | |
| | | | | | | | | | | | |
| | |
| | Transportation (0.3%) | | | | | | | | |
| | | | Other Securities^ | | | 2,257,177 | | | | 0.3 | % |
| | | | | | | | | | | | |
| | | | Total | | | 2,257,177 | | | | | |
| | | | | | | | | | | | |
| | |
| | Utilities (0.3%) | | | | | | | | |
| | | | Other Securities^ | | | 2,054,246 | | | | 0.3 | % |
| | | | | | | | | | | | |
| | | | Total | | | 2,054,246 | | | | | |
| | | | | | | | | | | | |
| | | | Total Bank Loans (cost $101,384,785) | | | 101,808,835 | | | | | |
| | | | | | | | | | | | |
Principal Amount | | | Long-Term Fixed Income (49.0%) | | | | | | |
| | Asset-Backed Securities (4.0%) | | | | | | | | |
| | | | Marlette Funding Trust | | | | | | | | |
| | $1,839,766 | | | 3.060%, 1/17/2023, Series 2016-1A, Class A* | | | 1,839,316 | | | | 0.2 | % |
| | | | NRZ Advance Receivables Trust Advance Receivables Backed | | | | | | | | |
| | 2,000,000 | | | 2.751%, 6/15/2049, Series 2016-T1, Class AT1* | | | 1,992,500 | | | | 0.3 | % |
| | | | SoFi Consumer Loan Program, LLC | | | | | | | | |
| | 1,932,099 | | | 3.050%, 12/26/2025, Series 2016-3, Class Ad | | | 1,925,006 | | | | 0.3 | % |
| | | | Other Securities^ | | | 24,222,699 | | | | 3.2 | % |
| | | | | | | | | | | | |
| | | | Total | | | 29,979,521 | | | | | |
| | | | | | | | | | | | |
| | |
| | Basic Materials (0.8%) | | | | | | | | |
| | | | Other Securities^ | | | 5,851,814 | | | | 0.8 | % |
| | | | | | | | | | | | |
| | | | Total | | | 5,851,814 | | | | | |
| | | | | | | | | | | | |
| | |
| | Capital Goods (1.5%) | | | | | | | | |
| | | | Other Securities^ | | | 11,311,809 | | | | 1.5 | % |
| | | | | | | | | | | | |
| | | | Total | | | 11,311,809 | | | | | |
| | | | | | | | | | | | |
| | |
| | Collateralized Mortgage Obligations (12.2%) | | | | | | | | |
| | | | Alternative Loan Trust | | | | | | | | |
| | 490,679 | | | 5.500%, 5/25/2035, Series 2005-J3, Class 2A13 | | | 489,279 | | | | 0.1 | % |
| | | | Countrywide Alternative Loan Trust | | | | | | | | |
| | 1,665,336 | | | 1.156% - 6.000%, 2/25/2035 - 4/25/2036, Series 2005-43, Class 4A1e | | | 1,429,554 | | | | 0.1 | % |
| | | | Countrywide Home Loan Mortgage Pass Through Trust | | | | | | | | |
| | 2,185,295 | | | 3.147% - 3.155%, 11/25/2035 - 2/20/2036, Series 2005-HY10, Class 5A1 | | | 1,792,865 | | | | 0.3 | % |
| | | | Federal Home Loan Mortgage Corporation | | | | | | | | |
| | 29,431,307 | | | 2.500% - 3.000%, 12/15/2022 - 2/15/2033, Series-4170, Class IGf | | | | | | | | |
| | | | Federal National Mortgage Association | | | 2,483,701 | | | | 0.4 | % |
| | 10,241,474 | | | 2.500% - 3.500%, 2/25/2028-1/25/2033, Series 2012-150, Class YIf | | | 1,098,276 | | | | 0.1 | % |
| | | | Other Securities^ | | | 83,753,140 | | | | 11.2 | % |
| | | | | | | | | | | | |
| | | | Total | | | 91,046,815 | | | | | |
| | | | | | | | | | | | |
| | |
| | Commercial Mortgage-Backed Securities (0.3%) | | | | | | | | |
| | | | Other Securities^ | | | 2,728,468 | | | | 0.3 | % |
| | | | | | | | | | | | |
| | | | Total | | | 2,728,468 | | | | | |
| | | | | | | | | | | | |
| | |
| | Communications Services (3.3%) | | | | | | | | |
| | | | Other Securities^ | | | 24,541,558 | | | | 3.3 | % |
| | | | | | | | | | | | |
| | | | Total | | | 24,541,558 | | | | | |
| | | | | | | | | | | | |
The accompanying Notes to Financial Statements are an integral part of this schedule.
16
DIVERSIFIED INCOME PLUS FUND
Summary Schedule of Investments as of December 31, 2016
| | | | | | | | | | | | |
Principal
Amount | | | Long-Term Fixed Income (49.0%) | | Value | | | % of Net
Assets | |
| | Consumer Cyclical (2.3%) | | | | | | | | |
| | | | Other Securities^ | | $ | 17,258,614 | | | | 2.3 | % |
| | | | | | | | | | | | |
| | | | Total | | | 17,258,614 | | | | | |
| | | | | | | | | | | | |
| | |
| | Consumer Non-Cyclical (2.6%) | | | | | | | | |
| | | | Other Securities^ | | | 19,642,208 | | | | 2.6 | % |
| | | | | | | | | | | | |
| | | | Total | | | 19,642,208 | | | | | |
| | | | | | | | | | | | |
| | |
| | Energy (2.3%) | | | | | | | | |
| | | | Other Securities^ | | | 17,091,082 | | | | 2.3 | % |
| | | | | | | | | | | | |
| | | | Total | | | 17,091,082 | | | | | |
| | | | | | | | | | | | |
| | |
| | Financials (7.2%) | | | | | | | | |
| | | | Bank of America Corporation | | | | | | | | |
| | 1,363,000 | | | 2.061% - 8.000%, 5/2/2017 - 10/21/2022e,g | | | 1,404,364 | | | | 0.1 | % |
| | | | Goldman Sachs Group, Inc. | | | | | | | | |
| | 1,659,000 | | | 2.000% - 7.500%, 1/31/2019 - 11/10/2026e,g | | | 1,695,633 | | | | 0.2 | % |
| | | | Goldman Sachs Group, Inc., Convertible | | | | | | | | |
| | 3,800,000 | | | 0.500%, 9/24/2022 | | | 4,197,252 | | | | 0.6 | % |
| | | | Other Securities^ | | | 46,865,776 | | | | 6.3 | % |
| | | | | | | | | | | | |
| | | | Total | | | 54,163,025 | | | | | |
| | | | | | | | | | | | |
| | |
| | Foreign Government (3.4%) | | | | | | | | |
| | | | Other Securities^ | | | 25,663,373 | | | | 3.4 | % |
| | | | | | | | | | | | |
| | | | Total | | | 25,663,373 | | | | | |
| | | | | | | | | | | | |
| | |
| | Mortgage-Backed Securities (5.3%) | | | | | | | | |
| | | | Federal Home Loan Mortgage Corporation Gold 15-Yr. Pass Through | | | | | | | | |
| | 4,500,000 | | | 3.000%, 1/1/2032c | | | 4,615,650 | | | | 0.6 | % |
| | | | Federal National Mortgage Association Conventional 15-Yr. Pass Through | | | | | | | | |
| | 7,000,000 | | | 2.500%, 1/1/2032c | | | 7,007,700 | | | | 0.9 | % |
| | | | Federal National Mortgage Association Conventional 30-Yr. Pass Through | | | | | | | | |
| | 18,800,000 | | | 3.000%, 1/1/2047c | | | 18,662,760 | | | | 2.5 | % |
| | 4,000,000 | | | 3.500%, 1/1/2047c | | | 4,097,200 | | | | 0.6 | % |
| | 5,200,000 | | | 4.000%, 1/1/2047c | | | 5,464,160 | | | | 0.7 | % |
| | | | | | | | | | | | |
| | | | Total | | | 39,847,470 | | | | | |
| | | | | | | | | | | | |
| | |
| | Technology (1.6%) | | | | | | | | |
| | | | Other Securities^ | | | 11,803,629 | | | | 1.6 | % |
| | | | | | | | | | | | |
| | | | Total | | | 11,803,629 | | | | | |
| | | | | | | | | | | | |
| | |
| | Transportation (0.5%) | | | | | | | | |
| | | | Other Securities^ | | | 3,485,840 | | | | 0.5 | % |
| | | | | | | | | | | | |
| | | | Total | | | 3,485,840 | | | | | |
| | | | | | | | | | | | |
| | |
| | U.S. Government and Agencies (0.5%) | | | | | | | | |
| | | | U.S. Treasury Notes | | | | | | | | |
| | 2,300,000 | | | 1.625%, 2/15/2026 | | | 2,145,764 | | | | 0.3 | % |
| | | | Other Securities^ | | | 1,370,492 | | | | 0.2 | % |
| | | | | | | | | | | | |
| | | | Total | | | 3,516,256 | | | | | |
| | | | | | | | | | | | |
| | |
| | Utilities (1.2%) | | | | | | | | |
| | | | Other Securities^ | | | 9,252,023 | | | | 1.2 | % |
| | | | | | | | | | | | |
| | | | Total | | | 9,252,023 | | | | | |
| | | | | | | | | | | | |
| | | | Total Long-Term Fixed Income (cost $363,387,901) | | | 367,183,505 | | | | | |
| | | | | | | | | | | | |
Shares | | | Common Stock (27.2%) | | | | | | |
| | Consumer Discretionary (4.1%) | | | | | | | | |
| | 5,990 | | | Amazon.com, Inc.h | | | 4,491,721 | | | | 0.6 | % |
| | 3,420 | | | AutoZone, Inc.h | | | 2,701,082 | | | | 0.4 | % |
| | 43,122 | | | Comcast Corporation | | | 2,977,574 | | | | 0.4 | % |
| | 50,600 | | | NIKE, Inc. | | | 2,571,998 | | | | 0.4 | % |
| | 28,790 | | | Walt Disney Company | | | 3,000,494 | | | | 0.4 | % |
| | | | Other Securities^ | | | 14,999,602 | | | | 1.9 | % |
| | | | | | | | | | | | |
| | | | Total | | | 30,742,471 | | | | | |
| | | | | | | | | | | | |
| | |
| | Consumer Staples (1.2%) | | | | | | | | |
| | 20,480 | | | Philip Morris International, Inc. | | | 1,873,715 | | | | 0.3 | % |
| | | | Other Securities^ | | | 7,214,805 | | | | 0.9 | % |
| | | | | | | | | | | | |
| | | | Total | | | 9,088,520 | | | | | |
| | | | | | | | | | | | |
| | |
| | Energy (1.8%) | | | | | | | | |
| | 362,106 | | | BP plc | | | 2,268,039 | | | | 0.3 | % |
| | | | Other Securities^ | | | 11,310,312 | | | | 1.5 | % |
| | | | | | | | | | | | |
| | | | Total | | | 13,578,351 | | | | | |
| | | | | | | | | | | | |
| | |
| | Financials (4.8%) | | | | | | | | |
| | 183,600 | | | Ares Capital Corporation | | | 3,027,564 | | | | 0.4 | % |
| | 173,780 | | | Bank of America Corporation | | | 3,840,538 | | | | 0.5 | % |
| | 14,360 | | | Goldman Sachs Group, Inc. | | | 3,438,502 | | | | 0.5 | % |
| | 180,000 | | | Golub Capital BDC, Inc. | | | 3,310,200 | | | | 0.4 | % |
| | 57,560 | | | Synchrony Financial | | | 2,087,701 | | | | 0.3 | % |
| | | | Other Securities^ | | | 20,207,712 | | | | 2.7 | % |
| | | | | | | | | | | | |
| | | | Total | | | 35,912,217 | | | | | |
| | | | | | | | | | | | |
| | |
| | Health Care (2.6%) | | | | | | | | |
| | 32,550 | | | Bristol-Myers Squibb Company | | | 1,902,222 | | | | 0.3 | % |
| | 20,560 | | | Celgene Corporationh | | | 2,379,820 | | | | 0.3 | % |
| | 32,200 | | | Medtronic plc | | | 2,293,606 | | | | 0.3 | % |
| | 45,580 | | | Merck & Company, Inc. | | | 2,683,295 | | | | 0.4 | % |
| | | | Other Securities^ | | | 9,977,833 | | | | 1.3 | % |
| | | | | | | | | | | | |
| | | | Total | | | 19,236,776 | | | | | |
| | | | | | | | | | | | |
| | |
| | Industrials (2.9%) | | | | | | | | |
| | 7,990 | | | Acuity Brands, Inc. | | | 1,844,571 | | | | 0.3 | % |
| | 16,620 | | | Illinois Tool Works, Inc. | | | 2,035,285 | | | | 0.3 | % |
| | 34,090 | | | Jacobs Engineering Group, Inc.h | | | 1,943,130 | | | | 0.3 | % |
| | 23,670 | | | Union Pacific Corporation | | | 2,454,106 | | | | 0.4 | % |
| | | | Other Securities^ | | | 13,399,368 | | | | 1.6 | % |
| | | | | | | | | | | | |
| | | | Total | | | 21,676,460 | | | | | |
| | | | | | | | | | | | |
| | |
| | Information Technology (4.0%) | | | | | | | | |
| | 2,790 | | | Alphabet, Inc., Class Ah | | | 2,210,936 | | | | 0.3 | % |
| | 28,500 | | | Apple, Inc. | | | 3,300,870 | | | | 0.4 | % |
| | 18,670 | | | Facebook, Inc.h | | | 2,147,984 | | | | 0.3 | % |
| | 33,270 | | | Microsoft Corporation | | | 2,067,398 | | | | 0.3 | % |
| | 46,920 | | | PayPal Holdings, Inc.h | | | 1,851,932 | | | | 0.2 | % |
| | 33,790 | | | Visa, Inc. | | | 2,636,296 | | | | 0.4 | % |
| | 57,370 | | | Xilinx, Inc. | | | 3,463,427 | | | | 0.5 | % |
| | | | Other Securities^ | | | 12,124,893 | | | | 1.6 | % |
| | | | | | | | | | | | |
| | | | Total | | | 29,803,736 | | | | | |
| | | | | | | | | | | | |
The accompanying Notes to Financial Statements are an integral part of this schedule.
17
DIVERSIFIED INCOME PLUS FUND
Summary Schedule of Investments as of December 31, 2016
| | | | | | | | | | | | |
Shares | | | Common Stock (27.2%) | | Value | | | % of Net
Assets | |
| | Materials (1.1%) | | | | | | | | |
| | | | Other Securities^ | | $ | 8,099,865 | | | | 1.1 | % |
| | | | | | | | | | | | |
| | | | Total | | | 8,099,865 | | | | | |
| | | | | | | | | | | | |
| | |
| | Real Estate (3.9%) | | | | | | | | |
| | 12,016 | | | Simon Property Group, Inc. | | | 2,134,883 | | | | 0.3 | % |
| | | | Other Securities^ | | | 27,566,093 | | | | 3.6 | % |
| | | | | | | | | | | | |
| | | | Total | | | 29,700,976 | | | | | |
| | | | | | | | | | | | |
| | |
| | Telecommunications Services (0.4%) | | | | | | | | |
| | | | Other Securities^ | | | 2,855,293 | | | | 0.4 | % |
| | | | | | | | | | | | |
| | | | Total | | | 2,855,293 | | | | | |
| | | | | | | | | | | | |
| | |
| | Utilities (0.4%) | | | | | | | | |
| | | | Other Securities^ | | | 2,834,867 | | | | 0.4 | % |
| | | | | | | | | | | | |
| | | | Total | | | 2,834,867 | | | | | |
| | | | | | | | | | | | |
| | | | Total Common Stock
(cost $191,261,988) | | | 203,529,532 | | | | | |
| | | | | | | | | | | | |
| | | |
Shares | | | Registered Investment Companies (3.8%) | | | | | | |
| | Equity Funds/ETFs (1.5%) | | | | | | | | |
| | 418,500 | | | Alerian MLP ETF | | | 5,273,100 | | | | 0.7 | % |
| | 63,090 | | | Materials Select Sector SPDR Fund | | | 3,135,573 | | | | 0.4 | % |
| | 41,840 | | | Utilities Select Sector SPDR Fund | | | 2,032,169 | | | | 0.3 | % |
| | | | Other Securities^ | | | 1,106,684 | | | | 0.1 | % |
| | | | | | | | | | | | |
| | | | Total | | | 11,547,526 | | | | | |
| | | | | | | | | | | | |
| | |
| | Fixed Income Funds/ETFs (2.3%) | | | | | | | | |
| | 64,400 | | | iShares S&P U.S. Preferred Stock Index Fund | | | 2,396,324 | | | | 0.3 | % |
| | 180,885 | | | Vanguard Short-Term Corporate Bond ETF | | | 14,356,842 | | | | 1.9 | % |
| | | | Other Securities^ | | | 529,056 | | | | 0.1 | % |
| | | | | | | | | | | | |
| | | | Total | | | 17,282,222 | | | | | |
| | | | | | | | | | | | |
| | | | Total Registered Investment Companies (cost $30,692,216) | | | 28,829,748 | | | | | |
| | | | | | | | | | | | |
| | | |
Shares | | | Preferred Stock (2.4%) | | | | | | |
| | Consumer Staples (0.4%) | | | | | | | | |
| | | | Other Securities^ | | | 2,665,383 | | | | 0.4 | % |
| | | | | | | | | | | | |
| | | | Total | | | 2,665,383 | | | | | |
| | | | | | | | | | | | |
| | |
| | Energy (<0.1%) | | | | | | | | |
| | | | Other Securities^ | | | 175,565 | | | | <0.1 | % |
| | | | | | | | | | | | |
| | | | Total | | | 175,565 | | | | | |
| | | | | | | | | | | | |
| | |
| | Financials (1.7%) | | | | | | | | |
| | 40,200 | | | Goldman Sachs Group, Inc., 5.500%g | | | 1,020,276 | | | | 0.1 | % |
| | | | Other Securities^ | | | 11,915,028 | | | | 1.6 | % |
| | | | | | | | | | | | |
| | | | Total | | | 12,935,304 | | | | | |
| | | | | | | | | | | | |
| | |
| | Health Care (0.2%) | | | | | | | | |
| | | | Other Securities^ | | | 1,174,350 | | | | 0.2 | % |
| | | | | | | | | | | | |
| | | | Total | | | 1,174,350 | | | | | |
| | | | | | | | | | | | |
| | |
| | Real Estate (0.1%) | | | | | | | | |
| | | | Other Securities^ | | | 982,300 | | | | 0.1 | % |
| | | | | | | | | | | | |
| | | | Total | | | 982,300 | | | | | |
| | | | | | | | | | | | |
| | | | Total Preferred Stock
(cost $17,656,574) | | | 17,932,902 | | | | | |
| | | | | | | | | | | | |
Shares | | | Collateral Held for Securities Loaned (<0.1%) | | | | | | |
| | 222,600 | | | Thrivent Cash Management Trust | | | 222,600 | | | | <0.1 | % |
| | | | | | | | | | | | |
| | | | Total Collateral Held for Securities Loaned (cost $222,600) | | | 222,600 | | | | | |
| | | | | | | | | | | | |
| | | |
Shares or
Principal
Amount | | | Short-Term Investments (9.4%)i | | | | | | |
| | | | Thrivent Core Short-Term Reserve Fund | | | | | | | | |
| | 6,727,263 | | | 0.910% | | | 67,272,626 | | | | 9.0 | % |
| | | | Other Securities^ | | | 3,399,232 | | | | 0.4 | % |
| | | | | | | | | | | | |
| | | | Total Short-Term Investments (cost $70,671,742) | | | 70,671,858 | | | | | |
| | | | | | | | | | | | |
| | | | Total Investments (cost $775,277,806) 105.4% | | $ | 790,178,980 | | | | | |
| | | | | | | | | | | | |
| | | | Other Assets and Liabilities, Net (5.4%) | | | (40,732,308 | ) | | | | |
| | | | | | | | | | | | |
| | | | Total Net Assets 100.0% | | $ | 749,446,672 | | | | | |
| | | | | | | | | | | | |
| ^ | The Summary Schedule of Investments shows the 50 largest holdings in unaffiliated issuers, any holding or issuer that exceeds 1% of net assets and all affiliated holdings as of the report date. The remaining securities held are grouped by category as “Other securities”. |
| a | The stated interest rate represents the weighted average of all contracts within the bank loan facility. |
| b | All or a portion of the loan is unfunded. |
| c | Denotes investments purchased on a when-issued or delayed delivery basis. |
| d | Denotes securities sold under Rule 144A of the Securities Act of 1933, which exempts them from registration. These securities may be resold to other dealers in the program or to other qualified institutional buyers. As of December 31, 2016, the value of these investments was $74,011,964 or 9.9% of total net assets. |
| e | Denotes variable rate securities. Variable rate securities are securities whose yields vary with a designated market index or market rate. The rate shown is as of December 31, 2016. |
| f | Denotes interest only security. Interest only securities represent the right to receive monthly interest payments on an underlying pool of mortgages or assets. The principal shown is the outstanding par amount of the pool as of the end of the period. The actual effective yield of the security is different than the stated coupon rate. |
| g | Denotes perpetual securities. Perpetual securities pay an indefinite stream of interest and have no contractual maturity date. Date shown, if applicable, is next call date. |
| h | Non-income producing security. |
| i | The interest rate shown reflects the yield, coupon rate or the discount rate at the date of purchase. |
The accompanying Notes to Financial Statements are an integral part of this schedule.
18
DIVERSIFIED INCOME PLUS FUND
Summary Schedule of Investments as of December 31, 2016
| * | Denotes restricted securities. Restricted securities are investment securities which cannot be offered for public sale without first being registered under the Securities Act of 1933. The value of all restricted securities held in Diversified Income Plus Fund as of December 31, 2016 was $21,294,634 or 2.8% of total net assets. The following table indicates the acquisition date and cost of restricted securities shown in the schedule as of December 31, 2016. |
| | | | | | | | |
Security | | Acquisition
Date | | | Cost | |
Marlette Funding Trust, 1/17/2023 | | | 7/20/2016 | | | $ | 1,839,214 | |
NRZ Advance Receivables Trust
Advance Receivables Backed, 6/15/2049 | | | 6/23/2016 | | | | 1,999,997 | |
The following table presents the total amount of securities loaned with continuous maturity, by type, offset by the gross payable upon return of collateral for securities loaned by Thrivent Diversified Income Plus Fund as of December 31, 2016:
Securities Lending Transactions
| | | | |
Common Stock | | $ | 210,587 | |
| | | | |
Total lending | | $ | 210,587 | |
Gross amount payable upon return of collateral for securities loaned | | $ | 222,600 | |
| | | | |
Net amounts due to counterparty | | $ | 12,013 | |
| | | | |
Definitions:
| | | | |
| ETF | | - | | Exchange Traded Fund. |
Unrealized Appreciation (Depreciation)
Gross unrealized appreciation and depreciation of investments, based on cost for federal income tax purposes, were as follows:
| | | | |
Gross unrealized appreciation | | $ | 32,097,224 | |
Gross unrealized depreciation | | | (18,252,465 | ) |
| | | | |
Net unrealized appreciation (depreciation) | | $ | 13,844,759 | |
Cost for federal income tax purposes | | $ | 776,334,221 | |
The accompanying Notes to Financial Statements are an integral part of this schedule.
19
DIVERSIFIED INCOME PLUS FUND
Summary Schedule of Investments as of December 31, 2016
Fair Valuation Measurements
The following table is a summary of the inputs used, as of December 31, 2016, in valuing Diversified Income Plus Fund’s assets carried at fair value.
| | | | | | | | | | | | | | | | |
Investments in Securities | | Total | | | Level 1 | | | Level 2 | | | Level 3 | |
Bank Loans | | | | | | | | | | | | | | | | |
Basic Materials | | | 6,133,237 | | | | — | | | | 6,133,237 | | | | — | |
Capital Goods | | | 5,555,969 | | | | — | | | | 2,958,907 | | | | 2,597,062 | |
Communications Services | | | 27,795,504 | | | | — | | | | 24,897,695 | | | | 2,897,809 | |
Consumer Cyclical | | | 15,455,830 | | | | — | | | | 14,848,330 | | | | 607,500 | |
Consumer Non-Cyclical | | | 17,163,599 | | | | — | | | | 17,163,599 | | | | — | |
Energy | | | 4,730,891 | | | | — | | | | 3,618,492 | | | | 1,112,399 | |
Financials | | | 7,562,255 | | | | — | | | | 7,562,255 | | | | — | |
Technology | | | 13,100,127 | | | | — | | | | 12,033,258 | | | | 1,066,869 | |
Transportation | | | 2,257,177 | | | | — | | | | 2,257,177 | | | | — | |
Utilities | | | 2,054,246 | | | | — | | | | 1,175,965 | | | | 878,281 | |
Long-Term Fixed Income | | | | | | | | | | | | | | | | |
Asset-Backed Securities | | | 29,979,521 | | | | — | | | | 29,979,521 | | | | — | |
Basic Materials | | | 5,851,814 | | | | — | | | | 5,851,814 | | | | — | |
Capital Goods | | | 11,311,809 | | | | — | | | | 11,311,809 | | | | — | |
Collateralized Mortgage Obligations | | | 91,046,815 | | | | — | | | | 91,046,815 | | | | — | |
Commercial Mortgage-Backed Securities | | | 2,728,468 | | | | — | | | | 2,728,468 | | | | — | |
Communications Services | | | 24,541,558 | | | | — | | | | 24,541,558 | | | | — | |
Consumer Cyclical | | | 17,258,614 | | | | — | | | | 17,258,614 | | | | — | |
Consumer Non-Cyclical | | | 19,642,208 | | | | — | | | | 19,642,208 | | | | — | |
Energy | | | 17,091,082 | | | | — | | | | 17,091,082 | | | | — | |
Financials | | | 54,163,025 | | | | — | | | | 49,965,773 | | | | 4,197,252 | |
Foreign Government | | | 25,663,373 | | | | — | | | | 25,663,373 | | | | — | |
Mortgage-Backed Securities | | | 39,847,470 | | | | — | | | | 39,847,470 | | | | — | |
Technology | | | 11,803,629 | | | | — | | | | 11,803,629 | | | | — | |
Transportation | | | 3,485,840 | | | | — | | | | 3,485,840 | | | | — | |
U.S. Government and Agencies | | | 3,516,256 | | | | — | | | | 3,516,256 | | | | — | |
Utilities | | | 9,252,023 | | | | — | | | | 9,252,023 | | | | — | |
Common Stock | | | | | | | | | | | | | | | | |
Consumer Discretionary | | | 30,742,471 | | | | 23,365,563 | | | | 7,376,908 | | | | — | |
Consumer Staples | | | 9,088,520 | | | | 4,831,050 | | | | 4,257,470 | | | | — | |
Energy | | | 13,578,351 | | | | 8,188,431 | | | | 5,389,720 | | | | 200 | |
Financials | | | 35,912,217 | | | | 23,658,420 | | | | 12,253,797 | | | | — | |
Health Care | | | 19,236,776 | | | | 14,702,135 | | | | 4,534,641 | | | | — | |
Industrials | | | 21,676,460 | | | | 12,439,547 | | | | 9,236,913 | | | | — | |
Information Technology | | | 29,803,736 | | | | 27,979,905 | | | | 1,823,831 | | | | — | |
Materials | | | 8,099,865 | | | | 2,460,097 | | | | 5,639,768 | | | | — | |
Real Estate | | | 29,700,976 | | | | 27,473,931 | | | | 2,227,045 | | | | — | |
Telecommunications Services | | | 2,855,293 | | | | 818,214 | | | | 2,037,079 | | | | — | |
Utilities | | | 2,834,867 | | | | 1,635,255 | | | | 1,199,612 | | | | — | |
Registered Investment Companies | | | | | | | | | | | | | | | | |
Fixed Income Funds/ETFs | | | 17,282,222 | | | | 17,282,222 | | | | — | | | | — | |
Equity Funds/ETFs | | | 11,547,526 | | | | 11,547,526 | | | | — | | | | — | |
Preferred Stock | | | | | | | | | | | | | | | | |
Consumer Staples | | | 2,665,383 | | | | 2,603,601 | | | | 61,782 | | | | — | |
Energy | | | 175,565 | | | | — | | | | — | | | | 175,565 | |
Financials | | | 12,935,304 | | | | 11,620,064 | | | | 1,315,240 | | | | — | |
Health Care | | | 1,174,350 | | | | 1,174,350 | | | | — | | | | — | |
Real Estate | | | 982,300 | | | | 982,300 | | | | — | | | | — | |
Short-Term Investments | | | 3,399,232 | | | | — | | | | 3,399,232 | | | | — | |
| | | | | | | | | | | | | | | | |
Subtotal Investments in Securities | | $ | 722,683,754 | | | $ | 192,762,611 | | | $ | 516,388,206 | | | $ | 13,532,937 | |
| | | | | | | | | | | | | | | | |
| | |
Other Investments * | | Total | | | | |
Short-Term Investments | | | 67,272,626 | | |
Collateral Held for Securities Loaned | | | 222,600 | | |
| | | | | |
Subtotal Other Investments | | $ | 67,495,226 | | |
| | | | | |
Total Investments at Value | | $ | 790,178,980 | | |
| | | | | |
| * | Certain investments are measured at fair value using a net asset value per share that is not publicly available (practical expedient). According to disclosure requirements of Accounting Standards Codification (ASC) 820, Fair Value Measurement, securities valued using the practical expedient are not classified in the fair value hierarchy. The fair value amounts presented in this table are intended to permit reconciliation of the fair value hierarchy to the amounts presented in the Statement of Assets and Liabilities. |
The accompanying Notes to Financial Statements are an integral part of this schedule.
20
DIVERSIFIED INCOME PLUS FUND
Summary Schedule of Investments as of December 31, 2016
| | | | | | | | | | | | | | | | |
Other Financial Instruments | | Total | | | Level 1 | | | Level 2 | | | Level 3 | |
Asset Derivatives | | | | | | | | | | | | | | | | |
Futures Contracts | | | 233,479 | | | | 233,479 | | | | — | | | | — | |
| | | | | | | | | | | | | | | | |
Total Asset Derivatives | | $ | 233,479 | | | $ | 233,479 | | | $ | — | | | $ | — | |
| | | | | | | | | | | | | | | | |
Liability Derivatives | | | | | | | | | | | | | | | | |
Futures Contracts | | | 122,357 | | | | 122,357 | | | | — | | | | — | |
| | | | | | | | | | | | | | | | |
Total Liability Derivatives | | $ | 122,357 | | | $ | 122,357 | | | $ | — | | | $ | — | |
| | | | | | | | | | | | | | | | |
There were no significant transfers between Levels during the period ended December 31, 2016. Transfers between Levels are identified as of the end of the period.
The following table presents Diversified Income Plus Fund’s futures contracts held as of December 31, 2016. Investments and/or cash totaling $1,799,673 were pledged as the initial margin deposit for these contracts.
| | | | | | | | | | | | | | | | | | | | |
Futures Contracts | | Number of
Contracts
Long/(Short) | | | Expiration
Date | | | Notional
Principal
Amount | | | Value | | | Unrealized
Gain/(Loss) | |
CBOT 10-Yr. U.S. Treasury Note | | | (46 | ) | | | March 2017 | | | ($ | 5,750,572 | ) | | ($ | 5,716,938 | ) | | $ | 33,634 | |
CBOT 2-Yr. U.S. Treasury Note | | | (58 | ) | | | March 2017 | | | | (12,571,323 | ) | | | (12,567,875 | ) | | | 3,448 | |
CBOT 5-Yr. U.S. Treasury Note | | | 250 | | | | March 2017 | | | | 29,461,713 | | | | 29,416,016 | | | | (45,697 | ) |
CBOT U.S. Long Bond | | | 25 | | | | March 2017 | | | | 3,812,581 | | | | 3,766,406 | | | | (46,175 | ) |
CME E-mini S&P 500 Index | | | 29 | | | | March 2017 | | | | 3,271,761 | | | | 3,242,490 | | | | (29,271 | ) |
CME S&P 500 Index | | | (55 | ) | | | March 2017 | | | | (30,944,147 | ) | | | (30,747,750 | ) | | | 196,397 | |
CME Ultra Long Term U.S. Treasury Bond | | | 1 | | | | March 2017 | | | | 161,464 | | | | 160,250 | | | | (1,214 | ) |
Total Futures Contracts | | | | | | | | | | | | | | | | | | $ | 111,122 | |
The following table summarizes the fair value and Statement of Assets and Liabilities location, as of December 31, 2016, for Diversified Income Plus Fund’s investments in financial derivative instruments by primary risk exposure as discussed under item (2) Significant Accounting Policies of the Notes to Financial Statements.
| | | | | | |
Derivatives by risk category | | Statement of Assets and Liabilities Location | | Fair Value | |
Asset Derivatives | | | | | | |
Interest Rate Contracts | | | | | | |
Futures* | | Net Assets - Net unrealized appreciation/(depreciation) on Futures contracts | | $ | 37,082 | |
Total Interest Rate Contracts | | | | | 37,082 | |
Equity Contracts | | | | | | |
Futures* | | Net Assets - Net unrealized appreciation/(depreciation) on Futures contracts | | | 196,397 | |
Total Equity Contracts | | | | | 196,397 | |
| | | | | | |
Total Asset Derivatives | | | | $ | 233,479 | |
| | | | | | |
Liability Derivatives | | | | | | |
Interest Rate Contracts | | | | | | |
Futures* | | Net Assets - Net unrealized appreciation/(depreciation) on Futures contracts | | | 93,086 | |
Total Interest Rate Contracts | | | | | 93,086 | |
Equity Contracts | | | | | | |
Futures* | | Net Assets - Net unrealized appreciation/(depreciation) on Futures contracts | | | 29,271 | |
Total Equity Contracts | | | | | 29,271 | |
| | | | | | |
Total Liability Derivatives | | | | $ | 122,357 | |
| | | | | | |
| * | Includes cumulative appreciation/depreciation of futures contracts as reported in the Schedule of Investments. Only current day’s variation margin is reported within the Statement of Assets and Liabilities. |
The following table summarizes the net realized gains/(losses) and Statement of Operations location, for the period ended December 31, 2016, for Diversified Income Plus Fund’s investments in financial derivative instruments by primary risk exposure.
| | | | | | |
Derivatives by risk category | | Statement of Operations Location | | Realized Gains/(Losses)
recognized in Income | |
Interest Rate Contracts | | | | | | |
Futures | | Net realized gains/(losses) on Futures contracts | | | 835,866 | |
Total Interest Rate Contracts | | | | | 835,866 | |
Equity Contracts | | | | | | |
Futures | | Net realized gains/(losses) on Futures contracts | | | (4,281,194 | ) |
Total Equity Contracts | | | | | (4,281,194 | ) |
| | | | | | |
Total | | | | ($ | 3,445,328 | ) |
| | | | | | |
The accompanying Notes to Financial Statements are an integral part of this schedule.
21
DIVERSIFIED INCOME PLUS FUND
Summary Schedule of Investments as of December 31, 2016
The following table summarizes the change in net unrealized appreciation/(depreciation) and Statement of Operations location, for the period ended December 31, 2016, for Diversified Income Plus Fund’s investments in financial derivative instruments by primary risk exposure.
| | | | | | |
Derivatives by risk category | | Statement of Operations Location | | Change in unrealized
appreciation/(depreciation)
recognized in Income | |
Interest Rate Contracts | | | | | | |
Futures | | Change in net unrealized appreciation/(depreciation) on Futures contracts | | | (65,057 | ) |
Total Interest Rate Contracts | | | | | (65,057 | ) |
Equity Contracts | | | | | | |
Futures | | Change in net unrealized appreciation/(depreciation) on Futures contracts | | | 727,411 | |
Total Equity Contracts | | | | | 727,411 | |
| | | | | | |
Total | | | | $ | 662,354 | |
| | | | | | |
The following table presents Diversified Income Plus Fund’s average volume of derivative activity during the period ended December 31, 2016.
| | | | | | | | |
Derivative Risk Category | | Futures
(Notional)* | | | Futures
(Percentage
of
Average
Net Assets) | |
Equity Contracts | | $ | 30,981,418 | | | | 4.4 | % |
Interest Rate | | | | | | | | |
Contracts | | | 73,727,913 | | | | 10.4 | |
| * | Notional amount represents long or short, or both, derivative positions held by the Fund. |
Investment in Affiliates
Affiliated issuers, as defined under the Investment Company Act of 1940, include those in which the Fund’s holdings of an issuer represent 5% or more of the outstanding voting securities of an issuer, any affiliated mutual fund, or a company which is under common ownership or control with the Fund. The Fund owns shares of Thrivent Cash Management Trust for the purpose of securities lending and Thrivent Core Short-Term Reserve Fund primarily to serve as a cash sweep vehicle for the Fund. Thrivent Cash Management Trust and Thrivent Core Short-Term Reserve Fund are established for the sole use of affiliated funds.
A summary of transactions for the fiscal year to date, in Diversified Income Plus Fund, is as follows:
| | | | | | | | | | | | | | | | | | | | | | | | |
Fund | | Value
December 31,
2015 | | | Gross
Purchases | | | Gross
Sales | | | Shares Held
at
December 31,
2016 | | | Value
December 31,
2016 | | | Income Earned
January 1, 2016 -
December 31, 2016 | |
Cash Management Trust-Collateral Investment | | $ | 714,690 | | | $ | 17,698,806 | | | $ | 18,190,896 | | | | 222,600 | | | $ | 222,600 | | | $ | 23,134 | |
Cash Management Trust-Short Term Investment | | | 33,870,084 | | | | 115,242,836 | | | | 149,112,920 | | | | — | | | | — | | | | 33,165 | |
Core Short-Term Reserve | | | — | | | | 293,517,621 | | | | 226,244,995 | | | | 6,727,263 | | | | 67,272,626 | | | | 240,287 | |
Total Value and Income Earned | | $ | 34,584,774 | | | | | | | | | | | | | | | $ | 67,495,226 | | | $ | 296,586 | |
The accompanying Notes to Financial Statements are an integral part of this schedule.
22
(This page intentionally left blank)
23
THRIVENT MUTUAL FUNDS
Statement of Assets and Liabilities
| | | | | | | | |
As of December 31, 2016 | | Growth and
Income Plus
Fund | | | Diversified
Income Plus
Fund | |
Assets | | | | | | | | |
Investments at cost | | $ | 77,973,550 | | | $ | 775,277,806 | |
Investments in securities at value | | | 75,149,650 | | | | 722,683,754 | |
Investments in affiliates at value | | | 5,587,115 | | | | 67,495,226 | |
Investments at Value | | | 80,736,765 | | | | 790,178,980 | |
Cash | | | 12,145 | (a) | | | 945,129 | (b) |
Dividends and interest receivable | | | 264,416 | | | | 3,839,656 | |
Prepaid expenses | | | 9,803 | | | | 38,744 | |
Receivable for investments sold | | | 94,218 | | | | 1,173,897 | |
Receivable for fund shares sold | | | 38,184 | | | | 720,373 | |
Receivable for expense reimbursements | | | 24,130 | | | | — | |
Receivable for variation margin | | | 16,336 | | | | 183,109 | |
Total Assets | | | 81,195,997 | | | | 797,079,888 | |
Liabilities | | | | | | | | |
Accrued expenses | | | 46,292 | | | | 95,508 | |
Payable for investments purchased | | | 3,423,011 | | | | 46,373,099 | |
Payable upon return of collateral for securities loaned | | | — | | | | 222,600 | |
Payable for fund shares redeemed | | | 32,070 | | | | 266,006 | |
Payable for variation margin | | | 4,693 | | | | 32,343 | |
Payable for investment advisory fees | | | 42,583 | | | | 346,947 | |
Payable for administrative fees | | | 7,013 | | | | 17,188 | |
Payable for distribution fees | | | 15,205 | | | | 125,108 | |
Payable for transfer agent fees | | | 6,933 | | | | 40,194 | |
Payable for trustee fees | | | 150 | | | | 570 | |
Payable for trustee deferred compensation | | | 20,178 | | | | 84,590 | |
Commitments and contingent liabilities^ | | | — | | | | — | |
Mortgage dollar roll deferred revenue | | | 2,021 | | | | 29,063 | |
Total Liabilities | | | 3,600,149 | | | | 47,633,216 | |
Net Assets | | | | | | | | |
Capital stock (beneficial interest) | | | 76,866,074 | | | | 748,144,870 | |
Accumulated undistributed net investment income/(loss) | | | (69,404 | ) | | | 140,674 | |
Accumulated undistributed net realized gain/(loss) | | | (1,967,436 | ) | | | (13,846,742 | ) |
Net unrealized appreciation/(depreciation) on: | | | | | | | | |
Investments | | | 2,763,215 | | | | 14,901,174 | |
Futures contracts | | | 4,570 | | | | 111,122 | |
Foreign currency transactions | | | (1,171 | ) | | | (4,426 | ) |
Total Net Assets | | $ | 77,595,848 | | | $ | 749,446,672 | |
Class A Share Capital | | $ | 71,650,696 | | | $ | 591,283,211 | |
Shares of beneficial interest outstanding (Class A) | | | 7,197,478 | | | | 84,470,720 | |
Net asset value per share | | $ | 9.95 | | | $ | 7.00 | |
Maximum public offering price | | $ | 10.42 | | | $ | 7.33 | |
Class S Share Capital | | $ | 5,945,152 | | | $ | 158,163,461 | |
Shares of beneficial interest outstanding (Class S) | | | 596,280 | | | | 22,795,848 | |
Net asset value per share | | $ | 9.97 | | | $ | 6.94 | |
| (a) | Includes foreign currency holdings of $12,116 (cost $12,081). |
| (b) | Includes foreign currency holdings of $45,569 (cost $45,442). |
| ^ | Commitments and contingent liability accrual. Additional information can be found in the accompanying Notes to Financial Statements. |
The accompanying Notes to Financial Statements are an integral part of this statement.
24
THRIVENT MUTUAL FUNDS
Statement of Operations
| | | | | | | | |
For the year ended December 31, 2016 | | Growth and
Income Plus
Fund | | | Diversified
Income Plus
Fund | |
Investment Income | | | | | | | | |
Dividends | | $ | 1,285,622 | | | $ | 7,464,653 | |
Taxable interest | | | 932,139 | | | | 22,027,834 | |
Income from mortgage dollar rolls | | | 32,741 | | | | 274,280 | |
Income from securities loaned, net | | | — | | | | 23,134 | |
Income from affiliated investments | | | 25,505 | | | | 273,452 | |
Foreign tax withholding | | | (52,716 | ) | | | (210,411 | ) |
Total Investment Income | | | 2,223,291 | | | | 29,852,942 | |
Expenses | | | | | | | | |
Adviser fees | | | 485,574 | | | | 3,905,322 | |
Administrative service fees | | | 83,447 | | | | 197,811 | |
Audit and legal fees | | | 33,625 | | | | 39,730 | |
Custody fees | | | 84,704 | | | | 108,708 | |
Distribution expenses Class A | | | 178,803 | | | | 1,462,225 | |
Insurance expenses | | | 5,244 | | | | 8,118 | |
Printing and postage expenses Class A | | | 21,718 | | | | 128,213 | |
Printing and postage expenses Class S | | | 1,532 | | | | 16,754 | |
SEC and state registration expenses | | | 32,782 | | | | 78,053 | |
Transfer agent fees Class A | | | 77,484 | | | | 442,408 | |
Transfer agent fees Class S | | | 3,944 | | | | 70,172 | |
Trustees’ fees | | | 8,549 | | | | 32,184 | |
Other expenses | | | 55,885 | | | | 73,775 | |
Total Expenses Before Reimbursement | | | 1,073,291 | | | | 6,563,473 | |
Less: | | | | | | | | |
Reimbursement from adviser | | | (258,239 | ) | | | — | |
| Total Net Expenses | | | 815,052 | | | | 6,563,473 | |
| Net Investment Income/(Loss) | | | 1,408,239 | | | | 23,289,469 | |
Realized and Unrealized Gains/(Losses) | | | | | | | | |
Net realized gains/(losses) on: | | | | | | | | |
Investments | | | (1,691,332 | ) | | | (9,189,868 | ) |
Distributions of realized capital gains from affiliated investments | | | — | | | | 13 | |
Futures contracts | | | 783 | | | | (3,445,328 | ) |
Foreign currency and forward contract transactions | | | (8,685 | ) | | | (25,348 | ) |
Swap agreements | | | 415 | | | | — | |
Change in net unrealized appreciation/(depreciation) on: | | | | | | | | |
Investments | | | 4,982,217 | | | | 34,495,037 | |
Futures contracts | | | (716 | ) | | | 662,354 | |
Foreign currency transactions | | | 464 | | | | 380 | |
Swap agreements | | | (5,862 | ) | | | — | |
Net Realized and Unrealized Gains/(Losses) | | | 3,277,284 | | | | 22,497,240 | |
Net Increase/(Decrease) in Net Assets Resulting From Operations | | $ | 4,685,523 | | | $ | 45,786,709 | |
The accompanying Notes to Financial Statements are an integral part of this schedule.
25
THRIVENT MUTUAL FUNDS
Statement of Changes in Net Assets
| | | | | | | | | | | | | | | | |
| | | Growth and Income Plus Fund | | | Diversified Income Plus Fund | |
For the periods ended | | 12/31/2016 | | | 12/31/2015 | | | 12/31/2016 | | | 12/31/2015 | |
Operations | | | | | | | | | | | | | | | | |
Net investment income/(loss) | | $ | 1,408,239 | | | $ | 1,490,488 | | | $ | 23,289,469 | | | $ | 23,677,401 | |
Net realized gains/(losses) | | | (1,698,819 | ) | | | 1,246,931 | | | | (12,660,531 | ) | | | 4,250,446 | |
Change in net unrealized appreciation/(depreciation) | | | 4,976,103 | | | | (3,552,856 | ) | | | 35,157,771 | | | | (31,743,912 | ) |
Net Change in Net Assets Resulting From Operations | | | 4,685,523 | | | | (815,437 | ) | | | 45,786,709 | | | | (3,816,065 | ) |
Distributions to Shareholders | | | | | | | | | | | | | | | | |
From net investment income Class A | | | (1,366,155 | ) | | | (1,445,573 | ) | | | (20,136,760 | ) | | | (20,122,834 | ) |
From net investment income Class S | | | (76,629 | ) | | | (41,967 | ) | | | (4,728,858 | ) | | | (4,220,503 | ) |
| | | | | | | | | | | | | | | | |
Total From Net Investment Income | | | (1,442,784 | ) | | | (1,487,540 | ) | | | (24,865,618 | ) | | | (24,343,337 | ) |
| | | | | | | | | | | | | | | | |
From net realized gains Class A | | | — | | | | (1,330,640 | ) | | | — | | | | (2,769,924 | ) |
From net realized gains Class S | | | — | | | | (27,864 | ) | | | — | | | | (517,423 | ) |
| | | | | | | | | | | | | | | | |
Total From Net Realized Gains | | | — | | | | (1,358,504 | ) | | | — | | | | (3,287,347 | ) |
| | | | | | | | | | | | | | | | |
From return of capital Class A | | | (72,414 | ) | | | (41,792 | ) | | | — | | | | — | |
From return of capital Class S | | | (3,542 | ) | | | (954 | ) | | | — | | | | — | |
| | | | | | | | | | | | | | | | |
Total From Return of Capital | | | (75,956 | ) | | | (42,746 | ) | | | — | | | | — | |
| | | | | | | | | | | | | | | | |
Total Distributions to Shareholders | | | (1,518,740 | ) | | | (2,888,790 | ) | | | (24,865,618 | ) | | | (27,630,684 | ) |
Capital Stock Transactions | | | | | | | | | | | | | | | | |
Class A | | | | | | | | | | | | | | | | |
Sold | | | 5,711,808 | | | | 11,176,229 | | | | 51,187,531 | | | | 98,370,305 | |
Distributions reinvested | | | 1,364,817 | | | | 2,701,932 | | | | 18,039,645 | | | | 20,547,070 | |
Redeemed | | | (10,569,626 | ) | | | (14,592,625 | ) | | | (80,899,240 | ) | | | (88,661,786 | ) |
| | | | | | | | | | | | | | | | |
Total Class A Capital Stock Transactions | | | (3,493,001 | ) | | | (714,464 | ) | | | (11,672,064 | ) | | | 30,255,589 | |
| | | | | | | | | | | | | | | | |
Class S | | | | | | | | | | | | | | | | |
Sold | | | 4,915,301 | | | | 843,740 | | | | 79,039,960 | | | | 36,529,007 | |
Distributions reinvested | | | 69,865 | | | | 60,437 | | | | 4,567,406 | | | | 4,680,060 | |
Redeemed | | | (687,926 | ) | | | (1,085,378 | ) | | | (37,225,248 | ) | | | (44,105,282 | ) |
| | | | | | | | | | | | | | | | |
Total Class S Capital Stock Transactions | | | 4,297,240 | | | | (181,201 | ) | | | 46,382,118 | | | | (2,896,215 | ) |
| | | | | | | | | | | | | | | | |
Capital Stock Transactions | | | 804,239 | | | | (895,665 | ) | | | 34,710,054 | | | | 27,359,374 | |
Net Increase/(Decrease) in Net Assets | | | 3,971,022 | | | | (4,599,892 | ) | | | 55,631,145 | | | | (4,087,375 | ) |
Net Assets, Beginning of Period | | | 73,624,826 | | | | 78,224,718 | | | | 693,815,527 | | | | 697,902,902 | |
Net Assets, End of Period | | $ | 77,595,848 | | | $ | 73,624,826 | | | $ | 749,446,672 | | | $ | 693,815,527 | |
Accumulated Undistributed Net Investment Income/(Loss) | | $ | (69,404 | ) | | $ | (22,292 | ) | | $ | 140,674 | | | $ | 1,603,766 | |
Capital Stock Share Transactions | | | | | | | | | | | | | | | | |
Class A shares | | | | | | | | | | | | | | | | |
Sold | | | 596,515 | | | | 1,106,202 | | | | 7,457,590 | | | | 13,863,237 | |
Distributions reinvested | | | 139,612 | | | | 277,376 | | | | 2,625,278 | | | | 2,924,247 | |
Redeemed | | | (1,093,987 | ) | | | (1,448,321 | ) | | | (11,785,147 | ) | | | (12,546,117 | ) |
| | | | | | | | | | | | | | | | |
Total Class A shares | | | (357,860 | ) | | | (64,743 | ) | | | (1,702,279 | ) | | | 4,241,367 | |
| | | | | | | | | | | | | | | | |
Class S shares | | | | | | | | | | | | | | | | |
Sold | | | 502,611 | | | | 84,324 | | | | 11,516,263 | | | | 5,202,465 | |
Distributions reinvested | | | 7,081 | | | | 6,149 | | | | 668,952 | | | | 671,011 | |
Redeemed | | | (70,902 | ) | | | (108,898 | ) | | | (5,467,058 | ) | | | (6,290,858 | ) |
| | | | | | | | | | | | | | | | |
Total Class S shares | | | 438,790 | | | | (18,425 | ) | | | 6,718,157 | | | | (417,382 | ) |
| | | | | | | | | | | | | | | | |
The accompanying Notes to Financial Statements are an integral part of this statement.
26
THRIVENT MUTUAL FUNDS
NOTESTO FINANCIAL STATEMENTS
December 31, 2016
(1) ORGANIZATION
Thrivent Mutual Funds (the “Trust”) was organized as a Massachusetts Business Trust on March 10, 1987 and is registered as an open-end management investment company under the Investment Company Act of 1940 (the “1940 Act”). The Trust is divided into twenty-one separate series each with its own investment objective and policies. The Trust currently consists of four asset allocation funds, four income plus funds, seven equity funds, five fixed-income funds, and one money market fund.
This shareholder report includes Thrivent Growth and Income Plus Fund and Thrivent Diversified Income Plus Fund (each, a “Fund” and, collectively, the “Funds”), two of the Trust’s twenty-one Funds. The other Funds of the Trust have a fiscal year-end of October 31 and are presented under a separate shareholder report.
The Funds are each investment companies that follow the accounting and reporting guidance of the Financial Accounting Standards Board (FASB) Accounting Standard Codification Topic 946—Financial Services—Investment Companies.
(A) Share Classes – Effective February 1, 2016, Institutional Class shares were renamed Class S shares. Effective February 29, 2016, Class A Shares were closed to new shareholders and are open to current Class A shareholders and others who reside at the same mailing address (“household”). Effective February 29, 2016, the maximum front-end sales charge imposed on Class A Shares of equity funds was changed from 5.50% to 4.50%. Please refer to the Supplement to Class A Shares Prospectus dated February 12, 2016 for additional information. As of December 31, 2016, the Trust includes two classes of shares: Class A and Class S shares. The classes of shares differ principally in their respective distribution expenses and other class-specific expenses and arrangements. Class A shares have an annual 12b-1 fee of 0.25%. Class A shares have a maximum front-end sales load of 4.50%. Class S shares are offered at net asset value and have no annual 12b-1 fees. Institutional Class shares were offered at net asset value and had no annual 12b-1 fees. The share classes have identical rights to earnings, assets and voting privileges, except for class-specific expenses and exclusive rights to vote on matters affecting only individual classes. All 21 Funds of the Trust offer Class A and Class S shares.
(B) Other – Under the Trust’s organizational documents, its officers and trustees are indemnified against certain liabilities arising out of the performance of their duties to the Trust. In addition, in the normal course of business, the Trust enters into contracts with vendors and others that provide general damage clauses. The Trust’s maximum exposure under these contracts is unknown, as this would involve future claims that may be made against the Trust. However, based on experience, the Trust expects the risk of loss to be remote.
(2) SIGNIFICANT ACCOUNTING POLICIES
(A) Valuation of Investments – Securities traded on U.S. or foreign securities exchanges or included in a national market system are valued at the official closing price at the close of each business day unless otherwise stated below. Over-the-counter securities and listed securities for which no price is readily available are valued at the current bid price considered best to represent the value at that time. Security prices are based on quotes that are obtained from an independent pricing service approved by the Trust’s Board of Trustees (“Board”). The pricing service, in determining values of fixed-income securities, takes into consideration such factors as current quotations by broker/dealers, coupon, maturity, quality, type of issue, trading characteristics, and other yield and risk factors it deems relevant in determining valuations. Securities which cannot be valued by the approved pricing service are valued using valuations obtained from dealers that make markets in the securities. Exchange-listed options and futures contracts are valued at the last quoted sales price. Swap agreements are valued at the clearinghouse end of day prices as furnished by an independent pricing service. Forward foreign currency exchange contracts are marked-to-market based upon foreign currency exchange rates provided by the pricing service. Investments in open-ended mutual funds are valued at the net asset value at the close of each business day.
The Board has delegated responsibility for daily valuation of the Funds’ securities to the Adviser, Thrivent Asset Management, LLC (“Thrivent Asset Mgt.” or the “Adviser”). The Adviser has formed a Valuation Committee (“Committee”) that is responsible for overseeing the Fund valuation policies in accordance with Valuation Policies and Procedures. The Committee meets on a monthly and on an as-needed basis to review price challenges, price overrides, stale prices, shadow prices, manual prices, money market pricing, international fair valuation, and other securities requiring fair valuation.
The Committee monitors for significant events occurring prior to the close of trading on the New York Stock Exchange that could have a material impact on the value of any securities that are held by the Funds. Examples of such events include trading halts, national news/events, and issuer-specific developments. If the Committee decides that such events warrant using fair value estimates, the Committee will take such events into consideration in determining the fair value of such securities. If market quotations or prices are not readily available or determined to be unreliable, the securities will be valued at fair value as determined in good faith pursuant to procedures adopted by the Board.
27
THRIVENT MUTUAL FUNDS
NOTESTO FINANCIAL STATEMENTS
December 31, 2016
In accordance with U.S. Generally Accepted Accounting Principles (“GAAP”), the various inputs used to determine the fair value of the Funds’ investments are summarized in three broad levels. Level 1 includes quoted prices in active markets for identical securities, typically included in this level are U.S. equity securities, futures, options and registered investment company funds. Level 2 includes other significant observable inputs such as quoted prices for similar securities, interest rates, prepayment speeds and credit risk, typically included in this level are fixed income securities, international securities, swaps and forward contracts. Level 3 includes significant unobservable inputs such as the Adviser’s own assumptions and broker evaluations in determining the fair value of investments. Of the Level 3 securities, those for which market values were not readily available or were deemed unreliable were fair valued as determined in good faith under procedures established by the Board. The valuation levels are not necessarily an indication of the risk associated with investing in these securities or other investments. Investments measured using net asset value per share as a practical expedient for fair value and that are not publicly available-for-sale are not categorized within the fair value hierarchy.
Valuation of International Securities – Because many foreign markets close before the U.S. markets, events may occur between the close of the foreign markets and the close of the U.S. markets that could have a material impact on the valuation of foreign securities. The Funds, under the supervision of the Board, evaluate the impacts of these events and may adjust the valuation of foreign securities to reflect fair value as of the close of the U.S. markets. The Board has authorized the Adviser to make fair valuation determinations pursuant to policies approved by the Board.
(B) Foreign Currency Translation – The accounting records of each Fund are maintained in U.S. dollars. Securities and other assets and liabilities that are denominated in foreign currencies are translated into U.S. dollars at the daily closing rates of exchange.
Foreign currency amounts related to the purchase or sale of securities and income and expenses are translated at the exchange rate on the transaction date. Net realized and unrealized currency gains and losses are recorded from closed currency contracts, disposition of foreign currencies, exchange gains or losses between the trade date and settlement date on securities transactions, and other translation gains or losses on dividends, interest income and foreign withholding taxes. The Funds do not separately report the effect of changes in foreign exchange rates from changes in prices on securities held. Such changes are included in net realized and unrealized gain or loss from investments in the Statement of Operations.
For federal income tax purposes, the Funds treat the effect of changes in foreign exchange rates arising from actual foreign currency transactions and the changes in foreign exchange rates between the trade date and settlement date as ordinary income.
(C) Foreign Denominated Investments – Foreign denominated assets and currency contracts may involve more risks than domestic transactions including currency risk, political and economic risk, regulatory risk, and market risk. Certain Funds may also invest in securities of companies located in emerging markets. Future economic or political developments could adversely affect the liquidity or value, or both, of such securities.
(D) Federal Income Taxes – No provision has been made for income taxes because each Fund’s policy is to qualify as a regulated investment company under the Internal Revenue Code and distribute substantially all investment company taxable income and net capital gain on a timely basis. It is also the intention of each Fund to distribute an amount sufficient to avoid imposition of any federal excise tax. The Funds, accordingly, anticipate paying no federal taxes and no federal tax provision was recorded. Each Fund is treated as a separate taxable entity for federal income tax purposes. Certain Funds may utilize earnings and profits distributed to shareholders on the redemption of shares as part of the dividends paid deduction.
GAAP requires management of the Funds (i.e., the Adviser) to make additional tax disclosures with respect to the tax effects of certain income tax positions, whether those positions were taken on previously filed tax returns or are expected to be taken on future returns. These positions must meet a “more likely than not” standard that, based on the technical merits of the position, would have a greater than 50 percent likelihood of being sustained upon examination. In evaluating whether a tax position has met the more-likely-than-not recognition threshold, the Adviser must presume that the position will be examined by the appropriate taxing authority that has full knowledge of all relevant information.
The Adviser analyzed all open tax years, as defined by the statute of limitations, for all major jurisdictions. Open tax years are those that are open for examination by taxing authorities. Major jurisdictions for the Funds include U.S. Federal, Minnesota, Wisconsin, and Massachusetts as well as certain foreign countries. As of December 31, 2016, open U.S. Federal, Minnesota, Wisconsin and Massachusetts tax years include the tax years ended December 31, 2013 through 2016. Additionally, as of December 31, 2016, the tax year ended December 31, 2012 is open for Wisconsin. The Funds have no examinations in progress and none are expected at this time.
As of December 31, 2016, the Adviser has reviewed all open tax years and major jurisdictions and concluded that there is no effect to the Funds’ tax liability, financial position or results of operations. There is no tax liability resulting from unrecognized tax benefits related to uncertain income tax
28
THRIVENT MUTUAL FUNDS
NOTESTO FINANCIAL STATEMENTS
December 31, 2016
positions taken or expected to be taken in future tax returns. The Funds are also not aware of any tax positions for which it is reasonably possible that the total amounts of unrecognized tax benefits will significantly change in the next 12 months.
Foreign Income Taxes – Funds are subject to foreign income taxes imposed by certain countries in which they invest. Withholding taxes on foreign dividends have been provided for in accordance with the applicable country’s tax rules and rates. These amounts are shown as foreign tax withholding on the Statement of Operations. The Funds pay tax on foreign capital gains, where applicable.
(E) Expenses and Income – Estimated expenses are accrued daily. The Funds are charged for those expenses that are directly attributable to them. Expenses that are not directly attributable to a Fund are allocated among all appropriate Funds in proportion to their respective net assets, number of shareholder accounts or other reasonable basis. Net investment income, expenses which are not class-specific, and realized and unrealized gains and losses are allocated directly to each class based upon the relative net asset value of outstanding shares.
Interest income is recorded daily on all debt securities, as is accretion of market discount and original issue discount and amortization of premium. Paydown gains and losses on mortgage- and asset-backed securities are recorded as components of interest income. Dividend income and capital gain distributions are recorded on the ex-dividend date. However, in certain foreign market where declaration of the dividend follows the ex-dividend date, the dividend will be recorded as soon as the Fund is informed of the declaration date.
For certain securities, including real estate investment trusts, the Trust records distributions received in excess of income as a reduction of cost of investments and/or realized gain. Such amounts are based on estimates if actual amounts are not available. Actual amounts of income, realized gain and return of capital may differ from the estimated amounts. The Trust adjusts the estimated amounts of the components of distributions as adjustments to investment income, unrealized appreciation/depreciation and realized gain/loss on investments as necessary, once the issuers provide information about the actual composition of the distributions.
(F) Distributions to Shareholders – Net investment income is distributed to each shareholder as a dividend. Dividends from Growth and Income Plus Fund are declared and paid quarterly. Dividends from Diversified Income Plus Fund are declared and paid monthly. Additionally, it is possible that such dividends may be reclassified as return of capital or capital gains after year end. Such determination cannot be made until tax information is received from the real estate investments of the Fund. Net realized gains from securities transactions, if any, are distributed at least annually.
(G) Derivative Financial Instruments – Each of the Funds may invest in derivatives. Derivatives, a category that includes options, futures, swaps, foreign currency forward contracts and hybrid instruments, are financial instruments whose value is derived from another security, an index or a currency. Each Fund may use derivatives for hedging (attempting to offset a potential loss in one position by establishing an interest in an opposite position). This includes the use of currency-based derivatives to manage the risk of its positions in foreign securities. Each Fund may also use derivatives for replication of a certain asset class or speculation (investing for potential income or capital gain). These contracts may be transacted on an exchange or over-the-counter (OTC).
A derivative may incur a mark to market loss if the value of the derivative decreases due to an unfavorable change in the market rates or values of the underlying derivative. Losses can also occur if the counterparty does not perform under the derivative. A Fund’s risk of loss from the counterparty credit risk on OTC derivatives is generally limited to the aggregate unrealized gain netted against any collateral held by such Fund. With exchange traded futures and centrally cleared swaps, there is minimal counterparty credit risk to the Funds because the exchange’s clearinghouse, as counterparty to such derivatives, guarantees against a possible default. The clearinghouse stands between the buyer and the seller of the derivative; thus, the credit risk is limited to the failure of the clearinghouse. However, credit risk still exists in exchange traded futures and centrally cleared swaps with respect to initial and variation margin that is held in a broker’s customer accounts. While brokers are required to segregate customer margin from their own assets, in the event that a broker becomes insolvent or goes into bankruptcy and at that time there is a shortfall in the aggregate amount of margin held by the broker for all its clients, U.S. bankruptcy laws will typically allocate that shortfall on a pro-rata basis across all the broker’s customers, potentially resulting in losses to the Funds. Using derivatives to hedge can guard against potential risks, but it also adds to the Funds’ expenses and can eliminate some opportunities for gains. In addition, a derivative used for mitigating exposure or replication may not accurately track the value of the underlying asset. Another risk with derivatives is that some types can amplify a gain or loss, potentially earning or losing substantially more money than the actual cost of the derivative.
In order to define their contractual rights and to secure rights that will help the Funds mitigate their counterparty risk, the Funds may enter into an International Swaps and Derivatives Association, Inc. Master Agreement (“ISDA Master Agreement”) or similar agreement with its derivative contract counterparties. An ISDA Master Agreement is a bilateral agreement between a Fund and a counterparty that governs OTC derivatives and foreign exchange contracts and typically includes, among other things, collateral posting terms and
29
THRIVENT MUTUAL FUNDS
NOTESTO FINANCIAL STATEMENTS
December 31, 2016
netting provisions in the event of a default and/or termination event. Under an ISDA Master Agreement, each Fund may, under certain circumstances, offset with the counterparty certain derivatives’ payables and/or receivables with collateral held and/or posted and create one single net payment. The provisions of the ISDA Master Agreement typically permit a single net payment in the event of a default (close-out netting) including the bankruptcy or insolvency of the counterparty. Note, however, that bankruptcy and insolvency laws of a particular jurisdiction may impose restrictions on or prohibitions against the right of offset in bankruptcy, insolvency or other events.
Collateral and margin requirements vary by type of derivative. Margin requirements are established by the broker or clearinghouse for exchange traded and centrally cleared derivatives (futures, options, and centrally cleared swaps). Brokers can ask for margining in excess of the minimum in certain situations. Collateral terms are contract specific for OTC derivatives (foreign currency exchange contracts, options and swaps). For derivatives traded under an ISDA Master Agreement, the collateral requirements are typically calculated by netting the mark to market amount for each transaction under such agreement and comparing that amount to the value of any collateral currently pledged by the Fund and the counterparty. For financial reporting purposes, non-cash collateral that has been pledged to cover obligations of the Fund has been noted in the Schedule of Investments. To the extent amounts due to the Fund from its counterparties are not fully collateralized, contractually or otherwise, the Fund bears the risk of loss from counterparty nonperformance. The Funds attempt to mitigate counterparty risk by only entering into agreements with counterparties that they believe have the financial resources to honor their obligations and by monitoring the financial stability of those counterparties.
Options – Each of the Funds may buy put and call options and write put and covered call options. The Funds intend to use such derivative instruments as hedges to facilitate buying or selling securities or to provide protection against adverse movements in security prices or interest rates. The Funds may also enter into options contracts to protect against adverse foreign exchange rate fluctuations. Option contracts are valued daily and unrealized appreciation or depreciation is recorded. A Fund will realize a gain or loss upon expiration or closing of the option transaction. When an option is exercised, the proceeds upon sale for a written call option or the cost of a security for purchased put and call options is adjusted by the amount of premium received or paid.
Buying put options tends to decrease a Fund’s exposure to the underlying security while buying call options tends to increase a Fund’s exposure to the underlying security. The risk associated with purchasing put and call options is limited to the premium paid. There is no significant counterparty risk on exchange-traded options as the exchange guarantees the contract against default. Writing put options tends to increase a Fund’s exposure to the underlying security while writing call options tends to decrease a Fund’s exposure to the underlying security. The writer of an option has no control over whether the underlying security may be bought or sold, and therefore bears the market risk of an unfavorable change in the price of the underlying security. The counterparty risk for purchased options arises when a Fund has purchased an option, exercises that option, and the counterparty doesn’t buy from the Fund or sell to the Fund the underlying asset as required. In the case where a Fund has written an option, the Fund doesn’t have counterparty risk. Counterparty risk on purchased over-the-counter options is partially mitigated by the Fund’s collateral posting requirements. As the option increases in value to the Fund, the Fund receives collateral from the counterparty. Risks of loss may exceed amounts recognized on the Statement of Assets and Liabilities.
Futures Contracts – Each of the Funds may use futures contracts to manage the exposure to interest rate and market or currency fluctuations. Gains or losses on futures contracts can offset changes in the yield of securities. When a futures contract is opened, cash or other investments equal to the required “initial margin deposit” are held on deposit with and pledged to the broker. Additional securities held by the Funds may be earmarked to cover open futures contracts. The futures contract’s daily change in value (“variation margin”) is either paid to or received from the broker, and is recorded as an unrealized gain or loss. When the contract is closed, realized gain or loss is recorded equal to the difference between the value of the contract when opened and the value of the contract when closed. Futures contracts involve, to varying degrees, risk of loss in excess of the variation margin disclosed in the Statement of Assets and Liabilities. Exchange-traded futures have no significant counterparty risk as the exchange guarantees the contracts against default.
During the year ended December 31, 2016, Growth and Income Plus Fund and Diversified Income Plus Fund used treasury futures to manage the duration and yield curve exposure of the Fund versus the benchmark.
During the year ended December 31, 2016, Growth and Income Plus Fund and Diversified Income Plus Fund used equity futures to manage exposure to the equities market.
Foreign Currency Forward Contracts – In connection with purchases and sales of securities denominated in foreign currencies all Funds may enter into foreign currency forward contracts. Additionally, the Funds may enter into such contracts to mitigate currency and counterparty exposure to other foreign-currency-denominated investments. These contracts are recorded at value and the related realized and change in unrealized foreign exchange gains and losses are included in the Statement of Operations. In the event that counterparties fail to settle these forward contracts, the
30
THRIVENT MUTUAL FUNDS
NOTESTO FINANCIAL STATEMENTS
December 31, 2016
Funds could be exposed to foreign currency fluctuations. Foreign currency contracts are valued daily and unrealized appreciation or depreciation is recorded daily as the difference between the contract exchange rate and the closing forward rate applied to the face amount of the contract. A realized gain or loss is recorded at the time a forward contract is closed. These contracts are over-the-counter and the Fund is exposed to counterparty risk equal to the discounted net amount of payments to the Fund.
Swap Agreements – Each of the Funds may enter into swap transactions, which involve swapping one or more investment characteristics of a security or a basket of securities with another party. Such transactions include market risk, risk of default by the other party to the transaction, risk of imperfect correlation and manager risk and may involve commissions or other costs. Swap transactions generally do not involve delivery of securities, other underlying assets or principal. Accordingly, the risk of loss with respect to swap transactions is generally limited to the net amount of payments that the Fund is contractually obligated to make, or in the case of the counterparty defaulting, the net amount of payments that the Fund is contractually entitled to receive. Risks of loss may exceed amounts recognized on the Statement of Assets and Liabilities. If there is a default by the counterparty, the Fund may have contractual remedies pursuant to the agreements related to the transaction. The contracts are valued daily and unrealized appreciation or depreciation is recorded. Swap agreements are valued at the clearinghouse end of day prices as furnished by an independent pricing service. The pricing service takes into account such factors as swap curves, default probabilities, recent trades, recovery rates and other factors it deems relevant in determining valuations. Daily fluctuations in the value of the centrally cleared credit default contracts are recorded in variation margin in the Statement of Assets and Liabilities and recorded as unrealized gain or loss. The Fund accrues for the periodic payment and amortizes upfront payments, if any, on swap agreements on a daily basis with the net amount recorded as realized gains or losses in the Statement of Operations. Receipts and payments received or made as a result of a credit event or termination of the contract are also recognized as realized gains or losses in the Statement of Operations. Collateral, in the form of cash or securities, may be required to be held with the Fund’s custodian, or a third party, in connection with these agreements. Certain swap agreements are over-the-counter and the Fund is exposed to counterparty risk, which is the discounted net amount of payments owed to the Fund. This risk is partially mitigated by the Fund’s collateral posting requirements. As the swap increases in value to the Fund, the Fund receives collateral from the counterparty. Certain interest rate and credit default index swaps must be cleared through a clearinghouse or central counterparty.
Credit Default Swaps – A credit default swap is a swap agreement between two parties to exchange the credit risk of a particular issuer, basket of securities or reference entity. In a credit default swap transaction, a buyer pays periodic fees in return for payment by the seller which is contingent upon an adverse credit event occurring in the underlying issuer or reference entity. The seller collects periodic fees from the buyer and profits if the credit of the underlying issuer or reference entity remains stable or improves while the swap is outstanding, but the seller in a credit default swap contract would be required to pay the amount of credit loss, determined as specified in the agreement, to the buyer in the event of an adverse credit event in the reference entity. A buyer of a credit default swap is said to buy protection whereas a seller of a credit default swap is said to sell protection. The Funds may be either the protection seller or the protection buyer.
Certain Funds enter into credit default derivative contracts directly through credit default swaps (CDS) or through credit default swap indices (CDX Indices). CDX indices are static pools of equally weighted credit default swaps referencing corporate bonds and/or loans designed to provide diversified credit exposure to these asset classes. Funds sell default protection and assume long-risk positions in individual credits or indices. Index positions are entered into to gain exposure to the corporate bond and/or loan markets in a cost-efficient and diversified structure. In the event that a position defaults, by going into bankruptcy and failing to pay interest or principal on borrowed money, within any given CDX Index held, the maximum potential amount of future payments required would be equal to the pro-rata share of that position within the index based on the notional amount of the index. In the event of a default under a CDS contract the maximum potential amount of future payments would be the notional amount. For CDS, the default events could be bankruptcy and failing to pay interest or principal on borrowed money or a restructuring. A restructuring is a change in the underlying obligations which would include reduction in interest or principal, maturity extension and subordination to other obligations.
During the year ended December 31, 2016, Growth and Income Plus Fund used CDX indexes (comprised of credit default swaps) to help manage credit risk exposures within the fund.
For financial reporting purposes the Funds do not offset derivative assets and derivative liabilities that are subject to netting arrangements in the Statement of Assets and Liabilities.
31
THRIVENT MUTUAL FUNDS
NOTESTO FINANCIAL STATEMENTS
December 31, 2016
The amounts presented in the tables below are offset first by financial instruments that have the right to offset under master netting or similar arrangements, then any remaining amount is reduced by cash and non-cash collateral received/pledged. The actual amounts of collateral may be greater than the amounts presented in the tables.
The following table presents the gross and net information about assets subject to master netting arrangements, as presented in the Statement of Assets and Liabilities:
| | | | | | | | | | | | | | | | | | | | | | | | | | | | |
| | | | | | | | | | | | Gross Amounts Not Offset in the
Statement of Assets and Liabilities | | | | |
Fund | | Gross Amounts
of Recognized
Assets | | | Gross
Amounts
Offset | | | Net Amounts
of
Recognized
Assets | | | Financial
Instruments | | | Cash
Collateral
Received | | | Non-Cash
Collateral
Received | | | Net
Amount | |
Growth and Income Plus | | | | | | | | | | | | | | | | | | | | | | | | | | | | |
Futures Contracts | | | 16,336 | | | | — | | | | 16,336 | | | | 4,693 | | | | — | | | | — | | | | 11,643 | (*) |
Diversified Income Plus | | | | | | | | | | | | | | | | | | | | | | | | | | | | |
Futures Contracts | | | 183,109 | | | | — | | | | 183,109 | | | | 32,343 | | | | — | | | | — | | | | 150,766 | (*) |
| (*) | Net futures amount represents the net amount receivable from the counterparty in the event of a default. |
The following table presents the gross and net information about liabilities subject to master netting arrangements, as presented in the Statement of Assets and Liabilities:
| | | | | | | | | | | | | | | | | | | | | | | | | | | | |
| | | | | | | | | | | | Gross Amounts Not Offset in the
Statement of Assets and Liabilities | | | | |
Fund | | Gross Amounts
of Recognized
Liabilities | | | Gross
Amounts
Offset | | | Net Amounts
of
Recognized
Liabilities | | | Financial
Instruments | | | Cash
Collateral
Pledged | | | Non-Cash
Collateral
Pledged** | | | Net
Amount | |
Growth and Income Plus | | | | | | | | | | | | | | | | | | | | | | | | | | | | |
Futures Contracts | | | 4,693 | | | | — | | | | 4,693 | | | | 4,693 | | | | — | | | | — | | | | — | |
Diversified Income Plus | | | | | | | | | | | | | | | | | | | | | | | | | | | | |
Futures Contracts | | | 32,343 | | | | — | | | | 32,343 | | | | 32,343 | | | | — | | | | — | | | | — | |
Securities Lending | | | 222,600 | | | | — | | | | 222,600 | | | | 210,587 | | | | — | | | | — | | | | 12,013 | Ù |
| ** | Excess of collateral pledged to the counterparty may not be shown for financial reporting purposes. |
| Ù | Net securities lending amounts represent the net amount payable to the counterparty in the event of a default. |
(H) Mortgage Dollar Roll Transactions — Certain Funds enter into dollar roll transactions on securities issued or to be issued by the Government National Mortgage Association, Federal National Mortgage Association and Federal Home Loan Mortgage Corporation, in which the Funds sell mortgage securities and simultaneously agree to repurchase similar (same type and coupon) securities at a later date at an agreed upon price. The Funds must maintain liquid securities having a value at least equal to the repurchase price (including accrued interest) for such dollar rolls. In addition, the Funds are required to segregate collateral with the fund custodian—depending on market movements—on their mortgage dollar rolls. Securities segregated for collateral are footnoted within each Schedule of Investments. The value of the securities that the Funds are required to purchase may decline below the agreed upon repurchase price of those securities.
During the period between the sale and repurchase, the Funds forgo principal and interest paid on the mortgage securities sold. The Funds are compensated from negotiated fees paid by brokers offered as an inducement to the Funds to “roll over” their purchase commitments, thus enhancing the yield. Mortgage dollar rolls may be renewed with a new purchase and repurchase price and a cash settlement made on settlement date without physical delivery of the securities subject to the contract. The fees received are recognized over the roll period and are included in Income from mortgage dollar rolls in the Statement of Operations.
(I) Securities Lending — The Trust has entered into a Securities Lending Agreement (the “Agreement”) with Deutsche Bank AG (“Deutsche”). The Agreement authorizes Deutsche to lend securities to authorized borrowers on behalf of the Funds. Pursuant to the Agreement, all loaned securities are initially collateralized by cash equal to at least 102% of the value of the loaned securities. Daily market fluctuations could cause the value of loaned securities to be more or less that the value of the collateral received. Any additional collateral is adjusted and settled on the next business day. The Trust has
32
THRIVENT MUTUAL FUNDS
NOTESTO FINANCIAL STATEMENTS
December 31, 2016
the ability to recall the loans at any time and could do so in order to vote proxies or sell the loaned securities. All cash collateral received is invested in Thrivent Cash Management Trust. The Funds receive income and corporate action proceeds from Duetsche that would have been earned on the securities loaned while simultaneously seeking to earn income on the investment of cash collateral. Amounts earned on investments in Thrivent Cash Management Trust, net of rebates, fees paid to Deutsche for services provided and any other securities lending expenses, are included in Income from securities loaned on the Statement of Operations. By investing any cash collateral it receives in these transactions, a Portfolio could realize additional gains or losses. If the borrower fails to return the securities or the invested collateral has declined in value, the Fund could lose money. Generally, in the event of borrower default, the Portfolio has the right to use the collateral to offset any losses incurred. However, in the event the Fund is delayed or prevented from exercising its right to dispose of the collateral, there may be a potential loss. Some of these losses may be indemnified by the lending agent.
As of December 31, 2016, the value of securities on loan is as follows:
| | | | |
Fund | | Securities on
Loan | |
Diversified Income Plus | | $ | 210,587 | |
(J) When-Issued and Delayed Delivery Transactions —Each Fund may purchase or sell securities on a when-issued or delayed delivery basis. These transactions involve a commitment by a Fund to purchase or sell securities for a predetermined price or yield, with payment and delivery taking place beyond the customary settlement period. When delayed delivery purchases are outstanding, a Fund will designate liquid assets in an amount sufficient to meet the purchase price. When purchasing a security on a delayed delivery basis, a Fund assumes the rights and risks of ownership of the security, including the risk of price and yield fluctuations, and takes such fluctuations into account when determining its net asset value. A Fund may dispose of a delayed delivery transaction after it is entered into, and may sell when-issued securities before they are delivered, which may result in a capital gain or loss. When a Fund has sold a security on a delayed delivery basis, a Fund does not participate in future gains and losses with respect to the security.
(K) Treasury Inflation Protected Securities — Certain Funds may invest in treasury inflation protected securities (TIPS). These securities are fixed income securities whose principal value is periodically adjusted to the rate of inflation. The coupon interest rate is generally fixed at issuance. Interest is paid based on the principal value, which is adjusted for inflation. Any increase in the principal amount will be included as taxable interest in the Statement of Operations and received in cash upon maturity or sale of the security.
(L) Repurchase Agreements — Each Fund may engage in repurchase agreement transactions in pursuit of its investment objective. A repurchase agreement consists of a purchase and a simultaneous agreement to resell an investment for later delivery at an agreed upon price and rate of interest. The Fund uses a third-party custodian to maintain the collateral. If the original seller of a security subject to a repurchase agreement fails to repurchase the security at the agreed upon time, the Fund could incur a loss due to a drop in the value of the security during the time it takes the Fund to either sell the security or take action to enforce the original seller’s agreement to repurchase the security. Also, if a defaulting original seller filed for bankruptcy or became insolvent, disposition of such security might be delayed by pending legal action. The Fund may only enter into repurchase agreements with banks and other recognized financial institutions such as broker/dealers that are found by the Adviser or subadviser to be creditworthy. During the year ended December 31, 2016, none of the Funds engaged in these types of investments.
(M) Equity-Linked Structured Securities — Certain Funds may invest in equity-linked structured notes. Equity-linked structured notes are debt securities which combine the characteristics of common stock and the sale of an option. The return component is based upon the performance of a single equity security, a basket of equity securities, or an equity index and the sale of an option. There is no guaranteed return of principal with these securities. The appreciation potential of these securities may be limited by a maximum payment or call right and can be influenced by many unpredictable factors. In addition to the performance of the equity, the nature and credit of the issuer may also impact return. During the year ended December 31, 2016, none of the Funds engaged in these types of transactions.
(N) Stripped Securities — Certain Funds may invest in Interest Only and Principal Only stripped mortgage or asset backed securities. These securities represent a participation in securities that are structured in classes with rights to receive different portions of the interest and principal. Interest only securities receive all the interest and principal only securities receive all the principal. If the underlying pool of mortgages or assets experience greater than anticipated prepayments of principal, the Fund may not fully recoup its initial investment in an interest only security. Principal only securities increase in value if prepayments are greater than anticipated and decline if prepayments are slower than anticipated. The market value of these securities is highly sensitive to changes in interest rates. As interest rates increase, the price of the principal only security decreases. Similarly, as interest rates decrease, the price of the principal only security increases. The principal only security represents the payment with the longest maturity, therefore making it the most sensitive to interest rate changes.
33
THRIVENT MUTUAL FUNDS
NOTESTO FINANCIAL STATEMENTS
December 31, 2016
(O) Credit Risk — The Funds may be susceptible to credit risk to the extent an issuer or counterparty defaults on its payment obligation. The Funds’ policy is to monitor the creditworthiness of issuers and counterparties. Interest receivable on defaulted securities is monitored for ability to collect payments in default and is adjusted accordingly.
(P) Accounting Estimates — The preparation of financial statements in conformity with GAAP requires management to make estimates and assumptions that affect the reported amounts of assets and liabilities and disclosure of contingent assets and liabilities at the date of the financial statements and the reported amounts of income and expenses during the reporting period. Actual results could differ from those estimates.
(Q) Loan Commitments — Certain Funds may enter into loan commitments, which generally have interest rates which are reset daily, monthly, quarterly or semi-annually by reference to a base lending rate, plus a premium. These base rates are primarily the London-Interbank Offered Rate (“LIBOR”), and secondarily the prime rate offered by one or more major United States banks (the “Prime Rate”) and the certificate of deposit (“CD”) rate or other base lending rates used by commercial lenders. Loan commitments often require prepayments from excess cash flows or allow the borrower to repay at its election. The rate at which the borrower repays cannot be predicted with accuracy. Therefore, the remaining maturity may be considerably less than the stated maturity shown in the Schedule of Investments.
All or a portion of these loan commitments may be unfunded. A Fund is obligated to fund these commitments at the borrower’s discretion. Therefore, the Fund must have funds sufficient to cover its contractual obligation. These unfunded loan commitments, which are marked to market daily, are presented in the Schedule of Investments.
(R) Litigation — Awards from class action litigation are recorded as realized gains on the payment date.
(S) Bank Loans (Leveraged Loans) — Certain Funds may invest in bank loans, which are senior secured loans that are made by banks or other lending institutions to companies that are typically rated below investment grade. A fund may invest in multiple series or tranches of a bank loan, with varying terms and different associated risks. Transactions in bank loan securities may settle on a delayed basis, which may result in the proceeds of the sale to not be readily available for a fund to make additional investments. Interest rates of bank loan securities typically reset periodically, as the rates are tied a reference index, such as the London Interbank Offered Rate (“LIBOR”), plus a premium. Income is recorded daily on bank loan securities. On an ongoing basis, a fund may receive a commitment fee based on the undrawn portion of the underlying line of credit of the bank loan. This commitment fee is accrued as income over the term of the bank loan. A fund may receive consent and amendment fees for accepting an amendment to the current terms of a bank loan. Consent and amendment fees are accrued as income when the changes to the bank loan are immaterial and to capital when the changes are material.
(T) Recent Accounting Pronouncements —
Fair Value Measurement (Topic 820), Disclosure for Investments in Certain Entities That Calculate Net Asset Value per Share (or Its Equivalent).
In May 2015, the Financial Accounting Standards Board (FASB) issued Accounting Standards Update (ASU No. 2015-07, Fair Value Measurement (Topic 820), Disclosure for Investments in Certain Entities That Calculate Net Asset Value per Share (or Its Equivalent). ASU No. 2015-07 changes the disclosure requirements for investments for which fair value is measured using the net asset value per share practical expedient. The disclosure requirements are effective for annual periods beginning after December 15, 2015 and interim periods within those fiscal years. Management has evaluated the impact of this guidance and has determined there to be no impact to financial statement amounts. However, footnote disclosures related to investments valued using the net asset value per share practical expedient were increased within the Schedule of Investments Fair Valuation Measurement tables to meet the requirement of this guidance.
Investment Company Reporting Modernization.
In October 2016, the Securities and Exchange Commission (SEC) adopted new rules and forms to modernize the reporting and disclosure of information by registered investment companies. The SEC also adopted amendments to Regulation S-X, which describe the specific format and content of financial reports, to require standardized and enhanced disclosures about derivatives in investment company financial statements and other amendments. These amendments are effective August 1, 2017. At this time, management is evaluating the implications of this guidance and the impact it will have on the financial statements and footnote disclosures.
34
THRIVENT MUTUAL FUNDS
NOTESTO FINANCIAL STATEMENTS
December 31, 2016
(U) Other — For financial statement purposes, investment security transactions are accounted for on the trade date. Realized gains and losses from investment transactions are determined on a specific cost identification basis, which is the same basis used for federal income tax purposes.
(3) FEES AND COMPENSATION PAID TO AFFILIATES
(A) Investment Advisory Fees — The Trust has entered into an Investment Advisory Agreement with Thrivent Asset Mgt. Under the Investment Advisory Agreement, each of the Funds pays a fee for investment advisory services. The fees are accrued daily and paid monthly. The annual rates of fees as a percent of average daily net assets under the Investment Advisory Agreement were as follows:
| | | | | | | | | | | | | | | | | | | | | | | | | | | | | | | | | | | | | | | | | | | | |
Fund (M - Millions) | | $0 to
$50M | | | Over $50
to $100M | | | Over
$100 to
$200M | | | Over
$200 to
$250M | | | Over
$250 to
$500M | | | Over
$500 to
$750M | | | Over
$750 to
$1,000M | | | Over
$1,000 to
$2,000M | | | Over
$2,000 to
$2,500M | | | Over
$2,500 to
$5,000M | | | Over
$5,000M | |
Growth and Income Plus | | | 0.650 | % | | | 0.650 | % | | | 0.650 | % | | | 0.650 | % | | | 0.600 | % | | | 0.600 | % | | | 0.600 | % | | | 0.600 | % | | | 0.600 | % | | | 0.600 | % | | | 0.600 | % |
Diversified Income Plus | | | 0.550 | % | | | 0.550 | % | | | 0.550 | % | | | 0.550 | % | | | 0.550 | % | | | 0.550 | % | | | 0.550 | % | | | 0.550 | % | | | 0.550 | % | | | 0.550 | % | | | 0.550 | % |
(B) Expense Reimbursements — For the period ended December 31, 2016, contractual expense reimbursements to limit expenses to the following percentages were in effect:
| | | | | | | | | | | | |
Fund | | Class A | | | Class S | | | Expiration
Date | |
Growth and Income Plus | | | 1.10 | %* | | | 0.80 | % | | | 2/28/2017 | |
| * | Prior contractual expense cap of 1.25% expired on 2/1/2016. |
Expense reimbursements are accrued daily and paid by Thrivent Asset Management monthly. Thrivent does not recoup amounts previously reimbursed or waived in prior fiscal years.
All Funds in the Trust except for Money Market Fund may invest cash in other Funds in the Trust, Thrivent Cash Management Trust, and Thrivent Core Short-Term Reserve Fund, subject to certain limitations. These related-party transactions are subject to the same terms as non-related party transactions. To avoid duplicate investment advisory fees, Thrivent Asset Mgt. reimburses an amount equal to any investment advisory fees indirectly incurred by the asset allocation, income plus, equity and fixed income funds as a result of their investment in any other mutual fund for which the Advisor or an affiliate serves as investment adviser, other than Thrivent Cash Management Trust and Thrivent Core Short-Term Reserve Fund.
(C) Distribution Plan — Effective January 1, 2016, Thrivent Distributors, LLC became the Trust’s distributor. The Trust has adopted a Distribution Plan pursuant to Rule 12b-1 under the 1940 Act. Class A shares generally have a Rule 12b-1 fee of up to 0.25% of average net assets.
(D) Sales Charges and Other Fees — For the year ended December 31, 2016, Thrivent Investment Management, Inc. (“Thrivent Investment Mgt.”) and Thrivent Distributors, LLC received $202,243 of aggregate underwriting concessions from the sales of the Trust’s Class A shares. Sales charges are not an expense of the Trust and are not reflected in the financial statements of any of the Funds.
The Trust has entered into an accounting and administrative services agreement with Thrivent Asset Mgt. pursuant to which Thrivent Asset Mgt. provides certain accounting and administrative personnel and services to the Funds. The Funds pay an annual fixed fee per fund plus percentage of net assets to Thrivent Asset Mgt. These fees are accrued daily and paid monthly. For the year ended December 31, 2016, Thrivent Asset Mgt. received aggregate fees for accounting and administrative personnel and services of $281,257 from the Funds covered in this shareholder report.
The Trust has entered into an agreement with Thrivent Financial Investor Services, Inc. (“Thrivent Investor Services”) to provide transfer agency, sub transfer agency, and dividend payment services necessary to the Funds on a per-account basis. These fees are accrued daily and paid monthly. For the year ended December 31, 2016, Thrivent Investor Services received $558,306 for transfer agent services from the Funds covered in this shareholder report. In addition, the Trust paid $46,320 in sub transfer agent fees to Thrivent Investment Management, Inc. The sub transfer agent contract with Thrivent Investment Management, Inc. ended on October 31, 2016.
Each Trustee who is not affiliated with the Adviser receives an annual fee from the Trust for services as a Trustee and is eligible to participate in a deferred compensation plan with respect to fees received from the Funds. Participants in the plan may designate their deferred Trustee’s fees as if invested in a series of Thrivent Mutual Funds. The value of each Trustee’s deferred compensation account will increase or decrease as if invested in shares of that series. Their fees as well as the change in value are included in Trustee’s fees in the Statement of Operations. The deferred fees remain in
35
THRIVENT MUTUAL FUNDS
NOTESTO FINANCIAL STATEMENTS
December 31, 2016
the appropriate Fund until distribution in accordance with the plan. The Payable for trustee deferred compensation, located in the Statement of Assets and Liabilities, is unsecured.
Those Trustees not participating in the above plan received $21,480 in fees from the Funds covered in this shareholder report for the year ended December 31, 2016. In addition, the Trust reimbursed independent Trustees for reasonable expenses incurred in relation to attendance at the meetings and industry conferences.
Certain officers and non-independent Trustees of the Trust are officers and directors of Thrivent Asset Mgt., Thrivent Investment Mgt. and Thrivent Investor Services; however, they receive no compensation from the Funds.
(E) Indirect Expenses — Some Funds invest in other open-ended funds. Fees and expenses of those underlying funds are not included in those Funds’ expense ratios reported in the Financial Highlights. The Funds indirectly bear their proportionate share of the annualized weighted average expense ratio of the underlying funds in which they invest.
(4) TAX INFORMATION
Distributions are based on amounts calculated in accordance with the applicable federal income tax regulations, which may differ from GAAP. To the extent that these differences are permanent in nature, such amounts are reclassified within the capital accounts based on their federal tax-basis treatment; temporary differences do not require reclassifications.
On the Statement of Assets and Liabilities, as a result of permanent book-to-tax differences, reclassification adjustments were made as follows [Increase/(Decrease)]:
| | | | | | | | | | | | |
Fund | | Accumulated
Undistributed
Net
Investment
Income/(Loss) | | | Accumulated
Undistributed
Net Realized
Gain/(Loss) | | | Capital Stock | |
Growth and Income Plus | | ($ | 12,567 | ) | | $ | 24,082 | | | ($ | 11,515 | ) |
Diversified Income Plus | | | 113,057 | | | | (111,245 | ) | | | (1,812 | ) |
At December 31, 2016, the components of distributable earnings on a tax basis were as follows:
| | | | | | | | |
Fund | | Undistributed
Ordinary Incomea | | | Undistributed
Long-Term
Capital Gain | |
Diversified Income Plus | | $ | 470,296 | | | $ | — | |
| a | Undistributed Ordinary Income may include income derived from Short-Term Capital Gains. |
At December 31, 2016, the following Funds had accumulated net realized capital loss carryovers expiring as follows:
| | | | | | | | |
Fund | | Capital Loss
Carryover | | | Expiration
Year | |
Growth and Income Plus | | $ | 1,728,912 | | | | Unlimited | |
| | | | | | | | |
Diversified Income Plus | | $ | 12,315,346 | | | | Unlimited | |
| | | | | | | | |
To the extent that these Funds realize future net capital gains, taxable distributions will be reduced by any unused capital loss carryovers as permitted by the Internal Revenue Code.
36
THRIVENT MUTUAL FUNDS
NOTESTO FINANCIAL STATEMENTS
December 31, 2016
The tax character of distributions paid during the years ended December 31, 2016 and 2015 was as follows:
| | | | | | | | | | | | | | | | | | | | | | | | |
| | | Ordinary Incomea | | | Long-Term Capital Gain | | | Return of Capital | |
Fund | | 12/31/2016 | | | 12/31/2015 | | | 12/31/2016 | | | 12/31/2015 | | | 12/31/2016 | | | 12/31/2015 | |
Growth and Income Plus | | $ | 1,442,784 | | | $ | 1,487,540 | | | $ | — | | | $ | 1,358,504 | | | $ | 75,956 | | | $ | 42,746 | |
Diversified Income Plus | | | 24,865,618 | | | | 24,343,337 | | | | — | | | | 3,287,347 | | | | — | | | | — | |
| (a) | Ordinary income includes income derived from short-term capital gains, if any. |
(5) SECURITY TRANSACTIONS
(A) Purchases and Sales of Investment Securities — For the year ended December 31, 2016, the cost of purchases and the proceeds from sales of investment securities, other than U.S. Government and short-term securities, were as follows:
| | | | | | | | |
| | | In thousands | |
Fund | | Purchases | | | Sales | |
Growth and Income Plus | | $ | 56,421 | | | $ | 56,802 | |
Diversified Income Plus | | | 422,153 | | | | 427,828 | |
Purchases and Sales of U.S. Government Securities were:
| | | | | | | | |
| | | In thousands | |
Fund | | Purchases | | | Sales | |
Growth and Income Plus | | $ | 26,862 | | | $ | 25,709 | |
Diversified Income Plus | | | 230,190 | | | | 195,655 | |
(B) Investments in Restricted Securities — Certain Funds may own restricted securities which were purchased in private placement transactions without registration under the Securities Act of 1933. Unless such securities subsequently become registered, they generally may be resold only in privately negotiated transactions with a limited number of purchasers. As of December 31, 2016, the following Funds held restricted securities:
| | | | | | | | |
Fund | | Number of
Securities | | | Percent of Fund’s
Net Assets | |
Growth and Income Plus | | | 4 | | | | 0.21 | % |
Diversified Income Plus | | | 19 | | | | 2.84 | % |
The Funds have no right to require registration of unregistered securities.
(C) Investments in High-Yielding Securities — The Funds may invest in high-yielding securities. These securities will typically be in the lower rating categories or will be non-rated and generally will involve more risk than securities in the higher rating categories. Lower rated or unrated securities (e.g., junk bonds) are more likely to react to developments affecting market risk and credit risk than are more highly rated securities, which react primarily to movements in the general level of interest rates.
(D) Investments in Options and Futures Contracts — The movement in the price of the security underlying an option or futures contract may not correlate perfectly with the movement in the prices of the portfolio securities being hedged. A lack of correlation could render a Fund’s hedging strategy unsuccessful and could result in a loss to the Fund. In the event that a liquid secondary market would not exist, the Fund could be prevented from entering into a closing transaction, which could result in additional losses to the Fund.
(E) Written Option Contracts — During the year ended December 31, 2016, none of the Funds engaged in these types of investments.
(6) SECURITY TRANSACTIONS WITH AFFILIATED FUNDS
The Funds are permitted to purchase or sell securities from or to certain other Funds or affiliated Portfolios under specified conditions outlined in procedures adopted by the Board. The procedures have been designed to ensure that any purchase or sale of securities by a Fund from or to another fund or portfolio that is or could be considered an affiliate by virtue of having a common investment adviser (or affiliated investment advisers), common Trustees and/or common officers complies with Rule 17a-7 of the 1940 Act. Further, as defined under the procedures, each transaction is executed at the current market price. For the year ended December 31, 2016, Diversified Income Plus Fund engaged in sale transactions that complied with Rule 17a-7 of the 1940 Act in the amount of $5,471,667, which resulted in a net realized loss of $24,025.
(7) RELATED PARTY TRANSACTIONS
As of December 31, 2016, no related parties held shares in excess of 5% of the Funds covered in this shareholder report.
(8) SUBSEQUENT EVENTS
The Adviser of the Funds has evaluated the impact of subsequent events through February 20, 2017, and, except as already included in the Notes to Financial Statements, has determined that no additional items require disclosure.
37
THRIVENT MUTUAL FUNDS
FINANCIAL HIGHLIGHTS
| | | | | | | | | | | | | | | | | | | | | | | | |
| | | FOR A SHARE OUTSTANDING THROUGHOUT EACH PERIOD* | |
| | | | | | Income from Investment Operations | | | Less Distributions From | |
| | | Net Asset
Value,
Beginning
of Period | | | Net
Investment
Income/
(Loss) | | | Net Realized
and Unrealized
Gain/(Loss) on
Investments(a) | | | Total from
Investment
Operations | | | Net
Investment
Income | | | Net Realized
Gain on
Investments | |
GROWTH AND INCOME PLUS FUND | |
Class A Shares | | | | | | | | | | | | | | | | | | | | | | | | |
Year Ended 12/31/2016 | | $ | 9.55 | | | $ | 0.18 | | | $ | 0.42 | | | $ | 0.60 | | | $ | (0.19 | ) | | $ | — | |
Year Ended 12/31/2015 | | | 10.03 | | | | 0.19 | | | | (0.29 | ) | | | (0.10 | ) | | | (0.19 | ) | | | (0.18 | ) |
Year Ended 12/31/2014 | | | 10.38 | | | | 0.19 | | | | 0.01 | | | | 0.20 | | | | (0.20 | ) | | | (0.35 | ) |
Year Ended 12/31/2013 | | | 9.59 | | | | 0.18 | | | | 1.83 | | | | 2.01 | | | | (0.19 | ) | | | (1.03 | ) |
Year Ended 12/31/2012 | | | 8.70 | | | | 0.20 | | | | 0.89 | | | | 1.09 | | | | (0.20 | ) | | | — | |
| Class S Shares | |
Year Ended 12/31/2016 | | | 9.56 | | | | (0.02 | ) | | | 0.65 | | | | 0.63 | | | | (0.21 | ) | | | — | |
Year Ended 12/31/2015 | | | 10.05 | | | | 0.26 | | | | (0.33 | ) | | | (0.07 | ) | | | (0.23 | ) | | | (0.18 | ) |
Year Ended 12/31/2014 | | | 10.39 | | | | 0.29 | | | | (0.05 | ) | | | 0.24 | | | | (0.23 | ) | | | (0.35 | ) |
Year Ended 12/31/2013 | | | 9.60 | | | | 0.44 | | | | 1.61 | | | | 2.05 | | | | (0.23 | ) | | | (1.03 | ) |
Year Ended 12/31/2012 | | | 8.71 | | | | 0.24 | | | | 0.88 | | | | 1.12 | | | | (0.23 | ) | | | — | |
| | | | | | | | | | | | | | | | | | | | | | | | |
DIVERSIFIED INCOME PLUS FUND | |
Class A Shares | |
Year Ended 12/31/2016 | | | 6.79 | | | | 0.22 | | | | 0.23 | | | | 0.45 | | | | (0.24 | ) | | | — | |
Year Ended 12/31/2015 | | | 7.10 | | | | 0.23 | | | | (0.27 | ) | | | (0.04 | ) | | | (0.24 | ) | | | (0.03 | ) |
Year Ended 12/31/2014 | | | 7.25 | | | | 0.24 | | | | 0.02 | | | | 0.26 | | | | (0.23 | ) | | | (0.18 | ) |
Year Ended 12/31/2013 | | | 6.82 | | | | 0.23 | | | | 0.47 | | | | 0.70 | | | | (0.23 | ) | | | (0.04 | ) |
Year Ended 12/31/2012 | | | 6.22 | | | | 0.27 | | | | 0.59 | | | | 0.86 | | | | (0.26 | ) | | | — | |
Class S Shares | |
Year Ended 12/31/2016 | | | 6.74 | | | | 0.24 | | | | 0.22 | | | | 0.46 | | | | (0.26 | ) | | | — | |
Year Ended 12/31/2015 | | | 7.04 | | | | 0.25 | | | | (0.26 | ) | | | (0.01 | ) | | | (0.26 | ) | | | (0.03 | ) |
Year Ended 12/31/2014 | | | 7.19 | | | | 0.26 | | | | 0.02 | | | | 0.28 | | | | (0.25 | ) | | | (0.18 | ) |
Year Ended 12/31/2013 | | | 6.77 | | | | 0.26 | | | | 0.46 | | | | 0.72 | | | | (0.26 | ) | | | (0.04 | ) |
Year Ended 12/31/2012 | | | 6.19 | | | | 0.30 | | | | 0.57 | | | | 0.87 | | | | (0.29 | ) | | | — | |
| (a) | The amount shown may not correlate with the change in aggregate gains and losses of portfolio securities due to the timing of sales and redemptions of fund shares. |
| (b) | Total investment return assumes dividend reinvestment and does not reflect any deduction for applicable sales charges. Not annualized for periods less than one year. |
| * | All per share amounts have been rounded to the nearest cent. |
| ** | Computed on an annualized basis for periods less than one year. |
The accompanying Notes to Financial Statements are an integral part of this statement.
38
THRIVENT MUTUAL FUNDS
FINANCIAL HIGHLIGHTS –CONTINUED
| | | | | | | | | | | | | | | | | | | | | | | | | | | | | | | | | | | | | | |
| |
| | | | RATIOS/SUPPLEMENTAL DATA | |
| | | | | | | | | | | | | | | | Ratio to Average Net
Assets ** | | | Ratios to Average Net Assets
Before Expenses Waived,
Credited or Paid
Indirectly ** | | | | |
Return of
Capital | | | Total Distributions | | | Net Asset
Value, End of
Period | | | Total
Return(b) | | | Net Assets,
End of Period
(in millions) | | | Expenses | | | Net Investment
Income/(Loss) | | | Expenses | | | Net Investment
Income/(Loss) | | | Portfolio
Turnover
Rate | |
| | | | | | | | | | | | | | | | | | | | | | | | | | | | | | | | | | | | | | |
| | | | | | | | | | | | | | | | | | | | | | | | | | | | | | | | | | | | | | |
| $ | (0.01 | ) | | $ | (0.20 | ) | | $ | 9.95 | | | | 6.29 | % | | $ | 71.7 | | | | 1.10 | % | | | 1.87 | % | | | 1.45 | % | | | 1.53 | % | | | 114 | % |
| | (0.01 | ) | | | (0.38 | ) | | | 9.55 | | | | (1.03 | )% | | | 72.1 | | | | 1.15 | % | | | 1.92 | % | | | 1.44 | % | | | 1.63 | % | | | 181 | % |
| | — | | | | (0.55 | ) | | | 10.03 | | | | 1.89 | % | | | 76.5 | | | | 1.15 | % | | | 1.93 | % | | | 1.42 | % | | | 1.66 | % | | | 167 | % |
| | — | | | | (1.22 | ) | | | 10.38 | | | | 21.08 | % | | | 49.8 | | | | 1.15 | % | | | 1.69 | % | | | 1.50 | % | | | 1.34 | % | | | 162 | % |
| | — | | | | (0.20 | ) | | | 9.59 | | | | 12.60 | % | | | 25.6 | | | | 1.15 | % | | | 2.18 | % | | | 1.47 | % | | | 1.86 | % | | | 164 | % |
| | | | | | | | | | | | | | | | | | | | | | | | | | | | | | | | | | | | | | |
| | (0.01 | ) | | | (0.22 | ) | | | 9.97 | | | | 6.67 | % | | | 5.9 | | | | 0.80 | % | | | 2.19 | % | | | 1.23 | % | | | 1.76 | % | | | 114 | % |
| | (0.01 | ) | | | (0.42 | ) | | | 9.56 | | | | (0.77 | )% | | | 1.5 | | | | 0.80 | % | | | 2.26 | % | | | 1.13 | % | | | 1.93 | % | | | 181 | % |
| | — | | | | (0.58 | ) | | | 10.05 | | | | 2.34 | % | | | 1.8 | | | | 0.80 | % | | | 2.24 | % | | | 1.12 | % | | | 1.92 | % | | | 167 | % |
| | — | | | | (1.26 | ) | | | 10.39 | | | | 21.56 | % | | | 2.3 | | | | 0.80 | % | | | 2.02 | % | | | 0.92 | % | | | 1.90 | % | | | 162 | % |
| | — | | | | (0.23 | ) | | | 9.60 | | | | 12.97 | % | | | 35.3 | | | | 0.80 | % | | | 2.52 | % | | | 0.94 | % | | | 2.38 | % | | | 164 | % |
| | | | | | | | | | | | | | | | | | | | | | | | | | | | | | | | | | | | | | |
| | | | | | | | | | | | | | | | | | | | | | | | | | | | | | | | | | | | | | |
| | | | | | | | | | | | | | | | | | | | | | | | | | | | | | | | | | | | | | |
| | — | | | | (0.24 | ) | | | 7.00 | | | | 6.70 | % | | | 591.3 | | | | 0.97 | % | | | 3.23 | % | | | 0.97 | % | | | 3.23 | % | | | 91 | % |
| | — | | | | (0.27 | ) | | | 6.79 | | | | (0.62 | )% | | | 585.5 | | | | 0.98 | % | | | 3.28 | % | | | 0.98 | % | | | 3.28 | % | | | 108 | % |
| | — | | | | (0.41 | ) | | | 7.10 | | | | 3.54 | % | | | 581.7 | | | | 0.98 | % | | | 3.33 | % | | | 0.98 | % | | | 3.33 | % | | | 137 | % |
| | — | | | | (0.27 | ) | | | 7.25 | | | | 10.40 | % | | | 459.1 | | | | 1.00 | % | | | 3.34 | % | | | 1.00 | % | | | 3.34 | % | | | 155 | % |
| | — | | | | (0.26 | ) | | | 6.82 | | | | 14.08 | % | | | 290.7 | | | | 0.99 | % | | | 4.14 | % | | | 1.03 | % | | | 4.10 | % | | | 153 | % |
| | | | | | | | | | | | | | | | | | | | | | | | | | | | | | | | | | | | | | |
| | — | | | | (0.26 | ) | | | 6.94 | | | | 6.91 | % | | | 158.2 | | | | 0.70 | % | | | 3.51 | % | | | 0.70 | % | | | 3.51 | % | | | 91 | % |
| | — | | | | (0.29 | ) | | | 6.74 | | | | (0.19 | )% | | | 108.3 | | | | 0.69 | % | | | 3.56 | % | | | 0.69 | % | | | 3.56 | % | | | 108 | % |
| | — | | | | (0.43 | ) | | | 7.04 | | | | 3.90 | % | | | 116.2 | | | | 0.69 | % | | | 3.60 | % | | | 0.69 | % | | | 3.60 | % | | | 137 | % |
| | — | | | | (0.30 | ) | | | 7.19 | | | | 10.70 | % | | | 107.5 | | | | 0.70 | % | | | 3.66 | % | | | 0.70 | % | | | 3.66 | % | | | 155 | % |
| | — | | | | (0.29 | ) | | | 6.77 | | | | 14.23 | % | | | 54.2 | | | | 0.72 | % | | | 4.47 | % | | | 0.72 | % | | | 4.47 | % | | | 153 | % |
The accompanying Notes to Financial Statements are an integral part of this statement.
39
ADDITIONAL INFORMATION
(unaudited)
Shareholder Notification of Federal Tax Information
The following information is provided solely to satisfy the requirements set forth by the Internal Revenue Code. Shareholders will be provided information regarding their distribution in February 2017.
The funds designate the percentage of dividends declared from net investment income as dividends qualifying for the 70% dividends received deduction for corporations and the percentage as qualified dividend income for individuals under the Jobs and Growth Tax Relief Reconciliation Act of 2003 as follows:
| | | | | | | | |
Fund | | Dividends
Received
Deduction
for
Corporations | | | Qualified
Dividend
Income for
Individuals | |
Growth and Income Plus | | | 29 | % | | | 67 | % |
Diversified Income Plus | | | 11 | % | | | 19 | % |
Proxy Voting
The policies and procedures that the Trust uses to determine how to vote proxies relating to portfolio securities are attached to the Trust’s Statement of Additional Information. You may request a free copy of the Statement of Additional Information by calling 1-800-847-4836. You also may review the Statement of Additional Information or the report of how the Trust voted proxies relating to portfolio securities during the most recent 12-month period ended June 30 at ThriventFunds.com or sec.gov.
Quarterly Schedule of Investments
The Trust files its Schedule of Portfolio Holdings on Form N-Q with the SEC for the first and third quarters of each fiscal year. You may request a free copy of the Trust’s Forms N-Q by calling 1-800-847-4836. The Trust’s most recent Form N-Q Schedule of Investments also is at ThriventFunds.com or sec.gov. You also may review and copy the Forms N-Q for the Trust at the SEC’s Public Reference Room in Washington, DC. You may get information about the operation of the Public Reference Room by calling 1-800-SEC-0330.
Summary Schedule of Investments
The summary schedule of investments is designed to streamline the report and help investors better focus on a fund’s principal holdings. A complete listing of holdings for a fund in which the summary is included in the shareholder report is available free of charge by calling 1-800-847-4836. It is also available at ThriventFunds.com or sec.gov where it is part of form N-CSR.
Board Approval of Advisory Agreement and Subadvisory Agreements
Both the Investment Company Act of 1940 (the “Investment Company Act”) and the terms of the Advisory and Subadvisory Agreements of the Thrivent Mutual Funds (the “Trust”) require that these agreements be approved annually by the Board of Trustees (the “Board”), including a majority of the Trustees who are not “interested persons” of the Trust, as defined in the Investment Company Act (the “Independent Trustees”). The ten-member Board includes eight Independent Trustees, including the Chairman.
At its meeting on November 15-16, 2016, the Board voted unanimously to renew the existing Advisory Agreement, as amended, between the Trust and Thrivent Asset Management, LLC (the “Adviser”) for each series of the Trust (each, a “Fund”). The Board also unanimously approved the Subadvisory Agreements for each of the Funds for which there is an investment subadviser (each a “Subadviser”). The Adviser and Subadvisers are referred to, collectively, as the “Advisory Organizations.” In connection with its evaluation of the agreements with the Advisory Organizations, the Board reviewed a broad range of information requested for this purpose and considered a variety of factors, including the following:
| | 1. | The nature, extent, and quality of the services provided by the Advisory Organizations; |
40
ADDITIONAL INFORMATION
(unaudited)
| | 2. | The performance of the Funds; |
| | 3. | The advisory fee and net operating expense ratio of each Fund compared to a peer group; |
| | 4. | The cost of services provided and profit realized by the Adviser; |
| | 5. | The extent to which economies of scale may be realized as the Funds grow; |
| | 6. | Whether fee levels reflect these economies of scale for the benefit of the Funds’ shareholders; |
| | 7. | Other benefits realized by the Adviser and its affiliates from their relationship with the Trust; and |
| | 8. | Any other factors that the Board deemed relevant to its consideration. |
In connection with the renewal process, the Contracts Committee of the Board (consisting of all of the Independent Trustees) met on five occasions from May 24 to November 16, 2016 to consider information relevant to the renewal process. The Independent Trustees also retained the services of Management Practice Inc. (“MPI”) as an independent consultant to assist in the compilation, organization, and evaluation of relevant information. This information included Fund-by-Fund statistical comparisons of the advisory fees, other fees, net operating expenses and performance of each of the Funds in comparison to a peer group of comparable funds; portfolio turnover percentages; brokerage costs; information with respect to services provided to the Funds and fees charged, including effective advisory fees that take into account breakpoints and fee waivers by the Adviser; asset and flow trends for the Funds; the cost of services and profit realized by the Adviser and its affiliates that provide services to the Funds; and information regarding the types of services furnished to the Funds. The Contracts Committee also received from the Adviser a summary document containing information about each Fund, including its inception date, investment strategy, and the names of Lipper peer groups, custom or other benchmarks, and portfolio managers. The summary document also included information regarding historical changes in certain of the Funds’ information.
The Board received information from the Adviser regarding the personnel providing services to the Funds, including investment management, compliance and administrative personnel. The Board also received monthly reports from the Adviser’s investment management staff with respect to the performance of the Funds. In addition to its review of the information presented to the Board during the contract renewal process, the Board also considered information obtained from management throughout the course of the year. The Board also reviewed information from MPI, including Fund-by-Fund analyses and independent assessment of information relating to the Funds and the agreements.
The Independent Trustees were represented by independent counsel throughout the review process and during executive sessions without management present to consider reapproval of the agreements. As noted above, the Independent Trustees were assisted throughout the process by an independent consultant, MPI. Each Independent Trustee relied on his or her own business judgment in determining the weight to be given to each factor considered in evaluating the materials that were presented to them. The Contracts Committee’s and Board’s review and conclusions were based on a comprehensive consideration of all information presented to them and were not the result of any single controlling factor. In addition, each Trustee may have weighed individual factors differently. The key factors considered and the conclusions reached are described below.
Nature, Extent and Quality of Services
At each of the Board’s regular quarterly meetings, management presented information describing the services furnished to the Funds by the Adviser, transfer agent, administrator and, as appropriate, the Subadvisers. During these meetings, management reported on the investment management, portfolio trading and compliance services provided to the Funds. During the renewal process, the Board considered the specific services provided under the Advisory Agreement. The Board also considered information relating to the investment experience and qualifications of the Adviser’s portfolio managers and those of the Subadvisers overseeing investments for the Trust.
The Board received reports at each of its quarterly meetings from the Adviser’s Head of Equity Investments and Head of Fixed Income Funds, as supplemented by the Adviser’s Chief Investment Officer, who was also present at all of the meetings. At each quarterly meeting, the Head of Equity Investments and Head of Fixed Income Funds presented information about each
41
ADDITIONAL INFORMATION
(unaudited)
of the Funds. The Adviser noted that the Head of Equity Investments and Head of Fixed Income Funds monitor the Funds’ risk profiles and that the Adviser had implemented a process to monitor market and relative risks in comparison to the Funds’ Lipper peer groups and market benchmarks. On a schedule agreed to by the Adviser and the Independent Trustees, the Board received presentations from certain Subadvisers regarding their portfolio management services to certain Funds. These reports and presentations gave the Board the opportunity to evaluate the portfolio managers’ abilities and the quality of services they provide to the Funds. The Adviser also reviewed with the Board the services provided by the Subadvisers and its oversight of the Subadvisers. The Adviser and the Trust’s Chief Compliance Officer presented information to the Board describing the portfolio compliance functions performed by the Adviser. The Independent Trustees also met in-person, including in executive session, with and received quarterly reports from the Trust’s Chief Compliance Officer.
The Board considered the depth and quality of the Adviser’s oversight of the Subadvisers. In addition, the Board noted the broad functions that the Adviser performed in support of the subadvised Funds, including, among other things, management of portfolio cash, subadviser expense management and payment, performance and compliance monitoring. The Board noted that investment management staff of the Adviser and the Trust’s Chief Compliance Officer conduct in-person oversight visits of each Subadviser, report the results of the visit to the Board and then follow through with additional inquiry on any questions or concerns that arise during the visit. The Board also noted that, as part of its oversight practice, the Adviser requires the Subadvisers to respond to a variety of compliance checklists and certifications to ensure their ongoing compliance with a subadvised Fund’s policies. The Board noted that the Adviser requires the Subadvisers to complete an annual questionnaire addressing a range of compliance topics. In addition, the Board noted that the Adviser has dedicated personnel responsible for daily monitoring of the Subadvisers’ activities pertaining to the subadvised Funds.
The Board considered the adequacy of the Advisory Organizations’ resources used to provide services to the Trust pursuant to the Advisory and Subadvisory Agreements. The Adviser reviewed with the Board the Adviser’s process for overseeing the portfolio management teams of the Funds, and explained similarities and differences for how it oversees the Adviser’s teams and the teams of the Subadvisers. In addition, the Adviser noted that its investments in technology and personnel have benefitted the Funds and discussed continued investments in these resources. The Adviser also discussed how it has continued to strengthen its compliance program. The Board viewed these actions as a positive factor in reapproving the existing Advisory Agreement, as they demonstrated the Adviser’s commitment to provide the Funds with quality service and competitive investment performance. The Board concluded that, within the context of its full deliberations, the nature, extent and quality of the investment advisory services provided to the Funds by the Adviser and Subadvisers supported renewal of the Advisory Agreement and Subadvisory Agreements.
Performance of the Funds
In connection with each of its regular quarterly meetings, the Board received information on the performance of each Fund, including net performance, relative performance rankings within each Fund’s Lipper peer group, Morningstar ratings, and performance as compared to benchmark index returns. At each quarterly Board meeting, the Head of Equity Investments and Head of Fixed Income Funds reviewed with the Board the economic and market environment, risk management, and style consistency in connection with management of the Funds. The Board considered investment performance for each Fund, to the extent applicable, over the one-, two-, three-, five-, and ten-year periods. When evaluating investment performance, the Board considered longer-term performance and the trend of performance, and focused particularly upon the three-year performance record. Although the Board conducted its review on a Fund-by-Fund basis, it noted that, for the period ended June 30, 2016, the three-year average performance ranking of the Funds’ Class A shares against their Lipper categories was 41% (on a scale of 1-99%, with 1% being the best). The Board noted that, for the period ended June 30, 2016, the three-year average ranking of the Funds’ Class S shares against their Lipper categories was 31% (on a scale of 1-99%, with 1% being the best).
The Board noted that certain Funds did not fit well within a Lipper peer group because of differences between the principal investment strategies of these Funds and funds included in their respective Lipper peer group. In such cases, the Adviser provided additional information regarding these Funds’ performance compared to a customized benchmark that the Adviser believed better represented the investment strategies of such Funds. The Board concluded that the performance of each individual Fund was either satisfactory or that the Adviser had taken appropriate actions in an effort to improve performance.
42
ADDITIONAL INFORMATION
(unaudited)
Advisory Fees and Fund Expenses
The Board reviewed information prepared by MPI comparing each Fund’s advisory fee with the advisory fee of its peer group. The Board considered both the contractual and effective advisory fees for each of the Funds. The Board noted that the majority of the Funds’ gross advisory fees were near or below the medians of their peer groups, with many in the lowest (i.e., least expensive) quartile. Although the Board conducted its review on a Fund-by-Fund basis, it noted that the average ranking of the Funds’ advisory fees for its Class A shares was 32% and the average ranking of the of the Funds’ advisory fees for its Class S shares was 33% (on a scale of 1-99%, with 1% being the lowest fee). The Board viewed favorably the Adviser’s proposal to provide certain fee waivers and expense limitations for certain Funds and considered the effect of the waivers and limitations in lowering the Funds’ expenses. On the basis of its review, the Board concluded that the advisory fees charged to the Funds for investment management services were reasonable.
The Board also reviewed information prepared by MPI comparing each Fund’s overall expense ratio with the expense ratio of its peer group. The Board conducted its review on a Fund-by-Fund basis and noted that all but five Funds (each of which is discussed below) had better total net expense ratios than their peer group medians. The Board further noted that the Funds’ Class A shares had an average ranking of 40% while the Funds’ Class S shares had an average ranking of 23% (on a scale of 1-99%, with 1% being the lowest expenses). With respect to the Thrivent Money Market Fund, the Board noted that the Adviser, like many investment advisers in the industry, continued to waive fees in order to maintain a zero yield. With respect to Thrivent Partner Worldwide Allocation Fund, the Board viewed favorably management’s willingness to institute a fee waiver for the Class S shares and to lower the existing contractual expense cap with respect to the Class A shares. With respect to Thrivent Moderately Aggressive Allocation Fund, Thrivent Aggressive Allocation Fund, and Thrivent Moderate Allocation Fund, the Board noted that management implemented a new simplified fee structure in 2015, which had been approved by shareholders.
Cost of Services and Profitability
The Board considered the Adviser’s estimates of its profitability, which included allocations by the Adviser of its costs in providing advisory services to the Funds. The internal audit department (i.e., Business Risk Management) of the Adviser conducted a review of such allocations and a department representative reported to the Board his views regarding the reasonableness and consistency of these allocations. The Board considered the profitability of the Adviser both overall and on a Fund-by-Fund basis. The Board also considered the expense reimbursements and waivers in effect. The Board received a comprehensive presentation that discussed, among other things, profitability benchmarks and trends based on a sample of asset managers, as well as the Adviser’s view of its profitability. Based on its review of the data prepared by MPI and expense and profit information provided by the Adviser, the Board concluded that the profits earned by the Adviser from the Advisory Agreement were not excessive in light of the nature, extent and quality of services provided to the Funds.
With respect to fees paid to Subadvisers under the Subadvisory Agreements, the Board did not consider profitability information with respect to the Subadvisers, which are not affiliated with the Adviser. The Board considered that those contracts had been negotiated on an arm’s-length basis between the Adviser and each Subadviser, and that each Subadviser’s separate profitability from its relationship with the Funds was not a material factor in determining whether to renew the Subadvisory Agreements.
Economies of Scale and Breakpoints
The Board considered information regarding the extent to which economies of scale may be realized as a Fund’s assets increase and whether the fee levels reflect these economies of scale for the benefit of shareholders. The Adviser explained its general goal with respect to the employment of fee waivers, expense reimbursements and breakpoints. The Board considered information provided by the Adviser related to advisory fee rates, breakpoints in the advisory fee rates and fee waivers provided by the Adviser. The Board also considered management’s view that it is difficult to generalize as to whether, or to what extent, economies in the advisory function may be realized as a Fund’s assets increase. The Board noted that expected economies of scale, where they exist, may be shared through the use of fee breakpoints, fee waivers and expense limitations by the Adviser, and/or a lower overall fee rate.
43
ADDITIONAL INFORMATION
(unaudited)
Other Benefits to the Adviser and its Affiliates
The Board considered information regarding potential “fall-out” or ancillary benefits that the Adviser and its affiliates may receive as a result of their relationship with the Trust, both tangible and intangible, such as their ability to leverage investment professionals who manage other portfolios, an enhanced reputation as an investment adviser which may help in attracting other clients and investment personnel, and the engagement of affiliates as service providers to the Funds. The Board noted that such benefits were difficult to quantify but were consistent with benefits received by other mutual fund advisers. The Board also considered the research received by the Adviser generated from commission dollars spent on the Funds’ portfolio trading.
Based on the factors discussed above, the Contracts Committee unanimously recommended approval of the Advisory Agreement and the Subadvisory Agreements, and the Board, including all of the Independent Trustees voting separately, approved each of the agreements.
44
BOARDOF TRUSTEESAND OFFICERS
The following table provides information about the Trustees and Officers of the Trust. The Board is responsible for the management and supervision of the Funds’ business affairs and for exercising all powers except those reserved to the shareholders. Each Trustee overseas each of 21 series of the Trust and also serves as:
| | • | | Director of Thrivent Series Fund, Inc., a registered investment company consisting of 27 Portfolios that serve as underlying funds for variable contracts issued by Thrivent Financial and Thrivent Life Insurance Company (“TLIC”) and investment options in the retirement plan offered by Thrivent Financial. |
| | • | | Trustee of Thrivent Cash Management Trust, a registered investment company consisting of one portfolio that serves as a cash collateral fund for a securities lending program sponsored by Thrivent Financial. |
| | • | | Trustee of Thrivent Core Funds, a registered investment company that only offers its shares to the Trust and Thrivent Series Fund, Inc. |
The Trust, Thrivent Series Fund, Inc., Thrivent Cash Management Trust, and Thrivent Core Funds are collectively referred to as the “Fund Complex.” The Statement of Additional Information includes additional information about the Trustees and is available, without charge, by calling 1-800-847-4836.
Interested Trustee (1)(2)(3)(4)
| | |
Name (Year of Birth) Year Elected | | Principal Occupation(s) and Directorships of Public Companies and Other Investment Companies During the Past Five Years |
Russell W. Swansen (1957) 2009 | | Senior Vice President, Chief Investment Officer, Thrivent Financial since 2003. Director of Twin Bridge Capital Partners; Invenshure, LLC; Children’s Cancer Research Fund; and Intellectual Takeout. |
| |
David S. Royal (1971) 2015 | | President, Thrivent Mutual Funds, Thrivent Financial since 2015; Vice President and Deputy General Counsel from 2006 to 2015. Director of Fairview Hospital Foundation. |
Independent Trustees (2)(3)(4)(5) |
Name (Year of Birth) Year Elected | | Principal Occupation(s) and Directorships of Public Companies and Other Investment Companies During the Past Five Years |
| |
Janice B. Case (1952) 2011 | | Retired. Independent Trustee of North American Electric Reliability Corporation (the electric reliability organization (“ERD”) for North America) since 2008. |
| |
Robert J. Chersi (1961) 2017 | | Founder of Chersi Services LLC (consulting firm) since 2012; Executive Director of Center for Global Governance, Reporting & Regulation and Adjunct Professor of Finance and Economics at Pace University since 2013; Helpful Executive in Research (counseling) in the Department of Accounting & Information Systems at Rutgers University since 2013; Chief Financial Officer of Fidelity Investments Financial Services from 2008 to 2012. Director and Chairman of the Audit Committee of Old Mutual Asset Management PLC since 2016; Advisory Board member of the Pace University Lubin School of Business; Trustee of Fidelity Investments Financial Services’ Political Action Committee. |
| |
Richard A. Hauser (1943) 2004 | | Retired. Vice President and Assistant General Counsel, The Boeing Company from 2007 to 2016. |
| |
Marc S. Joseph (1960) 2011 | | Managing Director of Granite Ridge LLP (consulting and advisory firm) since 2009; Managing Director of Triangle Crest (private investing and consulting firm) since 2004. |
| |
Paul R. Laubscher (1956) 2009 | | Portfolio Manager for U.S. private real estate portfolios of IBM Retirement Funds. |
| |
James A. Nussle (1960) 2011 | | President and Chief Executive Officer of Credit Union National Association since September 2014; President and Chief Operating Officer of Growth Energy (trade association) from 2010 through August 2014; Advisory Board member of AVISTA Capital Partners (private equity firm) since 2010; CEO of The Nussle Group LLC (consulting firm) since 2009. Advisory Board member of AVISTA Capital Partners and Director of Portfolio Recovery Associates (PRAA). |
45
BOARDOF TRUSTEESAND OFFICERS
Independent Trustees (2)(3)(4)(5)
| | |
Name (Year of Birth) Year Elected | | Principal Occupation(s) and Directorships of Public Companies and Other Investment Companies During the Past Five Years |
| |
Verne O. Sedlacek (1954) 2017 | | Chief Executive Officer of E&F Advisors LLC (consulting) since 2015; President & Chief Executive Officer of the Commonfund from 2003 to 2015. Director of Association of Governing Boards of Universities and Collleges since 2007; Trustee of Valparaiso University since 2015; Trustee of Museum of American Finance since 2015; Chairman of the Board of Directors of AGB Institutional Strategies since 2016. |
| |
Constance L. Souders (1950) 2007 | | Retired. |
| | |
Executive Officers (4) | | |
Name (Year of Birth) Position Held With Thrivent | | Principal Occupation(s) During the Past Five Years |
| |
David S. Royal (1971)
President | | Vice President, Thrivent Mutual Funds, Thrivent Financial since 2015; Vice President and Deputy General Counsel from 2006 to 2015. |
| |
Russell W. Swansen (1957) Chief Investment Officer | | Senior Vice President and Chief Investment Officer, Thrivent Financial since 2003. |
| |
Gerard V. Vaillancourt (1967) Treasurer and Principal Accounting Officer | | Vice President, Mutual Fund Accounting since 2006. |
| |
Michael W. Kremenak (1978) Secretary and Chief Legal Officer | | Vice President, Thrivent Financial since 2015; Senior Counsel, Thrivent Financial from 2013 to 2015; Vice President and Assistant General Counsel at Nuveen Investments from 2011 to 2013. |
| |
Ted S. Dryden (1965) Chief Compliance Officer | | Investment Company and Investment Adviser Chief Compliance Officer, Thrivent Financial since December 2010. |
| |
Janice M. Guimond (1964) Vice President | | Vice President, Investment Operations, Thrivent Financial since 2004. |
| |
Kathleen M. Koelling (1977) Privacy and Identity Theft and Anti-Money Laundering Officer (6) | | Privacy and Identity Theft and Anti-Money Laundering Officer, Thrivent Financial since 2011; Senior Counsel, Thrivent Financial since 2002. |
| |
Mark D. Anema (1961) Vice President | | Vice President, New Product Management and Development, Thrivent Financial since 2007. |
| |
Kathryn A. Stelter (1962) Vice President | | Director, Mutual Fund Operations, Thrivent Financial since 2014; Director, Mutual Fund Operations at Hartford Funds from 2006 to 2014. |
| |
James M. Odland (1955) Assistant Secretary | | Vice President, Managing Counsel, Thrivent Financial since 2005. |
| |
Jill M. Forte (1974) Assistant Secretary | | Counsel, Thrivent Financial since 2015; Associate Counsel, Ameriprise Financial, Inc. from 2013 to 2015; Manager - Legal Affairs, Ameriprise Financial, Inc. from 2010 to 2013. |
| |
Troy A. Beaver (1967) Vice President | | Vice President, Mutual Fund Distribution & Sales, Thrivent Financial since 2015; Vice President, Marketing, American Century Investments from 2006 to 2015. |
| |
Sarah L. Bergstrom (1977) Assistant Treasurer | | Director, Fund Accounting Administration, Thrivent Financial since 2007. |
| (1) | “Interested Trustee” of the Fund as defined in the Investment Company Act of 1940 by virtue of positions with Thrivent Financial. Mr. Swansen and Mr. Royal are considered interested trustees because of their principal occupation with Thrivent Financial. |
| (2) | Each Trustee generally serves an indefinite term until her or his successor is duly elected and qualified. Trustees serve at the discretion of the board until their successors are duly appointed and qualified. |
| (3) | Each Trustee oversees 50 portfolios. |
| (4) | The address for each Trustee and Officer unless otherwise noted is 625 Fourth Avenue South, Minneapolis, MN 55415. |
| (5) | The Trustees other than Mr. Swansen and Mr. Royal are not “interested trustees” of the Fund and are referred to as “Independent Trustees.” |
| (6) | The address for this Officer is 4321 North Ballard Road, Appleton, WI 54913. |
46
(This page intentionally left blank)
(This page intentionally left blank)


As of the end of the period covered by this report, registrant has adopted a code of ethics (as defined in Item 2 of Form N-CSR) applicable to registrant’s Principal Executive Officer, Principal Financial Officer and Principal Accounting Officer. No waivers were granted to such code of ethics during the period covered by this report. A copy of this code of ethics is filed as an exhibit to this Form N-CSR.
| Item 3. | Audit Committee Financial Expert |
Registrant’s Board of Trustees has determined that Constance L. Souders, an independent trustee, is the Audit Committee Financial Expert.
| Item 4. | Principal Accountant Fees and Services |
(a) through (d)
Thrivent Growth and Income Plus Fund and Thrivent Diversified Income Plus Fund (each a “Fund” and collectively, the “Funds”) are each a series of Thrivent Mutual Funds, a Massachusetts business trust (the “Trust”). The Trust, as of the date of filing this Form N-CSR, contains a total of 21 series (the “Series”), including the Funds. This Form N-CSR relates to the annual report of each Fund.
The following table presents the aggregate fees billed to the Funds for the respective fiscal years ended December 31, 2015 and December 31, 2016 by the Funds’ independent public accountants, PricewaterhouseCoopers LLP (“PwC”), for professional services rendered for the audit of the Funds’ annual financial statements and fees billed for other services rendered by PwC during those periods.
| | | | | | | | |
Fiscal Years Ended | | 12/31/15 | | | 12/31/16 | |
Audit Fees | | $ | 32,033 | | | $ | 23,478 | |
Audit-Related Fees(1) | | $ | 0 | | | $ | 0 | |
Tax Fees(2) | | $ | 20,484 | | | $ | 11,821 | |
All Other Fees(3) | | $ | 130,474 | | | $ | 0 | |
| | | | | | | | |
Total | | $ | 182,991 | | | $ | 35,299 | |
| | | | | | | | |
(1) Audit-related fees consist of the aggregate fees billed for assurance and related services that are reasonably related to the performance of the audit of financial statements and are not reported under the category of audit fees.
(2) Tax fees consist of the aggregate fees billed for professional services rendered by the principal accountant relating to tax compliance, tax advice, and tax planning and specifically include fees for tax return preparation.
(3) All other fees consist of the aggregate fees billed for products and services provided by the principal accountant other than audit, audit-related, and tax services.
The following table presents the aggregate fees billed to all Series of the Trust (other than the Funds) with fiscal years ending on October 31 for the fiscal years ended October 31, 2015 and October 31, 2016 by PwC for professional services rendered for the audit of the annual financial statements of the applicable Series and fees billed for other services rendered by PwC during those periods.
| | | | | | | | |
Fiscal Years Ended | | 10/31/15 | | | 10/31/16 | |
Audit Fees | | $ | 360,289 | | | $ | 398,264 | |
Audit-Related Fees(1) | | $ | 0 | | | $ | 16,000 | |
Tax Fees(2) | | $ | 145,851 | | | $ | 104,949 | |
All Other Fees(3) | | $ | 100,325 | | | $ | 12,629 | |
| | | | | | | | |
Total | | $ | 606,465 | | | $ | 531,842 | |
| | | | | | | | |
(1) Audit-related fees consist of the aggregate fees billed for assurance and related services that are reasonably related to the performance of the audit of financial statements and are not reported under the category of audit fees.
(2) Tax fees consist of the aggregate fees billed for professional services rendered by the principal accountant relating to tax compliance, tax advice, and tax planning and specifically include fees for tax return preparation.
(3) All other fees consist of the aggregate fees billed for products and services provided by the principal accountant other than audit, audit-related, and tax services. The 2015 payments included payments for access to a PwC-sponsored online library that provides interpretive guidance regarding U.S. and foreign accounting standards, fees related to the merger of certain series of Thrivent Mutual Funds and certain series of Thrivent Series Fund, Inc., and other tax related work. These figures are also reported in response to Item 4(g) below.
| | (e) | Registrant’s audit committee charter, adopted in February 2010, provides that the audit committee (comprised of the independent Trustees of registrant) is responsible for pre-approval of all auditing services performed for the registrant. The audit committee also is responsible for pre-approval (subject to the de minimis exceptions for non-audit services described in Section 10A(i)(1)(B) of the Securities Exchange Act of 1934) of all non-auditing services performed for the registrant or an affiliate of registrant. In addition, registrant’s audit committee charter permits a designated member of the audit committee to pre-approve, between meetings, one or more audit or non-audit service projects, subject to an expense limit and notification to the audit committee at the next committee meeting. Registrant’s audit committee pre-approved all fees described above that PwC billed to registrant. |
| | (f) | Less than 50% of the hours billed by PwC for auditing services to registrant for the fiscal year ended December 31, 2016 was for work performed by persons other than full-time permanent employees of PwC. |
| | (g) | The aggregate non-audit fees billed by PwC to registrant and to registrant’s investment adviser and any entity controlling, controlled by, or under common control with registrant’s investment adviser for the fiscal years set forth below are disclosed in the table below. The disclosed payments were for access to a PwC-sponsored online library that provides interpretive guidance regarding U.S. and foreign accounting standards. |
| | | | | | | | | | | | | | | | |
Fiscal Year Ended | | 10/31/15 | | | 12/31/15 | | | 10/31/16 | | | 12/31/16 | |
| Registrant(1) | | $ | 0 | | | $ | 0 | | | $ | 0 | | | $ | 0 | |
| Adviser | | $ | 100,325 | | | $ | 130,474 | | | $ | 12,629 | | | $ | 0 | |
| | (h) | Registrant’s audit committee has considered the non-audit services provided to the registrant and registrant’s investment adviser and any entity controlling, controlled by, or under common control with registrant’s investment adviser as described above and determined that these services do not compromise PwC’s independence. |
| Item 5. | Audit Committee of Listed Registrants |
Not applicable.
| Item 6. | Schedule of Investments |
(a) The summary schedule of investments for these funds: Growth and Income Plus Fund and Diversified Income Plus Fund, are included as part of the report to shareholders filed under Item 1 of this Form. The schedule of investments for said funds are filed under this Item.

Report of Independent Registered Public Accounting Firm
To the Board of Trustees and Shareholders of Thrivent Diversified Income Plus Fund and Thrivent Growth and Income Plus Fund:
In our opinion, the accompanying statements of assets and liabilities, including the summary schedules of investments, and the related statements of operations and of changes in net assets and the financial highlights (included in Item 1 of this Form N-CSR) and the schedules of investments (included in Item 6 of this Form N-CSR) present fairly, in all material respects, the financial position of Thrivent Diversified Income Plus Fund and Thrivent Growth and Income Plus Fund (constituting part of the Thrivent Mutual Funds) (hereafter referred to as the “Funds”) as of December 31, 2016, the results of each of their operations for the year then ended, the changes in each of their net assets for each of the two years in the period then ended and their financial highlights for each of the five years in the period then ended, in conformity with accounting principles generally accepted in the United States of America. These financial statements, financial highlights and schedules of investments (hereafter referred to as “financial statements”) are the responsibility of the Funds’ management. Our responsibility is to express an opinion on these financial statements based on our audits. We conducted our audits of these financial statements in accordance with the standards of the Public Company Accounting Oversight Board (United States). Those standards require that we plan and perform the audit to obtain reasonable assurance about whether the financial statements are free of material misstatement. An audit includes examining, on a test basis, evidence supporting the amounts and disclosures in the financial statements, assessing the accounting principles used and significant estimates made by management, and evaluating the overall financial statement presentation. We believe that our audits, which included confirmation of securities as of December 31, 2016 by correspondence with the custodian, agent banks, transfer agent and brokers provide a reasonable basis for our opinion.

February 20, 2017
PricewaterhouseCoopers LLP, 45 South Seventh Street, Suite 3400, Minneapolis, MN 55402
T: (612) 596 6000, F: (612) 373 7160, www.pwc.com/us
GROWTHAND INCOME PLUS FUND
Schedule of Investments as of December 31, 2016
| | | | | | | | |
Principal Amount | | | Bank Loans (11.4%)a | | Value | |
| | Basic Materials (0.7%) | | | | |
| | | | Arch Coal, Inc., Term Loan | | | | |
| $ | 15,486 | | | 10.000%, 10/5/2021 | | $ | 15,686 | |
| | | | Chemours Company, Term Loan | | | | |
| | 81,298 | | | 3.770%, 5/12/2022 | | | 80,739 | |
| | | | Fortescue Metals Group, Ltd., Term Loan | | | | |
| | 109,468 | | | 3.750%, 6/30/2019 | | | 109,687 | |
| | | | Ineos US Finance, LLC, Term Loan | | | | |
| | 182,895 | | | 3.750%, 12/15/2020 | | | 183,658 | |
| | | | Tronox Pigments BV, Term Loan | | | | |
| | 142,300 | | | 4.500%, 3/19/2020 | | | 142,774 | |
| | | | | | | | |
| | | | Total | | | 532,544 | |
| | | | | | | | |
| |
| | Capital Goods (0.7%) | | | | |
| | | | Accudyne Industries, LLC, Term Loan | | | | |
| | 62,705 | | | 4.000%, 12/13/2019 | | | 59,190 | |
| | | | Advanced Disposal Services, Inc., Term Loan | | | | |
| | 75,583 | | | 3.500%, 11/10/2023 | | | 76,197 | |
| | | | Berry Plastics Group, Inc., Term Loan | | | | |
| | 117,487 | | | 3.500%, 2/8/2020 | | | 118,288 | |
| | | | Cortes NP Acquisition Corporation, Term Loan | | | | |
| | 225,000 | | | 6.000%, 11/30/2023 | | | 227,813 | |
| | | | Reynolds Group, Inc., Term Loan | | | | |
| | 54,863 | | | 4.250%, 2/5/2023 | | | 55,536 | |
| | | | | | | | |
| | | | Total | | | 537,024 | |
| | | | | | | | |
| |
| | Communications Services (3.2%) | | | | |
| | | | Atlantic Broadband Penn, LLC, Term Loan | | | | |
| | 57,837 | | | 3.250%, 11/30/2019 | | | 57,981 | |
| | | | Beasley Broadcast Group, Inc., Term Loan | | | | |
| | 65,000 | | | 7.000%, 11/1/2023 | | | 65,000 | |
| | | | Birch Communication Inc., Term Loan | | | | |
| | 82,897 | | | 8.250%, 7/17/2020 | | | 72,949 | |
| | | | Block Communications, Inc., Term Loan | | | | |
| | 98,990 | | | 4.248%, 11/7/2021 | | | 99,856 | |
| | | | Charter Communications Operating, LLC, Term Loan | | | | |
| | 72,131 | | | 3.020%, 7/1/2020 | | | 72,432 | |
| | | | Cincinnati Bell, Inc., Term Loan | | | | |
| | 47,820 | | | 4.000%, 9/10/2020 | | | 47,931 | |
| | | | CommScope, Inc., Term Loan | | | | |
| | 108,625 | | | 3.270%, 12/29/2022 | | | 109,548 | |
| | | | CSC Holdings, LLC, Term Loan | | | | |
| | 24,671 | | | 3.876%, 10/11/2024 | | | 24,913 | |
| | | | FairPoint Communications, Inc., Term Loan | | | | |
| | 100,654 | | | 7.500%, 2/14/2019 | | | 101,503 | |
| | | | Grande Communications Networks, LLC, Term Loan | | | | |
| | 88,783 | | | 4.500%, 5/29/2020 | | | 89,316 | |
| | | | Gray Television, Inc., Term Loan | | | | |
| | 151,351 | | | 3.938%, 6/13/2021 | | | 153,432 | |
| | | | Hargray Communications Group, Inc., Term Loan | | | | |
| | 111,284 | | | 4.750%, 6/26/2019 | | | 112,490 | |
| | | | Integra Telecom Holdings, Inc., Term Loan | | | | |
| | 64,056 | | | 5.250%, 8/14/2020 | | | 64,168 | |
| | | | Intelsat Jackson Holdings SA, Term Loan | | | | |
| | 39,444 | | | 3.750%, 6/30/2019 | | | 38,084 | |
| | | | Level 3 Communications, Inc., Term Loan | | | | |
| | 121,000 | | | 4.000%, 8/1/2019 | | | 122,603 | |
| | | | Liberty Cablevision of Puerto Rico, LLC, Term Loan | | | | |
| | 105,000 | | | 4.500%, 1/7/2022 | | | 104,148 | |
| | | | LTS Buyer, LLC, Term Loan | | | | |
| | 135,497 | | | 4.248%, 4/13/2020 | | | 136,133 | |
| | | | NEP/NCP Holdco, Inc., Term Loan | | | | |
| | 183,541 | | | 4.250%, 1/22/2020 | | | 184,000 | |
| | | | Nexstar Broadcasting, Inc., Term Loan | | | | |
| | 115,000 | | | 0.000%, 9/26/2023b,c | | | 115,898 | |
| | | | Numericable US, LLC, Term Loan | | | | |
| | 89,687 | | | 5.137%, 1/15/2024 | | | 90,745 | |
| | | | SBA Senior Finance II, LLC, Term Loan | | | | |
| | 97,500 | | | 3.270%, 3/24/2021 | | | 97,927 | |
| | | | TNS, Inc., Term Loan | | | | |
| | 35,082 | | | 5.000%, 2/14/2020 | | | 35,378 | |
| | | | Univision Communications, Inc., Term Loan | | | | |
| | 88,716 | | | 4.000%, 3/1/2020 | | | 89,159 | |
| | | | WideOpenWest Finance, LLC, Term Loan | | | | |
| | 124,688 | | | 4.500%, 8/18/2023 | | | 125,912 | |
| | | | XO Communications, LLC, Term Loan | | | | |
| | 97,348 | | | 4.250%, 3/20/2021 | | | 97,591 | |
| | | | Yankee Cable Acquisition, LLC, Term Loan | | | | |
| | 77,984 | | | 4.250%, 3/1/2020 | | | 78,016 | |
| | | | Zayo Group, LLC, Term Loan | | | | |
| | 88,768 | | | 3.750%, 5/6/2021 | | | 89,669 | |
| | | | | | | | |
| | | | Total | | | 2,476,782 | |
| | | | | | | | |
| |
| | Consumer Cyclical (2.1%) | | | | |
| | | | Amaya BV, Term Loan | | | | |
| | 159,170 | | | 5.000%, 8/1/2021 | | | 159,658 | |
| | | | Burlington Coat Factory Warehouse Corporation, Term Loan | | | | |
| | 87,246 | | | 3.510%, 8/13/2021 | | | 87,759 | |
| | | | Cengage Learning Acquisitions, Term Loan | | | | |
| | 139,300 | | | 5.250%, 6/7/2023 | | | 135,317 | |
| | | | Ceridian HCM Holding, Inc., Term Loan | | | | |
| | 43,366 | | | 4.500%, 9/15/2020 | | | 43,022 | |
| | | | Charter Communications Operating, LLC, Term Loan | | | | |
| | 44,390 | | | 3.020%, 1/3/2021 | | | 44,563 | |
| | | | Dollar Tree, Inc., Term Loan | | | | |
| | 34,204 | | | 3.250%, 7/6/2022 | | | 34,483 | |
| | | | Four Seasons Holdings, Inc., Term Loan | | | | |
| | 85,000 | | | 3.750%, 11/30/2023 | | | 85,885 | |
| | | | Golden Nugget, Inc., Term Loan | | | | |
| | 61,335 | | | 4.500%, 11/21/2019 | | | 61,948 | |
| | | | Golden Nugget, Inc., Term Loan Delayed Draw | | | | |
| | 29,066 | | | 4.500%, 11/21/2019 | | | 29,356 | |
| | | | IMG Worldwide, Inc., Term Loan | | | | |
| | 92,979 | | | 5.250%, 5/6/2021 | | | 93,851 | |
| | 75,000 | | | 8.250%, 5/6/2022 | | | 75,938 | |
The accompanying Notes to Financial Statements are an integral part of this schedule.
1
GROWTHAND INCOME PLUS FUND
Schedule of Investments as of December 31, 2016
| | | | | | | | |
Principal Amount | | | Bank Loans (11.4%)a | | Value | |
| | Consumer Cyclical (2.1%) - continued | | | | |
| | | | KAR Auction Services, Inc., Term Loan | | | | |
| $ | 99,250 | | | 4.500%, 3/9/2023 | | $ | 100,491 | |
| | | | Michaels Stores, Inc., Term Loan | | | | |
| | 56,093 | | | 3.750%, 1/30/2023 | | | 56,706 | |
| | | | Mohegan Tribal Gaming Authority, Term Loan | | | | |
| | 119,700 | | | 5.500%, 10/13/2023 | | | 120,524 | |
| | | | Scientific Games International, Inc., Term Loan | | | | |
| | 89,240 | | | 6.000%, 10/18/2020 | | | 90,374 | |
| | 213,104 | | | 6.000%, 10/1/2021 | | | 215,636 | |
| | | | Seminole Hard Rock Entertainment, Inc., Term Loan | | | | |
| | 146,212 | | | 3.520%, 5/14/2020 | | | 146,943 | |
| | | | Seminole Indian Tribe of Florida, Term Loan | | | | |
| | 47,581 | | | 3.248%, 4/29/2020 | | | 47,700 | |
| | | | | | | | |
| | | | Total | | | 1,630,154 | |
| | | | | | | | |
| |
| | Consumer Non-Cyclical (1.7%) | | | | |
| | | | Air Medical Group Holdings, Inc., Term Loan | | | | |
| | 74,625 | | | 5.000%, 4/28/2022 | | | 75,698 | |
| | | | CHS/Community Health Systems, Inc., Term Loan | | | | |
| | 11,104 | | | 3.750%, 12/31/2019 | | | 10,750 | |
| | 165,088 | | | 4.000%, 1/27/2021 | | | 159,586 | |
| | | | Endo Luxembourg Finance I Company SARL, Term Loan | | | | |
| | 99,000 | | | 3.813%, 9/26/2022 | | | 99,425 | |
| | | | JBS USA, LLC, Term Loan | | | | |
| | 60,653 | | | 3.750%, 5/25/2018 | | | 60,703 | |
| | 38,992 | | | 3.750%, 9/18/2020 | | | 39,309 | |
| | 24,750 | | | 4.000%, 10/30/2022 | | | 24,956 | |
| | | | Libbey Glass, Inc., Term Loan | | | | |
| | 116,193 | | | 3.750%, 4/9/2021 | | | 117,283 | |
| | | | LTF Merger Sub, Inc., Term Loan | | | | |
| | 73,875 | | | 4.250%, 6/10/2022 | | | 74,279 | |
| | | | Mallinckrodt International Finance SA, Term Loan | | | | |
| | 39,595 | | | 3.748%, 3/19/2021 | | | 39,680 | |
| | | | McGraw-Hill Global Education Holdings, LLC, Term Loan | | | | |
| | 114,425 | | | 5.000%, 5/4/2022 | | | 114,443 | |
| | | | MultiPlan, Inc., Term Loan | | | | |
| | 37,118 | | | 5.000%, 6/7/2023 | | | 37,735 | |
| | | | Ortho-Clinical Diagnostics, Inc., Term Loan | | | | |
| | 126,985 | | | 4.750%, 6/30/2021 | | | 125,760 | |
| | | | Valeant Pharmaceuticals International, Inc., Term Loan | | | | |
| | 335,069 | | | 5.500%, 4/1/2022b,c | | | 335,133 | |
| | | | | | | | |
| | | | Total | | | 1,314,740 | |
| | | | | | | | |
| |
| | Energy (0.5%) | | | | |
| | | | Energy Solutions, LLC, Term Loan | | | | |
| | 50,358 | | | 6.750%, 5/29/2020 | | | 50,673 | |
| | | | Exgen Renewables I, LLC, Term Loan | | | | |
| | 31,177 | | | 5.250%, 2/8/2021 | | | 31,372 | |
| | | | Houston Fuel Oil Terminal, LLC, Term Loan | | | | |
| | 59,543 | | | 4.250%, 8/19/2021 | | | 59,097 | |
| | | | McJunkin Red Man Corporation, Term Loan | | | | |
| | 44,905 | | | 5.000%, 11/8/2019 | | | 45,073 | |
| | | | MEG Energy Corporation, Term Loan | | | | |
| | 68,506 | | | 3.750%, 3/31/2020 | | | 66,451 | |
| | | | Pacific Drilling SA, Term Loan | | | | |
| | 66,585 | | | 4.500%, 6/3/2018 | | | 23,371 | |
| | | | Targa Resources Partners, LP, Term Loan | | | | |
| | 40,000 | | | 5.750%, 2/27/2022 | | | 40,200 | |
| | | | Western Refining, Inc., Term Loan | | | | |
| | 39,592 | | | 5.250%, 11/12/2020 | | | 39,765 | |
| | 14,900 | | | 5.500%, 6/23/2023 | | | 14,974 | |
| | | | | | | | |
| | | | Total | | | 370,976 | |
| | | | | | | | |
| |
| | Financials (0.7%) | | | | |
| | | | Delos Finance Sarl, Term Loan | | | | |
| | 80,000 | | | 3.748%, 3/6/2021 | | | 80,514 | |
| | | | DJO Finance, LLC, Term Loan | | | | |
| | 59,250 | | | 4.250%, 6/7/2020 | | | 56,788 | |
| | | | Harland Clarke Holdings Corporation, Term Loan | | | | |
| | 42,028 | | | 7.000%, 5/22/2018 | | | 42,041 | |
| | 76,000 | | | 7.000%, 12/31/2019 | | | 76,285 | |
| | | | MoneyGram International, Inc., Term Loan | | | | |
| | 97,375 | | | 4.250%, 3/27/2020 | | | 96,077 | |
| | | | Sable International Finance, Ltd., Term Loan | | | | |
| | 45,000 | | | 5.748%, 1/3/2023b,c | | | 45,535 | |
| | | | TransUnion, LLC, Term Loan | | | | |
| | 58,351 | | | 3.520%, 4/9/2021 | | | 58,820 | |
| | | | WaveDivision Holdings, LLC, Term Loan | | | | |
| | 109,085 | | | 4.000%, 10/15/2019 | | | 109,658 | |
| | | | | | | | |
| | | | Total | | | 565,718 | |
| | | | | | | | |
| |
| | Technology (1.4%) | | | | |
| | | | Avago Technoligies Cayman Finance, Ltd., Term Loan | | | | |
| | 144,701 | | | 3.704%, 2/1/2023 | | | 146,691 | |
| | | | First Data Corporation, Term Loan | | | | |
| | 182,795 | | | 3.756%, 3/24/2021 | | | 184,852 | |
| | 86,648 | | | 3.756%, 7/8/2022 | | | 87,532 | |
| | | | NXP BV, Term Loan | | | | |
| | 69,825 | | | 3.270%, 12/7/2020 | | | 70,139 | |
| | | | ON Semiconductor Corporation, Term Loan | | | | |
| | 204,488 | | | 4.020%, 3/31/2023 | | | 206,970 | |
| | | | Rackspace Hosting, LLC, Term Loan | | | | |
| | 60,000 | | | 4.500%, 12/20/2023 | | | 60,725 | |
| | | | RP Crown Parent, LLC, Term Loan | | | | |
| | 90,000 | | | 4.500%, 10/12/2023 | | | 90,877 | |
| | | | SS&C European Holdings SARL, Term Loan | | | | |
| | 36,507 | | | 4.001%, 7/8/2022 | | | 36,987 | |
| | 3,725 | | | 4.002%, 7/8/2022 | | | 3,774 | |
| | | | Western Digital Corporation, Term Loan | | | | |
| | 174,125 | | | 4.520%, 4/29/2023 | | | 176,791 | |
| | | | | | | | |
| | | | Total | | | 1,065,338 | |
| | | | | | | | |
| |
| | Transportation (0.2%) | | | | |
| | | | OSG Bulk Ships, Inc., Term Loan | | | | |
| | 75,144 | | | 5.250%, 8/5/2019 | | | 73,172 | |
| | | | XPO Logistics, Inc., Term Loan | | | | |
| | 84,917 | | | 4.250%, 11/1/2021 | | | 85,952 | |
| | | | | | | | |
| | | | Total | | | 159,124 | |
| | | | | | | | |
The accompanying Notes to Financial Statements are an integral part of this schedule.
2
GROWTHAND INCOME PLUS FUND
Schedule of Investments as of December 31, 2016
| | | | | | | | |
Principal Amount | | | Bank Loans (11.4%)a | | Value | |
| | Utilities (0.2%) | | | | |
| | | | Calpine Corporation, Term Loan | | | | |
| $ | 75,000 | | | 0.000%, 1/15/2024b,c | | $ | 75,281 | |
| | | | Intergen NV, Term Loan | | | | |
| | 54,050 | | | 5.500%, 6/12/2020 | | | 52,338 | |
| | | | Talen Energy Supply, LLC, Term Loan | | | | |
| | 53,570 | | | 6.000%, 12/6/2023 | | | 54,240 | |
| | | | | | | | |
| | | | Total | | | 181,859 | |
| | | | | | | | |
| | | | Total Bank Loans (cost $8,797,620) | | | 8,834,259 | |
| | | | | | | | |
| | |
Shares | | | Common Stock (63.2%) | | | |
| | Consumer Discretionary (10.2%) | | | | |
| | 1,530 | | | Amazon.com, Inc.d | | | 1,147,301 | |
| | 10,530 | | | American Axle & Manufacturing Holdings, Inc.d | | | 203,229 | |
| | 3,190 | | | Aramark | | | 113,947 | |
| | 870 | | | AutoZone, Inc.d | | | 687,117 | |
| | 2,880 | | | Berkeley Group Holdings plc | | | 99,559 | |
| | 420 | | | Brembo SPA | | | 25,408 | |
| | 4,000 | | | Bridgestone Corporation | | | 143,923 | |
| | 2,615 | | | Bunzl plc | | | 67,889 | |
| | 2,370 | | | Burlington Stores, Inc.d | | | 200,857 | |
| | 600 | | | Canon Marketing Japan, Inc. | | | 10,075 | |
| | 2,016 | | | Cedar Fair, LP | | | 129,427 | |
| | 11,028 | | | Comcast Corporation | | | 761,483 | |
| | 4,100 | | | Denso Corporation | | | 177,352 | |
| | 4,066 | | | Eutelsat Communications | | | 78,627 | |
| | 7,020 | | | Ford Motor Company | | | 85,153 | |
| | 4,300 | | | Fuji Heavy Industries, Ltd. | | | 175,201 | |
| | 2,920 | | | General Motors Company | | | 101,733 | |
| | 1,100 | | | Hakuhodo Dy Holdings, Inc. | | | 13,545 | |
| | 10,600 | | | Honda Motor Company, Ltd. | | | 309,470 | |
| | 5,700 | | | Inchcape plc | | | 49,259 | |
| | 729 | | | Intertek Group plc | | | 31,244 | |
| | 361 | | | Linamar Corporation | | | 15,511 | |
| | 397 | | | LVMH Moet Hennessy Louis Vuitton SE | | | 75,697 | |
| | 3,110 | | | Newell Brands, Inc. | | | 138,862 | |
| | 300 | | | Nifco, Inc. | | | 15,807 | |
| | 12,950 | | | NIKE, Inc. | | | 658,249 | |
| | 353 | | | Nokian Renkaat Oyj | | | 13,124 | |
| | 1,900 | | | Panasonic Corporation | | | 19,270 | |
| | 4,636 | | | Persimmon plc | | | 101,147 | |
| | 652 | | | Publicis Groupe SA | | | 44,926 | |
| | 540 | | | Restaurant Brands International, Inc. | | | 25,736 | |
| | 2,421 | | | Restoration Hardware Holdings, Inc.d | | | 74,325 | |
| | 200 | | | RTL Group SA | | | 14,653 | |
| | 800 | | | Sekisui Chemical Company, Ltd. | | | 12,735 | |
| | 4,864 | | | Starbucks Corporation | | | 270,049 | |
| | 4,500 | | | Sumitomo Forestry Company, Ltd. | | | 59,433 | |
| | 3,000 | | | Sumitomo Rubber Industries, Ltd. | | | 47,467 | |
| | 200 | | | Swatch Group AG | | | 12,206 | |
| | 12,610 | | | Time, Inc. | | | 225,088 | |
| | 5,830 | | | Toll Brothers, Inc.d | | | 180,730 | |
| | 2,470 | | | Tractor Supply Company | | | 187,251 | |
| | 71 | | | Valora Holding AG | | | 20,168 | |
| | 7,370 | | | Walt Disney Company | | | 768,101 | |
| | 280 | | | Whirlpool Corporation | | | 50,896 | |
| | 500 | | | Whitbread plc | | | 23,259 | |
| | 3,340 | | | Wolters Kluwer NV | | | 120,805 | |
| | 2,723 | | | WPP plc | | | 60,596 | |
| | 1,500 | | | Yokohama Rubber Company, Ltd. | | | 26,813 | |
| | | | | | | | |
| | | | Total | | | 7,874,703 | |
| | | | | | | | |
| |
| | Consumer Staples (2.9%) | | | | |
| | 4,430 | | | AdvancePierre Foods Holdings, Inc. | | | 131,925 | |
| | 2,300 | | | Axfood AB | | | 36,117 | |
| | 9,474 | | | Coca-Cola Amatil, Ltd. | | | 69,094 | |
| | 3,900 | | | Coca-Cola HBC AG | | | 84,924 | |
| | 800 | | | Ebro Foods SA | | | 16,743 | |
| | 436 | | | Henkel AG & Company KGaA | | | 45,376 | |
| | 5,952 | | | Imperial Brands plc | | | 259,393 | |
| | 800 | | | Jeronimo Martins SGPS SA | | | 12,408 | |
| | 315 | | | Kesko Oyj | | | 15,720 | |
| | 2,000 | | | Kewpie Corporation | | | 48,508 | |
| | 1,000 | | | Kirin Holdings Company, Ltd. | | | 16,231 | |
| | 13,992 | | | Koninklijke Ahold Delhaize NV | | | 294,714 | |
| | 2 | | | Lindt & Spruengli AG | | | 10,349 | |
| | 1,200 | | | Nestle SA | | | 85,965 | |
| | 5,240 | | | Philip Morris International, Inc. | | | 479,408 | |
| | 1,000 | | | Suedzucker AG | | | 23,837 | |
| | 3,835 | | | Tate & Lyle plc | | | 33,375 | |
| | 230 | | | Universal Corporation | | | 14,662 | |
| | 4,030 | | | Walgreens Boots Alliance, Inc. | | | 333,523 | |
| | 7,390 | | | Whole Foods Market, Inc. | | | 227,316 | |
| | 7,300 | | | William Morrison Supermarkets plc | | | 20,734 | |
| | | | | | | | |
| | | | Total | | | 2,260,322 | |
| | | | | | | | |
| |
| | Energy (4.1%) | | | | |
| | 280 | | | Arch Coal, Inc.d | | | 21,854 | |
| | 90,291 | | | BP plc | | | 565,535 | |
| | 2,900 | | | Concho Resources, Inc.d | | | 384,540 | |
| | 400 | | | Contura Energy, Inc.d | | | 28,400 | |
| | 1,955 | | | Crescent Point Energy Corporation | | | 26,573 | |
| | 6,880 | | | Devon Energy Corporation | | | 314,210 | |
| | 2,600 | | | Galp Energia SGPS SA | | | 38,762 | |
| | 7,280 | | | Halliburton Company | | | 393,775 | |
| | 2,668 | | | John Wood Group plc | | | 28,810 | |
| | 3,439 | | | OMV AG | | | 121,238 | |
| | 3,795 | | | Petrofac, Ltd. | | | 40,613 | |
| | 2,320 | | | Pioneer Natural Resources Company | | | 417,762 | |
| | 3,530 | | | Range Resources Corporation | | | 121,291 | |
| | 3,033 | | | Royal Dutch Shell plc | | | 82,727 | |
| | 769 | | | Royal Dutch Shell plc, Class A | | | 21,227 | |
| | 7,131 | | | Royal Dutch Shell plc, Class B | | | 204,888 | |
| | 2,988 | | | Statoil ASA | | | 54,536 | |
| | 284 | | | Tecnicas Reunidas SA | | | 11,615 | |
| | 3,013 | | | Total SA | | | 154,544 | |
| | 3,013 | | | Total SA Rightsd,e | | | 52 | |
| | 170 | | | Vantage Drilling Internationald | | | 17,170 | |
| | 10,690 | | | WPX Energy, Inc.d | | | 155,753 | |
| | | | | | | | |
| | | | Total | | | 3,205,875 | |
| | | | | | | | |
| |
| | Financials (9.3%) | | | | |
| | 18,967 | | | Aberdeen Asset Management plc | | | 59,970 | |
| | 1,160 | | | Affiliated Managers Group, Inc.d | | | 168,548 | |
| | 8,250 | | | Apollo Investment Corporation | | | 48,345 | |
| | 3,800 | | | Ares Capital Corporation | | | 62,662 | |
| | 3,954 | | | ASX, Ltd. | | | 141,653 | |
| | 6,574 | | | Australia & New Zealand Banking Group, Ltd. | | | 143,913 | |
| | 42,790 | | | Bank of America Corporation | | | 945,659 | |
| | 8,071 | | | Bank of East Asia, Ltd. | | | 30,812 | |
| | 349 | | | Bank of Montreal | | | 25,102 | |
| | 5,140 | | | Bank of Nova Scotia | | | 286,200 | |
| | 4,040 | | | Bank of the Ozarks, Inc. | | | 212,464 | |
| | 710 | | | Canadian Imperial Bank of Commerce | | | 57,936 | |
| | 3,000 | | | Chiba Bank, Ltd. | | | 18,390 | |
| | 1,593 | | | CI Financial Corporation | | | 34,253 | |
| | 6,045 | | | CNP Assurances | | | 111,889 | |
| | 2,513 | | | Danske Bank AS | | | 76,028 | |
| | 16,692 | | | Direct Line Insurance Group plc | | | 75,968 | |
The accompanying Notes to Financial Statements are an integral part of this schedule.
3
GROWTHAND INCOME PLUS FUND
Schedule of Investments as of December 31, 2016
| | | | | | | | |
Shares | | | Common Stock (63.2%) | | Value | |
| | Financials (9.3%) - continued | | | | |
| | 10,150 | | | Encore Capital Group, Inc.d | | $ | 290,797 | |
| | 1,900 | | | Erste Group Bank AG | | | 55,551 | |
| | 20,647 | | | FlexiGroup, Ltd. | | | 33,602 | |
| | 24,000 | | | Fukuoka Financial Group, Inc. | | | 106,440 | |
| | 2,186 | | | Genworth MI Canada, Inc. | | | 54,803 | |
| | 3,670 | | | Goldman Sachs Group, Inc. | | | 878,781 | |
| | 2,300 | | | Hang Seng Bank, Ltd. | | | 42,653 | |
| | 1,269 | | | Hannover Rueckversicherung SE | | | 137,087 | |
| | 19,075 | | | Henderson Group plc | | | 55,054 | |
| | 23,732 | | | HSBC Holdings plc | | | 191,485 | |
| | 777 | | | Intact Financial Corporation | | | 55,614 | |
| | 2,270 | | | Intercontinental Exchange, Inc. | | | 128,073 | |
| | 15,460 | | | KeyCorp | | | 282,454 | |
| | 1,781 | | | Macquarie Group, Ltd. | | | 111,566 | |
| | 37,801 | | | Mapfre SA | | | 115,146 | |
| | 48,800 | | | Mizuho Financial Group, Inc. | | | 87,573 | |
| | 900 | | | MS and AD Insurance Group Holdings, Inc. | | | 27,871 | |
| | 5,583 | | | National Bank of Canada | | | 226,746 | |
| | 5,486 | | | Nordea Bank AB | | | 60,788 | |
| | 1,749 | | | Power Corporation of Canada | | | 39,145 | |
| | 2,200 | | | Raymond James Financial, Inc. | | | 152,394 | |
| | 8,500 | | | Resona Holdings, Inc. | | | 43,563 | |
| | 456 | | | Schroders plc | | | 16,748 | |
| | 4,000 | | | Seven Bank, Ltd. | | | 11,437 | |
| | 2,235 | | | Swiss Re AG | | | 211,460 | |
| | 14,730 | | | Synchrony Financial | | | 534,257 | |
| | 4,100 | | | T&D Holdings, Inc. | | | 54,109 | |
| | 257 | | | TMX Group, Ltd. | | | 13,690 | |
| | 5,968 | | | United Overseas Bank, Ltd. | | | 83,844 | |
| | 7,262 | | | Westpac Banking Corporation | | | 170,468 | |
| | 5,270 | | | XL Group, Ltd. | | | 196,360 | |
| | 4,500 | | | Zions Bancorporation | | | 193,680 | |
| | 151 | | | Zurich Insurance Group AGd | | | 41,498 | |
| | | | | | | | |
| | | | Total | | | 7,204,529 | |
| | | | | | | | |
| |
| | Health Care (6.1%) | | | | |
| | 3,090 | | | Acadia Healthcare Company, Inc.d | | | 102,279 | |
| | 4,950 | | | Akorn, Inc.d | | | 108,058 | |
| | 1,850 | | | Allergan plcd | | | 388,518 | |
| | 1,317 | | | AstraZeneca plc | | | 71,919 | |
| | 8,330 | | | Bristol-Myers Squibb Company | | | 486,805 | |
| | 2,078 | | | CAE, Inc. | | | 29,066 | |
| | 5,260 | | | Celgene Corporationd | | | 608,845 | |
| | 1,410 | | | Essilor International SA | | | 159,088 | |
| | 3,093 | | | GlaxoSmithKline plc | | | 59,412 | |
| | 1,464 | | | Hikma Pharmaceuticals plc | | | 34,123 | |
| | 3,980 | | | Hologic, Inc.d | | | 159,678 | |
| | 300 | | | Lonza Group AG | | | 51,849 | |
| | 8,240 | | | Medtronic plc | | | 586,935 | |
| | 11,660 | | | Merck & Company, Inc. | | | 686,424 | |
| | 1,000 | | | Merck KGaA | | | 104,121 | |
| | 6,218 | | | Novartis AG | | | 452,195 | |
| | 3,100 | | | Novo Nordisk AS | | | 111,204 | |
| | 339 | | | Roche Holding AG-Genusschein | | | 77,276 | |
| | 830 | | | Teleflex, Inc. | | | 133,755 | |
| | 2,900 | | | Vertex Pharmaceuticals, Inc.d | | | 213,643 | |
| | 1,010 | | | Waters Corporationd | | | 135,734 | |
| | | | | | | | |
| | | | Total | | | 4,760,927 | |
| | | | | | | | |
| |
| | Industrials (7.1%) | | | | |
| | 11 | | | A P Moller - Maersk AS | | | 17,534 | |
| | 3,386 | | | ABB, Ltd. | | | 71,247 | |
| | 2,040 | | | Acuity Brands, Inc. | | | 470,954 | |
| | 2,155 | | | Adecco SA | | | 140,672 | |
| | 11,600 | | | Air New Zealand, Ltd. | | | 17,666 | |
| | 7,000 | | | Asahi Glass Company, Ltd. | | | 47,493 | |
| | 500 | | | Atlas Copco Aktiebolag | | | 15,168 | |
| | 958 | | | Berendsen plc | | | 10,271 | |
| | 2,000 | | | Dai Nippon Printing Company, Ltd. | | | 19,733 | |
| | 3,460 | | | Delta Air Lines, Inc. | | | 170,197 | |
| | 1,620 | | | Deutsche Post AG | | | 53,128 | |
| | 900 | | | DSV AS | | | 39,969 | |
| | 12,158 | | | El Al Israel Airlines, Ltd. | | | 8,040 | |
| | 1,320 | | | Equifax, Inc. | | | 156,064 | |
| | 106 | | | Flughafen Zuerich AG | | | 19,643 | |
| | 600 | | | Fraport AG Frankfurt Airport Services Worldwide | | | 35,405 | |
| | 1,700 | | | Fuji Machine Manufacturing Company, Ltd. | | | 19,409 | |
| | 700 | | | Hitachi Transport System, Ltd. | | | 14,182 | |
| | 264 | | | Hochtief AG | | | 36,858 | |
| | 4,260 | | | Illinois Tool Works, Inc. | | | 521,680 | |
| | 1,200 | | | Inaba Denki Sangyo Company, Ltd. | | | 41,256 | |
| | 17,000 | | | ITOCHU Corporation | | | 225,093 | |
| | 8,730 | | | Jacobs Engineering Group, Inc.d | | | 497,610 | |
| | 800 | | | Jardine Matheson Holdings, Ltd. | | | 44,200 | |
| | 4,200 | | | KITZ Corporation | | | 22,931 | |
| | 2,000 | | | Komatsu, Ltd. | | | 45,300 | |
| | 3,970 | | | KONE Oyj | | | 177,394 | |
| | 947 | | | Koninklijke Boskalis Westminster NV | | | 32,854 | |
| | 2,600 | | | Marubeni Corporation | | | 14,706 | |
| | 3,050 | | | Masonite International Corporationd | | | 200,690 | |
| | 6,872 | | | Meggitt plc | | | 38,808 | |
| | 1,450 | | | Middleby Corporationd | | | 186,774 | |
| | 1,800 | | | MIRAIT Holdings Corporation | | | 16,222 | |
| | 1,300 | | | Mitsubishi Corporation | | | 27,610 | |
| | 6,500 | | | Mitsubishi Electric Corporation | | | 90,410 | |
| | 4,000 | | | Mitsubishi Heavy Industries, Ltd. | | | 18,184 | |
| | 2,000 | | | Mitsuboshi Belting, Ltd. | | | 17,007 | |
| | 900 | | | Mitsui & Company, Ltd. | | | 12,332 | |
| | 2,525 | | | National Express Group plc | | | 11,003 | |
| | 3,200 | | | Nitto Kogyo Corporation | | | 43,568 | |
| | 1,000 | | | Okuma Corporation | | | 9,514 | |
| | 2,940 | | | Oshkosh Corporation | | | 189,953 | |
| | 1,084 | | | Philips Lighting NVd,f | | | 26,701 | |
| | 831 | | | Randstad Holding NV | | | 45,013 | |
| | 1,547 | | | RELX NV | | | 26,020 | |
| | 105 | | | Rieter Holding AG | | | 18,261 | |
| | 3,993 | | | Rolls-Royce Holdings plcd | | | 32,797 | |
| | 1,700 | | | Sanwa Holdings Corporation | | | 16,169 | |
| | 257 | | | Schindler Holding AG, Participation Certificate | | | 45,261 | |
| | 352 | | | Schneider Electric SE | | | 24,453 | |
| | 1,803 | | | Siemens AG | | | 220,760 | |
| | 897 | | | Skanska AB | | | 21,119 | |
| | 3,131 | | | SKF AB | | | 57,411 | |
| | 2,700 | | | Smiths Group plc | | | 47,000 | |
| | 9,500 | | | Sojitz Corporation | | | 23,001 | |
| | 366 | | | Sulzer, Ltd. | | | 37,677 | |
| | 6,060 | | | Union Pacific Corporation | | | 628,301 | |
| | 2,351 | | | Vinci SA | | | 159,926 | |
| | 1,740 | | | WABCO Holdings, Inc.d | | | 184,701 | |
| | 535 | | | Wolseley plc | | | 32,660 | |
| | 719 | | | WSP Global, Inc. | | | 23,932 | |
| | 600 | | | Yuasa Trading Company, Ltd. | | | 14,946 | |
| | | | | | | | |
| | | | Total | | | 5,534,841 | |
| | | | | | | | |
| |
| | Information Technology (9.4%) | | | | |
| | 860 | | | Alliance Data Systems Corporation | | | 196,510 | |
| | 720 | | | Alphabet, Inc., Class Ad | | | 570,564 | |
| | 381 | | | Alphabet, Inc., Class Cd | | | 294,063 | |
| | 7,310 | | | Apple, Inc. | | | 846,644 | |
| | 1,700 | | | Canon, Inc. | | | 47,876 | |
The accompanying Notes to Financial Statements are an integral part of this schedule.
4
GROWTHAND INCOME PLUS FUND
Schedule of Investments as of December 31, 2016
| | | | | | | | |
Shares | | | Common Stock (63.2%) | | Value | |
| | Information Technology (9.4%) - continued | | | | |
| | 1,008 | | | Capital Power Corporation | | $ | 17,440 | |
| | 500 | | | DTS Corporation | | | 10,636 | |
| | 4,780 | | | Facebook, Inc.d | | | 549,939 | |
| | 6,030 | | | Finisar Corporationd | | | 182,528 | |
| | 3,700 | | | FUJIFILM Holdings NPV | | | 140,103 | |
| | 6,470 | | | Juniper Networks, Inc. | | | 182,842 | |
| | 1,900 | | | Konica Minolta Holdings, Inc. | | | 18,830 | |
| | 8,520 | | | Microsoft Corporation | | | 529,433 | |
| | 1,700 | | | NEC Networks & System Integration Corporation | | | 30,650 | |
| | 500 | | | Nice, Ltd. | | | 34,306 | |
| | 1,200 | | | Nichicon Corporation | | | 10,449 | |
| | 300 | | | NTT Data Corporation | | | 14,493 | |
| | 65 | | | NVIDIA Corporation | | | 6,938 | |
| | 2,770 | | | Palo Alto Networks, Inc.d | | | 346,388 | |
| | 18,990 | | | Pandora Media, Inc.d | | | 247,630 | |
| | 12,010 | | | PayPal Holdings, Inc.d | | | 474,035 | |
| | 3,120 | | | Plantronics, Inc. | | | 170,851 | |
| | 12,790 | | | Pure Storage, Inc.d | | | 144,655 | |
| | 100 | | | Rohm Company, Ltd. | | | 5,737 | |
| | 600 | | | Ryosan Company, Ltd. | | | 18,089 | |
| | 4,310 | | | Salesforce.com, Inc.d | | | 295,063 | |
| | 209 | | | SAP SE | | | 18,080 | |
| | 900 | | | Seagate Technology plc | | | 34,353 | |
| | 497 | | | Software AG | | | 18,013 | |
| | 3,707 | | | Telefonaktiebolaget LM Ericsson | | | 21,727 | |
| | 500 | | | Tokyo Electron, Ltd. | | | 47,025 | |
| | 3,810 | | | Twitter, Inc.d | | | 62,103 | |
| | 5,090 | | | Vantiv, Inc.d | | | 303,466 | |
| | 8,650 | | | Visa, Inc. | | | 674,873 | |
| | 11,840 | | | Xilinx, Inc. | | | 714,781 | |
| | | | | | | | |
| | | | Total | | | 7,281,113 | |
| | | | | | | | |
| |
| | Materials (2.6%) | | | | |
| | 800 | | | Adeka Corporation | | | 10,853 | |
| | 1,509 | | | APERAM | | | 68,865 | |
| | 510 | | | Ashland Global Holdings, Inc. | | | 55,738 | |
| | 1,195 | | | BHP Billiton plc | | | 19,028 | |
| | 17,720 | | | BHP Billiton, Ltd. | | | 317,452 | |
| | 12,335 | | | BlueScope Steel, Ltd. | | | 81,979 | |
| | 439 | | | Croda International plc | | | 17,266 | |
| | 1,300 | | | Crown Holdings, Inc.d | | | 68,341 | |
| | 7,100 | | | Daicel Corporation | | | 78,058 | |
| | 1,640 | | | Domtar Corporation | | | 64,009 | |
| | 680 | | | Eagle Materials, Inc. | | | 67,000 | |
| | 4,500 | | | Evonik Industries AG | | | 134,140 | |
| | 1,040 | | | FMC Corporation | | | 58,822 | |
| | 12 | | | Givaudan SA | | | 21,962 | |
| | 1,300 | | | JSR Corporation | | | 20,462 | |
| | 3,130 | | | Kinross Gold Corporationd | | | 9,734 | |
| | 4,700 | | | Kuraray Company, Ltd. | | | 70,479 | |
| | 1,100 | | | Kyoei Steel, Ltd. | | | 20,914 | |
| | 281 | | | LafargeHolcim, Ltd. | | | 14,750 | |
| | 5,700 | | | Mitsubishi Chemical Holdings Corporation | | | 36,854 | |
| | 1,000 | | | Mitsubishi Gas Chemical Company, Inc. | | | 17,039 | |
| | 700 | | | Mitsubishi Materials Corporation | | | 21,411 | |
| | 200 | | | Nippon Shokubai Company, Ltd. | | | 12,455 | |
| | 20,160 | | | Norsk Hydro ASA | | | 96,218 | |
| | 2,167 | | | Nufarm, Ltd. | | | 14,279 | |
| | 5,997 | | | Orora, Ltd. | | | 12,897 | |
| | 1,080 | | | Packaging Corporation of America | | | 91,606 | |
| | 730 | | | PPG Industries, Inc. | | | 69,175 | |
| | 531 | | | Rio Tinto, Ltd. | | | 22,749 | |
| | 2,930 | | | Steel Dynamics, Inc. | | | 104,249 | |
| | 400 | | | Sumitomo Seika Chemicals Company, Ltd. | | | 15,665 | |
| | 2,100 | | | Toagosei Company, Ltd. | | | 20,612 | |
| | 2,000 | | | Tosoh Corporation | | | 14,108 | |
| | 3,199 | | | UPM-Kymmene Oyj | | | 78,234 | |
| | 1,679 | | | Verso Corporationd | | | 11,921 | |
| | 600 | | | Yamato Kogyo Company, Ltd. | | | 16,734 | |
| | 3,680 | | | Yara International ASA | | | 144,768 | |
| | 400 | | | Yodogawa Steel Works, Ltd. | | | 10,425 | |
| | | | | | | | |
| | | | Total | | | 2,011,251 | |
| | | | | | | | |
| |
| | Real Estate (9.6%) | | | | |
| | 650 | | | Acadia Realty Trust | | | 21,242 | |
| | 300 | | | Agree Realty Corporation | | | 13,815 | |
| | 2,892 | | | Alexandria Real Estate Equities, Inc. | | | 321,388 | |
| | 900 | | | American Campus Communities, Inc. | | | 44,793 | |
| | 1,400 | | | American Homes 4 Rent | | | 29,372 | |
| | 1,400 | | | Apartment Investment & Management Company | | | 63,630 | |
| | 1,200 | | | Apple Hospitality REIT, Inc. | | | 23,976 | |
| | 900 | | | AvalonBay Communities, Inc. | | | 159,435 | |
| | 400 | | | Bluerock Residential Growth REIT, Inc. | | | 5,488 | |
| | 1,621 | | | Boston Properties, Inc. | | | 203,889 | |
| | 1,200 | | | Brandywine Realty Trust | | | 19,812 | |
| | 10,578 | | | Brixmor Property Group, Inc. | | | 258,315 | |
| | 3,240 | | | Camden Property Trust | | | 272,387 | |
| | 11,300 | | | CapitaLand Retail China Trustd | | | 10,690 | |
| | 625 | | | Care Capital Properties, Inc. | | | 15,625 | |
| | 356 | | | Chesapeake Lodging Trust | | | 9,206 | |
| | 700 | | | CoreCivic, Inc. | | | 17,122 | |
| | 250 | | | CoreSite Realty Corporation | | | 19,843 | |
| | 700 | | | Corporate Office Properties Trust | | | 21,854 | |
| | 2,456 | | | Cousins Properties, Inc. | | | 20,901 | |
| | 1,830 | | | Crown Castle International Corporation | | | 158,789 | |
| | 1,600 | | | CubeSmart | | | 42,832 | |
| | 750 | | | CyrusOne, Inc. | | | 33,548 | |
| | 100 | | | Daito Trust Construction Company, Ltd. | | | 15,034 | |
| | 700 | | | DCT Industrial Trust, Inc. | | | 33,516 | |
| | 2,200 | | | DDR Corporation | | | 33,594 | |
| | 16,100 | | | DEXUS Property Group | | | 111,689 | |
| | 772 | | | DiamondRock Hospitality Company | | | 8,901 | |
| | 1,118 | | | Digital Realty Trust, Inc. | | | 109,855 | |
| | 700 | | | Douglas Emmett, Inc. | | | 25,592 | |
| | 12,380 | | | Duke Realty Corporation | | | 328,813 | |
| | 350 | | | DuPont Fabros Technology, Inc. | | | 15,376 | |
| | 121 | | | EastGroup Properties, Inc. | | | 8,935 | |
| | 400 | | | Education Realty Trust, Inc. | | | 16,920 | |
| | 456 | | | EPR Properties | | | 32,727 | |
| | 680 | | | Equinix, Inc. | | | 243,039 | |
| | 800 | | | Equity Commonwealthd | | | 24,192 | |
| | 700 | | | Equity Lifestyle Properties, Inc. | | | 50,470 | |
| | 600 | | | Equity One, Inc. | | | 18,414 | |
| | 3,418 | | | Equity Residential | | | 219,982 | |
| | 500 | | | Essex Property Trust, Inc. | | | 116,250 | |
| | 950 | | | Extra Space Storage, Inc. | | | 73,378 | |
| | 400 | | | Federal Realty Investment Trust | | | 56,844 | |
| | 700 | | | First Industrial Realty Trust, Inc. | | | 19,635 | |
| | 1,478 | | | Forest City Realty Trust, Inc. | | | 30,802 | |
| | 1,200 | | | Gaming and Leisure Properties, Inc. | | | 36,744 | |
| | 4,139 | | | General Growth Properties, Inc. | | | 103,392 | |
| | 500 | | | GEO Group, Inc. | | | 17,965 | |
| | 1,800 | | | Gramercy Property Trust | | | 16,524 | |
| | 4,839 | | | H&R Real Estate Investment Trust | | | 80,623 | |
| | 1,161 | | | Hamborner REIT AG | | | 11,044 | |
The accompanying Notes to Financial Statements are an integral part of this schedule.
5
GROWTHAND INCOME PLUS FUND
Schedule of Investments as of December 31, 2016
| | | | | | | | |
Shares | | | Common Stock (63.2%) | | Value | |
| | Real Estate (9.6%) - continued | | | | |
| | 3,100 | | | HCP, Inc. | | $ | 92,132 | |
| | 900 | | | Healthcare Realty Trust, Inc. | | | 27,288 | |
| | 1,250 | | | Healthcare Trust of America, Inc. | | | 36,388 | |
| | 1,000 | | | Highwoods Properties, Inc. | | | 51,010 | |
| | 1,200 | | | Hospitality Properties Trust | | | 38,088 | |
| | 5,070 | | | Host Hotels & Resorts, Inc. | | | 95,519 | |
| | 800 | | | Hudson Pacific Properties, Inc. | | | 27,824 | |
| | 19,000 | | | Hysan Development Company, Ltd. | | | 78,357 | |
| | 1,500 | | | Iron Mountain, Inc. | | | 48,720 | |
| | 600 | | | Kilroy Realty Corporation | | | 43,932 | |
| | 3,400 | | | Kimco Realty Corporation | | | 85,544 | |
| | 467 | | | Lamar Advertising Company | | | 31,401 | |
| | 700 | | | LaSalle Hotel Properties | | | 21,329 | |
| | 1,000 | | | Liberty Property Trust | | | 39,500 | |
| | 313 | | | Life Storage, Inc. | | | 26,686 | |
| | 2,000 | | | Link REIT | | | 12,966 | |
| | 1,075 | | | Macerich Company | | | 76,153 | |
| | 600 | | | Mack-Cali Realty Corporation | | | 17,412 | |
| | 2,200 | | | Medical Properties Trust, Inc. | | | 27,060 | |
| | 734 | | | Mid-America Apartment Communities, Inc. | | | 71,873 | |
| | 500 | | | National Health Investors, Inc. | | | 37,085 | |
| | 1,600 | | | National Retail Properties, Inc. | | | 70,720 | |
| | 713 | | | National Storage Affiliates Trust | | | 15,736 | |
| | 74,628 | | | New World Development Company, Ltd. | | | 78,629 | |
| | 1,150 | | | NorthStar Realty Finance Corporation | | | 17,422 | |
| | 1,000 | | | Omega Healthcare Investors, Inc. | | | 31,260 | |
| | 800 | | | Outfront Media, Inc. | | | 19,896 | |
| | 307 | | | Parkway, Inc.d | | | 6,831 | |
| | 400 | | | Pebblebrook Hotel Trust | | | 11,900 | |
| | 1,550 | | | Physicians Realty Trust | | | 29,388 | |
| | 300 | | | Piedmont Office Realty Trust, Inc. | | | 6,273 | |
| | 5,295 | | | Prologis, Inc. | | | 279,523 | |
| | 1,368 | | | Public Storage, Inc. | | | 305,748 | |
| | 339 | | | QTS Realty Trust, Inc. | | | 16,831 | |
| | 620 | | | Quality Care Properties, Inc.d | | | 9,610 | |
| | 1,270 | | | Realty Income Corporation | | | 73,000 | |
| | 1,000 | | | Regency Centers Corporation | | | 68,950 | |
| | 650 | | | Retail Opportunity Investments Corporation | | | 13,735 | |
| | 1,200 | | | Retail Properties of America, Inc. | | | 18,396 | |
| | 1,095 | | | RLJ Lodging Trust | | | 26,817 | |
| | 1,123 | | | Senior Housing Property Trust | | | 21,258 | |
| | 3,009 | | | Simon Property Group, Inc. | | | 534,609 | |
| | 700 | | | SL Green Realty Corporation | | | 75,285 | |
| | 5,100 | | | Spirit Realty Captial, Inc. | | | 55,386 | |
| | 29,270 | | | Stockland | | | 96,699 | |
| | 1,295 | | | Store Capital Corporation | | | 31,999 | |
| | 1,108 | | | Summit Hotel Properties, Inc. | | | 17,761 | |
| | 500 | | | Sun Communities, Inc. | | | 38,305 | |
| | 1,000 | | | Sun Hung Kai Properties, Ltd. | | | 12,592 | |
| | 1,421 | | | Sunstone Hotel Investors, Inc. | | | 21,670 | |
| | 733 | | | Tanger Factory Outlet Centers, Inc. | | | 26,227 | |
| | 450 | | | Taubman Centers, Inc. | | | 33,268 | |
| | 1,900 | | | UDR, Inc. | | | 69,312 | |
| | 600 | | | Urban Edge Properties | | | 16,506 | |
| | 200 | | | Urstadt Biddle Properties, Inc. | | | 4,822 | |
| | 2,350 | | | Ventas, Inc. | | | 146,922 | |
| | 4,942 | | | VEREIT, Inc. | | | 41,809 | |
| | 1,950 | | | Vornado Realty Trust | | | 203,521 | |
| | 800 | | | Washington Prime Group, Inc. | | | 8,328 | |
| | 800 | | | Weingarten Realty Investors | | | 28,632 | |
| | 2,349 | | | Welltower, Inc. | | | 157,219 | |
| | 2,000 | | | Wharf Holdings, Ltd. | | | 13,248 | |
| | 2,000 | | | Wheelock and Company, Ltd. | | | 11,224 | |
| | 19,200 | | | Wing Tai Holdings, Ltd. | | | 21,030 | |
| | 400 | | | WP Carey, Inc. | | | 23,636 | |
| | | | | | | | |
| | | | Total | | | 7,446,402 | |
| | | | | | | | |
| |
| | Telecommunications Services (0.9%) | | | | |
| | 2,660 | | | Elisa Oyj | | | 86,348 | |
| | 2,363 | | | Freenet AG | | | 66,411 | |
| | 40,101 | | | KCOM Group plc | | | 46,826 | |
| | 10,202 | | | Koninklijke (Royal) KPN NV | | | 30,169 | |
| | 2,400 | | | Nippon Telegraph & Telephone Corporation | | | 101,028 | |
| | 2,600 | | | NTT DOCOMO, Inc. | | | 59,138 | |
| | 47,774 | | | PCCW, Ltd. | | | 25,826 | |
| | 1,093 | | | Proximus SA | | | 31,420 | |
| | 4,400 | | | Telefonica Deutschland Holding AG | | | 18,807 | |
| | 2,709 | | | Telenor ASA | | | 40,437 | |
| | 597 | | | Vivendi SA | | | 11,323 | |
| | 6,540 | | | Zayo Group Holdings, Inc.d | | | 214,904 | |
| | | | | | | | |
| | | | Total | | | 732,637 | |
| | | | | | | | |
| |
| | Utilities (1.0%) | | | | |
| | 899 | | | ATCO, Ltd. | | | 29,903 | |
| | 14,700 | | | Centrica plc | | | 42,337 | |
| | 20,000 | | | Electricidade de Portugal SA | | | 60,871 | |
| | 9,234 | | | MDU Resources Group, Inc. | | | 265,662 | |
| | 2,886 | | | NorthWestern Corporation | | | 164,127 | |
| | 24,000 | | | Osaka Gas Company, Ltd. | | | 92,089 | |
| | 13,500 | | | Redes Energeticas Nacionais SGPS SA | | | 38,303 | |
| | 2,000 | | | Toho Gas Company, Ltd. | | | 16,244 | |
| | 2,300 | | | United Utilities Group plc | | | 25,494 | |
| | | | | | | | |
| | | | Total | | | 735,030 | |
| | | | | | | | |
| | | | Total Common Stock (cost $46,316,324) | | | 49,047,630 | |
| | | | | | | | |
| | |
Principal Amount | | | Long-Term Fixed Income (17.7%) | | | |
| | Asset-Backed Securities (0.1%) | | | | |
| | | | Marlette Funding Trust | | | | |
| $ | 73,591 | | | 3.060%, 1/17/2023, Series 2016-1A, Class A* | | | 73,573 | |
| | | | Vericrest Opportunity Loan Transferee | | | | |
| | 21,980 | | | 3.500%, 6/26/2045, Series 2015-NPL9, Class A1f | | | 21,935 | |
| | | | | | | | |
| | | | Total | | | 95,508 | |
| | | | | | | | |
| |
| | Basic Materials (0.4%) | | | | |
| | | | Albemarle Corporation | | | | |
| | 14,000 | | | 3.000%, 12/1/2019 | | | 14,311 | |
| | | | Alcoa Nederland Holding BV | | | | |
| | 15,000 | | | 6.750%, 9/30/2024f | | | 16,275 | |
| | | | ArcelorMittal SA | | | | |
| | 45,000 | | | 6.500%, 3/1/2021 | | | 49,275 | |
| | | | Dow Chemical Company | | | | |
| | 8,000 | | | 8.550%, 5/15/2019 | | | 9,165 | |
| | | | First Quantum Minerals, Ltd. | | | | |
| | 60,000 | | | 7.000%, 2/15/2021f | | | 59,676 | |
| | | | Glencore Funding, LLC | | | | |
| | 10,000 | | | 1.940%, 4/16/2018f,g | | | 9,887 | |
| | | | LyondellBasell Industries NV | | | | |
| | 8,000 | | | 5.000%, 4/15/2019 | | | 8,446 | |
| | | | Newmont Mining Corporation, Convertible | | | | |
| | 30,000 | | | 1.625%, 7/15/2017 | | | 30,581 | |
| | | | NOVA Chemicals Corporation | | | | |
| | 35,516 | | | 5.250%, 8/1/2023f | | | 35,871 | |
The accompanying Notes to Financial Statements are an integral part of this schedule.
6
GROWTHAND INCOME PLUS FUND
Schedule of Investments as of December 31, 2016
| | | | | | | | |
Principal Amount | | | Long-Term Fixed Income (17.7%) | | Value | |
| | Basic Materials (0.4%) - continued | | | | |
| | | | Royal Gold, Inc., Convertible | | | | |
| $ | 20,000 | | | 2.875%, 6/15/2019 | | $ | 21,125 | |
| | | | RPM International, Inc., Convertible | | | | |
| | 40,000 | | | 2.250%, 12/15/2020 | | | 47,875 | |
| | | | | | | | |
| | | | Total | | | 302,487 | |
| | | | | | | | |
| |
| | Capital Goods (0.5%) | | | | |
| | | | AECOM | | | | |
| | 55,000 | | | 5.875%, 10/15/2024 | | | 58,719 | |
| | | | Building Materials Corporation of America | | | | |
| | 55,000 | | | 6.000%, 10/15/2025f | | | 57,887 | |
| | | | Cemex SAB de CV | | | | |
| | 60,000 | | | 5.700%, 1/11/2025f | | | 60,450 | |
| | | | Crown Americas Capital Corporation IV | | | | |
| | 45,000 | | | 4.500%, 1/15/2023 | | | 45,900 | |
| | | | General Electric Company | | | | |
| | 16,000 | | | 5.000%, 1/21/2021h | | | 16,603 | |
| | | | Lockheed Martin Corporation | | | | |
| | 10,000 | | | 2.500%, 11/23/2020 | | | 10,077 | |
| | | | Reynolds Group Issuer, Inc. | | | | |
| | 60,000 | | | 5.125%, 7/15/2023f | | | 60,975 | |
| | | | Roper Industries, Inc. | | | | |
| | 9,000 | | | 2.050%, 10/1/2018 | | | 9,029 | |
| | | | United Rentals North America, Inc. | | | | |
| | 60,000 | | | 5.500%, 7/15/2025 | | | 61,200 | |
| | | | | | | | |
| | | | Total | | | 380,840 | |
| | | | | | | | |
| |
| | Collateralized Mortgage Obligations (2.0%) | | | | |
| | | | Alternative Loan Trust | | | | |
| | 131,568 | | | 5.500%, 10/25/2035, Series 2005-47CB, Class A7 | | | 112,183 | |
| | | | Angel Oak Mortgage Trust | | | | |
| | 22,568 | | | 4.500%, 11/25/2045, Series 2015-1, Class A*,i | | | 22,699 | |
| | | | Banc of America Alternative Loan Trust | | | | |
| | 47,256 | | | 6.000%, 11/25/2035, Series 2005-10, Class 3CB1 | | | 41,690 | |
| | | | CHL Mortgage Pass-Through Trust | | | | |
| | 70,078 | | | 2.919%, 1/25/2036, Series 2005-31, Class 4A2 | | | 62,432 | |
| | | | Citigroup Mortgage Loan Trust, Inc. | | | | |
| | 21,802 | | | 3.037%, 3/25/2037, Series 2007-AR4, Class 2A1A | | | 18,557 | |
| | | | CitiMortgage Alternative Loan Trust | | | | |
| | 75,532 | | | 5.750%, 4/25/2037, Series 2007-A4, Class 1A5 | | | 64,714 | |
| | | | Countrywide Alternative Loan Trust | | | | |
| | 68,878 | | | 6.500%, 8/25/2036, Series 2006-23CB, Class 2A3 | | | 46,456 | |
| | | | Countrywide Home Loan Mortgage Pass Through Trust | | | | |
| | 105,751 | | | 3.155%, 11/25/2035, Series 2005-22, Class 2A1 | | | 86,712 | |
| | | | Credit Suisse First Boston Mortgage Securities Corporation | | | | |
| | 46,261 | | | 5.250%, 10/25/2035, Series 2005-9, Class 1A3 | | | 44,706 | |
| | | | Deutsche Alt-A Securities, Inc., Mortgage Loan Trust | | | | |
| | 48,529 | | | 5.500%, 11/25/2035, Series 2005-5, Class 1A4 | | | 48,733 | |
| | | | J.P. Morgan Alternative Loan Trust | | | | |
| | 119,126 | | | 6.500%, 3/25/2036, Series 2006-S1, Class 1A19 | | | 103,975 | |
| | | | J.P. Morgan Mortgage Trust | | | | |
| | 67,991 | | | 2.834%, 6/25/2035, Series 2005-A3, Class 3A4 | | | 67,527 | |
| | 64,872 | | | 3.077%, 6/25/2035, Series 2005-A3, Class 4A1 | | | 65,111 | |
| | 50,150 | | | 3.247%, 8/25/2035, Series 2005-A5, Class 1A2 | | | 49,728 | |
| | 70,004 | | | 3.186%, 1/25/2037, Series 2006-A7, Class 2A2 | | | 62,683 | |
| | | | MortgageIT Trust | | | | |
| | 58,030 | | | 1.016%, 12/25/2035, Series 2005-5, Class A1g | | | 53,557 | |
| | | | New York Mortgage Trust | | | | |
| | 59,547 | | | 3.112%, 5/25/2036, Series 2006-1, Class 2A3 | | | 53,583 | |
| | | | Residential Accredit Loans, Inc. Trust | | | | |
| | 58,664 | | | 5.750%, 9/25/2035, Series 2005-QS13, Class 2A3 | | | 52,384 | |
| | | | Residential Funding Mortgage Security I Trust | | | | |
| | 50,463 | | | 5.750%, 2/25/2036, Series 2006-S2, Class A1 | | | 46,930 | |
| | 66,368 | | | 6.000%, 7/25/2037, Series 2007-S7, Class A20 | | | 61,152 | |
| | | | Sequoia Mortgage Trust | | | | |
| | 37,052 | | | 3.280%, 9/20/2046, Series 2007-1, Class 4A1 | | | 30,049 | |
| | | | Structured Adjustable Rate Mortgage Loan Trust | | | | |
| | 77,430 | | | 3.364%, 9/25/2035, Series 2005-18, Class 1A1 | | | 63,415 | |
| | | | Structured Asset Mortgage Investments, Inc. | | | | |
| | 122,379 | | | 1.066%, 12/25/2035, Series 2005-AR4, Class A1g | | | 89,394 | |
| | | | WaMu Mortgage Pass Through Certificates | | | | |
| | 109,742 | | | 1.307%, 1/25/2047, Series 2006-AR19, Class 1Ag | | | 85,591 | |
| | | | Wells Fargo Mortgage Backed Securities Trust | | | | |
| | 49,089 | | | 3.003%, 3/25/2036, Series 2006-AR2, Class 2A1 | | | 48,971 | |
| | 47,890 | | | 3.037%, 7/25/2036, Series 2006-AR10, Class 2A1 | | | 46,857 | |
| | 39,283 | | | 6.000%, 7/25/2037, Series 2007-8, Class 1A16 | | | 38,807 | |
| | | | | | | | |
| | | | Total | | | 1,568,596 | |
| | | | | | | | |
| |
| | Communications Services (0.9%) | | | | |
| | | | America Movil SAB de CV | | | | |
| | 8,000 | | | 5.000%, 10/16/2019 | | | 8,569 | |
| | | | American Tower Corporation | | | | |
| | 10,000 | | | 2.800%, 6/1/2020 | | | 10,000 | |
| | | | AT&T, Inc. | | | | |
| | 8,000 | | | 5.875%, 10/1/2019 | | | 8,739 | |
| | 10,000 | | | 1.928%, 6/30/2020g | | | 10,054 | |
| | 15,000 | | | 2.800%, 2/17/2021 | | | 14,869 | |
| | | | British Sky Broadcasting Group plc | | | | |
| | 14,000 | | | 2.625%, 9/16/2019f | | | 14,051 | |
| | | | CCOH Safari, LLC | | | | |
| | 60,000 | | | 5.750%, 2/15/2026f | | | 62,100 | |
The accompanying Notes to Financial Statements are an integral part of this schedule.
7
GROWTHAND INCOME PLUS FUND
Schedule of Investments as of December 31, 2016
| | | | | | | | |
Principal
Amount | | | Long-Term Fixed Income (17.7%) | | Value | |
| | Communications Services (0.9%) - continued | | | | |
| | | | CenturyLink, Inc. | | | | |
| $ | 30,000 | | | 6.450%, 6/15/2021 | | $ | 31,575 | |
| | | | Charter Communications Operating, LLC | | | | |
| | 15,000 | | | 3.579%, 7/23/2020 | | | 15,293 | |
| | 5,000 | | | 4.464%, 7/23/2022 | | | 5,220 | |
| | | | Clear Channel Worldwide Holdings, Inc. | | | | |
| | 50,000 | | | 6.500%, 11/15/2022 | | | 51,125 | |
| | | | Columbus International, Inc. | | | | |
| | 50,000 | | | 7.375%, 3/30/2021f | | | 53,207 | |
| | | | Crown Castle International Corporation | | | | |
| | 5,000 | | | 3.400%, 2/15/2021 | | | 5,070 | |
| | 10,000 | | | 2.250%, 9/1/2021 | | | 9,665 | |
| | | | CSC Holdings, LLC | | | | |
| | 5,000 | | | 5.500%, 4/15/2027f | | | 5,062 | |
| | | | Digicel, Ltd. | | | | |
| | 53,677 | | | 6.000%, 4/15/2021* | | | 48,535 | |
| | | | FairPoint Communications, Inc. | | | | |
| | 60,000 | | | 8.750%, 8/15/2019f | | | 62,625 | |
| | | | Frontier Communications Corporation | | | | |
| | 55,000 | | | 8.875%, 9/15/2020 | | | 58,575 | |
| | | | Neptune Finco Corporation | | | | |
| | 35,000 | | | 10.875%, 10/15/2025f | | | 41,650 | |
| | | | Orange SA | | | | |
| | 10,000 | | | 1.625%, 11/3/2019 | | | 9,846 | |
| | | | SFR Group SA | | | | |
| | 50,000 | | | 6.000%, 5/15/2022f | | | 51,312 | |
| | | | Sprint Corporation | | | | |
| | 60,000 | | | 7.625%, 2/15/2025 | | | 63,075 | |
| | | | Telefonica Emisiones SAU | | | | |
| | 9,000 | | | 3.192%, 4/27/2018 | | | 9,128 | |
| | | | T-Mobile USA, Inc. | | | | |
| | 25,000 | | | 6.633%, 4/28/2021 | | | 26,094 | |
| | | | Verizon Communications, Inc. | | | | |
| | 27,000 | | | 2.625%, 2/21/2020 | | | 27,242 | |
| | 12,000 | | | 4.500%, 9/15/2020 | | | 12,832 | |
| | | | | | | | |
| | | | Total | | | 715,513 | |
| | | | | | | | |
| |
| | Consumer Cyclical (0.9%) | | | | |
| | | | Allison Transmission, Inc. | | | | |
| | 50,000 | | | 5.000%, 10/1/2024f | | | 50,500 | |
| | | | Brookfield Residential Properties, Inc. | | | | |
| | 60,000 | | | 6.125%, 7/1/2022f | | | 60,300 | |
| | | | Cinemark USA, Inc. | | | | |
| | 28,000 | | | 4.875%, 6/1/2023 | | | 28,350 | |
| | | | Daimler Finance North America, LLC | | | | |
| | 7,000 | | | 1.875%, 1/11/2018f | | | 7,009 | |
| | | | eBay, Inc. | | | | |
| | 10,000 | | | 2.500%, 3/9/2018 | | | 10,087 | |
| | | | ERAC USA Finance, LLC | | | | |
| | 12,000 | | | 2.350%, 10/15/2019f | | | 11,984 | |
| | | | Ford Motor Credit Company, LLC | | | | |
| | 13,000 | | | 5.000%, 5/15/2018 | | | 13,507 | |
| | 14,000 | | | 2.597%, 11/4/2019 | | | 13,972 | |
| | | | General Motors Financial Company, Inc. | | | | |
| | 10,000 | | | 3.150%, 1/15/2020 | | | 10,057 | |
| | 21,000 | | | 4.375%, 9/25/2021 | | | 21,764 | |
| | | | Home Depot, Inc. | | | | |
| | 5,000 | | | 1.333%, 9/15/2017g | | | 5,008 | |
| | 10,000 | | | 2.625%, 6/1/2022 | | | 10,038 | |
| | | | KB Home | | | | |
| | 22,000 | | | 4.750%, 5/15/2019 | | | 22,440 | |
| | | | L Brands, Inc. | | | | |
| | 30,000 | | | 6.625%, 4/1/2021 | | | 33,675 | |
| | | | Lennar Corporation | | | | |
| | 60,000 | | | 4.750%, 11/15/2022 | | | 61,500 | |
| | | | Live Nation Entertainment, Inc. | | | | |
| | 60,000 | | | 5.375%, 6/15/2022f | | | 62,100 | |
| | | | Macy’s Retail Holdings, Inc. | | | | |
| | 10,000 | | | 7.450%, 7/15/2017 | | | 10,315 | |
| | | | MGM Resorts International | | | | |
| | 60,000 | | | 6.000%, 3/15/2023 | | | 64,800 | |
| | | | Newell Rubbermaid, Inc. | | | | |
| | 10,000 | | | 3.150%, 4/1/2021 | | | 10,169 | |
| | | | Ralph Lauren Corporation | | | | |
| | 10,000 | | | 2.625%, 8/18/2020 | | | 10,094 | |
| | | | Toll Brothers Finance Corporation | | | | |
| | 16,000 | | | 4.000%, 12/31/2018 | | | 16,420 | |
| | | | Visa, Inc. | | | | |
| | 10,000 | | | 2.200%, 12/14/2020 | | | 10,005 | |
| | | | Walgreens Boots Alliance, Inc. | | | | |
| | 10,000 | | | 1.750%, 5/30/2018 | | | 10,008 | |
| | 10,000 | | | 2.600%, 6/1/2021 | | | 9,928 | |
| | | | West Corporation | | | | |
| | 50,000 | | | 5.375%, 7/15/2022f | | | 48,312 | |
| | | | Yum! Brands, Inc. | | | | |
| | 60,000 | | | 5.000%, 6/1/2024f | | | 61,275 | |
| | | | | | | | |
| | | | Total | | | 673,617 | |
| | | | | | | | |
| |
| | Consumer Non-Cyclical (0.9%) | | | | |
| | | | Abbott Laboratories | | | | |
| | 15,000 | | | 2.350%, 11/22/2019 | | | 15,010 | |
| | | | Actavis Funding SCS | | | | |
| | 7,000 | | | 2.208%, 3/12/2020g | | | 7,134 | |
| | | | Anheuser-Busch InBev Finance, Inc. | | | | |
| | 15,000 | | | 2.146%, 2/1/2021g | | | 15,264 | |
| | 10,000 | | | 2.650%, 2/1/2021 | | | 10,046 | |
| | | | Anheuser-Busch InBev Worldwide, Inc. | | | | |
| | 9,000 | | | 6.500%, 7/15/2018 | | | 9,638 | |
| | | | BAT International Finance plc | | | | |
| | 10,000 | | | 1.473%, 6/15/2018f,g | | | 10,002 | |
| | | | Baxter International, Inc. | | | | |
| | 10,000 | | | 1.700%, 8/15/2021 | | | 9,611 | |
| | | | Bayer U.S. Finance, LLC | | | | |
| | 10,000 | | | 2.375%, 10/8/2019f | | | 10,013 | |
| | | | Boston Scientific Corporation | | | | |
| | 5,000 | | | 6.000%, 1/15/2020 | | | 5,491 | |
| | | | Bunge Limited Finance Corporation | | | | |
| | 10,000 | | | 3.500%, 11/24/2020 | | | 10,170 | |
| | | | Celgene Corporation | | | | |
| | 10,000 | | | 3.550%, 8/15/2022 | | | 10,245 | |
| | | | Cott Beverages, Inc. | | | | |
| | 55,000 | | | 5.375%, 7/1/2022 | | | 55,963 | |
| | | | CVS Health Corporation | | | | |
| | 8,000 | | | 2.250%, 12/5/2018 | | | 8,069 | |
| | | | EMD Finance, LLC | | | | |
| | 6,000 | | | 1.343%, 3/17/2017f,g | | | 6,001 | |
| | | | Envision Healthcare Corporation | | | | |
| | 50,000 | | | 5.125%, 7/1/2022f | | | 49,813 | |
| | | | Express Scripts Holding Company | | | | |
| | 10,000 | | | 3.000%, 7/15/2023 | | | 9,669 | |
| | | | Forest Laboratories, Inc. | | | | |
| | 12,000 | | | 4.375%, 2/1/2019f | | | 12,465 | |
| | | | Gilead Sciences, Inc. | | | | |
| | 10,000 | | | 3.250%, 9/1/2022 | | | 10,196 | |
The accompanying Notes to Financial Statements are an integral part of this schedule.
8
GROWTHAND INCOME PLUS FUND
Schedule of Investments as of December 31, 2016
| | | | | | | | |
Principal
Amount | | | Long-Term Fixed Income (17.7%) | | Value | |
| | Consumer Non-Cyclical (0.9%) - continued | | | | |
| | | | Grifols Worldwide Operations, Ltd. | | | | |
| $ | 40,000 | | | 5.250%, 4/1/2022 | | $ | 41,400 | |
| | | | HCA, Inc. | | | | |
| | 23,677 | | | 4.750%, 5/1/2023 | | | 24,239 | |
| | | | Iconix Brand Group, Inc., Convertible | | | | |
| | 35,000 | | | 1.500%, 3/15/2018 | | | 32,900 | |
| | | | JBS USA, LLC | | | | |
| | 60,000 | | | 5.750%, 6/15/2025f | | | 60,750 | |
| | | | Kraft Heinz Foods Company | | | | |
| | 10,000 | | | 5.375%, 2/10/2020 | | | 10,824 | |
| | | | Laboratory Corporation of America Holdings | | | | |
| | 5,000 | | | 2.625%, 2/1/2020 | | | 4,993 | |
| | | | Mead Johnson Nutrition Company | | | | |
| | 10,000 | | | 3.000%, 11/15/2020 | | | 10,117 | |
| | | | Merck & Company, Inc. | | | | |
| | 5,000 | | | 1.257%, 2/10/2020g | | | 5,026 | |
| | | | Mylan NV | | | | |
| | 10,000 | | | 3.150%, 6/15/2021f | | | 9,805 | |
| | | | PepsiCo, Inc. | | | | |
| | 12,000 | | | 1.394%, 10/6/2021g | | | 12,047 | |
| | | | Pernod Ricard SA | | | | |
| | 10,000 | | | 5.750%, 4/7/2021f | | | 11,099 | |
| | | | Perrigo Finance plc | | | | |
| | 10,000 | | | 3.500%, 12/15/2021 | | | 10,071 | |
| | | | Pinnacle Foods, Inc. | | | | |
| | 50,000 | | | 5.875%, 1/15/2024 | | | 53,000 | |
| | | | Revlon Consumer Products Corporation | | | | |
| | 23,677 | | | 5.750%, 2/15/2021 | | | 23,795 | |
| | | | Reynolds American, Inc. | | | | |
| | 6,000 | | | 3.250%, 6/12/2020 | | | 6,144 | |
| | | | Shire Acquisitions Investments Ireland Designated Activity Company | | | | |
| | 10,000 | | | 1.900%, 9/23/2019 | | | 9,869 | |
| | | | Tenet Healthcare Corporation | | | | |
| | 45,000 | | | 8.125%, 4/1/2022 | | | 42,458 | |
| | | | Teva Pharmaceutical Finance Netherlands III BV | | | | |
| | 10,000 | | | 1.700%, 7/19/2019 | | | 9,821 | |
| | | | TreeHouse Foods, Inc. | | | | |
| | 40,000 | | | 4.875%, 3/15/2022 | | | 41,000 | |
| | | | Valeant Pharmaceuticals International | | | | |
| | 23,677 | | | 7.250%, 7/15/2022f | | | 19,356 | |
| | | | | | | | |
| | | | Total | | | 703,514 | |
| | | | | | | | |
| |
| | Energy (0.7%) | | | | |
| | | | Anadarko Petroleum Corporation | | | | |
| | 9,000 | | | 8.700%, 3/15/2019 | | | 10,225 | |
| | | | Antero Resources Corporation | | | | |
| | 40,000 | | | 5.125%, 12/1/2022 | | | 40,400 | |
| | | | BP Capital Markets plc | | | | |
| | 5,000 | | | 1.676%, 5/3/2019 | | | 4,963 | |
| | | | Buckeye Partners, LP | | | | |
| | 13,000 | | | 2.650%, 11/15/2018 | | | 13,083 | |
| | | | Chevron Corporation | | | | |
| | 10,000 | | | 1.421%, 11/16/2018g | | | 10,040 | |
| | | | Concho Resources, Inc. | | | | |
| | 58,677 | | | 6.500%, 1/15/2022 | | | 60,713 | |
| | 15,000 | | | 4.375%, 1/15/2025 | | | 14,970 | |
| | | | Contura Energy, Inc. | | | | |
| | 14,000 | | | 10.000%, 8/1/2021* | | | 14,945 | |
| | | | Crestwood Midstream Partners, LP | | | | |
| | 40,000 | | | 6.250%, 4/1/2023 | | | 40,800 | |
| | | | Devon Energy Corporation | | | | |
| | 10,000 | | | 3.250%, 5/15/2022 | | | 9,926 | |
| | | | Ecopetrol SA | | | | |
| | 6,000 | | | 5.875%, 9/18/2023 | | | 6,351 | |
| | | | Enbridge, Inc. | | | | |
| | 6,000 | | | 1.384%, 6/2/2017g | | | 6,001 | |
| | | | Encana Corporation | | | | |
| | 3,000 | | | 3.900%, 11/15/2021 | | | 3,022 | |
| | | | EOG Resources, Inc. | | | | |
| | 10,000 | | | 2.625%, 3/15/2023 | | | 9,684 | |
| | | | EQT Corporation | | | | |
| | 8,000 | | | 8.125%, 6/1/2019 | | | 8,998 | |
| | | | Exxon Mobil Corporation | | | | |
| | 10,000 | | | 1.708%, 3/1/2019 | | | 10,019 | |
| | | | Marathon Petroleum Corporation | | | | |
| | 10,000 | | | 3.400%, 12/15/2020 | | | 10,219 | |
| | | | MEG Energy Corporation | | | | |
| | 30,000 | | | 6.375%, 1/30/2023f | | | 26,700 | |
| | | | Northern Tier Energy, LLC | | | | |
| | 35,000 | | | 7.125%, 11/15/2020 | | | 36,356 | |
| | | | Petrobras Global Finance BV | | | | |
| | 20,000 | | | 8.375%, 5/23/2021 | | | 21,550 | |
| | | | Petroleos Mexicanos | | | | |
| | 24,000 | | | 6.500%, 3/13/2027f | | | 24,756 | |
| | | | Regency Energy Partners, LP | | | | |
| | 45,000 | | | 5.000%, 10/1/2022 | | | 47,638 | |
| | | | Sabine Pass Liquefaction, LLC | | | | |
| | 60,000 | | | 5.625%, 3/1/2025 | | | 64,200 | |
| | | | Schlumberger Holdings Corporation | | | | |
| | 10,000 | | | 3.000%, 12/21/2020f | | | 10,204 | |
| | | | Shell International Finance BV | | | | |
| | 10,000 | | | 1.352%, 5/11/2020g | | | 10,006 | |
| | | | Sunoco Logistics Partners Operations, LP | | | | |
| | 10,000 | | | 4.400%, 4/1/2021 | | | 10,522 | |
| | | | Transcontinental Gas Pipe Line Company, LLC | | | | |
| | 10,000 | | | 7.850%, 2/1/2026f | | | 12,594 | |
| | | | Whiting Petroleum Corporation, Convertible | | | | |
| | 20,000 | | | 1.250%, 4/1/2020 | | | 17,550 | |
| | | | | | | | |
| | | | Total | | | 556,435 | |
| | | | | | | | |
| |
| | Financials (1.9%) | | | | |
| | | | Abbey National Treasury Services plc | | | | |
| | 14,000 | | | 1.407%, 9/29/2017g | | | 13,975 | |
| | | | ACE INA Holdings, Inc. | | | | |
| | 10,000 | | | 2.875%, 11/3/2022 | | | 10,071 | |
| | | | AerCap Ireland Capital, Ltd. | | | | |
| | 30,000 | | | 3.950%, 2/1/2022 | | | 30,262 | |
| | | | Air Lease Corporation | | | | |
| | 14,000 | | | 2.125%, 1/15/2018 | | | 14,024 | |
| | 5,000 | | | 2.625%, 9/4/2018 | | | 5,034 | |
| | | | Ally Financial, Inc. | | | | |
| | 40,000 | | | 4.750%, 9/10/2018 | | | 41,200 | |
| | | | American Express Credit Corporation | | | | |
| | 5,000 | | | 2.009%, 9/14/2020g | | | 5,083 | |
| | | | AMG Capital Trust II, Convertible | | | | |
| | 800 | | | 5.150%, 10/15/2037 | | | 43,675 | |
| | | | Bank of America Corporation | | | | |
| | 14,000 | | | 5.700%, 5/2/2017 | | | 14,191 | |
| | 14,000 | | | 1.700%, 8/25/2017 | | | 14,018 | |
| | 8,000 | | | 8.000%, 1/30/2018h | | | 8,220 | |
| | 24,000 | | | 2.066%, 3/22/2018g | | | 24,162 | |
| | 20,000 | | | 5.650%, 5/1/2018 | | | 20,952 | |
The accompanying Notes to Financial Statements are an integral part of this schedule.
9
GROWTHAND INCOME PLUS FUND
Schedule of Investments as of December 31, 2016
| | | | | | | | |
Principal
Amount | | | Long-Term Fixed Income (17.7%) | | Value | |
| | Financials (1.9%) - continued | | | | |
| | | | Bank of Montreal | | | | |
| $ | 7,000 | | | 1.500%, 7/18/2019 | | $ | 6,905 | |
| | | | BB&T Corporation | | | | |
| | 13,000 | | | 2.050%, 6/19/2018 | | | 13,065 | |
| | | | Bear Stearns Companies, LLC | | | | |
| | 15,000 | | | 6.400%, 10/2/2017 | | | 15,538 | |
| | | | Blackstone Mortgage Trust, Inc., Convertible | | | | |
| | 40,000 | | | 5.250%, 12/1/2018 | | | 44,600 | |
| | | | BNP Paribas SA | | | | |
| | 9,000 | | | 2.375%, 9/14/2017 | | | 9,060 | |
| | | | Caisse Centrale Desjardins du Quebec | | | | |
| | 7,000 | | | 1.552%, 1/29/2018f,g | | | 6,993 | |
| | | | Citigroup, Inc. | | | | |
| | 21,000 | | | 1.850%, 11/24/2017 | | | 21,038 | |
| | 10,000 | | | 2.361%, 9/1/2023g | | | 10,199 | |
| | | | CNA Financial Corporation | | | | |
| | 10,000 | | | 5.750%, 8/15/2021 | | | 11,161 | |
| | | | Credit Agricole SA | | | | |
| | 8,000 | | | 1.923%, 6/10/2020f,g | | | 8,027 | |
| | | | Discover Bank | | | | |
| | 3,000 | | | 8.700%, 11/18/2019 | | | 3,405 | |
| | | | Discover Financial Services | | | | |
| | 6,000 | | | 6.450%, 6/12/2017 | | | 6,123 | |
| | | | Fifth Third Bancorp | | | | |
| | 16,000 | | | 5.450%, 1/15/2017 | | | 16,022 | |
| | | | Goldman Sachs Group, Inc. | | | | |
| | 6,000 | | | 2.625%, 1/31/2019 | | | 6,062 | |
| | 9,000 | | | 7.500%, 2/15/2019 | | | 9,974 | |
| | 5,000 | | | 2.042%, 4/23/2020g | | | 5,048 | |
| | 10,000 | | | 2.241%, 11/15/2021g | | | 10,054 | |
| | 10,000 | | | 2.537%, 11/29/2023g | | | 10,310 | |
| | | | Goldman Sachs Group, Inc., Convertible | | | | |
| | 375,000 | | | 0.500%, 9/24/2022 | | | 414,202 | |
| | | | Hartford Financial Services Group, Inc. | | | | |
| | 14,000 | | | 6.000%, 1/15/2019 | | | 15,060 | |
| | | | HCP, Inc. | | | | |
| | 9,000 | | | 3.750%, 2/1/2019 | | | 9,250 | |
| | | | Health Care REIT, Inc. | | | | |
| | 8,000 | | | 4.700%, 9/15/2017 | | | 8,172 | |
| | | | Hospitality Properties Trust | | | | |
| | 10,000 | | | 4.250%, 2/15/2021 | | | 10,338 | |
| | | | Huntington Bancshares, Inc. | | | | |
| | 10,000 | | | 3.150%, 3/14/2021 | | | 10,133 | |
| | | | Hutchison Whampoa Finance CI, Ltd. | | | | |
| | 15,000 | | | 1.625%, 10/31/2017f | | | 14,965 | |
| | | | Icahn Enterprises, LP | | | | |
| | 25,000 | | | 6.000%, 8/1/2020 | | | 25,531 | |
| | | | ING Capital Funding Trust III | | | | |
| | 8,000 | | | 4.438%, 3/31/2017g,h | | | 7,960 | |
| | | | Intesa Sanpaolo SPA | | | | |
| | 3,000 | | | 3.875%, 1/16/2018 | | | 3,040 | |
| | 12,000 | | | 3.875%, 1/15/2019 | | | 12,211 | |
| | | | J.P. Morgan Chase & Company | | | | |
| | 8,000 | | | 7.900%, 4/30/2018h | | | 8,284 | |
| | 6,000 | | | 6.300%, 4/23/2019 | | | 6,554 | |
| | 5,000 | | | 2.250%, 1/23/2020 | | | 4,985 | |
| | 13,000 | | | 2.112%, 10/24/2023g | | | 13,260 | |
| | | | KeyCorp | | | | |
| | 9,000 | | | 2.300%, 12/13/2018 | | | 9,052 | |
| | | | Liberty Mutual Group, Inc. | | | | |
| | 3,000 | | | 5.000%, 6/1/2021f | | | 3,261 | |
| | | | Lincoln National Corporation | | | | |
| | 7,000 | | | 6.250%, 2/15/2020 | | | 7,726 | |
| | | | Lloyds Bank plc | | | | |
| | 7,000 | | | 1.490%, 3/16/2018g | | | 7,010 | |
| | | | Macquarie Bank, Ltd. | | | | |
| | 10,000 | | | 2.060%, 1/15/2019f,g | | | 10,079 | |
| | | | MetLife, Inc. | | | | |
| | 14,000 | | | 1.903%, 12/15/2017 | | | 14,036 | |
| | | | Mizuho Corporate Bank, Ltd. | | | | |
| | 11,000 | | | 1.550%, 10/17/2017f | | | 10,990 | |
| | | | Morgan Stanley | | | | |
| | 12,000 | | | 6.625%, 4/1/2018 | | | 12,689 | |
| | 5,000 | | | 2.026%, 1/27/2020g | | | 5,044 | |
| | 8,000 | | | 4.875%, 11/1/2022 | | | 8,565 | |
| | 15,000 | | | 2.282%, 10/24/2023g | | | 15,167 | |
| | | | MPT Operating Partnership, LP | | | | |
| | 40,000 | | | 5.500%, 5/1/2024 | | | 40,400 | |
| | | | Murray Street Investment Trust I | | | | |
| | 18,000 | | | 4.647%, 3/9/2017 | | | 18,094 | |
| | | | National City Corporation | | | | |
| | 6,000 | | | 6.875%, 5/15/2019 | | | 6,602 | |
| | | | New York Life Global Funding | | | | |
| | 10,000 | | | 1.550%, 11/2/2018f | | | 9,969 | |
| | | | Nomura Holdings, Inc. | | | | |
| | 6,000 | | | 2.750%, 3/19/2019 | | | 6,054 | |
| | | | Quicken Loans, Inc. | | | | |
| | 60,000 | | | 5.750%, 5/1/2025f | | | 58,350 | |
| | | | Realty Income Corporation | | | | |
| | 10,000 | | | 2.000%, 1/31/2018 | | | 10,027 | |
| | | | Regions Bank | | | | |
| | 5,000 | | | 7.500%, 5/15/2018 | | | 5,356 | |
| | | | Regions Financial Corporation | | | | |
| | 10,000 | | | 3.200%, 2/8/2021 | | | 10,133 | |
| | | | Reinsurance Group of America, Inc. | | | | |
| | 12,000 | | | 5.625%, 3/15/2017 | | | 12,097 | |
| | | | Simon Property Group, LP | | | | |
| | 10,000 | | | 2.500%, 9/1/2020 | | | 10,068 | |
| | 15,000 | | | 2.500%, 7/15/2021 | | | 15,001 | |
| | | | State Street Corporation | | | | |
| | 10,000 | | | 1.809%, 8/18/2020g | | | 10,134 | |
| | | | SunTrust Banks, Inc. | | | | |
| | 10,000 | | | 2.900%, 3/3/2021 | | | 10,133 | |
| | | | Synchrony Financial | | | | |
| | 18,000 | | | 1.875%, 8/15/2017 | | | 18,014 | |
| | 5,000 | | | 2.111%, 2/3/2020g | | | 4,943 | |
| | | | Toronto-Dominion Bank | | | | |
| | 10,000 | | | 1.722%, 1/22/2019g | | | 10,082 | |
| | 10,000 | | | 1.889%, 12/14/2020g | | | 10,118 | |
| | | | UnitedHealth Group, Inc. | | | | |
| | 10,000 | | | 3.350%, 7/15/2022 | | | 10,292 | |
| | | | USB Realty Corporation | | | | |
| | 5,000 | | | 2.027%, 1/15/2022f,g,h | | | 4,400 | |
| | | | Voya Financial, Inc. | | | | |
| | 9,000 | | | 2.900%, 2/15/2018 | | | 9,110 | |
| | | | Wells Fargo & Company | | | | |
| | 7,000 | | | 1.567%, 1/30/2020g | | | 6,997 | |
| | 7,000 | | | 2.100%, 7/26/2021 | | | 6,805 | |
| | 15,000 | | | 2.117%, 10/31/2023g | | | 15,185 | |
| | | | Westpac Banking Corporation | | | | |
| | 15,000 | | | 1.761%, 8/19/2021g | | | 15,043 | |
| | | | | | | | |
| | | | Total | | | 1,459,422 | |
| | | | | | | | |
| |
| | Foreign Government (3.9%) | | | | |
| | | | Argentina Government International Bond | | | | |
| | 55,000 | | | 7.500%, 4/22/2026f | | | 57,750 | |
The accompanying Notes to Financial Statements are an integral part of this schedule.
10
GROWTHAND INCOME PLUS FUND
Schedule of Investments as of December 31, 2016
| | | | | | | | |
Principal
Amount | | | Long-Term Fixed Income (17.7%) | | Value | |
| | Foreign Government (3.9%) - continued | | | | |
| | | | Brazil Government International Bond | | | | |
| $ | 70,000 | | | 4.875%, 1/22/2021 | | $ | 72,100 | |
| | 100,000 | | | 2.625%, 1/5/2023 | | | 89,000 | |
| | 35,000 | | | 6.000%, 4/7/2026 | | | 36,225 | |
| | 40,000 | | | 7.125%, 1/20/2037 | | | 41,700 | |
| | 48,000 | | | 5.000%, 1/27/2045 | | | 38,938 | |
| | | | Colombia Government International Bond | | | | |
| | 40,000 | | | 4.375%, 7/12/2021 | | | 41,900 | |
| | 55,000 | | | 2.625%, 3/15/2023 | | | 51,838 | |
| | 40,000 | | | 4.000%, 2/26/2024 | | | 40,400 | |
| | 27,000 | | | 5.625%, 2/26/2044 | | | 27,810 | |
| | 48,000 | | | 5.000%, 6/15/2045 | | | 45,540 | |
| | | | Croatia Government International Bond | | | | |
| | 8,000 | | | 6.750%, 11/5/2019f | | | 8,680 | |
| | 48,000 | | | 6.625%, 7/14/2020f | | | 52,208 | |
| | 26,000 | | | 6.000%, 1/26/2024f | | | 28,178 | |
| | | | Hungary Government International Bond | | | | |
| | 16,000 | | | 6.375%, 3/29/2021 | | | 17,916 | |
| | 68,000 | | | 5.750%, 11/22/2023 | | | 75,395 | |
| | 70,000 | | | 5.375%, 3/25/2024 | | | 76,300 | |
| | | | Indonesia Government International Bond | | | | |
| | 60,000 | | | 4.875%, 5/5/2021f | | | 63,517 | |
| | 40,000 | | | 3.375%, 4/15/2023f | | | 39,019 | |
| | 60,000 | | | 5.875%, 1/15/2024f | | | 66,198 | |
| | 60,000 | | | 4.125%, 1/15/2025f | | | 59,450 | |
| | 10,000 | | | 4.750%, 1/8/2026f | | | 10,323 | |
| | 40,000 | | | 8.500%, 10/12/2035f | | | 54,264 | |
| | 80,000 | | | 5.125%, 1/15/2045f | | | 79,821 | |
| | | | Mexico Government International Bond | | | | |
| | 8,000 | | | 5.750%, 10/12/2110 | | | 7,380 | |
| | 24,000 | | | 3.625%, 3/15/2022 | | | 24,048 | |
| | 64,000 | | | 4.000%, 10/2/2023 | | | 64,147 | |
| | 40,000 | | | 3.600%, 1/30/2025 | | | 38,560 | |
| | 42,000 | | | 4.125%, 1/21/2026 | | | 41,664 | |
| | 16,000 | | | 6.750%, 9/27/2034 | | | 18,960 | |
| | 24,000 | | | 6.050%, 1/11/2040 | | | 25,956 | |
| | 66,000 | | | 4.750%, 3/8/2044 | | | 59,994 | |
| | 40,000 | | | 5.550%, 1/21/2045 | | | 40,900 | |
| | 28,000 | | | 4.600%, 1/23/2046 | | | 25,130 | |
| | 49,000 | | | 4.350%, 1/15/2047 | | | 42,017 | |
| | | | Panama Government International Bond | | | | |
| | 24,000 | | | 4.000%, 9/22/2024 | | | 24,420 | |
| | 37,000 | | | 3.750%, 3/16/2025 | | | 36,723 | |
| | 36,000 | | | 6.700%, 1/26/2036 | | | 43,686 | |
| | | | Peru Government International Bond | | | | |
| | 19,000 | | | 5.625%, 11/18/2050 | | | 21,517 | |
| | 36,000 | | | 4.125%, 8/25/2027 | | | 37,395 | |
| | 42,000 | | | 8.750%, 11/21/2033 | | | 61,320 | |
| | | | Philippines Government International Bond | | | | |
| | 64,000 | | | 4.000%, 1/15/2021 | | | 68,070 | |
| | 40,000 | | | 7.750%, 1/14/2031 | | | 56,229 | |
| | 50,000 | | | 6.375%, 10/23/2034 | | | 65,036 | |
| | 20,000 | | | 5.000%, 1/13/2037 | | | 22,568 | |
| | 40,000 | | | 3.950%, 1/20/2040 | | | 39,380 | |
| | | | Romania Government International Bond | | | | |
| | 42,000 | | | 4.375%, 8/22/2023f | | | 43,218 | |
| | 20,000 | | | 4.875%, 1/22/2024f | | | 21,154 | |
| | 8,000 | | | 6.125%, 1/22/2044f | | | 9,338 | |
| | | | Russia Government International Bond | | | | |
| | 40,000 | | | 3.500%, 1/16/2019f | | | 40,652 | |
| | 200,000 | | | 5.000%, 4/29/2020f | | | 212,230 | |
| | 48,000 | | | 4.875%, 9/16/2023f | | | 50,564 | |
| | 53,500 | | | 7.500%, 3/31/2030f | | | 64,414 | |
| | 60,000 | | | 5.625%, 4/4/2042f | | | 64,522 | |
| | | | South Africa Government International Bond | | | | |
| | 50,000 | | | 5.500%, 3/9/2020 | | | 52,940 | |
| | | | Turkey Government International Bond | | | | |
| | 16,000 | | | 7.500%, 11/7/2019 | | | 17,400 | |
| | 56,000 | | | 7.000%, 6/5/2020 | | | 60,128 | |
| | 80,000 | | | 5.125%, 3/25/2022 | | | 79,392 | |
| | 40,000 | | | 6.250%, 9/26/2022 | | | 41,542 | |
| | 54,000 | | | 5.750%, 3/22/2024 | | | 54,156 | |
| | 67,000 | | | 4.250%, 4/14/2026 | | | 59,556 | |
| | 48,000 | | | 6.875%, 3/17/2036 | | | 49,374 | |
| | 32,000 | | | 4.875%, 4/16/2043 | | | 25,776 | |
| | 16,000 | | | 6.625%, 2/17/2045 | | | 15,910 | |
| | | | | | | | |
| | | | Total | | | 3,001,836 | |
| | | | | | | | |
| |
| | Mortgage-Backed Securities (3.9%) | | | | |
| | | | Federal Home Loan Mortgage Corporation Gold 15-Yr. Pass Through | | | | |
| | 250,000 | | | 3.000%, 1/1/2032c | | | 256,425 | |
| | | | Federal Home Loan Mortgage Corporation Gold 30-Yr. Pass Through | | | | |
| | 150,000 | | | 4.000%, 1/1/2047c | | | 157,470 | |
| | | | Federal National Mortgage Association Conventional 15-Yr. Pass Through | | | | |
| | 600,000 | | | 2.500%, 1/1/2032c | | | 600,660 | |
| | | | Federal National Mortgage Association Conventional 30-Yr. Pass Through | | | | |
| | 450,000 | | | 3.000%, 1/1/2047c | | | 446,715 | |
| | 780,000 | | | 3.500%, 1/1/2047c | | | 798,954 | |
| | 475,000 | | | 4.000%, 1/1/2047c | | | 499,130 | |
| | 250,000 | | | 4.500%, 1/1/2047c | | | 268,800 | |
| | | | | | | | |
| | | | Total | | | 3,028,154 | |
| | | | | | | | |
| |
| | Technology (0.8%) | | | | |
| | | | Alliance Data Systems Corporation | | | | |
| | 25,000 | | | 5.375%, 8/1/2022f | | | 24,125 | |
| | | | Apple, Inc. | | | | |
| | 10,000 | | | 1.202%, 5/6/2020g | | | 9,992 | |
| | | | Automatic Data Processing, Inc. | | | | |
| | 5,000 | | | 2.250%, 9/15/2020 | | | 5,022 | |
| | | | Cisco Systems, Inc. | | | | |
| | 10,000 | | | 1.431%, 3/1/2019g | | | 10,057 | |
| | | | Diamond 1 Finance Corporation | | | | |
| | 10,000 | | | 3.480%, 6/1/2019f | | | 10,205 | |
| | | | Equinix, Inc. | | | | |
| | 40,000 | | | 5.750%, 1/1/2025 | | | 41,800 | |
| | | | Fidelity National Information Services, Inc. | | | | |
| | 12,000 | | | 1.450%, 6/5/2017 | | | 12,004 | |
| | 10,000 | | | 3.625%, 10/15/2020 | | | 10,345 | |
| | 15,000 | | | 2.250%, 8/15/2021 | | | 14,612 | |
The accompanying Notes to Financial Statements are an integral part of this schedule.
11
GROWTHAND INCOME PLUS FUND
Schedule of Investments as of December 31, 2016
| | | | | | | | |
Principal
Amount | | | Long-Term Fixed Income (17.7%) | | Value | |
| | Technology (0.8%) - continued | | | | |
| | | | First Data Corporation | | | | |
| $ | 40,000 | | | 5.375%, 8/15/2023f | | $ | 41,500 | |
| | | | Hewlett Packard Enterprise Company | | | | |
| | 10,000 | | | 3.600%, 10/15/2020 | | | 10,166 | |
| | | | Intel Corporation | | | | |
| | 10,000 | | | 3.100%, 7/29/2022 | | | 10,272 | |
| | | | Intel Corporation, Convertible | | | | |
| | 30,000 | | | 2.950%, 12/15/2035 | | | 40,519 | |
| | | | Iron Mountain, Inc. | | | | |
| | 23,677 | | | 6.000%, 8/15/2023 | | | 25,157 | |
| | | | Micron Technology, Inc., Convertible | | | | |
| | 30,000 | | | 2.375%, 5/1/2032 | | | 69,712 | |
| | 37,000 | | | 3.000%, 11/15/2043 | | | 36,746 | |
| | | | NXP BV | | | | |
| | 40,000 | | | 3.875%, 9/1/2022f | | | 40,500 | |
| | | | NXP Semiconductors NV, Convertible | | | | |
| | 60,000 | | | 1.000%, 12/1/2019 | | | 68,250 | |
| | | | Oracle Corporation | | | | |
| | 10,000 | | | 2.500%, 5/15/2022 | | | 9,920 | |
| | | | Sensata Technologies BV | | | | |
| | 60,000 | | | 4.875%, 10/15/2023f | | | 61,350 | |
| | | | Texas Instruments, Inc. | | | | |
| | 10,000 | | | 1.750%, 5/1/2020 | | | 9,884 | |
| | | | Tyco Electronics Group SA | | | | |
| | 13,000 | | | 6.550%, 10/1/2017 | | | 13,484 | |
| | | | | | | | |
| | | | Total | | | 575,622 | |
| | | | | | | | |
| |
| | Transportation (0.1%) | | | | |
| | | | Air Canada Pass Through Trust | | | | |
| | 4,658 | | | 3.875%, 3/15/2023f | | | 4,495 | |
| | | | American Airlines Pass Through Trust | | | | |
| | 4,795 | | | 4.950%, 1/15/2023 | | | 5,112 | |
| | | | Avis Budget Car Rental, LLC | | | | |
| | 50,000 | | | 5.125%, 6/1/2022f | | | 49,000 | |
| | | | Delta Air Lines, Inc. | | | | |
| | 5,361 | | | 4.950%, 5/23/2019 | | | 5,619 | |
| | | | ERAC USA Finance, LLC | | | | |
| | 5,000 | | | 2.600%, 12/1/2021f | | | 4,916 | |
| | | | J.B. Hunt Transport Services, Inc. | | | | |
| | 10,000 | | | 3.300%, 8/15/2022 | | | 10,029 | |
| | | | Korea Expressway Corporation | | | | |
| | 10,000 | | | 1.625%, 4/28/2017f | | | 9,994 | |
| | | | United Airlines Pass Through Trust | | | | |
| | 10,000 | | | 3.700%, 12/1/2022 | | | 10,075 | |
| | | | | | | | |
| | | | Total | | | 99,240 | |
| | | | | | | | |
| |
| | U.S. Government and Agencies (0.2%) | | | | |
| | | | U.S. Treasury Notes | | | | |
| | 60,000 | | | 2.125%, 6/30/2022 | | | 60,146 | |
| | 90,000 | | | 1.625%, 2/15/2026 | | | 83,965 | |
| | | | | | | | |
| | | | Total | | | 144,111 | |
| | | | | | | | |
| |
| | Utilities (0.5%) | | | | |
| | | | Ameren Corporation | | | | |
| | 10,000 | | | 2.700%, 11/15/2020 | | | 10,046 | |
| | | | Arizona Public Service Company | | | | |
| | 5,000 | | | 2.200%, 1/15/2020 | | | 5,003 | |
| | | | Berkshire Hathaway Energy Company | | | | |
| | 14,000 | | | 2.400%, 2/1/2020 | | | 14,030 | |
| | | | Calpine Corporation | | | | |
| | 45,000 | | | 5.375%, 1/15/2023 | | | 43,987 | |
| | | | DTE Energy Company | | | | |
| | 14,000 | | | 2.400%, 12/1/2019 | | | 14,062 | |
| | | | Dynegy, Inc. | | | | |
| | 60,000 | | | 7.375%, 11/1/2022 | | | 57,300 | |
| | | | El Paso Corporation | | | | |
| | 7,000 | | | 7.000%, 6/15/2017 | | | 7,162 | |
| | | | Emera U.S. Finance, LP | | | | |
| | 4,000 | | | 2.150%, 6/15/2019f | | | 3,992 | |
| | | | Energy Transfer Equity, LP | | | | |
| | 60,000 | | | 5.500%, 6/1/2027 | | | 58,500 | |
| | | | Energy Transfer Partners, LP | | | | |
| | 10,000 | | | 4.150%, 10/1/2020 | | | 10,348 | |
| | | | Eversource Energy | | | | |
| | 5,000 | | | 1.600%, 1/15/2018 | | | 4,988 | |
| | | | Exelon Generation Company, LLC | | | | |
| | 6,000 | | | 5.200%, 10/1/2019 | | | 6,428 | |
| | 5,000 | | | 2.950%, 1/15/2020 | | | 5,057 | |
| | | | Fortis, Inc. | | | | |
| | 10,000 | | | 2.100%, 10/4/2021f | | | 9,656 | |
| | | | NextEra Energy Capital Holdings, Inc. | | | | |
| | 10,000 | | | 2.300%, 4/1/2019 | | | 10,072 | |
| | | | NiSource Finance Corporation | | | | |
| | 5,000 | | | 6.400%, 3/15/2018 | | | 5,265 | |
| | 10,000 | | | 5.450%, 9/15/2020 | | | 10,912 | |
| | | | NRG Energy, Inc. | | | | |
| | 23,677 | | | 6.625%, 3/15/2023 | | | 23,736 | |
| | | | Pacific Gas & Electric Company | | | | |
| | 8,000 | | | 5.625%, 11/30/2017 | | | 8,296 | |
| | | | PG&E Corporation | | | | |
| | 6,000 | | | 2.400%, 3/1/2019 | | | 6,021 | |
| | | | PPL Capital Funding, Inc. | | | | |
| | 15,000 | | | 3.500%, 12/1/2022 | | | 15,324 | |
| | | | PSEG Power, LLC | | | | |
| | 8,000 | | | 3.000%, 6/15/2021 | | | 8,018 | |
| | | | Sempra Energy | | | | |
| | 14,000 | | | 6.150%, 6/15/2018 | | | 14,830 | |
| | 5,000 | | | 2.400%, 3/15/2020 | | | 4,990 | |
| | | | Southern California Edison Company | | | | |
| | 5,000 | | | 2.400%, 2/1/2022 | | | 4,981 | |
| | | | Southern Company | | | | |
| | 10,000 | | | 1.850%, 7/1/2019 | | | 9,965 | |
| | | | Tesoro Corporation | | | | |
| | 35,000 | | | 4.750%, 12/15/2023f | | | 35,175 | |
| | | | Xcel Energy, Inc. | | | | |
| | 10,000 | | | 1.200%, 6/1/2017 | | | 9,990 | |
| | | | | | | | |
| | | | Total | | | 418,134 | |
| | | | | | | | |
| | | | Total Long-Term Fixed Income (cost $13,685,563) | | | 13,723,029 | |
| | | | | | | | |
| | |
Shares | | | Registered Investment Companies (3.8%) | | | |
| | Equity Funds/ETFs (1.9%) | | | | |
| | 2,075 | | | AllianzGI NFJ Dividend Interest & Premium Strategy Fund | | | 26,166 | |
| | 2,300 | | | BlackRock Resources & Commodities Strategy Trust | | | 19,021 | |
| | 1,025 | | | Guggenheim Multi-Asset Income ETF | | | 20,664 | |
| | 1,850 | | | iShares MSCI EAFE Index Fund | | | 106,800 | |
| | 16,150 | | | Materials Select Sector SPDR Fund | | | 802,655 | |
| | 10,710 | | | Utilities Select Sector SPDR Fund | | | 520,185 | |
| | | | | | | | |
| | | | Total | | | 1,495,491 | |
| | | | | | | | |
| |
| | Fixed Income Funds/ETFs (1.9%) | | | | |
| | 10,797 | | | Aberdeen Asia-Pacific Income Fund, Inc. | | | 49,990 | |
| | 3,250 | | | Doubleline Income Solutions Fund | | | 61,718 | |
| | 1,625 | | | First Trust High Income Long/Short Fund | | | 26,130 | |
| | 400 | | | iShares J.P. Morgan USD Emerging Markets Bond ETF | | | 44,088 | |
| | 14,214 | | | iShares S&P U.S. Preferred Stock Index Fund | | | 528,903 | |
The accompanying Notes to Financial Statements are an integral part of this schedule.
12
GROWTHAND INCOME PLUS FUND
Schedule of Investments as of December 31, 2016
| | | | | | | | |
Shares | | | Registered Investment Companies (3.8%) | | Value | |
| | Fixed Income Funds/ETFs (1.9%) - continued | | | | |
| | 10,029 | | | MFS Intermediate Income Trust | | $ | 44,529 | |
| | 4,227 | | | Pimco Dynamic Credit And Mortgage Income Fund | | | 85,470 | |
| | 17,948 | | | PowerShares Preferred Portfolio | | | 255,400 | |
| | 8,317 | | | Templeton Global Income Fund | | | 53,894 | |
| | 3,390 | | | Vanguard Short-Term Corporate Bond ETF | | | 269,064 | |
| | 3,796 | | | Western Asset Emerging Markets Debt Fund, Inc. | | | 55,839 | |
| | 5,878 | | | Western Asset High Income Opportunity Fund, Inc. | | | 29,331 | |
| | | | | | | | |
| | | | Total | | | 1,504,356 | |
| | | | | | | | |
| | | | Total Registered Investment Companies (cost $3,040,332) | | | 2,999,847 | |
| | | | | | | | |
| | |
Shares | | | Preferred Stock (0.3%) | | | |
| | Consumer Staples (<0.1%) | | | | |
| | 134 | | | Henkel AG & Company KGaA, 1.470% | | | 15,951 | |
| | | | | | | | |
| | | | Total | | | 15,951 | |
| | | | | | | | |
| |
| | Energy (<0.1%) | | | | |
| | 297 | | | Alpha Natural Resources, Inc., 0.000%d | | | 5,940 | |
| | 297 | | | ANR Holdings, Inc., 0.000%d | | | 1,604 | |
| | | | | | | | |
| | | | Total | | | 7,544 | |
| | | | | | | | |
| |
| | Health Care (0.1%) | | | | |
| | 85 | | | Allergan plc, Convertible, 5.500% | | | 64,706 | |
| | | | | | | | |
| | | | Total | | | 64,706 | |
| | | | | | | | |
| |
| | Real Estate (0.2%) | | | | |
| | 1,500 | | | American Tower Corporation, Convertible, 5.500% | | | 156,750 | |
| | | | | | | | |
| | | | Total | | | 156,750 | |
| | | | | | | | |
| | | | Total Preferred Stock (cost $246,664) | | | 244,951 | |
| | | | | | | | |
| | |
Shares or
Principal
Amount | | | Short-Term Investments (7.6%)j | | | |
| | | | Federal Home Loan Bank Discount Notes | | | | |
| | 100,000 | | | 0.350%, 1/20/2017k | | | 99,982 | |
| | 100,000 | | | 0.355%, 1/25/2017k | | | 99,977 | |
| | 100,000 | | | 0.365%, 1/27/2017k | | | 99,975 | |
| | | | Thrivent Core Short-Term Reserve Fund | | | | |
| | 558,711 | | | 0.910% | | | 5,587,115 | |
| | | | | | | | |
| | | | Total Short-Term Investments (cost $5,887,047) | | | 5,887,049 | |
| | | | | | | | |
| | | | Total Investments (cost $77,973,550) 104.0% | | $ | 80,736,765 | |
| | | | | | | | |
| | | | Other Assets and Liabilities, Net (4.0%) | | | (3,140,917 | ) |
| | | | | | | | |
| | | | Total Net Assets 100.0% | | $ | 77,595,848 | |
| | | | | | | | |
| a | The stated interest rate represents the weighted average of all contracts within the bank loan facility. |
| b | All or a portion of the loan is unfunded. |
| c | Denotes investments purchased on a when-issued or delayed delivery basis. |
| d | Non-income producing security. |
| e | Security is valued at fair value. Market quotations or prices were not readily available or were determined to be unreliable. Fair value was determined in good faith pursuant to procedures adopted by the Board. Further information on fair valuation can be found in the Notes to Financial Statements. |
| f | Denotes securities sold under Rule 144A of the Securities Act of 1933, which exempts them from registration. These securities may be resold to other dealers in the program or to other qualified institutional buyers. As of December 31, 2016, the value of these investments was $2,652,144 or 3.4% of total net assets. |
| g | Denotes variable rate securities. Variable rate securities are securities whose yields vary with a designated market index or market rate. The rate shown is as of December 31, 2016. |
| h | Denotes perpetual securities. Perpetual securities pay an indefinite stream of interest and have no contractual maturity date. Date shown, if applicable, is next call date. |
| i | Denotes step coupon securities. Step coupon securities pay an initial coupon rate for the first period and then different coupon rates for following periods. The rate shown is as of December 31, 2016. |
| j | The interest rate shown reflects the yield, coupon rate or the discount rate at the date of purchase. |
| k | All or a portion of the security is held on deposit with the counterparty and pledged as the initial margin deposit for open futures contracts. |
| * | Denotes restricted securities. Restricted securities are investment securities which cannot be offered for public sale without first being registered under the Securities Act of 1933. The value of all restricted securities held in Growth and Income Plus Fund as of December 31, 2016 was $159,752 or 0.2% of total net assets. The following table indicates the acquisition date and cost of restricted securities shown in the schedule as of December 31, 2016. |
| | | | | | | | |
Security | | Acquisition
Date | | | Cost | |
Angel Oak Mortgage Trust, 11/25/2045 | | | 3/4/2016 | | | $ | 22,343 | |
Contura Energy, Inc., 8/1/2021 | | | 2/12/2014 | | | | 19,568 | |
Digicel, Ltd., 4/15/2021 | | | 8/19/2013 | | | | 54,294 | |
Marlette Funding Trust, 1/17/2023 | | | 7/20/2016 | | | | 73,569 | |
Definitions:
| | | | |
ETF | | - | | Exchange Traded Fund. |
REIT | | - | | Real Estate Investment Trust is a company that buys, develops, manages and/or sells real estate assets. |
The accompanying Notes to Financial Statements are an integral part of this schedule.
13
DIVERSIFIED INCOME PLUS FUND
Schedule of Investments as of December 31, 2016
| | | | | | | | |
Principal
Amount | | | Bank Loans (13.6%)a | | Value | |
| | Basic Materials (0.8%) | | | | |
| | | | Arch Coal, Inc., Term Loan | | | | |
| $ | 240,232 | | | 10.000%, 10/5/2021 | | $ | 243,336 | |
| | | | Chemours Company, Term Loan | | | | |
| | 899,059 | | | 3.770%, 5/12/2022 | | | 892,883 | |
| | | | Fortescue Metals Group, Ltd., Term Loan | | | | |
| | 1,252,686 | | | 3.750%, 6/30/2019 | | | 1,255,191 | |
| | | | Ineos US Finance, LLC, Term Loan | | | | |
| | 2,090,257 | | | 3.750%, 12/15/2020 | | | 2,098,973 | |
| | | | Tronox Pigments BV, Term Loan | | | | |
| | 1,637,402 | | | 4.500%, 3/19/2020 | | | 1,642,854 | |
| | | | | | | | |
| | | | Total | | | 6,133,237 | |
| | | | | | | | |
| |
| | Capital Goods (0.7%) | | | | |
| | | | Accudyne Industries, LLC, Term Loan | | | | |
| | 689,075 | | | 4.000%, 12/13/2019 | | | 650,439 | |
| | | | Advanced Disposal Services, Inc., Term Loan | | | | |
| | 813,753 | | | 3.500%, 11/10/2023 | | | 820,369 | |
| | | | Berry Plastics Group, Inc., Term Loan | | | | |
| | 866,250 | | | 3.500%, 2/8/2020 | | | 872,158 | |
| | | | Cortes NP Acquisition Corporation, Term Loan | | | | |
| | 2,565,000 | | | 6.000%, 11/30/2023 | | | 2,597,062 | |
| | | | Reynolds Group, Inc., Term Loan | | | | |
| | 608,475 | | | 4.250%, 2/5/2023 | | | 615,941 | |
| | | | | | | | |
| | | | Total | | | 5,555,969 | |
| | | | | | | | |
| |
| | Communications Services (3.7%) | | | | |
| | | | Atlantic Broadband Penn, LLC, Term Loan | | | | |
| | 685,552 | | | 3.250%, 11/30/2019 | | | 687,266 | |
| | | | Beasley Broadcast Group, Inc., Term Loan | | | | |
| | 720,000 | | | 7.000%, 11/1/2023 | | | 720,000 | |
| | | | Birch Communication Inc., Term Loan | | | | |
| | 967,128 | | | 8.250%, 7/17/2020 | | | 851,073 | |
| | | | Block Communications, Inc., Term Loan | | | | |
| | 1,197,466 | | | 4.248%, 11/7/2021 | | | 1,207,943 | |
| | | | CBS Radio, Inc., Term Loan | | | | |
| | 466,415 | | | 4.500%, 10/17/2023 | | | 470,496 | |
| | | | Charter Communications Operating, LLC, Term Loan | | | | |
| | 428,889 | | | 3.020%, 7/1/2020 | | | 430,677 | |
| | | | Cincinnati Bell, Inc., Term Loan | | | | |
| | 590,300 | | | 4.000%, 9/10/2020 | | | 591,670 | |
| | | | CommScope, Inc., Term Loan | | | | |
| | 908,500 | | | 3.270%, 12/29/2022 | | | 916,222 | |
| | | | FairPoint Communications, Inc., Term Loan | | | | |
| | 1,252,050 | | | 7.500%, 2/14/2019 | | | 1,262,617 | |
| | | | Grande Communications Networks, LLC, Term Loan | | | | |
| | 1,158,043 | | | 4.500%, 5/29/2020 | | | 1,164,992 | |
| | | | Gray Television, Inc., Term Loan | | | | |
| | 1,308,741 | | | 3.938%, 6/13/2021 | | | 1,326,736 | |
| | | | Hargray Communications Group, Inc., Term Loan | | | | |
| | 1,281,152 | | | 4.750%, 6/26/2019 | | | 1,295,027 | |
| | | | Integra Telecom Holdings, Inc., Term Loan | | | | |
| | 740,894 | | | 5.250%, 8/14/2020 | | | 742,191 | |
| | | | Intelsat Jackson Holdings SA, Term Loan | | | | |
| | 453,775 | | | 3.750%, 6/30/2019 | | | 438,129 | |
| | | | Level 3 Communications, Inc., Term Loan | | | | |
| | 1,450,000 | | | 4.000%, 1/15/2020 | | | 1,468,850 | |
| | | | Liberty Cablevision of Puerto Rico, LLC, Term Loan | | | | |
| | 1,025,000 | | | 4.500%, 1/7/2022 | | | 1,016,677 | |
| | | | LTS Buyer, LLC, Term Loan | | | | |
| | 1,541,685 | | | 4.248%, 4/13/2020 | | | 1,548,916 | |
| | | | NEP/NCP Holdco, Inc., Term Loan | | | | |
| | 2,030,914 | | | 4.250%, 1/22/2020 | | | 2,035,992 | |
| | | | Nexstar Broadcasting, Inc., Term Loan | | | | |
| | 440,000 | | | 0.000%, 9/26/2023b,c | | | 443,436 | |
| | | | Numericable US, LLC, Term Loan | | | | |
| | 1,056,284 | | | 5.137%, 1/15/2024 | | | 1,068,737 | |
| | | | SBA Senior Finance II, LLC, Term Loan | | | | |
| | 1,072,500 | | | 3.270%, 3/24/2021 | | | 1,077,198 | |
| | 108,350 | | | 3.270%, 6/10/2022 | | | 108,696 | |
| | | | TNS, Inc., Term Loan | | | | |
| | 569,467 | | | 5.000%, 2/14/2020 | | | 574,273 | |
| | | | Univision Communications, Inc., Term Loan | | | | |
| | 1,410,615 | | | 4.000%, 3/1/2020 | | | 1,417,668 | |
| | | | Virgin Media Bristol, LLC, Term Loan | | | | |
| | 600,000 | | | 3.486%, 1/31/2025 | | | 602,328 | |
| | | | WideOpenWest Finance, LLC, Term Loan | | | | |
| | 1,421,438 | | | 4.500%, 8/18/2023 | | | 1,435,396 | |
| | | | XO Communications, LLC, Term Loan | | | | |
| | 1,069,750 | | | 4.250%, 3/20/2021 | | | 1,072,424 | |
| | | | Yankee Cable Acquisition, LLC, Term Loan | | | | |
| | 795,108 | | | 4.250%, 3/1/2020 | | | 795,442 | |
| | | | Zayo Group, LLC, Term Loan | | | | |
| | 1,014,148 | | | 3.750%, 5/6/2021 | | | 1,024,432 | |
| | | | | | | | |
| | | | Total | | | 27,795,504 | |
| | | | | | | | |
| |
| | Consumer Cyclical (2.1%) | | | | |
| | | | Amaya BV, Term Loan | | | | |
| | 1,801,506 | | | 5.000%, 8/1/2021 | | | 1,807,019 | |
| | | | Burlington Coat Factory Warehouse Corporation, Term Loan | | | | |
| | 860,432 | | | 3.510%, 8/13/2021 | | | 865,499 | |
| | | | Cengage Learning Acquisitions, Term Loan | | | | |
| | 1,626,825 | | | 5.250%, 6/7/2023 | | | 1,580,314 | |
| | | | Ceridian HCM Holding, Inc., Term Loan | | | | |
| | 424,232 | | | 4.500%, 9/15/2020 | | | 420,872 | |
| | | | Charter Communications Operating, LLC, Term Loan | | | | |
| | 868,500 | | | 3.020%, 1/3/2021 | | | 871,878 | |
| | | | Dollar Tree, Inc., Term Loan | | | | |
| | 150,341 | | | 3.250%, 7/6/2022 | | | 151,563 | |
| | | | Four Seasons Holdings, Inc., Term Loan | | | | |
| | 950,000 | | | 3.750%, 11/30/2023 | | | 959,896 | |
| | | | Golden Nugget, Inc., Term Loan | | | | |
| | 327,075 | | | 4.500%, 11/21/2019 | | | 330,346 | |
| | | | Golden Nugget, Inc., Term Loan Delayed Draw | | | | |
| | 140,175 | | | 4.500%, 11/21/2019 | | | 141,577 | |
The accompanying Notes to Financial Statements are an integral part of this schedule.
14
DIVERSIFIED INCOME PLUS FUND
Schedule of Investments as of December 31, 2016
| | | | | | | | |
Principal
Amount | | | Bank Loans (13.6%)a | | Value | |
| | Consumer Cyclical (2.1%) - continued | | | | |
| | | | IMG Worldwide, Inc., Term Loan | | | | |
| $ | 1,369,287 | | | 5.250%, 5/6/2021 | | $ | 1,382,131 | |
| | 600,000 | | | 8.250%, 5/6/2022 | | | 607,500 | |
| | | | Michaels Stores, Inc., Term Loan | | | | |
| | 912,179 | | | 3.750%, 1/30/2023 | | | 922,159 | |
| | | | Mohegan Tribal Gaming Authority, Term Loan | | | | |
| | 1,296,750 | | | 5.500%, 10/13/2023 | | | 1,305,672 | |
| | | | Scientific Games International, Inc., Term Loan | | | | |
| | 873,000 | | | 6.000%, 10/18/2020 | | | 884,096 | |
| | 1,381,899 | | | 6.000%, 10/1/2021 | | | 1,398,316 | |
| | | | Seminole Hard Rock Entertainment, Inc., Term Loan | | | | |
| | 1,155,804 | | | 3.520%, 5/14/2020 | | | 1,161,583 | |
| | | | Seminole Indian Tribe of Florida, Term Loan | | | | |
| | 663,750 | | | 3.248%, 4/29/2020 | | | 665,409 | |
| | | | | | | | |
| | | | Total | | | 15,455,830 | |
| | | | | | | | |
| |
| | Consumer Non-Cyclical (2.3%) | | | | |
| | | | Air Medical Group Holdings, Inc., Term Loan | | | | |
| | 940,275 | | | 5.000%, 4/28/2022 | | | 953,796 | |
| | | | Albertson’s, LLC, Term Loan | | | | |
| | 694,807 | | | 0.000%, 12/21/2022b,c | | | 703,492 | |
| | 1,260,193 | | | 0.000%, 6/22/2023b,c | | | 1,275,416 | |
| | | | CHS/Community Health Systems, Inc., Term Loan | | | | |
| | 234,617 | | | 3.750%, 12/31/2019 | | | 227,140 | |
| | 1,733,597 | | | 4.000%, 1/27/2021 | | | 1,675,816 | |
| | | | Endo Luxembourg Finance I Company SARL, Term Loan | | | | |
| | 623,700 | | | 3.813%, 9/26/2022 | | | 626,376 | |
| | | | Hanesbrands, Inc., Term Loan | | | | |
| | 367,356 | | | 3.270%, 4/29/2022 | | | 369,766 | |
| | | | JBS USA, LLC, Term Loan | | | | |
| | 1,451,250 | | | 3.750%, 9/18/2020 | | | 1,463,049 | |
| | 128,700 | | | 4.000%, 10/30/2022 | | | 129,772 | |
| | | | Libbey Glass, Inc., Term Loan | | | | |
| | 527,517 | | | 3.750%, 4/9/2021 | | | 532,465 | |
| | | | LTF Merger Sub, Inc., Term Loan | | | | |
| | 783,075 | | | 4.250%, 6/10/2022 | | | 787,359 | |
| | | | Mallinckrodt International Finance SA, Term Loan | | | | |
| | 450,392 | | | 3.748%, 3/19/2021 | | | 451,356 | |
| | | | McGraw-Hill Global Education Holdings, LLC, Term Loan | | | | |
| | 1,358,175 | | | 5.000%, 5/4/2022 | | | 1,358,392 | |
| | | | MultiPlan, Inc., Term Loan | | | | |
| | 278,386 | | | 5.000%, 6/7/2023 | | | 283,010 | |
| | | | Ortho-Clinical Diagnostics, Inc., Term Loan | | | | |
| | 1,477,400 | | | 4.750%, 6/30/2021 | | | 1,463,158 | |
| | | | PetSmart, Inc., Term Loan | | | | |
| | 613,443 | | | 4.000%, 3/11/2022 | | | 614,977 | |
| | | | Sterigenics-Nordion Holdings, LLC, Term Loan | | | | |
| | 395,000 | | | 4.250%, 5/16/2022 | | | 396,236 | |
| | | | Valeant Pharmaceuticals International, Inc., Term Loan | | | | |
| | 3,851,292 | | | 5.500%, 4/1/2022b,c | | | 3,852,023 | |
| | | | | | | | |
| | | | Total | | | 17,163,599 | |
| | | | | | | | |
| |
| | Energy (0.6%) | | | | |
| | | | Energy Solutions, LLC, Term Loan | | | | |
| | 647,807 | | | 6.750%, 5/29/2020 | | | 651,856 | |
| | | | Exgen Renewables I, LLC, Term Loan | | | | |
| | 572,880 | | | 5.250%, 2/8/2021 | | | 576,460 | |
| | | | Houston Fuel Oil Terminal, LLC, Term Loan | | | | |
| | 679,784 | | | 4.250%, 8/19/2021 | | | 674,686 | |
| | | | McJunkin Red Man Corporation, Term Loan | | | | |
| | 671,937 | | | 5.000%, 11/8/2019 | | | 674,456 | |
| | | | MEG Energy Corporation, Term Loan | | | | |
| | 818,250 | | | 3.750%, 3/31/2020 | | | 793,703 | |
| | | | Pacific Drilling SA, Term Loan | | | | |
| | 868,500 | | | 4.500%, 6/3/2018 | | | 304,843 | |
| | | | Targa Resources Partners, LP, Term Loan | | | | |
| | 435,535 | | | 5.750%, 2/27/2022 | | | 437,713 | |
| | | | Western Refining, Inc., Term Loan | | | | |
| | 420,663 | | | 5.250%, 11/12/2020 | | | 422,506 | |
| | 193,700 | | | 5.500%, 6/23/2023 | | | 194,668 | |
| | | | | | | | |
| | | | Total | | | 4,730,891 | |
| | | | | | | | |
| |
| | Financials (1.0%) | | | | |
| | | | Delos Finance Sarl, Term Loan | | | | |
| | 930,000 | | | 3.748%, 3/6/2021 | | | 935,980 | |
| | | | DJO Finance, LLC, Term Loan | | | | |
| | 543,125 | | | 4.250%, 6/7/2020 | | | 520,553 | |
| | | | Harland Clarke Holdings Corporation, Term Loan | | | | |
| | 436,442 | | | 7.000%, 5/22/2018 | | | 436,577 | |
| | 921,500 | | | 7.000%, 12/31/2019 | | | 924,956 | |
| | | | MoneyGram International, Inc., Term Loan | | | | |
| | 1,137,190 | | | 4.250%, 3/27/2020 | | | 1,122,031 | |
| | | | Sable International Finance, Ltd., Term Loan | | | | |
| | 1,395,000 | | | 5.748%, 1/3/2023b,c | | | 1,411,573 | |
| | | | TransUnion, LLC, Term Loan | | | | |
| | 1,069,762 | | | 3.520%, 4/9/2021 | | | 1,078,363 | |
| | | | WaveDivision Holdings, LLC, Term Loan | | | | |
| | 1,126,309 | | | 4.000%, 10/15/2019 | | | 1,132,222 | |
| | | | | | | | |
| | | | Total | | | 7,562,255 | |
| | | | | | | | |
| |
| | Technology (1.8%) | | | | |
| | | | Avago Technoligies Cayman Finance, Ltd., Term Loan | | | | |
| | 1,682,571 | | | 3.704%, 2/1/2023 | | | 1,705,706 | |
| | | | First Data Corporation, Term Loan | | | | |
| | 2,569,014 | | | 3.756%, 3/24/2021 | | | 2,597,915 | |
| | 555,250 | | | 3.756%, 7/8/2022 | | | 560,919 | |
| | | | NXP BV, Term Loan | | | | |
| | 764,995 | | | 3.270%, 12/7/2020 | | | 768,438 | |
| | | | ON Semiconductor Corporation, Term Loan | | | | |
| | 2,309,212 | | | 4.020%, 3/31/2023 | | | 2,337,246 | |
| | | | Rackspace Hosting, LLC, Term Loan | | | | |
| | 680,000 | | | 4.500%, 12/20/2023 | | | 688,214 | |
| | | | RP Crown Parent, LLC, Term Loan | | | | |
| | 1,025,000 | | | 4.500%, 10/12/2023 | | | 1,034,994 | |
| | | | SS&C European Holdings SARL, Term Loan | | | | |
| | 308,651 | | | 4.001%, 7/8/2022 | | | 312,704 | |
| | 31,497 | | | 4.002%, 7/8/2022 | | | 31,911 | |
The accompanying Notes to Financial Statements are an integral part of this schedule.
15
DIVERSIFIED INCOME PLUS FUND
Schedule of Investments as of December 31, 2016
| | | | | | | | |
Principal
Amount | | | Bank Loans (13.6%)a | | Value | |
| | Technology (1.8%) - continued | | | | |
| | | | Western Digital Corporation, Term Loan | | | | |
| $ | 1,965,125 | | | 4.520%, 4/29/2023 | | $ | 1,995,211 | |
| | | | Xerox Business Services, LLC, Term Loan | | | | |
| | 1,055,000 | | | 6.250%, 12/7/2023 | | | 1,066,869 | |
| | | | | | | | |
| | | | Total | | | 13,100,127 | |
| | | | | | | | |
| |
| | Transportation (0.3%) | | | | |
| | | | OSG Bulk Ships, Inc., Term Loan | | | | |
| | 787,041 | | | 5.250%, 8/5/2019 | | | 766,381 | |
| | | | XPO Logistics, Inc., Term Loan | | | | |
| | 1,472,842 | | | 4.250%, 11/1/2021 | | | 1,490,796 | |
| | | | | | | | |
| | | | Total | | | 2,257,177 | |
| | | | | | | | |
| |
| | Utilities (0.3%) | | | | |
| | | | Calpine Corporation, Term Loan | | | | |
| | 875,000 | | | 0.000%, 1/15/2024b,c | | | 878,281 | |
| | | | Intergen NV, Term Loan | | | | |
| | 640,274 | | | 5.500%, 6/12/2020 | | | 619,996 | |
| | | | Talen Energy Supply, LLC, Term Loan | | | | |
| | 549,105 | | | 6.000%, 12/6/2023 | | | 555,969 | |
| | | | | | | | |
| | | | Total | | | 2,054,246 | |
| | | | | | | | |
| | | | Total Bank Loans (cost $101,384,785) | | | 101,808,835 | |
| | | | | | | | |
| | |
Principal
Amount | | | Long-Term Fixed Income (49.0%) | | | |
| | Asset-Backed Securities (4.0%) | | | | |
| | | | Asset Backed Securities Corporation Home Equity Loan Trust | | | | |
| | 846,603 | | | 0.896%, 7/25/2036, Series 2006-HE5, Class A4d | | | 780,233 | |
| | 184,361 | | | 0.916%, 11/25/2036, Series 2006-HE6, Class A4d | | | 169,091 | |
| | | | Bayview Opportunity Master Fund Trust | | | | |
| | 458,698 | | | 3.623%, 4/28/2030, Series 2015-3, Class A1e | | | 459,681 | |
| | 376,154 | | | 3.228%, 7/28/2034, Series 2014-18NP, Class A*,f | | | 376,693 | |
| | 1,250,176 | | | 3.721%, 7/28/2035, Series 2015-NPLA, Class Ae,f | | | 1,249,890 | |
| | | | Citi Held For Asset Issuance | | | | |
| | 1,201,271 | | | 4.480%, 8/15/2022, Series 2016-MF1, Class A* | | | 1,215,645 | |
| | | | Credit-Based Asset Servicing & Securitization, LLC | | | | |
| | 2,150,000 | | | 1.176%, 12/25/2035, Series 2005-CB8, Class M1d | | | 1,239,713 | |
| | | | GSAA Home Equity Trust | | | | |
| | 2,020,362 | | | 1.026%, 7/25/2037, Series 2007-7, Class A4d | | | 1,826,700 | |
| | | | J.P. Morgan Mortgage Acquisition Trust | | | | |
| | 2,008,251 | | | 4.480%, 3/25/2047, Series 2007-HE1, Class AF4f | | | 1,488,662 | |
| | | | Lehman XS Trust | | | | |
| | 1,824,336 | | | 5.440%, 8/25/2035, Series 2005-2, Class 2A3Bf | | | 1,598,203 | |
| | | | Marlette Funding Trust | | | | |
| | 1,839,766 | | | 3.060%, 1/17/2023, Series 2016-1A, Class A* | | | 1,839,316 | |
| | | | Merrill Lynch Mortgage Investors Trust | | | | |
| | 1,362,422 | | | 2.830%, 6/25/2035, Series 2005-A5, Class M1 | | | 911,763 | |
| | | | Murray Hill Marketplace Trust | | | | |
| | 561,273 | | | 4.190%, 11/25/2022, Series 2016-LC1, Class A* | | | 563,964 | |
| | | | NCF Dealer Floorplan Master Trust | | | | |
| | 1,100,000 | | | 3.812%, 3/21/2022, Series 2016-1A, Class A*,d | | | 1,092,087 | |
| | | | NRZ Advance Receivables Trust Advance Receivables Backed | | | | |
| | 2,000,000 | | | 2.751%, 6/15/2049, Series 2016-T1, Class AT1* | | | 1,992,500 | |
| | | | Preston Ridge Partners Mortgage Trust, LLC | | | | |
| | 1,163,627 | | | 4.000%, 9/27/2021, Series 2016-1A, Class A1*,f | | | 1,159,121 | |
| | | | Pretium Mortgage Credit Partners I, LLC | | | | |
| | 1,444,453 | | | 4.000%, 7/27/2031, Series 2016-NPL4, Class A*,f | | | 1,443,862 | |
| | | | Renaissance Home Equity Loan Trust | | | | |
| | 550,696 | | | 5.746%, 5/25/2036, Series 2006-1, Class AF6f | | | 361,350 | |
| | 1,361,394 | | | 5.797%, 8/25/2036, Series 2006-2, Class AF3f | | | 820,897 | |
| | | | Residential Asset Mortgage Products Trust | | | | |
| | 842,307 | | | 5.991%, 3/25/2033, Series 2003-RS2, Class AI5g | | | 843,688 | |
| | | | SoFi Consumer Loan Program, LLC | | | | |
| | 1,932,099 | | | 3.050%, 12/26/2025, Series 2016-3, Class Ae | | | 1,925,006 | |
| | | | Sunset Mortgage Loan Company, LLC | | | | |
| | 953,520 | | | 4.459%, 9/18/2045, Series 2015-NPL1, Class A*,f | | | 949,462 | |
| | 626,639 | | | 3.844%, 7/16/2047, Series 2016-NPL1, Class A*,f | | | 628,772 | |
| | | | US Residential Opportunity Fund Trust | | | | |
| | 1,472,691 | | | 3.475%, 7/27/2036, Series 2016-1III, Class A*,f | | | 1,466,445 | |
| | | | Vericrest Opportunity Loan Transferee | | | | |
| | 1,205,638 | | | 3.375%, 10/25/2058, Series 2015-NPL3, Class A1*,f | | | 1,203,949 | |
| | 1,266,781 | | | 3.500%, 6/26/2045, Series 2015-NPL8, Class A1e,f | | | 1,269,172 | |
| | 787,678 | | | 3.625%, 7/25/2045, Series 2015-NP10, Class A1e,f | | | 788,637 | |
| | 314,778 | | | 3.500%, 2/25/2055, Series 2015-NPL4, Class A1*,f | | | 315,019 | |
| | | | | | | | |
| | | | Total | | | 29,979,521 | |
| | | | | | | | |
| |
| | Basic Materials (0.8%) | | | | |
| | | | Alcoa Nederland Holding BV | | | | |
| | 440,000 | | | 6.750%, 9/30/2024e | | | 477,400 | |
| | | | ArcelorMittal SA | | | | |
| | 1,080,000 | | | 6.500%, 3/1/2021 | | | 1,182,600 | |
| | | | Dow Chemical Company | | | | |
| | 106,000 | | | 8.550%, 5/15/2019 | | | 121,437 | |
| | | | First Quantum Minerals, Ltd. | | | | |
| | 485,000 | | | 6.750%, 2/15/2020e | | | 483,787 | |
| | 770,000 | | | 7.000%, 2/15/2021e | | | 765,842 | |
The accompanying Notes to Financial Statements are an integral part of this schedule.
16
DIVERSIFIED INCOME PLUS FUND
Schedule of Investments as of December 31, 2016
| | | | | | | | |
Principal
Amount | | | Long-Term Fixed Income (49.0%) | | Value | |
| | Basic Materials (0.8%) - continued | |
| | | | Glencore Funding, LLC | | | | |
| $ | 95,000 | | | 1.940%, 4/16/2018d,e | | $ | 93,927 | |
| | | | INEOS Group Holdings SA | | | | |
| | 600,000 | | | 5.875%, 2/15/2019e | | | 613,500 | |
| | | | LyondellBasell Industries NV | | | | |
| | 110,000 | | | 5.000%, 4/15/2019 | | | 116,130 | |
| | | | Newmont Mining Corporation, Convertible | | | | |
| | 880,000 | | | 1.625%, 7/15/2017 | | | 897,050 | |
| | | | Royal Gold, Inc., Convertible | | | | |
| | 390,000 | | | 2.875%, 6/15/2019 | | | 411,938 | |
| | | | RPM International, Inc., Convertible | | | | |
| | 575,000 | | | 2.250%, 12/15/2020 | | | 688,203 | |
| | | | | | | | |
| | | | Total | | | 5,851,814 | |
| | | | | | | | |
|
| | Capital Goods (1.5%) | |
| | | | AECOM | | | | |
| | 1,410,000 | | | 5.875%, 10/15/2024 | | | 1,505,330 | |
| | | | Building Materials Corporation of America | | | | |
| | 1,100,000 | | | 6.000%, 10/15/2025e | | | 1,157,750 | |
| | | | Cemex SAB de CV | | | | |
| | 1,290,000 | | | 5.700%, 1/11/2025e | | | 1,299,675 | |
| | | | CNH Industrial Capital, LLC | | | | |
| | 1,100,000 | | | 4.375%, 11/6/2020 | | | 1,128,875 | |
| | | | Crown Americas Capital Corporation IV | | | | |
| | 1,080,000 | | | 4.500%, 1/15/2023 | | | 1,101,600 | |
| | | | Crown Cork & Seal Company, Inc. | | | | |
| | 610,000 | | | 7.375%, 12/15/2026 | | | 683,200 | |
| | | | General Electric Company | | | | |
| | 153,000 | | | 5.000%, 1/21/2021h | | | 158,768 | |
| | | | Ingersoll-Rand Luxembourg Finance SA | | | | |
| | 310,000 | | | 2.625%, 5/1/2020 | | | 310,481 | |
| | | | L3 Technologies, Inc. | | | | |
| | 385,000 | | | 4.950%, 2/15/2021 | | | 411,006 | |
| | | | Lockheed Martin Corporation | | | | |
| | 90,000 | | | 2.500%, 11/23/2020 | | | 90,690 | |
| | | | Reynolds Group Issuer, Inc. | | | | |
| | 1,285,000 | | | 5.125%, 7/15/2023e | | | 1,305,881 | |
| | | | Roper Technologies, Inc. | | | | |
| | 360,000 | | | 2.800%, 12/15/2021 | | | 359,463 | |
| | | | Standard Industries, Inc. | | | | |
| | 285,000 | | | 5.500%, 2/15/2023e | | | 295,004 | |
| | | | Textron, Inc. | | | | |
| | 213,000 | | | 7.250%, 10/1/2019 | | | 239,286 | |
| | | | United Rentals North America, Inc. | | | | |
| | 1,240,000 | | | 5.500%, 7/15/2025 | | | 1,264,800 | |
| | | | | | | | |
| | | | Total | | | 11,311,809 | |
| | | | | | | | |
|
| | Collateralized Mortgage Obligations (12.2%) | |
| | | | Alternative Loan Trust | | | | |
| | 490,679 | | | 5.500%, 5/25/2035, Series 2005-J3, Class 2A13 | | | 489,279 | |
| | 1,251,975 | | | 6.000%, 6/25/2036, Series 2006-24CB, Class A9 | | | 1,091,061 | |
| | | | American Home Mortgage Assets Trust | | | | |
| | 2,351,589 | | | 0.946%, 12/25/2046, Series 2006-6, Class A1Ad | | | 1,662,798 | |
| | 1,808,576 | | | 0.946%, 6/25/2047, Series 2007-5, Class A1d | | | 1,313,130 | |
| | | | American Home Mortgage Investment Trust | | | | |
| | 2,064,064 | | | 6.750%, 12/25/2036, Series 2006-3, Class 3A2 | | | 892,632 | |
| | | | Angel Oak Mortgage Trust | | | | |
| | 888,284 | | | 4.500%, 11/25/2045, Series 2015-1, Class A*,f | | | 893,428 | |
| | | | Banc of America Alternative Loan Trust | | | | |
| | 600,893 | | | 1.256%, 4/25/2035, Series 2005-3, Class 1CB1d | | | 463,395 | |
| | 1,417,675 | | | 6.000%, 11/25/2035, Series 2005-10, Class 3CB1 | | | 1,250,709 | |
| | 1,058,371 | | | 1.556%, 5/25/2046, Series 2006-4, Class 3CB1d | | | 734,878 | |
| | | | Banc of America Funding Corporation | | | | |
| | 479,003 | | | 3.388%, 5/20/2036, Series 2006-D, Class 6A1 | | | 417,816 | |
| | | | Bayview Opportunity Master Fund Trust | | | | |
| | 754,597 | | | 3.475%, 7/28/2031, Series 2016-RPL3, Class A1e | | | 750,079 | |
| | | | BCAP, LLC Trust | | | | |
| | 1,755,379 | | | 0.936%, 3/25/2037, Series 2007-AA1, Class 2A1d | | | 1,629,002 | |
| | | | Bear Stearns Adjustable Rate Mortgage Trust | | | | |
| | 687,716 | | | 2.830%, 10/25/2035, Series 2005-9, Class A1d | | | 662,138 | |
| | 327,153 | | | 3.177%, 2/25/2036, Series 2005-12, Class 11A1 | | | 276,214 | |
| | | | Citicorp Mortgage Securities Trust | | | | |
| | 496,283 | | | 6.000%, 5/25/2037, Series 2007-4, Class 1A5 | | | 493,850 | |
| | | | Citigroup Mortgage Loan Trust, Inc. | | | | |
| | 424,578 | | | 5.500%, 11/25/2035, Series 2005-9, Class 21A2 | | | 410,242 | |
| | | | CitiMortgage Alternative Loan Trust | | | | |
| | 990,308 | | | 5.750%, 4/25/2037, Series 2007-A4, Class 1A5 | | | 848,473 | |
| | | | COLT Mortgage Loan Trust | | | | |
| | 1,502,448 | | | 2.750%, 9/25/2046, Series 2016-2, Class A1* | | | 1,510,327 | |
| | | | Countrywide Alternative Loan Trust | | | | |
| | 370,014 | | | 1.156%, 2/25/2035, Series 2005-J1, Class 5A1d | | | 343,519 | |
| | 709,709 | | | 3.036%, 10/25/2035, Series 2005-43, Class 4A1 | | | 575,344 | |
| | 323,845 | | | 5.500%, 2/25/2036, Series 2005-85CB, Class 2A2 | | | 300,508 | |
| | 261,768 | | | 6.000%, 4/25/2036, Series 2006-4CB, Class 1A1 | | | 210,183 | |
| | 976,233 | | | 6.500%, 8/25/2036, Series 2006-23CB, Class 2A3 | | | 658,438 | |
| | 222,637 | | | 6.000%, 1/25/2037, Series 2006-39CB, Class 1A16 | | | 212,583 | |
| | 872,188 | | | 5.500%, 5/25/2037, Series 2007-8CB, Class A1 | | | 746,422 | |
| | | | Countrywide Home Loan Mortgage Pass Through Trust | | | | |
| | 1,628,361 | | | 3.155%, 11/25/2035, Series 2005-22, Class 2A1 | | | 1,335,200 | |
| | 556,934 | | | 3.147%, 2/20/2036, Series 2005-HY10, Class 5A1 | | | 457,665 | |
The accompanying Notes to Financial Statements are an integral part of this schedule.
17
DIVERSIFIED INCOME PLUS FUND
Schedule of Investments as of December 31, 2016
| | | | | | | | |
Principal
Amount | | | Long-Term Fixed Income (49.0%) | | Value | |
| | Collateralized Mortgage Obligations (12.2%) - continued | |
| | | | Credit Suisse First Boston Mortgage Securities Corporation | | | | |
| $ | 492,213 | | | 5.250%, 10/25/2035, Series 2005-9, Class 1A3 | | $ | 475,668 | |
| | | | CSMC Mortgage-Backed Trust | | | | |
| | 1,115,528 | | | 5.500%, 3/25/2037, Series 2007-2, Class 3A4 | | | 1,003,646 | |
| | | | Deutsche Alt-A Securities, Inc., Mortgage Loan Trust | | | | |
| | 1,177,086 | | | 2.356%, 8/25/2035, Series 2005-AR1, Class 2A3 | | | 909,381 | |
| | 469,367 | | | 0.956%, 11/25/2035, Series 2005-5, Class 2A1d | | | 259,906 | |
| | 776,467 | | | 5.500%, 11/25/2035, Series 2005-5, Class 1A4 | | | 779,727 | |
| | 1,106,588 | | | 1.337%, 4/25/2047, Series 2007-OA2, Class A1d | | | 937,313 | |
| | 1,938,267 | | | 0.976%, 8/25/2047, Series 2007-OA5, Class A1Bd | | | 1,590,799 | |
| | | | Federal Home Loan Mortgage Corporation | | | | |
| | 7,123,412 | | | 2.500%, 12/15/2022, Series-4155, Class AIi | | | 390,681 | |
| | 2,312,452 | | | 2.500%, 5/15/2027, Series-4106, Class HIi | | | 172,950 | |
| | 2,752,025 | | | 2.500%, 2/15/2028, Series-4162, Class AIi | | | 234,529 | |
| | 8,723,486 | | | 2.500%, 3/15/2028, Series-4177, Class EIi | | | 784,713 | |
| | 4,530,180 | | | 3.000%, 4/15/2028, Series-4193, Class AIi | | | 423,180 | |
| | 3,989,752 | | | 3.000%, 2/15/2033, Series-4170, Class IGi | | | 477,648 | |
| | | | Federal National Mortgage Association | | | | |
| | 3,754,360 | | | 2.500%, 2/25/2028, Series 2013-46, Class CIi | | | 331,667 | |
| | 2,884,467 | | | 3.000%, 4/25/2028, Series 2013-30, Class DIi | | | 280,889 | |
| | 3,602,647 | | | 3.500%, 1/25/2033, Series 2012-150, Class YIi | | | 485,720 | |
| | | | First Horizon Alternative Mortgage Securities Trust | | | | |
| | 1,019,311 | | | 2.728%, 3/25/2035, Series 2005-AA2, Class 1A1 | | | 895,876 | |
| | 1,106,753 | | | 3.083%, 7/25/2035, Series 2005-AA5, Class 2A1 | | | 997,295 | |
| | 1,101,672 | | | 6.000%, 8/25/2036, Series 2006-FA4, Class 1A4d | | | 911,583 | |
| | | | First Horizon Mortgage Pass-Through Trust | | | | |
| | 1,522,309 | | | 2.987%, 8/25/2037, Series 2007-AR2, Class 1A2 | | | 1,207,972 | |
| | | | GMAC Mortgage Corporation Loan Trust | | | | |
| | 1,790,815 | | | 3.384%, 5/25/2035, Series 2005-AR2, Class 4A | | | 1,652,356 | |
| | | | Government National Mortgage Association | | | | |
| | 3,413,670 | | | 4.000%, 1/16/2027, Series 2012-3, Class IOi | | | 336,250 | |
| | | | Greenpoint Mortgage Funding Trust | | | | |
| | 884,594 | | | 0.792%, 10/25/2045, Series 2005-AR4, Class G41Bd | | | 691,576 | |
| | | | IndyMac IMJA Mortgage Loan Trust | | | | |
| | 973,023 | | | 6.250%, 11/25/2037, Series 2007-A3, Class A1 | | | 774,896 | |
| | | | IndyMac INDX Mortgage Loan Trust | | | | |
| | 1,604,072 | | | 3.030%, 10/25/2035, Series 2005-AR19, Class A1 | | | 1,306,953 | |
| | 1,300,363 | | | 1.396%, 7/25/2045, Series 2005-16IP, Class A1d | | | 1,087,773 | |
| | | | J.P. Morgan Alternative Loan Trust | | | | |
| | 1,793,944 | | | 6.500%, 3/25/2036, Series 2006-S1, Class 1A19 | | | 1,565,778 | |
| | | | J.P. Morgan Mortgage Trust | | | | |
| | 222,157 | | | 6.500%, 1/25/2035, Series 2005-S1, Class 1A2 | | | 209,164 | |
| | 1,203,608 | | | 3.247%, 8/25/2035, Series 2005-A5, Class 1A2 | | | 1,193,459 | |
| | 1,541,349 | | | 3.066%, 2/25/2036, Series 2006-A1, Class 2A2 | | | 1,358,640 | |
| | 848,428 | | | 3.110%, 10/25/2036, Series 2006-A6, Class 1A2 | | | 769,278 | |
| | 990,002 | | | 1.136%, 1/25/2037, Series 2006-S4, Class A8d | | | 524,030 | |
| | 684,837 | | | 3.186%, 1/25/2037, Series 2006-A7, Class 2A2 | | | 613,210 | |
| | 674,843 | | | 6.250%, 8/25/2037, Series 2007-S3, Class 1A10 | | | 500,014 | |
| | | | Lehman Mortgage Trust | | | | |
| | 715,859 | | | 1.506%, 12/25/2035, Series 2005-2, Class 3A1d | | | 506,471 | |
| | | | Master Asset Securitization Trust | | | | |
| | 874,792 | | | 1.256%, 6/25/2036, Series 2006-2, Class 2A2d | | | 454,929 | |
| | | | MASTR Alternative Loans Trust | | | | |
| | 285,887 | | | 6.500%, 7/25/2034, Series 2004-6, Class 6A1 | | | 286,707 | |
| | 769,079 | | | 1.206%, 12/25/2035, Series 2005-6, Class 2A1d | | | 349,407 | |
| | | | Merrill Lynch Alternative Note Asset Trust | | | | |
| | 995,773 | | | 6.000%, 3/25/2037, Series 2007-F1, Class 2A1 | | | 776,009 | |
| | 631,501 | | | 6.000%, 3/25/2037, Series 2007-F1, Class 2A6 | | | 479,655 | |
| | | | Morgan Stanley Mortgage Loan Trust | | | | |
| | 630,654 | | | 3.179%, 11/25/2035, Series 2005-6AR, Class 5A1 | | | 454,690 | |
| | | | MortgageIT Trust | | | | |
| | 1,299,862 | | | 1.016%, 12/25/2035, Series 2005-5, Class A1d | | | 1,199,667 | |
| | 1,070,820 | | | 0.956%, 4/25/2036, Series 2006-1, Class 1A2d | | | 792,402 | |
| | | | New Century Alternative Mortgage Loan Trust | | | | |
| | 1,422,419 | | | 6.167%, 7/25/2036, Series 2006-ALT1, Class AF6f | | | 828,277 | |
| | | | Pretium Mortgage Credit Partners, LLC | | | | |
| | 1,562,467 | | | 4.375%, 11/27/2030, Series 2015-NPL4, Class A1*,f | | | 1,575,117 | |
| | | | Residential Accredit Loans, Inc. Trust | | | | |
| | 905,306 | | | 5.750%, 9/25/2035, Series 2005-QS13, Class 2A3 | | | 808,390 | |
| | 1,370,562 | | | 6.000%, 4/25/2036, Series 2006-QS4, Class A2 | | | 1,176,733 | |
The accompanying Notes to Financial Statements are an integral part of this schedule.
18
DIVERSIFIED INCOME PLUS FUND
Schedule of Investments as of December 31, 2016
| | | | | | | | |
Principal
Amount | | | Long-Term Fixed Income (49.0%) | | Value | |
| | Collateralized Mortgage Obligations (12.2%) - continued | | | | |
| $ | 982,588 | | | 6.000%, 1/25/2037, Series 2007-QS1, Class 1A1 | | $ | 871,294 | |
| | 1,903,222 | | | 5.750%, 4/25/2037, Series 2007-QS6, Class A28 | | | 1,584,144 | |
| | 1,920,439 | | | 6.250%, 4/25/2037, Series 2007-QS6, Class A6 | | | 1,647,382 | |
| | 436,588 | | | 6.000%, 6/25/2037, Series 2007-QS8, Class A10 | | | 359,800 | |
| | 1,996,490 | | | 0.946%, 7/25/2037, Series 2007-QH6, Class A1d | | | 1,707,738 | |
| | | | Residential Asset Securitization Trust | | | | |
| | 1,534,007 | | | 6.240%, 8/25/2022, Series 2007-A8, Class 3A1 | | | 1,313,484 | |
| | 632,324 | | | 5.500%, 4/25/2035, Series 2005-A1, Class A3 | | | 631,634 | |
| | 1,156,276 | | | 1.136%, 8/25/2037, Series 2007-A8, Class 2A3d | | | 301,508 | |
| | | | Residential Funding Mortgage Security I Trust | | | | |
| | 937,555 | | | 5.978%, 12/25/2032, Series 2003-S12, Class M1 | | | 994,857 | |
| | 950,646 | | | 5.750%, 2/25/2036, Series 2006-S2, Class A1 | | | 884,084 | |
| | 1,393,735 | | | 6.000%, 7/25/2037, Series 2007-S7, Class A20 | | | 1,284,181 | |
| | | | Sequoia Mortgage Trust | | | | |
| | 2,021,015 | | | 3.280%, 9/20/2046, Series 2007-1, Class 4A1 | | | 1,639,023 | |
| | | | Structured Adjustable Rate Mortgage Loan Trust | | | | |
| | 359,201 | | | 3.322%, 12/25/2034, Series 2004-18, Class 5A | | | 349,628 | |
| | 815,473 | | | 3.142%, 7/25/2035, Series 2005-15, Class 4A1 | | | 695,768 | |
| | 509,130 | | | 3.364%, 9/25/2035, Series 2005-18, Class 1A1 | | | 416,977 | |
| | | | Structured Asset Mortgage Investments, Inc. | | | | |
| | 1,701,071 | | | 1.066%, 12/25/2035, Series 2005-AR4, Class A1d | | | 1,242,583 | |
| | 1,305,275 | | | 0.966%, 5/25/2046, Series 2006-AR5, Class 2A1d | | | 978,632 | |
| | | | Suntrust Alternative Loan Trust | | | | |
| | 1,049,585 | | | 5.750%, 12/25/2035, Series 2005-1F, Class 2A5 | | | 994,192 | |
| | | | Vericrest Opportunity Loan Transferee | | | | |
| | 761,825 | | | 3.500%, 7/25/2046, Series 2016-NPL8, Class A1e,f | | | 759,170 | |
| | | | WaMu Mortgage Pass Through Certificates | | | | |
| | 838,949 | | | 2.617%, 11/25/2036, Series 2006-AR14, Class 1A1 | | | 743,841 | |
| | 1,708,002 | | | 2.137%, 1/25/2037, Series 2006-AR18, Class 1A1 | | | 1,452,232 | |
| | 146,050 | | | 2.804%, 8/25/2046, Series 2006-AR8, Class 1A1 | | | 126,985 | |
| | 1,128,597 | | | 1.487%, 9/25/2046, Series 2006-AR11, Class 3A1Ad | | | 864,590 | |
| | 1,868,567 | | | 1.527%, 9/25/2046, Series 2006-AR11, Class 1Ad | | | 1,535,639 | |
| | 1,959,161 | | | 1.361%, 12/25/2046, Series 2006-AR17, Class 1Ad | | | 1,519,046 | |
| | 1,416,303 | | | 1.307%, 1/25/2047, Series 2006-AR19, Class 1Ad | | | 1,104,615 | |
| | 794,727 | | | 1.848%, 3/25/2047, Series 2007-OA2, Class 2Ad | | | 636,747 | |
| | | | Washington Mutual Mortgage Pass Through Certificates | | | | |
| | 774,853 | | | 1.356%, 6/25/2035, Series 2005-4, Class 5A5d | | | 591,446 | |
| | 1,002,217 | | | 6.000%, 11/25/2035, Series 2005-10, Class 2A9 | | | 945,004 | |
| | 1,718,846 | | | 7.000%, 4/25/2037, Series 2007-2, Class 1A1 | | | 968,708 | |
| | | | Washington Mutual Mortgage Pass Through Certificates Trust | | | | |
| | 1,162,295 | | | 7.000%, 2/25/2036, Series 2006-1, Class 2CB1 | | | 864,808 | |
| | 1,889,131 | | | 1.317%, 2/25/2047, Series 2007-OA3, Class 2Ad | | | 1,408,155 | |
| | | | Wells Fargo Mortgage Backed Securities Trust | | | | |
| | 1,620,109 | | | 3.037%, 7/25/2036, Series 2006-AR10, Class 2A1 | | | 1,585,158 | |
| | 227,055 | | | 1.456%, 5/25/2037, Series 2007-6, Class A2d | | | 189,474 | |
| | 529,362 | | | 6.000%, 7/25/2037, Series 2007-8, Class 1A16 | | | 522,954 | |
| | 887,640 | | | 6.000%, 11/25/2037, Series 2007-15, Class A1 | | | 879,047 | |
| | | | | | | | |
| | | | Total | | | 91,046,815 | |
| | | | | | | | |
| |
| | Commercial Mortgage-Backed Securities (0.3%) | | | | |
| | | | Greenwich Capital Commercial Funding Corporation | | | | |
| | 1,350,000 | | | 5.867%, 12/10/2049 | | | 1,379,647 | |
| | | | Morgan Stanley Capital, Inc. | | | | |
| | 1,350,000 | | | 5.406%, 3/15/2044 | | | 1,348,821 | |
| | | | | | | | |
| | | | Total | | | 2,728,468 | |
| | | | | | | | |
| |
| | Communications Services (3.3%) | | | | |
| | | | Altice US Finance I Corporation | | | | |
| | 1,025,000 | | | 5.500%, 5/15/2026e | | | 1,045,500 | |
| | | | AMC Networks, Inc. | | | | |
| | 1,525,000 | | | 5.000%, 4/1/2024 | | | 1,528,813 | |
| | | | American Tower Corporation | | | | |
| | 95,000 | | | 2.800%, 6/1/2020 | | | 94,996 | |
| | 152,000 | | | 3.450%, 9/15/2021 | | | 153,825 | |
| | | | AT&T, Inc. | | | | |
| | 176,000 | | | 5.875%, 10/1/2019 | | | 192,266 | |
| | 95,000 | | | 1.928%, 6/30/2020d | | | 95,515 | |
| | 370,000 | | | 2.800%, 2/17/2021 | | | 366,758 | |
| | | | CenturyLink, Inc. | | | | |
| | 600,000 | | | 6.450%, 6/15/2021 | | | 631,500 | |
| | | | Charter Communications Operating, LLC | | | | |
| | 337,000 | | | 3.579%, 7/23/2020 | | | 343,581 | |
| | 47,000 | | | 4.464%, 7/23/2022 | | | 49,066 | |
| | | | Clear Channel Worldwide Holdings, Inc. | | | | |
| | 1,445,000 | | | 6.500%, 11/15/2022 | | | 1,477,513 | |
| | | | Columbus International, Inc. | | | | |
| | 1,400,000 | | | 7.375%, 3/30/2021e | | | 1,489,796 | |
| | | | Comcast Corporation | | | | |
| | 250,000 | | | 1.625%, 1/15/2022 | | | 239,202 | |
The accompanying Notes to Financial Statements are an integral part of this schedule.
19
DIVERSIFIED INCOME PLUS FUND
Schedule of Investments as of December 31, 2016
| | | | | | | | |
Principal
Amount | | | Long-Term Fixed Income (49.0%) | | Value | |
| | Communications Services (3.3%) - continued | | | | |
| | | | Crown Castle International Corporation | | | | |
| $ | 175,000 | | | 3.400%, 2/15/2021 | | $ | 177,439 | |
| | 290,000 | | | 2.250%, 9/1/2021 | | | 280,297 | |
| | | | CSC Holdings, LLC | | | | |
| | 110,000 | | | 5.500%, 4/15/2027e | | | 111,375 | |
| | | | Digicel, Ltd. | | | | |
| | 1,400,000 | | | 6.000%, 4/15/2021* | | | 1,265,894 | |
| | | | DISH Network Corporation, Convertible | | | | |
| | 1,025,000 | | | 3.375%, 8/15/2026e | | | 1,166,578 | |
| | | | FairPoint Communications, Inc. | | | | |
| | 1,100,000 | | | 8.750%, 8/15/2019e | | | 1,148,125 | |
| | | | Frontier Communications Corporation | | | | |
| | 1,520,000 | | | 8.875%, 9/15/2020 | | | 1,618,800 | |
| | | | Hughes Satellite Systems Corporation | | | | |
| | 774,000 | | | 6.500%, 6/15/2019 | | | 841,725 | |
| | | | Level 3 Communications, Inc. | | | | |
| | 670,000 | | | 5.375%, 1/15/2024 | | | 676,700 | |
| | | | Level 3 Escrow II, Inc. | | | | |
| | 600,000 | | | 5.375%, 8/15/2022 | | | 619,500 | |
| | | | Liberty Interactive, LLC, Convertible | | | | |
| | 975,000 | | | 1.750%, 9/30/2046e | | | 1,048,125 | |
| | | | Neptune Finco Corporation | | | | |
| | 645,000 | | | 10.875%, 10/15/2025e | | | 767,550 | |
| | | | Nexstar Escrow Corporation | | | | |
| | 1,470,000 | | | 5.625%, 8/1/2024e | | | 1,458,975 | |
| | | | Orange SA | | | | |
| | 245,000 | | | 1.625%, 11/3/2019 | | | 241,223 | |
| | | | SBA Tower Trust | | | | |
| | 300,000 | | | 3.598%, 4/15/2043e | | | 301,107 | |
| | | | SFR Group SA | | | | |
| | 1,370,000 | | | 6.000%, 5/15/2022e | | | 1,405,963 | |
| | | | Sprint Corporation | | | | |
| | 1,230,000 | | | 7.625%, 2/15/2025 | | | 1,293,038 | |
| | | | Telefonica Emisiones SAU | | | | |
| | 211,000 | | | 3.192%, 4/27/2018 | | | 214,004 | |
| | | | T-Mobile USA, Inc. | | | | |
| | 1,230,000 | | | 6.125%, 1/15/2022 | | | 1,297,650 | |
| | | | Verizon Communications, Inc. | | | | |
| | 255,000 | | | 1.375%, 8/15/2019 | | | 250,917 | |
| | 115,000 | | | 2.625%, 2/21/2020 | | | 116,029 | |
| | 152,000 | | | 4.500%, 9/15/2020 | | | 162,538 | |
| | | | Zillow Group, Inc., Convertible | | | | |
| | 360,000 | | | 2.000%, 12/1/2021e | | | 369,675 | |
| | | | | | | | |
| | | | Total | | | 24,541,558 | |
| | | | | | | | |
| |
| | Consumer Cyclical (2.3%) | | | | |
| | | | Allison Transmission, Inc. | | | | |
| | 1,520,000 | | | 5.000%, 10/1/2024e | | | 1,535,200 | |
| | | | Argos Merger Sub, Inc. | | | | |
| | 1,370,000 | | | 7.125%, 3/15/2023e | | | 1,397,400 | |
| | | | BMW US Capital, LLC | | | | |
| | 185,000 | | | 1.500%, 4/11/2019e | | | 183,172 | |
| | | | Brookfield Residential Properties, Inc. | | | | |
| | 990,000 | | | 6.125%, 7/1/2022e | | | 994,950 | |
| | | | eBay, Inc. | | | | |
| | 120,000 | | | 2.500%, 3/9/2018 | | | 121,038 | |
| | | | Ford Motor Credit Company, LLC | | | | |
| | 220,000 | | | 5.000%, 5/15/2018 | | | 228,579 | |
| | 290,000 | | | 1.897%, 8/12/2019 | | | 285,202 | |
| | 155,000 | | | 2.597%, 11/4/2019 | | | 154,695 | |
| | | | General Motors Financial Company, Inc. | | | | |
| | 290,000 | | | 3.150%, 1/15/2020 | | | 291,644 | |
| | 167,000 | | | 4.375%, 9/25/2021 | | | 173,074 | |
| | | | Home Depot, Inc. | | | | |
| | 95,000 | | | 1.333%, 9/15/2017d | | | 95,160 | |
| | 140,000 | | | 2.000%, 4/1/2021 | | | 138,767 | |
| | 95,000 | | | 2.625%, 6/1/2022 | | | 95,357 | |
| | | | Jaguar Land Rover Automotive plc | | | | |
| | 500,000 | | | 4.125%, 12/15/2018e | | | 513,750 | |
| | 710,000 | | | 5.625%, 2/1/2023e | | | 740,175 | |
| | | | L Brands, Inc. | | | | |
| | 860,000 | | | 5.625%, 2/15/2022 | | | 918,050 | |
| | | | Lennar Corporation | | | | |
| | 610,000 | | | 12.250%, 6/1/2017 | | | 635,925 | |
| | 250,000 | | | 4.125%, 12/1/2018 | | | 255,625 | |
| | | | Live Nation Entertainment, Inc. | | | | |
| | 250,000 | | | 5.375%, 6/15/2022e | | | 258,750 | |
| | 640,000 | | | 4.875%, 11/1/2024e | | | 641,600 | |
| | | | Macy’s Retail Holdings, Inc. | | | | |
| | 88,000 | | | 7.450%, 7/15/2017 | | | 90,775 | |
| | | | MGM Resorts International | | | | |
| | 1,255,000 | | | 6.000%, 3/15/2023 | | | 1,355,400 | |
| | | | Newell Rubbermaid, Inc. | | | | |
| | 120,000 | | | 3.150%, 4/1/2021 | | | 122,022 | |
| | | | Prime Security Services Borrower, LLC | | | | |
| | 920,000 | | | 9.250%, 5/15/2023e | | | 1,001,650 | |
| | | | Ralph Lauren Corporation | | | | |
| | 95,000 | | | 2.625%, 8/18/2020 | | | 95,890 | |
| | | | Royal Caribbean Cruises, Ltd. | | | | |
| | 1,241,613 | | | 5.250%, 11/15/2022 | | | 1,326,974 | |
| | | | Starbucks Corporation | | | | |
| | 135,000 | | | 2.100%, 2/4/2021 | | | 134,456 | |
| | | | Toll Brothers Finance Corporation | | | | |
| | 208,000 | | | 4.000%, 12/31/2018 | | | 213,460 | |
| | | | Visa, Inc. | | | | |
| | 90,000 | | | 2.200%, 12/14/2020 | | | 90,050 | |
| | | | Walgreens Boots Alliance, Inc. | | | | |
| | 120,000 | | | 1.750%, 5/30/2018 | | | 120,102 | |
| | 120,000 | | | 2.600%, 6/1/2021 | | | 119,141 | |
| | | | West Corporation | | | | |
| | 1,400,000 | | | 5.375%, 7/15/2022e | | | 1,352,750 | |
| | | | Yum! Brands, Inc. | | | | |
| | 1,545,000 | | | 5.000%, 6/1/2024e | | | 1,577,831 | |
| | | | | | | | |
| | | | Total | | | 17,258,614 | |
| | | | | | | | |
| |
| | Consumer Non-Cyclical (2.6%) | | | | |
| | | | Abbott Laboratories | | | | |
| | 290,000 | | | 2.350%, 11/22/2019 | | | 290,198 | |
| | | | Anheuser-Busch InBev Finance, Inc. | | | | |
| | 145,000 | | | 2.146%, 2/1/2021d | | | 147,550 | |
| | 375,000 | | | 2.650%, 2/1/2021 | | | 376,721 | |
| | | | Anheuser-Busch InBev Worldwide, Inc. | | | | |
| | 75,000 | | | 6.500%, 7/15/2018 | | | 80,315 | |
| | | | B&G Foods, Inc. | | | | |
| | 500,000 | | | 4.625%, 6/1/2021 | | | 510,000 | |
| | | | BAT International Finance plc | | | | |
| | 95,000 | | | 1.473%, 6/15/2018d,e | | | 95,018 | |
| | | | Baxter International, Inc. | | | | |
| | 290,000 | | | 1.700%, 8/15/2021 | | | 278,729 | |
| | | | Bayer U.S. Finance, LLC | | | | |
| | 300,000 | | | 2.375%, 10/8/2019e | | | 300,389 | |
| | | | Boston Scientific Corporation | | | | |
| | 50,000 | | | 6.000%, 1/15/2020 | | | 54,909 | |
The accompanying Notes to Financial Statements are an integral part of this schedule.
20
DIVERSIFIED INCOME PLUS FUND
Schedule of Investments as of December 31, 2016
| | | | | | | | |
Principal
Amount | | | Long-Term Fixed Income (49.0%) | | Value | |
| | Consumer Non-Cyclical (2.6%) - continued | | | | |
| | | | Bunge Limited Finance Corporation | | | | |
| $ | 90,000 | | | 3.500%, 11/24/2020 | | $ | 91,533 | |
| | | | Celgene Corporation | | | | |
| | 95,000 | | | 3.550%, 8/15/2022 | | | 97,325 | |
| | | | Cott Beverages, Inc. | | | | |
| | 1,400,000 | | | 5.375%, 7/1/2022 | | | 1,424,500 | |
| | | | CVS Health Corporation | | | | |
| | 106,000 | | | 2.250%, 12/5/2018 | | | 106,908 | |
| | | | EMD Finance, LLC | | | | |
| | 55,000 | | | 1.343%, 3/17/2017d,e | | | 55,013 | |
| | | | Envision Healthcare Corporation | | | | |
| | 1,400,000 | | | 5.125%, 7/1/2022e | | | 1,394,750 | |
| | | | Express Scripts Holding Company | | | | |
| | 115,000 | | | 3.000%, 7/15/2023 | | | 111,196 | |
| | | | Forest Laboratories, Inc. | | | | |
| | 153,000 | | | 4.375%, 2/1/2019e | | | 158,932 | |
| | | | Gilead Sciences, Inc. | | | | |
| | 275,000 | | | 1.950%, 3/1/2022 | | | 265,797 | |
| | 95,000 | | | 3.250%, 9/1/2022 | | | 96,865 | |
| | | | Grifols Worldwide Operations, Ltd. | | | | |
| | 950,000 | | | 5.250%, 4/1/2022 | | | 983,250 | |
| | | | HCA, Inc. | | | | |
| | 505,000 | | | 5.250%, 6/15/2026 | | | 522,044 | |
| | 925,000 | | | 4.500%, 2/15/2027 | | | 908,813 | |
| | | | Iconix Brand Group, Inc., Convertible | | | | |
| | 790,000 | | | 1.500%, 3/15/2018 | | | 742,600 | |
| | | | Intercept Pharmaceuticals, Inc., Convertible | | | | |
| | 467,000 | | | 3.250%, 7/1/2023 | | | 416,214 | |
| | | | JBS USA, LLC | | | | |
| | 610,000 | | | 5.875%, 7/15/2024e | | | 629,825 | |
| | 1,240,000 | | | 5.750%, 6/15/2025e | | | 1,255,500 | |
| | | | Kraft Heinz Foods Company | | | | |
| | 280,000 | | | 5.375%, 2/10/2020 | | | 303,083 | |
| | | | Laboratory Corporation of America Holdings | | | | |
| | 40,000 | | | 2.625%, 2/1/2020 | | | 39,940 | |
| | | | Mead Johnson Nutrition Company | | | | |
| | 90,000 | | | 3.000%, 11/15/2020 | | | 91,057 | |
| | | | Medtronic plc | | | | |
| | 291,000 | | | 4.375%, 3/15/2035 | | | 307,374 | |
| | | | Molson Coors Brewing Company | | | | |
| | 255,000 | | | 1.450%, 7/15/2019 | | | 251,128 | |
| | | | Mylan NV | | | | |
| | 95,000 | | | 3.150%, 6/15/2021e | | | 93,150 | |
| | | | PepsiCo, Inc. | | | | |
| | 285,000 | | | 1.394%, 10/6/2021d | | | 286,115 | |
| | | | Pernod Ricard SA | | | | |
| | 250,000 | | | 5.750%, 4/7/2021e | | | 277,480 | |
| | | | Perrigo Finance plc | | | | |
| | 290,000 | | | 3.500%, 12/15/2021 | | | 292,053 | |
| | | | Pinnacle Foods, Inc. | | | | |
| | 800,000 | | | 5.875%, 1/15/2024 | | | 848,000 | |
| | | | Reynolds American, Inc. | | | | |
| | 52,000 | | | 3.250%, 6/12/2020 | | | 53,252 | |
| | | | Shire Acquisitions Investments Ireland Designated Activity Company | | | | |
| | 275,000 | | | 1.900%, 9/23/2019 | | | 271,386 | |
| | | | Teleflex, Inc. | | | | |
| | 1,015,000 | | | 4.875%, 6/1/2026 | | | 1,004,850 | |
| | | | Tenet Healthcare Corporation | | | | |
| | 1,435,000 | | | 8.125%, 4/1/2022 | | | 1,353,923 | |
| | | | Teva Pharmaceutical Finance Netherlands III BV | | | | |
| | 375,000 | | | 1.700%, 7/19/2019 | | | 368,286 | |
| | | | TreeHouse Foods, Inc. | | | | |
| | 850,000 | | | 4.875%, 3/15/2022 | | | 871,250 | |
| | | | Tyson Foods, Inc. | | | | |
| | 152,000 | | | 4.500%, 6/15/2022 | | | 161,587 | |
| | | | VPII Escrow Corporation | | | | |
| | 610,000 | | | 7.500%, 7/15/2021e | | | 516,975 | |
| | | | VRX Escrow Corporation | | | | |
| | 1,140,000 | | | 6.125%, 4/15/2025e | | | 856,425 | |
| | | | | | | | |
| | | | Total | | | 19,642,208 | |
| | | | | | | | |
| |
| | Energy (2.3%) | | | | |
| | | | Anadarko Petroleum Corporation | | | | |
| | 99,000 | | | 8.700%, 3/15/2019 | | | 112,469 | |
| | 42,000 | | | 4.850%, 3/15/2021 | | | 44,998 | |
| | | | Antero Resources Corporation | | | | |
| | 1,080,000 | | | 5.125%, 12/1/2022 | | | 1,090,800 | |
| | | | BP Capital Markets plc | | | | |
| | 230,000 | | | 1.676%, 5/3/2019 | | | 228,316 | |
| | | | Buckeye Partners, LP | | | | |
| | 152,000 | | | 2.650%, 11/15/2018 | | | 152,970 | |
| | | | Chesapeake Energy Corporation, Convertible | | | | |
| | 600,000 | | | 5.500%, 9/15/2026e | | | 649,500 | |
| | | | Chevron Corporation | | | | |
| | 90,000 | | | 1.421%, 11/16/2018d | | | 90,361 | |
| | | | Concho Resources, Inc. | | | | |
| | 575,000 | | | 6.500%, 1/15/2022 | | | 594,953 | |
| | 860,000 | | | 5.500%, 10/1/2022 | | | 891,175 | |
| | 410,000 | | | 4.375%, 1/15/2025 | | | 409,184 | |
| | | | Contura Energy, Inc. | | | | |
| | 319,000 | | | 10.000%, 8/1/2021* | | | 340,533 | |
| | | | Crestwood Midstream Partners, LP | | | | |
| | 850,000 | | | 6.250%, 4/1/2023 | | | 867,000 | |
| | | | Devon Energy Corporation | | | | |
| | 281,000 | | | 3.250%, 5/15/2022 | | | 278,926 | |
| | | | Ecopetrol SA | | | | |
| | 210,000 | | | 5.875%, 9/18/2023 | | | 222,285 | |
| | | | Encana Corporation | | | | |
| | 32,000 | | | 3.900%, 11/15/2021 | | | 32,230 | |
| | | | Enterprise Products Operating, LLC | | | | |
| | 1,390,000 | | | 7.034%, 1/15/2068 | | | 1,418,961 | |
| | | | EOG Resources, Inc. | | | | |
| | 230,000 | | | 2.625%, 3/15/2023 | | | 222,735 | |
| | | | EQT Corporation | | | | |
| | 105,000 | | | 5.150%, 3/1/2018 | | | 108,230 | |
| | 104,000 | | | 8.125%, 6/1/2019 | | | 116,967 | |
| | | | Exxon Mobil Corporation | | | | |
| | 185,000 | | | 1.708%, 3/1/2019 | | | 185,357 | |
| | | | Marathon Oil Corporation | | | | |
| | 275,000 | | | 2.800%, 11/1/2022 | | | 262,673 | |
| | | | Marathon Petroleum Corporation | | | | |
| | 90,000 | | | 3.400%, 12/15/2020 | | | 91,974 | |
| | | | MEG Energy Corporation | | | | |
| | 250,000 | | | 6.500%, 3/15/2021e | | | 231,250 | |
| | 610,000 | | | 6.375%, 1/30/2023e | | | 542,900 | |
| | | | MPLX, LP | | | | |
| | 1,525,000 | | | 4.875%, 12/1/2024 | | | 1,568,459 | |
| | | | Northern Tier Energy, LLC | | | | |
| | 1,075,000 | | | 7.125%, 11/15/2020 | | | 1,116,656 | |
| | | | Petrobras Global Finance BV | | | | |
| | 180,000 | | | 8.375%, 5/23/2021 | | | 193,950 | |
| | | | Petroleos Mexicanos | | | | |
| | 145,000 | | | 4.607%, 3/11/2022d,e | | | 149,531 | |
The accompanying Notes to Financial Statements are an integral part of this schedule.
21
DIVERSIFIED INCOME PLUS FUND
Schedule of Investments as of December 31, 2016
| | | | | | | | |
Principal
Amount | | | Long-Term Fixed Income (49.0%) | | Value | |
| | Energy (2.3%) - continued | | | | |
| $ | 216,000 | | | 6.500%, 3/13/2027e | | $ | 222,804 | |
| | | | Regency Energy Partners, LP | | | | |
| | 1,080,000 | | | 5.000%, 10/1/2022 | | | 1,143,301 | |
| | | | Sabine Pass Liquefaction, LLC | | | | |
| | 1,290,000 | | | 5.625%, 3/1/2025 | | | 1,380,300 | |
| | | | Schlumberger Holdings Corporation | | | | |
| | 90,000 | | | 3.000%, 12/21/2020e | | | 91,832 | |
| | | | Shell International Finance BV | | | | |
| | 95,000 | | | 1.352%, 5/11/2020d | | | 95,061 | |
| | | | Sinopec Group Overseas Development, Ltd. | | | | |
| | 290,000 | | | 1.750%, 9/29/2019e | | | 285,255 | |
| | | | Sunoco Logistics Partners Operations, LP | | | | |
| | 90,000 | | | 4.400%, 4/1/2021 | | | 94,702 | |
| | | | TransCanada Trust | | | | |
| | 725,000 | | | 5.875%, 8/15/2076 | | | 754,000 | |
| | | | Transcontinental Gas Pipe Line Company, LLC | | | | |
| | 95,000 | | | 7.850%, 2/1/2026e | | | 119,646 | |
| | | | Whiting Petroleum Corporation, Convertible | | | | |
| | 785,000 | | | 1.250%, 4/1/2020 | | | 688,838 | |
| | | | | | | | |
| | | | Total | | | 17,091,082 | |
| | | | | | | | |
| |
| | Financials (7.2%) | | | | |
| | | | ACE INA Holdings, Inc. | | | | |
| | 90,000 | | | 2.875%, 11/3/2022 | | | 90,635 | |
| | | | Aegon NV | | | | |
| | 1,080,000 | | | 1.677%, 4/15/2017d,h | | | 773,343 | |
| | | | AerCap Ireland Capital, Ltd. | | | | |
| | 500,000 | | | 3.950%, 2/1/2022 | | | 504,375 | |
| | | | Aetna, Inc. | | | | |
| | 195,000 | | | 1.900%, 6/7/2019 | | | 194,503 | |
| | | | Air Lease Corporation | | | | |
| | 47,000 | | | 2.625%, 9/4/2018 | | | 47,319 | |
| | | | Ally Financial, Inc. | | | | |
| | 900,000 | | | 3.750%, 11/18/2019 | | | 903,852 | |
| | 500,000 | | | 4.125%, 3/30/2020 | | | 510,000 | |
| | | | American Express Credit Corporation | | | | |
| | 95,000 | | | 2.009%, 9/14/2020d | | | 96,583 | |
| | | | AMG Capital Trust II, Convertible | | | | |
| | 11,325 | | | 5.150%, 10/15/2037 | | | 618,275 | |
| | | | BAC Capital Trust XIV | | | | |
| | 840,000 | | | 4.000%, 1/19/2017d,h | | | 659,400 | |
| | | | Banco de Brasil SA | | | | |
| | 800,000 | | | 9.000%, 6/18/2024e,h | | | 752,000 | |
| | | | Bank of America Corporation | | | | |
| | 272,000 | | | 5.700%, 5/2/2017 | | | 275,703 | |
| | 99,000 | | | 8.000%, 1/30/2018h | | | 101,722 | |
| | 107,000 | | | 5.650%, 5/1/2018 | | | 112,095 | |
| | 255,000 | | | 5.625%, 7/1/2020 | | | 280,195 | |
| | 250,000 | | | 2.625%, 4/19/2021 | | | 248,070 | |
| | 380,000 | | | 2.061%, 10/21/2022d | | | 386,579 | |
| | | | Bank of Montreal | | | | |
| | 250,000 | | | 1.500%, 7/18/2019 | | | 246,617 | |
| | | | Barclays Bank plc | | | | |
| | 150,000 | | | 5.140%, 10/14/2020 | | | 158,300 | |
| | | | Barclays plc | | | | |
| | 290,000 | | | 3.200%, 8/10/2021 | | | 286,633 | |
| | | | Berkshire Hathaway Finance Corporation | | | | |
| | 285,000 | | | 1.700%, 3/15/2019 | | | 284,680 | |
| | | | Blackstone Mortgage Trust, Inc., Convertible | | | | |
| | 835,000 | | | 5.250%, 12/1/2018 | | | 931,025 | |
| | | | BNZ International Funding, Ltd. | | | | |
| | 250,000 | | | 1.939%, 9/14/2021d,e | | | 250,664 | |
| | | | Caisse Centrale Desjardins du Quebec | | | | |
| | 50,000 | | | 1.552%, 1/29/2018d,e | | | 49,949 | |
| | | | Capital One NA | | | | |
| | 290,000 | | | 2.400%, 9/5/2019 | | | 290,516 | |
| | | | Centene Escrow Corporation | | | | |
| | 1,555,000 | | | 5.625%, 2/15/2021 | | | 1,634,927 | |
| | | | Central Fidelity Capital Trust I | | | | |
| | 960,000 | | | 1.880%, 4/15/2027d | | | 866,400 | |
| | | | CIT Group, Inc. | | | | |
| | 1,315,000 | | | 5.000%, 8/15/2022 | | | 1,370,888 | |
| | | | Citigroup, Inc. | | | | |
| | 153,000 | | | 1.850%, 11/24/2017 | | | 153,280 | |
| | 225,000 | | | 2.050%, 6/7/2019 | | | 224,057 | |
| | 255,000 | | | 2.650%, 10/26/2020 | | | 254,983 | |
| | 240,000 | | | 2.361%, 9/1/2023d | | | 244,772 | |
| | | | CNA Financial Corporation | | | | |
| | 350,000 | | | 5.750%, 8/15/2021 | | | 390,642 | |
| | | | Credit Agricole SA | | | | |
| | 70,000 | | | 1.923%, 6/10/2020d,e | | | 70,239 | |
| | | | Credit Suisse Group AG | | | | |
| | 600,000 | | | 7.500%, 12/11/2023e,h | | | 627,750 | |
| | 1,240,000 | | | 6.250%, 12/18/2024e,h | | | 1,206,768 | |
| | | | Credit Suisse Group Funding, Ltd. | | | | |
| | 580,000 | | | 2.750%, 3/26/2020 | | | 574,589 | |
| | | | CyrusOne, LP | | | | |
| | 860,000 | | | 6.375%, 11/15/2022 | | | 905,150 | |
| | | | Discover Bank | | | | |
| | 68,000 | | | 8.700%, 11/18/2019 | | | 77,172 | |
| | | | Discover Financial Services | | | | |
| | 150,000 | | | 6.450%, 6/12/2017 | | | 153,072 | |
| | | | Duke Realty, LP | | | | |
| | 155,000 | | | 4.375%, 6/15/2022 | | | 165,020 | |
| | | | Fifth Third Bancorp | | | | |
| | 575,000 | | | 4.900%, 9/30/2019h | | | 534,940 | |
| | | | Goldman Sachs Group, Inc. | | | | |
| | 144,000 | | | 2.625%, 1/31/2019 | | | 145,496 | |
| | 460,000 | | | 7.500%, 2/15/2019 | | | 509,767 | |
| | 250,000 | | | 2.000%, 4/25/2019 | | | 248,907 | |
| | 50,000 | | | 2.042%, 4/23/2020d | | | 50,478 | |
| | 220,000 | | | 2.241%, 11/15/2021d | | | 221,189 | |
| | 95,000 | | | 2.537%, 11/29/2023d | | | 97,946 | |
| | 440,000 | | | 5.300%, 11/10/2026h | | | 421,850 | |
| | | | Goldman Sachs Group, Inc., Convertible | | | | |
| | 3,800,000 | | | 0.500%, 9/24/2022 | | | 4,197,252 | |
| | | | Guardian Life Global Funding | | | | |
| | 250,000 | | | 2.000%, 4/26/2021e | | | 243,607 | |
| | | | Hartford Financial Services Group, Inc. | | | | |
| | 185,000 | | | 6.000%, 1/15/2019 | | | 199,007 | |
| | | | HCP, Inc. | | | | |
| | 107,000 | | | 3.750%, 2/1/2019 | | | 109,972 | |
| | | | Health Care REIT, Inc. | | | | |
| | 186,000 | | | 4.700%, 9/15/2017 | | | 189,988 | |
| | | | Hospitality Properties Trust | | | | |
| | 95,000 | | | 4.250%, 2/15/2021 | | | 98,208 | |
| | | | HSBC Holdings plc | | | | |
| | 290,000 | | | 2.358%, 1/5/2022d | | | 295,404 | |
| | | | Huntington Bancshares, Inc. | | | | |
| | 185,000 | | | 3.150%, 3/14/2021 | | | 187,454 | |
| | | | Icahn Enterprises, LP | | | | |
| | 550,000 | | | 6.000%, 8/1/2020 | | | 561,688 | |
The accompanying Notes to Financial Statements are an integral part of this schedule.
22
DIVERSIFIED INCOME PLUS FUND
Schedule of Investments as of December 31, 2016
| | | | | | | | |
Principal
Amount | | | Long-Term Fixed Income (49.0%) | | Value | |
| | Financials (7.2%) - continued | | | | |
| | | | ILFC E-Capital Trust II | | | | |
| | $1,525,000 | | | 4.920%, 12/21/2065d,e | | $ | 1,342,000 | |
| | | | ING Capital Funding Trust III | | | | |
| | 150,000 | | | 4.438%, 3/31/2017d,h | | | 149,250 | |
| | | | International Lease Finance Corporation | | | | |
| | 610,000 | | | 5.875%, 8/15/2022 | | | 661,850 | |
| | | | Intesa Sanpaolo SPA | | | | |
| | 70,000 | | | 3.875%, 1/16/2018 | | | 70,923 | |
| | 156,000 | | | 3.875%, 1/15/2019 | | | 158,740 | |
| | | | J.P. Morgan Chase & Company | | | | |
| | 128,000 | | | 7.900%, 4/30/2018h | | | 132,544 | |
| | 144,000 | | | 6.300%, 4/23/2019 | | | 157,293 | |
| | 40,000 | | | 2.250%, 1/23/2020 | | | 39,881 | |
| | 255,000 | | | 4.950%, 3/25/2020 | | | 274,576 | |
| | 290,000 | | | 2.295%, 8/15/2021 | | | 284,363 | |
| | 205,000 | | | 2.700%, 5/18/2023 | | | 200,346 | |
| | 289,000 | | | 2.112%, 10/24/2023d | | | 294,771 | |
| | | | J.P. Morgan Chase Bank NA | | | | |
| | 250,000 | | | 1.588%, 9/23/2019d | | | 250,188 | |
| | | | KeyBank NA | | | | |
| | 250,000 | | | 1.600%, 8/22/2019 | | | 246,464 | |
| | | | Liberty Mutual Group, Inc. | | | | |
| | 975,000 | | | 10.750%, 6/15/2058* | | | 1,462,500 | |
| | 42,000 | | | 5.000%, 6/1/2021e | | | 45,656 | |
| | | | Lincoln National Corporation | | | | |
| | 250,000 | | | 6.250%, 2/15/2020 | | | 275,936 | |
| | | | Lloyds Banking Group plc | | | | |
| | 1,200,000 | | | 6.413%, 10/1/2035e,h | | | 1,287,000 | |
| | | | Macquarie Bank, Ltd. | | | | |
| | 95,000 | | | 2.060%, 1/15/2019d,e | | | 95,748 | |
| | | | MetLife Capital Trust IV | | | | |
| | 1,422,000 | | | 7.875%, 12/15/2037e | | | 1,714,221 | |
| | | | MGIC Investment Corporation, Convertible | | | | |
| | 500,000 | | | 9.000%, 4/1/2063e | | | 623,125 | |
| | 75,000 | | | 2.000%, 4/1/2020 | | | 111,187 | |
| | | | Mitsubishi UFJ Financial Group, Inc. | | | | |
| | 250,000 | | | 2.017%, 9/13/2021d | | | 250,362 | |
| | | | Mizuho Financial Group, Inc. | | | | |
| | 250,000 | | | 2.097%, 9/13/2021d | | | 249,915 | |
| | | | Morgan Stanley | | | | |
| | 50,000 | | | 2.026%, 1/27/2020d | | | 50,442 | |
| | 290,000 | | | 2.800%, 6/16/2020 | | | 292,169 | |
| | 250,000 | | | 2.500%, 4/21/2021 | | | 247,068 | |
| | 110,000 | | | 4.875%, 11/1/2022 | | | 117,763 | |
| | 335,000 | | | 2.282%, 10/24/2023d | | | 338,722 | |
| | | | MPT Operating Partnership, LP | | | | |
| | 850,000 | | | 5.500%, 5/1/2024 | | | 858,500 | |
| | | | Murray Street Investment Trust I | | | | |
| | 157,000 | | | 4.647%, 3/9/2017 | | | 157,818 | |
| | | | National City Corporation | | | | |
| | 136,000 | | | 6.875%, 5/15/2019 | | | 149,634 | |
| | | | National Westminster Bank plc | | | | |
| | 1,860,000 | | | 1.188%, 2/2/2017d,h | | | 1,290,831 | |
| | | | New York Life Global Funding | | | | |
| | 90,000 | | | 1.550%, 11/2/2018e | | | 89,725 | |
| | | | Nomura Holdings, Inc. | | | | |
| | 141,000 | | | 2.750%, 3/19/2019 | | | 142,280 | |
| | | | Prudential Financial, Inc. | | | | |
| | 1,225,000 | | | 5.625%, 6/15/2043 | | | 1,272,469 | |
| | | | Quicken Loans, Inc. | | | | |
| | 1,425,000 | | | 5.750%, 5/1/2025e | | | 1,385,813 | |
| | | | Realty Income Corporation | | | | |
| | 131,000 | | | 2.000%, 1/31/2018 | | | 131,356 | |
| | | | Regions Bank | | | | |
| | 43,000 | | | 7.500%, 5/15/2018 | | | 46,061 | |
| | | | Regions Financial Corporation | | | | |
| | 115,000 | | | 3.200%, 2/8/2021 | | | 116,534 | |
| | | | Reinsurance Group of America, Inc. | | | | |
| | 175,000 | | | 5.625%, 3/15/2017 | | | 176,421 | |
| | | | Royal Bank of Scotland Group plc | | | | |
| | 930,000 | | | 7.640%, 9/30/2017h | | | 862,575 | |
| | 385,000 | | | 7.648%, 9/30/2031h | | | 439,862 | |
| | | | Santander Uk Group Holdings plc | | | | |
| | 290,000 | | | 2.875%, 8/5/2021 | | | 283,578 | |
| | | | Santander UK plc | | | | |
| | 110,000 | | | 3.050%, 8/23/2018 | | | 111,717 | |
| | | | Simon Property Group, LP | | | | |
| | 95,000 | | | 2.500%, 9/1/2020 | | | 95,646 | |
| | 145,000 | | | 2.500%, 7/15/2021 | | | 145,011 | |
| | | | Societe Generale SA | | | | |
| | 1,240,000 | | | 8.250%, 11/29/2018h | | | 1,289,674 | |
| | 1,200,000 | | | 8.000%, 9/29/2025e,h | | | 1,200,600 | |
| | | | Standard Chartered plc | | | | |
| | 290,000 | | | 2.041%, 8/19/2019d,e | | | 291,175 | |
| | 1,140,000 | | | 6.409%, 1/30/2027e,h | | | 872,100 | |
| | | | State Street Capital Trust IV | | | | |
| | 1,440,000 | | | 1.963%, 6/15/2037d | | | 1,272,600 | |
| | | | State Street Corporation | | | | |
| | 95,000 | | | 1.809%, 8/18/2020d | | | 96,271 | |
| | | | Sumitomo Mitsui Financial Group, Inc. | | | | |
| | 285,000 | | | 2.631%, 3/9/2021d | | | 293,203 | |
| | | | SunTrust Banks, Inc. | | | | |
| | 120,000 | | | 2.900%, 3/3/2021 | | | 121,595 | |
| | | | Synchrony Financial | | | | |
| | 156,000 | | | 1.875%, 8/15/2017 | | | 156,122 | |
| | 35,000 | | | 2.111%, 2/3/2020d | | | 34,604 | |
| | 156,000 | | | 3.750%, 8/15/2021 | | | 160,200 | |
| | | | Toronto-Dominion Bank | | | | |
| | 95,000 | | | 1.722%, 1/22/2019d | | | 95,779 | |
| | 90,000 | | | 1.889%, 12/14/2020d | | | 91,058 | |
| | | | UnitedHealth Group, Inc. | | | | |
| | 95,000 | | | 3.350%, 7/15/2022 | | | 97,774 | |
| | | | USB Realty Corporation | | | | |
| | 1,240,000 | | | 2.027%, 1/15/2022d,e,h | | | 1,091,200 | |
| | | | Voya Financial, Inc. | | | | |
| | 204,000 | | | 2.900%, 2/15/2018 | | | 206,502 | |
| | | | Wells Fargo & Company | | | | |
| | 50,000 | | | 1.567%, 1/30/2020d | | | 49,975 | |
| | 290,000 | | | 2.150%, 1/30/2020 | | | 288,447 | |
| | 280,000 | | | 2.100%, 7/26/2021 | | | 272,204 | |
| | 335,000 | | | 2.117%, 10/31/2023d | | | 339,135 | |
| | | | Westpac Banking Corporation | | | | |
| | 375,000 | | | 1.761%, 8/19/2021d | | | 376,078 | |
| | | | | | | | |
| | | | Total | | | 54,163,025 | |
| | | | | | | | |
| |
| | Foreign Government (3.4%) | | | | |
| | | �� | Brazil Government International Bond | | | | |
| | 505,000 | | | 4.875%, 1/22/2021 | | | 520,150 | |
| | 720,000 | | | 2.625%, 1/5/2023 | | | 640,800 | |
| | 289,000 | | | 6.000%, 4/7/2026 | | | 299,115 | |
| | 415,000 | | | 7.125%, 1/20/2037 | | | 432,638 | |
| | 498,000 | | | 5.000%, 1/27/2045 | | | 403,978 | |
| | 345,000 | | | 5.625%, 2/21/2047 | | | 302,737 | |
| | | | Colombia Government International Bond | | | | |
| | 415,000 | | | 4.375%, 7/12/2021 | | | 434,713 | |
| | 323,000 | | | 2.625%, 3/15/2023 | | | 304,428 | |
The accompanying Notes to Financial Statements are an integral part of this schedule.
23
DIVERSIFIED INCOME PLUS FUND
Schedule of Investments as of December 31, 2016
| | | | | | | | |
Principal
Amount | | | Long-Term Fixed Income (49.0%) | | Value | |
| | Foreign Government (3.4%) - continued | | | | |
| $ | 400,000 | | | 4.000%, 2/26/2024 | | $ | 404,000 | |
| | 215,000 | | | 5.625%, 2/26/2044 | | | 221,450 | |
| | 498,000 | | | 5.000%, 6/15/2045 | | | 472,478 | |
| | | | Croatia Government International Bond | | | | |
| | 83,000 | | | 6.750%, 11/5/2019e | | | 90,055 | |
| | 497,000 | | | 6.625%, 7/14/2020e | | | 540,567 | |
| | 220,000 | | | 6.000%, 1/26/2024e | | | 238,425 | |
| | | | Hungary Government International Bond | | | | |
| | 166,000 | | | 6.375%, 3/29/2021 | | | 185,880 | |
| | 640,000 | | | 5.750%, 11/22/2023 | | | 709,600 | |
| | 598,000 | | | 5.375%, 3/25/2024 | | | 651,820 | |
| | | | Indonesia Government International Bond | | | | |
| | 475,000 | | | 4.875%, 5/5/2021e | | | 502,840 | |
| | 415,000 | | | 3.375%, 4/15/2023e | | | 404,824 | |
| | 390,000 | | | 5.875%, 1/15/2024e | | | 430,289 | |
| | 289,000 | | | 4.125%, 1/15/2025e | | | 286,352 | |
| | 312,000 | | | 4.750%, 1/8/2026e | | | 322,073 | |
| | 370,000 | | | 8.500%, 10/12/2035e | | | 501,939 | |
| | 830,000 | | | 5.125%, 1/15/2045e | | | 828,138 | |
| | | | Mexico Government International Bond | | | | |
| | 80,000 | | | 5.750%, 10/12/2110 | | | 73,800 | |
| | 248,000 | | | 3.625%, 3/15/2022 | | | 248,496 | |
| | 660,000 | | | 4.000%, 10/2/2023 | | | 661,518 | |
| | 504,000 | | | 3.600%, 1/30/2025 | | | 485,856 | |
| | 432,000 | | | 4.125%, 1/21/2026 | | | 428,544 | |
| | 166,000 | | | 6.750%, 9/27/2034 | | | 196,710 | |
| | 166,000 | | | 6.050%, 1/11/2040 | | | 179,529 | |
| | 400,000 | | | 4.750%, 3/8/2044 | | | 363,600 | |
| | 260,000 | | | 5.550%, 1/21/2045 | | | 265,850 | |
| | 252,000 | | | 4.600%, 1/23/2046 | | | 226,170 | |
| | 275,000 | | | 4.350%, 1/15/2047 | | | 235,812 | |
| | | | Panama Government International Bond | | | | |
| | 249,000 | | | 4.000%, 9/22/2024 | | | 253,357 | |
| | 435,000 | | | 3.750%, 3/16/2025 | | | 431,738 | |
| | 296,000 | | | 6.700%, 1/26/2036 | | | 359,196 | |
| | | | Peru Government International Bond | | | | |
| | 145,000 | | | 5.625%, 11/18/2050 | | | 164,213 | |
| | 324,000 | | | 4.125%, 8/25/2027 | | | 336,555 | |
| | 390,000 | | | 8.750%, 11/21/2033 | | | 569,400 | |
| | | | Philippines Government International Bond | | | | |
| | 592,000 | | | 4.000%, 1/15/2021 | | | 629,645 | |
| | 315,000 | | | 7.750%, 1/14/2031 | | | 442,806 | |
| | 180,000 | | | 6.375%, 10/23/2034 | | | 234,129 | |
| | 144,000 | | | 5.000%, 1/13/2037 | | | 162,493 | |
| | 288,000 | | | 3.950%, 1/20/2040 | | | 283,539 | |
| | | | Romania Government International Bond | | | | |
| | 314,000 | | | 4.375%, 8/22/2023e | | | 323,106 | |
| | 150,000 | | | 4.875%, 1/22/2024e | | | 158,652 | |
| | 74,000 | | | 6.125%, 1/22/2044e | | | 86,376 | |
| | | | Russia Government International Bond | | | | |
| | 260,000 | | | 3.500%, 1/16/2019e | | | 264,238 | |
| | 1,200,000 | | | 5.000%, 4/29/2020e | | | 1,273,380 | |
| | 432,000 | | | 4.875%, 9/16/2023e | | | 455,077 | |
| | 347,750 | | | 7.500%, 3/31/2030e | | | 418,691 | |
| | 440,000 | | | 5.625%, 4/4/2042e | | | 473,164 | |
| | | | South Africa Government International Bond | | | | |
| | 25,000 | | | 5.500%, 3/9/2020 | | | 26,470 | |
| | 340,000 | | | 5.875%, 5/30/2022 | | | 370,185 | |
| | 444,000 | | | 4.300%, 10/12/2028 | | | 411,810 | |
| | | | Turkey Government International Bond | | | | |
| | 162,000 | | | 7.500%, 11/7/2019 | | | 176,175 | |
| | 504,000 | | | 7.000%, 6/5/2020 | | | 541,156 | |
| | 615,000 | | | 5.125%, 3/25/2022 | | | 610,326 | |
| | 260,000 | | | 6.250%, 9/26/2022 | | | 270,023 | |
| | 426,000 | | | 5.750%, 3/22/2024 | | | 427,231 | |
| | 640,000 | | | 4.250%, 4/14/2026 | | | 568,893 | |
| | 300,000 | | | 4.875%, 10/9/2026 | | | 277,559 | |
| | 478,000 | | | 6.875%, 3/17/2036 | | | 491,680 | |
| | 296,000 | | | 4.875%, 4/16/2043 | | | 238,428 | |
| | 441,000 | | | 6.625%, 2/17/2045 | | | 438,508 | |
| | | | | | | | |
| | | | Total | | | 25,663,373 | |
| | | | | | | | |
| |
| | Mortgage-Backed Securities (5.3%) | | | | |
| | | | Federal Home Loan Mortgage Corporation Gold 15-Yr. Pass Through | | | | |
| | 4,500,000 | | | 3.000%, 1/1/2032c | | | 4,615,650 | |
| | | | Federal National Mortgage Association Conventional 15-Yr. Pass Through | | | | |
| | 7,000,000 | | | 2.500%, 1/1/2032c | | | 7,007,700 | |
| | | | Federal National Mortgage Association Conventional 30-Yr. Pass Through | | | | |
| | 18,800,000 | | | 3.000%, 1/1/2047c | | | 18,662,760 | |
| | 4,000,000 | | | 3.500%, 1/1/2047c | | | 4,097,200 | |
| | 5,200,000 | | | 4.000%, 1/1/2047c | | | 5,464,160 | |
| | | | | | | | |
| | | | Total | | | 39,847,470 | |
| | | | | | | | |
| |
| | Technology (1.6%) | | | | |
| | | | Alliance Data Systems Corporation | | | | |
| | 650,000 | | | 5.375%, 8/1/2022e | | | 627,250 | |
| | | | Apple, Inc. | | | | |
| | 95,000 | | | 1.202%, 5/6/2020d | | | 94,922 | |
| | | | Automatic Data Processing, Inc. | | | | |
| | 95,000 | | | 2.250%, 9/15/2020 | | | 95,420 | |
| | | | Cisco Systems, Inc. | | | | |
| | 115,000 | | | 1.511%, 2/21/2018d | | | 115,661 | |
| | 95,000 | | | 1.431%, 3/1/2019d | | | 95,542 | |
| | | | CommScope Technologies Finance, LLC | | | | |
| | 905,000 | | | 6.000%, 6/15/2025e | | | 959,300 | |
| | | | Cypress Semiconductor Corporation, Convertible | | | | |
| | 600,000 | | | 4.500%, 1/15/2022e | | | 674,625 | |
| | | | Diamond 1 Finance Corporation | | | | |
| | 120,000 | | | 3.480%, 6/1/2019e | | | 122,466 | |
| | | | Equinix, Inc. | | | | |
| | 950,000 | | | 5.750%, 1/1/2025 | | | 992,750 | |
| | | | Fidelity National Information Services, Inc. | | | | |
| | 90,000 | | | 3.625%, 10/15/2020 | | | 93,105 | |
| | 375,000 | | | 2.250%, 8/15/2021 | | | 365,296 | |
| | | | First Data Corporation | | | | |
| | 850,000 | | | 5.375%, 8/15/2023e | | | 881,875 | |
| | | | Hewlett Packard Enterprise Company | | | | |
| | 365,000 | | | 3.600%, 10/15/2020 | | | 371,046 | |
| | | | Intel Corporation | | | | |
| | 205,000 | | | 1.700%, 5/19/2021 | | | 200,023 | |
The accompanying Notes to Financial Statements are an integral part of this schedule.
24
DIVERSIFIED INCOME PLUS FUND
Schedule of Investments as of December 31, 2016
| | | | | | | | |
Principal
Amount | | | Long-Term Fixed Income (49.0%) | | Value | |
| | Technology (1.6%) - continued | | | | |
| $ | 95,000 | | | 3.100%, 7/29/2022 | | $ | 97,584 | |
| | | | Intel Corporation, Convertible | | | | |
| | 800,000 | | | 2.950%, 12/15/2035 | | | 1,080,500 | |
| | | | Micron Technology, Inc., Convertible | | | | |
| | 425,000 | | | 2.375%, 5/1/2032 | | | 987,594 | |
| | 600,000 | | | 3.000%, 11/15/2043 | | | 595,875 | |
| | | | Microsoft Corporation | | | | |
| | 290,000 | | | 1.100%, 8/8/2019 | | | 285,971 | |
| | | | NXP BV | | | | |
| | 755,000 | | | 3.875%, 9/1/2022e | | | 764,438 | |
| | | | NXP Semiconductors NV, Convertible | | | | |
| | 780,000 | | | 1.000%, 12/1/2019 | | | 887,250 | |
| | | | Oracle Corporation | | | | |
| | 95,000 | | | 2.500%, 5/15/2022 | | | 94,240 | |
| | | | Sensata Technologies BV | | | | |
| | 1,200,000 | | | 4.875%, 10/15/2023e | | | 1,227,000 | |
| | | | Texas Instruments, Inc. | | | | |
| | 95,000 | | | 1.750%, 5/1/2020 | | | 93,896 | |
| | | | | | | | |
| | | | Total | | | 11,803,629 | |
| | | | | | | | |
| |
| | Transportation (0.5%) | | | | |
| | | | American Airlines Pass Through Trust | | | | |
| | 108,680 | | | 4.950%, 1/15/2023 | | | 115,880 | |
| | | | Avis Budget Car Rental, LLC | | | | |
| | 1,415,000 | | | 5.125%, 6/1/2022e | | | 1,386,700 | |
| | | | Delta Air Lines, Inc. | | | | |
| | 69,696 | | | 4.950%, 5/23/2019 | | | 73,042 | |
| | | | ERAC USA Finance, LLC | | | | |
| | 225,000 | | | 2.600%, 12/1/2021e | | | 221,209 | |
| | | | J.B. Hunt Transport Services, Inc. | | | | |
| | 95,000 | | | 3.300%, 8/15/2022 | | | 95,277 | |
| | | | Korea Expressway Corporation | | | | |
| | 200,000 | | | 1.625%, 4/28/2017e | | | 199,878 | |
| | | | Trinity Industries, Inc., Convertible | | | | |
| | 321,000 | | | 3.875%, 6/1/2036 | | | 410,679 | |
| | | | United Airlines Pass Through Trust | | | | |
| | 90,000 | | | 3.700%, 12/1/2022 | | | 90,675 | |
| | | | XPO Logistics, Inc. | | | | |
| | 850,000 | | | 6.500%, 6/15/2022e | | | 892,500 | |
| | | | | | | | |
| | | | Total | | | 3,485,840 | |
| | | | | | | | |
| |
| | U.S. Government and Agencies (0.5%) | | | | |
| | | | U.S. Treasury Notes | | | | |
| | 200,000 | | | 0.875%, 1/31/2017j | | | 200,080 | |
| | 875,000 | | | 1.125%, 8/31/2021 | | | 844,620 | |
| | 325,000 | | | 2.125%, 6/30/2022 | | | 325,792 | |
| | 2,300,000 | | | 1.625%, 2/15/2026 | | | 2,145,764 | |
| | | | | | | | |
| | | | Total | | | 3,516,256 | |
| | | | | | | | |
| |
| | Utilities (1.2%) | | | | |
| | | | Ameren Corporation | | | | |
| | 90,000 | | | 2.700%, 11/15/2020 | | | 90,414 | |
| | | | Calpine Corporation | | | | |
| | 870,000 | | | 6.000%, 1/15/2022e | | | 909,150 | |
| | 1,080,000 | | | 5.375%, 1/15/2023 | | | 1,055,700 | |
| | | | Dominion Resources, Inc. | | | | |
| | 275,000 | | | 1.600%, 8/15/2019 | | | 270,685 | |
| | | | Dynegy, Inc. | | | | |
| | 1,200,000 | | | 7.375%, 11/1/2022 | | | 1,146,000 | |
| | | | Electricite de France SA | | | | |
| | 540,000 | | | 5.250%, 1/19/2023e,h | | | 507,600 | |
| | | | Emera U.S. Finance, LP | | | | |
| | 150,000 | | | 2.150%, 6/15/2019e | | | 149,689 | |
| | | | Energy Transfer Equity, LP | | | | |
| | 1,240,000 | | | 5.500%, 6/1/2027 | | | 1,209,000 | |
| | | | Energy Transfer Partners, LP | | | | |
| | 220,000 | | | 4.150%, 10/1/2020 | | | 227,658 | |
| | | | Exelon Generation Company, LLC | | | | |
| | 144,000 | | | 5.200%, 10/1/2019 | | | 154,263 | |
| | | | Fortis, Inc. | | | | |
| | 250,000 | | | 2.100%, 10/4/2021e | | | 241,397 | |
| | | | NextEra Energy Capital Holdings, Inc. | | | | |
| | 120,000 | | | 2.300%, 4/1/2019 | | | 120,867 | |
| | | | NiSource Finance Corporation | | | | |
| | 295,000 | | | 5.450%, 9/15/2020 | | | 321,904 | |
| | | | NRG Energy, Inc. | | | | |
| | 610,000 | | | 6.625%, 3/15/2023 | | | 611,525 | |
| | | | PPL Capital Funding, Inc. | | | | |
| | 350,000 | | | 3.500%, 12/1/2022 | | | 357,550 | |
| | | | PSEG Power, LLC | | | | |
| | 60,000 | | | 3.000%, 6/15/2021 | | | 60,132 | |
| | | | Southern Company | | | | |
| | 255,000 | | | 1.850%, 7/1/2019 | | | 254,101 | |
| | | | Tesoro Corporation | | | | |
| | 1,170,000 | | | 4.750%, 12/15/2023e | | | 1,175,850 | |
| | | | Williams Partners, LP | | | | |
| | 275,000 | | | 5.250%, 3/15/2020 | | | 293,630 | |
| | | | Xcel Energy, Inc. | | | | |
| | 95,000 | | | 1.200%, 6/1/2017 | | | 94,908 | |
| | | | | | | | |
| | | | Total | | | 9,252,023 | |
| | | | | | | | |
| | | | Total Long-Term Fixed Income (cost $363,387,901) | | | 367,183,505 | |
| | | | | | | | |
| | |
Shares | | | Common Stock (27.2%) | | | |
| | Consumer Discretionary (4.1%) | | | | |
| | 5,990 | | | Amazon.com, Inc.k | | | 4,491,721 | |
| | 40,100 | | | American Axle & Manufacturing Holdings, Inc.k | | | 773,930 | |
| | 12,170 | | | Aramark | | | 434,712 | |
| | 3,420 | | | AutoZone, Inc.k | | | 2,701,082 | |
| | 11,103 | | | Berkeley Group Holdings plc | | | 383,820 | |
| | 1,700 | | | Brembo SPA | | | 102,842 | |
| | 16,300 | | | Bridgestone Corporation | | | 586,487 | |
| | 10,163 | | | Bunzl plc | | | 263,847 | |
| | 9,010 | | | Burlington Stores, Inc.k | | | 763,598 | |
| | 2,500 | | | Canon Marketing Japan, Inc. | | | 41,978 | |
| | 7,674 | | | Cedar Fair, LP | | | 492,671 | |
| | 43,122 | | | Comcast Corporation | | | 2,977,574 | |
| | 16,200 | | | Denso Corporation | | | 700,755 | |
| | 16,100 | | | Eutelsat Communications | | | 311,337 | |
| | 27,390 | | | Ford Motor Company | | | 332,241 | |
| | 16,700 | | | Fuji Heavy Industries, Ltd. | | | 680,432 | |
| | 11,390 | | | General Motors Company | | | 396,828 | |
| | 4,000 | | | Hakuhodo Dy Holdings, Inc. | | | 49,253 | |
| | 42,800 | | | Honda Motor Company, Ltd. | | | 1,249,559 | |
| | 22,200 | | | Inchcape plc | | | 191,853 | |
| | 2,922 | | | Intertek Group plc | | | 125,232 | |
| | 1,331 | | | Linamar Corporation | | | 57,189 | |
| | 1,532 | | | LVMH Moet Hennessy Louis Vuitton SE | | | 292,110 | |
| | 11,810 | | | Newell Brands, Inc. | | | 527,316 | |
| | 1,400 | | | Nifco, Inc. | | | 73,765 | |
| | 50,600 | | | NIKE, Inc. | | | 2,571,998 | |
| | 1,415 | | | Nokian Renkaat Oyj | | | 52,607 | |
| | 7,500 | | | Panasonic Corporation | | | 76,066 | |
| | 17,872 | | | Persimmon plc | | | 389,927 | |
| | 2,516 | | | Publicis Groupe SA | | | 173,365 | |
| | 2,130 | | | Restaurant Brands International, Inc. | | | 101,516 | |
| | 9,199 | | | Restoration Hardware Holdings, Inc.k | | | 282,409 | |
| | 800 | | | RTL Group SA | | | 58,611 | |
| | 3,100 | | | Sekisui Chemical Company, Ltd. | | | 49,347 | |
| | 19,016 | | | Starbucks Corporation | | | 1,055,768 | |
The accompanying Notes to Financial Statements are an integral part of this schedule.
25
DIVERSIFIED INCOME PLUS FUND
Schedule of Investments as of December 31, 2016
| | | | | | | | |
Shares | | | Common Stock (27.2%) | | Value | |
| | Consumer Discretionary (4.1%) - continued | | | | |
| | 16,900 | | | Sumitomo Forestry Company, Ltd. | | $ | 223,203 | |
| | 12,300 | | | Sumitomo Rubber Industries, Ltd. | | | 194,615 | |
| | 700 | | | Swatch Group AG | | | 42,720 | |
| | 48,070 | | | Time, Inc. | | | 858,050 | |
| | 22,220 | | | Toll Brothers, Inc.k | | | 688,820 | |
| | 9,430 | | | Tractor Supply Company | | | 714,888 | |
| | 300 | | | Valora Holding AG | | | 85,216 | |
| | 28,790 | | | Walt Disney Company | | | 3,000,494 | |
| | 1,100 | | | Whirlpool Corporation | | | 199,947 | |
| | 2,200 | | | Whitbread plc | | | 102,341 | |
| | 13,400 | | | Wolters Kluwer NV | | | 484,668 | |
| | 10,500 | | | WPP plc | | | 233,662 | |
| | 5,600 | | | Yokohama Rubber Company, Ltd. | | | 100,101 | |
| | | | | | | | |
| | | | Total | | | 30,742,471 | |
| | | | | | | | |
| |
| | Consumer Staples (1.2%) | | | | |
| | 16,860 | | | AdvancePierre Foods Holdings, Inc. | | | 502,091 | |
| | 8,600 | | | Axfood AB | | | 135,046 | |
| | 38,014 | | | Coca-Cola Amatil, Ltd. | | | 277,235 | |
| | 15,200 | | | Coca-Cola HBC AG | | | 330,986 | |
| | 3,100 | | | Ebro Foods SA | | | 64,878 | |
| | 1,746 | | | Henkel AG & Company KGaA | | | 181,713 | |
| | 23,918 | | | Imperial Brands plc | | | 1,042,365 | |
| | 3,000 | | | Jeronimo Martins SGPS SA | | | 46,529 | |
| | 1,200 | | | Kesko Oyj | | | 59,887 | |
| | 7,900 | | | Kewpie Corporation | | | 191,605 | |
| | 4,100 | | | Kirin Holdings Company, Ltd. | | | 66,548 | |
| | 56,141 | | | Koninklijke Ahold Delhaize NV | | | 1,182,502 | |
| | 9 | | | Lindt & Spruengli AG | | | 46,570 | |
| | 4,600 | | | Nestle SA | | | 329,533 | |
| | 20,480 | | | Philip Morris International, Inc. | | | 1,873,715 | |
| | 3,700 | | | Suedzucker AG | | | 88,196 | |
| | 15,390 | | | Tate & Lyle plc | | | 133,934 | |
| | 4,124 | | | Universal Corporation | | | 262,905 | |
| | 15,760 | | | Walgreens Boots Alliance, Inc. | | | 1,304,298 | |
| | 28,870 | | | Whole Foods Market, Inc. | | | 888,041 | |
| | 28,146 | | | William Morrison Supermarkets plc | | | 79,943 | |
| | | | | | | | |
| | | | Total | | | 9,088,520 | |
| | | | | | | | |
| |
| | Energy (1.8%) | | | | |
| | 4,334 | | | Arch Coal, Inc.k | | | 338,269 | |
| | 362,106 | | | BP plc | | | 2,268,039 | |
| | 11,340 | | | Concho Resources, Inc.k | | | 1,503,684 | |
| | 9,305 | | | Contura Energy, Inc.k | | | 660,655 | |
| | 7,841 | | | Crescent Point Energy Corporation | | | 106,579 | |
| | 26,880 | | | Devon Energy Corporation | | | 1,227,609 | |
| | 10,100 | | | Galp Energia SGPS SA | | | 150,574 | |
| | 28,450 | | | Halliburton Company | | | 1,538,860 | |
| | 10,707 | | | John Wood Group plc | | | 115,620 | |
| | 14,329 | | | OMV AG | | | 505,152 | |
| | 15,230 | | | Petrofac, Ltd. | | | 162,986 | |
| | 9,080 | | | Pioneer Natural Resources Company | | | 1,635,036 | |
| | 13,430 | | | Range Resources Corporation | | | 461,455 | |
| | 11,769 | | | Royal Dutch Shell plc | | | 321,007 | |
| | 3,066 | | | Royal Dutch Shell plc, Class A | | | 84,633 | |
| | 28,631 | | | Royal Dutch Shell plc, Class B | | | 822,628 | |
| | 11,292 | | | Statoil ASA | | | 206,098 | |
| | 1,143 | | | Tecnicas Reunidas SA | | | 46,746 | |
| | 11,691 | | | Total SA | | | 599,658 | |
| | 11,691 | | | Total SA Rightsk,l | | | 200 | |
| | 2,273 | | | Vantage Drilling Internationalk | | | 229,573 | |
| | 40,720 | | | WPX Energy, Inc.k | | | 593,290 | |
| | | | | | | | |
| | | | Total | | | 13,578,351 | |
| | | | | | | | |
| |
| | Financials (4.8%) | | | | |
| | 76,150 | | | Aberdeen Asset Management plc | | | 240,772 | |
| | 4,440 | | | Affiliated Managers Group, Inc.k | | | 645,132 | |
| | 300,000 | | | Apollo Investment Corporation | | | 1,758,000 | |
| | 183,600 | | | Ares Capital Corporation | | | 3,027,564 | |
| | 15,600 | | | ASX, Ltd. | | | 558,872 | |
| | 26,395 | | | Australia & New Zealand Banking Group, Ltd. | | | 577,819 | |
| | 173,780 | | | Bank of America Corporation | | | 3,840,538 | |
| | 29,864 | | | Bank of East Asia, Ltd. | | | 114,009 | |
| | 1,396 | | | Bank of Montreal | | | 100,407 | |
| | 20,217 | | | Bank of Nova Scotia | | | 1,125,701 | |
| | 15,360 | | | Bank of the Ozarks, Inc. | | | 807,782 | |
| | 2,738 | | | Canadian Imperial Bank of Commerce | | | 223,420 | |
| | 13,000 | | | Chiba Bank, Ltd. | | | 79,692 | |
| | 7,248 | | | CI Financial Corporation | | | 155,848 | |
| | 23,306 | | | CNP Assurances | | | 431,380 | |
| | 10,090 | | | Danske Bank AS | | | 305,261 | |
| | 64,761 | | | Direct Line Insurance Group plc | | | 294,739 | |
| | 38,660 | | | Encore Capital Group, Inc.k | | | 1,107,609 | |
| | 7,200 | | | Erste Group Bank AG | | | 210,508 | |
| | 80,106 | | | FlexiGroup, Ltd. | | | 130,368 | |
| | 91,000 | | | Fukuoka Financial Group, Inc. | | | 403,583 | |
| | 8,483 | | | Genworth MI Canada, Inc.m | | | 212,667 | |
| | 14,360 | | | Goldman Sachs Group, Inc. | | | 3,438,502 | |
| | 180,000 | | | Golub Capital BDC, Inc. | | | 3,310,200 | |
| | 9,100 | | | Hang Seng Bank, Ltd. | | | 168,756 | |
| | 5,000 | | | Hannover Rueckversicherung SE | | | 540,139 | |
| | 74,200 | | | Henderson Group plc | | | 214,156 | |
| | 95,222 | | | HSBC Holdings plc | | | 768,314 | |
| | 3,023 | | | Intact Financial Corporation | | | 216,371 | |
| | 8,730 | | | Intercontinental Exchange, Inc. | | | 492,547 | |
| | 58,900 | | | KeyCorp | | | 1,076,103 | |
| | 6,954 | | | Macquarie Group, Ltd. | | | 435,614 | |
| | 151,675 | | | Mapfre SA | | | 462,019 | |
| | 190,000 | | | Mizuho Financial Group, Inc. | | | 340,962 | |
| | 3,600 | | | MS and AD Insurance Group Holdings, Inc. | | | 111,483 | |
| | 22,582 | | | National Bank of Canada | | | 917,139 | |
| | 22,026 | | | Nordea Bank AB | | | 244,062 | |
| | 6,743 | | | Power Corporation of Canada | | | 150,916 | |
| | 8,380 | | | Raymond James Financial, Inc. | | | 580,483 | |
| | 34,300 | | | Resona Holdings, Inc. | | | 175,788 | |
| | 1,717 | | | Schroders plc | | | 63,062 | |
| | 15,600 | | | Seven Bank, Ltd. | | | 44,606 | |
| | 8,800 | | | Swiss Re AG | | | 832,594 | |
| | 57,560 | | | Synchrony Financial | | | 2,087,701 | |
| | 15,500 | | | T&D Holdings, Inc. | | | 204,560 | |
| | 991 | | | TMX Group, Ltd. | | | 52,788 | |
| | 22,627 | | | United Overseas Bank, Ltd. | | | 317,884 | |
| | 28,428 | | | Westpac Banking Corporation | | | 667,318 | |
| | 20,090 | | | XL Group, Ltd. | | | 748,553 | |
| | 17,140 | | | Zions Bancorporation | | | 737,706 | |
| | 583 | | | Zurich Insurance Group AGk | | | 160,220 | |
| | | | | | | | |
| | | | Total | | | 35,912,217 | |
| | | | | | | | |
| |
| | Health Care (2.6%) | | | | |
| | 11,790 | | | Acadia Healthcare Company, Inc.k | | | 390,249 | |
| | 18,840 | | | Akorn, Inc.k | | | 411,277 | |
| | 7,220 | | | Allergan plck | | | 1,516,272 | |
| | 3,177 | | | Anthem, Inc. | | | 456,757 | |
| | 5,077 | | | AstraZeneca plc | | | 277,245 | |
| | 32,550 | | | Bristol-Myers Squibb Company | | | 1,902,222 | |
| | 8,341 | | | CAE, Inc. | | | 116,668 | |
| | 20,560 | | | Celgene Corporationk | | | 2,379,820 | |
| | 5,658 | | | Essilor International SA | | | 638,384 | |
| | 11,924 | | | GlaxoSmithKline plc | | | 229,043 | |
| | 5,645 | | | Hikma Pharmaceuticals plc | | | 131,573 | |
| | 15,140 | | | Hologic, Inc.k | | | 607,417 | |
The accompanying Notes to Financial Statements are an integral part of this schedule.
26
DIVERSIFIED INCOME PLUS FUND
Schedule of Investments as of December 31, 2016
| | | | | | | | |
Shares | | | Common Stock (27.2%) | | Value | |
| | Health Care (2.6%) - continued | | | | |
| | 1,600 | | | Laboratory Corporation of America Holdingsk | | $ | 205,408 | |
| | 1,200 | | | Lonza Group AG | | | 207,395 | |
| | 32,200 | | | Medtronic plc | | | 2,293,606 | |
| | 45,580 | | | Merck & Company, Inc. | | | 2,683,295 | |
| | 3,856 | | | Merck KGaA | | | 401,492 | |
| | 24,846 | | | Novartis AG | | | 1,806,888 | |
| | 11,900 | | | Novo Nordisk AS | | | 426,879 | |
| | 1,312 | | | Roche Holding AG-Genusschein | | | 299,074 | |
| | 3,160 | | | Teleflex, Inc. | | | 509,234 | |
| | 11,310 | | | Vertex Pharmaceuticals, Inc.k | | | 833,208 | |
| | 3,820 | | | Waters Corporationk | | | 513,370 | |
| | | | | | | | |
| | | | Total | | | 19,236,776 | |
| | | | | | | | |
| |
| | Industrials (2.9%) | | | | |
| | 45 | | | A P Moller - Maersk AS | | | 71,728 | |
| | 13,055 | | | ABB, Ltd. | | | 274,700 | |
| | 7,990 | | | Acuity Brands, Inc. | | | 1,844,571 | |
| | 8,650 | | | Adecco SA | | | 564,644 | |
| | 43,600 | | | Air New Zealand, Ltd. | | | 66,399 | |
| | 29,000 | | | Asahi Glass Company, Ltd. | | | 196,755 | |
| | 1,900 | | | Atlas Copco Aktiebolag | | | 57,639 | |
| | 3,695 | | | Berendsen plc | | | 39,616 | |
| | 8,000 | | | Dai Nippon Printing Company, Ltd. | | | 78,933 | |
| | 13,520 | | | Delta Air Lines, Inc. | | | 665,049 | |
| | 6,248 | | | Deutsche Post AG | | | 204,904 | |
| | 3,700 | | | DSV AS | | | 164,318 | |
| | 46,872 | | | El Al Israel Airlines, Ltd. | | | 30,996 | |
| | 5,040 | | | Equifax, Inc. | | | 595,879 | |
| | 425 | | | Flughafen Zuerich AG | | | 78,756 | |
| | 2,500 | | | Fraport AG Frankfurt Airport Services Worldwide | | | 147,520 | |
| | 7,000 | | | Fuji Machine Manufacturing Company, Ltd. | | | 79,920 | |
| | 2,900 | | | Hitachi Transport System, Ltd. | | | 58,752 | |
| | 1,000 | | | Hochtief AG | | | 139,613 | |
| | 16,620 | | | Illinois Tool Works, Inc. | | | 2,035,285 | |
| | 4,700 | | | Inaba Denki Sangyo Company, Ltd. | | | 161,585 | |
| | 66,700 | | | ITOCHU Corporation | | | 883,159 | |
| | 34,090 | | | Jacobs Engineering Group, Inc.k | | | 1,943,130 | |
| | 3,100 | | | Jardine Matheson Holdings, Ltd. | | | 171,275 | |
| | 16,800 | | | KITZ Corporation | | | 91,723 | |
| | 7,700 | | | Komatsu, Ltd. | | | 174,406 | |
| | 15,600 | | | KONE Oyj | | | 697,066 | |
| | 3,986 | | | Koninklijke Boskalis Westminster NV | | | 138,283 | |
| | 10,700 | | | Marubeni Corporation | | | 60,520 | |
| | 11,630 | | | Masonite International Corporationk | | | 765,254 | |
| | 25,568 | | | Meggitt plc | | | 144,388 | |
| | 5,510 | | | Middleby Corporationk | | | 709,743 | |
| | 6,600 | | | MIRAIT Holdings Corporation | | | 59,481 | |
| | 5,500 | | | Mitsubishi Corporation | | | 116,813 | |
| | 26,400 | | | Mitsubishi Electric Corporation | | | 367,202 | |
| | 18,000 | | | Mitsubishi Heavy Industries, Ltd. | | | 81,829 | |
| | 8,000 | | | Mitsuboshi Belting, Ltd. | | | 68,026 | |
| | 3,700 | | | Mitsui & Company, Ltd. | | | 50,699 | |
| | 10,132 | | | National Express Group plc | | | 44,153 | |
| | 3,000 | | | NIPPO Corporation | | | 55,891 | |
| | 11,900 | | | Nitto Kogyo Corporation | | | 162,020 | |
| | 4,000 | | | Okuma Corporation | | | 38,058 | |
| | 11,170 | | | Oshkosh Corporation | | | 721,694 | |
| | 4,179 | | | Philips Lighting NVe,k | | | 102,938 | |
| | 3,337 | | | Randstad Holding NV | | | 180,758 | |
| | 5,968 | | | RELX NV | | | 100,381 | |
| | 367 | | | Rieter Holding AG | | | 63,828 | |
| | 15,396 | | | Rolls-Royce Holdings plck | | | 126,456 | |
| | 6,200 | | | Sanwa Holdings Corporation | | | 58,968 | |
| | 1,029 | | | Schindler Holding AG, Participation Certificate | | | 181,221 | |
| | 1,359 | | | Schneider Electric SE | | | 94,408 | |
| | 7,073 | | | Siemens AG | | | 866,021 | |
| | 3,460 | | | Skanska AB | | | 81,464 | |
| | 12,563 | | | SKF AB | | | 230,357 | |
| | 10,300 | | | Smiths Group plc | | | 179,294 | |
| | 36,900 | | | Sojitz Corporation | | | 89,341 | |
| | 1,471 | | | Sulzer, Ltd. | | | 151,429 | |
| | 23,670 | | | Union Pacific Corporation | | | 2,454,106 | |
| | 9,430 | | | Vinci SA | | | 641,475 | |
| | 6,640 | | | WABCO Holdings, Inc.k | | | 704,836 | |
| | 2,066 | | | Wolseley plc | | | 126,122 | |
| | 2,655 | | | WSP Global, Inc. | | | 88,371 | |
| | 2,100 | | | Yuasa Trading Company, Ltd. | | | 52,311 | |
| | | | | | | | |
| | | | Total | | | 21,676,460 | |
| | | | | | | | |
| |
| | Information Technology (4.0%) | | | | |
| | 1,815 | | | Advanced Micro Devices, Inc.k | | | 20,582 | |
| | 3,290 | | | Alliance Data Systems Corporation | | | 751,765 | |
| | 2,790 | | | Alphabet, Inc., Class Ak | | | 2,210,936 | |
| | 1,457 | | | Alphabet, Inc., Class Ck | | | 1,124,542 | |
| | 28,500 | | | Apple, Inc. | | | 3,300,870 | |
| | 6,400 | | | Canon, Inc. | | | 180,238 | |
| | 3,887 | | | Capital Power Corporation | | | 67,251 | |
| | 2,000 | | | DTS Corporation | | | 42,543 | |
| | 18,670 | | | Facebook, Inc.k | | | 2,147,984 | |
| | 22,930 | | | Finisar Corporationk | | | 694,091 | |
| | 14,400 | | | FUJIFILM Holdings NPV | | | 545,268 | |
| | 24,610 | | | Juniper Networks, Inc. | | | 695,479 | |
| | 7,900 | | | Konica Minolta Holdings, Inc. | | | 78,295 | |
| | 33,270 | | | Microsoft Corporation | | | 2,067,398 | |
| | 6,300 | | | NEC Networks & System Integration Corporation | | | 113,584 | |
| | 2,100 | | | Nice, Ltd. | | | 144,086 | |
| | 5,100 | | | Nichicon Corporation | | | 44,406 | |
| | 1,500 | | | NTT Data Corporation | | | 72,468 | |
| | 7,490 | | | NVIDIA Corporation | | | 799,483 | |
| | 10,840 | | | Palo Alto Networks, Inc.k | | | 1,355,542 | |
| | 72,320 | | | Pandora Media, Inc.k | | | 943,053 | |
| | 46,920 | | | PayPal Holdings, Inc.k | | | 1,851,932 | |
| | 11,860 | | | Plantronics, Inc. | | | 649,454 | |
| | 48,700 | | | Pure Storage, Inc.k | | | 550,797 | |
| | 800 | | | Rohm Company, Ltd. | | | 45,898 | |
| | 2,400 | | | Ryosan Company, Ltd. | | | 72,356 | |
| | 16,840 | | | Salesforce.com, Inc.k | | | 1,152,866 | |
| | 808 | | | SAP SE | | | 69,896 | |
| | 3,640 | | | Seagate Technology plc | | | 138,939 | |
| | 1,992 | | | Software AG | | | 72,197 | |
| | 14,886 | | | Telefonaktiebolaget LM Ericsson | | | 87,246 | |
| | 2,000 | | | Tokyo Electron, Ltd. | | | 188,099 | |
| | 14,530 | | | Twitter, Inc.k | | | 236,839 | |
| | 19,920 | | | Vantiv, Inc.k | | | 1,187,630 | |
| | 33,790 | | | Visa, Inc. | | | 2,636,296 | |
| | 57,370 | | | Xilinx, Inc. | | | 3,463,427 | |
| | | | | | | | |
| | | | Total | | | 29,803,736 | |
| | | | | | | | |
| |
| | Materials (1.1%) | | | | |
| | 3,200 | | | Adeka Corporation | | | 43,412 | |
| | 5,855 | | | APERAM | | | 267,199 | |
| | 1,940 | | | Ashland Global Holdings, Inc. | | | 212,023 | |
| | 4,609 | | | BHP Billiton plc | | | 73,390 | |
| | 71,142 | | | BHP Billiton, Ltd. | | | 1,274,499 | |
| | 47,551 | | | BlueScope Steel, Ltd. | | | 316,028 | |
| | 2,300 | | | Croda International plc | | | 90,458 | |
| | 4,950 | | | Crown Holdings, Inc.k | | | 260,221 | |
| | 27,200 | | | Daicel Corporation | | | 299,038 | |
The accompanying Notes to Financial Statements are an integral part of this schedule.
27
DIVERSIFIED INCOME PLUS FUND
Schedule of Investments as of December 31, 2016
| | | | | | | | |
Shares | | | Common Stock (27.2%) | | Value | |
| | Materials (1.1%) - continued | | | | |
| | 6,220 | | | Domtar Corporation | | $ | 242,767 | |
| | 2,570 | | | Eagle Materials, Inc. | | | 253,222 | |
| | 18,266 | | | Evonik Industries AG | | | 544,490 | |
| | 3,990 | | | FMC Corporation | | | 225,674 | |
| | 46 | | | Givaudan SA | | | 84,188 | |
| | 5,400 | | | JSR Corporation | | | 84,998 | |
| | 12,080 | | | Kinross Gold Corporationk | | | 37,569 | |
| | 19,000 | | | Kuraray Company, Ltd. | | | 284,916 | |
| | 4,500 | | | Kyoei Steel, Ltd. | | | 85,556 | |
| | 1,127 | | | LafargeHolcim, Ltd. | | | 59,158 | |
| | 22,200 | | | Mitsubishi Chemical Holdings Corporation | | | 143,538 | |
| | 4,000 | | | Mitsubishi Gas Chemical Company, Inc. | | | 68,158 | |
| | 2,400 | | | Mitsubishi Materials Corporation | | | 73,409 | |
| | 800 | | | Nippon Shokubai Company, Ltd. | | | 49,822 | |
| | 79,171 | | | Norsk Hydro ASA | | | 377,862 | |
| | 8,703 | | | Nufarm, Ltd. | | | 57,345 | |
| | 22,158 | | | Orora, Ltd. | | | 47,651 | |
| | 4,080 | | | Packaging Corporation of America | | | 346,066 | |
| | 2,810 | | | PPG Industries, Inc. | | | 266,276 | |
| | 2,134 | | | Rio Tinto, Ltd. | | | 91,423 | |
| | 11,180 | | | Steel Dynamics, Inc. | | | 397,784 | |
| | 1,800 | | | Sumitomo Seika Chemicals Company, Ltd. | | | 70,494 | |
| | 8,200 | | | Toagosei Company, Ltd. | | | 80,486 | |
| | 9,000 | | | Tosoh Corporation | | | 63,486 | |
| | 12,196 | | | UPM-Kymmene Oyj | | | 298,261 | |
| | 30,774 | | | Verso Corporationk | | | 218,495 | |
| | 2,800 | | | Yamato Kogyo Company, Ltd. | | | 78,090 | |
| | 15,016 | | | Yara International ASA | | | 590,715 | |
| | 1,600 | | | Yodogawa Steel Works, Ltd. | | | 41,698 | |
| | | | | | | | |
| | | | Total | | | 8,099,865 | |
| | | | | | | | |
| |
| | Real Estate (3.9%) | | | | |
| | 2,750 | | | Acadia Realty Trust | | | 89,870 | |
| | 1,300 | | | Agree Realty Corporation | | | 59,865 | |
| | 11,118 | | | Alexandria Real Estate Equities, Inc. | | | 1,235,543 | |
| | 3,650 | | | American Campus Communities, Inc. | | | 181,660 | |
| | 5,800 | | | American Homes 4 Rent | | | 121,684 | |
| | 5,550 | | | Apartment Investment & Management Company | | | 252,247 | |
| | 4,800 | | | Apple Hospitality REIT, Inc. | | | 95,904 | |
| | 3,700 | | | AvalonBay Communities, Inc. | | | 655,455 | |
| | 1,700 | | | Bluerock Residential Growth REIT, Inc. | | | 23,324 | |
| | 6,542 | | | Boston Properties, Inc. | | | 822,853 | |
| | 4,700 | | | Brandywine Realty Trust | | | 77,597 | |
| | 40,830 | | | Brixmor Property Group, Inc. | | | 997,069 | |
| | 12,480 | | | Camden Property Trust | | | 1,049,194 | |
| | 43,600 | | | CapitaLand Retail China Trustk | | | 41,247 | |
| | 2,475 | | | Care Capital Properties, Inc. | | | 61,875 | |
| | 1,438 | | | Chesapeake Lodging Trust | | | 37,187 | |
| | 2,900 | | | CoreCivic, Inc. | | | 70,934 | |
| | 950 | | | CoreSite Realty Corporation | | | 75,402 | |
| | 2,800 | | | Corporate Office Properties Trust | | | 87,416 | |
| | 9,761 | | | Cousins Properties, Inc. | | | 83,066 | |
| | 7,140 | | | Crown Castle International Corporation | | | 619,538 | |
| | 6,300 | | | CubeSmart | | | 168,651 | |
| | 2,950 | | | CyrusOne, Inc. | | | 131,953 | |
| | 600 | | | Daito Trust Construction Company, Ltd. | | | 90,203 | |
| | 2,800 | | | DCT Industrial Trust, Inc. | | | 134,064 | |
| | 8,700 | | | DDR Corporation | | | 132,849 | |
| | 62,700 | | | DEXUS Property Group | | | 434,963 | |
| | 3,025 | | | DiamondRock Hospitality Company | | | 34,878 | |
| | 4,372 | | | Digital Realty Trust, Inc. | | | 429,593 | |
| | 2,800 | | | Douglas Emmett, Inc. | | | 102,368 | |
| | 48,110 | | | Duke Realty Corporation | | | 1,277,802 | |
| | 1,550 | | | DuPont Fabros Technology, Inc. | | | 68,091 | |
| | 486 | | | EastGroup Properties, Inc. | | | 35,886 | |
| | 1,600 | | | Education Realty Trust, Inc. | | | 67,680 | |
| | 1,779 | | | EPR Properties | | | 127,679 | |
| | 2,743 | | | Equinix, Inc. | | | 980,376 | |
| | 3,300 | | | Equity Commonwealthk | | | 99,792 | |
| | 2,800 | | | Equity Lifestyle Properties, Inc. | | | 201,880 | |
| | 2,400 | | | Equity One, Inc. | | | 73,656 | |
| | 13,982 | | | Equity Residential | | | 899,882 | |
| | 2,000 | | | Essex Property Trust, Inc. | | | 465,000 | |
| | 3,850 | | | Extra Space Storage, Inc. | | | 297,374 | |
| | 1,600 | | | Federal Realty Investment Trust | | | 227,376 | |
| | 2,750 | | | First Industrial Realty Trust, Inc. | | | 77,137 | |
| | 5,917 | | | Forest City Realty Trust, Inc. | | | 123,310 | |
| | 4,850 | | | Gaming and Leisure Properties, Inc. | | | 148,507 | |
| | 16,627 | | | General Growth Properties, Inc. | | | 415,342 | |
| | 1,900 | | | GEO Group, Inc. | | | 68,267 | |
| | 7,100 | | | Gramercy Property Trust | | | 65,178 | |
| | 19,416 | | | H&R Real Estate Investment Trust | | | 323,492 | |
| | 5,400 | | | Hamborner REIT AG | | | 51,369 | |
| | 12,400 | | | HCP, Inc. | | | 368,528 | |
| | 3,500 | | | Healthcare Realty Trust, Inc. | | | 106,120 | |
| | 5,050 | | | Healthcare Trust of America, Inc. | | | 147,005 | |
| | 4,000 | | | Highwoods Properties, Inc. | | | 204,040 | |
| | 4,800 | | | Hospitality Properties Trust | | | 152,352 | |
| | 20,452 | | | Host Hotels & Resorts, Inc. | | | 385,316 | |
| | 3,150 | | | Hudson Pacific Properties, Inc. | | | 109,557 | |
| | 75,000 | | | Hysan Development Company, Ltd. | | | 309,303 | |
| | 6,100 | | | Iron Mountain, Inc. | | | 198,128 | |
| | 2,300 | | | Kilroy Realty Corporation | | | 168,406 | |
| | 13,800 | | | Kimco Realty Corporation | | | 347,208 | |
| | 1,870 | | | Lamar Advertising Company | | | 125,739 | |
| | 3,000 | | | LaSalle Hotel Properties | | | 91,410 | |
| | 4,000 | | | Liberty Property Trust | | | 158,000 | |
| | 1,264 | | | Life Storage, Inc. | | | 107,769 | |
| | 7,000 | | | Link REIT | | | 45,382 | |
| | 4,200 | | | Macerich Company | | | 297,528 | |
| | 2,350 | | | Mack-Cali Realty Corporation | | | 68,197 | |
| | 8,650 | | | Medical Properties Trust, Inc. | | | 106,395 | |
| | 2,966 | | | Mid-America Apartment Communities, Inc. | | | 290,431 | |
| | 2,000 | | | National Health Investors, Inc. | | | 148,340 | |
| | 6,400 | | | National Retail Properties, Inc. | | | 282,880 | |
| | 2,852 | | | National Storage Affiliates Trust | | | 62,944 | |
| | 288,976 | | | New World Development Company, Ltd. | | | 304,467 | |
| | 4,750 | | | NorthStar Realty Finance Corporation | | | 71,962 | |
| | 3,950 | | | Omega Healthcare Investors, Inc. | | | 123,477 | |
| | 3,400 | | | Outfront Media, Inc. | | | 84,558 | |
| | 1,220 | | | Parkway, Inc.k | | | 27,145 | |
| | 1,700 | | | Pebblebrook Hotel Trust | | | 50,575 | |
| | 6,250 | | | Physicians Realty Trust | | | 118,500 | |
| | 1,200 | | | Piedmont Office Realty Trust, Inc. | | | 25,092 | |
| | 21,182 | | | Prologis, Inc. | | | 1,118,198 | |
| | 5,502 | | | Public Storage, Inc. | | | 1,229,697 | |
| | 1,308 | | | QTS Realty Trust, Inc. | | | 64,942 | |
| | 2,480 | | | Quality Care Properties, Inc.k | | | 38,440 | |
| | 5,100 | | | Realty Income Corporation | | | 293,148 | |
| | 4,100 | | | Regency Centers Corporation | | | 282,695 | |
| | 2,850 | | | Retail Opportunity Investments Corporation | | | 60,221 | |
| | 4,800 | | | Retail Properties of America, Inc. | | | 73,584 | |
The accompanying Notes to Financial Statements are an integral part of this schedule.
28
DIVERSIFIED INCOME PLUS FUND
Schedule of Investments as of December 31, 2016
| | | | | | | | |
Shares | | | Common Stock (27.2%) | | Value | |
| | Real Estate (3.9%) - continued | | | | |
| | 4,381 | | | RLJ Lodging Trust | | $ | 107,291 | |
| | 4,426 | | | Senior Housing Property Trust | | | 83,784 | |
| | 12,016 | | | Simon Property Group, Inc. | | | 2,134,883 | |
| | 2,700 | | | SL Green Realty Corporation | | | 290,385 | |
| | 20,600 | | | Spirit Realty Captial, Inc. | | | 223,716 | |
| | 113,376 | | | Stockland | | | 374,559 | |
| | 5,531 | | | Store Capital Corporation | | | 136,671 | |
| | 4,560 | | | Summit Hotel Properties, Inc. | | | 73,097 | |
| | 1,950 | | | Sun Communities, Inc. | | | 149,389 | |
| | 5,000 | | | Sun Hung Kai Properties, Ltd. | | | 62,962 | |
| | 5,787 | | | Sunstone Hotel Investors, Inc. | | | 88,252 | |
| | 2,463 | | | Tanger Factory Outlet Centers, Inc. | | | 88,126 | |
| | 1,700 | | | Taubman Centers, Inc. | | | 125,681 | |
| | 7,800 | | | UDR, Inc. | | | 284,544 | |
| | 2,400 | | | Urban Edge Properties | | | 66,024 | |
| | 900 | | | Urstadt Biddle Properties, Inc. | | | 21,699 | |
| | 9,400 | | | Ventas, Inc. | | | 587,688 | |
| | 19,828 | | | VEREIT, Inc. | | | 167,745 | |
| | 7,850 | | | Vornado Realty Trust | | | 819,304 | |
| | 3,400 | | | Washington Prime Group, Inc. | | | 35,394 | |
| | 3,200 | | | Weingarten Realty Investors | | | 114,528 | |
| | 9,480 | | | Welltower, Inc. | | | 634,496 | |
| | 8,000 | | | Wharf Holdings, Ltd. | | | 52,992 | |
| | 11,000 | | | Wheelock and Company, Ltd. | | | 61,735 | |
| | 67,900 | | | Wing Tai Holdings, Ltd. | | | 74,371 | |
| | 1,700 | | | WP Carey, Inc. | | | 100,453 | |
| | | | | | | | |
| | | | Total | | | 29,700,976 | |
| | | | | | | | |
| |
| | Telecommunications Services (0.4%) | | | | |
| | 10,673 | | | Elisa Oyj | | | 346,462 | |
| | 9,200 | | | Freenet AG | | | 258,563 | |
| | 161,636 | | | KCOM Group plc | | | 188,743 | |
| | 40,934 | | | Koninklijke (Royal) KPN NV | | | 121,047 | |
| | 9,300 | | | Nippon Telegraph & Telephone Corporation | | | 391,485 | |
| | 10,300 | | | NTT DOCOMO, Inc. | | | 234,276 | |
| | 181,949 | | | PCCW, Ltd. | | | 98,359 | |
| | 4,600 | | | Proximus SA | | | 132,236 | |
| | 15,900 | | | Telefonica Deutschland Holding AG | | | 67,963 | |
| | 10,214 | | | Telenor ASA | | | 152,462 | |
| | 2,398 | | | Vivendi SA | | | 45,483 | |
| | 24,900 | | | Zayo Group Holdings, Inc.k | | | 818,214 | |
| | | | | | | | |
| | | | Total | | | 2,855,293 | |
| | | | | | | | |
| |
| | Utilities (0.4%) | | | | |
| | 3,470 | | | ATCO, Ltd. | | | 115,421 | |
| | 56,600 | | | Centrica plc | | | 163,011 | |
| | 78,400 | | | Electricidade de Portugal SA | | | 238,615 | |
| | 35,186 | | | MDU Resources Group, Inc. | | | 1,012,301 | |
| | 10,954 | | | NorthWestern Corporation | | | 622,954 | |
| | 93,000 | | | Osaka Gas Company, Ltd. | | | 356,847 | |
| | 50,098 | | | Redes Energeticas Nacionais SGPS SA | | | 142,140 | |
| | 8,000 | | | Toho Gas Company, Ltd. | | | 64,975 | |
| | 10,700 | | | United Utilities Group plc | | | 118,603 | |
| | | | | | | | |
| | | | Total | | | 2,834,867 | |
| | | | | | | | |
| | | | Total Common Stock (cost $191,261,988) | | | 203,529,532 | |
| | | | | | | | |
| | |
Shares | | | Registered Investment Companies (3.8%) | | | |
| | Equity Funds/ETFs (1.5%) | | | | |
| | 418,500 | | | Alerian MLP ETF | | | 5,273,100 | |
| | 19,170 | | | iShares MSCI EAFE Index Fund | | | 1,106,684 | |
| | 63,090 | | | Materials Select Sector SPDR Fund | | | 3,135,573 | |
| | 41,840 | | | Utilities Select Sector SPDR Fund | | | 2,032,169 | |
| | | | | | | | |
| | | | Total | | | 11,547,526 | |
| | | | | | | | |
| |
| | Fixed Income Funds/ETFs (2.3%) | | | | |
| | 4,800 | | | iShares J.P. Morgan USD Emerging Markets Bond ETF | | | 529,056 | |
| | 64,400 | | | iShares S&P U.S. Preferred Stock Index Fund | | | 2,396,324 | |
| | 180,885 | | | Vanguard Short-Term Corporate Bond ETF | | | 14,356,842 | |
| | | | | | | | |
| | | | Total | | | 17,282,222 | |
| | | | | | | | |
| | | | Total Registered Investment Companies (cost $30,692,216) | | | 28,829,748 | |
| | | | | | | | |
| | |
Shares | | | Preferred Stock (2.4%) | | | |
| | Consumer Staples (0.4%) | | | | |
| | 4,850 | | | Bunge, Ltd., Convertible, 4.875%h | | | 495,233 | |
| | 31,000 | | | CHS, Inc., 6.750%h | | | 814,680 | |
| | 48,800 | | | CHS, Inc., 7.100%h | | | 1,293,688 | |
| | 519 | | | Henkel AG & Company KGaA, 1.470% | | | 61,782 | |
| | | | | | | | |
| | | | Total | | | 2,665,383 | |
| | | | | | | | |
| |
| | Energy (<0.1%) | | | | |
| | 6,912 | | | Alpha Natural Resources, Inc., 0.000%k | | | 138,240 | |
| | 6,912 | | | ANR Holdings, Inc., 0.000%k | | | 37,325 | |
| | | | | | | | |
| | | | Total | | | 175,565 | |
| | | | | | | | |
| |
| | Financials (1.7%) | | | | |
| | 8,335 | | | Agribank FCB, 6.875%h | | | 886,115 | |
| | 54,977 | | | Annaly Capital Management, Inc., 7.500%h | | | 1,327,145 | |
| | 44,780 | | | Citigroup, Inc., 6.875%h | | | 1,224,733 | |
| | 35,980 | | | Citigroup, Inc., 7.257%d | | | 929,003 | |
| | 12,970 | | | Cobank ACB, 6.250%h | | | 1,315,240 | |
| | 60,150 | | | GMAC Capital Trust I, 6.602%d | | | 1,527,810 | |
| | 40,200 | | | Goldman Sachs Group, Inc., 5.500%h | | | 1,020,276 | |
| | 11,380 | | | Morgan Stanley, 6.875%h | | | 307,715 | |
| | 32,100 | | | Morgan Stanley, 7.125%h | | | 902,973 | |
| | 24,500 | | | PNC Financial Services Group, Inc., 6.125%h | | | 668,605 | |
| | 39,100 | | | U.S. Bancorp, 6.500%h | | | 1,106,139 | |
| | 1,445 | | | Wells Fargo & Company, Convertible, 7.500%h | | | 1,719,550 | |
| | | | | | | | |
| | | | Total | | | 12,935,304 | |
| | | | | | | | |
| |
| | Health Care (0.2%) | | | | |
| | 1,280 | | | Allergan plc, Convertible, 5.500% | | | 974,400 | |
| | 310 | | | Teva Pharmaceutical Industries, Ltd., Convertible, 7.000% | | | 199,950 | |
| | | | | | | | |
| | | | Total | | | 1,174,350 | |
| | | | | | | | |
| |
| | Real Estate (0.1%) | | | | |
| | 9,400 | | | American Tower Corporation, Convertible, 5.500% | | | 982,300 | |
| | | | | | | | |
| | | | Total | | | 982,300 | |
| | | | | | | | |
| | | | Total Preferred Stock (cost $17,656,574) | | | 17,932,902 | |
| | | | | | | | |
| | |
Shares | | | Collateral Held for Securities Loaned (<0.1%) | | | |
| | 222,600 | | | Thrivent Cash Management Trust | | | 222,600 | |
| | | | | | | | |
| | | | Total Collateral Held for Securities Loaned (cost $222,600) | | | 222,600 | |
| | | | | | | | |
The accompanying Notes to Financial Statements are an integral part of this schedule.
29
DIVERSIFIED INCOME PLUS FUND
Schedule of Investments as of December 31, 2016
| | | | | | | | |
Shares or
Principal
Amount | | | Short-Term Investments (9.4%)n | | Value | |
| | | | Federal Home Loan Bank Discount Notes | | | | |
| | 100,000 | | | 0.344%, 1/6/2017o | | $ | 99,997 | |
| | 200,000 | | | 0.440%, 1/11/2017o | | | 199,983 | |
| | 1,800,000 | | | 0.468%, 1/17/2017o | | | 1,799,734 | |
| | 400,000 | | | 0.355%, 1/25/2017o | | | 399,907 | |
| | 200,000 | | | 0.435%, 2/1/2017o | | | 199,919 | |
| | | | Thrivent Core Short-Term Reserve Fund | | | | |
| | 6,727,263 | | | 0.910% | | | 67,272,626 | |
| | | | U.S. Treasury Bills | | | | |
| | 400,000 | | | 0.412%, 1/26/2017j | | | 399,892 | |
| | 300,000 | | | 0.445%, 2/23/2017j | | | 299,800 | |
| | | | | | | | |
| | | | Total Short-Term Investments (cost $70,671,742) | | | 70,671,858 | |
| | | | | | | | |
| | | | Total Investments (cost $775,277,806) 105.4% | | $ | 790,178,980 | |
| | | | | | | | |
| | | | Other Assets and Liabilities, Net (5.4%) | | | (40,732,308 | ) |
| | | | | | | | |
| | | | Total Net Assets 100.0% | | $ | 749,446,672 | |
| | | | | | | | |
| a | The stated interest rate represents the weighted average of all contracts within the bank loan facility. |
| b | All or a portion of the loan is unfunded. |
| c | Denotes investments purchased on a when-issued or delayed delivery basis. |
| d | Denotes variable rate securities. Variable rate securities are securities whose yields vary with a designated market index or market rate. The rate shown is as of December 31, 2016. |
| e | Denotes securities sold under Rule 144A of the Securities Act of 1933, which exempts them from registration. These securities may be resold to other dealers in the program or to other qualified institutional buyers. As of December 31, 2016, the value of these investments was $74,011,964 or 9.9% of total net assets. |
| f | Denotes step coupon securities. Step coupon securities pay an initial coupon rate for the first period and then different coupon rates for following periods. The rate shown is as of December 31, 2016. |
| g | All or a portion of the security is insured or guaranteed. |
| h | Denotes perpetual securities. Perpetual securities pay an indefinite stream of interest and have no contractual maturity date. Date shown, if applicable, is next call date. |
| i | Denotes interest only security. Interest only securities represent the right to receive monthly interest payments on an underlying pool of mortgages or assets. The principal shown is the outstanding par amount of the pool as of the end of the period. The actual effective yield of the security is different than the stated coupon rate. |
| j | At December 31, 2016, $419,977 of investments were segregated to cover exposure to a counterparty for margin on open mortgage-backed security transactions. |
| k | Non-income producing security. |
| l | Security is valued at fair value. Market quotations or prices were not readily available or were determined to be unreliable. Fair value was determined in good faith pursuant to procedures adopted by the Board. Further information on fair valuation can be found in the Notes to Financial Statements. |
| m | All or a portion of the security is on loan. |
| n | The interest rate shown reflects the yield, coupon rate or the discount rate at the date of purchase. |
| o | All or a portion of the security is held on deposit with the counterparty and pledged as the initial margin deposit for open futures contracts. |
| * | Denotes restricted securities. Restricted securities are investment securities which cannot be offered for public sale without first being registered under the Securities Act of 1933. The value of all restricted securities held in Diversified Income Plus Fund as of December 31, 2016 was $21,294,634 or 2.8% of total net assets. The following table indicates the acquisition date and cost of restricted securities shown in the schedule as of December 31, 2016. |
The accompanying Notes to Financial Statements are an integral part of this schedule.
30
DIVERSIFIED INCOME PLUS FUND
Schedule of Investments as of December 31, 2016
| | | | | | | | |
Security | | Acquisition
Date | | | Cost | |
Angel Oak Mortgage Trust, 11/25/2045 | | | 12/10/2015 | | | $ | 885,638 | |
Bayview Opportunity Master Fund Trust, 7/28/2034 | | | 3/19/2015 | | | | 375,213 | |
Citi Held For Asset Issuance, 8/15/2022 | | | 2/26/2016 | | | | 1,198,315 | |
COLT Mortgage Loan Trust, 9/25/2046 | | | 9/9/2016 | | | | 1,511,098 | |
Contura Energy, Inc., 8/1/2021 | | | 11/4/2013 | | | | 501,280 | |
Digicel, Ltd., 4/15/2021 | | | 6/9/2014 | | | | 1,432,101 | |
Liberty Mutual Group, Inc., 6/15/2058 | | | 1/12/2009 | | | | 1,048,254 | |
Marlette Funding Trust, 1/17/2023 | | | 7/20/2016 | | | | 1,839,214 | |
Murray Hill Marketplace Trust, 11/25/2022 | | | 10/6/2016 | | | | 561,259 | |
NCF Dealer Floorplan Master Trust, 3/21/2022 | | | 4/8/2016 | | | | 1,079,545 | |
NRZ Advance Receivables Trust Advance Receivables Backed, 6/15/2049 | | | 6/23/2016 | | | | 1,999,997 | |
Preston Ridge Partners Mortgage Trust, LLC, 9/27/2021 | | | 9/23/2016 | | | | 1,163,627 | |
Pretium Mortgage Credit Partners I, LLC, 7/27/2031 | | | 6/17/2016 | | | | 1,444,453 | |
Pretium Mortgage Credit Partners, LLC, 11/27/2030 | | | 11/6/2015 | | | | 1,560,986 | |
Sunset Mortgage Loan Company, LLC, 9/18/2045 | | | 10/2/2015 | | | | 953,520 | |
Sunset Mortgage Loan Company, LLC, 7/16/2047 | | | 7/27/2016 | | | | 626,639 | |
US Residential Opportunity Fund Trust, 7/27/2036 | | | 7/20/2016 | | | | 1,472,691 | |
Vericrest Opportunity Loan Transferee, 2/25/2055 | | | 2/25/2015 | | | | 314,446 | |
Vericrest Opportunity Loan Transferee, 10/25/2058 | | | 2/6/2015 | | | | 1,199,148 | |
The following table presents the total amount of securities loaned with continuous maturity, by type, offset by the gross payable upon return of collateral for securities loaned by Thrivent Diversified Income Plus Fund as of December 31, 2016:
| | | | |
Securities Lending Transactions | | | |
Common Stock | | $ | 210,587 | |
| | | | |
Total lending | | $ | 210,587 | |
Gross amount payable upon return of collateral for securities loaned | | $ | 222,600 | |
| | | | |
Net amounts due to counterparty | | $ | 12,013 | |
| | | | |
Definitions:
| | | | |
ETF | | - | | Exchange Traded Fund. |
REIT | | - | | Real Estate Investment Trust is a company that buys, develops, manages and/or sells real estate assets. |
The accompanying Notes to Financial Statements are an integral part of this schedule.
31
| Item 7. | Disclosure of Proxy Voting Policies and Procedures for Closed-End Management Investment Companies |
Not applicable.
| Item 8. | Portfolio Managers of Closed-End Management Investment Companies |
Not applicable.
| Item 9. | Purchases of Equity Securities by Closed-End Management Investment Company and Affiliated Purchasers. |
Not applicable.
| Item 10. | Submission of Matters to a Vote of Security Holders |
There have been no material changes to the procedures by which shareholders may recommend nominees to registrant’s board of trustees.
| Item 11. | Controls and Procedures |
(a)(i) Registrant’s President and Treasurer have concluded that registrant’s disclosure controls and procedures (as defined in Rule 30a-3(c) under the Investment Company Act of 1940) are effective, based on their evaluation of these controls and procedures as of a date within 90 days of the filing date of this report.
(a)(ii) Registrant’s President and Treasurer are aware of no change in registrant’s internal control over financial reporting (as defined in Rule 30a-3(d) under the Investment Company Act of 1940) that occurred during registrant’s most recent fiscal quarter that has materially affected, or is reasonably likely to materially affect, registrant’s internal control over financial reporting.
(a) The code of ethics pursuant to Item 2 is attached hereto.
(b) Certifications pursuant to Rules 30a-2(a) and 30a-2(b) under the Investment Company Act of 1940 are attached hereto.
SIGNATURES
Pursuant to the requirements of the Securities Exchange Act of 1934 and the Investment Company Act of 1940, the registrant has duly caused this report to be signed on its behalf by the undersigned, thereunto duly authorized.
| | | | |
| Date: February 28, 2017 | | THRIVENT MUTUAL FUNDS |
| | | | |
| | |
| | By: | | |
| | | | /s/ David S. Royal |
| | | | David S. Royal |
| | | | President |
Pursuant to the requirements of the Securities Exchange Act of 1934 and the Investment Company Act of 1940, this report has been signed below by the following persons on behalf of the registrant and in the capacities and on the dates indicated.
| | | | |
| Date: February 28, 2017 | | By: | | |
| | | | /s/ David S. Royal |
| | | | David S. Royal |
| | | | President |
| | |
| Date: February 28, 2017 | | By: | | |
| | | | /s/ Gerard V. Vaillancourt |
| | | | Gerard V. Vaillancourt |
| | | | Treasurer |