UNITED STATES
SECURITIES AND EXCHANGE COMMISSION
Washington, D.C. 20549
FORM N-CSR
CERTIFIED SHAREHOLDER REPORT OF REGISTERED
MANAGEMENT INVESTMENT COMPANIES
Investment Company Act file number: 811-05075
Thrivent Mutual Funds
(Exact name of registrant as specified in charter)
625 Fourth Avenue South
Minneapolis, Minnesota 55415
(Address of principal executive offices) (Zip code)
Michael W. Kremenak
Secretary and Chief Legal Officer
625 Fourth Avenue South
Minneapolis, Minnesota 55415
(Name and address of agent for service)
Registrant’s telephone number, including area code: (612) 844-4198
Date of fiscal year end: October 31
Date of reporting period: October 31, 2016
| Item 1. | Report to Stockholders |

THRIVENT® MUTUAL FUNDS
OCTOBER 31, 2016
THRIVENT MUTUAL FUNDS ANNUAL REPORT
More than 250,000 members have given up paper.
Add yours to the stack!
Go paperless and start accessing reports and other documents online. Get started at Thrivent.com/gopaperless.
Some mutual fund account types may be restricted from eDelivery enrollment. See ThriventFunds.com for details.
TABLEOF CONTENTS
Dear Shareholder:
Through the second half of fiscal 2016, Thrivent Mutual Funds has continued to build on our success of the past few years.
Our investment team of more than 100 investment professionals and portfolio managers has continued to deliver strong relative performance for many of our 21 Thrivent Mutual Funds throughout fiscal 2016.
In addition, the longer-term performance of many of our funds has also been strong. Review the Portfolio Perspective section of this report for performance information.
This continues a run of success that we hope to continue well into the future. You may recall that in February of this year, Thrivent Mutual Funds was honored as one of the winners of the prestigious Thomson Reuters Lipper Fund Awards.
It was the second year in a row that Thomson Reuters Lipper, a well-known institution that tracks and compares mutual fund performance, has honored Thrivent Mutual Funds, based on three-year risk-adjusted performance (period ending November 30, 2015).
Thrivent Mutual Funds was named Best Overall—Small Fund Family, as well as the Best Mixed-Assets—Small Fund Family. This award covers six of our Funds: Thrivent Aggressive Allocation Fund, Thrivent Moderately Aggressive Allocation Fund, Thrivent Moderate Allocation Fund, Thrivent Moderately Conservative Allocation Fund, Thrivent Balanced Income Plus Fund, and Thrivent Diversified Income Plus Fund.
There will be periods, of course, in which our Funds underperform relative to their peers. But you can rest assured that we will always take a long-term view of fund performance and seek to provide consistently competitive returns over time.
We continue to stay focused on improving your shareholder experience and actively managing your funds in order to help you meet your particular investment goals. Thrivent Mutual Funds will continue to pursue new ways to serve you better and to provide innovative investment solutions.
Sincerely,

David S. Royal
President
Thrivent Mutual Funds
Some Thrivent Mutual Funds had fee waivers in effect for 2015. If these waivers had not been in effect, performance would have been lower for these funds. See ThriventFunds.com or the Prospectus for current waiver information.
*Award for US region only.
For the 2016 Thomson Reuters Lipper Fund Awards (based on period ended 11/30/2015), a small fund family is defined as having assets of $57.7 billion or less. The 2015 definition (based on period ending 11/30/2014) was $52.6 billion or less. Money Market assets are excluded. For 2016, 27 Fund Families were included in the Overall Small Fund Family group and 43 Fund Families were included in the Mixed-Assets Small Fund Family asset class group. For 2015, 38 Fund Families were included in the Mixed-Assets Small Fund Family asset class group. This recognition only indicates performance for the three-year time period.
Thomson Reuters Lipper methodology: Asset Class Group Awards and Overall Group Awards are given to the best large and best small fund families separately. Small fund family groups need to have at least 3 distinct portfolios in 1 of the asset classes (equity, bond, or mixed-asset) to qualify for an Asset Class Group award; they must have at least 3 equity, 3 bond and 3 mixed- asset funds to qualify for an Overall Group award.
The lowest average decile rank of the 3 years’ Consistent Return measure of the eligible funds per asset class and group will determine the Asset Class Group award winner over the 3-year period. An Overall Group award will be given to the group with the lowest weighted average decile ranking of its respective asset class results based on the methodology described above. In cases of identical results the lower average percentile rank will determine the winner. Front-end sales charges are not taken into consideration.
The Consistent Return measure takes into account both short- and long-term risk-adjusted performance relative to fund classification. The measure is based on the Effective Return computation. Effective Return is a risk-adjusted return measure that looks back over a variety of holding periods (measured in days, weeks, months, and/or years). Lipper ratings for Consistent Return reflect funds’ historical risk-adjusted returns, relative to peers.
Copyright 2016 Reuters. All rights reserved. Any copying, republication or redistribution of Lipper content is expressly prohibited without the prior written consent of Lipper.
2
Performance data cited represents past performance and should not be viewed as an indication of future results. Investment return and principal value of the investment will fluctuate so that an investor’s shares, when redeemed, may be worth more or less than the original cost. Current performance may be lower or higher than the performance data quoted. Call 800-847-4836 or visit ThriventFunds.com for performance results current to the most recent month-end.
Investing in a mutual fund involves risks, including the possible loss of principal. The prospectus contains more complete information on the investment objectives, risks, charges and expenses of the fund, which investors should read and consider carefully before investing. Prospectuses are available from a Thrivent Financial representative or at ThriventFunds.com.
3
Dear Shareholder:
The stock market experienced slow growth with very little volatility through the final six months of the fiscal year that ended October 31, 2016. After a gain of only 0.43% through the first six months of fiscal 2016, the S&P 500 Index was up 4.51% for the full 12-month period. Yields on U.S. 10-year Treasuries remained under 2% as investors continued to move to the bond market over concerns of a slowing economy and low or negative yields on government issues in Europe and Japan.
Economic Review
The U.S. economy experienced an uptick in gross domestic product (GDP) growth, which is the broadest measure of economic output. During the third quarter (through September 30, 2016), GDP grew at an annualized rate of 2.9%, according to the U.S. Commerce Department. However, that figure is somewhat deceiving. While net trade added 0.8%, this was driven by a huge surge in soybean exports due to a drought in South America. In addition, an inventory buildup added 0.6%. Neither development is considered to be sustainable.
The economy has been sluggish through much of the second half of fiscal 2016 due to a variety of factors, including declining corporate earnings, a slow recovery in the energy industry, an elevated dollar, and tepid consumer spending and manufacturing production, as well as a slow global economy.
Market Review
Although there was earlier speculation that the Federal Reserve (Fed) would begin raising interest rates this year, the slow economy convinced them to hold rates steady since December 2015, which was the last time rates were raised. However, we still believe the Fed may make one rate hike before the end of calendar year 2016.
In the stock market, much of the second half of our fiscal year has been characterized by a stagnant or slow market due to economic uncertainty. Although oil began to rebound during the first few months of 2016—from under $27 a barrel on February 11 to over $40 a barrel in April—price improvement has slowed since then, ending October at $48.24 a barrel (West Texas Crude). The S&P Energy Sector was up 15.27% for 2016 through October 31.
The global market has been in a stagnant phase over the past year. The MSCI EAFE Index, which tracks developed markets in Europe, Australasia and the Far East, posted a total return of just 0.22% for the 12-month period ended October 31. The MSCI Emerging Markets Index, which tracks stocks in developing economies, has done much better, posting a gain of 9.27% for the same 12-month period.
The bond market has been solid throughout 2016, although interest rates have remained historically low. The Bloomberg Barclays U.S. Aggregate Bond Index, which tracks a broad range of investment-grade bonds, was up 4.37% for the 12-month period ended October 31, 2016. But the yield for 10-year U.S. Treasuries has been under 2% for most of 2016. After dropping to an all-time low of 1.36% on July 8, 2016, the yield on Treasuries ended the period at 1.82%.
Our Outlook
The stronger-than-expected GDP growth in the third quarter could bode well for the stock market going forward although, as noted, the underlying details were not as impressive. As a result, we still anticipate a GDP growth rate of only about 1.5% for all of 2016, which is lower than the historic average.
Although job growth slowed during the past quarter, the unemployment rate is still hovering at about 4.9%, which is considered to be close to full employment. This slowdown in monthly job gains is a natural trend as the economy nears full employment. However, we still see some weakness in the jobs picture. Although the labor force participation rate for those in their prime working years (25 to 54 year olds) moved up to its highest level since 2012 at 81.7% in September, it is still about 1.5 percentage points below the pre-recession level.
While wage growth of 2.6% this year through September is encouraging, if wages continue to climb at a strong rate, that could impact corporate profit margins, which could become a headwind over the next 12 to 18 months.
Globally, over the next 12 months, we believe that China will have GDP growth of about 6%, Japan will have flat or negative growth, and Europe will have growth of about 1.6%. Actual reported annualized GDP growth through the second quarter of calendar year 2016 was 6.7% for China, 0.8% for Japan, and 1.6% for Europe.
In the U.S., despite weak corporate earnings growth and sluggish consumer spending, the economy has avoided recession so far, and we are not projecting a recession in the near term. We expect modest growth with a somewhat elevated risk of recession sometime in the next 12 months if job growth slows and consumer spending ebbs.
Sincerely,

Russell W. Swansen
Chief Investment Officer
Thrivent Mutual Funds
4
(This page intentionally left blank)
5
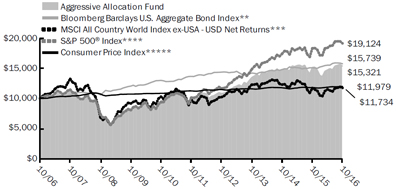
THRIVENT AGGRESSIVE ALLOCATION FUND
Russell W. Swansen, David C. Francis, CFA, Mark L. Simenstad, CFA, Darren M. Bagwell, CFA, and Stephen D. Lowe, CFA, Portfolio Co-Managers
The Fund seeks long-term capital growth.
The Fund invests in other Thrivent mutual funds and in directly held equity and debt instruments. The Fund is subject to its own fees and expenses and the expenses of the other funds in which it invests, and is subject to all of the risks of the other funds in which it invests. The value of the Fund is influenced by factors impacting the overall market, certain asset classes, certain investment styles, and specific issuers. The Fund may incur losses due to incorrect assessments of investments by its investment adviser. Foreign investments involve additional risks, including currency fluctuations, liquidity, political, economic and market instability, and different legal and accounting standards. Bond prices generally fall as interest rates rise. Credit risk is the risk that an issuer of a debt security may not pay its debt, and high yield securities are subject to increased credit risk as well as liquidity risk. The use of derivatives (such as futures and swaps) involves additional risks and transaction costs, which could leave the Fund in a worse position than if it had not used these instruments.
How did the Fund perform during the 12-month period ended October 31, 2016?
Thrivent Aggressive Allocation Fund earned a return of 1.34%, compared with the median return of its peer group, the Lipper Mixed-Asset Target Allocation Aggressive Growth Funds category, of 1.51%. The Fund’s market benchmarks, the S&P 500® Index, the Bloomberg Barclays U.S. Aggregate Bond Index and the MSCI All Country World Index ex-USA - USD Net Returns, earned returns of 4.51%, 4.37% and 0.22%, respectively.
What factors affected the Fund’s performance?
The primary factors impacting performance were the Fund’s equity and fixed-income allocations and security selection within the equity and bond portfolios. We positioned the Fund with a moderate underweighting to equity securities for much of the period, but this was not a significant factor given that stock and bond market returns domestically were similar. However, within equities, the portfolio was overweighted in international versus domestic stocks, which had the greatest effect on returns because U.S. stocks generally outperformed international stocks. Stock selection was generally favorable both domestically and internationally, particularly in the small- and mid-cap segments of the portfolio. The Fund’s large-cap allocations were generally behind their benchmarks.
Over the period, the Treasury yield curve flattened significantly, meaning that yields on shorter-term Treasuries rose while yields on Treasuries of five years and longer fell substantially. Rates on short-term securities rose because the Federal Reserve delivered a rate hike in December 2015, and the market began to price in another hike in late 2016. Rates on longer-term securities declined due to concerns about slow economic growth and low inflation, along with increased foreign demand for higher-yielding U.S. securities from Europe and Japan, where yields dove into negative territory. Plunging commodity prices and slowing economic growth caused corporate credit to sell off in the first few months of the period, but the segment rebounded as a result of recovering commodities and monetary policy easing by global central banks. Corporate bond returns were strong, with yield spreads over Treasuries declining as investors sought out higher-yielding assets.
The fixed-income portion of the Fund outperformed in part because it was positioned with a long duration. This duration stance made the portfolio more sensitive to interest rate changes, which helped as long-term rates declined. The Fund also benefited from the flattening in the Treasury yield curve. Additionally, the Fund was overweighted in corporate credit and underweighted in U.S. Treasury securities, which boosted results since corporate bonds significantly outperformed Treasuries. Within credit, our high-yield exposure underperformed relative to the benchmark’s high-yield holdings due to our higher-quality bias because the riskier segments of high yield posted stronger returns. This was offset by strong performance from the Fund’s investment-grade corporate bonds and leveraged loans. Additionally, holdings in U.S. agency and nonagency mortgage-backed securities contributed to outperformance within fixed income.
What is your outlook?
Equity valuations are quite full and fixed-income markets are generally being distorted by the actions of central bankers targeting low interest rates in hopes of stimulating economic growth and mitigating deflationary pressures. Negative interest rates can be found across broad sections of sovereign bonds in developed markets outside the U.S. and are intended to stimulate growth. Central bank actions are appearing increasingly ineffective, while calls for fiscal stimulus and regulatory relief are becoming more prevalent as necessary policy actions to achieve the dual goals of accelerating economic growth and modest inflation. We continue to believe equity markets are already discounting success in achieving these goals and are not prepared for incremental ineffective policy actions; therefore, we remain modestly defensive. We anticipate the actions will ultimately be effective, but are mindful of the risks.
Quoted Fund performance is for Class A shares and does not reflect a sales charge.
The returns shown do not reflect taxes a shareholder would pay on distributions or redemptions.
6
| | | | |
| Portfolio Composition | | | | |
| (% of Portfolio) | | | | |
Large Cap | | | 42.4 | % |
International | | | 19.8 | % |
Small Cap | | | 17.8 | % |
Short-Term Investments | | | 9.2 | % |
Mid Cap | | | 6.1 | % |
Investment Grade Debt | | | 4.1 | % |
High Yield | | | 0.6 | % |
| | | | |
Total | | | 100.0 | % |
Top 10 Holdings | | | | |
| (% of Net Assets) | | | | |
Thrivent Partner Worldwide Allocation Fund | | | 12.3 | % |
Thrivent Large Cap Growth Fund | | | 7.1 | % |
Thrivent Mid Cap Stock Fund | | | 6.4 | % |
Thrivent Large Cap Value Fund | | | 6.0 | % |
Thrivent Large Cap Stock Fund | | | 3.3 | % |
Thrivent Small Cap Stock Fund | | | 2.9 | % |
Thrivent Limited Maturity Bond Fund | | | 0.8 | % |
Amazon.com, Inc. | | | 0.7 | % |
SPDR S&P 500 ETF Trust | | | 0.7 | % |
Thrivent High Yield Fund | | | 0.6 | % |
| |
These securities represent 40.8% of the total net assets of the Fund. | | | | |
Portfolio Composition illustrates market exposure of all asset classes, including derivatives.
The list of Top 10 Holdings excludes short-term investments.
Quoted Portfolio Composition and Top 10 Holdings are subject to change.
Average Annual Total Returns1
As of October 31, 2016
| | | | | | | | | | | | |
| Class A2 | | 1-Year | | | 5 Years | | | 10 Years | |
without sales charge | | | 1.34 | % | | | 8.96 | % | | | 4.84 | % |
with sales charge | | | -3.20 | % | | | 7.95 | % | | | 4.36 | % |
| | | |
| Class S | | 1-Year | | | 5 Years | | | 10 Years | |
Net Asset Value | | | 1.76 | % | | | 9.41 | % | | | 5.23 | % |
Value of a $10,000 Investment
Class A Shares *,1,(a )
| 1 | Past performance is not an indication of future results. Average annual total returns represent past performance and reflect changes in share prices, the reinvestment of all dividends and capital gains, and the effects of compounding. The prospectus contains more complete information on the investment objectives, risks, charges and expenses of the investment company, which investors should read and consider carefully before investing. To obtain a prospectus, contact a registered representative or visit ThriventFunds.com. At various times, the Fund’s adviser waived its management fee and/or reimbursed Fund expenses. Had the adviser not done so, the Fund’s total returns would have been lower. The returns shown do not reflect taxes a shareholder would pay on distributions or redemptions. Total investment return and principal value of your investment will fluctuate, and your shares, when redeemed, may be worth more or less than their original cost. Current performance may be higher or lower than the performance data quoted. Call 800-THRIVENT (847-4836) or visit ThriventFunds.com for performance results current to the most recent month-end. |
| 2 | Class A performance with sales charge reflects the maximum sales charge of 4.5%. |
| (a) | Performance of other classes will be greater or less than the line shown based on the differences in loads and fees paid by shareholders investing in the different classes. |
| * | As you compare performance, please note that the Fund’s performance reflects the maximum 4.5% sales charge, while the Consumer Price Index, the MSCI All Country World Index ex-USA - USD Net Returns, the S&P 500® Index and the Bloomberg Barclays U.S. Aggregate Bond Index do not reflect any such charges. If you were to purchase any of the above individual securities represented in those Indexes, any charges you would pay would reduce your total return as well. |
| ** | The Bloomberg Barclays U.S. Aggregate Bond Index is an index that measures the performance of U.S. investment grade bonds. It is not possible to invest directly in the Index. The performance of the Index does not reflect deductions for fees, expenses or taxes. |
| *** | The MSCI All Country World Index ex-USA - USD Net Returns is an unmanaged market capitalization-weighted index that is designed to represent the performance of developed and emerging stock markets throughout the world. It is not possible to invest directly in the Index. The performance of the Index does not reflect deductions for fees, expenses or taxes. |
| **** | The S&P 500® Index is an index that represents the average performance of a group of 500 widely held, publicly traded stocks. “S&P 500®” is a trademark of The McGraw-Hill Companies, Inc. and has been licensed for use by Thrivent Financial for Lutherans. The product is not sponsored, endorsed or promoted by Standard & Poor’s and Standard & Poor’s makes no representation regarding the advisability of investing in the product. It is not possible to invest directly in the Index. The performance of the Index does not reflect deductions for fees, expenses or taxes. |
| ***** | The consumer Price Index is an inflationary indicator that measures the change in the cost of a fixed basket of products and services, including housing, electricity, food and transportation. It is not possible to invest directly in the Index. |
7
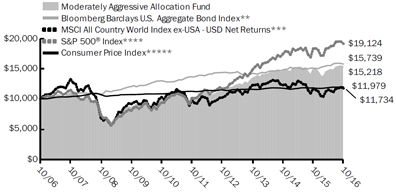
THRIVENT MODERATELY AGGRESSIVE ALLOCATION FUND
Russell W. Swansen, David C. Francis, CFA, Mark L. Simenstad, CFA, Darren M. Bagwell, CFA, and Stephen D. Lowe, CFA, Portfolio Co-Managers
The Fund seeks long-term capital growth.
The Fund invests in other Thrivent mutual funds and in directly held equity and debt instruments. The Fund is subject to its own fees and expenses and the expenses of the other funds in which it invests, and is subject to all of the risks of the other funds in which it invests. The value of the Fund is influenced by factors impacting the overall market, certain asset classes, certain investment styles, and specific issuers. The Fund may incur losses due to incorrect assessments of investments by its investment adviser. Foreign investments involve additional risks, including currency fluctuations, liquidity, political, economic and market instability, and different legal and accounting standards. Bond prices generally fall as interest rates rise. Credit risk is the risk that an issuer of a debt security may not pay its debt, and high yield securities are subject to increased credit risk as well as liquidity risk. The use of derivatives (such as futures and swaps) involves additional risks and transaction costs, which could leave the Fund in a worse position than if it had not used these instruments.
How did the Fund perform during the 12-month period ended October 31, 2016?
Thrivent Moderately Aggressive Allocation Fund earned a return of 2.36%, compared with the median return of its peer group, the Lipper Mixed-Asset Target Allocation Growth Funds category, of 2.33%. The Fund’s market benchmarks, the S&P 500® Index, the Bloomberg Barclays U.S. Aggregate Bond Index and the MSCI All Country World Index ex-USA - USD Net Returns, earned returns of 4.51%, 4.37% and 0.22%, respectively.
What factors affected the Fund’s performance?
The primary factors impacting performance were the Fund’s equity and fixed-income allocations and security selection within the equity and bond portfolios. We positioned the Fund with a moderate underweighting to equity securities for much of the period, but this was not a significant factor given that stock and bond market returns domestically were similar. However, within equities, the portfolio was overweighted in international versus domestic stocks, which had the greatest effect on returns because U.S. stocks generally outperformed international stocks. Stock selection was generally favorable both domestically and internationally, particularly in the small- and mid-cap segments of the portfolio. The Fund’s large-cap allocations were generally behind their benchmarks.
Over the period, the Treasury yield curve flattened significantly, meaning that yields on shorter-term Treasuries rose while yields on Treasuries of five years and longer fell substantially. Rates on short-term securities rose because the Federal Reserve delivered a rate hike in December 2015, and the market began to price in another hike in late 2016. Rates on longer-term securities declined due to concerns about slow economic growth and low inflation, along with increased foreign demand for higher-yielding U.S. securities from Europe and Japan, where yields dove into negative territory. Plunging commodity prices and slowing economic growth caused corporate credit to sell off in the first few months of the period, but the segment rebounded as a result of recovering commodities and monetary policy easing by global central banks. Corporate bond returns were strong, with yield spreads over Treasuries declining as investors sought out higher-yielding assets.
The fixed-income portion of the Fund outperformed in part because it was positioned with a long duration. This duration stance made the portfolio more sensitive to interest rate changes, which helped as long-term rates declined. The Fund also benefited from the flattening in the Treasury yield curve. Additionally, the Fund was overweighted in corporate credit and underweighted in U.S. Treasury securities, which boosted results since corporate bonds significantly outperformed Treasuries. Within credit, our high-yield exposure underperformed relative to the benchmark’s high-yield holdings due to our higher-quality bias because the riskier segments of high yield posted stronger returns. This was offset by strong performance from the Fund’s investment-grade corporate bonds and leveraged loans. Additionally, holdings in U.S. agency and nonagency mortgage-backed securities contributed to outperformance within fixed income.
What is your outlook?
Equity valuations are quite full and fixed-income markets are generally being distorted by the actions of central bankers targeting low interest rates in hopes of stimulating economic growth and mitigating deflationary pressures. Negative interest rates can be found across broad sections of sovereign bonds in developed markets outside the U.S. and are intended to stimulate growth. Central bank actions are appearing increasingly ineffective, while calls for fiscal stimulus and regulatory relief are becoming more prevalent as necessary policy actions to achieve the dual goals of accelerating economic growth and modest inflation. We continue to believe equity markets are already discounting success in achieving these goals and are not prepared for incremental ineffective policy actions; therefore, we remain modestly defensive. We anticipate the actions will ultimately be effective, but are mindful of the risks.
Quoted Fund performance is for Class A shares and does not reflect a sales charge.
The returns shown do not reflect taxes a shareholder would pay on distributions or redemptions.
8
| | | | |
| Portfolio Composition | | | | |
| (% of Portfolio) | | | | |
Large Cap | | | 35.4 | % |
Investment Grade Debt | | | 16.4 | % |
International | | | 13.6 | % |
Small Cap | | | 12.4 | % |
Short-Term Investments | | | 11.0 | % |
Mid Cap | | | 6.5 | % |
High Yield | | | 2.4 | % |
Floating Rate Debt | | | 2.3 | % |
| | | | |
Total | | | 100.0 | % |
Top 10 Holdings | | | | |
| (% of Net Assets) | | | | |
Thrivent Partner Worldwide Allocation Fund | | | 10.3 | % |
Thrivent Large Cap Value Fund | | | 8.5 | % |
Thrivent Large Cap Growth Fund | | | 6.9 | % |
Thrivent Mid Cap Stock Fund | | | 6.1 | % |
Thrivent Large Cap Stock Fund | | | 5.1 | % |
Thrivent Income Fund | | | 3.0 | % |
Federal National Mortgage Association Conventional 30-Yr. Pass Through | | | 1.9 | % |
Thrivent Limited Maturity Bond Fund | | | 1.7 | % |
Thrivent Small Cap Stock Fund | | | 1.7 | % |
Federal National Mortgage Association Conventional 30-Yr. Pass Through | | | 1.0 | % |
| |
These securities represent 46.2% of the total net assets of the Fund. | | | | |
Portfolio Composition illustrates market exposure of all asset classes, including derivatives.
The list of Top 10 Holdings excludes short-term investments.
Quoted Portfolio Composition and Top 10 Holdings are subject to change.
Average Annual Total Returns1
As of October 31, 2016
| | | | | | | | | | | | |
| Class A2 | | 1-Year | | | 5 Years | | | 10 Years | |
without sales charge | | | 2.36 | % | | | 8.21 | % | | | 4.77 | % |
with sales charge | | | -2.27 | % | | | 7.22 | % | | | 4.29 | % |
| | | |
| Class S | | 1-Year | | | 5 Years | | | 10 Years | |
Net Asset Value | | | 2.66 | % | | | 8.61 | % | | | 5.14 | % |
Value of a $10,000 Investment
Class A Shares *,1,(a )
| 1 | Past performance is not an indication of future results. Average annual total returns represent past performance and reflect changes in share prices, the reinvestment of all dividends and capital gains, and the effects of compounding. The prospectus contains more complete information on the investment objectives, risks, charges and expenses of the investment company, which investors should read and consider carefully before investing. To obtain a prospectus, contact a registered representative or visit ThriventFunds.com. At various times, the Fund’s adviser waived its management fee and/or reimbursed Fund expenses. Had the adviser not done so, the Fund’s total returns would have been lower. The returns shown do not reflect taxes a shareholder would pay on distributions or redemptions. Total investment return and principal value of your investment will fluctuate, and your shares, when redeemed, may be worth more or less than their original cost. Current performance may be higher or lower than the performance data quoted. Call 800-THRIVENT (847-4836) or visit ThriventFunds.com for performance results current to the most recent month-end. |
| 2 | Class A performance with sales charge reflects the maximum sales charge of 4.5%. |
| (a) | Performance of other classes will be greater or less than the line shown based on the differences in loads and fees paid by shareholders investing in the different classes. |
| * | As you compare performance, please note that the Fund’s performance reflects the maximum 4.5% sales charge, while the Consumer Price Index, the MSCI All Country World Index ex-USA - USD Net Returns, the S&P 500® Index and the Bloomberg Barclays U.S. Aggregate Bond Index do not reflect any such charges. If you were to purchase any of the above individual securities represented in those Indexes, any charges you would pay would reduce your total return as well. |
| ** | The Bloomberg Barclays U.S. Aggregate Bond Index is an index that measures the performance of U.S. investment grade bonds. It is not possible to invest directly in the Index. The performance of the Index does not reflect deductions for fees, expenses or taxes. |
| *** | The MSCI All Country World Index ex-USA - USD Net Returns is an unmanaged market capitalization-weighted index that is designed to represent the performance of developed and emerging stock markets throughout the world. It is not possible to invest directly in the Index. The performance of the Index does not reflect deductions for fees, expenses or taxes. |
| **** | The S&P 500® Index is an index that represents the average performance of a group of 500 widely held, publicly traded stocks. “S&P 500®” is a trademark of The McGraw-Hill Companies, Inc. and has been licensed for use by Thrivent Financial for Lutherans. The product is not sponsored, endorsed or promoted by Standard & Poor’s and Standard & Poor’s makes no representation regarding the advisability of investing in the product. It is not possible to invest directly in the Index. The performance of the Index does not reflect deductions for fees, expenses or taxes. |
| ***** | The consumer Price Index is an inflationary indicator that measures the change in the cost of a fixed basket of products and services, including housing, electricity, food and transportation. It is not possible to invest directly in the Index. |
9
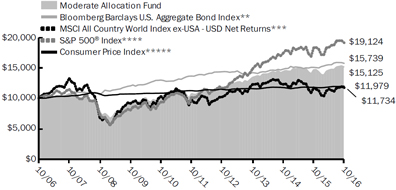
THRIVENT MODERATE ALLOCATION FUND
Russell W. Swansen, David C. Francis, CFA, Mark L. Simenstad, CFA, Darren M. Bagwell, CFA, and Stephen D. Lowe, CFA, Portfolio Co-Managers
The Fund seeks long-term capital growth while providing reasonable stability of principal.
The Fund invests in other Thrivent mutual funds and in directly held equity and debt instruments. The Fund is subject to its own fees and expenses and the expenses of the other funds in which it invests, and is subject to all of the risks of the other funds in which it invests. The value of the Fund is influenced by factors impacting the overall market, certain asset classes, certain investment styles, and specific issuers. The Fund may incur losses due to incorrect assessments of investments by its investment adviser. Foreign investments involve additional risks, including currency fluctuations, liquidity, political, economic and market instability, and different legal and accounting standards. Bond prices generally fall as interest rates rise. Credit risk is the risk that an issuer of a debt security may not pay its debt, and high yield securities are subject to increased credit risk as well as liquidity risk. The use of derivatives (such as futures and swaps) involves additional risks and transaction costs, which could leave the Fund in a worse position than if it had not used these instruments.
How did the Fund perform during the 12-month period ended October 31, 2016?
Thrivent Moderate Allocation Fund earned a return of 3.06%, compared with the median return of its peer group, the Lipper Mixed-Asset Target Allocation Moderate Funds category, of 3.08%. The Fund’s market benchmarks, the S&P 500® Index, the Bloomberg Barclays U.S. Aggregate Bond Index and the MSCI All Country World Index ex-USA - USD Net Returns, earned returns of 4.51%, 4.37%, and 0.22%, respectively.
What factors affected the Fund’s performance?
The primary factors impacting performance were the Fund’s equity and fixed-income allocations and security selection within the equity and bond portfolios. We positioned the Fund with a moderate underweighting to equity securities for much of the period, but this was not a significant factor given stock and bond market returns domestically were similar. However, within equities, the portfolio was overweighted in international versus domestic stocks, which had the greatest effect on returns because U.S. stocks generally outperformed international stocks. Stock selection was generally favorable both domestically and internationally, particularly in the small- and mid-cap segments of the portfolio. The Fund’s large-cap allocations were generally behind their benchmarks.
Over the period, the Treasury yield curve flattened significantly, meaning that yields on shorter-term Treasuries rose while yields on Treasuries of five years and longer fell substantially. Rates on short-term securities rose because the Federal Reserve delivered a rate hike in December 2015, and the market began to price in another hike in late 2016. Rates on longer-term securities declined due to concerns about slow economic growth and low inflation, along with increased foreign demand for higher-yielding U.S. securities from Europe and Japan, where yields dove into negative territory. Plunging commodity prices and slowing economic growth caused corporate credit to sell off in the first few months of the period, but the segment rebounded as a result of recovering commodities and monetary policy easing by global central banks. Corporate bond returns were strong, with yield spreads over Treasuries declining as investors sought out higher-yielding assets.
The fixed-income portion of the Fund outperformed in part because it was positioned with a long duration. This duration stance made the portfolio more sensitive to interest rate changes, which helped as long-term rates declined. The Fund also benefited from the flattening in the Treasury yield curve. Additionally, the Fund was overweighted in corporate credit and underweighted in U.S. Treasury securities, which boosted results since corporates significantly outperformed Treasuries. Within credit, our high-yield exposure underperformed relative to the benchmark’s high-yield holdings due to our higher-quality bias because the riskier segments of high yield posted stronger returns. This was offset by strong performance from the Fund’s investment-grade corporate bonds and leveraged loans. Additionally, holdings in U.S. agency and nonagency mortgage-backed securities contributed to outperformance within fixed income.
What is your outlook?
Equity valuations are quite full and fixed-income markets are generally being distorted by the actions of central bankers targeting low interest rates in hopes of stimulating economic growth and mitigating deflationary pressures. Negative interest rates can be found across broad sections of sovereign bonds in developed markets outside the U.S. and are intended to stimulate growth. Central bank actions are appearing increasingly ineffective, while calls for fiscal stimulus and regulatory relief are becoming more prevalent as necessary policy actions to achieve the dual goals of accelerating economic growth and modest inflation. We continue to believe equity markets are already discounting success in achieving these goals and are not prepared for incremental ineffective policy actions; therefore, we remain modestly defensive. We anticipate the actions will ultimately be effective, but are mindful of the risks.
Quoted Fund performance is for Class A shares and does not reflect a sales charge.
The returns shown do not reflect taxes a shareholder would pay on distributions or redemptions.
10
| | | | |
Portfolio Composition | | | | |
(% of Portfolio) | | | | |
Investment Grade Debt | | | 31.1 | % |
Large Cap | | | 23.6 | % |
Short-Term Investments | | | 13.8 | % |
International | | | 10.5 | % |
Small Cap | | | 8.7 | % |
Mid Cap | | | 4.4 | % |
High Yield | | | 4.3 | % |
Floating Rate Debt | | | 3.6 | % |
| | | | |
Total | | | 100.0 | % |
| | | | |
Top 10 Holdings | | | | |
(% of Net Assets) | | | | |
Thrivent Large Cap Value Fund | | | 7.7 | % |
Thrivent Partner Worldwide Allocation Fund | | | 5.9 | % |
Thrivent Large Cap Growth Fund | | | 5.9 | % |
Thrivent Income Fund | | | 5.8 | % |
Thrivent Mid Cap Stock Fund | | | 4.3 | % |
Federal National Mortgage Association Conventional 30-Yr. Pass Through | | | 3.7 | % |
Thrivent Limited Maturity Bond Fund | | | 3.3 | % |
Federal National Mortgage Association Conventional 30-Yr. Pass Through | | | 2.2 | % |
Thrivent Large Cap Stock Fund | | | 2.1 | % |
Thrivent High Yield Fund | | | 1.8 | % |
These securities represent 42.7% of the total net assets of the Fund. | | | | |
Portfolio Composition illustrates market exposure of all asset classes, including derivatives.
The list of Top 10 Holdings excludes short-term investments.
Quoted Portfolio Composition and Top 10 Holdings are subject to change.
Average Annual Total Returns1
As of October 31, 2016
| | | | | | | | | | | | |
| Class A2 | | 1-Year | | | 5 Years | | | 10 Years | |
without sales charge | | | 3.06 | % | | | 7.03 | % | | | 4.71 | % |
with sales charge | | | -1.66 | % | | | 6.05 | % | | | 4.23 | % |
| | | |
| Class S | | 1-Year | | | 5 Years | | | 10 Years | |
Net Asset Value | | | 3.31 | % | | | 7.38 | % | | | 5.04 | % |
Value of a $10,000 Investment
Class A Shares*,1,(a )
| 1 | Past performance is not an indication of future results. Average annual total returns represent past performance and reflect changes in share prices, the reinvestment of all dividends and capital gains, and the effects of compounding. The prospectus contains more complete information on the investment objectives, risks, charges and expenses of the investment company, which investors should read and consider carefully before investing. To obtain a prospectus, contact a registered representative or visit ThriventFunds.com. At various times, the Fund’s adviser waived its management fee and/or reimbursed Fund expenses. Had the adviser not done so, the Fund’s total returns would have been lower. The returns shown do not reflect taxes a shareholder would pay on distributions or redemptions. Total investment return and principal value of your investment will fluctuate, and your shares, when redeemed, may be worth more or less than their original cost. Current performance may be higher or lower than the performance data quoted. Call 800-THRIVENT (847-4836) or visit ThriventFunds.com for performance results current to the most recent month-end. |
| 2 | Class A performance with sales charge reflects the maximum sales charge of 4.5%. |
| (a) | Performance of other classes will be greater or less than the line shown based on the differences in loads and fees paid by shareholders investing in the different classes. |
| * | As you compare performance, please note that the Fund’s performance reflects the maximum 4.5% sales charge, while the Consumer Price Index, the MSCI All Country World Index ex-USA - USD Net Returns, the S&P 500® Index and the Bloomberg Barclays U.S. Aggregate Bond Index do not reflect any such charges. If you were to purchase any of the above individual securities represented in those Indexes, any charges you would pay would reduce your total return as well. |
| ** | The Bloomberg Barclays U.S. Aggregate Bond Index is an index that measures the performance of U.S. investment grade bonds. It is not possible to invest directly in the Index. The performance of the Index does not reflect deductions for fees, expenses or taxes. |
| *** | The MSCI All Country World Index ex-USA - USD Net Returns is an unmanaged market capitalization-weighted index that is designed to represent the performance of developed and emerging stock markets throughout the world. It is not possible to invest directly in the Index. The performance of the Index does not reflect deductions for fees, expenses or taxes. |
| **** | The S&P 500® Index is an index that represents the average performance of a group of 500 widely held, publicly traded stocks. “S&P 500®” is a trademark of The McGraw-Hill Companies, Inc. and has been licensed for use by Thrivent Financial for Lutherans. The product is not sponsored, endorsed or promoted by Standard & Poor’s and Standard & Poor’s makes no representation regarding the advisability of investing in the product. It is not possible to invest directly in the Index. The performance of the Index does not reflect deductions for fees, expenses or taxes. |
| ***** | The consumer Price Index is an inflationary indicator that measures the change in the cost of a fixed basket of products and services, including housing, electricity, food and transportation. It is not possible to invest directly in the Index. |
11
THRIVENT MODERATELY CONSERVATIVE ALLOCATION FUND
Russell W. Swansen, David C. Francis, CFA, Mark L. Simenstad, CFA, Darren M. Bagwell, CFA, and Stephen D. Lowe, CFA, Portfolio Co-Managers
The Fund seeks long-term capital growth while providing reasonable stability of principal.
The Fund invests in other Thrivent mutual funds and in directly held equity and debt instruments. The Fund is subject to its own fees and expenses and the expenses of the other funds in which it invests, and is subject to all of the risks of the other funds in which it invests. The value of the Fund is influenced by factors impacting the overall market, certain asset classes, certain investment styles, and specific issuers. The Fund may incur losses due to incorrect assessments of investments by its investment adviser. Foreign investments involve additional risks, including currency fluctuations, liquidity, political, economic and market instability, and different legal and accounting standards. Bond prices generally fall as interest rates rise. Credit risk is the risk that an issuer of a debt security may not pay its debt, and high yield securities are subject to increased credit risk as well as liquidity risk. The use of derivatives (such as futures and swaps) involves additional risks and transaction costs, which could leave the Fund in a worse position than if it had not used these instruments.
How did the Fund perform during the 12-month period ended October 31, 2016?
Thrivent Moderately Conservative Allocation Fund earned a return of 3.65%, compared with the median return of its peer group, the Lipper Mixed-Asset Target Allocation Conservative Funds category, of 3.25%. The Fund’s market benchmarks, the S&P 500® Index, the Bloomberg Barclays U.S. Aggregate Bond Index and the MSCI All Country World Index ex-USA - USD Net Returns, earned returns of 4.51%, 4.37%, and 0.22%, respectively.
What factors affected the Fund’s performance?
The primary factors impacting performance were the Fund’s equity and fixed-income allocations and security selection within the equity and bond portfolios. We positioned the Fund with a moderate underweighting to equity securities for much of the period, but this was not a significant factor given that stock and bond market returns domestically were similar. However, within equities, the portfolio was overweighted in international versus domestic stocks, which had the greatest effect on returns because U.S. stocks generally outperformed international stocks. Stock selection was generally favorable both domestically and internationally, particularly in the small- and mid-cap segments of the portfolio. The Fund’s large-cap allocations were generally behind their benchmarks.
Over the period, the Treasury yield curve flattened significantly, meaning that yields on shorter-term Treasuries rose while yields on Treasuries of five years and longer fell substantially. Rates on short-term securities rose because the Federal Reserve delivered a rate hike in December 2015, and the market began to price in another hike in late 2016. Rates on longer-term securities declined due to concerns about slow economic growth and low inflation, along with increased foreign demand for higher-yielding U.S. securities from Europe and Japan, where yields dove into negative territory. Plunging commodity prices and slowing economic growth caused corporate credit to sell off in the first few months of the period, but the segment rebounded as a result of recovering commodities and monetary policy easing by global central banks. Corporate bond returns were strong, with yield spreads over Treasuries declining as investors sought out higher-yielding assets.
The fixed-income portion of the Fund outperformed in part because it was positioned with a long duration. This duration stance made the portfolio more sensitive to interest rate changes, which helped as long-term rates declined. The Fund also benefited from the flattening in the Treasury yield curve. Additionally, the Fund was overweighted in corporate credit and underweighted in U.S. Treasury securities, which boosted results since corporate bonds significantly outperformed Treasuries. Within credit, our high-yield exposure underperformed relative to the benchmark’s high-yield holdings due to our higher-quality bias because the riskier segments of high yield posted stronger returns. This was offset by strong performance from the Fund’s investment-grade corporate bonds and leveraged loans. Additionally, holdings in U.S. agency and nonagency mortgage-backed securities contributed to outperformance within fixed income.
What is your outlook?
Equity valuations are quite full and fixed-income markets are generally being distorted by the actions of central bankers targeting low interest rates in hopes of stimulating economic growth and mitigating deflationary pressures. Negative interest rates can be found across broad sections of sovereign bonds in developed markets outside the U.S. and are intended to stimulate growth. Central bank actions are appearing increasingly ineffective, while calls for fiscal stimulus and regulatory relief are becoming more prevalent as necessary policy actions to achieve the dual goals of accelerating economic growth and modest inflation. We continue to believe equity markets are already discounting success in achieving these goals and are not prepared for incremental ineffective policy actions; therefore, we remain modestly defensive. We anticipate the actions will ultimately be effective, but are mindful of the risks.
Quoted Fund performance is for Class A shares and does not reflect a sales charge.
The returns shown do not reflect taxes a shareholder would pay on distributions or redemptions.
12
| | | | |
Portfolio Composition | | | | |
(% of Portfolio) | | | | |
Investment Grade Debt | | | 42.4 | % |
Short-Term Investments | | | 16.4 | % |
Large Cap | | | 16.2 | % |
Floating Rate Debt | | | 6.7 | % |
International | | | 6.0 | % |
High Yield | | | 6.0 | % |
Small Cap | | | 3.9 | % |
Mid Cap | | | 2.4 | % |
| | | | |
Total | | | 100.0 | % |
| | | | |
Top 10 Holdings | | | | |
(% of Net Assets) | | | | |
Thrivent Income Fund | | | 8.5 | % |
Thrivent Large Cap Value Fund | | | 6.3 | % |
Federal National Mortgage Association Conventional 30-Yr. Pass Through | | | 5.0 | % |
Thrivent Limited Maturity Bond Fund | | | 4.8 | % |
Thrivent Partner Worldwide Allocation Fund | | | 4.3 | % |
Thrivent Large Cap Growth Fund | | | 2.8 | % |
Thrivent High Yield Fund | | | 2.6 | % |
Federal National Mortgage Association Conventional 30-Yr. Pass Through | | | 2.6 | % |
U.S. Treasury Notes | | | 2.1 | % |
Federal National Mortgage Association Conventional | | | 1.9 | % |
These securities represent 40.9% of the total net assets of the Fund. | | | | |
Portfolio Composition illustrates market exposure of all asset classes, including derivatives.
The list of Top 10 Holdings excludes short-term investments.
Quoted Portfolio Composition and Top 10 Holdings are subject to change.
Average Annual Total Returns1
As of October 31, 2016
| | | | | | | | | | | | |
| Class A2 | | 1-Year | | | 5 Years | | | 10 Years | |
without sales charge | | | 3.65 | % | | | 5.56 | % | | | 4.31 | % |
with sales charge | | | -1.02 | % | | | 4.58 | % | | | 3.84 | % |
| | | |
| Class S | | 1-Year | | | 5 Years | | | 10 Years | |
Net Asset Value | | | 4.05 | % | | | 5.92 | % | | | 4.62 | % |
Value of a $10,000 Investment
Class A Shares*,1,(a )

| 1 | Past performance is not an indication of future results. Average annual total returns represent past performance and reflect changes in share prices, the reinvestment of all dividends and capital gains, and the effects of compounding. The prospectus contains more complete information on the investment objectives, risks, charges and expenses of the investment company, which investors should read and consider carefully before investing. To obtain a prospectus, contact a registered representative or visit ThriventFunds.com. At various times, the Fund’s adviser waived its management fee and/or reimbursed Fund expenses. Had the adviser not done so, the Fund’s total returns would have been lower. The returns shown do not reflect taxes a shareholder would pay on distributions or redemptions. Total investment return and principal value of your investment will fluctuate, and your shares, when redeemed, may be worth more or less than their original cost. Current performance may be higher or lower than the performance data quoted. Call 800-THRIVENT (847-4836) or visit ThriventFunds.com for performance results current to the most recent month-end. |
| 2 | Class A performance with sales charge reflects the maximum sales charge of 4.5%. |
| (a) | Performance of other classes will be greater or less than the line shown based on the differences in loads and fees paid by shareholders investing in the different classes. |
| * | As you compare performance, please note that the Fund’s performance reflects the maximum 4.5% sales charge, while the Consumer Price Index, the MSCI All Country World Index ex-USA – USD Net Returns, the S&P 500® Index and the Bloomberg Barclays U.S. Aggregate Bond Index do not reflect any such charges. If you were to purchase any of the above individual securities represented in those Indexes, any charges you would pay would reduce your total return as well. |
| ** | The Bloomberg Barclays U.S. Aggregate Bond Index is an index that measures the performance of U.S. investment grade bonds. It is not possible to invest directly in the Index. The performance of the Index does not reflect deductions for fees, expenses or taxes. |
| *** | The MSCI All Country World Index ex-USA - USD Net Returns is an unmanaged market capitalization-weighted index that is designed to represent the performance of developed and emerging stock markets throughout the world. It is not possible to invest directly in the Index. The performance of the Index does not reflect deductions for fees, expenses or taxes. |
| **** | The S&P 500® Index is an index that represents the average performance of a group of 500 widely held, publicly traded stocks. “S&P 500®” is a trademark of The McGraw-Hill Companies, Inc. and has been licensed for use by Thrivent Financial for Lutherans. The product is not sponsored, endorsed or promoted by Standard & Poor’s and Standard & Poor’s makes no representation regarding the advisability of investing in the product. It is not possible to invest directly in the Index. The performance of the Index does not reflect deductions for fees, expenses or taxes. |
| ***** | The consumer Price Index is an inflationary indicator that measures the change in the cost of a fixed basket of products and services, including housing, electricity, food and transportation. It is not possible to invest directly in the Index. |
13
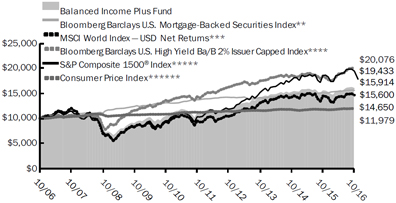
THRIVENT BALANCED INCOME PLUS FUND
Mark L. Simenstad, CFA, Noah J. Monsen, CFA, Reginald L. Pfeifer, CFA, Stephen D. Lowe, CFA, and John T. Groton, CFA, Portfolio Co-Managers
The Fund seeks long-term total return through a balance between income and the potential for long-term capital growth.
The Fund invests in equity securities and debt securities. The value of the Fund is influenced by factors impacting the overall market, certain asset classes, certain investment styles, and specific issuers. The Fund may incur losses due to incorrect assessments of investments by its investment adviser. Bond prices generally fall as interest rates rise. Credit risk is the risk that an issuer of a debt security may not pay its debt, and high yield securities are subject to increased credit risk as well as liquidity risk. Leveraged loans, REITs, preferred securities, sovereign debt, and mortgage-related and other asset-backed securities are subject to additional risks. Foreign investments involve additional risks, including currency fluctuations, liquidity, political, economic and market instability, and different legal and accounting standards; these risks are magnified for investments in emerging markets. An ETF is subject to additional fees and expenses, tracking error, and the risks of the underlying investments that it holds. The use of derivatives (such as futures and swaps) involves additional risks and transaction costs, which could leave the Fund in a worse position than if it had not used these instruments.
How did the Fund perform during the 12-month period ended October 31, 2016?
Thrivent Balanced Income Plus Fund earned a return of 2.83%, compared with the median return of its peer group, the Lipper Mixed-Asset Target Allocation Moderate Funds category, of 3.08%. The Fund’s market benchmarks, the S&P Composite 1500 Index, the MSCI World Index Net Returns, the Bloomberg Barclays U.S. Mortgage-Backed Securities Index and the Bloomberg Barclays U.S. High Yield Ba/B 2% Issuer Capped Index, earned returns of 4.68%, 1.18%, 3.27% and 8.63%, respectively. The Fund’s third market benchmark, the U.S. High Yield Loan Index, was decommissioned by Bloomberg Barclays effective September 30, 2016.
What factors affected the Fund’s performance?
During the first few months of the period, a Federal Reserve (Fed) rate increase in December 2015 and guidance on additional increases in 2016 and 2017 led the U.S. dollar to continue strengthening, which caused prices for oil and other commodities to plunge further and risk aversion to spike. Energy prices and risk assets bottomed in mid-February before the tide quickly turned following a flurry of quantitative and monetary easing announcements by the European Central Bank, the Bank of Japan and other central banks outside the U.S. The U.S. economy showed slower-than-expected growth and the Fed took on a more dovish tone, pushing out market expectations for additional rate hikes. The dollar declined and commodity prices subsequently started to recover, causing risk assets to rally. Accommodative monetary policies outside the U.S. and the surprise result of the “Brexit” vote at the end of June that allows the United Kingdom to leave the European Union kept overseas interest rates extremely low, resulting in strong demand for U.S. securities with higher yields. Over the full period, interest rates moved modestly higher for Treasury securities with maturities of two years and under, while rates declined for Treasuries with maturities of three years and longer, causing the yield curve to flatten.
The Fund’s fixed-income portfolio benefited from the rebound in energy, metals and mining, and leveraged loans in the corporate sector. Also, exposure to nonagency residential mortgage-backed securities aided results. The primary detractor in fixed income was a higher-quality bias within high-yield credit in light of the strong outperformance of lower-quality bonds.
Within our U.S. and international equity portfolios, we continued to drive returns through stock selection while keeping sector weightings close to neutral versus their respective benchmarks. In the U.S. equity market, yield-driven and more stable sectors outperformed for the first eight months of the reporting period in conjunction with falling Treasury rates. During that time frame, our U.S. equity portfolio benefited from stock selection in these sectors, including consumer staples, real estate, utilities and telecommunication services. Stock selection was challenging in the more cyclical consumer discretionary, energy and financial sectors. Sector leadership reversed in mid-2016, causing yield-driven sectors to lag and our stock selection success to broaden out to the majority of sectors in the final months. In international equities, we positioned our portfolio with an emphasis on low-volatility stocks due to the risk aversion in the market, which benefited performance over the period. We experienced strong stock selection in financials, while consumer discretionary and materials stocks detracted.
Real estate investment trust (REIT) stocks performed well, given stable occupancy rates, increasing rent levels for most property types, and lower long-term Treasury yields. In the Fund’s REIT portfolio, stock selection was favorable in the office, industrial and retail sectors. Also, an overweighting in data center REITs and underweighting in hotel REITs proved helpful.
What is your outlook?
While we believe a Fed rate increase is likely in December 2016, we continue to anticipate policymakers will proceed at a slow pace. However, the election results have increased the odds of fiscal stimulus, which may result in higher economic growth and inflation expectations. In the fixed-income portfolio, we have reduced exposure to high-yield bonds and alternative equity securities, while adding agency and nonagency mortgage-backed securities, which offer attractive yields with less volatility. We also reduced the Fund’s duration and bias to benefit from a flatter yield curve. In the international equity portfolio, we have shifted away from low-volatility exposure and moved toward emphasizing value stocks. In the U.S. equity portfolio, we continue to implement our bottom-up stock selection process as our industry analysts search for the best ideas regardless of the macroeconomic backdrop.
Quoted Fund performance is for Class A shares and does not reflect a sales charge.
The returns shown do not reflect taxes a shareholder would pay on distributions or redemptions.
14
| | | | |
| Portfolio Composition | |
| (% of Portfolio) | |
Common Stock | | | 41.2 | % |
Long-Term Fixed Income | | | 30.6 | % |
Bank Loans | | | 15.3 | % |
Short-Term Investments | | | 9.0 | % |
Preferred Stock | | | 1.4 | % |
Registered Investment Companies | | | 2.5 | % |
| | | | |
Total | | | 100.0 | % |
Major Market Sectors | | | | |
| (% of Net Assets) | | | | |
Financials | | | 11.4 | % |
Consumer Discretionary | | | 11.4 | % |
Information Technology | | | 9.9 | % |
Foreign Government | | | 7.6 | % |
Real Estate | | | 7.1 | % |
Telecommunications Services | | | 6.9 | % |
Consumer Staples | | | 6.7 | % |
Mortgage-Backed Securities | | | 5.3 | % |
Materials | | | 5.2 | % |
Energy | | | 4.8 | % |
| | | | |
Top 10 Holdings | | | | |
| (% of Net Assets) | | | | |
Federal National Mortgage Association Conventional 30-Yr. Pass Through | | | 2.0 | % |
Federal National Mortgage Association Conventional 30-Yr. Pass Through | | | 1.1 | % |
Amazon.com, Inc. | | | 1.0 | % |
Apple, Inc. | | | 0.8 | % |
Comcast Corporation | | | 0.7 | % |
Materials Select Sector SPDR Fund | | | 0.7 | % |
Citigroup, Inc. | | | 0.7 | % |
Abbott Laboratories | | | 0.7 | % |
Visa, Inc. | | | 0.7 | % |
Microsoft Corporation | | | 0.6 | % |
These securities represent 9.0% of the total net assets of the Fund. | | | | |
Quoted Major Market Sectors, Portfolio Composition and Top 10 Holdings are subject to change.
The lists of Major Market Sectors and Top 10 Holdings exclude short-term investments and collateral held for securities loaned.
The Portfolio Composition chart excludes collateral held for securities loaned.
Average Annual Total Returns1
As of October 31, 2016
| | | | | | | | | | | | |
| Class A2 | | 1-Year | | | 5 Years | | | 10 Years | |
without sales charge | | | 2.83 | % | | | 7.97 | % | | | 5.24 | % |
with sales charge | | | -1.77 | % | | | 6.99 | % | | | 4.76 | % |
| | | |
| Class S | | 1-Year | | | 5 Years | | | 10 Years | |
Net Asset Value | | | 3.30 | % | | | 8.42 | % | | | 5.73 | % |
Value of a $10,000 Investment
Class A Shares *,1,(a )
| 1 | Past performance is not an indication of future results. Average annual total returns represent past performance and reflect changes in share prices, the reinvestment of all dividends and capital gains, and the effects of compounding. The prospectus contains more complete information on the investment objectives, risks, charges and expenses of the investment company, which investors should read and consider carefully before investing. To obtain a prospectus, contact a registered representative or visit ThriventFunds.com. At various times, the Fund’s adviser waived its management fee and/or reimbursed Fund expenses. Had the adviser not done so, the Fund’s total returns would have been lower. The returns shown do not reflect taxes a shareholder would pay on distributions or redemptions. Total investment return and principal value of your investment will fluctuate, and your shares, when redeemed, may be worth more or less than their original cost. Current performance may be higher or lower than the performance data quoted. Call 800-THRIVENT (847-4836) or visit ThriventFunds.com for performance results current to the most recent month-end. |
| 2 | Class A performance with sales charge reflects the maximum sales charge of 4.5%. |
| (a) | Performance of other classes will be greater or less than the line shown based on the differences in loads and fees paid by shareholders investing in the different classes. |
| * | As you compare performance, please note that the Fund’s performance reflects the maximum 4.5% sales charge, while the benchmark indices do not reflect any such charges. If you were to purchase any of the above individual securities represented in those Indexes, any charges you would pay would reduce your total return as well. |
| ** | The Bloomberg Barclays U.S. Mortgage-Backed Securities Index (MBS) is formed by grouping the universe of over 600,000 individual fixed-rate U.S. government agency MBS pools into approximately 3,500 generic types of securities. |
| *** | The MSCI World Index – USD Net Returns is an unmanaged market-capitalization-weighted index that represents the performance of large and mid-cap stock across 23 developed market countries. It is not possible to invest directly in the Index. The performance of the Index does not reflect deductions for fees, expenses, or taxes. |
| **** | The Bloomberg Barclays U.S. High-Yield Ba/B 2% Issuer Capped Index covers the USD denominated, non-investment grade, Ba or B rated, fixed-rate, taxable corporate bond market. The index limits issuer exposures to a maximum 2%, redistributing excess market value index-wide on a pro-rata basis. |
| ***** | The S&P composite 1500® Index measures the performance of 1,500 publicly traded stocks. “S&P 1500®” is a trademark of The McGraw-Hill Companies, Inc. and has been licensed for use by Thrivent Financial for Lutherans. The product is not sponsored, endorsed or promoted by Standard & Poor’s and Standard & Poor’s makes no representation regarding the advisability of investing in the product. |
| ****** | The Consumer Price Index is an inflationary indicator that measures the change in the cost of a fixed basket of products and services, including housing, electricity, food and transportation. |
15
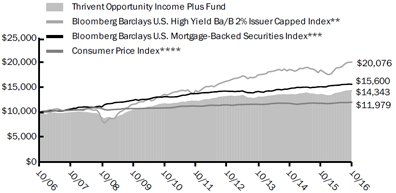
THRIVENT OPPORTUNITY INCOME PLUS FUND
Michael G. Landreville, CFA and CPA (inactive), Gregory R. Anderson, CFA and CPA (inactive), Conrad E. Smith, CFA, Paul J. Ocenasek, CFA, and Kent L. White, CFA, Portfolio Co-Managers
The Fund seeks a high level of current income consistent with capital preservation.
The Fund primarily invests in a broad range of debt securities. The value of the Fund is influenced by factors impacting the overall market, certain asset classes, certain investment styles, and specific issuers. The Fund may incur losses due to incorrect assessments of investments by its investment adviser. Bond prices generally fall as interest rates rise. Credit risk is the risk that an issuer of a debt security may not pay its debt, and high yield securities are subject to increased credit risk as well as liquidity risk. Leveraged loans, sovereign debt, and mortgage-related and other asset-backed securities are subject to additional risks. Foreign investments involve additional risks, including currency fluctuations, liquidity, political, economic and market instability, and different legal and accounting standards; these risks are magnified for investments in emerging markets. An ETF is subject to additional fees and expenses, tracking error, and the risks of the underlying investments that it holds. The use of derivatives (such as futures and swaps) involves additional risks and transaction costs, which could leave the Fund in a worse position than if it had not used these instruments.
How did the Fund perform during the 12-month period ended October 31, 2016?
Thrivent Opportunity Income Plus Fund earned a return of 5.60%, compared with the median return of its peer group, the Lipper Multi-Sector Income Funds category, of 5.79%. The Fund’s market benchmarks, the Bloomberg Barclays U.S. High Yield Ba/B 2% Issuer Capped Index and the Bloomberg Barclays U.S. Mortgage-Backed Securities Index, earned returns of 8.63% and 3.27%, respectively. The Fund’s third market benchmark, the U.S. High Yield Loan Index, was decommissioned by Bloomberg Barclays effective September 30, 2016.
What factors affected the Fund’s performance?
At the start of the period, investors began pricing in a Federal Reserve (Fed) rate hike by the end of 2015 and interest rates began to rise, particularly for Treasury securities with maturities less than 10 years. The Fed delivered with a rate increase in December, while offering guidance that more increases were coming. The news caused the dollar to strengthen and prices for oil and other commodities to plummet. The resulting risk aversion drove corporate bond spreads significantly wider, particularly for high-yield bonds, which went from a spread of 5.60% to Treasuries at the beginning of November 2015 to 8.40% by February 11, the day that marked the bottom of the sell off for risk assets. Energy and commodity-related sectors led the market decline, including metals and mining, exploration and production, refining, midstream and oil services.
The tide quickly turned in mid-February following a flurry of quantitative and monetary easing announcements by the European Central Bank, the Bank of Japan and other central banks outside the U.S. At the same time, the U.S. economy showed slower-than-expected growth and the Fed pushed out expectations for additional rate hikes. The dollar declined and commodity prices started to recover, causing risk assets to rally and spreads to tighten for both high-yield and investment-grade corporate bonds. Accommodative monetary policies outside the U.S. and the surprise result of the “Brexit” vote at the end of June that allows the United Kingdom to leave the European Union kept overseas interest rates extremely low, in some cases falling into negative territory. These historically low rates resulted in strong demand for U.S. securities with higher yields and pushed corporate bond spreads even tighter.
During the period, a significant portion of the Fund continued to be invested in corporate bonds, including approximately 30% in floating-rate leveraged bank loans, 15% in high-yield corporate bonds and 10% in investment-grade corporate bonds. Approximately 20% of the Fund was invested in securitized assets, including nonagency residential mortgage-backed securities (RMBS). We increased the Fund’s emerging market exposure to approximately 15% of net assets.
The Fund’s modest shortfall versus its Lipper peers and underperformance versus the Bloomberg Barclays U.S. High Yield Ba/B 2% Issuer Capped Index was primarily due to the Fund’s higher-quality bias within high-yield credit. Lower-quality bonds considerably outperformed this year with CCC-rated bonds advancing more than 16% over the full period, but up nearly 60% from their February lows. Elsewhere in corporates, however, the Fund benefited from the rebound in energy, metals and mining and leveraged loans. Also, the Fund’s approximately 10% weighting in nonagency RMBS aided results. The Fund outperformed the Bloomberg Barclays U.S. Mortgage-Backed Securities Index due to its higher exposure to the corporate sector.
What is your outlook?
While we believe a Fed rate increase is likely in December 2016, we continue to anticipate policymakers will proceed at a slow pace. However, the election results have increased the odds of fiscal stimulus, which may result in higher economic growth and inflation expectations. That being said, we believe investors should expect a more subdued return environment over the next 12 months because rates will likely move higher, and some tailwinds from heavy overseas demand for U.S. yield product may subside. We have reduced our exposure to high-yield bonds by around 3% because of their lofty valuations and lowered our weighting in alternative equity securities to about 2% due to their strong returns. With the proceeds, we are adding exposure to agency and nonagency mortgage-backed securities, which continue to offer attractive yields with less volatility. After the significant rate decline in August, we reduced the Fund’s duration, or interest-rate sensitivity, and its bias to benefit from a flatter yield curve, which we had implemented by overweighting securities with maturities of five years and longer.
Quoted Fund performance is for Class A shares and does not reflect a sales charge.
The returns shown do not reflect taxes a shareholder would pay on distributions or redemptions.
16
Bond Quality Ratings Distributions
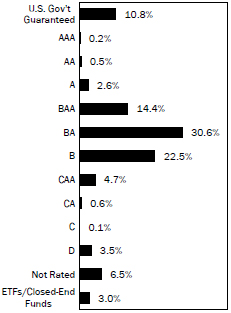
| | | | |
Major Market Sectors | | | | |
(% of Net Assets) | | | | |
Foreign Government | | | 15.1 | % |
Communications Services | | | 12.4 | % |
Financials | | | 9.8 | % |
Mortgage-Backed Securities | | | 9.1 | % |
Collateralized Mortgage Obligations | | | 8.1 | % |
Consumer Non-Cyclical | | | 7.7 | % |
Consumer Cyclical | | | 7.6 | % |
Technology | | | 5.1 | % |
Energy | | | 4.3 | % |
Asset-Backed Securities | | | 4.1 | % |
Top 10 Holdings | | | | |
| (% of Net Assets) | | | | |
Federal National Mortgage Association Conventional 30-Yr. Pass Through | | | 2.7 | % |
Federal National Mortgage Association Conventional 30-Yr. Pass Through | | | 1.9 | % |
Federal National Mortgage Association Conventional 15-Yr. Pass Through | | | 1.2 | % |
Federal National Mortgage Association Conventional | | | 1.1 | % |
Valeant Pharmaceuticals International, Inc., Term Loan | | | 1.0 | % |
U.S. Treasury Notes | | | 1.0 | % |
Federal National Mortgage Association Conventional 30-Yr. Pass Through | | | 0.9 | % |
WideOpenWest Finance, LLC, Term Loan | | | 0.9 | % |
First Data Corporation, Term Loan | | | 0.8 | % |
Federal Home Loan Mortgage Corporation Gold 30-Yr. Pass Through | | | 0.8 | % |
These securities represent 12.3% of the total net assets of the Fund. | | | | |
Bond quality ratings are obtained from Moody’s Investors Service, Inc. (“Moody’s”) and Standard & Poor’s Ratings Services (“S&P”). Ratings from S&P, when used, are converted into their equivalent Moody’s ratings. If Moody’s and S&P have assigned different ratings to a security, the lowest rating for the security is used.
Investments in derivatives and short-term investments are not reflected in the table.
Quoted Major Market Sectors, Bond Quality Ratings Distributions and Top 10 Holdings are subject to change.
The lists of Major Market Sectors and Top 10 Holdings exclude short-term investments and collateral held for securities loaned.
Average Annual Total Returns1
As of October 31, 2016
| | | | | | | | | | | | |
| Class A2 | | 1-Year | | | 5 Years | | | 10 Years | |
without sales charge | | | 5.60 | % | | | 3.25 | % | | | 4.13 | % |
with sales charge | | | 0.89 | % | | | 2.31 | % | | | 3.65 | % |
| | | |
| Class S | | 1-Year | | | 5 Years | | | 10 Years | |
Net Asset Value | | | 5.84 | % | | | 3.52 | % | | | 4.44 | % |
Value of a $10,000 Investment
Class A Shares *,1,(a )
| 1 | Past performance is not an indication of future results. Average annual total returns represent past performance and reflect changes in share prices, the reinvestment of all dividends and capital gains, and the effects of compounding. The prospectus contains more complete information on the investment objectives, risks, charges and expenses of the investment company, which investors should read and consider carefully before investing. To obtain a prospectus, contact a registered representative or visit ThriventFunds.com. At various times, the Fund’s adviser waived its management fee and/or reimbursed Fund expenses. Had the adviser not done so, the Fund’s total returns would have been lower. The returns shown do not reflect taxes a shareholder would pay on distributions or redemptions. Total investment return and principal value of your investment will fluctuate, and your shares, when redeemed, may be worth more or less than their original cost. Current performance may be higher or lower than the performance data quoted. Call 800-THRIVENT (847-4836) or visit ThriventFunds.com for performance results current to the most recent month-end. |
| 2 | Class A performance with sales charge reflects the maximum sales charge of 4.5%. |
| (a) | Performance of other classes will be greater or less than the line shown based on the differences in loads and fees paid by shareholders investing in the different classes. |
| * | As you compare performance, please note that the Fund’s performance reflects the maximum 4.5% sales charge, while the benchmark indices do not reflect any such charges, deductions for fees, expenses or taxes. It is not possible to invest directly in the indices shown. If you were to purchase any of the above individual securities represented in those indices, any charges you would pay would reduce your total return as well. |
| ** | The Bloomberg Barclays U.S. High-Yield Ba/B 2% Issuer Capped Index covers the USD denominated, non-investment grade, Ba or B rated, fixed-rate, taxable corporate bond market. The Index limits issuer exposures to a maximum 2%, redistributing excess market value index-wide on a pro-rata basis. |
| *** | The Bloomberg Barclays U.S. Mortgage-Backed Securities Index (MBS) is formed by grouping the universe of over 600,000 individual fixed-rate U.S. government agency MBS pools into approximately 3,500 generic types of securities. |
| **** | The Consumer Price Index is an inflationary indicator that measures the change in the cost of a fixed basket of products and services, including housing, electricity, food and transportation. |
17
THRIVENT PARTNER EMERGING MARKETS EQUITY FUND
Subadvised by Aberdeen Asset Managers Limited
The Fund seeks long-term capital growth.
The Fund primarily invests in emerging markets equities. Foreign investments involve additional risks, including currency fluctuations, liquidity, political, economic and market instability, and different legal and accounting standards; these risks are magnified for investments in emerging markets. The value of the Fund is influenced by factors impacting the overall market, certain asset classes, certain investment styles, and specific issuers. The Fund may incur losses due to incorrect assessments of investments by its investment advisers. Small and medium-sized companies often have greater price volatility and less liquidity than larger companies. Large cap companies may be unable to respond quickly to new competitive challenges and may not be able to attain a high growth rate.
How did the Fund perform during the 12-month period ended October 31, 2016?
Thrivent Partner Emerging Markets Equity Fund earned a return of 11.36%, compared with the median return of its peer group, the Lipper Emerging Markets Funds category, of 8.10%. The Fund’s market benchmark, the MSCI Emerging Markets Index - USD Net Returns, earned a return of 9.27%.
What factors affected the Fund’s performance?
Emerging market equities ended higher over the year. One of the key events during the review period was the rate hike by the U.S. Federal Reserve (Fed) in December, although the well-telegraphed move did not rattle markets. At the start of 2016, weak crude oil prices and a sell off in Chinese shares heightened risk aversion. However, continued monetary stimulus from global central banks and a sharp rebound in commodity prices spurred a comeback. In June, the U.K.’s vote to leave the European Union sent shockwaves across global markets, causing the British pound to crash to a multi-year low. Meanwhile, a delay in additional interest rate hikes by the Fed and signs of stabilization in the Chinese economy supported improving investor sentiment. However, caution ahead of the U.S. election capped gains toward the end of the period.
The Fund outperformed the benchmark and Lipper peers driven by positive stock selection and allocation effects. Asia was a key contributor, including China, where currency weakness benefited the Fund. However, our portfolio’s lack of exposure to Tencent and Alibaba detracted because the companies posted steady operating results and hold large positions in the benchmark. The Fund’s underweighting to Korea added to relative performance because the market underperformed the regional index. An overweighting to Indonesia was also positive since the market rose over the review period along with investor sentiment, which was buoyed by the promising pace of reforms and further monetary easing. Stock selection in Indonesia was positive as well, led by strong performance from Astra International, which is well positioned to capitalize on a recovery and better outlook in the country. The Fund’s overweighting to Indian equities, which underperformed the broader emerging markets, was a negative factor; however, this was more than offset by a positive contribution from stock selection. Indian companies Ultra Tech Cement and Grasim Industries performed well due to their sequential improvements in profitability delivered during the year.
In EMEA (Europe, Middle East and Africa), stock selection in Poland was positive, led by food retailer Jeronimo Martins, in light of an improving operating environment. In Russia, the Fund benefited from the strong performance of Lukoil, which saw its shares rebound based on a better outlook for oil prices and improvements in its second-quarter results. Conversely, stock selection in South Africa was weak with retail holding Truworths International reporting lackluster results.
In Latin America, the Fund gained from an overweighting to Brazil because both its stock market and currency performed well. Attention turned to economic reform following the end of a lengthy impeachment process. The Fund’s Brazilian holdings, such as lender Banco Bradesco, shopping mall operator Multiplan and retailer Lojas Renner, contributed favorably to relative performance. However, overall stock selection was negative due to the lack of exposure to state-owned companies such as Petrobras, which benefited from the improving political landscape. Elsewhere, the Fund’s positive stock selection in Mexico offset the impact of a weaker peso.
What is your outlook?
A knee-jerk sell off across markets following Donald Trump’s victory in the U.S. presidential election seemed understandable since investors had largely priced in a Hillary Clinton win. However, until we see greater clarity regarding Trump’s policies, it is difficult to predict the impact on emerging markets. One potential concern is the possibility of increased trade barriers and a winding back of trade agreements. The other pertinent factor is the impact on the U.S. dollar and the Fed’s monetary policy. On a brighter note, however, most emerging economies are in a better position to weather the uncertainty than they were during the “taper tantrum” in 2013. In addition, many of these countries, such as Brazil, India and Indonesia, still have room to ease rates to help spur economic activity. At the corporate level, quarterly earnings have been in line or slightly above expectations for the most part, supported by lower input costs and improved cost management. We remain confident in the quality of the Fund’s holdings, while valuations are still attractive despite the turnaround in emerging markets this year.
Quoted Fund performance is for Class A shares and does not reflect a sales charge.
The returns shown do not reflect taxes a shareholder would pay on distributions or redemptions.
18
| | | | |
| Portfolio Composition | | | |
| (% of Portfolio) | | | | |
Common Stock | | | 93.1 | % |
Preferred Stock | | | 4.9 | % |
Short-Term Investments | | | 2.0 | % |
| | | | |
Total | | | 100.0 | % |
Major Market Sectors | | | |
| (% of Net Assets) | | | | |
Financials | | | 29.2 | % |
Consumer Staples | | | 14.9 | % |
Information Technology | | | 12.2 | % |
Materials | | | 10.6 | % |
Consumer Discretionary | | | 9.3 | % |
Energy | | | 7.4 | % |
Real Estate | | | 5.8 | % |
Telecommunications Services | | | 4.9 | % |
Industrials | | | 1.6 | % |
Health Care | | | 1.3 | % |
Top 10 Countries | | | | |
| (% of Net Assets) | | | | |
India | | | 13.9 | % |
Brazil | | | 12.2 | % |
Hong Kong | | | 11.1 | % |
Mexico | | | 7.8 | % |
South Korea | | | 6.9 | % |
Taiwan | | | 5.2 | % |
Indonesia | | | 5.1 | % |
Thailand | | | 4.7 | % |
Turkey | | | 4.6 | % |
Russia | | | 4.5 | % |
Investments in securities in these countries represent 76.0% of the total net assets of the Fund. | | | | |
Quoted Portfolio Composition, Major Market Sectors and Top 10 Countries are subject to change.
Portfolio Composition excludes collateral held for securities loaned.
The lists of Major Market Sectors and Top 10 Countries exclude short-term investments and collateral held for securities loaned.
Average Annual Total Returns1
As of October 31, 2016
| | | | | | | | |
| Class A2 | | 1-Year | | | From
Inception
8/31/2012 | |
without sales charge | | | 11.36 | % | | | -2.96 | % |
with sales charge | | | 6.36 | % | | | -4.02 | % |
| | |
| Class S | | 1-Year | | | From
Inception
8/31/2012 | |
Net Asset Value | | | 11.67 | % | | | -2.65 | % |
Value of a $10,000 Investment
Class A Shares *,1,(a )
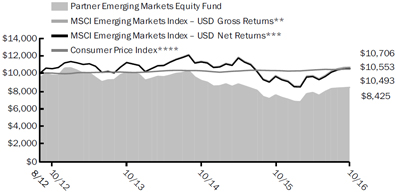
| 1 | Past performance is not an indication of future results. Average annual total returns represent past performance and reflect changes in share prices, the reinvestment of all dividends and capital gains, and the effects of compounding. The prospectus contains more complete information on the investment objectives, risks, charges and expenses of the investment company, which investors should read and consider carefully before investing. To obtain a prospectus, contact a registered representative or visit ThriventFunds.com. At various times, the Fund’s adviser waived its management fee and/or reimbursed Fund expenses. Had the adviser not done so, the Fund’s total returns would have been lower. The returns shown do not reflect taxes a shareholder would pay on distributions or redemptions. Total investment return and principal value of your investment will fluctuate, and your shares, when redeemed, may be worth more or less than their original cost. Current performance may be higher or lower than the performance data quoted. Call 800-THRIVENT (847-4836) or visit ThriventFunds.com for performance results current to the most recent month-end. |
| 2 | Class A performance with sales charge reflects the maximum sales charge of 4.5%. |
| (a) | Performance of other classes will be greater or less than the line shown based on the differences in loads and fees paid by shareholders investing in the different classes. |
| * | As you compare performance, please note that the Fund’s performance reflects the maximum 4.5% sales charge, while the MSCI Emerging Markets Index - USD Gross Returns, the MSCI Emerging Markets Index - USD Net Returns, and the Consumer Price Index do not reflect any such charges. If you were to purchase any of the above individual securities represented in the Index, any charges you would pay would reduce your total return as well. |
| ** | The MSCI Emerging Markets Index - USD Gross Returns is a modified capitalization-weighted index of selected emerging economies from around the world. It is not possible to invest directly in the Index. The performance of the Index does not reflect deductions for fees, expenses or taxes. |
| *** | The MSCI Emerging Markets Index - USD Net Returns is a modified capitalization-weighted index of selected emerging economies from around the world. It is not possible to invest directly in the Index. The performance of the Index does not reflect deductions for fees, expenses or taxes. |
| **** | The Consumer Price Index is an inflationary indicator that measures the change in the cost of a fixed basket of products and services, including housing, electricity, food and transportation. It is not possible to invest directly in the Index. |
19
THRIVENT SMALL CAP STOCK FUND
Matthew D. Finn, CFA, and James M. Tinucci, CFA, Portfolio Co-Managers
The Fund seeks long-term capital growth.
The Fund primarily invests in securities of small companies. Smaller, less seasoned companies often have greater price volatility, lower trading volume, and less liquidity than larger, more established companies. The value of the Fund is influenced by factors impacting the overall market, certain asset classes, certain investment styles, and specific issuers. The Fund may incur losses due to incorrect assessments of investments by its investment adviser.
How did the Fund perform during the 12-month period ended October 31, 2016?
Thrivent Small Cap Stock Fund earned a return of 5.72%, compared with the median return of its peer group, the Lipper Small Cap Core Funds category, of 3.32%. The Fund’s market benchmark, the Russell 2000® Index, earned a return of 4.11%.
What factors affected the Fund’s performance?
The Fund provided strong results relative to its benchmark and Lipper peer group driven by favorable stock selection, while sector allocations generally detracted from performance. Stock selection was strongest in the health care, industrials and energy sectors.
In health care, the position in shares of Align Technology drove performance; this has been a multi-year holding in the portfolio. The company makes the Invisaline System for treating the misalignment of teeth. It has a strong competitive position due to its patents and market share. Some shares have been sold due to valuation concerns; however, we still hold some due to the long-term secular growth opportunity for its business.
In the industrial sector, positions in Waste Connections (WCN)—a waste collection and disposal company—and Granite Construction (GVA)—a provider of construction services and supplies for building roads, bridges and tunnels—were major contributors to performance. The WCN position was the result of its acquisition of Progressive Waste Solution in June of this year. Again, we have reduced the position due to valuation, but continue to hold shares in the portfolio. GVA was a cyclical investment thesis. As the U.S. moves through its economic cycle, eventually federal, state and local governments’ budgets improve, and they begin to fund deferred infrastructure projects. This cycle has not been an exception. The deferred spending was exacerbated by the inability of the federal government to fund a long-term highway bill until this year. Shares of GVA benefited as investors have become more optimistic of the prospects for increased spending. We have recently reduced the position due to valuation concerns, but still hold some shares.
In energy, positions in three exploration and production companies—Callon Petroleum, Parsley Energy and WPX Energy—drove performance. All are located in the Permian Basin in western Texas. This area is one of the lower-cost shale “plays” where improving production profiles have driven stock performance as well as the oil price recovery. We remain overweighted in the energy sector.
In terms of sector allocations, the Fund’s results were hindered by underweighted positions in the utilities, real estate investment trust (REIT) and materials sectors relative to the benchmark and peer funds. These sectors were among the strongest-performing areas of the market. While utilities and REITs benefited from declining interest rates during much of the period, we had difficulty finding good companies at attractive prices. In materials, much of the sector’s strong performance was driven by the silver, gold, precious metals and minerals industries. However, we typically avoid these areas because they do not offer the core attributes that we favor and can forecast—sales and income growth, capital requirements and free cash flow.
What is your outlook?
Investor sentiment about the economy fluctuates much more rapidly and with greater amplitude than actual changes in activity. These swings in economic sentiment often result in sharp movements in stock prices. Our focus remains on finding solid companies that are attractively priced with long runways ahead of them for growth in sales, income and free cash flow. Short-term price changes are an opportunity for investors that are focused on the long term.
While the U.S. economy is later in its cycle, many overseas trading partners are not. In addition, a number of industries are still depressed and have multi-year potential for improvement, including energy, agriculture, commodities and some areas of financial services. We will continue to look for opportunities in industries and companies that can grow regardless of the economic environment.
Quoted Fund performance is for Class A shares and does not reflect a sales charge.
The returns shown do not reflect taxes a shareholder would pay on distributions or redemptions.
20
| | | | |
| Portfolio Composition | | | | |
| (% of Portfolio) | | | | |
Common Stock | | | 95.1 | % |
Registered Investment Companies | | | 3.4 | % |
Short-Term Investments | | | 1.5 | % |
| | | | |
Total | | | 100.0 | % |
| | | | |
| Major Market Sectors | | | | |
| (% of Net Assets) | | | | |
Financials | | | 22.3 | % |
Industrials | | | 18.9 | % |
Information Technology | | | 16.5 | % |
Health Care | | | 11.2 | % |
Consumer Discretionary | | | 7.9 | % |
Materials | | | 5.4 | % |
Energy | | | 4.5 | % |
Real Estate | | | 3.7 | % |
Equity Funds/ETFs | | | 3.4 | % |
Utilities | | | 2.3 | % |
| | | | |
Top 10 Holdings | | | | |
(% of Net Assets) | | | | |
Microsemi Corporation | | | 2.6 | % |
Nutrisystem, Inc. | | | 2.1 | % |
Hanmi Financial Corporation | | | 2.1 | % |
Arista Networks, Inc. | | | 2.0 | % |
DST Systems, Inc. | | | 1.9 | % |
AZZ, Inc. | | | 1.9 | % |
Granite Construction, Inc. | | | 1.9 | % |
Primerica, Inc. | | | 1.7 | % |
Booz Allen Hamilton Holding Corporation | | | 1.7 | % |
Synovus Financial Corporation | | | 1.7 | % |
These securities represent 19.6% of the total net assets of the Fund. | | | | |
Quoted Major Market Sectors, Portfolio Composition and Top 10 Holdings are subject to change.
The lists of Major Market Sectors and Top 10 Holdings exclude short-term investments and collateral held for securities loaned.
The Portfolio Composition chart excludes collateral held for securities loaned.
| | | | | | | | | | | | |
Average Annual Total Returns1 | |
As of October 31, 2016 | |
| Class A2 | | 1-Year | | | 5 Years | | | 10 Years | |
without sales charge | | | 5.72 | % | | | 10.22 | % | | | 4.21 | % |
with sales charge | | | 0.93 | % | | | 9.21 | % | | | 3.73 | % |
| | | |
| Class S | | 1-Year | | | 5 Years | | | 10 Years | |
Net Asset Value | | | 6.12 | % | | | 10.77 | % | | | 4.81 | % |
Value of a $10,000 Investment
Class A Shares *,1,(a )
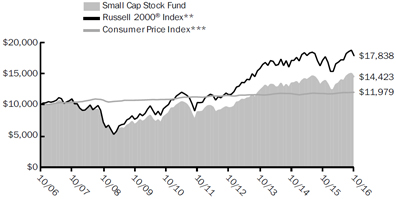
| 1 | Past performance is not an indication of future results. Average annual total returns represent past performance and reflect changes in share prices, the reinvestment of all dividends and capital gains, and the effects of compounding. The prospectus contains more complete information on the investment objectives, risks, charges and expenses of the investment company, which investors should read and consider carefully before investing. To obtain a prospectus, contact a registered representative or visit ThriventFunds.com. At various times, the Fund’s adviser waived its management fee and/or reimbursed Fund expenses. Had the adviser not done so, the Fund’s total returns would have been lower. The returns shown do not reflect taxes a shareholder would pay on distributions or redemptions. Total investment return and principal value of your investment will fluctuate, and your shares, when redeemed, may be worth more or less than their original cost. Current performance may be higher or lower than the performance data quoted. Call 800-THRIVENT (847-4836) or visit ThriventFunds.com for performance results current to the most recent month-end. |
| 2 | Class A performance with sales charge reflects the maximum sales charge of 4.5%. |
| (a) | Performance of other classes will be greater or less than the line shown based on the differences in loads and fees paid by shareholders investing in the different classes. |
| * | As you compare performance, please note that the Fund’s performance reflects the maximum 4.5% sales charge, while the Russell 2000® Index and the Consumer Price Index do not reflect any such charges. If you were to purchase any of the above individual securities represented in the Index, any charges you would pay would reduce your total return as well. |
| ** | The Russell 2000® Index measures the performance of small cap stocks. It is not possible to invest directly in the Index. The performance of the Index does not reflect deductions for fees, expenses or taxes. |
| *** | The Consumer Price Index is an inflationary indicator that measures the change in the cost of a fixed basket of products and services, including housing, electricity, food and transportation. It is not possible to invest directly in the Index. |
21
THRIVENT MID CAP STOCK FUND
Brian J. Flanagan, CFA, Portfolio Manager
The Fund seeks long-term capital growth.
The Fund primarily invests in securities of mid-sized companies, which often have greater price volatility, lower trading volume, and less liquidity than larger, more established companies. The value of the Fund is influenced by factors impacting the overall market, certain asset classes, certain investment styles, and specific issuers. The Fund may incur losses due to incorrect assessments of investments by its investment adviser.
How did the Fund perform during the 12-month period ended October 31, 2016?
Thrivent Mid Cap Stock Fund earned a return of 12.93%, compared with the median return of its peer group, the Lipper Mid Cap Core Funds category, of 3.05%. The Fund’s market benchmark, the Russell Midcap® Index, earned a return of 4.17%.
What factors affected the Fund’s performance?
The Fund produced exceptional absolute and relative returns during the reporting period, which was led by stock selection in the information technology, financial and energy sectors. Within information technology, NVIDIA and Applied Materials significantly outperformed their peers. NVIDIA benefited from expanding addressable end-markets, including gaming, automotive and artificial intelligence, combined with new product introductions, excellent execution and shareholder-friendly capital management. Applied Materials was also the beneficiary of growing end markets in semiconductor equipment and organic light-emitting diode displays, while expanding its market share by introducing new products in each area.
The Fund’s financial sector returns were buoyed by strong regional bank performance and an investment in Nasdaq. Solid results from Zions Bancorporation, First Republic Bank and KeyCorp were propelled by low valuations, solid loan growth and the prospect of rising interest rates. Nasdaq’s valuation improved based on the company’s continued business model diversification away from a reliance on unpredictable trading revenues to more stable recurring revenues.
Finally, the Fund’s significant outperformance in the energy sector resulted from rising oil prices and our focus on the lowest-cost exploration and production companies with the best acreage, such as Continental Resources, Parsley Energy and WPX Energy. We positioned the Fund with an underweighting in utilities, which detracted from relative performance because declining interest rates continued to drive strong returns in the sector.
What is your outlook?
We believe equity markets remain in a somewhat precarious position because low gross domestic product growth, the contentious presidential election, continued terrorism fears and the potential for an increase in the federal funds rate are creating a difficult investing environment. In contrast, markets could be supported by low unemployment and rising wages, the potential for improving investor confidence from the current low levels, and continued worldwide monetary stimulus with the possibility of increasing fiscal stimulus.
Given this mixed backdrop, we are currently deploying a barbell approach across the Fund’s holdings. At one end, we are focusing on companies that can improve returns through superior growth and margin potential. At the other end, we are looking for struggling companies that offer attractive return opportunities based on normalized earnings and cash flow. We continue to find opportunities within the information technology sector where companies have focused on building more stable business models with recurring revenues, increasing returns through lower capital requirements, and offering shareholder-friendly capital management policies. At the other end of the spectrum, we are focused on the airline and regional bank industries. Airlines have suffered from too much capacity and declining fares; however, valuations now reflect this negative backdrop, while at the same time capacity growth is slowing and fares are starting to increase. We believe airline company valuations will improve if this latter environment continues. Many of the characteristics that benefited regional banks over the past year remain in place including low valuations, decent loan growth and the potential for rising interest rates. We are currently focused on regional banks with company-specific opportunities that will provide potential benefits in addition to the industry tailwinds.
The Fund remains underweighted in those industries that will suffer under a rising interest rate environment. Many mid-cap sectors have seen their returns become highly correlated with U.S. Treasury bond rates, including utilities, consumer staples and real estate. As interest rates declined during the period, valuations in these sectors increased significantly. In light of these extended valuations, the prospect for rising rates on the horizon and the high correlation to U.S. Treasuries, we believe the risk/reward potential in these sectors tilts toward risk versus reward.
Quoted Fund performance is for Class A shares and does not reflect a sales charge.
The returns shown do not reflect taxes a shareholder would pay on distributions or redemptions.
22
| | | | |
| Portfolio Composition | | | | |
| (% of Portfolio) | | | | |
Common Stock | | | 92.0 | % |
Short-Term Investments | | | 6.5 | % |
Commercial Paper | | | 1.5 | % |
| | | | |
Total | | | 100.0 | % |
Major Market Sectors | | | | |
| (% of Net Assets) | | | | |
Information Technology | | | 18.9 | % |
Financials | | | 16.6 | % |
Industrials | | | 16.2 | % |
Consumer Discretionary | | | 11.8 | % |
Health Care | | | 9.3 | % |
Real Estate | | | 6.0 | % |
Energy | | | 5.5 | % |
Materials | | | 4.0 | % |
Consumer Staples | | | 2.1 | % |
Utilities | | | 1.6 | % |
Top 10 Holdings | | | | |
| (% of Net Assets) | | | | |
NVIDIA Corporation | | | 4.5 | % |
Zions Bancorporation | | | 3.1 | % |
Oshkosh Corporation | | | 3.1 | % |
Southwest Airlines Company | | | 3.1 | % |
Huntington Bancshares, Inc. | | | 2.9 | % |
Applied Materials, Inc. | | | 2.7 | % |
Steel Dynamics, Inc. | | | 2.7 | % |
Alliance Data Systems Corporation | | | 2.7 | % |
C.R. Bard, Inc. | | | 2.6 | % |
First Republic Bank | | | 2.5 | % |
These securities represent 29.9% of the total net assets of the Fund.
Quoted Major Market Sectors, Portfolio Composition and Top 10 Holdings are subject to change.
The lists of Major Market Sectors and Top 10 Holdings exclude short-term investments and collateral held for securities loaned.
The Portfolio Composition chart excludes collateral held for securities loaned.
| | | | | | | | | | | | |
Average Annual Total Returns1 | |
As of October 31, 2016 | |
| | | |
Class A2 | | | 1-Year | | | | 5 Years | | | | 10 Years | |
without sales charge | | | 12.93 | % | | | 14.02 | % | | | 7.55 | % |
with sales charge | | | 7.84 | % | | | 12.98 | % | | | 7.06 | % |
| | | |
Class S | | | 1-Year | | | | 5 Years | | | | 10 Years | |
Net Asset Value | | | 13.36 | % | | | 14.49 | % | | | 8.06 | % |
Value of a $10,000 Investment
Class A Shares *,1,(a )
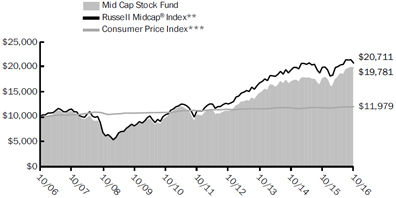
| 1 | Past performance is not an indication of future results. Average annual total returns represent past performance and reflect changes in share prices, the reinvestment of all dividends and capital gains, and the effects of compounding. The prospectus contains more complete information on the investment objectives, risks, charges and expenses of the investment company, which investors should read and consider carefully before investing. To obtain a prospectus, contact a registered representative or visit ThriventFunds.com. At various times, the Fund’s adviser waived its management fee and/or reimbursed Fund expenses. Had the adviser not done so, the Fund’s total returns would have been lower. The returns shown do not reflect taxes a shareholder would pay on distributions or redemptions. Total investment return and principal value of your investment will fluctuate, and your shares, when redeemed, may be worth more or less than their original cost. Current performance may be higher or lower than the performance data quoted. Call 800-THRIVENT (847-4836) or visit ThriventFunds.com for performance results current to the most recent month-end. |
| 2 | Class A performance with sales charge reflects the maximum sales charge of 4.5%. |
| (a) | Performance of other classes will be greater or less than the line shown based on the differences in loads and fees paid by shareholders investing in the different classes. |
| * | As you compare performance, please note that the Fund’s performance reflects the maximum 4.5% sales charge, while the Russell Midcap® Index and the Consumer Price Index do not reflect any such charges. If you were to purchase any of the above individual securities represented in the Index, any charges you would pay would reduce your total return as well. |
| ** | The Russell Midcap® Index is an index that measures the performance of the smallest 800 securities in the Russell 1000® Index, as ranked by total market capitalization. It is not possible to invest directly in these Indexes. The performance of these Indexes does not reflect deductions for fees, expenses or taxes. |
| *** | The Consumer Price Index is an inflationary indicator that measures the change in the cost of a fixed basket of products and services, including housing, electricity, food and transportation. It is not possible to invest directly in the Index. |
23
THRIVENT PARTNER WORLDWIDE ALLOCATION FUND

Managed by Thrivent Asset Management, LLC, and subadvisers Principal Global Investors, LLC, Aber-deen Asset Managers Limited and Goldman Sachs Asset Management, L.P.
The Fund seeks long-term capital growth.
The Fund primarily invests in equity and debt securities of issuers throughout the world. Foreign investments involve additional risks, including currency fluctuations, liquidity, political, economic and market instability, and different legal and accounting standards; these risks are magnified for investments in emerging markets. The value of the Fund is influenced by factors impacting the overall market, certain asset classes, certain investment styles, and specific issuers. The Fund may incur losses due to incorrect assessments of investments by its investment advisers. Small and medium-sized companies often have greater price volatility and less liquidity than larger companies. Large cap companies may be unable to respond quickly to new competitive challenges and may not be able to attain a high growth rate. Bond prices generally fall as interest rates rise. Credit risk is the risk that an issuer of a debt security may not pay its debt, and high yield securities are subject to increased credit risk as well as liquidity risk. The investment styles employed by the Fund’s sub-advisers may not be complementary.
How did the Fund perform during the 12-month period ended October 31, 2016?
Thrivent Partner Worldwide Allocation Fund earned a return of 2.21%, compared with the median return of its peer group, the Lipper International Multi-Cap Core Funds category, of -2.45%. The Fund’s market benchmark, the MSCI All Country World Index ex-USA - USD Net Returns, earned a return of 0.22%.
What factors affected the Fund’s performance?
The Fund has allocations to managers in the following international asset categories: large-cap value, large-cap growth, small-cap EAFE (Europe, Australasia and Far East), emerging market equity and emerging market debt. We experienced favorable returns from each manager in their respective asset classes with the exception of large-cap value. In that segment, the Fund underwent a manager change midway through the period.
Emerging market debt and equity returns were quite strong over the period, outpacing all other asset categories represented within the Fund as well as the benchmark index. Our managers outperformed relative to other emerging market debt and equity managers. Small-cap EAFE returns were modestly ahead of large-cap EAFE, but our manager added significant value versus its benchmark. Large-cap growth also performed well. Large-cap value lagged primarily due to softer results early in the reporting period, but experienced a solid recovery later in the period.
What is your outlook?
We remain cautiously optimistic that policies to stimulate growth and mitigate deflationary risks will ultimately prove successful. That being said, the risks are not insignificant in an environment where equity valuations are quite full and yields on fixed-income securities are being substantially distorted by the actions of central bankers. We are particularly concerned about how policymakers will ultimately unwind their aggressive interventions and how that will cascade into risk assets.
An additional concern is the amount of debt that has been issued in emerging markets over the last cycle. China has been particularly aggressive in expanding the debt burden in both the public and private sector. Growth is slowing in many markets, and debt service obligations remain elevated. We believe a moderate approach to risk management is appropriate at this point in the cycle.
Quoted Fund performance is for Class A shares and does not reflect a sales charge.
The returns shown do not reflect taxes a shareholder would pay on distributions or redemptions.
24
| | | | |
| Portfolio Composition | | | | |
| (% of Portfolio) | | | | |
Common Stock | | | 88.2 | % |
Long-Term Fixed Income | | | 9.7 | % |
Short-Term Investments | | | 1.1 | % |
Preferred Stock | | | 1.0 | % |
Registered Investment Companies | | | < 0.1 | % |
| | | | |
Total | | | 100.0 | % |
| | | | |
| Major Market Sectors | | | | |
| (% of Net Assets) | | | | |
Financials | | | 17.4 | % |
Consumer Discretionary | | | 12.5 | % |
Industrials | | | 11.6 | % |
Consumer Staples | | | 10.7 | % |
Health Care | | | 8.4 | % |
Materials | | | 7.4 | % |
Information Technology | | | 6.7 | % |
Energy | | | 6.4 | % |
Foreign Government | | | 6.1 | % |
Telecommunications Services | | | 4.5 | % |
| | | | |
| Top 10 Countries | | | | |
| (% of Net Assets) | | | | |
Japan | | | 18.7 | % |
United Kingdom | | | 11.1 | % |
Germany | | | 6.5 | % |
Australia | | | 6.2 | % |
Switzerland | | | 5.9 | % |
France | | | 5.0 | % |
Canada | | | 3.5 | % |
Hong Kong | | | 3.2 | % |
India | | | 2.5 | % |
Netherlands | | | 2.5 | % |
Investments in securities in these countries represent 65.1% of the total net assets of the Fund.
Quoted Major Market Sectors, Portfolio Composition and Top 10 Countries are subject to change.
The lists of Major Market Sectors and Top 10 Countries exclude short-term investments and collateral held for securities loaned.
The Portfolio Composition chart excludes collateral held for securities loaned.
| | | | | | | | | | | | |
Average Annual Total Returns1 | |
As of October 31, 2016 | |
| | | |
Class A2 | | | 1-Year | | | | 5 Years | | |
| From
Inception 2/29/2008 |
|
without sales charge | | | 2.21 | % | | | 4.83 | % | | | 1.07 | % |
with sales charge | | | -2.35 | % | | | 3.88 | % | | | 0.53 | % |
| | | |
Class S | | | 1-Year | | | | 5 Years | | |
| From
Inception 2/29/2008 |
|
Net Asset Value | | | 2.60 | % | | | 5.24 | % | | | 1.44 | % |
Value of a $10,000 Investment
Class A Shares *,1,(a )
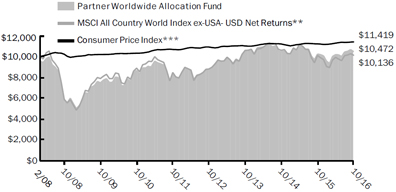
| 1 | Past performance is not an indication of future results. Average annual total returns represent past performance and reflect changes in share prices, the reinvestment of all dividends and capital gains, and the effects of compounding. The prospectus contains more complete information on the investment objectives, risks, charges and expenses of the investment company, which investors should read and consider carefully before investing. To obtain a prospectus, contact a registered representative or visit ThriventFunds.com. At various times, the Fund’s adviser waived its management fee and/or reimbursed Fund expenses. Had the adviser not done so, the Fund’s total returns would have been lower. The returns shown do not reflect taxes a shareholder would pay on distributions or redemptions. Total investment return and principal value of your investment will fluctuate, and your shares, when redeemed, may be worth more or less than their original cost. Current performance may be higher or lower than the performance data quoted. Call 800-THRIVENT (847-4836) or visit ThriventFunds.com for performance results current to the most recent month-end. |
| 2 | Class A performance with sales charge reflects the maximum sales charge of 4.5%. |
| (a) | Performance of other classes will be greater or less than the line shown based on the differences in loads and fees paid by shareholders investing in the different classes. |
| * | Effective February 28, 2015, the MSCI All Country World Index ex-USA Gross was replaced with the MSCI All Country World Index ex-USA- USD Net Returns. The Adviser made this benchmark change because it believes that this Index is a more appropriate benchmark for the Fund. Thus the MSCI All Country World Index ex-USA Gross will not be shown in shareholder reports of the Fund for fiscal periods ended October 31, 2016 and beyond. As you compare performance, please note that the Fund’s performance reflects the maximum 4.5% sales charge, while the MSCI All Country World Index ex-USA - USD Net Returns, and the Consumer Price Index do not reflect any such charges. If you were to purchase any of the above individual securities represented in the Index, any charges you would pay would reduce your total return as well. |
| ** | The MSCI All Country World Index ex-USA- USD Net Returns is an unmanaged market capitalization-weighted index that is designed to represent the performance of developed and emerging stock markets throughout the world. It is not possible to invest directly in the Index. The performance of the Index does not reflect deductions for fees, expenses or taxes. |
| *** | The Consumer Price Index is an inflationary indicator that measures the change in the cost of a fixed basket of products and services, including housing, electricity, food and transportation. It is not possible to invest directly in the Index. |
25
THRIVENT LARGE CAP GROWTH FUND
Darren M. Bagwell, CFA, Portfolio Manager
The Fund seeks long-term capital appreciation.
The Fund primarily invests in securities of large companies, which may be unable to respond quickly to new competitive challenges and may not be able to attain a high growth rate. The value of the Fund is influenced by factors impacting the overall market, certain asset classes, certain investment styles, and specific issuers. The Fund may incur losses due to incorrect assessments of investments by its investment adviser. Foreign investments involve additional risks, including currency fluctuations, liquidity, political, economic and market instability, and different legal and accounting standards.
How did the Fund perform during the 12-month period ended October 31, 2016?
Thrivent Large Cap Growth Fund earned a return of -4.52%, compared with the median return for its peer group, the Lipper Large Cap Growth Funds category, of -0.12%. The Fund’s market benchmark, the Russell 1000® Growth Index, earned a return of 2.28%.
What factors affected the Fund’s performance?
The Fund’s disappointing underperformance can be tied primarily to three factors: our emphasis on and poor selection within the specialty pharmaceutical and biotechnology areas of health care; our larger-than-normal cash balances over the course of the year; and our emphasis on transportation stocks within industrials, where we underestimated the immediate earnings and sentiment impacts of an increase in energy prices. We remain confident in the multi-year theses behind our holdings. That being said, the concentrated nature of the Fund magnifies short-term swings in performance in deference to what we believe are the long-term performance benefits of greater focus and persistence of our holdings.
In health care, our positions in specialty pharmaceutical maker Allergan and biotechnology firm Vertex Pharmaceuticals were notable underperformers. We believe Allergan is run by one of the best management teams in the industry with a proven track record of value creation. However, the U.S. Treasury’s unprecedented move to block its merger with Pfizer using grandfathered policy changes, combined with election-driven drug pricing rhetoric, created a toxic atmosphere for the company. Allergan’s shares traded down well below the company’s peers despite superior management and growth prospects. We continue to own Allergan because we expect its value recognition has only been delayed. Vertex Pharmaceuticals is in the process of developing novel and expanded therapies for cystic fibrosis and other genetic diseases. Despite the company’s inevitable hiccups in achieving approvals and entering new international markets, we continue to believe its first-mover leader status will result in significant earnings growth in the future. Therefore, we remain holders of this stock.
Entering 2016, we believed that transportation-related stocks such as Delta Air Lines and Union Pacific Railroad were the best-managed options for us in a sector where the impact of rising oil prices was overestimated, pricing was stable and volume declines were manageable. Unfortunately, while oil prices stayed contained below $50 per barrel, airline industry pricing was much less disciplined than we expected. Also, crude-by-rail volumes in the low-growth environment of 2016 were worse than anticipated because we underestimated the duration and impact of the economy’s weakness. We continue to own Union Pacific because we believe the company has superior return potential and performance characteristics, especially if cyclical prospects improve. However, we decided to sell Delta Air Lines until pricing discipline improves.
Finally, we kept the Fund’s cash balances higher as a reflection of valuation concerns in light of our predictions for slower earnings growth in the face of economic weakness. Unfortunately, while earnings did indeed stagnate, stocks revalued higher as a result of historically low interest rates, which pushed multiples to near-record levels.
The Fund’s positive contributors were concentrated in the information technology sector, including Amazon.com, Facebook and PayPal. All of these names and several others provided exposure to the powerful secular trends of online retailing, cloud infrastructure and services, and financial payment technologies.
What is your outlook?
Our outlook calls for economic growth, earnings and equity appreciation to be generally below consensus. We believe gross domestic product (GDP) will stay near a 2% real annualized rate of growth, constrained by low productivity, slow work force growth and sluggish international trade. With inflation stuck near 2%, we believe top-line growth will be between 5% and 6%, while margins will have a difficult time expanding from current record levels, especially as wages rise. We see earnings growth closer to the 6% to 8% level, versus the consensus expectation of 12% to 13%. The prospects for rising interest rates and slower earnings growth should keep markets relatively flat, but volatile, in 2017. Upside risks to our outlook include better GDP and sales growth from stronger global growth than we expect in Europe or China, as well as improved productivity that could allow for greater domestic growth and margins. Downside risks include exogenous geopolitical events, an overly aggressive Federal Reserve that raises rates either too much or too fast, and weaker domestic consumer consumption trends.
Quoted Fund performance is for Class A shares and does not reflect a sales charge.
The returns shown do not reflect taxes a shareholder would pay on distributions or redemptions.
26
| | | | |
| Portfolio Composition | | | | |
| (% of Portfolio) | | | | |
Common Stock | | | 95.3 | % |
Short-Term Investments | | | 4.7 | % |
| | | | |
Total | | | 100.0 | % |
| | | | |
| Major Market Sectors | | | | |
| (% of Net Assets) | | | | |
Information Technology | | | 47.0 | % |
Consumer Discretionary | | | 20.0 | % |
Health Care | | | 16.6 | % |
Industrials | | | 4.5 | % |
Consumer Staples | | | 3.7 | % |
Financials | | | 1.8 | % |
Energy | | | 1.8 | % |
| | | | |
| Top 10 Holdings | | | | |
| (% of Net Assets) | | | | |
Amazon.com, Inc. | | | 8.7 | % |
Facebook, Inc. | | | 8.1 | % |
Apple, Inc. | | | 5.3 | % |
Visa, Inc. | | | 5.2 | % |
Alphabet, Inc., Class A | | | 5.1 | % |
Microsoft Corporation | | | 5.0 | % |
Salesforce.com, Inc. | | | 4.0 | % |
Alphabet, Inc., Class C | | | 3.9 | % |
MasterCard, Inc. | | | 3.5 | % |
Gilead Sciences, Inc. | | | 3.4 | % |
These securities represent 52.2% of the total net assets of the Fund.
Quoted Major Market Sectors, Portfolio Composition and Top 10 Holdings are subject to change.
The lists of Major Market Sectors and Top 10 Holdings exclude short-term investments and collateral held for securities loaned.
The Portfolio Composition chart excludes collateral held for securities loaned.
| | | | | | | | | | | | |
Average Annual Total Returns1 | |
As of October 31, 2016 | |
| | | |
Class A2 | | | 1-Year | | | | 5 Years | | | | 10 Years | |
without sales charge | | | -4.52 | % | | | 12.56 | % | | | 6.10 | % |
with sales charge | | | -8.82 | % | | | 11.54 | % | | | 5.61 | % |
| | | |
Class S | | | 1-Year | | | | 5 Years | | | | 10 Years | |
Net Asset Value | | | -4.26 | % | | | 12.97 | % | | | 6.51 | % |
Value of a $10,000 Investment
Class A Shares *,1,(a )
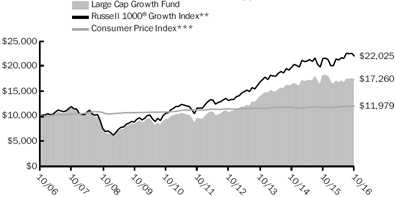
| 1 | Past performance is not an indication of future results. Average annual total returns represent past performance and reflect changes in share prices, the reinvestment of all dividends and capital gains, and the effects of compounding. The prospectus contains more complete information on the investment objectives, risks, charges and expenses of the investment company, which investors should read and consider carefully before investing. To obtain a prospectus, contact a registered representative or visit ThriventFunds.com. At various times, the Fund’s adviser waived its management fee and/or reimbursed Fund expenses. Had the adviser not done so, the Fund’s total returns would have been lower. The returns shown do not reflect taxes a shareholder would pay on distributions or redemptions. Total investment return and principal value of your investment will fluctuate, and your shares, when redeemed, may be worth more or less than their original cost. Current performance may be higher or lower than the performance data quoted. Call 800-THRIVENT (847-4836) or visit ThriventFunds.com for performance results current to the most recent month-end. |
| 2 | Class A performance with sales charge reflects the maximum sales charge of 4.5%. |
| (a) | Performance of other classes will be greater or less than the line shown based on the differences in loads and fees paid by shareholders investing in the different classes. |
| * | As you compare performance, please note that the Fund’s performance reflects the maximum 4.5% sales charge, while the Russell 1000® Growth Index and the Consumer Price Index do not reflect any such charges. If you were to purchase any of the above individual securities represented in the Index, any charges you would pay would reduce your total return as well. |
| ** | The Russell 1000® Growth Index measures the performance of large cap growth stocks. It is not possible to invest directly in the Index. The performance of the Index does not reflect deductions for fees, expenses or taxes. |
| *** | The Consumer Price Index is an inflationary indicator that measures the change in the cost of a fixed basket of products and services, including housing, electricity, food and transportation. It is not possible to invest directly in the Index. |
27
THRIVENT LARGE CAP VALUE FUND
Kurt J. Lauber, CFA, Portfolio Manager
The Fund seeks to achieve long-term growth of capital.
The Fund primarily invests in securities of large companies, which may be unable to respond quickly to new competitive challenges and may not be able to attain a high growth rate. The value of the Fund is influenced by factors impacting the overall market, certain asset classes, certain investment styles, and specific issuers. The Fund may incur losses due to incorrect assessments of investments by its investment adviser. Foreign investments involve additional risks, including currency fluctuations, liquidity, political, economic and market instability, and different legal and accounting standards.
How did the Fund perform during the 12-month period ended October 31, 2016?
Thrivent Large Cap Value Fund earned a return of 3.86%, compared with the 2.85% median return of its peer group, the Lipper Large Cap Value Funds category. The Fund’s market benchmark, the Russell 1000® Value Index, earned a return of 6.37%.
What factors affected the Fund’s performance?
Stock selection led to the Fund’s better relative performance versus its Lipper peers. Sector allocations were slightly negative overall, although the Fund’s largest overweighting in technology helped materially. Stock selection was strong in the health care, energy and materials sectors, but detracted from performance in consumer staples and financials.
In health care, performance benefited from Shire’s acquisition of Fund holding Baxalta. Merck also made strong gains after its new cancer product showed better results than a treatment under development at Bristol-Myers Squibb, the perceived leader in next-generation lung cancer drugs. UnitedHealth Group showed superior operating performance among health maintenance organizations (HMOs), while shares of other HMOs fell after their potential mergers ran into regulatory roadblocks.
In energy, the Fund benefited from increased weightings in Marathon Oil and Devon Energy, which both issued equity at the depths of oil-price fears in February. Chevron was the Fund’s best-performing integrated energy company. Years of expensive projects that dragged down operations and free cash flow came to fruition just in time for the recovery in energy prices. Our addition of Baker Hughes and its subsequent merger deal with General Electric benefited performance, but was more than offset by Weatherford International’s poor operating execution. In materials, the addition of Albemarle benefited performance due to a bottoming in bromine fundamentals and the increased demand from electric vehicles for lithium.
The consumer staples sector was responsible for the majority of the Fund’s underperformance versus the benchmark, primarily due to our position in CVS Health. Investors worried that pharmaceutical pricing pressures and new regulatory scrutiny of generics would have a negative impact on the business models of prescription benefit managers. Lack of exposure to strongly performing food product companies such as Tyson Foods also hindered performance in the staples sector. In financials, asset managers Invesco and Blackstone were hurt by market volatility caused by “Brexit,” the surprise result of the vote at the end of June that allows the U.K. to leave the European Union. Invesco was also pressured by the increased regulatory risk resulting from the Department of Labor’s new fiduciary rules.
What is your outlook?
As the world faces one of the slowest economic recoveries in history, external macro shocks such as Brexit or the ongoing deceleration of China’s economy continue to knock the market off its recovery path. Although the elections and more European referendums could add external shocks, we believe the economy will continue on its slow, steady recovery. While valuations might look unattractive on a price-to-earnings basis, they appear fair based on the more important factor of price-to-free cash flow. As a result, we did not change the Fund’s allocations materially.
The Fund will remain overweight in technology in light of it being one of the best-performing sectors this year. Cisco Systems, Microsoft and Oracle still trade at a discount to the market due to fears of technology obsolescence, but have shown further evidence of their ability to transition to cloud computing. We added Apple because the low customer replacement rate for iPhones sets up greater demand for next year’s new product release. We sold Intel after a rebound in personal computer sales and some potential over-ordering of semiconductors.
While energy and materials exposure did not change much, we swapped some stocks because of better valuations or operating performance. In energy, we sold long-time holding EOG Resources for Pioneer Natural Resources due to its similar valuation, but much larger reserve potential. We sold Cameron International after its acquisition by Schlumberger was completed, but purchased Baker Hughes after its deal with Haliburton fell apart, which should allow Baker to improve operations. We took profits in Albemarle after its rapid rise and bought Eastman Chemical, whose product margins are at a trough. In industrials, we added to Delta Air Lines because we believe the economy is stronger than investors perceive and the industry structure is better than the previous cycle. We continued to hold CSX in anticipation of a recovery in crude-by-rail volumes, while adding Norfolk Southern because it entered into a new operating plan that should provide improved margins.
Quoted Fund performance is for Class A shares and does not reflect a sales charge.
The returns shown do not reflect taxes a shareholder would pay on distributions or redemptions.
28
| | | | |
| Portfolio Composition | | | | |
| (% of Portfolio) | | | | |
Common Stock | | | 97.0 | % |
Short-Term Investments | | | 3.0 | % |
| | | | |
Total | | | 100.0 | % |
Major Market Sectors | | | | |
| (% of Net Assets) | | | | |
Financials | | | 23.8 | % |
Information Technology | | | 16.3 | % |
Health Care | | | 12.2 | % |
Energy | | | 11.0 | % |
Industrials | | | 10.4 | % |
Consumer Discretionary | | | 9.7 | % |
Consumer Staples | | | 5.0 | % |
Utilities | | | 3.5 | % |
Materials | | | 3.3 | % |
Telecommunications Services | | | 1.8 | % |
| | | | |
| Top 10 Holdings | | | | |
| (% of Net Assets) | | | | |
Cisco Systems, Inc. | | | 4.5 | % |
Microsoft Corporation | | | 3.9 | % |
Merck & Company, Inc. | | | 3.8 | % |
Citigroup, Inc. | | | 3.6 | % |
Chevron Corporation | | | 3.6 | % |
PG&E Corporation | | | 3.5 | % |
Comcast Corporation | | | 2.9 | % |
CVS Health Corporation | | | 2.8 | % |
Harley-Davidson, Inc. | | | 2.5 | % |
Bank of America Corporation | | | 2.4 | % |
These securities represent 33.5% of the total net assets of the Fund.
Quoted Major Market Sectors, Portfolio Composition and Top 10 Holdings are subject to change.
The lists of Major Market Sectors and Top 10 Holdings exclude short-term investments and collateral held for securities loaned.
The Portfolio Composition chart excludes collateral held for securities loaned.
| | | | | | | | | | | | |
Average Annual Total Returns1 | |
As of October 31, 2016 | |
| | | |
Class A2 | | | 1-Year | | | | 5 Years | | | | 10 Years | |
without sales charge | | | 3.86 | % | | | 11.73 | % | | | 4.72 | % |
with sales charge | | | -0.81 | % | | | 10.71 | % | | | 4.25 | % |
| | | |
Class S | | | 1-Year | | | | 5 Years | | | | 10 Years | |
Net Asset Value | | | 4.29 | % | | | 12.23 | % | | | 5.25 | % |
Value of a $10,000 Investment
Class A Shares *,1,(a )
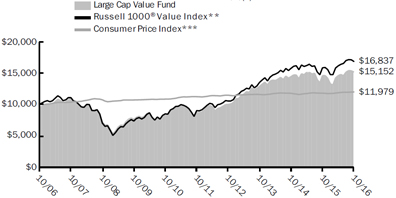
| 1 | Past performance is not an indication of future results. Average annual total returns represent past performance and reflect changes in share prices, the reinvestment of all dividends and capital gains, and the effects of compounding. The prospectus contains more complete information on the investment objectives, risks, charges and expenses of the investment company, which investors should read and consider carefully before investing. To obtain a prospectus, contact a registered representative or visit ThriventFunds.com. At various times, the Fund’s adviser waived its management fee and/or reimbursed Fund expenses. Had the adviser not done so, the Fund’s total returns would have been lower. The returns shown do not reflect taxes a shareholder would pay on distributions or redemptions. Total investment return and principal value of your investment will fluctuate, and your shares, when redeemed, may be worth more or less than their original cost. Current performance may be higher or lower than the performance data quoted. Call 800-THRIVENT (847-4836) or visit ThriventFunds.com for performance results current to the most recent month-end. |
| 2 | Class A performance with sales charge reflects the maximum sales charge of 4.5%. |
| (a) | Performance of other classes will be greater or less than the line shown based on the differences in loads and fees paid by shareholders investing in the different classes. |
| * | As you compare performance, please note that the Fund’s performance reflects the maximum 4.5% sales charge, while the Russell 1000® Value Index and the Consumer Price Index do not reflect any such charges. If you were to purchase any of the above individual securities represented in the Index, any charges you would pay would reduce your total return as well. |
| ** | The Russell 1000® Value Index measures the performance of large cap value stocks. It is not possible to invest directly in the Index. The performance of the Index does not reflect deductions for fees, expenses or taxes. |
| *** | The Consumer Price Index is an inflationary indicator that measures the change in the cost of a fixed basket of products and services, including housing electricity, food and transportation. It is not possible to invest directly in the Index. |
29
THRIVENT LARGE CAP STOCK FUND
Darren M. Bagwell, CFA, and Kurt J. Lauber, CFA, Portfolio Co-Managers
The Fund seeks long-term capital growth.
The Fund primarily invests in securities of large companies, which may be unable to respond quickly to new competitive challenges and may not be able to attain a high growth rate. The value of the Fund is influenced by factors impacting the overall market, certain asset classes, certain investment styles, and specific issuers. The Fund may incur losses due to incorrect assessments of investments by its investment adviser. Foreign investments involve additional risks, including currency fluctuations, liquidity, political, economic and market instability, and different legal and accounting standards.
How did the Fund perform during the 12-month period ended October 31, 2016?
Thrivent Large Cap Stock Fund earned a return of -1.48%, compared with the median return of its peer group, the Lipper Global Large Cap Core Funds category, of 0.78%. The Fund’s market benchmark, the MSCI World Large Cap Index - USD Net Returns, earned a return of 1.06%.
What factors affected the Fund’s performance?
The Fund’s shortfall versus its benchmark and Lipper peers was mainly the result of stock selection in the U.S. segment of the portfolio and an overweighting in international securities. In the domestic portfolio, poor stock selection in the industrials, information technology, health care, consumer staples and energy sectors were all factors in the Fund’s underperformance. In industrials, our positions in Boeing, Delta Air Lines and Union Pacific all performed below the overall market as well as other stocks within this group. Additionally, the Fund was underweighted in this strongly performing sector. In information technology, our position in Apple did not keep pace with the market or the group, but was offset by strong performance from Facebook and Alphabet, the parent company of Google. Biotechnology shares in health care experienced intense selling pressure following quite strong results in the prior fiscal year. In energy, we saw a particularly sharp decline in Weatherford International, which was partially offset by favorable returns from our positions in Chevron and Columbia Pipeline.
In the consumer discretionary sector, we realized solid returns from our position in Amazon.com, but experienced weakness from Starbucks. The Fund’s holdings in the chemical industry performed well. We also saw modestly better returns than the group in the financial sector.
Internationally, our portfolio outperformed the international benchmarks; however, overseas stocks generally did not keep pace with the better returns experienced in the U.S. In financials, our holdings in the banking and diversified financials space performed well versus their peers. In consumer staples, we also saw favorable results from our holdings in food and staples retailing, tobacco and food products. Overseas, our positions in real estate investment trusts (REITs) performed quite well, while we also held a modest overweighting in the group, which added value. However, an underweighted position in the materials group proved detrimental after commodity prices staged a strong rebound. In particular, lower-quality metals and mining companies rallied sharply, which was an area where the Fund had little exposure. Our holdings in the household durables industry within consumer discretionary also performed poorly, including particular weakness in Berkeley Group Holdings and Persimmon.
What is your outlook?
Valuations both domestically and internationally are quite rich, anticipating a continuation of the economic recovery, tepid as it may have been and continues to be. The U.S. recovery has led the rest of the world by 18 to 24 months, while serious fundamental issues have impaired the recoveries in the developed world outside the U.S. Central bankers have taken aggressive actions to stimulate or accelerate growth. While these actions have had some moderate impact, it appears that additional monetary actions will likely prove insufficient to achieve the goal of faster growth and moderately higher inflation.
The growing consensus seems to be that fiscal and regulatory policy must now take the lead. Should those policies be effective, we see a greater opportunity to improve revenues and margins outside the U.S. because domestic companies are already operating at cyclically high levels of profitability, and momentum seems to be moderating. The Fund remains overweighted in international versus domestic stocks; however, we are monitoring economic conditions quite closely since sustained or accelerating economic growth will be a necessary condition to validate current valuation levels.
Quoted Fund performance is for Class A shares and does not reflect a sales charge.
The returns shown do not reflect taxes a shareholder would pay on distributions or redemptions.
30
| | | | |
| Portfolio Composition | | | | |
| (% of Portfolio) | | | | |
Common Stock | | | 85.4 | % |
Short-Term Investments | | | 11.7 | % |
Commercial Paper | | | 2.7 | % |
Registered Investment Companies | | | 0.2 | % |
| | | | |
Total | | | 100.0 | % |
| | | | |
| Major Market Sectors | | | | |
| (% of Net Assets) | | | | |
Consumer Discretionary | | | 14.2 | % |
Information Technology | | | 13.8 | % |
Financials | | | 13.6 | % |
Industrials | | | 10.1 | % |
Health Care | | | 8.5 | % |
Energy | | | 7.7 | % |
Consumer Staples | | | 6.7 | % |
Materials | | | 4.3 | % |
Utilities | | | 2.7 | % |
Telecommunications Services | | | 1.8 | % |
| | | | |
| Top 10 Holdings | | | | |
| (% of Net Assets) | | | | |
Apple, Inc. | | | 3.5 | % |
Amazon.com, Inc. | | | 2.4 | % |
Alphabet, Inc., Class A | | | 2.2 | % |
Alphabet, Inc., Class C | | | 2.1 | % |
Starbucks Corporation | | | 2.1 | % |
AutoZone, Inc. | | | 2.1 | % |
PG&E Corporation | | | 2.1 | % |
Comcast Corporation | | | 1.9 | % |
Pfizer, Inc. | | | 1.9 | % |
Baker Hughes, Inc. | | | 1.8 | % |
These securities represent 22.1% of the total net assets of the Fund. | | | | |
Quoted Major Market Sectors, Portfolio Composition and Top 10 Holdings are subject to change.
The lists of Major Market Sectors and Top 10 Holdings exclude short-term investments and collateral held for securities loaned.
The Portfolio Composition chart excludes collateral held for securities loaned.
Average Annual Total Returns1
As of October 31, 2016
| | | | | | | | | | | | |
| Class A2 | | 1-Year | | | 5 Years | | | 10 Years | |
without sales charge | | | -1.48 | % | | | 9.76 | % | | | 3.85 | % |
with sales charge | | | -5.91 | % | | | 8.76 | % | | | 3.37 | % |
| | | |
| Class S | | 1-Year | | | 5 Years | | | 10 Years | |
Net Asset Value | | | -1.08 | % | | | 10.23 | % | | | 4.33 | % |
Value of a $10,000 Investment
Class A Shares *,1,(a )
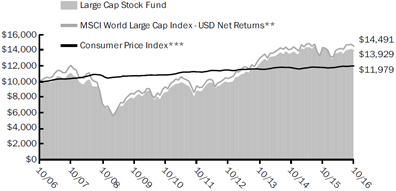
| 1 | Past performance is not an indication of future results. Average annual total returns represent past performance and reflect changes in share prices, the reinvestment of all dividends and capital gains, and the effects of compounding. The prospectus contains more complete information on the investment objectives, risks, charges and expenses of the investment company, which investors should read and consider carefully before investing. To obtain a prospectus, contact a registered representative or visit ThriventFunds.com. At various times, the Fund’s adviser waived its management fee and/or reimbursed Fund expenses. Had the adviser not done so, the Fund’s total returns would have been lower. The returns shown do not reflect taxes a shareholder would pay on distributions or redemptions. Total investment return and principal value of your investment will fluctuate, and your shares, when redeemed, may be worth more or less than their original cost. Current performance may be higher or lower than the performance data quoted. Call 800-THRIVENT (847-4836) or visit ThriventFunds.com for performance results current to the most recent month-end. |
| 2 | Class A performance with sales charge reflects the maximum sales charge of 4.5%. |
| (a) | Performance of other classes will be greater or less than the line shown based on the differences in loads and fees paid by shareholders investing in the different classes. |
| * | Effective February 28, 2015, the Russell Developed Large Cap Index was replaced with the MSCI World Large Cap Index - USD Net Returns. The Adviser made this benchmark change because it believes that this Index is a more appropriate benchmark for the Fund. Thus the Russell Developed Large Cap Index will not be shown in shareholder reports of the Fund for fiscal periods ended October 31, 2016 and beyond. As you compare performance, please note that the Fund’s performance reflects the maximum 4.5% sales charge, while the MSCI World Large Cap Index-USD Net Returns and the Consumer Price Index do not reflect any such charges. If you were to purchase any of the above individual securities represented in the Index, any charges you would pay would reduce your total return as well. |
| ** | The MSCI World Large Cap Index - USD Net Returns is an index that represents large cap stocks in 23 developed market countries. |
| *** | The Consumer Price Index is an inflationary indicator that measures the change in the cost of a fixed basket of products and services, including housing, electricity, food and transportation. It is not possible to invest directly in the Index. |
31
THRIVENT HIGH YIELD FUND
Paul J. Ocenasek, CFA, Portfolio Manager
The Fund seeks high current income and, secondarily, growth of capital.
The Fund primarily invests in high-yield, high-risk bonds, notes, debentures and other debt obligations, or preferred stocks. Credit risk is the risk that an issuer of a debt security may not pay its debt, and high yield securities are subject to increased credit risk as well as liquidity risk. Bond prices generally fall as interest rates rise. Leveraged loans are subject to numerous risks, including liquidity, credit, declines in the value of collateral underlying them, and detrimental legal actions against them. The value of the Fund is influenced by factors impacting the overall market, certain asset classes, certain investment styles, and specific issuers. The Fund may incur losses due to incorrect assessments of investments by its investment adviser. Foreign investments involve additional risks, including currency fluctuations, liquidity, political, economic and market instability, and different legal and accounting standards. Dealer inventories of bonds are at or near historic lows in relation to market size, which has the potential to decrease liquidity and increase price volatility in the fixed income markets.
How did the Fund perform during the 12-month period ended October 31, 2016?
Thrivent High Yield Fund earned a return of 6.05%, compared with the median return of its peer group, the Lipper U.S. High Current Yield Funds category, of 7.09%. The Fund’s market benchmark, the Bloomberg Barclays U.S. Corporate High Yield Bond Index, earned a return of 10.14%.
What factors affected the Fund’s performance?
During the first few months of the reporting period, the high-yield market continued the dramatic sell off that started in the summer of 2015. A Federal Reserve (Fed) rate increase in December 2015 and guidance on additional increases in 2016 led the U.S. dollar to continue strengthening, which caused prices for oil and other commodities to plunge further and risk aversion to spike. The yield spread between high-yield bonds and Treasuries widened dramatically from 5.60% at the beginning of November 2015 to 8.40% by February 11—the day that marked the bottom of the sell off for risk assets. Energy and commodity-related sectors led the sell off, including metals and mining (M&M), and exploration and production (E&P).
The tide quickly turned in mid-February after the European Central Bank, the Bank of Japan and a number of other central banks outside the U.S. announced a flurry of quantitative and monetary easing measures including corporate bond purchases. At the same time, the U.S. economy showed slower-than-expected growth and the Federal Reserve took on a much more dovish tone, pushing out market expectations for additional rate hikes. As a result, the dollar declined and commodity prices started to increase, causing risk assets to rally. By period end, high-yield spreads had tightened to 4.77% over Treasuries. The high-yield default rate increased from 2.5% to 6.5%, driven by a significant jump in defaults in energy and commodity-related industries.
In a reversal from last year, lower-quality bonds—as a whole—considerably outperformed over the period with CCC-rated bonds advancing 16.22% versus gains of 8.50% and 8.74% for B-rated and BB-rated bonds, respectively. However, these returns masked the extreme volatility experienced in the high-yield market with CCC-rated bonds actually up 59.1% from their February lows.
The Fund’s underperformance versus the median return of its Lipper peers was mainly the result of our more conservative posture, including a modest 2.5% underweighting in M&M that detracted due to the 42.7% advance of the sector during the period. Also, while the Fund was neutrally weighted in energy E&P, we had less exposure to the stronger performing CCC-rated securities in the industry. Meanwhile, our shortfall versus the benchmark was a widespread phenomenon among high-yield mutual funds. In the first few weeks of 2016, the corporate bond market experienced a substantial number of downgrades among investment-grade energy and M&M credits that dropped into the high-yield index. However, before our Fund and most other managers could establish positions in these credits, the prices of these so-called fallen angels rebounded in record time.
On the other hand, the Fund benefited from underweighted positions in health care and banking, which were two of the less cyclical, higher-quality sectors that underperformed. We also continued to put some of the previously held cash in the portfolio to work, which helped returns given the strong advance in the high-yield market.
What is your outlook?
Our outlook for the high-yield market continues to be fairly neutral. On the positive side, high yield remains one of the only sectors where investors are able to capture significant yields, which gives the segment a strong technical underpinning— at least in the short term. We also believe high-yield defaults have peaked and will start to move lower; however, this has likely been priced into the market. We think current valuations in high yield are unattractive given the segment’s recent outperformance and our outlook for relatively slow U.S. economic growth in the 2.0% to 2.5% range. Also, banks continue to tighten their lending standards, which does not bode well for credit in general.
We continue to maintain the Fund’s somewhat defensive posture with an underweighting in CCC-rated bonds. We are adding exposure in telecommunications, both wireless and wireline, and in the midstream area of energy because pipelines are less dependent on energy prices. The Fund remains underweighted in health care due to drug pricing issues and weakness among hospitals, and in banking because of the low interest rate environment, which puts pressure on bank earnings.
Quoted Fund performance is for Class A shares and does not reflect a sales charge.
The returns shown do not reflect taxes a shareholder would pay on distributions or redemptions.
32
Bond Quality Ratings Distributions
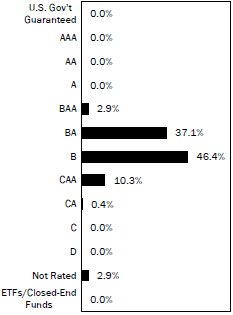
Major Market Sectors
(% of Net Assets)
| | | | |
Communications Services | | | 18.4 | % |
Consumer Cyclical | | | 14.6 | % |
Consumer Non-Cyclical | | | 11.4 | % |
Energy | | | 11.4 | % |
Financials | | | 9.0 | % |
Capital Goods | | | 8.4 | % |
Technology | | | 7.2 | % |
Basic Materials | | | 5.0 | % |
Transportation | | | 4.0 | % |
Utilities | | | 4.0 | % |
| | | | |
| Top 10 Holdings | | | | |
| (% of Net Assets) | | | | |
Sprint Corporation | | | 1.6 | % |
Frontier Communications Corporation | | | 0.9 | % |
Hughes Satellite Systems Corporation | | | 0.9 | % |
Alliance Data Systems Corporation | | | 0.8 | % |
Neptune Finco Corporation | | | 0.8 | % |
Berry Plastics Corporation | | | 0.8 | % |
Ally Financial, Inc. | | | 0.8 | % |
Unitymedia Hessen GmbH & Company KG | | | 0.7 | % |
CCO Holdings, LLC | | | 0.7 | % |
Columbus International, Inc. | | | 0.7 | % |
These securities represent 8.7% of the total net assets of the Fund. | | | | |
Bond quality ratings are obtained from Moody’s Investors Service, Inc. (“Moody’s”) and Standard & Poor’s Ratings Services (“S&P”). Ratings from S&P, when
used, are converted into their equivalent Moody’s ratings. If Moody’s and S&P have assigned different ratings to a security, the lowest rating for the security is
used. Investments in derivatives and short-term investments are not reflected in the table.
Quoted Major Market Sectors, Bond Quality Ratings Distributions and Top 10 Holdings are subject to change.
The lists of Major Market Sectors and Top 10 Holdings exclude short-term investments and collateral held for securities loaned.
Average Annual Total Returns1
As of October 31, 2016
| | | | | | | | | | | | |
| Class A2 | | 1-Year | | | 5 Years | | | 10 Years | |
without sales charge | | | 6.05 | % | | | 6.26 | % | | | 6.46 | % |
with sales charge | | | 1.35 | % | | | 5.29 | % | | | 5.97 | % |
| | | |
| Class S | | 1-Year | | | 5 Years | | | 10 Years | |
Net Asset Value | | | 6.34 | % | | | 6.54 | % | | | 6.83 | % |
Value of a $10,000 Investment
Class A Shares *,1,(a )
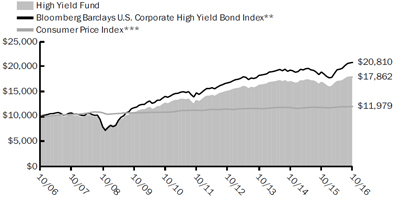
| 1 | Past performance is not an indication of future results. Average annual total returns represent past performance and reflect changes in share prices, the reinvestment of all dividends and capital gains, and the effects of compounding. The prospectus contains more complete information on the investment objectives, risks, charges and expenses of the investment company, which investors should read and consider carefully before investing. To obtain a prospectus, contact a registered representative or visit ThriventFunds.com. At various times, the Fund’s adviser waived its management fee and/or reimbursed Fund expenses. Had the adviser not done so, the Fund’s total returns would have been lower. The returns shown do not reflect taxes a shareholder would pay on distributions or redemptions. Total investment return and principal value of your investment will fluctuate, and your shares, when redeemed, may be worth more or less than their original cost. Current performance may be higher or lower than the performance data quoted. Call 800-THRIVENT (847-4836) or visit ThriventFunds.com for performance results current to the most recent month-end. |
| 2 | Class A performance with sales charge reflects the maximum sales charge of 4.5%. |
| (a) | Performance of other classes will be greater or less than the line shown based on the differences in loads and fees paid by shareholders investing in the different classes. |
| * | As you compare performance, please note that the Fund’s performance reflects the maximum 4.5% sales charge, while the Bloomberg Barclays U.S. Corporate High Yield Bond Index and the Consumer Price Index do not reflect any such charges. If you were to purchase any of the above individual securities represented in the Index, any charges you would pay would reduce your total return as well. |
| ** | The Bloomberg Barclays U.S. Corporate High Yield Bond Index is an index which measures the performance of fixed-rate non-investment grade bonds. It is not possible to invest directly in the Index. The performance of the Index does not reflect deductions for fees, expenses or taxes. |
| *** | The Consumer Price Index is an inflationary indicator that measures the change in the cost of a fixed basket of products and services, including housing, electricity, food and transportation. It is not possible to invest directly in the Index. |
33
THRIVENT INCOME FUND
Stephen D. Lowe, CFA, Portfolio Manager
The Fund seeks high current income while preserving principal and, secondarily, long-term growth of capital.
The Fund primarily invests in investment-grade corporate bonds, government bonds, asset-backed securities and mortgage-backed securities. The value of the Fund is influenced by factors impacting the overall market, certain asset classes, certain investment styles, and specific issuers. The Fund may incur losses due to incorrect assessments of investments by its investment adviser. Bond prices generally fall as interest rates rise. Credit risk is the risk that an issuer of a debt security may not pay its debt, and high yield securities are subject to increased credit risk as well as liquidity risk. The value of mortgage-related and other asset-backed securities will be influenced by the factors affecting the housing market and the assets underlying such securities. Foreign investments involve additional risks, including currency fluctuations, liquidity, political, economic and market instability, and different legal and accounting standards. The prices of futures contracts can be highly volatile and the loss from investing in them can exceed the initial investment. Dealer inventories of bonds are at or near historic lows in relation to market size, which has the potential to decrease liquidity and increase price volatility in the fixed income markets.
How did the Fund perform during the 12-month period ended October 31, 2016?
Thrivent Income Fund earned a return of 6.62%, compared with the median return of its peer group, the Lipper Corporate Debt Funds BBB-Rated category, of 6.66%. The Fund’s market benchmark, the Bloomberg Barclays U.S. Aggregate Bond Index, earned a return of 4.37%.
What factors affected the Fund’s performance?
At the start of the period, interest rates began to rise, particularly for shorter-maturity Treasuries, as the market anticipated a Federal Reserve (Fed) rate hike by the end of 2015. The Fed delivered with a rate hike in December, while offering guidance that more increases were coming in 2016 and 2017. The news caused the dollar to strengthen further and prices for oil and other commodities to plummet. The resulting risk aversion drove corporate bond spreads significantly wider.
Energy prices and risk assets bottomed out on February 11 before the tide quickly turned following a flurry of quantitative and monetary easing announcements by the European Central Bank, the Bank of Japan and other central banks outside the U.S. At the same time, the U.S. economy showed slower-than-expected growth and the Fed took on a much more dovish tone, pushing out market expectations for additional rate hikes. The dollar declined and commodity prices subsequently started to recover, causing risk assets to rally and spreads to tighten for both high-yield and investment-grade corporate bonds.
The extraordinarily accommodative monetary policies outside the U.S. and the surprise result of the “Brexit” vote at the end of June that allows the United Kingdom to leave the European Union kept overseas interest rates extremely low, in some cases falling into negative territory. These historically low rates resulted in strong demand for U.S. securities with higher yields and pushed corporate bond spreads even tighter. As a result, corporate bonds, particularly high yield, were the strongest performers within the fixed-income market over the period. This trend also contributed to a flattening of the yield curve as rates declined for Treasuries with maturities of three years and longer, while rates moved modestly higher for securities with maturities of two years and under.
The Fund’s outperformance versus the Bloomberg Barclays benchmark was primarily due to its much higher allocation to corporate securities, including investment-grade bonds, high-yield bonds and leveraged loans. Approximately 83% of the portfolio was invested in corporate securities versus only about 25% of the higher-quality Bloomberg Barclays index, plus the index had no high-yield exposure. In periods where risk assets perform so strongly, the Fund will typically outperform.
The Fund’s results were basically in line with the median return of its Lipper peers. On the positive side, the Fund benefited from widespread strength among its investment-grade industrial credits. The Fund’s investment-grade exposure represented around 64% of the portfolio. Also, our approximately 4% weighting in leveraged loans, which we own as a hedge in case short-term rates increase, performed well as rates rose later in the year and anticipation grew for another Fed hike. Offsetting these strengths, the Fund’s results were hindered by a higher-quality bias among our high-yield corporate bonds. Contrary to last year, lower-quality bonds considerably outperformed, with CCC-rated bonds advancing more than 16% over the full period, but up nearly 60% from their February lows. Also, the Fund was hurt by a lack of exposure to “fallen angels,” which were investment-grade metals and mining credits that were downgraded to high yield, and subsequently rebounded in record time.
What is your outlook?
We expect inflationary pressures to increase at least moderately in the coming year due to a number of factors including the tightening labor market. We also anticipate market volatility will increase in light of the potential for Fed rate hikes on the horizon and the uncertainties surrounding the new administration’s policies. While we believe a Fed rate increase is likely in December 2016, we continue to anticipate policymakers will proceed at a measured pace. Other potential headwinds that make us more cautious regarding the coming year include a possible decrease in demand from overseas investors, less attractive valuations in credit, increased company leverage and tighter bank lending standards. That being said, our portfolio remains overweighted in corporates, while maintaining a slightly shorter duration, which lessens the Fund’s interest-rate sensitivity. We continue to modestly increase exposure to both leveraged loans and short-duration, floating-rate securities.
Quoted Fund performance is for Class A shares and does not reflect a sales charge.
The returns shown do not reflect taxes a shareholder would pay on distributions or redemptions.
34
Bond Quality Ratings Distributions
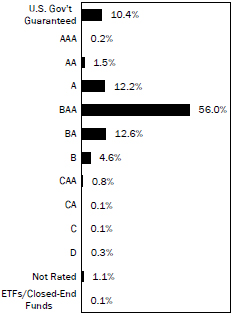
| | | | |
| Major Market Sectors | | | | |
| (% of Net Assets) | | | | |
Financials | | | 27.9 | % |
Consumer Non-Cyclical | | | 11.5 | % |
Communications Services | | | 11.2 | % |
Energy | | | 9.3 | % |
Utilities | | | 6.2 | % |
Consumer Cyclical | | | 5.4 | % |
U.S. Government and Agencies | | | 5.3 | % |
Mortgage-Backed Securities | | | 4.7 | % |
Technology | | | 3.5 | % |
Basic Materials | | | 2.9 | % |
| | | | |
| Top 10 Holdings | | | | |
| (% of Net Assets) | | | | |
Federal National Mortgage Association Conventional 30-Yr. Pass Through | | | 1.8 | % |
Federal National Mortgage Association Conventional 30-Yr. Pass Through | | | 0.7 | % |
Federal National Mortgage Association Conventional 15-Yr. Pass Through | | | 0.7 | % |
Federal National Mortgage Association Conventional | | | 0.7 | % |
U.S. Treasury Bonds | | | 0.5 | % |
Federal Home Loan Mortgage Corporation Gold 30-Yr. Pass Through | | | 0.5 | % |
U.S. Treasury Notes | | | 0.5 | % |
U.S. Treasury Notes | | | 0.5 | % |
U.S. Treasury Notes | | | 0.5 | % |
U.S. Treasury Notes | | | 0.4 | % |
These securities represent 6.8% of the total net assets of the Fund. | | | | |
Bond quality ratings are obtained from Moody’s Investors Service, Inc. (“Moody’s”) and Standard & Poor’s Ratings Services (“S&P”). Ratings from S&P, when
used, are converted into their equivalent Moody’s ratings. If Moody’s and S&P have assigned different ratings to a security, the lowest rating for the security is
used. Investments in derivatives and short-term investments are not reflected in the table.
Quoted Major Market Sectors, Bond Quality Ratings Distributions and Top 10 Holdings are subject to change.
The lists of Major Market Sectors and Top 10 Holdings exclude short-term investments and collateral held for securities loaned.
Average Annual Total Returns1
As of October 31, 2016
| | | | | | | | | | | | |
| Class A2 | | 1-Year | | | 5 Years | | | 10 Years | |
without sales charge | | | 6.62 | % | | | 4.77 | % | | | 5.14 | % |
with sales charge | | | 1.87 | % | | | 3.81 | % | | | 4.67 | % |
| | | |
| Class S | | 1-Year | | | 5 Years | | | 10 Years | |
Net Asset Value | | | 6.97 | % | | | 5.14 | % | | | 5.55 | % |
Value of a $10,000 Investment
Class A Shares *,1,(a )
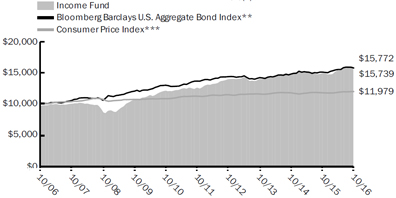
| 1 | Past performance is not an indication of future results. Average annual total returns represent past performance and reflect changes in share prices, the reinvestment of all dividends and capital gains, and the effects of compounding. The prospectus contains more complete information on the investment objectives, risks, charges and expenses of the investment company, which investors should read and consider carefully before investing. To obtain a prospectus, contact a registered representative or visit ThriventFunds.com. At various times, the Fund’s adviser waived its management fee and/or reimbursed Fund expenses. Had the adviser not done so, the Fund’s total returns would have been lower. The returns shown do not reflect taxes a shareholder would pay on distributions or redemptions. Total investment return and principal value of your investment will fluctuate, and your shares, when redeemed, may be worth more or less than their original cost. Current performance may be higher or lower than the performance data quoted. Call 800-THRIVENT (847-4836) or visit ThriventFunds.com for performance results current to the most recent month-end. |
| 2 | Class A performance with sales charge reflects the maximum sales charge of 4.5%. |
| (a) | Performance of other classes will be greater or less than the line shown based on the differences in loads and fees paid by shareholders investing in the different classes. |
| * | As you compare performance, please note that the Fund’s performance reflects the maximum 4.5% sales charge, while the Bloomberg Barclays U.S. Aggregate Bond Index and the Consumer Price Index do not reflect any such charges. If you were to purchase any of the above individual securities represented in the Index, any charges you would pay would reduce your total return as well. |
| ** | The Bloomberg Barclays U.S. Aggregate Bond Index is an index that measures the performance of U.S. investment grade bonds. It is not possible to invest directly in the Index. The performance of the Index does not reflect deductions for fees, expenses or taxes. |
| *** | The Consumer Price Index is an inflationary indicator that measures the change in the cost of a fixed basket of products and services, including housing, electricity, food and transportation. It is not possible to invest directly in the Index. |
35
THRIVENT MUNICIPAL BOND FUND
Janet I. Grangaard, CFA, Portfolio Manager
The Fund seeks a high level of current income exempt from federal income taxes, consistent with capital preservation.*
Municipal bonds are subject to risks including, but not limited to, credit risk and interest rate risk. Credit risk is the risk that an issuer of a bond to which the Fund is exposed may no longer be able to pay its debt. Interest rate risk means bond prices generally fall as interest rates rise, and changes by the Federal Reserve to monetary policy could affect interest rates and the value of some securities. Changes in federal income tax laws or rates may affect both the net asset value of the Fund and the taxable equivalent interest generated from securities in the Fund. Some issues may be subject to state and local taxes and/or the federal and state alternative minimum tax (AMT). Any increase in principal value may be taxable. The Fund may incur losses due to incorrect assessments of investments by its investment adviser. Investing in municipal bonds for the purpose of generating tax-exempt income may not be appropriate for investors in all income tax brackets. Please consult a tax advisor for more detailed information about your specific situation, including state/local tax treatment. These and other risks are described in the Fund’s prospectus. Dealer inventories of bonds are at or near historic lows in relation to market size, which has the potential to decrease liquidity and increase price volatility in the fixed income markets.
How did the Fund perform during the 12-month period ended October 31, 2016?
Thrivent Municipal Bond Fund earned a return of 3.79%, compared with the median return of its peer group, the Lipper General Municipal Debt Funds category, of 4.14%. The Fund’s market benchmark, the Bloomberg Barclays Municipal Bond Index, earned a return of 4.06%.
What factors affected the Fund’s performance?
The municipal market experienced widespread strength during the period as interest rates moved lower across the board and the municipal yield curve flattened. Lower-quality, high-yield municipal securities significantly outperformed higher-quality, investment-grade bonds. The supply of municipal bonds increased substantially over the period with calendar year 2016 on pace to break the all-time record for new bond issuance. At the same time, the market saw very strong demand from both U.S. and foreign investors as well as banks. Extraordinarily accommodative monetary policies outside the U.S. and the surprise “Brexit” vote at the end of June kept overseas interest rates extremely low. As a result, demand for U.S. securities—including municipal bonds—increased despite the fact that foreign investors do not benefit from the tax exemption.
Midway through the period, Puerto Rico defaulted on its general obligation bonds, which was in violation of its constitution. However, defaults across the rest of the municipal bond market remained very low. Several areas we highlighted as laggards last year—including Puerto Rican bonds and New Jersey appropriation debt—performed well this year, benefiting from narrowing credit spreads and the outperformance of lower-quality bonds. Puerto Rico’s bonds rallied in part due to the PROMESA legislation the U.S. government passed to help the commonwealth sort out its financial troubles. In New Jersey, lawmakers passed legislation to fund $16 billion in road construction improvements through the Transportation Trust Fund Authority, which is backed by revenues from higher gasoline taxes.
The Fund underperformed the Lipper median primarily because it had only around 3% of its assets invested in high-yield bonds. We also had no exposure to Puerto Rico and a very small weighting in New Jersey credits. Additionally, the Fund purchased several solid credits after the market peaked in mid-summer that underperformed because rates moved higher through the period end. The Fund’s worst-performing sector was county bonds—mainly because our positions are AAA-rated—followed by water and sewer, which tends to be a more stable, defensive sector.
The Fund’s top-performing sectors were higher education, hospital and toll road revenue bonds. Our performance also continued to benefit from pre-refunding activity. In fact, our best-performing position was a convertible capital appreciation bond from the San Diego Unified School District that was pre-refunded. With pre-refunding, the bond issuer sells a second deal, usually with a lower yield, and invests the proceeds in an escrow account composed of U.S. Treasuries. The result is an immediate increase in the pre-refunded bond’s credit quality and price, while locking in its maturity to the first call date.
What is your outlook?
The results from the recent election raise more questions than answers for the municipal bond market. Several of the top goals outlined by the new administration could potentially have wide-ranging effects on the municipal market, including increased infrastructure spending, tax cuts or reform, trade protectionism and the repeal or restructuring of the Affordable Care Act. We will remain vigilant in monitoring developments regarding these issues and more that could impact the market. While we believe a Federal Reserve rate increase is likely in December 2016 with more to come in 2017, we continue to anticipate policymakers will proceed at a relatively slow pace. However, inflationary pressures are beginning to rise with the tightening labor market, increasing service sector costs and the growing possibility of fiscal stimulus. These issues aside, the backdrop for municipal bonds may also be more challenging next year if rates go up, supply continues to increase and demand lessens to some extent as rates begin to edge higher around the globe.
*Investors may be subject to state taxes, the federal alternative minimum tax and capital gains taxes.
Quoted Fund performance is for Class A shares and does not reflect a sales charge.
The returns shown do not reflect taxes a shareholder would pay on distributions or redemptions.
36
Bond Quality Ratings Distributions
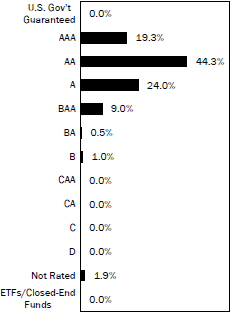
Major Market Sectors
(% of Net Assets)
| | | | |
Escrowed/Pre-refunded | | | 16.7 | % |
Transportation | | | 15.2 | % |
Education | | | 13.5 | % |
Health Care | | | 13.2 | % |
General Obligation | | | 12.2 | % |
Other Revenue | | | 11.4 | % |
Tax Revenue | | | 6.5 | % |
Water & Sewer | | | 5.5 | % |
Electric Revenue | | | 3.5 | % |
Housing Finance | | | 0.7 | % |
| | | | |
| Top 10 States | |
| (% of Net Assets) | |
California | | | 11.2 | % |
Texas | | | 11.2 | % |
New York | | | 6.9 | % |
Illinois | | | 6.8 | % |
Florida | | | 6.5 | % |
Ohio | | | 6.3 | % |
Massachusetts | | | 4.2 | % |
Pennsylvania | | | 3.6 | % |
Washington | | | 3.3 | % |
Colorado | | | 3.2 | % |
Investments in securities in these States represent 63.2% of the total net assets of the Fund. | | | | |
Bond quality ratings are obtained from Moody’s Investors Service, Inc. (“Moody’s”) and Standard & Poor’s Ratings Services (“S&P”). Ratings from S&P, when
used, are converted into their equivalent Moody’s ratings. If Moody’s and S&P have assigned different ratings to a security, the lowest rating for the security is
used. Investments in derivatives and short-term investments are not reflected in the table.
Quoted Major Market Sectors, Bond Quality Ratings Distributions and Top 10 States are subject to change.
The lists of Major Market Sectors and Top 10 States exclude short-term investments.
Average Annual Total Returns1
As of October 31, 2016
| | | | | | | | | | | | |
| Class A2 | | 1-Year | | | 5 Years | | | 10 Years | |
without sales charge | | | 3.79 | % | | | 4.25 | % | | | 4.28 | % |
with sales charge | | | -0.91 | % | | | 3.30 | % | | | 3.79 | % |
| | | |
| Class S | | 1-Year | | | 5 Years | | | 10 Years | |
Net Asset Value | | | 4.04 | % | | | 4.51 | % | | | 4.56 | % |
Value of a $10,000 Investment
Class A Shares *,1,(a )
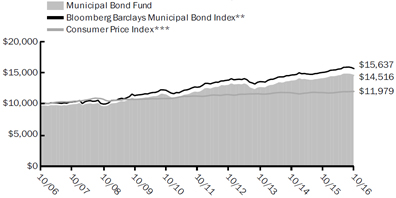
| 1 | Past performance is not an indication of future results. Average annual total returns represent past performance and reflect changes in share prices, the reinvestment of all dividends and capital gains, and the effects of compounding. The prospectus contains more complete information on the investment objectives, risks, charges and expenses of the investment company, which investors should read and consider carefully before investing. To obtain a prospectus, contact a registered representative or visit ThriventFunds.com. At various times, the Fund’s adviser waived its management fee and/or reimbursed Fund expenses. Had the adviser not done so, the Fund’s total returns would have been lower. The returns shown do not reflect taxes a shareholder would pay on distributions or redemptions. Total investment return and principal value of your investment will fluctuate, and your shares, when redeemed, may be worth more or less than their original cost. Current performance may be higher or lower than the performance data quoted. Call 800-THRIVENT (847-4836) or visit ThriventFunds.com for performance results current to the most recent month-end. |
| 2 | Class A performance with sales charge reflects the maximum sales charge of 4.5%. |
| (a) | Performance of other classes will be greater or less than the line shown based on the differences in loads and fees paid by shareholders investing in the different classes. |
| * | As you compare performance, please note that the Fund’s performance reflects the maximum 4.5% sales charge, while the Bloomberg Barclays Municipal Bond Index and the Consumer Price Index do not reflect any such charges. If you were to purchase any of the above individual securities represented in the Index, any charges you would pay would reduce your total return as well. |
| ** | The Bloomberg Barclays Municipal Bond Index is a market-value-weighted index of investment-grade municipal bonds with maturities of one year or more. It is not possible to invest directly in the Index. The performance of the Index does not reflect deductions for fees, expenses or taxes. |
| *** | The Consumer Price Index is an inflationary indicator that measures the change in the cost of a fixed basket of products and services, including housing, electricity, food and transportation. It is not possible to invest directly in the Index. |
37
THRIVENT GOVERNMENT BOND FUND
Michael G. Landreville, CFA and CPA (inactive), Portfolio Manager
The Fund seeks total return, consistent with preservation of capital.
The Fund primarily invests in securities issued or guaranteed by the U.S. government or its agencies and instrumentalities. The value of the Fund is influenced by factors impacting the overall market, debt securities in particular, and the U.S. government. The Fund may incur losses due to incorrect assessments of investments by its investment adviser. The value of U.S. government securities may be affected by changes in the credit rating of the U.S. government. Certain U.S. government securities are not backed by the full faith and credit of the U.S. government. Bond prices generally fall as interest rates rise. Inflation-linked debt securities, such as TIPS, are subject to the effects of changes in market interest rates caused by factors other than inflation (real interest rates). The value of mortgage-related and other asset-backed securities will be influenced by the factors affecting the housing market and the assets underlying such securities. Dealer inventories of bonds are at or near historic lows in relation to market size, which has the potential to decrease liquidity and increase price volatility in the fixed income markets.
How did the Fund perform during the 12-month period ended October 31, 2016?
Thrivent Government Bond Fund earned a return of 3.36%, compared with the median return of its peer group, the Lipper General U.S. Government Funds category, of 2.37%. The Fund’s market benchmarks, the Bloomberg Barclays U.S. Agency Index and the Bloomberg Barclays U.S. Treasury Index, earned returns of 2.42% and 3.32%, respectively.
What factors affected the Fund’s performance?
At the start of the period, U.S. economic growth was averaging above 2% and the market was beginning to price in a Federal Reserve (Fed) rate hike by the end of 2015. Interest rates started to rise, particularly for Treasury securities with maturities less than 10 years. In December, the Fed did indeed raise rates, but offered guidance that additional increases were in store. As a result, the dollar continued to strengthen, causing prices for oil and other commodities to plummet and risk aversion to spike.
The tide quickly turned in mid-February following a flurry of quantitative and monetary easing announcements by the European Central Bank, the Bank of Japan and other central banks outside the U.S. At the same time, the U.S. economy showed slower-than-expected growth and the Fed pushed out market expectations for additional rate hikes. The dollar declined and commodity prices subsequently started to recover. By June, market expectations had shifted to no interest rate increases before the end of 2016. Extraordinarily accommodative monetary policies overseas and the surprise Brexit decision by U.K. voters at the end of June kept overseas interest rates extremely low, in some cases falling into negative territory. These historically low rates resulted in strong demand for U.S. securities with higher yields and longer-maturity Treasuries.
As a result, interest rates moved modestly higher over the period for Treasury securities with maturities of two years and under, while rates declined for Treasuries with maturities of three years and longer, causing the yield curve to flatten. Because bond prices move in the opposite direction of interest rates, longer-duration fixed-income assets outperformed. Following last year’s weakness, Treasury Inflation Protected Securities (TIPS) performed well with the Bloomberg Barclays TIPS Index gaining 6.20%. TIPS benefited from stabilizing energy prices, which put some upward pressure on inflation and increased demand for inflation protection. Mortgage-backed securities also turned in strong results due to improving fundamentals in the housing market.
Over time, the Fund’s composition stays fairly constant and consists primarily of U.S. government and agency securities. Approximately 40% of the Fund’s portfolio is invested in U.S. Treasuries, 40% in government debt issued by agencies such as Fannie Mae and Freddie Mac, 10% in agency mortgage-backed securities and asset-backed securities, and 10% in TIPS. The Fund’s outperformance versus the Lipper peer group and both Bloomberg Barclays benchmarks was due to several factors. Results were boosted by our modest 2% overweighting in TIPS and slightly higher weighting in longer-maturity Treasuries. Also, the Fund benefited from our positions in some high-quality European sovereign debt and other sovereign and supranational debt, which are mostly guaranteed by the Export-Import Bank of the United States. In addition, the Fund saw favorable results from its longer duration, or interest-rate sensitivity, and its bias to benefit from a flatter yield curve, which we implemented by overweighting securities with maturities of five years and longer.
What is your outlook?
We continue to expect U.S. economic growth to remain in the 2% to 3% range and inflation to stay around the Fed’s unofficial target of 2%, although the tightening labor market may result in some inflationary pressures. Recent election results have also increased the odds of fiscal stimulus, which may result in higher economic growth and inflation expectations. We anticipate the Fed will raise rates in December 2016 with additional hikes in 2017. We will probably see more interest rate volatility this year, most likely with some upward pressure on rates.
If inflationary pressures increase, we expect to see the yield curve steepen. Therefore, after benefiting from the significant rate decline in August, we reduced the Fund’s duration and yield curve-flattening bias. The portfolio is now more neutrally positioned in regard to interest rate moves. We kept the remainder of the Fund’s portfolio fairly consistent in order to maintain its stance as a conservative and defensive investment vehicle in case the market experiences another sell off among risk assets.
Quoted Fund performance is for Class A shares and does not reflect a sales charge.
The returns shown do not reflect taxes a shareholder would pay on distributions or redemptions.
38
Bond Quality Ratings Distributions
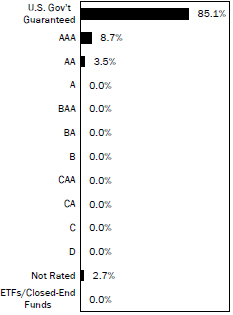
| | | | |
Major Market Sectors (% of Net Assets) | | | | |
U.S. Government and Agencies | | | 73.2 | % |
Foreign Government | | | 8.4 | % |
Mortgage-Backed Securities | | | 7.7 | % |
Asset-Backed Securities | | | 2.4 | % |
Utilities | | | 1.9 | % |
Financials | | | 1.9 | % |
Energy | | | 0.8 | % |
Collateralized Mortgage Obligations | | | 0.6 | % |
| | | | |
| Top 10 Holdings | | | | |
| (% of Net Assets) | | | | |
Federal National Mortgage Association | | | 10.0 | % |
U.S. Treasury Notes | | | 7.4 | % |
U.S. Treasury Bonds, TIPS | | | 7.1 | % |
U.S. Treasury Notes | | | 6.3 | % |
Federal Home Loan Mortgage Corporation | | | 5.6 | % |
U.S. Treasury Notes | | | 3.3 | % |
Federal National Mortgage Association Conventional 30-Yr. Pass Through | | | 3.2 | % |
Federal National Mortgage Association | | | 3.2 | % |
Tennessee Valley Authority | | | 2.9 | % |
U.S. Treasury Bonds, TIPS | | | 2.9 | % |
These securities represent 51.9% of the total net assets of the Fund. | | | | |
Bond quality ratings are obtained from Moody’s Investors Service, Inc. (“Moody’s”) and Standard & Poor’s Ratings Services (“S&P”). Ratings from S&P, when
used, are converted into their equivalent Moody’s ratings. If Moody’s and S&P have assigned different ratings to a security, the lowest rating for the security is
used. Investments in derivatives and short-term investments are not reflected in the table.
Quoted Major Market Sectors, Bond Quality Ratings Distributions and Top 10 Holdings are subject to change.
The lists of Major Market Sectors and Top 10 Holdings exclude short-term investments and collateral held for securities loaned.
Average Annual Total Returns1
As of October 31, 2016
| | | | | | | | | | | | |
| Class A2 | | 1-Year | | | 5 Years | | | From Inception 2/26/2010 | |
without sales charge | | | 3.36 | % | | | 1.84 | % | | | 2.97 | % |
with sales charge | | | 1.36 | % | | | 1.42 | % | | | 2.66 | % |
| | | |
| Class S | | 1-Year | | | 5 Years | | | From Inception 2/26/2010 | |
Net Asset Value | | | 3.41 | % | | | 2.12 | % | | | 3.26 | % |
Value of a $10,000 Investment
Class A Shares *,1,(a )
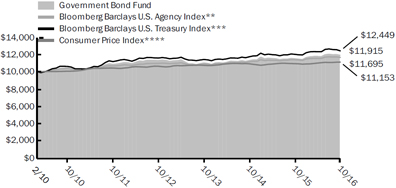
| 1 | Past performance is not an indication of future results. Average annual total returns represent past performance and reflect changes in share prices, the reinvestment of all dividends and capital gains, and the effects of compounding. The prospectus contains more complete information on the investment objectives, risks, charges and expenses of the investment company, which investors should read and consider carefully before investing. To obtain a prospectus, contact a registered representative or visit ThriventFunds.com. At various times, the Fund’s adviser waived its management fee and/or reimbursed Fund expenses. Had the adviser not done so, the Fund’s total returns would have been lower. The returns shown do not reflect taxes a shareholder would pay on distributions or redemptions. Total investment return and principal value of your investment will fluctuate, and your shares, when redeemed, may be worth more or less than their original cost. Current performance may be higher or lower than the performance data quoted. Call 800-THRIVENT (847-4836) or visit ThriventFunds.com for performance results current to the most recent month-end. |
| 2 | Class A performance with sales charge reflects the maximum sales charge of 2%. |
| (a) | Performance of other classes will be greater or less than the line shown based on the differences in loads and fees paid by shareholders investing in the different classes. |
| * | As you compare performance, please note that the Fund’s performance reflects the maximum 2.0% sales charge, while the Bloomberg Barclays U.S. Treasury Index, the Bloomberg Barclays U.S. Agency Index and the Consumer Price Index do not reflect any such charges. If you were to purchase any of the above individual securities represented in the Index, any charges you would pay would reduce your total return as well. |
| ** | The Bloomberg Barclays U.S. Agency Index is an index that measures the performance of the U.S. investment-grade fixed-income securities market. It is not possible to invest directly in the Index. The performance of the Index does not reflect deductions for fees, expenses or taxes. |
| *** | The Bloomberg Barclays U.S. Treasury Index is an index that measures the performance of the U.S. Treasury bond market. It is not possible to invest directly in the Index. The performance of the Index does not reflect deductions for fees, expenses or taxes. |
| **** | The Consumer Price Index is an inflationary indicator that measures the change in the cost of a fixed basket of products and services, including housing, electricity, food and transportation. It is not possible to invest directly in the Index. |
39
THRIVENT LIMITED MATURITY BOND FUND
Michael G. Landreville, CFA and CPA (inactive) and Gregory R. Anderson, CFA, Portfolio Co-Managers
The Fund seeks a high level of current income consistent with stability of principal.
The Fund primarily invests in investment-grade debt securities. The value of the Fund is influenced by factors impacting the overall market, debt securities in particular, and specific issuers. The Fund may incur losses due to incorrect assessments of investments by its investment adviser. Bond prices generally fall as interest rates rise. Credit risk is the risk that an issuer of a debt security may not pay its debt. The value of mortgage-related and other asset-backed securities will be influenced by the factors affecting the housing market and the assets underlying such securities. Foreign investments involve additional risks, including currency fluctuations, liquidity, political, economic and market instability, and different legal and accounting standards. The prices of futures contracts can be highly volatile and the loss from investing in them can exceed the initial investment. Dealer inventories of bonds are at or near historic lows in relation to market size, which has the potential to decrease liquidity and increase price volatility in the fixed income markets. Collateralized debt obligations are subject to additional risks.
How did the Fund perform during the 12-month period ended October 31, 2016?
Thrivent Limited Maturity Bond Fund earned a return of 2.42%, compared with the median return of its peer group, the Lipper Short Investment Grade Debt Funds category, of 1.69%. The Fund’s market benchmark, the Bloomberg Barclays Government/ Credit 1-3 Year Bond Index, earned a return of 1.31%.
What factors affected the Fund’s performance?
At the start of the period, U.S. economic growth had averaged above 2% for the preceding four quarters and investors began pricing in a Federal Reserve (Fed) rate hike by the end of 2015. As a result, interest rates started to rise, particularly for Treasury securities with maturities less than 10 years. In December, the Fed did indeed raise rates, but also gave guidance that suggested several additional rate increases were in store for 2016 and 2017. As a result, the dollar continued to strengthen, causing prices for oil and other commodities to plummet and risk aversion to spike. This risk-off environment pushed corporate bond spreads significantly wider.
Energy prices and risk assets bottomed out on February 11 before the tide quickly turned following a flurry of quantitative and monetary easing announcements by the European Central Bank, the Bank of Japan and a number of other central banks outside the U.S. At the same time, the U.S. economy showed slower-than-expected growth and the Fed took on a much more dovish tone, pushing out market expectations for additional rate hikes. The dollar declined and commodity prices subsequently started to recover, causing risk assets to rally and spreads to tighten for both high-yield and investment-grade corporate bonds. By June, market expectations had shifted to no interest rate increases before the end of 2016.
At the end of June, U.K. voters shocked the world with their Brexit vote to leave the European Union. Interest rates plummeted globally, which drove renewed demand for any securities with yield and pushed corporate bond spreads even tighter. The end result over the full period was that interest rates moved modestly higher for Treasury securities with maturities of two years and under, while rates declined for Treasuries with maturities of three years and longer, causing the yield curve to flatten and longer-duration Treasuries to outperform.
The Fund’s outperformance versus the Bloomberg Barclays benchmark and its Lipper peers was the result of both our interest rate strategy and security selection. In terms of the former, the Fund benefited from our positioning for a flatter yield curve, which we implemented by overweighting securities with maturities of five years and longer. These securities benefited more from the decline in longer-term Treasury yields. Likewise, we kept the Fund’s duration, or interest-rate sensitivity, longer than the benchmark and peers, which also helped as long-term rates fell. Security selection was strong in both the corporate and securitized sectors. On the corporate side, the Fund benefited from the rebound in energy credits, metals and mining credits and leveraged loans. In the securitized sector, the Fund’s approximately 7% weighting in nonagency residential mortgage-backed securities contributed favorably to results. Versus the Bloomberg Barclays benchmark, the Fund also benefited from its approximately 75% weighting in spread-related fixed-income securities, including corporate bonds and securitized assets, versus the index weight of 25% in these sectors.
What is your outlook?
While we believe a Fed rate increase is likely in December 2016, we continue to anticipate policymakers will proceed at a slow pace. However, the election results have increased the odds of fiscal stimulus, which may result in higher economic growth and inflation expectations. That being said, we believe investors should expect a more subdued return environment over the next 12 months because rates will likely move higher and some of the tailwinds from heavy overseas demand for U.S. yield product may subside. Although rising short-term rates are a difficult backdrop for a fund focused on shorter-maturity assets, we believe our portfolio is well-positioned. We continue to modestly increase exposure to floating-rate securities that have coupons resetting monthly or quarterly, allowing these securities to weather a rising rate environment better than regular bonds. After the significant rate decline in August, we reduced the Fund’s duration and lowered its weighting in securities longer than five years. We continue to believe the relative strength of the U.S. economy warrants an overweighting to spread-related fixed income in both the corporate and securitized sectors.
Quoted Fund performance is for Class A shares.
The returns shown do not reflect taxes a shareholder would pay on distributions or redemptions.
40
Bond Quality Ratings Distributions
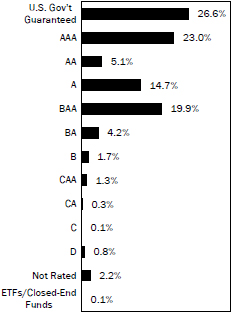
| | | | |
| Major Market Sectors | | | | |
| (% of Net Assets) | | | | |
U.S. Government and Agencies | | | 21.4 | % |
Financials | | | 19.3 | % |
Asset-Backed Securities | | | 17.1 | % |
Collateralized Mortgage Obligations | | | 9.6 | % |
Consumer Non-Cyclical | | | 5.7 | % |
Mortgage-Backed Securities | | | 4.4 | % |
Energy | | | 3.5 | % |
Communications Services | | | 3.1 | % |
Utilities | | | 2.5 | % |
Commercial Mortgage-Backed Securities | | | 2.0 | % |
| | | | |
| Top 10 Holdings | | | | |
| (% of Net Assets) | | | | |
U.S. Treasury Notes | | | 4.3 | % |
U.S. Treasury Notes | | | 3.0 | % |
U.S. Treasury Notes | | | 2.3 | % |
U.S. Treasury Bonds, TIPS | | | 2.2 | % |
U.S. Treasury Bonds | | | 2.2 | % |
Federal National Mortgage Association | | | 1.8 | % |
Federal Home Loan Mortgage Corporation Gold 30-Yr. Pass Through | | | 1.7 | % |
Federal Home Loan Mortgage Corporation Gold 15-Yr. Pass Through | | | 1.5 | % |
U.S. Treasury Notes | | | 1.4 | % |
U.S. Treasury Bonds, TIPS | | | 1.1 | % |
These securities represent 21.5% of the total net assets of the Fund.
Bond quality ratings are obtained from Moody’s Investors Service, Inc. (“Moody’s”) and Standard & Poor’s Ratings Services (“S&P”). Ratings from S&P, when
used, are converted into their equivalent Moody’s ratings. If Moody’s and S&P have assigned different ratings to a security, the lowest rating for the security is
used. Investments in derivatives and short-term investments are not reflected in the table.
Quoted Major Market Sectors, Bond Quality Ratings Distributions and Top 10 Holdings are subject to change.
The lists of Major Market Sectors and Top 10 Holdings exclude short-term investments and collateral held for securities loaned.
Average Annual Total Returns1
As of October 31, 2016
| | | | | | | | | | | | |
| Class A2 | | 1-Year | | | 5 Years | | | 10 Years | |
Net Asset Value | | | 2.42 | % | | | 1.64 | % | | | 2.50 | % |
| | | |
| Class S2 | | 1-Year | | | 5 Years | | | 10 Years | |
Net Asset Value | | | 2.72 | % | | | 1.90 | % | | | 2.78 | % |
Value of a $10,000 Investment
Class A Shares 1,(a)
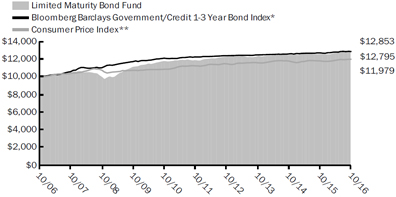
| 1 | Past performance is not an indication of future results. Average annual total returns represent past performance and reflect changes in share prices, the reinvestment of all dividends and capital gains, and the effects of compounding. The prospectus contains more complete information on the investment objectives, risks, charges and expenses of the investment company, which investors should read and consider carefully before investing. To obtain a prospectus, contact a registered representative or visit ThriventFunds.com. At various times, the Fund’s adviser waived its management fee and/or reimbursed Fund expenses. Had the adviser not done so, the Fund’s total returns would have been lower. The returns shown do not reflect taxes a shareholder would pay on distributions or redemptions. Total investment return and principal value of your investment will fluctuate, and your shares, when redeemed, may be worth more or less than their original cost. Current performance may be higher or lower than the performance data quoted. Call 800-THRIVENT (847-4836) or visit ThriventFunds.com for performance results current to the most recent month-end. |
| 2 | Class A shares and Class S shares have no sales load. |
| (a) | Performance of other classes will be greater or less than the line shown based on the differences in loads and fees paid by shareholders investing in the different classes. |
| * | The Bloomberg Barclays Government/Credit 1-3 Year Bond Index is an index that measures the performance of government and fixed-rate debt securities with maturities of 1-3 years. It is not possible to invest directly in the Index. The performance of the Index does not reflect deductions for fees, expenses or taxes. |
| ** | The Consumer Price Index is an inflationary indicator that measures the change in the cost of a fixed basket of products and services, including housing, electricity, food and transportation. It is not possible to invest directly in the Index. |
41
THRIVENT MONEY MARKET FUND
William D. Stouten, Portfolio Manager
The Fund seeks a high level of current income, while maintaining liquidity and a constant net asset value of $1.00 per share.
The Fund invests at least 99.5% of its total assets in government securities, cash and repurchase agreements collateralized fully by government securities or cash. You could lose money by investing in the Fund. Although the Fund seeks to preserve the value of your investment at $1.00 per share, it cannot guarantee it will do so. An investment in the Fund is not insured or guaranteed by the Federal Deposit Insurance Corporation or any other government agency. The Fund’s sponsor has no legal obligation to provide financial support to the Fund, and you should not expect that the sponsor will provide financial support to the Fund at any time. Credit risk is the risk that an issuer of a bond to which the Fund’s portfolio is exposed may no longer be able to pay its debt. A weak economy, strong equity markets, or changes by the Federal Reserve to its monetary policies may cause short-term interest rates to increase and affect the Fund’s ability to maintain a stable share price. Securities issued or guaranteed by U.S. government-related organizations are not backed by the full faith and credit of the U.S. government.
How did the Fund perform during the 12-month period ended October 31, 2016?
Thrivent Money Market Fund earned a return of 0.00%, compared with the median net return of its peer group, the Lipper Money Market Funds category, of 0.01%.
What factors affected the Fund’s performance?
At the start of the period, the market expected U.S. gross domestic product (GDP) to remain between 2% and 3% in the quarters ahead. The Federal Open Market Committee raised the target federal funds rate in December 2015 for the first time since 2006, while also giving guidance that suggested several additional rate increases in 2016 and 2017. As a result, the dollar continued to strengthen, causing prices for oil and other commodities to plummet and risk aversion to spike.
The tide quickly turned in mid-February following a flurry of quantitative and monetary easing announcements by the European Central Bank, the Bank of Japan and a number of other central banks outside the U.S. At the same time, the U.S. economy showed slower-than-expected growth, and the Federal Reserve (Fed) took on a much more dovish tone, pushing out market expectations for additional rate hikes. The dollar declined and commodity prices subsequently started to increase. By June, market expectations had shifted to no additional interest rate increases before the end of 2016. Over the period, the Treasury yield curve flattened as rates moved higher for securities with maturities of two years and under, while rates fell for longer-maturity Treasuries.
New money market reforms approved by the Securities and Exchange Commission (SEC) in 2014 were scheduled to go into effect in the final month of this reporting period. With the October 14 deadline approaching, the market experienced a huge shift because a significant number of prime money market funds converted to government money market funds. Assets in government money market funds rose from $870 billion in January 2016 to $1.6 trillion by period end.
We opted to change Thrivent Money Market Fund’s investment strategies on February 1, 2016, so that it could qualify as a government money market fund. Under the new rules, government money market funds are able to maintain a stable $1.00 NAV and will not be required to impose redemption gates or liquidity fees. To meet the new criteria, the Fund must invest at least 99.5% of its total assets in government securities, cash and repurchase agreements collateralized by government securities. The Fund is also required to maintain a weighted average maturity (WAM) of not more than 60 days and a weighted average life (WAL) of not more than 120 days.
As of October 31, 2016, net assets in the Fund totaled approximately $435 million and 100% of the portfolio was invested in U.S. government obligations or U.S. government-supported securities. We continued to invest heavily in variable-rate demand notes (VRDNs) to lessen the Fund’s sensitivity to rising interest rates. VRDNs are desirable because they typically have weekly interest rate resets, ensuring that their yields reflect the current rate environment. The Fund’s WAL and WAM remained well within the new guidelines for government money market funds, ending the period at 102 days and 34 days, respectively. In light of ongoing low rates, we continued to voluntarily waive certain fees and expenses to manage a zero net return for the Fund. In addition to emphasizing a conservative posture for the Fund, we also continued to focus on our primary goals of liquidity, safety and a stable $1.00 NAV share price.
What is your outlook?
At period end, market expectations favored a federal funds rate increase in December 2016. The Fund’s return will continue to be driven mainly by the extent and timing of the Fed’s future rate increases. Thrivent expects to continue waiving the Fund’s fees to maintain a zero, or close to zero, return for shareholders until at least one more rate hike occurs. We will continue to focus on safety and liquidity as we look to capitalize on the potential for higher rates in the coming months.
An investment in the Thrivent Money Market Fund is not insured or guaranteed by the FDIC or any other government agency.
Although the Fund seeks to preserve the value of your investment at $1.00 per share, it is possible to lose money by investing in the Fund.
Quoted Fund performance is for Class A shares.
The returns shown do not reflect taxes a shareholder would pay on distributions or redemptions.
42
| | | | |
| Portfolio Composition | | | | |
| (% of Portfolio) | | | | |
U.S. Government Agency Debt | | | 86.6 | % |
U.S. Treasury Debt | | | 13.4 | % |
| | | | |
Total | | | 100.0 | % |
Quoted Portfolio Composition is subject to change.
Average Annual Total Returns1
As of October 31, 2016
| | | | | | | | | | | | |
Class A2 | | | 1-Year | | | | 5 Years | | | | 10 Years | |
Net Asset Value | | | 0.00 | % | | | 0.00 | % | | | 0.86 | % |
| | | |
Class S2 | | | 1-Year | | | | 5 Years | | | | 10 Years | |
Net Asset Value | | | 0.00 | % | | | 0.00 | % | | | 0.92 | % |
Money Market Fund Yields*
As of October 31, 2016
| | | | | | | | |
| | | Class A | | | Class S | |
7-Day Yield | | | 0.00 | % | | | 0.00 | % |
7-Day Yield Gross of Waivers | | | -0.30 | % | | | -0.04 | % |
| | |
7-Day Effective Yield | | | 0.00 | % | | | 0.00 | % |
7-Day Effective Yield Gross of Waivers | | | -0.30 | % | | | -0.04 | % |
| 1 | Past performance is not an indication of future results. Average annual total returns represent past performance and reflect changes in share prices, the reinvestment of all dividends and capital gains, and the effects of compounding. The prospectus contains more complete information on the investment objectives, risks, charges and expenses of the investment company, which investors should read and consider carefully before investing. To obtain a prospectus, contact a registered representative or visit ThriventFunds.com. At various times, the Fund’s adviser waived its management fee and/or reimbursed Fund expenses. Had the adviser not done so, the Fund’s total returns would have been lower. The returns shown do not reflect taxes a shareholder would pay on distributions or redemptions. Total investment return and principal value of your investment will fluctuate, and your shares, when redeemed, may be worth more or less than their original cost. Current performance may be higher or lower than the performance data quoted. Call 800-THRIVENT (847-4836) or visit ThriventFunds.com for performance results current to the most recent month-end. |
| 2 | Class A shares and Class S shares have no sales load. |
| * | Seven-day yields of Thrivent Money Market Fund refer to the income generated by an investment in the Fund over a specified seven-day period. Effective yields reflect the reinvestment of income. A yield gross of waivers represents what the yield would have been if the Adviser were not waiving or reimbursing certain expenses associated with the Fund. Yields are subject to daily fluctuation and should not be considered an indication of future results. |
43
SHAREHOLDER EXPENSE EXAMPLE
(unaudited)
As a shareholder of a Fund, you incur, depending on the Fund and share class, two types of costs: (1) transaction costs, including sales charges (loads) on purchase payments; and (2) ongoing costs, including management fees, distribution (12b-1) fees and other Fund expenses. This Example is intended to help you understand your ongoing costs (in dollars) of investing in your Fund and to compare these costs with the ongoing costs of investing in other mutual funds. The Example is based on an investment of $1,000 invested at the beginning of the period and held for the entire period from May 1, 2016 through October 31, 2016.
Actual Expenses
In the table below, the first section, labeled “Actual,” provides information about actual account values and actual expenses. You may use the information in this section, together with the amount you invested, to estimate the expenses that you paid over the period. Simply divide your account value by $1,000 (for example, an $8,600 account value divided by $1,000 = 8.6), then multiply the result by the number from the appropriate Class line under the heading entitled “Expenses Paid During Period” to estimate the expenses you paid. A small account fee of $12 may be charged to Class A shareholder accounts if the value falls to an amount of $2,000 or less, in the case of a non-qualified account, and $1,000 or less, in the case of a qualified account. This fee is not included in the table below. If it were and you were assessed such a fee, the expenses you paid during the period would have been higher and the ending account value would have been lower.
Hypothetical Example for Comparison Purposes
In the table below, the second section, labeled “Hypothetical,” provides information about hypothetical account values and hypothetical expenses based on the Fund’s actual expense ratio and an assumed rate of return of 5% per year before expenses, which is not the Fund’s actual return. The hypothetical account values and expenses may not be used to estimate the actual ending account balance or expenses you paid for the period. You may use this information to compare the ongoing costs of investing in the Fund and other funds. To do so, compare this 5% hypothetical example with the 5% hypothetical examples that appear in the shareholder reports of the other funds. A small account fee of $12 may be charged to Class A shareholder accounts if the value falls to an amount of $2,000 or less, in the case of a non-qualified account, and $1,000 or less, in the case of a qualified account. This fee is not included in the table below. If it were and you were assessed such a fee, the expenses you paid during the period would have been higher and the ending account value would have been lower.
Please note that the expenses shown in the table are meant to highlight your ongoing costs only and do not reflect any transactional costs, such as sales charges (loads). Therefore, the second section of the table is useful in comparing ongoing costs only, and will not help you determine the relative total costs of owning different funds. In addition, if these transactional costs were included, your costs would have been higher.
| | | | | | | | | | | | | | | | |
| | | Beginning Account
Value 5/1/2016 | | | Ending Account Value
10/31/2016 | | | Expenses Paid During
Period 5/1/2016 - 10/31/2016* | | | Annualized Expense
Ratio | |
Thrivent Aggressive Allocation Fund | |
| | | | |
Actual | | | | | | | | | | | | | | | | |
Class A | | | $1,000 | | | | $1,042 | | | | $4.81 | | | | 0.94% | |
Class S | | | $1,000 | | | | $1,044 | | | | $2.98 | | | | 0.58% | |
| | | | |
Hypothetical** | | | | | | | | | | | | | | | | |
Class A | | | $1,000 | | | | $1,020 | | | | $4.76 | | | | 0.94% | |
Class S | | | $1,000 | | | | $1,022 | | | | $2.95 | | | | 0.58% | |
Thrivent Moderately Aggressive Allocation Fund | |
| | | | |
Actual | | | | | | | | | | | | | | | | |
Class A | | | $1,000 | | | | $1,038 | | | | $4.20 | | | | 0.82% | |
Class S | | | $1,000 | | | | $1,039 | | | | $2.65 | | | | 0.52% | |
| | | | |
Hypothetical** | | | | | | | | | | | | | | | | |
Class A | | | $1,000 | | | | $1,021 | | | | $4.16 | | | | 0.82% | |
Class S | | | $1,000 | | | | $1,023 | | | | $2.63 | | | | 0.52% | |
Thrivent Moderate Allocation Fund | |
| | | | |
Actual | | | | | | | | | | | | | | | | |
Class A | | | $1,000 | | | | $1,034 | | | | $4.14 | | | | 0.81% | |
Class S | | | $1,000 | | | | $1,035 | | | | $2.61 | | | | 0.51% | |
| | | | |
Hypothetical** | | | | | | | | | | | | | | | | |
Class A | | | $1,000 | | | | $1,021 | | | | $4.11 | | | | 0.81% | |
Class S | | | $1,000 | | | | $1,023 | | | | $2.59 | | | | 0.51% | |
44
| | | | | | | | | | | | | | |
| | | Beginning Account
Value 5/1/2016 | | Ending Account Value
10/31/2016 | | | Expenses Paid During
Period 5/1/2016 - 10/31/2016* | | | Annualized Expense
Ratio | |
Thrivent Moderately Conservative Allocation Fund | |
| | | | |
Actual | | | | | | | | | | | | | | |
Class A | | $1,000 | | | $1,028 | | | | $4.27 | | | | 0.84% | |
Class S | | $1,000 | | | $1,030 | | | | $2.79 | | | | 0.55% | |
| | | | |
Hypothetical** | | | | | | | | | | | | | | |
Class A | | $1,000 | | | $1,021 | | | | $4.25 | | | | 0.84% | |
Class S | | $1,000 | | | $1,022 | | | | $2.78 | | | | 0.55% | |
Thrivent Balanced Income Plus Fund | |
| | | | |
Actual | | | | | | | | | | | | | | |
Class A | | $1,000 | | | $1,030 | | | | $5.34 | | | | 1.05% | |
Class S | | $1,000 | | | $1,032 | | | | $3.65 | | | | 0.71% | |
| | | | |
Hypothetical** | | | | | | | | | | | | | | |
Class A | | $1,000 | | | $1,020 | | | | $5.31 | | | | 1.05% | |
Class S | | $1,000 | | | $1,022 | | | | $3.63 | | | | 0.71% | |
Thrivent Opportunity Income Plus Fund | |
| | | | |
Actual | | | | | | | | | | | | | | |
Class A | | $1,000 | | | $1,039 | | | | $4.64 | | | | 0.90% | |
Class S | | $1,000 | | | $1,041 | | | | $3.39 | | | | 0.66% | |
| | | | |
Hypothetical** | | | | | | | | | | | | | | |
Class A | | $1,000 | | | $1,021 | | | | $4.60 | | | | 0.90% | |
Class S | | $1,000 | | | $1,022 | | | | $3.36 | | | | 0.66% | |
Thrivent Partner Emerging Markets Equity Fund | |
| | | | |
Actual | | | | | | | | | | | | | | |
Class A | | $1,000 | | | $1,075 | | | | $8.65 | | | | 1.66% | |
Class S | | $1,000 | | | $1,077 | | | | $6.93 | | | | 1.33% | |
| | | | |
Hypothetical** | | | | | | | | | | | | | | |
Class A | | $1,000 | | | $1,017 | | | | $8.41 | | | | 1.66% | |
Class S | | $1,000 | | | $1,018 | | | | $6.74 | | | | 1.33% | |
Thrivent Small Cap Stock Fund | |
| | | | |
Actual | | | | | | | | | | | | | | |
Class A | | $1,000 | | | $1,073 | | | | $6.24 | | | | 1.20% | |
Class S | | $1,000 | | | $1,076 | | | | $4.18 | | | | 0.80% | |
| | | | |
Hypothetical** | | | | | | | | | | | | | | |
Class A | | $1,000 | | | $1,019 | | | | $6.08 | | | | 1.20% | |
Class S | | $1,000 | | | $1,021 | | | | $4.07 | | | | 0.80% | |
Thrivent Mid Cap Stock Fund | |
| | | | |
Actual | | | | | | | | | | | | | | |
Class A | | $1,000 | | | $1,105 | | | | $5.75 | | | | 1.09% | |
Class S | | $1,000 | | | $1,107 | | | | $3.81 | | | | 0.72% | |
| | | | |
Hypothetical** | | | | | | | | | | | | | | |
Class A | | $1,000 | | | $1,020 | | | | $5.52 | | | | 1.09% | |
Class S | | $1,000 | | | $1,022 | | | | $3.65 | | | | 0.72% | |
Thrivent Partner Worldwide Allocation Fund | |
| | | | |
Actual | | | | | | | | | | | | | | |
Class A | | $1,000 | | | $1,028 | | | | $7.17 | | | | 1.41% | |
Class S | | $1,000 | | | $1,030 | | | | $5.15 | | | | 1.01% | |
| | | | |
Hypothetical** | | | | | | | | | | | | | | |
Class A | | $1,000 | | | $1,018 | | | | $7.14 | | | | 1.41% | |
Class S | | $1,000 | | | $1,020 | | | | $5.12 | | | | 1.01% | |
45
| | | | | | | | | | | | | | |
| | | Beginning Account
Value 5/1/2016 | | Ending Account Value
10/31/2016 | | | Expenses Paid During
Period 5/1/2016 - 10/31/2016* | | | Annualized Expense
Ratio | |
Thrivent Large Cap Growth Fund | |
| | | | |
Actual | | | | | | | | | | | | | | |
Class A | | $1,000 | | | $1,040 | | | | $6.19 | | | | 1.21% | |
Class S | | $1,000 | | | $1,043 | | | | $4.26 | | | | 0.83% | |
| | | | |
Hypothetical** | | | | | | | | | | | | | | |
Class A | | $1,000 | | | $1,019 | | | | $6.12 | | | | 1.21% | |
Class S | | $1,000 | | | $1,021 | | | | $4.22 | | | | 0.83% | |
Thrivent Large Cap Value Fund | |
| | | | |
Actual | | | | | | | | | | | | | | |
Class A | | $1,000 | | | $1,040 | | | | $4.76 | | | | 0.93% | |
Class S | | $1,000 | | | $1,042 | | | | $2.72 | | | | 0.53% | |
| | | | |
Hypothetical** | | | | | | | | | | | | | | |
Class A | | $1,000 | | | $1,020 | | | | $4.71 | | | | 0.93% | |
Class S | | $1,000 | | | $1,022 | | | | $2.70 | | | | 0.53% | |
Thrivent Large Cap Stock Fund | |
| | | | |
Actual | | | | | | | | | | | | | | |
Class A | | $1,000 | | | $1,026 | | | | $5.27 | | | | 1.03% | |
Class S | | $1,000 | | | $1,028 | | | | $3.32 | | | | 0.65% | |
| | | | |
Hypothetical** | | | | | | | | | | | | | | |
Class A | | $1,000 | | | $1,020 | | | | $5.25 | | | | 1.03% | |
Class S | | $1,000 | | | $1,022 | | | | $3.31 | | | | 0.65% | |
Thrivent High Yield Fund | |
| | | | |
Actual | | | | | | | | | | | | | | |
Class A | | $1,000 | | | $1,052 | | | | $4.17 | | | | 0.81% | |
Class S | | $1,000 | | | $1,053 | | | | $2.82 | | | | 0.55% | |
| | | | |
Hypothetical** | | | | | | | | | | | | | | |
Class A | | $1,000 | | | $1,021 | | | | $4.11 | | | | 0.81% | |
Class S | | $1,000 | | | $1,022 | | | | $2.78 | | | | 0.55% | |
Thrivent Income Fund | |
| | | | |
Actual | | | | | | | | | | | | | | |
Class A | | $1,000 | | | $1,033 | | | | $3.91 | | | | 0.76% | |
Class S | | $1,000 | | | $1,034 | | | | $2.25 | | | | 0.44% | |
| | | | |
Hypothetical** | | | | | | | | | | | | | | |
Class A | | $1,000 | | | $1,021 | | | | $3.88 | | | | 0.76% | |
Class S | | $1,000 | | | $1,023 | | | | $2.24 | | | | 0.44% | |
Thrivent Municipal Bond Fund | |
| | | | |
Actual | | | | | | | | | | | | | | |
Class A | | $1,000 | | | $1,004 | | | | $3.72 | | | | 0.74% | |
Class S | | $1,000 | | | $1,006 | | | | $2.49 | | | | 0.49% | |
| | | | |
Hypothetical** | | | | | | | | | | | | | | |
Class A | | $1,000 | | | $1,021 | | | | $3.75 | | | | 0.74% | |
Class S | | $1,000 | | | $1,023 | | | | $2.51 | | | | 0.49% | |
Thrivent Government Bond Fund | |
| | | | |
Actual | | | | | | | | | | | | | | |
Class A | | $1,000 | | | $1,011 | | | | $4.32 | | | | 0.85% | |
Class S | | $1,000 | | | $1,010 | | | | $4.21 | | | | 0.83% | |
| | | | |
Hypothetical** | | | | | | | | | | | | | | |
Class A | | $1,000 | | | $1,021 | | | | $4.34 | | | | 0.85% | |
Class S | | $1,000 | | | $1,021 | | | | $4.24 | | | | 0.83% | |
46
| | | | | | | | | | | | | | |
| | | Beginning Account
Value 5/1/2016 | | Ending Account Value
10/31/2016 | | | Expenses Paid During
Period 5/1/2016 - 10/31/2016* | | | Annualized Expense
Ratio | |
Thrivent Limited Maturity Bond Fund | |
| | | | |
Actual | | | | | | | | | | | | | | |
Class A | | $1,000 | | | $1,015 | | | | $3.15 | | | | 0.62% | |
Class S | | $1,000 | | | $1,016 | | | | $2.07 | | | | 0.41% | |
| | | | |
Hypothetical** | | | | | | | | | | | | | | |
Class A | | $1,000 | | | $1,022 | | | | $3.16 | | | | 0.62% | |
Class S | | $1,000 | | | $1,023 | | | | $2.08 | | | | 0.41% | |
Thrivent Money Market Fund | |
| | | | |
Actual | | | | | | | | | | | | | | |
Class A | | $1,000 | | | $1,000 | | | | $2.28 | | | | 0.45% | |
Class S | | $1,000 | | | $1,000 | | | | $2.31 | | | | 0.46% | |
| | | | |
Hypothetical** | | | | | | | | | | | | | | |
Class A | | $1,000 | | | $1,023 | | | | $2.31 | | | | 0.45% | |
Class S | | $1,000 | | | $1,023 | | | | $2.33 | | | | 0.46% | |
| * | Expenses are equal to the Fund’s annualized expense ratio, multiplied by the average account value over the period, multiplied by 184/366 to reflect the one-half year period. |
| ** | Assuming 5% annualized total return before expenses. |
47

Report of Independent Registered Public Accounting Firm
To the Trustees and Shareholders of Thrivent Aggressive Allocation Fund, Thrivent Moderately Aggressive Allocation Fund, Thrivent Moderate Allocation Fund, Thrivent Moderately Conservative Allocation Fund, Thrivent Balanced Income Plus Fund, Thrivent Opportunity Income Plus Fund, Thrivent Partner Emerging Markets Equity Fund, Thrivent Small Cap Stock Fund, Thrivent Mid Cap Stock Fund, Thrivent Partner Worldwide Allocation Fund, Thrivent Large Cap Growth Fund, Thrivent Large Cap Value Fund, Thrivent Large Cap Stock Fund, Thrivent High Yield Fund, Thrivent Income Fund, Thrivent Municipal Bond Fund, Thrivent Government Bond Fund, Thrivent Limited Maturity Bond Fund, and Thrivent Money Market Fund:
In our opinion, the accompanying statements of assets and liabilities, including the schedules of investments of Thrivent Partner Emerging Markets Equity Fund, Thrivent Small Cap Stock Fund, Thrivent Mid Cap Stock Fund, Thrivent Large Cap Growth Fund, Thrivent Large Cap Value Fund, Thrivent Government Bond Fund, and Thrivent Money Market Fund, and the summary schedules of investments of Thrivent Aggressive Allocation Fund, Thrivent Moderately Aggressive Allocation Fund, Thrivent Moderate Allocation Fund, Thrivent Moderately Conservative Allocation Fund, Thrivent Balanced Income Plus Fund, Thrivent Opportunity Income Plus Fund, Thrivent Partner Worldwide Allocation Fund, Thrivent Large Cap Stock Fund, Thrivent High Yield Fund, Thrivent Income Fund, Thrivent Municipal Bond Fund, and Thrivent Limited Maturity Bond Fund (collectively constituting part of the Thrivent Mutual Funds) (hereafter collectively referred to as the “Funds”), and the related statements of operations and of changes in net assets and the financial highlights present fairly, in all material respects, the financial position of the Funds as of October 31, 2016, the results of each of their operations for the year then ended, the changes in each of their net assets for each of the two years in the period then ended and their financial highlights for each of the periods presented, in conformity with accounting principles generally accepted in the United States of America. These financial statements and financial highlights (hereafter referred to as “financial statements”) are the responsibility of the Funds’ management. Our responsibility is to express an opinion on these financial statements based on our audits. We conducted our audits of these financial statements in accordance with the standards of the Public Company Accounting Oversight Board (United States). Those standards require that we plan and perform the audit to obtain reasonable assurance about whether the financial statements are free of material misstatement. An audit includes examining, on a test basis, evidence supporting the amounts and disclosures in the financial statements, assessing the accounting principles used and significant estimates made by management, and evaluating the overall financial statement presentation. We believe that our audits, which included confirmation of securities as of October 31, 2016 by correspondence with the custodian, agent banks, transfer agent and brokers provide a reasonable basis for our opinion.

December 20, 2016
|
PricewaterhouseCoopers LLP, 45 South Seventh Street, Suite 3400, Minneapolis, MN 55402 |
T: (612) 596 6000, F: (612) 373 7160, www.pwc.com/us |
48
AGGRESSIVE ALLOCATION FUND
Summary Schedule of Investments as of October 31, 2016
| | | | | | | | | | | | |
| Shares | | | Common Stock (47.3%) | | Value | | | % of Net Assets | |
| Consumer Discretionary (6.6%) | | | | | | | | |
| | 7,680 | | | Amazon.com, Inc.a | | | $6,065,818 | | | | 0.7 | % |
| | 36,790 | | | Comcast Corporation | | | 2,274,358 | | | | 0.3 | % |
| | 16,750 | | | Home Depot, Inc. | | | 2,043,667 | | | | 0.2 | % |
| | 75,196 | | | Nutrisystem, Inc. | | | 2,383,713 | | | | 0.3 | % |
| | | | Other Securities^ | | | 44,155,779 | | | | 5.1 | % |
| | | | | |
| | | | Total | | | 56,923,335 | | | | | |
| | | | | |
| | |
| Consumer Staples (1.6%) | | | | | | | | |
| | | | Other Securities^ | | | 14,244,277 | | | | 1.6 | % |
| | | | | |
| | | | Total | | | 14,244,277 | | | | | |
| | | | | |
| | |
| Energy (6.7%) | | | | | | | | |
| | 75,676 | | | Canadian Natural Resources, Ltd. | | | 2,399,686 | | | | 0.3 | % |
| | 46,868 | | | Chevron Corporation | | | 4,909,423 | | | | 0.6 | % |
| | 21,786 | | | Concho Resources, Inc.a | | | 2,765,515 | | | | 0.3 | % |
| | 37,396 | | | EOG Resources, Inc. | | | 3,381,346 | | | | 0.4 | % |
| | 48,433 | | | EQT Corporation | | | 3,196,578 | | | | 0.4 | % |
| | 83,090 | | | Halliburton Company | | | 3,822,140 | | | | 0.4 | % |
| | 15,500 | | | Pioneer Natural Resources Company | | | 2,774,810 | | | | 0.3 | % |
| | 42,719 | | | Royal Dutch Shell plc ADR | | | 2,127,833 | | | | 0.3 | % |
| | 54,855 | | | Schlumberger, Ltd. | | | 4,291,307 | | | | 0.5 | % |
| | 122,209 | | | Suncor Energy, Inc. ADR | | | 3,668,714 | | | | 0.4 | % |
| | 64,730 | | | Valero Energy Corporation | | | 3,834,605 | | | | 0.5 | % |
| | 319,025 | | | WPX Energy, Inc.a | | | 3,464,612 | | | | 0.4 | % |
| | | | Other Securities^ | | | 17,802,293 | | | | 1.9 | % |
| | | | | |
| | | | Total | | | 58,438,862 | | | | | |
| | | | | |
| | |
| Financials (5.0%) | | | | | | | | |
| | | | Other Securities^ | | | 43,504,316 | | | | 5.0 | % |
| | | | | |
| | | | Total | | | 43,504,316 | | | | | |
| | | | | |
| | |
| Health Care (6.0%) | | | | | | | | |
| | 14,820 | | | Alexion Pharmaceuticals, Inc.a | | | 1,934,010 | | | | 0.2 | % |
| | 10,639 | | | Allergan plca | | | 2,222,913 | | | | 0.3 | % |
| | 22,690 | | | Celgene Corporationa | | | 2,318,464 | | | | 0.3 | % |
| | 40,131 | | | Gilead Sciences, Inc. | | | 2,954,846 | | | | 0.3 | % |
| | 35,896 | | | NuVasive, Inc.a | | | 2,144,068 | | | | 0.3 | % |
| | 14,009 | | | Teleflex, Inc. | | | 2,005,108 | | | | 0.2 | % |
| | | | Other Securities^ | | | 38,916,403 | | | | 4.4 | % |
| | | | | |
| | | | Total | | | 52,495,812 | | | | | |
| | | | | |
| | |
| Industrials (5.5%) | | | | | | | | |
| | 55,630 | | | Southwest Airlines Company | | | 2,227,981 | | | | 0.3 | % |
| | 30,705 | | | Union Pacific Corporation | | | 2,707,567 | | | | 0.3 | % |
| | | | Other Securities^ | | | 42,954,258 | | | | 4.9 | % |
| | | | | |
| | | | Total | | | 47,889,806 | | | | | |
| | | | | |
| | |
| Information Technology (11.4%) | | | | | | | | |
| | 5,260 | | | Alphabet, Inc., Class Aa | | | 4,260,074 | | | | 0.5 | % |
| | 3,531 | | | Alphabet, Inc., Class Ca | | | 2,770,211 | | | | 0.3 | % |
| | 35,564 | | | Apple, Inc. | | | 4,037,937 | | | | 0.5 | % |
| | 26,822 | | | Arista Networks, Inc.a | | | 2,273,165 | | | | 0.3 | % |
| | 24,507 | | | DST Systems, Inc. | | | 2,356,593 | | | | 0.3 | % |
| | 43,050 | | | Facebook, Inc.a | | | 5,639,120 | | | | 0.6 | % |
| | 36,803 | | | Guidewire Software, Inc.a | | | 2,114,332 | | | | 0.2 | % |
| | 34,910 | | | MasterCard, Inc. | | | 3,736,068 | | | | 0.4 | % |
| | 77,990 | | | Microsoft Corporation | | | 4,673,161 | | | | 0.5 | % |
| | 37,763 | | | NVIDIA Corporation | | | 2,687,215 | | | | 0.3 | % |
| | 64,614 | | | PayPal Holdings, Inc.a | | | 2,691,819 | | | | 0.3 | % |
| | 28,942 | | | Proofpoint, Inc.a | | | 2,268,474 | | | | 0.3 | % |
| | 51,380 | | | Salesforce.com, Inc.a | | | 3,861,721 | | | | 0.4 | % |
| | 9,771 | | | Ultimate Software Group, Inc.a | | | 2,061,583 | | | | 0.2 | % |
| | 43,690 | | | Visa, Inc. | | | 3,604,862 | | | | 0.4 | % |
| | 45,190 | | | Xilinx, Inc. | | | 2,298,815 | | | | 0.3 | % |
| | | | Other Securities^ | | | 47,914,174 | | | | 5.6 | % |
| | | | | |
| | | | Total | | | 99,249,324 | | | | | |
| | | | | |
| | |
| Materials (2.3%) | | | | | | | | |
| | | | Other Securities^ | | | 20,193,586 | | | | 2.3 | % |
| | | | | |
| | | | Total | | | 20,193,586 | | | | | |
| | | | | |
| | |
| Real Estate (1.1%) | | | | | | | | |
| | | | Other Securities^ | | | 9,409,344 | | | | 1.1 | % |
| | | | | |
| | | | Total | | | 9,409,344 | | | | | |
| | | | | |
| | |
| Telecommunications Services (0.3%) | | | | | | | | |
| | | | Other Securities^ | | | 2,684,299 | | | | 0.3 | % |
| | | | | |
| | | | Total | | | 2,684,299 | | | | | |
| | | | | |
| | |
| Utilities (0.8%) | | | | | | | | |
| | | | Other Securities^ | | | 7,198,627 | | | | 0.8 | % |
| | | | | |
| | | | Total | | | 7,198,627 | | | | | |
| | | | | |
| | | | | | | | | | | | |
| | | | | |
| | | | Total Common Stock (cost $369,684,140) | | | 412,231,588 | | | | | |
| | | | | |
| | | |
| Shares | | | Registered Investment Companies (41.2%) | | Value | | | % of Net
Assets | |
| Affiliated Equity Holdings (38.0%) | | | | | | | | |
| | 6,928,175 | | | Thrivent Large Cap Growth Fund | | | 62,284,289 | | | | 7.1 | % |
| | 1,137,651 | | | Thrivent Large Cap Stock Fund | | | 28,452,647 | | | | 3.3 | % |
| | 2,650,742 | | | Thrivent Large Cap Value Fund | | | 51,848,520 | | | | 6.0 | % |
| | 2,312,069 | | | Thrivent Mid Cap Stock Fund | | | 55,489,646 | | | | 6.4 | % |
| | 11,061,524 | | | Thrivent Partner Worldwide Allocation Fund | | | 107,407,399 | | | | 12.3 | % |
| | 1,211,561 | | | Thrivent Small Cap Stock Fund | | | 25,055,081 | | | | 2.9 | % |
| | | | | |
| | | | Total | | | 330,537,582 | | | | | |
| | | | | |
| | |
| Affiliated Fixed Income Holdings (1.9%) | | | | | | | | |
| | 1,195,460 | | | Thrivent High Yield Fund | | | 5,690,392 | | | | 0.6 | % |
| | 427,112 | | | Thrivent Income Fund | | | 3,950,783 | | | | 0.5 | % |
| | 536,022 | | | Thrivent Limited Maturity Bond Fund | | | 6,689,559 | | | | 0.8 | % |
| | | | | |
| | | | Total | | | 16,330,734 | | | | | |
| | | | | |
| | |
| Equity Funds/ETFs (1.3%) | | | | | | | | |
| | 20,271 | | | iShares Russell 2000 Growth Index Fund | | | 2,835,305 | | | | 0.3 | % |
| | 27,802 | | | SPDR S&P 500 ETF Trust | | | 5,909,315 | | | | 0.7 | % |
| | | | Other Securities^ | | | 2,881,460 | | | | 0.3 | % |
| | | | | |
| | | | Total | | | 11,626,080 | | | | | |
| | | | | |
| | | | | | | | | | | | |
| | | | | |
| | | | Total Registered Investment Companies (cost $291,750,958) | | | 358,494,396 | | | | | |
| | | | | |
| | | |
Principal Amount | | | Long-Term Fixed Income (3.2%) | | Value | | | % of Net
Assets | |
| | |
| Collateralized Mortgage Obligations (<0.1%) | | | | | | | | |
| | | | Other Securities^ | | | 240,043 | | | | <0.1 | % |
| | | | | |
| | | | Total | | | 240,043 | | | | | |
| | | | | |
| | |
| Mortgage-Backed Securities (1.4%) | | | | | | | | |
| | | | Federal National Mortgage Association Conventional | | | | | | | | |
| | $800,000 | | | 3.000%, 11/1/2046b | | | 823,625 | | | | 0.1 | % |
The accompanying Notes to Financial Statements are an integral part of this schedule.
49
AGGRESSIVE ALLOCATION FUND
Summary Schedule of Investments as of October 31, 2016
| | | | | | | | | | | | |
Principal Amount | | | Long-Term Fixed Income (3.2%) | | Value | | | % of Net
Assets | |
| Mortgage-Backed Securities (1.4%) - continued | | | | | | | | |
| | | | Federal National Mortgage Association Conventional 15-Yr. Pass Through | | | | | | | | |
| | $950,000 | | | 2.500%, 11/1/2031b | | | $977,535 | | | | 0.1 | % |
| | | | Federal National Mortgage Association Conventional 30-Yr. Pass Through | | | | | | | | |
| | 5,100,000 | | | 3.500%, 11/1/2046b | | | 5,354,203 | | | | 0.6 | % |
| | 2,850,000 | | | 4.000% - 4.500%, | | | | | | | | |
| | | | 11/1/2046b | | | 3,078,907 | | | | 0.4 | % |
| | | | Other Securities^ | | | 1,587,099 | | | | 0.2 | % |
| | | | | |
| | | | Total | | | 11,821,369 | | | | | |
| | | | | |
| | |
| U.S. Government and Agencies (1.8%) | | | | | | | | |
| | | | U.S. Treasury Bonds | | | | | | | | |
| | 1,630,000 | | | 3.625%, 2/15/2044 | | | 1,981,024 | | | | 0.2 | % |
| | | | U.S. Treasury Bonds, TIPS | | | | | | | | |
| | 2,027,220 | | | 0.625%, 1/15/2026 | | | 2,116,069 | | | | 0.2 | % |
| | 935,152 | | | 1.000%, 2/15/2046 | | | 1,007,434 | | | | 0.1 | % |
| | | | U.S. Treasury Notes | | | | | | | | |
| | 3,120,000 | | | 0.750%, 2/15/2019 | | | 3,108,057 | | | | 0.4 | % |
| | 2,700,000 | | | 1.125%, 8/31/2021 | | | 2,676,164 | | | | 0.3 | % |
| | 3,000,000 | | | 2.250%, 11/15/2024 | | | 3,119,064 | | | | 0.4 | % |
| | 1,840,000 | | | 0.875% - 2.125%, | | | | | | | | |
| | | | 11/15/2017 - 9/30/2021 | | | 1,858,253 | | | | 0.2 | % |
| | | | | |
| | | | Total | | | 15,866,065 | | | | | |
| | | | | |
| | | | | | | | | | | | |
| | | | | |
| | | | Total Long-Term Fixed Income (cost $27,558,572) | | | 27,927,477 | | | | | |
| | | | | |
| | | |
Shares or
Principal
Amount | | | Short-Term Investments (9.7%)c | | Value | | | % of Net
Assets | |
| | | | Federal Home Loan Bank Discount Notes | | | | | | | | |
| | 4,300,000 | | | 0.340%, 1/4/2017d | | | 4,297,553 | | | | 0.5 | % |
| | | | Federal National Mortgage Association Discount Notes | | | | | | | | |
| | 4,000,000 | | | 0.345%, 1/11/2017d | | | 3,997,476 | | | | 0.4 | % |
| | | | Thrivent Core Short-Term Reserve Fund | | | | | | | | |
| | 7,429,328 | | | 0.790% | | | 74,293,277 | | | | 8.5 | % |
| | | | Other Securities^ | | | 1,999,457 | | | | 0.3 | % |
| | | | | |
| | | | Total Short-Term Investments (cost $84,587,323) | | | 84,587,763 | | | | | |
| | | | | |
| | | | Total Investments (cost $773,580,993) 101.4% | | | $883,241,224 | | | | | |
| | | | | |
| | | | Other Assets and Liabilities, Net (1.4%) | | | (12,348,394 | ) | | | | |
| | | | | |
| | | | Total Net Assets 100.0% | | | $870,892,830 | | | | | |
| | | | | |
| ^ | The Summary Schedule of Investments shows the 50 largest holdings in unaffiliated issuers, any holding or issuer that exceeds 1% of net assets and all affiliated holdings as of the report date. The remaining securities held are grouped by category as “Other securities”. |
| a | Non-income producing security. |
| b | Denotes investments purchased on a when-issued or delayed delivery basis. |
| c | The interest rate shown reflects the yield, coupon rate or the discount rate at the date of purchase, |
| d | All or a portion of the security is held on deposit with the counterparty and pledged as the initial margin deposit for open futures contracts. |
Definitions:
| | | | |
ADR | | - | | American Depositary Receipt, which are certificates for an underlying foreign security’s shares held by an issuing U.S. depository bank. |
ETF | | - | | Exchange Traded Fund. |
TIPS | | - | | Treasury Inflation Protected Security. |
Unrealized Appreciation (Depreciation)
Gross unrealized appreciation and depreciation of investments, based on cost for federal income tax purposes, were as follows:
| | | | |
Gross unrealized appreciation | | | $127,219,507 | |
Gross unrealized depreciation | | | (23,502,156 | ) |
| | | | |
Net unrealized appreciation (depreciation) | | | $103,717,351 | |
| |
Cost for federal income tax purposes | | | $779,523,873 | |
The accompanying Notes to Financial Statements are an integral part of this schedule.
50
AGGRESSIVE ALLOCATION FUND
Summary Schedule of Investments as of October 31, 2016
Fair Valuation Measurements
The following table is a summary of the inputs used, as of October 31, 2016, in valuing Aggressive Allocation Fund’s assets carried at fair value.
| | | | | | | | | | | | | | | | |
| Investments in Securities | | Total | | | Level 1 | | | Level 2 | | | Level 3 | |
| | | | |
Common Stock | | | | | | | | | | | | | | | | |
Consumer Discretionary | | | 56,923,335 | | | | 55,728,719 | | | | 1,194,616 | | | | – | |
Consumer Staples | | | 14,244,277 | | | | 13,496,163 | | | | 748,114 | | | | – | |
Energy | | | 58,438,862 | | | | 57,810,339 | | | | 628,523 | | | | – | |
Financials^ | | | 43,504,316 | | | | 41,929,490 | | | | 1,574,826 | | | | 0 | |
Health Care | | | 52,495,812 | | | | 51,848,821 | | | | 646,991 | | | | – | |
Industrials | | | 47,889,806 | | | | 46,683,771 | | | | 1,206,035 | | | | – | |
Information Technology | | | 99,249,324 | | | | 98,995,036 | | | | 254,288 | | | | – | |
Materials | | | 20,193,586 | | | | 19,478,657 | | | | 714,929 | | | | – | |
Real Estate | | | 9,409,344 | | | | 9,016,992 | | | | 392,352 | | | | – | |
Telecommunications Services | | | 2,684,299 | | | | 2,208,323 | | | | 475,976 | | | | – | |
Utilities | | | 7,198,627 | | | | 7,010,706 | | | | 187,921 | | | | – | |
| | | | |
Registered Investment Companies | | | | | | | | | | | | | | | | |
Affiliated Equity Holdings | | | 330,537,582 | | | | 330,537,582 | | | | – | | | | – | |
Affiliated Fixed Income Holdings | | | 16,330,734 | | | | 16,330,734 | | | | – | | | | – | |
Equity Funds/ETFs | | | 11,626,080 | | | | 11,626,080 | | | | – | | | | – | |
Long-Term Fixed Income | | | | | | | | | | | | | | | | |
Collateralized Mortgage Obligations | | | 240,043 | | | | – | | | | 240,043 | | | | – | |
Mortgage-Backed Securities | | | 11,821,369 | | | | – | | | | 11,821,369 | | | | – | |
U.S. Government and Agencies | | | 15,866,065 | | | | – | | | | 15,866,065 | | | | – | |
Short-Term Investments | | | 10,294,486 | | | | – | | | | 10,294,486 | | | | – | |
| |
Subtotal Investments in Securities | | | $808,947,947 | | | | $762,701,413 | | | | $46,246,534 | | | | $0 | |
| |
| |
| | | | |
| Other Investments* | | Total | | | | | | | | | | |
Short-Term Investments | | | 74,293,277 | | | | | | | | | | | | | |
| | | | | | | | | | | | | |
Subtotal Other Investments | | | $74,293,277 | | | | | | | | | | | | | |
| | | | | | | | | | | | | |
| | | | | | | | | | | | | |
| | | | | | | | | | | | | | | | |
| | | | | | | | | | | | | |
Total Investments at Value | | | $883,241,224 | | | | | | | | | | | | | |
| | | | | | | | | | | | | |
| | | | | | | | | | | | | |
| * | Certain investments are measured at fair value using a net asset value per share that is not publicly available (practical expedient). According to disclosure requirements of Accounting Standards Codification (ASC) 820, Fair Value Measurement, securities valued using the practical expedient are not classified in the fair value hierarchy. The fair value amounts presented in this table are intended to permit reconciliation of the fair value hierarchy to the amounts presented in the Statement of Assets and Liabilities. |
| | | | | | | | | | | | | | | | |
| Other Financial Instruments | | Total | | | Level 1 | | | Level 2 | | | Level 3 | |
| | | | |
Asset Derivatives | | | | | | | | | | | | | | | | |
Futures Contracts | | | 3,190,230 | | | | 3,190,230 | | | | – | | | | – | |
| |
Total Asset Derivatives | | | $3,190,230 | | | | $3,190,230 | | | | $– | | | | $– | |
| |
| |
| | | | |
Liability Derivatives | | | | | | | | | | | | | | | | |
Futures Contracts | | | 4,118,320 | | | | 4,118,320 | | | | – | | | | – | |
| |
Total Liability Derivatives | | | $4,118,320 | | | | $4,118,320 | | | | $– | | | | $– | |
| |
| |
There were no significant transfers between Levels during the period ended October 31, 2016. Transfers between Levels are identified as of the end of the period.
| ^ | Level 3 security in this section is fair valued at <$1. |
The following table presents Aggressive Allocation Fund’s futures contracts held as of October 31, 2016. Investments and/or cash totaling $10,294,486 were pledged as the initial margin deposit for these contracts.
| | | | | | | | | | | | | | | | | | | | |
| Futures Contracts | | Number of
Contracts
Long/
(Short) | | | Expiration Date | | | Notional Principal Amount | | | Value | | | Unrealized Gain/(Loss) | |
CBOT 10-Yr. U.S. Treasury Note | | | (13 | ) | | | December 2016 | | | | ($1,702,755 | ) | | | ($1,685,125 | ) | | | $17,630 | |
CBOT 2-Yr. U.S. Treasury Note | | | (14 | ) | | | December 2016 | | | | (3,055,457 | ) | | | (3,053,968 | ) | | | 1,489 | |
CBOT 5-Yr. U.S. Treasury Note | | | 33 | | | | December 2016 | | | | 4,001,610 | | | | 3,986,297 | | | | (15,313 | ) |
CBOT U.S. Long Bond | | | (14 | ) | | | December 2016 | | | | (2,381,486 | ) | | | (2,278,063 | ) | | | 103,423 | |
CME E-mini S&P Mid-Cap 400 Index | | | (674 | ) | | | December 2016 | | | | (104,626,008 | ) | | | (101,558,320 | ) | | | 3,067,688 | |
CME S&P 500 Index | | | 127 | | | | December 2016 | | | | 68,926,148 | | | | 67,313,175 | | | | (1,612,973 | ) |
CME Ultra Long Term U.S. Treasury Bond | | | 13 | | | | December 2016 | | | | 2,433,074 | | | | 2,287,187 | | | | (145,887 | ) |
ICE mini MSCI EAFE Index | | | 794 | | | | December 2016 | | | | 68,388,518 | | | | 66,128,290 | | | | (2,260,228 | ) |
NYBOT NYF mini Russell 2000 Index | | | 33 | | | | December 2016 | | | | 4,008,609 | | | | 3,924,690 | | | | (83,919 | ) |
Total Futures Contracts | | | | | | | | | | | | | | | | | | | ($928,090 | ) |
The accompanying Notes to Financial Statements are an integral part of this schedule.
51
AGGRESSIVE ALLOCATION FUND
Summary Schedule of Investments as of October 31, 2016
The following table summarizes the fair value and Statement of Assets and Liabilities location, as of October 31, 2016, for Aggressive Allocation Fund’s investments in financial derivative instruments by primary risk exposure as discussed under item (2) Significant Accounting Policies of the Notes to Financial Statements.
| | | | | | |
| Derivatives by risk category | | Statement of Assets and Liabilities Location | | Fair Value | |
| | |
Asset Derivatives | | | | | | |
| | |
Interest Rate Contracts | | | | | | |
Futures* | | Net Assets - Net unrealized appreciation/(depreciation) on Futures contracts | | | $122,542 | |
Total Interest Rate Contracts | | | | | 122,542 | |
| | |
Equity Contracts | | | | | | |
Futures* | | Net Assets - Net unrealized appreciation/(depreciation) on Futures contracts | | | 3,067,688 | |
Total Equity Contracts | | | | | 3,067,688 | |
| |
Total Asset Derivatives | | | | | $3,190,230 | |
| |
| | |
Liability Derivatives | | | | | | |
| | |
Interest Rate Contracts | | | | | | |
Futures* | | Net Assets - Net unrealized appreciation/(depreciation) on Futures contracts | | | 161,200 | |
Total Interest Rate Contracts | | | | | 161,200 | |
| | |
Equity Contracts | | | | | | |
Futures* | | Net Assets - Net unrealized appreciation/(depreciation) on Futures contracts | | | 3,957,120 | |
Total Equity Contracts | | | | | 3,957,120 | |
| |
Total Liability Derivatives | | | | | $4,118,320 | |
| |
| * | Includes cumulative appreciation/depreciation of futures contracts as reported in the Schedule of Investments. Only current day’s variation margin is reported within the Statement of Assets and Liabilities. |
The following table summarizes the net realized gains/(losses) and Statement of Operations location, for the period ended October 31, 2016, for Aggressive Allocation Fund’s investments in financial derivative instruments by primary risk exposure.
| | | | | | |
| Derivatives by risk category | | Statement of Operations Location | | Realized Gains/(Losses)
recognized in Income | |
| | |
Interest Rate Contracts | | | | | | |
Futures | | Net realized gains/(losses) on Futures contracts | | | 94,640 | |
| | |
Total Interest Rate Contracts | | | | | 94,640 | |
| | |
Equity Contracts | | | | | | |
Futures | | Net realized gains/(losses) on Futures contracts | | | 1,689,792 | |
| | |
Total Equity Contracts | | | | | 1,689,792 | |
| |
Total | | | | | $1,784,432 | |
| |
| |
The following table summarizes the change in net unrealized appreciation/(depreciation) and Statement of Operations location, for the period ended October 31, 2016, for Aggressive Allocation Fund’s investments in financial derivative instruments by primary risk exposure.
| | | | | | |
| Derivatives by risk category | | Statement of Operations Location | | Change in unrealized
appreciation/
(depreciation)
recognized in Income | |
| | |
Interest Rate Contracts | | | | | | |
Futures | | Change in net unrealized appreciation/(depreciation) on Futures contracts | | | (13,916 | ) |
| | |
Total Interest Rate Contracts | | | | | (13,916 | ) |
| | |
Equity Contracts | | | | | | |
Futures | | Change in net unrealized appreciation/(depreciation) on Futures contracts | | | (11,753,476 | ) |
| | |
Total Equity Contracts | | | | | (11,753,476 | ) |
| |
Total | | | | | ($11,767,392 | ) |
| |
| |
The following table presents Aggressive Allocation Fund’s average volume of derivative activity during the period ended October 31, 2016.
| | | | | | | | |
| Derivative Risk Category | | Futures
(Notional)* | | | Futures
(Percentage
of Average
Net Assets) | |
Equity Contracts | | $ | 267,550,983 | | | | 31.8 | % |
Interest Rate Contracts | | | 12,509,577 | | | | 1.5 | |
| * | Notional amount represents long or short, or both, derivative positions held by the Fund. |
The accompanying Notes to Financial Statements are an integral part of this schedule.
52
AGGRESSIVE ALLOCATION FUND
Summary Schedule of Investments as of October 31, 2016
Investment in Affiliates
Affiliated issuers, as defined under the Investment Company Act of 1940, include those in which the Fund’s holdings of an issuer represent 5% or more of the outstanding voting securities of an issuer, any affiliated mutual fund, or a company which is under common ownership or control with the Fund. The Fund owns shares of Thrivent Cash Management Trust for the purpose of securities lending and Thrivent Core Short-Term Reserve Fund primarily to serve as a cash sweep vehicle for the Fund. Thrivent Cash Management Trust and Thrivent Core Short-Term Reserve Fund are established for the sole use of affiliated funds.
A summary of transactions for the fiscal year to date, in Aggressive Allocation Fund, is as follows:
| | | | | | | | | | | | | | | | | | | | | | | | |
| Fund | | Value
October 31, 2015 | | | Gross
Purchases | | | Gross
Sales | | | Shares Held at
October 31, 2016 | | | Value
October 31, 2016 | | | Income Earned
November 1, 2015 -
October 31, 2016 | |
Opportunity Income Plus | | | $4,517,490 | | | | $75,736 | | | | $4,549,147 | | | | – | | | | $ – | | | | $80,864 | |
Small Cap Stock | | | 23,609,385 | | | | 1,775,799 | | | | – | | | | 1,211,561 | | | | 25,055,081 | | | | 54,429 | |
Mid Cap Stock | | | 48,948,999 | | | | 5,194,356 | | | | – | | | | 2,312,069 | | | | 55,489,646 | | | | 215,340 | |
Partner Worldwide Allocation | | | 104,686,309 | | | | 2,419,885 | | | | – | | | | 11,061,524 | | | | 107,407,399 | | | | 2,419,885 | |
Large Cap Growth | | | 65,053,956 | | | | 3,272,957 | | | | – | | | | 6,928,175 | | | | 62,284,289 | | | | – | |
Large Cap Value | | | 49,713,905 | | | | 3,386,663 | | | | – | | | | 2,650,742 | | | | 51,848,520 | | | | 752,542 | |
Large Cap Stock | | | 28,762,834 | | | | 1,380,275 | | | | – | | | | 1,137,651 | | | | 28,452,647 | | | | 393,559 | |
High Yield | | | 5,381,033 | | | | 311,504 | | | | 33,830 | | | | 1,195,460 | | | | 5,690,392 | | | | 304,316 | |
Income | | | 3,693,281 | | | | 151,504 | | | | – | | | | 427,112 | | | | 3,950,783 | | | | 133,951 | |
Limited Maturity Bond | | | 6,534,478 | | | | 121,731 | | | | 25,372 | | | | 536,022 | | | | 6,689,559 | | | | 118,710 | |
Cash Management Trust-Collateral Investment | | | – | | | | 2,852,500 | | | | 2,852,500 | | | | – | | | | – | | | | 18 | |
Cash Management Trust-Short Term Investment | | | – | | | | 96,577,834 | | | | 96,577,834 | | | | – | | | | – | | | | 40,641 | |
Core Short-Term Reserve | | | – | | | | 124,645,809 | | | | 50,352,532 | | | | 7,429,328 | | | | 74,293,277 | | | | 169,507 | |
Total Value and Income Earned | | | $340,901,670 | | | | | | | | | | | | | | | | $421,161,593 | | | | $4,683,762 | |
The accompanying Notes to Financial Statements are an integral part of this schedule.
53
MODERATELY AGGRESSIVE ALLOCATION FUND
Summary Schedule of Investments as of October 31, 2016
| | | | | | | | | | | | |
Principal
Amount | | | Bank Loans (1.0%) | | Value | | | % of Net
Assets | |
| Basic Materials (0.1%) | |
| | | | Other Securities^ | | | $1,288,040 | | | | 0.1 | % |
| | | | | |
| | | | Total | | | 1,288,040 | | | | | |
| | | | | |
| | |
| Capital Goods (<0.1%) | | | | | | | | |
| | | | Other Securities^ | | | 799,058 | | | | <0.1 | % |
| | | | | |
| | | | Total | | | 799,058 | | | | | |
| | | | | |
| | |
| Communications Services (0.3%) | | | | | | | | |
| | | | Other Securities^ | | | 5,537,046 | | | | 0.3 | % |
| | | | | |
| | | | Total | | | 5,537,046 | | | | | |
| | | | | |
| | |
| Consumer Cyclical (0.2%) | | | | | | | | |
| | | | Other Securities^ | | | 2,910,615 | | | | 0.2 | % |
| | | | | |
| | | | Total | | | 2,910,615 | | | | | |
| | | | | |
| | |
| Consumer Non-Cyclical (0.1%) | | | | | | | | |
| | | | Other Securities^ | | | 2,894,187 | | | | 0.1 | % |
| | | | | |
| | | | Total | | | 2,894,187 | | | | | |
| | | | | |
|
| Energy (0.1%) | |
| | | | Other Securities^ | | | 1,371,575 | | | | 0.1 | % |
| | | | | |
| | | | Total | | | 1,371,575 | | | | | |
| | | | | |
| | |
| Financials (0.1%) | | | | | | | | |
| | | | Other Securities^ | | | 1,381,144 | | | | 0.1 | % |
| | | | | |
| | | | Total | | | 1,381,144 | | | | | |
| | | | | |
| | |
| Technology (0.1%) | | | | | | | | |
| | | | Other Securities^ | | | 1,941,000 | | | | 0.1 | % |
| | | | | |
| | | | Total | | | 1,941,000 | | | | | |
| | | | | |
| | |
| Transportation (<0.1%) | | | | | | | | |
| | | | Other Securities^ | | | 568,396 | | | | <0.1 | % |
| | | | | |
| | | | Total | | | 568,396 | | | | | |
| | | | | |
| | |
| Utilities (<0.1%) | | | | | | | | |
| | | | Other Securities^ | | | 263,430 | | | | <0.1 | % |
| | | | | |
| | | | Total | | | 263,430 | | | | | |
| | | | | |
| | | | | |
| | | | | |
| | | | Total Bank Loans (cost $19,109,351) | | | 18,954,491 | | | | | |
| | | | | |
| | | |
| Shares | | | Registered Investment Companies (45.4%) | | Value | | | % of Net
Assets | |
| Affiliated Equity Holdings (38.6%) | | | | | | | | |
| | 15,413,729 | | | Thrivent Large Cap Growth Fund | | | 138,569,427 | | | | 6.9 | % |
| | 4,059,972 | | | Thrivent Large Cap Stock Fund | | | 101,539,892 | | | | 5.1 | % |
| | 8,662,899 | | | Thrivent Large Cap Value Fund | | | 169,446,299 | | | | 8.5 | % |
| | 5,080,309 | | | Thrivent Mid Cap Stock Fund | | | 121,927,424 | | | | 6.1 | % |
| | 21,293,565 | | | Thrivent Partner Worldwide Allocation Fund | | | 206,760,515 | | | | 10.3 | % |
| | 1,622,012 | | | Thrivent Small Cap Stock Fund | | | 33,543,209 | | | | 1.7 | % |
| | | | | |
| | | | Total | | | 771,786,766 | | | | | |
| | | | | |
| | |
| Affiliated Fixed Income Holdings (5.7%) | | | | | | | | |
| | 4,037,028 | | | Thrivent High Yield Fund | | | 19,216,252 | | | | 1.0 | % |
| | 6,417,176 | | | Thrivent Income Fund | | | 59,358,880 | | | | 3.0 | % |
| | 2,767,130 | | | Thrivent Limited Maturity Bond Fund | | | 34,533,782 | | | | 1.7 | % |
| | | | | |
| | | | Total | | | 113,108,914 | | | | | |
| | | | | |
| Equity Funds/ETFs (0.8%) | | | | | | | | |
| | 19,769 | | | iShares Russell 2000 Growth Index Fund | | | 2,765,090 | | | | 0.1 | % |
| | 48,549 | | | SPDR S&P 500 ETF Trust | | | 10,319,090 | | | | 0.5 | % |
| | | | Other Securities^ | | | 3,948,840 | | | | 0.2 | % |
| | | | | |
| | | | Total | | | 17,033,020 | | | | | |
| | | | | |
| Fixed Income Funds/ETFs (0.3%) | | | | | |
| | 29,045 | | | iShares iBoxx $ Investment | | | | | |
| | | | Grade Corporate Bond ETF | | | 3,513,864 | | | | 0.2 | % |
| | | | Other Securities^ | | | 3,356,054 | | | | 0.1 | % |
| | | | | |
| | | | Total | | | 6,869,918 | | | | | |
| | | | | |
| | | | | |
| | | | | |
| | | | Total Registered Investment Companies (cost $751,283,395) | | | 908,798,618 | | | | | |
| | | | | |
| | | |
| Shares | | | Common Stock (31.3%) | | Value | | | % of Net
Assets | |
| Consumer Discretionary (3.8%) | | | | | |
| | 5,890 | | | Amazon.com, Inc.a | | | 4,652,040 | | | | 0.2 | % |
| | 51,820 | | | Comcast Corporation | | | 3,203,512 | | | | 0.2 | % |
| | | | Other Securities^ | | | 68,054,284 | | | | 3.4 | % |
| | | | | |
| | | | Total | | | 75,909,836 | | | | | |
| | | | | |
| |
| Consumer Staples (1.1%) | | | | | |
| | | | Other Securities^ | | | 21,349,508 | | | | 1.1 | % |
| | | | | |
| | | | Total | | | 21,349,508 | | | | | |
| | | | | |
| | |
| Energy (5.1%) | | | | | | | | |
| | 129,936 | | | Canadian Natural Resources, Ltd. | | | 4,120,271 | | | | 0.2 | % |
| | 90,582 | | | Chevron Corporation | | | 9,488,464 | | | | 0.5 | % |
| | 35,132 | | | Concho Resources, Inc.a | | | 4,459,656 | | | | 0.2 | % |
| | 64,016 | | | EOG Resources, Inc. | | | 5,788,327 | | | | 0.3 | % |
| | 80,402 | | | EQT Corporation | | | 5,306,532 | | | | 0.3 | % |
| | 33,500 | | | Exxon Mobil Corporation | | | 2,791,220 | | | | 0.2 | % |
| | 140,560 | | | Halliburton Company | | | 6,465,760 | | | | 0.3 | % |
| | 24,570 | | | Pioneer Natural Resources Company | | | 4,398,521 | | | | 0.2 | % |
| | 73,390 | | | Royal Dutch Shell plc ADR | | | 3,655,556 | | | | 0.2 | % |
| | 94,182 | | | Schlumberger, Ltd. | | | 7,367,858 | | | | 0.4 | % |
| | 209,832 | | | Suncor Energy, Inc. ADR | | | 6,299,157 | | | | 0.3 | % |
| | 111,840 | | | Valero Energy Corporation | | | 6,625,402 | | | | 0.3 | % |
| | 495,810 | | | WPX Energy, Inc.a | | | 5,384,497 | | | | 0.3 | % |
| | | | Other Securities^ | | | 28,875,893 | | | | 1.4 | % |
| | | | | |
| | | | Total | | | 101,027,114 | | | | | |
| | | | | |
| |
| Financials (4.0%) | | | | | |
| | 89,844 | | | Zions Bancorporation | | | 2,893,875 | | | | 0.2 | % |
| | | | Other Securities^ | | | 77,061,522 | | | | 3.8 | % |
| | | | | |
| | | | Total | | | 79,955,397 | | | | | |
| | | | | |
| |
| Health Care (3.5%) | | | | | |
| | 36,986 | | | Gilead Sciences, Inc. | | | 2,723,279 | | | | 0.1 | % |
| | 26,130 | | | Johnson & Johnson | | | 3,030,819 | | | | 0.2 | % |
| | | | Other Securities^ | | | 64,132,676 | | | | 3.2 | % |
| | | | | |
| | | | Total | | | 69,886,774 | | | | | |
| | | | | |
| |
| Industrials (3.9%) | | | | | |
| | 72,251 | | | Southwest Airlines Company | | | 2,893,653 | | | | 0.2 | % |
| | 33,007 | | | Union Pacific Corporation | | | 2,910,557 | | | | 0.2 | % |
| | | | Other Securities^ | | | 72,969,259 | | | | 3.5 | % |
| | | | | |
| | | | Total | | | 78,773,469 | | | | | |
| | | | | |
| |
| Information Technology (6.1%) | | | | | |
| | 4,732 | | | Alphabet, Inc., Class Aa | | | 3,832,447 | | | | 0.2 | % |
The accompanying Notes to Financial Statements are an integral part of this schedule.
54
MODERATELY AGGRESSIVE ALLOCATION FUND
Summary Schedule of Investments as of October 31, 2016
| | | | | | | | | | | | |
| Shares | | | Common Stock (31.3%) | | Value | | | % of Net
Assets | |
| Information Technology (6.1%) - continued | | | | | | | | |
| | 34,204 | | | Apple, Inc. | | | $3,883,522 | | | | 0.2 | % |
| | 122,580 | | | Cisco Systems, Inc. | | | 3,760,754 | | | | 0.2 | % |
| | 28,495 | | | DST Systems, Inc. | | | 2,740,079 | | | | 0.1 | % |
| | 32,920 | | | Facebook, Inc.a | | | 4,312,191 | | | | 0.2 | % |
| | 36,770 | | | MasterCard, Inc. | | | 3,935,125 | | | | 0.2 | % |
| | 95,070 | | | Microsoft Corporation | | | 5,696,594 | | | | 0.3 | % |
| | 71,100 | | | Oracle Corporation | | | 2,731,662 | | | | 0.1 | % |
| | 50,610 | | | Salesforce.com, Inc.a | | | 3,803,848 | | | | 0.2 | % |
| | 33,430 | | | Visa, Inc. | | | 2,758,309 | | | | 0.1 | % |
| | 53,980 | | | Xilinx, Inc. | | | 2,745,963 | | | | 0.1 | % |
| | | | Other Securities^ | | | 82,142,300 | | | | 4.2 | % |
| | | | | |
| | | | Total | | | 122,342,794 | | | | | |
| | | | | |
| | |
| Materials (1.8%) | | | | | | | | |
| | | | Other Securities^ | | | 36,498,138 | | | | 1.8 | % |
| | | | | |
| | | | Total | | | 36,498,138 | | | | | |
| | | | | |
| | |
| Real Estate (1.0%) | | | | | | | | |
| | | | Other Securities^ | | | 20,782,256 | | | | 1.0 | % |
| | | | | |
| | | | Total | | | 20,782,256 | | | | | |
| | | | | |
| | |
| Telecommunications Services (0.2%) | | | | | | | | |
| | | | Other Securities^ | | | 4,772,041 | | | | 0.2 | % |
| | | | | |
| | | | Total | | | 4,772,041 | | | | | |
| | | | | |
| | |
| Utilities (0.8%) | | | | | | | | |
| | | | Other Securities^ | | | 15,542,620 | | | | 0.8 | % |
| | | | | |
| | | | Total | | | 15,542,620 | | | | | |
| | | | | |
| | | | | |
| | | | | |
| | | | Total Common Stock (cost $567,222,352) | | | 626,839,947 | | | | | |
| | | | | |
| | | |
Principal
Amount | | | Long-Term Fixed Income (15.3%) | | Value | | | % of Net
Assets | |
| Asset-Backed Securities (0.7%) | | | | | | | | |
| | | | Other Securities^ | | | 14,318,272 | | | | 0.7 | % |
| | | | | |
| | | | Total | | | 14,318,272 | | | | | |
| | | | | |
| | |
| Basic Materials (0.1%) | | | | | | | | |
| | | | Other Securities^ | | | 1,946,528 | | | | 0.1 | % |
| | | | | |
| | | | Total | | | 1,946,528 | | | | | |
| | | | | |
| | |
| Capital Goods (0.3%) | | | | | | | | |
| | | | Other Securities^ | | | 5,895,751 | | | | 0.3 | % |
| | | | | |
| | | | Total | | | 5,895,751 | | | | | |
| | | | | |
| | |
| Collateralized Mortgage Obligations (0.7%) | | | | | | | | |
| | | | Federal National Mortgage Association | | | | | | | | |
| | $834,267 | | | 3.500%, 1/25/2033b | | | 109,660 | | | | <0.1 | % |
| | | | Other Securities^ | | | 14,833,517 | | | | 0.7 | % |
| | | | | |
| | | | Total | | | 14,943,177 | | | | | |
| | | | | |
| |
| Commercial Mortgage-Backed Securities (0.3%) | | | | | |
| | | | Federal National Mortgage Association | | | | | | | | |
| | 22,093 | | | 1.272%, 1/25/2017 | | | 22,079 | | | | <0.1 | % |
| | | | Other Securities^ | | | 5,086,311 | | | | 0.3 | % |
| | | | | |
| | | | Total | | | 5,108,390 | | | | | |
| | | | | |
| | |
| Communications Services (0.7%) | | | | | | | | |
| | | | Other Securities^ | | | 13,871,302 | | | | 0.7 | % |
| | | | | |
| | | | Total | | | 13,871,302 | | | | | |
| | | | | |
| | |
| Consumer Cyclical (0.4%) | | | | | | | | |
| | | | Other Securities^ | | | 8,293,093 | | | | 0.4 | % |
| | | | | |
| | | | Total | | | 8,293,093 | | | | | |
| | | | | |
| | |
| Consumer Non-Cyclical (0.7%) | | | | | | | | |
| | | | Other Securities^ | | | 13,610,901 | | | | 0.7 | % |
| | | | | |
| | | | Total | | | 13,610,901 | | | | | |
| | | | | |
| | |
| Energy (0.4%) | | | | | | | | |
| | | | Other Securities^ | | | 8,702,501 | | | | 0.4 | % |
| | | | | |
| | | | Total | | | 8,702,501 | | | | | |
| | | | | |
| | |
| Financials (1.3%) | | | | | | | | |
| | | | Other Securities^ | | | 25,017,957 | | | | 1.3 | % |
| | | | | |
| | | | Total | | | 25,017,957 | | | | | |
| | | | | |
| | |
| Foreign Government (<0.1%) | | | | | | | | |
| | | | Other Securities^ | | | 424,959 | | | | <0.1 | % |
| | | | | |
| | | | Total | | | 424,959 | | | | | |
| | | | | |
| | |
| Mortgage-Backed Securities (5.0%) | | | | | | | | |
| | | | Federal Home Loan Mortgage Corporation Gold 15-Yr. Pass Through | | | | | | | | |
| | 9,050,000 | | | 3.000%, 11/1/2031c | | | 9,470,684 | | | | 0.5 | % |
| | | | Federal Home Loan Mortgage Corporation Gold 30-Yr. Pass Through | | | | | | | | |
| | 3,675,000 | | | 4.000%, 11/1/2046c | | | 3,930,958 | | | | 0.2 | % |
| | | | Federal National Mortgage Association Conventional | | | | | | | | |
| | 12,300,000 | | | 3.000%, 11/1/2046c | | | 12,663,234 | | | | 0.7 | % |
| | | | Federal National Mortgage Association Conventional 15-Yr. Pass Through | | | | | | | | |
| | 5,850,000 | | | 2.500%, 11/1/2031c | | | 6,019,559 | | | | 0.3 | % |
| | | | Federal National Mortgage Association Conventional 30-Yr. Pass Through | | | | | | | | |
| | 36,100,000 | | | 3.500%, 11/1/2046c | | | 37,899,361 | | | | 1.9 | % |
| | 18,850,000 | | | 4.000%, 11/1/2046c | | | 20,184,225 | | | | 1.0 | % |
| | 7,915,000 | | | 4.500%, 11/1/2046c | | | 8,650,848 | | | | 0.4 | % |
| | 873,203 | | | 1.735% - 2.088%, 7/1/2043 - 8/1/2043d | | | 898,107 | | | | <0.1 | % |
| | | | | |
| | | | Total | | | 99,716,976 | | | | | |
| | | | | |
| | |
| Technology (0.3%) | | | | | | | | |
| | | | Other Securities^ | | | 6,063,700 | | | | 0.3 | % |
| | | | | |
| | | | Total | | | 6,063,700 | | | | | |
| | | | | |
| | |
| Transportation (0.1%) | | | | | | | | |
| | | | Other Securities^ | | | 1,699,265 | | | | 0.1 | % |
| | | | | |
| | | | Total | | | 1,699,265 | | | | | |
| | | | | |
| | |
| U.S. Government and Agencies (3.9%) | | | | | | | | |
| | | | U.S. Treasury Bonds | | | | | | | | |
| | 6,780,000 | | | 3.000%, 5/15/2042 | | | 7,380,667 | | | | 0.4 | % |
| | 6,700,000 | | | 3.625%, 2/15/2044 | | | 8,142,858 | | | | 0.4 | % |
| | 2,187,000 | | | 2.250% - 5.250%, 11/15/2028 - 8/15/2046 | | | 2,750,452 | | | | 0.1 | % |
The accompanying Notes to Financial Statements are an integral part of this schedule.
55
MODERATELY AGGRESSIVE ALLOCATION FUND
Summary Schedule of Investments as of October 31, 2016
| | | | | | | | | | | | |
Principal Amount | | | Long-Term Fixed Income (15.3%) | | Value | | | % of Net
Assets | |
| U.S. Government and Agencies (3.9%) - continued | | | | | | | | |
| | | | U.S. Treasury Bonds, TIPS | | | | | | | | |
| | $14,712,363 | | | 0.125%, 1/15/2023 | | | $14,923,147 | | | | 0.8 | % |
| | 12,061,959 | | | 0.625%, 1/15/2026 | | | 12,590,611 | | | | 0.6 | % |
| | 9,402,348 | | | 1.000%, 2/15/2046 | | | 10,129,093 | | | | 0.5 | % |
| | | | U.S. Treasury Notes | | | | | | | | |
| | 2,840,000 | | | 1.500%, 10/31/2019 | | | 2,880,493 | | | | 0.1 | % |
| | 5,000,000 | | | 1.375%, 9/30/2020 | | | 5,033,595 | | | | 0.3 | % |
| | 8,634,000 | | | 1.125%, 8/31/2021 | | | 8,557,779 | | | | 0.4 | % |
| | 6,238,000 | | | 0.750% - 1.625%, 2/15/2019 - 9/30/2023 | | | 6,234,634 | | | | 0.3 | % |
| | | | | |
| | | | Total | | | 78,623,329 | | | | | |
| | | | | |
| Utilities (0.4%) | | | | | | | | |
| | | | Other Securities^ | | | 7,737,313 | | | | 0.4 | % |
| | | | | |
| | | | Total | | | 7,737,313 | | | | | |
| | | | | |
| | | | | |
| | | | | |
| | | | Total Long-Term Fixed Income (cost $300,065,978) | | | 305,973,414 | | | | | |
| | | | | |
| | | |
| Shares | | | Preferred Stock (<0.1%) | | Value | | | % of Net
Assets | |
| Energy (<0.1%) | | | | | | | | |
| | | | Other Securities^ | | | 5,978 | | | | <0.1 | % |
| | | | | |
| | | | Total | | | 5,978 | | | | | |
| | | | | |
| | | | | |
| | | | | |
| | | | Total Preferred Stock (cost $1,235) | | | 5,978 | | | | | |
| | | | | |
| | | |
| Shares | | | Collateral Held for Securities Loaned (0.1%) | | Value | | | % of Net
Assets | |
| | 2,585,839 | | | Thrivent Cash Management Trust | | | 2,585,839 | | | | 0.1 | % |
| | | | | |
| | | | Total Collateral Held for Securities Loaned (cost $2,585,839) | | | 2,585,839 | | | | | |
| | | | | |
| | | |
Shares or
Principal
Amount | | | Short-Term Investments (12.1%)e | | Value | | | % of Net
Assets | |
| | | | Federal Home Loan Bank Discount Notes | | | | | | | | |
| | 7,600,000 | | | 0.344%, 1/6/2017f | | | 7,595,539 | | | | 0.4 | % |
| | | | Thrivent Core Short-Term Reserve Fund | | | | | | | | |
| | 23,163,168 | | | 0.790% | | | 231,631,678 | | | | 11.6 | % |
| | | | Other Securities^ | | | 2,098,507 | | | | 0.1 | % |
| | | | | |
| | | | Total Short-Term Investments (cost $241,325,256) | | | 241,325,724 | | | | | |
| | | | | |
| | | | Total Investments (cost $1,881,593,406) 105.2% | | | $2,104,484,011 | | | | | |
| | | | | |
| | | | Other Assets and Liabilities, Net (5.2%) | | | (103,868,763 | ) | | | | |
| | | | | |
| | | | Total Net Assets 100.0% | | | $2,000,615,248 | | | | | |
| | | | | |
| ^ | The Summary Schedule of Investments shows the 50 largest holdings in unaffiliated issuers, any holding or issuer that exceeds 1% of net assets and all affiliated holdings as of the report date. The remaining securities held are grouped by category as “Other securities”. |
| a | Non-income producing security. |
| b | Denotes interest only security. Interest only securities represent the right to receive monthly interest payments on an underlying pool of mortgages or assets. The principal shown is the outstanding par amount of the pool as of the end of the period. The actual effective yield of the security is different than the stated coupon rate. |
| c | Denotes investments purchased on a when-issued or delayed delivery basis. |
| d | Denotes variable rate securities. Variable rate securities are securities whose yields vary with a designated market index or market rate. The rate shown is as of October 31, 2016. |
| e | The interest rate shown reflects the yield, coupon rate or the discount rate at the date of purchase. |
| f | All or a portion of the security is held on deposit with the counterparty and pledged as the initial margin deposit for open futures contracts. |
Moderately Aggressive Allocation Fund held restricted securities as of October31, 2016. Restricted securities are investment securities which cannot be offered for public sale without first being registered under the Securities Act of 1933. As of October 31, 2016, the value of these investments was $11,696,545 or 0.6% of total net assets.
The following table presents the total amount of securities loaned with continuous maturity, by type, offset by the gross payable upon return of collateral for securities loaned by Thrivent Moderately Aggressive Allocation Fund as of October 31, 2016:
| | | | |
Securities Lending Transactions | | | | |
Taxable Debt Security | | | $1,825,285 | |
Common Stock | | | 667,758 | |
| | | | |
Total lending | | | $2,493,043 | |
Gross amount payable upon return of collateral for securities loaned | | | $2,585,839 | |
| | | | |
Net amounts due to counterparty | | | $92,796 | |
| | | | |
Definitions:
| | | | |
| ADR | | - | | American Depositary Receipt, which are certificates for an underlying foreign security’s shares held by an issuing U.S. depository bank. |
| ETF | | - | | Exchange Traded Fund. |
| TIPS | | - | | Treasury Inflation Protected Security. |
Unrealized Appreciation (Depreciation)
Gross unrealized appreciation and depreciation of investments, based on cost for federal income tax purposes, were as follows:
| | | | |
| Gross unrealized appreciation | | | $247,449,164 | |
| Gross unrealized depreciation | | | (39,056,527) | |
| | | | |
| Net unrealized appreciation (depreciation) | | | $208,392,637 | |
| |
| Cost for federal income tax purposes | | | $1,896,091,374 | |
The accompanying Notes to Financial Statements are an integral part of this schedule.
56
MODERATELY AGGRESSIVE ALLOCATION FUND
Summary Schedule of Investments as of October 31, 2016
Fair Valuation Measurements
The following table is a summary of the inputs used, as of October 31, 2016, in valuing Moderately Aggressive Allocation Fund’s assets carried at fair value.
| | | | | | | | | | | | | | | | |
| Investments in Securities | | Total | | | Level 1 | | | Level 2 | | | Level 3 | |
| | | | |
Bank Loans | | | | | | | | | | | | | | | | |
Basic Materials | | | 1,288,040 | | | | – | | | | 1,288,040 | | | | – | |
Capital Goods | | | 799,058 | | | | – | | | | 799,058 | | | | – | |
Communications Services | | | 5,537,046 | | | | – | | | | 5,537,046 | | | | – | |
Consumer Cyclical | | | 2,910,615 | | | | – | | | | 2,910,615 | | | | – | |
Consumer Non-Cyclical | | | 2,894,187 | | | | – | | | | 2,894,187 | | | | – | |
Energy | | | 1,371,575 | | | | – | | | | 803,835 | | | | 567,740 | |
Financials | | | 1,381,144 | | | | – | | | | 1,381,144 | | | | – | |
Technology | | | 1,941,000 | | | | – | | | | 1,941,000 | | | | – | |
Transportation | | | 568,396 | | | | – | | | | 568,396 | | | | – | |
Utilities | | | 263,430 | | | | – | | | | 104,334 | | | | 159,096 | |
| | | | |
Registered Investment Companies | | | | | | | | | | | | | | | | |
Affiliated Equity Holdings | | | 771,786,766 | | | | 771,786,766 | | | | – | | | | – | |
Affiliated Fixed Income Holdings | | | 113,108,914 | | | | 113,108,914 | | | | – | | | | – | |
Equity Funds/ETFs | | | 17,033,020 | | | | 17,033,020 | | | | – | | | | – | |
Fixed Income Funds/ETFs | | | 6,869,918 | | | | 6,869,918 | | | | – | | | | – | |
| | | | |
Common Stock | | | | | | | | | | | | | | | | |
Consumer Discretionary | | | 75,909,836 | | | | 73,998,600 | | | | 1,911,236 | | | | – | |
Consumer Staples | | | 21,349,508 | | | | 20,121,427 | | | | 1,228,081 | | | | – | |
Energy | | | 101,027,114 | | | | 99,924,338 | | | | 1,102,776 | | | | – | |
Financials^ | | | 79,955,397 | | | | 77,382,923 | | | | 2,572,474 | | | | 0 | |
Health Care | | | 69,886,774 | | | | 68,814,885 | | | | 1,071,889 | | | | – | |
Industrials | | | 78,773,469 | | | | 76,788,278 | | | | 1,985,191 | | | | – | |
Information Technology | | | 122,342,794 | | | | 121,918,185 | | | | 424,609 | | | | – | |
Materials | | | 36,498,138 | | | | 35,327,048 | | | | 1,171,090 | | | | – | |
Real Estate | | | 20,782,256 | | | | 20,109,180 | | | | 673,076 | | | | – | |
Telecommunications Services | | | 4,772,041 | | | | 3,983,765 | | | | 788,276 | | | | – | |
Utilities | | | 15,542,620 | | | | 15,230,089 | | | | 312,531 | | | | – | |
| | | | |
Long–Term Fixed Income | | | | | | | | | | | | | | | | |
Asset–Backed Securities | | | 14,318,272 | | | | – | | | | 13,368,272 | | | | 950,000 | |
Basic Materials | | | 1,946,528 | | | | – | | | | 1,946,528 | | | | – | |
Capital Goods | | | 5,895,751 | | | | – | | | | 5,895,751 | | | | – | |
Collateralized Mortgage Obligations | | | 14,943,177 | | | | – | | | | 14,943,177 | | | | – | |
Commercial Mortgage-Backed Securities | | | 5,108,390 | | | | – | | | | 5,108,390 | | | | – | |
Communications Services | | | 13,871,302 | | | | – | | | | 13,871,302 | | | | – | |
Consumer Cyclical | | | 8,293,093 | | | | – | | | | 8,293,093 | | | | – | |
Consumer Non-Cyclical | | | 13,610,901 | | | | – | | | | 13,610,901 | | | | – | |
Energy | | | 8,702,501 | | | | – | | | | 8,702,501 | | | | – | |
Financials | | | 25,017,957 | | | | – | | | | 25,017,957 | | | | – | |
Foreign Government | | | 424,959 | | | | – | | | | 424,959 | | | | – | |
Mortgage-Backed Securities | | | 99,716,976 | | | | – | | | | 99,716,976 | | | | – | |
Technology | | | 6,063,700 | | | | – | | | | 6,063,700 | | | | – | |
Transportation | | | 1,699,265 | | | | – | | | | 1,699,265 | | | | – | |
U.S. Government and Agencies | | | 78,623,329 | | | | – | | | | 78,623,329 | | | | – | |
Utilities | | | 7,737,313 | | | | – | | | | 7,611,576 | | | | 125,737 | |
| | | | |
Preferred Stock | | | | | | | | | | | | | | | | |
Energy | | | 5,978 | | | | – | �� | | | – | | | | 5,978 | |
Short-Term Investments | | | 9,694,046 | | | | – | | | | 9,694,046 | | | | – | |
| |
Subtotal Investments in Securities | | | $1,870,266,494 | | | | $1,522,397,336 | | | | $346,060,607 | | | | $1,808,551 | |
| |
| |
| | | | |
Other Investments * | | | Total | | | | | | | | | | | | | |
| | | | | | | | | | | | | |
Short–Term Investments | | | 231,631,678 | | | | | | | | | | | | | |
Collateral Held for Securities Loaned | | | 2,585,839 | | | | | | | | | | | | | |
| | | | | | | | | | | | | |
Subtotal Other Investments | | | $234,217,517 | | | | | | | | | | | | | |
| | | | | | | | | | | | | |
| | | | | | | | | | | | | |
| | | | | | | | | | | | | |
| | | | | | | | | | | | | |
Total Investments at Value | | | $2,104,484,011 | | | | | | | | | | | | | |
| | | | | | | | | | | | | |
| | | | | | | | | | | | | |
| * | Certain investments are measured at fair value using a net asset value per share that is not publicly available (practical expedient). According to disclosure requirements of Accounting Standards Codification (ASC) 820, Fair Value Measurement, securities valued using the practical expedient are not classified in the fair value hierarchy. The fair value amounts presented in this table are intended to permit reconciliation of the fair value hierarchy to the amounts presented in the Statement of Assets and Liabilities. |
| ^ | Level 3 security in this section is fair valued at <1. |
The accompanying Notes to Financial Statements are an integral part of this schedule.
57
MODERATELY AGGRESSIVE ALLOCATION FUND
Summary Schedule of Investments as of October 31, 2016
| | | | | | | | | | | | | | | | |
| | | | |
| Other Financial Instruments | | Total | | | Level 1 | | | Level 2 | | | Level 3 | |
| | | | |
Asset Derivatives | | | | | | | | | | | | | | | | |
Futures Contracts | | | 4,830,067 | | | | 4,830,067 | | | | – | | | | – | |
| |
Total Asset Derivatives | | | $4,830,067 | | | | $4,830,067 | | | | $– | | | | $– | |
| |
| |
Liability Derivatives | |
Futures Contracts | | | 6,747,105 | | | | 6,747,105 | | | | – | | | | – | |
| |
Total Liability Derivatives | | | $6,747,105 | | | | $6,747,105 | | | | $– | | | | $– | |
| |
| |
There were no significant transfers between Levels during the period ended October 31, 2016. Transfers between Levels are identified as of the end of the period.
The following table presents Moderately Aggressive Allocation Fund’s futures contracts held as of October 31, 2016. Investments and/or cash totaling $9,694,046 were pledged as the initial margin deposit for these contracts.
| | | | | | | | | | | | | | | | | | | | |
| Futures Contracts | | Number of
Contracts
Long/(Short) | | | Expiration Date | | | Notional Principal Amount | | | Value | | | Unrealized Gain/(Loss) | |
CBOT 10-Yr. U.S. Treasury Note | | | (83 | ) | | | December 2016 | | | | ($10,871,438 | ) | | | ($10,758,875 | ) | | | $112,563 | |
CBOT 5-Yr. U.S. Treasury Note | | | 297 | | | | December 2016 | | | | 36,014,490 | | | | 35,876,673 | | | | (137,817 | ) |
CBOT U.S. Long Bond | | | (22 | ) | | | December 2016 | | | | (3,742,335 | ) | | | (3,579,813 | ) | | | 162,522 | |
CME E-mini S&P Mid-Cap 400 Index | | | (922 | ) | | | December 2016 | | | | (143,277,201 | ) | | | (138,926,960 | ) | | | 4,350,241 | |
CME S&P 500 Index | | | 212 | | | | December 2016 | | | | 115,057,822 | | | | 112,365,300 | | | | (2,692,522 | ) |
CME Ultra Long Term U.S. Treasury Bond | | | (17 | ) | | | December 2016 | | | | (3,195,678 | ) | | | (2,990,937 | ) | | | 204,741 | |
ICE mini MSCI EAFE Index | | | 926 | | | | December 2016 | | | | 79,757,894 | | | | 77,121,910 | | | | (2,635,984 | ) |
NYBOT NYF mini Russell 2000 Index | | | 206 | | | | December 2016 | | | | 25,780,362 | | | | 24,499,580 | | |
| (1,280,782
| )
|
Total Futures Contracts | | | | | | | | | | | | | | | | | | | ($1,917,038) | |
The following table summarizes the fair value and Statement of Assets and Liabilities location, as of October 31, 2016, for Moderately Aggressive Allocation Fund’s investments in financial derivative instruments by primary risk exposure as discussed under item (2) Significant Accounting Policies of the Notes to Financial Statements.
| | | | | | |
| Derivatives by risk category | | Statement of Assets and Liabilities Location | | Fair Value | |
| | |
Asset Derivatives | | | | | | |
| | |
Interest Rate Contracts | | | | | | |
Futures* | | Net Assets - Net unrealized appreciation/(depreciation) on Futures contracts | | | $479,826 | |
Total Interest Rate Contracts | | | | | 479,826 | |
Equity Contracts | | | | | | |
Futures* | | Net Assets - Net unrealized appreciation/(depreciation) on Futures contracts | | | 4,350,241 | |
Total Equity Contracts | | | | | 4,350,241 | |
Total Asset Derivatives | | | | | $4,830,067 | |
| | | | | | | |
| | |
Liability Derivatives | | | | | | |
| | |
Interest Rate Contracts | | | | | | |
Futures* | | Net Assets - Net unrealized appreciation/(depreciation) on Futures contracts | | | 137,817 | |
Total Interest Rate Contracts | | | | | 137,817 | |
Equity Contracts | | | | | | |
Futures* | | Net Assets - Net unrealized appreciation/(depreciation) on Futures contracts | | | 6,609,288 | |
Total Equity Contracts | | | | | 6,609,288 | |
Total Liability Derivatives | | | | | $6,747,105 | |
| | | | | | | |
| * | Includes cumulative appreciation/depreciation of futures contracts as reported in the Schedule of Investments. Only current day’s variation margin is reported within the Statement of Assets and Liabilities. |
The accompanying Notes to Financial Statements are an integral part of this schedule.
58
MODERATELY AGGRESSIVE ALLOCATION FUND
Summary Schedule of Investments as of October 31, 2016
The following table summarizes the net realized gains/(losses) and Statement of Operations location, for the period ended October 31, 2016, for Moderately Aggressive Allocation Fund’s investments in financial derivative instruments by primary risk exposure.
| | | | | | |
| Derivatives by risk category | | Statement of Operations Location | | Realized Gains/(Losses)
recognized in Income | |
| | |
Interest Rate Contracts | | | | | | |
Futures | | Net realized gains/(losses) on Futures contracts | | | 890,044 | |
Total Interest Rate Contracts | | | | | 890,044 | |
| | |
Equity Contracts | | | | | | |
Futures | | Net realized gains/(losses) on Futures contracts | | | 2,360,576 | |
Total Equity Contracts | | | | | 2,360,576 | |
| | |
Credit Contracts | | | | | | |
Credit Default Swaps | | Net realized gains/(losses) on Swap agreements | | | 177,346 | |
Total Credit Contracts | | | | | 177,346 | |
Total | | | | | $3,427,966 | |
| | | | | | | |
The following table summarizes the change in net unrealized appreciation/(depreciation) and Statement of Operations location, for the period ended October 31, 2016, for Moderately Aggressive Allocation Fund’s investments in financial derivative instruments by primary risk exposure.
| | | | | | |
| Derivatives by risk category | | Statement of Operations Location | | Change in unrealized
appreciation/(depreciation)
recognized in Income | |
| | |
Interest Rate Contracts | | | | | | |
Futures | | Change in net unrealized appreciation/(depreciation) on Futures contracts | | | 231,445 | |
Total Interest Rate Contracts | | | | | 231,445 | |
| | |
Equity Contracts | | | | | | |
Futures | | Change in net unrealized appreciation/(depreciation) on Futures contracts | | | (20,043,963 | ) |
Total Equity Contracts | | | | | (20,043,963 | ) |
| | |
Credit Contracts | | | | | | |
Credit Default Swaps | | Change in net unrealized appreciation/(depreciation) on Swap agreements | | | 56,131 | |
Total Credit Contracts | | | | | 56,131 | |
Total | | | | | ($19,756,387 | ) |
| | | | | | | |
The following table presents Moderately Aggressive Allocation Fund’s average volume of derivative activity during the period ended October 31, 2016.
| | | | | | | | | | | | | | | | |
| Derivative Risk Category | | Futures (Notional)* | | | Futures
(Percentage
of Average
Net Assets) | | | Swaps (Notional)* | | | Swaps
(Percentage
of Average
Net Assets) | |
Equity Contracts | | $ | 381,502,830 | | | | 19.9 | % | | | N/A | | | | N/A | |
Interest Rate Contracts | | | 60,433,098 | | | | 3.1 | | | | N/A | | | | N/A | |
Credit Contracts | | | N/A | | | | N/A | | | $ | 86,857 | | | | <0.1 | % |
| * | Notional amount represents long or short, or both, derivative positions held by the Fund. |
The accompanying Notes to Financial Statements are an integral part of this schedule.
59
MODERATELY AGGRESSIVE ALLOCATION FUND
Summary Schedule of Investments as of October 31, 2016
Investment in Affiliates
Affiliated issuers, as defined under the Investment Company Act of 1940, include those in which the Fund’s holdings of an issuer represent 5% or more of the outstanding voting securities of an issuer, any affiliated mutual fund, or a company which is under common ownership or control with the Fund. The Fund owns shares of Thrivent Cash Management Trust for the purpose of securities lending and Thrivent Core Short-Term Reserve Fund primarily to serve as a cash sweep vehicle for the Fund. Thrivent Cash Management Trust and Thrivent Core Short-Term Reserve Fund are established for the sole use of affiliated funds.
A summary of transactions for the fiscal year to date, in Moderately Aggressive Allocation Fund, is as follows:
| | | | | | | | | | | | | | | | | | | | | | | | |
| Fund | | Value
October 31, 2015 | | | Gross Purchases | | | Gross Sales | | | Shares Held at
October 31, 2016 | | | Value
October 31, 2016 | | | Income Earned
November 1, 2015 -
October 31, 2016 | |
Small Cap Stock | | | $31,607,741 | | | | $2,377,402 | | | | $– | | | | 1,622,012 | | | | $33,543,209 | | | | $72,868 | |
Mid Cap Stock | | | 107,555,658 | | | | 11,413,561 | | | | – | | | | 5,080,309 | | | | 121,927,424 | | | | 473,166 | |
Partner Worldwide | | | | | | | | | | | | | | | | | | | | | | | | |
Allocation | | | 201,522,383 | | | | 4,658,307 | | | | – | | | | 21,293,565 | | | | 206,760,515 | | | | 4,658,307 | |
Large Cap Growth | | | 144,731,352 | | | | 7,281,641 | | | | – | | | | 15,413,729 | | | | 138,569,427 | | | | – | |
Large Cap Value | | | 162,470,158 | | | | 11,067,965 | | | | – | | | | 8,662,899 | | | | 169,446,299 | | | | 2,459,386 | |
Large Cap Stock | | | 102,646,866 | | | | 4,925,832 | | | | – | | | | 4,059,972 | | | | 101,539,892 | | | | 1,404,507 | |
High Yield | | | 26,732,544 | | | | 1,046,386 | | | | 8,670,020 | | | | 4,037,028 | | | | 19,216,252 | | | | 1,035,859 | |
Income | | | 64,198,400 | | | | 2,281,414 | | | | 8,694,309 | | | | 6,417,176 | | | | 59,358,880 | | | | 2,017,571 | |
Government Bond | | | 3,571,067 | | | | – | | | | 3,553,570 | | | | – | | | | – | | | | 544 | |
Limited Maturity Bond | | | 33,715,188 | | | | 612,595 | | | | 97,154 | | | | 2,767,130 | | | | 34,533,782 | | | | 612,796 | |
Cash Management Trust-Collateral Investment | | | 738,414 | | | | 42,753,469 | | | | 40,906,044 | | | | 2,585,839 | | | | 2,585,839 | | | | 13,636 | |
Cash Management Trust-Short Term Investment | | | 7,000,000 | | | | 238,255,118 | | | | 245,255,118 | | | | – | | | | – | | | | 118,755 | |
Core Short-Term Reserve | | | – | | | | 316,013,768 | | | | 84,382,090 | | | | 23,163,168 | | | | 231,631,678 | | | | 528,084 | |
| Total Value and Income Earned | | | $886,489,771 | | | | | | | | | | | | | | | | $1,119,113,197 | | | | $13,395,479 | |
The accompanying Notes to Financial Statements are an integral part of this schedule.
60
MODERATE ALLOCATION FUND
Summary Schedule of Investments as of October 31, 2016
| | | | | | | | | | | | |
Principal
Amount | | | Bank Loans (1.8%) | | Value | | | % of Net
Assets | |
| Basic Materials (0.1%) | |
| | | | Other Securities^ | | | $2,152,813 | | | | 0.1 | % |
| | | | | |
| | | | Total | | | 2,152,813 | | | | | |
| | | | | |
|
| Capital Goods (0.1%) | |
| | | | Other Securities^ | | | 1,430,327 | | | | 0.1 | % |
| | | | | |
| | | | Total | | | 1,430,327 | | | | | |
| | | | | |
|
| Communications Services (0.5%) | |
| | | | Other Securities^ | | | 9,843,771 | | | | 0.5 | % |
| | | | | |
| | | | Total | | | 9,843,771 | | | | | |
| | | | | |
|
| Consumer Cyclical (0.3%) | |
| | | | Other Securities^ | | | 5,325,872 | | | | 0.3 | % |
| | | | | |
| | | | Total | | | 5,325,872 | | | | | |
| | | | | |
|
| Consumer Non-Cyclical (0.3%) | |
| | | | Other Securities^ | | | 4,576,986 | | | | 0.3 | % |
| | | | | |
| | | | Total | | | 4,576,986 | | | | | |
| | | | | |
|
| Energy (0.1%) | |
| | | | Other Securities^ | | | 2,369,706 | | | | 0.1 | % |
| | | | | |
| | | | Total | | | 2,369,706 | | | | | |
| | | | | |
|
| Financials (0.1%) | |
| | | | Other Securities^ | | | 2,649,687 | | | | 0.1 | % |
| | | | | |
| | | | Total | | | 2,649,687 | | | | | |
| | | | | |
|
| Technology (0.2%) | |
| | | | Other Securities^ | | | 3,936,217 | | | | 0.2 | % |
| | | | | |
| | | | Total | | | 3,936,217 | | | | | |
| | | | | |
|
| Transportation (0.1%) | |
| | | | Other Securities^ | | | 925,821 | | | | 0.1 | % |
| | | | | |
| | | | Total | | | 925,821 | | | | | |
| | | | | |
|
| Utilities (<0.1%) | |
| | | | Other Securities^ | | | 481,171 | | | | <0.1 | % |
| | | | | |
| | | | Total | | | 481,171 | | | | | |
| | | | | |
| | | | Total Bank Loans (cost $33,996,304) | | | 33,692,371 | | | | | |
| | | | | |
| | | |
| Shares | | | Registered Investment Companies (38.9%) | | Value | | | % of Net
Assets | |
| Affiliated Equity Holdings (27.1%) | | | | | | | | |
| | 12,133,177 | | | Thrivent Large Cap Growth Fund | | | 109,077,260 | | | | 5.9 | % |
| | 1,587,961 | | | Thrivent Large Cap Stock Fund | | | 39,714,901 | | | | 2.1 | % |
| | 7,375,203 | | | Thrivent Large Cap Value Fund | | | 144,258,964 | | | | 7.7 | % |
| | 3,310,082 | | | Thrivent Mid Cap Stock Fund | | | 79,441,957 | | | | 4.3 | % |
| | 11,415,969 | | | Thrivent Partner Worldwide | | | | | | | | |
| | | | Allocation Fund | | | 110,849,059 | | | | 5.9 | % |
| | 1,064,587 | | | Thrivent Small Cap Stock Fund | | | 22,015,655 | | | | 1.2 | % |
| | | | | |
| | | | Total | | | 505,357,796 | | | | | |
| | | | | |
|
| Affiliated Fixed Income Holdings (10.9%) | |
| | 7,062,740 | | | Thrivent High Yield Fund | | | 33,618,643 | | | | 1.8 | % |
| | 11,599,057 | | | Thrivent Income Fund | | | 107,291,277 | | | | 5.8 | % |
| | 4,966,752 | | | Thrivent Limited Maturity Bond Fund | | | 61,985,059 | | | | 3.3 | % |
| | | | | |
| | | | Total | | | 202,894,979 | | | | | |
| | | | | |
|
| Equity Funds/ETFs (0.6%) | |
| | 34,945 | | | SPDR S&P 500 ETF Trust | | | 7,427,560 | | | | 0.4 | % |
| | | | Other Securities^ | | | 3,286,024 | | | | 0.2 | % |
| | | | | |
| | | | Total | | | 10,713,584 | | | | | |
| | | | | |
|
| Fixed Income Funds/ETFs (0.3%) | |
| | 20,000 | | | iShares Barclays 1-3 Year Credit Bond Fund | | | 2,111,000 | | | | 0.1 | % |
| | 21,200 | | | iShares iBoxx $ Investment Grade Corporate Bond ETF | | | 2,564,776 | | | | 0.1 | % |
| | | | Other Securities^ | | | 1,493,952 | | | | 0.1 | % |
| | | | | |
| | | | Total | | | 6,169,728 | | | | | |
| | | | | |
| | | | | | | | | | | | |
| | | | | |
| | | | Total Registered Investment Companies (cost $576,848,845) | | | 725,136,087 | | | | | |
| | | | | |
| | | |
Principal Amount | | | Long-Term Fixed Income (29.3%) | | Value | | | % of Net
Assets | |
| Asset-Backed Securities (0.9%) | |
| | | | Other Securities^ | | | 17,577,615 | | | | 0.9 | % |
| | | | | |
| | | | Total | | | 17,577,615 | | | | | |
| | | | | |
|
| Basic Materials (0.2%) | |
| | | | Other Securities^ | | | 3,137,848 | | | | 0.2 | % |
| | | | | |
| | | | Total | | | 3,137,848 | | | | | |
| | | | | |
|
| Capital Goods (0.6%) | |
| | | | Other Securities^ | | | 10,720,392 | | | | 0.6 | % |
| | | | | |
| | | | Total | | | 10,720,392 | | | | | |
| | | | | |
|
| Collateralized Mortgage Obligations (1.4%) | |
| | | | Federal National Mortgage Association | | | | | | | | |
| | $1,853,927 | | | 3.500%, 1/25/2033a | | | 243,688 | | | | <0.1 | % |
| | | | Other Securities^ | | | 24,187,743 | | | | 1.4 | % |
| | | | | |
| | | | Total | | | 24,431,431 | | | | | |
| | | | | |
|
| Commercial Mortgage-Backed Securities (0.5%) | |
| | | | Federal National Mortgage Association | | | | | | | | |
| | 18,411 | | | 1.272%, 1/25/2017 | | | 18,399 | | | | <0.1 | % |
| | | | Other Securities^ | | | 9,059,408 | | | | 0.5 | % |
| | | | | |
| | | | Total | | | 9,077,807 | | | | | |
| | | | | |
|
| Communications Services (1.3%) | |
| | | | Other Securities^ | | | 24,925,669 | | | | 1.3 | % |
| | | | | |
| | | | Total | | | 24,925,669 | | | | | |
| | | | | |
|
| Consumer Cyclical (0.8%) | |
| | | | Other Securities^ | | | 15,151,199 | | | | 0.8 | % |
| | | | | |
| | | | Total | | | 15,151,199 | | | | | |
| | | | | |
|
| Consumer Non-Cyclical (1.3%) | |
| | | | Other Securities^ | | | 24,896,530 | | | | 1.3 | % |
| | | | | |
| | | | Total | | | 24,896,530 | | | | | |
| | | | | |
| Energy (0.8%) | |
| | | | Other Securities^ | | | 15,007,905 | | | | 0.8 | % |
| | | | | |
| | | | Total | | | 15,007,905 | | | | | |
| | | | | |
|
| Financials (2.5%) | |
| | | | Other Securities^ | | | 45,739,774 | | | | 2.5 | % |
| | | | | |
| | | | Total | | | 45,739,774 | | | | | |
| | | | | |
The accompanying Notes to Financial Statements are an integral part of this schedule.
61
MODERATE ALLOCATION FUND
Summary Schedule of Investments as of October 31, 2016
| | | | | | | | | | | | |
| | | |
Principal Amount | | | Long-Term Fixed Income (29.3%) | | Value | | | % of Net
Assets | |
| Foreign Government (<0.1%) | |
| | | | Other Securities^ | | $ | 707,143 | | | | <0.1 | % |
| | | | | |
| | | | Total | | | 707,143 | | | | | |
| | | | | |
|
| Mortgage-Backed Securities (9.5%) | |
| | | | Federal Home Loan Mortgage Corporation Gold 15-Yr. Pass Through | | | | | | | | |
| | 15,037,500 | | | 3.000%, 11/1/2031b | | | 15,736,509 | | | | 0.8 | % |
| | | | Federal Home Loan Mortgage Corporation Gold 30-Yr. Pass Through | | | | | | | | |
| | 8,787,500 | | | 4.000%, 11/1/2046b | | | 9,399,535 | | | | 0.5 | % |
| | | | Federal National Mortgage Association Conventional | | | | | | | | |
| | 18,250,000 | | | 3.000%, 11/1/2046b | | | 18,788,944 | | | | 1.0 | % |
| | | | Federal National Mortgage Association Conventional 15- Yr. Pass Through | | | | | | | | |
| | 9,325,000 | | | 2.500%, 11/1/2031b | | | 9,595,280 | | | | 0.5 | % |
| | | | Federal National Mortgage Association Conventional 30- Yr. Pass Through | | | | | | | | |
| | 64,950,000 | | | 3.500%, 11/1/2046b | | | 68,187,355 | | | | 3.7 | % |
| | 37,550,000 | | | 4.000%, 11/1/2046b | | | 40,207,834 | | | | 2.2 | % |
| | 11,709,000 | | | 4.500%, 11/1/2046b | | | 12,797,572 | | | | 0.7 | % |
| | 2,737,650 | | | 1.735% - 2.088%, | | | | | | | | |
| | | | 7/1/2043 - 8/1/2043c | | | 2,817,046 | | | | 0.1 | % |
| | | | | |
| | | | Total | | | 177,530,075 | | | | | |
| | | | | |
|
| Technology (0.6%) | |
| | | | Other Securities^ | | | 11,011,807 | | | | 0.6 | % |
| | | | | |
| | | | Total | | | 11,011,807 | | | | | |
| | | | | |
|
| Transportation (0.2%) | |
| | | | Other Securities^ | | | 3,869,285 | | | | 0.2 | % |
| | | | | |
| | | | Total | | | 3,869,285 | | | | | |
| | | | | |
|
| U.S. Government and Agencies (7.9%) | |
| | | | U.S. Treasury Bonds | | | | | | | | |
| | 6,720,000 | | | 3.625%, 2/15/2044 | | | 8,167,165 | | | | 0.4 | % |
| | 4,121,000 | | | 2.250% - 5.250%, | | | | | | | | |
| | | | 11/15/2028 - 8/15/2046 | | | 4,689,580 | | | | 0.2 | % |
| | | | U.S. Treasury Bonds, TIPS | | | | | | | | |
| | 7,199,667 | | | 0.125%, 1/15/2023 | | | 7,302,817 | | | | 0.4 | % |
| | 5,980,299 | | | 0.625%, 1/15/2026 | | | 6,242,403 | | | | 0.3 | % |
| | 16,517,637 | | | 1.000%, 2/15/2046 | | | 17,794,352 | | | | 1.0 | % |
| | | | U.S. Treasury Notes | | | | | | | | |
| | 7,770,000 | | | 0.875%, 11/15/2017 | | | 7,780,622 | | | | 0.4 | % |
| | 8,575,000 | | | 0.875%, 3/31/2018 | | | 8,585,384 | | | | 0.5 | % |
| | 4,010,000 | | | 0.750%, 2/15/2019 | | | 3,994,650 | | | | 0.2 | % |
| | 3,900,000 | | | 1.000%, 10/15/2019 | | | 3,900,152 | | | | 0.2 | % |
| | 19,010,000 | | | 1.500%, 10/31/2019d | | | 19,281,044 | | | | 1.0 | % |
| | 24,000,000 | | | 1.375%, 9/30/2020 | | | 24,161,256 | | | | 1.3 | % |
| | 5,053,000 | | | 1.125%, 8/31/2021 | | | 5,008,392 | | | | 0.3 | % |
| | 19,000,000 | | | 2.125%, 6/30/2022 | | | 19,675,393 | | | | 1.1 | % |
| | 5,400,000 | | | 2.250%, 11/15/2024 | | | 5,614,315 | | | | 0.3 | % |
| | 4,669,000 | | | 1.375% - 2.125%, | | | | | | | | |
| | | | 5/31/2021 - 9/30/2023 | | | 4,721,926 | | | | 0.3 | % |
| | | | | |
| | | | Total | | | 146,919,451 | | | | | |
| | | | | |
| | |
| Utilities (0.8%) | | | | | | | | |
| | | | Other Securities^ | | | 14,293,468 | | | | 0.8 | % |
| | | | | |
| | | | Total | | | 14,293,468 | | | | | |
| | | | | |
| | | | | | | | | | | | |
| | | | | |
| | | | Total Long-Term Fixed Income (cost $536,741,200) | | | 544,997,399 | | | | | |
| | | | | |
| | | |
| Shares | | | Common Stock (23.5%) | | Value | | | % of Net
Assets | |
|
| Consumer Discretionary (2.8%) | |
| | 2,830 | | | Amazon.com, Inc.e | | | 2,235,191 | | | | 0.1 | % |
| | 46,100 | | | Comcast Corporation | | | 2,849,902 | | | | 0.2 | % |
| | | | Other Securities^ | | | 46,704,141 | | | | 2.5 | % |
| | | | | |
| | | | Total | | | 51,789,234 | | | | | |
| | | | | |
|
| Consumer Staples (0.9%) | |
| | | | Other Securities^ | | | 16,835,821 | | | | 0.9 | % |
| | | | | |
| | | | Total | | | 16,835,821 | | | | | |
| | | | | |
|
| Energy (3.8%) | |
| | 83,098 | | | Canadian Natural Resources, Ltd. | | | 2,635,038 | | | | 0.1 | % |
| | 66,591 | | | Chevron Corporation | | | 6,975,407 | | | | 0.4 | % |
| | 23,087 | | | Concho Resources, Inc.e | | | 2,930,664 | | | | 0.2 | % |
| | 41,569 | | | EOG Resources, Inc. | | | 3,758,669 | | | | 0.2 | % |
| | 54,360 | | | EQT Corporation | | | 3,587,760 | | | | 0.2 | % |
| | 30,040 | | | Exxon Mobil Corporation | | | 2,502,933 | | | | 0.1 | % |
| | 101,780 | | | Halliburton Company | | | 4,681,880 | | | | 0.3 | % |
| | 17,260 | | | Pioneer Natural Resources Company | | | 3,089,885 | | | | 0.2 | % |
| | 46,955 | | | Royal Dutch Shell plc ADR | | | 2,338,829 | | | | 0.1 | % |
| | 60,231 | | | Schlumberger, Ltd. | | | 4,711,871 | | | | 0.3 | % |
| | 134,193 | | | Suncor Energy, Inc. ADR | | | 4,028,474 | | | | 0.2 | % |
| | 74,530 | | | Valero Energy Corporation | | | 4,415,157 | | | | 0.2 | % |
| | 285,295 | | | WPX Energy, Inc.e | | | 3,098,304 | | | | 0.2 | % |
| | | | Other Securities^ | | | 21,837,422 | | | | 1.1 | % |
| | | | | |
| | | | Total | | | 70,592,293 | | | | | |
| | | | | |
|
| Financials (3.1%) | |
| | 69,779 | | | Zions Bancorporation | | | 2,247,582 | | | | 0.1 | % |
| | | | Other Securities^ | | | 56,425,639 | | | | 3.0 | % |
| | | | | |
| | | | Total | | | 58,673,221 | | | | | |
| | | | | |
|
| Health Care (2.6%) | |
| | 23,430 | | | Johnson & Johnson | | | 2,717,646 | | | | 0.2 | % |
| | 75,410 | | | Pfizer, Inc. | | | 2,391,251 | | | | 0.1 | % |
| | | | Other Securities^ | | | 43,089,679 | | | | 2.3 | % |
| | | | | |
| | | | Total | | | 48,198,576 | | | | | |
| | | | | |
|
| Industrials (2.9%) | |
| | | | Other Securities^ | | | 55,028,068 | | | | 2.9 | % |
| | | | | |
| | | | Total | | | 55,028,068 | | | | | |
| | | | | |
|
| Information Technology (4.3%) | |
| | 2,869 | | | Alphabet, Inc., Class Ae | | | 2,323,603 | | | | 0.1 | % |
| | 22,834 | | | Apple, Inc. | | | 2,592,572 | | | | 0.2 | % |
| | 134,200 | | | Cisco Systems, Inc. | | | 4,117,256 | | | | 0.2 | % |
| | 25,800 | | | MasterCard, Inc. | | | 2,761,116 | | | | 0.2 | % |
| | 77,130 | | | Microsoft Corporation | | | 4,621,630 | | | | 0.3 | % |
| | 73,730 | | | Oracle Corporation | | | 2,832,707 | | | | 0.2 | % |
| | 33,500 | | | Salesforce.com, Inc.e | | | 2,517,860 | | | | 0.1 | % |
| | | | Other Securities^ | | | 57,724,718 | | | | 3.0 | % |
| | | | | |
| | | | Total | | | 79,491,462 | | | | | |
| | | | | |
The accompanying Notes to Financial Statements are an integral part of this schedule.
62
MODERATE ALLOCATION FUND
Summary Schedule of Investments as of October 31, 2016
| | | | | | | | | | | | |
| Shares | | | Common Stock (23.5%) | | Value | | | % of Net
Assets | |
| Materials (1.4%) | | | | | | | | |
| | | | Other Securities^ | | | $25,481,897 | | | | 1.4 | % |
| | | | | |
| | | | Total | | | 25,481,897 | | | | | |
| | | | | |
| | |
| Real Estate (0.8%) | | | | | | | | |
| | | | Other Securities^ | | | 15,568,965 | | | | 0.8 | % |
| | | | | |
| | | | Total | | | 15,568,965 | | | | | |
| | | | | |
| | |
| Telecommunications Services (0.2%) | | | | | | | | |
| | | | Other Securities^ | | | 4,396,420 | | | | 0.2 | % |
| | | | | |
| | | | Total | | | 4,396,420 | | | | | |
| | | | | |
| | |
| Utilities (0.7%) | | | | | | | | |
| | | | Other Securities^ | | | 12,418,433 | | | | 0.7 | % |
| | | | | |
| | | | Total | | | 12,418,433 | | | | | |
| | | | | |
| | | | | | | | | | | | |
| | | | | |
| | | | Total Common Stock (cost $399,073,855) | | | 438,474,390 | | | | | |
| | | | | |
| | | |
| Shares | | | Preferred Stock (<0.1%) | | Value | | | % of Net
Assets | |
| | |
| Energy (<0.1%) | | | | | | | | |
| | | | Other Securities^ | | | 11,472 | | | | <0.1 | % |
| | | | | |
| | | | Total | | | 11,472 | | | | | |
| | | | | |
| | | | | | | | | | | | |
| | | | | |
| | | | Total Preferred Stock (cost $2,371) | | | 11,472 | | | | | |
| | | | | |
| | | |
| Shares | | | Collateral Held for Securities Loaned (0.2%) | | Value | | | % of Net
Assets | |
| | 3,757,689 | | | Thrivent Cash Management Trust | | | 3,757,689 | | | | 0.2 | % |
| | | | | |
| | | | Total Collateral Held for Securities Loaned (cost $3,757,689) | | | 3,757,689 | | | | | |
| | | | | |
| | | |
Shares or
Principal
Amount | | | Short-Term Investments (16.0%)f | | Value | | | % of Net
Assets | |
| | | | Federal Home Loan Bank Discount Notes | | | | | | | | |
| | 3,400,000 | | | 0.350%, 1/13/2017g | | | 3,397,793 | | | | 0.2 | % |
| | 5,600,000 | | | 0.350%, 1/20/2017g | | | 5,596,018 | | | | 0.3 | % |
| | | | Federal National Mortgage Association Discount Notes | | | | | | | | |
| | 1,300,000 | | | 0.345%, 1/11/2017g | | | 1,299,180 | | | | 0.1 | % |
| | | | Thrivent Core Short-Term Reserve Fund | | | | | | | | |
| | 28,668,952 | | | 0.790% | | | 286,689,526 | | | | 15.4 | % |
| | | | | |
| | | | Total Short-Term Investments (cost $296,981,873) | | | 296,982,517 | | | | | |
| | | | | |
| | | | Total Investments (cost $1,847,402,137) 109.7% | | | $2,043,051,925 | | | | | |
| | | | | |
| | | | Other Assets and Liabilities, Net (9.7%) | | | (181,209,787 | ) | | | | |
| | | | | |
| | | | Total Net Assets 100.0% | | | $1,861,842,138 | | | | | |
| | | | | |
| ^ | The Summary Schedule of Investments shows the 50 largest holdings in unaffiliated issuers, any holding or issuer that exceeds 1% of net assets and all affiliated holdings as of the report date. The remaining securities held are grouped by category as “Other securities”. |
| a | Denotes interest only security. Interest only securities represent the right to receive monthly interest payments on an underlying pool of mortgages or assets. The principal shown is the outstanding par amount of the pool as of the end of the period. The actual effective yield of the security is different than the stated coupon rate. |
| b | Denotes investments purchased on a when-issued or delayed delivery basis. |
| c | Denotes variable rate securities. Variable rate securities are securities whose yields vary with a designated market index or market rate. The rate shown is as of October 31, 2016. |
| d | At October 31, 2016, $30,428 of investments were segregated to cover exposure to a counterparty for margin on open mortgage-backed security transactions. |
| e | Non-income producing security. |
| f | The interest rate shown reflects the yield, coupon rate or the discount rate at the date of purchase. |
| g | All or a portion of the security is held on deposit with the counterparty and pledged as the initial margin deposit for open futures contracts. |
Moderate Allocation Fund held restricted securities as of October 31, 2016. Restricted securities are investment securities which cannot be offered for public sale without first being registered under the Securities Act of 1933. As of October 31, 2016, the value of these investments was $18,287,164 or 1.0% of total net assets.
The following table presents the total amount of securities loaned with continuous maturity, by type, offset by the gross payable upon return of collateral for securities loaned by Thrivent Moderate Allocation Fund as of October 31, 2016:
Securities Lending Transactions
| | | | |
Taxable Debt Security | | $ | 2,541,435 | |
Common Stock | | | 1,078,686 | |
| | | | |
Total lending | | $ | 3,620,121 | |
Gross amount payable upon return of collateral for securities loaned | | $ | 3,757,689 | |
| | | | |
Net amounts due to counterparty | | $ | 137,568 | |
| | | | |
Definitions:
| | |
ADR | | - American Depositary Receipt, which are certificates for an underlying foreign security’s shares held by an issuing U.S. depository bank. |
ETF | | - Exchange Traded Fund. |
TIPS | | - Treasury Inflation Protected Security. |
Unrealized Appreciation (Depreciation)
Gross unrealized appreciation and depreciation of investments, based on cost for federal income tax purposes, were as follows:
| | | | |
Gross unrealized appreciation | | | $208,318,238 | |
Gross unrealized depreciation | | | (23,642,871 | ) |
| | | | |
Net unrealized appreciation (depreciation) | | | $184,675,367 | |
| |
Cost for federal income tax purposes | | | $1,858,376,558 | |
The accompanying Notes to Financial Statements are an integral part of this schedule.
63
MODERATE ALLOCATION FUND
Summary Schedule of Investments as of October 31, 2016
Fair Valuation Measurements
The following table is a summary of the inputs used, as of October 31, 2016, in valuing Moderate Allocation Fund’s assets carried at fair value.
| | | | | | | | | | | | | | | | |
| Investments in Securities | | Total | | | Level 1 | | | Level 2 | | | Level 3 | |
| | | | |
Bank Loans | | | | | | | | | | | | | | | | |
Basic Materials | | | 2,152,813 | | | | – | | | | 2,152,813 | | | | – | |
Capital Goods | | | 1,430,327 | | | | – | | | | 1,430,327 | | | | – | |
Communications Services | | | 9,843,771 | | | | – | | | | 9,843,771 | | | | – | |
Consumer Cyclical | | | 5,325,872 | | | | – | | | | 5,325,872 | | | | – | |
Consumer Non-Cyclical | | | 4,576,986 | | | | – | | | | 4,576,986 | | | | – | |
Energy | | | 2,369,706 | | | | – | | | | 1,341,065 | | | | 1,028,641 | |
Financials | | | 2,649,687 | | | | – | | | | 2,649,687 | | | | – | |
Technology | | | 3,936,217 | | | | – | | | | 3,936,217 | | | | – | |
Transportation | | | 925,821 | | | | – | | | | 925,821 | | | | – | |
Utilities | | | 481,171 | | | | – | | | | 181,912 | | | | 299,259 | |
| | | | |
Registered Investment Companies | | | | | | | | | | | | | | | | |
Affiliated Equity Holdings | | | 505,357,796 | | | | 505,357,796 | | | | – | | | | – | |
Affiliated Fixed Income Holdings | | | 202,894,979 | | | | 202,894,979 | | | | – | | | | – | |
Equity Funds/ETFs | | | 10,713,584 | | | | 10,713,584 | | | | – | | | | – | |
Fixed Income Funds/ETFs | | | 6,169,728 | | | | 6,169,728 | | | | – | | | | – | |
| | | | |
Long-Term Fixed Income | | | | | | | | | | | | | | | | |
Asset-Backed Securities | | | 17,577,615 | | | | – | | | | 17,327,615 | | | | 250,000 | |
Basic Materials | | | 3,137,848 | | | | – | | | | 3,137,848 | | | | – | |
Capital Goods | | | 10,720,392 | | | | – | | | | 10,720,392 | | | | – | |
Collateralized Mortgage Obligations | | | 24,431,431 | | | | – | | | | 24,431,431 | | | | – | |
Commercial Mortgage-Backed Securities | | | 9,077,807 | | | | – | | | | 9,077,807 | | | | – | |
Communications Services | | | 24,925,669 | | | | – | | | | 24,925,669 | | | | – | |
Consumer Cyclical | | | 15,151,199 | | | | – | | | | 15,151,199 | | | | – | |
Consumer Non-Cyclical | | | 24,896,530 | | | | – | | | | 24,896,530 | | | | – | |
Energy | | | 15,007,905 | | | | – | | | | 15,007,905 | | | | – | |
Financials | | | 45,739,774 | | | | – | | | | 45,739,774 | | | | – | |
Foreign Government | | | 707,143 | | | | – | | | | 707,143 | | | | – | |
Mortgage-Backed Securities | | | 177,530,075 | | | | – | | | | 177,530,075 | | | | – | |
Technology | | | 11,011,807 | | | | – | | | | 11,011,807 | | | | – | |
Transportation | | | 3,869,285 | | | | – | | | | 3,869,285 | | | | – | |
U.S. Government and Agencies | | | 146,919,451 | | | | – | | | | 146,919,451 | | | | – | |
Utilities | | | 14,293,468 | | | | – | | | | 14,065,944 | | | | 227,524 | |
| | | | |
Common Stock | | | | | | | | | | | | | | | | |
Consumer Discretionary | | | 51,789,234 | | | | 49,641,852 | | | | 2,147,382 | | | | – | |
Consumer Staples | | | 16,835,821 | | | | 15,459,908 | | | | 1,375,913 | | | | – | |
Energy | | | 70,592,293 | | | | 69,310,686 | | | | 1,281,607 | | | | – | |
Financials^ | | | 58,673,221 | | | | 55,811,603 | | | | 2,861,618 | | | | 0 | |
Health Care | | | 48,198,576 | | | | 47,009,005 | | | | 1,189,571 | | | | – | |
Industrials | | | 55,028,068 | | | | 52,786,252 | | | | 2,241,816 | | | | – | |
Information Technology | | | 79,491,462 | | | | 79,022,212 | | | | 469,250 | | | | – | |
Materials | | | 25,481,897 | | | | 24,181,445 | | | | 1,300,452 | | | | – | |
Real Estate | | | 15,568,965 | | | | 14,820,961 | | | | 748,004 | | | | – | |
Telecommunications Services | | | 4,396,420 | | | | 3,525,385 | | | | 871,035 | | | | – | |
Utilities | | | 12,418,433 | | | | 12,075,594 | | | | 342,839 | | | | – | |
| | | | |
Preferred Stock | | | | | | | | | | | | | | | | |
Energy | | | 11,472 | | | | – | | | | – | | | | 11,472 | |
Short-Term Investments | | | 10,292,991 | | | | – | | | | 10,292,991 | | | | – | |
| |
Subtotal Investments in Securities | | | $1,752,604,710 | | | | $1,148,780,990 | | | | $602,006,824 | | | | $1,816,896 | |
| |
| | | | |
| Other Investments * | | Total | | | | | | | | | | |
Short-Term Investments | | | 286,689,526 | | | | | | | | | | | | | |
Collateral Held for Securities Loaned | | | 3,757,689 | | | | | | | | | | | | | |
| | | | | | | | | | | | | |
Subtotal Other Investments | | | $290,447,215 | | | | | | | | | | | | | |
| | | | | | | | | | | | | |
| | | | | | | | | | | | | | | | |
| | | | | | | | | | | | | |
Total Investments at Value | | | $2,043,051,925 | | | | | | | | | | | | | |
| | | | | | | | | | | | | |
| * | Certain investments are measured at fair value using a net asset value per share that is not publicly available (practical expedient). According to disclosure requirements of Accounting Standards Codification (ASC) 820, Fair Value Measurement, securities valued using the practical expedient are not classified in the fair value hierarchy. The fair value amounts presented in this table are intended to permit reconciliation of the fair value hierarchy to the amounts presented in the Statement of Assets and Liabilities. |
| ^ | Level 3 security in this section is fair valued at <$1. |
The accompanying Notes to Financial Statements are an integral part of this schedule.
64
MODERATE ALLOCATION FUND
Summary Schedule of Investments as of October 31, 2016
| | | | | | | | | | | | | | | | |
| Other Financial Instruments | | Total | | | Level 1 | | | Level 2 | | | Level 3 | |
| | | | |
Asset Derivatives | | | | | | | | | | | | | | | | |
Futures Contracts | | | 3,039,612 | | | | 3,039,612 | | | | – | | | | – | |
| |
Total Asset Derivatives | | | $3,039,612 | | | | $3,039,612 | | | | $– | | | | $– | |
| |
| | | | |
Liability Derivatives | | | | | | | | | | | | | | | | |
Futures Contracts | | | 5,911,776 | | | | 5,911,776 | | | | – | | | | – | |
| |
Total Liability Derivatives | | | $5,911,776 | | | | $5,911,776 | | | | $– | | | | $– | |
| |
There were no significant transfers between Levels during the period ended October 31, 2016. Transfers between Levels are identified as of the end of the period.
The following table presents Moderate Allocation Fund’s futures contracts held as of October 31, 2016. Investments and/or cash totaling $10,292,991 were pledged as the initial margin deposit for these contracts.
| | | | | | | | | | | | | | | | | | | | |
| Futures Contracts | | Number of
Contracts
Long/(Short) | | | Expiration Date | | | Notional Principal Amount | | | Value | | | Unrealized Gain/
(Loss) | |
CBOT 10-Yr. U.S. Treasury Note | | | 176 | | | | December 2016 | | | | $23,020,814 | | | | $22,814,000 | | | | ($206,814 | ) |
CBOT 2-Yr. U.S. Treasury Note | | | (64 | ) | | | December 2016 | | | | (13,967,805 | ) | | | (13,961,001 | ) | | | 6,804 | |
CBOT 5-Yr. U.S. Treasury Note | | | 250 | | | | December 2016 | | | | 30,315,228 | | | | 30,199,221 | | | | (116,007 | ) |
CBOT U.S. Long Bond | | | 105 | | | | December 2016 | | | | 17,732,216 | | | | 17,085,469 | | | | (646,747 | ) |
CME E-mini S&P Mid-Cap 400 Index | | | (535 | ) | | | December 2016 | | | | (83,140,778 | ) | | | (80,613,800 | ) | | | 2,526,978 | |
CME S&P 500 Index | | | 28 | | | | December 2016 | | | | 15,129,550 | | | | 14,840,700 | | | | (288,850 | ) |
CME Ultra Long Term U.S. Treasury Bond | | | (42 | ) | | | December 2016 | | | | (7,895,205 | ) | | | (7,389,375 | ) | | | 505,830 | |
ICE mini MSCI EAFE Index | | | 1,190 | | | | December 2016 | | | | 102,376,030 | | | | 99,109,150 | | | | (3,266,880 | ) |
NYBOT NYF mini Russell 2000 Index | | | 223 | | | | December 2016 | | | | 27,907,868 | | | | 26,521,390 | | | | (1,386,478 | ) |
Total Futures Contracts | | | | | | | | | | | | | | | | | | | ($2,872,164 | ) |
The following table summarizes the fair value and Statement of Assets and Liabilities location, as of October 31, 2016, for Moderate Allocation Fund’s investments in financial derivative instruments by primary risk exposure as discussed under item (2) Significant Accounting Policies of the Notes to Financial Statements.
| | | | | | |
| Derivatives by risk category | | Statement of Assets and Liabilities Location | | Fair Value | |
| | |
Asset Derivatives | | | | | | |
| | |
Equity Contracts | | | | | | |
Futures* | | Net Assets - Net unrealized appreciation/(depreciation) on Futures contracts | | | $2,526,978 | |
Total Equity Contracts | | | | | 2,526,978 | |
| | |
Interest Rate Contracts | | | | | | |
Futures* | | Net Assets - Net unrealized appreciation/(depreciation) on Futures contracts | | | 512,634 | |
Total Interest Rate Contracts | | | | | 512,634 | |
| |
Total Asset Derivatives | | | | | $3,039,612 | |
| |
| |
| | |
Liability Derivatives | | | | | | |
| | |
Interest Rate Contracts | | | | | | |
Futures* | | Net Assets - Net unrealized appreciation/(depreciation) on Futures contracts | | | 969,568 | |
Total Interest Rate Contracts | | | | | 969,568 | |
| | |
Equity Contracts | | | | | | |
Futures* | | Net Assets - Net unrealized appreciation/(depreciation) on Futures contracts | | | 4,942,208 | |
Total Equity Contracts | | | | | 4,942,208 | |
| |
Total Liability Derivatives | | | | | $5,911,776 | |
| |
| |
| * | Includes cumulative appreciation/depreciation of futures contracts as reported in the Schedule of Investments. Only current day’s variation margin is reported within the Statement of Assets and Liabilities. |
The accompanying Notes to Financial Statements are an integral part of this schedule.
65
MODERATE ALLOCATION FUND
Summary Schedule of Investments as of October 31, 2016
The following table summarizes the net realized gains/(losses) and Statement of Operations location, for the period ended October 31, 2016, for Moderate Allocation Fund’s investments in financial derivative instruments by primary risk exposure.
| | | | | | |
| Derivatives by risk category | | Statement of Operations Location | | Realized Gains/(Losses)
recognized in Income | |
| | |
Interest Rate Contracts | | | | | | |
Futures | | Net realized gains/(losses) on Futures contracts | | | 4,594,356 | |
Total Interest Rate Contracts | | | | | 4,594,356 | |
| | |
Equity Contracts | | | | | | |
Futures | | Net realized gains/(losses) on Futures contracts | | | 1,729,633 | |
Total Equity Contracts | | | | | 1,729,633 | |
| | |
Credit Contracts | | | | | | |
Credit Default Swaps | | Net realized gains/(losses) on Swap agreements | | | 121,958 | |
Total Credit Contracts | | | | | 121,958 | |
| |
Total | | | | | $6,445,947 | |
| |
| |
The following table summarizes the change in net unrealized appreciation/(depreciation) and Statement of Operations location, for the period ended October 31, 2016, for Moderate Allocation Fund’s investments in financial derivative instruments by primary risk exposure.
| | | | | | |
| Derivatives by risk category | | Statement of Operations Location | | Change in unrealized
appreciation/(depreciation)
recognized in Income | |
| | |
Interest Rate Contracts | | | | | | |
Futures | | Change in net unrealized appreciation/(depreciation) on Futures contracts | | | (992,393 | ) |
Total Interest Rate Contracts | | | | | (992,393 | ) |
| | |
Equity Contracts | | | | | | |
Futures | | Change in net unrealized appreciation/(depreciation) on Futures contracts | | | (12,062,119 | ) |
Total Equity Contracts | | | | | (12,062,119 | ) |
| | |
Credit Contracts | | | | | | |
Credit Default Swaps | | Change in net unrealized appreciation/(depreciation) on Swap agreements | | | (89,103 | ) |
Total Credit Contracts | | | | | (89,103 | ) |
| |
Total | | | | | ($13,143,615 | ) |
| |
| |
The following table presents Moderate Allocation Fund’s average volume of derivative activity during the period ended October 31, 2016.
| | | | | | | | |
| Derivative Risk Category | | Futures (Notional)* | | Futures
(Percentage
of Average
Net Assets) | | Swaps (Notional)* | | Swaps
(Percentage
of Average
Net Assets) |
Equity Contracts | | $237,944,620 | | 13.3% | | N/A | | N/A |
Interest Rate Contracts | | 147,802,845 | | 8.2 | | N/A | | N/A |
Credit Contracts | | N/A | | N/A | | $9,220 | | <0.1% |
| * | Notional amount represents long or short, or both, derivative positions held by the Fund. |
The accompanying Notes to Financial Statements are an integral part of this schedule.
66
MODERATE ALLOCATION FUND
Summary Schedule of Investments as of October 31, 2016
Investment in Affiliates
Affiliated issuers, as defined under the Investment Company Act of 1940, include those in which the Fund’s holdings of an issuer represent 5% or more of the outstanding voting securities of an issuer, any affiliated mutual fund, or a company which is under common ownership or control with the Fund. The Fund owns shares of Thrivent Cash Management Trust for the purpose of securities lending and Thrivent Core Short-Term Reserve Fund primarily to serve as a cash sweep vehicle for the Fund. Thrivent Cash Management Trust and Thrivent Core Short-Term Reserve Fund are established for the sole use of affiliated funds.
A summary of transactions for the fiscal year to date, in Moderate Allocation Fund, is as follows:
| | | | | | | | | | | | | | | | | | | | | | | | |
| Fund | | Value
October 31, 2015 | | | Gross Purchases | | | Gross Sales | | | Shares Held at
October 31, 2016 | | | Value
October 31, 2016 | | | Income Earned
November 1, 2015 -
October 31, 2016 | |
Small Cap Stock | | | $20,745,336 | | | | $1,560,377 | | | | $ – | | | | 1,064,587 | | | | $22,015,655 | | | | $47,826 | |
Mid Cap Stock | | | 70,078,016 | | | | 7,436,519 | | | | – | | | | 3,310,082 | | | | 79,441,957 | | | | 308,292 | |
Partner Worldwide Allocation | | | 154,037,612 | | | | 2,497,426 | | | | 45,000,000 | | | | 11,415,969 | | | | 110,849,059 | | | | 2,497,426 | |
Large Cap Growth | | | 113,927,723 | | | | 5,731,866 | | | | – | | | | 12,133,177 | | | | 109,077,260 | | | | – | |
Large Cap Value | | | 138,319,791 | | | | 9,422,768 | | | | – | | | | 7,375,203 | | | | 144,258,964 | | | | 2,093,810 | |
Large Cap Stock | | | 40,147,868 | | | | 1,926,621 | | | | – | | | | 1,587,961 | | | | 39,714,901 | | | | 549,339 | |
High Yield | | | 43,743,635 | | | | 1,827,767 | | | | 12,140,124 | | | | 7,062,740 | | | | 33,618,643 | | | | 1,809,335 | |
Income | | | 135,810,509 | | | | 4,148,788 | | | | 35,350,310 | | | | 11,599,057 | | | | 107,291,277 | | | | 3,671,893 | |
Government Bond | | | 23,350,646 | | | | – | | | | 23,172,372 | | | | – | | | | – | | | | 6,390 | |
Limited Maturity Bond | | | 60,715,036 | | | | 1,099,585 | | | | 373,664 | | | | 4,966,752 | | | | 61,985,059 | | | | 1,099,947 | |
Cash Management Trust-Collateral Investment | | | 675,685 | | | | 81,145,726 | | | | 78,063,722 | | | | 3,757,689 | | | | 3,757,689 | | | | 27,110 | |
Cash Management Trust-Short Term Investment | | | 3,000,000 | | | | 314,572,330 | | | | 317,572,330 | | | | – | | | | – | | | | 154,709 | |
Core Short-Term Reserve | | | – | | | | 395,256,537 | | | | 108,567,011 | | | | 28,668,952 | | | | 286,689,526 | | | | 695,012 | |
Total Value and Income Earned | | | $804,551,857 | | | | | | | | | | | | | | | | $998,699,990 | | | | $12,961,089 | |
The accompanying Notes to Financial Statements are an integral part of this schedule.
67
MODERATELY CONSERVATIVE ALLOCATION FUND
Summary Schedule of Investments as of October 31, 2016
| | | | | | | | | | | | |
Principal Amount | | | Bank Loans (2.7%) | | Value | | | % of Net Assets | |
| Basic Materials (0.3%) | | | | | | | | |
| | | | Other Securities^ | | $ | 1,877,046 | | | | 0.3 | % |
| | | | | |
| | | | Total | | | 1,877,046 | | | | | |
| | | | | |
|
| Capital Goods (0.1%) | |
| | | | Other Securities^ | | | 880,435 | | | | 0.1 | % |
| | | | | |
| | | | Total | | | 880,435 | | | | | |
| | | | | |
|
| Communications Services (0.7%) | |
| | | | Other Securities^ | | | 5,703,897 | | | | 0.7 | % |
| | | | | |
| | | | Total | | | 5,703,897 | | | | | |
| | | | | |
|
| Consumer Cyclical (0.4%) | |
| | | | Other Securities^ | | | 2,996,068 | | | | 0.4 | % |
| | | | | |
| | | | Total | | | 2,996,068 | | | | | |
| | | | | |
|
| Consumer Non-Cyclical (0.4%) | |
| | | | Other Securities^ | | | 3,367,134 | | | | 0.4 | % |
| | | | | |
| | | | Total | | | 3,367,134 | | | | | |
| | | | | |
|
| Energy (0.2%) | |
| | | | Other Securities^ | | | 1,265,302 | | | | 0.2 | % |
| | | | | |
| | | | Total | | | 1,265,302 | | | | | |
| | | | | |
|
| Financials (0.2%) | |
| | | | Other Securities^ | | | 1,482,159 | | | | 0.2 | % |
| | | | | |
| | | | Total | | | 1,482,159 | | | | | |
| | | | | |
|
| Technology (0.3%) | |
| | | | Other Securities^ | | | 2,578,992 | | | | 0.3 | % |
| | | | | |
| | | | Total | | | 2,578,992 | | | | | |
| | | | | |
|
| Transportation (0.1%) | |
| | | | Other Securities^ | | | 685,921 | | | | 0.1 | % |
| | | | | |
| | | | Total | | | 685,921 | | | | | |
| | | | | |
|
| Utilities (<0.1%) | |
| | | | Other Securities^ | | | 272,366 | | | | <0.1 | % |
| | | | | |
| | | | Total | | | 272,366 | | | | | |
| | | | | |
| | | | | | | | | | | | |
| | | | | |
| | | | Total Bank Loans (cost $21,188,742) | | | 21,109,320 | | | | | |
| | | | | |
| | | |
Principal Amount | | | Long-Term Fixed Income (42.7%) | | Value | | | % of Net Assets | |
| Asset-Backed Securities (1.7%) | |
| | | | Renaissance Home Equity Loan Trust | | | | | | | | |
| | $1,693,394 | | | 6.011%, 5/25/2036a | | | 1,183,011 | | | | 0.2 | % |
| | | | Other Securities^ | | | 12,325,892 | | | | 1.5 | % |
| | | | | |
| | | | Total | | | 13,508,903 | | | | | |
| | | | | |
|
| Basic Materials (0.3%) | |
| | | | Other Securities^ | | | 2,114,602 | | | | 0.3 | % |
| | | | | |
| | | | Total | | | 2,114,602 | | | | | |
| | | | | |
|
| Capital Goods (0.8%) | |
| | | | Other Securities^ | | | 6,203,870 | | | | 0.8 | % |
| | | | | |
| | | | Total | | | 6,203,870 | | | | | |
| | | | | |
|
| Collateralized Mortgage Obligations (2.2%) | |
| | | | Federal National Mortgage Association | | | | | | | | |
| | 1,915,725 | | | 3.500%, 1/25/2033b | | | 251,811 | | | | <0.1 | % |
| | | | Pretium Mortgage Credit | | | | | | | | |
| | | | Partners, LLC | | | | | | | | |
| | 1,033,020 | | | 4.375%, 11/27/2030* | | | 1,041,524 | | | | 0.2 | % |
| | | | Other Securities^ | | | 15,856,998 | | | | 2.0 | % |
| | | | | |
| | | | Total | | | 17,150,333 | | | | | |
| | | | | |
|
| Commercial Mortgage-Backed Securities (0.8%) | |
| | | | Federal National Mortgage Association | | | | | | | | |
| | 33,139 | | | 1.272%, 1/25/2017 | | | 33,119 | | | | <0.1 | % |
| | | | Greenwich Capital Commercial Funding Corporation | | | | | | | | |
| | 1,000,000 | | | 5.867%, 12/10/2049 | | | 1,028,771 | | | | 0.1 | % |
| | | | UBS Commercial Mortgage Trust | | | | | | | | |
| | 992,694 | | | 3.400%, 5/10/2045 | | | 1,050,012 | | | | 0.1 | % |
| | | | Other Securities^ | | | 4,248,664 | | | | 0.6 | % |
| | | | | |
| | | | Total | | | 6,360,566 | | | | | |
| | | | | |
|
| Communications Services (2.0%) | |
| | | | Other Securities^ | | | 15,382,892 | | | | 2.0 | % |
| | | | | |
| | | | Total | | | 15,382,892 | | | | | |
| | | | | |
|
| Consumer Cyclical (1.2%) | |
| | | | Other Securities^ | | | 9,393,816 | | | | 1.2 | % |
| | | | | |
| | | | Total | | | 9,393,816 | | | | | |
| | | | | |
|
| Consumer Non-Cyclical (1.9%) | |
| | | | Other Securities^ | | | 14,612,170 | | | | 1.9 | % |
| | | | | |
| | | | Total | | | 14,612,170 | | | | | |
| | | | | |
|
| Energy (1.2%) | |
| | | | Other Securities^ | | | 9,317,234 | | | | 1.2 | % |
| | | | | |
| | | | Total | | | 9,317,234 | | | | | |
| | | | | |
|
| Financials (3.6%) | |
| | | | Other Securities^ | | | 27,620,648 | | | | 3.6 | % |
| | | | | |
| | | | Total | | | 27,620,648 | | | | | |
| | | | | |
|
| Foreign Government (0.1%) | |
| | | | Other Securities^ | | | 465,161 | | | | 0.1 | % |
| | | | | |
| | | | Total | | | 465,161 | | | | | |
| | | | | |
|
| Mortgage-Backed Securities (14.1%) | |
| | | | Federal Home Loan Mortgage Corporation Gold 15-Yr. Pass Through | | | | | | | | |
| | 5,120,000 | | | 3.000%, 11/1/2031c | | | 5,358,000 | | | | 0.7 | % |
| | | | Federal Home Loan Mortgage Corporation Gold 30-Yr. Pass Through | | | | | | | | |
| | 6,245,000 | | | 4.000%, 11/1/2046c | | | 6,679,954 | | | | 0.9 | % |
| | | | Federal National Mortgage Association Conventional | | | | | | | | |
| | 14,200,000 | | | 3.000%, 11/1/2046c | | | 14,619,343 | | | | 1.9 | % |
| | | | Federal National Mortgage Association Conventional 15-Yr. Pass Through | | | | | | | | |
| | 9,540,000 | | | 2.500%, 11/1/2031c | | | 9,816,511 | | | | 1.3 | % |
| | | | Federal National Mortgage Association Conventional 30-Yr. Pass Through | | | | | | | | |
| | 1,648,266 | | | 1.735%, 7/1/2043d | | | 1,693,691 | | | | 0.2 | % |
The accompanying Notes to Financial Statements are an integral part of this schedule.
68
MODERATELY CONSERVATIVE ALLOCATION FUND
Summary Schedule of Investments as of October 31, 2016
| | | | | | | | | | | | |
Principal
Amount | | | Long-Term Fixed Income (42.7%) | | Value | | | % of Net
Assets | |
| Mortgage-Backed Securities (14.1%) - continued | | | | | | | | |
| $ | 37,050,000 | | | 3.500%, 11/1/2046c | | | $38,896,713 | | | | 5.0 | % |
| | 18,650,000 | | | 4.000%, 11/1/2046c | | | 19,970,069 | | | | 2.6 | % |
| | 10,725,000 | | | 4.500%, 11/1/2046c | | | 11,722,091 | | | | 1.5 | % |
| | | | | |
| | | | Total | | | 108,756,372 | | | | | |
| | | | | |
|
| Technology (0.8%) | |
| | | | Other Securities^ | | | 6,377,124 | | | | 0.8 | % |
| | | | | |
| | | | Total | | | 6,377,124 | | | | | |
| | | | | |
|
| Transportation (0.3%) | |
| | | | Other Securities^ | | | 2,316,582 | | | | 0.3 | % |
| | | | | |
| | | | Total | | | 2,316,582 | | | | | |
| | | | | |
|
| U.S. Government and Agencies (10.6%) | |
| | | | U.S. Treasury Bonds | | | | | | | | |
| | 2,000,000 | | | 3.000%, 5/15/2042 | | | 2,177,188 | | | | 0.3 | % |
| | 1,580,000 | | | 3.625%, 2/15/2044 | | | 1,920,256 | | | | 0.2 | % |
| | 990,000 | | | 2.250% - 4.375%, | | | | | | | | |
| | | | 5/15/2040 - 8/15/2046 | | | 1,147,270 | | | | 0.2 | % |
| | | | U.S. Treasury Bonds, TIPS | | | | | | | | |
| | 3,652,005 | | | 0.125%, 1/15/2023 | | | 3,704,327 | | | | 0.5 | % |
| | 5,878,938 | | | 0.625%, 1/15/2026 | | | 6,136,600 | | | | 0.8 | % |
| | 9,981,735 | | | 1.000%, 2/15/2046 | | | 10,753,264 | | | | 1.4 | % |
| | | | U.S. Treasury Notes | | | | | | | | |
| | 2,150,000 | | | 0.875%, 11/15/2017 | | | 2,152,939 | | | | 0.3 | % |
| | 5,500,000 | | | 0.875%, 3/31/2018 | | | 5,506,661 | | | | 0.7 | % |
| | 2,500,000 | | | 0.750%, 2/15/2019 | | | 2,490,430 | | | | 0.3 | % |
| | 1,900,000 | | | 1.000%, 10/15/2019 | | | 1,900,074 | | | | 0.2 | % |
| | 6,520,000 | | | 1.500%, 10/31/2019 | | | 6,612,962 | | | | 0.9 | % |
| | 7,000,000 | | | 1.375%, 9/30/2020 | | | 7,047,033 | | | | 0.9 | % |
| | 1,000,000 | | | 1.375%, 5/31/2021 | | | 1,003,789 | | | | 0.1 | % |
| | 9,370,000 | | | 1.125%, 8/31/2021 | | | 9,287,282 | | | | 1.2 | % |
| | 16,000,000 | | | 2.125%, 6/30/2022 | | | 16,568,752 | | | | 2.1 | % |
| | 2,755,000 | | | 1.625%, 8/15/2022 | | | 2,777,922 | | | | 0.4 | % |
| | 710,000 | | | 1.375% - 2.250%, | | | | | | | | |
| | | | 9/30/2023 - 11/15/2024 | | | 729,303 | | | | 0.1 | % |
| | | | | |
| | | | Total | | | 81,916,052 | | | | | |
| | | | | |
|
| Utilities (1.1%) | |
| | | | Other Securities^ | | | 8,707,537 | | | | 1.1 | % |
| | | | | |
| | | | Total | | | 8,707,537 | | | | | |
| | | | | |
| | | | | | | | | | | | |
| | | | | |
| | | | Total Long-Term Fixed Income (cost $326,212,828) | | | 330,203,862 | | | | | |
| | | | | |
| | | |
| Shares | | | Registered Investment Companies (32.5%) | | Value | | | % of Net
Assets | |
| Affiliated Equity Holdings (15.8%) | |
| | 2,428,665 | | | Thrivent Large Cap Growth Fund | | | 21,833,703 | | | | 2.8 | % |
| | 41,223 | | | Thrivent Large Cap Stock Fund | | | 1,030,981 | | | | 0.2 | % |
| | 2,491,385 | | | Thrivent Large Cap Value Fund | | | 48,731,496 | | | | 6.3 | % |
| | 539,082 | | | Thrivent Mid Cap Stock Fund | | | 12,937,979 | | | | 1.7 | % |
| | 3,412,488 | | | Thrivent Partner Worldwide Allocation Fund | | | 33,135,261 | | | | 4.3 | % |
| | 202,436 | | | Thrivent Small Cap Stock Fund | | | 4,186,370 | | | | 0.5 | % |
| | | | | |
| | | | Total | | | 121,855,790 | | | | | |
| | | | | |
|
| Affiliated Fixed Income Holdings (15.9%) | |
| | 4,252,869 | | | Thrivent High Yield Fund | | | 20,243,656 | | | | 2.6 | % |
| | 7,082,374 | | | Thrivent Income Fund | | | 65,511,956 | | | | 8.5 | % |
| | 2,980,454 | | | Thrivent Limited Maturity Bond Fund | | | 37,196,061 | | | | 4.8 | % |
| | | | | |
| | | | Total | | | 122,951,673 | | | | | |
| | | | | |
|
| Equity Funds/ETFs (0.4%) | |
| | 13,902 | | | SPDR S&P 500 ETF Trust | | | 2,954,870 | | | | 0.4 | % |
| | | | Other Securities^ | | | 507,769 | | | | <0.1 | % |
| | | | | |
| | | | Total | | | 3,462,639 | | | | | |
| | | | | |
|
| Fixed Income Funds/ETFs (0.4%) | |
| | 16,000 | | | iShares Barclays 1-3 Year Credit Bond Fund | | | 1,688,800 | | | | 0.2 | % |
| | 8,000 | | | iShares iBoxx $ Investment Grade Corporate Bond ETF | | | 967,840 | | | | 0.2 | % |
| | | | | |
| | | | Total | | | 2,656,640 | | | | | |
| | | | | |
| | | | | | | | | | | | |
| | | | | |
| | | | Total Registered Investment Companies (cost $205,181,879) | | | 250,926,742 | | | | | |
| | | | | |
| | | |
| Shares | | | Common Stock (16.3%) | | Value | | | % of Net
Assets | |
|
| Consumer Discretionary (1.9%) | |
| | 1,705 | | | Amazon.com, Inc.e | | | 1,346,643 | | | | 0.2 | % |
| | 21,110 | | | Comcast Corporation | | | 1,305,020 | | | | 0.2 | % |
| | | | Other Securities^ | | | 12,180,873 | | | | 1.5 | % |
| | | | | |
| | | | Total | | | 14,832,536 | | | | | |
| | | | | |
|
| Consumer Staples (0.7%) | |
| | 11,780 | | | CVS Health Corporation | | | 990,698 | | | | 0.1 | % |
| | | | Other Securities^ | | | 4,020,738 | | | | 0.6 | % |
| | | | | |
| | | | Total | | | 5,011,436 | | | | | |
| | | | | |
|
| Energy (2.5%) | |
| | 19,915 | | | Chevron Corporation | | | 2,086,096 | | | | 0.3 | % |
| | 16,047 | | | EQT Corporation | | | 1,059,102 | | | | 0.1 | % |
| | 29,680 | | | Halliburton Company | | | 1,365,280 | | | | 0.2 | % |
| | 5,560 | | | Pioneer Natural Resources Company | | | 995,351 | | | | 0.1 | % |
| | 14,937 | | | Schlumberger, Ltd. | | | 1,168,522 | | | | 0.2 | % |
| | 33,291 | | | Suncor Energy, Inc. ADR | | | 999,396 | | | | 0.1 | % |
| | 19,420 | | | Valero Energy Corporation | | | 1,150,441 | | | | 0.2 | % |
| | | | Other Securities^ | | | 10,694,611 | | | | 1.3 | % |
| | | | | |
| | | | Total | | | 19,518,799 | | | | | |
| | | | | |
|
| Financials (2.1%) | |
| | | | Other Securities^ | | | 16,198,502 | | | | 2.1 | % |
| | | | | |
| | | | Total | | | 16,198,502 | | | | | |
| | | | | |
|
| Health Care (1.9%) | |
| | 8,460 | | | Johnson & Johnson | | | 981,275 | | | | 0.1 | % |
| | | | Other Securities^ | | | 13,910,839 | | | | 1.8 | % |
| | | | | |
| | | | Total | | | 14,892,114 | | | | | |
| | | | | |
|
| Industrials (1.9%) | |
| | | | Other Securities^ | | | 14,943,879 | | | | 1.9 | % |
| | | | | |
| | | | Total | | | 14,943,879 | | | | | |
| | | | | |
|
| Information Technology (3.4%) | |
| | 1,407 | | | Alphabet, Inc., Class Ae | | | 1,139,529 | | | | 0.1 | % |
| | 11,719 | | | Apple, Inc. | | | 1,330,575 | | | | 0.2 | % |
| | 55,190 | | | Cisco Systems, Inc. | | | 1,693,229 | | | | 0.2 | % |
| | 9,570 | | | Facebook, Inc.e | | | 1,253,574 | | | | 0.2 | % |
| | 11,320 | | | MasterCard, Inc. | | | 1,211,466 | | | | 0.2 | % |
| | 35,910 | | | Microsoft Corporation | | | 2,151,727 | | | | 0.3 | % |
| | 29,300 | | | Oracle Corporation | | | 1,125,706 | | | | 0.1 | % |
| | 15,390 | | | Salesforce.com, Inc.e | | | 1,156,712 | | | | 0.2 | % |
| | | | Other Securities^ | | | 14,837,025 | | | | 1.9 | % |
| | | | | |
| | | | Total | | | 25,899,543 | | | | | |
| | | | | |
The accompanying Notes to Financial Statements are an integral part of this schedule.
69
MODERATELY CONSERVATIVE ALLOCATION FUND
Summary Schedule of Investments as of October 31, 2016
| | | | | | | | | | | | |
| Shares | | | Common Stock (16.3%) | | Value | | | % of Net
Assets | |
| Materials (0.9%) | | | | | | | | |
| | | | Other Securities^ | | | $6,666,581 | | | | 0.9 | % |
| | | | | |
| | | | Total | | | 6,666,581 | | | | | |
| | | | | |
| | |
| Real Estate (0.4%) | | | | | | | | |
| | | | Other Securities^ | | | 3,386,994 | | | | 0.4 | % |
| | | | | |
| | | | Total | | | 3,386,994 | | | | | |
| | | | | |
| | |
| Telecommunications Services (0.1%) | | | | | | | | |
| | | | Other Securities^ | | | 1,068,914 | | | | 0.1 | % |
| | | | | |
| | | | Total | | | 1,068,914 | | | | | |
| | | | | |
| | |
| Utilities (0.5%) | | | | | | | | |
| | | | Other Securities^ | | | 3,669,044 | | | | 0.5 | % |
| | | | | |
| | | | Total | | | 3,669,044 | | | | | |
| | | | | |
| | | | Total Common Stock (cost $110,762,954) | | | 126,088,342 | | | | | |
| | | | | |
| | | |
| Shares | | | Preferred Stock (<0.1%) | | Value | | | % of Net
Assets | |
| Energy (<0.1%) | |
| | | | Other Securities^ | | | 5,502 | | | | <0.1 | % |
| | | | | |
| | | | Total | | | 5,502 | | | | | |
| | | | | |
| | |
| Financials (<0.1%) | | | | | | | | |
| | | | Other Securities^ | | | 251,503 | | | | <0.1 | % |
| | | | | |
| | | | Total | | | 251,503 | | | | | |
| | | | | |
| | | | | | | | | | | | |
| | | | | |
| | | | Total Preferred Stock (cost $280,170) | | | 257,005 | | | | | |
| | | | | |
| | | |
| Shares | | | Collateral Held for Securities Loaned (0.3%) | | Value | | | % of Net
Assets | |
| | 2,400,919 | | | Thrivent Cash Management Trust | | | 2,400,919 | | | | 0.3 | % |
| | | | | |
| | | | Total Collateral Held for Securities Loaned (cost $2,400,919) | | | 2,400,919 | | | | | |
| | | | | |
| | | |
Shares or
Principal
Amount | | | Short-Term Investments (19.7%)f | | Value | | | % of Net
Assets | |
| | | | Federal Home Loan Bank Discount Notes | | | | | | | | |
| | 2,000,000 | | | 0.350%, 1/20/2017g | | | 1,998,578 | | | | 0.3 | % |
| | | | Thrivent Core Short-Term Reserve Fund | | | | | | | | |
| | 14,880,977 | | | 0.790% | | | 148,809,768 | | | | 19.3 | % |
| | | | Other Securities^ | | | 999,864 | | | | 0.1 | % |
| | | | | |
| | | | Total Short-Term Investments (cost $151,807,988) | | | 151,808,210 | | | | | |
| | | | | |
| | | | Total Investments (cost $817,835,480) 114.2% | | | $882,794,400 | | | | | |
| | | | | |
| | | | Other Assets and Liabilities, Net (14.2%) | | | (110,094,436 | ) | | | | |
| | | | | |
| | | | Total Net Assets 100.0% | | | $772,699,964 | | | | | |
| | | | | |
| ^ | The Summary Schedule of Investments shows the 50 largest holdings in unaffiliated issuers, any holding or issuer that exceeds 1% of net assets and all affiliated holdings as of the report date. The remaining securities held are grouped by category as “Other securities”. |
| a | Denotes step coupon securities. Step coupon securities pay an initial coupon rate for the first period and then different coupon rates for following periods. The rate shown is as of October 31, 2016. |
| b | Denotes interest only security. Interest only securities represent the right to receive monthly interest payments on an underlying pool of mortgages or assets. The principal shown is the outstanding par amount of the pool as of the end of the period. The actual effective yield of the security is different than the stated coupon rate. |
| c | Denotes investments purchased on a when-issued or delayed delivery basis. |
| d | Denotes variable rate securities. Variable rate securities are securities whose yields vary with a designated market index or market rate. The rate shown is as of October 31, 2016. |
| e | Non-income producing security. |
| f | The interest rate shown reflects the yield, coupon rate or the discount rate at the date of purchase. |
| g | All or a portion of the security is held on deposit with the counterparty and pledged as the initial margin deposit for open futures contracts. |
| * | Denotes restricted securities. Restricted securities are investment securities which cannot be offered for public sale without first being registered under the Securities Act of 1933. The value of all restricted securities held in Moderately Conservative Allocation Fund as of October 31, 2016 was $13,501,642 or 1.7% of total net assets. The following table indicates the acquisition date and cost of restricted securities shown in the schedule as of October 31, 2016. |
| | | | | | | | |
| Security | | Acquisition
Date | | | Cost | |
Pretium Mortgage Credit Partners, LLC, 11/27/2030 | | | 11/6/2015 | | | $ | 1,032,041 | |
The following table presents the total amount of securities loaned with continuous maturity, by type, offset by the gross payable upon return of collateral for securities loaned by Thrivent Moderately Conservative Allocation Fund as of October 31, 2016:
Securities Lending Transactions
| | | | |
Taxable Debt Security | | $ | 1,730,247 | |
Common Stock | | | 587,040 | |
| | | | |
Total lending | | $ | 2,317,287 | |
Gross amount payable upon return of collateral for securities loaned | | $ | 2,400,919 | |
| | | | |
Net amounts due to counterparty | | $ | 83,632 | |
| | | | |
Definitions:
| | |
ADR | | - American Depositary Receipt, which are certificates for an underlying foreign security’s shares held by an issuing U.S. depository bank. |
ETF | | - Exchange Traded Fund. |
TIPS | | - Treasury Inflation Protected Security. |
Unrealized Appreciation (Depreciation)
Gross unrealized appreciation and depreciation of investments, based on cost for federal income tax purposes, were as follows:
| | | | |
Gross unrealized appreciation | | | $67,604,196 | |
Gross unrealized depreciation | | | (6,563,728 | ) |
| | | | |
Net unrealized appreciation (depreciation) | | | $61,040,468 | |
| |
Cost for federal income tax purposes | | | $821,753,932 | |
The accompanying Notes to Financial Statements are an integral part of this schedule.
70
MODERATELY CONSERVATIVE ALLOCATION FUND
Summary Schedule of Investments as of October 31, 2016
Fair Valuation Measurements
The following table is a summary of the inputs used, as of October 31, 2016, in valuing Moderately Conservative Allocation Fund’s assets carried at fair value.
| | | | | | | | | | | | | | | | |
| Investments in Securities | | Total | | | Level 1 | | | Level 2 | | | Level 3 | |
| | | | |
Bank Loans | | | | | | | | | | | | | | | | |
Basic Materials | | | 1,877,046 | | | | – | | | | 1,877,046 | | | | – | |
Capital Goods | | | 880,435 | | | | – | | | | 880,435 | | | | – | |
Communications Services | | | 5,703,897 | | | | – | | | | 5,703,897 | | | | – | |
Consumer Cyclical | | | 2,996,068 | | | | – | | | | 2,996,068 | | | | – | |
Consumer Non-Cyclical | | | 3,367,134 | | | | – | | | | 3,367,134 | | | | – | |
Energy | | | 1,265,302 | | | | – | | | | 705,277 | | | | 560,025 | |
Financials | | | 1,482,159 | | | | – | | | | 1,482,159 | | | | – | |
Technology | | | 2,578,992 | | | | – | | | | 2,578,992 | | | | – | |
Transportation | | | 685,921 | | | | – | | | | 685,921 | | | | – | |
Utilities | | | 272,366 | | | | – | | | | 117,713 | | | | 154,653 | |
| | | | |
Long-Term Fixed Income | | | | | | | | | | | | | | | | |
Asset-Backed Securities | | | 13,508,903 | | | | – | | | | 12,508,903 | | | | 1,000,000 | |
Basic Materials | | | 2,114,602 | | | | – | | | | 2,114,602 | | | | – | |
Capital Goods | | | 6,203,870 | | | | – | | | | 6,203,870 | | | | – | |
Collateralized Mortgage Obligations | | | 17,150,333 | | | | – | | | | 17,150,333 | | | | – | |
Commercial Mortgage-Backed Securities | | | 6,360,566 | | | | – | | | | 6,360,566 | | | | – | |
Communications Services | | | 15,382,892 | | | | – | | | | 15,382,892 | | | | – | |
Consumer Cyclical | | | 9,393,816 | | | | – | | | | 9,393,816 | | | | – | |
Consumer Non-Cyclical | | | 14,612,170 | | | | – | | | | 14,612,170 | | | | – | |
Energy | | | 9,317,234 | | | | – | | | | 9,317,234 | | | | – | |
Financials | | | 27,620,648 | | | | – | | | | 27,620,648 | | | | – | |
Foreign Government | | | 465,161 | | | | – | | | | 465,161 | | | | – | |
Mortgage-Backed Securities | | | 108,756,372 | | | | – | | | | 108,756,372 | | | | – | |
Technology | | | 6,377,124 | | | | – | | | | 6,377,124 | | | | – | |
Transportation | | | 2,316,582 | | | | – | | | | 2,316,582 | | | | – | |
U.S. Government and Agencies | | | 81,916,052 | | | | – | | | | 81,916,052 | | | | – | |
Utilities | | | 8,707,537 | | | | – | | | | 8,587,787 | | | | 119,750 | |
| | | | |
Registered Investment Companies | | | | | | | | | | | | | | | | |
Affiliated Fixed Income Holdings | | | 122,951,673 | | | | 122,951,673 | | | | – | | | | – | |
Affiliated Equity Holdings | | | 121,855,790 | | | | 121,855,790 | | | | – | | | | – | |
Equity Funds/ETFs | | | 3,462,639 | | | | 3,462,639 | | | | – | | | | – | |
Fixed Income Funds/ETFs | | | 2,656,640 | | | | 2,656,640 | | | | – | | | | – | |
| | | | |
Common Stock | | | | | | | | | | | | | | | | |
Consumer Discretionary | | | 14,832,536 | | | | 14,832,536 | | | | – | | | | – | |
Consumer Staples | | | 5,011,436 | | | | 5,011,436 | | | | – | | | | – | |
Energy | | | 19,518,799 | | | | 19,457,120 | | | | 61,679 | | | | – | |
Financials | | | 16,198,502 | | | | 16,198,502 | | | | – | | | | – | |
Health Care | | | 14,892,114 | | | | 14,892,114 | | | | – | | | | – | |
Industrials | | | 14,943,879 | | | | 14,943,879 | | | | – | | | | – | |
Information Technology | | | 25,899,543 | | | | 25,899,543 | | | | – | | | | – | |
Materials | | | 6,666,581 | | | | 6,666,581 | | | | – | | | | – | |
Real Estate | | | 3,386,994 | | | | 3,386,994 | | | | – | | | | – | |
Telecommunications Services | | | 1,068,914 | | | | 1,068,914 | | | | – | | | | – | |
Utilities | | | 3,669,044 | | | | 3,669,044 | | | | – | | | | – | |
| | | | |
Preferred Stock | | | | | | | | | | | | | | | | |
Energy | | | 5,502 | | | | – | | | | – | | | | 5,502 | |
Financials | | | 251,503 | | | | – | | | | 251,503 | | | | – | |
Short-Term Investments | | | 2,998,442 | | | | – | | | | 2,998,442 | | | | – | |
| |
Subtotal Investments in Securities | | | $731,583,713 | | | | $376,953,405 | | | | $352,790,378 | | | | $1,839,930 | |
| |
| |
| | | | |
Other Investments * | | | Total | | | | | | | | | | | | | |
| | | | | | | | | | | | | |
Short-Term Investments | | | 148,809,768 | | | | | | | | | | | | | |
Collateral Held for Securities Loaned | | | 2,400,919 | | | | | | | | | | | | | |
| | | | | | | | | | | | | |
Subtotal Other Investments | | | $151,210,687 | | | | | | | | | | | | | |
| | | | | | | | | | | | | |
| | | | | | | | | | | | | |
| | | | | | | | | | | | | |
| | | | | | | | | | | | | |
Total Investments at Value | | | $882,794,400 | | | | | | | | | | | | | |
| | | | | | | | | | | | | |
| | | | | | | | | | | | | |
| * | Certain investments are measured at fair value using a net asset value per share that is not publicly available (practical expedient). According to disclosure requirements of Accounting Standards Codification (ASC) 820, Fair Value Measurement, securities valued using the practical expedient are not classified in the fair value hierarchy. The fair value amounts presented in this table are intended to permit reconciliation of the fair value hierarchy to the amounts presented in the Statement of Assets and Liabilities. |
The accompanying Notes to Financial Statements are an integral part of this schedule.
71
MODERATELY CONSERVATIVE ALLOCATION FUND
Summary Schedule of Investments as of October 31, 2016
| | | | | | | | | | | | | | | | |
| | | | |
| Other Financial Instruments | | Total | | | Level 1 | | | Level 2 | | | Level 3 | |
| | | | |
Asset Derivatives | | | | | | | | | | | | | | | | |
Futures Contracts | | | 788,833 | | | | 788,833 | | | | – | | | | – | |
| |
Total Asset Derivatives | | | $788,833 | | | | $788,833 | | | | $– | | | | $– | |
| |
| |
Liability Derivatives | | | | | | | | | | | | | | | | |
Futures Contracts | | | 1,991,171 | | | | 1,991,171 | | | | – | | | | – | |
| |
Total Liability Derivatives | | | $1,991,171 | | | | $1,991,171 | | | | $– | | | | $– | |
| |
| |
There were no significant transfers between Levels during the period ended October 31, 2016. Transfers between Levels are identified as of the end of the period.
The following table presents Moderately Conservative Allocation Fund’s futures contracts held as of October 31, 2016. Investments and/or cash totaling $2,998,442 were pledged as the initial margin deposit for these contracts.
| | | | | | | | | | | | | | | | | | | | |
| Futures Contracts | | Number of
Contracts
Long/(Short) | | | Expiration Date | | | Notional Principal Amount | | | Value | | | Unrealized Gain/(Loss) | |
CBOT 10-Yr. U.S. Treasury Note | | | 50 | | | | December 2016 | | | | $6,540,004 | | | | $6,481,250 | | | | ($58,754 | ) |
CBOT 2-Yr. U.S. Treasury Note | | | (20 | ) | | | December 2016 | | | | (4,364,939 | ) | | | (4,362,813 | ) | | | 2,126 | |
CBOT 5-Yr. U.S. Treasury Note | | | 153 | | | | December 2016 | | | | 18,552,919 | | | | 18,481,922 | | | | (70,997 | ) |
CBOT U.S. Long Bond | | | 92 | | | | December 2016 | | | | 15,536,799 | | | | 14,970,125 | | | | (566,674 | ) |
CME E-mini S&P Mid-Cap 400 Index | | | (102 | ) | | | December 2016 | | | | (15,850,412 | ) | | | (15,369,360 | ) | | | 481,052 | |
CME S&P 500 Index | | | (7 | ) | | | December 2016 | | | | (3,799,046 | ) | | | (3,710,175 | ) | | | 88,871 | |
CME Ultra Long Term U.S. Treasury Bond | | | (18 | ) | | | December 2016 | | | | (3,383,659 | ) | | | (3,166,875 | ) | | | 216,784 | |
ICE mini MSCI EAFE Index | | | 267 | | | | December 2016 | | | | 22,997,147 | | | | 22,237,096 | | | | (760,051 | ) |
NYBOT NYF mini Russell 2000 Index | | | 86 | | | | December 2016 | | | | 10,762,676 | | | | 10,227,981 | | | | (534,695 | ) |
Total Futures Contracts | | | | | | | | | | | | | | | | | | | ($1,202,338 | ) |
The following table summarizes the fair value and Statement of Assets and Liabilities location, as of October 31, 2016, for Moderately Conservative Allocation Fund’s investments in financial derivative instruments by primary risk exposure as discussed under item (2) Significant Accounting Policies of the Notes to Financial Statements.
| | | | | | |
| Derivatives by risk category | | Statement of Assets and Liabilities Location | | Fair Value | |
| | |
Asset Derivatives | | | | | | |
| | |
Equity Contracts | | | | | | |
Futures* | | Net Assets - Net unrealized appreciation/(depreciation) on Futures contracts | | | $569,923 | |
Total Equity Contracts | | | 569,923 | |
| | |
Interest Rate Contracts | | | | | | |
Futures* | | Net Assets - Net unrealized appreciation/(depreciation) on Futures contracts | | | 218,910 | |
Total Interest Rate Contracts | | | | | 218,910 | |
| | | | | | | |
Total Asset Derivatives | | | | | $788,833 | |
| |
| | |
Liability Derivatives | | | | | | |
| | |
Interest Rate Contracts | | | | | | |
Futures* | | Net Assets - Net unrealized appreciation/(depreciation) on Futures contracts | | | 696,425 | |
Total Interest Rate Contracts | | | | | 696,425 | |
| | |
Equity Contracts | | | | | | |
Futures* | | Net Assets - Net unrealized appreciation/(depreciation) on Futures contracts | | | 1,294,746 | |
Total Equity Contracts | | | | | 1,294,746 | |
| | | | | | | |
Total Liability Derivatives | | | | | $1,991,171 | |
| |
| * | Includes cumulative appreciation/depreciation of futures contracts as reported in the Schedule of Investments. Only current day’s variation margin is reported within the Statement of Assets and Liabilities. |
The following table summarizes the net realized gains/(losses) and Statement of Operations location, for the period ended October 31, 2016, for Moderately Conservative Allocation Fund’s investments in financial derivative instruments by primary risk exposure.
| | | | |
| Derivatives by risk category | | Statement of Operations Location | | Realized Gains/(Losses)
recognized in Income |
| | |
Interest Rate Contracts | | | | |
Futures | | Net realized gains/(losses) on Futures contracts | | 3,555,473 |
Total Interest Rate Contracts | | | | 3,555,473 |
| | |
Equity Contracts | | | | |
Futures | | Net realized gains/(losses) on Futures contracts | | (423,108) |
Total Equity Contracts | | | | (423,108) |
| | | | | |
Total | | | | $3,132,365 |
|
|
The accompanying Notes to Financial Statements are an integral part of this schedule.
72
MODERATELY CONSERVATIVE ALLOCATION FUND
Summary Schedule of Investments as of October 31, 2016
The following table summarizes the change in net unrealized appreciation/(depreciation) and Statement of Operations location, for the period ended October 31, 2016, for Moderately Conservative Allocation Fund’s investments in financial derivative instruments by primary risk exposure.
| | | | | | |
| Derivatives by risk category | | Statement of Operations Location | | Change in unrealized
appreciation/(depreciation)
recognized in Income | |
| | |
Interest Rate Contracts | | | | | | |
Futures | | Change in net unrealized appreciation/(depreciation) on Futures contracts | | | (857,649 | ) |
Total Interest Rate Contracts | | | | | (857,649 | ) |
| | |
Equity Contracts | | | | | | |
Futures | | Change in net unrealized appreciation/(depreciation) on Futures contracts | | | (2,544,287 | ) |
Total Equity Contracts | | | | | (2,544,287 | ) |
| | | | | | | |
Total | | | | | ($3,401,936 | ) |
| |
| |
The following table presents Moderately Conservative Allocation Fund’s average volume of derivative activity during the period ended October 31, 2016.
| | | | | | | | |
| Derivative Risk Category | | Futures (Notional)* | | | Futures
(Percentage
of Average
Net Assets) | |
Equity Contracts | | $ | 65,396,360 | | | | 8.8 | % |
Interest Rate Contracts | | | 87,575,724 | | | | 11.7 | |
| * | Notional amount represents long or short, or both, derivative positions held by the Fund. |
Investment in Affiliates
Affiliated issuers, as defined under the Investment Company Act of 1940, include those in which the Fund’s holdings of an issuer represent 5% or more of the outstanding voting securities of an issuer, any affiliated mutual fund, or a company which is under common ownership or control with the Fund. The Fund owns shares of Thrivent Cash Management Trust for the purpose of securities lending and Thrivent Core Short-Term Reserve Fund primarily to serve as a cash sweep vehicle for the Fund. Thrivent Cash Management Trust and Thrivent Core Short-Term Reserve Fund are established for the sole use of affiliated funds.
A summary of transactions for the fiscal year to date, in Moderately Conservative Allocation Fund, is as follows:
| | | | | | | | | | | | | | | | | | | | | | | | |
| Fund | | Value
October 31, 2015 | | | Gross
Purchases | | | Gross Sales | | | Shares Held at
October 31, 2016 | | | Value
October 31, 2016 | | | Income Earned
November 1, 2015 -
October 31, 2016 | |
Small Cap Stock | | | $3,944,813 | | | | $296,712 | | | | $– | | | | 202,436 | | | | $4,186,370 | | | | $9,094 | |
Mid Cap Stock | | | 11,412,961 | | | | 1,211,117 | | | | – | | | | 539,082 | | | | 12,937,979 | | | | 50,209 | |
Partner Worldwide Allocation | | | 45,583,777 | | | | 746,536 | | | | 13,000,000 | | | | 3,412,488 | | | | 33,135,261 | | | | 746,536 | |
Large Cap Growth | | | 22,804,607 | | | | 1,147,332 | | | | – | | | | 2,428,665 | | | | 21,833,703 | | | | – | |
Large Cap Value | | | 46,725,210 | | | | 3,183,064 | | | | – | | | | 2,491,385 | | | | 48,731,496 | | | | 707,301 | |
Large Cap Stock | | | 1,042,221 | | | | 50,014 | | | | – | | | | 41,223 | | | | 1,030,981 | | | | 14,261 | |
High Yield | | | 20,593,574 | | | | 1,095,044 | | | | 1,557,641 | | | | 4,252,869 | | | | 20,243,656 | | | | 1,084,006 | |
Income | | | 55,117,992 | | | | 9,007,635 | | | | 383,360 | | | | 7,082,374 | | | | 65,511,956 | | | | 2,217,723 | |
Government Bond | | | 10,254,616 | | | | – | | | | 10,178,261 | | | | – | | | | – | | | | 2,720 | |
Limited Maturity Bond | | | 36,517,087 | | | | 659,844 | | | | 307,420 | | | | 2,980,454 | | | | 37,196,061 | | | | 660,082 | |
Cash Management Trust-Collateral Investment | | | 467,514 | | | | 42,806,952 | | | | 40,873,547 | | | | 2,400,919 | | | | 2,400,919 | | | | 17,977 | |
Cash Management Trust-Short Term Investment | | | 7,000,000 | | | | 159,802,560 | | | | 166,802,560 | | | | – | | | | – | | | | 90,327 | |
Core Short-Term Reserve | | | – | | | | 208,747,628 | | | | 59,937,860 | | | | 14,880,977 | | | | 148,809,768 | | | | 379,506 | |
Total Value and Income Earned | | | $261,464,372 | | | | | | | | | | | | | | | | $396,018,150 | | | | $5,979,742 | |
The accompanying Notes to Financial Statements are an integral part of this schedule.
73
BALANCED INCOME PLUS FUND
Summary Schedule of Investments as of October 31, 2016
| | | | | | | | | | | | |
Principal
Amount | | | Bank Loans (16.3%) | | Value | | | % of Net
Assets | |
| Basic Materials (1.0%) | | | | | | | | |
| | | | Ineos US Finance, LLC, Term Loan | | | | | | | | |
| | $1,012,522 | | | 3.750%, 12/15/2020a | | | $1,014,840 | | | | 0.3 | % |
| | | | Other Securities^ | | | 2,019,449 | | | | 0.7 | % |
| | | | | |
| | | | Total | | | 3,034,289 | | | | | |
| | | | | |
|
| Capital Goods (1.1%) | |
| | | | Cortes NP Acquisition Corporation, Term Loan | | | | | | | | |
| | 1,220,000 | | | 0.000%, 10/3/2023a,b,c | | | 1,212,375 | | | | 0.4 | % |
| | | | Other Securities^ | | | 1,900,614 | | | | 0.7 | % |
| | | | | |
| | | | Total | | | 3,112,989 | | | | | |
| | | | | |
|
| Communications Services (4.4%) | |
| | | | NEP/NCP Holdco, Inc., Term Loan | | | | | | | | |
| | 973,377 | | | 4.250%, 1/22/2020a | | | 970,028 | | | | 0.3 | % |
| | | | Other Securities^ | | | 12,189,164 | | | | 4.1 | % |
| | | | | |
| | | | Total | | | 13,159,192 | | | | | |
| | | | | |
|
| Consumer Cyclical (2.8%) | |
| | | | Amaya BV, Term Loan | | | | | | | | |
| | 1,038,899 | | | 5.000%, 8/1/2021a | | | 1,037,435 | | | | 0.3 | % |
| | | | Scientific Games International Inc., Term Loan | | | | | | | | |
| | 1,092,340 | | | 6.000%, 10/1/2021a | | | 1,096,436 | | | | 0.4 | % |
| | | | Other Securities^ | | | 6,234,959 | | | | 2.1 | % |
| | | | | |
| | | | Total | | | 8,368,830 | | | | | |
| | | | | |
|
| Consumer Non-Cyclical (2.8%) | |
| | | | Valeant Pharmaceuticals International, Inc., Term Loan | | | | | | | | |
| | 1,626,182 | | | 5.500%, 4/1/2022a | | | 1,620,084 | | | | 0.5 | % |
| | | | Other Securities^ | | | 6,609,942 | | | | 2.3 | % |
| | | | | |
| | | | Total | | | 8,230,026 | | | | | |
| | | | | |
|
| Energy (0.8%) | |
| | | | Other Securities^ | | | 2,407,332 | | | | 0.8 | % |
| | | | | |
| | | | Total | | | 2,407,332 | | | | | |
| | | | | |
|
| Financials (0.8%) | |
| | | | Other Securities^ | | | 2,504,205 | | | | 0.8 | % |
| | | | | |
| | | | Total | | | 2,504,205 | | | | | |
| | | | | |
|
| Technology (1.8%) | |
| | | | ON Semiconductor Corporation, Term Loan | | | | | | | | |
| | 1,100,000 | | | 3.777%, 3/31/2023a | | | 1,106,050 | | | | 0.4 | % |
| | | | Other Securities^ | | | 4,116,949 | | | | 1.4 | % |
| | | | | |
| | | | Total | | | 5,222,999 | | | | | |
| | | | | |
|
| Transportation (0.4%) | |
| | | | XPO Logistics, Inc., Term Loan | | | | | | | | |
| | 964,956 | | | 4.250%, 10/30/2021a | | | 969,434 | | | | 0.3 | % |
| | | | Other Securities^ | | | 269,543 | | | | 0.1 | % |
| | | | | |
| | | | Total | | | 1,238,977 | | | | | |
| | | | | |
|
| Utilities (0.4%) | |
| | | | Other Securities^ | | | 1,105,580 | | | | 0.4 | % |
| | | | | |
| | | | Total | | | 1,105,580 | | | | | |
| | | | | |
| | | | | | | | | | | | |
| | | | | |
| | | | Total Bank Loans (cost $48,686,565) | | | 48,384,419 | | | | | |
| | | | | |
| | | | | | | | | | | | |
| Shares | | | Common Stock (43.9%) | | Value | | | % of Net
Assets | |
| Consumer Discretionary (7.0%) | | | | | | | | |
| | 3,830 | | | Amazon.com, Inc.d | | | 3,025,011 | | | | 1.0 | % |
| | 2,400 | | | AutoZone, Inc.d | | | 1,781,184 | | | | 0.6 | % |
| | 34,718 | | | Comcast Corporation | | | 2,146,267 | | | | 0.7 | % |
| | 35,460 | | | NIKE, Inc. | | | 1,779,383 | | | | 0.6 | % |
| | 20,180 | | | Walt Disney Company | | | 1,870,484 | | | | 0.6 | % |
| | | | Other Securities^ | | | 10,212,771 | | | | 3.5 | % |
| | | | | |
| | | | Total | | | 20,815,100 | | | | | |
| | | | | |
| | |
| Consumer Staples (2.4%) | | | | | | | | |
| | 10,709 | | | Anheuser-Busch InBev NV ADR | | | 1,236,782 | | | | 0.4 | % |
| | 14,590 | | | Philip Morris International, Inc. | | | 1,407,060 | | | | 0.5 | % |
| | | | Other Securities^ | | | 4,549,550 | | | | 1.5 | % |
| | | | | |
| | | | Total | | | 7,193,392 | | | | | |
| | | | | |
| | |
| Energy (2.8%) | | | | | | | | |
| | 201,059 | | | BP plc | | | 1,188,607 | | | | 0.4 | % |
| | 16,540 | | | EOG Resources, Inc. | | | 1,495,547 | | | | 0.5 | % |
| | 16,920 | | | EQT Corporation | | | 1,116,720 | | | | 0.4 | % |
| | | | Other Securities^ | | | 4,523,240 | | | | 1.5 | % |
| | | | | |
| | | | Total | | | 8,324,114 | | | | | |
| | | | | |
| |
| Financials (5.5%) | | | | |
| | 41,350 | | | Citigroup, Inc. | | | 2,032,352 | | | | 0.7 | % |
| | 22,230 | | | J.P. Morgan Chase & Company | | | 1,539,650 | | | | 0.5 | % |
| | 40,340 | | | Synchrony Financial | | | 1,153,321 | | | | 0.4 | % |
| | | | Other Securities^ | | | 11,747,390 | | | | 3.9 | % |
| | | | | |
| | | | Total | | | 16,472,713 | | | | | |
| | | | | |
| |
| Health Care (4.4%) | | | | |
| | 50,000 | | | Abbott Laboratories | | | 1,962,000 | | | | 0.7 | % |
| | 5,060 | | | Allergan plcd | | | 1,057,236 | | | | 0.4 | % |
| | 18,340 | | | Medtronic plc | | | 1,504,247 | | | | 0.5 | % |
| | 31,940 | | | Merck & Company, Inc. | | | 1,875,517 | | | | 0.6 | % |
| | | | Other Securities^ | | | 6,834,475 | | | | 2.2 | % |
| | | | | |
| | | | Total | | | 13,233,475 | | | | | |
| | | | | |
| |
| Industrials (4.6%) | | | | |
| | 11,650 | | | Illinois Tool Works, Inc. | | | 1,323,091 | | | | 0.5 | % |
| | 18,360 | | | Ingersoll-Rand plc | | | 1,235,444 | | | | 0.4 | % |
| | 23,900 | | | Jacobs Engineering Group, Inc.d | | | 1,232,762 | | | | 0.4 | % |
| | 16,590 | | | Union Pacific Corporation | | | 1,462,906 | | | | 0.5 | % |
| | | | Other Securities^ | | | 8,307,653 | | | | 2.8 | % |
| | | | | |
| | | | Total | | | 13,561,856 | | | | | |
| | | | | |
| |
| Information Technology (7.0%) | | | | |
| | 1,960 | | | Alphabet, Inc., Class Ad | | | 1,587,404 | | | | 0.5 | % |
| | 20,823 | | | Apple, Inc. | | | 2,364,243 | | | | 0.8 | % |
| | 11,300 | | | Facebook, Inc.d | | | 1,480,187 | | | | 0.5 | % |
| | 31,770 | | | Microsoft Corporation | | | 1,903,658 | | | | 0.6 | % |
| | 6,400 | | | Palo Alto Networks, Inc.d | | | 984,512 | | | | 0.3 | % |
| | 32,880 | | | PayPal Holdings, Inc.d | | | 1,369,781 | | | | 0.5 | % |
| | 23,680 | | | Visa, Inc. | | | 1,953,837 | | | | 0.7 | % |
| | 36,620 | | | Xilinx, Inc. | | | 1,862,859 | | | | 0.6 | % |
| | | | Other Securities^ | | | 7,190,394 | | | | 2.5 | % |
| | | | | |
| | | | Total | | | 20,696,875 | | | | | |
| | | | | |
| |
| Materials (1.7%) | | | | |
| | | | Other Securities^ | | | 4,963,036 | | | | 1.7 | % |
| | | | | |
| | | | Total | | | 4,963,036 | | | | | |
| | | | | |
| |
| Real Estate (6.9%) | | | | |
| | 8,010 | | | Simon Property Group, Inc. | | | 1,489,540 | | | | 0.5 | % |
The accompanying Notes to Financial Statements are an integral part of this schedule.
74
BALANCED INCOME PLUS FUND
Summary Schedule of Investments as of October 31, 2016
| | | | | | | | | | | | |
| Shares | | | Common Stock (43.9%) | | Value | | | % of Net Assets | |
| Real Estate (6.9%) – continued | | | | | | | | |
| | 14,223 | | | Welltower, Inc. | | | $974,702 | | | | 0.3 | % |
| | | | Other Securities^ | | | 17,996,139 | | | | 6.1 | % |
| | | | | |
| | | | Total | | | 20,460,381 | | | | | |
| | | | | |
| | |
| Telecommunications Services (0.9%) | | | | | | | | |
| | | | Other Securities^ | | | 2,799,307 | | | | 0.9 | % |
| | | | | |
| | | | Total | | | 2,799,307 | | | | | |
| | | | | |
| | |
| Utilities (0.7%) | | | | | | | | |
| | | | Other Securities^ | | | 1,959,953 | | | | 0.7 | % |
| | | | | |
| | | | Total | | | 1,959,953 | | | | | |
| | | | | |
| | | | | | | | | | | | |
| | | | | |
| | | | Total Common Stock (cost $122,248,822) | | | 130,480,202 | | | | | |
| | | | | |
| | | |
Principal
Amount | | | Long-Term Fixed Income (32.4%) | | Value | | | % of Net
Assets | |
| Asset-Backed Securities (1.7%) | | | | | | | | |
| | | | Other Securities^ | | | 5,354,332 | | | | 1.7 | % |
| | | | | |
| | | | Total | | | 5,354,332 | | | | | |
| | | | | |
| | |
| Basic Materials (0.6%) | | | | | | | | |
| | | | Other Securities^ | | | 1,755,502 | | | | 0.6 | % |
| | | | | |
| | | | Total | | | 1,755,502 | | | | | |
| | | | | |
| | |
| Capital Goods (0.8%) | | | | | | | | |
| | | | Other Securities^ | | | 2,387,995 | | | | 0.8 | % |
| | | | | |
| | | | Total | | | 2,387,995 | | | | | |
| | | | | |
| | |
| Collateralized Mortgage Obligations (3.7%) | | | | | | | | |
| | | | Other Securities^ | | | 11,003,705 | | | | 3.7 | % |
| | | | | |
| | | | Total | | | 11,003,705 | | | | | |
| | | | | |
| | |
| Communications Services (1.6%) | | | | | | | | |
| | | | Other Securities^ | | | 4,859,785 | | | | 1.6 | % |
| | | | | |
| | | | Total | | | 4,859,785 | | | | | |
| | | | | |
| | |
| Consumer Cyclical (1.6%) | | | | | | | | |
| | | | Other Securities^ | | | 4,688,125 | | | | 1.6 | % |
| | | | | |
| | | | Total | | | 4,688,125 | | | | | |
| | | | | |
| | |
| Consumer Non-Cyclical (1.4%) | | | | | | | | |
| | | | Other Securities^ | | | 4,095,017 | | | | 1.4 | % |
| | | | | |
| | | | Total | | | 4,095,017 | | | | | |
| | | | | |
| | |
| Energy (1.2%) | | | | | | | | |
| | | | Petroleos Mexicanos | | | | | | | | |
| | 29,000 | | | 5.500%, 2/4/2019e | | | 30,697 | | | | <0.1 | % |
| | | | Other Securities^ | | | 3,619,188 | | | | 1.2 | % |
| | | | | |
| | | | Total | | | 3,649,885 | | | | | |
| | | | | |
| | |
| Financials (4.1%) | | | | | | | | |
| | | | Goldman Sachs Group, Inc., Convertible | | | | | | | | |
| | 1,400,000 | | | 0.500%, 9/24/2022 | | | 1,523,676 | | | | 0.5 | % |
| | | | Other Securities^ | | | 10,719,097 | | | | 3.6 | % |
| | | | | |
| | | | Total | | | 12,242,773 | | | | | |
| | | | | |
| | |
| Foreign Government (7.6%) | | | | | | | | |
| | | | Mexico Government International Bond | | | | | | | | |
| | 2,920,000 | | | 3.600% - 6.750%, 3/15/2022 - 10/12/2110 | | | 3,050,456 | | | | 1.0 | % |
| | | | Russia Government International Bond | | | | | | | | |
| | $1,000,000 | | | 5.000%, 4/29/2020e | | | 1,066,880 | | | | 0.4 | % |
| | | | Turkey Government International Bond | | | | | | | | |
| | 3,276,000 | | | 4.250% - 7.500%, 11/7/2019 - 2/17/2045 | | | 3,423,119 | | | | 1.1 | % |
| | | | Other Securities^ | | | 15,041,946 | | | | 5.1 | % |
| | | | | |
| | | | Total | | | 22,582,401 | | | | | |
| | | | | |
| | |
| Mortgage-Backed Securities (5.3%) | | | | | | | | |
| | | | Federal Home Loan Mortgage Corporation Gold 15-Yr. Pass Through | | | | | | | | |
| | 1,250,000 | | | 3.000%, 11/1/2031c | | | 1,308,106 | | | | 0.4 | % |
| | | | Federal Home Loan Mortgage Corporation Gold 30-Yr. Pass Through | | | | | | | | |
| | 1,000,000 | | | 4.000%, 11/1/2046c | | | 1,069,648 | | | | 0.4 | % |
| | | | Federal National Mortgage Association Conventional | | | | | | | | |
| | 1,800,000 | | | 3.000%, 11/1/2046c | | | 1,853,156 | | | | 0.6 | % |
| | | | Federal National Mortgage Association Conventional 15- Yr. Pass Through | | | | | | | | |
| | 1,550,000 | | | 2.500%, 11/1/2031c | | | 1,594,926 | | | | 0.5 | % |
| | | | Federal National Mortgage Association Conventional 30- Yr. Pass Through | | | | | | | | |
| | 5,500,000 | | | 3.500%, 11/1/2046c | | | 5,774,141 | | | | 2.0 | % |
| | 3,150,000 | | | 4.000%, 11/1/2046c | | | 3,372,961 | | | | 1.1 | % |
| | 850,000 | | | 4.500%, 11/1/2046c | | | 929,023 | | | | 0.3 | % |
| | | | | |
| | | | Total | | | 15,901,961 | | | | | |
| | | | | |
| | |
| Technology (1.1%) | | | | | | | | |
| | | | Other Securities^ | | | 3,152,282 | | | | 1.1 | % |
| | | | | |
| | | | Total | | | 3,152,282 | | | | | |
| | | | | |
| | |
| Transportation (0.4%) | | | | | | | | |
| | | | Other Securities^ | | | 1,075,073 | | | | 0.4 | % |
| | | | | |
| | | | Total | | | 1,075,073 | | | | | |
| | | | | |
| | |
| U.S. Government and Agencies (0.6%) | | | | | | | | |
| | | | U.S. Treasury Notes | | | | | | | | |
| | 1,250,000 | | | 1.625%, 2/15/2026 | | | 1,229,298 | | | | 0.4 | % |
| | | | Other Securities^ | | | 680,060 | | | | 0.2 | % |
| | | | | |
| | | | Total | | | 1,909,358 | | | | | |
| | | | | |
| | |
| Utilities (0.7%) | | | | | | | | |
| | | | Other Securities^ | | | 2,005,634 | | | | 0.7 | % |
| | | | Total | | | 2,005,634 | | | | | |
| | | | | |
| | | | | | | | | | | | |
| | | | | |
| | | | Total Long-Term Fixed Income (cost $95,527,301) | | | 96,663,828 | | | | | |
| | | | | |
| | | |
| Shares | | | Registered Investment Companies (2.6%) | | Value | | | % of Net
Assets | |
| Equity Funds/ETFs (1.5%) | | | | | | | | |
| | 44,220 | | | Materials Select Sector SPDR Fund | | | 2,067,285 | | | | 0.7 | % |
| | 29,320 | | | Utilities Select Sector SPDR Fund | | | 1,449,288 | | | | 0.5 | % |
| | | | Other Securities^ | | | 828,206 | | | | 0.3 | % |
| | | | | |
| | | | Total | | | 4,344,779 | | | | | |
| | | | | |
The accompanying Notes to Financial Statements are an integral part of this schedule.
75
BALANCED INCOME PLUS FUND
Summary Schedule of Investments as of October 31, 2016
| | | | | | | | | | | | |
| Shares | | | Registered Investment Companies (2.6%) | | Value | | | % of Net
Assets | |
| Fixed Income Funds/ETFs (1.1%) | | | | | | | | |
| | | | Other Securities^ | | | $3,255,699 | | | | 1.1 | % |
| | | | | |
| | | | Total | | | 3,255,699 | | | | | |
| | | | | |
| | | | | | | | | | | | |
| | | | | |
| | | | Total Registered Investment Companies (cost $7,280,291) | | | 7,600,478 | | | | | |
| | | | | |
| | | |
| Shares | | | Preferred Stock (1.4%) | | Value | | | % of Net
Assets | |
| | |
| Consumer Staples (0.1%) | | | | | | | | |
| | | | Other Securities^ | | | 442,470 | | | | 0.1 | % |
| | | | | |
| | | | Total | | | 442,470 | | | | | |
| | | | | |
| | |
| Energy (<0.1%) | | | | | | | | |
| | | | Other Securities^ | | | 19,072 | | | | <0.1 | % |
| | | | | |
| | | | Total | | | 19,072 | | | | | |
| | | | | |
| | |
| Financials (1.0%) | | | | | | | | |
| | | | Other Securities^ | | | 3,003,376 | | | | 1.0 | % |
| | | | | |
| | | | Total | | | 3,003,376 | | | | | |
| | | | | |
| | |
| Health Care (0.1%) | | | | | | | | |
| | | | Other Securities^ | | | 278,933 | | | | 0.1 | % |
| | | | | |
| | | | Total | | | 278,933 | | | | | |
| | | | | |
| | |
| Real Estate (0.2%) | | | | | | | | |
| | | | Other Securities^ | | | 581,676 | | | | 0.2 | % |
| | | | | |
| | | | Total | | | 581,676 | | | | | |
| | | | | |
| | | | | | | | | | | | |
| | | | | |
| | | | Total Preferred Stock (cost $4,058,137) | | | 4,325,527 | | | | | |
| | | | | |
| | | |
| Shares | | | Collateral Held for Securities Loaned (1.4%) | | Value | | | % of Net
Assets | |
| | 4,071,925 | | | Thrivent Cash Management Trust | | | 4,071,925 | | | | 1.4 | % |
| | | | | |
| | | | Total Collateral Held for Securities Loaned (cost $4,071,925) | | | 4,071,925 | | | | | |
| | | | | |
| | | |
Shares or
Principal
Amount | | | Short-Term Investments (9.7%)f | | Value | | | % of Net
Assets | |
| | | | Thrivent Core Short-Term Reserve Fund | | | | | | | | |
| | 2,801,564 | | | 0.790% | | | 28,015,637 | | | | 9.4 | % |
| | | | Other Securities^ | | | 799,521 | | | | 0.3 | % |
| | | | | |
| | | | Total Short-Term Investments (cost $28,815,108) | | | 28,815,158 | | | | | |
| | | | | |
| | | | Total Investments (cost $310,688,149) 107.7% | | $ | 320,341,537 | | | | | |
| | | | | |
| | | | Other Assets and Liabilities, Net (7.7%) | | | (22,923,452 | ) | | | | |
| | | | | |
| | | | Total Net Assets 100.0% | | $ | 297,418,085 | | | | | |
| | | | | |
| ^ | The Summary Schedule of lnvestments shows the 50 largest holdings in unaffiliated issuers, any holding or issuer that exceeds 1% of net assets and all affiliated holdings as of the report date. The remaining securities held are grouped by category as “Other securities”. |
| a | The stated interest rate represents the weighted average of all contracts within the bank loan facility. |
| b | All or a portion of the loan is unfunded. |
| c | Denotes investments purchased on a when-issued or delayed delivery basis. |
| d | Non-income producing security. |
| e | Denotes securities sold under Rule 144A of the Securities Act of 1933, which exempts them from registration. These securities may be resold to other dealers in the program or to other qualified institutional buyers. As of October 31, 2016, the value of these investments was $19,840,061 or 6.7% of total net assets. |
| f | The interest rate shown reflects the yield, coupon rate or the discount rate at the date of purchase. |
Balanced Income Plus Fund held restricted securities as of October 31, 2016. Restricted securities are investment securities which cannot be offered for public sale without first being registered under the Securities Act of 1933. As of October 31, 2016, the value of these investments was $3,383,889 or 1.1% of total net assets.
The following table presents the total amount of securities loaned with continuous maturity, by type, offset by the gross payable upon return of collateral for securities loaned by Thrivent Balanced Income Plus Fund as of October 31, 2016:
| | | | |
| Securities Lending Transactions | | | | |
Common Stock | | $ | 1,717,578 | |
Taxable Debt Security | | | 2,229,666 | |
| | | | |
Total lending | | $ | 3,947,244 | |
Gross amount payable upon return of collateral for securities loaned | | $ | 4,071,925 | |
| | | | |
Net amounts due to counterparty | | $ | 124,681 | |
| | | | |
Definitions:
| | | | |
ADR | | - | | American Depositary Receipt, which are certificates for an underlying foreign security’s shares held by an issuing U.S. depository bank. |
Unrealized Appreciation (Depreciation)
Gross unrealized appreciation and depreciation of investments, based on cost for federal income tax purposes, were as follows:
| | | | |
Gross unrealized appreciation | | | $18,339,911 | |
Gross unrealized depreciation | | | (9,403,164 | ) |
| | | | |
Net unrealized appreciation (depreciation) | | | $8,936,747 | |
| |
Cost for federal income tax purposes | | | $311,404,790 | |
The accompanying Notes to Financial Statements are an integral part of this schedule.
76
BALANCED INCOME PLUS FUND
Summary Schedule of Investments as of October 31, 2016
Fair Valuation Measurements
The following table is a summary of the inputs used, as of October 31, 2016, in valuing Balanced Income Plus Fund’s assets carried at fair value.
| | | | | | | | | | | | | | | | |
| Investments in Securities | | Total | | | Level 1 | | | Level 2 | | | Level 3 | |
| | | | |
Bank Loans | | | | | | | | | | | | | | | | |
Basic Materials | | | 3,034,289 | | | | – | | | | 3,034,289 | | | | – | |
Capital Goods | | | 3,112,989 | | | | – | | | | 3,112,989 | | | | – | |
Communications Services | | | 13,159,192 | | | | – | | | | 12,594,268 | | | | 564,924 | |
Consumer Cyclical | | | 8,368,830 | | | | – | | | | 8,368,830 | | | | – | |
Consumer Non-Cyclical | | | 8,230,026 | | | | – | | | | 7,647,202 | | | | 582,824 | |
Energy | | | 2,407,332 | | | | – | | | | 1,508,570 | | | | 898,762 | |
Financials | | | 2,504,205 | | | | – | | | | 2,504,205 | | | | – | |
Technology | | | 5,222,999 | | | | – | | | | 5,222,999 | | | | – | |
Transportation | | | 1,238,977 | | | | – | | | | 1,238,977 | | | | – | |
Utilities | | | 1,105,580 | | | | – | | | | 800,022 | | | | 305,558 | |
| | | | |
Common Stock | | | | | | | | | | | | | | | | |
Consumer Discretionary | | | 20,815,100 | | | | 15,266,946 | | | | 5,548,154 | | | | – | |
Consumer Staples | | | 7,193,392 | | | | 3,654,687 | | | | 3,538,705 | | | | – | |
Energy | | | 8,324,114 | | | | 5,146,935 | | | | 3,177,179 | | | | – | |
Financials^ | | | 16,472,713 | | | | 9,140,644 | | | | 7,332,069 | | | | 0 | |
Health Care | | | 13,233,475 | | | | 10,161,445 | | | | 3,072,030 | | | | – | |
Industrials | | | 13,561,856 | | | | 7,842,751 | | | | 5,719,105 | | | | – | |
Information Technology | | | 20,696,875 | | | | 19,487,955 | | | | 1,208,920 | | | | – | |
Materials | | | 4,963,036 | | | | 1,538,303 | | | | 3,424,733 | | | | – | |
Real Estate | | | 20,460,381 | | | | 18,553,210 | | | | 1,907,171 | | | | – | |
Telecommunications Services | | | 2,799,307 | | | | 558,645 | | | | 2,240,662 | | | | – | |
Utilities | | | 1,959,953 | | | | 1,082,613 | | | | 877,340 | | | | – | |
| | | | |
Long-Term Fixed Income | | | | | | | | | | | | | | | | |
Asset-Backed Securities | | | 5,354,332 | | | | – | | | | 5,104,332 | | | | 250,000 | |
Basic Materials | | | 1,755,502 | | | | – | | | | 1,755,502 | | | | – | |
Capital Goods | | | 2,387,995 | | | | – | | | | 2,387,995 | | | | – | |
Collateralized Mortgage Obligations | | | 11,003,705 | | | | – | | | | 11,003,705 | | | | – | |
Communications Services | | | 4,859,785 | | | | – | | | | 4,859,785 | | | | – | |
Consumer Cyclical | | | 4,688,125 | | | | – | | | | 4,688,125 | | | | – | |
Consumer Non-Cyclical | | | 4,095,017 | | | | – | | | | 4,095,017 | | | | – | |
Energy | | | 3,649,885 | | | | – | | | | 3,649,885 | | | | – | |
Financials | | | 12,242,773 | | | | – | | | | 10,719,097 | | | | 1,523,676 | |
Foreign Government | | | 22,582,401 | | | | – | | | | 22,582,401 | | | | – | |
Mortgage-Backed Securities | | | 15,901,961 | | | | – | | | | 15,901,961 | | | | – | |
Technology | | | 3,152,282 | | | | – | | | | 3,152,282 | | | | – | |
Transportation | | | 1,075,073 | | | | – | | | | 1,075,073 | | | | – | |
U.S. Government and Agencies | | | 1,909,358 | | | | – | | | | 1,909,358 | | | | – | |
Utilities | | | 2,005,634 | | | | – | | | | 2,005,634 | | | | – | |
| | | | |
Registered Investment Companies | | | | | | | | | | | | | | | | |
Equity Funds/ETFs | | | 4,344,779 | | | | 4,344,779 | | | | – | | | | – | |
Fixed Income Funds/ETFs | | | 3,255,699 | | | | 3,255,699 | | | | – | | | | – | |
| | | | |
Preferred Stock | | | | | | | | | | | | | | | | |
Consumer Staples | | | 442,470 | | | | 442,470 | | | | – | | | | – | |
Energy | | | 19,072 | | | | – | | | | – | | | | 19,072 | |
Financials | | | 3,003,376 | | | | 2,316,295 | | | | 687,081 | | | | – | |
Health Care | | | 278,933 | | | | 83,380 | | | | 195,553 | | | | – | |
Real Estate | | | 581,676 | | | | 581,676 | | | | – | | | | – | |
Short-Term Investments | | | 799,521 | | | | – | | | | 799,521 | | | | – | |
| |
Subtotal Investments in Securities | | | $288,253,975 | | | | $103,458,433 | | | | $180,650,726 | | | | $4,144,816 | |
| |
| |
| | | | |
| Other Investments* | | Total | | | | | | | | | | |
| | | | | | | | | | | | | |
Short-Term Investments | | | 28,015,637 | | | | | | | | | | | | | |
Collateral Held for Securities Loaned | | | 4,071,925 | | | | | | | | | | | | | |
| | | | | | | | | | | | | |
Subtotal Other Investments | | | $32,087,562 | | | | | | | | | | | | | |
| | | | | | | | | | | | | |
| | | | | | | | | | | | | | | | |
| | | | | | | | | | | | | |
Total Investments at Value | | | $320,341,537 | | | | | | | | | | | | | |
| | | | | | | | | | | | | |
| * | Certain investments are measured at fair value using a net asset value per share that is not publicly available (practical expedient). According to disclosure requirements of Accounting Standards Codification (ASC) 820, Fair Value Measurement, securities valued using the practical expedient are not classified in the fair value hierarchy. The fair value amounts presented in this table are intended to permit reconciliation of the fair value hierarchy to the amounts presented in the Statement of Assets and Liabilities. |
| ^ | Level 3 security in this section is fair valued at <$1. |
The accompanying Notes to Financial Statements are an integral part of this schedule.
77
BALANCED INCOME PLUS FUND
Summary Schedule of Investments as of October 31, 2016
| | | | | | | | | | | | | | | | |
| | | | |
| Other Financial Instruments | | Total | | | Level 1 | | | Level 2 | | | Level 3 | |
Asset Derivatives | | | | | | | | | | | | | | | | |
Futures Contracts | | | 318,922 | | | | 318,922 | | | | – | | | | – | |
| |
Total Asset Derivatives | | | $318,922 | | | | $318,922 | | | | $– | | | | $– | |
| |
| |
Liability Derivatives | | | | | | | | | | | | | | | | |
Futures Contracts | | | 196,873 | | | | 196,873 | | | | – | | | | – | |
| |
Total Liability Derivatives | | | $196,873 | | | | $196,873 | | | | $– | | | | $– | |
| |
| |
There were no significant transfers between Levels during the period ended October 31, 2016. Transfers between Levels are identified as of the end of the period.
The following table presents Balanced Income Plus Fund’s futures contracts held as of October 31, 2016. Investments and/or cash totaling $699,528 were pledged as the initial margin deposit for these contracts.
| | | | | | | | | | | | | | | | | | | | |
| Futures Contracts | | Number of
Contracts
Long/(Short) | | | Expiration Date | | | Notional Principal Amount | | | Value | | | Unrealized Gain/(Loss) | |
CBOT 10-Yr. U.S. Treasury Note | | | (52 | ) | | | December 2016 | | | | ($6,811,021 | ) | | | ($6,740,500 | ) | | | $70,521 | |
CBOT 2-Yr. U.S. Treasury Note | | | (66 | ) | | | December 2016 | | | | (14,404,299 | ) | | | (14,397,282 | ) | | | 7,017 | |
CBOT 5-Yr. U.S. Treasury Note | | | 14 | | | | December 2016 | | | | 1,697,653 | | | | 1,691,157 | | | | (6,496) | |
CBOT U.S. Long Bond | | | (8 | ) | | | December 2016 | | | | (1,360,849 | ) | | | (1,301,750 | ) | | | 59,099 | |
CME E-mini S&P 500 Index | | | 33 | | | | December 2016 | | | | 3,553,877 | | | | 3,498,165 | | | | (55,712) | |
CME S&P 500 Index | | | (17 | ) | | | December 2016 | | | | (9,158,154 | ) | | | (9,010,424 | ) | | | 147,730 | |
CME Ultra Long Term U.S. Treasury Bond | | | 12 | | | | December 2016 | | | | 2,245,915 | | | | 2,111,250 | | | | (134,665) | |
Ultra 10-Yr. U.S. Treasury Note | | | (12 | ) | | | December 2016 | | | | (1,732,743 | ) | | | (1,698,188 | ) | | | 34,555 | |
Total Futures Contracts | | | | | | | | | | | | | | | | | | | $122,049 | |
The following table summarizes the fair value and Statement of Assets and Liabilities location, as of October 31, 2016, for Balanced Income Plus Fund’s investments in financial derivative instruments by primary risk exposure as discussed under item (2) Significant Accounting Policies of the Notes to Financial Statements.
| | | | | | |
| Derivatives by risk category | | Statement of Assets and Liabilities Location | | Fair Value | |
| | |
Asset Derivatives | | | | | | |
| | |
Interest Rate Contracts | | | | | | |
Futures* | | Net Assets - Net unrealized appreciation/(depreciation) on Futures contracts | | $ | 171,192 | |
Total Interest Rate Contracts | | | | | 171,192 | |
| | |
Equity Contracts | | | | | | |
Futures* | | Net Assets - Net unrealized appreciation/(depreciation) on Futures contracts | | | 147,730 | |
Total Equity Contracts | | | | | 147,730 | |
Total Asset Derivatives | | | | $ | 318,922 | |
| | | | | | | |
| | |
Liability Derivatives | | | | | | |
| | |
Interest Rate Contracts | | | | | | |
Futures* | | Net Assets - Net unrealized appreciation/(depreciation) on Futures contracts | | | 141,161 | |
Total Interest Rate Contracts | | | | | 141,161 | |
| | |
Equity Contracts | | | | | | |
Futures* | | Net Assets - Net unrealized appreciation/(depreciation) on Futures contracts | | | 55,712 | |
Total Equity Contracts | | | | | 55,712 | |
Total Liability Derivatives | | | | $ | 196,873 | |
| | | | | | | |
| * | Includes cumulative appreciation/depreciation of futures contracts as reported in the Schedule of Investments. Only current day’s variation margin is reported within the Statement of Assets and Liabilities. |
The accompanying Notes to Financial Statements are an integral part of this schedule.
78
BALANCED INCOME PLUS FUND
Summary Schedule of Investments as of October 31, 2016
The following table summarizes the net realized gains/(losses) and Statement of Operations location, for the period ended October 31, 2016, for Balanced Income Plus Fund’s investments in financial derivative instruments by primary risk exposure.
| | | | | | |
| Derivatives by risk category | | Statement of Operations Location | | Realized Gains/(Losses)
recognized in Income | |
| | |
Interest Rate Contracts | | | | | | |
Futures | | Net realized gains/(losses) on Futures contracts | | | 241,300 | |
Total Interest Rate Contracts | | | | | 241,300 | |
| | |
Equity Contracts | | | | | | |
Futures | | Net realized gains/(losses) on Futures contracts | | | 58,060 | |
Total Equity Contracts | | | | | 58,060 | |
| | |
Credit Contracts | | | | | | |
Credit Default Swaps | | Net realized gains/(losses) on Swap agreements | | | (11,518 | ) |
Total Credit Contracts | | | | | (11,518 | ) |
Total | | | | $ | 287,842 | |
| | | | | | | |
The following table summarizes the change in net unrealized appreciation/(depreciation) and Statement of Operations location, for the period ended October 31, 2016, for Balanced Income Plus Fund’s investments in financial derivative instruments by primary risk exposure.
| | | | | | |
| Derivatives by risk category | | Statement of Operations Location | | Change in
unrealized
appreciation/
(depreciation)
recognized in
Income | |
| | |
Interest Rate Contracts | | | | | | |
Futures | | Change in net unrealized appreciation/(depreciation) on Futures contracts | | | (14,386 | ) |
Total Interest Rate Contracts | | | | | (14,386 | ) |
| | |
Equity Contracts | | | | | | |
Futures | | Change in net unrealized appreciation/(depreciation) on Futures contracts | | | 73,611 | |
Total Equity Contracts | | | | | 73,611 | |
| | |
Credit Contracts | | | | | | |
Credit Default Swaps | | Change in net unrealized appreciation/(depreciation) on Swap agreements | | | (11,011 | ) |
Total Credit Contracts | | | | | (11,011 | ) |
Total | | | | | $48,214 | |
| | | | | | | |
The following table presents Balanced Income Plus Fund’s average volume of derivative activity during the period ended October 31, 2016.
| | | | | | | | | | | | | | | | |
| Derivative Risk Category | | Futures
(Notional)* | | | Futures
(Percentage
of Average
Net Assets) | | | Swaps
(Notional)* | | | Swaps
(Percentage
of Average
Net Assets) | |
Equity Contracts | | | $3,388,950 | | | | 1.2 | % | | | N/A | | | | N/A | |
Interest Rate Contracts | | | 27,900,885 | | | | 9.8 | | | | N/A | | | | N/A | |
Credit Contracts | | | N/A | | | | N/A | | | | $29,375 | | | | <0.1 | % |
| * | Notional amount represents long or short, or both, derivative positions held by the Fund. |
Investment in Affiliates
Affiliated issuers, as defined under the Investment Company Act of 1940, include those in which the Fund’s holdings of an issuer represent 5% or more of the outstanding voting securities of an issuer, any affiliated mutual fund, or a company which is under common ownership or control with the Fund. The Fund owns shares of Thrivent Cash Management Trust for the purpose of securities lending and Thrivent Core Short-Term Reserve Fund primarily to serve as a cash sweep vehicle for the Fund. Thrivent Cash Management Trust and Thrivent Core Short-Term Reserve Fund are established for the sole use of affiliated funds.
A summary of transactions for the fiscal year to date, in Balanced Income Plus Fund, is as follows:
| | | | | | | | | | | | | | | | | | | | | | | | |
| Fund | | Value
October 31,
2015 | | | Gross Purchases | | | Gross Sales | | | Shares Held at
October 31,
2016 | | | Value
October 31,
2016 | | | Income Earned
November 1, 2015 -
October 31, 2016 | |
Cash Management Trust-Collateral Investment | | | $8,831,966 | | | | $85,220,475 | | | | $89,980,516 | | | | 4,071,925 | | | | $4,071,925 | | | | $53,890 | |
Cash Management Trust-Short Term Investment | | | 19,990,880 | | | | 46,446,916 | | | | 66,437,796 | | | | – | | | | – | | | | 22,435 | |
Core Short-Term Reserve | | | – | | | | 88,360,000 | | | | 60,344,363 | | | | 2,801,564 | | | | 28,015,637 | | | | 75,712 | |
Total Value and Income Earned | | | $28,822,846 | | | | | | | | | | | | | | | | $32,087,562 | | | | $152,037 | |
The accompanying Notes to Financial Statements are an integral part of this schedule.
79
OPPORTUNITY INCOME PLUS FUND
Summary Schedule of Investments as of October 31, 2016
| | | | | | | | | | | | |
Principal
Amount | | | Bank Loans (29.8%) | | Value | | | % of Net
Assets | |
| Basic Materials (2.0%) | |
| | | | Fortescue Metals Group, Ltd., Term Loan | | | | | | | | |
| $ | 2,587,969 | | | 3.750%, 6/30/2019a | | $ | 2,585,536 | | | | 0.6 | % |
| | | | Ineos US Finance, LLC, Term Loan | | | | | | | | |
| | 2,873,595 | | | 3.750%, 12/15/2020a | | | 2,880,176 | | | | 0.6 | % |
| | | | Tronox Pigments BV, Term Loan | | | | | | | | |
| | 1,598,003 | | | 4.500%, 3/19/2020a | | | 1,589,646 | | | | 0.4 | % |
| | | | Other Securities^ | | | 1,662,407 | | | | 0.4 | % |
| | | | | |
| | | | Total | | | 8,717,765 | | | | | |
| | | | | |
|
| Capital Goods (1.6%) | |
| | | | Cortes NP Acquisition Corporation, Term Loan | | | | | | | | |
| | 2,825,000 | | | 0.000%, 10/3/2023a,b,c | | | 2,807,344 | | | | 0.6 | % |
| | | | Other Securities^ | | | 4,166,494 | | | | 1.0 | % |
| | | | | |
| | | | Total | | | 6,973,838 | | | | | |
| | | | | |
|
| Communications Services (9.3%) | |
| | | | Block Communications, Inc., Term Loan | | | | | | | | |
| | 1,587,876 | | | 4.088%, 11/7/2021a | | | 1,599,785 | | | | 0.4 | % |
| | | | FairPoint Communications, Inc., Term Loan | | | | | | | | |
| | 1,586,915 | | | 7.500%, 2/14/2019a | | | 1,589,105 | | | | 0.4 | % |
| | | | Grande Communications Networks, LLC, Term Loan | | | | | | | | |
| | 2,210,813 | | | 4.500%, 5/29/2020a | | | 2,208,049 | | | | 0.5 | % |
| | | | Hargray Communications Group, Inc., Term Loan | | | | | | | | |
| | 1,744,824 | | | 4.750%, 6/26/2019a | | | 1,753,548 | | | | 0.4 | % |
| | | | Level 3 Communications, Inc., Term Loan | | | | | | | | |
| | 2,250,000 | | | 4.000%, 8/1/2019a | | | 2,259,652 | | | | 0.5 | % |
| | | | Liberty Cablevision of Puerto Rico, LLC, Term Loan | | | | | | | | |
| | 2,275,000 | | | 4.500%, 1/7/2022a | | | 2,237,076 | | | | 0.5 | % |
| | | | LTS Buyer, LLC, Term Loan | | | | | | | | |
| | 1,591,413 | | | 4.088%, 4/13/2020a | | | 1,593,005 | | | | 0.4 | % |
| | | | NEP/NCP Holdco, Inc., Term Loan | | | | | | | | |
| | 2,723,195 | | | 4.250%, 1/22/2020a | | | 2,713,827 | | | | 0.6 | % |
| | | | Numericable US, LLC, Term Loan | | | | | | | | |
| | 1,592,686 | | | 5.137%, 1/15/2024a | | | 1,605,825 | | | | 0.4 | % |
| | | | Univision Communications, Inc., Term Loan | | | | | | | | |
| | 1,911,075 | | | 4.000%, 3/1/2020a | | | 1,914,057 | | | | 0.4 | % |
| | | | Virgin Media Investment Holdings, Ltd., Term Loan | | | | | | | | |
| | 1,538,539 | | | 3.500%, 6/30/2023a | | | 1,544,509 | | | | 0.3 | % |
| | | | WideOpenWest Finance, LLC, Term Loan | | | | | | | | |
| | 3,950,000 | | | 4.500%, 8/18/2023a | | | 3,939,217 | | | | 0.9 | % |
| | | | Zayo Group, LLC, Term Loan | | | | | | | | |
| | 2,006,852 | | | 3.750%, 5/6/2021a | | | 2,016,204 | | | | 0.5 | % |
| | | | Other Securities^ | | | 13,566,984 | | | | 3.1 | % |
| | | | | |
| | | | Total | | | 40,540,843 | | | | | |
| | | | | |
|
| Consumer Cyclical (4.4%) | |
| | | | Amaya BV, Term Loan | | | | | | | | |
| | 2,395,139 | | | 5.000%, 8/1/2021a | | | 2,391,762 | | | | 0.6 | % |
| | | | Cengage Learning Acquisitions, Term Loan | | | | | | | | |
| | 2,234,400 | | | 5.250%, 6/7/2023a | | | 2,181,802 | | | | 0.5 | % |
| | | | IMG Worldwide, Inc., Term Loan | | | | | | | | |
| | 1,623,181 | | | 5.250%, 5/6/2021a | | | 1,630,080 | | | | 0.4 | % |
| | | | Mohegan Tribal Gaming Authority, Term Loan | | | | | | | | |
| | 1,750,000 | | | 0.000%, 9/30/2023a,b,c | | | 1,742,895 | | | | 0.4 | % |
| | | | Scientific Games International Inc., Term Loan | | | | | | | | |
| | 2,222,163 | | | 6.000%, 10/18/2020a | | | 2,233,962 | | | | 0.5 | % |
| | | | Other Securities^ | | | 8,944,149 | | | | 2.0 | % |
| | | | | |
| | | | Total | | | 19,124,650 | | | | | |
| | | | | |
|
| Consumer Non-Cyclical (4.7%) | |
| | | | CHS/Community Health Systems, Inc., Term Loan | | | | | | | | |
| | 1,863,751 | | | 4.000%, 1/27/2021a | | | 1,757,983 | | | | 0.4 | % |
| | | | McGraw-Hill Global Education Holdings, LLC, Term Loan | | | | | | | | |
| | 1,805,475 | | | 5.000%, 5/4/2022a | | | 1,800,582 | | | | 0.4 | % |
| | | | Ortho-Clinical Diagnostics, Inc., Term Loan | | | | | | | | |
| | 1,862,025 | | | 4.750%, 6/30/2021a | | | 1,817,020 | | | | 0.4 | % |
| | | | Valeant Pharmaceuticals International, Inc., Term Loan | | | | | | | | |
| | 4,441,789 | | | 5.500%, 4/1/2022a | | | 4,425,132 | | | | 1.0 | % |
| | | | Other Securities^ | | | 10,589,163 | | | | 2.5 | % |
| | | | | |
| | | | Total | | | 20,389,880 | | | | | |
| | | | | |
|
| Energy (1.4%) | |
| | | | Other Securities^ | | | 6,083,881 | | | | 1.4 | % |
| | | | | |
| | | | Total | | | 6,083,881 | | | | | |
| | | | | |
|
| Financials (1.4%) | |
| | | | MoneyGram International, Inc., Term Loan | | | | | | | | |
| | 1,579,004 | | | 4.250%, 3/27/2020a | | | 1,531,634 | | | | 0.3 | % |
| | | | Other Securities^ | | | 4,521,469 | | | | 1.1 | % |
| | | | | |
| | | | Total | | | 6,053,103 | | | | | |
| | | | | |
|
| Technology (3.7%) | |
| | | | Avago Technoligies Cayman Finance, Ltd., Term Loan | | | | | | | | |
| | 2,260,309 | | | 3.535%, 2/1/2023a | | | 2,282,596 | | | | 0.5 | % |
| | | | First Data Corporation, Term Loan | | | | | | | | |
| | 3,410,000 | | | 0.000%, 3/24/2021a,b,c | | | 3,423,640 | | | | 0.8 | % |
| | | | ON Semiconductor Corporation, Term Loan | | | | | | | | |
| | 3,085,000 | | | 3.777%, 3/31/2023a | | | 3,101,968 | | | | 0.7 | % |
| | | | Western Digital Corporation, Term Loan | | | | | | | | |
| | 2,788,013 | | | 4.500%, 4/29/2023a | | | 2,817,872 | | | | 0.6 | % |
| | | | Other Securities^ | | | 4,639,117 | | | | 1.1 | % |
| | | | | |
| | | | Total | | | 16,265,193 | | | | | |
| | | | | |
|
| Transportation (0.9%) | |
| | | | XPO Logistics, Inc., Term Loan | | | | | | | | |
| | 2,780,781 | | | 4.250%, 10/30/2021a | | | 2,793,684 | | | | 0.6 | % |
| | | | Other Securities^ | | | 1,380,882 | | | | 0.3 | % |
| | | | | |
| | | | Total | | | 4,174,566 | | | | | |
| | | | | |
The accompanying Notes to Financial Statements are an integral part of this schedule.
80
OPPORTUNITY INCOME PLUS FUND
Summary Schedule of Investments as of October 31, 2016
| | | | | | | | | | |
Principal
Amount | | | Bank Loans (29.8%) | | Value | | | % of Net
Assets |
| Utilities (0.4%) |
| | | | Other Securities^ | | | $1,923,588 | | | 0.4% |
| | | | |
| | | | Total | | | 1,923,588 | | | |
| | | | |
| | | | | | | | | | |
| | | | |
| | | | Total Bank Loans (cost $131,667,687) | | | 130,247,307 | | | |
| | | | |
| | | |
Principal
Amount | | | Long-Term Fixed Income (61.5%) | | Value | | | % of Net
Assets |
| Asset-Backed Securities (4.1%) | | | | | | |
| | | | Other Securities^ | | | 18,320,740 | | | 4.1% |
| | | | |
| | | | Total | | | 18,320,740 | | | |
| | | | |
|
| Basic Materials (0.7%) |
| | | | Other Securities^ | | | 3,234,437 | | | 0.7% |
| | | | |
| | | | Total | | | 3,234,437 | | | |
| | | | |
|
| Capital Goods (1.8%) |
| | | | Other Securities^ | | | 7,628,400 | | | 1.8% |
| | | | |
| | | | Total | | | 7,628,400 | | | |
| | | | |
|
| Collateralized Mortgage Obligations (8.1%) |
| | | | Other Securities^ | | | 35,197,225 | | | 8.1% |
| | | | |
| | | | Total | | | 35,197,225 | | | |
| | | | |
|
| Communications Services (3.1%) |
| | | | Other Securities^ | | | 13,678,275 | | | 3.1% |
| | | | |
| | | | Total | | | 13,678,275 | | | |
| | | | |
|
| Consumer Cyclical (3.2%) |
| | | | Other Securities^ | | | 13,953,051 | | | 3.2% |
| | | | |
| | | | Total | | | 13,953,051 | | | |
| | | | |
|
| Consumer Non-Cyclical (2.9%) |
| | | | Valeant Pharmaceuticals International | | | | | | |
| | 469,079 | | | 7.250%, 7/15/2022d | | | 408,099 | | | 0.1% |
| | | | VPII Escrow Corporation | | | | | | |
| | 500,000 | | | 7.500%, 7/15/2021d | | | 445,000 | | | 0.1% |
| | | | Other Securities^ | | | 11,610,647 | | | 2.7% |
| | | | |
| | | | Total | | | 12,463,746 | | | |
| | | | |
|
| Energy (2.2%) |
| | | | Ecopetrol SA | | | | | | |
| | 225,000 | | | 5.875%, 9/18/2023 | | | 241,312 | | | 0.1% |
| | | | Petrobras Global Finance BV | | | | | | |
| | 90,000 | | | 8.375%, 5/23/2021 | | | 99,567 | | | <0.1% |
| | | | Petroleos Mexicanos | | | | | | |
| | 77,000 | | | 5.500%, 2/4/2019d | | | 81,504 | | | <0.1% |
| | | | Other Securities^ | | | 9,055,030 | | | 2.1% |
| | | | |
| | | | Total | | | 9,477,413 | | | |
| | | | |
|
| Financials (6.4%) |
| | | | Other Securities^ | | | 27,791,974 | | | 6.4% |
| | | | |
| | | | Total | | | 27,791,974 | | | |
| | | | |
|
| Foreign Government (15.1%) |
| | | | Brazil Government International Bond | | | | | | |
| | 1,800,000 | | | 2.625%, 1/5/2023 | | | 1,663,200 | | | 0.4% |
| | 4,594,000 | | | 4.875% - 7.125%, | | | | | | |
| | | | 1/22/2021 - 2/21/2047 | | | 4,710,612 | | | 1.1% |
| | | | Colombia Government International Bond | | | | | | |
| | 4,352,000 | | | 2.625% - 5.625%, | | | | | | |
| | | | 7/12/2021 - 6/15/2045e | | | 4,476,905 | | | 0.9% |
| | | | Hungary Government International Bond | | | | | | |
| | 1,450,000 | | | 5.750%, 11/22/2023 | | | 1,691,787 | | | 0.4% |
| | 1,452,000 | | | 5.375%, 3/25/2024 | | | 1,668,209 | | | 0.4% |
| | | | Indonesia Government International Bond | | | | | | |
| | 1,720,000 | | | 5.125%, 1/15/2045d | | | 1,871,842 | | | 0.4% |
| | 5,410,000 | | | 3.375% - 8.500%, | | | | | | |
| | | | 5/5/2021 - 10/12/2035d | | | 6,215,498 | | | 1.5% |
| | | | Mexico Government International Bond | | | | | | |
| | 8,560,000 | | | 3.600% - 6.750%, | | | | | | |
| | | | 3/15/2022 - 10/12/2110e | | | 8,955,864 | | | 2.0% |
| | | | Philippines Government International Bond | | | | | | |
| | 1,400,000 | | | 4.000%, 1/15/2021 | | | 1,522,940 | | | 0.4% |
| | 2,205,000 | | | 3.950% - 7.750%, | | | | | | |
| | | | 1/14/2031 - 1/20/2040 | | | 2,861,128 | | | 0.6% |
| | | | Russia Government International Bond | | | | | | |
| | 3,000,000 | | | 5.000%, 4/29/2020d | | | 3,200,640 | | | 0.7% |
| | 1,820,000 | | | 4.875%, 9/16/2023d,e | | | 1,956,427 | | | 0.5% |
| | 2,855,100 | | | 3.500% - 7.500%, | | | | | | |
| | | | 1/16/2019 - 4/4/2042d | | | 3,193,169 | | | 0.8% |
| | | | Turkey Government International Bond | | | | | | |
| | 9,284,000 | | | 4.250% - 7.500%, | | | | | | |
| | | | 11/7/2019 - 2/17/2045 | | | 9,695,253 | | | 2.2% |
| | | | Other Securities^ | | | 12,154,427 | | | 2.8% |
| | | | |
| | | | Total | | | 65,837,901 | | | |
| | | | |
|
| Mortgage-Backed Securities (9.1%) |
| | | | Federal Home Loan Mortgage Corporation Gold 15-Yr. Pass Through | | | | | | |
| | 2,250,000 | | | 3.000%, 11/1/2031c | | | 2,354,590 | | | 0.5% |
| | | | Federal Home Loan Mortgage Corporation Gold 30-Yr. Pass Through | | | | | | |
| | 3,050,000 | | | 4.000%, 11/1/2046c | | | 3,262,428 | | | 0.8% |
| | | | Federal National Mortgage Association Conventional | | | | | | |
| | 4,700,000 | | | 3.000%, 11/1/2046c | | | 4,838,797 | | | 1.1% |
| | | | Federal National Mortgage Association Conventional 15- Yr. Pass Through | | | | | | |
| | 5,050,000 | | | 2.500%, 11/1/2031c | | | 5,196,371 | | | 1.2% |
| | | | Federal National Mortgage Association Conventional 30- Yr. Pass Through | | | | | | |
| | 11,300,000 | | | 3.500%, 11/1/2046c | | | 11,863,235 | | | 2.7% |
| | 7,812,500 | | | 4.000%, 11/1/2046c | | | 8,365,478 | | | 1.9% |
| | 3,650,000 | | | 4.500%, 11/1/2046c | | | 3,989,336 | | | 0.9% |
| | | | |
| | | | Total | | | 39,870,235 | | | |
| | | | |
|
| Technology (1.4%) |
| | | | Other Securities^ | | | 6,252,054 | | | 1.4% |
| | | | |
| | | | Total | | | 6,252,054 | | | |
| | | | |
The accompanying Notes to Financial Statements are an integral part of this schedule.
81
OPPORTUNITY INCOME PLUS FUND
Summary Schedule of Investments as of October 31, 2016
| | | | | | | | | | | | |
Principal
Amount | | | Long-Term Fixed Income (61.5%) | | Value | | | % of Net
Assets | |
| Transportation (0.6%) | |
| | | | Other Securities^ | | | $2,815,209 | | | | 0.6 | % |
| | | | | |
| | | | Total | | | 2,815,209 | | | | | |
| | | | | |
|
| U.S. Government and Agencies (1.4%) | |
| | | | U.S. Treasury Notes | | | | | | | | |
| | 4,450,000 | | | 1.625%, 2/15/2026 | | | 4,376,299 | | | | 1.0 | % |
| | 1,565,000 | | | 1.125% - 2.125%, | | | | | | | | |
| | | | 8/31/2021 - 6/30/2022 | | | 1,591,122 | | | | 0.4 | % |
| | | | | |
| | | | Total | | | 5,967,421 | | | | | |
| | | | | |
|
| Utilities (1.4%) | |
| | | | Other Securities^ | | | 6,039,743 | | | | 1.4 | % |
| | | | | |
| | | | Total | | | 6,039,743 | | | | | |
| | | | | |
| | | | | | | | | | | | |
| | | | | |
| | | | Total Long-Term Fixed Income (cost $266,437,851) | | | 268,527,824 | | | | | |
| | | | | |
| | | |
| Shares | | | Registered Investment Companies (3.1%) | | Value | | | % of Net
Assets | |
| Equity Funds/ETFs (0.2%) | |
| | | | Other Securities^ | | | 1,056,535 | | | | 0.2 | % |
| | | | | |
| | | | Total | | | 1,056,535 | | | | | |
| | | | | |
|
| Fixed Income Funds/ETFs (2.9%) | |
| | 118,910 | | | PowerShares Senior Loan Portfolio | | | 2,756,334 | | | | 0.6 | % |
| | 39,695 | | | Vanguard Short-Term Corporate Bond ETF | | | 3,188,302 | | | | 0.7 | % |
| | | | Other Securities^ | | | 6,828,872 | | | | 1.6 | % |
| | | | | |
| | | | Total | | | 12,773,508 | | | | | |
| | | | | |
| | | | | | | | | | | | |
| | | | | |
| | | | Total Registered Investment Companies (cost $15,195,041) | | | 13,830,043 | | | | | |
| | | | | |
| | | |
| Shares | | | Preferred Stock (1.7%) | | Value | | | % of Net
Assets | |
| Consumer Staples (0.1%) | |
| | | | Other Securities^ | | | 423,872 | | | | 0.1 | % |
| | | | | |
| | | | Total | | | 423,872 | | | | | |
| | | | | |
|
| Energy (<0.1%) | |
| | | | Other Securities^ | | | 73,370 | | | | <0.1 | % |
| | | | | |
| | | | Total | | | 73,370 | | | | | |
| | | | | |
|
| Financials (1.6%) | |
| | | | Other Securities^ | | | 6,819,522 | | | | 1.6 | % |
| | | | | |
| | | | Total | | | 6,819,522 | | | | | |
| | | | | |
| | | | | | | | | | | | |
| | | | | |
| | | | Total Preferred Stock (cost $6,798,497) | | | 7,316,764 | | | | | |
| | | | | |
| | | |
| Shares | | | Common Stock (1.2%) | | Value | | | % of Net
Assets | |
| Energy (0.7%) | |
| | 27,327 | | | Arch Coal, Inc.e,f | | | 2,005,255 | | | | 0.4 | % |
| | | | Other Securities^ | | | 1,100,038 | | | | 0.3 | % |
| | | | | |
| | | | Total | | | 3,105,293 | | | | | |
| | | | | |
|
| Financials (0.4%) | |
| | | | Other Securities^ | | | 1,695,444 | | | | 0.4 | % |
| | | | | |
| | | | Total | | | 1,695,444 | | | | | |
| | | | | |
|
| Materials (0.1%) | |
| | | | Other Securities^ | | | 295,451 | | | | 0.1 | % |
| | | | | |
| | | | Total | | | 295,451 | | | | | |
| | | | | |
| | | | | | | | | | | | |
| | | | | |
| | | | Total Common Stock (cost $4,916,686) | | | 5,096,188 | | | | | |
| | | | | |
| | | |
| Shares | | | Collateral Held for Securities Loaned (2.8%) | | Value | | | % of Net
Assets | |
| | 12,236,852 | | | Thrivent Cash Management Trust | | | 12,236,852 | | | | 2.8 | % |
| | | | | |
| | | | Total Collateral Held for Securities Loaned (cost $12,236,852) | | | 12,236,852 | | | | | |
| | | | | |
| | | |
Shares or
Principal
Amount | | | Short-Term Investments (14.0%)g | | Value | | | % of Net
Assets | |
| | | | Thrivent Core Short-Term Reserve Fund | | | | | | | | |
| | 6,015,200 | | | 0.790% | | | 60,152,003 | | | | 13.8 | % |
| | | | Other Securities^ | | | 899,645 | | | | 0.2 | % |
| | | | | |
| | | | Total Short-Term Investments (cost $61,051,584) | | | 61,051,648 | | | | | |
| | | | | |
| | | | Total Investments (cost $498,304,198) 114.1% | | | $498,306,626 | | | | | |
| | | | | |
| | | | Other Assets and Liabilities, Net (14.1%) | | | (61,736,026 | ) | | | | |
| | | | | |
| | | | Total Net Assets 100.0% | | | $436,570,600 | | | | | |
| | | | | |
| ^ | The Summary Schedule of lnvestments shows the50 largest holdings in unaffiliated issuers, any holding or issuer that exceeds 1% of net assets and all affiliated holdings as of the report date. The remaining securities held are grouped by category as “Other securities”. |
| a | The stated interest rate represents the weighted average of all contracts within the bank loan facility. |
| b | All or a portion of the loan is unfunded. |
| c | Denotes investments purchased on a when-issued or delayed delivery basis. |
| d | Denotes securities sold under Rule 144A of the Securities Act of 1933, which exempts them from registration. These securities may be resold to other dealers in the program or to other qualified institutional buyers. As of October 31, 2016, the value of these investments was $57,888,789 or 13.3% of total net assets. |
| e | All or a portion of the security is on loan. |
| f | Non-income producing security. |
| g | The interest rate shown reflects the yield, coupon rate or the discount rate at the date of purchase. |
Opportunity Income Plus Fund held restricted securities as of October 31, 2016. Restricted securities are investment securities which cannot be offered for public sale without first being registered under the Securities Act of 1933. As of October 31, 2016, the value of these investments was $12,028,907 or 2.8% of total net assets.
The accompanying Notes to Financial Statements are an integral part of this schedule.
82
OPPORTUNITY INCOME PLUS FUND
Summary Schedule of Investments as of October 31, 2016
The following table presents the total amount of securities loaned with continuous maturity, by type, offset by the gross payable upon return of collateral for securities loaned by Thrivent Opportunity Income Plus Fund as of October 31, 2016:
| | | | |
| Securities lending Transactions | | | | |
Taxable Debt Security | | | $9,733,591 | |
Common Stock | | | 2,003,274 | |
| | | | |
Total lending | | | $11,736,865 | |
Gross amount payable upon return of collateral for securities loaned | | | $12,236,852 | |
| | | | |
Net amounts due to counterparty | | | $499,987 | |
| | | | |
Definitions:
| | | | |
ETF | | - | | Exchange Traded Fund. |
Unrealized Appreciation (Depreciation)
Gross unrealized appreciation and depreciation of investments, based on cost for federal income tax purposes, were as follows:
| | | | |
Gross unrealized appreciation | | | $8,377,820 | |
Gross unrealized depreciation | | | (8,357,950 | ) |
| | | | |
Net unrealized appreciation (depreciation) | | | $19,870 | |
Cost for federal income tax purposes | | | $498,286,756 | |
The accompanying Notes to Financial Statements are an integral part of this schedule.
83
OPPORTUNITY INCOME PLUS FUND
Summary Schedule of Investments as of October 31, 2016
Fair Valuation Measurements
The following table is a summary of the inputs used, as of October 31, 2016, in valuing Opportunity Income Plus Fund’s assets carried at fair value.
| | | | | | | | | | | | | | | | |
| Investments in Securities | | Total | | | Level 1 | | | Level 2 | | | Level 3 | |
| | | | |
Bank Loans | | | | | | | | | | | | | | | | |
Basic Materials | | | 8,717,765 | | | | – | | | | 8,717,765 | | | | – | |
Capital Goods | | | 6,973,838 | | | | – | | | | 6,973,838 | | | | – | |
Communications Services | | | 40,540,843 | | | | – | | | | 38,941,058 | | | | 1,599,785 | |
Consumer Cyclical | | | 19,124,650 | | | | – | | | | 19,124,650 | | | | – | |
Consumer Non-Cyclical | | | 20,389,880 | | | | – | | | | 20,389,880 | | | | – | |
Energy | | | 6,083,881 | | | | – | | | | 4,593,476 | | | | 1,490,405 | |
Financials | | | 6,053,103 | | | | – | | | | 6,053,103 | | | | – | |
Technology | | | 16,265,193 | | | | – | | | | 16,265,193 | | | | – | |
Transportation | | | 4,174,566 | | | | – | | | | 4,174,566 | | | | – | |
Utilities | | | 1,923,588 | | | | – | | | | 1,000,216 | | | | 923,372 | |
| | | | |
Long-Term Fixed Income | | | | | | | | | | | | | | | | |
Asset-Backed Securities | | | 18,320,740 | | | | – | | | | 18,320,740 | | | | – | |
Basic Materials | | | 3,234,437 | | | | – | | | | 3,234,437 | | | | – | |
Capital Goods | | | 7,628,400 | | | | – | | | | 7,628,400 | | | | – | |
Collateralized Mortgage Obligations | | | 35,197,225 | | | | – | | | | 35,197,225 | | | | – | |
Communications Services | | | 13,678,275 | | | | – | | | | 13,678,275 | | | | – | |
Consumer Cyclical | | | 13,953,051 | | | | – | | | | 13,953,051 | | | | – | |
Consumer Non-Cyclical | | | 12,463,746 | | | | – | | | | 12,463,746 | | | | – | |
Energy | | | 9,477,413 | | | | – | | | | 9,477,413 | | | | – | |
Financials | | | 27,791,974 | | | | – | | | | 27,791,974 | | | | – | |
Foreign Government | | | 65,837,901 | | | | – | | | | 65,837,901 | | | | – | |
Mortgage-Backed Securities | | | 39,870,235 | | | | – | | | | 39,870,235 | | | | – | |
Technology | | | 6,252,054 | | | | – | | | | 6,252,054 | | | | – | |
Transportation | | | 2,815,209 | | | | – | | | | 2,815,209 | | | | – | |
U.S. Government and Agencies | | | 5,967,421 | | | | – | | | | 5,967,421 | | | | – | |
Utilities | | | 6,039,743 | | | | – | | | | 6,039,743 | | | | – | |
| | | | |
Registered Investment Companies | | | | | | | | | | | | | | | | |
Fixed Income Funds/ETFs | | | 12,773,508 | | | | 12,773,508 | | | | – | | | | – | |
Equity Funds/ETFs | | | 1,056,535 | | | | 1,056,535 | | | | – | | | | – | |
| | | | |
Preferred Stock | | | | | | | | | | | | | | | | |
Consumer Staples | | | 423,872 | | | | 423,872 | | | | – | | | | – | |
Energy | | | 73,370 | | | | – | | | | – | | | | 73,370 | |
Financials | | | 6,819,522 | | | | 5,601,487 | | | | 1,218,035 | | | | – | |
| | | | |
Common Stock | | | | | | | | | | | | | | | | |
Energy | | | 3,105,293 | | | | 2,282,203 | | | | 823,090 | | | | – | |
Financials | | | 1,695,444 | | | | 1,695,444 | | | | – | | | | – | |
Materials | | | 295,451 | | | | 295,451 | | | | – | | | | – | |
| | | | |
Short-Term Investments | | | 899,645 | | | | – | | | | 899,645 | | | | – | |
| |
Subtotal Investments in Securities | | | $425,917,771 | | | | $24,128,500 | | | | $397,702,339 | | | | $4,086,932 | |
| |
| | | | |
| Other Investments* | | Total | | | | | | | | | | |
| | | | | | | | | | | | | |
Short-Term Investments | | | 60,152,003 | | | | | | | | | | | | | |
Collateral Held for Securities Loaned | | | 12,236,852 | | | | | | | | | | | | | |
| | | | | | | | | | | | | |
Subtotal Other Investments | | | $72,388,855 | | | | | | | | | | | | | |
| | | | | | | | | | | | | |
| | | | | | | | | | | | | | | | |
| | | | | | | | | | | | | |
Total Investments at Value | | | $498,306,626 | | | | | | | | | | | | | |
| | | | | | | | | | | | | |
| * | Certain investments are measured at fair value using a net asset value per share that is not publicly available (practical expedient). According to disclosure requirements of Accounting Standards Codification (ASC) 820, Fair Value Measurement, securities valued using the practical expedient are not classified in the fair value hierarchy. The fair value amounts presented in this table are intended to permit reconciliation of the fair value hierarchy to the amounts presented in the Statement of Assets and Liabilities. |
| | | | | | | | | | | | | | | | |
| Other Financial Instruments | | Total | | | Level 1 | | | Level 2 | | | Level 3 | |
| | | | |
Asset Derivatives | | | | | | | | | | | | | | | | |
Futures Contracts | | | 624,945 | | | | 624,945 | | | | – | | | | – | |
| |
Total Asset Derivatives | | | $624,945 | | | | $624,945 | | | | $– | | | | $– | |
| |
| | | | |
Liability Derivatives | | | | | | | | | | | | | | | | |
Futures Contracts | | | 317,295 | | | | 317,295 | | | | – | | | | – | |
| |
Total Liability Derivatives | | | $317,295 | | | | $317,295 | | | | $– | | | | $– | |
| |
There were no significant transfers between Levels during the period ended October 31, 2016. Transfers between Levels are identified as of the end of the period.
The accompanying Notes to Financial Statements are an integral part of this schedule.
84
OPPORTUNITY INCOME PLUS FUND
Summary Schedule of Investments as of October 31, 2016
The following table presents Opportunity Income Plus Fund’s futures contracts held as of October 31, 2016. Investments and/or cash totaling $899,645 were pledged as the initial margin deposit for these contracts.
| | | | | | | | | | | | | | | | | | |
| Futures Contracts | | Number of
Contracts
Long/(Short) | | | Expiration Date | | Notional Principal Amount | | | Value | | | Unrealized Gain/(Loss) | |
CBOT 10-Yr. U.S. Treasury Note | | | (207 | ) | | December 2016 | | | ($27,113,104 | ) | | | ($26,832,375 | ) | | | $280,729 | |
CBOT 2-Yr. U.S. Treasury Note | | | (167 | ) | | December 2016 | | | (36,447,241 | ) | | | (36,429,485 | ) | | | 17,756 | |
CBOT 5-Yr. U.S. Treasury Note | | | 55 | | | December 2016 | | | 6,669,350 | | | | 6,643,828 | | | | (25,522 | ) |
CBOT U.S. Long Bond | | | (9 | ) | | December 2016 | | | (1,530,955 | ) | | | (1,464,469 | ) | | | 66,486 | |
CME S&P 500 Index | | | (24 | ) | | December 2016 | | | (12,934,500 | ) | | | (12,720,600 | ) | | | 213,900 | |
CME Ultra Long Term U.S. Treasury Bond | | | 26 | | | December 2016 | | | 4,866,148 | | | | 4,574,375 | | | | (291,773 | ) |
Ultra 10-Yr. U.S. Treasury Note | | | (16 | ) | | December 2016 | | | (2,310,324 | ) | | | (2,264,250 | ) | | | 46,074 | |
Total Futures Contracts | | | | | | | | | | | | | | | | | $307,650 | |
The following table summarizes the fair value and Statement of Assets and Liabilities location, as of October 31, 2016, for Opportunity Income Plus Fund’s investments in financial derivative instruments by primary risk exposure as discussed under item (2) Significant Accounting Policies of the Notes to Financial Statements.
| | | | | | |
| Derivatives by risk category | | Statement of Assets and Liabilities Location | | Fair Value | |
| | |
Asset Derivatives | | | | | | |
| | |
Interest Rate Contracts | | | | | | |
Futures* | | Net Assets - Net unrealized appreciation/(depreciation) on Futures contracts | | | $411,045 | |
Total Interest Rate Contracts | | | | | 411,045 | |
| | |
Equity Contracts | | | | | | |
Futures* | | Net Assets - Net unrealized appreciation/(depreciation) on Futures contracts | | | 213,900 | |
Total Equity Contracts | | | | | 213,900 | |
Total Asset Derivatives | | | | | $624,945 | |
| | | | | | | |
| | |
Liability Derivatives | | | | | | |
Interest Rate Contracts | | | | | | |
Futures* | | Net Assets - Net unrealized appreciation/(depreciation) on Futures contracts | | | 317,295 | |
Total Interest Rate Contracts | | | | | 317,295 | |
Total Liability Derivatives | | | | | $317,295 | |
| | | | | | | |
| * | Includes cumulative appreciation/depreciation of futures contracts as reported in the Schedule of Investments. Only current day’s variation margin is reported within the Statement of Assets and Liabilities. |
The following table summarizes the net realized gains/ (losses) and Statement of Operations location, for the period ended October 31, 2016, for Opportunity Income Plus Fund’s investments in financial derivative instruments by primary risk exposure.
| | | | | | |
| Derivatives by risk category | | Statement of Operations Location | | Realized Gains/(Losses)
recognized in Income | |
| | |
Interest Rate Contracts | | | | | | |
Futures | | Net realized gains/(losses) on Futures contracts | | | 714,179 | |
| | |
Total Interest Rate Contracts | | | | | 714,179 | |
| | |
Equity Contracts | | | | | | |
Futures | | Net realized gains/(losses) on Futures contracts | | | (94,133 | ) |
| | |
Total Equity Contracts | | | | | (94,133 | ) |
| | |
Credit Contracts | | | | | | |
Credit Default Swaps | | Net realized gains/(losses) on Swap agreements | | | (44,583 | ) |
| | |
Total Credit Contracts | | | | | (44,583 | ) |
| |
Total | | | $575,463 | |
| |
The accompanying Notes to Financial Statements are an integral part of this schedule.
85
OPPORTUNITY INCOME PLUS FUND
Summary Schedule of Investments as of October 31, 2016
The following table summarizes the change in net unrealized appreciation/(depreciation) and Statement of Operations location, for the period ended October 31, 2016, for Opportunity Income Plus Fund’s investments in financial derivative instruments by primary risk exposure.
| | | | | | |
| Derivatives by risk category | | Statement of Operations Location | | Change in unrealized
appreciation/(depreciation)
recognized in Income | |
| | |
Interest Rate Contracts | | | | | | |
Futures | | Change in net unrealized appreciation/(depreciation) on Futures contracts | | | (67,273 | ) |
| | |
Total Interest Rate Contracts | | | | | (67,273 | ) |
| | |
Equity Contracts | | | | | | |
Futures | | Change in net unrealized appreciation/(depreciation) on Futures contracts | | | 213,900 | |
| | |
Total Equity Contracts | | | | | 213,900 | |
| | |
Credit Contracts | | | | | | |
Credit Default Swaps | | Change in net unrealized appreciation/(depreciation) on Swap agreements | | | 24,213 | |
| | |
Total Credit Contracts | | | | | 24,213 | |
| |
Total | | | | | $170,840 | |
| |
The following table presents Opportunity Income Plus Fund’s average volume of derivative activity during the period ended October 31, 2016.
| | | | | | | | | | | | | | | | |
| Derivative Risk Category | | Futures
(Notional)* | | | Futures
(Percentage of
Average Net
Assets) | | | Swaps
(Notional)* | | | Swaps
(Percentage of
Average Net
Assets) | |
Equity Contracts | | | $3,043,614 | | | | 0.7 | % | | | N/A | | | | N/A | |
Interest Rate Contracts | | | 81,756,035 | | | | 20.0 | | | | N/A | | | | N/A | |
Credit Contracts | | | N/A | | | | N/A | | | | $10,764 | | | | <0.1 | % |
| * | Notional amount represents long or short, or both, derivative positions held by the Fund. |
Investment in Affiliates
Affiliated issuers, as defined under the Investment Company Act of 1940, include those in which the Fund’s holdings of an issuer represent 5% or more of the outstanding voting securities of an issuer, any affiliated mutual fund, or a company which is under common ownership or control with the Fund. The Fund owns shares of Thrivent Cash Management Trust for the purpose of securities lending and Thrivent Core Short-Term Reserve Fund primarily to serve as a cash sweep vehicle for the Fund. Thrivent Cash Management Trust and Thrivent Core Short-Term Reserve Fund are established for the sole use of affiliated funds.
A summary of transactions for the fiscal year to date, in Opportunity Income Plus Fund, is as follows:
| | | | | | | | | | | | | | | | | | | | | | | | |
| Fund | | Value
October 31, 2015 | | | Gross Purchases | | | Gross Sales | | | Shares Held at
October 31, 2016 | | | Value
October 31, 2016 | | | Income Earned
November 1, 2015 -
October 31, 2016 | |
Cash Management Trust-Collateral Investment | | | $8,644,084 | | | | $78,030,334 | | | | $74,437,566 | | | | 12,236,852 | | | | $12,236,852 | | | | $63,594 | |
Cash Management Trust-Short Term Investment | | | 54,752,388 | | | | 92,704,684 | | | | 147,457,072 | | | | – | | | | – | | | | 54,787 | |
Core Short-Term Reserve | | | – | | | | 189,074,393 | | | | 128,922,390 | | | | 6,015,200 | | | | 60,152,003 | | | | 163,519 | |
Total Value and Income Earned | | | $63,396,472 | | | | | | | | | | | | | | | | $72,388,855 | | | | $281,900 | |
The accompanying Notes to Financial Statements are an integral part of this schedule.
86
PARTNER EMERGING MARKETS EQUITY FUND
Schedule of Investments as of October 31, 2016
| | | | | | | | |
| Shares | | | Common Stock (92.4%) | | Value | |
| Brazil (12.2%) | | | | |
| | 18,000 | | | Ambev SA | | | $106,184 | |
| | 31,980 | | | Banco Bradesco SA ADR | | | 332,912 | |
| | 9,000 | | | BRF SA | | | 150,508 | |
| | 22,500 | | | Lojas Renner SA | | | 190,249 | |
| | 6,700 | | | Multiplan Empreendimentos Imobiliarios SA | | | 134,776 | |
| | 11,500 | | | Ultrapar Participacoes SA | | | 261,488 | |
| | 19,200 | | | Vale SA ADRa | | | 132,864 | |
| | | | | |
| | | | Total | | | 1,308,981 | |
| | | | | |
| |
| Chile (1.4%) | | | | |
| | 6,300 | | | Banco Santander Chile SA ADR | | | 143,955 | |
| | 1,057 | | | S.A.C.I. Falabella | | | 8,300 | |
| | | | | |
| | | | Total | | | 152,255 | |
| | | | | |
| |
| China (1.3%) | | | | |
| | 198,000 | | | PetroChina Company, Ltd. | | | 135,479 | |
| | | | | |
| | | | Total | | | 135,479 | |
| | | | | |
| |
| Hong Kong (11.1%) | | | | |
| | 53,000 | | | AIA Group, Ltd. | | | 333,424 | |
| | 27,500 | | | China Mobile, Ltd. | | | 315,051 | |
| | 60,000 | | | Hang Lung Group, Ltd. | | | 229,514 | |
| | 3,806 | | | Hong Kong Exchanges and Clearing, Ltd. | | | 100,617 | |
| | 15,000 | | | Swire Pacific, Ltd. | | | 155,908 | |
| | 18,600 | | | Swire Properties, Ltd. | | | 53,413 | |
| | | | | |
| | | | Total | | | 1,187,927 | |
| | | | | |
| |
| Hungary (1.3%) | | | | |
| | 6,500 | | | Richter Gedeon Nyrt | | | 139,536 | |
| | | | | |
| | | | Total | | | 139,536 | |
| | | | | |
| |
| India (13.9%) | | | | |
| | 40,000 | | | Ambuja Cements, Ltd. GDR | | | 143,860 | |
| | 12,500 | | | Grasim Industries, Ltd. GDR | | | 180,750 | |
| | 3,000 | | | HDFC Bank, Ltd. ADR | | | 212,340 | |
| | 31,445 | | | ICICI Bank, Ltd. ADR | | | 260,679 | |
| | 14,000 | | | Infosys, Ltd. ADR | | | 213,640 | |
| | 75,120 | | | ITC, Ltd. GDR | | | 272,836 | |
| | 3,600 | | | Ultra Tech Cement, Ltd. GDR | | | 213,686 | |
| | | | | |
| | | | Total | | | 1,497,791 | |
| | | | | |
| |
| Indonesia (5.1%) | | | | |
| | 684,500 | | | Astra International Tbk PT | | | 431,856 | |
| | 93,400 | | | Indocement Tunggal Prakarsa Tbk PT | | | 117,601 | |
| | | | | |
| | | | Total | | | 549,457 | |
| | | | | |
| |
| Luxembourg (1.3%) | | | | |
| | 5,100 | | | Tenaris SA ADR | | | 143,820 | |
| | | | | |
| | | | Total | | | 143,820 | |
| | | | | |
| |
| Malaysia (1.9%) | | | | |
| | 89,607 | | | CIMB Group Holdings Berhad | | | 107,346 | |
| | 20,000 | | | Public Bank Berhad | | | 94,684 | |
| | | | | |
| | | | Total | | | 202,030 | |
| | | | | |
| |
| Mexico (7.8%) | | | | |
| | 3,500 | | | Fomento Economico Mexicano SAB de CV ADR | | | 334,845 | |
| | 1,100 | | | Grupo Aeroportuario del Sureste SAB de CV ADR | | | 174,900 | |
| | 56,000 | | | Grupo Financiero Banorte SAB de CV ADR | | | 330,353 | |
| | | | | |
| | | | Total | | | 840,098 | |
| | | | | |
| |
| Philippines (4.0%) | | | | |
| | 1,100 | | | Ayala Corporation | | | 18,964 | |
| | 315,000 | | | Ayala Land, Inc. | | | 235,618 | |
| | 83,000 | | | Bank of the Philippines Islands | | | 173,293 | |
| | | | | |
| | | | Total | | | 427,875 | |
| | | | | |
| |
| Poland (1.3%) | | | | |
| | 4,521 | | | Bank Pekao SA | | | 139,537 | |
| | | | | |
| | | | Total | | | 139,537 | |
| | | | | |
| |
| Portugal (1.5%) | | | | |
| | 9,200 | | | Jeronimo Martins SGPS SA | | | 158,085 | |
| | | | | |
| | | | Total | | | 158,085 | |
| | | | | |
| |
| Russia (4.5%) | | | | |
| | 5,200 | | | Lukoil ADR | | | 252,940 | |
| | 1,378 | | | Magnit PJSC | | | 231,063 | |
| | | | | |
| | | | Total | | | 484,003 | |
| | | | | |
| |
| South Africa (3.4%) | | | | |
| | 12,900 | | | Massmart Holdings, Ltd. | | | 111,801 | |
| | 11,496 | | | MTN Group, Ltd. | | | 99,295 | |
| | 28,096 | | | Truworths International, Ltd. | | | 149,066 | |
| | | | | |
| | | | Total | | | 360,162 | |
| | | | | |
| |
| South Korea (2.1%) | | | | |
| | 217 | | | Amorepacific Corporation | | | 37,878 | |
| | 296 | | | Amorepacific Group | | | 38,210 | |
| | 157 | | | E-Mart Company, Ltd. | | | 22,263 | |
| | 173 | | | NAVER Corporation | | | 129,433 | |
| | | | | |
| | | | Total | | | 227,784 | |
| | | | | |
| |
| Taiwan (5.2%) | | | | |
| | 31,000 | | | Taiwan Mobile Company, Ltd. | | | 108,464 | |
| | 75,000 | | | Taiwan Semiconductor Manufacturing Company, Ltd. | | | 450,102 | |
| | | | | |
| | | | Total | | | 558,566 | |
| | | | | |
| |
| Thailand (4.7%) | | | | |
| | 18,900 | | | Siam Cement pcl | | | 272,170 | |
| | 55,700 | | | Siam Commercial Bank pcl | | | 228,055 | |
| | | | | |
| | | | Total | | | 500,225 | |
| | | | | |
| |
| Turkey (4.6%) | | | | |
| | 62,900 | | | Akbank TAS | | | 168,330 | |
| | 9,900 | | | BIM Birlesik Magazalar AS | | | 161,391 | |
| | 59,500 | | | Turkiye Garanti Bankasi AS | | | 161,908 | |
| | | | | |
| | | | Total | | | 491,629 | |
| | | | | |
| |
| United Kingdom (2.0%) | | | | |
| | 5,100 | | | BHP Billiton plc | | | 76,921 | |
| | 16,246 | | | Standard Chartered plca | | | 141,274 | |
| | | | | |
| | | | Total | | | 218,195 | |
| | | | | |
| |
| United States (1.8%) | | | | |
| | 2,300 | | | Yum! Brands, Inc. | | | 198,444 | |
| | | | | |
| | | | Total | | | 198,444 | |
| | | | | |
| | | | Total Common Stock (cost $10,405,998) | | | 9,921,879 | |
| | | | | |
| | |
| Shares | | | Preferred Stock (4.8%) | | | |
| South Korea (4.8%) | | | | |
| | 450 | | | Samsung Electronics Company, Ltd. | | | 517,397 | |
| | | | | |
| | | | Total | | | 517,397 | |
| | | | | |
| | | | Total Preferred Stock (cost $450,504) | | | 517,397 | |
| | | | | |
The accompanying Notes to Financial Statements are an integral part of this schedule.
87
PARTNER EMERGING MARKETS EQUITY FUND
Schedule of Investments as of October 31, 2016
| | | | | | | | |
| | |
Shares or
Principal
Amount | | | Short-Term Investments (2.0%)b | | Value | |
| | 21,457 | | | Thrivent Core Short-Term Reserve Fund 0.790% | | | $214,568 | |
| | | | | |
| | | | Total Short-Term Investments (cost $214,568) | | | 214,568 | |
| | | | | |
| | | | Total Investments (cost $11,071,070) 99.2% | | | $10,653,844 | |
| | | | | |
| | | | Other Assets and Liabilities, Net 0.8% | | | 82,137 | |
| | | | | |
| | | | Total Net Assets 100.0% | | | $10,735,981 | |
| | | | | |
| a | Non-income producing security. |
| b | The interest rate shown reflects the yield, coupon rate or the discount rate at the date of purchase. |
Definitions:
| | | | |
ADR | | - | | American Depositary Receipt, which are certificates for an underlying foreign security’s shares held by an issuing U.S. depository bank. |
GDR | | - | | Global Depository Receipts, which are certificates for shares of an underlying foreign security’s shares held by an issuing depository bank from more than one country. |
| | | | |
Unrealized Appreciation (Depreciation) | | | | |
Gross unrealized appreciation and depreciation of investments, based on cost for federal income tax purposes, were as follows: | | | | |
Gross unrealized appreciation | | | $775,300 | |
Gross unrealized depreciation | | | (1,193,599 | ) |
| | | | |
Net unrealized appreciation (depreciation) | | | $(418,299 | ) |
| |
Cost for federal income tax purposes | | | $11,072,143 | |
The accompanying Notes to Financial Statements are an integral part of this schedule.
88
PARTNER EMERGING MARKETS EQUITY FUND
Schedule of Investments as of October 31, 2016
Fair Valuation Measurements
The following table is a summary of the inputs used, as of October 31, 2016, in valuing Partner Emerging Markets Equity Fund’s assets carried at fair value.
| | | | | | | | | | | | | | | | |
| Investments in Securities | | Total | | | Level 1 | | | Level 2 | | | Level 3 | |
| | | | |
Common Stock | | | | | | | | | | | | | | | | |
Consumer Discretionary | | | 1,000,178 | | | | 198,444 | | | | 801,734 | | | | – | |
Consumer Staples | | | 1,602,801 | | | | 334,845 | | | | 1,267,956 | | | | – | |
Energy | | | 793,727 | | | | 143,820 | | | | 649,907 | | | | – | |
Financials | | | 3,135,860 | | | | 949,886 | | | | 2,185,974 | | | | – | |
Health Care | | | 139,536 | | | | – | | | | 139,536 | | | | – | |
Industrials | | | 174,900 | | | | 174,900 | | | | – | | | | – | |
Information Technology | | | 793,175 | | | | 213,640 | | | | 579,535 | | | | – | |
Materials | | | 1,137,852 | | | | 490,410 | | | | 647,442 | | | | – | |
Real Estate | | | 621,040 | | | | – | | | | 621,040 | | | | – | |
Telecommunications Services | | | 522,810 | | | | – | | | | 522,810 | | | | – | |
| | | | |
Preferred Stock | | | | | | | | | | | | | | | | |
Information Technology | | | 517,397 | | | | – | | | | 517,397 | | | | – | |
| |
Subtotal Investments in Securities | | | $10,439,276 | | | | $2,505,945 | | | | $7,933,331 | | | | $– | |
| |
| | | | |
| Other Investments* | | Total | | | | | | | | | | |
Short-Term Investments | | | 214,568 | | | | | | | | | | | | | |
| | | | | | | | | | | | | |
Subtotal Other Investments | | | $214,568 | | | | | | | | | | | | | |
| | | | | | | | | | | | | |
| | | | | | | | | | | | | | | | |
| | | | | | | | | | | | | |
Total Investments at Value | | | $10,653,844 | | | | | | | | | | | | | |
| | | | | | | | | | | | | |
| * | Certain investments are measured at fair value using a net asset value per share that is not publicly available (practical expedient). According to disclosure requirements of Accounting Standards Codification (ASC) 820, Fair Value Measurement, securities valued using the practical expedient are not classified in the fair value hierarchy. The fair value amounts presented in this table are intended to permit reconciliation of the fair value hierarchy to the amounts presented in the Statement of Assets and Liabilities. |
There were no significant transfers between Levels during the period ended October 31, 2016. Transfers between Levels are identified as of the end of the period.
Investment in Affiliates
Affiliated issuers, as defined under the Investment Company Act of 1940, include those in which the Fund’s holdings of an issuer represent 5% or more of the outstanding voting securities of an issuer, any affiliated mutual fund, or a company which is under common ownership or control with the Fund. The Fund owns shares of Thrivent Core Short-Term Reserve Fund primarily to serve as a cash sweep vehicle for the Fund. Thrivent Core Short-Term Reserve Fund is established for the sole use of affiliated funds.
A summary of transactions for the fiscal year to date, in Partner Emerging Markets Equity Fund, is as follows:
| | | | | | | | | | | | | | | | | | | | | | | | |
| Fund | | Value
October 31,
2015 | | | Gross Purchases | | | Gross Sales | | | Shares Held at
October 31,
2016 | | | Value
October 31,
2016 | | | Income Earned
November 1,
2015 -
October 31,
2016 | |
Cash Management Trust- Short Term Investment | | | $210,247 | | | | $720,449 | | | | $930,696 | | | | – | | | | $– | | | | $131 | |
Core Short-Term Reserve | | | – | | | | 1,360,341 | | | | 1,145,773 | | | | 21,457 | | | | 214,568 | | | | 548 | |
Total Value and Income Earned | | | $210,247 | | | | | | | | | | | | | | | | $214,568 | | | | $679 | |
The accompanying Notes to Financial Statements are an integral part of this schedule.
89
SMALL CAP STOCK FUND
Schedule of Investments as of October 31, 2016
| | | | | | | | |
| Shares | | | Common Stock (94.6%) | | Value | |
| Consumer Discretionary (7.9%) | | | | |
| | 79,234 | | | Aaron’s, Inc. | | | $1,957,872 | |
| | 77,306 | | | Cedar Fair, LP | | | 4,394,846 | |
| | 129,447 | | | Core-Mark Holding Company, Inc. | | | 4,575,952 | |
| | 56,510 | | | G-III Apparel Group, Ltd.a | | | 1,476,041 | |
| | 183,110 | | | Houghton Mifflin Harcourt Companya | | | 2,316,342 | |
| | 109,847 | | | MDC Partners, Inc.b | | | 928,207 | |
| | 292,760 | | | Nutrisystem, Inc. | | | 9,280,492 | |
| | 46,970 | | | Oxford Industries, Inc. | | | 2,945,958 | |
| | 50,780 | | | Papa John’s International, Inc. | | | 3,831,351 | |
| | 67,300 | | | Penn National Gaming, Inc.a | | | 870,189 | |
| | 384,675 | | | Tuesday Morning Corporationa | | | 1,904,141 | |
| | 35,110 | | | Zoe’s Kitchen, Inc.a,b | | | 795,944 | |
| | | | | |
| | | | Total | | | 35,277,335 | |
| | | | | |
| |
| Consumer Staples (1.9%) | | | | |
| | 29,190 | | | AdvancePierre Foods Holdings, Inc. | | | 816,152 | |
| | 25,255 | | | Casey’s General Stores, Inc. | | | 2,853,562 | |
| | 89,740 | | | WhiteWave Foods Companya | | | 4,889,933 | |
| | | | | |
| | | | Total | | | 8,559,647 | |
| | | | | |
| |
| Energy (4.5%) | | | | |
| | 450,300 | | | Callon Petroleum Companya | | | 5,849,397 | |
| | 94,090 | | | Parsley Energy, Inc.a | | | 3,095,561 | |
| | 120,490 | | | RPC, Inc.b | | | 2,080,862 | |
| | 40,000 | | | RSP Permian, Inc.a | | | 1,444,000 | |
| | 62,470 | | | U.S. Silica Holdings, Inc. | | | 2,885,489 | |
| | 451,795 | | | WPX Energy, Inc.a | | | 4,906,494 | |
| | | | | |
| | | | Total | | | 20,261,803 | |
| | | | | |
| |
| Financials (22.3%) | | | | |
| | 87,690 | | | Allied World Assurance Company Holdings AG | | | 3,768,916 | |
| | 130,085 | | | Ameris Bancorp | | | 4,722,086 | |
| | 98,980 | | | Argo Group International Holdings, Ltd. | | | 5,503,288 | |
| | 241,349 | | | Assured Guaranty, Ltd. | | | 7,213,922 | |
| | 213,730 | | | BancorpSouth, Inc. | | | 5,022,655 | |
| | 114,992 | | | Chemical Financial Corporation | | | 4,938,906 | |
| | 256,426 | | | CoBiz Financial, Inc. | | | 3,261,739 | |
| | 367,230 | | | Hanmi Financial Corporation | | | 9,180,750 | |
| | 214,609 | | | Hope Bancorp, Inc. | | | 3,463,789 | |
| | 154,541 | | | Horace Mann Educators Corporation | | | 5,555,749 | |
| | 156,830 | | | Houlihan Lokey, Inc. | | | 3,821,947 | |
| | 22,461 | | | Infinity Property & Casualty Corporation | | | 1,840,679 | |
| | 549,951 | | | Janus Capital Group, Inc. | | | 7,050,372 | |
| | 27,000 | | | Meta Financial Group, Inc. | | | 1,977,750 | |
| | 110,170 | | | National Bank Holdings Corporation | | | 2,681,538 | |
| | 29,960 | | | PacWest Bancorp | | | 1,299,964 | |
| | 142,710 | | | Primerica, Inc.b | | | 7,806,237 | |
| | 113,682 | | | Renasant Corporation | | | 3,835,631 | |
| | 15,600 | | | State Auto Financial Corporation | | | 357,240 | |
| | 146,075 | | | Stifel Financial Corporationa | | | 5,717,375 | |
| | 230,140 | | | Synovus Financial Corporation | | | 7,610,730 | |
| | 134,270 | | | United Community Banks, Inc. | | | 2,896,204 | |
| | | | | |
| | | | Total | | | 99,527,467 | |
| | | | | |
| |
| Health Care (11.2%) | | | | |
| | 101,690 | | | Akorn, Inc.a | | | 2,435,476 | |
| | 27,820 | | | Align Technology, Inc.a | | | 2,390,294 | |
| | 47,730 | | | Analogic Corporation | | | 3,906,700 | |
| | 231,460 | | | Catalent, Inc.a | | | 5,279,603 | |
| | 43,390 | | | Chemed Corporation | | | 6,136,214 | |
| | 44,910 | | | Heska Corporationa | | | 2,218,554 | |
| | 50,850 | | | Neurocrine Biosciences, Inc.a | | | 2,225,705 | |
| | 105,398 | | | NuVasive, Inc.a | | | 6,295,423 | |
| | 174,350 | | | Omnicell, Inc.a | | | 5,688,169 | |
| | 99,460 | | | PerkinElmer, Inc. | | | 5,061,519 | |
| | 38,150 | | | Teleflex, Inc. | | | 5,460,409 | |
| | 35,814 | | | West Pharmaceutical Services, Inc. | | | 2,722,938 | |
| | | | | |
| | | | Total | | | 49,821,004 | |
| | | | | |
| |
| Industrials (18.9%) | | | | |
| | 160,370 | | | AZZ, Inc. | | | 8,539,703 | |
| | 146,380 | | | BWX Technologies, Inc. | | | 5,741,024 | |
| | 39,844 | | | CLARCOR, Inc. | | | 2,478,695 | |
| | 59,240 | | | Curtiss-Wright Corporation | | | 5,309,089 | |
| | 55,075 | | | EMCOR Group, Inc. | | | 3,329,834 | |
| | 47,236 | | | Encore Wire Corporation | | | 1,613,109 | |
| | 172,761 | | | Granite Construction, Inc. | | | 8,492,931 | |
| | 38,261 | | | ICF International, Inc.a | | | 1,775,310 | |
| | 83,750 | | | Kirby Corporationa | | | 4,937,062 | |
| | 33,490 | | | Lindsay Corporationb | | | 2,622,267 | |
| | 85,820 | | | MRC Global, Inc.a | | | 1,264,987 | |
| | 98,084 | | | MSA Safety, Inc. | | | 5,718,297 | |
| | 96,260 | | | Oshkosh Corporation | | | 5,149,910 | |
| | 28,400 | | | Proto Labs, Inc.a | | | 1,269,480 | |
| | 248,220 | | | Raven Industries, Inc. | | | 5,324,319 | |
| | 75,840 | | | Saia, Inc.a | | | 2,703,696 | |
| | 104,660 | | | Tennant Company | | | 6,588,347 | |
| | 213,770 | | | TransUniona | | | 6,678,175 | |
| | 60,813 | | | Waste Connections, Inc. | | | 4,573,746 | |
| | | | | |
| | | | Total | | | 84,109,981 | |
| | | | | |
| |
| Information Technology (16.5%) | | | | |
| | 104,202 | | | Arista Networks, Inc.a,b | | | 8,831,120 | |
| | 251,740 | | | Booz Allen Hamilton Holding Corporation | | | 7,670,518 | |
| | 18,494 | | | CACI International, Inc.a | | | 1,809,638 | |
| | 57,200 | | | Criteo SA ADRa,b | | | 2,067,780 | |
| | 65,650 | | | Dolby Laboratories, Inc. | | | 3,124,283 | |
| | 90,257 | | | DST Systems, Inc. | | | 8,679,113 | |
| | 52,310 | | | Envestnet, Inc.a | | | 1,849,159 | |
| | 24,190 | | | Finisar Corporationa | | | 662,322 | |
| | 77,490 | | | Guidewire Software, Inc.a | | | 4,451,800 | |
| | 145,680 | | | Integrated Device Technology, Inc.a | | | 3,017,033 | |
| | 7,281 | | | Littelfuse, Inc. | | | 1,015,699 | |
| | 47,130 | | | M/A-COM Technology Solutions Holdings, Inc.a | | | 1,732,499 | |
| | 280,150 | | | Microsemi Corporationa | | | 11,802,719 | |
| | 223,090 | | | National Instruments Corporation | | | 6,266,598 | |
| | 188,004 | | | Pegasystems, Inc. | | | 5,809,324 | |
| | 23,895 | | | Q2 Holdings, Inc.a | | | 671,450 | |
| | 223,032 | | | Virtusa Corporationa | | | 4,224,226 | |
| | | | | |
| | | | Total | | | 73,685,281 | |
| | | | | |
| |
| Materials (5.4%) | | | | |
| | 63,974 | | | Balchem Corporation | | | 4,855,627 | |
| | 79,915 | | | Chemtura Corporationa | | | 2,621,212 | |
| | 53,670 | | | Materion Corporation | | | 1,626,201 | |
| | 69,060 | | | Methanex Corporation | | | 2,510,331 | |
| | 80,510 | | | Scotts Miracle-Gro Company | | | 7,092,126 | |
| | 73,720 | | | Sensient Technologies Corporation | | | 5,492,877 | |
| | | | | |
| | | | Total | | | 24,198,374 | |
| | | | | |
| |
| Real Estate (3.7%) | | | | |
| | 87,200 | | | American Assets Trust, Inc. | | | 3,462,712 | |
| | 221,777 | | | Cousins Properties, Inc. | | | 1,723,207 | |
| | 23,120 | | | Mid-America Apartment Communities, Inc. | | | 2,144,380 | |
| | 27,722 | | | Parkway, Inc.a | | | 499,551 | |
| | 43,717 | | | Pebblebrook Hotel Trust | | | 1,061,449 | |
| | 120,500 | | | Physicians Realty Trust | | | 2,382,285 | |
| | 198,030 | | | Terreno Realty Corporation | | | 5,168,583 | |
| | | | | |
| | | | Total | | | 16,442,167 | |
| | | | | |
The accompanying Notes to Financial Statements are an integral part of this schedule.
90
SMALL CAP STOCK FUND
Schedule of Investments as of October 31, 2016
| | | | | | | | |
| Shares | | | Common Stock (94.6%) | | Value | |
| Utilities (2.3%) | | | | |
| | 91,660 | | | MDU Resources Group, Inc. | | | $2,402,408 | |
| | 117,060 | | | PNM Resources, Inc. | | | 3,845,421 | |
| | 55,280 | | | Southwest Gas Corporation | | | 4,005,589 | |
| | | | | |
| | | | Total | | | 10,253,418 | |
| | | | | |
| | | | | | | | |
| | | | | |
| | | | Total Common Stock (cost $365,562,854) | | | 422,136,477 | |
| | | | | |
| | |
| Shares | | | Registered Investment Companies (3.4%) | | Value | |
| Equity Funds/ETFs (3.4%) | | | | |
| | 57,700 | | | iShares Russell 2000 Index Fundb | | | 6,837,450 | |
| | 22,330 | | | iShares Russell 2000 Value Index Fund | | | 2,266,048 | |
| | 74,730 | | | Materials Select Sector SPDR Fund | | | 3,493,628 | |
| | 47,780 | | | SPDR S&P Biotech ETFb | | | 2,682,847 | |
| | | | | |
| | | | Total | | | 15,279,973 | |
| | | | | |
| | | | | | | | |
| | | | | |
| | | | Total Registered Investment Companies (cost $14,097,048) | | | 15,279,973 | |
| | | | | |
| | |
| Shares | | | Collateral Held for Securities Loaned (6.7%) | | Value | |
| | 30,024,962 | | | Thrivent Cash Management Trust | | | 30,024,962 | |
| | | | | |
| | | | Total Collateral Held for Securities Loaned (cost $30,024,962) | | | 30,024,962 | |
| | | | | |
| | |
Shares or
Principal
Amount | | | Short-Term Investments (1.5%)c | | Value | |
| | 653,802 | | | Thrivent Core Short-Term Reserve Fund 0.790% | | | 6,538,025 | |
| | | | | |
| | | | Total Short-Term Investments (cost $6,538,025) | | | 6,538,025 | |
| | | | | |
| | | | Total Investments (cost $416,222,889) 106.2% | | | $473,979,437 | |
| | | | | |
| | | | Other Assets and Liabilities, Net (6.2%) | | | (27,516,101 | ) |
| | | | | |
| | | | Total Net Assets 100.0% | | | $446,463,336 | |
| | | | | |
| a | Non-income producing security. |
| b | All or a portion of the security is on loan. |
| c | The interest rate shown reflects the yield, coupon rate or the discount rate at the date of purchase. |
The following table presents the total amount of securities loaned with continuous maturity, by type, offset by the gross payable upon return of collateral for securities loaned by Thrivent Small Cap Stock Fund as of October 31, 2016:
| | | | |
Securities Lending Transactions | | | | |
Common Stock | | | $29,250,374 | |
| | | | |
Total lending | | | $29,250,374 | |
Gross amount payable upon return of collateral for securities loaned | | | $30,024,962 | |
| | | | |
Net amounts due to counterparty | | | $774,588 | |
| | | | |
Definitions:
| | | | |
| ADR | | - | | American Depositary Receipt, which are certificates for an underlying foreign security’s shares held by an issuing U.S. depository bank. |
| ETF | | - | | Exchange Traded Fund. |
Unrealized Appreciation (Depreciation)
Gross unrealized appreciation and depreciation of investments, based on cost for federal income tax purposes, were as follows:
| | | | |
Gross unrealized appreciation | | | $73,503,181 | |
Gross unrealized depreciation | | | (16,331,709) | |
| | | | |
Net unrealized appreciation (depreciation) | | | $57,171,472 | |
| |
Cost for federal income tax purposes | | | $416,807,965 | |
The accompanying Notes to Financial Statements are an integral part of this schedule.
91
SMALL CAP STOCK FUND
Schedule of Investments as of October 31, 2016
Fair Valuation Measurements
The following table is a summary of the inputs used, as of October 31, 2016, in valuing Small Cap Stock Fund’s assets carried at fair value.
| | | | | | | | | | | | | | | | |
| Investments in Securities | | Total | | | Level 1 | | | Level 2 | | | Level 3 | |
|
Common Stock | |
Consumer Discretionary | | | 35,277,335 | | | | 35,277,335 | | | | – | | | | – | |
Consumer Staples | | | 8,559,647 | | | | 8,559,647 | | | | – | | | | – | |
Energy | | | 20,261,803 | | | | 20,261,803 | | | | – | | | | – | |
Financials | | | 99,527,467 | | | | 99,527,467 | | | | – | | | | – | |
Health Care | | | 49,821,004 | | | | 49,821,004 | | | | – | | | | – | |
Industrials | | | 84,109,981 | | | | 84,109,981 | | | | – | | | | – | |
Information Technology | | | 73,685,281 | | | | 73,685,281 | | | | – | | | | – | |
Materials | | | 24,198,374 | | | | 24,198,374 | | | | – | | | | – | |
Real Estate | | | 16,442,167 | | | | 16,442,167 | | | | – | | | | – | |
Utilities | | | 10,253,418 | | | | 10,253,418 | | | | – | | | | – | |
Registered Investment Companies | |
Equity Funds/ETFs | | | 15,279,973 | | | | 15,279,973 | | | | – | | | | – | |
| |
Subtotal Investments in Securities | | | $437,416,450 | | | | $437,416,450 | | | | $– | | | | $– | |
| |
| | | | |
Other Investments * | | | Total | | | | | | | | | | | | | |
| | | | | | | | | | | | | |
Short-Term Investments | | | 6,538,025 | | | | | | | | | | | | | |
Collateral Held for Securities Loaned | | | 30,024,962 | | | | | | | | | | | | | |
| | | | | | | | | | | | | |
Subtotal Other Investments | | | $36,562,987 | | | | | | | | | | | | | |
| | | | | | | | | | | | | |
| | | | | | | | | | | | | |
| | | | | | | | | | | | | |
| | | | | | | | | | | | | |
Total Investments at Value | | | $473,979,437 | | | | | | | | | | | | | |
| | | | | | | | | | | | | |
| | | | | | | | | | | | | |
| * | Certain investments are measured affair value using a net asset value per share that is not publicly available (practical expedient). According to disclosure requirements of Accounting Standards Codification (ASC) 820, Fair Value Measurement, securities valued using the practical expedient are not classified in the fair value hierarchy. The fair value amounts presented in this table are intended to permit reconciliation of the fair value hierarchy to the amounts presented in the Statement of Assets and Liabilities. |
There were no significant transfers between Levels during the period ended October 31, 2016. Transfers between Levels are identified as of the end of the period.
Investment in Affiliates
Affiliated issuers, as defined under the Investment Company Act of 1940, include those in which the Fund’s holdings of an issuer represent 5% or more of the outstanding voting securities of an issuer, any affiliated mutual fund, or a company which is under common ownership or control with the Fund. The Fund owns shares of Thrivent Cash Management Trust for the purpose of securities lending and Thrivent Core Short-Term Reserve Fund primarily to serve as a cash sweep vehicle for the Fund. Thrivent Cash Management Trust and Thrivent Core Short-Term Reserve Fund are established for the sole use of affiliated funds.
A summary of transactions for the fiscal year to date, in Small CapStock Fund, is as follows:
| | | | | | | | | | | | | | | | | | | | | | | | |
| Fund | | Value
October 31, 2015 | | | Gross Purchases | | | Gross Sales | | | Shares Held at
October 31, 2016 | | | Value
October 31, 2016 | | | Income Earned
November 1, 2015 -
October 31, 2016 | |
Cash Management Trust-Collateral Investment | | | $36,769,900 | | | | $349,248,389 | | | | $355,993,327 | | | | 30,024,962 | | | | $30,024,962 | | | | $219,569 | |
Cash Management Trust-Short Term Investment | | | 2,250,791 | | | | 82,122,367 | | | | 84,373,158 | | | | – | | | | – | | | | 9,392 | |
Core Short-Term Reserve | | | – | | | | 61,061,585 | | | | 54,523,560 | | | | 653,802 | | | | 6,538,025 | | | | 27,635 | |
Total Value and Income Earned | | | $39,020,691 | | | | | | | | | | | | | | | | $36,562,987 | | | | $256,596 | |
The accompanying Notes to Financial Statements are an integral part of this schedule.
92
MID CAP STOCK FUND
Schedule of Investments as of October 31, 2016
| | | | | | | | |
| Shares | | | Common Stock (92.0%) | | Value | |
| Consumer Discretionary (11.8%) | |
| | 540,750 | | | Aramark | | | $20,132,123 | |
| | 303,550 | | | Cheesecake Factory, Inc. | | | 16,145,825 | |
| | 488,550 | | | Dish DBS Corporationa | | | 28,609,488 | |
| | 212,875 | | | Dollar Tree, Inc.a | | | 16,082,706 | |
| | 272,636 | | | Scripps Networks Interactive, Inc. | | | 17,546,853 | |
| | 305,500 | | | Tempur-Pedic International, Inc.a,b | | | 16,518,385 | |
| | 1,003,987 | | | Time, Inc. | | | 13,051,831 | |
| | 577,376 | | | Toll Brothers, Inc.a | | | 15,843,197 | |
| | 98,150 | | | Whirlpool Corporation | | | 14,704,833 | |
| | | | | |
| | | | Total | | | 158,635,241 | |
| | | | | |
|
| Consumer Staples (2.1%) | |
| | 218,750 | | | Ingredion, Inc. | | | 28,693,437 | |
| | | | | |
| | | | Total | | | 28,693,437 | |
| | | | | |
|
| Energy (5.5%) | |
| | 95,975 | | | Cimarex Energy Company | | | 12,393,252 | |
| | 362,200 | | | Continental Resources, Inc.a,b | | | 17,715,202 | |
| | 522,523 | | | Parsley Energy, Inc.a | | | 17,191,007 | |
| | 495,625 | | | Patterson-UTI Energy, Inc. | | | 11,141,650 | |
| | 501,600 | | | RPC, Inc.b | | | 8,662,632 | |
| | 605,175 | | | WPX Energy, Inc.a | | | 6,572,200 | |
| | | | | |
| | | | Total | | | 73,675,943 | |
| | | | | |
|
| Financials (16.6%) | |
| | 856,750 | | | Assured Guaranty, Ltd. | | | 25,608,257 | |
| | 455,225 | | | First Republic Bank | | | 33,882,397 | |
| | 3,665,126 | | | Huntington Bancshares, Inc. | | | 38,850,336 | |
| | 2,151,750 | | | KeyCorp | | | 30,382,710 | |
| | 178,600 | | | M&T Bank Corporation | | | 21,919,578 | |
| | 506,649 | | | Raymond James Financial, Inc. | | | 30,459,738 | |
| | 1,299,300 | | | Zions Bancorporation | | | 41,850,453 | |
| | | | | |
| | | | Total | | | 222,953,469 | |
| | | | | |
|
| Health Care (9.3%) | |
| | 163,514 | | | C.R. Bard, Inc. | | | 35,430,214 | |
| | 157,600 | | | Edwards Lifesciences Corporation | | | 15,006,672 | |
| | 821,300 | | | Hologic, Inc.a | | | 29,575,013 | |
| | 251,789 | | | Universal Health Services, Inc. | | | 30,393,450 | |
| | 107,900 | | | Waters Corporationa | | | 15,013,206 | |
| | | | | |
| | | | Total | | | 125,418,555 | |
| | | | | |
|
| Industrials (16.2%) | |
| | 302,250 | | | AGCO Corporation | | | 15,438,930 | |
| | 151,620 | | | Equifax, Inc. | | | 18,796,331 | |
| | 185,200 | | | Huntington Ingalls Industries, Inc. | | | 29,883,872 | |
| | 787,750 | | | Masco Corporation | | | 24,325,720 | |
| | 781,394 | | | Oshkosh Corporation | | | 41,804,579 | |
| | 1,039,990 | | | Southwest Airlines Company | | | 41,651,600 | |
| | 380,100 | | | United Continental Holdings, Inc.a | | | 21,373,023 | |
| | 249,550 | | | WABCO Holdings, Inc.a | | | 24,570,693 | |
| | | | | |
| | | | Total | | | 217,844,748 | |
| | | | | |
|
| Information Technology (18.9%) | |
| | 313,025 | | | Akamai Technologies, Inc.a | | | 21,745,846 | |
| | 175,100 | | | Alliance Data Systems Corporationa | | | 35,802,697 | |
| | 1,252,840 | | | Applied Materials, Inc. | | | 36,432,587 | |
| | 833,150 | | | Juniper Networks, Inc. | | | 21,945,171 | |
| | 851,187 | | | NVIDIA Corporation | | | 60,570,467 | |
| | 434,353 | | | PayPal Holdings, Inc.a | | | 18,095,146 | |
| | 435,000 | | | Red Hat, Inc.a | | | 33,690,750 | |
| | 1,105,751 | | | Teradyne, Inc. | | | 25,752,941 | |
| | | | | |
| | | | Total | | | 254,035,605 | |
| | | | | |
|
| Materials (4.0%) | |
| | 885,300 | | | Owens-Illinois, Inc.a | | | 17,086,290 | |
| | 1,321,583 | | | Steel Dynamics, Inc. | | | 36,290,669 | |
| | | | | |
| | | | Total | | | 53,376,959 | |
| | | | | |
|
| Real Estate (6.0%) | |
| | 193,600 | | | Camden Property Trust | | | 15,766,784 | |
| | 176,350 | | | Digital Realty Trust, Inc. | | | 16,476,381 | |
| | 623,400 | | | Duke Realty Corporation | | | 16,301,910 | |
| | 585 650 | | | General Growth Properties, Inc. | | | 14,611,967 | |
| | 1,089,809 | | | Host Hotels & Resorts, Inc. | | | 16,870,243 | |
| | | | | |
| | | | Total | | | 80,027,285 | |
| | | | | |
|
| Utilities (1.6%) | |
| | 512,250 | | | Public Service Enterprise Group, Inc. | | | 21,555,480 | |
| | | | | |
| | | | Total | | | 21,555,480 | |
| | | | | |
| | | | | |
| | | | | |
| | | | Total Common Stock (cost $909,179,885) | | | 1,236,216,722 | |
| | | | | |
| | |
| Shares | | | Collateral Held for Securities Loaned (2.1%) | | Value | |
| | 27,756,275 | | | Thrivent Cash Management Trust | | | 27,756,275 | |
| | | | | |
| | | | Total Collateral Held for Securities Loaned (cost $27,756,275) | | | 27,756,275 | |
| | | | | |
| | |
Shares or
Principal
Amount | | | Short-Term Investments (8.0%)c | | Value | |
| | | | Federal Home Loan Bank Discount Notes | | | | |
| | 7,700,000 | | | 0.316%, 11/1/2016 | | | 7,700,000 | |
| | 5,450,000 | | | 0.323%, 11/9/2016 | | | 5,449,760 | |
| | 3,200,000 | | | 0.325%, 11/14/2016 | | | 3,199,770 | |
| | 1,400,000 | | | 0.335%, 11/18/2016 | | | 1,399,868 | |
| | 1,700,000 | | | 0.340%, 11/25/2016 | | | 1,699,774 | |
| | 1,400,000 | | | 0.345%, 11/30/2016 | | | 1,399,775 | |
| | 17,700,000 | | | 0.351%, 12/2/2016 | | | 17,696,796 | |
| | 4,500,000 | | | 0.350%, 12/7/2016 | | | 4,499,055 | |
| | 6,462,588 | | | Thrivent Core Short-Term Reserve Fund 0.790% | | | 64,625,884 | |
| | | | | |
| | | | Total Short-Term Investments (cost $107,667,190) | | | 107,670,682 | |
| | | | | |
| | | | Total Investments (cost $1,044,603,350) 102.1% | | | $1,371,643,679 | |
| | | | | |
| | | | Other Assets and Liabilities, Net (2.1%) | | | (28,865,845 | ) |
| | | | | |
| | | | Total Net Assets 100.0% | | | $1,342,777,834 | |
| | | | | |
| a | Non-income producing security. |
| b | All or a portion of the security is on loan. |
| c | The interest rate shown reflects the yield, coupon rate or the discount rate at the date of purchase. |
The accompanying Notes to Financial Statements are an integral part of this schedule.
93
MID CAP STOCK FUND
Schedule of Investments as of October 31, 2016
The following table presents the total amount of securities loaned with continuous maturity, by type, offset by the gross payable upon return of collateral for securities loaned by Thrivent Mid Cap Stock Fund as of October 31, 2016:
Securities Lending Transactions
| | | | |
Common Stock | | $ | 26,658,099 | |
| | | | |
Total lending | | $ | 26,658,099 | |
Gross amount payable upon return of collateral for securities loaned | | $ | 27,756,275 | |
| | | | |
Net amounts due to counterparty | | $ | 1,098,176 | |
| | | | |
Unrealized Appreciation (Depreciation)
Gross unrealized appreciation and depreciation of investments, based on cost for federal income tax purposes, were as follows:
| | | | |
Gross unrealized appreciation | | | $347,094,271 | |
Gross unrealized depreciation | | | (21,019,224 | ) |
| | | | |
Net unrealized appreciation (depreciation) | | | $326,075,047 | |
| |
Cost for federal income tax purposes | | | $1,045,568,632 | |
Fair Valuation Measurements
The following table is a summary of the inputs used, as of October 31, 2016, in valuing Mid Cap Stock Fund’s assets carried at fair value.
| | | | | | | | | | | | | | | | |
| Investments in Securities | | Total | | | Level 1 | | | Level 2 | | | Level 3 | |
| | | | |
Common Stock | | | | | | | | | | | | | | | | |
Consumer Discretionary | | | 158,635,241 | | | | 158,635,241 | | | | – | | | | – | |
Consumer Staples | | | 28,693,437 | | | | 28,693,437 | | | | – | | | | – | |
Energy | | | 73,675,943 | | | | 73,675,943 | | | | – | | | | – | |
Financials | | | 222,953,469 | | | | 222,953,469 | | | | – | | | | – | |
Health Care | | | 125,418,555 | | | | 125,418,555 | | | | – | | | | – | |
Industrials | | | 217,844,748 | | | | 217,844,748 | | | | – | | | | – | |
Information Technology | | | 254,035,605 | | | | 254,035,605 | | | | – | | | | – | |
Materials | | | 53,376,959 | | | | 53,376,959 | | | | – | | | | – | |
Real Estate | | | 80,027,285 | | | | 80,027,285 | | | | – | | | | – | |
Utilities | | | 21,555,480 | | | | 21,555,480 | | | | – | | | | – | |
Short-Term Investments | | | 43,044,798 | | | | – | | | | 43,044,798 | | | | – | |
| |
Subtotal Investments in Securities | | | $1,279,261,520 | | | | $1,236,216,722 | | | | $43,044,798 | | | | $– | |
| |
| |
| | | | |
Other Investments * | | | Total | | | | | | | | | | | | | |
| | | | | | | | | | | | | |
Short-Term Investments | | | 64,625,884 | | | | | | | | | | | | | |
Collateral Held for Securities Loaned | | | 27,756,275 | | | | | | | | | | | | | |
| | | | | | | | | | | | | |
Subtotal Other Investments | | | $92,382,159 | | | | | | | | | | | | | |
| | | | | | | | | | | | | |
| | | | | | | | | | | | | |
| | | | | | | | | | | | | |
| | | | | | | | | | | | | |
Total Investments at Value | | | $1,371,643,679 | | | | | | | | | | | | | |
| | | | | | | | | | | | | |
| | | | | | | | | | | | | |
| * | Certain investments are measured at fair value using a net asset value per share that is not publicly available (practical expedient). According to disclosure requirements of Accounting Standards Codification (ASC) 820, Fair Value Measurement, securities valued using the practical expedient are not classified in the fair value hierarchy. The fair value amounts presented in this table are intended to permit reconciliation of the fair value hierarchy to the amounts presented in the Statement of Assets and Liabilities. |
There were no significant transfers between Levels during the period ended October 31, 2016. Transfers between Levels are identified as of the end of the period.
The accompanying Notes to Financial Statements are an integral part of this schedule.
94
MID CAP STOCK FUND
Schedule of Investments as of October 31, 2016
Investment in Affiliates
Affiliated issuers, as defined under the Investment Company Act of 1940, include those in which the Fund’s holdings of an issuer represent 5% or more of the outstanding voting securities of an issuer, any affiliated mutual fund, or a company which is under common ownership or control with the Fund. The Fund owns shares of Thrivent Cash Management Trust for the purpose of securities lending and Thrivent Core Short-Term Reserve Fund primarily to serve as a cash sweep vehicle for the Fund. Thrivent Cash Management Trust and Thrivent Core Short-Term Reserve Fund are established for the sole use of affiliated funds.
A summary of transactions for the fiscal year to date, in Mid Cap Stock Fund, is as follows:
| | | | | | | | | | | | | | | | | | | | | | | | |
| Fund | | Value
October 31,
2015 | | | Gross Purchases | | | Gross Sales | | | Shares Held at
October 31,
2016 | | | Value
October 31,
2016 | | | Income Earned November 1, 2015 -
October 31, 2016 | |
Cash Management Trust-Collateral Investment | | | $71,928,749 | | | | $275,773,586 | | | | $319,946,060 | | | | 27,756,275 | | | | $27,756,275 | | | | $119,082 | |
Cash Management Trust-Short Term Investment | | | 76,906,562 | | | | 73,897,198 | | | | 150,803,760 | | | | – | | | | – | | | | 62,223 | |
Core Short-Term Reserve | | | – | | | | 106,084,882 | | | | 41,458,998 | | | | 6,462,588 | | | | 64,625,884 | | | | 183,434 | |
Total Value and Income Earned | | | $148,835,311 | | | | | | | | | | | | | | | | $92,382,159 | | | | $364,739 | |
The accompanying Notes to Financial Statements are an integral part of this schedule.
95
PARTNER WORLDWIDE ALLOCATION FUND
Summary Schedule of Investments as of October 31, 2016
| | | | | | | | | | | | |
| Shares | | | Common Stock (87.5%) | | Value | | | % of Net
Assets | |
| Australia (6.2%) | |
| | 313,700 | | | Australia & New Zealand Banking Group, Ltd. | | | $6,623,900 | | | | 0.9 | % |
| | 308,300 | | | Westpac Banking Corporation | | | 7,129,415 | | | | 1.0 | % |
| | | | Other Securities^ | | | 33,099,135 | | | | 4.3 | % |
| | | | | |
| | | | Total | | | 46,852,450 | | | | | |
| | | | | |
| Austria (0.6%) | |
| | | | Other Securities^ | | | 4,497,905 | | | | 0.6 | % |
| | | | | |
| | | | Total | | | 4,497,905 | | | | | |
| | | | | |
|
| Belgium (0.9%) | |
| | | | Other Securities^ | | | 7,011,717 | | | | 0.9 | % |
| | | | | |
| | | | Total | | | 7,011,717 | | | | | |
| | | | | |
|
| Bermuda (0.1%) | |
| | | | Other Securities^ | | | 685,542 | | | | 0.1 | % |
| | | | | |
| | | | Total | | | 685,542 | | | | | |
| | | | | |
|
| Brazil (1.7%) | |
| | 306,485 | | | Banco Bradesco SA ADR | | | 3,190,509 | | | | 0.4 | % |
| | | | Other Securities^ | | | 9,374,197 | | | | 1.3 | % |
| | | | | |
| | | | Total | | | 12,564,706 | | | | | |
| | | | | |
|
| Canada (3.5%) | |
| | 65,270 | | | Transcanada Corporation | | | 2,954,741 | | | | 0.4 | % |
| | | | Other Securities^ | | | 23,782,736 | | | | 3.1 | % |
| | | | | |
| | | | Total | | | 26,737,477 | | | | | |
| | | | | |
|
| Cayman Islands (0.2%) | |
| | | | Other Securities^ | | | 1,464,648 | | | | 0.2 | % |
| | | | | |
| | | | Total | | | 1,464,648 | | | | | |
| | | | | |
|
| Chile (0.2%) | |
| | | | Other Securities^ | | | 1,565,168 | | | | 0.2 | % |
| | | | | |
| | | | Total | | | 1,565,168 | | | | | |
| | | | | |
|
| China (0.1%) | |
| | | | Other Securities^ | | | 803,977 | | | | 0.1 | % |
| | | | | |
| | | | Total | | | 803,977 | | | | | |
| | | | | |
|
| Denmark (1.5%) | |
| | 93,303 | | | Novo Nordisk AS | | | 3,323,967 | | | | 0.5 | % |
| | | | Other Securities^ | | | 7,691,266 | | | | 1.0 | % |
| | | | | |
| | | | Total | | | 11,015,233 | | | | | |
| | | | | |
|
| Faroe Islands (0.1%) | |
| | | | Other Securities^ | | | 795,066 | | | | 0.1 | % |
| | | | | |
| | | | Total | | | 795,066 | | | | | |
| | | | | |
|
| Finland (1.1%) | |
| | | | Other Securities^ | | | 8,073,644 | | | | 1.1 | % |
| | | | | |
| | | | Total | | | 8,073,644 | | | | | |
| | | | | |
|
| France (5.0%) | |
| | 153,655 | | | AXA SA | | | 3,466,829 | | | | 0.5 | % |
| | 66,300 | | | Sanofi | | | 5,159,412 | | | | 0.7 | % |
| | 162,156 | | | Total SA | | | 7,768,104 | | | | 1.0 | % |
| | 44,825 | | | Vinci SA | | | 3,246,220 | | | | 0.4 | % |
| | | | Other Securities^ | | | 18,453,132 | | | | 2.4 | % |
| | | | | |
| | | | Total | | | 38,093,697 | | | | | |
| | | | | |
|
| Germany (6.3%) | |
| | 28,800 | | | Allianz SE | | | 4,495,824 | | | | 0.6 | % |
| | 49,452 | | | SAP SE | | | 4,356,713 | | | | 0.6 | % |
| | 74,829 | | | Siemens AG | | | 8,501,917 | | | | 1.1 | % |
| | | | Other Securities^ | | | 30,472,613 | | | | 4.0 | % |
| | | | | |
| | | | Total | | | 47,827,067 | | | | | |
| | | | | |
|
| Hong Kong (3.2%) | |
| | 880,400 | | | AIA Group, Ltd. | | | 5,538,603 | | | | 0.7 | % |
| | 291,500 | | | China Mobile, Ltd. | | | 3,339,539 | | | | 0.4 | % |
| | | | Other Securities^ | | | 14,995,220 | | | | 2.1 | % |
| | | | | |
| | | | Total | | | 23,873,362 | | | | | |
| | | | | |
|
| Hungary (0.2%) | |
| | | | Other Securities^ | | | 1,417,046 | | | | 0.2 | % |
| | | | | |
| | | | Total | | | 1,417,046 | | | | | |
| | | | | |
|
| India (2.5%) | |
| | 194,191 | | | Housing Development Finance Corporation | | | 4,010,421 | | | | 0.5 | % |
| | 796,296 | | | ITC, Ltd. | | | 2,883,279 | | | | 0.4 | % |
| | 48,428 | | | Ultra Tech Cement, Ltd. | | | 2,876,935 | | | | 0.4 | % |
| | | | Other Securities^ | | | 8,970,244 | | | | 1.2 | % |
| | | | | |
| | | | Total | | | 18,740,879 | | | | | |
| | | | | |
|
| Indonesia (0.8%) | |
| | 6,836,300 | | | Astra International Tbk PT | | | 4,313,076 | | | | 0.6 | % |
| | | | Other Securities^ | | | 1,349,263 | | | | 0.2 | % |
| | | | | |
| | | | Total | | | 5,662,339 | | | | | |
| | | | | |
|
| Ireland (0.4%) | |
| | | | Other Securities^ | | | 3,357,325 | | | | 0.4 | % |
| | | | | |
| | | | Total | | | 3,357,325 | | | | | |
| | | | | |
|
| Israel (0.3%) | |
| | | | Other Securities^ | | | 2,251,228 | | | | 0.3 | % |
| | | | | |
| | | | Total | | | 2,251,228 | | | | | |
| | | | | |
|
| Italy (2.0%) | |
| | 226,298 | | | Assicurazioni Generali SPA | | | 2,923,182 | | | | 0.4 | % |
| | | | Other Securities^ | | | 12,080,227 | | | | 1.6 | % |
| | | | | |
| | | | Total | | | 15,003,409 | | | | | |
| | | | | |
|
| Japan (18.6%) | |
| | 110,600 | | | Bridgestone Corporation | | | 4,127,998 | | | | 0.5 | % |
| | 84,600 | | | Fuji Heavy Industries, Ltd. | | | 3,305,873 | | | | 0.4 | % |
| | 240,800 | | | Honda Motor Company, Ltd. | | | 7,205,127 | | | | 1.0 | % |
| | 137,600 | | | KDDI Corporation | | | 4,182,101 | | | | 0.6 | % |
| | 2,011,200 | | | Mizuho Financial Group, Inc. | | | 3,386,363 | | | | 0.5 | % |
| | 87,600 | | | Nippon Telegraph & Telephone Corporation | | | 3,883,907 | | | | 0.5 | % |
| | 119,500 | | | NTT DOCOMO, Inc. | | | 3,001,124 | | | | 0.4 | % |
| | 792,000 | | | Osaka Gas Company, Ltd. | | | 3,294,089 | | | | 0.4 | % |
| | 80,200 | | | Otsuka Holdings Company, Ltd. | | | 3,510,023 | | | | 0.5 | % |
| | 66,600 | | | Toyota Motor Corporation | | | 3,863,250 | | | | 0.5 | % |
| | | | Other Securities^ | | | 100,907,885 | | | | 13.3 | % |
| | | | | |
| | | | Total | | | 140,667,740 | | | | | |
| | | | | |
|
| Jersey (0.3%) | |
| | | | Other Securities^ | | | 2,411,696 | | | | 0.3 | % |
| | | | | |
| | | | Total | | | 2,411,696 | | | | | |
| | | | | |
|
| Luxembourg (0.8%) | |
| | | | Other Securities^ | | | 6,124,218 | | | | 0.8 | % |
| | | | | |
| | | | Total | | | 6,124,218 | | | | | |
| | | | | |
|
| Malaysia (0.2%) | |
| | | | Other Securities^ | | | 1,802,679 | | | | 0.2 | % |
| | | | | |
| | | | Total | | | 1,802,679 | | | | | |
| | | | | |
|
| Mexico (1.2%) | |
| | 38,000 | | | Fomento Economico Mexicano SAB de CV ADR | | | 3,635,460 | | | | 0.5 | % |
| | 558,813 | | | Grupo Financiero Banorte SAB de CV ADR | | | 3,296,527 | | | | 0.4 | % |
| | | | Other Securities^ | | | 2,247,994 | | | | 0.3 | % |
| | | | | |
| | | | Total | | | 9,179,981 | | | | | |
| | | | | |
The accompanying Notes to Financial Statements are an integral part of this schedule.
96
PARTNER WORLDWIDE ALLOCATION FUND
Summary Schedule of Investments as of October 31, 2016
| | | | | | | | | | | | |
| Shares | | | Common Stock (87.5%) | | Value | | | % of Net
Assets | |
| Netherlands (2.3%) | |
| | 134,790 | | | Koninklijke Ahold Delhaize NV | | | $3,074,899 | | | | 0.4 | % |
| | 78,027 | | | Unilever NV | | | 3,263,570 | | | | 0.4 | % |
| | | | Other Securities^ | | | 11,213,652 | | | | 1.5 | % |
| | | | | |
| | | | Total | | | 17,552,121 | | | | | |
| | | | | |
|
| New Zealand (<0.1%) | |
| | | | Other Securities^ | | | 266,510 | | | | <0.1 | % |
| | | | | |
| | | | Total | | | 266,510 | | | | | |
| | | | | |
|
| Norway (1.3%) | |
| | 632,299 | | | Norsk Hydro ASA | | | 2,826,845 | | | | 0.4 | % |
| | | | Other Securities^ | | | 7,190,684 | | | | 0.9 | % |
| | | | | |
| | | | Total | | | 10,017,529 | | | | | |
| | | | | |
|
| Philippines (0.6%) | |
| | | | Other Securities^ | | | 4,521,385 | | | | 0.6 | % |
| | | | | |
| | | | Total | | | 4,521,385 | | | | | |
| | | | | |
|
| Poland (0.2%) | |
| | | | Other Securities^ | | | 1,478,329 | | | | 0.2 | % |
| | | | | |
| | | | Total | | | 1,478,329 | | | | | |
| | | | | |
|
| Portugal (0.9%) | |
| | | | Other Securities^ | | | 6,856,726 | | | | 0.9 | % |
| | | | | |
| | | | Total | | | 6,856,726 | | | | | |
| | | | | |
|
| Russia (0.7%) | |
| | | | Other Securities^ | | | 5,053,310 | | | | 0.7 | % |
| | | | | |
| | | | Total | | | 5,053,310 | | | | | |
| | | | | |
|
| Singapore (0.7%) | |
| | | | Other Securities^ | | | 5,514,506 | | | | 0.7 | % |
| | | | | |
| | | | Total | | | 5,514,506 | | | | | |
| | | | | |
|
| South Africa (0.6%) | |
| | | | Other Securities^ | | | 4,162,891 | | | | 0.6 | % |
| | | | | |
| | | | Total | | | 4,162,891 | | | | | |
| | | | | |
|
| South Korea (0.3%) | |
| | | | Other Securities^ | | | 2,221,117 | | | | 0.3 | % |
| | | | | |
| | | | Total | | | 2,221,117 | | | | | |
| | | | | |
|
| Spain (1.2%) | |
| | 518,456 | | | Iberdrola SA | | | 3,528,344 | | | | 0.5 | % |
| | | | Other Securities^ | | | 5,370,364 | | | | 0.7 | % |
| | | | | |
| | | | Total | | | 8,898,708 | | | | | |
| | | | | |
|
| Sweden (1.4%) | |
| | 435,000 | | | Nordea Bank AB | | | 4,571,470 | | | | 0.6 | % |
| | | | Other Securities^ | | | 6,188,841 | | | | 0.8 | % |
| | | | | |
| | | | Total | | | 10,760,311 | | | | | |
| | | | | |
|
| Switzerland (5.9%) | |
| | 219,491 | | | ABB, Ltd. | | | 4,528,194 | | | | 0.6 | % |
| | 15,204 | | | Lonza Group AG | | | 2,869,021 | | | | 0.4 | % |
| | 122,570 | | | Nestle SA | | | 8,888,030 | | | | 1.2 | % |
| | 66,959 | | | Novartis AG | | | 4,751,918 | | | | 0.6 | % |
| | 3,300 | | | Roche Holding AG-BR | | | 766,970 | | | | 0.1 | % |
| | 30,489 | | | Roche Holding AG-Genusschein | | | 7,002,766 | | | | 0.9 | % |
| | | | Other Securities^ | | | 16,117,910 | | | | 2.1 | % |
| | | | | |
| | | | Total | | | 44,924,809 | | | | | |
| | | | | |
|
| Taiwan (0.7%) | |
| | 752,362 | | | Taiwan Semiconductor | | | | | | | | |
| | | | Manufacturing Company, Ltd. | | | 4,515,193 | | | | 0.6 | % |
| | | | Other Securities^ | | | 1,123,479 | | | | 0.1 | % |
| | | | | |
| | | | Total | | | 5,638,672 | | | | | |
| | | | | |
|
| Thailand (0.7%) | |
| | | | Other Securities^ | | | 5,203,945 | | | | 0.7 | % |
| | | | | |
| | | | Total | | | 5,203,945 | | | | | |
| | | | | |
|
| Turkey (0.7%) | |
| | | | Other Securities^ | | | 5,165,525 | | | | 0.7 | % |
| | | | | |
| | | | Total | | | 5,165,525 | | | | | |
| | | | | |
|
| United Kingdom (11.1%) | |
| | 61,100 | | | AstraZeneca plc | | | 3,421,314 | | | | 0.4 | % |
| | 82,034 | | | British American Tobacco plc | | | 4,701,630 | | | | 0.6 | % |
| | 104,896 | | | Diageo plc | | | 2,791,980 | | | | 0.4 | % |
| | 158,149 | | | GlaxoSmithKline plc | | | 3,124,139 | | | | 0.4 | % |
| | 971,942 | | | HSBC Holdings plc | | | 7,319,857 | | | | 1.0 | % |
| | 69,947 | | | Imperial Brands plc | | | 3,383,479 | | | | 0.4 | % |
| | 37,271 | | | Royal Dutch Shell plc | | | 928,700 | | | | 0.1 | % |
| | 8,879 | | | Royal Dutch Shell plc, Class A | | | 221,150 | | | | <0.1 | % |
| | 273,279 | | | Royal Dutch Shell plc, Class B | | | 7,048,581 | | | | 0.9 | % |
| | | | Other Securities^ | | | 51,175,905 | | | | 6.9 | % |
| | | | | |
| | | | Total | | | 84,116,735 | | | | | |
| | | | | |
|
| United States (0.2%) | |
| | | | Other Securities^ | | | 1,647,948 | | | | 0.2 | % |
| | | | | |
| | | | Total | | | 1,647,948 | | | | | |
| | | | | |
| | | | | | | | | | | | |
| | | | | |
| | | | Total Common Stock (cost $640,872,363) | | | 662,481,276 | | | | | |
| | | | | |
| | | |
Principal
Amount | | | Long-Term Fixed Income (9.6%) | | | | | % of Net
Assets | |
| Angola (0.1%) | |
| | | | Other Securities^ | | | 401,164 | | | | 0.1 | % |
| | | | | |
| | | | Total | | | 401,164 | | | | | |
| | | | | |
|
| Argentina (0.5%) | |
| | | | Other Securities^ | | | 3,774,487 | | | | 0.5 | % |
| | | | | |
| | | | Total | | | 3,774,487 | | | | | |
| | | | | |
|
| Armenia (<0.1%) | |
| | | | Other Securities^ | | | 221,550 | | | | <0.1 | % |
| | | | | |
| | | | Total | | | 221,550 | | | | | |
| | | | | |
|
| Azerbaijan (0.1%) | |
| | | | Other Securities^ | | | 607,179 | | | | 0.1 | % |
| | | | | |
| | | | Total | | | 607,179 | | | | | |
| | | | | |
|
| Belize (<0.1%) | |
| | | | Other Securities^ | | | 73,726 | | | | <0.1 | % |
| | | | | |
| | | | Total | | | 73,726 | | | | | |
| | | | | |
|
| Bermuda (0.1%) | |
| | | | Other Securities^ | | | 675,486 | | | | 0.1 | % |
| | | | | |
| | | | Total | | | 675,486 | | | | | |
| | | | | |
|
| Brazil (0.3%) | |
| | | | Other Securities^ | | | 2,129,200 | | | | 0.3 | % |
| | | | | |
| | | | Total | | | 2,129,200 | | | | | |
| | | | | |
|
| Bulgaria (0.2%) | |
| | | | Other Securities^ | | | 1,369,944 | | | | 0.2 | % |
| | | | | |
| | | | Total | | | 1,369,944 | | | | | |
| | | | | |
|
| Cayman Islands (0.1%) | |
| | | | Other Securities^ | | | 514,198 | | | | 0.1 | % |
| | | | | |
| | | | Total | | | 514,198 | | | | | |
| | | | | |
|
| Chile (0.2%) | |
| | | | Other Securities^ | | | 1,817,593 | | | | 0.2 | % |
| | | | | |
| | | | Total | | | 1,817,593 | | | | | |
| | | | | |
The accompanying Notes to Financial Statements are an integral part of this schedule.
97
PARTNER WORLDWIDE ALLOCATION FUND
Summary Schedule of Investments as of October 31, 2016
| | | | | | | | | | |
Principal
Amount | | Long-Term Fixed Income (9.6%) | | Value | | | % of Net
Assets | |
Colombia (0.3%) | | | | | | | | |
| | Other Securities^ | | | $2,598,101 | | | | 0.3 | % |
| | | |
| | Total | | | 2,598,101 | | | | | |
| | | |
|
Costa Rica (0.3%) | |
| | Other Securities^ | | | 2,021,248 | | | | 0.3 | % |
| | | |
| | Total | | | 2,021,248 | | | | | |
| | | |
|
Croatia (<0.1%) | |
| | Other Securities^ | | | 286,211 | | | | <0.1 | % |
| | | |
| | Total | | | 286,211 | | | | | |
| | | |
|
Dominican Republic (0.5%) | |
| | Other Securities^ | | | 3,856,542 | | | | 0.5 | % |
| | | |
| | Total | | | 3,856,542 | | | | | |
| | | |
|
Ecuador (0.1%) | |
| | Other Securities^ | | | 976,337 | | | | 0.1 | % |
| | | |
| | Total | | | 976,337 | | | | | |
| | | |
|
El Salvador (0.2%) | |
| | Other Securities^ | | | 1,058,934 | | | | 0.2 | % |
| | | |
| | Total | | | 1,058,934 | | | | | |
| | | |
|
Gabon (<0.1%) | |
| | Other Securities^ | | | 366,712 | | | | <0.1 | % |
| | | |
| | Total | | | 366,712 | | | | | |
| | | |
|
Ghana (0.1%) | |
| | Other Securities^ | | | 412,055 | | | | 0.1 | % |
| | | |
| | Total | | | 412,055 | | | | | |
| | | |
|
Guatemala (0.2%) | |
| | Other Securities^ | | | 1,592,753 | | | | 0.2 | % |
| | | |
| | Total | | | 1,592,753 | | | | | |
| | | |
|
Honduras (0.1%) | |
| | Other Securities^ | | | 781,597 | | | | 0.1 | % |
| | | |
| | Total | | | 781,597 | | | | | |
| | | |
|
Hong Kong (<0.1%) | |
| | Other Securities^ | | | 200,713 | | | | <0.1 | % |
| | | |
| | Total | | | 200,713 | | | | | |
| | | |
|
Hungary (0.3%) | |
| | Other Securities^ | | | 2,446,707 | | | | 0.3 | % |
| | | |
| | Total | | | 2,446,707 | | | | | |
| | | |
|
India (<0.1%) | |
| | Other Securities^ | | | 267,029 | | | | <0.1 | % |
| | | |
| | Total | | | 267,029 | | | | | |
| | | |
|
Indonesia (0.6%) | |
| | Other Securities^ | | | 4,895,054 | | | | 0.6 | % |
| | | |
| | Total | | | 4,895,054 | | | | | |
| | | |
|
Israel (<0.1%) | |
| | Other Securities^ | | | 166,200 | | | | <0.1 | % |
| | | |
| | Total | | | 166,200 | | | | | |
| | | |
|
Japan (0.1%) | |
| | Other Securities^ | | | 661,000 | | | | 0.1 | % |
| | | |
| | Total | | | 661,000 | | | | | |
| | | |
|
Kazakhstan (0.1%) | |
| | Other Securities^ | | | 827,035 | | | | 0.1 | % |
| | | |
| | Total | | | 827,035 | | | | | |
| | | |
|
Kenya (0.1%) | |
| | Other Securities^ | | | 428,925 | | | | 0.1 | % |
| | | |
| | Total | | | 428,925 | | | | | |
| | | |
|
Luxembourg (0.3%) | |
| | Other Securities^ | | | 2,394,122 | | | | 0.3 | % |
| | | |
| | Total | | | 2,394,122 | | | | | |
| | | |
|
Macedonia, The Former Yugoslav Republic Of (0.1%) | |
| | Other Securities^ | | | 719,739 | | | | 0.1 | % |
| | | |
| | Total | | | 719,739 | | | | | |
| | | |
|
Mauritius (0.1%) | |
| | Other Securities^ | | | 468,601 | | | | 0.1 | % |
| | | |
| | Total | | | 468,601 | | | | | |
| | | |
|
Mexico (0.9%) | |
| | Other Securities^ | | | 6,184,902 | | | | 0.9 | % |
| | | |
| | Total | | | 6,184,902 | | | | | |
| | | |
|
Mongolia (0.1%) | |
| | Other Securities^ | | | 353,025 | | | | 0.1 | % |
| | | |
| | Total | | | 353,025 | | | | | |
| | | |
|
Netherlands (0.2%) | |
| | Other Securities^ | | | 1,270,675 | | | | 0.2 | % |
| | | |
| | Total | | | 1,270,675 | | | | | |
| | | |
|
Nigeria (0.1%) | |
| | Other Securities^ | | | 397,961 | | | | 0.1 | % |
| | | |
| | Total | | | 397,961 | | | | | |
| | | |
|
Pakistan (0.1%) | |
| | Other Securities^ | | | 853,237 | | | | 0.1 | % |
| | | |
| | Total | | | 853,237 | | | | | |
| | | |
|
Panama (<0.1%) | |
| | Other Securities^ | | | 54,250 | | | | <0.1 | % |
| | | |
| | Total | | | 54,250 | | | | | |
| | | |
|
Paraguay (0.2%) | |
| | Other Securities^ | | | 1,234,091 | | | | 0.2 | % |
| | | |
| | Total | | | 1,234,091 | | | | | |
| | | |
|
Peru (0.1%) | |
| | Other Securities^ | | | 1,067,568 | | | | 0.1 | % |
| | | |
| | Total | | | 1,067,568 | | | | | |
| | | |
|
Philippines (<0.1%) | |
| | Other Securities^ | | | 367,414 | | | | <0.1 | % |
| | | |
| | Total | | | 367,414 | | | | | |
| | | |
|
Poland (0.2%) | |
| | Other Securities^ | | | 1,615,787 | | | | 0.2 | % |
| | | |
| | Total | | | 1,615,787 | | | | | |
| | | |
|
Romania (<0.1%) | |
| | Other Securities^ | | | 266,194 | | | | <0.1 | % |
| | | |
| | Total | | | 266,194 | | | | | |
| | | |
|
Russia (0.4%) | |
| | Other Securities^ | | | 3,319,174 | | �� | | 0.4 | % |
| | | |
| | Total | | | 3,319,174 | | | | | |
| | | |
|
Serbia (<0.1%) | |
| | Other Securities^ | | | 241,185 | | | | <0.1 | % |
| | | |
| | Total | | | 241,185 | | | | | |
| | | |
|
South Africa (0.2%) | |
| | Other Securities^ | | | 1,512,487 | | | | 0.2 | % |
| | | |
| | Total | | | 1,512,487 | | | | | |
| | | |
|
South Korea (<0.1%) | |
| | Other Securities^ | | | 578,206 | | | | <0.1 | % |
| | | |
| | Total | | | 578,206 | | | | | |
| | | |
The accompanying Notes to Financial Statements are an integral part of this schedule.
98
PARTNER WORLDWIDE ALLOCATION FUND
Summary Schedule of Investments as of October 31, 2016
| | | | | | | | | | |
Principal
Amount | | Long-Term Fixed Income (9.6%) | | Value | | | % of Net
Assets | |
Sri Lanka (0.2%) | | | | | | | | |
| | Other Securities^ | | | $1,277,518 | | | | 0.2 | % |
| | | |
| | Total | | | 1,277,518 | | | | | |
| | | |
| | |
Suriname (<0.1%) | | | | | | | | |
| | Other Securities^ | | | 292,639 | | | | <0.1 | % |
| | | |
| | Total | | | 292,639 | | | | | |
| | | |
| | |
Turkey (0.6%) | | | | | | | | |
| | Other Securities^ | | | 4,126,061 | | | | 0.6 | % |
| | | |
| | Total | | | 4,126,061 | | | | | |
| | | |
| | |
Ukraine (<0.1%) | | | | | | | | |
| | Other Securities^ | | | 94,189 | | | | <0.1 | % |
| | | |
| | Total | | | 94,189 | | | | | |
| | | |
| | |
United Arab Emirates (0.2%) | | | | | | | | |
| | Other Securities^ | | | 882,570 | | | | 0.2 | % |
| | | |
| | Total | | | 882,570 | | | | | |
| | | |
| | |
United States (0.3%) | | | | | | | | |
| | HSBC Bank USA NA | | | | | | | | |
| $380,000 | | 6.000%, 8/15/2040*,a | | | 365,855 | | | | 0.1 | % |
| | HSBC Bank USA NA | | | | | | | | |
| 901,000 | | 10.000%, 1/5/2017b | | | 289,756 | | | | <0.1 | % |
| | Other Securities^ | | | 2,143,237 | | | | 0.2 | % |
| | | |
| | Total | | | 2,798,848 | | | | | |
| | | |
| | |
Venezuela (0.3%) | | | | | | | | |
| | Other Securities^ | | | 2,252,118 | | | | 0.3 | % |
| | | |
| | Total | | | 2,252,118 | | | | | |
| | | |
| | |
Vietnam (0.1%) | | | | | | | | |
| | Other Securities^ | | | 439,018 | | | | 0.1 | % |
| | | |
| | Total | | | 439,018 | | | | | |
| | | |
| | |
Virgin Islands, British (<0.1%) | | | | | | | | |
| | Other Securities^ | | | 175,950 | | | | <0.1 | % |
| | | |
| | Total | | | 175,950 | | | | | |
| | | |
| | |
Zambia (0.3%) | | | | | | | | |
| | Other Securities^ | | | 1,905,072 | | | | 0.3 | % |
| | | |
| | Total | | | 1,905,072 | | | | | |
| | | |
| | | | | | | | | | |
| | | |
| | Total Long-Term Fixed Income (cost $72,402,725) | | | 72,570,281 | | | | | |
| | | |
| | | |
| Shares | | Preferred Stock (1.0%) | | | | | % of Net
Assets | |
| | |
Brazil (0.1%) | | | | | | | | |
| | Other Securities^ | | | 1,000,016 | | | | 0.1 | % |
| | | |
| | Total | | | 1,000,016 | | | | | |
| | | |
| | |
Germany (0.2%) | | | | | | | | |
| | Other Securities^ | | | 1,476,792 | | | | 0.2 | % |
| | | |
| | Total | | | 1,476,792 | | | | | |
| | | |
| | |
South Korea (0.7%) | | | | | | | | |
| 4,230 | | Samsung Electronics Company, Ltd. | | | 4,863,527 | | | | 0.7 | % |
| | | |
| | Total | | | 4,863,527 | | | | | |
| | | |
| | | | | | | | | | |
| | | |
| | Total Preferred Stock (cost $6,358,737) | | | 7,340,335 | | | | | |
| | | |
| | |
Equity Funds/ETFs (<0.1%) | | | | | | | | |
| | Other Securities^ | | | 136,455 | | | | <0.1 | % |
| | | |
| | Total | | | 136,455 | | | | | |
| | | |
| | Total Registered Investment Companies (cost $137,158) | | | 136,455 | | | | | |
| | | |
| | | |
| Shares | | Collateral Held for Securities Loaned (0.3%) | | Value | | | % of Net
Assets | |
| 2,547,690 | | Thrivent Cash Management Trust | | | 2,547,690 | | | | 0.3 | % |
| | | |
| | Total Collateral Held for Securities Loaned (cost $2,547,690) | | | 2,547,690 | | | | | |
| | | |
| | | |
Shares or
Principal
Amount | | Short-Term Investments (1.1%)c | | | | | % of Net
Assets | |
| 828,902 | | Thrivent Core Short-Term Reserve Fund 0.790% | | | 8,289,014 | | | | 1.1 | % |
| | Other Securities^ | | | 199,916 | | | | <0.1 | % |
| | | |
| | Total Short-Term Investments (cost $8,488,917) | | | 8,488,930 | | | | | |
| | | |
| | Total Investments (cost $730,807,590) 99.5% | | $ | 753,564,967 | | | | | |
| | | |
| | Other Assets and Liabilities, Net 0.5% | | | 3,686,529 | | | | | |
| | | |
| | Total Net Assets 100.0% | | $ | 757,251,496 | | | | | |
| | | |
| ^ | The Summary Schedule of Investments shows the 50 largest holdings in unaffiliated issuers, any holding or issuer that exceeds 1% of net assets and all affiliated holdings as of the report date. The remaining securities held are grouped by category as “Other securities”. |
| a | Principal amount is displayed in Brazilian Real. Security is linked to Brazilian Government Bonds due August 15, 2040. |
| b | Principal amount is displayed in Brazilian Real. Security is linked to Brazilian Government Bonds due January 1, 2017. |
| c | The interest rate shown reflects the yield, coupon rate or the discount rate at the date of purchase. |
| * | Denotes restricted securities. Restricted securities are investment securities which cannot be offered for public sale without first being registered under the Securities Act of 1933. The value of all restricted securities held in Partner Worldwide Allocation Fund as of October 31, 2016 was $3,238,051 or 0.4% of total net assets. The following table indicates the acquisition date and cost of restricted securities shown in the schedule as of October 31, 2016. |
| | | | | | | | |
| Security | | Acquisition Date | | | Cost | |
HSBC Bank USA NA, 8/15/2040 | | | 12/2/2011 | | | $ | 473,544 | |
The following table presents the total amount of securities loaned with continuous maturity, by type, offset by the gross payable upon return of collateral for securities loaned by Thrivent Partner Worldwide Allocation Fund as of October 31, 2016:
Securities Lending Transactions
| | | | |
Common Stock | | | $2,432,681 | |
| | | | |
Total lending | | | $2,432,681 | |
Gross amount payable upon return of collateral for securities loaned | | | $2,547,690 | |
| | | | |
Net amounts due to counterparty | | | $115,009 | |
| | | | |
Definitions:
| | | | |
ADR | | - | | American Depositary Receipt, which are certificates for an underlying foreign security’s shares held by an issuing U.S. depository bank. |
The accompanying Notes to Financial Statements are an integral part of this schedule.
99
PARTNER WORLDWIDE ALLOCATION FUND
Summary Schedule of Investments as of October 31, 2016
Unrealized Appreciation (Depreciation)
Gross unrealized appreciation and depreciation of investments, based on cost for federal income tax purposes, were as follows:
| | | | |
Gross unrealized appreciation | | | $64,485,579 | |
Gross unrealized depreciation | | | (43,581,633 | ) |
| | | | |
Net unrealized appreciation (depreciation) | | | $20,903,946 | |
| |
Cost for federal income tax purposes | | | $732,661,021 | |
The accompanying Notes to Financial Statements are an integral part of this schedule.
100
PARTNER WORLDWIDE ALLOCATION FUND
Summary Schedule of Investments as of October 31, 2016
Fair Valuation Measurements
The following table is a summary of the inputs used, as of October 31, 2016, in valuing Partner Worldwide Allocation Fund’s assets carried at fair value.
| | | | | | | | | | | | | | | | |
| Investments in Securities | | Total | | | Level 1 | | | Level 2 | | | Level 3 | |
| | | | |
Common Stock | | | | | | | | | | | | | | | | |
Consumer Discretionary | | | 92,717,351 | | | | 2,612,584 | | | | 90,104,767 | | | | – | |
Consumer Staples | | | 79,706,999 | | | | 3,635,460 | | | | 76,071,530 | | | | 9 | |
Energy | | | 39,071,150 | | | | 1,579,200 | | | | 37,491,950 | | | | – | |
Financials | | | 126,467,006 | | | | 4,644,820 | | | | 121,821,857 | | | | 329 | |
Health Care | | | 63,480,227 | | | | 1,477,522 | | | | 62,002,705 | | | | – | |
Industrials | | | 88,162,860 | | | | 1,685,400 | | | | 86,477,459 | | | | 1 | |
Information Technology | | | 44,620,694 | | | | – | | | | 44,620,694 | | | | – | |
Materials | | | 53,731,122 | | | | 1,014,272 | | | | 52,716,850 | | | | – | |
Real Estate | | | 29,637,343 | | | | – | | | | 29,637,343 | | | | – | |
Telecommunications Services | | | 30,765,989 | | | | – | | | | 30,765,989 | | | | – | |
Utilities | | | 14,120,535 | | | | – | | | | 14,120,535 | | | | – | |
| | | | |
Long-Term Fixed Income | | | | | | | | | | | | | | | | |
Basic Materials | | | 804,720 | | | | – | | | | 804,720 | | | | – | |
Capital Goods | | | 739,547 | | | | – | | | | 739,547 | | | | – | |
Communications Services | | | 2,976,960 | | | | – | | | | 2,976,960 | | | | – | |
Consumer Cyclical | | | 436,200 | | | | – | | | | 436,200 | | | | – | |
Consumer Non-Cyclical^ | | | 1,139,980 | | | | – | | | | 1,139,980 | | | | 0 | |
Energy | | | 8,473,500 | | | | – | | | | 8,473,500 | | | | – | |
Financials | | | 5,499,641 | | | | – | | | | 5,499,641 | | | | – | |
Foreign Government | | | 46,911,191 | | | | – | | | | 46,911,191 | | | | – | |
Technology | | | 457,637 | | | | – | | | | 457,637 | | | | – | |
Transportation | | | 744,500 | | | | – | | | | 744,500 | | | | – | |
U.S. Government and Agencies | | | 1,977,361 | | | | – | | | | 1,977,361 | | | | – | |
U.S. Municipal | | | 783,921 | | | | – | | | | 783,921 | | | | – | |
Utilities | | | 1,625,123 | | | | – | | | | 1,625,123 | | | | – | |
| | | | |
Preferred Stock | | | | | | | | | | | | | | | | |
Consumer Discretionary | | | 1,476,792 | | | | – | | | | 1,476,792 | | | | – | |
Information Technology | | | 4,863,527 | | | | – | | | | 4,863,527 | | | | – | |
Materials | | | 1,000,016 | | | | 1,000,016 | | | | – | | | | – | |
| | | | |
Registered Investment Companies | | | | | | | | | | | | | | | | |
Equity Funds/ETFs | | | 136,455 | | | | 136,455 | | | | – | | | | – | |
Short-Term Investments | | | 199,916 | | | | – | | | | 199,916 | | | | – | |
| |
Subtotal Investments in Securities | | | $742,728,263 | | | | $17,785,729 | | | | $724,942,195 | | | | $339 | |
| |
| | | | |
| Other Investments* | | Total | | | | | | | | | | |
| | | | | | | | | | | | | |
Short-Term Investments | | | 8,289,014 | | | | | | | | | | | | | |
Collateral Held for Securities Loaned | | | 2,547,690 | | | | | | | | | | | | | |
| | | | | | | | | | | | | |
Subtotal Other Investments | | | $10,836,704 | | | | | | | | | | | | | |
| | | | | | | | | | | | | |
| | | | | | | | | | | | | | | | |
| | | | | | | | | | | | | |
Total Investments at Value | | | $753,564,967 | | | | | | | | | | | | | |
| | | | | | | | | | | | | |
| * | Certain investments are measured at fair value using a net asset value per share that is not publicly available (practical expedient). According to disclosure requirements of Accounting Standards Codification (ASC) 820, Fair Value Measurement, securities valued using the expedient are not classified in the fair value hierarchy. The fair value amounts presented in this table are intended to permit reconciliation of the fair value hierarchy to the amounts presented in the Statement of Assets and Liabilities. |
| | | | | | | | | | |
| | | | |
| Other Financial Instruments | | Total | | Level 1 | | Level 2 | | Level 3 | |
| | | | |
Asset Derivatives | | | | | | | | | | |
Futures Contracts | | 151,242 | | 151,242 | | – | | | – | |
Foreign Currency Forward Contracts | | 623,340 | | – | | 623,340 | | | – | |
| |
Total Asset Derivatives | | $774,582 | | $151,242 | | $623,340 | | | $– | |
| |
| | | | |
Liability Derivatives | | | | | | | | | | |
Futures Contracts | | 213,932 | | 213,932 | | – | | | – | |
Foreign Currency Forward Contracts | | 311,732 | | – | | 311,732 | | | – | |
| |
Total Liability Derivatives | | $525,664 | | $213,932 | | $311,732 | | | $– | |
| |
There were no significant transfers between Levels during the period ended October 31, 2016. Transfers between Levels are identified as of the end of the period.
| ^ | Level 3 security in this section is fair valued at <$1. |
The accompanying Notes to Financial Statements are an integral part of this schedule.
101
PARTNER WORLDWIDE ALLOCATION FUND
Summary Schedule of Investments as of October 31, 2016
The following table presents Partner Worldwide Allocation Fund’s futures contracts held as of October 31, 2016. Investments and/or cash totaling $598,434 were pledged as the initial margin deposit for these contracts.
| | | | | | | | | | | | | | | | | | |
| Futures Contracts | | Number of
Contracts
Long/(Short) | | | Expiration Date | | Notional Principal Amount | | | Value | | | Unrealized Gain/
(Loss) | |
CBOT 10-Yr. U.S. Treasury Note | | | 50 | | | December 2016 | | | $6,534,697 | | | | $6,481,250 | | | | ($53,447 | ) |
CBOT 2-Yr. U.S. Treasury Note | | | 32 | | | December 2016 | | | 6,981,418 | | | | 6,980,500 | | | | (918 | ) |
CBOT 5-Yr. U.S. Treasury Note | | | 16 | | | December 2016 | | | 1,933,418 | | | | 1,932,751 | | | | (667 | ) |
CBOT U.S. Long Bond | | | 10 | | | December 2016 | | | 1,700,048 | | | | 1,627,188 | | | | (72,860 | ) |
CME Ultra Long Term U.S. Treasury Bond | | | 9 | | | December 2016 | | | 1,648,940 | | | | 1,583,438 | | | | (65,502 | ) |
Eurex 10-Yr. Euro BUND | | | (19 | ) | | December 2016 | | | (3,436,327 | ) | | | (3,381,602 | ) | | | 54,725 | |
Eurex 2-Yr. Euro SCHATZ | | | (11 | ) | | December 2016 | | | (1,352,936 | ) | | | (1,352,193 | ) | | | 743 | |
Eurex 30-Yr. Euro BUXL | | | (2 | ) | | December 2016 | | | (413,837 | ) | | | (395,368 | ) | | | 18,469 | |
Eurex 5-Yr. Euro BOBL | | | (11 | ) | | December 2016 | | | (1,589,762 | ) | | | (1,583,073 | ) | | | 6,689 | |
Eurex Euro STOXX 50 Index | | | 25 | | | December 2016 | | | 810,850 | | | | 837,313 | | | | 26,463 | |
FTSE 100 Index | | | 5 | | | December 2016 | | | 406,737 | | | | 423,108 | | | | 16,371 | |
ICE mini MSCI EAFE Index | | | 22 | | | December 2016 | | | 1,851,955 | | | | 1,832,270 | | | | (19,685 | ) |
SFE S&P ASX Share Price Index 200 | | | 2 | | | December 2016 | | | 197,829 | | | | 201,205 | | | | 3,376 | |
SGX MSCI Singapore Index | | | 2 | | | November 2016 | | | 45,158 | | | | 44,305 | | | | (853 | ) |
TSE Tokyo Price Index | | | 4 | | | December 2016 | | | 507,681 | | | | 532,087 | | | | 24,406 | |
Total Futures Contracts | | | | | | | | | | | | | | | | | ($62,690 | ) |
The accompanying Notes to Financial Statements are an integral part of this schedule.
102
PARTNER WORLDWIDE ALLOCATION FUND
Summary Schedule of Investments as of October 31, 2016
The following table presents Partner Worldwide Allocation Fund’s foreign currency forward contracts held as of October 31, 2016.
| | | | | | | | | | | | | | | | | | | | |
Foreign Currency
Forward Contracts | | Counterparty | | Contracts to
Deliver/Receive | | | Settlement Date | | Value on
Settlement Date | | | Value | | | Unrealized Gain/(Loss) | |
| | | | | | |
Purchases | | | | | | | | | | | | | | | | | | | | |
Argentina Peso | | HSBC | | | 882,946 | | | 12/12/2016 | | | $56,114 | | | | $56,777 | | | | $ 663 | |
Argentina Peso | | DB | | | 799,491 | | | 11/22/2016 | | | 51,249 | | | | 52,021 | | | | 772 | |
Argentina Peso | | CITI | | | 2,390,817 | | | 11/29/2016 - 12/12/2016 | | | 152,272 | | | | 153,900 | | | | 1,628 | |
Argentina Peso | | BNP | | | 13,103,550 | | | 11/14/2016 - 12/14/2016 | | | 831,408 | | | | 847,428 | | | | 16,020 | |
Brazilian Real | | CITI | | | 420,168 | | | 11/3/2016 | | | 128,000 | | | | 131,513 | | | | 3,513 | |
Brazilian Real | | MSC | | | 2,686,471 | | | 11/3/2016 | | | 820,740 | | | | 840,868 | | | | 20,128 | |
Brazilian Real | | RBC | | | 1,630,236 | | | 11/3/2016 - 12/2/2016 | | | 508,000 | | | | 508,034 | | | | 34 | |
Brazilian Real | | JPM | | | 2,116,993 | | | 11/3/2016 | | | 664,467 | | | | 662,621 | | | | (1,846 | ) |
Chinese Yuan | | SB | | | 6,791,225 | | | 12/21/2016 | | | 1,010,000 | | | | 1,000,935 | | | | (9,065 | ) |
Chinese Yuan | | JPM | | | 849,867 | | | 12/21/2016 | | | 126,000 | | | | 125,259 | | | | (741 | ) |
Chinese Yuan Offshor | | UBS | | | 2,533,119 | | | 12/21/2016 | | | 372,375 | | | | 372,251 | | | | (124 | ) |
Chinese Yuan Offshor | | SB | | | 872,756 | | | 12/21/2016 | | | 128,000 | | | | 128,255 | | | | 255 | |
Chinese Yuan Offshor | | WBC | | | 1,743,799 | | | 12/21/2016 | | | 256,000 | | | | 256,258 | | | | 258 | |
Chinese Yuan Offshor | | BNP | | | 871,268 | | | 12/21/2016 | | | 128,000 | | | | 128,036 | | | | 36 | |
Colombian Peso | | CSFB | | | 716,383,464 | | | 11/4/2016 - 11/8/2016 | | | 241,298 | | | | 238,091 | | | | (3,207 | ) |
Colombian Peso | | CITI | | | 352,041,084 | | | 11/3/2016 - 11/8/2016 | | | 120,548 | | | | 116,992 | | | | (3,556 | ) |
Colombian Peso | | RBS | | | 301,954,680 | | | 11/8/2016 | | | 102,000 | | | | 100,303 | | | | (1,697 | ) |
Czech Republic Korun | | SSB | | | 11,013,491 | | | 6/21/2017 - 9/20/2017 | | | 455,244 | | | | 454,438 | | | | (806 | ) |
Czech Republic Korun | | MSC | | | 2,676,545 | | | 9/21/2017 | | | 109,320 | | | | 110,439 | | | | 1,119 | |
Czech Republic Korun | | BOA | | | 3,046,198 | | | 6/21/2017 | | | 125,938 | | | | 125,692 | | | | (246 | ) |
Czech Republic Korun | | UBS | | | 3,044,220 | | | 6/21/2017 | | | 126,169 | | | | 125,610 | | | | (559 | ) |
Czech Republic Korun | | CITI | | | 6,106,520 | | | 6/21/2017 | | | 252,460 | | | | 251,967 | | | | (493 | ) |
Euro | | CITI | | | 1,043,606 | | | 11/10/2016 | | | 1,167,521 | | | | 1,146,018 | | | | (21,503 | ) |
Euro | | UBS | | | 20,000 | | | 12/21/2016 | | | 22,329 | | | | 22,004 | | | | (325 | ) |
Euro | | DB | | | 59,122 | | | 12/21/2016 | | | 66,382 | | | | 65,047 | | | | (1,335 | ) |
Euro | | BOA | | | 145,274 | | | 12/21/2016 | | | 160,714 | | | | 159,833 | | | | (881 | ) |
Euro | | BNP | | | 147,000 | | | 12/21/2016 | | | 164,461 | | | | 161,732 | | | | (2,729 | ) |
Euro | | SSB | | | 22,814 | | | 6/21/2017 | | | 25,614 | | | | 25,247 | | | | (367 | ) |
Euro | | HSBC | | | 406,827 | | | 11/10/2016 | | | 455,523 | | | | 446,751 | | | | (8,772 | ) |
Hungarian Forint | | MSC | | | 35,734,755 | | | 12/21/2016 | | | 130,144 | | | | 127,260 | | | | (2,884 | ) |
Indian Rupee | | CITI | | | 25,570,108 | | | 11/15/2016 | | | 382,100 | | | | 382,047 | | | | (53 | ) |
Indian Rupee | | UBS | | | 17,069,845 | | | 11/7/2016 - 11/17/2016 | | | 254,872 | | | | 255,153 | | | | 281 | |
Indian Rupee | | JPM | | | 17,181,388 | | | 11/3/2016 - 12/9/2016 | | | 255,857 | | | | 256,479 | | | | 622 | |
Indian Rupee | | SB | | | 8,575,706 | | | 11/15/2016 | | | 128,000 | | | | 128,131 | | | | 131 | |
Indian Rupee | | MSC | | | 25,563,599 | | | 11/17/2016 | | | 382,000 | | | | 381,841 | | | | (159 | ) |
Indonesian Rupiah | | MSC | | | 3,967,052,002 | | | 12/20/2016 | | | 302,229 | | | | 301,865 | | | | (364 | ) |
Indonesian Rupiah | | BNP | | | 2,202,712,549 | | | 1/9/2017 | | | 166,999 | | | | 168,816 | | | | 1,817 | |
Indonesian Rupiah | | CITI | | | 8,424,485,042 | | | 11/10/2016 - 12/16/2016 | | | 639,817 | | | | 643,256 | | | | 3,439 | |
Indonesian Rupiah | | DB | | | 2,202,712,549 | | | 11/8/2016 | | | 166,368 | | | | 168,646 | | | | 2,278 | |
Israel Shekel | | CITI | | | 482,278 | | | 12/21/2016 | | | 128,000 | | | | 125,927 | | | | (2,073 | ) |
Malaysian Ringgit | | UBS | | | 2,042,702 | | | 11/9/2016 - 11/28/2016 | | | 491,804 | | | | 486,735 | | | | (5,069 | ) |
Malaysian Ringgit | | MSC | | | 2,519,914 | | | 11/18/2016 - 11/30/2016 | | | 597,981 | | | | 600,241 | | | | 2,260 | |
Malaysian Ringgit | | JPM | | | 2,382,744 | | | 11/25/2016 - 12/1/2016 | | | 568,505 | | | | 567,555 | | | | (950 | ) |
Malaysian Ringgit | | HSBC | | | 2,590,911 | | | 11/9/2016 - 11/28/2016 | | | 625,424 | | | | 617,278 | | | | (8,146 | ) |
Malaysian Ringgit | | CITI | | | 260,931 | | | 11/14/2016 | | | 62,135 | | | | 62,175 | | | | 40 | |
Mexican Peso | | JPM | | | 4,814,190 | | | 12/21/2016 | | | 256,000 | | | | 253,300 | | | | (2,700 | ) |
Mexican Peso | | UBS | | | 2,433,626 | | | 12/21/2016 | | | 128,000 | | | | 128,046 | | | | 46 | |
Mexican Peso | | CITI | | | 8,731,148 | | | 12/21/2016 | | | 455,226 | | | | 459,392 | | | | 4,166 | |
Mexican Peso | | BNP | | | 18,368,214 | | | 12/21/2016 | | | 952,356 | | | | 966,448 | | | | 14,092 | |
Mexican Peso | | HSBC | | | 12,445,155 | | | 12/21/2016 | | | 639,000 | | | | 654,805 | | | | 15,805 | |
Mexican Peso | | BOA | | | 8,668,513 | | | 12/21/2016 | | | 450,628 | | | | 456,096 | | | | 5,468 | |
Mexican Peso | | RBS | | | 24,049,085 | | | 12/21/2016 | | | 1,270,348 | | | | 1,265,349 | | | | (4,999 | ) |
Mexican Peso | | ML | | | 3,077,360 | | | 11/30/2016 | | | 161,717 | | | | 162,262 | | | | 545 | |
Peruvian Nuevo Sol | | CITI | | | 850,682 | | | 11/23/2016 | | | 247,846 | | | | 252,255 | | | | 4,409 | |
Philippines Peso | | BNP | | | 23,393,704 | | | 11/3/2016 - 12/8/2016 | | | 483,247 | | | | 483,226 | | | | (21 | ) |
The accompanying Notes to Financial Statements are an integral part of this schedule.
103
PARTNER WORLDWIDE ALLOCATION FUND
Summary Schedule of Investments as of October 31, 2016
| | | | | | | | | | | | | | | | | | | | | | | | |
Foreign Currency
Forward Contracts | | Counterparty | | | Contracts to
Deliver/ Receive | | | Settlement Date | | | Value on
Settlement Date | | | Value | | | Unrealized Gain/(Loss) | |
| | | | | | |
Purchases | | | | | | | | | | | | | | | | | | | | | | | | |
Philippines Peso | | | UBS | | | | 23,683,325 | | | | 11/18/2016 - 12/20/2016 | | | | $492,039 | | | | $489,246 | | | | ($2,793 | ) |
Polish Zloty | | | BNP | | | | 4,486,959 | | | | 12/21/2016 | | | | 1,152,623 | | | | 1,143,365 | | | | (9,258 | ) |
Polish Zloty | | | DB | | | | 490,958 | | | | 12/21/2016 | | | | 127,927 | | | | 125,106 | | | | (2,821 | ) |
Polish Zloty | | | BOA | | | | 1,551,382 | | | | 12/21/2016 | | | | 402,799 | | | | 395,322 | | | | (7,477 | ) |
Polish Zloty | | | JPM | | | | 503,026 | | | | 12/21/2016 | | | | 127,853 | | | | 128,181 | | | | 328 | |
Polish Zloty | | | UBS | | | | 4,947,655 | | | | 12/21/2016 | | | | 1,279,686 | | | | 1,260,759 | | | | (18,927 | ) |
Polish Zloty | | | HSBC | | | | 503,666 | | | | 12/21/2016 | | | | 128,146 | | | | 128,344 | | | | 198 | |
Russian Ruble | | | CITI | | | | 32,316,937 | | | | 11/29/2016 | | | | 513,592 | | | | 507,232 | | | | (6,360 | ) |
Russian Ruble | | | UBS | | | | 7,740,282 | | | | 11/29/2016 | | | | 122,788 | | | | 121,488 | | | | (1,300 | ) |
Russian Ruble | | | CSFB | | | | 25,107,723 | | | | 11/23/2016 | | | | 397,897 | | | | 394,479 | | | | (3,418 | ) |
Singapore Dollar | | | BOA | | | | 1,057,500 | | | | 12/21/2016 | | | | 762,000 | | | | 760,683 | | | | (1,317 | ) |
Singapore Dollar | | | CITI | | | | 172,735 | | | | 12/21/2016 | | | | 127,000 | | | | 124,252 | | | | (2,748 | ) |
Singapore Dollar | | | HSBC | | | | 175,094 | | | | 12/21/2016 | | | | 128,000 | | | | 125,949 | | | | (2,051 | ) |
Singapore Dollar | | | BNP | | | | 345,023 | | | | 12/21/2016 | | | | 254,000 | | | | 248,182 | | | | (5,818 | ) |
Singapore Dollar | | | MSC | | | | 175,064 | | | | 12/21/2016 | | | | 127,000 | | | | 125,928 | | | | (1,072 | ) |
Singapore Dollar | | | JPM | | | | 688,635 | | | | 12/21/2016 | | | | 503,727 | | | | 495,350 | | | | (8,377 | ) |
South African Rand | | | MSC | | | | 8,970,605 | | | | 12/21/2016 | | | | 618,657 | | | | 658,803 | | | | 40,146 | |
South African Rand | | | CITI | | | | 2,250,462 | | | | 12/21/2016 | | | | 156,429 | | | | 165,275 | | | | 8,846 | |
South African Rand | | | JPM | | | | 726,623 | | | | 12/21/2016 | | | | 51,000 | | | | 53,363 | | | | 2,363 | |
South Korean Won | | | BOA | | | | 104,409,488 | | | | 11/14/2016 | | | | 92,850 | | | | 91,268 | | | | (1,582 | ) |
South Korean Won | | | SB | | | | 382,883,613 | | | | 11/17/2016 - 11/21/2016 | | | | 338,295 | | | | 334,720 | | | | (3,575 | ) |
South Korean Won | | | HSBC | | | | 145,408,000 | | | | 11/28/2016 | | | | 128,000 | | | | 127,134 | | | | (866 | ) |
South Korean Won | | | MSC | | | | 438,570,824 | | | | 11/17/2016 - 11/30/2016 | | | | 385,432 | | | | 383,436 | | | | (1,996 | ) |
South Korean Won | | | CITI | | | | 142,736,443 | | | | 11/14/2016 | | | | 127,000 | | | | 124,770 | | | | (2,230 | ) |
Thai Baht | | | DB | | | | 741,937 | | | | 11/10/2016 | | | | 21,119 | | | | 21,196 | | | | 77 | |
Turkish Lira | | | CITI | | | | 381,844 | | | | 12/21/2016 | | | | 126,000 | | | | 122,057 | | | | (3,943 | ) |
Turkish Lira | | | JPM | | | | 383,096 | | | | 12/21/2016 | | | | 127,000 | | | | 122,457 | | | | (4,543 | ) |
Turkish Lira | | | RBS | | | | 1,171,135 | | | | 12/21/2016 | | | | 383,000 | | | | 374,355 | | | | (8,645 | ) |
Turkish Lira | | | HSBC | | | | 396,367 | | | | 12/21/2016 | | | | 127,000 | | | | 126,699 | | | | (301 | ) |
Turkish Lira | | | MSC | | | | 800,370 | | | | 12/21/2016 | | | | 254,000 | | | | 255,839 | | | | 1,839 | |
United Arab Emirates | | | BNP | | | | 8,188,967 | | | | 12/7/2016 | | | | 2,228,048 | | | | 2,229,293 | | | | 1,245 | |
Total Purchases | | | | | | | | | | | | | | | $30,965,656 | | | | $30,933,435 | | | | ($32,221 | ) |
| | | | | | |
Sales | | | | | | | | | | | | | | | | | | | | | | | | |
Argentina Peso | | | BOA | | | | 2,269,836 | | | | 1/18/2017 | | | | $141,865 | | | | $142,805 | | | | ($940 | ) |
Brazilian Real | | | BOA | | | | 400,602 | | | | 11/3/2016 | | | | 128,000 | | | | 125,389 | | | | 2,611 | |
Brazilian Real | | | RBC | | | | 3,457,984 | | | | 11/3/2016 | | | | 1,087,000 | | | | 1,082,353 | | | | 4,647 | |
Brazilian Real | | | JPM | | | | 2,116,993 | | | | 12/2/2016 | | | | 658,679 | | | | 656,854 | | | | 1,825 | |
Brazilian Real | | | MSC | | | | 2,176,511 | | | | 11/3/2016 | | | | 669,487 | | | | 681,251 | | | | (11,764 | ) |
Chilean Peso | | | RBS | | | | 137,719,226 | | | | 11/14/2016 - 11/28/2016 | | | | 207,943 | | | | 210,541 | | | | (2,598 | ) |
Chilean Peso | | | CSFB | | | | 169,248,512 | | | | 11/25/2016 - 11/28/2016 | | | | 256,000 | | | | 258,645 | | | | (2,645 | ) |
Chilean Peso | | | HSBC | | | | 84,766,023 | | | | 11/14/2016 | | | | 127,000 | | | | 129,646 | | | | (2,646 | ) |
Chinese Yuan | | | WBC | | | | 2,366,419 | | | | 12/21/2016 | | | | 351,832 | | | | 348,778 | | | | 3,054 | |
Chinese Yuan | | | BNP | | | | 860,196 | | | | 12/21/2016 | | | | 127,000 | | | | 126,781 | | | | 219 | |
Chinese Yuan | | | HSBC | | | | 4,311,712 | | | | 12/21/2016 | | | | 637,500 | | | | 635,488 | | | | 2,012 | |
Chinese Yuan | | | CITI | | | | 3,442,247 | | | | 12/21/2016 | | | | 508,000 | | | | 507,340 | | | | 660 | |
Chinese Yuan Offshor | | | MSC | | | | 1,723,177 | | | | 12/21/2016 | | | | 254,000 | | | | 253,227 | | | | 773 | |
Colombian Peso | | | HSBC | | | | 373,291,950 | | | | 11/8/2016 | | | | 127,500 | | | | 124,000 | | | | 3,500 | |
Columbian Peso | | | CSFB | | | | 202,279,584 | | | | 11/3/2016 | | | | 67,326 | | | | 67,274 | | | | 52 | |
Czech Republic Korun | | | SSB | | | | 609,864 | | | | 6/21/2017 | | | | 25,614 | | | | 25,164 | | | | 450 | |
Euro | | | BNP | | | | 230,420 | | | | 11/10/2016 | | | | 258,790 | | | | 253,032 | | | | 5,758 | |
Euro | | | JPM | | | | 116,000 | | | | 12/21/2016 | | | | 127,853 | | | | 127,625 | | | | 228 | |
Euro | | | UBS | | | | 2,836,875 | | | | 12/21/2016 - 6/21/2017 | | | | 3,196,314 | | | | 3,121,909 | | | | 74,405 | |
Euro | | | CITI | | | | 226,587 | | | | 6/21/2017 | | | | 252,460 | | | | 250,752 | | | | 1,708 | |
Euro | | | HSBC | | | | 225,045 | | | | 11/10/2016 - 12/21/2016 | | | | 250,511 | | | | 247,371 | | | | 3,140 | |
Euro | | | DB | | | | 113,000 | | | | 12/21/2016 | | | | 127,927 | | | | 124,325 | | | | 3,602 | |
Euro | | | BOA | | | | 471,667 | | | | 12/21/2016 - 6/21/2017 | | | | 528,737 | | | | 519,663 | | | | 9,074 | |
Euro | | | WBC | | | | 5,636,010 | | | | 11/10/2016 | | | | 6,355,474 | | | | 6,189,088 | | | | 166,386 | |
The accompanying Notes to Financial Statements are an integral part of this schedule.
104
PARTNER WORLDWIDE ALLOCATION FUND
Summary Schedule of Investments as of October 31, 2016
| | | | | | | | | | | | | | | | | | | | | | |
Foreign Currency Forward Contracts | | Counterparty | | Contracts to
Deliver/Receive | | | Settlement Date | | | Value on
Settlement Date | | | Value | | | Unrealized Gain/(Loss) | |
| | | | | | |
Sales | | | | | | | | | | | | | | | | | | | | | | |
Euro | | SSB | | | 411,610 | | | | 6/21/2017 - 9/20/2017 | | | | $455,244 | | | | $455,507 | | | | ($263 | ) |
Euro | | MSC | | | 387,902 | | | | 11/10/2016 - 9/21/2017 | | | | 434,195 | | | | 427,060 | | | | 7,135 | |
Hungarian Forint | | BNP | | | 191,425,838 | | | | 12/21/2016 | | | | 690,640 | | | | 681,713 | | | | 8,927 | |
Hungarian Forint | | UBS | | | 68,842,916 | | | | 12/21/2016 | | | | 248,230 | | | | 245,166 | | | | 3,064 | |
Hungarian Forint | | BOA | | | 35,623,345 | | | | 12/21/2016 | | | | 128,052 | | | | 126,863 | | | | 1,189 | |
Indian Rupee | | JPM | | | 17,140,198 | | | | 11/3/2016 - 11/7/2016 | | | | 256,488 | | | | 256,459 | | | | 29 | |
Indian Rupee | | HSBC | | | 8,533,257 | | | | 11/17/2016 | | | | 127,000 | | | | 127,460 | | | | (460 | ) |
Indian Rupee | | UBS | | | 25,639,247 | | | | 11/15/2016 - 12/9/2016 | | | | 382,291 | | | | 382,633 | | | | (342 | ) |
Indonesian Rupiah | | BNP | | | 2,202,712,549 | | | | 11/8/2016 | | | | 168,532 | | | | 168,816 | | | | (284 | ) |
Indonesian Rupiah | | JPM | | | 3,324,571,710 | | | | 11/14/2016 | | | | 254,000 | | | | 254,347 | | | | (347 | ) |
Indonesian Rupiah | | SB | | | 1,647,131,580 | | | | 12/20/2016 | | | | 125,764 | | | | 125,335 | | | | 429 | |
Israel Shekel | | DB | | | 478,409 | | | | 12/21/2016 | | | | 127,000 | | | | 124,917 | | | | 2,083 | |
Malaysian Ringgit | | HSBC | | | 1,067,430 | | | | 11/14/2016 | | | | 255,000 | | | | 254,348 | | | | 652 | |
Mexican Peso | | HSBC | | | 19,648,443 | | | | 11/30/2016 | | | | 1,049,528 | | | | 1,036,015 | | | | 13,513 | |
Mexican Peso | | CITI | | | 9,384,764 | | | | 11/30/2016 | | | | 494,042 | | | | 494,836 | | | | (794 | ) |
Mexican Peso | | RBS | | | 7,321,220 | | | | 12/21/2016 | | | | 379,000 | | | | 385,207 | | | | (6,207 | ) |
New Taiwan Dollar | | BOA | | | 12,108,678 | | | | 11/14/2016 | | | | 382,870 | | | | 383,939 | | | | (1,069 | ) |
New Taiwan Dollar | | CITI | | | 18,656,275 | | | | 11/22/2016 | | | | 596,619 | | | | 591,754 | | | | 4,865 | |
New Taiwan Dollar | | UBS | | | 30,780,636 | | | | 11/10/2016 - 12/22/2016 | | | | 975,965 | | | | 976,719 | | | | (754 | ) |
New Taiwan Dollar | | MSC | | | 22,639,560 | | | | 11/14/2016 - 11/22/2016 | | | | 721,516 | | | | 718,010 | | | | 3,506 | |
New Taiwan Dollar | | HSBC | | | 4,115,471 | | | | 12/22/2016 | | | | 130,754 | | | | 130,657 | | | | 97 | |
Philippines Peso | | BNP | | | 11,696,852 | | | | 11/3/2016 | | | | 241,172 | | | | 241,569 | | | | (397 | ) |
Philippines Peso | | JPM | | | 6,114,059 | | | | 11/18/2016 | | | | 127,000 | | | | 126,300 | | | | 700 | |
Philippines Peso | | MSC | | | 6,209,513 | | | | 11/14/2016 | | | | 127,000 | | | | 128,264 | | | | (1,264 | ) |
Polish Zloty | | UBS | | | 86,410 | | | | 12/21/2016 | | | | 22,329 | | | | 22,019 | | | | 310 | |
Polish Zloty | | BNP | | | 7,075,373 | | | | 12/12/2016 - 12/21/2016 | | | | 1,791,504 | | | | 1,803,072 | | | | (11,568 | ) |
Polish Zloty | | BOA | | | 125,829 | | | | 12/21/2016 | | | | 32,662 | | | | 32,064 | | | | 598 | |
Polish Zloty | | DB | | | 254,758 | | | | 12/21/2016 | | | | 66,382 | | | | 64,917 | | | | 1,465 | |
Russian Ruble | | CITI | | | 7,997,634 | | | | 11/23/2016 | | | | 127,000 | | | | 125,655 | | | | 1,345 | |
Russian Ruble | | MSC | | | 14,762,190 | | | | 11/29/2016 | | | | 235,878 | | | | 231,700 | | | | 4,178 | |
Russian Ruble | | CSFB | | | 8,023,040 | | | | 11/23/2016 | | | | 128,000 | | | | 126,054 | | | | 1,946 | |
Singapore Dollar | | MSC | | | 800,745 | | | | 12/21/2016 | | | | 587,315 | | | | 575,993 | | | | 11,322 | |
Singapore Dollar | | CITI | | | 176,530 | | | | 12/21/2016 | | | | 128,000 | | | | 126,982 | | | | 1,018 | |
Singapore Dollar | | RBC | | | 302,696 | | | | 12/21/2016 | | | | 222,097 | | | | 217,736 | | | | 4,361 | |
Singapore Dollar | | SB | | | 1,130,503 | | | | 12/21/2016 | | | | 831,203 | | | | 813,195 | | | | 18,008 | |
South African Rand | | JPM | | | 1,756,642 | | | | 12/21/2016 | | | | 127,000 | | | | 129,008 | | | | (2,008 | ) |
South African Rand | | CITI | | | 1,404,149 | | | | 12/21/2016 | | | | 99,904 | | | | 103,629 | | | | (3,725 | ) |
South African Rand | | MSC | | | 7,885,323 | | | | 12/21/2016 | | | | 555,000 | | | | 579,101 | | | | (24,101 | ) |
South African Rand | | UBS | | | 706,630 | | | | 12/21/2016 | | | | 51,000 | | | | 51,895 | | | | (895 | ) |
South Korean Won | | UBS | | | 440,336,488 | | | | 11/17/2016 | | | | 386,742 | | | | 384,930 | | | | 1,812 | |
South Korean Won | | BOA | | | 144,736,806 | | | | 11/28/2016 | | | | 128,000 | | | | 126,547 | | | | 1,453 | |
South Korean Won | | CITI | | | 597,937,672 | | | | 11/21/2016 - 12/1/2016 | | | | 529,782 | | | | 522,692 | | | | 7,090 | |
South Korean Won | | SB | | | 388,540,993 | | | | 11/14/2016 - 11/21/2016 | | | | 346,850 | | | | 339,664 | | | | 7,186 | |
South Korean Won | | MSC | | | 539,724,552 | | | | 11/17/2016 | | | | 477,992 | | | | 471,813 | | | | 6,179 | |
South Korean Won | | JPM | | | 725,885,628 | | | | 11/14/2016 - 11/25/2016 | | | | 642,187 | | | | 634,611 | | | | 7,576 | |
South Korean Won | | BNP | | | 445,395,217 | | | | 11/14/2016 | | | | 391,956 | | | | 389,334 | | | | 2,622 | |
Turkish Lira | | UBS | | | 397,570 | | | | 12/21/2016 | | | | 127,000 | | | | 127,084 | | | | (84 | ) |
Turkish Lira | | RBS | | | 400,280 | | | | 12/21/2016 | | | | 128,000 | | | | 127,950 | | | | 50 | |
Turkish Lira | | MSC | | | 634,321 | | | | 12/21/2016 | | | | 203,000 | | | | 204,165 | | | | (1,165 | ) |
Turkish Lira | | HSBC | | | 797,469 | | | | 12/21/2016 | | | | 254,000 | | | | 254,911 | | | | (911 | ) |
Turkish Lira | | BOA | | | 394,533 | | | | 12/21/2016 | | | | 128,000 | | | | 126,113 | | | | 1,887 | |
Turkish Lira | | BNP | | | 1,899,640 | | | | 12/21/2016 | | | | 627,420 | | | | 607,222 | | | | 20,198 | |
Turkish Lira | | SB | | | 752,732 | | | | 12/21/2016 | | | | 242,068 | | | | 240,612 | | | | 1,456 | |
United Arab Emirates | | BNP | | | 8,188,967 | | | | 12/7/2016 | | | | 2,218,000 | | | | 2,229,293 | | | | (11,293 | ) |
Total Sales | | | | | | | | $37,186,985 | | | | $36,843,156 | | | | $343,829 | |
Net Unrealized Gain/(Loss) on Foreign Currency Forward Contracts | | | | | | | | | | | | | | | | $311,608 | |
The accompanying Notes to Financial Statements are an integral part of this schedule.
105
PARTNER WORLDWIDE ALLOCATION FUND
Summary Schedule of Investments as of October 31, 2016
| | | | | | |
| Counterparty |
BOA | | | - | | | Bank of America |
BNP | | | - | | | BNP Paribas |
CITI | | | - | | | Citibank |
CSFB | | | - | | | CS First Boston Corporation |
DB | | | - | | | Deutsche Bank |
HSBC | | | - | | | HSBC Securities, Inc. |
JPM | | | - | | | J.P. Morgan |
ML | | | - | | | Merrill Lynch |
MSC | | | - | | | Morgan Stanley & Company |
RBC | | | - | | | The Royal Bank of Canada |
RBS | | | - | | | The Royal Bank of Scotland |
SB | | | - | | | Standard Bank plc |
SSB | | | - | | | State Street Bank |
UBS | | | - | | | UBS Securities, Ltd. |
WBC | | | - | | | Westpac Banking Corporation |
The following table summarizes the fair value and Statement of Assets and Liabilities location, as of October 31, 2016, for Partner Worldwide Allocation Fund’s investments in financial derivative instruments by primary risk exposure as discussed under item (2) Significant Accounting Policies of the Notes to Financial Statements.
| | | | | | |
| Derivatives by risk category | | Statement of Assets and Liabilities Location | | Fair Value | |
| | |
Asset Derivatives | | | | | | |
| | |
Interest Rate Contracts | | | | | | |
Futures* | | Net Assets - Net unrealized appreciation/(depreciation) on Futures contracts | | | $80,626 | |
Total Interest Rate Contracts | | | | | 80,626 | |
| | |
Equity Contracts | | | | | | |
Futures* | | Net Assets - Net unrealized appreciation/(depreciation) on Futures contracts | | | 70,616 | |
Total Equity Contracts | | | | | 70,616 | |
| | |
Foreign Exchange Contracts | | | | | | |
Forward Contracts | | Net Assets - Net unrealized appreciation/(depreciation) on Foreign currency forward contracts | | | 623,340 | |
Total Foreign Exchange Contracts | | | | | 623,340 | |
| |
Total Asset Derivatives | | | | | $774,582 | |
| |
| | |
Liability Derivatives | | | | | | |
| | |
Interest Rate Contracts | | | | | | |
Futures* | | Net Assets - Net unrealized appreciation/(depreciation) on Futures contracts | | | 193,394 | |
Total Interest Rate Contracts | | | | | 193,394 | |
| | |
Equity Contracts | | | | | | |
Futures* | | Net Assets - Net unrealized appreciation/(depreciation) on Futures contracts | | | 20,538 | |
Total Equity Contracts | | | | | 20,538 | |
| | |
Foreign Exchange Contracts | | | | | | |
Forward Contracts | | Net Assets - Net unrealized appreciation/(depreciation) on Foreign currency forward contracts | | | 311,732 | |
Total Foreign Exchange Contracts | | | | | 311,732 | |
| |
Total Liability Derivatives | | | | | $525,664 | |
| |
| * | Includes cumulative appreciation/depreciation of futures contracts as reported in the Schedule of Investments. Only current day’s variation margin is reported within the Statement of Assets and Liabilities. |
The accompanying Notes to Financial Statements are an integral part of this schedule.
106
PARTNER WORLDWIDE ALLOCATION FUND
Summary Schedule of Investments as of October 31, 2016
The following table summarizes the net realized gains/(losses) and Statement of Operations location, for the period ended October 31, 2016, for Partner Worldwide Allocation Fund’s investments in financial derivative instruments by primary risk exposure.
| | | | | | |
| Derivatives by risk category | | Statement of Operations Location | | Realized Gains/(Losses)
recognized in Income | |
| | |
Interest Rate Contracts | | | | | | |
Futures | | Net realized gains/(losses) on Futures contracts | | | 227,201 | |
Total Interest Rate Contracts | | | | | 227,201 | |
| | |
Equity Contracts | | | | | | |
Futures | | Net realized gains/(losses) on Futures contracts | | | (1,159,617 | ) |
Total Equity Contracts | | | | | (1,159,617 | ) |
| | |
Foreign Exchange Contracts | | | | | | |
Forward Contracts | | Net realized gains/(losses) on Foreign currency transactions | | | (304,941 | ) |
Total Foreign Exchange Contracts | | | | | (304,941 | ) |
| |
Total | | | | | ($1,237,357 | ) |
| |
The following table summarizes the change in net unrealized appreciation/(depreciation) and Statement of Operations location, for the period ended October 31, 2016, for Partner Worldwide Allocation Fund’s investments in financial derivative instruments by primary risk exposure.
| | | | | | |
| Derivatives by risk category | | Statement of Operations Location | | Change in unrealized
appreciation/(depreciation)
recognized in Income | |
| | |
Interest Rate Contracts | | | | | | |
Futures | | Change in net unrealized appreciation/(depreciation) on Futures contracts | | | 149,274 | |
Total Interest Rate Contracts | | | | | 149,274 | |
| | |
Equity Contracts | | | | | | |
Futures | | Change in net unrealized appreciation/(depreciation) on Futures contracts | | | (91,224 | ) |
Total Equity Contracts | | | | | (91,224 | ) |
| | |
Foreign Exchange Contracts | | | | | | |
Forward Contracts | | Change in net unrealized appreciation/(depreciation) on Foreign currency forward contracts | | | 353,737 | |
Total Foreign Exchange Contracts | | | | | 353,737 | |
| |
Total | | | | | $411,787 | |
| |
The following table presents Partner Worldwide Allocation Fund’s average volume of derivative activity during the period ended October 31, 2016.
| | | | | | | | |
| Derivative Risk Category | | Futures (Notional)* | | Futures
(Percentage of
Average Net
Assets) | | Forwards (Notional)* | | Forwards
(Percentage
of Average
Net Assets) |
Equity Contracts | | $4,699,872 | | 0.6% | | N/A | | N/A |
Interest Rate Contracts | | 36,811,583 | | 5.0 | | N/A | | N/A |
Foreign Exchange Contracts | | N/A | | N/A | | $61,978,902 | | 8.4% |
| * | Notional amount represents long or short, or both, derivative positions held by the Fund. |
Investment in Affiliates
Affiliated issuers, as defined under the Investment Company Act of 1940, include those in which the Fund’s holdings of an issuer represent 5% or more of the outstanding voting securities of an issuer, any affiliated mutual fund, or a company which is under common ownership or control with the Fund. The Fund owns shares of Thrivent Cash Management Trust for the purpose of securities lending and Thrivent Core Short-Term Reserve Fund primarily to serve as a cash sweep vehicle for the Fund. Thrivent Cash Management Trust and Thrivent Core Short-Term Reserve Fund are established for the sole use of affiliated funds.
A summary of transactions for the fiscal year to date, in Partner Worldwide Allocation Fund, is as follows:
| | | | | | | | | | | | | | | | | | | | | | | | |
| Fund | | Value
October 31, 2015 | | | Gross Purchases | | | Gross Sales | | | Shares Held at
October 31, 2016 | | | Value
October 31, 2016 | | | Income Earned
November 1, 2015 -
October 31, 2016 | |
Cash Management Trust-Collateral Investment | | | $3,226,844 | | | | $50,572,998 | | | | $51,252,152 | | | | 2,547,690 | | | | $2,547,690 | | | | $67,175 | |
Cash Management Trust-Short Term Investment | | | 15,002,977 | | | | 242,333,334 | | | | 257,336,311 | | | | – | | | | – | | | | 14,175 | |
Core Short-Term Reserve | | | – | | | | 109,187,380 | | | | 100,898,366 | | | | 828,902 | | | | 8,289,014 | | | | 29,330 | |
Total Value and Income Earned | | | $18,229,821 | | | | | | | | | | | | | | | | $10,836,704 | | | | $110,680 | |
The accompanying Notes to Financial Statements are an integral part of this schedule.
107
LARGE CAP GROWTH FUND
Schedule of Investments as of October 31, 2016
| | | | | | | | |
| Shares | | | Common Stock (95.4%) | | Value | |
| Consumer Discretionary (20.0%) | | | | |
| | 75,741 | | | Amazon.com, Inc.a | | | $59,821,757 | |
| | 15,590 | | | AutoZone, Inc.a | | | 11,570,274 | |
| | 256,340 | | | Comcast Corporation | | | 15,846,939 | |
| | 162,980 | | | Home Depot, Inc. | | | 19,885,190 | |
| | 216,510 | | | Las Vegas Sands Corporation | | | 12,531,599 | |
| | 158,190 | | | Starbucks Corporation | | | 8,395,143 | |
| | 104,190 | | | Walt Disney Company | | | 9,657,371 | |
| | | | | |
| | | | Total | | | 137,708,273 | |
| | | | | |
| |
| Consumer Staples (3.7%) | | | | |
| | 194,740 | | | CVS Health Corporation | | | 16,377,634 | |
| | 114,210 | | | Walgreens Boots Alliance, Inc. | | | 9,448,593 | |
| | | | | |
| | | | Total | | | 25,826,227 | |
| | | | | |
| |
| Energy (1.8%) | | | | |
| | 74,380 | | | EQT Corporation | | | 4,909,080 | |
| | 40,930 | | | Pioneer Natural Resources Company | | | 7,327,289 | |
| | | | | |
| | | | Total | | | 12,236,369 | |
| | | | | |
| |
| Financials (1.8%) | | | | |
| | 70,830 | | | Goldman Sachs Group, Inc. | | | 12,624,739 | |
| | | | | |
| | | | Total | | | 12,624,739 | |
| | | | | |
| |
| Health Care (16.6%) | | | | |
| | 391,497 | | | Abbott Laboratories | | | 15,362,342 | |
| | 146,679 | | | Alexion Pharmaceuticals, Inc.a | | | 19,141,610 | |
| | 104,665 | | | Allergan plca | | | 21,868,705 | |
| | 223,800 | | | Celgene Corporationa | | | 22,867,884 | |
| | 320,748 | | | Gilead Sciences, Inc. | | | 23,616,675 | |
| | 149,527 | | | Vertex Pharmaceuticals, Inc.a | | | 11,343,118 | |
| | | | | |
| | | | Total | | | 114,200,334 | |
| | | | | |
| |
| Industrials (4.5%) | | | | |
| | 111,130 | | | Cummins, Inc. | | | 14,204,637 | |
| | 190,266 | | | Union Pacific Corporation | | | 16,777,656 | |
| | | | | |
| | | | Total | | | 30,982,293 | |
| | | | | |
| |
| Information Technology (47.0%) | | | | |
| | 43,803 | | | Alphabet, Inc., Class Aa | | | 35,476,050 | |
| | 34,188 | | | Alphabet, Inc., Class Ca | | | 26,821,854 | |
| | 319,374 | | | Apple, Inc. | | | 36,261,724 | |
| | 426,470 | | | Facebook, Inc.a | | | 55,863,305 | |
| | 222,960 | | | MasterCard, Inc. | | | 23,861,179 | |
| | 579,710 | | | Microsoft Corporation | | | 34,736,223 | |
| | 197,470 | | | NVIDIA Corporation | | | 14,051,965 | |
| | 542,280 | | | PayPal Holdings, Inc.a | | | 22,591,385 | |
| | 368,100 | | | Salesforce.com, Inc.a | | | 27,666,396 | |
| | 432,230 | | | Visa, Inc. | | | 35,663,297 | |
| | 209,540 | | | Xilinx, Inc. | | | 10,659,300 | |
| | | | | |
| | | | Total | | | 323,652,678 | |
| | | | | |
| | | | Total Common Stock (cost $530,610,037) | | | 657,230,913 | |
| | | | | |
| | |
Shares or
Principal
Amount | | | Short-Term Investments (4.7%)b | | Value | |
| | 3,209,014 | | | Thrivent Core Short-Term Reserve Fund 0.790% | | | 32,090,142 | |
| | | | | |
| | | | Total Short-Term Investments (cost $32,090,142) | | | 32,090,142 | |
| | | | | |
| | | | Total Investments
(cost $562,700,179) 100.1% | | | $689,321,055 | |
| | | | | |
| | | | Other Assets and Liabilities, Net (0.1%) | | | (430,215 | ) |
| | | | | |
| | | | Total Net Assets 100.0% | | | $688,890,840 | |
| | | | | |
| a | Non-income producing security. |
| b | The interest rate shown reflects the yield, coupon rate or the discount rate at the date of purchase. |
Unrealized Appreciation (Depreciation)
Gross unrealized appreciation and depreciation of investments, based on cost for federal income tax purposes, were as follows:
| | | | |
Gross unrealized appreciation | | $ | 146,066,271 | |
Gross unrealized depreciation | | | (20,660,787 | ) |
| | | | |
Net unrealized appreciation (depreciation) | | $ | 125,405,484 | |
| |
Cost for federal income tax purposes | | $ | 563,915,571 | |
The accompanying Notes to Financial Statements are an integral part of this schedule.
108
LARGE CAP GROWTH FUND
Schedule of Investments as of October 31, 2016
Fair Valuation Measurements
The following table is a summary of the inputs used, as of October 31, 2016, in valuing Large Cap Growth Fund’s assets carried at fair value.
| | | | | | | | | | | | | | | | |
| Investments in Securities | | Total | | | Level 1 | | | Level 2 | | | Level 3 | |
| | | | |
Common Stock | | | | | | | | | | | | | | | | |
Consumer Discretionary | | | 137,708,273 | | | | 137,708,273 | | | | | | | | | |
Consumer Staples | | | 25,826,227 | | | | 25,826,227 | | | | — | | | | — | |
Energy | | | 12,236,369 | | | | 12,236,369 | | | | — | | | | — | |
Financials | | | 12,624,739 | | | | 12,624,739 | | | | — | | | | — | |
Health Care | | | 114,200,334 | | | | 114,200,334 | | | | — | | | | — | |
Industrials | | | 30,982,293 | | | | 30,982,293 | | | | — | | | | — | |
Information Technology | | | 323,652,678 | | | | 323,652,678 | | | | — | | | | — | |
| |
Subtotal Investments in Securities | | | $657,230,913 | | | | $657,230,913 | | | | $— | | | | $— | |
| |
| | | | |
| Other Investments * | | Total | |
Short-Term Investments | | | 32,090,142 | |
Subtotal Other Investments | | | $32,090,142 | |
| | | | | |
Total Investments at Value | | | $689,321,055 | |
| |
| * | Certain investments are measured at fair value using a net asset value per share that is not publicly available (practical expedient). According to disclosure requirements of Accounting Standards Codification (ASC) 820, Fair Value Measurement, securities valued using the practical expedient are not classified in the fair value hierarchy. The fair value amounts presented in this table are intended to permit reconciliation of the fair value hierarchy to the amounts presented in the Statement of Assets and Liabilities. |
There were no significant transfers between Levels during the period ended October 31, 2016. Transfers between Levels are identified as of the end of the period.
The following table summarizes the net realized gains/(losses) and Statement of Operations location, for the period ended October 31, 2016, for Large Cap Growth Fund’s investments in financial derivative instruments by primary risk exposure.
| | | | |
| Derivatives by risk category | | Statement of Operations Location | | Realized Gains/(Losses)
recognized in Income |
Equity Contracts | | | | |
Futures | | Net realized gains/(losses) on Futures contracts | | (2,952,068) |
Total Equity Contracts | | | | (2,952,068) |
|
Total | | | | ($2,952,068) |
|
The following table summarizes the change in net unrealized appreciation/(depreciation) and Statement of Operations location, for the period ended October 31, 2016, for Large Cap Growth Fund’s investments in financial derivative instruments by primary risk exposure.
| | | | |
| Derivatives by risk category | | Statement of Operations Location | | Change in unrealized
appreciation/(depreciation)
recognized in Income |
Equity Contracts | | | | |
Futures | | Change in net unrealized appreciation/(depreciation) on Futures contracts | | (1,436,394) |
Total Equity Contracts | | | | (1,436,394) |
|
Total | | | | ($1,436,394) |
|
The following table presents Large Cap Growth Fund’s average volume of derivative activity during the period ended October 31, 2016.
| | | | | | | | | | | | |
| Derivative Risk Category | | | | | Futures (Notional)* | | | Futures
(Percentage
of Average
Net Assets) | |
Equity Contracts | | | | | | | $7,705,644 | | | | 1.1 | % |
| * | Notional amount represents long or short, or both, derivative positions held by the Fund. |
The accompanying Notes to Financial Statements are an integral part of this schedule.
109
LARGE CAP GROWTH FUND
Schedule of Investments as of October 31, 2016
Investment in Affiliates
Affiliated issuers, as defined under the Investment Company Act of 1940, include those in which the Fund’s holdings of an issuer represent 5% or more of the outstanding voting securities of an issuer, any affiliated mutual fund, or a company which is under common ownership or control with the Fund. The Fund owns shares of Thrivent Cash Management Trust for the purpose of securities lending and Thrivent Core Short-Term Reserve Fund primarily to serve as a cash sweep vehicle for the Fund. Thrivent Cash Management Trust and Thrivent Core Short-Term Reserve Fund are established for the sole use of affiliated funds.
A summary of transactions for the fiscal year to date, in Large Cap Growth Fund, is as follows:
| | | | | | | | | | | | | | | | | | | | | | | | |
| Fund | | Value
October 31, 2015 | | | Gross Purchases | | | Gross Sales | | | Shares Held at
October 31, 2016 | | | Value
October 31, 2016 | | | Income Earned
November 1, 2015 -
October 31, 2016 | |
Cash Management Trust-Collateral Investment | | | $20,126,400 | | | | $70,111,075 | | | | $90,237,475 | | | | – | | | | $– | | | | $5,040 | |
Cash Management Trust-Short Term Investment | | | 51,267,870 | | | | 139,416,807 | | | | 190,684,677 | | | | – | | | | – | | | | 62,309 | |
Core Short-Term Reserve | | | – | | | | 112,084,559 | | | | 79,994,417 | | | | 3,209,014 | | | | 32,090,142 | | | | 73,271 | |
Total Value and Income Earned | | | $71,394,270 | | | | | | | | | | | | | | | | $32,090,142 | | | | $140,620 | |
The accompanying Notes to Financial Statements are an integral part of this schedule.
110
LARGE CAP VALUE FUND
Schedule of Investments as of October 31, 2016
| | | | | | | | |
| Shares | | | Common Stock (97.0%) | | Value | |
| Consumer Discretionary (9.7%) | |
| | 387,500 | | | Comcast Corporation | | | $23,955,250 | |
| | 110,764 | | | Delphi Automotive plc | | | 7,207,414 | |
| | 364,389 | | | Harley-Davidson, Inc.a | | | 20,777,461 | |
| | 284,831 | | | Lowe’s Companies, Inc. | | | 18,983,986 | |
| | 131,700 | | | Scripps Networks Interactive, Inc. | | | 8,476,212 | |
| | | | | |
| | | | Total | | | 79,400,323 | |
| | | | | |
| |
| Consumer Staples (5.0%) | | | | |
| | 268,440 | | | CVS Health Corporation | | | 22,575,804 | |
| | 56,750 | | | Kimberly-Clark Corporation | | | 6,492,768 | |
| | 119,487 | | | Philip Morris International, Inc. | | | 11,523,326 | |
| | | | | |
| | | | Total | | | 40,591,898 | |
| | | | | |
| |
| Energy (11.0%) | | | | |
| | 182,501 | | | Baker Hughes, Inc. | | | 10,110,555 | |
| | 277,609 | | | Chevron Corporation | | | 29,079,543 | |
| | 256,900 | | | Devon Energy Corporation | | | 9,733,941 | |
| | 125,232 | | | EQT Corporation | | | 8,265,312 | |
| | 1,304,761 | | | Marathon Oil Corporation | | | 17,196,750 | |
| | 50,050 | | | Pioneer Natural Resources Company | | | 8,959,951 | |
| | 1,284,300 | | | Weatherford International plcb | | | 6,190,326 | |
| | | | | |
| | | | Total | | | 89,536,378 | |
| | | | | |
| |
| Financials (23.8%) | | | | |
| | 134,550 | | | American International Group, Inc. | | | 8,301,735 | |
| | 1,202,810 | | | Bank of Amerlca Corporation | | | 19,846,365 | |
| | 413,000 | | | Blackstone Group, LP | | | 10,337,390 | |
| | 109,250 | | | Capital One Financial Corporation | | | 8,088,870 | |
| | 73,967 | | | Chubb, Ltd. | | | 9,393,809 | |
| | 595,290 | | | Citigroup, Inc. | | | 29,258,503 | |
| | 219,800 | | | Comerica, Inc. | | | 11,449,382 | |
| | 620,650 | | | Fifth Third Bancorp | | | 13,505,344 | |
| | 73,200 | | | Goldman Sachs Group, Inc. | | | 13,047,168 | |
| | 37,450 | | | Intercontinental Exchange, Inc. | | | 10,126,106 | |
| | 363,910 | | | Invesco, Ltd. | | | 10,222,232 | |
| | 330,620 | | | MetLife, Inc. | | | 15,525,915 | |
| | 285,930 | | | Morgan Stanley | | | 9,598,670 | |
| | 550,300 | | | Synchrony Financial | | | 15,733,077 | |
| | 321,200 | | | Zions Bancorporation | | | 10,345,852 | |
| | | | | |
| | | | Total | | | 194,780,418 | |
| | | | | |
| |
| Health Care (12.2%) | | | | |
| | 47,898 | | | Amgen, Inc. | | | 6,761,282 | |
| | 193,050 | | | Express Scripts Holding Companyb | | | 13,011,570 | |
| | 174,433 | | | Medtronic plc | | | 14,306,995 | |
| | 522,660 | | | Merck & Company, Inc. | | | 30,690,595 | |
| | 542,700 | | | Pfizer, Inc. | | | 17,209,017 | |
| | 222,950 | | | Roche Holding AG ADR | | | 6,393,091 | |
| | 78,903 | | | UnitedHealth Group, Inc. | | | 11,151,361 | |
| | | | | |
| | | | Total | | | 99,523,911 | |
| | | | | |
| |
| Industrials (10.4%) | | | | |
| | 60,100 | | | Boeing Company | | | 8,560,043 | |
| | 321,850 | | | CSX Corporation | | | 9,819,643 | |
| | 268,300 | | | Delta Air Lines, Inc. | | | 11,206,891 | |
| | 117,303 | | | Honeywell International, Inc. | | | 12,865,793 | |
| | 169,150 | | | Ingersoll-Rand plc | | | 11,382,104 | |
| | 98,600 | | | Norfolk Southern Corporation | | | 9,169,800 | |
| | 44,600 | | | Rockwell Automation, Inc. | | | 5,339,512 | |
| | 154,450 | | | United Parcel Service, Inc. | | | 16,643,532 | |
| | | | | |
| | | | Total | | | 84,987,318 | |
| | | | | |
| |
| Information Technology (16.3%) | | | | |
| | 14,950 | | | Alphabet, Inc.b | | | 11,728,873 | |
| | 122,150 | | | Apple, Inc. | | | 13,868,911 | |
| | 1,194,280 | | | Cisco Systems, Inc. | | | 36,640,510 | |
| | 536,831 | | | Microsoft Corporation | | | 32,166,914 | |
| | 500,950 | | | Oracle Corporation | | | 19,246,499 | |
| | 276,000 | | | Texas Instruments, Inc. | | | 19,554,600 | |
| | | | | |
| | | | Total | | | 133,206,307 | |
| | | | | |
| |
| Materials (3.3%) | | | | |
| | 181,900 | | | Dow Chemical Company | | | 9,788,039 | |
| | 142,286 | | | Eastman Chemical Company | | | 10,231,786 | |
| | 299,100 | | | Mosaic Company | | | 7,037,823 | |
| | | | | |
| | | | Total | | | 27,057,648 | |
| | | | | |
| |
| Telecommunications Services (1.8%) | | | | |
| | 301,399 | | | Verizon Communications, Inc. | | | 14,497,292 | |
| | | | | |
| | | | Total | | | 14,497,292 | |
| | | | | |
| |
| Utilities (3.5%) | | | | |
| | 464,540 | | | PG&E Corporation | | | 28,857,225 | |
| | | | | |
| | | | Total | | | 28,857,225 | |
| | | | | |
| | | | | | | | |
| | | | | |
| | | | Total Common Stock (cost $628,537,352) | | | 792,438,718 | |
| | | | | |
| | |
| Shares | | | Collateral Held for Securities Loaned (0.7%) | | Value | |
| | 5,787,975 | | | Thrivent Cash Management Trust | | | 5,787,975 | |
| | | | | |
| | | | Total Collateral Held for Securities Loaned (cost $5,787,975) | | | 5,787,975 | |
| | | | | |
| | |
Shares or
Principal
Amount | | | Short-Term Investments (3.0%)c | | Value | |
| | 2,471,499 | | | Thrivent Core Short-Term Reserve Fund 0.790% | | | 24,714,989 | |
| | | | | |
| | | | Total Short-Term Investments (cost $24,714,989) | | | 24,714,989 | |
| | | | | |
| | | | Total Investments (cost $659,040,316) 100.7% | | | $822,941,682 | |
| | | | | |
| | | | Other Assets and Liabilities, Net (0.7%) | | | (5,580,388 | ) |
| | | | | |
| | | | Total Net Assets 100.0% | | | $817,361,294 | |
| | | | | |
| a | All or a portion of the security is on loan. |
| b | Non-Income producing security. |
| c | The interest rate shown reflects the yield, coupon rate or the discount rate at the date of purchase. |
The following table presents the total amount of securities loaned with continuous maturity, by type, offset by the gross payable upon return of collateral for securities loaned by Thrivent Large Cap Value Fund as of October 31, 2016:
Securities Lending Transactions
| | | | |
| Common Stock | | | $5,764,722 | |
| | | | |
| Total lending | | | $5,764,722 | |
| Gross amount payable upon return of collateral for securities loaned | | | $5,787,975 | |
| | | | |
| Net amounts due to counterparty | | | $23,253 | |
| | | | |
Definitions:
| | | | |
| ADR | | - | | American Depositary Receipt, which are certificates for an underlying foreign security’s shares held by an Issuing U.S. depository bank. |
The accompanying Notes to Financial Statements are an integral part of this schedule.
111
LARGE CAP VALUE FUND
Schedule of Investments as of October 31, 2016
Unrealized Appreciation (Depreciation)
Gross unrealized appreciation and depreciation of investments, based on cost for federal income tax purposes, were as follows:
| | | | |
Gross unrealized appreciation | | | $181,194,891 | |
Gross unrealized depreciation | | | (17,134,001 | ) |
| | | | |
Net unrealized appreciation (depreciation) | | | $164,060,890 | |
| |
Cost for federal income tax purposes | | | $658,880,792 | |
Fair Valuation Measurements
The following table is a summary of the inputs used, as of October 31, 2016, in valuing Large Cap Value Fund’s assets carried at fair value.
| | | | | | | | | | | | | | | | |
| Investments in Securities | | Total | | | Level 1 | | | Level 2 | | | Level 3 | |
Common Stock | | | | | | | | | | | | | | | | |
Consumer Discretionary | | | 79,400,323 | | | | 79,400,323 | | | | | | | | | |
Consumer Staples | | | 40,591,898 | | | | 40,591,898 | | | | – | | | | – | |
Energy | | | 89,536,378 | | | | 89,536,378 | | | | – | | | | – | |
Financials | | | 194,780,418 | | | | 194,780,418 | | | | – | | | | – | |
Health Care | | | 99,523,911 | | | | 99,523,911 | | | | – | | | | – | |
Industrials | | | 84,987,318 | | | | 84,987,318 | | | | – | | | | – | |
Information Technology | | | 133,206,307 | | | | 133,206,307 | | | | – | | | | – | |
Materials | | | 27,057,648 | | | | 27,057,648 | | | | – | | | | – | |
Telecommunications Services | | | 14,497,292 | | | | 14,497,292 | | | | – | | | | – | |
Utilities | | | 28,857,225 | | | | 28,857,225 | | | | – | | | | – | |
| |
Subtotal Investments in Securities | | | $792,438,718 | | | | $792,438,718 | | | | $– | | | | $– | |
| |
| | | | |
| Other Investments * | | Total | |
Short-Term Investments | | | 24,714,989 | |
Collateral Held for Securities Loaned | | | 5,787,975 | |
Subtotal Other Investments | | | $30,502,964 | |
| | | | | |
Total Investments at Value | | | $822,941,682 | |
| * | Certain investments are measured at fair value using a net asset value per share that is not publicly available (practical expedient). According to disclosure requirements of Accounting Standards Codification (ASC) 820, Fair Value Measurement, securities valued using the practical expedient are not classified in the fair value hierarchy. The fair value amounts presented in this table are intended to permit reconciliation of the fair value hierarchy to the amounts presented in the Statement of Assets and Liabilities. |
There were no significant transfers between Levels during the period ended October 31, 2016. Transfers between Levels are identified as of the end of the period.
The following table summarizes the net realized gains/(losses) and Statement of Operations location, for the period ended October 31, 2016, for Large Cap Value Fund’s investments in financial derivative instruments by primary risk exposure.
| | | | |
| Derivatives by risk category | | Statement of Operations Location | | Realized Gains/(Losses)
recognized in Income |
Equity Contracts | | | | |
Futures | | Net realized gains/(losses) on Futures contracts | | 150,215 |
Total Equity Contracts | | | | 150,215 |
Total | | | | $150,215 |
Investment in Affiliates
Affiliated issuers, as defined under the Investment Company Act of 1940, include those in which the Fund’s holdings of an issuer represent 5% or more of the outstanding voting securities of an issuer, any affiliated mutual fund, or a company which is under common ownership or control with the Fund. The Fund owns shares of Thrivent Cash Management Trust for the purpose of securities lending and Thrivent Core Short-Term Reserve Fund primarily to serve as a cash sweep vehicle for the Fund. Thrivent Cash Management Trust and Thrivent Core Short-Term Reserve Fund are established for the sole use of affiliated funds.
A summary of transactions for the fiscal year to date, in Large Cap Value Fund, is as follows:
| | | | | | | | | | | | | | | | | | | | | | | | |
| Fund | | Value
October 31, 2015 | | | Gross Purchases | | | Gross Sales | | | Shares Held at
October 31, 2016 | | | Value
October 31, 2016 | | | Income Earned
November 1, 2015 -
October 31, 2016 | |
Cash Management Trust-Collateral Investment | | | $1,205,820 | | | | $148,247,510 | | | | $143,665,355 | | | | 5,787,975 | | | | $5,787,975 | | | | $45,068 | |
Cash Management Trust-Short Term Investment | | | 14,270,955 | | | | 47,428,644 | | | | 61,699,599 | | | | | | | | | | | | 22,643 | |
Core Short-Term Reserve | | | – | | | | 44,022,156 | | | | 19,307,167 | | | | 2,471,499 | | | | 24,714,989 | | | | 61,582 | |
Total Value and Income Earned | | | $15,476,775 | | | | | | | | | | | | | | | | $30,502,964 | | | | $129,293 | |
The accompanying Notes to Financial Statements are an integral part of this schedule.
112
LARGE CAP STOCK FUND
Summary Schedule of Investments as of October 31, 2016
| | | | | | | | | | | | |
| Shares | | | Common Stock (84.9%) | | Value | | | % of Net
Assets | |
| Consumer Discretionary (14.2%) | |
| | 49,590 | | | Amazon.com, Inc.a | | | $39,167,174 | | | | 2.4 | % |
| | 45,670 | | | AutoZone, Inc.a | | | 33,894,447 | | | | 2.1 | % |
| | 485,430 | | | Comcast Corporation | | | 30,009,283 | | | | 1.9 | % |
| | 359,700 | | | Honda Motor Company, Ltd. | | | 10,762,809 | | | | 0.7 | % |
| | 642,460 | | | Starbucks Corporation | | | 34,095,352 | | | | 2.1 | % |
| | 116,230 | | | Walt Disney Company | | | 10,773,359 | | | | 0.7 | % |
| | | | Other Securities^ | | | 68,244,049 | | | | 4.3 | % |
| | | | | |
| | | | Total | | | 226,946,473 | | | | | |
| | | | | |
|
| Consumer Staples (6.7%) | |
| | 156,310 | | | CVS Health Corporation | | | 13,145,671 | | | | 0.8 | % |
| | 217,563 | | | Imperial Brands plc | | | 10,523,967 | | | | 0.7 | % |
| | 523,511 | | | Koninklijke Ahold Delhaize NV | | | 11,942,604 | | | | 0.8 | % |
| | 293,560 | | | Philip Morris International, Inc. | | | 28,310,926 | | | | 1.8 | % |
| | 151,600 | | | Walgreens Boots Alliance, Inc. | | | 12,541,868 | | | | 0.8 | % |
| | | | Other Securities^ | | | 30,295,601 | | | | 1.8 | % |
| | | | | |
| | | | Total | | | 106,760,637 | | | | | |
| | | | | |
|
| Energy (7.7%) | |
| | 524,220 | | | Baker Hughes, Inc. | | | 29,041,788 | | | | 1.8 | % |
| | 2,591,061 | | | BP plc | | | 15,317,655 | | | | 1.0 | % |
| | 249,564 | | | Chevron Corporation | | | 26,141,829 | | | | 1.6 | % |
| | 121,020 | | | Pioneer Natural Resources Company | | | 21,665,000 | | | | 1.4 | % |
| | | | Other Securities^ | | | 32,126,153 | | | | 1.9 | % |
| | | | | |
| | | | Total | | | 124,292,425 | | | | | |
| | | | | |
|
| Financials (13.6%) | |
| | 181,028 | | | Bank of Nova Scotia | | | 9,728,247 | | | | 0.6 | % |
| | 92,800 | | | Chubb, Ltd. | | | 11,785,600 | | | | 0.7 | % |
| | 391,040 | | | Citigroup, Inc. | | | 19,219,616 | | | | 1.2 | % |
| | 89,320 | | | Goldman Sachs Group, Inc. | | | 15,920,397 | | | | 1.0 | % |
| | 103,870 | | | Intercontinental Exchange, Inc. | | | 28,085,409 | | | | 1.8 | % |
| | 420,100 | | | Invesco, Ltd. | | | 11,800,609 | | | | 0.7 | % |
| | 349,714 | | | J.P. Morgan Chase & Company | | | 24,221,192 | | | | 1.5 | % |
| | | | Other Securities^ | | | 96,823,050 | | | | 6.1 | % |
| | | | | |
| | | | Total | | | 217,584,120 | | | | | |
| | | | | |
|
| Health Care (8.5%) | |
| | 210,540 | | | Celgene Corporationa | | | 21,512,977 | | | | 1.3 | % |
| | 76,438 | | | Essilor International SA | | | 8,589,639 | | | | 0.5 | % |
| | 168,460 | | | Gilead Sciences, Inc. | | | 12,403,710 | | | | 0.8 | % |
| | 448,500 | | | Merck & Company, Inc. | | | 26,335,920 | | | | 1.7 | % |
| | 123,800 | | | Novartis AG | | | 8,785,787 | | | | 0.6 | % |
| | 946,150 | | | Pfizer, Inc. | | | 30,002,416 | | | | 1.9 | % |
| | | | Other Securities^ | | | 29,054,590 | | | | 1.7 | % |
| | | | | |
| | | | Total | | | 136,685,039 | | | | | |
| | | | | |
|
| Industrials (10.1%) | |
| | 136,070 | | | Boeing Company | | | 19,380,450 | | | | 1.2 | % |
| | 91,900 | | | Cummins, Inc. | | | 11,746,658 | | | | 0.7 | % |
| | 405,050 | | | Delta Air Lines, Inc. | | | 16,918,938 | | | | 1.1 | % |
| | 230,570 | | | Norfolk Southern Corporation | | | 21,443,010 | | | | 1.3 | % |
| | 124,110 | | | Union Pacific Corporation | | | 10,944,020 | | | | 0.7 | % |
| | 71,380 | | | United Parcel Service, Inc. | | | 7,691,909 | | | | 0.5 | % |
| | | | Other Securities^ | | | 73,219,771 | | | | 4.6 | % |
| | | | | |
| | | | Total | | | 161,344,756 | | | | | |
| | | | | |
|
| Information Technology (13.8%) | |
| | 43,052 | | | Alphabet, Inc., Class Aa | | | 34,867,815 | | | | 2.2 | % |
| | 43,588 | | | Alphabet, Inc., Class Ca | | | 34,196,530 | | | | 2.1 | % |
| | 495,946 | | | Apple, Inc. | | | 56,309,709 | | | | 3.5 | % |
| | 362,700 | | | Cisco Systems, Inc. | | | 11,127,636 | | | | 0.7 | % |
| | 182,510 | | | Facebook, Inc.a | | | 23,906,985 | | | | 1.5 | % |
| | 382,740 | | | Microsoft Corporation | | | $22,933,781 | | | | 1.4 | % |
| | 200,380 | | | Salesforce.com, Inc.a | | | 15,060,561 | | | | 1.0 | % |
| | | | Other Securities^ | | | 23,323,566 | | | | 1.4 | % |
| | | | | |
| | | | Total | | | 221,726,583 | | | | | |
| | | | | |
|
| Materials (4.3%) | |
| | 467,378 | | | BHP Billiton, Ltd. | | | 8,165,476 | | | | 0.5 | % |
| | 262,000 | | | Dow Chemical Company | | | 14,098,220 | | | | 0.9 | % |
| | 169,780 | | | Eastman Chemical Company | | | 12,208,880 | | | | 0.8 | % |
| | | | Other Securities^ | | | 35,235,510 | | | | 2.1 | % |
| | | | | |
| | | | Total | | | 69,708,086 | | | | | |
| | | | | |
|
| Real Estate (1.5%) | |
| | | | Other Securities^ | | | 24,237,237 | | | | 1.5 | % |
| | | | | |
| | | | Total | | | 24,237,237 | | | | | |
| | | | | |
|
| Telecommunications Services (1.8%) | |
| | | | Other Securities^ | | | 28,350,354 | | | | 1.8 | % |
| | | | | |
| | | | Total | | | 28,350,354 | | | | | |
| | | | | |
|
| Utilities (2.7%) | |
| | 529,410 | | | PG&E Corporation | | | 32,886,949 | | | | 2.1 | % |
| | | | Other Securities^ | | | 11,087,511 | | | | 0.6 | % |
| | | | | |
| | | | Total | | | 43,974,460 | | | | | |
| | | | | |
| | | | Total Common Stock (cost $1,068,341,134) | | | 1,361,610,170 | | | | | |
| | | | | |
| | | |
| Shares | | | Registered Investment Companies (0.2%) | | Value | | | % of Net
Assets | |
| Equity Funds/ETFs (0.2%) | |
| | | | Other Securities^ | | | 2,619,824 | | | | 0.2 | % |
| | | | | |
| | | | Total | | | 6,619,824 | | | | | |
| | | | | |
| | | | | | | | | | | | |
| | | | | |
| | | | Total Registered Investment Companies (cost $2,639,893) | | | 2,619,824 | | | | | |
| | | | | |
| | | |
| Shares | | | Collateral Held for Securities Loaned (0.9%) | | Value | | | % of Net
Assets | |
| | 13,952,780 | | | Thrivent Cash Management Trust | | | 13,952,780 | | | | 0.9 | % |
| | | | | |
| | | | Total Collateral Held for Securities Loaned (cost $13,952,780) | | | 13,952,780 | | | | | |
| | | | | |
| | | |
Shares or
Principal
Amount | | | Short-Term Investments (14.3%)b | | Value | | | % of Net
Assets | |
| | | | Federal Home Loan Bank Discount Notes | | | | | | | | |
| | 9,600,000 | | | 0.326%, 11/9/2016 | | | 9,599,578 | | | | 0.6 | % |
| | 16,300,000 | | | 0.265%, 11/23/2016 | | | 16,298,011 | | | | 1.0 | % |
| | 24,250,000 | | | 0.337%, 12/2/2016c | | | 24,245,611 | | | | 1.5 | % |
| | 33,000,000 | | | 0.350%, 12/7/2016 | | | 32,993,070 | | | | 2.1 | % |
| | 10,800,000 | | | 0.280%, 12/23/2016 | | | 10,796,728 | | | | 0.7 | % |
| | | | Federal Home Loan Bank Discount Notes | | | | | | | | |
| | 57,757,000 | | | 0.250% - 0.365%, | | | | | | | | |
| | | | 11/1/2016 - 1/27/2017 | | | 57,733,323 | | | | 3.5 | % |
The accompanying Notes to Financial Statements are an integral part of this schedule.
113
LARGE CAP STOCK FUND
Summary Schedule of Investments as of October 31, 2016
| | | | | | | | | | | | |
| | | |
Shares or
Principal
Amount | | | Short-Term Investments (14.3%)b | | Value | | | % of Net
Assets | |
| | | | Thrivent Core Short-Term Reserve Fund | | | | | | | | |
| | 7,842,880 | | | 0.790% | | | $78,428,796 | | | | 4.9 | % |
| | | | | |
| | | | Total Short-Term Investments (cost $230,082,357) | | | 230,095,117 | | | | | |
| | | | | |
| | | | Total Investments (cost $1,315,016,164) 100.3% | | | $1,608,277,891 | | | | | |
| | | | | |
| | | | Other Assets and Liabilities, Net (0.3%) | | | (4,806,314 | ) | | | | |
| | | | | |
| | | | Total Net Assets 100.0% | | | $1,603,471,577 | | | | | |
| | | | | |
| ^ | The Summary Schedule of Investments shows the 50 largest holdings in unaffiliated Issuers, any holding or Issuer that exceeds 1% of net assets and all affiliated holdings as of the report date. The remaining securities held are grouped by category as “Other securities”. |
| a | Non-income producing security. |
| b | The Interest rate shown reflects the yield, coupon rate or the discount rate at the date of purchase. |
| c | All or a portion of the security is held on deposit with the counterparty and pledged as the Initial margin deposit for open futures contracts. |
The following table presents the total amount of securities loaned with continuous maturity, by type, offset by the gross payable upon return of collateral for securities loaned by Thrivent Large Cap Stock Fund as of October 31, 2016:
Securities Lending Transactions
| | | | |
Common Stock | | | $13,213,208 | |
| | | | |
Total lending | | | $13,213,208 | |
Gross amount payable upon return of collateral for securities loaned | | | $13,952,780 | |
| | | | |
Net amounts due to counterparty | | | $739,572 | |
| | | | |
Unrealized Appreciation (Depreciation)
Gross unrealized appreciation and depreciation of Investments, based on cost for federal Income tax purposes, were as follows:
| | | | |
Gross unrealized appreciation | | | $314,191,847 | |
Gross unrealized depreciation | | | (31,304,151 | ) |
| | | | |
Net unrealized appreciation (depreciation) | | | $282,887,696 | |
| |
Cost for federal income tax purposes | | | $1,325,390,195 | |
Fair Valuation Measurements
The following table Is a summary of the Inputs used, as of October 31, 2016, In valuing Large Cap Stock Fund’s assets carried at fair value.
| | | | | | | | | | | | | | | | |
| Investments in Securities | | Total | | | Level 1 | | | Level 2 | | | Level 3 | |
Common Stock | | | | | | | | | | | | | | | | |
Consumer Discretionary | | | 226,946,473 | | | | 155,803,815 | | | | 71,142,658 | | | | – | |
Consumer Staples | | | 106,760,637 | | | | 61,484,311 | | | | 45,276,326 | | | | – | |
Energy | | | 124,292,425 | | | | 86,384,479 | | | | 37,907,946 | | | | – | |
Financials | | | 217,584,120 | | | | 124,558,128 | | | | 93,025,990 | | | | 2 | |
Health Care | | | 136,685,039 | | | | 97,205,251 | | | | 39,479,788 | | | | – | |
Industrials | | | 161,344,756 | | | | 88,124,985 | | | | 73,219,771 | | | | – | |
Information Technology | | | 221,726,583 | | | | 205,764,219 | | | | 15,962,364 | | | | – | |
Materials | | | 69,708,086 | | | | 26,729,384 | | | | 42,978,702 | | | | – | |
Real Estate | | | 24,237,237 | | | | – | | | | 24,237,237 | | | | – | |
Telecommunications Services | | | 28,350,354 | | | | – | | | | 28,350,354 | | | | – | |
Utilities | | | 43,974,460 | | | | 32,886,949 | | | | 11,087,511 | | | | – | |
Registered Investment Companies | | | | | | | | | | | | | | | | |
Equity Funds/ETFs | | | 2,619,824 | | | | 2,619,824 | | | | – | | | | – | |
Short-Term Investments | | | 151,666,321 | | | | – | | | | 151,666,321 | | | | – | |
| |
Subtotal Investments in Securities | | | $1,515,896,315 | | | | $881,561,345 | | | | $634,334,968 | | | | $2 | |
| |
| | | | |
| Other Investments* | | Total | | | | | | | | | | |
| | | | | | | | | | | | | |
Short-Term Investments | | | 78,428,796 | | | | | | | | | | | | | |
Collateral Held for Securities Loaned | | | 13,952,780 | | | | | | | | | | | | | |
| | | | | | | | | | | | | |
Subtotal Other Investments | | | $92,381,576 | | | | | | | | | | | | | |
| | | | | | | | | | | | | |
| | | | | | | | | | | | | | | | |
| | | | | | | | | | | | | |
Total Investments at Value | | | $1,608,277,891 | | | | | | | | | | | | | |
| | | | | | | | | | | | | |
| * | Certain Investments are measured at fair value using a net asset value per share that Is not publicly available (practical expedient). According to disclosure requirements of Accounting Standards Codification (ASC) 820, Fair Value Measurement, securities valued using the practical expedient are not classified in the fair value hierarchy. The fair value amounts presented in this table are intended to permit reconciliation of the fair value hierarchy to the amounts presented in the Statement of Assets and Liabilities. |
| | | | | | | | | | | | | | | | |
| | | | |
| Other Financial Instruments | | Total | | | Level 1 | | | Level 2 | | | Level 3 | |
Asset Derivatives | | | | | | | | | | | | | | | | |
Futures Contracts | | | 1,589,783 | | | | 1,589,783 | | | | – | | | | – | |
| |
Total Asset Derivatives | | | $1,589,783 | | | | $1,589,783 | | | | $– | | | | $– | |
| |
Liability Derivatives | | | | | | | | | | | | | | | | |
Futures Contracts | | | 2,572,471 | | | | 2,572,471 | | | | – | | | | – | |
| |
Total Liability Derivatives | | | $2,572,471 | | | | $2,572,471 | | | | $– | | | | $– | |
| |
There were no significant transfers between Levels during the period ended October 31, 2016. Transfers between Levels are identified as of the end of the period.
The accompanying Notes to Financial Statements are an integral part of this schedule.
114
LARGE CAP STOCK FUND
Summary Schedule of Investments as of October 31, 2016
The following table presents Large Cap Stock Fund’s futures contracts held as of October 31, 2016. Investments and/or cash totaling $12,197,792 were pledged as the Initial margin deposit for these contracts.
| | | | | | | | | | | | | | | | | | | | |
| Futures Contracts | | Number of
Contracts
Long/ (Short) | | | Expiration Date | | | Notional Principal Amount | | | Value | | | Unrealized Gain/(Loss) | |
Eurex Euro STOXX 50 Index | | | 2,189 | | | | December 2016 | | | | $71,725,317 | | | | $73,315,100 | | | | $1,589,783 | |
Eurex Stoxx Europe 600 Index | | | 578 | | | | December 2016 | | | | 10,786,864 | | | | 10,726,264 | | | | (60,600 | ) |
FTSE 100 Index | | | 250 | | | | December 2016 | | | | 21,165,078 | | | | 21,155,399 | | | | (9,679 | ) |
ICE mini MSCI EAFE Index | | | 879 | | | | December 2016 | | | | 75,709,707 | | | | 73,207,515 | | | | (2,502,192 | ) |
Total Futures Contracts | | | | | | | | | | | | | | | | | | | ($982,688 | ) |
The following table summarizes the fair value and Statement of Assets and Liabilities location, as of October 31, 2016, for Large Cap Stock Fund’s Investments In financial derivative Instruments by primary risk exposure as discussed under Item (2) Significant Accounting Policies of the Notes to Financial Statements.
| | | | | | |
| Derivatives by risk category | | Statement of Assets and Liabilities Location | | Fair Value | |
| | |
Asset Derivatives | | | | | | |
| | |
Equity Contracts | | | | | | |
Futures* | | Net Assets - Net unrealized appreciation/(depreciation) on Futures contracts | | | $1,589,783 | |
Total Equity Contracts | | | | | 1,589,783 | |
| |
Total Asset Derivatives | | | | | $1,589,783 | |
| |
| | |
Liability Derivatives | | | | | | |
| | |
Equity Contracts | | | | | | |
Futures* | | Net Assets - Net unrealized appreciation/(depreciation) on Futures contracts | | | 2,572,471 | |
Total Equity Contracts | | | | | 2,572,471 | |
| |
Total Liability Derivatives | | | | | $2,572,471 | |
| |
| * | Includes cumulative appreciation/depreciation of futures contracts as reported In the Schedule of Investments. Only current day’s variation margin is reported within the Statement of Assets and Liabilities. |
The following table summarizes the net realized gains/(losses) and Statement of Operations location, for the period ended October 31, 2016, for Large Cap Stock Fund’s Investments In financial derivative Instruments by primary risk exposure.
| | | | | | |
| Derivatives by risk category | | Statement of Operations Location | | Realized Gains/(Losses)
recognized in Income | |
| | |
Equity Contracts | | | | | | |
Futures | | Net realized gains/(losses) on Futures contracts | | | (7,465,909 | ) |
| | |
Total Equity Contracts | | | | | (7,465,909 | ) |
| |
Total | | | | | ($7,465,909 | ) |
| |
The following table summarizes the change In net unrealized appreciation/(depreciation) and Statement of Operations location, for the period ended October 31, 2016, for Large Cap Stock Fund’s Investments In financial derivative Instruments by primary risk exposure.
| | | | | | |
| Derivatives by risk category | | Statement of Operations Location | | Change in unrealized
appreciation/
(depreciation) recognized in Income | |
| | |
Equity Contracts | | | | | | |
Futures | | Change in net unrealized appreciation/(depreciation) on Futures contracts | | | (12,687,959 | ) |
| | |
Total Equity Contracts | | | | | (12,687,959 | ) |
| |
Total | | | | | ($12,687,959 | ) |
| |
The following table presents Large Cap Stock Fund’s average volume of derivative activity during the period ended October 31, 2016.
| | | | | | | | |
| Derivative Risk Category | | Futures (Notional)* | | | Futures
(Percentage
of Average
Net Assets) | |
Equity Contracts | | $ | 220,088,057 | | | | 13.6 | % |
| * | Notional amount represents long or short, or both, derivative positions held by the Fund. |
The accompanying Notes to Financial Statements are an integral part of this schedule.
115
LARGE CAP STOCK FUND
Summary Schedule of Investments as of October 31, 2016
Investment in Affiliates
Affiliated issuers, as defined under the Investment Company Act of 1940, include those in which the Fund’s holdings of an issuer represent 5% or more of the outstanding voting securities of an issuer, any affiliated mutual fund, or a company which is under common ownership or control with the Fund. The Fund owns shares of Thrivent Cash Management Trust for the purpose of securities lending and Thrivent Core Short-Term Reserve Fund primarily to serve as a cash sweep vehicle for the Fund. Thrivent Cash Management Trust and Thrivent Core Short-Term Reserve Fund are established for the sole use of affiliated funds.
A summary of transactions for the fiscal year to date, in Large Cap Stock Fund, is as follows:
| | | | | | | | | | | | | | | | | | | | | | | | |
| Fund | | Value
October 31,
2015 | | | Gross Purchases | | | Gross Sales | | | Shares
Held at
October 31,
2016 | | | Value
October 31,
2016 | | | Income
Earned
November 1,
2015 -
October 31,
2016 | |
Cash Management Trust- Collateral Investment | | | $12,071,792 | | | | $220,518,484 | | | | $218,637,496 | | | | 13,952,780 | | | | $13,952,780 | | | | $221,163 | |
Cash Management Trust- Short Term Investment | | | 257,091,734 | | | | 395,939,204 | | | | 653,030,938 | | | | – | | | | – | | | | 211,272 | |
Core Short-Term Reserve | | | – | | | | 200,408,862 | | | | 121,980,066 | | | | 7,842,880 | | | | 78,428,796 | | | | 246,122 | |
Total Value and Income Earned | | | $269,163,526 | | | | | | | | | | | | | | | | $92,381,576 | | | | $678,557 | |
The accompanying Notes to Financial Statements are an integral part of this schedule.
116
HIGH YIELD FUND
Summary Schedule of Investments as of October 31, 2016
| | | | | | | | | | | | |
Principal Amount | | | Bank Loans (2.4%) | | Value | | | % of Net
Assets | |
| Basic Materials (0.5%) | | | | | | | | |
| | | | Other Securities^ | | | $3,212,091 | | | | 0.5 | % |
| | | | | |
| | | | Total | | | 3,212,091 | | | | | |
| | | | | |
| | |
| Capital Goods (0.4%) | | | | | | | | |
| | | | Other Securities^ | | | 2,683,125 | | | | 0.4 | % |
| | | | | |
| | | | Total | | | 2,683,125 | | | | | |
| | | | | |
| | |
| Consumer Cyclical (1.4%) | | | | | | | | |
| | | | Scientific Games International, Inc., Term Loan | | | | | | | | |
| | $4,372,125 | | | 6.000%, 10/1/2021a | | | 4,388,521 | | | | 0.6 | % |
| | | | Other Securities^ | | | 5,548,050 | | | | 0.8 | % |
| | | | | |
| | | | Total | | | 9,936,571 | | | | | |
| | | | | |
|
| Energy (0.1%) | |
| | | | Other Securities^ | | | 1,014,723 | | | | 0.1 | % |
| | | | | |
| | | | Total | | | 1,014,723 | | | | | |
| | | | | |
| | | | | | | | | | | | |
| | | | | |
| | | | Total Bank Loans (cost $16,345,908) | | | 16,846,510 | | | | | |
| | | | | |
| | | |
Principal Amount | | | Long-Term Fixed Income (90.2%) | | Value | | | % of Net
Assets | |
| | |
| Asset-Backed Securities (0.1%) | | | | | | | | |
| | | | Other Securities^ | | | 999,436 | | | | 0.1 | % |
| | | | | |
| | | | Total | | | 999,436 | | | | | |
| | | | | |
| | |
| Basic Materials (4.5%) | | | | | | | | |
| | | | Other Securities^ | | | 31,900,692 | | | | 4.5 | % |
| | | | | |
| | | | Total | | | 31,900,692 | | | | | |
| | | | | |
| | |
| Capital Goods (8.0%) | | | | | | | | |
| | | | Ardagh Packaging Finance plc | | | | | | | | |
| | 3,810,000 | | | 7.250%, 5/15/2024b | | | 4,019,550 | | | | 0.6 | % |
| | | | Berry Plastics Corporation | | | | | | | | |
| | 5,630,000 | | | 5.125%, 7/15/2023 | | | 5,728,525 | | | | 0.8 | % |
| | | | Building Materials Corporation of America | | | | | | | | |
| | 3,710,000 | | | 6.000%, 10/15/2025b | | | 3,960,240 | | | | 0.6 | % |
| | | | Other Securities^ | | | 42,386,064 | | | | 6.0 | % |
| | | | | |
| | | | Total | | | 56,094,379 | | | | | |
| | | | | |
| | |
| Communications Services (18.4%) | | | | | | | | |
| | | | Altice Financing SA | | | | | | | | |
| | 4,515,000 | | | 6.625% - 7.500%, 2/15/2023 - 5/15/2026b | | | 4,650,450 | | | | 0.6 | % |
| | | | Altice Finco SA | | | | | | | | |
| | 1,610,000 | | | 7.625% - 9.875%, 12/15/2020 - 2/15/2025b,c | | | 1,675,312 | | | | 0.2 | % |
| | | | Altice US Finance I Corporation | | | | | | | | |
| | 2,600,000 | | | 5.500%, 5/15/2026b | | | 2,652,000 | | | | 0.4 | % |
| | | | CCO Holdings, LLC | | | | | | | | |
| | 4,500,000 | | | 5.875%, 4/1/2024b | | | 4,758,750 | | | | 0.7 | % |
| | 3,670,000 | | | 5.250% - 5.250%, 3/15/2021 - 9/30/2022 | | | 3,819,094 | | | | 0.6 | % |
| | | | Columbus International, Inc. | | | | | | | | |
| | 4,435,000 | | | 7.375%, 3/30/2021b | | | 4,745,450 | | | | 0.7 | % |
| | | | CSC Holdings, LLC | | | | | | | | |
| | 745,000 | | | 5.500%, 4/15/2027b | | | 755,709 | | | | 0.1 | % |
| | | | Frontier Communications Corporation | | | | | | | | |
| | 6,287,000 | | | 10.500%, 9/15/2022 | | | 6,538,480 | | | | 0.9 | % |
| | | | Hughes Satellite Systems Corporation | | | | | | | | |
| | 6,190,000 | | | 6.625%, 8/1/2026b | | | 6,128,100 | | | | 0.9 | % |
| | | | Neptune Finco Corporation | | | | | | | | |
| | 5,050,000 | | | 10.875%, 10/15/2025b | | | 5,807,500 | | | | 0.8 | % |
| | | | SFR Group SA | | | | | | | | |
| | 3,910,000 | | | 6.000%, 5/15/2022b | | | 4,009,001 | | | | 0.6 | % |
| | 4,670,000 | | | 6.250% - 7.375%, 5/15/2024 - 5/1/2026b | | | 4,692,357 | | | | 0.6 | % |
| | | | Sprint Communications, Inc. | | | | | | | | |
| | 4,640,000 | | | 6.000%, 11/15/2022 | | | 4,323,923 | | | | 0.6 | % |
| | 2,530,000 | | | 7.000%, 3/1/2020b | | | 2,751,375 | | | | 0.4 | % |
| | | | Sprint Corporation | | | | | | | | |
| | 11,385,000 | | | 7.625%, 2/15/2025c | | | 11,014,987 | | | | 1.6 | % |
| | | | T-Mobile USA, Inc. | | | | | | | | |
| | 6,350,000 | | | 6.000% - 6.542%, 4/28/2020 - 4/15/2024 | | | 6,654,500 | | | | 1.0 | % |
| | | | Unitymedia Hessen GmbH & Company KG | | | | | | | | |
| | 4,650,000 | | | 5.500%, 1/15/2023b | | | 4,818,562 | | | | 0.7 | % |
| | | | WMG Acquisition Corporation | | | | | | | | |
| | 3,675,000 | | | 6.750%, 4/15/2022b | | | 3,881,719 | | | | 0.6 | % |
| | | | Zayo Group, LLC | | | | | | | | |
| | 3,575,000 | | | 6.375%, 5/15/2025 | | | 3,763,832 | | | | 0.5 | % |
| | | | Other Securities^ | | | 42,355,507 | | | | 5.9 | % |
| | | | | |
| | | | Total | | | 129,796,608 | | | | | |
| | | | | |
| | |
| Consumer Cyclical (13.2%) | | | | | | | | |
| | | | Allison Transmission, Inc. | | | | | | | | |
| | 3,480,000 | | | 5.000%, 10/1/2024b | | | 3,549,600 | | | | 0.5 | % |
| | | | Brookfield Residential Properties, Inc. | | | | | | | | |
| | 3,570,000 | | | 6.125%, 7/1/2022b | | | 3,623,550 | | | | 0.5 | % |
| | | | Cinemark USA, Inc. | | | | | | | | |
| | 4,205,000 | | | 4.875%, 6/1/2023 | | | 4,210,256 | | | | 0.6 | % |
| | | | Dana Financing Luxembourg SARL | | | | | | | | |
| | 3,575,000 | | | 6.500%, 6/1/2026b | | | 3,802,906 | | | | 0.5 | % |
| | | | Live Nation Entertainment, Inc. | | | | | | | | |
| | 3,575,000 | | | 5.375%, 6/15/2022b | | | 3,700,125 | | | | 0.5 | % |
| | | | LKQ Corporation | | | | | | | | |
| | 3,495,000 | | | 4.750%, 5/15/2023 | | | 3,586,744 | | | | 0.5 | % |
| | | | Other Securities^ | | | 70,068,574 | | | | 10.1 | % |
| | | | | |
| | | | Total | | | 92,541,755 | | | | | |
| | | | | |
| | |
| Consumer Non-Cyclical (11.3%) | | | | | | | | |
| | | | Energizer Holdings, Inc. | | | | | | | | |
| | 3,760,000 | | | 5.500%, 6/15/2025b | | | 3,807,000 | | | | 0.5 | % |
| | | | Grifols Worldwide Operations, Ltd. | | | | | | | | |
| | 3,855,000 | | | 5.250%, 4/1/2022 | | | 4,018,838 | | | | 0.6 | % |
| | | | HCA, Inc. | | | | | | | | |
| | 4,190,000 | | | 5.875%, 3/15/2022 | | | 4,609,000 | | | | 0.6 | % |
| | 11,440,000 | | | 4.500% - 6.500%, 2/15/2020 - 2/15/2027 | | | 11,973,394 | | | | 1.7 | % |
| | | | JBS USA, LLC | | | | | | | | |
| | 4,795,000 | | | 5.750%, 6/15/2025b | | | 4,699,100 | | | | 0.7 | % |
| | | | MPH Acquisition Holdings, LLC | | | | | | | | |
| | 3,810,000 | | | 7.125%, 6/1/2024b | | | 4,076,319 | | | | 0.6 | % |
| | | | Revlon Consumer Products Corporation | | | | | | | | |
| | 4,240,000 | | | 5.750%, 2/15/2021 | | | 4,282,400 | | | | 0.6 | % |
| | | | TreeHouse Foods, Inc. | | | | | | | | |
| | 3,635,000 | | | 4.875%, 3/15/2022 | | | 3,771,312 | | | | 0.5 | % |
The accompanying Notes to Financial Statements are an integral part of this schedule.
117
HIGH YIELD FUND
Summary Schedule of Investments as of October 31, 2016
| | | | | | | | | | | | |
| | | |
Principal Amount | | | Long-Term Fixed Income (90.2%) | | Value | | | % of Net
Assets | |
| Consumer Non-Cyclical (11.3%) - continued | | | | | | | | |
| | | | Valeant Pharmaceuticals International | | | | | | | | |
| | $4,755,000 | | | 5.500% - 7.250%, | | | | | | | | |
| | | | 7/15/2022 - 3/1/2023b | | | $3,936,675 | | | | 0.6 | % |
| | | | VPII Escrow Corporation | | | | | | | | |
| | 2,830,000 | | | 7.500%, 7/15/2021b | | | 2,518,700 | | | | 0.4 | % |
| | | | Other Securities^ | | | 31,800,329 | | | | 4.5 | % |
| | | | | |
| | | | Total | | | 79,493,067 | | | | | |
| | | | | |
| | |
| Energy (11.2%) | | | | | | | | |
| | | | Cheniere Corpus Christi Holdings, LLC | | | | | | | | |
| | 1,800,000 | | | 7.000%, 6/30/2024b | | | 1,908,000 | | | | 0.3 | % |
| | | | Concho Resources, Inc. | | | | | | | | |
| | 4,260,000 | | | 6.500%, 1/15/2022 | | | 4,409,100 | | | | 0.6 | % |
| | | | MPLX, LP | | | | | | | | |
| | 4,315,000 | | | 4.875%, 12/1/2024 | | | 4,512,851 | | | | 0.6 | % |
| | | | Range Resources Corporation | | | | | | | | |
| | 3,820,000 | | | 5.000%, 3/15/2023b,c | | | 3,695,850 | | | | 0.5 | % |
| | | | Rice Energy, Inc. | | | | | | | | |
| | 3,895,000 | | | 6.250%, 5/1/2022 | | | 3,963,163 | | | | 0.6 | % |
| | | | Rowan Companies, Inc. | | | | | | | | |
| | 4,760,000 | | | 4.875%, 6/1/2022 | | | 4,093,600 | | | | 0.6 | % |
| | | | Sabine Pass Liquefaction, LLC | | | | | | | | |
| | 6,650,000 | | | 5.625% - 5.875%, | | | | | | | | |
| | | | 2/1/2021 - 6/30/2026 | | | 7,069,921 | | | | 1.1 | % |
| | | | Other Securities^ | | | 49,174,066 | | | | 6.9 | % |
| | | | | |
| | | | Total | | | 78,826,551 | | | | | |
| | | | | |
| | |
| Financials (7.9%) | | | | | | | | |
| | | | Ally Financial, Inc. | | | | | | | | |
| | 5,630,000 | | | 4.125%, 3/30/2020 | | | 5,721,488 | | | | 0.8 | % |
| | 2,120,000 | | | 4.125%, 2/13/2022 | | | 2,120,657 | | | | 0.3 | % |
| | | | Argos Merger Sub, Inc. | | | | | | | | |
| | 4,270,000 | | | 7.125%, 3/15/2023b,c | | | 4,467,487 | | | | 0.6 | % |
| | | | Centene Escrow Corporation | | | | | | | | |
| | 4,060,000 | | | 6.125%, 2/15/2024 | | | 4,323,900 | | | | 0.6 | % |
| | | | CyrusOne, LP | | | | | | | | |
| | 3,460,000 | | | 6.375%, 11/15/2022 | | | 3,667,600 | | | | 0.5 | % |
| | | | Icahn Enterprises, LP | | | | | | | | |
| | 3,625,000 | | | 6.000%, 8/1/2020 | | | 3,561,562 | | | | 0.5 | % |
| | | | Quicken Loans, Inc. | | | | | | | | |
| | 3,745,000 | | | 5.750%, 5/1/2025b | | | 3,698,188 | | | | 0.5 | % |
| | | | Other Securities^ | | | 28,134,631 | | | | 4.1 | % |
| | | | | |
| | | | Total | | | 55,695,513 | | | | | |
| | | | | |
| | |
| Foreign Government (0.3%) | | | | | | | | |
| | | | Other Securities^ | | | 2,075,750 | | | | 0.3 | % |
| | | | | |
| | | | Total | | | 2,075,750 | | | | | |
| | | | | |
| | |
| Technology (7.2%) | | | | | | | | |
| | | | Alliance Data Systems Corporation | | | | | | | | |
| | 6,120,000 | | | 5.375%, 8/1/2022b | | | 5,890,500 | | | | 0.8 | % |
| | | | Cengage Learning, Inc. | | | | | | | | |
| | 4,770,000 | | | 9.500%, 6/15/2024b | | | 4,495,725 | | | | 0.6 | % |
| | | | CommScope Technologies Finance, LLC | | | | | | | | |
| | 4,225,000 | | | 6.000%, 6/15/2025b | | | 4,436,250 | | | | 0.6 | % |
| | | | Micron Technology, Inc. | | | | | | | | |
| | 4,270,000 | | | 5.250%, 8/1/2023b | | | 4,184,600 | | | | 0.6 | % |
| | | | NXP Funding, LLC | | | | | | | | |
| | 3,285,000 | | | 5.750%, 3/15/2023b | | | 3,498,525 | | | | 0.5 | % |
| | | | Sensata Technologies BV | | | | | | | | |
| | $4,130,000 | | | 4.875%, 10/15/2023b | | | 4,279,712 | | | | 0.6 | % |
| | | | Other Securities^ | | | 24,043,501 | | | | 3.5 | % |
| | | | | |
| | | | Total | | | 50,828,813 | | | | | |
| | | | | |
| | |
| Transportation (4.0%) | | | | | | | | |
| | | | XPO Logistics, Inc. | | | | | | | | |
| | 4,290,000 | | | 6.500%, 6/15/2022b,c | | | 4,461,600 | | | | 0.6 | % |
| | | | Other Securities^ | | | 23,554,101 | | | | 3.4 | % |
| | | | | |
| | | | Total | | | 28,015,701 | | | | | |
| | | | | |
| | |
| U.S. Government and Agencies (0.1%) | | | | | | | | |
| | | | Other Securities^ | | | 800,434 | | | | 0.1 | % |
| | | | | |
| | | | Total | | | 800,434 | | | | | |
| | | | | |
| | |
| Utilities (4.0%) | | | | | | | | |
| | | | Dynegy, Inc. | | | | | | | | |
| | 4,280,000 | | | 7.625%, 11/1/2024c | | | 4,098,100 | | | | 0.6 | % |
| | | | Energy Transfer Equity, LP | | | | | | | | |
| | 3,755,000 | | | 5.500%, 6/1/2027 | | | 3,661,125 | | | | 0.5 | % |
| | | | Regency Energy Partners, LP | | | | | | | | |
| | 3,950,000 | | | 5.500%, 4/15/2023 | | | 4,067,900 | | | | 0.6 | % |
| | | | Other Securities^ | | | 16,091,721 | | | | 2.3 | % |
| | | | | |
| | | | Total | | | 27,918,846 | | | | | |
| | | | | |
| | | | | | | | | | | | |
| | | | | |
| | | | Total Long-Term Fixed Income (cost $639,422,740) | | | 634,987,545 | | | | | |
| | | | | |
| | | |
| Shares | | | Preferred Stock (1.2%) | | Value | | | % of Net
Assets | |
| | |
| Consumer Staples (0.1%) | | | | | | | | |
| | | | Other Securities^ | | | 1,084,840 | | | | 0.1 | % |
| | | | | |
| | | | Total | | | 1,084,840 | | | | | |
| | | | | |
| | |
| Financials (1.1%) | | | | | | | | |
| | | | Other Securities^ | | | 7,582,947 | | | | 1.1 | % |
| | | | | |
| | | | Total | | | 7.582.947 | | | | | |
| | | | | |
| | | | | | | | | | | | |
| | | | | |
| | | | Total Preferred Stock (cost $8,214,056) | | | 8.667.787 | | | | | |
| | | | | |
| | | |
| Shares | | | Registered Investment Companies (0.8%) | | Value | | | % of Net
Assets | |
| | |
| Equity Funds/ETFs (0.8%) | | | | | | | | |
| | 50,000 | | | Energy Select Sector SPDR Fund | | | 3,431,000 | | | | 0.5 | % |
| | | | Other Securities^ | | | 1,873,550 | | | | 0.3 | % |
| | | | | |
| | | | Total | | | 5,304,550 | | | | | |
| | | | | |
| | | | | | | | | | | | |
| | | | | |
| | | | Total Registered Investment Companies (cost $4,897,547) | | | 5,304,550 | | | | | |
| | | | | |
| | | |
| Shares | | | Common Stock (0.1%) | | Value | | | % of Net
Assets | |
| | |
| Consumer Discretionary (<0.1%) | | | | | | | | |
| | | | Other Securities^ | | | 4 | | | | <0.1 | % |
| | | | | |
| | | | Total | | | 4 | | | | | |
| | | | | |
| | |
| Energy (0.1%) | | | | | | | | |
| | | | Other Securities^ | | | 547,344 | | | | 0.1 | % |
| | | | | |
| | | | Total | | | 547,344 | | | | | |
| | | | | |
The accompanying Notes to Financial Statements are an integral part of this schedule.
118
HIGH YIELD FUND
Summary Schedule of Investments as of October 31, 2016
| | | | | | | | | | | | |
| | | |
| Shares | | | Common Stock (0.1%) | | Value | | | % of Net
Assets | |
| Financials (<0.1%) | | | | | | | | |
| | | | Other Securities^ | | | $0 | | | | <0.1 | % |
| | | | | |
| | | | Total | | | 0 | | | | | |
| | | | | |
| | | | | | | | | | | | |
| | | | | |
| | | | Total Common Stock (cost $3,140,190) | | | 547,348 | | | | | |
| | | | | |
| | | |
| Shares | | | Collateral Held for Securities Loaned (9.4%) | | Value | | | % of Net
Assets | |
| | 66,352,314 | | | Thrivent Cash Management Trust | | | 66,352,314 | | | | 9.4 | % |
| | | | | |
| | | | Total Collateral Held for Securities Loaned (cost $66,352,314) | | | 66,352,314 | | | | | |
| | | | | |
| | | |
Shares or
Principal
Amount | | | Short-Term Investments (5.1%)d | | Value | | | % of Net
Assets | |
| | | | Thrivent Core Short-Term Reserve Fund | | | | | | | | |
| | 3,595,387 | | | 0.790% | | | 35,953,868 | | | | 5.1 | % |
| | | | | |
| | | | Total Short-Term Investments (cost $35,953,868) | | | 35,953,868 | | | | | |
| | | | | |
| | | | Total Investments (cost $774,326,623) 109.2% | | | $768,659,922 | | | | | |
| | | | | |
| | | | Other Assets and Liabilities, Net (9.2%) | | | (64,941,784 | ) | | | | |
| | | | | |
| | | | Total Net Assets 100.0% | | | $703,718,138 | | | | | |
| | | | | |
| ^ | The Summary Schedule of Investments shows the 50 largest holdings In unaffiliated Issuers, any holding or Issuer that exceeds 1% of net assets and all affiliated holdings as of the report date. The remaining securities held are grouped by category as “Other securities”. |
| a | The stated Interest rate represents the weighted average of all contracts within the bank loan facility. |
| b | Denotes securities sold under Rule 144A of the Securities Act of 1933, which exempts them from registration. These securities may be resold to other dealers in the program or to other qualified Institutional buyers. As of October 31, 2016, the value of these Investments was $291,403,643 or 41.4% of total net assets. |
| c | All or a portion of the security is on loan. |
| d | The Interest rate shown reflects the yield, coupon rate or the discount rate at the date of purchase. |
High Yield Fund held restricted securities as of October 31, 2016. Restricted securities are investment securities which cannot be offered for public sale without first being registered under the Securities Act of 1933. As of October 31, 2016, the value of these Investments was $12,917,052 or 1.8% of total net assets.
The following table presents the total amount of securities loaned with continuous maturity, by type, offset by the gross payable upon return of collateral for securities loaned by Thrivent High Yield Fund as of October 31, 2016:
| | | | |
| Securities lending Transactions | | | |
Taxable Debt Security | | | $61,367,077 | |
Common Stock | | | 1,873,550 | |
| | | | |
Total lending | | | $63,240,627 | |
Gross amount payable upon return of collateral for securities loaned | | | $66,352,314 | |
| | | | |
Net amounts due to counterparty | | | $3,111,687 | |
| | | | |
Unrealized Appreciation (Depreciation)
Gross unrealized appreciation and depreciation of Investments, based on cost for federal Income tax purposes, were as follows:
| | | | |
Gross unrealized appreciation | | | $22,424,898 | |
Gross unrealized depreciation | | | (28,545,695 | ) |
| | | | |
Net unrealized appreciation (depreciation) | | | ($6,120,797 | ) |
Cost for federal Income tax purposes | | | $774,780,719 | |
The accompanying Notes to Financial Statements are an integral part of this schedule.
119
HIGH YIELD FUND
Summary Schedule of Investments as of October 31, 2016
Fair Valuation Measurements
The following table is a summary of the inputs used, as of October 31, 2016, in valuing High Yield Fund’s assets carried at fair value.
| | | | | | | | | | | | | | | | |
| Investments in Securities | | Total | | | Level 1 | | | Level 2 | | | Level 3 | |
| | | | |
Bank Loans | | | | | | | | | | | | | | | | |
Basic Materials | | | 3,212,091 | | | | – | | | | 3,212,091 | | | | – | |
Capital Goods | | | 2,683,125 | | |
| –
|
| | | 2,683,125 | | | | – | |
Consumer Cyclical | | | 9,936,571 | | | | – | | | | 9,936,571 | | | | – | |
Energy | | | 1,014,723 | | | | – | | | | 1,014,723 | | | | – | |
| | | | |
Long-Term Fixed Income | | | | | | | | | | | | | | | | |
Asset-Backed Securities | | | 999,436 | | | | – | | | | 999,436 | | | | – | |
Basic Materials | | | 31,900,692 | | | | – | | | | 31,900,692 | | | | – | |
Capital Goods | | | 56,094,379 | | | | – | | | | 56,094,379 | | | | – | |
Communications Services | | | 129,796,608 | | | | – | | | | 129,796,608 | | | | – | |
Consumer Cyclical | | | 92,541,755 | | | | – | | | | 92,541,755 | | | | – | |
Consumer Non-Cyclical | | | 79,493,067 | | | | – | | | | 79,493,067 | | | | – | |
Energy | | | 78,826,551 | | | | – | | | | 78,826,551 | | | | – | |
Financials | | | 55,695,513 | | | | – | | | | 55,695,513 | | | | – | |
Foreign Government | | | 2,075,750 | | | | – | | | | 2,075,750 | | | | – | |
Technology | | | 50,828,813 | | | | – | | | | 50,828,813 | | | | – | |
Transportation | | | 28,015,701 | | | | – | | | | 28,015,701 | | | | – | |
U.S. Government and Agencies | | | 800,434 | | | | – | | | | 800,434 | | | | – | |
Utilities | | | 27,918,846 | | | | – | | | | 27,918,846 | | | | – | |
| | | | |
Preferred Stock | | | | | | | | | | | | | | | | |
Consumer Staples | | | 1,084,840 | | | | 1,084,840 | | | | – | | | | – | |
Financials | | | 7,582,947 | | | | 7,582,947 | | | | – | | | | – | |
| | | | |
Registered Investment Companies | | | | | | | | | | | | | | | | |
Equity Funds/ETFs | | | 5,304,550 | | | | 5,304,550 | | | | – | | | | – | |
| | | | |
Common Stock | | | | | | | | | | | | | | | | |
Consumer Discretionary | | | 4 | | | | – | | | | – | | | | 4 | |
Energy | | | 547,344 | | | | 547,344 | | | | – | | | | – | |
Financials^ | | | – | | | | – | | | | – | | | | 0 | |
| |
Subtotal Investments in Securities | | | $666,353,740 | | | | $14,519,681 | | | | $651,834,055 | | | | $4 | |
| |
| | | | |
Other Investments* | | | Total | | | | | | | | | | | | | |
| | | | | | | | | | | | | |
Short-Term Investments | | | 35,953,868 | | | | | | | | | | | | | |
Collateral Held for Securities Loaned | | | 66,352,314 | | | | | | | | | | | | | |
| | | | | | | | | | | | | |
Subtotal Other Investments | | | $102,306,182 | | | | | | | | | | | | | |
| | | | | | | | | | | | | |
| | | | | | | | | | | | | | | | |
| | | | | | | | | | | | | |
Total Investments at Value | | | $768,659,922 | | | | | | | | | | | | | |
| | | | | | | | | | | | | |
| * | Certain investments are measured at fair value using a net asset value per share that is not publicly available (practical expedient). According to disclosure requirements of Accounting Standards Codification (ASC) 820, Fair Value Measurement, securities valued using the practical expedient are not classified in the fair value hierarchy. The fair value amounts presented in this table are intended to permit reconciliation of the fair value hierarchy to the amounts presented in the Statement of Assets and Liabilities. |
There were no significant transfers between Levels during the period ended October 31, 2016. Transfers between Levels are identified as of the end of the period.
| ^ | Level 3 security in this section is fair valued at <$1. |
The following table summarizes the net realized gains/(losses) and Statement of Operations location, for the period ended October 31, 2016, for High Yield Fund’s investments in financial derivative instruments by primary risk exposure.
| | | | | | |
| Derivatives by risk category | | Statement of Operations Location | | Realized Gains/(Losses) recognized in Income | |
| | |
Credit Contracts | | | | | | |
Credit Default Swaps | | Net realized gains/(losses) on Swap agreements | | | 96,104 | |
Total Credit Contracts | | | | | 96,104 | |
| |
Total | | | | $ | 96,104 | |
| |
The accompanying Notes to Financial Statements are an integral part of this schedule.
120
HIGH YIELD FUND
Summary Schedule of Investments as of October 31, 2016
The following table presents High Yield Fund’s average volume of derivative activity during the period ended October 31, 2016.
| | | | | | | | |
| Derivative Risk Category | | Swaps (Notional)* | | | Swaps
(Percentage
of Average
Net Assets) | |
Credit Contracts | | $ | 78,016 | | | | <0.1 | % |
| * | Notional amount represents long or short, or both, derivative positions held by the Fund. |
Investment in Affiliates
Affiliated issuers, as defined under the Investment Company Act of 1940, include those in which the Fund’s holdings of an issuer represent 5% or more of the outstanding voting securities of an issuer, any affiliated mutual fund, or a company which is under common ownership or control with the Fund. The Fund owns shares of Thrivent Cash Management Trust for the purpose of securities lending and Thrivent Core Short-Term Reserve Fund primarily to serve as a cash sweep vehicle for the Fund. Thrivent Cash Management Trust and Thrivent Core Short-Term Reserve Fund are established for the sole use of affiliated funds.
A summary of transactions for the fiscal year to date, in High Yield Fund, is as follows:
| | | | | | | | | | | | | | | | | | | | | | | | |
| Fund | | Value
October 31,
2015 | | | Gross Purchases | | | Gross Sales | | | Shares Held at
October 31,
2016 | | | Value
October 31,
2016 | | | Income
Earned
November 1,
2015 -
October 31,
2016 | |
Cash Management Trust-Collateral Investment | | | $54,627,809 | | | | $214,273,100 | | | | $202,548,595 | | | | 66,352,314 | | | | $66,352,314 | | | | $293,408 | |
Cash Management Trust-Short Term Investment | | | 26,658,341 | | | | 93,593,237 | | | | 120,251,578 | | | | – | | | | – | | | | 36,523 | |
Core Short-Term Reserve | | | – | | | | 126,362,029 | | | | 90,408,161 | | | | 3,595,387 | | | | 35,953,868 | | | | 61,186 | |
Total Value and Income Earned | | | $81,286,150 | | | | | | | | | | | | | | | | $102,306,182 | | | | $391,117 | |
The accompanying Notes to Financial Statements are an integral part of this schedule.
121
INCOME FUND
Summary Schedule of Investments as of October 31, 2016
| | | | | | | | | | | | |
| | | |
Principal Amount | | | Bank Loans (3.4%) | | Value | | | % of Net
Assets | |
| Basic Materials (0.2%) | | | | | | | | |
| | | | Other Securities^ | | | $1,591,217 | | | | 0.2 | % |
| | | | | |
| | | | Total | | | 1,591,217 | | | | | |
| | | | | |
| | |
| Capital Goods (0.2%) | | | | | | | | |
| | | | Other Securities^ | | | 1,877,409 | | | | 0.2 | % |
| | | | | |
| | | | Total | | | 1,877,409 | | | | | |
| | | | | |
| | |
| Communications Services (1.1%) | | | | | | | | |
| | | | Other Securities^ | | | 9,023,909 | | | | 1.1 | % |
| | | | | |
| | | | Total | | | 9,023,909 | | | | | |
| | | | | |
|
| Consumer Cyclical (0.4%) | |
| | | | Other Securities^ | | | 3,254,627 | | | | 0.4 | % |
| | | | | |
| | | | Total | | | 3,254,627 | | | | | |
| | | | | |
| | |
| Consumer Non-Cyclical (0.6%) | | | | | | | | |
| | | | Other Securities^ | | | 5,360,084 | | | | 0.6 | % |
| | | | | |
| | | | Total | | | 5,360,084 | | | | | |
| | | | | |
| | |
| Energy (0.1%) | | | | | | | | |
| | | | Other Securities^ | | | 744,200 | | | | 0.1 | % |
| | | | | |
| | | | Total | | | 744,200 | | | | | |
| | | | | |
| | |
| Financials (0.2%) | | | | | | | | |
| | | | Other Securities^ | | | 1,289,337 | | | | 0.2 | % |
| | | | | |
| | | | Total | | | 1,289,337 | | | | | |
| | | | | |
|
| Technology (0.4%) | |
| | | | Other Securities^ | | | 3,483,803 | | | | 0.4 | % |
| | | | | |
| | | | Total | | | 3,483,803 | | | | | |
| | | | | |
|
| Transportation (0.1%) | |
| | | | Other Securities^ | | | 947,262 | | | | 0.1 | % |
| | | | | |
| | | | Total | | | 947,262 | | | | | |
| | | | | |
| | |
| Utilities (0.1%) | | | | | | | | |
| | | | Other Securities^ | | | 684,985 | | | | 0.1 | % |
| | | | | |
| | | | Total | | | 684,985 | | | | | |
| | | | | |
| | | | | | | | | | | | |
| | | | | |
| | | | Total Bank Loans (cost $28,020,342) | | | 28,256,833 | | | | | |
| | | | | |
| | | |
Principal Amount | | | Long-Term Fixed Income (90.4%) | | Value | | | % of Net
Assets | |
| | Asset-Backed Securities (1.2%) | | | | | | | | |
| | | | Other Securities^ | | | 10,307,925 | | | | 1.2 | % |
| | | | | |
| | | | Total | | | 10,307,925 | | | | | |
| | | | | |
| | |
| Basic Materials (2.7%) | | | | | | | | |
| | | | Georgia-Pacific, LLC | | | | | | | | |
| | $2,220,000 | | | 3.163%, 11/15/2021a,b | | | 2,301,185 | | | | 0.3 | % |
| | | | Other Securities^ | | | 19,487,128 | | | | 2.4 | % |
| | | | | |
| | | | Total | | | 21,788,313 | | | | | |
| | | | | |
| | |
| Capital Goods (2.0%) | | | | | | | | |
| | | | Other Securities^ | | | 16,344,169 | | | | 2.0 | % |
| | | | | |
| | | | Total | | | 16,344,169 | | | | | |
| | | | | |
| | |
| Collateralized Mortgage Obligations (0.6%) | | | | | | | | |
| | | | Other Securities^ | | | 4,751,506 | | | | 0.6 | % |
| | | | | |
| | | | Total | | | 4,751,506 | | | | | |
| | | | | |
| | |
| Commercial Mortgage-Backed Securities (0.2%) | | | | | | | | |
| | | | Other Securities^ | | | 1,840,921 | | | | 0.2 | % |
| | | | | |
| | | | Total | | | 1,840,921 | | | | | |
| | | | | |
| | |
| Communications Services (10.1%) | | | | | | | | |
| | | | American Tower Corporation | | | | | | | | |
| | 3,000,000 | | | 3.450%, 9/15/2021 | | | 3,133,068 | | | | 0.4 | % |
| | | | AT&T, Inc. | | | | | | | | |
| | 10,895,000 | | | 1.768% - 4.750%, 6/30/2020 - 5/15/2046c | | | 11,002,496 | | | | 1.3 | % |
| | | | Charter Communications Operating, LLC | | | | | | | | |
| | 2,630,000 | | | 4.464%, 7/23/2022a | | | 2,801,418 | | | | 0.3 | % |
| | | | Comcast Corporation | | | | | | | | |
| | 2,260,000 | | | 3.375%, 8/15/2025 | | | 2,370,476 | | | | 0.3 | % |
| | | | Crown Castle International Corporation | | | | | | | | |
| | 2,340,000 | | | 5.250%, 1/15/2023 | | | 2,614,739 | | | | 0.3 | % |
| | | | Omnicom Group, Inc. | | | | | | | | |
| | 2,380,000 | | | 4.450%, 8/15/2020 | | | 2,587,476 | | | | 0.3 | % |
| | | | Time Warner Cable, Inc. | | | | | | | | |
| | 2,200,000 | | | 4.125%, 2/15/2021 | | | 2,336,948 | | | | 0.3 | % |
| | | | Time Warner Entertainment Company, LP | | | | | | | | |
| | 2,380,000 | | | 8.375%, 3/15/2023 | | | 3,075,391 | | | | 0.4 | % |
| | | | Verizon Communications, Inc. | | | | | | | | |
| | 2,700,000 | | | 3.500%, 11/1/2024 | | | 2,814,283 | | | | 0.4 | % |
| | 2,312,000 | | | 4.272%, 1/15/2036 | | | 2,321,463 | | | | 0.3 | % |
| | 2,747,000 | | | 4.522%, 9/15/2048 | | | 2,731,702 | | | | 0.3 | % |
| | 7,404,000 | | | 2.625% - 4.862%, 2/21/2020 - 8/21/2046b | | | 7,615,577 | | | | 1.0 | % |
| | | | Other Securities^ | | | 37,929,674 | | | | 4.5 | % |
| | | | | |
| | | | Total | | | 83,334,711 | | | | | |
| | | | | |
| | |
| Consumer Cyclical (5.0%) | | | | | | | | |
| | | | General Motors Company | | | | | | | | |
| | 1,850,000 | | | 5.000%, 4/1/2035 | | | 1,883,814 | | | | 0.2 | % |
| | | | General Motors Financial Company, Inc. | | | | | | | | |
| | 7,020,000 | | | 3.450% - 4.200%, 3/1/2021 - 1/15/2025 | | | 7,152,085 | | | | 0.9 | % |
| | | | Other Securities^ | | | 32,053,425 | | | | 3.9 | % |
| | | | | |
| | | | Total | | | 41,089,324 | | | | | |
| | | | | |
| | |
| Consumer Non-Cyclical (10.7%) | | | | | | | | |
| | | | AbbVie, Inc. | | | | | | | | |
| | 2,540,000 | | | 3.200%, 5/14/2026 | | | 2,497,798 | | | | 0.3 | % |
| | | | Anheuser-Busch InBev Finance, Inc. | | | | | | | | |
| | 2,530,000 | | | 3.650%, 2/1/2026 | | | 2,662,223 | | | | 0.3 | % |
| | 5,020,000 | | | 3.300% - 4.900%, 2/1/2023 - 2/1/2046 | | | 5,535,126 | | | | 0.7 | % |
| | | | Biogen, Inc. | | | | | | | | |
| | 2,260,000 | | | 3.625%, 9/15/2022 | | | 2,408,615 | | | | 0.3 | % |
| | | | Express Scripts Holding Company | | | | | | | | |
| | 2,190,000 | | | 4.500%, 2/25/2026 | | | 2,346,206 | | | | 0.3 | % |
| | | | Pernod Ricard SA | | | | | | | | |
| | 2,370,000 | | | 5.750%, 4/7/2021a | | | 2,707,455 | | | | 0.3 | % |
| | | | SABMiller Holdings, Inc. | | | | | | | | |
| | 2,680,000 | | | 3.750%, 1/15/2022a | | | 2,886,317 | | | | 0.4 | % |
| | | | Other Securities^ | | | 66,756,850 | | | | 8.1 | % |
| | | | | |
| | | | Total | | | 67,800,590 | | | | | |
| | | | | |
The accompanying Notes to Financial Statements are an integral part of this schedule.
122
INCOME FUND
Summary Schedule of Investments as of October 31, 2016
| | | | | | | | | | | | |
| | | |
Principal Amount | | | Long-Term Fixed Income (90.4%) | | Value | | | % of Net
Assets | |
| Energy (9.1%) | | | | | | | | |
| | | | Devon Energy Corporation | | | | | | | | |
| | $2,160,000 | | | 5.850%, 12/15/2025b | | | $2,475,926 | | | | 0.3 | % |
| | | | MPLX, LP | | | | | | | | |
| | 2,530,000 | | | 4.875%, 6/1/2025 | | | 2,639,169 | | | | 0.3 | % |
| | | | Other Securities^ | | | 69,914,173 | | | | 8.5 | % |
| | | | | |
| | | | Total | | | 75,029,268 | | | | | |
| | | | | |
| | |
| Financials (26.5%) | | | | | | | | |
| | | | Bank of America Corporation | | | | | | | | |
| | 2,170,000 | | | 4.125%, 1/22/2024 | | | 2,328,844 | | | | 0.3 | % |
| | 13,750,000 | | | 1.936% - 7.625%, | | | | | | | | |
| | | | 3/22/2018 - 12/29/2049c,d | | | 14,678,481 | | | | 1.8 | % |
| | | | Berkshire Hathaway, Inc. | | | | | | | | |
| | 1,640,000 | | | 2.750%, 3/15/2023 | | | 1,688,697 | | | | 0.2 | % |
| | | | Citigroup, Inc. | | | | | | | | |
| | 2,630,000 | | | 4.400%, 6/10/2025 | | | 2,777,532 | | | | 0.3 | % |
| | 5,735,000 | | | 2.255% - 5.500%, | | | | | | | | |
| | | | 9/1/2023 - 9/29/2027c | | | 6,079,669 | | | | 0.7 | % |
| | | | CoreStates Capital III | | | | | | | | |
| | 1,360,000 | | | 1.387%, 2/15/2027a,c | | | 1,203,600 | | | | 0.2 | % |
| | | | Credit Suisse Group Funding, Ltd. | | | | | | | | |
| | 2,600,000 | | | 3.750%, 3/26/2025 | | | 2,578,914 | | | | 0.3 | % |
| | | | Goldman Sachs Group, Inc. | | | | | | | | |
| | 2,550,000 | | | 3.850%, 7/8/2024 | | | 2,690,683 | | | | 0.3 | % |
| | 2,240,000 | | | 5.150%, 5/22/2045 | | | 2,420,154 | | | | 0.3 | % |
| | 8,550,000 | | | 2.350% - 5.375%, | | | | | | | | |
| | | | 3/15/2020 - 12/29/2049b,d | | | 9,066,034 | | | | 1.1 | % |
| | | | J.P. Morgan Chase & Company | | | | | | | | |
| | 10,040,000 | | | 2.112% - 7.900%, | | | | | | | | |
| | | | 8/15/2021 - 12/29/2049b,c,d | | | 10,734,310 | | | | 1.3 | % |
| | | | Morgan Stanley | | | | | | | | |
| | 12,375,000 | | | 2.282% - 5.500%, | | | | | | | | |
| | | | 1/26/2020 - 1/27/2045c | | | 13,085,128 | | | | 1.6 | % |
| | | | Wells Fargo & Company | | | | | | | | |
| | 6,180,000 | | | 3.000% - 5.875%, | | | | | | | | |
| | | | 4/22/2026 - 12/31/2049d | | | 6,352,973 | | | | 0.8 | % |
| | | | Other Securities^ | | | 142,010,399 | | | | 17.3 | % |
| | | | | |
| | | | Total | | | 217,695,418 | | | | | |
| | | | | |
| | |
| Foreign Government (0.8%) | | | | | | | | |
| | | | Other Securities^ | | | 6,140,310 | | | | 0.8 | % |
| | | | | |
| | | | Total | | | 6,140,310 | | | | | |
| | | | | |
| | |
| Mortgage-Backed Securities (4.7%) | | | | | | | | |
| | | | Federal Home Loan Mortgage Corporation Gold 15-Yr. Pass Through | | | | | | | | |
| | 2,425,000 | | | 3.000%, 11/1/2031e | | | 2,537,725 | | | | 0.3 | % |
| | | | Federal Home Loan Mortgage Corporation Gold 30-Yr. Pass Through | | | | | | | | |
| | 3,925,000 | | | 4.000%, 11/1/2046e | | | 4,198,370 | | | | 0.5 | % |
| | | | Federal National Mortgage Association Conventional | | | | | | | | |
| | 5,400,000 | | | 3.000%, 11/1/2046e | | | 5,559,468 | | | | 0.7 | % |
| | | | Federal National Mortgage Association Conventional 15-Yr. Pass Through | | | | | | | | |
| | 5,500,000 | | | 2.500%, 11/1/2031e | | | 5,659,414 | | | | 0.7 | % |
| | | | Federal National Mortgage Association Conventional 30-Yr. Pass Through | | | | | | | | |
| | 13,875,000 | | | 3.500%, 11/1/2046e | | | 14,566,583 | | | | 1.8 | % |
| | 5,500,000 | | | 4.000%, 11/1/2046e | | | 5,889,296 | | | | 0.7 | % |
| | 325,000 | | | 4.500%, 11/1/2046e | | | 355,215 | | | | <0.1 | % |
| | | | | |
| | | | Total | | | 38,766,071 | | | | | |
| | | | | |
| | |
| Technology (3.1%) | | | | | | | | |
| | | | Apple, Inc. | | | | | | | | |
| | 2,550,000 | | | 3.250%, 2/23/2026 | | | 2,659,836 | | | | 0.3 | % |
| | | | Other Securities^ | | | 22,908,515 | | | | 2.8 | % |
| | | | | |
| | | | Total | | | 25,568,351 | | | | | |
| | | | | |
| | |
| Transportation (2.1%) | | | | | | | | |
| | | | British Airways plc | | | | | | | | |
| | 2,271,388 | | | 4.625%, 6/20/2024a | | | 2,430,385 | | | | 0.3 | % |
| | | | Burlington Northern Santa Fe, LLC | | | | | | | | |
| | 1,500,000 | | | 4.700%, 9/1/2045 | | | 1,715,759 | | | | 0.2 | % |
| | | | Other Securities^ | | | 13,256,451 | | | | 1.6 | % |
| | | | | |
| | | | Total | | | 17,402,595 | | | | | |
| | | | | |
| | |
| U.S. Government and Agencies (5.3%) | | | | | | | | |
| | | | U.S. Treasury Bonds | | | | | | | | |
| | 3,500,000 | | | 1.500%, 8/15/2026 | | | 3,395,546 | | | | 0.4 | % |
| | 2,980,000 | | | 3.125%, 2/15/2042 | | | 3,316,996 | | | | 0.4 | % |
| | 2,450,000 | | | 2.500%, 2/15/2045 | | | 2,407,316 | | | | 0.3 | % |
| | 4,060,000 | | | 3.000%, 11/15/2045 | | | 4,407,954 | | | | 0.5 | % |
| | | | U.S. Treasury Bonds, TIPS | | | | | | | | |
| | 2,018,290 | | | 0.750% - 1.000%, | | | | | | | | |
| | | | 2/15/2045 - 2/15/2046 | | | 2,107,409 | | | | 0.2 | % |
| | | | U.S. Treasury Notes | | | | | | | | |
| | 2,500,000 | | | 1.375%, 5/31/2020 | | | 2,521,583 | | | | 0.3 | % |
| | 3,270,000 | | | 1.125%, 2/28/2021 | | | 3,251,351 | | | | 0.4 | % |
| | 4,000,000 | | | 2.000%, 5/31/2021 | | | 4,123,124 | | | | 0.5 | % |
| | 3,350,000 | | | 2.000%, 7/31/2022 | | | 3,445,398 | | | | 0.4 | % |
| | 4,040,000 | | | 1.875%, 8/31/2022 | | | 4,125,850 | | | | 0.5 | % |
| | 3,870,000 | | | 2.125%, 12/31/2022 | | | 4,003,484 | | | | 0.5 | % |
| | 4,830,000 | | | 0.875% - 1.625%, | | | | | | | | |
| | | | 11/30/2016 - 10/31/2023 | | | 4,836,521 | | | | 0.7 | % |
| | | | U.S. Treasury Notes, TIPS | | | | | | | | |
| | 1,446,883 | | | 0.125%, 7/15/2026 | | | 1,450,861 | | | | 0.2 | % |
| | | | | |
| | | | Total | | | 43,393,393 | | | | | |
| | | | | |
| | |
| U.S. Municipals (0.2%) | | | | | | | | |
| | | | Other Securities^ | | | 1,700,821 | | | | 0.2 | % |
| | | | | |
| | | | Total | | | 1,700,821 | | | | | |
| | | | | |
| | |
| Utilities (6.1%) | | | | | | | | |
| | | | ITC Holdings Corporation | | | | | | | | |
| | 2,920,000 | | | 4.050%, 7/1/2023 | | | 3,101,823 | | | | 0.4 | % |
| | | | MidAmerican Energy Holdings Company | | | | | | | | |
| | 2,550,000 | | | 3.750%, 11/15/2023 | | | 2,754,671 | | | | 0.3 | % |
| | | | Nevada Power Company | | | | | | | | |
| | 1,700,000 | | | 6.750%, 7/1/2037 | | | 2,356,227 | | | | 0.3 | % |
| | | | Pennsylvania Electric Company | | | | | | | | |
| | 2,300,000 | | | 5.200%, 4/1/2020 | | | 2,469,740 | | | | 0.3 | % |
The accompanying Notes to Financial Statements are an integral part of this schedule.
123
INCOME FUND
Summary Schedule of Investments as of October 31, 2016
| | | | | | | | | | | | |
Principal Amount | | | Long-Term Fixed Income (90.4%) | | Value | | | % of Net
Assets | |
| Utilities (6.1%) - continued | |
| | | | Other Securities^ | | | $39,520,065 | | | | 4.8 | % |
| | | | | |
| | | | Total | | | 50,202,526 | | | | | |
| | | | | |
| | | | | | | | | | | | |
| | | | | |
| | | | Total Long-Term Fixed Income (cost $718,969,990) | | | 743,156,212 | | | | | |
| | | | | |
| | | |
| Shares | | | Preferred Stock (1.4%) | | Value | | | % of Net
Assets | |
| Consumer Staples (0.2%) | |
| | | | Other Securities^ | | | 1,285,350 | | | | 0.2 | % |
| | | | | |
| | | | Total | | | 1,285,350 | | | | | |
| | | | | |
|
| Financials (1.2%) | |
| | 57,878 | | | Citigroup, Inc., 7.257%c | | | 1,505,407 | | | | 0.2 | % |
| | 18,075 | | | Countrywide Capital V, 7.000% | | | 465,612 | | | | <0.1 | % |
| | 54,060 | | | Goldman Sachs Group, Inc., 5.500%d | | | 1,409,344 | | | | 0.2 | % |
| | 51,800 | | | Morgan Stanley, 7.125%d | | | 1,511,524 | | | | 0.2 | % |
| | 58,500 | | | Wells Fargo & Company, 5.850%d | | | 1,558,440 | | | | 0.2 | % |
| | | | Other Securities^ | | | 3,873,912 | | | | 0.4 | % |
| | | | | |
| | | | Total | | | 10,324,239 | | | | | |
| | | | | |
| | | | | | | | | | | | |
| | | | | |
| | | | Total Preferred Stock (cost $11,047,097) | | | 11,609,589 | | | | | |
| | | | | |
| | | |
| Shares | | | Common Stock (0.1%) | | Value | | | % of Net
Assets | |
| Energy (0.1%) | |
| | | | Other Securities^ | | | 853,230 | | | | 0.1 | % |
| | | | | |
| | | | Total | | | 853,230 | | | | | |
| | | | | |
| | | | | | | | | | | | |
| | | | | |
| | | | Total Common Stock (cost $770,971) | | | 853,230 | | | | | |
| | | | | |
| | | |
| Shares | | | Collateral Held for Securities Loaned (2.5%) | | Value | | | % of Net
Assets | |
| | 20,144,903 | | | Thrivent Cash Management Trust | | | 20,144,903 | | | | 2.5 | % |
| | | | | |
| | | | Total Collateral Held for Securities Loaned (cost $20,144,903) | | | 20,144,903 | | | | | |
| | | | | |
| | | |
Shares or
Principal
Amount | | | Short-Term Investments (8.8%)f | | Value | | | % of Net
Assets | |
| | | | Federal Home Loan Bank Discount Notes | | | | | | | | |
| | 2,700,000 | | | 0.311%, 11/1/2016 | | | 2,700,000 | | | | 0.3 | % |
| | 4,900,000 | | | 0.322%, 11/25/2016 | | | 4,899,348 | | | | 0.6 | % |
| | 2,500,000 | | | 0.345%, 11/30/2016 | | | 2,499,597 | | | | 0.3 | % |
| | 8,000,000 | | | 0.310%, 1/17/2017 | | | 7,994,528 | | | | 1.0 | % |
| | | | Federal National Mortgage Association Discount Notes | | | | | | | | |
| | 1,000,000 | | | 0.345%, 1/11/2017g | | | 999,369 | | | | 0.1 | % |
| | | | Federal Home Loan Bank Discount Notes | | | | | | | | |
| | 11,200,000 | | | 0.285% - 0.365%, 11/2/2016 - 1/27/2017 | | | 11,196,955 | | | | 1.4 | % |
| | | | Thrivent Core Short-Term Reserve Fund | | | | | | | | |
| | 4,226,259 | | | 0.790% | | | 42,262,592 | | | | 5.1 | % |
| | | | | |
| | | | Total Short-Term Investments (cost $72,551,093) | | | 72,552,389 | | | | | |
| | | | | |
| | | | Total Investments (cost $851,504,396) 106.6% | | | $876,573,156 | | | | | |
| | | | | |
| | | | Other Assets and Liabilities, Net (6.6%) | | | (54,469,773 | ) | | | | |
| | | | | |
| | | | Total Net Assets 100.0% | | | $822,103,383 | | | | | |
| | | | | |
| ^ | The Summary Schedule of Investments shows the 50 largest holdings in unaffiliated issuers, any holding or issuer that exceeds 1% of net assets and all affiliated holdings as of the report date. The remaining securities held are grouped by category as “Other securities”. |
| a | Denotes securities sold under Rule 144A of the Securities Act of 1933, which exempts them from registration. These securities may be resold to other dealers in the program or to other qualified institutional buyers. As of October 31, 2016, the value of these investments was $124,083,043 or 15.1% of total net assets. |
| b | All or a portion of the security is on loan. |
| c | Denotes variable rate securities. Variable rate securities are securities whose yields vary with a designated market index or market rate. The rate shown is as of October 31, 2016. |
| d | Denotes perpetual securities. Perpetual securities pay an indefinite stream of interest, but may be called by the issuer at an earlier date. |
| e | Denotes investments purchased on a when-issued or delayed delivery basis. |
| f | The interest rate shown reflects the yield, coupon rate or the discount rate at the date of purchase. |
| g | All or a portion of the security is held on deposit with the counterparty and pledged as the initial margin deposit for open futures contracts. |
Income Fund held restricted securities as of October 31, 2016. Restricted securities are investment securities which cannot be offered for public sale without first being registered under the Securities Act of 1933. As of October 31, 2016, the value of these investments was $1,172,830 or 0.1% of total net assets.
The following table presents the total amount of securities loaned with continuous maturity, by type, offset by the gross payable upon return of collateral for securities loaned by Thrivent Income Fund as of October 31, 2016:
| | | | |
Securities lending Transactions | | | | |
Taxable Debt Security | | | $16,247,643 | |
Common Stock | | | 785,166 | |
| | | | |
Total lending | | | $17,032,809 | |
Gross amount payable upon return of collateral for securities loaned | | | $20,144,903 | |
| | | | |
Net amounts due to counterparty | | | $3,112,094 | |
| | | | |
Definitions:
| | |
TIPS | | - Treasury Inflation Protected Security. |
The accompanying Notes to Financial Statements are an integral part of this schedule.
124
INCOME FUND
Summary Schedule of Investments as of October 31, 2016
Unrealized Appreciation (Depreciation)
Gross unrealized appreciation and depreciation of investments, based on cost for federal income tax purposes, were as follows:
| | | | |
Gross unrealized appreciation | | | $31,115,960 | |
Gross unrealized depreciation | | | (5,920,591 | ) |
| | | | |
Net unrealized appreciation (depreciation) | | | $25,195,369 | |
| |
Cost for federal income tax purposes | | | $851,377,787 | |
The accompanying Notes to Financial Statements are an integral part of this schedule.
125
INCOME FUND
Summary Schedule of Investments as of October 31, 2016
Fair Valuation Measurements
The following table is a summary of the inputs used, as of October 31, 2016, in valuing Income Fund’s assets carried at fair value.
| | | | | | | | | | | | | | | | |
| Investments in Securities | | Total | | | Level 1 | | | Level 2 | | | Level 3 | |
| | | | |
Bank Loans | | | | | | | | | | | | | | | | |
Basic Materials | | | 1,591,217 | | | | – | | | | 1,591,217 | | | | – | |
Capital Goods | | | 1,877,409 | | | | – | | | | 1,877,409 | | | | – | |
Communications Services | | | 9,023,909 | | | | – | | | | 9,023,909 | | | | – | |
Consumer Cyclical | | | 3,254,627 | | | | – | | | | 3,254,627 | | | | – | |
Consumer Non-Cyclical | | | 5,360,084 | | | | – | | | | 4,916,812 | | | | 443,272 | |
Energy | | | 744,200 | | | | – | | | | 467,188 | | | | 277,012 | |
Financials | | | 1,289,337 | | | | – | | | | 1,289,337 | | | | – | |
Technology | | | 3,483,803 | | | | – | | | | 3,483,803 | | | | – | |
Transportation | | | 947,262 | | | | – | | | | 947,262 | | | | – | |
Utilities | | | 684,985 | | | | – | | | | 684,985 | | | | – | |
Long-Term Fixed Income | | | | | | | | | | | | | | | | |
Asset-Backed Securities | | | 10,307,925 | | | | – | | | | 10,307,925 | | | | – | |
Basic Materials | | | 21,788,313 | | | | – | | | | 21,788,313 | | | | – | |
Capital Goods | | | 16,344,169 | | | | – | | | | 16,344,169 | | | | – | |
Collateralized Mortgage Obligations | | | 4,751,506 | | | | – | | | | 4,751,506 | | | | – | |
Commercial Mortgage-Backed Securities | | | 1,840,921 | | | | – | | | | 1,840,921 | | | | – | |
Communications Services | | | 83,334,711 | | | | – | | | | 83,334,711 | | | | – | |
Consumer Cyclical | | | 41,089,324 | | | | – | | | | 41,089,324 | | | | – | |
Consumer Non-Cyclical | | | 87,800,590 | | | | – | | | | 87,800,590 | | | | – | |
Energy | | | 75,029,268 | | | | – | | | | 75,029,268 | | | | – | |
Financials | | | 217,695,418 | | | | – | | | | 217,695,418 | | | | – | |
Foreign Government | | | 6,140,310 | | | | – | | | | 6,140,310 | | | | – | |
Mortgage-Backed Securities | | | 38,766,071 | | | | – | | | | 38,766,071 | | | | – | |
Technology | | | 25,568,351 | | | | – | | | | 25,568,351 | | | | – | |
Transportation | | | 17,402,595 | | | | – | | | | 17,402,595 | | | | – | |
U.S. Government and Agencies | | | 43,393,393 | | | | – | | | | 43,393,393 | | | | – | |
U.S. Municipals | | | 1,700,821 | | | | – | | | | 1,700,821 | | | | – | |
Utilities | | | 50,202,526 | | | | – | | | | 50,202,526 | | | | – | |
Preferred Stock | | | | | | | | | | | | | | | | |
Consumer Staples | | | 1,285,350 | | | | 1,285,350 | | | | – | | | | – | |
Financials | | | 10,324,239 | | | | 8,991,816 | | | | 1,332,423 | | | | – | |
Common Stock | | | | | | | | | | | | | | | | |
Energy | | | 853,230 | | | | 853,230 | | | | – | | | | – | |
Short-Term Investments | | | 30,289,797 | | | | – | | | | 30,289,797 | | | | – | |
| |
Subtotal Investments in Securities | | | $814,165,661 | | | | $11,130,396 | | | | $802,314,981 | | | | $720,284 | |
| |
| | | | |
| Other Investments* | | Total | | | | | | | | | | |
Short-Term Investments | | | 42,262,592 | | | | | | | | | | | | | |
Collateral Held for Securities Loaned | | | 20,144,903 | | | | | | | | | | | | | |
| | | | | | | | | | | | | |
Subtotal Other Investments | | | $62,407,495 | | | | | | | | | | | | | |
| | | | | | | | | | | | | |
| | | | | | | | | | | | | | | | |
| | | | | | | | | | | | | |
Total Investments at Value | | | $876,573,156 | | | | | | | | | | | | | |
| | | | | | | | | | | | | |
| * | Certain investments are measured at fair value using a net asset value per share that is not publicly available (practical expedient). According to disclosure requirements of Accounting Standards Codification (ASC) 820, Fair Value Measurement, securities valued using the practical expedient are not classified in the fair value hierarchy. The fair value amounts presented in this table are intended to permit reconciliation of the fair value hierarchy to the amounts presented in the Statement of Assets and Liabilities. |
| | | | | | | | | | | | | | | | |
| | | | |
| Other Financial Instruments | | Total | | | Level 1 | | | Level 2 | | | Level 3 | |
Asset Derivatives | | | | | | | | | | | | | | | | |
Futures Contracts | | | 816,422 | | | | 816,422 | | | | – | | | | – | |
| |
Total Asset Derivatives | | | $816,422 | | | | $816,422 | | | | $– | | | | $– | |
| |
Liability Derivatives | | | | | | | | | | | | | | | | |
Futures Contracts | | | 1,872,488 | | | | 1,872,488 | | | | – | | | | – | |
| |
Total Liability Derivatives | | | $1,872,488 | | | | $1,872,488 | | | | $– | | | | $– | |
| |
There were no significant transfers between Levels during the period ended October 31, 2016. Transfers between Levels are identified as of the end of the period.
The accompanying Notes to Financial Statements are an integral part of this schedule.
126
INCOME FUND
Summary Schedule of Investments as of October 31, 2016
The following table presents Income Fund’s futures contracts held as of October 31, 2016. Investments and/or cash totaling $499,685 were pledged as the initial margin deposit for these contracts.
| | | | | | | | | | | | | | | | | | |
| Futures Contracts | | Number of
Contracts Long/(Short) | | | Expiration Date | | Notional Principal Amount | | | Value | | | Unrealized Gain/(Loss) | |
CBOT 10-Yr. U.S. Treasury Note | | | (530 | ) | | December 2016 | | | ($69,420,025 | ) | | | ($68,701,250 | ) | | | $718,775 | |
CBOT 5-Yr. U.S. Treasury Note | | | (247 | ) | | December 2016 | | | (29,934,476 | ) | | | (29,836,829 | ) | | | 97,647 | |
CBOT U.S. Long Bond | | | 304 | | | December 2016 | | | 51,338,988 | | | | 49,466,500 | | | | (1,872,488 | ) |
Total Futures Contracts | | | | | | | | | | | | | | | | | ($1,056,066 | ) |
The following table summarizes the fair value and Statement of Assets and Liabilities location, as of October 31, 2016, for Income Fund’s investments in financial derivative instruments by primary risk exposure as discussed under item (2) Significant Accounting Policies of the Notes to Financial Statements.
| | | | | | |
| Derivatives by risk category | | Statement of Assets and Liabilities Location | | Fair Value | |
| | |
Asset Derivatives | | | | | | |
| | |
Interest Rate Contracts | | | | | | |
Futures* | | Net Assets - Net unrealized appreciation/(depreciation) on Futures contracts | | | $816,422 | |
Total Interest Rate Contracts | | | | | 816,422 | |
| |
Total Asset Derivatives | | | | | $816,422 | |
| |
| | |
Liability Derivatives | | | | | | |
| | |
Interest Rate Contracts | | | | | | |
Futures* | | Net Assets - Net unrealized appreciation/(depreciation) on Futures contracts | | | 1,872,488 | |
Total Interest Rate Contracts | | | | | 1,872,488 | |
| |
Total Liability Derivatives | | | | | $1,872,488 | |
| |
| * | Includes cumulative appreciation/depreciation of futures contracts as reported in the Schedule of Investments. Only current day’s variation margin is reported within the Statement of Assets and Liabilities. |
The following table summarizes the net realized gains/ (losses) and Statement of Operations location, for the period ended October 31, 2016, for Income Fund’s investments in financial derivative instruments by primary risk exposure.
| | | | | | |
| Derivatives by risk category | | Statement of Operations Location | | Realized Gains/(Losses) recognized in Income | |
| | |
Interest Rate Contracts | | | | | | |
Futures | | Net realized gains/(losses) on Futures contracts | | | 2,193,383 | |
| | |
Total Interest Rate Contracts | | | | | 2,193,383 | |
| | |
Credit Contracts | | | | | | |
Credit Default Swaps | | Net realized gains/(losses) on Swap agreements | | | (242,913 | ) |
| | |
Total Credit Contracts | | | | | (242,913 | ) |
| |
Total | | | | | $1,950,470 | |
| |
The following table summarizes the change in net unrealized appreciation/ (depreciation) and Statement of Operations location, for the period ended October 31, 2016, for Income Fund’s investments in financial derivative instruments by primary risk exposure.
| | | | | | |
| Derivatives by risk category | | Statement of Operations Location | | Change in unrealized
appreciation/ (depreciation) recognized in Income | |
| | |
Interest Rate Contracts | | | | | | |
Futures | | Change in net unrealized appreciation/(depreciation) on Futures contracts | | | (1,353,015 | ) |
| | |
Total Interest Rate Contracts | | | | | (1,353,015 | ) |
| |
Total | | | | | ($1,353,015 | ) |
| |
The following table presents Income Fund’s average volume of derivative activity during the period ended October 31, 2016.
| | | | | | | | | | | | | | | | |
| Derivative Risk Category | | Futures (Notional)* | | | Futures
(Percentage of
Average Net
Assets) | | | Swaps (Notional)* | | | Swaps
(Percentage of
Average Net
Assets) | |
Interest Rate Contracts | | | $152,662,390 | | | | 19.5 | % | | | N/A | | | | N/A | |
Credit Contracts | | | N/A | | | | N/A | | | | $14,979 | | | | <0.1 | % |
| * | Notional amount represents long or short, or both, derivative positions held by the Fund. |
The accompanying Notes to Financial Statements are an integral part of this schedule.
127
INCOME FUND
Summary Schedule of Investments as of October 31, 2016
Investment in Affiliates
Affiliated issuers, as defined under the Investment Company Act of 1940, include those in which the Fund’s holdings of an issuer represent 5% or more of the outstanding voting securities of an issuer, any affiliated mutual fund, or a company which is under common ownership or control with the Fund. The Fund owns shares of Thrivent Cash Management Trust for the purpose of securities lending and Thrivent Core Short-Term Reserve Fund primarily to serve as a cash sweep vehicle for the Fund. Thrivent Cash Management Trust and Thrivent Core Short-Term Reserve Fund are established for the sole use of affiliated funds.
A summary of transactions for the fiscal year to date, in Income Fund, is as follows:
| | | | | | | | | | | | | | | | | | | | | | | | |
| Fund | | Value
October 31, 2015 | | | Gross Purchases | | | Gross Sales | | | Shares Held at
October 31, 2016 | | | Value
October 31, 2016 | | | Income Earned
November 1, 2015 - October 31, 2016 | |
Cash Management Trust-Collateral Investment | | | $12,776,357 | | | | $116,216,160 | | | | $108,847,614 | | | | 20,144,903 | | | | $20,144,903 | | | | $87,463 | |
Cash Management Trust-Short Term Investment | | | 19,111,151 | | | | 129,513,282 | | | | 148,624,433 | | | | – | | | | – | | | | 49,249 | |
Core Short-Term Reserve | | | – | | | | 129,731,695 | | | | 87,469,103 | | | | 4,226,259 | | | | 42,262,592 | | | | 120,757 | |
Total Value and Income Earned | | | $31,887,508 | | | | | | | | | | | | | | | | $62,407,495 | | | | $257,469 | |
The accompanying Notes to Financial Statements are an integral part of this schedule.
128
MUNICIPAL BOND FUND
Summary Schedule of Investments as of October 31, 2016
| | | | | | | | | | | | |
Principal Amount | | | Long-Term Fixed Income (98.9%) | | Value | | | % of Net
Assets | |
| Alabama (0.3%) | |
| | | | Other Securities^ | | | $4,327,650 | | | | 0.3 | % |
| | | | | |
| | | | Total | | | 4,327,650 | | | | | |
| | | | | |
|
| Alaska (0.3%) | |
| | | | Other Securities^ | | | 5,605,000 | | | | 0.3 | % |
| | | | | |
| | | | Total | | | 5,605,000 | | | | | |
| | | | | |
|
| Arizona (1.0%) | |
| | | | Other Securities^ | | | 16,032,702 | | | | 1.0 | % |
| | | | | |
| | | | Total | | | 16,032,702 | | | | | |
| | | | | |
|
| Arkansas (0.8%) | |
| | | | Other Securities^ | | | 13,257,916 | | | | 0.8 | % |
| | | | | |
| | | | Total | | | 13,257,916 | | | | | |
| | | | | |
|
| California (11.2%) | |
| | | | California Educational Fac. Auth. Rev. (Stanford University) | | | | | | | | |
| | $6,000,000 | | | 5.250%, 4/1/2040 | | | 8,422,440 | | | | 0.5 | % |
| | | | California Infrastructure and Economic Development Bank Rev. (Bay Area Toll Bridges Seismic Retrofit Rev.) (FGIC Insured) | | | | | | | | |
| | 5,000,000 | | | 5.000%, 7/1/2025, Ser. Aa,b | | | 6,361,350 | | | | 0.4 | % |
| | | | California Various Purpose G.O. | | | | | | | | |
| | 10,000,000 | | | 5.250%, 3/1/2038 | | | 10,529,000 | | | | 0.6 | % |
| | 13,575,000 | | | 5.250% - 6.000%, 4/1/2024 - 11/1/2039 | | | 15,246,677 | | | | 0.9 | % |
| | | | California Various Purpose G.O. Refg. | | | | | | | | |
| | 4,000,000 | | | 5.000%, 9/1/2035 | | | 4,789,720 | | | | 0.3 | % |
| | | | East Bay Municipal Utility District, Alameda and Contra Costa Counties, CA Water System Rev. Refg. (NATL-RE Insured) | | | | | | | | |
| | 10,000,000 | | | 5.000%, 6/1/2037, Ser. Aa,b | | | 10,252,800 | | | | 0.6 | % |
| | | | Los Angeles Community College District, Los Angeles County, CA G.O. (Election 2008) | | | | | | | | |
| | 10,050,000 | | | 6.000%, 8/1/2033, Ser. Ab | | | 11,415,795 | | | | 0.7 | % |
| | | | Los Angeles, CA Department of Airports Rev. (Los Angeles International Airport) | | | | | | | | |
| | 8,000,000 | | | 5.000%, 5/15/2040, Ser. A | | | 8,999,600 | | | | 0.5 | % |
| | | | Los Angeles, CA Department of Water & Power System Rev. | | | | | | | | |
| | 7,000,000 | | | 5.000%, 7/1/2044, Ser. D | | | 8,213,800 | | | | 0.5 | % |
| | | | San Diego Unified School District G.O. | | | | | | | | |
| | 10,000,000 | | | Zero Coupon, 7/1/2033, Ser. Ab,c | | | 11,508,700 | | | | 0.7 | % |
| | | | San Francisco, CA City & County Airport Commission Rev. (San Francisco International Airport) | | | | | | | | |
| | 7,030,000 | | | 6.000%, 5/1/2039, Ser. E | | | 7,881,544 | | | | 0.5 | % |
| | 7,825,000 | | | 5.000%, 5/1/2044, Ser. A, AMT | | | 8,852,266 | | | | 0.5 | % |
| | 4,000,000 | | | 5.500%, 5/1/2028, Ser. A, AMT | | | 4,788,320 | | | | 0.3 | % |
| | | | University of California Limited Rev. Refg. | | | | | | | | |
| | 8,000,000 | | | 5.000%, 5/15/2032, Ser. I | | | 9,693,440 | | | | 0.6 | % |
| | | | Other Securities^ | | | 60,040,546 | | | | 3.6 | % |
| | | | | |
| | | | Total | | | 186,995,998 | | | | | |
| | | | | |
|
| Colorado (3.2%) | |
| | | | University of Colorado University Enterprise Rev. | | | | | | | | |
| | 9,790,000 | | | 5.000%, 6/1/2033b | | | 11,465,559 | | | | 0.7 | % |
| | 7,500,000 | | | 5.000% - 5.375%, 6/1/2032 - 6/1/2034, Ser. Ab | | | 8,719,290 | | | | 0.5 | % |
| | | | Other Securities^ | | | 32,640,404 | | | | 2.0 | % |
| | | | | |
| | | | Total | | | 52,825,253 | | | | | |
| | | | | |
|
| District of Columbia (0.9%) | |
| | | | Other Securities^ | | | 14,990,730 | | | | 0.9 | % |
| | | | | |
| | | | Total | | | 14,990,730 | | | | | |
| | | | | |
|
| Florida (6.5%) | |
| | | | Citizens Property Insurance Corporation Rev. | | | | | | | | |
| | 10,000,000 | | | 5.000%, 6/1/2022, Ser. A1 | | | 11,724,600 | | | | 0.7 | % |
| | | | Miami-Dade County, FL Aviation Rev. (Miami International Airport-Hub of the Americas) | | | | | | | | |
| | 7,500,000 | | | 5.500%, 10/1/2036, Ser.Bb | | | 8,453,850 | | | | 0.5 | % |
| | 8,000,000 | | | 5.500%, 10/1/2041, Ser. A | | | 8,941,440 | | | | 0.5 | % |
| | | | Miami-Dade County, FL Public Fac. Rev. (Jackson Health System) | | | | | | | | |
| | 5,000,000 | | | 5.000%, 6/1/2035, Ser. A | | | 5,780,350 | | | | 0.3 | % |
| | | | Miami-Dade County, FL Public Fac. Rev. (Jackson Health System) (AGC Insured) | | | | | | | | |
| | 2,000,000 | | | 5.625%, 6/1/2034a | | | 2,207,180 | | | | 0.1 | % |
| | | | Other Securities^ | | | 71,611,091 | | | | 4.4 | % |
| | | | | |
| | | | Total | | | 108,718,511 | | | | | |
| | | | | |
|
| Georgia (1.1%) | |
| | | | Other Securities^ | | | 17,622,148 | | | | 1.1 | % |
| | | | | |
| | | | Total | | | 17,622,148 | | | | | |
| | | | | |
|
| Hawaii (1.3%) | |
| | | | Hawaii Airports System Rev. | | | | | | | | |
| | 3,040,000 | | | 5.250%, 7/1/2030, Ser. A | | | 3,435,291 | | | | 0.2 | % |
| | | | Hawaii State Department of Budget and Finance Special Purpose Senior Living Rev. Refg. | | | | | | | | |
| | 6,395,000 | | | 5.125% - 5.250%, 11/15/2032 - 11/15/2037 | | | 7,040,437 | | | | 0.4 | % |
| | | | Hawaii State Department of Transportation Airport Division Lease Rev. C.O.P. | | | | | | | | |
| | 1,600,000 | | | 5.000%, 8/1/2028, AMT | | | 1,834,304 | | | | 0.1 | % |
| | | | Hawaii State Harbor System Rev. | | | | | | | | |
| | 6,000,000 | | | 5.250%, 7/1/2030, Ser. A | | | 6,716,460 | | | | 0.4 | % |
| | | | Other Securities^ | | | 2,218,539 | | | | 0.2 | % |
| | | | | |
| | | | Total | | | 21,245,031 | | | | | |
| | | | | |
The accompanying Notes to Financial Statements are an integral part of this schedule.
129
MUNICIPAL BOND FUND
Summary Schedule of Investments as of October 31, 2016
| | | | | | | | | | |
Principal
Amount | | Long-Term Fixed Income (98.9%) | | Value | | | % of Net
Assets | |
Illinois (6.8%) | |
| | Chicago Metropolitan Water Reclamation District G.O. Refg. | | | | | | | | |
| 8,700,000 | | 5.250%, 12/1/2032, Ser. C | | | $10,865,865 | | | | 0.7 | % |
| | Illinois Finance Auth. Rev. (DePaul University) | | | | | | | | |
| 5,075,000 | | 5.000% - 6.000%, 10/1/2032 - 10/1/2041, Ser. Ab | | | 6,075,532 | | | | 0.4 | % |
| | Illinois Finance Auth. Rev. (Rush University Medical Center) | | | | | | | | |
| 6,000,000 | | 5.000% - 7.250%, 11/15/2027 - 11/1/2038, Ser. Ab | | | 6,835,260 | | | | 0.4 | % |
| | Illinois Finance Auth. Rev. (The Art Institute of Chicago) | | | | | | | | |
| 3,530,000 | | 5.000%, 3/1/2034, Ser. A | | | 3,966,096 | | | | 0.2 | % |
| | Illinois Finance Auth. Rev. Refg. (Rush University Medical Center) (NATL-RE Insured) | | | | | | | | |
| 2,020,000 | | 5.250%, 11/1/2035, Ser. Ba,b | | | 2,192,791 | | | | 0.1 | % |
| | Illinois Health Fac. Auth. Rev. Refg. (Lutheran General Health System) (AGM-CR Insured) | | | | | | | | |
| 1,380,000 | | 6.000%, 4/1/2018, Ser. Ca | | | 1,454,782 | | | | 0.1 | % |
| | Illinois Sales Tax Rev. (Build Illinois) (NATL-RE Insured) | | | | | | | | |
| 8,050,000 | | 5.750%, 6/15/2018, 2nd Ser.a | | | 8,638,616 | | | | 0.5 | % |
| | Metropolitan Pier and Exposition Auth., IL Dedicated Tax Rev. (McCormick Place Expansion) (NATL-RE Insured) | | | | | | | | |
| 7,000,000 | | 5.500% - 5.500%, 6/15/2020a,b | | | 7,262,469 | | | | 0.4 | % |
| | Metropolitan Pier and Exposition Auth., IL Refg. (McCormick Place Expansion) (NATL-RE Insured) | | | | | | | | |
| 17,605,000 | | Zero Coupon, 6/15/2020, Ser. Aa | | | 15,812,987 | | | | 1.0 | % |
| 5,100,000 | | Zero Coupons, 6/15/2024 - 12/15/2024, Ser. Aa | | | 3,851,174 | | | | 0.2 | % |
| | State of Illinois G.O. | | | | | | | | |
| 8,250,000 | | 5.500% - 5.500%, 3/1/2027 - 7/1/2038 | | | 8,851,440 | | | | 0.5 | % |
| | State of Illinois G.O. Refg. | | | | | | | | |
| 9,000,000 | | 5.000%, 8/1/2017 | | | 9,227,790 | | | | 0.6 | % |
| 5,335,000 | | 5.000%, 4/1/2018, Ser. A | | | 5,548,240 | | | | 0.3 | % |
| | Other Securities^ | | | 22,003,918 | | | | 1.4 | % |
| | | |
| | Total | | | 112,586,960 | | | | | |
| | | |
|
Indiana (2.5%) | |
| | Indiana Bond Bank Special Program Rev. (Clark Memorial Hospital) | | | | | | | | |
| 7,000,000 | | 5.500%, 8/1/2029, Ser. Db | | | 7,699,790 | | | | 0.5 | % |
| | Other Securities^ | | | 34,758,544 | | | | 2.0 | % |
| | | |
| | Total | | | 42,458,334 | | | | | |
| | | |
|
Iowa (0.8%) | |
| | Other Securities^ | | | 13,987,937 | | | | 0.8 | % |
| | | |
| | Total | | | 13,987,937 | | | | | |
| | | |
|
Kansas (0.2%) | |
| | Other Securities^ | | | 3,987,940 | | | | 0.2 | % |
| | | |
| | Total | | | 3,987,940 | | | | | |
| | | |
|
Kentucky (1.5%) | |
| | Other Securities^ | | | 25,289,119 | | | | 1.5 | % |
| | | |
| | Total | | | 25,289,119 | | | | | |
| | | |
|
Louisiana (2.4%) | |
| | Louisiana State Gas and Fuels Tax Rev. | | | | | | | | |
| 7,000,000 | | 5.000%, 5/1/2045, Ser. B | | | 7,780,080 | | | | 0.5 | % |
| | Other Securities^ | | | 32,850,227 | | | | 1.9 | % |
| | | |
| | Total | | | 40,630,307 | | | | | |
| | | |
|
Maryland (0.1%) | |
| | Other Securities^ | | | 1,154,450 | | | | 0.1 | % |
| | | |
| | Total | | | 1,154,450 | | | | | |
| | | |
|
Massachusetts (4.2%) | |
| | Massachusetts Health and Educational Fac. Auth. Rev. (Massachusetts Institute of Technology) | | | | | | | | |
| 15,295,000 | | 5.250%, 7/1/2033, Ser. L | | | 20,898,170 | | | | 1.3 | % |
| | Massachusetts Port Auth. Rev. | | | | | | | | |
| 8,300,000 | | 5.000%, 7/1/2042, Ser. A, AMT | | | 9,273,424 | | | | 0.6 | % |
| | Massachusetts School Building Auth. Sales Tax Refg. | | | | | | | | |
| 6,900,000 | | 5.000%, 8/15/2029, Ser. B | | | 8,263,854 | | | | 0.5 | % |
| | Other Securities^ | | | 31,821,722 | | | | 1.8 | % |
| | | |
| | Total | | | 70,257,170 | | | | | |
| | | |
|
Michigan (2.6%) | |
| | Great Lakes, MI Water Auth. Water Supply System Rev. | | | | | | | | |
| 10,000,000 | | 5.000%, 7/1/2046, Ser. A | | | 11,352,500 | | | | 0.7 | % |
| | Other Securities^ | | | 31,534,932 | | | | 1.9 | % |
| | | |
| | Total | | | 42,887,432 | | | | | |
| | | |
|
Minnesota (3.0%) | |
| | Other Securities^ | | | 49,464,732 | | | | 3.0 | % |
| | | |
| | Total | | | 49,464,732 | | | | | |
| | | |
|
Mississippi (0.3%) | |
| | Other Securities^ | | | 5,562,297 | | | | 0.3 | % |
| | | |
| | Total | | | 5,562,297 | | | | | |
| | | |
|
Missouri (0.7%) | |
| | Other Securities^ | | | 12,546,720 | | | | 0.7 | % |
| | | |
| | Total | | | 12,546,720 | | | | | |
| | | |
The accompanying Notes to Financial Statements are an integral part of this schedule.
130
MUNICIPAL BOND FUND
Summary Schedule of Investments as of October 31, 2016
| | | | | | | | | | | | |
Principal Amount | | | Long-Term Fixed Income (98.9%) | | Value | | | % of Net
Assets | |
| Nebraska (1.5%) | |
| | | | Omaha, NE Public Power District Rev. | | | | | | | | |
| | $8,150,000 | | | 5.000%, 2/1/2045, Ser. A | | | $9,527,106 | | | | 0.6 | % |
| | | | Other Securities^ | | | 14,814,587 | | | | 0.9 | % |
| | | | | |
| | | | Total | | | 24,341,693 | | | | | |
| | | | | |
|
| New Hampshire (0.2%) | |
| | | | Other Securities^ | | | 3,235,390 | | | | 0.2 | % |
| | | | | |
| | | | Total | | | 3,235,390 | | | | | |
| | | | | |
|
| New Jersey (1.3%) | |
| | | | New Jersey Educational Fac. Auth. Rev. Refg. (Kean University) | | | | | | | | |
| | 1,000,000 | | | 5.500%, 9/1/2036, Ser. A | | | 1,106,020 | | | | 0.1 | % |
| | | | New Jersey G.O. (AMBAC Insured) | | | | | | | | |
| | 1,000,000 | | | 5.250%, 7/15/2018, Ser. La | | | 1,064,940 | | | | 0.1 | % |
| | | | New Jersey Transportation Trust Fund Auth. Rev. | | | | | | | | |
| | 2,645,000 | | | 5.250% - 5.250%, 6/15/2033 - 6/15/2034, Ser. AA | | | 2,959,972 | | | | 0.2 | % |
| | | | New Jersey Transportation Trust Fund Auth. Rev. Federal Highway Reimbursement Notes | | | | | | | | |
| | 10,000,000 | | | 5.000%, 6/15/2023, Ser. A-2d | | | 10,444,500 | | | | 0.6 | % |
| | | | New Jersey Transportation Trust Fund Auth. Transportation System Rev. | | | | | | | | |
| | 1,500,000 | | | 5.000%, 6/15/2026, Ser. A | | | 1,637,775 | | | | 0.1 | % |
| | | | Other Securities^ | | | 4,026,230 | | | | 0.2 | % |
| | | | | |
| | | | Total | | | 21,239,437 | | | | | |
| | | | | |
|
| New York (6.9%) | |
| | | | New York City Municipal Water Finance Auth. Water and Sewer System Rev. | | | | | | | | |
| | 8,585,000 | | | 5.750%, 6/15/2040, Ser. A | | | 9,229,991 | | | | 0.5 | % |
| | | | New York City Transitional Finance Auth. Future Tax Secured Rev. | | | | | | | | |
| | 12,505,000 | | | 5.000%, 11/1/2021 | | | 14,808,796 | | | | 0.9 | % |
| | 15,000,000 | | | 5.000%, 11/1/2033, Ser. D-1 | | | 17,532,900 | | | | 1.1 | % |
| | 6,000,000 | | | 5.000%, 8/1/2038, Ser. B-1 | | | 7,119,240 | | | | 0.4 | % |
| | | | New York State Liberty Development Corporation Liberty Rev. | | | | | | | | |
| | 10,000,000 | | | 5.250%, 12/15/2043 | | | 11,670,100 | | | | 0.7 | % |
| | | | Other Securities^ | | | 53,968,462 | | | | 3.3 | % |
| | | | | |
| | | | Total | | | 114,329,489 | | | | | |
| | | | | |
|
| North Carolina (1.9%) | |
| | | | Other Securities^ | | | 30,892,002 | | | | 1.9 | % |
| | | | | |
| | | | Total | | | 30,892,002 | | | | | |
| | | | | |
|
| North Dakota (0.3%) | |
| | | | Other Securities^ | | | 4,629,662 | | | | 0.3 | % |
| | | | | |
| | | | Total | | | 4,629,662 | | | | | |
| | | | | |
|
| Ohio (6.3%) | |
| | | | Buckeye Tobacco Settlement Financing Auth. Rev. | | | | | | | | |
| | 16,920,000 | | | 5.125%, 6/1/2024, Ser. A-2 | | | 15,989,231 | | | | 0.9 | % |
| | | | Ohio Higher Educational Fac. Commission Rev. (Dayton University) | | | | | | | | |
| | 2,565,000 | | | 5.000%, 12/1/2035, Ser. A | | | 2,956,906 | | | | 0.2 | % |
| | | | Ohio Higher Educational Fac. Commission Rev. (Kenyon College) | | | | | | | | |
| | 4,740,000 | | | 5.250%, 7/1/2044 | | | 5,302,401 | | | | 0.3 | % |
| | | | Ohio Hospital Rev. (Cleveland Clinic Health System Obligated Group) | | | | | | | | |
| | 5,000,000 | | | 5.000%, 1/1/2034 | | | 5,706,300 | | | | 0.3 | % |
| | | | Ohio State Higher Educational Fac. Commission Rev. (Case Western Reserve University) | | | | | | | | |
| | 1,380,000 | | | 6.500%, 10/1/2020, Ser. B | | | 1,532,835 | | | | 0.1 | % |
| | 2,745,000 | | | 5.000%, 12/1/2028 | | | 3,284,118 | | | | 0.2 | % |
| | | | Ohio State Turnpike Commission Rev. | | | | | | | | |
| | 8,000,000 | | | 0.000%, 2/15/2034c | | | 7,670,800 | | | | 0.5 | % |
| | | | Ohio State Turnpike Commission Rev. Refg. (NATL-RE Insured) | | | | | | | | |
| | 10,000,000 | | | 5.500%, 2/15/2026, Ser. Aa | | | 12,830,600 | | | | 0.8 | % |
| | 2,000,000 | | | 5.500%, 2/15/2024, Ser. Aa | | | 2,466,800 | | | | 0.1 | % |
| | | | Ohio State University Refg. Rev. | | | | | | | | |
| | 7,800,000 | | | 0.600%, 6/1/2035, Ser. Ee | | | 7,800,000 | | | | 0.5 | % |
| | | | Other Securities^ | | | 40,070,363 | | | | 2.4 | % |
| | | | | |
| | | | Total | | | 105,610,354 | | | | | |
| | | | | |
|
| Oklahoma (0.9%) | |
| | | | Grand River, OK Dam Authority Rev. | | | | | | | | |
| | 7,815,000 | | | 5.000%, 6/1/2039, Ser. A | | | 9,028,357 | | | | 0.6 | % |
| | | | Other Securities^ | | | 5,789,182 | | | | 0.3 | % |
| | | | | |
| | | | Total | | | 14,817,539 | | | | | |
| | | | | |
|
| Oregon (0.3%) | |
| | | | Other Securities^ | | | 5,361,568 | | | | 0.3 | % |
| | | | | |
| | | | Total | | | 5,361,568 | | | | | |
| | | | | |
|
| Pennsylvania (3.6%) | |
| | | | Lycoming County, PA Auth. Health System Rev. (Susquehanna Health System) | | | | | | | | |
| | 7,075,000 | | | 5.750%, 7/1/2039, Ser. A | | | 7,856,009 | | | | 0.5 | % |
| | | | Pennsylvania Turnpike Commission Turnpike Rev. | | | | | | | | |
| | 6,000,000 | | | 5.000% - 5.000%, 12/1/2040 - 12/1/2046, Ser. A-1, B | | | 6,869,850 | | | | 0.4 | % |
The accompanying Notes to Financial Statements are an integral part of this schedule.
131
MUNICIPAL BOND FUND
Summary Schedule of Investments as of October 31, 2016
| | | | | | | | | | | | |
Principal Amount | | | Long-Term Fixed Income (98.9%) | | Value | | | % of Net Assets | |
| Pennsylvania (3.6%) - continued | |
| | | | Pennsylvania Turnpike Commission Turnpike Rev. (AGC Insured) | | | | | | | | |
| | $10,070,000 | | | 6.250%, 6/1/2038, Ser. Ca,b | | | $10,924,943 | | | | 0.7 | % |
| | | | Pennsylvania Turnpike Commission Turnpike Rev. (AGM Insured) | | | | | | | | |
| | 10,215,000 | | | 6.250%, 6/1/2033, Ser. Ca | | | 13,228,732 | | | | 0.8 | % |
| | | | Other Securities^ | | | 20,406,679 | | | | 1.2 | % |
| | | | | |
| | | | Total | | | 59,286,213 | | | | | |
| | | | | |
|
| South Carolina (2.2%) | |
| | | | County of Charleston, SC G.O. Transportation Sales Tax Refg. | | | | | | | | |
| | 10,005,000 | | | 5.000%, 11/1/2021 | | | 11,874,935 | | | | 0.7 | % |
| | | | Other Securities^ | | | 24,153,191 | | | | 1.5 | % |
| | | | | |
| | | | Total | | | 36,028,126 | | | | | |
| | | | | |
|
| South Dakota (0.3%) | |
| | | | Other Securities^ | | | 4,595,660 | | | | 0.3 | % |
| | | | | |
| | | | Total | | | 4,595,660 | | | | | |
| | | | | |
|
| Tennessee (0.5%) | |
| | | | Other Securities^ | | | 8,833,657 | | | | 0.5 | % |
| | | | | |
| | | | Total | | | 8,833,657 | | | | | |
| | | | | |
|
| Texas (11.2%) | |
| | | | Clifton, TX Higher Education Finance Corporation Education Rev. (IDEA Public Schools) | | | | | | | | |
| | 3,000,000 | | | 5.000% - 6.000%, 8/15/2042 - 8/15/2043 | | | 3,499,170 | | | | 0.2 | % |
| | | | Clifton, TX Higher Education Finance Corporation Education Rev. (IDEA Public Schools) (PSF-GTD Insured) | | | | | | | | |
| | 7,605,000 | | | 5.000% - 5.000%, 8/15/2036 - 8/15/2046, Ser. Aa | | | 8,872,328 | | | | 0.5 | % |
| | | | Clifton, TX Higher Education Finance Corporation Education Rev. (Uplift Education) | | | | | | | | |
| | 4,000,000 | | | 6.250%, 12/1/2045, Ser. A | | | 4,532,160 | | | | 0.3 | % |
| | | | Dallas Independent School District, Dallas County, TX Unlimited Tax School Building G.O. (PSF-GTD Insured) | | | | | | | | |
| | 10,000,000 | | | 6.375%, 2/15/2034a,b | | | 10,707,600 | | | | 0.6 | % |
| | | | Harris County Industrial Development Corporation Pollution Control Rev. (Exxon) | | | | | | | | |
| | 1,000,000 | | | 0.500%, 3/1/2024e | | | 1,000,000 | | | | 0.1 | % |
| | | | Harris County, TX G.O. and Rev. Refg. (NATL-RE Insured) | | | | | | | | |
| | 7,000,000 | | | Zero Coupon, 8/15/2024a | | | 6,085,800 | | | | 0.4 | % |
| | | | Harris County, TX Toll Road Rev. Refg. | | | | | | | | |
| | 11,500,000 | | | 5.000% - 5.250%, 8/15/2047, Ser. A, Bb | | | 12,878,825 | | | | 0.8 | % |
| | | | Houston, TX Water and Sewer System Rev. Refg. (AGM Insured) | | | | | | | | |
| | 10,000,000 | | | 5.750%, 12/1/2032, Ser. Aa,b | | | 14,514,800 | | | | 0.9 | % |
| | | | North Texas Tollway Auth. System Rev. (Special) | | | | | | | | |
| | 15,000,000 | | | 5.000%, 9/1/2030, Ser. D | | | 17,387,850 | | | | 1.1 | % |
| | | | North Texas Tollway Auth. System Rev. Refg. | | | | | | | | |
| | 6,000,000 | | | 5.000% - 5.625%, 1/1/2033 - 1/1/2042, Ser. A, Bb | | | 6,677,395 | | | | 0.4 | % |
| | | | North Texas Tollway Auth. System Rev. Refg. (AGC Insured) | | | | | | | | |
| | 5,000,000 | | | Zero Coupon, 1/1/2028, Ser. Da | | | 3,519,200 | | | | 0.2 | % |
| | | | Southeast Texas Housing Finance Corporation Single Family Mortgage Rev. (NATL-RE Insured) | | | | | | | | |
| | 11,615,000 | | | Zero Coupon, 9/1/2017a,b | | | 11,526,145 | | | | 0.7 | % |
| | | | State of Texas G.O. Refg. | | | | | | | | |
| | 13,940,000 | | | 5.000%, 10/1/2044, Ser. A | | | 16,352,178 | | | | 1.0 | % |
| | | | Texas College Student Loan G.O. | | | | | | | | |
| | 1,900,000 | | | 5.000%, 8/1/2017, AMT | | | 1,959,736 | | | | 0.1 | % |
| | | | Other Securities^ | | | 66,379,878 | | | | 3.9 | % |
| | | | | |
| | | | Total | | | 185,893,065 | | | | | |
| | | | | |
|
| Utah (1.6%) | |
| | | | Utah County, UT Hospital Rev. (IHC Health Services, Inc.) | | | | | | | | |
| | 7,500,000 | | | 5.000%, 5/15/2046, Ser. B | | | 8,811,000 | | | | 0.5 | % |
| | | | Other Securities^ | | | 17,851,745 | | | | 1.1 | % |
| | | | | |
| | | | Total | | | 26,662,745 | | | | | |
| | | | | |
|
| Vermont (0.1%) | |
| | | | Other Securities^ | | | 2,334,590 | | | | 0.1 | % |
| | | | | |
| | | | Total | | | 2,334,590 | | | | | |
| | | | | |
|
| Virginia (1.9%) | |
| | | | Virginia Commonwealth Transportation Board Rev. | | | | | | | | |
| | 10,000,000 | | | 5.000%, 5/15/2034 | | | 11,570,700 | | | | 0.7 | % |
| | | | Virginia Port Auth. Port Fac. Rev. | | | | | | | | |
| | 2,000,000 | | | 5.000%, 7/1/2040 | | | 2,182,840 | | | | 0.1 | % |
| | | | Virginia Small Business Financing Auth. Rev. (Elizabeth River Crossings Opco, LLC) | | | | | | | | |
| | 10,365,000 | | | 6.000%, 1/1/2037, AMT | | | 12,066,622 | | | | 0.7 | % |
| | | | Other Securities^ | | | 5,945,594 | | | | 0.4 | % |
| | | | | |
| | | | Total | | | 31,765,756 | | | | | |
| | | | | |
|
| Washington (3.3%) | |
| | | | State of Washington Various Purpose G.O. | | | | | | | | |
| | 12,095,000 | | | 5.000%, 8/1/2030, Ser. A | | | 14,434,052 | | | | 0.8 | % |
| | 5,390,000 | | | 5.000%, 8/1/2021, Ser. A | | | 6,321,446 | | | | 0.4 | % |
The accompanying Notes to Financial Statements are an integral part of this schedule.
132
MUNICIPAL BOND FUND
Summary Schedule of Investments as of October 31, 2016
| | | | | | | | | | | | |
Principal Amount | | | Long-Term Fixed Income (98.9%) | | Value | | | % of Net
Assets | |
| Washington (3.3%) - continued | | | | | | | | |
| | | | Washington Health Care Fac. Auth. Rev. (Kadlec Regional Medical Center) | | | | | | | | |
| $ | 2,625,000 | | | 5.250%, 12/1/2030b | | | $3,054,791 | | | | 0.2 | % |
| | | | Washington Health Care Fac. Auth. Rev. (Providence Health & Services) | | | | | | | | |
| | 5,000,000 | | | 5.250%, 10/1/2032, Ser. A | | | 5,532,250 | | | | 0.3 | % |
| | | | Washington Health Care Fac. Auth. Rev. (Seattle Cancer Care Alliance) | | | | | | | | |
| | 5,010,000 | | | 7.375%, 3/1/2038b | | | 5,748,474 | | | | 0.3 | % |
| | | | Other Securities^ | | | 20,732,432 | | | | 1.3 | % |
| | | | | |
| | | | Total | | | 55,823,445 | | | | | |
| | | | | |
| | |
| Wisconsin (2.5%) | | | | | | | | |
| | | | Wisconsin Health & Educational Fac. Auth. Rev. (Marquette University) | | | | | | | | |
| | 1,125,000 | | | 5.000%, 10/1/2033, Ser. B-1b | | | 1,263,600 | | | | 0.1 | % |
| | | | Wisconsin Health & Educational Fac. Auth. Rev. (Marshfield Clinic Health Systems) | | | | | | | | |
| | 2,000,000 | | | 5.000%, 2/15/2046, Ser. A | | | 2,220,980 | | | | 0.1 | % |
| | | | Wisconsin Health & Educational Fac. Auth. Rev. (Thedacare, Inc.) | | | | | | | | |
| | 9,030,000 | | | 5.000% - 5.500%, 12/15/2038 - 12/15/2044, Ser. A | | | 10,050,204 | | | | 0.6 | % |
| | | | Wisconsin Health & Educational Fac. Auth. Rev. Refg. (Ascension Health Credit Group) | | | | | | | | |
| | 9,275,000 | | | 5.000%, 11/15/2039, Ser. A | | | 10,913,243 | | | | 0.7 | % |
| | | | Wisconsin Health & Educational Fac. Auth. Rev. Refg. (Marquette University) | | | | | | | | |
| | 8,000,000 | | | 5.000%, 10/1/2041 | | | 9,318,640 | | | | 0.6 | % |
| | | | Other Securities^ | | | 7,336,247 | | | | 0.4 | % |
| | | | | |
| | | | Total | | | 41,102,914 | | | | | |
| | | | | |
| | |
| Wyoming (0.4%) | | | | | | | | |
| | | | Other Securities^ | | | 6,643,668 | | | | 0.4 | % |
| | | | | |
| | | | Total | | | 6,643,668 | | | | | |
| | | | | |
| | | | Total Long-Term Fixed Income (cost $1,523,993,392) | | | 1,645,861,310 | | | | | |
| | | | | |
| | | | | | | | | | | | |
| | | | | |
| | | | Total Investments (cost $1,523,993,392) 98.9% | | $ | 1,645,861,310 | | | | | |
| | | | | |
| | | | Other Assets and Liabilities, Net 1.1% | | | 18,212,531 | | | | | |
| | | | | |
| | | | Total Net Assets 100.0% | | $ | 1,664,073,841 | | | | | |
| | | | | |
| ^ | The Summary Schedule of Investments shows the 50 largest holdings in unaffiliated issuers, any holding or issuer that exceeds 1% of net assets and all affiliated holdings as of the report date. The remaining securities held are grouped by category as “Other securities”. |
| a | To reduce certain risks associated with securities issued by municipalities, which may include but are not limited to economic development in a specific industry or municipality, the principal and/or interest payments are guaranteed by the bond insurance company or government agency identified. |
| b | Denotes securities that have been pre-refunded or escrowed to maturity. Under such an arrangement, money is deposited into an irrevocable escrow account and is used to purchase U.S. Treasury securities or government agency securities with maturing principal and interest earnings sufficient to pay all debt service requirements of the pre-refunded bonds. |
| c | Denotes step coupon securities. Step coupon securities pay an initial coupon rate for the first period and then different coupon rates for following periods. The rate shown is as of October 31, 2016. |
| d | Denotes investments purchased on a when-issued or delayed delivery basis. |
| e | Denotes variable rate securities. Variable rate securities are securities whose yields vary with a designated market index or market rate. The rate shown is as of October 31, 2016. |
Municipal Bond Fund held restricted securities as of October 31, 2016. Restricted securities are investment securities which cannot be offered for public sale without first being registered under the Securities Act of 1933. As of October 31, 2016, the value of these investments was $1,645,170 or 0.1% of total net assets.
Definitions:
| | | | |
| AGC | | - | | Assured Guaranty, Ltd |
| AGM | | - | | Assured Guaranty Municipal Corporation |
| AMBAC | | - | | American Municipal Bond Insurance Company |
| AMT | | - | | Subject to Alternative Minimum Tax |
| Auth. | | - | | Authority |
| C.O.P. | | - | | Certificate of Participation |
| CR | | - | | Custodian Receipts |
| Fac. | | - | | Facility/Facilities |
| FGIC | | - | | Federal Guaranty Insurance Company |
| G.O. | | - | | General Obligation |
| NATL-RE | | - | | National Public Finance Guarantee Corporation |
| PSF-GTD | | - | | Permanent School Fund Guarantee Program |
| Refg. | | - | | Refunding |
| Rev. | | - | | Revenue |
| Ser. | | - | | Series |
Unrealized Appreciation (Depreciation)
Gross unrealized appreciation and depreciation of investments, based on cost for federal income tax purposes, were as follows:
| | | | |
| Gross unrealized appreciation | | | $125,634,925 | |
| Gross unrealized depreciation | | | (3,767,007 | ) |
| | | | |
| Net unrealized appreciation (depreciation) | | | $121,867,918 | |
| |
| Cost for federal income tax purposes | | | $1,523,993,392 | |
The accompanying Notes to Financial Statements are an integral part of this schedule.
133
MUNICIPAL BOND FUND
Summary Schedule of Investments as of October 31, 2016
Fair Valuation Measurements
The following table is a summary of the inputs used, as of October 31, 2016, in valuing Municipal Bond Fund’s assets carried at fair value.
| | | | | | | | | | | | | | | | |
| Investments in Securities | | Total | | | Level 1 | | | Level 2 | | | Level 3 | |
| | | | |
Long-Term Fixed Income | | | | | | | | | | | | | | | | |
Education | | | 224,104,591 | | | | – | | | | 224,104,591 | | | | – | |
Electric Revenue | | | 58,187,423 | | | | – | | | | 58,187,423 | | | | – | |
Escrowed/Pre-refunded | | | 278,276,837 | | | | – | | | | 278,276,837 | | | | – | |
General Obligation | | | 203,193,170 | | | | – | | | | 203,193,170 | | | | – | |
Health Care | | | 220,074,551 | | | | – | | | | 220,074,551 | | | | – | |
Housing Finance | | | 10,931,229 | | | | – | | | | 10,931,229 | | | | – | |
Industrial Development Revenue | | | 7,764,410 | | | | – | | | | 7,764,410 | | | | – | |
Other Revenue | | | 189,234,280 | | | | – | | | | 189,234,280 | | | | – | |
Tax Revenue | | | 108,359,504 | | | | – | | | | 108,359,504 | | | | – | |
Transportation | | | 253,593,044 | | | | – | | | | 253,593,044 | | | | – | |
Water & Sewer | | | 92,142,271 | | | | – | | | | 92,142,271 | | | | – | |
| |
Total | | | $1,645,861,310 | | | | $– | | | | $1,645,861,310 | | | | $– | |
| |
There were no significant transfers between Levels during the period ended October 31, 2016. Transfers between Levels are identified as of the end of the period.
The accompanying Notes to Financial Statements are an integral part of this schedule.
134
GOVERNMENT BOND FUND
Schedule of Investments as of October 31, 2016
| | | | | | | | |
Principal Amount | | | Long-Term Fixed Income (96.9%) | | Value | |
| Asset-Backed Securities (2.4%) | | | | |
| | | | Northstar Education Finance, Inc. | | | | |
| | $484,334 | | | 1.234%, 12/26/2031a,b | | | $474,071 | |
| | | | U.S. Small Business Administration | | | | |
| | 851,662 | | | 3.191%, 3/10/2024 | | | 891,871 | |
| | | | | |
| | | | Total | | | 1,365,942 | |
| | | | | |
| |
| Collateralized Mortgage Obligations (0.6%) | | | | |
| | | | NCUA Guaranteed Notes | | | | |
| | 333,131 | | | 0.977%, 10/7/2020b | | | 333,758 | |
| | | | | |
| | | | Total | | | 333,758 | |
| | | | | |
| |
| Energy (0.8%) | | | | |
| | | | Petroleos Mexicanos | | | | |
| | 425,000 | | | 2.378%, 4/15/2025 | | | 436,683 | |
| | | | | |
| | | | Total | | | 436,683 | |
| | | | | |
| |
| Financials (1.9%) | | | | |
| | | | Private Export Funding Corporation | | | | |
| | 1,000,000 | | | 2.050%, 11/15/2022 | | | 1,016,536 | |
| | | | | |
| | | | Total | | | 1,016,536 | |
| | | | | |
| |
| Foreign Government (8.4%) | | | | |
| | | | Asian Development Bank | | | | |
| | 1,000,000 | | | 2.125%, 3/19/2025 | | | 1,009,280 | |
| | | | Hashemite Kingdom of Jordan | | | | |
| | 500,000 | | | 2.503%, 10/30/2020 | | | 523,503 | |
| | | | Inter-American Development Bank | | | | |
| | 500,000 | | | 3.000%, 10/4/2023 | | | 537,630 | |
| | 600,000 | | | 4.375%, 1/24/2044 | | | 755,309 | |
| | | | KFW | | | | |
| | 500,000 | | | 1.014%, 12/29/2017b | | | 499,874 | |
| | | | Kommunalbanken AS | | | | |
| | 340,000 | | | 1.500%, 10/22/2019a | | | 341,046 | |
| | | | Kommuninvest I Sverige AB | | | | |
| | 500,000 | | | 1.500%, 1/22/2019a | | | 502,935 | |
| | | | Sweden Government International Bond | | | | |
| | 500,000 | | | 1.625%, 3/24/2020a | | | 505,198 | |
| | | | | |
| | | | Total | | | 4,674,775 | |
| | | | | |
| |
| Mortgage-Backed Securities (7.7%) | | | | |
| | | | Federal Home Loan Mortgage Corporation Gold 15-Yr. Pass Through | | | | |
| | 400,000 | | | 3.000%, 11/1/2031c | | | 418,594 | |
| | | | Federal National Mortgage Association Conventional 30-Yr. Pass Through | | | | |
| | 1,700,000 | | | 3.500%, 11/1/2046c | | | 1,784,734 | |
| | 1,500,000 | | | 4.000%, 11/1/2046c | | | 1,606,172 | |
| | 450,000 | | | 4.500%, 11/1/2046c | | | 491,836 | |
| | | | | |
| | | | Total | | | 4,301,336 | |
| | | | | |
| |
| U.S. Government and Agencies (73.2%) | | | | |
| | | | Federal Farm Credit Bank | | | | |
| | 500,000 | | | 2.210%, 8/1/2024 | | | 506,818 | |
| | | | Federal Home Loan Mortgage Corporation | | | | |
| | 3,000,000 | | | 2.375%, 1/13/2022 | | | 3,133,818 | |
| | | | Federal National Mortgage Association | | | | |
| | 1,500,000 | | | 1.250%, 8/17/2021 | | | 1,486,533 | |
| | 5,700,000 | | | 1.875%, 9/24/2026 | | | 5,557,312 | |
| | 1,250,000 | | | 6.250%, 5/15/2029 | | | 1,767,691 | |
| | | | Tennessee Valley Authority | | | | |
| | 1,225,000 | | | 5.250%, 9/15/2039 | | | 1,638,735 | |
| | | | U.S. Treasury Bonds | | | | |
| | 250,000 | | | 1.500%, 8/15/2026 | | | 242,539 | |
| | 850,000 | | | 6.500%, 11/15/2026 | | | 1,214,205 | |
| | 500,000 | | | 5.375%, 2/15/2031 | | | 710,195 | |
| | 850,000 | | | 3.625%, 2/15/2044 | | | 1,033,049 | |
| | | | U.S. Treasury Bonds, TIPS | | | | |
| | 3,907,645 | | | 0.125%, 1/15/2023 | | | 3,963,630 | |
| | 351,373 | | | 2.375%, 1/15/2025 | | | 416,019 | |
| | 362,151 | | | 2.125%, 2/15/2040 | | | 472,629 | |
| | 1,598,820 | | | 0.750%, 2/15/2042 | | | 1,608,800 | |
| | | | U.S. Treasury Notes | | | | |
| | 250,000 | | | 0.875%, 11/15/2017 | | | 250,342 | |
| | 500,000 | | | 1.250%, 12/15/2018 | | | 503,516 | |
| | 3,500,000 | | | 1.000%, 3/15/2019 | | | 3,505,607 | |
| | 1,500,000 | | | 0.875%, 9/15/2019 | | | 1,494,785 | |
| | 1,500,000 | | | 2.000%, 7/31/2020 | | | 1,545,879 | |
| | 500,000 | | | 2.250%, 7/31/2021 | | | 520,996 | |
| | 1,500,000 | | | 2.125%, 9/30/2021 | | | 1,554,785 | |
| | 1,750,000 | | | 2.125%, 6/30/2022 | | | 1,812,207 | |
| | 250,000 | | | 1.375%, 6/30/2023 | | | 246,602 | |
| | 900,000 | | | 1.375%, 9/30/2023 | | | 885,797 | |
| | 3,950,000 | | | 2.250%, 11/15/2024 | | | 4,106,768 | |
| | 500,000 | | | 1.625%, 2/15/2026 | | | 491,719 | |
| | | | | |
| | | | Total | | | 40,670,976 | |
| | | | | |
| |
| Utilities (1.9%) | | | | |
| | | | John Sevier Combined Cycle Generation, LLC | | | | |
| | 937,916 | | | 4.626%, 1/15/2042 | | | 1,069,122 | |
| | | | | |
| | | | Total | | | 1,069,122 | |
| | | | | |
| | | | | | | | |
| | | | | |
| | | | Total Long-Term Fixed Income (cost $51,871,754) | | | 53,869,128 | |
| | | | | |
| | |
Shares or
Principal
Amount | | | Short-Term Investments (10.4%)d | | Value | |
| | | | Federal Home Loan Bank Discount Notes | | | | |
| | 100,000 | | | 0.300%, 11/2/2016 | | | 99,999 | |
| | 4,100,000 | | | 0.255%, 11/16/2016e | | | 4,099,660 | |
| | | | Thrivent Core Short-Term Reserve Fund | | | | |
| | 157,001 | | | 0.790% | | | 1,570,009 | |
| | | | | |
| | | | Total Short-Term Investments (cost $5,769,573) | | | 5,769,668 | |
| | | | | |
| | | | Total Investments (cost $57,641,327) 107.3% | | $ | 59,638,796 | |
| | | | | |
| | | | Other Assets and Liabilities, Net (7.3%) | | | (4,083,141 | ) |
| | | | | |
| | | | Total Net Assets 100.0% | | $ | 55,555,655 | |
| | | | | |
The accompanying Notes to Financial Statements are an integral part of this schedule.
135
GOVERNMENT BOND FUND
Schedule of Investments as of October 31, 2016
| a | Denotes securities sold under Rule 144A of the Securities Act of 1933, which exempts them from registration. These securities may be resold to other dealers in the program or to other qualified institutional buyers. As of October 31, 2016, the value of these investments was $1,823,250 or 3.3% of total net assets. |
| b | Denotes variable rate securities. Variable rate securities are securities whose yields vary with a designated market index or market rate. The rate shown is as of October 31, 2016. |
| c | Denotes investments purchased on a when-issued or delayed delivery basis. |
| d | The interest rate shown reflects the yield, coupon rate or the discount rate at the date of purchase. |
| e | All or a portion of the security is held on deposit with the counterparty and pledged as the initial margin deposit for open futures contracts. |
Definitions:
| | | | |
| TIPS | | - | | Treasury Inflation Protected Security. |
Unrealized Appreciation (Depreciation)
Gross unrealized appreciation and depreciation of investments, based on cost for federal income tax purposes, were as follows:
| | | | |
| Gross unrealized appreciation | | | $2,284,187 | |
| Gross unrealized depreciation | | | (289,839) | |
| | | | |
| Net unrealized appreciation (depreciation) | | | $1,994,348 | |
| |
| Cost for federal income tax purposes | | | $57,644,448 | |
Fair Valuation Measurements
The following table is a summary of the inputs used, as of October 31, 2016, in valuing Government Bond Fund’s assets carried at fair value.
| | | | | | | | | | | | | | | | |
| Investments in Securities | | Total | | | Level 1 | | | Level 2 | | | Level 3 | |
| | | | |
Long-Term Fixed Income | | | | | | | | | | | | | | | | |
Asset-Backed Securities | | | 1,365,942 | | | | – | | | | 1,365,942 | | | | – | |
Collateralized Mortgage Obligations | | | 333,758 | | | | – | | | | 333,758 | | | | – | |
Energy | | | 436,683 | | | | – | | | | 436,683 | | | | – | |
Financials | | | 1,016,536 | | | | – | | | | 1,016,536 | | | | – | |
Foreign Government | | | 4,674,775 | | | | – | | | | 4,674,775 | | | | – | |
Mortgage-Backed Securities | | | 4,301,336 | | | | – | | | | 4,301,336 | | | | – | |
U.S. Government and Agencies | | | 40,670,976 | | | | – | | | | 40,670,976 | | | | – | |
Utilities | | | 1,069,122 | | | | – | | | | 1,069,122 | | | | – | |
Short-Term Investments | | | 4,199,659 | | | | – | | | | 4,199,659 | | | | – | |
| |
Subtotal Investments in Securities | | | $58,068,787 | | | | $– | | | | $58,068,787 | | | | $– | |
| |
| | | | |
| Other Investments* | | Total | | | | | | | | | | |
| | | | | | | | | | | | | |
Short-Term Investments | | | 1,570,009 | | | | | | | | | | | | | |
| | | | | | | | | | | | | |
Subtotal Other Investments | | | $1,570,009 | | | | | | | | | | | | | |
| | | | | | | | | | | | | |
| | | | | | | | | | | | | | | | |
| | | | | | | | | | | | | |
Total Investments at Value | | | $59,638,796 | | | | | | | | | | | | | |
| | | | | | | | | | | | | |
| * | Certain investments are measured at fair value using a net asset value per share that is not publicly available (practical expedient). According to disclosure requirements of Accounting Standards Codification (ASC) 820, Fair Value Measurement, securities valued using the practical expedient are not classified in the fair value hierarchy. The fair value amounts presented in this table are intended to permit reconciliation of the fair value hierarchy to the amounts presented in the Statement of Assets and Liabilities. |
| | | | | | | | | | | | | | | | |
| Other Financial Instruments | | Total | | | Level 1 | | | Level 2 | | | Level 3 | |
| | | | |
Asset Derivatives | | | | | | | | | | | | | | | | |
Futures Contracts | | | 266,868 | | | | 266,868 | | | | – | | | | – | |
| |
Total Asset Derivatives | | | $266,868 | | | | $266,868 | | | | $– | | | | $– | |
| |
| | | | |
Liability Derivatives | | | | | | | | | | | | | | | | |
Futures Contracts | | | 22,358 | | | | 22,358 | | | | – | | | | – | |
| |
Total Liability Derivatives | | | $22,358 | | | | $22,358 | | | | $– | | | | $– | |
| |
There were no significant transfers between Levels during the period ended October 31, 2016. Transfers between Levels are identified as of the end of the period.
The following table presents Government Bond Fund’s futures contracts held as of October 31, 2016. Investments and/or cash totaling $199,983 were pledged as the initial margin deposit for these contracts.
| | | | | | | | | | | | | | | | | | | | |
| Futures Contracts | | Number of
Contracts
Long/(Short) | | | Expiration Date | | | Notional Principal Amount | | | Value | | | Unrealized Gain/(Loss) | |
CBOT 10-Yr. U.S. Treasury Note | | | (40 | ) | | | December 2016 | | | | ($5,239,247 | ) | | | ($5,185,000 | ) | | | $54,247 | |
CBOT 2-Yr. U.S. Treasury Note | | | 11 | | | | December 2016 | | | | 2,400,096 | | | | 2,399,547 | | | | (549 | ) |
CBOT 5-Yr. U.S. Treasury Note | | | 47 | | | | December 2016 | | | | 5,699,263 | | | | 5,677,454 | | | | (21,809 | ) |
CBOT U.S. Long Bond | | | (19 | ) | | | December 2016 | | | | (3,232,016 | ) | | | (3,091,656 | ) | | | 140,360 | |
CME Ultra Long Term U.S. Treasury Bond | | | (6 | ) | | | December 2016 | | | | (1,127,886 | ) | | | (1,055,625 | ) | | | 72,261 | |
Total Futures Contracts | | | | | | | | | | | | | | | | | | | $244,510 | |
The accompanying Notes to Financial Statements are an integral part of this schedule.
136
GOVERNMENT BOND FUND
Schedule of Investments as of October 31, 2016
The following table summarizes the fair value and Statement of Assets and Liabilities location, as of October 31, 2016, for Government Bond Fund’s investments in financial derivative instruments by primary risk exposure as discussed under item (2) Significant Accounting Policies of the Notes to Financial Statements.
| | | | | | |
| Derivatives by risk category | | Statement of Assets and Liabilities Location | | Fair Value | |
| | |
Asset Derivatives | | | | | | |
| | |
Interest Rate Contracts | | | | | | |
Futures* | | Net Assets - Net unrealized appreciation/(depreciation) on Futures contracts | | | $266,868 | |
Total Interest Rate Contracts | | | | | 266,868 | |
| |
Total Asset Derivatives | | | | | $266,868 | |
| |
| | |
Liability Derivatives | | | | | | |
| | |
Interest Rate Contracts | | | | | | |
Futures* | | Net Assets - Net unrealized appreciation/(depreciation) on Futures contracts | | | 22,358 | |
Total Interest Rate Contracts | | | | | 22,358 | |
| |
Total Liability Derivatives | | | | | $22,358 | |
| |
| * | Includes cumulative appreciation/depreciation of futures contracts as reported in the Schedule of Investments. Only current day’s variation margin is reported within the Statement of Assets and Liabilities. |
The following table summarizes the net realized gains/(losses) and Statement of Operations location, for the period ended October 31, 2016, for Government Bond Fund’s investments in financial derivative instruments by primary risk exposure.
| | | | | | |
| Derivatives by risk category | | Statement of Operations Location | | Realized Gains/(Losses)
recognized in Income | |
Interest Rate Contracts | | | | | | |
Futures | | Net realized gains/(losses) on Futures contracts | | | (615,753 | ) |
Total Interest Rate Contracts | | | | | (615,753 | ) |
| |
Total | | | | | ($615,753 | ) |
| |
The following table summarizes the change in net unrealized appreciation/(depreciation) and Statement of Operations location, for the period ended October 31, 2016, for Government Bond Fund’s investments in financial derivative instruments by primary risk exposure.
| | | | | | |
| Derivatives by risk category | | Statement of Operations Location | | Change in unrealized
appreciation/(depreciation)
recognized in Income | |
Interest Rate Contracts | | | | | | |
Futures | | Change in net unrealized appreciation/(depreciation) on Futures contracts | | | 229,280 | |
Total Interest Rate Contracts | | | | | 229,280 | |
| |
Total | | | | | $229,280 | |
| |
The following table presents Government Bond Fund’s average volume of derivative activity during the period ended October 31, 2016.
| | | | | | | | |
| Derivative Risk Category | | Futures
(Notional)* | | | Futures
(Percentage
of Average
Net Assets) | |
Interest Rate | | | | | | | | |
Contracts | | $ | 16,787,182 | | | | 29.6 | % |
| * | Notional amount represents long or short, or both, derivative positions held by the Fund. |
Investment in Affiliates
Affiliated issuers, as defined under the Investment Company Act of 1940, include those in which the Fund’s holdings of an issuer represent 5% or more of the outstanding voting securities of an issuer, any affiliated mutual fund, or a company which is under common ownership or control with the Fund. The Fund owns shares of Thrivent Cash Management Trust for the purpose of securities lending and Thrivent Core Short-Term Reserve Fund primarily to serve as a cash sweep vehicle for the Fund. Thrivent Cash Management Trust and Thrivent Core Short-Term Reserve Fund are established for the sole use of affiliated funds.
A summary of transactions for the fiscal year to date, in Government Bond Fund, is as follows:
| | | | | | | | | | | | | | | | | | | | | | | | |
| Fund | | Value
October 31,
2015 | | | Gross Purchases | | | Gross Sales | | | Shares Held at
October 31,
2016 | | | Value
October 31,
2016 | | | Income Earned
November 1,
2015 - October 31,
2016 | |
Cash Management Trust-Collateral Investment | | | $818,750 | | | | $500 | | | | $819,250 | | | | – | | | | $– | | | | $23 | |
Cash Management Trust-Short Term Investment | | | 6,610,141 | | | | 26,427,892 | | | | 33,038,033 | | | | – | | | | – | | | | 5,615 | |
Core Short-Term Reserve | | | – | | | | 14,862,945 | | | | 13,292,936 | | | | 157,001 | | | | 1,570,009 | | | | 7,342 | |
Total Value and Income Earned | | | $7,428,891 | | | | | | | | | | | | | | | | $1,570,009 | | | | $12,980 | |
The accompanying Notes to Financial Statements are an integral part of this schedule.
137
LIMITED MATURITY BOND FUND
Summary Schedule of Investments as of October 31, 2016
| | | | | | | | | | | | |
Principal Amount | | | Bank Loans (1.5%) | | Value | | | % of Net Assets | |
| Basic Materials (0.1%) | | | | | | |
| | | | Other Securities^ | | | $341,066 | | | | 0.1 | % |
| | | | | |
| | | | Total | | | 341,066 | | | | | |
| | | | | |
| | |
| Capital Goods (0.2%) | | | | | | | | |
| | | | Other Securities^ | | | 1,855,244 | | | | 0.2 | % |
| | | | | |
| | | | Total | | | 1,855,244 | | | | | |
| | | | | |
| | |
| Communications Services (0.5%) | | | | | | | | |
| | | | Other Securities^ | | | 4,135,437 | | | | 0.5 | % |
| | | | | |
| | | | Total | | | 4,135,437 | | | | | |
| | | | | |
| | |
| Consumer Cyclical (0.4%) | | | | | | | | |
| | | | Other Securities^ | | | 2,844,665 | | | | 0.4 | % |
| | | | | |
| | | | Total | | | 2,844,665 | | | | | |
| | | | | |
| | |
| Consumer Non-Cyclical (0.1%) | | | | | | | | |
| | | | Other Securities^ | | | 837,658 | | | | 0.1 | % |
| | | | | |
| | | | Total | | | 837,658 | | | | | |
| | | | | |
| | |
| Energy (<0.1%) | | | | | | | | |
| | | | Other Securities^ | | | 247,620 | | | | <0.1 | % |
| | | | | |
| | | | Total | | | 247,620 | | | | | |
| | | | | |
| | |
| Financials (0.1%) | | | | | | | | |
| | | | Other Securities^ | | | 965,507 | | | | 0.1 | % |
| | | | | |
| | | | Total | | | 965,507 | | | | | |
| | | | | |
| | |
| Technology (0.1%) | | | | | | | | |
| | | | Other Securities^ | | | 391,560 | | | | 0.1 | % |
| | | | | |
| | | | Total | | | 391,560 | | | | | |
| | | | | |
| | |
| Utilities (<0.1%) | | | | | | | | |
| | | | Other Securities^ | | | 181,632 | | | | <0.1 | % |
| | | | | |
| | | | Total | | | 181,632 | | | | | |
| | | | | |
| | | | | | | | | | | | |
| | | | | |
| | | | Total Bank Loans (cost $12,480,131) | | | 11,800,389 | | | | | |
| | | | | |
| | | |
Principal Amount | | | Long-Term Fixed Income (94.5%) | | Value | | | % of Net Assets | |
| Asset-Backed Securities (17.1%) | | | | | | |
| | | | Americredit Automobile Receivables Trust | | | | | | | | |
| | $4,000,000 | | | 1.340%, 4/8/2020 | | | 4,000,497 | | | | 0.5 | % |
| | | | BA Credit Card Trust | | | | | | | | |
| | 3,850,000 | | | 0.915%, 6/15/2021a | | | 3,861,104 | | | | 0.5 | % |
| | | | Capital One Multi-Asset Execution Trust | | | | | | | | |
| | 5,400,000 | | | 1.260%, 1/15/2020 | | | 5,406,535 | | | | 0.7 | % |
| | | | CarMax Auto Owner Trust | | | | | | | | |
| | 5,200,000 | | | 1.210%, 11/15/2019 | | | 5,198,009 | | | | 0.7 | % |
| | | | Chase Issuance Trust | | | | | | | | |
| | 8,450,000 | | | 0.945% - 1.620%, 1/15/2020 - 5/17/2021a | | | 8,485,120 | | | | 1.1 | % |
| | | | Chesapeake Funding II, LLC | | | | | | | | |
| | 3,000,000 | | | 1.880%, 6/15/2028b | | | 3,008,929 | | | | 0.4 | % |
| | | | Chrysler Capital Auto Receivables Trust | | | | | | | | |
| | 4,000,000 | | | 1.360%, 1/15/2020b,c | | | 3,999,592 | | | | 0.5 | % |
| | | | Citibank Credit Card Issuance Trust | | | | | | | | |
| | 5,525,000 | | | 1.020%, 2/22/2019 | | | 5,525,624 | | | | 0.7 | % |
| | | | Ford Credit Auto Owner Trust | | | | | | | | |
| | 4,500,000 | | | 1.040%, 9/15/2019 | | | 4,498,277 | | | | 0.6 | % |
| | | | GoldenTree Loan Opportunities IX, Ltd. | | | | | | | | |
| | 3,200,000 | | | 2.238%, 10/29/2026*,a | | | 3,200,000 | | | | 0.4 | % |
| | | | Master Credit Card Trust | | | | | | | | |
| | 3,500,000 | | | 1.275%, 9/23/2019a,b | | | 3,518,142 | | | | 0.4 | % |
| | | | OZLM VIII, Ltd. | | | | | | | | |
| | 3,050,000 | | | 2.320%, 10/17/2026*,a | | | 3,052,433 | | | | 0.4 | % |
| | | | Prestige Auto Receivables Trust | | | | | | | | |
| | 4,500,000 | | | 1.460%, 7/15/2020b | | | 4,499,691 | | | | 0.6 | % |
| | | | SLM Student Loan Trust | | | | | | | | |
| | 3,403,923 | | | 0.934%, 3/25/2025a | | | 3,309,182 | | | | 0.4 | % |
| | | | SoFi Professional Loan Program, LLC | | | | | | | | |
| | 2,473,849 | | | 1.680%, 3/25/2031b | | | 2,476,747 | | | | 0.3 | % |
| | | | SoFi Professional Loan Program, LLC | | | | | | | | |
| | 5,249,034 | | | 1.480% - 2.510%, 3/25/2030 - 8/25/2033b | | | 5,285,353 | | | | 0.7 | % |
| | | | Toyota Auto Receivables Owner Trust | | | | | | | | |
| | 4,500,000 | | | 1.060%, 5/15/2019 | | | 4,499,912 | | | | 0.6 | % |
| | | | Verizon Owner Trust | | | | | | | | |
| | 3,500,000 | | | 1.420%, 1/20/2021b | | | 3,504,137 | | | | 0.4 | % |
| | | | Other Securities^ | | | 58,065,654 | | | | 7.2 | % |
| | | | | |
| | | | Total | | | 135,394,938 | | | | | |
| | | | | |
| | |
| Basic Materials (0.5%) | | | | | | | | |
| | | | Other Securities^ | | | 3,732,488 | | | | 0.5 | % |
| | | | | |
| | | | Total | | | 3,732,488 | | | | | |
| | | | | |
| | |
| Capital Goods (0.4%) | | | | | | | | |
| | | | Other Securities^ | | | 3,405,161 | | | | 0.4 | % |
| | | | | |
| | | | Total | | | 3,405,161 | | | | | |
| | | | | |
| | |
| Collateralized Mortgage Obligations (9.6%) | | | | | | | | |
| | | | Alm Loan Funding CLO | | | | | | | | |
| | 3,050,000 | | | 2.310%, 10/17/2026*,a | | | 3,050,988 | | | | 0.4 | % |
| | | | Babson CLO, Ltd. | | | | | | | | |
| | 3,050,000 | | | 2.270%, 10/17/2026*,a | | | 3,047,474 | | | | 0.4 | % |
| | | | Birchwood Park CLO, Ltd. | | | | | | | | |
| | 3,050,000 | | | 2.320%, 7/15/2026*,a | | | 3,052,357 | | | | 0.4 | % |
| | | | BlueMountain CLO, Ltd. | | | | | | | | |
| | 3,050,000 | | | 2.360%, 10/15/2026*,a | | | 3,057,365 | | | | 0.4 | % |
| | | | Carlyle Global Market Strategies CLO, Ltd. | | | | | | | | |
| | 3,000,000 | | | 2.380%, 10/15/2026*,a | | | 3,007,855 | | | | 0.4 | % |
| | | | Cent CLO 16, LP | | | | | | | | |
| | 3,050,000 | | | 2.007%, 8/1/2024*,a | | | 3,047,839 | | | | 0.4 | % |
| | | | Countrywide Alternative Loan Trust | | | | | | | | |
| | 576,000 | | | 5.500% - 5.500%, 11/25/2035 - 2/25/2036 | | | 545,426 | | | | <0.1 | % |
| | | | Countrywide Home Loans, Inc. | | | | | | | | |
| | 590,599 | | | 2.821%, 3/20/2036 | | | 471,549 | | | | 0.1 | % |
| | | | Dryden 34 Senior Loan Fund CLO | | | | | | | | |
| | 3,050,000 | | | 2.310%, 10/15/2026*,a | | | 3,051,342 | | | | 0.4 | % |
| | | | Madison Park Funding XIV CLO, Ltd. | | | | | | | | |
| | 3,350,000 | | | 2.331%, 7/20/2026*,a | | | 3,354,646 | | | | 0.4 | % |
| | | | Octagon Investment Partners XX CLO, Ltd. | | | | | | | | |
| | 3,050,000 | | | 2.258%, 8/12/2026*,a | | | 3,050,175 | | | | 0.4 | % |
The accompanying Notes to Financial Statements are an integral part of this schedule.
138
LIMITED MATURITY BOND FUND
Summary Schedule of Investments as of October 31, 2016
| | | | | | | | | | | | |
Principal Amount | | | Long-Term Fixed Income (94.5%) | | Value | | | % of Net
Assets | |
| Collateralized Mortgage Obligations (9.6%) - continued | | | | | | | | |
| | | | Voya CLO 3, Ltd. | | | | | | | | |
| | $3,050,000 | | | 2.302%, 7/25/2026*,a | | | $3,048,513 | | | | 0.4 | % |
| | | | Wells Fargo Commercial Mortgage Trust | | | | | | | | |
| | 2,925,000 | | | 2.632%, 5/15/2048 | | | 3,003,362 | | | | 0.4 | % |
| | | | Other Securities^ | | | 41,095,526 | | | | 5.1 | % |
| | | | | |
| | | | Total | | | 75,884,417 | | | | | |
| | | | | |
| | |
| Commercial Mortgage-Backed Securities (2.0%) | | | | | | | | |
| | | | Commercial Mortgage Pass-Through Certificates | | | | | | | | |
| | 4,000,000 | | | 1.580%, 6/8/2030a,b | | | 4,005,014 | | | | 0.5 | % |
| | | | Federal National Mortgage Association | | | | | | | | |
| | 173,061 | | | 1.272%, 1/25/2017 | | | 172,955 | | | | <0.1 | % |
| | | | SCG Trust | | | | | | | | |
| | 3,575,000 | | | 1.935%, 11/15/2026a,b | | | 3,548,021 | | | | 0.5 | % |
| | | | Other Securities^ | | | 8,515,546 | | | | 1.0 | % |
| | | | | |
| | | | Total | | | 16,241,536 | | | | | |
| | | | | |
| | |
| Communications Services (2.6%) | | | | | | | | |
| | | | Other Securities^ | | | 21,048,481 | | | | 2.6 | % |
| | | | | |
| | | | Total | | | 21,048,481 | | | | | |
| | | | | |
| | |
| Consumer Cyclical (1.5%) | | | | | | | | |
| | | | Other Securities^ | | | 12,239,174 | | | | 1.5 | % |
| | | | | |
| | | | Total | | | 12,239,174 | | | | | |
| | | | | |
| | |
| Consumer Non-Cyclical (5.6%) | | | | | | | | |
| | | | Unilever Capital Corporation | | | | | | | | |
| | 3,000,000 | | | 2.100%, 7/30/2020 | | | 3,053,538 | | | | 0.4 | % |
| | | | Other Securities^ | | | 40,982,965 | | | | 5.2 | % |
| | | | | |
| | | | Total | | | 44,036,503 | | | | | |
| | | | | |
| | |
| Energy (3.4%) | | | | | | | | |
| | | | Chevron Corporation | | | | | | | | |
| | 3,000,000 | | | 1.718%, 6/24/2018 | | | 3,020,511 | | | | 0.4 | % |
| | | | Other Securities^ | | | 23,815,004 | | | | 3.0 | % |
| | | | | |
| | | | Total | | | 26,835,515 | | | | | |
| | | | | |
| | |
| Financials (18.9%) | | | | | | | | |
| | | | Bank of America Corporation | | | | | | | | |
| | 7,090,000 | | | 1.700% - 6.100%, 8/25/2017 - 12/29/2049a,d | | | 7,173,847 | | | | 0.9 | % |
| | | | Bank of America NA | | | | | | | | |
| | 1,000,000 | | | 5.300%, 3/15/2017 | | | 1,014,490 | | | | 0.1 | % |
| | | | Bear Stearns Companies, LLC | | | | | | | | |
| | 1,500,000 | | | 6.400%, 10/2/2017 | | | 1,567,813 | | | | 0.2 | % |
| | | | DRB Prime Student Loan Trust | | | | | | | | |
| | 3,146,188 | | | 2.434%, 10/27/2031*,a | | | 3,207,099 | | | | 0.4 | % |
| | | | J.P. Morgan Chase & Company | | | | | | | | |
| | 3,100,000 | | | 1.782%, 1/25/2018a | | | 3,117,112 | | | | 0.4 | % |
| | 3,725,000 | | | 2.250% - 7.900%, 1/23/2020 - 4/29/2049d | | | 3,823,251 | | | | 0.5 | % |
| | | | J.P. Morgan Chase Bank NA | | | | | | | | |
| | 1,150,000 | | | 1.453%, 9/23/2019a | | | 1,151,597 | | | | 0.1 | % |
| | | | Japan Bank for International Cooperation | | | | | | | | |
| | 3,000,000 | | | 1.750%, 7/31/2018 | | | 3,017,064 | | | | 0.4 | % |
| | | | Wells Fargo & Company | | | | | | | | |
| | 5,885,000 | | | 1.567% - 5.875%, 1/30/2020 - 12/31/2049a,d | | | 6,015,038 | | | | 0.8 | % |
| | | | Other Securities^ | | | 119,085,462 | | | | 15.1 | % |
| | | | | |
| | | | Total | | | 149,172,773 | | | | | |
| | | | | |
| | |
| Foreign Government (0.9%) | | | | | | | | |
| | | | Other Securities^ | | | 6,948,170 | | | | 0.9 | % |
| | | | | |
| | | | Total | | | 6,948,170 | | | | | |
| | | | | |
| | |
| Mortgage-Backed Securities (4.4%) | | | | | | | | |
| | | | Federal Home Loan Mortgage Corporation Gold 15-Yr. Pass Through | | | | | | | | |
| | 11,570,000 | | | 3.000%, 11/1/2031c | | | 12,107,825 | | | | 1.5 | % |
| | | | Federal Home Loan Mortgage Corporation Gold 30-Yr. Pass Through | | | | | | | | |
| | 12,670,000 | | | 4.000%, 11/1/2046c | | | 13,552,445 | | | | 1.7 | % |
| | | | Federal National Mortgage Association Conventional 15-Yr. Pass Through | | | | | | | | |
| | 1,483,612 | | | 2.250%, 6/25/2025 | | | 1,508,212 | | | | 0.2 | % |
| | | | Federal National Mortgage Association Conventional 20-Yr. Pass Through | | | | | | | | |
| | 456,637 | | | 6.000%, 8/1/2024 | | | 522,698 | | | | 0.1 | % |
| | | | Federal National Mortgage Association Conventional 30-Yr. Pass Through | | | | | | | | |
| | 4,135,650 | | | 1.735%, 7/1/2043a | | | 4,249,624 | | | | 0.5 | % |
| | 2,525,722 | | | 2.056% - 5.464%, 9/1/2037 - 1/1/2043a | | | 2,616,162 | | | | 0.4 | % |
| | | | Other Securities^ | | | 282,459 | | | | <0.1 | % |
| | | | | |
| | | | Total | | | 34,839,425 | | | | | |
| | | | | |
| | |
| Technology (1.9%) | | | | | | | | |
| | | | Other Securities^ | | | 15,265,861 | | | | 1.9 | % |
| | | | | |
| | | | Total | | | 15,265,861 | | | | | |
| | | | | |
| | |
| Transportation (1.9%) | | | | | | | | |
| | | | Other Securities^ | | | 15,009,810 | | | | 1.9 | % |
| | | | | |
| | | | Total | | | 15,009,810 | | | | | |
| | | | | |
| | |
| U.S. Government and Agencies (21.4%) | | | | | | | | |
| | | | Federal Home Loan Mortgage Corporation | | | | | | | | |
| | 3,050,000 | | | 1.250%, 10/2/2019 | | | 3,065,619 | | | | 0.4 | % |
| | | | Federal National Mortgage Association | | | | | | | | |
| | 14,500,000 | | | 1.250%, 8/17/2021 | | | 14,369,819 | | | | 1.8 | % |
| | | | U.S. Treasury Bonds | | | | | | | | |
| | 12,000,000 | | | 5.375%, 2/15/2031 | | | 17,044,692 | | | | 2.2 | % |
| | 2,190,000 | | | 3.000% - 3.625%, 5/15/2042 - 2/15/2044 | | | 2,574,158 | | | | 0.3 | % |
| | | | U.S. Treasury Bonds, TIPS | | | | | | | | |
| | 17,473,450 | | | 0.125%, 4/15/2019 | | | 17,752,239 | | | | 2.2 | % |
| | 5,217,150 | | | 0.125%, 1/15/2023 | | | 5,291,896 | | | | 0.7 | % |
| | 6,588,465 | | | 0.625%, 1/15/2026 | | | 6,877,224 | | | | 0.9 | % |
| | 8,131,760 | | | 1.000%, 2/15/2046 | | | 8,760,296 | | | | 1.1 | % |
| | | | U.S. Treasury Notes | | | | | | | | |
| | 34,000,000 | | | 0.875%, 11/15/2017 | | | 34,046,478 | | | | 4.3 | % |
| | 23,500,000 | | | 0.875%, 3/31/2018 | | | 23,528,459 | | | | 3.0 | % |
The accompanying Notes to Financial Statements are an integral part of this schedule.
139
LIMITED MATURITY BOND FUND
Summary Schedule of Investments as of October 31, 2016
| | | | | | | | | | | | |
Principal Amount | | | Long-Term Fixed Income (94.5%) | | Value | | | % of Net
Assets | |
| U.S. Government and Agencies (21.4%) - continued | | | | | | | | |
| | $3,350,000 | | | 1.500%, 10/31/2019 | | | $3,397,764 | | | | 0.4 | % |
| | 18,225,000 | | | 1.125%, 8/31/2021 | | | 18,064,110 | | | | 2.3 | % |
| | 11,050,000 | | | 2.125%, 6/30/2022 | | | 11,442,794 | | | | 1.4 | % |
| | 2,570,000 | | | 1.625%, 8/15/2022 | | | 2,591,382 | | | | 0.3 | % |
| | | | Other Securities^ | | | 754,103 | | | | 0.1 | % |
| | | | | |
| | | | Total | | | 169,561,033 | | | | | |
| | | | | |
| | |
| Utilities (2.4%) | | | | | | | | |
| | | | Other Securities^ | | | 19,122,383 | | | | 2.4 | % |
| | | | | |
| | | | Total | | | 19,122,383 | | | | | |
| | | | | |
| | | | | | | | | | | | |
| | | | | |
| | | | Total Long-Term Fixed Income (cost $745,126,521) | | | 748,737,668 | | | | | |
| | | | | |
| | | |
| Shares | | | Preferred Stock (0.4%) | | Value | | | % of Net
Assets | |
| Financials (0.3%) | |
| | | | Other Securities^ | | | 2,198,570 | | | | 0.3 | % |
| | | | | |
| | | | Total | | | 2,198,570 | | | | | |
| | | | | |
|
| Utilities (0.1%) | |
| | | | Other Securities^ | | | 1,225,840 | | | | 0.1 | % |
| | | | | |
| | | | Total | | | 1,225,840 | | | | | |
| | | | | |
| | | | | | | | | | | | |
| | | | | |
| | | | Total Preferred Stock (cost $3,325,400) | | | 3,424,410 | | | | | |
| | | | | |
| | | |
| Shares | | | Common Stock (0.1%) | | Value | | | % of Net
Assets | |
| Energy (0.1%) | |
| | | | Other Securities^ | | | 549,205 | | | | 0.1 | % |
| | | | | |
| | | | Total | | | 549,205 | | | | | |
| | | | | |
| | | | | | | | | | | | |
| | | | | |
| | | | Total Common Stock (cost $494,251) | | | 549,205 | | | | | |
| | | | | |
| | | |
| Shares | | | Collateral Held for Securities Loaned (0.5%) | | Value | | | % of Net
Assets | |
| | 3,895,550 | | | Thrivent Cash Management Trust | | | 3,895,550 | | | | 0.5 | % |
| | | | | |
| | | | Total Collateral Held for Securities Loaned (cost $3,895,550) | | | 3,895,550 | | | | | |
| | | | | |
| | | |
Shares or
Principal
Amount | | | Short-Term Investments (6.5%)e | | Value | | | % of Net
Assets | |
| | | | Federal Home Loan Bank Discount Notes | | | | | | | | |
| | 11,800,000 | | | 0.307%, 11/2/2016 | | | 11,799,929 | | | | 1.5 | % |
| | 5,000,000 | | | 0.325%, 11/14/2016f | | | 4,999,640 | | | | 0.6 | % |
| | | | Federal Home Loan Bank Discount Notes | | | | | | | | |
| | 6,700,000 | | | 0.250% - 0.300%, 11/1/2016 - 12/9/2016 | | | 6,699,460 | | | | 0.9 | % |
| | | | Thrivent Core Short-Term Reserve Fund | | | | | | | | |
| | 2,782,089 | | | 0.790% | | | 27,820,890 | | | | 3.5 | % |
| | | | | |
| | | | Total Short-Term Investments (cost $51,319,476) | | | 51,319,919 | | | | | |
| | | | | |
| | | | Total Investments (cost $816,641,329) 103.5% | | | $819,727,141 | | | | | |
| | | | | |
| | | | Other Assets and Liabilities, Net (3.5%) | | | (27,558,935 | ) | | | | |
| | | | | |
| | | | Total Net Assets 100.0% | | | $792,168,206 | | | | | |
| | | | | |
| ^ | The Summary Schedule of Investments shows the 50 largest holdings in unaffiliated issuers, any holding or issuer that exceeds 1% of net assets and all affiliated holdings as of the report date. The remaining securities held are grouped by category as “Other securities”. |
| a | Denotes variable rate securities. Variable rate securities are securities whose yields vary with a designated market index or market rate. The rate shown is as of October 31, 2016. |
| b | Denotes securities sold under Rule 144A of the Securities Act of 1933, which exempts them from registration. These securities may be resold to other dealers in the program or to other qualified institutional buyers. As of October 31, 2016, the value of these investments was $151,632,286 or 19.1% of total net assets. |
| c | Denotes investments purchased on a when-issued or delayed delivery basis. |
| d | Denotes perpetual securities. Perpetual securities pay an indefinite stream of interest, but may be called by the issuer at an earlier date. |
| e | The interest rate shown reflects the yield, coupon rate or the discount rate at the date of purchase. |
| f | All or a portion of the security is held on deposit with the counterparty and pledged as the initial margin deposit for open futures contracts. |
| * | Denotes restricted securities. Restricted securities are investment securities which cannot be offered for public sale without first being registered under the Securities Act of 1933. The value of all restricted securities held in Limited Maturity Bond Fund as of October 31, 2016 was $70,446,645 or 8.9% of total net assets. The following table indicates the acquisition date and cost of restricted securities shown in the schedule as of October 31, 2016. |
| | | | | | | | |
Security | | Acquisition
Date | | | Cost | |
Alm Loan Funding CLO, 10/17/2026 | | | 7/31/2014 | | | $ | 3,048,475 | |
Babson CLO, Ltd., 10/17/2026 | | | 8/15/2014 | | | | 3,048,475 | |
Birchwood Park CLO, Ltd., 7/15/2026 | | | 7/31/2014 | | | | 3,050,000 | |
BlueMountain CLO, Ltd., 10/15/2026 | | | 8/27/2014 | | | | 3,046,920 | |
Carlyle Global Market Strategies CLO, Ltd., 10/15/2026 | | | 9/19/2014 | | | | 3,000,000 | |
| Cent CLO 16, LP, 8/1/2024 | | | 9/5/2014 | | | | 3,050,000 | |
| DRB Prime Student Loan Trust, 10/27/2031 | | | 9/23/2015 | | | | 3,170,147 | |
Dryden 34 Senior Loan Fund CLO, 10/15/2026 | | | 7/21/2014 | | | | 3,050,000 | |
GoldenTree Loan Opportunities IX, Ltd., 10/29/2026 | | | 10/7/2016 | | | | 3,200,000 | |
Madison Park Funding XIV CLO, Ltd., 7/20/2026 | | | 7/3/2014 | | | | 3,345,980 | |
Octagon Investment Partners XX CLO, Ltd., 8/12/2026 | | | 7/10/2014 | | | | 3,050,000 | |
OZLM VIII, Ltd., 10/17/2026 | | | 8/7/2014 | | | | 3,032,615 | |
Voya CLO 3, Ltd., 7/25/2026 | | | 7/10/2014 | | | | 3,045,425 | |
The accompanying Notes to Financial Statements are an integral part of this schedule.
140
LIMITED MATURITY BOND FUND
Summary Schedule of Investments as of October 31, 2016
The following table presents the total amount of securities loaned with continuous maturity, by type, offset by the gross payable upon return of collateral for securities loaned by Thrivent Limited Maturity Bond Fund as of October 31, 2016:
Securities Lending Transactions
| | | | |
Taxable Debt Security | | | $3,281,507 | |
Common Stock | | | 498,984 | |
| | | | |
Total lending | | | $3,780,491 | |
Gross amount payable upon return of collateral for securities loaned | | | $3,895,550 | |
| | | | |
Net amounts due to counterparty | | | $115,059 | |
| | | | |
Definitions:
| | | | |
| CLO | | - | | Collateralized Loan Obligation |
| TIPS | | - | | Treasury Inflation Protected Security. |
Unrealized Appreciation (Depreciation)
Gross unrealized appreciation and depreciation of investments, based on cost for federal income tax purposes, were as follows:
| | | | |
Gross unrealized appreciation | | | $9,161,813 | |
Gross unrealized depreciation | | | (5,961,665 | ) |
| | | | |
Net unrealized appreciation (depreciation) | | | $3,200,148 | |
| |
Cost for federal income tax purposes | | | $816,526,993 | |
The accompanying Notes to Financial Statements are an integral part of this schedule.
141
LIMITED MATURITY BOND FUND
Summary Schedule of Investments as of October 31, 2016
Fair Valuation Measurements
The following table is a summary of the inputs used, as of October 31, 2016, in valuing Limited Maturity Bond Fund’s assets carried at fair value.
| | | | | | | | | | | | | | | | |
| Investments in Securities | | Total | | | Level 1 | | | Level 2 | | | Level 3 | |
| | | | |
Bank Loans | | | | | | | | | | | | | | | | |
Basic Materials | | | 341,066 | | | | – | | | | 341,066 | | | | – | |
Capital Goods | | | 1,855,244 | | | | – | | | | 1,855,244 | | | | – | |
Communications Services | | | 4,135,437 | | | | – | | | | 4,135,437 | | | | – | |
Consumer Cyclical | | | 2,844,665 | | | | – | | | | 2,844,665 | | | | – | |
Consumer Non-Cyclical | | | 837,658 | | | | – | | | | 837,658 | | | | – | |
Energy | | | 247,620 | | | | – | | | | 247,620 | | | | – | |
Financials | | | 965,507 | | | | – | | | | 965,507 | | | | – | |
Technology | | | 391,560 | | | | – | | | | 391,560 | | | | – | |
Utilities | | | 181,632 | | | | – | | | | – | | | | 181,632 | |
| | | | |
Long-Term Fixed Income | | | | | | | | | | | | | | | | |
Asset-Backed Securities | | | 135,394,938 | | | | – | | | | 129,127,034 | | | | 6,267,904 | |
Basic Materials | | | 3,732,488 | | | | – | | | | 3,732,488 | | | | – | |
Capital Goods | | | 3,405,161 | | | | – | | | | 3,405,161 | | | | – | |
Collateralized Mortgage Obligations | | | 75,884,417 | | | | – | | | | 75,884,417 | | | | – | |
Commercial Mortgage-Backed Securities | | | 16,241,536 | | | | – | | | | 16,241,536 | | | | – | |
Communications Services | | | 21,048,481 | | | | – | | | | 21,048,481 | | | | – | |
Consumer Cyclical | | | 12,239,174 | | | | – | | | | 12,239,174 | | | | – | |
Consumer Non-Cyclical | | | 44,036,503 | | | | – | | | | 44,036,503 | | | | – | |
Energy | | | 26,835,515 | | | | – | | | | 26,835,515 | | | | – | |
Financials | | | 149,172,773 | | | | – | | | | 149,172,773 | | | | – | |
Foreign Government | | | 6,948,170 | | | | – | | | | 6,948,170 | | | | – | |
Mortgage-Backed Securities | | | 34,839,425 | | | | – | | | | 34,839,425 | | | | – | |
Technology | | | 15,265,861 | | | | – | | | | 15,265,861 | | | | – | |
Transportation | | | 15,009,810 | | | | – | | | | 15,009,810 | | | | – | |
U.S. Government and Agencies | | | 169,561,033 | | | | – | | | | 169,561,033 | | | | – | |
Utilities | | | 19,122,383 | | | | – | | | | 19,122,383 | | | | – | |
| | | | |
Preferred Stock | | | | | | | | | | | | | | | | |
Financials | | | 2,198,570 | | | | 1,404,540 | | | | 794,030 | | | | – | |
Utilities | | | 1,225,840 | | | | 1,225,840 | | | | – | | | | – | |
| | | | |
Common Stock | | | | | | | | | | | | | | | | |
Energy | | | 549,205 | | | | 549,205 | | | | – | | | | – | |
Short-Term Investments | | | 23,499,029 | | | | – | | | | 23,499,029 | | | | – | |
| |
Subtotal Investments in Securities | | | $788,010,701 | | | | $3,179,585 | | | | $778,381,580 | | | | $6,449,536 | |
| |
| | | | |
| Other Investments* | | Total | | | | | | | | | | |
| | | | | | | | | | | | | |
Short-Term Investments | | | 27,820,890 | | | | | | | | | | | | | |
Collateral Held for Securities Loaned | | | 3,895,550 | | | | | | | | | | | | | |
| | | | | | | | | | | | | |
Subtotal Other Investments | | | $31,716,440 | | | | | | | | | | | | | |
| | | | | | | | | | | | | |
| | | | | | | | | | | | | | | | |
| | | | | | | | | | | | | |
Total Investments at Value | | | $819,727,141 | | | | | | | | | | | | | |
| | | | | | | | | | | | | |
| * | Certain investments are measured at fair value using a net asset value per share that is not publicly available (practical expedient). According to disclosure requirements of Accounting Standards Codification (ASC) 820, Fair Value Measurement, securities valued using the practical expedient are not classified in the fair value hierarchy. The fair value amounts presented in this table are intended to permit reconciliation of the fair value hierarchy to the amounts presented in the Statement of Assets and Liabilities. |
| | | | | | | | | | | | | | | | |
| | | | |
| Other Financial Instruments | | Total | | | Level 1 | | | Level 2 | | | Level 3 | |
Asset Derivatives | | | | | | | | | | | | | | | | |
Futures Contracts | | | 1,635,940 | | | | 1,635,940 | | | | – | | | | – | |
| |
Total Asset Derivatives | | | $1,635,940 | | | | $1,635,940 | | | | $– | | | | $– | |
| |
| | | | |
Liability Derivatives | | | | | | | | | | | | | | | | |
Futures Contracts | | | 27,356 | | | | 27,356 | | | | – | | | | – | |
| |
Total Liability Derivatives | | | $27,356 | | | | $27,356 | | | | $– | | | | $– | |
| |
There were no significant transfers between Levels during the period ended October 31, 2016. Transfers between Levels are identified as of the end of the period.
The accompanying Notes to Financial Statements are an integral part of this schedule.
142
LIMITED MATURITY BOND FUND
Summary Schedule of Investments as of October 31, 2016
The following table presents Limited Maturity Bond Fund’s futures contracts held as of October 31, 2016. Investments and/or cash totaling $1,099,921 were pledged as the initial margin deposit for these contracts.
| | | | | | | | | | | | | | | | | | | | |
| Futures Contracts | | Number of Contracts Long/(Short) | | | Expiration Date | | | Notional Principal Amount | | | Value | | | Unrealized Gain/(Loss) | |
CBOT 10-Yr. U.S. Treasury Note | | | (355 | ) | | | December 2016 | | | | ($46,498,319 | ) | | | ($46,016,875 | ) | | | $481,444 | |
CBOT 2-Yr. U.S. Treasury Note | | | 548 | | | | December 2016 | | | | 119,568,421 | | | | 119,541,065 | | | | (27,356 | ) |
CBOT 5-Yr. U.S. Treasury Note | | | (340 | ) | | | December 2016 | | | | (41,205,351 | ) | | | (41,070,939 | ) | | | 134,412 | |
CBOT U.S. Long Bond | | | (112 | ) | | | December 2016 | | | | (19,051,887 | ) | | | (18,224,500 | ) | | | 827,387 | |
CME Ultra Long Term U.S. Treasury Bond | | | (16 | ) | | | December 2016 | | | | (3,007,697 | ) | | | (2,815,000 | ) | | | 192,697 | |
Total Futures Contracts | | | | | | | | | | | | | | | | | | | $1,608,584 | |
The following table summarizes the fair value and Statement of Assets and Liabilities location, as of October 31, 2016, for Limited Maturity Bond Fund’s investments in financial derivative instruments by primary risk exposure as discussed under item (2) Significant Accounting Policies of the Notes to Financial Statements.
| | | | | | |
| Derivatives by risk category | | Statement of Assets and Liabilities Location | | Fair Value | |
| | |
Asset Derivatives | | | | | | |
| | |
Interest Rate Contracts | | | | | | |
Futures* | | Net Assets - Net unrealized appreciation/(depreciation) on Futures contracts | | | $1,635,940 | |
Total Interest Rate Contracts | | | | | 1,635,940 | |
| |
Total Asset Derivatives | | | | | $1,635,940 | |
| |
| | |
Liability Derivatives | | | | | | |
| | |
Interest Rate Contracts | | | | | | |
Futures* | | Net Assets - Net unrealized appreciation/(depreciation) on Futures contracts | | | 27,356 | |
Total Interest Rate Contracts | | | | | 27,356 | |
| |
Total Liability Derivatives | | | | | $27,356 | |
| |
| * | Includes cumulative appreciation/depreciation of futures contracts as reported in the Schedule of Investments. Only current day’s variation margin is reported within the Statement of Assets and Liabilities. |
The following table summarizes the net realized gains/(losses) and Statement of Operations location, for the period ended October 31, 2016, for Limited Maturity Bond Fund’s investments in financial derivative instruments by primary risk exposure.
| | | | | | |
| Derivatives by risk category | | Statement of Operations Location | | Realized Gains/(Losses) recognized in Income | |
| | |
Interest Rate Contracts | | | | | | |
Futures | | Net realized gains/(losses) on Futures contracts | | | (4,580,005 | ) |
| | |
Total Interest Rate Contracts | | | | | (4,580,005 | ) |
| |
Total | | | | | ($4,580,005 | ) |
| |
The following table summarizes the change in net unrealized appreciation/(depreciation) and Statement of Operations location, for the period ended October 31, 2016, for Limited Maturity Bond Fund’s investments in financial derivative instruments by primary risk exposure.
| | | | | | |
| Derivatives by risk category | | Statement of Operations Location | | Change in unrealized appreciation/(depreciation) recognized in Income | |
| | |
Interest Rate Contracts | | | | | | |
Futures | | Change in net unrealized appreciation/(depreciation) on Futures contracts | | | 1,851,861 | |
Total Interest Rate Contracts | | | | | 1,851,861 | |
| |
Total | | | | | $1,851,861 | |
| |
The accompanying Notes to Financial Statements are an integral part of this schedule.
143
LIMITED MATURITY BOND FUND
Summary Schedule of Investments as of October 31, 2016
The following table presents Limited Maturity Bond Fund’s average volume of derivative activity during the period ended October 31, 2016.
| | | | | | | | |
| Derivative Risk Category | | Futures (Notional)* | | | Futures (Percentage of Average Net Assets) | |
Interest Rate Contracts | | $ | 183,833,296 | | | | 24.6 | % |
| * | Notional amount represents long or short, or both, derivative positions held by the Fund. |
Investment in Affiliates
Affiliated issuers, as defined under the Investment Company Act of 1940, include those in which the Fund’s holdings of an issuer represent 5% or more of the outstanding voting securities of an issuer, any affiliated mutual fund, or a company which is under common ownership or control with the Fund. The Fund owns shares of Thrivent Cash Management Trust for the purpose of securities lending and Thrivent Core Short-Term Reserve Fund primarily to serve as a cash sweep vehicle for the Fund. Thrivent Cash Management Trust and Thrivent Core Short-Term Reserve Fund are established for the sole use of affiliated funds.
A summary of transactions for the fiscal year to date, in Limited Maturity Bond Fund, is as follows:
| | | | | | | | | | | | | | | | | | | | | | | | |
| Fund | | Value October 31, 2015 | | | Gross Purchases | | | Gross Sales | | | Shares Held at October 31, 2016 | | | Value October 31, 2016 | | | Income
Earned November 1, 2015 - October 31, 2016 | |
Cash Management Trust-Collateral Investment | | | $4,701,470 | | | | $59,935,072 | | | | $60,740,992 | | | | 3,895,550 | | | | $3,895,550 | | | | $28,496 | |
Cash Management Trust-Short Term Investment | | | 35,527,966 | | | | 108,735,339 | | | | 144,263,305 | | | | – | | | | – | | | | 51,490 | |
Core Short-Term Reserve | | | – | | | | 125,602,280 | | | | 97,781,390 | | | | 2,782,089 | | | | 27,820,890 | | | | 106,532 | |
Total Value and Income Earned | | | $40,229,436 | | | | | | | | | | | | | | | | $31,716,440 | | | | $186,518 | |
The accompanying Notes to Financial Statements are an integral part of this schedule.
144
MONEY MARKET FUND
Schedule of Investments as of October 31, 2016
| | | | | | | | |
Principal Amount | | | U.S. Government Agency Debt (85.9%)a | | Value | |
| | | | Federal Agricultural Mortgage Corporation | | | | |
| | $4,250,000 | | | 0.882%, 1/25/2017b | | | $4,250,000 | |
| | 4,280,000 | | | 0.636%, 3/7/2017b | | | 4,280,000 | |
| | | | Federal Farm Credit Bank | | | | |
| | 1,420,000 | | | 0.570%, 12/14/2016b | | | 1,420,389 | |
| | 2,220,000 | | | 0.556%, 3/13/2017b | | | 2,219,431 | |
| | 370,000 | | | 0.585%, 4/17/2017b | | | 369,949 | |
| | 3,700,000 | | | 0.590%, 8/10/2017b | | | 3,698,568 | |
| | | | Federal Home Loan Bank | | | | |
| | 4,410,000 | | | 0.314%, 11/1/2016 | | | 4,410,000 | |
| | 14,374,000 | | | 0.297%, 11/2/2016 | | | 14,373,882 | |
| | 2,910,000 | | | 0.270%, 11/3/2016 | | | 2,909,956 | |
| | 6,560,000 | | | 0.313%, 11/4/2016 | | | 6,559,829 | |
| | 1,420,000 | | | 0.255%, 11/7/2016 | | | 1,419,940 | |
| | 5,560,000 | | | 0.312%, 11/8/2016 | | | 5,559,663 | |
| | 700,000 | | | 0.330%, 11/9/2016 | | | 699,949 | |
| | 1,000,000 | | | 0.260%, 11/10/2016 | | | 999,935 | |
| | 8,310,000 | | | 0.314%, 11/14/2016 | | | 8,309,057 | |
| | 8,710,000 | | | 0.293%, 11/16/2016 | | | 8,708,938 | |
| | 11,240,000 | | | 0.292%, 11/18/2016 | | | 11,238,451 | |
| | 225,000 | | | 0.300%, 11/21/2016 | | | 224,962 | |
| | 2,850,000 | | | 0.335%, 11/22/2016 | | | 2,849,443 | |
| | 4,210,000 | | | 0.321%, 11/23/2016 | | | 4,209,173 | |
| | 3,600,000 | | | 0.625%, 11/23/2016 | | | 3,600,550 | |
| | 8,835,000 | | | 0.321%, 11/25/2016 | | | 8,833,107 | |
| | 690,000 | | | 0.360%, 11/29/2016 | | | 689,807 | |
| | 8,270,000 | | | 0.304%, 11/30/2016 | | | 8,267,973 | |
| | 10,680,000 | | | 0.339%, 12/2/2016 | | | 10,676,882 | |
| | 5,330,000 | | | 0.350%, 12/7/2016 | | | 5,328,134 | |
| | 7,950,000 | | | 0.302%, 12/9/2016 | | | 7,947,468 | |
| | 3,550,000 | | | 0.380%, 12/14/2016 | | | 3,548,389 | |
| | 4,250,000 | | | 4.750%, 12/16/2016 | | | 4,273,126 | |
| | 4,300,000 | | | 0.295%, 12/20/2016 | | | 4,298,273 | |
| | 5,529,000 | | | 0.300%, 12/21/2016 | | | 5,526,696 | |
| | 3,550,000 | | | 0.300%, 12/22/2016 | | | 3,548,491 | |
| | 7,485,000 | | | 0.300%, 12/23/2016 | | | 7,481,751 | |
| | 4,000,000 | | | 0.300%, 12/27/2016 | | | 3,998,133 | |
| | 4,330,000 | | | 0.310%, 12/29/2016 | | | 4,327,837 | |
| | 5,908,000 | | | 0.312%, 12/30/2016 | | | 5,904,981 | |
| | 5,830,000 | | | 0.320%, 1/3/2017 | | | 5,826,734 | |
| | 3,540,000 | | | 0.345%, 1/4/2017 | | | 3,537,829 | |
| | 10,130,000 | | | 0.348%, 1/6/2017 | | | 10,123,544 | |
| | 4,780,000 | | | 0.320%, 1/9/2017 | | | 4,777,068 | |
| | 3,540,000 | | | 0.335%, 1/10/2017 | | | 3,537,694 | |
| | 3,660,000 | | | 0.350%, 1/11/2017 | | | 3,657,474 | |
| | 7,360,000 | | | 0.342%, 1/13/2017 | | | 7,354,900 | |
| | 4,290,000 | | | 0.350%, 1/18/2017 | | | 4,286,747 | |
| | 4,220,000 | | | 0.818%, 1/19/2017b | | | 4,219,901 | |
| | 8,470,000 | | | 0.350%, 1/20/2017 | | | 8,463,412 | |
| | 7,860,000 | | | 0.359%, 1/25/2017 | | | 7,853,328 | |
| | 3,720,000 | | | 0.624%, 1/26/2017b | | | 3,720,000 | |
| | 3,530,000 | | | 0.360%, 1/27/2017 | | | 3,526,929 | |
| | 3,700,000 | | | 0.763%, 3/30/2017b | | | 3,700,000 | |
| | 3,700,000 | | | 0.673%, 5/16/2017b | | | 3,699,438 | |
| | 3,700,000 | | | 0.792%, 8/23/2017b | | | 3,699,850 | |
| | 4,260,000 | | | 0.500%, 9/29/2017c | | | 4,260,000 | |
| | | | Federal Home Loan Mortgage Corporation | | | | |
| | 6,225,000 | | | 0.625%, 11/1/2016 | | | 6,225,000 | |
| | 1,170,000 | | | 0.334%, 1/23/2017 | | | 1,169,099 | |
| | 3,550,000 | | | 0.700%, 1/27/2017 | | | 3,551,877 | |
| | 3,750,000 | | | 0.655%, 7/21/2017b | | | 3,749,722 | |
| | | | Federal National Mortgage Association | | | | |
| | 3,580,000 | | | 0.550%, 11/14/2016 | | | 3,580,227 | |
| | 5,288,000 | | | 1.375%, 11/15/2016 | | | 5,289,807 | |
| | 3,740,000 | | | 0.330%, 12/7/2016 | | | 3,738,766 | |
| | 4,260,000 | | | 0.807%, 12/20/2017b | | | 4,260,000 | |
| | 4,310,000 | | | 0.846%, 1/11/2018b | | | 4,310,000 | |
| | | | Overseas Private Investment Corporation | | | | |
| | 2,719,306 | | | 0.700%, 11/2/2016b | | | 2,719,306 | |
| | 5,842,105 | | | 0.700%, 11/2/2016b | | | 5,842,105 | |
| | 6,842,105 | | | 0.700%, 11/7/2016b | | | 6,842,105 | |
| | 2,200,000 | | | 0.700%, 11/7/2016b | | | 2,200,000 | |
| | 4,700,000 | | | 0.750%, 11/7/2016b | | | 4,700,000 | |
| | 8,350,000 | | | 0.750%, 11/7/2016b | | | 8,350,000 | |
| | 7,150,000 | | | 0.750%, 11/7/2016b | | | 7,150,000 | |
| | 2,630,940 | | | 0.750%, 11/7/2016b | | | 2,630,940 | |
| | 5,544,180 | | | 0.750%, 11/7/2016b | | | 5,544,180 | |
| | 4,855,000 | | | 0.800%, 11/7/2016b | | | 4,855,000 | |
| | 6,000,000 | | | 0.800%, 11/7/2016b | | | 6,000,000 | |
| | 7,450,000 | | | 0.870%, 11/18/2016 | | | 7,511,934 | |
| | 938,829 | | | 0.990%, 11/21/2016 | | | 946,807 | |
| | 7,400,000 | | | 1.010%, 3/17/2017 | | | 7,446,341 | |
| | 4,350,000 | | | 0.760%, 3/30/2017 | | | 4,366,605 | |
| | | | | |
| | | | Total | | | 376,187,782 | |
| | | | | |
| | |
Principal
Amount | | | U.S. Treasury Debt (13.3%)a | | Value | |
| | | | U.S. Treasury Bills | | | | |
| | 3,540,000 | | | 0.324%, 1/19/2017 | | | 3,537,483 | |
| | | | U.S. Treasury Notes | | | | |
| | 13,000,000 | | | 0.424%, 1/31/2017b | | | 13,001,994 | |
| | 3,480,000 | | | 0.500%, 1/31/2017 | | | 3,480,956 | |
| | 8,700,000 | | | 0.417%, 7/31/2017b | | | 8,698,813 | |
| | 6,500,000 | | | 0.612%, 1/31/2018b | | | 6,510,645 | |
| | 10,640,000 | | | 0.530%, 4/30/2018b | | | 10,652,034 | |
| | 12,450,000 | | | 0.514%, 7/31/2018b | | | 12,452,605 | |
| | | | | |
| | | | Total | | | 58,334,530 | |
| | | | | |
| | | | | | | | |
| | | | | |
| | | | Total Investments (at amortized cost) 99.2% | | | $434,522,312 | |
| | | | | |
| | | | Other Assets and Liabilities, Net 0.8% | | | 3,447,568 | |
| | | | | |
| | | | Total Net Assets 100.0% | | | $437,969,880 | |
| | | | | |
| a | The interest rate shown reflects the yield, coupon rate or the discount rate at the date of purchase, |
| b | Denotes variable rate securities. Variable rate securities are securities whose yields vary with a designated market index or market rate. The rate shown is as of October 31, 2016. |
| c | Denotes step coupon securities. Step coupon securities pay an initial coupon rate for the first period and then different coupon rates for following periods. The rate shown is as of October 31, 2016. |
| | | | |
Cost for federal income tax purposes | | | $434,522,312 | |
The accompanying Notes to Financial Statements are an integral part of this schedule.
145
MONEY MARKET FUND
Schedule of Investments as of October 31, 2016
Fair Valuation Measurements
The following table is a summary of the inputs used, as of October 31, 2016, in valuing Money Market Fund’s assets carried at fair value or amortized cost, which approximates fair value.
| | | | | | | | | | | | | | | | |
| Investments in Securities | | Total | | | Level 1 | | | Level 2 | | | Level 3 | |
U.S. Government Agency Debt | | | 376,187,782 | | | | – | | | | 376,187,782 | | | | – | |
U.S. Treasury Debt | | | 58,334,530 | | | | – | | | | 58,334,530 | | | | – | |
| |
Total | | | $434,522,312 | | | | $– | | | | $434,522,312 | | | | $– | |
| |
There were no significant transfers between Levels during the period ended October 31, 2016. Transfers between Levels are identified as of the end of the period.
The accompanying Notes to Financial Statements are an integral part of this schedule.
146
(This page intentionally left blank)
147
THRIVENT MUTUAL FUNDS
STATEMENTOF ASSETSAND LIABILITIES
| | | | | | | | | | | | | | | | |
| As of October 31, 2016 | | Aggressive
Allocation
Fund | | | Moderately
Aggressive
Allocation
Fund | | | Moderate
Allocation
Fund | | | Moderately
Conservative
Allocation
Fund | |
Assets | | | | | | | | | | | | | | | | |
Investments at cost | | | $773,580,993 | | | | $1,881,593,406 | | | | $1,847,402,137 | | | | $817,835,480 | |
Investments in securities at value | | | 462,079,631 | | | | 985,370,814 | | | | 1,044,351,935 | | | | 486,776,250 | |
Investments in affiliates at value | | | 421,161,593 | | | | 1,119,113,197 | | | | 998,699,990 | | | | 396,018,150 | |
Investments at Value | | | 883,241,224 | | | | 2,104,484,011 | | | | 2,043,051,925 | | | | 882,794,400 | |
| | | | |
Cash | | | 1,384 | (a) | | | 213,627 | (b) | | | 259,758 | (c) | | | 176,922 | (d) |
Initial margin deposit on open future contracts | | | – | | | | – | | | | – | | | | – | |
Initial margin deposit on open currency contracts | | | – | | | | – | | | | – | | | | – | |
Dividends and interest receivable | | | 247,711 | | | | 1,887,309 | | | | 3,043,475 | | | | 1,713,053 | |
Prepaid expenses | | | 20,298 | | | | 26,479 | | | | 25,042 | | | | 17,258 | |
Prepaid trustee fees | | | 3,232 | | | | 5,215 | | | | 5,055 | | | | 2,821 | |
Receivable for investments sold | | | 1,671,296 | | | | 2,327,829 | | | | 1,356,949 | | | | 1,209,146 | |
Receivable for fund shares sold | | | 449,116 | | | | 1,250,445 | | | | 796,501 | | | | 1,141,462 | |
Unrealized gain on forward contracts | | | – | | | | – | | | | – | | | | – | |
Receivable for expense reimbursements | | | 201,675 | | | | 472,022 | | | | 338,382 | | | | 101,582 | |
Receivable for variation margin | | | 61,200 | | | | 130,272 | | | | 214,525 | | | | 110,074 | |
Total Assets | | | 885,897,136 | | | | 2,110,797,209 | | | | 2,049,091,612 | | | | 887,266,718 | |
| | | | |
Liabilities | | | | | | | | | | | | | | | | |
Distributions payable | | | – | | | | – | | | | – | | | | – | |
Accrued expenses | | | 118,647 | | | | 189,288 | | | | 160,969 | | | | 83,875 | |
Payable for investments purchased | | | 12,860,652 | | | | 103,230,733 | | | | 179,663,652 | | | | 110,754,742 | |
Payable upon return of collateral for securities loaned | | | – | | | | 2,585,839 | | | | 3,757,689 | | | | 2,400,919 | |
Payable for fund shares redeemed | | | 335,619 | | | | 1,129,201 | | | | 1,389,947 | | | | 512,205 | |
Unrealized loss on forward contracts | | | – | | | | – | | | | – | | | | – | |
Payable for variation margin | | | 847,764 | | | | 1,216,749 | | | | 640,725 | | | | 126,953 | |
Payable for investment advisory fees | | | 551,851 | | | | 1,163,304 | | | | 1,002,793 | | | | 387,445 | |
Payable for administrative fees | | | 19,272 | | | | 36,582 | | | | 34,409 | | | | 17,631 | |
Payable for distribution fees | | | 156,608 | | | | 387,289 | | | | 359,591 | | | | 149,672 | |
Payable for transfer agent fees | | | 60,148 | | | | 121,682 | | | | 90,067 | | | | 34,435 | |
Payable for trustee deferred compensation | | | 49,418 | | | | 77,961 | | | | 77,217 | | | | 51,561 | |
Mortgage dollar roll deferred revenue | | | 4,327 | | | | 43,333 | | | | 72,415 | | | | 47,316 | |
Total Liabilities | | | 15,004,306 | | | | 110,181,961 | | | | 187,249,474 | | | | 114,566,754 | |
| | | | |
Net Assets | | | | | | | | | | | | | | | | |
Capital stock (beneficial interest) | | | 762,376,705 | | | | 1,763,993,893 | | | | 1,667,442,978 | | | | 705,866,984 | |
Accumulated undistributed net investment income/(loss) | | | 766,083 | | | | 9,090,220 | | | | 1,026,113 | | | | 943,431 | |
Accumulated undistributed net realized gain/(loss) | | | (980,675 | ) | | | 6,558,097 | | | | 597,539 | | | | 2,133,217 | |
Net unrealized appreciation/(depreciation) on: | | | | | | | | | | | | | | | | |
Investments | | | 44,930,037 | | | | 68,902,134 | | | | 49,799,458 | | | | 20,111,536 | |
Affiliated investments | | | 64,730,194 | | | | 153,988,471 | | | | 145,850,330 | | | | 44,847,384 | |
Futures contracts | | | (928,090 | ) | | | (1,917,038 | ) | | | (2,872,164 | ) | | | (1,202,338 | ) |
Foreign currency forward contracts | | | – | | | | – | | | | – | | | | – | |
Foreign currency transactions | | | (1,424 | ) | | | (529 | ) | | | (2,116 | ) | | | (250 | ) |
Total Net Assets | | | $870,892,830 | | | | $2,000,615,248 | | | | $1,861,842,138 | | | | $772,699,964 | |
| | | | |
Class A Share Capital | | | $729,959,032 | | | | $1,809,590,324 | | | | $1,682,882,936 | | | | $703,285,519 | |
Shares of beneficial interest outstanding (Class A) | | | 55,672,765 | | | | 138,047,038 | | | | 134,441,348 | | | | 59,695,480 | |
Net asset value per share | | | $13.11 | | | | $13.11 | | | | $12.52 | | | | $11.78 | |
Maximum public offering price | | | $13.73 | | | | $13.73 | | | | $13.11 | | | | $12.34 | |
Class S Share Capital | | | $140,933,798 | | | | $191,024,924 | | | | $178,959,202 | | | | $69,414,445 | |
Shares of beneficial interest outstanding (Class S) | | | 10,635,056 | | | | 14,436,717 | | | | 14,258,302 | | | | 5,874,347 | |
Net asset value per share | | | $13.25 | | | | $13.23 | | | | $12.55 | | | | $11.82 | |
| (a) | Includes foreign currency holdings of $1,352 (cost $1,352). |
| (b) | Includes foreign currency holdings of $62,065 (cost $61,392). |
| (c) | Includes foreign currency holdings of $43,121 (cost $42,822). |
| (d) | Includes foreign currency holdings of $15 (cost $16). |
| (e) | Includes foreign currency holdings of $30,041 (cost $30,041). |
| (f) | Includes foreign currency holdings of $16,418 (cost $15,448). |
| (g) | Includes foreign currency holdings of $2,055,528 (cost $2,060,584). |
The accompanying Notes to Financial Statements are an integral part of this statement.
148
THRIVENT MUTUAL FUNDS
STATEMENTOF ASSETSAND LIABILITIES –CONTINUED
| | | | | | | | | | | | | | | | | | | | | | | | | | |
Balanced
Income Plus
Fund | | | Opportunity
Income Plus
Fund | | | Partner Emerging
Markets Equity
Fund | | | Small Cap
Stock Fund | | | Mid Cap
Stock Fund | | | Partner
Worldwide
Allocation
Fund | | | Large Cap
Growth
Fund | |
| | | | | | |
| | | | | | | | | | | | | | | | | | | | | | | | | | |
| | $310,688,149 | | | | $498,304,198 | | | | $11,071,070 | | | | $416,222,889 | | | | $1,044,603,350 | | | | $730,807,590 | | | | $562,700,179 | |
| | 288,253,975 | | | | 425,917,771 | | | | 10,439,276 | | | | 437,416,450 | | | | 1,279,261,520 | | | | 742,728,263 | | | | 657,230,913 | |
| | 32,087,562 | | | | 72,388,855 | | | | 214,568 | | | | 36,562,987 | | | | 92,382,159 | | | | 10,836,704 | | | | 32,090,142 | |
| | 320,341,537 | | | | 498,306,626 | | | | 10,653,844 | | | | 473,979,437 | | | | 1,371,643,679 | | | | 753,564,967 | | | | 689,321,055 | |
| | 32,634(e) | | | | 7,762 | | | | 16,418 | (f) | | | – | | | | – | | | | 2,078,934 | (g) | | | – | |
| | – | | | | – | | | | – | | | | – | | | | – | | | | 398,518 | | | | – | |
| | – | | | | – | | | | – | | | | – | | | | – | | | | 880,000 | | | | – | |
| | 1,086,469 | | | | 2,541,568 | | | | 11,643 | | | | 145,393 | | | | 244,546 | | | | 3,799,608 | | | | 240,928 | |
| | 5,790 | | | | 12,043 | | | | 19,354 | | | | 11,773 | | | | 14,849 | | | | 10,521 | | | | 19,442 | |
| | 2,329 | | | | 2,815 | | | | 1,100 | | | | 3,162 | | | | 6,972 | | | | 4,578 | | | | 4,171 | |
| | 530,220 | | | | 613,252 | | | | 10,140 | | | | 7,126,945 | | | | – | | | | 2,521,760 | | | | – | |
| | 140,931 | | | | 587,737 | | | | 89,600 | | | | 89,660 | | | | 372,872 | | | | 63,956 | | | | 218,920 | |
| | – | | | | – | | | | – | | | | – | | | | – | | | | 623,340 | | | | – | |
| | – | | | | 806 | | | | 15,566 | | | | – | | | | – | | | | 17,962 | | | | 9,319 | |
| | 27,850 | | | | 50,013 | | | | – | | | | – | | | | – | | | | 2,070,916 | | | | – | |
| | 322,167,760 | | | | 502,122,622 | | | | 10,817,665 | | | | 481,356,370 | | | | 1,372,282,918 | | | | 766,035,060 | | | | 689,813,835 | |
| | | | | | |
| | | | | | | | | | | | | | | | | | | | | | | | | | |
| | – | | | | 73,602 | | | | – | | | | – | | | | – | | | | – | | | | – | |
| | 61,492 | | | | 59,953 | | | | 20,121 | | | | 51,135 | | | | 96,493 | | | | 180,976 | | | | 47,759 | |
| | 20,211,912 | | | | 52,387,347 | | | | 5,059 | | | | 4,174,229 | | | | – | | | | 2,851,965 | | | | – | |
| | 4,071,925 | | | | 12,236,852 | | | | – | | | | 30,024,962 | | | | 27,756,275 | | | | 2,547,690 | | | | – | |
| | 75,286 | | | | 386,397 | | | | 24,522 | | | | 78,855 | | | | 277,935 | | | | 60,712 | | | | 259,285 | |
| | – | | | | – | | | | – | | | | – | | | | – | | | | 311,732 | | | | – | |
| | 19,211 | | | | 31,031 | | | | – | | | | – | | | | – | | | | 2,056,397 | | | | – | |
| | 138,846 | | | | 166,080 | | | | 10,862 | | | | 259,553 | | | | 731,709 | | | | 560,715 | | | | 433,395 | |
| | 10,377 | | | | 12,477 | | | | 5,996 | | | | 12,786 | | | | 26,260 | | | | 17,483 | | | | 16,433 | |
| | 49,329 | | | | 54,529 | | | | 2,093 | | | | 71,760 | | | | 212,698 | | | | 30,274 | | | | 38,360 | |
| | 16,235 | | | | 17,291 | | | | 1,637 | | | | 33,015 | | | | 72,582 | | | | 10,024 | | | | 17,605 | |
| | 88,260 | | | | 109,204 | | | | 11,394 | | | | 186,739 | | | | 331,132 | | | | 155,596 | | | | 110,158 | |
| | 6,802 | | | | 17,259 | | | | – | | | | – | | | | – | | | | – | | | | – | |
| | 24,749,675 | | | | 65,552,022 | | | | 81,684 | | | | 34,893,034 | | | | 29,505,084 | | | | 8,783,564 | | | | 922,995 | |
| | | | | | |
| | | | | | | | | | | | | | | | | | | | | | | | | | |
| | 290,502,694 | | | | 448,795,040 | | | | 12,970,623 | | | | 367,703,774 | | | | 956,741,887 | | | | 743,746,439 | | | | 559,819,928 | |
| | 264,964 | | | | (68,725 | ) | | | 60,550 | | | | 735,175 | | | | 1,695,974 | | | | 13,919,395 | | | | (172,683 | ) |
| | (3,120,721) | | | | (12,465,793 | ) | | | (1,879,030 | ) | | | 20,267,839 | | | | 57,299,644 | | | | (23,323,019 | ) | | | 2,625,563 | |
| | | | | | |
| | | | | | | | | | | | | | | | | | | | | | | | | | |
| | 9,653,388 | | | | 2,428 | | | | (417,226 | ) | | | 57,756,548 | | | | 327,040,329 | | | | 22,757,377 | | | | 126,620,876 | |
| | – | | | | – | | | | – | | | | – | | | | – | | | | – | | | | – | |
| | 122,049 | | | | 307,650 | | | | – | | | | – | | | | – | | | | (62,690 | ) | | | – | |
| | – | | | | – | | | | – | | | | – | | | | – | | | | 311,608 | | | | – | |
| | (4,289) | | | | – | | | | 1,064 | | | | – | | | | – | | | | (97,614 | ) | | | (2,844 | ) |
| | $297,418,085 | | | | $436,570,600 | | | | $10,735,981 | | | | $446,463,336 | | | | $1,342,777,834 | | | | $757,251,496 | | | | $688,890,840 | |
| | $231,789,268 | | | | $258,386,526 | | | | $9,765,682 | | | | $331,373,595 | | | | $1,005,072,337 | | | | $141,311,309 | | | | $178,808,310 | |
| | 18,967,260 | | | | 25,249,624 | | | | 1,157,542 | | | | 18,901,953 | | | | 46,464,179 | | | | 14,641,227 | | | | 21,738,132 | |
| | $12.22 | | | | $10.23 | | | | $8.44 | | | | $17.53 | | | | $21.63 | | | | $9.65 | | | | $8.23 | |
| | $12.80 | | | | $10.71 | | | | $8.84 | | | | $18.36 | | | | $22.65 | | | | $10.10 | | | | $8.62 | |
| | $65,628,817 | | | | $178,184,074 | | | | $970,299 | | | | $115,089,741 | | | | $337,705,497 | | | | $615,940,187 | | | | $510,082,530 | |
| | 5,380,598 | | | | 17,412,585 | | | | 115,672 | | | | 5,565,578 | | | | 14,070,520 | | | | 63,406,893 | | | | 56,739,418 | |
| | $12.20 | | | | $10.23 | | | | $8.39 | | | | $20.68 | | | | $24.00 | | | | $9.71 | | | | $8.99 | |
The accompanying Notes to Financial Statements are an integral part of this statement.
149
THRIVENT MUTUAL FUNDS
STATEMENTOF ASSETSAND LIABILITIES –CONTINUED
| | | | | | | | |
| As of October 31, 2016 | | Large Cap
Value Fund | | | Large Cap
Stock Fund | |
Assets | | | | | | | | |
Investments at cost | | | $659,040,316 | | | | $1,315,016,164 | |
Investments in securities at value | | | 792,438,718 | | | | 1,515,896,315 | |
Investments in affiliates at value | | | 30,502,964 | | | | 92,381,576 | |
Investments at Value | | | 822,941,682 | | | | 1,608,277,891 | |
| | |
Cash | | | – | | | | 485,865 | (a) |
Dividends and interest receivable | | | 528,882 | | | | 2,132,806 | |
Prepaid expenses | | | 11,889 | | | | 17,897 | |
Prepaid trustee fees | | | 4,743 | | | | 8,132 | |
Receivable for investments sold | | | 5,179,404 | | | | 19,850,591 | |
Receivable for fund shares sold | | | 204,359 | | | | 181,007 | |
Receivable for expense reimbursements | | | – | | | | – | |
Receivable for variation margin | | | – | | | | 319,095 | |
Total Assets | | | 828,870,959 | | | | 1,631,273,284 | |
| | |
Liabilities | | | | | | | | |
Distributions payable | | | – | | | | – | |
Accrued expenses | | | 45,479 | | | | 197,821 | |
Payable for investments purchased | | | 4,916,997 | | | | 10,304,558 | |
Payable upon return of collateral for securities loaned | | | 5,787,975 | | | | 13,952,780 | |
Payable for fund shares redeemed | | | 223,287 | | | | 603,814 | |
Payable for variation margin | | | – | | | | 956,522 | |
Payable for investment advisory fees | | | 313,576 | | | | 779,937 | |
Payable for administrative fees | | | 18,376 | | | | 30,481 | |
Payable for distribution fees | | | 42,457 | | | | 299,015 | |
Payable for transfer agent fees | | | 18,742 | | | | 64,003 | |
Payable for trustee deferred compensation | | | 142,776 | | | | 612,776 | |
Mortgage dollar roll deferred revenue | | | – | | | | – | |
Total Liabilities | | | 11,509,665 | | | | 27,801,707 | |
| | |
Net Assets | | | | | | | | |
Capital stock (beneficial interest) | | | 617,266,143 | | | | 1,268,657,052 | |
Accumulated undistributed net investment income/(loss) | | | 9,032,248 | | | | 14,065,321 | |
Accumulated undistributed net realized gain/(loss) | | | 27,161,537 | | | | 28,525,792 | |
Net unrealized appreciation/(depreciation) on: | | | | | | | | |
Investments | | | 163,901,366 | | | | 293,261,727 | |
Futures contracts | | | – | | | | (982,688 | ) |
Foreign currency transactions | | | – | | | | (55,627 | ) |
Total Net Assets | | | $817,361,294 | | | | $1,603,471,577 | |
| | |
Class A Share Capital | | | $198,622,356 | | | | $1,399,752,967 | |
Shares of beneficial interest outstanding (Class A) | | | 10,226,879 | | | | 56,504,289 | |
Net asset value per share | | | $19.42 | | | | $24.77 | |
Maximum public offering price | | | $20.34 | | | | $25.94 | |
Class S Share Capital | | | $618,738,938 | | | | $203,718,610 | |
Shares of beneficial interest outstanding (Class S) | | | 31,627,976 | | | | 8,145,027 | |
Net asset value per share | | | $19.56 | | | | $25.01 | |
| 1 | Securities held by this fund are valued on the basis of amortized cost, which approximates market value. |
| (a) | Includes foreign currency holdings of $484,145 (cost $484,147). |
The accompanying Notes to Financial Statements are an integral part of this statement.
150
THRIVENT MUTUAL FUNDS
STATEMENTOF ASSETSAND LIABILITIES –CONTINUED
| | | | | | | | | | | | | | | | | | | | | | |
| High Yield Fund | | | Income Fund | | | Municipal Bond Fund | | | Government Bond
Fund | | | Limited Maturity Bond
Fund | | | Money Market Fund | |
| | $774,326,623 | | | | $851,504,396 | | | | $1,523,993,392 | | | | $57,641,327 | | | | $816,641,329 | | | | $434,522,312 | |
| | 666,353,740 | | | | 814,165,661 | | | | 1,645,861,310 | | | | 58,068,787 | | | | 788,010,701 | | | | 434,522,312 | |
| | 102,306,182 | | | | 62,407,495 | | | | – | | | | 1,570,009 | | | | 31,716,440 | | | | – | |
| | 768,659,922 | | | | 876,573,156 | | | | 1,645,861,310 | | | | 59,638,796 | | | | 819,727,141 | | | | 434,522,312 | 1 |
| | 44,100 | | | | 33,226 | | | | 91,882 | | | | – | | | | 3,017,715 | | | | 8,317 | |
| | 10,191,877 | | | | 7,203,953 | | | | 22,037,222 | | | | 252,507 | | | | 2,728,746 | | | | 228,043 | |
| | 15,980 | | | | 18,402 | | | | 19,703 | | | | 5,722 | | | | 29,106 | | | | 19,500 | |
| | 4,158 | | | | 4,665 | | | | 8,683 | | | | 1,100 | | | | 4,436 | | | | 3,045 | |
| | 1,232,642 | | | | 7,549,329 | | | | 16,366,865 | | | | – | | | | 1,068,789 | | | | – | |
| | 1,073,554 | | | | 279,866 | | | | 1,445,975 | | | | 61,825 | | | | 3,066,709 | | | | 4,799,225 | |
| | – | | | | – | | | | – | | | | 935 | | | | – | | | | 151,184 | |
| | – | | | | 161,500 | | | | – | | | | 3,453 | | | | 25,690 | | | | – | |
| | 781,222,233 | | | | 891,824,097 | | | | 1,685,831,640 | | | | 59,964,338 | | | | 829,668,332 | | | | 439,731,626 | |
| | 668,352 | | | | 169,265 | | | | 638,535 | | | | 150 | | | | 20,011 | | | | – | |
| | 69,644 | | | | 65,185 | | | | 93,291 | | | | 18,592 | | | | 72,500 | | | | 71,271 | |
| | 9,201,048 | | | | 47,825,608 | | | | 19,241,207 | | | | 4,306,359 | | | | 32,427,038 | | | | – | |
| | 66,352,314 | | | | 20,144,903 | | | | – | | | | – | | | | 3,895,550 | | | | – | |
| | 693,340 | | | | 932,500 | | | | 542,712 | | | | 17,940 | | | | 538,686 | | | | 1,449,885 | |
| | – | | | | 56,841 | | | | – | | | | 18,844 | | | | 123,483 | | | | – | |
| | 230,564 | | | | 237,342 | | | | 556,925 | | | | 18,643 | | | | 192,612 | | | | 127,823 | |
| | 16,602 | | | | 18,392 | | | | 31,208 | | | | 6,672 | | | | 17,748 | | | | 12,407 | |
| | 100,449 | | | | 76,361 | | | | 312,653 | | | | 928 | | | | 36,836 | | | | 40,212 | |
| | 26,363 | | | | 20,452 | | | | 38,205 | | | | 840 | | | | 33,853 | | | | 60,148 | |
| | 145,419 | | | | 159,771 | | | | 303,063 | | | | 18,256 | | | | 130,952 | | | | – | |
| | – | | | | 14,094 | | | | – | | | | 1,459 | | | | 10,857 | | | | – | |
| | 77,504,095 | | | | 69,720,714 | | | | 21,757,799 | | | | 4,408,683 | | | | 37,500,126 | | | | 1,761,746 | |
| | 768,640,586 | | | | 798,057,567 | | | | 1,551,507,461 | | | | 53,282,517 | | | | 794,005,228 | | | | 437,976,754 | |
| | (567,090) | | | | 50,186 | | | | 157,086 | | | | (5,544 | ) | | | 30,872 | | | | – | |
| | (58,688,657) | | | | (17,064 | ) | | | (9,458,624 | ) | | | 36,703 | | | | (6,562,290 | ) | | | (6,874 | ) |
| | (5,666,701) | | | | 25,068,760 | | | | 121,867,918 | | | | 1,997,469 | | | | 3,085,812 | | | | – | |
| | – | | | | (1,056,066 | ) | | | – | | | | 244,510 | | | | 1,608,584 | | | | – | |
| | – | | | | – | | | | – | | | | – | | | | – | | | | – | |
| | $703,718,138 | | | | $822,103,383 | | | | $1,664,073,841 | | | | $55,555,655 | | | | $792,168,206 | | | | $437,969,880 | |
| | $471,529,108 | | | | $359,253,164 | | | | $1,471,038,700 | | | | $8,670,634 | | | | $351,196,239 | | | | $381,341,837 | |
| | 99,160,526 | | | | 38,799,027 | | | | 126,304,206 | | | | 855,202 | | | | 28,141,946 | | | | 381,348,703 | |
| | $4.76 | | | | $9.26 | | | | $11.65 | | | | $10.14 | | | | $12.48 | | | | $1.00 | |
| | $4.98 | | | | $9.70 | | | | $12.20 | | | | $10.35 | | | | $12.48 | | | | $1.00 | |
| | $232,189,030 | | | | $462,850,219 | | | | $193,035,141 | | | | $46,885,021 | | | | $440,971,967 | | | | $56,628,043 | |
| | 48,796,957 | | | | 50,026,861 | | | | 16,574,242 | | | | 4,623,030 | | | | 35,344,289 | | | | 56,628,050 | |
| | $4.76 | | | | $9.25 | | | | $11.65 | | | | $10.14 | | | | $12.48 | | | | $1.00 | |
The accompanying Notes to Financial Statements are an integral part of this statement.
151
THRIVENT MUTUAL FUNDS
STATEMENTOF OPERATIONS
| | | | | | | | | | | | | | | | |
| For the year ended October 31, 2016 | | Aggressive
Allocation Fund | | | Moderately
Aggressive
Allocation Fund | | | Moderate
Allocation Fund | | | Moderately
Conservative
Allocation Fund | |
Investment Income | | | | | | | | | | | | | | | | |
Dividends | | | $6,957,877 | | | | $12,450,742 | | | | $8,581,563 | | | | $2,753,840 | |
Taxable interest | | | 325,235 | | | | 7,805,968 | | | | 13,815,634 | | | | 8,472,451 | |
Income from mortgage dollar rolls | | | 191,629 | | | | 1,476,045 | | | | 2,720,941 | | | | 1,670,886 | |
Income from securities loaned, net | | | 18 | | | | 13,636 | | | | 27,110 | | | | 17,977 | |
Income from affiliated investments | | | 4,683,744 | | | | 13,381,843 | | | | 12,933,979 | | | | 5,961,765 | |
Foreign tax withholding | | | (62,535 | ) | | | (101,417 | ) | | | (85,627 | ) | | | (9,023 | ) |
Total Investment Income | | | 12,095,968 | | | | 35,026,817 | | | | 37,993,600 | | | | 18,867,896 | |
| | | | |
Expenses | | | | | | | | | | | | | | | | |
Adviser fees | | | 6,228,603 | | | | 13,087,765 | | | | 11,343,133 | | | | 4,419,551 | |
Sub-Adviser fees | | | – | | | | – | | | | – | | | | – | |
Administrative service fees | | | 221,538 | | | | 415,705 | | | | 393,082 | | | | 204,438 | |
Audit and legal fees | | | 39,606 | | | | 46,901 | | | | 46,060 | | | | 38,945 | |
Custody fees | | | 136,054 | | | | 165,576 | | | | 170,112 | | | | 107,867 | |
Distribution expenses Class A | | | 1,789,136 | | | | 4,436,952 | | | | 4,161,065 | | | | 1,749,358 | |
Insurance expenses | | | 8,783 | | | | 13,784 | | | | 13,214 | | | | 8,387 | |
Printing and postage expenses Class A | | | 239,877 | | | | 451,652 | | | | 339,039 | | | | 130,855 | |
Printing and postage expenses Class S | | | 9,042 | | | | 15,438 | | | | 9,572 | | | | 3,814 | |
SEC and state registration expenses | | | 67,126 | | | | 104,909 | | | | 96,580 | | | | 56,249 | |
Transfer agent fees Class A | | | 876,374 | | | | 1,666,897 | | | | 1,219,078 | | | | 459,563 | |
Transfer agent fees Class S | | | 24,675 | | | | 44,380 | | | | 26,649 | | | | 10,124 | |
Trustees’ fees | | | 26,179 | | | | 43,669 | | | | 43,347 | | | | 24,939 | |
Other expenses | | | 44,256 | | | | 81,316 | | | | 81,947 | | | | 58,235 | |
Total Expenses Before Reimbursement | | | 9,711,249 | | | | 20,574,944 | | | | 17,942,878 | | | | 7,272,325 | |
Less: | | | | | | | | | | | | | | | | |
Reimbursement from adviser | | | (2,275,656 | ) | | | (5,315,090 | ) | | | (3,838,322 | ) | | | (1,153,100 | ) |
Total Net Expenses | | | 7,435,593 | | | | 15,259,854 | | | | 14,104,556 | | | | 6,119,225 | |
| | | | | | | | | | | | | | | | |
Net Investment Income/(Loss) | | | 4,660,375 | | | | 19,766,963 | | | | 23,889,044 | | | | 12,748,671 | |
Realized and Unrealized Gains/(Losses) Net realized gains/(losses) on: | | | | | | | | | | | | | | | | |
Investments | | | 553,410 | | | | 5,322,853 | | | | 6,851,959 | | | | 4,750,535 | |
Affiliated investments | | | (123,000 | ) | | | 694,451 | | | | (11,070,863 | ) | | | (3,037,091 | ) |
Distributions of realized capital gains from affiliated investments | | | 13,611,782 | | | | 32,920,845 | | | | 23,556,725 | | | | 5,399,144 | |
Futures contracts | | | 1,784,432 | | | | 3,250,620 | | | | 6,323,989 | | | | 3,132,365 | |
Foreign currency and forward contract transactions | | | 183,451 | | | | 335,097 | | | | 233,731 | | | | 64,567 | |
Swap agreements | | | – | | | | 177,346 | | | | 121,958 | | | | – | |
Change in net unrealized appreciation/(depreciation) on: | | | | | | | | | | | | | | | | |
Investments | | | 11,913,152 | | | | 23,879,725 | | | | 18,454,468 | | | | 5,539,662 | |
Affiliated investments | | | (7,392,416 | ) | | | (19,200,177 | ) | | | (1,167,780 | ) | | | 1,877,079 | |
Futures contracts | | | (11,767,392 | ) | | | (19,812,518 | ) | | | (13,054,512 | ) | | | (3,401,936 | ) |
Foreign currency forward contracts | | | – | | | | – | | | | – | | | | – | |
Foreign currency transactions | | | (314 | ) | | | 685 | | | | (980 | ) | | | 135 | |
Swap agreements | | | – | | | | 56,131 | | | | (89,103 | ) | | | – | |
Net Realized and Unrealized Gains/(Losses) | | | 8,763,105 | | | | 27,625,058 | | | | 30,159,592 | | | | 14,324,460 | |
| | | | | | | | | | | | | | | | |
Net Increase/(Decrease) in Net Assets Resulting From Operations | | | $13,423,480 | | | | $47,392,021 | | | | $54,048,636 | | | | $27,073,131 | |
The accompanying Notes to Financial Statements are an integral part of this statement.
152
THRIVENT MUTUAL FUNDS
STATEMENTOF OPERATIONS –CONTINUED
| | | | | | | | | | | | | | | | | | | | | | | | | | |
Balanced
Income
Plus Fund | | | Opportunity
Income Plus
Fund | | | Partner
Emerging
Markets
Equity
Fund | | | Small Cap
Stock
Fund | | | Mid Cap
Stock
Fund | | | Partner
Worldwide
Allocation
Fund | | | Large Cap
Growth
Fund | |
| | | | | | | | | | | | | | | | | | | | | | | | | | |
| | $4,265,471 | | | $ | 1,519,347 | | | $ | 258,090 | | | $ | 5,997,461 | | | $ | 14,269,921 | | | $ | 20,417,167 | | | $ | 6,212,733 | |
| | 5,674,712 | | | | 16,138,830 | | | | 1,364 | | | | 23,462 | | | | 117,343 | | | | 5,029,577 | | | | 77,139 | |
| | 239,068 | | | | 630,560 | | | | – | | | | – | | | | – | | | | – | | | | – | |
| | 53,890 | | | | 63,594 | | | | – | | | | 219,569 | | | | 119,082 | | | | 67,175 | | | | 5,040 | |
| | 98,147 | | | | 218,306 | | | | 679 | | | | 37,027 | | | | 245,657 | | | | 43,505 | | | | 135,580 | |
| | (139,239) | | | | – | | | | (25,422 | ) | | | (37,211 | ) | | | – | | | | (1,724,147 | ) | | | – | |
| | 10,192,049 | | | | 18,570,637 | | | | 234,711 | | | | 6,240,308 | | | | 14,752,003 | | | | 23,833,277 | | | | 6,430,492 | |
| | | | | | |
| | | | | | | | | | | | | | | | | | | | | | | | | | |
| | 1,560,973 | | | | 1,842,557 | | | | 48,768 | | | | 2,924,580 | | | | 8,087,080 | | | | 3,488,873 | | | | 5,015,770 | |
| | – | | | | – | | | | 68,997 | | | | – | | | | – | | | | 2,892,596 | | | | – | |
| | 121,086 | | | | 143,702 | | | | 71,767 | | | | 148,219 | | | | 294,612 | | | | 202,490 | | | | 192,548 | |
| | 38,013 | | | | 38,812 | | | | 32,264 | | | | 33,156 | | | | 38,587 | | | | 51,440 | | | | 35,076 | |
| | 98,954 | | | | 35,962 | | | | 16,754 | | | | 13,211 | | | | 22,529 | | | | 496,894 | | | | 17,360 | |
| | 568,055 | | | | 631,134 | | | | 23,527 | | | | 814,822 | | | | 2,363,747 | | | | 359,543 | | | | 463,573 | |
| | 6,217 | | | | 6,789 | | | | 4,963 | | | | 7,259 | | | | 11,458 | | | | 8,496 | | | | 7,991 | |
| | 60,429 | | | | 64,571 | | | | 4,044 | | | | 121,567 | | | | 271,362 | | | | 78,127 | | | | 72,457 | |
| | 2,608 | | | | 24,829 | | | | 694 | | | | 8,775 | | | | 12,924 | | | | 11,556 | | | | 21,997 | |
| | 39,958 | | | | 55,124 | | | | 30,600 | | | | 37,849 | | | | 52,210 | | | | 47,881 | | | | 58,047 | |
| | 247,660 | | | | 271,599 | | | | 19,328 | | | | 584,235 | | | | 1,190,388 | | | | 400,027 | | | | 364,642 | |
| | 6,790 | �� | | | 167,132 | | | | 1,357 | | | | 50,987 | | | | 65,543 | | | | 42,194 | | | | 142,712 | |
| | 21,910 | | | | 26,251 | | | | 8,500 | | | | 34,619 | | | | 68,723 | | | | 42,291 | | | | 36,104 | |
| | 61,116 | | | | 47,436 | | | | 18,550 | | | | 20,895 | | | | 28,983 | | | | 89,524 | | | | 22,330 | |
| | 2,833,769 | | | | 3,355,898 | | | | 350,113 | | | | 4,800,174 | | | | 12,508,146 | | | | 8,211,932 | | | | 6,450,607 | |
| | | | | | | | | | | | | | | | | | | | | | | | | | |
| | – | | | | (81,622 | ) | | | (189,514 | ) | | | – | | | | – | | | | (268,628 | ) | | | (141,747 | ) |
| | 2,833,769 | | | | 3,274,276 | | | | 160,599 | | | | 4,800,174 | | | | 12,508,146 | | | | 7,943,304 | | | | 6,308,860 | |
| | | | | | | | | | | | | | | | | | | | | | | | | | |
| | 7,358,280 | | | | 15,296,361 | | | | 74,112 | | | | 1,440,134 | | | | 2,243,857 | | | | 15,889,973 | | | | 121,632 | |
| | | | | | | | | | | | | | | | | | | | | | | | | | |
| | | | | | | | | | | | | | | | | | | | | | | | | | |
| | (2,361,385) | | | | (7,466,272 | ) | | | (277,736 | ) | | | 20,381,436 | | | | 59,371,445 | | | | (10,380,508 | ) | | | 9,475,295 | |
| | – | | | | – | | | | – | | | | – | | | | – | | | | – | | | | – | |
| | 12 | | | | 2,748 | | | | – | | | | 15 | | | | 43 | | | | 7 | | | | 28 | |
| | 299,360 | | | | 620,046 | | | | – | | | | – | | | | – | | | | (932,416 | ) | | | (2,952,068 | ) |
| | (13,357) | | | | – | | | | 1,293 | | | | (7 | ) | | | – | | | | (619,268 | ) | | | 1,044 | |
| | (11,518) | | | | (44,583 | ) | | | – | | | | – | | | | – | | | | – | | | | – | |
| | | | | | | | | | | | | | | | | | | | | | | | | | |
| | 2,828,756 | | | | 14,494,412 | | | | 1,260,371 | | | | 2,698,974 | | | | 94,157,311 | | | | 13,414,337 | | | | (35,487,587 | ) |
| | – | | | | – | | | | – | | | | – | | | | – | | | | – | | | | – | |
| | 59,225 | | | | 146,627 | | | | – | | | | – | | | | – | | | | 58,050 | | | | (1,436,394 | ) |
| | – | | | | – | | | | – | | | | – | | | | – | | | | 353,737 | | | | – | |
| | (4,083) | | | | – | | | | 1,394 | | | | 7 | | | | – | | | | (53,604 | ) | | | 165 | |
| | (11,011) | | | | 24,213 | | | | | | | | | | | | | | | | | | | | | |
| 785,999
|
| |
| 7,777,191
|
| |
| 985,322
|
| |
| 23,080,425
|
| |
| 153,528,799
|
| |
| 1,840,335
|
| |
| (30,399,517
| )
|
| | | | | | | | | | | | | | | | | | | | | | | | | | |
| | $8,144,279 | | | $ | 23,073,552 | | | $ | 1,059,434 | | | $ | 24,520,559 | | | $ | 155,772,656 | | | $ | 17,730,308 | | | $ | (30,277,885 | ) |
The accompanying Notes to Financial Statements are an integral part of this statement.
153
THRIVENT MUTUAL FUNDS
STATEMENTOF OPERATIONS –CONTINUED
| | | | | | | | |
| For the year ended October 31, 2016 | | Large Cap
Value Fund | | | Large Cap
Stock Fund | |
Investment Income | | | | | | | | |
Dividends | | | $17,631,457 | | | | $34,014,823 | |
Taxable interest | | | 15,553 | | | | 260,125 | |
Tax-Exempt interest | | | – | | | | – | |
Income from mortgage dollar rolls | | | – | | | | – | |
Income from securities loaned, net | | | 45,068 | | | | 221,163 | |
Income from affiliated investments | | | 84,225 | | | | 457,394 | |
Foreign tax withholding | | | (34,039 | ) | | | (1,596,391 | ) |
Total Investment Income | | | 17,742,264 | | | | 33,357,114 | |
| | |
Expenses | | | | | | | | |
Adviser fees | | | 3,525,394 | | | | 9,226,625 | |
Administrative service fees | | | 211,016 | | | | 361,659 | |
Audit and legal fees | | | 35,624 | | | | 46,710 | |
Custody fees | | | 22,450 | | | | 160,653 | |
Distribution expenses Class A | | | 494,085 | | | | 3,564,374 | |
Insurance expenses | | | 8,587 | | | | 12,909 | |
Printing and postage expenses Class A | | | 58,289 | | | | 455,154 | |
Printing and postage expenses Class S | | | 21,812 | | | | 6,888 | |
SEC and state registration expenses | | | 50,945 | | | | 56,518 | |
Transfer agent fees Class A | | | 305,084 | | | | 1,874,319 | |
Transfer agent fees Class S | | | 146,177 | | | | 40,415 | |
Trustees’ fees | | | 42,039 | | | | 96,040 | |
Other expenses | | | 23,835 | | | | 50,330 | |
Total Expenses Before Reimbursement | | | 4,945,337 | | | | 15,952,594 | |
Less: | | | | | | | | |
Reimbursement from adviser | | | – | | | | – | |
Total Net Expenses | | | 4,945,337 | | | | 15,952,594 | |
| | | | | | | | |
Net Investment Income/(Loss) | | | 12,796,927 | | | | 17,404,520 | |
Realized and Unrealized Gains/(Losses) | | | | | | | | |
Net realized gains/(losses) on: | | | | | | | | |
Investments | | | 27,149,057 | | | | 62,047,017 | |
Distributions of realized capital gains from affiliated investments | | | 8 | | | | 78 | |
Futures contracts | | | 150,215 | | | | (7,465,909 | ) |
Foreign currency and forward contract transactions | | | – | | | | 452,457 | |
Swap agreements | | | – | | | | – | |
Change in net unrealized appreciation/(depreciation) on: | | | | | | | | |
Investments | | | (6,849,530 | ) | | | (87,170,599 | ) |
Futures contracts | | | – | | | | (12,687,959 | ) |
Foreign currency transactions | | | | | | | (42,764 | ) |
Net Realized and Unrealized Gains/(Losses) | | | 20,449,750 | | | | (44,867,679 | ) |
| | | | | | | | |
Net Increase/(Decrease) in Net Assets Resulting From Operations | | | $33,246,677 | | | | $(27,463,159 | ) |
The accompanying Notes to Financial Statements are an integral part of this statement.
154
THRIVENT MUTUAL FUNDS
STATEMENTOF OPERATIONS –CONTINUED
| | | | | | | | | | |
High Yield
Fund | | Income
Fund | | Municipal
Bond Fund | | Government
Bond Fund | | Limited
Maturity
Bond
Fund | | Money
Market
Fund |
| | | | | | | | | | |
| $562,589 | | $841,821 | | $– | | $– | | $248,514 | | $– |
| 40,941,894 | | 29,438,344 | | 432,328 | | 1,064,623 | | 15,612,063 | | 1,772,059 |
| – | | – | | 64,864,456 | | – | | – | | – |
| – | | 596,143 | | – | | 77,918 | | 417,416 | | – |
| 293,408 | | 87,463 | | – | | 23 | | 28,496 | | – |
| 97,709 | | 170,006 | | – | | 12,957 | | 158,022 | | – |
| – | | – | | – | | – | | – | | – |
| 41,895,600 | | 31,133,777 | | 65,296,784 | | 1,155,521 | | 16,464,511 | | 1,772,059 |
| | | | | |
| | | | | | | | | | |
| 2,604,073 | | 2,675,694 | | 6,433,095 | | 227,220 | | 2,178,587 | | 1,660,921 |
| 191,067 | | 211,269 | | 362,273 | | 80,225 | | 204,417 | | 147,202 |
| 40,930 | | 41,435 | | 46,610 | | 30,620 | | 40,969 | | 31,696 |
| 16,471 | | 27,740 | | 32,650 | | 7,496 | | 26,164 | | 19,030 |
| 1,157,181 | | 890,202 | | 3,708,696 | | 12,714 | | 445,888 | | 502,624 |
| 8,147 | | 8,666 | | 12,284 | | 5,273 | | 8,507 | | 6,888 |
| 114,298 | | 89,534 | | 161,763 | | 3,151 | | 115,196 | | 271,665 |
| 27,778 | | 22,824 | | 10,865 | | 6,056 | | 29,134 | | 6,392 |
| 52,389 | | 62,898 | | 86,650 | | 29,487 | | 96,870 | | 121,279 |
| 425,554 | | 339,197 | | 513,424 | | 16,918 | | 392,422 | | 714,615 |
| 184,596 | | 153,990 | | 58,865 | | 37,468 | | 182,520 | | 14,697 |
| 39,151 | | 43,294 | | 80,785 | | 9,019 | | 39,949 | | 21,683 |
| 41,552 | | 44,799 | | 98,622 | | 18,832 | | 43,734 | | 23,550 |
| 4,903,187 | | 4,611,542 | | 11,606,582 | | 484,479 | | 3,804,357 | | 3,542,242 |
| | | | | | | | | | |
| – | | – | | – | | (17,915) | | – | | (1,770,183) |
| 4,903,187 | | 4,611,542 | | 11,606,582 | | 466,564 | | 3,804,357 | | 1,772,059 |
| | | | | | | | | | |
| 36,992,413 | | 26,522,235 | | 53,690,202 | | 688,957 | | 12,660,154 | | – |
| | | | | | | | | | |
| | | | | | | | | | |
| (22,656,199) | | 164,544 | | 318,466 | | 661,040 | | 1,438,923 | | (6,874) |
| 25 | | 25 | | – | | 2 | | 17 | | – |
| – | | 2,193,383 | | – | | (615,753) | | (4,580,005) | | – |
| – | | – | | – | | – | | – | | – |
| 96,104 | | (242,913) | | – | | – | | – | | �� |
| | | | | | | | | | |
| 24,216,256 | | 24,428,919 | | 5,093,881 | | 707,548 | | 7,564,619 | | – |
| – | | (1,353,015) | | – | | 229,280 | | 1,851,861 | | – |
| – | | – | | – | | – | | – | | – |
| 1,656,186 | | 25,190,943 | | 5,412,347 | | 982,117 | | 6,275,415 | | (6,874) |
| | | | | | | | | | |
| $38,648,599 | | $51,713,178 | | $59,102,549 | | $1,671,074 | | $18,935,569 | | $(6,874) |
The accompanying Notes to Financial Statements are an integral part of this statement.
155
THRIVENT MUTUAL FUNDS
STATEMENTOF CHANGESIN NET ASSETS
| | | | | | | | | | | | | | | | |
| | | Aggressive Allocation Fund | | | Moderately Aggressive
Allocation Fund | |
| For the periods ended | | 10/31/2016 | | | 10/31/2015 | | | 10/31/2016 | | | 10/31/2015 | |
Operations | | | | | | | | | | | | | | | | |
Net investment income/(loss) | | | $4,660,375 | | | | $2,434,138 | | | | $19,766,963 | | | | $16,083,224 | |
Net realized gains/(losses) | | | 16,010,075 | | | | 56,365,464 | | | | 42,701,212 | | | | 105,196,673 | |
Change in net unrealized appreciation/(depreciation) | | | (7,246,970 | ) | | | (35,718,501 | ) | | | (15,076,154 | ) | | | (78,206,378 | ) |
Net Change in Net Assets Resulting From Operations | | | 13,423,480 | | | | 23,081,101 | | | | 47,392,021 | | | | 43,073,519 | |
Distributions to Shareholders | | | | | | | | | | | | | | | | |
From net investment income Class A | | | (1,960,009 | ) | | | (3,667,967 | ) | | | (13,405,401 | ) | | | (19,351,593 | ) |
From net investment income Class S | | | (817,287 | ) | | | (1,006,360 | ) | | | (1,402,161 | ) | | | (1,721,944 | ) |
Total From Net Investment Income | | | (2,777,296 | ) | | | (4,674,327 | ) | | | (14,807,562 | ) | | | (21,073,537 | ) |
From net realized gains Class A | | | (55,213,498 | ) | | | (47,727,584 | ) | | | (106,605,653 | ) | | | (74,364,014 | ) |
From net realized gains Class S | | | (8,928,498 | ) | | | (7,609,788 | ) | | | (7,318,053 | ) | | | (5,030,910 | ) |
Total From Net Realized Gains | | | (64,141,996 | ) | | | (55,337,372 | ) | | | (113,923,706 | ) | | | (79,394,924 | ) |
Total Distributions to Shareholders | | | (66,919,292 | ) | | | (60,011,699 | ) | | | (128,731,268 | ) | | | (100,468,461 | ) |
Capital Stock Transactions | | | | | | | | | | | | | | | | |
| | | | |
Class A | | | | | | | | | | | | | | | | |
Sold | | | 65,237,377 | | | | 91,090,948 | | | | 137,283,402 | | | | 203,613,424 | |
Distributions reinvested | | | 57,099,992 | | | | 51,331,733 | | | | 119,739,532 | | | | 93,483,608 | |
Redeemed | | | (77,545,137 | ) | | | (65,890,573 | ) | | | (184,356,179 | ) | | | (175,346,044 | ) |
Total Class A Capital Stock Transactions | | | 44,792,232 | | | | 76,532,108 | | | | 72,666,755 | | | | 121,750,988 | |
| | | | |
Class S | | | | | | | | | | | | | | | | |
Sold | | | 37,664,993 | | | | 19,583,880 | | | | 81,535,330 | | | | 17,044,428 | |
Distributions reinvested | | | 9,745,785 | | | | 8,616,144 | | | | 8,713,045 | | | | 6,751,598 | |
Redeemed | | | (20,132,636 | ) | | | (15,326,153 | ) | | | (21,106,475 | ) | | | (14,941,479 | ) |
Total Class S Capital Stock Transactions | | | 27,278,142 | | | | 12,873,871 | | | | 69,141,900 | | | | 8,854,547 | |
Capital Stock Transactions | | | 72,070,374 | | | | 89,405,979 | | | | 141,808,655 | | | | 130,605,535 | |
| | | | | | | | | | | | | | | | |
Net Increase/(Decrease) in Net Assets | | | 18,574,562 | | | | 52,475,381 | | | | 60,469,408 | | | | 73,210,593 | |
Net Assets, Beginning of Period | | | 852,318,268 | | | | 799,842,887 | | | | 1,940,145,840 | | | | 1,866,935,247 | |
Net Assets, End of Period | | | $870,892,830 | | | | $852,318,268 | | | | $2,000,615,248 | | | | $1,940,145,840 | |
Accumulated Undistributed Net Investment Income/(Loss) | | | $766,083 | | | | $(1,250,771 | ) | | | $9,090,220 | | | | $3,988,570 | |
| | | | |
Capital Stock Share Transactions | | | | | | | | | | | | | | | | |
| | | | |
Class A shares | | | | | | | | | | | | | | | | |
Sold | | | 5,172,533 | | | | 6,452,111 | | | | 10,857,093 | | | | 14,761,901 | |
Distributions reinvested | | | 4,497,779 | | | | 3,753,313 | | | | 9,480,825 | | | | 6,924,657 | |
Redeemed | | | (6,092,573 | ) | | | (4,675,388 | ) | | | (14,483,401 | ) | | | (12,727,702 | ) |
Total Class A shares | | | 3,577,739 | | | | 5,530,036 | | | | 5,854,517 | | | | 8,958,856 | |
| | | | |
Class S shares | | | | | | | | | | | | | | | | |
Sold | | | 2,957,130 | | | | 1,395,897 | | | | 6,336,912 | | | | 1,228,399 | |
Distributions reinvested | | | 759,381 | | | | 623,696 | | | | 683,779 | | | | 495,813 | |
Redeemed | | | (1,557,150 | ) | | | (1,077,317 | ) | | | (1,641,837 | ) | | | (1,079,077 | ) |
Total Class S shares | | | 2,159,361 | | | | 942,276 | | | | 5,378,854 | | | | 645,135 | |
The accompanying Notes to Financial Statements are an integral part of this statement.
156
THRIVENT MUTUAL FUNDS
STATEMENTOF CHANGESIN NET ASSETS –CONTINUED
| | | | | | | | | | | | | | |
| Moderate Allocation Fund | | Moderately Conservative
Allocation Fund | | Balanced Income Plus Fund | | Opportunity Income Plus Fund |
| 10/31/2016 | | 10/31/2015 | | 10/31/2016 | | 10/31/2015 | | 10/31/2016 | | 10/31/2015 | | 10/31/2016 | | 10/31/2015 |
| | | | | | | | | | | | | | |
$23,889,044 | | $23,027,099 | | $12,748,671 | | $11,943,262 | | $7,358,280 | | $7,027,606 | | $15,296,361 | | $15,187,352 |
26,017,499 | | 81,964,874 | | 10,309,520 | | 21,052,354 | | (2,086,888) | | 13,747,391 | | (6,888,061) | | 176,132 |
4,142,093 | | (70,275,319) | | 4,014,940 | | (22,949,915) | | 2,872,887 | | (14,594,923) | | 14,665,252 | | (13,402,357) |
54,048,636 | | 34,716,654 | | 27,073,131 | | 10,045,701 | | 8,144,279 | | 6,180,074 | | 23,073,552 | | 1,961,127 |
| | | | | | | | | | | | | | |
(20,799,685) | | (23,392,724) | | (10,919,225) | | (12,150,961) | | (5,460,684) | | (5,268,715) | | (9,299,965) | | (9,931,225) |
(2,016,074) | | (1,715,991) | | (890,310) | | (690,166) | | (1,585,099) | | (1,467,729) | | (6,128,993) | | (5,264,909) |
(22,815,759) | | (25,108,715) | | (11,809,535) | | (12,841,127) | | (7,045,783) | | (6,736,444) | | (15,428,958) | | (15,196,134) |
(77,681,404) | | (53,981,872) | | (19,909,558) | | (15,836,610) | | (11,192,000) | | (10,119,356) | | – | | – |
(4,958,350) | | (2,945,410) | | (1,028,124) | | (701,253) | | (2,583,869) | | (2,477,501) | | – | | – |
(82,639,754) | | (56,927,282) | | (20,937,682) | | (16,537,863) | | (13,775,869) | | (12,596,857) | | – | | – |
(105,455,513) | | (82,035,997) | | (32,747,217) | | (29,378,990) | | (20,821,652) | | (19,333,301) | | (15,428,958) | | (15,196,134) |
| | | | | | | | | | | | | | |
| | | | | | | |
| | | | | | | | | | | | | | |
123,736,412 | | 180,529,384 | | 58,645,562 | | 77,229,759 | | 21,255,002 | | 34,595,508 | | 31,129,039 | | 43,915,819 |
97,951,067 | | 76,940,106 | | 30,581,641 | | 27,743,255 | | 16,316,271 | | 15,095,541 | | 8,454,782 | | 9,024,813 |
(195,875,001) | | (189,870,162) | | (96,806,214) | | (101,351,851) | | (28,203,897) | | (28,373,073) | | (50,899,554) | | (50,129,080) |
25,812,478 | | 67,599,328 | | (7,579,011) | | 3,621,163 | | 9,367,376 | | 21,317,976 | | (11,315,733) | | 2,811,552 |
| | | | | | | |
| | | | | | | | | | | | | | |
82,263,512 | | 27,111,684 | | 38,472,595 | | 11,789,103 | | 16,900,191 | | 3,484,041 | | 73,358,555 | | 66,501,319 |
6,915,346 | | 4,618,017 | | 1,893,154 | | 1,382,501 | | 4,124,623 | | 3,952,415 | | 5,785,465 | | 5,072,970 |
(16,463,587) | | (10,067,678) | | (8,489,431) | | (7,092,128) | | (7,463,758) | | (5,477,087) | | (46,137,730) | | (38,025,572) |
72,715,271 | | 21,662,023 | | 31,876,318 | | 6,079,476 | | 13,561,056 | | 1,959,369 | | 33,006,290 | | 33,548,717 |
98,527,749 | | 89,261,351 | | 24,297,307 | | 9,700,639 | | 22,928,432 | | 23,277,345 | | 21,690,557 | | 36,360,269 |
| | | | | | | | | | | | | | |
47,120,872 | | 41,942,008 | | 18,623,221 | | (9,632,650) | | 10,251,059 | | 10,124,118 | | 29,335,151 | | 23,125,262 |
1,814,721,266 | | 1,772,779,258 | | 754,076,743 | | 763,709,393 | | 287,167,026 | | 277,042,908 | | 407,235,449 | | 384,110,187 |
$1,861,842,138 | | $1,814,721,266 | | $772,699,964 | | $754,076,743 | | $297,418,085 | | $287,167,026 | | $436,570,600 | | $407,235,449 |
$1,026,113 | | $(62,229) | | $943,431 | | $71,945 | | $264,964 | | $(26,287) | | $(68,725) | | $33,060 |
| | | | | | | |
| | | | | | | | | | | | | | |
| | | | | | | |
| | | | | | | | | | | | | | |
10,125,334 | | 13,883,003 | | 5,077,283 | | 6,435,798 | | 1,756,907 | | 2,652,885 | | 3,106,685 | | 4,286,912 |
8,086,338 | | 6,018,298 | | 2,675,751 | | 2,339,667 | | 1,363,052 | | 1,181,443 | | 845,085 | | 881,478 |
(16,005,915) | | (14,629,220) | | (8,395,974) | | (8,463,636) | | (2,345,271) | | (2,184,682) | | (5,103,684) | | (4,891,551) |
2,205,757 | | 5,272,081 | | (642,940) | | 311,829 | | 774,688 | | 1,649,646 | | (1,151,914) | | 276,839 |
| | | | | | | |
| | | | | | | | | | | | | | |
6,659,857 | | 2,084,258 | | 3,291,269 | | 983,172 | | 1,393,608 | | 268,447 | | 7,311,458 | | 6,477,336 |
568,496 | | 360,363 | | 164,514 | | 116,290 | | 344,895 | | 309,641 | | 577,703 | | 495,794 |
(1,337,992) | | (772,708) | | (727,326) | | (594,313) | | (612,874) | | (422,075) | | (4,607,928) | | (3,737,999) |
5,890,361 | | 1,671,913 | | 2,728,457 | | 505,149 | | 1,125,629 | | 156,013 | | 3,281,233 | | 3,235,131 |
The accompanying Notes to Financial Statements are an integral part of this statement.
157
THRIVENT MUTUAL FUNDS
STATEMENTOF CHANGESIN NET ASSETS –CONTINUED
| | | | | | | | | | | | | | | | |
| | | Partner Emerging Markets Equity Fund | | | Small Cap Stock Fund | |
| For the periods ended | | 10/31/2016 | | | 10/31/2015 | | | 10/31/2016 | | | 10/31/2015 | |
Operations | | | | | | | | | | | | | | | | |
Net investment income/(loss) | | | $74,112 | | | | $100,615 | | | | $1,440,134 | | | | $414,726 | |
Net realized gains/(losses) | | | (276,443 | ) | | | (1,177,591 | ) | | | 20,381,444 | | | | 37,646,306 | |
Change in net unrealized appreciation/(depreciation) | | | 1,261,765 | | | | (1,202,686 | ) | | | 2,698,981 | | | | (35,006,354 | ) |
Net Change in Net Assets Resulting From Operations | | | 1,059,434 | | | | (2,279,662 | ) | | | 24,520,559 | | | | 3,054,678 | |
Distributions to Shareholders | | | | | | | | | | | | | | | | |
From net investment income Class A | | | (94,804 | ) | | | (171,330 | ) | | | – | | | | – | |
From net investment income Class S | | | (4,952 | ) | | | (12,050 | ) | | | (257,072 | ) | | | – | |
Total From Net Investment Income | | | (99,756 | ) | | | (183,380 | ) | | | (257,072 | ) | | | – | |
From net realized gains Class A | | | – | | | | – | | | | (28,309,678 | ) | | | (28,063,939 | ) |
From net realized gains Class S | | | – | | | | – | | | | (8,200,599 | ) | | | (8,677,622 | ) |
Total From Net Realized Gains | | | – | | | | – | | | | (36,510,277 | ) | | | (36,741,561 | ) |
Total Distributions to Shareholders | | | (99,756 | ) | | | (183,380 | ) | | | (36,767,349 | ) | | | (36,741,561 | ) |
Capital Stock Transactions | | | | | | | | | | | | | | | | |
| | | | |
Class A | | | | | | | | | | | | | | | | |
Sold | | | 1,861,845 | | | | 2,273,645 | | | | 20,495,736 | | | | 15,671,278 | |
Issued in connection with merger | | | – | | | | – | | | | – | | | | 102,944,746 | |
Distributions reinvested | | | 94,696 | | | | 170,774 | | | | 28,141,481 | | | | 27,858,973 | |
Redeemed | | | (2,757,135 | ) | | | (3,194,728 | ) | | | (49,639,939 | ) | | | (37,167,763 | ) |
Total Class A Capital Stock Transactions | | | (800,594 | ) | | | (750,309 | ) | | | (1,002,722 | ) | | | 109,307,234 | |
| | | | |
Class S | | | | | | | | | | | | | | | | |
Sold | | | 975,577 | | | | 21,943 | | | | 20,117,342 | | | | 3,723,870 | |
Issued in connection with merger | | | – | | | | – | | | | – | | | | 16,448,200 | |
Distributions reinvested | | | 4,952 | | | | 12,050 | | | | 8,405,973 | | | | 8,601,863 | |
Redeemed | | | (390,152 | ) | | | (156,243 | ) | | | (11,837,387 | ) | | | (11,997,188 | ) |
Total Class S Capital Stock Transactions | | | 590,377 | | | | (122,250 | ) | | | 16,685,928 | | | | 16,776,745 | |
Capital Stock Transactions | | | (210,217 | ) | | | (872,559 | ) | | | 15,683,206 | | | | 126,083,979 | |
| | | | | | | | | | | | | | | | |
Net Increase/(Decrease) in Net Assets | | | 749,461 | | | | (3,335,601 | ) | | | 3,436,416 | | | | 92,397,096 | |
Net Assets, Beginning of Period | | | 9,986,520 | | | | 13,322,121 | | | | 443,026,920 | | | | 350,629,824 | |
Net Assets, End of Period | | | $10,735,981 | | | | $9,986,520 | | | | $446,463,336 | | | | $443,026,920 | |
Accumulated Undistributed Net Investment Income/(Loss) | | | $60,550 | | | | $84,901 | | | | $735,175 | | | | $127,025 | |
| | | | |
Capital Stock Share Transactions | | | | | | | | | | | | | | | | |
| | | | |
Class A shares | | | | | | | | | | | | | | | | |
Sold | | | 239,743 | | | | 268,210 | | | | 1,203,221 | | | | 833,226 | |
Issued in connection with merger | | | – | | | | – | | | | – | | | | 5,555,223 | |
Distributions reinvested | | | 13,319 | | | | 19,653 | | | | 1,729,655 | | | | 1,565,974 | |
Redeemed | | | (354,362 | ) | | | (378,697 | ) | | | (2,904,610 | ) | | | (1,994,458 | ) |
Total Class A shares | | | (101,300 | ) | | | (90,834 | ) | | | 28,266 | | | | 5,959,965 | |
| | | | |
Class S shares | | | | | | | | | | | | | | | | |
Sold | | | 121,236 | | | | 2,539 | | | | 980,464 | | | | 172,976 | |
Issued in connection with merger | | | – | | | | – | | | | – | | | | 764,363 | |
Distributions reinvested | | | 702 | | | | 1,396 | | | | 438,489 | | | | 417,769 | |
Redeemed | | | (51,480 | ) | | | (18,145 | ) | | | (612,466 | ) | | | (556,550 | ) |
Total Class S shares | | | 70,458 | | | | (14,210 | ) | | | 806,487 | | | | 798,558 | |
The accompanying Notes to Financial Statements are an integral part of this statement.
158
THRIVENT MUTUAL FUNDS
STATEMENTOF CHANGESIN NET ASSETS –CONTINUED
| | | | | | | | | | | | | | |
| Mid Cap Stock Fund | | Partner Worldwide Allocation Fund | | Large Cap Growth Fund | | Large Cap Value Fund |
| 10/31/2016 | | 10/31/2015 | | 10/31/2016 | | 10/31/2015 | | 10/31/2016 | | 10/31/2015 | | 10/31/2016 | | 10/31/2015 |
| | | | | | | | | | | | | | |
$2,243,857 | | $2,144,373 | | $15,889,973 | | $16,222,227 | | $121,632 | | $(547,363) | | $12,796,927 | | $11,237,841 |
59,371,488 | | 138,101,468 | | (11,932,185) | | (1,616,237) | | 6,524,299 | | 34,112,651 | | 27,299,280 | | 43,955,518 |
94,157,311 | | (92,361,963) | | 13,772,520 | | (30,311,303) | | (36,923,816) | | 40,571,647 | | (6,849,530) | | (44,368,818) |
155,772,656 | | 47,883,878 | | 17,730,308 | | (15,705,313) | | (30,277,885) | | 74,136,935 | | 33,246,677 | | 10,824,541 |
| | | | | | | | | | | | | | |
(1,515,333) | | (1,522,843) | | (2,749,370) | | (3,444,161) | | – | | – | | (2,093,598) | | (2,222,529) |
(1,303,044) | | (1,521,511) | | (13,837,153) | | (15,490,719) | | – | | (13,643) | | (8,894,480) | | (7,640,908) |
(2,818,377) | | (3,044,354) | | (16,586,523) | | (18,934,880) | | – | | (13,643) | | (10,988,078) | | (9,863,437) |
(105,602,697) | | (75,530,082) | | – | | – | | (10,554,846) | | (3,062,287) | | (10,849,589) | | (8,028,586) |
(30,210,205) | | (27,337,807) | | – | | – | | (25,895,384) | | (6,375,893) | | (31,112,550) | | (19,057,649) |
(135,812,902) | | (102,867,889) | | – | | – | | (36,450,230) | | (9,438,180) | | (41,962,139) | | (27,086,235) |
(138,631,279) | | (105,912,243) | | (16,586,523) | | (18,934,880) | | (36,450,230) | | (9,451,823) | | (52,950,217) | | (36,949,672) |
| | | | | | | | | | | | | | |
| | | | | | | |
| | | | | | | | | | | | | | |
32,971,715 | | 29,915,145 | | 6,303,225 | | 18,208,299 | | 21,545,901 | | 37,743,770 | | 10,099,319 | | 23,154,735 |
– | | 297,889,729 | | – | | – | | – | | – | | – | | – |
106,122,858 | | 76,263,527 | | 2,711,758 | | 3,389,926 | | 10,441,454 | | 3,019,873 | | 12,625,478 | | 9,980,502 |
(106,899,848) | | (78,387,255) | | (35,101,165) | | (25,149,514) | | (52,224,920) | | (24,982,136) | | (49,127,599) | | (31,479,441) |
32,194,725 | | 325,681,146 | | (26,086,182) | | (3,551,289) | | (20,237,565) | | 15,781,507 | | (26,402,802) | | 1,655,796 |
| | | | | | | |
| | | | | | | | | | | | | | |
30,255,959 | | 6,871,477 | | 27,494,901 | | 6,791,697 | | 70,577,539 | | 141,036,582 | | 68,372,146 | | 59,860,067 |
– | | 20,677,412 | | – | | – | | – | | – | | – | | – |
31,315,358 | | 28,744,076 | | 13,754,929 | | 15,410,048 | | 25,485,074 | | 6,373,950 | | 39,579,574 | | 26,566,722 |
(18,051,696) | | (16,248,958) | | (66,692,379) | | (6,449,284) | | (48,340,067) | | (21,570,232) | | (56,567,197) | | (49,030,680) |
43,519,621 | | 40,044,007 | | (25,442,549) | | 15,752,461 | | 47,722,546 | | 125,840,300 | | 51,384,523 | | 37,396,109 |
75,714,346 | | 365,725,153 | | (51,528,731) | | 12,201,172 | | 27,484,981 | | 141,621,807 | | 24,981,721 | | 39,051,905 |
| | | | | | | | | | | | | | |
92,855,723 | | 307,696,788 | | (50,384,946) | | (22,439,021) | | (39,243,134) | | 206,306,919 | | 5,278,181 | | 12,926,774 |
1,249,922,111 | | 942,225,323 | | 807,636,442 | | 830,075,463 | | 728,133,974 | | 521,827,055 | | 812,083,113 | | 799,156,339 |
$1,342,777,834 | | $1,249,922,111 | | $757,251,496 | | $807,636,442 | | $688,890,840 | | $728,133,974 | | $817,361,294 | | $812,083,113 |
$1,695,974 | | $1,926,651 | | $13,919,395 | | $14,144,656 | | $(172,683) | | $(622,485) | | $9,032,248 | | $7,888,379 |
| | | | | | | |
| | | | | | | | | | | | | | |
| | | | | | | |
| | | | | | | | | | | | | | |
1,659,387 | | 1,386,745 | | 674,236 | | 1,833,237 | | 2,600,756 | | 4,444,358 | | 541,543 | | 1,149,134 |
– | | 14,358,787 | | – | | – | | – | | – | | – | | – |
5,567,707 | | 3,653,853 | | 290,027 | | 352,750 | | 1,218,367 | | 372,349 | | 684,401 | | 496,682 |
(5,332,108) | | (3,633,831) | | (3,720,961) | | (2,550,600) | | (6,062,439) | | (2,936,275) | | (2,562,149) | | (1,564,922) |
1,894,986 | | 15,765,554 | | (2,756,698) | | (364,613) | | (2,243,316) | | 1,880,432 | | (1,336,205) | | 80,894 |
| | | | | | | |
| | | | | | | | | | | | | | |
1,326,214 | | 289,163 | | 2,890,563 | | 669,805 | | 7,697,418 | | 15,330,221 | | 3,606,912 | | 2,939,704 |
– | | 909,779 | | – | | – | | – | | – | | – | | – |
1,482,091 | | 1,255,645 | | 1,466,410 | | 1,598,553 | | 2,728,595 | | 727,595 | | 2,130,812 | | 1,311,602 |
(835,470) | | (692,706) | | (7,059,363) | | (644,227) | | (5,190,937) | | (2,320,032) | | (2,951,421) | | (2,425,795) |
1,972,835 | | 1,761,881 | | (2,702,390) | | 1,624,131 | | 5,235,076 | | 13,737,784 | | 2,786,303 | | 1,825,511 |
The accompanying Notes to Financial Statements are an integral part of this statement.
159
THRIVENT MUTUAL FUNDS
STATEMENTOF CHANGESIN NET ASSETS –CONTINUED
| | | | | | | | | | | | | | | | |
| | | Large Cap Stock Fund | | | High Yield Fund | |
| For the periods ended | | 10/31/2016 | | | 10/31/2015 | | | 10/31/2016 | | | 10/31/2015 | |
Operations | | | | | | | | | | | | | | | | |
Net investment income/(loss) | | | $17,404,520 | | | | $18,230,004 | | | | $36,992,413 | | | | $41,721,871 | |
Net realized gains/(losses) | | | 55,033,643 | | | | 40,163,960 | | | | (22,560,070 | ) | | | (5,924,707 | ) |
Change in net unrealized appreciation/(depreciation) | | | (99,901,322 | ) | | | 21,739,013 | | | | 24,216,256 | | | | (41,710,671 | ) |
Net Change in Net Assets Resulting From Operations | | | (27,463,159 | ) | | | 80,132,977 | | | | 38,648,599 | | | | (5,913,507 | ) |
Distributions to Shareholders | | | | | | | | | | | | | | | | |
From net investment income Class A | | | (14,540,527 | ) | | | (14,720,739 | ) | | | (25,349,732 | ) | | | (27,573,722 | ) |
From net investment income Class S | | | (2,812,218 | ) | | | (2,349,319 | ) | | | (12,038,128 | ) | | | (13,984,687 | ) |
Total From Net Investment Income | | | (17,352,745 | ) | | | (17,070,058 | ) | | | (37,387,860 | ) | | | (41,558,409 | ) |
From net realized gains Class A | | | (52,918,188 | ) | | | (132,446,097 | ) | | | – | | | | – | |
From net realized gains Class S | | | (7,041,905 | ) | | | (14,476,717 | ) | | | – | | | | – | |
Total From Net Realized Gains | | | (59,960,093 | ) | | | (146,922,814 | ) | | | – | | | | – | |
Total Distributions to Shareholders | | | (77,312,838 | ) | | | (163,992,872 | ) | | | (37,387,860 | ) | | | (41,558,409 | ) |
Capital Stock Transactions | | | | | | | | | | | | | | | | |
| | | | |
Class A | | | | | | | | | | | | | | | | |
Sold | | | 31,807,363 | | | | 51,154,677 | | | | 25,600,691 | | | | 36,970,979 | |
Issued in connection with merger | | | – | | | | 10,914,181 | | | | – | | | | – | |
Distributions reinvested | | | 66,516,478 | | | | 145,125,104 | | | | 18,437,780 | | | | 19,890,164 | |
Redeemed | | | (165,805,457 | ) | | | (165,306,148 | ) | | | (62,420,385 | ) | | | (75,679,777 | ) |
Total Class A Capital Stock Transactions | | | (67,481,616 | ) | | | 41,887,814 | | | | (18,381,914 | ) | | | (18,818,634 | ) |
| | | | |
Class S | | | | | | | | | | | | | | | | |
Sold | | | 29,142,606 | | | | 6,727,810 | | | | 51,609,457 | | | | 80,542,470 | |
Issued in connection with merger | | | – | | | | 455,444 | | | | – | | | | – | |
Distributions reinvested | | | 9,781,760 | | | | 16,737,878 | | | | 11,129,973 | | | | 13,136,989 | |
Redeemed | | | (10,989,539 | ) | | | (2,343,499 | ) | | | (67,063,286 | ) | | | (88,557,672 | ) |
Total Class S Capital Stock Transactions | | | 27,934,827 | | | | 21,577,633 | | | | (4,323,856 | ) | | | 5,121,787 | |
Capital Stock Transactions | | | (39,546,789 | ) | | | 63,465,447 | | | | (22,705,770 | ) | | | (13,696,847 | ) |
| | | | | | | | | | | | | | | | |
Net Increase/(Decrease) in Net Assets | | | (144,322,786 | ) | | | (20,394,448 | ) | | | (21,445,031 | ) | | | (61,168,763 | ) |
Net Assets, Beginning of Period | | | 1,747,794,363 | | | | 1,768,188,811 | | | | 725,163,169 | | | | 786,331,932 | |
Net Assets, End of Period | | | $1,603,471,577 | | | | $1,747,794,363 | | | | $703,718,138 | | | | $725,163,169 | |
Accumulated Undistributed Net Investment Income/(Loss) | | | $14,065,321 | | | | $13,262,095 | | | | $(567,090 | ) | | | $(298,541 | ) |
| | | | |
Capital Stock Share Transactions | | | | | | | | | | | | | | | | |
| | | | |
Class A shares | | | | | | | | | | | | | | | | |
Sold | | | 1,312,514 | | | | 1,961,041 | | | | 5,556,695 | | | | 7,554,705 | |
Issued in connection with merger | | | – | | | | 431,886 | | | | – | | | | – | |
Distributions reinvested | | | 2,679,988 | | | | 5,760,184 | | | | 3,990,104 | | | | 4,075,675 | |
Redeemed | | | (6,759,279 | ) | | | (6,325,538 | ) | | | (13,576,822 | ) | | | (15,498,759 | ) |
Total Class A shares | | | (2,766,777 | ) | | | 1,827,573 | | | | (4,030,023 | ) | | | (3,868,379 | ) |
| | | | |
Class S shares | | | | | | | | | | | | | | | | |
Sold | | | 1,146,990 | | | | 258,813 | | | | 11,113,013 | | | | 16,506,227 | |
Issued in connection with merger | | | – | | | | 17,864 | | | | – | | | | – | |
Distributions reinvested | | | 390,628 | | | | 658,152 | | | | 2,405,625 | | | | 2,690,739 | |
Redeemed | | | (461,673 | ) | | | (88,488 | ) | | | (14,448,344 | ) | | | (18,254,035 | ) |
Total Class S shares | | | 1,075,945 | | | | 846,341 | | | | (929,706 | ) | | | 942,931 | |
The accompanying Notes to Financial Statements are an integral part of this statement.
160
THRIVENT MUTUAL FUNDS
STATEMENTOF CHANGESIN NET ASSETS –CONTINUED
| | | | | | | | | | | | | | |
| Income Fund | | Municipal Bond Fund | | Government Bond Fund | | Limited Maturity Bond Fund |
| 10/31/2016 | | 10/31/2015 | | 10/31/2016 | | 10/31/2015 | | 10/31/2016 | | 10/31/2015 | | 10/31/2016 | | 10/31/2015 |
| | | | | | | | | | | | | | |
$26,522,235 | | $29,067,166 | | $53,690,202 | | $53,840,356 | | $688,957 | | $1,237,629 | | $12,660,154 | | $12,344,218 |
2,115,039 | | 4,242,818 | | 318,466 | | 1,590,457 | | 45,289 | | 1,063,505 | | (3,141,065) | | 535,217 |
23,075,904 | | (26,797,791) | | 5,093,881 | | (13,109,693) | | 936,828 | | 27,130 | | 9,416,480 | | (4,584,322) |
51,713,178 | | 6,512,193 | | 59,102,549 | | 42,321,120 | | 1,671,074 | | 2,328,264 | | 18,935,569 | | 8,295,113 |
| | | | | | | | | | | | | | |
(11,397,719) | | (12,755,357) | | (48,820,860) | | (49,769,743) | | (118,264) | | (135,587) | | (5,674,988) | | (5,105,964) |
(15,104,655) | | (16,024,450) | | (4,953,163) | | (3,864,669) | | (572,821) | | (1,099,914) | | (7,040,316) | | (7,197,140) |
(26,502,374) | | (28,779,807) | | (53,774,023) | | (53,634,412) | | (691,085) | | (1,235,501) | | (12,715,304) | | (12,303,104) |
(1,703,569) | | (1,808,136) | | – | | – | | (176,952) | | (39,437) | | – | | – |
(1,910,031) | | (1,939,607) | | – | | – | | (886,350) | | (254,474) | | – | | – |
(3,613,600) | | (3,747,743) | | – | | – | | (1,063,302) | | (293,911) | | – | | – |
(30,115,974) | | (32,527,550) | | (53,774,023) | | (53,634,412) | | (1,754,387) | | (1,529,412) | | (12,715,304) | | (12,303,104) |
| | | | | | | | | | | | | | |
| | | | | | | |
| | | | | | | | | | | | | | |
21,289,760 | | 29,273,133 | | 100,455,335 | | 131,574,439 | | 1,612,545 | | 9,365,094 | | 138,318,951 | | 205,770,896 |
– | | – | | – | | – | | – | | – | | – | | – |
11,414,438 | | 12,604,472 | | 41,365,218 | | 41,889,434 | | 288,213 | | 168,965 | | 5,513,848 | | 4,903,933 |
(52,791,793) | | (60,279,172) | | (140,330,279) | | (145,715,577) | | (11,862,255) | | (5,010,020) | | (169,866,978) | | (194,607,739) |
(20,087,595) | | (18,401,567) | | 1,490,274 | | 27,748,296 | | (9,961,497) | | 4,524,039 | | (26,034,179) | | 16,067,090 |
| | | | | | | |
| | | | | | | | | | | | | | |
98,445,739 | | 80,527,040 | | 118,077,949 | | 37,739,390 | | 30,413,528 | | 17,819,196 | | 153,280,207 | | 109,954,671 |
– | | – | | – | | – | | – | | – | | – | | – |
16,306,160 | | 17,439,399 | | 4,545,888 | | 3,528,277 | | 1,435,402 | | 1,344,959 | | 6,846,997 | | 7,092,846 |
(94,039,780) | | (92,341,159) | | (37,452,944) | | (29,152,600) | | (58,813,467) | | (34,695,667) | | (78,918,726) | | (225,830,410) |
20,712,119 | | 5,625,280 | | 85,170,893 | | 12,115,067 | | (26,964,537) | | (15,531,512) | | 81,208,478 | | (108,782,893) |
624,524 | | (12,776,287) | | 86,661,167 | | 39,863,363 | | (36,926,034) | | (11,007,473) | | 55,174,299 | | (92,715,803) |
| | | | | | | | | | | | | | |
22,221,728 | | (38,791,644) | | 91,989,693 | | 28,550,071 | | (37,009,347) | | (10,208,621) | | 61,394,564 | | (96,723,794) |
799,881,655 | | 838,673,299 | | 1,572,084,148 | | 1,543,534,077 | | 92,565,002 | | 102,773,623 | | 730,773,642 | | 827,497,436 |
$822,103,383 | | $799,881,655 | | $1,664,073,841 | | $1,572,084,148 | | $55,555,655 | | $92,565,002 | | $792,168,206 | | $730,773,642 |
$50,186 | | $273,430 | | $157,086 | | $240,907 | | $(5,544) | | $(3,413) | | $30,872 | | $94,870 |
| | | | | | | |
| | | | | | | | | | | | | | |
| | | | | | | |
| | | | | | | | | | | | | | |
2,337,558 | | 3,180,804 | | 8,538,620 | | 11,293,944 | | 161,047 | | 925,986 | | 11,180,963 | | 16,547,966 |
– | | – | | – | | – | | – | | – | | – | | – |
1,261,686 | | 1,372,016 | | 3,514,351 | | 3,596,858 | | 28,950 | | 16,698 | | 444,896 | | 394,388 |
(5,857,884) | | (6,591,845) | | (11,936,056) | | (12,531,266) | | (1,181,617) | | (495,114) | | (13,732,089) | | (15,652,771) |
(2,258,640) | | (2,039,025) | | 116,915 | | 2,359,536 | | (991,620) | | 447,570 | | (2,106,230) | | 1,289,583 |
| | | | | | | |
| | | | | | | | | | | | | | |
10,918,020 | | 8,805,558 | | 10,013,429 | | 3,241,260 | | 3,017,632 | | 1,758,824 | | 12,365,198 | | 8,853,249 |
– | | – | | – | | – | | – | | – | | – | | – |
1,801,715 | | 1,900,342 | | 385,988 | | 302,991 | | 144,080 | | 132,786 | | 552,299 | | 570,427 |
(10,444,011) | | (10,135,634) | | (3,184,467) | | (2,510,881) | | (5,840,362) | | (3,419,685) | | (6,370,903) | | (18,200,738) |
2,275,724 | | 570,266 | | 7,214,950 | | 1,033,370 | | (2,678,650) | | (1,528,075) | | 6,546,594 | | (8,777,062) |
The accompanying Notes to Financial Statements are an integral part of this statement.
161
THRIVENT MUTUAL FUNDS
STATEMENTOF CHANGESIN NET ASSETS –CONTINUED
| | | | | | | | |
| | | Money Market Fund | |
| For the periods ended | | 10/31/2016 | | | 10/31/2015 | |
Operations | | | | | | | | |
Net investment income/(loss) | | | $– | | | | $(2,340 | ) |
Net realized gains/(losses) | | | (6,874 | ) | | | 2,340 | |
Net Change in Net Assets Resulting From Operations | | | (6,874 | ) | | | – | |
Distributions to Shareholders | | | | | | | | |
Total Distributions to Shareholders | | | – | | | | – | |
Capital Stock Transactions | | | | | | | | |
| | |
Class A | | | | | | | | |
Sold | | | 437,861,023 | | | | 582,002,487 | |
Redeemed | | | (466,036,904 | ) | | | (595,223,839 | ) |
Total Class A Capital Stock Transactions | | | (28,175,881 | ) | | | (13,221,352 | ) |
| | |
Class S | | | | | | | | |
Sold | | | 167,552,466 | | | | 9,118,627 | |
Redeemed | | | (121,285,465 | ) | | | (4,979,553 | ) |
Total Class S Capital Stock Transactions | | | 46,267,001 | | | | 4,139,074 | |
Capital Stock Transactions | | | 18,091,120 | | | | (9,082,278 | ) |
| | | | | | | | |
Net Increase/(Decrease) in Net Assets | | | 18,084,246 | | | | (9,082,278 | |
Net Assets, Beginning of Period | | | 419,885,634 | | | | 428,967,912 | |
Net Assets, End of Period | | | $437,969,880 | | | | $419,885,634 | |
Accumulated Undistributed Net Investment Income/(Loss) | | | $– | | | | $– | |
| | |
Capital Stock Share Transactions | | | | | | | | |
| | |
Class A shares | | | | | | | | |
Sold | | | 437,861,023 | | | | 582,002,485 | |
Redeemed | | | (466,036,904 | ) | | | (595,223,837 | ) |
Total Class A shares | | | (28,175,881 | ) | | | (13,221,352 | ) |
| | |
Class S shares | | | | | | | | |
Sold | | | 167,552,466 | | | | 9,118,627 | |
Redeemed | | | (121,285,465 | ) | | | (4,979,553 | ) |
Total Class S shares | | | 46,267,001 | | | | 4,139,074 | |
The accompanying Notes to Financial Statements are an integral part of this statement.
162
THRIVENT MUTUAL FUNDS
NOTESTO FINANCIAL STATEMENTS
October 31, 2016
(1) ORGANIZATION
Thrivent Mutual Funds (the “Trust”) was organized as a Massachusetts Business Trust on March 10, 1987 and is registered as an open-end management investment company under the Investment Company Act of 1940 (the “1940 Act”). The Trust is divided into twenty-one separate series (each, a “Fund” and, collectively, the “Funds”), each with its own investment objective and policies. The Trust currently consists of four asset allocation funds, four income plus funds, seven equity funds, five fixed-income funds and one money market fund. Thrivent Growth and Income Plus Fund and Thrivent Diversified Income Plus Fund have a fiscal year end on a calendar-year basis and are presented under a separate shareholder report.
The Funds are each investment companies that follow the accounting and reporting guidance of the Financial Accounting Standards Board (FASB) Accounting Standard Codification Topic 946 - Financial Services - Investment Companies.
(A) Mergers – At meetings held on August 14, 2015 and August 20, 2015, shareholders of Thrivent Partner Small Cap Growth Fund, Thrivent Partner Small Cap Value Fund, Thrivent Mid Cap Growth Fund, Thrivent Partner Mid Cap Value Fund, and Thrivent Natural Resources Fund (the “Target Funds”) approved the merger of the Target Funds into the Funds shown below (the “Acquiring Funds”).
| | | | |
| Target Funds | | | | Acquiring Funds |
Partner Small Cap Growth | | > | | Small Cap Stock |
Partner Small Cap Value | | > | | Small Cap Stock |
Mid Cap Growth | | > | | Mid Cap Stock |
Partner Mid Cap Value | | > | | Mid Cap Stock |
Natural Resources | | > | | Large Cap Stock |
The mergers occurred at the close of business on August 28, 2015. Acquisition of the assets and liabilities of the Target Funds by the Acquiring Funds were followed by the distribution of the Acquiring Funds’ shares to the Target Funds’ shareholders. The shares issued of the Acquiring Funds are disclosed in the Statement of Changes in Net Assets.
The mergers were accomplished by tax free exchanges as detailed below:
| | | | | | | | |
| Fund | | Description | | | Net Assets as of
August 28, 2015 | |
Small Cap Stock | | | Acquiring Fund | | | $ | 341,632,324 | |
Partner Small Cap Growth | | | Target Fund | | | $ | 17,008,339 | |
Partner Small Cap Value | | | Target Fund | | | $ | 102,384,607 | |
Small Cap Stock | | | After Acquisition | | | $ | 461,025,270 | |
Mid Cap Stock | | | Acquiring Fund | | | $ | 897,454,060 | |
Mid Cap Growth | | | Target Fund | | | $ | 290,801,272 | |
Partner Mid Cap Value | | | Target Fund | | | $ | 27,765,869 | |
Mid Cap Stock | | | After Acquisition | | | $ | 1,216,021,201 | |
Large Cap Stock | | | Acquiring Fund | | | $ | 1,684,824,704 | |
Natural Resources | | | Target Fund | | | $ | 11,369,625 | |
Large Cap Stock | | | After Acquisition | | | $ | 1,696,194,329 | |
As of August 28, 2015, the net assets of the Target Funds were comprised of the following:
| | | | | | | | | | | | | | | | |
| Target Fund | | Unrealized Appreciation/ (Depreciation) | | | Undistributed Net
Investment Income | | | Accumulated Net Realized
Gains/(Losses) | | | Capital Stock | |
Partner Small Cap Growth | | $ | 1,800,899 | | | $ | (176,995 | ) | | $ | 72,075 | | | $ | 15,312,360 | |
Partner Small Cap Value | | $ | 30,840,549 | | | $ | 414,562 | | | $ | 52,986,554 | | | $ | 18,142,942 | |
Mid Cap Growth | | $ | 72,126,041 | | | $ | (640,530 | ) | | $ | 55,322,617 | | | $ | 163,993,144 | |
Partner Mid Cap Value | | $ | (3,081,699 | ) | | $ | 911,473 | | | $ | 23,497,442 | | | $ | 6,438,653 | |
Natural Resources | | $ | (6,093,047 | ) | | $ | (23,238 | ) | | $ | (24,733,620 | ) | | $ | 42,219,530 | |
The Target Funds’ capital loss carryovers are carried over to the Acquiring Funds. The amounts, if any, and applicable limitations are disclosed in Note (4) Tax Information.
Assuming the mergers had been completed on November 1, 2014 the Acquiring Funds’ pro-forma results of operations for the year ended October 31, 2015 would be the following:
163
THRIVENT MUTUAL FUNDS
NOTESTO FINANCIAL STATEMENTS
October 31, 2016
Assuming the mergers had been completed on November 1, 2014 the Acquiring Funds’ pro-forma results of operations for the year ended October 31, 2015 would be the following:
| | | | | | | | | | | | | | | | |
| Acquiring Fund | | Net Change
in Unrealized
Appreciation/
(Depreciation) | | | Net Investment
Income | | | Net Gains/(Losses) on
Investments | | | Net Increase in
Net Assets from
Operations | |
Small Cap Stock | | $ | (100,624,718 | ) | | $ | 1,984,021 | | | $ | 103,912,249 | | | $ | 5,271,552 | |
Mid Cap Stock | | $ | (167,432,539 | ) | | $ | 1,195,786 | | | $ | 249,895,238 | | | $ | 83,658,485 | |
Large Cap Stock | | $ | 31,789,186 | | | $ | 18,487,868 | | | $ | 21,569,566 | | | $ | 71,846,620 | |
The financial statements reflect the operations of the Acquiring Funds for the period prior to the merger and the combined Funds for the period subsequent to the mergers. Because the combined investment funds have been managed as a single integrated fund since the mergers were completed, it is not practicable to separate the amounts of revenue and earnings of Thrivent Partner Small Cap Growth Fund, Thrivent Partner Small Cap Value Fund, Thrivent Mid Cap Growth Fund, Thrivent Partner Mid Cap Value Fund, and Thrivent Natural Resources Fund that have been included in the Acquiring Funds’ Statement of Operations since the mergers were completed.
(B) Share Classes – Effective February 1, 2016, Institutional Class shares were renamed Class S shares. Effective February 29, 2016, Class A Shares were closed to new shareholders and are open to current Class A shareholders and others who reside at the same mailing address (“household”), with the exception of Government Bond Fund. Class A shares of Government Bond Fund are closed to all purchases and exchanges into the Fund, other than reinvestment of dividends by current shareholders of the Fund. Effective February 29, 2016, the maximum front-end sales charge imposed on Class A Shares of equity funds was changed from 5.50% to 4.50%. Please refer to the Supplement to Class A Shares Prospectus dated February 12, 2016 for additional information. As of October 31, 2016, the Trust includes two classes of shares: Class A and Class S shares. The classes of shares differ principally in their respective distribution expenses and other class-specific expenses and arrangements. Class A shares have an annual 12b-1 fee of 0.25% or a reduced fee of 0.13%. Class A shares have a maximum front-end sales load of 4.50%, although some Funds have a reduced or no front-end sales load. Class S shares are offered at net asset value and have no annual 12b-1 fees. Institutional Class shares were offered at net asset value and had no annual 12b-1 fees. The share classes have identical rights to earnings, assets and voting privileges, except for class-specific expenses and exclusive rights to vote on matters affecting only individual classes. All 21 Funds of the Trust offer Class A and Class S shares.
(C) Other – Under the Trust’s organizational documents, its officers and trustees are indemnified against certain liabilities arising out of the performance of their duties to the Trust. In addition, in the normal course of business, the Trust enters into contracts with vendors and others that provide general damage clauses. The Trust’s maximum exposure under these contracts is unknown, as this would involve future claims that may be made against the Trust. However, based on experience, the Trust expects the risk of loss to be remote.
(2) SIGNIFICANT ACCOUNTING POLICIES
(A) Valuation of Investments – Securities traded on U.S. or foreign securities exchanges or included in a national market system are valued at the official closing price at the close of each business day unless otherwise stated below. Over-the-counter securities and listed securities for which no price is readily available are valued at the current bid price considered best to represent the value at that time. Security prices are based on quotes that are obtained from an independent pricing service approved by the Trust’s Board of Trustees (“Board”). The pricing service, in determining values of fixed-income securities, takes into consideration such factors as current quotations by broker/ dealers, coupon, maturity, quality, type of issue, trading characteristics, and other yield and risk factors it deems relevant in determining valuations. Securities which cannot be valued by the approved pricing service are valued using valuations obtained from dealers that make markets in the securities. Exchange-listed options and futures contracts are valued at the last quoted sales price. Swap agreements are valued at the clearing house end of day prices as furnished by an independent pricing service. Forward foreign currency exchange contracts are marked-to-market based upon foreign currency exchange rates provided by the pricing service. Investments in open-ended mutual funds are valued at the net asset value at the close of each business day.
Securities held by the Money Market Fund are valued on the basis of amortized cost (which approximates market value), whereby a portfolio security is valued at its cost initially and thereafter valued to reflect a constant amortization to maturity of any discount or premium. The Money Market Fund and the Trust’s investment adviser, Thrivent Asset Management, LLC (“Thrivent Asset Mgt.” or the “Adviser”), follow procedures designed to help maintain a constant net asset value of $1.00 per share.
164
THRIVENT MUTUAL FUNDS
NOTESTO FINANCIAL STATEMENTS
October 31, 2016
The Board has delegated responsibility for daily valuation of the Funds’ securities to the Adviser. The Adviser has formed a Valuation Committee (“Committee”) that is responsible for overseeing the Fund valuation policies in accordance with Valuation Policies and Procedures. The Committee meets on a monthly and on an as-needed basis to review price challenges, price overrides, stale prices, shadow prices, manual prices, money market pricing, international fair valuation, and other securities requiring fair valuation.
The Committee monitors for significant events occurring prior to the close of trading on the New York Stock Exchange that could have a material impact on the value of any securities that are held by the Funds. Examples of such events include trading halts, national news/events, and issuer-specific developments. If the Committee decides that such events warrant using fair value estimates, the Committee will take such events into consideration in determining the fair value of such securities. If market quotations or prices are not readily available or determined to be unreliable, the securities will be valued at fair value as determined in good faith pursuant to procedures adopted by the Board.
In accordance with U.S. Generally Accepted Accounting Principles (“GAAP”), the various inputs used to determine the fair value of the Funds’ investments are summarized in three broad levels. Level 1 includes quoted prices in active markets for identical securities, typically included in this level are U.S. equity securities, futures, options and registered investment company funds. Level 2 includes other significant observable inputs such as quoted prices for similar securities, interest rates, prepayment speeds and credit risk, typically included in this level are fixed income securities, international securities, swaps and forward contracts. Level 3 includes significant unobservable inputs such as the Adviser’s own assumptions and broker evaluations in determining the fair value of investments. Of the Level 3 securities, those for which market values were not readily available or were deemed unreliable were fair valued as determined in good faith under procedures established by the Board. The valuation levels are not necessarily an indication of the risk associated with investing in these securities or other investments. Investments measured using net asset value per share as a practical expedient for fair value and that are not publicly available-for-sale are not categorized within the fair value hierarchy.
Valuation of International Securities – Because many foreign markets close before the U.S. markets, events may occur between the close of the foreign markets and the close of the U. S. markets that could have a material impact on the valuation of foreign securities. The Funds, under the supervision of the Board, evaluate the impacts of these events and may adjust the valuation of foreign securities to reflect fair value as of the close of the U.S. markets. The Board has authorized the Adviser to make fair valuation determinations pursuant to policies approved by the Board.
(B) Foreign Currency Translation – The accounting records of each Fund are maintained in U.S. dollars. Securities and other assets and liabilities that are denominated in foreign currencies are translated into U.S. dollars at the daily closing rates of exchange.
Foreign currency amounts related to the purchase or sale of securities and income and expenses are translated at the exchange rate on the transaction date. Net realized and unrealized currency gains and losses are recorded from closed currency contracts, disposition of foreign currencies, exchange gains or losses between the trade date and settlement date on securities transactions, and other translation gains or losses on dividends, interest income and foreign withholding taxes. The Funds do not separately report the effect of changes in foreign exchange rates from changes in prices on securities held. Such changes are included in net realized and unrealized gain or loss from investments in the Statement of Operations.
For federal income tax purposes, the Funds treat the effect of changes in foreign exchange rates arising from actual foreign currency transactions and the changes in foreign exchange rates between the trade date and settlement date as ordinary income.
(C) Foreign Denominated Investments – Foreign denominated assets and currency contracts may involve more risks than domestic transactions including currency risk, political and economic risk, regulatory risk, and market risk. Certain Funds may also invest in securities of companies located in emerging markets. Future economic or political developments could adversely affect the liquidity or value, or both, of such securities.
(D) Federal Income Taxes – No provision has been made for income taxes because each Fund’s policy is to qualify as a regulated investment company under the Internal Revenue Code and distribute substantially all investment company taxable income and net capital gain on a timely basis. It is also the intention of each Fund to distribute an amount sufficient to avoid imposition of any federal excise tax. The Funds, accordingly, anticipate paying no federal taxes and no federal tax provision was recorded. Each Fund is treated as a separate taxable entity for federal income tax purposes. Funds may utilize earnings and profits distributed to shareholders on the redemption of shares as part of the dividends paid deduction.
Foreign Income Taxes – Funds are subject to foreign income taxes imposed by certain countries in which they invest. Withholding taxes on foreign dividends have been provided for in accordance with the applicable country’s tax rules and
165
THRIVENT MUTUAL FUNDS
NOTESTO FINANCIAL STATEMENTS
October 31, 2016
rates. These amounts are shown as foreign tax withholding on the Statement of Operations. The Funds pay tax on foreign capital gains, where applicable.
GAAP requires management of the Funds (i.e., the Adviser) to make additional tax disclosures with respect to the tax effects of certain income tax positions, whether those positions were taken on previously filed tax returns or are expected to be taken on future returns. These positions must meet a “more likely than not” standard that, based on the technical merits of the position, would have a greater than 50 percent likelihood of being sustained upon examination. In evaluating whether a tax position has met the more-likely-than-not recognition threshold, the Adviser must presume that the position will be examined by the appropriate taxing authority that has full knowledge of all relevant information.
The Adviser analyzed all open tax years, as defined by the statute of limitations, for all major jurisdictions. Open tax years are those that are open for examination by taxing authorities. Major jurisdictions for the Funds include U.S. Federal, Minnesota, Wisconsin, and Massachusetts as well as certain foreign countries. As of October 31, 2016, open U.S. Federal, Minnesota, Wisconsin and Massachusetts tax years include the tax years ended October 31, 2013 through 2016. Additionally, as of October 31, 2016, the tax year ended October 31, 2012 is open for Wisconsin. The Funds have no examinations in progress and none are expected at this time.
As of October 31, 2016, the Adviser has reviewed all open tax years and major jurisdictions and concluded that there is no effect to the Funds’ tax liability, financial position or results of operations. There is no tax liability resulting from unrecognized tax benefits related to uncertain income tax positions taken or expected to be taken in future tax returns. The Funds are also not aware of any tax positions for which it is reasonably possible that the total amounts of unrecognized tax benefits will significantly change in the next 12 months.
(E) Expenses and Income – Estimated expenses are accrued daily. The Funds are charged for those expenses that are directly attributable to them. Expenses that are not directly attributable to a Fund are allocated among all appropriate Funds in proportion to their respective net assets, number of shareholder accounts or other reasonable basis. Net investment income, expenses which are not class-specific, and realized and unrealized gains and losses are allocated directly to each class based upon the relative net asset value of outstanding shares.
Interest income is recorded daily on all debt securities, as is accretion of market discount and original issue discount and amortization of premium. Paydown gains and losses on mortgage- and asset-backed securities are recorded as components of interest income. Dividend income and capital gain distributions are recorded on the ex-dividend date. However, in certain foreign market where declaration of the dividend follows the ex-dividend date, the dividend will be recorded as soon as the Fund is informed of the declaration date.
For certain securities, including real estate investment trusts, the Trust records distributions received in excess of income as a reduction of cost of investments and/or realized gain. Such amounts are based on estimates if actual amounts are not available. Actual amounts of income, realized gain and return of capital may differ from the estimated amounts. The Trust adjusts the estimated amounts of the components of distributions as adjustments to investment income, unrealized appreciation/depreciation and realized gain/ loss on investments as necessary, once the issuers provide information about the actual composition of the distributions.
(F) Distributions to Shareholders – Dividend and capital gain distributions are recorded on the ex-dividend date. With the exception of the Money Market Fund, net realized gains from securities transactions, if any, are paid at least annually after the close of the fiscal year.
| | | | | | | | |
| Fund | | Dividends Declared | | | Dividends Paid | |
Aggressive Allocation | | | Annually | | | | Annually | |
Moderately Aggressive Allocation | | | Annually | | | | Annually | |
Moderate Allocation | | | Quarterly | | | | Quarterly | |
Moderately Conservative Allocation | | | Quarterly | | | | Quarterly | |
Balanced Income Plus | | | Quarterly | | | | Quarterly | |
Opportunity Income Plus | | | Daily | | | | Monthly | |
Partner Emerging Markets Equity | | | Annually | | | | Annually | |
Small Cap Stock | | | Annually | | | | Annually | |
Mid Cap Stock | | | Annually | | | | Annually | |
Partner Worldwide Allocation | | | Annually | | | | Annually | |
Large Cap Growth | | | Annually | | | | Annually | |
Large Cap Value | | | Annually | | | | Annually | |
Large Cap Stock | | | Annually | | | | Annually | |
High Yield | | | Daily | | | | Monthly | |
Income | | | Daily | | | | Monthly | |
Municipal Bond | | | Daily | | | | Monthly | |
Government Bond | | | Daily | | | | Monthly | |
Limited Maturity Bond | | | Daily | | | | Monthly | |
Money Market* | | | Daily | | | | Monthly | |
| * | Dividends are net of any short-term realized gains or losses on the sale of securities. |
(G) Derivative Financial Instruments – Each of the Funds, with the exception of the Money Market Fund, may invest in derivatives. Derivatives, a category that includes options, futures, swaps, foreign currency forward contracts and hybrid instruments, are financial instruments whose value is derived from another security, an index or a currency. Each applicable Fund may use derivatives for hedging (attempting to offset a potential loss in one position by establishing an interest in an opposite position). This includes the use of currency-based derivatives to manage the risk of its positions in foreign securities. Each applicable Fund may also use derivatives for replication of a certain
166
THRIVENT MUTUAL FUNDS
NOTESTO FINANCIAL STATEMENTS
October 31, 2016
asset class or speculation (investing for potential income or capital gain). These contracts may be transacted on an exchange or over-the-counter (OTC).
A derivative may incur a mark to market loss if the value of the derivative decreases due to an unfavorable change in the market rates or values of the underlying derivative. Losses can also occur if the counterparty does not perform under the derivative. A Fund’s risk of loss from the counterparty credit risk on OTC derivatives is generally limited to the aggregate unrealized gain netted against any collateral held by such Fund. With exchange traded futures and centrally cleared swaps, there is minimal counterparty credit risk to the Funds because the exchange’s clearinghouse, as counterparty to such derivatives, guarantees against a possible default. The clearinghouse stands between the buyer and the seller of the derivative; thus, the credit risk is limited to the failure of the clearinghouse. However, credit risk still exists in exchange traded futures and centrally cleared swaps with respect to initial and variation margin that is held in a broker’s customer accounts. While brokers are required to segregate customer margin from their own assets, in the event that a broker becomes insolvent or goes into bankruptcy and at that time there is a shortfall in the aggregate amount of margin held by the broker for all its clients, U.S. bankruptcy laws will typically allocate that shortfall on a pro-rata basis across all the broker’s customers, potentially resulting in losses to the Funds. Using derivatives to hedge can guard against potential risks, but it also adds to the Funds’ expenses and can eliminate some opportunities for gains. In addition, a derivative used for mitigating exposure or replication may not accurately track the value of the underlying asset. Another risk with derivatives is that some types can amplify a gain or loss, potentially earning or losing substantially more money than the actual cost of the derivative.
In order to define their contractual rights and to secure rights that will help the Funds mitigate their counterparty risk, the Funds may enter into an International Swaps and Derivatives Association, Inc. Master Agreement (“ISDA Master Agreement”) or similar agreement with its derivative contract counterparties. An ISDA Master Agreement is a bilateral agreement between a Fund and a counterparty that governs OTC derivatives and foreign exchange contracts and typically includes, among other things, collateral posting terms and netting provisions in the event of a default and/or termination event. Under an ISDA Master Agreement, each Fund may, under certain circumstances, offset with the counterparty certain derivatives’ payables and/or receivables with collateral held and/or posted and create one single net payment. The provisions of the ISDA Master Agreement typically permit a single net payment in the event of a default (close-out netting) including the bankruptcy or insolvency of the counterparty. Note, however, that bankruptcy and insolvency laws of a particular jurisdiction may impose restrictions on or prohibitions against the right of offset in bankruptcy, insolvency or other events.
Collateral and margin requirements vary by type of derivative. Margin requirements are established by the broker or clearinghouse for exchange traded and centrally cleared derivatives (futures, options, and centrally cleared swaps). Brokers can ask for margining in excess of the minimum in certain situations. Collateral terms are contract specific for OTC derivatives (foreign currency exchange contracts, options, swaps). For derivatives traded under an ISDA Master Agreement, the collateral requirements are typically calculated by netting the mark to market amount for each transaction under such agreement and comparing that amount to the value of any collateral currently pledged by the Fund and the counterparty. For financial reporting purposes, non-cash collateral that has been pledged to cover obligations of the Fund has been noted in the Schedule of Investments. To the extent amounts due to the Fund from its counterparties are not fully collateralized, contractually or otherwise, the Fund bears the risk of loss from counterparty nonperformance. The Funds attempt to mitigate counterparty risk by only entering into agreements with counterparties that they believe have the financial resources to honor their obligations and by monitoring the financial stability of those counterparties.
Options – All Funds, with the exception of the Money Market Fund, may buy put and call options and write put and covered call options. The Funds intend to use such derivative instruments as hedges to facilitate buying or selling securities or to provide protection against adverse movements in security prices or interest rates. The Funds may also enter into options contracts to protect against adverse foreign exchange rate fluctuations. Option contracts are valued daily and unrealized appreciation or depreciation is recorded. A Fund will realize a gain or loss upon expiration or closing of the option transaction. When an option is exercised, the proceeds upon sale for a written call option or the cost of a security for purchased put and call options is adjusted by the amount of premium received or paid.
Buying put options tends to decrease a Fund’s exposure to the underlying security while buying call options tends to increase a Fund’s exposure to the underlying security. The risk associated with purchasing put and call options is limited to the premium paid. There is no significant counterparty risk on exchange-traded options as the exchange guarantees the contract against default. Writing put options tends to increase a Fund’s exposure to the underlying security while writing call options tends to decrease a Fund’s exposure to the underlying security. The writer of an option has no control over whether the underlying security may be bought or sold, and therefore bears the market risk of an unfavorable change in the price of the underlying security. The counterparty risk for purchased options arises when a Fund has purchased an option, exercises that option, and the counterparty doesn’t buy from the Fund
167
THRIVENT MUTUAL FUNDS
NOTESTO FINANCIAL STATEMENTS
October 31, 2016
or sell to the Fund the underlying asset as required. In the case where a Fund has written an option, the Fund doesn’t have counterparty risk. Counterparty risk on purchased over-the-counter options is partially mitigated by the Fund’s collateral posting requirements. As the option increases in value to the Fund, the Fund receives collateral from the counterparty. Risks of loss may exceed amounts recognized on the Statement of Assets and Liabilities.
Futures Contracts – All Funds, with the exception of the Money Market Fund, may use futures contracts to manage the exposure to interest rate and market or currency fluctuations. Gains or losses on futures contracts can offset changes in the yield of securities. When a futures contract is opened, cash or other investments equal to the required “initial margin deposit” are held on deposit with and pledged to the broker. Additional securities held by the Funds may be earmarked to cover open futures contracts. The futures contract’s daily change in value (“variation margin”) is either paid to or received from the broker, and is recorded as an unrealized gain or loss. When the contract is closed, realized gain or loss is recorded equal to the difference between the value of the contract when opened and the value of the contract when closed. Futures contracts involve, to varying degrees, risk of loss in excess of the variation margin disclosed in the Statement of Assets and Liabilities. Exchange-traded futures have no significant counterparty risk as the exchange guarantees the contracts against default.
Foreign Currency Forward Contracts – In connection with purchases and sales of securities denominated in foreign currencies all Funds, with the exception of the Money Market Fund, may enter into foreign currency forward contracts. Additionally, the Funds may enter into such contracts to mitigate currency and counterparty exposure to other foreign-currency-denominated investments. These contracts are recorded at value and the related realized and change in unrealized foreign exchange gains and losses are included in the Statement of Operations. In the event that counterparties fail to settle these forward contracts, the Funds could be exposed to foreign currency fluctuations. Foreign currency contracts are valued daily and unrealized appreciation or depreciation is recorded daily as the difference between the contract exchange rate and the closing forward rate applied to the face amount of the contract. A realized gain or loss is recorded at the time a forward contract is closed. These contracts are over-the-counter and the Fund is exposed to counterparty risk equal to the discounted net amount of payments to the Fund.
Swap Agreements – All Funds, with the exception of the Money Market Fund, may enter into swap transactions, which involve swapping one or more investment characteristics of a security or a basket of securities with another party. Such transactions include market risk, risk of default by the other party to the transaction, risk of imperfect correlation and manager risk and may involve commissions or other costs. Swap transactions generally do not involve delivery of securities, other underlying assets or principal. Accordingly, the risk of loss with respect to swap transactions is generally limited to the net amount of payments that the Fund is contractually obligated to make, or in the case of the counterparty defaulting, the net amount of payments that the Fund is contractually entitled to receive. Risks of loss may exceed amounts recognized on the Statement of Assets and Liabilities. If there is a default by the counterparty, the Fund may have contractual remedies pursuant to the agreements related to the transaction. The contracts are valued daily and unrealized appreciation or depreciation is recorded. Swap agreements are valued at the clearing house end of day prices as furnished by an independent pricing service. The pricing service takes into account such factors as swap curves, default probabilities, recent trades, recovery rates and other factors it deems relevant in determining valuations. Daily fluctuations in the value of the centrally cleared credit default contracts are recorded in variation margin in the Statement of Assets and Liabilities and recorded as unrealized gain or loss. The Fund accrues for the periodic payment and amortizes upfront payments, if any, on swap agreements on a daily basis with the net amount recorded as realized gains or losses in the Statement of Operations. Receipts and payments received or made as a result of a credit event or termination of the contract are also recognized as realized gains or losses in the Statement of Operations. Collateral, in the form of cash or securities, may be required to be held with the Fund’s custodian, or a third party, in connection with these agreements. Certain swap agreements are over-the-counter and the Fund is exposed to counterparty risk, which is the discounted net amount of payments owed to the Fund. This risk is partially mitigated by the Fund’s collateral posting requirements. As the swap increases in value to the Fund, the Fund receives collateral from the counterparty. Certain interest rate and credit default index swaps must be cleared through a clearinghouse or central counterparty.
Credit Default Swaps – A credit default swap is a swap agreement between two parties to exchange the credit risk of a particular issuer, basket of securities or reference entity. In a credit default swap transaction, a buyer pays periodic fees in return for payment by the seller which is contingent upon an adverse credit event occurring in the underlying issuer or reference entity. The seller collects periodic fees from the buyer and profits if the credit of the underlying issuer or reference entity remains stable or improves while the swap is outstanding, but the seller in a credit default swap contract would be required to pay the amount of credit loss, determined as specified in the agreement, to the buyer in the event of an adverse credit event in the reference entity. A buyer of a credit default swap is said to buy protection
168
THRIVENT MUTUAL FUNDS
NOTESTO FINANCIAL STATEMENTS
October 31, 2016
whereas a seller of a credit default swap is said to sell protection. The Funds may be either the protection seller or the protection buyer.
Certain Funds enter into credit default derivative contracts directly through credit default swaps (CDS) or through credit default swap indices (CDX Indices). CDX indices are static pools of equally weighted credit default swaps referencing corporate bonds and/or loans designed to provide diversified credit exposure to these asset classes. Funds sell default protection and assume long-risk positions in individual credits or indices. Index positions are entered into to gain exposure to the corporate bond and/or loan markets in a cost-efficient and diversified structure. In the event that a position defaults, by going into bankruptcy and failing to pay interest or principal on borrowed money, within any given CDX Index held, the maximum potential amount of future payments required would be equal to the pro-rata share of that position within the index based on the notional amount of the index. In the event of a default under a CDS contract the maximum potential amount of future payments would be the notional amount. For CDS, the default events could be bankruptcy and failing to pay interest or principal on borrowed money or a restructuring. A restructuring is a change in the underlying obligations which would include reduction in interest or principal, maturity extension and subordination to other obligations.
For financial reporting purposes, the Funds do not offset derivative assets and derivative liabilities that are subject to netting arrangements in the Statement of Assets and Liabilities.
The amounts presented in the tables below are offset first by financial instruments that have the right to offset under master netting or similar arrangements, then any remaining amount is reduced by cash and non-cash collateral received/pledged. The actual amounts of collateral may be greater than the amounts presented in the tables.
The following table presents the gross and net information about assets subject to master netting arrangements, as presented in the Statement of Assets and Liabilities:
| | | | | | | | | | | | | | | | | | | | | | | | | | | | |
| | | | | | | | | | | | Gross Amounts Not Offset in the
Statement of Assets and Liabilities | | | | |
| Fund | | Gross Amounts
of Recognized
Assets | | | Gross
Amounts
Offset | | | Net Amounts of
Recognized
Assets | | | Financial Instruments | | | Cash
Collateral
Received | | | Non-Cash Collateral Received | | | Net Amount | |
Aggressive Allocation | | | | | | | | | | | | | | | | | | | | | | | | | | | | |
Futures Contracts | | | 61,200 | | | | – | | | | 61,200 | | | | 61,200 | | | | – | | | | – | | | | – | |
Moderately Aggressive | | | | | | | | | | | | | | | | | | | | | | | | | | | | |
Allocation | | | | | | | | | | | | | | | | | | | | | | | | | | | | |
Futures Contracts | | | 130,272 | | | | – | | | | 130,272 | | | | 130,272 | | | | – | | | | – | | | | – | |
Moderate Allocation | | | | | | | | | | | | | | | | | | | | | | | | | | | | |
Futures Contracts | | | 214,525 | | | | – | | | | 214,525 | | | | 214,525 | | | | – | | | | – | | | | – | |
Moderately Conservative | | | | | | | | | | | | | | | | | | | | | | | | | | | | |
Allocation | | | | | | | | | | | | | | | | | | | | | | | | | | | | |
Futures Contracts | | | 110,074 | | | | – | | | | 110,074 | | | | 110,074 | | | | – | | | | – | | | | – | |
Balanced Income Plus | | | | | | | | | | | | | | | | | | | | | | | | | | | | |
Futures Contracts | | | 27,850 | | | | – | | | | 27,850 | | | | 19,211 | | | | – | | | | – | | | | 8,639 | (*) |
Opportunity Income Plus | | | | | | | | | | | | | | | | | | | | | | | | | | | | |
Futures Contracts | | | 50,013 | | | | – | | | | 50,013 | | | | 31,031 | | | | – | | | | – | | | | 18,982 | (*) |
Partner Worldwide Allocation | | | | | | | | | | | | | | | | | | | | | | | | | | | | |
Futures Contracts | | | 2,070,916 | | | | – | | | | 2,070,916 | | | | 2,056,397 | | | | – | | | | – | | | | 14,519 | (*) |
Exchange Contracts | | | 623,340 | | | | – | | | | 623,340 | | | | 266,786 | | | | – | | | | – | | | | 356,554 | (†) |
Large Cap Stock | | | | | | | | | | | | | | | | | | | | | | | | | | | | |
Futures Contracts | | | 319,095 | | | | – | | | | 319,095 | | | | 319,095 | | | | – | | | | – | | | | – | |
Income | | | | | | | | | | | | | | | | | | | | | | | | | | | | |
Futures Contracts | | | 161,500 | | | | – | | | | 161,500 | | | | 56,841 | | | | – | | | | – | | | | 104,659 | (*) |
Government Bond | | | | | | | | | | | | | | | | | | | | | | | | | | | | |
Futures Contracts | | | 3,453 | | | | – | | | | 3,453 | | | | 3,453 | | | | – | | | | – | | | | – | |
Limited Maturity Bond | | | | | | | | | | | | | | | | | | | | | | | | | | | | |
Futures Contracts | | | 25,691 | | | | – | | | | 25,691 | | | | 25,691 | | | | – | | | | – | | | | – | |
| (*) | Net futures amount represents the net amount receivable from the counter party in the event of a default. |
| (†) | Net exchange contract amount represents the net amount receivable from the counter party in the event of a default. |
169
THRIVENT MUTUAL FUNDS
NOTESTO FINANCIAL STATEMENTS
October 31, 2016
The following table presents the gross and net information about liabilities subject to master netting arrangements, as presented in the Statement of Assets and Liabilities:
| | | | | | | | | | | | | | | | | | | | | | | | | | | | |
| | | | | | | | | | | | Gross Amounts Not Offset in the
Statement of Assets and Liabilities | | | | |
| Fund | | Gross Amounts
of Recognized
Liabilities | | | Gross
Amounts
Offset | | | Net Amounts of
Recognized
Liabilities | | | Financial Instruments | | | Cash
Collateral
Pledged | | | Non-Cash Collateral Pledged** | | | Net Amount | |
Aggressive Allocation | | | | | | | | | | | | | | | | | | | | | | | | | | | | |
Futures Contracts | | | 847,764 | | | | – | | | | 847,764 | | | | 61,200 | | | | – | | | | 786,564 | | | | – | |
Moderately Aggressive Allocation | | | | | | | | | | | | | | | | | | | | | | | | | | | | |
Futures Contracts | | | 1,216,749 | | | | – | | | | 1,216,749 | | | | 130,272 | | | | – | | | | 1,086,477 | | | | – | |
Securities Lending | | | 2,585,839 | | | | – | | | | 2,585,839 | | | | 2,493,043 | | | | – | | | | – | | | | 92,796 | ^ |
Moderate Allocation | | | | | | | | | | | | | | | | | | | | | | | | | | | | |
Futures Contracts | | | 640,725 | | | | – | | | | 640,725 | | | | 214,525 | | | | – | | | | 426,200 | | | | – | |
Securities Lending | | | 3,757,689 | | | | – | | | | 3,757,689 | | | | 3,620,121 | | | | – | | | | – | | | | 137,568 | ^ |
Moderately Conservative Allocation | | | | | | | | | | | | | | | | | | | | | | | | | | | | |
Futures Contracts | | | 126,953 | | | | – | | | | 126,953 | | | | 110,074 | | | | – | | | | 16,879 | | | | – | |
Securities Lending | | | 2,400,919 | | | | – | | | | 2,400,919 | | | | 2,317,287 | | | | – | | | | – | | | | 83,632 | ^ |
Balanced Income Plus | | | | | | | | | | | | | | | | | | | | | | | | | | | | |
Futures Contracts | | | 19,211 | | | | – | | | | 19,211 | | | | 19,211 | | | | – | | | | – | | | | – | |
Securities Lending | | | 4,071,925 | | | | – | | | | 4,071,925 | | | | 3,947,244 | | | | – | | | | – | | | | 124,681 | ^ |
Opportunity Income Plus | | | | | | | | | | | | | | | | | | | | | | | | | | | | |
Futures Contracts | | | 31,031 | | | | – | | | | 31,031 | | | | 31,031 | | | | – | | | | – | | | | – | |
Securities Lending | | | 12,236,852 | | | | – | | | | 12,236,852 | | | | 11,736,865 | | | | – | | | | – | | | | 499,987 | ^ |
Small Cap Stock | | | | | | | | | | | | | | | | | | | | | | | | | | | | |
Securities Lending | | | 30,024,962 | | | | – | | | | 30,024,962 | | | | 29,250,374 | | | | – | | | | – | | | | 774,588 | ^ |
Mid Cap Stock | | | | | | | | | | | | | | | | | | | | | | | | | | | | |
Securities Lending | | | 27,756,275 | | | | – | | | | 27,756,275 | | | | 26,658,099 | | | | – | | | | – | | | | 1,098,176 | ^ |
Partner Worldwide Allocation | | | | | | | | | | | | | | | | | | | | | | | | | | | | |
Futures Contracts | | | 2,056,397 | | | | – | | | | 2,056,397 | | | | 2,056,397 | | | | – | | | | – | | | | – | |
Exchange Contracts | | | 311,732 | | | | – | | | | 311,732 | | | | 266,786 | | | | 44,946 | | | | – | | | | – | |
Securities Lending | | | 2,547,690 | | | | – | | | | 2,547,690 | | | | 2,432,681 | | | | – | | | | – | | | | 115,009 | ^ |
Large Cap Value | | | | | | | | | | | | | | | | | | | | | | | | | | | | |
Securities Lending | | | 5,787,975 | | | | – | | | | 5,787,975 | | | | 5,764,722 | | | | – | | | | – | | | | 23,253 | ^ |
Large Cap Stock | | | | | | | | | | | | | | | | | | | | | | | | | | | | |
Futures Contracts | | | 956,522 | | | | – | | | | 956,522 | | | | 319,095 | | | | – | | | | 637,427 | | | | – | |
Securities Lending | | | 13,952,780 | | | | – | | | | 13,952,780 | | | | 13,213,208 | | | | – | | | | – | | | | 739,572 | ^ |
High Yield | | | | | | | | | | | | | | | | | | | | | | | | | | | | |
Securities Lending | | | 66,352,314 | | | | – | | | | 66,352,314 | | | | 63,240,627 | | | | – | | | | – | | | | 3,111,687 | ^ |
Income | | | | | | | | | | | | | | | | | | | | | | | | | | | | |
Futures Contracts | | | 56,841 | | | | – | | | | 56,841 | | | | 56,841 | | | | – | | | | – | | | | – | |
Securities Lending | | | 20,144,903 | | | | – | | | | 20,144,903 | | | | 17,032,809 | | | | – | | | | – | | | | 3,112,094 | ^ |
Government Bond | | | | | | | | | | | | | | | | | | | | | | | | | | | | |
Futures Contracts | | | 18,844 | | | | – | | | | 18,844 | | | | 3,453 | | | | – | | | | 15,391 | | | | – | |
Limited Maturity Bond | | | | | | | | | | | | | | | | | | | | | | | | | | | | |
Futures Contracts | | | 123,483 | | | | – | | | | 123,483 | | | | 25,691 | | | | – | | | | 97,792 | | | | – | |
Securities Lending | | | 3,895,550 | | | | – | | | | 3,895,550 | | | | 3,780,491 | | | | – | | | | – | | | | 115,059 | ^ |
| ** | Excess of collateral pledged to the counterparty may not be shown for financial reporting purposes. |
| ^ | Net securities lending amounts represent the net amount payable to the counter party in the event of a default. |
(H) Mortgage Dollar Roll Transactions – Certain Funds enter into dollar roll transactions on securities issued or to be issued by the Government National Mortgage Association, Federal National Mortgage Association and Federal Home Loan Mortgage Corporation, in which the Funds sell mortgage securities and simultaneously agree to repurchase similar (same type and coupon) securities at a later date at an agreed upon price. The Funds must maintain liquid securities having a value at least equal to the repurchase price (including accrued interest) for such dollar rolls. In addition, the Funds
170
THRIVENT MUTUAL FUNDS
NOTESTO FINANCIAL STATEMENTS
October 31, 2016
are required to segregate collateral with the fund custodian - depending on market movements - on their mortgage dollar rolls. The value of the securities that the Funds are required to purchase may decline below the agreed upon repurchase price of those securities.
During the period between the sale and repurchase, the Funds forgo principal and interest paid on the mortgage securities sold. The Funds are compensated from negotiated fees paid by brokers offered as an inducement to the Funds to “roll over” their purchase commitments, thus enhancing the yield. Mortgage dollar rolls may be renewed with a new purchase and repurchase price and a cash settlement made on settlement date without physical delivery of the securities subject to the contract. The fees received are recognized over the roll period and are included in Income from mortgage dollar rolls in the Statement of Operations.
(I) Securities Lending – The Trust has entered into a Securities Lending Agreement (the “Agreement”) with Deutsche Bank AG (“Deutsche”). The Agreement authorizes Deutsche to lend securities to authorized borrowers on behalf of the Funds. Pursuant to the Agreement, all loaned securities are initially collateralized by cash equal to at least 102% of the value of the loaned securities. Daily market fluctuations could cause the value of loaned securities to be more or less that the value of the collateral received. Any additional collateral is adjusted and settled on the next business day. The Trust has the ability to recall the loans at any time and could do so in order to vote proxies or sell the loaned securities. All cash collateral received is invested in Thrivent Cash Management Trust. The Funds receive dividends and interest that would have been earned on the securities loaned while simultaneously seeking to earn income on the investment of cash collateral. Amounts earned on investments in Thrivent Cash Management Trust, net of rebates, fees paid to Deutsche for services provided and any other securities lending expenses, are included in Income from securities loaned on the Statement of Operations. By investing any cash collateral it receives in these transactions, a Fund could realize additional gains or losses. If the borrower fails to return the securities or the invested collateral has declined in value, the Fund could lose money. Generally, in the event of borrower default, the Fund has the right to use the collateral to offset any losses incurred. However, in the event the Fund is delayed or prevented from exercising its right to dispose of the collateral, there may be a potential loss. Some of these losses may be indemnified by the lending agent.
As of October 31, 2016, the value of securities on loan is as follows:
| | | | |
| Fund | | Securities
on Loan | |
Moderately Aggressive Allocation | | $ | 2,493,043 | |
Moderate Allocation | | | 3,620,121 | |
Moderately Conservative Allocation | | | 2,317,287 | |
Balanced Income Plus | | | 3,947,244 | |
Opportunity Income Plus | | | 11,736,865 | |
Small Cap Stock | | | 29,250,374 | |
Mid Cap Stock | | | 26,658,099 | |
Partner Worldwide Allocation | | | 2,432,681 | |
Large Cap Value | | | 5,764,722 | |
Large Cap Stock | | | 13,213,208 | |
High Yield | | | 63,240,627 | |
Income | | | 17,032,809 | |
Limited Maturity Bond | | | 3,780,491 | |
(J) When-Issued and Delayed Delivery Transactions – Each Fund may purchase or sell securities on a when-issued or delayed delivery basis. These transactions involve a commitment by a Fund to purchase or sell securities for a predetermined price or yield, with payment and delivery taking place beyond the customary settlement period. When delayed delivery purchases are outstanding, a Fund will designate liquid assets in an amount sufficient to meet the purchase price. When purchasing a security on a delayed delivery basis, a Fund assumes the rights and risks of ownership of the security, including the risk of price and yield fluctuations, and takes such fluctuations into account when determining its net asset value. A Fund may dispose of a delayed delivery transaction after it is entered into, and may sell when-issued securities before they are delivered, which may result in a capital gain or loss. When a Fund has sold a security on a delayed delivery basis, a Fund does not participate in future gains and losses with respect to the security.
(K) Treasury Inflation Protected Securities – Certain Funds may invest in treasury inflation protected securities (TIPS). These securities are fixed income securities whose principal value is periodically adjusted to the rate of inflation. The coupon interest rate is generally fixed at issuance. Interest is paid based on the principal value, which is adjusted for inflation. Any increase in the principal amount will be included as taxable interest in the Statement of Operations and received in cash upon maturity or sale of the security.
(L) Repurchase Agreements – Each Fund may engage in repurchase agreement transactions in pursuit of its investment objective. A repurchase agreement consists of a purchase and a simultaneous agreement to resell an investment for later delivery at an agreed upon price and rate of interest. The Fund uses a third-party custodian to maintain the collateral. If the original seller of a security subject to a repurchase agreement fails to repurchase the security at the agreed upon time, the Fund could incur a loss due to a drop in the value of the security during the time it takes the Fund to either sell the security or take action to enforce the original seller’s agreement to repurchase the security. Also, if a defaulting original seller filed for bankruptcy or became insolvent, disposition of such security might be delayed by pending legal action. The Fund may only enter into repurchase agreements with banks and other recognized financial institutions such as broker/dealers that are found
171
THRIVENT MUTUAL FUNDS
NOTESTO FINANCIAL STATEMENTS
October 31, 2016
by the Adviser or subadviser to be creditworthy. During the year ended October 31, 2016, none of the Funds engaged in these types of investments.
(M) Equity-Linked Structured Securities – Certain Funds may invest in equity-linked structured notes. Equity-linked structured notes are debt securities which combine the characteristics of common stock and the sale of an option. The return component is based upon the performance of a single equity security, a basket of equity securities, or an equity index and the sale of an option. There is no guaranteed return of principal with these securities. The appreciation potential of these securities may be limited by a maximum payment or call right and can be influenced by many unpredictable factors. In addition to the performance of the equity, the nature and credit of the issuer may also impact return. During the year ended October 31, 2016, none of the Funds engaged in these types of transactions.
(N) Stripped Securities – Certain Funds may invest in Interest Only and Principal Only stripped mortgage or asset backed securities. These securities represent a participation in securities that are structured in classes with rights to receive different portions of the interest and principal. Interest only securities receive all the interest and principal only securities receive all the principal. If the underlying pool of mortgages or assets experience greater than anticipated prepayments of principal, the Fund may not fully recoup its initial investment in an interest only security. Principal only securities increase in value if prepayments are greater than anticipated and decline if prepayments are slower than anticipated. The market value of these securities is highly sensitive to changes in interest rates. As interest rates increase, the price of the principal only security decreases. Similarly, as interest rates decrease, the price of the principal only security increases. The principal only security represents the payment with the longest maturity, therefore making it the most sensitive to interest rate changes.
(O) Credit Risk – The Funds may be susceptible to credit risk to the extent an issuer or counterparty defaults on its payment obligation. The Funds’ policy is to monitor the creditworthiness of issuers and counterparties. Interest receivable on defaulted securities is monitored for ability to collect payments in default and is adjusted accordingly.
(P) Accounting Estimates – The preparation of financial statements in conformity with GAAP requires management to make estimates and assumptions that affect the reported amounts of assets and liabilities and disclosure of contingent assets and liabilities at the date of the financial statements and the reported amounts of income and expenses during the reporting period. Actual results could differ from those estimates.
(Q) Loan Commitments – Certain Funds may enter into loan commitments, which generally have interest rates which are reset daily, monthly, quarterly or semi-annually by reference to a base lending rate, plus a premium. These base rates are primarily the London-Interbank Offered Rate (“LIBOR”), and secondarily the prime rate offered by one or more major United States banks (the “Prime Rate”) and the certificate of deposit (“CD”) rate or other base lending rates used by commercial lenders. Loan commitments often require prepayments from excess cash flows or allow the borrower to repay at its election. The rate at which the borrower repays cannot be predicted with accuracy. Therefore, the remaining maturity may be considerably less than the stated maturity shown in the Schedule of Investments.
All or a portion of these loan commitments may be unfunded. A Fund is obligated to fund these commitments at the borrower’s discretion. Therefore, the Fund must have funds sufficient to cover its contractual obligation. These unfunded loan commitments, which are marked to market daily, are presented in the Schedule of Investments.
(R) Loss Contingencies – High Yield Fund and Income Fund are defendants in an adversary action filed on July 31, 2009 by the Official Committee of Unsecured Creditors of Motors Liquidation Company, formerly known as General Motors Corporation (GM), against prior and current holders of term loan debt of GM. The suit seeks to determine whether GM’s term loan facility was secured at the time it entered bankruptcy. High Yield Fund at one time held term loans in an original principal amount of at least $4,723,994 and, if the plaintiffs are successful, it is reasonably possible that the Fund will be required to make payments in some amount. This loss contingency has not been accrued as a liability because the amount of potential damages and the likelihood of loss cannot be reasonably estimated. Thrivent Income Fund is also named as a defendant in this action, but we do not expect that the Fund’s assets will be subject to a loss contingency.
(S) Litigation – Awards from class action litigation are recorded as realized gains on the payment date.
(T) Recent Accounting Pronouncements –
Fair Value Measurement (Topic 820), Disclosure for Investments in Certain Entities That Calculate Net Asset Value per Share (or Its Equivalent).
In May 2015, the Financial Accounting Standards Board (FASB) issued Accounting Standards Update (ASU No. 2015-07, Fair Value Measurement (Topic 820), Disclosure for Investments in Certain Entities That Calculate Net Asset Value
172
THRIVENT MUTUAL FUNDS
NOTESTO FINANCIAL STATEMENTS
October 31, 2016
per Share (or Its Equivalent). ASU No. 2015-07 changes the disclosure requirements for investments for which fair value is measured using the net asset value per share practical expedient. The disclosure requirements are effective for annual periods beginning after December 15, 2015 and interim periods within those fiscal years. Management has elected to early adopt ASU No. 2015-07. Management has evaluated the impact of this guidance and has determined there to be no impact to financial statement amounts. However, footnote disclosures related to investments valued using the net asset value per share practical expedient were increased within the Schedule of Investments Fair Valuation Measurement tables to meet the requirement of this guidance.
Investment Company Reporting Modernization.
In October 2016, the Securities and Exchange Commission (SEC) adopted new rules and forms to modernize the reporting and disclosure of information by registered investment companies. The SEC also adopted amendments to Regulation S-X, which describe the specific format and content of financial reports, to require standardized and enhanced disclosures about derivatives in investment company financial statements and other amendments. These amendments are effective August 1, 2017. At this time, management is evaluating the implications of this guidance and the impact it will have on the financial statements and footnote disclosures.
(U) Other – For financial statement purposes, investment security transactions are accounted for on the trade date. Realized gains and losses from investment transactions are determined on a specific cost identification basis, which is the same basis used for federal income tax purposes.
(3) FEES AND COMPENSATION PAID TO AFFILIATES
(A) Investment Advisory Fees – The Trust has entered into an Investment Advisory Agreement with Thrivent Asset Mgt. Under the Investment Advisory Agreement, each of the Funds pays a fee for investment advisory services. The fees are accrued daily and paid monthly.
The annual rates of fees as a percent of average daily net assets under the Investment Advisory Agreement were as follows:
| | | | | | | | | | | | | | | | | | | | |
| Fund (M – Millions) | | $0 to
$500M | | | Over
$500 to
$2,000M | | | Over
$2,000 to
$5,000M | | | Over
$5,000 to
$10,000M | | | Over
$10,000M | |
Aggressive Allocation | | | 0.750 | % | | | 0.725 | % | | | 0.700 | % | | | 0.675 | % | | | 0.650 | % |
Moderately Aggressive Allocation | | | 0.700 | % | | | 0.675 | % | | | 0.650 | % | | | 0.625 | % | | | 0.600 | % |
Moderate Allocation | | | 0.650 | % | | | 0.625 | % | | | 0.600 | % | | | 0.575 | % | | | 0.550 | % |
Moderately Conservative Allocation | | | 0.600 | % | | | 0.575 | % | | | 0.550 | % | | | 0.525 | % | | | 0.500 | % |
| | | | | | | | | | | | | | | | | | | | | | | | | | | | | | | | | | | | | | | | | | | | |
| Fund (M – Millions) | | $0 to
$50M | | | Over
$50 to
$100M | | | Over
$100 to
$200M | | | Over
$200 to
$250M | | | Over
$250 to
$500M | | | Over
$500 to
$750M | | | Over
$750 to
$1,000M | | | Over
$1,000 to
$2,000M | | | Over
$2,000 to
$2,500M | | | Over
$2,500 to
$5,000M | | | Over
$5,000M | |
Balanced Income Plus | | | 0.550 | % | | | 0.550 | % | | | 0.550 | % | | | 0.550 | % | | | 0.550 | % | | | 0.500 | % | | | 0.500 | % | | | 0.475 | % | | | 0.475 | % | | | 0.450 | % | | | 0.425 | % |
Opportunity Income Plus | | | 0.450 | % | | | 0.450 | % | | | 0.450 | % | | | 0.450 | % | | | 0.450 | % | | | 0.400 | % | | | 0.400 | % | | | 0.375 | % | | | 0.375 | % | | | 0.350 | % | | | 0.325 | % |
Partner Emerging Markets Equity | | | 1.200 | % | | | 1.070 | % | | | 1.070 | % | | | 1.070 | % | | | 1.070 | % | | | 1.070 | % | | | 1.070 | % | | | 1.070 | % | | | 1.070 | % | | | 1.070 | % | | | 1.070 | % |
Small Cap Stock | | | 0.700 | % | | | 0.700 | % | | | 0.700 | % | | | 0.650 | % | | | 0.650 | % | | | 0.650 | % | | | 0.650 | % | | | 0.600 | % | | | 0.600 | % | | | 0.550 | % | | | 0.525 | % |
Mid Cap Stock | | | 0.700 | % | | | 0.700 | % | | | 0.700 | % | | | 0.650 | % | | | 0.650 | % | | | 0.650 | % | | | 0.650 | % | | | 0.600 | % | | | 0.600 | % | | | 0.550 | % | | | 0.525 | % |
Partner Worldwide Allocation | | | 0.900 | % | | | 0.900 | % | | | 0.900 | % | | | 0.900 | % | | | 0.850 | % | | | 0.850 | % | | | 0.850 | % | | | 0.800 | % | | | 0.800 | % | | | 0.800 | % | | | 0.800 | % |
Large Cap Growth | | | 0.750 | % | | | 0.750 | % | | | 0.750 | % | | | 0.750 | % | | | 0.750 | % | | | 0.700 | % | | | 0.700 | % | | | 0.650 | % | | | 0.650 | % | | | 0.600 | % | | | 0.575 | % |
Large Cap Value | | | 0.450 | % | | | 0.450 | % | | | 0.450 | % | | | 0.450 | % | | | 0.450 | % | | | 0.450 | % | | | 0.450 | % | | | 0.450 | % | | | 0.450 | % | | | 0.450 | % | | | 0.450 | % |
Large Cap Stock | | | 0.650 | % | | | 0.650 | % | | | 0.650 | % | | | 0.650 | % | | | 0.650 | % | | | 0.575 | % | | | 0.575 | % | | | 0.500 | % | | | 0.475 | % | | | 0.450 | % | | | 0.425 | % |
High Yield | | | 0.400 | % | | | 0.400 | % | | | 0.400 | % | | | 0.400 | % | | | 0.400 | % | | | 0.350 | % | | | 0.350 | % | | | 0.300 | % | | | 0.300 | % | | | 0.300 | % | | | 0.300 | % |
Income | | | 0.350 | % | | | 0.350 | % | | | 0.350 | % | | | 0.350 | % | | | 0.350 | % | | | 0.325 | % | | | 0.325 | % | | | 0.300 | % | | | 0.300 | % | | | 0.300 | % | | | 0.300 | % |
Municipal Bond | | | 0.450 | % | | | 0.450 | % | | | 0.450 | % | | | 0.450 | % | | | 0.450 | % | | | 0.400 | % | | | 0.400 | % | | | 0.350 | % | | | 0.350 | % | | | 0.325 | % | | | 0.300 | % |
Government Bond | | | 0.400 | % | | | 0.400 | % | | | 0.400 | % | | | 0.400 | % | | | 0.400 | % | | | 0.350 | % | | | 0.350 | % | | | 0.350 | % | | | 0.350 | % | | | 0.350 | % | | | 0.350 | % |
Limited Maturity Bond | | | 0.300 | % | | | 0.300 | % | | | 0.300 | % | | | 0.300 | % | | | 0.300 | % | | | 0.275 | % | | | 0.275 | % | | | 0.250 | % | | | 0.250 | % | | | 0.250 | % | | | 0.250 | % |
Money Market* | | | 0.350 | % | | | 0.350 | % | | | 0.350 | % | | | 0.350 | % | | | 0.350 | % | | | 0.350 | % | | | 0.350 | % | | | 0.350 | % | | | 0.350 | % | | | 0.350 | % | | | 0.350 | % |
| * | Investment Advisory Fees were effective February 1, 2016. |
173
THRIVENT MUTUAL FUNDS
NOTESTO FINANCIAL STATEMENTS
October 31, 2016
(B) Sub-Adviser – The following subadviser fees are charged as part of the total investment advisory fees stated in the table above. The subadvisory fees are borne directly by the Adviser and do not increase the overall fees paid by the Fund.
Partner Emerging Markets Equity Fund
The Adviser has entered into a subadvisory agreement for the performance of subadvisory services with Aberdeen Asset Managers Limited (“Aberdeen”). The fee payable for Aberdeen is equal to 0.85% of the first $50 million of average daily net assets, 0.72% for the next $50 million and 0.68% for assets over $100 million. Thrivent Partner Emerging Markets Equity Portfolio, Thrivent Partner Worldwide Allocation Portfolio; each a series of Thrivent Series Fund, Inc., the shares of which are only available for purchase by separate accounts of and retirement plans sponsored by Thrivent Financial, and Thrivent Partner Worldwide Allocation Fund are included in determining breakpoints for the assets managed by Aberdeen.
Partner Worldwide Allocation Fund
The adviser has entered into subadvisory agreements with Principal Global Investors, LLC (“Principal”), Aberdeen Asset Managers Limited (“Aberdeen”) and Goldman Sachs Asset Management, L.P. (“GSAM”) for the performance of subadvisory services.
The fee payable for Principal is equal to 0.35% of the first $500 million of average daily net assets, 0.30% of the next $500 million and 0.25% of average daily net assets over $1 billion. Thrivent Partner Worldwide Allocation Portfolio is included in determining breakpoints for the assets managed by Principal.
The fee payable for Aberdeen is equal to 0.85% of the first $50 million of average daily net assets, 0.72% of the next $50 million and 0.68% of average daily net assets over $100 million. Thrivent Partner Worldwide Allocation Portfolio, Thrivent Partner Emerging Markets Equity Fund, and Thrivent Partner Emerging Markets Equity Portfolio are included in determining breakpoints for the assets managed by Aberdeen.
The fee payable for GSAM for managing the emerging markets debt portion is equal to 0.50% of the first $200 million of average daily net assets, 0.45% of the next $200 million and 0.40% of average daily net assets over $400 million. The fee payable for GSAM for managing the international small- and mid-cap equities portion is equal to 0.58% of the first $250 million of average daily net assets; and 0.54% of average daily net assets in excess of $250 million. Thrivent Partner Worldwide Allocation Portfolio is included in determining breakpoints for the assets managed by GSAM.
Effective February 22, 2016, the Adviser terminated the subadvisory agreement with Mercator Asset Management, LP (“Mercator”). Effective January 1, 2016, the fee payable for Mercator was equal to 0.70% of the first $25 million of average daily net assets, 0.60% of the next $25 million, 0.50% of the next $250 million, 0.40% of the next $200 million and 0.20% of average daily net assets over $500 million. Thrivent Partner Worldwide Allocation Portfolio was included in determining breakpoints for the assets managed by Mercator. From November 1, 2015 until December 31, 2015, the fee payable for Mercator was equal to 0.75% of the first $25 million of average daily net assets, 0.60% of the next $25 million, 0.55% of the next $25 million, 0.50% of the next $225 million, 0.40% of the next $200 million and 0.20% of average daily net assets over $500 million. Thrivent Partner Worldwide Allocation Portfolio was included in determining breakpoints for the assets managed by Mercator.
(C) Expense Reimbursements – For the period ended October 31, 2016, voluntary expense reimbursements, as a percentage of net assets, were in effect:
| | | | | | | | | | | | |
| Fund | | Class A | | | Class S | | | Expiration
Date | |
Money Market* | | | 0.44 | % | | | 0.09 | % | | | N/A | |
| * | Prior contractual expense reimbursement of 0.20% for Class A and 0.10% for Class S expired on January 31, 2016. Thrivent Asset Management has voluntarily agreed to reimburse certain class-specific and fund level expenses to the extent necessary in order to maintain a minimum annualized net yield of 0.00% for all classes of the Fund. |
For the period ended October 31, 2016, contractual expense reimbursements to limit expenses to the following percentages were in effect:
| | | | | | | | | | | | |
| Fund | | Class A | | | Class S | | | Expiration Date | |
Opportunity Income Plus | | | 0.90 | %1 | | | N/A | | | | 2/28/2017 | |
Partner Emerging Markets Equity | | | 1.65 | % | | | 1.32 | % | | | 2/28/2017 | |
Partner Worldwide Allocation | | | 1.40 | % | | | N/A | | | | 2/28/2017 | |
Large Cap Growth | | | 1.20 | % | | | N/A | | | | 2/28/2017 | |
Government Bond | | | 0.85 | %2 | | | N/A | | | | 2/28/2017 | |
| 1 | Prior expense cap of 0.85% expired on January 31, 2016. |
| 2 | Prior expense cap of 0.90% expired on January 31, 2016. |
Thrivent does not recoup amounts previously reimbursed or waived in prior fiscal years.
All Funds in the Trust except for Money Market Fund may invest cash in other Funds in the Trust, Thrivent Cash Management Trust, and Thrivent Core Short-Term Reserve Fund, subject to certain limitations. These related-party transactions are subject to the same terms as non-related party transactions. To avoid duplicate investment advisory fees, Thrivent Asset Mgt. reimburses an amount equal to any investment advisory fees indirectly incurred by the asset allocation, income plus, equity and fixed income funds as a result of their investment in any other mutual fund for which the Advisor or an affiliate serves as investment adviser, other than Thrivent Cash Management Trust and Thrivent Core Short-Term Reserve Fund.
174
THRIVENT MUTUAL FUNDS
NOTESTO FINANCIAL STATEMENTS
October 31, 2016
(D) Distribution Plan – Through December 31, 2015, Thrivent Investment Management, Inc. (“Thrivent Investment Mgt.”) was the Trust’s distributor. Effective January 1, 2016, Thrivent Distributors, LLC became the Trust’s distributor. The Trust has adopted a Distribution Plan pursuant to Rule 12b-1 under the 1940 Act. Class A shares generally have a Rule 12b-1 fee of up to 0.25% (up to 0.125% for Government Bond Fund, Limited Maturity Bond Fund and Money Market Fund) of average net assets.
(E) Sales Charges and Other Fees – For the year ended October 31, 2016, Thrivent Investment Mgt. and Thrivent Distributors, LLC received $4,457,742 of aggregate underwriting concessions from the sales of the Trust’s Class A shares. Sales charges are not an expense of the Trust and are not reflected in the financial statements of any of the Funds.
The Trust has entered into an accounting and administrative services agreement with Thrivent Asset Mgt. pursuant to which Thrivent Asset Mgt. provides certain accounting and administrative personnel and services to the Funds. For the year ended October 31, 2016, Thrivent Asset Mgt. received aggregate fees for accounting and administrative personnel and services of $4,178,315 from the Trust.
The Trust has entered into an agreement with Thrivent Financial Investor Services Inc. (“Thrivent Investor Services”) to provide the Funds with transfer agent services. For the year ended October 31, 2016, Thrivent Investor Services received $13,584,411 for transfer agent services from the Trust.
Each Trustee who is not affiliated with the Adviser receives an annual fee from the Trust for services as a Trustee and is eligible to participate in a deferred compensation plan with respect to fees received from the Funds. Participants in the plan may designate their deferred Trustee’s fees as if invested in a series of the Thrivent Mutual Funds. The value of each Trustee’s deferred compensation account will increase or decrease as if invested in shares of that series. Their fees as well as the change in value are included in Trustee fees in the Statement of Operations. The deferred fees remain in the appropriate Fund until distribution in accordance with the plan. The Payable for trustee deferred compensation, located in the Statement of Assets and Liabilities, is unsecured.
Those Trustees not participating in the above plan received $276,259 in fees from the Trust for the year ended October 31, 2016. In addition, the Trust reimbursed independent Trustees for reasonable expenses incurred in relation to attendance at meetings and industry conferences.
Certain officers and non-independent Trustees of the Trust are officers and directors of Thrivent Asset Mgt., Thrivent Investment Mgt. and Thrivent Investor Services; however, they receive no compensation from the Trust.
(F) Indirect Expenses – Some Funds invest in other open-ended funds. Fees and expenses of those underlying funds are not included in those Funds’ expense ratios reported in the Financial Highlights. The Funds indirectly bear their proportionate share of the annualized weighted average expense ratio of the underlying funds in which they invest. The Adviser has contractually agreed, for as long as the current fee structure is in place, to waive an amount equal to any investment advisory fees indirectly incurred by the Asset Allocation Funds as a result of their investment in any other mutual fund for which the Adviser or an affiliate serves as investment adviser, other than Thrivent Cash Management Trust and Thrivent Core Short-Term Reserve Fund. This contractual provision may be terminated upon the mutual agreement between the Independent Trustees of the Trust and the Adviser.
(4) TAX INFORMATION
Distributions are based on amounts calculated in accordance with the applicable federal income tax regulations, which may differ from GAAP. To the extent that these differences are permanent in nature, such amounts are reclassified within the capital accounts based on their federal tax-basis treatment; temporary differences do not require reclassifications.
On the Statement of Assets and Liabilities, as a result of permanent book-to-tax differences, reclassification adjustments were made as follows [Increase/(Decrease)]:
| | | | | | | | | | | | |
| Fund | | Accumulated
Undistributed
Net
Investment
Income/(Loss) | | | Accumulated
Undistributed
Net Realized
Gain/(Loss) | | | Capital Stock | |
Aggressive Allocation | | | $133,775 | | | | ($132,493 | ) | | | ($1,282 | ) |
Moderately Aggressive Allocation | | | 142,249 | | | | (640,579 | ) | | | 498,330 | |
Moderate Allocation | | | 15,057 | | | | (14,397 | ) | | | (660 | ) |
Moderately Conservative Allocation | | | (67,650 | ) | | | 67,898 | | | | (248 | ) |
Balanced Income Plus | | | (21,246 | ) | | | 165,705 | | | | (144,459 | ) |
Opportunity Income Plus | | | 30,812 | | | | (30,812 | ) | | | – | |
Partner Emerging Markets Equity | | | 1,293 | | | | (1,293 | ) | | | – | |
Small Cap Stock | | | (574,912 | ) | | | 306,112 | | | | 268,800 | |
Mid Cap Stock | | | 343,843 | | | | (790,244 | ) | | | 446,401 | |
Partner Worldwide Allocation | | | 471,289 | | | | 42,537,593 | | | | (43,008,882 | ) |
Large Cap Growth | | | 328,170 | | | | (1,044 | ) | | | (327,126 | ) |
Large Cap Value | | | (664,980 | ) | | | (635,008 | ) | | | 1,299,988 | |
Large Cap Stock | | | 751,451 | | | | (751,436 | ) | | | (15 | ) |
High Yield | | | 126,898 | | | | 5,109,244 | | | | (5,236,142 | ) |
Income | | | (243,105 | ) | | | 243,105 | | | | – | |
Government Bond | | | (3 | ) | | | 3 | | | | – | |
Limited Maturity Bond | | | (8,848 | ) | | | 8,848 | | | | – | |
175
THRIVENT MUTUAL FUNDS
NOTESTO FINANCIAL STATEMENTS
October 31, 2016
At October 31, 2016, the components of distributable earnings on a tax basis were as follows:
| | | | | | | | |
| Fund | | Undistributed
Ordinary Incomea | | | Undistributed Long-
Term Capital Gain | |
Aggressive Allocation | | | $850,692 | | | | $3,967,439 | |
Moderately Aggressive Allocation | | | 9,203,782 | | | | 21,083,067 | |
Moderate Allocation | | | 3,367,909 | | | | 9,748,629 | |
Moderately Conservative Allocation | | | 2,524,825 | | | | 5,221,680 | |
Balanced Income Plus | | | 496,869 | | | | – | |
Opportunity Income Plus | | | 21,550 | | | | – | |
Partner Emerging Markets Equity | | | 72,369 | | | | – | |
Small Cap Stock | | | 1,091,551 | | | | 20,852,915 | |
Mid Cap Stock | | | 2,027,106 | | | | 58,264,926 | |
Partner Worldwide Allocation | | | 15,467,748 | | | | – | |
Large Cap Growth | | | – | | | | 3,840,955 | |
Large Cap Value | | | 9,175,024 | | | | 27,002,013 | |
Large Cap Stock | | | 15,931,410 | | | | 45,029,778 | |
High Yield | | | 28,994 | | | | – | |
Income | | | 1,148,911 | | | | 70,033 | |
Municipal Bondb | | | 460,149 | | | | – | |
Government Bond | | | 31,237 | | | | 115,679 | |
Limited Maturity Bond | | | 47,486 | | | | – | |
| a | Undistributed Ordinary Income includes income derived from Short-Term Capital Gains. |
| b | Municipal Bond Fund undistributed ordinary income is primarily exempt from federal income taxes. |
At October 31, 2016, the following Funds had accumulated net realized capital loss carryovers expiring as follows:
| | | | | | | | |
| Fund | | Capital Loss
Carryover | | | Expiration
Year | |
Balanced Income Plus | | | $2,280,209 | | | | Unlimited | |
| | | | | | | | |
| | |
Opportunity Income Plus | | | 5,032,291 | | | | 2017 | |
| | | 6,738,129 | | | | Unlimited | |
| | | | | | | | |
| | | 11,770,420 | | | | | |
| | | | | | | | |
| | |
Partner Emerging Markets Equity | | | 1,877,957 | | | | Unlimited | |
| | | | | | | | |
| | |
Partner Worldwide Allocation | | | 6,799,658 | | | | 2017 | |
| | | 15,730,284 | | | | Unlimited | |
| | | | | | | | |
| | | 22,529,942 | | | | | |
| | | | | | | | |
| | |
Large Cap Stock | | | 8,364,062 | | | | Unlimited | |
| | | | | | | | |
| | |
High Yield | | | 30,243,630 | | | | 2017 | |
| | | 28,441,596 | | | | Unlimited | |
| | | | | | | | |
| | | 58,685,226 | | | | | |
| | | | | | | | |
| | |
Municipal Bond | | | 9,219,699 | | | | Unlimited | |
| | | | | | | | |
| | |
Limited Maturity Bond | | | 5,988,052 | | | | Unlimited | |
| | | | | | | | |
| | |
Money Market | | | 6,874 | | | | Unlimited | |
| | | | | | | | |
To the extent that these Funds realize future net capital gains, taxable distributions will be reduced by any unused capital loss carryovers as permitted by the Internal Revenue Code. Unlimited capital loss carryovers will be utilized before capital loss carryovers with expiration dates.
In addition to the capital loss carryovers noted above, $43,008,882 and $5,236,142 of capital loss carryovers in Partner Worldwide Allocation Fund and High Yield Fund respectively, expired during the fiscal year 2016.
The capital loss carryovers attributable to Large Cap Stock Fund were obtained as a result of the reorganization, as described in Note (1)(A), with Natural Resources Fund in August 2015. These losses are limited under the Internal Revenue Code as to future utilization.
During the fiscal year 2016, capital loss carryovers utilized by the Funds were as follows:
| | | | |
| Fund | | Capital Loss
Carryover | |
Large Cap Growth | | | 1,041,797 | |
Municipal Bond | | | 282,992 | |
The following funds deferred, on a tax basis, the following Late Year Ordinary Losses:
| | | | |
| Fund | | Ordinary Losses | |
Large Cap Growth | | | 62,525 | |
These amounts are deferred for tax purposes, and are deemed to occur on the first day of the following fiscal year.
176
THRIVENT MUTUAL FUNDS
NOTESTO FINANCIAL STATEMENTS
October 31, 2016
The tax character of distributions paid during the years ended October 31, 2016 and 2015 was as follows:
| | | | | | | | | | | | | | | | | | | | | | | | |
| | | Tax-Exempt Income | | | Ordinary Incomea | | | Long-Term Capital Gain | |
| Fund | | 10/31/16 | | | 10/31/15 | | | 10/31/16 | | | 10/31/15 | | | 10/31/16 | | | 10/31/15 | |
Aggressive Allocation | | | $ – | | | | $ – | | | | $8,083,429 | | | | $11,863,700 | | | | $58,835,863 | | | | $48,147,999 | |
Moderately Aggressive Allocation | | | – | | | | – | | | | 24,142,726 | | | | 34,660,059 | | | | 104,588,542 | | | | 65,808,402 | |
Moderate Allocation | | | – | | | | – | | | | 29,739,180 | | | | 37,352,320 | | | | 75,716,333 | | | | 44,683,677 | |
Moderately Conservative Allocation | | | – | | | | – | | | | 13,233,600 | | | | 17,301,554 | | | | 19,513,617 | | | | 12,077,436 | |
Balanced Income Plus | | | – | | | | – | | | | 7,398,953 | | | | 9,178,085 | | | | 13,422,699 | | | | 10,155,216 | |
Opportunity Income Plus | | | – | | | | – | | | | 15,428,958 | | | | 15,196,134 | | | | – | | | | – | |
Partner Emerging Markets Equity | | | – | | | | – | | | | 99,756 | | | | 183,380 | | | | – | | | | – | |
Small Cap Stock | | | – | | | | – | | | | 738,604 | | | | 4,356,331 | | | | 36,028,745 | | | | 32,385,230 | |
Mid Cap Stock | | | – | | | | – | | | | 2,818,377 | | | | 3,044,354 | | | | 135,812,902 | | | | 102,867,889 | |
Partner Worldwide Allocation | | | – | | | | – | | | | 16,586,523 | | | | 18,934,880 | | | | – | | | | – | |
Large Cap Growth | | | – | | | | – | | | | – | | | | 13,622 | | | | 36,450,230 | | | | 9,438,201 | |
Large Cap Value | | | – | | | | – | | | | 10,988,078 | | | | 9,863,437 | | | | 41,962,139 | | | | 27,086,235 | |
Large Cap Stock | | | – | | | | – | | | | 17,352,745 | | | | 33,901,603 | | | | 59,960,093 | | | | 130,091,269 | |
High Yield | | | – | | | | – | | | | 37,387,860 | | | | 41,558,409 | | | | – | | | | – | |
Income | | | – | | | | – | | | | 26,502,374 | | | | 28,779,807 | | | | 3,613,600 | | | | 3,747,743 | |
Municipal Bond | | | 53,399,868 | | | | 53,297,012 | | | | 374,155 | | | | 337,400 | | | | – | | | | – | |
Government Bond | | | – | | | | – | | | | 1,320,174 | | | | 1,235,501 | | | | 434,213 | | | | 293,911 | |
Limited Maturity Bond | | | – | | | | – | | | | 12,715,304 | | | | 12,303,104 | | | | – | | | | – | |
| (a) | Ordinary income includes income derived from short-term capital gains. |
(5) SECURITY TRANSACTIONS
(A) Purchases and Sales of Investment Securities – For the year ended October 31, 2016, the cost of purchases and the proceeds from sales of investment securities, other than U.S. Government and short-term securities, were as follows:
| | | | | | | | |
| | | In thousands | |
| Fund | | Purchases | | | Sales | |
Aggressive Allocation | | | $319,339 | | | | $333,289 | |
Moderately Aggressive Allocation | | | 642,124 | | | | 660,468 | |
Moderate Allocation | | | 579,471 | | | | 659,056 | |
Moderately Conservative Allocation | | | 213,853 | | | | 225,279 | |
Balanced Income Plus | | | 182,838 | | | | 177,880 | |
Opportunity Income Plus | | | 204,511 | | | | 180,188 | |
Partner Emerging Markets Equity | | | 1,048 | | | | 1,372 | |
Small Cap Stock | | | 250,228 | | | | 275,308 | |
Mid Cap Stock | | | 255,832 | | | | 347,382 | |
Partner Worldwide Allocation | | | 747,338 | | | | 793,618 | |
Large Cap Growth | | | 433,136 | | | | 429,467 | |
Large Cap Value | | | 169,951 | | | | 194,288 | |
Large Cap Stock | | | 892,181 | | | | 958,013 | |
High Yield | | | 276,456 | | | | 298,021 | |
Income | | | 335,653 | | | | 373,462 | |
Municipal Bond | | | 268,229 | | | | 155,866 | |
Government Bond | | | 1,000 | | | | 4,289 | |
Limited Maturity Bond | | | 203,251 | | | | 151,472 | |
Purchases and sales of U.S. Government securities were:
| | | | | | | | |
| | | In thousands | |
| Fund | | Purchases | | | Sales | |
Aggressive Allocation | | | $141,078 | | | | $133,734 | |
Moderately Aggressive Allocation | | | 1,091,559 | | | | 1,064,006 | |
Moderate Allocation | | | 1,929,833 | | | | 1,875,183 | |
Moderately Conservative Allocation | | | 1,176,739 | | | | 1,161,518 | |
Balanced Income Plus | | | 170,317 | | | | 168,040 | |
Opportunity Income Plus | | | 439,113 | | | | 441,197 | |
Partner Worldwide Allocation | | | 31,471 | | | | 36,781 | |
Income | | | 479,737 | | | | 464,376 | |
Government Bond | | | 86,406 | | | | 115,927 | |
Limited Maturity Bond | | | 441,643 | | | | 451,324 | |
(B) Investments in Restricted Securities – Certain Funds may own restricted securities which were purchased in private placement transactions without registration under the Securities Act of 1933. Unless such securities subsequently become registered, they generally may be resold only in privately negotiated transactions with a limited number of purchasers. As of October 31, 2016, the following Funds held restricted securities:
| | | | | | | | |
| Fund | | Number of
Securities | | | Percent of Fund’s
Net Assets | |
Moderately Aggressive Allocation | | | 40 | | | | 0.58 | % |
Moderate Allocation | | | 40 | | | | 0.98 | % |
Moderately Conservative Allocation | | | 39 | | | | 1.75 | % |
Balanced Income Plus | | | 15 | | | | 1.14 | % |
Opportunity Income Plus | | | 20 | | | | 2.76 | % |
Partner Worldwide Allocation | | | 13 | | | | 0.43 | % |
High Yield | | | 10 | | | | 1.84 | % |
Income | | | 2 | | | | 0.14 | % |
Municipal Bond | | | 2 | | | | 0.10 | % |
Limited Maturity Bond | | | 32 | | | | 8.89 | % |
The Funds have no right to require registration of unregistered securities.
(C) Investments in High-Yielding Securities – High Yield Fund invests primarily in high-yielding fixed-income securities. Each of the other Funds, except the Money Market Fund, may also invest in high-yielding securities. These securities will typically be in the lower rating categories or will be non-rated and generally will involve more risk than securities in the higher rating categories. Lower rated or unrated securities (e.g., junk bonds) are more likely to react to developments
177
THRIVENT MUTUAL FUNDS
NOTESTO FINANCIAL STATEMENTS
October 31, 2016
affecting market risk and credit risk than are more highly rated securities, which react primarily to movements in the general level of interest rates.
(D) Investments in Options and Futures Contracts – The movement in the price of the security underlying an option or futures contract may not correlate perfectly with the movement in the prices of the portfolio securities being hedged. A lack of correlation could render a Fund’s hedging strategy unsuccessful and could result in a loss to the Fund. In the event that a liquid secondary market would not exist, the Fund could be prevented from entering into a closing transaction, which could result in additional losses to the Fund.
(E) Written Option Contracts – During the year ended October 31, 2016, none of the Funds engaged in these types of investments.
(6) SECURITY TRANSACTIONS WITH AFFILIATED FUNDS
The Funds are permitted to purchase or sell securities from or to certain other Funds under specified conditions outlined in procedures adopted by the Board. The procedures have been designed to ensure that any purchase or sale of securities by a Fund from or to another fund or portfolio that is or could be considered an affiliate by virtue of having a common investment adviser (or affiliated investment advisers), common Trustees and/or common officers complies with Rule 17a-7 of the 1940 Act. Further, as defined under the procedures, each transaction is executed at the current market price. For the year ended October 31, 2016, Moderate Allocation Fund engaged in purchase transactions in the amount of $10,161,357 and sale transactions in the amount of $10,299,207, Opportunity Income Plus Fund engaged in purchase transactions in the amount of $5,566,426 and High Yield Fund engaged in sale transactions in the amount of $8,939,707 that complied with Rule 17a-7 of the 1940 Act. The sale transactions in Moderate Allocation Fund resulted in a net realized gain of $1,753,040 and the sale transactions in High Yield Fund resulted in net realized losses of $122,598.
(7) RELATED PARTY TRANSACTIONS
As of October 31, 2016, related parties (other than the Thrivent Asset Allocation Funds) held the following shares in excess of 5% of Thrivent Mutual Funds:
| | | | | | | | |
| Fund | | Shares | | | Percent of Fund’s
Outstanding
Shares | |
Opportunity Income Plus | | | 2,696,242 | | | | 6.3 | % |
Partner Emerging Markets Equity | | | 374,351 | | | | 29.4 | % |
Partner Worldwide Allocation | | | 11,238,174 | | | | 14.4 | % |
Government Bond | | | 3,556,032 | | | | 64.9 | % |
As of October 31, 2016, retirement plans sponsored by Thrivent Financial for Lutherans held the following shares in excess of 5% of Thrivent Mutual Funds:
| | | | | | | | |
| Fund | | Shares | | | Percent of Fund’s
Outstanding
Shares | |
Aggressive Allocation | | | 8,544,520 | | | | 12.9 | % |
Moderately Aggressive Allocation | | | 8,852,659 | | | | 5.8 | % |
Balanced Income Plus | | | 3,718,679 | | | | 15.3 | % |
Income | | | 6,935,840 | | | | 7.8 | % |
(8) MONEY MARKET FUND REGULATORY REFORM
On July 23, 2014, the Securities and Exchange Commission adopted amendments to Rule 2a-7 under the Investment Company Act of 1940 – which is the primary rule governing the operation of money market funds. In connection with the amendments to Rule 2a-7, the Board of Trustees of Thrivent Money Market Fund (the “Fund”) approved changes to the Fund’s principal investment strategies to allow the Fund to qualify and begin operating as a “government money market fund,” effective February 1, 2016. As such, the Fund invests at least 99.5% of its total assets in government securities, cash, and repurchase agreements collateralized fully by government securities or cash.
(9) SUBSEQUENT EVENTS
The Adviser of the Funds has evaluated the impact of subsequent events through December 20, 2016, and, except as already included in the Notes to Financial Statements and in the next paragraph, has determined that no additional items require disclosure.
During November 2016, a single investor invested $1.9 million in Thrivent Partner Emerging Markets Equity Fund. This amount represented approximately 15% of the net assets of the Fund as of the date of the investment. In the event of significant redemption activity by a single investor or few large investors, the Fund could experience a loss when selling portfolio securities to meet such redemption requests. The Fund could be forced to sell portfolio securities at unfavorable prices in an effort to generate sufficient cash to pay redeeming shareholders.
(10) MARKET RISK
Over time, securities markets generally tend to move in cycles with periods when security prices rise and periods when security prices decline. The value of a Fund’s investments may move with these cycles and, in some instances, increase or decrease more than the applicable market(s) as measured by the Fund’s benchmark index(es). The securities markets may also decline because of factors that affect a particular industry. As of October 31, 2016, Large Cap Growth Fund had portfolio concentration greater than 30% in the Information Technology sector.
178
(This page intentionally left blank)
179
THRIVENT MUTUAL FUNDS
FINANCIAL HIGHLIGHTS
| | | | | | | | | | | | | | | | | | | | | | | | |
| |
| | | FOR A SHARE OUTSTANDING THROUGHOUT EACH PERIOD* | |
| | | | | | Income from Investment Operations | | | Less Distributions From | |
| | | Net Asset
Value,
Beginning of
Period | | | Net
Investment
Income/(Loss) | | |
Net Realized
and
Unrealized
Gain/(Loss) on
Investments(a) | | | Total from
Investment
Operations | | | Net
Investment
Income | | | Net Realized
Gain on
Investments | |
AGGRESSIVE ALLOCATION FUND | | | | | | | | | | | | | | | | | | | | | | | | |
Class A Shares | | | | | | | | | | | | | | | | | | | | | | | | |
Year Ended 10/31/2016 | | | $14.05 | | | | $0.07 | | | | $0.08 | | | | $0.15 | | | | $(0.03 | ) | | | $(1.06 | ) |
Year Ended 10/31/2015 | | | 14.77 | | | | 0.04 | | | | 0.33 | | | | 0.37 | | | | (0.07 | ) | | | (1.02 | ) |
Year Ended 10/31/2014 | | | 14.15 | | | | 0.05 | | | | 1.21 | | | | 1.26 | | | | (0.10 | ) | | | (0.54 | ) |
Year Ended 10/31/2013 | | | 11.54 | | | | 0.07 | | | | 2.73 | | | | 2.80 | | | | (0.09 | ) | | | (0.10 | ) |
Year Ended 10/31/2012 | | | 10.70 | | | | 0.04 | | | | 0.85 | | | | 0.89 | | | | (0.05 | ) | | | – | |
| | | | | | |
Class S Shares | | | | | | | | | | | | | | | | | | | | | | | | |
Year Ended 10/31/2016 | | | 14.19 | | | | 0.10 | | | | 0.11 | | | | 0.21 | | | | (0.09 | ) | | | (1.06 | ) |
Year Ended 10/31/2015 | | | 14.90 | | | | 0.09 | | | | 0.35 | | | | 0.44 | | | | (0.13 | ) | | | (1.02 | ) |
Year Ended 10/31/2014 | | | 14.27 | | | | 0.10 | | | | 1.23 | | | | 1.33 | | | | (0.16 | ) | | | (0.54 | ) |
Year Ended 10/31/2013 | | | 11.64 | | | | 0.12 | | | | 2.75 | | | | 2.87 | | | | (0.14 | ) | | | (0.10 | ) |
Year Ended 10/31/2012 | | | 10.78 | | | | 0.09 | | | | 0.86 | | | | 0.95 | | | | (0.09 | ) | | | – | |
MODERATELY AGGRESSIVE ALLOCATION FUND | |
Class A Shares | | | | | | | | | | | | | | | | | | | | | | | | |
Year Ended 10/31/2016 | | | 13.73 | | | | 0.13 | | | | 0.15 | | | | 0.28 | | | | (0.09 | ) | | | (0.81 | ) |
Year Ended 10/31/2015 | | | 14.17 | | | | 0.11 | | | | 0.20 | | | | 0.31 | | | | (0.15 | ) | | | (0.60 | ) |
Year Ended 10/31/2014 | | | 13.69 | | | | 0.12 | | | | 0.97 | | | | 1.09 | | | | (0.16 | ) | | | (0.45 | ) |
Year Ended 10/31/2013 | | | 11.64 | | | | 0.15 | | | | 2.16 | | | | 2.31 | | | | (0.17 | ) | | | (0.09 | ) |
Year Ended 10/31/2012 | | | 10.83 | | | | 0.11 | | | | 0.84 | | | | 0.95 | | | | (0.14 | ) | | | – | |
| | | | | | |
Class S Shares | | | | | | | | | | | | | | | | | | | | | | | | |
Year Ended 10/31/2016 | | | 13.86 | | | | 0.14 | | | | 0.18 | | | | 0.32 | | | | (0.14 | ) | | | (0.81 | ) |
Year Ended 10/31/2015 | | | 14.29 | | | | 0.16 | | | | 0.21 | | | | 0.37 | | | | (0.20 | ) | | | (0.60 | ) |
Year Ended 10/31/2014 | | | 13.79 | | | | 0.17 | | | | 0.98 | | | | 1.15 | | | | (0.20 | ) | | | (0.45 | ) |
Year Ended 10/31/2013 | | | 11.73 | | | | 0.20 | | | | 2.17 | | | | 2.37 | | | | (0.22 | ) | | | (0.09 | ) |
Year Ended 10/31/2012 | | | 10.92 | | | | 0.16 | | | | 0.83 | | | | 0.99 | | | | (0.18 | ) | | | – | |
MODERATE ALLOCATION FUND | | | | | | | | | | | | | | | | | | | | | | | | |
Class A Shares | | | | | | | | | | | | | | | | | | | | | | | | |
Year Ended 10/31/2016 | | | 12.90 | | | | 0.16 | | | | 0.20 | | | | 0.36 | | | | (0.15 | ) | | | (0.59 | ) |
Year Ended 10/31/2015 | | | 13.26 | | | | 0.16 | | | | 0.08 | | | | 0.24 | | | | (0.18 | ) | | | (0.42 | ) |
Year Ended 10/31/2014 | | | 12.88 | | | | 0.17 | | | | 0.73 | | | | 0.90 | | | | (0.20 | ) | | | (0.32 | ) |
Year Ended 10/31/2013 | | | 11.55 | | | | 0.18 | | | | 1.48 | | | | 1.66 | | | | (0.19 | ) | | | (0.14 | ) |
Year Ended 10/31/2012 | | | 10.80 | | | | 0.16 | | | | 0.77 | | | | 0.93 | | | | (0.17 | ) | | | (0.01 | ) |
| | | | | | |
Class S Shares | | | | | | | | | | | | | | | | | | | | | | | | |
Year Ended 10/31/2016 | | | 12.94 | | | | 0.19 | | | | 0.20 | | | | 0.39 | | | | (0.19 | ) | | | (0.59 | ) |
Year Ended 10/31/2015 | | | 13.29 | | | | 0.21 | | | | 0.08 | | | | 0.29 | | | | (0.22 | ) | | | (0.42 | ) |
Year Ended 10/31/2014 | | | 12.91 | | | | 0.21 | | | | 0.73 | | | | 0.94 | | | | (0.24 | ) | | | (0.32 | ) |
Year Ended 10/31/2013 | | | 11.57 | | | | 0.22 | | | | 1.49 | | | | 1.71 | | | | (0.23 | ) | | | (0.14 | ) |
Year Ended 10/31/2012 | | | 10.82 | | | | 0.20 | | | | 0.77 | | | | 0.97 | | | | (0.21 | ) | | | (0.01 | ) |
| (a) | The amount shown may not correlate with the change in aggregate gains and losses of portfolio securities due to the timing of sales and redemptions of fund shares. |
| (b) | Total investment return assumes dividend reinvestment and does not reflect any deduction for applicable sales charges. Not annualized for periods less than one year. |
| * | All per share amounts have been rounded to the nearest cent. |
| ** | Computed on an annualized basis for periods less than one year. |
The accompanying Notes to Financial Statements are an integral part of this statement.
180
THRIVENT MUTUAL FUNDS
FINANCIAL HIGHLIGHTS –CONTINUED
| | | | | | | | | | | | | | | | | | | | | | |
| | | RATIOS/SUPPLEMENTAL DATA |
| | | | | | | | | | | | Ratio to Average Net
Assets** | | Ratios to Average Net
Assets Before Expenses
Waived, Credited or Paid
Indirectly** | | |
Total Distributions | |
Net Asset Value, End of
Period | | | Total
Return(b) | | | Net Assets,
End of Period
(in millions) | | | Expenses | | Net Investment Income/(Loss) | | Expenses | | Net Investment
Income/(Loss) | | Portfolio
Turnover Rate |
| | | | | | | | | | | | | | | | | | | | | | |
| | | | | | | | | | | | | | | | | | | | | | |
$(1.09) | | | $13.11 | | | | 1.34% | | | | $730.0 | | | 0.94% | | 0.50% | | 1.21% | | 0.23% | | 57% |
(1.09) | | | 14.05 | | | | 2.78% | | | | 732.0 | | | 0.92% | | 0.23% | | 0.96% | | 0.19% | | 51% |
(0.64) | | | 14.77 | | | | 9.34% | | | | 687.6 | | | 0.81% | | 0.30% | | 0.81% | | 0.30% | | 51% |
(0.19) | | | 14.15 | | | | 24.64% | | | | 612.4 | | | 0.81% | | 0.52% | | 0.82% | | 0.51% | | 44% |
(0.05) | | | 11.54 | | | | 8.42% | | | | 494.3 | | | 0.82% | | 0.33% | | 0.86% | | 0.29% | | 66% |
| | | | | | | | |
| | | | | | | | | | | | | | | | | | | | | | |
(1.15) | | | 13.25 | | | | 1.76% | | | | 140.9 | | | 0.56% | | 0.86% | | 0.83% | | 0.59% | | 57% |
(1.15) | | | 14.19 | | | | 3.21% | | | | 120.3 | | | 0.49% | | 0.65% | | 0.54% | | 0.61% | | 51% |
(0.70) | | | 14.90 | | | | 9.73% | | | | 112.3 | | | 0.41% | | 0.70% | | 0.41% | | 0.70% | | 51% |
(0.24) | | | 14.27 | | | | 25.11% | | | | 94.6 | | | 0.40% | | 0.96% | | 0.40% | | 0.96% | | 44% |
(0.09) | | | 11.64 | | | | 8.94% | | | | 81.2 | | | 0.42% | | 0.73% | | 0.42% | | 0.73% | | 66% |
| | | | | | | | | | | | | | | | | | | | | | |
| | | | | | | | | | | | | | | | | | | | | | |
(0.90) | | | 13.11 | | | | 2.36% | | | | 1,809.6 | | | 0.82% | | 1.01% | | 1.10% | | 0.73% | | 90% |
(0.75) | | | 13.73 | | | | 2.34% | | | | 1,814.6 | | | 0.81% | | 0.81% | | 0.85% | | 0.76% | | 66% |
(0.61) | | | 14.17 | | | | 8.29% | | | | 1,746.7 | | | 0.76% | | 0.85% | | 0.76% | | 0.85% | | 61% |
(0.26) | | | 13.69 | | | | 20.28% | | | | 1,558.9 | | | 0.72% | | 1.15% | | 0.74% | | 1.13% | | 51% |
(0.14) | | | 11.64 | | | | 8.92% | | | | 1,268.2 | | | 0.77% | | 0.99% | | 0.77% | | 0.99% | | 78% |
| | | | | | | | |
| | | | | | | | | | | | | | | | | | | | | | |
(0.95) | | | 13.23 | | | | 2.66% | | | | 191.0 | | | 0.49% | | 1.28% | | 0.77% | | 1.00% | | 90% |
(0.80) | | | 13.86 | | | | 2.75% | | | | 125.5 | | | 0.42% | | 1.19% | | 0.47% | | 1.14% | | 66% |
(0.65) | | | 14.29 | | | | 8.73% | | | | 120.3 | | | 0.39% | | 1.22% | | 0.39% | | 1.22% | | 61% |
(0.31) | | | 13.79 | | | | 20.66% | | | | 107.5 | | | 0.35% | | 1.50% | | 0.35% | | 1.50% | | 51% |
(0.18) | | | 11.73 | | | | 9.29% | | | | 90.2 | | | 0.37% | | 1.39% | | 0.37% | | 1.39% | | 78% |
| | | | | | | | | | | | | | | | | | | | | | |
| | | | | | | | | | | | | | | | | | | | | | |
(0.74) | | | 12.52 | | | | 3.06% | | | | 1,682.9 | | | 0.81% | | 1.31% | | 1.02% | | 1.10% | | 138% |
(0.60) | | | 12.90 | | | | 1.93% | | | | 1,706.5 | | | 0.76% | | 1.25% | | 0.81% | | 1.21% | | 107% |
(0.52) | | | 13.26 | | | | 7.22% | | | | 1,683.8 | | | 0.72% | | 1.29% | | 0.72% | | 1.29% | | 73% |
(0.33) | | | 12.88 | | | | 14.74% | | | | 1,541.3 | | | 0.68% | | 1.51% | | 0.70% | | 1.48% | | 85% |
(0.18) | | | 11.55 | | | | 8.68% | | | | 1,316.5 | | | 0.71% | | 1.47% | | 0.71% | | 1.47% | | 94% |
| | | | | | | | |
| | | | | | | | | | | | | | | | | | | | | | |
(0.78) | | | 12.55 | | | | 3.31% | | | | 179.0 | | | 0.49% | | 1.56% | | 0.71% | | 1.35% | | 138% |
(0.64) | | | 12.94 | | | | 2.36% | | | | 108.3 | | | 0.41% | | 1.60% | | 0.46% | | 1.55% | | 107% |
(0.56) | | | 13.29 | | | | 7.56% | | | | 89.0 | | | 0.38% | | 1.62% | | 0.38% | | 1.62% | | 73% |
(0.37) | | | 12.91 | | | | 15.18% | | | | 75.2 | | | 0.35% | | 1.83% | | 0.35% | | 1.83% | | 85% |
(0.22) | | | 11.57 | | | | 9.05% | | | | 66.0 | | | 0.35% | | 1.83% | | 0.35% | | 1.83% | | 94% |
The accompanying Notes to Financial Statements are an integral part of this statement.
181
THRIVENT MUTUAL FUNDS
FINANCIAL HIGHLIGHTS –CONTINUED
| | | | | | | | | | | | | | | | | | | | | | | | |
| | | FOR A SHARE OUTSTANDING THROUGHOUT EACH PERIOD* | |
| | | | | | Income from Investment Operations | | | Less Distributions From | |
| | | Net Asset
Value,
Beginning of
Period | | | Net
Investment
Income/(Loss) | | |
Net Realized
and Unrealized
Gain/(Loss) on
Investments(a) | | | Total from
Investment
Operations | | | Net
Investment
Income | | | Net Realized
Gain on
Investments | |
MODERATELY CONSERVATIVE ALLOCATION FUND | | | | | | | | | | | | | | | | | |
Class A Shares | | | | | | | | | | | | | | | | | | | | | | | | |
Year Ended 10/31/2016 | | | $11.88 | | | | $0.20 | | | | $0.21 | | | | $0.41 | | | | $(0.18) | | | | $(0.33) | |
Year Ended 10/31/2015 | | | 12.19 | | | | 0.18 | | | | (0.03) | | | | 0.15 | | | | (0.20) | | | | (0.26) | |
Year Ended 10/31/2014 | | | 11.98 | | | | 0.20 | | | | 0.48 | | | | 0.68 | | | | (0.21) | | | | (0.26) | |
Year Ended 10/31/2013 | | | 11.34 | | | | 0.20 | | | | 0.83 | | | | 1.03 | | | | (0.20) | | | | (0.19) | |
Year Ended 10/31/2012 | | | 10.75 | | | | 0.19 | | | | 0.65 | | | | 0.84 | | | | (0.19) | | | | (0.06) | |
| | | | | | |
Class S Shares | | | | | | | | | | | | | | | | | | | | | | | | |
Year Ended 10/31/2016 | | | 11.91 | | | | 0.22 | | | | 0.24 | | | | 0.46 | | | | (0.22) | | | | (0.33) | |
Year Ended 10/31/2015 | | | 12.22 | | | | 0.23 | | | | (0.04) | | | | 0.19 | | | | (0.24) | | | | (0.26) | |
Year Ended 10/31/2014 | | | 12.01 | | | | 0.24 | | | | 0.48 | | | | 0.72 | | | | (0.25) | | | | (0.26) | |
Year Ended 10/31/2013 | | | 11.37 | | | | 0.23 | | | | 0.83 | | | | 1.06 | | | | (0.23) | | | | (0.19) | |
Year Ended 10/31/2012 | | | 10.78 | | | | 0.22 | | | | 0.65 | | | | 0.87 | | | | (0.22) | | | | (0.06) | |
BALANCED INCOME PLUS FUND | | | | | | | | | | | | | | | | | |
Class A Shares | | | | | | | | | | | | | | | | | | | | | | | | |
Year Ended 10/31/2016 | | | 12.80 | | | | 0.30 | | | | 0.03 | | | | 0.33 | | | | (0.29) | | | | (0.62) | |
Year Ended 10/31/2015 | | | 13.43 | | | | 0.31 | | | | (0.04) | | | | 0.27 | | | | (0.29) | | | | (0.61) | |
Year Ended 10/31/2014 | | | 14.21 | | | | 0.24 | | | | 0.72 | | | | 0.96 | | | | (0.22) | | | | (1.52) | |
Year Ended 10/31/2013 | | | 12.63 | | | | 0.14 | | | | 2.24 | | | | 2.38 | | | | (0.15) | | | | (0.65) | |
Year Ended 10/31/2012 | | | 12.11 | | | | 0.13 | | | | 0.83 | | | | 0.96 | | | | (0.13) | | | | (0.31) | |
| | | | | | |
Class S Shares | | | | | | | | | | | | | | | | | | | | | | | | |
Year Ended 10/31/2016 | | | 12.77 | | | | 0.34 | | | | 0.04 | | | | 0.38 | | | | (0.33) | | | | (0.62) | |
Year Ended 10/31/2015 | | | 13.40 | | | | 0.36 | | | | (0.03) | | | | 0.33 | | | | (0.35) | | | | (0.61) | |
Year Ended 10/31/2014 | | | 14.19 | | | | 0.30 | | | | 0.70 | | | | 1.00 | | | | (0.27) | | | | (1.52) | |
Year Ended 10/31/2013 | | | 12.61 | | | | 0.20 | | | | 2.24 | | | | 2.44 | | | | (0.20) | | | | (0.66) | |
Year Ended 10/31/2012 | | | 12.09 | | | | 0.19 | | | | 0.82 | | | | 1.01 | | | | (0.18) | | | | (0.31) | |
OPPORTUNITY INCOME PLUS FUND | | | | | | | | | | | | | | | | | |
Class A Shares | | | | | | | | | | | | | | | | | | | | | | | | |
Year Ended 10/31/2016 | | | 10.05 | | | | 0.36 | | | | 0.19 | | | | 0.55 | | | | (0.37) | | | | – | |
Year Ended 10/31/2015 | | | 10.38 | | | | 0.38 | | | | (0.33) | | | | 0.05 | | | | (0.38) | | | | – | |
Year Ended 10/31/2014 | | | 10.32 | | | | 0.36 | | | | 0.06 | | | | 0.42 | | | | (0.36) | | | | – | |
Year Ended 10/31/2013 | | | 10.70 | | | | 0.26 | | | | (0.39) | | | | (0.13) | | | | (0.25) | | | | – | |
Year Ended 10/31/2012 | | | 10.19 | | | | 0.26 | | | | 0.50 | | | | 0.76 | | | | (0.25) | | | | – | |
| | | | | | |
Class S Shares | | | | | | | | | | | | | | | | | | | | | | | | |
Year Ended 10/31/2016 | | | 10.05 | | | | 0.39 | | | | 0.18 | | | | 0.57 | | | | (0.39) | | | | – | |
Year Ended 10/31/2015 | | | 10.38 | | | | 0.40 | | | | (0.33) | | | | 0.07 | | | | (0.40) | | | | – | |
Year Ended 10/31/2014 | | | 10.32 | | | | 0.39 | | | | 0.05 | | | | 0.44 | | | | (0.38) | | | | – | |
Year Ended 10/31/2013 | | | 10.71 | | | | 0.29 | | | | (0.40) | | | | (0.11) | | | | (0.28) | | | | – | |
Year Ended 10/31/2012 | | | 10.19 | | | | 0.30 | | | | 0.51 | | | | 0.81 | | | | (0.29) | | | | – | |
The accompanying Notes to Financial Statements are an integral part of this statement.
182
THRIVENT MUTUAL FUNDS
FINANCIAL HIGHLIGHTS –CONTINUED
| | | | | | | | | | | | | | | | | | | | | | | | | | | | | | | | |
| | | RATIOS/SUPPLEMENTAL DATA | |
| | | | | | | | | | | | Ratio to Average Net
Assets** | | | Ratios to Average Net
Assets Before Expenses
Waived, Credited or Paid
Indirectly** | | | | |
Total Distributions | |
Net Asset
Value, End of
Period | | | Total
Return(b) | | | Net Assets,
End of Period
(in millions) | | | Expenses | | | Net Investment Income/(Loss) | | | Expenses | | | Net Investment
Income/(Loss) | | | Portfolio
Turnover Rate | |
| | | | | | | | | | | | | | | | | | | | | | | | | | | | | | | | |
| | | | | | | | | | | | | | | | | | | | | | | | | | | | | | | | |
$(0.51) | | | $11.78 | | | | 3.65% | | | | $703.3 | | | | 0.84% | | | | 1.69% | | | | 0.99% | | | | 1.54% | | | | 181% | |
(0.46) | | | 11.88 | | | | 1.32% | | | | 716.6 | | | | 0.80% | | | | 1.54% | | | | 0.83% | | | | 1.52% | | | | 187% | |
(0.47) | | | 12.19 | | | | 5.86% | | | | 731.4 | | | | 0.77% | | | | 1.64% | | | | 0.77% | | | | 1.64% | | | | 140% | |
(0.39) | | | 11.98 | | | | 9.32% | | | | 701.3 | | | | 0.71% | | | | 1.70% | | | | 0.75% | | | | 1.67% | | | | 166% | |
(0.25) | | | 11.34 | | | | 7.92% | | | | 632.9 | | | | 0.75% | | | | 1.70% | | | | 0.75% | | | | 1.70% | | | | 145% | |
| | | | | | | | |
| | | | | | | | | | | | | | | | | | | | | | | | | | | | | | | | |
(0.55) | | | 11.82 | | | | 4.05% | | | | 69.4 | | | | 0.53% | | | | 1.95% | | | | 0.69% | | | | 1.80% | | | | 181% | |
(0.50) | | | 11.91 | | | | 1.66% | | | | 37.5 | | | | 0.46% | | | | 1.87% | | | | 0.49% | | | | 1.84% | | | | 187% | |
(0.51) | | | 12.22 | | | | 6.20% | | | | 32.3 | | | | 0.44% | | | | 1.97% | | | | 0.44% | | | | 1.97% | | | | 140% | |
(0.42) | | | 12.01 | | | | 9.62% | | | | 31.7 | | | | 0.41% | | | | 2.01% | | | | 0.41% | | | | 2.01% | | | | 166% | |
(0.28) | | | 11.37 | | | | 8.26% | | | | 28.0 | | | | 0.41% | | | | 2.03% | | | | 0.41% | | | | 2.03% | | | | 145% | |
| | | | | | | | | | | | | | | | | | | | | | | | | | | | | | | | |
| | | | | | | | | | | | | | | | | | | | | | | | | | | | | | | | |
(0.91) | | | 12.22 | | | | 2.83% | | | | 231.8 | | | | 1.07% | | | | 2.52% | | | | 1.07% | | | | 2.52% | | | | 120% | |
(0.90) | | | 12.80 | | | | 2.18% | | | | 232.8 | | | | 1.06% | | | | 2.38% | | | | 1.06% | | | | 2.38% | | | | 148% | |
(1.74) | | | 13.43 | | | | 7.60% | | | | 222.1 | | | | 1.06% | | | | 1.85% | | | | 1.06% | | | | 1.85% | | | | 124% | |
(0.80) | | | 14.21 | | | | 19.95% | | | | 167.8 | | | | 1.09% | | | | 1.08% | | | | 1.10% | | | | 1.08% | | | | 236% | |
(0.44) | | | 12.63 | | | | 8.22% | | | | 141.0 | | | | 1.11% | | | | 1.06% | | | | 1.12% | | | | 1.06% | | | | 197% | |
| | | | | | | | |
| | | | | | | | | | | | | | | | | | | | | | | | | | | | | | | | |
(0.95) | | | 12.20 | | | | 3.30% | | | | 65.6 | | | | 0.70% | | | | 2.88% | | | | 0.70% | | | | 2.88% | | | | 120% | |
(0.96) | | | 12.77 | | | | 2.58% | | | | 54.4 | | | | 0.67% | | | | 2.77% | | | | 0.67% | | | | 2.77% | | | | 148% | |
(1.79) | | | 13.40 | | | | 7.95% | | | | 54.9 | | | | 0.66% | | | | 2.24% | | | | 0.66% | | | | 2.24% | | | | 124% | |
(0.86) | | | 14.19 | | | | 20.49% | | | | 54.7 | | | | 0.66% | | | | 1.52% | | | | 0.67% | | | | 1.51% | | | | 236% | |
(0.49) | | | 12.61 | | | | 8.72% | | | | 49.9 | | | | 0.66% | | | | 1.52% | | | | 0.67% | | | | 1.51% | | | | 197% | |
| | | | | | | | | | | | | | | | | | | | | | | | | | | | | | | | |
| | | | | | | | | | | | | | | | | | | | | | | | | | | | | | | | |
(0.37) | | | 10.23 | | | | 5.60% | | | | 258.4 | | | | 0.89% | | | | 3.65% | | | | 0.92% | | | | 3.62% | | | | 147% | |
(0.38) | | | 10.05 | | | | 0.47% | | | | 265.3 | | | | 0.85% | | | | 3.70% | | | | 0.94% | | | | 3.61% | | | | 165% | |
(0.36) | | | 10.38 | | | | 4.13% | | | | 271.1 | | | | 0.85% | | | | 3.48% | | | | 0.95% | | | | 3.38% | | | | 169% | |
(0.25) | | | 10.32 | | | | (1.26)% | | | | 228.4 | | | | 0.85% | | | | 2.42% | | | | 0.94% | | | | 2.33% | | | | 387% | |
(0.25) | | | 10.70 | | | | 7.59% | | | | 249.2 | | | | 0.85% | | | | 2.53% | | | | 0.94% | | | | 2.44% | | | | 355% | |
| | | | | | | | |
| | | | | | | | | | | | | | | | | | | | | | | | | | | | | | | | |
(0.39) | | | 10.23 | | | | 5.84% | | | | 178.2 | | | | 0.66% | | | | 3.88% | | | | 0.66% | | | | 3.88% | | | | 147% | |
(0.40) | | | 10.05 | | | | 0.69% | | | | 142.0 | | | | 0.63% | | | | 3.92% | | | | 0.63% | | | | 3.92% | | | | 165% | |
(0.38) | | | 10.38 | | | | 4.35% | | | | 113.1 | | | | 0.64% | | | | 3.72% | | | | 0.64% | | | | 3.72% | | | | 169% | |
(0.28) | | | 10.32 | | | | (1.04)% | | | | 24.8 | | | | 0.53% | | | | 2.58% | | | | 0.55% | | | | 2.56% | | | | 387% | |
(0.29) | | | 10.71 | | | | 8.03% | | | | 37.0 | | | | 0.53% | | | | 2.93% | | | | 0.54% | | | | 2.91% | | | | 355% | |
The accompanying Notes to Financial Statements are an integral part of this statement.
183
THRIVENT MUTUAL FUNDS
FINANCIAL HIGHLIGHTS –CONTINUED
| | | | | | | | | | | | | | | | | | | | | | | | | | | | | | |
| | | FOR A SHARE OUTSTANDING THROUGHOUT EACH PERIOD* |
| | | | | Income from Investment Operations | | Less Distributions From |
| | | Net Asset
Value,
Beginning of
Period | | Net
Investment
Income/(Loss) | |
Net Realized
and Unrealized
Gain/(Loss) on
Investments(a) | | Total from
Investment
Operations | | Net
Investment
Income | | Net Realized
Gain on
Investments |
PARTNER EMERGING MARKETS EQUITY FUND | | | | | | | | | | | | | | | | | | | | | | | | | | | | | | |
Class A Shares | | | | | | | | | | | | | | | | | | | | | | | | | | | | | | |
Year Ended 10/31/2016 | | | | $7.66 | | | | | $0.06 | | | | | $0.80 | | | | | $0.86 | | | | | $(0.08) | | | | | $ – | |
Year Ended 10/31/2015 | | | | 9.45 | | | | | 0.08 | | | | | (1.74 | ) | | | | (1.66 | ) | | | | (0.13 | ) | | | | – | |
Year Ended 10/31/2014 | | | | 10.51 | | | | | 0.14 | | | | | (1.10 | ) | | | | (0.96 | ) | | | | (0.10 | ) | | | | – | |
Year Ended 10/31/2013 | | | | 10.27 | | | | | 0.08 | | | | | 0.26 | | | | | 0.34 | | | | | – | | | | | (0.10 | ) |
Year Ended 10/31/2012(c) | | | | 10.00 | | | | | 0.01 | | | | | 0.26 | | | | | 0.27 | | | | | – | | | | | – | |
| | | | | | |
Class S Shares | | | | | | | | | | | | | | | | | | | | | | | | | | | | | | |
Year Ended 10/31/2016 | | | | 7.63 | | | | | 0.03 | | | | | 0.84 | | | | | 0.87 | | | | | (0.11 | ) | | | | – | |
Year Ended 10/31/2015 | | | | 9.47 | | | | | 0.12 | | | | | (1.75 | ) | | | | (1.63 | ) | | | | (0.21 | ) | | | | – | |
Year Ended 10/31/2014 | | | | 10.55 | | | | | 0.23 | | | | | (1.16 | ) | | | | (0.93 | ) | | | | (0.15 | ) | | | | – | |
Year Ended 10/31/2013 | | | | 10.27 | | | | | 0.12 | | | | | 0.26 | | | | | 0.38 | | | | | – | | | | | (0.10 | ) |
Year Ended 10/31/2012(c) | | | | 10.00 | | | | | 0.02 | | | | | 0.25 | | | | | 0.27 | | | | | – | | | | | – | |
SMALL CAP STOCK FUND | | | | | | | | | | | | | | | | | | | | | |
Class A Shares | | | | | | | | | | | | | | | | | | | | | | | | | | | | | | |
Year Ended 10/31/2016 | | | | 18.15 | | | | | 0.04 | | | | | 0.88 | | | | | 0.92 | | | | | – | | | | | (1.54 | ) |
Year Ended 10/31/2015 | | | | 20.12 | | | | | 0.08 | | | | | 0.14 | | | | | 0.22 | | | | | – | | | | | (2.19 | ) |
Year Ended 10/31/2014 | | | | 18.52 | | | | | (0.05 | ) | | | | 1.80 | | | | | 1.75 | | | | | – | | | | | (0.15 | ) |
Year Ended 10/31/2013 | | | | 14.28 | | | | | (0.05 | ) | | | | 4.29 | | | | | 4.24 | | | | | – | | | | | – | |
Year Ended 10/31/2012 | | | | 13.35 | | | | | (0.06 | ) | | | | 0.99 | | | | | 0.93 | | | | | – | | | | | – | |
| | | | | | |
Class S Shares | | | | | | | | | | | | | | | | | | | | | | | | | | | | | | |
Year Ended 10/31/2016 | | | | 21.10 | | | | | 0.01 | | | | | 1.15 | | | | | 1.16 | | | | | (0.04 | ) | | | | (1.54 | ) |
Year Ended 10/31/2015 | | | | 22.92 | | | | | 0.01 | | | | | 0.36 | | | | | 0.37 | | | | | – | | | | | (2.19 | ) |
Year Ended 10/31/2014 | | | | 20.98 | | | | | 0.05 | | | | | 2.04 | | | | | 2.09 | | | | | – | | | | | (0.15 | ) |
Year Ended 10/31/2013 | | | | 16.09 | | | | | 0.09 | | | | | 4.80 | | | | | 4.89 | | | | | – | | | | | – | |
Year Ended 10/31/2012 | | | | 14.96 | | | | | 0.05 | | | | | 1.08 | | | | | 1.13 | | | | | – | | | | | – | |
MID CAP STOCK FUND | | | | | | | | | | | | | | | | | | | | | | | | | | | | | | |
Class A Shares | | | | | | | | | | | | | | | | | | | | | | | | | | | | | | |
Year Ended 10/31/2016 | | | | 21.61 | | | | | 0.02 | | | | | 2.44 | | | | | 2.46 | | | | | (0.03 | ) | | | | (2.41 | ) |
Year Ended 10/31/2015 | | | | 23.55 | | | | | (0.07 | ) | | | | 0.82 | | | | | 0.75 | | | | | (0.05 | ) | | | | (2.64 | ) |
Year Ended 10/31/2014 | | | | 20.38 | | | | | 0.07 | | | | | 3.10 | | | | | 3.17 | | | | | – | | | | | – | |
Year Ended 10/31/2013 | | | | 15.34 | | | | | 0.01 | | | | | 5.03 | | | | | 5.04 | | | | | – | | | | | – | |
Year Ended 10/31/2012 | | | | 14.30 | | | | | (0.01 | ) | | | | 1.05 | | | | | 1.04 | | | | | – | | | | | – | |
| | | | | | |
Class S Shares | | | | | | | | | | | | | | | | | | | | | | | | | | | | | | |
Year Ended 10/31/2016 | | | | 23.69 | | | | | 0.02 | | | | | 2.79 | | | | | 2.81 | | | | | (0.09 | ) | | | | (2.41 | ) |
Year Ended 10/31/2015 | | | | 25.54 | | | | | 0.47 | | | | | 0.45 | | | | | 0.92 | | | | | (0.13 | ) | | | | (2.64 | ) |
Year Ended 10/31/2014 | | | | 22.09 | | | | | 0.22 | | | | | 3.31 | | | | | 3.53 | | | | | (0.08 | ) | | | | – | |
Year Ended 10/31/2013 | | | | 16.63 | | | | | 0.10 | | | | | 5.43 | | | | | 5.53 | | | | | (0.07 | ) | | | | – | |
Year Ended 10/31/2012 | | | | 15.43 | | | | | 0.07 | | | | | 1.13 | | | | | 1.20 | | | | | – | | | | | – | |
| (a) | The amount shown may not correlate with the change in aggregate gains and losses of portfolio securities due to the timing of sales and redemptions of fund shares. |
| (b) | Total investment return assumes dividend reinvestment and does not reflect any deduction for applicable sales charges. Not annualized for periods less than one year. |
| (c) | Since fund inception, August 31, 2012. |
| * | All per share amounts have been rounded to the nearest cent. |
| ** | Computed on an annualized basis for periods less than one year. |
The accompanying Notes to Financial Statements are an integral part of this statement.
184
THRIVENT MUTUAL FUNDS
FINANCIAL HIGHLIGHTS –CONTINUED
| | | | | | | | | | | | | | | | | | | | | | | | | | | | | | | | |
| | | RATIOS/SUPPLEMENTAL DATA | |
| | | | | | | | | | | | Ratio to Average Net
Assets** | | | Ratios to Average Net
Assets Before Expenses
Waived, Credited or Paid
Indirectly** | | | | |
Total Distributions | |
Net Asset
Value, End of
Period | | | Total
Return(b) | | | Net Assets,
End of Period
(in millions) | | | Expenses | | | Net Investment Income/(Loss) | | | Expenses | | | Net Investment
Income/(Loss) | | | Portfolio
Turnover Rate | |
| | | | | | | | | | | | | | | | | | | | | | | | | | | | | | | | |
| | | | | | | | | | | | | | | | | | | | | | | | | | | | | | | | |
$(0.08) | | | $8.44 | | | | 11.36% | | | | $9.8 | | | | 1.65% | | | | 0.75% | | | | 3.57% | | | | (1.17)% | | | | 11% | |
(0.13) | | | 7.66 | | | | (17.75)% | | | | 9.6 | | | | 1.65% | | | | 0.85% | | | | 3.46% | | | | (0.95)% | | | | 117% | |
(0.10) | | | 9.45 | | | | (9.17)% | | | | 12.8 | | | | 1.67% | | | | 1.32% | | | | 3.23% | | | | (0.25)% | | | | 69% | |
(0.10) | | | 10.51 | | | | 3.26% | | | | 14.6 | | | | 1.64% | | | | 0.81% | | | | 3.41% | | | | (0.96)% | | | | 103% | |
– | | | 10.27 | | | | 2.70% | | | | 14.4 | | | | 1.61% | | | | 0.60% | | | | 3.02% | | | | (0.81)% | | | | 33% | |
| | | | | | | | |
| | | | | | | | | | | | | | | | | | | | | | | | | | | | | | | | |
(0.11) | | | 8.39 | | | | 11.67% | | | | 1.0 | | | | 1.32% | | | | 0.94% | | | | 3.56% | | | | (1.30)% | | | | 11% | |
(0.21) | | | 7.63 | | | | (17.53)% | | | | 0.3 | | | | 1.32% | | | | 1.14% | | | | 3.05% | | | | (0.58)% | | | | 117% | |
(0.15) | | | 9.47 | | | | (8.90)% | | | | 0.6 | | | | 1.32% | | | | 1.64% | | | | 2.90% | | | | 0.06% | | | | 69% | |
(0.10) | | | 10.55 | | | | 3.65% | | | | 1.0 | | | | 1.32% | | | | 1.12% | | | | 3.14% | | | | (0.70)% | | | | 103% | |
– | | | 10.27 | | | | 2.70% | | | | 1.0 | | | | 1.32% | | | | 0.89% | | | | 2.75% | | | | (0.54)% | | | | 33% | |
| | | | | | | | | | | | | | | | | | | | | | | | | | | | | | | | |
| | | | | | | | | | | | | | | | | | | | | | | | | | | | | | | | |
(1.54) | | | 17.53 | | | | 5.72% | | | | 331.4 | | | | 1.21% | | | | 0.23% | | | | 1.21% | | | | 0.23% | | | | 58% | |
(2.19) | | | 18.15 | | | | 1.32% | | | | 342.6 | | | | 1.23% | | | | (0.01)% | | | | 1.23% | | | | (0.01)% | | | | 70% | |
(0.15) | | | 20.12 | | | | 9.48% | | | | 259.8 | | | | 1.25% | | | | (0.15)% | | | | 1.25% | | | | (0.15)% | | | | 56% | |
– | | | 18.52 | | | | 29.69% | | | | 255.6 | | | | 1.29% | | | | (0.16)% | | | | 1.29% | | | | (0.16)% | | | | 66% | |
– | | | 14.28 | | | | 6.97% | | | | 216.6 | | | | 1.33% | | | | (0.31)% | | | | 1.33% | | | | (0.31)% | | | | 91% | |
| | | | | | | | |
| | | | | | | | | | | | | | | | | | | | | | | | | | | | | | | | |
(1.58) | | | 20.68 | | | | 6.12% | | | | 115.1 | | | | 0.80% | | | | 0.64% | | | | 0.80% | | | | 0.64% | | | | 58% | |
(2.19) | | | 21.10 | | | | 1.86% | | | | 100.4 | | | | 0.75% | | | | 0.47% | | | | 0.75% | | | | 0.47% | | | | 70% | |
(0.15) | | | 22.92 | | | | 10.00% | | | | 90.8 | | | | 0.75% | | | | 0.35% | | | | 0.75% | | | | 0.35% | | | | 56% | |
– | | | 20.98 | | | | 30.39% | | | | 80.2 | | | | 0.76% | | | | 0.36% | | | | 0.76% | | | | 0.36% | | | | 66% | |
– | | | 16.09 | | | | 7.55% | | | | 63.4 | | | | 0.77% | | | | 0.26% | | | | 0.77% | | | | 0.26% | | | | 91% | |
| | | | | | | | | | | | | | | | | | | | | | | | | | | | | | | | |
| | | | | | | | | | | | | | | | | | | | | | | | | | | | | | | | |
(2.44) | | | 21.63 | | | | 12.93% | | | | 1,005.1 | | | | 1.09% | | | | 0.09% | | | | 1.09% | | | | 0.09% | | | | 21% | |
(2.69) | | | 21.61 | | | | 3.60% | | | | 963.3 | | | | 1.09% | | | | 0.10% | | | | 1.11% | | | | 0.09% | | | | 56% | |
– | | | 23.55 | | | | 15.55% | | | | 678.2 | | | | 1.11% | | | | 0.30% | | | | 1.11% | | | | 0.30% | | | | 27% | |
– | | | 20.38 | | | | 32.86% | | | | 625.4 | | | | 1.15% | | | | 0.07% | | | | 1.15% | | | | 0.07% | | | | 39% | |
– | | | 15.34 | | | | 7.27% | | | | 517.5 | | | | 1.18% | | | | (0.08)% | | | | 1.18% | | | | (0.08)% | | | | 36% | |
| | | | | | | | |
| | | | | | | | | | | | | | | | | | | | | | | | | | | | | | | | |
(2.50) | | | 24.00 | | | | 13.36% | | | | 337.7 | | | | 0.72% | | | | 0.47% | | | | 0.72% | | | | 0.47% | | | | 21% | |
(2.77) | | | 23.69 | | | | 4.05% | | | | 286.6 | | | | 0.69% | | | | 0.51% | | | | 0.70% | | | | 0.50% | | | | 56% | |
(0.08) | | | 25.54 | | | | 16.01% | | | | 264.0 | | | | 0.71% | | | | 0.70% | | | | 0.71% | | | | 0.70% | | | | 27% | |
(0.07) | | | 22.09 | | | | 33.41% | | | | 290.0 | | | | 0.71% | | | | 0.50% | | | | 0.71% | | | | 0.50% | | | | 39% | |
– | | | 16.63 | | | | 7.78% | | | | 220.4 | | | | 0.72% | | | | 0.38% | | | | 0.72% | | | | 0.38% | | | | 36% | |
The accompanying Notes to Financial Statements are an integral part of this statement.
185
THRIVENT MUTUAL FUNDS
FINANCIAL HIGHLIGHTS –CONTINUED
| | | | | | | | | | | | | | | | | | | | | | | | | | | | | | |
| | | FOR A SHARE OUTSTANDING THROUGHOUT EACH PERIOD * |
| | | | | Income from Investment Operations | | Less Distributions From |
| | | Net Asset
Value,
Beginning of
Period | | Net
Investment
Income/(Loss) | |
Net Realized
and Unrealized
Gain/(Loss) on
Investments(a) | | Total from
Investment
Operations | | Net
Investment
Income | | Net Realized
Gain on
Investments |
PARTNER WORLDWIDE ALLOCATION FUND | | | | | | | | | | | | | | | | | | | | | | | | | |
Class A Shares | | | | | | | | | | | | | | | | | | | | | | | | | |
Year Ended 10/31/2016 | | | $ | 9.62 | | | | $ | 0.21 | | | | $ | – | | | | $ | 0.21 | | | | $ | (0.18 | ) | | | $ | – | |
Year Ended 10/31/2015 | | | | 10.03 | | | | | 0.16 | | | | | (0.37 | ) | | | | (0.21 | ) | | | | (0.20 | ) | | | | – | |
Year Ended 10/31/2014 | | | | 10.29 | | | | | 0.16 | | | | | (0.25 | ) | | | | (0.09 | ) | | | | (0.17 | ) | | | | – | |
Year Ended 10/31/2013 | | | | 8.73 | | | | | 0.16 | | | | | 1.58 | | | | | 1.74 | | | | | (0.18 | ) | | | | – | |
Year Ended 10/31/2012 | | | | 8.30 | | | | | 0.19 | | | | | 0.32 | | | | | 0.51 | | | | | (0.08 | ) | | | | – | |
| | | | | |
Class S Shares | | | | | | | | | | | | | | | | | | | | | | | | | |
Year Ended 10/31/2016 | | | | 9.69 | | | | | 0.22 | | | | | 0.02 | | | | | 0.24 | | | | | (0.22 | ) | | | | – | |
Year Ended 10/31/2015 | | | | 10.11 | | | | | 0.20 | | | | | (0.38 | ) | | | | (0.18 | ) | | | | (0.24 | ) | | | | – | |
Year Ended 10/31/2014 | | | | 10.36 | | | | | 0.21 | | | | | (0.25 | ) | | | | (0.04 | ) | | | | (0.21 | ) | | | | – | |
Year Ended 10/31/2013 | | | | 8.79 | | | | | 0.19 | | | | | 1.59 | | | | | 1.78 | | | | | (0.21 | ) | | | | – | |
Year Ended 10/31/2012 | | | | 8.34 | | | | | 0.19 | | | | | 0.35 | | | | | 0.54 | | | | | (0.09 | ) | | | | – | |
LARGE CAP GROWTH FUND | | | | | | | | | | | | | | | | | | | | | | | | | |
Class A Shares | | | | | | | | | | | | | | | | | | | | | | | | | |
Year Ended 10/31/2016 | | | | 9.12 | | | | | (0.03 | ) | | | | (0.36 | ) | | | | (0.39 | ) | | | | – | | | | | (0.50 | ) |
Year Ended 10/31/2015 | | | | 8.31 | | | | | (0.02 | ) | | | | 0.97 | | | | | 0.95 | | | | | – | | | | | (0.14 | ) |
Year Ended 10/31/2014 | | | | 7.10 | | | | | (0.02 | ) | | | | 1.23 | | | | | 1.21 | | | | | – | | | | | – | |
Year Ended 10/31/2013 | | | | 5.48 | | | | | 0.01 | | | | | 1.63 | | | | | 1.64 | | | | | (0.02 | ) | | | | – | |
Year Ended 10/31/2012 | | | | 4.92 | | | | | 0.01 | | | | | 0.55 | | | | | 0.56 | | | | | – | | | | | – | |
| | | | | |
Class S Shares | | | | | | | | | | | | | | | | | | | | | | | | | |
Year Ended 10/31/2016 | | | | 9.89 | | | | | 0.01 | | | | | (0.41 | ) | | | | (0.40 | ) | | | | – | | | | | (0.50 | ) |
Year Ended 10/31/2015 | | | | 8.96 | | | | | – | | | | | 1.07 | | | | | 1.07 | | | | | – | | | | | (0.14 | ) |
Year Ended 10/31/2014 | | | | 7.65 | | | | | 0.01 | | | | | 1.33 | | | | | 1.34 | | | | | (0.03 | ) | | | | – | |
Year Ended 10/31/2013 | | | | 5.91 | | | | | 0.04 | | | | | 1.74 | | | | | 1.78 | | | | | (0.04 | ) | | | | – | |
Year Ended 10/31/2012 | | | | 5.28 | | | | | 0.03 | | | | | 0.60 | | | | | 0.63 | | | | | – | | | | | – | |
LARGE CAP VALUE FUND | | | | | | | | | | | | | | | | | | | | | | | | | |
Class A Shares | | | | | | | | | | | | | | | | | | | | | | | | | |
Year Ended 10/31/2016 | | | | 19.99 | | | | | 0.30 | | | | | 0.39 | | | | | 0.69 | | | | | (0.19 | ) | | | | (1.07 | ) |
Year Ended 10/31/2015 | | | | 20.65 | | | | | 0.22 | | | | | 0.01 | | | | | 0.23 | | | | | (0.19 | ) | | | | (0.70 | ) |
Year Ended 10/31/2014 | | | | 18.60 | | | | | 0.20 | | | | | 2.02 | | | | | 2.22 | | | | | (0.17 | ) | | | | – | |
Year Ended 10/31/2013 | | | | 14.66 | | | | | 0.22 | | | | | 3.96 | | | | | 4.18 | | | | | (0.24 | ) | | | | – | |
Year Ended 10/31/2012 | | | | 12.94 | | | | | 0.22 | | | | | 1.67 | | | | | 1.89 | | | | | (0.17 | ) | | | | – | |
| | | | | |
Class S Shares | | | | | | | | | | | | | | | | | | | | | | | | | |
Year Ended 10/31/2016 | | | | 20.14 | | | | | 0.32 | | | | | 0.46 | | | | | 0.78 | | | | | (0.29 | ) | | | | (1.07 | ) |
Year Ended 10/31/2015 | | | | 20.80 | | | | | 0.30 | | | | | 0.01 | | | | | 0.31 | | | | | (0.27 | ) | | | | (0.70 | ) |
Year Ended 10/31/2014 | | | | 18.73 | | | | | 0.29 | | | | | 2.03 | | | | | 2.32 | | | | | (0.25 | ) | | | | – | |
Year Ended 10/31/2013 | | | | 14.76 | | | | | 0.29 | | | | | 3.99 | | | | | 4.28 | | | | | (0.31 | ) | | | | – | |
Year Ended 10/31/2012 | | | | 13.04 | | | | | 0.27 | | | | | 1.70 | | | | | 1.97 | | | | | (0.25 | ) | | | | – | |
| (a) | The amount shown may not correlate with the change in aggregate gains and losses of portfolio securities due to the timing of sales and redemptions of fund shares. |
| (b) | Total investment return assumes dividend reinvestment and does not reflect any deduction for applicable sales charges. Not annualized for periods less than one year. |
| * | All per share amounts have been rounded to the nearest cent. |
| ** | Computed on an annualized basis for periods less than one year. |
The accompanying Notes to Financial Statements are an integral part of this statement.
186
THRIVENT MUTUAL FUNDS
FINANCIAL HIGHLIGHTS –CONTINUED
| | | | | | | | | | | | | | | | | | | | | | | | | | | | | | | | |
| | | RATIOS/SUPPLEMENTAL DATA | |
| | | | | | | | | | | | Ratio to Average Net
Assets** | | | Ratios to Average Net
Assets Before Expenses
Waived, Credited or Paid
Indirectly** | | | | |
Total Distributions | | Net Asset
Value, End of
Period | | | Total
Return(b) | | | Net Assets,
End of Period
(in millions) | | | Expenses | | | Net Investment
Income/(Loss) | | | Expenses | | | Net Investment
Income /(Loss) | | | Portfolio
Turnover Rate | |
| | | | | | | | | | | | | | | | | | | | | | | | | | | | | | | | |
| | | | | | | | | | | | | | | | | | | | | | | | | | | | | | | | |
$(0.18) | | | $9.65 | | | | 2.21% | | | | $141.3 | | | | 1.40% | | | | 1.82% | | | | 1.58% | | | | 1.64% | | | | 107% | |
(0.20) | | | 9.62 | | | | (2.14)% | | | | 167.3 | | | | 1.40% | | | | 1.61% | | | | 1.57% | | | | 1.44% | | | | 68% | |
(0.17) | | | 10.03 | | | | (0.89)% | | | | 178.2 | | | | 1.40% | | | | 1.57% | | | | 1.55% | | | | 1.41% | | | | 77% | |
(0.18) | | | 10.29 | | | | 20.26% | | | | 181.6 | | | | 1.37% | | | | 1.60% | | | | 1.60% | | | | 1.37% | | | | 74% | |
(0.08) | | | 8.73 | | | | 6.20% | | | | 159.5 | | | | 1.30% | | | | 2.02% | | | | 1.61% | | | | 1.71% | | | | 57% | |
| | | | | | | | |
| | | | | | | | | | | | | | | | | | | | | | | | | | | | | | | | |
(0.22) | | | 9.71 | | | | 2.60% | | | | 615.9 | | | | 1.00% | | | | 2.24% | | | | 1.00% | | | | 2.24% | | | | 107% | |
(0.24) | | | 9.69 | | | | (1.77)% | | | | 640.3 | | | | 0.98% | | | | 2.04% | | | | 0.99% | | | | 2.03% | | | | 68% | |
(0.21) | | | 10.11 | | | | (0.40)% | | | | 651.9 | | | | 0.97% | | | | 1.99% | | | | 0.99% | | | | 1.98% | | | | 77% | |
(0.21) | | | 10.36 | | | | 20.64% | | | | 671.5 | | | | 0.98% | | | | 1.99% | | | | 0.98% | | | | 1.99% | | | | 74% | |
(0.09) | | | 8.79 | | | | 6.58% | | | | 544.6 | | | | 0.98% | | | | 2.31% | | | | 0.98% | | | | 2.31% | | | | 57% | |
| | | | | | | | | | | | | | | | | | | | | | | | | | | | | | | | |
| | | | | | | | | | | | | | | | | | | | | | | | | | | | | | | | |
(0.50) | | | 8.23 | | | | (4.52)% | | | | 178.8 | | | | 1.20% | | | | (0.25)% | | | | 1.28% | | | | (0.33)% | | | | 67% | |
(0.14) | | | 9.12 | | | | 11.61% | | | | 218.8 | | | | 1.20% | | | | (0.35)% | | | | 1.30% | | | | (0.45)% | | | | 64% | |
– | | | 8.31 | | | | 17.10% | | | | 183.6 | | | | 1.20% | | | | (0.25)% | | | | 1.34% | | | | (0.38)% | | | | 45% | |
(0.02) | | | 7.10 | | | | 29.99% | | | | 157.0 | | | | 1.20% | | | | 0.14% | | | | 1.41% | | | | (0.07)% | | | | 63% | |
– | | | 5.48 | | | | 11.38% | | | | 125.0 | | | | 1.20% | | | | 0.19% | | | | 1.48% | | | | (0.09)% | | | | 101% | |
| | | | | | | | |
| | | | | | | | | | | | | | | | | | | | | | | | | | | | | | | | |
(0.50) | | | 8.99 | | | | (4.26)% | | | | 510.1 | | | | 0.82% | | | | 0.12% | | | | 0.82% | | | | 0.12% | | | | 67% | |
(0.14) | | | 9.89 | | | | 12.12% | | | | 509.3 | | | | 0.81% | | | | 0.03% | | | | 0.81% | | | | 0.03% | | | | 64% | |
(0.03) | | | 8.96 | | | | 17.53% | | | | 338.3 | | | | 0.81% | | | | 0.14% | | | | 0.81% | | | | 0.14% | | | | 45% | |
(0.04) | | | 7.65 | | | | 30.30% | | | | 286.9 | | | | 0.82% | | | | 0.52% | | | | 0.82% | | | | 0.52% | | | | 63% | |
– | | | 5.91 | | | | 11.94% | | | | 224.9 | | | | 0.83% | | | | 0.57% | | | | 0.83% | | | | 0.57% | | | | 101% | |
| | | | | | | | | | | | | | | | | | | | | | | | | | | | | | | | |
| | | | | | | | | | | | | | | | | | | | | | | | | | | | | | | | |
(1.26) | | | 19.42 | | | | 3.86% | | | | 198.6 | | | | 0.93% | | | | 1.34% | | | | 0.93% | | | | 1.34% | | | | 22% | |
(0.89) | | | 19.99 | | | | 1.14% | | | | 231.1 | | | | 0.94% | | | | 1.08% | | | | 0.94% | | | | 1.08% | | | | 31% | |
(0.17) | | | 20.65 | | | | 12.00% | | | | 237.1 | | | | 0.94% | | | | 1.00% | | | | 0.94% | | | | 1.00% | | | | 24% | |
(0.24) | | | 18.60 | | | | 28.92% | | | | 214.6 | | | | 0.98% | | | | 1.25% | | | | 0.98% | | | | 1.25% | | | | 39% | |
(0.17) | | | 14.66 | | | | 14.82% | | | | 171.1 | | | | 1.04% | | | | 1.42% | | | | 1.04% | | | | 1.42% | | | | 92% | |
| | | | | | | | |
| | | | | | | | | | | | | | | | | | | | | | | | | | | | | | | | |
(1.36) | | | 19.56 | | | | 4.29% | | | | 618.7 | | | | 0.53% | | | | 1.73% | | | | 0.53% | | | | 1.73% | | | | 22% | |
(0.97) | | | 20.14 | | | | 1.55% | | | | 580.9 | | | | 0.52% | | | | 1.50% | | | | 0.52% | | | | 1.50% | | | | 31% | |
(0.25) | | | 20.80 | | | | 12.47% | | | | 562.0 | | | | 0.52% | | | | 1.42% | | | | 0.52% | | | | 1.42% | | | | 24% | |
(0.31) | | | 18.73 | | | | 29.57% | | | | 508.9 | | | | 0.52% | | | | 1.72% | | | | 0.52% | | | | 1.72% | | | | 39% | |
(0.25) | | | 14.76 | | | | 15.37% | | | | 403.0 | | | | 0.53% | | | | 1.92% | | | | 0.53% | | | | 1.92% | | | | 92% | |
The accompanying Notes to Financial Statements are an integral part of this statement.
187
THRIVENT MUTUAL FUNDS
FINANCIAL HIGHLIGHTS –CONTINUED
| | | | | | | | | | | | | | | | | | | | | | | | | | | | | | |
| | | FOR A SHARE OUTSTANDING THROUGHOUT EACH PERIOD* |
| | | | | Income from Investment Operations | | Less Distributions From |
| | | Net Asset
Value,
Beginning of
Period | | Net
Investment
Income/(Loss) | |
Net Realized
and Unrealized
Gain/(Loss) on
Investments(a) | | Total from
Investment
Operations | | Net
Investment
Income | | Net Realized
Gain on
Investments |
LARGE CAP STOCK FUND | | | | | | | | | | | | | | | | | | | | | | | | | | | | | | |
Class A Shares | | | | | | | | | | | | | | | | | | | | | | | | | | | | | | |
Year Ended 10/31/2016 | | | $ | 26.32 | | | | $ | 0.26 | | | | $ | (0.66 | ) | | | $ | (0.40 | ) | | | $ | (0.24 | ) | | | $ | (0.91 | ) |
Year Ended 10/31/2015 | | | | 27.75 | | | | | 0.24 | | | | | 0.90 | | | | | 1.14 | | | | | (0.24 | ) | | | | (2.33 | ) |
Year Ended 10/31/2014 | | | | 27.54 | | | | | 0.22 | | | | | 2.57 | | | | | 2.79 | | | | | (0.10 | ) | | | | (2.48 | ) |
Year Ended 10/31/2013 | | | | 23.64 | | | | | 0.19 | | | | | 5.24 | | | | | 5.43 | | | | | (0.25 | ) | | | | (1.28 | ) |
Year Ended 10/31/2012 | | | | 21.30 | | | | | 0.20 | | | | | 2.29 | | | | | 2.49 | | | | | (0.15 | ) | | | | – | |
| | | | | | |
Class S Shares | | | | | | | | | | | | | | | | | | | | | | | | | | | | | | |
Year Ended 10/31/2016 | | | | 26.57 | | | | | 0.32 | | | | | (0.62 | ) | | | | (0.30 | ) | | | | (0.35 | ) | | | | (0.91 | ) |
Year Ended 10/31/2015 | | | | 27.99 | | | | | 0.39 | | | | | 0.86 | | | | | 1.25 | | | | | (0.34 | ) | | | | (2.33 | ) |
Year Ended 10/31/2014 | | | | 27.75 | | | | | 0.35 | | | | | 2.58 | | | | | 2.93 | | | | | (0.21 | ) | | | | (2.48 | ) |
Year Ended 10/31/2013 | | | | 23.82 | | | | | 0.30 | | | | | 5.27 | | | | | 5.57 | | | | | (0.36 | ) | | | | (1.28 | ) |
Year Ended 10/31/2012 | | | | 21.48 | | | | | 0.30 | | | | | 2.30 | | | | | 2.60 | | | | | (0.26 | ) | | | | – | |
HIGH YIELD FUND | | | | | | | | | | | | | | | | | | | | | | | | | | | | | | |
Class A Shares | | | | | | | | | | | | | | | | | | | | | | | | | | | | | | |
Year Ended 10/31/2016 | | | | 4.74 | | | | | 0.25 | | | | | 0.02 | | | | | 0.27 | | | | | (0.25 | ) | | | | – | |
Year Ended 10/31/2015 | | | | 5.04 | | | | | 0.26 | | | | | (0.30 | ) | | | | (0.04 | ) | | | | (0.26 | ) | | | | – | |
Year Ended 10/31/2014 | | | | 5.09 | | | | | 0.29 | | | | | (0.05 | ) | | | | 0.24 | | | | | (0.29 | ) | | | | – | |
Year Ended 10/31/2013 | | | | 5.01 | | | | | 0.31 | | | | | 0.07 | | | | | 0.38 | | | | | (0.30 | ) | | | | – | |
Year Ended 10/31/2012 | | | | 4.71 | | | | | 0.34 | | | | | 0.30 | | | | | 0.64 | | | | | (0.34 | ) | | | | – | |
| | | | | | |
Class S Shares | | | | | | | | | | | | | | | | | | | | | | | | | | | | | | |
Year Ended 10/31/2016 | | | | 4.74 | | | | | 0.26 | | | | | 0.03 | | | | | 0.29 | | | | | (0.27 | ) | | | | – | |
Year Ended 10/31/2015 | | | | 5.05 | | | | | 0.28 | | | | | (0.31 | ) | | | | (0.03 | ) | | | | (0.28 | ) | | | | – | |
Year Ended 10/31/2014 | | | | 5.10 | | | | | 0.30 | | | | | (0.05 | ) | | | | 0.25 | | | | | (0.30 | ) | | | | – | |
Year Ended 10/31/2013 | | | | 5.01 | | | | | 0.32 | | | | | 0.09 | | | | | 0.41 | | | | | (0.32 | ) | | | | – | |
Year Ended 10/31/2012 | | | | 4.72 | | | | | 0.35 | | | | | 0.29 | | | | | 0.64 | | | | | (0.35 | ) | | | | – | |
INCOME FUND | | | | | | | | | | | | | | | | | | | | | | | | | | | | | | |
Class A Shares | | | | | | | | | | | | | | | | | | | | | | | | | | | | | | |
Year Ended 10/31/2016 | | | | 9.01 | | | | | 0.29 | | | | | 0.29 | | | | | 0.58 | | | | | (0.29 | ) | | | | (0.04 | ) |
Year Ended 10/31/2015 | | | | 9.29 | | | | | 0.30 | | | | | (0.24 | ) | | | | 0.06 | | | | | (0.30 | ) | | | | (0.04 | ) |
Year Ended 10/31/2014 | | | | 9.09 | | | | | 0.32 | | | | | 0.20 | | | | | 0.52 | | | | | (0.32 | ) | | | | – | |
Year Ended 10/31/2013 | | | | 9.38 | | | | | 0.31 | | | | | (0.29 | ) | | | | 0.02 | | | | | (0.31 | ) | | | | – | |
Year Ended 10/31/2012 | | | | 8.77 | | | | | 0.33 | | | | | 0.61 | | | | | 0.94 | | | | | (0.33 | ) | | | | – | |
| | | | | | |
Class S Shares | | | | | | | | | | | | | | | | | | | | | | | | | | | | | | |
Year Ended 10/31/2016 | | | | 9.00 | | | | | 0.32 | | | | | 0.29 | | | | | 0.61 | | | | | (0.32 | ) | | | | (0.04 | ) |
Year Ended 10/31/2015 | | | | 9.29 | | | | | 0.34 | | | | | (0.26 | ) | | | | 0.08 | | | | | (0.33 | ) | | | | (0.04 | ) |
Year Ended 10/31/2014 | | | | 9.08 | | | | | 0.35 | | | | | 0.21 | | | | | 0.56 | | | | | (0.35 | ) | | | | – | |
Year Ended 10/31/2013 | | | | 9.37 | | | | | 0.35 | | | | | (0.30 | ) | | | | 0.05 | | | | | (0.34 | ) | | | | – | |
Year Ended 10/31/2012 | | | | 8.76 | | | | | 0.37 | | | | | 0.60 | | | | | 0.97 | | | | | (0.36 | ) | | | | – | |
| (a) | The amount shown may not correlate with the change in aggregate gains and losses of portfolio securities due to the timing of sales and redemptions of fund shares. |
| (b) | Total investment return assumes dividend reinvestment and does not reflect any deduction for applicable sales charges. Not annualized for periods less than one year. |
| * | All per share amounts have been rounded to the nearest cent. |
| ** | Computed on an annualized basis for periods less than one year. |
The accompanying Notes to Financial Statements are an integral part of this statement.
188
THRIVENT MUTUAL FUNDS
FINANCIAL HIGHLIGHTS –CONTINUED
| | | | | | | | | | | | | | | | | | | | | | | | | | | | | | | | |
| | | RATIOS/SUPPLEMENTAL DATA | |
| | | | | | | | | | | | Ratio to Average Net
Assets** | | | Ratios to Average Net
Assets Before Expenses
Waived, Credited or Paid
Indirectly** | | | | |
Total Distributions | | Net Asset
Value, End of
Period | | | Total
Return(b) | | | Net Assets,
End of Period
(in millions) | | | Expenses | | | Net Investment
Income/(Loss) | | | Expenses | | | Net Investment
Income/(Loss) | | | Portfolio
Turnover Rate | |
| | | | | | | | | | | | | | | | | | | | | | | | | | | | | | | | |
| | | | | | | | | | | | | | | | | | | | | | | | | | | | | | | | |
$(1.15) | | | $24.77 | | | | (1.48)% | | | | $1,399.8 | | | | 1.03% | | | | 1.03% | | | | 1.03% | | | | 1.03% | | | | 62% | |
(2.57) | | | 26.32 | | | | 4.59% | | | | 1,560.0 | | | | 1.02% | | | | 0.99% | | | | 1.02% | | | | 0.99% | | | | 52% | |
(2.58) | | | 27.75 | | | | 11.06% | | | | 1,594.0 | | | | 1.02% | | | | 0.82% | | | | 1.02% | | | | 0.82% | | | | 65% | |
(1.53) | | | 27.54 | | | | 24.57% | | | | 1,556.5 | | | | 1.05% | | | | 0.81% | | | | 1.05% | | | | 0.81% | | | | 66% | |
(0.15) | | | 23.64 | | | | 11.75% | | | | 1,382.5 | | | | 1.09% | | | | 0.84% | | | | 1.09% | | | | 0.84% | | | | 124% | |
| | | | | | | | |
| | | | | | | | | | | | | | | | | | | | | | | | | | | | | | | | |
(1.26) | | | 25.01 | | | | (1.08)% | | | | 203.7 | | | | 0.64% | | | | 1.42% | | | | 0.64% | | | | 1.42% | | | | 62% | |
(2.67) | | | 26.57 | | | | 5.02% | | | | 187.8 | | | | 0.61% | | | | 1.40% | | | | 0.61% | | | | 1.40% | | | | 52% | |
(2.69) | | | 27.99 | | | | 11.53% | | | | 174.2 | | | | 0.61% | | | | 1.24% | | | | 0.61% | | | | 1.24% | | | | 65% | |
(1.64) | | | 27.75 | | | | 25.10% | | | | 192.8 | | | | 0.61% | | | | 1.25% | | | | 0.61% | | | | 1.25% | | | | 66% | |
(0.26) | | | 23.82 | | | | 12.27% | | | | 170.3 | | | | 0.62% | | | | 1.30% | | | | 0.62% | | | | 1.30% | | | | 124% | |
| | | | | | | | | | | | | | | | | | | | | | | | | | | | | | | | |
| | | | | | | | | | | | | | | | | | | | | | | | | | | | | | | | |
(0.25) | | | 4.76 | | | | 6.05% | | | | 471.5 | | | | 0.81% | | | | 5.42% | | | | 0.81% | | | | 5.42% | | | | 42% | |
(0.26) | | | 4.74 | | | | (0.77)% | | | | 489.2 | | | | 0.81% | | | | 5.39% | | | | 0.81% | | | | 5.39% | | | | 38% | |
(0.29) | | | 5.04 | | | | 4.72% | | | | 540.1 | | | | 0.80% | | | | 5.59% | | | | 0.80% | | | | 5.59% | | | | 43% | |
(0.30) | | | 5.09 | | | | 7.85% | | | | 540.0 | | | | 0.81% | | | | 6.03% | | | | 0.81% | | | | 6.03% | | | | 61% | |
(0.34) | | | 5.01 | | | | 13.96% | | | | 520.0 | | | | 0.82% | | | | 6.95% | | | | 0.82% | | | | 6.95% | | | | 52% | |
| | | | | | | | |
| | | | | | | | | | | | | | | | | | | | | | | | | | | | | | | | |
(0.27) | | | 4.76 | | | | 6.34% | | | | 232.2 | | | | 0.55% | | | | 5.68% | | | | 0.55% | | | | 5.68% | | | | 42% | |
(0.28) | | | 4.74 | | | | (0.66)% | | | | 235.9 | | | | 0.50% | | | | 5.69% | | | | 0.50% | | | | 5.69% | | | | 38% | |
(0.30) | | | 5.05 | | | | 5.05% | | | | 246.2 | | | | 0.49% | | | | 5.90% | | | | 0.49% | | | | 5.90% | | | | 43% | |
(0.32) | | | 5.10 | | | | 8.42% | | | | 240.7 | | | | 0.48% | | | | 6.36% | | | | 0.48% | | | | 6.36% | | | | 61% | |
(0.35) | | | 5.01 | | | | 14.12% | | | | 285.7 | | | | 0.47% | | | | 7.30% | | | | 0.47% | | | | 7.30% | | | | 52% | |
| | | | | | | | | | | | | | | | | | | | | | | | | | | | | | | | |
| | | | | | | | | | | | | | | | | | | | | | | | | | | | | | | | |
(0.33) | | | 9.26 | | | | 6.62% | | | | 359.3 | | | | 0.77% | | | | 3.20% | | | | 0.77% | | | | 3.20% | | | | 104% | |
(0.34) | | | 9.01 | | | | 0.65% | | | | 370.0 | | | | 0.77% | | | | 3.29% | | | | 0.77% | | | | 3.29% | | | | 92% | |
(0.32) | | | 9.29 | | | | 5.79% | | | | 400.5 | | | | 0.77% | | | | 3.47% | | | | 0.77% | | | | 3.47% | | | | 97% | |
(0.31) | | | 9.09 | | | | 0.23% | | | | 419.5 | | | | 0.77% | | | | 3.40% | | | | 0.77% | | | | 3.40% | | | | 121% | |
(0.33) | | | 9.38 | | | | 10.92% | | | | 448.0 | | | | 0.77% | | | | 3.69% | | | | 0.77% | | | | 3.69% | | | | 117% | |
| | | | | | | | |
| | | | | | | | | | | | | | | | | | | | | | | | | | | | | | | | |
(0.36) | | | 9.25 | | | | 6.97% | | | | 462.9 | | | | 0.44% | | | | 3.53% | | | | 0.44% | | | | 3.53% | | | | 104% | |
(0.37) | | | 9.00 | | | | 0.90% | | | | 429.9 | | | | 0.41% | | | | 3.66% | | | | 0.41% | | | | 3.66% | | | | 92% | |
(0.35) | | | 9.29 | | | | 6.29% | | | | 438.1 | | | | 0.40% | | | | 3.83% | | | | 0.40% | | | | 3.83% | | | | 97% | |
(0.34) | | | 9.08 | | | | 0.60% | | | | 403.3 | | | | 0.40% | | | | 3.77% | | | | 0.40% | | | | 3.77% | | | | 121% | |
(0.36) | | | 9.37 | | | | 11.34% | | | | 456.1 | | | | 0.39% | | | | 4.07% | | | | 0.39% | | | | 4.07% | | | | 117% | |
The accompanying Notes to Financial Statements are an integral part of this statement.
189
THRIVENT MUTUAL FUNDS
FINANCIAL HIGHLIGHTS –CONTINUED
| | | | | | | | | | | | | | | | | | | | | | | | | | | | | | |
| | | FOR A SHARE OUTSTANDING THROUGHOUT EACH PERIOD* |
| | | | | Income from Investment Operations | | Less Distributions From |
| | | Net Asset
Value,
Beginning of
Period | | Net
Investment
Income/(Loss) | |
Net Realized
and Unrealized
Gain/(Loss) on
Investments(a) | | Total from
Investment
Operations | | Net
Investment
Income | | Net Realized
Gain on
Investments |
MUNICIPAL BOND FUND | | | | | | | | | | | | | | | | | | | | | | | | | | | | | | |
Class A Shares | | | | | | | | | | | | | | | | | | | | | | | | | | | | | | |
Year Ended 10/31/2016 | | | $ | 11.60 | | | | $ | 0.39 | | | | $ | 0.05 | | | | $ | 0.44 | | | | $ | (0.39 | ) | | | $ | – | |
Year Ended 10/31/2015 | | | | 11.68 | | | | | 0.40 | | | | | (0.08 | ) | | | | 0.32 | | | | | (0.40 | ) | | | | – | |
Year Ended 10/31/2014 | | | | 11.18 | | | | | 0.42 | | | | | 0.50 | | | | | 0.92 | | | | | (0.42 | ) | | | | – | |
Year Ended 10/31/2013 | | | | 11.93 | | | | | 0.42 | | | | | (0.74 | ) | | | | (0.32 | ) | | | | (0.42 | ) | | | | (0.01 | ) |
Year Ended 10/31/2012 | | | | 11.30 | | | | | 0.44 | | | | | 0.63 | | | | | 1.07 | | | | | (0.44 | ) | | | | – | |
| | | | | | |
Class S Shares | | | | | | | | | | | | | | | | | | | | | | | | | | | | | | |
Year Ended 10/31/2016 | | | | 11.60 | | | | | 0.41 | | | | | 0.06 | | | | | 0.47 | | | | | (0.42 | ) | | | | – | |
Year Ended 10/31/2015 | | | | 11.68 | | | | | 0.43 | | | | | (0.08 | ) | | | | 0.35 | | | | | (0.43 | ) | | | | – | |
Year Ended 10/31/2014 | | | | 11.18 | | | | | 0.44 | | | | | 0.50 | | | | | 0.94 | | | | | (0.44 | ) | | | | – | |
Year Ended 10/31/2013 | | | | 11.93 | | | | | 0.45 | | | | | (0.74 | ) | | | | (0.29 | ) | | | | (0.45 | ) | | | | (0.01 | ) |
Year Ended 10/31/2012 | | | | 11.30 | | | | | 0.47 | | | | | 0.63 | | | | | 1.10 | | | | | (0.47 | ) | | | | – | |
GOVERNMENT BOND FUND | | | | | | | | | | | | | | | | | | | | | | | | | | | | | | |
Class A Shares | | | | | | | | | | | | | | | | | | | | | | | | | | | | | | |
Year Ended 10/31/2016 | | | | 10.12 | | | | | 0.12 | | | | | 0.21 | | | | | 0.33 | | | | | (0.12 | ) | | | | (0.19 | ) |
Year Ended 10/31/2015 | | | | 10.05 | | | | | 0.09 | | | | | 0.09 | | | | | 0.18 | | | | | (0.08 | ) | | | | (0.03 | ) |
Year Ended 10/31/2014 | | | | 10.02 | | | | | 0.11 | | | | | 0.14 | | | | | 0.25 | | | | | (0.11 | ) | | | | (0.11 | ) |
Year Ended 10/31/2013 | | | | 10.76 | | | | | 0.07 | | | | | (0.33 | ) | | | | (0.26 | ) | | | | (0.08 | ) | | | | (0.40 | ) |
Year Ended 10/31/2012 | | | | 10.69 | | | | | 0.11 | | | | | 0.32 | | | | | 0.43 | | | | | (0.11 | ) | | | | (0.25 | ) |
| | | | | | |
Class S Shares | | | | | | | | | | | | | | | | | | | | | | | | | | | | | | |
Year Ended 10/31/2016 | | | | 10.12 | | | | | 0.12 | | | | | 0.22 | | | | | 0.34 | | | | | (0.13 | ) | | | | (0.19 | ) |
Year Ended 10/31/2015 | | | | 10.05 | | | | | 0.12 | | | | | 0.10 | | | | | 0.22 | | | | | (0.12 | ) | | | | (0.03 | ) |
Year Ended 10/31/2014 | | | | 10.02 | | | | | 0.14 | | | | | 0.14 | | | | | 0.28 | | | | | (0.14 | ) | | | | (0.11 | ) |
Year Ended 10/31/2013 | | | | 10.76 | | | | | 0.11 | | | | | (0.34 | ) | | | | (0.23 | ) | | | | (0.11 | ) | | | | (0.40 | ) |
Year Ended 10/31/2012 | | | | 10.69 | | | | | 0.14 | | | | | 0.32 | | | | | 0.46 | | | | | (0.14 | ) | | | | (0.25 | ) |
LIMITED MATURITY BOND FUND | | | | | | | | | | | | | | | | | | | | | | | | | | | | | | |
Class A Shares | | | | | | | | | | | | | | | | | | | | | | | | | | | | | | |
Year Ended 10/31/2016 | | | | 12.38 | | | | | 0.20 | | | | | 0.10 | | | | | 0.30 | | | | | (0.20 | ) | | | | – | |
Year Ended 10/31/2015 | | | | 12.44 | | | | | 0.17 | | | | | (0.06 | ) | | | | 0.11 | | | | | (0.17 | ) | | | | – | |
Year Ended 10/31/2014 | | | | 12.53 | | | | | 0.18 | | | | | (0.02 | ) | | | | 0.16 | | | | | (0.18 | ) | | | | (0.07 | ) |
Year Ended 10/31/2013 | | | | 12.62 | | | | | 0.15 | | | | | (0.09 | ) | | | | 0.06 | | | | | (0.15 | ) | | | | – | |
Year Ended 10/31/2012 | | | | 12.41 | | | | | 0.19 | | | | | 0.20 | | | | | 0.39 | | | | | (0.18 | ) | | | | – | |
| | | | | | |
Class S Shares | | | | | | | | | | | | | | | | | | | | | | | | | | | | | | |
Year Ended 10/31/2016 | | | | 12.37 | | | | | 0.22 | | | | | 0.11 | | | | | 0.33 | | | | | (0.22 | ) | | | | – | |
Year Ended 10/31/2015 | | | | 12.44 | | | | | 0.20 | | | | | (0.07 | ) | | | | 0.13 | | | | | (0.20 | ) | | | | – | |
Year Ended 10/31/2014 | | | | 12.53 | | | | | 0.21 | | | | | (0.02 | ) | | | | 0.19 | | | | | (0.21 | ) | | | | (0.07 | ) |
Year Ended 10/31/2013 | | | | 12.62 | | | | | 0.18 | | | | | (0.09 | ) | | | | 0.09 | | | | | (0.18 | ) | | | | – | |
Year Ended 10/31/2012 | | | | 12.40 | | | | | 0.22 | | | | | 0.21 | | | | | 0.43 | | | | | (0.21 | ) | | | | – | |
| (a) | The amount shown may not correlate with the change in aggregate gains and losses of portfolio securities due to the timing of sales and redemptions of fund shares. |
| (b) | Total investment return assumes dividend reinvestment and does not reflect any deduction for applicable sales charges. Not annualized for periods less than one year. |
| * | All per share amounts have been rounded to the nearest cent. |
| ** | Computed on an annualized basis for periods less than one year. |
The accompanying Notes to Financial Statements are an integral part of this statement.
190
THRIVENT MUTUAL FUNDS
FINANCIAL HIGHLIGHTS –CONTINUED
| | | | | | | | | | | | | | | | | | | | | | | | | | | | | | | | |
| | | RATIOS/SUPPLEMENTAL DATA | |
| | | | | | | | | | | | Ratio to Average Net
Assets** | | | Ratios to Average Net
Assets Before Expenses
Waived, Credited or Paid
Indirectly** | | | | |
Total Distributions | | Net Asset
Value, End of
Period | | | Total
Return(b) | | | Net Assets,
End of Period
(in millions) | | | Expenses | | | Net Investment
Income/(Loss) | | | Expenses | | | Net Investment
Income/(Loss) | | | Portfolio
Turnover Rate | |
| | | | | | | | | | | | | | | | | | | | | | | | | | | | | | | | |
| | | | | | | | | | | | | | | | | | | | | | | | | | | | | | | | |
$(0.39) | | | $11.65 | | | | 3.79% | | | | $1,471.0 | | | | 0.74% | | | | 3.29% | | | | 0.74% | | | | 3.29% | | | | 10% | |
(0.40) | | | 11.60 | | | | 2.75% | | | | 1,463.5 | | | | 0.74% | | | | 3.42% | | | | 0.74% | | | | 3.42% | | | | 8% | |
(0.42) | | | 11.68 | | | | 8.33% | | | | 1,446.3 | | | | 0.75% | | | | 3.65% | | | | 0.75% | | | | 3.65% | | | | 8% | |
(0.43) | | | 11.18 | | | | (2.76)% | | | | 1,397.2 | | | | 0.74% | | | | 3.65% | | | | 0.74% | | | | 3.65% | | | | 24% | |
(0.44) | | | 11.93 | | | | 9.61% | | | | 1,532.0 | | | | 0.74% | | | | 3.76% | | | | 0.74% | | | | 3.76% | | | | 13% | |
| | | | | | | | |
| | | | | | | | | | | | | | | | | | | | | | | | | | | | | | | | |
(0.42) | | | 11.65 | | | | 4.04% | | | | 193.0 | | | | 0.49% | | | | 3.53% | | | | 0.49% | | | | 3.53% | | | | 10% | |
(0.43) | | | 11.60 | | | | 3.01% | | | | 108.5 | | | | 0.48% | | | | 3.68% | | | | 0.48% | | | | 3.68% | | | | 8% | |
(0.44) | | | 11.68 | | | | 8.61% | | | | 97.2 | | | | 0.49% | | | | 3.90% | | | | 0.49% | | | | 3.90% | | | | 8% | |
(0.46) | | | 11.18 | | | | (2.51)% | | | | 91.8 | | | | 0.49% | | | | 3.91% | | | | 0.49% | | | | 3.91% | | | | 24% | |
(0.47) | | | 11.93 | | | | 9.89% | | | | 102.5 | | | | 0.49% | | | | 4.02% | | | | 0.49% | | | | 4.02% | | | | 13% | |
| | | | | | | | | | | | | | | | | | | | | | | | | | | | | | | | |
| | | | | | | | | | | | | | | | | | | | | | | | | | | | | | | | |
(0.31) | | | 10.14 | | | | 3.36% | | | | 8.7 | | | | 0.87% | | | | 1.16% | | | | 1.04% | | | | 0.98% | | | | 149% | |
(0.11) | | | 10.12 | | | | 1.83% | | | | 18.7 | | | | 0.90% | | | | 0.86% | | | | 1.12% | | | | 0.65% | | | | 145% | |
(0.22) | | | 10.05 | | | | 2.56% | | | | 14.1 | | | | 0.90% | | | | 1.08% | | | | 1.07% | | | | 0.90% | | | | 130% | |
(0.48) | | | 10.02 | | | | (2.51)% | | | | 13.0 | | | | 0.90% | | | | 0.71% | | | | 1.03% | | | | 0.57% | | | | 184% | |
(0.36) | | | 10.76 | | | | 4.08% | | | | 14.5 | | | | 0.89% | | | | 1.02% | | | | 0.99% | | | | 0.93% | | | | 191% | |
| | | | | | | | |
| | | | | | | | | | | | | | | | | | | | | | | | | | | | | | | | |
(0.32) | | | 10.14 | | | | 3.41% | | | | 46.9 | | | | 0.81% | | | | 1.22% | | | | 0.81% | | | | 1.22% | | | | 149% | |
(0.15) | | | 10.12 | | | | 2.17% | | | | 73.9 | | | | 0.57% | | | | 1.18% | | | | 0.57% | | | | 1.18% | | | | 145% | |
(0.25) | | | 10.05 | | | | 2.90% | | | | 88.7 | | | | 0.57% | | | | 1.41% | | | | 0.57% | | | | 1.41% | | | | 130% | |
(0.51) | | | 10.02 | | | | (2.18)% | | | | 95.1 | | | | 0.57% | | | | 1.06% | | | | 0.57% | | | | 1.06% | | | | 184% | |
(0.39) | | | 10.76 | | | | 4.44% | | | | 98.0 | | | | 0.55% | | | | 1.38% | | | | 0.55% | | | | 1.38% | | | | 191% | |
| | | | | | | | | | | | | | | | | | | | | | | | | | | | | | | | |
| | | | | | | | | | | | | | | | | | | | | | | | | | | | | | | | |
(0.20) | | | 12.48 | | | | 2.42% | | | | 351.2 | | | | 0.62% | | | | 1.58% | | | | 0.62% | | | | 1.58% | | | | 81% | |
(0.17) | | | 12.38 | | | | 0.89% | | | | 374.4 | | | | 0.62% | | | | 1.37% | | | | 0.62% | | | | 1.37% | | | | 89% | |
(0.25) | | | 12.44 | | | | 1.27% | | | | 360.2 | | | | 0.62% | | | | 1.44% | | | | 0.62% | | | | 1.44% | | | | 102% | |
(0.15) | | | 12.53 | | | | 0.46% | | | | 415.6 | | | | 0.60% | | | | 1.21% | | | | 0.61% | | | | 1.20% | | | | 121% | |
(0.18) | | | 12.62 | | | | 3.18% | | | | 408.2 | | | | 0.60% | | | | 1.51% | | | | 0.61% | | | | 1.50% | | | | 113% | |
| | | | | | | | |
| | | | | | | | | | | | | | | | | | | | | | | | | | | | | | | | |
(0.22) | | | 12.48 | | | | 2.72% | | | | 441.0 | | | | 0.41% | | | | 1.80% | | | | 0.41% | | | | 1.80% | | | | 81% | |
(0.20) | | | 12.37 | | | | 1.05% | | | | 356.4 | | | | 0.38% | | | | 1.62% | | | | 0.38% | | | | 1.62% | | | | 89% | |
(0.28) | | | 12.44 | | | | 1.52% | | | | 467.3 | | | | 0.37% | | | | 1.69% | | | | 0.37% | | | | 1.69% | | | | 102% | |
(0.18) | | | 12.53 | | | | 0.70% | | | | 448.1 | | | | 0.37% | | | | 1.44% | | | | 0.37% | | | | 1.44% | | | | 121% | |
(0.21) | | | 12.62 | | | | 3.52% | | | | 472.6 | | | | 0.36% | | | | 1.77% | | | | 0.36% | | | | 1.77% | | | | 113% | |
The accompanying Notes to Financial Statements are an integral part of this statement.
191
THRIVENT MUTUAL FUNDS
FINANCIAL HIGHLIGHTS –CONTINUED
| | | | | | | | | | | | | | | | | | | | | | | | |
| | | FOR A SHARE OUTSTANDING THROUGHOUT EACH PERIOD* | |
| | | | | | Income from Investment Operations | | | Less Distributions From | |
| | | Net Asset
Value,
Beginning of Period | | | Net Investment Income/(Loss) | | | Net Realized
and Unrealized Gain/(Loss) on Investments(a) | | | Total from Investment Operations | | | Net Investment
Income | | | Net Realized Gain on Investments | |
MONEY MARKET FUND | |
Class A Shares | | | | | | | | | | | | | | | | | | | | | | | | |
Year Ended 10/31/2016 | | | $1.00 | | | | $– | | | | $– | | | | $– | | | | $– | | | | $– | |
Year Ended 10/31/2015 | | | 1.00 | | | | – | | | | – | | | | – | | | | – | | | | – | |
Year Ended 10/31/2014 | | | 1.00 | | | | – | | | | – | | | | – | | | | – | | | | – | |
Year Ended 10/31/2013 | | | 1.00 | | | | – | | | | – | | | | – | | | | – | | | | – | |
Year Ended 10/31/2012 | | | 1.00 | | | | – | | | | – | | | | – | | | | – | | | | – | |
| | | | | | |
Class S Shares | | | | | | | | | | | | | | | | | | | | | | | | |
Year Ended 10/31/2016 | | | 1.00 | | | | – | | | | – | | | | – | | | | – | | | | – | |
Year Ended 10/31/2015 | | | 1.00 | | | | – | | | | – | | | | – | | | | – | | | | – | |
Year Ended 10/31/2014 | | | 1.00 | | | | – | | | | – | | | | – | | | | – | | | | – | |
Year Ended 10/31/2013 | | | 1.00 | | | | – | | | | – | | | | – | | | | – | | | | – | |
Year Ended 10/31/2012 | | | 1.00 | | | | – | | | | – | | | | – | | | | – | | | | – | |
| (a) | The amount shown may not correlate with the change in aggregate gains and losses of portfolio securities due to the timing of sales and redemptions of fund shares. |
| (b) | Total investment return assumes dividend reinvestment and does not reflect any deduction for applicable sales charges. Not annualized for periods less than one year. |
| * | All per share amounts have been rounded to the nearest cent. |
| ** | Computed on an annualized basis for periods less than one year. |
The accompanying Notes to Financial Statements are an integral part of this statement.
192
THRIVENT MUTUAL FUNDS
FINANCIAL HIGHLIGHTS –CONTINUED
| | | | | | | | | | | | | | | | | | | | | | | | | | | | | | | | |
| | | RATIOS/SUPPLEMENTAL DATA | |
| | | | | | | | | | | | Ratio to Average Net
Assets** | | | Ratios to Average Net
Assets Before Expenses
Waived, Credited or Paid
Indirectly** | | | | |
Total
Distributions | | Net Asset
Value, End of
Period | | | Total
Return(b) | | | Net Assets, End of Period (in millions) | | | Expenses | | | Net Investment Income/(Loss) | | | Expenses | | | Net Investment
Income/(Loss) | | | Portfolio Turnover Rate | |
| | | | | | | | | | | | | | | | | | | | | | | | | | | | | | | | |
| | | | | | | | | | | | | | | | | | | | | | | | | | | | | | | | |
$– | | | $1.00 | | | | 0.00% | | | | $381.3 | | | | 0.41% | | | | 0.00% | | | | 0.85% | | | | (0.43)% | | | | N/A | |
– | | | 1.00 | | | | 0.00% | | | | 409.5 | | | | 0.20% | | | | 0.00% | | | | 0.95% | | | | (0.75)% | | | | N/A | |
– | | | 1.00 | | | | 0.00% | | | | 422.7 | | | | 0.19% | | | | 0.00% | | | | 0.94% | | | | (0.75)% | | | | N/A | |
– | | | 1.00 | | | | 0.00% | | | | 469.0 | | | | 0.23% | | | | 0.00% | | | | 0.94% | | | | (0.71)% | | | | N/A | |
– | | | 1.00 | | | | 0.00% | | | | 493.9 | | | | 0.29% | | | | 0.00% | | | | 0.93% | | | | (0.64)% | | | | N/A | |
| | | | | | | | | | | | | | | | | | | | | | | | | | | | | | | | |
– | | | 1.00 | | | | 0.00% | | | | 56.6 | | | | 0.44% | | | | 0.00% | | | | 0.53% | | | | (0.09)% | | | | N/A | |
– | | | 1.00 | | | | 0.00% | | | | 10.4 | | | | 0.20% | | | | 0.00% | | | | 0.61% | | | | (0.41)% | | | | N/A | |
– | | | 1.00 | | | | 0.00% | | | | 6.2 | | | | 0.19% | | | | 0.00% | | | | 0.61% | | | | (0.42)% | | | | N/A | |
– | | | 1.00 | | | | 0.00% | | | | 6.5 | | | | 0.23% | | | | 0.00% | | | | 0.59% | | | | (0.37)% | | | | N/A | |
– | | | 1.00 | | | | 0.00% | | | | 12.5 | | | | 0.29% | | | | 0.00% | | | | 0.58% | | | | (0.29)% | | | | N/A | |
The accompanying Notes to Financial Statements are an integral part of this statement.
193
ADDITIONAL INFORMATION
(unaudited)
Shareholder Notification of Federal Tax Information
The following information is provided solely to satisfy the requirements set forth by the Internal Revenue Code. Shareholders will be provided information regarding their distributions in January 2017.
The Funds designate the following percentages of dividends declared from net investment income as dividends qualifying for the 70% dividends received deduction for corporations or as qualified dividend income for individuals under the Jobs and Growth Tax Relief Reconciliation Act of 2003 for the tax period ending October 31, 2016:
| | | | | | | | |
| Fund | | Dividends
Received
Deduction for
Corporations | | | Qualified
Dividend
Income for
Individuals | |
Aggressive Allocation | | | 64 | % | | | 83 | % |
Moderately Aggressive Allocation | | | 48 | % | | | 73 | % |
Moderate Allocation | | | 31 | % | | | 45 | % |
Moderately Conservative Allocation | | | 20 | % | | | 27 | % |
Balanced Income Plus | | | 18 | % | | | 36 | % |
Opportunity Income Plus | | | 3 | % | | | 3 | % |
Partner Emerging Markets Equity | | | 4 | % | | | 100 | % |
Small Cap Stock | | | 100 | % | | | 100 | % |
Mid Cap Stock | | | 100 | % | | | 100 | % |
Partner Worldwide Allocation | | | 0 | % | | | 100 | % |
Large Cap Value | | | 100 | % | | | 100 | % |
Large Cap Stock | | | 94 | % | | | 100 | % |
High Yield | | | 2 | % | | | 2 | % |
Income | | | 2 | % | | | 2 | % |
Limited Maturity Bond | | | 1 | % | | | 1 | % |
The Municipal Bond Fund designates 99.30% of the dividends declared from net investment income as exempt from federal income tax for the tax period ended October 31, 2016.
Pursuant to IRC 852(b)(3) of the Internal Revenue Code, the Funds hereby designate the following amounts as long-term capital gains distributed during the year ended October 31, 2016, or if subsequently determined to be different, the net capital gain of such year:
| | | | |
| Fund | | Distributions of Long-Term
Capital Gains | |
Aggressive Allocation | | | $58,835,863 | |
Moderately Aggressive Allocation | | | 104,845,132 | |
Moderate Allocation | | | 75,716,333 | |
Moderately Conservative Allocation | | | 19,513,617 | |
Balanced Income Plus | | | 13,422,699 | |
Small Cap Stock | | | 36,128,745 | |
Mid Cap Stock | | | 136,112,902 | |
Large Cap Growth | | | 36,450,230 | |
Large Cap Value | | | 42,858,698 | |
Large Cap Stock | | | 59,960,093 | |
Income | | | 3,613,600 | |
Government Bond | | | 434,213 | |
These amounts may include earnings and profits distributed to shareholders on the redemption of shares as part of the dividend paid deduction.
Proxy Voting
The policies and procedures that the Trust uses to determine how to vote proxies relating to portfolio securities are attached to the Trust’s Statement of Additional Information. You may request a free copy of the Statement of Additional Information or the report of how the Trust voted proxies relating to portfolio securities during the most recent 12-month period ended June 30 by calling 1-800-847-4836. You also may review the Statement of Additional Information or the report of how the Trust voted proxies relating to portfolio securities during the most recent 12-month period ended June 30 at ThriventFunds. com or sec.gov.
Quarterly Schedule of Portfolio Holdings
The Trust files its Schedule of Portfolio Holdings on Form N-Q with the SEC for the first and third quarters of each fiscal year. You may request a free copy of the Trust’s Forms N-Q by calling 1-800-847-4836. The Trust’s most recent Form N-Q Schedule of Investments also is at ThriventFunds.com or sec. gov. You also may review and copy the Forms N-Q for the Trust at the SEC’s Public Reference Room in Washington, DC. You may get information about the operation of the Public Reference Room by calling 1-800-SEC-0330.
Summary Schedule of Investments
The summary schedule of investments is designed to streamline the report and help investors better focus on a fund’s principal holdings. A complete listing of holdings for a fund in which the summary is included in the shareholder report is available free of charge by calling 1-800-847-4836. It is also available at ThriventFunds.com or sec.gov where it is part of form N-CSR.
194
BOARDOF TRUSTEESAND OFFICERS
The following table provides information about the Trustees and Officers of the Trust. The Board is responsible for the management and supervision of the Funds’ business affairs and for exercising all powers except those reserved to the shareholders. Each Trustee oversees each of 21 series of the Trust and also serves as:
| | • | | Director of Thrivent Series Fund, Inc., a registered investment company consisting of 27 Portfolios that serve as underlying funds for variable contracts issued by Thrivent Financial and Thrivent Life Insurance Company (“TLIC”) and investment options in the retirement plan offered by Thrivent Financial. |
| | • | | Trustee of Thrivent Cash Management Trust, a registered investment company consisting of one Fund that serves as a cash collateral fund for a securities lending program sponsored by Thrivent Financial. |
| | • | | Trustee of Thrivent Core Funds, a registered investment company that only offers its shares to the Trust and Thrivent Series Fund, Inc. |
The Trust, Thrivent Series Fund, Inc., Thrivent Cash Management Trust, and Thrivent Core Funds are collectively referred to as the “Fund Complex.” The Statement of Additional Information includes additional information about the Trustees and is available, without charge, by calling 1-800-847-4836.
Interested Trustee (1)(2)(3)(4)
| | |
Name (Year of Birth)
Year Elected | | Principal Occupation(s) and Directorships of Public Companies and Other Investment Companies
During the Past Five Years |
Russell W. Swansen (1957) 2009 | | Senior Vice President, Chief Investment Officer, Thrivent Financial since 2003. Director of Twin Bridge Capital Partners; Invenshure, LLC; Children’s Cancer Research Fund; and Intellectual Takeout. |
David S. Royal (1971) 2015 | | President, Thrivent Mutual Funds, Thrivent Financial since 2015; Vice President and Deputy General Counsel from 2006 to 2015. Director of Fairview Hospital Foundation. |
|
| Independent Trustees (2)(3)(4)(5) |
| |
Name (Year of Birth)
Year Elected | | Principal Occupation(s) and Directorships of Public Companies and Other Investment Companies
During the Past Five Years |
Janice B. Case (1952) 2011 | | Retired. Independent Trustee of North American Electric Reliability Corporation (the electric reliability organization (“ERD”) for North America) since 2008. |
Richard L. Gady (1943) 1987 | | Retired. |
Richard A. Hauser (1943) 2004 | | Retired. Vice President and Assistant General Counsel, The Boeing Company from 2007-2016. |
Marc S. Joseph (1960) 2011 | | Managing Director of Granite Ridge LLP (consulting and advisory firm) since 2009; Managing Director of Triangle Crest (private investing and consulting firm) since 2004. |
Paul R. Laubscher (1956) 2009 | | Portfolio Manager for U.S. private real estate portfolios of IBM Retirement Funds. |
James A. Nussle (1960) 2011 | | President and Chief Executive Officer of Credit Union National Association since September 2014; President and Chief Operating Officer of Growth Energy (trade association) from 2010 through August 2014; Advisory Board member of AVISTA Capital Partners (private equity firm) since 2010; CEO of The Nussle Group LLC (consulting firm) since 2009. |
Douglas D. Sims (1946) 2006 | | Retired. Currently, Director of Keystone Science School. Previously, Director of the Center for Corporate Excellence. |
Constance L. Souders (1950) 2007 | | Retired. |
195
BOARDOF TRUSTEESAND OFFICERS
Executive Officers (4)
| | |
Name (Year of Birth)
Position Held With Thrivent | | Principal Occupation(s) During the Past Five Years |
David S. Royal (1971) President | | Vice President, Thrivent Mutual Funds, Thrivent Financial since 2015; Vice President and Deputy General Counsel from 2006 to 2015. |
Russell W. Swansen (1957) Chief Investment Officer | | Senior Vice President and Chief Investment Officer, Thrivent Financial since 2003. |
Gerard V. Vaillancourt (1967) Treasurer and Principal Accounting Officer | | Vice President, Mutual Fund Accounting since 2006. |
Michael W. Kremenak (1978) Secretary and Chief Legal Officer | | Vice President, Thrivent Financial since 2015; Senior Counsel, Thrivent Financial from 2013 to 2015; Vice President and Assistant General Counsel at Nuveen Investments from 2011 to 2013. |
Ted S. Dryden (1965) Chief Compliance Officer | | Investment Company and Investment Adviser Chief Compliance Officer, Thrivent Financial since December 2010. |
Janice M. Guimond (1964) Vice President | | Vice President, Investment Operations, Thrivent Financial since 2004. |
Kathleen M. Koelling (1977) Privacy and Identity Theft and Anti-Money Laundering Officer (6) | | Privacy and Identity Theft and Anti-Money Laundering Officer, Thrivent Financial since 2011; Senior Counsel, Thrivent Financial since 2002. |
Mark D. Anema (1961) Vice President | | Vice President, New Product Management and Development, Thrivent Financial since 2007. |
Kathryn A. Stelter (1962) Vice President | | Director, Mutual Fund Operations, Thrivent Financial since 2014; Director, Mutual Fund Operations at Hartford Funds from 2006 to 2014. |
James M. Odland (1955) Assistant Secretary | | Vice President, Managing Counsel, Thrivent Financial since 2005. |
Jill M. Forte (1974) Assistant Secretary | | Counsel, Thrivent Financial since 2015; Associate Counsel, Ameriprise Financial, Inc. from 2013 to 2015; Manager - Legal Affairs, Ameriprise Financial, Inc. from 2010 to 2013. |
Troy A. Beaver (1967) Vice President | | Vice President, Mutual Fund Distribution & Sales, Thrivent Financial since 2015; Vice President, Marketing, American Century Investments from 2006 to 2015. |
Sarah L. Bergstrom (1977) Assistant Treasurer | | Director, Fund Accounting Administration, Thrivent Financial since 2007. |
| (1) | “Interested Trustee” of the Fund as defined in the Investment Company Act of 1940 by virtue of positions with Thrivent Financial. Mr. Swansen and Mr. Royal are considered interested trustees because of their principal occupation with Thrivent Financial. |
| (2) | Each Trustee generally serves an indefinite term until her or his successor is duly elected and qualified. Trustees serve at the discretion of the board until their successors are duly appointed and qualified. |
| (3) | Each Trustee oversees 50 portfolios. |
| (4) | The address for each Trustee and Officer unless otherwise noted is 625 Fourth Avenue South, Minneapolis, MN 55415. |
| (5) | The Trustees other than Mr. Swansen and Mr. Royal are not “interested trustees” of the Fund and are referred to as “Independent Trustees.” |
| (6) | The address for this Officer is 4321 North Ballard Road, Appleton, Wl 54913. |
196
Register on Thrivent.com
to access your accounts, member benefits and more.

This page is not part of the annual report.

4321 North Ballard Road, Appleton, WI 54919-0001
We’re listening to you!
| | |
In response to concerns regarding multiple mailings, we send one copy of a shareholder report and one copy of a prospectus for Thrivent Mutual Funds to each household. This process is known as householding. This consolidation helps reduce printing and postage costs, thereby saving money. If you wish to receive an additional copy of this report, call us toll-free at 800-847-4836. If you wish to revoke householding in the future, you may write to us at 4321 N. Ballard Road, Appleton, WI 54919-0001, or by calling us at 800-847-4836. We will begin to mail separate regulatory mailings within 30 days of receiving your request. | | |
It’s your choice—email, U.S. mail or some of each? Paperless delivery of documents provides faster access to important information. An email is sent to you when new documents are available. Paperless delivery options: • Prospectuses • Annual and semiannual reports • Most billing and contribution notices • Most contract and account statements • Most life insurance statements • Confirmation activity statements • Annual privacy notice • Thrivent magazine Go to Thrivent.com/gopaperless to learn more. Securities offered through Thrivent Distributors LLC, 625 Fourth Ave. S., Minneapolis, MN 55415, a FINRA member and a wholly owned subsidiary of Thrivent Financial, the marketing name for Thrivent Financial for Lutherans, Appleton, WI. | | |
23459AR R12-16
As of the end of the period covered by this report, registrant has adopted a code of ethics (as defined in Item 2 of Form N-CSR) applicable to registrant’s Principal Executive Officer, Principal Financial Officer and Principal Accounting Officer. No waivers were granted to such code of ethics during the period covered by this report. A copy of this code of ethics is filed as an exhibit to this Form N-CSR.
| Item 3. | Audit Committee Financial Expert |
Registrant’s Board of Trustees has determined that Constance L. Souders, an independent trustee, is the Audit Committee Financial Expert.
| Item 4. | Principal Accountant Fees and Services |
The aggregate fees billed by registrant’s independent public accountants, PricewaterhouseCoopers LLP (“PwC”), for the fiscal year ended October 31, 2015 and the fiscal year ended October 31, 2016, for professional services rendered in connection with the audit of registrant’s annual financial statements or services that are normally provided by the accountant in connection with statutory and regulatory filings or engagements were $360,289 and $398,264, respectively.
The aggregate fees PwC billed to registrant for the fiscal year ended October 31, 2015 and the fiscal year ended October 31, 2016, for assurance and other services that are reasonably related to the performance of registrant’s audit and are not reported under Item 4(a), were $0 for 2015 and $16,000 for 2016. The aggregate fees PwC billed to registrant’s investment adviser and any entity controlling, controlled by, or under common control with registrant’s investment adviser for the fiscal year ended October 31, 2015 and the fiscal year ended October 31, 2016, for assurance and other services directly related to the operations and financial reporting of registrant, were $0 for each respective period.
The aggregate tax fees PwC billed to registrant for the fiscal year ended October 31, 2015 and the fiscal year ended October 31, 2016, for tax compliance, tax advice and tax planning services, were $145,851 and $104,949, respectively. The aggregate tax fees PwC billed to registrant’s investment adviser and any entity controlling, controlled by, or under common control with registrant’s investment adviser for the fiscal year ended October 31, 2015 and the fiscal year ended October 31, 2016, for services directly related to the operations and financial reporting of registrant, were $0 for each respective period.
The aggregate fees PwC billed to registrant for each of the last two fiscal years for products and services provided, other than the services reported in paragraphs (a) through (c) of this item, were $0 for the years ended October 31, 2015 and October 31, 2016. The aggregate fees PwC billed to registrant’s investment adviser and any entity controlling, controlled by, or under common control with registrant’s investment adviser for the fiscal year ended October 31, 2015 and the fiscal year ended October 31, 2016, for products and services provided, other than the services reported in paragraphs (a) through (c) of this item, were $100,325 and $12,629, respectively. The 2015 payments included payments for access to a PwC-sponsored online library that provides interpretive guidance regarding U.S. and foreign accounting standards, fees related to the merger of certain series of Thrivent Mutual Funds and certain series of Thrivent Series Fund, Inc., and other tax related work. The 2016 payments included payments for access to a PwC-sponsored online library that provides interpretive guidance regarding U.S. and foreign accounting standards and other tax related work. These figures are also reported in response to Item 4(g) below.
| | (e) | Registrant’s audit committee charter provides that the audit committee (comprised of the independent Trustees of registrant) is responsible for pre-approval of all auditing services performed for the registrant. The audit committee also is responsible for pre-approval (subject to the de minimis exceptions for non-audit services described in Section 10A(i)(1)(B) of the Securities Exchange Act of 1934) of all non-auditing services performed for the registrant or an affiliate of registrant. In addition, registrant’s audit committee charter permits a designated member of the audit committee to pre-approve, between meetings, one or more audit or non-audit service projects, subject to an expense limit and notification to the audit committee at the next committee meeting. Registrant’s audit committee pre-approved all fees described above that PwC billed to registrant. |
| | (f) | Less than 50% of the hours billed by PwC for auditing services to registrant for the fiscal year ended October 31, 2016 were for work performed by persons other than full-time permanent employees of PwC. |
| | (g) | The aggregate non-audit fees billed by PwC to registrant and to registrant’s investment adviser and any entity controlling, controlled by, or under common control with registrant’s investment adviser for the fiscal year ended October 31, 2015 and the fiscal year ended October 31, 2016 were $100,325 and $12,629 for each respective period. These figures are also reported in response to Item 4(d) above. |
| | (h) | Registrant’s audit committee has considered the non-audit services provided to the registrant and registrant’s investment adviser and any entity controlling, controlled by, or under common control with registrant’s investment adviser as described above and determined that these services do not compromise PwC’s independence. |
| Item 5. | Audit Committee of Listed Registrants |
Not applicable.
| Item 6. | Schedule of Investments |
| | (a) | The summary schedule of investments for these funds; Aggressive Allocation Fund, Moderately Aggressive Allocation Fund, Moderate Allocation Fund, Moderately Conservative Allocation Fund, Balanced Income Plus Fund, Opportunity Income Plus Fund, Partner Worldwide Allocation Fund, Large Cap Stock Fund, High Yield Fund, Income Fund, Municipal Bond Fund and Limited Maturity Bond Fund, are included as part of the report to shareholders filed under Item 1 of this Form. The schedule of investments for said funds are filed under this Item. |

Report of Independent Registered Public Accounting Firm
To the Trustees and Shareholders of Thrivent Aggressive Allocation Fund,
Thrivent Moderately Aggressive Allocation Fund, Thrivent Moderate Allocation Fund,
Thrivent Moderately Conservative Allocation Fund, Thrivent Balanced Income Plus Fund,
Thrivent Opportunity Income Plus Fund, Thrivent Partner Worldwide Allocation Fund,
Thrivent Large Cap Stock Fund, Thrivent High Yield Fund, Thrivent Income Fund,
Thrivent Municipal Bond Fund, and Thrivent Limited Maturity Bond Fund:
In our opinion, the accompanying statements of assets and liabilities, including the summary schedules of investments, and the related statements of operations and of changes in net assets and the financial highlights (included in Item 1 of this Form N-CSR) and the schedules of investments (included in Item 6 of this Form N-CSR) present fairly, in all material respects, the financial position of Thrivent Aggressive Allocation Fund, Thrivent Moderately Aggressive Allocation Fund, Thrivent Moderate Allocation Fund, Thrivent Moderately Conservative Allocation Fund, Thrivent Balanced Income Plus Fund, Thrivent Opportunity Income Plus Fund, Thrivent Partner Worldwide Allocation Fund, Thrivent Large Cap Stock Fund, Thrivent High Yield Fund, Thrivent Income Fund, Thrivent Municipal Bond Fund, and Thrivent Limited Maturity Bond Fund (constituting part of the Thrivent Mutual Funds) (hereafter referred to as the “Funds”) as of October 31, 2016, the results of each of their operations for the year then ended, the changes in each of their net assets for each of the two years in the period then ended and their financial highlights for each of the periods presented, in conformity with accounting principles generally accepted in the United States of America. These financial statements, financial highlights and schedules of investments (hereafter referred to as “financial statements”) are the responsibility of the Funds’ management. Our responsibility is to express an opinion on these financial statements based on our audits. We conducted our audits of these financial statements in accordance with the standards of the Public Company Accounting Oversight Board (United States). Those standards require that we plan and perform the audit to obtain reasonable assurance about whether the financial statements are free of material misstatement. An audit includes examining, on a test basis, evidence supporting the amounts and disclosures in the financial statements, assessing the accounting principles used and significant estimates made by management, and evaluating the overall financial statement presentation. We believe that our audits, which included confirmation of securities as of October 31, 2016 by correspondence with the custodian, agent banks, transfer agent and brokers provides a reasonable basis for our opinion.

December 20, 2016
|
PricewaterhouseCoopers LLP, 45 South Seventh Street, Suite 3400, Minneapolis, MN 55402 |
T: (612) 596 6000, F: (612) 373 7160, www.pwc.com/us |
AGGRESSIVE ALLOCATION FUND
Schedule of Investments as of October 31, 2016
| | | | | | | | |
| Shares | | | Common Stock (47.3%) | | Value | |
| | Consumer Discretionary (6.6%) | | | | |
| | 14,917 | | | Aaron’s, Inc. | | | $368,599 | |
| | 905 | | | Adient plca | | | 41,187 | |
| | 7,680 | | | Amazon.com, Inc.a | | | 6,065,818 | |
| | 1,120 | | | American Axle & Manufacturing Holdings, Inc.a | | | 20,070 | |
| | 1,677 | | | American Public Education, Inc.a | | | 33,792 | |
| | 10,600 | | | Aramark | | | 394,638 | |
| | 910 | | | Armstrong Flooring, Inc.a | | | 14,733 | |
| | 1,090 | | | Ascent Capital Group, Inc.a | | | 22,214 | |
| | 1,620 | | | AutoZone, Inc.a | | | 1,202,299 | |
| | 7,350 | | | Barnes & Noble, Inc. | | | 75,705 | |
| | 120 | | | Bayerische Motoren Werke AG | | | 9,111 | |
| | 2,180 | | | Beazer Homes USA, Inc.a | | | 22,301 | |
| | 770 | | | Bed Bath & Beyond, Inc. | | | 31,123 | |
| | 80 | | | Beiersdorf AG | | | 7,053 | |
| | 1,800 | | | Berkeley Group Holdings plc | | | 51,915 | |
| | 1,140 | | | Big 5 Sporting Goods Corporation | | | 17,670 | |
| | 5,580 | | | Bloomin’ Brands, Inc. | | | 96,534 | |
| | 11,250 | | | BorgWarner, Inc. | | | 403,200 | |
| | 243 | | | Brembo SPA | | | 15,045 | |
| | 2,000 | | | Bridgestone Corporation | | | 74,647 | |
| | 34,496 | | | Brunswick Corporation | | | 1,500,576 | |
| | 130 | | | Buffalo Wild Wings, Inc.a | | | 18,935 | |
| | 1,508 | | | Bunzl plc | | | 40,486 | |
| | 18,620 | | | Burlington Stores, Inc.a | | | 1,395,383 | |
| | 6,110 | | | Caleres, Inc. | | | 152,811 | |
| | 4,730 | | | Callaway Golf Company | | | 48,293 | |
| | 2,000 | | | Calsonic Kansei Corporation | | | 25,065 | |
| | 7,660 | | | Carter’s, Inc. | | | 661,364 | |
| | 7,896 | | | Cedar Fair, LP | | | 448,888 | |
| | 6,420 | | | Cheesecake Factory, Inc. | | | 341,480 | |
| | 640 | | | Chuy’s Holdings, Inc.a | | | 18,176 | |
| | 3,700 | | | Cinemark Holdings, Inc. | | | 147,260 | |
| | 1,070 | | | ClubCorp Holdings, Inc. | | | 12,359 | |
| | 36,790 | | | Comcast Corporation | | | 2,274,358 | |
| | 500 | | | Compass Group plc | | | 9,047 | |
| | 37,870 | | | Core-Mark Holding Company, Inc. | | | 1,338,705 | |
| | 2,629 | | | CSS Industries, Inc. | | | 65,988 | |
| | 3,107 | | | Culp, Inc. | | | 86,996 | |
| | 13,920 | | | Dana, Inc. | | | 215,482 | |
| | 680 | | | Deckers Outdoor Corporationa | | | 35,489 | |
| | 8,488 | | | Delphi Automotive plc | | | 552,314 | |
| | 2,500 | | | Denso Corporation | | | 108,787 | |
| | 2,390 | | | DeVry Education Group, Inc. | | | 54,253 | |
| | 2,083 | | | Discovery Communications, Inc., Class Aa | | | 54,387 | |
| | 10,280 | | | Dish DBS Corporationa | | | 601,997 | |
| | 4,820 | | | Dollar General Corporation | | | 333,014 | |
| | 19,632 | | | Dollar Tree, Inc.a | | | 1,483,198 | |
| | 4,805 | | | Domino’s Pizza, Inc. | | | 813,198 | |
| | 9,500 | | | DSW, Inc. | | | 197,315 | |
| | 32,370 | | | Duluth Holdings, Inc.a | | | 878,846 | |
| | 3,400 | | | Etsy, Inc.a | | | 44,132 | |
| | 2,400 | | | Eutelsat Communications | | | 50,292 | |
| | 5,365 | | | Expedia, Inc. | | | 693,319 | |
| | 4,920 | | | Finish Line, Inc. | | | 96,875 | |
| | 2,400 | | | Fuji Heavy Industries, Ltd. | | | 93,784 | |
| | 7,860 | | | Gentex Corporation | | | 132,913 | |
| | 18,637 | | | G-III Apparel Group, Ltd.a | | | 486,798 | |
| | 11,230 | | | GNC Holdings, Inc. | | | 150,819 | |
| | 700 | | | Hakuhodo Dy Holdings, Inc. | | | 8,413 | |
| | 1,594 | | | Harley-Davidson, Inc. | | | 90,890 | |
| | 12,204 | | | Harman International Industries, Inc. | | | 972,781 | |
| | 3,582 | | | Haverty Furniture Companies, Inc. | | | 63,580 | |
| | 200 | | | Hennes & Mauritz AB | | | 5,625 | |
| | 16,750 | | | Home Depot, Inc. | | | 2,043,667 | |
| | 6,100 | | | Honda Motor Company, Ltd. | | | 182,522 | |
| | 20,290 | | | Houghton Mifflin Harcourt Companya | | | 256,669 | |
| | 1,090 | | | HSN, Inc. | | | 41,093 | |
| | 930 | | | Hyatt Hotels Corporationa | | | 47,235 | |
| | 1,610 | | | ILG, Inc. | | | 26,372 | |
| | 3,400 | | | Inchcape plc | | | 27,033 | |
| | 880 | | | International Speedway Corporation | | | 28,952 | |
| | 3,310 | | | Interpublic Group of Companies, Inc. | | | 74,111 | |
| | 500 | | | Intertek Group plc | | | 20,861 | |
| | 1,310 | | | Jack in the Box, Inc. | | | 122,786 | |
| | 2,010 | | | John Wiley and Sons, Inc. | | | 103,716 | |
| | 28,512 | | | Kate Spade & Companya | | | 477,576 | |
| | 100 | | | Koito Manufacturing Company, Ltd. | | | 5,250 | |
| | 200 | | | KOMERI Company, Ltd. | | | 4,883 | |
| | 5,174 | | | L Brands, Inc. | | | 373,511 | |
| | 4,000 | | | Ladbrokes plc | | | 6,531 | |
| | 21,967 | | | Las Vegas Sands Corporation | | | 1,271,450 | |
| | 5,410 | | | La-Z-Boy, Inc. | | | 126,594 | |
| | 14,610 | | | Liberty Interactive Corporationa | | | 270,139 | |
| | 206 | | | Linamar Corporation | | | 8,378 | |
| | 10,173 | | | Lithia Motors, Inc. | | | 872,640 | |
| | 14,440 | | | LKQ Corporationa | | | 466,123 | |
| | 2,250 | | | Lowe’s Companies, Inc. | | | 149,962 | |
| | 280 | | | Lululemon Athletica, Inc.a | | | 16,030 | |
| | 200 | | | LVMH Moet Hennessy Louis Vuitton SE | | | 36,412 | |
| | 12,670 | | | Masonite International Corporationa | | | 720,923 | |
| | 11,082 | | | MDC Partners, Inc. | | | 93,643 | |
| | 1,860 | | | Meredith Corporation | | | 84,351 | |
| | 800 | | | Meritage Homes Corporationa | | | 24,760 | |
| | 320 | | | Mohawk Industries, Inc.a | | | 58,976 | |
| | 340 | | | Monro Muffler Brake, Inc. | | | 18,700 | |
| | 480 | | | Murphy USA, Inc.a | | | 33,014 | |
| | 2,031 | | | New Media Investment Group, Inc. | | | 29,246 | |
| | 1,410 | | | New York Times Company | | | 15,369 | |
| | 30,150 | | | Newell Brands, Inc. | | | 1,447,803 | |
| | 8,020 | | | News Corporation, Class A | | | 97,202 | |
| | 2,190 | | | News Corporation, Class B | | | 27,156 | |
| | 200 | | | Nifco, Inc. | | | 11,518 | |
| | 300 | | | Nokian Renkaat Oyj | | | 10,063 | |
| | 27,629 | | | Nord Anglia Education, Inc.a | | | 595,129 | |
| | 75,196 | | | Nutrisystem, Inc. | | | 2,383,713 | |
| | 2,064 | | | O’Reilly Automotive, Inc.a | | | 545,804 | |
| | 19,484 | | | Oxford Industries, Inc. | | | 1,222,036 | |
| | 76 | | | Paddy Power plc | | | 7,876 | |
| | 16,140 | | | Papa John’s International, Inc. | | | 1,217,763 | |
| | 39,533 | | | Papa Murphy’s Holdings, Inc.a | | | 219,803 | |
| | 17,480 | | | Penn National Gaming, Inc.a | | | 226,016 | |
| | 3,534 | | | Persimmon plc | | | 73,154 | |
| | 740 | | | Priceline Group, Inc.a | | | 1,090,930 | |
| | 270 | | | Publicis Groupe SA | | | 18,522 | |
| | 10,434 | | | PVH Corporation | | | 1,116,229 | |
| | 3,287 | | | Ralph Lauren Corporation | | | 322,455 | |
| | 1,340 | | | Rent-A-Center, Inc. | | | 13,521 | |
| | 320 | | | Restaurant Brands International, Inc. | | | 14,230 | |
| | 6,099 | | | Restoration Hardware Holdings, Inc.a | | | 176,688 | |
| | 1,540 | | | Retailmenot, Inc.a | | | 13,937 | |
| | 24,547 | | | Ross Stores, Inc. | | | 1,535,169 | |
| | 2,260 | | | Royal Caribbean Cruises, Ltd. | | | 173,726 | |
| | 100 | | | RTL Group SA | | | 7,837 | |
| | 2,670 | | | Ruth’s Hospitality Group, Inc. | | | 42,320 | |
| | 4,570 | | | Sally Beauty Holdings, Inc.a | | | 118,546 | |
| | 6,300 | | | Scripps Networks Interactive, Inc. | | | 405,468 | |
| | 400 | | | Sekisui Chemical Company, Ltd. | | | 6,299 | |
| | 800 | | | Sekisui House, Ltd. | | | 13,219 | |
| | 1,590 | | | Select Comfort Corporationa | | | 30,512 | |
The accompanying Notes to Financial Statements are an integral part of this schedule.
1
AGGRESSIVE ALLOCATION FUND
Schedule of Investments as of October 31, 2016
| | | | | | | | |
| Shares | | | Common Stock (47.3%) | | Value | |
| | Consumer Discretionary (6.6%) - continued | | | | |
| | 4,320 | | | Signet Jewelers, Ltd. | | | $351,043 | |
| | 2,438 | | | Sportsman’s Warehouse Holdings, Inc.a | | | 22,430 | |
| | 16,890 | | | Starbucks Corporation | | | 896,352 | |
| | 4,504 | | | Stein Mart, Inc. | | | 27,114 | |
| | 1,540 | | | Steven Madden, Ltd.a | | | 51,436 | |
| | 2,400 | | | Sumitomo Forestry Company, Ltd. | | | 33,433 | |
| | 1,400 | | | Sumitomo Rubber Industries, Ltd. | | | 23,487 | |
| | 100 | | | Swatch Group AG | | | 5,765 | |
| | 3,490 | | | Tegna, Inc. | | | 68,474 | |
| | 6,250 | | | Tempur-Pedic International, Inc.a | | | 337,938 | |
| | 6,752 | | | Tenneco, Inc.a | | | 371,833 | |
| | 19,610 | | | Time, Inc. | | | 254,930 | |
| | 14,520 | | | TJX Companies, Inc. | | | 1,070,850 | |
| | 29,873 | | | Toll Brothers, Inc.a | | | 819,715 | |
| | 8,804 | | | Tower International, Inc. | | | 191,047 | |
| | 100 | | | Toyota Motor Corporation | | | 5,801 | |
| | 39,323 | | | Tuesday Morning Corporationa | | | 194,649 | |
| | 490 | | | Tupperware Brands Corporation | | | 29,165 | |
| | 1,389 | | | Ulta Salon Cosmetics & Fragrance, Inc.a | | | 337,999 | |
| | 4,338 | | | Under Armour, Inc., Class Aa | | | 134,912 | |
| | 4,367 | | | Under Armour, Inc., Class Ca | | | 112,931 | |
| | 6,110 | | | Vail Resorts, Inc. | | | 974,178 | |
| | 42 | | | Valora Holding AG | | | 12,213 | |
| | 3,330 | | | Vera Bradley, Inc.a | | | 44,522 | |
| | 6,347 | | | VF Corporation | | | 344,071 | |
| | 1,330 | | | Visteon Corporation | | | 93,911 | |
| | 3,090 | | | Vitamin Shoppe, Inc.a | | | 77,405 | |
| | 2,000 | | | Wacoal Holdings Corporation | | | 23,075 | |
| | 10,650 | | | Walt Disney Company | | | 987,148 | |
| | 1,900 | | | Whirlpool Corporation | | | 284,658 | |
| | 300 | | | Whitbread plc | | | 13,253 | |
| | 21,790 | | | Wingstop, Inc. | | | 583,100 | |
| | 2,209 | | | Wolters Kluwer NV | | | 85,423 | |
| | 1,700 | | | WPP plc | | | 36,912 | |
| | 900 | | | Yokohama Rubber Company, Ltd. | | | 15,626 | |
| | 5,940 | | | Yum! Brands, Inc. | | | 512,503 | |
| | 17,538 | | | Zoe’s Kitchen, Inc.a | | | 397,586 | |
| | | | | |
| | | | Total | | | 56,923,335 | |
| | | | | |
| |
| | Consumer Staples (1.6%) | | | | |
| | 17,210 | | | AdvancePierre Foods Holdings, Inc. | | | 481,192 | |
| | 1,300 | | | Axfood AB | | | 20,316 | |
| | 711 | | | British American Tobacco plc | | | 40,750 | |
| | 4,560 | | | Brown-Forman Corporation | | | 210,535 | |
| | 6,510 | | | Campbell Soup Company | | | 353,753 | |
| | 8,338 | | | Casey’s General Stores, Inc. | | | 942,111 | |
| | 29,210 | | | Coca-Cola Company | | | 1,238,504 | |
| | 2,400 | | | Coca-Cola HBC AG | | | 51,792 | |
| | 21,040 | | | CVS Health Corporation | | | 1,769,464 | |
| | 600 | | | Davide Campari - Milano SPA | | | 6,043 | |
| | 3,043 | | | Distribuidora Internacional de Alimentacion SA | | | 16,253 | |
| | 4,696 | | | e.l.f. Beauty, Inc.a | | | 121,439 | |
| | 400 | | | Ebro Foods SA | | | 8,625 | |
| | 8,020 | | | Estee Lauder Companies, Inc. | | | 698,783 | |
| | 5,560 | | | Flowers Foods, Inc. | | | 86,291 | |
| | 2,590 | | | General Mills, Inc. | | | 160,528 | |
| | 77 | | | George Weston, Ltd. | | | 6,275 | |
| | 16,457 | | | Hain Celestial Group, Inc.a | | | 598,541 | |
| | 500 | | | Henkel AG & Company KGaA | | | 55,091 | |
| | 3,576 | | | Imperial Brands plc | | | 172,978 | |
| | 4,640 | | | Ingredion, Inc. | | | 608,629 | |
| | 858 | | | J & J Snack Foods Corporation | | | 104,805 | |
| | 500 | | | Jeronimo Martins SGPS SA | | | 8,592 | |
| | 500 | | | Kao Corporation | | | 25,728 | |
| | 200 | | | Kesko Oyj | | | 9,938 | |
| | 1,200 | | | Kewpie Corporation | | | 34,081 | |
| | 300 | | | Kimberly-Clark Corporation | | | 34,323 | |
| | 600 | | | Kirin Holdings Company, Ltd. | | | 10,315 | |
| | 8,609 | | | Koninklijke Ahold Delhaize NV | | | 196,393 | |
| | 610 | | | Lancaster Colony Corporation | | | 79,696 | |
| | 1 | | | Lindt & Spruengli AG | | | 5,193 | |
| | 7,829 | | | Monster Beverage Corporationa | | | 1,130,038 | |
| | 700 | | | Nestle SA | | | 50,760 | |
| | 200 | | | Ontex Group NV | | | 6,050 | |
| | 3,350 | | | PepsiCo, Inc. | | | 359,120 | |
| | 553 | | | Philip Morris International, Inc. | | | 53,331 | |
| | 15,930 | | | Pinnacle Foods, Inc. | | | 819,121 | |
| | 156 | | | Premium Brands Holdings Corporation | | | 7,549 | |
| | 5,220 | | | Procter & Gamble Company | | | 453,096 | |
| | 6,082 | | | SpartanNash Company | | | 170,296 | |
| | 600 | | | Suedzucker AG | | | 15,392 | |
| | 7,421 | | | United Natural Foods, Inc.a | | | 309,752 | |
| | 270 | | | Universal Corporation | | | 14,634 | |
| | 11,610 | | | Walgreens Boots Alliance, Inc. | | | 960,495 | |
| | 31,890 | | | WhiteWave Foods Companya | | | 1,737,686 | |
| | | | | |
| | | | Total | | | 14,244,277 | |
| | | | | |
| |
| | Energy (6.7%) | | | | |
| | 2,010 | | | Anadarko Petroleum Corporation | | | 119,474 | |
| | 18,884 | | | Archrock, Inc. | | | 219,054 | |
| | 4,549 | | | Atwood Oceanics, Inc. | | | 34,709 | |
| | 9,195 | | | Baker Hughes, Inc. | | | 509,403 | |
| | 3,150 | | | Baytex Energy Corporation | | | 12,118 | |
| | 42,675 | | | BP plc | | | 252,283 | |
| | 4,754 | | | Bristow Group, Inc. | | | 47,588 | |
| | 93,901 | | | Callon Petroleum Companya | | | 1,219,774 | |
| | 75,676 | | | Canadian Natural Resources, Ltd. | | | 2,399,686 | |
| | 46,868 | | | Chevron Corporation | | | 4,909,423 | |
| | 10,205 | | | Cimarex Energy Company | | | 1,317,772 | |
| | 11,450 | | | Clean Energy Fuels Corporationa | | | 47,060 | |
| | 21,786 | | | Concho Resources, Inc.a | | | 2,765,515 | |
| | 22,520 | | | ConocoPhillips | | | 978,494 | |
| | 29,150 | | | Continental Resources, Inc.a | | | 1,425,726 | |
| | 2,742 | | | Crescent Point Energy Corporation | | | 32,647 | |
| | 6,390 | | | Delek US Holdings, Inc. | | | 107,991 | |
| | 4,230 | | | Devon Energy Corporation | | | 160,275 | |
| | 4,520 | | | Diamond Offshore Drilling, Inc. | | | 74,535 | |
| | 4,053 | | | Diamondback Energy, Inc.a | | | 369,998 | |
| | 23,486 | | | Ensco plc | | | 183,661 | |
| | 37,396 | | | EOG Resources, Inc. | | | 3,381,346 | |
| | 7,740 | | | EP Energy Corporationa | | | 27,554 | |
| | 48,433 | | | EQT Corporation | | | 3,196,578 | |
| | 20,730 | | | Exxon Mobil Corporation | | | 1,727,224 | |
| | 4,920 | | | Frank’s International NV | | | 55,350 | |
| | 1,500 | | | Galp Energia SGPS SA | | | 20,338 | |
| | 3,610 | | | Green Plains, Inc. | | | 93,860 | |
| | 1,190 | | | Gulfport Energy Corporationa | | | 28,691 | |
| | 83,090 | | | Halliburton Company | | | 3,822,140 | |
| | 6,127 | | | HollyFrontier Corporation | | | 152,869 | |
| | 5,570 | | | Hornbeck Offshore Services, Inc.a | | | 22,113 | |
| | 2,630 | | | Kinder Morgan, Inc. | | | 53,731 | |
| | 5,614 | | | Marathon Oil Corporation | | | 73,993 | |
| | 1,690 | | | Murphy Oil Corporation | | | 43,720 | |
| | 50,660 | | | Nabors Industries, Ltd. | | | 602,854 | |
| | 880 | | | Newfield Exploration Companya | | | 35,719 | |
| | 1,430 | | | Noble Energy, Inc. | | | 49,292 | |
| | 5,759 | | | Oasis Petroleum, Inc.a | | | 60,412 | |
| | 1,780 | | | Oceaneering International, Inc. | | | 42,364 | |
| | 2,340 | | | Oil States International, Inc.a | | | 68,445 | |
| | 2,022 | | | OMV AG | | | 63,106 | |
The accompanying Notes to Financial Statements are an integral part of this schedule.
2
AGGRESSIVE ALLOCATION FUND
Schedule of Investments as of October 31, 2016
| | | | | | | | |
| Shares | | | Common Stock (47.3%) | | Value | |
| | Energy (6.7%) - continued | | | | |
| | 50,604 | | | Parsley Energy, Inc.a | | | $1,664,872 | |
| | 59,721 | | | Patterson-UTI Energy, Inc. | | | 1,342,528 | |
| | 250 | | | PDC Energy, Inc.a | | | 15,332 | |
| | 1,700 | | | Phillips 66 | | | 137,955 | |
| | 9,773 | | | Pioneer Energy Services Corporationa | | | 34,694 | |
| | 15,500 | | | Pioneer Natural Resources Company | | | 2,774,810 | |
| | 4,550 | | | Rowan Companies plc | | | 60,378 | |
| | 1,766 | | | Royal Dutch Shell plc | | | 44,004 | |
| | 42,719 | | | Royal Dutch Shell plc ADR | | | 2,127,833 | |
| | 3,554 | | | Royal Dutch Shell plc, Class B | | | 91,667 | |
| | 22,595 | | | RPC, Inc. | | | 390,216 | |
| | 4,080 | | | RSP Permian, Inc.a | | | 147,288 | |
| | 54,855 | | | Schlumberger, Ltd. | | | 4,291,307 | |
| | 2,780 | | | SemGroup Corporation | | | 89,655 | |
| | 700 | | | SM Energy Company | | | 23,541 | |
| | 1,715 | | | Statoil ASA | | | 27,999 | |
| | 122,209 | | | Suncor Energy, Inc. ADR | | | 3,668,714 | |
| | 1,490 | | | Superior Energy Services, Inc. | | | 21,098 | |
| | 3,420 | | | Teekay Corporation | | | 22,333 | |
| | 7,837 | | | Teekay Tankers, Ltd. | | | 16,693 | |
| | 4,523 | | | Tesco Corporation | | | 30,983 | |
| | 16,090 | | | TETRA Technologies, Inc.a | | | 87,690 | |
| | 1,761 | | | Total SA | | | 84,361 | |
| | 41,849 | | | U.S. Silica Holdings, Inc. | | | 1,933,005 | |
| | 64,730 | | | Valero Energy Corporation | | | 3,834,605 | |
| | 249,337 | | | Weatherford International plca | | | 1,201,804 | |
| | 319,025 | | | WPX Energy, Inc.a | | | 3,464,612 | |
| | | | | |
| | | | Total | | | 58,438,862 | |
| | | | | |
| |
| | Financials (5.0%) | | | | |
| | 6,280 | | | Aberdeen Asset Management plc | | | 24,565 | |
| | 8,272 | | | Affiliated Managers Group, Inc.a | | | 1,097,364 | |
| | 1,000 | | | AIA Group, Ltd. | | | 6,291 | |
| | 8,960 | | | Allied World Assurance Company Holdings AG | | | 385,101 | |
| | 820 | | | American Financial Group, Inc. | | | 61,090 | |
| | 580 | | | American International Group, Inc. | | | 35,786 | |
| | 25,795 | | | Ameris Bancorp | | | 936,359 | |
| | 2,400 | | | AMERISAFE, Inc. | | | 133,440 | |
| | 210 | | | Arch Capital Group, Ltd.a | | | 16,374 | |
| | 10,118 | | | Argo Group International Holdings, Ltd. | | | 562,561 | |
| | 7,110 | | | Aspen Insurance Holdings, Ltd. | | | 343,057 | |
| | 1,330 | | | Associated Banc-Corp | | | 26,999 | |
| | 42,780 | | | Assured Guaranty, Ltd. | | | 1,278,694 | |
| | 1,186 | | | ASX, Ltd. | | | 42,425 | |
| | 3,800 | | | Australia & New Zealand Banking Group, Ltd. | | | 80,239 | |
| | 6,500 | | | Banco Santander SA | | | 31,850 | |
| | 24,530 | | | BancorpSouth, Inc. | | | 576,455 | |
| | 10,510 | | | Bank of America Corporation | | | 173,415 | |
| | 4,641 | | | Bank of East Asia, Ltd. | | | 18,656 | |
| | 1,037 | | | Bank of Montreal | | | 65,994 | |
| | 7,780 | | | Bank of New York Mellon Corporation | | | 336,641 | |
| | 3,026 | | | Bank of Nova Scotia | | | 162,614 | |
| | 20,017 | | | Bank of the Ozarks, Inc. | | | 739,828 | |
| | 1,680 | | | BankFinancial Corporation | | | 21,118 | |
| | 19,860 | | | BB&T Corporation | | | 778,512 | |
| | 8,330 | | | Beneficial Bancorp, Inc. | | | 120,785 | |
| | 1,780 | | | Blackstone Group, LP | | | 44,553 | |
| | 14,900 | | | Boston Private Financial Holdings, Inc. | | | 195,935 | |
| | 6,880 | | | Brookline Bancorp, Inc. | | | 88,064 | |
| | 7,810 | | | Brown & Brown, Inc. | | | 287,877 | |
| | 92 | | | Canadian Imperial Bank of Commerce | | | 6,893 | |
| | 490 | | | Capital One Financial Corporation | | | 36,280 | |
| | 26,150 | | | Capstead Mortgage Corporation | | | 248,686 | |
| | 2,680 | | | Cathay General Bancorp | | | 80,266 | |
| | 7,220 | | | Central Pacific Financial Corporation | | | 185,049 | |
| | 3,920 | | | Charles Schwab Corporation | | | 124,264 | |
| | 11,749 | | | Chemical Financial Corporation | | | 504,620 | |
| | 2,000 | | | Chiba Bank, Ltd. | | | 12,370 | |
| | 310 | | | Chubb, Ltd. | | | 39,370 | |
| | 1,113 | | | CI Financial Corporation | | | 20,479 | |
| | 2,630 | | | Citigroup, Inc. | | | 129,264 | |
| | 2,020 | | | Clifton Bancorp, Inc. | | | 30,886 | |
| | 2,100 | | | CNP Assurances | | | 36,368 | |
| | 34,044 | | | CoBiz Financial, Inc. | | | 433,040 | |
| | 3,485 | | | Columbia Banking System, Inc. | | | 115,075 | |
| | 3,960 | | | Comerica, Inc. | | | 206,276 | |
| | 3,800 | | | Concordia Financial Group, Ltd. | | | 17,619 | |
| | 9,756 | | | Direct Line Insurance Group plc | | | 41,274 | |
| | 30,730 | | | E*TRADE Financial Corporationa | | | 865,357 | |
| | 14,679 | | | East West Bancorp, Inc. | | | 579,967 | |
| | 650 | | | Eaton Vance Corporation | | | 22,789 | |
| | 3,963 | | | Employers Holdings, Inc. | | | 124,240 | |
| | 2,250 | | | Endurance Specialty Holdings, Ltd. | | | 206,887 | |
| | 2,240 | | | Enova International, Inc.a | | | 21,056 | |
| | 1,100 | | | Erste Group Bank AG | | | 34,495 | |
| | 24,156 | | | Essent Group, Ltd.a | | | 638,685 | |
| | 12,915 | | | Evercore Partners, Inc. | | | 694,181 | |
| | 400 | | | EXOR SPA | | | 17,006 | |
| | 400 | | | EXOR SPA Rightsa,b | | | 0 | |
| | 2,160 | | | F.N.B. Corporation | | | 28,231 | |
| | 4,860 | | | Federated Investors, Inc. | | | 131,220 | |
| | 6,800 | | | Fifth Third Bancorp | | | 147,968 | |
| | 1,780 | | | First American Financial Corporation | | | 69,527 | |
| | 10,375 | | | First Commonwealth Financial Corporation | | | 105,410 | |
| | 2,460 | | | First Financial Bancorp | | | 52,890 | |
| | 1,070 | | | First Financial Corporation | | | 42,907 | |
| | 850 | | | First Merchants Corporation | | | 23,928 | |
| | 22,280 | | | First Midwest Bancorp, Inc. | | | 430,227 | |
| | 1,300 | | | First NBC Bank Holding Companya | | | 7,020 | |
| | 25,974 | | | First Republic Bank | | | 1,933,245 | |
| | 12,068 | | | FlexiGroup, Ltd. | | | 20,609 | |
| | 1,370 | | | Franklin Resources, Inc. | | | 46,114 | |
| | 14,000 | | | Fukuoka Financial Group, Inc. | | | 60,585 | |
| | 4,420 | | | Genworth Financial, Inc.a | | | 18,299 | |
| | 1,278 | | | Genworth MI Canada, Inc. | | | 27,755 | |
| | 3,004 | | | Glacier Bancorp, Inc. | | | 84,893 | |
| | 7,460 | | | Goldman Sachs Group, Inc. | | | 1,329,670 | |
| | 13,120 | | | Great Western Bancorp, Inc. | | | 422,989 | |
| | 6,882 | | | Green Bancorp, Inc.a | | | 71,229 | |
| | 1,280 | | | Greenhill & Company, Inc. | | | 30,016 | |
| | 75 | | | Groupe Bruxelles Lambert SA | | | 6,448 | |
| | 910 | | | Hancock Holding Company | | | 30,530 | |
| | 1,600 | | | Hang Seng Bank, Ltd. | | | 28,855 | |
| | 52,155 | | | Hanmi Financial Corporation | | | 1,303,875 | |
| | 749 | | | Hannover Rueckversicherung SE | | | 83,560 | |
| | 8,325 | | | Hanover Insurance Group, Inc. | | | 634,282 | |
| | 2,930 | | | Hartford Financial Services Group, Inc. | | | 129,242 | |
| | 11,500 | | | Henderson Group plc | | | 32,538 | |
| | 7,644 | | | Home BancShares, Inc. | | | 164,422 | |
| | 213 | | | Home Capital Group, Inc. | | | 4,216 | |
| | 640 | | | HomeStreet, Inc.a | | | 17,632 | |
| | 930 | | | Hometrust Bancshares, Inc.a | | | 17,298 | |
| | 26,471 | | | Hope Bancorp, Inc. | | | 427,242 | |
| | 15,797 | | | Horace Mann Educators Corporation | | | 567,902 | |
| | 16,057 | | | Houlihan Lokey, Inc. | | | 391,309 | |
| | 77,630 | | | Huntington Bancshares, Inc. | | | 822,878 | |
The accompanying Notes to Financial Statements are an integral part of this schedule.
3
AGGRESSIVE ALLOCATION FUND
Schedule of Investments as of October 31, 2016
| | | | | | | | |
| Shares | | | Common Stock (47.3%) | | Value | |
| | Financials (5.0%) - continued | | | | |
| | 2,261 | | | Infinity Property & Casualty Corporation | | | $185,289 | |
| | 468 | | | Intact Financial Corporation | | | 31,814 | |
| | 4,778 | | | Intercontinental Exchange, Inc. | | | 1,291,923 | |
| | 1,590 | | | Invesco, Ltd. | | | 44,663 | |
| | 56,214 | | | Janus Capital Group, Inc. | | | 720,663 | |
| | 87,710 | | | KeyCorp | | | 1,238,465 | |
| | 20,257 | | | Kinsale Capital Group, Inc. | | | 487,181 | |
| | 530 | | | Lazard, Ltd. | | | 19,324 | |
| | 1,777 | | | Lincoln National Corporation | | | 87,233 | |
| | 790 | | | LPL Financial Holdings, Inc. | | | 24,458 | |
| | 5,320 | | | M&T Bank Corporation | | | 652,924 | |
| | 1,100 | | | Macquarie Group, Ltd. | | | 66,494 | |
| | 90 | | | Markel Corporationa | | | 78,969 | |
| | 7,850 | | | Meta Financial Group, Inc. | | | 575,013 | |
| | 1,430 | | | MetLife, Inc. | | | 67,153 | |
| | 29,600 | | | Mizuho Financial Group, Inc. | | | 49,839 | |
| | 1,340 | | | Morgan Stanley | | | 44,984 | |
| | 500 | | | MS and AD Insurance Group Holdings, Inc. | | | 14,843 | |
| | 20,940 | | | National Bank Holdings Corporation | | | 509,680 | |
| | 3,459 | | | National Bank of Canada | | | 123,475 | |
| | 560 | | | Navigators Group, Inc. | | | 52,192 | |
| | 2,220 | | | NMI Holdings, Inc.a | | | 16,983 | |
| | 1,100 | | | Nordea Bank AB | | | 11,560 | |
| | 1,880 | | | NorthStar Realty Europe Corporation | | | 18,593 | |
| | 2,500 | | | Old Mutual plc | | | 6,150 | |
| | 1,010 | | | Old Republic International Corporation | | | 17,029 | |
| | 20,052 | | | PacWest Bancorp | | | 870,056 | |
| | 1,035 | | | Power Corporation of Canada | | | 22,200 | |
| | 14,580 | | | Primerica, Inc. | | | 797,526 | |
| | 570 | | | Principal Financial Group, Inc. | | | 31,122 | |
| | 320 | | | Prosperity Bancshares, Inc. | | | 17,750 | |
| | 7,150 | | | Provident Financial Services, Inc. | | | 162,233 | |
| | 16,845 | | | Raymond James Financial, Inc. | | | 1,012,721 | |
| | 1,140 | | | Redwood Trust, Inc. | | | 16,028 | |
| | 11,614 | | | Renasant Corporation | | | 391,856 | |
| | 3,800 | | | Resona Holdings, Inc. | | | 16,843 | |
| | 314 | | | Safety Insurance Group, Inc. | | | 21,258 | |
| | 3,717 | | | Sandy Spring Bancorp, Inc. | | | 117,829 | |
| | 333 | | | Schroders plc | | | 11,462 | |
| | 980 | | | SEI Investments Company | | | 43,443 | |
| | 1,130 | | | Selective Insurance Group, Inc. | | | 41,753 | |
| | 2,400 | | | Seven Bank, Ltd. | | | 7,378 | |
| | 184,587 | | | SLM Corporationa | | | 1,301,338 | |
| | 1,570 | | | State Auto Financial Corporation | | | 35,953 | |
| | 4,440 | | | Stewart Information Services Corporation | | | 199,578 | |
| | 36,431 | | | Stifel Financial Corporationa | | | 1,425,909 | |
| | 12,519 | | | SVB Financial Groupa | | | 1,530,698 | |
| | 1,300 | | | Swiss Re AG | | | 120,655 | |
| | 2,340 | | | Synchrony Financial | | | 66,901 | |
| | 23,520 | | | Synovus Financial Corporation | | | 777,806 | |
| | 2,400 | | | T&D Holdings, Inc. | | | 29,023 | |
| | 300 | | | Talanx AG | | | 9,312 | |
| | 17,680 | | | TCF Financial Corporation | | | 252,824 | |
| | 26,431 | | | TD Ameritrade Holding Corporation | | | 904,205 | |
| | 920 | | | Territorial Bancorp, Inc. | | | 26,238 | |
| | 568 | | | Toronto-Dominion Bank | | | 25,772 | |
| | 2,190 | | | TriCo Bancshares | | | 57,641 | |
| | 18,810 | | | TrustCo Bank Corporation | | | 131,670 | |
| | 840 | | | Trustmark Corporation | | | 23,251 | |
| | 1,290 | | | Union Bankshares Corporation | | | 36,030 | |
| | 430 | | | United Bankshares, Inc. | | | 16,211 | |
| | 13,560 | | | United Community Banks, Inc. | | | 292,489 | |
| | 6,360 | | | United Financial Bancorp, Inc. | | | 93,556 | |
| | 680 | | | United Fire Group, Inc. | | | 26,874 | |
| | 3,497 | | | United Overseas Bank, Ltd. | | | 47,177 | |
| | 1,720 | | | Unum Group | | | 60,888 | |
| | 1,030 | | | Virtu Financial, Inc. | | | 13,184 | |
| | 3,080 | | | Voya Financial, Inc. | | | 94,094 | |
| | 10,880 | | | Western Alliance Bancorpa | | | 406,477 | |
| | 4,200 | | | Westpac Banking Corporation | | | 97,125 | |
| | 1,120 | | | Wintrust Financial Corporation | | | 60,424 | |
| | 3,540 | | | WisdomTree Investments, Inc. | | | 30,373 | |
| | 1,236 | | | WSFS Financial Corporation | | | 43,322 | |
| | 42,118 | | | Zions Bancorporation | | | 1,356,621 | |
| | | | | |
| | | | Total | | | 43,504,316 | |
| | | | | |
| |
| | Health Care (6.0%) | | | | |
| | 40,072 | | | Abbott Laboratories | | | 1,572,425 | |
| | 10,129 | | | ABIOMED, Inc.a | | | 1,063,444 | |
| | 23,540 | | | Acadia Healthcare Company, Inc.a | | | 846,498 | |
| | 460 | | | Acceleron Pharma, Inc.a | | | 12,894 | |
| | 690 | | | Aceto Corporation | | | 12,648 | |
| | 2,610 | | | Advaxis, Inc.a | | | 21,115 | |
| | 11,940 | | | Aerie Pharmaceuticals, Inc.a | | | 397,005 | |
| | 4,510 | | | Aetna, Inc. | | | 484,148 | |
| | 35,609 | | | Akorn, Inc.a | | | 852,836 | |
| | 14,820 | | | Alexion Pharmaceuticals, Inc.a | | | 1,934,010 | |
| | 8,518 | | | Align Technology, Inc.a | | | 731,867 | |
| | 10,639 | | | Allergan plca | | | 2,222,913 | |
| | 221 | | | Amgen, Inc. | | | 31,196 | |
| | 5,743 | | | Analogic Corporation | | | 470,065 | |
| | 8,565 | | | Asterias Biotherapeutics, Inc.a | | | 28,265 | |
| | 1,050 | | | AstraZeneca plc | | | 58,795 | |
| | 232 | | | Atrion Corporation | | | 101,883 | |
| | 66 | | | Bayer AG | | | 6,553 | |
| | 870 | | | Biogen, Inc.a | | | 243,757 | |
| | 8,555 | | | BioMarin Pharmaceutical, Inc.a | | | 688,849 | |
| | 2,610 | | | Boston Scientific Corporationa | | | 57,420 | |
| | 2,190 | | | Bristol-Myers Squibb Company | | | 111,493 | |
| | 3,456 | | | C.R. Bard, Inc. | | | 748,846 | |
| | 26,131 | | | Cardiovascular Systems, Inc.a | | | 612,249 | |
| | 23,350 | | | Catalent, Inc.a | | | 532,614 | |
| | 22,690 | | | Celgene Corporationa | | | 2,318,464 | |
| | 7,872 | | | Centene Corporationa | | | 491,843 | |
| | 340 | | | Charles River Laboratories International, Inc.a | | | 25,799 | |
| | 4,380 | | | Chemed Corporation | | | 619,420 | |
| | 6,250 | | | Coherus Biosciences, Inc.a | | | 170,938 | |
| | 1,500 | | | CONMED Corporation | | | 60,000 | |
| | 5,410 | | | Cooper Companies, Inc. | | | 952,376 | |
| | 1,190 | | | Cross Country Healthcare, Inc.a | | | 13,292 | |
| | 600 | | | CSL, Ltd. | | | 45,783 | |
| | 15,500 | | | Dentsply Sirona, Inc. | | | 892,335 | |
| | 7,310 | | | Dexcom, Inc.a | | | 571,934 | |
| | 13,330 | | | Edwards Lifesciences Corporationa | | | 1,269,283 | |
| | 560 | | | Emergent Biosolutions, Inc.a | | | 14,963 | |
| | 8,616 | | | Ensign Group, Inc. | | | 159,138 | |
| | 27,840 | | | Envision Healthcare Holdings, Inc.a | | | 550,675 | |
| | 1,260 | | | Essilor International SA | | | 141,591 | |
| | 820 | | | Express Scripts Holding Companya | | | 55,268 | |
| | 100 | | | Gerresheimer AG | | | 7,543 | |
| | 40,131 | | | Gilead Sciences, Inc. | | | 2,954,846 | |
| | 1,060 | | | Global Blood Therapeutics, Inc.a | | | 18,497 | |
| | 1,510 | | | Globus Medical, Inc.a | | | 33,416 | |
| | 900 | | | Grifols SA | | | 17,759 | |
| | 480 | | | Halyard Health, Inc.a | | | 15,528 | |
| | 4,380 | | | HCA Holdings, Inc.a | | | 335,201 | |
| | 10,320 | | | HealthEquity, Inc.a | | | 342,934 | |
| | 2,110 | | | Healthways, Inc.a | | | 52,328 | |
The accompanying Notes to Financial Statements are an integral part of this schedule.
4
AGGRESSIVE ALLOCATION FUND
Schedule of Investments as of October 31, 2016
| | | | | | | | |
| Shares | | | Common Stock (47.3%) | | Value | |
| | Health Care (6.0%) - continued | | | | |
| | 4,590 | | | Heska Corporationa | | | $226,746 | |
| | 1,100 | | | Hikma Pharmaceuticals plc | | | 23,593 | |
| | 2,550 | | | Hill-Rom Holdings, Inc. | | | 141,295 | |
| | 31,370 | | | Hologic, Inc.a | | | 1,129,634 | |
| | 90 | | | ICON plca | | | 7,225 | |
| | 1,430 | | | ICU Medical, Inc.a | | | 199,199 | |
| | 8,455 | | | Impax Laboratories, Inc.a | | | 169,945 | |
| | 20,094 | | | Inogen, Inc.a | | | 1,078,445 | |
| | 38,872 | | | Intersect ENT, Inc.a | | | 567,531 | |
| | 5,400 | | | Intra-Cellular Therapies, Inc.a | | | 66,960 | |
| | 18,701 | | | Ironwood Pharmaceuticals, Inc.a | | | 238,812 | |
| | 16,390 | | | Johnson & Johnson | | | 1,901,076 | |
| | 12,170 | | | Kindred Healthcare, Inc. | | | 119,874 | |
| | 176 | | | Lonza Group AG | | | 33,212 | |
| | 4,180 | | | Magellan Health Services, Inc.a | | | 215,061 | |
| | 7,151 | | | Medtronic plc | | | 586,525 | |
| | 2,310 | | | Merck & Company, Inc. | | | 135,643 | |
| | 542 | | | Merck KGaA | | | 55,788 | |
| | 2,090 | | | Mettler-Toledo International, Inc.a | | | 844,527 | |
| | 17,218 | | | Mylan NVa | | | 628,457 | |
| | 1,698 | | | National Healthcare Corporation | | | 109,861 | |
| | 490 | | | Natural Health Trends Corporation | | | 11,432 | |
| | 580 | | | Neogen Corporationa | | | 30,560 | |
| | 13,855 | | | Neurocrine Biosciences, Inc.a | | | 606,433 | |
| | 16,032 | | | Nevro Corporationa | | | 1,473,661 | |
| | 2,000 | | | Novartis AG | | | 141,935 | |
| | 1,800 | | | Novo Nordisk AS | | | 64,126 | |
| | 35,896 | | | NuVasive, Inc.a | | | 2,144,068 | |
| | 17,820 | | | Omnicell, Inc.a | | | 581,377 | |
| | 16,420 | | | OraSure Technologies, Inc.a | | | 123,314 | |
| | 2,380 | | | Orthofix International NVa | | | 87,227 | |
| | 100 | | | Otsuka Holdings Company, Ltd. | | | 4,377 | |
| | 4,980 | | | PDL BioPharma, Inc. | | | 16,036 | |
| | 10,160 | | | PerkinElmer, Inc. | | | 517,042 | |
| | 7,438 | | | Perrigo Company plc | | | 618,767 | |
| | 33,080 | | | Pfizer, Inc. | | | 1,048,967 | |
| | 2,440 | | | PharMerica Corporationa | | | 58,072 | |
| | 3,500 | | | Prothena Corporation plca | | | 167,370 | |
| | 690 | | | ResMed, Inc. | | | 41,241 | |
| | 970 | | | Roche Holding AG ADR | | | 27,815 | |
| | 200 | | | Roche Holding AG-Genusschein | | | 45,936 | |
| | 6,140 | | | Surgical Care Affiliates, Inc.a | | | 262,731 | |
| | 20,638 | | | Team Health Holdings, Inc.a | | | 884,338 | |
| | 14,009 | | | Teleflex, Inc. | | | 2,005,108 | |
| | 2,615 | | | Triple-S Management Corporationa | | | 54,078 | |
| | 7,330 | | | UnitedHealth Group, Inc. | | | 1,035,949 | |
| | 13,194 | | | Universal Health Services, Inc. | | | 1,592,648 | |
| | 1,770 | | | VCA Antech, Inc.a | | | 108,784 | |
| | 26,755 | | | Veeva Systems, Inc.a | | | 1,039,432 | �� |
| | 20,885 | | | Vertex Pharmaceuticals, Inc.a | | | 1,584,336 | |
| | 2,120 | | | Waters Corporationa | | | 294,977 | |
| | 390 | | | Wellcare Health Plans, Inc.a | | | 44,269 | |
| | 5,800 | | | West Pharmaceutical Services, Inc. | | | 440,974 | |
| | 14,370 | | | Wright Medical Group NVa | | | 314,847 | |
| | 2,850 | | | Ziopharm Oncology, Inc.a | | | 16,188 | |
| | 11,570 | | | Zoetis, Inc. | | | 553,046 | |
| | | | | |
| | | | Total | | | 52,495,812 | |
| | | | | |
| |
| | Industrials (5.5%) | | | | |
| | 1,600 | | | ABB, Ltd. | | | 33,008 | |
| | 4,860 | | | ABM Industries, Inc. | | | 189,929 | |
| | 500 | | | Adecco SA | | | 29,690 | |
| | 4,244 | | | Aegion Corporationa | | | 78,556 | |
| | 1,520 | | | Aerovironment, Inc.a | | | 36,465 | |
| | 6,400 | | | AGCO Corporation | | | 326,912 | |
| | 6,800 | | | Air New Zealand, Ltd. | | | 9,380 | |
| | 600 | | | Allison Transmission Holdings, Inc. | | | 17,574 | |
| | 200 | | | Andritz AG | | | 10,457 | |
| | 7,050 | | | Ardmore Shipping Corporation | | | 41,243 | |
| | 5,000 | | | Asahi Glass Company, Ltd. | | | 34,969 | |
| | 1,784 | | | Astec Industries, Inc. | | | 98,762 | |
| | 300 | | | Atlas Copco Aktiebolag | | | 8,789 | |
| | 16,410 | | | AZZ, Inc. | | | 873,832 | |
| | 15,144 | | | B/E Aerospace, Inc. | | | 901,371 | |
| | 1,300 | | | Babcock International Group plc | | | 15,714 | |
| | 6,050 | | | Barnes Group, Inc. | | | 241,032 | |
| | 400 | | | Berendsen plc | | | 4,720 | |
| | 1,330 | | | Boeing Company | | | 189,432 | |
| | 1,320 | | | Brady Corporation | | | 43,692 | |
| | 32,080 | | | BWX Technologies, Inc. | | | 1,258,178 | |
| | 348 | | | Canadian National Railway Company | | | 21,877 | |
| | 7,380 | | | Carlisle Companies, Inc. | | | 773,793 | |
| | 4,000 | | | Cathay Pacific Airways, Ltd. | | | 5,265 | |
| | 1,340 | | | CBIZ, Inc.a | | | 14,807 | |
| | 2,120 | | | CEB, Inc. | | | 103,138 | |
| | 1,855 | | | CIRCOR International, Inc. | | | 99,762 | |
| | 12,364 | | | CLARCOR, Inc. | | | 769,164 | |
| | 1,610 | | | Colfax Corporationa | | | 51,182 | |
| | 4,029 | | | Comfort Systems USA, Inc. | | | 116,237 | |
| | 1,338 | | | Commercial Vehicle Group, Inc.a | | | 6,075 | |
| | 7,540 | | | Copart, Inc.a | | | 395,624 | |
| | 840 | | | Crane Company | | | 57,128 | |
| | 1,441 | | | CSX Corporation | | | 43,965 | |
| | 13,230 | | | Cummins, Inc. | | | 1,691,059 | |
| | 6,050 | | | Curtiss-Wright Corporation | | | 542,201 | |
| | 1,000 | | | Dai Nippon Printing Company, Ltd. | | | 10,030 | |
| | 18,400 | | | Delta Air Lines, Inc. | | | 768,568 | |
| | 430 | | | Deluxe Corporation | | | 26,316 | |
| | 800 | | | Deutsche Post AG | | | 24,809 | |
| | 12,350 | | | Donaldson Company, Inc. | | | 451,022 | |
| | 500 | | | DSV AS | | | 24,210 | |
| | 700 | | | East Japan Railway Company | | | 61,620 | |
| | 8,100 | | | EMCOR Group, Inc. | | | 489,726 | |
| | 4,767 | | | Encore Wire Corporation | | | 162,793 | |
| | 5,170 | | | EnerSys | | | 336,722 | |
| | 2,975 | | | Equifax, Inc. | | | 368,811 | |
| | 2,755 | | | ESCO Technologies, Inc. | | | 122,735 | |
| | 7,590 | | | Federal Signal Corporation | | | 93,205 | |
| | 560 | | | Flowserve Corporation | | | 23,716 | |
| | 174 | | | Flughafen Zuerich AG | | | 31,985 | |
| | 3,130 | | | Fluor Corporation | | | 162,729 | |
| | 1,530 | | | Fortive Corporation | | | 78,107 | |
| | 8,420 | | | Fortune Brands Home and Security, Inc. | | | 459,985 | |
| | 2,563 | | | Franklin Electric Company, Inc. | | | 93,421 | |
| | 369 | | | Fraport AG Frankfurt Airport Services Worldwide | | | 21,904 | |
| | 2,000 | | | GasLog, Ltd. | | | 30,700 | |
| | 3,860 | | | Gener8 Maritime, Inc.a | | | 16,289 | |
| | 730 | | | Genesee & Wyoming, Inc.a | | | 49,596 | |
| | 300 | | | Getinge AB | | | 4,913 | |
| | 3,578 | | | Gibraltar Industries, Inc.a | | | 139,184 | |
| | 26,055 | | | Granite Construction, Inc. | | | 1,280,864 | |
| | 670 | | | Greenbrier Companies, Inc. | | | 21,105 | |
| | 1,150 | | | Hackett Group, Inc. | | | 18,538 | |
| | 9,500 | | | Harsco Corporation | | | 92,625 | |
| | 460 | | | HD Supply Holdings, Inc.a | | | 15,180 | |
| | 17,882 | | | Healthcare Services Group, Inc. | | | 661,098 | |
| | 11,338 | | | Heico Corporation | | | 765,995 | |
| | 3,100 | | | Herman Miller, Inc. | | | 86,180 | |
| | 4,660 | | | Hexcel Corporation | | | 211,983 | |
| | 400 | | | Hitachi Transport System, Ltd. | | | 8,246 | |
| | 154 | | | Hochtief AG | | | 21,028 | |
The accompanying Notes to Financial Statements are an integral part of this schedule.
5
AGGRESSIVE ALLOCATION FUND
Schedule of Investments as of October 31, 2016
| | | | | | | | |
| Shares | | | Common Stock (47.3%) | | Value | |
| | Industrials (5.5%) - continued | | | | |
| | 518 | | | Honeywell International, Inc. | | | $56,814 | |
| | 913 | | | Hub Group, Inc.a | | | 33,279 | |
| | 4,200 | | | Hubbell, Inc. | | | 438,984 | |
| | 3,910 | | | Huntington Ingalls Industries, Inc. | | | 630,918 | |
| | 6,309 | | | Huron Consulting Group, Inc.a | | | 353,619 | |
| | 3,907 | | | ICF International, Inc.a | | | 181,285 | |
| | 600 | | | Inaba Denki Sangyo Company, Ltd. | | | 21,769 | |
| | 10,540 | | | Ingersoll-Rand plc | | | 709,237 | |
| | 2,840 | | | Insperity, Inc. | | | 213,568 | |
| | 1,010 | | | Insteel Industries, Inc. | | | 27,169 | |
| | 820 | | | Interface, Inc. | | | 12,997 | |
| | 10,000 | | | ITOCHU Corporation | | | 126,287 | |
| | 1,920 | | | ITT Corporation | | | 67,622 | |
| | 2,850 | | | Jacobs Engineering Group, Inc.a | | | 147,003 | |
| | 400 | | | Jardine Matheson Holdings, Ltd. | | | 24,364 | |
| | 6,519 | | | JB Hunt Transport Services, Inc. | | | 532,016 | |
| | 9,050 | | | Johnson Controls International plc | | | 364,896 | |
| | 1,000 | | | Kamigumi Company, Ltd. | | | 8,539 | |
| | 890 | | | Kansas City Southern | | | 78,106 | |
| | 17,660 | | | Kennametal, Inc. | | | 499,955 | |
| | 4,035 | | | Kforce, Inc. | | | 70,007 | |
| | 8,560 | | | Kirby Corporationa | | | 504,612 | |
| | 2,700 | | | KITZ Corporation | | | 15,526 | |
| | 2,980 | | | Knight Transportation, Inc. | | | 87,165 | |
| | 2,320 | | | KONE Oyj | | | 106,748 | |
| | 629 | | | Koninklijke Boskalis Westminster NV | | | 20,286 | |
| | 12,320 | | | Korn/Ferry International | | | 251,205 | |
| | 100 | | | Kuehne & Nagel International AG | | | 13,554 | |
| | 100 | | | Legrand SA | | | 5,652 | |
| | 11,230 | | | Lincoln Electric Holdings, Inc. | | | 739,271 | |
| | 3,420 | | | Lindsay Corporation | | | 267,786 | |
| | 1,290 | | | Manpower, Inc. | | | 99,072 | |
| | 16,700 | | | Masco Corporation | | | 515,696 | |
| | 3,941 | | | Meggitt plc | | | 20,966 | |
| | 11,740 | | | Meritor, Inc.a | | | 120,687 | |
| | 11,551 | | | Middleby Corporationa | | | 1,294,983 | |
| | 1,100 | | | MIRAIT Holdings Corporation | | | 9,754 | |
| | 3,200 | | | Mitsubishi Electric Corporation | | | 43,293 | |
| | 1,000 | | | Mitsuboshi Belting, Ltd. | | | 8,624 | |
| | 4,360 | | | Moog, Inc.a | | | 253,185 | |
| | 8,660 | | | MRC Global, Inc.a | | | 127,648 | |
| | 10,024 | | | MSA Safety, Inc. | | | 584,399 | |
| | 880 | | | Mueller Industries, Inc. | | | 26,655 | |
| | 4,580 | | | MYR Group, Inc.a | | | 136,667 | |
| | 6,242 | | | Navigant Consulting, Inc.a | | | 146,063 | |
| | 3,030 | | | NCI Building Systems, Inc.a | | | 43,632 | |
| | 8,183 | | | Nielsen Holdings plc | | | 368,399 | |
| | 1,000 | | | Nippon Express Company, Ltd. | | | 4,939 | |
| | 1,900 | | | Nitto Kogyo Corporation | | | 27,872 | |
| | 1,532 | | | Nordson Corporation | | | 153,399 | |
| | 390 | | | Norfolk Southern Corporation | | | 36,270 | |
| | 370 | | | Northrop Grumman Corporation | | | 84,730 | |
| | 5,556 | | | Old Dominion Freight Line, Inc.a | | | 414,922 | |
| | 18,137 | | | On Assignment, Inc.a | | | 624,094 | |
| | 26,362 | | | Oshkosh Corporation | | | 1,410,367 | |
| | 450 | | | Parker Hannifin Corporation | | | 55,237 | |
| | 2,210 | | | Pentair, Ltd. | | | 121,837 | |
| | 38,084 | | | PGT, Inc.a | | | 373,223 | |
| | 15,835 | | | Proto Labs, Inc.a | | | 707,824 | |
| | 1,230 | | | Quanex Building Products Corporation | | | 20,049 | |
| | 400 | | | Randstad Holding NV | | | 20,573 | |
| | 25,370 | | | Raven Industries, Inc. | | | 544,187 | |
| | 8,080 | | | Raytheon Company | | | 1,103,809 | |
| | 380 | | | RBC Bearings, Inc.a | | | 27,113 | |
| | 1,040 | | | Regal-Beloit Corporation | | | 61,464 | |
| | 4,750 | | | Resources Connection, Inc. | | | 70,537 | |
| | 2,440 | | | Rexnord Corporationa | | | 48,532 | |
| | 55 | | | Rieter Holding AG | | | 10,460 | |
| | 190 | | | Rockwell Automation, Inc. | | | 22,747 | |
| | 10,000 | | | Rockwell Collins, Inc. | | | 843,200 | |
| | 590 | | | Rollins, Inc. | | | 18,184 | |
| | 4,257 | | | Roper Industries, Inc. | | | 737,781 | |
| | 800 | | | Ryder System, Inc. | | | 55,512 | |
| | 23,864 | | | Saia, Inc.a | | | 850,752 | |
| | 1,000 | | | Sanwa Holdings Corporation | | | 9,959 | |
| | 36 | | | Schindler Holding AG | | | 6,664 | |
| | 200 | | | Schindler Holding AG, Participation Certificate | | | 37,155 | |
| | 100 | | | Secom Company, Ltd. | | | 7,214 | |
| | 400 | | | Securitas AB | | | 6,174 | |
| | 900 | | | Siemens AG | | | 102,256 | |
| | 1,500 | | | Smiths Group plc | | | 25,992 | |
| | 55,630 | | | Southwest Airlines Company | | | 2,227,981 | |
| | 2,740 | | | SPX FLOW, Inc.a | | | 68,747 | |
| | 480 | | | Stanley Black & Decker, Inc. | | | 54,643 | |
| | 10,694 | | | Tennant Company | | | 673,187 | |
| | 2,100 | | | Tetra Tech, Inc. | | | 80,745 | |
| | 2,776 | | | Textron, Inc. | | | 111,262 | |
| | 1,120 | | | Toro Company | | | 53,626 | |
| | 21,850 | | | TransUniona | | | 682,594 | |
| | 540 | | | TrueBlue, Inc.a | | | 9,450 | |
| | 30,705 | | | Union Pacific Corporation | | | 2,707,567 | |
| | 18,720 | | | United Continental Holdings, Inc.a | | | 1,052,626 | |
| | 640 | | | United Parcel Service, Inc. | | | 68,966 | |
| | 8,881 | | | United Rentals, Inc.a | | | 671,936 | |
| | 1,189 | | | Universal Forest Products, Inc. | | | 102,242 | |
| | 2,896 | | | Universal Truckload Services, Inc. | | | 36,055 | |
| | 1,600 | | | Vinci SA | | | 115,872 | |
| | 5,220 | | | WABCO Holdings, Inc.a | | | 513,961 | |
| | 14,015 | | | WageWorks, Inc.a | | | 826,184 | |
| | 22,595 | | | Waste Connections, Inc. | | | 1,699,370 | |
| | 2,668 | | | Watsco, Inc. | | | 366,290 | |
| | 412 | | | WSP Global, Inc. | | | 13,346 | |
| | 6,220 | | | Xylem, Inc. | | | 300,613 | |
| | 1,920 | | | YRC Worldwide, Inc.a | | | 17,050 | |
| | 400 | | | Yuasa Trading Company, Ltd. | | | 9,583 | |
| | | | | |
| | | | Total | | | 47,889,806 | |
| | | | | |
| |
| | Information Technology (11.4%) | | | | |
| | 450 | | | Advanced Energy Industries, Inc.a | | | 21,465 | |
| | 35,899 | | | Agilent Technologies, Inc. | | | 1,564,119 | |
| | 23,397 | | | Akamai Technologies, Inc.a | | | 1,625,390 | |
| | 3,720 | | | Alliance Data Systems Corporationa | | | 760,628 | |
| | 5,260 | | | Alphabet, Inc., Class Aa | | | 4,260,074 | |
| | 3,531 | | | Alphabet, Inc., Class Ca | | | 2,770,211 | |
| | 12,342 | | | Ambarella, Inc.a | | | 757,429 | |
| | 7,110 | | | Amkor Technology, Inc.a | | | 65,910 | |
| | 24,941 | | | Amphenol Corporation | | | 1,644,360 | |
| | 11,360 | | | Analog Devices, Inc. | | | 728,176 | |
| | 1,973 | | | ANSYS, Inc.a | | | 180,234 | |
| | 35,564 | | | Apple, Inc. | | | 4,037,937 | |
| | 26,104 | | | Applied Materials, Inc. | | | 759,104 | |
| | 13,560 | | | Apptio, Inc.a | | | 267,539 | |
| | 26,822 | | | Arista Networks, Inc.a | | | 2,273,165 | |
| | 13,710 | | | Aspen Technology, Inc.a | | | 675,080 | |
| | 3,030 | | | AVX Corporation | | | 42,481 | |
| | 2,090 | | | Bankrate, Inc.a | | | 16,302 | |
| | 570 | | | Belden, Inc. | | | 36,942 | |
| | 9,400 | | | Blackhawk Network Holdings, Inc.a | | | 323,830 | |
| | 47,950 | | | Booz Allen Hamilton Holding Corporation | | | 1,461,037 | |
| | 560 | | | Broadcom, Ltd. | | | 95,357 | |
The accompanying Notes to Financial Statements are an integral part of this schedule.
6
AGGRESSIVE ALLOCATION FUND
Schedule of Investments as of October 31, 2016
| | | | | | | | |
| Shares | | | Common Stock (47.3%) | | Value | |
| | Information Technology (11.4%) - continued | | | | |
| | 11,905 | | | Brocade Communications Systems, Inc. | | | $126,193 | |
| | 8,626 | | | Brooks Automation, Inc. | | | 112,397 | |
| | 5,660 | | | CA, Inc. | | | 173,988 | |
| | 1,950 | | | Cabot Microelectronics Corporation | | | 107,757 | |
| | 2,790 | | | CACI International, Inc.a | | | 273,001 | |
| | 950 | | | Cadence Design Systems, Inc.a | | | 24,301 | |
| | 1,000 | | | Canon, Inc. | | | 28,728 | |
| | 72 | | | Cap Gemini SA | | | 5,963 | |
| | 16,238 | | | Cavium, Inc.a | | | 916,635 | |
| | 3,040 | | | CDK Global, Inc. | | | 166,014 | |
| | 1,250 | | | Check Point Software Technologies, Ltd.a | | | 105,700 | |
| | 24,077 | | | Ciena Corporationa | | | 466,612 | |
| | 48,980 | | | Cisco Systems, Inc. | | | 1,502,706 | |
| | 10,996 | | | Cognex Corporation | | | 567,394 | |
| | 1,560 | | | Coherent, Inc.a | | | 162,427 | |
| | 15,850 | | | CommVault Systems, Inc.a | | | 847,975 | |
| | 3,520 | | | Comtech Telecommunications Corporation | | | 36,608 | |
| | 5,940 | | | Convergys Corporation | | | 173,448 | |
| | 10,700 | | | CoreLogic, Inc.a | | | 455,392 | |
| | 35,168 | | | Criteo SA ADRa | | | 1,271,323 | |
| | 1,100 | | | CSG Systems International, Inc. | | | 41,833 | |
| | 1,550 | | | CTS Corporation | | | 28,210 | |
| | 17,750 | | | Dolby Laboratories, Inc. | | | 844,722 | |
| | 24,507 | | | DST Systems, Inc. | | | 2,356,593 | |
| | 2,470 | | | EarthLink Holdings Corporation | | | 14,128 | |
| | 12,080 | | | eBay, Inc.a | | | 344,401 | |
| | 7,890 | | | Entegris, Inc.a | | | 125,451 | |
| | 18,025 | | | Envestnet, Inc.a | | | 637,184 | |
| | 3,290 | | | EVERTEC, Inc. | | | 49,844 | |
| | 3,720 | | | ExlService Holdings, Inc.a | | | 163,792 | |
| | 3,657 | | | F5 Networks, Inc.a | | | 505,434 | |
| | 2,648 | | | Fabrineta | | | 100,518 | |
| | 43,050 | | | Facebook, Inc.a | | | 5,639,120 | |
| | 27,740 | | | Finisar Corporationa | | | 759,521 | |
| | 33,880 | | | FLIR Systems, Inc. | | | 1,115,330 | |
| | 740 | | | Forrester Research, Inc. | | | 27,565 | |
| | 24,177 | | | Fortinet, Inc.a | | | 775,115 | |
| | 2,200 | | | FUJIFILM Holdings NPV | | | 83,184 | |
| | 390 | | | Gartner, Inc.a | | | 33,556 | |
| | 36,803 | | | Guidewire Software, Inc.a | | | 2,114,332 | |
| | 400 | | | Halma plc | | | 5,121 | |
| | 6,150 | | | HP, Inc. | | | 89,113 | |
| | 3,712 | | | IAC/InterActiveCorporation | | | 239,201 | |
| | 32,430 | | | Integrated Device Technology, Inc.a | | | 671,625 | |
| | 12,230 | | | Intel Corporation | | | 426,460 | |
| | 7,637 | | | Ixiaa | | | 91,262 | |
| | 17,581 | | | Juniper Networks, Inc. | | | 463,084 | |
| | 580 | | | Keysight Technologies, Inc.a | | | 19,024 | |
| | 11,360 | | | Lam Research Corporation | | | 1,100,330 | |
| | 2,530 | | | Liberty Tripadvisor Holdings, Inc.a | | | 56,166 | |
| | 3,220 | | | Lionbridge Technologies, Inc.a | | | 15,553 | |
| | 722 | | | Littelfuse, Inc. | | | 100,719 | |
| | 18,860 | | | M/A-COM Technology Solutions Holdings, Inc.a | | | 693,294 | |
| | 8,181 | | | Manhattan Associates, Inc.a | | | 414,286 | |
| | 34,910 | | | MasterCard, Inc. | | | 3,736,068 | |
| | 14,456 | | | Maxim Integrated Products, Inc. | | | 572,891 | |
| | 680 | | | MAXIMUS, Inc. | | | 35,401 | |
| | 4,090 | | | Methode Electronics, Inc. | | | 127,608 | |
| | 300 | | | Micro Focus International plc | | | 7,856 | |
| | 28,640 | | | Microsemi Corporationa | | | 1,206,603 | |
| | 77,990 | | | Microsoft Corporation | | | 4,673,161 | |
| | 13,170 | | | Mobileye NVa | | | 489,661 | |
| | 21,989 | | | Monolithic Power Systems, Inc. | | | 1,732,953 | |
| | 5,475 | | | Nanometrics, Inc.a | | | 114,373 | |
| | 22,800 | | | National Instruments Corporation | | | 640,452 | |
| | 1,000 | | | NEC Networks & System Integration Corporation | | | 17,772 | |
| | 300 | | | Nice, Ltd. | | | 19,913 | |
| | 8,352 | | | Nice, Ltd. ADR | | | 555,157 | |
| | 400 | | | NS Solutions Corporation | | | 7,627 | |
| | 200 | | | NTT Data Corporation | | | 10,321 | |
| | 37,763 | | | NVIDIA Corporation | | | 2,687,215 | |
| | 7,617 | | | NXP Semiconductors NVa | | | 761,700 | |
| | 66,075 | | | Oclaro, Inc.a | | | 483,008 | |
| | 5,240 | | | ON Semiconductor Corporationa | | | 61,151 | |
| | 32,920 | | | Oracle Corporation | | | 1,264,786 | |
| | 100 | | | Oracle Corporation Japan | | | 5,442 | |
| | 880 | | | OSI Systems, Inc.a | | | 61,714 | |
| | 5,263 | | | Palo Alto Networks, Inc.a | | | 809,607 | |
| | 51,380 | | | Pandora Media, Inc.a | | | 582,135 | |
| | 21,600 | | | Paylocity Holding Corporationa | | | 939,384 | |
| | 64,614 | | | PayPal Holdings, Inc.a | | | 2,691,819 | |
| | 19,213 | | | Pegasystems, Inc. | | | 593,682 | |
| | 3,689 | | | Progress Software Corporationa | | | 99,271 | |
| | 28,942 | | | Proofpoint, Inc.a | | | 2,268,474 | |
| | 4,090 | | | PTC, Inc.a | | | 194,030 | |
| | 26,043 | | | Q2 Holdings, Inc.a | | | 731,808 | |
| | 560 | | | Qorvo, Inc.a | | | 31,164 | |
| | 11,410 | | | QUALCOMM, Inc. | | | 784,095 | |
| | 540 | | | Qualys, Inc.a | | | 20,115 | |
| | 5,540 | | | RealPage, Inc.a | | | 150,688 | |
| | 9,170 | | | Red Hat, Inc.a | | | 710,216 | |
| | 1,060 | | | Rudolph Technologies, Inc.a | | | 19,186 | |
| | 51,380 | | | Salesforce.com, Inc.a | | | 3,861,721 | |
| | 76 | | | SAP SE | | | 6,696 | |
| | 650 | | | ScanSource, Inc.a | | | 22,750 | |
| | 7,069 | | | ServiceNow, Inc.a | | | 621,436 | |
| | 4,190 | | | ShoreTel, Inc.a | | | 27,863 | |
| | 490 | | | Silicon Laboratories, Inc.a | | | 29,375 | |
| | 475 | | | Software AG | | | 17,264 | |
| | 18,000 | | | SS&C Technologies Holdings, Inc. | | | 574,740 | |
| | 1,360 | | | Stratasys, Ltd.a | | | 26,003 | |
| | 13,383 | | | Synopsys, Inc.a | | | 793,746 | |
| | 32,119 | | | Teradyne, Inc. | | | 748,052 | |
| | 1,340 | | | Tessera Technologies, Inc. | | | 49,714 | |
| | 1,190 | | | Texas Instruments, Inc. | | | 84,311 | |
| | 200 | | | Tokyo Electron, Ltd. | | | 18,041 | |
| | 1,450 | | | Total System Services, Inc. | | | 72,326 | |
| | 200 | | | Trend Micro, Inc. | | | 7,043 | |
| | 4,090 | | | Trimble, Inc.a | | | 113,048 | |
| | 7,877 | | | Tyler Technologies, Inc.a | | | 1,263,471 | |
| | 9,771 | | | Ultimate Software Group, Inc.a | | | 2,061,583 | |
| | 100 | | | United Internet AG | | | 4,111 | |
| | 51,728 | | | Virtusa Corporationa | | | 979,728 | |
| | 43,690 | | | Visa, Inc. | | | 3,604,862 | |
| | 45,190 | | | Xilinx, Inc. | | | 2,298,815 | |
| | 2,400 | | | Yahoo Japan Corporation | | | 9,206 | |
| | 940 | | | Yandex NVa | | | 18,509 | |
| | | | | |
| | | | Total | | | 99,249,324 | |
| | | | | |
| |
| | Materials (2.3%) | | | | |
| | 400 | | | Adeka Corporation | | | 6,047 | |
| | 7,773 | | | Agnico Eagle Mines, Ltd. | | | 394,868 | |
| | 100 | | | Air Liquide SA | | | 10,161 | |
| | 3,470 | | | Air Products and Chemicals, Inc. | | | 462,967 | |
| | 2,053 | | | American Vanguard Corporation | | | 31,206 | |
| | 882 | | | APERAM | | | 40,113 | |
| | 140 | | | Ashland Global Holdings, Inc. | | | 15,642 | |
| | 4,889 | | | Avery Dennison Corporation | | | 341,203 | |
The accompanying Notes to Financial Statements are an integral part of this schedule.
7
AGGRESSIVE ALLOCATION FUND
Schedule of Investments as of October 31, 2016
| | | | | | | | |
| Shares | | | Common Stock (47.3%) | | Value | |
| | Materials (2.3%) - continued | | | | |
| | 6,538 | | | Balchem Corporation | | | $496,234 | |
| | 6,502 | | | Ball Corporation | | | 501,109 | |
| | 43,393 | | | Barrick Gold Corporation | | | 763,283 | |
| | 7,774 | | | BHP Billiton, Ltd. | | | 135,818 | |
| | 7,860 | | | BlueScope Steel, Ltd. | | | 46,630 | |
| | 3,330 | | | Boise Cascade Companya | | | 64,102 | |
| | 3,310 | | | Cabot Corporation | | | 172,583 | |
| | 1,560 | | | Carpenter Technology Corporation | | | 49,312 | |
| | 7,891 | | | Celanese Corporation | | | 575,412 | |
| | 20,720 | | | Chemtura Corporationa | | | 679,616 | |
| | 888 | | | Clearwater Paper Corporationa | | | 47,153 | |
| | 1,220 | | | Continental Building Products, Inc.a | | | 24,949 | |
| | 300 | | | Croda International plc | | | 12,830 | |
| | 12,194 | | | Crown Holdings, Inc.a | | | 661,524 | |
| | 4,200 | | | Daicel Corporation | | | 55,227 | |
| | 1,000 | | | Denki Kagaku Kogyo KK | | | 4,537 | |
| | 840 | | | Dow Chemical Company | | | 45,200 | |
| | 1,627 | | | Eagle Materials, Inc. | | | 131,738 | |
| | 585 | | | Eastman Chemical Company | | | 42,067 | |
| | 7,180 | | | Ecolab, Inc. | | | 819,741 | |
| | 30,130 | | | Eldorado Gold Corporationa | | | 95,211 | |
| | 2,630 | | | Evonik Industries AG | | | 82,363 | |
| | 3,520 | | | Ferro Corporationa | | | 45,619 | |
| | 6,790 | | | Ferroglobe plc | | | 62,808 | |
| | 21,630 | | | FMC Corporation | | | 1,014,231 | |
| | 15 | | | Givaudan SA | | | 29,011 | |
| | 29,547 | | | Goldcorp, Inc. | | | 449,114 | |
| | 2,130 | | | Graphic Packaging Holding Company | | | 26,625 | |
| | 700 | | | Hexpol AB | | | 5,753 | |
| | 4,630 | | | Huntsman Corporation | | | 78,478 | |
| | 1,977 | | | Ingevity Corporationa | | | 81,848 | |
| | 490 | | | Innophos Holdings, Inc. | | | 22,462 | |
| | 1,196 | | | Innospec, Inc. | | | 72,059 | |
| | 22,388 | | | International Paper Company | | | 1,008,132 | |
| | 1,720 | | | Kadant, Inc. | | | 88,838 | |
| | 5,320 | | | KapStone Paper and Packaging Corporation | | | 96,505 | |
| | 53,861 | | | Kinross Gold Corporationa | | | 207,903 | |
| | 730 | | | Koppers Holdings, Inc.a | | | 23,907 | |
| | 1,200 | | | Kuraray Company, Ltd. | | | 18,193 | |
| | 2,120 | | | Martin Marietta Materials, Inc. | | | 393,006 | |
| | 6,030 | | | Materion Corporation | | | 182,709 | |
| | 7,060 | | | Methanex Corporation | | | 256,631 | |
| | 951 | | | Minerals Technologies, Inc. | | | 63,907 | |
| | 3,100 | | | Mitsubishi Chemical Holdings Corporation | | | 20,354 | |
| | 500 | | | Mitsubishi Gas Chemical Company, Inc. | | | 7,695 | |
| | 400 | | | Mitsubishi Materials Corporation | | | 11,460 | |
| | 3,100 | | | Mosaic Company | | | 72,943 | |
| | 5,654 | | | Myers Industries, Inc. | | | 68,131 | |
| | 380 | | | Neenah Paper, Inc. | | | 30,362 | |
| | 400 | | | Newcrest Mining, Ltd. | | | 7,004 | |
| | 22,848 | | | Newmont Mining Corporation | | | 846,290 | |
| | 200 | | | Nippon Shokubai Company, Ltd. | | | 13,802 | |
| | 12,170 | | | Norsk Hydro ASA | | | 54,409 | |
| | 14,270 | | | Nucor Corporation | | | 697,089 | |
| | 2,700 | | | OMNOVA Solutions, Inc.a | | | 20,520 | |
| | 3,354 | | | Orora, Ltd. | | | 7,391 | |
| | 28,217 | | | Owens-Illinois, Inc.a | | | 544,588 | |
| | 13,220 | | | Packaging Corporation of America | | | 1,090,650 | |
| | 1,720 | | | PolyOne Corporation | | | 50,276 | |
| | 440 | | | Quaker Chemical Corporation | | | 47,300 | |
| | 1,940 | | | Rayonier Advanced Materials, Inc. | | | 25,084 | |
| | 1,820 | | | Reliance Steel & Aluminum Company | | | 125,180 | |
| | 2,803 | | | Royal Gold, Inc. | | | 192,902 | |
| | 1,100 | | | RPC Group plc | | | 12,756 | |
| | 1,040 | | | RPM International, Inc. | | | 49,442 | |
| | 1,500 | | | Schnitzer Steel Industries, Inc. | | | 36,225 | |
| | 420 | | | Schweitzer-Mauduit International, Inc. | | | 15,502 | |
| | 8,226 | | | Scotts Miracle-Gro Company | | | 724,628 | |
| | 8,612 | | | Sealed Air Corporation | | | 392,966 | |
| | 8,250 | | | Sensient Technologies Corporation | | | 614,707 | |
| | 13,205 | | | Silver Wheaton Corporation | | | 318,373 | |
| | 6,320 | | | Sonoco Products Company | | | 317,833 | |
| | 32,291 | | | Steel Dynamics, Inc. | | | 886,711 | |
| | 200 | | | Sumitomo Seika Chemicals Company, Ltd. | | | 7,478 | |
| | 23,065 | | | Teck Resources, Ltd. | | | 497,743 | |
| | 1,000 | | | Tosoh Corporation | | | 6,530 | |
| | 1,900 | | | UPM-Kymmene Oyj | | | 44,197 | |
| | 1,735 | | | Versum Materials, Inc.a | | | 39,385 | |
| | 4,240 | | | Vulcan Materials Company | | | 479,968 | |
| | 11,875 | | | Westrock Company | | | 548,506 | |
| | 43,666 | | | Yamana Gold, Inc. | | | 155,451 | |
| | 2,128 | | | Yara International ASA | | | 75,170 | |
| | | | | |
| | | | Total | | | 20,193,586 | |
| | | | | |
| |
| | Real Estate (1.1%) | | | | |
| | 8,910 | | | American Assets Trust, Inc. | | | 353,816 | |
| | 4,130 | | | American Campus Communities, Inc. | | | 215,214 | |
| | 6,450 | | | Bluerock Residential Growth REIT, Inc. | | | 79,980 | |
| | 22,389 | | | Brixmor Property Group, Inc. | | | 569,128 | |
| | 4,060 | | | Camden Property Trust | | | 330,646 | |
| | 6,900 | | | CapitaMall Trust | | | 10,282 | |
| | 600 | | | Castellum AB | | | 8,130 | |
| | 13,680 | | | CBL & Associates Properties, Inc. | | | 146,376 | |
| | 14,377 | | | Cedar Realty Trust, Inc. | | | 97,332 | |
| | 6,340 | | | Chatham Lodging Trust | | | 112,218 | |
| | 1,310 | | | City Office REIT, Inc. | | | 16,454 | |
| | 20,340 | | | Corporate Office Properties Trust | | | 542,875 | |
| | 5,720 | | | Corrections Corporation of America | | | 82,654 | |
| | 22,657 | | | Cousins Properties, Inc. | | | 176,045 | |
| | 4,190 | | | CubeSmart | | | 109,233 | |
| | 1,050 | | | CyrusOne, Inc. | | | 46,841 | |
| | 41,460 | | | DDR Corporation | | | 633,923 | |
| | 9,306 | | | DEXUS Property Group | | | 63,217 | |
| | 3,490 | | | Digital Realty Trust, Inc. | | | 326,071 | |
| | 12,230 | | | Duke Realty Corporation | | | 319,814 | |
| | 5,730 | | | DuPont Fabros Technology, Inc. | | | 233,841 | |
| | 400 | | | EastGroup Properties, Inc. | | | 27,164 | |
| | 4,430 | | | Equity Lifestyle Properties, Inc. | | | 335,971 | |
| | 1,900 | | | First Industrial Realty Trust, Inc. | | | 50,179 | |
| | 4,671 | | | First Potomac Realty Trust | | | 41,665 | |
| | 4,380 | | | Franklin Street Properties Corporation | | | 50,677 | |
| | 6,200 | | | Frasers Centrepoint Trust | | | 9,269 | |
| | 11,450 | | | General Growth Properties, Inc. | | | 285,677 | |
| | 3,231 | | | H&R Real Estate Investment Trust | | | 54,946 | |
| | 900 | | | Hamborner REIT AG | | | 8,898 | |
| | 6,740 | | | HFF, Inc. | | | 179,486 | |
| | 1,720 | | | Hospitality Properties Trust | | | 47,059 | |
| | 22,998 | | | Host Hotels & Resorts, Inc. | | | 356,009 | |
| | 3,630 | | | Hudson Pacific Properties, Inc. | | | 122,041 | |
| | 1,300 | | | Hufvudstaden AB | | | 20,121 | |
| | 11,000 | | | Hysan Development Company, Ltd. | | | 50,769 | |
| | 2,530 | | | InfraREIT, Inc. | | | 42,049 | |
| | 5,120 | | | Kite Realty Group Trust | | | 127,642 | |
| | 4,980 | | | LaSalle Hotel Properties | | | 118,275 | |
| | 7,200 | | | Liberty Property Trust | | | 291,096 | |
| | 3,920 | | | Life Storage, Inc. | | | 316,148 | |
The accompanying Notes to Financial Statements are an integral part of this schedule.
8
AGGRESSIVE ALLOCATION FUND
Schedule of Investments as of October 31, 2016
| | | | | | | | |
| Shares | | | Common Stock (47.3%) | | Value | |
| | Real Estate (1.1%) - continued | | | | |
| | 2,500 | | | Link REIT | | | $17,785 | |
| | 3,360 | | | Mid-America Apartment Communities, Inc. | | | 311,640 | |
| | 42,544 | | | New World Development Company, Ltd. | | | 52,893 | |
| | 2,832 | | | Parkway, Inc.a | | | 51,033 | |
| | 14,625 | | | Pebblebrook Hotel Trust | | | 355,095 | |
| | 12,310 | | | Physicians Realty Trust | | | 243,369 | |
| | 437 | | | Potlatch Corporation | | | 16,781 | |
| | 2,420 | | | RE/MAX Holdings, Inc. | | | 105,149 | |
| �� | 7,620 | | | Retail Properties of America, Inc. | | | 118,643 | |
| | 372 | | | RioCan Real Estate Investment Trust | | | 7,233 | |
| | 2,690 | | | Silver Bay Realty Trust Corporation REIT | | | 45,058 | |
| | 2,000 | | | Sino Land Company, Ltd. | | | 3,396 | |
| | 17,522 | | | Stockland | | | 58,847 | |
| | 6,880 | | | Store Capital Corporation | | | 187,755 | |
| | 11,166 | | | Summit Hotel Properties, Inc. | | | 145,046 | |
| | 20,240 | | | Terreno Realty Corporation | | | 528,264 | |
| | 5,840 | | | Urstadt Biddle Properties, Inc. | | | 125,560 | |
| | 1,000 | | | Wharf Holdings, Ltd. | | | 7,498 | |
| | 1,000 | | | Wheelock and Company, Ltd. | | | 6,154 | |
| | 10,600 | | | Wing Tai Holdings, Ltd. | | | 12,914 | |
| | | | | |
| | | | Total | | | 9,409,344 | |
| | | | | |
| |
| | Telecommunications Services (0.3%) | | | | |
| | 9,520 | | | AT&T, Inc. | | | 350,241 | |
| | 700 | | | ATN International, Inc. | | | 47,348 | |
| | 430 | | | BCE, Inc. | | | 19,536 | |
| | 5,400 | | | BT Group plc | | | 24,786 | |
| | 1,486 | | | Cincinnati Bell, Inc.a | | | 29,200 | |
| | 1,866 | | | Elisa Oyj | | | 62,868 | |
| | 1,210 | | | FairPoint Communications, Inc.a | | | 18,876 | |
| | 1,400 | | | Freenet AG | | | 40,137 | |
| | 1,620 | | | General Communication, Inc.a | | | 25,661 | |
| | 4,150 | | | Inteliquent, Inc. | | | 69,679 | |
| | 24,963 | | | KCOM Group plc | | | 35,978 | |
| | 200 | | | KDDI Corporation | | | 6,079 | |
| | 11,490 | | | Koninklijke (Royal) KPN NV | | | 37,466 | |
| | 8,899 | | | Level 3 Communications, Inc.a | | | 499,679 | |
| | 172 | | | Millicom International Cellular SA | | | 7,557 | |
| | 2,400 | | | Nippon Telegraph & Telephone Corporation | | | 106,408 | |
| | 800 | | | NTT DOCOMO, Inc. | | | 20,091 | |
| | 2,000 | | | Orange SA | | | 31,468 | |
| | 27,444 | | | PCCW, Ltd. | | | 16,336 | |
| | 679 | | | Proximus SA | | | 19,435 | |
| | 8,209 | | | SBA Communications Corporationa | | | 929,916 | |
| | 100 | | | SoftBank Group Corporation | | | 6,298 | |
| | 2,500 | | | Telefonica Deutschland Holding AG | | | 9,696 | |
| | 1,570 | | | Telenor ASA | | | 24,971 | |
| | 3,054 | | | Verizon Communications, Inc. | | | 146,897 | |
| | 2,500 | | | Vodafone Group plc | | | 6,866 | |
| | 13,240 | | | Vonage Holdings Corporationa | | | 90,826 | |
| | | | | |
| | | | Total | | | 2,684,299 | |
| | | | | |
| |
| | Utilities (0.8%) | | | | |
| | 880 | | | Alliant Energy Corporation | | | 33,484 | |
| | 1,230 | | | American Electric Power Company, Inc. | | | 79,753 | |
| | 3,550 | | | American States Water Company | | | 141,929 | |
| | 8,090 | | | Aqua America, Inc. | | | 248,363 | |
| | 1,550 | | | Artesian Resources Corporation | | | 43,741 | |
| | 8,100 | | | Avista Corporation | | | 335,340 | |
| | 8,700 | | | Centrica plc | | | 22,788 | |
| | 1,310 | | | Consolidated Water Company, Ltd. | | | 14,672 | |
| | 4,070 | | | DTE Energy Company | | | 390,761 | |
| | 3,600 | | | DUET Group | | | 6,518 | �� |
| | 800 | | | E.ON SE | | | 5,863 | |
| | 9,690 | | | Edison International, Inc. | | | 712,021 | |
| | 12,100 | | | Electricidade de Portugal SA | | | 39,994 | |
| | 17,850 | | | Eversource Energy | | | 982,821 | |
| | 7,620 | | | Exelon Corporation | | | 259,613 | |
| | 5,780 | | | Great Plains Energy, Inc. | | | 164,383 | |
| | 1,750 | | | Hawaiian Electric Industries, Inc. | | | 51,625 | |
| | 19,250 | | | MDU Resources Group, Inc. | | | 504,542 | |
| | 660 | | | Middlesex Water Company | | | 23,826 | |
| | 4,810 | | | NiSource, Inc. | | | 111,881 | |
| | 1,230 | | | NorthWestern Corporation | | | 70,787 | |
| | 14,000 | | | Osaka Gas Company, Ltd. | | | 58,229 | |
| | 1,960 | | | PG&E Corporation | | | 121,755 | |
| | 11,990 | | | PNM Resources, Inc. | | | 393,871 | |
| | 3,930 | | | Portland General Electric Company | | | 171,505 | |
| | 10,820 | | | Public Service Enterprise Group, Inc. | | | 455,306 | |
| | 8,800 | | | Redes Energeticas Nacionais SGPS SA | | | 25,715 | |
| | 1,870 | | | Renewable Energy Group, Inc.a | | | 16,363 | |
| | 10,490 | | | Southern Company | | | 540,969 | |
| | 5,660 | | | Southwest Gas Corporation | | | 410,124 | |
| | 1,000 | | | Toho Gas Company, Ltd. | | | 9,273 | |
| | 1,700 | | | United Utilities Group plc | | | 19,541 | |
| | 391 | | | Unitil Corporation | | | 15,863 | |
| | 14,220 | | | Vectren Corporation | | | 715,408 | |
| | | | | |
| | | | Total | | | 7,198,627 | |
| | | | | |
| | | | | | | | |
| | | | | |
| | | | Total Common Stock (cost $369,684,140) | | | 412,231,588 | |
| | | | | |
| | |
| Shares | | | Registered Investment Companies (41.2%) | | Value | |
| Affiliated Equity Holdings (38.0%) | | | | |
| | 6,928,175 | | | Thrivent Large Cap Growth Fund | | | 62,284,289 | |
| | 1,137,651 | | | Thrivent Large Cap Stock Fund | | | 28,452,647 | |
| | 2,650,742 | | | Thrivent Large Cap Value Fund | | | 51,848,520 | |
| | 2,312,069 | | | Thrivent Mid Cap Stock Fund | | | 55,489,646 | |
| | 11,061,524 | | | Thrivent Partner Worldwide Allocation Fund | | | 107,407,399 | |
| | 1,211,561 | | | Thrivent Small Cap Stock Fund | | | 25,055,081 | |
| | | | | |
| | | | Total | | | 330,537,582 | |
| | | | | |
| |
| | Affiliated Fixed Income Holdings (1.9%) | | | | |
| | 1,195,460 | | | Thrivent High Yield Fund | | | 5,690,392 | |
| | 427,112 | | | Thrivent Income Fund | | | 3,950,783 | |
| | 536,022 | | | Thrivent Limited Maturity Bond Fund | | | 6,689,559 | |
| | | | | |
| | | | Total | | | 16,330,734 | |
| | | | | |
| |
| | Equity Funds/ETFs (1.3%) | | | | |
| | 3,440 | | | iShares MSCI EAFE Index Fund | | | 198,901 | |
| | 20,271 | | | iShares Russell 2000 Growth Index Fund | | | 2,835,305 | |
| | 6,721 | | | iShares Russell 2000 Index Fund | | | 796,438 | |
| | 2,290 | | | iShares Russell 2000 Value Index Fund | | | 232,389 | |
| | 7,660 | | | Materials Select Sector SPDR Fund | | | 358,105 | |
| | 27,802 | | | SPDR S&P 500 ETF Trust | | | 5,909,315 | |
| | 21,851 | | | SPDR S&P Biotech ETF | | | 1,226,934 | |
| | 250 | | | SPDR S&P MidCap 400 ETF Trust | | | 68,693 | |
| | | | | |
| | | | Total | | | 11,626,080 | |
| | | | | |
| | | | | | | | |
| | | | | |
| | | | Total Registered Investment Companies (cost $291,750,958) | | | 358,494,396 | |
| | | | | |
The accompanying Notes to Financial Statements are an integral part of this schedule.
9
AGGRESSIVE ALLOCATION FUND
Schedule of Investments as of October 31, 2016
| | | | | | | | |
| | |
Principal
Amount | | | Long-Term Fixed Income (3.2%) | | Value | |
| Collateralized Mortgage Obligations (<0.1%) | | | | |
| | | | MASTR Alternative Loans Trust | | | | |
| | $42,271 | | | 0.984%, 12/25/2035c | | | $19,585 | |
| | | | Residential Asset Securitization Trust | | | | |
| | 67,910 | | | 0.914%, 8/25/2037c | | | 18,124 | |
| | | | Sequoia Mortgage Trust | | | | |
| | 109,684 | | | 3.270%, 9/20/2046 | | | 88,723 | |
| | | | WaMu Mortgage Pass Through Certificates | | | | |
| | 52,143 | | | 2.795%, 9/25/2036 | | | 47,240 | |
| | 76,142 | | | 2.832%, 10/25/2036 | | | 66,371 | |
| | | | | |
| | | | Total | | | 240,043 | |
| | | | | |
| |
| Mortgage-Backed Securities (1.4%) | | | | |
| | | | Federal Home Loan Mortgage Corporation Gold 15-Yr. Pass Through | | | | |
| | 750,000 | | | 3.000%, 11/1/2031d | | | 784,863 | |
| | | | Federal Home Loan Mortgage Corporation Gold 30-Yr. Pass Through | | | | |
| | 750,000 | | | 4.000%, 11/1/2046d | | | 802,236 | |
| | | | Federal National Mortgage Association Conventional | | | | |
| | 800,000 | | | 3.000%, 11/1/2046d | | | 823,625 | |
| | | | Federal National Mortgage Association Conventional 15-Yr. Pass Through | | | | |
| | 950,000 | | | 2.500%, 11/1/2031d | | | 977,535 | |
| | | | Federal National Mortgage Association Conventional 30-Yr. Pass Through | | | | |
| | 5,100,000 | | | 3.500%, 11/1/2046d | | | 5,354,203 | |
| | 1,625,000 | | | 4.000%, 11/1/2046d | | | 1,740,020 | |
| | 1,225,000 | | | 4.500%, 11/1/2046d | | | 1,338,887 | |
| | | | | |
| | | | Total | | | 11,821,369 | |
| | | | | |
| |
| U.S. Government and Agencies (1.8%) | | | | |
| | | | U.S. Treasury Bonds | | | | |
| | 1,630,000 | | | 3.625%, 2/15/2044 | | | 1,981,024 | |
| | | | U.S. Treasury Bonds, TIPS | | | | |
| | 2,027,220 | | | 0.625%, 1/15/2026 | | | 2,116,069 | |
| | 935,152 | | | 1.000%, 2/15/2046 | | | 1,007,434 | |
| | | | U.S. Treasury Notes | | | | |
| | 600,000 | | | 0.875%, 11/15/2017 | | | 600,820 | |
| | 75,000 | | | 0.875%, 3/31/2018 | | | 75,091 | |
| | 3,120,000 | | | 0.750%, 2/15/2019 | | | 3,108,057 | |
| | 340,000 | | | 1.000%, 10/15/2019 | | | 340,013 | |
| | 575,000 | | | 1.500%, 10/31/2019 | | | 583,198 | |
| | 2,700,000 | | | 1.125%, 8/31/2021 | | | 2,676,164 | |
| | 250,000 | | | 2.125%, 9/30/2021 | | | 259,131 | |
| | 3,000,000 | | | 2.250%, 11/15/2024 | | | 3,119,064 | |
| | | | | |
| | | | Total | | | 15,866,065 | |
| | | | | |
| | | | | | | | |
| | | | | |
| | | | Total Long-Term Fixed Income (cost $27,558,572) | | | 27,927,477 | |
| | | | | |
| | |
Shares or
Principal
Amount | | | Short-Term Investments (9.7%)e | | Value | |
| | | | Federal Home Loan Bank Discount Notes | | | | |
| | 1,400,000 | | | 0.285%, 11/16/2016f | | | 1,399,884 | |
| | 4,300,000 | | | 0.340%, 1/4/2017f | | | 4,297,553 | |
| | 600,000 | | | 0.350%, 1/20/2017f | | | 599,573 | |
| | | | Federal National Mortgage Association Discount Notes | | | | |
| | 4,000,000 | | | 0.345%, 1/11/2017f | | | 3,997,476 | |
| | | | Thrivent Core Short-Term Reserve Fund | | | | |
| | 7,429,328 | | | 0.790% | | | 74,293,277 | |
| | | | | |
| | | | Total Short-Term Investments (cost $84,587,323) | | | 84,587,763 | |
| | | | | |
| | | | Total Investments (cost $773,580,993) 101.4% | | | $883,241,224 | |
| | | | | |
| | | | Other Assets and Liabilities, Net (1.4%) | | | (12,348,394 | ) |
| | | | | |
| | | | Total Net Assets 100.0% | | | $870,892,830 | |
| | | | | |
a | Non-income producing security. |
b | Security is valued at fair value. Market quotations or prices were not readily available or were determined to be unreliable. Fair value was determined in good faith pursuant to procedures adopted by the Board. Further information on fair valuation can be found in the Notes to Financial Statements. |
c | Denotes variable rate securities. Variable rate securities are securities whose yields vary with a designated market index or market rate. The rate shown is as of October 31, 2016. |
d | Denotes investments purchased on a when-issued or delayed delivery basis. |
e | The interest rate shown reflects the yield, coupon rate or the discount rate at the date of purchase. |
f | All or a portion of the security is held on deposit with the counterparty and pledged as the initial margin deposit for open futures contracts. |
Definitions:
| | | | |
ADR | | - | | American Depositary Receipt, which are certificates for an |
| | | | underlying foreign security’s shares held by an issuing U.S. |
| | | | depository bank. |
ETF | | - | | Exchange Traded Fund. |
REIT | | - | | Real Estate Investment Trust is a company that buys, |
| | | | develops, manages and/or sells real estate assets. |
TIPS | | - | | Treasury Inflation Protected Security. |
The accompanying Notes to Financial Statements are an integral part of this schedule.
10
MODERATELY AGGRESSIVE ALLOCATION FUND
Schedule of Investments as of October 31, 2016
| | | | | | | | |
Principal
Amount | | | Bank Loans (1.0%)a | | Value | |
| Basic Materials (0.1%) | | | | |
| | | | Arch Coal, Inc., Term Loan | | | | |
| | $127,120 | | | 10.000%, 10/5/2021 | | | $129,768 | |
| | | | Fortescue Metals Group, Ltd., Term Loan | | | | |
| | 249,081 | | | 3.750%, 6/30/2019 | | | 248,847 | |
| | | | Ineos US Finance, LLC, Term Loan | | | | |
| | 609,021 | | | 3.750%, 12/15/2020 | | | 610,415 | |
| | | | Tronox Pigments BV, Term Loan | | | | |
| | 300,582 | | | 4.500%, 3/19/2020 | | | 299,010 | |
| | | | | |
| | | | Total | | | 1,288,040 | |
| | | | | |
| |
| Capital Goods (<0.1%) | | | | |
| | | | Accudyne Industries, LLC, Term Loan | | | | |
| | 181,785 | | | 4.000%, 12/13/2019 | | | 166,864 | |
| | | | Advanced Disposal Services, Inc., Term Loan | | | | |
| | 155,000 | | | 0.000%, 10/28/2023b,c | | | 155,194 | |
| | | | Cortes NP Acquisition Corporation, Term Loan | | | | |
| | 480,000 | | | 0.000%, 10/3/2023b,c | | | 477,000 | |
| | | | | |
| | | | Total | | | 799,058 | |
| | | | | |
| |
| Communications Services (0.3%) | | | | |
| | | | Altice US Finance I Corporation, Term Loan | | | | |
| | 247,545 | | | 3.750%, 1/15/2025 | | | 248,226 | |
| | | | Beasley Broadcast Group, Inc., Term Loan | | | | |
| | 135,000 | | | 0.000%, 10/4/2023b,c | | | 133,481 | |
| | | | FairPoint Communications, Inc., Term Loan | | | | |
| | 312,447 | | | 7.500%, 2/14/2019 | | | 312,878 | |
| | | | Grande Communications Networks, LLC, Term Loan | | | | |
| | 319,286 | | | 4.500%, 5/29/2020 | | | 318,887 | |
| | | | Hargray Communications Group, Inc., Term Loan | | | | |
| | 310,066 | | | 4.750%, 6/26/2019 | | | 311,616 | |
| | | | Integra Telecom Holdings, Inc., Term Loan | | | | |
| | 199,592 | | | 5.250%, 8/14/2020 | | | 198,470 | |
| | 92,618 | | | 9.750%, 2/12/2021 | | | 88,972 | |
| | | | Intelsat Jackson Holdings SA, Term Loan | | | | |
| | 98,469 | | | 3.750%, 6/30/2019 | | | 94,049 | |
| | | | Liberty Cablevision of Puerto Rico, LLC, Term Loan | | | | |
| | 735,000 | | | 4.500%, 1/7/2022 | | | 722,747 | |
| | | | LTS Buyer, LLC, Term Loan | | | | |
| | 319,485 | | | 4.088%, 4/13/2020 | | | 319,805 | |
| | 17,077 | | | 8.000%, 4/12/2021 | | | 17,088 | |
| | | | NEP Broadcasting, LLC, Term Loan | | | | |
| | 31,429 | | | 10.000%, 7/22/2020 | | | 31,468 | |
| | | | NEP/NCP Holdco, Inc., Term Loan | | | | |
| | 409,347 | | | 4.250%, 1/22/2020 | | | 407,939 | |
| | | | Numericable US, LLC, Term Loan | | | | |
| | 422,875 | | | 5.137%, 1/15/2024 | | | 426,364 | |
| | | | Syniverse Holdings, Inc., Term Loan | | | | |
| | 284,945 | | | 4.000%, 4/23/2019 | | | 261,973 | |
| | | | TNS, Inc., Term Loan | | | | |
| | 176,716 | | | 5.000%, 2/14/2020 | | | 177,269 | |
| | | | Univision Communications, Inc., Term Loan | | | | |
| | 382,174 | | | 4.000%, 3/1/2020 | | | 382,770 | |
| | | | WideOpenWest Finance, LLC, Term Loan | | | | |
| $ | 300,000 | | | 4.500%, 8/18/2023 | | | 299,181 | |
| | | | WMG Acquisition Corporation, Term Loan | | | | |
| | 95,515 | | | 3.750%, 7/1/2020 | | | 95,311 | |
| | | | XO Communications, LLC, Term Loan | | | | |
| | 136,500 | | | 4.250%, 3/20/2021 | | | 136,586 | |
| | | | Yankee Cable Acquisition, LLC, Term Loan | | | | |
| | 248,451 | | | 4.250%, 3/1/2020 | | | 248,607 | |
| | | | Zayo Group, LLC, Term Loan | | | | |
| | 301,952 | | | 3.750%, 5/6/2021 | | | 303,359 | |
| | | | | |
| | | | Total | | | 5,537,046 | |
| | | | | |
| |
| Consumer Cyclical (0.2%) | | | | |
| | | | Amaya BV, Term Loan | | | | |
| | 561,078 | | | 5.000%, 8/1/2021 | | | 560,287 | |
| | | | Burlington Coat Factory Warehouse Corporation, Term Loan | | | | |
| | 283,862 | | | 3.500%, 8/13/2021 | | | 285,724 | |
| | | | Cengage Learning Acquisitions, Term Loan | | | | |
| | 354,113 | | | 5.250%, 6/7/2023 | | | 345,777 | |
| | | | Ceridian HCM Holding, Inc., Term Loan | | | | |
| | 172,373 | | | 4.500%, 9/15/2020 | | | 168,925 | |
| | | | Golden Nugget, Inc., Term Loan | | | | |
| | 138,985 | | | 4.500%, 11/21/2019 | | | 140,462 | |
| | | | Golden Nugget, Inc., Term Loan Delayed Draw | | | | |
| | 59,565 | | | 4.500%, 11/21/2019 | | | 60,198 | |
| | | | IMG Worldwide, Inc., Term Loan | | | | |
| | 295,466 | | | 5.250%, 5/6/2021 | | | 296,722 | |
| | 155,000 | | | 8.250%, 5/6/2022 | | | 154,678 | |
| | | | Mohegan Tribal Gaming Authority, Term Loan | | | | |
| | 240,000 | | | 0.000%, 9/30/2023b,c | | | 239,026 | |
| | | | Scientific Games International, Inc., Term Loan | | | | |
| | 165,739 | | | 6.000%, 10/18/2020 | | | 166,619 | |
| | 490,358 | | | 6.000%, 10/1/2021 | | | 492,197 | |
| | | | | |
| | | | Total | | | 2,910,615 | |
| | | | | |
| |
| Consumer Non-Cyclical (0.1%) | | | | |
| | | | Albertson’s, LLC, Term Loan | | | | |
| | 84,576 | | | 4.750%, 12/21/2022 | | | 85,412 | |
| | 281,905 | | | 4.750%, 6/22/2023 | | | 284,842 | |
| | | | CHS/Community Health Systems, Inc., Term Loan | | | | |
| | 384,028 | | | 4.000%, 1/27/2021 | | | 362,234 | |
| | | | Endo Luxembourg Finance I Company SARL, Term Loan | | | | |
| | 456,550 | | | 3.750%, 9/26/2022 | | | 455,810 | |
| | | | Mallinckrodt International Finance SA, Term Loan | | | | |
| | 99,241 | | | 3.588%, 3/19/2021 | | | 99,241 | |
| | | | McGraw-Hill Global Education Holdings, LLC, Term Loan | | | | |
| | 314,212 | | | 5.000%, 5/4/2022 | | | 313,361 | |
| | | | MultiPlan, Inc., Term Loan | | | | |
| | 191,354 | | | 5.000%, 6/7/2023 | | | 193,327 | |
| | | | Ortho-Clinical Diagnostics, Inc., Term Loan | | | | |
| | 409,739 | | | 4.750%, 6/30/2021 | | | 399,836 | |
The accompanying Notes to Financial Statements are an integral part of this schedule.
11
MODERATELY AGGRESSIVE ALLOCATION FUND
Schedule of Investments as of October 31, 2016
| | | | | | | | |
Principal
Amount | | | Bank Loans (1.0%)a | | Value | |
| Consumer Non-Cyclical (0.1%) - continued | | | | |
| | | | PetSmart, Inc., Term Loan | | | | |
| | $114,709 | | | 4.000%, 3/11/2022b,c | | | $114,934 | |
| | | | Valeant Pharmaceuticals International, Inc., Term Loan | | | | |
| | 587,392 | | | 5.500%, 4/1/2022 | | | 585,190 | |
| | | | | |
| | | | Total | | | 2,894,187 | |
| | | | | |
| |
| Energy (0.1%) | | | | |
| | | | Energy Solutions, LLC, Term Loan | | | | |
| | 131,175 | | | 6.750%, 5/29/2020 | | | 131,175 | |
| | | | Expro Holdings UK 2, Ltd., Term Loan | | | | |
| | 294,000 | | | 5.750%, 9/2/2021 | | | 255,118 | |
| | | | Houston Fuel Oil Terminal, LLC, Term Loan | | | | |
| | 340,891 | | | 4.250%, 8/19/2021 | | | 334,926 | |
| | | | McJunkin Red Man Corporation, Term Loan | | | | |
| | 173,559 | | | 5.000%, 11/8/2019 | | | 171,896 | |
| | | | MEG Energy Corporation, Term Loan | | | | |
| | 174,087 | | | 3.750%, 3/31/2020 | | | 163,995 | |
| | | | Pacific Drilling SA, Term Loan | | | | |
| | 208,012 | | | 4.500%, 6/3/2018 | | | 58,503 | |
| | | | Targa Resources Partners, LP, Term Loan | | | | |
| | 101,512 | | | 5.750%, 2/27/2022 | | | 101,639 | |
| | | | Western Refining, Inc., Term Loan | | | | |
| | 154,612 | | | 5.500%, 6/23/2023 | | | 154,323 | |
| | | | | |
| | | | Total | | | 1,371,575 | |
| | | | | |
| |
| Financials (0.1%) | | | | |
| | | | DJO Finance, LLC, Term Loan | | | | |
| | 251,812 | | | 4.250%, 6/7/2020 | | | 248,980 | |
| | | | Harland Clarke Holdings Corporation, Term Loan | | | | |
| | 65,187 | | | 6.993%, 8/4/2019 | | | 64,658 | |
| | 243,750 | | | 7.000%, 12/31/2019 | | | 242,024 | |
| | | | MoneyGram International, Inc., Term Loan | | | | |
| | 331,752 | | | 4.250%, 3/27/2020 | | | 321,799 | |
| | | | Telenet International Finance Luxembourg SA, Term Loan | | | | |
| | 255,000 | | | 4.357%, 6/30/2024 | | | 255,053 | |
| | | | WaveDivision Holdings, LLC, Term Loan | | | | |
| | 248,072 | | | 4.000%, 10/15/2019 | | | 248,630 | |
| | | | | |
| | | | Total | | | 1,381,144 | |
| | | | | |
| |
| Technology (0.1%) | | | | |
| | | | Avago Technoligies Cayman Finance, Ltd., Term Loan | | | | |
| | 377,843 | | | 3.535%, 2/1/2023 | | | 381,568 | |
| | | | First Data Corporation, Term Loan | | | | |
| | 235,000 | | | 0.000%, 3/24/2021b,c | | | 235,940 | |
| | 295,000 | | | 4.274%, 7/8/2022 | | | 297,030 | |
| | | | Interception Merger Sub, Inc., Term Loan | | | | |
| | 130,000 | | | 0.000%, 10/26/2023b,c | | | 130,671 | |
| | | | Micron Technologies, Inc., Term Loan | | | | |
| | 79,800 | | | 4.637%, 4/26/2022 | | | 80,249 | |
| | | | ON Semiconductor Corporation, Term Loan | | | | |
| | 405,000 | | | 3.777%, 3/31/2023 | | | 407,228 | |
| | | | Western Digital Corporation, Term Loan | | | | |
| | 403,987 | | | 4.500%, 4/29/2023 | | | 408,314 | |
| | | | | |
| | | | Total | | | 1,941,000 | |
| | | | | |
| |
| Transportation (<0.1%) | | | | |
| | | | OSG Bulk Ships, Inc., Term Loan | | | | |
| | 276,439 | | | 5.250%, 8/5/2019 | | | 274,021 | |
| | | | XPO Logistics, Inc., Term Loan | | | | |
| | 293,016 | | | 4.250%, 10/30/2021 | | | 294,375 | |
| | | | | |
| | | | Total | | | 568,396 | |
| | | | | |
| |
| Utilities (<0.1%) | | | | |
| | | | Intergen NV, Term Loan | | | | |
| | 168,355 | | | 5.500%, 6/12/2020 | | | 159,096 | |
| | | | Talen Energy Supply, LLC, Term Loan | | | | |
| | 104,465 | | | 0.000%, 10/18/2023b,c | | | 104,334 | |
| | | | | |
| | | | Total | | | 263,430 | |
| | | | | |
| | | | | | | | |
| | | | | |
| | | | Total Bank Loans (cost $19,109,351) | | | 18,954,491 | |
| | | | | |
| | |
| Shares | | | Registered Investment Companies (45.4%) | | Value | |
| Affiliated Equity Holdings (38.6%) | | | | |
| | 15,413,729 | | | Thrivent Large Cap Growth Fund | | | 138,569,427 | |
| | 4,059,972 | | | Thrivent Large Cap Stock Fund | | | 101,539,892 | |
| | 8,662,899 | | | Thrivent Large Cap Value Fund | | | 169,446,299 | |
| | 5,080,309 | | | Thrivent Mid Cap Stock Fund | | | 121,927,424 | |
| | 21,293,565 | | | Thrivent Partner Worldwide Allocation Fund | | | 206,760,515 | |
| | 1,622,012 | | | Thrivent Small Cap Stock Fund | | | 33,543,209 | |
| | | | | |
| | | | Total | | | 771,786,766 | |
| | | | | |
| |
| Affiliated Fixed Income Holdings (5.7%) | | | | |
| | 4,037,028 | | | Thrivent High Yield Fund | | | 19,216,252 | |
| | 6,417,176 | | | Thrivent Income Fund | | | 59,358,880 | |
| | 2,767,130 | | | Thrivent Limited Maturity Bond Fund | | | 34,533,782 | |
| | | | | |
| | | | Total | | | 113,108,914 | |
| | | | | |
| |
| Equity Funds/ETFs (0.8%) | | | | |
| | 3,990 | | | iShares MSCI EAFE Index Fund | | | 230,702 | |
| | 19,769 | | | iShares Russell 2000 Growth Index Fund | | | 2,765,090 | |
| | 12,511 | | | iShares Russell 2000 Index Fund | | | 1,482,553 | |
| | 3,220 | | | iShares Russell 2000 Value Index Fund | | | 326,766 | |
| | 10,780 | | | Materials Select Sector SPDR Fund | | | 503,965 | |
| | 48,549 | | | SPDR S&P 500 ETF Trust | | | 10,319,090 | |
| | 23,258 | | | SPDR S&P Biotech ETF | | | 1,305,937 | |
| | 360 | | | SPDR S&P MidCap 400 ETF Trust | | | 98,917 | |
| | | | | |
| | | | Total | | | 17,033,020 | |
| | | | | |
| |
| Fixed Income Funds/ETFs (0.3%) | | | | |
| | 13,000 | | | iShares Barclays 1-3 Year Credit Bond Fund | | | 1,372,150 | |
| | 29,045 | | | iShares iBoxx $ Investment Grade Corporate Bond ETF | | | 3,513,864 | |
| | 24,700 | | | Vanguard Short-Term Corporate Bond ETF | | | 1,983,904 | |
| | | | | |
| | | | Total | | | 6,869,918 | |
| | | | | |
| | | | | | | | |
| | | | | |
| | | | Total Registered Investment Companies (cost $751,283,395) | | | 908,798,618 | |
| | | | | |
| | |
| Shares | | | Common Stock (31.3%) | | Value | |
| Consumer Discretionary (3.8%) | | | | |
| | 30,640 | | | Aaron’s, Inc. | | | 757,114 | |
| | 1,599 | | | Adient plcd | | | 72,770 | |
| | 5,890 | | | Amazon.com, Inc.d | | | 4,652,040 | |
| | 5,120 | | | American Axle & Manufacturing Holdings, Inc.d | | | 91,750 | |
| | 7,640 | | | American Public Education, Inc.d | | | 153,946 | |
| | 13,100 | | | Aramark | | | 487,713 | |
| | 4,170 | | | Armstrong Flooring, Inc.d | | | 67,512 | |
The accompanying Notes to Financial Statements are an integral part of this schedule.
12
MODERATELY AGGRESSIVE ALLOCATION FUND
Schedule of Investments as of October 31, 2016
| | | | | | | | |
| Shares | | | Common Stock (31.3%) | | Value | |
| Consumer Discretionary (3.8%) - continued | | | | |
| | 4,960 | | | Ascent Capital Group, Inc.d | | | $101,085 | |
| | 1,240 | | | AutoZone, Inc.d | | | 920,278 | |
| | 20,850 | | | Barnes & Noble, Inc. | | | 214,755 | |
| | 200 | | | Bayerische Motoren Werke AG | | | 15,185 | |
| | 9,900 | | | Beazer Homes USA, Inc.d | | | 101,277 | |
| | 1,600 | | | Bed Bath & Beyond, Inc. | | | 64,672 | |
| | 100 | | | Beiersdorf AG | | | 8,816 | |
| | 2,900 | | | Berkeley Group Holdings plc | | | 83,640 | |
| | 5,180 | | | Big 5 Sporting Goods Corporation | | | 80,290 | |
| | 11,550 | | | Bloomin’ Brands, Inc. | | | 199,815 | |
| | 17,180 | | | BorgWarner, Inc. | | | 615,731 | |
| | 400 | | | Brembo SPA | | | 24,766 | |
| | 3,300 | | | Bridgestone Corporation | | | 123,168 | |
| | 48,151 | | | Brunswick Corporation | | | 2,094,568 | |
| | 550 | | | Buffalo Wild Wings, Inc.d | | | 80,108 | |
| | 2,515 | | | Bunzl plc | | | 67,521 | |
| | 17,952 | | | Burlington Stores, Inc.d | | | 1,345,323 | |
| | 11,720 | | | Caleres, Inc. | | | 293,117 | |
| | 21,510 | | | Callaway Golf Company | | | 219,617 | |
| | 2,000 | | | Calsonic Kansei Corporation | | | 25,065 | |
| | 20,170 | | | Carter’s, Inc. | | | 1,741,478 | |
| | 11,126 | | | Cedar Fair, LP | | | 632,513 | |
| | 7,870 | | | Cheesecake Factory, Inc. | | | 418,605 | |
| | 2,900 | | | Chuy’s Holdings, Inc.d | | | 82,360 | |
| | 8,730 | | | Cinemark Holdings, Inc. | | | 347,454 | |
| | 4,880 | | | ClubCorp Holdings, Inc. | | | 56,364 | |
| | 51,820 | | | Comcast Corporation | | | 3,203,512 | |
| | 800 | | | Compass Group plc | | | 14,475 | |
| | 42,404 | | | Core-Mark Holding Company, Inc. | | | 1,498,981 | |
| | 11,947 | | | CSS Industries, Inc. | | | 299,870 | |
| | 14,101 | | | Culp, Inc. | | | 394,828 | |
| | 28,840 | | | Dana, Inc. | | | 446,443 | |
| | 2,040 | | | Deckers Outdoor Corporationd | | | 106,468 | |
| | 18,902 | | | Delphi Automotive plc | | | 1,229,953 | |
| | 4,000 | | | Denso Corporation | | | 174,060 | |
| | 4,940 | | | DeVry Education Group, Inc. | | | 112,138 | |
| | 4,308 | | | Discovery Communications, Inc., Class Ad | | | 112,482 | |
| | 12,680 | | | Dish DBS Corporationd | | | 742,541 | |
| | 7,890 | | | Dollar General Corporation | | | 545,120 | |
| | 25,922 | | | Dollar Tree, Inc.d | | | 1,958,407 | |
| | 6,452 | | | Domino’s Pizza, Inc. | | | 1,091,936 | |
| | 23,080 | | | DSW, Inc. | | | 479,372 | |
| | 31,210 | | | Duluth Holdings, Inc.d | | | 847,352 | |
| | 9,980 | | | Etsy, Inc.d | | | 129,540 | |
| | 4,000 | | | Eutelsat Communications | | | 83,820 | |
| | 7,197 | | | Expedia, Inc. | | | 930,068 | |
| | 14,725 | | | Finish Line, Inc. | | | 289,935 | |
| | 3,900 | | | Fuji Heavy Industries, Ltd. | | | 152,398 | |
| | 16,370 | | | Gentex Corporation | | | 276,817 | |
| | 20,503 | | | G-III Apparel Group, Ltd.d | | | 535,538 | |
| | 36,270 | | | GNC Holdings, Inc. | | | 487,106 | |
| | 1,000 | | | Hakuhodo Dy Holdings, Inc. | | | 12,019 | |
| | 15,658 | | | Harley-Davidson, Inc. | | | 892,819 | |
| | 19,252 | | | Harman International Industries, Inc. | | | 1,534,577 | |
| | 16,238 | | | Haverty Furniture Companies, Inc. | | | 288,225 | |
| | 300 | | | Hennes & Mauritz AB | | | 8,437 | |
| | 12,680 | | | Home Depot, Inc. | | | 1,547,087 | |
| | 9,900 | | | Honda Motor Company, Ltd. | | | 296,224 | |
| | 29,310 | | | Houghton Mifflin Harcourt Companyd | | | 370,772 | |
| | 3,250 | | | HSN, Inc. | | | 122,525 | |
| | 2,790 | | | Hyatt Hotels Corporationd | | | 141,704 | |
| | 3,350 | | | ILG, Inc. | | | 54,873 | |
| | 5,600 | | | Inchcape plc | | | 44,524 | |
| | 1,830 | | | International Speedway Corporation | | | 60,207 | |
| | 7,420 | | | Interpublic Group of Companies, Inc. | | | 166,134 | |
| | 900 | | | Intertek Group plc | | | 37,550 | |
| | 2,720 | | | Jack in the Box, Inc. | | | 254,946 | |
| | 6,140 | | | John Wiley and Sons, Inc. | | | 316,824 | |
| | 29,367 | | | Kate Spade & Companyd | | | 491,897 | |
| | 200 | | | Koito Manufacturing Company, Ltd. | | | 10,500 | |
| | 300 | | | KOMERI Company, Ltd. | | | 7,325 | |
| | 6,926 | | | L Brands, Inc. | | | 499,988 | |
| | 6,500 | | | Ladbrokes plc | | | 10,612 | |
| | 16,763 | | | Las Vegas Sands Corporation | | | 970,242 | |
| | 11,215 | | | La-Z-Boy, Inc. | | | 262,431 | |
| | 25,950 | | | Liberty Interactive Corporationd | | | 479,816 | |
| | 337 | | | Linamar Corporation | | | 13,706 | |
| | 9,828 | | | Lithia Motors, Inc. | | | 843,046 | |
| | 23,000 | | | LKQ Corporationd | | | 742,440 | |
| | 13,900 | | | Lowe’s Companies, Inc. | | | 926,435 | |
| | 1,270 | | | Lululemon Athletica, Inc.d | | | 72,708 | |
| | 300 | | | LVMH Moet Hennessy Louis Vuitton SE | | | 54,619 | |
| | 12,220 | | | Masonite International Corporationd | | | 695,318 | |
| | 21,828 | | | MDC Partners, Inc. | | | 184,447 | |
| | 4,960 | | | Meredith Corporation | | | 224,936 | |
| | 1,660 | | | Meritage Homes Corporationd | | | 51,377 | |
| | 660 | | | Mohawk Industries, Inc.d | | | 121,638 | |
| | 1,580 | | | Monro Muffler Brake, Inc. | | | 86,900 | |
| | 1,000 | | | Murphy USA, Inc.d | | | 68,780 | |
| | 9,240 | | | New Media Investment Group, Inc. | | | 133,056 | |
| | 6,420 | | | New York Times Company | | | 69,978 | |
| | 40,480 | | | Newell Brands, Inc. | | | 1,943,850 | |
| | 16,660 | | | News Corporation, Class A | | | 201,919 | |
| | 4,560 | | | News Corporation, Class B | | | 56,544 | |
| | 300 | | | Nifco, Inc. | | | 17,278 | |
| | 400 | | | Nokian Renkaat Oyj | | | 13,417 | |
| | 26,288 | | | Nord Anglia Education, Inc.d | | | 566,244 | |
| | 85,783 | | | Nutrisystem, Inc. | | | 2,719,321 | |
| | 2,790 | | | O’Reilly Automotive, Inc.d | | | 737,788 | |
| | 24,393 | | | Oxford Industries, Inc. | | | 1,529,929 | |
| | 100 | | | Paddy Power plc | | | 10,363 | |
| | 17,870 | | | Papa John’s International, Inc. | | | 1,348,291 | |
| | 38,174 | | | Papa Murphy’s Holdings, Inc.d | | | 212,247 | |
| | 19,890 | | | Penn National Gaming, Inc.d | | | 257,178 | |
| | 6,000 | | | Persimmon plc | | | 124,200 | |
| | 1,190 | | | Priceline Group, Inc.d | | | 1,754,334 | |
| | 444 | | | Publicis Groupe SA | | | 30,458 | |
| | 15,188 | | | PVH Corporation | | | 1,624,812 | |
| | 4,421 | | | Ralph Lauren Corporation | | | 433,700 | |
| | 6,090 | | | Rent-A-Center, Inc. | | | 61,448 | |
| | 520 | | | Restaurant Brands International, Inc. | | | 23,124 | |
| | 5,846 | | | Restoration Hardware Holdings, Inc.d | | | 169,359 | |
| | 7,000 | | | Retailmenot, Inc.d | | | 63,350 | |
| | 32,984 | | | Ross Stores, Inc. | | | 2,062,819 | |
| | 4,690 | | | Royal Caribbean Cruises, Ltd. | | | 360,520 | |
| | 200 | | | RTL Group SA | | | 15,674 | |
| | 12,140 | | | Ruth’s Hospitality Group, Inc. | | | 192,419 | |
| | 11,250 | | | Sally Beauty Holdings, Inc.d | | | 291,825 | |
| | 12,840 | | | Scripps Networks Interactive, Inc. | | | 826,382 | |
| | 700 | | | Sekisui Chemical Company, Ltd. | | | 11,024 | |
| | 1,400 | | | Sekisui House, Ltd. | | | 23,133 | |
| | 3,300 | | | Select Comfort Corporationd | | | 63,327 | |
| | 5,830 | | | Signet Jewelers, Ltd. | | | 473,746 | |
| | 11,044 | | | Sportsman’s Warehouse Holdings, Inc.d | | | 101,605 | |
| | 12,800 | | | Starbucks Corporation | | | 679,296 | |
| | 20,446 | | | Stein Mart, Inc. | | | 123,085 | |
| | 4,390 | | | Steven Madden, Ltd.d | | | 146,626 | |
| | 3,900 | | | Sumitomo Forestry Company, Ltd. | | | 54,328 | |
| | 2,400 | | | Sumitomo Rubber Industries, Ltd. | | | 40,263 | |
The accompanying Notes to Financial Statements are an integral part of this schedule.
13
MODERATELY AGGRESSIVE ALLOCATION FUND
Schedule of Investments as of October 31, 2016
| | | | | | | | |
| Shares | | | Common Stock (31.3%) | | Value | |
| Consumer Discretionary (3.8%) - continued | | | | |
| | 200 | | | Swatch Group AG | | | $11,530 | |
| | 10,710 | | | Tegna, Inc. | | | 210,130 | |
| | 7,700 | | | Tempur-Pedic International, Inc.d | | | 416,339 | |
| | 6,538 | | | Tenneco, Inc.d | | | 360,048 | |
| | 24,260 | | | Time, Inc. | | | 315,380 | |
| | 23,130 | | | TJX Companies, Inc. | | | 1,705,837 | |
| | 38,805 | | | Toll Brothers, Inc.d | | | 1,064,809 | |
| | 29,302 | | | Tower International, Inc. | | | 635,853 | |
| | 100 | | | Toyota Motor Corporation | | | 5,801 | |
| | 55,384 | | | Tuesday Morning Corporationd | | | 274,151 | |
| | 1,020 | | | Tupperware Brands Corporation | | | 60,710 | |
| | 1,853 | | | Ulta Salon Cosmetics & Fragrance, Inc.d | | | 450,909 | |
| | 5,827 | | | Under Armour, Inc., Class Ad | | | 181,220 | |
| | 5,866 | | | Under Armour, Inc., Class Cd | | | 151,695 | |
| | 5,980 | | | Vail Resorts, Inc. | | | 953,451 | |
| | 60 | | | Valora Holding AG | | | 17,447 | |
| | 15,140 | | | Vera Bradley, Inc.d | | | 202,422 | |
| | 8,552 | | | VF Corporation | | | 463,604 | |
| | 2,760 | | | Visteon Corporation | | | 194,884 | |
| | 5,630 | | | Vitamin Shoppe, Inc.d | | | 141,032 | |
| | 2,000 | | | Wacoal Holdings Corporation | | | 23,075 | |
| | 8,130 | | | Walt Disney Company | | | 753,570 | |
| | 2,350 | | | Whirlpool Corporation | | | 352,077 | |
| | 500 | | | Whitbread plc | | | 22,088 | |
| | 21,010 | | | Wingstop, Inc. | | | 562,228 | |
| | 3,615 | | | Wolters Kluwer NV | | | 139,794 | |
| | 2,700 | | | WPP plc | | | 58,625 | |
| | 1,400 | | | Yokohama Rubber Company, Ltd. | | | 24,308 | |
| | 9,460 | | | Yum! Brands, Inc. | | | 816,209 | |
| | 18,534 | | | Zoe’s Kitchen, Inc.d | | | 420,166 | |
| | | | | |
| | | | Total | | | 75,909,836 | |
| | | | | |
| |
| Consumer Staples (1.1%) | | | | |
| | 17,925 | | | AdvancePierre Foods Holdings, Inc. | | | 501,183 | |
| | 2,200 | | | Axfood AB | | | 34,381 | |
| | 1,168 | | | British American Tobacco plc | | | 66,942 | |
| | 7,280 | | | Brown-Forman Corporation | | | 336,118 | |
| | 10,360 | | | Campbell Soup Company | | | 562,962 | |
| | 9,193 | | | Casey’s General Stores, Inc. | | | 1,038,717 | |
| | 46,510 | | | Coca-Cola Company | | | 1,972,024 | |
| | 3,800 | | | Coca-Cola HBC AG | | | 82,004 | |
| | 27,110 | | | CVS Health Corporation | | | 2,279,951 | |
| | 1,000 | | | Davide Campari - Milano SPA | | | 10,072 | |
| | 4,999 | | | Distribuidora Internacional de Alimentacion SA | | | 26,700 | |
| | 4,512 | | | e.l.f. Beauty, Inc.d | | | 116,680 | |
| | 700 | | | Ebro Foods SA | | | 15,094 | |
| | 12,770 | | | Estee Lauder Companies, Inc. | | | 1,112,650 | |
| | 18,750 | | | Flowers Foods, Inc. | | | 291,000 | |
| | 4,140 | | | General Mills, Inc. | | | 256,597 | |
| | 126 | | | George Weston, Ltd. | | | 10,267 | |
| | 22,129 | | | Hain Celestial Group, Inc.d | | | 804,832 | |
| | 800 | | | Henkel AG & Company KGaA | | | 88,146 | |
| | 5,980 | | | Imperial Brands plc | | | 289,265 | |
| | 5,640 | | | Ingredion, Inc. | | | 739,799 | |
| | 2,075 | | | J & J Snack Foods Corporation | | | 253,461 | |
| | 800 | | | Jeronimo Martins SGPS SA | | | 13,747 | |
| | 800 | | | Kao Corporation | | | 41,165 | |
| | 300 | | | Kesko Oyj | | | 14,907 | |
| | 1,900 | | | Kewpie Corporation | | | 53,961 | |
| | 2,560 | | | Kimberly-Clark Corporation | | | 292,890 | |
| | 1,000 | | | Kirin Holdings Company, Ltd. | | | 17,192 | |
| | 14,141 | | | Koninklijke Ahold Delhaize NV | | | 322,592 | |
| | 1,270 | | | Lancaster Colony Corporation | | | 165,925 | |
| | 2 | | | Lindt & Spruengli AG | | | 10,386 | |
| | 10,506 | | | Monster Beverage Corporationd | | | 1,516,436 | |
| | 1,120 | | | Nestle SA | | | 81,216 | |
| | 400 | | | Ontex Group NV | | | 12,099 | |
| | 5,330 | | | PepsiCo, Inc. | | | 571,376 | |
| | 5,319 | | | Philip Morris International, Inc. | | | 512,964 | |
| | 45,630 | | | Pinnacle Foods, Inc. | | | 2,346,295 | |
| | 254 | | | Premium Brands Holdings Corporation | | | 12,292 | |
| | 8,320 | | | Procter & Gamble Company | | | 722,176 | |
| | 22,478 | | | SpartanNash Company | | | 629,384 | |
| | 1,000 | | | Suedzucker AG | | | 25,653 | |
| | 9,999 | | | United Natural Foods, Inc.d | | | 417,358 | |
| | 1,230 | | | Universal Corporation | | | 66,666 | |
| | 8,860 | | | Walgreens Boots Alliance, Inc. | | | 732,988 | |
| | 34,520 | | | WhiteWave Foods Companyd | | | 1,880,995 | |
| | | | | |
| | | | Total | | | 21,349,508 | |
| | | | | |
| |
| Energy (5.1%) | | | | |
| | 3,200 | | | Anadarko Petroleum Corporation | | | 190,208 | |
| | 9,150 | | | Arch Coal, Inc.d,e | | | 671,427 | |
| | 63,576 | | | Archrock, Inc. | | | 737,482 | |
| | 20,652 | | | Atwood Oceanics, Inc. | | | 157,575 | |
| | 21,142 | | | Baker Hughes, Inc. | | | 1,171,267 | |
| | 5,174 | | | Baytex Energy Corporation | | | 19,904 | |
| | 70,103 | | | BP plc | | | 414,430 | |
| | 14,987 | | | Bristow Group, Inc. | | | 150,020 | |
| | 122,988 | | | Callon Petroleum Companyd | | | 1,597,614 | |
| | 129,936 | | | Canadian Natural Resources, Ltd. | | | 4,120,271 | |
| | 90,582 | | | Chevron Corporation | | | 9,488,464 | |
| | 16,740 | | | Cimarex Energy Company | | | 2,161,636 | |
| | 52,060 | | | Clean Energy Fuels Corporationd | | | 213,967 | |
| | 35,132 | | | Concho Resources, Inc.d | | | 4,459,656 | |
| | 35,880 | | | ConocoPhillips | | | 1,558,986 | |
| | 46,420 | | | Continental Resources, Inc.d | | | 2,270,402 | |
| | 1,012 | | | Contura Energy, Inc.d | | | 67,045 | |
| | 4,504 | | | Crescent Point Energy Corporation | | | 53,626 | |
| | 18,690 | | | Delek US Holdings, Inc. | | | 315,861 | |
| | 16,580 | | | Devon Energy Corporation | | | 628,216 | |
| | 9,370 | | | Diamond Offshore Drilling, Inc. | | | 154,511 | |
| | 3,912 | | | Diamondback Energy, Inc.d | | | 357,126 | |
| | 48,655 | | | Ensco plc | | | 380,482 | |
| | 64,016 | | | EOG Resources, Inc. | | | 5,788,327 | |
| | 16,040 | | | EP Energy Corporationd | | | 57,102 | |
| | 80,402 | | | EQT Corporation | | | 5,306,532 | |
| | 33,500 | | | Exxon Mobil Corporation | | | 2,791,220 | |
| | 13,830 | | | Frank’s International NV | | | 155,587 | |
| | 2,500 | | | Galp Energia SGPS SA | | | 33,896 | |
| | 10,640 | | | Green Plains, Inc. | | | 276,640 | |
| | 2,470 | | | Gulfport Energy Corporationd | | | 59,552 | |
| | 140,560 | | | Halliburton Company | | | 6,465,760 | |
| | 8,241 | | | HollyFrontier Corporation | | | 205,613 | |
| | 25,340 | | | Hornbeck Offshore Services, Inc.d | | | 100,600 | |
| | 4,190 | | | Kinder Morgan, Inc. | | | 85,602 | |
| | 55,994 | | | Marathon Oil Corporation | | | 738,001 | |
| | 3,500 | | | Murphy Oil Corporation | | | 90,545 | |
| | 131,370 | | | Nabors Industries, Ltd. | | | 1,563,303 | |
| | 4,010 | | | Newfield Exploration Companyd | | | 162,766 | |
| | 2,955 | | | Noble Energy, Inc. | | | 101,859 | |
| | 26,137 | | | Oasis Petroleum, Inc.d | | | 274,177 | |
| | 3,680 | | | Oceaneering International, Inc. | | | 87,584 | |
| | 4,850 | | | Oil States International, Inc.d | | | 141,862 | |
| | 3,370 | | | OMV AG | | | 105,177 | |
| | 55,931 | | | Parsley Energy, Inc.d | | | 1,840,130 | |
| | 79,088 | | | Patterson-UTI Energy, Inc. | | | 1,777,898 | |
| | 1,140 | | | PDC Energy, Inc.d | | | 69,916 | |
| | 2,710 | | | Phillips 66 | | | 219,916 | |
| | 44,403 | | | Pioneer Energy Services Corporationd | | | 157,631 | |
| | 24,570 | | | Pioneer Natural Resources Company | | | 4,398,521 | |
The accompanying Notes to Financial Statements are an integral part of this schedule.
14
MODERATELY AGGRESSIVE ALLOCATION FUND
Schedule of Investments as of October 31, 2016
| | | | | | | | |
| Shares | | | Common Stock (31.3%) | | Value | |
| Energy (5.1%) - continued | | | | |
| | 9,430 | | | Rowan Companies plc | | | $125,136 | |
| | 2,811 | | | Royal Dutch Shell plc | | | 70,043 | |
| | 73,390 | | | Royal Dutch Shell plc ADR | | | 3,655,556 | |
| | 5,985 | | | Royal Dutch Shell plc, Class B | | | 154,369 | |
| | 29,995 | | | RPC, Inc. | | | 518,014 | |
| | 5,750 | | | RSP Permian, Inc.d | | | 207,575 | |
| | 94,182 | | | Schlumberger, Ltd. | | | 7,367,858 | |
| | 10,280 | | | SemGroup Corporation | | | 331,530 | |
| | 3,158 | | | SM Energy Company | | | 106,204 | |
| | 2,799 | | | Statoil ASA | | | 45,696 | |
| | 209,832 | | | Suncor Energy, Inc. ADR | | | 6,299,157 | |
| | 3,080 | | | Superior Energy Services, Inc. | | | 43,613 | |
| | 15,200 | | | Teekay Corporation | | | 99,256 | |
| | 35,602 | | | Teekay Tankers, Ltd. | | | 75,832 | |
| | 20,528 | | | Tesco Corporation | | | 140,617 | |
| | 60,960 | | | TETRA Technologies, Inc.d | | | 332,232 | |
| | 2,893 | | | Total SA | | | 138,590 | |
| | 55,474 | | | U.S. Silica Holdings, Inc. | | | 2,562,344 | |
| | 111,840 | | | Valero Energy Corporation | | | 6,625,402 | |
| | 774 | | | Vantage Drilling Internationald | | | 65,016 | |
| | 473,586 | | | Weatherford International plcd | | | 2,282,684 | |
| | 495,810 | | | WPX Energy, Inc.d | | | 5,384,497 | |
| | | | | |
| | | | Total | | | 101,027,114 | |
| | | | | |
| |
| Financials (4.0%) | | | | |
| | 10,316 | | | Aberdeen Asset Management plc | | | 40,353 | |
| | 11,128 | | | Affiliated Managers Group, Inc.d | | | 1,476,240 | |
| | 1,600 | | | AIA Group, Ltd. | | | 10,066 | |
| | 12,620 | | | Allied World Assurance Company Holdings AG | | | 542,408 | |
| | 3,710 | | | American Financial Group, Inc. | | | 276,395 | |
| | 5,810 | | | American International Group, Inc. | | | 358,477 | |
| | 30,821 | | | Ameris Bancorp | | | 1,118,802 | |
| | 5,070 | | | AMERISAFE, Inc. | | | 281,892 | |
| | 970 | | | Arch Capital Group, Ltd.d | | | 75,631 | |
| | 14,244 | | | Argo Group International Holdings, Ltd. | | | 791,966 | |
| | 18,955 | | | Aspen Insurance Holdings, Ltd. | | | 914,579 | |
| | 6,050 | | | Associated Banc-Corp | | | 122,815 | |
| | 57,060 | | | Assured Guaranty, Ltd. | | | 1,705,523 | |
| | 1,949 | | | ASX, Ltd. | | | 69,718 | |
| | 6,200 | | | Australia & New Zealand Banking Group, Ltd. | | | 130,915 | |
| | 10,700 | | | Banco Santander SA | | | 52,431 | |
| | 36,500 | | | BancorpSouth, Inc. | | | 857,750 | |
| | 61,740 | | | Bank of America Corporation | | | 1,018,710 | |
| | 7,667 | | | Bank of East Asia, Ltd. | | | 30,821 | |
| | 1,692 | | | Bank of Montreal | | | 107,678 | |
| | 12,390 | | | Bank of New York Mellon Corporation | | | 536,115 | |
| | 4,956 | | | Bank of Nova Scotia | | | 266,330 | |
| | 19,489 | | | Bank of the Ozarks, Inc. | | | 720,313 | |
| | 7,650 | | | BankFinancial Corporation | | | 96,161 | |
| | 31,650 | | | BB&T Corporation | | | 1,240,680 | |
| | 21,490 | | | Beneficial Bancorp, Inc. | | | 311,605 | |
| | 18,110 | | | Blackstone Group, LP | | | 453,293 | |
| | 54,150 | | | Boston Private Financial Holdings, Inc. | | | 712,073 | |
| | 31,270 | | | Brookline Bancorp, Inc. | | | 400,256 | |
| | 14,950 | | | Brown & Brown, Inc. | | | 551,057 | |
| | 150 | | | Canadian Imperial Bank of Commerce | | | 11,239 | |
| | 4,540 | | | Capital One Financial Corporation | | | 336,142 | |
| | 85,450 | | | Capstead Mortgage Corporation | | | 812,630 | |
| | 9,150 | | | Cathay General Bancorp | | | 274,043 | |
| | 17,400 | | | Central Pacific Financial Corporation | | | 445,962 | |
| | 6,240 | | | Charles Schwab Corporation | | | 197,808 | |
| | 16,548 | | | Chemical Financial Corporation | | | 710,737 | |
| | 3,000 | | | Chiba Bank, Ltd. | | | 18,554 | |
| | 3,260 | | | Chubb, Ltd. | | | 414,020 | |
| | 1,817 | | | CI Financial Corporation | | | 33,433 | |
| | 26,280 | | | Citigroup, Inc. | | | 1,291,662 | |
| | 9,210 | | | Clifton Bancorp, Inc. | | | 140,821 | |
| | 3,400 | | | CNP Assurances | | | 58,882 | |
| | 72,480 | | | CoBiz Financial, Inc. | | | 921,946 | |
| | 15,803 | | | Columbia Banking System, Inc. | | | 521,815 | |
| | 15,860 | | | Comerica, Inc. | | | 826,147 | |
| | 6,200 | | | Concordia Financial Group, Ltd. | | | 28,748 | |
| | 16,027 | | | Direct Line Insurance Group plc | | | 67,804 | |
| | 77,090 | | | E*TRADE Financial Corporationd | | | 2,170,854 | |
| | 44,014 | | | East West Bancorp, Inc. | | | 1,738,993 | |
| | 2,960 | | | Eaton Vance Corporation | | | 103,778 | |
| | 17,977 | | | Employers Holdings, Inc. | | | 563,579 | |
| | 4,670 | | | Endurance Specialty Holdings, Ltd. | | | 429,407 | |
| | 10,180 | | | Enova International, Inc.d | | | 95,692 | |
| | 1,800 | | | Erste Group Bank AG | | | 56,446 | |
| | 23,582 | | | Essent Group, Ltd.d | | | 623,508 | |
| | 12,463 | | | Evercore Partners, Inc. | | | 669,886 | |
| | 600 | | | EXOR SPA | | | 25,509 | |
| | 600 | | | EXOR SPA Rightsd,f | | | 0 | |
| | 9,800 | | | F.N.B. Corporation | | | 128,086 | |
| | 10,920 | | | Federated Investors, Inc. | | | 294,840 | |
| | 33,420 | | | Fifth Third Bancorp | | | 727,219 | |
| | 6,030 | | | First American Financial Corporation | | | 235,532 | |
| | 47,130 | | | First Commonwealth Financial Corporation | | | 478,841 | |
| | 11,200 | | | First Financial Bancorp | | | 240,800 | |
| | 4,870 | | | First Financial Corporation | | | 195,287 | |
| | 3,900 | | | First Merchants Corporation | | | 109,785 | |
| | 62,240 | | | First Midwest Bancorp, Inc. | | | 1,201,854 | |
| | 5,940 | | | First NBC Bank Holding Companyd | | | 32,076 | |
| | 33,820 | | | First Republic Bank | | | 2,517,223 | |
| | 19,824 | | | FlexiGroup, Ltd. | | | 33,853 | |
| | 2,190 | | | Franklin Resources, Inc. | | | 73,715 | |
| | 23,000 | | | Fukuoka Financial Group, Inc. | | | 99,532 | |
| | 20,060 | | | Genworth Financial, Inc.d | | | 83,048 | |
| | 2,099 | | | Genworth MI Canada, Inc. | | | 45,586 | |
| | 13,635 | | | Glacier Bancorp, Inc. | | | 385,325 | |
| | 8,610 | | | Goldman Sachs Group, Inc. | | | 1,534,646 | |
| | 31,170 | | | Great Western Bancorp, Inc. | | | 1,004,921 | |
| | 31,249 | | | Green Bancorp, Inc.d | | | 323,427 | |
| | 5,790 | | | Greenhill & Company, Inc. | | | 135,776 | |
| | 100 | | | Groupe Bruxelles Lambert SA | | | 8,597 | |
| | 1,870 | | | Hancock Holding Company | | | 62,739 | |
| | 2,600 | | | Hang Seng Bank, Ltd. | | | 46,889 | |
| | 69,448 | | | Hanmi Financial Corporation | | | 1,736,200 | |
| | 1,229 | | | Hannover Rueckversicherung SE | | | 137,109 | |
| | 19,985 | | | Hanover Insurance Group, Inc. | | | 1,522,657 | |
| | 6,070 | | | Hartford Financial Services Group, Inc. | | | 267,748 | |
| | 18,800 | | | Henderson Group plc | | | 53,192 | |
| | 34,736 | | | Home BancShares, Inc. | | | 747,171 | |
| | 349 | | | Home Capital Group, Inc. | | | 6,908 | |
| | 2,940 | | | HomeStreet, Inc.d | | | 80,997 | |
| | 4,220 | | | Hometrust Bancshares, Inc.d | | | 78,492 | |
| | 51,505 | | | Hope Bancorp, Inc. | | | 831,291 | |
| | 22,250 | | | Horace Mann Educators Corporation | | | 799,887 | |
| | 22,624 | | | Houlihan Lokey, Inc. | | | 551,347 | |
| | 95,630 | | | Huntington Bancshares, Inc. | | | 1,013,678 | |
| | 3,181 | | | Infinity Property & Casualty Corporation | | | 260,683 | |
| | 765 | | | Intact Financial Corporation | | | 52,004 | |
| | 7,786 | | | Intercontinental Exchange, Inc. | | | 2,105,257 | |
| | 15,760 | | | Invesco, Ltd. | | | 442,698 | |
The accompanying Notes to Financial Statements are an integral part of this schedule.
15
MODERATELY AGGRESSIVE ALLOCATION FUND
Schedule of Investments as of October 31, 2016
| | | | | | | | |
| Shares | | | Common Stock (31.3%) | | Value | |
| Financials (4.0%) - continued | | | | |
| | 79,177 | | | Janus Capital Group, Inc. | | | $1,015,049 | |
| | 128,900 | | | KeyCorp | | | 1,820,068 | |
| | 19,491 | | | Kinsale Capital Group, Inc. | | | 468,759 | |
| | 2,400 | | | Lazard, Ltd. | | | 87,504 | |
| | 3,676 | | | Lincoln National Corporation | | | 180,455 | |
| | 3,580 | | | LPL Financial Holdings, Inc. | | | 110,837 | |
| | 7,350 | | | M&T Bank Corporation | | | 902,065 | |
| | 1,700 | | | Macquarie Group, Ltd. | | | 102,764 | |
| | 180 | | | Markel Corporationd | | | 157,937 | |
| | 8,810 | | | Meta Financial Group, Inc. | | | 645,333 | |
| | 14,120 | | | MetLife, Inc. | | | 663,075 | |
| | 48,300 | | | Mizuho Financial Group, Inc. | | | 81,325 | |
| | 12,840 | | | Morgan Stanley | | | 431,039 | |
| | 900 | | | MS and AD Insurance Group Holdings, Inc. | | | 26,718 | |
| | 25,200 | | | National Bank Holdings Corporation | | | 613,368 | |
| | 5,812 | | | National Bank of Canada | | | 207,469 | |
| | 1,170 | | | Navigators Group, Inc. | | | 109,044 | |
| | 10,110 | | | NMI Holdings, Inc.d | | | 77,342 | |
| | 1,700 | | | Nordea Bank AB | | | 17,866 | |
| | 8,500 | | | NorthStar Realty Europe Corporation | | | 84,065 | |
| | 4,100 | | | Old Mutual plc | | | 10,086 | |
| | 4,620 | | | Old Republic International Corporation | | | 77,893 | |
| | 20,736 | | | PacWest Bancorp | | | 899,735 | |
| | 1,688 | | | Power Corporation of Canada | | | 36,206 | |
| | 20,540 | | | Primerica, Inc. | | | 1,123,538 | |
| | 1,180 | | | Principal Financial Group, Inc. | | | 64,428 | |
| | 1,470 | | | Prosperity Bancshares, Inc. | | | 81,541 | |
| | 19,760 | | | Provident Financial Services, Inc. | | | 448,354 | |
| | 25,860 | | | Raymond James Financial, Inc. | | | 1,554,703 | |
| | 5,170 | | | Redwood Trust, Inc. | | | 72,690 | |
| | 16,365 | | | Renasant Corporation | | | 552,155 | |
| | 6,200 | | | Resona Holdings, Inc. | | | 27,481 | |
| | 1,398 | | | Safety Insurance Group, Inc. | | | 94,645 | |
| | 16,869 | | | Sandy Spring Bancorp, Inc. | | | 534,747 | |
| | 453 | | | Schroders plc | | | 15,592 | |
| | 2,940 | | | SEI Investments Company | | | 130,330 | |
| | 3,380 | | | Selective Insurance Group, Inc. | | | 124,891 | |
| | 3,900 | | | Seven Bank, Ltd. | | | 11,989 | |
| | 211,465 | | | SLM Corporationd | | | 1,490,828 | |
| | 2,210 | | | State Auto Financial Corporation | | | 50,609 | |
| | 11,170 | | | Stewart Information Services Corporation | | | 502,092 | |
| | 41,829 | | | Stifel Financial Corporationd | | | 1,637,187 | |
| | 19,866 | | | SVB Financial Groupd | | | 2,429,016 | |
| | 2,200 | | | Swiss Re AG | | | 204,186 | |
| | 23,560 | | | Synchrony Financial | | | 673,580 | |
| | 33,130 | | | Synovus Financial Corporation | | | 1,095,609 | |
| | 3,900 | | | T&D Holdings, Inc. | | | 47,162 | |
| | 400 | | | Talanx AG | | | 12,415 | |
| | 62,100 | | | TCF Financial Corporation | | | 888,030 | |
| | 37,023 | | | TD Ameritrade Holding Corporation | | | 1,266,557 | |
| | 4,200 | | | Territorial Bancorp, Inc. | | | 119,784 | |
| | 925 | | | Toronto-Dominion Bank | | | 41,971 | |
| | 9,950 | | | TriCo Bancshares | | | 261,884 | |
| | 51,920 | | | TrustCo Bank Corporation | | | 363,440 | |
| | 3,830 | | | Trustmark Corporation | | | 106,014 | |
| | 2,670 | | | Union Bankshares Corporation | | | 74,573 | |
| | 1,950 | | | United Bankshares, Inc. | | | 73,515 | |
| | 19,080 | | | United Community Banks, Inc. | | | 411,556 | |
| | 28,880 | | | United Financial Bancorp, Inc. | | | 424,825 | |
| | 1,410 | | | United Fire Group, Inc. | | | 55,723 | |
| | 5,714 | | | United Overseas Bank, Ltd. | | | 77,085 | |
| | 3,580 | | | Unum Group | | | 126,732 | |
| | 4,690 | | | Virtu Financial, Inc. | | | 60,032 | |
| | 6,400 | | | Voya Financial, Inc. | | | 195,520 | |
| | 10,483 | | | Western Alliance Bancorpd | | | 391,645 | |
| | 6,900 | | | Westpac Banking Corporation | | | 159,562 | |
| | 5,088 | | | Wintrust Financial Corporation | | | 274,498 | |
| | 16,070 | | | WisdomTree Investments, Inc. | | | 137,881 | |
| | 5,618 | | | WSFS Financial Corporation | | | 196,911 | |
| | 89,844 | | | Zions Bancorporation | | | 2,893,875 | |
| | | | | |
| | | | Total | | | 79,955,397 | |
| | | | | |
| |
| Health Care (3.5%) | | | | |
| | 30,562 | | | Abbott Laboratories | | | 1,199,253 | |
| | 10,602 | | | ABIOMED, Inc.d | | | 1,113,104 | |
| | 22,798 | | | Acadia Healthcare Company, Inc.d | | | 819,816 | |
| | 2,100 | | | Acceleron Pharma, Inc.d | | | 58,863 | |
| | 3,100 | | | Aceto Corporation | | | 56,823 | |
| | 11,860 | | | Advaxis, Inc.d | | | 95,947 | |
| | 11,510 | | | Aerie Pharmaceuticals, Inc.d | | | 382,708 | |
| | 7,170 | | | Aetna, Inc. | | | 769,699 | |
| | 38,899 | | | Akorn, Inc.d | | | 931,631 | |
| | 11,300 | | | Alexion Pharmaceuticals, Inc.d | | | 1,474,650 | |
| | 9,473 | | | Align Technology, Inc.d | | | 813,920 | |
| | 8,098 | | | Allergan plcd | | | 1,691,996 | |
| | 2,079 | | | Amgen, Inc. | | | 293,472 | |
| | 10,806 | | | Analogic Corporation | | | 884,471 | |
| | 38,913 | | | Asterias Biotherapeutics, Inc.d | | | 128,413 | |
| | 1,726 | | | AstraZeneca plc | | | 96,648 | |
| | 1,020 | | | Atrion Corporation | | | 447,933 | |
| | 100 | | | Bayer AG | | | 9,929 | |
| | 1,380 | | | Biogen, Inc.d | | | 386,648 | |
| | 11,483 | | | BioMarin Pharmaceutical, Inc.d | | | 924,611 | |
| | 4,140 | | | Boston Scientific Corporationd | | | 91,080 | |
| | 3,490 | | | Bristol-Myers Squibb Company | | | 177,676 | |
| | 4,231 | | | C.R. Bard, Inc. | | | 916,773 | |
| �� | 25,190 | | | Cardiovascular Systems, Inc.d | | | 590,202 | |
| | 32,870 | | | Catalent, Inc.d | | | 749,765 | |
| | 17,330 | | | Celgene Corporationd | | | 1,770,779 | |
| | 10,748 | | | Centene Corporationd | | | 671,535 | |
| | 1,540 | | | Charles River Laboratories International, Inc.d | | | 116,855 | |
| | 6,160 | | | Chemed Corporation | | | 871,147 | |
| | 6,030 | | | Coherus Biosciences, Inc.d | | | 164,921 | |
| | 4,770 | | | CONMED Corporation | | | 190,800 | |
| | 13,300 | | | Cooper Companies, Inc. | | | 2,341,332 | |
| | 5,430 | | | Cross Country Healthcare, Inc.d | | | 60,653 | |
| | 1,000 | | | CSL, Ltd. | | | 76,306 | |
| | 29,880 | | | Dentsply Sirona, Inc. | | | 1,720,192 | |
| | 9,810 | | | Dexcom, Inc.d | | | 767,534 | |
| | 21,270 | | | Edwards Lifesciences Corporationd | | | 2,025,329 | |
| | 2,560 | | | Emergent Biosolutions, Inc.d | | | 68,403 | |
| | 20,374 | | | Ensign Group, Inc. | | | 376,308 | |
| | 37,386 | | | Envision Healthcare Holdings, Inc.d | | | 739,495 | |
| | 2,070 | | | Essilor International SA | | | 232,614 | |
| | 8,210 | | | Express Scripts Holding Companyd | | | 553,354 | |
| | 100 | | | Gerresheimer AG | | | 7,543 | |
| | 36,986 | | | Gilead Sciences, Inc. | | | 2,723,279 | |
| | 4,850 | | | Global Blood Therapeutics, Inc.d | | | 84,633 | |
| | 3,890 | | | Globus Medical, Inc.d | | | 86,086 | |
| | 1,600 | | | Grifols SA | | | 31,572 | |
| | 2,210 | | | Halyard Health, Inc.d | | | 71,493 | |
| | 6,970 | | | HCA Holdings, Inc.d | | | 533,414 | |
| | 9,951 | | | HealthEquity, Inc.d | | | 330,672 | |
| | 9,610 | | | Healthways, Inc.d | | | 238,328 | |
| | 6,460 | | | Heska Corporationd | | | 319,124 | |
| | 1,700 | | | Hikma Pharmaceuticals plc | | | 36,462 | |
| | 4,100 | | | Hill-Rom Holdings, Inc. | | | 227,181 | |
| | 41,980 | | | Hologic, Inc.d | | | 1,511,700 | |
| | 142 | | | ICON plcd | | | 11,400 | |
The accompanying Notes to Financial Statements are an integral part of this schedule.
16
MODERATELY AGGRESSIVE ALLOCATION FUND
Schedule of Investments as of October 31, 2016
| | | | | | | | |
| Shares | | | Common Stock (31.3%) | | Value | |
| Health Care (3.5%) - continued | | | | |
| | 3,120 | | | ICU Medical, Inc.d | | | $434,616 | |
| | 8,210 | | | Impax Laboratories, Inc.d | | | 165,021 | |
| | 19,392 | | | Inogen, Inc.d | | | 1,040,769 | |
| | 37,490 | | | Intersect ENT, Inc.d | | | 547,354 | |
| | 5,200 | | | Intra-Cellular Therapies, Inc.d | | | 64,480 | |
| | 18,125 | | | Ironwood Pharmaceuticals, Inc.d | | | 231,456 | |
| | 26,130 | | | Johnson & Johnson | | | 3,030,819 | |
| | 28,700 | | | Kindred Healthcare, Inc. | | | 282,695 | |
| | 300 | | | Lonza Group AG | | | 56,611 | |
| | 8,310 | | | Magellan Health Services, Inc.d | | | 427,549 | |
| | 17,706 | | | Medtronic plc | | | 1,452,246 | |
| | 23,110 | | | Merck & Company, Inc. | | | 1,357,019 | |
| | 900 | | | Merck KGaA | | | 92,637 | |
| | 2,798 | | | Mettler-Toledo International, Inc.d | | | 1,130,616 | |
| | 23,127 | | | Mylan NVd | | | 844,135 | |
| | 7,695 | | | National Healthcare Corporation | | | 497,866 | |
| | 2,260 | | | Natural Health Trends Corporation | | | 52,726 | |
| | 1,210 | | | Neogen Corporationd | | | 63,755 | |
| | 15,803 | | | Neurocrine Biosciences, Inc.d | | | 691,697 | |
| | 15,451 | | | Nevro Corporationd | | | 1,420,256 | |
| | 3,400 | | | Novartis AG | | | 241,290 | |
| | 3,000 | | | Novo Nordisk AS | | | 106,877 | |
| | 39,456 | | | NuVasive, Inc.d | | | 2,356,707 | |
| | 25,100 | | | Omnicell, Inc.d | | | 818,887 | |
| | 36,660 | | | OraSure Technologies, Inc.d | | | 275,317 | |
| | 4,190 | | | Orthofix International NVd | | | 153,563 | |
| | 200 | | | Otsuka Holdings Company, Ltd. | | | 8,753 | |
| | 22,630 | | | PDL BioPharma, Inc. | | | 72,869 | |
| | 14,320 | | | PerkinElmer, Inc. | | | 728,745 | |
| | 10,011 | | | Perrigo Company plc | | | 832,815 | |
| | 72,190 | | | Pfizer, Inc. | | | 2,289,145 | |
| | 6,650 | | | PharMerica Corporationd | | | 158,270 | |
| | 3,400 | | | Prothena Corporation plcd | | | 162,588 | |
| | 3,140 | | | ResMed, Inc. | | | 187,678 | |
| | 9,570 | | | Roche Holding AG ADR | | | 274,420 | |
| | 325 | | | Roche Holding AG-Genusschein | | | 74,647 | |
| | 5,920 | | | Surgical Care Affiliates, Inc.d | | | 253,317 | |
| | 24,101 | | | Team Health Holdings, Inc.d | | | 1,032,728 | |
| | 16,745 | | | Teleflex, Inc. | | | 2,396,712 | |
| | 13,631 | | | Triple-S Management Corporationd | | | 281,889 | |
| | 14,461 | | | UnitedHealth Group, Inc. | | | 2,043,773 | |
| | 17,104 | | | Universal Health Services, Inc. | | | 2,064,624 | |
| | 3,670 | | | VCA Antech, Inc.d | | | 225,558 | |
| | 25,790 | | | Veeva Systems, Inc.d | | | 1,001,941 | |
| | 19,178 | | | Vertex Pharmaceuticals, Inc.d | | | 1,454,843 | |
| | 2,620 | | | Waters Corporationd | | | 364,547 | |
| | 800 | | | Wellcare Health Plans, Inc.d | | | 90,808 | |
| | 9,600 | | | West Pharmaceutical Services, Inc. | | | 729,888 | |
| | 19,310 | | | Wright Medical Group NVd | | | 423,082 | |
| | 12,940 | | | Ziopharm Oncology, Inc.d | | | 73,499 | |
| | 15,820 | | | Zoetis, Inc. | | | 756,196 | |
| | | | | |
| | | | Total | | | 69,886,774 | |
| | | | | |
| |
| Industrials (3.9%) | | | | |
| | 2,600 | | | ABB, Ltd. | | | 53,639 | |
| | 11,165 | | | ABM Industries, Inc. | | | 436,328 | |
| | 900 | | | Adecco SA | | | 53,442 | |
| | 19,276 | | | Aegion Corporationd | | | 356,799 | |
| | 4,510 | | | Aerovironment, Inc.d | | | 108,195 | |
| | 7,850 | | | AGCO Corporation | | | 400,978 | |
| | 11,059 | | | Air New Zealand, Ltd. | | | 15,255 | |
| | 2,750 | | | Allison Transmission Holdings, Inc. | | | 80,548 | |
| | 400 | | | Andritz AG | | | 20,914 | |
| | 32,030 | | | Ardmore Shipping Corporation | | | 187,376 | |
| | 7,000 | | | Asahi Glass Company, Ltd. | | | 48,957 | |
| | 8,129 | | | Astec Industries, Inc. | | | 450,021 | |
| | 500 | | | Atlas Copco Aktiebolag | | | 14,648 | |
| | 23,110 | | | AZZ, Inc. | | | 1,230,608 | |
| | 20,363 | | | B/E Aerospace, Inc. | | | 1,212,006 | |
| | 2,100 | | | Babcock International Group plc | | | 25,385 | |
| | 16,510 | | | Barnes Group, Inc. | | | 657,758 | |
| | 600 | | | Berendsen plc | | | 7,081 | |
| | 4,300 | | | Boeing Company | | | 612,449 | |
| | 2,740 | | | Brady Corporation | | | 90,694 | |
| | 65,210 | | | BWX Technologies, Inc. | | | 2,557,536 | |
| | 567 | | | Canadian National Railway Company | | | 35,644 | |
| | 16,800 | | | Carlisle Companies, Inc. | | | 1,761,480 | |
| | 6,000 | | | Cathay Pacific Airways, Ltd. | | | 7,897 | |
| | 6,120 | | | CBIZ, Inc.d | | | 67,626 | |
| | 4,390 | | | CEB, Inc. | | | 213,573 | |
| | 100 | | | Central Japan Railway Company | | | 17,005 | |
| | 8,431 | | | CIRCOR International, Inc. | | | 453,419 | |
| | 13,350 | | | CLARCOR, Inc. | | | 830,503 | |
| | 3,340 | | | Colfax Corporationd | | | 106,179 | |
| | 18,279 | | | Comfort Systems USA, Inc. | | | 527,349 | |
| | 6,090 | | | Commercial Vehicle Group, Inc.d | | | 27,649 | |
| | 15,530 | | | Copart, Inc.d | | | 814,859 | |
| | 2,390 | | | Crane Company | | | 162,544 | |
| | 13,930 | | | CSX Corporation | | | 425,004 | |
| | 12,070 | | | Cummins, Inc. | | | 1,542,787 | |
| | 8,520 | | | Curtiss-Wright Corporation | | | 763,562 | |
| | 1,000 | | | Dai Nippon Printing Company, Ltd. | | | 10,030 | |
| | 39,200 | | | Delta Air Lines, Inc. | | | 1,637,384 | |
| | 890 | | | Deluxe Corporation | | | 54,468 | |
| | 1,300 | | | Deutsche Post AG | | | 40,314 | |
| | 29,870 | | | Donaldson Company, Inc. | | | 1,090,852 | |
| | 900 | | | DSV AS | | | 43,578 | |
| | 1,100 | | | East Japan Railway Company | | | 96,831 | |
| | 13,085 | | | EMCOR Group, Inc. | | | 791,119 | |
| | 6,707 | | | Encore Wire Corporation | | | 229,044 | |
| | 11,740 | | | EnerSys | | | 764,626 | |
| | 3,675 | | | Equifax, Inc. | | | 455,590 | |
| | 12,514 | | | ESCO Technologies, Inc. | | | 557,499 | |
| | 17,335 | | | Federal Signal Corporation | | | 212,874 | |
| | 1,170 | | | Flowserve Corporation | | | 49,549 | |
| | 300 | | | Flughafen Zuerich AG | | | 55,147 | |
| | 6,500 | | | Fluor Corporation | | | 337,935 | |
| | 2,435 | | | Fortive Corporation | | | 124,307 | |
| | 11,296 | | | Fortune Brands Home and Security, Inc. | | | 617,100 | |
| | 11,646 | | | Franklin Electric Company, Inc. | | | 424,497 | |
| | 600 | | | Fraport AG Frankfurt Airport Services Worldwide | | | 35,616 | |
| | 9,110 | | | GasLog, Ltd. | | | 139,839 | |
| | 17,560 | | | Gener8 Maritime, Inc.d | | | 74,103 | |
| | 2,260 | | | Genesee & Wyoming, Inc.d | | | 153,544 | |
| | 600 | | | Getinge AB | | | 9,825 | |
| | 16,253 | | | Gibraltar Industries, Inc.d | | | 632,242 | |
| | 33,013 | | | Granite Construction, Inc. | | | 1,622,919 | |
| | 3,050 | | | Greenbrier Companies, Inc. | | | 96,075 | |
| | 5,230 | | | Hackett Group, Inc. | | | 84,308 | |
| | 43,190 | | | Harsco Corporation | | | 421,102 | |
| | 2,120 | | | HD Supply Holdings, Inc.d | | | 69,960 | |
| | 17,245 | | | Healthcare Services Group, Inc. | | | 637,548 | |
| | 12,251 | | | Heico Corporation | | | 827,678 | |
| | 5,640 | | | Herman Miller, Inc. | | | 156,792 | |
| | 10,580 | | | Hexcel Corporation | | | 481,284 | |
| | 700 | | | Hitachi Transport System, Ltd. | | | 14,430 | |
| | 253 | | | Hochtief AG | | | 34,547 | |
| | 5,063 | | | Honeywell International, Inc. | | | 555,310 | |
| | 4,152 | | | Hub Group, Inc.d | | | 151,340 | |
| | 11,140 | | | Hubbell, Inc. | | | 1,164,353 | |
| | 4,760 | | | Huntington Ingalls Industries, Inc. | | | 768,074 | |
The accompanying Notes to Financial Statements are an integral part of this schedule.
17
MODERATELY AGGRESSIVE ALLOCATION FUND
Schedule of Investments as of October 31, 2016
| | | | | | | | |
| Shares | | | Common Stock (31.3%) | | Value | |
| Industrials (3.9%) - continued | | | | |
| | 6,083 | | | Huron Consulting Group, Inc.d | | | $340,952 | |
| | 5,507 | | | ICF International, Inc.d | | | 255,525 | |
| | 900 | | | Inaba Denki Sangyo Company, Ltd. | | | 32,653 | |
| | 25,520 | | | Ingersoll-Rand plc | | | 1,717,241 | |
| | 5,530 | | | Insperity, Inc. | | | 415,856 | |
| | 2,090 | | | Insteel Industries, Inc. | | | 56,221 | |
| | 3,750 | | | Interface, Inc. | | | 59,437 | |
| | 16,400 | | | ITOCHU Corporation | | | 207,111 | |
| | 3,970 | | | ITT Corporation | | | 139,823 | |
| | 8,070 | | | Jacobs Engineering Group, Inc.d | | | 416,251 | |
| | 700 | | | Jardine Matheson Holdings, Ltd. | | | 42,637 | |
| | 8,755 | | | JB Hunt Transport Services, Inc. | | | 714,496 | |
| | 15,990 | | | Johnson Controls International plc | | | 644,717 | |
| | 1,000 | | | Kamigumi Company, Ltd. | | | 8,539 | |
| | 1,850 | | | Kansas City Southern | | | 162,356 | |
| | 47,860 | | | Kennametal, Inc. | | | 1,354,917 | |
| | 18,342 | | | Kforce, Inc. | | | 318,234 | |
| | 12,050 | | | Kirby Corporationd | | | 710,347 | |
| | 4,300 | | | KITZ Corporation | | | 24,726 | |
| | 7,790 | | | Knight Transportation, Inc. | | | 227,857 | |
| | 3,900 | | | KONE Oyj | | | 179,446 | |
| | 944 | | | Koninklijke Boskalis Westminster NV | | | 30,446 | |
| | 29,630 | | | Korn/Ferry International | | | 604,156 | |
| | 155 | | | Kuehne & Nagel International AG | | | 21,009 | |
| | 200 | | | Legrand SA | | | 11,305 | |
| | 27,251 | | | Lincoln Electric Holdings, Inc. | | | 1,793,933 | |
| | 4,820 | | | Lindsay Corporation | | | 377,406 | |
| | 2,670 | | | Manpower, Inc. | | | 205,056 | |
| | 20,650 | | | Masco Corporation | | | 637,672 | |
| | 6,366 | | | Meggitt plc | | | 33,867 | |
| | 38,600 | | | Meritor, Inc.d | | | 396,808 | |
| | 11,137 | | | Middleby Corporationd | | | 1,248,569 | |
| | 1,700 | | | MIRAIT Holdings Corporation | | | 15,074 | |
| | 5,000 | | | Mitsubishi Electric Corporation | | | 67,646 | |
| | 2,000 | | | Mitsuboshi Belting, Ltd. | | | 17,247 | |
| | 11,060 | | | Moog, Inc.d | | | 642,254 | |
| | 12,190 | | | MRC Global, Inc.d | | | 179,681 | |
| | 14,121 | | | MSA Safety, Inc. | | | 823,254 | |
| | 1,840 | | | Mueller Industries, Inc. | | | 55,734 | |
| | 10,390 | | | MYR Group, Inc.d | | | 310,038 | |
| | 28,338 | | | Navigant Consulting, Inc.d | | | 663,109 | |
| | 9,050 | | | NCI Building Systems, Inc.d | | | 130,320 | |
| | 10,994 | | | Nielsen Holdings plc | | | 494,950 | |
| | 3,000 | | | Nippon Express Company, Ltd. | | | 14,818 | |
| | 3,100 | | | Nitto Kogyo Corporation | | | 45,475 | |
| | 6,088 | | | Nordson Corporation | | | 609,591 | |
| | 4,140 | | | Norfolk Southern Corporation | | | 385,020 | |
| | 590 | | | Northrop Grumman Corporation | | | 135,110 | |
| | 7,486 | | | Old Dominion Freight Line, Inc.d | | | 559,054 | |
| | 18,320 | | | On Assignment, Inc.d | | | 630,391 | |
| | 34,294 | | | Oshkosh Corporation | | | 1,834,729 | |
| | 940 | | | Parker Hannifin Corporation | | | 115,385 | |
| | 4,590 | | | Pentair, Ltd. | | | 253,047 | |
| | 36,716 | | | PGT, Inc.d | | | 359,817 | |
| | 16,548 | | | Proto Labs, Inc.d | | | 739,696 | |
| | 5,610 | | | Quanex Building Products Corporation | | | 91,443 | |
| | 700 | | | Randstad Holding NV | | | 36,003 | |
| | 35,740 | | | Raven Industries, Inc. | | | 766,623 | |
| | 12,880 | | | Raytheon Company | | | 1,759,537 | |
| | 790 | | | RBC Bearings, Inc.d | | | 56,367 | |
| | 2,870 | | | Regal-Beloit Corporation | | | 169,617 | |
| | 7,560 | | | Resources Connection, Inc. | | | 112,266 | |
| | 5,070 | | | Rexnord Corporationd | | | 100,842 | |
| | 91 | | | Rieter Holding AG | | | 17,307 | |
| | 1,870 | | | Rockwell Automation, Inc. | | | 223,876 | |
| | 13,440 | | | Rockwell Collins, Inc. | | | 1,133,261 | |
| | 2,700 | | | Rollins, Inc. | | | 83,214 | |
| | 5,994 | | | Roper Industries, Inc. | | | 1,038,820 | |
| | 1,655 | | | Ryder System, Inc. | | | 114,840 | |
| | 26,528 | | | Saia, Inc.d | | | 945,723 | |
| | 1,600 | | | Sanwa Holdings Corporation | | | 15,935 | |
| | 59 | | | Schindler Holding AG | | | 10,921 | |
| | 300 | | | Schindler Holding AG, Participation Certificate | | | 55,733 | |
| | 100 | | | Secom Company, Ltd. | | | 7,214 | |
| | 600 | | | Securitas AB | | | 9,260 | |
| | 1,500 | | | Siemens AG | | | 170,427 | |
| | 2,500 | | | Smiths Group plc | | | 43,321 | |
| | 72,251 | | | Southwest Airlines Company | | | 2,893,653 | |
| | 12,460 | | | SPX FLOW, Inc.d | | | 312,621 | |
| | 1,000 | | | Stanley Black & Decker, Inc. | | | 113,840 | |
| | 15,064 | | | Tennant Company | | | 948,279 | |
| | 4,370 | | | Tetra Tech, Inc. | | | 168,026 | |
| | 5,748 | | | Textron, Inc. | | | 230,380 | |
| | 3,210 | | | Toro Company | | | 153,695 | |
| | 30,780 | | | TransUniond | | | 961,567 | |
| | 2,460 | | | TrueBlue, Inc.d | | | 43,050 | |
| | 33,007 | | | Union Pacific Corporation | | | 2,910,557 | |
| | 24,410 | | | United Continental Holdings, Inc.d | | | 1,372,574 | |
| | 6,590 | | | United Parcel Service, Inc. | | | 710,138 | |
| | 11,938 | | | United Rentals, Inc.d | | | 903,229 | |
| | 4,578 | | | Universal Forest Products, Inc. | | | 393,662 | |
| | 13,179 | | | Universal Truckload Services, Inc. | | | 164,079 | |
| | 2,700 | | | Vinci SA | | | 195,534 | |
| | 6,520 | | | WABCO Holdings, Inc.d | | | 641,959 | |
| | 13,587 | | | WageWorks, Inc.d | | | 800,954 | |
| | 30,757 | | | Waste Connections, Inc. | | | 2,313,234 | |
| | 2,525 | | | Watsco, Inc. | | | 346,657 | |
| | 672 | | | WSP Global, Inc. | | | 21,769 | |
| | 11,420 | | | Xylem, Inc. | | | 551,929 | |
| | 8,740 | | | YRC Worldwide, Inc.d | | | 77,611 | |
| | 400 | | | Yuasa Trading Company, Ltd. | | | 9,583 | |
| | | | | |
| | | | Total | | | 78,773,469 | |
| | | | | |
| |
| Information Technology (6.1%) | | | | |
| | 2,039 | | | Advanced Energy Industries, Inc.d | | | 97,260 | |
| | 53,800 | | | Agilent Technologies, Inc. | | | 2,344,066 | |
| | 30,715 | | | Akamai Technologies, Inc.d | | | 2,133,771 | |
| | 4,520 | | | Alliance Data Systems Corporationd | | | 924,204 | |
| | 4,732 | | | Alphabet, Inc., Class Ad | | | 3,832,447 | |
| | 3,294 | | | Alphabet, Inc., Class Cd | | | 2,584,275 | |
| | 11,917 | | | Ambarella, Inc.d | | | 731,346 | |
| | 14,750 | | | Amkor Technology, Inc.d | | | 136,732 | |
| | 37,238 | | | Amphenol Corporation | | | 2,455,101 | |
| | 21,080 | | | Analog Devices, Inc. | | | 1,351,228 | |
| | 2,655 | | | ANSYS, Inc.d | | | 242,534 | |
| | 34,204 | | | Apple, Inc. | | | 3,883,522 | |
| | 32,238 | | | Applied Materials, Inc. | | | 937,481 | |
| | 13,090 | | | Apptio, Inc.d | | | 258,266 | |
| | 30,563 | | | Arista Networks, Inc.d | | | 2,590,214 | |
| | 15,786 | | | Aspen Technology, Inc.d | | | 777,303 | |
| | 6,320 | | | AVX Corporation | | | 88,606 | |
| | 9,500 | | | Bankrate, Inc.d | | | 74,100 | |
| | 1,170 | | | Belden, Inc. | | | 75,828 | |
| | 23,220 | | | Blackhawk Network Holdings, Inc.d | | | 799,929 | |
| | 66,100 | | | Booz Allen Hamilton Holding Corporation | | | 2,014,067 | |
| | 890 | | | Broadcom, Ltd. | | | 151,549 | |
| | 29,314 | | | Brocade Communications Systems, Inc. | | | 310,728 | |
| | 39,179 | | | Brooks Automation, Inc. | | | 510,502 | |
| | 10,730 | | | CA, Inc. | | | 329,840 | |
The accompanying Notes to Financial Statements are an integral part of this schedule.
18
MODERATELY AGGRESSIVE ALLOCATION FUND
Schedule of Investments as of October 31, 2016
| | | | | | | | |
| Shares | | | Common Stock (31.3%) | | Value | |
| Information Technology (6.1%) - continued | | | | |
| | 8,825 | | | Cabot Microelectronics Corporation | | | $487,669 | |
| | 4,520 | | | CACI International, Inc.d | | | 442,282 | |
| | 4,340 | | | Cadence Design Systems, Inc.d | | | 111,017 | |
| | 1,700 | | | Canon, Inc. | | | 48,838 | |
| | 100 | | | Cap Gemini SA | | | 8,282 | |
| | 15,603 | | | Cavium, Inc.d | | | 880,789 | |
| | 4,850 | | | CDK Global, Inc. | | | 264,859 | |
| | 2,010 | | | Check Point Software Technologies, Ltd.d | | | 169,966 | |
| | 32,330 | | | Ciena Corporationd | | | 626,555 | |
| | 122,580 | | | Cisco Systems, Inc. | | | 3,760,754 | |
| | 14,829 | | | Cognex Corporation | | | 765,176 | |
| | 3,250 | | | Coherent, Inc.d | | | 338,390 | |
| | 27,660 | | | CommVault Systems, Inc.d | | | 1,479,810 | |
| | 9,480 | | | Comtech Telecommunications Corporation | | | 98,592 | |
| | 12,320 | | | Convergys Corporation | | | 359,744 | |
| | 20,910 | | | CoreLogic, Inc.d | | | 889,930 | |
| | 39,498 | | | Criteo SA ADRd | | | 1,427,853 | |
| | 3,300 | | | CSG Systems International, Inc. | | | 125,499 | |
| | 3,240 | | | CTS Corporation | | | 58,968 | |
| | 20,110 | | | Dolby Laboratories, Inc. | | | 957,035 | |
| | 28,495 | | | DST Systems, Inc. | | | 2,740,079 | |
| | 11,230 | | | EarthLink Holdings Corporation | | | 64,236 | |
| | 19,260 | | | eBay, Inc.d | | | 549,103 | |
| | 17,290 | | | Entegris, Inc.d | | | 274,911 | |
| | 19,360 | | | Envestnet, Inc.d | | | 684,376 | |
| | 6,810 | | | EVERTEC, Inc. | | | 103,171 | |
| | 7,820 | | | ExlService Holdings, Inc.d | | | 344,315 | |
| | 4,926 | | | F5 Networks, Inc.d | | | 680,822 | |
| | 12,050 | | | Fabrinetd | | | 457,418 | |
| | 32,920 | | | Facebook, Inc.d | | | 4,312,191 | |
| | 27,870 | | | Finisar Corporationd | | | 763,081 | |
| | 53,060 | | | FLIR Systems, Inc. | | | 1,746,735 | |
| | 1,540 | | | Forrester Research, Inc. | | | 57,365 | |
| | 32,444 | | | Fortinet, Inc.d | | | 1,040,155 | |
| | 3,600 | | | FUJIFILM Holdings NPV | | | 136,119 | |
| | 1,800 | | | Gartner, Inc.d | | | 154,872 | |
| | 41,312 | | | Guidewire Software, Inc.d | | | 2,373,374 | |
| | 800 | | | Halma plc | | | 10,242 | |
| | 9,790 | | | HP, Inc. | | | 141,857 | |
| | 4,985 | | | IAC/InterActiveCorporation | | | 321,233 | |
| | 37,840 | | | Integrated Device Technology, Inc.d | | | 783,666 | |
| | 19,480 | | | Intel Corporation | | | 679,268 | |
| | 34,704 | | | Ixiad | | | 414,713 | |
| | 21,691 | | | Juniper Networks, Inc. | | | 571,341 | |
| | 2,640 | | | Keysight Technologies, Inc.d | | | 86,592 | |
| | 15,280 | | | Lam Research Corporation | | | 1,480,021 | |
| | 6,840 | | | Liberty Tripadvisor Holdings, Inc.d | | | 151,848 | |
| | 14,630 | | | Lionbridge Technologies, Inc.d | | | 70,663 | |
| | 3,280 | | | Littelfuse, Inc. | | | 457,560 | |
| | 20,360 | | | M/A-COM Technology Solutions Holdings, Inc.d | | | 748,434 | |
| | 7,748 | | | Manhattan Associates, Inc.d | | | 392,359 | |
| | 36,770 | | | MasterCard, Inc. | | | 3,935,125 | |
| | 25,339 | | | Maxim Integrated Products, Inc. | | | 1,004,185 | |
| | 3,060 | | | MAXIMUS, Inc. | | | 159,304 | |
| | 15,435 | | | Methode Electronics, Inc. | | | 481,572 | |
| | 400 | | | Micro Focus International plc | | | 10,474 | |
| | 40,330 | | | Microsemi Corporationd | | | 1,699,103 | |
| | 95,070 | | | Microsoft Corporation | | | 5,696,594 | |
| | 12,720 | | | Mobileye NVd | | | 472,930 | |
| | 29,416 | | | Monolithic Power Systems, Inc. | | | 2,318,275 | |
| | 5,253 | | | Nanometrics, Inc.d | | | 109,735 | |
| | 32,120 | | | National Instruments Corporation | | | 902,251 | |
| | 1,600 | | | NEC Networks & System Integration Corporation | | | 28,435 | |
| | 500 | | | Nice, Ltd. | | | 33,189 | |
| | 11,236 | | | Nice, Ltd. ADR | | | 746,857 | |
| | 800 | | | NS Solutions Corporation | | | 15,255 | |
| | 300 | | | NTT Data Corporation | | | 15,482 | |
| | 37,187 | | | NVIDIA Corporation | | | 2,646,227 | |
| | 10,234 | | | NXP Semiconductors NVd | | | 1,023,400 | |
| | 63,697 | | | Oclaro, Inc.d | | | 465,625 | |
| | 16,720 | | | ON Semiconductor Corporationd | | | 195,122 | |
| | 71,100 | | | Oracle Corporation | | | 2,731,662 | |
| | 200 | | | Oracle Corporation Japan | | | 10,885 | |
| | 2,660 | | | OSI Systems, Inc.d | | | 186,546 | |
| | 7,056 | | | Palo Alto Networks, Inc.d | | | 1,085,424 | |
| | 69,020 | | | Pandora Media, Inc.d | | | 781,997 | |
| | 20,800 | | | Paylocity Holding Corporationd | | | 904,592 | |
| | 53,629 | | | PayPal Holdings, Inc.d | | | 2,234,184 | |
| | 27,069 | | | Pegasystems, Inc. | | | 836,432 | |
| | 16,789 | | | Progress Software Corporationd | | | 451,792 | |
| | 27,832 | | | Proofpoint, Inc.d | | | 2,181,472 | |
| | 8,470 | | | PTC, Inc.d | | | 401,817 | |
| | 26,244 | | | Q2 Holdings, Inc.d | | | 737,456 | |
| | 1,170 | | | Qorvo, Inc.d | | | 65,111 | |
| | 18,180 | | | QUALCOMM, Inc. | | | 1,249,330 | |
| | 2,490 | | | Qualys, Inc.d | | | 92,753 | |
| | 13,260 | | | RealPage, Inc.d | | | 360,672 | |
| | 11,320 | | | Red Hat, Inc.d | | | 876,734 | |
| | 4,850 | | | Rudolph Technologies, Inc.d | | | 87,785 | |
| | 50,610 | | | Salesforce.com, Inc.d | | | 3,803,848 | |
| | 100 | | | SAP SE | | | 8,810 | |
| | 2,930 | | | ScanSource, Inc.d | | | 102,550 | |
| | 9,502 | | | ServiceNow, Inc.d | | | 835,321 | |
| | 19,020 | | | ShoreTel, Inc.d | | | 126,483 | |
| | 1,030 | | | Silicon Laboratories, Inc.d | | | 61,748 | |
| | 781 | | | Software AG | | | 28,385 | |
| | 17,300 | | | SS&C Technologies Holdings, Inc. | | | 552,389 | |
| | 2,830 | | | Stratasys, Ltd.d | | | 54,110 | |
| | 18,584 | | | Synopsys, Inc.d | | | 1,102,217 | |
| | 46,846 | | | Teradyne, Inc. | | | 1,091,043 | |
| | 2,780 | | | Tessera Technologies, Inc. | | | 103,138 | |
| | 11,910 | | | Texas Instruments, Inc. | | | 843,823 | |
| | 400 | | | Tokyo Electron, Ltd. | | | 36,082 | |
| | 3,020 | | | Total System Services, Inc. | | | 150,638 | |
| | 300 | | | Trend Micro, Inc. | | | 10,564 | |
| | 8,460 | | | Trimble, Inc.d | | | 233,834 | |
| | 7,569 | | | Tyler Technologies, Inc.d | | | 1,214,068 | |
| | 11,017 | | | Ultimate Software Group, Inc.d | | | 2,324,477 | |
| | 200 | | | United Internet AG | | | 8,223 | |
| | 59,984 | | | Virtusa Corporationd | | | 1,136,097 | |
| | 33,430 | | | Visa, Inc. | | | 2,758,309 | |
| | 53,980 | | | Xilinx, Inc. | | | 2,745,963 | |
| | 4,000 | | | Yahoo Japan Corporation | | | 15,344 | |
| | 1,550 | | | Yandex NVd | | | 30,519 | |
| | | | | |
| | | | Total | | | 122,342,794 | |
| | | | | |
| |
| Materials (1.8%) | | | | |
| | 800 | | | Adeka Corporation | | | 12,093 | |
| | 13,365 | | | Agnico Eagle Mines, Ltd. | | | 678,942 | |
| | 114 | | | Air Liquide SA | | | 11,584 | |
| | 5,520 | | | Air Products and Chemicals, Inc. | | | 736,478 | |
| | 9,313 | | | American Vanguard Corporation | | | 141,558 | |
| | 1,449 | | | APERAM | | | 65,899 | |
| | 650 | | | Ashland Global Holdings, Inc. | | | 72,625 | |
| | 9,008 | | | Avery Dennison Corporation | | | 628,668 | |
| | 9,202 | | | Balchem Corporation | | | 698,432 | |
| | 11,172 | | | Ball Corporation | | | 861,026 | |
| | 74,498 | | | Barrick Gold Corporation | | | 1,310,420 | |
The accompanying Notes to Financial Statements are an integral part of this schedule.
19
MODERATELY AGGRESSIVE ALLOCATION FUND
Schedule of Investments as of October 31, 2016
| | | | | | | | |
| Shares | | | Common Stock (31.3%) | | Value | |
| Materials (1.8%) - continued | | | | |
| | 12,771 | | | BHP Billiton, Ltd. | | | $223,120 | |
| | 12,913 | | | BlueScope Steel, Ltd. | | | 76,608 | |
| | 11,210 | | | Boise Cascade Companyd | | | 215,793 | |
| | 6,850 | | | Cabot Corporation | | | 357,159 | |
| | 5,240 | | | Carpenter Technology Corporation | | | 165,636 | |
| | 12,300 | | | Celanese Corporation | | | 896,916 | |
| | 23,512 | | | Chemtura Corporationd | | | 771,194 | |
| | 4,001 | | | Clearwater Paper Corporationd | | | 212,453 | |
| | 5,540 | | | Continental Building Products, Inc.d | | | 113,293 | |
| | 500 | | | Croda International plc | | | 21,382 | |
| | 21,909 | | | Crown Holdings, Inc.d | | | 1,188,563 | |
| | 6,800 | | | Daicel Corporation | | | 89,415 | |
| | 2,000 | | | Denki Kagaku Kogyo KK | | | 9,073 | |
| | 8,090 | | | Dow Chemical Company | | | 435,323 | |
| | 2,721 | | | Eagle Materials, Inc. | | | 220,319 | |
| | 6,090 | | | Eastman Chemical Company | | | 437,932 | |
| | 11,430 | | | Ecolab, Inc. | | | 1,304,963 | |
| | 51,739 | | | Eldorado Gold Corporationd | | | 163,495 | |
| | 4,321 | | | Evonik Industries AG | | | 135,319 | |
| | 10,470 | | | Ferro Corporationd | | | 135,691 | |
| | 22,270 | | | Ferroglobe plc | | | 205,998 | |
| | 29,052 | | | FMC Corporation | | | 1,362,248 | |
| | 25 | | | Givaudan SA | | | 48,352 | |
| | 50,733 | | | Goldcorp, Inc. | | | 771,142 | |
| | 4,420 | | | Graphic Packaging Holding Company | | | 55,250 | |
| | 1,200 | | | Hexpol AB | | | 9,862 | |
| | 12,170 | | | Huntsman Corporation | | | 206,282 | |
| | 3,394 | | | Ingevity Corporationd | | | 140,512 | |
| | 2,240 | | | Innophos Holdings, Inc. | | | 102,682 | |
| | 5,389 | | | Innospec, Inc. | | | 324,687 | |
| | 39,322 | | | International Paper Company | | | 1,770,670 | |
| | 3,110 | | | Kadant, Inc. | | | 160,631 | |
| | 18,990 | | | KapStone Paper and Packaging Corporation | | | 344,479 | |
| | 92,314 | | | Kinross Gold Corporationd | | | 356,332 | |
| | 3,270 | | | Koppers Holdings, Inc.d | | | 107,092 | |
| | 1,900 | | | Kuraray Company, Ltd. | | | 28,805 | |
| | 3,458 | | | Martin Marietta Materials, Inc. | | | 641,044 | |
| | 10,220 | | | Materion Corporation | | | 309,666 | |
| | 9,940 | | | Methanex Corporation | | | 361,319 | |
| | 4,323 | | | Minerals Technologies, Inc. | | | 290,506 | |
| | 4,800 | | | Mitsubishi Chemical Holdings Corporation | | | 31,516 | |
| | 1,000 | | | Mitsubishi Gas Chemical Company, Inc. | | | 15,391 | |
| | 600 | | | Mitsubishi Materials Corporation | | | 17,191 | |
| | 16,680 | | | Mosaic Company | | | 392,480 | |
| | 25,695 | | | Myers Industries, Inc. | | | 309,625 | |
| | 790 | | | Neenah Paper, Inc. | | | 63,121 | |
| | 600 | | | Newcrest Mining, Ltd. | | | 10,506 | |
| | 40,908 | | | Newmont Mining Corporation | | | 1,515,232 | |
| | 200 | | | Nippon Shokubai Company, Ltd. | | | 13,802 | |
| | 19,851 | | | Norsk Hydro ASA | | | 88,749 | |
| | 25,970 | | | Nucor Corporation | | | 1,268,634 | |
| | 12,280 | | | OMNOVA Solutions, Inc.d | | | 93,328 | |
| | 5,488 | | | Orora, Ltd. | | | 12,093 | |
| | 39,427 | | | Owens-Illinois, Inc.d | | | 760,941 | |
| | 27,416 | | | Packaging Corporation of America | | | 2,261,820 | |
| | 3,580 | | | PolyOne Corporation | | | 104,643 | |
| | 1,350 | | | Quaker Chemical Corporation | | | 145,125 | |
| | 8,810 | | | Rayonier Advanced Materials, Inc. | | | 113,913 | |
| | 3,750 | | | Reliance Steel & Aluminum Company | | | 257,925 | |
| | 4,816 | | | Royal Gold, Inc. | | | 331,437 | |
| | 1,900 | | | RPC Group plc | | | 22,034 | |
| | 3,330 | | | RPM International, Inc. | | | 158,308 | |
| | 6,810 | | | Schnitzer Steel Industries, Inc. | | | 164,461 | |
| | 1,940 | | | Schweitzer-Mauduit International, Inc. | | | 71,605 | |
| | 11,584 | | | Scotts Miracle-Gro Company | | | 1,020,435 | |
| | 14,790 | | | Sealed Air Corporation | | | 674,868 | |
| | 12,660 | | | Sensient Technologies Corporation | | | 943,297 | |
| | 22,677 | | | Silver Wheaton Corporation | | | 546,742 | |
| | 13,110 | | | Sonoco Products Company | | | 659,302 | |
| | 43,409 | | | Steel Dynamics, Inc. | | | 1,192,011 | |
| | 400 | | | Sumitomo Seika Chemicals Company, Ltd. | | | 14,955 | |
| | 39,610 | | | Teck Resources, Ltd. | | | 854,784 | |
| | 2,000 | | | Tosoh Corporation | | | 13,061 | |
| | 3,099 | | | UPM-Kymmene Oyj | | | 72,088 | |
| | 11,191 | | | Verso Corporationd | | | 68,713 | |
| | 2,760 | | | Versum Materials, Inc.d | | | 62,652 | |
| | 7,289 | | | Vulcan Materials Company | | | 825,115 | |
| | 20,397 | | | Westrock Company | | | 942,137 | |
| | 74,993 | | | Yamana Gold, Inc. | | | 266,975 | |
| | 3,629 | | | Yara International ASA | | | 128,192 | |
| | | | | |
| | | | Total | | | 36,498,138 | |
| | | | | |
| |
| Real Estate (1.0%) | | | | |
| | 12,550 | | | American Assets Trust, Inc. | | | 498,360 | |
| | 8,560 | | | American Campus Communities, Inc. | | | 446,062 | |
| | 18,050 | | | Bluerock Residential Growth REIT, Inc. | | | 223,820 | |
| | 61,004 | | | Brixmor Property Group, Inc. | | | 1,550,722 | |
| | 5,010 | | | Camden Property Trust | | | 408,014 | |
| | 10,900 | | | CapitaMall Trust | | | 16,243 | |
| | 1,000 | | | Castellum AB | | | 13,550 | |
| | 52,220 | | | CBL & Associates Properties, Inc. | | | 558,754 | |
| | 65,239 | | | Cedar Realty Trust, Inc. | | | 441,668 | |
| | 22,680 | | | Chatham Lodging Trust | | | 401,436 | |
| | 5,990 | | | City Office REIT, Inc. | | | 75,234 | |
| | 55,570 | | | Corporate Office Properties Trust | | | 1,483,163 | |
| | 16,200 | | | Corrections Corporation of America | | | 234,090 | |
| | 31,931 | | | Cousins Properties, Inc. | | | 248,104 | |
| | 11,870 | | | CubeSmart | | | 309,451 | |
| | 1,000 | | | CyrusOne, Inc. | | | 44,610 | |
| | 100 | | | Daito Trust Construction Company, Ltd. | | | 16,758 | |
| | 118,020 | | | DDR Corporation | | | 1,804,526 | |
| | 16,000 | | | DEXUS Property Group | | | 108,690 | |
| | 4,290 | | | Digital Realty Trust, Inc. | | | 400,815 | |
| | 15,080 | | | Duke Realty Corporation | | | 394,342 | |
| | 16,260 | | | DuPont Fabros Technology, Inc. | | | 663,571 | |
| | 830 | | | EastGroup Properties, Inc. | | | 56,365 | |
| | 12,380 | | | Equity Lifestyle Properties, Inc. | | | 938,899 | |
| | 6,110 | | | First Industrial Realty Trust, Inc. | | | 161,365 | |
| | 21,183 | | | First Potomac Realty Trust | | | 188,952 | |
| | 19,900 | | | Franklin Street Properties Corporation | | | 230,243 | |
| | 10,000 | | | Frasers Centrepoint Trust | | | 14,951 | |
| | 14,150 | | | General Growth Properties, Inc. | | | 353,042 | |
| | 5,271 | | | H&R Real Estate Investment Trust | | | 89,638 | |
| | 1,356 | | | Hamborner REIT AG | | | 13,406 | |
| | 19,610 | | | HFF, Inc. | | | 522,214 | |
| | 7,820 | | | Hospitality Properties Trust | | | 213,955 | |
| | 28,365 | | | Host Hotels & Resorts, Inc. | | | 439,090 | |
| | 7,540 | | | Hudson Pacific Properties, Inc. | | | 253,495 | |
| | 2,200 | | | Hufvudstaden AB | | | 34,050 | |
| | 19,000 | | | Hysan Development Company, Ltd. | | | 87,692 | |
| | 11,490 | | | InfraREIT, Inc. | | | 190,964 | |
| | 12,320 | | | Kite Realty Group Trust | | | 307,138 | |
| | 15,020 | | | LaSalle Hotel Properties | | | 356,725 | |
| | 16,060 | | | Liberty Property Trust | | | 649,306 | |
| | 8,540 | | | Life Storage, Inc. | | | 688,751 | |
The accompanying Notes to Financial Statements are an integral part of this schedule.
20
MODERATELY AGGRESSIVE ALLOCATION FUND
Schedule of Investments as of October 31, 2016
| | | | | | | | |
| Shares | | | Common Stock (31.3%) | | Value | |
| Real Estate (1.0%) - continued | | | | |
| | 3,500 | | | Link REIT | | | $24,899 | |
| | 6,910 | | | Mid-America Apartment Communities, Inc. | | | 640,902 | |
| | 69,877 | | | New World Development Company, Ltd. | | | 86,875 | |
| | 3,991 | | | Parkway, Inc.d | | | 71,918 | |
| | 16,059 | | | Pebblebrook Hotel Trust | | | 389,913 | |
| | 17,350 | | | Physicians Realty Trust | | | 343,009 | |
| | 1,987 | | | Potlatch Corporation | | | 76,301 | |
| | 10,980 | | | RE/MAX Holdings, Inc. | | | 477,081 | |
| | 13,610 | | | Retail Properties of America, Inc. | | | 211,908 | |
| | 608 | | | RioCan Real Estate Investment Trust | | | 11,822 | |
| | 12,200 | | | Silver Bay Realty Trust Corporation REIT | | | 204,350 | |
| | 6,000 | | | Sino Land Company, Ltd. | | | 10,188 | |
| | 28,565 | | | Stockland | | | 95,934 | |
| | 19,430 | | | Store Capital Corporation | | | 530,245 | |
| | 26,461 | | | Summit Hotel Properties, Inc. | | | 343,728 | |
| | 28,504 | | | Terreno Realty Corporation | | | 743,954 | |
| | 15,750 | | | Urstadt Biddle Properties, Inc. | | | 338,625 | |
| | 2,000 | | | Wharf Holdings, Ltd. | | | 14,995 | |
| | 2,000 | | | Wheelock and Company, Ltd. | | | 12,308 | |
| | 17,300 | | | Wing Tai Holdings, Ltd. | | | 21,077 | |
| | | | | |
| | | | Total | | | 20,782,256 | |
| | | | | |
| |
| Telecommunications Services (0.2%) | | | | |
| | 15,160 | | | AT&T, Inc. | | | 557,737 | |
| | 2,100 | | | ATN International, Inc. | | | 142,044 | |
| | 702 | | | BCE, Inc. | | | 31,894 | |
| | 8,800 | | | BT Group plc | | | 40,393 | |
| | 6,754 | | | Cincinnati Bell, Inc.d | | | 132,716 | |
| | 3,200 | | | Elisa Oyj | | | 107,812 | |
| | 5,530 | | | FairPoint Communications, Inc.d | | | 86,268 | |
| | 2,400 | | | Freenet AG | | | 68,806 | |
| | 7,370 | | | General Communication, Inc.d | | | 116,741 | |
| | 6,600 | | | Inteliquent, Inc. | | | 110,814 | |
| | 40,821 | | | KCOM Group plc | | | 58,834 | |
| | 300 | | | KDDI Corporation | | | 9,118 | |
| | 18,876 | | | Koninklijke (Royal) KPN NV | | | 61,550 | |
| | 11,959 | | | Level 3 Communications, Inc.d | | | 671,498 | |
| | 200 | | | Millicom International Cellular SA | | | 8,787 | |
| | 3,900 | | | Nippon Telegraph & Telephone Corporation | | | 172,914 | |
| | 1,400 | | | NTT DOCOMO, Inc. | | | 35,160 | |
| | 3,300 | | | Orange SA | | | 51,921 | |
| | 44,725 | | | PCCW, Ltd. | | | 26,623 | |
| | 1,200 | | | Proximus SA | | | 34,347 | |
| | 11,005 | | | SBA Communications Corporationd | | | 1,246,647 | |
| | 200 | | | SoftBank Group Corporation | | | 12,596 | |
| | 4,000 | | | Telefonica Deutschland Holding AG | | | 15,513 | |
| | 2,562 | | | Telenor ASA | | | 40,748 | |
| | 16,103 | | | Verizon Communications, Inc. | | | 774,554 | |
| | 4,100 | | | Vodafone Group plc | | | 11,260 | |
| | 21,100 | | | Vonage Holdings Corporationd | | | 144,746 | |
| | | | | |
| | | | Total | | | 4,772,041 | |
| | | | | |
| |
| Utilities (0.8%) | | | | |
| | 1,820 | | | Alliant Energy Corporation | | | 69,251 | |
| | 1,950 | | | American Electric Power Company, Inc. | | | 126,438 | |
| | 12,320 | | | American States Water Company | | | 492,554 | |
| | 18,440 | | | Aqua America, Inc. | | | 566,108 | |
| | 7,040 | | | Artesian Resources Corporation | | | 198,669 | |
| | 25,860 | | | Avista Corporation | | | 1,070,604 | |
| | 14,100 | | | Centrica plc | | | 36,932 | |
| | 5,950 | | | Consolidated Water Company, Ltd. | | | 66,640 | |
| | 7,980 | | | DTE Energy Company | | | 766,160 | |
| | 5,900 | | | DUET Group | | | 10,681 | |
| | 1,300 | | | E.ON SE | | | 9,528 | |
| | 16,610 | | | Edison International, Inc. | | | 1,220,503 | |
| | 19,600 | | | Electricidade de Portugal SA | | | 64,783 | |
| | 31,430 | | | Eversource Energy | | | 1,730,536 | |
| | 12,120 | | | Exelon Corporation | | | 412,928 | |
| | 14,860 | | | Great Plains Energy, Inc. | | | 422,618 | |
| | 5,030 | | | Hawaiian Electric Industries, Inc. | | | 148,385 | |
| | 40,520 | | | MDU Resources Group, Inc. | | | 1,062,029 | |
| | 3,000 | | | Middlesex Water Company | | | 108,300 | |
| | 9,970 | | | NiSource, Inc. | | | 231,902 | |
| | 3,500 | | | NorthWestern Corporation | | | 201,425 | |
| | 24,000 | | | Osaka Gas Company, Ltd. | | | 99,821 | |
| | 19,900 | | | PG&E Corporation | | | 1,236,188 | |
| | 16,880 | | | PNM Resources, Inc. | | | 554,508 | |
| | 15,090 | | | Portland General Electric Company | | | 658,528 | |
| | 13,320 | | | Public Service Enterprise Group, Inc. | | | 560,506 | |
| | 14,100 | | | Redes Energeticas Nacionais SGPS SA | | | 41,203 | |
| | 8,520 | | | Renewable Energy Group, Inc.d | | | 74,550 | |
| | 16,670 | | | Southern Company | | | 859,672 | |
| | 7,970 | | | Southwest Gas Corporation | | | 577,506 | |
| | 2,000 | | | Toho Gas Company, Ltd. | | | 18,547 | |
| | 2,700 | | | United Utilities Group plc | | | 31,036 | |
| | 1,771 | | | Unitil Corporation | | | 71,849 | |
| | 34,620 | | | Vectren Corporation | | | 1,741,732 | |
| | | | | |
| | | | Total | | | 15,542,620 | |
| | | | | |
| | | | | | | | |
| | | | | |
| | | | Total Common Stock (cost $567,222,352) | | | 626,839,947 | |
| | | | | |
Principal
Amount | | | Long-Term Fixed Income (15.3%) | | Value | |
| Asset-Backed Securities (0.7%) | | | | |
| | | | Access Group, Inc. | | | | |
| | $153,801 | | | 1.034%, 2/25/2036g,h | | | 151,305 | |
| | | | AMSR Trust | | | | |
| | 425,000 | | | 1.931%, 11/17/2033g,h | | | 425,406 | |
| | | | BA Credit Card Trust | | | | |
| | 250,000 | | | 0.915%, 6/15/2021h | | | 250,721 | |
| | | | Capital One Multi-Asset Execution Trust | | | | |
| | 500,000 | | | 0.915%, 1/18/2022h | | | 501,189 | |
| | | | Chase Issuance Trust | | | | |
| | 175,000 | | | 1.590%, 2/18/2020 | | | 175,942 | |
| | 150,000 | | | 1.620%, 7/15/2020 | | | 150,998 | |
| | 500,000 | | | 0.945%, 5/17/2021h | | | 502,050 | |
| | | | Chesapeake Funding II, LLC | | | | |
| | 350,000 | | | 1.880%, 6/15/2028g | | | 351,042 | |
| | | | Chesapeake Funding, LLC | | | | |
| | 48,426 | | | 0.976%, 1/7/2025g,h | | | 48,420 | |
| | | | Commonbond Student Loan Trust | | | | |
| | 400,000 | | | 2.900%, 10/25/2040g | | | 399,851 | |
| | | | DRB Prime Student Loan Trust | | | | |
| | 373,640 | | | 3.200%, 1/25/2040* | | | 380,900 | |
| | 465,754 | | | 2.890%, 6/25/2040g | | | 462,253 | |
| | | | Earnest Student Loan Program | | | | |
| | 1,022,574 | | | 3.020%, 5/25/2034g | | | 1,020,245 | |
| | | | Edlinc Student Loan Funding Trust | | | | |
| | 106,543 | | | 3.410%, 10/1/2025*,h | | | 107,567 | |
| | | | Enterprise Fleet Financing, LLC | | | | |
| | 57,279 | | | 0.870%, 9/20/2019g | | | 57,251 | |
| | | | FirstEnergy Ohio PIRB Special Purpose Trust | | | | |
| | 18,951 | | | 0.679%, 1/15/2019 | | | 18,924 | |
| | | | Ford Credit Auto Owner Trust | | | | |
| | 175,000 | | | 2.260%, 11/15/2025g | | | 178,093 | |
The accompanying Notes to Financial Statements are an integral part of this schedule.
21
MODERATELY AGGRESSIVE ALLOCATION FUND
Schedule of Investments as of October 31, 2016
| | | | | | | | |
Principal
Amount | | | Long-Term Fixed Income (15.3%) | | Value | |
| Asset-Backed Securities (0.7%) - continued | | | | |
| | | | GoldenTree Loan Opportunities IX, Ltd. | | | | |
| | $250,000 | | | 2.238%, 10/29/2026*,h | | | $250,000 | |
| | | | Morgan Stanley Bank of America Merrill Lynch Trust | | | | |
| | 400,000 | | | 3.176%, 8/15/2045 | | | 420,846 | |
| | 400,000 | | | 3.246%, 12/15/2047 | | | 418,620 | |
| | | | Morgan Stanley Capital, Inc. | | | | |
| | 493,228 | | | 0.684%, 2/25/2037h | | | 293,530 | |
| | | | Murray Hill Marketplace Trust | | | | |
| | 515,000 | | | 4.190%, 11/25/2022* | | | 515,014 | |
| | | | NCF Dealer Floorplan Master Trust | | | | |
| | 500,000 | | | 3.776%, 3/21/2022*,h | | | 496,139 | |
| | | | OneMain Financial Issuance Trust | | | | |
| | 300,000 | | | 4.100%, 3/20/2028g | | | 308,439 | |
| | | | OZLM VIII, Ltd. | | | | |
| | 140,000 | | | 2.320%, 10/17/2026*,h | | | 140,112 | |
| | | | Renaissance Home Equity Loan Trust | | | | |
| | 2,232,477 | | | 5.746%, 5/25/2036i | | | 1,499,154 | |
| | 1,228,920 | | | 6.011%, 5/25/2036i | | | 858,528 | |
| | | | SLM Student Loan Trust | | | | |
| | 164,094 | | | 1.135%, 8/15/2022g,h | | | 164,271 | |
| | 2,747 | | | 1.282%, 4/25/2023g,h | | | 2,745 | |
| | 286,013 | | | 1.054%, 3/25/2026h | | | 285,789 | |
| | 200,000 | | | 1.585%, 5/17/2027g,h | | | 201,596 | |
| | | | Sofi Consumer Loan Program, LLC | | | | |
| | 633,315 | | | 3.260%, 8/25/2025g | | | 638,280 | |
| | | | SoFi Professional Loan Program, LLC | | | | |
| | 252,766 | | | 2.420%, 3/25/2030g | | | 255,237 | |
| | | | Sunset Mortgage Loan Company, LLC | | | | |
| | 565,153 | | | 3.844%, 7/16/2047*,i | | | 566,195 | |
| | | | Vericrest Opportunity Loan Transferee | | | | |
| | 365,561 | | | 3.375%, 10/25/2058*,i | | | 365,064 | |
| | 370,499 | | | 3.500%, 9/25/2046g,i | | | 370,190 | |
| | 700,000 | | | 3.500%, 10/25/2046g,i | | | 700,000 | |
| | | | Vericrest Opportunity Loan Trust | | | | |
| | 381,575 | | | 4.250%, 3/26/2046g,i | | | 386,366 | |
| | | | | |
| | | | Total | | | 14,318,272 | |
| | | | | |
| |
| Basic Materials (0.1%) | | | | |
| | | | Albemarle Corporation | | | | |
| | 40,000 | | | 3.000%, 12/1/2019 | | | 41,159 | |
| | | | Alcoa Nederland Holding BV | | | | |
| | 145,000 | | | 6.750%, 9/30/2024g | | | 150,075 | |
| | | | Anglo American plc | | | | |
| | 291,000 | | | 3.625%, 5/14/2020e,g | | | 292,455 | |
| | | | ArcelorMittal SA | | | | |
| | 275,000 | | | 6.500%, 3/1/2021e | | | 301,812 | |
| | | | Georgia-Pacific, LLC | | | | |
| | 90,000 | | | 2.539%, 11/15/2019g | | | 91,802 | |
| | | | Glencore Funding, LLC | | | | |
| | 65,000 | | | 1.940%, 4/16/2018g,h | | | 64,025 | |
| | 126,000 | | | 2.875%, 4/16/2020g | | | 126,630 | |
| | | | Kinross Gold Corporation | | | | |
| | 168,000 | | | 5.950%, 3/15/2024 | | | 176,400 | |
| | | | NOVA Chemicals Corporation | | | | |
| | 425,000 | | | 5.250%, 8/1/2023g | | | 432,969 | |
| | | | Novelis Corporation | | | | |
| | 100,000 | | | 5.875%, 9/30/2026g | | | 101,250 | |
| | | | Westlake Chemical Corporation | | | | |
| | 168,000 | | | 3.600%, 8/15/2026g | | | 167,951 | |
| | | | | |
| | | | Total | | | 1,946,528 | |
| | | | | |
| | | | | | | | |
| |
| Capital Goods (0.3%) | | | | |
| | | | AECOM | | | | |
| | 360,000 | | | 5.875%, 10/15/2024 | | | 380,250 | |
| | | | Ball Corporation | | | | |
| | 175,000 | | | 4.375%, 12/15/2020 | | | 186,375 | |
| | | | Building Materials Corporation of America | | | | |
| | 255,000 | | | 6.000%, 10/15/2025g | | | 272,200 | |
| | | | Cemex Finance, LLC | | | | |
| | 350,000 | | | 9.375%, 10/12/2022g | | | 382,375 | |
| | | | CNH Industrial Capital, LLC | | | | |
| | 330,000 | | | 4.375%, 11/6/2020 | | | 337,425 | |
| | | | Crown Americas Capital Corporation IV | | | | |
| | 275,000 | | | 4.500%, 1/15/2023 | | | 281,875 | |
| | | | General Electric Company | | | | |
| | 229,000 | | | 5.000%, 12/29/2049j | | | 242,603 | |
| | | | HD Supply, Inc. | | | | |
| | 325,000 | | | 5.750%, 4/15/2024g | | | 341,250 | |
| | | | Huntington Ingalls Industries, Inc. | | | | |
| | 400,000 | | | 5.000%, 12/15/2021g | | | 419,000 | |
| | | | L-3 Communications Corporation | | | | |
| | 168,000 | | | 3.950%, 5/28/2024 | | | 175,987 | |
| | | | Lockheed Martin Corporation | | | | |
| | 149,000 | | | 2.500%, 11/23/2020 | | | 152,858 | |
| | 168,000 | | | 4.500%, 5/15/2036 | | | 188,129 | |
| | | | Newell Rubbermaid, Inc. | | | | |
| | 84,000 | | | 2.600%, 3/29/2019 | | | 85,693 | |
| | 126,000 | | | 5.500%, 4/1/2046 | | | 148,466 | |
| | | | Northrop Grumman Corporation | | | | |
| | 120,000 | | | 3.850%, 4/15/2045 | | | 120,805 | |
| | | | Owens-Brockway Glass Container, Inc. | | | | |
| | 375,000 | | | 5.000%, 9/1/2022g | | | 392,344 | |
| | | | Pentair Finance SA | | | | |
| | 105,000 | | | 2.900%, 9/15/2018 | | | 106,457 | |
| | | | Republic Services, Inc. | | | | |
| | 130,000 | | | 2.900%, 7/1/2026 | | | 129,829 | |
| | | | Reynolds Group Issuer, Inc. | | | | |
| | 330,000 | | | 5.125%, 7/15/2023g | | | 338,765 | |
| | | | Roper Industries, Inc. | | | | |
| | 229,000 | | | 2.050%, 10/1/2018 | | | 231,123 | |
| | | | Standard Industries, Inc. | | | | |
| | 150,000 | | | 5.500%, 2/15/2023g | | | 156,000 | |
| | | | Textron, Inc. | | | | |
| | 60,000 | | | 5.600%, 12/1/2017 | | | 62,499 | |
| | 150,000 | | | 7.250%, 10/1/2019 | | | 170,318 | |
| | | | United Rentals North America, Inc. | | | | |
| | 550,000 | | | 5.500%, 7/15/2025 | | | 556,875 | |
| | | | Waste Management, Inc. | | | | |
| | 35,000 | | | 3.125%, 3/1/2025 | | | 36,250 | |
| | | | | |
| | | | Total | | | 5,895,751 | |
| | | | | |
| |
| Collateralized Mortgage Obligations (0.7%) | | | | |
| | | | Alm Loan Funding CLO | | | | |
| | 140,000 | | | 2.310%, 10/17/2026*,h | | | 140,045 | |
| | | | Angel Oak Mortgage Trust I, LLC | | | | |
| | 229,005 | | | 3.500%, 7/25/2046*,i | | | 228,274 | |
| | | | Apidos CLO XVIII | | | | |
| | 135,000 | | | 2.294%, 7/22/2026*,h | | | 134,987 | |
| | | | Ares CLO, Ltd. | | | | |
| | 450,000 | | | 2.164%, 10/12/2023*,h | | | 449,985 | |
| | | | Babson CLO, Ltd. | | | | |
| | 140,000 | | | 2.270%, 10/17/2026*,h | | | 139,884 | |
| | | | BCAP, LLC Trust | | | | |
| | 391,201 | | | 0.714%, 3/25/2037h | | | 364,323 | |
The accompanying Notes to Financial Statements are an integral part of this schedule.
22
MODERATELY AGGRESSIVE ALLOCATION FUND
Schedule of Investments as of October 31, 2016
| | | | | | | | |
Principal
Amount | | | Long-Term Fixed Income (15.3%) | | Value | |
| Collateralized Mortgage Obligations (0.7%) - continued | | | | |
| | | | Betony CLO, Ltd. | | | | |
| | $125,000 | | | 2.390%, 4/15/2027*,h | | | $125,043 | |
| | | | Birchwood Park CLO, Ltd. | | | | |
| | 140,000 | | | 2.320%, 7/15/2026*,h | | | 140,108 | |
| | | | BlueMountain CLO, Ltd. | | | | |
| | 140,000 | | | 2.360%, 10/15/2026*,h | | | 140,338 | |
| | | | Carlyle Global Market Strategies CLO, Ltd. | | | | |
| | 130,061 | | | 2.181%, 7/20/2023*,h | | | 130,169 | |
| | 150,000 | | | 2.380%, 10/15/2026*,h | | | 150,393 | |
| | | | Cent CLO 16, LP | | | | |
| | 140,000 | | | 2.007%, 8/1/2024*,h | | | 139,901 | |
| | | | Cent CLO 22, Ltd. | | | | |
| | 150,000 | | | 2.268%, 11/7/2026*,h | | | 150,008 | |
| | | | Citigroup Mortgage Loan Trust, Inc. | | | | |
| | 196,462 | | | 5.500%, 11/25/2035 | | | 187,966 | |
| | | | CitiMortgage Alternative Loan Trust | | | | |
| | 625,051 | | | 5.750%, 4/25/2037 | | | 536,247 | |
| | | | Countrywide Alternative Loan Trust | | | | |
| | 163,154 | | | 3.031%, 10/25/2035 | | | 132,796 | |
| | 116,874 | | | 6.500%, 8/25/2036 | | | 78,996 | |
| | 124,350 | | | 6.000%, 1/25/2037 | | | 118,939 | |
| | 566,180 | | | 5.500%, 5/25/2037 | | | 483,612 | |
| | 519,381 | | | 7.000%, 10/25/2037 | | | 309,874 | |
| | | | Countrywide Home Loans, Inc. | | | | |
| | 222,541 | | | 5.750%, 4/25/2037 | | | 188,847 | |
| | | | Deutsche Alt-A Securities Mortgage Loan Trust | | | | |
| | 163,717 | | | 6.000%, 10/25/2021 | | | 146,939 | |
| | | | Dryden 34 Senior Loan Fund CLO | | | | |
| | 140,000 | | | 2.310%, 10/15/2026*,h | | | 140,062 | |
| | | | Federal Home Loan Mortgage Corporation | | | | |
| | 944,730 | | | 4.000%, 7/15/2031k | | | 93,435 | |
| | 410,807 | | | 3.000%, 2/15/2033k | | | 48,557 | |
| | | | Federal National Mortgage Association | | | | |
| | 834,267 | | | 3.500%, 1/25/2033k | | | 109,660 | |
| | | | Galaxy XX CLO, Ltd. | | | | |
| | 450,000 | | | 2.331%, 7/20/2027*,h | | | 449,373 | |
| | | | Golub Capital Partners CLO 23M, Ltd. | | | | |
| | 400,000 | | | 2.263%, 5/5/2027*,h | | | 399,912 | |
| | | | J.P. Morgan Mortgage Trust | | | | |
| | 361,965 | | | 3.077%, 10/25/2036 | | | 327,056 | |
| | 511,115 | | | 0.914%, 1/25/2037h | | | 267,996 | |
| | 623,779 | | | 6.250%, 8/25/2037 | | | 467,802 | |
| | | | Limerock CLO III, LLC | | | | |
| | 450,000 | | | 2.411%, 10/20/2026*,h | | | 449,714 | |
| | | | Madison Park Funding XIV CLO, Ltd. | | | | |
| | 150,000 | | | 2.331%, 7/20/2026*,h | | | 150,208 | |
| | | | Madison Park Funding, Ltd. | | | | |
| | 400,000 | | | 2.107%, 8/15/2022*,h | | | 399,946 | |
| | | | Magnetite XII, Ltd. | | | | |
| | 450,000 | | | 2.380%, 4/15/2027*,h | | | 450,190 | |
| | | | MASTR Alternative Loans Trust | | | | |
| | 166,532 | | | 6.500%, 7/25/2034 | | | 166,972 | |
| | 309,983 | | | 0.984%, 12/25/2035h | | | 143,625 | |
| | | | Merrill Lynch Alternative Note Asset Trust | | | | |
| | 156,206 | | | 6.000%, 3/25/2037 | | | 123,676 | |
| | | | Mountain View CLO, Ltd. | | | | |
| | 450,000 | | | 2.340%, 7/15/2027*,h | | | 448,464 | |
| | | | Neuberger Berman CLO, Ltd. | | | | |
| | 100,000 | | | 2.238%, 8/4/2025*,h | | | 100,276 | |
| | | | NZCG Funding CLO, Ltd. | | | | |
| | 450,000 | | | 2.436%, 4/27/2027*,h | | | 448,812 | |
| | | | Octagon Investment Partners XX CLO, Ltd. | | | | |
| | 140,000 | | | 2.258%, 8/12/2026*,h | | | 140,008 | |
| | | | OHA Loan Funding, Ltd. | | | | |
| | 450,000 | | | 2.411%, 10/20/2026*,h | | | 452,783 | |
| | | | Pretium Mortgage Credit Partners, LLC | | | | |
| | 808,450 | | | 4.375%, 11/27/2030* | | | 815,106 | |
| | | | Race Point IX CLO, Ltd. | | | | |
| | 325,000 | | | 2.390%, 4/15/2027*,h | | | 325,408 | |
| | | | Residential Asset Securitization Trust | | | | |
| | 543,283 | | | 0.914%, 8/25/2037h | | | 144,993 | |
| | | | Sequoia Mortgage Trust | | | | |
| | 349,312 | | | 3.270%, 9/20/2046 | | | 282,559 | |
| | | | Shackleton VII CLO, Ltd. | | | | |
| | 450,000 | | | 2.420%, 4/15/2027*,h | | | 450,912 | |
| | | | Symphony CLO VIII, Ltd. | | | | |
| | 128,155 | | | 1.976%, 1/9/2023*,h | | | 128,072 | |
| | | | Symphony CLO XV, Ltd. | | | | |
| | 450,000 | | | 2.330%, 10/17/2026*,h | | | 450,860 | |
| | | | TBW Mortgage-Backed Trust | | | | |
| | 1,250,979 | | | 5.965%, 7/25/2037 | | | 852,247 | |
| | | | Voya CLO 3, Ltd. | | | | |
| | 140,000 | | | 2.302%, 7/25/2026*,h | | | 139,932 | |
| | | | WaMu Mortgage Pass Through Certificates | | | | |
| | 101,915 | | | 2.795%, 9/25/2036 | | | 92,332 | |
| | 208,122 | | | 2.832%, 10/25/2036 | | | 181,413 | |
| | | | Washington Mutual Mortgage Pass Through Certificates Trust | | | | |
| | 366,229 | | | 7.000%, 2/25/2036 | | | 271,248 | |
| | 552,890 | | | 1.274%, 2/25/2047h | | | 411,894 | |
| | | | | |
| | | | Total | | | 14,943,177 | |
| | | | | |
| |
| Commercial Mortgage-Backed Securities (0.3%) | | | | |
| | | | Citigroup Commercial Mortgage Trust | | | | |
| | 228,802 | | | 1.102%, 11/10/2046 | | | 228,400 | |
| | | | Commercial Mortgage Pass-Through Certificates | | | | |
| | 360,000 | | | 1.580%, 6/8/2030g,h | | | 360,451 | |
| | | | Credit Suisse First Boston Mortgage Securities | | | | |
| | 19,876 | | | 5.542%, 1/15/2049 | | | 19,844 | |
| | | | Federal National Mortgage Association | | | | |
| | 22,093 | | | 1.272%, 1/25/2017 | | | 22,079 | |
| | | | Greenwich Capital Commercial Funding Corporation | | | | |
| | 900,000 | | | 5.867%, 12/10/2049 | | | 925,894 | |
| | | | GS Mortgage Securities Trust | | | | |
| | 700,000 | | | 3.666%, 9/10/2047 | | | 751,573 | |
| | | | J.P. Morgan Chase Commercial Mortgage Securities Corporation | | | | |
| | 750,000 | | | 5.715%, 2/12/2049 | | | 761,190 | |
| | | | JPMBB Commercial Mortgage Securities Trust | | | | |
| | 325,000 | | | 3.231%, 1/15/2048 | | | 339,158 | |
| | | | Morgan Stanley Capital, Inc. | | | | |
| | 450,000 | | | 5.406%, 3/15/2044 | | | 452,725 | |
| | | | SCG Trust | | | | |
| | 150,000 | | | 1.935%, 11/15/2026g,h | | | 148,868 | |
The accompanying Notes to Financial Statements are an integral part of this schedule.
23
MODERATELY AGGRESSIVE ALLOCATION FUND
Schedule of Investments as of October 31, 2016
| | | | | | | | |
Principal
Amount | | | Long-Term Fixed Income (15.3%) | | Value | |
| Commercial Mortgage-Backed Securities (0.3%) - continued | | | | |
| | | | UBS Commercial Mortgage Trust | | | | |
| | $595,616 | | | 3.400%, 5/10/2045 | | | $630,007 | |
| | | | WFRBS Commercial Mortgage Trust | | | | |
| | 450,000 | | | 2.870%, 11/15/2045 | | | 468,201 | |
| | | | | |
| | | | Total | | | 5,108,390 | |
| | | | | |
| |
| Communications Services (0.7%) | | | | |
| | | | 21st Century Fox America, Inc. | | | | |
| | 190,000 | | | 6.900%, 3/1/2019 | | | 212,481 | |
| | | | Altice Financing SA | | | | |
| | 295,000 | | | 6.625%, 2/15/2023g | | | 303,850 | |
| | | | Altice US Finance I Corporation | | | | |
| | 180,000 | | | 5.500%, 5/15/2026g | | | 183,600 | |
| | | | AMC Networks, Inc. | | | | |
| | 505,000 | | | 5.000%, 4/1/2024 | | | 511,313 | |
| | | | America Movil SAB de CV | | | | |
| | 90,000 | | | 5.000%, 10/16/2019 | | | 98,032 | |
| | | | American Tower Corporation | | | | |
| | 20,000 | | | 2.800%, 6/1/2020 | | | 20,422 | |
| | 210,000 | | | 3.300%, 2/15/2021 | | | 218,128 | |
| | | | AT&T, Inc. | | | | |
| | 65,000 | | | 5.875%, 10/1/2019 | | | 71,991 | |
| | 60,000 | | | 1.768%, 6/30/2020h | | | 60,265 | |
| | 112,000 | | | 3.875%, 8/15/2021 | | | 118,737 | |
| | 95,000 | | | 3.000%, 6/30/2022 | | | 96,329 | |
| | 294,000 | | | 6.350%, 3/15/2040 | | | 353,107 | |
| | 125,000 | | | 5.550%, 8/15/2041 | | | 135,606 | |
| | 170,000 | | | 5.150%, 3/15/2042 | | | 175,455 | |
| | 95,000 | | | 4.750%, 5/15/2046 | | | 92,965 | |
| | | | British Sky Broadcasting Group plc | | | | |
| | 110,000 | | | 2.625%, 9/16/2019g | | | 111,501 | |
| | | | CCO Holdings, LLC | | | | |
| | 400,000 | | | 5.875%, 4/1/2024g | | | 423,000 | |
| | | | CenturyLink, Inc. | | | | |
| | 285,000 | | | 6.450%, 6/15/2021 | | | 304,237 | |
| | | | Charter Communications Operating, LLC | | | | |
| | 167,000 | | | 6.834%, 10/23/2055g | | | 199,124 | |
| | 113,000 | | | 3.579%, 7/23/2020g | | | 117,165 | |
| | 168,000 | | | 4.908%, 7/23/2025g | | | 181,197 | |
| | | | Clear Channel Worldwide Holdings, Inc. | | | | |
| | 480,000 | | | 6.500%, 11/15/2022 | | | 488,880 | |
| | | | Columbus International, Inc. | | | | |
| | 350,000 | | | 7.375%, 3/30/2021g | | | 374,500 | |
| | | | Comcast Corporation | | | | |
| | 140,000 | | | 2.750%, 3/1/2023 | | | 143,869 | |
| | 360,000 | | | 4.400%, 8/15/2035 | | | 396,853 | |
| | 58,000 | | | 4.650%, 7/15/2042 | | | 64,334 | |
| | 253,000 | | | 4.750%, 3/1/2044 | | | 286,216 | |
| | | | Cox Communications, Inc. | | | | |
| | 68,000 | | | 9.375%, 1/15/2019g | | | 78,107 | |
| | | | Crown Castle International Corporation | | | | |
| | 196,000 | | | 3.400%, 2/15/2021 | | | 203,670 | |
| | 371,000 | | | 5.250%, 1/15/2023 | | | 414,559 | |
| | 75,000 | | | 3.700%, 6/15/2026 | | | 76,818 | |
| | | | CSC Holdings, LLC | | | | |
| | 35,000 | | | 5.500%, 4/15/2027g | | | 35,503 | |
| | | | Digicel, Ltd. | | | | |
| | 480,000 | | | 6.000%, 4/15/2021* | | | 429,456 | |
| | | | Dish DBS Corporation | | | | |
| | 335,000 | | | 5.875%, 7/15/2022 | | | 345,887 | |
| | | | FairPoint Communications, Inc. | | | | |
| | 265,000 | | | 8.750%, 8/15/2019g | | | 269,637 | |
| | | | Frontier Communications Corporation | | | | |
| | 405,000 | | | 8.875%, 9/15/2020 | | | 430,313 | |
| | | | Gray Television, Inc. | | | | |
| | 345,000 | | | 5.125%, 10/15/2024g | | | 334,650 | |
| | | | Hughes Satellite Systems Corporation | | | | |
| | 247,000 | | | 6.500%, 6/15/2019 | | | 269,539 | |
| | | | Level 3 Communications, Inc. | | | | |
| | 360,000 | | | 5.375%, 1/15/2024 | | | 367,200 | |
| | | | Level 3 Financing, Inc. | | | | |
| | 130,000 | | | 5.375%, 5/1/2025 | | | 131,950 | |
| | | | Omnicom Group, Inc. | | | | |
| | 85,000 | | | 3.600%, 4/15/2026 | | | 88,299 | |
| | | | Quebecor Media, Inc. | | | | |
| | 235,000 | | | 5.750%, 1/15/2023 | | | 245,575 | |
| | | | S&P Global, Inc. | | | | |
| | 168,000 | | | 3.300%, 8/14/2020 | | | 175,052 | |
| | | | SES Global Americas Holdings GP | | | | |
| | 135,000 | | | 2.500%, 3/25/2019g | | | 135,003 | |
| | | | SFR Group SA | | | | |
| | 435,000 | | | 6.000%, 5/15/2022g | | | 446,014 | |
| | | | Sprint Communications, Inc. | | | | |
| | 230,000 | | | 6.000%, 11/15/2022 | | | 214,332 | |
| | | | Sprint Corporation | | | | |
| | 265,000 | | | 7.625%, 2/15/2025e | | | 256,388 | |
| | | | Telefonica Emisiones SAU | | | | |
| | 97,000 | | | 3.192%, 4/27/2018 | | | 99,074 | |
| | | | Time Warner Entertainment Company, LP | | | | |
| | 160,000 | | | 8.375%, 3/15/2023 | | | 206,749 | |
| | | | Time Warner, Inc. | | | | |
| | 84,000 | | | 3.600%, 7/15/2025 | | | 87,292 | |
| | 95,000 | | | 6.250%, 3/29/2041 | | | 116,141 | |
| | | | T-Mobile USA, Inc. | | | | |
| | 390,000 | | | 6.125%, 1/15/2022 | | | 411,450 | |
| | | | Unitymedia Hessen GmbH & Company KG | | | | |
| | 165,000 | | | 5.500%, 1/15/2023g | | | 170,981 | |
| | | | Univision Communications, Inc. | | | | |
| | 120,000 | | | 5.125%, 5/15/2023g | | | 121,800 | |
| | | | Verizon Communications, Inc. | | | | |
| | 130,000 | | | 1.627%, 6/17/2019h | | | 131,130 | |
| | 440,000 | | | 3.000%, 11/1/2021 | | | 453,157 | |
| | 378,000 | | | 5.150%, 9/15/2023 | | | 432,379 | |
| | 20,000 | | | 5.050%, 3/15/2034 | | | 21,703 | |
| | 117,000 | | | 4.272%, 1/15/2036 | | | 117,479 | |
| | 278,000 | | | 4.522%, 9/15/2048 | | | 276,452 | |
| | | | Viacom, Inc. | | | | |
| | 210,000 | | | 4.375%, 3/15/2043 | | | 193,198 | |
| | 126,000 | | | 5.850%, 9/1/2043 | | | 141,300 | |
| | | | Vodafone Group plc | | | | |
| | 168,000 | | | 6.150%, 2/27/2037 | | | 199,908 | |
| | | | | |
| | | | Total | | | 13,871,302 | |
| | | | | |
| |
| Consumer Cyclical (0.4%) | | | | |
| | | | Automatic Data Processing, Inc. | | | | |
| | 40,000 | | | 3.375%, 9/15/2025 | | | 42,968 | |
| | | | Cinemark USA, Inc. | | | | |
| | 460,000 | | | 4.875%, 6/1/2023 | | | 460,575 | |
| | | | CVS Health Corporation | | | | |
| | 40,000 | | | 2.250%, 8/12/2019 | | | 40,683 | |
| | 320,000 | | | 4.875%, 7/20/2035 | | | 360,168 | |
| | 140,000 | | | 5.125%, 7/20/2045 | | | 163,323 | |
| | | | Daimler Finance North America, LLC | | | | |
| | 168,000 | | | 1.496%, 10/30/2019g,h | | | 168,210 | |
The accompanying Notes to Financial Statements are an integral part of this schedule.
24
MODERATELY AGGRESSIVE ALLOCATION FUND
Schedule of Investments as of October 31, 2016
| | | | | | | | |
Principal
Amount | | | Long-Term Fixed Income (15.3%) | | Value | |
| Consumer Cyclical (0.4%) - continued | | | | |
| | | | Delphi Automotive plc | | | | |
| | $210,000 | | | 3.150%, 11/19/2020 | | | $216,400 | |
| | | | eBay, Inc. | | | | |
| | 85,000 | | | 2.500%, 3/9/2018 | | | 86,053 | |
| | | | Ford Motor Credit Company, LLC | | | | |
| | 470,000 | | | 5.000%, 5/15/2018 | | | 491,992 | |
| | 200,000 | | | 2.943%, 1/8/2019 | | | 204,060 | |
| | | | General Motors Company | | | | |
| | 80,000 | | | 6.600%, 4/1/2036 | | | 94,564 | |
| | 155,000 | | | 6.250%, 10/2/2043 | | | 177,474 | |
| | | | General Motors Financial Company, Inc. | | | | |
| | 126,000 | | | 3.700%, 11/24/2020 | | | 129,854 | |
| | 84,000 | | | 4.200%, 3/1/2021 | | | 88,371 | |
| | 135,000 | | | 4.300%, 7/13/2025 | | | 138,107 | |
| | | | Home Depot, Inc. | | | | |
| | 64,000 | | | 2.625%, 6/1/2022 | | | 66,061 | |
| | 105,000 | | | 3.000%, 4/1/2026 | | | 108,955 | |
| | 126,000 | | | 4.250%, 4/1/2046 | | | 138,294 | |
| | | | Hyundai Capital America | | | | |
| | 126,000 | | | 2.400%, 10/30/2018g | | | 127,422 | |
| | 126,000 | | | 3.000%, 10/30/2020g | | | 129,375 | |
| | | | Jaguar Land Rover Automotive plc | | | | |
| | 275,000 | | | 5.625%, 2/1/2023g | | | 284,493 | |
| | | | KB Home | | | | |
| | 140,000 | | | 4.750%, 5/15/2019 | | | 143,150 | |
| | | | L Brands, Inc. | | | | |
| | 275,000 | | | 5.625%, 2/15/2022 | | | 301,125 | |
| | | | Lear Corporation | | | | |
| | 210,000 | | | 5.250%, 1/15/2025 | | | 225,225 | |
| | | | Lennar Corporation | | | | |
| | 275,000 | | | 4.125%, 12/1/2018 | | | 282,563 | |
| | 275,000 | | | 4.875%, 12/15/2023 | | | 280,500 | |
| | | | Live Nation Entertainment, Inc. | | | | |
| | 210,000 | | | 4.875%, 11/1/2024g | | | 209,475 | |
| | | | McDonald’s Corporation | | | | |
| | 125,000 | | | 2.750%, 12/9/2020 | | | 128,669 | |
| | | | MGM Resorts International | | | | |
| | 360,000 | | | 6.000%, 3/15/2023 | | | 389,700 | |
| | | | PulteGroup, Inc. | | | | |
| | 490,000 | | | 4.250%, 3/1/2021 | | | 514,500 | |
| | | | Rite Aid Corporation | | | | |
| | 345,000 | | | 6.125%, 4/1/2023g | | | 363,975 | |
| | | | Schaeffler Verwaltung Zwei GmbH | | | | |
| | 345,000 | | | 4.500%, 9/15/2023g | | | 349,313 | |
| | | | Six Flags Entertainment Corporation | | | | |
| | 340,000 | | | 5.250%, 1/15/2021g | | | 350,200 | |
| | | | Time Warner, Inc. | | | | |
| | 168,000 | | | 7.625%, 4/15/2031 | | | 234,763 | |
| | | | Toll Brothers Finance Corporation | | | | |
| | 42,000 | | | 8.910%, 10/15/2017 | | | 44,678 | |
| | 74,000 | | | 4.000%, 12/31/2018 | | | 76,405 | |
| | | | West Corporation | | | | |
| | 290,000 | | | 5.375%, 7/15/2022g | | | 279,125 | |
| | | | ZF North America Capital, Inc. | | | | |
| | 380,000 | | | 4.500%, 4/29/2022g | | | 402,325 | |
| | | | | |
| | | | Total | | | 8,293,093 | |
| | | | | |
| |
| Consumer Non-Cyclical (0.7%) | | | | |
| | | | AbbVie, Inc. | | | | |
| | 110,000 | | | 2.500%, 5/14/2020 | | | 111,383 | |
| | 210,000 | | | 3.600%, 5/14/2025 | | | 214,144 | |
| | 210,000 | | | 4.450%, 5/14/2046 | | | 207,233 | |
| | | | Actavis Funding SCS | | | | |
| | 255,000 | | | 4.550%, 3/15/2035 | | | 263,290 | |
| | 126,000 | | | 4.850%, 6/15/2044 | | | 133,306 | |
| | | | Altria Group, Inc. | | | | |
| | 84,000 | | | 2.850%, 8/9/2022 | | | 86,413 | |
| | 105,000 | | | 2.625%, 9/16/2026 | | | 104,118 | |
| | | | Amgen, Inc. | | | | |
| | 84,000 | | | 2.700%, 5/1/2022 | | | 85,535 | |
| | 125,000 | | | 3.125%, 5/1/2025 | | | 127,092 | |
| | | | Anheuser-Busch InBev Finance, Inc. | | | | |
| | 90,000 | | | 2.017%, 2/1/2021h | | | 92,284 | |
| | 469,000 | | | 3.650%, 2/1/2026 | | | 493,511 | |
| | 420,000 | | | 4.700%, 2/1/2036 | | | 465,586 | |
| | 210,000 | | | 4.900%, 2/1/2046 | | | 240,143 | |
| | | | Aramark Services, Inc. | | | | |
| | 250,000 | | | 4.750%, 6/1/2026g | | | 250,000 | |
| | | | B&G Foods, Inc. | | | | |
| | 200,000 | | | 4.625%, 6/1/2021 | | | 205,500 | |
| | | | BAT International Finance plc | | | | |
| | 80,000 | | | 1.360%, 6/15/2018g,h | | | 80,103 | |
| | | | Baxter International, Inc. | | | | |
| | 105,000 | | | 2.600%, 8/15/2026 | | | 101,683 | |
| | | | Becton, Dickinson and Company | | | | |
| | 205,000 | | | 6.375%, 8/1/2019 | | | 229,860 | |
| | | | Biogen, Inc. | | | | |
| | 75,000 | | | 3.625%, 9/15/2022 | | | 79,932 | |
| | | | Boston Scientific Corporation | | | | |
| | 75,000 | | | 6.000%, 1/15/2020 | | | 83,940 | |
| | 125,000 | | | 3.850%, 5/15/2025 | | | 131,035 | |
| | 126,000 | | | 7.375%, 1/15/2040 | | | 165,156 | |
| | | | BRF SA | | | | |
| | 175,000 | | | 4.750%, 5/22/2024g | | | 178,080 | |
| | | | Bunge Limited Finance Corporation | | | | |
| | 108,000 | | | 8.500%, 6/15/2019 | | | 125,851 | |
| | 120,000 | | | 3.500%, 11/24/2020 | | | 125,227 | |
| | | | Cardinal Health, Inc. | | | | |
| | 45,000 | | | 1.950%, 6/15/2018 | | | 45,355 | |
| | 48,000 | | | 4.900%, 9/15/2045 | | | 54,805 | |
| | | | Celgene Corporation | | | | |
| | 180,000 | | | 2.875%, 8/15/2020 | | | 185,714 | |
| | 40,000 | | | 3.550%, 8/15/2022 | | | 42,110 | |
| | 105,000 | | | 5.000%, 8/15/2045 | | | 112,658 | |
| | | | Church & Dwight Company, Inc. | | | | |
| | 50,000 | | | 2.450%, 12/15/2019 | | | 50,743 | |
| | | | Cigna Corporation | | | | |
| | 15,000 | | | 5.375%, 2/15/2042 | | | 17,500 | |
| | | | ConAgra Foods, Inc. | | | | |
| | 63,000 | | | 7.125%, 10/1/2026 | | | 79,448 | |
| | | | EMD Finance, LLC | | | | |
| | 85,000 | | | 1.207%, 3/17/2017g,h | | | 85,030 | |
| | 96,000 | | | 2.950%, 3/19/2022g | | | 98,384 | |
| | | | Energizer Holdings, Inc. | | | | |
| | 320,000 | | | 5.500%, 6/15/2025g | | | 324,000 | |
| | | | Envision Healthcare Corporation | | | | |
| | 365,000 | | | 5.125%, 7/1/2022g | | | 365,000 | |
| | | | Express Scripts Holding Company | | | | |
| | 84,000 | | | 3.900%, 2/15/2022 | | | 89,816 | |
| | 195,000 | | | 4.500%, 2/25/2026 | | | 208,909 | |
| | 34,000 | | | 3.400%, 3/1/2027 | | | 33,380 | |
| | | | Fresenius Medical Care US Finance II, Inc. | | | | |
| | 275,000 | | | 5.875%, 1/31/2022g | | | 311,492 | |
| | | | Gilead Sciences, Inc. | | | | |
| | 45,000 | | | 2.550%, 9/1/2020 | | | 46,119 | |
| | 210,000 | | | 2.950%, 3/1/2027 | | | 207,635 | |
| | | | Grifols Worldwide Operations, Ltd. | | | | |
| | 400,000 | | | 5.250%, 4/1/2022 | | | 417,000 | |
The accompanying Notes to Financial Statements are an integral part of this schedule.
25
MODERATELY AGGRESSIVE ALLOCATION FUND
Schedule of Investments as of October 31, 2016
| | | | | | | | |
Principal
Amount | | | Long-Term Fixed Income (15.3%) | | Value | |
| Consumer Non-Cyclical (0.7%) - continued | | | | |
| | | | H. J. Heinz Company | | | | |
| | $125,000 | | | 3.500%, 7/15/2022 | | | $131,708 | |
| | | | HCA, Inc. | | | | |
| | 205,000 | | | 5.250%, 6/15/2026 | | | 214,225 | |
| | 275,000 | | | 4.500%, 2/15/2027 | | | 271,563 | |
| | | | Imperial Tobacco Finance plc | | | | |
| | 170,000 | | | 2.950%, 7/21/2020g | | | 174,560 | |
| | | | JBS USA, LLC | | | | |
| | 275,000 | | | 5.750%, 6/15/2025g | | | 269,500 | |
| | | | Kraft Foods Group, Inc. | | | | |
| | 168,000 | | | 5.000%, 6/4/2042 | | | 186,103 | |
| | | | Laboratory Corporation of America Holdings | | | | |
| | 60,000 | | | 2.625%, 2/1/2020 | | | 60,994 | |
| | | | LifePoint Health, Inc. | | | | |
| | 275,000 | | | 5.500%, 12/1/2021 | | | 284,969 | |
| | 95,000 | | | 5.375%, 5/1/2024g | | | 94,411 | |
| | | | McKesson Corporation | | | | |
| | 75,000 | | | 4.883%, 3/15/2044 | | | 81,147 | |
| | | | Mead Johnson Nutrition Company | | | | |
| | 84,000 | | | 3.000%, 11/15/2020 | | | 86,835 | |
| | | | Medtronic plc | | | | |
| | 420,000 | | | 4.375%, 3/15/2035 | | | 460,737 | |
| | | | Merck & Company, Inc. | | | | |
| | 65,000 | | | 1.182%, 2/10/2020h | | | 65,332 | |
| | 30,000 | | | 3.700%, 2/10/2045 | | | 30,781 | |
| | | | Mondelez International, Inc. | | | | |
| | 91,000 | | | 1.277%, 2/1/2019h | | | 90,995 | |
| | | | Mylan NV | | | | |
| | 170,000 | | | 3.000%, 12/15/2018g | | | 173,621 | |
| | | | PepsiCo, Inc. | | | | |
| | 168,000 | | | 2.850%, 2/24/2026 | | | 173,543 | |
| | | | Pernod Ricard SA | | | | |
| | 150,000 | | | 3.250%, 6/8/2026g | | | 150,670 | |
| | | | Perrigo Finance Unlimited Company | | | | |
| | 255,000 | | | 3.500%, 3/15/2021 | | | 263,493 | |
| | | | Reynolds American, Inc. | | | | |
| | 90,000 | | | 2.300%, 8/21/2017 | | | 90,720 | |
| | 257,000 | | | 5.700%, 8/15/2035 | | | 310,736 | |
| | | | Roche Holdings, Inc. | | | | |
| | 130,000 | | | 4.000%, 11/28/2044g | | | 142,276 | |
| | | | SABMiller Holdings, Inc. | | | | |
| | 64,000 | | | 3.750%, 1/15/2022g | | | 68,927 | |
| | | | Safeway, Inc. | | | | |
| | 4,000 | | | 3.400%, 12/1/2016 | | | 4,000 | |
| | | | Shire Acquisitions Investments Ireland Designated Activity Company | | | | |
| | 126,000 | | | 2.400%, 9/23/2021 | | | 125,023 | |
| | 126,000 | | | 3.200%, 9/23/2026 | | | 123,729 | |
| | | | Spectrum Brands, Inc. | | | | |
| | 180,000 | | | 5.750%, 7/15/2025 | | | 194,850 | |
| | | | Tenet Healthcare Corporation | | | | |
| | 480,000 | | | 8.125%, 4/1/2022 | | | 469,200 | |
| | | | Teva Pharmaceutical Finance Netherlands III BV | | | | |
| | 173,000 | | | 2.200%, 7/21/2021 | | | 170,912 | |
| | 105,000 | | | 2.800%, 7/21/2023 | | | 103,324 | |
| | 80,000 | | | 4.100%, 10/1/2046 | | | 74,265 | |
| | | | Thermo Fisher Scientific, Inc. | | | | |
| | 63,000 | | | 3.000%, 4/15/2023 | | | 63,947 | |
| | | | TreeHouse Foods, Inc. | | | | |
| | 185,000 | | | 4.875%, 3/15/2022 | | | 191,937 | |
| | | | UnitedHealth Group, Inc. | | | | |
| | 380,000 | | | 4.625%, 7/15/2035 | | | 433,439 | |
| | | | VRX Escrow Corporation | | | | |
| | 570,000 | | | 6.125%, 4/15/2025g | | | 450,300 | |
| | | | Zoetis, Inc. | | | | |
| | 168,000 | | | 4.700%, 2/1/2043 | | | 172,626 | |
| | | | | |
| | | | Total | | | 13,610,901 | |
| | | | | |
| |
| Energy (0.4%) | | | | |
| | | | Anadarko Petroleum Corporation | | | | |
| | 125,000 | | | 4.850%, 3/15/2021 | | | 135,703 | |
| | | | Antero Resources Corporation | | | | |
| | 290,000 | | | 5.125%, 12/1/2022 | | | 292,175 | |
| | | | Apache Corporation | | | | |
| | 165,000 | | | 4.750%, 4/15/2043 | | | 172,321 | |
| | | | Boardwalk Pipelines, LP | | | | |
| | 102,000 | | | 5.875%, 11/15/2016 | | | 102,154 | |
| | 80,000 | | | 5.950%, 6/1/2026 | | | 88,719 | |
| | | | BP Capital Markets plc | | | | |
| | 164,000 | | | 3.062%, 3/17/2022 | | | 170,902 | |
| | 252,000 | | | 3.535%, 11/4/2024 | | | 263,622 | |
| | 45,000 | | | 3.119%, 5/4/2026 | | | 45,533 | |
| | | | Buckeye Partners, LP | | | | |
| | 107,000 | | | 2.650%, 11/15/2018 | | | 108,186 | |
| | 28,000 | | | 3.950%, 12/1/2026c | | | 27,966 | |
| | | | Canadian Natural Resources, Ltd. | | | | |
| | 200,000 | | | 3.450%, 11/15/2021 | | | 206,028 | |
| | | | CNOOC Nexen Finance | | | | |
| | 108,000 | | | 1.625%, 4/30/2017 | | | 108,012 | |
| | | | CNPC General Capital, Ltd. | | | | |
| | 72,000 | | | 2.750%, 4/19/2017g | | | 72,385 | |
| | | | Columbia Pipeline Group, Inc. | | | | |
| | 165,000 | | | 2.450%, 6/1/2018 | | | 165,695 | |
| | | | Concho Resources, Inc. | | | | |
| | 205,000 | | | 6.500%, 1/15/2022 | | | 212,175 | |
| | 273,154 | | | 5.500%, 10/1/2022 | | | 280,666 | |
| | | | ConocoPhillips Company | | | | |
| | 105,000 | | | 4.200%, 3/15/2021 | | | 113,984 | |
| | | | Contura Energy, Inc. | | | | |
| | 35,000 | | | 10.000%, 8/1/2021* | | | 36,925 | |
| | | | Crestwood Midstream Partners, LP | | | | |
| | 155,000 | | | 6.125%, 3/1/2022 | | | 158,488 | |
| | | | Devon Energy Corporation | | | | |
| | 130,000 | | | 3.250%, 5/15/2022 | | | 130,525 | |
| | 84,000 | | | 5.850%, 12/15/2025 | | | 96,286 | |
| | | | Ecopetrol SA | | | | |
| | 80,000 | | | 5.875%, 9/18/2023 | | | 85,800 | |
| | | | Enbridge Energy Partners, LP | | | | |
| | 84,000 | | | 4.375%, 10/15/2020 | | | 89,620 | |
| | | | Enbridge, Inc. | | | | |
| | 90,000 | | | 1.289%, 6/2/2017e,h | | | 89,893 | |
| | | | Energy Transfer Partners, LP | | | | |
| | 168,000 | | | 4.650%, 6/1/2021 | | | 180,187 | |
| | 90,000 | | | 4.900%, 3/15/2035 | | | 84,422 | |
| | | | EnLink Midstream Partners, LP | | | | |
| | 85,000 | | | 4.150%, 6/1/2025 | | | 82,823 | |
| | 63,000 | | | 4.850%, 7/15/2026 | | | 64,173 | |
| | | | Enterprise Products Operating, LLC | | | | |
| | 48,000 | | | 5.100%, 2/15/2045 | | | 50,945 | |
| | | | EQT Corporation | | | | |
| | 53,000 | | | 5.150%, 3/1/2018 | | | 55,059 | |
| | 55,000 | | | 8.125%, 6/1/2019 | | | 62,731 | |
| | 150,000 | | | 4.875%, 11/15/2021 | | | 164,045 | |
| | | | Exxon Mobil Corporation | | | | |
| | 70,000 | | | 4.114%, 3/1/2046 | | | 75,536 | |
| | | | Magellan Midstream Partners, LP | | | | |
| | 120,000 | | | 5.000%, 3/1/2026 | | | 136,107 | |
The accompanying Notes to Financial Statements are an integral part of this schedule.
26
MODERATELY AGGRESSIVE ALLOCATION FUND
Schedule of Investments as of October 31, 2016
| | | | | | | | |
Principal
Amount | | | Long-Term Fixed Income (15.3%) | | Value | |
| Energy (0.4%) - continued | | | | |
| | | | Marathon Oil Corporation | | | | |
| | $126,000 | | | 2.700%, 6/1/2020 | | | $124,251 | |
| | | | Marathon Petroleum Corporation | | | | |
| | 65,000 | | | 3.400%, 12/15/2020 | | | 67,542 | |
| | 60,000 | | | 4.750%, 9/15/2044 | | | 53,068 | |
| | | | MEG Energy Corporation | | | | |
| | 275,000 | | | 6.500%, 3/15/2021g | | | 237,188 | |
| | | | MPLX, LP | | | | |
| | 475,000 | | | 4.875%, 12/1/2024 | | | 496,780 | |
| | 168,000 | | | 4.875%, 6/1/2025 | | | 175,249 | |
| | | | Newfield Exploration Company | | | | |
| | 250,000 | | | 5.625%, 7/1/2024 | | | 260,000 | |
| | | | Noble Energy, Inc. | | | | |
| | 73,000 | | | 5.625%, 5/1/2021 | | | 75,689 | |
| | | | Northern Tier Energy, LLC | | | | |
| | 360,000 | | | 7.125%, 11/15/2020 | | | 368,100 | |
| | | | Petrobras Global Finance BV | | | | |
| | 52,000 | | | 8.375%, 5/23/2021 | | | 57,528 | |
| | | | Petrobras International Finance Company | | | | |
| | 84,000 | | | 5.750%, 1/20/2020 | | | 86,688 | |
| | | | Petroleos Mexicanos | | | | |
| | 124,000 | | | 5.500%, 2/4/2019g | | | 131,254 | |
| | 68,000 | | | 2.378%, 4/15/2025 | | | 69,869 | |
| | | | Phillips 66 Partners, LP | | | | |
| | 105,000 | | | 3.550%, 10/1/2026 | | | 104,614 | |
| | | | Pioneer Natural Resources Company | | | | |
| | 46,000 | | | 3.450%, 1/15/2021 | | | 47,923 | |
| | 85,000 | | | 4.450%, 1/15/2026 | | | 93,117 | |
| | | | Regency Energy Partners, LP | | | | |
| | 275,000 | | | 5.000%, 10/1/2022 | | | 295,087 | |
| | | | Rice Energy, Inc. | | | | |
| | 275,000 | | | 6.250%, 5/1/2022 | | | 279,813 | |
| | | | Sabine Pass Liquefaction, LLC | | | | |
| | 275,000 | | | 5.625%, 3/1/2025 | | | 290,991 | |
| | | | Schlumberger Holdings Corporation | | | | |
| | 65,000 | | | 3.000%, 12/21/2020g | | | 67,445 | |
| | 105,000 | | | 4.000%, 12/21/2025g | | | 112,769 | |
| | | | Shell International Finance BV | | | | |
| | 60,000 | | | 1.266%, 5/11/2020h | | | 60,066 | |
| | | | Suncor Energy, Inc. | | | | |
| | 95,000 | | | 3.600%, 12/1/2024 | | | 98,675 | |
| | | | Sunoco Logistics Partners Operations, LP | | | | |
| | 285,000 | | | 4.400%, 4/1/2021 | | | 307,445 | |
| | | | Valero Energy Corporation | | | | |
| | 210,000 | | | 3.400%, 9/15/2026 | | | 205,534 | |
| | | | Weatherford International, Ltd. | | | | |
| | 315,000 | | | 8.250%, 6/15/2023e | | | 326,025 | |
| | | | | |
| | | | Total | | | 8,702,501 | |
| | | | | |
| |
| Financials (1.3%) | | | | |
| | | | ABN AMRO Bank NV | | | | |
| | 200,000 | | | 4.750%, 7/28/2025g | | | 210,098 | |
| | | | ACE INA Holdings, Inc. | | | | |
| | 125,000 | | | 4.350%, 11/3/2045 | | | 139,540 | |
| | | | AerCap Ireland Capital, Ltd. | | | | |
| | 80,000 | | | 3.750%, 5/15/2019 | | | 82,094 | |
| | 84,000 | | | 4.625%, 10/30/2020 | | | 88,410 | |
| | 360,000 | | | 5.000%, 10/1/2021 | | | 382,500 | |
| | 84,000 | | | 4.625%, 7/1/2022 | | | 87,675 | |
| | | | Aetna, Inc. | | | | |
| | 130,000 | | | 2.400%, 6/15/2021 | | | 131,179 | |
| | 180,000 | | | 2.800%, 6/15/2023 | | | 182,401 | |
| | 85,000 | | | 3.200%, 6/15/2026 | | | 85,300 | |
| | 130,000 | | | 4.250%, 6/15/2036 | | | 131,909 | |
| | | | Air Lease Corporation | | | | |
| | 75,000 | | | 2.125%, 1/15/2018 | | | 75,262 | |
| | 33,000 | | | 2.625%, 9/4/2018 | | | 33,405 | |
| | | | Aircastle, Ltd. | | | | |
| | 320,000 | | | 5.000%, 4/1/2023 | | | 331,200 | |
| | | | Ally Financial, Inc. | | | | |
| | 180,000 | | | 3.750%, 11/18/2019 | | | 180,225 | |
| | 200,000 | | | 4.125%, 3/30/2020 | | | 203,250 | |
| | | | American Express Credit Corporation | | | | |
| | 130,000 | | | 1.407%, 3/18/2019h | | | 130,304 | |
| | | | American International Group, Inc. | | | | |
| | 55,000 | | | 3.300%, 3/1/2021 | | | 57,497 | |
| | 126,000 | | | 4.125%, 2/15/2024 | | | 135,446 | |
| | 55,000 | | | 3.900%, 4/1/2026 | | | 57,611 | |
| | | | Aon plc | | | | |
| | 63,000 | | | 3.875%, 12/15/2025 | | | 66,834 | |
| | | | Argos Merger Sub, Inc. | | | | |
| | 350,000 | | | 7.125%, 3/15/2023e,g | | | 366,187 | |
| | | | Avalonbay Communities, Inc. | | | | |
| | 200,000 | | | 3.500%, 11/15/2025 | | | 207,920 | |
| | | | Banco Santander Chile | | | | |
| | 155,000 | | | 1.776%, 4/11/2017g,h | | | 154,612 | |
| | | | Bank of America Corporation | | | | |
| | 135,000 | | | 1.936%, 3/22/2018h | | | 136,142 | |
| | 110,000 | | | 1.716%, 4/1/2019h | | | 110,343 | |
| | 125,000 | | | 2.625%, 10/19/2020 | | | 127,092 | |
| | 200,000 | | | 3.300%, 1/11/2023 | | | 205,723 | |
| | 168,000 | | | 4.000%, 4/1/2024 | | | 179,499 | |
| | 170,000 | | | 4.000%, 1/22/2025 | | | 174,793 | |
| | 126,000 | | | 3.500%, 4/19/2026 | | | 129,329 | |
| | 208,000 | | | 5.875%, 2/7/2042 | | | 263,042 | |
| | 168,000 | | | 8.000%, 7/29/2049j | | | 171,150 | |
| | | | Bank of New York Mellon Corporation | | | | |
| | 210,000 | | | 2.500%, 4/15/2021 | | | 214,119 | |
| | | | Bank of Tokyo-Mitsubishi UFJ, Ltd. | | | | |
| | 55,000 | | | 2.850%, 9/8/2021g | | | 56,324 | |
| | | | Barclays Bank plc | | | | |
| | 42,000 | | | 10.179%, 6/12/2021g | | | 53,106 | |
| | | | Barclays plc | | | | |
| | 90,000 | | | 2.750%, 11/8/2019 | | | 90,722 | |
| | 168,000 | | | 3.650%, 3/16/2025 | | | 164,947 | |
| | | | BB&T Corporation | | | | |
| | 55,000 | | | 1.595%, 1/15/2020h | | | 55,048 | |
| | | | Berkshire Hathaway, Inc. | | | | |
| | 105,000 | | | 2.750%, 3/15/2023 | | | 108,118 | |
| | | | BPCE SA | | | | |
| | 96,000 | | | 5.700%, 10/22/2023g | | | 104,013 | |
| | | | Caisse Centrale Desjardins du Quebec | | | | |
| | 75,000 | | | 1.552%, 1/29/2018g,h | | | 74,919 | |
| | | | Capital One Financial Corporation | | | | |
| | 90,000 | | | 2.450%, 4/24/2019 | | | 91,522 | |
| | | | Centene Escrow Corporation | | | | |
| | 400,000 | | | 5.625%, 2/15/2021 | | | 419,604 | |
| | | | CIT Group, Inc. | | | | |
| | 355,000 | | | 5.000%, 8/15/2022 | | | 378,519 | |
| | | | Citigroup, Inc. | | | | |
| | 90,000 | | | 1.642%, 4/8/2019h | | | 90,118 | |
| | 170,000 | | | 2.700%, 3/30/2021 | | | 172,931 | |
| | 89,000 | | | 4.050%, 7/30/2022 | | | 94,065 | |
| | 235,000 | | | 4.400%, 6/10/2025 | | | 248,183 | |
| | 168,000 | | | 3.200%, 10/21/2026 | | | 167,607 | |
| | 126,000 | | | 4.125%, 7/25/2028 | | | 129,131 | |
| | 94,000 | | | 4.650%, 7/30/2045 | | | 102,851 | |
The accompanying Notes to Financial Statements are an integral part of this schedule.
27
MODERATELY AGGRESSIVE ALLOCATION FUND
Schedule of Investments as of October 31, 2016
| | | | | | | | |
Principal
Amount | | | Long-Term Fixed Income (15.3%) | | Value | |
| Financials (1.3%) - continued | | | | |
| | | | Citizens Bank NA | | | | |
| | $250,000 | | | 2.300%, 12/3/2018 | | | $252,700 | |
| | | | CoBank ACB | | | | |
| | 50,000 | | | 1.450%, 6/15/2022h | | | 47,467 | |
| | | | Compass Bank | | | | |
| | 90,000 | | | 2.750%, 9/29/2019 | | | 90,079 | |
| | | | Cooperatieve Centrale Raiffeisen- Boerenleenbank BA | | | | |
| | 72,000 | | | 3.950%, 11/9/2022 | | | 75,478 | |
| | | | Credit Agricole SA | | | | |
| | 110,000 | | | 1.680%, 4/15/2019g,h | | | 110,354 | |
| | | | Credit Suisse AG | | | | |
| | 73,000 | | | 5.400%, 1/14/2020 | | | 79,127 | |
| | | | Credit Suisse Group Funding, Ltd. | | | | |
| | 252,000 | | | 2.750%, 3/26/2020 | | | 252,541 | |
| | 168,000 | | | 3.750%, 3/26/2025 | | | 166,638 | |
| | | | CyrusOne, LP | | | | |
| | 275,000 | | | 6.375%, 11/15/2022 | | | 291,500 | |
| | | | Deutsche Bank AG | | | | |
| | 252,000 | | | 3.375%, 5/12/2021 | | | 247,941 | |
| | | | Digital Realty Trust LP | | | | |
| | 100,000 | | | 3.400%, 10/1/2020 | | | 103,716 | |
| | | | Discover Bank | | | | |
| | 190,000 | | | 8.700%, 11/18/2019 | | | 220,362 | |
| | | | Discover Financial Services | | | | |
| | 72,000 | | | 6.450%, 6/12/2017 | | | 74,146 | |
| | | | Duke Realty, LP | | | | |
| | 30,000 | | | 3.875%, 2/15/2021 | | | 31,826 | |
| | 90,000 | | | 4.375%, 6/15/2022 | | | 97,690 | |
| | | | ERP Operating, LP | | | | |
| | 32,000 | | | 3.375%, 6/1/2025 | | | 33,155 | |
| | | | European Investment Bank | | | | |
| | 165,000 | | | 1.875%, 3/15/2019 | | | 167,564 | |
| | | | Fifth Third Bancorp | | | | |
| | 93,000 | | | 5.450%, 1/15/2017 | | | 93,843 | |
| | 52,000 | | | 2.875%, 7/27/2020 | | | 53,710 | |
| | 55,000 | | | 2.875%, 10/1/2021 | | | 57,048 | |
| | | | GE Capital International Funding Company | | | | |
| | 350,000 | | | 4.418%, 11/15/2035 | | | 381,765 | |
| | | | Genworth Financial, Inc. | | | | |
| | 63,000 | | | 7.700%, 6/15/2020 | | | 60,952 | |
| | | | Goldman Sachs Group, Inc. | | | | |
| | 180,000 | | | 2.087%, 4/30/2018h | | | 181,666 | |
| | 95,000 | | | 1.917%, 11/15/2018h | | | 95,789 | |
| | 342,000 | | | 5.375%, 3/15/2020 | | | 377,582 | |
| | 75,000 | | | 2.042%, 4/23/2020h | | | 75,440 | |
| | 336,000 | | | 5.250%, 7/27/2021 | | | 377,643 | |
| | 210,000 | | | 2.350%, 11/15/2021 | | | 208,724 | |
| | 84,000 | | | 3.500%, 1/23/2025 | | | 86,147 | |
| | 145,000 | | | 4.750%, 10/21/2045 | | | 159,474 | |
| | | | Hartford Financial Services Group, Inc. | | | | |
| | 219,000 | | | 5.125%, 4/15/2022 | | | 247,802 | |
| | | | HBOS plc | | | | |
| | 213,000 | | | 6.750%, 5/21/2018g | | | 226,470 | |
| | | | HCP, Inc. | | | | |
| | 265,000 | | | 4.000%, 12/1/2022 | | | 279,245 | |
| | 60,000 | | | 3.400%, 2/1/2025 | | | 58,807 | |
| | | | HSBC Bank plc | | | | |
| | 180,000 | | | 1.457%, 5/15/2018g,h | | | 180,044 | |
| | | | HSBC Holdings plc | | | | |
| | 125,000 | | | 2.650%, 1/5/2022 | | | 124,372 | |
| | 200,000 | | | 3.600%, 5/25/2023 | | | 206,580 | |
| | 200,000 | | | 3.900%, 5/25/2026 | | | 207,018 | |
| | 200,000 | | | 6.875%, 12/29/2049j | | | 210,500 | |
| | | | Huntington Bancshares, Inc. | | | | |
| | 24,000 | | | 2.600%, 8/2/2018 | | | 24,341 | |
| | | | Huntington National Bank | | | | |
| | 250,000 | | | 2.200%, 11/6/2018 | | | 252,365 | |
| | | | Icahn Enterprises, LP | | | | |
| | 180,000 | | | 6.000%, 8/1/2020 | | | 176,850 | |
| | | | ING Capital Funding Trust III | | | | |
| | 90,000 | | | 4.438%, 12/29/2049h,j | | | 89,437 | |
| | | | Intesa Sanpaolo SPA | | | | |
| | 170,000 | | | 5.250%, 1/12/2024 | | | 183,311 | |
| | | | J.P. Morgan Chase & Company | | | | |
| | 116,000 | | | 6.300%, 4/23/2019 | | | 128,584 | |
| | 60,000 | | | 2.250%, 1/23/2020 | | | 60,417 | |
| | 95,000 | | | 2.295%, 8/15/2021 | | | 95,074 | |
| | 210,000 | | | 4.500%, 1/24/2022 | | | 231,349 | |
| | 126,000 | | | 3.200%, 1/25/2023 | | | 130,216 | |
| | 210,000 | | | 2.700%, 5/18/2023 | | | 210,626 | |
| | 95,000 | | | 2.112%, 10/24/2023h | | | 94,626 | |
| | 120,000 | | | 3.625%, 5/13/2024 | | | 126,150 | |
| | 240,000 | | | 3.125%, 1/23/2025 | | | 241,934 | |
| | 135,000 | | | 3.300%, 4/1/2026 | | | 137,543 | |
| | 220,000 | | | 7.900%, 4/29/2049j | | | 226,765 | |
| | | | KeyCorp | | | | |
| | 100,000 | | | 2.900%, 9/15/2020 | | | 102,962 | |
| | | | Liberty Mutual Group, Inc. | | | | |
| | 178,000 | | | 4.950%, 5/1/2022g | | | 199,521 | |
| | | | Liberty Property, LP | | | | |
| | 246,000 | | | 3.750%, 4/1/2025 | | | 255,215 | |
| | | | Lincoln National Corporation | | | | |
| | 84,000 | | | 8.750%, 7/1/2019 | | | 97,931 | |
| | 126,000 | | | 7.000%, 6/15/2040 | | | 160,895 | |
| | | | Lloyds Bank plc | | | | |
| | 85,000 | | | 1.374%, 3/16/2018h | | | 84,836 | |
| | | | Merrill Lynch & Company, Inc. | | | | |
| | 252,000 | | | 6.400%, 8/28/2017 | | | 262,120 | |
| | | | MetLife, Inc. | | | | |
| | 125,000 | | | 4.050%, 3/1/2045 | | | 124,120 | |
| | | | Mizuho Bank, Ltd. | | | | |
| | 108,000 | | | 1.850%, 3/21/2018g | | | 108,262 | |
| | | | Morgan Stanley | | | | |
| | 400,000 | | | 6.625%, 4/1/2018 | | | 427,077 | |
| | 120,000 | | | 2.162%, 4/25/2018h | | | 121,274 | |
| | 75,000 | | | 2.026%, 1/27/2020h | | | 75,747 | |
| | 105,000 | | | 2.500%, 4/21/2021 | | | 105,831 | |
| | 65,000 | | | 4.875%, 11/1/2022 | | | 71,393 | |
| | 100,000 | | | 4.000%, 7/23/2025 | | | 106,558 | |
| | 210,000 | | | 4.350%, 9/8/2026 | | | 222,956 | |
| | 75,000 | | | 4.300%, 1/27/2045 | | | 78,539 | |
| | 210,000 | | | 5.550%, 12/29/2049j | | | 214,987 | |
| | | | MPT Operating Partnership, LP | | | | |
| | 275,000 | | | 6.375%, 3/1/2024 | | | 296,313 | |
| | 185,000 | | | 5.500%, 5/1/2024 | | | 190,550 | |
| | | | Nasdaq, Inc. | | | | |
| | 110,000 | | | 3.850%, 6/30/2026 | | | 113,387 | |
| | | | National City Corporation | | | | |
| | 87,000 | | | 6.875%, 5/15/2019 | | | 97,331 | |
| | | | Prime Security Services Borrower, LLC | | | | |
| | 310,000 | | | 9.250%, 5/15/2023g | | | 329,375 | |
| | | | Prudential Financial, Inc. | | | | |
| | 55,000 | | | 2.350%, 8/15/2019 | | | 56,002 | |
| | | | Quicken Loans, Inc. | | | | |
| | 385,000 | | | 5.750%, 5/1/2025g | | | 380,187 | |
The accompanying Notes to Financial Statements are an integral part of this schedule.
28
MODERATELY AGGRESSIVE ALLOCATION FUND
Schedule of Investments as of October 31, 2016
| | | | | | | | |
Principal
Amount | | | Long-Term Fixed Income (15.3%) | | Value | |
| Financials (1.3%) - continued | | | | |
| | | | Realty Income Corporation | | | | |
| | $27,000 | | | 2.000%, 1/31/2018 | | | $27,153 | |
| | | | Regions Bank | | | | |
| | 71,000 | | | 7.500%, 5/15/2018 | | | 76,939 | |
| | | | Regions Financial Corporation | | | | |
| | 125,000 | | | 2.250%, 9/14/2018 | | | 126,000 | |
| | 126,000 | | | 3.200%, 2/8/2021 | | | 130,632 | |
| | | | Reinsurance Group of America, Inc. | | | | |
| | 50,000 | | | 5.625%, 3/15/2017 | | | 50,762 | |
| | 81,000 | | | 5.000%, 6/1/2021 | | | 88,172 | |
| | | | Reliance Standard Life Global Funding II | | | | |
| | 85,000 | | | 2.500%, 4/24/2019g | | | 86,113 | |
| | | | Royal Bank of Scotland Group plc | | | | |
| | 200,000 | | | 3.875%, 9/12/2023 | | | 195,812 | |
| | | | Santander Holdings USA, Inc. | | | | |
| | 115,000 | | | 3.450%, 8/27/2018 | | | 117,555 | |
| | | | Santander UK Group Holdings plc | | | | |
| | 147,000 | | | 2.875%, 10/16/2020 | | | 147,598 | |
| | | | Santander UK plc | | | | |
| | 48,000 | | | 3.050%, 8/23/2018 | | | 49,013 | |
| | | | Simon Property Group, LP | | | | |
| | 42,000 | | | 10.350%, 4/1/2019 | | | 49,887 | |
| | 55,000 | | | 2.500%, 9/1/2020 | | | 56,376 | |
| | 140,000 | | | 2.750%, 2/1/2023 | | | 142,450 | |
| | | | Skandinaviska Enskilda Banken AB | | | | |
| | 135,000 | | | 2.375%, 3/25/2019g | | | 136,762 | |
| | | | Standard Chartered plc | | | | |
| | 120,000 | | | 2.100%, 8/19/2019g | | | 119,898 | |
| | | | State Street Corporation | | | | |
| | 85,000 | | | 1.701%, 8/18/2020h | | | 85,784 | |
| | | | Sumitomo Mitsui Banking Corporation | | | | |
| | 90,000 | | | 1.460%, 1/16/2018h | | | 90,080 | |
| | | | Sumitomo Mitsui Financial Group, Inc. | | | | |
| | 126,000 | | | 3.010%, 10/19/2026 | | | 125,648 | |
| | | | Svenska Handelsbanken AB | | | | |
| | 120,000 | | | 1.347%, 6/17/2019h | | | 120,164 | |
| | | | Synchrony Financial | | | | |
| | 50,000 | | | 1.989%, 2/3/2020h | | | 48,943 | |
| | 55,000 | | | 3.750%, 8/15/2021 | | | 57,707 | |
| | 235,000 | | | 4.250%, 8/15/2024 | | | 244,951 | |
| | | | Toronto-Dominion Bank | | | | |
| | 65,000 | | | 1.786%, 12/14/2020h | | | 65,677 | |
| | | | UBS Group Funding Jersey, Ltd. | | | | |
| | 210,000 | | | 2.950%, 9/24/2020g | | | 214,344 | |
| | 126,000 | | | 4.125%, 9/24/2025g | | | 131,279 | |
| | | | UnitedHealth Group, Inc. | | | | |
| | 35,000 | | | 3.350%, 7/15/2022 | | | 37,235 | |
| | | | USB Realty Corporation | | | | |
| | 50,000 | | | 2.027%, 12/29/2049g,h,j | | | 44,875 | |
| | | | Voya Financial, Inc. | | | | |
| | 109,000 | | | 2.900%, 2/15/2018 | | | 110,796 | |
| | | | Wells Fargo & Company | | | | |
| | 75,000 | | | 1.567%, 1/30/2020h | | | 74,860 | |
| | 170,000 | | | 2.550%, 12/7/2020 | | | 172,968 | |
| | 168,000 | | | 3.450%, 2/13/2023 | | | 172,443 | |
| | 125,000 | | | 3.000%, 2/19/2025 | | | 125,177 | |
| | 175,000 | | | 3.000%, 4/22/2026 | | | 174,193 | |
| | 168,000 | | | 3.000%, 10/23/2026 | | | 166,847 | |
| | 168,000 | | | 4.900%, 11/17/2045 | | | 180,595 | |
| | | | Welltower, Inc. | | | | |
| | 27,000 | | | 2.250%, 3/15/2018 | | | 27,238 | |
| | 65,000 | | | 3.750%, 3/15/2023 | | | 67,764 | |
| | 55,000 | | | 4.000%, 6/1/2025 | | | 57,586 | |
| | | | | |
| | | | Total | | | 25,017,957 | |
| | | | | |
| |
| Foreign Government (<0.1%) | | | | |
| | | | Export-Import Bank of Korea | | | | |
| | 75,000 | | | 2.250%, 1/21/2020 | | | 75,625 | |
| | | | Kommunalbanken AS | | | | |
| | 125,000 | | | 1.500%, 10/22/2019g | | | 125,384 | |
| | | | Mexico Government International Bond | | | | |
| | 125,000 | | | 4.350%, 1/15/2047 | | | 118,250 | |
| | 100,000 | | | 4.125%, 1/21/2026 | | | 105,700 | |
| | | | | |
| | | | Total | | | 424,959 | |
| | | | | |
| |
| Mortgage-Backed Securities (5.0%) | | | | |
| | | | Federal Home Loan Mortgage Corporation Gold 15-Yr. Pass Through | | | | |
| | 9,050,000 | | | 3.000%, 11/1/2031c | | | 9,470,684 | |
| | | | Federal Home Loan Mortgage Corporation Gold 30-Yr. Pass Through | | | | |
| | 3,675,000 | | | 4.000%, 11/1/2046c | | | 3,930,958 | |
| | | | Federal National Mortgage Association Conventional | | | | |
| | 12,300,000 | | | 3.000%, 11/1/2046c | | | 12,663,234 | |
| | | | Federal National Mortgage Association Conventional 15-Yr. Pass Through | | | | |
| | 5,850,000 | | | 2.500%, 11/1/2031c | | | 6,019,559 | |
| | | | Federal National Mortgage Association Conventional 30-Yr. Pass Through | | | | |
| | 419,559 | | | 1.735%, 7/1/2043h | | | 431,121 | |
| | 223,362 | | | 2.043%, 7/1/2043h | | | 229,854 | |
| | 230,282 | | | 2.088%, 8/1/2043h | | | 237,132 | |
| | 36,100,000 | | | 3.500%, 11/1/2046c | | | 37,899,361 | |
| | 18,850,000 | | | 4.000%, 11/1/2046c | | | 20,184,225 | |
| | 7,915,000 | | | 4.500%, 11/1/2046c | | | 8,650,848 | |
| | | | | |
| | | | Total | | | 99,716,976 | |
| | | | | |
| |
| Technology (0.3%) | | | | |
| | | | Amphenol Corporation | | | | |
| | 69,000 | | | 2.550%, 1/30/2019 | | | 70,370 | |
| | | | Apple, Inc. | | | | |
| | 60,000 | | | 1.117%, 5/6/2020h | | | 59,896 | |
| | 294,000 | | | 3.200%, 5/13/2025 | | | 307,776 | |
| | 126,000 | | | 4.650%, 2/23/2046 | | | 138,870 | |
| | | | Cisco Systems, Inc. | | | | |
| | 80,000 | | | 1.342%, 3/1/2019h | | | 80,447 | |
| | | | CommScope Technologies Finance, LLC | | | | |
| | 245,000 | | | 6.000%, 6/15/2025g | | | 257,250 | |
| | | | Diamond 1 Finance Corporation | | | | |
| | 105,000 | | | 3.480%, 6/1/2019g | | | 107,730 | |
| | 83,000 | | | 5.450%, 6/15/2023g | | | 88,881 | |
| | 63,000 | | | 6.020%, 6/15/2026g | | | 68,673 | |
| | 126,000 | | | 8.100%, 7/15/2036g | | | 150,414 | |
| | 84,000 | | | 8.350%, 7/15/2046g | | | 101,782 | |
| | | | Equinix, Inc. | | | | |
| | 185,000 | | | 5.750%, 1/1/2025 | | | 195,637 | |
| | | | Fidelity National Information Services, Inc. | | | | |
| | 145,000 | | | 2.850%, 10/15/2018 | | | 148,302 | |
| | 124,000 | | | 3.625%, 10/15/2020 | | | 130,792 | |
| | | | First Data Corporation | | | | |
| | 185,000 | | | 5.375%, 8/15/2023g | | | 191,475 | |
The accompanying Notes to Financial Statements are an integral part of this schedule.
29
MODERATELY AGGRESSIVE ALLOCATION FUND
Schedule of Investments as of October 31, 2016
| | | | | | | | |
Principal
Amount | | | Long-Term Fixed Income (15.3%) | | Value | |
| Technology (0.3%) - continued | | | | |
| | | | Hewlett Packard Enterprise Company | | | | |
| | $96,000 | | | 2.700%, 10/5/2017g | | | $97,216 | |
| | 48,000 | | | 3.100%, 10/5/2018g | | | 49,076 | |
| | 48,000 | | | 4.650%, 10/15/2022g | | | 51,704 | |
| | | | IMS Health, Inc. | | | | |
| | 360,000 | | | 6.000%, 11/1/2020g | | | 365,400 | |
| | | | Intel Corporation | | | | |
| | 30,000 | | | 3.100%, 7/29/2022 | | | 31,673 | |
| | 65,000 | | | 3.700%, 7/29/2025 | | | 71,011 | |
| | 189,000 | | | 4.100%, 5/19/2046 | | | 194,442 | |
| | | | International Business Machines Corporation | | | | |
| | 168,000 | | | 4.700%, 2/19/2046 | | | 187,890 | |
| | | | Iron Mountain, Inc. | | | | |
| | 310,000 | | | 6.000%, 8/15/2023 | | | 329,375 | |
| | | | Microsoft Corporation | | | | |
| | 270,000 | | | 4.750%, 11/3/2055 | | | 302,668 | |
| | 270,000 | | | 4.200%, 11/3/2035 | | | 296,475 | |
| | 150,000 | | | 3.700%, 8/8/2046 | | | 146,576 | |
| | | | NXP BV | | | | |
| | 345,000 | | | 3.875%, 9/1/2022g | | | 364,838 | |
| | | | Oracle Corporation | | | | |
| | 55,000 | | | 2.500%, 5/15/2022 | | | 55,617 | |
| | 168,000 | | | 2.400%, 9/15/2023 | | | 167,577 | |
| | 160,000 | | | 2.950%, 5/15/2025 | | | 163,407 | |
| | | | Plantronics, Inc. | | | | |
| | 275,000 | | | 5.500%, 5/31/2023g | | | 279,812 | |
| | | | Qualcomm, Inc. | | | | |
| | 126,000 | | | 3.000%, 5/20/2022 | | | 131,329 | |
| | | | Seagate HDD Cayman | | | | |
| | 84,000 | | | 4.875%, 6/1/2027 | | | 75,894 | |
| | | | Sensata Technologies UK Financing Company plc | | | | |
| | 200,000 | | | 6.250%, 2/15/2026g | | | 216,500 | |
| | | | Western Digital Corporation | | | | |
| | 335,000 | | | 10.500%, 4/1/2024g | | | 386,925 | |
| | | | | |
| | | | Total | | | 6,063,700 | |
| | | | | |
| |
| Transportation (0.1%) | | | | |
| | | | Air Canada Pass Through Trust | | | | |
| | 46,581 | | | 3.875%, 3/15/2023g | | | 45,417 | |
| | | | American Airlines Pass Through Trust | | | | |
| | 100,223 | | | 3.375%, 5/1/2027 | | | 102,228 | |
| | | | Avis Budget Car Rental, LLC | | | | |
| | 255,000 | | | 5.125%, 6/1/2022e,g | | | 249,900 | |
| | 185,000 | | | 6.375%, 4/1/2024g | | | 185,925 | |
| | | | Burlington Northern Santa Fe, LLC | | | | |
| | 125,000 | | | 5.050%, 3/1/2041 | | | 147,400 | |
| | 180,000 | | | 3.900%, 8/1/2046 | | | 184,032 | |
| | | | Continental Airlines, Inc. | | | | |
| | 53,803 | | | 4.150%, 4/11/2024 | | | 57,897 | |
| | | | CSX Corporation | | | | |
| | 168,000 | | | 4.250%, 11/1/2066 | | | 161,988 | |
| | 42,000 | | | 3.700%, 11/1/2023 | | | 45,150 | |
| | | | Delta Air Lines, Inc. | | | | |
| | 26,658 | | | 4.950%, 5/23/2019 | | | 28,058 | |
| | | | ERAC USA Finance, LLC | | | | |
| | 30,000 | | | 2.800%, 11/1/2018g | | | 30,584 | |
| | | | J.B. Hunt Transport Services, Inc. | | | | |
| | 50,000 | | | 3.300%, 8/15/2022 | | | 51,796 | |
| | | | Southwest Airlines Company | | | | |
| | 97,000 | | | 2.750%, 11/6/2019 | | | 99,878 | |
| | | | Virgin Australia Holdings, Ltd. | | | | |
| | 27,193 | | | 5.000%, 10/23/2023g | | | 28,212 | |
| | | | XPO Logistics, Inc. | | | | |
| | 270,000 | | | 6.500%, 6/15/2022g | | | 280,800 | |
| | | | | |
| | | | Total | | | 1,699,265 | |
| | | | | |
| |
| U.S. Government and Agencies (3.9%) | | | | |
| | | | U.S. Treasury Bonds | | | | |
| | 550,000 | | | 5.250%, 11/15/2028 | | | 744,025 | |
| | 1,175,000 | | | 4.375%, 5/15/2040 | | | 1,576,749 | |
| | 6,780,000 | | | 3.000%, 5/15/2042 | | | 7,380,667 | |
| | 6,700,000 | | | 3.625%, 2/15/2044 | | | 8,142,858 | |
| | 462,000 | | | 2.250%, 8/15/2046 | | | 429,678 | |
| | | | U.S. Treasury Bonds, TIPS | | | | |
| | 14,712,363 | | | 0.125%, 1/15/2023 | | | 14,923,147 | |
| | 12,061,959 | | | 0.625%, 1/15/2026 | | | 12,590,611 | |
| | 9,402,348 | | | 1.000%, 2/15/2046 | | | 10,129,093 | |
| | | | U.S. Treasury Notes | | | | |
| | 2,200,000 | | | 0.750%, 2/15/2019 | | | 2,191,578 | |
| | 2,000,000 | | | 1.000%, 10/15/2019 | | | 2,000,078 | |
| | 2,840,000 | | | 1.500%, 10/31/2019 | | | 2,880,493 | |
| | 5,000,000 | | | 1.375%, 9/30/2020 | | | 5,033,595 | |
| | 1,750,000 | | | 1.375%, 5/31/2021 | | | 1,756,631 | |
| | 8,634,000 | | | 1.125%, 8/31/2021 | | | 8,557,779 | |
| | 120,000 | | | 1.625%, 8/15/2022 | | | 120,998 | |
| | 168,000 | | | 1.375%, 9/30/2023 | | | 165,349 | |
| | | | | |
| | | | Total | | | 78,623,329 | |
| | | | | |
| |
| Utilities (0.4%) | | | | |
| | | | AES Corporation | | | | |
| | 275,000 | | | 7.375%, 7/1/2021 | | | 310,063 | |
| | | | American Electric Power Company, Inc. | | | | |
| | 253,000 | | | 2.950%, 12/15/2022 | | | 261,601 | |
| | | | Arizona Public Service Company | | | | |
| | 65,000 | | | 2.200%, 1/15/2020 | | | 66,168 | |
| | | | Berkshire Hathaway Energy Company | | | | |
| | 45,000 | | | 2.400%, 2/1/2020 | | | 45,823 | |
| | | | Calpine Corporation | | | | |
| | 275,000 | | | 5.375%, 1/15/2023 | | | 272,250 | |
| | | | Chesapeake Midstream Partners, LP | | | | |
| | 210,000 | | | 6.125%, 7/15/2022 | | | 218,039 | |
| | | | CMS Energy Corporation | | | | |
| | 126,000 | | | 2.950%, 2/15/2027 | | | 125,737 | |
| | | | Commonwealth Edison Company | | | | |
| | 125,000 | | | 3.700%, 3/1/2045 | | | 126,142 | |
| | 105,000 | | | 4.350%, 11/15/2045 | | | 115,906 | |
| | | | Consolidated Edison Company of New York, Inc. | | | | |
| | 63,000 | | | 4.500%, 12/1/2045 | | | 70,303 | |
| | | | Consolidated Edison, Inc. | | | | |
| | 84,000 | | | 2.000%, 5/15/2021 | | | 84,152 | |
| | | | Dominion Resources, Inc. | | | | |
| | 180,000 | | | 2.962%, 7/1/2019 | | | 184,118 | |
| | | | DTE Electric Company | | | | |
| | 95,000 | | | 3.700%, 3/15/2045 | | | 97,394 | |
| | 135,000 | | | 3.700%, 6/1/2046 | | | 138,663 | |
| | | | DTE Energy Company | | | | |
| | 25,000 | | | 2.400%, 12/1/2019 | | | 25,433 | |
| | | | Duke Energy Corporation | | | | |
| | 175,000 | | | 2.100%, 6/15/2018 | | | 176,703 | |
| | 168,000 | | | 3.750%, 9/1/2046 | | | 158,985 | |
| | | | Duke Energy Indiana, LLC | | | | |
| | 170,000 | | | 3.750%, 5/15/2046 | | | 170,397 | |
| | | | Dynegy, Inc. | | | | |
| | 180,000 | | | 6.750%, 11/1/2019 | | | 182,176 | |
| | 320,000 | | | 7.375%, 11/1/2022 | | | 308,600 | |
The accompanying Notes to Financial Statements are an integral part of this schedule.
30
MODERATELY AGGRESSIVE ALLOCATION FUND
Schedule of Investments as of October 31, 2016
| | | | | | | | |
Principal
Amount | | | Long-Term Fixed Income (15.3%) | | Value | |
| Utilities (0.4%) - continued | | | | |
| | | | Edison International | | | | |
| | $170,000 | | | 2.950%, 3/15/2023 | | | $174,284 | |
| | | | Emera U.S. Finance, LP | | | | |
| | 130,000 | | | 2.150%, 6/15/2019g | | | 131,144 | |
| | 130,000 | | | 4.750%, 6/15/2046g | | | 138,151 | |
| | | | Enel Finance International NV | | | | |
| | 37,000 | | | 6.250%, 9/15/2017g | | | 38,497 | |
| | | | Energy Transfer Equity, LP | | | | |
| | 275,000 | | | 5.500%, 6/1/2027 | | | 268,125 | |
| | | | Eversource Energy | | | | |
| | 55,000 | | | 1.600%, 1/15/2018 | | | 55,092 | |
| | | | Exelon Corporation | | | | |
| | 90,000 | | | 5.100%, 6/15/2045 | | | 101,772 | |
| | 126,000 | | | 4.450%, 4/15/2046 | | | 131,079 | |
| | | | Exelon Generation Company, LLC | | | | |
| | 123,000 | | | 5.200%, 10/1/2019 | | | 134,524 | |
| | 50,000 | | | 2.950%, 1/15/2020 | | | 51,304 | |
| | | | ITC Holdings Corporation | | | | |
| | 30,000 | | | 4.050%, 7/1/2023 | | | 31,868 | |
| | 84,000 | | | 5.300%, 7/1/2043 | | | 94,839 | |
| | | | Kinder Morgan Energy Partners, LP | | | | |
| | 130,000 | | | 3.500%, 3/1/2021 | | | 133,635 | |
| | | | MidAmerican Energy Holdings Company | | | | |
| | 252,000 | | | 6.500%, 9/15/2037 | | | 342,998 | |
| | | | Monongahela Power Company | | | | |
| | 95,000 | | | 5.400%, 12/15/2043g | | | 117,826 | |
| | | | National Rural Utilities Cooperative Finance Corporation | | | | |
| | 150,000 | | | 2.300%, 11/1/2020 | | | 152,712 | |
| | | | NextEra Energy Capital Holdings, Inc. | | | | |
| | 105,000 | | | 2.300%, 4/1/2019 | | | 106,463 | |
| | | | NiSource Finance Corporation | | | | |
| | 245,000 | | | 5.650%, 2/1/2045 | | | 303,841 | |
| | | | Northern States Power Company | | | | |
| | 140,000 | | | 4.125%, 5/15/2044 | | | 152,903 | |
| | | | NRG Energy, Inc. | | | | |
| | 275,000 | | | 6.625%, 3/15/2023 | | | 274,313 | |
| | | | Oncor Electric Delivery Company, LLC | | | | |
| | 96,000 | | | 3.750%, 4/1/2045 | | | 97,347 | |
| | | | Pacific Gas & Electric Company | | | | |
| | 126,000 | | | 4.250%, 3/15/2046 | | | 136,682 | |
| | | | PG&E Corporation | | | | |
| | 45,000 | | | 2.400%, 3/1/2019 | | | 45,730 | |
| | | | PPL Capital Funding, Inc. | | | | |
| | 54,000 | | | 3.500%, 12/1/2022 | | | 56,881 | |
| | 195,000 | | | 5.000%, 3/15/2044 | | | 216,976 | |
| | | | Regency Energy Partners, LP | | | | |
| | 168,000 | | | 5.875%, 3/1/2022 | | | 188,155 | |
| | | | Sempra Energy | | | | |
| | 120,000 | | | 6.150%, 6/15/2018 | | | 128,282 | |
| | 60,000 | | | 2.400%, 3/15/2020 | | | 60,935 | |
| | | | Southern California Edison Company | | | | |
| | 35,000 | | | 2.400%, 2/1/2022 | | | 35,567 | |
| | | | Southern Company | | | | |
| | 170,000 | | | 1.850%, 7/1/2019 | | | 170,983 | |
| | 165,000 | | | 4.400%, 7/1/2046 | | | 174,260 | |
| | | | Southwestern Electric Power Company | | | | |
| | 65,000 | | | 3.900%, 4/1/2045 | | | 63,270 | |
| | | | TransAlta Corporation | | | | |
| | 125,000 | | | 1.900%, 6/3/2017 | | | 124,858 | |
| | | | Williams Partners, LP | | | | |
| | 170,000 | | | 5.100%, 9/15/2045 | | | 163,364 | |
| | | | | |
| | | | Total | | | 7,737,313 | |
| | | | | |
| | | | | | | | |
| | | | | |
| | | | Total Long-Term Fixed Income (cost $300,065,978) | | | 305,973,414 | |
| | | | | |
| | |
| Shares | | | Preferred Stock (<0.1%) | | Value | |
| Energy (<0.1%) | | | | |
| | 752 | | | Alpha Natural Resources, Inc., | | | | |
| | | | 0.000%d | | | 4,700 | |
| | 752 | | | ANR Holdings, Inc., 0.000%d | | | 1,278 | |
| | | | | |
| | | | Total | | | 5,978 | |
| | | | | |
| | | | | | | | |
| | | | | |
| | | | Total Preferred Stock (cost $1,235) | | | 5,978 | |
| | | | | |
| | |
| Shares | | | Collateral Held for Securities Loaned (0.1%) | | Value | |
| | 2,585,839 | | | Thrivent Cash Management Trust | | | 2,585,839 | |
| | | | | |
| | | | Total Collateral Held for Securities Loaned (cost $2,585,839) | | | 2,585,839 | |
| | | | | |
| | |
Shares or
Principal
Amount | | | Short-Term Investments (12.1%)l | | Value | |
| | | | Federal Home Loan Bank Discount Notes | | | | |
| | 7,600,000 | | | 0.344%, 1/6/2017m | | | 7,595,539 | |
| | 2,100,000 | | | 0.349%, 1/20/2017m | | | 2,098,507 | |
| | | | Thrivent Core Short-Term Reserve Fund | | | | |
| | 23,163,168 | | | 0.790% | | | 231,631,678 | |
| | | | | |
| | | | Total Short-Term Investments (cost $241,325,256) | | | 241,325,724 | |
| | | | | |
| | | | Total Investments (cost $1,881,593,406) 105.2% | | $ | 2,104,484,011 | |
| | | | | |
| | | | Other Assets and Liabilities, Net (5.2%) | | | (103,868,763 | ) |
| | | | | |
| | | | Total Net Assets 100.0% | | $ | 2,000,615,248 | |
| | | | | |
a | The stated interest rate represents the weighted average of all contracts within the bank loan facility. |
b | All or a portion of the loan is unfunded. |
c | Denotes investments purchased on a when-issued or delayed delivery basis. |
d | Non-income producing security. |
e | All or a portion of the security is on loan. |
f | Security is valued at fair value. Market quotations or prices were not readily available or were determined to be unreliable. Fair value was determined in good faith pursuant to procedures adopted by the Board. Further information on fair valuation can be found in the Notes to Financial Statements. |
g | Denotes securities sold under Rule 144A of the Securities Act of 1933, which exempts them from registration. These securities may be resold to other dealers in the program or to other qualified institutional buyers. As of October 31, 2016, the value of these investments was $27,782,599 or 1.4% of total net assets. |
h | Denotes variable rate securities. Variable rate securities are securities whose yields vary with a designated market index or market rate. The rate shown is as of October 31, 2016. |
i | Denotes step coupon securities. Step coupon securities pay an initial coupon rate for the first period and then different coupon rates for following periods. The rate shown is as of October 31, 2016. |
The accompanying Notes to Financial Statements are an integral part of this schedule.
31
MODERATELY AGGRESSIVE ALLOCATION FUND
Schedule of Investments as of October 31, 2016
j | Denotes perpetual securities. Perpetual securities pay an indefinite stream of interest, but may be called by the issuer at an earlier date. |
k | Denotes interest only security. Interest only securities represent the right to receive monthly interest payments on an underlying pool of mortgages or assets. The principal shown is the outstanding par amount of the pool as of the end of the period. The actual effective yield of the security is different than the stated coupon rate. |
l | The interest rate shown reflects the yield, coupon rate or the discount rate at the date of purchase. |
m | All or a portion of the security is held on deposit with the counterparty and pledged as the initial margin deposit for open futures contracts. |
* | Denotes restricted securities. Restricted securities are investment securities which cannot be offered for public sale without first being registered under the Securities Act of 1933. The value of all restricted securities held in Moderately Aggressive Allocation Fund as of October 31, 2016 was $11,696,545 or 0.6% of total net assets. The following table indicates the acquisition date and cost of restricted securities shown in the schedule as of October 31, 2016. |
| | | | | | | | |
Security | | Acquisition
Date | | | Cost | |
Alm Loan Funding CLO, 10/17/2026 | | | 7/31/2014 | | | $ | 139,930 | |
Angel Oak Mortgage Trust I, LLC, 7/25/2046 | | | 8/15/2016 | | | | 228,601 | |
Apidos CLO XVIII, 7/22/2026 | | | 6/25/2014 | | | | 134,662 | |
Ares CLO, Ltd., 10/12/2023 | | | 5/15/2015 | | | | 450,000 | |
Babson CLO, Ltd., 10/17/2026 | | | 8/15/2014 | | | | 139,930 | |
Betony CLO, Ltd., 4/15/2027 | | | 2/25/2015 | | | | 125,000 | |
Birchwood Park CLO, Ltd., 7/15/2026 | | | 7/31/2014 | | | | 140,000 | |
BlueMountain CLO, Ltd., 10/15/2026 | | | 8/27/2014 | | | | 139,859 | |
Carlyle Global Market Strategies CLO, Ltd., 7/20/2023 | | | 7/3/2014 | | | | 130,061 | |
Carlyle Global Market Strategies CLO, Ltd., 10/15/2026 | | | 9/19/2014 | | | | 150,000 | |
Cent CLO 16, LP, 8/1/2024 | | | 9/5/2014 | | | | 140,000 | |
Cent CLO 22, Ltd., 11/7/2026 | | | 9/19/2014 | | | | 150,000 | |
Contura Energy, Inc., 8/1/2021 | | | 3/28/2016 | | | | 27,521 | |
Digicel, Ltd., 4/15/2021 | | | 8/18/2014 | | | | 460,321 | |
DRB Prime Student Loan Trust, 1/25/2040 | | | 6/23/2016 | | | | 378,336 | |
Dryden 34 Senior Loan Fund CLO, 10/15/2026 | | | 7/21/2014 | | | | 140,000 | |
Edlinc Student Loan Funding Trust, 10/1/2025 | | | 2/28/2013 | | | | 107,242 | |
Galaxy XX CLO, Ltd., 7/20/2027 | | | 5/20/2015 | | | | 450,000 | |
GoldenTree Loan Opportunities IX, Ltd., 10/29/2026 | | | 10/7/2016 | | | | 250,000 | |
Golub Capital Partners CLO 23M, Ltd., 5/5/2027 | | | 5/18/2015 | | | | 399,000 | |
Limerock CLO III, LLC, 10/20/2026 | | | 10/16/2014 | | | | 450,000 | |
Madison Park Funding XIV CLO, Ltd., 7/20/2026 | | | 7/3/2014 | | | | 149,820 | |
Madison Park Funding, Ltd., 8/15/2022 | | | 5/8/2015 | | | | 400,000 | |
Magnetite XII, Ltd., 4/15/2027 | | | 2/6/2015 | | | | 450,000 | |
Mountain View CLO, Ltd., 7/15/2027 | | | 5/13/2015 | | | | 448,835 | |
Murray Hill Marketplace Trust, 11/25/2022 | | | 10/6/2016 | | | | 514,986 | |
NCF Dealer Floorplan Master Trust, 3/21/2022 | | | 4/8/2016 | | | | 490,437 | |
Neuberger Berman CLO, Ltd., 8/4/2025 | | | 6/19/2014 | | | | 100,000 | |
NZCG Funding CLO, Ltd., 4/27/2027 | | | 3/27/2015 | | | | 450,000 | |
Octagon Investment Partners XX CLO, Ltd., 8/12/2026 | | | 7/10/2014 | | | | 140,000 | |
OHA Loan Funding, Ltd., 10/20/2026 | | | 11/6/2014 | | | | 448,875 | |
OZLM VIII, Ltd., 10/17/2026 | | | 8/7/2014 | | | | 139,202 | |
Pretium Mortgage Credit Partners, LLC, 11/27/2030 | | | 11/6/2015 | | | | 807,685 | |
Race Point IX CLO, Ltd., 4/15/2027 | | | 2/13/2015 | | | | 325,000 | |
Shackleton VII CLO, Ltd., 4/15/2027 | | | 3/27/2015 | | | | 450,000 | |
Sunset Mortgage Loan Company, LLC, 7/16/2047 | | | 7/27/2016 | | | | 565,153 | |
Symphony CLO VIII, Ltd., 1/9/2023 | | | 9/15/2014 | | | | 128,155 | |
Symphony CLO XV, Ltd., 10/17/2026 | | | 10/17/2014 | | | | 446,625 | |
Vericrest Opportunity Loan Transferee, 10/25/2058 | | | 1/13/2016 | | | | 360,534 | |
Voya CLO 3, Ltd., 7/25/2026 | | | 7/10/2014 | | | | 139,790 | |
The following table presents the total amount of securities loaned with continuous maturity, by type, offset by the gross payable upon return of collateral for securities loaned by Thrivent Moderately Aggressive Allocation Fund as of October 31, 2016:
| | | | |
Securities Lending Transactions | | | |
Taxable Debt Security | | $ | 1,825,285 | |
Common Stock | | | 667,758 | |
| | | | |
Total lending | | $ | 2,493,043 | |
Gross amount payable upon return of collateral for securities loaned | | $ | 2,585,839 | |
| | | | |
Net amounts due to counterparty | | $ | 92,796 | |
| | | | |
Definitions:
| | | | |
ADR | | - | | American Depositary Receipt, which are certificates for an underlying foreign security’s shares held by an issuing U.S. depository bank. |
CLO | | - | | Collateralized Loan Obligation |
ETF | | - | | Exchange Traded Fund. |
REIT | | - | | Real Estate Investment Trust is a company that buys, develops, manages and/or sells real estate assets. |
TIPS | | - | | Treasury Inflation Protected Security. |
The accompanying Notes to Financial Statements are an integral part of this schedule.
32
MODERATE ALLOCATION FUND
Schedule of Investments as of October 31, 2016
| | | | | | | | |
Principal
Amount | | | Bank Loans (1.8%)a | | Value | |
| Basic Materials (0.1%) | | | | |
| | | | Arch Coal, Inc., Term Loan | | | | |
| | $204,314 | | | 10.000%, 10/5/2021 | | | $208,570 | |
| | | | Fortescue Metals Group, Ltd., Term Loan | | | | |
| | 485,703 | | | 3.750%, 6/30/2019 | | | 485,247 | |
| | | | Ineos US Finance, LLC, Term Loan | | | | |
| | 933,212 | | | 3.750%, 12/15/2020 | | | 935,349 | |
| | | | Tronox Pigments BV, Term Loan | | | | |
| | 526,400 | | | 4.500%, 3/19/2020 | | | 523,647 | |
| | | | | |
| | | | Total | | | 2,152,813 | |
| | | | | |
| |
| Capital Goods (0.1%) | | | | |
| | | | Accudyne Industries, LLC, Term Loan | | | | |
| | 338,042 | | | 4.000%, 12/13/2019 | | | 310,296 | |
| | | | Advanced Disposal Services, Inc., Term Loan | | | | |
| | 275,000 | | | 0.000%, 10/28/2023b,c | | | 275,344 | |
| | | | Cortes NP Acquisition Corporation, Term Loan | | | | |
| | 850,000 | | | 0.000%, 10/3/2023b,c | | | 844,687 | |
| | | | | |
| | | | Total | | | 1,430,327 | |
| | | | | |
| |
| Communications Services (0.5%) | | | | |
| | | | Altice US Finance I Corporation, Term Loan | | | | |
| | 504,259 | | | 3.750%, 1/15/2025 | | | 505,646 | |
| | | | Beasley Broadcast Group, Inc., Term Loan | | | | |
| | 240,000 | | | 0.000%, 10/4/2023b,c | | | 237,300 | |
| | | | FairPoint Communications, Inc., Term Loan | | | | |
| | 584,929 | | | 7.500%, 2/14/2019 | | | 585,736 | |
| | | | Grande Communications Networks, LLC, Term Loan | | | | |
| | 628,896 | | | 4.500%, 5/29/2020 | | | 628,110 | |
| | | | Hargray Communications Group, Inc., Term Loan | | | | |
| | 572,125 | | | 4.750%, 6/26/2019 | | | 574,986 | |
| | | | Integra Telecom Holdings, Inc., Term Loan | | | | |
| | 369,410 | | | 5.250%, 8/14/2020 | | | 367,334 | |
| | 194,057 | | | 9.750%, 2/12/2021 | | | 186,417 | |
| | | | Intelsat Jackson Holdings SA, Term Loan | | | | |
| | 198,591 | | | 3.750%, 6/30/2019 | | | 189,676 | |
| | | | Liberty Cablevision of Puerto Rico, LLC, Term Loan | | | | |
| | 905,000 | | | 4.500%, 1/7/2022 | | | 889,914 | |
| | | | LTS Buyer, LLC, Term Loan | | | | |
| | 593,813 | | | 4.088%, 4/13/2020 | | | 594,406 | |
| | 34,787 | | | 8.000%, 4/12/2021 | | | 34,809 | |
| | | | NEP Broadcasting, LLC, Term Loan | | | | |
| | 62,857 | | | 10.000%, 7/22/2020 | | | 62,936 | |
| | | | NEP/NCP Holdco, Inc., Term Loan | | | | |
| | 816,152 | | | 4.250%, 1/22/2020 | | | 813,345 | |
| | | | Syniverse Holdings, Inc., Term Loan | | | | |
| | 554,934 | | | 4.000%, 4/23/2019 | | | 510,195 | |
| | | | TNS, Inc., Term Loan | | | | |
| | 355,992 | | | 5.000%, 2/14/2020 | | | 357,107 | |
| | | | Univision Communications, Inc., Term Loan | | | | |
| | 706,458 | | | 4.000%, 3/1/2020 | | | 707,560 | |
| | | | Virgin Media Investment Holdings, Ltd., Term Loan | | | | |
| | 585,672 | | | 3.500%, 6/30/2023 | | | 587,944 | |
| | | | WideOpenWest Finance, LLC, Term Loan | | | | |
| | 525,000 | | | 4.500%, 8/18/2023 | | | 523,567 | |
| | | | WMG Acquisition Corporation, Term Loan | | | | |
| | 183,389 | | | 3.750%, 7/1/2020 | | | 182,996 | |
| | | | Yankee Cable Acquisition, LLC, Term Loan | | | | |
| | 462,408 | | | 4.250%, 3/1/2020 | | | 462,699 | |
| | | | Zayo Group, LLC, Term Loan | | | | |
| | 837,187 | | | 3.750%, 5/6/2021 | | | 841,088 | |
| | | | | |
| | | | Total | | | 9,843,771 | |
| | | | | |
| |
| Consumer Cyclical (0.3%) | | | | |
| | | | Amaya BV, Term Loan | | | | |
| | 1,020,276 | | | 5.000%, 8/1/2021 | | | 1,018,837 | |
| | | | Burlington Coat Factory Warehouse Corporation, Term Loan | | | | |
| | 496,130 | | | 3.500%, 8/13/2021 | | | 499,385 | |
| | | | Cengage Learning Acquisitions, Term Loan | | | | |
| | 698,250 | | | 5.250%, 6/7/2023 | | | 681,813 | |
| | | | Ceridian HCM Holding, Inc., Term Loan | | | | |
| | 264,183 | | | 4.500%, 9/15/2020 | | | 258,899 | |
| | | | Golden Nugget, Inc., Term Loan | | | | |
| | 268,494 | | | 4.500%, 11/21/2019 | | | 271,348 | |
| | | | Golden Nugget, Inc., Term Loan Delayed Draw | | | | |
| | 115,069 | | | 4.500%, 11/21/2019 | | | 116,292 | |
| | | | IMG Worldwide, Inc., Term Loan | | | | |
| | 585,520 | | | 5.250%, 5/6/2021 | | | 588,009 | |
| | 300,000 | | | 8.250%, 5/6/2022 | | | 299,376 | |
| | | | Mohegan Tribal Gaming Authority, Term Loan | | | | |
| | 425,000 | | | 0.000%, 9/30/2023b,c | | | 423,275 | |
| | | | Scientific Games International, Inc., Term Loan | | | | |
| | 268,108 | | | 6.000%, 10/18/2020 | | | 269,531 | |
| | 895,748 | | | 6.000%, 10/1/2021 | | | 899,107 | |
| | | | | |
| | | | Total | | | 5,325,872 | |
| | | | | |
| |
| Consumer Non-Cyclical (0.3%) | | | | |
| | | | Albertson’s, LLC, Term Loan | | | | |
| | 253,726 | | | 4.750%, 12/21/2022 | | | 256,236 | |
| | 483,809 | | | 4.750%, 6/22/2023 | | | 488,851 | |
| | | | CHS/Community Health Systems, Inc., Term Loan | | | | |
| | 678,283 | | | 4.000%, 1/27/2021 | | | 639,790 | |
| | | | Mallinckrodt International Finance SA, Term Loan | | | | |
| | 198,481 | | | 3.588%, 3/19/2021 | | | 198,481 | |
| | | | McGraw-Hill Global Education Holdings, LLC, Term Loan | | | | |
| | 598,500 | | | 5.000%, 5/4/2022 | | | 596,878 | |
| | | | MultiPlan, Inc., Term Loan | | | | |
| | 344,438 | | | 5.000%, 6/7/2023 | | | 347,989 | |
| | | | Ortho-Clinical Diagnostics, Inc., Term Loan | | | | |
| | 739,182 | | | 4.750%, 6/30/2021 | | | 721,316 | |
| | | | PetSmart, Inc., Term Loan | | | | |
| | 199,494 | | | 4.000%, 3/11/2022b,c | | | 199,885 | |
| | | | Valeant Pharmaceuticals International, Inc., Term Loan | | | | |
| | 1,131,805 | | | 5.500%, 4/1/2022 | | | 1,127,560 | |
| | | | | |
| | | | Total | | | 4,576,986 | |
| | | | | |
The accompanying Notes to Financial Statements are an integral part of this schedule.
33
MODERATE ALLOCATION FUND
Schedule of Investments as of October 31, 2016
| | | | | | | | |
Principal
Amount | | | Bank Loans (1.8%)a | | Value | |
| Energy (0.1%) | | | | |
| | | | Energy Solutions, LLC, Term Loan | | | | |
| | $290,463 | | | 6.750%, 5/29/2020 | | | $290,463 | |
| | | | Expro Holdings UK 2, Ltd., Term Loan | | | | |
| | 343,000 | | | 5.750%, 9/2/2021 | | | 297,638 | |
| | | | Houston Fuel Oil Terminal, LLC, Term Loan | | | | |
| | 617,400 | | | 4.250%, 8/19/2021 | | | 606,595 | |
| | | | McJunkin Red Man Corporation, Term Loan | | | | |
| | 343,843 | | | 5.000%, 11/8/2019 | | | 340,550 | |
| | | | MEG Energy Corporation, Term Loan | | | | |
| | 303,408 | | | 3.750%, 3/31/2020 | | | 285,819 | |
| | | | Pacific Drilling SA, Term Loan | | | | |
| | 420,862 | | | 4.500%, 6/3/2018 | | | 118,368 | |
| | | | Targa Resources Partners, LP, Term Loan | | | | |
| | 131,419 | | | 5.750%, 2/27/2022 | | | 131,583 | |
| | | | Western Refining, Inc., Term Loan | | | | |
| | 299,250 | | | 5.500%, 6/23/2023 | | | 298,690 | |
| | | | | |
| | | | Total | | | 2,369,706 | |
| | | | | |
| |
| Financials (0.1%) | | | | |
| | | | DJO Finance, LLC, Term Loan | | | | |
| | 395,000 | | | 4.250%, 6/7/2020 | | | 390,556 | |
| | | | Harland Clarke Holdings Corporation, Term Loan | | | | |
| | 111,750 | | | 6.993%, 8/4/2019 | | | 110,843 | |
| | 443,625 | | | 7.000%, 12/31/2019 | | | 440,484 | |
| | | | MoneyGram International, Inc., Term Loan | | | | |
| | 624,231 | | | 4.250%, 3/27/2020 | | | 605,504 | |
| | | | Telenet International Finance Luxembourg SA, Term Loan | | | | |
| | 515,000 | | | 4.357%, 6/30/2024 | | | 515,108 | |
| | | | WaveDivision Holdings, LLC, Term Loan | | | | |
| | 585,874 | | | 4.000%, 10/15/2019 | | | 587,192 | |
| | | | | |
| | | | Total | | | 2,649,687 | |
| | | | | |
| |
| Technology (0.2%) | | | | |
| | | | Avago Technoligies Cayman Finance, Ltd., Term Loan | | | | |
| | 742,191 | | | 3.535%, 2/1/2023 | | | 749,509 | |
| | | | First Data Corporation, Term Loan | | | | |
| | 340,000 | | | 0.000%, 3/24/2021b,c | | | 341,360 | |
| | 595,000 | | | 4.274%, 7/8/2022 | | | 599,094 | |
| | | | Interception Merger Sub, Inc., Term Loan | | | | |
| | 220,000 | | | 0.000%, 10/26/2023b,c | | | 221,135 | |
| | | | Micron Technologies, Inc., Term Loan | | | | |
| | 149,625 | | | 4.637%, 4/26/2022 | | | 150,467 | |
| | | | ON Semiconductor Corporation, Term Loan | | | | |
| | 765,000 | | | 3.777%, 3/31/2023 | | | 769,207 | |
| | | | SS&C European Holdings SARL, Term Loan | | | | |
| | 340,419 | | | 4.000%, 7/8/2022 | | | 342,867 | |
| | 41,429 | | | 4.000%, 7/8/2022 | | | 41,727 | |
| | | | Western Digital Corporation, Term Loan | | | | |
| | 713,213 | | | 4.500%, 4/29/2023 | | | 720,851 | |
| | | | | |
| | | | Total | | | 3,936,217 | |
| | | | | |
| |
| Transportation (0.1%) | | | | |
| | | | OSG Bulk Ships, Inc., Term Loan | | | | |
| | 395,523 | | | 5.250%, 8/5/2019 | | | 392,062 | |
| | | | XPO Logistics, Inc., Term Loan | | | | |
| | 531,293 | | | 4.250%, 10/30/2021 | | | 533,759 | |
| | | | | |
| | | | Total | | | 925,821 | |
| | | | | |
| |
| Utilities (<0.1%) | | | | |
| | | | Intergen NV, Term Loan | | | | |
| | 316,676 | | | 5.500%, 6/12/2020 | | | 299,259 | |
| | | | Talen Energy Supply, LLC, Term Loan | | | | |
| | 182,140 | | | 0.000%, 10/18/2023b,c | | | 181,912 | |
| | | | | |
| | | | Total | | | 481,171 | |
| | | | | |
| | | | | | | | |
| | | | | |
| | | | Total Bank Loans (cost $33,996,304) | | | 33,692,371 | |
| | | | | |
| | | | | | | | |
| | |
| Shares | | | Registered Investment Companies (38.9%) | | Value | |
| Affiliated Equity Holdings (27.1%) | | | | |
| | 12,133,177 | | | Thrivent Large Cap Growth Fund | | | 109,077,260 | |
| | 1,587,961 | | | Thrivent Large Cap Stock Fund | | | 39,714,901 | |
| | 7,375,203 | | | Thrivent Large Cap Value Fund | | | 144,258,964 | |
| | 3,310,082 | | | Thrivent Mid Cap Stock Fund | | | 79,441,957 | |
| | 11,415,969 | | | Thrivent Partner Worldwide Allocation Fund | | | 110,849,059 | |
| | 1,064,587 | | | Thrivent Small Cap Stock Fund | | | 22,015,655 | |
| | | | | |
| | | | Total | | | 505,357,796 | |
| | | | | |
| |
| Affiliated Fixed Income Holdings (10.9%) | | | | |
| | 7,062,740 | | | Thrivent High Yield Fund | | | 33,618,643 | |
| | 11,599,057 | | | Thrivent Income Fund | | | 107,291,277 | |
| | 4,966,752 | | | Thrivent Limited Maturity Bond Fund | | | 61,985,059 | |
| | | | | |
| | | | Total | | | 202,894,979 | |
| | | | | |
| |
| Equity Funds/ETFs (0.6%) | | | | |
| | 3,510 | | | iShares MSCI EAFE Index Fund | | | 202,948 | |
| | 10,439 | | | iShares Russell 2000 Growth Index Fund | | | 1,460,103 | |
| | 6,145 | | | iShares Russell 2000 Index Fund | | | 728,182 | |
| | 830 | | | iShares Russell 2000 Value Index Fund | | | 84,228 | |
| | 2,790 | | | Materials Select Sector SPDR Fund | | | 130,433 | |
| | 34,945 | | | SPDR S&P 500 ETF Trust | | | 7,427,560 | |
| | 10,400 | | | SPDR S&P Biotech ETF | | | 583,960 | |
| | 350 | | | SPDR S&P MidCap 400 ETF Trust | | | 96,170 | |
| | | | | |
| | | | Total | | | 10,713,584 | |
| | | | | |
| |
| Fixed Income Funds/ETFs (0.3%) | | | | |
| | 20,000 | | | iShares Barclays 1-3 Year Credit Bond Fund | | | 2,111,000 | |
| | 21,200 | | | iShares iBoxx $ Investment Grade Corporate Bond ETF | | | 2,564,776 | |
| | 18,600 | | | Vanguard Short-Term Corporate Bond ETF | | | 1,493,952 | |
| | | | | |
| | | | Total | | | 6,169,728 | |
| | | | | |
| | | | | | | | |
| | | | | |
| | | | Total Registered Investment Companies (cost $576,848,845) | | | 725,136,087 | |
| | | | | |
Principal
Amount | | | Long-Term Fixed Income (29.3%) | | Value | |
| Asset-Backed Securities (0.9%) | | | | |
| | | | Access Group, Inc. | | | | |
| | 128,167 | | | 1.034%, 2/25/2036d,e | | | 126,088 | |
| | | | AMSR Trust | | | | |
| | 725,000 | | | 1.931%, 11/17/2033d,e | | | 725,693 | |
| | | | BA Credit Card Trust | | | | |
| | 300,000 | | | 0.915%, 6/15/2021e | | | 300,865 | |
| | | | Capital One Multi-Asset Execution Trust | | | | |
| | 400,000 | | | 0.915%, 1/18/2022e | | | 400,951 | |
The accompanying Notes to Financial Statements are an integral part of this schedule.
34
MODERATE ALLOCATION FUND
Schedule of Investments as of October 31, 2016
| | | | | | | | |
Principal Amount | | | Long-Term Fixed Income (29.3%) | | Value | |
| Asset-Backed Securities (0.9%) - continued | | | | |
| | | | Chase Issuance Trust | | | | |
| | $250,000 | | | 1.590%, 2/18/2020 | | | $251,346 | |
| | 175,000 | | | 1.620%, 7/15/2020 | | | 176,165 | |
| | 350,000 | | | 0.945%, 5/17/2021e | | | 351,435 | |
| | | | Chesapeake Funding, LLC | | | | |
| | 121,066 | | | 0.976%, 1/7/2025d,e | | | 121,050 | |
| | | | Commonbond Student Loan Trust | | | | |
| | 675,000 | | | 2.900%, 10/25/2040d | | | 674,749 | |
| | | | DRB Prime Student Loan Trust | | | | |
| | 705,764 | | | 3.200%, 1/25/2040* | | | 719,478 | |
| | 745,207 | | | 2.890%, 6/25/2040d | | | 739,605 | |
| | | | Earnest Student Loan Program | | | | |
| | 889,195 | | | 3.020%, 5/25/2034d | | | 887,169 | |
| | | | Edlinc Student Loan Funding Trust | | | | |
| | 40,841 | | | 3.410%, 10/1/2025*,e | | | 41,234 | |
| | | | Enterprise Fleet Financing, LLC | | | | |
| | 57,279 | | | 0.870%, 9/20/2019d | | | 57,251 | |
| | | | FirstEnergy Ohio PIRB Special Purpose Trust | | | | |
| | 15,792 | | | 0.679%, 1/15/2019 | | | 15,770 | |
| | | | Ford Credit Auto Owner Trust | | | | |
| | 225,000 | | | 2.260%, 11/15/2025d | | | 228,976 | |
| | | | GoldenTree Loan Opportunities IX, Ltd. | | | | |
| | 250,000 | | | 2.238%, 10/29/2026*,e | | | 250,000 | |
| | | | Morgan Stanley Bank of America Merrill Lynch Trust | | | | |
| | 700,000 | | | 3.176%, 8/15/2045 | | | 736,480 | |
| | 700,000 | | | 3.246%, 12/15/2047 | | | 732,585 | |
| | | | Morgan Stanley Capital, Inc. | | | | |
| | 920,060 | | | 0.684%, 2/25/2037e | | | 547,546 | |
| | | | Murray Hill Marketplace Trust | | | | |
| | 900,000 | | | 4.190%, 11/25/2022* | | | 900,025 | |
| | | | NCF Dealer Floorplan Master Trust | | | | |
| | 1,000,000 | | | 3.776%, 3/21/2022*,e | | | 992,279 | |
| | | | OneMain Financial Issuance Trust | | | | |
| | 525,000 | | | 4.100%, 3/20/2028d | | | 539,769 | |
| | | | OZLM VIII, Ltd. | | | | |
| | 210,000 | | | 2.320%, 10/17/2026*,e | | | 210,168 | |
| | | | Renaissance Home Equity Loan Trust | | | | |
| | 1,335,362 | | | 6.011%, 5/25/2036f | | | 932,889 | |
| | | | SLM Student Loan Trust | | | | |
| | 122,308 | | | 1.135%, 7/15/2022d,e | | | 122,430 | |
| | 123,503 | | | 1.135%, 8/15/2022d,e | | | 123,635 | |
| | 3,496 | | | 1.282%, 4/25/2023d,e | | | 3,493 | |
| | 75,000 | | | 1.585%, 5/17/2027d,e | | | 75,598 | |
| | | | Sofi Consumer Loan Program, LLC | | | | |
| | 904,735 | | | 3.260%, 8/25/2025d | | | 911,828 | |
| | | | SoFi Professional Loan Program, LLC | | | | |
| | 452,319 | | | 2.420%, 3/25/2030d | | | 456,741 | |
| | | | Sunset Mortgage Loan Company, LLC | | | | |
| | 989,019 | | | 3.844%, 7/16/2047*,f | | | 990,842 | |
| | | | Vericrest Opportunity Loan Transferee | | | | |
| | 652,787 | | | 3.375%, 10/25/2058*,f | | | 651,899 | |
| | 957,145 | | | 4.250%, 2/26/2046d,f | | | 968,076 | |
| | 642,197 | | | 3.500%, 9/25/2046d,f | | | 641,663 | |
| | | | Vericrest Opportunity Loan Trust | | | | |
| | 699,554 | | | 4.250%, 3/26/2046d,f | | | 708,338 | |
| | | | Volvo Financial Equipment, LLC | | | | |
| | 263,715 | | | 0.820%, 4/16/2018d | | | 263,506 | |
| | | | | |
| | | | Total | | | 17,577,615 | |
| | | | | |
| |
| Basic Materials (0.2%) | | | | |
| | | | Albemarle Corporation | | | | |
| | 60,000 | | | 3.000%, 12/1/2019 | | | 61,738 | |
| | | | Alcoa Nederland Holding BV | | | | |
| | 250,000 | | | 6.750%, 9/30/2024d | | | 258,750 | |
| | | | Anglo American plc | | | | |
| | 512,000 | | | 3.625%, 5/14/2020d | | | 514,560 | |
| | | | ArcelorMittal SA | | | | |
| | 325,000 | | | 6.500%, 3/1/2021 | | | 356,687 | |
| | | | Georgia-Pacific, LLC | | | | |
| | 135,000 | | | 2.539%, 11/15/2019d | | | 137,704 | |
| | | | Glencore Funding, LLC | | | | |
| | 100,000 | | | 1.940%, 4/16/2018d,e | | | 98,500 | |
| | 232,000 | | | 2.875%, 4/16/2020d | | | 233,160 | |
| | | | Kinross Gold Corporation | | | | |
| | 304,000 | | | 5.950%, 3/15/2024 | | | 319,200 | |
| | | | NOVA Chemicals Corporation | | | | |
| | 664,000 | | | 5.250%, 8/1/2023d | | | 676,450 | |
| | | | Novelis Corporation | | | | |
| | 175,000 | | | 5.875%, 9/30/2026d | | | 177,188 | |
| | | | Westlake Chemical Corporation | | | | |
| | 304,000 | | | 3.600%, 8/15/2026d | | | 303,911 | |
| | | | | |
| | | | Total | | | 3,137,848 | |
| | | | | |
| |
| Capital Goods (0.6%) | | | | |
| | | | AECOM | | | | |
| | 590,000 | | | 5.875%, 10/15/2024 | | | 623,187 | |
| | | | Ball Corporation | | | | |
| | 450,000 | | | 4.375%, 12/15/2020 | | | 479,250 | |
| | | | Building Materials Corporation of America | | | | |
| | 460,000 | | | 6.000%, 10/15/2025d | | | 491,027 | |
| | | | Case New Holland, Inc. | | | | |
| | 206,000 | | | 7.875%, 12/1/2017 | | | 218,102 | |
| | | | Cemex Finance, LLC | | | | |
| | 580,000 | | | 9.375%, 10/12/2022d | | | 633,650 | |
| | | | CNH Industrial NV | | | | |
| | 450,000 | | | 4.500%, 8/15/2023 | | | 452,250 | |
| | | | Crown Americas Capital Corporation IV | | | | |
| | 325,000 | | | 4.500%, 1/15/2023 | | | 333,125 | |
| | | | General Electric Company | | | | |
| | 415,000 | | | 5.000%, 12/29/2049g | | | 439,651 | |
| | | | HD Supply, Inc. | | | | |
| | 555,000 | | | 5.750%, 4/15/2024d | | | 582,750 | |
| | | | Huntington Ingalls Industries, Inc. | | | | |
| | 600,000 | | | 5.000%, 12/15/2021d | | | 628,500 | |
| | | | L-3 Communications Corporation | | | | |
| | 312,000 | | | 3.950%, 5/28/2024 | | | 326,833 | |
| | | | Lockheed Martin Corporation | | | | |
| | 267,000 | | | 2.500%, 11/23/2020 | | | 273,913 | |
| | 304,000 | | | 4.500%, 5/15/2036 | | | 340,424 | |
| | | | Newell Rubbermaid, Inc. | | | | |
| | 156,000 | | | 2.600%, 3/29/2019 | | | 159,144 | |
| | 234,000 | | | 5.500%, 4/1/2046 | | | 275,724 | |
| | | | Northrop Grumman Corporation | | | | |
| | 280,000 | | | 3.850%, 4/15/2045 | | | 281,878 | |
| | | | Owens-Brockway Glass Container, Inc. | | | | |
| | 615,000 | | | 5.000%, 9/1/2022d | | | 643,444 | |
| | | | Pentair Finance SA | | | | |
| | 325,000 | | | 2.900%, 9/15/2018 | | | 329,510 | |
| | | | Republic Services, Inc. | | | | |
| | 235,000 | | | 2.900%, 7/1/2026 | | | 234,691 | |
| | | | Reynolds Group Issuer, Inc. | | | | |
| | 860,000 | | | 5.125%, 7/15/2023d | | | 882,842 | |
The accompanying Notes to Financial Statements are an integral part of this schedule.
35
MODERATE ALLOCATION FUND
Schedule of Investments as of October 31, 2016
| | | | | | | | |
Principal
Amount | | | Long-Term Fixed Income (29.3%) | | Value | |
| Capital Goods (0.6%) - continued | | | | |
| | | | Roper Industries, Inc. | | | | |
| | $363,000 | | | 2.050%, 10/1/2018 | | | $366,365 | |
| | | | Standard Industries, Inc. | | | | |
| | 195,000 | | | 5.500%, 2/15/2023d | | | 202,800 | |
| | | | Textron, Inc. | | | | |
| | 190,000 | | | 5.600%, 12/1/2017 | | | 197,915 | |
| | 250,000 | | | 7.250%, 10/1/2019 | | | 283,863 | |
| | | | United Rentals North America, Inc. | | | | |
| | 950,000 | | | 5.500%, 7/15/2025 | | | 961,875 | |
| | | | Waste Management, Inc. | | | | |
| | 75,000 | | | 3.125%, 3/1/2025 | | | 77,679 | |
| | | | | |
| | | | Total | | | 10,720,392 | |
| | | | | |
| |
| Collateralized Mortgage Obligations (1.4%) | | | | |
| | | | Alm Loan Funding CLO | | | | |
| | 210,000 | | | 2.310%, 10/17/2026*,e | | | 210,068 | |
| | | | Alternative Loan Trust | | | | |
| | 259,015 | | | 6.000%, 6/25/2036 | | | 226,544 | |
| | | | Angel Oak Mortgage Trust I, LLC | | | | |
| | 366,408 | | | 3.500%, 7/25/2046*,f | | | 365,238 | |
| | | | Apidos CLO XVIII | | | | |
| | 215,000 | | | 2.294%, 7/22/2026*,e | | | 214,980 | |
| | | | Ares CLO, Ltd. | | | | |
| | 525,000 | | | 2.164%, 10/12/2023*,e | | | 524,982 | |
| | | | Babson CLO, Ltd. | | | | |
| | 210,000 | | | 2.270%, 10/17/2026*,e | | | 209,826 | |
| | | | BCAP, LLC Trust | | | | |
| | 612,315 | | | 0.714%, 3/25/2037e | | | 570,244 | |
| | | | Betony CLO, Ltd. | | | | |
| | 190,000 | | | 2.390%, 4/15/2027*,e | | | 190,065 | |
| | | | Birchwood Park CLO, Ltd. | | | | |
| | 210,000 | | | 2.320%, 7/15/2026*,e | | | 210,162 | |
| | | | BlueMountain CLO, Ltd. | | | | |
| | 210,000 | | | 2.360%, 10/15/2026*,e | | | 210,507 | |
| | | | Carlyle Global Market Strategies CLO, Ltd. | | | | |
| | 186,422 | | | 2.181%, 7/20/2023*,e | | | 186,575 | |
| | 200,000 | | | 2.380%, 10/15/2026*,e | | | 200,524 | |
| | | | Cent CLO 16, LP | | | | |
| | 210,000 | | | 2.007%, 8/1/2024*,e | | | 209,851 | |
| | | | Cent CLO 22, Ltd. | | | | |
| | 200,000 | | | 2.268%, 11/7/2026*,e | | | 200,011 | |
| | | | Citigroup Mortgage Loan Trust, Inc. | | | | |
| | 368,367 | | | 5.500%, 11/25/2035 | | | 352,437 | |
| | | | CitiMortgage Alternative Loan Trust | | | | |
| | 1,215,378 | | | 5.750%, 4/25/2037 | | | 1,042,703 | |
| | | | Countrywide Alternative Loan Trust | | | | |
| | 387,490 | | | 3.031%, 10/25/2035 | | | 315,391 | |
| | 396,299 | | | 6.000%, 4/25/2036 | | | 321,052 | |
| | 233,156 | | | 6.000%, 1/25/2037 | | | 223,011 | |
| | 1,155,006 | | | 5.500%, 5/25/2037 | | | 986,570 | |
| | 1,078,108 | | | 7.000%, 10/25/2037 | | | 643,224 | |
| | | | Countrywide Home Loans, Inc. | | | | |
| | 445,083 | | | 5.750%, 4/25/2037 | | | 377,695 | |
| | | | Deutsche Alt-A Securities Mortgage Loan Trust | | | | |
| | 327,434 | | | 6.000%, 10/25/2021 | | | 293,878 | |
| | | | Dryden 34 Senior Loan Fund CLO | | | | |
| | 210,000 | | | 2.310%, 10/15/2026*,e | | | 210,092 | |
| | | | Federal Home Loan Mortgage Corporation | | | | |
| | 1,659,661 | | | 4.000%, 7/15/2031h | | | 164,142 | |
| | 924,316 | | | 3.000%, 2/15/2033h | | | 109,254 | |
| | | | Federal National Mortgage Association | | | | |
| | 1,853,927 | | | 3.500%, 1/25/2033h | | | 243,688 | |
| | | | Galaxy XX CLO, Ltd. | | | | |
| | 650,000 | | | 2.331%, 7/20/2027*,e | | | 649,095 | |
| | | | Golub Capital Partners CLO 23M, Ltd. | | | | |
| | 600,000 | | | 2.263%, 5/5/2027*,e | | | 599,868 | |
| | | | J.P. Morgan Mortgage Trust | | | | |
| | 210,685 | | | 3.212%, 6/25/2036 | | | 181,783 | |
| | 113,114 | | | 3.077%, 10/25/2036 | | | 102,205 | |
| | 817,784 | | | 0.914%, 1/25/2037e | | | 428,793 | |
| | 1,100,786 | | | 6.250%, 8/25/2037 | | | 825,533 | |
| | | | Limerock CLO III, LLC | | | | |
| | 650,000 | | | 2.411%, 10/20/2026*,e | | | 649,587 | |
| | | | Madison Park Funding XIV CLO, Ltd. | | | | |
| | 230,000 | | | 2.331%, 7/20/2026*,e | | | 230,319 | |
| | | | Madison Park Funding, Ltd. | | | | |
| | 725,000 | | | 2.107%, 8/15/2022*,e | | | 724,901 | |
| | | | Magnetite XII, Ltd. | | | | |
| | 650,000 | | | 2.380%, 4/15/2027*,e | | | 650,274 | |
| | | | MASTR Alternative Loans Trust | | | | |
| | 313,472 | | | 6.500%, 7/25/2034 | | | 314,301 | |
| | 563,605 | | | 0.984%, 12/25/2035e | | | 261,136 | |
| | | | Merrill Lynch Alternative Note Asset Trust | | | | |
| | 292,886 | | | 6.000%, 3/25/2037 | | | 231,893 | |
| | | | Mountain View CLO, Ltd. | | | | |
| | 675,000 | | | 2.340%, 7/15/2027*,e | | | 672,696 | |
| | | | Neuberger Berman CLO, Ltd. | | | | |
| | 150,000 | | | 2.238%, 8/4/2025*,e | | | 150,414 | |
| | | | NZCG Funding CLO, Ltd. | | | | |
| | 675,000 | | | 2.436%, 4/27/2027*,e | | | 673,219 | |
| | | | Octagon Investment Partners XX CLO, Ltd. | | | | |
| | 210,000 | | | 2.258%, 8/12/2026*,e | | | 210,012 | |
| | | | OHA Loan Funding, Ltd. | | | | |
| | 650,000 | | | 2.411%, 10/20/2026*,e | | | 654,020 | |
| | | | Pretium Mortgage Credit Partners, LLC | | | | |
| | 1,527,073 | | | 4.375%, 11/27/2030* | | | 1,539,644 | |
| | | | Race Point IX CLO, Ltd. | | | | |
| | 490,000 | | | 2.390%, 4/15/2027*,e | | | 490,616 | |
| | | | Residential Asset Securitization Trust | | | | |
| | 928,108 | | | 0.914%, 8/25/2037e | | | 247,697 | |
| | | | Shackleton VII CLO, Ltd. | | | | |
| | 675,000 | | | 2.420%, 4/15/2027*,e | | | 676,368 | |
| | | | Symphony CLO VIII, Ltd. | | | | |
| | 192,232 | | | 1.976%, 1/9/2023*,e | | | 192,108 | |
| | | | Symphony CLO XV, Ltd. | | | | |
| | 650,000 | | | 2.330%, 10/17/2026*,e | | | 651,242 | |
| | | | TBW Mortgage-Backed Trust | | | | |
| | 2,334,758 | | | 5.965%, 7/25/2037 | | | 1,590,585 | |
| | | | Voya CLO 3, Ltd. | | | | |
| | 210,000 | | | 2.302%, 7/25/2026*,e | | | 209,898 | |
| | | | WaMu Mortgage Pass Through Certificates | | | | |
| | 101,915 | | | 2.795%, 9/25/2036 | | | 92,332 | |
| | 383,249 | | | 2.832%, 10/25/2036 | | | 334,065 | |
| | | | Washington Mutual Mortgage Pass Through Certificates Trust | | | | |
| | 634,797 | | | 7.000%, 2/25/2036 | | | 470,163 | |
| | 958,342 | | | 1.274%, 2/25/2047e | | | 713,950 | |
| | | | | |
| | | | Total | | | 24,431,431 | |
| | | | | |
| |
| Commercial Mortgage-Backed Securities (0.5%) | | | | |
| | | | Citigroup Commercial Mortgage Trust | | | | |
| | 411,843 | | | 1.102%, 11/10/2046 | | | 411,120 | |
The accompanying Notes to Financial Statements are an integral part of this schedule.
36
MODERATE ALLOCATION FUND
Schedule of Investments as of October 31, 2016
| | | | | | | | |
Principal Amount | | | Long-Term Fixed Income (29.3%) | | Value | |
| Commercial Mortgage-Backed Securities (0.5%) - continued | | | | |
| | | | Commercial Mortgage Pass-Through Certificates | | | | |
| | $300,000 | | | 1.580%, 6/8/2030d,e | | | $300,376 | |
| | | | Credit Suisse First Boston Mortgage Securities | | | | |
| | 36,694 | | | 5.542%, 1/15/2049 | | | 36,634 | |
| | | | Federal National Mortgage Association | | | | |
| | 18,411 | | | 1.272%, 1/25/2017 | | | 18,399 | |
| | | | Greenwich Capital Commercial Funding Corporation | | | | |
| | 1,600,000 | | | 5.867%, 12/10/2049 | | | 1,646,034 | |
| | | | GS Mortgage Securities Trust | | | | |
| | 21,919 | | | 2.999%, 8/10/2044 | | | 21,907 | |
| | 1,200,000 | | | 3.666%, 9/10/2047 | | | 1,288,412 | |
| | | | J.P. Morgan Chase Commercial Mortgage Securities Corporation | | | | |
| | 1,200,000 | | | 5.715%, 2/12/2049 | | | 1,217,904 | |
| | | | JPMBB Commercial Mortgage Securities Trust | | | | |
| | 600,000 | | | 3.231%, 1/15/2048 | | | 626,137 | |
| | | | Morgan Stanley Capital, Inc. | |
| | 750,000 | | | 5.406%, 3/15/2044 | | | 754,541 | |
| | | | SCG Trust | |
| | 200,000 | | | 1.935%, 11/15/2026d,e | | | 198,491 | |
| | | | UBS Commercial Mortgage Trust | |
| | 1,091,964 | | | 3.400%, 5/10/2045 | | | 1,155,014 | |
| | | | Wells Fargo Commercial Mortgage Trust | | | | |
| | 500,000 | | | 3.617%, 9/15/2057 | | | 534,066 | |
| | | | WFRBS Commercial Mortgage Trust | | | | |
| | 835,000 | | | 2.870%, 11/15/2045 | | | 868,772 | |
| | | | | |
| | | | Total | | | 9,077,807 | |
| | | | | |
| |
| Communications Services (1.3%) | | | | |
| | | | 21st Century Fox America, Inc. | | | | |
| | 325,000 | | | 6.900%, 3/1/2019 | | | 363,454 | |
| | | | Altice Financing SA | | | | |
| | 470,000 | | | 6.625%, 2/15/2023d | | | 484,100 | |
| | | | Altice US Finance I Corporation | | | | |
| | 575,000 | | | 5.500%, 5/15/2026d | | | 586,500 | |
| | | | AMC Networks, Inc. | | | | |
| | 860,000 | | | 5.000%, 4/1/2024 | | | 870,750 | |
| | | | America Movil SAB de CV | | | | |
| | 252,000 | | | 5.000%, 10/16/2019 | | | 274,489 | |
| | | | American Tower Corporation | | | | |
| | 25,000 | | | 2.800%, 6/1/2020 | | | 25,528 | |
| | 380,000 | | | 3.300%, 2/15/2021 | | | 394,707 | |
| | | | AT&T, Inc. | | | | |
| | 164,000 | | | 5.875%, 10/1/2019 | | | 181,639 | |
| | 90,000 | | | 1.768%, 6/30/2020e | | | 90,397 | |
| | 286,000 | | | 3.875%, 8/15/2021 | | | 303,203 | |
| | 230,000 | | | 3.000%, 6/30/2022 | | | 233,218 | |
| | 457,000 | | | 6.350%, 3/15/2040 | | | 548,877 | |
| | 285,000 | | | 5.550%, 8/15/2041 | | | 309,182 | |
| | 325,000 | | | 5.150%, 3/15/2042 | | | 335,429 | |
| | 152,000 | | | 4.750%, 5/15/2046 | | | 148,744 | |
| | | | British Sky Broadcasting Group plc | | | | |
| | 255,000 | | | 2.625%, 9/16/2019d | | | 258,479 | |
| | | | CCO Holdings, LLC | | | | |
| | 600,000 | | | 5.875%, 4/1/2024d | | | 634,500 | |
| | | | CCOH Safari, LLC | | | | |
| | 200,000 | | | 5.750%, 2/15/2026d | | | 208,375 | |
| | | | CenturyLink, Inc. | | | | |
| | 465,000 | | | 6.450%, 6/15/2021 | | | 496,387 | |
| | | | Charter Communications Operating, LLC | | | | |
| | 304,000 | | | 6.834%, 10/23/2055d | | | 362,477 | |
| | 191,000 | | | 3.579%, 7/23/2020d | | | 198,040 | |
| | 316,000 | | | 4.908%, 7/23/2025d | | | 340,822 | |
| | | | Clear Channel Worldwide Holdings, Inc. | | | | |
| | 830,000 | | | 6.500%, 11/15/2022 | | | 845,355 | |
| | | | Columbus International, Inc. | | | | |
| | 575,000 | | | 7.375%, 3/30/2021d | | | 615,250 | |
| | | | Comcast Corporation | | | | |
| | 250,000 | | | 2.750%, 3/1/2023 | | | 256,909 | |
| | 630,000 | | | 4.400%, 8/15/2035 | | | 694,492 | |
| | 145,000 | | | 4.650%, 7/15/2042 | | | 160,835 | |
| | 473,000 | | | 4.750%, 3/1/2044 | | | 535,100 | |
| | | | Cox Communications, Inc. | | | | |
| | 140,000 | | | 9.375%, 1/15/2019d | | | 160,808 | |
| | | | Crown Castle International Corporation | | | | |
| | 358,000 | | | 3.400%, 2/15/2021 | | | 372,010 | |
| | 514,000 | | | 5.250%, 1/15/2023 | | | 574,349 | |
| | 140,000 | | | 3.700%, 6/15/2026 | | | 143,394 | |
| | | | CSC Holdings, LLC | | | | |
| | 65,000 | | | 5.500%, 4/15/2027d | | | 65,934 | |
| | | | Digicel, Ltd. | | | | |
| | 775,000 | | | 6.000%, 4/15/2021* | | | 693,392 | |
| | | | Dish DBS Corporation | | | | |
| | 530,000 | | | 5.875%, 7/15/2022 | | | 547,225 | |
| | | | FairPoint Communications, Inc. | | | | |
| | 445,000 | | | 8.750%, 8/15/2019d | | | 452,787 | |
| | | | Frontier Communications Corporation | | | | |
| | 655,000 | | | 8.875%, 9/15/2020 | | | 695,937 | |
| | | | Gray Television, Inc. | | | | |
| | 595,000 | | | 5.125%, 10/15/2024d | | | 577,150 | |
| | | | Hughes Satellite Systems Corporation | | | | |
| | 443,000 | | | 6.500%, 6/15/2019 | | | 483,424 | |
| | | | Level 3 Communications, Inc. | | | | |
| | 595,000 | | | 5.375%, 1/15/2024 | | | 606,900 | |
| | | | Level 3 Financing, Inc. | | | | |
| | 205,000 | | | 5.375%, 5/1/2025 | | | 208,075 | |
| | | | Neptune Finco Corporation | | | | |
| | 365,000 | | | 10.875%, 10/15/2025d | | | 419,750 | |
| | | | Omnicom Group, Inc. | | | | |
| | 156,000 | | | 3.600%, 4/15/2026 | | | 162,055 | |
| | | | Quebecor Media, Inc. | | | | |
| | 390,000 | | | 5.750%, 1/15/2023 | | | 407,550 | |
| | | | S&P Global, Inc. | | | | |
| | 304,000 | | | 3.300%, 8/14/2020 | | | 316,761 | |
| | | | SES Global Americas Holdings GP | | | | |
| | 175,000 | | | 2.500%, 3/25/2019d | | | 175,003 | |
| | | | SFR Group SA | | | | |
| | 700,000 | | | 6.000%, 5/15/2022d | | | 717,724 | |
| | | | Sprint Communications, Inc. | | | | |
| | 390,000 | | | 6.000%, 11/15/2022 | | | 363,433 | |
| | | | Sprint Corporation | | | | |
| | 305,000 | | | 7.625%, 2/15/2025 | | | 295,087 | |
| | | | Telefonica Emisiones SAU | | | | |
| | 252,000 | | | 3.192%, 4/27/2018 | | | 257,389 | |
| | | | Time Warner Entertainment Company, LP | | | | |
| | 379,000 | | | 8.375%, 3/15/2023 | | | 489,737 | |
| | | | Time Warner, Inc. | | | | |
| | 152,000 | | | 3.600%, 7/15/2025 | | | 157,958 | |
The accompanying Notes to Financial Statements are an integral part of this schedule.
37
MODERATE ALLOCATION FUND
Schedule of Investments as of October 31, 2016
| | | | | | | | |
Principal Amount | | | Long-Term Fixed Income (29.3%) | | Value | |
| Communications Services (1.3%) - continued | | | | |
| | $215,000 | | | 6.250%, 3/29/2041 | | | $262,847 | |
| | | | T-Mobile USA, Inc. | | | | |
| | 670,000 | | | 6.125%, 1/15/2022 | | | 706,850 | |
| | | | Unitymedia Hessen GmbH & Company KG | | | | |
| | 445,000 | | | 5.500%, 1/15/2023d | | | 461,131 | |
| | | | Univision Communications, Inc. | | | | |
| | 135,000 | | | 5.125%, 5/15/2023d | | | 137,025 | |
| | | | Verizon Communications, Inc. | | | | |
| | 165,000 | | | 1.627%, 6/17/2019e | | | 166,435 | |
| | 390,000 | | | 3.000%, 11/1/2021 | | | 401,662 | |
| | 684,000 | | | 5.150%, 9/15/2023 | | | 782,400 | |
| | 144,000 | | | 5.050%, 3/15/2034 | | | 156,262 | |
| | 242,000 | | | 4.272%, 1/15/2036 | | | 242,991 | |
| | 543,000 | | | 4.522%, 9/15/2048 | | | 539,976 | |
| | | | Viacom, Inc. | | | | |
| | 380,000 | | | 4.375%, 3/15/2043 | | | 349,597 | |
| | 228,000 | | | 5.850%, 9/1/2043 | | | 255,685 | |
| | | | Vodafone Group plc | | | | |
| | 304,000 | | | 6.150%, 2/27/2037 | | | 361,738 | |
| | | | | |
| | | | Total | | | 24,925,669 | |
| | | | | |
| |
| Consumer Cyclical (0.8%) | | | | |
| | | | AmeriGas Finance, LLC | | | | |
| | 285,000 | | | 5.625%, 5/20/2024 | | | 298,537 | |
| | | | Automatic Data Processing, Inc. | | | | |
| | 110,000 | | | 3.375%, 9/15/2025 | | | 118,163 | |
| | | | Cinemark USA, Inc. | | | | |
| | 775,000 | | | 4.875%, 6/1/2023 | | | 775,969 | |
| | | | CVS Health Corporation | |
| | 60,000 | | | 2.250%, 8/12/2019 | | | 61,025 | |
| | 565,000 | | | 4.875%, 7/20/2035 | | | 635,922 | |
| | 250,000 | | | 5.125%, 7/20/2045 | | | 291,648 | |
| | | | Daimler Finance North America, LLC | | | | |
| | 304,000 | | | 1.496%, 10/30/2019d,e | | | 304,381 | |
| | | | Delphi Automotive plc | | | | |
| | 380,000 | | | 3.150%, 11/19/2020 | | | 391,580 | |
| | | | eBay, Inc. | | | | |
| | 150,000 | | | 2.500%, 3/9/2018 | | | 151,859 | |
| | | | Ford Motor Credit Company, LLC | | | | |
| | 340,000 | | | 5.000%, 5/15/2018 | | | 355,909 | |
| | 320,000 | | | 2.551%, 10/5/2018 | | | 323,846 | |
| | 300,000 | | | 2.943%, 1/8/2019 | | | 306,090 | |
| | | | General Motors Company | | | | |
| | 145,000 | | | 6.600%, 4/1/2036 | | | 171,398 | |
| | 280,000 | | | 6.250%, 10/2/2043 | | | 320,599 | |
| | | | General Motors Financial Company, Inc. | | | | |
| | 228,000 | | | 3.700%, 11/24/2020 | | | 234,975 | |
| | 152,000 | | | 4.200%, 3/1/2021 | | | 159,910 | |
| | 360,000 | | | 4.300%, 7/13/2025 | | | 368,286 | |
| | | | Goodyear Tire & Rubber Company | | | | |
| | 450,000 | | | 5.125%, 11/15/2023 | | | 464,625 | |
| | | | Home Depot, Inc. | | | | |
| | 152,000 | | | 2.625%, 6/1/2022 | | | 156,895 | |
| | 190,000 | | | 3.000%, 4/1/2026 | | | 197,156 | |
| | 228,000 | | | 4.250%, 4/1/2046 | | | 250,247 | |
| | | | Hyundai Capital America | | | | |
| | 228,000 | | | 2.400%, 10/30/2018d | | | 230,572 | |
| | 228,000 | | | 3.000%, 10/30/2020d | | | 234,106 | |
| | | | Jaguar Land Rover Automotive plc | | | | |
| | 230,000 | | | 4.125%, 12/15/2018d | | | 235,175 | |
| | 270,000 | | | 5.625%, 2/1/2023d | | | 279,320 | |
| | | | KB Home | | | | |
| | 358,000 | | | 4.750%, 5/15/2019 | | | 366,055 | |
| | | | L Brands, Inc. | | | | |
| | 270,000 | | | 5.625%, 2/15/2022 | | | 295,650 | |
| | | | Lear Corporation | | | | |
| | 380,000 | | | 5.250%, 1/15/2025 | | | 407,550 | |
| | | | Lennar Corporation | | | | |
| | 270,000 | | | 4.125%, 12/1/2018 | | | 277,425 | |
| | 320,000 | | | 4.875%, 12/15/2023 | | | 326,400 | |
| | | | Live Nation Entertainment, Inc. | | | | |
| | 450,000 | | | 5.375%, 6/15/2022d | | | 465,750 | |
| | | | McDonald’s Corporation | | | | |
| | 225,000 | | | 2.750%, 12/9/2020 | | | 231,605 | |
| | | | MGM Resorts International | | | | |
| | 590,000 | | | 6.000%, 3/15/2023 | | | 638,675 | |
| | | | PulteGroup, Inc. | | | | |
| | 845,000 | | | 4.250%, 3/1/2021 | | | 887,250 | |
| | | | Rite Aid Corporation | | | | |
| | 565,000 | | | 6.125%, 4/1/2023d | | | 596,075 | |
| | | | Royal Caribbean Cruises, Ltd. | | | | |
| | 325,000 | | | 5.250%, 11/15/2022i | | | 355,469 | |
| | | | Schaeffler Verwaltung Zwei GmbH | | | | |
| | 595,000 | | | 4.500%, 9/15/2023d | | | 602,437 | |
| | | | Six Flags Entertainment Corporation | | | | |
| | 550,000 | | | 5.250%, 1/15/2021d | | | 566,500 | |
| | | | Time Warner, Inc. | | | | |
| | 304,000 | | | 7.625%, 4/15/2031 | | | 424,809 | |
| | | | Toll Brothers Finance Corporation | | | | |
| | 128,000 | | | 8.910%, 10/15/2017 | | | 136,160 | |
| | 132,000 | | | 4.000%, 12/31/2018 | | | 136,290 | |
| | | | West Corporation | | | | |
| | 475,000 | | | 5.375%, 7/15/2022d | | | 457,187 | |
| | | | ZF North America Capital, Inc. | | | | |
| | 625,000 | | | 4.500%, 4/29/2022d | | | 661,719 | |
| | | | | |
| | | | Total | | | 15,151,199 | |
| | | | | |
| |
| | Consumer Non-Cyclical (1.3%) | | | | |
| | | | AbbVie, Inc. | | | | |
| | 260,000 | | | 2.500%, 5/14/2020 | | | 263,269 | |
| | 390,000 | | | 3.600%, 5/14/2025 | | | 397,695 | |
| | 400,000 | | | 4.450%, 5/14/2046 | | | 394,730 | |
| | | | Actavis Funding SCS | | | | |
| | 470,000 | | | 4.550%, 3/15/2035 | | | 485,279 | |
| | 228,000 | | | 4.850%, 6/15/2044 | | | 241,221 | |
| | | | Altria Group, Inc. | | | | |
| | 152,000 | | | 2.850%, 8/9/2022 | | | 156,366 | |
| | 190,000 | | | 2.625%, 9/16/2026 | | | 188,403 | |
| | | | Amgen, Inc. | | | | |
| | 152,000 | | | 2.700%, 5/1/2022 | | | 154,777 | |
| | 150,000 | | | 3.125%, 5/1/2025 | | | 152,511 | |
| | | | Anheuser-Busch InBev Finance, Inc. | | | | |
| | 165,000 | | | 2.017%, 2/1/2021e | | | 169,187 | |
| | 865,000 | | | 3.650%, 2/1/2026 | | | 910,207 | |
| | 760,000 | | | 4.700%, 2/1/2036 | | | 842,488 | |
| | 390,000 | | | 4.900%, 2/1/2046 | | | 445,979 | |
| | | | Aramark Services, Inc. | | | | |
| | 430,000 | | | 4.750%, 6/1/2026d | | | 430,000 | |
| | | | B&G Foods, Inc. | | | | |
| | 230,000 | | | 4.625%, 6/1/2021 | | | 236,325 | |
| | | | BAT International Finance plc | | | | |
| | 120,000 | | | 1.360%, 6/15/2018d,e | | | 120,155 | |
| | | | Baxter International, Inc. | | | | |
| | 190,000 | | | 2.600%, 8/15/2026 | | | 183,997 | |
| | | | Becton, Dickinson and Company | | | | |
| | 397,000 | | | 6.375%, 8/1/2019 | | | 445,143 | |
| | | | Biogen, Inc. | | | | |
| | 240,000 | | | 3.625%, 9/15/2022 | | | 255,782 | |
The accompanying Notes to Financial Statements are an integral part of this schedule.
38
MODERATE ALLOCATION FUND
Schedule of Investments as of October 31, 2016
| | | | | | | | |
Principal Amount | | | Long-Term Fixed Income (29.3%) | | Value | |
| Consumer Non-Cyclical (1.3%) - continued | | | | |
| | | | Boston Scientific Corporation | | | | |
| | $110,000 | | | 6.000%, 1/15/2020 | | | $123,113 | |
| | 175,000 | | | 3.850%, 5/15/2025 | | | 183,449 | |
| | 228,000 | | | 7.375%, 1/15/2040 | | | 298,854 | |
| | | | BRF SA | | | | |
| | 315,000 | | | 4.750%, 5/22/2024d | | | 320,544 | |
| | | | Bunge Limited Finance Corporation | | | | |
| | 216,000 | | | 8.500%, 6/15/2019 | | | 251,703 | |
| | 204,000 | | | 3.500%, 11/24/2020 | | | 212,886 | |
| | | | Cardinal Health, Inc. | | | | |
| | 65,000 | | | 1.950%, 6/15/2018 | | | 65,513 | |
| | 114,000 | | | 4.900%, 9/15/2045 | | | 130,163 | |
| | | | Celgene Corporation | | | | |
| | 340,000 | | | 2.875%, 8/15/2020 | | | 350,794 | |
| | 65,000 | | | 3.550%, 8/15/2022 | | | 68,429 | |
| | 190,000 | | | 5.000%, 8/15/2045 | | | 203,857 | |
| | | | Church & Dwight Company, Inc. | | | | |
| | 80,000 | | | 2.450%, 12/15/2019 | | | 81,189 | |
| | | | Cigna Corporation | | | | |
| | 215,000 | | | 5.375%, 2/15/2042 | | | 250,829 | |
| | | | ConAgra Foods, Inc. | | | | |
| | 117,000 | | | 7.125%, 10/1/2026 | | | 147,547 | |
| | | | Cott Beverages, Inc. | | | | |
| | 325,000 | | | 5.375%, 7/1/2022 | | | 329,875 | |
| | | | EMD Finance, LLC | | | | |
| | 130,000 | | | 1.207%, 3/17/2017d,e | | | 130,046 | |
| | 344,000 | | | 2.950%, 3/19/2022d | | | 352,544 | |
| | | | Endo Finance, LLC | |
| | 225,000 | | | 6.500%, 2/1/2025d,f | | | 189,562 | |
| | | | Energizer Holdings, Inc. | |
| | 540,000 | | | 5.500%, 6/15/2025d | | | 546,750 | |
| | | | Envision Healthcare Corporation | | | | |
| | 625,000 | | | 5.125%, 7/1/2022d | | | 625,000 | |
| | | | Express Scripts Holding Company | | | | |
| | 152,000 | | | 3.900%, 2/15/2022 | | | 162,524 | |
| | 355,000 | | | 4.500%, 2/25/2026 | | | 380,321 | |
| | 61,000 | | | 3.400%, 3/1/2027 | | | 59,887 | |
| | | | Fresenius Medical Care US Finance II, Inc. | | | | |
| | 270,000 | | | 5.875%, 1/31/2022d | | | 305,829 | |
| | | | Gilead Sciences, Inc. | | | | |
| | 65,000 | | | 2.550%, 9/1/2020 | | | 66,617 | |
| | 380,000 | | | 2.950%, 3/1/2027 | | | 375,721 | |
| | | | Grifols Worldwide Operations, Ltd. | | | | |
| | 600,000 | | | 5.250%, 4/1/2022 | | | 625,500 | |
| | | | H. J. Heinz Company | | | | |
| | 275,000 | | | 3.500%, 7/15/2022 | | | 289,757 | |
| | | | HCA, Inc. | | | | |
| | 125,000 | | | 4.750%, 5/1/2023 | | | 130,156 | |
| | 305,000 | | | 5.250%, 6/15/2026 | | | 318,725 | |
| | 325,000 | | | 4.500%, 2/15/2027 | | | 320,937 | |
| | | | Imperial Tobacco Finance plc | | | | |
| | 365,000 | | | 2.950%, 7/21/2020d | | | 374,790 | |
| | | | JBS USA, LLC | | | | |
| | 325,000 | | | 5.750%, 6/15/2025d | | | 318,500 | |
| | | | Kraft Foods Group, Inc. | | | | |
| | 312,000 | | | 5.000%, 6/4/2042 | | | 345,620 | |
| | | | Laboratory Corporation of America Holdings | | | | |
| | 90,000 | | | 2.625%, 2/1/2020 | | | 91,491 | |
| | | | LifePoint Health, Inc. | | | | |
| | 450,000 | | | 5.500%, 12/1/2021 | | | 466,312 | |
| | 160,000 | | | 5.375%, 5/1/2024d | | | 159,008 | |
| | | | McKesson Corporation | | | | |
| | 175,000 | | | 4.883%, 3/15/2044 | | | 189,344 | |
| | | | Mead Johnson Nutrition Company | | | | |
| | 152,000 | | | 3.000%, 11/15/2020 | | | 157,130 | |
| | | | Medtronic plc | | | | |
| | 760,000 | | | 4.375%, 3/15/2035 | | | 833,715 | |
| | | | Merck & Company, Inc. | | | | |
| | 100,000 | | | 1.182%, 2/10/2020e | | | 100,511 | |
| | 70,000 | | | 3.700%, 2/10/2045 | | | 71,823 | |
| | | | Mondelez International, Inc. | | | | |
| | 118,000 | | | 1.277%, 2/1/2019e | | | 117,993 | |
| | | | Mylan NV | | | | |
| | 305,000 | | | 3.000%, 12/15/2018d | | | 311,497 | |
| | | | PepsiCo, Inc. | | | | |
| | 300,000 | | | 2.850%, 2/24/2026 | | | 309,898 | |
| | | | Pernod Ricard SA | | | | |
| | 250,000 | | | 3.250%, 6/8/2026d | | | 251,117 | |
| | | | Perrigo Finance Unlimited Company | | | | |
| | 470,000 | | | 3.500%, 3/15/2021 | | | 485,654 | |
| | | | Quintiles Transnational Holdings, Inc. | | | | |
| | 450,000 | | | 4.875%, 5/15/2023d | | | 464,062 | |
| | | | Reynolds American, Inc. | | | | |
| | 166,000 | | | 2.300%, 8/21/2017 | | | 167,328 | |
| | 481,000 | | | 5.700%, 8/15/2035 | | | 581,572 | |
| | | | Roche Holdings, Inc. | | | | |
| | 228,000 | | | 4.000%, 11/28/2044d | | | 249,530 | |
| | | | SABMiller Holdings, Inc. | | | | |
| | 152,000 | | | 3.750%, 1/15/2022d | | | 163,702 | |
| | | | Safeway, Inc. | | | | |
| | 13,000 | | | 3.400%, 12/1/2016 | | | 13,000 | |
| | | | Shire Acquisitions Investments Ireland Designated Activity Company | | | | |
| | 228,000 | | | 2.400%, 9/23/2021 | | | 226,232 | |
| | 228,000 | | | 3.200%, 9/23/2026 | | | 223,890 | |
| | | | Spectrum Brands, Inc. | | | | |
| | 305,000 | | | 5.750%, 7/15/2025 | | | 330,162 | |
| | | | Tenet Healthcare Corporation | | | | |
| | 760,000 | | | 8.125%, 4/1/2022 | | | 742,900 | |
| | | | Teva Pharmaceutical Finance Netherlands III BV | | | | |
| | 314,000 | | | 2.200%, 7/21/2021 | | | 310,210 | |
| | 190,000 | | | 2.800%, 7/21/2023 | | | 186,968 | |
| | 140,000 | | | 4.100%, 10/1/2046 | | | 129,964 | |
| | | | Thermo Fisher Scientific, Inc. | | | | |
| | 117,000 | | | 3.000%, 4/15/2023 | | | 118,758 | |
| | | | TreeHouse Foods, Inc. | | | | |
| | 215,000 | | | 4.875%, 3/15/2022 | | | 223,062 | |
| | | | UnitedHealth Group, Inc. | | | | |
| | 685,000 | | | 4.625%, 7/15/2035 | | | 781,330 | |
| | | | VRX Escrow Corporation | | | | |
| | 905,000 | | | 6.125%, 4/15/2025d | | | 714,950 | |
| | | | Zoetis, Inc. | | | | |
| | 304,000 | | | 4.700%, 2/1/2043 | | | 312,372 | |
| | | | | |
| | | | Total | | | 24,896,530 | |
| | | | | |
| |
| | Energy (0.8%) | | | | |
| | | | Anadarko Petroleum Corporation | | | | |
| | 225,000 | | | 4.850%, 3/15/2021 | | | 244,265 | |
| | | | Antero Resources Corporation | | | | |
| | 475,000 | | | 5.125%, 12/1/2022 | | | 478,562 | |
| | | | Apache Corporation | | | | |
| | 300,000 | | | 4.750%, 4/15/2043 | | | 313,310 | |
| | | | Boardwalk Pipelines, LP | | | | |
| | 243,000 | | | 5.875%, 11/15/2016 | | | 243,366 | |
| | 150,000 | | | 5.950%, 6/1/2026 | | | 166,349 | |
| | | | BP Capital Markets plc | | | | |
| | 315,000 | | | 3.062%, 3/17/2022 | | | 328,257 | |
The accompanying Notes to Financial Statements are an integral part of this schedule.
39
MODERATE ALLOCATION FUND
Schedule of Investments as of October 31, 2016
| | | | | | | | |
Principal Amount | | | Long-Term Fixed Income (29.3%) | | Value | |
| Energy (0.8%) - continued | | | | |
| | $463,000 | | | 3.535%, 11/4/2024 | | | $484,353 | |
| | 85,000 | | | 3.119%, 5/4/2026 | | | 86,007 | |
| | | | Buckeye Partners, LP | | | | |
| | 226,000 | | | 2.650%, 11/15/2018 | | | 228,505 | |
| | 50,000 | | | 3.950%, 12/1/2026c | | | 49,939 | |
| | | | Canadian Natural Resources, Ltd. | | | | |
| | 310,000 | | | 3.450%, 11/15/2021 | | | 319,343 | |
| | | | CNOOC Nexen Finance | | | | |
| | 216,000 | | | 1.625%, 4/30/2017 | | | 216,024 | |
| | | | CNPC General Capital, Ltd. | | | | |
| | 140,000 | | | 2.750%, 4/19/2017d | | | 140,748 | |
| | | | Columbia Pipeline Group, Inc. | | | | |
| | 300,000 | | | 2.450%, 6/1/2018 | | | 301,264 | |
| | | | Concho Resources, Inc. | | | | |
| | 490,000 | | | 6.500%, 1/15/2022 | | | 507,150 | |
| | 269,675 | | | 5.500%, 10/1/2022 | | | 277,091 | |
| | | | ConocoPhillips Company | | | | |
| | 190,000 | | | 4.200%, 3/15/2021 | | | 206,258 | |
| | | | Contura Energy, Inc. | | | | |
| | 67,000 | | | 10.000%, 8/1/2021* | | | 70,685 | |
| | | | Crestwood Midstream Partners, LP | | | | |
| | 150,000 | | | 6.125%, 3/1/2022 | | | 153,375 | |
| | | | Devon Energy Corporation | | | | |
| | 230,000 | | | 3.250%, 5/15/2022 | | | 230,929 | |
| | 152,000 | | | 5.850%, 12/15/2025i | | | 174,232 | |
| | | | Ecopetrol SA | | | | |
| | 125,000 | | | 5.875%, 9/18/2023 | | | 134,062 | |
| | | | Enbridge Energy Partners, LP | |
| | 152,000 | | | 4.375%, 10/15/2020 | | | 162,169 | |
| | | | Enbridge, Inc. | |
| | 115,000 | | | 1.289%, 6/2/2017e,i | | | 114,864 | |
| | | | Energy Transfer Partners, LP | | | | |
| | 304,000 | | | 4.650%, 6/1/2021 | | | 326,053 | |
| | 215,000 | | | 4.900%, 3/15/2035 | | | 201,674 | |
| | | | EnLink Midstream Partners, LP | | | | |
| | 155,000 | | | 4.150%, 6/1/2025 | | | 151,030 | |
| | 115,000 | | | 4.850%, 7/15/2026 | | | 117,142 | |
| | | | Enterprise Products Operating, LLC | | | | |
| | 198,000 | | | 5.100%, 2/15/2045 | | | 210,149 | |
| | | | EQT Corporation | | | | |
| | 165,000 | | | 5.150%, 3/1/2018 | | | 171,411 | |
| | 160,000 | | | 8.125%, 6/1/2019 | | | 182,489 | |
| | 175,000 | | | 4.875%, 11/15/2021 | | | 191,385 | |
| | | | Exxon Mobil Corporation | | | | |
| | 125,000 | | | 4.114%, 3/1/2046 | | | 134,886 | |
| | | | Magellan Midstream Partners, LP | | | | |
| | 215,000 | | | 5.000%, 3/1/2026 | | | 243,859 | |
| | | | Marathon Oil Corporation | | | | |
| | 228,000 | | | 2.700%, 6/1/2020 | | | 224,835 | |
| | | | Marathon Petroleum Corporation | | | | |
| | 115,000 | | | 3.400%, 12/15/2020 | | | 119,498 | |
| | 119,000 | | | 4.750%, 9/15/2044 | | | 105,252 | |
| | | | MEG Energy Corporation | | | | |
| | 270,000 | | | 6.500%, 3/15/2021d | | | 232,875 | |
| | | | MPLX, LP | | | | |
| | 780,000 | | | 4.875%, 12/1/2024 | | | 815,765 | |
| | 304,000 | | | 4.875%, 6/1/2025 | | | 317,118 | |
| | | | Newfield Exploration Company | | | | |
| | 410,000 | | | 5.625%, 7/1/2024 | | | 426,400 | |
| | | | Noble Energy, Inc. | | | | |
| | 215,000 | | | 5.625%, 5/1/2021 | | | 222,921 | |
| | | | Northern Tier Energy, LLC | | | | |
| | 620,000 | | | 7.125%, 11/15/2020 | | | 633,950 | |
| | | | Petrobras Global Finance BV | | | | |
| | 96,000 | | | 8.375%, 5/23/2021 | | | 106,205 | |
| | | | Petrobras International Finance Company | | | | |
| | 152,000 | | | 5.750%, 1/20/2020 | | | 156,864 | |
| | | | Petroleos Mexicanos | | | | |
| | 222,000 | | | 5.500%, 2/4/2019d | | | 234,987 | |
| | 102,000 | | | 2.378%, 4/15/2025 | | | 104,804 | |
| | | | Phillips 66 Partners, LP | | | | |
| | 190,000 | | | 3.550%, 10/1/2026 | | | 189,301 | |
| | | | Pioneer Natural Resources Company | | | | |
| | 84,000 | | | 3.450%, 1/15/2021 | | | 87,511 | |
| | 150,000 | | | 4.450%, 1/15/2026 | | | 164,324 | |
| | | | Regency Energy Partners, LP | | | | |
| | 325,000 | | | 5.000%, 10/1/2022 | | | 348,739 | |
| | | | Rice Energy, Inc. | | | | |
| | 460,000 | | | 6.250%, 5/1/2022 | | | 468,050 | |
| | | | Sabine Pass Liquefaction, LLC | | | | |
| | 325,000 | | | 5.625%, 3/1/2025 | | | 343,899 | |
| | | | Schlumberger Holdings Corporation | | | | |
| | 115,000 | | | 3.000%, 12/21/2020d | | | 119,326 | |
| | 190,000 | | | 4.000%, 12/21/2025d | �� | | 204,059 | |
| | | | Shell International Finance BV | | | | |
| | 90,000 | | | 1.266%, 5/11/2020e | | | 90,099 | |
| | | | Suncor Energy, Inc. | | | | |
| | 210,000 | | | 3.600%, 12/1/2024 | | | 218,124 | |
| | | | Sunoco Logistics Partners Operations, LP | | | | |
| | 505,000 | | | 4.400%, 4/1/2021 | | | 544,771 | |
| | | | Valero Energy Corporation | |
| | 380,000 | | | 3.400%, 9/15/2026 | | | 371,918 | |
| | | | Weatherford International, Ltd. | |
| | 575,000 | | | 8.250%, 6/15/2023i | | | 595,125 | |
| | | | | |
| | | | Total | | | 15,007,905 | |
| | | | | |
| |
| | Financials (2.5%) | | | | |
| | | | ABN AMRO Bank NV | | | | |
| | 300,000 | | | 4.750%, 7/28/2025d | | | 315,147 | |
| | | | ACE INA Holdings, Inc. | | | | |
| | 225,000 | | | 4.350%, 11/3/2045 | | | 251,171 | |
| | | | AerCap Ireland Capital, Ltd. | | | | |
| | 150,000 | | | 3.750%, 5/15/2019 | | | 153,927 | |
| | 152,000 | | | 4.625%, 10/30/2020 | | | 159,980 | |
| | 590,000 | | | 5.000%, 10/1/2021 | | | 626,875 | |
| | 152,000 | | | 4.625%, 7/1/2022 | | | 158,650 | |
| | | | Aetna, Inc. | | | | |
| | 235,000 | | | 2.400%, 6/15/2021 | | | 237,132 | |
| | 305,000 | | | 2.800%, 6/15/2023 | | | 309,068 | |
| | 155,000 | | | 3.200%, 6/15/2026 | | | 155,546 | |
| | 235,000 | | | 4.250%, 6/15/2036 | | | 238,452 | |
| | | | Air Lease Corporation | | | | |
| | 175,000 | | | 2.125%, 1/15/2018 | | | 175,611 | |
| | 50,000 | | | 2.625%, 9/4/2018 | | | 50,613 | |
| | | | Aircastle, Ltd. | | | | |
| | 545,000 | | | 5.000%, 4/1/2023 | | | 564,075 | |
| | | | Ally Financial, Inc. | | | | |
| | 210,000 | | | 3.750%, 11/18/2019 | | | 210,262 | |
| | 400,000 | | | 4.125%, 3/30/2020 | | | 406,500 | |
| | | | American Express Credit Corporation | | | | |
| | 165,000 | | | 1.407%, 3/18/2019e | | | 165,385 | |
| | | | American International Group, Inc. | | | | |
| | 80,000 | | | 3.300%, 3/1/2021 | | | 83,633 | |
| | 228,000 | | | 4.125%, 2/15/2024 | | | 245,093 | |
| | 100,000 | | | 3.900%, 4/1/2026 | | | 104,747 | |
| | | | Aon plc | | | | |
| | 114,000 | | | 3.875%, 12/15/2025 | | | 120,938 | |
| | | | Argos Merger Sub, Inc. | | | | |
| | 560,000 | | | 7.125%, 3/15/2023d,i | | | 585,900 | |
The accompanying Notes to Financial Statements are an integral part of this schedule.
40
MODERATE ALLOCATION FUND
Schedule of Investments as of October 31, 2016
| | | | | | | | |
Principal
Amount | | | Long-Term Fixed Income (29.3%) | | Value | |
| Financials (2.5%) - continued | | | | |
| | | | Avalonbay Communities, Inc. | | | | |
| | $325,000 | | | 3.500%, 11/15/2025 | | | $337,869 | |
| | | | Banco Santander Chile | | | | |
| | 200,000 | | | 1.776%, 4/11/2017d,e | | | 199,500 | |
| | | | Bank of America Corporation | | | | |
| | 205,000 | | | 1.936%, 3/22/2018e | | | 206,735 | |
| | 140,000 | | | 1.716%, 4/1/2019e | | | 140,436 | |
| | 265,000 | | | 2.625%, 10/19/2020 | | | 269,434 | |
| | 285,000 | | | 3.300%, 1/11/2023 | | | 293,155 | |
| | 312,000 | | | 4.000%, 4/1/2024 | | | 333,355 | |
| | 310,000 | | | 4.000%, 1/22/2025 | | | 318,740 | |
| | 230,000 | | | 3.500%, 4/19/2026 | | | 236,077 | |
| | 389,000 | | | 5.875%, 2/7/2042 | | | 491,939 | |
| | 312,000 | | | 8.000%, 7/29/2049g | | | 317,850 | |
| | | | Bank of New York Mellon Corporation | | | | |
| | 380,000 | | | 2.500%, 4/15/2021 | | | 387,453 | |
| | | | Bank of Tokyo-Mitsubishi UFJ, Ltd. | | | | |
| | 80,000 | | | 2.850%, 9/8/2021d | | | 81,926 | |
| | | | Barclays Bank plc | | | | |
| | 78,000 | | | 10.179%, 6/12/2021d | | | 98,626 | |
| | | | Barclays plc | | | | |
| | 210,000 | | | 2.750%, 11/8/2019 | | | 211,684 | |
| | 315,000 | | | 3.650%, 3/16/2025 | | | 309,276 | |
| | | | BB&T Corporation | | | | |
| | 85,000 | | | 1.595%, 1/15/2020e | | | 85,074 | |
| | | | Berkshire Hathaway, Inc. | | | | |
| | 190,000 | | | 2.750%, 3/15/2023 | | | 195,642 | |
| | | | BPCE SA | | | | |
| | 210,000 | | | 5.700%, 10/22/2023d | | | 227,528 | |
| | | | Caisse Centrale Desjardins du Quebec | | | | |
| | 115,000 | | | 1.552%, 1/29/2018d,e | | | 114,875 | |
| | | | Capital One Financial Corporation | | | | |
| | 180,000 | | | 2.450%, 4/24/2019 | | | 183,045 | |
| | | | Centene Escrow Corporation | | | | |
| | 600,000 | | | 5.625%, 2/15/2021 | | | 629,406 | |
| | | | CIT Group, Inc. | | | | |
| | 580,000 | | | 5.000%, 8/15/2022 | | | 618,425 | |
| | | | Citigroup, Inc. | | | | |
| | 115,000 | | | 1.642%, 4/8/2019e | | | 115,151 | |
| | 315,000 | | | 2.700%, 3/30/2021 | | | 320,432 | |
| | 188,000 | | | 4.050%, 7/30/2022 | | | 198,700 | |
| | 555,000 | | | 4.400%, 6/10/2025 | | | 586,133 | |
| | 304,000 | | | 3.200%, 10/21/2026 | | | 303,288 | |
| | 228,000 | | | 4.125%, 7/25/2028 | | | 233,666 | |
| | 171,000 | | | 4.650%, 7/30/2045 | | | 187,101 | |
| | | | Citizens Bank NA | | | | |
| | 380,000 | | | 2.300%, 12/3/2018 | | | 384,103 | |
| | | | CoBank ACB | | | | |
| | 85,000 | | | 1.450%, 6/15/2022e | | | 80,694 | |
| | | | Compass Bank | | | | |
| | 210,000 | | | 2.750%, 9/29/2019 | | | 210,184 | |
| | | | Cooperatieve Centrale Raiffeisen-Boerenleenbank BA | | | | |
| | 182,000 | | | 3.950%, 11/9/2022 | | | 190,793 | |
| | | | Credit Agricole SA | | | | |
| | 140,000 | | | 1.680%, 4/15/2019d,e | | | 140,450 | |
| | | | Credit Suisse AG | | | | |
| | 152,000 | | | 5.400%, 1/14/2020 | | | 164,758 | |
| | | | Credit Suisse Group Funding, Ltd. | | | | |
| | 456,000 | | | 2.750%, 3/26/2020 | | | 456,978 | |
| | 304,000 | | | 3.750%, 3/26/2025 | | | 301,535 | |
| | | | CyrusOne, LP | | | | |
| | 470,000 | | | 6.375%, 11/15/2022 | | | 498,200 | |
| | | | Deutsche Bank AG | |
| | 468,000 | | | 3.375%, 5/12/2021 | | | 460,461 | |
| | | | Digital Realty Trust LP | |
| | 340,000 | | | 3.400%, 10/1/2020 | | | 352,635 | |
| | | | Discover Bank | | | | |
| | 355,000 | | | 8.700%, 11/18/2019 | | | 411,729 | |
| | | | Discover Financial Services | | | | |
| | 144,000 | | | 6.450%, 6/12/2017 | | | 148,293 | |
| | | | Duke Realty, LP | | | | |
| | 70,000 | | | 3.875%, 2/15/2021 | | | 74,260 | |
| | 210,000 | | | 4.375%, 6/15/2022 | | | 227,944 | |
| | | | ERP Operating, LP | | | | |
| | 75,000 | | | 3.375%, 6/1/2025 | | | 77,707 | |
| | | | European Investment Bank | | | | |
| | 215,000 | | | 1.875%, 3/15/2019 | | | 218,341 | |
| | | | Fifth Third Bancorp | | | | |
| | 228,000 | | | 5.450%, 1/15/2017 | | | 230,066 | |
| | 164,000 | | | 2.875%, 7/27/2020 | | | 169,394 | |
| | 80,000 | | | 2.875%, 10/1/2021 | | | 82,979 | |
| | | | GE Capital International Funding Company | | | | |
| | 625,000 | | | 4.418%, 11/15/2035 | | | 681,723 | |
| | | | Genworth Financial, Inc. | | | | |
| | 114,000 | | | 7.700%, 6/15/2020 | | | 110,295 | |
| | | | Goldman Sachs Group, Inc. | | | | |
| | 150,000 | | | 2.087%, 4/30/2018e | | | 151,388 | |
| | 120,000 | | | 1.917%, 11/15/2018e | | | 120,996 | |
| | 726,000 | | | 5.375%, 3/15/2020 | | | 801,534 | |
| | 115,000 | | | 2.042%, 4/23/2020e | | | 115,675 | |
| | 608,000 | | | 5.250%, 7/27/2021 | | | 683,355 | |
| | 380,000 | | | 2.350%, 11/15/2021 | | | 377,692 | |
| | 152,000 | | | 3.500%, 1/23/2025 | | | 155,886 | |
| | 245,000 | | | 4.750%, 10/21/2045 | | | 269,456 | |
| | | | Hartford Financial Services Group, Inc. | | | | |
| | 368,000 | | | 5.125%, 4/15/2022 | | | 416,398 | |
| | | | HBOS plc | | | | |
| | 400,000 | | | 6.750%, 5/21/2018d | | | 425,296 | |
| | | | HCP, Inc. | | | | |
| | 480,000 | | | 4.000%, 12/1/2022 | | | 505,802 | |
| | 140,000 | | | 3.400%, 2/1/2025 | | | 137,216 | |
| | | | HSBC Bank plc | | | | |
| | 275,000 | | | 1.457%, 5/15/2018d,e | | | 275,068 | |
| | | | HSBC Holdings plc | | | | |
| | 320,000 | | | 3.400%, 3/8/2021 | | | 329,892 | |
| | 250,000 | | | 2.650%, 1/5/2022 | | | 248,744 | |
| | 230,000 | | | 3.600%, 5/25/2023 | | | 237,567 | |
| | 275,000 | | | 3.900%, 5/25/2026 | | | 284,650 | |
| | 300,000 | | | 6.875%, 12/29/2049g | | | 315,750 | |
| | | | Huntington Bancshares, Inc. | | | | |
| | 72,000 | | | 2.600%, 8/2/2018 | | | 73,024 | |
| | | | Huntington National Bank | | | | |
| | 250,000 | | | 2.200%, 11/6/2018 | | | 252,365 | |
| | | | Icahn Enterprises, LP | | | | |
| | 305,000 | | | 6.000%, 8/1/2020 | | | 299,662 | |
| | | | ING Capital Funding Trust III | | | | |
| | 200,000 | | | 4.438%, 12/29/2049e,g | | | 198,750 | |
| | | | Intesa Sanpaolo SPA | | | | |
| | 325,000 | | | 5.250%, 1/12/2024 | | | 350,448 | |
| | | | J.P. Morgan Chase & Company | | | | |
| | 267,000 | | | 6.300%, 4/23/2019 | | | 295,965 | |
| | 90,000 | | | 2.250%, 1/23/2020 | | | 90,626 | |
| | 180,000 | | | 2.295%, 8/15/2021 | | | 180,141 | |
| | 400,000 | | | 4.500%, 1/24/2022 | | | 440,666 | |
| | 228,000 | | | 3.200%, 1/25/2023 | | | 235,630 | |
The accompanying Notes to Financial Statements are an integral part of this schedule.
41
MODERATE ALLOCATION FUND
Schedule of Investments as of October 31, 2016
| | | | | | | | |
Principal
Amount | | | Long-Term Fixed Income (29.3%) | | Value | |
| Financials (2.5%) - continued | | | | |
| | $385,000 | | | 2.700%, 5/18/2023 | | | $386,147 | |
| | 165,000 | | | 2.112%, 10/24/2023e | | | 164,351 | |
| | 280,000 | | | 3.625%, 5/13/2024 | | | 294,350 | |
| | 550,000 | | | 3.125%, 1/23/2025 | | | 554,432 | |
| | 250,000 | | | 3.300%, 4/1/2026 | | | 254,709 | |
| | 369,000 | | | 7.900%, 4/29/2049g | | | 380,347 | |
| | | | KeyBank NA | | | | |
| | 250,000 | | | 2.350%, 3/8/2019 | | | 254,320 | |
| | | | KeyCorp | | | | |
| | 350,000 | | | 2.900%, 9/15/2020 | | | 360,365 | |
| | | | Kookmin Bank | | | | |
| | 250,000 | | | 1.625%, 8/1/2019d | | | 248,948 | |
| | | | Liberty Mutual Group, Inc. | | | | |
| | 313,000 | | | 4.950%, 5/1/2022d | | | 350,843 | |
| | | | Liberty Property, LP | | | | |
| | 435,000 | | | 3.750%, 4/1/2025 | | | 451,295 | |
| | | | Lincoln National Corporation | | | | |
| | 151,000 | | | 8.750%, 7/1/2019 | | | 176,042 | |
| | 234,000 | | | 7.000%, 6/15/2040 | | | 298,805 | |
| | | | Lloyds Bank plc | | | | |
| | 130,000 | | | 1.374%, 3/16/2018e | | | 129,750 | |
| | | | Merrill Lynch & Company, Inc. | | | | |
| | 468,000 | | | 6.400%, 8/28/2017 | | | 486,795 | |
| | | | MetLife, Inc. | | | | |
| | 290,000 | | | 4.050%, 3/1/2045 | | | 287,958 | |
| | | | Mitsubishi UFJ Financial Group, Inc. | | | | |
| | 250,000 | | | 2.190%, 9/13/2021 | | | 248,124 | |
| | | | Mizuho Bank, Ltd. | | | | |
| | 216,000 | | | 1.850%, 3/21/2018d | | | 216,524 | |
| | | | Morgan Stanley | | | | |
| | 420,000 | | | 6.625%, 4/1/2018 | | | 448,431 | |
| | 100,000 | | | 2.162%, 4/25/2018e | | | 101,062 | |
| | 115,000 | | | 2.026%, 1/27/2020e | | | 116,145 | |
| | 190,000 | | | 2.500%, 4/21/2021 | | | 191,503 | |
| | 180,000 | | | 4.875%, 11/1/2022 | | | 197,705 | |
| | 300,000 | | | 4.000%, 7/23/2025 | | | 319,672 | |
| | 450,000 | | | 4.350%, 9/8/2026 | | | 477,763 | |
| | 175,000 | | | 4.300%, 1/27/2045 | | | 183,258 | |
| | 380,000 | | | 5.550%, 12/29/2049g | | | 389,025 | |
| | | | MPT Operating Partnership, LP | | | | |
| | 440,000 | | | 6.375%, 3/1/2024 | | | 474,100 | |
| | 215,000 | | | 5.500%, 5/1/2024 | | | 221,450 | |
| | | | Nasdaq, Inc. | | | | |
| | 180,000 | | | 3.850%, 6/30/2026 | | | 185,542 | |
| | | | National City Corporation | | | | |
| | 236,000 | | | 6.875%, 5/15/2019 | | | 264,024 | |
| | | | Prime Security Services Borrower, LLC | | | | |
| | 480,000 | | | 9.250%, 5/15/2023d | | | 510,000 | |
| | | | Prudential Financial, Inc. | | | | |
| | 80,000 | | | 2.350%, 8/15/2019 | | | 81,457 | |
| | | | Quicken Loans, Inc. | | | | |
| | 630,000 | | | 5.750%, 5/1/2025d | | | 622,125 | |
| | | | Realty Income Corporation | | | | |
| | 81,000 | | | 2.000%, 1/31/2018 | | | 81,460 | |
| | | | Regions Bank | | | | |
| | 250,000 | | | 7.500%, 5/15/2018 | | | 270,910 | |
| | | | Regions Financial Corporation | | | | |
| | 250,000 | | | 2.250%, 9/14/2018 | | | 252,000 | |
| | 112,000 | | | 3.200%, 2/8/2021 | | | 116,117 | |
| | | | Reinsurance Group of America, Inc. | | | | |
| | 120,000 | | | 5.625%, 3/15/2017 | | | 121,829 | |
| | 209,000 | | | 5.000%, 6/1/2021 | | | 227,505 | |
| | | | Reliance Standard Life Global Funding II | | | | |
| | 110,000 | | | 2.500%, 4/24/2019d | | | 111,440 | |
| | | | Royal Bank of Scotland Group plc | | | | |
| | 300,000 | | | 3.875%, 9/12/2023 | | | 293,718 | |
| | | | Santander Holdings USA, Inc. | | | | |
| | 210,000 | | | 3.450%, 8/27/2018 | | | 214,666 | |
| | | | Santander UK Group Holdings plc | | | | |
| | 266,000 | | | 2.875%, 10/16/2020 | | | 267,082 | |
| | | | Santander UK plc | | | | |
| | 144,000 | | | 3.050%, 8/23/2018 | | | 147,039 | |
| | | | Simon Property Group, LP | | | | |
| | 128,000 | | | 10.350%, 4/1/2019 | | | 152,037 | |
| | 85,000 | | | 2.500%, 9/1/2020 | | | 87,127 | |
| | 320,000 | | | 2.750%, 2/1/2023 | | | 325,601 | |
| | | | Skandinaviska Enskilda Banken AB | | | | |
| | 175,000 | | | 2.375%, 3/25/2019d | | | 177,284 | |
| | | | Standard Chartered plc | | | | |
| | 250,000 | | | 2.100%, 8/19/2019d | | | 249,787 | |
| | | | State Street Corporation | | | | |
| | 129,000 | | | 1.701%, 8/18/2020e | | | 130,190 | |
| | | | Sumitomo Mitsui Banking Corporation | | | | |
| | 140,000 | | | 1.460%, 1/16/2018e | | | 140,124 | |
| | | | Sumitomo Mitsui Financial Group, Inc. | | | | |
| | 228,000 | | | 3.010%, 10/19/2026 | | | 227,363 | |
| | | | Svenska Handelsbanken AB | | | | |
| | 180,000 | | | 1.347%, 6/17/2019e | | | 180,246 | |
| | | | Synchrony Financial | | | | |
| | 75,000 | | | 1.989%, 2/3/2020e | | | 73,414 | |
| | 85,000 | | | 3.750%, 8/15/2021 | | | 89,183 | |
| | 430,000 | | | 4.250%, 8/15/2024 | | | 448,208 | |
| | | | Toronto-Dominion Bank | | | | |
| | 115,000 | | | 1.786%, 12/14/2020e | | | 116,198 | |
| | | | UBS Group Funding Jersey, Ltd. | | | | |
| | 380,000 | | | 2.950%, 9/24/2020d | | | 387,860 | |
| | 228,000 | | | 4.125%, 9/24/2025d | | | 237,553 | |
| | | | UnitedHealth Group, Inc. | | | | |
| | 55,000 | | | 3.350%, 7/15/2022 | | | 58,513 | |
| | | | USB Realty Corporation | | | | |
| | 80,000 | | | 2.027%, 12/29/2049d,e,g | | | 71,800 | |
| | | | Voya Financial, Inc. | | | | |
| | 280,000 | | | 2.900%, 2/15/2018 | | | 284,613 | |
| | | | Wells Fargo & Company | | | | |
| | 115,000 | | | 1.567%, 1/30/2020e | | | 114,785 | |
| | 305,000 | | | 2.550%, 12/7/2020 | | | 310,324 | |
| | 304,000 | | | 3.450%, 2/13/2023 | | | 312,039 | |
| | 285,000 | | | 3.000%, 2/19/2025 | | | 285,404 | |
| | 325,000 | | | 3.000%, 4/22/2026 | | | 323,502 | |
| | 304,000 | | | 3.000%, 10/23/2026 | | | 301,913 | |
| | 300,000 | | | 4.900%, 11/17/2045 | | | 322,491 | |
| | | | Welltower, Inc. | | | | |
| | 80,000 | | | 2.250%, 3/15/2018 | | | 80,705 | |
| | 152,000 | | | 3.750%, 3/15/2023 | | | 158,463 | |
| | 160,000 | | | 4.000%, 6/1/2025 | | | 167,524 | |
| | | | | |
| | | | Total | | | 45,739,774 | |
| | | | | |
| |
| Foreign Government (<0.1%) | | | | |
| | | | Export-Import Bank of Korea | | | | |
| | 115,000 | | | 2.250%, 1/21/2020 | | | 115,958 | |
| | | | Kommunalbanken AS | | | | |
| | 190,000 | | | 1.500%, 10/22/2019d | | | 190,585 | |
| | | | Mexico Government International Bond | | | | |
| | 200,000 | | | 4.350%, 1/15/2047 | | | 189,200 | |
The accompanying Notes to Financial Statements are an integral part of this schedule.
42
MODERATE ALLOCATION FUND
Schedule of Investments as of October 31, 2016
| | | | | | | | |
Principal
Amount | | | Long-Term Fixed Income (29.3%) | | Value | |
| Foreign Government (<0.1%) - continued | | | | |
| | $200,000 | | | 4.125%, 1/21/2026 | | | $211,400 | |
| | | | | |
| | | | Total | | | 707,143 | |
| | | | | |
| |
| Mortgage-Backed Securities (9.5%) | | | | |
| | | | Federal Home Loan Mortgage Corporation Gold 15-Yr. Pass Through | | | | |
| | 15,037,500 | | | 3.000%, 11/1/2031c | | | 15,736,509 | |
| | | | Federal Home Loan Mortgage Corporation Gold 30-Yr. Pass Through | | | | |
| | 8,787,500 | | | 4.000%, 11/1/2046c | | | 9,399,535 | |
| | | | Federal National Mortgage Association Conventional | | | | |
| | 18,250,000 | | | 3.000%, 11/1/2046c | | | 18,788,944 | |
| | | | Federal National Mortgage Association Conventional 15-Yr. Pass Through | | | | |
| | 9,325,000 | | | 2.500%, 11/1/2031c | | | 9,595,280 | |
| | | | Federal National Mortgage Association Conventional 30-Yr. Pass Through | | | | |
| | 599,369 | | | 1.735%, 7/1/2043e | | | 615,888 | |
| | 1,063,631 | | | 2.043%, 7/1/2043e | | | 1,094,543 | |
| | 1,074,650 | | | 2.088%, 8/1/2043e | | | 1,106,615 | |
| | 64,950,000 | | | 3.500%, 11/1/2046c | | | 68,187,355 | |
| | 37,550,000 | | | 4.000%, 11/1/2046c | | | 40,207,834 | |
| | 11,709,000 | | | 4.500%, 11/1/2046c | | | 12,797,572 | |
| | | | | |
| | | | Total | | | 177,530,075 | |
| | | | | |
| |
| Technology (0.6%) | | | | |
| | | | Amphenol Corporation | | | | |
| | 90,000 | | | 2.550%, 1/30/2019 | | | 91,787 | |
| | | | Apple, Inc. | | | | |
| | 90,000 | | | 1.117%, 5/6/2020e | | | 89,844 | |
| | 532,000 | | | 3.200%, 5/13/2025 | | | 556,927 | |
| | 228,000 | | | 4.650%, 2/23/2046 | | | 251,289 | |
| | | | Cisco Systems, Inc. | | | | |
| | 120,000 | | | 1.342%, 3/1/2019e | | | 120,671 | |
| | | | CommScope Technologies Finance, LLC | | | | |
| | 420,000 | | | 6.000%, 6/15/2025d | | | 441,000 | |
| | | | Diamond 1 Finance Corporation | | | | |
| | 190,000 | | | 3.480%, 6/1/2019d | | | 194,940 | |
| | 152,000 | | | 5.450%, 6/15/2023d | | | 162,770 | |
| | 117,000 | | | 6.020%, 6/15/2026d | | | 127,536 | |
| | 228,000 | | | 8.100%, 7/15/2036d | | | 272,177 | |
| | 152,000 | | | 8.350%, 7/15/2046d | | | 184,177 | |
| | | | Equinix, Inc. | | | | |
| | 540,000 | | | 5.750%, 1/1/2025 | | | 571,050 | |
| | | | Fidelity National Information Services, Inc. | | | | |
| | 310,000 | | | 2.850%, 10/15/2018 | | | 317,059 | |
| | 225,000 | | | 3.625%, 10/15/2020 | | | 237,325 | |
| | | | First Data Corporation | | | | |
| | 315,000 | | | 5.375%, 8/15/2023d | | | 326,025 | |
| | | | Hewlett Packard Enterprise Company | | | | |
| | 344,000 | | | 2.700%, 10/5/2017d | | | 348,356 | |
| | 172,000 | | | 3.100%, 10/5/2018d | | | 175,857 | |
| | 172,000 | | | 4.650%, 10/15/2022d | | | 185,271 | |
| | | | IMS Health, Inc. | | | | |
| | 363,000 | | | 6.000%, 11/1/2020d | | | 368,445 | |
| | | | Intel Corporation | | | | |
| | 45,000 | | | 3.100%, 7/29/2022 | | | 47,509 | |
| | 205,000 | | | 3.700%, 7/29/2025 | | | 223,956 | |
| | 351,000 | | | 4.100%, 5/19/2046 | | | 361,107 | |
| | | | International Business Machines Corporation | | | | |
| | 312,000 | | | 4.700%, 2/19/2046 | | | 348,938 | |
| | | | Iron Mountain, Inc. | | | | |
| | 530,000 | | | 6.000%, 8/15/2023 | | | 563,125 | |
| | | | Microsoft Corporation | | | | |
| | 475,000 | | | 4.750%, 11/3/2055 | | | 532,472 | |
| | 475,000 | | | 4.200%, 11/3/2035 | | | 521,576 | |
| | 260,000 | | | 3.700%, 8/8/2046 | | | 254,065 | |
| | | | NXP BV | | | | |
| | 595,000 | | | 3.875%, 9/1/2022d | | | 629,213 | |
| | | | Oracle Corporation | | | | |
| | 85,000 | | | 2.500%, 5/15/2022 | | | 85,953 | |
| | 312,000 | | | 2.400%, 9/15/2023 | | | 311,214 | |
| | 380,000 | | | 2.950%, 5/15/2025 | | | 388,092 | |
| | | | Plantronics, Inc. | | | | |
| | 325,000 | | | 5.500%, 5/31/2023d | | | 330,688 | |
| | | | Qualcomm, Inc. | | | | |
| | 234,000 | | | 3.000%, 5/20/2022 | | | 243,897 | |
| | | | Seagate HDD Cayman | | | | |
| | 152,000 | | | 4.875%, 6/1/2027 | | | 137,333 | |
| | | | Sensata Technologies UK Financing Company plc | | | | |
| | 325,000 | | | 6.250%, 2/15/2026d | | | 351,813 | |
| | | | Western Digital Corporation | | | | |
| | 570,000 | | | 10.500%, 4/1/2024d | | | 658,350 | |
| | | | | |
| | | | Total | | | 11,011,807 | |
| | | | | |
| |
| Transportation (0.2%) | | | | |
| | | | Air Canada Pass Through Trust | | | | |
| | 74,530 | | | 3.875%, 3/15/2023d | | | 72,667 | |
| | | | American Airlines Pass Through Trust | | | | |
| | 338,850 | | | 3.375%, 5/1/2027 | | | 345,627 | |
| | | | Avis Budget Car Rental, LLC | | | | |
| | 425,000 | | | 5.125%, 6/1/2022d,i | | | 416,500 | |
| | 305,000 | | | 6.375%, 4/1/2024d | | | 306,525 | |
| | | | Burlington Northern Santa Fe, LLC | | | | |
| | 285,000 | | | 5.050%, 3/1/2041 | | | 336,073 | |
| | 325,000 | | | 3.900%, 8/1/2046 | | | 332,279 | |
| | | | Continental Airlines, Inc. | | | | |
| | 460,000 | | | 6.125%, 4/29/2018 | | | 483,000 | |
| | 157,270 | | | 4.150%, 4/11/2024 | | | 169,238 | |
| | | | CSX Corporation | | | | |
| | 304,000 | | | 4.250%, 11/1/2066 | | | 293,122 | |
| | 126,000 | | | 3.700%, 11/1/2023 | | | 135,449 | |
| | | | Delta Air Lines, Inc. | | | | |
| | 69,311 | | | 4.950%, 5/23/2019 | | | 72,950 | |
| | | | ERAC USA Finance, LLC | | | | |
| | 84,000 | | | 2.800%, 11/1/2018d | | | 85,634 | |
| | | | J.B. Hunt Transport Services, Inc. | | | | |
| | 75,000 | | | 3.300%, 8/15/2022 | | | 77,694 | |
| | | | Southwest Airlines Company | | | | |
| | 226,000 | | | 2.750%, 11/6/2019 | | | 232,706 | |
| | | | Virgin Australia Holdings, Ltd. | | | | |
| | 45,321 | | | 5.000%, 10/23/2023d | | | 47,021 | |
| | | | XPO Logistics, Inc. | | | | |
| | 445,000 | | | 6.500%, 6/15/2022d,i | | | 462,800 | |
| | | | | |
| | | | Total | | | 3,869,285 | |
| | | | | |
| |
| U.S. Government and Agencies (7.9%) | | | | |
| | | | U.S. Treasury Bonds | | | | |
| | 550,000 | | | 5.250%, 11/15/2028 | | | 744,025 | |
| | 1,175,000 | | | 4.375%, 5/15/2040 | | | 1,576,749 | |
| | 560,000 | | | 3.000%, 5/15/2042 | | | 609,613 | |
| | 6,720,000 | | | 3.625%, 2/15/2044 | | | 8,167,165 | |
| | 1,000,000 | | | 2.500%, 5/15/2046 | | | 981,680 | |
The accompanying Notes to Financial Statements are an integral part of this schedule.
43
MODERATE ALLOCATION FUND
Schedule of Investments as of October 31, 2016
| | | | | | | | |
Principal
Amount | | | Long-Term Fixed Income (29.3%) | | Value | |
| U.S. Government and Agencies (7.9%) - continued | | | | |
| | $836,000 | | | 2.250%, 8/15/2046 | | | $777,513 | |
| | | | U.S. Treasury Bonds, TIPS | | | | |
| | 7,199,667 | | | 0.125%, 1/15/2023 | | | 7,302,817 | |
| | 5,980,299 | | | 0.625%, 1/15/2026 | | | 6,242,403 | |
| | 16,517,637 | | | 1.000%, 2/15/2046 | | | 17,794,352 | |
| | | | U.S. Treasury Notes | | | | |
| | 7,770,000 | | | 0.875%, 11/15/2017 | | | 7,780,622 | |
| | 8,575,000 | | | 0.875%, 3/31/2018 | | | 8,585,384 | |
| | 4,010,000 | | | 0.750%, 2/15/2019 | | | 3,994,650 | |
| | 3,900,000 | | | 1.000%, 10/15/2019 | | | 3,900,152 | |
| | 19,010,000 | | | 1.500%, 10/31/2019j | | | 19,281,044 | |
| | 24,000,000 | | | 1.375%, 9/30/2020 | | | 24,161,256 | |
| | 1,500,000 | | | 1.375%, 5/31/2021 | | | 1,505,683 | |
| | 5,053,000 | | | 1.125%, 8/31/2021 | | | 5,008,392 | |
| | 1,000,000 | | | 2.125%, 9/30/2021 | | | 1,036,523 | |
| | 19,000,000 | | | 2.125%, 6/30/2022 | | | 19,675,393 | |
| | 1,865,000 | | | 1.625%, 8/15/2022 | | | 1,880,517 | |
| | 304,000 | | | 1.375%, 9/30/2023 | | | 299,203 | |
| | 5,400,000 | | | 2.250%, 11/15/2024 | | | 5,614,315 | |
| | | | | |
| | | | Total | | | 146,919,451 | |
| | | | | |
| |
| Utilities (0.8%) | | | | |
| | | | AES Corporation | | | | |
| | 270,000 | | | 7.375%, 7/1/2021 | | | 304,425 | |
| | | | American Electric Power Company, Inc. | | | | |
| | 479,000 | | | 2.950%, 12/15/2022 | | | 495,284 | |
| | | | Arizona Public Service Company | | | | |
| | 100,000 | | | 2.200%, 1/15/2020 | | | 101,797 | |
| | | | Berkshire Hathaway Energy Company | | | | |
| | 105,000 | | | 2.400%, 2/1/2020 | | | 106,920 | |
| | | | Calpine Corporation | | | | |
| | 325,000 | | | 5.375%, 1/15/2023 | | | 321,750 | |
| | | | Chesapeake Midstream Partners, LP | | | | |
| | 390,000 | | | 6.125%, 7/15/2022 | | | 404,930 | |
| | | | CMS Energy Corporation | | | | |
| | 228,000 | | | 2.950%, 2/15/2027 | | | 227,524 | |
| | | | Commonwealth Edison Company | | | | |
| | 290,000 | | | 3.700%, 3/1/2045 | | | 292,650 | |
| | 190,000 | | | 4.350%, 11/15/2045 | | | 209,735 | |
| | | | Consolidated Edison Company of New York, Inc. | | | | |
| | 114,000 | | | 4.500%, 12/1/2045 | | | 127,215 | |
| | | | Consolidated Edison, Inc. | | | | |
| | 156,000 | | | 2.000%, 5/15/2021 | | | 156,282 | |
| | | | Covanta Holding Corporation | | | | |
| | 200,000 | | | 7.250%, 12/1/2020 | | | 205,250 | |
| | | | Dominion Resources, Inc. | | | | |
| | 300,000 | | | 2.962%, 7/1/2019 | | | 306,863 | |
| | | | DTE Electric Company | | | | |
| | 215,000 | | | 3.700%, 3/15/2045 | | | 220,417 | |
| | 245,000 | | | 3.700%, 6/1/2046 | | | 251,648 | |
| | | | DTE Energy Company | | | | |
| | 40,000 | | | 2.400%, 12/1/2019 | | | 40,693 | |
| | | | Duke Energy Corporation | | | | |
| | 216,000 | | | 2.100%, 6/15/2018 | | | 218,102 | |
| | 304,000 | | | 3.750%, 9/1/2046 | | | 287,688 | |
| | | | Duke Energy Indiana, LLC | | | | |
| | 310,000 | | | 3.750%, 5/15/2046 | | | 310,724 | |
| | | | Dynegy, Inc. | | | | |
| | 450,000 | | | 6.750%, 11/1/2019 | | | 455,440 | |
| | 395,000 | | | 7.375%, 11/1/2022 | | | 380,928 | |
| | | | Edison International | | | | |
| | 300,000 | | | 2.950%, 3/15/2023 | | | 307,559 | |
| | | | Emera U.S. Finance, LP | | | | |
| | 235,000 | | | 2.150%, 6/15/2019d | | | 237,068 | |
| | 235,000 | | | 4.750%, 6/15/2046d | | | 249,734 | |
| | | | Enel Finance International NV | | | | |
| | 108,000 | | | 6.250%, 9/15/2017d | | | 112,370 | |
| | | | Energy Transfer Equity, LP | | | | |
| | 325,000 | | | 5.500%, 6/1/2027 | | | 316,875 | |
| | | | Eversource Energy | | | | |
| | 85,000 | | | 1.600%, 1/15/2018 | | | 85,143 | |
| | | | Exelon Corporation | | | | |
| | 165,000 | | | 5.100%, 6/15/2045 | | | 186,583 | |
| | 234,000 | | | 4.450%, 4/15/2046 | | | 243,432 | |
| | | | Exelon Generation Company, LLC | | | | |
| | 247,000 | | | 5.200%, 10/1/2019 | | | 270,142 | |
| | 75,000 | | | 2.950%, 1/15/2020 | | | 76,957 | |
| | | | ITC Holdings Corporation | | | | |
| | 84,000 | | | 4.050%, 7/1/2023 | | | 89,230 | |
| | 152,000 | | | 5.300%, 7/1/2043 | | | 171,613 | |
| | | | Kinder Morgan Energy Partners, LP | | | | |
| | 230,000 | | | 3.500%, 3/1/2021 | | | 236,432 | |
| | | | MidAmerican Energy Holdings Company | | | | |
| | 468,000 | | | 6.500%, 9/15/2037 | | | 636,996 | |
| | | | Monongahela Power Company | | | | |
| | 210,000 | | | 5.400%, 12/15/2043d | | | 260,457 | |
| | | | National Rural Utilities Cooperative Finance Corporation | | | | |
| | 300,000 | | | 2.300%, 11/1/2020 | | | 305,425 | |
| | | | NextEra Energy Capital Holdings, Inc. | | | | |
| | 195,000 | | | 2.300%, 4/1/2019 | | | 197,717 | |
| | | | NiSource Finance Corporation | | | | |
| | 435,000 | | | 5.650%, 2/1/2045 | | | 539,473 | |
| | | | Northern States Power Company | | | | |
| | 315,000 | | | 4.125%, 5/15/2044 | | | 344,031 | |
| | | | NRG Energy, Inc. | | | | |
| | 270,000 | | | 6.625%, 3/15/2023 | | | 269,325 | |
| | | | Oncor Electric Delivery Company, LLC | | | | |
| | 210,000 | | | 3.750%, 4/1/2045 | | | 212,947 | |
| | | | Pacific Gas & Electric Company | | | | |
| | 228,000 | | | 4.250%, 3/15/2046 | | | 247,330 | |
| | | | PG&E Corporation | | | | |
| | 110,000 | | | 2.400%, 3/1/2019 | | | 111,786 | |
| | | | PPL Capital Funding, Inc. | | | | |
| | 105,000 | | | 3.500%, 12/1/2022 | | | 110,601 | |
| | 365,000 | | | 5.000%, 3/15/2044 | | | 406,134 | |
| | | | Regency Energy Partners, LP | | | | |
| | 304,000 | | | 5.875%, 3/1/2022 | | | 340,471 | |
| | | | Sempra Energy | | | | |
| | 350,000 | | | 6.150%, 6/15/2018 | | | 374,156 | |
| | 95,000 | | | 2.400%, 3/15/2020 | | | 96,480 | |
| | | | Southern California Edison Company | | | | |
| | 55,000 | | | 2.400%, 2/1/2022 | | | 55,891 | |
| | | | Southern Company | | | | |
| | 315,000 | | | 1.850%, 7/1/2019 | | | 316,822 | |
| | 300,000 | | | 4.400%, 7/1/2046 | | | 316,837 | |
| | | | Southwestern Electric Power Company | | | | |
| | 110,000 | | | 3.900%, 4/1/2045 | | | 107,072 | |
| | | | Targa Resources Partners, LP | | | | |
| | 500,000 | | | 5.250%, 5/1/2023 | | | 496,300 | |
| | | | TransAlta Corporation | | | | |
| | 245,000 | | | 1.900%, 6/3/2017 | | | 244,721 | |
The accompanying Notes to Financial Statements are an integral part of this schedule.
44
MODERATE ALLOCATION FUND
Schedule of Investments as of October 31, 2016
| | | | | | | | |
Principal
Amount | | | Long-Term Fixed Income (29.3%) | | Value | |
| Utilities (0.8%) - continued | | | | |
| | | | Williams Partners, LP | | | | |
| | $305,000 | | | 5.100%, 9/15/2045 | | | $293,093 | |
| | | | | |
| | | | Total | | | 14,293,468 | |
| | | | | |
| | | | | | | | |
| | | | | |
| | | | Total Long-Term Fixed Income (cost $536,741,200) | | | 544,997,399 | |
| | | | | |
| | |
| Shares | | | Common Stock (23.5%) | | Value | |
| |
| Consumer Discretionary (2.8%) | | | | |
| | 18,209 | | | Aaron’s, Inc. | | | 449,944 | |
| | 1,273 | | | Adient plck | | | 57,934 | |
| | 2,830 | | | Amazon.com, Inc.k | | | 2,235,191 | |
| | 4,780 | | | American Axle & Manufacturing Holdings, Inc.k | | | 85,658 | |
| | 7,132 | | | American Public Education, Inc.k | | | 143,710 | |
| | 6,475 | | | Aramark | | | 241,064 | |
| | 3,890 | | | Armstrong Flooring, Inc.k | | | 62,979 | |
| | 4,620 | | | Ascent Capital Group, Inc.k | | | 94,156 | |
| | 600 | | | AutoZone, Inc.k | | | 445,296 | |
| | 16,570 | | | Barnes & Noble, Inc. | | | 170,671 | |
| | 220 | | | Bayerische Motoren Werke AG | | | 16,704 | |
| | 9,240 | | | Beazer Homes USA, Inc.k | | | 94,525 | |
| | 1,060 | | | Bed Bath & Beyond, Inc. | | | 42,845 | |
| | 100 | | | Beiersdorf AG | | | 8,816 | |
| | 3,400 | | | Berkeley Group Holdings plc | | | 98,061 | |
| | 4,830 | | | Big 5 Sporting Goods Corporation | | | 74,865 | |
| | 7,610 | | | Bloomin’ Brands, Inc. | | | 131,653 | |
| | 11,970 | | | BorgWarner, Inc. | | | 429,005 | |
| | 500 | | | Brembo SPA | | | 30,957 | |
| | 3,600 | | | Bridgestone Corporation | | | 134,365 | |
| | 31,833 | | | Brunswick Corporation | | | 1,384,735 | |
| | 520 | | | Buffalo Wild Wings, Inc.k | | | 75,738 | |
| | 2,817 | | | Bunzl plc | | | 75,629 | |
| | 9,486 | | | Burlington Stores, Inc.k | | | 710,881 | |
| | 8,460 | | | Caleres, Inc. | | | 211,585 | |
| | 20,070 | | | Callaway Golf Company | | | 204,915 | |
| | 2,000 | | | Calsonic Kansei Corporation | | | 25,065 | |
| | 17,190 | | | Carter’s, Inc. | | | 1,484,185 | |
| | 2,864 | | | Cedar Fair, LP | | | 162,818 | |
| | 3,700 | | | Cheesecake Factory, Inc. | | | 196,803 | |
| | 2,700 | | | Chuy’s Holdings, Inc.k | | | 76,680 | |
| | 6,300 | | | Cinemark Holdings, Inc. | | | 250,740 | |
| | 4,550 | | | ClubCorp Holdings, Inc. | | | 52,553 | |
| | 46,100 | | | Comcast Corporation | | | 2,849,902 | |
| | 900 | | | Compass Group plc | | | 16,285 | |
| | 17,344 | | | Core-Mark Holding Company, Inc. | | | 613,110 | |
| | 11,142 | | | CSS Industries, Inc. | | | 279,664 | |
| | 13,155 | | | Culp, Inc. | | | 368,340 | |
| | 18,990 | | | Dana, Inc. | | | 293,965 | |
| | 1,660 | | | Deckers Outdoor Corporationk | | | 86,635 | |
| | 17,922 | | | Delphi Automotive plc | | | 1,166,185 | |
| | 4,500 | | | Denso Corporation | | | 195,817 | |
| | 3,260 | | | DeVry Education Group, Inc. | | | 74,002 | |
| | 2,839 | | | Discovery Communications, Inc., Class Ak | | | 74,126 | |
| | 6,000 | | | Dish DBS Corporationk | | | 351,360 | |
| | 6,860 | | | Dollar General Corporation | | | 473,957 | |
| | 17,464 | | | Dollar Tree, Inc.k | | | 1,319,405 | |
| | 4,633 | | | Domino’s Pizza, Inc. | | | 784,089 | |
| | 18,210 | | | DSW, Inc. | | | 378,222 | |
| | 16,490 | | | Duluth Holdings, Inc.k | | | 447,704 | |
| | 8,060 | | | Etsy, Inc.k | | | 104,619 | |
| | 4,400 | | | Eutelsat Communications | | | 92,202 | |
| | 5,155 | | | Expedia, Inc. | | | 666,181 | |
| | 12,000 | | | Finish Line, Inc. | | | 236,280 | |
| | 4,500 | | | Fuji Heavy Industries, Ltd. | | | 175,844 | |
| | 10,780 | | | Gentex Corporation | | | 182,290 | |
| | 8,667 | | | G-III Apparel Group, Ltd.k | | | 226,382 | |
| | 30,450 | | | GNC Holdings, Inc. | | | 408,944 | |
| | 1,100 | | | Hakuhodo Dy Holdings, Inc. | | | 13,221 | |
| | 21,231 | | | Harley-Davidson, Inc. | | | 1,210,592 | |
| | 14,027 | | | Harman International Industries, Inc. | | | 1,118,092 | |
| | 15,146 | | | Haverty Furniture Companies, Inc. | | | 268,841 | |
| | 300 | | | Hennes & Mauritz AB | | | 8,437 | |
| | 6,120 | | | Home Depot, Inc. | | | 746,701 | |
| | 11,000 | | | Honda Motor Company, Ltd. | | | 329,138 | |
| | 9,060 | | | Houghton Mifflin Harcourt Companyk | | | 114,609 | |
| | 2,640 | | | HSN, Inc. | | | 99,528 | |
| | 2,260 | | | Hyatt Hotels Corporationk | | | 114,785 | |
| | 2,200 | | | ILG, Inc. | | | 36,036 | |
| | 6,200 | | | Inchcape plc | | | 49,295 | |
| | 1,200 | | | International Speedway Corporation | | | 39,480 | |
| | 6,770 | | | Interpublic Group of Companies, Inc. | | | 151,580 | |
| | 1,000 | | | Intertek Group plc | | | 41,722 | |
| | 1,790 | | | Jack in the Box, Inc. | | | 167,777 | |
| | 5,040 | | | John Wiley and Sons, Inc. | | | 260,064 | |
| | 16,017 | | | Kate Spade & Companyk | | | 268,285 | |
| | 200 | | | Koito Manufacturing Company, Ltd. | | | 10,500 | |
| | 400 | | | KOMERI Company, Ltd. | | | 9,767 | |
| | 4,983 | | | L Brands, Inc. | | | 359,723 | |
| | 7,200 | | | Ladbrokes plc | | | 11,755 | |
| | 8,120 | | | Las Vegas Sands Corporation | | | 469,986 | |
| | 7,390 | | | La-Z-Boy, Inc. | | | 172,926 | |
| | 20,550 | | | Liberty Interactive Corporationk | | | 379,970 | |
| | 374 | | | Linamar Corporation | | | 15,210 | |
| | 5,173 | | | Lithia Motors, Inc. | | | 443,740 | |
| | 20,630 | | | LKQ Corporationk | | | 665,936 | |
| | 18,070 | | | Lowe’s Companies, Inc. | | | 1,204,365 | |
| | 1,180 | | | Lululemon Athletica, Inc.k | | | 67,555 | |
| | 346 | | | LVMH Moet Hennessy Louis Vuitton SE | | | 62,993 | |
| | 6,450 | | | Masonite International Corporationk | | | 367,005 | |
| | 5,661 | | | MDC Partners, Inc. | | | 47,835 | |
| | 3,820 | | | Meredith Corporation | | | 173,237 | |
| | 1,090 | | | Meritage Homes Corporationk | | | 33,735 | |
| | 430 | | | Mohawk Industries, Inc.k | | | 79,249 | |
| | 1,480 | | | Monro Muffler Brake, Inc. | | | 81,400 | |
| | 660 | | | Murphy USA, Inc.k | | | 45,395 | |
| | 8,629 | | | New Media Investment Group, Inc. | | | 124,258 | |
| | 5,990 | | | New York Times Company | | | 65,291 | |
| | 29,040 | | | Newell Brands, Inc. | | | 1,394,501 | |
| | 10,970 | | | News Corporation, Class A | | | 132,956 | |
| | 3,000 | | | News Corporation, Class B | | | 37,200 | |
| | 400 | | | Nifco, Inc. | | | 23,037 | |
| | 600 | | | Nokian Renkaat Oyj | | | 20,125 | |
| | 13,864 | | | Nord Anglia Education, Inc.k | | | 298,631 | |
| | 33,922 | | | Nutrisystem, Inc. | | | 1,075,327 | |
| | 1,998 | | | O’Reilly Automotive, Inc.k | | | 528,351 | |
| | 12,873 | | | Oxford Industries, Inc. | | | 807,395 | |
| | 100 | | | Paddy Power plc | | | 10,363 | |
| | 7,470 | | | Papa John’s International, Inc. | | | 563,611 | |
| | 20,170 | | | Papa Murphy’s Holdings, Inc.k | | | 112,145 | |
| | 7,900 | | | Penn National Gaming, Inc.k | | | 102,147 | |
| | 6,600 | | | Persimmon plc | | | 136,620 | |
| | 1,060 | | | Priceline Group, Inc.k | | | 1,562,684 | |
| | 494 | | | Publicis Groupe SA | | | 33,888 | |
| | 10,855 | | | PVH Corporation | | | 1,161,268 | |
| | 3,158 | | | Ralph Lauren Corporation | | | 309,800 | |
| | 5,680 | | | Rent-A-Center, Inc. | | | 57,311 | |
| | 580 | | | Restaurant Brands International, Inc. | | | 25,793 | |
| | 3,104 | | | Restoration Hardware Holdings, Inc.k | | | 89,923 | |
| | 6,530 | | | Retailmenot, Inc.k | | | 59,097 | |
The accompanying Notes to Financial Statements are an integral part of this schedule.
45
MODERATELY ALLOCATION FUND
Schedule of Investments as of October 31, 2016
| | | | | | | | |
| Shares | | | Common Stock (23.5%) | | Value | |
| | Consumer Discretionary (2.8%) - continued | | | | |
| | 23,667 | | | Ross Stores, Inc. | | | $1,480,134 | |
| | 3,090 | | | Royal Caribbean Cruises, Ltd. | | | 237,528 | |
| | 200 | | | RTL Group SA | | | 15,674 | |
| | 11,330 | | | Ruth’s Hospitality Group, Inc. | | | 179,581 | |
| | 8,300 | | | Sally Beauty Holdings, Inc.k | | | 215,302 | |
| | 11,170 | | | Scripps Networks Interactive, Inc. | | | 718,901 | |
| | 800 | | | Sekisui Chemical Company, Ltd. | | | 12,599 | |
| | 1,500 | | | Sekisui House, Ltd. | | | 24,786 | |
| | 2,170 | | | Select Comfort Corporationk | | | 41,642 | |
| | 4,160 | | | Signet Jewelers, Ltd. | | | 338,042 | |
| | 10,300 | | | Sportsman’s Warehouse Holdings, Inc.k | | | 94,760 | |
| | 6,160 | | | Starbucks Corporation | | | 326,911 | |
| | 19,084 | | | Stein Mart, Inc. | | | 114,886 | |
| | 3,470 | | | Steven Madden, Ltd.k | | | 115,898 | |
| | 4,600 | | | Sumitomo Forestry Company, Ltd. | | | 64,079 | |
| | 2,500 | | | Sumitomo Rubber Industries, Ltd. | | | 41,941 | |
| | 200 | | | Swatch Group AG | | | 11,530 | |
| | 8,790 | | | Tegna, Inc. | | | 172,460 | |
| | 3,550 | | | Tempur-Pedic International, Inc.k | | | 191,948 | |
| | 3,489 | | | Tenneco, Inc.k | | | 192,139 | |
| | 11,986 | | | Time, Inc. | | | 155,818 | |
| | 20,740 | | | TJX Companies, Inc. | | | 1,529,575 | |
| | 24,108 | | | Toll Brothers, Inc.k | | | 661,524 | |
| | 24,865 | | | Tower International, Inc. | | | 539,571 | |
| | 200 | | | Toyota Motor Corporation | | | 11,601 | |
| | 14,286 | | | Tuesday Morning Corporationk | | | 70,716 | |
| | 670 | | | Tupperware Brands Corporation | | | 39,878 | |
| | 1,329 | | | Ulta Salon Cosmetics & Fragrance, Inc.k | | | 323,399 | |
| | 4,174 | | | Under Armour, Inc., Class Ak | | | 129,811 | |
| | 4,202 | | | Under Armour, Inc., Class Ck | | | 108,664 | |
| | 3,115 | | | Vail Resorts, Inc. | | | 496,656 | |
| | 74 | | | Valora Holding AG | | | 21,518 | |
| | 14,130 | | | Vera Bradley, Inc.k | | | 188,918 | |
| | 6,107 | | | VF Corporation | | | 331,060 | |
| | 1,820 | | | Visteon Corporation | | | 128,510 | |
| | 4,330 | | | Vitamin Shoppe, Inc.k | | | 108,467 | |
| | 2,000 | | | Wacoal Holdings Corporation | | | 23,075 | |
| | 3,930 | | | Walt Disney Company | | | 364,272 | |
| | 1,150 | | | Whirlpool Corporation | | | 172,293 | |
| | 600 | | | Whitbread plc | | | 26,505 | |
| | 11,100 | | | Wingstop, Inc. | | | 297,036 | |
| | 4,017 | | | Wolters Kluwer NV | | | 155,339 | |
| | 3,000 | | | WPP plc | | | 65,139 | |
| | 1,600 | | | Yokohama Rubber Company, Ltd. | | | 27,780 | |
| | 8,490 | | | Yum! Brands, Inc. | | | 732,517 | |
| | 8,400 | | | Zoe’s Kitchen, Inc.k | | | 190,428 | |
| | | | | |
| | | | Total | | | 51,789,234 | |
| | | | | |
| |
| Consumer Staples (0.9%) | | | | |
| | 8,337 | | | AdvancePierre Foods Holdings, Inc. | | | 233,102 | |
| | 2,400 | | | Axfood AB | | | 37,507 | |
| | 1,301 | | | British American Tobacco plc | | | 74,564 | |
| | 6,530 | | | Brown-Forman Corporation | | | 301,490 | |
| | 9,290 | | | Campbell Soup Company | | | 504,819 | |
| | 3,871 | | | Casey’s General Stores, Inc. | | | 437,384 | |
| | 41,730 | | | Coca-Cola Company | | | 1,769,352 | |
| | 4,300 | | | Coca-Cola HBC AG | | | 92,794 | |
| | 23,480 | | | CVS Health Corporation | | | 1,974,668 | |
| | 1,100 | | | Davide Campari - Milano SPA | | | 11,079 | |
| | 5,570 | | | Distribuidora Internacional de Alimentacion SA | | | 29,750 | |
| | 2,360 | | | e.l.f. Beauty, Inc.k | | | 61,030 | |
| | 800 | | | Ebro Foods SA | | | 17,251 | |
| | 11,460 | | | Estee Lauder Companies, Inc. | | | 998,510 | |
| | 16,010 | | | Flowers Foods, Inc. | | | 248,475 | |
| | 3,710 | | | General Mills, Inc. | | | 229,946 | |
| | 139 | | | George Weston, Ltd. | | | 11,327 | |
| | 15,881 | | | Hain Celestial Group, Inc.k | | | 577,592 | |
| | 900 | | | Henkel AG & Company KGaA | | | 99,165 | |
| | 6,543 | | | Imperial Brands plc | | | 316,498 | |
| | 2,650 | | | Ingredion, Inc. | | | 347,600 | |
| | 1,692 | | | J & J Snack Foods Corporation | | | 206,678 | |
| | 900 | | | Jeronimo Martins SGPS SA | | | 15,465 | |
| | 900 | | | Kao Corporation | | | 46,311 | |
| | 400 | | | Kesko Oyj | | | 19,876 | |
| | 2,200 | | | Kewpie Corporation | | | 62,482 | |
| | 3,460 | | | Kimberly-Clark Corporation | | | 395,859 | |
| | 1,100 | | | Kirin Holdings Company, Ltd. | | | 18,911 | |
| | 15,970 | | | Koninklijke Ahold Delhaize NV | | | 364,316 | |
| | 840 | | | Lancaster Colony Corporation | | | 109,746 | |
| | 2 | | | Lindt & Spruengli AG | | | 10,385 | |
| | 7,561 | | | Monster Beverage Corporationk | | | 1,091,355 | |
| | 1,300 | | | Nestle SA | | | 94,268 | |
| | 400 | | | Ontex Group NV | | | 12,099 | |
| | 4,780 | | | PepsiCo, Inc. | | | 512,416 | |
| | 7,159 | | | Philip Morris International, Inc. | | | 690,414 | |
| | 39,700 | | | Pinnacle Foods, Inc. | | | 2,041,374 | |
| | 282 | | | Premium Brands Holdings Corporation | | | 13,647 | |
| | 7,470 | | | Procter & Gamble Company | | | 648,396 | |
| | 19,796 | | | SpartanNash Company | | | 554,288 | |
| | 1,100 | | | Suedzucker AG | | | 28,218 | |
| | 7,170 | | | United Natural Foods, Inc.k | | | 299,276 | |
| | 1,140 | | | Universal Corporation | | | 61,788 | |
| | 4,280 | | | Walgreens Boots Alliance, Inc. | | | 354,084 | |
| | 14,870 | | | WhiteWave Foods Companyk | | | 810,266 | |
| | | | | |
| | | | Total | | | 16,835,821 | |
| | | | | |
| |
| Energy (3.8%) | | | | |
| | 2,870 | | | Anadarko Petroleum Corporation | | | 170,593 | |
| | 14,706 | | | Arch Coal, Inc.i,k | | | 1,079,126 | |
| | 54,169 | | | Archrock, Inc. | | | 628,360 | |
| | 19,264 | | | Atwood Oceanics, Inc. | | | 146,984 | |
| | 22,544 | | | Baker Hughes, Inc. | | | 1,248,938 | |
| | 5,765 | | | Baytex Energy Corporation | | | 22,178 | |
| | 78,098 | | | BP plc | | | 461,694 | |
| | 12,462 | | | Bristow Group, Inc. | | | 124,745 | |
| | 52,280 | | | Callon Petroleum Companyk | | | 679,117 | |
| | 83,098 | | | Canadian Natural Resources, Ltd. | | | 2,635,038 | |
| | 66,591 | | | Chevron Corporation | | | 6,975,407 | |
| | 10,265 | | | Cimarex Energy Company | | | 1,325,519 | |
| | 48,570 | | | Clean Energy Fuels Corporationk | | | 199,623 | |
| | 23,087 | | | Concho Resources, Inc.k | | | 2,930,664 | |
| | 32,170 | | | ConocoPhillips | | | 1,397,786 | |
| | 28,120 | | | Continental Resources, Inc.k | | | 1,375,349 | |
| | 1,943 | | | Contura Energy, Inc.k | | | 128,724 | |
| | 5,018 | | | Crescent Point Energy Corporation | | | 59,746 | |
| | 14,850 | | | Delek US Holdings, Inc. | | | 250,965 | |
| | 19,460 | | | Devon Energy Corporation | | | 737,339 | |
| | 6,170 | | | Diamond Offshore Drilling, Inc. | | | 101,743 | |
| | 2,074 | | | Diamondback Energy, Inc.k | | | 189,335 | |
| | 32,054 | | | Ensco plc | | | 250,662 | |
| | 41,569 | | | EOG Resources, Inc. | | | 3,758,669 | |
| | 10,570 | | | EP Energy Corporationk | | | 37,629 | |
| | 54,360 | | | EQT Corporation | | | 3,587,760 | |
| | 30,040 | | | Exxon Mobil Corporation | | | 2,502,933 | |
| | 10,930 | | | Frank’s International NV | | | 122,963 | |
| | 2,800 | | | Galp Energia SGPS SA | | | 37,963 | |
| | 9,790 | | | Green Plains, Inc. | | | 254,540 | |
| | 1,630 | | | Gulfport Energy Corporationk | | | 39,299 | |
| | 101,780 | | | Halliburton Company | | | 4,681,880 | |
| | 5,912 | | | HollyFrontier Corporation | | | 147,504 | |
The accompanying Notes to Financial Statements are an integral part of this schedule.
46
MODERATELY ALLOCATION FUND
Schedule of Investments as of October 31, 2016
| | | | | | | | |
| Shares | | | Common Stock (23.5%) | | Value | |
| | Energy (3.8%) - continued | | | | |
| | 23,640 | | | Hornbeck Offshore Services, Inc.k | | | $93,851 | |
| | 3,760 | | | Kinder Morgan, Inc. | | | 76,817 | |
| | 75,845 | | | Marathon Oil Corporation | | | 999,637 | |
| | 2,310 | | | Murphy Oil Corporation | | | 59,760 | |
| | 104,730 | | | Nabors Industries, Ltd. | | | 1,246,287 | |
| | 3,740 | | | Newfield Exploration Companyk | | | 151,807 | |
| | 1,950 | | | Noble Energy, Inc. | | | 67,216 | |
| | 24,379 | | | Oasis Petroleum, Inc.k | | | 255,736 | |
| | 2,430 | | | Oceaneering International, Inc. | | | 57,834 | |
| | 3,190 | | | Oil States International, Inc.k | | | 93,308 | |
| | 3,670 | | | OMV AG | | | 114,540 | |
| | 24,932 | | | Parsley Energy, Inc.k | | | 820,263 | |
| | 53,616 | | | Patterson-UTI Energy, Inc. | | | 1,205,288 | |
| | 1,060 | | | PDC Energy, Inc.k | | | 65,010 | |
| | 2,430 | | | Phillips 66 | | | 197,195 | |
| | 41,429 | | | Pioneer Energy Services Corporationk | | | 147,073 | |
| | 17,260 | | | Pioneer Natural Resources Company | | | 3,089,885 | |
| | 6,210 | | | Rowan Companies plc | | | 82,407 | |
| | 3,224 | | | Royal Dutch Shell plc | | | 80,334 | |
| | 46,955 | | | Royal Dutch Shell plc ADR | | | 2,338,829 | |
| | 6,641 | | | Royal Dutch Shell plc, Class B | | | 171,289 | |
| | 10,195 | | | RPC, Inc. | | | 176,068 | |
| | 1,480 | | | RSP Permian, Inc.k | | | 53,428 | |
| | 60,231 | | | Schlumberger, Ltd. | | | 4,711,871 | |
| | 9,050 | | | SemGroup Corporation | | | 291,863 | |
| | 2,947 | | | SM Energy Company | | | 99,108 | |
| | 3,108 | | | Statoil ASA | | | 50,741 | |
| | 134,193 | | | Suncor Energy, Inc. ADR | | | 4,028,474 | |
| | 2,030 | | | Superior Energy Services, Inc. | | | 28,745 | |
| | 14,180 | | | Teekay Corporation | | | 92,595 | |
| | 33,211 | | | Teekay Tankers, Ltd. | | | 70,739 | |
| | 19,160 | | | Tesco Corporation | | | 131,246 | |
| | 54,070 | | | TETRA Technologies, Inc.k | | | 294,681 | |
| | 3,223 | | | Total SA | | | 154,398 | |
| | 30,696 | | | U.S. Silica Holdings, Inc. | | | 1,417,848 | |
| | 74,530 | | | Valero Energy Corporation | | | 4,415,157 | |
| | 1,463 | | | Vantage Drilling Internationalk | | | 122,892 | |
| | 342,115 | | | Weatherford International plck | | | 1,648,994 | |
| | 285,295 | | | WPX Energy, Inc.k | | | 3,098,304 | |
| | | | | |
| | | | Total | | | 70,592,293 | |
| | | | | |
| |
| Financials (3.1%) | | | | |
| | 11,492 | | | Aberdeen Asset Management plc | | | 44,953 | |
| | 7,959 | | | Affiliated Managers Group, Inc.k | | | 1,055,841 | |
| | 1,800 | | | AIA Group, Ltd. | | | 11,324 | |
| | 3,250 | | | Allied World Assurance Company Holdings AG | | | 139,685 | |
| | 3,460 | | | American Financial Group, Inc. | | | 257,770 | |
| | 7,900 | | | American International Group, Inc. | | | 487,430 | |
| | 11,123 | | | Ameris Bancorp | | | 403,765 | |
| | 4,110 | | | AMERISAFE, Inc. | | | 228,516 | |
| | 900 | | | Arch Capital Group, Ltd.k | | | 70,173 | |
| | 3,676 | | | Argo Group International Holdings, Ltd. | | | 204,386 | |
| | 14,600 | | | Aspen Insurance Holdings, Ltd. | | | 704,450 | |
| | 5,640 | | | Associated Banc-Corp | | | 114,492 | |
| | 19,410 | | | Assured Guaranty, Ltd. | | | 580,165 | |
| | 2,171 | | | ASX, Ltd. | | | 77,659 | |
| | 6,800 | | | Australia & New Zealand Banking Group, Ltd. | | | 143,585 | |
| | 11,900 | | | Banco Santander SA | | | 58,311 | |
| | 11,440 | | | BancorpSouth, Inc. | | | 268,840 | |
| | 79,920 | | | Bank of America Corporation | | | 1,318,680 | |
| | 8,475 | | | Bank of East Asia, Ltd. | | | 34,069 | |
| | 1,878 | | | Bank of Montreal | | | 119,515 | |
| | 11,100 | | | Bank of New York Mellon Corporation | | | 480,297 | |
| | 5,501 | | | Bank of Nova Scotia | | | 295,618 | |
| | 10,278 | | | Bank of the Ozarks, Inc. | | | 379,875 | |
| | 7,140 | | | BankFinancial Corporation | | | 89,750 | |
| | 28,400 | | | BB&T Corporation | | | 1,113,280 | |
| | 18,620 | | | Beneficial Bancorp, Inc. | | | 269,990 | |
| | 24,450 | | | Blackstone Group, LP | | | 611,983 | |
| | 47,400 | | | Boston Private Financial Holdings, Inc. | | | 623,310 | |
| | 29,180 | | | Brookline Bancorp, Inc. | | | 373,504 | |
| | 10,830 | | | Brown & Brown, Inc. | | | 399,194 | |
| | 166 | | | Canadian Imperial Bank of Commerce | | | 12,438 | |
| | 6,160 | | | Capital One Financial Corporation | | | 456,086 | |
| | 72,010 | | | Capstead Mortgage Corporation | | | 684,815 | |
| | 7,840 | | | Cathay General Bancorp | | | 234,808 | |
| | 14,090 | | | Central Pacific Financial Corporation | | | 361,127 | |
| | 5,600 | | | Charles Schwab Corporation | | | 177,520 | |
| | 4,270 | | | Chemical Financial Corporation | | | 183,397 | |
| | 3,000 | | | Chiba Bank, Ltd. | | | 18,554 | |
| | 4,450 | | | Chubb, Ltd. | | | 565,150 | |
| | 2,017 | | | CI Financial Corporation | | | 37,113 | |
| | 35,670 | | | Citigroup, Inc. | | | 1,753,180 | |
| | 8,590 | | | Clifton Bancorp, Inc. | | | 131,341 | |
| | 3,900 | | | CNP Assurances | | | 67,541 | |
| | 42,720 | | | CoBiz Financial, Inc. | | | 543,398 | |
| | 14,757 | | | Columbia Banking System, Inc. | | | 487,276 | |
| | 17,210 | | | Comerica, Inc. | | | 896,469 | |
| | 6,900 | | | Concordia Financial Group, Ltd. | | | 31,993 | |
| | 17,855 | | | Direct Line Insurance Group plc | | | 75,537 | |
| | 66,010 | | | E*TRADE Financial Corporationk | | | 1,858,842 | |
| | 37,793 | | | East West Bancorp, Inc. | | | 1,493,201 | |
| | 2,760 | | | Eaton Vance Corporation | | | 96,766 | |
| | 16,776 | | | Employers Holdings, Inc. | | | 525,928 | |
| | 3,080 | | | Endurance Specialty Holdings, Ltd. | | | 283,206 | |
| | 9,500 | | | Enova International, Inc.k | | | 89,300 | |
| | 2,000 | | | Erste Group Bank AG | | | 62,718 | |
| | 12,369 | | | Essent Group, Ltd.k | | | 327,036 | |
| | 6,654 | | | Evercore Partners, Inc. | | | 357,652 | |
| | 700 | | | EXOR SPA | | | 29,760 | |
| | 700 | | | EXOR SPA Rightsk,l | | | 0 | |
| | 9,140 | | | F.N.B. Corporation | | | 119,460 | |
| | 8,580 | | | Federated Investors, Inc. | | | 231,660 | |
| | 42,120 | | | Fifth Third Bancorp | | | 916,531 | |
| | 5,130 | | | First American Financial Corporation | | | 200,378 | |
| | 43,980 | | | First Commonwealth Financial Corporation | | | 446,837 | |
| | 10,450 | | | First Financial Bancorp | | | 224,675 | |
| | 4,550 | | | First Financial Corporation | | | 182,455 | |
| | 3,640 | | | First Merchants Corporation | | | 102,466 | |
| | 52,830 | | | First Midwest Bancorp, Inc. | | | 1,020,147 | |
| | 5,540 | | | First NBC Bank Holding Companyk | | | 29,916 | |
| | 21,306 | | | First Republic Bank | | | 1,585,806 | |
| | 22,085 | | | FlexiGroup, Ltd. | | | 37,715 | |
| | 1,960 | | | Franklin Resources, Inc. | | | 65,974 | |
| | 26,000 | | | Fukuoka Financial Group, Inc. | | | 112,514 | |
| | 18,720 | | | Genworth Financial, Inc.k | | | 77,501 | |
| | 2,338 | | | Genworth MI Canada, Inc. | | | 50,776 | |
| | 12,720 | | | Glacier Bancorp, Inc. | | | 359,467 | |
| | 6,850 | | | Goldman Sachs Group, Inc. | | | 1,220,944 | |
| | 26,170 | | | Great Western Bancorp, Inc. | | | 843,721 | |
| | 28,598 | | | Green Bancorp, Inc.k | | | 295,989 | |
| | 5,400 | | | Greenhill & Company, Inc. | | | 126,630 | |
| | 100 | | | Groupe Bruxelles Lambert SA | | | 8,597 | |
| | 1,240 | | | Hancock Holding Company | | | 41,602 | |
| | 2,900 | | | Hang Seng Bank, Ltd. | | | 52,300 | |
| | 23,572 | | | Hanmi Financial Corporation | | | 589,300 | |
| | 1,400 | | | Hannover Rueckversicherung SE | | | 156,187 | |
The accompanying Notes to Financial Statements are an integral part of this schedule.
47
MODERATELY ALLOCATION FUND
Schedule of Investments as of October 31, 2016
| | | | | | | | |
| Shares | | | Common Stock (23.5%) | | Value | |
| | Financials (3.1%) - continued | | | | |
| | 15,913 | | | Hanover Insurance Group, Inc. | | | $1,212,411 | |
| | 4,000 | | | Hartford Financial Services Group, Inc. | | | 176,440 | |
| | 20,900 | | | Henderson Group plc | | | 59,134 | |
| | 32,410 | | | Home BancShares, Inc. | | | 697,139 | |
| | 388 | | | Home Capital Group, Inc. | | | 7,680 | |
| | 2,740 | | | HomeStreet, Inc.k | | | 75,487 | |
| | 3,940 | | | Hometrust Bancshares, Inc.k | | | 73,284 | |
| | 27,209 | | | Hope Bancorp, Inc. | | | 439,153 | |
| | 5,738 | | | Horace Mann Educators Corporation | | | 206,281 | |
| | 6,668 | | | Houlihan Lokey, Inc. | | | 162,499 | |
| | 44,850 | | | Huntington Bancshares, Inc. | | | 475,410 | |
| | 773 | | | Infinity Property & Casualty Corporation | | | 63,347 | |
| | 849 | | | Intact Financial Corporation | | | 57,714 | |
| | 6,656 | | | Intercontinental Exchange, Inc. | | | 1,799,716 | |
| | 21,400 | | | Invesco, Ltd. | | | 601,126 | |
| | 20,423 | | | Janus Capital Group, Inc. | | | 261,823 | |
| | 85,790 | | | KeyCorp | | | 1,211,355 | |
| | 10,307 | | | Kinsale Capital Group, Inc. | | | 247,883 | |
| | 2,240 | | | Lazard, Ltd. | | | 81,670 | |
| | 2,424 | | | Lincoln National Corporation | | | 118,994 | |
| | 3,340 | | | LPL Financial Holdings, Inc. | | | 103,406 | |
| | 4,330 | | | M&T Bank Corporation | | | 531,421 | |
| | 1,900 | | | Macquarie Group, Ltd. | | | 114,854 | |
| | 120 | | | Markel Corporationk | | | 105,292 | |
| | 3,580 | | | Meta Financial Group, Inc. | | | 262,235 | |
| | 19,130 | | | MetLife, Inc. | | | 898,345 | |
| | 53,600 | | | Mizuho Financial Group, Inc. | | | 90,249 | |
| | 17,410 | | | Morgan Stanley | | | 584,454 | |
| | 1,000 | | | MS and AD Insurance Group Holdings, Inc. | | | 29,687 | |
| | 9,030 | | | National Bank Holdings Corporation | | | 219,790 | |
| | 6,452 | | | National Bank of Canada | | | 230,315 | |
| | 760 | | | Navigators Group, Inc. | | | 70,832 | |
| | 9,430 | | | NMI Holdings, Inc.k | | | 72,139 | |
| | 1,900 | | | Nordea Bank AB | | | 19,967 | |
| | 7,930 | | | NorthStar Realty Europe Corporation | | | 78,428 | |
| | 4,500 | | | Old Mutual plc | | | 11,070 | |
| | 4,310 | | | Old Republic International Corporation | | | 72,667 | |
| | 9,729 | | | PacWest Bancorp | | | 422,141 | |
| | 1,874 | | | Power Corporation of Canada | | | 40,196 | |
| | 5,300 | | | Primerica, Inc. | | | 289,910 | |
| | 780 | | | Principal Financial Group, Inc. | | | 42,588 | |
| | 1,380 | | | Prosperity Bancshares, Inc. | | | 76,549 | |
| | 15,520 | | | Provident Financial Services, Inc. | | | 352,149 | |
| | 14,538 | | | Raymond James Financial, Inc. | | | 874,025 | |
| | 4,820 | | | Redwood Trust, Inc. | | | 67,769 | |
| | 4,219 | | | Renasant Corporation | | | 142,349 | |
| | 6,900 | | | Resona Holdings, Inc. | | | 30,584 | |
| | 1,306 | | | Safety Insurance Group, Inc. | | | 88,416 | |
| | 15,743 | | | Sandy Spring Bancorp, Inc. | | | 499,053 | |
| | 558 | | | Schroders plc | | | 19,206 | |
| | 2,390 | | | SEI Investments Company | | | 105,949 | |
| | 2,750 | | | Selective Insurance Group, Inc. | | | 101,612 | |
| | 4,300 | | | Seven Bank, Ltd. | | | 13,219 | |
| | 134,240 | | | SLM Corporationk | | | 946,392 | |
| | 540 | | | State Auto Financial Corporation | | | 12,366 | |
| | 9,040 | | | Stewart Information Services Corporation | | | 406,348 | |
| | 16,426 | | | Stifel Financial Corporationk | | | 642,914 | |
| | 14,932 | | | SVB Financial Groupk | | | 1,825,736 | |
| | 2,390 | | | Swiss Re AG | | | 221,820 | |
| | 31,920 | | | Synchrony Financial | | | 912,593 | |
| | 8,550 | | | Synovus Financial Corporation | | | 282,748 | |
| | 4,400 | | | T&D Holdings, Inc. | | | 53,209 | |
| | 500 | | | Talanx AG | | | 15,519 | |
| | 53,730 | | | TCF Financial Corporation | | | 768,339 | |
| | 28,301 | | | TD Ameritrade Holding Corporation | | | 968,177 | |
| | 3,910 | | | Territorial Bancorp, Inc. | | | 111,513 | |
| | 1,027 | | | Toronto-Dominion Bank | | | 46,599 | |
| | 9,280 | | | TriCo Bancshares | | | 244,250 | |
| | 45,490 | | | TrustCo Bank Corporation | | | 318,430 | |
| | 3,570 | | | Trustmark Corporation | | | 98,818 | |
| | 1,760 | | | Union Bankshares Corporation | | | 49,157 | |
| | 1,820 | | | United Bankshares, Inc. | | | 68,614 | |
| | 4,650 | | | United Community Banks, Inc. | | | 100,300 | |
| | 26,950 | | | United Financial Bancorp, Inc. | | | 396,434 | |
| | 930 | | | United Fire Group, Inc. | | | 36,754 | |
| | 6,380 | | | United Overseas Bank, Ltd. | | | 86,070 | |
| | 2,360 | | | Unum Group | | | 83,544 | |
| | 4,380 | | | Virtu Financial, Inc. | | | 56,064 | |
| | 4,210 | | | Voya Financial, Inc. | | | 128,615 | |
| | 5,593 | | | Western Alliance Bancorpk | | | 208,954 | |
| | 7,600 | | | Westpac Banking Corporation | | | 175,749 | |
| | 4,744 | | | Wintrust Financial Corporation | | | 255,939 | |
| | 15,000 | | | WisdomTree Investments, Inc. | | | 128,700 | |
| | 5,234 | | | WSFS Financial Corporation | | | 183,452 | |
| | 69,779 | | | Zions Bancorporation | | | 2,247,582 | |
| | | | | |
| | | | Total | | | 58,673,221 | |
| | | | | |
| |
| Health Care (2.6%) | | | | |
| | 14,754 | | | Abbott Laboratories | | | 578,947 | |
| | 6,050 | | | ABIOMED, Inc.k | | | 635,190 | |
| | 12,045 | | | Acadia Healthcare Company, Inc.k | | | 433,138 | |
| | 1,960 | | | Acceleron Pharma, Inc.k | | | 54,939 | |
| | 2,890 | | | Aceto Corporation | | | 52,974 | |
| | 11,060 | | | Advaxis, Inc.k | | | 89,475 | |
| | 6,080 | | | Aerie Pharmaceuticals, Inc.k | | | 202,160 | |
| | 6,430 | | | Aetna, Inc. | | | 690,260 | |
| | 16,561 | | | Akorn, Inc.k | | | 396,636 | |
| | 5,450 | | | Alexion Pharmaceuticals, Inc.k | | | 711,225 | |
| | 3,924 | | | Align Technology, Inc.k | | | 337,150 | |
| | 3,922 | | | Allergan plck | | | 819,463 | |
| | 2,821 | | | Amgen, Inc. | | | 398,212 | |
| | 5,437 | | | Analogic Corporation | | | 445,018 | |
| | 36,323 | | | Asterias Biotherapeutics, Inc.k | | | 119,866 | |
| | 1,923 | | | AstraZeneca plc | | | 107,679 | |
| | 953 | | | Atrion Corporation | | | 418,510 | |
| | 100 | | | Bayer AG | | | 9,929 | |
| | 1,240 | | | Biogen, Inc.k | | | 347,423 | |
| | 8,240 | | | BioMarin Pharmaceutical, Inc.k | | | 663,485 | |
| | 3,720 | | | Boston Scientific Corporationk | | | 81,840 | |
| | 3,120 | | | Bristol-Myers Squibb Company | | | 158,839 | |
| | 1,967 | | | C.R. Bard, Inc. | | | 426,210 | |
| | 13,311 | | | Cardiovascular Systems, Inc.k | | | 311,877 | |
| | 8,000 | | | Catalent, Inc.k | | | 182,480 | |
| | 8,370 | | | Celgene Corporationk | | | 855,247 | |
| | 8,300 | | | Centene Corporationk | | | 518,584 | |
| | 1,440 | | | Charles River Laboratories International, Inc.k | | | 109,267 | |
| | 1,500 | | | Chemed Corporation | | | 212,130 | |
| | 3,180 | | | Coherus Biosciences, Inc.k | | | 86,973 | |
| | 3,970 | | | CONMED Corporation | | | 158,800 | |
| | 11,450 | | | Cooper Companies, Inc. | | | 2,015,658 | |
| | 5,070 | | | Cross Country Healthcare, Inc.k | | | 56,632 | |
| | 1,100 | | | CSL, Ltd. | | | 83,936 | |
| | 24,450 | | | Dentsply Sirona, Inc. | | | 1,407,587 | |
| | 7,040 | | | Dexcom, Inc.k | | | 550,810 | |
| | 16,070 | | | Edwards Lifesciences Corporationk | | | 1,530,185 | |
| | 2,390 | | | Emergent Biosolutions, Inc.k | | | 63,861 | |
| | 16,396 | | | Ensign Group, Inc. | | | 302,834 | |
The accompanying Notes to Financial Statements are an integral part of this schedule.
48
MODERATELY ALLOCATION FUND
Schedule of Investments as of October 31, 2016
| | | | | | | | |
| Shares | | | Common Stock (23.5%) | | Value | |
| | Health Care (2.6%) - continued | | | | |
| | 26,822 | | | Envision Healthcare Holdings, Inc.k | | | $530,539 | |
| | 2,326 | | | Essilor International SA | | | 261,382 | |
| | 11,150 | | | Express Scripts Holding Companyk | | | 751,510 | |
| | 100 | | | Gerresheimer AG | | | 7,543 | |
| | 22,883 | | | Gilead Sciences, Inc. | | | 1,684,875 | |
| | 4,520 | | | Global Blood Therapeutics, Inc.k | | | 78,874 | |
| | 2,060 | | | Globus Medical, Inc.k | | | 45,588 | |
| | 1,800 | | | Grifols SA | | | 35,518 | |
| | 2,060 | | | Halyard Health, Inc.k | | | 66,641 | |
| | 6,260 | | | HCA Holdings, Inc.k | | | 479,078 | |
| | 5,264 | | | HealthEquity, Inc.k | | | 174,923 | |
| | 8,970 | | | Healthways, Inc.k | | | 222,456 | |
| | 1,660 | | | Heska Corporationk | | | 82,004 | |
| | 1,900 | | | Hikma Pharmaceuticals plc | | | 40,752 | |
| | 3,700 | | | Hill-Rom Holdings, Inc. | | | 205,017 | |
| | 25,360 | | | Hologic, Inc.k | | | 913,214 | |
| | 164 | | | ICON plck | | | 13,166 | |
| | 2,620 | | | ICU Medical, Inc.k | | | 364,966 | |
| | 4,321 | | | Impax Laboratories, Inc.k | | | 86,852 | |
| | 10,238 | | | Inogen, Inc.k | | | 549,473 | |
| | 19,738 | | | Intersect ENT, Inc.k | | | 288,175 | |
| | 2,750 | | | Intra-Cellular Therapies, Inc.k | | | 34,100 | |
| | 9,689 | | | Ironwood Pharmaceuticals, Inc.k | | | 123,729 | |
| | 23,430 | | | Johnson & Johnson | | | 2,717,646 | |
| | 20,660 | | | Kindred Healthcare, Inc. | | | 203,501 | |
| | 322 | | | Lonza Group AG | | | 60,762 | |
| | 7,060 | | | Magellan Health Services, Inc.k | | | 363,237 | |
| | 19,308 | | | Medtronic plc | | | 1,583,642 | |
| | 31,400 | | �� | Merck & Company, Inc. | | | 1,843,808 | |
| | 1,000 | | | Merck KGaA | | | 102,931 | |
| | 2,012 | | | Mettler-Toledo International, Inc.k | | | 813,009 | |
| | 16,597 | | | Mylan NVk | | | 605,790 | |
| | 7,182 | | | National Healthcare Corporation | | | 464,675 | |
| | 2,110 | | | Natural Health Trends Corporation | | | 49,226 | |
| | 790 | | | Neogen Corporationk | | | 41,625 | |
| | 6,307 | | | Neurocrine Biosciences, Inc.k | | | 276,057 | |
| | 8,161 | | | Nevro Corporationk | | | 750,159 | |
| | 3,800 | | | Novartis AG | | | 269,677 | |
| | 3,300 | | | Novo Nordisk AS | | | 117,564 | |
| | 16,693 | | | NuVasive, Inc.k | | | 997,073 | |
| | 6,470 | | | Omnicell, Inc.k | | | 211,084 | |
| | 33,470 | | | OraSure Technologies, Inc.k | | | 251,360 | |
| | 3,340 | | | Orthofix International NVk | | | 122,411 | |
| | 200 | | | Otsuka Holdings Company, Ltd. | | | 8,753 | |
| | 21,120 | | | PDL BioPharma, Inc. | | | 68,006 | |
| | 3,690 | | | PerkinElmer, Inc. | | | 187,784 | |
| | 7,180 | | | Perrigo Company plc | | | 597,304 | |
| | 75,410 | | | Pfizer, Inc. | | | 2,391,251 | |
| | 5,180 | | | PharMerica Corporationk | | | 123,284 | |
| | 1,800 | | | Prothena Corporation plck | | | 86,076 | |
| | 2,930 | | | ResMed, Inc. | | | 175,126 | |
| | 13,070 | | | Roche Holding AG ADR | | | 374,782 | |
| | 362 | | | Roche Holding AG-Genusschein | | | 83,145 | |
| | 3,120 | | | Surgical Care Affiliates, Inc.k | | | 133,505 | |
| | 15,573 | | | Team Health Holdings, Inc.k | | | 667,303 | |
| | 8,450 | | | Teleflex, Inc. | | | 1,209,448 | |
| | 12,717 | | | Triple-S Management Corporationk | | | 262,988 | |
| | 14,331 | | | UnitedHealth Group, Inc. | | | 2,025,400 | |
| | 10,648 | | | Universal Health Services, Inc. | | | 1,285,320 | |
| | 2,420 | | | VCA Antech, Inc.k | | | 148,733 | |
| | 13,640 | | | Veeva Systems, Inc.k | | | 529,914 | |
| | 11,008 | | | Vertex Pharmaceuticals, Inc.k | | | 835,067 | |
| | 1,300 | | | Waters Corporationk | | | 180,882 | |
| | 530 | | | Wellcare Health Plans, Inc.k | | | 60,160 | |
| | 4,260 | | | West Pharmaceutical Services, Inc. | | | 323,888 | |
| | 13,850 | | | Wright Medical Group NVk | | | 303,454 | |
| | 12,080 | | | Ziopharm Oncology, Inc.k | | | 68,614 | |
| | 11,660 | | | Zoetis, Inc. | | | 557,348 | |
| | | | | |
| | | | Total | | | 48,198,576 | |
| | | | | |
| |
| Industrials (2.9%) | | | | |
| | 2,900 | | | ABB, Ltd. | | | 59,828 | |
| | 7,900 | | | ABM Industries, Inc. | | | 308,732 | |
| | 1,000 | | | Adecco SA | | | 59,380 | |
| | 17,989 | | | Aegion Corporationk | | | 332,976 | |
| | 3,660 | | | Aerovironment, Inc.k | | | 87,803 | |
| | 3,700 | | | AGCO Corporation | | | 188,996 | |
| | 12,225 | | | Air New Zealand, Ltd. | | | 16,863 | |
| | 2,560 | | | Allison Transmission Holdings, Inc. | | | 74,982 | |
| | 400 | | | Andritz AG | | | 20,914 | |
| | 29,880 | | | Ardmore Shipping Corporation | | | 174,798 | |
| | 8,000 | | | Asahi Glass Company, Ltd. | | | 55,950 | |
| | 7,588 | | | Astec Industries, Inc. | | | 420,072 | |
| | 500 | | | Atlas Copco Aktiebolag | | | 14,648 | |
| | 5,960 | | | AZZ, Inc. | | | 317,370 | |
| | 14,577 | | | B/E Aerospace, Inc. | | | 867,623 | |
| | 2,400 | | | Babcock International Group plc | | | 29,011 | |
| | 14,150 | | | Barnes Group, Inc. | | | 563,736 | |
| | 700 | | | Berendsen plc | | | 8,261 | |
| | 5,040 | | | Boeing Company | | | 717,847 | |
| | 1,800 | | | Brady Corporation | | | 59,580 | |
| | 43,210 | | | BWX Technologies, Inc. | | | 1,694,696 | |
| | 630 | | | Canadian National Railway Company | | | 39,605 | |
| | 14,000 | | | Carlisle Companies, Inc. | | | 1,467,900 | |
| | 7,000 | | | Cathay Pacific Airways, Ltd. | | | 9,214 | |
| | 5,710 | | | CBIZ, Inc.k | | | 63,096 | |
| | 2,890 | | | CEB, Inc. | | | 140,599 | |
| | 100 | | | Central Japan Railway Company | | | 17,005 | |
| | 7,868 | | | CIRCOR International, Inc. | | | 423,141 | |
| | 5,558 | | | CLARCOR, Inc. | | | 345,763 | |
| | 2,200 | | | Colfax Corporationk | | | 69,938 | |
| | 17,060 | | | Comfort Systems USA, Inc. | | | 492,181 | |
| | 5,685 | | | Commercial Vehicle Group, Inc.k | | | 25,810 | |
| | 11,920 | | | Copart, Inc.k | | | 625,442 | |
| | 1,900 | | | Crane Company | | | 129,219 | |
| | 18,940 | | | CSX Corporation | | | 577,859 | |
| | 6,970 | | | Cummins, Inc. | | | 890,905 | |
| | 2,200 | | | Curtiss-Wright Corporation | | | 197,164 | |
| | 2,000 | | | Dai Nippon Printing Company, Ltd. | | | 20,061 | |
| | 40,440 | | | Delta Air Lines, Inc. | | | 1,689,179 | |
| | 580 | | | Deluxe Corporation | | | 35,496 | |
| | 1,500 | | | Deutsche Post AG | | | 46,517 | |
| | 24,080 | | | Donaldson Company, Inc. | | | 879,402 | |
| | 1,000 | | | DSV AS | | | 48,420 | |
| | 1,200 | | | East Japan Railway Company | | | 105,634 | |
| | 5,377 | | | EMCOR Group, Inc. | | | 325,093 | |
| | 1,634 | | | Encore Wire Corporation | | | 55,801 | |
| | 9,510 | | | EnerSys | | | 619,386 | |
| | 1,820 | | | Equifax, Inc. | | | 225,625 | |
| | 11,678 | | | ESCO Technologies, Inc. | | | 520,255 | |
| | 15,788 | | | Federal Signal Corporation | | | 193,877 | |
| | 770 | | | Flowserve Corporation | | | 32,609 | |
| | 300 | | | Flughafen Zuerich AG | | | 55,147 | |
| | 4,280 | | | Fluor Corporation | | | 222,517 | |
| | 2,185 | | | Fortive Corporation | | | 111,544 | |
| | 8,106 | | | Fortune Brands Home and Security, Inc. | | | 442,831 | |
| | 10,861 | | | Franklin Electric Company, Inc. | | | 395,883 | |
| | 700 | | | Fraport AG Frankfurt Airport Services Worldwide | | | 41,553 | |
| | 8,500 | | | GasLog, Ltd. | | | 130,475 | |
| | 16,380 | | | Gener8 Maritime, Inc.k | | | 69,124 | |
| | 1,860 | | | Genesee & Wyoming, Inc.k | | | 126,368 | |
The accompanying Notes to Financial Statements are an integral part of this schedule.
49
MODERATELY ALLOCATION FUND
Schedule of Investments as of October 31, 2016
| | | | | | | | |
| Shares | | | Common Stock (23.5%) | | Value | |
| | Industrials (2.9%) - continued | | | | |
| | 700 | | | Getinge AB | | | $11,463 | |
| | 15,163 | | | Gibraltar Industries, Inc.k | | | 589,841 | |
| | 10,652 | | | Granite Construction, Inc. | | | 523,652 | |
| | 2,850 | | | Greenbrier Companies, Inc. | | | 89,775 | |
| | 4,880 | | | Hackett Group, Inc. | | | 78,666 | |
| | 40,290 | | | Harsco Corporation | | | 392,827 | |
| | 1,980 | | | HD Supply Holdings, Inc.k | | | 65,340 | |
| | 9,120 | | | Healthcare Services Group, Inc. | | | 337,166 | |
| | 6,758 | | | Heico Corporation | | | 456,570 | |
| | 4,340 | | | Herman Miller, Inc. | | | 120,652 | |
| | 7,440 | | | Hexcel Corporation | | | 338,446 | |
| | 800 | | | Hitachi Transport System, Ltd. | | | 16,492 | |
| | 300 | | | Hochtief AG | | | 40,964 | |
| | 6,860 | | | Honeywell International, Inc. | | | 752,405 | |
| | 3,871 | | | Hub Group, Inc.k | | | 141,098 | |
| | 9,360 | | | Hubbell, Inc. | | | 978,307 | |
| | 2,200 | | | Huntington Ingalls Industries, Inc. | | | 354,992 | |
| | 3,222 | | | Huron Consulting Group, Inc.k | | | 180,593 | |
| | 1,415 | | | ICF International, Inc.k | | | 65,656 | |
| | 1,000 | | | Inaba Denki Sangyo Company, Ltd. | | | 36,281 | |
| | 23,870 | | | Ingersoll-Rand plc | | | 1,606,212 | |
| | 4,080 | | | Insperity, Inc. | | | 306,816 | |
| | 1,380 | | | Insteel Industries, Inc. | | | 37,122 | |
| | 3,500 | | | Interface, Inc. | | | 55,475 | |
| | 18,200 | | | ITOCHU Corporation | | | 229,842 | |
| | 2,610 | | | ITT Corporation | | | 91,924 | |
| | 6,390 | | | Jacobs Engineering Group, Inc.k | | | 329,596 | |
| | 800 | | | Jardine Matheson Holdings, Ltd. | | | 48,728 | |
| | 6,270 | | | JB Hunt Transport Services, Inc. | | | 511,695 | |
| | 12,738 | | | Johnson Controls International plc | | | 513,596 | |
| | 2,000 | | | Kamigumi Company, Ltd. | | | 17,077 | |
| | 1,210 | | | Kansas City Southern | | | 106,190 | |
| | 40,630 | | | Kennametal, Inc. | | | 1,150,235 | |
| | 17,122 | | | Kforce, Inc. | | | 297,067 | |
| | 3,110 | | | Kirby Corporationk | | | 183,334 | |
| | 4,900 | | | KITZ Corporation | | | 28,176 | |
| | 5,930 | | | Knight Transportation, Inc. | | | 173,452 | |
| | 4,246 | | | KONE Oyj | | | 195,367 | |
| | 1,153 | | | Koninklijke Boskalis Westminster NV | | | 37,186 | |
| | 24,320 | | | Korn/Ferry International | | | 495,885 | |
| | 200 | | | Kuehne & Nagel International AG | | | 27,108 | |
| | 200 | | | Legrand SA | | | 11,305 | |
| | 22,920 | | | Lincoln Electric Holdings, Inc. | | | 1,508,824 | |
| | 1,240 | | | Lindsay Corporation | | | 97,092 | |
| | 1,760 | | | Manpower, Inc. | | | 135,168 | |
| | 9,700 | | | Masco Corporation | | | 299,536 | |
| | 7,074 | | | Meggitt plc | | | 37,634 | |
| | 32,630 | | | Meritor, Inc.k | | | 335,436 | |
| | 5,883 | | | Middleby Corporationk | | | 659,543 | |
| | 1,900 | | | MIRAIT Holdings Corporation | | | 16,848 | |
| | 5,700 | | | Mitsubishi Electric Corporation | | | 77,116 | |
| | 2,000 | | | Mitsuboshi Belting, Ltd. | | | 17,247 | |
| | 9,000 | | | Moog, Inc.k | | | 522,630 | |
| | 2,970 | | | MRC Global, Inc.k | | | 43,778 | |
| | 3,637 | | | MSA Safety, Inc. | | | 212,037 | |
| | 1,210 | | | Mueller Industries, Inc. | | | 36,651 | |
| | 8,590 | | | MYR Group, Inc.k | | | 256,326 | |
| | 26,435 | | | Navigant Consulting, Inc.k | | | 618,579 | |
| | 7,350 | | | NCI Building Systems, Inc.k | | | 105,840 | |
| | 7,887 | | | Nielsen Holdings plc | | | 355,073 | |
| | 3,000 | | | Nippon Express Company, Ltd. | | | 14,818 | |
| | 3,400 | | | Nitto Kogyo Corporation | | | 49,876 | |
| | 5,479 | | | Nordson Corporation | | | 548,612 | |
| | 5,688 | | | Norfolk Southern Corporation | | | 528,984 | |
| | 540 | | | Northrop Grumman Corporation | | | 123,660 | |
| | 5,380 | | | Old Dominion Freight Line, Inc.k | | | 401,778 | |
| | 9,814 | | | On Assignment, Inc.k | | | 337,700 | |
| | 13,136 | | | Oshkosh Corporation | | | 702,776 | |
| | 620 | | | Parker Hannifin Corporation | | | 76,105 | |
| | 3,020 | | | Pentair, Ltd. | | | 166,493 | |
| | 19,387 | | | PGT, Inc.k | | | 189,993 | |
| | 7,686 | | | Proto Labs, Inc.k | | | 343,564 | |
| | 5,240 | | | Quanex Building Products Corporation | | | 85,412 | |
| | 800 | | | Randstad Holding NV | | | 41,146 | |
| | 9,220 | | | Raven Industries, Inc. | | | 197,769 | |
| | 11,550 | | | Raytheon Company | | | 1,577,846 | |
| | 520 | | | RBC Bearings, Inc.k | | | 37,102 | |
| | 2,240 | | | Regal-Beloit Corporation | | | 132,384 | |
| | 6,780 | | | Resources Connection, Inc. | | | 100,683 | |
| | 3,340 | | | Rexnord Corporationk | | | 66,433 | |
| | 111 | | | Rieter Holding AG | | | 21,111 | |
| | 2,600 | | | Rockwell Automation, Inc. | | | 311,272 | |
| | 9,650 | | | Rockwell Collins, Inc. | | | 813,688 | |
| | 2,520 | | | Rollins, Inc. | | | 77,666 | |
| | 4,239 | | | Roper Industries, Inc. | | | 734,661 | |
| | 1,090 | | | Ryder System, Inc. | | | 75,635 | |
| | 11,130 | | | Saia, Inc.k | | | 396,785 | |
| | 1,800 | | | Sanwa Holdings Corporation | | | 17,927 | |
| | 65 | | | Schindler Holding AG | | | 12,032 | |
| | 352 | | | Schindler Holding AG, Participation Certificate | | | 65,393 | |
| | 200 | | | Secom Company, Ltd. | | | 14,428 | |
| | 700 | | | Securitas AB | | | 10,804 | |
| | 1,700 | | | Siemens AG | | | 193,150 | |
| | 2,800 | | | Smiths Group plc | | | 48,519 | |
| | 45,145 | | | Southwest Airlines Company | | | 1,808,057 | |
| | 11,630 | | | SPX FLOW, Inc.k | | | 291,797 | |
| | 650 | | | Stanley Black & Decker, Inc. | | | 73,996 | |
| | 3,880 | | | Tennant Company | | | 244,246 | |
| | 2,880 | | | Tetra Tech, Inc. | | | 110,736 | |
| | 3,794 | | | Textron, Inc. | | | 152,064 | |
| | 2,560 | | | Toro Company | | | 122,573 | |
| | 7,940 | | | TransUnionk | | | 248,046 | |
| | 2,300 | | | TrueBlue, Inc.k | | | 40,250 | |
| | 23,527 | | | Union Pacific Corporation | | | 2,074,611 | |
| | 15,450 | | | United Continental Holdings, Inc.k | | | 868,754 | |
| | 8,980 | | | United Parcel Service, Inc. | | | 967,685 | |
| | 8,556 | | | United Rentals, Inc.k | | | 647,347 | |
| | 4,075 | | | Universal Forest Products, Inc. | | | 350,409 | |
| | 12,300 | | | Universal Truckload Services, Inc. | | | 153,135 | |
| | 3,000 | | | Vinci SA | | | 217,260 | |
| | 3,050 | | | WABCO Holdings, Inc.k | | | 300,303 | |
| | 7,207 | | | WageWorks, Inc.k | | | 424,853 | |
| | 18,038 | | | Waste Connections, Inc. | | | 1,356,638 | |
| | 1,355 | | | Watsco, Inc. | | | 186,028 | |
| | 745 | | | WSP Global, Inc. | | | 24,133 | |
| | 8,700 | | | Xylem, Inc. | | | 420,471 | |
| | 8,160 | | | YRC Worldwide, Inc.k | | | 72,461 | |
| | 600 | | | Yuasa Trading Company, Ltd. | | | 14,374 | |
| | | | | |
| | | | Total | | | 55,028,068 | |
| | | | | |
| |
| Information Technology (4.3%) | | | | |
| | 1,906 | | | Advanced Energy Industries, Inc.k | | | 90,916 | |
| | 40,151 | | | Agilent Technologies, Inc. | | | 1,749,379 | |
| | 19,972 | | | Akamai Technologies, Inc.k | | | 1,387,455 | |
| | 2,100 | | | Alliance Data Systems Corporationk | | | 429,387 | |
| | 2,869 | | | Alphabet, Inc., Class Ak | | | 2,323,603 | |
| | 2,140 | | | Alphabet, Inc., Class Ck | | | 1,678,916 | |
| | 6,288 | | | Ambarella, Inc.k | | | 385,895 | |
| | 9,720 | | | Amkor Technology, Inc.k | | | 90,104 | |
| | 26,499 | | | Amphenol Corporation | | | 1,747,079 | |
| | 15,870 | | | Analog Devices, Inc. | | | 1,017,267 | |
The accompanying Notes to Financial Statements are an integral part of this schedule.
50
MODERATELY ALLOCATION FUND
Schedule of Investments as of October 31, 2016
| | | | | | | | |
| Shares | | | Common Stock (23.5%) | | Value | |
| | Information Technology (4.3%) - continued | | | | |
| | 1,908 | | | ANSYS, Inc.k | | | $174,296 | |
| | 22,834 | | | Apple, Inc. | | | 2,592,572 | |
| | 15,026 | | | Applied Materials, Inc. | | | 436,956 | |
| | 6,890 | | | Apptio, Inc.k | | | 135,940 | |
| | 12,071 | | | Arista Networks, Inc.k | | | 1,023,017 | |
| | 9,044 | | | Aspen Technology, Inc.k | | | 445,327 | |
| | 4,170 | | | AVX Corporation | | | 58,463 | |
| | 8,860 | | | Bankrate, Inc.k | | | 69,108 | |
| | 780 | | | Belden, Inc. | | | 50,552 | |
| | 19,080 | | | Blackhawk Network Holdings, Inc.k | | | 657,306 | |
| | 30,760 | | | Booz Allen Hamilton Holding Corporation | | | 937,257 | |
| | 800 | | | Broadcom, Ltd. | | | 136,224 | |
| | 21,627 | | | Brocade Communications Systems, Inc. | | | 229,246 | |
| | 36,559 | | | Brooks Automation, Inc. | | | 476,364 | |
| | 7,860 | | | CA, Inc. | | | 241,616 | |
| | 8,237 | | | Cabot Microelectronics Corporation | | | 455,177 | |
| | 1,904 | | | CACI International, Inc.k | | | 186,306 | |
| | 4,050 | | | Cadence Design Systems, Inc.k | | | 103,599 | |
| | 1,800 | | | Canon, Inc. | | | 51,710 | |
| | 100 | | | Cap Gemini SA | | | 8,282 | |
| | 8,270 | | | Cavium, Inc.k | | | 466,841 | |
| | 4,350 | | | CDK Global, Inc. | | | 237,553 | |
| | 2,240 | | | Check Point Software Technologies, Ltd.k | | | 189,414 | |
| | 23,210 | | | Ciena Corporationk | | | 449,810 | |
| | 134,200 | | | Cisco Systems, Inc. | | | 4,117,256 | |
| | 8,871 | | | Cognex Corporation | | | 457,744 | |
| | 2,140 | | | Coherent, Inc.k | | | 222,817 | |
| | 21,350 | | | CommVault Systems, Inc.k | | | 1,142,225 | |
| | 8,700 | | | Comtech Telecommunications Corporation | | | 90,480 | |
| | 8,120 | | | Convergys Corporation | | | 237,104 | |
| | 16,560 | | | CoreLogic, Inc.k | | | 704,794 | |
| | 20,624 | | | Criteo SA ADRk | | | 745,558 | |
| | 2,670 | | | CSG Systems International, Inc. | | | 101,540 | |
| | 2,130 | | | CTS Corporation | | | 38,766 | |
| | 8,050 | | | Dolby Laboratories, Inc. | | | 383,099 | |
| | 11,861 | | | DST Systems, Inc. | | | 1,140,554 | |
| | 10,480 | | | EarthLink Holdings Corporation | | | 59,946 | |
| | 17,300 | | | eBay, Inc.k | | | 493,223 | |
| | 13,810 | | | Entegris, Inc.k | | | 219,579 | |
| | 8,240 | | | Envestnet, Inc.k | | | 291,284 | |
| | 4,490 | | | EVERTEC, Inc. | | | 68,023 | |
| | 6,170 | | | ExlService Holdings, Inc.k | | | 271,665 | |
| | 3,518 | | | F5 Networks, Inc.k | | | 486,223 | |
| | 11,245 | | | Fabrinetk | | | 426,860 | |
| | 15,910 | | | Facebook, Inc.k | | | 2,084,051 | |
| | 13,750 | | | Finisar Corporationk | | | 376,475 | |
| | 38,630 | | | FLIR Systems, Inc. | | | 1,271,700 | |
| | 1,010 | | | Forrester Research, Inc. | | | 37,622 | |
| | 23,308 | | | Fortinet, Inc.k | | | 747,254 | |
| | 4,000 | | | FUJIFILM Holdings NPV | | | 151,244 | |
| | 1,680 | | | Gartner, Inc.k | | | 144,547 | |
| | 19,269 | | | Guidewire Software, Inc.k | | | 1,107,004 | |
| | 800 | | | Halma plc | | | 10,242 | |
| | 8,780 | | | HP, Inc. | | | 127,222 | |
| | 3,576 | | | IAC/InterActiveCorporation | | | 230,437 | |
| | 14,270 | | | Integrated Device Technology, Inc.k | | | 295,532 | |
| | 17,480 | | | Intel Corporation | | | 609,528 | |
| | 32,387 | | | Ixiak | | | 387,025 | |
| | 10,164 | | | Juniper Networks, Inc. | | | 267,720 | |
| | 2,460 | | | Keysight Technologies, Inc.k | | | 80,688 | |
| | 10,970 | | | Lam Research Corporation | | | 1,062,554 | |
| | 5,270 | | | Liberty Tripadvisor Holdings, Inc.k | | | 116,994 | |
| | 13,650 | | | Lionbridge Technologies, Inc.k | | | 65,930 | |
| | 3,058 | | | Littelfuse, Inc. | | | 426,591 | |
| | 8,890 | | | M/A-COM Technology Solutions Holdings, Inc.k | | | 326,796 | |
| | 4,183 | | | Manhattan Associates, Inc.k | | | 211,827 | |
| | 25,800 | | | MasterCard, Inc. | | | 2,761,116 | |
| | 18,071 | | | Maxim Integrated Products, Inc. | | | 716,154 | |
| | 2,860 | | | MAXIMUS, Inc. | | | 148,892 | |
| | 13,681 | | | Methode Electronics, Inc. | | | 426,847 | |
| | 600 | | | Micro Focus International plc | | | 15,711 | |
| | 10,400 | | | Microsemi Corporationk | | | 438,152 | |
| | 77,130 | | | Microsoft Corporation | | | 4,621,630 | |
| | 6,720 | | | Mobileye NVk | | | 249,850 | |
| | 19,532 | | | Monolithic Power Systems, Inc. | | | 1,539,317 | |
| | 2,793 | | | Nanometrics, Inc.k | | | 58,346 | |
| | 8,280 | | | National Instruments Corporation | | | 232,585 | |
| | 1,800 | | | NEC Networks & System Integration Corporation | | | 31,989 | |
| | 500 | | | Nice, Ltd. | | | 33,189 | |
| | 8,067 | | | Nice, Ltd. ADR | | | 536,213 | |
| | 1,000 | | | NS Solutions Corporation | | | 19,068 | |
| | 400 | | | NTT Data Corporation | | | 20,642 | |
| | 17,576 | | | NVIDIA Corporation | | | 1,250,708 | |
| | 7,330 | | | NXP Semiconductors NVk | | | 733,000 | |
| | 33,651 | | | Oclaro, Inc.k | | | 245,989 | |
| | 13,960 | | | ON Semiconductor Corporationk | | | 162,913 | |
| | 73,730 | | | Oracle Corporation | | | 2,832,707 | |
| | 200 | | | Oracle Corporation Japan | | | 10,885 | |
| | 2,160 | | | OSI Systems, Inc.k | | | 151,481 | |
| | 5,058 | | | Palo Alto Networks, Inc.k | | | 778,072 | |
| | 49,520 | | | Pandora Media, Inc.k | | | 561,062 | |
| | 11,000 | | | Paylocity Holding Corporationk | | | 478,390 | |
| | 25,769 | | | PayPal Holdings, Inc.k | | | 1,073,537 | |
| | 6,983 | | | Pegasystems, Inc. | | | 215,775 | |
| | 15,667 | | | Progress Software Corporationk | | | 421,599 | |
| | 14,735 | | | Proofpoint, Inc.k | | | 1,154,929 | |
| | 5,580 | | | PTC, Inc.k | | | 264,715 | |
| | 12,877 | | | Q2 Holdings, Inc.k | | | 361,844 | |
| | 770 | | | Qorvo, Inc.k | | | 42,851 | |
| | 16,300 | | | QUALCOMM, Inc. | | | 1,120,136 | |
| | 2,320 | | | Qualys, Inc.k | | | 86,420 | |
| | 9,620 | | | RealPage, Inc.k | | | 261,664 | |
| | 5,300 | | | Red Hat, Inc.k | | | 410,485 | |
| | 4,520 | | | Rudolph Technologies, Inc.k | | | 81,812 | |
| | 33,500 | | | Salesforce.com, Inc.k | | | 2,517,860 | |
| | 100 | | | SAP SE | | | 8,810 | |
| | 2,740 | | | ScanSource, Inc.k | | | 95,900 | |
| | 6,808 | | | ServiceNow, Inc.k | | | 598,491 | |
| | 17,750 | | | ShoreTel, Inc.k | | | 118,037 | |
| | 670 | | | Silicon Laboratories, Inc.k | | | 40,166 | |
| | 870 | | | Software AG | | | 31,620 | |
| | 9,100 | | | SS&C Technologies Holdings, Inc. | | | 290,563 | |
| | 1,860 | | | Stratasys, Ltd.k | | | 35,563 | |
| | 13,546 | | | Synopsys, Inc.k | | | 803,413 | |
| | 25,415 | | | Teradyne, Inc. | | | 591,915 | |
| | 1,840 | | | Tessera Technologies, Inc. | | | 68,264 | |
| | 16,120 | | | Texas Instruments, Inc. | | | 1,142,102 | |
| | 400 | | | Tokyo Electron, Ltd. | | | 36,082 | |
| | 1,990 | | | Total System Services, Inc. | | | 99,261 | |
| | 300 | | | Trend Micro, Inc. | | | 10,564 | |
| | 5,570 | | | Trimble, Inc.k | | | 153,955 | |
| | 3,987 | | | Tyler Technologies, Inc.k | | | 639,515 | |
| | 6,841 | | | Ultimate Software Group, Inc.k | | | 1,443,383 | |
| | 300 | | | United Internet AG | | | 12,334 | |
| | 23,074 | | | Virtusa Corporationk | | | 437,022 | |
| | 16,150 | | | Visa, Inc. | | | 1,332,536 | |
The accompanying Notes to Financial Statements are an integral part of this schedule.
51
MODERATELY ALLOCATION FUND
Schedule of Investments as of October 31, 2016
| | | | | | | | |
| Shares | | | Common Stock (23.5%) | | Value | |
| | Information Technology (4.3%) - continued | | | | |
| | 36,010 | | | Xilinx, Inc. | | | $1,831,829 | |
| | 4,400 | | | Yahoo Japan Corporation | | | 16,878 | |
| | 1,730 | | | Yandex NVk | | | 34,064 | |
| | | | | |
| | | | Total | | | 79,491,462 | |
| | | | | |
| |
| Materials (1.4%) | | | | |
| | 800 | | | Adeka Corporation | | | 12,093 | |
| | 8,547 | | | Agnico Eagle Mines, Ltd. | | | 434,188 | |
| | 127 | | | Air Liquide SA | | | 12,905 | |
| | 4,950 | | | Air Products and Chemicals, Inc. | | | 660,429 | |
| | 8,699 | | | American Vanguard Corporation | | | 132,225 | |
| | 1,614 | | | APERAM | | | 73,403 | |
| | 610 | | | Ashland Global Holdings, Inc. | | | 68,155 | |
| | 6,053 | | | Avery Dennison Corporation | | | 422,439 | |
| | 2,373 | | | Balchem Corporation | | | 180,111 | |
| | 7,139 | | | Ball Corporation | | | 550,203 | |
| | 47,648 | | | Barrick Gold Corporation | | | 838,128 | |
| | 14,228 | | | BHP Billiton, Ltd. | | | 248,575 | |
| | 14,385 | | | BlueScope Steel, Ltd. | | | 85,341 | |
| | 9,540 | | | Boise Cascade Companyk | | | 183,645 | |
| | 4,520 | | | Cabot Corporation | | | 235,673 | |
| | 4,440 | | | Carpenter Technology Corporation | | | 140,348 | |
| | 8,540 | | | Celanese Corporation | | | 622,737 | |
| | 9,381 | | | Chemtura Corporationk | | | 307,697 | |
| | 3,739 | | | Clearwater Paper Corporationk | | | 198,541 | |
| | 5,170 | | | Continental Building Products, Inc.k | | | 105,726 | |
| | 600 | | | Croda International plc | | | 25,659 | |
| | 14,823 | | | Crown Holdings, Inc.k | | | 804,148 | |
| | 7,600 | | | Daicel Corporation | | | 99,934 | |
| | 2,000 | | | Denki Kagaku Kogyo KK | | | 9,073 | |
| | 10,970 | | | Dow Chemical Company | | | 590,296 | |
| | 1,733 | | | Eagle Materials, Inc. | | | 140,321 | |
| | 8,233 | | | Eastman Chemical Company | | | 592,035 | |
| | 10,250 | | | Ecolab, Inc. | | | 1,170,242 | |
| | 33,083 | | | Eldorado Gold Corporationk | | | 104,542 | |
| | 4,814 | | | Evonik Industries AG | | | 150,758 | |
| | 8,490 | | | Ferro Corporationk | | | 110,030 | |
| | 18,780 | | | Ferroglobe plc | | | 173,715 | |
| | 20,847 | | | FMC Corporation | | | 977,516 | |
| | 28 | | | Givaudan SA | | | 54,154 | |
| | 32,447 | | | Goldcorp, Inc. | | | 493,194 | |
| | 2,910 | | | Graphic Packaging Holding Company | | | 36,375 | |
| | 1,400 | | | Hexpol AB | | | 11,506 | |
| | 9,310 | | | Huntsman Corporation | | | 157,804 | |
| | 2,178 | | | Ingevity Corporationk | | | 90,169 | |
| | 2,090 | | | Innophos Holdings, Inc. | | | 95,806 | |
| | 5,029 | | | Innospec, Inc. | | | 302,997 | |
| | 25,243 | | | International Paper Company | | | 1,136,692 | |
| | 2,410 | | | Kadant, Inc. | | | 124,476 | |
| | 16,520 | | | KapStone Paper and Packaging Corporation | | | 299,673 | |
| | 60,454 | | | Kinross Gold Corporationk | | | 233,352 | |
| | 3,060 | | | Koppers Holdings, Inc.k | | | 100,215 | |
| | 2,100 | | | Kuraray Company, Ltd. | | | 31,837 | |
| | 2,208 | | | Martin Marietta Materials, Inc. | | | 409,319 | |
| | 4,330 | | | Materion Corporation | | | 131,199 | |
| | 2,560 | | | Methanex Corporation | | | 93,056 | |
| | 4,037 | | | Minerals Technologies, Inc. | | | 271,286 | |
| | 5,400 | | | Mitsubishi Chemical Holdings Corporation | | | 35,456 | |
| | 1,000 | | | Mitsubishi Gas Chemical Company, Inc. | | | 15,391 | |
| | 800 | | | Mitsubishi Materials Corporation | | | 22,921 | |
| | 20,010 | | | Mosaic Company | | | 470,835 | |
| | 23,972 | | | Myers Industries, Inc. | | | 288,863 | |
| | 520 | | | Neenah Paper, Inc. | | | 41,548 | |
| | 700 | | | Newcrest Mining, Ltd. | | | 12,257 | |
| | 26,341 | | | Newmont Mining Corporation | | | 975,671 | |
| | 200 | | | Nippon Shokubai Company, Ltd. | | | 13,802 | |
| | 22,019 | | | Norsk Hydro ASA | | | 98,441 | |
| | 19,970 | | | Nucor Corporation | | | 975,534 | |
| | 11,460 | | | OMNOVA Solutions, Inc.k | | | 87,096 | |
| | 6,098 | | | Orora, Ltd. | | | 13,437 | |
| | 21,404 | | | Owens-Illinois, Inc.k | | | 413,097 | |
| | 21,357 | | | Packaging Corporation of America | | | 1,761,952 | |
| | 2,350 | | | PolyOne Corporation | | | 68,690 | |
| | 1,090 | | | Quaker Chemical Corporation | | | 117,175 | |
| | 8,220 | | | Rayonier Advanced Materials, Inc. | | | 106,285 | |
| | 2,480 | | | Reliance Steel & Aluminum Company | | | 170,574 | |
| | 3,073 | | | Royal Gold, Inc. | | | 211,484 | |
| | 2,100 | | | RPC Group plc | | | 24,353 | |
| | 2,770 | | | RPM International, Inc. | | | 131,686 | |
| | 6,360 | | | Schnitzer Steel Industries, Inc. | | | 153,594 | |
| | 1,810 | | | Schweitzer-Mauduit International, Inc. | | | 66,807 | |
| | 2,988 | | | Scotts Miracle-Gro Company | | | 263,213 | |
| | 9,457 | | | Sealed Air Corporation | | | 431,523 | |
| | 4,360 | | | Sensient Technologies Corporation | | | 324,864 | |
| | 14,496 | | | Silver Wheaton Corporation | | | 349,499 | |
| | 8,640 | | | Sonoco Products Company | | | 434,506 | |
| | 22,095 | | | Steel Dynamics, Inc. | | | 606,729 | |
| | 400 | | | Sumitomo Seika Chemicals Company, Ltd. | | | 14,955 | |
| | 25,327 | | | Teck Resources, Ltd. | | | 546,557 | |
| | 2,000 | | | Tosoh Corporation | | | 13,061 | |
| | 3,399 | | | UPM-Kymmene Oyj | | | 79,066 | |
| | 17,718 | | | Verso Corporationk | | | 108,789 | |
| | 2,475 | | | Versum Materials, Inc.k | | | 56,183 | |
| | 4,654 | | | Vulcan Materials Company | | | 526,833 | |
| | 13,042 | | | Westrock Company | | | 602,410 | |
| | 47,962 | | | Yamana Gold, Inc. | | | 170,745 | |
| | 4,022 | | | Yara International ASA | | | 142,074 | |
| | | | | |
| | | | Total | | | 25,481,897 | |
| | | | | |
| |
| Real Estate (0.8%) | | | | |
| | 3,230 | | | American Assets Trust, Inc. | | | 128,263 | |
| | 5,640 | | | American Campus Communities, Inc. | | | 293,900 | |
| | 16,610 | | | Bluerock Residential Growth REIT, Inc. | | | 205,964 | |
| | 52,103 | | | Brixmor Property Group, Inc. | | | 1,324,458 | |
| | 2,300 | | | Camden Property Trust | | | 187,312 | |
| | 12,500 | | | CapitaMall Trust | | | 18,627 | |
| | 1,100 | | | Castellum AB | | | 14,905 | |
| | 46,450 | | | CBL & Associates Properties, Inc. | | | 497,015 | |
| | 60,886 | | | Cedar Realty Trust, Inc. | | | 412,198 | |
| | 19,750 | | | Chatham Lodging Trust | | | 349,575 | |
| | 5,590 | | | City Office REIT, Inc. | | | 70,210 | |
| | 46,620 | | | Corporate Office Properties Trust | | | 1,244,288 | |
| | 12,850 | | | Corrections Corporation of America | | | 185,683 | |
| | 8,231 | | | Cousins Properties, Inc. | | | 63,955 | |
| | 9,420 | | | CubeSmart | | | 245,579 | |
| | 550 | | | CyrusOne, Inc. | | | 24,536 | |
| | 100 | | | Daito Trust Construction Company, Ltd. | | | 16,758 | |
| | 102,330 | | | DDR Corporation | | | 1,564,626 | |
| | 17,700 | | | DEXUS Property Group | | | 120,238 | |
| | 2,150 | | | Digital Realty Trust, Inc. | | | 200,875 | |
| | 7,500 | | | Duke Realty Corporation | | | 196,125 | |
| | 12,920 | | | DuPont Fabros Technology, Inc. | | | 527,265 | |
| | 550 | | | EastGroup Properties, Inc. | | | 37,350 | |
| | 11,390 | | | Equity Lifestyle Properties, Inc. | | | 863,818 | |
| | 5,120 | | | First Industrial Realty Trust, Inc. | | | 135,219 | |
| | 19,768 | | | First Potomac Realty Trust | | | 176,331 | |
The accompanying Notes to Financial Statements are an integral part of this schedule.
52
MODERATELY ALLOCATION FUND
Schedule of Investments as of October 31, 2016
| | | | | | | | |
| Shares | | | Common Stock (23.5%) | | Value | |
| | Real Estate (0.8%) - continued | | | | |
| | 18,560 | | | Franklin Street Properties Corporation | | | $214,739 | |
| | 11,200 | | | Frasers Centrepoint Trust | | | 16,745 | |
| | 7,000 | | | General Growth Properties, Inc. | | | 174,650 | |
| | 5,847 | | | H&R Real Estate Investment Trust | | | 99,433 | |
| | 1,533 | | | Hamborner REIT AG | | | 15,156 | |
| | 15,770 | | | HFF, Inc. | | | 419,955 | |
| | 7,290 | | | Hospitality Properties Trust | | | 199,454 | |
| | 13,307 | | | Host Hotels & Resorts, Inc. | | | 205,992 | |
| | 4,960 | | | Hudson Pacific Properties, Inc. | | | 166,755 | |
| | 2,400 | | | Hufvudstaden AB | | | 37,146 | |
| | 21,000 | | | Hysan Development Company, Ltd. | | | 96,923 | |
| | 10,720 | | | InfraREIT, Inc. | | | 178,166 | |
| | 11,270 | | | Kite Realty Group Trust | | | 280,961 | |
| | 12,270 | | | LaSalle Hotel Properties | | | 291,413 | |
| | 11,150 | | | Liberty Property Trust | | | 450,794 | |
| | 6,860 | | | Life Storage, Inc. | | | 553,259 | |
| | 4,000 | | | Link REIT | | | 28,456 | |
| | 3,970 | | | Mid-America Apartment Communities, Inc. | | | 368,217 | |
| | 77,983 | | | New World Development Company, Ltd. | | | 96,952 | |
| | 1,028 | | | Parkway, Inc.k | | | 18,525 | |
| | 6,815 | | | Pebblebrook Hotel Trust | | | 165,468 | |
| | 5,300 | | | Physicians Realty Trust | | | 104,781 | |
| | 1,854 | | | Potlatch Corporation | | | 71,194 | |
| | 10,250 | | | RE/MAX Holdings, Inc. | | | 445,363 | |
| | 10,700 | | | Retail Properties of America, Inc. | | | 166,599 | |
| | 675 | | | RioCan Real Estate Investment Trust | | | 13,125 | |
| | 11,380 | | | Silver Bay Realty Trust Corporation REIT | | | 190,615 | |
| | 6,000 | | | Sino Land Company, Ltd. | | | 10,188 | |
| | 31,712 | | | Stockland | | | 106,503 | |
| | 15,410 | | | Store Capital Corporation | | | 420,539 | |
| | 24,232 | | | Summit Hotel Properties, Inc. | | | 314,774 | |
| | 7,357 | | | Terreno Realty Corporation | | | 192,018 | |
| | 13,590 | | | Urstadt Biddle Properties, Inc. | | | 292,185 | |
| | 2,000 | | | Wharf Holdings, Ltd. | | | 14,995 | |
| | 3,000 | | | Wheelock and Company, Ltd. | | | 18,462 | |
| | 19,200 | | | Wing Tai Holdings, Ltd. | | | 23,392 | |
| | | | | |
| | | | Total | | | 15,568,965 | |
| | | | | |
| |
| Telecommunications Services (0.2%) | | | | |
| | 13,600 | | | AT&T, Inc. | | | 500,344 | |
| | 1,700 | | | ATN International, Inc. | �� | | 114,988 | |
| | 779 | | | BCE, Inc. | | | 35,393 | |
| | 9,800 | | | BT Group plc | | | 44,983 | |
| | 6,302 | | | Cincinnati Bell, Inc.k | | | 123,834 | |
| | 3,500 | | | Elisa Oyj | | | 117,920 | |
| | 5,160 | | | FairPoint Communications, Inc.k | | | 80,496 | |
| | 2,600 | | | Freenet AG | | | 74,540 | |
| | 6,880 | | | General Communication, Inc.k | | | 108,979 | |
| | 5,930 | | | Inteliquent, Inc. | | | 99,565 | |
| | 45,133 | | | KCOM Group plc | | | 65,049 | |
| | 300 | | | KDDI Corporation | | | 9,118 | |
| | 21,028 | | | Koninklijke (Royal) KPN NV | | | 68,567 | |
| | 8,581 | | | Level 3 Communications, Inc.k | | | 481,823 | |
| | 200 | | | Millicom International Cellular SA | | | 8,787 | |
| | 4,400 | | | Nippon Telegraph & Telephone Corporation | | | 195,082 | |
| | 1,600 | | | NTT DOCOMO, Inc. | | | 40,182 | |
| | 3,600 | | | Orange SA | | | 56,642 | |
| | 49,807 | | | PCCW, Ltd. | | | 29,648 | |
| | 1,300 | | | Proximus SA | | | 37,209 | |
| | 7,904 | | | SBA Communications Corporationk | | | 895,365 | |
| | 200 | | | SoftBank Group Corporation | | | 12,596 | |
| | 4,500 | | | Telefonica Deutschland Holding AG | | | 17,453 | |
| | 2,844 | | | Telenor ASA | | | 45,233 | |
| | 20,582 | | | Verizon Communications, Inc. | | | 989,994 | |
| | 4,600 | | | Vodafone Group plc | | | 12,633 | |
| | 18,950 | | | Vonage Holdings Corporationk | | | 129,997 | |
| | | | | |
| | | | Total | | | 4,396,420 | |
| | | | | |
| |
| Utilities (0.7%) | | | | |
| | 1,200 | | | Alliant Energy Corporation | | | 45,660 | |
| | 1,750 | | | American Electric Power Company, Inc. | | | 113,470 | |
| | 10,600 | | | American States Water Company | | | 423,788 | |
| | 13,900 | | | Aqua America, Inc. | | | 426,730 | |
| | 6,570 | | | Artesian Resources Corporation | | | 185,405 | |
| | 22,470 | | | Avista Corporation | | | 930,258 | |
| | 15,700 | | | Centrica plc | | | 41,122 | |
| | 5,560 | | | Consolidated Water Company, Ltd. | | | 62,272 | |
| | 5,640 | | | DTE Energy Company | | | 541,496 | |
| | 6,500 | | | DUET Group | | | 11,768 | |
| | 1,400 | | | E.ON SE | | | 10,260 | |
| | 13,690 | | | Edison International, Inc. | | | 1,005,941 | |
| | 21,800 | | | Electricidade de Portugal SA | | | 72,055 | |
| | 25,120 | | | Eversource Energy | | | 1,383,107 | |
| | 10,880 | | | Exelon Corporation | | | 370,682 | |
| | 11,240 | | | Great Plains Energy, Inc. | | | 319,666 | |
| | 4,000 | | | Hawaiian Electric Industries, Inc. | | | 118,000 | |
| | 24,860 | | | MDU Resources Group, Inc. | | | 651,581 | |
| | 2,800 | | | Middlesex Water Company | | | 101,080 | |
| | 6,570 | | | NiSource, Inc. | | | 152,818 | |
| | 2,770 | | | NorthWestern Corporation | | | 159,414 | |
| | 26,000 | | | Osaka Gas Company, Ltd. | | | 108,139 | |
| | 26,920 | | | PG&E Corporation | | | 1,672,270 | |
| | 4,350 | | | PNM Resources, Inc. | | | 142,898 | |
| | 13,450 | | | Portland General Electric Company | | | 586,958 | |
| | 6,250 | | | Public Service Enterprise Group, Inc. | | | 263,000 | |
| | 15,900 | | | Redes Energeticas Nacionais SGPS SA | | | 46,463 | |
| | 7,950 | | | Renewable Energy Group, Inc.k | | | 69,563 | |
| | 15,000 | | | Southern Company | | | 773,550 | |
| | 2,050 | | | Southwest Gas Corporation | | | 148,543 | |
| | 2,000 | | | Toho Gas Company, Ltd. | | | 18,547 | |
| | 3,000 | | | United Utilities Group plc | | | 34,485 | |
| | 1,653 | | | Unitil Corporation | | | 67,062 | |
| | 27,040 | | | Vectren Corporation | | | 1,360,382 | |
| | | | | |
| | | | Total | | | 12,418,433 | |
| | | | | |
| | | | | | | | |
| | | | | |
| | | | Total Common Stock (cost $399,073,855) | | | 438,474,390 | |
| | | | | |
| | | | | | | | |
| Shares | | | Preferred Stock (<0.1%) | | Value | |
| | Energy (<0.1%) | | | | |
| | 1,443 | | | Alpha Natural Resources, Inc., | | | | |
| | | | 0.000%k | | | 9,019 | |
| | 1,443 | | | ANR Holdings, Inc., 0.000%k | | | 2,453 | |
| | | | | |
| | | | Total | | | 11,472 | |
| | | | | |
| | | | | | | | |
| | | | | |
| | | | Total Preferred Stock (cost $2,371) | | | 11,472 | |
| | | | | |
| | | | | | | | |
| Shares | | | Collateral Held for Securities Loaned (0.2%) | | Value | |
| | 3,757,689 | | | Thrivent Cash Management Trust | | | 3,757,689 | |
| | | | | |
| | | | Total Collateral Held for Securities Loaned (cost $3,757,689) | | | 3,757,689 | |
| | | | | |
The accompanying Notes to Financial Statements are an integral part of this schedule.
53
MODERATELY ALLOCATION FUND
Schedule of Investments as of October 31, 2016
| | | | | | | | |
Shares or
Principal
Amount | | | Short-Term Investments (16.0%)m | | Value | |
| | | | Federal Home Loan Bank Discount Notes | | | | |
| | 3,400,000 | | | 0.350%, 1/13/2017n | | | $3,397,793 | |
| | 5,600,000 | | | 0.350%, 1/20/2017n | | | 5,596,018 | |
| | | | Federal National Mortgage Association Discount Notes | | | | |
| | 1,300,000 | | | 0.345%, 1/11/2017n | | | 1,299,180 | |
| | | | Thrivent Core Short-Term Reserve Fund | | | | |
| | 28,668,952 | | | 0.790% | | | 286,689,526 | |
| | | | | |
| | | | Total Short-Term Investments (cost $296,981,873) | | | 296,982,517 | |
| | | | | |
| | | | Total Investments (cost $1,847,402,137) 109.7% | | | $2,043,051,925 | |
| | | | | |
| | | | Other Assets and Liabilities, Net (9.7%) | | | (181,209,787 | ) |
| | | | | |
| | | | Total Net Assets 100.0% | | | $1,861,842,138 | |
| | | | | |
a | The stated interest rate represents the weighted average of all contracts within the bank loan facility. |
b | All or a portion of the loan is unfunded. |
c | Denotes investments purchased on a when-issued or delayed delivery basis. |
d | Denotes securities sold under Rule 144A of the Securities Act of 1933, which exempts them from registration. These securities may be resold to other dealers in the program or to other qualified institutional buyers. As of October 31, 2016, the value of these investments was $46,634,878 or 2.5% of total net assets. |
e | Denotes variable rate securities. Variable rate securities are securities whose yields vary with a designated market index or market rate. The rate shown is as of October 31, 2016. |
f | Denotes step coupon securities. Step coupon securities pay an initial coupon rate for the first period and then different coupon rates for following periods. The rate shown is as of October 31, 2016. |
g | Denotes perpetual securities. Perpetual securities pay an indefinite stream of interest, but may be called by the issuer at an earlier date. |
h | Denotes interest only security. Interest only securities represent the right to receive monthly interest payments on an underlying pool of mortgages or assets. The principal shown is the outstanding par amount of the pool as of the end of the period. The actual effective yield of the security is different than the stated coupon rate. |
i | All or a portion of the security is on loan. |
j | At October 31, 2016, $30,428 of investments were segregated to cover exposure to a counterparty for margin on open mortgage-backed security transactions. |
k | Non-income producing security. |
l | Security is valued at fair value. Market quotations or prices were not readily available or were determined to be unreliable. Fair value was determined in good faith pursuant to procedures adopted by the Board. Further information on fair valuation can be found in the Notes to Financial Statements. |
m | The interest rate shown reflects the yield, coupon rate or the discount rate at the date of purchase. |
n | All or a portion of the security is held on deposit with the counterparty and pledged as the initial margin deposit for open futures contracts. |
* | Denotes restricted securities. Restricted securities are investment securities which cannot be offered for public sale without first being registered under the Securities Act of 1933. The value of all restricted securities held in Moderate Allocation Fund as of October 31, 2016 was $18,287,164 or 1.0% of total net assets. The following table indicates the acquisition date and cost of restricted securities shown in the schedule as of October 31, 2016. |
| | | | | | | | |
Security | | Acquisition
Date | | | Cost | |
Alm Loan Funding CLO, 10/17/2026 | | | 7/31/2014 | | | | $209,895 | |
Angel Oak Mortgage Trust I, LLC, 7/25/2046 | | | 8/15/2016 | | | | 365,761 | |
Apidos CLO XVIII, 7/22/2026 | | | 6/25/2014 | | | | 214,463 | |
Ares CLO, Ltd., 10/12/2023 | | | 5/15/2015 | | | | 525,000 | |
Babson CLO, Ltd., 10/17/2026 | | | 8/15/2014 | | | | 209,895 | |
Betony CLO, Ltd., 4/15/2027 | | | 2/25/2015 | | �� | | 190,000 | |
Birchwood Park CLO, Ltd., 7/15/2026 | | | 7/31/2014 | | | | 210,000 | |
BlueMountain CLO, Ltd., 10/15/2026 | | | 8/27/2014 | | | | 209,788 | |
Carlyle Global Market Strategies CLO, Ltd., 7/20/2023 | | | 7/3/2014 | | | | 186,421 | |
Carlyle Global Market Strategies CLO, Ltd., 10/15/2026 | | | 9/19/2014 | | | | 200,000 | |
Cent CLO 16, LP, 8/1/2024 | | | 9/5/2014 | | | | 210,000 | |
Cent CLO 22, Ltd., 11/7/2026 | | | 9/19/2014 | | | | 200,000 | |
Contura Energy, Inc., 8/1/2021 | | | 3/28/2016 | | | | 52,975 | |
Digicel, Ltd., 4/15/2021 | | | 8/18/2014 | | | | 732,503 | |
DRB Prime Student Loan Trust, 1/25/2040 | | | 6/23/2016 | | | | 714,634 | |
Dryden 34 Senior Loan Fund CLO, 10/15/2026 | | | 7/21/2014 | | | | 210,000 | |
Edlinc Student Loan Funding Trust, 10/1/2025 | | | 2/28/2013 | | | | 41,109 | |
Galaxy XX CLO, Ltd., 7/20/2027 | | | 5/20/2015 | | | | 650,000 | |
GoldenTree Loan Opportunities IX, Ltd., 10/29/2026 | | | 10/7/2016 | | | | 250,000 | |
Golub Capital Partners CLO 23M, Ltd., 5/5/2027 | | | 5/18/2015 | | | | 598,500 | |
Limerock CLO III, LLC, 10/20/2026 | | | 10/16/2014 | | | | 650,000 | |
Madison Park Funding XIV CLO, Ltd., 7/20/2026 | | | 7/3/2014 | | | | 229,724 | |
Madison Park Funding, Ltd., 8/15/2022 | | | 5/8/2015 | | | | 725,000 | |
Magnetite XII, Ltd., 4/15/2027 | | | 2/6/2015 | | | | 650,000 | |
Mountain View CLO, Ltd., 7/15/2027 | | | 5/13/2015 | | | | 673,252 | |
Murray Hill Marketplace Trust, 11/25/2022 | | | 10/6/2016 | | | | 899,976 | |
NCF Dealer Floorplan Master Trust, 3/21/2022 | | | 4/8/2016 | | | | 980,874 | |
Neuberger Berman CLO, Ltd., 8/4/2025 | | | 6/19/2014 | | | | 150,000 | |
NZCG Funding CLO, Ltd., 4/27/2027 | | | 3/27/2015 | | | | 675,000 | |
Octagon Investment Partners XX CLO, Ltd., 8/12/2026 | | | 7/10/2014 | | | | 210,000 | |
OHA Loan Funding, Ltd., 10/20/2026 | | | 11/6/2014 | | | | 648,375 | |
OZLM VIII, Ltd., 10/17/2026 | | | 8/7/2014 | | | | 208,803 | |
Pretium Mortgage Credit Partners, LLC, 11/27/2030 | | | 11/6/2015 | | | | 1,525,626 | |
Race Point IX CLO, Ltd., 4/15/2027 | | | 2/13/2015 | | | | 490,000 | |
Shackleton VII CLO, Ltd., 4/15/2027 | | | 3/27/2015 | | | | 675,000 | |
The accompanying Notes to Financial Statements are an integral part of this schedule.
54
MODERATELY ALLOCATION FUND
Schedule of Investments as of October 31, 2016
| | | | | | | | |
Security | | Acquisition
Date | | | Cost | |
Sunset Mortgage Loan Company, LLC, 7/16/2047 | | | 7/27/2016 | | | $ | 989,019 | |
Symphony CLO VIII, Ltd., 1/9/2023 | | | 9/15/2014 | | | | 192,232 | |
Symphony CLO XV, Ltd., 10/17/2026 | | | 10/17/2014 | | | | 645,125 | |
Vericrest Opportunity Loan Transferee, 10/25/2058 | | | 1/13/2016 | | | | 643,811 | |
Voya CLO 3, Ltd., 7/25/2026 | | | 7/10/2014 | | | | 209,685 | |
The following table presents the total amount of securities loaned with continuous maturity, by type, offset by the gross payable upon return of collateral for securities loaned by Thrivent Moderate Allocation Fund as of October 31, 2016:
| | | | |
Securities Lending Transactions | | | |
Taxable Debt Security | | $ | 2,541,435 | |
Common Stock | | | 1,078,686 | |
| | | | |
Total lending | | $ | 3,620,121 | |
Gross amount payable upon return of collateral for securities loaned | | $ | 3,757,689 | |
| | | | |
Net amounts due to counterparty | | $ | 137,568 | |
| | | | |
Definitions:
| | | | |
ADR | | - | | American Depositary Receipt, which are certificates for an underlying foreign security’s shares held by an issuing U.S. depository bank. |
CLO | | - | | Collateralized Loan Obligation |
ETF | | - | | Exchange Traded Fund. |
REIT | | - | | Real Estate Investment Trust is a company that buys, develops, manages and/or sells real estate assets. |
TIPS | | - | | Treasury Inflation Protected Security. |
The accompanying Notes to Financial Statements are an integral part of this schedule.
55
MODERATELY CONSERVATIVE ALLOCATION FUND
Schedule of Investments as of October 31, 2016
| | | | | | | | |
Principal
Amount | | | Bank Loans (2.7%)a | | Value | |
| Basic Materials (0.3%) | | | | |
| | | | Arch Coal, Inc., Term Loan | | | | |
| | $111,179 | | | 10.000%, 10/5/2021 | | | $113,495 | |
| | | | Chemours Company, Term Loan | | | | |
| | 359,059 | | | 3.750%, 5/12/2022 | | | 354,391 | |
| | | | Fortescue Metals Group, Ltd., Term Loan | | | | |
| | 444,714 | | | 3.750%, 6/30/2019 | | | 444,296 | |
| | | | Ineos US Finance, LLC, Term Loan | | | | |
| | 683,930 | | | 3.750%, 12/15/2020 | | | 685,496 | |
| | | | Tronox Pigments BV, Term Loan | | | | |
| | 280,837 | | | 4.500%, 3/19/2020 | | | 279,368 | |
| | | | | |
| | | | Total | | | 1,877,046 | |
| | | | | |
| |
| Capital Goods (0.1%) | | | | |
| | | | Accudyne Industries, LLC, Term Loan | | | | |
| | 172,840 | | | 4.000%, 12/13/2019 | | | 158,654 | |
| | | | Advanced Disposal Services, Inc., Term Loan | | | | |
| | 175,000 | | | 0.000%, 10/28/2023b,c | | | 175,219 | |
| | | | Cortes NP Acquisition Corporation, Term Loan | | | | |
| | 550,000 | | | 0.000%, 10/3/2023b,c | | | 546,562 | |
| | | | | |
| | | | Total | | | 880,435 | |
| | | | | |
| |
| Communications Services (0.7%) | | | | |
| | | | Altice US Finance I Corporation, Term Loan | | | | |
| | 238,377 | | | 3.750%, 1/15/2025 | | | 239,033 | |
| | | | Beasley Broadcast Group, Inc., Term Loan | | | | |
| | 155,000 | | | 0.000%, 10/4/2023b,c | | | 153,256 | |
| | | | FairPoint Communications, Inc., Term Loan | | | | |
| | 303,206 | | | 7.500%, 2/14/2019 | | | 303,624 | |
| | | | Grande Communications Networks, LLC, Term Loan | | | | |
| | 295,098 | | | 4.500%, 5/29/2020 | | | 294,729 | |
| | | | Hargray Communications Group, Inc., Term Loan | | | | |
| | 291,964 | | | 4.750%, 6/26/2019 | | | 293,424 | |
| | | | Integra Telecom Holdings, Inc., Term Loan | | | | |
| | 190,210 | | | 5.250%, 8/14/2020 | | | 189,141 | |
| | 92,618 | | | 9.750%, 2/12/2021 | | | 88,972 | |
| | | | Intelsat Jackson Holdings SA, Term Loan | | | | |
| | 96,057 | | | 3.750%, 6/30/2019 | | | 91,745 | |
| | | | Liberty Cablevision of Puerto Rico, LLC, Term Loan | | | | |
| | 455,000 | | | 4.500%, 1/7/2022 | | | 447,415 | |
| | | | LTS Buyer, LLC, Term Loan | | | | |
| | 305,352 | | | 4.088%, 4/13/2020 | | | 305,658 | |
| | 16,445 | | | 8.000%, 4/12/2021 | | | 16,455 | |
| | | | NEP Broadcasting, LLC, Term Loan | | | | |
| | 31,429 | | | 10.000%, 7/22/2020 | | | 31,468 | |
| | | | NEP/NCP Holdco, Inc., Term Loan | | | | |
| | 430,379 | | | 4.250%, 1/22/2020 | | | 428,898 | |
| | | | Numericable US, LLC, Term Loan | | | | |
| | 497,500 | | | 5.137%, 1/15/2024 | | | 501,604 | |
| | | | Syniverse Holdings, Inc., Term Loan | | | | |
| | 275,769 | | | 4.000%, 4/23/2019 | | | 253,536 | |
| | | | TNS, Inc., Term Loan | | | | |
| | 166,471 | | | 5.000%, 2/14/2020 | | | 166,992 | |
| | | | Univision Communications, Inc., Term Loan | | | | |
| | 369,365 | | | 4.000%, 3/1/2020 | | | 369,941 | |
| | | | Virgin Media Investment Holdings, Ltd., Term Loan | | | | |
| | 280,926 | | | 3.500%, 6/30/2023 | | | 282,016 | |
| | | | WideOpenWest Finance, LLC, Term Loan | | | | |
| | 350,000 | | | 4.500%, 8/18/2023 | | | 349,045 | |
| | | | WMG Acquisition Corporation, Term Loan | | | | |
| | 87,874 | | | 3.750%, 7/1/2020 | | | 87,686 | |
| | | | XO Communications, LLC, Term Loan | | | | |
| | 136,500 | | | 4.250%, 3/20/2021 | | | 136,586 | |
| | | | Yankee Cable Acquisition, LLC, Term Loan | | | | |
| | 235,790 | | | 4.250%, 3/1/2020 | | | 235,939 | |
| | | | Zayo Group, LLC, Term Loan | | | | |
| | 434,708 | | | 3.750%, 5/6/2021 | | | 436,734 | |
| | | | | |
| | | | Total | | | 5,703,897 | |
| | | | | |
| |
| Consumer Cyclical (0.4%) | | | | |
| | | | Amaya BV, Term Loan | | | | |
| | 513,206 | | | 5.000%, 8/1/2021 | | | 512,482 | |
| | | | Boyd Gaming Corporation, Term Loan | | | | |
| | 240,000 | | | 3.534%, 9/15/2023 | | | 241,666 | |
| | | | Burlington Coat Factory Warehouse Corporation, Term Loan | | | | |
| | 291,883 | | | 3.500%, 8/13/2021 | | | 293,797 | |
| | | | Cengage Learning Acquisitions, Term Loan | | | | |
| | 384,038 | | | 5.250%, 6/7/2023 | | | 374,997 | |
| | | | Ceridian HCM Holding, Inc., Term Loan | | | | |
| | 113,221 | | | 4.500%, 9/15/2020 | | | 110,957 | |
| | | | Golden Nugget, Inc., Term Loan | | | | |
| | 157,713 | | | 4.500%, 11/21/2019 | | | 159,390 | |
| | | | Golden Nugget, Inc., Term Loan Delayed Draw | | | | |
| | 67,591 | | | 4.500%, 11/21/2019 | | | 68,310 | |
| | | | IMG Worldwide, Inc., Term Loan | | | | |
| | 322,697 | | | 5.250%, 5/6/2021 | | | 324,068 | |
| | 145,000 | | | 8.250%, 5/6/2022 | | | 144,698 | |
| | | | Mohegan Tribal Gaming Authority, Term Loan | | | | |
| | 275,000 | | | 0.000%, 9/30/2023b,c | | | 273,884 | |
| | | | Scientific Games International, Inc., Term Loan | | | | |
| | 489,981 | | | 6.000%, 10/1/2021 | | | 491,819 | |
| | | | | |
| | | | Total | | | 2,996,068 | |
| | | | | |
| |
| Consumer Non-Cyclical (0.4%) | | | | |
| | | | Albertson’s, LLC, Term Loan | | | | |
| | 338,302 | | | 4.750%, 12/21/2022 | | | 341,648 | |
| | 190,476 | | | 4.750%, 6/22/2023 | | | 192,461 | |
| | | | CHS/Community Health Systems, Inc., Term Loan | | | | |
| | 438,889 | | | 4.000%, 1/27/2021 | | | 413,982 | |
| | | | Endo Luxembourg Finance I Company SARL, Term Loan | | | | |
| | 124,373 | | | 3.750%, 9/26/2022 | | | 124,172 | |
| | | | Mallinckrodt International Finance SA, Term Loan | | | | |
| | 99,241 | | | 3.588%, 3/19/2021 | | | 99,240 | |
| | | | McGraw-Hill Global Education Holdings, LLC, Term Loan | | | | |
| | 299,250 | | | 5.000%, 5/4/2022 | | | 298,439 | |
| | | | MultiPlan, Inc., Term Loan | | | | |
| | 478,386 | | | 5.000%, 6/7/2023 | | | 483,318 | |
The accompanying Notes to Financial Statements are an integral part of this schedule.
56
MODERATELY CONSERVATIVE ALLOCATION FUND
Schedule of Investments as of October 31, 2016
| | | | | | | | |
Principal
Amount | | | Bank Loans (2.7%)a | | Value | |
| Consumer Non-Cyclical (0.4%) - continued | | | | |
| | | | Ortho-Clinical Diagnostics, Inc., Term Loan | | | | |
| | $376,746 | | | 4.750%, 6/30/2021 | | | $367,640 | |
| | | | PetSmart, Inc., Term Loan | | | | |
| | 129,671 | | | 4.000%, 3/11/2022b,c | | | 129,925 | |
| | | | Revlon Consumer Products Corporation, Term Loan | | | | |
| | 165,000 | | | 4.250%, 9/7/2023 | | | 165,292 | |
| | | | Valeant Pharmaceuticals International, Inc., Term Loan | | | | |
| | 753,844 | | | 5.500%, 4/1/2022 | | | 751,017 | |
| | | | | |
| | | | Total | | | 3,367,134 | |
| | | | | |
| |
| Energy (0.2%) | | | | |
| | | | Energy Solutions, LLC, Term Loan | | | | |
| | 131,175 | | | 6.750%, 5/29/2020 | | | 131,175 | |
| | | | Expro Holdings UK 2, Ltd., Term Loan | | | | |
| | 147,000 | | | 5.750%, 9/2/2021 | | | 127,559 | |
| | | | Houston Fuel Oil Terminal, LLC, Term Loan | | | | |
| | 338,846 | | | 4.250%, 8/19/2021 | | | 332,916 | |
| | | | McJunkin Red Man Corporation, Term Loan | | | | |
| | 186,958 | | | 5.000%, 11/8/2019 | | | 185,167 | |
| | | | MEG Energy Corporation, Term Loan | | | | |
| | 198,956 | | | 3.750%, 3/31/2020 | | | 187,423 | |
| | | | Pacific Drilling SA, Term Loan | | | | |
| | 198,338 | | | 4.500%, 6/3/2018 | | | 55,783 | |
| | | | Targa Resources Partners, LP, Term Loan | | | | |
| | 95,814 | | | 5.750%, 2/27/2022 | | | 95,934 | |
| | | | Western Refining, Inc., Term Loan | | | | |
| | 149,625 | | | 5.500%, 6/23/2023 | | | 149,345 | |
| | | | | |
| | | | Total | | | 1,265,302 | |
| | | | | |
| |
| Financials (0.2%) | | | | |
| | | | DJO Finance, LLC, Term Loan | | | | |
| | 241,938 | | | 4.250%, 6/7/2020 | | | 239,216 | |
| | | | Harland Clarke Holdings Corporation, Term Loan | | | | |
| | 55,875 | | | 6.993%, 8/4/2019 | | | 55,422 | |
| | 282,750 | | | 7.000%, 12/31/2019 | | | 280,748 | |
| | | | MoneyGram International, Inc., Term Loan | | | | |
| | 322,608 | | | 4.250%, 3/27/2020 | | | 312,930 | |
| | | | Telenet International Finance Luxembourg SA, Term Loan | | | | |
| | 230,000 | | | 4.357%, 6/30/2024 | | | 230,048 | |
| | | | WaveDivision Holdings, LLC, Term Loan | | | | |
| | 362,978 | | | 4.000%, 10/15/2019 | | | 363,795 | |
| | | | | |
| | | | Total | | | 1,482,159 | |
| | | | | |
| |
| Technology (0.3%) | | | | |
| | | | Avago Technologies Cayman Finance, Ltd., Term Loan | | | | |
| | 354,228 | | | 3.535%, 2/1/2023 | | | 357,720 | |
| | | | First Data Corporation, Term Loan | | | | |
| | 155,000 | | | 0.000%, 3/24/2021b,c | | | 155,620 | |
| | 450,000 | | | 4.274%, 7/8/2022 | | | 453,096 | |
| | | | Interception Merger Sub, Inc., Term Loan | | | | |
| | 150,000 | | | 0.000%, 10/26/2023b,c | | | 150,774 | |
| | | | Micron Technologies, Inc., Term Loan | | | | |
| | 179,550 | | | 4.637%, 4/26/2022 | | | 180,561 | |
| | | | NXP BV, Term Loan | | | | |
| | 133,300 | | | 3.405%, 12/7/2020 | | | 133,708 | |
| | | | ON Semiconductor Corporation, Term Loan | | | | |
| | 495,000 | | | 3.777%, 3/31/2023 | | | 497,723 | |
| | | | SS&C European Holdings SARL, Term Loan | | | | |
| | 160,197 | | | 4.000%, 7/8/2022 | | | 161,349 | |
| | 19,496 | | | 4.000%, 7/8/2022 | | | 19,636 | |
| | | | Western Digital Corporation, Term Loan | | | | |
| | 463,838 | | | 4.500%, 4/29/2023 | | | 468,805 | |
| | | | | |
| | | | Total | | | 2,578,992 | |
| | | | | |
| |
| Transportation (0.1%) | | | | |
| | | | OSG Bulk Ships, Inc., Term Loan | | | | |
| | 197,761 | | | 5.250%, 8/5/2019 | | | 196,031 | |
| | | | XPO Logistics, Inc., Term Loan | | | | |
| | 487,628 | | | 4.250%, 10/30/2021 | | | 489,890 | |
| | | | | |
| | | | Total | | | 685,921 | |
| | | | | |
| |
| Utilities (<0.1%) | | | | |
| | | | Intergen NV, Term Loan | | | | |
| | 163,654 | | | 5.500%, 6/12/2020 | | | 154,653 | |
| | | | Talen Energy Supply, LLC, Term Loan | | | | |
| | 117,860 | | | 0.000%, 10/18/2023b,c | | | 117,713 | |
| | | | | |
| | | | Total | | | 272,366 | |
| | | | | |
| | | | | | | | |
| | | | | |
| | | | Total Bank Loans (cost $21,188,742) | | | 21,109,320 | |
| | | | | |
| | |
Principal
Amount | | | Long-Term Fixed Income (42.7%) | | Value | |
| Asset-Backed Securities (1.7%) | | | | |
| | | | Access Group, Inc. | | | | |
| | 230,701 | | | 1.034%, 2/25/2036d,e | | | 226,958 | |
| | | | AMSR Trust | | | | |
| | 450,000 | | | 1.931%, 11/17/2033d,e | | | 450,430 | |
| | | | BA Credit Card Trust | | | | |
| | 220,000 | | | 0.915%, 6/15/2021e | | | 220,634 | |
| | | | Capital One Multi-Asset Execution Trust | | | | |
| | 300,000 | | | 0.915%, 1/18/2022e | | | 300,714 | |
| | | | Chase Issuance Trust | | | | |
| | 175,000 | | | 1.590%, 2/18/2020 | | | 175,942 | |
| | 125,000 | | | 1.620%, 7/15/2020 | | | 125,832 | |
| | 400,000 | | | 0.945%, 5/17/2021e | | | 401,640 | |
| | | | Chesapeake Funding II, LLC | | | | |
| | 350,000 | | | 1.880%, 6/15/2028d | | | 351,042 | |
| | | | Chesapeake Funding, LLC | | | | |
| | 121,066 | | | 0.976%, 1/7/2025d,e | | | 121,050 | |
| | | | Commonbond Student Loan Trust | | | | |
| | 425,000 | | | 2.900%, 10/25/2040d | | | 424,842 | |
| | | | DRB Prime Student Loan Trust | | | | |
| | 664,248 | | | 3.200%, 1/25/2040* | | | 677,156 | |
| | | | Earnest Student Loan Program | | | | |
| | 711,356 | | | 3.020%, 5/25/2034d | | | 709,735 | |
| | | | Edlinc Student Loan Funding Trust | | | | |
| | 163,366 | | | 3.410%, 10/1/2025*,e | | | 164,935 | |
| | | | FirstEnergy Ohio PIRB Special Purpose Trust | | | | |
| | 28,426 | | | 0.679%, 1/15/2019 | | | 28,386 | |
| | | | Ford Credit Auto Owner Trust | | | | |
| | 170,000 | | | 2.260%, 11/15/2025d | | | 173,004 | |
| | | | GoldenTree Loan Opportunities IX, Ltd. | | | | |
| | 250,000 | | | 2.238%, 10/29/2026*,e | | | 250,000 | |
The accompanying Notes to Financial Statements are an integral part of this schedule.
57
MODERATELY CONSERVATIVE ALLOCATION FUND
Schedule of Investments as of October 31, 2016
| | | | | | | | |
Principal
Amount | | | Long-Term Fixed Income (42.7%) | | Value | |
| Asset-Backed Securities (1.7%) - continued | | | | |
| | | | Morgan Stanley Bank of America Merrill Lynch Trust | | | | |
| | $675,000 | | | 3.176%, 8/15/2045 | | | $710,178 | |
| | 675,000 | | | 3.246%, 12/15/2047 | | | 706,421 | |
| | | | Morgan Stanley Capital, Inc. | | | | |
| | 635,505 | | | 0.684%, 2/25/2037e | | | 378,202 | |
| | | | Murray Hill Marketplace Trust | | | | |
| | 560,000 | | | 4.190%, 11/25/2022* | | | 560,015 | |
| | | | OneMain Financial Issuance Trust | | | | |
| | 325,000 | | | 4.100%, 3/20/2028d | | | 334,143 | |
| | | | OZLM VIII, Ltd. | | | | |
| | 170,000 | | | 2.320%, 10/17/2026*,e | | | 170,136 | |
| | | | Renaissance Home Equity Loan Trust | | | | |
| | 1,693,394 | | | 6.011%, 5/25/2036f | | | 1,183,011 | |
| | | | SLM Student Loan Trust | | | | |
| | 51,819 | | | 1.135%, 8/15/2022d,e | | | 51,875 | |
| | 2,497 | | | 1.282%, 4/25/2023d,e | | | 2,495 | |
| | 272,860 | | | 0.934%, 3/25/2025e | | | 265,265 | |
| | 257,411 | | | 1.054%, 3/25/2026e | | | 257,210 | |
| | 300,000 | | | 1.585%, 5/17/2027d,e | | | 302,394 | |
| | | | Sofi Consumer Loan Program, LLC | | | | |
| | 904,735 | | | 3.260%, 8/25/2025d | | | 911,828 | |
| | | | SoFi Professional Loan Program, LLC | | | | |
| | 266,070 | | | 2.420%, 3/25/2030d | | | 268,671 | |
| | | | Sunset Mortgage Loan Company, LLC | | | | |
| | 612,250 | | | 3.844%, 7/16/2047*,f | | | 613,378 | |
| | | | Vericrest Opportunity Loan Transferee | | | | |
| | 417,784 | | | 3.375%, 10/25/2058*,f | | | 417,216 | |
| | 395,199 | | | 3.500%, 9/25/2046d,f | | | 394,869 | |
| | 750,000 | | | 3.500%, 10/25/2046d,f | | | 750,000 | |
| | | | Vericrest Opportunity Loan Trust | | | | |
| | 423,972 | | | 4.250%, 3/26/2046d,f | | | 429,296 | |
| | | | | |
| | | | Total | | | 13,508,903 | |
| | | | | |
| |
| Basic Materials (0.3%) | | | | |
| | | | Albemarle Corporation | | | | |
| | 45,000 | | | 3.000%, 12/1/2019 | | | 46,303 | |
| | | | Alcoa Nederland Holding BV | | | | |
| | 150,000 | | | 6.750%, 9/30/2024d | | | 155,250 | |
| | | | Anglo American plc | | | | |
| | 300,000 | | | 3.625%, 5/14/2020d,g | | | 301,500 | |
| | | | ArcelorMittal SA | | | | |
| | 310,000 | | | 6.500%, 3/1/2021g | | | 340,225 | |
| | | | Georgia-Pacific, LLC | | | | |
| | 110,000 | | | 2.539%, 11/15/2019d | | | 112,203 | |
| | | | Glencore Funding, LLC | | | | |
| | 80,000 | | | 1.940%, 4/16/2018d,e | | | 78,800 | |
| | 136,000 | | | 2.875%, 4/16/2020d | | | 136,680 | |
| | | | Kinross Gold Corporation | | | | |
| | 160,000 | | | 5.950%, 3/15/2024 | | | 168,000 | |
| | | | NOVA Chemicals Corporation | | | | |
| | 500,000 | | | 5.250%, 8/1/2023d | | | 509,375 | |
| | | | Novelis Corporation | | | | |
| | 105,000 | | | 5.875%, 9/30/2026d | | | 106,313 | |
| | | | Westlake Chemical Corporation | | | | |
| | 160,000 | | | 3.600%, 8/15/2026d | | | 159,953 | |
| | | | | |
| | | | Total | | | 2,114,602 | |
| | | | | |
| |
| Capital Goods (0.8%) | | | | |
| | | | AECOM | | | | |
| | 380,000 | | | 5.875%, 10/15/2024 | | | 401,375 | |
| | | | Building Materials Corporation of America | | | | |
| | 190,000 | | | 6.000%, 10/15/2025d | | | 202,815 | |
| | | | Cemex Finance, LLC | | | | |
| | 370,000 | | | 9.375%, 10/12/2022d | | | 404,225 | |
| | | | CNH Industrial Capital, LLC | | | | |
| | 345,000 | | | 4.375%, 11/6/2020 | | | 352,763 | |
| | | | Crown Americas Capital Corporation IV | | | | |
| | 310,000 | | | 4.500%, 1/15/2023 | | | 317,750 | |
| | | | General Electric Company | | | | |
| | 251,000 | | | 5.000%, 12/29/2049h | | | 265,909 | |
| | | | Huntington Ingalls Industries, Inc. | | | | |
| | 400,000 | | | 5.000%, 12/15/2021d | | | 419,000 | |
| | | | L-3 Communications Corporation | | | | |
| | 184,000 | | | 3.950%, 5/28/2024 | | | 192,748 | |
| | | | Lockheed Martin Corporation | | | | |
| | 162,000 | | | 2.500%, 11/23/2020 | | | 166,194 | |
| | 184,000 | | | 4.500%, 5/15/2036 | | | 206,046 | |
| | | | Newell Rubbermaid, Inc. | | | | |
| | 92,000 | | | 2.600%, 3/29/2019 | | | 93,854 | |
| | 138,000 | | | 5.500%, 4/1/2046 | | | 162,606 | |
| | | | Northrop Grumman Corporation | | | | |
| | 205,000 | | | 3.850%, 4/15/2045 | | | 206,375 | |
| | | | Owens-Brockway Glass Container, Inc. | | | | |
| | 395,000 | | | 5.000%, 9/1/2022d | | | 413,269 | |
| | | | Pentair Finance SA | | | | |
| | 225,000 | | | 2.900%, 9/15/2018 | | | 228,122 | |
| | | | Republic Services, Inc. | | | | |
| | 125,000 | | | 2.900%, 7/1/2026 | | | 124,836 | |
| | | | Reynolds Group Issuer, Inc. | | | | |
| | 515,000 | | | 5.125%, 7/15/2023d | | | 528,678 | |
| | | | Roper Industries, Inc. | | | | |
| | 241,000 | | | 2.050%, 10/1/2018 | | | 243,234 | |
| | | | Standard Industries, Inc. | | | | |
| | 295,000 | | | 5.500%, 2/15/2023d | | | 306,800 | |
| | | | Textron, Inc. | | | | |
| | 135,000 | | | 5.600%, 12/1/2017 | | | 140,624 | |
| | 125,000 | | | 7.250%, 10/1/2019 | | | 141,932 | |
| | | | United Rentals North America, Inc. | | | | |
| | 620,000 | | | 5.500%, 7/15/2025 | | | 627,750 | |
| | | | Waste Management, Inc. | | | | |
| | 55,000 | | | 3.125%, 3/1/2025 | | | 56,965 | |
| | | | | |
| | | | Total | | | 6,203,870 | |
| | | | | |
| |
| Collateralized Mortgage Obligations (2.2%) | | | | |
| | | | Alm Loan Funding CLO | | | | |
| | 170,000 | | | 2.310%, 10/17/2026*,e | | | 170,055 | |
| | | | Alternative Loan Trust | | | | |
| | 280,599 | | | 6.000%, 6/25/2036 | | | 245,422 | |
| | | | Angel Oak Mortgage Trust I, LLC | | | | |
| | 229,005 | | | 3.500%, 7/25/2046*,f | | | 228,274 | |
| | | | Apidos CLO XVIII | | | | |
| | 175,000 | | | 2.294%, 7/22/2026*,e | | | 174,984 | |
| | | | Ares CLO, Ltd. | | | | |
| | 550,000 | | | 2.164%, 10/12/2023*,e | | | 549,982 | |
| | | | Babson CLO, Ltd. | | | | |
| | 170,000 | | | 2.270%, 10/17/2026*,e | | | 169,859 | |
| | | | Betony CLO, Ltd. | | | | |
| | 150,000 | | | 2.390%, 4/15/2027*,e | | | 150,051 | |
| | | | Birchwood Park CLO, Ltd. | | | | |
| | 170,000 | | | 2.320%, 7/15/2026*,e | | | 170,131 | |
| | | | BlueMountain CLO, Ltd. | | | | |
| | 170,000 | | | 2.360%, 10/15/2026*,e | | | 170,410 | |
| | | | Carlyle Global Market Strategies CLO, Ltd. | | | | |
| | 151,739 | | | 2.181%, 7/20/2023*,e | | | 151,863 | |
| | 175,000 | | | 2.380%, 10/15/2026*,e | | | 175,458 | |
The accompanying Notes to Financial Statements are an integral part of this schedule.
58
MODERATELY CONSERVATIVE ALLOCATION FUND
Schedule of Investments as of October 31, 2016
| | | | | | | | |
Principal
Amount | | | Long-Term Fixed Income (42.7%) | | Value | |
| Collateralized Mortgage Obligations (2.2%) - continued | | | | |
| | | | Cent CLO 16, LP | | | | |
| | $170,000 | | | 2.007%, 8/1/2024*,e | | | $169,880 | |
| | | | Cent CLO 22, Ltd. | | | | |
| | 175,000 | | | 2.268%, 11/7/2026*,e | | | 175,010 | |
| | | | Citigroup Mortgage Loan Trust, Inc. | | | | |
| | 196,462 | | | 5.500%, 11/25/2035 | | | 187,966 | |
| | | | CitiMortgage Alternative Loan Trust | | | | |
| | 625,051 | | | 5.750%, 4/25/2037 | | | 536,247 | |
| | | | Countrywide Alternative Loan Trust | | | | |
| | 377,293 | | | 3.031%, 10/25/2035 | | | 307,091 | |
| | 233,747 | | | 6.500%, 8/25/2036 | | | 157,992 | |
| | 124,350 | | | 6.000%, 1/25/2037 | | | 118,940 | |
| | 770,004 | | | 5.500%, 5/25/2037 | | | 657,713 | |
| | 716,116 | | | 7.000%, 10/25/2037 | | | 427,251 | |
| | | | Countrywide Home Loans, Inc. | | | | |
| | 222,541 | | | 5.750%, 4/25/2037 | | | 188,848 | |
| | | | Deutsche Alt-A Securities Mortgage Loan Trust | | | | |
| | 178,600 | | | 6.000%, 10/25/2021 | | | 160,297 | |
| | | | Dryden 34 Senior Loan Fund CLO | | | | |
| | 170,000 | | | 2.310%, 10/15/2026*,e | | | 170,075 | |
| | | | Federal Home Loan Mortgage Corporation | | | | |
| | 1,158,760 | | | 3.000%, 4/15/2028i | | | 109,688 | |
| | 958,550 | | | 3.000%, 2/15/2033i | | | 113,300 | |
| | | | Federal National Mortgage Association | | | | |
| | 1,915,725 | | | 3.500%, 1/25/2033i | | | 251,811 | |
| | | | Galaxy XX CLO, Ltd. | | | | |
| | 550,000 | | | 2.331%, 7/20/2027*,e | | | 549,234 | |
| | | | Golub Capital Partners CLO 23M, Ltd. | | | | |
| | 500,000 | | | 2.263%, 5/5/2027*,e | | | 499,890 | |
| | | | Greenpoint Mortgage Funding Trust | | | | |
| | 753,517 | | | 0.725%, 10/25/2045e | | | 589,845 | |
| | | | J.P. Morgan Mortgage Trust | | | | |
| | 60,328 | | | 3.077%, 10/25/2036 | | | 54,509 | |
| | 562,227 | | | 0.914%, 1/25/2037e | | | 294,795 | |
| | 733,857 | | | 6.250%, 8/25/2037 | | | 550,355 | |
| | | | Limerock CLO III, LLC | | | | |
| | 500,000 | | | 2.411%, 10/20/2026*,e | | | 499,683 | |
| | | | Madison Park Funding XIV CLO, Ltd. | | | | |
| | 190,000 | | | 2.331%, 7/20/2026*,e | | | 190,263 | |
| | | | Madison Park Funding, Ltd. | | | | |
| | 550,000 | | | 2.107%, 8/15/2022*,e | | | 549,925 | |
| | | | Magnetite XII, Ltd. | | | | |
| | 525,000 | | | 2.380%, 4/15/2027*,e | | | 525,222 | |
| | | | MASTR Alternative Loans Trust | | | | |
| | 166,532 | | | 6.500%, 7/25/2034 | | | 166,972 | |
| | 422,704 | | | 0.984%, 12/25/2035e | | | 195,852 | |
| | | | Merrill Lynch Alternative Note Asset Trust | | | | |
| | 156,206 | | | 6.000%, 3/25/2037 | | | 123,676 | |
| | | | Mountain View CLO, Ltd. | | | | |
| | 525,000 | | | 2.340%, 7/15/2027*,e | | | 523,208 | |
| | | | Neuberger Berman CLO, Ltd. | | | | |
| | 150,000 | | | 2.238%, 8/4/2025*,e | | | 150,414 | |
| | | | NZCG Funding CLO, Ltd. | | | | |
| | 525,000 | | | 2.436%, 4/27/2027*,e | | | 523,614 | |
| | | | Octagon Investment Partners XX CLO, Ltd. | | | | |
| | 170,000 | | | 2.258%, 8/12/2026*,e | | | 170,010 | |
| | | | OHA Loan Funding, Ltd. | | | | |
| | 500,000 | | | 2.411%, 10/20/2026*,e | | | 503,092 | |
| | | | Pretium Mortgage Credit Partners, LLC | | | | |
| | 1,033,020 | | | 4.375%, 11/27/2030* | | | 1,041,524 | |
| | | | Race Point IX CLO, Ltd. | | | | |
| | 400,000 | | | 2.390%, 4/15/2027*,e | | | 400,503 | |
| | | | Residential Accredit Loans, Inc. Trust | | | | |
| | 127,464 | | | 5.750%, 9/25/2035 | | | 114,137 | |
| | | | Residential Asset Securitization Trust | | | | |
| | 701,740 | | | 0.914%, 8/25/2037e | | | 187,283 | |
| | | | Sequoia Mortgage Trust | | | | |
| | 938,486 | | | 3.270%, 9/20/2046 | | | 759,142 | |
| | | | Shackleton VII CLO, Ltd. | | | | |
| | 525,000 | | | 2.420%, 4/15/2027*,e | | | 526,064 | |
| | | | Symphony CLO VIII, Ltd. | | | | |
| | 155,616 | | | 1.976%, 1/9/2023*,e | | | 155,516 | |
| | | | Symphony CLO XV, Ltd. | | | | |
| | 500,000 | | | 2.330%, 10/17/2026*,e | | | 500,956 | |
| | | | Voya CLO 3, Ltd. | | | | |
| | 170,000 | | | 2.302%, 7/25/2026*,e | | | 169,917 | |
| | | | WaMu Mortgage Pass Through Certificates | | | | |
| | 151,687 | | | 2.795%, 9/25/2036 | | | 137,424 | |
| | 136,955 | | | 2.832%, 10/25/2036 | | | 119,379 | |
| | | | Washington Mutual Mortgage Pass Through Certificates Trust | | | | |
| | 390,644 | | | 7.000%, 2/25/2036 | | | 289,331 | |
| | | | | |
| | | | Total | | | 17,150,333 | |
| | | | | |
| |
| Commercial Mortgage-Backed Securities (0.8%) | | | | |
| | | | Citigroup Commercial Mortgage Trust | | | | |
| | 251,682 | | | 1.102%, 11/10/2046 | | | 251,240 | |
| | | | Commercial Mortgage Pass-Through Certificates | | | | |
| | 540,000 | | | 1.580%, 6/8/2030d,e | | | 540,677 | |
| | | | Credit Suisse First Boston Mortgage Securities | | | | |
| | 25,992 | | | 5.542%, 1/15/2049 | | | 25,949 | |
| | | | Federal National Mortgage Association | | | | |
| | 33,139 | | | 1.272%, 1/25/2017 | | | 33,119 | |
| | | | Greenwich Capital Commercial Funding Corporation | | | | |
| | 1,000,000 | | | 5.867%, 12/10/2049 | | | 1,028,771 | |
| | | | GS Mortgage Securities Trust | | | | |
| | 800,000 | | | 3.666%, 9/10/2047 | | | 858,941 | |
| | | | J.P. Morgan Chase Commercial Mortgage Securities Corporation | | | | |
| | 800,000 | | | 5.715%, 2/12/2049 | | | 811,936 | |
| | | | JPMBB Commercial Mortgage Securities Trust | | | | |
| | 550,000 | | | 3.231%, 1/15/2048 | | | 573,959 | |
| | | | Morgan Stanley Capital, Inc. | | | | |
| | 500,000 | | | 5.406%, 3/15/2044 | | | 503,028 | |
| | | | SCG Trust | | | | |
| | 150,000 | | | 1.935%, 11/15/2026d,e | | | 148,868 | |
| | | | UBS Commercial Mortgage Trust | | | | |
| | 992,694 | | | 3.400%, 5/10/2045 | | | 1,050,012 | |
| | | | Wells Fargo Commercial Mortgage Trust | | | | |
| | 500,000 | | | 3.617%, 9/15/2057 | | | 534,066 | |
| | | | | |
| | | | Total | | | 6,360,566 | |
| | | | | |
| |
| Communications Services (2.0%) | | | | |
| | | | 21st Century Fox America, Inc. | | | | |
| | 190,000 | | | 6.900%, 3/1/2019 | | | 212,481 | |
The accompanying Notes to Financial Statements are an integral part of this schedule.
59
MODERATELY CONSERVATIVE ALLOCATION FUND
Schedule of Investments as of October 31, 2016
| | | | | | | | |
Principal
Amount | | | Long-Term Fixed Income (42.7%) | | Value | |
| Communications Services (2.0%) - continued | | | | |
| | | | Altice Financing SA | | | | |
| | $307,000 | | | 6.625%, 2/15/2023d | | | $316,210 | |
| | | | Altice US Finance I Corporation | | | | |
| | 115,000 | | | 5.500%, 5/15/2026d | | | 117,300 | |
| | | | AMC Networks, Inc. | | | | |
| | 525,000 | | | 5.000%, 4/1/2024 | | | 531,563 | |
| | | | America Movil SAB de CV | | | | |
| | 164,000 | | | 5.000%, 10/16/2019 | | | 178,636 | |
| | | | American Tower Corporation | | | | |
| | 20,000 | | | 2.800%, 6/1/2020 | | | 20,422 | |
| | 230,000 | | | 3.300%, 2/15/2021 | | | 238,902 | |
| | | | AT&T, Inc. | | | | |
| | 112,000 | | | 5.875%, 10/1/2019 | | | 124,046 | |
| | 75,000 | | | 1.768%, 6/30/2020e | | | 75,331 | |
| | 168,000 | | | 3.875%, 8/15/2021 | | | 178,105 | |
| | 160,000 | | | 3.000%, 6/30/2022 | | | 162,238 | |
| | 286,000 | | | 6.350%, 3/15/2040 | | | 343,499 | |
| | 160,000 | | | 5.550%, 8/15/2041 | | | 173,576 | |
| | 200,000 | | | 5.150%, 3/15/2042 | | | 206,418 | |
| | 160,000 | | | 4.750%, 5/15/2046 | | | 156,572 | |
| | | | British Sky Broadcasting Group plc | | | | |
| | 180,000 | | | 2.625%, 9/16/2019d | | | 182,456 | |
| | | | CCO Holdings, LLC | | | | |
| | 400,000 | | | 5.875%, 4/1/2024d | | | 423,000 | |
| | | | CenturyLink, Inc. | | | | |
| | 340,000 | | | 6.450%, 6/15/2021 | | | 362,950 | |
| | | | Charter Communications Operating, LLC | | | | |
| | 162,000 | | | 6.834%, 10/23/2055d | | | 193,162 | |
| | 108,000 | | | 3.579%, 7/23/2020d | | | 111,981 | |
| | 188,000 | | | 4.908%, 7/23/2025d | | | 202,768 | |
| | | | Clear Channel Worldwide Holdings, Inc. | | | | |
| | 495,000 | | | 6.500%, 11/15/2022 | | | 504,157 | |
| | | | Columbus International, Inc. | | | | |
| | 370,000 | | | 7.375%, 3/30/2021d | | | 395,900 | |
| | | | Comcast Corporation | | | | |
| | 150,000 | | | 2.750%, 3/1/2023 | | | 154,145 | |
| | 395,000 | | | 4.400%, 8/15/2035 | | | 435,436 | |
| | 100,000 | | | 4.650%, 7/15/2042 | | | 110,921 | |
| | 282,000 | | | 4.750%, 3/1/2044 | | | 319,023 | |
| | | | Cox Communications, Inc. | | | | |
| | 84,000 | | | 9.375%, 1/15/2019d | | | 96,485 | |
| | | | Crown Castle International Corporation | | | | |
| | 218,000 | | | 3.400%, 2/15/2021 | | | 226,531 | |
| | 418,000 | | | 5.250%, 1/15/2023 | | | 467,077 | |
| | 85,000 | | | 3.700%, 6/15/2026 | | | 87,061 | |
| | | | CSC Holdings, LLC | | | | |
| | 40,000 | | | 5.500%, 4/15/2027d | | | 40,575 | |
| | | | Digicel, Ltd. | | | | |
| | 570,000 | | | 6.000%, 4/15/2021* | | | 509,979 | |
| | | | Dish DBS Corporation | | | | |
| | 350,000 | | | 5.875%, 7/15/2022 | | | 361,375 | |
| | | | FairPoint Communications, Inc. | | | | |
| | 275,000 | | | 8.750%, 8/15/2019d | | | 279,812 | |
| | | | Frontier Communications Corporation | | | | |
| | 480,000 | | | 8.875%, 9/15/2020 | | | 510,000 | |
| | | | Gray Television, Inc. | | | | |
| | 355,000 | | | 5.125%, 10/15/2024d | | | 344,350 | |
| | | | Hughes Satellite Systems Corporation | | | | |
| | 283,000 | | | 6.500%, 6/15/2019 | | | 308,824 | |
| | | | Level 3 Communications, Inc. | | | | |
| | 380,000 | | | 5.375%, 1/15/2024 | | | 387,600 | |
| | | | Level 3 Financing, Inc. | | | | |
| | 135,000 | | | 5.375%, 5/1/2025 | | | 137,025 | |
| | | | Omnicom Group, Inc. | | | | |
| | 95,000 | | | 3.600%, 4/15/2026 | | | 98,688 | |
| | | | Quebecor Media, Inc. | | | | |
| | 250,000 | | | 5.750%, 1/15/2023 | | | 261,250 | |
| | | | S&P Global, Inc. | | | | |
| | 184,000 | | | 3.300%, 8/14/2020 | | | 191,724 | |
| | | | SES Global Americas Holdings GP | | | | |
| | 130,000 | | | 2.500%, 3/25/2019d | | | 130,002 | |
| | | | SFR Group SA | | | | |
| | 515,000 | | | 6.000%, 5/15/2022d | | | 528,040 | |
| | | | Sprint Communications, Inc. | | | | |
| | 235,000 | | | 6.000%, 11/15/2022 | | | 218,992 | |
| | | | Sprint Corporation | | | | |
| | 305,000 | | | 7.625%, 2/15/2025 | | | 295,087 | |
| | | | Telefonica Emisiones SAU | | | | |
| | 189,000 | | | 3.192%, 4/27/2018 | | | 193,041 | |
| | | | Time Warner Entertainment Company, LP | | | | |
| | 270,000 | | | 8.375%, 3/15/2023 | | | 348,889 | |
| | | | Time Warner, Inc. | | | | |
| | 80,000 | | | 3.600%, 7/15/2025 | | | 83,136 | |
| | 155,000 | | | 6.250%, 3/29/2041 | | | 189,494 | |
| | | | T-Mobile USA, Inc. | | | | |
| | 310,000 | | | 6.125%, 1/15/2022 | | | 327,050 | |
| | | | Unitymedia Hessen GmbH & Company KG | | | | |
| | 190,000 | | | 5.500%, 1/15/2023d | | | 196,887 | |
| | | | Univision Communications, Inc. | | | | |
| | 135,000 | | | 5.125%, 5/15/2023d | | | 137,025 | |
| | | | Verizon Communications, Inc. | | | | |
| | 125,000 | | | 1.627%, 6/17/2019e | | | 126,087 | |
| | 290,000 | | | 3.000%, 11/1/2021 | | | 298,672 | |
| | 393,000 | | | 5.150%, 9/15/2023 | | | 449,537 | |
| | 100,000 | | | 5.050%, 3/15/2034 | | | 108,515 | |
| | 180,000 | | | 4.272%, 1/15/2036 | | | 180,737 | |
| | 325,000 | | | 4.522%, 9/15/2048 | | | 323,190 | |
| | | | Viacom, Inc. | | | | |
| | 200,000 | | | 4.375%, 3/15/2043 | | | 183,998 | |
| | 120,000 | | | 5.850%, 9/1/2043 | | | 134,571 | |
| | | | Vodafone Group plc | | | | |
| | 160,000 | | | 6.150%, 2/27/2037 | | | 190,388 | |
| | | | | |
| | | | Total | | | 15,382,892 | |
| | | | | |
| |
| Consumer Cyclical (1.2%) | | | | |
| | | | AmeriGas Finance, LLC | | | | |
| | 345,000 | | | 5.625%, 5/20/2024 | | | 361,387 | |
| | | | Automatic Data Processing, Inc. | | | | |
| | 75,000 | | | 3.375%, 9/15/2025 | | | 80,566 | |
| | | | Cinemark USA, Inc. | | | | |
| | 505,000 | | | 4.875%, 6/1/2023 | | | 505,631 | |
| | | | CVS Health Corporation | | | | |
| | 50,000 | | | 2.250%, 8/12/2019 | | | 50,854 | |
| | 320,000 | | | 4.875%, 7/20/2035 | | | 360,168 | |
| | 150,000 | | | 5.125%, 7/20/2045 | | | 174,989 | |
| | | | Daimler Finance North America, LLC | | | | |
| | 160,000 | | | 1.496%, 10/30/2019d,e | | | 160,200 | |
| | | | Delphi Automotive plc | | | | |
| | 230,000 | | | 3.150%, 11/19/2020 | | | 237,009 | |
| | | | eBay, Inc. | | | | |
| | 90,000 | | | 2.500%, 3/9/2018 | | | 91,115 | |
| | | | Ford Motor Credit Company, LLC | | | | |
| | 165,000 | | | 5.000%, 5/15/2018 | | | 172,721 | |
The accompanying Notes to Financial Statements are an integral part of this schedule.
60
MODERATELY CONSERVATIVE ALLOCATION FUND
Schedule of Investments as of October 31, 2016
| | | | | | | | |
Principal
Amount | | | Long-Term Fixed Income (42.7%) | | Value | |
| Consumer Cyclical (1.2%) - continued | | | | |
| | $260,000 | | | 2.551%, 10/5/2018 | | | $263,125 | |
| | 200,000 | | | 2.943%, 1/8/2019 | | | 204,060 | |
| | | | General Motors Company | | | | |
| | 85,000 | | | 6.600%, 4/1/2036 | | | 100,475 | |
| | 193,000 | | | 6.250%, 10/2/2043 | | | 220,984 | |
| | | | General Motors Financial Company, Inc. | | | | |
| | 138,000 | | | 3.700%, 11/24/2020 | | | 142,221 | |
| | 92,000 | | | 4.200%, 3/1/2021 | | | 96,788 | |
| | 250,000 | | | 4.300%, 7/13/2025 | | | 255,754 | |
| | | | Home Depot, Inc. | | | | |
| | 108,000 | | | 2.625%, 6/1/2022 | | | 111,478 | |
| | 115,000 | | | 3.000%, 4/1/2026 | | | 119,331 | |
| | 120,000 | | | 4.250%, 4/1/2046 | | | 131,709 | |
| | | | Hyundai Capital America | | | | |
| | 138,000 | | | 2.400%, 10/30/2018d | | | 139,557 | |
| | 138,000 | | | 3.000%, 10/30/2020d | | | 141,696 | |
| | | | Jaguar Land Rover Automotive plc | | | | |
| | 315,000 | | | 5.625%, 2/1/2023d | | | 325,874 | |
| | | | KB Home | | | | |
| | 160,000 | | | 4.750%, 5/15/2019 | | | 163,600 | |
| | | | L Brands, Inc. | | | | |
| | 315,000 | | | 5.625%, 2/15/2022 | | | 344,925 | |
| | | | Lear Corporation | | | | |
| | 200,000 | | | 5.250%, 1/15/2025 | | | 214,500 | |
| | | | Lennar Corporation | | | | |
| | 315,000 | | | 4.125%, 12/1/2018 | | | 323,662 | |
| | 315,000 | | | 4.875%, 12/15/2023 | | | 321,300 | |
| | | | Live Nation Entertainment, Inc. | | | | |
| | 215,000 | | | 4.875%, 11/1/2024d | | | 214,463 | |
| | | | McDonald’s Corporation | | | | |
| | 135,000 | | | 2.750%, 12/9/2020 | | | 138,963 | |
| | | | MGM Resorts International | | | | |
| | 380,000 | | | 6.000%, 3/15/2023 | | | 411,350 | |
| | | | PulteGroup, Inc. | | | | |
| | 510,000 | | | 4.250%, 3/1/2021 | | | 535,500 | |
| | | | Rite Aid Corporation | | | | |
| | 365,000 | | | 6.125%, 4/1/2023d | | | 385,075 | |
| | | | Schaeffler Verwaltung Zwei GmbH | | | | |
| | 355,000 | | | 4.500%, 9/15/2023d | | | 359,438 | |
| | | | Six Flags Entertainment Corporation | | | | |
| | 405,000 | | | 5.250%, 1/15/2021d | | | 417,150 | |
| | | | Time Warner, Inc. | | | | |
| | 160,000 | | | 7.625%, 4/15/2031 | | | 223,584 | |
| | | | Toll Brothers Finance Corporation | | | | |
| | 100,000 | | | 8.910%, 10/15/2017 | | | 106,375 | |
| | 67,000 | | | 4.000%, 12/31/2018 | | | 69,177 | |
| | | | West Corporation | | | | |
| | 305,000 | | | 5.375%, 7/15/2022d | | | 293,562 | |
| | | | ZF North America Capital, Inc. | | | | |
| | 400,000 | | | 4.500%, 4/29/2022d | | | 423,500 | |
| | | | | |
| | | | Total | | | 9,393,816 | |
| | | | | |
| |
| Consumer Non-Cyclical (1.9%) | | | | |
| | | | AbbVie, Inc. | | | | |
| | 185,000 | | | 2.500%, 5/14/2020 | | | 187,326 | |
| | 230,000 | | | 3.600%, 5/14/2025 | | | 234,538 | |
| | 230,000 | | | 4.450%, 5/14/2046 | | | 226,970 | |
| | | | Actavis Funding SCS | | | | |
| | 280,000 | | | 4.550%, 3/15/2035 | | | 289,102 | |
| | 120,000 | | | 4.850%, 6/15/2044 | | | 126,958 | |
| | | | Altria Group, Inc. | | | | |
| | 80,000 | | | 2.850%, 8/9/2022 | | | 82,298 | |
| | 100,000 | | | 2.625%, 9/16/2026 | | | 99,160 | |
| | | | Amgen, Inc. | | | | |
| | 92,000 | | | 2.700%, 5/1/2022 | | | 93,681 | |
| | 75,000 | | | 3.125%, 5/1/2025 | | | 76,255 | |
| | | | Anheuser-Busch InBev Finance, Inc. | | | | |
| | 100,000 | | | 2.017%, 2/1/2021e | | | 102,538 | |
| | 497,000 | | | 3.650%, 2/1/2026 | | | 522,974 | |
| | 460,000 | | | 4.700%, 2/1/2036 | | | 509,927 | |
| | 230,000 | | | 4.900%, 2/1/2046 | | | 263,014 | |
| | | | Aramark Services, Inc. | | | | |
| | 260,000 | | | 4.750%, 6/1/2026d | | | 260,000 | |
| | | | B&G Foods, Inc. | | | | |
| | 230,000 | | | 4.625%, 6/1/2021 | | | 236,325 | |
| | | | BAT International Finance plc | | | | |
| | 100,000 | | | 1.360%, 6/15/2018d,e | | | 100,129 | |
| | | | Baxter International, Inc. | | | | |
| | 100,000 | | | 2.600%, 8/15/2026 | | | 96,841 | |
| | | | Becton, Dickinson and Company | | | | |
| | 246,000 | | | 6.375%, 8/1/2019 | | | 275,832 | |
| | | | Biogen, Inc. | | | | |
| | 165,000 | | | 3.625%, 9/15/2022 | | | 175,850 | |
| | | | Boston Scientific Corporation | | | | |
| | 90,000 | | | 6.000%, 1/15/2020 | | | 100,728 | |
| | 75,000 | | | 3.850%, 5/15/2025 | | | 78,621 | |
| | 120,000 | | | 7.375%, 1/15/2040 | | | 157,292 | |
| | | | BRF SA | | | | |
| | 170,000 | | | 4.750%, 5/22/2024d | | | 172,992 | |
| | | | Bunge Limited Finance Corporation | | | | |
| | 162,000 | | | 8.500%, 6/15/2019 | | | 188,777 | |
| | 91,000 | | | 3.500%, 11/24/2020 | | | 94,964 | |
| | | | Cardinal Health, Inc. | | | | |
| | 55,000 | | | 1.950%, 6/15/2018 | | | 55,434 | |
| | 81,000 | | | 4.900%, 9/15/2045 | | | 92,484 | |
| | | | Celgene Corporation | | | | |
| | 230,000 | | | 2.875%, 8/15/2020 | | | 237,302 | |
| | 50,000 | | | 3.550%, 8/15/2022 | | | 52,637 | |
| | 100,000 | | | 5.000%, 8/15/2045 | | | 107,293 | |
| | | | Church & Dwight Company, Inc. | | | | |
| | 65,000 | | | 2.450%, 12/15/2019 | | | 65,966 | |
| | | | Cigna Corporation | | | | |
| | 50,000 | | | 5.375%, 2/15/2042 | | | 58,332 | |
| | | | ConAgra Foods, Inc. | | | | |
| | 69,000 | | | 7.125%, 10/1/2026 | | | 87,015 | |
| | | | EMD Finance, LLC | | | | |
| | 105,000 | | | 1.207%, 3/17/2017d,e | | | 105,037 | |
| | 232,000 | | | 2.950%, 3/19/2022d | | | 237,762 | |
| | | | Energizer Holdings, Inc. | | | | |
| | 171,000 | | | 5.500%, 6/15/2025d | | | 173,137 | |
| | | | Envision Healthcare Corporation | | | | |
| | 120,000 | | | 5.125%, 7/1/2022d | | | 120,000 | |
| | | | Express Scripts Holding Company | | | | |
| | 92,000 | | | 3.900%, 2/15/2022 | | | 98,370 | |
| | 215,000 | | | 4.500%, 2/25/2026 | | | 230,335 | |
| | 37,000 | | | 3.400%, 3/1/2027 | | | 36,325 | |
| | | | Fresenius Medical Care US Finance II, Inc. | | | | |
| | 315,000 | | | 5.875%, 1/31/2022d | | | 356,800 | |
| | | | Gilead Sciences, Inc. | | | | |
| | 55,000 | | | 2.550%, 9/1/2020 | | | 56,368 | |
| | 200,000 | | | 2.950%, 3/1/2027 | | | 197,748 | |
| | | | Grifols Worldwide Operations, Ltd. | | | | |
| | 400,000 | | | 5.250%, 4/1/2022 | | | 417,000 | |
| | | | H. J. Heinz Company | | | | |
| | 200,000 | | | 3.500%, 7/15/2022 | | | 210,732 | |
| | | | HCA, Inc. | | | | |
| | 185,000 | | | 5.250%, 6/15/2026 | | | 193,325 | |
| | 210,000 | | | 4.500%, 2/15/2027 | | | 207,375 | |
The accompanying Notes to Financial Statements are an integral part of this schedule.
61
MODERATELY CONSERVATIVE ALLOCATION FUND
Schedule of Investments as of October 31, 2016
| | | | | | | | |
Principal
Amount | | | Long-Term Fixed Income (42.7%) | | Value | |
| Consumer Non-Cyclical (1.9%) - continued | | | | |
| | | | Imperial Tobacco Finance plc | | | | |
| | $250,000 | | | 2.950%, 7/21/2020d | | | $256,706 | |
| | | | JBS USA, LLC | | | | |
| | 310,000 | | | 5.750%, 6/15/2025d | | | 303,800 | |
| | | | Kraft Foods Group, Inc. | | | | |
| | 184,000 | | | 5.000%, 6/4/2042 | | | 203,827 | |
| | | | Laboratory Corporation of America Holdings | | | | |
| | 75,000 | | | 2.625%, 2/1/2020 | | | 76,243 | |
| | | | LifePoint Health, Inc. | | | | |
| | 325,000 | | | 5.500%, 12/1/2021 | | | 336,781 | |
| | 95,000 | | | 5.375%, 5/1/2024d | | | 94,411 | |
| | | | McKesson Corporation | | | | |
| | 125,000 | | | 4.883%, 3/15/2044 | | | 135,246 | |
| | | | Mead Johnson Nutrition Company | | | | |
| | 92,000 | | | 3.000%, 11/15/2020 | | | 95,105 | |
| | | | Medtronic plc | | | | |
| | 470,000 | | | 4.375%, 3/15/2035 | | | 515,587 | |
| | | | Merck & Company, Inc. | | | | |
| | 80,000 | | | 1.182%, 2/10/2020e | | | 80,409 | |
| | 50,000 | | | 3.700%, 2/10/2045 | | | 51,302 | |
| | | | Mondelez International, Inc. | | | | |
| | 87,000 | | | 1.277%, 2/1/2019e | | | 86,995 | |
| | | | Mylan NV | | | | |
| | 180,000 | | | 3.000%, 12/15/2018d | | | 183,834 | |
| | | | PepsiCo, Inc. | | | | |
| | 180,000 | | | 2.850%, 2/24/2026 | | | 185,939 | |
| | | | Pernod Ricard SA | | | | |
| | 150,000 | | | 3.250%, 6/8/2026d | | | 150,670 | |
| | | | Perrigo Finance Unlimited Company | | | | |
| | 280,000 | | | 3.500%, 3/15/2021 | | | 289,326 | |
| | | | Reynolds American, Inc. | | | | |
| | 130,000 | | | 2.300%, 8/21/2017 | | | 131,040 | |
| | 299,000 | | | 5.700%, 8/15/2035 | | | 361,518 | |
| | | | Roche Holdings, Inc. | | | | |
| | 138,000 | | | 4.000%, 11/28/2044d | | | 151,032 | |
| | | | SABMiller Holdings, Inc. | | | | |
| | 108,000 | | | 3.750%, 1/15/2022d | | | 116,314 | |
| | | | Safeway, Inc. | | | | |
| | 10,000 | | | 3.400%, 12/1/2016 | | | 10,000 | |
| | | | Shire Acquisitions Investments Ireland Designated Activity Company | | | | |
| | 120,000 | | | 2.400%, 9/23/2021 | | | 119,069 | |
| | 120,000 | | | 3.200%, 9/23/2026 | | | 117,837 | |
| | | | Spectrum Brands, Inc. | | | | |
| | 185,000 | | | 5.750%, 7/15/2025 | | | 200,262 | |
| | | | Tenet Healthcare Corporation | | | | |
| | 500,000 | | | 8.125%, 4/1/2022 | | | 488,750 | |
| | | | Teva Pharmaceutical Finance Netherlands III BV | | | | |
| | 170,000 | | | 2.200%, 7/21/2021 | | | 167,948 | |
| | 100,000 | | | 2.800%, 7/21/2023 | | | 98,404 | |
| | 75,000 | | | 4.100%, 10/1/2046 | | | 69,624 | |
| | | | Thermo Fisher Scientific, Inc. | | | | |
| | 69,000 | | | 3.000%, 4/15/2023 | | | 70,037 | |
| | | | TreeHouse Foods, Inc. | | | | |
| | 210,000 | | | 4.875%, 3/15/2022 | | | 217,875 | |
| | | | UnitedHealth Group, Inc. | | | | |
| | 405,000 | | | 4.625%, 7/15/2035 | | | 461,954 | |
| | | | VRX Escrow Corporation | | | | |
| | 595,000 | | | 6.125%, 4/15/2025d | | | 470,050 | |
| | | | Zoetis, Inc. | | | | |
| | 160,000 | | | 4.700%, 2/1/2043 | | | 164,406 | |
| | | | | |
| | | | Total | | | 14,612,170 | |
| | | | | |
| |
| Energy (1.2%) | | | | |
| | | | Anadarko Petroleum Corporation | | | | |
| | 140,000 | | | 4.850%, 3/15/2021 | | | 151,987 | |
| | | | Antero Resources Corporation | | | | |
| | 305,000 | | | 5.125%, 12/1/2022 | | | 307,288 | |
| | | | Apache Corporation | | | | |
| | 160,000 | | | 4.750%, 4/15/2043 | | | 167,099 | |
| | | | Boardwalk Pipelines, LP | | | | |
| | 172,000 | | | 5.875%, 11/15/2016 | | | 172,259 | |
| | 90,000 | | | 5.950%, 6/1/2026 | | | 99,809 | |
| | | | BP Capital Markets plc | | | | |
| | 104,000 | | | 3.062%, 3/17/2022 | | | 108,377 | |
| | 275,000 | | | 3.535%, 11/4/2024 | | | 287,682 | |
| | 50,000 | | | 3.119%, 5/4/2026 | | | 50,592 | |
| | | | Buckeye Partners, LP | | | | |
| | 128,000 | | | 2.650%, 11/15/2018 | | | 129,419 | |
| | 28,000 | | | 3.950%, 12/1/2026c | | | 27,966 | |
| | | | Canadian Natural Resources, Ltd. | | | | |
| | 175,000 | | | 3.450%, 11/15/2021 | | | 180,274 | |
| | | | CNOOC Nexen Finance | | | | |
| | 168,000 | | | 1.625%, 4/30/2017 | | | 168,019 | |
| | | | CNPC General Capital, Ltd. | | | | |
| | 104,000 | | | 2.750%, 4/19/2017d | | | 104,556 | |
| | | | Columbia Pipeline Group, Inc. | | | | |
| | 210,000 | | | 2.450%, 6/1/2018 | | | 210,885 | |
| | | | Concho Resources, Inc. | | | | |
| | 185,000 | | | 6.500%, 1/15/2022 | | | 191,475 | |
| | 314,086 | | | 5.500%, 10/1/2022 | | | 322,723 | |
| | | | ConocoPhillips Company | | | | |
| | 115,000 | | | 4.200%, 3/15/2021 | | | 124,840 | |
| | | | Contura Energy, Inc. | | | | |
| | 32,000 | | | 10.000%, 8/1/2021* | | | 33,760 | |
| | | | Crestwood Midstream Partners, LP | | | | |
| | 170,000 | | | 6.125%, 3/1/2022 | | | 173,825 | |
| | | | Devon Energy Corporation | | | | |
| | 135,000 | | | 3.250%, 5/15/2022 | | | 135,545 | |
| | 92,000 | | | 5.850%, 12/15/2025 | | | 105,456 | |
| | | | Ecopetrol SA | | | | |
| | 75,000 | | | 5.875%, 9/18/2023 | | | 80,438 | |
| | | | Enbridge Energy Partners, LP | | | | |
| | 80,000 | | | 4.375%, 10/15/2020 | | | 85,352 | |
| | | | Enbridge, Inc. | | | | |
| | 80,000 | | | 1.289%, 6/2/2017e,g | | | 79,905 | |
| | | | Energy Transfer Partners, LP | | | | |
| | 160,000 | | | 4.650%, 6/1/2021 | | | 171,607 | |
| | 155,000 | | | 4.900%, 3/15/2035 | | | 145,393 | |
| | | | EnLink Midstream Partners, LP | | | | |
| | 45,000 | | | 4.150%, 6/1/2025 | | | 43,847 | |
| | 50,000 | | | 4.850%, 7/15/2026 | | | 50,931 | |
| | | | Enterprise Products Operating, LLC | | | | |
| | 132,000 | | | 5.100%, 2/15/2045 | | | 140,099 | |
| | | | EQT Corporation | | | | |
| | 99,000 | | | 5.150%, 3/1/2018 | | | 102,847 | |
| | 118,000 | | | 8.125%, 6/1/2019 | | | 134,586 | |
| | | | Exxon Mobil Corporation | | | | |
| | 80,000 | | | 4.114%, 3/1/2046 | | | 86,327 | |
| | | | Magellan Midstream Partners, LP | | | | |
| | 130,000 | | | 5.000%, 3/1/2026 | | | 147,449 | |
| | | | Marathon Oil Corporation | | | | |
| | 120,000 | | | 2.700%, 6/1/2020 | | | 118,334 | |
| | | | Marathon Petroleum Corporation | | | | |
| | 70,000 | | | 3.400%, 12/15/2020 | | | 72,738 | |
| | 75,000 | | | 4.750%, 9/15/2044 | | | 66,335 | |
| | | | MEG Energy Corporation | | | | |
| | 315,000 | | | 6.500%, 3/15/2021d | | | 271,688 | |
The accompanying Notes to Financial Statements are an integral part of this schedule.
62
MODERATELY CONSERVATIVE ALLOCATION FUND
Schedule of Investments as of October 31, 2016
| | | | | | | | |
Principal
Amount | | | Long-Term Fixed Income (42.7%) | | Value | |
| Energy (1.2%) - continued | | | | |
| | | | MPLX, LP | | | | |
| | $500,000 | | | 4.875%, 12/1/2024 | | | $522,926 | |
| | 160,000 | | | 4.875%, 6/1/2025 | | | 166,904 | |
| | | | Newfield Exploration Company | | | | |
| | 250,000 | | | 5.625%, 7/1/2024 | | | 260,000 | |
| | | | Noble Energy, Inc. | | | | |
| | 145,000 | | | 5.625%, 5/1/2021 | | | 150,342 | |
| | | | Northern Tier Energy, LLC | | | | |
| | 370,000 | | | 7.125%, 11/15/2020 | | | 378,325 | |
| | | | Petrobras Global Finance BV | | | | |
| | 58,000 | | | 8.375%, 5/23/2021 | | | 64,165 | |
| | | | Petrobras International Finance Company | | | | |
| | 80,000 | | | 5.750%, 1/20/2020 | | | 82,560 | |
| | | | Petroleos Mexicanos | | | | |
| | 132,000 | | | 5.500%, 2/4/2019d | | | 139,722 | |
| | 80,750 | | | 2.378%, 4/15/2025 | | | 82,970 | |
| | | | Phillips 66 Partners, LP | | | | |
| | 100,000 | | | 3.550%, 10/1/2026 | | | 99,632 | |
| | | | Pioneer Natural Resources Company | | | | |
| | 51,000 | | | 3.450%, 1/15/2021 | | | 53,132 | |
| | 90,000 | | | 4.450%, 1/15/2026 | | | 98,594 | |
| | | | Regency Energy Partners, LP | | | | |
| | 310,000 | | | 5.000%, 10/1/2022 | | | 332,644 | |
| | | | Rice Energy, Inc. | | | | |
| | 285,000 | | | 6.250%, 5/1/2022 | | | 289,988 | |
| | | | Sabine Pass Liquefaction, LLC | | | | |
| | 310,000 | | | 5.625%, 3/1/2025 | | | 328,027 | |
| | | | Schlumberger Holdings Corporation | | | | |
| | 70,000 | | | 3.000%, 12/21/2020d | | | 72,633 | |
| | 100,000 | | | 4.000%, 12/21/2025d | | | 107,400 | |
| | | | Shell International Finance BV | | | | |
| | 75,000 | | | 1.266%, 5/11/2020e | | | 75,083 | |
| | | | Suncor Energy, Inc. | | | | |
| | 155,000 | | | 3.600%, 12/1/2024 | | | 160,996 | |
| | | | Sunoco Logistics Partners Operations, LP | | | | |
| | 315,000 | | | 4.400%, 4/1/2021 | | | 339,808 | |
| | | | Valero Energy Corporation | | | | |
| | 200,000 | | | 3.400%, 9/15/2026 | | | 195,746 | |
| | | | Weatherford International, Ltd. | | | | |
| | 255,000 | | | 8.250%, 6/15/2023g | | | 263,925 | |
| | | | | |
| | | | Total | | | 9,317,234 | |
| | | | | |
| |
| Financials (3.6%) | | | | |
| | | | ABN AMRO Bank NV | | | | |
| | 200,000 | | | 4.750%, 7/28/2025d | | | 210,098 | |
| | | | ACE INA Holdings, Inc. | | | | |
| | 138,000 | | | 4.350%, 11/3/2045 | | | 154,052 | |
| | | | AerCap Ireland Capital, Ltd. | | | | |
| | 90,000 | | | 3.750%, 5/15/2019 | | | 92,356 | |
| | 80,000 | | | 4.625%, 10/30/2020 | | | 84,200 | |
| | 380,000 | | | 5.000%, 10/1/2021 | | | 403,750 | |
| | 80,000 | | | 4.625%, 7/1/2022 | | | 83,500 | |
| | | | Aetna, Inc. | | | | |
| | 140,000 | | | 2.400%, 6/15/2021 | | | 141,270 | |
| | 185,000 | | | 2.800%, 6/15/2023 | | | 187,468 | |
| | 90,000 | | | 3.200%, 6/15/2026 | | | 90,317 | |
| | 140,000 | | | 4.250%, 6/15/2036 | | | 142,056 | |
| | | | Air Lease Corporation | | | | |
| | 125,000 | | | 2.125%, 1/15/2018 | | | 125,436 | |
| | 40,000 | | | 2.625%, 9/4/2018 | | | 40,490 | |
| | | | Ally Financial, Inc. | | | | |
| | 210,000 | | | 3.750%, 11/18/2019 | | | 210,262 | |
| | 200,000 | | | 4.125%, 3/30/2020 | | | 203,250 | |
| | | | American Express Credit Corporation | | | | |
| | 125,000 | | | 1.407%, 3/18/2019e | | | 125,292 | |
| | | | American International Group, Inc. | | | | |
| | 65,000 | | | 3.300%, 3/1/2021 | | | 67,952 | |
| | 138,000 | | | 4.125%, 2/15/2024 | | | 148,346 | |
| | 60,000 | | | 3.900%, 4/1/2026 | | | 62,848 | |
| | | | Aon plc | | | | |
| | 69,000 | | | 3.875%, 12/15/2025 | | | 73,200 | |
| | | | Argos Merger Sub, Inc. | | | | |
| | 475,000 | | | 7.125%, 3/15/2023d,g | | | 496,969 | |
| | | | Avalonbay Communities, Inc. | | | | |
| | 200,000 | | | 3.500%, 11/15/2025 | | | 207,920 | |
| | | | Banco Santander Chile | | | | |
| | 150,000 | | | 1.776%, 4/11/2017d,e | | | 149,625 | |
| | | | Bank of America Corporation | | | | |
| | 165,000 | | | 1.936%, 3/22/2018e | | | 166,396 | |
| | 105,000 | | | 1.716%, 4/1/2019e | | | 105,327 | |
| | 160,000 | | | 2.625%, 10/19/2020 | | | 162,677 | |
| | 205,000 | | | 3.300%, 1/11/2023 | | | 210,866 | |
| | 184,000 | | | 4.000%, 4/1/2024 | | | 196,594 | |
| | 150,000 | | | 4.000%, 1/22/2025 | | | 154,229 | |
| | 138,000 | | | 3.500%, 4/19/2026 | | | 141,646 | |
| | 212,000 | | | 5.875%, 2/7/2042 | | | 268,100 | |
| | 184,000 | | | 8.000%, 7/29/2049h | | | 187,450 | |
| | | | Bank of New York Mellon Corporation | | | | |
| | 230,000 | | | 2.500%, 4/15/2021 | | | 234,511 | |
| | | | Bank of Tokyo-Mitsubishi UFJ, Ltd. | | | | |
| | 65,000 | | | 2.850%, 9/8/2021d | | | 66,565 | |
| | | | Barclays Bank plc | | | | |
| | 46,000 | | | 10.179%, 6/12/2021d | | | 58,164 | |
| | | | Barclays plc | | | | |
| | 150,000 | | | 2.750%, 11/8/2019 | | | 151,203 | |
| | 236,000 | | | 3.650%, 3/16/2025 | | | 231,712 | |
| | | | BB&T Corporation | | | | |
| | 65,000 | | | 1.595%, 1/15/2020e | | | 65,057 | |
| | | | Berkshire Hathaway, Inc. | | | | |
| | 115,000 | | | 2.750%, 3/15/2023 | | | 118,415 | |
| | | | BPCE SA | | | | |
| | 156,000 | | | 5.700%, 10/22/2023d | | | 169,021 | |
| | | | Caisse Centrale Desjardins du Quebec | | | | |
| | 95,000 | | | 1.552%, 1/29/2018d,e | | | 94,897 | |
| | | | Capital One Financial Corporation | | | | |
| | 115,000 | | | 2.450%, 4/24/2019 | | | 116,945 | |
| | | | Centene Escrow Corporation | | | | |
| | 400,000 | | | 5.625%, 2/15/2021 | | | 419,604 | |
| | | | CIT Group, Inc. | | | | |
| | 375,000 | | | 5.000%, 8/15/2022 | | | 399,844 | |
| | | | Citigroup, Inc. | | | | |
| | 90,000 | | | 1.642%, 4/8/2019e | | | 90,118 | |
| | 185,000 | | | 2.700%, 3/30/2021 | | | 188,190 | |
| | 139,000 | | | 4.050%, 7/30/2022 | | | 146,911 | |
| | 145,000 | | | 4.400%, 6/10/2025 | | | 153,134 | |
| | 160,000 | | | 3.200%, 10/21/2026 | | | 159,625 | |
| | 120,000 | | | 4.125%, 7/25/2028 | | | 122,982 | |
| | 90,000 | | | 4.650%, 7/30/2045 | | | 98,474 | |
| | | | Citizens Bank NA | | | | |
| | 250,000 | | | 2.300%, 12/3/2018 | | | 252,700 | |
| | | | CoBank ACB | | | | |
| | 80,000 | | | 1.450%, 6/15/2022e | | | 75,947 | |
| | | | Compass Bank | | | | |
| | 150,000 | | | 2.750%, 9/29/2019 | | | 150,132 | |
| | | | Cooperatieve Centrale Raiffeisen-Boerenleenbank BA | | | | |
| | 133,000 | | | 3.950%, 11/9/2022 | | | 139,425 | |
The accompanying Notes to Financial Statements are an integral part of this schedule.
63
MODERATELY CONSERVATIVE ALLOCATION FUND
Schedule of Investments as of October 31, 2016
| | | | | | | | |
Principal
Amount | | | Long-Term Fixed Income (42.7%) | | Value | |
| Financials (3.6%) - continued | | | | |
| | | | Credit Agricole SA | | | | |
| | $105,000 | | | 1.680%, 4/15/2019d,e | | | $105,338 | |
| | | | Credit Suisse AG | | | | |
| | 92,000 | | | 5.400%, 1/14/2020 | | | 99,722 | |
| | | | Credit Suisse Group Funding, Ltd. | | | | |
| | 276,000 | | | 2.750%, 3/26/2020 | | | 276,592 | |
| | 184,000 | | | 3.750%, 3/26/2025 | | | 182,508 | |
| | | | CyrusOne, LP | | | | |
| | 315,000 | | | 6.375%, 11/15/2022 | | | 333,900 | |
| | | | Deutsche Bank AG | | | | |
| | 275,000 | | | 3.375%, 5/12/2021 | | | 270,570 | |
| | | | Digital Realty Trust LP | | | | |
| | 230,000 | | | 3.400%, 10/1/2020 | | | 238,547 | |
| | | | Discover Bank | | | | |
| | 135,000 | | | 8.700%, 11/18/2019 | | | 156,573 | |
| | | | Discover Financial Services | | | | |
| | 108,000 | | | 6.450%, 6/12/2017 | | | 111,220 | |
| | | | Duke Realty, LP | | | | |
| | 50,000 | | | 3.875%, 2/15/2021 | | | 53,043 | |
| | 150,000 | | | 4.375%, 6/15/2022 | | | 162,817 | |
| | | | ERP Operating, LP | | | | |
| | 54,000 | | | 3.375%, 6/1/2025 | | | 55,949 | |
| | | | European Investment Bank | | | | |
| | 160,000 | | | 1.875%, 3/15/2019 | | | 162,487 | |
| | | | Fifth Third Bancorp | | | | |
| | 147,000 | | | 5.450%, 1/15/2017 | | | 148,332 | |
| | 112,000 | | | 2.875%, 7/27/2020 | | | 115,684 | |
| | 65,000 | | | 2.875%, 10/1/2021 | | | 67,420 | |
| | | | GE Capital International Funding Company | | | | |
| | 150,000 | | | 4.418%, 11/15/2035 | | | 163,614 | |
| | | | Genworth Financial, Inc. | | | | |
| | 60,000 | | | 7.700%, 6/15/2020 | | | 58,050 | |
| | | | Goldman Sachs Group, Inc. | | | | |
| | 270,000 | | | 2.087%, 4/30/2018e | | | 272,499 | |
| | 90,000 | | | 1.917%, 11/15/2018e | | | 90,747 | |
| | 368,000 | | | 5.375%, 3/15/2020 | | | 406,287 | |
| | 95,000 | | | 2.042%, 4/23/2020e | | | 95,558 | |
| | 99,000 | | | 5.250%, 7/27/2021 | | | 111,270 | |
| | 200,000 | | | 2.350%, 11/15/2021 | | | 198,785 | |
| | 92,000 | | | 3.500%, 1/23/2025 | | | 94,352 | |
| | 160,000 | | | 4.750%, 10/21/2045 | | | 175,971 | |
| | | | Hartford Financial Services Group, Inc. | | | | |
| | 209,000 | | | 5.125%, 4/15/2022 | | | 236,487 | |
| | | | HBOS plc | | | | |
| | 271,000 | | | 6.750%, 5/21/2018d | | | 288,138 | |
| | | | HCP, Inc. | | | | |
| | 290,000 | | | 4.000%, 12/1/2022 | | | 305,589 | |
| | 100,000 | | | 3.400%, 2/1/2025 | | | 98,011 | |
| | | | HSBC Bank plc | | | | |
| | 220,000 | | | 1.457%, 5/15/2018d,e | | | 220,054 | |
| | | | HSBC Holdings plc | | | | |
| | 200,000 | | | 3.400%, 3/8/2021 | | | 206,183 | |
| | 125,000 | | | 2.650%, 1/5/2022 | | | 124,372 | |
| | 350,000 | | | 3.900%, 5/25/2026 | | | 362,282 | |
| | 200,000 | | | 6.875%, 12/29/2049h | | | 210,500 | |
| | | | Huntington Bancshares, Inc. | | | | |
| | 56,000 | | | 2.600%, 8/2/2018 | | | 56,797 | |
| | | | Huntington National Bank | | | | |
| | 250,000 | | | 2.200%, 11/6/2018 | | | 252,365 | |
| | | | Icahn Enterprises, LP | | | | |
| | 185,000 | | | 6.000%, 8/1/2020 | | | 181,762 | |
| | | | ING Capital Funding Trust III | | | | |
| | 140,000 | | | 4.438%, 12/29/2049e,h | | | 139,125 | |
| | | | Intesa Sanpaolo SPA | | | | |
| | 200,000 | | | 5.250%, 1/12/2024 | | | 215,660 | |
| | | | J.P. Morgan Chase & Company | | | | |
| | 171,000 | | | 6.300%, 4/23/2019 | | | 189,551 | |
| | 75,000 | | | 2.250%, 1/23/2020 | | | 75,521 | |
| | 90,000 | | | 2.295%, 8/15/2021 | | | 90,071 | |
| | 230,000 | | | 4.500%, 1/24/2022 | | | 253,383 | |
| | 134,000 | | | 3.200%, 1/25/2023 | | | 138,484 | |
| | 230,000 | | | 2.700%, 5/18/2023 | | | 230,685 | |
| | 105,000 | | | 2.112%, 10/24/2023e | | | 104,587 | |
| | 200,000 | | | 3.625%, 5/13/2024 | | | 210,250 | |
| | 145,000 | | | 3.125%, 1/23/2025 | | | 146,168 | |
| | 150,000 | | | 3.300%, 4/1/2026 | | | 152,825 | |
| | | | KeyCorp | | | | |
| | 220,000 | | | 2.900%, 9/15/2020 | | | 226,515 | |
| | | | Liberty Mutual Group, Inc. | | | | |
| | 180,000 | | | 4.950%, 5/1/2022d | | | 201,763 | |
| | | | Liberty Property, LP | | | | |
| | 216,000 | | | 3.750%, 4/1/2025 | | | 224,091 | |
| | | | Lincoln National Corporation | | | | |
| | 80,000 | | | 8.750%, 7/1/2019 | | | 93,267 | |
| | 138,000 | | | 7.000%, 6/15/2040 | | | 176,219 | |
| | | | Lloyds Bank plc | | | | |
| | 105,000 | | | 1.374%, 3/16/2018e | | | 104,798 | |
| | | | Merrill Lynch & Company, Inc. | | | | |
| | 275,000 | | | 6.400%, 8/28/2017 | | | 286,044 | |
| | | | MetLife, Inc. | | | | |
| | 210,000 | | | 4.050%, 3/1/2045 | | | 208,521 | |
| | | | Mizuho Bank, Ltd. | | | | |
| | 200,000 | | | 1.850%, 3/21/2018d | | | 200,485 | |
| | | | Morgan Stanley | | | | |
| | 300,000 | | | 6.625%, 4/1/2018 | | | 320,308 | |
| | 180,000 | | | 2.162%, 4/25/2018e | | | 181,911 | |
| | 95,000 | | | 2.026%, 1/27/2020e | | | 95,946 | |
| | 115,000 | | | 2.500%, 4/21/2021 | | | 115,910 | |
| | 135,000 | | | 4.875%, 11/1/2022 | | | 148,279 | |
| | 70,000 | | | 4.000%, 7/23/2025 | | | 74,590 | |
| | 275,000 | | | 4.350%, 9/8/2026 | | | 291,966 | |
| | 125,000 | | | 4.300%, 1/27/2045 | | | 130,898 | |
| | 230,000 | | | 5.550%, 12/29/2049h | | | 235,463 | |
| | | | MPT Operating Partnership, LP | | | | |
| | 325,000 | | | 6.375%, 3/1/2024 | | | 350,188 | |
| | 210,000 | | | 5.500%, 5/1/2024 | | | 216,300 | |
| | | | Nasdaq, Inc. | | | | |
| | 110,000 | | | 3.850%, 6/30/2026 | | | 113,387 | |
| | | | National City Corporation | | | | |
| | 168,000 | | | 6.875%, 5/15/2019 | | | 187,949 | |
| | | | Prime Security Services Borrower, LLC | | | | |
| | 315,000 | | | 9.250%, 5/15/2023d | | | 334,688 | |
| | | | Prudential Financial, Inc. | | | | |
| | 65,000 | | | 2.350%, 8/15/2019 | | | 66,184 | |
| | | | Quicken Loans, Inc. | | | | |
| | 405,000 | | | 5.750%, 5/1/2025d | | | 399,938 | |
| | | | Realty Income Corporation | | | | |
| | 62,000 | | | 2.000%, 1/31/2018 | | | 62,352 | |
| | | | Regions Bank | | | | |
| | 250,000 | | | 7.500%, 5/15/2018 | | | 270,910 | |
| | | | Regions Financial Corporation | | | | |
| | 125,000 | | | 2.250%, 9/14/2018 | | | 126,000 | |
| | | | Reinsurance Group of America, Inc. | | | | |
| | 75,000 | | | 5.625%, 3/15/2017 | | | 76,143 | |
| | 139,000 | | | 5.000%, 6/1/2021 | | | 151,307 | |
The accompanying Notes to Financial Statements are an integral part of this schedule.
64
MODERATELY CONSERVATIVE ALLOCATION FUND
Schedule of Investments as of October 31, 2016
| | | | | | | | |
Principal
Amount | | | Long-Term Fixed Income (42.7%) | | Value | |
| Financials (3.6%) - continued | | | | |
| | | | Reliance Standard Life Global Funding II | | | | |
| | $85,000 | | | 2.500%, 4/24/2019d | | | $86,113 | |
| | | | Royal Bank of Scotland Group plc | | | | |
| | 200,000 | | | 3.875%, 9/12/2023 | | | 195,812 | |
| | | | Santander Holdings USA, Inc. | | | | |
| | 125,000 | | | 3.450%, 8/27/2018 | | | 127,777 | |
| | | | Santander UK Group Holdings plc | | | | |
| | 160,000 | | | 2.875%, 10/16/2020 | | | 160,651 | |
| | | | Santander UK plc | | | | |
| | 112,000 | | | 3.050%, 8/23/2018 | | | 114,364 | |
| | | | Simon Property Group, LP | | | | |
| | 100,000 | | | 10.350%, 4/1/2019 | | | 118,779 | |
| | 70,000 | | | 2.500%, 9/1/2020 | | | 71,752 | |
| | 225,000 | | | 2.750%, 2/1/2023 | | | 228,938 | |
| | | | Skandinaviska Enskilda Banken AB | | | | |
| | 130,000 | | | 2.375%, 3/25/2019d | | | 131,697 | |
| | | | Standard Chartered plc | | | | |
| | 130,000 | | | 2.100%, 8/19/2019d | | | 129,889 | |
| | | | State Street Corporation | | | | |
| | 104,000 | | | 1.701%, 8/18/2020e | | | 104,959 | |
| | | | Sumitomo Mitsui Banking Corporation | | | | |
| | 110,000 | | | 1.460%, 1/16/2018e | | | 110,097 | |
| | | | Sumitomo Mitsui Financial Group, Inc. | | | | |
| | 120,000 | | | 3.010%, 10/19/2026 | | | 119,665 | |
| | | | Svenska Handelsbanken AB | | | | |
| | 150,000 | | | 1.347%, 6/17/2019e | | | 150,205 | |
| | | | Synchrony Financial | | | | |
| | 60,000 | | | 1.989%, 2/3/2020e | | | 58,731 | |
| | 70,000 | | | 3.750%, 8/15/2021 | | | 73,445 | |
| | 260,000 | | | 4.250%, 8/15/2024 | | | 271,010 | |
| | | | Toronto-Dominion Bank | | | | |
| | 70,000 | | | 1.786%, 12/14/2020e | | | 70,729 | |
| | | | UBS Group Funding Jersey, Ltd. | | | | |
| | 230,000 | | | 2.950%, 9/24/2020d | | | 234,757 | |
| | 138,000 | | | 4.125%, 9/24/2025d | | | 143,782 | |
| | | | UnitedHealth Group, Inc. | | | | |
| | 45,000 | | | 3.350%, 7/15/2022 | | | 47,874 | |
| | | | USB Realty Corporation | | | | |
| | 65,000 | | | 2.027%, 12/29/2049d,e,h | | | 58,337 | |
| | | | Voya Financial, Inc. | | | | |
| | 194,000 | | | 2.900%, 2/15/2018 | | | 197,196 | |
| | | | Wells Fargo & Company | | | | |
| | 95,000 | | | 1.567%, 1/30/2020e | | | 94,823 | |
| | 180,000 | | | 2.550%, 12/7/2020 | | | 183,142 | |
| | 160,000 | | | 3.450%, 2/13/2023 | | | 164,231 | |
| | 205,000 | | | 3.000%, 2/19/2025 | | | 205,291 | |
| | 175,000 | | | 3.000%, 4/22/2026 | | | 174,193 | |
| | 163,000 | | | 3.000%, 10/23/2026 | | | 161,881 | |
| | 182,000 | | | 4.900%, 11/17/2045 | | | 195,644 | |
| | | | Welltower, Inc. | | | | |
| | 61,000 | | | 2.250%, 3/15/2018 | | | 61,537 | |
| | 108,000 | | | 3.750%, 3/15/2023 | | | 112,592 | |
| | 90,000 | | | 4.000%, 6/1/2025 | | | 94,232 | |
| | | | | |
| | | | Total | | | 27,620,648 | |
| | | | | |
| |
| Foreign Government (0.1%) | | | | |
| | | | Export-Import Bank of Korea | | | | |
| | 90,000 | | | 2.250%, 1/21/2020 | | | 90,750 | |
| | | | Kommunalbanken AS | | | | |
| | 150,000 | | | 1.500%, 10/22/2019d | | | 150,461 | |
| | | | Mexico Government International Bond | | | | |
| | 125,000 | | | 4.350%, 1/15/2047 | | | 118,250 | |
| | 100,000 | | | 4.125%, 1/21/2026 | | | 105,700 | |
| | | | | |
| | | | Total | | | 465,161 | |
| | | | | |
| |
| Mortgage-Backed Securities (14.1%) | | | | |
| | | | Federal Home Loan Mortgage Corporation Gold 15-Yr. Pass Through | | | | |
| | 5,120,000 | | | 3.000%, 11/1/2031c | | | 5,358,000 | |
| | | | Federal Home Loan Mortgage Corporation Gold 30-Yr. Pass Through | | | | |
| | 6,245,000 | | | 4.000%, 11/1/2046c | | | 6,679,954 | |
| | | | Federal National Mortgage Association Conventional | | | | |
| | 14,200,000 | | | 3.000%, 11/1/2046c | | | 14,619,343 | |
| | | | Federal National Mortgage Association Conventional 15-Yr. Pass Through | | | | |
| | 9,540,000 | | | 2.500%, 11/1/2031c | | | 9,816,511 | |
| | | | Federal National Mortgage Association Conventional 30-Yr. Pass Through | | | | |
| | 1,648,266 | | | 1.735%, 7/1/2043e | | | 1,693,691 | |
| | 37,050,000 | | | 3.500%, 11/1/2046c | | | 38,896,713 | |
| | 18,650,000 | | | 4.000%, 11/1/2046c | | | 19,970,069 | |
| | 10,725,000 | | | 4.500%, 11/1/2046c | | | 11,722,091 | |
| | | | | |
| | | | Total | | | 108,756,372 | |
| | | | | |
| |
| Technology (0.8%) | | | | |
| | | | Amphenol Corporation | | | | |
| | 66,000 | | | 2.550%, 1/30/2019 | | | 67,311 | |
| | | | Apple, Inc. | | | | |
| | 75,000 | | | 1.117%, 5/6/2020e | | | 74,870 | |
| | 322,000 | | | 3.200%, 5/13/2025 | | | 337,088 | |
| | 138,000 | | | 4.650%, 2/23/2046 | | | 152,096 | |
| | | | Cisco Systems, Inc. | | | | |
| | 100,000 | | | 1.342%, 3/1/2019e | | | 100,559 | |
| | | | CommScope Technologies Finance, LLC | | | | |
| | 215,000 | | | 6.000%, 6/15/2025d | | | 225,750 | |
| | | | Diamond 1 Finance Corporation | | | | |
| | 115,000 | | | 3.480%, 6/1/2019d | | | 117,990 | |
| | 90,000 | | | 5.450%, 6/15/2023d | | | 96,377 | |
| | 69,000 | | | 6.020%, 6/15/2026d | | | 75,214 | |
| | 120,000 | | | 8.100%, 7/15/2036d | | | 143,251 | |
| | 80,000 | | | 8.350%, 7/15/2046d | | | 96,935 | |
| | | | Equinix, Inc. | | | | |
| | 210,000 | | | 5.750%, 1/1/2025 | | | 222,075 | |
| | | | Fidelity National Information Services, Inc. | | | | |
| | 195,000 | | | 2.850%, 10/15/2018 | | | 199,440 | |
| | 138,000 | | | 3.625%, 10/15/2020 | | | 145,559 | |
| | | | First Data Corporation | | | | |
| | 210,000 | | | 5.375%, 8/15/2023d | | | 217,350 | |
| | | | Hewlett Packard Enterprise Company | | | | |
| | 230,000 | | | 2.700%, 10/5/2017d | | | 232,913 | |
| | 115,000 | | | 3.100%, 10/5/2018d | | | 117,579 | |
| | 115,000 | | | 4.650%, 10/15/2022d | | | 123,873 | |
| | | | IMS Health, Inc. | | | | |
| | 413,000 | | | 6.000%, 11/1/2020d | | | 419,195 | |
| | | | Intel Corporation | | | | |
| | 40,000 | | | 3.100%, 7/29/2022 | | | 42,230 | |
| | 140,000 | | | 3.700%, 7/29/2025 | | | 152,946 | |
| | 207,000 | | | 4.100%, 5/19/2046 | | | 212,960 | |
The accompanying Notes to Financial Statements are an integral part of this schedule.
65
MODERATELY CONSERVATIVE ALLOCATION FUND
Schedule of Investments as of October 31, 2016
| | | | | | | | |
Principal
Amount | | | Long-Term Fixed Income (42.7%) | | Value | |
| Technology (0.8%) - continued | | | | |
| | | | International Business Machines Corporation | | | | |
| | $184,000 | | | 4.700%, 2/19/2046 | | | $205,784 | |
| | | | Iron Mountain, Inc. | | | | |
| | 125,000 | | | 6.000%, 8/15/2023 | | | 132,813 | |
| | | | Microsoft Corporation | | | | |
| | 280,000 | | | 4.750%, 11/3/2055 | | | 313,878 | |
| | 280,000 | | | 4.200%, 11/3/2035 | | | 307,455 | |
| | 150,000 | | | 3.700%, 8/8/2046 | | | 146,576 | |
| | | | NXP BV | | | | |
| | 360,000 | | | 3.875%, 9/1/2022d | | | 380,700 | |
| | | | Oracle Corporation | | | | |
| | 65,000 | | | 2.500%, 5/15/2022 | | | 65,729 | |
| | 184,000 | | | 2.400%, 9/15/2023 | | | 183,537 | |
| | 270,000 | | | 2.950%, 5/15/2025 | | | 275,750 | |
| | | | Plantronics, Inc. | | | | |
| | 310,000 | | | 5.500%, 5/31/2023d | | | 315,425 | |
| | | | Qualcomm, Inc. | | | | |
| | 138,000 | | | 3.000%, 5/20/2022 | | | 143,836 | |
| | | | Seagate HDD Cayman | | | | |
| | 80,000 | | | 4.875%, 6/1/2027 | | | 72,280 | |
| | | | Sensata Technologies UK Financing Company plc | | | | |
| | 240,000 | | | 6.250%, 2/15/2026d | | | 259,800 | |
| | | | | |
| | | | Total | | | 6,377,124 | |
| | | | | |
| |
| Transportation (0.3%) | | | | |
| | | | Air Canada Pass Through Trust | | | | |
| | 60,556 | | | 3.875%, 3/15/2023d | | | 59,042 | |
| | | | American Airlines Pass Through Trust | | | | |
| | 248,172 | | | 3.375%, 5/1/2027 | | | 253,135 | |
| | | | Avis Budget Car Rental, LLC | | | | |
| | 270,000 | | | 5.125%, 6/1/2022d,g | | | 264,600 | |
| | 190,000 | | | 6.375%, 4/1/2024d | | | 190,950 | |
| | | | Burlington Northern Santa Fe, LLC | | | | |
| | 205,000 | | | 5.050%, 3/1/2041 | | | 241,737 | |
| | 200,000 | | | 3.900%, 8/1/2046 | | | 204,479 | |
| | | | Continental Airlines, Inc. | | | | |
| | 120,021 | | | 4.150%, 4/11/2024 | | | 129,155 | |
| | | | CSX Corporation | | | | |
| | 160,000 | | | 4.250%, 11/1/2066 | | | 154,275 | |
| | 98,000 | | | 3.700%, 11/1/2023 | | | 105,350 | |
| | | | Delta Air Lines, Inc. | | | | |
| | 58,648 | | | 4.950%, 5/23/2019 | | | 61,727 | |
| | | | ERAC USA Finance, LLC | | | | |
| | 66,000 | | | 2.800%, 11/1/2018d | | | 67,284 | |
| | | | J.B. Hunt Transport Services, Inc. | | | | |
| | 60,000 | | | 3.300%, 8/15/2022 | | | 62,155 | |
| | | | Southwest Airlines Company | | | | |
| | 162,000 | | | 2.750%, 11/6/2019 | | | 166,807 | |
| | | | Virgin Australia Holdings, Ltd. | | | | |
| | 42,300 | | | 5.000%, 10/23/2023d | | | 43,886 | |
| | | | XPO Logistics, Inc. | | | | |
| | 300,000 | | | 6.500%, 6/15/2022d | | | 312,000 | |
| | | | | |
| | | | Total | | | 2,316,582 | |
| | | | | |
| |
| U.S. Government and Agencies (10.6%) | | | | |
| | | | U.S. Treasury Bonds | | | | |
| | 550,000 | | | 4.375%, 5/15/2040 | | | 738,053 | |
| | 2,000,000 | | | 3.000%, 5/15/2042 | | | 2,177,188 | |
| | 1,580,000 | | | 3.625%, 2/15/2044 | | | 1,920,256 | |
| | 440,000 | | | 2.250%, 8/15/2046 | | | 409,217 | |
| | | | U.S. Treasury Bonds, TIPS | | | | |
| | 3,652,005 | | | 0.125%, 1/15/2023 | | | 3,704,327 | |
| | 5,878,938 | | | 0.625%, 1/15/2026 | | | 6,136,600 | |
| | 9,981,735 | | | 1.000%, 2/15/2046 | | | 10,753,264 | |
| | | | U.S. Treasury Notes | | | | |
| | 2,150,000 | | | 0.875%, 11/15/2017 | | | 2,152,939 | |
| | 5,500,000 | | | 0.875%, 3/31/2018 | | | 5,506,661 | |
| | 2,500,000 | | | 0.750%, 2/15/2019 | | | 2,490,430 | |
| | 1,900,000 | | | 1.000%, 10/15/2019 | | | 1,900,074 | |
| | 6,520,000 | | | 1.500%, 10/31/2019 | | | 6,612,962 | |
| | 7,000,000 | | | 1.375%, 9/30/2020 | | | 7,047,033 | |
| | 1,000,000 | | | 1.375%, 5/31/2021 | | | 1,003,789 | |
| | 9,370,000 | | | 1.125%, 8/31/2021 | | | 9,287,282 | |
| | 16,000,000 | | | 2.125%, 6/30/2022 | | | 16,568,752 | |
| | 2,755,000 | | | 1.625%, 8/15/2022 | | | 2,777,922 | |
| | 160,000 | | | 1.375%, 9/30/2023 | | | 157,475 | |
| | 550,000 | | | 2.250%, 11/15/2024 | | | 571,828 | |
| | | | | |
| | | | Total | | | 81,916,052 | |
| | | | | |
| |
| Utilities (1.1%) | | | | |
| | | | AES Corporation | | | | |
| | 315,000 | | | 7.375%, 7/1/2021 | | | 355,162 | |
| | | | American Electric Power Company, Inc. | | | | |
| | 216,000 | | | 2.950%, 12/15/2022 | | | 223,343 | |
| | | | Arizona Public Service Company | | | | |
| | 80,000 | | | 2.200%, 1/15/2020 | | | 81,437 | |
| | | | Berkshire Hathaway Energy Company | | | | |
| | 75,000 | | | 2.400%, 2/1/2020 | | | 76,371 | |
| | | | Calpine Corporation | | | | |
| | 310,000 | | | 5.375%, 1/15/2023 | | | 306,900 | |
| | | | Chesapeake Midstream Partners, LP | | | | |
| | 230,000 | | | 6.125%, 7/15/2022 | | | 238,805 | |
| | | | CMS Energy Corporation | | | | |
| | 120,000 | | | 2.950%, 2/15/2027 | | | 119,750 | |
| | | | Commonwealth Edison Company | | | | |
| | 205,000 | | | 3.700%, 3/1/2045 | | | 206,874 | |
| | 115,000 | | | 4.350%, 11/15/2045 | | | 126,945 | |
| | | | Consolidated Edison Company of New York, Inc. | | | | |
| | 69,000 | | | 4.500%, 12/1/2045 | | | 76,998 | |
| | | | Consolidated Edison, Inc. | | | | |
| | 92,000 | | | 2.000%, 5/15/2021 | | | 92,166 | |
| | | | Dominion Resources, Inc. | | | | |
| | 180,000 | | | 2.962%, 7/1/2019 | | | 184,118 | |
| | | | DTE Electric Company | | | | |
| | 115,000 | | | 3.700%, 3/15/2045 | | | 117,897 | |
| | 145,000 | | | 3.700%, 6/1/2046 | | | 148,934 | |
| | | | DTE Energy Company | | | | |
| | 30,000 | | | 2.400%, 12/1/2019 | | | 30,520 | |
| | | | Duke Energy Corporation | | | | |
| | 168,000 | | | 2.100%, 6/15/2018 | | | 169,635 | |
| | 160,000 | | | 3.750%, 9/1/2046 | | | 151,415 | |
| | | | Duke Energy Indiana, LLC | | | | |
| | 185,000 | | | 3.750%, 5/15/2046 | | | 185,432 | |
| | | | Dynegy, Inc. | | | | |
| | 200,000 | | | 6.750%, 11/1/2019 | | | 202,418 | |
| | 235,000 | | | 7.375%, 11/1/2022 | | | 226,628 | |
| | | | Edison International | | | | |
| | 180,000 | | | 2.950%, 3/15/2023 | | | 184,536 | |
| | | | Emera U.S. Finance, LP | | | | |
| | 125,000 | | | 2.150%, 6/15/2019d | | | 126,100 | |
| | 120,000 | | | 4.750%, 6/15/2046d | | | 127,524 | |
| | | | Enel Finance International NV | | | | |
| | 84,000 | | | 6.250%, 9/15/2017d | | | 87,399 | |
| | | | Energy Transfer Equity, LP | | | | |
| | 310,000 | | | 5.500%, 6/1/2027 | | | 302,250 | |
| | | | Eversource Energy | | | | |
| | 70,000 | | | 1.600%, 1/15/2018 | | | 70,118 | |
The accompanying Notes to Financial Statements are an integral part of this schedule.
66
MODERATELY CONSERVATIVE ALLOCATION FUND
Schedule of Investments as of October 31, 2015
| | | | | | | | |
Principal
Amount | | | Long-Term Fixed Income (42.7%) | | Value | |
| Utilities (1.1%) - continued | | | | |
| | | | Exelon Corporation | | | | |
| | $100,000 | | | 5.100%, 6/15/2045 | | | $113,080 | |
| | 138,000 | | | 4.450%, 4/15/2046 | | | 143,563 | |
| | | | Exelon Generation Company, LLC | | | | |
| | 189,000 | | | 5.200%, 10/1/2019 | | | 206,708 | |
| | 60,000 | | | 2.950%, 1/15/2020 | | | 61,565 | |
| | | | ITC Holdings Corporation | | | | |
| | 66,000 | | | 4.050%, 7/1/2023 | | | 70,110 | |
| | 80,000 | | | 5.300%, 7/1/2043 | | | 90,322 | |
| | | | Kinder Morgan Energy Partners, LP | | | | |
| | 135,000 | | | 3.500%, 3/1/2021 | | | 138,775 | |
| | | | MidAmerican Energy Holdings Company | | | | |
| | 276,000 | | | 6.500%, 9/15/2037 | | | 375,664 | |
| | | | Monongahela Power Company | | | | |
| | 150,000 | | | 5.400%, 12/15/2043d | | | 186,041 | |
| | | | National Rural Utilities Cooperative Finance Corporation | | | | |
| | 175,000 | | | 2.300%, 11/1/2020 | | | 178,165 | |
| | | | NextEra Energy Capital Holdings, Inc. | | | | |
| | 115,000 | | | 2.300%, 4/1/2019 | | | 116,602 | |
| | | | NiSource Finance Corporation | | | | |
| | 255,000 | | | 5.650%, 2/1/2045 | | | 316,243 | |
| | | | Northern States Power Company | | | | |
| | 225,000 | | | 4.125%, 5/15/2044 | | | 245,737 | |
| | | | NRG Energy, Inc. | | | | |
| | 315,000 | | | 6.625%, 3/15/2023 | | | 314,212 | |
| | | | Pacific Gas & Electric Company | | | | |
| | 138,000 | | | 4.250%, 3/15/2046 | | | 149,700 | |
| | | | PG&E Corporation | | | | |
| | 75,000 | | | 2.400%, 3/1/2019 | | | 76,217 | |
| | | | PPL Capital Funding, Inc. | | | | |
| | 78,000 | | | 3.500%, 12/1/2022 | | | 82,161 | |
| | 225,000 | | | 5.000%, 3/15/2044 | | | 250,357 | |
| | | | Regency Energy Partners, LP | | | | |
| | 160,000 | | | 5.875%, 3/1/2022 | | | 179,195 | |
| | | | Sempra Energy | | | | |
| | 250,000 | | | 6.150%, 6/15/2018 | | | 267,254 | |
| | 75,000 | | | 2.400%, 3/15/2020 | | | 76,168 | |
| | | | Southern California Edison Company | | | | |
| | 45,000 | | | 2.400%, 2/1/2022 | | | 45,729 | |
| | | | Southern Company | | | | |
| | 185,000 | | | 1.850%, 7/1/2019 | | | 186,070 | |
| | 185,000 | | | 4.400%, 7/1/2046 | | | 195,383 | |
| | | | Southwestern Electric Power Company | | | | |
| | 65,000 | | | 3.900%, 4/1/2045 | | | 63,270 | |
| | | | TransAlta Corporation | | | | |
| | 182,000 | | | 1.900%, 6/3/2017 | | | 181,793 | |
| | | | Williams Partners, LP | | | | |
| | 185,000 | | | 5.100%, 9/15/2045 | | | 177,778 | |
| | | | | |
| | | | Total | | | 8,707,537 | |
| | | | | |
| | | | | | | | |
| | | | | |
| | | | Total Long-Term Fixed Income (cost $326,212,828) | | | 330,203,862 | |
| | | | | |
| | |
| Shares | | | Registered Investment Companies (32.5%) | | Value | |
| Affiliated Equity Holdings (15.8%) | | | | |
| | 2,428,665 | | | Thrivent Large Cap Growth Fund | | | 21,833,703 | |
| | 41,223 | | | Thrivent Large Cap Stock Fund | | | 1,030,981 | |
| | 2,491,385 | | | Thrivent Large Cap Value Fund | | | 48,731,496 | |
| | 539,082 | | | Thrivent Mid Cap Stock Fund | | | 12,937,979 | |
| | 3,412,488 | | | Thrivent Partner Worldwide Allocation Fund | | | 33,135,261 | |
| | 202,436 | | | Thrivent Small Cap Stock Fund | | | 4,186,370 | |
| | | | | |
| | | | Total | | | 121,855,790 | |
| | | | | |
| |
| Affiliated Fixed Income Holdings (15.9%) | | | | |
| | 4,252,869 | | | Thrivent High Yield Fund | | | 20,243,656 | |
| | 7,082,374 | | | Thrivent Income Fund | | | 65,511,956 | |
| | 2,980,454 | | | Thrivent Limited Maturity Bond Fund | | | 37,196,061 | |
| | | | | |
| | | | Total | | | 122,951,673 | |
| | | | | |
| |
| Equity Funds/ETFs (0.4%) | | | | |
| | 418 | | | iShares Russell 2000 Growth Index Fund | | | 58,466 | |
| | 1,748 | | | iShares Russell 2000 Index Fund | | | 207,138 | |
| | 440 | | | iShares Russell 2000 Value Index Fund | | | 44,651 | |
| | 1,450 | | | Materials Select Sector SPDR Fund | | | 67,788 | |
| | 13,902 | | | SPDR S&P 500 ETF Trust | | | 2,954,870 | |
| | 1,821 | | | SPDR S&P Biotech ETF | | | 102,249 | |
| | 100 | | | SPDR S&P MidCap 400 ETF Trust | | | 27,477 | |
| | | | | |
| | | | Total | | | 3,462,639 | |
| | | | | |
| |
| Fixed Income Funds/ETFs (0.4%) | | | | |
| | 16,000 | | | iShares Barclays 1-3 Year Credit Bond Fund | | | 1,688,800 | |
| | 8,000 | | | iShares iBoxx $ Investment Grade Corporate Bond ETF | | | 967,840 | |
| | | | | |
| | | | Total | | | 2,656,640 | |
| | | | | |
| | | | | | | | |
| | | | | |
| | | | Total Registered Investment Companies (cost $205,181,879) | | | 250,926,742 | |
| | | | | |
| | |
| Shares | | | Common Stock (16.3%) | | Value | |
| Consumer Discretionary (1.9%) | | | | |
| | 4,785 | | | Aaron’s, Inc. | | | 118,237 | |
| | 428 | | | Adient plcj | | | 19,478 | |
| | 1,705 | | | Amazon.com, Inc.j | | | 1,346,643 | |
| | 740 | | | American Axle & Manufacturing Holdings, Inc.j | | | 13,261 | |
| | 1,104 | | | American Public Education, Inc.j | | | 22,246 | |
| | 1,975 | | | Aramark | | | 73,529 | |
| | 600 | | | Armstrong Flooring, Inc.j | | | 9,714 | |
| | 710 | | | Ascent Capital Group, Inc.j | | | 14,470 | |
| | 355 | | | AutoZone, Inc.j | | | 263,467 | |
| | 3,510 | | | Barnes & Noble, Inc. | | | 36,153 | |
| | 1,430 | | | Beazer Homes USA, Inc.j | | | 14,629 | |
| | 310 | | | Bed Bath & Beyond, Inc. | | | 12,530 | |
| | 750 | | | Big 5 Sporting Goods Corporation | | | 11,625 | |
| | 2,220 | | | Bloomin’ Brands, Inc. | | | 38,406 | |
| | 2,860 | | | BorgWarner, Inc. | | | 102,502 | |
| | 5,669 | | | Brunswick Corporation | | | 246,601 | |
| | 80 | | | Buffalo Wild Wings, Inc.j | | | 11,652 | |
| | 1,102 | | | Burlington Stores, Inc.j | | | 82,584 | |
| | 2,660 | | | Caleres, Inc. | | | 66,527 | |
| | 3,110 | | | Callaway Golf Company | | | 31,753 | |
| | 4,060 | | | Carter’s, Inc. | | | 350,540 | |
| | 1,495 | | | Cedar Fair, LP | | | 84,991 | |
| | 1,150 | | | Cheesecake Factory, Inc. | | | 61,168 | |
| | 420 | | | Chuy’s Holdings, Inc.j | | | 11,928 | |
| | 1,590 | | | Cinemark Holdings, Inc. | | | 63,282 | |
| | 700 | | | ClubCorp Holdings, Inc. | | | 8,085 | |
| | 21,110 | | | Comcast Corporation | | | 1,305,020 | |
| | 3,982 | | | Core-Mark Holding Company, Inc. | | | 140,764 | |
| | 1,725 | | | CSS Industries, Inc. | | | 43,297 | |
| | 2,208 | | | Culp, Inc. | | | 61,824 | |
| | 5,530 | | | Dana, Inc. | | | 85,604 | |
| | 330 | | | Deckers Outdoor Corporationj | | | 17,223 | |
| | 6,928 | | | Delphi Automotive plc | | | 450,805 | |
| | 950 | | | DeVry Education Group, Inc. | | | 21,565 | |
The accompanying Notes to Financial Statements are an integral part of this schedule.
67
MODERATELY CONSERVATIVE ALLOCATION FUND
Schedule of Investments as of October 31, 2016
| | | | | | | | |
| Shares | | | Common Stock (16.3%) | | Value | |
| Consumer Discretionary (1.9%) - continued | | | | |
| | 836 | | | Discovery Communications, Inc., Class Aj | | | $21,828 | |
| | 1,850 | | | Dish DBS Corporationj | | | 108,336 | |
| | 2,440 | | | Dollar General Corporation | | | 168,580 | |
| | 3,950 | | | Dollar Tree, Inc.j | | | 298,422 | |
| | 990 | | | Domino’s Pizza, Inc. | | | 167,548 | |
| | 4,480 | | | DSW, Inc. | | | 93,050 | |
| | 1,940 | | | Duluth Holdings, Inc.j | | | 52,671 | |
| | 1,660 | | | Etsy, Inc.j | | | 21,547 | |
| | 1,097 | | | Expedia, Inc. | | | 141,765 | |
| | 2,440 | | | Finish Line, Inc. | | | 48,044 | |
| | 3,150 | | | Gentex Corporation | | | 53,266 | |
| | 2,001 | | | G-III Apparel Group, Ltd.j | | | 52,266 | |
| | 5,840 | | | GNC Holdings, Inc. | | | 78,431 | |
| | 9,639 | | | Harley-Davidson, Inc. | | | 549,616 | |
| | 3,090 | | | Harman International Industries, Inc. | | | 246,304 | |
| | 2,351 | | | Haverty Furniture Companies, Inc. | | | 41,730 | |
| | 3,690 | | | Home Depot, Inc. | | | 450,217 | |
| | 4,150 | | | Houghton Mifflin Harcourt Companyj | | | 52,498 | |
| | 530 | | | HSN, Inc. | | | 19,981 | |
| | 450 | | | Hyatt Hotels Corporationj | | | 22,856 | |
| | 640 | | | ILG, Inc. | | | 10,483 | |
| | 350 | | | International Speedway Corporation | | | 11,515 | |
| | 1,810 | | | Interpublic Group of Companies, Inc. | | | 40,526 | |
| | 530 | | | Jack in the Box, Inc. | | | 49,677 | |
| | 1,000 | | | John Wiley and Sons, Inc. | | | 51,600 | |
| | 2,207 | | | Kate Spade & Companyj | | | 36,967 | |
| | 1,060 | | | L Brands, Inc. | | | 76,521 | |
| | 4,898 | | | Las Vegas Sands Corporation | | | 283,496 | |
| | 2,160 | | | La-Z-Boy, Inc. | | | 50,544 | |
| | 6,890 | | | Liberty Interactive Corporationj | | | 127,396 | |
| | 562 | | | Lithia Motors, Inc. | | | 48,208 | |
| | 7,450 | | | LKQ Corporationj | | | 240,486 | |
| | 8,100 | | | Lowe’s Companies, Inc. | | | 539,865 | |
| | 190 | | | Lululemon Athletica, Inc.j | | | 10,878 | |
| | 760 | | | Masonite International Corporationj | | | 43,244 | |
| | 2,928 | | | MDC Partners, Inc. | | | 24,742 | |
| | 860 | | | Meredith Corporation | | | 39,001 | |
| | 320 | | | Meritage Homes Corporationj | | | 9,904 | |
| | 120 | | | Mohawk Industries, Inc.j | | | 22,116 | |
| | 220 | | | Monro Muffler Brake, Inc. | | | 12,100 | |
| | 190 | | | Murphy USA, Inc.j | | | 13,068 | |
| | 1,363 | | | New Media Investment Group, Inc. | | | 19,627 | |
| | 920 | | | New York Times Company | | | 10,028 | |
| | 6,240 | | | Newell Brands, Inc. | | | 299,645 | |
| | 3,190 | | | News Corporation, Class A | | | 38,663 | |
| | 870 | | | News Corporation, Class B | | | 10,788 | |
| | 1,783 | | | Nord Anglia Education, Inc.j | | | 38,406 | |
| | 8,376 | | | Nutrisystem, Inc. | | | 265,519 | |
| | 450 | | | O’Reilly Automotive, Inc.j | | | 118,998 | |
| | 2,761 | | | Oxford Industries, Inc. | | | 173,170 | |
| | 1,640 | | | Papa John’s International, Inc. | | | 123,738 | |
| | 2,393 | | | Papa Murphy’s Holdings, Inc.j | | | 13,305 | |
| | 1,900 | | | Penn National Gaming, Inc.j | | | 24,567 | |
| | 380 | | | Priceline Group, Inc.j | | | 560,207 | |
| | 2,570 | | | PVH Corporation | | | 274,939 | |
| | 650 | | | Ralph Lauren Corporation | | | 63,765 | |
| | 880 | | | Rent-A-Center, Inc. | | | 8,879 | |
| | 291 | | | Restoration Hardware Holdings, Inc.j | | | 8,430 | |
| | 1,010 | | | Retailmenot, Inc.j | | | 9,141 | |
| | 5,120 | | | Ross Stores, Inc. | | | 320,205 | |
| | 900 | | | Royal Caribbean Cruises, Ltd. | | | 69,183 | |
| | 1,750 | | | Ruth’s Hospitality Group, Inc. | | | 27,737 | |
| | 2,000 | | | Sally Beauty Holdings, Inc.j | | | 51,880 | |
| | 4,540 | | | Scripps Networks Interactive, Inc. | | | 292,194 | |
| | 630 | | | Select Comfort Corporationj | | | 12,090 | |
| | 870 | | | Signet Jewelers, Ltd. | | | 70,696 | |
| | 1,607 | | | Sportsman’s Warehouse Holdings, Inc.j | | | 14,784 | |
| | 3,720 | | | Starbucks Corporation | | | 197,420 | |
| | 2,958 | | | Stein Mart, Inc. | | | 17,807 | |
| | 730 | | | Steven Madden, Ltd.j | | | 24,382 | |
| | 1,750 | | | Tegna, Inc. | | | 34,335 | |
| | 1,100 | | | Tempur-Pedic International, Inc.j | | | 59,477 | |
| | 466 | | | Tenneco, Inc.j | | | 25,663 | |
| | 3,714 | | | Time, Inc. | | | 48,282 | |
| | 7,490 | | | TJX Companies, Inc. | | | 552,387 | |
| | 5,910 | | | Toll Brothers, Inc.j | | | 162,170 | |
| | 4,667 | | | Tower International, Inc. | | | 101,274 | |
| | 7,448 | | | Tuesday Morning Corporationj | | | 36,868 | |
| | 190 | | | Tupperware Brands Corporation | | | 11,309 | |
| | 290 | | | Ulta Salon Cosmetics & Fragrance, Inc.j | | | 70,569 | |
| | 890 | | | Under Armour, Inc., Class Aj | | | 27,679 | |
| | 896 | | | Under Armour, Inc., Class Cj | | | 23,171 | |
| | 436 | | | Vail Resorts, Inc. | | | 69,516 | |
| | 2,190 | | | Vera Bradley, Inc.j | | | 29,280 | |
| | 1,280 | | | VF Corporation | | | 69,389 | |
| | 530 | | | Visteon Corporation | | | 37,423 | |
| | 1,410 | | | Vitamin Shoppe, Inc.j | | | 35,321 | |
| | 2,350 | | | Walt Disney Company | | | 217,821 | |
| | 350 | | | Whirlpool Corporation | | | 52,437 | |
| | 1,310 | | | Wingstop, Inc. | | | 35,056 | |
| | 3,070 | | | Yum! Brands, Inc. | | | 264,880 | |
| | 1,528 | | | Zoe’s Kitchen, Inc.j | | | 34,640 | |
| | | | | |
| | | | Total | | | 14,832,536 | |
| | | | | |
| |
| Consumer Staples (0.7%) | | | | |
| | 1,418 | | | AdvancePierre Foods Holdings, Inc. | | | 39,647 | |
| | 2,360 | | | Brown-Forman Corporation | | | 108,961 | |
| | 3,360 | | | Campbell Soup Company | | | 182,582 | |
| | 893 | | | Casey’s General Stores, Inc. | | | 100,900 | |
| | 15,060 | | | Coca-Cola Company | | | 638,544 | |
| | 11,780 | | | CVS Health Corporation | | | 990,698 | |
| | 274 | | | e.l.f. Beauty, Inc.j | | | 7,086 | |
| | 4,130 | | | Estee Lauder Companies, Inc. | | | 359,847 | |
| | 2,980 | | | Flowers Foods, Inc. | | | 46,250 | |
| | 1,340 | | | General Mills, Inc. | | | 83,053 | |
| | 3,390 | | | Hain Celestial Group, Inc.j | | | 123,294 | |
| | 800 | | | Ingredion, Inc. | | | 104,936 | |
| | 423 | | | J & J Snack Foods Corporation | | | 51,670 | |
| | 1,630 | | | Kimberly-Clark Corporation | | | 186,488 | |
| | 250 | | | Lancaster Colony Corporation | | | 32,663 | |
| | 1,620 | | | Monster Beverage Corporationj | | | 233,831 | |
| | 1,730 | | | PepsiCo, Inc. | | | 185,456 | |
| | 3,243 | | | Philip Morris International, Inc. | | | 312,755 | |
| | 8,550 | | | Pinnacle Foods, Inc. | | | 439,641 | |
| | 2,700 | | | Procter & Gamble Company | | | 234,360 | |
| | 3,451 | | | SpartanNash Company | | | 96,628 | |
| | 1,530 | | | United Natural Foods, Inc.j | | | 63,862 | |
| | 180 | | | Universal Corporation | | | 9,756 | |
| | 2,560 | | | Walgreens Boots Alliance, Inc. | | | 211,789 | |
| | 3,060 | | | WhiteWave Foods Companyj | | | 166,739 | |
| | | | | |
| | | | Total | | | 5,011,436 | |
| | | | | |
| |
| Energy (2.5%) | | | | |
| | 1,030 | | | Anadarko Petroleum Corporation | | | 61,223 | |
| | 8,002 | | | Arch Coal, Inc.g,j | | | 587,187 | |
| | 10,071 | | | Archrock, Inc. | | | 116,824 | |
| | 2,994 | | | Atwood Oceanics, Inc. | | | 22,844 | |
| | 9,092 | | | Baker Hughes, Inc. | | | 503,697 | |
| | 2,431 | | | Bristow Group, Inc. | | | 24,334 | |
| | 16,333 | | | Callon Petroleum Companyj | | | 212,166 | |
The accompanying Notes to Financial Statements are an integral part of this schedule.
68
MODERATELY CONSERVATIVE ALLOCATION FUND
Schedule of Investments as of October 31, 2016
| | | | | | | | |
| Shares | | | Common Stock (16.3%) | | Value | |
| Energy (2.5%) - continued | | | | |
| | 20,619 | | | Canadian Natural Resources, Ltd. | | | $653,828 | |
| | 19,915 | | | Chevron Corporation | | | 2,086,096 | |
| | 2,615 | | | Cimarex Energy Company | | | 337,675 | |
| | 7,530 | | | Clean Energy Fuels Corporationj | | | 30,948 | |
| | 5,509 | | | Concho Resources, Inc.j | | | 699,312 | |
| | 11,610 | | | ConocoPhillips | | | 504,454 | |
| | 7,270 | | | Continental Resources, Inc.j | | | 355,576 | |
| | 931 | | | Contura Energy, Inc.j | | | 61,679 | |
| | 3,150 | | | Delek US Holdings, Inc. | | | 53,235 | |
| | 8,320 | | | Devon Energy Corporation | | | 315,245 | |
| | 1,800 | | | Diamond Offshore Drilling, Inc. | | | 29,682 | |
| | 288 | | | Diamondback Energy, Inc.j | | | 26,292 | |
| | 9,334 | | | Ensco plc | | | 72,992 | |
| | 10,547 | | | EOG Resources, Inc. | | | 953,660 | |
| | 3,080 | | | EP Energy Corporationj | | | 10,965 | |
| | 16,047 | | | EQT Corporation | | | 1,059,102 | |
| | 10,840 | | | Exxon Mobil Corporation | | | 903,189 | |
| | 2,330 | | | Frank’s International NV | | | 26,213 | |
| | 2,170 | | | Green Plains, Inc. | | | 56,420 | |
| | 480 | | | Gulfport Energy Corporationj | | | 11,573 | |
| | 29,680 | | | Halliburton Company | | | 1,365,280 | |
| | 1,250 | | | HollyFrontier Corporation | | | 31,187 | |
| | 3,660 | | | Hornbeck Offshore Services, Inc.j | | | 14,530 | |
| | 1,350 | | | Kinder Morgan, Inc. | | | 27,580 | |
| | 34,531 | | | Marathon Oil Corporation | | | 455,119 | |
| | 670 | | | Murphy Oil Corporation | | | 17,333 | |
| | 24,270 | | | Nabors Industries, Ltd. | | | 288,813 | |
| | 580 | | | Newfield Exploration Companyj | | | 23,542 | |
| | 570 | | | Noble Energy, Inc. | | | 19,648 | |
| | 3,789 | | | Oasis Petroleum, Inc.j | | | 39,747 | |
| | 710 | | | Oceaneering International, Inc. | | | 16,898 | |
| | 930 | | | Oil States International, Inc.j | | | 27,202 | |
| | 5,527 | | | Parsley Energy, Inc.j | | | 181,838 | |
| | 12,130 | | | Patterson-UTI Energy, Inc. | | | 272,682 | |
| | 160 | | | PDC Energy, Inc.j | | | 9,813 | |
| | 880 | | | Phillips 66 | | | 71,412 | |
| | 6,425 | | | Pioneer Energy Services Corporationj | | | 22,809 | |
| | 5,560 | | | Pioneer Natural Resources Company | | | 995,351 | |
| | 1,810 | | | Rowan Companies plc | | | 24,019 | |
| | 11,652 | | | Royal Dutch Shell plc ADR | | | 580,386 | |
| | 4,090 | | | RPC, Inc. | | | 70,634 | |
| | 770 | | | RSP Permian, Inc.j | | | 27,797 | |
| | 14,937 | | | Schlumberger, Ltd. | | | 1,168,522 | |
| | 1,590 | | | SemGroup Corporation | | | 51,277 | |
| | 465 | | | SM Energy Company | | | 15,638 | |
| | 33,291 | | | Suncor Energy, Inc. ADR | | | 999,396 | |
| | 600 | | | Superior Energy Services, Inc. | | | 8,496 | |
| | 2,200 | | | Teekay Corporation | | | 14,366 | |
| | 5,153 | | | Teekay Tankers, Ltd. | | | 10,976 | |
| | 2,972 | | | Tesco Corporation | | | 20,358 | |
| | 9,300 | | | TETRA Technologies, Inc.j | | | 50,685 | |
| | 7,181 | | | U.S. Silica Holdings, Inc. | | | 331,690 | |
| | 19,420 | | | Valero Energy Corporation | | | 1,150,441 | |
| | 723 | | | Vantage Drilling Internationalj | | | 60,732 | |
| | 100,259 | | | Weatherford International plcj | | | 483,248 | |
| | 73,015 | | | WPX Energy, Inc.j | | | 792,943 | |
| | | | | |
| | | | Total | | | 19,518,799 | |
| | | | | |
| |
| Financials (2.1%) | | | | |
| | 1,700 | | | Affiliated Managers Group, Inc.j | | | 225,522 | |
| | 1,690 | | | Allied World Assurance Company Holdings AG | | | 72,636 | |
| | 540 | | | American Financial Group, Inc. | | | 40,230 | |
| | 3,570 | | | American International Group, Inc. | | | 220,269 | |
| | 3,215 | | | Ameris Bancorp | | | 116,705 | |
| | 1,170 | | | AMERISAFE, Inc. | | | 65,052 | |
| | 140 | | | Arch Capital Group, Ltd.j | | | 10,916 | |
| | 1,914 | | | Argo Group International Holdings, Ltd. | | | 106,418 | |
| | 3,260 | | | Aspen Insurance Holdings, Ltd. | | | 157,295 | |
| | 870 | | | Associated Banc-Corp | | | 17,661 | |
| | 7,970 | | | Assured Guaranty, Ltd. | | | 238,223 | |
| | 5,130 | | | BancorpSouth, Inc. | | | 120,555 | |
| | 35,660 | | | Bank of America Corporation | | | 588,390 | |
| | 4,000 | | | Bank of New York Mellon Corporation | | | 173,080 | |
| | 1,228 | | | Bank of the Ozarks, Inc. | | | 45,387 | |
| | 1,100 | | | BankFinancial Corporation | | | 13,827 | |
| | 10,200 | | | BB&T Corporation | | | 399,840 | |
| | 4,380 | | | Beneficial Bancorp, Inc. | | | 63,510 | |
| | 11,170 | | | Blackstone Group, LP | | | 279,585 | |
| | 8,370 | | | Boston Private Financial Holdings, Inc. | | | 110,066 | |
| | 4,520 | | | Brookline Bancorp, Inc. | | | 57,856 | |
| | 3,420 | | | Brown & Brown, Inc. | | | 126,061 | |
| | 2,860 | | | Capital One Financial Corporation | | | 211,754 | |
| | 13,680 | | | Capstead Mortgage Corporation | | | 130,097 | |
| | 1,450 | | | Cathay General Bancorp | | | 43,428 | |
| | 3,510 | | | Central Pacific Financial Corporation | | | 89,961 | |
| | 2,020 | | | Charles Schwab Corporation | | | 64,034 | |
| | 2,220 | | | Chemical Financial Corporation | | | 95,349 | |
| | 2,130 | | | Chubb, Ltd. | | | 270,510 | |
| | 16,210 | | | Citigroup, Inc. | | | 796,722 | |
| | 1,330 | | | Clifton Bancorp, Inc. | | | 20,336 | |
| | 10,118 | | | CoBiz Financial, Inc. | | | 128,701 | |
| | 2,289 | | | Columbia Banking System, Inc. | | | 75,583 | |
| | 7,220 | | | Comerica, Inc. | | | 376,090 | |
| | 15,930 | | | E*TRADE Financial Corporationj | | | 448,589 | |
| | 7,786 | | | East West Bancorp, Inc. | | | 307,625 | |
| | 420 | | | Eaton Vance Corporation | | | 14,725 | |
| | 2,604 | | | Employers Holdings, Inc. | | | 81,635 | |
| | 900 | | | Endurance Specialty Holdings, Ltd. | | | 82,755 | |
| | 1,470 | | | Enova International, Inc.j | | | 13,818 | |
| | 1,481 | | | Essent Group, Ltd.j | | | 39,158 | |
| | 847 | | | Evercore Partners, Inc. | | | 45,526 | |
| | 1,420 | | | F.N.B. Corporation | | | 18,559 | |
| | 2,270 | | | Federated Investors, Inc. | | | 61,290 | |
| | 18,560 | | | Fifth Third Bancorp | | | 403,866 | |
| | 940 | | | First American Financial Corporation | | | 36,716 | |
| | 6,820 | | | First Commonwealth Financial Corporation | | | 69,291 | |
| | 1,620 | | | First Financial Bancorp | | | 34,830 | |
| | 700 | | | First Financial Corporation | | | 28,070 | |
| | 560 | | | First Merchants Corporation | | | 15,764 | |
| | 11,560 | | | First Midwest Bancorp, Inc. | | | 223,224 | |
| | 860 | | | First NBC Bank Holding Companyj | | | 4,644 | |
| | 5,140 | | | First Republic Bank | | | 382,570 | |
| | 700 | | | Franklin Resources, Inc. | | | 23,562 | |
| | 2,910 | | | Genworth Financial, Inc.j | | | 12,047 | |
| | 1,980 | | | Glacier Bancorp, Inc. | | | 55,955 | |
| | 3,470 | | | Goldman Sachs Group, Inc. | | | 618,493 | |
| | 6,610 | | | Great Western Bancorp, Inc. | | | 213,106 | |
| | 4,437 | | | Green Bancorp, Inc.j | | | 45,923 | |
| | 840 | | | Greenhill & Company, Inc. | | | 19,698 | |
| | 360 | | | Hancock Holding Company | | | 12,078 | |
| | 8,414 | | | Hanmi Financial Corporation | | | 210,350 | |
| | 3,979 | | | Hanover Insurance Group, Inc. | | | 303,160 | |
| | 1,170 | | | Hartford Financial Services Group, Inc. | | | 51,609 | |
| | 5,022 | | | Home BancShares, Inc. | | | 108,023 | |
| | 420 | | | HomeStreet, Inc.j | | | 11,571 | |
| | 610 | | | Hometrust Bancshares, Inc.j | | | 11,346 | |
| | 7,133 | | | Hope Bancorp, Inc. | | | 115,127 | |
| | 2,984 | | | Horace Mann Educators Corporation | | | 107,275 | |
The accompanying Notes to Financial Statements are an integral part of this schedule.
69
MODERATELY CONSERVATIVE ALLOCATION FUND
Schedule of Investments as of October 31, 2016
| | | | | | | | |
| Shares | | | Common Stock (16.3%) | | Value | |
| Financials (2.1%) - continued | | | | |
| | 3,037 | | | Houlihan Lokey, Inc. | | | $74,012 | |
| | 14,200 | | | Huntington Bancshares, Inc. | | | 150,520 | |
| | 413 | | | Infinity Property & Casualty Corporation | | | 33,845 | |
| | 1,990 | | | Intercontinental Exchange, Inc. | | | 538,076 | |
| | 9,800 | | | Invesco, Ltd. | | | 275,282 | |
| | 10,645 | | | Janus Capital Group, Inc. | | | 136,469 | |
| | 28,690 | | | KeyCorp | | | 405,103 | |
| | 1,246 | | | Kinsale Capital Group, Inc. | | | 29,966 | |
| | 340 | | | Lazard, Ltd. | | | 12,396 | |
| | 709 | | | Lincoln National Corporation | | | 34,805 | |
| | 520 | | | LPL Financial Holdings, Inc. | | | 16,099 | |
| | 1,440 | | | M&T Bank Corporation | | | 176,731 | |
| | 40 | | | Markel Corporationj | | | 35,097 | |
| | 800 | | | Meta Financial Group, Inc. | | | 58,600 | |
| | 8,720 | | | MetLife, Inc. | | | 409,491 | |
| | 8,040 | | | Morgan Stanley | | | 269,903 | |
| | 2,710 | | | National Bank Holdings Corporation | | | 65,961 | |
| | 220 | | | Navigators Group, Inc. | | | 20,504 | |
| | 1,460 | | | NMI Holdings, Inc.j | | | 11,169 | |
| | 1,230 | | | NorthStar Realty Europe Corporation | | | 12,165 | |
| | 660 | | | Old Republic International Corporation | | | 11,128 | |
| | 1,493 | | | PacWest Bancorp | | | 64,781 | |
| | 2,760 | | | Primerica, Inc. | | | 150,972 | |
| | 230 | | | Principal Financial Group, Inc. | | | 12,558 | |
| | 210 | | | Prosperity Bancshares, Inc. | | | 11,649 | |
| | 3,370 | | | Provident Financial Services, Inc. | | | 76,465 | |
| | 4,329 | | | Raymond James Financial, Inc. | | | 260,260 | |
| | 750 | | | Redwood Trust, Inc. | | | 10,545 | |
| | 2,193 | | | Renasant Corporation | | | 73,992 | |
| | 209 | | | Safety Insurance Group, Inc. | | | 14,149 | |
| | 2,451 | | | Sandy Spring Bancorp, Inc. | | | 77,697 | |
| | 470 | | | SEI Investments Company | | | 20,835 | |
| | 550 | | | Selective Insurance Group, Inc. | | | 20,323 | |
| | 24,257 | | | SLM Corporationj | | | 171,012 | |
| | 280 | | | State Auto Financial Corporation | | | 6,412 | |
| | 2,160 | | | Stewart Information Services Corporation | | | 97,092 | |
| | 4,126 | | | Stifel Financial Corporationj | | | 161,492 | |
| | 2,598 | | | SVB Financial Groupj | | | 317,657 | |
| | 14,460 | | | Synchrony Financial | | | 413,411 | |
| | 4,450 | | | Synovus Financial Corporation | | | 147,162 | |
| | 9,710 | | | TCF Financial Corporation | | | 138,853 | |
| | 7,340 | | | TD Ameritrade Holding Corporation | | | 251,101 | |
| | 600 | | | Territorial Bancorp, Inc. | | | 17,112 | |
| | 1,440 | | | TriCo Bancshares | | | 37,901 | |
| | 10,120 | | | TrustCo Bank Corporation | | | 70,840 | |
| | 550 | | | Trustmark Corporation | | | 15,224 | |
| | 510 | | | Union Bankshares Corporation | | | 14,244 | |
| | 280 | | | United Bankshares, Inc. | | | 10,556 | |
| | 2,490 | | | United Community Banks, Inc. | | | 53,709 | |
| | 4,180 | | | United Financial Bancorp, Inc. | | | 61,488 | |
| | 270 | | | United Fire Group, Inc. | | | 10,670 | |
| | 680 | | | Unum Group | | | 24,072 | |
| | 680 | | | Virtu Financial, Inc. | | | 8,704 | |
| | 1,220 | | | Voya Financial, Inc. | | | 37,271 | |
| | 744 | | | Western Alliance Bancorpj | | | 27,796 | |
| | 739 | | | Wintrust Financial Corporation | | | 39,869 | |
| | 2,330 | | | WisdomTree Investments, Inc. | | | 19,991 | |
| | 808 | | | WSFS Financial Corporation | | | 28,320 | |
| | 20,533 | | | Zions Bancorporation | | | 661,368 | |
| | | | | |
| | | | Total | | | 16,198,502 | |
| | | | | |
| |
| Health Care (1.9%) | | | | |
| | 8,838 | | | Abbott Laboratories | | | 346,803 | |
| | 759 | | | ABIOMED, Inc.j | | | 79,687 | |
| | 1,316 | | | Acadia Healthcare Company, Inc.j | | | 47,323 | |
| | 300 | | | Acceleron Pharma, Inc.j | | | 8,409 | |
| | 450 | | | Aceto Corporation | | | 8,248 | |
| | 1,710 | | | Advaxis, Inc.j | | | 13,834 | |
| | 710 | | | Aerie Pharmaceuticals, Inc.j | | | 23,608 | |
| | 2,330 | | | Aetna, Inc. | | | 250,125 | |
| | 3,606 | | | Akorn, Inc.j | | | 86,364 | |
| | 3,240 | | | Alexion Pharmaceuticals, Inc.j | | | 422,820 | |
| | 881 | | | Align Technology, Inc.j | | | 75,696 | |
| | 2,328 | | | Allergan plcj | | | 486,412 | |
| | 1,297 | | | Amgen, Inc. | | | 183,085 | |
| | 1,524 | | | Analogic Corporation | | | 124,739 | |
| | 5,629 | | | Asterias Biotherapeutics, Inc.j | | | 18,576 | |
| | 151 | | | Atrion Corporation | | | 66,312 | |
| | 440 | | | Biogen, Inc.j | | | 123,279 | |
| | 1,770 | | | BioMarin Pharmaceutical, Inc.j | | | 142,520 | |
| | 1,340 | | | Boston Scientific Corporationj | | | 29,480 | |
| | 1,120 | | | Bristol-Myers Squibb Company | | | 57,019 | |
| | 592 | | | C.R. Bard, Inc. | | | 128,275 | |
| | 1,557 | | | Cardiovascular Systems, Inc.j | | | 36,481 | |
| | 4,280 | | | Catalent, Inc.j | | | 97,627 | |
| | 4,960 | | | Celgene Corporationj | | | 506,813 | |
| | 2,310 | | | Centene Corporationj | | | 144,329 | |
| | 220 | | | Charles River Laboratories International, Inc.j | | | 16,694 | |
| | 800 | | | Chemed Corporation | | | 113,136 | |
| | 370 | | | Coherus Biosciences, Inc.j | | | 10,120 | |
| | 760 | | | CONMED Corporation | | | 30,400 | |
| | 2,810 | | | Cooper Companies, Inc. | | | 494,672 | |
| | 780 | | | Cross Country Healthcare, Inc.j | | | 8,713 | |
| | 7,550 | | | Dentsply Sirona, Inc. | | | 434,653 | |
| | 1,490 | | | Dexcom, Inc.j | | | 116,578 | |
| | 5,460 | | | Edwards Lifesciences Corporationj | | | 519,901 | |
| | 370 | | | Emergent Biosolutions, Inc.j | | | 9,886 | |
| | 4,128 | | | Ensign Group, Inc. | | | 76,244 | |
| | 5,800 | | | Envision Healthcare Holdings, Inc.j | | | 114,724 | |
| | 5,030 | | | Express Scripts Holding Companyj | | | 339,022 | |
| | 11,134 | | | Gilead Sciences, Inc. | | | 819,796 | |
| | 700 | | | Global Blood Therapeutics, Inc.j | | | 12,215 | |
| | 600 | | | Globus Medical, Inc.j | | | 13,278 | |
| | 320 | | | Halyard Health, Inc.j | | | 10,352 | |
| | 2,260 | | | HCA Holdings, Inc.j | | | 172,958 | |
| | 622 | | | HealthEquity, Inc.j | | | 20,669 | |
| | 1,390 | | | Healthways, Inc.j | | | 34,472 | |
| | 860 | | | Heska Corporationj | | | 42,484 | |
| | 1,300 | | | Hill-Rom Holdings, Inc. | | | 72,033 | |
| | 6,290 | | | Hologic, Inc.j | | | 226,503 | |
| | 720 | | | ICU Medical, Inc.j | | | 100,296 | |
| | 583 | | | Impax Laboratories, Inc.j | | | 11,718 | |
| | 1,188 | | | Inogen, Inc.j | | | 63,760 | |
| | 2,288 | | | Intersect ENT, Inc.j | | | 33,405 | |
| | 320 | | | Intra-Cellular Therapies, Inc.j | | | 3,968 | |
| | 1,322 | | | Ironwood Pharmaceuticals, Inc.j | | | 16,882 | |
| | 8,460 | | | Johnson & Johnson | | | 981,275 | |
| | 5,200 | | | Kindred Healthcare, Inc. | | | 51,220 | |
| | 2,100 | | | Magellan Health Services, Inc.j | | | 108,045 | |
| | 7,915 | | | Medtronic plc | | | 649,188 | |
| | 14,270 | | | Merck & Company, Inc. | | | 837,934 | |
| | 410 | | | Mettler-Toledo International, Inc.j | | | 165,673 | |
| | 3,570 | | | Mylan NVj | | | 130,305 | |
| | 1,117 | | | National Healthcare Corporation | | | 72,270 | |
| | 320 | | | Natural Health Trends Corporation | | | 7,466 | |
| | 230 | | | Neogen Corporationj | | | 12,119 | |
| | 1,478 | | | Neurocrine Biosciences, Inc.j | | | 64,692 | |
| | 951 | | | Nevro Corporationj | | | 87,416 | |
| | 3,443 | | | NuVasive, Inc.j | | | 205,650 | |
The accompanying Notes to Financial Statements are an integral part of this schedule.
70
MODERATELY CONSERVATIVE ALLOCATION FUND
Schedule of Investments as of October 31, 2016
| | | | | | | | |
| Shares | | | Common Stock (16.3%) | | Value | |
| Health Care (1.9%) - continued | | | | |
| | 3,370 | | | Omnicell, Inc.j | | | $109,946 | |
| | 8,970 | | | OraSure Technologies, Inc.j | | | 67,365 | |
| | 1,120 | | | Orthofix International NVj | | | 41,048 | |
| | 3,270 | | | PDL BioPharma, Inc. | | | 10,529 | |
| | 1,920 | | | PerkinElmer, Inc. | | | 97,709 | |
| | 1,520 | | | Perrigo Company plc | | | 126,449 | |
| | 30,180 | | | Pfizer, Inc. | | | 957,008 | |
| | 1,130 | | | PharMerica Corporationj | | | 26,894 | |
| | 200 | | | Prothena Corporation plcj | | | 9,564 | |
| | 450 | | | ResMed, Inc. | | | 26,896 | |
| | 5,880 | | | Roche Holding AG ADR | | | 168,609 | |
| | 360 | | | Surgical Care Affiliates, Inc.j | | | 15,404 | |
| | 2,874 | | | Team Health Holdings, Inc.j | | | 123,151 | |
| | 2,034 | | | Teleflex, Inc. | | | 291,126 | |
| | 1,724 | | | Triple-S Management Corporationj | | | 35,652 | |
| | 5,670 | | | UnitedHealth Group, Inc. | | | 801,341 | |
| | 2,580 | | | Universal Health Services, Inc. | | | 311,432 | |
| | 710 | | | VCA Antech, Inc.j | | | 43,637 | |
| | 1,635 | | | Veeva Systems, Inc.j | | | 63,520 | |
| | 4,480 | | | Vertex Pharmaceuticals, Inc.j | | | 339,853 | |
| | 450 | | | Waters Corporationj | | | 62,613 | |
| | 160 | | | Wellcare Health Plans, Inc.j | | | 18,162 | |
| | 1,550 | | | West Pharmaceutical Services, Inc. | | | 117,846 | |
| | 2,970 | | | Wright Medical Group NVj | | | 65,073 | |
| | 1,870 | | | Ziopharm Oncology, Inc.j | | | 10,622 | |
| | 2,720 | | | Zoetis, Inc. | | | 130,016 | |
| | | | | |
| | | | Total | | | 14,892,114 | |
| | | | | |
| |
| Industrials (1.9%) | | | | |
| | 2,050 | | | ABM Industries, Inc. | | | 80,114 | |
| | 2,789 | | | Aegion Corporationj | | | 51,624 | |
| | 750 | | | Aerovironment, Inc.j | | | 17,993 | |
| | 1,150 | | | AGCO Corporation | | | 58,742 | |
| | 390 | | | Allison Transmission Holdings, Inc. | | | 11,423 | |
| | 4,630 | | | Ardmore Shipping Corporation | | | 27,086 | |
| | 1,172 | | | Astec Industries, Inc. | | | 64,882 | |
| | 3,100 | | | AZZ, Inc. | | | 165,075 | |
| | 3,110 | | | B/E Aerospace, Inc. | | | 185,107 | |
| | 3,170 | | | Barnes Group, Inc. | | | 126,293 | |
| | 2,180 | | | Boeing Company | | | 310,497 | |
| | 520 | | | Brady Corporation | | | 17,212 | |
| | 11,720 | | | BWX Technologies, Inc. | | | 459,658 | |
| | 3,670 | | | Carlisle Companies, Inc. | | | 384,799 | |
| | 880 | | | CBIZ, Inc.j | | | 9,724 | |
| | 850 | | | CEB, Inc. | | | 41,352 | |
| | 1,198 | | | CIRCOR International, Inc. | | | 64,428 | |
| | 1,333 | | | CLARCOR, Inc. | | | 82,926 | |
| | 650 | | | Colfax Corporationj | | | 20,664 | |
| | 2,646 | | | Comfort Systems USA, Inc. | | | 76,337 | |
| | 879 | | | Commercial Vehicle Group, Inc.j | | | 3,991 | |
| | 3,470 | | | Copart, Inc.j | | | 182,071 | |
| | 400 | | | Crane Company | | | 27,204 | |
| | 8,570 | | | CSX Corporation | | | 261,471 | |
| | 3,440 | | | Cummins, Inc. | | | 439,701 | |
| | 1,140 | | | Curtiss-Wright Corporation | | | 102,167 | |
| | 16,020 | | | Delta Air Lines, Inc. | | | 669,155 | |
| | 170 | | | Deluxe Corporation | | | 10,404 | |
| | 5,970 | | | Donaldson Company, Inc. | | | 218,024 | |
| | 2,032 | | | EMCOR Group, Inc. | | | 122,855 | |
| | 869 | | | Encore Wire Corporation | | | 29,676 | |
| | 2,510 | | | EnerSys | | | 163,476 | |
| | 565 | | | Equifax, Inc. | | | 70,043 | |
| | 1,818 | | | ESCO Technologies, Inc. | | | 80,992 | |
| | 4,135 | | | Federal Signal Corporation | | | 50,778 | |
| | 230 | | | Flowserve Corporation | | | 9,740 | |
| | 1,240 | | | Fluor Corporation | | | 64,468 | |
| | 790 | | | Fortive Corporation | | | 40,330 | |
| | 1,770 | | | Fortune Brands Home and Security, Inc. | | | 96,695 | |
| | 1,681 | | | Franklin Electric Company, Inc. | | | 61,272 | |
| | 1,310 | | | GasLog, Ltd. | | | 20,109 | |
| | 2,540 | | | Gener8 Maritime, Inc.j | | | 10,719 | |
| | 380 | | | Genesee & Wyoming, Inc.j | | | 25,817 | |
| | 2,359 | | | Gibraltar Industries, Inc.j | | | 91,765 | |
| | 3,878 | | | Granite Construction, Inc. | | | 190,642 | |
| | 440 | | | Greenbrier Companies, Inc. | | | 13,860 | |
| | 750 | | | Hackett Group, Inc. | | | 12,090 | |
| | 6,250 | | | Harsco Corporation | | | 60,937 | |
| | 300 | | | HD Supply Holdings, Inc.j | | | 9,900 | |
| | 1,093 | | | Healthcare Services Group, Inc. | | | 40,408 | |
| | 1,082 | | | Heico Corporation | | | 73,100 | |
| | 1,430 | | | Herman Miller, Inc. | | | 39,754 | |
| | 1,950 | | | Hexcel Corporation | | | 88,706 | |
| | 3,123 | | | Honeywell International, Inc. | | | 342,531 | |
| | 604 | | | Hub Group, Inc.j | | | 22,016 | |
| | 2,130 | | | Hubbell, Inc. | | | 222,628 | |
| | 700 | | | Huntington Ingalls Industries, Inc. | | | 112,952 | |
| | 391 | | | Huron Consulting Group, Inc.j | | | 21,916 | |
| | 738 | | | ICF International, Inc.j | | | 34,243 | |
| | 9,160 | | | Ingersoll-Rand plc | | | 616,376 | |
| | 1,230 | | | Insperity, Inc. | | | 92,496 | |
| | 400 | | | Insteel Industries, Inc. | | | 10,760 | |
| | 540 | | | Interface, Inc. | | | 8,559 | |
| | 760 | | | ITT Corporation | | | 26,767 | |
| | 1,360 | | | Jacobs Engineering Group, Inc.j | | | 70,149 | |
| | 1,340 | | | JB Hunt Transport Services, Inc. | | | 109,357 | |
| | 4,288 | | | Johnson Controls International plc | | | 172,892 | |
| | 350 | | | Kansas City Southern | | | 30,716 | |
| | 9,140 | | | Kennametal, Inc. | | | 258,753 | |
| | 2,652 | | | Kforce, Inc. | | | 46,012 | |
| | 1,620 | | | Kirby Corporationj | | | 95,499 | |
| | 1,360 | | | Knight Transportation, Inc. | | | 39,780 | |
| | 6,070 | | | Korn/Ferry International | | | 123,767 | |
| | 5,700 | | | Lincoln Electric Holdings, Inc. | | | 375,231 | |
| | 640 | | | Lindsay Corporation | | | 50,112 | |
| | 520 | | | Manpower, Inc. | | | 39,936 | |
| | 3,100 | | | Masco Corporation | | | 95,728 | |
| | 6,170 | | | Meritor, Inc.j | | | 63,428 | |
| | 690 | | | Middleby Corporationj | | | 77,356 | |
| | 2,130 | | | Moog, Inc.j | | | 123,689 | |
| | 1,590 | | | MRC Global, Inc.j | | | 23,437 | |
| | 1,896 | | | MSA Safety, Inc. | | | 110,537 | |
| | 350 | | | Mueller Industries, Inc. | | | 10,601 | |
| | 2,250 | | | MYR Group, Inc.j | | | 67,140 | |
| | 4,107 | | | Navigant Consulting, Inc.j | | | 96,104 | |
| | 1,490 | | | NCI Building Systems, Inc.j | | | 21,456 | |
| | 1,700 | | | Nielsen Holdings plc | | | 76,534 | |
| | 924 | | | Nordson Corporation | | | 92,520 | |
| | 2,600 | | | Norfolk Southern Corporation | | | 241,800 | |
| | 200 | | | Northrop Grumman Corporation | | | 45,800 | |
| | 1,160 | | | Old Dominion Freight Line, Inc.j | | | 86,629 | |
| | 1,287 | | | On Assignment, Inc.j | | | 44,286 | |
| | 4,864 | | | Oshkosh Corporation | | | 260,224 | |
| | 180 | | | Parker Hannifin Corporation | | | 22,095 | |
| | 880 | | | Pentair, Ltd. | | | 48,514 | |
| | 2,285 | | | PGT, Inc.j | | | 22,393 | |
| | 1,363 | | | Proto Labs, Inc.j | | | 60,926 | |
| | 810 | | | Quanex Building Products Corporation | | | 13,203 | |
| | 4,800 | | | Raven Industries, Inc. | | | 102,960 | |
| | 4,170 | | | Raytheon Company | | | 569,664 | |
| | 150 | | | RBC Bearings, Inc.j | | | 10,703 | |
| | 480 | | | Regal-Beloit Corporation | | | 28,368 | |
The accompanying Notes to Financial Statements are an integral part of this schedule.
71
MODERATELY CONSERVATIVE ALLOCATION FUND
Schedule of Investments as of October 31, 2016
| | | | | | | | |
| Shares | | | Common Stock (16.3%) | | Value | |
| Industrials (1.9%) - continued | | | | |
| | 2,440 | | | Resources Connection, Inc. | | | $36,234 | |
| | 970 | | | Rexnord Corporationj | | | 19,293 | |
| | 1,190 | | | Rockwell Automation, Inc. | | | 142,467 | |
| | 2,060 | | | Rockwell Collins, Inc. | | | 173,699 | |
| | 390 | | | Rollins, Inc. | | | 12,020 | |
| | 950 | | | Roper Industries, Inc. | | | 164,644 | |
| | 320 | | | Ryder System, Inc. | | | 22,205 | |
| | 2,488 | | | Saia, Inc.j | | | 88,697 | |
| | 10,990 | | | Southwest Airlines Company | | | 440,149 | |
| | 1,800 | | | SPX FLOW, Inc.j | | | 45,162 | |
| | 190 | | | Stanley Black & Decker, Inc. | | | 21,630 | |
| | 2,021 | | | Tennant Company | | | 127,222 | |
| | 840 | | | Tetra Tech, Inc. | | | 32,298 | |
| | 1,104 | | | Textron, Inc. | | | 44,248 | |
| | 550 | | | Toro Company | | | 26,334 | |
| | 4,130 | | | TransUnionj | | | 129,021 | |
| | 350 | | | TrueBlue, Inc.j | | | 6,125 | |
| | 10,176 | | | Union Pacific Corporation | | | 897,320 | |
| | 3,730 | | | United Continental Holdings, Inc.j | | | 209,738 | |
| | 4,010 | | | United Parcel Service, Inc. | | | 432,118 | |
| | 1,840 | | | United Rentals, Inc.j | | | 139,214 | |
| | 692 | | | Universal Forest Products, Inc. | | | 59,505 | |
| | 1,904 | | | Universal Truckload Services, Inc. | | | 23,705 | |
| | 950 | | | WABCO Holdings, Inc.j | | | 93,537 | |
| | 868 | | | WageWorks, Inc.j | | | 51,169 | |
| | 4,579 | | | Waste Connections, Inc. | | | 344,387 | |
| | 255 | | | Watsco, Inc. | | | 35,009 | |
| | 2,850 | | | Xylem, Inc. | | | 137,741 | |
| | 1,260 | | | YRC Worldwide, Inc.j | | | 11,189 | |
| | | | | |
| | | | Total | | | 14,943,879 | |
| | | | | |
| |
| Information Technology (3.4%) | | | | |
| | 298 | | | Advanced Energy Industries, Inc.j | | | 14,215 | |
| | 10,760 | | | Agilent Technologies, Inc. | | | 468,813 | |
| | 4,640 | | | Akamai Technologies, Inc.j | | | 322,341 | |
| | 600 | | | Alliance Data Systems Corporationj | | | 122,682 | |
| | 1,407 | | | Alphabet, Inc., Class Aj | | | 1,139,529 | |
| | 1,154 | | | Alphabet, Inc., Class Cj | | | 905,359 | |
| | 724 | | | Ambarella, Inc.j | | | 44,432 | |
| | 2,840 | | | Amkor Technology, Inc.j | | | 26,327 | |
| | 6,490 | | | Amphenol Corporation | | | 427,886 | |
| | 5,130 | | | Analog Devices, Inc. | | | 328,833 | |
| | 400 | | | ANSYS, Inc.j | | | 36,540 | |
| | 11,719 | | | Apple, Inc. | | | 1,330,575 | |
| | 4,682 | | | Applied Materials, Inc. | | | 136,153 | |
| | 810 | | | Apptio, Inc.j | | | 15,981 | |
| | 2,987 | | | Arista Networks, Inc.j | | | 253,148 | |
| | 1,645 | | | Aspen Technology, Inc.j | | | 81,000 | |
| | 1,220 | | | AVX Corporation | | | 17,104 | |
| | 1,370 | | | Bankrate, Inc.j | | | 10,686 | |
| | 230 | | | Belden, Inc. | | | 14,906 | |
| | 4,650 | | | Blackhawk Network Holdings, Inc.j | | | 160,193 | |
| | 9,460 | | | Booz Allen Hamilton Holding Corporation | | | 288,246 | |
| | 280 | | | Broadcom, Ltd. | | | 47,678 | |
| | 5,223 | | | Brocade Communications Systems, Inc. | | | 55,364 | |
| | 5,666 | | | Brooks Automation, Inc. | | | 73,828 | |
| | 2,500 | | | CA, Inc. | | | 76,850 | |
| | 1,279 | | | Cabot Microelectronics Corporation | | | 70,678 | |
| | 715 | | | CACI International, Inc.j | | | 69,963 | |
| | 620 | | | Cadence Design Systems, Inc.j | | | 15,860 | |
| | 951 | | | Cavium, Inc.j | | | 53,684 | |
| | 1,570 | | | CDK Global, Inc. | | | 85,738 | |
| | 4,990 | | | Ciena Corporationj | | | 96,706 | |
| | 55,190 | | | Cisco Systems, Inc. | | | 1,693,229 | |
| | 1,962 | | | Cognex Corporation | | | 101,239 | |
| | 630 | | | Coherent, Inc.j | | | 65,596 | |
| | 5,370 | | | CommVault Systems, Inc.j | | | 287,295 | |
| | 1,950 | | | Comtech Telecommunications Corporation | | | 20,280 | |
| | 2,370 | | | Convergys Corporation | | | 69,204 | |
| | 5,060 | | | CoreLogic, Inc.j | | | 215,354 | |
| | 3,947 | | | Criteo SA ADRj | | | 142,684 | |
| | 530 | | | CSG Systems International, Inc. | | | 20,156 | |
| | 620 | | | CTS Corporation | | | 11,284 | |
| | 1,920 | | | Dolby Laboratories, Inc. | | | 91,373 | |
| | 2,806 | | | DST Systems, Inc. | | | 269,825 | |
| | 1,620 | | | EarthLink Holdings Corporation | | | 9,266 | |
| | 6,250 | | | eBay, Inc.j | | | 178,187 | |
| | 3,760 | | | Entegris, Inc.j | | | 59,784 | |
| | 1,895 | | | Envestnet, Inc.j | | | 66,988 | |
| | 1,300 | | | EVERTEC, Inc. | | | 19,695 | |
| | 1,750 | | | ExlService Holdings, Inc.j | | | 77,053 | |
| | 740 | | | F5 Networks, Inc.j | | | 102,275 | |
| | 1,741 | | | Fabrinetj | | | 66,088 | |
| | 9,570 | | | Facebook, Inc.j | | | 1,253,574 | |
| | 2,080 | | | Finisar Corporationj | | | 56,950 | |
| | 8,500 | | | FLIR Systems, Inc. | | | 279,820 | |
| | 290 | | | Forrester Research, Inc. | | | 10,802 | |
| | 5,020 | | | Fortinet, Inc.j | | | 160,941 | |
| | 260 | | | Gartner, Inc.j | | | 22,370 | |
| | 3,871 | | | Guidewire Software, Inc.j | | | 222,389 | |
| | 3,170 | | | HP, Inc. | | | 45,933 | |
| | 770 | | | IAC/InterActiveCorporation | | | 49,619 | |
| | 3,840 | | | Integrated Device Technology, Inc.j | | | 79,526 | |
| | 6,300 | | | Intel Corporation | | | 219,681 | |
| | 5,021 | | | Ixiaj | | | 60,001 | |
| | 3,204 | | | Juniper Networks, Inc. | | | 84,393 | |
| | 380 | | | Keysight Technologies, Inc.j | | | 12,464 | |
| | 2,340 | | | Lam Research Corporation | | | 226,652 | |
| | 1,197 | | | Liberty Tripadvisor Holdings, Inc.j | | | 26,573 | |
| | 2,110 | | | Lionbridge Technologies, Inc.j | | | 10,191 | |
| | 479 | | | Littelfuse, Inc. | | | 66,821 | |
| | 1,720 | | | M/A-COM Technology Solutions Holdings, Inc.j | | | 63,227 | |
| | 577 | | | Manhattan Associates, Inc.j | | | 29,219 | |
| | 11,320 | | | MasterCard, Inc. | | | 1,211,466 | |
| | 5,181 | | | Maxim Integrated Products, Inc. | | | 205,323 | |
| | 450 | | | MAXIMUS, Inc. | | | 23,427 | |
| | 2,343 | | | Methode Electronics, Inc. | | | 73,102 | |
| | 5,420 | | | Microsemi Corporationj | | | 228,345 | |
| | 35,910 | | | Microsoft Corporation | | | 2,151,727 | |
| | 710 | | | Mobileye NVj | | | 26,398 | |
| | 3,512 | | | Monolithic Power Systems, Inc. | | | 276,781 | |
| | 384 | | | Nanometrics, Inc.j | | | 8,022 | |
| | 4,310 | | | National Instruments Corporation | | | 121,068 | |
| | 1,720 | | | Nice, Ltd. ADR | | | 114,328 | |
| | 7,582 | | | NVIDIA Corporation | | | 539,535 | |
| | 1,570 | | | NXP Semiconductors NVj | | | 157,000 | |
| | 3,962 | | | Oclaro, Inc.j | | | 28,962 | |
| | 2,700 | | | ON Semiconductor Corporationj | | | 31,509 | |
| | 29,300 | | | Oracle Corporation | | | 1,125,706 | |
| | 430 | | | OSI Systems, Inc.j | | | 30,156 | |
| | 1,080 | | | Palo Alto Networks, Inc.j | | | 166,136 | |
| | 10,670 | | | Pandora Media, Inc.j | | | 120,891 | |
| | 1,200 | | | Paylocity Holding Corporationj | | | 52,188 | |
| | 13,925 | | | PayPal Holdings, Inc.j | | | 580,116 | |
| | 3,631 | | | Pegasystems, Inc. | | | 112,198 | |
| | 2,426 | | | Progress Software Corporationj | | | 65,284 | |
| | 1,679 | | | Proofpoint, Inc.j | | | 131,600 | |
| | 1,630 | | | PTC, Inc.j | | | 77,327 | |
| | 1,796 | | | Q2 Holdings, Inc.j | | | 50,468 | |
The accompanying Notes to Financial Statements are an integral part of this schedule.
72
MODERATELY CONSERVATIVE ALLOCATION FUND
Schedule of Investments as of October 31, 2016
| | | | | | | | |
| Shares | | | Common Stock (16.3%) | | Value | |
| Information Technology (3.4%) - continued | | | | |
| | 220 | | | Qorvo, Inc.j | | | $12,243 | |
| | 5,880 | | | QUALCOMM, Inc. | | | 404,074 | |
| | 360 | | | Qualys, Inc.j | | | 13,410 | |
| | 2,380 | | | RealPage, Inc.j | | | 64,736 | |
| | 1,650 | | | Red Hat, Inc.j | | | 127,793 | |
| | 700 | | | Rudolph Technologies, Inc.j | | | 12,670 | |
| | 15,390 | | | Salesforce.com, Inc.j | | | 1,156,712 | |
| | 430 | | | ScanSource, Inc.j | | | 15,050 | |
| | 1,490 | | | ServiceNow, Inc.j | | | 130,986 | |
| | 2,750 | | | ShoreTel, Inc.j | | | 18,288 | |
| | 190 | | | Silicon Laboratories, Inc.j | | | 11,391 | |
| | 1,000 | | | SS&C Technologies Holdings, Inc. | | | 31,930 | |
| | 540 | | | Stratasys, Ltd.j | | | 10,325 | |
| | 3,160 | | | Synopsys, Inc.j | | | 187,420 | |
| | 7,751 | | | Teradyne, Inc. | | | 180,521 | |
| | 540 | | | Tessera Technologies, Inc. | | | 20,034 | |
| | 7,330 | | | Texas Instruments, Inc. | | | 519,330 | |
| | 570 | | | Total System Services, Inc. | | | 28,432 | |
| | 1,630 | | | Trimble, Inc.j | | | 45,053 | |
| | 457 | | | Tyler Technologies, Inc.j | | | 73,303 | |
| | 1,096 | | | Ultimate Software Group, Inc.j | | | 231,245 | |
| | 6,118 | | | Virtusa Corporationj | | | 115,875 | |
| | 9,670 | | | Visa, Inc. | | | 797,872 | |
| | 12,630 | | | Xilinx, Inc. | | | 642,488 | |
| | | | | |
| | | | Total | | | 25,899,543 | |
| | | | | |
| |
| Materials (0.9%) | | | | |
| | 2,119 | | | Agnico Eagle Mines, Ltd. | | | 107,645 | |
| | 1,780 | | | Air Products and Chemicals, Inc. | | | 237,488 | |
| | 1,349 | | | American Vanguard Corporation | | | 20,505 | |
| | 90 | | | Ashland Global Holdings, Inc. | | | 10,056 | |
| | 1,410 | | | Avery Dennison Corporation | | | 98,404 | |
| | 1,236 | | | Balchem Corporation | | | 93,812 | |
| | 1,763 | | | Ball Corporation | | | 135,874 | |
| | 11,818 | | | Barrick Gold Corporation | | | 207,879 | |
| | 1,770 | | | Boise Cascade Companyj | | | 34,073 | |
| | 1,320 | | | Cabot Corporation | | | 68,825 | |
| | 830 | | | Carpenter Technology Corporation | | | 26,236 | |
| | 2,070 | | | Celanese Corporation | | | 150,944 | |
| | 2,379 | | | Chemtura Corporationj | | | 78,031 | |
| | 587 | | | Clearwater Paper Corporationj | | | 31,170 | |
| | 800 | | | Continental Building Products, Inc.j | | | 16,360 | |
| | 4,141 | | | Crown Holdings, Inc.j | | | 224,649 | |
| | 5,000 | | | Dow Chemical Company | | | 269,050 | |
| | 428 | | | Eagle Materials, Inc. | | | 34,655 | |
| | 3,723 | | | Eastman Chemical Company | | | 267,721 | |
| | 3,700 | | | Ecolab, Inc. | | | 422,429 | |
| | 8,214 | | | Eldorado Gold Corporationj | | | 25,956 | |
| | 1,730 | | | Ferro Corporationj | | | 22,421 | |
| | 3,560 | | | Ferroglobe plc | | | 32,930 | |
| | 4,470 | | | FMC Corporation | | | 209,598 | |
| | 8,046 | | | Goldcorp, Inc. | | | 122,299 | |
| | 840 | | | Graphic Packaging Holding Company | | | 10,500 | |
| | 2,110 | | | Huntsman Corporation | | | 35,765 | |
| | 536 | | | Ingevity Corporationj | | | 22,190 | |
| | 320 | | | Innophos Holdings, Inc. | | | 14,669 | |
| | 785 | | | Innospec, Inc. | | | 47,296 | |
| | 6,401 | | | International Paper Company | | | 288,237 | |
| | 800 | | | Kadant, Inc. | | | 41,320 | |
| | 2,950 | | | KapStone Paper and Packaging Corporation | | | 53,513 | |
| | 14,167 | | | Kinross Gold Corporationj | | | 54,685 | |
| | 480 | | | Koppers Holdings, Inc.j | | | 15,720 | |
| | 547 | | | Martin Marietta Materials, Inc. | | | 101,403 | |
| | 1,390 | | | Materion Corporation | | | 42,117 | |
| | 1,330 | | | Methanex Corporation | | | 48,345 | |
| | 627 | | | Minerals Technologies, Inc. | | | 42,134 | |
| | 8,670 | | | Mosaic Company | | | 204,005 | |
| | 3,719 | | | Myers Industries, Inc. | | | 44,814 | |
| | 150 | | | Neenah Paper, Inc. | | | 11,985 | |
| | 6,806 | | | Newmont Mining Corporation | | | 252,094 | |
| | 6,580 | | | Nucor Corporation | | | 321,433 | |
| | 1,770 | | | OMNOVA Solutions, Inc.j | | | 13,452 | |
| | 5,916 | | | Owens-Illinois, Inc.j | | | 114,179 | |
| | 5,585 | | | Packaging Corporation of America | | | 460,763 | |
| | 680 | | | PolyOne Corporation | | | 19,876 | |
| | 220 | | | Quaker Chemical Corporation | | | 23,650 | |
| | 1,270 | | | Rayonier Advanced Materials, Inc. | | | 16,421 | |
| | 730 | | | Reliance Steel & Aluminum Company | | | 50,209 | |
| | 758 | | | Royal Gold, Inc. | | | 52,166 | |
| | 530 | | | RPM International, Inc. | | | 25,196 | |
| | 980 | | | Schnitzer Steel Industries, Inc. | | | 23,667 | |
| | 280 | | | Schweitzer-Mauduit International, Inc. | | | 10,335 | |
| | 1,559 | | | Scotts Miracle-Gro Company | | | 137,332 | |
| | 2,340 | | | Sealed Air Corporation | | | 106,774 | |
| | 1,760 | | | Sensient Technologies Corporation | | | 131,138 | |
| | 3,592 | | | Silver Wheaton Corporation | | | 86,603 | |
| | 2,520 | | | Sonoco Products Company | | | 126,731 | |
| | 6,849 | | | Steel Dynamics, Inc. | | | 188,074 | |
| | 6,282 | | | Teck Resources, Ltd. | | | 135,566 | |
| | 890 | | | Versum Materials, Inc.j | | | 20,203 | |
| | 1,162 | | | Vulcan Materials Company | | | 131,538 | |
| | 3,229 | | | Westrock Company | | | 149,148 | |
| | 11,889 | | | Yamana Gold, Inc. | | | 42,325 | |
| | | | | |
| | | | Total | | | 6,666,581 | |
| | | | | |
| |
| Real Estate (0.4%) | | | | |
| | 1,680 | | | American Assets Trust, Inc. | | | 66,713 | |
| | 1,650 | | | American Campus Communities, Inc. | | | 85,981 | |
| | 3,700 | | | Bluerock Residential Growth REIT, Inc. | | | 45,880 | |
| | 11,675 | | | Brixmor Property Group, Inc. | | | 296,779 | |
| | 750 | | | Camden Property Trust | | | 61,080 | |
| | 7,950 | | | CBL & Associates Properties, Inc. | | | 85,065 | |
| | 9,455 | | | Cedar Realty Trust, Inc. | | | 64,010 | |
| | 3,520 | | | Chatham Lodging Trust | | | 62,304 | |
| | 860 | | | City Office REIT, Inc. | | | 10,802 | |
| | 10,380 | | | Corporate Office Properties Trust | | | 277,042 | |
| | 2,730 | | | Corrections Corporation of America | | | 39,448 | |
| | 4,286 | | | Cousins Properties, Inc. | | | 33,302 | |
| | 2,000 | | | CubeSmart | | | 52,140 | |
| | 50 | | | CyrusOne, Inc. | | | 2,231 | |
| | 22,140 | | | DDR Corporation | | | 338,521 | |
| | 700 | | | Digital Realty Trust, Inc. | | | 65,401 | |
| | 2,350 | | | Duke Realty Corporation | | | 61,452 | |
| | 2,740 | | | DuPont Fabros Technology, Inc. | | | 111,819 | |
| | 160 | | | EastGroup Properties, Inc. | | | 10,866 | |
| | 2,540 | | | Equity Lifestyle Properties, Inc. | | | 192,634 | |
| | 970 | | | First Industrial Realty Trust, Inc. | | | 25,618 | |
| | 3,068 | | | First Potomac Realty Trust | | | 27,367 | |
| | 2,880 | | | Franklin Street Properties Corporation | | | 33,322 | |
| | 2,150 | | | General Growth Properties, Inc. | | | 53,642 | |
| | 3,280 | | | HFF, Inc. | | | 87,346 | |
| | 1,130 | | | Hospitality Properties Trust | | | 30,917 | |
| | 4,239 | | | Host Hotels & Resorts, Inc. | | | 65,620 | |
| | 1,440 | | | Hudson Pacific Properties, Inc. | | | 48,413 | |
| | 1,670 | | | InfraREIT, Inc. | | | 27,755 | |
| | 2,840 | | | Kite Realty Group Trust | | | 70,801 | |
| | 2,490 | | | LaSalle Hotel Properties | | | 59,137 | |
| | 2,990 | | | Liberty Property Trust | | | 120,886 | |
| | 1,050 | | | Life Storage, Inc. | | | 84,682 | |
The accompanying Notes to Financial Statements are an integral part of this schedule.
73
MODERATELY CONSERVATIVE ALLOCATION FUND
Schedule of Investments as of October 31, 2016
| | | | | | | | |
| Shares | | | Common Stock (16.3%) | | Value | |
| Real Estate (0.4%) - continued | | | | |
| | 990 | | | Mid-America Apartment Communities, Inc. | | | $91,822 | |
| | 535 | | | Parkway, Inc.j | | | 9,641 | |
| | 1,509 | | | Pebblebrook Hotel Trust | | | 36,639 | |
| | 2,330 | | | Physicians Realty Trust | | | 46,064 | |
| | 290 | | | Potlatch Corporation | | | 11,136 | |
| | 1,590 | | | RE/MAX Holdings, Inc. | | | 69,086 | |
| | 3,760 | | | Retail Properties of America, Inc. | | | 58,543 | |
| | 1,770 | | | Silver Bay Realty Trust Corporation REIT | | | 29,648 | |
| | 3,270 | | | Store Capital Corporation | | | 89,238 | |
| | 6,166 | | | Summit Hotel Properties, Inc. | | | 80,096 | |
| | 3,827 | | | Terreno Realty Corporation | | | 99,885 | |
| | 3,080 | | | Urstadt Biddle Properties, Inc. | | | 66,220 | |
| | | | | |
| | | | Total | | | 3,386,994 | |
| | | | | |
| |
| Telecommunications Services (0.1%) | | | | |
| | 4,910 | | | AT&T, Inc. | | | 180,639 | |
| | 330 | | | ATN International, Inc. | | | 22,321 | |
| | 976 | | | Cincinnati Bell, Inc.j | | | 19,178 | |
| | 800 | | | FairPoint Communications, Inc.j | | | 12,480 | |
| | 1,060 | | | General Communication, Inc.j | | | 16,790 | |
| | 2,140 | | | Inteliquent, Inc. | | | 35,931 | |
| | 1,850 | | | Level 3 Communications, Inc.j | | | 103,878 | |
| | 1,700 | | | SBA Communications Corporationj | | | 192,576 | |
| | 9,123 | | | Verizon Communications, Inc. | | | 438,816 | |
| | 6,750 | | | Vonage Holdings Corporationj | | | 46,305 | |
| | | | | |
| | | | Total | | | 1,068,914 | |
| | | | | |
| |
| Utilities (0.5%) | | | | |
| | 350 | | | Alliant Energy Corporation | | | 13,318 | |
| | 630 | | | American Electric Power Company, Inc. | | | 40,849 | |
| | 1,930 | | | American States Water Company | | | 77,161 | |
| | 3,650 | | | Aqua America, Inc. | | | 112,055 | |
| | 1,010 | | | Artesian Resources Corporation | | | 28,502 | |
| | 4,410 | | | Avista Corporation | | | 182,574 | |
| | 860 | | | Consolidated Water Company, Ltd. | | | 9,632 | |
| | 1,750 | | | DTE Energy Company | | | 168,018 | |
| | 4,710 | | | Edison International, Inc. | | | 346,091 | |
| | 8,480 | | | Eversource Energy | | | 466,909 | |
| | 3,930 | | | Exelon Corporation | | | 133,895 | |
| | 2,600 | | | Great Plains Energy, Inc. | | | 73,944 | |
| | 840 | | | Hawaiian Electric Industries, Inc. | | | 24,780 | |
| | 6,430 | | | MDU Resources Group, Inc. | | | 168,530 | |
| | 430 | | | Middlesex Water Company | | | 15,523 | |
| | 1,920 | | | NiSource, Inc. | | | 44,659 | |
| | 580 | | | NorthWestern Corporation | | | 33,379 | |
| | 12,250 | | | PG&E Corporation | | | 760,970 | |
| | 2,270 | | | PNM Resources, Inc. | | | 74,570 | |
| | 2,300 | | | Portland General Electric Company | | | 100,372 | |
| | 1,950 | | | Public Service Enterprise Group, Inc. | | | 82,056 | |
| | 1,230 | | | Renewable Energy Group, Inc.j | | | 10,763 | |
| | 5,400 | | | Southern Company | | | 278,478 | |
| | 1,070 | | | Southwest Gas Corporation | | | 77,532 | |
| | 257 | | | Unitil Corporation | | | 10,426 | |
| | 6,640 | | | Vectren Corporation | | | 334,058 | |
| | | | | |
| | | | Total | | | 3,669,044 | |
| | | | | |
| | | | | |
| | | | | |
| | | | Total Common Stock (cost $110,762,954) | | | 126,088,342 | |
| | | | | |
| | |
| Shares | | | Preferred Stock (<0.1%) | | Value | |
| Energy (<0.1%) | | | | |
| | 692 | | | Alpha Natural Resources, Inc., 0.000%j | | | 4,326 | |
| | 692 | | | ANR Holdings, Inc., 0.000%j | | | 1,176 | |
| | | | | |
| | | | Total | | | 5,502 | |
| | | | | |
| |
| Financials (<0.1%) | | | | |
| | 244,000 | | | J.P. Morgan Chase & Companyh | | | 251,503 | |
| | | | | |
| | | | Total | | | 251,503 | |
| | | | | |
| | | | | |
| | | | | |
| | | | Total Preferred Stock (cost $280,170) | | | 257,005 | |
| | | | | |
| | |
| Shares | | | Collateral Held for Securities Loaned (0.3%) | | Value | |
| | 2,400,919 | | | Thrivent Cash Management Trust | | | 2,400,919 | |
| | | | | |
| | | | Total Collateral Held for Securities Loaned (cost $2,400,919) | | | 2,400,919 | |
| | | | | |
| | |
Shares or
Principal
Amount | | | Short-Term Investments (19.7%)k | | Value | |
| | | | Federal Farm Credit Discount Notes | | | | |
| | 500,000 | | | 0.336%, 11/22/2016l | | | 499,941 | |
| | | | Federal Home Loan Bank Discount Notes | | | | |
| | 100,000 | | | 0.330%, 11/9/2016l | | | 99,995 | |
| | 400,000 | | | 0.345%, 12/2/2016l | | | 399,928 | |
| | 2,000,000 | | | 0.350%, 1/20/2017l | | | 1,998,578 | |
| | | | Thrivent Core Short-Term Reserve Fund | | | | |
| | 14,880,977 | | | 0.790% | | | 148,809,768 | |
| | | | | |
| | | | Total Short-Term Investments (cost $151,807,988) | | | 151,808,210 | |
| | | | | |
| | | | Total Investments (cost $817,835,480) 114.2% | | | $882,794,400 | |
| | | | | |
| | | | Other Assets and Liabilities, Net (14.2%) | | | (110,094,436 | ) |
| | | | | |
| | | | Total Net Assets 100.0% | | | $772,699,964 | |
| | | | | |
a | The stated interest rate represents the weighted average of all contracts within the bank loan facility. |
b | All or a portion of the loan is unfunded. |
c | Denotes investments purchased on a when-issued or delayed delivery basis. |
d | Denotes securities sold under Rule 144A of the Securities Act of 1933, which exempts them from registration. These securities may be resold to other dealers in the program or to other qualified institutional buyers. As of October 31, 2016, the value of these investments was $29,150,136 or 3.8% of total net assets. |
e | Denotes variable rate securities. Variable rate securities are securities whose yields vary with a designated market index or market rate. The rate shown is as of October 31, 2016. |
f | Denotes step coupon securities. Step coupon securities pay an initial coupon rate for the first period and then different coupon rates for following periods. The rate shown is as of October 31, 2016. |
g | All or a portion of the security is on loan. |
h | Denotes perpetual securities. Perpetual securities pay an indefinite stream of interest, but may be called by the issuer at an earlier date. |
i | Denotes interest only security. Interest only securities represent the right to receive monthly interest payments on an underlying pool of mortgages or assets. The principal shown is the outstanding par amount of the pool as of the end of the period. |
| The actual effective yield of the security is different than the stated coupon rate. |
j | Non-income producing security. |
k | The interest rate shown reflects the yield, coupon rate or the discount rate at the date of purchase. |
The accompanying Notes to Financial Statements are an integral part of this schedule.
74
MODERATELY CONSERVATIVE ALLOCATION FUND
Schedule of Investments as of October 31, 2016
l | All or a portion of the security is held on deposit with the counterparty and pledged as the initial margin deposit for open futures contracts. |
* | Denotes restricted securities. Restricted securities are investment securities which cannot be offered for public sale without first being registered under the Securities Act of 1933. The value of all restricted securities held in Moderately Conservative Allocation Fund as of October 31, 2016 was $13,501,642 or 1.7% of total net assets. The following table indicates the acquisition date and cost of restricted securities shown in the schedule as of October 31, 2016. |
| | | | | | | | |
Security | | Acquisition
Date | | | Cost | |
Alm Loan Funding CLO, 10/17/2026 | | | 7/31/2014 | | | | $169,915 | |
Angel Oak Mortgage Trust I, LLC, 7/25/2046 | | | 8/15/2016 | | | | 228,601 | |
Apidos CLO XVIII, 7/22/2026 | | | 6/25/2014 | | | | 174,563 | |
Ares CLO, Ltd., 10/12/2023 | | | 5/15/2015 | | | | 550,000 | |
Babson CLO, Ltd., 10/17/2026 | | | 8/15/2014 | | | | 169,915 | |
Betony CLO, Ltd., 4/15/2027 | | | 2/25/2015 | | | | 150,000 | |
Birchwood Park CLO, Ltd., 7/15/2026 | | | 7/31/2014 | | | | 170,000 | |
BlueMountain CLO, Ltd., 10/15/2026 | | | 8/27/2014 | | | | 169,828 | |
Carlyle Global Market Strategies CLO, Ltd., 7/20/2023 | | | 7/3/2014 | | | | 151,739 | |
Carlyle Global Market Strategies CLO, Ltd., 10/15/2026 | | | 9/19/2014 | | | | 175,000 | |
Cent CLO 16, LP, 8/1/2024 | | | 9/5/2014 | | | | 170,000 | |
Cent CLO 22, Ltd., 11/7/2026 | | | 9/19/2014 | | | | 175,000 | |
Contura Energy, Inc., 8/1/2021 | | | 3/28/2016 | | | | 25,382 | |
Digicel, Ltd., 4/15/2021 | | | 8/18/2014 | | | | 548,567 | |
DRB Prime Student Loan Trust, 1/25/2040 | | | 6/23/2016 | | | | 672,597 | |
Dryden 34 Senior Loan Fund CLO, 10/15/2026 | | | 7/21/2014 | | | | 170,000 | |
Edlinc Student Loan Funding Trust, 10/1/2025 | | | 2/28/2013 | | | | 164,437 | |
Galaxy XX CLO, Ltd., 7/20/2027 | | | 5/20/2015 | | | | 550,000 | |
GoldenTree Loan Opportunities IX, Ltd., 10/29/2026 | | | 10/7/2016 | | | | 250,000 | |
Golub Capital Partners CLO 23M, Ltd., 5/5/2027 | | | 5/18/2015 | | | | 498,750 | |
Limerock CLO III, LLC, 10/20/2026 | | | 10/16/2014 | | | | 500,000 | |
Madison Park Funding XIV CLO, Ltd., 7/20/2026 | | | 7/3/2014 | | | | 189,772 | |
Madison Park Funding, Ltd., 8/15/2022 | | | 5/8/2015 | | | | 550,000 | |
Magnetite XII, Ltd., 4/15/2027 | | | 2/6/2015 | | | | 525,000 | |
Mountain View CLO, Ltd., 7/15/2027 | | | 5/13/2015 | | | | 523,640 | |
Murray Hill Marketplace Trust, 11/25/2022 | | | 10/6/2016 | | | | 559,985 | |
Neuberger Berman CLO, Ltd., 8/4/2025 | | | 6/19/2014 | | | | 150,000 | |
NZCG Funding CLO, Ltd., 4/27/2027 | | | 3/27/2015 | | | | 525,000 | |
Octagon Investment Partners XX CLO, Ltd., 8/12/2026 | | | 7/10/2014 | | | | 170,000 | |
OHA Loan Funding, Ltd., 10/20/2026 | | | 11/6/2014 | | | | 498,750 | |
OZLM VIII, Ltd., 10/17/2026 | | | 8/7/2014 | | | | 169,031 | |
Pretium Mortgage Credit Partners, LLC, 11/27/2030 | | | 11/6/2015 | | | | 1,032,041 | |
Race Point IX CLO, Ltd., 4/15/2027 | | | 2/13/2015 | | | | 400,000 | |
Shackleton VII CLO, Ltd., 4/15/2027 | | | 3/27/2015 | | | | 525,000 | |
Sunset Mortgage Loan Company, LLC, 7/16/2047 | | | 7/27/2016 | | | | 612,250 | |
Symphony CLO VIII, Ltd., 1/9/2023 | | | 9/15/2014 | | | | 155,616 | |
Symphony CLO XV, Ltd., 10/17/2026 | | | 10/17/2014 | | | | 496,250 | |
Vericrest Opportunity Loan Transferee, 10/25/2058 | | | 1/13/2016 | | | | 412,039 | |
Voya CLO 3, Ltd., 7/25/2026 | | | 7/10/2014 | | | | 169,745 | |
The accompanying Notes to Financial Statements are an integral part of this schedule.
75
MODERATELY CONSERVATIVE ALLOCATION FUND
Schedule of Investments as of October 31, 2016
The following table presents the total amount of securities loaned with continuous maturity, by type, offset by the gross payable upon return of collateral for securities loaned by Thrivent Moderately Conservative Allocation Fund as of October 31, 2016:
| | | | |
Securities Lending Transactions | | | |
Taxable Debt Security | | $ | 1,730,247 | |
Common Stock | | | 587,040 | |
| |
Total lending | | $ | 2,317,287 | |
Gross amount payable upon return of collateral for securities loaned | | $ | 2,400,919 | |
| |
Net amounts due to counterparty | | | $83,632 | |
| |
Definitions:
| | | | |
ADR | | - | | American Depositary Receipt, which are certificates for an underlying foreign security’s shares held by an issuing U.S. depository bank. |
CLO | | - | | Collateralized Loan Obligation |
ETF | | - | | Exchange Traded Fund. |
REIT | | - | | Real Estate Investment Trust is a company that buys, develops, manages and/or sells real estate assets. |
TIPS | | - | | Treasury Inflation Protected Security. |
The accompanying Notes to Financial Statements are an integral part of this schedule.
76
BALANCED INCOME PLUS FUND
Schedule of Investments as of October 31, 2016
| | | | | | | | |
Principal
Amount | | | Bank Loans (16.3%)a | | Value | |
| Basic Materials (1.0%) | | | | |
| | | | Arch Coal, Inc., Term Loan | | | | |
| | $84,372 | | | 10.000%, 10/5/2021 | | | $86,129 | |
| | | | Chemours Company, Term Loan | | | | |
| | 468,772 | | | 3.750%, 5/12/2022 | | | 462,678 | |
| | | | Fortescue Metals Group, Ltd., Term Loan | | | | |
| | 911,640 | | | 3.750%, 6/30/2019 | | | 910,783 | |
| | | | Ineos US Finance, LLC, Term Loan | | | | |
| | 1,012,522 | | | 3.750%, 12/15/2020 | | | 1,014,840 | |
| | | | Tronox Pigments BV, Term Loan | | | | |
| | 562,802 | | | 4.500%, 3/19/2020 | | | 559,859 | |
| | | | | |
| | | | Total | | | 3,034,289 | |
| | | | | |
| |
| Capital Goods (1.1%) | | | | |
| | | | Accudyne Industries, LLC, Term Loan | | | | |
| | 344,486 | | | 4.000%, 12/13/2019 | | | 316,211 | |
| | | | ADS Waste Holdings, Inc., Term Loan | | | | |
| | 236,474 | | | 3.750%, 10/9/2019 | | | 236,541 | |
| | | | Advanced Disposal Services, Inc., Term Loan | | | | |
| | 155,000 | | | 0.000%, 10/28/2023b,c | | | 155,194 | |
| | | | Berry Plastics Group, Inc., Term Loan | | | | |
| | 488,389 | | | 3.500%, 2/8/2020 | | | 488,926 | |
| | | | Cortes NP Acquisition Corporation, Term Loan | | | | |
| | 1,220,000 | | | 0.000%, 10/3/2023b,c | | | 1,212,375 | |
| | | | HD Supply, Inc., Term Loan | | | | |
| | 140,000 | | | 3.630%, 10/17/2023 | | | 140,088 | |
| | | | Rexnord, LLC, Term Loan | | | | |
| | 277,395 | | | 4.000%, 8/21/2020 | | | 278,019 | |
| | | | Reynolds Group, Inc., Term Loan | | | | |
| | 285,000 | | | 4.250%, 2/5/2023 | | | 285,635 | |
| | | | | |
| | | | Total | | | 3,112,989 | |
| | | | | |
| |
| Communications Services (4.4%) | | | | |
| | | | Atlantic Broadband Penn, LLC, Term Loan | | | | |
| | 346,838 | | | 3.250%, 11/30/2019 | | | 347,379 | |
| | | | Beasley Broadcast Group, Inc., Term Loan | | | | |
| | 225,000 | | | 0.000%, 10/4/2023b,c | | | 222,469 | |
| | | | Birch Communication Inc., Term Loan | | | | |
| | 586,864 | | | 7.750%, 7/17/2020 | | | 472,425 | |
| | | | Block Communications, Inc., Term Loan | | | | |
| | 560,719 | | | 4.088%, 11/7/2021 | | | 564,924 | |
| | | | Cincinnati Bell, Inc., Term Loan | | | | |
| | 412,250 | | | 4.000%, 9/10/2020 | | | 412,893 | |
| | | | CSC Holdings, LLC, Term Loan | | | | |
| | 197,368 | | | 3.876%, 10/11/2024 | | | 197,986 | |
| | | | FairPoint Communications, Inc., Term Loan | | | | |
| | 554,956 | | | 7.500%, 2/14/2019 | | | 555,722 | |
| | | | Grande Communications Networks, LLC, Term Loan | | | | |
| | 556,331 | | | 4.500%, 5/29/2020 | | | 555,636 | |
| | | | Gray Television, Inc., Term Loan | | | | |
| | 333,863 | | | 3.938%, 6/13/2021 | | | 335,949 | |
| | | | Hargray Communications Group, Inc., Term Loan | | | | |
| | 609,955 | | | 4.750%, 6/26/2019 | | | 613,005 | |
| | | | Integra Telecom Holdings, Inc., Term Loan | | | | |
| | 364,318 | | | 5.250%, 8/14/2020 | | | 362,271 | |
| | | | Intelsat Jackson Holdings SA, Term Loan | | | | |
| | 217,409 | | | 3.750%, 6/30/2019 | | | 207,650 | |
| | | | Level 3 Communications, Inc., Term Loan | | | | |
| | 490,000 | | | 4.000%, 8/1/2019 | | | 492,102 | |
| | | | Liberty Cablevision of Puerto Rico, LLC, Term Loan | | | | |
| | 605,000 | | | 4.500%, 1/7/2022 | | | 594,915 | |
| | | | LTS Buyer, LLC, Term Loan | | | | |
| | 532,125 | | | 4.088%, 4/13/2020 | | | 532,657 | |
| | | | MCC Georgia, LLC, Term Loan | | | | |
| | 371,450 | | | 3.750%, 6/30/2021 | | | 372,379 | |
| | | | NEP/NCP Holdco, Inc., Term Loan | | | | |
| | 973,377 | | | 4.250%, 1/22/2020 | | | 970,028 | |
| | | | Nexstar Broadcasting, Inc., Term Loan | | | | |
| | 210,000 | | | 0.000%, 9/26/2023b,c | | | 210,788 | |
| | | | Numericable US, LLC, Term Loan | | | | |
| | 544,500 | | | 4.563%, 7/29/2022 | | | 544,729 | |
| | 19,850 | | | 4.750%, 2/10/2023 | | | 19,850 | |
| | 343,786 | | | 5.137%, 1/15/2024 | | | 346,622 | |
| | | | SBA Senior Finance II, LLC, Term Loan | | | | |
| | 562,063 | | | 3.340%, 3/24/2021 | | | 562,484 | |
| | | | TNS, Inc., Term Loan | | | | |
| | 306,406 | | | 5.000%, 2/14/2020 | | | 307,365 | |
| | | | Univision Communications, Inc., Term Loan | | | | |
| | 526,793 | | | 4.000%, 3/1/2020 | | | 527,614 | |
| | | | Virgin Media Investment Holdings, Ltd., Term Loan | | | | |
| | 360,227 | | | 3.500%, 6/30/2023 | | | 361,625 | |
| | | | WideOpenWest Finance, LLC, Term Loan | | | | |
| | 700,000 | | | 4.500%, 8/18/2023 | | | 698,089 | |
| | | | WMG Acquisition Corporation, Term Loan | | | | |
| | 347,321 | | | 3.750%, 7/1/2020 | | | 346,578 | |
| | | | XO Communications, LLC, Term Loan | | | | |
| | 438,750 | | | 4.250%, 3/20/2021 | | | 439,026 | |
| | | | Yankee Cable Acquisition, LLC, Term Loan | | | | |
| | 454,009 | | | 4.250%, 3/1/2020 | | | 454,295 | |
| | | | Zayo Group, LLC, Term Loan | | | | |
| | 527,279 | | | 3.750%, 5/6/2021 | | | 529,737 | |
| | | | | |
| | | | Total | | | 13,159,192 | |
| | | | | |
| |
| Consumer Cyclical (2.8%) | | | | |
| | | | Amaya BV, Term Loan | | | | |
| | 1,038,899 | | | 5.000%, 8/1/2021 | | | 1,037,435 | |
| | | | Burlington Coat Factory Warehouse Corporation, Term Loan | | | | |
| | 435,997 | | | 3.500%, 8/13/2021 | | | 438,857 | |
| | | | Cengage Learning Acquisitions, Term Loan | | | | |
| | 788,025 | | | 5.250%, 6/7/2023 | | | 769,475 | |
| | | | Ceridian HCM Holding, Inc., Term Loan | | | | |
| | 240,398 | | | 4.500%, 9/15/2020 | | | 235,590 | |
| | | | Charter Communications Operating, LLC, Term Loan | | | | |
| | 483,750 | | | 3.000%, 1/3/2021 | | | 484,355 | |
| | | | Dollar Tree, Inc., Term Loan | | | | |
| | 170,000 | | | 3.000%, 7/6/2022 | | | 171,487 | |
The accompanying Notes to Financial Statements are an integral part of this schedule.
77
BALANCED INCOME PLUS FUND
Schedule of Investments as of October 31, 2016
| | | | | | | | |
Principal
Amount | | | Bank Loans (16.3%)a | | Value | |
| Consumer Cyclical (2.8%) - continued | | | | |
| | | | Golden Nugget, Inc., Term Loan | | | | |
| | $339,024 | | | 4.500%, 11/21/2019 | | | $342,628 | |
| | | | Golden Nugget, Inc., Term Loan Delayed Draw | | | | |
| | 148,819 | | | 4.500%, 11/21/2019 | | | 150,401 | |
| | | | IMG Worldwide, Inc., Term Loan | | | | |
| | 621,267 | | | 5.250%, 5/6/2021 | | | 623,907 | |
| | 300,000 | | | 8.250%, 5/6/2022 | | | 299,376 | |
| | | | Michaels Stores, Inc., Term Loan | | | | |
| | 582,480 | | | 3.750%, 1/30/2023 | | | 586,744 | |
| | | | Mohegan Tribal Gaming Authority, Term Loan | | | | |
| | 625,000 | | | 0.000%, 9/30/2023b,c | | | 622,462 | |
| | | | Scientific Games International, Inc., Term Loan | | | | |
| | 539,738 | | | 6.000%, 10/18/2020 | | | 542,603 | |
| | 1,092,340 | | | 6.000%, 10/1/2021 | | | 1,096,436 | |
| | | | Seminole Hard Rock Entertainment, Inc., Term Loan | | | | |
| | 595,843 | | | 3.588%, 5/14/2020 | | | 597,333 | |
| | | | Seminole Indian Tribe of Florida, Term Loan | | | | |
| | 368,911 | | | 3.088%, 4/29/2020 | | | 369,741 | |
| | | | | |
| | | | Total | | | 8,368,830 | |
| | | | | |
| |
| Consumer Non-Cyclical (2.8%) | | | | |
| | | | Air Medical Group Holdings, Inc., Term Loan | | | | |
| | 463,838 | | | 5.000%, 4/28/2022 | | | 467,316 | |
| | | | Albertson’s, LLC, Term Loan | | | | |
| | 194,026 | | | 4.750%, 12/21/2022 | | | 195,945 | |
| | 380,952 | | | 4.750%, 6/22/2023 | | | 384,922 | |
| | | | CHS/Community Health Systems, Inc., Term Loan | | | | |
| | 124,844 | | | 3.750%, 1/27/2021 | | | 117,939 | |
| | 853,131 | | | 4.000%, 1/27/2021 | | | 804,716 | |
| | | | Endo Luxembourg Finance I Company SARL, Term Loan | | | | |
| | 401,963 | | | 3.750%, 9/26/2022 | | | 401,311 | |
| | | | JBS USA, LLC, Term Loan | | | | |
| | 439,511 | | | 3.750%, 5/25/2018 | | | 438,597 | |
| | 109,175 | | | 4.000%, 10/30/2022 | | | 108,929 | |
| | | | Libbey Glass, Inc., Term Loan | | | | |
| | 264,155 | | | 3.750%, 4/9/2021 | | | 265,145 | |
| | | | LTF Merger Sub, Inc., Term Loan | | | | |
| | 469,062 | | | 4.250%, 6/10/2022 | | | 468,697 | |
| | | | Mallinckrodt International Finance SA, Term Loan | | | | |
| | 218,329 | | | 3.588%, 3/19/2021 | | | 218,329 | |
| | | | McGraw-Hill Global Education Holdings, LLC, Term Loan | | | | |
| | 658,350 | | | 5.000%, 5/4/2022 | | | 656,566 | |
| | | | MultiPlan, Inc., Term Loan | | | | |
| | 191,354 | | | 5.000%, 6/7/2023 | | | 193,327 | |
| | | | Ortho-Clinical Diagnostics, Inc., Term Loan | | | | |
| | 703,808 | | | 4.750%, 6/30/2021 | | | 686,797 | |
| | | | Owens-Brockway Glass Container, Inc., Term Loan | | | | |
| | 543,125 | | | 3.500%, 9/1/2022 | | | 543,125 | |
| | | | Revlon Consumer Products Corporation, Term Loan | | | | |
| | 340,000 | | | 4.250%, 9/7/2023 | | | 340,602 | |
| | | | Sterigenics-Nordion Holdings, LLC, Term Loan | | | | |
| | 319,275 | | | 4.250%, 5/16/2022 | | | 317,679 | |
| | | | Valeant Pharmaceuticals International, Inc., Term Loan | | | | |
| | 1,626,182 | | | 5.500%, 4/1/2022 | | | 1,620,084 | |
| | | | | |
| | | | Total | | | 8,230,026 | |
| | | | | |
| |
| Energy (0.8%) | | | | |
| | | | Energy Solutions, LLC, Term Loan | | | | |
| | 324,706 | | | 6.750%, 5/29/2020 | | | 324,706 | |
| | | | Exgen Renewables I, LLC, Term Loan | | | | |
| | 296,183 | | | 5.250%, 2/8/2021 | | | 298,404 | |
| | | | Houston Fuel Oil Terminal, LLC, Term Loan | | | | |
| | 328,325 | | | 4.250%, 8/19/2021 | | | 322,579 | |
| | | | McJunkin Red Man Corporation, Term Loan | | | | |
| | 343,655 | | | 5.000%, 11/8/2019 | | | 340,363 | |
| | | | MEG Energy Corporation, Term Loan | | | | |
| | 418,410 | | | 3.750%, 3/31/2020 | | | 394,155 | |
| | | | Pacific Drilling SA, Term Loan | | | | |
| | 527,287 | | | 4.500%, 6/3/2018 | | | 148,300 | |
| | | | Targa Resources Partners, LP, Term Loan | | | | |
| | 251,163 | | | 5.750%, 2/27/2022 | | | 251,477 | |
| | | | Western Refining, Inc., Term Loan | | | | |
| | 208,393 | | | 5.250%, 11/12/2020 | | | 207,872 | |
| | 119,700 | | | 5.500%, 6/23/2023 | | | 119,476 | |
| | | | | |
| | | | Total | | | 2,407,332 | |
| | | | | |
| |
| Financials (0.8%) | | | | |
| | | | DJO Finance, LLC, Term Loan | | | | |
| | 212,313 | | | 4.250%, 6/7/2020 | | | 209,924 | |
| | | | Harland Clarke Holdings Corporation, Term Loan | | | | |
| | 258,208 | | | 7.000%, 5/22/2018 | | | 256,917 | |
| | 414,375 | | | 7.000%, 12/31/2019 | | | 411,441 | |
| | | | MoneyGram International, Inc., Term Loan | | | | |
| | 557,586 | | | 4.250%, 3/27/2020 | | | 540,858 | |
| | | | TransUnion, LLC, Term Loan | | | | |
| | 536,254 | | | 3.500%, 4/9/2021 | | | 537,595 | |
| | | | WaveDivision Holdings, LLC, Term Loan | | | | |
| | 546,241 | | | 4.000%, 10/15/2019 | | | 547,470 | |
| | | | | |
| | | | Total | | | 2,504,205 | |
| | | | | |
| |
| Technology (1.8%) | | | | |
| | | | Avago Technoligies Cayman Finance, Ltd., Term Loan | | | | |
| | 813,037 | | | 3.535%, 2/1/2023 | | | 821,053 | |
| | | | First Data Corporation, Term Loan | | | | |
| | 555,000 | | | 0.000%, 3/24/2021b,c | | | 557,220 | |
| | 210,000 | | | 4.274%, 7/8/2022 | | | 211,445 | |
| | | | Interception Merger Sub, Inc., Term Loan | | | | |
| | 320,000 | | | 0.000%, 10/26/2023b,c | | | 321,651 | |
| | | | NXP BV, Term Loan | | | | |
| | 365,000 | | | 3.405%, 12/7/2020 | | | 366,117 | |
| | | | ON Semiconductor Corporation, Term Loan | | | | |
| | 1,100,000 | | | 3.777%, 3/31/2023 | | | 1,106,050 | |
| | | | RP Crown Parent, LLC, Term Loan | | | | |
| | 490,000 | | | 4.500%, 10/12/2023 | | | 489,652 | |
| | | | SS&C European Holdings SARL, Term Loan | | | | |
| | 25,995 | | | 4.000%, 7/8/2022 | | | 26,182 | |
| | 213,596 | | | 4.000%, 7/8/2022 | | | 215,132 | |
The accompanying Notes to Financial Statements are an integral part of this schedule.
78
BALANCED INCOME PLUS FUND
Schedule of Investments as of October 31, 2016
| | | | | | | | |
Principal
Amount | | | Bank Loans (16.3%)a | | Value | |
| Technology (1.8%) - continued | | | | |
| | | | Versum Materials, Inc., Term Loan | | | | |
| | $140,000 | | | 3.340%, 9/29/2023 | | | $140,641 | |
| | | | Western Digital Corporation, Term Loan | | | | |
| | 957,600 | | | 4.500%, 4/29/2023 | | | 967,856 | |
| | | | | |
| | | | Total | | | 5,222,999 | |
| | | | | |
| |
| Transportation (0.4%) | | | | |
| | | | OSG Bulk Ships, Inc., Term Loan | | | | |
| | 271,922 | | | 5.250%, 8/5/2019 | | | 269,543 | |
| | | | XPO Logistics, Inc., Term Loan | | | | |
| | 964,956 | | | 4.250%, 10/30/2021 | | | 969,434 | |
| | | | | |
| | | | Total | | | 1,238,977 | |
| | | | | |
| |
| Utilities (0.4%) | | | | |
| | | | Calpine Corporation, Term Loan | | | | |
| | 531,901 | | | 3.590%, 5/27/2022 | | | 532,502 | |
| | | | Intergen NV, Term Loan | | | | |
| | 323,342 | | | 5.500%, 6/12/2020 | | | 305,558 | |
| | | | Talen Energy Supply, LLC, Term Loan | | | | |
| | 267,855 | | | 0.000%, 10/18/2023b,c | | | 267,520 | |
| | | | | |
| | | | Total | | | 1,105,580 | |
| | | | | |
| | | | | | | | |
| | | | | |
| | | | Total Bank Loans (cost $48,686,565) | | | 48,384,419 | |
| | | | | |
| | |
| Shares | | | Common Stock (43.9%) | | Value | |
| Consumer Discretionary (7.0%) | | | | |
| | 3,830 | | | Amazon.com, Inc.d | | | 3,025,011 | |
| | 8,480 | | | Aramark | | | 315,710 | |
| | 2,400 | | | AutoZone, Inc.d | | | 1,781,184 | |
| | 600 | | | Bayerische Motoren Werke AG | | | 45,556 | |
| | 400 | | | Beiersdorf AG | | | 35,264 | |
| | 8,700 | | | Berkeley Group Holdings plc | | | 250,921 | |
| | 1,200 | | | Brembo SPA | | | 74,297 | |
| | 9,300 | | | Bridgestone Corporation | | | 347,110 | |
| | 7,242 | | | Bunzl plc | | | 194,429 | |
| | 6,290 | | | Burlington Stores, Inc.d | | | 471,373 | |
| | 6,000 | | | Calsonic Kansei Corporation | | | 75,196 | |
| | 5,350 | | | Cedar Fair, LP | | | 304,148 | |
| | 34,718 | | | Comcast Corporation | | | 2,146,267 | |
| | 2,300 | | | Compass Group plc | | | 41,617 | |
| | 11,600 | | | Denso Corporation | | | 504,774 | |
| | 11,400 | | | Eutelsat Communications | | | 238,886 | |
| | 19,200 | | | Ford Motor Company | | | 225,408 | |
| | 11,300 | | | Fuji Heavy Industries, Ltd. | | | 441,565 | |
| | 7,980 | | | General Motors Company | | | 252,168 | |
| | 2,900 | | | Hakuhodo Dy Holdings, Inc. | | | 34,854 | |
| | 800 | | | Hennes & Mauritz AB | | | 22,498 | |
| | 28,300 | | | Honda Motor Company, Ltd. | | | 846,782 | |
| | 15,900 | | | Inchcape plc | | | 126,417 | |
| | 2,400 | | | Intertek Group plc | | | 100,133 | |
| | 600 | | | Koito Manufacturing Company, Ltd. | | | 31,501 | |
| | 1,100 | | | KOMERI Company, Ltd. | | | 26,859 | |
| | 18,600 | | | Ladbrokes plc | | | 30,368 | |
| | 944 | | | Linamar Corporation | | | 38,392 | |
| | 893 | | | LVMH Moet Hennessy Louis Vuitton SE | | | 162,581 | |
| | 8,110 | | | Masonite International Corporationd | | | 461,459 | |
| | 28,390 | | | MDC Partners, Inc.e | | | 239,895 | |
| | 8,240 | | | Newell Brands, Inc. | | | 395,685 | |
| | 1,000 | | | Nifco, Inc. | | | 57,592 | |
| | 35,460 | | | NIKE, Inc. | | | 1,779,383 | |
| | 1,400 | | | Nokian Renkaat Oyj | | | 46,958 | |
| | 300 | | | Paddy Power plc | | | 31,088 | |
| | 16,900 | | | Persimmon plc | | | 349,829 | |
| | 1,274 | | | Publicis Groupe SA | | | 87,396 | |
| | 1,510 | | | Restaurant Brands International, Inc. | | | 67,150 | |
| | 6,417 | | | Restoration Hardware Holdings, Inc.d,e | | | 185,900 | |
| | 600 | | | RTL Group SA | | | 47,023 | |
| | 2,200 | | | Sekisui Chemical Company, Ltd. | | | 34,647 | |
| | 3,800 | | | Sekisui House, Ltd. | | | 62,790 | |
| | 7,980 | | | Starbucks Corporation | | | 423,499 | |
| | 11,900 | | | Sumitomo Forestry Company, Ltd. | | | 165,770 | |
| | 7,000 | | | Sumitomo Rubber Industries, Ltd. | | | 117,434 | |
| | 500 | | | Swatch Group AG | | | 28,824 | |
| | 31,030 | | | Time, Inc. | | | 403,390 | |
| | 14,340 | | | Toll Brothers, Inc.d | | | 393,490 | |
| | 500 | | | Toyota Motor Corporation | | | 29,003 | |
| | 6,570 | | | Tractor Supply Company | | | 411,479 | |
| | 200 | | | Valora Holding AG | | | 58,158 | |
| | 6,000 | | | Wacoal Holdings Corporation | | | 69,225 | |
| | 20,180 | | | Walt Disney Company | | | 1,870,484 | |
| | 760 | | | Whirlpool Corporation | | | 113,863 | |
| | 1,400 | | | Whitbread plc | | | 61,846 | |
| | 10,243 | | | Wolters Kluwer NV | | | 396,101 | |
| | 7,600 | | | WPP plc | | | 165,020 | |
| | 4,000 | | | Yokohama Rubber Company, Ltd. | | | 69,450 | |
| | | | | |
| | | | Total | | | 20,815,100 | |
| | | | | |
| |
| Consumer Staples (2.4%) | | | | |
| | 11,760 | | | AdvancePierre Foods Holdings, Inc. | | | 328,810 | |
| | 10,709 | | | Anheuser-Busch InBev NV ADR | | | 1,236,782 | |
| | 6,100 | | | Axfood AB | | | 95,330 | |
| | 3,350 | | | British American Tobacco plc | | | 191,999 | |
| | 10,900 | | | Coca-Cola HBC AG | | | 235,222 | |
| | 2,900 | | | Davide Campari - Milano SPA | | | 29,208 | |
| | 14,340 | | | Distribuidora Internacional de Alimentacion SA | | | 76,592 | |
| | 2,200 | | | Ebro Foods SA | | | 47,439 | |
| | 356 | | | George Weston, Ltd. | | | 29,010 | |
| | 2,300 | | | Henkel AG & Company KGaA | | | 253,420 | |
| | 16,919 | | | Imperial Brands plc | | | 818,406 | |
| | 2,100 | | | Jeronimo Martins SGPS SA | | | 36,085 | |
| | 2,400 | | | Kao Corporation | | | 123,496 | |
| | 900 | | | Kesko Oyj | | | 44,721 | |
| | 5,600 | | | Kewpie Corporation | | | 159,044 | |
| | 2,900 | | | Kirin Holdings Company, Ltd. | | | 49,856 | |
| | 41,229 | | | Koninklijke Ahold Delhaize NV | | | 940,537 | |
| | 6 | | | Lindt & Spruengli AG | | | 31,157 | |
| | 3,300 | | | Nestle SA | | | 239,296 | |
| | 1,200 | | | Ontex Group NV | | | 36,298 | |
| | 14,590 | | | Philip Morris International, Inc. | | | 1,407,060 | |
| | 721 | | | Premium Brands Holdings Corporation | | | 34,892 | |
| | 2,600 | | | Suedzucker AG | | | 66,697 | |
| | 800 | | | Universal Corporation | | | 43,360 | |
| | 7,720 | | | Walgreens Boots Alliance, Inc. | | | 638,675 | |
| | | | | |
| | | | Total | | | 7,193,392 | |
| | | | | |
| |
| Energy (2.8%) | | | | |
| | 6,073 | | | Arch Coal, Inc.d,e | | | 445,637 | |
| | 14,842 | | | Baytex Energy Corporation | | | 57,097 | |
| | 201,059 | | | BP plc | | | 1,188,607 | |
| | 6,800 | | | Continental Resources, Inc.d | | | 332,588 | |
| | 3,229 | | | Contura Energy, Inc.d | | | 213,921 | |
| | 12,920 | | | Crescent Point Energy Corporation | | | 153,830 | |
| | 16,540 | | | EOG Resources, Inc. | | | 1,495,547 | |
| | 16,920 | | | EQT Corporation | | | 1,116,720 | |
| | 7,200 | | | Galp Energia SGPS SA | | | 97,620 | |
| | 9,387 | | | OMV AG | | | 292,966 | |
| | 2,620 | | | Pioneer Natural Resources Company | | | 469,033 | |
| | 8,207 | | | Royal Dutch Shell plc | | | 204,498 | |
The accompanying Notes to Financial Statements are an integral part of this schedule.
79
BALANCED INCOME PLUS FUND
Schedule of Investments as of October 31, 2016
| | | | | | | | |
| Shares | | | Common Stock (43.9%) | | Value | |
| Energy (2.8%) - continued | | | | |
| | 17,100 | | | Royal Dutch Shell plc, Class B | | | $441,054 | |
| | 7,967 | | | Statoil ASA | | | 130,069 | |
| | 8,298 | | | Total SA | | | 397,517 | |
| | 1,216 | | | Vantage Drilling Internationald | | | 102,144 | |
| | 181,940 | | | Weatherford International plcd | | | 876,951 | |
| | 28,390 | | | WPX Energy, Inc.d | | | 308,315 | |
| | | | | |
| | | | Total | | | 8,324,114 | |
| | | | | |
| |
| Financials (5.5%) | | | | |
| | 29,587 | | | Aberdeen Asset Management plc | | | 115,734 | |
| | 3,090 | | | Affiliated Managers Group, Inc.d | | | 409,919 | |
| | 4,800 | | | AIA Group, Ltd. | | | 30,197 | |
| | 48,200 | | | Apollo Investment Corporation | | | 284,862 | |
| | 22,200 | | | Ares Capital Corporation | | | 339,660 | |
| | 5,591 | | | ASX, Ltd. | | | 199,996 | |
| | 17,600 | | | Australia & New Zealand Banking Group, Ltd. | | | 371,631 | |
| | 30,100 | | | Banco Santander SA | | | 147,492 | |
| | 1,950 | | | Bank of America Corporation | | | 32,175 | |
| | 21,389 | | | Bank of East Asia, Ltd. | | | 85,982 | |
| | 4,825 | | | Bank of Montreal | | | 307,062 | |
| | 14,131 | | | Bank of Nova Scotia | | | 759,385 | |
| | 10,710 | | | Bank of the Ozarks, Inc. | | | 395,842 | |
| | 428 | | | Canadian Imperial Bank of Commerce | | | 32,069 | |
| | 9,000 | | | Chiba Bank, Ltd. | | | 55,663 | |
| | 5,174 | | | CI Financial Corporation | | | 95,202 | |
| | 41,350 | | | Citigroup, Inc. | | | 2,032,352 | |
| | 9,800 | | | CNP Assurances | | | 169,719 | |
| | 17,900 | | | Concordia Financial Group, Ltd. | | | 82,997 | |
| | 45,967 | | | Direct Line Insurance Group plc | | | 194,467 | |
| | 26,950 | | | Encore Capital Group, Inc.d,e | | | 534,958 | |
| | 5,100 | | | Erste Group Bank AG | | | 159,931 | |
| | 1,700 | | | EXOR SPA | | | 72,275 | |
| | 1,700 | | | EXOR SPA Rightsd,f | | | 0 | |
| | 56,859 | | | FlexiGroup, Ltd. | | | 97,098 | |
| | 65,000 | | | Fukuoka Financial Group, Inc. | | | 281,286 | |
| | 6,021 | | | Genworth MI Canada, Inc. | | | 130,762 | |
| | 300 | | | Groupe Bruxelles Lambert SA | | | 25,790 | |
| | 7,300 | | | Hang Seng Bank, Ltd. | | | 131,651 | |
| | 3,600 | | | Hannover Rueckversicherung SE | | | 401,623 | |
| | 53,400 | | | Henderson Group plc | | | 151,088 | |
| | 996 | | | Home Capital Group, Inc. | | | 19,715 | |
| | 2,143 | | | Intact Financial Corporation | | | 145,679 | |
| | 2,280 | | | Intercontinental Exchange, Inc. | | | 616,489 | |
| | 22,230 | | | J.P. Morgan Chase & Company | | | 1,539,650 | |
| | 41,060 | | | KeyCorp | | | 579,767 | |
| | 4,800 | | | Macquarie Group, Ltd. | | | 290,157 | |
| | 135,000 | | | Mizuho Financial Group, Inc. | | | 227,307 | |
| | 2,500 | | | MS and AD Insurance Group Holdings, Inc. | | | 74,217 | |
| | 16,574 | | | National Bank of Canada | | | 591,637 | |
| | 4,700 | | | Nordea Bank AB | | | 49,393 | |
| | 11,300 | | | Old Mutual plc | | | 27,797 | |
| | 4,814 | | | Power Corporation of Canada | | | 103,257 | |
| | 5,840 | | | Raymond James Financial, Inc. | | | 351,101 | |
| | 17,900 | | | Resona Holdings, Inc. | | | 79,341 | |
| | 1,248 | | | Schroders plc | | | 42,956 | |
| | 11,100 | | | Seven Bank, Ltd. | | | 34,123 | |
| | 6,300 | | | Swiss Re AG | | | 584,714 | |
| | 40,340 | | | Synchrony Financial | | | 1,153,321 | |
| | 11,100 | | | T&D Holdings, Inc. | | | 134,231 | |
| | 1,200 | | | Talanx AG | | | 37,246 | |
| | 2,596 | | | Toronto-Dominion Bank | | | 117,791 | |
| | 16,148 | | | United Overseas Bank, Ltd. | | | 217,847 | |
| | 19,700 | | | Westpac Banking Corporation | | | 455,561 | |
| | 14,000 | | | XL Group, Ltd. | | | 485,800 | |
| | 11,945 | | | Zions Bancorporation | | | 384,748 | |
| | | | | |
| | | | Total | | | 16,472,713 | |
| | | | | |
| |
| Health Care (4.4%) | | | | |
| | 50,000 | | | Abbott Laboratories | | | 1,962,000 | |
| | 8,220 | | | Acadia Healthcare Company, Inc.d | | | 295,591 | |
| | 13,130 | | | Akorn, Inc.d | | | 314,463 | |
| | 5,060 | | | Allergan plcd | | | 1,057,236 | |
| | 350 | | | Anthem, Inc. | | | 42,651 | |
| | 4,950 | | | AstraZeneca plc | | | 277,177 | |
| | 300 | | | Bayer AG | | | 29,787 | |
| | 3,000 | | | CSL, Ltd. | | | 228,917 | |
| | 6,062 | | | Essilor International SA | | | 681,211 | |
| | 400 | | | Gerresheimer AG | | | 30,172 | |
| | 8,960 | | | Gilead Sciences, Inc. | | | 659,725 | |
| | 4,600 | | | Grifols SA | | | 90,769 | |
| | 4,900 | | | Hikma Pharmaceuticals plc | | | 105,097 | |
| | 10,560 | | | Hologic, Inc.d | | | 380,266 | |
| | 410 | | | ICON plcd | | | 32,915 | |
| | 500 | | | Laboratory Corporation of America Holdingsd | | | 62,670 | |
| | 800 | | | Lonza Group AG | | | 150,961 | |
| | 18,340 | | | Medtronic plc | | | 1,504,247 | |
| | 31,940 | | | Merck & Company, Inc. | | | 1,875,517 | |
| | 2,500 | | | Merck KGaA | | | 257,326 | |
| | 9,700 | | | Novartis AG | | | 688,386 | |
| | 8,400 | | | Novo Nordisk AS | | | 299,254 | |
| | 600 | | | Otsuka Holdings Company, Ltd. | | | 26,259 | |
| | 21,640 | | | Pfizer, Inc. | | | 686,204 | |
| | 900 | | | Roche Holding AG-Genusschein | | | 206,714 | |
| | 2,200 | | | Teleflex, Inc. | | | 314,886 | |
| | 7,930 | | | Vertex Pharmaceuticals, Inc.d | | | 601,570 | |
| | 2,670 | | | Waters Corporationd | | | 371,504 | |
| | | | | |
| | | | Total | | | 13,233,475 | |
| | | | | |
| |
| Industrials (4.6%) | | | | |
| | 7,400 | | | ABB, Ltd. | | | 152,665 | |
| | 2,500 | | | Adecco SA | | | 148,450 | |
| | 31,200 | | | Air New Zealand, Ltd. | | | 43,037 | |
| | 1,100 | | | Andritz AG | | | 57,514 | |
| | 21,000 | | | Asahi Glass Company, Ltd. | | | 146,870 | |
| | 1,200 | | | Atlas Copco Aktiebolag | | | 35,154 | |
| | 6,100 | | | Babcock International Group plc | | | 73,736 | |
| | 1,800 | | | Berendsen plc | | | 21,242 | |
| | 1,617 | | | Canadian National Railway Company | | | 101,652 | |
| | 18,000 | | | Cathay Pacific Airways, Ltd. | | | 23,692 | |
| | 300 | | | Central Japan Railway Company | | | 51,014 | |
| | 4,000 | | | Dai Nippon Printing Company, Ltd. | | | 40,121 | |
| | 9,480 | | | Delta Air Lines, Inc. | | | 395,980 | |
| | 3,700 | | | Deutsche Post AG | | | 114,741 | |
| | 2,600 | | | DSV AS | | | 125,892 | |
| | 3,100 | | | East Japan Railway Company | | | 272,888 | |
| | 3,220 | | | Equifax, Inc. | | | 399,183 | |
| | 800 | | | Flughafen Zuerich AG | | | 147,059 | |
| | 1,600 | | | Fraport AG Frankfurt Airport Services Worldwide | | | 94,977 | |
| | 1,800 | | | Getinge AB | | | 29,476 | |
| | 2,000 | | | Hitachi Transport System, Ltd. | | | 41,229 | |
| | 700 | | | Hochtief AG | | | 95,583 | |
| | 11,650 | | | Illinois Tool Works, Inc. | | | 1,323,091 | |
| | 2,500 | | | Inaba Denki Sangyo Company, Ltd. | | | 90,703 | |
| | 18,360 | | | Ingersoll-Rand plc | | | 1,235,444 | |
| | 47,900 | | | ITOCHU Corporation | | | 604,915 | |
| | 23,900 | | | Jacobs Engineering Group, Inc.d | | | 1,232,762 | |
| | 2,200 | | | Jardine Matheson Holdings, Ltd. | | | 134,002 | |
| | 4,000 | | | Kamigumi Company, Ltd. | | | 34,154 | |
| | 12,200 | | | KITZ Corporation | | | 70,152 | |
The accompanying Notes to Financial Statements are an integral part of this schedule.
80
BALANCED INCOME PLUS FUND
Schedule of Investments as of October 31, 2016
| | | | | | | | |
| Shares | | | Common Stock (43.9%) | | Value | |
| Industrials (4.6%) - continued | | | | |
| | 11,100 | | | KONE Oyj | | | $510,732 | |
| | 2,722 | | | Koninklijke Boskalis Westminster NV | | | 87,789 | |
| | 500 | | | Kuehne & Nagel International AG | | | 67,771 | |
| | 500 | | | Legrand SA | | | 28,262 | |
| | 14,750 | | | Masco Corporation | | | 455,480 | |
| | 18,089 | | | Meggitt plc | | | 96,233 | |
| | 4,160 | | | Middleby Corporationd | | | 466,378 | |
| | 4,700 | | | MIRAIT Holdings Corporation | | | 41,676 | |
| | 15,000 | | | Mitsubishi Electric Corporation | | | 202,938 | |
| | 6,000 | | | Mitsuboshi Belting, Ltd. | | | 51,741 | |
| | 8,000 | | | Nippon Express Company, Ltd. | | | 39,516 | |
| | 8,600 | | | Nitto Kogyo Corporation | | | 126,157 | |
| | 9,260 | | | Oshkosh Corporation | | | 495,410 | |
| | 1,800 | | | Randstad Holding NV | | | 92,580 | |
| | 262 | | | Rieter Holding AG | | | 49,829 | |
| | 4,500 | | | Sanwa Holdings Corporation | | | 44,817 | |
| | 100 | | | Schindler Holding AG | | | 18,511 | |
| | 900 | | | Schindler Holding AG, Participation Certificate | | | 167,199 | |
| | 500 | | | Secom Company, Ltd. | | | 36,070 | |
| | 1,800 | | | Securitas AB | | | 27,781 | |
| | 4,400 | | | Siemens AG | | | 499,919 | |
| | 7,300 | | | Smiths Group plc | | | 126,496 | |
| | 16,590 | | | Union Pacific Corporation | | | 1,462,906 | |
| | 7,700 | | | Vinci SA | | | 557,633 | |
| | 3,820 | | | WABCO Holdings, Inc.d | | | 376,117 | |
| | 1,883 | | | WSP Global, Inc. | | | 60,998 | |
| | 1,400 | | | Yuasa Trading Company, Ltd. | | | 33,539 | |
| | | | | |
| | | | Total | | | 13,561,856 | |
| | | | | |
| |
| Information Technology (7.0%) | | | | |
| | 1,960 | | | Alphabet, Inc., Class Ad | | | 1,587,404 | |
| | 1,029 | | | Alphabet, Inc., Class Cd | | | 807,292 | |
| | 20,823 | | | Apple, Inc. | | | 2,364,243 | |
| | 4,500 | | | Canon, Inc. | | | 129,276 | |
| | 300 | | | Cap Gemini SA | | | 24,845 | |
| | 5,850 | | | Check Point Software Technologies, Ltd.d | | | 494,676 | |
| | 11,300 | | | Facebook, Inc.d | | | 1,480,187 | |
| | 15,990 | | | Finisar Corporationd | | | 437,806 | |
| | 10,100 | | | FUJIFILM Holdings NPV | | | 381,890 | |
| | 2,200 | | | Halma plc | | | 28,164 | |
| | 17,160 | | | Juniper Networks, Inc. | | | 451,994 | |
| | 1,100 | | | Micro Focus International plc | | | 28,804 | |
| | 31,770 | | | Microsoft Corporation | | | 1,903,658 | |
| | 4,400 | | | NEC Networks & System Integration Corporation | | | 78,196 | |
| | 1,500 | | | Nice, Ltd. | | | 99,567 | |
| | 2,500 | | | NS Solutions Corporation | | | 47,671 | |
| | 1,000 | | | NTT Data Corporation | | | 51,605 | |
| | 1,795 | | | NVIDIA Corporation | | | 127,732 | |
| | 500 | | | Oracle Corporation Japan | | | 27,211 | |
| | 6,400 | | | Palo Alto Networks, Inc.d | | | 984,512 | |
| | 50,420 | | | Pandora Media, Inc.d | | | 571,259 | |
| | 32,880 | | | PayPal Holdings, Inc.d | | | 1,369,781 | |
| | 8,270 | | | Plantronics, Inc. | | | 427,642 | |
| | 33,950 | | | Pure Storage, Inc.d,e | | | 418,943 | |
| | 7,910 | | | Salesforce.com, Inc.d | | | 594,516 | |
| | 300 | | | SAP SE | | | 26,430 | |
| | 2,241 | | | Software AG | | | 81,448 | |
| | 1,100 | | | Tokyo Electron, Ltd. | | | 99,226 | |
| | 900 | | | Trend Micro, Inc. | | | 31,693 | |
| | 10,130 | | | Twitter, Inc.d,e | | | 181,834 | |
| | 2,680 | | | Ultimate Software Group, Inc.d | | | 565,453 | |
| | 700 | | | United Internet AG | | | 28,780 | |
| | 13,960 | | | Vantiv, Inc.d | | | 814,706 | |
| | 23,680 | | | Visa, Inc. | | | 1,953,837 | |
| | 36,620 | | | Xilinx, Inc. | | | 1,862,859 | |
| | 11,500 | | | Yahoo Japan Corporation | | | 44,114 | |
| | 4,450 | | | Yandex NVd | | | 87,621 | |
| | | | | |
| | | | Total | | | 20,696,875 | |
| | | | | |
| |
| Materials (1.7%) | | | | |
| | 2,200 | | | Adeka Corporation | | | 33,256 | |
| | 300 | | | Air Liquide SA | | | 30,484 | |
| | 4,155 | | | APERAM | | | 188,965 | |
| | 1,350 | | | Ashland Global Holdings, Inc. | | | 150,836 | |
| | 36,629 | | | BHP Billiton, Ltd. | | | 639,939 | |
| | 37,035 | | | BlueScope Steel, Ltd. | | | 219,715 | |
| | 1,500 | | | Croda International plc | | | 64,147 | |
| | 3,450 | | | Crown Holdings, Inc.d | | | 187,163 | |
| | 19,400 | | | Daicel Corporation | | | 255,094 | |
| | 6,000 | | | Denki Kagaku Kogyo KK | | | 27,220 | |
| | 4,340 | | | Domtar Corporation | | | 156,023 | |
| | 1,800 | | | Eagle Materials, Inc. | | | 145,746 | |
| | 12,393 | | | Evonik Industries AG | | | 388,107 | |
| | 2,780 | | | FMC Corporation | | | 130,354 | |
| | 100 | | | Givaudan SA | | | 193,407 | |
| | 3,500 | | | Hexpol AB | | | 28,764 | |
| | 8,620 | | | Kinross Gold Corporationd | | | 33,273 | |
| | 5,600 | | | Kuraray Company, Ltd. | | | 84,899 | |
| | 13,700 | | | Mitsubishi Chemical Holdings Corporation | | | 89,953 | |
| | 2,500 | | | Mitsubishi Gas Chemical Company, Inc. | | | 38,477 | |
| | 2,200 | | | Mitsubishi Materials Corporation | | | 63,032 | |
| | 1,900 | | | Newcrest Mining, Ltd. | | | 33,268 | |
| | 600 | | | Nippon Shokubai Company, Ltd. | | | 41,406 | |
| | 56,329 | | | Norsk Hydro ASA | | | 251,832 | |
| | 15,653 | | | Orora, Ltd. | | | 34,493 | |
| | 2,850 | | | Packaging Corporation of America | | | 235,125 | |
| | 1,960 | | | PPG Industries, Inc. | | | 182,535 | |
| | 5,500 | | | RPC Group plc | | | 63,781 | |
| | 7,800 | | | Steel Dynamics, Inc. | | | 214,188 | |
| | 1,400 | | | Sumitomo Seika Chemicals Company, Ltd. | | | 52,344 | |
| | 6,000 | | | Tosoh Corporation | | | 39,183 | |
| | 8,697 | | | UPM-Kymmene Oyj | | | 202,306 | |
| | 16,785 | | | Verso Corporationd | | | 103,060 | |
| | 10,210 | | | Yara International ASA | | | 360,661 | |
| | | | | |
| | | | Total | | | 4,963,036 | |
| | | | | |
| |
| Real Estate (6.9%) | | | | |
| | 1,800 | | | Acadia Realty Trust | | | 60,642 | |
| | 1,250 | | | Agree Realty Corporation | | | 60,437 | |
| | 7,610 | | | Alexandria Real Estate Equities, Inc. | | | 820,434 | |
| | 2,400 | | | American Campus Communities, Inc. | | | 125,064 | |
| | 3,800 | | | American Homes 4 Rent | | | 80,218 | |
| | 3,600 | | | Apartment Investment & Management Company | | | 158,652 | |
| | 3,100 | | | Apple Hospitality REIT, Inc. | | | 55,893 | |
| | 2,400 | | | AvalonBay Communities, Inc. | | | 410,832 | |
| | 1,100 | | | Bluerock Residential Growth REIT, Inc. | | | 13,640 | |
| | 4,747 | | | Boston Properties, Inc. | | | 571,919 | |
| | 1,800 | | | Brandywine Realty Trust | | | 27,900 | |
| | 27,901 | | | Brixmor Property Group, Inc. | | | 709,243 | |
| | 8,830 | | | Camden Property Trust | | | 719,115 | |
| | 30,600 | | | CapitaMall Trust | | | 45,598 | |
| | 1,650 | | | Care Capital Properties, Inc. | | | 43,840 | |
| | 2,800 | | | Castellum AB | | | 37,940 | |
| | 1,025 | | | Chesapeake Lodging Trust | | | 22,253 | |
| | 600 | | | CoreSite Realty Corporation | | | 44,244 | |
| | 1,800 | | | Corporate Office Properties Trust | | | 48,042 | |
The accompanying Notes to Financial Statements are an integral part of this schedule.
81
BALANCED INCOME PLUS FUND
Schedule of Investments as of October 31, 2016
| | | | | | | | |
| Shares | | | Common Stock (43.9%) | | Value | |
| Real Estate (6.9%) - continued | | | | |
| | 6,353 | | | Cousins Properties, Inc. | | | $49,363 | |
| | 5,010 | | | Crown Castle International Corporation | | | 455,860 | |
| | 4,700 | | | CubeSmart | | | 122,529 | |
| | 1,900 | | | CyrusOne, Inc. | | | 84,759 | |
| | 300 | | | Daito Trust Construction Company, Ltd. | | | 50,274 | |
| | 700 | | | DCT Industrial Trust, Inc. | | | 32,725 | |
| | 5,700 | | | DDR Corporation | | | 87,153 | |
| | 45,100 | | | DEXUS Property Group | | | 306,370 | |
| | 2,057 | | | DiamondRock Hospitality Company | | | 18,822 | |
| | 2,886 | | | Digital Realty Trust, Inc. | | | 269,639 | |
| | 1,800 | | | Douglas Emmett, Inc. | | | 65,700 | |
| | 32,800 | | | Duke Realty Corporation | | | 857,720 | |
| | 1,100 | | | DuPont Fabros Technology, Inc. | | | 44,891 | |
| | 54 | | | EastGroup Properties, Inc. | | | 3,667 | |
| | 1,100 | | | Education Realty Trust, Inc. | | | 46,849 | |
| | 1,219 | | | EPR Properties | | | 88,646 | |
| | 1,819 | | | Equinix, Inc. | | | 649,892 | |
| | 1,300 | | | Equity Commonwealthd | | | 39,273 | |
| | 1,800 | | | Equity Lifestyle Properties, Inc. | | | 136,512 | |
| | 1,000 | | | Equity One, Inc. | | | 28,500 | |
| | 9,360 | | | Equity Residential | | | 577,980 | |
| | 1,325 | | | Essex Property Trust, Inc. | | | 283,669 | |
| | 2,700 | | | Extra Space Storage, Inc. | | | 197,505 | |
| | 1,000 | | | Federal Realty Investment Trust | | | 145,230 | |
| | 1,800 | | | First Industrial Realty Trust, Inc. | | | 47,538 | |
| | 2,500 | | | Forest City Realty Trust, Inc. | | | 53,975 | |
| | 28,000 | | | Frasers Centrepoint Trust | | | 41,862 | |
| | 2,650 | | | Gaming and Leisure Properties, Inc. | | | 86,999 | |
| | 11,114 | | | General Growth Properties, Inc. | | | 277,294 | |
| | 1,400 | | | GEO Group, Inc. | | | 33,544 | |
| | 4,700 | | | Gramercy Property Trust | | | 43,334 | |
| | 14,958 | | | H&R Real Estate Investment Trust | | | 254,374 | |
| | 3,800 | | | Hamborner REIT AG | | | 37,568 | |
| | 8,150 | | | HCP, Inc. | | | 279,137 | |
| | 2,300 | | | Healthcare Realty Trust, Inc. | | | 73,347 | |
| | 3,300 | | | Healthcare Trust of America, Inc. | | | 100,980 | |
| | 2,600 | | | Highwoods Properties, Inc. | | | 129,038 | |
| | 3,200 | | | Hospitality Properties Trust | | | 87,552 | |
| | 14,611 | | | Host Hotels & Resorts, Inc. | | | 226,178 | |
| | 2,050 | | | Hudson Pacific Properties, Inc. | | | 68,921 | |
| | 6,100 | | | Hufvudstaden AB | | | 94,413 | |
| | 54,000 | | | Hysan Development Company, Ltd. | | | 249,231 | |
| | 4,000 | | | Iron Mountain, Inc. | | | 134,920 | |
| | 1,600 | | | Kilroy Realty Corporation | | | 114,928 | |
| | 10,100 | | | Kimco Realty Corporation | | | 268,761 | |
| | 1,236 | | | Lamar Advertising Company | | | 78,424 | |
| | 2,100 | | | LaSalle Hotel Properties | | | 49,875 | |
| | 1,900 | | | Liberty Property Trust | | | 76,817 | |
| | 807 | | | Life Storage, Inc. | | | 65,085 | |
| | 10,000 | | | Link REIT | | | 71,139 | |
| | 2,850 | | | Macerich Company | | | 201,723 | |
| | 1,550 | | | Mack-Cali Realty Corporation | | | 39,804 | |
| | 5,900 | | | Medical Properties Trust, Inc. | | | 82,246 | |
| | 1,300 | | | Mid-America Apartment Communities, Inc. | | | 120,575 | |
| | 1,400 | | | National Health Investors, Inc. | | | 106,064 | |
| | 4,100 | | | National Retail Properties, Inc. | | | 187,042 | |
| | 700 | | | National Storage Affiliates Trust | | | 13,706 | |
| | 197,317 | | | New World Development Company, Ltd. | | | 245,314 | |
| | 3,150 | | | NorthStar Realty Finance Corporation | | | 45,738 | |
| | 2,700 | | | Omega Healthcare Investors, Inc. | | | 85,941 | |
| | 1,600 | | | Outfront Media, Inc. | | | 34,416 | |
| | 794 | | | Parkway, Inc.d | | | 14,308 | |
| | 1,100 | | | Pebblebrook Hotel Trust | | | 26,708 | |
| | 4,100 | | | Physicians Realty Trust | | | 81,057 | |
| | 845 | | | Post Properties, Inc. | | | 55,593 | |
| | 14,423 | | | Prologis, Inc. | | | 752,304 | |
| | 3,480 | | | Public Storage, Inc. | | | 743,746 | |
| | 823 | | | QTS Realty Trust, Inc. | | | 37,825 | |
| | 2,860 | | | Realty Income Corporation | | | 169,426 | |
| | 2,700 | | | Regency Centers Corporation | | | 194,589 | |
| | 1,800 | | | Retail Opportunity Investments Corporation | | | 36,198 | |
| | 3,100 | | | Retail Properties of America, Inc. | | | 48,267 | |
| | 1,733 | | | RioCan Real Estate Investment Trust | | | 33,696 | |
| | 3,388 | | | RLJ Lodging Trust | | | 66,811 | |
| | 2,907 | | | Senior Housing Property Trust | | | 61,832 | |
| | 8,010 | | | Simon Property Group, Inc. | | | 1,489,540 | |
| | 16,000 | | | Sino Land Company, Ltd. | | | 27,167 | |
| | 1,800 | | | SL Green Realty Corporation | | | 176,796 | |
| | 15,100 | | | Spirit Realty Captial, Inc. | | | 179,841 | |
| | 81,014 | | | Stockland | | | 272,081 | |
| | 3,370 | | | Store Capital Corporation | | | 91,967 | |
| | 3,900 | | | Summit Hotel Properties, Inc. | | | 50,661 | |
| | 1,300 | | | Sun Communities, Inc. | | | 100,009 | |
| | 3,755 | | | Sunstone Hotel Investors, Inc. | | | 47,163 | |
| | 1,732 | | | Tanger Factory Outlet Centers, Inc. | | | 60,274 | |
| | 1,150 | | | Taubman Centers, Inc. | | | 83,329 | |
| | 5,800 | | | UDR, Inc. | | | 202,826 | |
| | 1,500 | | | Urban Edge Properties | | | 38,715 | |
| | 600 | | | Urstadt Biddle Properties, Inc. | | | 12,900 | |
| | 6,300 | | | Ventas, Inc. | | | 426,825 | |
| | 12,989 | | | VEREIT, Inc. | | | 122,097 | |
| | 6,120 | | | Vornado Realty Trust | | | 567,814 | |
| | 2,200 | | | Washington Prime Group, Inc. | | | 23,078 | |
| | 2,100 | | | Weingarten Realty Investors | | | 76,041 | |
| | 14,223 | | | Welltower, Inc. | | | 974,702 | |
| | 5,000 | | | Wharf Holdings, Ltd. | | | 37,489 | |
| | 7,000 | | | Wheelock and Company, Ltd. | | | 43,079 | |
| | 48,900 | | | Wing Tai Holdings, Ltd. | | | 59,576 | |
| | 1,100 | | | WP Carey, Inc. | | | 66,814 | |
| | | | | |
| | | | Total | | | 20,460,381 | |
| | | | | |
| |
| Telecommunications Services (0.9%) | | | | |
| | 1,993 | | | BCE, Inc. | | | 90,549 | |
| | 25,200 | | | BT Group plc | | | 115,670 | |
| | 9,000 | | | Elisa Oyj | | | 303,222 | |
| | 6,600 | | | Freenet AG | | | 189,217 | |
| | 114,933 | | | KCOM Group plc | | | 165,649 | |
| | 1,000 | | | KDDI Corporation | | | 30,393 | |
| | 54,138 | | | Koninklijke (Royal) KPN NV | | | 176,531 | |
| | 500 | | | Millicom International Cellular SA | | | 21,968 | |
| | 11,300 | | | Nippon Telegraph & Telephone Corporation | | | 501,006 | |
| | 4,100 | | | NTT DOCOMO, Inc. | | | 102,968 | |
| | 9,000 | | | Orange SA | | | 141,604 | |
| | 130,109 | | | PCCW, Ltd. | | | 77,447 | |
| | 3,300 | | | Proximus SA | | | 94,455 | |
| | 600 | | | SoftBank Group Corporation | | | 37,789 | |
| | 11,300 | | | Telefonica Deutschland Holding AG | | | 43,825 | |
| | 7,291 | | | Telenor ASA | | | 115,962 | |
| | 11,800 | | | Vodafone Group plc | | | 32,407 | |
| | 17,360 | | | Zayo Group Holdings, Inc.d | | | 558,645 | |
| | | | | |
| | | | Total | | | 2,799,307 | |
| | | | | |
| |
| Utilities (0.7%) | | | | |
| | 40,400 | | | Centrica plc | | | 105,818 | |
| | 16,800 | | | DUET Group | | | 30,415 | |
| | 3,700 | | | E.ON SE | | | 27,117 | |
The accompanying Notes to Financial Statements are an integral part of this schedule.
82
BALANCED INCOME PLUS FUND
Schedule of Investments as of October 31, 2016
| | | | | | | | |
| Shares | | | Common Stock (43.9%) | | Value | |
| Utilities (0.7%) - continued | | | | |
| | 55,800 | | | Electricidade de Portugal SA | | | $184,434 | |
| | 24,530 | | | MDU Resources Group, Inc. | | | 642,931 | |
| | 7,640 | | | NorthWestern Corporation | | | 439,682 | |
| | 67,000 | | | Osaka Gas Company, Ltd. | | | 278,667 | |
| | 39,700 | | | Redes Energeticas Nacionais SGPS SA | | | 116,011 | |
| | 5,000 | | | Toho Gas Company, Ltd. | | | 46,367 | |
| | 7,700 | | | United Utilities Group plc | | | 88,511 | |
| | | | | |
| | | | Total | | | 1,959,953 | |
| | | | | |
| | | | | | | | |
| | | | | |
| | | | Total Common Stock (cost $122,248,822) | | | 130,480,202 | |
| | | | | |
| | |
Principal
Amount | | | Long-Term Fixed Income (32.4%) | | Value | |
| Asset-Backed Securities (1.7%) | | | | |
| | | | Asset Backed Securities Corporation Home Equity Loan Trust | | | | |
| | $253,066 | | | 0.674%, 7/25/2036g | | | 233,743 | |
| | | | Bayview Opportunity Master Fund Trust | | | | |
| | 63,317 | | | 3.623%, 4/28/2030h | | | 63,393 | |
| | 185,780 | | | 3.228%, 7/28/2034*,i | | | 185,461 | |
| | 272,887 | | | 3.721%, 7/28/2035h,i | | | 272,816 | |
| | | | Conseco Financial Corporation | | | | |
| | 32,860 | | | 6.330%, 11/1/2029 | | | 33,184 | |
| | | | Earnest Student Loan Program, LLC | | | | |
| | 314,460 | | | 2.680%, 7/25/2035h | | | 312,422 | |
| | | | GMAC Mortgage Corporation Loan Trust | | | | |
| | 143,222 | | | 1.024%, 8/25/2035g,j | | | 134,464 | |
| | 205,824 | | | 0.705%, 12/25/2036g,j | | | 186,421 | |
| | | | J.P. Morgan Mortgage Acquisition Trust | | | | |
| | 184,263 | | | 4.541%, 3/25/2047i | | | 138,311 | |
| | | | Lehman XS Trust | | | | |
| | 190,006 | | | 5.440%, 8/25/2035i | | | 166,917 | |
| | | | Marlette Funding Trust | | | | |
| | 343,856 | | | 3.060%, 1/17/2023* | | | 344,450 | |
| | | | Merrill Lynch Mortgage Investors Trust | | | | |
| | 288,361 | | | 2.820%, 6/25/2035 | | | 191,320 | |
| | | | Murray Hill Marketplace Trust | | | | |
| | 135,000 | | | 4.190%, 11/25/2022* | | | 135,003 | |
| | | | NRZ Advance Receivables Trust Advance Receivables Backed | | | | |
| | 450,000 | | | 2.751%, 6/15/2049* | | | 449,177 | |
| | | | Popular ABS Mortgage Pass-Through Trust | | | | |
| | 250,000 | | | 4.279%, 11/25/2035i | | | 238,298 | |
| | | | Preston Ridge Partners Mortgage Trust, LLC | | | | |
| | 223,319 | | | 4.000%, 9/27/2021*,i | | | 222,991 | |
| | | | Pretium Mortgage Credit Partners I, LLC | | | | |
| | 243,213 | | | 4.000%, 7/27/2031*,i | | | 243,521 | |
| | | | Renaissance Home Equity Loan Trust | | | | |
| | 322,449 | | | 5.608%, 5/25/2036i | | | 211,989 | |
| | 468,650 | | | 5.285%, 1/25/2037i | | | 253,206 | |
| | | | Sunset Mortgage Loan Company, LLC | | | | |
| | 113,807 | | | 4.459%, 9/18/2045*,i | | | 113,581 | |
| | 141,288 | | | 3.844%, 7/16/2047*,i | | | 141,549 | |
| | | | United Airlines Pass Through Trust | | | | |
| | 60,000 | | | 3.700%, 12/1/2022 | | | 63,600 | |
| | | | US Residential Opportunity Fund Trust | | | | |
| | 292,672 | | | 3.475%, 7/27/2036* | | | 292,918 | |
| | | | Vericrest Opportunity Loan Transferee | | | | |
| | 94,001 | | | 3.375%, 10/25/2058*,i | | | 93,874 | |
| | 99,250 | | | 3.500%, 6/26/2045h | | | 99,273 | |
| | 250,000 | | | 3.500%, 10/25/2046h,i | | | 250,000 | |
| | | | Wachovia Asset Securitization, Inc. | | | | |
| | 336,302 | | | 0.674%, 7/25/2037*,g,j | | | 282,450 | |
| | | | | |
| | | | Total | | | 5,354,332 | |
| | | | | |
| |
| Basic Materials (0.6%) | | | | |
| | | | Albemarle Corporation | | | | |
| | 88,000 | | | 3.000%, 12/1/2019 | | | 90,549 | |
| | | | Alcoa Nederland Holding BV | | | | |
| | 80,000 | | | 6.750%, 9/30/2024h | | | 82,800 | |
| | | | ArcelorMittal SA | | | | |
| | 260,000 | | | 6.500%, 3/1/2021e | | | 285,350 | |
| | | | Dow Chemical Company | | | | |
| | 66,000 | | | 8.550%, 5/15/2019 | | | 76,902 | |
| | | | First Quantum Minerals, Ltd. | | | | |
| | 310,000 | | | 7.000%, 2/15/2021h | | | 294,306 | |
| | | | Glencore Funding, LLC | | | | |
| | 60,000 | | | 1.940%, 4/16/2018g,h | | | 59,100 | |
| | | | LyondellBasell Industries NV | | | | |
| | 62,000 | | | 5.000%, 4/15/2019 | | | 66,269 | |
| | | | Newmont Mining Corporation, Convertible | | | | |
| | 190,000 | | | 1.625%, 7/15/2017 | | | 203,656 | |
| | | | NOVA Chemicals Corporation | | | | |
| | 281,626 | | | 5.250%, 8/1/2023h | | | 286,907 | |
| | | | Royal Gold, Inc., Convertible | | | | |
| | 140,000 | | | 2.875%, 6/15/2019 | | | 149,975 | |
| | | | RPM International, Inc., Convertible | | | | |
| | 140,000 | | | 2.250%, 12/15/2020 | | | 159,688 | |
| | | | | |
| | | | Total | | | 1,755,502 | |
| | | | | |
| |
| Capital Goods (0.8%) | | | | |
| | | | Ball Corporation | | | | |
| | 200,000 | | | 4.375%, 12/15/2020 | | | 213,000 | |
| | | | Berry Plastics Corporation | | | | |
| | 155,000 | | | 6.000%, 10/15/2022 | | | 163,913 | |
| | | | Building Materials Corporation of America | | | | |
| | 285,000 | | | 6.000%, 10/15/2025h | | | 304,223 | |
| | | | Cemex SAB de CV | | | | |
| | 310,000 | | | 5.700%, 1/11/2025h | | | 315,425 | |
| | | | CNH Industrial Capital, LLC | | | | |
| | 310,000 | | | 4.375%, 11/6/2020 | | | 316,975 | |
| | | | Crown Americas Capital Corporation IV | | | | |
| | 260,000 | | | 4.500%, 1/15/2023 | | | 266,500 | |
| | | | General Electric Company | | | | |
| | 96,000 | | | 5.000%, 12/29/2049k | | | 101,702 | |
| | | | L-3 Communications Corporation | | | | |
| | 65,000 | | | 4.950%, 2/15/2021 | | | 71,148 | |
| | | | Lockheed Martin Corporation | | | | |
| | 60,000 | | | 2.500%, 11/23/2020 | | | 61,553 | |
| | | | Owens-Brockway Glass Container, Inc. | | | | |
| | 200,000 | | | 5.000%, 9/1/2022h | | | 209,250 | |
| | | | Roper Industries, Inc. | | | | |
| | 60,000 | | | 2.050%, 10/1/2018 | | | 60,556 | |
The accompanying Notes to Financial Statements are an integral part of this schedule.
83
BALANCED INCOME PLUS FUND
Schedule of Investments as of October 31, 2016
| | | | | | | | |
Principal
Amount | | | Long-Term Fixed Income (32.4%) | | Value | |
| Capital Goods (0.8%) - continued | | | | |
| | | | United Rentals North America, Inc. | | | | |
| | $300,000 | | | 5.500%, 7/15/2025 | | | $303,750 | |
| | | | | |
| | | | Total | | | 2,387,995 | |
| | | | | |
| |
| Collateralized Mortgage Obligations (3.7%) | | | | |
| | | | Alternative Loan Trust | | | | |
| | 57,204 | | | 5.500%, 5/25/2035 | | | 57,042 | |
| | | | Angel Oak Mortgage Trust | | | | |
| | 192,632 | | | 4.500%, 11/25/2045*,i | | | 193,791 | |
| | | | Banc of America Alternative Loan Trust | | | | |
| | 470,893 | | | 6.000%, 11/25/2035 | | | 416,778 | |
| | | | Banc of America Mortgage Securities, Inc. | | | | |
| | 156,954 | | | 3.227%, 9/25/2035 | | | 150,324 | |
| | | | Bayview Opportunity Master Fund Trust | | | | |
| | 274,849 | | | 3.475%, 7/28/2031h | | | 275,321 | |
| | | | Bear Stearns ALT-A Trust | | | | |
| | 164,125 | | | 3.070%, 10/25/2033 | | | 160,028 | |
| | | | COLT Mortgage Loan Trust | | | | |
| | 308,648 | | | 2.750%, 9/25/2046* | | | 310,568 | |
| | | | Countrywide Alternative Loan Trust | | | | |
| | 420,745 | | | 6.500%, 8/25/2036 | | | 284,385 | |
| | | | Countrywide Home Loan Mortgage Pass Through Trust | | | | |
| | 319,680 | | | 3.115%, 11/25/2035 | | | 262,103 | |
| | | | Credit Suisse First Boston Mortgage Securities Corporation | | | | |
| | 278,928 | | | 5.250%, 10/25/2035 | | | 271,475 | |
| | | | Deutsche Alt-A Securities, Inc., Mortgage Loan Trust | | | | |
| | 502,595 | | | 5.500%, 11/25/2035 | | | 503,319 | |
| | 340,000 | | | 1.294%, 4/25/2047g | | | 288,762 | |
| | | | GMAC Mortgage Corporation Loan Trust | | | | |
| | 312,987 | | | 3.385%, 5/25/2035 | | | 288,651 | |
| | | | HarborView Mortgage Loan Trust | | | | |
| | 153,394 | | | 3.108%, 7/19/2035 | | | 134,653 | |
| | 160,216 | | | 4.432%, 12/19/2035 | | | 139,300 | |
| | | | IndyMac INDA Mortgage Loan Trust | | | | |
| | 227,266 | | | 3.180%, 8/25/2036 | | | 215,843 | |
| | | | IndyMac INDX Mortgage Loan Trust | | | | |
| | 361,253 | | | 0.744%, 4/25/2046g | | | 265,632 | |
| | | | J.P. Morgan Alternative Loan Trust | | | | |
| | 233,639 | | | 2.879%, 3/25/2036 | | | 195,221 | |
| | 555,546 | | | 6.500%, 3/25/2036 | | | 456,088 | |
| | | | J.P. Morgan Mortgage Trust | | | | |
| | 425,372 | | | 3.229%, 8/25/2035 | | | 421,420 | |
| | 476,040 | | | 3.064%, 1/25/2037 | | | 425,913 | |
| | | | Lehman Mortgage Trust | | | | |
| | 46,811 | | | 6.000%, 1/25/2036 | | | 42,905 | |
| | | | Master Asset Securitization Trust | | | | |
| | 92,988 | | | 1.034%, 6/25/2036g | | | 49,168 | |
| | | | MortgageIT Trust | | | | |
| | 487,109 | | | 0.794%, 12/25/2035g | | | 443,918 | |
| | 664,999 | | | 0.734%, 4/25/2036g | | | 491,595 | |
| | | | New York Mortgage Trust | | | | |
| | 211,359 | | | 3.011%, 5/25/2036 | | | 190,311 | |
| | | | Residential Accredit Loans, Inc. Trust | | | | |
| | 324,652 | | | 5.750%, 9/25/2035 | | | 290,706 | |
| | | | Residential Funding Mortgage Security I Trust | | | | |
| | 554,427 | | | 6.000%, 7/25/2037 | | | 511,999 | |
| | | | Structured Adjustable Rate Mortgage Loan Trust | | | | |
| | 305,889 | | | 2.938%, 1/25/2035 | | | 250,615 | |
| | 217,669 | | | 3.268%, 7/25/2035 | | | 185,819 | |
| | 351,493 | | | 3.295%, 9/25/2035 | | | 286,065 | |
| | | | Structured Asset Mortgage Investments, Inc. | | | | |
| | 812,031 | | | 0.844%, 12/25/2035g | | | 593,701 | |
| | | | Vericrest Opportunity Loan Transferee | | | | |
| | 292,758 | | | 3.500%, 7/25/2046h,i | | | 292,664 | |
| | | | WaMu Mortgage Pass Through Certificates | | | | |
| | 158,106 | | | 2.030%, 1/25/2037 | | | 134,070 | |
| | 269,386 | | | 1.264%, 1/25/2047g | | | 210,017 | |
| | | | Washington Mutual Mortgage Pass Through Certificates Trust | | | | |
| | 331,734 | | | 1.274%, 2/25/2047g | | | 247,136 | |
| | | | Wells Fargo Mortgage Backed Securities Trust | | | | |
| | 402,573 | | | 3.022%, 7/25/2036 | | | 393,771 | |
| | 216,057 | | | 3.066%, 10/25/2036 | | | 200,852 | |
| | 275,673 | | | 6.000%, 7/25/2037 | | | 276,104 | |
| | 197,696 | | | 6.000%, 7/25/2037 | | | 195,672 | |
| | | | | |
| | | | Total | | | 11,003,705 | |
| | | | | |
| |
| Communications Services (1.6%) | | | | |
| | | | Altice US Finance I Corporation | | | | |
| | 200,000 | | | 5.500%, 5/15/2026h | | | 204,000 | |
| | | | AMC Networks, Inc. | | | | |
| | 305,000 | | | 5.000%, 4/1/2024 | | | 308,813 | |
| | | | America Movil SAB de CV | | | | |
| | 56,000 | | | 5.000%, 10/16/2019 | | | 60,998 | |
| | | | American Tower Corporation | | | | |
| | 60,000 | | | 2.800%, 6/1/2020 | | | 61,267 | |
| | | | AT&T, Inc. | | | | |
| | 66,000 | | | 5.875%, 10/1/2019 | | | 73,098 | |
| | 60,000 | | | 1.768%, 6/30/2020g | | | 60,265 | |
| | 55,000 | | | 2.800%, 2/17/2021 | | | 55,753 | |
| | | | British Sky Broadcasting Group plc | | | | |
| | 94,000 | | | 2.625%, 9/16/2019h | | | 95,283 | |
| | | | CCOH Safari, LLC | | | | |
| | 310,000 | | | 5.750%, 2/15/2026h | | | 322,981 | |
| | | | CenturyLink, Inc. | | | | |
| | 200,000 | | | 6.450%, 6/15/2021 | | | 213,500 | |
| | | | Charter Communications Operating, LLC | | | | |
| | 64,000 | | | 3.579%, 7/23/2020h | | | 66,359 | |
| | 29,000 | | | 4.464%, 7/23/2022h | | | 30,890 | |
| | | | Clear Channel Worldwide Holdings, Inc. | | | | |
| | 265,000 | | | 6.500%, 11/15/2022 | | | 269,902 | |
| | | | Columbus International, Inc. | | | | |
| | 175,000 | | | 7.375%, 3/30/2021h | | | 187,250 | |
| | | | Crown Castle International Corporation | | | | |
| | 25,000 | | | 3.400%, 2/15/2021 | | | 25,978 | |
| | 35,000 | | | 2.250%, 9/1/2021 | | | 34,707 | |
| | | | CSC Holdings, LLC | | | | |
| | 20,000 | | | 5.500%, 4/15/2027h | | | 20,288 | |
| | | | Digicel, Ltd. | | | | |
| | 287,750 | | | 6.000%, 4/15/2021* | | | 257,450 | |
| | | | DISH Network Corporation, Convertible | | | | |
| | 315,000 | | | 3.375%, 8/15/2026h | | | 360,872 | |
The accompanying Notes to Financial Statements are an integral part of this schedule.
84
BALANCED INCOME PLUS FUND
Schedule of Investments as of October 31, 2016
| | | | | | | | |
Principal
Amount | | | Long-Term Fixed Income (32.4%) | | Value | |
| Communications Services (1.6%) - continued | | | | |
| | | | Frontier Communications Corporation | | | | |
| | $275,000 | | | 8.875%, 9/15/2020 | | | $292,188 | |
| | | | Hughes Satellite Systems Corporation | | | | |
| | 190,000 | | | 6.500%, 6/15/2019 | | | 207,337 | |
| | | | Liberty Interactive, LLC, Convertible | | | | |
| | 175,000 | | | 1.750%, 9/30/2046h | | | 175,875 | |
| | | | Neptune Finco Corporation | | | | |
| | 95,000 | | | 10.875%, 10/15/2025h | | | 109,250 | |
| | | | SFR Group SA | | | | |
| | 290,000 | | | 6.000%, 5/15/2022h | | | 297,343 | |
| | | | Sprint Corporation | | | | |
| | 295,000 | | | 7.625%, 2/15/2025 | | | 285,413 | |
| | | | Telefonica Emisiones SAU | | | | |
| | 66,000 | | | 3.192%, 4/27/2018 | | | 67,411 | |
| | | | T-Mobile USA, Inc. | | | | |
| | 210,000 | | | 6.633%, 4/28/2021 | | | 220,238 | |
| | | | Univision Communications, Inc. | | | | |
| | 130,000 | | | 5.125%, 5/15/2023h | | | 131,950 | |
| | | | Verizon Communications, Inc. | | | | |
| | 187,000 | | | 2.625%, 2/21/2020 | | | 190,698 | |
| | 88,000 | | | 4.500%, 9/15/2020 | | | 95,660 | |
| | | | Viacom, Inc. | | | | |
| | 78,000 | | | 2.250%, 2/4/2022 | | | 76,768 | |
| | | | | |
| | | | Total | | | 4,859,785 | |
| | | | | |
| |
| Consumer Cyclical (1.6%) | | | | |
| | | | Allison Transmission, Inc. | | | | |
| | 280,000 | | | 5.000%, 10/1/2024h | | | 285,600 | |
| | | | AmeriGas Finance, LLC | | | | |
| | 100,000 | | | 5.625%, 5/20/2024 | | | 104,750 | |
| | | | BMW US Capital, LLC | | | | |
| | 75,000 | | | 1.500%, 4/11/2019h | | | 75,037 | |
| | | | Brookfield Residential Properties, Inc. | | | | |
| | 125,000 | | | 6.125%, 7/1/2022h | | | 126,875 | |
| | | | Cinemark USA, Inc. | | | | |
| | 204,000 | | | 4.875%, 6/1/2023 | | | 204,255 | |
| | | | Corrections Corporation of America | | | | |
| | 195,000 | | | 5.000%, 10/15/2022e | | | 175,987 | |
| | | | Daimler Finance North America, LLC | | | | |
| | 48,000 | | | 1.875%, 1/11/2018h | | | 48,238 | |
| | | | eBay, Inc. | | | | |
| | 50,000 | | | 2.500%, 3/9/2018 | | | 50,620 | |
| | | | ERAC USA Finance, LLC | | | | |
| | 88,000 | | | 2.350%, 10/15/2019h | | | 89,138 | |
| | | | Ford Motor Credit Company, LLC | | | | |
| | 100,000 | | | 5.000%, 5/15/2018 | | | 104,679 | |
| | 85,000 | | | 2.597%, 11/4/2019 | | | 86,058 | |
| | | | General Motors Financial Company, Inc. | | | | |
| | 35,000 | | | 3.150%, 1/15/2020 | | | 35,604 | |
| | 138,000 | | | 4.375%, 9/25/2021 | | | 146,534 | |
| | | | Home Depot, Inc. | | | | |
| | 60,000 | | | 1.220%, 9/15/2017g | | | 60,176 | |
| | 60,000 | | | 2.625%, 6/1/2022 | | | 61,932 | |
| | | | Hyundai Capital America | | | | |
| | 72,000 | | | 1.450%, 2/6/2017h | | | 72,072 | |
| | | | Jaguar Land Rover Automotive plc | | | | |
| | 75,000 | | | 4.125%, 12/15/2018h | | | 76,687 | |
| | 211,000 | | | 5.625%, 2/1/2023h | | | 218,284 | |
| | | | KB Home | | | | |
| | 160,000 | | | 4.750%, 5/15/2019 | | | 163,600 | |
| | | | L Brands, Inc. | | | | |
| | 211,000 | | | 6.625%, 4/1/2021 | | | 242,650 | �� |
| | | | Lennar Corporation | | | | |
| | 225,000 | | | 4.500%, 11/15/2019 | | | 237,094 | |
| | | | Live Nation Entertainment, Inc. | | | | |
| | 70,000 | | | 5.375%, 6/15/2022h | | | 72,450 | |
| | | | Macy’s Retail Holdings, Inc. | | | | |
| | 60,000 | | | 7.450%, 7/15/2017 | | | 62,583 | |
| | | | MGM Resorts International | | | | |
| | 310,000 | | | 6.000%, 3/15/2023 | | | 335,575 | |
| | | | Newell Rubbermaid, Inc. | | | | |
| | 50,000 | | | 3.150%, 4/1/2021 | | | 52,064 | |
| | | | PulteGroup, Inc. | | | | |
| | 200,000 | | | 4.250%, 3/1/2021 | | | 210,000 | |
| | | | Ralph Lauren Corporation | | | | |
| | 60,000 | | | 2.625%, 8/18/2020 | | | 61,645 | |
| | | | Royal Caribbean Cruises, Ltd. | | | | |
| | 287,750 | | | 5.250%, 11/15/2022 | | | 314,727 | |
| | | | Toll Brothers Finance Corporation | | | | |
| | 136,000 | | | 4.000%, 12/31/2018 | | | 140,420 | |
| | | | Visa, Inc. | | | | |
| | 60,000 | | | 2.200%, 12/14/2020 | | | 61,176 | |
| | | | Walgreens Boots Alliance, Inc. | | | | |
| | 50,000 | | | 1.750%, 5/30/2018 | | | 50,240 | |
| | 50,000 | | | 2.600%, 6/1/2021 | | | 50,613 | |
| | | | West Corporation | | | | |
| | 305,000 | | | 5.375%, 7/15/2022h | | | 293,562 | |
| | | | Yum! Brands, Inc. | | | | |
| | 305,000 | | | 5.000%, 6/1/2024h | | | 317,200 | |
| | | | | |
| | | | Total | | | 4,688,125 | |
| | | | | |
| |
| Consumer Non-Cyclical (1.4%) | | | | |
| | | | Actavis Funding SCS | | | | |
| | 40,000 | | | 2.100%, 3/12/2020g | | | 40,655 | |
| | | | Anheuser-Busch InBev Finance, Inc. | | | | |
| | 80,000 | | | 2.017%, 2/1/2021g | | | 82,030 | |
| | 55,000 | | | 2.650%, 2/1/2021 | | | 56,249 | |
| | | | B&G Foods, Inc. | | | | |
| | 120,000 | | | 4.625%, 6/1/2021 | | | 123,300 | |
| | | | BAT International Finance plc | | | | |
| | 60,000 | | | 1.360%, 6/15/2018g,h | | | 60,077 | |
| | | | Baxter International, Inc. | | | | |
| | 40,000 | | | 1.700%, 8/15/2021 | | | 39,770 | |
| | | | Becton, Dickinson and Company | | | | |
| | 68,000 | | | 1.450%, 5/15/2017 | | | 68,147 | |
| | | | Boston Scientific Corporation | | | | |
| | 40,000 | | | 6.000%, 1/15/2020 | | | 44,768 | |
| | | | Bunge Limited Finance Corporation | | | | |
| | 60,000 | | | 3.500%, 11/24/2020 | | | 62,613 | |
| | | | Cardinal Health, Inc. | | | | |
| | 60,000 | | | 1.950%, 6/15/2018 | | | 60,474 | |
| | | | Celgene Corporation | | | | |
| | 60,000 | | | 3.550%, 8/15/2022 | | | 63,165 | |
| | | | Cott Beverages, Inc. | | | | |
| | 290,000 | | | 5.375%, 7/1/2022 | | | 294,350 | |
| | | | CVS Health Corporation | | | | |
| | 66,000 | | | 2.250%, 12/5/2018 | | | 66,910 | |
| | | | EMD Finance, LLC | | | | |
| | 35,000 | | | 1.207%, 3/17/2017g,h | | | 35,012 | |
| | | | Envision Healthcare Corporation | | | | |
| | 300,000 | | | 5.125%, 7/1/2022h | | | 300,000 | |
| | | | Express Scripts Holding Company | | | | |
| | 50,000 | | | 3.900%, 2/15/2022 | | | 53,462 | |
| | | | Forest Laboratories, Inc. | | | | |
| | 91,000 | | | 4.375%, 2/1/2019h | | | 95,587 | |
| | | | Gilead Sciences, Inc. | | | | |
| | 20,000 | | | 2.550%, 9/1/2020 | | | 20,497 | |
| | 60,000 | | | 3.250%, 9/1/2022 | | | 63,131 | |
The accompanying Notes to Financial Statements are an integral part of this schedule.
85
BALANCED INCOME PLUS FUND
Schedule of Investments as of October 31, 2016
| | | | | | | | |
Principal
Amount | | | Long-Term Fixed Income (32.4%) | | Value | |
| Consumer Non-Cyclical (1.4%) - continued | |
| | | | Grifols Worldwide Operations, Ltd. | | | | |
| | $200,000 | | | 5.250%, 4/1/2022 | | | $208,500 | |
| | | | HCA, Inc. | | | | |
| | 187,750 | | | 4.750%, 5/1/2023 | | | 195,495 | |
| | | | Iconix Brand Group, Inc., Convertible | | | | |
| | 220,000 | | | 1.500%, 3/15/2018 | | | 187,550 | |
| | | | Intercept Pharmaceuticals, Inc., Convertible | | | | |
| | 115,000 | | | 3.250%, 7/1/2023 | | | 112,628 | |
| | | | JBS USA, LLC | | | | |
| | 300,000 | | | 5.750%, 6/15/2025h | | | 294,000 | |
| | | | Laboratory Corporation of America Holdings | | | | |
| | 35,000 | | | 2.625%, 2/1/2020 | | | 35,580 | |
| | | | Mead Johnson Nutrition Company | | | | |
| | 60,000 | | | 3.000%, 11/15/2020 | | | 62,025 | |
| | | | Merck & Company, Inc. | | | | |
| | 35,000 | | | 1.182%, 2/10/2020g | | | 35,179 | |
| | | | Mondelez International, Inc. | | | | |
| | 48,000 | | | 2.250%, 2/1/2019 | | | 48,723 | |
| | | | Perrigo Finance plc | | | | |
| | 35,000 | | | 3.500%, 12/15/2021 | | | 36,136 | |
| | | | Pinnacle Foods, Inc. | | | | |
| | 200,000 | | | 5.875%, 1/15/2024 | | | 214,500 | |
| | | | Revlon Consumer Products Corporation | | | | |
| | 187,750 | | | 5.750%, 2/15/2021 | | | 189,628 | |
| | | | Reynolds American, Inc. | | | | |
| | 33,000 | | | 3.250%, 6/12/2020 | | | 34,459 | |
| | | | SABMiller plc | | | | |
| | 66,000 | | | 6.500%, 7/15/2018h | | | 71,548 | |
| | | | Safeway, Inc. | | | | |
| | 15,000 | | | 3.400%, 12/1/2016 | | | 15,000 | |
| | | | Tenet Healthcare Corporation | | | | |
| | 260,000 | | | 8.125%, 4/1/2022 | | | 254,150 | |
| | | | Teva Pharmaceutical Finance Netherlands III BV | | | | |
| | 55,000 | | | 1.700%, 7/19/2019 | | | 54,573 | |
| | | | TreeHouse Foods, Inc. | | | | |
| | 200,000 | | | 4.875%, 3/15/2022 | | | 207,500 | |
| | | | Valeant Pharmaceuticals International | | | | |
| | 187,750 | | | 7.250%, 7/15/2022h | | | 163,343 | |
| | | | WM Wrigley Jr. Company | | | | |
| | 44,000 | | | 2.000%, 10/20/2017h | | | 44,303 | |
| | | | | |
| | | | Total | | | 4,095,017 | |
| | | | | |
| |
| Energy (1.2%) | | | | |
| | | | Anadarko Petroleum Corporation | | | | |
| | 55,000 | | | 8.700%, 3/15/2019 | | | 63,040 | |
| | | | Antero Resources Corporation | | | | |
| | 200,000 | | | 5.125%, 12/1/2022 | | | 201,500 | |
| | | | Boardwalk Pipelines, LP | | | | |
| | 72,000 | | | 5.875%, 11/15/2016 | | | 72,108 | |
| | | | BP Capital Markets plc | | | | |
| | 35,000 | | | 1.676%, 5/3/2019 | | | 35,055 | |
| | | | Buckeye Partners, LP | | | | |
| | 80,000 | | | 2.650%, 11/15/2018 | | | 80,887 | |
| | | | Chesapeake Energy Corporation, Convertible | | | | |
| | 180,000 | | | 5.500%, 9/15/2026h | | | 168,975 | |
| | | | Chevron Corporation | | | | |
| | 60,000 | | | 1.328%, 11/16/2018g | | | 60,261 | |
| | | | Concho Resources, Inc. | | | | |
| | 252,750 | | | 6.500%, 1/15/2022 | | | 261,596 | |
| | | | Contura Energy, Inc. | | | | |
| | 111,000 | | | 10.000%, 8/1/2021* | | | 117,105 | |
| | | | Crestwood Midstream Partners, LP | | | | |
| | 200,000 | | | 6.250%, 4/1/2023 | | | 202,500 | |
| | | | Ecopetrol SA | | | | |
| | 35,000 | | | 5.875%, 9/18/2023 | | | 37,537 | |
| | | | Enbridge, Inc. | | | | |
| | 45,000 | | | 1.289%, 6/2/2017e,g | | | 44,947 | |
| | | | EQT Corporation | | | | |
| | 68,000 | | | 8.125%, 6/1/2019 | | | 77,558 | |
| | | | Exxon Mobil Corporation | | | | |
| | 70,000 | | | 1.708%, 3/1/2019 | | | 70,530 | |
| | | | Marathon Petroleum Corporation | | | | |
| | 60,000 | | | 3.400%, 12/15/2020 | | | 62,347 | |
| | | | MEG Energy Corporation | | | | |
| | 211,000 | | | 6.375%, 1/30/2023h | | | 174,075 | |
| | | | MPLX, LP | | | | |
| | 305,000 | | | 4.875%, 12/1/2024 | | | 318,985 | |
| | | | Northern Tier Energy, LLC | | | | |
| | 195,000 | | | 7.125%, 11/15/2020 | | | 199,388 | |
| | | | Occidental Petroleum Corporation | | | | |
| | 60,000 | | | 2.600%, 4/15/2022 | | | 61,227 | |
| | | | Petrobras Global Finance BV | | | | |
| | 30,000 | | | 8.375%, 5/23/2021 | | | 33,189 | |
| | | | Petroleos Mexicanos | | | | |
| | 29,000 | | | 5.500%, 2/4/2019h | | | 30,697 | |
| | | | Pioneer Natural Resources Company | | | | |
| | 20,000 | | | 3.450%, 1/15/2021 | | | 20,836 | |
| | | | Regency Energy Partners, LP | | | | |
| | 260,000 | | | 5.000%, 10/1/2022 | | | 278,991 | |
| | | | Sabine Pass Liquefaction, LLC | | | | |
| | 310,000 | | | 5.625%, 3/1/2025 | | | 328,027 | |
| | | | Schlumberger Holdings Corporation | | | | |
| | 60,000 | | | 3.000%, 12/21/2020h | | | 62,257 | |
| | | | Shell International Finance BV | | | | |
| | 60,000 | | | 1.266%, 5/11/2020g | | | 60,066 | |
| | | | Sunoco Logistics Partners Operations, LP | | | | |
| | 60,000 | | | 4.400%, 4/1/2021 | | | 64,725 | |
| | | | TransCanada Trust | | | | |
| | 225,000 | | | 5.875%, 8/15/2076 | | | 240,750 | |
| | | | Transcontinental Gas Pipe Line Company, LLC | | | | |
| | 55,000 | | | 7.850%, 2/1/2026h | | | 69,751 | |
| | | | Whiting Petroleum Corporation, Convertible | | | | |
| | 180,000 | | | 1.250%, 4/1/2020 | | | 150,975 | |
| | | | | |
| | | | Total | | | 3,649,885 | |
| | | | | |
| |
| Financials (4.1%) | | | | |
| | | | Abbey National Treasury Services plc | | | | |
| | 92,000 | | | 1.264%, 9/29/2017g | | | 91,863 | |
| | | | ACE INA Holdings, Inc. | | | | |
| | 60,000 | | | 2.875%, 11/3/2022 | | | 62,511 | |
| | | | Aetna, Inc. | | | | |
| | 60,000 | | | 1.900%, 6/7/2019 | | | 60,481 | |
| | | | Air Lease Corporation | | | | |
| | 92,000 | | | 2.125%, 1/15/2018 | | | 92,321 | |
| | 29,000 | | | 2.625%, 9/4/2018 | | | 29,355 | |
| | | | Ally Financial, Inc. | | | | |
| | 245,000 | | | 4.750%, 9/10/2018 | | | 251,764 | |
| | | | American Express Credit Corporation | | | | |
| | 60,000 | | | 1.906%, 9/14/2020g | | | 60,898 | |
| | | | AMG Capital Trust II, Convertible | | | | |
| | 3,125 | | | 5.150%, 10/15/2037 | | | 160,938 | |
The accompanying Notes to Financial Statements are an integral part of this schedule.
86
BALANCED INCOME PLUS FUND
Schedule of Investments as of October 31, 2016
| | | | | | | | |
Principal
Amount | | | Long-Term Fixed Income (32.4%) | | Value | |
| Financials (4.1%) - continued | | | | |
| | | | Australia and New Zealand Banking Group, Ltd. | | | | |
| | $200,000 | | | 6.750%, 12/29/2049e,h,k | | | $219,515 | |
| | | | BAC Capital Trust XIV | | | | |
| | 300,000 | | | 4.000%, 9/29/2049g,k | | | 246,000 | |
| | | | Bank of America Corporation | | | | |
| | 100,000 | | | 5.700%, 5/2/2017 | | | 102,165 | |
| | 88,000 | | | 1.700%, 8/25/2017 | | | 88,202 | |
| | 176,000 | | | 1.936%, 3/22/2018g | | | 177,489 | |
| | 155,000 | | | 5.650%, 5/1/2018 | | | 163,950 | |
| | 65,000 | | | 8.000%, 7/29/2049k | | | 66,219 | |
| | 185,000 | | | 6.300%, 12/29/2049k | | | 201,863 | |
| | | | Bank of Montreal | | | | |
| | 50,000 | | | 1.500%, 7/18/2019 | | | 49,807 | |
| | | | BB&T Corporation | | | | |
| | 101,000 | | | 2.050%, 6/19/2018 | | | 102,005 | |
| | | | Bear Stearns Companies, LLC | | | | |
| | 103,000 | | | 6.400%, 10/2/2017 | | | 107,657 | |
| | | | Blackstone Mortgage Trust, Inc., Convertible | | | | |
| | 255,000 | | | 5.250%, 12/1/2018 | | | 284,325 | |
| | | | BNP Paribas SA | | | | |
| | 72,000 | | | 2.375%, 9/14/2017 | | | 72,633 | |
| | 270,000 | | | 7.625%, 12/29/2049h,k | | | 282,150 | |
| | | | Caisse Centrale Desjardins du Quebec | | | | |
| | 41,000 | | | 1.552%, 1/29/2018g,h | | | 40,955 | |
| | | | Central Fidelity Capital Trust I | | | | |
| | 285,000 | | | 1.880%, 4/15/2027g | | | 252,225 | |
| | | | Citigroup, Inc. | | | | |
| | 132,000 | | | 1.850%, 11/24/2017 | | | 132,449 | |
| | 35,000 | | | 2.255%, 9/1/2023g | | | 35,124 | |
| | | | CNA Financial Corporation | | | | |
| | 65,000 | | | 5.750%, 8/15/2021 | | | 74,394 | |
| | | | Credit Agricole SA | | | | |
| | 44,000 | | | 1.815%, 6/10/2020g,h | | | 44,162 | |
| | | | Credit Suisse Group AG | | | | |
| | 227,000 | | | 7.500%, 12/29/2049h,k | | | 234,945 | |
| | | | CyrusOne, LP | | | | |
| | 187,750 | | | 6.375%, 11/15/2022 | | | 199,015 | |
| | | | Discover Bank | | | | |
| | 24,000 | | | 8.700%, 11/18/2019 | | | 27,835 | |
| | | | Discover Financial Services | | | | |
| | 41,000 | | | 6.450%, 6/12/2017 | | | 42,222 | |
| | | | Fifth Third Bancorp | | | | |
| | 128,000 | | | 5.450%, 1/15/2017 | | | 129,160 | |
| | | | Goldman Sachs Group, Inc. | | | | |
| | 44,000 | | | 2.625%, 1/31/2019 | | | 44,834 | |
| | 66,000 | | | 7.500%, 2/15/2019 | | | 74,203 | |
| | 40,000 | | | 2.042%, 4/23/2020g | | | 40,235 | �� |
| | 55,000 | | | 2.241%, 11/15/2021g | | | 54,940 | |
| | 60,000 | | | 2.429%, 11/29/2023g | | | 60,891 | |
| | 285,000 | | | 5.300%, 12/29/2049k | | | 290,344 | |
| | | | Goldman Sachs Group, Inc., Convertible | | | | |
| | 1,400,000 | | | 0.500%, 9/24/2022 | | | 1,523,676 | |
| | | | Hartford Financial Services Group, Inc. | | | | |
| | 100,000 | | | 6.000%, 1/15/2019 | | | 108,604 | |
| | | | HCP, Inc. | | | | |
| | 68,000 | | | 3.750%, 2/1/2019 | | | 70,317 | |
| | | | Health Care REIT, Inc. | | | | |
| | 68,000 | | | 4.700%, 9/15/2017 | | | 69,896 | |
| | | | Hospitality Properties Trust | | | | |
| | 55,000 | | | 4.250%, 2/15/2021 | | | 58,187 | |
| | | | Huntington Bancshares, Inc. | | | | |
| | 70,000 | | | 3.150%, 3/14/2021 | | | 72,229 | |
| | | | Hutchison Whampoa Finance CI, Ltd. | | | | |
| | 91,000 | | | 1.625%, 10/31/2017h | | | 91,056 | |
| | | | Icahn Enterprises, LP | | | | |
| | 110,000 | | | 6.000%, 8/1/2020 | | | 108,075 | |
| | | | ILFC E-Capital Trust II | | | | |
| | 330,000 | | | 4.250%, 12/21/2065g,h | | | 268,950 | |
| | | | ING Capital Funding Trust III | | | | |
| | 56,000 | | | 4.438%, 12/29/2049g,k | | | 55,650 | |
| | | | International Lease Finance Corporation | | | | |
| | 250,000 | | | 5.875%, 8/15/2022 | | | 275,320 | |
| | | | Intesa Sanpaolo SPA | | | | |
| | 24,000 | | | 3.875%, 1/16/2018 | | | 24,484 | |
| | 102,000 | | | 3.875%, 1/15/2019 | | | 104,943 | |
| | | | J.P. Morgan Chase & Company | | | | |
| | 44,000 | | | 6.300%, 4/23/2019 | | | 48,773 | |
| | 25,000 | | | 2.250%, 1/23/2020 | | | 25,174 | |
| | 78,000 | | | 2.112%, 10/24/2023g | | | 77,693 | |
| | 49,000 | | | 7.900%, 4/29/2049k | | | 50,507 | |
| | | | KeyCorp | | | | |
| | 58,000 | | | 2.300%, 12/13/2018 | | | 58,752 | |
| | 90,000 | | | 5.000%, 12/29/2049k | | | 88,358 | |
| | | | Liberty Mutual Group, Inc. | | | | |
| | 27,000 | | | 5.000%, 6/1/2021h | | | 30,121 | |
| | | | Lincoln National Corporation | | | | |
| | 50,000 | | | 6.250%, 2/15/2020 | | | 56,216 | |
| | | | Lloyds Bank plc | | | | |
| | 36,000 | | | 1.374%, 3/16/2018g | | | 35,931 | |
| | | | Macquarie Bank, Ltd. | | | | |
| | 55,000 | | | 2.060%, 1/15/2019g,h | | | 55,552 | |
| | | | MetLife, Inc. | | | | |
| | 92,000 | | | 1.903%, 12/15/2017 | | | 92,584 | |
| | | | MGIC Investment Corporation, Convertible | | | | |
| | 70,000 | | | 9.000%, 4/1/2063h | | | 86,888 | |
| | | | Mizuho Corporate Bank, Ltd. | | | | |
| | 50,000 | | | 1.550%, 10/17/2017h | | | 50,003 | |
| | | | Morgan Stanley | | | | |
| | 88,000 | | | 6.625%, 4/1/2018 | | | 93,957 | |
| | 40,000 | | | 2.026%, 1/27/2020g | | | 40,398 | |
| | 57,000 | | | 4.875%, 11/1/2022 | | | 62,607 | |
| | 60,000 | | | 2.282%, 10/24/2023g | | | 59,928 | |
| | | | MPT Operating Partnership, LP | | | | |
| | 200,000 | | | 5.500%, 5/1/2024 | | | 206,000 | |
| | | | Murray Street Investment Trust I | | | | |
| | 144,000 | | | 4.647%, 3/9/2017 | | | 145,732 | |
| | | | National City Corporation | | | | |
| | 48,000 | | | 6.875%, 5/15/2019 | | | 53,700 | |
| | | | New York Life Global Funding | | | | |
| | 60,000 | | | 1.550%, 11/2/2018h | | | 60,137 | |
| | | | Nomura Holdings, Inc. | | | | |
| | 48,000 | | | 2.750%, 3/19/2019 | | | 48,921 | |
| | | | Quicken Loans, Inc. | | | | |
| | 295,000 | | | 5.750%, 5/1/2025h | | | 291,313 | |
| | | | Realty Income Corporation | | | | |
| | 75,000 | | | 2.000%, 1/31/2018 | | | 75,426 | |
| | | | Regions Bank | | | | |
| | 36,000 | | | 7.500%, 5/15/2018 | | | 39,011 | |
| | | | Regions Financial Corporation | | | | |
| | 50,000 | | | 3.200%, 2/8/2021 | | | 51,838 | |
| | | | Reinsurance Group of America, Inc. | | | | |
| | 88,000 | | | 5.625%, 3/15/2017 | | | 89,341 | |
The accompanying Notes to Financial Statements are an integral part of this schedule.
87
BALANCED INCOME PLUS FUND
Schedule of Investments as of October 31, 2016
| | | | | | | | |
Principal
Amount | | | Long-Term Fixed Income (32.4%) | | Value | |
| Financials (4.1%) - continued | | | | |
| | | | Royal Bank of Scotland Group plc | | | | |
| | $330,000 | | | 7.640%, 3/29/2049k | | | $320,100 | |
| | 265,000 | | | 7.648%, 8/29/2049k | | | 313,363 | |
| | | | Simon Property Group, LP | | | | |
| | 60,000 | | | 2.500%, 9/1/2020 | | | 61,501 | |
| | 80,000 | | | 2.500%, 7/15/2021 | | | 81,756 | |
| | | | SLM Corporation | | | | |
| | 30,000 | | | 4.625%, 9/25/2017 | | | 30,431 | |
| | | | Standard Chartered plc | | | | |
| | 360,000 | | | 6.409%, 1/29/2049e,h,k | | | 349,650 | |
| | | | State Street Capital Trust IV | | | | |
| | 300,000 | | | 1.850%, 6/15/2037g | | | 258,000 | |
| | | | State Street Corporation | | | | |
| | 60,000 | | | 1.701%, 8/18/2020g | | | 60,553 | |
| | | | Sumitomo Mitsui Banking Corporation | | | | |
| | 132,000 | | | 1.300%, 1/10/2017 | | | 132,075 | |
| | 50,000 | | | 1.460%, 1/16/2018g | | | 50,044 | |
| | | | SunTrust Banks, Inc. | | | | |
| | 50,000 | | | 2.900%, 3/3/2021 | | | 51,613 | |
| | | | Synchrony Financial | | | | |
| | 132,000 | | | 1.875%, 8/15/2017 | | | 132,322 | |
| | 25,000 | | | 1.989%, 2/3/2020g | | | 24,471 | |
| | | | Toronto-Dominion Bank | | | | |
| | 55,000 | | | 1.722%, 1/22/2019g | | | 55,425 | |
| | 60,000 | | | 1.786%, 12/14/2020g | | | 60,625 | |
| | | | UnitedHealth Group, Inc. | | | | |
| | 60,000 | | | 3.350%, 7/15/2022 | | | 63,832 | |
| | | | USB Realty Corporation | | | | |
| | 295,000 | | | 2.027%, 12/29/2049g,h,k | | | 264,763 | |
| | | | Voya Financial, Inc. | | | | |
| | 72,000 | | | 2.900%, 2/15/2018 | | | 73,186 | |
| | | | Wells Fargo & Company | | | | |
| | 41,000 | | | 1.567%, 1/30/2020g | | | 40,923 | |
| | 45,000 | | | 2.100%, 7/26/2021 | | | 44,768 | |
| | 50,000 | | | 2.117%, 10/31/2023g | | | 49,870 | |
| | | | Westpac Banking Corporation | | | | |
| | 65,000 | | | 1.661%, 8/19/2021g | | | 65,210 | |
| | | | | |
| | | | Total | | | 12,242,773 | |
| | | | | |
| |
| Foreign Government (7.6%) | | | | |
| | | | Argentina Government International Bond | | | | |
| | 310,000 | | | 6.250%, 4/22/2019h | | | 328,600 | |
| | 150,000 | | | 6.875%, 4/22/2021h | | | 162,300 | |
| | | | Brazil Government International Bond | | | | |
| | 447,000 | | | 4.875%, 1/22/2021 | | | 472,926 | |
| | 620,000 | | | 2.625%, 1/5/2023 | | | 572,880 | |
| | 240,000 | | | 6.000%, 4/7/2026 | | | 264,600 | |
| | 280,000 | | | 7.125%, 1/20/2037 | | | 319,200 | |
| | 336,000 | | | 5.000%, 1/27/2045 | | | 296,520 | |
| | 235,000 | | | 5.625%, 2/21/2047 | | | 225,013 | |
| | | | Colombia Government International Bond | | | | |
| | 280,000 | | | 4.375%, 7/12/2021 | | | 298,200 | |
| | 340,000 | | | 2.625%, 3/15/2023e | | | 328,950 | |
| | 330,000 | | | 4.000%, 2/26/2024 | | | 343,200 | |
| | 180,000 | | | 5.625%, 2/26/2044 | | | 196,650 | |
| | 336,000 | | | 5.000%, 6/15/2045 | | | 341,040 | |
| | | | Croatia Government International Bond | | | | |
| | 56,000 | | | 6.750%, 11/5/2019h | | | 61,508 | |
| | 336,000 | | | 6.625%, 7/14/2020h | | | 372,691 | |
| | 180,000 | | | 6.000%, 1/26/2024e,h | | | 203,130 | |
| | | | Export-Import Bank of Korea | | | | |
| | 40,000 | | | 2.250%, 1/21/2020 | | | 40,333 | |
| | | | Hungary Government International Bond | | | | |
| | 112,000 | | | 6.375%, 3/29/2021 | | | 129,209 | |
| | 524,000 | | | 5.750%, 11/22/2023 | | | 611,377 | |
| | 538,000 | | | 5.375%, 3/25/2024 | | | 618,110 | |
| | | | Indonesia Government International Bond | | | | |
| | 370,000 | | | 4.875%, 5/5/2021h | | | 402,390 | |
| | 305,000 | | | 3.375%, 4/15/2023h | | | 307,707 | |
| | 384,000 | | | 5.875%, 1/15/2024h | | | 445,472 | |
| | 232,000 | | | 4.125%, 1/15/2025h | | | 243,343 | |
| | 264,000 | | | 4.750%, 1/8/2026h | | | 287,788 | |
| | 290,000 | | | 8.500%, 10/12/2035h | | | 428,993 | |
| | 560,000 | | | 5.125%, 1/15/2045h | | | 609,437 | |
| | | | Mexico Government International Bond | | | | |
| | 200,000 | | | 4.350%, 1/15/2047 | | | 189,200 | |
| | 56,000 | | | 5.750%, 10/12/2110 | | | 57,260 | |
| | 168,000 | | | 3.625%, 3/15/2022 | | | 175,560 | |
| | 400,000 | | | 4.000%, 10/2/2023 | | | 420,400 | |
| | 434,000 | | | 3.600%, 1/30/2025 | | | 442,680 | |
| | 372,000 | | | 4.125%, 1/21/2026 | | | 393,204 | |
| | 112,000 | | | 6.750%, 9/27/2034 | | | 144,480 | |
| | 158,000 | | | 6.050%, 1/11/2040 | | | 187,822 | |
| | 316,000 | | | 4.750%, 3/8/2044 | | | 315,210 | |
| | 256,000 | | | 5.550%, 1/21/2045 | | | 286,720 | |
| | 448,000 | | | 4.600%, 1/23/2046 | | | 437,920 | |
| | | | Panama Government International Bond | | | | |
| | 168,000 | | | 4.000%, 9/22/2024 | | | 180,810 | |
| | 265,000 | | | 3.750%, 3/16/2025 | | | 280,900 | |
| | 240,000 | | | 6.700%, 1/26/2036 | | | 318,900 | |
| | | | Peru Government International Bond | | | | |
| | 122,000 | | | 5.625%, 11/18/2050 | | | 154,940 | |
| | 336,000 | | | 4.125%, 8/25/2027e | | | 374,220 | |
| | 290,000 | | | 8.750%, 11/21/2033 | | | 457,475 | |
| | | | Philippines Government International Bond | | | | |
| | 464,000 | | | 4.000%, 1/15/2021 | | | 504,746 | |
| | 245,000 | | | 7.750%, 1/14/2031 | | | 370,026 | |
| | 140,000 | | | 6.375%, 10/23/2034 | | | 195,015 | |
| | 124,000 | | | 5.000%, 1/13/2037 | | | 151,367 | |
| | 248,000 | | | 3.950%, 1/20/2040 | | | 267,077 | |
| | | | Romania Government International Bond | | | | |
| | 252,000 | | | 4.375%, 8/22/2023h | | | 273,722 | |
| | 120,000 | | | 4.875%, 1/22/2024h | | | 134,453 | |
| | 58,000 | | | 6.125%, 1/22/2044h | | | 75,307 | |
| | | | Russia Government International Bond | | | | |
| | 256,000 | | | 3.500%, 1/16/2019h | | | 260,892 | |
| | 1,000,000 | | | 5.000%, 4/29/2020h | | | 1,066,880 | |
| | 655,000 | | | 4.875%, 9/16/2023h | | | 704,099 | |
| | 342,400 | | | 7.500%, 3/31/2030h | | | 414,050 | |
| | 384,000 | | | 5.625%, 4/4/2042h | | | 423,782 | |
| | | | South Africa Government International Bond | | | | |
| | 25,000 | | | 5.500%, 3/9/2020 | | | 27,142 | |
| | 275,000 | | | 5.875%, 5/30/2022 | | | 310,304 | |
| | 259,000 | | | 4.300%, 10/12/2028 | | | 251,152 | |
| | | | Turkey Government International Bond | | | | |
| | 112,000 | | | 7.500%, 11/7/2019 | | | 124,320 | |
The accompanying Notes to Financial Statements are an integral part of this schedule.
88
BALANCED INCOME PLUS FUND
Schedule of Investments as of October 31, 2016
| | | | | | | | |
Principal
Amount | | | Long-Term Fixed Income (32.4%) | | Value | |
| Foreign Government (7.6%) - continued | | | | |
| | $280,000 | | | 7.000%, 6/5/2020 | | | $307,755 | |
| | 525,000 | | | 5.125%, 3/25/2022 | | | 542,253 | |
| | 256,000 | | | 6.250%, 9/26/2022 | | | 278,474 | |
| | 364,000 | | | 5.750%, 3/22/2024 | | | 386,907 | |
| | 525,000 | | | 4.250%, 4/14/2026 | | | 502,724 | |
| | 255,000 | | | 4.875%, 10/9/2026 | | | 254,235 | |
| | 340,000 | | | 6.875%, 3/17/2036 | | | 386,546 | |
| | 232,000 | | | 4.875%, 4/16/2043 | | | 206,113 | |
| | 387,000 | | | 6.625%, 2/17/2045 | | | 433,792 | |
| | | | | |
| | | | Total | | | 22,582,401 | |
| | | | | |
| |
| Mortgage-Backed Securities (5.3%) | | | | |
| | | | Federal Home Loan Mortgage Corporation Gold 15-Yr. Pass Through | | | | |
| | 1,250,000 | | | 3.000%, 11/1/2031c | | | 1,308,106 | |
| | | | Federal Home Loan Mortgage Corporation Gold 30-Yr. Pass Through | | | | |
| | 1,000,000 | | | 4.000%, 11/1/2046c | | | 1,069,648 | |
| | | | Federal National Mortgage Association Conventional | | | | |
| | 1,800,000 | | | 3.000%, 11/1/2046c | | | 1,853,156 | |
| | | | Federal National Mortgage Association Conventional 15-Yr. Pass Through | | | | |
| | 1,550,000 | | | 2.500%, 11/1/2031c | | | 1,594,926 | |
| | | | Federal National Mortgage Association Conventional 30-Yr. Pass Through | | | | |
| | 5,500,000 | | | 3.500%, 11/1/2046c | | | 5,774,141 | |
| | 3,150,000 | | | 4.000%, 11/1/2046c | | | 3,372,961 | |
| | 850,000 | | | 4.500%, 11/1/2046c | | | 929,023 | |
| | | | | |
| | | | Total | | | 15,901,961 | |
| | | | | |
| |
| Technology (1.1%) | | | | |
| | | | Alliance Data Systems Corporation | | | | |
| | 165,000 | | | 5.375%, 8/1/2022h | | | 158,812 | |
| | | | Apple, Inc. | | | | |
| | 60,000 | | | 1.117%, 5/6/2020g | | | 59,896 | |
| | | | Automatic Data Processing, Inc. | | | | |
| | 60,000 | | | 2.250%, 9/15/2020 | | | 61,527 | |
| | | | Cisco Systems, Inc. | | | | |
| | 55,000 | | | 1.411%, 2/21/2018g | | | 55,329 | |
| | 60,000 | | | 1.342%, 3/1/2019g | | | 60,335 | |
| | | | Diamond 1 Finance Corporation | | | | |
| | 50,000 | | | 3.480%, 6/1/2019h | | | 51,300 | |
| | | | Equinix, Inc. | | | | |
| | 200,000 | | | 5.750%, 1/1/2025 | | | 211,500 | |
| | | | Fidelity National Information Services, Inc. | | | | |
| | 91,000 | | | 1.450%, 6/5/2017 | | | 91,105 | |
| | 60,000 | | | 3.625%, 10/15/2020 | | | 63,287 | |
| | 65,000 | | | 2.250%, 8/15/2021 | | | 64,989 | |
| | | | First Data Corporation | | | | |
| | 200,000 | | | 5.375%, 8/15/2023h | | | 207,000 | |
| | | | Hewlett Packard Enterprise Company | | | | |
| | 60,000 | | | 3.850%, 10/15/2020h | | | 63,568 | |
| | | | IMS Health, Inc. | | | | |
| | 193,000 | | | 6.000%, 11/1/2020h | | | 195,895 | |
| | | | Intel Corporation | | | | |
| | 60,000 | | | 3.100%, 7/29/2022 | | | 63,345 | |
| | | | Intel Corporation, Convertible | | | | |
| | 200,000 | | | 2.950%, 12/15/2035 | | | 260,125 | |
| | | | Iron Mountain, Inc. | | | | |
| | 127,750 | | | 6.000%, 8/15/2023 | | | 135,734 | |
| | | | Micron Technology, Inc., Convertible | | | | |
| | 110,000 | | | 2.375%, 5/1/2032 | | | 202,056 | |
| | 180,000 | | | 3.000%, 11/15/2043 | | | 158,738 | |
| | | | NXP BV | | | | |
| | 215,000 | | | 3.875%, 9/1/2022h | | | 227,363 | |
| | | | NXP Semiconductors NV, Convertible | | | | |
| | 203,000 | | | 1.000%, 12/1/2019 | | | 232,943 | |
| | | | Oracle Corporation | | | | |
| | 60,000 | | | 2.500%, 5/15/2022 | | | 60,673 | |
| | | | Sensata Technologies BV | | | | |
| | 290,000 | | | 4.875%, 10/15/2023h | | | 300,512 | |
| | | | Texas Instruments, Inc. | | | | |
| | 60,000 | | | 1.750%, 5/1/2020 | | | 60,431 | |
| | | | Tyco Electronics Group SA | | | | |
| | 101,000 | | | 6.550%, 10/1/2017 | | | 105,819 | |
| | | | | |
| | | | Total | | | 3,152,282 | |
| | | | | |
| |
| Transportation (0.4%) | | | | |
| | | | Air Canada Pass Through Trust | | | | |
| | 18,633 | | | 3.875%, 3/15/2023h | | | 18,167 | |
| | | | American Airlines Pass Through Trust | | | | |
| | 38,357 | | | 4.950%, 1/15/2023 | | | 41,858 | |
| | | | Avis Budget Car Rental, LLC | | | | |
| | 290,000 | | | 5.125%, 6/1/2022e,h | | | 284,200 | |
| | | | Continental Airlines, Inc. | | | | |
| | 121,149 | | | 6.250%, 4/11/2020 | | | 128,417 | |
| | | | Delta Air Lines, Inc. | | | | |
| | 53,316 | | | 4.950%, 5/23/2019 | | | 56,116 | |
| | | | ERAC USA Finance, LLC | | | | |
| | 50,000 | | | 2.600%, 12/1/2021h | | | 50,569 | |
| | | | J.B. Hunt Transport Services, Inc. | | | | |
| | 60,000 | | | 3.300%, 8/15/2022 | | | 62,155 | |
| | | | Korea Expressway Corporation | | | | |
| | 78,000 | | | 1.625%, 4/28/2017h | | | 77,988 | |
| | | | Trinity Industries, Inc., Convertible | | | | |
| | 50,000 | | | 3.875%, 6/1/2036 | | | 55,656 | |
| | | | US Airways Pass Through Trust | | | | |
| | 87,154 | | | 3.950%, 11/15/2025 | | | 91,947 | |
| | | | XPO Logistics, Inc. | | | | |
| | 200,000 | | | 6.500%, 6/15/2022h | | | 208,000 | |
| | | | | |
| | | | Total | | | 1,075,073 | |
| | | | | |
| |
| U.S. Government and Agencies (0.6%) | | | | |
| | | | U.S. Treasury Notes | | | | |
| | 310,000 | | | 1.125%, 8/31/2021 | | | 307,263 | |
| | 360,000 | | | 2.125%, 6/30/2022 | | | 372,797 | |
| | 1,250,000 | | | 1.625%, 2/15/2026 | | | 1,229,298 | |
| | | | | |
| | | | Total | | | 1,909,358 | |
| | | | | |
| |
| Utilities (0.7%) | | | | |
| | | | AES Corporation | | | | |
| | 187,750 | | | 7.375%, 7/1/2021 | | | 211,688 | |
| | | | Ameren Corporation | | | | |
| | 60,000 | | | 2.700%, 11/15/2020 | | | 61,754 | |
| | | | Arizona Public Service Company | | | | |
| | 35,000 | | | 2.200%, 1/15/2020 | | | 35,629 | |
| | | | Berkshire Hathaway Energy Company | | | | |
| | 88,000 | | | 2.400%, 2/1/2020 | | | 89,609 | |
| | | | Calpine Corporation | | | | |
| | 180,000 | | | 5.375%, 1/15/2023 | | | 178,200 | |
| | | | DTE Energy Company | | | | |
| | 88,000 | | | 2.400%, 12/1/2019 | | | 89,525 | |
| | | | Dynegy, Inc. | | | | |
| | 160,000 | | | 7.375%, 11/1/2022 | | | 154,300 | |
| | | | El Paso Corporation | | | | |
| | 46,000 | | | 7.000%, 6/15/2017 | | | 47,517 | |
The accompanying Notes to Financial Statements are an integral part of this schedule.
89
BALANCED INCOME PLUS FUND
Schedule of Investments as of October 31, 2016
| | | | | | | | |
Principal
Amount | | | Long-Term Fixed Income (32.4%) | | Value | |
| Utilities (0.7%) - continued | | | | |
| | | | Emera U.S. Finance, LP | | | | |
| | $25,000 | | | 2.150%, 6/15/2019h | | | $25,220 | |
| | | | Energy Transfer Equity, LP | | | | |
| | 300,000 | | | 5.500%, 6/1/2027 | | | 292,500 | |
| | | | Eversource Energy | | | | |
| | 30,000 | | | 1.600%, 1/15/2018 | | | 30,050 | |
| | | | Exelon Generation Company, LLC | | | | |
| | 44,000 | | | 5.200%, 10/1/2019 | | | 48,123 | |
| | 25,000 | | | 2.950%, 1/15/2020 | | | 25,652 | |
| | | | Fortis, Inc. | | | | |
| | 30,000 | | | 2.100%, 10/4/2021h | | | 29,754 | |
| | | | NextEra Energy Capital Holdings, Inc. | | | | |
| | 50,000 | | | 2.300%, 4/1/2019 | | | 50,697 | |
| | | | NiSource Finance Corporation | | | | |
| | 36,000 | | | 6.400%, 3/15/2018 | | | 38,273 | |
| | | | NRG Energy, Inc. | | | | |
| | 187,750 | | | 6.625%, 3/15/2023 | | | 187,281 | |
| | | | Pacific Gas & Electric Company | | | | |
| | 57,000 | | | 5.625%, 11/30/2017 | | | 59,612 | |
| | | | PG&E Corporation | | | | |
| | 49,000 | | | 2.400%, 3/1/2019 | | | 49,795 | |
| | | | PSEG Power, LLC | | | | |
| | 50,000 | | | 3.000%, 6/15/2021 | | | 51,153 | |
| | | | Sempra Energy | | | | |
| | 92,000 | | | 6.150%, 6/15/2018 | | | 98,350 | |
| | 25,000 | | | 2.400%, 3/15/2020 | | | 25,389 | |
| | | | Southern California Edison Company | | | | |
| | 20,000 | | | 2.400%, 2/1/2022 | | | 20,324 | |
| | | | Southern Company | | | | |
| | 45,000 | | | 1.850%, 7/1/2019 | | | 45,260 | |
| | | | Xcel Energy, Inc. | | | | |
| | 60,000 | | | 1.200%, 6/1/2017 | | | 59,979 | |
| | | | | |
| | | | Total | | | 2,005,634 | |
| | | | | |
| | | | | | | | |
| | | | | |
| | | | Total Long-Term Fixed Income (cost $95,527,301) | | | 96,663,828 | |
| | | | | |
| | |
| Shares | | | Registered Investment Companies (2.6%) | | Value | |
| Equity Funds/ETFs (1.5%) | | | | |
| | 12,700 | | | AllianzGI NFJ Dividend Interest & Premium Strategy Fund | | | 155,194 | |
| | 14,100 | | | BlackRock Resources & Commodities Strategy Trust | | | 112,377 | |
| | 6,250 | | | Guggenheim Multi-Asset Income ETF | | | 120,625 | |
| | 7,610 | | | iShares MSCI EAFE Index Fund | | | 440,010 | |
| | 44,220 | | | Materials Select Sector SPDR Fund | | | 2,067,285 | |
| | 29,320 | | | Utilities Select Sector SPDR Fund | | | 1,449,288 | |
| | | | | |
| | | | Total | | | 4,344,779 | |
| | | | | |
| |
| Fixed Income Funds/ETFs (1.1%) | | | | |
| | 70,773 | | | Aberdeen Asia-Pacific Income Fund, Inc. | | | 348,203 | |
| | 20,150 | | | Doubleline Income Solutions Fund | | | 377,813 | |
| | 11,232 | | | First Trust High Income Long/Short Fund | | | 174,321 | |
| | 66,849 | | | MFS Intermediate Income Trust | | | 297,478 | |
| | 24,364 | | | Pimco Dynamic Credit And Mortgage Income Fund | | | 495,076 | |
| | 54,598 | | | Templeton Global Income Fund | | | 346,151 | |
| | 8,025 | | | Vanguard Short-Term Corporate Bond ETF | | | 644,568 | |
| | 24,853 | | | Western Asset Emerging Markets Debt Fund, Inc. | | | 380,499 | |
| | 38,627 | | | Western Asset High Income Opportunity Fund, Inc. | | | 191,590 | |
| | | | | |
| | | | Total | | | 3,255,699 | |
| | | | | |
| | | | | | | | |
| | | | | |
| | | | Total Registered Investment Companies (cost $7,280,291) | | | 7,600,478 | |
| | | | | |
| | |
| Shares | | | Preferred Stock (1.4%) | | Value | |
| Consumer Staples (0.1%) | | | | |
| | 1,325 | | | Bunge, Ltd., Convertible, 4.875%k | | | 128,710 | |
| | 10,600 | | | CHS, Inc., 7.100%k | | | 313,760 | |
| | | | | |
| | | | Total | | | 442,470 | |
| | | | | |
| |
| Energy (<0.1%) | | | | |
| | 2,399 | | | Alpha Natural Resources, Inc., 0.000%d | | | 14,994 | |
| | 2,399 | | | ANR Holdings, Inc., 0.000%d | | | 4,078 | |
| | | | | |
| | | | Total | | | 19,072 | |
| | | | | |
| |
| Financials (1.0%) | | | | |
| | 2,826 | | | Agribank FCB, 6.875%k | | | 303,972 | |
| | 12,465 | | | Citigroup, Inc., 6.875%k | | | 357,621 | |
| | 2,200 | | | Cobank ACB, 6.250%k | | | 234,506 | |
| | 7,200 | | | Countrywide Capital V, 7.000% | | | 185,472 | |
| | 11,000 | | | GMAC Capital Trust I, 6.602%g | | | 280,830 | |
| | 12,400 | | | Goldman Sachs Group, Inc., 5.500%k | | | 323,268 | |
| | 430 | | | M&T Bank Corporation, 6.375%k | | | 452,575 | |
| | 10,600 | | | Morgan Stanley, 7.125%k | | | 309,308 | |
| | 7,155 | | | U.S. Bancorp, 6.500%k | | | 209,999 | |
| | 265 | | | Wells Fargo & Company, Convertible, 7.500%k | | | 345,825 | |
| | | | | |
| | | | Total | | | 3,003,376 | |
| | | | | |
| |
| Health Care (0.1%) | | | | |
| | 255 | | | Allergan plc, Convertible, 5.500% | | | 195,553 | |
| | 110 | | | Teva Pharmaceutical Industries, Ltd., Convertible, 7.000% | | | 83,380 | |
| | | | | |
| | | | Total | | | 278,933 | |
| | | | | |
| |
| Real Estate (0.2%) | | | | |
| | 5,300 | | | American Tower Corporation, Convertible, 5.500% | | | 581,676 | |
| | | | | |
| | | | Total | | | 581,676 | |
| | | | | |
| | | | | | | | |
| | | | | |
| | | | Total Preferred Stock (cost $4,058,137) | | | 4,325,527 | |
| | | | | |
| | |
| Shares | | | Collateral Held for Securities Loaned (1.4%) | | Value | |
| | 4,071,925 | | | Thrivent Cash Management Trust | | | 4,071,925 | |
| | | | | |
| | | | Total Collateral Held for Securities Loaned (cost $4,071,925) | | | 4,071,925 | |
| | | | | |
| | |
Shares or
Principal
Amount | | | Short-Term Investments (9.7%)l | | Value | |
| | | | Federal Home Loan Bank Discount Notes | | | | |
| | 100,000 | | | 0.325%, 11/14/2016 | | | 99,993 | |
| | 300,000 | | | 0.344%, 1/6/2017m | | | 299,824 | |
| | 200,000 | | | 0.350%, 1/20/2017m | | | 199,858 | |
| | 100,000 | | | 0.355%, 1/25/2017m | | | 99,924 | |
| | 100,000 | | | 0.365%, 1/27/2017m | | | 99,922 | |
The accompanying Notes to Financial Statements are an integral part of this schedule.
90
BALANCED INCOME PLUS FUND
Schedule of Investments as of October 31, 2016
| | | | | | | | |
| | |
Shares or
Principal
Amount | | | Short-Term Investments (9.7%)l | | Value | |
| | | | Thrivent Core Short-Term Reserve Fund | | | | |
| | 2,801,564 | | | 0.790% | | | $28,015,637 | |
| | | | | |
| | | | Total Short-Term Investments (cost $28,815,108) | | | 28,815,158 | |
| | | | | |
| | | | Total Investments (cost $310,688,149) 107.7% | | | $320,341,537 | |
| | | | | |
| | | | Other Assets and Liabilities, Net (7.7%) | | | (22,923,452 | ) |
| | | | | |
| | | | Total Net Assets 100.0% | | | $297,418,085 | |
| | | | | |
a | The stated interest rate represents the weighted average of all contracts within the bank loan facility. |
b | All or a portion of the loan is unfunded. |
c | Denotes investments purchased on a when-issued or delayed delivery basis. |
d | Non-income producing security. |
e | All or a portion of the security is on loan. |
f | Security is valued at fair value. Market quotations or prices were not readily available or were determined to be unreliable. Fair value was determined in good faith pursuant to procedures adopted by the Board. Further information on fair valuation can be found in the Notes to Financial Statements. |
g | Denotes variable rate securities. Variable rate securities are securities whose yields vary with a designated market index or market rate. The rate shown is as of October 31, 2016. |
h | Denotes securities sold under Rule 144A of the Securities Act of 1933, which exempts them from registration. These securities may be resold to other dealers in the program or to other qualified institutional buyers. As of October 31, 2016, the value of these investments was $19,840,061 or 6.7% of total net assets. |
i | Denotes step coupon securities. Step coupon securities pay an initial coupon rate for the first period and then different coupon rates for following periods. The rate shown is as of October 31, 2016. |
j | All or a portion of the security is insured or guaranteed. |
k | Denotes perpetual securities. Perpetual securities pay an indefinite stream of interest, but may be called by the issuer at an earlier date. |
l | The interest rate shown reflects the yield, coupon rate or the discount rate at the date of purchase. |
m | All or a portion of the security is held on deposit with the counterparty and pledged as the initial margin deposit for open futures contracts. |
* | Denotes restricted securities. Restricted securities are investment securities which cannot be offered for public sale without first being registered under the Securities Act of 1933. The value of all restricted securities held in Balanced Income Plus Fund as of October 31, 2016 was $3,383,889 or 1.1% of total net assets. The following table indicates the acquisition date and cost of restricted securities shown in the schedule as of October 31, 2016. |
| | | | | | | | |
Security | | Acquisition
Date | | | Cost | |
Angel Oak Mortgage Trust, 11/25/2045 | | | 12/10/2015 | | | $ | 192,226 | |
Bayview Opportunity Master Fund Trust, 7/28/2034 | | | 12/12/2014 | | | | 185,315 | |
COLT Mortgage Loan Trust, 9/25/2046 | | | 9/9/2016 | | | | 310,432 | |
Contura Energy, Inc., 8/1/2021 | | | 2/12/2014 | | | | 193,841 | |
Digicel, Ltd., 4/15/2021 | | | 8/19/2013 | | | | 287,103 | |
Marlette Funding Trust, 1/17/2023 | | | 7/20/2016 | | | | 343,753 | |
Murray Hill Marketplace Trust, 11/25/2022 | | | 10/6/2016 | | | | 134,997 | |
NRZ Advance Receivables Trust Advance Receivables Backed, 6/15/2049 | | | 6/23/2016 | | | | 449,999 | |
Preston Ridge Partners Mortgage Trust, LLC, 9/27/2021 | | | 9/23/2016 | | | | 223,319 | |
Pretium Mortgage Credit Partners I, LLC, 7/27/2031 | | | 6/17/2016 | | | | 243,213 | |
Sunset Mortgage Loan Company, LLC, 9/18/2045 | | | 10/2/2015 | | | | 113,807 | |
Sunset Mortgage Loan Company, LLC, 7/16/2047 | | | 7/27/2016 | | | | 141,289 | |
US Residential Opportunity Fund Trust, 7/27/2036 | | | 7/20/2016 | | | | 292,672 | |
Vericrest Opportunity Loan Transferee, 10/25/2058 | | | 1/13/2016 | | | | 92,709 | |
Wachovia Asset Securitization, Inc., 7/25/2037 | | | 3/16/2007 | | | | 331,153 | |
The following table presents the total amount of securities loaned with continuous maturity, by type, offset by the gross payable upon return of collateral for securities loaned by Thrivent Balanced Income Plus Fund as of October 31, 2016:
| | | | |
Securities Lending Transactions | | | |
Common Stock | | $ | 1,717,578 | |
Taxable Debt Security | | | 2,229,666 | |
| | | | |
Total lending | | $ | 3,947,244 | |
Gross amount payable upon return of collateral for securities loaned | | $ | 4,071,925 | |
| | | | |
Net amounts due to counterparty | | $ | 124,681 | |
| | | | |
Definitions:
| | | | |
ADR | | - | | American Depositary Receipt, which are certificates for an underlying foreign security’s shares held by an issuing U.S. depository bank. |
ETF | | - | | Exchange Traded Fund. |
REIT | | - | | Real Estate Investment Trust is a company that buys, develops, manages and/or sells real estate assets. |
The accompanying Notes to Financial Statements are an integral part of this schedule.
91
OPPORTUNITY INCOME PLUS FUND
Schedule of Investments as of October 31, 2016
| | | | | | | | |
Principal
Amount | | | Bank Loans (29.8%)a | | Value | |
| | Basic Materials (2.0%) | | | | |
| | | | Arch Coal, Inc., Term Loan | | | | |
| | $379,674 | | | 10.000%, 10/5/2021 | | | $387,582 | |
| | | | Chemours Company, Term Loan | | | | |
| | 1,291,616 | | | 3.750%, 5/12/2022 | | | 1,274,825 | |
| | | | Fortescue Metals Group, Ltd., Term Loan | | | | |
| | 2,587,969 | | | 3.750%, 6/30/2019 | | | 2,585,536 | |
| | | | Ineos US Finance, LLC, Term Loan | | | | |
| | 2,873,595 | | | 3.750%, 12/15/2020 | | | 2,880,176 | |
| | | | Tronox Pigments BV, Term Loan | | | | |
| | 1,598,003 | | | 4.500%, 3/19/2020 | | | 1,589,646 | |
| | | | | |
| | | | Total | | | 8,717,765 | |
| | | | | |
| |
| | Capital Goods (1.6%) | | | | |
| | | | Accudyne Industries, LLC, Term Loan | | | | |
| | 1,277,688 | | | 4.000%, 12/13/2019 | | | 1,172,815 | |
| | | | ADS Waste Holdings, Inc., Term Loan | | | | |
| | 665,957 | | | 3.750%, 10/9/2019 | | | 666,143 | |
| | | | Advanced Disposal Services, Inc., Term Loan | | | | |
| | 435,000 | | | 0.000%, 10/28/2023b,c | | | 435,544 | |
| | | | Berry Plastics Group, Inc., Term Loan | | | | |
| | 250,900 | | | 3.500%, 2/8/2020 | | | 251,176 | |
| | | | Cortes NP Acquisition Corporation, Term Loan | | | | |
| | 2,825,000 | | | 0.000%, 10/3/2023b,c | | | 2,807,344 | |
| | | | Rexnord, LLC, Term Loan | | | | |
| | 812,149 | | | 4.000%, 8/21/2020 | | | 813,976 | |
| | | | Reynolds Group, Inc., Term Loan | | | | |
| | 825,000 | | | 4.250%, 2/5/2023 | | | 826,840 | |
| | | | | |
| | | | Total | | | 6,973,838 | |
| | | | | |
| |
| | Communications Services (9.3%) | | | | |
| | | | Altice US Finance I Corporation, Term Loan | | | | |
| | 275,000 | | | 0.000%, 1/15/2025b,c | | | 275,756 | |
| | | | Atlantic Broadband Penn, LLC, Term Loan | | | | |
| | 523,236 | | | 3.250%, 11/30/2019 | | | 524,052 | |
| | | | Beasley Broadcast Group, Inc., Term Loan | | | | |
| | 965,000 | | | 0.000%, 10/4/2023b,c | | | 954,144 | |
| | | | Birch Communication Inc., Term Loan | | | | |
| | 1,692,366 | | | 7.750%, 7/17/2020 | | | 1,362,355 | |
| | | | Block Communications, Inc., Term Loan | | | | |
| | 1,587,876 | | | 4.088%, 11/7/2021 | | | 1,599,785 | |
| | | | CBS Radio, Inc., Term Loan | | | | |
| | 1,130,000 | | | 4.500%, 10/17/2023 | | | 1,135,650 | |
| | | | Charter Communications Operating, LLC, Term Loan | | | | |
| | 776,100 | | | 3.500%, 1/24/2023 | | | 780,516 | |
| | | | Cincinnati Bell, Inc., Term Loan | | | | |
| | 1,311,568 | | | 4.000%, 9/10/2020 | | | 1,313,614 | |
| | | | FairPoint Communications, Inc., Term Loan | | | | |
| | 1,586,915 | | | 7.500%, 2/14/2019 | | | 1,589,105 | |
| | | | Grande Communications Networks, LLC, Term Loan | | | | |
| | 2,210,813 | | | 4.500%, 5/29/2020 | | | 2,208,049 | |
| | | | Hargray Communications Group, Inc., Term Loan | | | | |
| | 1,744,824 | | | 4.750%, 6/26/2019 | | | 1,753,548 | |
| | | | Integra Telecom Holdings, Inc., Term Loan | | | | |
| | 1,055,989 | | | 5.250%, 8/14/2020 | | | 1,050,054 | |
| | | | Intelsat Jackson Holdings SA, Term Loan | | | | |
| | 600,000 | | | 3.750%, 6/30/2019 | | | 573,066 | |
| | | | Level 3 Communications, Inc., Term Loan | | | | |
| | 2,250,000 | | | 4.000%, 8/1/2019 | | | 2,259,652 | |
| | | | Liberty Cablevision of Puerto Rico, LLC, Term Loan | | | | |
| | 2,275,000 | | | 4.500%, 1/7/2022 | | | 2,237,076 | |
| | | | LTS Buyer, LLC, Term Loan | | | | |
| | 1,591,413 | | | 4.088%, 4/13/2020 | | | 1,593,005 | |
| | | | NEP/NCP Holdco, Inc., Term Loan | | | | |
| | 2,723,195 | | | 4.250%, 1/22/2020 | | | 2,713,827 | |
| | | | Numericable US, LLC, Term Loan | | | | |
| | 977,612 | | | 4.750%, 2/10/2023 | | | 977,613 | |
| | 1,592,686 | | | 5.137%, 1/15/2024 | | | 1,605,825 | |
| | | | SBA Senior Finance II, LLC, Term Loan | | | | |
| | 728,213 | | | 3.340%, 3/24/2021 | | | 728,759 | |
| | 375,250 | | | 3.340%, 6/10/2022 | | | 374,860 | |
| | | | TNS, Inc., Term Loan | | | | |
| | 1,163,641 | | | 5.000%, 2/14/2020 | | | 1,167,283 | |
| | | | Univision Communications, Inc., Term Loan | | | | |
| | 1,911,075 | | | 4.000%, 3/1/2020 | | | 1,914,057 | |
| | | | Virgin Media Investment Holdings, Ltd., Term Loan | | | | |
| | 1,538,539 | | | 3.500%, 6/30/2023 | | | 1,544,509 | |
| | | | WideOpenWest Finance, LLC, Term Loan | | | | |
| | 3,950,000 | | | 4.500%, 8/18/2023 | | | 3,939,217 | |
| | | | WMG Acquisition Corporation, Term Loan | | | | |
| | 553,338 | | | 3.750%, 7/1/2020 | | | 552,153 | |
| | | | XO Communications, LLC, Term Loan | | | | |
| | 536,250 | | | 4.250%, 3/20/2021 | | | 536,588 | |
| | | | Yankee Cable Acquisition, LLC, Term Loan | | | | |
| | 1,259,728 | | | 4.250%, 3/1/2020 | | | 1,260,521 | |
| | | | Zayo Group, LLC, Term Loan | | | | |
| | 2,006,852 | | | 3.750%, 5/6/2021 | | | 2,016,204 | |
| | | | | |
| | | | Total | | | 40,540,843 | |
| | | | | |
| |
| | Consumer Cyclical (4.4%) | | | | |
| | | | Amaya BV, Term Loan | | | | |
| | 2,395,139 | | | 5.000%, 8/1/2021 | | | 2,391,762 | |
| | | | Boyd Gaming Corporation, Term Loan | | | | |
| | 1,390,000 | | | 3.534%, 9/15/2023 | | | 1,399,647 | |
| | | | Burlington Coat Factory Warehouse Corporation, Term Loan | | | | |
| | 1,452,029 | | | 3.500%, 8/13/2021 | | | 1,461,554 | |
| | | | Cengage Learning Acquisitions, Term Loan | | | | |
| | 2,234,400 | | | 5.250%, 6/7/2023 | | | 2,181,802 | |
| | | | Ceridian HCM Holding, Inc., Term Loan | | | | |
| | 863,962 | | | 4.500%, 9/15/2020 | | | 846,683 | |
| | | | Golden Nugget, Inc., Term Loan | | | | |
| | 505,400 | | | 4.500%, 11/21/2019 | | | 510,772 | |
| | | | Golden Nugget, Inc., Term Loan Delayed Draw | | | | |
| | 216,600 | | | 4.500%, 11/21/2019 | | | 218,902 | |
The accompanying Notes to Financial Statements are an integral part of this schedule.
92
OPPORTUNITY INCOME PLUS FUND
Schedule of Investments as of October 31, 2016
| | | | | | | | |
Principal
Amount | | | Bank Loans (29.8%)a | | Value | |
| Consumer Cyclical (4.4%) - continued | | | | |
| | | | IMG Worldwide, Inc., Term Loan | | | | |
| | $1,623,181 | | | 5.250%, 5/6/2021 | | | $1,630,080 | |
| | 700,000 | | | 8.250%, 5/6/2022 | | | 698,544 | |
| | | | KAR Auction Services, Inc., Term Loan | | | | |
| | 1,492,500 | | | 4.375%, 3/9/2023 | | | 1,507,888 | |
| | | | Michaels Stores, Inc., Term Loan | | | | |
| | 403,889 | | | 3.750%, 1/30/2023 | | | 406,846 | |
| | | | Mohegan Tribal Gaming Authority, Term Loan | | | | |
| | 1,750,000 | | | 0.000%, 9/30/2023b,c | | | 1,742,895 | |
| | | | Scientific Games International, Inc., Term Loan | | | | |
| | 2,222,163 | | | 6.000%, 10/18/2020 | | | 2,233,962 | |
| | 769,129 | | | 6.000%, 10/1/2021 | | | 772,013 | |
| | | | Seminole Hard Rock Entertainment, Inc., Term Loan | | | | |
| | 922,252 | | | 3.588%, 5/14/2020 | | | 924,558 | |
| | | | Seminole Indian Tribe of Florida, Term Loan | | | | |
| | 196,300 | | | 3.088%, 4/29/2020 | | | 196,742 | |
| | | | | |
| | | | Total | | | 19,124,650 | |
| | | | | |
| |
| Consumer Non-Cyclical (4.7%) | | | | |
| | | | Air Medical Group Holdings, Inc., Term Loan | | | | |
| | 1,256,850 | | | 5.000%, 4/28/2022 | | | 1,266,276 | |
| | | | Albertson’s, LLC, Term Loan | | | | |
| | 597,004 | | | 4.750%, 12/21/2022 | | | 602,908 | |
| | 1,180,952 | | | 4.750%, 6/22/2023 | | | 1,193,258 | |
| | | | CHS/Community Health Systems, Inc., Term Loan | | | | |
| | 858,420 | | | 3.750%, 1/27/2021 | | | 810,941 | |
| | 1,863,751 | | | 4.000%, 1/27/2021 | | | 1,757,983 | |
| | | | Endo Luxembourg Finance I Company SARL, Term Loan | | | | |
| | 1,161,225 | | | 3.750%, 9/26/2022 | | | 1,159,344 | |
| | | | JBS USA, LLC, Term Loan | | | | |
| | 1,032,200 | | | 4.000%, 10/30/2022 | | | 1,029,878 | |
| | | | LTF Merger Sub, Inc., Term Loan | | | | |
| | 1,367,688 | | | 4.250%, 6/10/2022 | | | 1,366,621 | |
| | | | Mallinckrodt International Finance SA, Term Loan | | | | |
| | 600,405 | | | 3.588%, 3/19/2021 | | | 600,405 | |
| | | | McGraw-Hill Global Education Holdings, LLC, Term Loan | | | | |
| | 1,805,475 | | | 5.000%, 5/4/2022 | | | 1,800,582 | |
| | | | MultiPlan, Inc., Term Loan | | | | |
| | 765,418 | | | 5.000%, 6/7/2023 | | | 773,309 | |
| | | | Ortho-Clinical Diagnostics, Inc., Term Loan | | | | |
| | 1,862,025 | | | 4.750%, 6/30/2021 | | | 1,817,020 | |
| | | | PetSmart, Inc., Term Loan | | | | |
| | 822,911 | | | 4.000%, 3/11/2022b,c | | | 824,524 | |
| | | | Revlon Consumer Products Corporation, Term Loan | | | | |
| | 960,000 | | | 4.250%, 9/7/2023 | | | 961,699 | |
| | | | Valeant Pharmaceuticals International, Inc., Term Loan | | | | |
| | 4,441,789 | | | 5.500%, 4/1/2022 | | | 4,425,132 | |
| | | | | |
| | | | Total | | | 20,389,880 | |
| | | | | |
| |
| Energy (1.4%) | | | | |
| | | | Exgen Renewables I, LLC, Term Loan | | | | |
| | 1,052,228 | | | 5.250%, 2/8/2021 | | | 1,060,120 | |
| | | | Houston Fuel Oil Terminal, LLC, Term Loan | | | | |
| | 900,406 | | | 4.250%, 8/19/2021 | | | 884,649 | |
| | | | McJunkin Red Man Corporation, Term Loan | | | | |
| | 884,169 | | | 5.000%, 11/8/2019 | | | 875,699 | |
| | | | MEG Energy Corporation, Term Loan | | | | |
| | 1,202,603 | | | 3.750%, 3/31/2020 | | | 1,132,888 | |
| | | | Pacific Drilling SA, Term Loan | | | | |
| | 2,210,738 | | | 4.500%, 6/3/2018 | | | 621,770 | |
| | | | Targa Resources Partners, LP, Term Loan | | | | |
| | 605,000 | | | 5.750%, 2/27/2022 | | | 605,756 | |
| | | | Western Refining, Inc., Term Loan | | | | |
| | 520,982 | | | 5.250%, 11/12/2020 | | | 519,680 | |
| | 384,038 | | | 5.500%, 6/23/2023 | | | 383,319 | |
| | | | | |
| | | | Total | | | 6,083,881 | |
| | | | | |
| |
| Financials (1.4%) | | | | |
| | | | Harland Clarke Holdings Corporation, Term Loan | | | | |
| | 729,127 | | | 7.000%, 5/22/2018 | | | 725,481 | |
| | 1,199,250 | | | 7.000%, 12/31/2019 | | | 1,190,759 | |
| | | | MoneyGram International, Inc., Term Loan | | | | |
| | 1,579,004 | | | 4.250%, 3/27/2020 | | | 1,531,634 | |
| | | | TransUnion, LLC, Term Loan | | | | |
| | 1,096,883 | | | 3.500%, 4/9/2021 | | | 1,099,626 | |
| | | | WaveDivision Holdings, LLC, Term Loan | | | | |
| | 1,502,223 | | | 4.000%, 10/15/2019 | | | 1,505,603 | |
| | | | | |
| | | | Total | | | 6,053,103 | |
| | | | | |
| |
| Technology (3.7%) | | | | |
| | | | Avago Technoligies Cayman Finance, Ltd., Term Loan | | | | |
| | 2,260,309 | | | 3.535%, 2/1/2023 | | | 2,282,596 | |
| | | | First Data Corporation, Term Loan | | | | |
| | 3,410,000 | | | 0.000%, 3/24/2021b,c | | | 3,423,640 | |
| | 380,000 | | | 4.274%, 7/8/2022 | | | 382,614 | |
| | | | Interception Merger Sub, Inc., Term Loan | | | | |
| | 910,000 | | | 0.000%, 10/26/2023b,c | | | 914,696 | |
| | | | Micron Technologies, Inc., Term Loan | | | | |
| | 638,988 | | | 4.637%, 4/26/2022b,c | | | 642,585 | |
| | | | NXP BV, Term Loan | | | | |
| | 1,005,398 | | | 3.405%, 12/7/2020 | | | 1,008,474 | |
| | | | ON Semiconductor Corporation, Term Loan | | | | |
| | 3,085,000 | | | 3.777%, 3/31/2023 | | | 3,101,968 | |
| | | | RP Crown Parent, LLC, Term Loan | | | | |
| | 1,375,000 | | | 4.500%, 10/12/2023 | | | 1,374,024 | |
| | | | SS&C European Holdings SARL, Term Loan | | | | |
| | 34,118 | | | 4.000%, 7/8/2022 | | | 34,363 | |
| | 280,345 | | | 4.000%, 7/8/2022 | | | 282,361 | |
| | | | Western Digital Corporation, Term Loan | | | | |
| | 2,788,013 | | | 4.500%, 4/29/2023 | | | 2,817,872 | |
| | | | | |
| | | | Total | | | 16,265,193 | |
| | | | | |
| |
| Transportation (0.9%) | | | | |
| | | | OSG Bulk Ships, Inc., Term Loan | | | | |
| | 1,393,071 | | | 5.250%, 8/5/2019 | | | 1,380,882 | |
The accompanying Notes to Financial Statements are an integral part of this schedule.
93
OPPORTUNITY INCOME PLUS FUND
Schedule of Investments as of October 31, 2016
| | | | | | | | |
Principal
Amount | | | Bank Loans (29.8%)a | | Value | |
| Transportation (0.9%) - continued | | | | |
| | | | XPO Logistics, Inc., Term Loan | | | | |
| | $2,780,781 | | | 4.250%, 10/30/2021 | | | $2,793,684 | |
| | | | | |
| | | | Total | | | 4,174,566 | |
| | | | | |
| |
| Utilities (0.4%) | | | | |
| | | | Calpine Corporation, Term Loan | | | | |
| | 250,870 | | | 3.590%, 5/27/2022 | | | 251,154 | |
| | | | Intergen NV, Term Loan | | | | |
| | 977,113 | | | 5.500%, 6/12/2020 | | | 923,372 | |
| | | | Talen Energy Supply, LLC, Term Loan | | | | |
| | 750,000 | | | 0.000%, 10/18/2023b,c | | | 749,062 | |
| | | | | |
| | | | Total | | | 1,923,588 | |
| | | | | |
| | | | | | | | |
| | | | | |
| | | | Total Bank Loans (cost $131,667,687) | | | 130,247,307 | |
| | | | | |
| | |
Principal
Amount | | | Long-Term Fixed Income (61.5%) | | Value | |
| Asset-Backed Securities (4.1%) | | | | |
| | | | Asset Backed Securities Corporation Home Equity Loan Trust | | | | |
| | 690,179 | | | 0.674%, 7/25/2036d | | | 637,482 | |
| | | | Bayview Opportunity Master Fund Trust | | | | |
| | 221,611 | | | 3.623%, 4/28/2030e | | | 221,877 | |
| | 268,349 | | | 3.228%, 7/28/2034*,f | | | 267,889 | |
| | 682,217 | | | 3.721%, 7/28/2035e,f | | | 682,040 | |
| | | | CAM Mortgage, LLC | | | | |
| | 73,294 | | | 3.500%, 7/15/2064*,f | | | 73,291 | |
| | | | Citi Held For Asset Issuance | | | | |
| | 635,550 | | | 4.480%, 8/15/2022* | | | 644,861 | |
| | | | Credit Based Asset Servicing and Securitization, LLC | | | | |
| | 652,057 | | | 3.473%, 12/25/2036f | | | 487,582 | |
| | | | DRB Prime Student Loan Trust | | | | |
| | 465,754 | | | 2.890%, 6/25/2040e | | | 462,253 | |
| | | | Earnest Student Loan Program, LLC | | | | |
| | 967,569 | | | 2.680%, 7/25/2035e | | | 961,299 | |
| | | | First Horizon ABS Trust | | | | |
| | 300,797 | | | 0.685%, 10/25/2034d,g | | | 289,112 | |
| | | | GMAC Mortgage Corporation Loan Trust | | | | |
| | 651,008 | | | 1.024%, 8/25/2035d,g | | | 611,199 | |
| | 252,411 | | | 3.563%, 9/19/2035 | | | 236,941 | |
| | 823,297 | | | 0.705%, 12/25/2036d,g | | | 745,685 | |
| | | | J.P. Morgan Mortgage Acquisition Trust | | | | |
| | 460,657 | | | 4.541%, 3/25/2047f | | | 345,779 | |
| | | | Lehman XS Trust | | | | |
| | 633,355 | | | 5.440%, 8/25/2035f | | | 556,389 | |
| | | | Marlette Funding Trust | | | | |
| | 1,074,548 | | | 3.060%, 1/17/2023* | | | 1,076,404 | |
| | | | Merrill Lynch Mortgage Investors Trust | | | | |
| | 897,124 | | | 2.820%, 6/25/2035 | | | 595,217 | |
| | | | Murray Hill Marketplace Trust | | | | |
| | 390,000 | | | 4.190%, 11/25/2022* | | | 390,010 | |
| | | | NCF Dealer Floorplan Master Trust | | | | |
| | 500,000 | | | 3.776%, 3/21/2022*,d | | | 496,139 | |
| | | | NRZ Advance Receivables Trust Advance Receivables Backed | | | | |
| | 1,000,000 | | | 2.751%, 6/15/2049* | | | 998,171 | |
| | | | Popular ABS Mortgage Pass-Through Trust | | | | |
| | 900,000 | | | 4.279%, 11/25/2035f | | | 857,873 | |
| | | | Preston Ridge Partners Mortgage Trust, LLC | | | | |
| | 694,769 | | | 4.000%, 9/27/2021*,f | | | 693,750 | |
| | | | Pretium Mortgage Credit Partners I, LLC | | | | |
| | 778,282 | | | 4.000%, 7/27/2031*,f | | | 779,267 | |
| | | | Renaissance Home Equity Loan Trust | | | | |
| | 1,314,876 | | | 5.608%, 5/25/2036f | | | 864,446 | |
| | 937,299 | | | 5.285%, 1/25/2037f | | | 506,412 | |
| | | | Sunset Mortgage Loan Company, LLC | | | | |
| | 512,129 | | | 4.459%, 9/18/2045*,f | | | 511,112 | |
| | 423,865 | | | 3.844%, 7/16/2047*,f | | | 424,646 | |
| | | | United Airlines Pass Through Trust | | | | |
| | 160,000 | | | 3.700%, 12/1/2022 | | | 169,600 | |
| | | | US Residential Opportunity Fund Trust | | | | |
| | 878,016 | | | 3.475%, 7/27/2036* | | | 878,753 | |
| | | | Vericrest Opportunity Loan Transferee | | | | |
| | 334,227 | | | 3.375%, 10/25/2058*,f | | | 333,772 | |
| | 496,253 | | | 3.500%, 6/26/2045e | | | 496,365 | |
| | | | Wachovia Asset Securitization, Inc. | | | | |
| | 1,220,573 | | | 0.674%, 7/25/2037*,d,g | | | 1,025,124 | |
| | | | | |
| | | | Total | | | 18,320,740 | |
| | | | | |
| |
| Basic Materials (0.7%) | | | | |
| | | | Albemarle Corporation | | | | |
| | 242,000 | | | 3.000%, 12/1/2019 | | | 249,010 | |
| | | | Alcoa Nederland Holding BV | | | | |
| | 255,000 | | | 6.750%, 9/30/2024e | | | 263,925 | |
| | | | ArcelorMittal SA | | | | |
| | 675,000 | | | 6.500%, 3/1/2021h | | | 740,812 | |
| | | | Dow Chemical Company | | | | |
| | 136,000 | | | 8.550%, 5/15/2019 | | | 158,466 | |
| | | | First Quantum Minerals, Ltd. | | | | |
| | 269,000 | | | 6.750%, 2/15/2020e | | | 257,567 | |
| | 559,000 | | | 7.000%, 2/15/2021e | | | 530,701 | |
| | | | Glencore Funding, LLC | | | | |
| | 170,000 | | | 1.940%, 4/16/2018d,e | | | 167,450 | |
| | | | Inmet Mining Corporation | | | | |
| | 79 | | | 8.750%, 6/1/2020* | | | 56 | |
| | | | LyondellBasell Industries NV | | | | |
| | 140,000 | | | 5.000%, 4/15/2019 | | | 149,640 | |
| | | | NOVA Chemicals Corporation | | | | |
| | 703,617 | | | 5.250%, 8/1/2023e | | | 716,810 | |
| | | | | |
| | | | Total | | | 3,234,437 | |
| | | | | |
| |
| Capital Goods (1.8%) | | | | |
| | | | Berry Plastics Corporation | | | | |
| | 450,000 | | | 6.000%, 10/15/2022 | | | 475,875 | |
| | | | Building Materials Corporation of America | | | | |
| | 825,000 | | | 6.000%, 10/15/2025e | | | 880,646 | |
| | | | Cemex SAB de CV | | | | |
| | 830,000 | | | 5.700%, 1/11/2025e | | | 844,525 | |
| | | | CNH Industrial Capital, LLC | | | | |
| | 1,000,000 | | �� | 4.375%, 11/6/2020 | | | 1,022,500 | |
| | | | Crown Americas Capital Corporation IV | | | | |
| | 675,000 | | | 4.500%, 1/15/2023 | | | 691,875 | |
| | | | General Electric Company | | | | |
| | 260,000 | | | 5.000%, 12/29/2049i | | | 275,444 | |
| | | | Huntington Ingalls Industries, Inc. | | | | |
| | 800,000 | | | 5.000%, 12/15/2021e | | | 838,000 | |
The accompanying Notes to Financial Statements are an integral part of this schedule.
94
OPPORTUNITY INCOME PLUS FUND
Schedule of Investments as of October 31, 2016
| | | | | | | | |
Principal
Amount | | | Long-Term Fixed Income (61.5%) | | Value | |
| Capital Goods (1.8%) - continued | | | | |
| | | | L-3 Communications Corporation | | | | |
| | $195,000 | | | 4.950%, 2/15/2021 | | | $213,443 | |
| | | | Lockheed Martin Corporation | | | | |
| | 160,000 | | | 2.500%, 11/23/2020 | | | 164,142 | |
| | | | Owens-Brockway Glass Container, Inc. | | | | |
| | 540,000 | | | 5.000%, 9/1/2022e | | | 564,975 | |
| | | | Roper Industries, Inc. | | | | |
| | 215,000 | | | 2.050%, 10/1/2018 | | | 216,993 | |
| | | | Sealed Air Corporation | | | | |
| | 545,000 | | | 4.875%, 12/1/2022e | | | 574,294 | |
| | | | United Rentals North America, Inc. | | | | |
| | 855,000 | | | 5.500%, 7/15/2025 | | | 865,688 | |
| | | | | |
| | | | Total | | | 7,628,400 | |
| | | | | |
| |
| Collateralized Mortgage Obligations (8.1%) | | | | |
| | | | Alternative Loan Trust | | | | |
| | 132,284 | | | 5.500%, 5/25/2035 | | | 131,909 | |
| | | | American Home Mortgage Assets Trust | | | | |
| | 766,854 | | | 0.724%, 12/25/2046d | | | 514,515 | |
| | 750,512 | | | 0.724%, 6/25/2047d | | | 544,486 | |
| | | | Angel Oak Mortgage Trust | | | | |
| | 605,415 | | | 4.500%, 11/25/2045*,f | | | 609,057 | |
| | | | Banc of America Alternative Loan Trust | | | | |
| | 661,795 | | | 6.000%, 11/25/2035 | | | 585,742 | |
| | 511,174 | | | 1.334%, 5/25/2046d | | | 355,200 | |
| | | | Banc of America Mortgage Securities, Inc. | | | | |
| | 352,361 | | | 3.227%, 9/25/2035 | | | 337,477 | |
| | | | Banc of America Mortgage Trust | | | | |
| | 278,867 | | | 3.239%, 7/25/2035 | | | 257,691 | |
| | | | Bayview Opportunity Master Fund Trust | | | | |
| | 916,163 | | | 3.475%, 7/28/2031e | | | 917,736 | |
| | | | BCAP, LLC Trust | | | | |
| | 850,437 | | | 0.714%, 3/25/2037d | | | 792,006 | |
| | | | Bear Stearns ALT-A Trust | | | | |
| | 574,943 | | | 3.070%, 10/25/2033 | | | 560,593 | |
| | 329,416 | | | 3.071%, 6/25/2034 | | | 324,985 | |
| | | | CHL Mortgage Pass-Through Trust | | | | |
| | 238,525 | | | 6.250%, 9/25/2036 | | | 204,336 | |
| | 405,941 | | | 6.000%, 4/25/2037 | | | 349,385 | |
| | | | CitiMortgage Alternative Loan Trust | | | | |
| | 347,251 | | | 5.750%, 4/25/2037 | | | 297,915 | |
| | | | COLT Mortgage Loan Trust | | | | |
| | 949,687 | | | 2.750%, 9/25/2046* | | | 955,595 | |
| | | | Countrywide Alternative Loan Trust | | | | |
| | 420,745 | | | 6.500%, 8/25/2036 | | | 284,385 | |
| | 862,292 | | | 6.000%, 11/25/2036 | | | 711,268 | |
| | 620,585 | | | 6.000%, 1/25/2037 | | | 593,582 | |
| | 452,944 | | | 5.500%, 5/25/2037 | | | 386,890 | |
| | 330,223 | | | 7.000%, 10/25/2037 | | | 197,018 | |
| | | | Countrywide Home Loan Mortgage Pass Through Trust | | | | |
| | 340,992 | | | 3.115%, 11/25/2035 | | | 279,577 | |
| | | | Countrywide Home Loans, Inc. | | | | |
| | 287,031 | | | 2.821%, 3/20/2036 | | | 229,173 | |
| | | | Credit Suisse First Boston Mortgage Securities Corporation | | | | |
| | 278,928 | | | 5.250%, 10/25/2035 | | | 271,475 | |
| | | | Deutsche Alt-A Securities, Inc., Mortgage Loan Trust | | | | |
| | 502,595 | | | 5.500%, 11/25/2035 | | | 503,319 | |
| | 340,000 | | | 1.294%, 4/25/2047d | | | 288,762 | |
| | 627,045 | | | 0.754%, 8/25/2047d | | | 513,622 | |
| | | | First Horizon Alternative Mortgage Securities Trust | | | | |
| | 828,879 | | | 2.752%, 7/25/2035 | | | 746,843 | |
| | | | GMAC Mortgage Corporation Loan Trust | | | | |
| | 469,481 | | | 3.385%, 5/25/2035 | | | 432,976 | |
| | | | Greenpoint Mortgage Funding Trust | | | | |
| | 326,122 | | | 0.725%, 10/25/2045d | | | 255,285 | |
| | | | HarborView Mortgage Loan Trust | | | | |
| | 531,766 | | | 3.108%, 7/19/2035 | | | 466,797 | |
| | 354,611 | | | 4.432%, 12/19/2035 | | | 308,317 | |
| | | | IndyMac INDA Mortgage Loan Trust | | | | |
| | 909,065 | | | 3.180%, 8/25/2036 | | | 863,372 | |
| | | | IndyMac INDX Mortgage Loan Trust | | | | |
| | 536,041 | | | 3.026%, 10/25/2035 | | | 437,857 | |
| | 722,506 | | | 0.744%, 4/25/2046d | | | 531,264 | |
| | | | J.P. Morgan Alternative Loan Trust | | | | |
| | 1,168,197 | | | 2.879%, 3/25/2036 | | | 976,103 | |
| | 588,199 | | | 6.500%, 3/25/2036 | | | 482,895 | |
| | | | J.P. Morgan Mortgage Trust | | | | |
| | 600,436 | | | 3.058%, 7/25/2035 | | | 586,341 | |
| | 425,372 | | | 3.229%, 8/25/2035 | | | 421,420 | |
| | 377,047 | | | 3.077%, 10/25/2036 | | | 340,683 | |
| | 453,372 | | | 3.064%, 1/25/2037 | | | 405,631 | |
| | | | Lehman Mortgage Trust | | | | |
| | 187,244 | | | 6.000%, 1/25/2036 | | | 171,621 | |
| | | | Master Asset Securitization Trust | | | | |
| | 371,950 | | | 1.034%, 6/25/2036d | | | 196,673 | |
| | | | Merrill Lynch Mortgage Investors Trust | | | | |
| | 619,805 | | | 6.250%, 8/25/2036 | | | 495,492 | |
| | | | Morgan Stanley Mortgage Loan Trust | | | | |
| | 464,560 | | | 3.280%, 11/25/2035 | | | 335,994 | |
| | | | MortgageIT Trust | | | | |
| | 730,664 | | | 0.794%, 12/25/2035d | | | 665,876 | |
| | 664,999 | | | 0.734%, 4/25/2036d | | | 491,595 | |
| | | | Pretium Mortgage Credit Partners, LLC | | | | |
| | 718,623 | | | 4.375%, 11/27/2030* | | | 724,538 | |
| | | | Residential Accredit Loans, Inc. Trust | | | | |
| | 638,826 | | | 5.500%, 2/25/2035 | | | 630,822 | |
| | 294,446 | | | 4.013%, 9/25/2035 | | | 247,988 | |
| | 662,814 | | | 5.750%, 9/25/2035 | | | 593,510 | |
| | 385,955 | | | 0.754%, 7/25/2036d | | | 253,816 | |
| | 754,583 | | | 5.750%, 4/25/2037 | | | 629,785 | |
| | 564,232 | | | 6.250%, 4/25/2037 | | | 485,295 | |
| | | | Residential Asset Securitization Trust | | | | |
| | 512,670 | | | 6.239%, 8/25/2022 | | | 441,904 | |
| | | | Residential Funding Mortgage Security I Trust | | | | |
| | 554,427 | | | 6.000%, 7/25/2037 | | | 511,999 | |
| | | | Sequoia Mortgage Trust | | | | |
| | 849,527 | | | 3.270%, 9/20/2046 | | | 687,184 | |
| | | | Structured Adjustable Rate Mortgage Loan Trust | | | | |
| | 323,368 | | | 2.938%, 1/25/2035 | | | 264,936 | |
| | 435,338 | | | 3.268%, 7/25/2035 | | | 371,638 | |
| | | | Structured Asset Mortgage Investments, Inc. | | | | |
| | 1,033,154 | | | 0.844%, 12/25/2035d | | | 755,370 | |
| | 878,498 | | | 0.744%, 5/25/2046d | | | 652,182 | |
The accompanying Notes to Financial Statements are an integral part of this schedule.
95
OPPORTUNITY INCOME PLUS FUND
Schedule of Investments as of October 31, 2016
| | | | | | | | |
Principal
Amount | | | Long-Term Fixed Income (61.5%) | | Value | |
| Collateralized Mortgage Obligations (8.1%) - continued | | | | |
| | | | Vericrest Opportunity Loan Transferee | | | | |
| | $975,862 | | | 3.500%, 7/25/2046e,f | | | $975,547 | |
| | | | WaMu Mortgage Pass Through Certificates | | | | |
| | 612,001 | | | 2.752%, 8/25/2036 | | | 555,831 | |
| | 575,101 | | | 2.030%, 1/25/2037 | | | 487,672 | |
| | 190,780 | | | 2.813%, 8/25/2046 | | | 166,008 | |
| | 709,704 | | | 1.484%, 9/25/2046d | | | 582,946 | |
| | 970,574 | | | 1.254%, 1/25/2047d | | | 872,942 | |
| | 653,057 | | | 1.264%, 1/25/2047d | | | 509,132 | |
| | | | Washington Mutual Mortgage Pass Through Certificates Trust | | | | |
| | 604,272 | | | 1.274%, 2/25/2047d | | | 450,173 | |
| | | | Wells Fargo Mortgage Backed Securities Trust | | | | |
| | 345,552 | | | 2.911%, 3/25/2036 | | | 326,833 | |
| | 678,595 | | | 2.921%, 3/25/2036 | | | 676,873 | |
| | 423,315 | | | 3.022%, 7/25/2036 | | | 414,060 | |
| | 146,442 | | | 6.000%, 7/25/2037 | | | 144,942 | |
| | 172,296 | | | 6.000%, 7/25/2037 | | | 172,565 | |
| | | | | |
| | | | Total | | | 35,197,225 | |
| | | | | |
| |
| Communications Services (3.1%) | | | | |
| | | | Altice US Finance I Corporation | | | | |
| | 575,000 | | | 5.500%, 5/15/2026e | | | 586,500 | |
| | | | AMC Networks, Inc. | | | | |
| | 855,000 | | | 5.000%, 4/1/2024 | | | 865,688 | |
| | | | America Movil SAB de CV | | | | |
| | 134,000 | | | 5.000%, 10/16/2019 | | | 145,958 | |
| | | | American Tower Corporation | | | | |
| | 170,000 | | | 2.800%, 6/1/2020 | | | 173,591 | |
| | | | AT&T, Inc. | | | | |
| | 171,000 | | | 5.875%, 10/1/2019 | | | 189,391 | |
| | 165,000 | | | 1.768%, 6/30/2020d | | | 165,728 | |
| | 250,000 | | | 2.800%, 2/17/2021 | | | 253,423 | |
| | | | British Sky Broadcasting Group plc | | | | |
| | 240,000 | | | 2.625%, 9/16/2019e | | | 243,275 | |
| | | | CCOH Safari, LLC | | | | |
| | 860,000 | | | 5.750%, 2/15/2026e | | | 896,012 | |
| | | | CenturyLink, Inc. | | | | |
| | 500,000 | | | 6.450%, 6/15/2021 | | | 533,750 | |
| | | | Charter Communications Operating, LLC | | | | |
| | 190,000 | | | 3.579%, 7/23/2020e | | | 197,003 | |
| | 80,000 | | | 4.464%, 7/23/2022e | | | 85,214 | |
| | | | Clear Channel Worldwide Holdings, Inc. | | | | |
| | 835,000 | | | 6.500%, 11/15/2022 | | | 850,447 | |
| | | | Columbus International, Inc. | | | | |
| | 800,000 | | | 7.375%, 3/30/2021e | | | 856,000 | |
| | | | Crown Castle International Corporation | | | | |
| | 80,000 | | | 3.400%, 2/15/2021 | | | 83,131 | |
| | 120,000 | | | 2.250%, 9/1/2021 | | | 118,997 | |
| | 553,000 | | | 5.250%, 1/15/2023 | | | 617,928 | |
| | | | CSC Holdings, LLC | | | | |
| | 60,000 | | | 5.500%, 4/15/2027e | | | 60,863 | |
| | | | Digicel, Ltd. | | | | |
| | 779,079 | | | 6.000%, 4/15/2021* | | | 697,042 | |
| | | | FairPoint Communications, Inc. | | | | |
| | 630,000 | | | 8.750%, 8/15/2019e | | | 641,025 | |
| | | | Frontier Communications Corporation | | | | |
| | 780,000 | | | 8.875%, 9/15/2020 | | | 828,750 | |
| | | | Hughes Satellite Systems Corporation | | | | |
| | 338,000 | | | 6.500%, 6/15/2019 | | | 368,842 | |
| | | | Neptune Finco Corporation | | | | |
| | 365,000 | | | 10.875%, 10/15/2025e | | | 419,750 | |
| | | | SFR Group SA | | | | |
| | 800,000 | | | 6.000%, 5/15/2022e | | | 820,256 | |
| | | | Sprint Corporation | | | | |
| | 825,000 | | | 7.625%, 2/15/2025 | | | 798,187 | |
| | | | Telefonica Emisiones SAU | | | | |
| | 218,000 | | | 3.192%, 4/27/2018 | | | 222,661 | |
| | | | T-Mobile USA, Inc. | | | | |
| | 525,000 | | | 6.633%, 4/28/2021 | | | 550,594 | |
| | | | Univision Communications, Inc. | | | | |
| | 345,000 | | | 5.125%, 5/15/2023e | | | 350,175 | |
| | | | Verizon Communications, Inc. | | | | |
| | 559,000 | | | 2.625%, 2/21/2020 | | | 570,055 | |
| | 238,000 | | | 4.500%, 9/15/2020 | | | 258,718 | |
| | | | Viacom, Inc. | | | | |
| | 233,000 | | | 2.250%, 2/4/2022 | | | 229,321 | |
| | | | | |
| | | | Total | | | 13,678,275 | |
| | | | | |
| |
| Consumer Cyclical (3.2%) | | | | |
| | | | Allison Transmission, Inc. | | | | |
| | 870,000 | | | 5.000%, 10/1/2024e | | | 887,400 | |
| | | | AmeriGas Finance, LLC | | | | |
| | 290,000 | | | 5.625%, 5/20/2024 | | | 303,775 | |
| | | | BMW US Capital, LLC | | | | |
| | 200,000 | | | 1.500%, 4/11/2019e | | | 200,098 | |
| | | | Brookfield Residential Properties, Inc. | | | | |
| | 570,000 | | | 6.125%, 7/1/2022e | | | 578,550 | |
| | | | Cinemark USA, Inc. | | | | |
| | 394,000 | | | 4.875%, 6/1/2023 | | | 394,492 | |
| | | | Corrections Corporation of America | | | | |
| | 565,000 | | | 5.000%, 10/15/2022h | | | 509,913 | |
| | | | Daimler Finance North America, LLC | | | | |
| | 135,000 | | | 1.875%, 1/11/2018e | | | 135,668 | |
| | | | eBay, Inc. | | | | |
| | 125,000 | | | 2.500%, 3/9/2018 | | | 126,549 | |
| | | | ERAC USA Finance, LLC | | | | |
| | 238,000 | | | 2.350%, 10/15/2019e | | | 241,077 | |
| | | | Ford Motor Credit Company, LLC | | | | |
| | 203,000 | | | 5.000%, 5/15/2018 | | | 212,499 | |
| | 250,000 | | | 2.597%, 11/4/2019 | | | 253,112 | |
| | | | General Motors Financial Company, Inc. | | | | |
| | 110,000 | | | 3.150%, 1/15/2020 | | | 111,897 | |
| | 364,000 | | | 4.375%, 9/25/2021 | | | 386,509 | |
| | | | GLP Capital, LP | | | | |
| | 800,000 | | | 4.875%, 11/1/2020 | | | 853,000 | |
| | | | Home Depot, Inc. | | | | |
| | 160,000 | | | 1.220%, 9/15/2017d | | | 160,468 | |
| | 160,000 | | | 2.625%, 6/1/2022 | | | 165,153 | |
| | | | Hyundai Capital America | | | | |
| | 195,000 | | | 1.450%, 2/6/2017e | | | 195,196 | |
| | | | Jaguar Land Rover Automotive plc | | | | |
| | 425,000 | | | 4.125%, 12/15/2018e | | | 434,562 | |
| | 376,000 | | | 5.625%, 2/1/2023e | | | 388,980 | |
| | | | KB Home | | | | |
| | 412,000 | | | 4.750%, 5/15/2019 | | | 421,270 | |
| | | | L Brands, Inc. | | | | |
| | 376,000 | | | 6.625%, 4/1/2021 | | | 432,400 | |
| | | | Lennar Corporation | | | | |
| | 740,000 | | | 4.750%, 11/15/2022 | | | 769,600 | |
The accompanying Notes to Financial Statements are an integral part of this schedule.
96
OPPORTUNITY INCOME PLUS FUND
Schedule of Investments as of October 31, 2016
| | | | | | | | |
Principal
Amount | | | Long-Term Fixed Income (61.5%) | | Value | |
| Consumer Cyclical (3.2%) - continued | | | | |
| | | | Live Nation Entertainment, Inc. | | | | |
| | $175,000 | | | 5.375%, 6/15/2022e | | | $181,125 | |
| | 355,000 | | | 4.875%, 11/1/2024e | | | 354,113 | |
| | | | Macy’s Retail Holdings, Inc. | | | | |
| | 250,000 | | | 7.450%, 7/15/2017 | | | 260,764 | |
| | | | MGM Resorts International | | | | |
| | 825,000 | | | 6.000%, 3/15/2023 | | | 893,062 | |
| | | | Newell Rubbermaid, Inc. | | | | |
| | 125,000 | | | 3.150%, 4/1/2021 | | | 130,160 | |
| | | | Ralph Lauren Corporation | | | | |
| | 160,000 | | | 2.625%, 8/18/2020 | | | 164,387 | |
| | | | Royal Caribbean Cruises, Ltd. | | | | |
| | 799,079 | | | 5.250%, 11/15/2022h | | | 873,993 | |
| | | | Six Flags Entertainment Corporation | | | | |
| | 550,000 | | | 5.250%, 1/15/2021e | | | 566,500 | |
| | | | Toll Brothers Finance Corporation | | | | |
| | 268,000 | | | 4.000%, 12/31/2018 | | | 276,710 | |
| | | | Visa, Inc. | | | | |
| | 160,000 | | | 2.200%, 12/14/2020 | | | 163,136 | |
| | | | Walgreens Boots Alliance, Inc. | | | | |
| | 125,000 | | | 1.750%, 5/30/2018 | | | 125,599 | |
| | 125,000 | | | 2.600%, 6/1/2021 | | | 126,534 | |
| | | | West Corporation | | | | |
| | 800,000 | | | 5.375%, 7/15/2022e | | | 770,000 | |
| | | | Yum! Brands, Inc. | | | | |
| | 870,000 | | | 5.000%, 6/1/2024e | | | 904,800 | |
| | | | | |
| | | | Total | | | 13,953,051 | |
| | | | | |
| |
| Consumer Non-Cyclical (2.9%) | | | | |
| | | | Actavis Funding SCS | | | | |
| | 100,000 | | | 2.100%, 3/12/2020d | | | 101,636 | |
| | | | Anheuser-Busch InBev Finance, Inc. | | | | |
| | 225,000 | | | 2.017%, 2/1/2021d | | | 230,709 | |
| | 165,000 | | | 2.650%, 2/1/2021 | | | 168,748 | |
| | | | B&G Foods, Inc. | | | | |
| | 340,000 | | | 4.625%, 6/1/2021 | | | 349,350 | |
| | | | BAT International Finance plc | | | | |
| | 160,000 | | | 1.360%, 6/15/2018d,e | | | 160,206 | |
| | | | Baxter International, Inc. | | | | |
| | 110,000 | | | 1.700%, 8/15/2021 | | | 109,366 | |
| | | | Bayer U.S. Finance, LLC | | | | |
| | 170,000 | | | 2.375%, 10/8/2019e | | | 172,384 | |
| | | | Becton, Dickinson and Company | | | | |
| | 182,000 | | | 1.450%, 5/15/2017 | | | 182,393 | |
| | | | Boston Scientific Corporation | | | | |
| | 110,000 | | | 6.000%, 1/15/2020 | | | 123,113 | |
| | | | Bunge Limited Finance Corporation | | | | |
| | 160,000 | | | 3.500%, 11/24/2020 | | | 166,969 | |
| | | | Cardinal Health, Inc. | | | | |
| | 160,000 | | | 1.950%, 6/15/2018 | | | 161,263 | |
| | | | Celgene Corporation | | | | |
| | 160,000 | | | 3.550%, 8/15/2022 | | | 168,440 | |
| | | | Cott Beverages, Inc. | | | | |
| | 815,000 | | | 5.375%, 7/1/2022 | | | 827,225 | |
| | | | CVS Health Corporation | | | | |
| | 136,000 | | | 2.250%, 12/5/2018 | | | 137,875 | |
| | | | EMD Finance, LLC | | | | |
| | 105,000 | | | 1.207%, 3/17/2017d,e | | | 105,037 | |
| | | | Envision Healthcare Corporation | | | | |
| | 800,000 | | | 5.125%, 7/1/2022e | | | 800,000 | |
| | | | Express Scripts Holding Company | | | | |
| | 140,000 | | | 3.900%, 2/15/2022 | | | 149,693 | |
| | | | Forest Laboratories, Inc. | | | | |
| | 236,000 | | | 4.375%, 2/1/2019e | | | 247,896 | |
| | | | Gilead Sciences, Inc. | | | | |
| | 155,000 | | | 3.250%, 9/1/2022 | | | 163,087 | |
| | | | Grifols Worldwide Operations, Ltd. | | | | |
| | 750,000 | | | 5.250%, 4/1/2022 | | | 781,875 | |
| | | | HCA, Inc. | | | | |
| | 469,079 | | | 4.750%, 5/1/2023 | | | 488,429 | |
| | 285,000 | | | 5.250%, 6/15/2026 | | | 297,825 | |
| | | | JBS USA, LLC | | | | |
| | 855,000 | | | 5.750%, 6/15/2025e | | | 837,900 | |
| | | | Laboratory Corporation of America Holdings | | | | |
| | 90,000 | | | 2.625%, 2/1/2020 | | | 91,491 | |
| | | | Mead Johnson Nutrition Company | | | | |
| | 160,000 | | | 3.000%, 11/15/2020 | | | 165,400 | |
| | | | Merck & Company, Inc. | | | | |
| | 95,000 | | | 1.182%, 2/10/2020d | | | 95,486 | |
| | | | Mondelez International, Inc. | | | | |
| | 140,000 | | | 2.250%, 2/1/2019 | | | 142,109 | |
| | | | PepsiCo, Inc. | | | | |
| | 175,000 | | | 1.394%, 10/6/2021d | | | 175,743 | |
| | | | Perrigo Finance plc | | | | |
| | 110,000 | | | 3.500%, 12/15/2021 | | | 113,572 | |
| | | | Pinnacle Foods, Inc. | | | | |
| | 500,000 | | | 5.875%, 1/15/2024 | | | 536,250 | |
| | | | Post Holdings, Inc. | | | | |
| | 850,000 | | | 5.000%, 8/15/2026e | | | 824,500 | |
| | | | Revlon Consumer Products Corporation | | | | |
| | 469,079 | | | 5.750%, 2/15/2021 | | | 473,770 | |
| | | | Reynolds American, Inc. | | | | |
| | 87,000 | | | 3.250%, 6/12/2020 | | | 90,847 | |
| | | | SABMiller plc | | | | |
| | 182,000 | | | 6.500%, 7/15/2018e | | | 197,300 | |
| | | | Safeway, Inc. | | | | |
| | 55,000 | | | 3.400%, 12/1/2016 | | | 55,000 | |
| | | | Shire Acquisitions Investments Ireland Designated Activity Company | | | | |
| | 185,000 | | | 1.900%, 9/23/2019 | | | 184,653 | |
| | | | Tenet Healthcare Corporation | | | | |
| | 675,000 | | | 8.125%, 4/1/2022 | | | 659,813 | |
| | | | Teva Pharmaceutical Finance Netherlands III BV | | | | |
| | 165,000 | | | 1.700%, 7/19/2019 | | | 163,720 | |
| | | | TreeHouse Foods, Inc. | | | | |
| | 550,000 | | | 4.875%, 3/15/2022 | | | 570,625 | |
| | | | Valeant Pharmaceuticals International | | | | |
| 469,079 | | | 7.250%, 7/15/2022e | | | 408,099 | |
| | | | VPII Escrow Corporation | | | | |
| | 500,000 | | | 7.500%, 7/15/2021e | | | 445,000 | |
| | | | WM Wrigley Jr. Company | | | | |
| | 138,000 | | | 2.000%, 10/20/2017e | | | 138,949 | |
| | | | | |
| | | | Total | | | 12,463,746 | |
| | | | | |
| |
| Energy (2.2%) | | | | |
| | | | Anadarko Petroleum Corporation | | | | |
| | 150,000 | | | 8.700%, 3/15/2019 | | | 171,928 | |
| | | | Boardwalk Pipelines, LP | | | | |
| | 192,000 | | | 5.875%, 11/15/2016 | | | 192,289 | |
| | | | BP Capital Markets plc | | | | |
| | 155,000 | | | 1.676%, 5/3/2019 | | | 155,245 | |
| | | | Buckeye Partners, LP | | | | |
| | 268,000 | | | 2.650%, 11/15/2018 | | | 270,970 | |
| | | | Chevron Corporation | | | | |
| | 160,000 | | | 1.328%, 11/16/2018d | | | 160,696 | |
| | | | Concho Resources, Inc. | | | | |
| | 859,079 | | | 6.500%, 1/15/2022 | | | 889,147 | |
The accompanying Notes to Financial Statements are an integral part of this schedule.
97
OPPORTUNITY INCOME PLUS FUND
Schedule of Investments as of October 31, 2016
| | | | |
Principal
Amount | | Long-Term Fixed Income (61.5%) | | Value |
| | | | | | | | |
| Energy (2.2%) - continued | | | | |
| | | | Contura Energy, Inc. | | | | |
| | $426,000 | | | 10.000%, 8/1/2021* | | | $449,430 | |
| | | | Crestwood Midstream Partners, LP | | | | |
| | 550,000 | | | 6.250%, 4/1/2023 | | | 556,875 | |
| | | | Ecopetrol SA | | | | |
| | 225,000 | | | 5.875%, 9/18/2023 | | | 241,312 | |
| | | | Enbridge, Inc. | | | | |
| | 118,000 | | | 1.289%, 6/2/2017d,h | | | 117,860 | |
| | | | EQT Corporation | | | | |
| | 52,000 | | | 5.150%, 3/1/2018 | | | 54,021 | |
| | 134,000 | | | 8.125%, 6/1/2019 | | | 152,834 | |
| | | | Exxon Mobil Corporation | | | | |
| | 200,000 | | | 1.708%, 3/1/2019 | | | 201,514 | |
| | | | Marathon Petroleum Corporation | | | | |
| | 160,000 | | | 3.400%, 12/15/2020 | | | 166,258 | |
| | | | MEG Energy Corporation | | | | |
| | 376,000 | | | 6.375%, 1/30/2023e | | | 310,200 | |
| | | | MPLX, LP | | | | |
| | 845,000 | | | 4.875%, 12/1/2024 | | | 883,745 | |
| | | | Northern Tier Energy, LLC | | | | |
| | 560,000 | | | 7.125%, 11/15/2020 | | | 572,600 | |
| | | | Occidental Petroleum Corporation | | | | |
| | 160,000 | | | 2.600%, 4/15/2022 | | | 163,272 | |
| | | | Petrobras Global Finance BV | | | | |
| | 90,000 | | | 8.375%, 5/23/2021 | | | 99,567 | |
| | | | Petroleos Mexicanos | | | | |
| | 77,000 | | | 5.500%, 2/4/2019e | | | 81,504 | |
| | | | Pioneer Natural Resources Company | | | | |
| | 56,000 | | | 3.450%, 1/15/2021 | | | 58,341 | |
| | | | Regency Energy Partners, LP | | | | |
| | 675,000 | | | 5.000%, 10/1/2022 | | | 724,305 | |
| | | | Sabine Pass Liquefaction, LLC | | | | |
| | 805,000 | | | 5.625%, 3/1/2025 | | | 851,811 | |
| | | | Schlumberger Holdings Corporation | | | | |
| | 160,000 | | | 3.000%, 12/21/2020e | | | 166,019 | |
| | | | Shell International Finance BV | | | | |
| | 170,000 | | | 1.266%, 5/11/2020d | | | 170,188 | |
| | | | Sunoco Logistics Partners Operations, LP | | | | |
| | 160,000 | | | 4.400%, 4/1/2021 | | | 172,601 | |
| | | | TransCanada Trust | | | | |
| | 600,000 | | | 5.875%, 8/15/2076 | | | 642,000 | |
| | | | Transcontinental Gas Pipe Line Company, LLC | | | | |
| | 150,000 | | | 7.850%, 2/1/2026e | | | 190,231 | |
| | | | Weatherford International, Ltd. | | | | |
| | 590,000 | | | 8.250%, 6/15/2023h | | | 610,650 | |
| | | | | |
| | | | Total | | | 9,477,413 | |
| | | | | |
| |
| Financials (6.4%) | | | | |
| | | | Abbey National Treasury Services plc | | | | |
| | 240,000 | | | 1.264%, 9/29/2017d | | | 239,643 | |
| | | | ACE INA Holdings, Inc. | | | | |
| | 160,000 | | | 2.875%, 11/3/2022 | | | 166,697 | |
| | | | AerCap Ireland Capital, Ltd. | | | | |
| | 430,000 | | | 3.950%, 2/1/2022 | | | 438,265 | |
| | | | Aetna, Inc. | | | | |
| | 160,000 | | | 1.900%, 6/7/2019 | | | 161,282 | |
| | | | Air Lease Corporation | | | | |
| | 244,000 | | | 2.125%, 1/15/2018 | | | 244,852 | |
| | 80,000 | | | 2.625%, 9/4/2018 | | | 80,981 | |
| | | | Ally Financial, Inc. | | | | |
| | 540,000 | | | 3.750%, 11/18/2019 | | | 540,675 | |
| | | | American Express Credit Corporation | | | | |
| | 160,000 | | | 1.906%, 9/14/2020d | | | 162,395 | |
| | | | BAC Capital Trust XIV | | | | |
| | 760,000 | | | 4.000%, 9/29/2049d,i | | | 623,200 | |
| | | | Bank of America Corporation | | | | |
| | 268,000 | | | 5.700%, 5/2/2017 | | | 273,802 | |
| | 240,000 | | | 1.700%, 8/25/2017 | | | 240,551 | |
| | 484,000 | | | 1.936%, 3/22/2018d | | | 488,096 | |
| | 420,000 | | | 5.650%, 5/1/2018 | | | 444,250 | |
| | 177,000 | | | 8.000%, 7/29/2049i | | | 180,319 | |
| | | | Bank of Montreal | | | | |
| | 130,000 | | | 1.500%, 7/18/2019 | | | 129,498 | |
| | | | BB&T Corporation | | | | |
| | 202,000 | | | 2.050%, 6/19/2018 | | | 204,010 | |
| | | | Bear Stearns Companies, LLC | | | | |
| | 295,000 | | | 6.400%, 10/2/2017 | | | 308,337 | |
| | | | BNP Paribas SA | | | | |
| | 208,000 | | | 2.375%, 9/14/2017 | | | 209,828 | |
| | 730,000 | | | 7.625%, 12/29/2049e,h,i | | | 762,850 | |
| | | | Caisse Centrale Desjardins du Quebec | | | | |
| | 115,000 | | | 1.552%, 1/29/2018d,e | | | 114,875 | |
| | | | Centene Escrow Corporation | | | | |
| | 500,000 | | | 5.625%, 2/15/2021 | | | 524,505 | |
| | | | Central Fidelity Capital Trust I | | | | |
| | 710,000 | | | 1.880%, 4/15/2027d | | | 628,350 | |
| | | | CIT Group, Inc. | | | | |
| | 450,000 | | | 3.875%, 2/19/2019 | | | 456,889 | |
| | | | Citigroup, Inc. | | | | |
| | 363,000 | | | 1.850%, 11/24/2017 | | | 364,235 | |
| | 190,000 | | | 2.255%, 9/1/2023d | | | 190,674 | |
| | | | CNA Financial Corporation | | | | |
| | 185,000 | | | 5.750%, 8/15/2021 | | | 211,735 | |
| | | | Credit Agricole SA | | | | |
| | 250,000 | | | 1.815%, 6/10/2020d,e | | | 250,919 | |
| | | | Credit Suisse Group AG | | | | |
| | 588,000 | | | 7.500%, 12/29/2049e,i | | | 608,580 | |
| | | | CyrusOne, LP | | | | |
| | 469,079 | | | 6.375%, 11/15/2022 | | | 497,224 | |
| | | | Discover Bank | | | | |
| | 70,000 | | | 8.700%, 11/18/2019 | | | 81,186 | |
| | | | Discover Financial Services | | | | |
| | 138,000 | | | 6.450%, 6/12/2017 | | | 142,114 | |
| | | | Fifth Third Bancorp | | | | |
| | 315,000 | | | 5.450%, 1/15/2017 | | | 317,854 | |
| | | | Goldman Sachs Group, Inc. | | | | |
| | 138,000 | | | 2.625%, 1/31/2019 | | | 140,617 | |
| | 228,000 | | | 7.500%, 2/15/2019 | | | 256,337 | |
| | 115,000 | | | 2.042%, 4/23/2020d | | | 115,675 | |
| | 175,000 | | | 2.241%, 11/15/2021d | | | 174,809 | |
| | 170,000 | | | 2.429%, 11/29/2023d | | | 172,524 | |
| | 300,000 | | | 5.300%, 12/29/2049i | | | 305,625 | |
| | | | Hartford Financial Services Group, Inc. | | | | |
| | 263,000 | | | 6.000%, 1/15/2019 | | | 285,627 | |
| | | | HCP, Inc. | | | | |
| | 139,000 | | | 3.750%, 2/1/2019 | | | 143,737 | |
| | | | Health Care REIT, Inc. | | | | |
| | 134,000 | | | 4.700%, 9/15/2017 | | | 137,735 | |
| | | | Hospitality Properties Trust | | | | |
| | 150,000 | | | 4.250%, 2/15/2021 | | | 158,693 | |
| | | | Huntington Bancshares, Inc. | | | | |
| | 200,000 | | | 3.150%, 3/14/2021 | | | 206,369 | |
| | | | Hutchison Whampoa Finance CI, Ltd. | | | | |
| | 234,000 | | | 1.625%, 10/31/2017e | | | 234,144 | |
| | | | Icahn Enterprises, LP | | | | |
| | 315,000 | | | 6.000%, 8/1/2020 | | | 309,487 | |
The accompanying Notes to Financial Statements are an integral part of this schedule.
98
OPPORTUNITY INCOME PLUS FUND
Schedule of Investments as of October 31, 2016
| | | | | | | | |
Principal
Amount | | | Long-Term Fixed Income (61.5%) | | Value | |
| Financials (6.4%) - continued | | | | |
| | | | ILFC E-Capital Trust II | | | | |
| | $865,000 | | | 4.250%, 12/21/2065d,e | | | $704,975 | |
| | | | ING Capital Funding Trust III | | | | |
| | 144,000 | | | 4.438%, 12/29/2049d,i | | | 143,100 | |
| | | | International Lease Finance Corporation | | | | |
| | 420,000 | | | 5.875%, 4/1/2019 | | | 451,366 | |
| | | | Intesa Sanpaolo SPA | | | | |
| | 68,000 | | | 3.875%, 1/16/2018 | | | 69,372 | |
| | 201,000 | | | 3.875%, 1/15/2019 | | | 206,799 | |
| | | | J.P. Morgan Chase & Company | | | | |
| | 138,000 | | | 6.300%, 4/23/2019 | | | 152,971 | |
| | 75,000 | | | 2.250%, 1/23/2020 | | | 75,521 | |
| | 220,000 | | | 2.700%, 5/18/2023 | | | 220,655 | |
| | 231,000 | | | 2.112%, 10/24/2023d | | | 230,091 | |
| | 136,000 | | | 7.900%, 4/29/2049i | | | 140,182 | |
| | | | KeyCorp | | | | |
| | 223,000 | | | 2.300%, 12/13/2018 | | | 225,890 | |
| | 240,000 | | | 5.000%, 12/29/2049i | | | 235,620 | |
| | | | Liberty Mutual Group, Inc. | | | | |
| | 54,000 | | | 5.000%, 6/1/2021e | | | 60,242 | |
| | | | Lincoln National Corporation | | | | |
| | 130,000 | | | 6.250%, 2/15/2020 | | | 146,162 | |
| | | | Lloyds Bank plc | | | | |
| | 105,000 | | | 1.374%, 3/16/2018d | | | 104,798 | |
| | | | Macquarie Bank, Ltd. | | | | |
| | 150,000 | | | 2.060%, 1/15/2019d,e | | | 151,504 | |
| | | | MetLife, Inc. | | | | |
| | 244,000 | | | 1.903%, 12/15/2017 | | | 245,549 | |
| | | | Mizuho Corporate Bank, Ltd. | | | | |
| | 191,000 | | | 1.550%, 10/17/2017e | | | 191,011 | |
| | | | Morgan Stanley | | | | |
| | 238,000 | | | 6.625%, 4/1/2018 | | | 254,111 | |
| | 115,000 | | | 2.026%, 1/27/2020d | | | 116,145 | |
| | 150,000 | | | 4.875%, 11/1/2022 | | | 164,754 | |
| | 180,000 | | | 2.282%, 10/24/2023d | | | 179,784 | |
| | | | MPT Operating Partnership, LP | | | | |
| | 550,000 | | | 5.500%, 5/1/2024 | | | 566,500 | |
| | | | Murray Street Investment Trust I | | | | |
| | 386,000 | | | 4.647%, 3/9/2017 | | | 390,644 | |
| | | | National City Corporation | | | | |
| | 140,000 | | | 6.875%, 5/15/2019 | | | 156,624 | |
| | | | New York Life Global Funding | | | | |
| | 160,000 | | | 1.550%, 11/2/2018e | | | 160,366 | |
| | | | Nomura Holdings, Inc. | | | | |
| | 135,000 | | | 2.750%, 3/19/2019 | | | 137,591 | |
| | | | Quicken Loans, Inc. | | | | |
| | 550,000 | | | 5.750%, 5/1/2025e | | | 543,125 | |
| | | | Realty Income Corporation | | | | |
| | 191,000 | | | 2.000%, 1/31/2018 | | | 192,086 | |
| | | | Regions Bank | | | | |
| | 250,000 | | | 7.500%, 5/15/2018 | | | 270,910 | |
| | | | Regions Financial Corporation | | | | |
| | 135,000 | | | 3.200%, 2/8/2021 | | | 139,962 | |
| | | | Reinsurance Group of America, Inc. | | | | |
| | 305,000 | | | 5.625%, 3/15/2017 | | | 309,648 | |
| | | | Royal Bank of Scotland Group plc | | | | |
| | 848,000 | | | 7.640%, 3/29/2049i | | | 822,560 | |
| | 638,000 | | | 7.648%, 8/29/2049i | | | 754,435 | |
| | | | Simon Property Group, LP | | | | |
| | 160,000 | | | 2.500%, 9/1/2020 | | | 164,004 | |
| | 225,000 | | | 2.500%, 7/15/2021 | | | 229,938 | |
| | | | SLM Corporation | | | | |
| | 150,000 | | | 4.625%, 9/25/2017 | | | 152,157 | |
| | | | Societe Generale SA | | | | |
| | 345,000 | | | 8.250%, 9/29/2049i | | | 354,919 | |
| | | | Standard Chartered plc | | | | |
| | 960,000 | | | 6.409%, 1/29/2049e,h,i | | | 932,400 | |
| | | | State Street Capital Trust IV | | | | |
| | 1,000,000 | | | 1.850%, 6/15/2037d | | | 860,000 | |
| | | | State Street Corporation | | | | |
| | 160,000 | | | 1.701%, 8/18/2020d | | | 161,476 | |
| | | | Sumitomo Mitsui Banking Corporation | | | | |
| | 360,000 | | | 1.300%, 1/10/2017 | | | 360,206 | |
| | 135,000 | | | 1.460%, 1/16/2018d | | | 135,120 | |
| | | | SunTrust Banks, Inc. | | | | |
| | 125,000 | | | 2.900%, 3/3/2021 | | | 129,033 | |
| | | | Synchrony Financial | | | | |
| | 363,000 | | | 1.875%, 8/15/2017 | | | 363,885 | |
| | 75,000 | | | 1.989%, 2/3/2020d | | | 73,414 | |
| | | | Toronto-Dominion Bank | | | | |
| | 150,000 | | | 1.722%, 1/22/2019d | | | 151,160 | |
| | 160,000 | | | 1.786%, 12/14/2020d | | | 161,667 | |
| | | | UnitedHealth Group, Inc. | | | | |
| | 160,000 | | | 3.350%, 7/15/2022 | | | 170,219 | |
| | | | USB Realty Corporation | | | | |
| | 785,000 | | | 2.027%, 12/29/2049d,e,i | | | 704,537 | |
| | | | Voya Financial, Inc. | | | | |
| | 210,000 | | | 2.900%, 2/15/2018 | | | 213,460 | |
| | | | Wells Fargo & Company | | | | |
| | 115,000 | | | 1.567%, 1/30/2020d | | | 114,785 | |
| | 120,000 | | | 2.100%, 7/26/2021 | | | 119,381 | |
| | 200,000 | | | 2.117%, 10/31/2023d | | | 199,480 | |
| | | | Westpac Banking Corporation | | | | |
| | 195,000 | | | 1.661%, 8/19/2021d | | | 195,630 | |
| | | | | |
| | | | Total | | | 27,791,974 | |
| | | | | |
| |
| Foreign Government (15.1%) | | | | |
| | | | Argentina Government International Bond | | | | |
| | 780,000 | | | 6.250%, 4/22/2019e | | | 826,800 | |
| | 200,000 | | | 6.875%, 4/22/2021e | | | 216,400 | |
| | | | Brazil Government International Bond | | | | |
| | 1,303,000 | | | 4.875%, 1/22/2021 | | | 1,378,574 | |
| | 1,800,000 | | | 2.625%, 1/5/2023 | | | 1,663,200 | |
| | 699,000 | | | 6.000%, 4/7/2026 | | | 770,648 | |
| | 860,000 | | | 7.125%, 1/20/2037 | | | 980,400 | |
| | 1,032,000 | | | 5.000%, 1/27/2045 | | | 910,740 | |
| | 700,000 | | | 5.625%, 2/21/2047 | | | 670,250 | |
| | | | Colombia Government International Bond | | | | |
| | 860,000 | | | 4.375%, 7/12/2021 | | | 915,900 | |
| | 1,010,000 | | | 2.625%, 3/15/2023h | | | 977,175 | |
| | 910,000 | | | 4.000%, 2/26/2024h | | | 946,400 | |
| | 540,000 | | | 5.625%, 2/26/2044 | | | 589,950 | |
| | 1,032,000 | | | 5.000%, 6/15/2045 | | | 1,047,480 | |
| | | | Croatia Government International Bond | | | | |
| | 172,000 | | | 6.750%, 11/5/2019e | | | 188,918 | |
| | 1,075,000 | | | 6.625%, 7/14/2020e | | | 1,192,390 | |
| | 521,000 | | | 6.000%, 1/26/2024e,h | | | 587,948 | |
| | | | Export-Import Bank of Korea | | | | |
| | 110,000 | | | 2.250%, 1/21/2020 | | | 110,916 | |
| | | | Hungary Government International Bond | | | | |
| | 344,000 | | | 6.375%, 3/29/2021 | | | 396,856 | |
| | 1,450,000 | | | 5.750%, 11/22/2023 | | | 1,691,787 | |
| | 1,452,000 | | | 5.375%, 3/25/2024 | | | 1,668,209 | |
The accompanying Notes to Financial Statements are an integral part of this schedule.
99
OPPORTUNITY INCOME PLUS FUND
Schedule of Investments as of October 31, 2016
| | | | | | | | |
Principal
Amount | | | Long-Term Fixed Income (61.5%) | | Value | |
| Foreign Government (15.1%) - continued | | | | |
| | | | Indonesia Government International Bond | | | | |
| | $1,140,000 | | | 4.875%, 5/5/2021e | | | $1,239,796 | |
| | 860,000 | | | 3.375%, 4/15/2023e | | | 867,633 | |
| | 1,116,000 | | | 5.875%, 1/15/2024e | | | 1,294,653 | |
| | 675,000 | | | 4.125%, 1/15/2025e | | | 708,001 | |
| | 744,000 | | | 4.750%, 1/8/2026e | | | 811,039 | |
| | 875,000 | | | 8.500%, 10/12/2035e | | | 1,294,376 | |
| | 1,720,000 | | | 5.125%, 1/15/2045e | | | 1,871,842 | |
| | | | Mexico Government International Bond | | | | |
| | 500,000 | | | 4.350%, 1/15/2047 | | | 473,000 | |
| | 170,000 | | | 5.750%, 10/12/2110 | | | 173,825 | |
| | 516,000 | | | 3.625%, 3/15/2022h | | | 539,220 | |
| | 1,124,000 | | | 4.000%, 10/2/2023 | | | 1,181,324 | |
| | 1,290,000 | | | 3.600%, 1/30/2025 | | | 1,315,800 | |
| | 1,200,000 | | | 4.125%, 1/21/2026 | | | 1,268,400 | |
| | 344,000 | | | 6.750%, 9/27/2034 | | | 443,760 | |
| | 460,000 | | | 6.050%, 1/11/2040 | | | 546,825 | |
| | 910,000 | | | 4.750%, 3/8/2044 | | | 907,725 | |
| | 744,000 | | | 5.550%, 1/21/2045 | | | 833,280 | |
| | 1,302,000 | | | 4.600%, 1/23/2046 | | | 1,272,705 | |
| | | | Panama Government International Bond | | | | |
| | 514,000 | | | 4.000%, 9/22/2024 | | | 553,192 | |
| | 750,000 | | | 3.750%, 3/16/2025 | | | 795,000 | |
| | 716,000 | | | 6.700%, 1/26/2036 | | | 951,385 | |
| | | | Peru Government International Bond | | | | |
| | 350,000 | | | 5.625%, 11/18/2050 | | | 444,500 | |
| | 1,032,000 | | | 4.125%, 8/25/2027h | | | 1,149,390 | |
| | 855,000 | | | 8.750%, 11/21/2033 | | | 1,348,762 | |
| | | | Philippines Government International Bond | | | | |
| | 1,400,000 | | | 4.000%, 1/15/2021 | | | 1,522,940 | |
| | 675,000 | | | 7.750%, 1/14/2031 | | | 1,019,459 | |
| | 450,000 | | | 6.375%, 10/23/2034 | | | 626,833 | |
| | 360,000 | | | 5.000%, 1/13/2037 | | | 439,451 | |
| | 720,000 | | | 3.950%, 1/20/2040 | | | 775,385 | |
| | | | Romania Government International Bond | | | | |
| | 730,000 | | | 4.375%, 8/22/2023e | | | 792,926 | |
| | 380,000 | | | 4.875%, 1/22/2024e | | | 425,767 | |
| | 174,000 | | | 6.125%, 1/22/2044e | | | 225,920 | |
| | | | Russia Government International Bond | | | | |
| | 744,000 | | | 3.500%, 1/16/2019e | | | 758,218 | |
| | 3,000,000 | | | 5.000%, 4/29/2020e | | | 3,200,640 | |
| | 1,820,000 | | | 4.875%, 9/16/2023e,h | | | 1,956,427 | |
| | 995,100 | | | 7.500%, 3/31/2030e | | | 1,203,333 | |
| | 1,116,000 | | | 5.625%, 4/4/2042e | | | 1,231,618 | |
| | | | South Africa Government International Bond | | | | |
| | 175,000 | | | 5.500%, 3/9/2020 | | | 189,996 | |
| | 735,000 | | | 5.875%, 5/30/2022 | | | 829,358 | |
| | 957,000 | | | 4.300%, 10/12/2028 | | | 928,003 | |
| | | | Turkey Government International Bond | | | | |
| | 340,000 | | | 7.500%, 11/7/2019 | | | 377,400 | |
| | 860,000 | | | 7.000%, 6/5/2020 | | | 945,247 | |
| | 1,450,000 | | | 5.125%, 3/25/2022 | | | 1,497,650 | |
| | 744,000 | | | 6.250%, 9/26/2022 | | | 809,314 | |
| | 1,052,000 | | | 5.750%, 3/22/2024 | | | 1,118,204 | |
| | 1,450,000 | | | 4.250%, 4/14/2026 | | | 1,388,477 | |
| | 745,000 | | | 4.875%, 10/9/2026 | | | 742,765 | |
| | 1,024,000 | | | 6.875%, 3/17/2036 | | | 1,164,186 | |
| | 700,000 | | | 4.875%, 4/16/2043 | | | 621,894 | |
| | 919,000 | | | 6.625%, 2/17/2045 | | | 1,030,116 | |
| | | | | |
| | | | Total | | | 65,837,901 | |
| | | | | |
| |
| Mortgage-Backed Securities (9.1%) | | | | |
| | | | Federal Home Loan Mortgage Corporation Gold 15-Yr. Pass Through | | | | |
| | 2,250,000 | | | 3.000%, 11/1/2031c | | | 2,354,590 | |
| | | | Federal Home Loan Mortgage Corporation Gold 30-Yr. Pass Through | | | | |
| | 3,050,000 | | | 4.000%, 11/1/2046c | | | 3,262,428 | |
| | | | Federal National Mortgage Association Conventional | | | | |
| | 4,700,000 | | | 3.000%, 11/1/2046c | | | 4,838,797 | |
| | | | Federal National Mortgage Association Conventional 15-Yr. Pass Through | | | | |
| | 5,050,000 | | | 2.500%, 11/1/2031c | | | 5,196,371 | |
| | | | Federal National Mortgage Association Conventional 30-Yr. Pass Through | | | | |
| | 11,300,000 | | | 3.500%, 11/1/2046c | | | 11,863,235 | |
| | 7,812,500 | | | 4.000%, 11/1/2046c | | | 8,365,478 | |
| | 3,650,000 | | | 4.500%, 11/1/2046c | | | 3,989,336 | |
| | | | | |
| | | | Total | | | 39,870,235 | |
| | | | | |
|
| Technology (1.4%) | |
| | | | Alliance Data Systems Corporation | | | | |
| | 440,000 | | | 5.375%, 8/1/2022e | | | 423,500 | |
| | | | Apple, Inc. | | | | |
| | 170,000 | | | 1.117%, 5/6/2020d | | | 169,705 | |
| | | | Automatic Data Processing, Inc. | | | | |
| | 160,000 | | | 2.250%, 9/15/2020 | | | 164,073 | |
| | | | Cisco Systems, Inc. | | | | |
| | 140,000 | | | 1.411%, 2/21/2018d | | | 140,838 | |
| | 160,000 | | | 1.342%, 3/1/2019d | | | 160,894 | |
| | | | Diamond 1 Finance Corporation | | | | |
| | 125,000 | | | 3.480%, 6/1/2019e | | | 128,250 | |
| | | | Equinix, Inc. | | | | |
| | 540,000 | | | 5.750%, 1/1/2025 | | | 571,050 | |
| | | | Fidelity National Information Services, Inc. | | | | |
| | 236,000 | | | 1.450%, 6/5/2017 | | | 236,273 | |
| | 160,000 | | | 3.625%, 10/15/2020 | | | 168,765 | |
| | 195,000 | | | 2.250%, 8/15/2021 | | | 194,966 | |
| | | | First Data Corporation | | | | |
| | 550,000 | | | 5.375%, 8/15/2023e | | | 569,250 | |
| | | | Hewlett Packard Enterprise Company | | | | |
| | 165,000 | | | 3.850%, 10/15/2020e | | | 174,812 | |
| | | | IMS Health, Inc. | | | | |
| | 375,000 | | | 6.000%, 11/1/2020e | | | 380,625 | |
| | | | Intel Corporation | | | | |
| | 220,000 | | | 1.700%, 5/19/2021 | | | 219,691 | |
| | 160,000 | | | 3.100%, 7/29/2022 | | | 168,921 | |
| | | | Iron Mountain, Inc. | | | | |
| | 360,079 | | | 6.000%, 8/15/2023 | | | 382,584 | |
| | | | NXP BV | | | | |
| | 615,000 | | | 3.875%, 9/1/2022e | | | 650,363 | |
| | | | Oracle Corporation | | | | |
| | 170,000 | | | 2.500%, 5/15/2022 | | | 171,906 | |
| | | | Sensata Technologies BV | | | | |
| | 765,000 | | | 4.875%, 10/15/2023e | | | 792,731 | |
| | | | Texas Instruments, Inc. | | | | |
| | 170,000 | | | 1.750%, 5/1/2020 | | | 171,220 | |
The accompanying Notes to Financial Statements are an integral part of this schedule.
100
OPPORTUNITY INCOME PLUS FUND
Schedule of Investments as of October 31, 2016
| | | | | | | | |
Principal
Amount | | | Long-Term Fixed Income (61.5%) | | Value | |
| Technology (1.4%) - continued | | | | |
| | | | Tyco Electronics Group SA | | | | |
| | $202,000 | | | 6.550%, 10/1/2017 | | | $211,637 | |
| | | | | |
| | | | Total | | | 6,252,054 | |
| | | | | |
| |
| Transportation (0.6%) | | | | |
| | | | Air Canada Pass Through Trust | | | | |
| | 60,556 | | | 3.875%, 3/15/2023e | | | 59,042 | |
| | | | American Airlines Pass Through Trust | | | | |
| | 111,876 | | | 4.950%, 1/15/2023 | | | 122,085 | |
| | | | Avis Budget Car Rental, LLC | | | | |
| | 800,000 | | | 5.125%, 6/1/2022e,h | | | 784,000 | |
| | | | Continental Airlines, Inc. | | | | |
| | 302,680 | | | 6.250%, 4/11/2020 | | | 320,841 | |
| | | | Delta Air Lines, Inc. | | | | |
| | 108,232 | | | 4.950%, 5/23/2019 | | | 113,915 | |
| | | | ERAC USA Finance, LLC | | | | |
| | 160,000 | | | 2.600%, 12/1/2021e | | | 161,822 | |
| | | | J.B. Hunt Transport Services, Inc. | | | | |
| | 160,000 | | | 3.300%, 8/15/2022 | | | 165,747 | |
| | | | Korea Expressway Corporation | | | | |
| | 200,000 | | | 1.625%, 4/28/2017e | | | 199,970 | |
| | | | US Airways Pass Through Trust | | | | |
| | 348,617 | | | 3.950%, 11/15/2025 | | | 367,787 | |
| | | | XPO Logistics, Inc. | | | | |
| | 500,000 | | | 6.500%, 6/15/2022e,h | | | 520,000 | |
| | | | | |
| | | | Total | | | 2,815,209 | |
| | | | | |
| |
| U.S. Government and Agencies (1.4%) | | | | |
| | | | U.S. Treasury Notes | | | | |
| | 665,000 | | | 1.125%, 8/31/2021 | | | 659,130 | |
| | 900,000 | | | 2.125%, 6/30/2022 | | | 931,992 | |
| | 4,450,000 | | | 1.625%, 2/15/2026 | | | 4,376,299 | |
| | | | | |
| | | | Total | | | 5,967,421 | |
| | | | | |
| |
| Utilities (1.4%) | | | | |
| | | | AES Corporation | | | | |
| | 469,079 | | | 7.375%, 7/1/2021 | | | 528,887 | |
| | | | Ameren Corporation | | | | |
| | 160,000 | | | 2.700%, 11/15/2020 | | | 164,678 | |
| | | | Arizona Public Service Company | | | | |
| | 95,000 | | | 2.200%, 1/15/2020 | | | 96,707 | |
| | | | Berkshire Hathaway Energy Company | | | | |
| | 240,000 | | | 2.400%, 2/1/2020 | | | 244,388 | |
| | | | Calpine Corporation | | | | |
| | 675,000 | | | 5.375%, 1/15/2023 | | | 668,250 | |
| | | | DTE Energy Company | | | | |
| | 242,000 | | | 2.400%, 12/1/2019 | | | 246,194 | |
| | | | Dynegy, Inc. | | | | |
| | 775,000 | | | 7.375%, 11/1/2022 | | | 747,391 | |
| | | | El Paso Corporation | | | | |
| | 122,000 | | | 7.000%, 6/15/2017 | | | 126,024 | |
| | | | Emera U.S. Finance, LP | | | | |
| | 135,000 | | | 2.150%, 6/15/2019e | | | 136,188 | |
| | | | Energy Transfer Equity, LP | | | | |
| | 855,000 | | | 5.500%, 6/1/2027 | | | 833,625 | |
| | | | Eversource Energy | | | | |
| | 80,000 | | | 1.600%, 1/15/2018 | | | 80,134 | |
| | | | Exelon Generation Company, LLC | | | | |
| | 138,000 | | | 5.200%, 10/1/2019 | | | 150,930 | |
| | 70,000 | | | 2.950%, 1/15/2020 | | | 71,826 | |
| | | | Fortis, Inc. | | | | |
| | 160,000 | | | 2.100%, 10/4/2021e | | | 158,686 | |
| | | | NextEra Energy Capital Holdings, Inc. | | | | |
| | 125,000 | | | 2.300%, 4/1/2019 | | | 126,742 | |
| | | | NiSource Finance Corporation | | | | |
| | 97,000 | | | 6.400%, 3/15/2018 | | | 103,125 | |
| | | | NRG Energy, Inc. | | | | |
| | 469,079 | | | 6.625%, 3/15/2023 | | | 467,906 | |
| | | | Pacific Gas & Electric Company | | | | |
| | 134,000 | | | 5.625%, 11/30/2017 | | | 140,140 | |
| | | | PG&E Corporation | | | | |
| | 136,000 | | | 2.400%, 3/1/2019 | | | 138,208 | |
| | | | PSEG Power, LLC | | | | |
| | 143,000 | | | 3.000%, 6/15/2021 | | | 146,297 | |
| | | | Sempra Energy | | | | |
| | 244,000 | | | 6.150%, 6/15/2018 | | | 260,840 | |
| | 75,000 | | | 2.400%, 3/15/2020 | | | 76,168 | |
| | | | Southern California Edison Company | | | | |
| | 55,000 | | | 2.400%, 2/1/2022 | | | 55,891 | |
| | | | Southern Company | | | | |
| | 100,000 | | | 1.850%, 7/1/2019 | | | 100,578 | |
| | | | Xcel Energy, Inc. | | | | |
| | 170,000 | | | 1.200%, 6/1/2017 | | | 169,940 | |
| | | | | |
| | | | Total | | | 6,039,743 | |
| | | | | |
| | | | | | | | |
| | | | | |
| | | | Total Long-Term Fixed Income (cost $266,437,851) | | | 268,527,824 | |
| | | | | |
| | |
| Shares | | | Registered Investment Companies (3.1%) | | Value | |
| Equity Funds/ETFs (0.2%) | | | | |
| | 34,500 | | | AllianzGI NFJ Dividend Interest & Premium Strategy Fund | | | 421,590 | |
| | 38,500 | | | BlackRock Resources & Commodities Strategy Trust | | | 306,845 | |
| | 17,000 | | | Guggenheim Multi-Asset Income ETF | | | 328,100 | |
| | | | | |
| | | | Total | | | 1,056,535 | |
| | | | | |
| |
| Fixed Income Funds/ETFs (2.9%) | | | | |
| | 184,069 | | | Aberdeen Asia-Pacific Income Fund, Inc. | | | 905,620 | |
| | 57,050 | | | Doubleline Income Solutions Fund | | | 1,069,688 | |
| | 29,204 | | | First Trust High Income Long/Short Fund | | | 453,246 | |
| | 171,926 | | | MFS Intermediate Income Trust | | | 765,071 | |
| | 61,304 | | | Pimco Dynamic Credit And Mortgage Income Fund | | | 1,245,697 | |
| | 118,910 | | | PowerShares Senior Loan Portfolio | | | 2,756,334 | |
| | 141,898 | | | Templeton Global Income Fund | | | 899,633 | |
| | 39,695 | | | Vanguard Short-Term Corporate Bond ETF | | | 3,188,302 | |
| | 64,671 | | | Western Asset Emerging Markets Debt Fund, Inc. | | | 990,113 | |
| | 100,767 | | | Western Asset High Income Opportunity Fund, Inc. | | | 499,804 | |
| | | | | |
| | | | Total | | | 12,773,508 | |
| | | | | |
| | | | | | | | |
| | | | | |
| | | | Total Registered Investment Companies (cost $15,195,041) | | | 13,830,043 | |
| | | | | |
| | |
| Shares | | | Preferred Stock (1.7%) | | Value | |
| Consumer Staples (0.1%) | | | | |
| | 14,320 | | | CHS, Inc., | | | 423,872 | |
| | | | 7.100%i | | | | |
| | | | | |
| | | | Total | | | 423,872 | |
| | | | | |
| |
| Energy (<0.1%) | | | | |
| | 9,229 | | | Alpha Natural Resources, Inc., 0.000%j | | | 57,681 | |
| | 9,229 | | | ANR Holdings, Inc., 0.000%j | | | 15,689 | |
| | | | | |
| | | | Total | | | 73,370 | |
| | | | | |
| |
| Financials (1.6%) | | | | |
| | 7,320 | | | Agribank FCB, 6.875%i | | | 787,357 | |
| | 28,995 | | | Citigroup, Inc., 6.875%i | | | 831,867 | |
The accompanying Notes to Financial Statements are an integral part of this schedule.
101
OPPORTUNITY INCOME PLUS FUND
Schedule of Investments as of October 31, 2016
| | | | | | | | |
| Shares | | | Preferred Stock (1.7%) | | Value | |
| Financials (1.6%) - continued | | | | |
| | 5,700 | | | Cobank ACB, 6.250%i | | | $607,585 | |
| | 19,000 | | | Countrywide Capital V, 7.000% | | | 489,440 | |
| | 23,000 | | | GMAC Capital Trust I, 6.602%d | | | 587,190 | |
| | 24,100 | | | Goldman Sachs Group, Inc., 5.500%i | | | 628,287 | |
| | 580 | | | M&T Bank Corporation, 6.375%i | | | 610,450 | |
| | 28,300 | | | Morgan Stanley, 7.125%i | | | 825,794 | |
| | 19,266 | | | U.S. Bancorp, 6.500%i | | | 565,457 | |
| | 679 | | | Wells Fargo & Company, Convertible, 7.500%i | | | 886,095 | |
| | | | | |
| | | | Total | | | 6,819,522 | |
| | | | | |
| | | | | | | | |
| | | | | |
| | | | Total Preferred Stock (cost $6,798,497) | | | 7,316,764 | |
| | | | | |
| | |
| Shares | | | Common Stock (1.2%) | | Value | |
| Energy (0.7%) | | | | |
| | 27,327 | | | Arch Coal, Inc.h,j | | | 2,005,255 | |
| | 12,424 | | | Contura Energy, Inc.j | | | 823,090 | |
| | 3,297 | | | Vantage Drilling Internationalj | | | 276,948 | |
| | | | | |
| | | | Total | | | 3,105,293 | |
| | | | | |
| |
| Financials (0.4%) | | | | |
| | 130,900 | | | Apollo Investment Corporation | | | 773,619 | |
| | 60,250 | | | Ares Capital Corporation | | | 921,825 | |
| | | | | |
| | | | Total | | | 1,695,444 | |
| | | | | |
| |
| Materials (0.1%) | | | | |
| | 48,119 | | | Verso Corporationj | | | 295,451 | |
| | | | | |
| | | | Total | | | 295,451 | |
| | | | | |
| | | | | | | | |
| | | | | |
| | | | Total Common Stock (cost $4,916,686) | | | 5,096,188 | |
| | | | | |
| | |
| Shares | | | Collateral Held for Securities Loaned (2.8%) | | Value | |
| | 12,236,852 | | | Thrivent Cash Management Trust | | | 12,236,852 | |
| | | | | |
| | | | Total Collateral Held for Securities Loaned (cost $12,236,852) | | | 12,236,852 | |
| | | | | |
Shares or
Principal
Amount | | | Short-Term Investments (14.0%)k | | Value | |
| | | | Federal Home Loan Bank Discount Notes | | | | |
| | 400,000 | | | 0.285%, 11/16/2016l | | | 399,967 | |
| | 100,000 | | | 0.344%, 11/30/2016l | | | 99,984 | |
| | 200,000 | | | 0.355%, 1/25/2017l | | | 199,849 | |
| | 200,000 | | | 0.365%, 1/27/2017l | | | 199,845 | |
| | | | Thrivent Core Short-Term Reserve Fund | | | | |
| | 6,015,200 | | | 0.790% | | | 60,152,003 | |
| | | | | |
| | | | Total Short-Term Investments (cost $61,051,584) | | | 61,051,648 | |
| | | | | |
| | | | Total Investments (cost $498,304,198) 114.1% | | | $498,306,626 | |
| | | | | |
| | | | Other Assets and Liabilities, Net (14.1%) | | | (61,736,026 | ) |
| | | | | |
| | | | Total Net Assets 100.0% | | | $436,570,600 | |
| | | | | |
a | The stated interest rate represents the weighted average of all contracts within the bank loan facility. |
b | All or a portion of the loan is unfunded. |
c | Denotes investments purchased on a when-issued or delayed delivery basis. |
d | Denotes variable rate securities. Variable rate securities are securities whose yields vary with a designated market index or market rate. The rate shown is as of October 31, 2016. |
e | Denotes securities sold under Rule 144A of the Securities Act of 1933, which exempts them from registration. These securities may be resold to other dealers in the program or to other qualified institutional buyers. As of October 31, 2016, the value of these investments was $57,888,789 or 13.3% of total net assets. |
f | Denotes step coupon securities. Step coupon securities pay an initial coupon rate for the first period and then different coupon rates for following periods. The rate shown is as of October 31, 2016. |
g | All or a portion of the security is insured or guaranteed. |
h | All or a portion of the security is on loan. |
i | Denotes perpetual securities. Perpetual securities pay an indefinite stream of interest, but may be called by the issuer at an earlier date. |
j | Non-income producing security. |
k | The interest rate shown reflects the yield, coupon rate or the discount rate at the date of purchase. |
l | All or a portion of the security is held on deposit with the counterparty and pledged as the initial margin deposit for open futures contracts. |
* | Denotes restricted securities. Restricted securities are investment securities which cannot be offered for public sale without first being registered under the Securities Act of 1933. The value of all restricted securities held in Opportunity Income Plus Fund as of October 31, 2016 was $12,028,907 or 2.8% of total net assets. The following table indicates the acquisition date and cost of restricted securities shown in the schedule as of October 31, 2016. |
| | | | | | | | |
Security | | Acquisition
Date | | | Cost | |
Angel Oak Mortgage Trust, 11/25/2045 | | | 12/10/2015 | | | | $604,140 | |
Bayview Opportunity Master Fund Trust, 7/28/2034 | | | 11/12/2014 | | | | 267,678 | |
CAM Mortgage, LLC, 7/15/2064 | | | 6/24/2015 | | | | 73,294 | |
Citi Held For Asset Issuance, 8/15/2022 | | | 2/26/2016 | | | | 633,986 | |
COLT Mortgage Loan Trust, 9/25/2046 | | | 9/9/2016 | | | | 955,175 | |
Contura Energy, Inc., 8/1/2021 | | | 11/4/2013 | | | | 744,481 | |
Digicel, Ltd., 4/15/2021 | | | 8/19/2013 | | | | 778,785 | |
Inmet Mining Corporation, 6/1/2020 | | | 8/19/2013 | | | | 82 | |
Marlette Funding Trust, 1/17/2023 | | | 7/20/2016 | | | | 1,074,225 | |
Murray Hill Marketplace Trust, 11/25/2022 | | | 10/6/2016 | | | | 389,990 | |
NCF Dealer Floorplan Master Trust, 3/21/2022 | | | 4/8/2016 | | | | 490,437 | |
NRZ Advance Receivables Trust | | | | | | | | |
Advance Receivables Backed, 6/15/2049 | | | 6/23/2016 | | | | 999,998 | |
Preston Ridge Partners Mortgage Trust, LLC, 9/27/2021 | | | 9/23/2016 | | | | 694,769 | |
Pretium Mortgage Credit Partners I, LLC, 7/27/2031 | | | 6/17/2016 | | | | 778,282 | |
Pretium Mortgage Credit Partners, LLC, 11/27/2030 | | | 11/6/2015 | | | | 717,942 | |
Sunset Mortgage Loan Company, LLC, 7/16/2047 | | | 7/27/2016 | | | | 423,865 | |
The accompanying Notes to Financial Statements are an integral part of this schedule.
102
OPPORTUNITY INCOME PLUS FUND
Schedule of Investments as of October 31, 2016
| | | | | | | | |
Security | | Acquisition
Date | | | Cost | |
Sunset Mortgage Loan Company, LLC, 9/18/2045 | | | 10/2/2015 | | | | $512,130 | |
US Residential Opportunity Fund Trust, 7/27/2036 | | | 7/20/2016 | | | | 878,016 | |
Vericrest Opportunity Loan Transferee, 10/25/2058 | | | 1/13/2016 | | | | 329,631 | |
Wachovia Asset Securitization, Inc., 7/25/2037 | | | 3/16/2007 | | | | 1,220,573 | |
The following table presents the total amount of securities loaned with continuous maturity, by type, offset by the gross payable upon return of collateral for securities loaned by Thrivent Opportunity Income Plus Fund as of October 31, 2016:
| | | | |
Securities Lending Transactions | | | |
Taxable Debt Security | | $ | 9,733,591 | |
Common Stock | | | 2,003,274 | |
| | | | |
Total lending | | $ | 11,736,865 | |
Gross amount payable upon return of collateral for securities loaned | | $ | 12,236,852 | |
| | | | |
Net amounts due to counterparty | | $ | 499,987 | |
| | | | |
Definitions:
| | | | |
ETF | | - | | Exchange Traded Fund. |
REIT | | - | | Real Estate Investment Trust is a company that buys, develops, manages and/or sells real estate assets. |
The accompanying Notes to Financial Statements are an integral part of this schedule.
103
PARTNER WORLDWIDE ALLOCATION FUND
Schedule of Investments as of October 31, 2016
| | | | | | | | |
| Shares | | | Common Stock (87.5%) | | Value | |
| Australia (6.2%) | | | | |
| | 20,864 | | | Altium, Ltd. | | | $124,204 | |
| | 11,137 | | | APN Outdoor Group Pty, Ltd. | | | 40,164 | |
| | 111,755 | | | Aristocrat Leisure, Ltd. | | | 1,301,146 | |
| | 313,700 | | | Australia & New Zealand Banking Group, Ltd. | | | 6,623,900 | |
| | 73,193 | | | Bendigo and Adelaide Bank, Ltd. | | | 618,105 | |
| | 34,600 | | | BHP Billiton, Ltd. | | | 604,490 | |
| | 223,365 | | | BlueScope Steel, Ltd. | | | 1,325,141 | |
| | 77,479 | | | BWP Trust | | | 174,741 | |
| | 197,442 | | | Challenger, Ltd. | | | 1,611,820 | |
| | 252,449 | | | Charter Hall Group | | | 900,754 | |
| | 16,190 | | | Cochlear, Ltd. | | | 1,573,041 | |
| | 35,347 | | | Commonwealth Bank of Australia | | | 1,967,797 | |
| | 6,639 | | | Costa Group Holdings, Ltd. | | | 14,360 | |
| | 642,804 | | | Cromwell Property Group | | | 444,477 | |
| | 452,080 | | | CSR, Ltd. | | | 1,255,294 | |
| | 25,662 | | | Downer EDI, Ltd. | | | 113,423 | |
| | 129,000 | | | FlexiGroup, Ltd. | | | 220,293 | |
| | 379,684 | | | Fortescue Metals Group, Ltd. | | | 1,593,392 | |
| | 133,392 | | | Genworth Mortgage Insurance Australia, Ltd. | | | 310,063 | |
| | 105,748 | | | Incitec Pivot, Ltd. | | | 236,513 | |
| | 330,956 | | | Investa Office Fund | | | 1,065,979 | |
| | 32,900 | | | IOOF Holdings, Ltd.a | | | 204,810 | |
| | 58,379 | | | JB Hi-Fi, Ltd. | | | 1,258,471 | |
| | 28,223 | | | Macquarie Group, Ltd. | | | 1,706,063 | |
| | 743,050 | | | Metcash, Ltd.b | | | 1,121,385 | |
| | 131,250 | | | Mineral Resources, Ltd. | | | 1,154,657 | |
| | 610,639 | | | Mirvac Group | | | 968,677 | |
| | 26,200 | | | Monadelphous Group, Ltd. | | | 185,148 | |
| | 418,543 | | | Myer Holdings, Ltd. | | | 373,052 | |
| | 20,900 | | | National Australia Bank, Ltd. | | | 443,653 | |
| | 487,227 | | | Orora, Ltd. | | | 1,073,642 | |
| | 206,826 | | | OZ Minerals, Ltd. | | | 1,056,745 | |
| | 48,387 | | | Pact Group Holdings, Ltd. | | | 241,206 | |
| | 28,675 | | | Ramsay Health Care, Ltd. | | | 1,596,764 | |
| | 69,598 | | | Regis Resources, Ltd. | | | 175,522 | |
| | 20,510 | | | Rio Tinto, Ltd. | | | 848,590 | |
| | 26,840 | | | Sandfire Resources NL | | | 105,872 | |
| | 19,042 | | | Seven Group Holdings, Ltd. | | | 131,248 | |
| | 83,528 | | | Sigma Pharmaceuticals, Ltd. | | | 84,296 | |
| | 421,902 | | | Southern Cross Media Group, Ltd. | | | 460,574 | |
| | 59,393 | | | St Barbara, Ltd.b | | | 121,222 | |
| | 237,511 | | | Star Entertainment Group, Ltd. | | | 898,727 | |
| | 14,050 | | | Technology One, Ltd. | | | 60,001 | |
| | 238,183 | | | Telstra Corporation, Ltd. | | | 900,794 | |
| | 197,191 | | | Treasury Wine Estates, Ltd. | | | 1,607,573 | |
| | 3,859 | | | Wesfarmers, Ltd. | | | 120,165 | |
| | 308,300 | | | Westpac Banking Corporation | | | 7,129,415 | |
| | 306,593 | | | Whitehaven Coal, Ltd.b | | | 705,081 | |
| | | | | |
| | | | Total | | | 46,852,450 | |
| | | | | |
| |
| Austria (0.6%) | | | | |
| | 45,405 | | | BUWOG AG | | | 1,097,436 | |
| | 1,694 | | | Lenzing AG | | | 220,641 | |
| | 83,820 | | | OMV AG | | | 2,616,003 | |
| | 930 | | | Porr AG | | | 33,426 | |
| | 2,819 | | | S IMMO AG | | | 30,251 | |
| | 9,200 | | | Vienna Insurance Group AG Wiener Versicherung Gruppe | | | 181,312 | |
| | 9,000 | | | Voestalpine AG | | | 318,836 | |
| | | | | |
| | | | Total | | | 4,497,905 | |
| | | | | |
| |
| Belgium (0.9%) | | | | |
| | 47,315 | | | Agfa-Gevaert NVb | | | 196,647 | |
| | 13,399 | | | Anheuser-Busch InBev NV | | | 1,537,807 | |
| | 2,429 | | | Barco NV | | | 190,918 | |
| | 2,453 | | | Befimmo SA | | | 142,967 | |
| | 13,759 | | | bpost SA | | | 366,053 | |
| | 3,117 | | | Galapagos NVb | | | 189,654 | |
| | 465 | | | Gimv NV | | | 25,027 | |
| | 4,700 | | | Groupe Bruxelles Lambert SA | | | 404,046 | |
| | 3,911 | | | Ion Beam Applications SA | | | 185,738 | |
| | 7,601 | | | Melexis NV | | | 497,651 | |
| | 47,706 | | | NV Bekaert SA | | | 2,120,840 | |
| | 4,800 | | | Proximus SA | | | 137,389 | |
| | 9,242 | | | SA D’Ieteren NV | | | 407,431 | |
| | 8,505 | | | Tessenderlo Chemie NVb | | | 283,946 | |
| | 3,534 | | | Warehouses De Pauw CVA | | | 325,603 | |
| | | | | |
| | | | Total | | | 7,011,717 | |
| | | | | |
| |
| Bermuda (0.1%) | | | | |
| | 1,514 | | | Brookfield Business Partners, LP | | | 35,127 | |
| | 1,344,000 | | | G-Resources Group, Ltd. | | | 23,614 | |
| | 2,247 | | | HAL Trust | | | 444,071 | |
| | 3,000 | | | Jardine Matheson Holdings, Ltd. | | | 182,730 | |
| | | | | |
| | | | Total | | | 685,542 | |
| | | | | |
| |
| Brazil (1.7%) | | | | |
| | 194,000 | | | Ambev SA | | | 1,144,430 | |
| | 306,485 | | | Banco Bradesco SA ADR | | | 3,190,509 | |
| | 95,778 | | | BRF SA | | | 1,601,701 | |
| | 226,000 | | | Lojas Renner SA | | | 1,910,946 | |
| | 74,666 | | | Multiplan Empreendimentos Imobiliarios SA | | | 1,501,975 | |
| | 118,412 | | | Ultrapar Participacoes SA | | | 2,692,463 | |
| | 75,532 | | | Vale SA ADRa,b | | | 522,682 | |
| | | | | |
| | | | Total | | | 12,564,706 | |
| | | | | |
| |
| Canada (3.5%) | | | | |
| | 17,265 | | | Bank of Montreala | | | 1,098,740 | |
| | 28,701 | | | Baytex Energy Corporation | | | 110,413 | |
| | 152,922 | | | Birchcliff Energy, Ltd.b | | | 973,648 | |
| | 56,522 | | | Brookfield Asset Management, Inc. | | | 1,979,303 | |
| | 42,748 | | | Canadian National Railway Company | | | 2,687,327 | |
| | 35,446 | | | CGI Group, Inc.b | | | 1,683,639 | |
| | 52,552 | | | CI Financial Corporation | | | 966,960 | |
| | 32,610 | | | Cominar Real Estate Investment Trust | | | 361,280 | |
| | 19,170 | | | Crescent Point Energy Corporation | | | 228,245 | |
| | 32,645 | | | Dollarama, Inc. | | | 2,439,431 | |
| | 1,974 | | | George Weston, Ltd. | | | 160,857 | |
| | 55,398 | | | H&R Real Estate Investment Trust | | | 942,092 | |
| | 13,646 | | | IGM Financial, Inc. | | | 366,254 | |
| | 362,678 | | | Kinross Gold Corporationb | | | 1,408,747 | |
| | 21,566 | | | National Bank of Canada | | | 769,835 | |
| | 21,832 | | | Premium Brands Holdings Corporation | | | 1,056,524 | |
| | 39,868 | | | Restaurant Brands International, Inc. | | | 1,772,406 | |
| | 60,400 | | | Seven Generations Energy, Ltd.b | | | 1,287,885 | |
| | 68,833 | | | Teck Resources, Ltd. | | | 1,486,173 | |
| | 30,009 | | | Toronto-Dominion Bank | | | 1,361,625 | |
| | 65,270 | | | Transcanada Corporation | | | 2,954,741 | |
| | 179,592 | | | Yamana Gold, Inc. | | | 641,352 | |
| | | | | |
| | | | Total | | | 26,737,477 | |
| | | | | |
| |
| Cayman Islands (0.2%) | | | | |
| | 2,612 | | | Phoenix Group Holdingsb | | | 7,098 | |
| | 1,285,830 | | | WH Group, Ltd.c | | | 1,041,389 | |
| | 484,000 | | | Xinyi Glass Holdings Company, Ltd. | | | 416,161 | |
| | | | | |
| | | | Total | | | 1,464,648 | |
| | | | | |
| |
| Chile (0.2%) | | | | |
| | 63,646 | | | Banco Santander Chile SA ADR | | | 1,454,311 | |
| | 14,118 | | | S.A.C.I. Falabella | | | 110,857 | |
| | | | | |
| | | | Total | | | 1,565,168 | |
| | | | | |
The accompanying Notes to Financial Statements are an integral part of this schedule.
104
PARTNER WORLDWIDE ALLOCATION FUND
Schedule of Investments as of October 31, 2016
| | | | | | | | |
| Shares | | | Common Stock (87.5%) | | Value | |
| China (0.1%) | | | | |
| | 1,175,000 | | | PetroChina Company, Ltd. | | | $803,977 | |
| | | | | |
| | | | Total | | | 803,977 | |
| | | | | |
| |
| Denmark (1.5%) | | | | |
| | 3,000 | | | Aktieselskabet Schouw & Company | | | 190,315 | |
| | 14,246 | | | DFDS AS | | | 688,341 | |
| | 9,000 | | | DSV AS | | | 435,779 | |
| | 93,303 | | | Novo Nordisk AS | | | 3,323,967 | |
| | 13,483 | | | Pandora AS | | | 1,753,539 | |
| | 45,032 | | | Royal Unibrew AS | | | 2,106,662 | |
| | 13,173 | | | Sydbank AS | | | 411,344 | |
| | 26,278 | | | Vestas Wind Systems AS | | | 2,105,286 | |
| | | | | |
| | | | Total | | | 11,015,233 | |
| | | | | |
| |
| Faroe Islands (0.1%) | | | | |
| | 18,963 | | | Bakkafrost PF | | | 795,066 | |
| | | | | |
| | | | Total | | | 795,066 | |
| | | | | |
| |
| Finland (1.1%) | | | | |
| | 9,267 | | | Cramo Oyj | | | 242,878 | |
| | 40,500 | | | Elisa Oyj | | | 1,364,500 | |
| | 24,300 | | | Fortum Oyj | | | 405,056 | |
| | 31,846 | | | KONE Oyj | | | 1,465,295 | |
| | 7,900 | | | Orion Oyj | | | 336,256 | |
| | 123,887 | | | Outokumpu Oyjb | | | 863,691 | |
| | 12,281 | | | Ramirent Oyj | | | 90,553 | |
| | 52,021 | | | Sponda Oyj | | | 246,292 | |
| | 8,266 | | | Tieto Oyj | | | 226,758 | |
| | 117,744 | | | UPM-Kymmene Oyj | | | 2,738,917 | |
| | 6,294 | | | Valmet Oyj | | | 93,448 | |
| | | | | |
| | | | Total | | | 8,073,644 | |
| | | | | |
| |
| France (5.0%) | | | | |
| | 2,399 | | | Alten SA | | | 171,407 | |
| | 6,158 | | | Assystem | | | 184,547 | |
| | 153,655 | | | AXA SA | | | 3,466,829 | |
| | 20,328 | | | Cap Gemini SA | | | 1,683,509 | |
| | 4,601 | | | Christian Dior SE | | | 887,381 | |
| | 23,334 | | | Eiffage SA | | | 1,727,531 | |
| | 1,102 | | | Euler Hermes Group | | | 95,595 | |
| | 2,006 | | | Eurofins Scientific SE | | | 911,623 | |
| | 92,640 | | | Eutelsat Communications | | | 1,941,265 | |
| | 11,710 | | | Faurecia | | | 431,649 | |
| | 4,900 | | | Fonciere des Regions SA | | | 428,241 | |
| | 990 | | | Guerbet | | | 58,833 | |
| | 16,546 | | | Havas SA | | | 134,682 | |
| | 11,429 | | | Ipsos SA | | | 373,278 | |
| | 15,600 | | | Legrand SA | | | 881,765 | |
| | 5,053 | | | Neopost SA | | | 153,038 | |
| | 20,259 | | | Nexans SAb | | | 1,151,574 | |
| | 12,555 | | | Nexity SA | | | 630,371 | |
| | 104,690 | | | Orange SA | | | 1,647,165 | |
| | 10,000 | | | Peugeot SAb | | | 149,751 | |
| | 66,300 | | | Sanofi | | | 5,159,412 | |
| | 32,183 | | | SCOR SE | | | 1,042,207 | |
| | 996 | | | SEB SA | | | 146,587 | |
| | 6,603 | | | Teleperformance SA | | | 697,661 | |
| | 19,638 | | | Thales SA | | | 1,847,649 | |
| | 162,156 | | | Total SA | | | 7,768,104 | |
| | 29,541 | | | UbiSoft Entertainment SAb | | | 1,005,155 | |
| | 1,124 | | | Vicat SA | | | 70,668 | |
| | 44,825 | | | Vinci SA | | | 3,246,220 | |
| | | | | |
| | | | Total | | | 38,093,697 | |
| | | | | |
| |
| Germany (6.3%) | | | | |
| | 2,095 | | | Aareal Bank AG | | | 75,777 | |
| | 15,076 | | | Adidas AG | | | 2,476,907 | |
| | 28,800 | | | Allianz SE | | | 4,495,824 | |
| | 10,355 | | | AURELIUS Equity Opportunities SE & Company KGaA | | | 618,272 | |
| | 17,264 | | | Bayer AG | | | 1,714,145 | |
| | 4,400 | | | Bayerische Motoren Werke AG | | | 383,882 | |
| | 2,163 | | | Bechtle AG | | | 227,486 | |
| | 1,279 | | | Carl Zeiss Meditec AG | | | 46,041 | |
| | 3,811 | | | Cewe Stiftung & Company KGaA | | | 365,177 | |
| | 18,822 | | | Covestro AGc | | | 1,114,595 | |
| | 166,542 | | | Deutsche Telekom AG | | | 2,717,183 | |
| | 231,200 | | | E.ON SE | | | 1,694,440 | |
| | 45,647 | | | Evonik Industries AG | | | 1,429,511 | |
| | 92,801 | | | Evotec AGb | | | 508,896 | |
| | 8,500 | | | Fraport AG Frankfurt Airport Services Worldwide | | | 504,566 | |
| | 35,797 | | | Fresenius SE & Company KGaA | | | 2,644,953 | |
| | 14,955 | | | Gerresheimer AG | | | 1,128,061 | |
| | 5,800 | | | Grammer AG | | | 332,033 | |
| | 11,397 | | | Hannover Rueckversicherung SE | | | 1,271,470 | |
| | 3,587 | | | Homag Group AG | | | 162,782 | |
| | 4,062 | | | Indus Holding AG | | | 239,758 | |
| | 14,479 | | | Jenoptik AG | | | 248,836 | |
| | 7,473 | | | Jungheinrich AG | | | 235,939 | |
| | 85,046 | | | Kloeckner & Company SEb | | | 1,062,048 | |
| | 4,802 | | | Koenig & Bauer AGb | | | 226,005 | |
| | 9,500 | | | Merck KGaA | | | 977,840 | |
| | 6,100 | | | Metro AG | | | 182,721 | |
| | 6,888 | | | Nemetschek SE | | | 429,619 | |
| | 25,443 | | | Osram Licht AG | | | 1,445,088 | |
| | 6,823 | | | Pfeiffer Vacuum Technology AG | | | 619,114 | |
| | 1,267 | | | Rheinmetall AG | | | 87,953 | |
| | 49,452 | | | SAP SE | | | 4,356,713 | |
| | 74,829 | | | Siemens AG | | | 8,501,917 | |
| | 30,201 | | | Software AG | | | 1,097,636 | |
| | 9,258 | | | Stada Arzneimittel AG | | | 464,277 | |
| | 604 | | | STRATEC Biomedical AG | | | 34,531 | |
| | 43,573 | | | Suedzucker AG | | | 1,117,764 | |
| | 33,825 | | | TAG Immobilien AG | | | 451,047 | |
| | 7,902 | | | Takkt AG | | | 187,414 | |
| | 16,945 | | | Talanx AG | | | 525,951 | |
| | 383 | | | Tipp24 SE | | | 13,016 | |
| | 32,061 | | | Zalando SEb,c | | | 1,409,879 | |
| | | | | |
| | | | Total | | | 47,827,067 | |
| | | | | |
| |
| Hong Kong (3.2%) | | | | |
| | 880,400 | | | AIA Group, Ltd. | | | 5,538,603 | |
| | 63,000 | | | Champion REIT | | | 35,787 | |
| | 260,500 | | | Cheung Kong Property Holdings, Ltd. | | | 1,925,789 | |
| | 291,500 | | | China Mobile, Ltd. | | | 3,339,539 | |
| | 85,000 | | | Emperor Entertainment Hotel, Ltd. | | | 20,576 | |
| | 220,000 | | | Emperor International Holdings, Ltd. | | | 51,513 | |
| | 130,000 | | | Giordano International, Ltd. | | | 68,537 | |
| | 11,000 | | | Great Eagle Holdings, Ltd. | | | 48,795 | |
| | 148,000 | | | Haitong International Securities Group, Ltd. | | | 94,689 | |
| | 629,000 | | | Hang Lung Group, Ltd. | | | 2,406,077 | |
| | 47,739 | | | Hong Kong Exchanges and Clearing, Ltd. | | | 1,262,052 | |
| | 15,000 | | | Hopewell Holdings, Ltd. | | | 52,521 | |
| | 86,000 | | | Hutchison Telecommunications Hong Kong Holdings, Ltd. | | | 27,697 | |
| | 39,000 | | | Hysan Development Company, Ltd. | | | 180,000 | |
| | 83,000 | | | Melco International Development, Ltd. | | | 108,235 | |
| | 961,000 | | | New World Development Company, Ltd. | | | 1,194,763 | |
| | 2,066,938 | | | PCCW, Ltd. | | | 1,230,339 | |
| | 960,000 | | | Shun Tak Holdings, Ltd. | | | 323,631 | |
The accompanying Notes to Financial Statements are an integral part of this schedule.
105
PARTNER WORLDWIDE ALLOCATION FUND
Schedule of Investments as of October 31, 2016
| | | | | | | | |
| Shares | | | Common Stock (87.5%) | | Value | |
| Hong Kong (3.2%) - continued | | | | |
| | 440,000 | | | Sino Land Company, Ltd. | | | $747,094 | |
| | 663,500 | | | SmarTone Telecommunications Holdings, Ltd. | | | 1,001,571 | |
| | 35,000 | | | Sunlight Real Estate Investment Trust | | | 21,649 | |
| | 99,500 | | | Swire Pacific, Ltd., Class A | | | 1,034,189 | |
| | 270,000 | | | Swire Pacific, Ltd., Class B | | | 504,910 | |
| | 166,950 | | | Swire Properties, Ltd. | | | 479,427 | |
| | 240,000 | | | Texwinca Holdings, Ltd. | | | 168,211 | |
| | 1,298,000 | | | Truly International Holdings, Ltd. | | | 507,626 | |
| | 200,000 | | | Wharf Holdings, Ltd. | | | 1,499,542 | |
| | | | | |
| | | | Total | | | 23,873,362 | |
| | | | | |
| |
| Hungary (0.2%) | | | | |
| | 66,010 | | | Richter Gedeon Nyrt | | | 1,417,046 | |
| | | | | |
| | | | Total | | | 1,417,046 | |
| | | | | |
| |
| India (2.5%) | | | | |
| | 47,500 | | | Grasim Industries, Ltd. | | | 690,436 | |
| | 35,179 | | | Hero Motocorp, Ltd. | | | 1,765,753 | |
| | 129,000 | | | Hindustan Unilever, Ltd. | | | 1,621,377 | |
| | 194,191 | | | Housing Development Finance Corporation | | | 4,010,421 | |
| | 522,000 | | | ICICI Bank, Ltd. | | | 2,171,226 | |
| | 108,797 | | | Infosys, Ltd. | | | 1,631,139 | |
| | 796,296 | | | ITC, Ltd. | | | 2,883,279 | |
| | 30,447 | | | Tata Consultancy Services, Ltd. | | | 1,090,313 | |
| | 48,428 | | | Ultra Tech Cement, Ltd. | | | 2,876,935 | |
| | | | | |
| | | | Total | | | 18,740,879 | |
| | | | | |
| |
| Indonesia (0.8%) | | | | |
| | 6,836,300 | | | Astra International Tbk PT | | | 4,313,076 | |
| | 1,071,600 | | | Indocement Tunggal Prakarsa Tbk PT | | | 1,349,263 | |
| | | | | |
| | | | Total | | | 5,662,339 | |
| | | | | |
| |
| Ireland (0.4%) | | | | |
| | 37,456 | | | CRH plc | | | 1,215,979 | |
| | 19,650 | | | DCC plc | | | 1,598,720 | |
| | 178,400 | | | Henderson Group plc | | | 504,759 | |
| | 26,886 | | | Hibernia REIT plc | | | 37,867 | |
| | | | | |
| | | | Total | | | 3,357,325 | |
| | | | | |
| |
| Israel (0.3%) | | | | |
| | 17,437 | | | Amot Investments, Ltd. | | | 72,765 | |
| | 155,875 | | | El Al Israel Airlines, Ltd. | | | 151,953 | |
| | 57,039 | | | Plus500, Ltd. | | | 431,812 | |
| | 31,023 | | | Shufersal, Ltd. | | | 117,176 | |
| | 34,570 | | | Teva Pharmaceutical Industries, Ltd. ADR | | | 1,477,522 | |
| | | | | |
| | | | Total | | | 2,251,228 | |
| | | | | |
| |
| Italy (2.0%) | | | | |
| | 14,209 | | | Ascopiave SPA | | | 41,553 | |
| | 226,298 | | | Assicurazioni Generali SPA | | | 2,923,182 | |
| | 2,262 | | | ASTM SPA | | | 24,419 | |
| | 5,745 | | | Banca IFIS SPA | | | 166,383 | |
| | 15,905 | | | Banca Mediolanum SPA | | | 109,969 | |
| | 88,377 | | | Banca popolare dell’Emilia Romagna Societa | | | 415,292 | |
| | 148,583 | | | Beni Stabili SPA | | | 86,634 | |
| | 12,705 | | | Biesse SPA | | | 219,192 | |
| | 5,831 | | | Brembo SPA | | | 361,019 | |
| | 7,966 | | | Buzzi Unicem SPA | | | 154,921 | |
| | 76,753 | | | Credito Valtellinese Societa Cooperativa | | | 33,780 | |
| | 17,620 | | | De’Longhi | | | 412,270 | |
| | 29,014 | | | DiaSorin SPA | | | 1,783,141 | |
| | 249,400 | | | Enel SPA | | | 1,072,260 | |
| | 18,000 | | | EXOR SPA | | | 765,269 | |
| | 18,000 | | | EXOR SPA Rightsb,d | | | 2 | |
| | 20,417 | | | Finecobank Banca Fineco SPA | | | 119,317 | |
| | 44,103 | | | Hera SPA | | | 112,730 | |
| | 388 | | | Industria Macchine Automatiche SPA | | | 23,997 | |
| | 22,502 | | | Interpump Group SPA | | | 360,894 | |
| | 380,678 | | | Intesa Sanpaolo SPA | | | 882,671 | |
| | 66,700 | | | Intesa Sanpaolo SPA-RSP | | | 144,410 | |
| | 333 | | | Italmobiliare SPA | | | 15,796 | |
| | 11,882 | | | La Doria SPA | | | 100,014 | |
| | 3,320 | | | Moncler SPA | | | 55,271 | |
| | 56,760 | | | Prysmian SPA | | | 1,411,492 | |
| | 93,731 | | | Recordati SPA | | | 2,650,618 | |
| | 760 | | | Reply SPA | | | 95,527 | |
| | 76,308 | | | Societa Cattolica di Assicurazioni SCRL | | | 461,386 | |
| | | | | |
| | | | Total | | | 15,003,409 | |
| | | | | |
| |
| Japan (18.6%) | | | | |
| | 3,200 | | | Adastria Holdings Company, Ltd. | | | 83,770 | |
| | 21,700 | | | AEON Financial Service Company, Ltd. | | | 382,013 | |
| | 4,800 | | | Aichi Steel Corporation | | | 231,120 | |
| | 3,600 | | | Aoyama Trading Company, Ltd. | | | 126,824 | |
| | 156,000 | | | Asahi Glass Company, Ltd. | | | 1,091,034 | |
| | 28,200 | | | Asatsu-DK, Inc. | | | 782,585 | |
| | 9,700 | | | Avex Group Holdings, Inc. | | | 128,305 | |
| | 4,000 | | | BML, Inc. | | | 106,090 | |
| | 110,600 | | | Bridgestone Corporation | | | 4,127,998 | |
| | 1,500 | | | C. Uyemura & Company, Ltd. | | | 69,821 | |
| | 7,200 | | | Canon Electronics, Inc. | | | 111,992 | |
| | 34,400 | | | Canon Marketing Japan, Inc. | | | 594,115 | |
| | 10,600 | | | Canon, Inc. | | | 304,517 | |
| | 6,700 | | | Capcom Company, Ltd. | | | 173,082 | |
| | 6,600 | | | Cawachi, Ltd. | | | 169,856 | |
| | 29,000 | | | Central Glass Company, Ltd. | | | 118,623 | |
| | 3,500 | | | Chiyoda Integre Company, Ltd.b | | | 72,440 | |
| | 13,000 | | | Chugoku Marine Paints, Ltd. | | | 94,606 | |
| | 3,300 | | | Cocokara Fine, Inc. | | | 127,647 | |
| | 27,200 | | | Daicel Corporation | | | 357,658 | |
| | 79,500 | | | Daiichi Sankyo Company, Ltd. | | | 1,910,325 | |
| | 52,400 | | | Daiwa House Industry Company, Ltd. | | | 1,438,201 | |
| | 8,700 | | | Dena Company, Ltd. | | | 279,896 | |
| | 45,000 | | | Denki Kagaku Kogyo KK | | | 204,146 | |
| | 23,000 | | | Denso Corporation | | | 1,000,845 | |
| | 25,200 | | | DIC Corporation | | | 763,354 | |
| | 1,800 | | | DISCO Corporation | | | 217,553 | |
| | 5,300 | | | Doshisha Company, Ltd. | | | 109,676 | |
| | 18,100 | | | Doutor Nichires Holdings Company, Ltd. | | | 362,284 | |
| | 42,392 | | | DOWA Holdings Company, Ltd. | | | 314,837 | |
| | 50,000 | | | DTS Corporation | | | 1,107,701 | |
| | 18,000 | | | DUSKIN Company, Ltd. | | | 345,750 | |
| | 35,100 | | | EDION Corporation | | | 310,965 | |
| | 29,400 | | | Electric Power Development Company, Ltd. | | | 684,636 | |
| | 6,600 | | | EPS Holdings, Inc. | | | 86,613 | |
| | 20,300 | | | Fancl Corporation | | | 306,815 | |
| | 14,990 | | | Fields Corporation | | | 181,736 | |
| | 13,300 | | | Foster Electric Company, Ltd. | | | 244,056 | |
| | 4 | | | Frontier Real Estate Investment Corporation | | | 18,815 | |
| | 84,600 | | | Fuji Heavy Industries, Ltd. | | | 3,305,873 | |
| | 5,700 | | | Fuji Machine Manufacturing Company, Ltd. | | | 72,544 | |
| | 7,700 | | | Fuji Soft, Inc. | | | 204,533 | |
| | 5,000 | | | Fujibo Holdings, Inc. | | | 158,122 | |
| | 4,000 | | | Fujicco Company, Ltd. | | | 91,517 | |
| | 42,900 | | | FUJIFILM Holdings NPV | | | 1,622,088 | |
| | 83,700 | | | Fujikura, Ltd. | | | 491,780 | |
The accompanying Notes to Financial Statements are an integral part of this schedule.
106
PARTNER WORLDWIDE ALLOCATION FUND
Schedule of Investments as of October 31, 2016
| | | | | | | | |
| Shares | | | Common Stock (87.5%) | | Value | |
| Japan (18.6%) - continued | | | | |
| | 179,000 | | | Fukuoka Financial Group, Inc. | | | $774,618 | |
| | 3,300 | | | Futaba Corporation | | | 53,877 | |
| | 3,800 | | | Fuyo General Lease Company, Ltd. | | | 192,711 | |
| | 8,700 | | | Geo Holdings Corporation | | | 110,368 | |
| | 53,800 | | | Gree, Inc. | | | 298,327 | |
| | 17,300 | | | Gunma Bank, Ltd. | | | 82,605 | |
| | 136 | | | Hankyu REIT, Inc. | | | 193,663 | |
| | 115,800 | | | Haseko Corporation | | | 1,126,943 | |
| | 19,400 | | | Heiwa Corporation | | | 455,731 | |
| | 4,300 | | | Heiwa Real Estate Company, Ltd. | | | 61,189 | |
| | 310 | | | Heiwa Real Estate REIT, Inc. | | | 234,614 | |
| | 366,981 | | | Hiroshima Bank, Ltd. | | | 1,570,553 | |
| | 4,700 | | | Hitachi Capital Corporation | | | 104,845 | |
| | 25,300 | | | Hitachi High-Technologies Corporation | | | 1,055,162 | |
| | 9,900 | | | Hitachi Transport System, Ltd. | | | 204,083 | |
| | 244,000 | | | Hitachi, Ltd. | | | 1,300,738 | |
| | 34,700 | | | Hokuhoku Financial Group, Inc. | | | 500,193 | |
| | 240,800 | | | Honda Motor Company, Ltd. | | | 7,205,127 | |
| | 46,000 | | | Hosiden Corporation | | | 341,148 | |
| | 8,300 | | | IBJ Leasing Company, Ltd. | | | 173,592 | |
| | 421 | | | Ichigo Real Estate Investment Corporation | | | 283,721 | |
| | 69,900 | | | Iida Group Holdings Company, Ltd. | | | 1,351,133 | |
| | 11,100 | | | INES Corporation | | | 123,452 | |
| | 90,300 | | | ITOCHU Corporation | | | 1,140,372 | |
| | 23,200 | | | Iyo Bank, Ltd. | | | 142,583 | |
| | 44,900 | | | Japan Airlines Company, Ltd. | | | 1,325,080 | |
| | 5,000 | | | Japan Digital Laboratory Company, Ltd. | | | 77,706 | |
| | 19,800 | | | Japan Post Bank Company, Ltd. | | | 233,342 | |
| | 17,300 | | | Japan Securities Finance Company, Ltd. | | | 76,888 | |
| | 2,600 | | | J-Oil Mills, Inc. | | | 92,449 | |
| | 74,200 | | | JTEKT Corporation | | | 1,098,051 | |
| | 4,200 | | | Kadokawa Dwango Corporation | | | 62,023 | |
| | 14,000 | | | Kamigumi Company, Ltd. | | | 119,539 | |
| | 19,000 | | | Kandenko Company, Ltd. | | | 187,305 | |
| | 12,000 | | | Kanematsu Corporation | | | 19,746 | |
| | 32,900 | | | Kao Corporation | | | 1,692,920 | |
| | 137,600 | | | KDDI Corporation | | | 4,182,101 | |
| | 40,400 | | | Keihin Corporation | | | 660,418 | |
| | 198 | | | Kenedix Office Investment Corporation | | | 1,116,436 | |
| | 22 | | | Kenedix Residential Investment Corporation | | | 62,494 | |
| | 4,000 | | | Kewpie Corporation | | | 113,603 | |
| | 65,600 | | | Kinden Corporation | | | 790,028 | |
| | 16,000 | | | Kissei Pharmaceutical Company, Ltd. | | | 418,162 | |
| | 47,400 | | | KITZ Corporation | | | 272,559 | |
| | 11,674 | | | Koei Tecmo Holdings Company, Ltd. | | | 223,337 | |
| | 17,800 | | | Kohnan Shoji Company, Ltd. | | | 352,089 | |
| | 46,100 | | | Kokuyo Company, Ltd. | | | 610,727 | |
| | 8,600 | | | KOMERI Company, Ltd. | | | 209,990 | |
| | 56,400 | | | K’s Holdings Corporation | | | 976,056 | |
| | 82,900 | | | Kuraray Company, Ltd. | | | 1,256,807 | |
| | 1,400 | | | Kuroda Electric Company, Ltd. | | | 27,240 | |
| | 17,500 | | | Kyocera Corporation | | | 850,307 | |
| | 30,000 | | | Maeda Road Construction Company, Ltd. | | | 555,003 | |
| | 158,000 | | | Makino Milling Machine Company, Ltd. | | | 1,003,975 | |
| | 3,200 | | | Mandom Corporation | | | 149,250 | |
| | 6,400 | | | Maruwa Company, Ltd. | | | 241,516 | |
| | 90,500 | | | Marvelous, Inc. | | | 643,175 | |
| | 7,300 | | | Matsui Securities Company, Ltd. | | | 58,406 | |
| | 37,700 | | | Matsumotokiyoshi Holdings Company, Ltd. | | | 1,942,241 | |
| | 1,500 | | | Mimasu Semiconductor Industry Company, Ltd. | | | 19,089 | |
| | 26,700 | | | MIRAIT Holdings Corporation | | | 236,753 | |
| | 66,000 | | | Mitsubishi Chemical Holdings Corporation | | | 433,351 | |
| | 81,300 | | | Mitsubishi Electric Corporation | | | 1,099,923 | |
| | 115,000 | | | Mitsubishi Heavy Industries, Ltd. | | | 491,955 | |
| | 16,800 | | | Mitsubishi Materials Corporation | | | 481,336 | |
| | 428,400 | | | Mitsubishi UFJ Financial Group, Inc. | | | 2,210,463 | |
| | 68,400 | | | Mitsui & Company, Ltd. | | | 947,683 | |
| | 453,000 | | | Mitsui Engineering & Shipbuilding Company, Ltd. | | | 629,436 | |
| | 2,011,200 | | | Mizuho Financial Group, Inc. | | | 3,386,363 | |
| | 2,700 | | | Mochida Pharmaceutical Company, Ltd. | | | 211,551 | |
| | 613 | | | Mori Trust Sogo REIT, Inc. | | | 986,307 | |
| | 32,000 | | | Morinaga and Company, Ltd. | | | 1,488,489 | |
| | 61,412 | | | MS and AD Insurance Group Holdings, Inc. | | | 1,823,127 | |
| | 21,400 | | | Namura Shipbuilding Company, Ltd. | | | 130,494 | |
| | 9,400 | | | NEC Networks & System Integration Corporation | | | 167,054 | |
| | 63,600 | | | Net One Systems Company, Ltd. | | | 461,949 | |
| | 4,700 | | | Nifco, Inc. | | | 270,681 | |
| | 10,000 | | | Nikkon Holdings Company, Ltd. | | | 214,771 | |
| | 205,000 | | | Nippon Electric Glass Company, Ltd. | | | 1,115,196 | |
| | 17,500 | | | Nippon Flour Mills Company, Ltd. | | | 258,811 | |
| | 10,000 | | | Nippon Shokubai Company, Ltd. | | | 690,100 | |
| | 219,600 | | | Nippon Suisan Kaisha, Ltd. | | | 1,055,476 | |
| | 87,600 | | | Nippon Telegraph & Telephone Corporation | | | 3,883,907 | |
| | 20,000 | | | Nippon Thompson Company, Ltd. | | | 79,125 | |
| | 79,000 | | | Nipro Corporation | | | 975,566 | |
| | 46,700 | | | Nishi-Nippon City Bank, Ltd. | | | 464,907 | |
| | 139,378 | | | Nissan Motor Company, Ltd. | | | 1,417,821 | |
| | 54,000 | | | Nisshin OilliO Group, Ltd. | | | 245,503 | |
| | 45,100 | | | Nisshinbo Holdings, Inc. | | | 449,028 | |
| | 1,300 | | | Nissin Electric Company, Ltd. | | | 17,335 | |
| | 800 | | | Nittetsu Mining Company, Ltd. | | | 33,380 | |
| | 12,400 | | | Nitto Denko Corporation | | | 863,888 | |
| | 13,683 | | | Nitto Kogyo Corporation | | | 200,722 | |
| | 14,600 | | | Nomura Real Estate Holdings, Inc. | | | 246,545 | |
| | 15,400 | | | Noritz Corporation | | | 319,174 | |
| | 40,700 | | | North Pacific Bank, Ltd. | | | 151,786 | |
| | 15,700 | | | NSD Company, Ltd. | | | 252,679 | |
| | 3,400 | | | NTT Data Corporation | | | 175,458 | |
| | 119,500 | | | NTT DOCOMO, Inc. | | | 3,001,124 | |
| | 114,800 | | | Obayashi Corporation | | | 1,105,893 | |
| | 29,500 | | | Okamura Corporation | | | 289,421 | |
| | 5,700 | | | Okinawa Electric Power Company, Inc. | | | 132,043 | |
| | 127,000 | | | Okuma Corporation | | | 1,062,794 | |
| | 19,300 | | | Oracle Corporation Japan | | | 1,050,361 | |
| | 792,000 | | | Osaka Gas Company, Ltd. | | | 3,294,089 | |
| | 80,200 | | | Otsuka Holdings Company, Ltd. | | | 3,510,023 | |
| | 18,500 | | | Paltac Corporation | | | 453,992 | |
| | 15,400 | | | Paramount Bed Holdings Company, Ltd. | | | 586,515 | |
| | 10,300 | | | Plenus Company, Ltd. | | | 211,995 | |
| | 76,900 | | | Rengo Company, Ltd. | | | 482,264 | |
| | 9,500 | | | Round One Corporation | | | 67,112 | |
| | 8,000 | | | Ryobi, Ltd. | | | 32,249 | |
| | 8,500 | | | San-in Godo Bank, Ltd. | | | 61,157 | |
| | 45,000 | | | Sanyo Shokai, Ltd. | | | 72,463 | |
| | 6,900 | | | Secom Company, Ltd. | | | 497,760 | |
The accompanying Notes to Financial Statements are an integral part of this schedule.
107
PARTNER WORLDWIDE ALLOCATION FUND
Schedule of Investments as of October 31, 2016
| | | | | | | | |
| Shares | | | Common Stock (87.5%) | | Value | |
| Japan (18.6%) - continued | | | | |
| | 74,300 | | | Seino Holdings Company, Ltd. | | | $823,295 | |
| | 471 | | | Sekisui House SI Investment Corporation | | | 546,009 | |
| | 84,800 | | | Sekisui House, Ltd. | | | 1,401,212 | |
| | 8,700 | | | SENKO Company, Ltd. | | | 60,147 | |
| | 25,000 | | | Shimachu Company, Ltd. | | | 670,822 | |
| | 29,000 | | | Shindengen Electric Manufacturing Company, Ltd. | | | 125,411 | |
| | 19,400 | | | Shinko Electric Industries Company, Ltd. | | | 125,025 | |
| | 39,000 | | | ShinMaywa Industries, Ltd. | | | 301,880 | |
| | 16,100 | | | Showa Denko KK | | | 212,734 | |
| | 74,600 | | | SKY Perfect JSAT Holdings, Inc. | | | 369,684 | |
| | 12,700 | | | SoftBank Group Corporation | | | 799,860 | |
| | 34,100 | | | Sumco Corporation | | | 356,773 | |
| | 5,000 | | | Sumitomo Bakelite Company, Ltd | | | 27,154 | |
| | 130,591 | | | Sumitomo Corporation | | | 1,501,354 | |
| | 13,800 | | | Sumitomo Electric Industries, Ltd. | | | 203,874 | |
| | 275,000 | | | Sumitomo Heavy Industries, Ltd. | | | 1,447,741 | |
| | 14,000 | | | Sumitomo Metal Mining Company, Ltd. | | | 181,928 | |
| | 36,700 | | | Sumitomo Mitsui Financial Group, Inc. | | | 1,272,451 | |
| | 23,200 | | | Tadano, Ltd. | | | 260,531 | |
| | 9,700 | | | Tamron Company, Ltd. | | | 169,832 | |
| | 64,000 | | | TIS, Inc. | | | 1,448,222 | |
| | 39,000 | | | Toagosei Company, Ltd. | | | 434,089 | |
| | 34,200 | | | Toho Holdings Company, Ltd. | | | 717,567 | |
| | 80,900 | | | Tohoku Electric Power Company, Inc. | | | 991,175 | |
| | 6,800 | | | Tokai Rika Company, Ltd. | | | 127,518 | |
| | 25,300 | | | Tokyo Electron, Ltd. | | | 2,282,187 | |
| | 56,000 | | | Tokyo Gas Company, Ltd. | | | 254,098 | |
| | 418 | | | Tokyu REIT, Inc. | | | 551,213 | |
| | 27,000 | | | Toppan Forms Company, Ltd. | | | 268,379 | |
| | 13,000 | | | Toray Industries, Inc. | | | 120,990 | |
| | 20,300 | | | Tosei Corporation | | | 151,950 | |
| | 94,000 | | | Toshiba Machine Company, Ltd. | | | 339,492 | |
| | 67,000 | | | Tosoh Corporation | | | 437,544 | |
| | 4,000 | | | TOTO, Ltd. | | | 159,803 | |
| | 12,700 | | | Toyota Industries Corporation | | | 582,719 | |
| | 66,600 | | | Toyota Motor Corporation | | | 3,863,250 | |
| | 44,000 | | | Tsubakimoto Chain Company | | | 348,545 | |
| | 119,000 | | | Ube Industries, Ltd. | | | 245,567 | |
| | 2,400 | | | ULVAC, Inc. | | | 75,778 | |
| | 47,000 | | | Valor Company, Ltd. | | | 1,333,128 | |
| | 4,300 | | | Warabeya Nichiyo Holdings Company, Ltd. | | | 103,713 | |
| | 26,700 | | | West Japan Railway Company | | | 1,644,101 | |
| | 5,700 | | | Xebio Holdings Company, Ltd. | | | 88,482 | |
| | 47,600 | | | Yahoo Japan Corporation | | | 182,593 | |
| | 205,900 | | | Yamada Denki Company, Ltd. | | | 1,064,294 | |
| | 32,200 | | | Yamato Kogyo Company, Ltd. | | | 906,582 | |
| | 14,700 | | | Yodogawa Steel Works, Ltd. | | | 401,350 | |
| | 6,700 | | | Yorozu Corporation | | | 105,508 | |
| | 4,900 | | | Zenkoku Hosho Company, Ltd. | | | 210,675 | |
| | | | | |
| | | | Total | | | 140,667,740 | |
| | | | | |
| |
| Jersey (0.3%) | | | | |
| | 4,479 | | | Phoenix Group Holdings | | | 40,013 | |
| | 109,228 | | | WPP plc | | | 2,371,683 | |
| | | | | |
| | | | Total | | | 2,411,696 | |
| | | | | |
| |
| Luxembourg (0.8%) | | | | |
| | 17,919 | | | APERAM | | | 814,939 | |
| | 5,100 | | | Millicom International Cellular SA | | | 224,077 | |
| | 46,526 | | | Oriflame Holdings AGb | | | 1,709,338 | |
| | 116,583 | | | Subsea 7 SAb | | | 1,305,074 | |
| | 56,000 | | | Tenaris SA ADRa | | | 1,579,200 | |
| | 20,560 | | | Ternium SA ADR | | | 491,590 | |
| | | | | |
| | | | Total | | | 6,124,218 | |
| | | | | |
| |
| Malaysia (0.2%) | | | | |
| | 293,534 | | | CIMB Group Holdings Berhad | | | 351,645 | |
| | 306,500 | | | Public Bank Berhad | | | 1,451,034 | |
| | | | | |
| | | | Total | | | 1,802,679 | |
| | | | | |
| |
| Mexico (1.2%) | | | | |
| | 38,000 | | | Fomento Economico Mexicano SAB de CV ADR | | | 3,635,460 | |
| | 10,600 | | | Grupo Aeroportuario del Sureste SAB de CV ADR | | | 1,685,400 | |
| | 558,813 | | | Grupo Financiero Banorte SAB de CV ADR | | | 3,296,527 | |
| | 207,000 | | | Organizacion Soriana SAB de CVb | | | 562,594 | |
| | | | | |
| | | | Total | | | 9,179,981 | |
| | | | | |
| |
| Netherlands (2.3%) | | | | |
| | 334,786 | | | Aegon NV | | | 1,448,272 | |
| | 8,200 | | | Akzo Nobel NV | | | 529,813 | |
| | 8,200 | | | Akzo Nobel NV Rightsd | | | 1 | |
| | 224,800 | | | Arcelor Mittalb | | | 1,518,972 | |
| | 19,124 | | | ASM International NV | | | 815,747 | |
| | 36,223 | | | BE Semiconductor Industries NV | | | 1,180,037 | |
| | 17,465 | | | Corbion NV | | | 402,895 | |
| | 2,988 | | | Euronext NVc | | | 119,657 | |
| | 18,280 | | | Ferrari NV | | | 964,636 | |
| | 134,790 | | | Koninklijke Ahold Delhaize NV | | | 3,074,899 | |
| | 41,946 | | | Koninklijke Boskalis Westminster NV | | | 1,352,831 | |
| | 3,300 | | | Koninklijke Vopak NV | | | 166,560 | |
| | 34,943 | | | NN Group NV | | | 1,052,581 | |
| | 17,300 | | | Randstad Holding NV | | | 889,792 | |
| | 3,002 | | | TKH Group NV | | | 115,534 | |
| | 78,027 | | | Unilever NV | | | 3,263,570 | |
| | 78,027 | | | Unilever NV Rightsd | | | 9 | |
| | 16,972 | | | Wolters Kluwer NV | | | 656,315 | |
| | | | | |
| | | | Total | | | 17,552,121 | |
| | | | | |
| |
| New Zealand (<0.1%) | | | | |
| | 76,720 | | | Trade Me Group, Ltd. | | | 266,510 | |
| | | | | |
| | | | Total | | | 266,510 | |
| | | | | |
| |
| Norway (1.3%) | | | | |
| | 10,791 | | | Aker BP ASAb | | | 172,674 | |
| | 54,632 | | | Aker Solutions ASAb | | | 250,584 | |
| | 24,365 | | | Austevoll Seafood ASA | | | 219,675 | |
| | 16,805 | | | Borregaard ASA | | | 164,719 | |
| | 51,476 | | | BW LPG, Ltd.c | | | 166,060 | |
| | 75,526 | | | Marine Harvest ASA | | | 1,370,516 | |
| | 632,299 | | | Norsk Hydro ASA | | | 2,826,845 | |
| | 14,702 | | | Ocean Yield ASA | | | 122,759 | |
| | 81,993 | | | Orkla ASA | | | 774,213 | |
| | 11,879 | | | Petroleum Geo-Services ASAb | | | 31,888 | |
| | 34,375 | | | SalMar ASA | | | 1,115,527 | |
| | 14,012 | | | SpareBank 1 SMN | | | 103,025 | |
| | 14,379 | | | Statoil ASA | | | 234,752 | |
| | 16,588 | | | Storebrand ASAb | | | 85,314 | |
| | 97,746 | | | Telenor ASA | | | 1,554,636 | |
| | 12,000 | | | TGS Nopec Geophysical Company ASA | | | 242,728 | |
| | 16,465 | | | Yara International ASA | | | 581,614 | |
| | | | | |
| | | | Total | | | 10,017,529 | |
| | | | | |
| |
| Philippines (0.6%) | | | | |
| | 3,500,800 | | | Ayala Land, Inc. | | | 2,618,573 | |
| | 911,364 | | | Bank of the Philippine Islands | | | 1,902,812 | |
| | | | | |
| | | | Total | | | 4,521,385 | |
| | | | | |
The accompanying Notes to Financial Statements are an integral part of this schedule.
108
PARTNER WORLDWIDE ALLOCATION FUND
Schedule of Investments as of October 31, 2016
| | | | | | | | |
| Shares | | | Common Stock (87.5%) | | Value | |
| Poland (0.2%) | | | | |
| | 47,898 | | | Bank Pekao SA | | | $1,478,329 | |
| | | | | |
| | | | Total | | | 1,478,329 | |
| | | | | |
| |
| Portugal (0.9%) | | | | |
| | 66,048 | | | Altri SGPS SA | | | 230,143 | |
| | 2,978,379 | | | Banco Espirito Santo SAb,d | | | 327 | |
| | 386,200 | | | Electricidade de Portugal SA | | | 1,276,498 | |
| | 191,248 | | | Galp Energia SGPS SA | | | 2,593,006 | |
| | 160,433 | | | Jeronimo Martins SGPS SA | | | 2,756,752 | |
| | | | | |
| | | | Total | | | 6,856,726 | |
| | | | | |
| |
| Russia (0.7%) | | | | |
| | 51,500 | | | Lukoil ADR | | | 2,505,080 | |
| | 15,197 | | | Magnit PJSC | | | 2,548,230 | |
| | | | | |
| | | | Total | | | 5,053,310 | |
| | | | | |
| |
| Singapore (0.7%) | | | | |
| | 58,700 | | | Indofood Agri Resources, Ltd. | | | 20,227 | |
| | 63,900 | | | Mapletree Greater China Commercial Trustb | | | 47,797 | |
| | 33,400 | | | Oversea-Chinese Banking Corporation, Ltd. | | | 203,477 | |
| | 879,600 | | | Sheng Siong Group, Ltd. | | | 660,748 | |
| | 209,100 | | | StarHub, Ltd. | | | 507,574 | |
| | 86,900 | | | United Engineers, Ltd. | | | 161,708 | |
| | 184,293 | | | United Overseas Bank, Ltd. | | | 2,486,228 | |
| | 150,700 | | | Venture Corporation, Ltd. | | | 1,029,462 | |
| | 52,300 | | | Wing Tai Holdings, Ltd. | | | 63,719 | |
| | 335,200 | | | Yanlord Land Group, Ltd. | | | 333,566 | |
| | | | | |
| | | | Total | | | 5,514,506 | |
| | | | | |
| |
| South Africa (0.6%) | | | | |
| | 141,890 | | | Massmart Holdings, Ltd. | | | 1,229,722 | |
| | 138,659 | | | MTN Group, Ltd. | | | 1,197,645 | |
| | 327,111 | | | Truworths International, Ltd. | | | 1,735,524 | |
| | | | | |
| | | | Total | | | 4,162,891 | |
| | | | | |
| |
| South Korea (0.3%) | | | | |
| | 569 | | | Amorepacific Corporation | | | 99,320 | |
| | 2,918 | | | Amorepacific Group | | | 376,682 | |
| | 2,013 | | | E-Mart Company, Ltd. | | | 285,444 | |
| | 1,951 | | | NAVER Corporation | | | 1,459,671 | |
| | | | | |
| | | | Total | | | 2,221,117 | |
| | | | | |
| |
| Spain (1.2%) | | | | |
| | 10,900 | | | Abertis Infraestructuras SA | | | 161,567 | |
| | 11,724 | | | Aena SAc | | | 1,717,992 | |
| | 39,300 | | | Banco Bilbao Vizcaya Argentaria SA | | | 282,910 | |
| | 52,000 | | | CaixaBank SA | | | 156,905 | |
| | 15,890 | | | CIE Automotive SA | | | 327,126 | |
| | 461 | | | Construcciones y Auxiliar de Ferrocarriles SA | | | 173,732 | |
| | 103,800 | | | Distribuidora Internacional de Alimentacion SA | | | 554,408 | |
| | 35,215 | | | Ebro Foods SA | | | 759,357 | |
| | 14,140 | | | Faes Farma SA | | | 51,909 | |
| | 15,825 | | | Gamesa Corporacion Tecnologia SA | | | 365,376 | |
| | 518,456 | | | Iberdrola SA | | | 3,528,344 | |
| | 13,001 | | | Lar Espana Real Estate SOCIMI SA | | | 93,311 | |
| | 4,443 | | | Let’s GOWEX SAb,d | | | 0 | |
| | 68,115 | | | Prosegur Compania de Seguridad SA | | | 493,918 | |
| | 2,370 | | | Tecnicas Reunidas SA | | | 88,677 | |
| | 17,000 | | | Zardoya Otis SA | | | 143,176 | |
| | | | | |
| | | | Total | | | 8,898,708 | |
| | | | | |
| |
| Sweden (1.4%) | | | | |
| | 52,500 | | | Alfa Laval AB | | | 753,200 | |
| | 49,600 | | | Axfood AB | | | 775,146 | |
| | 1,535 | | | Bilia AB | | | 36,600 | |
| | 6,404 | | | Bure Equity AB | | | 70,167 | |
| | 26,600 | | | Castellum AB | | | 360,429 | |
| | 39,397 | | | Dios Fastigheter AB | | | 262,360 | |
| | 741 | | | Fabege AB | | | 12,515 | |
| | 5,974 | | | Fastighets AB Balderb | | | 135,690 | |
| | 39,977 | | | Granges AB | | | 388,478 | |
| | 16,040 | | | Indutrade AB | | | 298,350 | |
| | 21,663 | | | Inwido AB | | | 236,734 | |
| | 72,327 | | | Klovern AB, Class B | | | 76,297 | |
| | 10,686 | | | Kungsleden AB | | | 67,379 | |
| | 17,182 | | | Loomis AB | | | 488,404 | |
| | 5,797 | | | NCC ABb | | | 147,313 | |
| | 435,000 | | | Nordea Bank AB | | | 4,571,470 | |
| | 4,656 | | | Peab AB | | | 39,488 | |
| | 7,999 | | | SAAB AB | | | 283,306 | |
| | 26,200 | | | Securitas AB | | | 404,368 | |
| | 27,400 | | | Svenska Handelsbanken AB | | | 373,548 | |
| | 126,400 | | | Telefonaktiebolaget LM Ericsson | | | 613,149 | |
| | 1,750 | | | Vitrolife AB | | | 90,536 | |
| | 14,208 | | | Wihlborgs Fastigheter AB | | | 275,384 | |
| | | | | |
| | | | Total | | | 10,760,311 | |
| | | | | |
| |
| Switzerland (5.9%) | | | | |
| | 219,491 | | | ABB, Ltd. | | | 4,528,194 | |
| | 15,031 | | | Actelion, Ltd. | | | 2,171,918 | |
| | 3,666 | | | Adecco SA | | | 217,687 | |
| | 4,194 | | | Ascom Holding AG | | | 71,818 | |
| | 329 | | | Autoneum Holding AG | | | 87,059 | |
| | 792 | | | Bobst Group SA | | | 43,620 | |
| | 10,972 | | | Cembra Money Bank AGb | | | 838,618 | |
| | 1,214 | | | Daetwyler Holding AG | | | 166,306 | |
| | 974 | | | dorma+kaba Holding AG | | | 676,817 | |
| | 328 | | | Emmi AG | | | 193,760 | |
| | 523 | | | Forbo Holding AG | | | 666,708 | |
| | 1,748 | | | Georg Fischer AG | | | 1,549,770 | |
| | 100 | | | Givaudan SA | | | 193,407 | |
| | 699,230 | | | Glencore Xstrata plcb | | | 2,140,426 | |
| | 1,200 | | | Helvetia Holding AG | | | 624,318 | |
| | 207 | | | Implenia AG | | | 13,864 | |
| | 1,591 | | | Kardex AG | | | 136,221 | |
| | 823 | | | Komax Holding AG | | | 198,191 | |
| | 16,982 | | | Logitech International SA | | | 410,735 | |
| | 15,204 | | | Lonza Group AG | | | 2,869,021 | |
| | 1,929 | | | Mobimo Holding AG | | | 464,152 | |
| | 122,570 | | | Nestle SA | | | 8,888,030 | |
| | 66,959 | | | Novartis AG | | | 4,751,918 | |
| | 3,369 | | | Partners Group Holding AG | | | 1,705,524 | |
| | 1,250 | | | Rieter Holding AG | | | 237,734 | |
| | 3,300 | | | Roche Holding AG-BR | | | 766,970 | |
| | 30,489 | | | Roche Holding AG-Genusschein | | | 7,002,766 | |
| | 214 | | | Schweiter Technologies AG | | | 230,533 | |
| | 2,300 | | | Swiss Prime Site AGb | | | 190,760 | |
| | 1,400 | | | Swisscom AG | | | 639,972 | |
| | 3,141 | | | Tecan Group AG | | | 517,576 | |
| | 1,005 | | | Temenos Group AGb | | | 64,904 | |
| | 3,714 | | | UBS Group AG | | | 52,507 | |
| | 2,014 | | | Valiant Holding AG | | | 191,010 | |
| | 3,405 | | | Valora Holding AG | | | 990,136 | |
| | 314 | | | Zehnder Group AGb | | | 13,048 | |
| | 1,600 | | | Zurich Insurance Group AGb | | | 418,811 | |
| | | | | |
| | | | Total | | | 44,924,809 | |
| | | | | |
| |
| Taiwan (0.7%) | | | | |
| | 321,100 | | | Taiwan Mobile Company, Ltd. | | | 1,123,479 | |
| | 752,362 | | | Taiwan Semiconductor Manufacturing Company, Ltd. | | | 4,515,193 | |
| | | | | |
| | | | Total | | | 5,638,672 | |
| | | | | |
The accompanying Notes to Financial Statements are an integral part of this schedule.
109
PARTNER WORLDWIDE ALLOCATION FUND
Schedule of Investments as of October 31, 2016
| | | | | | | | |
| Shares | | | Common Stock (87.5%) | | Value | |
| Thailand (0.7%) | | | | |
| | 191,150 | | | Siam Cement pcl | | | $2,752,659 | |
| | 598,700 | | | Siam Commercial Bank pcl | | | 2,451,286 | |
| | | | | |
| | | | Total | | | 5,203,945 | |
| | | | | |
| |
| Turkey (0.7%) | | | | |
| | 652,258 | | | Akbank TAS | | | 1,745,546 | |
| | 105,296 | | | BIM Birlesik Magazalar AS | | | 1,716,546 | |
| | 626,000 | | | Turkiye Garanti Bankasi AS | | | 1,703,433 | |
| | | | | |
| | | | Total | | | 5,165,525 | |
| | | | | |
| |
| United Kingdom (11.1%) | | | | |
| | 203,396 | | | 3i Group plc | | | 1,667,285 | |
| | 46,563 | | | Abcam plc | | | 495,861 | |
| | 45,700 | | | Aggreko plc | | | 446,836 | |
| | 49,153 | | | Amec Foster Wheeler plc | | | 268,176 | |
| | 86,523 | | | Anglo American plcb | | | 1,200,876 | |
| | 31,158 | | | Ashmore Group plc | | | 133,811 | |
| | 6,054 | | | ASOS plcb | | | 388,630 | |
| | 61,100 | | | AstraZeneca plc | | | 3,421,314 | |
| | 160,020 | | | Auto Trader Group plcc | | | 733,130 | |
| | 30,200 | | | Babcock International Group plc | | | 365,054 | |
| | 159,631 | | | Beazley plc | | | 710,772 | |
| | 25,581 | | | Bellway plc | | | 740,272 | |
| | 42,359 | | | Berendsen plc | | | 499,884 | |
| | 10,000 | | | BHP Billiton plc | | | 150,371 | |
| | 51,000 | | | BHP Billiton plc | | | 769,207 | |
| | 2,243 | | | Big Yellow Group plc | | | 18,977 | |
| | 15,905 | | | Bodycote plc | | | 115,270 | |
| | 82,034 | | | British American Tobacco plc | | | 4,701,630 | |
| | 58,400 | | | British Land Company plc | | | 418,111 | |
| | 28,880 | | | Bunzl plc | | | 775,354 | |
| | 70,611 | | | Burberry Group plc | | | 1,273,480 | |
| | 9,500 | | | Close Brothers Group plc | | | 154,161 | |
| | 138,000 | | | Cobham plc | | | 240,776 | |
| | 138,476 | | | Compass Group plc | | | 2,505,635 | |
| | 57,900 | | | Countrywide plc | | | 127,051 | |
| | 30,370 | | | Crest Nicholson Holdings plc | | | 150,942 | |
| | 6,300 | | | Croda International plc | | | 269,419 | |
| | 27,144 | | | CYBG plcb | | | 89,727 | |
| | 104,896 | | | Diageo plc | | | 2,791,980 | |
| | 67,663 | | | Direct Line Insurance Group plc | | | 286,254 | |
| | 177,561 | | | Domino’s Pizza Group plc | | | 738,280 | |
| | 55,766 | | | DS Smith plc | | | 271,927 | |
| | 8,262 | | | Electrocomponents plc | | | 37,680 | |
| | 10,487 | | | Fenner plc | | | 28,105 | |
| | 158,149 | | | GlaxoSmithKline plc | | | 3,124,139 | |
| | 1,386 | | | Greggs plc | | | 16,201 | |
| | 28,537 | | | Halma plc | | | 365,329 | |
| | 19,586 | | | Hansteen Holdings plc | | | 25,771 | |
| | 25,263 | | | Hiscox, Ltd. | | | 315,456 | |
| | 12,748 | | | Hostelworld Group plcc | | | 34,678 | |
| | 50,911 | | | Howden Joinery Group plc | | | 233,130 | |
| | 971,942 | | | HSBC Holdings plc | | | 7,319,857 | |
| | 5,711 | | | Hunting plc | | | 35,098 | |
| | 95,917 | | | IG Group Holdings plc | | | 968,593 | |
| | 69,947 | | | Imperial Brands plc | | | 3,383,479 | |
| | 29,914 | | | Inchcape plc | | | 237,839 | |
| | 320,406 | | | Indivior plc | | | 1,230,585 | |
| | 112,420 | | | Informa plc | | | 924,894 | |
| | 104,145 | | | Intermediate Capital Group plc | | | 771,420 | |
| | 39,300 | | | Interserve plc | | | 162,830 | |
| | 27,736 | | | Intertek Group plc | | | 1,157,209 | |
| | 1,203 | | | J D Wetherspoon plc | | | 12,811 | |
| | 34,989 | | | JD Sports Fashion plc | | | 650,531 | |
| | 127,066 | | | John Wood Group plc | | | 1,194,320 | |
| | 59,733 | | | Jupiter Fund Management plc | | | 314,948 | |
| | 277,086 | | | Ladbrokes plc | | | 452,388 | |
| | 52,000 | | | Legal & General Group plc | | | 133,030 | |
| | 9,736 | | | LondonMetric Property plc | | | 17,764 | |
| | 299,000 | | | Marks and Spencer Group plc | | | 1,244,081 | |
| | 63,466 | | | Meggitt plc | | | 337,638 | |
| | 51,493 | | | Micro Focus International plc | | | 1,348,377 | |
| | 236,000 | | | Mitie Group plc | | | 606,508 | |
| | 50,309 | | | National Express Group plc | | | 226,005 | |
| | 3,000 | | | Next plc | | | 176,502 | |
| | 98,100 | | | Old Mutual plc | | | 241,321 | |
| | 31,040 | | | OneSavings Bank plc | | | 110,180 | |
| | 150,025 | | | Paragon Group of Companies plc | | | 608,497 | |
| | 35,888 | | | Persimmon plc | | | 742,879 | |
| | 50,459 | | | Premier Oil plcb | | | 40,631 | |
| | 218,459 | | | QinetiQ Group plc | | | 615,214 | |
| | 30,926 | | | Reckitt Benckiser Group plc | | | 2,766,667 | |
| | 90,247 | | | RELX plc | | | 1,610,929 | |
| | 9,812 | | | Rentokil Initial plc | | | 27,369 | |
| | 56,600 | | | Restaurant Group plc | | | 259,645 | |
| | 44,383 | | | Rio Tinto plc | | | 1,543,439 | |
| | 37,271 | | | Royal Dutch Shell plc | | | 928,700 | |
| | 8,879 | | | Royal Dutch Shell plc, Class A | | | 221,150 | |
| | 273,279 | | | Royal Dutch Shell plc, Class B | | | 7,048,581 | |
| | 30,600 | | | RPC Group plc | | | 354,856 | |
| | 127,836 | | | Saga plc | | | 310,080 | |
| | 7,018 | | | Schroders plc | | | 241,559 | |
| | 84,400 | | | Sky plc | | | 843,771 | |
| | 58,600 | | | Smiths Group plc | | | 1,015,435 | |
| | 8,589 | | | Spectris plc | | | 215,057 | |
| | 22,345 | | | Spirax-Sarco Engineering plc | | | 1,204,738 | |
| | 32,588 | | | SSE plc | | | 633,613 | |
| | 93,000 | | | Stagecoach Group plc | | | 224,971 | |
| | 165,332 | | | Standard Chartered plcb | | | 1,437,718 | |
| | 7,173 | | | Stobart Group, Ltd. | | | 14,245 | |
| | 54,413 | | | Synthomer plc | | | 238,035 | |
| | 70,789 | | | Tate & Lyle plc | | | 675,115 | |
| | 241,180 | | | Taylor Wimpey plc | | | 417,663 | |
| | 152,947 | | | Tritax Big Box REIT plc | | | 254,228 | |
| | 44,599 | | | Tullett Prebon plc | | | 193,792 | |
| | 36,292 | | | Unilever plc | | | 1,515,168 | |
| | 16,538 | | | Virgin Money Holdings (UK) plc | | | 66,598 | |
| | 468,055 | | | Vodafone Group plc | | | 1,285,437 | |
| | 13,551 | | | WH Smith plc | | | 243,912 | |
| | 510,234 | | | William Hill plc | | | 1,845,760 | |
| | 6,068 | | | WS Atkins plc | | | 112,133 | |
| | | | | |
| | | | Total | | | 84,116,735 | |
| | | | | |
| |
| United States (0.2%) | | | | |
| | 19,100 | | | Yum! Brands, Inc. | | | 1,647,948 | |
| | | | | |
| | | | Total | | | 1,647,948 | |
| | | | | |
| | | | | | | | |
| | | | | |
| | | | Total Common Stock (cost $640,872,363) | | | 662,481,276 | |
| | | | | |
| | |
Principal
Amount | | | Long-Term Fixed Income (9.6%) | | | |
| Angola (0.1%) | | | | |
| | | | Angola Government International Bond | | | | |
| | $410,000 | | | 9.500%, 11/12/2025 | | | 401,164 | |
| | | | | |
| | | | Total | | | 401,164 | |
| | | | | |
| |
| Argentina (0.5%) | | | | |
| | | | Argentina Government International Bond | | | | |
| | 410,000 | | | 6.875%, 4/22/2021c | | | 443,620 | |
| | 460,000 | | | 7.500%, 4/22/2026c | | | 502,550 | |
| | 150,000 | | | 6.625%, 7/6/2028c | | | 154,275 | |
| | 399,070 | | | 7.820%, 12/31/2033e | | | 468,309 | |
The accompanying Notes to Financial Statements are an integral part of this schedule.
110
PARTNER WORLDWIDE ALLOCATION FUND
Schedule of Investments as of October 31, 2016
| | | | | | | | |
Principal
Amount | | | Long-Term Fixed Income (9.6%) | | Value | |
| Argentina (0.5%) - continued | | | | |
| | $154,224 | | | 8.280%, 12/31/2033 | | | $167,796 | |
| | 81,318 | | | 8.280%, 12/31/2033 | | | 91,198 | |
| | 714,000 | | | 0.000%, 12/15/2035e,f | | | 80,810 | |
| | 400,000 | | | 7.125%, 7/6/2036c | | | 412,400 | |
| | 300,000 | | | 7.125%, 7/6/2036 | | | 309,300 | |
| | 300,000 | | | 2.500%, 12/31/2038g | | | 205,050 | |
| | | | Argentine Bonos del Tesoro | | | | |
| | 2,810,000 | | | 16.000%, 10/17/2023h | | | 187,766 | |
| | 6,380,000 | | | 15.500%, 10/17/2026h | | | 426,316 | |
| | | | Cablevision SA | | | | |
| | 150,000 | | | 6.500%, 6/15/2021c | | | 156,000 | |
| | | | YPF SA | | | | |
| | 155,000 | | | 8.875%, 12/19/2018 | | | 169,097 | |
| | | | | |
| | | | Total | | | 3,774,487 | |
| | | | | |
| |
| Armenia (<0.1%) | | | | |
| | | | Armenia Government International Bond | | | | |
| | 210,000 | | | 7.150%, 3/26/2025 | | | 221,550 | |
| | | | | |
| | | | Total | | | 221,550 | |
| | | | | |
| |
| Azerbaijan (0.1%) | | | | |
| | | | State Oil Company of Azerbaijan Republic | | | | |
| | 610,000 | | | 4.750%, 3/13/2023 | | | 607,179 | |
| | | | | |
| | | | Total | | | 607,179 | |
| | | | | |
| |
| Belize (<0.1%) | | | | |
| | | | Belize Government International Bond | | | | |
| | 135,900 | | | 5.000%, 2/20/2038*,g | | | 73,726 | |
| | | | | |
| | | | Total | | | 73,726 | |
| | | | | |
| |
| Bermuda (0.1%) | | | | |
| | | | Bermuda Government International Bond | | | | |
| | 200,000 | | | 3.717%, 1/25/2027c | | | 200,470 | |
| | | | Digicel, Ltd. | | | | |
| | 200,000 | | | 6.000%, 4/15/2021* | | | 178,940 | |
| | 330,000 | | | 6.750%, 3/1/2023c | | | 296,076 | |
| | | | | |
| | | | Total | | | 675,486 | |
| | | | | |
| |
| Brazil (0.3%) | | | | |
| | | | Banco do Brasil SA/Cayman | | | | |
| | 600,000 | | | 9.000%, 6/18/2049i | | | 555,600 | |
| | | | Brazil Government International Bond | | | | |
| | 400,000 | | | 2.625%, 1/5/2023 | | | 369,600 | |
| | | | Brazil Loan Trust 1 | | | | |
| | 350,095 | | | 5.477%, 7/24/2023* | | | 352,720 | |
| | | | Brazil Minas SPE via State of Minas Gerais | | | | |
| | 660,000 | | | 5.333%, 2/15/2028* | | | 646,800 | |
| | | | Independencia International, Ltd. | | | | |
| | 95,246 | | | 12.000%, 12/30/2016*,d,j | | | 0 | |
| | | | Tupy SA | | | | |
| | 200,000 | | | 6.625%, 7/17/2024c | | | 204,480 | |
| | | | | |
| | | | Total | | | 2,129,200 | |
| | | | | |
| |
| Bulgaria (0.2%) | | | | |
| | | | Bulgaria Government International Bond | | | | |
| | 100,000 | | | 4.250%, 7/9/2017e | | | 112,887 | |
| | 150,000 | | | 1.875%, 3/21/2023e | | | 172,269 | |
| | 100,000 | | | 2.950%, 9/3/2024e | | | 121,576 | |
| | 100,000 | | | 2.625%, 3/26/2027e | | | 117,312 | |
| | 350,000 | | | 3.000%, 3/21/2028e | | | 417,782 | |
| | 380,000 | | | 3.125%, 3/26/2035e | | | 428,118 | |
| | | | | |
| | | | Total | | | 1,369,944 | |
| | | | | |
| |
| Cayman Islands (0.1%) | | | | |
| | | | Petrobras International Finance Company | | | | |
| | 220,000 | | | 5.750%, 1/20/2020 | | | 227,040 | |
| | 290,000 | | | 5.375%, 1/27/2021 | | | 287,158 | |
| | | | | |
| | | | Total | | | 514,198 | |
| | | | | |
| |
| Chile (0.2%) | | | | |
| | | | Banco del Estado de Chile | | | | |
| | 290,000 | | | 4.125%, 10/7/2020 | | | 309,666 | |
| | 100,000 | | | 4.125%, 10/7/2020c | | | 106,782 | |
| | | | Chile Government International Bond | | | | |
| | 364,000 | | | 3.125%, 1/21/2026 | | | 380,744 | |
| | | | GNL Quintero SA | | | | |
| | 310,000 | | | 4.634%, 7/31/2029c | | | 325,500 | |
| | | | Itau CorpBanca | | | | |
| | 286,000 | | | 3.875%, 9/22/2019c | | | 297,901 | |
| | | | Sociedad Quimica y Minera de Chile SA | | | | |
| | 200,000 | | | 3.625%, 4/3/2023 | | | 196,000 | |
| | 200,000 | | | 4.375%, 1/28/2025* | | | 201,000 | |
| | | | | |
| | | | Total | | | 1,817,593 | |
| | | | | |
| |
| Colombia (0.3%) | | | | |
| | | | Banco de Bogota S.A. | | | | |
| | 200,000 | | | 5.000%, 1/15/2017 | | | 201,280 | |
| | 650,000 | | | 6.250%, 5/12/2026c,k | | | 671,125 | |
| | | | Colombia Government International Bond | | | | |
| | 30,000 | | | 8.125%, 5/21/2024 | | | 38,805 | |
| | 320,000 | | | 4.500%, 1/28/2026 | | | 342,400 | |
| | 200,000 | | | 3.875%, 3/22/2026e | | | 245,919 | |
| | 187,000 | | | 6.125%, 1/18/2041 | | | 213,647 | |
| | 810,000 | | | 5.625%, 2/26/2044 | | | 884,925 | |
| | | | | |
| | | | Total | | | 2,598,101 | |
| | | | | |
| |
| Costa Rica (0.3%) | | | | |
| | | | Banco de Costa Rica | | | | |
| | 200,000 | | | 5.250%, 8/12/2018 | | | 203,956 | |
| | 220,000 | | | 5.250%, 8/12/2018c | | | 224,352 | |
| | | | Banco Nacional de Costa Rica | | | | |
| | 220,000 | | | 4.875%, 11/1/2018c | | | 223,766 | |
| | 280,000 | | | 6.250%, 11/1/2023c | | | 291,099 | |
| | | | Costa Rica Government International Bond | | | | |
| | 30,000 | | | 9.995%, 8/1/2020 | | | 36,139 | |
| | 200,000 | | | 5.625%, 4/30/2043 | | | 176,920 | |
| | 210,000 | | | 5.625%, 4/30/2043c | | | 185,766 | |
| | 650,000 | | | 7.158%, 3/12/2045c | | | 679,250 | |
| | | | | |
| | | | Total | | | 2,021,248 | |
| | | | | |
| |
| Croatia (<0.1%) | | | | |
| | | | Croatia Government International Bond | | | | |
| | 100,000 | | | 3.875%, 5/30/2022e | | | 118,460 | |
| | 150,000 | | | 3.000%, 3/11/2025e | | | 167,751 | |
| | | | | |
| | | | Total | | | 286,211 | |
| | | | | |
| |
| Dominican Republic (0.5%) | | | | |
| | | | Aeropuertos Dominicanos Siglo XXI SA | | | | |
| | 400,000 | | | 9.750%, 11/13/2019 | | | 419,000 | |
| | | | Dominican Republic Government International Bond | | | | |
| | 24,134 | | | 9.040%, 1/23/2018 | | | 25,100 | |
| | 4,000,000 | | | 15.000%, 4/5/2019l | | | 96,151 | |
| | 900,000 | | | 16.000%, 7/10/2020l | | | 23,068 | |
| | 400,000 | | | 7.500%, 5/6/2021 | | | 440,080 | |
| | 600,000 | | | 11.500%, 5/10/2024l | | | 13,584 | |
| | 100,000 | | | 6.875%, 1/29/2026c | | | 110,750 | |
The accompanying Notes to Financial Statements are an integral part of this schedule.
111
PARTNER WORLDWIDE ALLOCATION FUND
Schedule of Investments as of October 31, 2016
| | | | | | | | |
Principal Amount | | | Long-Term Fixed Income (9.6%) | | Value | |
| Dominican Republic (0.5%) - continued | | | | |
| | $290,000 | | | 8.625%, 4/20/2027 | | | $340,750 | |
| | 1,600,000 | | | 18.500%, 2/4/2028c,l | | | 50,570 | |
| | 3,700,000 | | | 11.375%, 7/6/2029l | | | 82,369 | |
| | 392,000 | | | 7.450%, 4/30/2044 | | | 435,120 | |
| | 990,000 | | | 6.850%, 1/27/2045 | | | 1,029,600 | |
| | 760,000 | | | 6.850%, 1/27/2045c | | | 790,400 | |
| | | | | |
| | | | Total | | | 3,856,542 | |
| | | | | |
| |
| Ecuador (0.1%) | | | | |
| | | | Ecuador Government International Bond | | | | |
| | 310,000 | | | 10.750%, 3/28/2022 | | | 327,825 | |
| | 430,000 | | | 7.950%, 6/20/2024 | | | 405,275 | |
| | | | EP PetroEcuador | | | | |
| | 246,316 | | | 6.487%, 9/24/2019f | | | 243,237 | |
| | | | | |
| | | | Total | | | 976,337 | |
| | | | | |
| |
| El Salvador (0.2%) | | | | |
| | | | El Salvador Government International Bond | | | | |
| | 100,000 | | | 7.375%, 12/1/2019 | | | 105,433 | |
| | 40,000 | | | 7.750%, 1/24/2023 | | | 43,700 | |
| | 92,000 | | | 5.875%, 1/30/2025 | | | 91,080 | |
| | 99,000 | | | 6.375%, 1/18/2027 | | | 98,505 | |
| | 50,000 | | | 8.250%, 4/10/2032 | | | 54,493 | |
| | 494,000 | | | 7.650%, 6/15/2035 | | | 511,740 | |
| | 150,000 | | | 7.625%, 2/1/2041 | | | 153,983 | |
| | | | | |
| | | | Total | | | 1,058,934 | |
| | | | | |
| |
| Gabon (<0.1%) | | | | |
| | | | Gabon Government International Bond | | | | |
| | 400,000 | | | 6.375%, 12/12/2024 | | | 366,712 | |
| | | | | |
| | | | Total | | | 366,712 | |
| | | | | |
| |
| Ghana (0.1%) | | | | |
| | | | Ghana Government International Bond | | | | |
| | 350,000 | | | 10.750%, 10/14/2030c | | | 412,055 | |
| | | | | |
| | | | Total | | | 412,055 | |
| | | | | |
| |
| Guatemala (0.2%) | | | | |
| | | | Agromercantil Senior Trust | | | | |
| | 170,000 | | | 6.250%, 4/10/2019c | | | 178,075 | |
| | | | Guatemala Government International Bond | | | | |
| | 400,000 | | | 5.750%, 6/6/2022 | | | 446,000 | |
| | 230,000 | | | 4.500%, 5/3/2026c | | | 235,750 | |
| | 700,000 | | | 4.875%, 2/13/2028 | | | 732,928 | |
| | | | | |
| | | | Total | | | 1,592,753 | |
| | | | | |
| |
| Honduras (0.1%) | | | | |
| | | | Honduras Government International Bond | | | | |
| | 290,000 | | | 8.750%, 12/16/2020* | | | 328,497 | |
| | 400,000 | | | 8.750%, 12/16/2020 | | | 453,100 | |
| | | | | |
| | | | Total | | | 781,597 | |
| | | | | |
| |
| Hong Kong (<0.1%) | | | | |
| | | | China Resources Cement Holdings, Ltd. | | | | |
| | 200,000 | | | 2.125%, 10/5/2017 | | | 200,713 | |
| | | | | |
| | | | Total | | | 200,713 | |
| | | | | |
| |
| Hungary (0.3%) | | | | |
| | | | Hungary Government International Bond | | | | |
| | 750,000 | | | 6.250%, 1/29/2020 | | | 840,000 | |
| | 10,000 | | | 6.375%, 3/29/2021 | | | 11,537 | |
| | 390,000 | | | 5.375%, 2/21/2023 | | | 442,572 | |
| | 720,000 | | | 5.750%, 11/22/2023 | | | 840,060 | |
| | 20,000 | | | 5.375%, 3/25/2024 | | | 22,978 | |
| | 190,000 | | | 7.625%, 3/29/2041 | | | 289,560 | |
| | | | | |
| | | | Total | | | 2,446,707 | |
| | | | | |
| |
| India (<0.1%) | | | | |
| | | | Greenko Dutch BV | | | | |
| | 250,000 | | | 8.000%, 8/1/2019c | | | 267,029 | |
| | | | | |
| | | | Total | | | 267,029 | |
| | | | | |
| |
| Indonesia (0.6%) | | | | |
| | | | Indonesia Government International Bond | | | | |
| | 330,000 | | | 2.625%, 6/14/2023c,e | | | 376,145 | |
| | 843,000 | | | 5.875%, 1/15/2024 | | | 977,950 | |
| | 200,000 | | | 4.125%, 1/15/2025 | | | 209,778 | |
| | 520,000 | | | 3.375%, 7/30/2025e | | | 617,096 | |
| | 210,000 | | | 4.750%, 1/8/2026c | | | 228,922 | |
| | 200,000 | | | 3.750%, 6/14/2028c,e | | | 235,651 | |
| | 280,000 | | | 8.500%, 10/12/2035 | | | 414,200 | |
| | 280,000 | | | 5.250%, 1/17/2042 | | | 306,609 | |
| | 600,000 | | | 6.750%, 1/15/2044 | | | 791,003 | |
| | 200,000 | | | 5.950%, 1/8/2046 | | | 242,177 | |
| | | | Perusahaan Penerbit SBSN Indonesia III | | | | |
| | 260,000 | | | 4.325%, 5/28/2025 | | | 271,388 | |
| | | | PT Perusahaan Gas Negara (Persero) Tbk PT | | | | |
| | 210,000 | | | 5.125%, 5/16/2024 | | | 224,135 | |
| | | | | |
| | | | Total | | | 4,895,054 | |
| | | | | |
| |
| Israel (<0.1%) | | | | |
| | | | Delek and Avner Yam Tethys, Ltd. | | | | |
| | 160,000 | | | 3.839%, 12/30/2018c | | | 166,200 | |
| | | | | |
| | | | Total | | | 166,200 | |
| | | | | |
| |
| Japan (0.1%) | | | | |
| | | | SoftBank Group Corporation | | | | |
| | 200,000 | | | 4.500%, 4/15/2020 | | | 205,500 | |
| | 200,000 | | | 4.500%, 4/15/2020c | | | 205,500 | |
| | | | Universal Entertainment Corporation | | | | |
| | 250,000 | | | 8.500%, 8/24/2020* | | | 250,000 | |
| | | | | |
| | | | Total | | | 661,000 | |
| | | | | |
| |
| Kazakhstan (0.1%) | | | | |
| | | | Kazakhstan Government International Bond | | | | |
| | 200,000 | | | 4.875%, 10/14/2044 | | | 202,008 | |
| | | | KazMunayGas National Company JSC | | | | |
| | 570,000 | | | 9.125%, 7/2/2018 | | | 625,027 | |
| | | | | |
| | | | Total | | | 827,035 | |
| | | | | |
| |
| Kenya (0.1%) | | | | |
| | | | Kenya Government International Bond | | | | |
| | 430,000 | | | 6.875%, 6/24/2024 | | | 428,925 | |
| | | | | |
| | | | Total | | | 428,925 | |
| | | | | |
| |
| Luxembourg (0.3%) | | | | |
| | | | Altice Financing SA | | | | |
| | 200,000 | | | 6.625%, 2/15/2023c | | | 206,000 | |
| | | | Gazprom Neft OAO Via GPN Capital SA | | | | |
| | 450,000 | | | 6.000%, 11/27/2023c | | | 475,312 | |
| | | | Gazprom OAO Via Gaz Capital SA | | | | |
| | 350,000 | | | 9.250%, 4/23/2019 | | | 399,384 | |
| | | | Sberbank of Russia Via SB Capital SA | | | | |
| | 200,000 | | | 5.500%, 2/26/2024 | | | 198,000 | |
The accompanying Notes to Financial Statements are an integral part of this schedule.
112
PARTNER WORLDWIDE ALLOCATION FUND
Schedule of Investments as of October 31, 2016
| | | | | | | | |
Principal
Amount | | | Long-Term Fixed Income (9.6%) | | Value | |
| Luxembourg (0.3%) - continued | |
| | | | Severstal OAO | | | | |
| | $170,000 | | | 6.700%, 10/25/2017 | | | $176,784 | |
| | | | Telefonica Celular del Paraguay SA | | | | |
| | 200,000 | | | 6.750%, 12/13/2022 | | | 208,500 | |
| | | | Wind Acquisition Finance SA | | | | |
| | 450,000 | | | 7.000%, 4/23/2021e | | | 514,367 | |
| | 210,000 | | | 7.375%, 4/23/2021 | | | 215,775 | |
| | | | | |
| | | | Total | | | 2,394,122 | |
| | | | | |
| |
| Macedonia, The Former Yugoslav Republic Of (0.1%) | | | | |
| | | | Macedonia Government International Bond | | | | |
| | 340,000 | | | 4.875%, 12/1/2020c,e | | | 394,166 | |
| | 280,000 | | | 5.625%, 7/26/2023c,e | | | 325,573 | |
| | | | | |
| | | | Total | | | 719,739 | |
| | | | | |
| |
| Mauritius (0.1%) | | | | |
| | | | Greenko Investment Company | | | | |
| | 200,000 | | | 4.875%, 8/16/2023c | | | 194,754 | |
| | | | MTN Mauritius Investment, Ltd. | | | | |
| | 270,000 | | | 6.500%, 10/13/2026c | | | 273,847 | |
| | | | | |
| | | | Total | | | 468,601 | |
| | | | | |
| |
| Mexico (0.9%) | | | | |
| | | | America Movil SAB de CV | | | | |
| | 2,010,000 | | | 6.000%, 6/9/2019m | | | 105,195 | |
| | | | Cemex SAB de CV | | | | |
| | 100,000 | | | 4.750%, 1/11/2022c,e | | | 113,903 | |
| | | | Gruma, SAB de CV | | | | |
| | 200,000 | | | 4.875%, 12/1/2024c | | | 217,000 | |
| | | | Metalsa SA de CV | | | | |
| | 190,000 | | | 4.900%, 4/24/2023c | | | 186,200 | |
| | | | Mexican Bonos | | | | |
| | 4,783,300 | | | 8.000%, 12/7/2023m | | | 280,456 | |
| | 6,814,200 | | | 7.500%, 6/3/2027m | | | 391,519 | |
| | | | Mexico Government International Bond | | | | |
| |
| Mauritius (0.1%) | | | | |
| | | | Bond | | | | |
| | 200,000 | | | 4.350%, 1/15/2047 | | | 189,200 | |
| | 150,000 | | | 4.000%, 3/15/2115e | | | 148,691 | |
| | 338,000 | | | 5.750%, 10/12/2110 | | | 345,605 | |
| | 9,316,000 | | | 10.000%, 12/5/2024m | | | 612,960 | |
| | 62,000 | | | 4.750%, 3/8/2044 | | | 61,845 | |
| | | | Pemex Project Funding Master Trust | | | | |
| | 91,000 | | | 5.750%, 3/1/2018 | | | 95,550 | |
| | 10,000 | | | 6.625%, 6/15/2035 | | | 10,065 | |
| | | | Petroleos Mexicanos | | | | |
| | 130,000 | | | 5.500%, 2/4/2019c | | | 137,605 | |
| | 70,000 | | | 3.500%, 7/23/2020 | | | 70,245 | |
| | 170,000 | | | 6.375%, 2/4/2021 | | | 185,980 | |
| | 310,000 | | | 6.375%, 2/4/2021c | | | 339,140 | |
| | 10,000 | | | 3.500%, 1/30/2023 | | | 9,445 | |
| | 710,000 | | | 5.125%, 3/15/2023e | | | 867,090 | |
| | 570,000 | | | 6.875%, 8/4/2026c | | | 637,260 | |
| | 610,000 | | | 6.875%, 8/4/2026 | | | 681,980 | |
| | 39,000 | | | 5.500%, 6/27/2044 | | | 33,595 | |
| | 20,000 | | | 6.375%, 1/23/2045 | | | 19,010 | |
| | 10,000 | | | 5.625%, 1/23/2046 | | | 8,647 | |
| | 197,000 | | | 6.750%, 9/21/2047c | | | 195,276 | |
| | | | Sigma Alimentos SA de CV | | | | |
| | 240,000 | | | 4.125%, 5/2/2026c | | | 241,440 | |
| | | | | |
| | | | Total | | | 6,184,902 | |
| | | | | |
| |
| Mongolia (0.1%) | | | | |
| | | | Mongolia Government International Bond | | | | |
| | 400,000 | | | 5.125%, 12/5/2022 | | | 353,025 | |
| | | | | |
| | | | Total | | | 353,025 | |
| | | | | |
| |
| Netherlands (0.2%) | | | | |
| | | | IHS Netherlands Holdco BV | | | | |
| | 440,000 | | | 9.500%, 10/27/2021c | | | 457,637 | |
| | | | Listrindo Capital BV | | | | |
| | 200,000 | | | 4.950%, 9/14/2026c | | | 202,006 | |
| | | | Petrobras Global Finance BV | | | | |
| | 365,000 | | | 4.875%, 3/17/2020 | | | 367,646 | |
| | 220,000 | | | 8.375%, 5/23/2021 | | | 243,386 | |
| | | | | |
| | | | Total | | | 1,270,675 | |
| | | | | |
| |
| Nigeria (0.1%) | | | | |
| | | | Nigeria Government International Bond | | | | |
| | 206,000 | | | 6.750%, 1/28/2021 | | | 204,855 | |
| | 200,000 | | | 6.375%, 7/12/2023 | | | 193,106 | |
| | | | | |
| | | | Total | | | 397,961 | |
| | | | | |
| |
| Pakistan (0.1%) | | | | |
| | | | Pakistan Government International Bond | | | | |
| | 100,000 | | | 6.875%, 6/1/2017 | | | 101,930 | |
| | 360,000 | | | 8.250%, 4/15/2024c | | | 405,518 | |
| | 110,000 | | | 7.875%, 3/31/2036 | | | 111,461 | |
| | | | Third Pakistan International Sukuk Company, Ltd. | | | | |
| | 230,000 | | | 5.500%, 10/13/2021c | | | 234,328 | |
| | | | | |
| | | | Total | | | 853,237 | |
| | | | | |
| |
| Panama (<0.1%) | | | | |
| | | | Panama Notas del Tesoro | | | | |
| | 50,000 | | | 4.875%, 2/5/2021 | | | 54,250 | |
| | | | | |
| | | | Total | | | 54,250 | |
| | | | | |
| |
| Paraguay (0.2%) | | | | |
| | | | Banco Regional SAECA | | | | |
| | 150,000 | | | 8.125%, 1/24/2019 | | | 162,030 | |
| | 180,000 | | | 8.125%, 1/24/2019c | | | 194,436 | |
| | | | Paraguay Government International Bond | | | | |
| | 410,000 | | | 5.000%, 4/15/2026c | | | 435,625 | |
| | 400,000 | | | 6.100%, 8/11/2044 | | | 442,000 | |
| | | | | |
| | | | Total | | | 1,234,091 | |
| | | | | |
| |
| Peru (0.1%) | | | | |
| | | | Abengoa Transmision Sur SA | | | | |
| | 319,328 | | | 6.875%, 4/30/2043* | | | 343,278 | |
| | | | Corporacion Financiera de Desarrollo SA | | | | |
| | 200,000 | | | 4.750%, 2/8/2022c | | | 218,700 | |
| | | | Corporacion Lindley SA | | | | |
| | 90,000 | | | 6.750%, 11/23/2021c | | | 102,600 | |
| | 260,000 | | | 6.750%, 11/23/2021 | | | 296,400 | |
| | 22,000 | | | 4.625%, 4/12/2023 | | | 22,990 | |
| | 80,000 | | | 4.625%, 4/12/2023c | | | 83,600 | |
| | | | | |
| | | | Total | | | 1,067,568 | |
| | | | | |
| |
| Philippines (<0.1%) | | | | |
| | | | Energy Development Corporation | | | | |
| | 200,000 | | | 6.500%, 1/20/2021 | | | 226,250 | |
| | | | Philippines Government International Bond | | | | |
| | 120,000 | | | 9.875%, 1/15/2019 | | | 141,164 | |
| | | | | |
| | | | Total | | | 367,414 | |
| | | | | |
| |
| Poland (0.2%) | | | | |
| | | | Poland Government International Bond | | | | |
| | 6,550,000 | | | 1.750%, 7/25/2021n | | | 1,615,787 | |
| | | | | |
| | | | Total | | | 1,615,787 | |
| | | | | |
The accompanying Notes to Financial Statements are an integral part of this schedule.
113
PARTNER WORLDWIDE ALLOCATION FUND
Schedule of Investments as of October 31, 2016
| | | | | | | | |
Principal
Amount | | | Long-Term Fixed Income (9.6%) | | Value | |
| Romania (<0.1%) | |
| | | | Romania Government International Bond | | | | |
| | $230,000 | | | 2.875%, 5/26/2028e | | | $266,194 | |
| | | | | |
| | | | Total | | | 266,194 | |
| | | | | |
| |
| Russia (0.4%) | | | | |
| | | | Gazprom OAO Via Gaz Capital SA | | | | |
| | 500,000 | | | 7.288%, 8/16/2037 | | | 568,750 | |
| | | | Lukoil International Finance BV | | | | |
| | 200,000 | | | 6.125%, 11/9/2020 | | | 217,032 | |
| | | | Mobile Telesystems OJSC | | | | |
| | 200,000 | | | 5.000%, 5/30/2023 | | | 206,760 | |
| | | | Phosagro OAO via Phosagro Bond Funding, Ltd. | | | | |
| | 200,000 | | | 4.204%, 2/13/2018* | | | 203,240 | |
| | | | Russia Government International Bond | | | | |
| | 200,000 | | | 4.875%, 9/16/2023c | | | 214,992 | |
| | 200,000 | | | 4.875%, 9/16/2023 | | | 214,992 | |
| | 1,600,000 | | | 4.750%, 5/27/2026 | | | 1,693,408 | |
| | | | | |
| | | | Total | | | 3,319,174 | |
| | | | | |
| |
| Serbia (<0.1%) | | | | |
| | | | Serbia Government International Bond | | | | |
| | 210,000 | | | 7.250%, 9/28/2021 | | | 241,185 | |
| | | | | |
| | | | Total | | | 241,185 | |
| | | | | |
| |
| South Africa (0.2%) | | | | |
| | | | South Africa Government International Bond | | | | |
| | 100,000 | | | 4.665%, 1/17/2024 | | | 104,800 | |
| | 900,000 | | | 5.875%, 9/16/2025 | | | 1,009,692 | |
| | 410,000 | | | 5.000%, 10/12/2046 | | | 397,995 | |
| | | | | |
| | | | Total | | | 1,512,487 | |
| | | | | |
| |
| South Korea (<0.1%) | | | | |
| | | | Export-Import Bank of Korea | | | | |
| | 200,000 | | | 1.443%, 8/14/2017*,f | | | 199,806 | |
| | | | Kookmin Bank | | | | |
| | 380,000 | | | 1.625%, 8/1/2019c | | | 378,400 | |
| | | | | |
| | | | Total | | | 578,206 | |
| | | | | |
| |
| Sri Lanka (0.2%) | | | | |
| | | | Sri Lanka Government International Bond | | | | |
| | 200,000 | | | 5.750%, 1/18/2022c | | | 202,774 | |
| | 200,000 | | | 6.125%, 6/3/2025 | | | 200,517 | |
| | 600,000 | | | 6.850%, 11/3/2025c | | | 631,554 | |
| | 230,000 | | | 6.825%, 7/18/2026c | | | 242,673 | |
| | | | | |
| | | | Total | | | 1,277,518 | |
| | | | | |
| |
| Suriname (<0.1%) | | | | |
| | | | Republic of Suriname | | | | |
| | 280,000 | | | 9.250%, 10/26/2026c | | | 292,639 | |
| | | | | |
| | | | Total | | | 292,639 | |
| | | | | |
| |
| Turkey (0.6%) | | | | |
| | | | Export Credit Bank of Turkey | | | | |
| | 200,000 | | | 5.875%, 4/24/2019 | | | 207,756 | |
| | | | Turkey Government International Bond | | | | |
| | 413,000 | | | 7.500%, 7/14/2017 | | | 428,260 | |
| | 140,000 | | | 6.750%, 4/3/2018 | | | 147,525 | |
| | 900,000 | | | 7.000%, 6/5/2020 | | | 989,212 | |
| | 600,000 | | | 6.250%, 9/26/2022 | | | 652,673 | |
| | 640,000 | | | 5.750%, 3/22/2024 | | | 680,276 | |
| | 421,000 | | | 7.375%, 2/5/2025 | | | 493,109 | |
| | 200,000 | | | 4.250%, 4/14/2026 | | | 191,514 | |
| | 50,000 | | | 8.000%, 2/14/2034 | | | 62,880 | |
| | 240,000 | | | 6.875%, 3/17/2036 | | | 272,856 | |
| | | | | |
| | | | Total | | | 4,126,061 | |
| | | | | |
| |
| Ukraine (<0.1%) | | | | |
| | | | Ukraine Government International Bond | | | | |
| | 298,000 | | | Zero Coupon, 5/31/2040* | | | 94,189 | |
| | | | | |
| | | | Total | | | 94,189 | |
| | | | | |
| |
| United Arab Emirates (0.2%) | | | | |
| | | | Abu Dhabi Government International Bond | | | | |
| | 200,000 | | | 3.125%, 5/3/2026 | | | 207,940 | |
| | | | Dolphin Energy, Ltd. | | | | |
| | 210,000 | | | 5.500%, 12/15/2021 | | | 239,930 | |
| | | | Ruwais Power Company PJSC | | | | |
| | 360,000 | | | 6.000%, 8/31/2036c | | | 434,700 | |
| | | | | |
| | | | Total | | | 882,570 | |
| | | | | |
| |
| United States (0.3%) | | | | |
| | | | Cemex Finance, LLC. | | | | |
| | 140,000 | | | 4.625%, 6/15/2024e | | | 157,902 | |
| | | | Comcel Trust | | | | |
| | 200,000 | | | 6.875%, 2/6/2024 | | | 204,500 | |
| | | | Commonwealth of Puerto Rico Public Improvement Refg. G.O. | | | | |
| | 30,000 | | | 5.500%, 7/1/2032, Ser. Aj | | | 19,088 | |
| | 10,000 | | | 5.500%, 7/1/2039, Ser. Aj | | | 6,438 | |
| | 100,000 | | | 6.000%, 7/1/2039, Ser. Bj | | | 64,750 | |
| | | | Commonwealth of Puerto Rico Refg. G.O. | | | | |
| | 120,000 | | | 8.000%, 7/1/2035, Ser. Aj | | | 81,750 | |
| | | | HSBC Bank USA NA | | | | |
| | 901,000 | | | 10.000%, 1/5/2017o | | | 289,756 | |
| | 380,000 | | | 6.000%, 8/15/2040*,p | | | 365,855 | |
| | | | Puerto Rico Sales Tax Financing Corporation Refg. Rev. | | | | |
| | 10,000 | | | 5.375%, 8/1/2038, Ser. C | | | 5,092 | |
| | 350,000 | | | 5.250%, 8/1/2041, Ser. C | | | 175,049 | |
| | 60,000 | | | 5.000%, 8/1/2043, Ser. A-1 | | | 30,006 | |
| | 5,000 | | | 5.250%, 8/1/2043, Ser. A-1 | | | 2,501 | |
| | | | Puerto Rico Sales Tax Financing Corporation Rev. | | | | |
| | 95,000 | | | 5.500%, 8/1/2028, Ser. A | | | 48,749 | |
| | 55,000 | | | 6.750%, 8/1/2032, Ser. A | | | 30,326 | |
| | 5,000 | | | 5.500%, 8/1/2037, Ser. A | | | 2,558 | |
| | 35,000 | | | 5.375%, 8/1/2039, Ser. A | | | 17,818 | |
| | 550,000 | | | 5.500%, 8/1/2042, Ser. A | | | 281,292 | |
| | 35,000 | | | 6.000%, 8/1/2042, Ser. A | | | 18,504 | |
| | | | U.S. Treasury Notes | | | | |
| | 1,000,000 | | | 1.250%, 10/31/2021 | | | 996,914 | |
| | | | | |
| | | | Total | | | 2,798,848 | |
| | | | | |
| |
| Venezuela (0.3%) | | | | |
| | | | Petroleos de Venezuela SA | | | | |
| | 1,740,000 | | | 6.000%, 5/16/2024 | | | 652,500 | |
| | 1,677,000 | | | 6.000%, 11/15/2026 | | | 622,955 | |
| | 120,000 | | | 5.375%, 4/12/2027 | | | 43,896 | |
| | 20,000 | | | 5.500%, 4/12/2037 | | | 7,330 | |
| | | | Venezuela Government International Bond | | | | |
| | 290,000 | | | 7.750%, 10/13/2019 | | | 147,175 | |
| | 77,000 | | | 6.000%, 12/9/2020 | | | 34,188 | |
| | 330,000 | | | 9.000%, 5/7/2023 | | | 151,470 | |
| | 389,000 | | | 8.250%, 10/13/2024 | | | 171,549 | |
The accompanying Notes to Financial Statements are an integral part of this schedule.
114
PARTNER WORLDWIDE ALLOCATION FUND
Schedule of Investments as of October 31, 2016
| | | | | | | | |
Principal
Amount | | | Long-Term Fixed Income (9.6%) | | Value | |
| Venezuela (0.3%) - continued | | | | |
| | $603,000 | | | 9.250%, 5/7/2028 | | | $279,490 | |
| | 260,000 | | | 9.375%, 1/13/2034 | | | 120,640 | |
| | 50,000 | | | 7.000%, 3/31/2038 | | | 20,925 | |
| | | | | |
| | | | Total | | | 2,252,118 | |
| | | | | |
| |
| Vietnam (0.1%) | | | | |
| | | | Debt and Asset Trading Corporation | | | | |
| | 200,000 | | | 1.000%, 10/10/2025 | | | 116,000 | |
| | | | Vietnam Government International Bond | | | | |
| | 290,000 | | | 6.750%, 1/29/2020c | | | 323,018 | |
| | | | | |
| | | | Total | | | 439,018 | |
| | | | | |
| |
| Virgin Islands, British (<0.1%) | | | | |
| | | | Central American Bottling Corporation | | | | |
| | 20,000 | | | 6.750%, 2/9/2022 | | | 20,700 | |
| | 150,000 | | | 6.750%, 2/9/2022c | | | 155,250 | |
| | | | | |
| | | | Total | | | 175,950 | |
| | | | | |
| |
| Zambia (0.3%) | | | | |
| | | | Zambia Government International Bond | | | | |
| | 400,000 | | | 5.375%, 9/20/2022 | | | 347,712 | |
| | 210,000 | | | 8.500%, 4/14/2024 | | | 204,353 | |
| | 380,000 | | | 8.970%, 7/30/2027c | | | 372,567 | |
| | 1,000,000 | | | 8.970%, 7/30/2027 | | | 980,440 | |
| | | | | |
| | | | Total | | | 1,905,072 | |
| | | | | |
| | | | | | | | |
| | | | | |
| | | | Total Long-Term Fixed Income (cost $72,402,725) | | | 72,570,281 | |
| | | | | |
| | |
| Shares | | | Preferred Stock (1.0%) | | | |
| Brazil (0.1%) | | | | |
| | 155,282 | | | Vale SA ADRb | | | 1,000,016 | |
| | | | | |
| | | | Total | | | 1,000,016 | |
| | | | | |
| |
| Germany (0.2%) | | | | |
| | 10,711 | | | Volkswagen AG | | | 1,476,792 | |
| | | | | |
| | | | Total | | | 1,476,792 | |
| | | | | |
| |
| South Korea (0.7%) | | | | |
| | 4,230 | | | Samsung Electronics Company, Ltd. | | | 4,863,527 | |
| | | | | |
| | | | Total | | | 4,863,527 | |
| | | | | |
| | | | | | | | |
| | | | | |
| | | | Total Preferred Stock (cost $6,358,737) | | | 7,340,335 | |
| | | | | |
| | |
| Shares | | | Registered Investment Companies (<0.1%) | | Value | |
| Equity Funds/ETFs (<0.1%) | | | | |
| | 2,360 | | | iShares MSCI EAFE Index Fund | | | 136,455 | |
| | | | | |
| | | | Total | | | 136,455 | |
| | | | | |
| | | | | | | | |
| | | | | |
| | | | Total Registered Investment Companies (cost $137,158) | | | 136,455 | |
| | | | | |
| | |
| Shares | | | Collateral Held for Securities Loaned (0.3%) | | | |
| | 2,547,690 | | | Thrivent Cash Management Trust | | | 2,547,690 | |
| | | | | |
| | | | Total Collateral Held for Securities Loaned (cost $2,547,690) | | | 2,547,690 | |
| | | | | |
| | |
Shares or
Principal
Amount | | | Short-Term Investments (1.1%)q | | | |
| | | | Federal Home Loan Bank Discount Notes | | | | |
| | 100,000 | | | 0.320%, 11/16/2016r | | | 99,992 | |
| | 100,000 | | | 0.355%, 1/25/2017r | | | 99,924 | |
| | | | Thrivent Core Short-Term Reserve Fund | | | | |
| | 828,902 | | | 0.790% | | | 8,289,014 | |
| | | | | |
| | | | Total Short-Term Investments (cost $8,488,917) | | | 8,488,930 | |
| | | | | |
| | | | Total Investments (cost $730,807,590) 99.5% | | | $753,564,967 | |
| | | | | |
| | | | Other Assets and Liabilities, Net 0.5% | | | 3,686,529 | |
| | | | | |
| | | | Total Net Assets 100.0% | | | $757,251,496 | |
| | | | | |
a | All or a portion of the security is on loan. |
b | Non-income producing security. |
c | Denotes securities sold under Rule 144A of the Securities Act of 1933, which exempts them from registration. These securities may be resold to other dealers in the program or to other qualified institutional buyers. As of October 31, 2016, the value of these investments was $24,490,332 or 3.2% of total net assets. |
d | Security is valued at fair value. Market quotations or prices were not readily available or were determined to be unreliable. Fair value was determined in good faith pursuant to procedures adopted by the Board. Further information on fair valuation can be found in the Notes to Financial Statements. |
e | Principal amount is displayed in Euros. |
f | Denotes variable rate securities. Variable rate securities are securities whose yields vary with a designated market index or market rate. The rate shown is as of October 31, 2016. |
g | Denotes step coupon securities. Step coupon securities pay an initial coupon rate for the first period and then different coupon rates for following periods. The rate shown is as of October 31, 2016. |
h | Principal amount is displayed in Argentine Pesos. |
i | Denotes perpetual securities. Perpetual securities pay an indefinite stream of interest, but may be called by the issuer at an earlier date. |
j | Defaulted security. Interest is not being accrued. |
k | Denotes investments purchased on a when-issued or delayed delivery basis. |
l | Principal amount is displayed in Dominican Republic Pesos. |
m | Principal amount is displayed in Mexican Pesos. |
n | Principal amount is displayed in Polish Zloty. |
o | Principal amount is displayed in Brazilian Real. Security is linked to Brazilian Government Bonds due January 1, 2017. |
p | Principal amount is displayed in Brazilian Real. Security is linked to Brazilian Government Bonds due August 15, 2040. |
q | The interest rate shown reflects the yield, coupon rate or the discount rate at the date of purchase. |
r | All or a portion of the security is held on deposit with the counterparty and pledged as the initial margin deposit for open futures contracts. |
* | Denotes restricted securities. Restricted securities are investment securities which cannot be offered for public sale without first being registered under the Securities Act of 1933. The value of all restricted securities held in Partner Worldwide Allocation Fund as of October 31, 2016 was $3,238,051 or 0.4% of total net assets. The following table indicates the acquisition date and cost of restricted securities shown in the schedule as of October 31, 2016. |
The accompanying Notes to Financial Statements are an integral part of this schedule.
115
PARTNER WORLDWIDE ALLOCATION FUND
Schedule of Investments as of October 31, 2016
| | | | | | | | |
Security | | Acquisition
Date | | | Cost | |
Abengoa Transmision Sur SA, 4/30/2043 | | | 4/8/2014 | | | $ | 319,312 | |
Belize Government International Bond, 8/20/2017 | | | 3/20/2013 | | | | 101,084 | |
Brazil Loan Trust 1, 7/24/2023 | | | 7/25/2013 | | | | 359,361 | |
Brazil Minas SPE via State of Minas Gerais, 2/15/2028 | | | 3/22/2013 | | | | 709,407 | |
Digicel, Ltd., 4/15/2021 | | | 1/20/2016 | | | | 173,344 | |
Export-Import Bank of Korea, 8/14/2017 | | | 5/29/2015 | | | | 200,090 | |
Honduras Government International Bond, 12/16/2020 | | | 12/11/2013 | | | | 290,000 | |
HSBC Bank USA NA, 8/15/2040 | | | 12/2/2011 | | | | 473,544 | |
Independencia International, Ltd., 12/30/2016 | | | 3/29/2010 | | | | 100,627 | |
Phosagro OAO via Phosagro Bond Funding, Ltd., 2/13/2018 | | | 2/6/2013 | | | | 200,000 | |
Sociedad Quimica y Minera de Chile SA, 1/28/2025 | | | 10/23/2014 | | | | 198,820 | |
Ukraine Government International Bond, 5/31/2040 | | | 11/12/2015 | | | | 138,403 | |
Universal Entertainment Corporation, 8/24/2020 | | | 10/18/2016 | | | | 250,310 | |
The following table presents the total amount of securities loaned with continuous maturity, by type, offset by the gross payable upon return of collateral for securities loaned by Thrivent Partner Worldwide Allocation Fund as of October 31, 2016:
| | | | |
Securities Lending Transactions | | | |
Common Stock | | $ | 2,432,681 | |
| | | | |
Total lending | | $ | 2,432,681 | |
Gross amount payable upon return of collateral for securities loaned | | $ | 2,547,690 | |
| | | | |
Net amounts due to counterparty | | | $115,009 | |
| | | | |
Definitions:
| | | | |
ADR | | - | | American Depositary Receipt, which are certificates for an underlying foreign security’s shares held by an issuing U.S. depository bank. |
G.O. | | - | | General Obligation |
REIT | | - | | Real Estate Investment Trust is a company that buys, develops, manages and/or sells real estate assets. |
Refg. | | - | | Refunding |
Rev. | | - | | Revenue |
Ser. | | - | | Series |
The accompanying Notes to Financial Statements are an integral part of this schedule.
116
LARGE CAP STOCK FUND
Schedule of Investments as of October 31, 2016
| | | | | | | | |
| Shares | | | Common Stock (84.9%) | | Value | |
| Consumer Discretionary (14.2%) | | | | |
| | 49,590 | | | Amazon.com, Inc.a | | | $39,167,174 | |
| | 45,670 | | | AutoZone, Inc.a | | | 33,894,447 | |
| | 7,200 | | | Bayerische Motoren Werke AG | | | 546,667 | |
| | 5,200 | | | Beiersdorf AG | | | 458,432 | |
| | 110,600 | | | Berkeley Group Holdings plc | | | 3,189,873 | |
| | 14,400 | | | Brembo SPA | | | 891,559 | |
| | 117,100 | | | Bridgestone Corporation | | | 4,370,602 | |
| | 92,476 | | | Bunzl plc | | | 2,482,743 | |
| | 72,000 | | | Calsonic Kansei Corporation | | | 902,347 | |
| | 485,430 | | | Comcast Corporation | | | 30,009,283 | |
| | 29,500 | | | Compass Group plc | | | 533,784 | |
| | 146,600 | | | Denso Corporation | | | 6,379,298 | |
| | 144,600 | | | Eutelsat Communications | | | 3,030,083 | |
| | 147,100 | | | Fuji Heavy Industries, Ltd. | | | 5,748,155 | |
| | 35,600 | | | Hakuhodo Dy Holdings, Inc. | | | 427,868 | |
| | 11,300 | | | Hennes & Mauritz AB | | | 317,786 | |
| | 359,700 | | | Honda Motor Company, Ltd. | | | 10,762,809 | |
| | 199,200 | | | Inchcape plc | | | 1,583,789 | |
| | 31,300 | | | Intertek Group plc | | | 1,305,907 | |
| | 8,300 | | | Koito Manufacturing Company, Ltd. | | | 435,766 | |
| | 14,100 | | | KOMERI Company, Ltd. | | | 344,286 | |
| | 236,700 | | | Ladbrokes plc | | | 386,451 | |
| | 121,050 | | | Las Vegas Sands Corporation | | | 7,006,374 | |
| | 11,959 | | | Linamar Corporation | | | 486,366 | |
| | 11,700 | | | LVMH Moet Hennessy Louis Vuitton SE | | | 2,130,126 | |
| | 13,500 | | | Nifco, Inc. | | | 777,489 | |
| | 18,100 | | | Nokian Renkaat Oyj | | | 607,106 | |
| | 5,000 | | | Paddy Power plc | | | 518,131 | |
| | 214,300 | | | Persimmon plc | | | 4,435,996 | |
| | 16,256 | | | Publicis Groupe SA | | | 1,115,162 | |
| | 19,290 | | | Restaurant Brands International, Inc. | | | 857,826 | |
| | 7,900 | | | RTL Group SA | | | 619,134 | |
| | 28,000 | | | Sekisui Chemical Company, Ltd. | | | 440,963 | |
| | 49,600 | | | Sekisui House, Ltd. | | | 819,577 | |
| | 642,460 | | | Starbucks Corporation | | | 34,095,352 | |
| | 159,200 | | | Sumitomo Forestry Company, Ltd. | | | 2,217,696 | |
| | 92,300 | | | Sumitomo Rubber Industries, Ltd. | | | 1,548,450 | |
| | 7,000 | | | Swatch Group AG | | | 403,536 | |
| | 6,600 | | | Toyota Motor Corporation | | | 382,845 | |
| | 2,345 | | | Valora Holding AG | | | 681,900 | |
| | 86,000 | | | Wacoal Holdings Corporation | | | 992,230 | |
| | 116,230 | | | Walt Disney Company | | | 10,773,359 | |
| | 20,000 | | | Whitbread plc | | | 883,508 | |
| | 130,554 | | | Wolters Kluwer NV | | | 5,048,582 | |
| | 95,300 | | | WPP plc | | | 2,069,263 | |
| | 49,900 | | | Yokohama Rubber Company, Ltd. | | | 866,393 | |
| | | | | |
| | | | Total | | | 226,946,473 | |
| | | | | |
| |
| Consumer Staples (6.7%) | | | | |
| | 77,100 | | | Axfood AB | | | 1,204,915 | |
| | 42,746 | | | British American Tobacco plc | | | 2,449,910 | |
| | 137,800 | | | Coca-Cola HBC AG | | | 2,973,723 | |
| | 156,310 | | | CVS Health Corporation | | | 13,145,671 | |
| | 36,700 | | | Davide Campari - Milano SPA | | | 369,627 | |
| | 182,975 | | | Distribuidora Internacional de Alimentacion SA | | | 977,291 | |
| | 28,700 | | | Ebro Foods SA | | | 618,871 | |
| | 4,487 | | | George Weston, Ltd. | | | 365,637 | |
| | 29,900 | | | Henkel AG & Company KGaA | | | 3,294,467 | |
| | 217,563 | | | Imperial Brands plc | | | 10,523,967 | |
| | 26,500 | | | Jeronimo Martins SGPS SA | | | 455,355 | |
| | 31,200 | | | Kao Corporation | | | 1,605,444 | |
| | 10,800 | | | Kesko Oyj | | | 536,654 | |
| | 72,200 | | | Kewpie Corporation | | | 2,050,533 | |
| | 65,430 | | | Kimberly-Clark Corporation | | | 7,485,846 | |
| | 37,400 | | | Kirin Holdings Company, Ltd. | | | 642,968 | |
| | 523,511 | | | Koninklijke Ahold Delhaize NV | | | 11,942,604 | |
| | 100 | | | Lindt & Spruengli AG | | | 519,278 | |
| | 41,200 | | | Nestle SA | | | 2,987,573 | |
| | 15,900 | | | Ontex Group NV | | | 480,949 | |
| | 293,560 | | | Philip Morris International, Inc. | | | 28,310,926 | |
| | 9,151 | | | Premium Brands Holdings Corporation | | | 442,848 | |
| | 32,500 | | | Suedzucker AG | | | 833,712 | |
| | 151,600 | | | Walgreens Boots Alliance, Inc. | | | 12,541,868 | |
| | | | | |
| | | | Total | | | 106,760,637 | |
| | | | | |
| |
| Energy (7.7%) | | | | |
| | 524,220 | | | Baker Hughes, Inc. | | | 29,041,788 | |
| | 189,379 | | | Baytex Energy Corporationb | | | 728,544 | |
| | 2,591,061 | | | BP plc | | | 15,317,655 | |
| | 249,564 | | | Chevron Corporation | | | 26,141,829 | |
| | 164,852 | | | Crescent Point Energy Corporation | | | 1,962,787 | |
| | 111,977 | | | EQT Corporation | | | 7,390,482 | |
| | 91,600 | | | Galp Energia SGPS SA | | | 1,241,944 | |
| | 120,488 | | | OMV AG | | | 3,760,402 | |
| | 121,020 | | | Pioneer Natural Resources Company | | | 21,665,000 | |
| | 104,658 | | | Royal Dutch Shell plc | | | 2,607,815 | |
| | 215,647 | | | Royal Dutch Shell plc, Class B | | | 5,562,101 | |
| | 27,424 | | | Schlumberger, Ltd. | | | 2,145,380 | |
| | 101,321 | | | Statoil ASAb | | | 1,654,168 | |
| | 105,887 | | | Total SA | | | 5,072,530 | |
| | | | | |
| | | | Total | | | 124,292,425 | |
| | | | | |
| |
| Financials (13.6%) | | | | |
| | 377,525 | | | Aberdeen Asset Management plc | | | 1,476,745 | |
| | 61,400 | | | AIA Group, Ltd. | | | 386,268 | |
| | 71,343 | | | ASX, Ltd. | | | 2,552,019 | |
| | 222,100 | | | Australia & New Zealand Banking Group, Ltd. | | | 4,689,730 | |
| | 381,700 | | | Banco Santander SA | | | 1,870,350 | |
| | 409,267 | | | Bank of America Corporation | | | 6,752,906 | |
| | 270,394 | | | Bank of East Asia, Ltd.b | | | 1,086,959 | |
| | 61,205 | | | Bank of Montrealb | | | 3,895,071 | |
| | 181,028 | | | Bank of Nova Scotia | | | 9,728,247 | |
| | 5,433 | | | Canadian Imperial Bank of Commerce | | | 407,080 | |
| | 111,000 | | | Chiba Bank, Ltd. | | | 686,512 | |
| | 92,800 | | | Chubb, Ltd. | | | 11,785,600 | |
| | 65,641 | | | CI Financial Corporation | | | 1,207,798 | |
| | 391,040 | | | Citigroup, Inc. | | | 19,219,616 | |
| | 123,400 | | | CNP Assurances | | | 2,137,077 | |
| | 228,600 | | | Concordia Financial Group, Ltd. | | | 1,059,951 | |
| | 586,525 | | | Direct Line Insurance Group plc | | | 2,481,346 | |
| | 64,500 | | | Erste Group Bank AG | | | 2,022,652 | |
| | 20,700 | | | EXOR SPA | | | 880,059 | |
| | 20,700 | | | EXOR SPA Rightsa,c | | | 2 | |
| | 725,497 | | | FlexiGroup, Ltd. | | | 1,238,930 | |
| | 824,000 | | | Fukuoka Financial Group, Inc. | | | 3,565,837 | |
| | 76,830 | | | Genworth MI Canada, Inc.b | | | 1,668,574 | |
| | 89,320 | | | Goldman Sachs Group, Inc. | | | 15,920,397 | |
| | 4,400 | | | Groupe Bruxelles Lambert SA | | | 378,256 | |
| | 92,400 | | | Hang Seng Bank, Ltd. | | | 1,666,371 | |
| | 45,400 | | | Hannover Rueckversicherung SE | | | 5,064,907 | |
| | 678,000 | | | Henderson Group plc | | | 1,918,310 | |
| | 12,639 | | | Home Capital Group, Inc.b | | | 250,179 | |
| | 27,152 | | | Intact Financial Corporation | | | 1,845,761 | |
| | 103,870 | | | Intercontinental Exchange, Inc. | | | 28,085,409 | |
| | 420,100 | | | Invesco, Ltd. | | | 11,800,609 | |
| | 349,714 | | | J.P. Morgan Chase & Company | | | 24,221,192 | |
| | 60,800 | | | Macquarie Group, Ltd. | | | 3,675,322 | |
| | 1,713,900 | | | Mizuho Financial Group, Inc. | | | 2,885,784 | |
The accompanying Notes to Financial Statements are an integral part of this schedule.
117
LARGE CAP STOCK FUND
Schedule of Investments as of October 31, 2016
| | | | | | | | |
| Shares | | | Common Stock (84.9%) | | Value | |
| Financials (13.6%) - continued | | | | |
| | 32,800 | | | MS and AD Insurance Group Holdings, Inc. | | | $973,727 | |
| | 210,232 | | | National Bank of Canada | | | 7,504,591 | |
| | 59,600 | | | Nordea Bank AB | | | 626,344 | |
| | 141,200 | | | Old Mutual plc | | | 347,345 | |
| | 61,056 | | | Power Corporation of Canada | | | 1,309,611 | |
| | 229,000 | | | Resona Holdings, Inc. | | | 1,015,038 | |
| | 15,566 | | | Schroders plc | | | 535,781 | |
| | 141,900 | | | Seven Bank, Ltd. | | | 436,227 | |
| | 79,100 | | | Swiss Re AG | | | 7,341,411 | |
| | 236,880 | | | Synchrony Financial | | | 6,772,399 | |
| | 140,400 | | | T&D Holdings, Inc. | | | 1,697,837 | |
| | 15,000 | | | Talanx AG | | | 465,581 | |
| | 32,869 | | | Toronto-Dominion Bank | | | 1,491,394 | |
| | 204,922 | | | United Overseas Bank, Ltd. | | | 2,764,526 | |
| | 250,400 | | | Westpac Banking Corporation | | | 5,790,482 | |
| | | | | |
| | | | Total | | | 217,584,120 | |
| | | | | |
| |
| Health Care (8.5%) | | | | |
| | 63,171 | | | AstraZeneca plc | | | 3,537,280 | |
| | 3,900 | | | Bayer AG | | | 387,232 | |
| | 210,540 | | | Celgene Corporationa | | | 21,512,977 | |
| | 38,300 | | | CSL, Ltd. | | | 2,922,502 | |
| | 76,438 | | | Essilor International SA | | | 8,589,639 | |
| | 5,900 | | | Gerresheimer AG | | | 445,039 | |
| | 168,460 | | | Gilead Sciences, Inc. | | | 12,403,710 | |
| | 58,700 | | | Grifols SA | | | 1,158,291 | |
| | 60,500 | | | Hikma Pharmaceuticals plc | | | 1,297,629 | |
| | 5,134 | | | ICON plca | | | 412,158 | |
| | 10,700 | | | Lonza Group AG | | | 2,019,108 | |
| | 448,500 | | | Merck & Company, Inc. | | | 26,335,920 | |
| | 33,100 | | | Merck KGaA | | | 3,407,000 | |
| | 123,800 | | | Novartis AG | | | 8,785,787 | |
| | 107,000 | | | Novo Nordisk AS | | | 3,811,929 | |
| | 8,800 | | | Otsuka Holdings Company, Ltd. | | | 385,140 | |
| | 946,150 | | | Pfizer, Inc. | | | 30,002,416 | |
| | 11,900 | | | Roche Holding AG-Genusschein | | | 2,733,212 | |
| | 86,186 | | | Vertex Pharmaceuticals, Inc.a | | | 6,538,070 | |
| | | | | |
| | | | Total | | | 136,685,039 | |
| | | | | |
| |
| Industrials (10.1%) | | | | |
| | 94,400 | | | ABB, Ltd. | | | 1,947,512 | |
| | 32,100 | | | Adecco SA | | | 1,906,096 | |
| | 362,099 | | | Air New Zealand, Ltd. | | | 499,480 | |
| | 15,000 | | | Andritz AG | | | 784,284 | |
| | 246,000 | | | Asahi Glass Company, Ltd. | | | 1,720,477 | |
| | 17,300 | | | Atlas Copco Aktiebolagb | | | 506,805 | |
| | 78,400 | | | Babcock International Group plc | | | 947,690 | |
| | 23,700 | | | Berendsen plc | | | 279,687 | |
| | 136,070 | | | Boeing Company | | | 19,380,450 | |
| | 20,499 | | | Canadian National Railway Company | | | 1,288,657 | |
| | 245,000 | | | Cathay Pacific Airways, Ltd.b | | | 322,478 | |
| | 4,000 | | | Central Japan Railway Company | | | 680,185 | |
| | 91,900 | | | Cummins, Inc. | | | 11,746,658 | |
| | 63,000 | | | Dai Nippon Printing Company, Ltd. | | | 631,908 | |
| | 405,050 | | | Delta Air Lines, Inc. | | | 16,918,938 | |
| | 43,300 | | | Deutsche Post AG | | | 1,342,778 | |
| | 33,500 | | | DSV AS | | | 1,622,066 | |
| | 38,400 | | | East Japan Railway Company | | | 3,380,295 | |
| | 10,500 | | | Flughafen Zuerich AG | | | 1,930,153 | |
| | 22,700 | | | Fraport AG Frankfurt Airport Services Worldwide | | | 1,347,489 | |
| | 22,800 | | | Getinge AB | | | 373,361 | |
| | 26,500 | | | Hitachi Transport System, Ltd. | | | 546,283 | |
| | 9,800 | | | Hochtief AG | | | 1,338,166 | |
| | 30,300 | | | Inaba Denki Sangyo Company, Ltd. | | | 1,099,326 | |
| | 603,300 | | | ITOCHU Corporation | | | 7,618,894 | |
| | 28,400 | | | Jardine Matheson Holdings, Ltd. | | | 1,729,844 | |
| | 66,000 | | | Kamigumi Company, Ltd. | | | 563,542 | |
| | 141,900 | | | KITZ Corporation | | | 815,952 | |
| | 140,800 | | | KONE Oyj | | | 6,478,475 | |
| | 32,939 | | | Koninklijke Boskalis Westminster NV | | | 1,062,339 | |
| | 5,500 | | | Kuehne & Nagel International AG | | | 745,482 | |
| | 7,200 | | | Legrand SA | | | 406,969 | |
| | 229,611 | | | Meggitt plc | | | 1,221,526 | |
| | 55,800 | | | MIRAIT Holdings Corporation | | | 494,786 | |
| | 193,000 | | | Mitsubishi Electric Corporation | | | 2,611,132 | |
| | 65,000 | | | Mitsuboshi Belting, Ltd. | | | 560,528 | |
| | 108,000 | | | Nippon Express Company, Ltd. | | | 533,460 | |
| | 108,600 | | | Nitto Kogyo Corporation | | | 1,593,100 | |
| | 230,570 | | | Norfolk Southern Corporation | | | 21,443,010 | |
| | 24,500 | | | Randstad Holding NV | | | 1,260,110 | |
| | 3,243 | | | Rieter Holding AG | | | 616,778 | |
| | 55,900 | | | Sanwa Holdings Corporation | | | 556,727 | |
| | 2,300 | | | Schindler Holding AG | | | 425,748 | |
| | 11,900 | | | Schindler Holding AG, Participation Certificate | | | 2,210,744 | |
| | 7,100 | | | Secom Company, Ltd. | | | 512,188 | |
| | 23,700 | | | Securitas AB | | | 365,783 | |
| | 55,800 | | | Siemens AG | | | 6,339,881 | |
| | 93,400 | | | Smiths Group plc | | | 1,618,458 | |
| | 124,110 | | | Union Pacific Corporation | | | 10,944,020 | |
| | 71,380 | | | United Parcel Service, Inc. | | | 7,691,909 | |
| | 98,400 | | | Vinci SAb | | | 7,126,114 | |
| | 23,835 | | | WSP Global, Inc. | | | 772,110 | |
| | 20,200 | | | Yuasa Trading Company, Ltd. | | | 483,925 | |
| | | | | |
| | | | Total | | | 161,344,756 | |
| | | | | |
| |
| Information Technology (13.8%) | | | | |
| | 43,052 | | | Alphabet, Inc., Class Aa | | | 34,867,815 | |
| | 43,588 | | | Alphabet, Inc., Class Ca | | | 34,196,530 | |
| | 495,946 | | | Apple, Inc. | | | 56,309,709 | |
| | 57,400 | | | Canon, Inc. | | | 1,648,990 | |
| | 4,300 | | | Cap Gemini SA | | | 356,114 | |
| | 73,820 | | | Check Point Software Technologies, Ltd.a | | | 6,242,219 | |
| | 362,700 | | | Cisco Systems, Inc. | | | 11,127,636 | |
| | 182,510 | | | Facebook, Inc.a | | | 23,906,985 | |
| | 132,600 | | | FUJIFILM Holdings NPV | | | 5,013,726 | |
| | 29,100 | | | Halma plc | | | 372,537 | |
| | 15,000 | | | Micro Focus International plc | | | 392,785 | |
| | 382,740 | | | Microsoft Corporation | | | 22,933,781 | |
| | 56,500 | | | NEC Networks & System Integration Corporation | | | 1,004,104 | |
| | 19,300 | | | Nice, Ltd. | | | 1,281,096 | |
| | 30,500 | | | NS Solutions Corporation | | | 581,588 | |
| | 13,800 | | | NTT Data Corporation | | | 712,152 | |
| | 6,500 | | | Oracle Corporation Japan | | | 353,748 | |
| | 200,380 | | | Salesforce.com, Inc.a | | | 15,060,561 | |
| | 5,000 | | | SAP SE | | | 440,499 | |
| | 28,600 | | | Software AG | | | 1,039,449 | |
| | 14,800 | | | Tokyo Electron, Ltd. | | | 1,335,034 | |
| | 12,300 | | | Trend Micro, Inc. | | | 433,136 | |
| | 10,600 | | | United Internet AG | | | 435,817 | |
| | 146,400 | | | Yahoo Japan Corporation | | | 561,589 | |
| | 56,830 | | | Yandex NVa | | | 1,118,983 | |
| | | | | |
| | | | Total | | | 221,726,583 | |
| | | | | |
| |
| Materials (4.3%) | | | | |
| | 29,100 | | | Adeka Corporation | | | 439,890 | |
| | 3,900 | | | Air Liquide SA | | | 396,291 | |
| | 53,027 | | | APERAM | | | 2,411,617 | |
| | 467,378 | | | BHP Billiton, Ltd. | | | 8,165,476 | |
| | 472,556 | | | BlueScope Steel, Ltd. | | | 2,803,499 | |
The accompanying Notes to Financial Statements are an integral part of this schedule.
118
LARGE CAP STOCK FUND
Schedule of Investments as of October 31, 2016
| | | | | | | | |
| Shares | | | Common Stock (84.9%) | | Value | |
| Materials (4.3%) - continued | |
| | 21,100 | | | Croda International plc | | | $902,341 | |
| | 245,600 | | | Daicel Corporation | | | 3,229,443 | |
| | 88,000 | | | Denki Kagaku Kogyo KK | | | 399,220 | |
| | 262,000 | | | Dow Chemical Company | | | 14,098,220 | |
| | 169,780 | | | Eastman Chemical Company | | | 12,208,880 | |
| | 158,137 | | | Evonik Industries AG | | | 4,952,321 | |
| | 1,000 | | | Givaudan SA | | | 1,934,068 | |
| | 45,400 | | | Hexpol AB | | | 373,108 | |
| | 109,400 | | | Kinross Gold Corporationa | | | 422,284 | |
| | 71,200 | | | Kuraray Company, Ltd. | | | 1,079,429 | |
| | 173,300 | | | Mitsubishi Chemical Holdings Corporation | | | 1,137,875 | |
| | 35,500 | | | Mitsubishi Gas Chemical Company, Inc. | | | 546,371 | |
| | 21,700 | | | Mitsubishi Materials Corporation | | | 621,726 | |
| | 24,400 | | | Newcrest Mining, Ltd. | | | 427,230 | |
| | 6,500 | | | Nippon Shokubai Company, Ltd. | | | 448,565 | |
| | 708,682 | | | Norsk Hydro ASA | | | 3,168,333 | |
| | 198,513 | | | Orora, Ltd. | | | 437,439 | |
| | 70,400 | | | RPC Group plc | | | 816,400 | |
| | 15,800 | | | Sumitomo Seika Chemicals Company, Ltd. | | | 590,741 | |
| | 89,000 | | | Tosoh Corporation | | | 581,215 | |
| | 109,965 | | | UPM-Kymmene Oyj | | | 2,557,965 | |
| | 129,037 | | | Yara International ASA | | | 4,558,139 | |
| | | | | |
| | | | Total | | | 69,708,086 | |
| | | | | |
| |
| Real Estate (1.5%) | | | | |
| | 354,400 | | | CapitaMall Trust | | | 528,106 | |
| | 36,300 | | | Castellum AB | | | 491,864 | |
| | 5,300 | | | Daito Trust Construction Company, Ltd. | | | 888,168 | |
| | 562,300 | | | DEXUS Property Group | | | 3,819,777 | |
| | 326,300 | | | Frasers Centrepoint Trust | | | 487,838 | |
| | 188,216 | | | H&R Real Estate Investment Trust | | | 3,200,781 | |
| | 45,196 | | | Hamborner REIT AG | | | 446,825 | |
| | 76,500 | | | Hufvudstaden AB | | | 1,184,027 | |
| | 663,000 | | | Hysan Development Company, Ltd. | | | 3,060,001 | |
| | 122,500 | | | Link REIT | | | 871,457 | |
| | 2,498,635 | | | New World Development Company, Ltd. | | | 3,106,428 | |
| | 21,990 | | | RioCan Real Estate Investment Trust | | | 427,570 | |
| | 224,000 | | | Sino Land Company, Ltd. | | | 380,339 | |
| | 1,025,853 | | | Stockland | | | 3,445,264 | |
| | 73,000 | | | Wharf Holdings, Ltd. | | | 547,333 | |
| | 99,000 | | | Wheelock and Company, Ltd. | | | 609,257 | |
| | 609,200 | | | Wing Tai Holdings, Ltd. | | | 742,202 | |
| | | | | |
| | | | Total | | | 24,237,237 | |
| | | | | |
| |
| Telecommunications Services (1.8%) | | | | |
| | 25,280 | | | BCE, Inc. | | | 1,148,560 | |
| | 320,600 | | | BT Group plc | | | 1,471,573 | |
| | 113,100 | | | Elisa Oyj | | | 3,810,493 | |
| | 82,900 | | | Freenet AG | | | 2,376,682 | |
| | 1,391,702 | | | KCOM Group plc | | | 2,005,813 | |
| | 12,900 | | | KDDI Corporation | | | 392,072 | |
| | 690,775 | | | Koninklijke (Royal) KPN NV | | | 2,252,456 | |
| | 6,700 | | | Millicom International Cellular SA | | | 294,376 | |
| | 143,700 | | | Nippon Telegraph & Telephone Corporation | | | 6,371,204 | |
| | 52,300 | | | NTT DOCOMO, Inc. | | | 1,313,462 | |
| | 113,900 | | | Orange SA | | | 1,792,073 | |
| | 1,649,744 | | | PCCW, Ltd. | | | 982,006 | |
| | 40,800 | | | Proximus SA | | | 1,167,803 | |
| | 8,500 | | | SoftBank Group Corporation | | | 535,339 | |
| | 142,300 | | | Telefonica Deutschland Holding AG | | | 551,887 | |
| | 92,502 | | | Telenor ASAb | | | 1,471,231 | |
| | 150,500 | | | Vodafone Group plc | | | 413,324 | |
| | | | | |
| | | | Total | | | 28,350,354 | |
| | | | | |
| |
| Utilities (2.7%) | | | | |
| | 513,300 | | | Centrica plc | | | 1,344,469 | |
| | 214,100 | | | DUET Group | | | 387,612 | |
| | 48,200 | | | E.ON SE | | | 353,253 | |
| | 700,900 | | | Electricidade de Portugal SA | | | 2,316,669 | |
| | 839,000 | | | Osaka Gas Company, Ltd. | | | 3,489,571 | |
| | 529,410 | | | PG&E Corporation | | | 32,886,949 | |
| | 462,200 | | | Redes Energeticas Nacionais SGPS SA | | | 1,350,635 | |
| | 79,000 | | | Toho Gas Company, Ltd. | | | 732,594 | |
| | 96,800 | | | United Utilities Group plc | | | 1,112,708 | |
| | | | | |
| | | | Total | | | 43,974,460 | |
| | | | | |
| | | | | |
| | | | | |
| | | | Total Common Stock (cost $1,068,341,134) | | | 1,361,610,170 | |
| | | | | |
| | |
| Shares | | | Registered Investment Companies (0.2%) | | Value | |
| Equity Funds/ETFs (0.2%) | | | | |
| | 45,310 | | | iShares MSCI EAFE Index Fund | | | 2,619,824 | |
| | | | | |
| | | | Total | | | 2,619,824 | |
| | | | | |
| | | | | |
| | | | | |
| | | | Total Registered Investment Companies (cost $2,639,893) | | | 2,619,824 | |
| | | | | |
| | |
| Shares | | | Collateral Held for Securities Loaned (0.9%) | | Value | |
| | 13,952,780 | | | Thrivent Cash Management Trust | | | 13,952,780 | |
| | | | | |
| | | | Total Collateral Held for Securities Loaned (cost $13,952,780) | | | 13,952,780 | |
| | | | | |
| | |
Shares or
Principal
Amount | | | Short-Term Investments (14.3%)d | | Value | |
| | | | Federal Home Loan Bank Discount Notes | | | | |
| | 450,000 | | | 0.320%, 11/1/2016 | | | 450,000 | |
| | 1,400,000 | | | 0.310%, 11/2/2016 | | | 1,399,992 | |
| | 9,600,000 | | | 0.326%, 11/9/2016 | | | 9,599,578 | |
| | 2,055,000 | | | 0.335%, 11/14/2016 | | | 2,054,852 | |
| | 4,000,000 | | | 0.285%, 11/16/2016 | | | 3,999,668 | |
| | 2,100,000 | | | 0.250%, 11/18/2016 | | | 2,099,803 | |
| | 16,300,000 | | | 0.265%, 11/23/2016 | | | 16,298,011 | |
| | 7,500,000 | | | 0.300%, 11/25/2016 | | | 7,499,002 | |
| | 1,700,000 | | | 0.289%, 11/30/2016 | | | 1,699,726 | |
| | 24,250,000 | | | 0.337%, 12/2/2016e | | | 24,245,611 | |
| | 33,000,000 | | | 0.350%, 12/7/2016 | | | 32,993,070 | |
| | 6,900,000 | | | 0.347%, 12/9/2016 | | | 6,898,468 | |
| | 10,800,000 | | | 0.280%, 12/23/2016 | | | 10,796,728 | |
| | 2,250,000 | | | 0.290%, 12/30/2016 | | | 2,249,226 | |
| | 6,600,000 | | | 0.310%, 1/3/2017 | | | 6,596,304 | |
| | 6,600,000 | | | 0.338%, 1/6/2017 | | | 6,596,126 | |
| | 102,000 | | | 0.350%, 1/11/2017 | | | 101,936 | |
| | 1,400,000 | | | 0.350%, 1/13/2017 | | | 1,399,091 | |
| | 7,100,000 | | | 0.340%, 1/20/2017 | | | 7,094,952 | |
| | 3,100,000 | | | 0.356%, 1/25/2017 | | | 3,097,656 | |
| | 4,500,000 | | | 0.365%, 1/27/2017 | | | 4,496,521 | |
The accompanying Notes to Financial Statements are an integral part of this schedule.
119
LARGE CAP STOCK FUND
Schedule of Investments as of October 31, 2016
| | | | | | | | |
Shares or
Principal
Amount | | | Short-Term Investments (14.3%)d | | Value | |
| | | | Thrivent Core Short-Term Reserve Fund | | | | |
| | 7,842,880 | | | 0.790% | | | $78,428,796 | |
| | | | | |
| | | | Total Short-Term Investments (cost $230,082,357) | | | 230,095,117 | |
| | | | | |
| | | | Total Investments (cost $1,315,016,164) 100.3% | | | $1,608,277,891 | |
| | | | | |
| | | | Other Assets and Liabilities, Net (0.3%) | | | (4,806,314 | ) |
| | | | | |
| | | | Total Net Assets 100.0% | | | $1,603,471,577 | |
| | | | | |
a | Non-income producing security. |
b | All or a portion of the security is on loan. |
c | Security is valued at fair value. Market quotations or prices were not readily available or were determined to be unreliable. Fair value was determined in good faith pursuant to procedures adopted by the Board. Further information on fair valuation can be found in the Notes to Financial Statements. |
d | The interest rate shown reflects the yield, coupon rate or the discount rate at the date of purchase. |
e | All or a portion of the security is held on deposit with the counterparty and pledged as the initial margin deposit for open futures contracts. |
The following table presents the total amount of securities loaned with continuous maturity, by type, offset by the gross payable upon return of collateral for securities loaned by Thrivent Large Cap Stock Fund as of October 31, 2016:
| | | | |
Securities Lending Transactions | | | |
Common Stock | | $ | 13,213,208 | |
| | | | |
Total lending | | $ | 13,213,208 | |
Gross amount payable upon return of collateral for securities loaned | | $ | 13,952,780 | |
| | | | |
Net amounts due to counterparty | | | $739,572 | |
| | | | |
The accompanying Notes to Financial Statements are an integral part of this schedule.
120
HIGH YIELD FUND
Schedule of Investments as of October 31, 2016
| | | | | | | | |
Principal
Amount | | | Bank Loans (2.4%)a | | Value | |
| Basic Materials (0.5%) | | | | |
| | | | Fortescue Metals Group, Ltd., Term Loan | | | | |
| | $3,215,114 | | | 3.750%, 6/30/2019 | | | $3,212,091 | |
| | | | | |
| | | | Total | | | 3,212,091 | |
| | | | | |
| |
| Capital Goods (0.4%) | | | | |
| | | | Cortes NP Acquisition Corporation, Term Loan | | | | |
| | 2,700,000 | | | 0.000%, 10/3/2023b,c | | | 2,683,125 | |
| | | | | |
| | | | Total | | | 2,683,125 | |
| | | | | |
| |
| Consumer Cyclical (1.4%) | | | | |
| | | | IMG Worldwide, Inc., Term Loan | | | | |
| | 2,750,000 | | | 8.250%, 5/6/2022 | | | 2,744,280 | |
| | | | Mohegan Tribal Gaming Authority, Term Loan | | | | |
| | 2,815,200 | | | 0.000%, 9/30/2023b,c | | | 2,803,770 | |
| | | | Scientific Games International, Inc., Term Loan | | | | |
| | 4,372,125 | | | 6.000%, 10/1/2021 | | | 4,388,521 | |
| | | | | |
| | | | Total | | | 9,936,571 | |
| | | | | |
| |
| Energy (0.1%) | | | | |
| | | | Chesapeake Energy Corporation, Term Loan | | | | |
| | 950,000 | | | 8.500%, 8/23/2021 | | | 1,014,723 | |
| | | | | |
| | | | Total | | | 1,014,723 | |
| | | | | |
| | | | | |
| | | | | |
| | | | Total Bank Loans (cost $16,345,908) | | | 16,846,510 | |
| | | | | |
| | |
Principal
Amount | | | Long-Term Fixed Income (90.2%) | | Value | |
| Asset-Backed Securities (0.1%) | | | | |
| | | | Renaissance Home Equity Loan Trust | | | | |
| | 1,488,318 | | | 5.746%, 5/25/2036d | | | 999,436 | |
| | | | | |
| | | | Total | | | 999,436 | |
| | | | | |
| |
| Basic Materials (4.5%) | | | | |
| | | | Alcoa Nederland Holding BV | | | | |
| | 1,425,000 | | | 6.750%, 9/30/2024e | | | 1,474,875 | |
| | 1,425,000 | | | 7.000%, 9/30/2026e | | | 1,467,465 | |
| | | | ArcelorMittal SA | | | | |
| | 1,935,000 | | | 6.500%, 3/1/2021f | | | 2,123,662 | |
| | | | Bluescope Steel Finance, Ltd. | | | | |
| | 2,380,000 | | | 6.500%, 5/15/2021e | | | 2,511,138 | |
| | | | First Quantum Minerals, Ltd. | | | | |
| | 1,966,000 | | | 6.750%, 2/15/2020e | | | 1,882,445 | |
| | 1,901,000 | | | 7.000%, 2/15/2021e | | | 1,804,762 | |
| | | | GCP Applied Technologies, Inc. | | | | |
| | 1,310,000 | | | 9.500%, 2/1/2023e | | | 1,483,575 | |
| | | | HudBay Minerals, Inc. | | | | |
| | 2,780,000 | | | 9.500%, 10/1/2020 | | | 2,849,500 | |
| | | | INEOS Group Holdings SA | | | | |
| | 2,855,000 | | | 5.625%, 8/1/2024e,f | | | 2,830,019 | |
| | | | Midwest Vanadium, Pty. Ltd. | | | | |
| | 2,925,408 | | | 11.500%, 2/15/2018*,g | | | 95,076 | |
| | | | Novelis Corporation | | | | |
| | 1,430,000 | | | 6.250%, 8/15/2024e | | | 1,487,200 | |
| | 2,030,000 | | | 5.875%, 9/30/2026e | | | 2,055,375 | |
| | | | PQ Corporation | | | | |
| | 950,000 | | | 6.750%, 11/15/2022e | | | 1,024,813 | |
| | | | Resolute Forest Products, Inc. | | | | |
| | 3,335,000 | | | 5.875%, 5/15/2023 | | | 2,826,412 | |
| | | | Teck Resources, Ltd. | | | | |
| | 1,430,000 | | | 8.000%, 6/1/2021e | | | 1,562,275 | |
| | 950,000 | | | 8.500%, 6/1/2024e,f | | | 1,099,625 | |
| | | | Tembec Industries, Inc. | | | | |
| | 2,340,000 | | | 9.000%, 12/15/2019e | | | 1,860,300 | |
| | | | Versum Materials, Inc. | | | | |
| | 1,430,000 | | | 5.500%, 9/30/2024e | | | 1,462,175 | |
| | | | | |
| | | | Total | | | 31,900,692 | |
| | | | | |
| |
| Capital Goods (8.0%) | | | | |
| | | | Abengoa Finance SAU | | | | |
| | 2,750,000 | | | 7.750%, 2/1/2020*,h | | | 96,250 | |
| | | | Abengoa Greenfield SA | | | | |
| | 3,040,000 | | | 6.500%, 10/1/2019*,h | | | 136,800 | |
| | | | Advanced Disposal Services, Inc. | | | | |
| | 1,425,000 | | | 5.625%, 11/15/2024c,e | | | 1,432,125 | |
| | | | AECOM | | | | |
| | 2,340,000 | | | 5.750%, 10/15/2022 | | | 2,456,017 | |
| | 935,000 | | | 5.875%, 10/15/2024 | | | 987,594 | |
| | | | Anixter, Inc. | | | | |
| | 3,045,000 | | | 5.125%, 10/1/2021 | | | 3,178,980 | |
| | | | Ardagh Packaging Finance plc | | | | |
| | 3,810,000 | | | 7.250%, 5/15/2024e | | | 4,019,550 | |
| | | | Berry Plastics Corporation | | | | |
| | 5,630,000 | | | 5.125%, 7/15/2023 | | | 5,728,525 | |
| | | | Bombardier, Inc. | | | | |
| | 3,805,000 | | | 7.500%, 3/15/2025e | | | 3,405,475 | |
| | | | Building Materials Corporation of America | | | | |
| | 3,710,000 | | | 6.000%, 10/15/2025e | | | 3,960,240 | |
| | | | Case New Holland, Inc. | | | | |
| | 577,000 | | | 7.875%, 12/1/2017 | | | 610,899 | |
| | | | Cemex Finance, LLC | | | | |
| | 2,305,000 | | | 9.375%, 10/12/2022e | | | 2,518,212 | |
| | | | Cemex SAB de CV | | | | |
| | 2,500,000 | | | 5.700%, 1/11/2025e,f | | | 2,543,750 | |
| | | | CNH Industrial Capital, LLC | | | | |
| | 1,440,000 | | | 3.625%, 4/15/2018 | | | 1,452,600 | |
| | 1,575,000 | | | 4.375%, 11/6/2020 | | | 1,610,438 | |
| | | | CNH Industrial NV | | | | |
| | 1,700,000 | | | 4.500%, 8/15/2023 | | | 1,708,500 | |
| | | | Eagle Materials, Inc. | | | | |
| | 1,430,000 | | | 4.500%, 8/1/2026 | | | 1,441,391 | |
| | | | Huntington Ingalls Industries, Inc. | | | | |
| | 2,350,000 | | | 5.000%, 11/15/2025e | | | 2,471,918 | |
| | | | Owens-Brockway Glass Container, Inc. | | | | |
| | 2,680,000 | | | 5.875%, 8/15/2023e | | | 2,855,875 | |
| | | | Reynolds Group Issuer, Inc. | | | | |
| | 2,370,000 | | | 8.250%, 2/15/2021 | | | 2,476,060 | |
| | 1,995,000 | | | 5.125%, 7/15/2023e | | | 2,047,987 | |
| | | | U.S. Concrete, Inc. | | | | |
| | 2,620,000 | | | 6.375%, 6/1/2024 | | | 2,724,800 | |
| | | | United Rentals North America, Inc. | | | | |
| | 1,375,000 | | | 6.125%, 6/15/2023 | | | 1,436,875 | |
| | 2,340,000 | | | 5.500%, 7/15/2025 | | | 2,369,250 | |
| | 2,380,000 | | | 5.875%, 9/15/2026 | | | 2,424,268 | |
| | | | | |
| | | | Total | | | 56,094,379 | |
| | | | | |
| |
| Communications Services (18.4%) | | | | |
| | | | Altice Financing SA | | | | |
| | 1,660,000 | | | 6.625%, 2/15/2023e | | | 1,709,800 | |
| | 2,855,000 | | | 7.500%, 5/15/2026e | | | 2,940,650 | |
| | | | Altice Finco SA | | | | |
| | 950,000 | | | 9.875%, 12/15/2020e | | | 1,005,812 | |
| | 460,000 | | | 8.125%, 1/15/2024e | | | 471,500 | |
| | 200,000 | | | 7.625%, 2/15/2025e,f | | | 198,000 | |
| | | | Altice US Finance I Corporation | | | | |
| | 2,600,000 | | | 5.500%, 5/15/2026e | | | 2,652,000 | |
The accompanying Notes to Financial Statements are an integral part of this schedule.
121
HIGH YIELD FUND
Schedule of Investments as of October 31, 2016
| | | | | | | | |
Principal
Amount | | | Long-Term Fixed Income (90.2%) | | Value | |
| Communications Services (18.4%) - continued | | | | |
| | | | AMC Networks, Inc. | | | | |
| | $3,340,000 | | | 4.750%, 12/15/2022 | | | $3,406,800 | |
| | 2,400,000 | | | 5.000%, 4/1/2024 | | | 2,430,000 | |
| | | | CBS Radio, Inc. | | | | |
| | 2,845,000 | | | 7.250%, 11/1/2024e | | | 2,955,244 | |
| | | | CCO Holdings, LLC | | | | |
| | 1,835,000 | | | 5.250%, 3/15/2021 | | | 1,908,400 | |
| | 1,835,000 | | | 5.250%, 9/30/2022 | | | 1,910,694 | |
| | 4,500,000 | | | 5.875%, 4/1/2024e | | | 4,758,750 | |
| | | | CCOH Safari, LLC | | | | |
| | 2,750,000 | | | 5.750%, 2/15/2026e | | | 2,865,156 | |
| | | | CenturyLink, Inc. | | | | |
| | 2,375,000 | | | 7.500%, 4/1/2024f | | | 2,472,969 | |
| | | | Clear Channel Worldwide Holdings, Inc. | | | | |
| | 3,005,000 | | | 6.500%, 11/15/2022 | | | 3,060,592 | |
| | | | Columbus International, Inc. | | | | |
| | 4,435,000 | | | 7.375%, 3/30/2021e | | | 4,745,450 | |
| | | | CSC Holdings, LLC | | | | |
| | 745,000 | | | 5.500%, 4/15/2027e | | | 755,709 | |
| | | | Digicel, Ltd. | | | | |
| | 1,470,000 | | | 7.000%, 2/15/2020* | | | 1,411,200 | |
| | 2,780,000 | | | 6.000%, 4/15/2021* | | | 2,487,266 | |
| | | | Frontier Communications Corporation | | | | |
| | 6,287,000 | | | 10.500%, 9/15/2022 | | | 6,538,480 | |
| | | | Gray Television, Inc. | | | | |
| | 3,190,000 | | | 5.875%, 7/15/2026e | | | 3,174,050 | |
| | | | Hughes Satellite Systems Corporation | | | | |
| | 6,190,000 | | | 6.625%, 8/1/2026e | | | 6,128,100 | |
| | | | Level 3 Escrow II, Inc. | | | | |
| | 3,000,000 | | | 5.375%, 8/15/2022 | | | 3,082,500 | |
| | | | Level 3 Financing, Inc. | | | | |
| | 1,380,000 | | | 6.125%, 1/15/2021 | | | 1,424,850 | |
| | 2,380,000 | | | 5.250%, 3/15/2026e | | | 2,415,700 | |
| | | | McGraw-Hill Global Education Holdings, LLC | | | | |
| | 2,855,000 | | | 7.875%, 5/15/2024e,f | | | 3,090,538 | |
| | | | Neptune Finco Corporation | | | | |
| | 5,050,000 | | | 10.875%, 10/15/2025e | | | 5,807,500 | |
| | | | Nexstar Escrow Corporation | | | | |
| | 2,750,000 | | | 5.625%, 8/1/2024e | | | 2,729,375 | |
| | | | SFR Group SA | | | | |
| | 3,910,000 | | | 6.000%, 5/15/2022e | | | 4,009,001 | |
| | 2,290,000 | | | 6.250%, 5/15/2024e | | | 2,288,557 | |
| | 2,380,000 | | | 7.375%, 5/1/2026e | | | 2,403,800 | |
| | | | Sinclair Television Group, Inc. | | | | |
| | 1,430,000 | | | 5.875%, 3/15/2026e | | | 1,476,475 | |
| | | | Sprint Communications, Inc. | | | | |
| | 2,530,000 | | | 7.000%, 3/1/2020e | | | 2,751,375 | |
| | 4,640,000 | | | 6.000%, 11/15/2022 | | | 4,323,923 | |
| | | | Sprint Corporation | | | | |
| | 11,385,000 | | | 7.625%, 2/15/2025f | | | 11,014,987 | |
| | | | T-Mobile USA, Inc. | | | | |
| | 3,210,000 | | | 6.542%, 4/28/2020 | | | 3,314,325 | |
| | 3,140,000 | | | 6.000%, 4/15/2024 | | | 3,340,175 | |
| | | | Unitymedia Hessen GmbH & Company KG | | | | |
| | 4,650,000 | | | 5.500%, 1/15/2023e | | | 4,818,562 | |
| | | | Virgin Media Secured Finance plc | | | | |
| | 1,030,000 | | | 5.250%, 1/15/2026e | | | 1,019,391 | |
| | 950,000 | | | 5.500%, 8/15/2026e | | | 958,313 | |
| | | | WMG Acquisition Corporation | | | | |
| | 3,675,000 | | | 6.750%, 4/15/2022e | | | 3,881,719 | |
| | 715,000 | | | 5.000%, 8/1/2023e | | | 723,938 | |
| | | | Zayo Group, LLC | | | | |
| | 3,575,000 | | | 6.375%, 5/15/2025 | | | 3,763,832 | |
| | | | Ziggo Bond Finance BV | | | | |
| | 1,180,000 | | | 5.875%, 1/15/2025e | | | 1,171,150 | |
| | | | | |
| | | | Total | | | 129,796,608 | |
| | | | | |
| |
| Consumer Cyclical (13.2%) | | | | |
| | | | Allison Transmission, Inc. | | | | |
| | 3,480,000 | | | 5.000%, 10/1/2024e | | | 3,549,600 | |
| | | | Beazer Homes USA, Inc. | | | | |
| | 960,000 | | | 8.750%, 3/15/2022e | | | 1,020,000 | |
| | | | Brookfield Residential Properties, Inc. | | | | |
| | 3,570,000 | | | 6.125%, 7/1/2022e | | | 3,623,550 | |
| | | | Choice Hotels International, Inc. | | | | |
| | 3,026,000 | | | 5.750%, 7/1/2022 | | | 3,309,687 | |
| | | | Churchill Downs, Inc. | | | | |
| | 3,110,000 | | | 5.375%, 12/15/2021 | | | 3,218,850 | |
| | | | Cinemark USA, Inc. | | | | |
| | 4,205,000 | | | 4.875%, 6/1/2023 | | | 4,210,256 | |
| | | | CST Brands, Inc. | | | | |
| | 1,890,000 | | | 5.000%, 5/1/2023 | | | 1,984,500 | |
| | | | Dana Financing Luxembourg SARL | | | | |
| | 3,575,000 | | | 6.500%, 6/1/2026e | | | 3,802,906 | |
| | | | Dollar Tree, Inc. | | | | |
| | 1,880,000 | | | 5.750%, 3/1/2023 | | | 2,002,200 | |
| | | | Goodyear Tire & Rubber Company | | | | |
| | 2,850,000 | | | 5.000%, 5/31/2026 | | | 2,874,938 | |
| | | | Hanesbrands, Inc. | | | | |
| | 1,800,000 | | | 4.875%, 5/15/2026e | | | 1,831,500 | |
| | | | Hilton Escrow Issuer, LLC | | | | |
| | 1,190,000 | | | 4.250%, 9/1/2024e | | | 1,192,975 | |
| | | | KB Home | | | | |
| | 930,000 | | | 7.250%, 6/15/2018 | | | 985,800 | |
| | 1,750,000 | | | 8.000%, 3/15/2020 | | | 1,942,500 | |
| | 1,420,000 | | | 7.500%, 9/15/2022 | | | 1,537,150 | |
| | | | L Brands, Inc. | | | | |
| | 1,430,000 | | | 6.625%, 4/1/2021 | | | 1,644,500 | |
| | 1,640,000 | | | 5.625%, 2/15/2022 | | | 1,795,800 | |
| | | | Lennar Corporation | | | | |
| | 940,000 | | | 4.500%, 11/15/2019 | | | 990,525 | |
| | 2,810,000 | | | 4.750%, 5/30/2025 | | | 2,850,745 | |
| | | | Live Nation Entertainment, Inc. | | | | |
| | 3,575,000 | | | 5.375%, 6/15/2022e | | | 3,700,125 | |
| | 1,500,000 | | | 4.875%, 11/1/2024e | | | 1,496,250 | |
| | | | LKQ Corporation | | | | |
| | 3,495,000 | | | 4.750%, 5/15/2023 | | | 3,586,744 | |
| | | | Masonite International Corporation | | | | |
| | 1,800,000 | | | 5.625%, 3/15/2023e | | | 1,863,000 | |
| | | | Mohegan Tribal Gaming Authority | | | | |
| | 2,850,000 | | | 7.875%, 10/15/2024e,f | | | 2,892,750 | |
| | | | New Cotai, LLC | | | | |
| | 1,924,106 | | | 10.625%, 5/1/2019* | | | 1,135,223 | |
| | | | PulteGroup, Inc. | | | | |
| | 1,905,000 | | | 5.500%, 3/1/2026 | | | 1,981,200 | |
| | 2,145,000 | | | 5.000%, 1/15/2027 | | | 2,128,913 | |
| | | | RHP Hotel Properties, LP | | | | |
| | 710,000 | | | 5.000%, 4/15/2021 | | | 731,300 | |
| | 840,000 | | | 5.000%, 4/15/2023 | | | 856,800 | |
| | | | Rite Aid Corporation | | | | |
| | 2,835,000 | | | 6.750%, 6/15/2021 | | | 2,976,750 | |
| | 2,840,000 | | | 6.125%, 4/1/2023e | | | 2,996,200 | |
| | | | Scientific Games International, Inc. | | | | |
| | 2,060,000 | | | 6.625%, 5/15/2021 | | | 1,694,350 | |
The accompanying Notes to Financial Statements are an integral part of this schedule.
122
HIGH YIELD FUND
Schedule of Investments as of October 31, 2016
| | | | | | | | |
Principal
Amount | | | Long-Term Fixed Income (90.2%) | | Value | |
| Consumer Cyclical (13.2%) - continued | | | | |
| | | | Seminole Indian Tribe of Florida | | | | |
| | $2,385,000 | | | 7.804%, 10/1/2020* | | | $2,414,812 | |
| | | | Studio City Finance, Ltd. | | | | |
| | 2,335,000 | | | 8.500%, 12/1/2020e,f | | | 2,416,725 | |
| | | | Summit Materials, LLC | | | | |
| | 2,350,000 | | | 6.125%, 7/15/2023 | | | 2,408,750 | |
| | | | Toll Brothers Finance Corporation | | | | |
| | 2,340,000 | | | 4.875%, 11/15/2025 | | | 2,386,800 | |
| | | | Tunica-Biloxi Gaming Authority | | | | |
| | 4,180,000 | | | 9.000%, 11/15/2015*,g | | | 1,463,000 | |
| | | | West Corporation | | | | |
| | 3,210,000 | | | 5.375%, 7/15/2022e | | | 3,089,625 | |
| | | | Yum! Brands, Inc. | | | | |
| | 1,910,000 | | | 5.250%, 6/1/2026e | | | 1,991,175 | |
| | | | ZF North America Capital, Inc. | | | | |
| | 1,875,000 | | | 4.500%, 4/29/2022e | | | 1,985,156 | |
| | 1,875,000 | | | 4.750%, 4/29/2025e | | | 1,978,125 | |
| | | | | |
| | | | Total | | | 92,541,755 | |
| | | | | |
| |
| Consumer Non-Cyclical (11.3%) | | | | |
| | | | Air Medical Merger Sub Corporation | | | | |
| | 2,810,000 | | | 6.375%, 5/15/2023e | | | 2,676,525 | |
| | | | Albertsons Companies, LLC | | | | |
| | 2,380,000 | | | 6.625%, 6/15/2024e | | | 2,469,250 | |
| | | | B&G Foods, Inc. | | | | |
| | 3,300,000 | | | 4.625%, 6/1/2021 | | | 3,390,750 | |
| | | | Cott Beverages, Inc. | | | | |
| | 2,885,000 | | | 5.375%, 7/1/2022 | | | 2,928,275 | |
| | | | Energizer Holdings, Inc. | | | | |
| | 3,760,000 | | | 5.500%, 6/15/2025e | | | 3,807,000 | |
| | | | Envision Healthcare Corporation | | | | |
| | 3,205,000 | | | 5.125%, 7/1/2022e | | | 3,205,000 | |
| | | | Grifols Worldwide Operations, Ltd. | | | | |
| | 3,855,000 | | | 5.250%, 4/1/2022 | | | 4,018,838 | |
| | | | HCA, Inc. | | | | |
| | 2,355,000 | | | 6.500%, 2/15/2020 | | | 2,608,162 | |
| | 4,190,000 | | | 5.875%, 3/15/2022 | | | 4,609,000 | |
| | 1,640,000 | | | 4.750%, 5/1/2023 | | | 1,707,650 | |
| | 3,295,000 | | | 5.375%, 2/1/2025 | | | 3,363,207 | |
| | 3,140,000 | | | 5.875%, 2/15/2026 | | | 3,297,000 | |
| | 1,010,000 | | | 4.500%, 2/15/2027 | | | 997,375 | |
| | | | JBS USA, LLC | | | | |
| | 2,750,000 | | | 5.875%, 7/15/2024e | | | 2,763,750 | |
| | 4,795,000 | | | 5.750%, 6/15/2025e | | | 4,699,100 | |
| | | | MPH Acquisition Holdings, LLC | | | | |
| | 3,810,000 | | | 7.125%, 6/1/2024e | | | 4,076,319 | |
| | | | Post Holdings, Inc. | | | | |
| | 2,775,000 | | | 5.000%, 8/15/2026e | | | 2,691,750 | |
| | | | Prestige Brands, Inc. | | | | |
| | 710,000 | | | 6.375%, 3/1/2024e | | | 754,375 | |
| | | | Revlon Consumer Products Corporation | | | | |
| | 4,240,000 | | | 5.750%, 2/15/2021 | | | 4,282,400 | |
| | | | Spectrum Brands Escrow Corporation | | | | |
| | 1,820,000 | | | 6.625%, 11/15/2022 | | | 1,950,822 | |
| | | | Spectrum Brands, Inc. | | | | |
| | 1,880,000 | | | 5.750%, 7/15/2025 | | | 2,035,100 | |
| | | | Teleflex, Inc. | | | | |
| | 2,225,000 | | | 5.250%, 6/15/2024 | | | 2,302,875 | |
| | | | Tenet Healthcare Corporation | | | | |
| | 2,750,000 | | | 6.000%, 10/1/2020 | | | 2,896,795 | |
| | 1,775,000 | | | 8.125%, 4/1/2022 | | | 1,735,062 | |
| | | | TreeHouse Foods, Inc. | | | | |
| | 3,635,000 | | | 4.875%, 3/15/2022 | | | 3,771,312 | |
| | | | Valeant Pharmaceuticals International | | | | |
| | 2,400,000 | | | 7.250%, 7/15/2022e | | | 2,088,000 | |
| | 2,355,000 | | | 5.500%, 3/1/2023e | | | 1,848,675 | |
| | | | VPII Escrow Corporation | | | | |
| | 2,830,000 | | | 7.500%, 7/15/2021e | | | 2,518,700 | |
| | | | | |
| | | | Total | | | 79,493,067 | |
| | | | | |
| |
| Energy (11.2%) | | | | |
| | | | Antero Resources Corporation | | | | |
| | 1,415,000 | | | 5.125%, 12/1/2022 | | | 1,425,613 | |
| | 2,360,000 | | | 5.625%, 6/1/2023 | | | 2,407,200 | |
| | | | Cheniere Corpus Christi Holdings, LLC | | | | |
| | 1,800,000 | | | 7.000%, 6/30/2024e | | | 1,908,000 | |
| | | | Concho Resources, Inc. | | | | |
| | 4,260,000 | | | 6.500%, 1/15/2022 | | | 4,409,100 | |
| | | | Continental Resources, Inc. | | | | |
| | 3,330,000 | | | 5.000%, 9/15/2022f | | | 3,263,400 | |
| | 2,390,000 | | | 4.500%, 4/15/2023 | | | 2,276,475 | |
| | | | Crestwood Midstream Partners, LP | | | | |
| | 2,065,000 | | | 6.125%, 3/1/2022 | | | 2,111,462 | |
| | 2,365,000 | | | 6.250%, 4/1/2023 | | | 2,394,563 | |
| | | | Diamondback Energy, Inc. | | | | |
| | 1,895,000 | | | 4.750%, 11/1/2024e | | | 1,895,000 | |
| | | | Holly Energy Partners, LP | | | | |
| | 835,000 | | | 6.000%, 8/1/2024e | | | 868,400 | |
| | | | Hornbeck Offshore Services, Inc. | | | | |
| | 1,885,000 | | | 5.875%, 4/1/2020 | | | 1,215,825 | |
| | 1,410,000 | | | 5.000%, 3/1/2021 | | | 838,950 | |
| | | | MEG Energy Corporation | | | | |
| | 945,000 | | | 6.500%, 3/15/2021e | | | 815,062 | |
| | 2,840,000 | | | 6.375%, 1/30/2023e | | | 2,343,000 | |
| | | | MPLX, LP | | | | |
| | 4,315,000 | | | 4.875%, 12/1/2024 | | | 4,512,851 | |
| | | | Murphy Oil Corporation | | | | |
| | 1,190,000 | | | 6.875%, 8/15/2024 | | | 1,255,396 | |
| | | | Oasis Petroleum, Inc. | | | | |
| | 3,100,000 | | | 6.875%, 1/15/2023f | | | 3,038,000 | |
| | | | Precision Drilling Corporation | | | | |
| | 2,200,000 | | | 6.625%, 11/15/2020 | | | 2,142,250 | |
| | 940,000 | | | 6.500%, 12/15/2021 | | | 908,275 | |
| | 1,150,000 | | | 5.250%, 11/15/2024 | | | 1,013,725 | |
| | | | Range Resources Corporation | | | | |
| | 3,820,000 | | | 5.000%, 3/15/2023e,f | | | 3,695,850 | |
| | | | Rice Energy, Inc. | | | | |
| | 3,895,000 | | | 6.250%, 5/1/2022 | | | 3,963,163 | |
| | 940,000 | | | 7.250%, 5/1/2023f | | | 996,400 | |
| | | | Rowan Companies, Inc. | | | | |
| | 4,760,000 | | | 4.875%, 6/1/2022 | | | 4,093,600 | |
| | | | Sabine Pass Liquefaction, LLC | | | | |
| | 2,355,000 | | | 5.625%, 2/1/2021 | | | 2,478,638 | |
| | 1,915,000 | | | 5.625%, 3/1/2025 | | | 2,026,357 | |
| | 2,380,000 | | | 5.875%, 6/30/2026e | | | 2,564,926 | |
| | | | Sunoco, LP | | | | |
| | 2,335,000 | | | 5.500%, 8/1/2020 | | | 2,370,025 | |
| | 1,170,000 | | | 6.375%, 4/1/2023 | | | 1,196,325 | |
| | | | Tesoro Logistics, LP | | | | |
| | 2,100,000 | | | 5.500%, 10/15/2019 | | | 2,241,750 | |
| | 1,870,000 | | | 6.250%, 10/15/2022 | | | 1,982,200 | |
| | | | Weatherford International, Ltd. | | | | |
| | 1,905,000 | | | 7.750%, 6/15/2021f | | | 1,924,050 | |
| | 2,145,000 | | | 4.500%, 4/15/2022f | | | 1,930,500 | |
| | | | Whiting Petroleum Corporation | | | | |
| | 955,000 | | | 5.000%, 3/15/2019 | | | 907,250 | |
| | 953,000 | | | 5.750%, 3/15/2021f | | | 883,907 | |
The accompanying Notes to Financial Statements are an integral part of this schedule.
123
HIGH YIELD FUND
Schedule of Investments as of October 31, 2016
| | | | | | | | |
Principal
Amount | | | Long-Term Fixed Income (90.2%) | | Value | |
| Energy (11.2%) - continued | | | | |
| | | | WPX Energy, Inc. | | | | |
| | $1,910,000 | | | 7.500%, 8/1/2020 | | | $2,012,663 | |
| | 2,330,000 | | | 8.250%, 8/1/2023f | | | 2,516,400 | |
| | | | | |
| | | | Total | | | 78,826,551 | |
| | | | | |
| |
| Financials (7.9%) | | | | |
| | | | AerCap Ireland Capital, Ltd. | | | | |
| | 1,405,000 | | | 4.625%, 10/30/2020 | | | 1,478,763 | |
| | | | Aircastle, Ltd. | | | | |
| | 2,800,000 | | | 5.000%, 4/1/2023 | | | 2,898,000 | |
| | | | Ally Financial, Inc. | | | | |
| | 5,630,000 | | | 4.125%, 3/30/2020 | | | 5,721,488 | |
| | 2,120,000 | | | 4.125%, 2/13/2022 | | | 2,120,657 | |
| | | | Argos Merger Sub, Inc. | | | | |
| | 4,270,000 | | | 7.125%, 3/15/2023e,f | | | 4,467,487 | |
| | | | Banco do Brasil SA/Cayman Islands | | | | |
| | 1,250,000 | | | 6.250%, 12/31/2049e,i | | | 925,000 | |
| | | | BBVA International Preferred SA Unipersonal | | | | |
| | 1,415,000 | | | 5.919%, 4/29/2049i | | | 1,418,537 | |
| | | | Centene Escrow Corporation | | | | |
| | 4,060,000 | | | 6.125%, 2/15/2024 | | | 4,323,900 | |
| | | | CIT Group, Inc. | | | | |
| | 3,205,000 | | | 3.875%, 2/19/2019 | | | 3,254,069 | |
| | | | Credit Agricole SA | | | | |
| | 935,000 | | | 6.625%, 9/29/2049e,f,i | | | 909,287 | |
| | | | CyrusOne, LP | | | | |
| | 3,460,000 | | | 6.375%, 11/15/2022 | | | 3,667,600 | |
| | | | Drawbridge Special Opportunities Fund, LP | | | | |
| | 3,215,000 | | | 5.000%, 8/1/2021e | | | 3,078,362 | |
| | | | HSBC Holdings plc | | | | |
| | 960,000 | | | 6.875%, 12/29/2049i | | | 1,010,400 | |
| | | | Icahn Enterprises, LP | | | | |
| | 3,625,000 | | | 6.000%, 8/1/2020 | | | 3,561,562 | |
| | | | ILFC E-Capital Trust II | | | | |
| | 1,605,000 | | | 4.250%, 12/21/2065e,j | | | 1,308,075 | |
| | | | Jefferies Finance, LLC | | | | |
| | 2,350,000 | | | 7.375%, 4/1/2020* | | | 2,332,375 | |
| | | | Lloyds Banking Group plc | | | | |
| | 920,000 | | | 6.657%, 1/29/2049e,i | | | 1,023,500 | |
| | | | MPT Operating Partnership, LP | | | | |
| | 1,052,000 | | | 6.375%, 2/15/2022f | | | 1,091,450 | |
| | 2,640,000 | | | 5.500%, 5/1/2024 | | | 2,719,200 | |
| | | | Prime Security Services Borrower, LLC | | | | |
| | 3,000,000 | | | 9.250%, 5/15/2023e | | | 3,187,500 | |
| | | | Quicken Loans, Inc. | | | | |
| | 3,745,000 | | | 5.750%, 5/1/2025e | | | 3,698,188 | |
| | | | Royal Bank of Scotland Group plc | | | | |
| | 1,635,000 | | | 7.500%, 12/29/2049i | | | 1,500,113 | |
| | | | | |
| | | | Total | | | 55,695,513 | |
| | | | | |
| |
| Foreign Government (0.3%) | | | | |
| | | | Argentina Government International Bond | | | | |
| | 1,900,000 | | | 7.500%, 4/22/2026e | | | 2,075,750 | |
| | | | | |
| | | | Total | | | 2,075,750 | |
| | | | | |
| |
| Technology (7.2%) | | | | |
| | | | Alliance Data Systems Corporation | | | | |
| | 6,120,000 | | | 5.375%, 8/1/2022e | | | 5,890,500 | |
| | | | Brocade Communications Systems, Inc. | | | | |
| | 3,410,000 | | | 4.625%, 1/15/2023 | | | 3,358,850 | |
| | | | Cengage Learning, Inc. | | | | |
| | 4,770,000 | | | 9.500%, 6/15/2024e | | | 4,495,725 | |
| | | | CommScope Technologies Finance, LLC | | | | |
| | 4,225,000 | | | 6.000%, 6/15/2025e | | | 4,436,250 | |
| | | | Diamond Finance Corporation | | | | |
| | 950,000 | | | 5.875%, 6/15/2021e | | | 1,001,260 | |
| | 1,430,000 | | | 7.125%, 6/15/2024e | | | 1,566,501 | |
| | | | Equinix, Inc. | | | | |
| | 2,815,000 | | | 5.750%, 1/1/2025 | | | 2,976,863 | |
| | 970,000 | | | 5.875%, 1/15/2026 | | | 1,036,852 | |
| | | | First Data Corporation | | | | |
| | 3,000,000 | | | 5.375%, 8/15/2023e | | | 3,105,000 | |
| | 1,690,000 | | | 7.000%, 12/1/2023e | | | 1,770,275 | |
| | | | Inception Merger Sub, Inc. | | | | |
| | 2,370,000 | | | 8.625%, 11/15/2024c,e | | | 2,370,000 | |
| | | | Micron Technology, Inc. | | | | |
| | 4,270,000 | | | 5.250%, 8/1/2023e | | | 4,184,600 | |
| | | | NXP Funding, LLC | | | | |
| | 3,285,000 | | | 5.750%, 3/15/2023e | | | 3,498,525 | |
| | | | Plantronics, Inc. | | | | |
| | 2,110,000 | | | 5.500%, 5/31/2023e | | | 2,146,925 | |
| | | | Sensata Technologies BV | | | | |
| | 4,130,000 | | | 4.875%, 10/15/2023e | | | 4,279,712 | |
| | | | SS&C Technologies Holdings, Inc. | | | | |
| | 1,410,000 | | | 5.875%, 7/15/2023 | | | 1,476,975 | |
| | | | Western Digital Corporation | | | | |
| | 2,800,000 | | | 10.500%, 4/1/2024e | | | 3,234,000 | |
| | | | | |
| | | | Total | | | 50,828,813 | |
| | | | | |
| |
| Transportation (4.0%) | | | | |
| | | | American Airlines Pass Through Trust | | | | |
| | 2,976,918 | | | 5.600%, 7/15/2020e | | | 3,114,600 | |
| | | | Avis Budget Car Rental, LLC | | | | |
| | 3,100,000 | | | 5.125%, 6/1/2022e,f | | | 3,038,000 | |
| | 3,150,000 | | | 5.500%, 4/1/2023f | | | 3,118,500 | |
| | | | Continental Airlines, Inc. | | | | |
| | 1,440,000 | | | 6.125%, 4/29/2018 | | | 1,512,000 | |
| | | | Dynagas LNG Partners, LP | | | | |
| | 1,870,000 | | | 6.250%, 10/30/2019 | | | 1,729,750 | |
| | | | Eletson Holdings, Inc. | | | | |
| | 1,830,000 | | | 9.625%, 1/15/2022* | | | 1,345,050 | |
| | | | Navios Maritime Holdings, Inc. | | | | |
| | 2,030,000 | | | 8.125%, 2/15/2019f | | | 1,177,400 | |
| | 1,605,000 | | | 8.125%, 11/15/2021e | | | 1,211,775 | |
| | | | Navios South American Logistics, Inc. | | | | |
| | 1,600,000 | | | 7.250%, 5/1/2022e | | | 1,264,000 | |
| | | | Teekay Offshore Partners, LP | | | | |
| | 3,210,000 | | | 6.000%, 7/30/2019 | | | 2,724,487 | |
| | | | Ultrapetrol Bahamas, Ltd. | | | | |
| | 3,280,000 | | | 8.875%, 6/15/2021g | | | 623,200 | |
| | | | United Airlines Pass Through Trust | | | | |
| | 1,177,140 | | | 5.375%, 8/15/2021 | | | 1,224,226 | |
| | | | XPO Logistics, Inc. | | | | |
| | 4,290,000 | | | 6.500%, 6/15/2022e,f | | | 4,461,600 | |
| | 1,430,000 | | | 6.125%, 9/1/2023e | | | 1,471,113 | |
| | | | | |
| | | | Total | | | 28,015,701 | |
| | | | | |
| |
| U.S. Government and Agencies (0.1%) | | | | |
| | | | U.S. Treasury Notes | | | | |
| | 800,000 | | | 0.875%, 11/30/2016 | | | 800,434 | |
| | | | | |
| | | | Total | | | 800,434 | |
| | | | | |
| |
| Utilities (4.0%) | | | | |
| | | | AES Corporation | | | | |
| | 2,350,000 | | | 4.875%, 5/15/2023 | | | 2,331,646 | |
| | | | Calpine Corporation | | | | |
| | 3,280,000 | | | 5.375%, 1/15/2023f | | | 3,247,200 | |
The accompanying Notes to Financial Statements are an integral part of this schedule.
124
HIGH YIELD FUND
Schedule of Investments as of October 31, 2016
| | | | | | | | |
Principal
Amount | | | Long-Term Fixed Income (90.2%) | | Value | |
| Utilities (4.0%) - continued | | | | |
| | | | Covanta Holding Corporation | | | | |
| | $2,400,000 | | | 7.250%, 12/1/2020 | | | $2,463,000 | |
| | 1,650,000 | | | 6.375%, 10/1/2022 | | | 1,678,875 | |
| | | | Dynegy, Inc. | | | | |
| | 4,280,000 | | | 7.625%, 11/1/2024f | | | 4,098,100 | |
| | | | Electricite de France SA | | | | |
| | 2,500,000 | | | 5.250%, 12/29/2049e,i | | | 2,475,000 | |
| | | | Energy Transfer Equity, LP | | | | |
| | 3,755,000 | | | 5.500%, 6/1/2027 | | | 3,661,125 | |
| | | | Holly Energy Partners, LP | | | | |
| | 2,400,000 | | | 6.500%, 3/1/2020 | | | 2,466,000 | |
| | | | Regency Energy Partners, LP | | | | |
| | 3,950,000 | | | 5.500%, 4/15/2023 | | | 4,067,900 | |
| | | | Targa Resources Partners, LP | | | | |
| | 1,430,000 | | | 5.375%, 2/1/2027e | | | 1,430,000 | |
| | | | | |
| | | | Total | | | 27,918,846 | |
| | | | | |
| | | | | | | | |
| | | | | |
| | | | Total Long-Term Fixed Income (cost $639,422,740) | | | 634,987,545 | |
| | | | | |
| | |
| Shares | | | Preferred Stock (1.2%) | | Value | |
| Consumer Staples (0.1%) | | | | |
| | 36,650 | | | CHS, Inc., | | | 1,084,840 | |
| | | | 7.100%i | | | | |
| | | | | |
| | | | Total | | | 1,084,840 | |
| | | | | |
| |
| Financials (1.1%) | | | | |
| | 52,669 | | | Citigroup, Inc., 6.875%i | | | 1,511,074 | |
| | 48,000 | | | Discover Financial Services 6.500%i | | | 1,257,120 | |
| | 74,979 | | | Goldman Sachs Group, Inc., 5.500%i | | | 1,954,702 | |
| | 16,984 | | | Morgan Stanley, 6.875%i | | | 493,555 | |
| | 17,280 | | | PNC Financial Services Group, Inc., 6.125%i | | | 487,296 | |
| | 1,440 | | | Wells Fargo & Company, Convertible, 7.500%i | | | 1,879,200 | |
| | | | | |
| | | �� | Total | | | 7,582,947 | |
| | | | | |
| | | | | | | | |
| | | | | |
| | | | Total Preferred Stock (cost $8,214,056) | | | 8,667,787 | |
| | | | | |
| | |
| Shares | | | Registered Investment Companies (0.8%) | | Value | |
| Equity Funds/ETFs (0.8%) | | | | |
| | 50,000 | | | Energy Select Sector SPDR Fund | | | 3,431,000 | |
| | 53,000 | | | SPDR S&P Oil & Gas Exploration & Production ETFf | | | 1,873,550 | |
| | | | | |
| | | | Total | | | 5,304,550 | |
| | | | | |
| | | | | | | | |
| | | | | |
| | | | Total Registered Investment Companies (cost $4,897,547) | | | 5,304,550 | |
| | | | | |
| | |
| Shares | | | Common Stock (0.1%) | | Value | |
| Consumer Discretionary (<0.1%) | | | | |
| | 36,330 | | | TVMAX Holdings, Inc.k,l | | | 4 | |
| | | | | |
| | | | Total | | | 4 | |
| | | | | |
| |
| Energy (0.1%) | | | | |
| | 6,516 | | | Vantage Drilling Internationall | | | 547,344 | |
| | | | | |
| | | | Total | | | 547,344 | |
| | | | | |
| |
| Financials (<0.1%) | | | | |
| | 10 | | | New Cotai, LLCk,l | | | 0 | |
| | | | | |
| | | | Total | | | 0 | |
| | | | | |
| | | | | | | | |
| | | | | |
| | | | Total Common Stock (cost $3,140,190) | | | 547,348 | |
| | | | | |
| | |
| Shares | | | Collateral Held for Securities Loaned (9.4%) | | Value | |
| | 66,352,314 | | | Thrivent Cash Management Trust | | | 66,352,314 | |
| | | | | |
| | | | Total Collateral Held for Securities Loaned (cost $66,352,314) | | | 66,352,314 | |
| | | | | |
| | |
Shares or
Principal
Amount | | | Short-Term Investments (5.1%)m | | Value | |
| | | | Thrivent Core Short-Term Reserve Fund | | | | |
| | 3,595,387 | | | 0.790% | | | 35,953,868 | |
| | | | | |
| | | | Total Short-Term Investments (cost $35,953,868) | | | 35,953,868 | |
| | | | | |
| | | | Total Investments (cost $774,326,623) 109.2% | | | $768,659,922 | |
| | | | | |
| | | | Other Assets and Liabilities, Net (9.2%) | | | (64,941,784 | ) |
| | | | | |
| | | | Total Net Assets 100.0% | | | $703,718,138 | |
| | | | | |
a | The stated interest rate represents the weighted average of all contracts within the bank loan facility. |
b | All or a portion of the loan is unfunded. |
c | Denotes investments purchased on a when-issued or delayed delivery basis. |
d | Denotes step coupon securities. Step coupon securities pay an initial coupon rate for the first period and then different coupon rates for following periods. The rate shown is as of October 31, 2016. |
e | Denotes securities sold under Rule 144A of the Securities Act of 1933, which exempts them from registration. These securities may be resold to other dealers in the program or to other qualified institutional buyers. As of October 31, 2016, the value of these investments was $291,403,643 or 41.4% of total net assets. |
f | All or a portion of the security is on loan. |
g | Defaulted security. Interest is not being accrued. |
h | In bankruptcy. Interest is not being accrued. |
i | Denotes perpetual securities. Perpetual securities pay an indefinite stream of interest, but may be called by the issuer at an earlier date. |
j | Denotes variable rate securities. Variable rate securities are securities whose yields vary with a designated market index or market rate. The rate shown is as of October 31, 2016. |
k | Security is valued at fair value. Market quotations or prices were not readily available or were determined to be unreliable. Fair value was determined in good faith pursuant to procedures adopted by the Board. Further information on fair valuation can be found in the Notes to Financial Statements. |
l | Non-income producing security. |
m | The interest rate shown reflects the yield, coupon rate or the discount rate at the date of purchase. |
* | Denotes restricted securities. Restricted securities are investment securities which cannot be offered for public sale without first being registered under the Securities Act of 1933. The value of all restricted securities held in High Yield Fund as of October 31, 2016 was $12,917,052 or 1.8% of total net assets. The following table indicates the acquisition date and cost of restricted securities shown in the schedule as of October 31, 2016. |
| | | | | | | | |
Security | | Acquisition
Date | | | Cost | |
Abengoa Finance SAU, 2/1/2020 | | | 12/6/2013 | | | $ | 2,750,000 | |
Abengoa Greenfield SA, 10/1/2019 | | | 9/24/2014 | | | | 3,040,000 | |
Digicel, Ltd., 4/15/2021 | | | 3/19/2013 | | | | 2,780,000 | |
The accompanying Notes to Financial Statements are an integral part of this schedule.
125
HIGH YIELD FUND
Schedule of Investments as of October 31, 2016
| | | | | | | | |
Security | | Acquisition
Date | | | Cost | |
Digicel, Ltd., 2/15/2020 | | | 2/7/2012 | | | $ | 1,470,000 | |
Eletson Holdings, Inc., 1/15/2022 | | | 12/12/2013 | | | | 1,804,691 | |
Jefferies Finance, LLC, 4/1/2020 | | | 3/19/2013 | | | | 2,350,000 | |
Midwest Vanadium, Pty. Ltd., 2/15/2018 | | | 2/9/2011 | | | | 2,773,675 | |
New Cotai, LLC, 5/1/2019 | | | 4/15/2013 | | | | 1,966,294 | |
Seminole Indian Tribe of Florida, 10/1/2020 | | | 7/8/2010 | | | | 2,279,083 | |
Tunica-Biloxi Gaming Authority, 11/15/2016 | | | 11/8/2005 | | | | 4,182,396 | |
The following table presents the total amount of securities loaned with continuous maturity, by type, offset by the gross payable upon return of collateral for securities loaned by Thrivent High Yield Fund as of October 31, 2016:
| | | | |
Securities Lending Transactions | | | |
Taxable Debt Security | | $ | 61,367,077 | |
Common Stock | | | 1,873,550 | |
| | | | |
Total lending | | $ | 63,240,627 | |
Gross amount payable upon return of collateral for securities loaned | | $ | 66,352,314 | |
| | | | |
Net amounts due to counterparty | | | $3,111,687 | |
| | | | |
Definitions:
| | | | |
ETF | | - | | Exchange Traded Fund. |
The accompanying Notes to Financial Statements are an integral part of this schedule.
126
INCOME FUND
Schedule of Investments as of October 31, 2016
| | | | | | | | |
Principal Amount | | | Bank Loans (3.4%)a | | Value | |
| Basic Materials (0.2%) | | | | |
| | | | Arch Coal, Inc., Term Loan | | | | |
| | $149,516 | | | 10.000%, 10/5/2021 | | | $152,630 | |
| | | | Fortescue Metals Group, Ltd., Term Loan | | | | |
| | 585,295 | | | 3.750%, 6/30/2019 | | | 584,745 | |
| | | | Ineos US Finance, LLC, Term Loan | | | | |
| | 851,891 | | | 3.750%, 12/ 15/2020 | | | 853,842 | |
| | | | | |
| | | | Total | | | 1,591,217 | |
| | | | | |
| |
| Capital Goods (0.2%) | | | | |
| | | | ADS Waste Holdings, Inc., Term Loan | | | | |
| | 679,750 | | | 3.750%, 10/9/2019 | | | 679,940 | |
| | | | Cortes NP Acquisition Corporation, Term Loan | | | | |
| | 1,205,000 | | | 0.000%, 10/3/2023b,c | | | 1,197,469 | |
| | | | | |
| | | | Total | | | 1,877,409 | |
| | | | | |
| |
| Communications Services (1.1%) | | | | |
| | | | Beasley Broadcast Group, Inc., Term Loan | | | | |
| | 200,000 | | | 0.000%, 10/4/2023b,c | | | 197,750 | |
| | | | CSC Holdings, LLC, Term Loan | | | | |
| | 312,500 | | | 3.876%, 10/11/2024 | | | 313,478 | |
| | | | Hargray Communications Group, Inc., Term Loan | | | | |
| | 887,650 | | | 4.750%, 6/26/2019 | | | 892,088 | |
| | | | Intelsat Jackson Holdings SA, Term Loan | | | | |
| | 141,101 | | | 3.750%, 6/30/2019 | | | 134,767 | |
| | | | Level 3 Communications, Inc., Term Loan | | | | |
| | 900,000 | | | 4.000%, 1/15/2020 | | | 904,050 | |
| | | | LTS Buyer, LLC, Term Loan | | | | |
| | 928,010 | | | 4.088%, 4/13/2020 | | | 928,938 | |
| | | | NEP/NCP Holdco, Inc., Term Loan | | | | |
| | 868,775 | | | 4.250%, 1/22/2020 | | | 865,787 | |
| | | | Numericable US, LLC, Term Loan | | | | |
| | 942,875 | | | 4.750%, 2/10/2023 | | | 942,875 | |
| | | | TNS, Inc., Term Loan | | | | |
| | 455,875 | | | 5.000%, 2/14/2020 | | | 457,302 | |
| | | | Univision Communications, Inc., Term Loan | | | | |
| | 902,358 | | | 4.000%, 3/1/2020 | | | 903,766 | |
| | | | Virgin Media Investment Holdings, Ltd., Term Loan | | | | |
| | 430,989 | | | 3.500%, 6/30/2023 | | | 432,661 | |
| | | | WideOpenWest Finance, LLC, Term Loan | | | | |
| | 450,000 | | | 4.500%, 8/18/2023 | | | 448,772 | |
| | | | Yankee Cable Acquisition, LLC, Term Loan | | | | |
| | 810,575 | | | 4.250%, 3/1/2020 | | | 811,085 | |
| | | | Zayo Group, LLC, Term Loan | | | | |
| | 786,923 | | | 3.750%, 5/6/2021 | | | 790,590 | |
| | | | | |
| | | | Total | | | 9,023,909 | |
| | | | | |
| |
| Consumer Cyclical (0.4%) | | | | |
| | | | Amaya BV, Term Loan | | | | |
| | 928,250 | | | 5.000%, 8/1/2021 | | | 926,941 | |
| | | | Burlington Coat Factory Warehouse Corporation, Term Loan | | | | |
| | 723,862 | | | 3.500%, 8/13/2021 | | | 728,611 | |
| | | | Cengage Learning Acquisitions, Term Loan | | | | |
| | 503,738 | | | 5.250%, 6/7/2023 | | | 491,879 | |
| | | | IMG Worldwide, Inc., Term Loan | | | | |
| | 740,530 | | | 5.250%, 5/6/2021 | | | 743,678 | |
| | | | Mohegan Tribal Gaming Authority, Term Loan | | | | |
| | 365,000 | | | 0.000%, 9/30/2023b,c | | | 363,518 | |
| | | | | |
| | | | Total | | | 3,254,627 | |
| | | | | |
| |
| Consumer Non-Cyclical (0.6%) | | | | |
| | | | Albertson’s, LLC, Term Loan | | | | |
| | 495,238 | | | 4.750%, 6/22/2023 | | | 500,398 | |
| | | | CHS/Community Health Systems, Inc., Term Loan | | | | |
| | 413,478 | | | 4.000%, 1/27/2021 | | | 390,013 | |
| | | | JBS USA, LLC, Term Loan | | | | |
| | 1,538,375 | | | 4.000%, 10/30/2022 | | | 1,534,914 | |
| | | | McGraw-Hill Global Education Holdings, LLC, Term Loan | | | | |
| | 723,187 | | | 5.000%, 5/4/2022 | | | 721,228 | |
| | | | Ortho-Clinical Diagnostics, Inc., Term Loan | | | | |
| | 426,726 | | | 4.750%, 6/30/2021 | | | 416,412 | |
| | | | Sterigenics-Nordion Holdings, LLC, Term Loan | | | | |
| | 445,500 | | | 4.250%, 5/16/2022 | | | 443,272 | |
| | | | Valeant Pharmaceuticals International, Inc., Term Loan | | | | |
| | 1,358,943 | | | 5.500%, 4/1/2022 | | | 1,353,847 | |
| | | | | |
| | | | Total | | | 5,360,084 | |
| | | | | |
| |
| Energy (0.1%) | | | | |
| | | | Houston Fuel Oil Terminal, LLC, Term Loan | | | | |
| | 223,858 | | | 4.250%, 8/19/2021 | | | 219,941 | |
| | | | McJunkin Red Man Corporation, Term Loan | | | | |
| | 235,778 | | | 5.000%, 11/8/2019 | | | 233,520 | |
| | | | MEG Energy Corporation, Term Loan | | | | |
| | 248,048 | | | 3.750%, 3/31/2020 | | | 233,668 | |
| | | | Targa Resources Partners, LP, Term Loan | | | | |
| | 57,000 | | | 5.750%, 2/27/2022 | | | 57,071 | |
| | | | | |
| | | | Total | | | 744,200 | |
| | | | | |
| |
| Financials (0.2%) | | | | |
| | | | Harland Clarke Holdings Corporation, Term Loan | | | | |
| | 424,125 | | | 7.000%, 12/31/2019 | | | 421,122 | |
| | | | WaveDivision Holdings, LLC, Term Loan | | | | |
| | 866,266 | | | 4.000%, 10/15/2019 | | | 868,215 | |
| | | | | |
| | | | Total | | | 1,289,337 | |
| | | | | |
| |
| Technology (0.4%) | | | | |
| | | | Avago Technoligies Cayman Finance, Ltd., Term Loan | | | | |
| | 1,150,396 | | | 3.535%, 2/1/2023 | | | 1,161,739 | |
| | | | First Data Corporation, Term Loan | | | | |
| | 775,000 | | | 0.000%, 3/24/2021b,c | | | 778,100 | |
| | | | Interception Merger Sub, Inc., Term Loan | | | | |
| | 180,000 | | | 0.000%, 10/26/2023b,c | | | 180,929 | |
| | | | ON Semiconductor Corporation, Term Loan | | | | |
| | 435,000 | | | 3.777%, 3/31/2023 | | | 437,392 | |
| | | | Syniverse Holdings, Inc., Term Loan | | | | |
| | 337,664 | | | 4.000%, 4/23/2019 | | | 310,651 | |
The accompanying Notes to Financial Statements are an integral part of this schedule.
127
INCOME FUND
Schedule of Investments as of October 31, 2016
| | | | | | | | |
Principal
Amount | | | Bank Loans (3.4%)a | | Value | |
| Technology (0.4%) - continued | | | | |
| | | | Western Digital Corporation, Term Loan | | | | |
| | $608,475 | | | 4.500%, 4/29/2023 | | | $614,992 | |
| | | | | |
| | | | Total | | | 3,483,803 | |
| | | | | |
| |
| Transportation (0.1%) | | | | |
| | | | XPO Logistics, Inc., Term Loan | | | | |
| | 942,887 | | | 4.250%, 10/30/2021 | | | 947,262 | |
| | | | | |
| | | | Total | | | 947,262 | |
| | | | | |
| |
| Utilities (0.1%) | | | | |
| | | | Calpine Corporation, Term Loan | | | | |
| | 684,212 | | | 3.590%, 5/27/2022 | | | 684,985 | |
| | | | | |
| | | | Total | | | 684,985 | |
| | | | | |
| | | | | | | | |
| | | | | |
| | | | Total Bank Loans (cost $28,020,342) | | | 28,256,833 | |
| | | | | |
| | |
Principal
Amount | | | Long-Term Fixed Income (90.4%) | | Value | |
| Asset-Backed Securities (1.2%) | | | | |
| | | | Bayview Opportunity Master Fund Trust | | | | |
| | 1,841,985 | | | 3.721%, 7/28/2035d,e | | | 1,841,507 | |
| | | | CAM Mortgage, LLC | | | | |
| | 206,140 | | | 3.500%, 7/15/2064*,e | | | 206,132 | |
| | | | Delta Air Lines, Inc. | | | | |
| | 1,056,495 | | | 4.250%, 7/30/2023 | | | 1,096,113 | |
| | | | First Horizon ABS Trust | | | | |
| | 225,597 | | | 0.685%, 10/25/2034f,g | | | 216,834 | |
| | | | GMAC Mortgage Corporation Loan Trust | | | | |
| | 781,210 | | | 1.024%, 8/25/2035f,g | | | 733,439 | |
| | 1,337,858 | | | 0.705%, 12/25/2036f,g | | | 1,211,738 | |
| | | | IndyMac Seconds Asset-Backed Trust | | | | |
| | 928,654 | | | 0.874%, 10/25/2036f,g | | | 592,023 | |
| | | | Preferred Term Securities XXIII, Ltd. | | | | |
| | 1,294,367 | | | 1.050%, 12/22/2036*,g | | | 966,698 | |
| | | | Renaissance Home Equity Loan Trust | | | | |
| | 1,302,279 | | | 5.746%, 5/25/2036e | | | 874,506 | |
| | | | Vericrest Opportunity Loan Transferee | | | | |
| | 1,116,568 | | | 3.500%, 6/26/2045d | | | 1,116,821 | |
| | 1,435,717 | | | 4.250%, 2/26/2046d,e | | | 1,452,114 | |
| | | | | |
| | | | Total | | | 10,307,925 | |
| | | | | |
| |
| Basic Materials (2.7%) | | | | |
| | | | Air Liquide Finance SA | | | | |
| | 1,800,000 | | | 2.250%, 9/27/2023d | | | 1,783,575 | |
| | | | Anglo American plc | | | | |
| | 720,000 | | | 3.625%, 5/14/2020d | | | 723,600 | |
| | | | Barrick Gold Corporation | | | | |
| | 1,062,000 | | | 4.100%, 5/1/2023 | | | 1,141,629 | |
| | | | Dow Chemical Company | | | | |
| | 1,430,000 | | | 4.250%, 11/15/2020 | | | 1,539,734 | |
| | | | Freeport-McMoRan, Inc. | | | | |
| | 1,325,000 | | | 3.875%, 3/15/2023 | | | 1,195,812 | |
| | | | Georgia-Pacific, LLC | | | | |
| | 2,220,000 | | | 3.163%, 11/15/2021d,h | | | 2,301,185 | |
| | | | Glencore Funding, LLC | | | | |
| | 1,810,000 | | | 3.125%, 4/29/2019d,h | | | 1,833,530 | |
| | 1,820,000 | | | 4.125%, 5/30/2023d | | | 1,806,350 | |
| | | | International Paper Company | | | | |
| | 1,260,000 | | | 3.000%, 2/15/2027 | | | 1,242,804 | |
| | 1,810,000 | | | 4.800%, 6/15/2044 | | | 1,842,698 | |
| | | | Kinross Gold Corporation | | | | |
| | 1,080,000 | | | 5.950%, 3/15/2024 | | | 1,134,000 | |
| | | | LyondellBasell Industries NV | | | | |
| | 600,000 | | | 6.000%, 11/15/2021 | | | 698,291 | |
| | 730,000 | | | 5.750%, 4/15/2024 | | | 853,628 | |
| | | | Westlake Chemical Corporation | | | | |
| | 1,800,000 | | | 3.600%, 8/15/2026d | | | 1,799,474 | |
| | | | Weyerhaeuser Company | | | | |
| | 1,430,000 | | | 7.375%, 3/15/2032 | | | 1,892,003 | |
| | | | | |
| | | | Total | | | 21,788,313 | |
| | | | | |
| |
| Capital Goods (2.0%) | | | | |
| | | | AECOM | | | | |
| | 1,130,000 | | | 5.875%, 10/15/2024 | | | 1,193,562 | |
| | | | BAE Systems plc | | | | |
| | 1,030,000 | | | 4.750%, 10/11/2021d | | | 1,138,753 | |
| | | | Bombardier, Inc. | | | | |
| | 720,000 | | | 7.500%, 3/15/2025d | | | 644,400 | |
| | | | General Electric Capital Corporation | | | | |
| | 1,800,000 | | | 1.850%, 3/15/2023g | | | 1,834,792 | |
| | | | General Electric Company | | | | |
| | 1,440,000 | | | 1.158%, 5/5/2026g | | | 1,397,056 | |
| | | | L-3 Communications Corporation | | | | |
| | 1,440,000 | | | 4.750%, 7/15/2020 | | | 1,563,234 | |
| | 720,000 | | | 4.950%, 2/15/2021 | | | 788,098 | |
| | | | Republic Services, Inc. | | | | |
| | 1,830,000 | | | 3.550%, 6/1/2022 | | | 1,959,677 | |
| | | | Roper Technologies, Inc. | | | | |
| | 1,080,000 | | | 3.125%, 11/15/2022 | | | 1,103,917 | |
| | | | Textron, Inc. | | | | |
| | 1,311,000 | | | 5.600%, 12/1/2017 | | | 1,365,615 | |
| | 720,000 | | | 4.300%, 3/1/2024 | | | 775,125 | |
| | 370,000 | | | 3.875%, 3/1/2025 | | | 385,467 | |
| | | | United Rentals North America, Inc. | | | | |
| | 750,000 | | | 5.500%, 7/15/2025 | | | 759,375 | |
| | | | Waste Management, Inc. | | | | |
| | 1,360,000 | | | 4.100%, 3/1/2045 | | | 1,435,098 | |
| | | | | |
| | | | Total | | | 16,344,169 | |
| | | | | |
| |
| Collateralized Mortgage Obligations (0.6%) | | | | |
| | | | CitiMortgage Alternative Loan Trust | | | | |
| | 878,545 | | | 5.750%, 4/25/2037 | | | 753,725 | |
| | | | Countrywide Alternative Loan Trust | | | | |
| | 1,165,782 | | | 6.000%, 1/25/2037 | | | 1,115,057 | |
| | | | Wachovia Mortgage Loan Trust, LLC | | | | |
| | 900,550 | | | 3.062%, 5/20/2036 | | | 793,223 | |
| | | | WaMu Mortgage Pass Through Certificates | | | | |
| | 757,791 | | | 0.824%, 10/25/2045g | | | 716,521 | |
| | | | Washington Mutual Mortgage Pass Through Certificates Trust | | | | |
| | 1,842,966 | | | 1.274%, 2/25/2047g | | | 1,372,980 | |
| | | | | |
| | | | Total | | | 4,751,506 | |
| | | | | |
| |
| Commercial Mortgage-Backed Securities (0.2%) | | | | |
| | | | Bear Stearns Commercial Mortgage Securities, Inc. | | | | |
| | 1,391,495 | | | 5.331%, 2/11/2044 | | | 1,398,412 | |
| | | | Citigroup/Deutsche Bank Commercial Mortgage Trust | | | | |
| | 413,648 | | | 5.322%, 12/11/2049 | | | 415,033 | |
| | | | Credit Suisse First Boston Mortgage Securities | | | | |
| | 27,521 | | | 5.542%, 1/15/2049 | | | 27,476 | |
| | | | | |
| | | | Total | | | 1,840,921 | |
| | | | | |
| |
| Communications Services (10.1%) | | | | |
| | | | 21st Century Fox America, Inc. | | | | |
| | 1,100,000 | | | 7.625%, 11/30/2028 | | | 1,520,295 | |
The accompanying Notes to Financial Statements are an integral part of this schedule.
128
INCOME FUND
Schedule of Investments as of October 31, 2016
| | | | | | | | |
Principal
Amount | | | Long-Term Fixed Income (90.4%) | | Value | |
| Communications Services (10.1%) - continued | | | | |
| | | | America Movil SAB de CV | | | | |
| | $1,080,000 | | | 3.125%, 7/16/2022 | | | $1,107,421 | |
| | | | American Tower Corporation | | | | |
| | 3,000,000 | | | 3.450%, 9/15/2021 | | | 3,133,068 | |
| | 1,440,000 | | | 3.125%, 1/15/2027 | | | 1,398,053 | |
| | | | AT&T, Inc. | | | | |
| | 1,440,000 | | | 1.768%, 6/30/2020g | | | 1,446,350 | |
| | 1,815,000 | | | 3.800%, 3/15/2022 | | | 1,910,551 | |
| | 1,460,000 | | | 3.600%, 2/17/2023 | | | 1,503,168 | |
| | 1,810,000 | | | 4.450%, 4/1/2024 | | | 1,956,956 | |
| | 760,000 | | | 3.400%, 5/15/2025 | | | 757,516 | |
| | 1,810,000 | | | 4.300%, 12/15/2042 | | | 1,666,518 | |
| | 1,800,000 | | | 4.750%, 5/15/2046 | | | 1,761,437 | |
| | | | CenturyLink, Inc. | | | | |
| | 900,000 | | | 5.800%, 3/15/2022 | | | 913,500 | |
| | | | Charter Communications Operating, LLC | | | | |
| | 2,630,000 | | | 4.464%, 7/23/2022d | | | 2,801,418 | |
| | 1,880,000 | | | 6.484%, 10/23/2045d | | | 2,203,078 | |
| | | | Columbus International, Inc. | | | | |
| | 1,090,000 | | | 7.375%, 3/30/2021d | | | 1,166,300 | |
| | | | Comcast Corporation | | | | |
| | 2,260,000 | | | 3.375%, 8/15/2025 | | | 2,370,476 | |
| | 1,790,000 | | | 2.350%, 1/15/2027 | | | 1,729,398 | |
| | 1,300,000 | | | 6.400%, 5/15/2038 | | | 1,754,407 | |
| | | | Cox Communications, Inc. | | | | |
| | 1,100,000 | | | 9.375%, 1/15/2019d | | | 1,263,493 | |
| | 1,970,000 | | | 3.850%, 2/1/2025d | | | 1,999,325 | |
| | 1,080,000 | | | 3.350%, 9/15/2026d | | | 1,065,026 | |
| | | | Crown Castle International Corporation | | | | |
| | 540,000 | | | 3.400%, 2/15/2021 | | | 561,132 | |
| | 2,340,000 | | | 5.250%, 1/15/2023 | | | 2,614,739 | |
| | 1,550,000 | | | 4.450%, 2/15/2026 | | | 1,679,092 | |
| | | | Frontier Communications Corporation | | | | |
| | 1,120,000 | | | 6.875%, 1/15/2025 | | | 938,000 | |
| | | | Hughes Satellite Systems Corporation | | | | |
| | 778,000 | | | 6.500%, 6/15/2019 | | | 848,992 | |
| | | | Level 3 Financing, Inc. | | | | |
| | 720,000 | | | 5.125%, 5/1/2023 | | | 727,200 | |
| | | | Omnicom Group, Inc. | | | | |
| | 2,380,000 | | | 4.450%, 8/15/2020 | | | 2,587,476 | |
| | 560,000 | | | 3.650%, 11/1/2024 | | | 586,931 | |
| | | | S&P Global, Inc. | | | | |
| | 1,080,000 | | | 2.950%, 1/22/2027d | | | 1,064,552 | |
| | | | Scripps Networks Interactive, Inc. | | | | |
| | 1,890,000 | | | 3.500%, 6/15/2022 | | | 1,958,607 | |
| | | | SES Global Americas Holdings GP | | | | |
| | 1,820,000 | | | 2.500%, 3/25/2019d | | | 1,820,034 | |
| | | | SFR Group SA | | | | |
| | 1,080,000 | | | 6.000%, 5/15/2022d | | | 1,107,346 | |
| | | | Sprint Communications, Inc. | | | | |
| | 710,000 | | | 7.000%, 3/1/2020d | | | 772,125 | |
| | | | Sprint Corporation | | | | |
| | 900,000 | | | 7.125%, 6/15/2024 | | | 846,000 | |
| | | | Time Warner Cable, Inc. | | | | |
| | 2,200,000 | | | 4.125%, 2/15/2021 | | | 2,336,948 | |
| | | | Time Warner Entertainment Company, LP | | | | |
| | 2,380,000 | | | 8.375%, 3/15/2023 | | | 3,075,391 | |
| | | | Time Warner, Inc. | | | | |
| | 1,510,000 | | | 4.750%, 3/29/2021 | | | 1,662,320 | |
| | 1,400,000 | | | 7.700%, 5/1/2032 | | | 1,934,062 | |
| | | | Univision Communications, Inc. | | | | |
| | 1,080,000 | | | 6.750%, 9/15/2022d | | | 1,138,104 | |
| | | | UPCB Finance VI, Ltd. | | | | |
| | 1,120,000 | | | 6.875%, 1/15/2022d | | | 1,164,800 | |
| | | | Verizon Communications, Inc. | | | | |
| | 1,624,000 | | | 2.625%, 2/21/2020 | | | 1,656,116 | |
| | 2,170,000 | | | 3.450%, 3/15/2021 | | | 2,282,862 | |
| | 2,700,000 | | | 3.500%, 11/1/2024 | | | 2,814,283 | |
| | 1,440,000 | | | 2.625%, 8/15/2026h | | | 1,378,185 | |
| | 2,312,000 | | | 4.272%, 1/15/2036 | | | 2,321,463 | |
| | 2,170,000 | | | 4.862%, 8/21/2046 | | | 2,298,414 | |
| | 2,747,000 | | | 4.522%, 9/15/2048 | | | 2,731,702 | |
| | | | Viacom, Inc. | | | | |
| | 1,080,000 | | | 5.850%, 9/1/2043 | | | 1,211,140 | |
| | | | Vodafone Group plc | | | | |
| | 1,090,000 | | | 2.500%, 9/26/2022 | | | 1,086,001 | |
| | 730,000 | | | 4.375%, 2/19/2043 | | | 702,940 | |
| | | | | |
| | | | Total | | | 83,334,711 | |
| | | | | |
| |
| Consumer Cyclical (5.0%) | | | | |
| | | | CVS Health Corporation | | | | |
| | 1,310,000 | | | 2.750%, 12/1/2022 | | | 1,332,432 | |
| | 1,130,000 | | | 4.750%, 12/1/2022 | | | 1,266,859 | |
| | 900,000 | | | 3.875%, 7/20/2025 | | | 960,395 | |
| | 1,880,000 | | | 5.125%, 7/20/2045 | | | 2,193,191 | |
| | | | Dana, Inc. | | | | |
| | 720,000 | | | 6.000%, 9/15/2023 | | | 751,500 | |
| | | | Dollar Tree, Inc. | | | | |
| | 1,130,000 | | | 5.750%, 3/1/2023 | | | 1,203,450 | |
| | | | Ford Motor Credit Company, LLC | | | | |
| | 800,000 | | | 2.597%, 11/4/2019 | | | 809,960 | |
| | 1,425,000 | | | 4.250%, 9/20/2022 | | | 1,517,608 | |
| | 1,150,000 | | | 3.096%, 5/4/2023 | | | 1,150,081 | |
| | 1,490,000 | | | 3.664%, 9/8/2024 | | | 1,507,196 | |
| | 1,280,000 | | | 4.134%, 8/4/2025 | | | 1,330,207 | |
| | | | General Motors Company | | | | |
| | 1,850,000 | | | 5.000%, 4/1/2035 | | | 1,883,814 | |
| | | | General Motors Financial Company, Inc. | | | | |
| | 1,460,000 | | | 4.200%, 3/1/2021 | | | 1,535,977 | |
| | 1,900,000 | | | 3.450%, 4/10/2022 | | | 1,921,183 | |
| | 2,170,000 | | | 3.700%, 5/9/2023 | | | 2,198,384 | |
| | 1,490,000 | | | 4.000%, 1/15/2025 | | | 1,496,541 | |
| | | | Hilton Worldwide Finance, LLC | | | | |
| | 730,000 | | | 5.625%, 10/15/2021 | | | 751,900 | |
| | | | Home Depot, Inc. | | | | |
| | 540,000 | | | 2.125%, 9/15/2026 | | | 521,196 | |
| | 1,820,000 | | | 4.250%, 4/1/2046 | | | 1,997,585 | |
| | | | Hyundai Capital America | | | | |
| | 685,000 | | | 2.875%, 8/9/2018d | | | 698,220 | |
| | 2,150,000 | | | 2.450%, 6/15/2021d | | | 2,163,459 | |
| | | | Johnson Controls, Inc. | | | | |
| | 1,850,000 | | | 5.250%, 12/1/2041 | | | 2,106,416 | |
| | | | L Brands, Inc. | | | | |
| | 1,100,000 | | | 5.625%, 2/15/2022 | | | 1,204,500 | |
| | | | Lennar Corporation | | | | |
| | 1,120,000 | | | 4.500%, 11/15/2019 | | | 1,180,200 | |
| | | | MGM Resorts International | | | | |
| | 760,000 | | | 6.000%, 3/15/2023 | | | 822,700 | |
| | | | Scientific Games International, Inc. | | | | |
| | 720,000 | | | 7.000%, 1/1/2022d | | | 765,792 | |
| | | | Starwood Hotels & Resorts Worldwide, Inc. | | | | |
| | 1,150,000 | | | 6.750%, 5/15/2018 | | | 1,238,374 | |
| | | | Toll Brothers Finance Corporation | | | | |
| | 1,000,000 | | | 6.750%, 11/1/2019 | | | 1,124,930 | |
The accompanying Notes to Financial Statements are an integral part of this schedule.
129
INCOME FUND
Schedule of Investments as of October 31, 2016
| | | | | | | | |
Principal Amount | | | Long-Term Fixed Income (90.4%) | | Value | |
| Consumer Cyclical (5.0%) - continued | | | | |
| | $540,000 | | | 4.375%, 4/15/2023 | | | $548,100 | |
| | | | Visa, Inc. | | | | |
| | 1,640,000 | | | 3.150%, 12/14/2025 | | | 1,710,787 | |
| | | | ZF North America Capital, Inc. | | | | |
| | 1,130,000 | | | 4.500%, 4/29/2022d | | | 1,196,387 | |
| | | | | |
| | | | Total | | | 41,089,324 | |
| | | | | |
| |
| Consumer Non-Cyclical (10.7%) | | | | |
| | | | AbbVie, Inc. | | | | |
| | 2,540,000 | | | 3.200%, 5/14/2026 | | | 2,497,798 | |
| | | | Actavis Funding SCS | | | | |
| | 1,520,000 | | | 3.450%, 3/15/2022 | | | 1,578,065 | |
| | 1,445,000 | | | 3.850%, 6/15/2024 | | | 1,503,096 | |
| | | | Altria Group, Inc. | | | | |
| | 900,000 | | | 2.625%, 9/16/2026 | | | 892,438 | |
| | | | Anheuser-Busch InBev Finance, Inc. | | | | |
| | 1,430,000 | | | 3.300%, 2/1/2023 | | | 1,492,478 | |
| | 2,530,000 | | | 3.650%, 2/1/2026 | | | 2,662,223 | |
| | 1,790,000 | | | 4.700%, 2/1/2036 | | | 1,984,281 | |
| | 1,800,000 | | | 4.900%, 2/1/2046 | | | 2,058,367 | |
| | | | Baxter International, Inc. | | | | |
| | 1,080,000 | | | 2.600%, 8/15/2026 | | | 1,045,880 | |
| | | | Bayer U.S. Finance, LLC | | | | |
| | 1,800,000 | | | 3.375%, 10/8/2024d | | | 1,851,502 | |
| | | | Becton Dickinson and Company | | | | |
| | 1,880,000 | | | 3.125%, 11/8/2021 | | | 1,968,751 | |
| | | | Biogen, Inc. | | | | |
| | 2,260,000 | | | 3.625%, 9/15/2022 | | | 2,408,615 | |
| | | | Boston Scientific Corporation | | | | |
| | 2,140,000 | | | 3.375%, 5/15/2022 | | | 2,233,250 | |
| | | | BRF GmbH | | | | |
| | 1,440,000 | | | 4.350%, 9/29/2026d | | | 1,392,480 | |
| | | | BRF SA | | | | |
| | 1,090,000 | | | 4.750%, 5/22/2024d | | | 1,109,184 | |
| | | | Bunge Limited Finance Corporation | | | | |
| | 1,470,000 | �� | | 8.500%, 6/15/2019 | | | 1,712,978 | |
| | 1,080,000 | | | 3.500%, 11/24/2020 | | | 1,127,043 | |
| | | | Celgene Corporation | | | | |
| | 730,000 | | | 3.950%, 10/15/2020 | | | 780,706 | |
| | 1,090,000 | | | 3.250%, 8/15/2022 | | | 1,131,999 | |
| | | | Diageo Capital plc | | | | |
| | 1,880,000 | | | 2.625%, 4/29/2023 | | | 1,926,173 | |
| | | | Endo Finance, LLC | | | | |
| | 740,000 | | | 6.500%, 2/1/2025d,e | | | 623,450 | |
| | | | Express Scripts Holding Company | | | | |
| | 1,080,000 | | | 4.750%, 11/15/2021 | | | 1,194,921 | |
| | 2,190,000 | | | 4.500%, 2/25/2026 | | | 2,346,206 | |
| | | | Forest Laboratories, Inc. | | | | |
| | 1,450,000 | | | 5.000%, 12/15/2021d | | | 1,618,615 | |
| | | | H. J. Heinz Company | | | | |
| | 1,880,000 | | | 3.500%, 7/15/2022 | | | 1,980,883 | |
| | 1,140,000 | | | 5.200%, 7/15/2045 | | | 1,278,089 | |
| | | | HCA, Inc. | | | | |
| | 1,440,000 | | | 4.750%, 5/1/2023 | | | 1,499,400 | |
| | | | Imperial Tobacco Finance plc | | | | |
| | 1,310,000 | | | 3.750%, 7/21/2022d | | | 1,382,008 | |
| | | | JBS USA, LLC | | | | |
| | 1,090,000 | | | 7.250%, 6/1/2021d | | | 1,117,250 | |
| | | | Kraft Foods Group, Inc. | | | | |
| | 2,110,000 | | | 3.500%, 6/6/2022 | | | 2,228,044 | |
| | | | Kraft Heinz Foods Company | | | | |
| | 720,000 | | | 3.000%, 6/1/2026 | | | 711,904 | |
| | | | Kroger Company | | | | |
| | 1,800,000 | | | 2.650%, 10/15/2026 | | | 1,746,004 | |
| | | | Laboratory Corporation of America Holdings | | | | |
| | 750,000 | | | 3.200%, 2/1/2022 | | | 780,123 | |
| | 750,000 | | | 4.700%, 2/1/2045 | | | 793,487 | |
| | | | Mylan NV | | | | |
| | 1,075,000 | | | 3.950%, 6/15/2026d | | | 1,072,226 | |
| | | | Mylan, Inc. | | | | |
| | 1,080,000 | | | 3.125%, 1/15/2023d | | | 1,067,552 | |
| | | | Newell Rubbermaid, Inc. | | | | |
| | 1,550,000 | | | 3.850%, 4/1/2023 | | | 1,644,875 | |
| | | | PepsiCo, Inc. | | | | |
| | 1,440,000 | | | 3.450%, 10/6/2046 | | | 1,365,885 | |
| | | | Pernod Ricard SA | | | | |
| | 2,370,000 | | | 5.750%, 4/7/2021d | | | 2,707,455 | |
| | 1,090,000 | | | 4.450%, 1/15/2022d | | | 1,193,340 | |
| | | | Perrigo Finance Unlimited Company | | | | |
| | 1,460,000 | | | 3.500%, 3/15/2021 | | | 1,508,628 | |
| | 1,900,000 | | | 4.375%, 3/15/2026 | | | 1,993,662 | |
| | | | Reynolds American, Inc. | | | | |
| | 1,880,000 | | | 4.000%, 6/12/2022 | | | 2,022,124 | |
| | 940,000 | | | 5.850%, 8/15/2045 | | | 1,168,708 | |
| | | | SABMiller Holdings, Inc. | | | | |
| | 2,680,000 | | | 3.750%, 1/15/2022d | | | 2,886,317 | |
| | | | Shire Acquisitions Investments Ireland Designated Activity Company | | | | |
| | 1,800,000 | | | 2.875%, 9/23/2023 | | | 1,770,237 | |
| | 720,000 | | | 3.200%, 9/23/2026 | | | 707,021 | |
| | | | Tenet Healthcare Corporation | | | | |
| | 1,090,000 | | | 8.125%, 4/1/2022 | | | 1,065,475 | |
| | | | Teva Pharmaceutical Finance Netherlands III BV | | | | |
| | 1,710,000 | | | 2.800%, 7/21/2023 | | | 1,682,710 | |
| | 1,440,000 | | | 3.150%, 10/1/2026 | | | 1,400,452 | |
| | | | Thermo Fisher Scientific, Inc. | | | | |
| | 2,170,000 | | | 3.000%, 4/15/2023 | | | 2,202,609 | |
| | | | Valeant Pharmaceuticals International | | | | |
| | 1,440,000 | | | 6.375%, 10/15/2020d | | | 1,242,000 | |
| | | | Watson Pharmaceuticals, Inc. | | | | |
| | 1,820,000 | | | 3.250%, 10/1/2022 | | | 1,874,369 | |
| | | | Whirlpool Corporation | | | | |
| | 1,873,000 | | | 3.700%, 3/1/2023 | | | 1,977,832 | |
| | | | Zoetis, Inc. | | | | |
| | 1,810,000 | | | 3.250%, 2/1/2023 | | | 1,849,595 | |
| | 720,000 | | | 4.700%, 2/1/2043 | | | 739,827 | |
| | | | | |
| | | | Total | | | 87,800,590 | |
| | | | | |
| |
| Energy (9.1%) | | | | |
| | | | Anadarko Petroleum Corporation | | | | |
| | 730,000 | | | 5.550%, 3/15/2026h | | | 829,859 | |
| | | | Antero Resources Corporation | | | | |
| | 1,120,000 | | | 5.625%, 6/1/2023 | | | 1,142,400 | |
| | | | BP Capital Markets plc | | | | |
| | 1,090,000 | | | 2.750%, 5/10/2023 | | | 1,100,714 | |
| | 1,510,000 | | | 3.814%, 2/10/2024 | | | 1,614,204 | |
| | 910,000 | | | 3.119%, 5/4/2026 | | | 920,777 | |
| | 1,440,000 | | | 3.017%, 1/16/2027 | | | 1,443,994 | |
| | | | Buckeye Partners, LP | | | | |
| | 360,000 | | | 3.950%, 12/1/2026c | | | 359,559 | |
| | 1,100,000 | | | 5.850%, 11/15/2043 | | | 1,163,211 | |
| | | | Canadian Natural Resources, Ltd. | | | | |
| | 1,890,000 | | | 3.450%, 11/15/2021 | | | 1,946,961 | |
| | 900,000 | | | 6.250%, 3/15/2038 | | | 1,025,342 | |
| | | | Concho Resources, Inc. | | | | |
| | 1,070,000 | | | 6.500%, 1/15/2022 | | | 1,107,450 | |
The accompanying Notes to Financial Statements are an integral part of this schedule.
130
INCOME FUND
Schedule of Investments as of October 31, 2016
| | | | | | | | |
Principal Amount | | | Long-Term Fixed Income (90.4%) | | Value | |
| Energy (9.1%) - continued | | | | |
| | | | Continental Resources, Inc. | | | | |
| | $1,450,000 | | | 3.800%, 6/1/2024 | | | $1,334,000 | |
| | | | Devon Energy Corporation | | | | |
| | 2,160,000 | | | 5.850%, 12/15/2025h | | | 2,475,926 | |
| | | | Ecopetrol SA | | | | |
| | 1,440,000 | | | 5.875%, 9/18/2023 | | | 1,544,400 | |
| | | | El Paso Pipeline Partners Operating Company, LLC | | | | |
| | 1,650,000 | | | 5.000%, 10/1/2021 | | | 1,803,404 | |
| | 1,470,000 | | | 4.300%, 5/1/2024 | | | 1,519,560 | |
| | 720,000 | | | 4.700%, 11/1/2042 | | | 668,034 | |
| | | | Enbridge Energy Partners, LP | | | | |
| | 1,450,000 | | | 5.200%, 3/15/2020 | | | 1,571,587 | |
| | 940,000 | | | 4.375%, 10/15/2020 | | | 1,002,889 | |
| | 510,000 | | | 4.200%, 9/15/2021 | | | 540,191 | |
| | | | Encana Corporation | | | | |
| | 1,450,000 | | | 3.900%, 11/15/2021 | | | 1,467,110 | |
| | | | Energy Transfer Partners, LP | | | | |
| | 995,000 | | | 4.650%, 6/1/2021 | | | 1,067,180 | |
| | | | EnLink Midstream Partners, LP | | | | |
| | 720,000 | | | 4.150%, 6/1/2025 | | | 701,556 | |
| | 540,000 | | | 4.850%, 7/15/2026 | | | 550,058 | |
| | | | Enterprise Products Operating, LLC | | | | |
| | 1,010,000 | | | 3.700%, 2/15/2026 | | | 1,030,088 | |
| | 885,000 | | | 7.034%, 1/15/2068 | | | 934,339 | |
| | | | EQT Midstream Partners, LP | | | | |
| | 1,720,000 | | | 4.000%, 8/1/2024 | | | 1,699,116 | |
| | | | Exxon Mobil Corporation | | | | |
| | 1,820,000 | | | 2.726%, 3/1/2023 | | | 1,860,859 | |
| | | | Hornbeck Offshore Services, Inc. | | | | |
| | 940,000 | | | 5.000%, 3/1/2021 | | | 559,300 | |
| | | | Magellan Midstream Partners, LP | | | | |
| | 720,000 | | | 5.000%, 3/1/2026 | | | 816,643 | |
| | 1,500,000 | | | 4.200%, 3/15/2045 | | | 1,444,863 | |
| | | | Marathon Oil Corporation | | | | |
| | 1,273,000 | | | 5.900%, 3/15/2018 | | | 1,337,234 | |
| | | | Marathon Petroleum Corporation | | | | |
| | 1,080,000 | | | 6.500%, 3/1/2041 | | | 1,165,741 | |
| | 720,000 | | | 4.750%, 9/15/2044 | | | 636,820 | |
| | | | MPLX, LP | | | | |
| | 2,530,000 | | | 4.875%, 6/1/2025 | | | 2,639,169 | |
| | | | NiSource Finance Corporation | | | | |
| | 750,000 | | | 6.800%, 1/15/2019 | | | 830,923 | |
| | | | Noble Holding International, Ltd. | | | | |
| | 1,865,000 | | | 7.200%, 4/1/2025h | | | 1,519,975 | |
| | | | ONEOK Partners, LP | | | | |
| | 1,080,000 | | | 3.375%, 10/1/2022 | | | 1,100,598 | |
| | | | Petrobras Global Finance BV | | | | |
| | 1,790,000 | | | 8.375%, 5/23/2021 | | | 1,980,277 | |
| | | | Petroleos Mexicanos | | | | |
| | 1,800,000 | | | 4.625%, 9/21/2023d | | | 1,795,140 | |
| | | | Phillips 66 Partners, LP | | | | |
| | 900,000 | | | 3.550%, 10/1/2026 | | | 896,690 | |
| | | | Pioneer Natural Resources Company | | | | |
| | 1,850,000 | | | 3.950%, 7/15/2022 | | | 1,974,734 | |
| | | | Plains All American Pipeline, LP | | | | |
| | 1,790,000 | | | 2.850%, 1/31/2023 | | | 1,725,238 | |
| | 505,000 | | | 4.650%, 10/15/2025h | | | 535,311 | |
| | | | Regency Energy Partners, LP | | | | |
| | 1,810,000 | | | 5.000%, 10/1/2022 | | | 1,942,210 | |
| | | | Sabine Pass Liquefaction, LLC | | | | |
| | 1,090,000 | | | 5.750%, 5/15/2024 | | | 1,152,675 | |
| | | | Schlumberger Holdings Corporation | | | | |
| | 1,800,000 | | | 3.625%, 12/21/2022d | | | 1,924,061 | |
| | | | Spectra Energy Partners, LP | | | | |
| | 1,810,000 | | | 3.375%, 10/15/2026 | | | 1,798,376 | |
| | | | Suncor Energy, Inc. | | | | |
| | 1,080,000 | | | 3.600%, 12/1/2024 | | | 1,121,782 | |
| | | | Sunoco Logistics Partners Operations, LP | | | | |
| | 1,800,000 | | | 3.450%, 1/15/2023 | | | 1,813,559 | |
| | | | Tesoro Logistics, LP | | | | |
| | 1,120,000 | | | 5.500%, 10/15/2019 | | | 1,195,600 | |
| | | | TransCanada Trust | | | | |
| | 900,000 | | | 5.875%, 8/15/2076 | | | 963,000 | |
| | | | Transcontinental Gas Pipe Line Company, LLC | | | | |
| | 1,075,000 | | | 7.850%, 2/1/2026d | | | 1,363,321 | |
| | | | Valero Energy Corporation | | | | |
| | 1,800,000 | | | 3.400%, 9/15/2026 | | | 1,761,718 | |
| | | | Williams Partners, LP | | | | |
| | 1,070,000 | | | 4.500%, 11/15/2023 | | | 1,118,892 | |
| | 900,000 | | | 3.900%, 1/15/2025 | | | 897,625 | |
| | | | Woodside Finance, Ltd. | | | | |
| | 1,870,000 | | | 3.650%, 3/5/2025d | | | 1,874,825 | |
| | | | WPX Energy, Inc. | | | | |
| | 720,000 | | | 6.000%, 1/15/2022h | | | 718,200 | |
| | | | | |
| | | | Total | | | 75,029,268 | |
| | | | | |
| |
| Financials (26.5%) | | | | |
| | | | Aegon NV | | | | |
| | 1,400,000 | | | 1.677%, 7/29/2049g,i | | | 951,443 | |
| | | | AerCap Ireland Capital, Ltd. | | | | |
| | 540,000 | | | 3.950%, 2/1/2022 | | | 550,379 | |
| | | | Aetna, Inc. | | | | |
| | 1,800,000 | | | 3.200%, 6/15/2026 | | | 1,806,343 | |
| | 1,440,000 | | | 4.375%, 6/15/2046 | | | 1,460,261 | |
| | | | Aflac, Inc. | | | | |
| | 1,440,000 | | | 4.000%, 10/15/2046 | | | 1,420,309 | |
| | | | Air Lease Corporation | | | | |
| | 740,000 | | | 2.125%, 1/15/2018 | | | 742,583 | |
| | 1,490,000 | | | 3.750%, 2/1/2022 | | | 1,567,915 | |
| | 740,000 | | | 4.250%, 9/15/2024 | | | 781,336 | |
| | | | Ally Financial, Inc. | | | | |
| | 1,140,000 | | | 4.125%, 3/30/2020 | | | 1,158,525 | |
| | | | American Express Company | | | | |
| | 1,120,000 | | | 4.900%, 12/29/2049i | | | 1,099,280 | |
| | | | American International Group, Inc. | | | | |
| | 630,000 | | | 3.750%, 7/10/2025 | | | 657,682 | |
| | 1,370,000 | | | 4.500%, 7/16/2044 | | | 1,393,409 | |
| | | | Aon plc | | | | |
| | 1,090,000 | | | 3.875%, 12/15/2025 | | | 1,156,341 | |
| | | | Ares Capital Corporation | | | | |
| | 1,810,000 | | | 4.875%, 11/30/2018 | | | 1,885,117 | |
| | | | Associated Banc-Corporation | | | | |
| | 1,850,000 | | | 4.250%, 1/15/2025 | | | 1,914,075 | |
| | | | Assured Guaranty US Holdings, Inc. | | | | |
| | 1,800,000 | | | 5.000%, 7/1/2024h | | | 1,996,978 | |
| | | | Australia and New Zealand Banking Group, Ltd. | | | | |
| | 720,000 | | | 6.750%, 12/29/2049d,h,i | | | 790,254 | |
| | | | AXA SA | | | | |
| | 1,420,000 | | | 8.600%, 12/15/2030 | | | 1,995,100 | |
| | | | Axis Specialty Finance, LLC | | | | |
| | 510,000 | | | 5.875%, 6/1/2020 | | | 563,758 | |
| | | | Banco de Brasil SA | | | | |
| | 778,000 | | | 9.000%, 12/31/2049d,i | | | 720,428 | |
| | | | Bank of America Corporation | | | | |
| | 2,160,000 | | | 1.936%, 3/22/2018g | | | 2,178,278 | |
| | 1,720,000 | | | 7.625%, 6/1/2019 | | | 1,963,714 | |
The accompanying Notes to Financial Statements are an integral part of this schedule.
131
INCOME FUND
Schedule of Investments as of October 31, 2016
| | | | | | | | |
Principal Amount | | | Long-Term Fixed Income (90.4%) | | Value | |
| Financials (26.5%) - continued | | | | |
| | $1,630,000 | | | 2.625%, 4/19/2021 | | | $1,649,545 | |
| | 2,170,000 | | | 4.125%, 1/22/2024 | | | 2,328,844 | |
| | 1,670,000 | | | 4.200%, 8/26/2024 | | | 1,745,113 | |
| | 1,250,000 | | | 3.950%, 4/21/2025 | | | 1,283,243 | |
| | 730,000 | | | 3.875%, 8/1/2025 | | | 768,304 | |
| | 1,050,000 | | | 5.875%, 2/7/2042 | | | 1,327,856 | |
| | 1,890,000 | | | 4.750%, 4/21/2045 | | | 1,967,688 | |
| | 920,000 | | | 6.500%, 10/23/2049i | | | 998,200 | |
| | 730,000 | | | 6.300%, 12/29/2049i | | | 796,540 | |
| | | | Barclays Bank plc | | | | |
| | 1,090,000 | | | 10.179%, 6/12/2021d | | | 1,378,233 | |
| | | | BBVA Bancomer SA/Texas | | | | |
| | 1,215,000 | | | 6.750%, 9/30/2022d | | | 1,366,328 | |
| | | | Berkshire Hathaway, Inc. | | | | |
| | 1,640,000 | | | 2.750%, 3/15/2023 | | | 1,688,697 | |
| | | | Boston Properties, LP | | | | |
| | 1,800,000 | | | 2.750%, 10/1/2026 | | | 1,739,084 | |
| | | | BPCE SA | | | | |
| | 735,000 | | | 5.700%, 10/22/2023d | | | 796,348 | |
| | 810,000 | | | 5.150%, 7/21/2024d | | | 853,476 | |
| | | | Camden Property Trust | | | | |
| | 1,860,000 | | | 3.500%, 9/15/2024 | | | 1,893,117 | |
| | | | Capital One Financial Corporation | | | | |
| | 1,810,000 | | | 4.200%, 10/29/2025 | | | 1,879,473 | |
| | | | Centene Escrow Corporation | | | | |
| | 730,000 | | | 5.625%, 2/15/2021 | | | 765,777 | |
| | | | Citigroup, Inc. | | | | |
| | 1,440,000 | | | 2.255%, 9/1/2023g | | | 1,445,112 | |
| | 2,630,000 | | | 4.400%, 6/10/2025 | | | 2,777,532 | |
| | 1,695,000 | | | 5.500%, 9/13/2025 | | | 1,908,684 | |
| | 1,090,000 | | | 3.700%, 1/12/2026 | | | 1,134,919 | |
| | 1,510,000 | | | 4.450%, 9/29/2027 | | | 1,590,954 | |
| | | | Citizens Bank NA | | | | |
| | 1,440,000 | | | 2.550%, 5/13/2021 | | | 1,458,236 | |
| | | | Citizens Financial Group, Inc. | | | | |
| | 720,000 | | | 2.375%, 7/28/2021 | | | 720,741 | |
| | | | CNA Financial Corporation | | | | |
| | 1,005,000 | | | 7.350%, 11/15/2019 | | | 1,150,984 | |
| | 1,130,000 | | | 7.250%, 11/15/2023 | | | 1,373,721 | |
| | | | Compass Bank | | | | |
| | 925,000 | | | 2.750%, 9/29/2019 | | | 925,812 | |
| | | | Cooperatieve Centrale Raiffeisen-Boerenleenbank BA | | | | |
| | 710,000 | | | 11.000%, 12/29/2049d,i | | | 855,479 | |
| | | | CoreStates Capital III | | | | |
| | 1,360,000 | | | 1.387%, 2/15/2027d,g | | | 1,203,600 | |
| | | | Credit Agricole SA | | | | |
| | 1,430,000 | | | 8.125%, 12/29/2049d,h,i | | | 1,535,591 | |
| | | | Credit Suisse Group Funding, Ltd. | | | | |
| | 1,810,000 | | | 3.125%, 12/10/2020 | | | 1,828,131 | |
| | 2,600,000 | | | 3.750%, 3/26/2025 | | | 2,578,914 | |
| | | | DDR Corporation | | | | |
| | 710,000 | | | 7.875%, 9/1/2020 | | | 846,323 | |
| | 990,000 | | | 3.625%, 2/1/2025 | | | 993,152 | |
| | | | Discover Bank of Greenwood Delaware | | | | |
| | 865,000 | | | 4.200%, 8/8/2023 | | | 922,079 | |
| | 900,000 | | | 4.250%, 3/13/2026 | | | 955,156 | |
| | 720,000 | | | 3.450%, 7/27/2026 | | | 720,482 | |
| | | | Duke Realty, LP | | | | |
| | 1,780,000 | | | 3.875%, 10/15/2022 | | | 1,889,210 | |
| | | | Essex Portfolio, LP | | | | |
| | 2,060,000 | | | 3.500%, 4/1/2025 | | | 2,113,729 | |
| | | | Fairfax Financial Holdings, Ltd. | | | | |
| | 1,085,000 | | | 5.800%, 5/15/2021d | | | 1,183,173 | |
| | | | Five Corners Funding Trust | | | | |
| | 1,090,000 | | | 4.419%, 11/15/2023d | | | 1,181,467 | |
| | | | GE Capital International Funding Company | | | | |
| | 1,473,000 | | | 4.418%, 11/15/2035 | | | 1,606,685 | |
| | | | Goldman Sachs Group, Inc. | | | | |
| | 1,600,000 | | | 5.375%, 3/15/2020 | | | 1,766,466 | |
| | 1,750,000 | | | 5.250%, 7/27/2021 | | | 1,966,893 | |
| | 1,800,000 | | | 2.350%, 11/15/2021 | | | 1,789,067 | |
| | 810,000 | | | 4.000%, 3/3/2024 | | | 863,484 | |
| | 2,550,000 | | | 3.850%, 7/8/2024 | | | 2,690,683 | |
| | 1,510,000 | | | 4.250%, 10/21/2025 | | | 1,579,874 | |
| | 2,240,000 | | | 5.150%, 5/22/2045 | | | 2,420,154 | |
| | 1,080,000 | | | 5.300%, 12/29/2049h,i | | | 1,100,250 | |
| | | | Hartford Financial Services Group, Inc. | | | | |
| | 1,770,000 | | | 5.125%, 4/15/2022 | | | 2,002,785 | |
| | | | HCP, Inc. | | | | |
| | 800,000 | | | 4.250%, 11/15/2023 | | | 841,678 | |
| | | | Host Hotels & Resorts, LP | | | | |
| | 760,000 | | | 4.000%, 6/15/2025 | | | 769,745 | |
| | | | HSBC Finance Corporation | | | | |
| | 1,290,000 | | | 6.676%, 1/15/2021 | | | 1,472,343 | |
| | | | HSBC Holdings plc | | | | |
| | 1,080,000 | | | 3.600%, 5/25/2023 | | | 1,115,532 | |
| | 720,000 | | | 6.875%, 12/29/2049i | | | 757,800 | |
| | | | Huntington Bancshares, Inc. | | | | |
| | 1,650,000 | | | 7.000%, 12/15/2020 | | | 1,928,776 | |
| | | | Icahn Enterprises, LP | | | | |
| | 960,000 | | | 6.000%, 8/1/2020 | | | 943,200 | |
| | | | ILFC E-Capital Trust II | | | | |
| | 1,270,000 | | | 4.250%, 12/21/2065d,g | | | 1,035,050 | |
| | | | ING Bank NV | | | | |
| | 1,835,000 | | | 5.800%, 9/25/2023d | | | 2,063,599 | |
| | | | J.P. Morgan Chase & Company | | | | |
| | 720,000 | | | 2.295%, 8/15/2021 | | | 720,564 | |
| | 1,810,000 | | | 2.112%, 10/24/2023g | | | 1,802,878 | |
| | 1,670,000 | | | 3.875%, 9/10/2024 | | | 1,744,100 | |
| | 730,000 | | | 3.900%, 7/15/2025 | | | 775,487 | |
| | 1,850,000 | | | 5.500%, 10/15/2040 | | | 2,256,264 | |
| | 730,000 | | | 6.750%, 1/29/2049h,i | | | 810,300 | |
| | 1,090,000 | | | 7.900%, 4/29/2049i | | | 1,123,517 | |
| | 1,440,000 | | | 6.000%, 12/29/2049i | | | 1,501,200 | |
| | | | KeyCorp | | | | |
| | 180,000 | | | 5.000%, 12/29/2049i | | | 176,715 | |
| | | | Kilroy Realty, LP | | | | |
| | 1,450,000 | | | 4.250%, 8/15/2029 | | | 1,503,644 | |
| | | | Liberty Mutual Group, Inc. | | | | |
| | 1,965,000 | | | 4.950%, 5/1/2022d | | | 2,202,576 | |
| | 1,810,000 | | | 4.850%, 8/1/2044d | | | 1,871,075 | |
| | | | Liberty Property, LP | | | | |
| | 1,125,000 | | | 4.750%, 10/1/2020 | | | 1,216,180 | |
| | 1,090,000 | | | 4.400%, 2/15/2024 | | | 1,176,726 | |
| | | | Lincoln National Corporation | | | | |
| | 1,850,000 | | | 4.000%, 9/1/2023 | | | 1,969,773 | |
| | | | Lloyds Bank plc | | | | |
| | 1,090,000 | | | 4.650%, 3/24/2026 | | | 1,121,911 | |
| | | | MetLife Capital Trust IV | | | | |
| | 300,000 | | | 7.875%, 12/15/2037d | | | 384,000 | |
| | | | MetLife Capital Trust X | | | | |
| | 750,000 | | | 9.250%, 4/8/2038d | | | 1,092,375 | |
| | | | Mitsubishi UFJ Financial Group, Inc. | | | | |
| | 720,000 | | | 2.190%, 9/13/2021 | | | 714,597 | |
| | | | Mizuho Bank, Ltd. | | | | |
| | 1,600,000 | | | 3.600%, 9/25/2024d | | | 1,691,880 | |
The accompanying Notes to Financial Statements are an integral part of this schedule.
132
INCOME FUND
Schedule of Investments as of October 31, 2016
| | | | | | | | |
Principal
Amount | | | Long-Term Fixed Income (90.4%) | | Value | |
| Financials (26.5%) - continued | | | | |
| | | | Morgan Stanley | | | | |
| | $1,600,000 | | | 5.500%, 1/26/2020 | | | $1,763,941 | |
| | 1,450,000 | | | 2.500%, 4/21/2021 | | | 1,461,470 | |
| | 1,795,000 | | | 4.875%, 11/1/2022 | | | 1,971,556 | |
| | 1,810,000 | | | 2.282%, 10/24/2023g | | | 1,807,828 | |
| | 1,130,000 | | | 4.000%, 7/23/2025 | | | 1,204,100 | |
| | 1,450,000 | | | 5.000%, 11/24/2025 | | | 1,603,855 | |
| | 720,000 | | | 3.125%, 7/27/2026 | | | 716,568 | |
| | 1,490,000 | | | 4.350%, 9/8/2026 | | | 1,581,926 | |
| | 930,000 | | | 4.300%, 1/27/2045 | | | 973,884 | |
| | | | National Retail Properties, Inc. | | | | |
| | 1,800,000 | | | 3.900%, 6/15/2024 | | | 1,889,030 | |
| | | | Nationwide Building Society | | | | |
| | 1,510,000 | | | 3.900%, 7/21/2025d | | | 1,613,689 | |
| | 1,080,000 | | | 4.000%, 9/14/2026d | | | 1,065,388 | |
| | | | Nordea Bank AB | | | | |
| | 1,110,000 | | | 5.500%, 9/29/2049d,i | | | 1,098,900 | |
| | | | Omega Healthcare Investors, Inc. | | | | |
| | 1,640,000 | | | 5.875%, 3/15/2024 | | | 1,704,401 | |
| | 1,130,000 | | | 5.250%, 1/15/2026 | | | 1,194,820 | |
| | | | Peachtree Corners Funding Trust | | | | |
| | 1,700,000 | | | 3.976%, 2/15/2025d | | | 1,706,154 | |
| | | | PNC Capital Trust C | | | | |
| | 1,880,000 | | | 1.412%, 6/1/2028g | | | 1,778,950 | |
| | | | Prologis, LP | | | | |
| | 1,490,000 | | | 4.250%, 8/15/2023 | | | 1,634,208 | |
| | | | Prudential Financial, Inc. | | | | |
| | 1,085,000 | | | 3.500%, 5/15/2024 | | | 1,137,281 | |
| | 825,000 | | | 6.200%, 11/15/2040 | | | 1,040,943 | |
| | | | Realty Income Corporation | | | | |
| | 2,170,000 | | | 3.875%, 7/15/2024 | | | 2,293,772 | |
| | | | Regions Bank | | | | |
| | 250,000 | | | 7.500%, 5/15/2018 | | | 270,910 | |
| | | | Reinsurance Group of America, Inc. | | | | |
| | 1,070,000 | | | 6.450%, 11/15/2019 | | | 1,205,246 | |
| | 1,095,000 | | | 4.700%, 9/15/2023 | | | 1,193,921 | |
| | | | Royal Bank of Scotland Group plc | | | | |
| | 1,440,000 | | | 3.875%, 9/12/2023 | | | 1,409,848 | |
| | 1,510,000 | | | 7.500%, 12/29/2049i | | | 1,385,425 | |
| | 1,080,000 | | | 8.625%, 12/29/2049i | | | 1,074,600 | |
| | | | Santander Holdings USA, Inc. | | | | |
| | 1,790,000 | | | 2.700%, 5/24/2019 | | | 1,807,424 | |
| | 1,500,000 | | | 4.500%, 7/17/2025 | | | 1,531,409 | |
| | | | Santander UK Group Holdings plc | | | | |
| | 940,000 | | | 2.875%, 10/16/2020 | | | 943,822 | |
| | 1,500,000 | | | 4.750%, 9/15/2025d | | | 1,494,930 | |
| | | | Santander UK plc | | | | |
| | 800,000 | | | 3.125%, 1/8/2021 | | | 810,311 | |
| | | | Societe Generale SA | | | | |
| | 1,510,000 | | | 8.000%, 12/31/2049d,h,i | | | 1,523,213 | |
| | | | Sumitomo Mitsui Financial Group, Inc. | | | | |
| | 1,440,000 | | | 3.010%, 10/19/2026 | | | 1,435,980 | |
| | | | SunTrust Banks, Inc. | | | | |
| | 1,090,000 | | | 2.900%, 3/3/2021 | | | 1,125,169 | |
| | | | Synchrony Financial | | | | |
| | 1,490,000 | | | 2.700%, 2/3/2020 | | | 1,506,257 | |
| | 1,560,000 | | | 4.250%, 8/15/2024 | | | 1,626,058 | |
| | 1,440,000 | | | 3.700%, 8/4/2026 | | | 1,418,551 | |
| | | | Toronto-Dominion Bank | | | | |
| | 1,440,000 | | | 3.625%, 9/15/2031 | | | 1,438,422 | |
| | | | Travelers Companies, Inc. | | | | |
| | 1,080,000 | | | 3.750%, 5/15/2046 | | | 1,100,967 | |
| | | | UBS Group Funding Jersey, Ltd. | | | | |
| | 900,000 | | | 2.650%, 2/1/2022d | | | 895,181 | |
| | 1,510,000 | | | 4.125%, 9/24/2025d | | | 1,573,267 | |
| | | | UnionBanCal Corporation | | | | |
| | 1,420,000 | | | 3.500%, 6/18/2022 | | | 1,490,503 | |
| | | | UnitedHealth Group, Inc. | | | | |
| | 1,520,000 | | | 3.350%, 7/15/2022 | | | 1,617,082 | |
| | 760,000 | | | 4.750%, 7/15/2045 | | | 879,883 | |
| | | | Wells Fargo & Company | | | | |
| | 1,440,000 | | | 3.000%, 4/22/2026 | | | 1,433,363 | |
| | 1,090,000 | | | 4.100%, 6/3/2026 | | | 1,145,186 | |
| | 1,810,000 | | | 3.000%, 10/23/2026 | | | 1,797,574 | |
| | 1,840,000 | | | 5.875%, 12/31/2049i | | | 1,976,850 | |
| | | | Welltower, Inc. | | | | |
| | 720,000 | | | 6.125%, 4/15/2020 | | | 814,307 | |
| | 1,350,000 | | | 4.950%, 1/15/2021 | | | 1,486,274 | |
| | 950,000 | | | 4.000%, 6/1/2025 | | | 994,674 | |
| | | | Westpac Banking Corporation | | | | |
| | 1,820,000 | | | 2.850%, 5/13/2026 | | | 1,818,426 | |
| | | | XLIT, Ltd. | | | | |
| | 1,130,000 | | | 4.450%, 3/31/2025 | | | 1,148,368 | |
| | 1,160,000 | | | 5.250%, 12/15/2043 | | | 1,236,972 | |
| | | | | |
| | | | Total | | | 217,695,418 | |
| | | | | |
| |
| Foreign Government (0.8%) | | | | |
| | | | Argentina Government International Bond | | | | |
| | 910,000 | | | 6.875%, 4/22/2021d | | | 984,620 | |
| | | | Brazil Government International Bond | | | | |
| | 900,000 | | | 6.000%, 4/7/2026 | | | 992,250 | |
| | | | Mexico Government International Bond | | | | |
| | 1,120,000 | | | 4.000%, 10/2/2023 | | | 1,177,120 | |
| | 1,249,000 | | | 3.600%, 1/30/2025 | | | 1,273,980 | |
| | 1,620,000 | | | 4.125%, 1/21/2026 | | | 1,712,340 | |
| | | | | |
| | | | Total | | | 6,140,310 | |
| | | | | |
| |
| Mortgage-Backed Securities (4.7%) | | | | |
| | | | Federal Home Loan Mortgage Corporation Gold 15-Yr. Pass Through | | | | |
| | 2,425,000 | | | 3.000%, 11/1/2031c | | | 2,537,725 | |
| | | | Federal Home Loan Mortgage Corporation Gold 30-Yr. Pass Through | | | | |
| | 3,925,000 | | | 4.000%, 11/1/2046c | | | 4,198,370 | |
| | | | Federal National Mortgage Association Conventional | | | | |
| | 5,400,000 | | | 3.000%, 11/1/2046c | | | 5,559,468 | |
| | | | Federal National Mortgage Association Conventional 15-Yr. Pass Through | | | | |
| | 5,500,000 | | | 2.500%, 11/1/2031c | | | 5,659,414 | |
| | | | Federal National Mortgage Association Conventional 30-Yr. Pass Through | | | | |
| | 13,875,000 | | | 3.500%, 11/1/2046c | | | 14,566,583 | |
| | 5,500,000 | | | 4.000%, 11/1/2046c | | | 5,889,296 | |
| | 325,000 | | | 4.500%, 11/1/2046c | | | 355,215 | |
| | | | | |
| | | | Total | | | 38,766,071 | |
| | | | | |
| |
| Technology (3.1%) | | | | |
| | | | Apple, Inc. | | | | |
| | 2,550,000 | | | 3.250%, 2/23/2026 | | | 2,659,836 | |
| | 1,450,000 | | | 2.450%, 8/4/2026 | | | 1,421,015 | |
| | | | Diamond 1 Finance Corporation | | | | |
| | 1,440,000 | | | 4.420%, 6/15/2021d | | | 1,505,818 | |
| | 1,080,000 | | | 6.020%, 6/15/2026d | | | 1,177,259 | |
The accompanying Notes to Financial Statements are an integral part of this schedule.
133
INCOME FUND
Schedule of Investments as of October 31, 2016
| | | | | | | | |
Principal
Amount | | | Long-Term Fixed Income (90.4%) | | Value | |
| Technology (3.1%) - continued | | | | |
| | | | Equinix, Inc. | | | | |
| | $1,110,000 | | | 5.375%, 1/1/2022 | | | $1,176,600 | |
| | | | Fidelity National Information Services, Inc. | | | | |
| | 1,810,000 | | | 3.875%, 6/5/2024 | | | 1,912,106 | |
| | 1,080,000 | | | 3.000%, 8/15/2026 | | | 1,055,587 | |
| | | | First Data Corporation | | | | |
| | 750,000 | | | 5.375%, 8/15/2023d | | | 776,250 | |
| | | | Hewlett Packard Enterprise Company | | | | |
| | 1,510,000 | | | 3.100%, 10/5/2018d | | | 1,543,862 | |
| | 1,500,000 | | | 3.850%, 10/15/2020d | | | 1,589,203 | |
| | | | Intel Corporation | | | | |
| | 1,630,000 | | | 4.100%, 5/19/2046 | | | 1,676,934 | |
| | | | Microsoft Corporation | | | | |
| | 1,440,000 | | | 3.450%, 8/8/2036 | | | 1,421,578 | |
| | | | Oracle Corporation | | | | |
| | 2,150,000 | | | 2.650%, 7/15/2026 | | | 2,120,818 | |
| | 1,800,000 | | | 4.000%, 7/15/2046 | | | 1,777,554 | |
| | | | Qualcomm, Inc. | | | | |
| | 1,510,000 | | | 3.450%, 5/20/2025 | | | 1,582,732 | |
| | | | Seagate HDD Cayman | | | | |
| | 1,130,000 | | | 4.875%, 6/1/2027 | | | 1,020,962 | |
| | | | Sensata Technologies BV | | | | |
| | 1,110,000 | | | 4.875%, 10/15/2023d | | | 1,150,237 | |
| | | | | |
| | | | Total | | | 25,568,351 | |
| | | | | |
| |
| Transportation (2.1%) | | | | |
| | | | American Airlines Pass Through Trust | | | | |
| | 1,224,704 | | | 4.000%, 7/15/2025 | | | 1,304,297 | |
| | | | British Airways plc | | | | |
| | 2,271,388 | | | 4.625%, 6/20/2024d | | | 2,430,385 | |
| | | | Burlington Northern Santa Fe, LLC | | | | |
| | 1,500,000 | | | 4.700%, 9/1/2045 | | | 1,715,759 | |
| | | | Continental Airlines, Inc. | | | | |
| | 467,354 | | | 7.250%, 11/10/2019 | | | 525,773 | |
| | 665,052 | | | 4.000%, 10/29/2024 | | | 713,268 | |
| | | | Delta Air Lines, Inc. | | | | |
| | 746,430 | | | 4.950%, 5/23/2019 | | | 785,618 | |
| | | | ERAC USA Finance, LLC | | | | |
| | 2,050,000 | | | 5.250%, 10/1/2020d | | | 2,281,006 | |
| | 1,000,000 | | | 3.800%, 11/1/2025d | | | 1,060,021 | |
| | 1,440,000 | | | 3.300%, 12/1/2026d | | | 1,462,271 | |
| | | | Penske Truck Leasing Company, LP | | | | |
| | 1,490,000 | | | 3.375%, 2/1/2022d | | | 1,540,048 | |
| | | | United Airlines Pass Through Trust | | | | |
| | 857,514 | | | 3.750%, 9/3/2026 | | | 900,925 | |
| | | | US Airways Pass Through Trust | | | | |
| | 1,568,776 | | | 3.950%, 11/15/2025 | | | 1,655,044 | |
| | | | Virgin Australia Holdings, Ltd. | | | | |
| | 991,017 | | | 5.000%, 10/23/2023d | | | 1,028,180 | |
| | | | | |
| | | | Total | | | 17,402,595 | |
| | | | | |
| |
| U.S. Government and Agencies (5.3%) | | | | |
| | | | U.S. Treasury Bonds | | | | |
| | 3,500,000 | | | 1.500%, 8/15/2026 | | | 3,395,546 | |
| | 2,980,000 | | | 3.125%, 2/15/2042 | | | 3,316,996 | |
| | 2,450,000 | | | 2.500%, 2/15/2045 | | | 2,407,316 | |
| | 4,060,000 | | | 3.000%, 11/15/2045 | | | 4,407,954 | |
| | | | U.S. Treasury Bonds, TIPS | | | | |
| | 920,502 | | | 0.750%, 2/15/2045 | | | 924,769 | |
| | 1,097,788 | | | 1.000%, 2/15/2046 | | | 1,182,640 | |
| | | | U.S. Treasury Notes | | | | |
| | 500,000 | | | 0.875%, 11/30/2016 | | | 500,271 | |
| | 2,500,000 | | | 1.375%, 5/31/2020 | | | 2,521,583 | |
| | 3,270,000 | | | 1.125%, 2/28/2021 | | | 3,251,351 | |
| | 4,000,000 | | | 2.000%, 5/31/2021 | | | 4,123,124 | |
| | 3,350,000 | | | 2.000%, 7/31/2022 | | | 3,445,398 | |
| | 4,040,000 | | | 1.875%, 8/31/2022 | | | 4,125,850 | |
| | 3,870,000 | | | 2.125%, 12/31/2022 | | | 4,003,484 | |
| | 2,160,000 | | | 1.625%, 5/31/2023 | | | 2,165,232 | |
| | 2,170,000 | | | 1.625%, 10/31/2023 | | | 2,171,018 | |
| | | | U.S. Treasury Notes, TIPS | | | | |
| | 1,446,883 | | | 0.125%, 7/15/2026 | | | 1,450,861 | |
| | | | | |
| | | | Total | | | 43,393,393 | |
| | | | | |
| |
| U.S. Municipals (0.2%) | | | | |
| | | | Denver, CO City & County Airport Rev. | | | | |
| | 1,450,000 | | | 5.250%, 11/15/2022, Ser. A, AMT | | | 1,700,821 | |
| | | | | |
| | | | Total | | | 1,700,821 | |
| | | | | |
| |
| Utilities (6.1%) | | | | |
| | | | Access Midstream Partners, LP | | | | |
| | 730,000 | | | 4.875%, 5/15/2023 | | | 739,319 | |
| | | | American Electric Power Company, Inc. | | | | |
| | 1,435,000 | | | 2.950%, 12/15/2022 | | | 1,483,786 | |
| | | | Arizona Public Service Company | | | | |
| | 1,620,000 | | | 8.750%, 3/1/2019 | | | 1,883,718 | |
| | | | Baltimore Gas and Electric Company | | | | |
| | 1,440,000 | | | 2.400%, 8/15/2026 | | | 1,410,028 | |
| | | | Calpine Corporation | |
| | 1,080,000 | | | 5.375%, 1/15/2023 | | | 1,069,200 | |
| | | | Cleveland Electric Illuminating Company | |
| | 554,000 | | | 5.700%, 4/1/2017 | | | 563,400 | |
| | | | DCP Midstream Operating, LP | | | | |
| | 1,450,000 | | | 5.600%, 4/1/2044 | | | 1,359,375 | |
| | | | Duke Energy Corporation | | | | |
| | 2,160,000 | | | 2.650%, 9/1/2026 | | | 2,101,730 | |
| | | | Dynegy, Inc. | | | | |
| | 750,000 | | | 7.375%, 11/1/2022 | | | 723,281 | |
| | | | Electricite de France SA | | | | |
| | 1,800,000 | | | 5.250%, 12/29/2049d,i | | | 1,782,000 | |
| | | | Emera U.S. Finance, LP | | | | |
| | 1,790,000 | | | 3.550%, 6/15/2026d | | | 1,828,283 | |
| | | | Energy Transfer Equity, LP | | | | |
| | 1,130,000 | | | 5.500%, 6/1/2027 | | | 1,101,750 | |
| | | | Enterprise Products Operating, LLC | | | | |
| | 1,070,000 | | | 6.650%, 4/15/2018 | | | 1,144,719 | |
| | | | Exelon Corporation | | | | |
| | 1,880,000 | | | 3.950%, 6/15/2025 | | | 2,004,482 | |
| | 1,090,000 | | | 3.400%, 4/15/2026 | | | 1,125,520 | |
| | | | Exelon Generation Company, LLC | | | | |
| | 1,440,000 | | | 4.250%, 6/15/2022 | | | 1,533,097 | |
| | | | FirstEnergy Transmission, LLC | | | | |
| | 2,170,000 | | | 4.350%, 1/15/2025d | | | 2,299,436 | |
| | | | Fortis, Inc. | |
| | 1,440,000 | | | 3.055%, 10/4/2026d | | | 1,417,016 | |
| | | | ITC Holdings Corporation | |
| | 2,920,000 | | | 4.050%, 7/1/2023 | | | 3,101,823 | |
| | | | MidAmerican Energy Holdings Company | | | | |
| | 2,550,000 | | | 3.750%, 11/15/2023 | | | 2,754,671 | |
| | | | Nevada Power Company | | | | |
| | 1,700,000 | | | 6.750%, 7/1/2037 | | | 2,356,227 | |
| | | | NiSource Finance Corporation | | | | |
| | 1,800,000 | | | 5.450%, 9/15/2020 | | | 2,008,222 | |
| | | | Ohio Power Company | | | | |
| | 1,600,000 | | | 6.050%, 5/1/2018 | | | 1,703,414 | |
| | | | Oncor Electric Delivery Company, LLC | | | | |
| | 1,510,000 | | | 3.750%, 4/1/2045 | | | 1,531,191 | |
The accompanying Notes to Financial Statements are an integral part of this schedule.
134
INCOME FUND
Schedule of Investments as of October 31, 2016
| | | | | | | | |
Principal Amount | | | Long-Term Fixed Income (90.4%) | | Value | |
| Utilities (6.1%) - continued | | | | |
| | | | Pacific Gas and Electric Company | | | | |
| | $730,000 | | | 2.950%, 3/1/2026 | | | $749,403 | |
| | | | Pennsylvania Electric Company | | | | |
| | 2,300,000 | | | 5.200%, 4/1/2020 | | | 2,469,740 | |
| | | | PPL Capital Funding, Inc. | | | | |
| | 1,795,000 | | | 3.500%, 12/1/2022 | | | 1,890,753 | |
| | 1,810,000 | | | 3.950%, 3/15/2024 | | | 1,934,510 | |
| | 1,080,000 | | | 3.100%, 5/15/2026 | | | 1,084,079 | |
| | | | Southern Company | | | | |
| | 1,440,000 | | | 3.250%, 7/1/2026 | | | 1,475,809 | |
| | | | Xcel Energy, Inc. | | | | |
| | 1,510,000 | | | 3.300%, 6/1/2025 | | | 1,572,544 | |
| | | | | |
| | | | Total | | | 50,202,526 | |
| | | | | |
| | | | | | | | |
| | | | | |
| | | | Total Long-Term Fixed Income (cost $718,969,990) | | | 743,156,212 | |
| | | | | |
| | |
| Shares | | | Preferred Stock (1.4%) | | Value | |
| Consumer Staples (0.2%) | | | | |
| | 43,424 | | | CHS, Inc., 7.100%i | | | 1,285,350 | |
| | | | | |
| | | | Total | | | 1,285,350 | |
| | | | | |
| |
| Financials (1.2%) | | | | |
| | 57,878 | | | Citigroup, Inc., 7.257%g | | | 1,505,407 | |
| | 12,500 | | | Cobank ACB, 6.250%i | | | 1,332,423 | |
| | 18,075 | | | Countrywide Capital V, 7.000% | | | 465,612 | |
| | 51,800 | | | Discover Financial Services 6.500%i | | | 1,356,642 | |
| | 46,410 | | | GMAC Capital Trust I, 6.602%g | | | 1,184,847 | |
| | 54,060 | | | Goldman Sachs Group, Inc., 5.500%i | | | 1,409,344 | |
| | 51,800 | | | Morgan Stanley, 7.125%i | | | 1,511,524 | |
| | 58,500 | | | Wells Fargo & Company, 5.850%i | | | 1,558,440 | |
| | | | | |
| | | | Total | | | 10,324,239 | |
| | | | | |
| | | | | | | | |
| | | | | |
| | | | Total Preferred Stock (cost $11,047,097) | | | 11,609,589 | |
| | | | | |
| | |
| Shares | | | Common Stock (0.1%) | | Value | |
| Energy (0.1%) | | | | |
| | 10,761 | | | Arch Coal, Inc.h,j | | | 789,642 | |
| | 757 | | | Vantage Drilling Internationalj | | | 63,588 | |
| | | | | |
| | | | Total | | | 853,230 | |
| | | | | |
| | | | | |
| | | | | |
| | | | Total Common Stock (cost $770,971) | | | 853,230 | |
| | | | | |
| | |
| Shares | | | Collateral Held for Securities Loaned (2.5%) | | Value | |
| | 20,144,903 | | | Thrivent Cash Management Trust | | | 20,144,903 | |
| | | | | |
| | | | Total Collateral Held for Securities Loaned (cost $20,144,903) | | | 20,144,903 | |
| | | | | |
Shares or
Principal Amount | | | Short-Term Investments (8.8%)k | | Value | |
| | | | Federal Home Loan Bank Discount Notes | | | | |
| | 2,700,000 | | | 0.311%, 11/1/2016 | | | 2,700,000 | |
| | 800,000 | | | 0.290%, 11/2/2016 | | | 799,995 | |
| | 1,900,000 | | | 0.310%, 11/4/2016 | | | 1,899,968 | |
| | 500,000 | | | 0.335%, 11/18/2016 | | | 499,953 | |
| | 4,900,000 | | | 0.322%, 11/25/2016 | | | 4,899,348 | |
| | 2,500,000 | | | 0.345%, 11/30/2016 | | | 2,499,597 | |
| | 2,200,000 | | | 0.348%, 12/2/2016 | | | 2,199,602 | |
| | 2,300,000 | | | 0.295%, 12/7/2016 | | | 2,299,517 | |
| | 600,000 | | | 0.285%, 12/9/2016 | | | 599,867 | |
| | 800,000 | | | 0.310%, 1/3/2017 | | | 799,552 | |
| | 1,000,000 | | | 0.350%, 1/13/2017 | | | 999,351 | |
| | 8,000,000 | | | 0.310%, 1/17/2017 | | | 7,994,528 | |
| | 1,100,000 | | | 0.365%, 1/27/2017 | | | 1,099,150 | |
| | | | Federal National Mortgage Association Discount Notes | | | | |
| | 1,000,000 | | | 0.345%, 1/11/2017l | | | 999,369 | |
| | 4,226,259 | | | Thrivent Core Short-Term Reserve Fund 0.790% | | | 42,262,592 | |
| | | | | |
| | | | Total Short-Term Investments (cost $72,551,093) | | | 72,552,389 | |
| | | | | |
| | | | Total Investments (cost $851,504,396) 106.6% | | | $876,573,156 | |
| | | | | |
| | | | Other Assets and Liabilities, Net (6.6%) | | | (54,469,773 | ) |
| | | | | |
| | | | Total Net Assets 100.0% | | | $822,103,383 | |
| | | | | |
a | The stated interest rate represents the weighted average of all contracts within the bank loan facility. |
b | All or a portion of the loan is unfunded. |
c | Denotes investments purchased on a when-issued or delayed delivery basis. |
d | Denotes securities sold under Rule 144A of the Securities Act of 1933, which exempts them from registration. These securities may be resold to other dealers in the program or to other qualified institutional buyers. As of October 31, 2016, the value of these investments was $124,083,043 or 15.1% of total net assets. |
e | Denotes step coupon securities. Step coupon securities pay an initial coupon rate for the first period and then different coupon rates for following periods. The rate shown is as of October 31, 2016. |
f | All or a portion of the security is insured or guaranteed. |
g | Denotes variable rate securities. Variable rate securities are securities whose yields vary with a designated market index or market rate. The rate shown is as of October 31, 2016. |
h | All or a portion of the security is on loan. |
i | Denotes perpetual securities. Perpetual securities pay an indefinite stream of interest, but may be called by the issuer at an earlier date. |
j | Non-income producing security. |
k | The interest rate shown reflects the yield, coupon rate or the discount rate at the date of purchase. |
l | All or a portion of the security is held on deposit with the counterparty and pledged as the initial margin deposit for open futures contracts. |
The accompanying Notes to Financial Statements are an integral part of this schedule.
135
INCOME FUND
Schedule of Investments as of October 31, 2016
* | Denotes restricted securities. Restricted securities are investment securities which cannot be offered for public sale without first being registered under the Securities Act of 1933. The value of all restricted securities held in Income Fund as of October 31, 2016 was $1,172,830 or 0.1% of total net assets. The following table indicates the acquisition date and cost of restricted securities shown in the schedule as of October 31, 2016. |
| | | | | | | | |
Security | | Acquisition
Date | | | Cost | |
CAM Mortgage, LLC, 7/15/2064 | | | 6/24/2015 | | | | $206,140 | |
Preferred Term Securities XXIII, Ltd., 12/22/2036 | | | 9/14/2006 | | | | 1,294,367 | |
The following table presents the total amount of securities loaned with continuous maturity, by type, offset by the gross payable upon return of collateral for securities loaned by Thrivent Income Fund as of October 31, 2016:
| | | | |
Securities Lending Transactions | | | | |
Taxable Debt Security | | $ | 16,247,643 | |
Common Stock | | | 785,166 | |
Total lending | | $ | 17,032,809 | |
Gross amount payable upon return of collateral for securities loaned | | $ | 20,144,903 | |
Net amounts due to counterparty | | | $3,112,094 | |
Definitions:
| | | | |
AMT | | - | | Subject to Alternative Minimum Tax |
Rev. | | - | | Revenue |
Ser. | | - | | Series |
TIPS | | - | | Treasury Inflation Protected Security. |
The accompanying Notes to Financial Statements are an integral part of this schedule.
136
MUNICIPAL BOND FUND
Schedule of Investments as of October 31, 2016
| | | | | | | | |
Principal
Amount | | | Long-Term Fixed Income (98.9%) | | Value | |
| Alabama (0.3%) | | | | |
| | | | Alabama Public School and College Auth. Capital Improvement Rev. Refg. | | | | |
| | $1,500,000 | | | 5.000%, 5/1/2029, Ser. Aa | | | $1,646,220 | |
| | | | Auburn University, AL General Fee Rev. Refg. | | | | |
| | 1,000,000 | | | 5.000%, 6/1/2032, Ser. A | | | 1,194,580 | |
| | 1,250,000 | | | 5.000%, 6/1/2033, Ser. A | | | 1,486,850 | |
| | | | | |
| | | | Total | | | 4,327,650 | |
| | | | | |
| |
| Alaska (0.3%) | | | | |
| | | | Valdez, AK Marine Terminal Rev. (Exxon Mobil) | | | | |
| | 1,805,000 | | | 0.500%, 12/1/2029b | | | 1,805,000 | |
| | | | Valdez, AK Marine Terminal Rev. (Exxon Pipeline Company) | | | | |
| | 3,800,000 | | | 0.500%, 10/1/2025b | | | 3,800,000 | |
| | | | | |
| | | | Total | | | 5,605,000 | |
| | | | | |
| |
| Arizona (1.0%) | | | | |
| | | | Arizona State Transportation Board Highway Rev. | | | | |
| | 1,500,000 | | | 5.000%, 7/1/2036, Ser. Aa | | | 1,760,145 | |
| | | | Arizona State University Board of Regents System Rev. Green Bonds | | | | |
| | 1,000,000 | | | 5.000%, 7/1/2042, Ser. B | | | 1,172,200 | |
| | | | Glendale, AZ Industrial Development Auth. Rev. (Midwestern University) | | | | |
| | 2,515,000 | | | 5.000%, 5/15/2031 | | | 2,842,478 | |
| | | | Northern Arizona Capital Fac. Lease Rev. (Student & Academic Services, LLC) (BAM Insured) | | | | |
| | 750,000 | | | 5.000%, 6/1/2039c | | | 861,458 | |
| | | | Northern Arizona University Refg. C.O.P. | | | | |
| | 1,000,000 | | | 5.000%, 9/1/2022 | | | 1,175,410 | |
| | | | Northern Arizona University Refg. Rev. | | | | |
| | 1,180,000 | | | 5.000%, 6/1/2036, Ser. A | | | 1,395,763 | |
| | 750,000 | | | 5.000%, 6/1/2037, Ser. A | | | 885,068 | |
| | 320,000 | | | 5.000%, 6/1/2038, Ser. A | | | 375,574 | |
| | | | Phoenix, AZ Civic Improvement Corporation Airport Rev. | | | | |
| | 3,060,000 | | | 5.250%, 7/1/2033, Ser. A | | | 3,411,563 | |
| | | | Phoenix-Mesa Gateway Airport Auth. Special Fac. Rev. | | | | |
| | 1,450,000 | | | 5.000%, 7/1/2038, AMT | | | 1,588,953 | |
| | | | Yavapai County, AZ Industrial Development Auth. Hospital Fac. Rev. Refg. (Yavapai Regional Medical Center) | | | | |
| | 500,000 | | | 5.000%, 8/1/2036d | | | 564,090 | |
| | | | | |
| | | | Total | | | 16,032,702 | |
| | | | | |
| |
| Arkansas (0.8%) | | | | |
| | | | Pulaski County, AR Hospital Rev. (Arkansas Children’s Hospital) | | | | |
| | 3,055,000 | | | 5.000%, 3/1/2035 | | | 3,583,210 | |
| | | | Rogers, AR Sales and Use Tax Refg. and Improvement | | | | |
| | 2,975,000 | | | 4.000%, 11/1/2027, Ser. 2011 | | | 3,244,892 | |
| | 55,000 | | | 4.125%, 11/1/2031, Ser. 2011 | | | 55,000 | |
| | | | University of Arkansas Rev. | | | | |
| | 900,000 | | | 5.000%, 11/1/2037, Ser. A | | | 1,084,725 | |
| | 1,300,000 | | | 5.000%, 11/1/2046, Ser. A | | | 1,550,445 | |
| | | | University of Arkansas Rev. Refg. Various Fac. Rev. (Pine Bluff Campus) | | | | |
| | 650,000 | | | 5.000%, 12/1/2029, Ser. A | | | 780,052 | |
| | | | University of Arkansas Rev. Student Fee (Community College at Morrilton) | | | | |
| | 570,000 | | | 5.000%, 5/1/2046 | | | 675,011 | |
| | | | University of Arkansas Rev. Various Fac. (Fayetteville Campus) | | | | |
| | 1,135,000 | | | 5.000%, 11/1/2039, Ser. A | | | 1,322,581 | |
| | 825,000 | | | 5.000%, 11/1/2041, Ser. A | | | 962,000 | |
| | | | | |
| | | | Total | | | 13,257,916 | |
| | | | | |
| |
| California (11.2%) | | | | |
| | | | Anaheim Public Financing Auth. Lease Rev. (Anaheim Public Improvements) (AGM Insured) | | | | |
| | 3,950,000 | | | 6.000%, 9/1/2024, Ser. Ac | | | 4,901,752 | |
| | | | Beverly Hills Unified School District, Los Angeles County, CA G.O. (2008 Election) | | | | |
| | 10,000,000 | | | Zero Coupon, 8/1/2031 | | | 6,547,700 | |
| | | | California Educational Fac. Auth. Rev. (Stanford University) | | | | |
| | 6,000,000 | | | 5.250%, 4/1/2040 | | | 8,422,440 | |
| | | | California Health Fac. Financing Auth. Rev. | | | | |
| | 1,750,000 | | | 5.000%, 8/15/2055 | | | 2,020,638 | |
| | | | California Infrastructure and Economic Development Bank Rev. (Bay Area Toll Bridges Seismic Retrofit Rev.) (FGIC Insured) | | | | |
| | 5,000,000 | | | 5.000%, 7/1/2025, Ser. Aa,c | | | 6,361,350 | |
| | | | California Municipal Finance Auth. Refg. Rev. (Biola University) | | | | |
| | 1,500,000 | | | 5.875%, 10/1/2034 | | | 1,589,775 | |
| | 1,250,000 | | | 5.000%, 10/1/2042 | | | 1,386,950 | |
| | | | California Various Purpose G.O. | | | | |
| | 3,565,000 | | | 5.500%, 4/1/2024 | | | 3,951,838 | |
| | 10,000 | | | 5.250%, 4/1/2029 | | | 10,039 | |
| | 10,000,000 | | | 5.250%, 3/1/2038 | | | 10,529,000 | |
| | 5,000,000 | | | 6.000%, 4/1/2038 | | | 5,577,600 | |
| | 5,000,000 | | | 6.000%, 11/1/2039 | | | 5,707,200 | |
| | | | California Various Purpose G.O. Refg. | | | | |
| | 4,000,000 | | | 5.000%, 9/1/2035 | | | 4,789,720 | |
| | | | Chula Vista Industrial Development Rev. Refg. (San Diego Gas & Electric Company) | | | | |
| | 2,010,000 | | | 5.875%, 2/15/2034, Ser. C | | | 2,236,145 | |
| | | | East Bay Municipal Utility District, Alameda and Contra Costa Counties, CA Water System Rev. Refg. (NATL-RE Insured) | | | | |
| | 10,000,000 | | | 5.000%, 6/1/2037, Ser. Aa,c | | | 10,252,800 | |
| | | | Foothill-De Anza, CA Community College District G.O. | | | | |
| | 5,000,000 | | | 5.000%, 8/1/2040, Ser. Ca | | | 5,897,400 | |
| | | | Golden West Schools Financing Auth. Rev. (NATL-RE Insured) | | | | |
| | 420,000 | | | 5.800%, 2/1/2022, Ser. Ac | | | 511,123 | |
| | | | Los Angeles Community College District, Los Angeles County, CA G.O. (Election 2008) | | | | |
| | 10,050,000 | | | 6.000%, 8/1/2033, Ser. Aa | | | 11,415,795 | |
The accompanying Notes to Financial Statements are an integral part of this schedule.
137
MUNICIPAL BOND FUND
Schedule of Investments as of October 31, 2016
| | | | | | | | |
Principal
Amount | | | Long-Term Fixed Income (98.9%) | | Value | |
| California (11.2%) - continued | | | | |
| | | | Los Angeles Unified School District, Los Angeles County, CA G.O. | | | | |
| | $1,000,000 | | | 5.000%, 7/1/2032, Ser. A | | | $1,160,590 | |
| | 5,000,000 | | | 5.000%, 1/1/2034, Ser. I | | | 5,518,000 | |
| | | | Los Angeles, CA Department of Airports Rev. (Los Angeles International Airport) | | | | |
| | 8,000,000 | | | 5.000%, 5/15/2040, Ser. A | | | 8,999,600 | |
| | | | Los Angeles, CA Department of Water & Power System Rev. | | | | |
| | 7,000,000 | | | 5.000%, 7/1/2044, Ser. D | | | 8,213,800 | |
| | | | Pittsburg, CA Redevelopment Agency Tax Allocation (Los Medanos Community Development) (AMBAC Insured) | | | | |
| | 5,000,000 | | | Zero Coupon, 8/1/2024c | | | 4,176,700 | |
| | | | Pomona, CA Single Family Mortgage Rev. Refg. (GNMA/FNMA Collateralized) | | | | |
| | 2,345,000 | | | 7.600%, 5/1/2023, Ser. Aa,c | | | 2,827,273 | |
| | | | San Bernardino, CA Single Family Mortgage Rev. Refg. (GNMA Collateralized) | | | | |
| | 830,000 | | | 7.500%, 5/1/2023, Ser. Aa,c | | | 997,726 | |
| | | | San Diego County, CA C.O.P. | | | | |
| | 5,000,000 | | | 5.250%, 7/1/2030 | | | 5,602,700 | |
| | | | San Diego Unified School District G.O. | | | | |
| | 10,000,000 | | | Zero Coupon, 7/1/2033, Ser. Aa,e | | | 11,508,700 | |
| | | | San Francisco, CA City & County Airport Commission Rev. (San Francisco International Airport) | | | | |
| | 4,000,000 | | | 5.500%, 5/1/2028, Ser. A, AMT | | | 4,788,320 | |
| | 7,030,000 | | | 6.000%, 5/1/2039, Ser. E | | | 7,881,544 | |
| | 7,825,000 | | | 5.000%, 5/1/2044, Ser. A, AMT | | | 8,852,266 | |
| | | | San Jose, CA Redevelopment Agency Tax Allocation Refg. (Merged Area Redevelopment) (NATL-RE Insured) | | | | |
| | 2,760,000 | | | 5.000%, 8/1/2025, Ser. Ac | | | 2,769,964 | |
| | | | Santa Monica Community College District, Los Angeles County, CA G.O. | | | | |
| | 5,000,000 | | | Zero Coupon, 8/1/2025, Ser. C | | | 4,150,950 | |
| | | | Tuolumne Wind Proj. Auth. Rev. (Tuolumne Company) | | | | |
| | 2,000,000 | | | 5.625%, 1/1/2029, Ser. Aa | | | 2,200,460 | |
| | | | University of California Limited Rev. Refg. | | | | |
| | 8,000,000 | | | 5.000%, 5/15/2032, Ser. I | | | 9,693,440 | |
| | | | University of California Rev. | | | | |
| | 810,000 | | | 5.250%, 5/15/2039, Ser. Oa | | | 897,763 | |
| | 2,765,000 | | | 5.250%, 5/15/2039, Ser. Oa | | | 3,064,588 | |
| | 1,425,000 | | | 5.250%, 5/15/2039, Ser. Oa | | | 1,582,349 | |
| | | | | |
| | | | Total | | | 186,995,998 | |
| | | | | |
| |
| Colorado (3.2%) | | | | |
| | | | Colorado Educational and Cultural Fac. Auth. Charter School Refg. Rev. (Pinnacle Charter School, Inc. K-8 Fac.) | | | | |
| | 500,000 | | | 5.000%, 6/1/2019 | | | 541,260 | |
| | 200,000 | | | 5.000%, 6/1/2021 | | | 226,618 | |
| | | | Colorado Educational and Cultural Fac. Auth. Charter School Rev. (Cheyenne Mountain Charter Academy) | | | | |
| | 475,000 | | | 5.125%, 6/15/2032, Ser. Aa | | | 487,901 | |
| | 1,000,000 | | | 5.375%, 6/15/2038, Ser. Aa | | | 1,028,710 | |
| | | | Colorado Educational and Cultural Fac. Auth. Charter School Rev. (Crown Pointe Academy of Westminster) | | | | |
| | 1,000,000 | | | 5.000%, 7/15/2039 | | | 1,030,780 | |
| | | | Colorado Educational and Cultural Fac. Auth. Charter School Rev. (Pinnacle Charter School, Inc. High School) | | | | |
| | 3,000,000 | | | 5.125%, 12/1/2039 | | | 3,161,880 | |
| | | | Colorado Health Fac. Auth. Hospital Rev. (Parkview Medical Center, Inc.) | | | | |
| | 4,000,000 | | | 5.000%, 9/1/2046 | | | 4,570,480 | |
| | | | Colorado Health Fac. Auth. Hospital Rev. Refg. (Valley View Hospital Association) | | | | |
| | 3,000,000 | | | 5.750%, 5/15/2036 | | | 3,181,380 | |
| | | | Colorado Health Fac. Auth. Rev. (Evangelical Lutheran Good Samaritan Society) | | | | |
| | 2,110,000 | | | 5.000%, 12/1/2024 | | | 2,393,732 | |
| | 500,000 | | | 5.625%, 6/1/2043 | | | 576,255 | |
| | | | Colorado Higher Education Capital Construction Lease Purchase Financing Program C.O.P. | | | | |
| | 405,000 | | | 5.500%, 11/1/2027a | | | 441,899 | |
| | 1,180,000 | | | 5.500%, 11/1/2027a | | | 1,287,510 | |
| | | | Denver, CO Health and Hospital Auth. Healthcare Rev. | | | | |
| | 5,000,000 | | | 5.500%, 12/1/2030 | | | 5,529,550 | |
| | 2,000,000 | | | 5.250%, 12/1/2031, Ser. A | | | 2,005,620 | |
| | | | E-470 Colorado Public Highway Auth. Rev. | | | | |
| | 1,000,000 | | | 5.000%, 9/1/2020, Ser. A | | | 1,133,620 | |
| | | | Larimer County, CO Poudre School District R-1 G.O. Improvement (NATL-RE-IBC Insured) | | | | |
| | 775,000 | | | 7.000%, 12/15/2016c | | | 780,828 | |
| | | | Park Creek, CO Metropolitan District Rev. Refg. | | | | |
| | 1,220,000 | | | 5.000%, 12/1/2022 | | | 1,424,191 | |
| | 1,000,000 | | | 5.000%, 12/1/2024 | | | 1,193,020 | |
| | | | Plaza Metropolitan District No. 1 Rev. Refg. (City of Lakewood) | | | | |
| | 1,000,000 | | | 5.000%, 12/1/2021* | | | 1,093,870 | |
| | 500,000 | | | 5.000%, 12/1/2022* | | | 551,300 | |
| | | | University of Colorado University Enterprise Rev. | | | | |
| | 1,250,000 | | | 5.375%, 6/1/2032, Ser. Aa | | | 1,388,600 | |
| | 3,250,000 | | | 5.000%, 6/1/2033, Ser. A | | | 3,817,840 | |
| | 9,790,000 | | | 5.000%, 6/1/2033a | | | 11,465,559 | |
| | 3,000,000 | | | 5.000%, 6/1/2034, Ser. A | | | 3,512,850 | |
| | | | | |
| | | | Total | | | 52,825,253 | |
| | | | | |
| |
| District of Columbia (0.9%) | | | | |
| | | | District of Columbia Income Tax Secured Rev. Refg. | | | | |
| | 2,325,000 | | | 5.000%, 12/1/2017, Ser. A | | | 2,431,834 | |
| | 5,225,000 | | | 5.000%, 12/1/2028, Ser. C | | | 5,814,536 | |
The accompanying Notes to Financial Statements are an integral part of this schedule.
138
MUNICIPAL BOND FUND
Schedule of Investments as of October 31, 2016
| | | | | | | | |
Principal
Amount | | | Long-Term Fixed Income (98.9%) | | Value | |
| District of Columbia (0.9%) - continued | | | | |
| | | | Metropolitan Washington DC Airports Auth. Airport System Rev. Refg. | | | | |
| | $6,000,000 | | | 5.000%, 10/1/2038, Ser. A, AMT | | | $6,744,360 | |
| | | | | |
| | | | Total | | | 14,990,730 | |
| | | | | |
| |
| Florida (6.5%) | | | | |
| | | | Broward County, FL Water and Sewer Utility Rev. | | | | |
| | 3,115,000 | | | 5.250%, 10/1/2034, Ser. Aa | | | 3,371,894 | |
| | | | Broward County, FL Water and Sewer Utility Rev. Refg. | | | | |
| | 1,000,000 | | | 5.000%, 10/1/2030, Ser. A | | | 1,216,530 | |
| | 1,500,000 | | | 5.000%, 10/1/2031, Ser. B | | | 1,815,375 | |
| | | | Citizens Property Insurance Corporation Rev. | | | | |
| | 10,000,000 | | | 5.000%, 6/1/2022, Ser. A1 | | | 11,724,600 | |
| | | | CityPlace Community Development District Special Assessment and Rev. | | | | |
| | 500,000 | | | 5.000%, 5/1/2017 | | | 508,180 | |
| | 2,000,000 | | | 5.000%, 5/1/2026 | | | 2,314,220 | |
| | | | County of Broward, FL Fuel System Rev. (Fort Lauderdale Fuel Fac.) (AGM Insured) | | | | |
| | 1,155,000 | | | 5.000%, 4/1/2021, Ser. A, AMTc | | | 1,318,617 | |
| | 605,000 | | | 5.000%, 4/1/2022, Ser. A, AMTc | | | 702,538 | |
| | 700,000 | | | 5.000%, 4/1/2025, Ser. A, AMTc | | | 808,871 | |
| | | | Florida State Municipal Power Agency Rev. | | | | |
| | 1,000,000 | | | 5.000%, 10/1/2030, Ser. B | | | 1,195,160 | |
| | 840,000 | | | 5.000%, 10/1/2031, Ser. B | | | 998,768 | |
| | | | Greater Orlando Aviation Auth. Airport Fac. Rev. | | | | |
| | 1,500,000 | | | 5.000%, 10/1/2039, Ser. Ca | | | 1,672,500 | |
| | | | Gulf Breeze, FL Rev. Refg. | | | | |
| | 2,020,000 | | | 5.000%, 12/1/2033 | | | 2,269,026 | |
| | | | Halifax Hospital Medical Center Rev. | | | | |
| | 755,000 | | | 5.000%, 6/1/2020 | | | 848,152 | |
| | | | Hillsborough County, FL Community Investment Tax Refg. Rev. | | | | |
| | 4,025,000 | | | 5.000%, 11/1/2017, Ser. B | | | 4,191,917 | |
| | | | Jacksonville, FL Port Auth. Rev. Refg. | | | | |
| | 2,390,000 | | | 5.000%, 11/1/2038, AMT | | | 2,625,893 | |
| | | | Leon County Educational Fac. Auth. C.O.P. (Southgate Residence Hall) | | | | |
| | 1,145,000 | | | 8.500%, 9/1/2017a | | | 1,218,887 | |
| | | | Miami-Dade County Industrial Development Auth. (Pinecrest Academy, Inc.) | | | | |
| | 1,500,000 | | | 5.250%, 9/15/2044 | | | 1,638,180 | |
| | | | Miami-Dade County, FL Aviation Rev. (Miami International Airport-Hub of the Americas) | | | | |
| | 7,500,000 | | | 5.500%, 10/1/2036, Ser. Ba | | | 8,453,850 | |
| | 8,000,000 | | | 5.500%, 10/1/2041, Ser. A | | | 8,941,440 | |
| | | | Miami-Dade County, FL Public Fac. Rev. (Jackson Health System) | | | | |
| | 5,000,000 | | | 5.000%, 6/1/2035, Ser. A | | | 5,780,350 | |
| | | | Miami-Dade County, FL Public Fac. Rev. (Jackson Health System) (AGC Insured) | | | | |
| | 2,000,000 | | | 5.625%, 6/1/2034c | | | 2,207,180 | |
| | | | Orange County, FL Health Fac. Auth. Hospital Rev. (Orlando Health, Inc.) | | | | |
| | 5,010,000 | | | 5.125%, 10/1/2026 | | | 5,494,667 | |
| | | | Orange County, FL Health Fac. Auth. Hospital Rev. (Orlando Regional Healthcare System) (NATL-RE Insured) | | | | |
| | 2,700,000 | | | 6.250%, 10/1/2018, Ser. Ac | | | 2,888,892 | |
| | | | Orlando-Orange County, FL Expressway Auth. Rev. | | | | |
| | 3,600,000 | | | 5.000%, 7/1/2030, Ser. Aa | | | 4,101,768 | |
| | 4,095,000 | | | 5.000%, 7/1/2035, Ser. Ca | | | 4,665,761 | |
| | | | Palm Beach County Health Fac. Auth. Rev. Refg. (Lifespace Communities, Inc.) | | | | |
| | 3,000,000 | | | 5.000%, 5/15/2038, Ser. C | | | 3,419,880 | |
| | | | South FL Water Management District C.O.P. Refg. | | | | |
| | 4,000,000 | | | 5.000%, 10/1/2036 | | | 4,720,280 | |
| | | | St. Johns County Industrial Development Auth. Rev. (Presbyterian Retirement Communities) | | | | |
| | 6,490,000 | | | 5.875%, 8/1/2040, Ser. A | | | 7,269,125 | |
| | | | Tallahassee, FL Consolidated Utility Systems Rev. | | | | |
| | 4,535,000 | | | 5.000%, 10/1/2032 | | | 4,704,110 | |
| | | | Tampa, FL Hospital Rev. Refg. (H. Lee Moffitt Cancer Center) | | | | |
| | 5,000,000 | | | 5.000%, 7/1/2037, Ser. Bd | | | 5,631,900 | |
| | | | | |
| | | | Total | | | 108,718,511 | |
| | | | | |
| |
| Georgia (1.1%) | | | | |
| | | | Atlanta, GA Airport General Rev. | | | | |
| | 1,000,000 | | | 5.000%, 1/1/2033, Ser. C, AMT | | | 1,110,700 | |
| | 500,000 | | | 5.000%, 1/1/2034, Ser. C, AMT | | | 553,315 | |
| | 500,000 | | | 5.000%, 1/1/2037, Ser. C, AMT | | | 550,785 | |
| | | | Atlanta, GA Airport General Rev. Refg. | | | | |
| | 1,425,000 | | | 5.000%, 1/1/2033, Ser. B | | | 1,681,956 | |
| | | | Atlanta, GA Water & Wastewater Rev. Refg. | | | | |
| | 2,500,000 | | | 5.000%, 11/1/2031 | | | 2,990,375 | |
| | | | Brunswick, GA Water and Sewer Rev. Refg. and Improvement (NATL-RE Insured) | | | | |
| | 1,055,000 | | | 6.100%, 10/1/2019a,c | | | 1,145,350 | |
| | | | Burke County Development Auth. Pollution Control Rev. (Oglethorpe Power Corporation Vogtle) | | | | |
| | 6,000,000 | | | 5.700%, 1/1/2043, Ser. C | | | 6,289,800 | |
| | | | Cherokee County, GA Water and Sewerage (NATL-RE Insured) | | | | |
| | 2,455,000 | | | 5.500%, 8/1/2018c | | | 2,590,590 | |
| | | | Georgia Refg. Electric Auth. Rev. | | | | |
| | 610,000 | | | 5.000%, 1/1/2035, Ser. A | | | 709,277 | |
| | | | | |
| | | | Total | | | 17,622,148 | |
| | | | | |
| |
| Hawaii (1.3%) | | | | |
| | | | Hawaii Airports System Rev. | | | | |
| | 3,040,000 | | | 5.250%, 7/1/2030, Ser. A | | | 3,435,291 | |
| | | | Hawaii State Department of Budget and Finance Special Purpose Senior Living Rev. Refg. | | | | |
| | 1,000,000 | | | 5.125%, 11/15/2032 | | | 1,098,600 | |
| | 5,395,000 | | | 5.250%, 11/15/2037 | | | 5,941,837 | |
| | | | Hawaii State Department of Transportation Airport Division Lease Rev. C.O.P. | | | | |
| | 1,600,000 | | | 5.000%, 8/1/2028, AMT | | | 1,834,304 | |
The accompanying Notes to Financial Statements are an integral part of this schedule.
139
MUNICIPAL BOND FUND
Schedule of Investments as of October 31, 2016
| | | | | | | | |
Principal
Amount | | | Long-Term Fixed Income (98.9%) | | Value | |
| Hawaii (1.3%) - continued | | | | |
| | | | Hawaii State Harbor System Rev. | | | | |
| | $6,000,000 | | | 5.250%, 7/1/2030, Ser. A | | | $6,716,460 | |
| | | | Honolulu, HI City & County Wastewater System Rev. | | | | |
| | 350,000 | | | 5.000%, 7/1/2036, Ser. A | | | 419,724 | |
| | | | Honolulu, HI City & County Wastewater System Rev. Refg. | | | | |
| | 1,500,000 | | | 5.000%, 7/1/2036, Ser. B | | | 1,798,815 | |
| | | | | |
| | | | Total | | | 21,245,031 | |
| | | | | |
| |
| Illinois (6.8%) | | | | |
| | | | Chicago IL G.O. Refg. | | | | |
| | 4,000,000 | | | 5.000%, 1/1/2023, Ser. C | | | 4,272,800 | |
| | | | Chicago IL O’Hare International Airport Rev. Refg. | | | | |
| | 1,200,000 | | | 5.000%, 1/1/2029 | | | 1,428,132 | |
| | | | Chicago Metropolitan Water Reclamation District G.O. Refg. | | | | |
| | 8,700,000 | | | 5.250%, 12/1/2032, Ser. C | | | 10,865,865 | |
| | | | Chicago, IL Midway International Airport Rev. | | | | |
| | 1,120,000 | | | 5.000%, 1/1/2026, Ser. A, AMT | | | 1,313,065 | |
| | | | Cook County, IL School District No. 99 (Cicero) G.O. School (NATL-RE Insured) | | | | |
| | 1,815,000 | | | 8.500%, 12/1/2016c | | | 1,826,108 | |
| | | | Illinois Finance Auth. Rev. (DePaul University) | | | | |
| | 4,075,000 | | | 6.000%, 10/1/2032, Ser. Aa | | | 4,922,722 | |
| | 1,000,000 | | | 5.000%, 10/1/2041 | | | 1,152,810 | |
| | | | Illinois Finance Auth. Rev. (Rush University Medical Center) | | | | |
| | 1,000,000 | | | 5.000%, 11/15/2027, Ser. A | | | 1,209,860 | |
| | 5,000,000 | | | 7.250%, 11/1/2038, Ser. Aa | | | 5,625,400 | |
| | | | Illinois Finance Auth. Rev. (The Art Institute of Chicago) | | | | |
| | 3,530,000 | | | 5.000%, 3/1/2034, Ser. A | | | 3,966,096 | |
| | | | Illinois Finance Auth. Rev. Refg. (Rush University Medical Center) (NATL- RE Insured ) | | | | |
| | 2,020,000 | | | 5.250%, 11/1/2035, Ser. Ba,c | | | 2,192,791 | |
| | | | Illinois Health Fac. Auth. Rev. Refg. (Lutheran General Health System) (AGM-CR Insured) | | | | |
| | 1,380,000 | | | 6.000%, 4/1/2018, Ser. Cc | | | 1,454,782 | |
| | | | Illinois Sales Tax Rev. (Build Illinois) (NATL-RE Insured) | | | | |
| | 8,050,000 | | | 5.750%, 6/15/2018, 2nd Ser.c | | | 8,638,616 | |
| | | | McHenry and Lake Counties G.O. School (AGM Insured) | | | | |
| | 60,000 | | | 9.000%, 12/1/2017c | | | 60,376 | |
| | 1,475,000 | | | 9.000%, 12/1/2017a,c | | | 1,540,992 | |
| | | | Metropolitan Pier and Exposition Auth., IL Dedicated Tax Rev. (McCormick Place Expansion) (NATL-RE Insured) | | | | |
| | 5,695,000 | | | 5.500%, 6/15/2020c | | | 5,906,000 | |
| | 1,305,000 | | | 5.500%, 6/15/2020a,c | | | 1,356,469 | |
| | | | Metropolitan Pier and Exposition Auth., IL Refg. (McCormick Place Expansion) (NATL-RE Insured) | | | | |
| | 17,605,000 | | | Zero Coupon, 6/15/2020, Ser. Ac | | | 15,812,987 | |
| | 3,100,000 | | | Zero Coupon, 6/15/2024, Ser. Ac | | | 2,362,014 | |
| | 2,000,000 | | | Zero Coupon, 12/15/2024, Ser. Ac | | | 1,489,160 | |
| | | | Railsplitter Tobacco Settlement Auth. Tobacco Settlement Rev. | | | | |
| | 6,340,000 | | | 5.000%, 6/1/2017 | | | 6,486,327 | |
| | | | Regional Transportation Auth., Cook, DuPage, Kane, Lake, McHenry and Will Counties, IL Rev. (NATL-RE Insured) | | | | |
| | 2,025,000 | | | 6.700%, 11/1/2021, Ser. Ac | | | 2,296,168 | |
| | | | State of Illinois G.O. | | | | |
| | 5,000,000 | | | 5.000%, 3/1/2027 | | | 5,291,550 | |
| | 1,500,000 | | | 5.500%, 7/1/2033 | | | 1,647,000 | |
| | 1,750,000 | | | 5.500%, 7/1/2038 | | | 1,912,890 | |
| | | | State of Illinois G.O. Refg. | | | | |
| | 9,000,000 | | | 5.000%, 8/1/2017 | | | 9,227,790 | |
| | 5,335,000 | | | 5.000%, 4/1/2018, Ser. A | | | 5,548,240 | |
| | | | University of Illinois Auxiliary Fac. System Rev. | | | | |
| | 2,500,000 | | | 5.750%, 4/1/2038, Ser. Aa | | | 2,779,950 | |
| | | | | |
| | | | Total | | | 112,586,960 | |
| | | | | |
| |
| Indiana (2.5%) | | | | |
| | | | Indiana Bond Bank Special Program Rev. (Clark Memorial Hospital) | | | | |
| | 7,000,000 | | | 5.500%, 8/1/2029, Ser. Da | | | 7,699,790 | |
| | | | Indiana Finance Auth. Hospital Rev. (Deaconess Hospital) | | | | |
| | 1,500,000 | | | 6.750%, 3/1/2039, Ser. Aa | | | 1,698,405 | |
| | | | Indiana Finance Auth. Private Activity (Ohio River Bridges East End Crossing) | | | | |
| | 1,000,000 | | | 5.000%, 1/1/2019, Ser. B, AMT | | | 1,006,740 | |
| | | | Indiana Finance Auth. Wastewater Utility Rev. (CWA Auth., Inc.) (NATL-RE Insured) | | | | |
| | 6,000,000 | | | 5.000%, 10/1/2041, Ser. Ac | | | 7,000,140 | |
| | | | Indiana Health and Educational Fac. Financing Auth. Health System Rev. Refg. (Sisters of St. Francis Health Services, Inc.) (AGM Insured) | | | | |
| | 450,000 | | | 5.250%, 5/15/2041, Ser. Ea,c | | | 479,313 | |
| | | | Indiana Municipal Power Agency Power Supply System Rev. | | | | |
| | 1,750,000 | | | 5.250%, 1/1/2034, Ser. A | | | 2,037,928 | |
| | 4,155,000 | | | 5.000%, 1/1/2042, Ser. A | | | 4,703,709 | |
| | | | Indiana Transportation Finance Auth. Highway Rev. | | | | |
| | 45,000 | | | 6.800%, 12/1/2016, Ser. A | | | 45,207 | |
| | | | Indianapolis Local Public Improvement Bank Rev. (Waterworks) | | | | |
| | 5,000,000 | | | 5.750%, 1/1/2038, Ser. A | | | 5,506,600 | |
| | | | Knox County, IN Economic Development Rev. Refg. (Good Samaritan Hospital) | | | | |
| | 2,850,000 | | | 5.000%, 4/1/2037, Ser. A | | | 3,047,591 | |
| | 6,965,000 | | | 5.000%, 4/1/2042, Ser. A | | | 7,405,536 | |
| | | | Purdue University, IN Rev. Refg. | | | | |
| | 1,500,000 | | | 5.000%, 7/1/2028, Ser. A | | | 1,827,375 | |
| | | | | |
| | | | Total | | | 42,458,334 | |
| | | | | |
| |
| Iowa (0.8%) | | | | |
| | | | Ames, IA Rev. Refg. (Mary Greeley Medical Center) | | | | |
| | 4,430,000 | | | 5.000%, 6/15/2032 | | | 5,263,416 | |
The accompanying Notes to Financial Statements are an integral part of this schedule.
140
MUNICIPAL BOND FUND
Schedule of Investments as of October 31, 2016
| | | | | | | | |
Principal
Amount | | | Long-Term Fixed Income (98.9%) | | Value | |
| Iowa (0.8%) - continued | | | | |
| | | | Cedar Falls Community School District, Black Hawk County School Infrastructure Sales, Services and Use Tax Rev. | | | | |
| | $3,165,000 | | | 5.400%, 6/1/2029 | | | $3,473,841 | |
| | | | Des Moines, IA Airport Auth. Rev. Refg. | | | | |
| | 1,205,000 | | | 5.000%, 6/1/2024, AMT | | | 1,369,639 | |
| | | | Waterloo, IA Community School District Tax Rev. Refg. (School Infrastructure Sales, Services, and Use) | | | | |
| | 3,560,000 | | | 5.000%, 7/1/2029, Ser. A | | | 3,881,041 | |
| | | | | |
| | | | Total | | | 13,987,937 | |
| | | | | |
| |
| Kansas (0.2%) | | | | |
| | | | Kansas Development Finance Auth. Rev. | | | | |
| | 3,575,000 | | | 5.000%, 5/15/2030, Ser. S | | | 3,957,704 | |
| | | | Sedgwick and Shawnee Counties, KS Single Family Mortgage Rev. (GNMA Collateralized) | | | | |
| | 30,000 | | | 6.700%, 6/1/2029, Ser. A-2c | | | 30,236 | |
| | | | | |
| | | | Total | | | 3,987,940 | |
| | | | | |
| |
| Kentucky (1.5%) | | | | |
| | | | Kentucky Economic Development Finance Auth. Hospital Rev. (Owensboro Medical Health System, Inc.) | | | | |
| | 5,880,000 | | | 6.375%, 6/1/2040, Ser. A | | | 6,634,639 | |
| | | | Kentucky Public Transportation Infrastructure Auth. Subordinate Toll Rev. (Downtown Crossing) | | | | |
| | 5,000,000 | | | 5.000%, 7/1/2017, Ser. A | | | 5,131,150 | |
| | | | Kentucky State Turnpike Auth. Economic Development Road Rev. | | | | |
| | 5,000,000 | | | 5.000%, 7/1/2028, Ser. A | | | 5,837,650 | |
| | | | Paducah, KY Electric Plant Board Rev. (AGC Insured) | | | | |
| | 2,500,000 | | | 5.250%, 10/1/2035, Ser. Aa,c | | | 2,748,325 | |
| | | | Paducah, KY Electric Plant Board Rev. (AGM Insured) | | | | |
| | 750,000 | | | 5.000%, 10/1/2035, Ser. Ac | | | 874,320 | |
| | | | Pikeville, KY Hospital Rev. (Pikeville Medical Center, Inc.) | | | | |
| | 3,540,000 | | | 6.500%, 3/1/2041 | | | 4,063,035 | |
| | | | | |
| | | | Total | | | 25,289,119 | |
| | | | | |
| |
| Louisiana (2.4%) | | | | |
| | | | City of Alexandria, LA Utilities Rev. | | | | |
| | 5,000,000 | | | 5.000%, 5/1/2043, Ser. A | | | 5,739,150 | |
| | | | City of New Orleans, LA G.O. Refg. | | | | |
| | 750,000 | | | 5.000%, 12/1/2026 | | | 921,045 | |
| | 850,000 | | | 5.000%, 12/1/2027 | | | 1,036,813 | |
| | 350,000 | | | 5.000%, 12/1/2029 | | | 418,005 | |
| | | | Lafayette Public Power Auth. Electric Rev. | | | | |
| | 375,000 | | | 5.000%, 11/1/2022 | | | 448,927 | |
| | 1,520,000 | | | 5.000%, 11/1/2031 | | | 1,758,002 | |
| | | | Louisiana Local Government Environmental Fac. & Community Development Auth. East Baton Rouge Sewer Rev. | | | | |
| | 4,900,000 | | | 5.000%, 2/1/2035, Ser. A | | | 5,513,970 | |
| | | | Louisiana State Gas and Fuels Tax Rev. | | | | |
| | 5,000,000 | | | 5.000%, 5/1/2033, Ser. B | | | 5,622,500 | |
| | 7,000,000 | | | 5.000%, 5/1/2045, Ser. B | | | 7,780,080 | |
| | | | Louisiana State Public Fac. Auth. Rev. (University of New Orleans Research & Technology Foundation, Inc. Student Housing) (AGM Insured) | | | | |
| | 1,355,000 | | | 5.000%, 9/1/2030c | | | 1,599,876 | |
| | 800,000 | | | 5.000%, 9/1/2031c | | | 940,208 | |
| | | | Louisiana Utilities Rev. (Parish of St. Tammany) | | | | |
| | 2,000,000 | | | 5.500%, 8/1/2035, Ser. B | | | 2,283,980 | |
| | | | New Orleans, LA Aviation Board Rev. | | | | |
| | 2,500,000 | | | 5.000%, 1/1/2040, Ser. B, AMT | | | 2,811,500 | |
| | | | Port of New Orleans Board of Commissioners Port Fac. Refg. Rev. | | | | |
| | 1,365,000 | | | 5.000%, 4/1/2030, Ser. B, AMT | | | 1,519,027 | |
| | 1,500,000 | | | 5.000%, 4/1/2031, Ser. B, AMT | | | 1,660,050 | |
| | 525,000 | | | 5.000%, 4/1/2033, Ser. B, AMT | | | 577,174 | |
| | | | | |
| | | | Total | | | 40,630,307 | |
| | | | | |
| |
| Maryland (0.1%) | | | | |
| | | | Maryland Health & Higher Educational Fac. Auth. Rev. (Loyola University) | | | | |
| | 1,000,000 | | | 5.000%, 10/1/2045 | | | 1,154,450 | |
| | | | | |
| | | | Total | | | 1,154,450 | |
| | | | | |
| |
| Massachusetts (4.2%) | | | | |
| | | | Massachusetts Bay Transportation Auth. Sales Tax Rev. (NATL-RE Insured) | | | | |
| | 5,000,000 | | | 5.500%, 7/1/2025, Ser. Bc | | | 6,497,000 | |
| | | | Massachusetts Development Finance Agency Rev. (Dana-Farber Cancer Institute) | | | | |
| | 6,500,000 | | | 5.000%, 12/1/2046 | | | 7,580,690 | |
| | | | Massachusetts Development Finance Agency Rev. (Northeastern University) | | | | |
| | 750,000 | | | 5.000%, 10/1/2031 | | | 879,060 | |
| | | | Massachusetts Development Finance Agency Rev. (Wellesley College) | | | | |
| | 3,000,000 | | | 5.000%, 7/1/2042, Ser. J | | | 3,516,660 | |
| | | | Massachusetts Health and Educational Fac. Auth. Rev. (Massachusetts Institute of Technology) | | | | |
| | 15,295,000 | | | 5.250%, 7/1/2033, Ser. L | | | 20,898,170 | |
| | | | Massachusetts Health and Educational Fac. Auth. Rev. (Tufts University) | | | | |
| | 5,400,000 | | | 5.500%, 2/15/2028, Ser. M | | | 7,070,112 | |
| | | | Massachusetts Port Auth. Rev. | | | | |
| | 8,300,000 | | | 5.000%, 7/1/2042, Ser. A, AMT | | | 9,273,424 | |
| | | | Massachusetts School Building Auth. Sales Tax Refg. | | | | |
| | 6,900,000 | | | 5.000%, 8/15/2029, Ser. B | | | 8,263,854 | |
| | | | Massachusetts Water Pollution Abatement Trust Pool Program Refg. | | | | |
| | 5,000,000 | | | 5.000%, 8/1/2024 | | | 6,278,200 | |
| | | | | |
| | | | Total | | | 70,257,170 | |
| | | | | |
The accompanying Notes to Financial Statements are an integral part of this schedule.
141
MUNICIPAL BOND FUND
Schedule of Investments as of October 31, 2016
| | | | | | | | |
Principal
Amount | | | Long-Term Fixed Income (98.9%) | | Value | |
| Michigan (2.6%) | | | | |
| | | | East Lansing Building Auth., Ingham and Clinton Counties, MI Building Auth. Rev. (G.O. Limited Tax) | | | | |
| | $1,645,000 | | | 5.700%, 4/1/2020 | | | $1,775,465 | |
| | | | Flint Hospital Building Auth. Rev. Refg. (Hurley Medical Center) | | | | |
| | 3,000,000 | | | 5.000%, 7/1/2019, Ser. B | | | 3,107,370 | |
| | | | Grand Valley, MI State University General Rev. | | | | |
| | 1,045,000 | | | 5.750%, 12/1/2034a | | | 1,049,347 | |
| | | | Grand Valley, MI State University General Rev. Refg. | | | | |
| | 650,000 | | | 5.000%, 12/1/2029, Ser. B | | | 772,129 | |
| | | | Grand Valley, MI State University Rev. | | | | |
| | 1,850,000 | | | 5.000%, 12/1/2031, Ser. A | | | 2,175,563 | |
| | | | Great Lakes, MI Water Auth. Water Supply System Rev. | | | | |
| | 10,000,000 | | | 5.000%, 7/1/2046, Ser. A | | | 11,352,500 | |
| | | | Kalamazoo Hospital Finance Auth. Hospital Rev. (Bronson Methodist Hospital) (AGM Insured) | | | | |
| | 4,000,000 | | | 5.250%, 5/15/2036c | | | 4,413,160 | |
| | | | Kalamazoo Hospital Finance Auth. Hospital Rev. Refg. (Bronson Methodist Hospital) (AGM Insured) | | | | |
| | 3,250,000 | | | 5.000%, 5/15/2026, Ser. Ac | | | 3,435,055 | |
| | | | Kent County, MI G.O. | | | | |
| | 2,775,000 | | | 5.000%, 1/1/2024, AMT | | | 3,185,450 | |
| | | | Michigan State Finance Auth. Rev. (Beaumont Health Credit Group) | | | | |
| | 6,000,000 | | | 5.000%, 11/1/2044 | | | 6,729,060 | |
| | | | Rochester Community School District, Oakland and Macomb Counties, MI School Building and Site G.O. (NATL-RE Q-SBLF Insured) | | | | |
| | 4,560,000 | | | 5.000%, 5/1/2019c | | | 4,892,333 | |
| | | | | |
| | | | Total | | | 42,887,432 | |
| | | | | |
| |
| Minnesota (3.0%) | | | | |
| | | | Goodhue County, MN Education District No. 6051 C.O.P. | | | | |
| | 250,000 | | | 5.000%, 2/1/2029 | | | 289,685 | |
| | 500,000 | | | 5.000%, 2/1/2034 | | | 567,490 | |
| | 750,000 | | | 5.000%, 2/1/2039 | | | 842,378 | |
| | | | Ham Lake, MN Charter School Lease Rev. (DaVinci Academy of Arts and Science) | | | | |
| | 340,000 | | | 5.000%, 7/1/2036, Ser. A | | | 353,726 | |
| | | | Minnesota Higher Education Fac. Auth. Rev. (College of St. Scholastica, Inc.) | | | | |
| | 1,575,000 | | | 5.250%, 12/1/2035, Ser. H | | | 1,676,666 | |
| | 1,800,000 | | | 6.300%, 12/1/2040, Ser. 7J | | | 1,990,422 | |
| | | | Minnesota State Municipal Power Agency Electric Rev. | | | | |
| | 200,000 | | | 5.000%, 10/1/2029 | | | 237,484 | |
| | 150,000 | | | 5.000%, 10/1/2030 | | | 177,252 | |
| | 200,000 | | | 5.000%, 10/1/2032 | | | 234,296 | |
| | 175,000 | | | 5.000%, 10/1/2033 | | | 204,328 | |
| | 1,500,000 | | | 5.000%, 10/1/2047 | | | 1,752,495 | |
| | | | North Oaks, MN Senior Housing Rev. (Presbyterian Homes of North Oaks, Inc.) | | | | |
| | 2,000,000 | | | 6.125%, 10/1/2039a | | | 2,048,180 | |
| | | | North Oaks, MN Senior Housing Rev. Refg. (Waverly Gardens) | | | | |
| | 4,000,000 | | | 5.000%, 10/1/2047 | | | 4,197,600 | |
| | | | Northern Municipal Power Agency, MN Electric System Rev. (AMBAC Insured) | | | | |
| | 2,000,000 | | | 5.000%, 1/1/2026, Ser. Aa,c | | | 2,096,840 | |
| | | | Rochester, MN Health Care Fac. Rev. (Olmsted Medical Center) | | | | |
| | 1,000,000 | | | 5.875%, 7/1/2030 | | | 1,137,070 | |
| | | | Shakopee Independent School District No. 720 G.O. School Building Crossover Refg. | | | | |
| | 1,425,000 | | | 5.000%, 2/1/2018 | | | 1,498,231 | |
| | | | St Paul, MN Housing and Redevelopment Auth. Health Care Fac. Rev. (HealthPartners Obligated Group) | | | | |
| | 5,945,000 | | | 5.000%, 7/1/2032, Ser. A | | | 6,980,025 | |
| | | | St. Cloud, MN Health Care Rev. Refg. (CentraCare Health System) | | | | |
| | 125,000 | | | 5.125%, 5/1/2030, Ser. A | | | 139,217 | |
| | 1,915,000 | | | 5.125%, 5/1/2030, Ser. Aa | | | 2,180,113 | |
| | 1,000,000 | | | 5.000%, 5/1/2046, Ser. A | | | 1,164,260 | |
| | | | St. Louis Park, MN Health Care Fac. Rev. Refg. (Park Nicollet Health Services) | | | | |
| | 1,000,000 | | | 5.750%, 7/1/2030, Ser. Ca | | | 1,080,910 | |
| | 5,745,000 | | | 5.750%, 7/1/2039a | | | 6,464,446 | |
| | | | St. Paul, MN Housing and Redevelopment Auth. Educational Fac. Rev. Refg. (Saint Paul Academy and Summit School) | | | | |
| | 4,000,000 | | | 5.000%, 10/1/2024 | | | 4,137,200 | |
| | | | St. Paul, MN Housing and Redevelopment Auth. Health Care Fac. Rev. (HealthPartners) | | | | |
| | 1,500,000 | | | 5.250%, 11/15/2016a | | | 1,502,610 | |
| | 230,000 | | | 5.250%, 5/15/2019a | | | 230,400 | |
| | | | University of Minnesota Rev. (State Supported Biomedical Science Research Fac. Funding) | | | | |
| | 1,655,000 | | | 5.000%, 8/1/2030, Ser. B | | | 1,902,902 | |
| | | | Western Minnesota Municipal Power Agency Rev. | | | | |
| | 1,000,000 | | | 5.000%, 1/1/2033, Ser. A | | | 1,169,500 | |
| | 1,000,000 | | | 5.000%, 1/1/2034, Ser. A | | | 1,165,920 | |
| | 300,000 | | | 5.000%, 1/1/2035, Ser. A | | | 348,921 | |
| | 1,000,000 | | | 5.000%, 1/1/2040, Ser. A | | | 1,154,560 | |
| | | | Winona, MN Health Care Fac. Rev. Refg. (Winona Health Obligated Group) | | | | |
| | 500,000 | | | 5.000%, 7/1/2034 | | | 539,605 | |
| | | | | |
| | | | Total | | | 49,464,732 | |
| | | | | |
| |
| Mississippi (0.3%) | | | | |
| | | | D’Iberville Tax Increment Refg. (Gulf Coast Promenade) | | | | |
| | 1,750,000 | | | 5.000%, 4/1/2033 | | | 1,897,315 | |
| | | | Mississippi Development Bank S.O. (Desoto County Highway Construction) | | | | |
| | 3,180,000 | | | 5.000%, 1/1/2030 | | | 3,664,982 | |
| | | | | |
| | | | Total | | | 5,562,297 | |
| | | | | |
The accompanying Notes to Financial Statements are an integral part of this schedule.
142
MUNICIPAL BOND FUND
Schedule of Investments as of October 31, 2016
| | | | | | | | |
Principal
Amount | | | Long-Term Fixed Income (98.9%) | | Value | |
| Missouri (0.7%) | | | | |
| | | | Jackson County, MO Special Obligation Rev. (Harry S. Truman Sports Complex) (AMBAC Insured) | | | | |
| | $7,500,000 | | | 5.000%, 12/1/2027a,c | | | $7,526,625 | |
| | | | Missouri State Environmental Improvement and Energy Resources Auth. Water Pollution Rev. | | | | |
| | 175,000 | | | 5.250%, 1/1/2018 | | | 175,679 | |
| | | | Missouri State Health and Educational Fac. Auth. Health Fac. Rev. (Lake Regional Health System) | | | | |
| | 810,000 | | | 5.000%, 2/15/2019 | | | 873,391 | |
| | 925,000 | | | 5.000%, 2/15/2022 | | | 1,055,665 | |
| | 1,680,000 | | | 5.000%, 2/15/2034 | | | 1,836,240 | |
| | | | St. Louis, MO Airport Rev. Refg. (Lambert-St. Louis International Airport) | | | | |
| | 1,000,000 | | | 5.000%, 7/1/2032, AMT | | | 1,079,120 | |
| | | | | |
| | | | Total | | | 12,546,720 | |
| | | | | |
| |
| Nebraska (1.5%) | | | | |
| | | | Douglas County, NE Hospital Auth. No. 3 Health Fac. Refg. Rev. (Nebraska Methodist Health System) | | | | |
| | 2,000,000 | | | 5.750%, 11/1/2048a | | | 2,190,440 | |
| | | | Lincoln, NE Lincoln Electric System Rev. Refg. | | | | |
| | 2,500,000 | | | 5.000%, 9/1/2037 | | | 2,948,125 | |
| | | | Nebraska Public Power District Rev. | | | | |
| | 1,325,000 | | | 5.000%, 1/1/2033, Ser. A | | | 1,534,681 | |
| | | | Omaha, NE Public Power District Rev. | | | | |
| | 8,150,000 | | | 5.000%, 2/1/2045, Ser. A | | | 9,527,106 | |
| | | | Omaha, NE Sanitary Sewerage System Rev. | | | | |
| | 1,340,000 | | | 5.000%, 11/15/2034 | | | 1,586,868 | |
| | | | University of Nebraska Lincoln Student Fees and Fac. Rev. | | | | |
| | 1,000,000 | | | 5.000%, 7/1/2037 | | | 1,145,480 | |
| | | | University of Nebraska Lincoln Student Fees and Fac. Rev. Refg. | | | | |
| | 3,050,000 | | | 5.000%, 7/1/2038 | | | 3,528,972 | |
| | | | University of Nebraska Student Housing Rev. | | | | |
| | 1,680,000 | | | 5.000%, 5/15/2040, Ser. B | | | 1,880,021 | |
| | | | | |
| | | | Total | | | 24,341,693 | |
| | | | | |
| |
| New Hampshire (0.2%) | | | | |
| | | | New Hampshire State Turnpike System Rev. Refg. | | | | |
| | 1,000,000 | | | 5.000%, 2/1/2017, Ser. B | | | 1,010,910 | |
| | 2,000,000 | | | 5.000%, 10/1/2019 | | | 2,224,480 | |
| | | | | |
| | | | Total | | | 3,235,390 | |
| | | | | |
| |
| New Jersey (1.3%) | | | | |
| | | | New Jersey Educational Fac. Auth. Rev. Refg. (Kean University) | | | | |
| | 1,000,000 | | | 5.500%, 9/1/2036, Ser. A | | | 1,106,020 | |
| | | | New Jersey G.O. (AMBAC Insured) | | | | |
| | 1,000,000 | | | 5.250%, 7/15/2018, Ser. Lc | | | 1,064,940 | |
| | | | New Jersey Transportation Trust Fund Auth. Rev. | | | | |
| | 1,000,000 | | | 5.250%, 6/15/2033, Ser. AA | | | 1,120,550 | |
| | 1,645,000 | | | 5.250%, 6/15/2034, Ser. AA | | | 1,839,422 | |
| | | | New Jersey Transportation Trust Fund Auth. Rev. Federal Highway Reimbursement Notes | | | | |
| | 10,000,000 | | | 5.000%, 6/15/2023, Ser. A-2d | | | 10,444,500 | |
| | | | New Jersey Transportation Trust Fund Auth. Transportation System Rev. | | | | |
| | 1,500,000 | | | 5.000%, 6/15/2026, Ser. A | | | 1,637,775 | |
| | | | Ocean County, NJ Utilities Auth. Waste Water Rev. (NATL-RE Insured) | | | | |
| | 3,180,000 | | | 5.250%, 1/1/2025c | | | 4,026,230 | |
| | | | | |
| | | | Total | | | 21,239,437 | |
| | | | | |
| |
| New York (6.9%) | | | | |
| | | | City of New York G.O. | | | | |
| | 40,000 | | | 5.250%, 8/1/2017, Ser. B | | | 40,156 | |
| | 1,920,000 | | | 5.000%, 8/1/2032, Ser. A | | | 2,262,125 | |
| | | | Metropolitan Transportation Auth. State Service Contract Refg. | | | | |
| | 5,000,000 | | | 5.500%, 7/1/2017, Ser. A | | | 5,159,300 | |
| | | | New York City Municipal Water Finance Auth. Water and Sewer System Rev. | | | | |
| | 8,585,000 | | | 5.750%, 6/15/2040, Ser. A | | | 9,229,991 | |
| | 2,570,000 | | | 5.750%, 6/15/2040, Ser. Aa | | | 2,771,360 | |
| | 3,250,000 | | | 5.375%, 6/15/2043, Ser. EE | | | 3,766,327 | |
| | | | New York City Transitional Finance Auth. Future Tax Secured Rev. | | | | |
| | 12,505,000 | | | 5.000%, 11/1/2021 | | | 14,808,796 | |
| | 15,000,000 | | | 5.000%, 11/1/2033, Ser. D-1 | | | 17,532,900 | |
| | 6,000,000 | | | 5.000%, 8/1/2038, Ser. B-1 | | | 7,119,240 | |
| | | | New York City Trust for Cultural Resources Refg. Rev. (The Museum of Modern Art) | | | | |
| | 2,030,000 | | | 5.000%, 4/1/2017, Ser. A | | | 2,067,027 | |
| | | | New York State Dormitory Auth. State Personal Income Tax Rev. | | | | |
| | 15,000 | | | 5.000%, 2/15/2029, Ser. Aa | | | 16,377 | |
| | 5,110,000 | | | 5.000%, 2/15/2029, Ser. A | | | 5,546,598 | |
| | 5,000,000 | | | 5.000%, 3/15/2039, Ser. C | | | 5,862,400 | |
| | | | New York State Dormitory Auth. State University Educational Fac. Rev. | | | | |
| | 2,570,000 | | | 5.875%, 5/15/2017, Ser. A | | | 2,640,315 | |
| | | | New York State Liberty Development Corporation Liberty Rev. | | | | |
| | 10,000,000 | | | 5.250%, 12/15/2043 | | | 11,670,100 | |
| | | | New York State Urban Development Corporation State Personal Income Tax Rev. (State Fac. and Equipment) | | | | |
| | 3,870,000 | | | 5.000%, 3/15/2036, Ser. B-1 | | | 4,206,574 | |
| | | | New York Transportation Development Corporation Special Fac. Rev (Laguardia Airport) | | | | |
| | 2,000,000 | | | 5.000%, 7/1/2046, AMT | | | 2,180,020 | |
| | | | Port Auth. of New York & New Jersey Rev. | | | | |
| | 1,125,000 | | | 5.000%, 12/1/2024, AMT | | | 1,354,185 | |
| | 2,500,000 | | | 5.000%, 9/1/2035 | | | 2,973,375 | |
| | 2,500,000 | | | 5.000%, 9/1/2036 | | | 2,965,500 | |
| | 5,000,000 | | | 5.000%, 9/1/2039 | | | 5,903,600 | |
| | | | Triborough NY Bridge & Tunnel Auth. Rev. | | | | |
| | 2,550,000 | | | 5.000%, 11/15/2037, Ser. 2008B-3 | | | 3,051,483 | |
The accompanying Notes to Financial Statements are an integral part of this schedule.
143
MUNICIPAL BOND FUND
Schedule of Investments as of October 31, 2016
| | | | | | | | |
Principal
Amount | | | Long-Term Fixed Income (98.9%) | | Value | |
| New York (6.9%) - continued | | | | |
| | $1,000,000 | | | 5.250%, 11/15/2045, Ser. A | | | $1,201,740 | |
| | | | | |
| | | | Total | | | 114,329,489 | |
| | | | | |
| |
| North Carolina (1.9%) | | | | |
| | | | North Carolina Capital Fac. Finance Agency Rev. Refg. (Johnson and Wales University) | | | | |
| | 1,000,000 | | | 5.000%, 4/1/2032 | | | 1,141,610 | |
| | 1,000,000 | | | 5.000%, 4/1/2033 | | | 1,137,810 | |
| | | | North Carolina Eastern Municipal Power Agency Power System Rev. | | | | |
| | 7,190,000 | | | 5.250%, 1/1/2020, Ser. Aa | | | 7,546,912 | |
| | 2,580,000 | | | 5.000%, 1/1/2021, Ser. Aa | | | 2,985,215 | |
| | 2,000,000 | | | 5.000%, 1/1/2026, Ser. Ba | | | 2,168,760 | |
| | 1,475,000 | | | 6.000%, 1/1/2026, Ser. Aa | | | 1,827,805 | |
| | | | North Carolina Medical Care Commission Health System Rev. Refg. (Mission Health Combined Group) | | | | |
| | 1,000,000 | | | 5.000%, 10/1/2035d | | | 1,159,660 | |
| | 500,000 | | | 5.000%, 10/1/2036d | | | 578,295 | |
| | | | North Carolina Municipal Power Agency No. 1 Catawba Electric Rev. Refg. | | | | |
| | 925,000 | | | 5.000%, 1/1/2025, Ser. A | | | 999,527 | |
| | 2,275,000 | | | 5.000%, 1/1/2025, Ser. Aa | | | 2,466,965 | |
| | 360,000 | | | 5.000%, 1/1/2030, Ser. A | | | 388,120 | |
| | 890,000 | | | 5.000%, 1/1/2030, Ser. Aa | | | 965,098 | |
| | | | Raleigh Durham, NC Airport Auth. Rev. | | | | |
| | 4,895,000 | | | 5.000%, 5/1/2036, Ser. A | | | 5,454,596 | |
| | | | University of North Carolina at Wilmington, Rev. (Student Housing) | | | | |
| | 1,745,000 | | | 5.000%, 6/1/2022 | | | 2,071,629 | |
| | | | | |
| | | | Total | | | 30,892,002 | |
| | | | | |
| |
| North Dakota (0.3%) | | | | |
| | | | North Dakota Public Finance Auth. Rev. (State Revolving Fund) | | | | |
| | 1,495,000 | | | 5.000%, 10/1/2031, Ser. A | | | 1,725,977 | |
| | | | Ward County, ND Health Care Fac. Rev. (Trinity) | | | | |
| | 2,895,000 | | | 5.125%, 7/1/2025 | | | 2,903,685 | |
| | | | | |
| | | | Total | | | 4,629,662 | |
| | | | | |
| |
| Ohio (6.3%) | | | | |
| | | | American Municipal Power Ohio, Inc. Rev. (Greenup Hydroelectric) | | | | |
| | 1,000,000 | | | 5.000%, 2/15/2041, Ser. A | | | 1,159,290 | |
| | | | AMP Fremont Energy Center Rev. | | | | |
| | 3,000,000 | | | 5.000%, 2/15/2037, Ser. B | | | 3,407,490 | |
| | | | Buckeye Tobacco Settlement Financing Auth. Rev. | | | | |
| | 16,920,000 | | | 5.125%, 6/1/2024, Ser. A-2 | | | 15,989,231 | |
| | | | City of Toledo, OH Water System Rev. Improvements | | | | |
| | 2,455,000 | | | 5.000%, 11/15/2036 | | | 2,927,170 | |
| | 3,125,000 | | | 5.000%, 11/15/2037 | | | 3,716,969 | |
| | | | City of Toledo, OH Water System Rev. Improvements and Refg. | | | | |
| | 2,500,000 | | | 5.000%, 11/15/2038 | | | 2,931,925 | |
| | | | County of Fairfield, OH Hospital Rev. Refg. and Improvement (Fairfield Medical Center) | | | | |
| | 3,470,000 | | | 5.250%, 6/15/2043 | | | 3,856,350 | |
| | | | Cuyahoga County, OH G.O. Capital Improvement and Refg. | | | | |
| | 2,540,000 | | | 5.000%, 12/1/2021, Ser. A | | | 2,916,809 | |
| | | | Cuyahoga County, OH Sales Tax Rev. | | | | |
| | 1,000,000 | | | 5.000%, 12/1/2035 | | | 1,186,750 | |
| | | | Hamilton County, OH Health Care Improvement Rev. Refg. (Life Enriching Communities) | | | | |
| | 1,800,000 | | | 5.000%, 1/1/2046 | | | 1,955,610 | |
| | | | Kent State University General Receipts Rev. | | | | |
| | 350,000 | | | 5.000%, 5/1/2017, Ser. A | | | 357,424 | |
| | 1,000,000 | | | 5.000%, 5/1/2021 | | | 1,160,910 | |
| | 2,000,000 | | | 5.000%, 5/1/2029 | | | 2,449,580 | |
| | 1,500,000 | | | 5.000%, 5/1/2037, Ser. A | | | 1,690,755 | |
| | | | Lucas County, OH Health Care System Refg. Rev. (Sunset Retirement Communities) | | | | |
| | 1,360,000 | | | 5.125%, 8/15/2025 | | | 1,538,622 | |
| | 1,750,000 | | | 5.500%, 8/15/2030 | | | 1,973,685 | |
| | | | Miami University OH Rev. | | | | |
| | 1,600,000 | | | 5.000%, 9/1/2036 | | | 1,841,024 | |
| | | | Ohio Higher Educational Fac. Commission Rev. (Dayton University) | | | | |
| | 2,565,000 | | | 5.000%, 12/1/2035, Ser. A | | | 2,956,906 | |
| | | | Ohio Higher Educational Fac. Commission Rev. (Kenyon College) | | | | |
| | 4,740,000 | | | 5.250%, 7/1/2044 | | | 5,302,401 | |
| | | | Ohio Hospital Rev. (Cleveland Clinic Health System Obligated Group) | | | | |
| | 5,000,000 | | | 5.000%, 1/1/2034 | | | 5,706,300 | |
| | | | Ohio State Higher Educational Fac. Commission Rev. (Case Western Reserve University) | | | | |
| | 1,380,000 | | | 6.500%, 10/1/2020, Ser. B | | | 1,532,835 | |
| | 2,745,000 | | | 5.000%, 12/1/2028 | | | 3,284,118 | |
| | | | Ohio State Turnpike Commission Rev. | | | | |
| | 8,000,000 | | | 0.000%, 2/15/2034e | | | 7,670,800 | |
| | | | Ohio State Turnpike Commission Rev. Refg. (NATL-RE Insured) | | | | |
| | 2,000,000 | | | 5.500%, 2/15/2024, Ser. Ac | | | 2,466,800 | |
| | 10,000,000 | | | 5.500%, 2/15/2026, Ser. Ac | | | 12,830,600 | |
| | | | Ohio State University Refg. Rev. | | | | |
| | 7,800,000 | | | 0.600%, 6/1/2035, Ser. Eb | | | 7,800,000 | |
| | | | Ohio State University Rev. | | | | |
| | 5,000,000 | | | 0.600%, 12/1/2031b | | | 5,000,000 | |
| | | | | |
| | | | Total | | | 105,610,354 | |
| | | | | |
| |
| Oklahoma (0.9%) | | | | |
| | | | Grand River, OK Dam Authority Rev. | | | | |
| | 7,815,000 | | | 5.000%, 6/1/2039, Ser. A | | | 9,028,357 | |
| | | | Oklahoma Agricultural and Mechanical Colleges General Rev. | | | | |
| | 3,000,000 | | | 5.000%, 8/1/2038, Ser. C | | | 3,499,560 | |
| | | | Oklahoma Municipal Power Auth. Power Supply System Rev. | | | | |
| | 1,620,000 | | | 6.000%, 1/1/2038, Ser. Aa | | | 1,717,022 | |
| | | | Oklahoma State Turnpike Auth. | | | | |
| | 500,000 | | | 5.000%, 1/1/2028, Ser. A | | | 572,600 | |
| | | | | |
| | | | Total | | | 14,817,539 | |
| | | | | |
| |
| Oregon (0.3%) | | | | |
| | | | Clackamas County, OR Hospital Fac. Auth. Rev. (Legacy Health Systems) | | | | |
| | 300,000 | | | 5.500%, 7/15/2035, Ser. Aa | | | 335,844 | |
| | | | Port of Portland, OR Rev. Refg. (Portland International Airport) | | | | |
| | 1,025,000 | | | 5.000%, 7/1/2035, Ser. 23 | | | 1,204,324 | |
The accompanying Notes to Financial Statements are an integral part of this schedule.
144
MUNICIPAL BOND FUND
Schedule of Investments as of October 31, 2016
| | | | | | | | |
Principal
Amount | | | Long-Term Fixed Income (98.9%) | | Value | |
| Oregon (0.3%) - continued | | | | |
| | | | Salem-Keizer School District No. 24J, Marion and Polk Counties, OR G.O. | | | | |
| | $5,000,000 | | | Zero Coupon, 6/15/2028, Ser. B | | | $3,821,400 | |
| | | | | |
| | | | Total | | | 5,361,568 | |
| | | | | |
| |
| Pennsylvania (3.6%) | | | | |
| | | | Allegheny County Hospital Development Auth. Rev. (University of Pittsburgh Medical Center) | | | | |
| | 3,000,000 | | | 5.000%, 6/15/2018, Ser. B | | | 3,195,330 | |
| | 2,100,000 | | | 5.625%, 8/15/2039 | | | 2,326,548 | |
| | | | Beaver County Industrial Development Auth. Pollution Control Rev. Refg. (FirstEnergy Generation) | | | | |
| | 3,000,000 | | | 2.700%, 4/1/2035, Ser. Ab | | | 2,836,860 | |
| | 5,000,000 | | | 2.500%, 12/1/2041, Ser. Bb | | | 4,927,550 | |
| | | | Cornwall-Lebanon School District, Lebanon County, PA G.O. Notes (AGM Insured) | | | | |
| | 1,520,000 | | | Zero Coupon, 3/15/2017c | | | 1,514,452 | |
| | | | Cumberland County, PA Municipal Auth. Rev. (Diakon Lutheran Social Ministries) | | | | |
| | 205,000 | | | 6.125%, 1/1/2029 | | | 225,133 | |
| | 1,860,000 | | | 6.125%, 1/1/2029a | | | 2,062,926 | |
| | | | Lycoming County, PA Auth. Health System Rev. (Susquehanna Health System) | | | | |
| | 7,075,000 | | | 5.750%, 7/1/2039, Ser. A | | | 7,856,009 | |
| | | | Pennsylvania Economic Development Financing Auth. Unemployment Compensation Rev. | | | | |
| | 3,000,000 | | | 5.000%, 7/1/2020, Ser. B | | | 3,317,880 | |
| | | | Pennsylvania Turnpike Commission Turnpike Rev. | | | | |
| | 3,000,000 | | | 5.000%, 12/1/2040, Ser. B | | | 3,437,940 | |
| | 3,000,000 | | | 5.000%, 12/1/2046, Ser. A-1 | | | 3,431,910 | |
| | | | Pennsylvania Turnpike Commission Turnpike Rev. (AGC Insured) | | | | |
| | 10,070,000 | | | 6.250%, 6/1/2038, Ser. Ca,c | | | 10,924,943 | |
| | | | Pennsylvania Turnpike Commission Turnpike Rev. (AGM Insured) | | | | |
| | 10,215,000 | | | 6.250%, 6/1/2033, Ser. Cc | | | 13,228,732 | |
| | | | | |
| | | | Total | | | 59,286,213 | |
| | | | | |
| |
| South Carolina (2.2%) | | | | |
| | | | Beaufort-Jasper Water & Sewer Auth. Rev. Refg. | | | | |
| | 330,000 | | | 5.000%, 3/1/2024, Ser. Bd | | | 403,920 | |
| | 425,000 | | | 5.000%, 3/1/2025, Ser. Bd | | | 527,646 | |
| | | | Charleston County, SC Airport System Rev. | | | | |
| | 6,215,000 | | | 5.500%, 7/1/2031, Ser. A, AMT | | | 7,224,689 | |
| | | | County of Charleston, SC G.O. Transportation Sales Tax Refg. | | | | |
| | 10,005,000 | | | 5.000%, 11/1/2021 | | | 11,874,935 | |
| | | | Greenwood County, SC Hospital Fac. Refg. Rev. (Self Regional Healthcare) | | | | |
| | 1,120,000 | | | 5.000%, 10/1/2024, Ser. B | | | 1,293,992 | |
| | 2,890,000 | | | 5.000%, 10/1/2031, Ser. B | | | 3,238,274 | |
| | | | Greenwood County, SC Hospital Fac. Rev. (Self Regional Healthcare) | | | | |
| | 2,250,000 | | | 5.375%, 10/1/2039 | | | 2,462,062 | |
| | | | Piedmont, SC Municipal Power Agency Electric Rev. Refg. (NATL-RE Insured) | | | | |
| | 4,000,000 | | | 6.250%, 1/1/2021c | | | 4,782,000 | |
| | | | South Carolina State Public Service Auth. | | | | |
| | 305,000 | | | 5.500%, 1/1/2038, Ser. Aa | | | 333,926 | |
| | 3,550,000 | | | 5.500%, 1/1/2038, Ser. Aa | | | 3,886,682 | |
| | | | | |
| | | | Total | | | 36,028,126 | |
| | | | | |
| |
| South Dakota (0.3%) | | | | |
| | | | South Dakota Board Of Regents Housing & Auxiliary Fac. System Rev. | | | | |
| | 1,000,000 | | | 5.000%, 4/1/2033, Ser. B | | | 1,168,360 | |
| | | | South Dakota Health & Educational Fac. Auth. Rev. (Regional Health) | | | | |
| | 1,000,000 | | | 5.000%, 9/1/2023 | | | 1,130,680 | |
| | 820,000 | | | 5.000%, 9/1/2025 | | | 918,695 | |
| | | | South Dakota Health & Educational Fac. Auth. Rev. (Sanford Health) | | | | |
| | 1,250,000 | | | 5.500%, 11/1/2040 | | | 1,377,925 | |
| | | | | |
| | | | Total | | | 4,595,660 | |
| | | | | |
| |
| Tennessee (0.5%) | | | | |
| | | | Jackson-Madison County General Hospital, Inc. | | | | |
| | 555,000 | | | 5.625%, 4/1/2038 | | | 586,801 | |
| | 1,505,000 | | | 5.625%, 4/1/2038a | | | 1,605,970 | |
| | 930,000 | | | 5.750%, 4/1/2041 | | | 984,917 | |
| | 2,520,000 | | | 5.750%, 4/1/2041a | | | 2,693,502 | |
| | | | Tennessee State School Bond Auth. Rev. (2nd Program) | | | | |
| | 500,000 | | | 5.000%, 11/1/2031 | | | 603,815 | |
| | 450,000 | | | 5.000%, 11/1/2032 | | | 540,868 | |
| | 1,275,000 | | | 5.000%, 11/1/2034 | | | 1,521,126 | |
| | 250,000 | | | 5.000%, 11/1/2036 | | | 296,658 | |
| | | | | |
| | | | Total | | | 8,833,657 | |
| | | | | |
| |
| Texas (11.2%) | | | | |
| | | | Amarillo Health Fac. Corporation Hospital Rev. (Baptist St. Anthony’s Hospital Corporation) (AGM Insured) | | | | |
| | 2,000,000 | | | 5.500%, 1/1/2017a,c | | | 2,015,800 | |
| | | | Clifton, TX Higher Education Finance Corporation Education Rev. (IDEA Public Schools) | | | | |
| | 1,000,000 | | | 5.000%, 8/15/2042 | | | 1,106,070 | |
| | 2,000,000 | | | 6.000%, 8/15/2043 | | | 2,393,100 | |
| | | | Clifton, TX Higher Education Finance Corporation Education Rev. (IDEA Public Schools) (PSF-GTD Insured) | | | | |
| | 1,000,000 | | | 5.000%, 8/15/2036, Ser. Ac | | | 1,180,610 | |
| | 4,605,000 | | | 5.000%, 8/15/2039c | | | 5,358,378 | |
| | 2,000,000 | | | 5.000%, 8/15/2046, Ser. Ac | | | 2,333,340 | |
| | | | Clifton, TX Higher Education Finance Corporation Education Rev. (Uplift Education) | | | | |
| | 4,000,000 | | | 6.250%, 12/1/2045, Ser. A | | | 4,532,160 | |
| | | | Dallas and Fort Worth, TX International Airport Rev. Refg. | | | | |
| | 4,000,000 | | | 5.250%, 11/1/2033, Ser. F | | | 4,767,480 | |
The accompanying Notes to Financial Statements are an integral part of this schedule.
145
MUNICIPAL BOND FUND
Schedule of Investments as of October 31, 2016
| | | | | | | | |
Principal
Amount | | | Long-Term Fixed Income (98.9%) | | Value | |
| Texas (11.2%) - continued | | | | |
| | | | Dallas Independent School District, Dallas County, TX Unlimited Tax School Building G.O. (PSF-GTD Insured) | | | | |
| | $10,000,000 | | | 6.375%, 2/15/2034a,c | | | $10,707,600 | |
| | | | Harris County Health Fac. Development Corporation Hospital Rev. Refg. (Memorial Hermann Healthcare System) | | | | |
| | 2,015,000 | | | 7.250%, 12/1/2035, Ser. Ba | | | 2,278,179 | |
| | | | Harris County Industrial Development Corporation Pollution Control Rev. (Exxon) | | | | |
| | 1,000,000 | | | 0.500%, 3/1/2024b | | | 1,000,000 | |
| | | | Harris County, TX G.O. and Rev. Refg. (NATL-RE Insured) | | | | |
| | 7,000,000 | | | Zero Coupon, 8/15/2024c | | | 6,085,800 | |
| | | | Harris County, TX Toll Road Rev. Refg. | | | | |
| | 5,000,000 | | | 5.000%, 8/15/2047, Ser. A | | | 5,872,800 | |
| | 6,500,000 | | | 5.250%, 8/15/2047, Ser. Ba | | | 7,006,025 | |
| | | | Houston, TX Water and Sewer System Rev. Refg. (AGM Insured) | | | | |
| | 10,000,000 | | | 5.750%, 12/1/2032, Ser. Aa,c | | | 14,514,800 | |
| | | | Lewisville Independent School District, Denton County, TX G.O. Unlimited Tax School Building and Refg. (PSF-GTD Insured) | | | | |
| | 5,315,000 | | | Zero Coupon, 8/15/2019c | | | 5,146,302 | |
| | | | New Hope Cultural Education Facilities Corporation, TX Student Housing Rev. (Collegiate Housing College Station I LLC - Texas A&M University) | | | | |
| | 1,000,000 | | | 5.000%, 4/1/2029, Ser. A | | | 1,104,770 | |
| | | | North East Independent School District, Bexar County, TX G.O. Unlimited Tax Refg. (PSF-GTD Insured) | | | | |
| | 5,000,000 | | | 5.250%, 2/1/2028c | | | 6,507,350 | |
| | 2,000,000 | | | 5.250%, 2/1/2029c | | | 2,610,640 | |
| | | | North Texas Education Finance Corporation Education Rev. (Uplift Education) | | | | |
| | 4,500,000 | | | 5.125%, 12/1/2042, Ser. A | | | 4,908,330 | |
| | | | North Texas Tollway Auth. System Rev. (Special) | | | | |
| | 15,000,000 | | | 5.000%, 9/1/2030, Ser. D | | | 17,387,850 | |
| | | | North Texas Tollway Auth. System Rev. Refg. | | | | |
| | 420,000 | | | 5.625%, 1/1/2033a | | | 443,276 | |
| | 125,000 | | | 5.625%, 1/1/2033 | | | 131,103 | |
| | 455,000 | | | 5.625%, 1/1/2033, Ser. Aa | | | 480,216 | |
| | 5,000,000 | | | 5.000%, 1/1/2042, Ser. B | | | 5,622,800 | |
| | | | North Texas Tollway Auth. System Rev. Refg. (AGC Insured) | | | | |
| | 5,000,000 | | | Zero Coupon, 1/1/2028, Ser. Dc | | | 3,519,200 | |
| | | | Northside Independent School District School Building G.O. (PSF-GTD Insured) | | | | |
| | 4,550,000 | | | 1.350%, 6/1/2033b,c | | | 4,567,063 | |
| | | | Northwest Independent School District G.O. (Denton, Tarrant and Wise Counties, TX) (PSF-GTD Insured) | | | | |
| | 5,705,000 | | | 5.000%, 2/15/2038c | | | 6,629,153 | |
| | | | Pharr, TX Higher Education Finance Auth. Education Rev. (Idea Public Schools) | | | | |
| | 2,500,000 | | | 6.250%, 8/15/2029, Ser. A | | | 2,760,900 | |
| | 350,000 | | | 6.500%, 8/15/2039, Ser. A | | | 388,371 | |
| | 1,650,000 | | | 6.500%, 8/15/2039, Ser. Aa | | | 1,888,375 | |
| | | | Red River Education Finance Corporation Rev. (St. Edwards University) | | | | |
| | 2,000,000 | | | 5.000%, 6/1/2046 | | | 2,277,340 | |
| | | | San Juan Higher Education Finance Auth. Education Rev. (IDEA Public Schools) | | | | |
| | 2,000,000 | | | 6.700%, 8/15/2040, Ser. Aa | | | 2,397,360 | |
| | | | San Leanna Education Fac. Corporation Higher Education Rev. (Saint Edward’s University) | | | | |
| | 555,000 | | | 5.125%, 6/1/2024a | | | 568,936 | |
| | 605,000 | | | 5.125%, 6/1/2024 | | | 615,587 | |
| | 180,000 | | | 5.125%, 6/1/2027 | | | 182,866 | |
| | 820,000 | | | 5.125%, 6/1/2027a | | | 840,590 | |
| | | | Socorro, TX Independent School District G.O. Refg. (PSF-GTD Insured) | | | | |
| | 2,000,000 | | | 5.000%, 8/15/2034c | | | 2,260,120 | |
| | | | Southeast Texas Housing Finance Corporation Single Family Mortgage Rev. (NATL-RE Insured) | | | | |
| | 11,615,000 | | | Zero Coupon, 9/1/2017a,c | | | 11,526,145 | |
| | | | Southwest Higher Education Auth., Inc., Higher Education Rev. (Southern Methodist University) | | | | |
| | 1,700,000 | | | 5.000%, 10/1/2041 | | | 1,912,194 | |
| | | | State of Texas G.O. Refg. | | | | |
| | 13,940,000 | | | 5.000%, 10/1/2044, Ser. A | | | 16,352,178 | |
| | | | Tarrant County Cultural Education Fac. Finance Corporation Hospital Rev. (Hendrick Medical Center) | | | | |
| | 2,640,000 | | | 5.000%, 9/1/2030 | | | 3,068,050 | |
| | | | Tarrant County Cultural Education Fac. Finance Corporation Hospital Rev. (Hendrick Medical Center) (AGC Insured) | | | | |
| | 1,250,000 | | | 5.250%, 9/1/2026, Ser. Bc | | | 1,371,362 | |
| | 2,000,000 | | | 5.250%, 9/1/2027, Ser. Bc | | | 2,192,820 | |
| | 1,000,000 | | | 5.250%, 9/1/2028, Ser. Bc | | | 1,095,240 | |
| | | | Tarrant County Cultural Education Fac. Finance Corporation Refg. Rev. (Texas Health Resources System) | | | | |
| | 2,000,000 | | | 5.000%, 2/15/2023, Ser. A | | | 2,024,700 | |
| | | | Texas College Student Loan G.O. | | | | |
| | 1,900,000 | | | 5.000%, 8/1/2017, AMT | | | 1,959,736 | |
| | | | | |
| | | | Total | | | 185,893,065 | |
| | | | | |
| |
| Utah (1.6%) | | | | |
| | | | Riverton, UT Hospital Rev. | | | | |
| | 3,010,000 | | | 5.000%, 8/15/2041 | | | 3,252,817 | |
| | | | Utah Associated Municipal Power Systems Rev. Refg. (Central-St. George Transmission) | | | | |
| | 6,000,000 | | | 5.250%, 12/1/2027a | | | 6,769,020 | |
| | | | Utah County, UT Hospital Rev. (IHC Health Services, Inc.) | | | | |
| | 1,085,000 | | | 5.000%, 5/15/2023, Ser. A | | | 1,321,953 | |
| | 3,175,000 | | | 5.000%, 5/15/2043 | | | 3,571,621 | |
| | 1,610,000 | | | 5.000%, 5/15/2045, Ser. A | | | 1,849,214 | |
The accompanying Notes to Financial Statements are an integral part of this schedule.
146
MUNICIPAL BOND FUND
Schedule of Investments as of October 31, 2016
| | | | | | | | |
Principal
Amount | | | Long-Term Fixed Income (98.9%) | | Value | |
| Utah (1.6%) - continued | | | | |
| | $7,500,000 | | | 5.000%, 5/15/2046, Ser. B | | | $8,811,000 | |
| | | | Utah State Charter School Finance Auth. Charter School Rev. (North Davis Preparatory) | | | | |
| | 1,000,000 | | | 6.250%, 7/15/2030 | | | 1,087,120 | |
| | | | | |
| | | | Total | | | 26,662,745 | |
| | | | | |
| |
| Vermont (0.1%) | | | | |
| | | | Vermont Educational & Health Buildings Financing Agency Rev. Refg. (University of Vermont Medical Center) | | | | |
| | 1,000,000 | | | 5.000%, 12/1/2035, Ser. A | | | 1,168,200 | |
| | 1,000,000 | | | 5.000%, 12/1/2036, Ser. A | | | 1,166,390 | |
| | | | | |
| | | | Total | | | 2,334,590 | |
| | | | | |
| |
| Virginia (1.9%) | | | | |
| | | | Fairfax County, VA Industrial Development Auth. Health Care Rev. (Inova Health System) | | | | |
| | 1,000,000 | | | 5.000%, 5/15/2025, Ser. C | | | 1,094,280 | |
| | 2,405,000 | | | 5.000%, 5/15/2044, Ser. A | | | 2,785,326 | |
| | | | Fairfax County, VA Industrial Development Auth. Health Care Rev. Refg. (Inova Health System) | | | | |
| | 1,930,000 | | | 5.250%, 8/15/2019 | | | 2,065,988 | |
| | | | Virginia Commonwealth Transportation Board Rev. | | | | |
| | 10,000,000 | | | 5.000%, 5/15/2034 | | | 11,570,700 | |
| | | | Virginia Port Auth. Port Fac. Rev. | | | | |
| | 2,000,000 | | | 5.000%, 7/1/2040 | | | 2,182,840 | |
| | | | Virginia Small Business Financing Auth. Rev. (Elizabeth River Crossings Opco, LLC) | | | | |
| | 10,365,000 | | | 6.000%, 1/1/2037, AMT | | | 12,066,622 | |
| | | | | |
| | | | Total | | | 31,765,756 | |
| | | | | |
| |
| Washington (3.3%) | | | | |
| | | | Clark County, WA Public Utility District No. 1 Electric Rev. Refg. | | | | |
| | 785,000 | | | 5.000%, 1/1/2029 | | | 953,461 | |
| | | | Clark County, WA Public Utility District No. 1 Generating System Rev. Refg. | | | | |
| | 2,480,000 | | | 5.000%, 1/1/2024 | | | 3,039,314 | |
| | | | FYI Properties Lease Rev. (State of Washington DIS) | | | | |
| | 2,555,000 | | | 5.500%, 6/1/2034 | | | 2,816,198 | |
| | | | Pierce County, WA School District No. 10, Tacoma G.O. Refg. | | | | |
| | 2,170,000 | | | 5.000%, 12/1/2039 | | | 2,552,397 | |
| | | | Port of Seattle Special Fac. Rev. Refg. (Seatac Fuel Fac., LLC) | | | | |
| | 670,000 | | | 5.000%, 6/1/2019, AMT | | | 731,573 | |
| | 1,000,000 | | | 5.000%, 6/1/2020, AMT | | | 1,122,020 | |
| | | | Snohomish County, WA Edmonds School District No. 15 U.T.G.O. | | | | |
| | 1,000,000 | | | 5.000%, 12/1/2033 | | | 1,168,690 | |
| | | | State of Washington Various Purpose G.O. | | | | |
| | 5,390,000 | | | 5.000%, 8/1/2021, Ser. A | | | 6,321,446 | |
| | 12,095,000 | | | 5.000%, 8/1/2030, Ser. A | | | 14,434,052 | |
| | | | Washington Health Care Fac. Auth. Rev. (Kadlec Regional Medical Center) | | | | |
| | 2,625,000 | | | 5.250%, 12/1/2030a | | | 3,054,791 | |
| | | | Washington Health Care Fac. Auth. Rev. (Providence Health & Services) | | | | |
| | 5,000,000 | | | 5.250%, 10/1/2032, Ser. A | | | 5,532,250 | |
| | | | Washington Health Care Fac. Auth. Rev. (Seattle Cancer Care Alliance) | | | | |
| | 5,010,000 | | | 7.375%, 3/1/2038a | | | 5,748,474 | |
| | | | Washington Higher Education Fac. Auth. Refg. Rev. (Gonzaga University) | | | | |
| | 5,325,000 | | | 5.000%, 4/1/2029, Ser. B | | | 5,835,668 | |
| | | | Washington Higher Education Fac. Auth. Rev. Refg. (Whitworth University) | | | | |
| | 1,290,000 | | | 5.875%, 10/1/2034 | | | 1,418,961 | |
| | 1,000,000 | | | 5.625%, 10/1/2040 | | | 1,094,150 | |
| | | | | |
| | | | Total | | | 55,823,445 | |
| | | | | |
| |
| Wisconsin (2.5%) | | | | |
| | | | Kaukauna, WI Electric System Rev. (AGM Insured) | | | | |
| | 3,000,000 | | | 5.000%, 12/15/2035, Ser. Ac | | | 3,428,730 | |
| | | | Monroe, WI Redevelopment Auth. Rev. (Monroe Clinic, Inc.) | | | | |
| | 3,520,000 | | | 5.875%, 2/15/2039a | | | 3,907,517 | |
| | | | Wisconsin Health & Educational Fac. Auth. Rev. (Marquette University) | | | | |
| | 1,125,000 | | | 5.000%, 10/1/2033, Ser. B-1a | | | 1,263,600 | |
| | | | Wisconsin Health & Educational Fac. Auth. Rev. (Marshfield Clinic Health Systems) | | | | |
| | 2,000,000 | | | 5.000%, 2/15/2046, Ser. A | | | 2,220,980 | |
| | | | Wisconsin Health & Educational Fac. Auth. Rev. (Thedacare, Inc.) | | | | |
| | 5,335,000 | | | 5.500%, 12/15/2038, Ser. A | | | 5,831,155 | |
| | 1,195,000 | | | 5.000%, 12/15/2039 | | | 1,370,749 | |
| | 2,500,000 | | | 5.000%, 12/15/2044 | | | 2,848,300 | |
| | | | Wisconsin Health & Educational Fac. Auth. Rev. Refg. (Ascension Health Credit Group) | | | | |
| | 9,275,000 | | | 5.000%, 11/15/2039, Ser. A | | | 10,913,243 | |
| | | | Wisconsin Health & Educational Fac. Auth. Rev. Refg. (Marquette University) | | | | |
| | 8,000,000 | | | 5.000%, 10/1/2041 | | | 9,318,640 | |
| | | | | |
| | | | Total | | | 41,102,914 | |
| | | | | |
| |
| Wyoming (0.4%) | | | | |
| | | | Wyoming Municipal Power Agency Power Supply System Rev. | | | | |
| | 3,270,000 | | | 5.375%, 1/1/2042, Ser. A | | | 3,421,793 | |
| | | | Wyoming State Farm Loan Board Capital Fac. Refg. Rev. | | | | |
| | 2,990,000 | | | 5.750%, 10/1/2020 | | | 3,221,875 | |
| | | | | |
| | | | Total | | | 6,643,668 | |
| | | | | |
| | | | Total Long-Term Fixed Income (cost $1,523,993,392) | | | 1,645,861,310 | |
| | | | | |
| | | | Total Investments (cost $1,523,993,392) 98.9% | | | $1,645,861,310 | |
| | | | | |
| | | | Other Assets and Liabilities, Net 1.1% | | | 18,212,531 | |
| | | | | |
| | | | Total Net Assets 100.0% | | | $1,664,073,841 | |
| | | | | |
The accompanying Notes to Financial Statements are an integral part of this schedule.
147
MUNICIPAL BOND FUND
Schedule of Investments as of October 31, 2016
a | Denotes securities that have been pre-refunded or escrowed to maturity. Under such an arrangement, money is deposited into an irrevocable escrow account and is used to purchase U.S. Treasury securities or government agency securities with maturing principal and interest earnings sufficient to pay all debt service requirements of the pre-refunded bonds. |
b | Denotes variable rate securities. Variable rate securities are securities whose yields vary with a designated market index or market rate. The rate shown is as of October 31, 2016. |
c | To reduce certain risks associated with securities issued by municipalities, which may include but are not limited to economic development in a specific industry or municipality, the principal and/or interest payments are guaranteed by the bond insurance company or government agency identified. |
d | Denotes investments purchased on a when-issued or delayed delivery basis. |
e | Denotes step coupon securities. Step coupon securities pay an initial coupon rate for the first period and then different coupon rates for following periods. The rate shown is as of October 31, 2016. |
* | Denotes restricted securities. Restricted securities are investment securities which cannot be offered for public sale without first being registered under the Securities Act of 1933. The value of all restricted securities held in Municipal Bond Fund as of October 31, 2016 was $1,645,170 or 0.1% of total net assets. The following table indicates the acquisition date and cost of restricted securities shown in the schedule as of October 31, 2016. |
| | | | | | | | |
Security | | Acquisition Date | | | Cost | |
Plaza Metropolitan District No. 1 Rev. Refg. (City of Lakewood), 12/1/2022 | | | 1/23/2013 | | | | $533,693 | |
Plaza Metropolitan District No. 1 Rev. Refg. (City of Lakewood), 12/1/2021 | | | 1/23/2013 | | | | 1,064,462 | |
Definitions:
| | | | |
| AGC | | - | | Assured Guaranty, Ltd |
| AGM | | - | | Assured Guaranty Municipal Corporation |
| AMBAC | | - | | American Municipal Bond Insurance Company |
| AMT | | - | | Subject to Alternative Minimum Tax |
| Auth | | - | | Authority |
| BAM | | - | | Build America Mutual |
| C.O.P. | | - | | Certificate of Participation |
| CR | | - | | Custodian Receipts |
| Fac. | | - | | Facility/Facilities |
| FGIC | | - | | Federal Guaranty Insurance Company |
| FNMA | | - | | Federal National Mortgage Association |
| GNMA | | - | | Government National Mortgage Association |
| G.O. | | - | | General Obligation |
| IBC | | - | | Insured Bond Certificate |
| NATL-RE | | - | | National Public Finance Guarantee Corporation |
| Proj. | | - | | Project |
| PSF-GTD | | - | | Permanent School Fund Guarantee Program |
| Q-SBLF | | - | | Qualified School Bond Loan Fund |
| Refg. | | - | | Refunding |
| Rev. | | - | | Revenue |
| Ser. | | - | | Series |
| U.T.G.O. | | - | | Unlimited Tax General Obligation |
The accompanying Notes to Financial Statements are an integral part of this schedule.
148
LIMITED MATURITY BOND FUND
Schedule of Investments as of October 31, 2016
| | | | | | | | |
Principal
Amount | | | Bank Loans (1.5%)a | | Value | |
| Basic Materials (0.1%) | | | | |
| | | | Arch Coal, Inc., Term Loan | | | | |
| $ | 94,497 | | | 10.000%, 10/5/2021 | | | $96,465 | |
| | | | Fortescue Metals Group, Ltd., Term Loan | | | | |
| | 244,831 | | | 3.750%, 6/30/2019 | | | 244,601 | |
| | | | | |
| | | | Total | | | 341,066 | |
| | | | | |
| |
| Capital Goods (0.2%) | | | | |
| | | | Accudyne Industries, LLC, Term Loan | | | | |
| | 503,424 | | | 4.000%, 12/13/2019 | | | 462,103 | |
| | | | ADS Waste Holdings, Inc., Term Loan | | | | |
| | 707,039 | | | 3.750%, 10/9/2019 | | | 707,237 | |
| | | | Berry Plastics Group, Inc., Term Loan | | | | |
| | 685,150 | | | 3.500%, 2/8/2020 | | | 685,904 | |
| | | | | |
| | | | Total | | | 1,855,244 | |
| | | | | |
| |
| Communications Services (0.5%) | | | | |
| | | | Grande Communications Networks, LLC, Term Loan | | | | |
| | 686,948 | | | 4.500%, 5/29/2020 | | | 686,090 | |
| | | | Integra Telecom Holdings, Inc., Term Loan | | | | |
| | 878,907 | | | 5.250%, 8/14/2020 | | | 873,967 | |
| | | | LTS Buyer, LLC, Term Loan | | | | |
| | 541,800 | | | 4.088%, 4/13/2020 | | | 542,342 | |
| | | | NEP/NCP Holdco, Inc., Term Loan | | | | |
| | 685,367 | | | 4.250%, 1/22/2020 | | | 683,009 | |
| | | | TNS, Inc., Term Loan | | | | |
| | 469,046 | | | 5.000%, 2/14/2020 | | | 470,514 | |
| | | | Univision Communications, Inc., Term Loan | | | | |
| | 878,145 | | | 4.000%, 3/1/2020 | | | 879,515 | |
| | | | | |
| | | | Total | | | 4,135,437 | |
| | | | | |
| |
| Consumer Cyclical (0.4%) | | | | |
| | | | Burlington Coat Factory Warehouse Corporation, Term Loan | | | | |
| | 498,283 | | | 3.500%, 8/13/2021 | | | 501,551 | |
| | | | Cengage Learning Acquisitions, Term Loan | | | | |
| | 349,125 | | | 5.250%, 6/7/2023 | | | 340,907 | |
| | | | Ceridian HCM Holding, Inc., Term Loan | | | | |
| | 530,290 | | | 4.500%, 9/15/2020 | | | 519,684 | |
| | | | Mohegan Tribal Gaming Authority, Term Loan | | | | |
| | 225,000 | | | 0.000%, 9/30/2023b,c | | | 224,086 | |
| | | | Scientific Games International, Inc., Term Loan | | | | |
| | 909,288 | | | 6.000%, 10/18/2020 | | | 914,116 | |
| | | | Seminole Hard Rock Entertainment, Inc., Term Loan | | | | |
| | 343,462 | | | 3.588%, 5/14/2020 | | | 344,321 | |
| | | | | |
| | | | Total | | | 2,844,665 | |
| | | | | |
| |
| Consumer Non-Cyclical (0.1%) | | | | |
| | | | Albertson’s, LLC, Term Loan | | | | |
| | 342,857 | | | 4.750%, 6/22/2023 | | | 346,430 | |
| | | | JBS USA, LLC, Term Loan | | | | |
| | 492,252 | | | 3.750%, 5/25/2018 | | | 491,228 | |
| | | | | |
| | | | Total | | | 837,658 | |
| | | | | |
| |
| Energy (<0.1%) | | | | |
| | | | Pacific Drilling SA, Term Loan | | | | |
| | 880,425 | | | 4.500%, 6/3/2018 | | | 247,620 | |
| | | | | |
| | | | Total | | | 247,620 | |
| | | | | |
| |
| Financials (0.1%) | | | | |
| | | | Harland Clarke Holdings Corporation, Term Loan | | | | |
| | 233,344 | | | 7.000%, 5/22/2018 | | | 232,177 | |
| | 48,750 | | | 7.000%, 12/31/2019 | | | 48,405 | |
| | | | WaveDivision Holdings, LLC, Term Loan | | | | |
| | 683,387 | | | 4.000%, 10/15/2019 | | | 684,925 | |
| | | | | |
| | | | Total | | | 965,507 | |
| | | | | |
| |
| Technology (0.1%) | | | | |
| | | | First Data Corporation, Term Loan | | | | |
| | 390,000 | | | 0.000%, 3/24/2021b,c | | | 391,560 | |
| | | | | |
| | | | Total | | | 391,560 | |
| | | | | |
| |
| Utilities (<0.1%) | | | | |
| | | | Intergen NV, Term Loan | | | | |
| | 192,203 | | | 5.500%, 6/12/2020 | | | 181,632 | |
| | | | | |
| | | | Total | | | 181,632 | |
| | | | | |
| | | | Total Bank Loans (cost $12,480,131) | | | 11,800,389 | |
| | | | | |
| | |
Principal
Amount | | | Long-Term Fixed Income (94.5%) | | Value | |
| Asset-Backed Securities (17.1%) | | | | |
| | | | American Homes 4 Rent | | | | |
| | 2,464,396 | | | 1.535%, 6/17/2031d,e | | | 2,456,902 | |
| | | | Americredit Automobile Receivables Trust | | | | |
| | 4,000,000 | | | 1.340%, 4/8/2020 | | | 4,000,497 | |
| | | | BA Credit Card Trust | | | | |
| | 3,850,000 | | | 0.915%, 6/15/2021e | | | 3,861,104 | |
| | | | Barclays Dryrock Issuance Trust | | | | |
| | 2,750,000 | | | 1.520%, 5/16/2022 | | | 2,754,744 | |
| | | | Bayview Opportunity Master Fund Trust | | | | |
| | 1,378,676 | | | 3.598%, 9/28/2031d,f | | | 1,377,788 | |
| | 1,424,312 | | | 3.228%, 7/28/2034*,f | | | 1,421,870 | |
| | | | Brazos Higher Education Authority, Inc. | | | | |
| | 1,602,449 | | | 1.625%, 2/25/2030e | | | 1,590,364 | �� |
| | | | Capital One Multi-Asset Execution Trust | | | | |
| | 5,400,000 | | | 1.260%, 1/15/2020 | | | 5,406,535 | |
| | | | CarMax Auto Owner Trust | | | | |
| | 5,200,000 | | | 1.210%, 11/15/2019 | | | 5,198,009 | |
| | | | Chase Issuance Trust | | | | |
| | 1,750,000 | | | 1.100%, 1/15/2020 | | | 1,748,144 | |
| | 2,975,000 | | | 1.590%, 2/18/2020 | | | 2,991,019 | |
| | 2,225,000 | | | 1.620%, 7/15/2020 | | | 2,239,805 | |
| | 1,500,000 | | | 0.945%, 5/17/2021e | | | 1,506,152 | |
| | | | Chesapeake Funding II, LLC | | | | |
| | 3,000,000 | | | 1.880%, 6/15/2028d | | | 3,008,929 | |
| | | | Chesapeake Funding, LLC | | | | |
| | 484,263 | | | 0.976%, 1/7/2025d,e | | | 484,200 | |
| | | | Chrysler Capital Auto Receivables Trust | | | | |
| | 4,000,000 | | | 1.360%, 1/15/2020c,d | | | 3,999,592 | |
| | | | Citibank Credit Card Issuance Trust | | | | |
| | 5,525,000 | | | 1.020%, 2/22/2019 | | | 5,525,624 | |
| | | | Commonbond Student Loan Trust | | | | |
| | 787,159 | | | 3.200%, 6/25/2032* | | | 806,451 | |
| | | | CPS Auto Receivables Trust | | | | |
| | 1,566,208 | | | 2.070%, 11/15/2019d | | | 1,573,384 | |
| | | | Credit Based Asset Servicing and Securitization, LLC | | | | |
| | 684,660 | | | 3.473%, 12/25/2036f | | | 511,961 | |
The accompanying Notes to Financial Statements are an integral part of this schedule.
149
LIMITED MATURITY BOND FUND
Schedule of Investments as of October 31, 2016
| | | | | | | | |
Principal
Amount | | | Long-Term Fixed Income (94.5%) | | Value | |
| Asset-Backed Securities (17.1%) - continued | | | | |
| | | | Edlinc Student Loan Funding Trust | | | | |
| $ | 1,242,998 | | | 3.410%, 10/1/2025*,e | | $ | 1,254,943 | |
| | | | Ford Credit Auto Owner Trust | | | | |
| | 4,500,000 | | | 1.040%, 9/15/2019 | | | 4,498,277 | |
| | 2,875,000 | | | 2.260%, 11/15/2025d | | | 2,925,810 | |
| | | | FRS, LLC | | | | |
| | 1,569,681 | | | 1.800%, 4/15/2043* | | | 1,539,406 | |
| | | | GMAC Mortgage Corporation Loan Trust | | | | |
| | 195,303 | | | 1.024%, 8/25/2035e,g | | | 183,360 | |
| | 341,095 | | | 5.750%, 10/25/2036g | | | 327,589 | |
| | 617,473 | | | 0.705%, 12/25/2036e,g | | | 559,264 | |
| | | | GoldenTree Loan Opportunities IX, Ltd. | | | | |
| | 3,200,000 | | | 2.238%, 10/29/2026*,e | | | 3,200,000 | |
| | | | Impac CMB Trust | | | | |
| | 1,184,421 | | | 1.054%, 4/25/2035e | | | 1,080,376 | |
| | 447,356 | | | 1.174%, 8/25/2035e | | | 391,992 | |
| | | | John Deere Owner Trust | | | | |
| | 1,500,000 | | | 1.250%, 6/15/2020 | | | 1,500,604 | |
| | | | Master Credit Card Trust | | | | |
| | 3,500,000 | | | 1.275%, 9/23/2019d,e | | | 3,518,142 | |
| | | | Mill City Mortgage Loan Trust | | | | |
| | 1,453,095 | | | 2.500%, 4/25/2057d | | | 1,464,251 | |
| | | | MLCC Mortgage Investors, Inc. | | | | |
| | 1,186,269 | | | 1.194%, 9/25/2029e | | | 1,175,005 | |
| | | | Mortgage Equity Conversion Asset Trust | | | | |
| | 1,802,618 | | | 1.090%, 1/25/2042*,e | | | 1,541,238 | |
| | 1,796,078 | | | 1.070%, 2/25/2042*,e | | | 1,526,666 | |
| | | | Navient Student Loan Trust | | | | |
| | 2,360,711 | | | 1.284%, 6/25/2065d,e | | | 2,367,184 | |
| | | | NextGear Floorplan Master Owner Trust | | | | |
| | 2,000,000 | | | 1.920%, 10/15/2019* | | | 1,997,689 | |
| | | | Northstar Education Finance, Inc. | | | | |
| | 1,937,333 | | | 1.234%, 12/26/2031d,e | | | 1,896,283 | |
| | | | OneMain Direct Auto Receivables Trust | | | | |
| | 1,593,569 | | | 2.040%, 1/15/2021d | | | 1,598,232 | |
| | | | OneMain Financial Issuance Trust | | | | |
| | 1,750,000 | | | 4.100%, 3/20/2028d | | | 1,799,229 | |
| | | | OZLM VIII, Ltd. | | | | |
| | 3,050,000 | | | 2.320%, 10/17/2026*,e | | | 3,052,433 | |
| | | | Prestige Auto Receivables Trust | | | | |
| | 4,500,000 | | | 1.460%, 7/15/2020d | | | 4,499,691 | |
| | | | Renaissance Home Equity Loan Trust | | | | |
| | 1,433,107 | | | 5.608%, 5/25/2036f | | | 942,175 | |
| | 702,974 | | | 5.285%, 1/25/2037f | | | 379,809 | |
| | | | Securitized Term Auto Receivables Trust | | | | |
| | 2,250,000 | | | 1.284%, 11/26/2018d | | | 2,250,000 | |
| | | | Selene Non-Performing Loans, LLC | | | | |
| | 309,056 | | | 2.981%, 5/25/2054*,f | | | 308,436 | |
| | | | SLM Student Loan Trust | | | | |
| | 811,836 | | | 1.135%, 8/15/2022d,e | | | 812,707 | |
| | 215,300 | | | 1.285%, 10/16/2023d,e | | | 215,407 | |
| | 3,403,923 | | | 0.934%, 3/25/2025e | | | 3,309,182 | |
| | 2,002,088 | | | 1.054%, 3/25/2026e | | | 2,000,520 | |
| | 1,800,000 | | | 1.585%, 5/17/2027d,e | | | 1,814,363 | |
| | | | Sofi Consumer Loan Program | | | | |
| | 2,400,000 | | | 3.050%, 12/26/2025d | | | 2,399,951 | |
| | | | Sofi Professional Loan Program, LLC | | | | |
| | 2,473,849 | | | 1.680%, 3/25/2031d | | | 2,476,747 | |
| | | | SoFi Professional Loan Program, LLC | | | | |
| | 2,022,131 | | | 2.420%, 3/25/2030d | | | 2,041,900 | |
| | 1,852,069 | | | 1.480%, 5/26/2031d | | | 1,852,065 | |
| | 1,374,834 | | | 2.510%, 8/25/2033d | | | 1,391,388 | |
| | | | Toyota Auto Receivables Owner Trust | | | | |
| | 4,500,000 | | | 1.060%, 5/15/2019 | | | 4,499,912 | |
| | | | Vericrest Opportunity Loan Transferee | | | | |
| | 1,628,069 | | | 3.500%, 6/26/2045d,f | | | 1,627,628 | |
| | 1,196,431 | | | 4.250%, 2/26/2046d,f | | | 1,210,094 | |
| | 2,122,150 | | | 4.000%, 5/25/2046d,f | | | 2,138,935 | |
| | 1,111,971 | | | 3.750%, 6/25/2046d,f | | | 1,115,164 | |
| | 354,895 | | | 3.375%, 10/26/2054d | | | 355,456 | |
| | | | Verizon Owner Trust | | | | |
| | 3,500,000 | | | 1.420%, 1/20/2021d | | | 3,504,137 | |
| | | | Wachovia Asset Securitization, Inc. | | | | |
| | 457,715 | | | 0.674%, 7/25/2037*,e,g | | | 384,422 | |
| | | | Wheels SPV 2, LLC | | | | |
| | 2,000,000 | | | 1.590%, 5/20/2025d | | | 2,003,802 | |
| | | | | |
| | | | Total | | | 135,394,938 | |
| | | | | |
| |
| Basic Materials (0.5%) | | | | |
| | | | Albemarle Corporation | | | | |
| | 860,000 | | | 3.000%, 12/1/2019 | | | 884,911 | |
| | | | Georgia-Pacific, LLC | | | | |
| | 1,995,000 | | | 2.539%, 11/15/2019d | | | 2,034,952 | |
| | | | Glencore Funding, LLC | | | | |
| | 825,000 | | | 1.940%, 4/16/2018d,e | | | 812,625 | |
| | | | | |
| | | | Total | | | 3,732,488 | |
| | | | | |
| |
| Capital Goods (0.4%) | | | | |
| | | | Lockheed Martin Corporation | | | | |
| | 1,355,000 | | | 2.500%, 11/23/2020 | | | 1,390,081 | |
| | | | Roper Technologies, Inc. | | | | |
| | 617,000 | | | 1.850%, 11/15/2017 | | | 618,764 | |
| | 923,000 | | | 6.250%, 9/1/2019 | | | 1,031,685 | |
| | | | Textron, Inc. | | | | |
| | 350,000 | | | 3.875%, 3/1/2025 | | | 364,631 | |
| | | | | |
| | | | Total | | | 3,405,161 | |
| | | | | |
| |
| Collateralized Mortgage Obligations (9.6%) | | | | |
| | | | Alm Loan Funding CLO | | | | |
| | 3,050,000 | | | 2.310%, 10/17/2026*,e | | | 3,050,988 | |
| | | | American Home Mortgage Assets Trust | | | | |
| | 1,103,936 | | | 1.444%, 11/25/2046e | | | 577,746 | |
| | | | Apidos CLO XVIII | | | | |
| | 3,000,000 | | | 2.294%, 7/22/2026*,e | | | 2,999,722 | |
| | | | Babson CLO, Ltd. | | | | |
| | 3,050,000 | | | 2.270%, 10/17/2026*,e | | | 3,047,474 | |
| | | | BCAP, LLC Trust | | | | |
| | 1,700,875 | | | 0.714%, 3/25/2037e | | | 1,584,012 | |
| | | | Bear Stearns Adjustable Rate Mortgage Trust | | | | |
| | 358,387 | | | 2.830%, 10/25/2035e | | | 344,884 | |
| | | | Betony CLO, Ltd. | | | | |
| | 2,750,000 | | | 2.390%, 4/15/2027*,e | | | 2,750,937 | |
| | | | Birchwood Park CLO, Ltd. | | | | |
| | 3,050,000 | | | 2.320%, 7/15/2026*,e | | | 3,052,357 | |
| | | | BlueMountain CLO, Ltd. | | | | |
| | 3,050,000 | | | 2.360%, 10/15/2026*,e | | | 3,057,365 | |
| | | | Carlyle Global Market Strategies CLO, Ltd. | | | | |
| | 2,601,230 | | | 2.181%, 7/20/2023*,e | | | 2,603,371 | |
| | 3,000,000 | | | 2.380%, 10/15/2026*,e | | | 3,007,855 | |
| | | | Cent CLO 16, LP | | | | |
| | 3,050,000 | | | 2.007%, 8/1/2024*,e | | | 3,047,839 | |
The accompanying Notes to Financial Statements are an integral part of this schedule.
150
LIMITED MATURITY BOND FUND
Schedule of Investments as of October 31, 2016
| | | | | | | | |
Principal
Amount | | | Long-Term Fixed Income (94.5%) | | Value | |
| Collateralized Mortgage Obligations (9.6%) - continued | | | | |
| | | | Cent CLO 22, Ltd. | | | | |
| $ | 3,000,000 | | | 2.268%, 11/7/2026*,e | | $ | 3,000,165 | |
| | | | Countrywide Alternative Loan Trust | | | | |
| | 311,180 | | | 5.500%, 11/25/2035 | | | 299,246 | |
| | 264,820 | | | 5.500%, 2/25/2036 | | | 246,180 | |
| | 388,594 | | | 6.000%, 1/25/2037 | | | 371,686 | |
| | | | Countrywide Home Loans, Inc. | | | | |
| | 590,599 | | | 2.821%, 3/20/2036 | | | 471,549 | |
| | 585,530 | | | 2.996%, 9/20/2036 | | | 462,654 | |
| | | | Deutsche Alt-A Securities, Inc., Mortgage Loan Trust | | | | |
| | 1,133,334 | | | 1.294%, 4/25/2047e | | | 962,541 | |
| | | | Dryden 34 Senior Loan Fund CLO | | | | |
| | 3,050,000 | | | 2.310%, 10/15/2026*,e | | | 3,051,342 | |
| | | | HarborView Mortgage Loan Trust | | | | |
| | 1,014,845 | | | 2.660%, 6/19/2034 | | | 992,093 | |
| | | | J.P. Morgan Alternative Loan Trust | | | | |
| | 874,980 | | | 2.879%, 3/25/2036 | | | 731,101 | |
| | | | J.P. Morgan Mortgage Trust | | | | |
| | 603,390 | | | 2.943%, 2/25/2036 | | | 526,588 | |
| | 365,660 | | | 3.077%, 10/25/2036 | | | 330,394 | |
| | | | Madison Park Funding XIV CLO, Ltd. | | | | |
| | 3,350,000 | | | 2.331%, 7/20/2026*,e | | | 3,354,646 | |
| | | | Master Asset Securitization Trust | | | | |
| | 706,706 | | | 1.034%, 6/25/2036e | | | 373,678 | |
| | | | MortgageIT Trust | | | | |
| | 1,088,933 | | | 0.794%, 12/25/2035e | | | 992,378 | |
| | | | NCUA Guaranteed Notes | | | | |
| | 2,025,437 | | | 0.977%, 10/7/2020e | | | 2,029,245 | |
| | | | Neuberger Berman CLO, Ltd. | | | | |
| | 2,400,000 | | | 2.238%, 8/4/2025*,e | | | 2,406,619 | |
| | | | Octagon Investment Partners XX CLO, Ltd. | | | | |
| | 3,050,000 | | | 2.258%, 8/12/2026*,e | | | 3,050,175 | |
| | | | Race Point IX CLO, Ltd. | | | | |
| | 1,200,000 | | | 2.390%, 4/15/2027*,e | | | 1,201,508 | |
| | | | Residential Accredit Loans, Inc. Trust | | | | |
| | 512,080 | | | 4.013%, 9/25/2035 | | | 431,283 | |
| | | | Sequoia Mortgage Trust | | | | |
| | 2,153,732 | | | 1.950%, 9/20/2034e | | | 2,068,742 | |
| | | | Structured Asset Securities Corporation Trust | | | | |
| | 1,756,337 | | | 5.500%, 12/25/2034 | | | 1,765,811 | |
| | | | Symphony CLO VIII, Ltd. | | | | |
| | 2,791,940 | | | 1.976%, 1/9/2023*,e | | | 2,790,140 | |
| | | | Voya CLO 3, Ltd. | | | | |
| | 3,050,000 | | | 2.302%, 7/25/2026*,e | | | 3,048,513 | |
| | | | Wachovia Mortgage Loan Trust, LLC | | | | |
| | 343,067 | | | 3.062%, 5/20/2036 | | | 302,180 | |
| | | | WaMu Mortgage Pass Through Certificates | | | | |
| | 344,451 | | | 0.824%, 10/25/2045e | | | 325,691 | |
| | 947,091 | | | 1.404%, 10/25/2046e | | | 783,058 | |
| | 1,152,152 | | | 1.327%, 12/25/2046e | | | 892,571 | |
| | 1,061,218 | | | 1.264%, 1/25/2047e | | | 827,339 | |
| | | | Washington Mutual Mortgage Pass Through Certificates Trust | | | | |
| | 736,433 | | | 1.444%, 9/25/2046e | | | 491,243 | |
| | 1,216,357 | | | 1.274%, 2/25/2047e | | | 906,167 | |
| | | | Wells Fargo Commercial Mortgage Trust | | | | |
| | 2,925,000 | | | 2.632%, 5/15/2048 | | | 3,003,362 | |
| | | | Wells Fargo Mortgage Backed Securities Trust | | | | |
| | 2,088,942 | | | 3.105%, 10/25/2034 | | | 2,084,753 | |
| | 1,122,998 | | | 5.500%, 8/25/2035 | | | 1,147,257 | |
| | 501,051 | | | 2.911%, 3/25/2036 | | | 473,908 | |
| | 565,496 | | | 2.921%, 3/25/2036 | | | 564,061 | |
| | | | | |
| | | | Total | | | 75,884,417 | |
| | | | | |
| |
| Commercial Mortgage-Backed Securities (2.0%) | | | | |
| | | | Bear Stearns Commercial Mortgage Securities, Inc. | | | | |
| | 2,656,183 | | | 5.331%, 2/11/2044 | | | 2,669,386 | |
| | | | Citigroup Commercial Mortgage Trust | | | | |
| | 750,000 | | | 5.711%, 12/10/2049 | | | 760,091 | |
| | | | Citigroup/Deutsche Bank Commercial Mortgage Trust | | | | |
| | 1,065,648 | | | 5.322%, 12/11/2049 | | | 1,069,217 | |
| | | | Commercial Mortgage Pass-Through Certificates | | | | |
| | 4,000,000 | | | 1.580%, 6/8/2030d,e | | | 4,005,014 | |
| | | | Credit Suisse First Boston Mortgage Securities | | | | |
| | 56,173 | | | 5.542%, 1/15/2049 | | | 56,082 | |
| | | | Federal National Mortgage Association | | | | |
| | 173,061 | | | 1.272%, 1/25/2017 | | | 172,955 | |
| | | | GS Mortgage Securities Trust | | | | |
| | 150,042 | | | 2.999%, 8/10/2044 | | | 149,960 | |
| | | | Morgan Stanley Capital, Inc. | | | | |
| | 2,386,356 | | | 5.406%, 3/15/2044 | | | 2,400,805 | |
| | | | SCG Trust | | | | |
| | 3,575,000 | | | 1.935%, 11/15/2026d,e | | | 3,548,021 | |
| | | | WFRBS Commercial Mortgage Trust | | | | |
| | 1,409,426 | | | 1.406%, 9/15/2046 | | | 1,410,005 | |
| | | | | |
| | | | Total | | | 16,241,536 | |
| | | | | |
| |
| Communications Services (2.6%) | | | | |
| | | | American Tower Corporation | | | | |
| | 1,800,000 | | | 3.450%, 9/15/2021 | | | 1,879,841 | |
| | | | American Tower Trust I | | | | |
| | 1,000,000 | | | 1.551%, 3/15/2018* | | | 999,723 | |
| | | | AT&T, Inc. | | | | |
| | 1,500,000 | | | 1.750%, 1/15/2018 | | | 1,502,958 | |
| | 1,400,000 | | | 1.768%, 6/30/2020e | | | 1,406,174 | |
| | 1,600,000 | | | 2.800%, 2/17/2021 | | | 1,621,907 | |
| | | | Charter Communications Operating, LLC | | | | |
| | 1,142,000 | | | 3.579%, 7/23/2020d | | | 1,184,093 | |
| | 1,142,000 | | | 4.464%, 7/23/2022d | | | 1,216,433 | |
| | | | Crown Castle International Corporation | | | | |
| | 250,000 | | | 3.400%, 2/15/2021 | | | 259,783 | |
| | 1,000,000 | | | 2.250%, 9/1/2021 | | | 991,640 | |
| | | | Moody’s Corporation | | | | |
| | 1,250,000 | | | 2.750%, 7/15/2019 | | | 1,280,474 | |
| | | | NBC Universal Enterprise, Inc. | | | | |
| | 1,750,000 | | | 1.662%, 4/15/2018d | | | 1,758,146 | |
| | | | SES Global Americas Holdings GP | | | | |
| | 1,125,000 | | | 2.500%, 3/25/2019d | | | 1,125,022 | |
| | | | Verizon Communications, Inc. | | | | |
| | 1,000,000 | | | 1.234%, 6/9/2017e | | | 1,001,722 | |
| | 2,080,000 | | | 1.627%, 6/17/2019e | | | 2,098,088 | |
| | 1,425,000 | | | 3.000%, 11/1/2021 | | | 1,467,610 | |
The accompanying Notes to Financial Statements are an integral part of this schedule.
151
LIMITED MATURITY BOND FUND
Schedule of Investments as of October 31, 2016
| | | | | | | | |
Principal
Amount | | | Long-Term Fixed Income (94.5%) | | Value | |
| Communications Services (2.6%) - continued | | | | |
| | | | Viacom, Inc. | | | | |
| $ | 1,275,000 | | | 2.250%, 2/4/2022 | | | $1,254,867 | |
| | | | | |
| | | | Total | | | 21,048,481 | |
| | | | | |
| |
| Consumer Cyclical (1.5%) | | | | |
| | | | BMW US Capital, LLC | | | | |
| | 1,450,000 | | | 1.500%, 4/11/2019d | | | 1,450,710 | |
| | | | CVS Health Corporation | | | | |
| | 870,000 | | | 2.250%, 8/12/2019 | | | 884,862 | |
| | | | Daimler Finance North America, LLC | | | | |
| | 2,250,000 | | | 1.469%, 8/3/2017d,e | | | 2,257,591 | |
| | | | eBay, Inc. | | | | |
| | 725,000 | | | 2.500%, 3/9/2018 | | | 733,985 | |
| | | | Home Depot, Inc. | | | | |
| | 675,000 | | | 1.220%, 9/15/2017e | | | 676,976 | |
| | 1,600,000 | | | 4.400%, 4/1/2021 | | | 1,775,576 | |
| | | | Newell Rubbermaid, Inc. | | | | |
| | 1,150,000 | | | 3.150%, 4/1/2021 | | | 1,197,471 | |
| | | | Ralph Lauren Corporation | | | | |
| | 225,000 | | | 2.625%, 8/18/2020 | | | 231,170 | |
| | | | Walgreens Boots Alliance, Inc. | | | | |
| | 870,000 | | | 1.750%, 5/30/2018 | | | 874,169 | |
| | 870,000 | | | 2.600%, 6/1/2021 | | | 880,675 | |
| | | | Yale University | | | | |
| | 1,250,000 | | | 2.086%, 4/15/2019 | | | 1,275,989 | |
| | | | | |
| | | | Total | | | 12,239,174 | |
| | | | | |
| |
| Consumer Non-Cyclical (5.6%) | | | | |
| | | | Actavis Funding SCS | | | | |
| | 1,995,000 | | | 2.100%, 3/12/2020e | | | 2,027,646 | |
| | | | Altria Group, Inc. | | | | |
| | 500,000 | | | 2.850%, 8/9/2022 | | | 514,361 | |
| | | | Anheuser-Busch InBev Finance, Inc. | | | | |
| | 2,000,000 | | | 2.017%, 2/1/2021e | | | 2,050,750 | |
| | | | BAT International Finance plc | | | | |
| | 1,905,000 | | | 1.360%, 6/15/2018d,e | | | 1,907,458 | |
| | | | Bayer U.S. Finance, LLC | | | | |
| | 1,000,000 | | | 2.375%, 10/8/2019d | | | 1,014,023 | |
| | | | Boston Scientific Corporation | | | | |
| | 1,665,000 | | | 6.000%, 1/15/2020 | | | 1,863,476 | |
| | | | Bunge Limited Finance Corporation | | | | |
| | 1,100,000 | | | 3.500%, 11/24/2020 | | | 1,147,914 | |
| | | | Cardinal Health, Inc. | | | | |
| | 1,035,000 | | | 1.950%, 6/15/2018 | | | 1,043,169 | |
| | | | Celgene Corporation | | | | |
| | 1,050,000 | | | 3.550%, 8/15/2022 | | | 1,105,387 | |
| | | | Church & Dwight Company, Inc. | | | | |
| | 1,155,000 | | | 2.450%, 12/15/2019 | | | 1,172,162 | |
| | | | EMD Finance, LLC | | | | |
| | 1,980,000 | | | 1.207%, 3/17/2017d,e | | | 1,980,695 | |
| | | | Express Scripts Holding Company | | | | |
| | 1,100,000 | | | 3.900%, 2/15/2022 | | | 1,176,157 | |
| | | | Forest Laboratories, Inc. | | | | |
| | 2,250,000 | | | 4.375%, 2/1/2019d | | | 2,363,411 | |
| | | | Gilead Sciences, Inc. | | | | |
| | 1,000,000 | | | 2.550%, 9/1/2020 | | | 1,024,872 | |
| | | | Howard Hughes Medical Institute | | | | |
| | 1,500,000 | | | 3.500%, 9/1/2023 | | | 1,615,662 | |
| | | | Imperial Tobacco Finance plc | | | | |
| | 1,500,000 | | | 3.750%, 7/21/2022d | | | 1,582,452 | |
| | | | Japan Tobacco, Inc. | | | | |
| | 2,500,000 | | | 2.100%, 7/23/2018d | | | 2,522,940 | |
| | | | Laboratory Corporation of America Holdings | | | | |
| | 1,390,000 | | | 2.625%, 2/1/2020 | | | 1,413,032 | |
| | | | Mead Johnson Nutrition Company | | | | |
| | 1,150,000 | | | 3.000%, 11/15/2020 | | | 1,188,816 | |
| | | | Merck & Company, Inc. | | | | |
| | 1,490,000 | | | 1.182%, 2/10/2020e | | | 1,497,621 | |
| | | | Mondelez International, Inc. | | | | |
| | 1,484,000 | | | 1.277%, 2/1/2019e | | | 1,483,913 | |
| | | | PepsiCo, Inc. | | | | |
| | 1,065,000 | | | 1.394%, 10/6/2021e | | | 1,069,520 | |
| | | | Reynolds American, Inc. | | | | |
| | 447,000 | | | 3.250%, 6/12/2020 | | | 466,763 | |
| | | | SABMiller Holdings, Inc. | | | | |
| | 2,000,000 | | | 2.450%, 1/15/2017d | | | 2,005,832 | |
| | | | Shire Acquisitions Investments Ireland Designated Activity Company | | | | |
| | 1,850,000 | | | 1.900%, 9/23/2019 | | | 1,846,531 | |
| | | | Teva Pharmaceutical Finance Netherlands III BV | | | | |
| | 1,875,000 | | | 1.700%, 7/19/2019 | | | 1,860,454 | |
| | | | Unilever Capital Corporation | | | | |
| | 2,000,000 | | | 2.200%, 3/6/2019 | | | 2,037,948 | |
| | 3,000,000 | | | 2.100%, 7/30/2020 | | | 3,053,538 | |
| | | | | |
| | | | Total | | | 44,036,503 | |
| | | | | |
| |
| Energy (3.4%) | | | | |
| | | | Anadarko Petroleum Corporation | | | | |
| | 860,000 | | | 4.850%, 3/15/2021 | | | 933,637 | |
| | | | BP Capital Markets plc | | | | |
| | 1,400,000 | | | 1.676%, 5/3/2019 | | | 1,402,213 | |
| | | | Cameron International Corporation | | | | |
| | 1,275,000 | | | 1.400%, 6/15/2017 | | | 1,276,446 | |
| | | | Chevron Corporation | | | | |
| | 3,000,000 | | | 1.718%, 6/24/2018 | | | 3,020,511 | |
| | | | DCP Midstream Operating, LP | | | | |
| | 1,350,000 | | | 2.700%, 4/1/2019 | | | 1,319,625 | |
| | | | Ecopetrol SA | | | | |
| | 350,000 | | | 5.875%, 9/18/2023 | | | 375,375 | |
| | | | Enable Midstream Partners, LP | | | | |
| | 1,250,000 | | | 2.400%, 5/15/2019 | | | 1,233,116 | |
| | | | Enbridge, Inc. | | | | |
| | 1,375,000 | | | 1.289%, 6/2/2017e,h | | | 1,373,372 | |
| | | | Exxon Mobil Corporation | | | | |
| | 1,900,000 | | | 1.708%, 3/1/2019 | | | 1,914,385 | |
| | 1,465,000 | | | 1.205%, 3/6/2022e | | | 1,452,232 | |
| | | | Marathon Petroleum Corporation | | | | |
| | 1,400,000 | | | 3.400%, 12/15/2020 | | | 1,454,758 | |
| | | | Occidental Petroleum Corporation | | | | |
| | 975,000 | | | 2.600%, 4/15/2022 | | | 994,937 | |
| | | | Petroleos Mexicanos | | | | |
| | 850,000 | | | 5.500%, 2/4/2019d | | | 899,725 | |
| | 1,445,000 | | | 2.378%, 4/15/2025 | | | 1,484,722 | |
| | | | Pioneer Natural Resources Company | | | | |
| | 1,005,000 | | | 3.450%, 1/15/2021 | | | 1,047,009 | |
| | | | Schlumberger Holdings Corporation | | | | |
| | 1,400,000 | | | 3.000%, 12/21/2020d | | | 1,452,667 | |
| | | | Shell International Finance BV | | | | |
| | 1,400,000 | | | 1.266%, 5/11/2020e | | | 1,401,545 | |
| | | | Sinopec Group Overseas Development, Ltd. | | | | |
| | 1,175,000 | | | 1.750%, 9/29/2019d | | | 1,167,991 | |
| | | | Sunoco Logistics Partners Operations, LP | | | | |
| | 1,675,000 | | | 4.400%, 4/1/2021 | | | 1,806,915 | |
The accompanying Notes to Financial Statements are an integral part of this schedule.
152
LIMITED MATURITY BOND FUND
Schedule of Investments as of October 31, 2016
| | | | | | | | |
Principal
Amount | | | Long-Term Fixed Income (94.5%) | | Value | |
| Energy (3.4%) - continued | | | | |
| | | | Transcontinental Gas Pipe Line Company, LLC | | | | |
| $ | 650,000 | | | 7.850%, 2/1/2026d | | $ | 824,334 | |
| | | | | |
| | | | Total | | | 26,835,515 | |
| | | | | |
| |
| Financials (18.9%) | | | | |
| | | | ABN AMRO Bank NV | | | | |
| | 1,660,000 | | | 2.450%, 6/4/2020d | | | 1,683,642 | |
| | | | ACE INA Holdings, Inc. | | | | |
| | 150,000 | | | 2.875%, 11/3/2022 | | | 156,279 | |
| | | | Aetna, Inc. | | | | |
| | 1,800,000 | | | 1.900%, 6/7/2019 | | | 1,814,427 | |
| | | | Aflac, Inc. | | | | |
| | 1,650,000 | | | 2.400%, 3/16/2020 | | | 1,687,990 | |
| | | | American Express Credit Corporation | | | | |
| | 2,080,000 | | | 1.407%, 3/18/2019e | | | 2,084,859 | |
| | 650,000 | | | 1.906%, 9/14/2020e | | | 659,730 | |
| | | | American International Group, Inc. | | | | |
| | 1,170,000 | | | 3.300%, 3/1/2021 | | | 1,223,127 | |
| | | | Ares Capital Corporation | | | | |
| | 1,100,000 | | | 4.875%, 11/30/2018 | | | 1,145,651 | |
| | | | Bank of America Corporation | | | | |
| | 1,450,000 | | | 1.700%, 8/25/2017 | | | 1,453,326 | |
| | 1,000,000 | | | 1.936%, 3/22/2018e | | | 1,008,462 | |
| | 1,775,000 | | | 1.716%, 4/1/2019e | | | 1,780,527 | |
| | 1,065,000 | | | 2.061%, 10/21/2022e | | | 1,065,874 | |
| | 900,000 | | | 4.000%, 1/22/2025 | | | 925,374 | |
| | 900,000 | | | 6.100%, 12/29/2049i | | | 940,284 | |
| | | | Bank of America NA | | | | |
| | 1,000,000 | | | 5.300%, 3/15/2017 | | | 1,014,490 | |
| | | | Bank of New York Mellon Corporation | | | | |
| | 500,000 | | | 4.500%, 12/31/2049i | | | 486,875 | |
| | | | Bank of Tokyo-Mitsubishi UFJ, Ltd. | | | | |
| | 1,135,000 | | | 2.850%, 9/8/2021d | | | 1,162,323 | |
| | | | BB&T Corporation | | | | |
| | 1,220,000 | | | 1.595%, 1/15/2020e | | | 1,221,063 | |
| | | | Bear Stearns Companies, LLC | | | | |
| | 1,500,000 | | | 6.400%, 10/2/2017 | | | 1,567,813 | |
| | | | BNZ International Funding, Ltd. | | | | |
| | 1,175,000 | | | 1.836%, 9/14/2021d,e | | | 1,178,142 | |
| | | | Caisse Centrale Desjardins du Quebec | | | | |
| | 1,760,000 | | | 1.552%, 1/29/2018d,e | | | 1,758,089 | |
| | | | Citigroup, Inc. | | | | |
| | 1,475,000 | | | 1.642%, 4/8/2019e | | | 1,476,931 | |
| | 1,525,000 | | | 2.255%, 9/1/2023e | | | 1,530,414 | |
| | | | CNA Financial Corporation | | | | |
| | 2,000,000 | | | 5.875%, 8/15/2020 | | | 2,252,822 | |
| | 1,250,000 | | | 5.750%, 8/15/2021 | | | 1,430,645 | |
| | | | CoBank ACB | | | | |
| | 1,560,000 | | | 1.450%, 6/15/2022e | | | 1,480,967 | |
| | | | Cooperatieve Centrale Raiffeisen- Boerenleenbank BA | | | | |
| | 1,400,000 | | | 2.500%, 1/19/2021 | | | 1,430,859 | |
| | | | Credit Agricole SA | | | | |
| | 1,350,000 | | | 1.680%, 4/15/2019d,e | | | 1,354,343 | |
| | 1,450,000 | | | 1.815%, 6/10/2020d,e | | | 1,455,330 | |
| | 950,000 | | | 8.125%, 12/29/2049d,h,i | | | 1,020,148 | |
| | | | Credit Suisse Group AG | | | | |
| | 1,500,000 | | | 6.500%, 8/8/2023d | | | 1,633,125 | |
| | 810,000 | | | 7.500%, 12/29/2049d,i | | | 838,350 | |
| | | | Discover Bank | | | | |
| | 1,650,000 | | | 8.700%, 11/18/2019 | | | 1,913,668 | |
| | | | Discover Financial Services | | | | |
| | 2,250,000 | | | 2.600%, 11/13/2018 | | | 2,285,152 | |
| | | | DRB Prime Student Loan Trust | | | | |
| | 3,146,188 | | | 2.434%, 10/27/2031*,e | | | 3,207,099 | |
| | | | European Investment Bank | | | | |
| | 1,500,000 | | | 1.250%, 5/15/2018 | | | 1,504,350 | |
| | | | Fifth Third Bancorp | | | | |
| | 1,145,000 | | | 2.875%, 10/1/2021 | | | 1,187,634 | |
| | | | Goldman Sachs Capital II | | | | |
| | 70,000 | | | 4.000%, 12/29/2049e,i | | | 57,575 | |
| | | | Goldman Sachs Group, Inc. | | | | |
| | 1,525,000 | | | 1.917%, 11/15/2018e | | | 1,537,661 | |
| | 1,755,000 | | | 2.042%, 4/23/2020e | | | 1,765,304 | |
| | 1,530,000 | | | 2.241%, 11/15/2021e | | | 1,528,331 | |
| | 1,125,000 | | | 2.429%, 11/29/2023e | | | 1,141,704 | |
| | | | HCP, Inc. | | | | |
| | 1,210,000 | | | 4.000%, 12/1/2022 | | | 1,275,044 | |
| | | | Hospitality Properties Trust | | | | |
| | 1,600,000 | | | 4.250%, 2/15/2021 | | | 1,692,722 | |
| | | | HSBC Holdings plc | | | | |
| | 1,175,000 | | | 2.358%, 1/5/2022c,e | | | 1,180,329 | |
| | | | HSBC USA, Inc. | | | | |
| | 1,530,000 | | | 1.163%, 6/23/2017e | | | 1,526,764 | |
| | | | Huntington Bancshares, Inc. | | | | |
| | 1,450,000 | | | 3.150%, 3/14/2021 | | | 1,496,172 | |
| | | | ING Bank NV | | | | |
| | 2,250,000 | | | 1.774%, 8/17/2020d,e | | | 2,252,264 | |
| | 500,000 | | | 2.625%, 12/5/2022d | | | 512,096 | |
| | | | ING Capital Funding Trust III | | | | |
| | 715,000 | | | 4.438%, 12/29/2049e,i | | | 710,531 | |
| | | | ING Groep NV | | | | |
| | 1,350,000 | | | 6.000%, 12/31/2045i | | | 1,336,500 | |
| | | | Intesa Sanpaolo SPA | | | | |
| | 1,500,000 | | | 5.017%, 6/26/2024d | | | 1,391,971 | |
| | | | J.P. Morgan Chase & Company | | | | |
| | 3,100,000 | | | 1.782%, 1/25/2018e | | | 3,117,112 | |
| | 1,400,000 | | | 2.250%, 1/23/2020 | | | 1,409,731 | |
| | 1,250,000 | | | 3.875%, 9/10/2024 | | | 1,305,464 | |
| | 1,075,000 | | | 7.900%, 4/29/2049i | | | 1,108,056 | |
| | | | J.P. Morgan Chase Bank NA | | | | |
| | 1,150,000 | | | 1.453%, 9/23/2019e | | | 1,151,597 | |
| | | | Japan Bank for International Cooperation | | | | |
| | 3,000,000 | | | 1.750%, 7/31/2018 | | | 3,017,064 | |
| | | | KeyBank NA | | | | |
| | 2,250,000 | | | 1.362%, 6/1/2018e | | | 2,250,428 | |
| | | | Kilroy Realty, LP | | | | |
| | 700,000 | | | 3.800%, 1/15/2023 | | | 723,187 | |
| | | | Lloyds Bank plc | | | | |
| | 1,985,000 | | | 1.374%, 3/16/2018e | | | 1,981,181 | |
| | | | Lloyds Banking Group plc | | | | |
| | 350,000 | | | 4.582%, 12/10/2025d | | | 355,657 | |
| | | | Metropolitan Life Global Funding I | | | | |
| | 2,250,000 | | | 3.650%, 6/14/2018d | | | 2,325,096 | |
| | | | Mitsubishi UFJ Financial Group, Inc. | | | | |
| | 1,175,000 | | | 1.912%, 9/13/2021e | | | 1,177,014 | |
| | | | Mizuho Financial Group Cayman 3, Ltd. | | | | |
| | 675,000 | | | 4.600%, 3/27/2024d | | | 732,947 | |
| | | | Mizuho Financial Group, Inc. | | | | |
| | 1,175,000 | | | 1.992%, 9/13/2021e | | | 1,178,115 | |
| | | | Morgan Stanley | | | | |
| | 1,755,000 | | | 2.026%, 1/27/2020e | | | 1,772,480 | |
| | 1,400,000 | | | 2.282%, 10/24/2023e | | | 1,398,320 | |
| | 1,425,000 | | | 5.000%, 11/24/2025 | | | 1,576,202 | |
| | 1,000,000 | | | 5.450%, 12/29/2049i | | | 1,002,600 | |
| | 900,000 | | | 5.550%, 12/29/2049i | | | 921,375 | |
The accompanying Notes to Financial Statements are an integral part of this schedule.
153
LIMITED MATURITY BOND FUND
Schedule of Investments as of October 31, 2016
| | | | | | | | |
Principal
Amount | | | Long-Term Fixed Income (94.5%) | | Value | |
| Financials (18.9%) - continued | | | | |
| | | | NCUA Guaranteed Notes | | | | |
| $ | 1,222,305 | | | 0.879%, 12/7/2020e | | $ | 1,219,225 | |
| | | | New York Life Global Funding | | | | |
| | 550,000 | | | 1.550%, 11/2/2018d | | | 551,257 | |
| | | | Peachtree Corners Funding Trust | | | | |
| | 1,125,000 | | | 3.976%, 2/15/2025d | | | 1,129,073 | |
| | | | Prudential Financial, Inc. | | | | |
| | 1,150,000 | | | 2.350%, 8/15/2019 | | | 1,170,941 | |
| | | | Realty Income Corporation | | | | |
| | 1,000,000 | | | 2.000%, 1/31/2018 | | | 1,005,684 | |
| | | | Regions Financial Corporation | | | | |
| | 1,100,000 | | | 3.200%, 2/8/2021 | | | 1,140,434 | |
| | | | Reliance Standard Life Global Funding II | | | | |
| | 1,400,000 | | | 2.500%, 4/24/2019d | | | 1,418,332 | |
| | | | Santander UK plc | | | | |
| | 500,000 | | | 5.000%, 11/7/2023d | | | 517,961 | |
| | | | Santander UK plc | | | | |
| | 850,000 | | | 3.125%, 1/8/2021 | | | 860,956 | |
| | | | Simon Property Group, LP | | | | |
| | 1,350,000 | | | 2.500%, 9/1/2020 | | | 1,383,782 | |
| | 1,400,000 | | | 2.500%, 7/15/2021 | | | 1,430,724 | |
| | | | Skandinaviska Enskilda Banken AB | | | | |
| | 2,500,000 | | | 1.375%, 5/29/2018d | | | 2,503,802 | |
| | | | SLM Corporation | | | | |
| | 500,000 | | | 4.625%, 9/25/2017 | | | 507,190 | |
| | | | Stadshypotek AB | | | | |
| | 2,000,000 | | | 1.875%, 10/2/2019d | | | 2,014,238 | |
| | | | Standard Chartered plc | | | | |
| | 1,000,000 | | | 3.950%, 1/11/2023d,h | | | 995,371 | |
| | | | State Street Corporation | | | | |
| | 2,062,000 | | | 1.701%, 8/18/2020e | | | 2,081,016 | |
| | | | Sumitomo Mitsui Banking Corporation | | | | |
| | 2,075,000 | | | 1.460%, 1/16/2018e | | | 2,076,838 | |
| | | | Sumitomo Mitsui Financial Group, Inc. | | | | |
| | 1,450,000 | | | 4.436%, 4/2/2024d | | | 1,570,939 | |
| | | | SunTrust Banks, Inc. | | | | |
| | 725,000 | | | 2.900%, 3/3/2021 | | | 748,392 | |
| | | | Svensk Exportkredit AB | | | | |
| | 2,500,000 | | | 1.182%, 1/23/2017e | | | 2,501,655 | |
| | | | Svenska Handelsbanken AB | | | | |
| | 500,000 | | | 1.347%, 6/17/2019e | | | 500,683 | |
| | | | Swedbank AB | | | | |
| | 1,750,000 | | | 1.750%, 3/12/2018d | | | 1,755,003 | |
| | | | Synchrony Financial | | | | |
| | 1,175,000 | | | 1.989%, 2/3/2020e | | | 1,150,153 | |
| | 1,230,000 | | | 3.750%, 8/15/2021 | | | 1,290,528 | |
| | | | Toronto-Dominion Bank | | | | |
| | 1,400,000 | | | 1.786%, 12/14/2020e | | | 1,414,589 | |
| | | | UBS AG | | | | |
| | 2,000,000 | | | 1.557%, 3/26/2018e | | | 2,007,868 | |
| | | | USB Group Funding Jersey, Ltd. | | | | |
| | 1,750,000 | | | 2.297%, 9/24/2020d,e | | | 1,769,506 | |
| | | | USB Realty Corporation | | | | |
| | 1,200,000 | | | 2.027%, 12/29/2049d,e,i | | | 1,077,000 | |
| | | | Voya Financial, Inc. | | | | |
| | 1,500,000 | | | 2.900%, 2/15/2018 | | | 1,524,712 | |
| | 500,000 | | | 5.650%, 5/15/2053 | | | 497,500 | |
| | | | Wells Fargo & Company | | | | |
| | 1,760,000 | | | 1.567%, 1/30/2020e | | | 1,756,714 | |
| | 925,000 | | | 3.450%, 2/13/2023 | | | 949,461 | |
| | 1,400,000 | | | 2.117%, 10/31/2023e | | | 1,396,360 | |
| | 900,000 | | | 4.100%, 6/3/2026 | | | 945,566 | |
| | 900,000 | | | 5.875%, 12/31/2049i | | | 966,937 | |
| | | | Westpac Banking Corporation | | | | |
| | 2,500,000 | | | 1.250%, 12/15/2017d | | | 2,498,975 | |
| | | | XLIT, Ltd. | | | | |
| | 900,000 | | | 4.450%, 3/31/2025 | | | 914,630 | |
| | | | | |
| | | | Total | | | 149,172,773 | |
| | | | | |
| |
| Foreign Government (0.9%) | | | | |
| | | | Bank of England Euro Note | | | | |
| | 1,000,000 | | | 1.250%, 3/16/2018d | | | 1,002,823 | |
| | | | Costa Rica Government International Bond | | | | |
| | 1,350,000 | | | 4.250%, 1/26/2023d | | | 1,306,125 | |
| | | | Export-Import Bank of Korea | | | | |
| | 1,720,000 | | | 2.250%, 1/21/2020 | | | 1,734,329 | |
| | | | Kommunalbanken AS | | | | |
| | 2,760,000 | | | 1.500%, 10/22/2019d | | | 2,768,493 | |
| | | | Poland Government International Bond | | | | |
| | 125,000 | | | 4.000%, 1/22/2024 | | | 136,400 | |
| | | | | |
| | | | Total | | | 6,948,170 | |
| | | | | |
| |
| Mortgage-Backed Securities (4.4%) | | | | |
| | | | Federal Home Loan Mortgage Corporation Gold 15-Yr. Pass Through | | | | |
| | 11,570,000 | | | 3.000%, 11/1/2031c | | | 12,107,825 | |
| | | | Federal Home Loan Mortgage Corporation Gold 30-Yr. Pass Through | | | | |
| | 236,696 | | | 6.500%, 9/1/2037 | | | 282,459 | |
| | 12,670,000 | | | 4.000%, 11/1/2046c | | | 13,552,445 | |
| | | | Federal National Mortgage Association Conventional 15-Yr. Pass Through | | | | |
| | 1,483,612 | | | 2.250%, 6/25/2025 | | | 1,508,212 | |
| | | | Federal National Mortgage Association Conventional 20-Yr. Pass Through | | | | |
| | 456,637 | | | 6.000%, 8/1/2024 | | | 522,698 | |
| | | | Federal National Mortgage Association Conventional 30-Yr. Pass Through | | | | |
| | 300,909 | | | 5.464%, 9/1/2037e | | | 319,031 | |
| | 162,143 | | | 5.210%, 10/1/2037e | | | 162,625 | |
| | 2,062,670 | | | 2.056%, 1/1/2043e | | | 2,134,506 | |
| | 4,135,650 | | | 1.735%, 7/1/2043e | | | 4,249,624 | |
| | | | | |
| | | | Total | | | 34,839,425 | |
| | | | | |
| |
| Technology (1.9%) | | | | |
| | | | Amphenol Corporation | | | | |
| | 1,122,000 | | | 2.550%, 1/30/2019 | | | 1,144,279 | |
| | | | Apple, Inc. | | | | |
| | 2,450,000 | | | 1.088%, 5/6/2019e | | | 2,456,564 | |
| | 1,400,000 | | | 1.117%, 5/6/2020e | | | 1,397,570 | |
| | | | Automatic Data Processing, Inc. | | | | |
| | 850,000 | | | 2.250%, 9/15/2020 | | | 871,637 | |
| | | | Cisco Systems, Inc. | | | | |
| | 1,200,000 | | | 1.411%, 2/21/2018e | | | 1,207,182 | |
| | 1,905,000 | | | 1.342%, 3/1/2019e | | | 1,915,649 | |
| | | | Diamond 1 Finance Corporation | | | | |
| | 865,000 | | | 3.480%, 6/1/2019d | | | 887,489 | |
| | | | Hewlett Packard Enterprise Company | | | | |
| | 2,200,000 | | | 3.038%, 10/5/2018d,e | | | 2,251,920 | |
| | | | Intel Corporation | | | | |
| | 745,000 | | | 3.100%, 7/29/2022 | | | 786,538 | |
The accompanying Notes to Financial Statements are an integral part of this schedule.
154
LIMITED MATURITY BOND FUND
Schedule of Investments as of October 31, 2016
| | | | | | | | |
Principal
Amount | | | Long-Term Fixed Income (94.5%) | | Value | |
| Technology (1.9%) - continued | | | | |
| | | | Oracle Corporation | | | | |
| $ | 1,325,000 | | | 2.500%, 5/15/2022 | | | $1,339,857 | |
| | | | Texas Instruments, Inc. | | | | |
| | 1,000,000 | | | 1.750%, 5/1/2020 | | | 1,007,176 | |
| | | | | |
| | | | Total | | | 15,265,861 | |
| | | | | |
| |
| Transportation (1.9%) | | | | |
| | | | Air Canada Pass Through Trust | | | | |
| | 1,117,950 | | | 3.875%, 3/15/2023d | | | 1,090,001 | |
| | | | American Airlines Pass Through Trust | | | | |
| | 985,734 | | | 5.600%, 7/15/2020d | | | 1,031,325 | |
| | 1,198,671 | | | 4.950%, 1/15/2023 | | | 1,308,050 | |
| | 817,435 | | | 3.700%, 5/1/2023 | | | 805,174 | |
| | | | British Airways plc | | | | |
| | 1,352,017 | | | 4.625%, 6/20/2024d | | | 1,446,658 | |
| | | | Continental Airlines, Inc. | | | | |
| | 1,655,469 | | | 4.150%, 4/11/2024 | | | 1,781,450 | |
| | | | Delta Air Lines, Inc. | | | | |
| | 549,161 | | | 4.750%, 5/7/2020 | | | 590,348 | |
| | | | ERAC USA Finance, LLC | | | | |
| | 1,400,000 | | | 2.600%, 12/1/2021d | | | 1,415,946 | |
| | | | J.B. Hunt Transport Services, Inc. | | | | |
| | 1,200,000 | | | 3.300%, 8/15/2022 | | | 1,243,106 | |
| | | | TTX Company | | | | |
| | 1,750,000 | | | 2.250%, 2/1/2019d | | | 1,768,295 | |
| | 650,000 | | | 4.125%, 10/1/2023* | | | 685,253 | |
| | | | US Airways Pass Through Trust | | | | |
| | 871,543 | | | 3.950%, 11/15/2025 | | | 919,469 | |
| | | | Virgin Australia Holdings, Ltd. | | | | |
| | 891,311 | | | 5.000%, 10/23/2023d | | | 924,735 | |
| | | | | |
| | | | Total | | | 15,009,810 | |
| | | | | |
| |
| U.S. Government and Agencies (21.4%) | | | | |
| | | | Federal Home Loan Mortgage Corporation | | | | |
| | 750,000 | | | 1.250%, 8/1/2019 | | | 754,103 | |
| | 3,050,000 | | | 1.250%, 10/2/2019 | | | 3,065,619 | |
| | | | Federal National Mortgage Association | | | | |
| | 14,500,000 | | | 1.250%, 8/17/2021 | | | 14,369,819 | |
| | | | U.S. Treasury Bonds | | | | |
| | 12,000,000 | | | 5.375%, 2/15/2031 | | | 17,044,692 | |
| | 690,000 | | | 3.000%, 5/15/2042 | | | 751,130 | |
| | 1,500,000 | | | 3.625%, 2/15/2044 | | | 1,823,028 | |
| | | | U.S. Treasury Bonds, TIPS | | | | |
| | 17,473,450 | | | 0.125%, 4/15/2019 | | | 17,752,239 | |
| | 5,217,150 | | | 0.125%, 1/15/2023 | | | 5,291,896 | |
| | 6,588,465 | | | 0.625%, 1/15/2026 | | | 6,877,224 | |
| | 8,131,760 | | | 1.000%, 2/15/2046 | | | 8,760,296 | |
| | | | U.S. Treasury Notes | | | | |
| | 34,000,000 | | | 0.875%, 11/15/2017 | | | 34,046,478 | |
| | 23,500,000 | | | 0.875%, 3/31/2018 | | | 23,528,459 | |
| | 3,350,000 | | | 1.500%, 10/31/2019 | | | 3,397,764 | |
| | 18,225,000 | | | 1.125%, 8/31/2021 | | | 18,064,110 | |
| | 11,050,000 | | | 2.125%, 6/30/2022 | | | 11,442,794 | |
| | 2,570,000 | | | 1.625%, 8/15/2022 | | | 2,591,382 | |
| | | | | |
| | | | Total | | | 169,561,033 | |
| | | | | |
| |
| Utilities (2.4%) | | | | |
| | | | Ameren Corporation | | | | |
| | 1,100,000 | | | 2.700%, 11/15/2020 | | | 1,132,162 | |
| | | | American Electric Power Company, Inc. | | | | |
| | 500,000 | | | 1.650%, 12/15/2017 | | | 501,302 | |
| | | | Berkshire Hathaway Energy Company | | | | |
| | 1,250,000 | | | 2.400%, 2/1/2020 | | | 1,272,854 | |
| | | | DTE Energy Company | | | | |
| | 570,000 | | | 2.400%, 12/1/2019 | | | 579,878 | |
| | | | Electricite de France SA | | | | |
| | 1,000,000 | | | 5.250%, 12/29/2049d,i | | | 990,000 | |
| | | | Eversource Energy | | | | |
| | 1,265,000 | | | 1.600%, 1/15/2018 | | | 1,267,124 | |
| | 1,250,000 | | | 1.450%, 5/1/2018 | | | 1,250,795 | |
| | | | Exelon Corporation | | | | |
| | 1,350,000 | | | 2.850%, 6/15/2020 | | | 1,389,398 | |
| | | | Exelon Generation Company, LLC | | | | |
| | 1,125,000 | | | 2.950%, 1/15/2020 | | | 1,154,350 | |
| | | | Kansas City Power & Light Company | | | | |
| | 175,000 | | | 3.150%, 3/15/2023 | | | 179,090 | |
| | | | National Rural Utilities Cooperative Finance Corporation | | | | |
| | 850,000 | | | 4.750%, 4/30/2043 | | | 867,991 | |
| | | | NextEra Energy Capital Holdings, Inc. | | | | |
| | 850,000 | | | 2.300%, 4/1/2019 | | | 861,844 | |
| | | | PG&E Corporation | | | | |
| | 1,500,000 | | | 2.400%, 3/1/2019 | | | 1,524,350 | |
| | | | Public Service Electric And Gas Company | | | | |
| | 2,070,000 | | | 1.800%, 6/1/2019 | | | 2,092,219 | |
| | | | Sempra Energy | | | | |
| | 1,750,000 | | | 2.300%, 4/1/2017 | | | 1,758,214 | |
| | 1,420,000 | | | 2.400%, 3/15/2020 | | | 1,442,122 | |
| | | | Southern California Edison Company | | | | |
| | 845,000 | | | 2.400%, 2/1/2022 | | | 858,690 | |
| | | | | |
| | | | Total | | | 19,122,383 | |
| | | | | |
| | | | Total Long-Term Fixed Income (cost $745,126,521) | | | 748,737,668 | |
| | | | | |
| | |
| Shares | | | Preferred Stock (0.4%) | | Value | |
| Financials (0.3%) | | | | |
| | 54,000 | | | Citigroup, Inc., 7.257%e | | | 1,404,540 | |
| | 7,350 | | | Farm Credit Bank of Texas, 6.750%i | | | 794,030 | |
| | | | | |
| | | | Total | | | 2,198,570 | |
| | | | | |
| |
| Utilities (0.1%) | | | | |
| | 44,000 | | | Southern California Edison Company Trust IV, 5.375%i | | | 1,225,840 | |
| | | | | |
| | | | Total | | | 1,225,840 | |
| | | | | |
| | | | Total Preferred Stock (cost $3,325,400) | | | 3,424,410 | |
| | | | | |
| | |
| Shares | | | Common Stock (0.1%) | | Value | |
| Energy (0.1%) | | | | |
| | 6,801 | | | Arch Coal, Inc.h,j | | | 499,057 | |
| | 597 | | | Vantage Drilling Internationalj | | | 50,148 | |
| | | | | |
| | | | Total | | | 549,205 | |
| | | | | |
| | | | Total Common Stock (cost $494,251) | | | 549,205 | |
| | | | | |
| | |
| Shares | | | Collateral Held for Securities Loaned (0.5%) | | Value | |
| | 3,895,550 | | | Thrivent Cash Management Trust | | | 3,895,550 | |
| | | | | |
| | | | Total Collateral Held for Securities Loaned (cost $3,895,550) | | | 3,895,550 | |
| | | | | |
The accompanying Notes to Financial Statements are an integral part of this schedule.
155
LIMITED MATURITY BOND FUND
Schedule of Investments as of October 31, 2016
| | | | | | | | |
Shares or
Principal
Amount | | | Short-Term Investments (6.5%)k | | Value | |
| | | | Federal Home Loan Bank Discount Notes | | | | |
| | 3,000,000 | | | 0.260%, 11/1/2016 | | $ | 3,000,000 | |
| | 11,800,000 | | | 0.307%, 11/2/2016 | | | 11,799,929 | |
| | 5,000,000 | | | 0.325%, 11/14/2016l | | | 4,999,640 | |
| | 800,000 | | | 0.300%, 11/21/2016 | | | 799,911 | |
| | 1,200,000 | | | 0.275%, 11/25/2016 | | | 1,199,840 | |
| | 1,400,000 | | | 0.250%, 11/30/2016 | | | 1,399,775 | |
| | 300,000 | | | 0.285%, 12/9/2016 | | | 299,934 | |
| | | | Thrivent Core Short-Term Reserve Fund | | | | |
| | 2,782,089 | | | 0.790% | | | 27,820,890 | |
| | | | | |
| | | | Total Short-Term Investments (cost $51,319,476) | | | 51,319,919 | |
| | | | | |
| | | | Total Investments (cost $816,641,329) 103.5% | | $ | 819,727,141 | |
| | | | | |
| | | | Other Assets and Liabilities, Net (3.5%) | | | (27,558,935 | ) |
| | | | | |
| | | | Total Net Assets 100.0% | | $ | 792,168,206 | |
| | | | | |
a | The stated interest rate represents the weighted average of all contracts within the bank loan facility. |
b | All or a portion of the loan is unfunded. |
c | Denotes investments purchased on a when-issued or delayed delivery basis. |
d | Denotes securities sold under Rule 144A of the Securities Act of 1933, which exempts them from registration. These securities may be resold to other dealers in the program or to other qualified institutional buyers. As of October 31, 2016, the value of these investments was $151,632,286 or 19.1% of total net assets. |
e | Denotes variable rate securities. Variable rate securities are securities whose yields vary with a designated market index or market rate. The rate shown is as of October 31, 2016. |
f | Denotes step coupon securities. Step coupon securities pay an initial coupon rate for the first period and then different coupon rates for following periods. The rate shown is as of October 31, 2016. |
g | All or a portion of the security is insured or guaranteed. |
h | All or a portion of the security is on loan. |
i | Denotes perpetual securities. Perpetual securities pay an indefinite stream of interest, but may be called by the issuer at an earlier date. |
j | Non-income producing security. |
k | The interest rate shown reflects the yield, coupon rate or the discount rate at the date of purchase. |
l | All or a portion of the security is held on deposit with the counterparty and pledged as the initial margin deposit for open futures contracts. |
* | Denotes restricted securities. Restricted securities are investment securities which cannot be offered for public sale without first being registered under the Securities Act of 1933. The value of all restricted securities held in Limited Maturity Bond Fund as of October 31, 2016 was $70,446,645 or 8.9% of total net assets. The following table indicates the acquisition date and cost of restricted securities shown in the schedule as of October 31, 2016. |
| | | | | | | | |
Security | | Acquisition
Date | | | Cost | |
Alm Loan Funding CLO, 10/17/2026 | | | 7/31/2014 | | | $ | 3,048,475 | |
American Tower Trust I, 3/15/2018 | | | 3/6/2013 | | | | 1,000,000 | |
Apidos CLO XVIII, 7/22/2026 | | | 6/25/2014 | | | | 2,992,500 | |
Babson CLO, Ltd., 10/17/2026 | | | 8/15/2014 | | | | 3,048,475 | |
Bayview Opportunity Master Fund Trust, 7/28/2034 | | | 6/27/2014 | | | | 1,422,815 | |
Betony CLO, Ltd., 4/15/2027 | | | 2/25/2015 | | | | 2,750,000 | |
Birchwood Park CLO, Ltd., 7/15/2026 | | | 7/31/2014 | | | | 3,050,000 | |
BlueMountain CLO, Ltd., 10/15/2026 | | | 8/27/2014 | | | | 3,046,920 | |
Carlyle Global Market Strategies CLO, Ltd., 7/20/2023 | | | 7/3/2014 | | | | 2,601,230 | |
Carlyle Global Market Strategies CLO, Ltd., 10/15/2026 | | | 9/19/2014 | | | | 3,000,000 | |
Cent CLO 16, LP, 8/1/2024 | | | 9/5/2014 | | | | 3,050,000 | |
Cent CLO 22, Ltd., 11/7/2026 | | | 9/19/2014 | | | | 3,000,000 | |
Commonbond Student Loan Trust, 6/25/2032 | | | 6/17/2015 | | | | 786,959 | |
DRB Prime Student Loan Trust, 10/27/2031 | | | 9/23/2015 | | | | 3,170,147 | |
Dryden 34 Senior Loan Fund CLO, 10/15/2026 | | | 7/21/2014 | | | | 3,050,000 | |
Edlinc Student Loan Funding Trust, 10/1/2025 | | | 11/29/2012 | | | | 1,251,603 | |
FRS, LLC, 4/15/2043 | | | 4/10/2013 | | | | 1,569,484 | |
GoldenTree Loan Opportunities IX, Ltd., 10/29/2026 | | | 10/7/2016 | | | | 3,200,000 | |
Madison Park Funding XIV CLO, Ltd., 7/20/2026 | | | 7/3/2014 | | | | 3,345,980 | |
Mortgage Equity Conversion Asset Trust, 1/25/2042 | | | 1/18/2007 | | | | 1,802,618 | |
Mortgage Equity Conversion Asset Trust, 2/25/2042 | | | 2/14/2007 | | | | 1,796,078 | |
Neuberger Berman CLO, Ltd., 8/4/2025 | | | 6/19/2014 | | | | 2,400,000 | |
NextGear Floorplan Master Owner Trust, 10/15/2019 | | | 11/3/2014 | | | | 1,999,644 | |
Octagon Investment Partners XX CLO, Ltd., 8/12/2026 | | | 7/10/2014 | | | | 3,050,000 | |
OZLM VIII, Ltd., 10/17/2026 | | | 8/7/2014 | | | | 3,032,615 | |
Race Point IX CLO, Ltd., 4/15/2027 | | | 2/13/2015 | | | | 1,200,000 | |
Selene Non-Performing Loans, LLC, 5/25/2054 | | | 5/23/2014 | | | | 309,056 | |
Symphony CLO VIII, Ltd., 1/9/2023 | | | 9/15/2014 | | | | 2,791,940 | |
TTX Company, 10/1/2023 | | | 9/19/2013 | | | | 649,993 | |
Voya CLO 3, Ltd., 7/25/2026 | | | 7/10/2014 | | | | 3,045,425 | |
Wachovia Asset Securitization, Inc., 7/25/2037 | | | 3/16/2007 | | | | 457,715 | |
The following table presents the total amount of securities loaned with continuous maturity, by type, offset by the gross payable upon return of collateral for securities loaned by Thrivent Limited Maturity Bond Fund as of October 31, 2016:
| | | | |
Securities Lending Transactions | | | |
Taxable Debt Security | | $ | 3,281,507 | |
Common Stock | | | 498,984 | |
| | | | |
Total lending | | $ | 3,780,491 | |
Gross amount payable upon return of collateral for securities loaned | | $ | 3,895,550 | |
| | | | |
Net amounts due to counterparty | | $ | 115,059 | |
| | | | |
Definitions:
| | | | |
| CLO | | - | | Collateralized Loan Obligation |
| TIPS | | - | | Treasury Inflation Protected Security. |
The accompanying Notes to Financial Statements are an integral part of this schedule.
156
| Item 7. | Disclosure of Proxy Voting Policies and Procedures for Closed-End Management Investment Companies |
Not applicable.
| Item 8. | Portfolio Managers of Closed-End Management Investment Companies |
Not applicable.
| Item 9. | Purchases of Equity Securities by Closed-End Management Investment Company and Affiliated Purchasers. |
Not applicable.
| Item 10. | Submission of Matters to a Vote of Security Holders |
There have been no material changes to the procedures by which shareholders may recommend nominees to registrant’s board of trustees.
| Item 11. | Controls and Procedures |
(a)(i) Registrant’s President and Treasurer have concluded that registrant’s disclosure controls and procedures (as defined in Rule 30a-3(c) under the Investment Company Act of 1940) are effective, based on their evaluation of these controls and procedures as of a date within 90 days of the filing date of this report.
(a)(ii) Registrant’s President and Treasurer are aware of no change in registrant’s internal control over financial reporting (as defined in Rule 30a-3(d) under the Investment Company Act of 1940) that occurred during registrant’s most recent fiscal quarter that has materially affected, or is reasonably likely to materially affect, registrant’s internal control over financial reporting.
| | (a) | The code of ethics pursuant to Item 2 is attached hereto. |
| | (b) | Certifications pursuant to Rules 30a-2(a) and 30a-2(b) under the Investment Company Act of 1940 are attached hereto. |
SIGNATURES
Pursuant to the requirements of the Securities Exchange Act of 1934 and the Investment Company Act of 1940, the registrant has duly caused this report to be signed on its behalf by the undersigned, thereunto duly authorized.
| | | | |
| Date: December 29, 2016 | | THRIVENT MUTUAL FUNDS |
| | |
| | By: | | |
| | | | /s/ David S. Royal |
| | | | David S. Royal |
| | | | President |
Pursuant to the requirements of the Securities Exchange Act of 1934 and the Investment Company Act of 1940, this report has been signed below by the following persons on behalf of the registrant and in the capacities and on the dates indicated.
| | | | |
| Date: December 29, 2016 | | By: | | |
| | | | /s/ David S. Royal |
| | | | David S. Royal |
| | | | President |
| | | | |
| Date: December 29, 2016 | | By: | | |
| | | | /s/ Gerard V. Vaillancourt |
| | | | Gerard V. Vaillancourt |
| | | | Treasurer |