UNITED STATES
SECURITIES AND EXCHANGE COMMISSION
Washington, D.C. 20549
FORM N-CSR
CERTIFIED SHAREHOLDER REPORT OF REGISTERED
MANAGEMENT INVESTMENT COMPANIES
Investment Company Act file number: 811-05075
Thrivent Mutual Funds
(Exact name of registrant as specified in charter)
625 Fourth Avenue South
Minneapolis, Minnesota 55415
(Address of principal executive offices) (Zip code)
Michael W. Kremenak, Secretary and Chief Legal Officer
625 Fourth Avenue South
Minneapolis, Minnesota 55415
(Name and address of agent for service)
Registrant’s telephone number, including area code: (612) 844-4198
Date of fiscal year end: December 31
Date of reporting period: December 31, 2015
| Item 1. | Report to Stockholders |

TABLEOF CONTENTS
Dear Shareholder:
It has been a productive year for your Thrivent Mutual Funds.
Before reviewing some of the accomplishments, I’d like to thank all of you who voted in our trustee elections. Our shareholder meeting was held August 14 at our offices in Minneapolis, and a few of you attended in person. It was a delight to speak face-to-face and hear your thoughts about your Funds and Thrivent Financial.
I know it can be an imposition to receive a proxy statement in the mail asking you to vote your shares. I also understand that most of you would prefer not to be called at home by someone asking you to vote. We appreciate it when you take the time to participate in the governance of your Thrivent Mutual Funds. When you vote promptly, you reduce the need for us to do additional soliciting of voters to achieve a legally required quorum, which helps hold down the costs of your Funds.
Beyond all that, your participation in these votes is critical to the management of the Funds. Unlike many other companies, mutual funds aren’t required to elect directors or trustees annually. (Some mutual funds are corporations and have directors. Some, like Thrivent Mutual Funds, are trusts and have trustees. There’s no practical difference from a shareholder’s perspective.) But mutual funds are legally required to have a majority of their trustees elected by shareholders. Although your board can appoint some new trustees as needed—to replace a trustee who is retiring, for example—every so often it must call a shareholder meeting to elect trustees, simply to comply with the law.
Because mailing proxy materials and holding shareholder meetings creates costs for your Funds, and because we’d rather not impose on you more frequently than necessary, we always try to combine trustee elections with other items that require a shareholder vote. At our shareholder meeting in August, shareholders approved changes to the investment advisory fee structure for our flagship Asset Allocation Funds. We’ve heard from you, our shareholders, that you prefer simple, transparent fees, and that’s what these changes are intended to accomplish. They also are expected to result in lower net annual operating expenses for the Asset Allocation Funds, which would benefit all of their shareholders.
In my last president’s letter, I wrote about the 10-year anniversary of the Asset Allocation Funds, which were launched on June 30, 2005. We continue to be proud of these Funds, which we believe offer a simple, all-in-one investment solution for many investors, one that is aligned with each investor’s tolerance for risk.
The performance of the Asset Allocation Funds has been competitive. Lipper, a Thomson Reuters company, is a well-known firm that tracks and compares mutual fund performance. Each of our four Asset Allocation Funds ranked above its Lipper peer group average for the one- and three-year periods ended December 31, 2015. Overall, 86% of our Funds ranked above their respective Lipper peer group averages for the one-year period, and 68% ranked above their respective Lipper peer group averages for the three-year period.
There will be periods, of course, in which our Funds, including the Asset Allocation Funds, underperform relative to their peers. You can be certain, however, that we will always take a long-term view of performance and seek to provide consistently competitive returns over time. I look forward to updating you on our progress.
Many thanks to each of you for your confidence in Thrivent Mutual Funds. Best wishes to you and yours in 2016.
Sincerely,

David S. Royal
President
Thrivent Mutual Funds
| | | | | | | | | | | | | | | | | | | | | | | | | | | | | | | | | | | | | | | | |
Performance as of December 31, 2015 Class A (Annualized Total Returns) | | 1-Year | | | 3-Year | | | 5-Year | | | 10-Year | | | Expense Ratio | |
| | POP | | | NAV | | | POP | | | NAV | | | POP | | | NAV | | | POP | | | NAV | | | NET | | | GROSS | |
Thrivent Aggressive Allocation Fund | | | -6.31 | % | | | -0.86 | % | | | 7.90 | % | | | 9.97 | % | | | 6.18 | % | | | 7.38 | % | | | 4.81 | % | | | 5.41 | % | | | 1.26 | %* | | | 1.53 | % |
Thrivent Moderately Aggressive Allocation Fund | | | -6.46 | % | | | -0.98 | % | | | 6.23 | % | | | 8.26 | % | | | 5.49 | % | | | 6.68 | % | | | 4.65 | % | | | 5.24 | % | | | 1.16 | %* | | | 1.44 | % |
Thrivent Moderate Allocation Fund | | | -6.29 | % | | | -0.87 | % | | | 4.40 | % | | | 6.39 | % | | | 4.58 | % | | | 5.77 | % | | | 4.46 | % | | | 5.05 | % | | | 1.08 | %* | | | 1.32 | % |
Thrivent Moderately Conservative Allocation Fund | | | -6.39 | % | | | -0.95 | % | | | 2.35 | % | | | 4.29 | % | | | 3.25 | % | | | 4.42 | % | | | 3.91 | % | | | 4.50 | % | | | 1.04 | %* | | | 1.21 | % |
| | | | | | | | |
Lipper Rankings as of December 31, 2015 | | 1-Year | | 3-Year | | 5-Year | | 10-Year |
Thrivent Aggressive Allocation Fund - Lipper (Mixed-Asset Target Alloc. Agg. Gro. Funds) | | 29
(49 of 171) | | 34
(53 of 156) | | 49
(60 of 122) | | 24
(21 of 88) |
Thrivent Moderately Aggressive Allocation Fund - Lipper (Mixed-Asset Target Alloc. Growth Funds) | | 43
(210 of 495) | | 43
(197 of 461) | | 56
(227 of 408) | | 50
(152 of 307) |
Thrivent Moderate Allocation Fund - Lipper (Mixed-Asset Target Alloc. Moderate Funds) | | 27
(151 of 569) | | 33
(170 of 516) | | 42
(181 of 438) | | 40
(128 of 319) |
Thrivent Moderately Conservative Allocation Fund - Lipper (Mixed-Asset Target Alloc. Consv. Funds) | | 32
(112 of 360) | | 22
(69 of 326) | | 44
(117 of 269) | | 36
(66 of 185) |
POP=Public Offering Price, which includes 5.5% max sales charge. NAV=Net Asset Value, no sales charge.
2
| * | The Adviser has contractually agreed, for as long as the current fee structure is in place, to waive certain investment advisory fees associated with the Fund. Refer to the expense table in the Fund’s prospectus. |
All rankings are based on total return and do not reflect sales charges. The lower the Lipper percentile ranking, the better the fund performance against its peers. Source for ranking is Lipper Inc. After analyzing each fund’s holdings and prospectus objectives, Lipper assigns the fund to a category or peer group called a Lipper classification. Once total return data has been calculated, Lipper ranks the relative performance of all funds in a particular classification against their respective peer group constituents, and then calculates percentile rankings based on those numerical rankings.
Performance data cited represents past performance and should not be viewed as an indication of future results. Investment return and principal value of the investment will fluctuate so that an investor’s shares, when redeemed, may be worth more or less than the original cost. Current performance may be lower or higher than the performance data quoted. Call 800-847-4836 or visit Thrivent- Funds.com for performance results current to the most recent month-end.
Risks: The Asset Allocation Funds invest in other Thrivent Mutual Funds and in directly held equity and debt instruments. Each Fund is subject to its own fees and expenses and the expenses of the other funds in which it invests, and is subject to all of the risks of the other funds in which it invests. The value of each Fund is influenced by factors impacting the overall market, certain asset classes, certain investment styles, and specific issuers. Each Fund may incur losses due to incorrect assessments of investments by its investment adviser. Foreign investments involve addition-al risks, including currency fluctuations, liquidity, political, economic and market instability, and different legal and accounting standards. Bond prices generally fall as interest rates rise. Credit risk is the risk that an issuer of a debt security may not pay its debt, and high yield securities are subject to increased credit risk as well as liquidity risk. The use of derivatives (such as futures and swaps) involves additional risks and transaction costs, which could leave each Fund in a worse position than if it had not used these instruments.
Investing in a mutual fund involves risks, including the possible loss of principal. The prospectus contains more complete information on the investment objectives, risks, charges and expenses of the fund, which investors should read and consider carefully before investing. Prospectuses are available from a Thrivent Financial representative or at ThriventFunds.com.
3
Dear Shareholder:
Financial markets delivered mixed results in 2015, pressured by slowing economic growth in China and plunging oil prices. The investment outlook is generally positive, although many of the issues that weighed on markets in 2015 could temper returns again in 2016.
Economic Review
The U.S. economy continued its slow but persistent recovery in 2015, expanding at a 2.2% average annual pace through the first three quarters of the year. Gains from strong consumer spending and a vibrant housing market were offset in part by sluggish business spending and exports. The job market improved. Employers created more than 2.6 million nonfarm jobs, and the unemployment rate fell to 5.0% from 5.7%.
Inflation and interest rates remained low, although the Federal Reserve, after holding short-term interest rates near 0% for seven years to help the economy, raised them by a quarter of a percentage point in December.
China grew 7% year-over-year in the first two quarters of the year, then 6.9% in the third. That far exceeded growth rates in the developed world—the euro area grew 0.3% in the third quarter, while Japan contracted 0.8%—but it was still the slowest rate of growth for China since the 2008 financial crisis. Investors worried this slowdown could derail other economies; they also blamed it for reducing demand for oil and other commodities that China had been consuming at a prodigious rate when it was growing faster. Crude oil prices fell to about $37 a barrel by year-end from above $100 in 2014.
Market Review
Judging strictly by market averages, U.S. stocks had an unremarkable year. The S&P 500 Index fell 14.97 points, or 0.7%, its first price decline since 2011, but still posted a positive total return of 1.38% after factoring in reinvested dividends. However, these numbers don’t reflect how volatile the stock market became as the year wore on, highlighted by an 11% plunge in the S&P 500 Index in August after China devalued its currency. Energy stocks were among the index’s worst performers, down nearly 24% in price, while consumer discretionary stocks rose 8.4%.
Japan’s Nikkei Stock Average rose 10.63% on a price basis, as Japan’s central bank bought financial assets to prop up the economy. In Europe, the Euro Stoxx 50 Index of blue chip stocks posted a total return of -4.47%, although that loss, reflecting returns to dollar-based investors, was largely due to declines in the value of the euro against the dollar. In euro terms, the index actually earned 6.42%. The MSCI Emerging Markets Index lost -14.92%.
Like stocks, bonds delivered mixed results, with lower-risk and intermediate-term assets generally performing best. The Barclays U.S. Aggregate Bond Index, dominated by U.S. Treasury bonds and other government-backed securities, earned 0.55%, and the Barclays Municipal Bond Index earned 3.3%. The Barclays U.S. Corporate High Yield Bond Index, home to many below-investment-grade energy bonds, lost 4.47%.
Our Outlook
The U.S. economy looks poised to continue growing in the 2% range in 2016. We anticipate growth of about 1% for Japan, 2% for the euro area, 3% for the U.K., and 6% for China.
The Fed likely will continue to nudge short-term interest rates higher, albeit at a modest pace with minimal disruptions to financial markets. Inflation could edge slightly higher if, as expected, oil prices begin to stabilize.
Overall, we anticipate modestly positive returns from financial assets, absent any material worsening in China’s economy or further weakness in oil prices. European stocks have an opportunity to outperform U.S. shares. Both were expensive heading into 2016, but corporate profit margins had more room to grow in Europe. Emerging market stocks are cheaper than stocks in developed economies, but look riskier pending improvements in commodities prices.
Select sectors of the bond market appear promising—despite the prospect of higher short-term interest rates—including investment-grade corporate bonds and municipal bonds. High-yield bonds will likely remain depressed until the oil market shows signs of stabilizing.
If you are concerned about the investment outlook, we encourage you to contact your Thrivent Financial representative. He or she can help keep your portfolio aligned with your goals and tolerance for risk. Meanwhile, thank you for the trust you have placed in our entire team of professionals at Thrivent Asset Management.
Sincerely,

Russell W. Swansen
Chief Investment Officer
Thrivent Mutual Funds
4
(This page intentionally left blank)
5
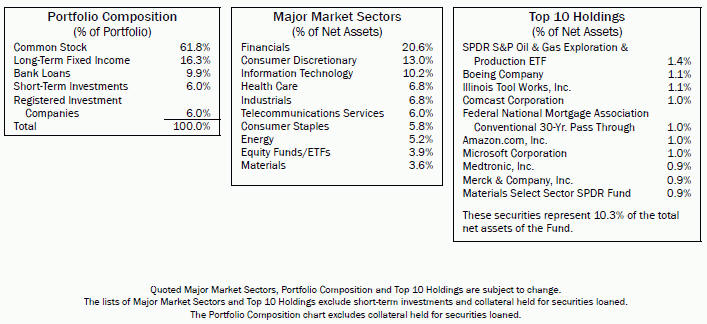
THRIVENT GROWTHAND INCOME PLUS FUND
Stephen D. Lowe, CFA, Darren M. Bagwell, CFA, Mark L. Simenstad, CFA, Noah J. Monson, CFA, Reginald L. Pfeifer, CFA, Portfolio Co-Managers
Thrivent Growth and Income Plus Fund seeks long-term capital growth and income.
The Fund invests in debt securities and equity securities. The value of the Fund is influenced by factors impacting the overall market, certain asset classes, certain investment styles, and specific issuers. The Fund may incur losses due to incorrect assessments of investments by its investment adviser. Bond prices generally fall as interest rates rise. Credit risk is the risk that an issuer of a debt security may not pay its debt, and high yield securities are subject to increased credit risk as well as liquidity risk. Leveraged loans, REITs, preferred securities, sovereign debt, and mortgage-related and other asset-backed securities are subject to additional risks. Foreign investments involve additional risks, including currency fluctuations, liquidity, political, economic and market instability, and different legal and accounting standards; these risks are magnified for investments in emerging markets. An ETF is subject to additional fees and expenses, tracking error, and the risks of the underlying investments that it holds. The use of derivatives (such as futures and swaps) involves additional risks and transaction costs, which could leave the Fund in a worse position than if it had not used these instruments.
How did the Fund perform during the 12-month period ended December 31, 2015?
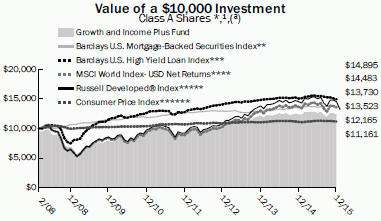
Thrivent Growth and Income Plus Fund earned a return of -1.03%, compared with the median return of its peer group, the Lipper Mixed-Asset Target Allocation Growth category, of -1.25%. The Fund’s market benchmarks, the MSCI World Index-USD Net Returns, the Barclays U.S. High Yield Loan Index and the Barclays U.S. Mortgage-Backed Securities Index, earned returns of -0.87%, -0.82% and 1.51%, respectively.
What factors affected the Fund’s performance?
The investment climate became increasingly risk-averse as the year wore on amid concerns about slowing economic growth in China, a steep slide in oil prices, and the prospect of higher short-term interest rates in the U.S. The Fund, which allocates about 70% of its assets to equities and 30% to fixed-income securities, generated modestly positive returns before expenses from both groups.
The equity portion of the Fund was invested in three sectors: international equities, domestic equities and real estate investment trusts (REITs). In all three, the Fund outperformed industry benchmarks. International holdings benefited from a focus on low-volatility stocks of companies with consistent earnings, solid free cash flow, and low debt. Domestic stock holdings benefited from strong security selection, with technology and health care stocks posting the largest absolute and relative returns. REITs also benefited from strong security selection, with data centers, multi-family apartments and self-storage REITs among the sector’s best performers.
Fixed-income markets were driven primarily by two factors in 2015: expectations that the Fed would raise short-term interest rates, which it did by a quarter of a percentage point in December; and the slump in oil prices. The Fed’s move constrained returns at the short end of the yield curve, while the slide in oil prices, which was linked to concerns about China’s economic stamina, pressured returns for below-investment-grade credits, particularly among energy issues in the high-yield sector.
By contrast, the Fund’s high-yield holdings generated modestly positive returns (before Fund expenses), largely by virtue of being concentrated in the sector’s higher-rated bonds. Elsewhere, the Fund’s securitized assets outperformed their benchmark due both to favorable security selection and a material allocation to nonagency mortgage-backed securities, which substantially outperformed the agency mortgage-backed securities that dominate the sector’s benchmark.
The Fund underperformed its benchmarks for investment-grade corporate bonds, leveraged loans and emerging-market bonds. Performance in the loan sector lagged due to an overweighted position in poor-performing energy, mining and metals issues. Returns on investment-grade corporate bonds lagged due to being underweighted in the banking industry, which did relatively well, and overweighted in BBB-rated securities, which did not. In emerging markets, the Fund suffered from having little exposure to Ukraine and Russia, both of which performed well after hostilities between those two countries eased.
What is your outlook?
Stocks in most developed economies were expensive as 2015 drew to a close. European shares could outperform U.S. shares in 2016 as corporate profit margins have more room to grow in Europe. Emerging market stocks are cheaper than stocks in developed markets, but still riskier pending improvements in commodities prices. REITs look reasonably attractive, not only because they are generating strong funds from operations but also because they will become their own investment sector in 2016 under the Global Industry Classification Standard, which could broaden their appeal to institutional investors.
While no single sector of the fixed-income markets stands out as dramatically undervalued, the Fund’s broad diversification provides a range of opportunities for profits in some sectors to offset losses in others. For example, floating-rate leveraged loans hold their value better than fixed-rate bonds when interest rates are rising, and returns on securitized assets are driven by different factors than those impacting the high-yield sector. Half the Fund’s fixed-income assets are invested in leveraged bank loans, high-yield bonds and emerging market bonds, all of which will be sensitive to commodities price trends.
Overall, we expect modestly positive returns from financial assets in 2016, with risk greater to the downside than the upside—especially if China’s slowing growth weighs on other economies, or if commodities prices fail to improve.
Quoted Fund performance is for Class A shares and does not reflect a sales charge.
The returns shown do not reflect taxes a shareholder would pay on distributions or redemptions.
6
Average Annual Total Returns1
As of December 31, 2015
| | | | | | | | | | | | |
Class A2 | | 1-Year | | | 5 Years | | | From
Inception
2/29/2008 | |
without sales charge | | | -1.03% | | | | 5.97% | | | | 3.27% | |
with sales charge | | | -6.44% | | | | 4.78% | | | | 2.53% | |
| | | |
Institutional Class3 | | 1-Year | | | 5 Years | | | From
Inception
2/29/2008 | |
Net Asset Value | | | -0.77% | | | | 6.37% | | | | 3.64% | |
| 1 | Past performance is not an indication of future results. Average annual total returns represent past performance and reflect changes in share prices, the reinvestment of all dividends and capital gains, and the effects of compounding. The prospectus contains more complete information on the investment objectives, risks, charges and expenses of the investment company, which investors should read and consider carefully before investing. To obtain a prospectus, contact a registered representative or visit ThriventFunds.com. At various times, the Fund’s adviser waived its management fee and/or reimbursed Fund expenses. Had the adviser not done so, the Fund’s total returns would have been lower. The returns shown do not reflect taxes a shareholder would pay on distributions or redemptions. Total investment return and principal value of your investment will fluctuate, and your shares, when redeemed, may be worth more or less than their original cost. Current performance may be higher or lower than the performance data quoted. Call 800-THRIVENT (847-4836) or visit ThriventFunds.com for performance results current to the most recent month-end. |
| 2 | Class A performance with sales charge reflects the maximum sales charge of 5.5%. |
| 3 | Institutional Class shares have no sales load and are available to institutional shareholders and certain Thrivent sponsored programs. Effective February 1, 2016, Institutional Class shares were renamed Class S shares. |
| (a) | Performance of other classes will be greater or less than the line shown based on the differences in loads and fees paid by shareholders investing in the different classes. |
| * | Effective February 28, 2015, the Russell Developed® Index was replaced with the MSCI World Index—USD Net Returns. The Adviser made this benchmark change because it believes that this Index is a more appropriate benchmark for the Fund. Thus the Russell Developed® Index will not be shown in shareholder reports of the Fund for fiscal periods ended December 31, 2016. As you compare performance, please note that the Fund’s performance reflects the maximum 5.5% sales charge, while the Indexes shown do not reflect any such charges, deductions for fees, expenses or taxes. If you were to purchase any of the above individual stocks or funds represented in those indices, any charges you would pay would reduce your total return as well. |
| ** | The Barclays U.S. Mortgage-Backed Securities Index (MBS) is formed by grouping the universe of over 600,000 individual fixed-rate U.S. government agency MBS pools into approximately 3,500 generic types of securities. It is not possible to invest directly in the Index. |
| *** | The Barclays U.S. High Yield Loan Index measures U.S. Dollar denominated syndicated term loans. It is not possible to invest directly in the Index. |
| **** | The MSCI World Index—USD Net Returns is an index that represents large and mid-cap stock performance across developed market countries throughout the world. It is not possible to invest directly in the Index. |
| ***** | The Russell Developed® Index measures the performance of the investable securities in developed countries globally. It is not possible to invest directly in the Index. |
| ****** | The Consumer Price Index is an inflationary indicator that measures the change in the cost of a fixed basket of products and services, including housing, electricity, food and transportation. It is not possible to invest directly in the Index. |
7
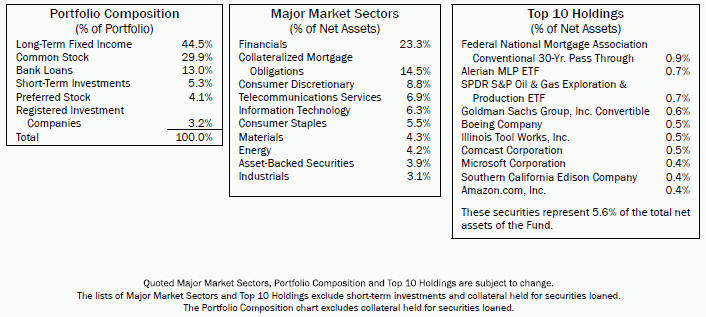
THRIVENT DIVERSIFIED INCOME PLUS FUND
Mark L. Simenstad, CFA, Stephen D. Lowe, CFA, Darren M. Bagwell, CFA, Noah J. Monsen, CFA, Reginald L. Pfeifer, CFA, Portfolio Co-Managers
Thrivent Diversified Income Plus Fund seeks to maximize income while maintaining prospects for capital appreciation.
The Fund invests in debt securities and equity securities. The value of the Fund is influenced by factors impacting the overall market, certain asset classes, certain investment styles, and specific issuers. The Fund may incur losses due to incorrect assessments of investments by its investment adviser. Bond prices generally fall as interest rates rise. Credit risk is the risk that an issuer of a debt security may not pay its debt, and high yield securities are subject to increased credit risk as well as liquidity risk. Leveraged loans, REITs, preferred securities, sovereign debt, and mortgage-related and other asset-backed securities are subject to additional risks. Foreign investments involve additional risks, including currency fluctuations, liquidity, political, economic and market instability, and different legal and accounting standards; these risks are magnified for investments in emerging markets. An ETF is subject to additional fees and expenses, tracking error, and the risks of the underlying investments that it holds. The use of derivatives (such as futures and swaps) involves additional risks and transaction costs, which could leave the Fund in a worse position than if it had not used these instruments.
How did the Fund perform during the 12-month period ended December 31, 2015?
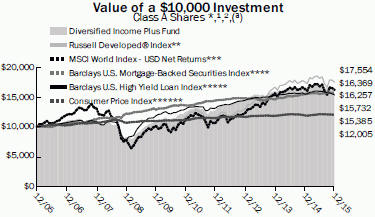
Thrivent Diversified Income Plus Fund earned a return of -0.62%, compared with the median return of its peer group, the Lipper Mixed-Asset Target Allocation Conservative category, of -1.56%. The Fund’s market benchmarks, the MSCI World Index-USD Net Returns, the Barclays U.S. High Yield Loan Index and the Barclays U.S. Mortgage-Backed Securities Index, earned returns of -0.87%, -0.82% and 1.51%, respectively.
What factors affected the Fund’s performance?
The investing climate became increasingly risk-averse over the year as investors focused on slowing economic growth in China and plunging oil prices. Investors also were weighing the prospect of higher short-term interest rates, which became a reality in December when the Federal Reserve raised short-term rates a quarter of a percentage point. That pressured bond returns at the short end of the yield curve. Meanwhile, the slide in oil prices, which was linked to concerns about China’s economic stamina, pressured returns for below-investment-grade credits, particularly among energy issues in the high-yield sector.
The Fund allocates about 70% of its assets to fixed-income securities and 30% to equities, and in 2015 generated modestly positive returns, before expenses, from both groups.
The Fund’s high-yield bonds outperformed their benchmark, generating modestly positive returns (before Fund expenses), largely by virtue of being concentrated in higher-rated securities within that sector. The Fund’s securitized assets—mainly mortgage-backed securities—also outperformed their benchmark and generated positive returns. This was due both to favorable security selection and a material allocation to nonagency mortgage-backed securities, which substantially outperformed the agency mortgage-backed securities that dominate the sector’s benchmark.
The Fund underperformed its benchmarks for investment-grade corporate bonds, leveraged loans and emerging-market bonds. Performance in the loan sector lagged due to an overweighted position in poor-performing energy, mining and metals issues. Returns on investment-grade corporate bonds lagged due to being underweighted in the banking industry, which did relatively well, and overweighted in BBB-rated securities, which did not. In emerging markets, the Fund suffered from having little exposure to Ukraine and Russia, both of which performed well after hostilities between those two countries eased.
The equity portion of the Fund was invested in three sectors: international equities, domestic equities and real estate investment trusts (REITs). In all three, the Fund outperformed industry benchmarks. International holdings benefited from a focus on low-volatility stocks issued by companies with consistent earnings, solid free cash flow, and low debt. Domestic stock holdings benefited from strong security selection, with technology and health care stocks posting the largest absolute and relative returns. REITs also benefited from strong security selection, with data centers, multi-family apartments and self-storage REITs among the sector’s best performers.
What is your outlook?
While no single sector of the fixed-income markets stands out as dramatically undervalued, the Fund’s broad diversification provides a range of opportunities to generate profit in some sectors to offset losses in others. For example, floating-rate leveraged loans hold their value better than fixed-rate bonds when interest rates are rising, and returns on securitized assets are driven by different factors than those impacting high-yield bonds. Half the Fund’s fixed-income assets are invested in leveraged bank loans, high-yield bonds and emerging market bonds, all of which will be sensitive to commodities price trends.
Stocks in most developed economies were expensive as 2015 drew to a close. Because corporate profit margins have more room to grow, European shares could outperform U.S. shares in 2016. Stocks in emerging markets are cheaper than developed markets, but still riskier pending improvements in commodities prices. REITs look reasonably attractive, not only because they are generating strong funds from operations but also because they will become their own investment sector in 2016 under the Global Industry Classification Standard, which could broaden their appeal to institutional investors.
Overall, we expect modestly positive returns from financial assets in 2016, with risk greater to the downside than the upside—especially if China’s slowing growth weighs on other economies, or if commodities prices fail to improve.
Quoted Fund performance is for Class A shares and does not reflect a sales charge.
The returns shown do not reflect taxes a shareholder would pay on distributions or redemptions.
8
Average Annual Total Returns1,2
As of December 31, 2015
| | | | | | | | | | | | |
Class A3 | | 1-Year | | | 5 Years | | | 10 Years | |
without sales charge | | | -0.62% | | | | 5.70% | | | | 5.54% | |
with sales charge | | | -5.03% | | | | 4.73% | | | | 5.06% | |
| | | |
Institutional Class4 | | 1-Year | | | 5 Years | | | 10 Years | |
Net Asset Value | | | -0.19% | | | | 6.03% | | | | 5.91% | |
| 1 | Past performance is not an indication of future results. Average annual total returns represent past performance and reflect changes in share prices, the reinvestment of all dividends and capital gains, and the effects of compounding. The prospectus contains more complete information on the investment objectives, risks, charges and expenses of the investment company, which investors should read and consider carefully before investing. To obtain a prospectus, contact a registered representative or visit ThriventFunds.com. At various times, the Fund’s adviser waived its management fee and/or reimbursed Fund expenses. Had the adviser not done so, the Fund’s total returns would have been lower. The returns shown do not reflect taxes a shareholder would pay on distributions or redemptions. Total investment return and principal value of your investment will fluctuate, and your shares, when redeemed, may be worth more or less than their original cost. Current performance may be higher or lower than the performance data quoted. Call 800-THRIVENT (847-4836) or visit ThriventFunds.com for performance results current to the most recent month-end. |
| 2 | Prior to July 3, 2006, the Fund, as a high yield fund, invested primarily in junk bonds. |
| 3 | Class A performance with sales charge reflects the maximum sales charge of 4.5%. |
| 4 | Institutional Class shares have no sales load and are available to institutional shareholders and certain Thrivent sponsored programs. Effective February 1, 2016, Institutional Class shares were renamed Class S shares. |
| (a) | Performance of other classes will be greater or less than the line shown based on the differences in loads and fees paid by shareholders investing in the different classes. |
| * | Effective February 28, 2015, the Russell Developed® Index was replaced with the MSCI World Index—USD Net Returns. The Adviser made this benchmark change because it believes that this Index is a more appropriate benchmark for the Fund. Thus the Russell Developed® Index will not be shown in shareholder reports of the Fund for fiscal periods ended December 31, 2016. As you compare performance, please note that the Fund’s performance reflects the maximum 4.5% sales charge, while the Russell Developed Index, the Barclays U.S. Mortgage-Backed Securities Index and the Consumer Price Index do not reflect any such charges, deductions for fees, expenses or taxes. If you were to purchase any of the above individual stocks or funds represented in those indices, any charges you would pay would reduce your total return as well. |
| ** | The Russell Developed® Index measures the performance of the investable securities in the developed countries globally. It is not possible to invest directly in the Index. |
| *** | The MSCI World Index—USD Net Returns is an index that represents large and mid-cap stock performance across developed market countries throughout the world. It is not possible to invest directly in the Index. |
| **** | The Barclays U.S. Mortgage-Backed Securities Index (MBS) is formed by grouping the universe of over 600,000 individual fixed-rate U.S. government agency MBS pools into approximately 3,500 generic types of securities. It is not possible to invest directly in the Index. |
| ***** | The Barclays U.S. High Yield Loan Index measures U.S. Dollar denominated syndicated term loans. It is not possible to invest directly in the Index. |
| ****** | The Consumer Price Index is an inflationary indicator that measures the change in the cost of a fixed basket of products and services, including housing, electricity, food and transportation. It is not possible to invest directly in the Index. |
9
SHAREHOLDER EXPENSE EXAMPLE
(unaudited)
As a shareholder of a Fund, you incur, depending on the Fund and share class, two types of costs: (1) transaction costs, including sales charges (loads) on purchase payments; and (2) ongoing costs, including management fees, distribution (12b-1) fees and other Fund expenses. This Example is intended to help you understand your ongoing costs (in dollars) of investing in your Fund and to compare these costs with the ongoing costs of investing in other mutual funds. The Example is based on an investment of $1,000 invested at the beginning of the period and held for the entire period from July 1, 2015 through December 31, 2015.
Actual Expenses
In the table below, the first section, labeled “Actual,” provides information about actual account values and actual expenses. You may use the information in this section, together with the amount you invested, to estimate the expenses that you paid over the period. Simply divide your account value by $1,000 (for example, an $8,600 account value divided by $1,000 = 8.6), then multiply the result by the number from the appropriate Class line under the heading entitled “Expenses Paid During Period” to estimate the expenses you paid. A small account fee of $12 may be charged to Class A shareholder accounts if the value falls to an amount of $2,000 or less, in the case of a non-qualified account, and $1,000 or less, in the case of a qualified account. This fee is not included in the table below. If it were and you were assessed such a fee, the expenses you paid during the period would have been higher and the ending account value would have been lower.
Hypothetical Example for Comparison Purposes
In the table below, the second section, labeled “Hypothetical,” provides information about hypothetical account values and hypothetical expenses based on the Fund’s actual expense ratio and an assumed rate of return of 5% per year before expenses, which is not the Fund’s actual return. The hypothetical account values and expenses may not be used to estimate the actual ending account balance or expenses you paid for the period. You may use this information to compare the ongoing costs of investing in the Fund and other funds. To do so, compare this 5% hypothetical example with the 5% hypothetical examples that appear in the shareholder reports of the other funds. A small account fee of $12 may be charged to Class A shareholder accounts if the value falls to an amount of $2,000 or less, in the case of a non-qualified account, and $1,000 or less, in the case of a qualified account. This fee is not included in the table below. If it were and you were assessed such a fee, the expenses you paid during the period would have been higher and the ending account value would have been lower.
Please note that the expenses shown in the table are meant to highlight your ongoing costs only and do not reflect any transactional costs, such as sales charges (loads). Therefore, the second section of the table is useful in comparing ongoing costs only, and will not help you determine the relative total costs of owning different funds. In addition, if these transactional costs were included, your costs would have been higher.
| | | | | | | | | | | | | | | | |
| | | Beginning
Account
Value
7/1/2015 | | | Ending
Account
Value
12/31/2015 | | | Expenses
Paid
During
Period
7/1/2015-
12/31/2015* | | | Annualized
Expense
Ratio | |
Thrivent Growth and Income Plus Fund | | | | | | | | | | | | | | | | |
Actual | | | | | | | | | | | | | | | | |
Class A | | $ | 1,000 | | | $ | 974 | | | $ | 5.72 | | | | 1.15 | % |
Institutional Class | | $ | 1,000 | | | $ | 975 | | | $ | 3.98 | | | | 0.80 | % |
Hypothetical** | | | | | | | | | | | | | | | | |
Class A | | $ | 1,000 | | | $ | 1,019 | | | $ | 5.85 | | | | 1.15 | % |
Institutional Class | | $ | 1,000 | | | $ | 1,021 | | | $ | 4.08 | | | | 0.80 | % |
Thrivent Diversified Income Plus Fund | | | | | | | | | | | | | | | | |
Actual | | | | | | | | | | | | | | | | |
Class A | | $ | 1,000 | | | $ | 977 | | | $ | 4.88 | | | | 0.98 | % |
Institutional Class | | $ | 1,000 | | | $ | 980 | | | $ | 3.46 | | | | 0.69 | % |
Hypothetical** | | | | | | | | | | | | | | | | |
Class A | | $ | 1,000 | | | $ | 1,020 | | | $ | 4.98 | | | | 0.98 | % |
Institutional Class | | $ | 1,000 | | | $ | 1,022 | | | $ | 3.53 | | | | 0.69 | % |
| * | Expenses are equal to the Fund’s annualized expense ratio, multiplied by the average account value over the period, multiplied by 184/365 to reflect the one-half year period. |
| ** | Assuming 5% annualized total return before expenses. |
10

Report of lndependent Registered Public Accounting Firm
To the Trustees and Shareholders of Thrivent Diversified Income Plus Fund and Thrivent Growth and Income Plus Fund:
In our opinion, the accompanying statements of assets and liabilities, including the summary schedules of investments of Thrivent Diversified Income Plus Fund and Thrivent Growth and Income Plus Fund (constituting part of the Thrivent Mutual Funds) (hereafter referred to as the “Funds”), and the related statements of operations and of changes in net assets and the financial highlights present fairly, in all material respects, the financial position of the Funds at December 31, 2015, the results of each of their operations for the year then ended, the changes in each of their net assets for each of the two years in the period then ended and their financial highlights for each of the five years in the period then ended, in conformity with accounting principles generally accepted in the United States of America. These financial statements and financial highlights (hereafter referred to as “financial statements”) are the responsibility of the Funds’ management. Our responsibility is to express an opinion on these financial statements based on our audits. We conducted our audits of these financial statements in accordance with the standards of the Public Company Accounting Oversight Board (United States). Those standards require that we plan and perform the audit to obtain reasonable assurance about whether the financial statements are free of material misstatement. An audit includes examining, on a test basis, evidence supporting the amounts and disclosures in the financial statements, assessing the accounting principles used and significant estimates made by management, and evaluating the overall financial statement presentation. We believe that our audits, which included confirmation of securities at December 31, 2015 by correspondence with the custodian, agent banks, transfer agent and brokers provides a reasonable basis for our opinion.

February 18, 2016
PricewaterhouseCoopers LLP, Suite 1400, 225 South Sixth Street, Minneapolis, MN 55402
T: (612) 596 6000, F: (612) 373 7160, www.pwc.com/us
11
GROWTHAND INCOME PLUS FUND
Summary Schedule of Investments as of December 31, 2015
| | | | | | | | | | | | |
Principal Amount | | | Bank Loans (10.2%) | | Value | | | % of Net
Assets | |
| Basic Materials (0.5%) | | | | | | | | |
| | | | Other Securities^ | | $ | 373,686 | | | | 0.5 | % |
| | | | | | | | | | | | |
| | | | Total | | | 373,686 | | | | | |
| | | | | | | | | | | | |
| | |
| Capital Goods (0.5%) | | | | | | | | |
| | | | Other Securities^ | | | 356,625 | | | | 0.5 | % |
| | | | | | | | | | | | |
| | | | Total | | | 356,625 | | | | | |
| | | | | | | | | | | | |
| | |
| Communications Services (3.6%) | | | | | | | | |
| | | | Other Securities^ | | | 2,657,579 | | | | 3.6 | % |
| | | | | | | | | | | | |
| | | | Total | | | 2,657,579 | | | | | |
| | | | | | | | | | | | |
| | |
| Consumer Cyclical (1.9%) | | | | | | | | |
| | | | Other Securities^ | | | 1,370,394 | | | | 1.9 | % |
| | | | | | | | | | | | |
| | | | Total | | | 1,370,394 | | | | | |
| | | | | | | | | | | | |
| | |
| Consumer Non-Cyclical (1.2%) | | | | | | | | |
| | | | Other Securities^ | | | 922,497 | | | | 1.2 | % |
| | | | | | | | | | | | |
| | | | Total | | | 922,497 | | | | | |
| | | | | | | | | | | | |
| | |
| Energy (0.5%) | | | | | | | | |
| | | | Other Securities^ | | | 343,532 | | | | 0.5 | % |
| | | | | | | | | | | | |
| | | | Total | | | 343,532 | | | | | |
| | | | | | | | | | | | |
| | |
| Financials (0.7%) | | | | | | | | |
| | | | Other Securities^ | | | 524,130 | | | | 0.7 | % |
| | | | | | | | | | | | |
| | | | Total | | | 524,130 | | | | | |
| | | | | | | | | | | | |
| | |
| Technology (0.6%) | | | | | | | | |
| | | | Other Securities^ | | | 424,172 | | | | 0.6 | % |
| | | | | | | | | | | | |
| | | | Total | | | 424,172 | | | | | |
| | | | | | | | | | | | |
| | |
| Transportation (0.4%) | | | | | | | | |
| | | | Other Securities^ | | | 315,220 | | | | 0.4 | % |
| | | | | | | | | | | | |
| | | | Total | | | 315,220 | | | | | |
| | | | | | | | | | | | |
| | |
| Utilities (0.3%) | | | | | | | | |
| | | | Other Securities^ | | | 222,609 | | | | 0.3 | % |
| | | | | | | | | | | | |
| | | | Total | | | 222,609 | | | | | |
| | | | | | | | | | | | |
| | | | Total Bank Loans (cost $8,031,853) | | | 7,510,444 | | | | | |
| | | | | | | | | | | | |
| | | |
Shares | | | Common Stock (63.3%) | | | | | | |
| Consumer Discretionary (10.0%) | | | | | | | | |
| | 1,070 | | | Amazon.com, Inc.a | | | 723,202 | | | | 1.0 | % |
| | 820 | | | AutoZone, Inc.a | | | 608,366 | | | | 0.8 | % |
| | 13,288 | | | Comcast Corporation | | | 749,842 | | | | 1.0 | % |
| | 9,380 | | | NIKE, Inc. | | | 586,250 | | | | 0.8 | % |
| | 6,734 | | | Starbucks Corporation | | | 404,242 | | | | 0.6 | % |
| | | | Other Securities^ | | | 4,282,063 | | | | 5.8 | % |
| | | | | | | | | | | | |
| | | | Total | | | 7,353,965 | | | | | |
| | | | | | | | | | | | |
| | |
| Consumer Staples (3.7%) | | | | | | | | |
| | 3,508 | | | Anheuser-Busch InBev NV ADR | | | 438,500 | | | | 0.6 | % |
| | 9,600 | | | Coca-Cola Company | | | 412,416 | | | | 0.6 | % |
| | 6,900 | | | Imperial Tobacco Group plc | | | 364,444 | | | | 0.5 | % |
| | | | Other Securities^ | | | 1,491,099 | | | | 2.0 | % |
| | | | | | | | | | | | |
| | | | Total | | | 2,706,459 | | | | | |
| | | | | | | | | | | | |
| | |
| Energy (4.0%) | | | | | | | | |
| | 6,000 | | | EOG Resources, Inc. | | | 424,740 | | | | 0.6 | % |
| | 12,900 | | | Spectra Energy Corporation | | | 308,826 | | | | 0.4 | % |
| | 7,710 | | | Total SA ADR | | | 346,565 | | | | 0.5 | % |
| | 57,140 | | | Weatherford International, Ltd.a | | | 479,405 | | | | 0.6 | % |
| | | | Other Securities^ | | | 1,418,966 | | | | 1.9 | % |
| | | | | | | | | | | | |
| | | | Total | | | 2,978,502 | | | | | |
| | | | | | | | | | | | |
| | |
| Financials (18.1%) | | | | | | | | |
| | 2,900 | | | Allianz SE | | | 511,209 | | | | 0.7 | % |
| | 18,430 | | | Charles Schwab Corporation | | | 606,900 | | | | 0.8 | % |
| | 10,100 | | | Citigroup, Inc. | | | 522,675 | | | | 0.7 | % |
| | 1,590 | | | Intercontinental Exchange, Inc. | | | 407,453 | | | | 0.6 | % |
| | 7,602 | | | MetLife, Inc. | | | 366,492 | | | | 0.5 | % |
| | 1,318 | | | Public Storage, Inc. | | | 326,469 | | | | 0.5 | % |
| | 2,624 | | | Simon Property Group, Inc. | | | 510,211 | | | | 0.7 | % |
| | 3,200 | | | Swiss Re AG | | | 312,532 | | | | 0.4 | % |
| | 13,250 | | | Synchrony Financiala | | | 402,933 | | | | 0.6 | % |
| | | | Other Securities^ | | | 9,326,457 | | | | 12.6 | % |
| | | | | | | | | | | | |
| | | | Total | | | 13,293,331 | | | | | |
| | | | | | | | | | | | |
| | |
| Health Care (6.8%) | | | | | | | | |
| | 13,070 | | | Abbott Laboratories | | | 586,974 | | | | 0.8 | % |
| | 1,670 | | | Allergan plca | | | 521,875 | | | | 0.7 | % |
| | 2,030 | | | Amgen, Inc. | | | 329,530 | | | | 0.5 | % |
| | 8,630 | | | Medtronic, Inc. | | | 663,820 | | | | 0.9 | % |
| | 12,490 | | | Merck & Company, Inc. | | | 659,722 | | | | 0.9 | % |
| | | | Other Securities^ | | | 2,246,849 | | | | 3.0 | % |
| | | | | | | | | | | | |
| | | | Total | | | 5,008,770 | | | | | |
| | | | | | | | | | | | |
| | |
| Industrials (6.8%) | | | | | | | | |
| | 5,690 | | | Boeing Company | | | 822,717 | | | | 1.1 | % |
| | 8,650 | | | Illinois Tool Works, Inc. | | | 801,682 | | | | 1.1 | % |
| | 7,550 | | | Ingersoll-Rand plc | | | 417,440 | | | | 0.6 | % |
| | 4,700 | | | Macquarie Infrastructure Corporation | | | 341,220 | | | | 0.5 | % |
| | | | Other Securities^ | | | 2,601,402 | | | | 3.5 | % |
| | | | | | | | | | | | |
| | | | Total | | | 4,984,461 | | | | | |
| | | | | | | | | | | | |
| | |
| Information Technology (9.1%) | | | | | | | | |
| | 4,720 | | | Alibaba Group Holding, Ltd. ADRa | | | 383,594 | | | | 0.5 | % |
| | 530 | | | Alphabet, Inc., Class Aa | | | 412,345 | | | | 0.6 | % |
| | 521 | | | Alphabet, Inc., Class Ca | | | 395,377 | | | | 0.5 | % |
| | 4,780 | | | Apple, Inc. | | | 503,143 | | | | 0.7 | % |
| | 15,550 | | | Cisco Systems, Inc. | | | 422,260 | | | | 0.6 | % |
| | 14,488 | | | EMC Corporation | | | 372,052 | | | | 0.5 | % |
| | 3,190 | | | MasterCard, Inc. | | | 310,578 | | | | 0.4 | % |
| | 12,950 | | | Microsoft Corporation | | | 718,466 | | | | 1.0 | % |
| | 8,250 | | | Visa, Inc. | | | 639,788 | | | | 0.9 | % |
| | 7,550 | | | Xilinx, Inc. | | | 354,624 | | | | 0.5 | % |
| | | | Other Securities^ | | | 2,215,200 | | | | 2.9 | % |
| | | | | | | | | | | | |
| | | | Total | | | 6,727,427 | | | | | |
| | | | | | | | | | | | |
| | |
| Materials (1.8%) | | | | | | | | |
| | | | Other Securities^ | | | 1,354,470 | | | | 1.8 | % |
| | | | | | | | | | | | |
| | | | Total | | | 1,354,470 | | | | | |
| | | | | | | | | | | | |
| | |
| Telecommunications Services (1.4%) | | | | | | | | |
| | | | Other Securities^ | | | 1,052,420 | | | | 1.4 | % |
| | | | | | | | | | | | |
| | | | Total | | | 1,052,420 | | | | | |
| | | | | | | | | | | | |
The accompanying Notes to Financial Statements are an integral part of this schedule.
12
GROWTHAND INCOME PLUS FUND
Summary Schedule of Investments as of December 31, 2015
| | | | | | | | | | | | |
Shares | | | Common Stock (63.3%) | | Value | | | % of Net
Assets | |
| Utilities (1.6%) | | | | | | | | |
| | 14,400 | | | Brookfield Infrastructure Partners, LP | | $ | 545,904 | | | | 0.8 | % |
| | | | Other Securities^ | | | 611,732 | | | | 0.8 | % |
| | | | | | | | | | | | |
| | | | Total | | | 1,157,636 | | | | | |
| | | | | | | | | | | | |
| | | | Total Common Stock (cost $47,537,403) | | | 46,617,441 | | | | | |
| | | | | | | | | | | | |
| | | |
Principal Amount | | | Long-Term Fixed Income (16.7%) | | | | | | |
| Asset-Backed Securities (0.1%) | | | | | | | | |
| | | | Other Securities^ | | | 78,456 | | | | 0.1 | % |
| | | | | | | | | | | | |
| | | | Total | | | 78,456 | | | | | |
| | | | | | | | | | | | |
| | |
| Basic Materials (0.2%) | | | | | | | | |
| | | | Other Securities^ | | | 169,839 | | | | 0.2 | % |
| | | | | | | | | | | | |
| | | | Total | | | 169,839 | | | | | |
| | | | | | | | | | | | |
| | |
| Capital Goods (0.6%) | | | | | | | | |
| | | | Other Securities^ | | | 479,036 | | | | 0.6 | % |
| | | | | | | | | | | | |
| | | | Total | | | 479,036 | | | | | |
| | | | | | | | | | | | |
| | |
| Collateralized Mortgage Obligations (2.7%) | | | | | | | | |
| | | | Other Securities^ | | | 1,928,787 | | | | 2.7 | % |
| | | | | | | | | | | | |
| | | | Total | | | 1,928,787 | | | | | |
| | | | | | | | | | | | |
| | |
| Communications Services (1.0%) | | | | | | | | |
| | | | Other Securities^ | | | 746,968 | | | | 1.0 | % |
| | | | | | | | | | | | |
| | | | Total | | | 746,968 | | | | | |
| | | | | | | | | | | | |
| | |
| Consumer Cyclical (1.1%) | | | | | | | | |
| | | | Other Securities^ | | | 794,530 | | | | 1.1 | % |
| | | | | | | | | | | | |
| | | | Total | | | 794,530 | | | | | |
| | | | | | | | | | | | |
| | |
| Consumer Non-Cyclical (0.9%) | | | | | | | | |
| | | | Other Securities^ | | | 662,353 | | | | 0.9 | % |
| | | | | | | | | | | | |
| | | | Total | | | 662,353 | | | | | |
| | | | | | | | | | | | |
| | |
| Energy (0.7%) | | | | | | | | |
| | | | Other Securities^ | | | 486,027 | | | | 0.7 | % |
| | | | | | | | | | | | |
| | | | Total | | | 486,027 | | | | | |
| | | | | | | | | | | | |
| | |
| Financials (1.8%) | | | | | | | | |
| | | | Goldman Sachs Group, Inc. Convertible | | | | | | | | |
| $ | 375,000 | | | 0.500%, 9/24/2022 | | | 387,911 | | | | 0.6 | % |
| | | | Other Securities^ | | | 917,344 | | | | 1.2 | % |
| | | | | | | | | | | | |
| | | | Total | | | 1,305,255 | | | | | |
| | | | | | | | | | | | |
| | |
| Foreign Government (3.6%) | | | | | | | | |
| | | | Other Securities^ | | | 2,625,149 | | | | 3.6 | % |
| | | | | | | | | | | | |
| | | | Total | | | 2,625,149 | | | | | |
| | | | | | | | | | | | |
| | |
| Mortgage-Backed Securities (2.6%) | | | | | | | | |
| | | | Federal National Mortgage Association Conventional 30- Yr. Pass Through | | | | | | | | |
| | 705,000 | | | 3.500%, 1/1/2046b | | | 727,365 | | | | 1.0 | % |
| | 475,000 | | | 4.000%, 1/1/2046b | | | 502,632 | | | | 0.7 | % |
| | 250,000 | | | 4.500%, 1/1/2046b | | | 269,969 | | | | 0.4 | % |
| | | | Other Securities^ | | | 416,076 | | | | 0.5 | % |
| | | | | | | | | | | | |
| | | | Total | | | 1,916,042 | | | | | |
| | | | | | | | | | | | |
| | |
| Technology (0.5%) | | | | | | | | |
| | | | Other Securities^ | | | 395,877 | | | | 0.5 | % |
| | | | | | | | | | | | |
| | | | Total | | | 395,877 | | | | | |
| | | | | | | | | | | | |
| | |
| Transportation (0.2%) | | | | | | | | |
| | | | Other Securities^ | | | 122,063 | | | | 0.2 | % |
| | | | | | | | | | | | |
| | | | Total | | | 322,063 | | | | | |
| | | | | | | | | | | | |
| | |
| U.S. Government and Agencies (0.2%) | | | | | | | | |
| | | | Other Securities^ | | | 150,939 | | | | 0.2 | % |
| | | | | | | | | | | | |
| | | | Total | | | 350,939 | | | | | |
| | | | | | | | | | | | |
| | |
| Utilities (0.5%) | | | | | | | | |
| | | | Other Securities^ | | | 404,535 | | | | 0.5 | % |
| | | | | | | | | | | | |
| | | | Total | | | 304,535 | | | | | |
| | | | | | | | | | | | |
| | | | Total Long-Term Fixed Income (cost $12,568,855) | | | 12,265,856 | | | | | |
| | | | | | | | | | | | |
| | | |
Shares | | | Registered Investment Companies (6.2%) | | | | | | |
| Equity Funds/ETFs (3.9%) | | | | | | | | |
| | 11,514 | | | iShares S&P U.S. Preferred Stock Index Fund | | | 447,319 | | | | 0.6 | % |
| | 14,890 | | | Materials Select Sector SPDR Fund | | | 646,524 | | | | 0.9 | % |
| | 34,200 | | | SPDR S&P Oil & Gas Exploration & Production ETF | | | 1,033,524 | | | | 1.4 | % |
| | 13,410 | | | Utilities Select Sector SPDR Fund | | | 580,385 | | | | 0.8 | % |
| | | | Other Securities^ | | | 161,438 | | | | 0.2 | % |
| | | | | | | | | | | | |
| | | | Total | | | 2,869,190 | | | | | |
| | | | | | | | | | | | |
| | |
| Fixed Income Funds/ETFs (2.3%) | | | | | | | | |
| | 11,300 | | | SPDR Barclays High Yield Bond ETF | | | 383,183 | | | | 0.5 | % |
| | 7,145 | | | Vanguard Short-Term Corporate Bond ETF | | | 564,384 | | | | 0.8 | % |
| | | | Other Securities^ | | | 722,803 | | | | 1.0 | % |
| | | | | | | | | | | | |
| | | | Total | | | 3,670,370 | | | | | |
| | | | | | | | | | | | |
| | | | Total Registered Investment Companies (cost $5,014,192) | | | 4,539,560 | | | | | |
| | | | | | | | | | | | |
| | | |
Shares or Principal Amount | | | Short-Term Investments (6.1%)c | | | | | | |
| | | | Federal National Mortgage Association Discount Notes | | | | | | | | |
| | 100,000 | | | 0.100%, 1/4/2016d | | | 99,999 | | | | 0.2 | % |
| | | | Thrivent Cash Management Trust | | | | | | | | |
| | 4,226,851 | | | 0.220% | | | 4,226,851 | | | | 5.7 | % |
| | | | Other Securities^ | | | 199,958 | | | | 0.2 | % |
| | | | | | | | | | | | |
| | | | Total Short-Term Investments (at amortized cost) | | | 4,526,808 | | | | | |
| | | | | | | | | | | | |
| | | | Total Investments (cost $77,679,111) 102.5% | | $ | 75,460,109 | | | | | |
| | | | | | | | | | | | |
| | | | Other Assets and Liabilities, Net (2.5%) | | | (1,835,283 | ) | | | | |
| | | | | | | | | | | | |
| | | | Total Net Assets 100.0% | | $ | 73,624,826 | | | | | |
| | | | | | | | | | | | |
The accompanying Notes to Financial Statements are an integral part of this schedule.
13
GROWTHAND INCOME PLUS FUND
Summary Schedule of Investments as of December 31, 2015
| ^ | The Summary Schedule of Investments shows the 50 largest holdings in unaffiliated issuers, any holding or issuer that exceeds 1% of net assets and all affiliated holdings as of the report date. The remaining securities held are grouped by category as “Other securities”. |
| a | Non-income producing security. |
| b | Denotes investments purchased on a when-issued or delayed delivery basis. |
| c | The interest rate shown reflects the yield, coupon rate or the discount rate at the date of purchase. |
| d | All or a portion of the security is held on deposit with the counterparty and pledged as the initial margin deposit for open futures contracts. |
Definitions:
| | | | |
| ADR | | - | | American Depositary Receipt, which are certificates for an underlying foreign security’s shares held by an issuing U.S. depository bank. |
| ETF | | - | | Exchange Traded Fund. |
Unrealized Appreciation (Depreciation)
Gross unrealized appreciation and depreciation of investments, based on cost for federal income tax purposes, were as follows:
| | | | |
Gross unrealized appreciation | | $ | 2,419,479 | |
Gross unrealized depreciation | | | (4,913,446 | ) |
| | | | |
Net unrealized appreciation (depreciation) | | ($ | 2,493,967 | ) |
Cost for federal income tax purposes | | $ | 77,954,076 | |
The accompanying Notes to Financial Statements are an integral part of this schedule.
14
GROWTHAND INCOME PLUS FUND
Summary Schedule of Investments as of December 31, 2015
Fair Valuation Measurements
The following table is a summary of the inputs used, as of December 31, 2015, in valuing Growth and Income Plus Fund’s assets carried at fair value.
| | | | | | | | | | | | | | | | |
Investments in Securities | | Total | | | Level 1 | | | Level 2 | | | Level 3 | |
Bank Loans | | | | | | | | | | | | | | | | |
Basic Materials | | | 373,686 | | | | — | | | | 300,541 | | | | 73,145 | |
Capital Goods | | | 356,625 | | | | — | | | | 356,625 | | | | — | |
Communications Services | | | 2,657,579 | | | | — | | | | 2,485,529 | | | | 172,050 | |
Consumer Cyclical | | | 1,370,394 | | | | — | | | | 1,370,394 | | | | — | |
Consumer Non-Cyclical | | | 922,497 | | | | — | | | | 883,889 | | | | 38,608 | |
Energy | | | 343,532 | | | | — | | | | 153,141 | | | | 190,391 | |
Financials | | | 524,130 | | | | — | | | | 524,130 | | | | — | |
Technology | | | 424,172 | | | | — | | | | 423,913 | | | | 259 | |
Transportation | | | 315,220 | | | | — | | | | 315,220 | | | | — | |
Utilities | | | 222,609 | | | | — | | | | 222,609 | | | | — | |
Common Stock | | | | | | | | | | | | | | | | |
Consumer Discretionary | | | 7,353,965 | | | | 5,442,742 | | | | 1,911,223 | | | | — | |
Consumer Staples | | | 2,706,459 | | | | 1,043,439 | | | | 1,663,020 | | | | — | |
Energy | | | 2,978,502 | | | | 2,634,757 | | | | 343,745 | | | | — | |
Financials | | | 13,293,331 | | | | 9,535,690 | | | | 3,757,641 | | | | — | |
Health Care | | | 5,008,770 | | | | 3,917,586 | | | | 1,091,184 | | | | — | |
Industrials | | | 4,984,461 | | | | 3,094,314 | | | | 1,890,147 | | | | — | |
Information Technology | | | 6,727,427 | | | | 5,910,561 | | | | 816,866 | | | | — | |
Materials | | | 1,354,470 | | | | 433,742 | | | | 920,728 | | | | — | |
Telecommunications Services | | | 1,052,420 | | | | 161,135 | | | | 891,285 | | | | — | |
Utilities | | | 1,157,636 | | | | 850,238 | | | | 307,398 | | | | — | |
Long-Term Fixed Income | | | | | | | | | | | | | | | | |
Asset-Backed Securities | | | 78,456 | | | | — | | | | 78,456 | | | | — | |
Basic Materials | | | 169,839 | | | | — | | | | 169,839 | | | | — | |
Capital Goods | | | 479,036 | | | | — | | | | 479,036 | | | | — | |
Collateralized Mortgage Obligations | | | 1,928,787 | | | | — | | | | 1,928,787 | | | | — | |
Communications Services | | | 746,968 | | | | — | | | | 746,968 | | | | — | |
Consumer Cyclical | | | 794,530 | | | | — | | | | 794,530 | | | | — | |
Consumer Non-Cyclical | | | 662,353 | | | | — | | | | 662,353 | | | | — | |
Energy | | | 486,027 | | | | — | | | | 486,027 | | | | — | |
Financials | | | 1,305,255 | | | | — | | | | 917,344 | | | | 387,911 | |
Foreign Government | | | 2,625,149 | | | | — | | | | 2,625,149 | | | | — | |
Mortgage-Backed Securities | | | 1,916,042 | | | | — | | | | 1,916,042 | | | | — | |
Technology | | | 395,877 | | | | — | | | | 395,877 | | | | — | |
Transportation | | | 122,063 | | | | — | | | | 122,063 | | | | — | |
U.S. Government and Agencies | | | 150,939 | | | | — | | | | 150,939 | | | | — | |
Utilities | | | 404,535 | | | | — | | | | 404,535 | | | | — | |
Registered Investment Companies | | | | | | | | | | | | | | | | |
Equity Funds/ETFs | | | 2,869,190 | | | | 2,869,190 | | | | — | | | | — | |
Fixed Income Funds/ETFs | | | 1,670,370 | | | | 1,670,370 | | | | — | | | | — | |
Short-Term Investments | | | 4,526,808 | | | | 4,226,851 | | | | 299,957 | | | | — | |
| | | | | | | | | | | | | | | | |
Total | | $ | 75,460,109 | | | $ | 41,790,615 | | | $ | 32,807,130 | | | $ | 862,364 | |
| | | | | | | | | | | | | | | | |
| | | | |
Other Financial Instruments | | Total | | | Level 1 | | | Level 2 | | | Level 3 | |
Asset Derivatives | | | | | | | | | | | | | | | | |
Futures Contracts | | | 10,629 | | | | 10,629 | | | | — | | | | — | |
Credit Default Swaps | | | 5,862 | | | | — | | | | 5,862 | | | | — | |
| | | | | | | | | | | | | | | | |
Total Asset Derivatives | | $ | 16,491 | | | $ | 10,629 | | | $ | 5,862 | | | $ | — | |
| | | | | | | | | | | | | | | | |
Liability Derivatives | | | | | | | | | | | | | | | | |
Futures Contracts | | | 5,343 | | | | 5,343 | | | | — | | | | — | |
| | | | | | | | | | | | | | | | |
Total Liability Derivatives | | $ | 5,343 | | | $ | 5,343 | | | $ | — | | | $ | — | |
| | | | | | | | | | | | | | | | |
There were no significant transfers between Levels during the period ended December 31, 2015. Transfers between Levels are identified as of the end of the period.
The accompanying Notes to Financial Statements are an integral part of this schedule.
15
GROWTHAND INCOME PLUS FUND
Summary Schedule of Investments as of December 31, 2015
The following table presents Growth and Income Plus Fund’s futures contracts held as of December 31, 2015. Investments totaling $199,973 were pledged as the initial margin deposit for these contracts.
| | | | | | | | | | | | | | | | | | |
Futures Contracts | | Number of
Contracts
Long/(Short) | | | Expiration
Date | | Notional
Principal
Amount | | | Value | | | Unrealized
Gain/(Loss) | |
2-Yr. U.S. Treasury Bond Futures | | | (19 | ) | | March 2016 | | ($ | 4,133,035 | ) | | ($ | 4,127,453 | ) | | $ | 5,582 | |
5-Yr. U.S. Treasury Bond Futures | | | 13 | | | March 2016 | | | 1,540,642 | | | | 1,538,164 | | | | (2,478 | ) |
10-Yr. U.S. Treasury Bond Futures | | | (6 | ) | | March 2016 | | | (756,685 | ) | | | (755,438 | ) | | | 1,247 | |
30-Yr. U.S. Treasury Bond Futures | | | 2 | | | March 2016 | | | 306,178 | | | | 307,500 | | | | 1,322 | |
S&P 500 Mini-Futures | | | 3 | | | March 2016 | | | 308,175 | | | | 305,310 | | | | (2,865 | ) |
Ultra Long Term U.S. Treasury Bond Futures | | | 2 | | | March 2016 | | | 314,897 | | | | 317,375 | | | | 2,478 | |
Total Futures Contracts | | | | | | | | | | | | | | | | $ | 5,286 | |
The following table presents Growth and Income Plus Fund’s swaps contracts held as of December 31, 2015. Investments totaling $99,983 were pledged as collateral under the agreement between the counterparty, the custodian and the fund for open swap contracts.
| | | | | | | | | | | | | | | | | | | | |
Credit Default Swaps and Counterparty | | Buy/Sell Protection1 | | | Termination
Date | | | Notional
Principal
Amount2 | | | Value3 | | | Unrealized
Gain/(Loss) | |
CDX HY 24, 5 Year, at 5.00%; CS First Boston Corporation | | | Buy | | | | 6/20/2020 | | | $ | 247,500 | | | $ | 5,862 | | | $ | 5,862 | |
Total Credit Default Swaps | | | | | | | | | | | | | | $ | 5,862 | | | $ | 5,862 | |
| 1 | As the buyer of protection, Growth and Income Plus Fund pays periodic fees in return for payment by the seller which is contingent upon an adverse credit event occurring in the underlying issuer or reference entity. As the seller of protection, Growth and Income Plus Fund collects periodic fees from the buyer and profits if the credit of the underlying issuer or reference entity remains stable or improves while the swap is outstanding, but the seller in a credit default swap contract would be required to pay the amount of credit loss, determined as specified in the agreement, to the buyer in the event of an adverse credit event in the reference entity. |
| 2 | The maximum potential amount of future payments Growth and Income Plus Fund could be required to make as the seller or receive as the buyer of protection. |
| 3 | The values for credit indexes (CDX or LCDX) serve as an indicator of the current status of the payment/performance risk and represent the liability or profit for the credit default swap contract had the contract been closed as of the reporting date. When protection has been sold, the value of the swap will increase when the swap spread declines representing an improvement in the reference entity’s credit worthiness. The value of the swap will decrease when the swap spread increases representing a deterioration in the reference entity’s credit worthiness. When protection has been purchased, the value of the swap will increase when the swap spread increases representing a deterioration in the reference entity’s credit worthiness. The value of the swap will decrease when the swap spread declines representing an improvement in the reference entity’s credit worthiness. |
The following table summarizes the fair value and Statement of Assets and Liabilities location, as of December 31, 2015, for Growth and Income Plus Fund’s investments in financial derivative instruments by primary risk exposure as discussed under item (2) Significant Accounting Policies of the Notes to Financial Statements.
| | | | | | |
Derivatives by risk category | | Statement of Assets and Liabilities Location | | Fair Value | |
Asset Derivatives | | | | | | |
Interest Rate Contracts | | | | | | |
Futures* | | Net Assets - Net unrealized appreciation/(depreciation) on Futures contracts | | $ | 10,629 | |
Total Interest Rate Contracts | | | 10,629 | |
Credit Contracts | | | | | | |
Credit Default Swaps | | Net Assets -Net unrealized appreciation/(depreciation) on Swap agreements | | | 5,862 | |
Total Credit Contracts | | | | | 5,862 | |
| | | | | | |
Total Asset Derivatives | | | | $ | 16,491 | |
| | | | | | |
Liability Derivatives | | | | | | |
Interest Rate Contracts | | | | | | |
Futures* | | Net Assets - Net unrealized appreciation/(depreciation) on Futures contracts | | | 2,478 | |
Total Interest Rate Contracts | | | 2,478 | |
Equity Contracts | | | | | | |
Futures* | | Net Assets - Net unrealized appreciation/(depreciation) on Futures contracts | | | 2,865 | |
Total Equity Contracts | | | | | 2,865 | |
| | | | | | |
Total Liability Derivatives | | | | $ | 5,343 | |
| | | | | | |
| * | Includes cumulative appreciation/depreciation of futures contracts as reported in the Schedule of Investments. Only current day’s variation margin is reported within the Statement of Assets and Liabilities. |
The accompanying Notes to Financial Statements are an integral part of this schedule.
16
GROWTHAND INCOME PLUS FUND
Summary Schedule of Investments as of December 31, 2015
The following table summarizes the net realized gains/(losses) and Statement of Operations location, for the period ended December 31, 2015, for Growth and Income Plus Fund’s investments in financial derivative instruments by primary risk exposure.
| | | | | | |
Derivatives by risk category | | Statement of Operations Location | | Realized Gains/(Losses)
recognized in Income | |
Interest Rate Contracts | | | | | | |
Futures | | Net realized gains/(losses) on Futures contracts | | | 19,141 | |
Total Interest Rate Contracts | | | | | 19,141 | |
Equity Contracts | | | | | | |
Futures | | Net realized gains/(losses) on Futures contracts | | | 139,636 | |
Total Equity Contracts | | | | | 139,636 | |
Credit Contracts | | | | | | |
Credit Default Swaps | | Net realized gains/(losses) on Swap agreements | | | (2,875 | ) |
Total Credit Contracts | | | | | (2,875 | ) |
| | | | | | |
Total | | | | $ | 155,902 | |
| | | | | | |
The following table summarizes the change in net unrealized appreciation/(depreciation) and Statement of Operations location, for the period ended December 31, 2015, for Growth and Income Plus Fund’s investments in financial derivative instruments by primary risk exposure.
| | | | | | |
Derivatives by risk category | | Statement of Operations Location | | Change in unrealized
appreciation/(depreciation)
recognized in Income | |
Interest Rate Contracts | | | | | | |
Futures | | Change in net unrealized appreciation/(depreciation) on Futures contracts | | | (26,656 | ) |
Total Interest Rate Contracts | | | | | (26,656 | ) |
Equity Contracts | | | | | | |
Futures | | Change in net unrealized appreciation/(depreciation) on Futures contracts | | | (61,470 | ) |
Total Equity Contracts | | | | | (61,470 | ) |
Credit Contracts | | | | | | |
Credit Default Swaps | | Change in net unrealized appreciation/(depreciation) on Swap agreements | | | 5,862 | |
Total Credit Contracts | | | | | 5,862 | |
| | | | | | |
Total | | | | ($ | 82,264 | ) |
| | | | | | |
The following table presents Growth and Income Plus Fund’s average volume of derivative activity during the period ended December 31, 2015.
| | | | | | | | | | | | | | | | |
Derivative Risk Category | | Futures
(Notional)* | | | Futures
(Percentage of
Average Net Assets) | | | Swaps
(Notional)* | | | Swaps
(Percentage of
Average Net Assets) | |
Equity Contracts | | $ | 823,190 | | | | 1.1 | % | | | N/A | | | | N/A | |
Interest Rate | | | | | | | | | | | | | | | | |
Contracts | | | 7,617,758 | | | | 9.9 | | | | N/A | | | | N/A | |
Credit Contracts | | | N/A | | | | N/A | | | $ | 6,776 | | | | <0.1 | % |
| * | Notional amount represents long or short, or both, derivative positions held by the Fund. |
Investment in Affiliates
Affiliated issuers, as defined under the Investment Company Act of 1940, include those in which the Fund’s holdings of an issuer represent 5% or more of the outstanding voting securities of an issuer, any affiliated mutual fund, or a company which is under common ownership or control with the Fund.
A summary of transactions for the fiscal year to date, in Growth and Income Plus Fund, is as follows:
| | | | | | | | | | | | | | | | | | | | | | | | |
Fund | | Value
December 31,
2014 | | | Gross
Purchases | | | Gross Sales | | | Shares Held at
December 31,
2015 | | | Value
December 31,
2015 | | | Income Earned
January 1, 2015 -
December 31, 2015 | |
Cash Management Trust- Short Term Investment | | $ | 6,347,729 | | | $ | 59,422,951 | | | $ | 61,543,829 | | | | 4,226,851 | | | $ | 4,226,851 | | | $ | 3,381 | |
Total Value and Income Earned | | $ | 6,347,729 | | | | | | | | | | | | | | | $ | 4,226,851 | | | $ | 3,381 | |
The accompanying Notes to Financial Statements are an integral part of this schedule.
17
DIVERSIFIED INCOME PLUS FUND
Summary Schedule of Investments as of December 31, 2015
| | | | | | | | | | | | |
Principal Amount | | | Bank Loans (13.1%) | | Value | | | % of Net
Assets | |
| Basic Materials (0.7%) | | | | | | | | |
| | | | Other Securities^ | | $ | 5,072,793 | | | | 0.7 | % |
| | | | | | | | | | | | |
| | | | Total | | | 5,072,793 | | | | | |
| | | | | | | | | | | | |
| | |
| Capital Goods (0.5%) | | | | | | | | |
| | | | Other Securities^ | | | 3,204,525 | | | | 0.5 | % |
| | | | | | | | | | | | |
| | | | Total | | | 3,204,525 | | | | | |
| | | | | | | | | | | | |
| | |
| Communications Services (4.1%) | | | | | | | | |
| | | | Other Securities^ | | | 28,305,463 | | | | 4.1 | % |
| | | | | | | | | | | | |
| | | | Total | | | 28,305,463 | | | | | |
| | | | | | | | | | | | |
| | |
| Consumer Cyclical (2.4%) | | | | | | | | |
| | | | Other Securities^ | | | 16,696,225 | | | | 2.4 | % |
| | | | | | | | | | | | |
| | | | Total | | | 16,696,225 | | | | | |
| | | | | | | | | | | | |
| | |
| Consumer Non-Cyclical (1.8%) | | | | | | | | |
| | | | Other Securities^ | | | 12,495,931 | | | | 1.8 | % |
| | | | | | | | | | | | |
| | | | Total | | | 12,495,931 | | | | | |
| | | | | | | | | | | | |
| | |
| Energy (0.7%) | | | | | | | | |
| | | | Other Securities^ | | | 5,151,123 | | | | 0.7 | % |
| | | | | | | | | | | | |
| | | | Total | | | 5,151,123 | | | | | |
| | | | | | | | | | | | |
| | |
| Financials (0.9%) | | | | | | | | |
| | | | Other Securities^ | | | 6,464,805 | | | | 0.9 | % |
| | | | | | | | | | | | |
| | | | Total | | | 6,464,805 | | | | | |
| | | | | | | | | | | | |
| | |
| Technology (1.0%) | | | | | | | | |
| | | | Avago Technologies Cayman Finance, Ltd., Term Loan | | | | | | | | |
| | $2,250,000 | | | 0.000%, 11/13/2022a,b,c | | | 2,223,292 | | | | 0.3 | % |
| | | | Other Securities^ | | | 4,871,886 | | | | 0.7 | % |
| | | | | | | | | | | | |
| | | | Total | | | 7,095,178 | | | | | |
| | | | | | | | | | | | |
| | |
| Transportation (0.6%) | | | | | | | | |
| | | | Other Securities^ | | | 4,125,090 | | | | 0.6 | % |
| | | | | | | | | | | | |
| | | | Total | | | 4,125,090 | | | | | |
| | | | | | | | | | | | |
| | |
| Utilities (0.4%) | | | | | | | | |
| | | | Other Securities^ | | | 2,418,309 | | | | 0.4 | % |
| | | | | | | | | | | | |
| | | | Total | | | 2,418,309 | | | | | |
| | | | | | | | | | | | |
| | | | Total Bank Loans (cost $98,368,414) | | | 91,029,442 | | | | | |
| | | | | | | | | | | | |
| | | |
Principal Amount | | | Long-Term Fixed Income (45.0%) | | | | | | |
| Asset-Backed Securities (3.9%) | | | | | | | | |
| | | | Other Securities^ | | | 26,890,128 | | | | 3.9 | % |
| | | | | | | | | | | | |
| | | | Total | | | 26,890,128 | | | | | |
| | | | | | | | | | | | |
| | |
| Basic Materials (0.6%) | | | | | | | | |
| | | | Other Securities^ | | | 4,155,884 | | | | 0.6 | % |
| | | | | | | | | | | | |
| | | | Total | | | 4,155,884 | | | | | |
| | | | | | | | | | | | |
| | |
| Capital Goods (1.4%) | | | | | | | | |
| | | | Other Securities^ | | | 9,590,065 | | | | 1.4 | % |
| | | | | | | | | | | | |
| | | | Total | | | 9,590,065 | | | | | |
| | | | | | | | | | | | |
| | |
| Collateralized Mortgage Obligations (14.5%) | | | | | | | | |
| | | | Alternative Loan Trust | | | | | | | | |
| | 1,719,387 | | | 5.500%, 5/25/2035 | | | 1,725,047 | | | | 0.2 | % |
| | | | Countrywide Alternative Loan Trust | | | | | | | | |
| $ | 2,065,647 | | | 0.822% - 6.000%, 2/25/2035 - 4/25/2036d | | | 1,870,758 | | | | 0.3 | % |
| | | | Countrywide Home Loan Mortgage Pass Through Trust | | | | | | | | |
| | 2,868,126 | | | 2.706% - 2.725%, 11/25/2035 - 2/20/2036 | | | 2,459,298 | | | | 0.4 | % |
| | | | Federal National Mortgage Association | | | | | | | | |
| | 12,266,756 | | | 2.500% - 3.500%, 2/25/2028 - 1/25/2033e | | | 1,348,524 | | | | 0.2 | % |
| | | | J.P. Morgan Alternative Loan Trust | | | | | | | | |
| | 2,152,086 | | | 6.500%, 3/25/2036 | | | 1,861,793 | | | | 0.3 | % |
| | | | RALI Trust | | | | | | | | |
| | 2,590,023 | | | 0.602%, 11/25/2036d | | | 1,881,405 | | | | 0.3 | % |
| | | | Washington Mutual Mortgage Pass Through Certificates | | | | | | | | |
| | 2,751,932 | | | 1.007%, 2/25/2047d | | | 1,972,577 | | | | 0.3 | % |
| | | | Wells Fargo Mortgage Backed Securities Trust | | | | | | | | |
| | 2,130,204 | | | 2.731%, 7/25/2036 | | | 2,087,257 | | | | 0.3 | % |
| | | | Other Securities^ | | | 85,792,928 | | | | 12.2 | % |
| | | | | | | | | | | | |
| | | | Total | | | 100,999,587 | | | | | |
| | | | | | | | | | | | |
| | |
| Commercial Mortgage-Backed Securities (0.4%) | | | | | | | | |
| | | | Other Securities^ | | | 2,788,122 | | | | 0.4 | % |
| | | | | | | | | | | | |
| | | | Total | | | 2,788,122 | | | | | |
| | | | | | | | | | | | |
| | |
| Communications Services (2.2%) | | | | | | | | |
| | | | Other Securities^ | | | 15,263,966 | | | | 2.2 | % |
| | | | | | | | | | | | |
| | | | Total | | | 15,263,966 | | | | | |
| | | | | | | | | | | | |
| | |
| Consumer Cyclical (2.1%) | | | | | | | | |
| | | | Other Securities^ | | | 14,660,081 | | | | 2.1 | % |
| | | | | | | | | | | | |
| | | | Total | | | 14,660,081 | | | | | |
| | | | | | | | | | | | |
| | |
| Consumer Non-Cyclical (2.1%) | | | | | | | | |
| | | | Other Securities^ | | | 14,534,830 | | | | 2.1 | % |
| | | | | | | | | | | | |
| | | | Total | | | 14,534,830 | | | | | |
| | | | | | | | | | | | |
| | |
| Energy (1.4%) | | | | | | | | |
| | | | Other Securities^ | | | 9,834,467 | | | | 1.4 | % |
| | | | | | | | | | | | |
| | | | Total | | | 9,834,467 | | | | | |
| | | | | | | | | | | | |
| | |
| Financials (8.4%) | | | | | | | | |
| | | | Bank of America Corporation | | | | | | | | |
| | 539,000 | | | 5.650% - 8.000%, 5/2/2017 - 12/29/2049f | | | 561,520 | | | | 0.1 | % |
| | | | Goldman Sachs Group, Inc. | | | | | | | | |
| | 494,000 | | | 1.476% - 7.500%, 1/31/2019 - 11/29/2023d | | | 525,521 | | | | 0.1 | % |
| | | | Goldman Sachs Group, Inc. Convertible | | | | | | | | |
| | 3,800,000 | | | 0.500%, 9/24/2022 | | | 3,930,834 | | | | 0.6 | % |
| | | | ILFC E-Capital Trust II | | | | | | | | |
| | 2,550,000 | | | 4.740%, 12/21/2065d,g | | | 2,346,000 | | | | 0.4 | % |
| | | | Other Securities^ | | | 50,925,444 | | | | 7.2 | % |
| | | | | | | | | | | | |
| | | | Total | | | 58,289,319 | | | | | |
| | | | | | | | | | | | |
The accompanying Notes to Financial Statements are an integral part of this schedule.
18
DIVERSIFIED INCOME PLUS FUND
Summary Schedule of Investments as of December 31, 2015
| | | | | | | | | | | | |
Principal Amount | | | Long-Term Fixed Income (45.0%) | | Value | | | % of Net
Assets | |
| Foreign Government (3.1%) | | | | | | | | |
| | | | Other Securities^ | | $ | 21,430,419 | | | | 3.1 | % |
| | | | | | | | | | | | |
| | | | Total | | | 21,430,419 | | | | | |
| | | | | | | | | | | | |
| | |
| Mortgage-Backed Securities (1.2%) | | | | | | | | |
| | | | Federal National Mortgage Association Conventional 30- Yr. Pass Through | | | | | | | | |
| | 6,000,000 | | | 3.500%, 1/1/2046c | | | 6,190,339 | | | | 0.9 | % |
| | 1,850,000 | | | 4.000%, 1/1/2046c | | | 1,957,618 | | | | 0.3 | % |
| | | | | | | | | | | | |
| | | | Total | | | 8,147,957 | | | | | |
| | | | | | | | | | | | |
| | |
| Technology (1.3%) | | | | | | | | |
| | | | Other Securities^ | | | 8,782,431 | | | | 1.3 | % |
| | | | | | | | | | | | |
| | | | Total | | | 8,782,431 | | | | | |
| | | | | | | | | | | | |
| | |
| Transportation (0.4%) | | | | | | | | |
| | | | Other Securities^ | | | 2,872,455 | | | | 0.4 | % |
| | | | | | | | | | | | |
| | | | Total | | | 2,872,455 | | | | | |
| | | | | | | | | | | | |
| | |
| U.S. Government and Agencies (0.2%) | | | | | | | | |
| | | | Other Securities^ | | | 1,595,486 | | | | 0.2 | % |
| | | | | | | | | | | | |
| | | | Total | | | 1,595,486 | | | | | |
| | | | | | | | | | | | |
| | |
| Utilities (1.8%) | | | | | | | | |
| | | | Southern California Edison Company | | | | | | | | |
| | 2,800,000 | | | 6.250%, 8/1/2049f | | | 3,084,900 | | | | 0.4 | % |
| | | | Other Securities^ | | | 9,537,828 | | | | 1.4 | % |
| | | | | | | | | | | | |
| | | | Total | | | 12,622,728 | | | | | |
| | | | | | | | | | | | |
| | | | Total Long-Term Fixed Income (cost $314,302,944) | | | 312,457,925 | | | | | |
| | | | | | | | | | | | |
| | | |
Shares | | | Common Stock (30.3%) | | | | | | |
| Consumer Discretionary (4.3%) | | | | | | | | |
| | 4,520 | | | Amazon.com, Inc.h | | | 3,055,023 | | | | 0.4 | % |
| | 3,470 | | | AutoZone, Inc.h | | | 2,574,428 | | | | 0.4 | % |
| | 55,902 | | | Comcast Corporation | | | 3,154,550 | | | | 0.5 | % |
| | 39,700 | | | NIKE, Inc. | | | 2,481,250 | | | | 0.4 | % |
| | | | Other Securities^ | | | 18,746,86 7 | | | | 2.6 | % |
| | | | | | | | | | | | |
| | | | Total | | | 30,012,118 | | | | | |
| | | | | | | | | | | | |
| | |
| Consumer Staples (1.6%) | | | | | | | | |
| | 14,832 | | | Anheuser-Busch InBev NV ADR | | | 1,854,000 | | | | 0.3 | % |
| | | | Other Securities^ | | | 9,114,427 | | | | 1.3 | % |
| | | | | | | | | | | | |
| | | | Total | | | 10,968,427 | | | | | |
| | | | | | | | | | | | |
| | |
| Energy (2.1%) | | | | | | | | |
| | 44,200 | | | Royal Dutch Shell plc ADR | | | 2,023,918 | | | | 0.3 | % |
| | 84,000 | | | Spectra Energy Corporation | | | 2,010,960 | | | | 0.3 | % |
| | 51,031 | | | Total SA ADR | | | 2,293,843 | | | | 0.3 | % |
| | 241,670 | | | Weatherford International, Ltd.h | | | 2,027,611 | | | | 0.3 | % |
| | | | Other Securities^ | | | 6,272,630 | | | | 0.9 | % |
| | | | | | | | | | | | |
| | | | Total | | | 14,628,962 | | | | | |
| | | | | | | | | | | | |
| | |
| Financials (10.1%) | | | | | | | | |
| | 11,400 | | | Allianz SE | | | 2,009,580 | | | | 0.3 | % |
| | 204,000 | | | Annaly Capital Management, Inc. | | | 1,913,520 | | | | 0.3 | % |
| | 183,600 | | | Ares Capital Corporation | | | 2,616,300 | | | | 0.4 | % |
| | 78,420 | | | Charles Schwab Corporation | | | 2,582,371 | | | | 0.4 | % |
| | 42,700 | | | Citigroup, Inc. | | | 2,209,725 | | | | 0.3 | % |
| | 180,000 | | | Golub Capital BDC, Inc. | | | 2,993,400 | | | | 0.4 | % |
| | 10,526 | | | Simon Property Group, Inc. | | | 2,046,675 | | | | 0.3 | % |
| | 140,000 | | | Solar Capital, Ltd. | | | 2,300,200 | | | | 0.3 | % |
| | 359,100 | | | Two Harbors Investment Corporation | | | 2,908,710 | | | | 0.4 | % |
| | | | Other Securities^ | | | 48,522,754 | | | | 7.0 | % |
| | | | | | | | | | | | |
| | | | Total | | | 70,103,235 | | | | | |
| | | | | | | | | | | | |
| | |
| Health Care (3.0%) | | | | | | | | |
| | 55,740 | | | Abbott Laboratories | | | 2,503,284 | | | | 0.4 | % |
| | 6,590 | | | Allergan plch | | | 2,059,375 | | | | 0.3 | % |
| | 36,620 | | | Medtronic, Inc. | | | 2,816,810 | | | | 0.4 | % |
| | 53,330 | | | Merck & Company, Inc. | | | 2,816,891 | | | | 0.4 | % |
| | | | Other Securities^ | | | 10,320,836 | | | | 1.5 | % |
| | | | | | | | | | | | |
| | | | Total | | | 20,517,196 | | | | | |
| | | | | | | | | | | | |
| | |
| Industrials (3.1%) | | | | | | | | |
| | 24,430 | | | Boeing Company | | | 3,532,334 | | | | 0.5 | % |
| | 37,130 | | | Illinois Tool Works, Inc. | | | 3,441,208 | | | | 0.5 | % |
| | 31,000 | | | Macquarie Infrastructure Corporation | | | 2,250,600 | | | | 0.3 | % |
| | | | Other Securities^ | | | 12,285,525 | | | | 1.8 | % |
| | | | | | | | | | | | |
| | | | Total | | | 21,509,667 | | | | | |
| | | | | | | | | | | | |
| | |
| Information Technology (4.0%) | | | | | | | | |
| | 20,180 | | | Apple, Inc. | | | 2,124,147 | | | | 0.3 | % |
| | 55,660 | | | Microsoft Corporation | | | 3,088,017 | | | | 0.5 | % |
| | 34,730 | | | Visa, Inc. | | | 2,693,311 | | | | 0.4 | % |
| | | | Other Securities^ | | | 19,982,426 | | | | 2.8 | % |
| | | | | | | | | | | | |
| | | | Total | | | 27,887,901 | | | | | |
| | | | | | | | | | | | |
| | |
| Materials (0.8%) | | | | | | | | |
| | | | Other Securities^ | | | 5,690,756 | | | | 0.8 | % |
| | | | | | | | | | | | |
| | | | Total | | | 5,690,756 | | | | | |
| | | | | | | | | | | | |
| | |
| Telecommunications Services (0.6%) | | | | | | | | |
| | | | Other Securities^ | | | 3,993,442 | | | | 0.6 | % |
| | | | | | | | | | | | |
| | | | Total | | | 3,993,442 | | | | | |
| | | | | | | | | | | | |
| | |
| Utilities (0.7%) | | | | | | | | |
| | 59,000 | | | Brookfield Infrastructure Partners, LP | | | 2,236,690 | | | | 0.3 | % |
| | | | Other Securities^ | | | 2,404,549 | | | | 0.4 | % |
| | | | | | | | | | | | |
| | | | Total | | | 4,641,239 | | | | | |
| | | | | | | | | | | | |
| | | | Total Common Stock (cost $216,739,368) | | | 209,952,943 | | | | | |
| | | | | | | | | | | | |
| | | |
Shares | | | Preferred Stock (4.2%) | | | | | | |
| Financials (3.9%) | | | | | | | | |
| | 1,200 | | | Bank of America Corporation, Convertible, 7.250%f | | | 1,311,924 | | | | 0.2 | % |
| | 20,070 | | | Cobank ACB, 6.250%f,g | | | 2,060,312 | | | | 0.3 | % |
| | 24,000 | | | Countrywide Capital V, 7.000% | | | 615,120 | | | | 0.1 | % |
| | 86,800 | | | GMAC Capital Trust I, 8.125% | | | 2,201,248 | | | | 0.3 | % |
| | 78,200 | | | Goldman Sachs Group, Inc., 5.500%f | | | 2,024,598 | | | | 0.3 | % |
| | 72,000 | | | HSBC USA, Inc., 6.500%f | | | 1,874,160 | | | | 0.3 | % |
| | 93,000 | | | RBS Capital Funding Trust V, 5.900%f | | | 2,282,220 | | | | 0.3 | % |
The accompanying Notes to Financial Statements are an integral part of this schedule.
19
DIVERSIFIED INCOME PLUS FUND
Summary Schedule of Investments as of December 31, 2015
| | | | | | | | | | | | |
Shares | | | Preferred Stock (4.2%) | | Value | | | % of Net
Assets | |
| Financials (3.9%) – continued | | | | | | | | |
| | 1,695 | | | Wells Fargo & Company, Convertible, 7.500%f | | $ | 1,967,895 | | | | 0.3 | % |
| | | | Other Securities^ | | | 12,728,296 | | | | 1.8 | % |
| | | | | | | | | | | | |
| | | | Total | | | 27,065,773 | | | | | |
| | | | | | | | | | | | |
| | |
| Materials (0.3%) | | | | | | | | |
| | | | Other Securities^ | | | 2,161,886 | | | | 0.3 | % |
| | | | | | | | | | | | |
| | | | Total | | | 2,161,886 | | | | | |
| | | | | | | | | | | | |
| | | | Total Preferred Stock (cost $28,810,087) | | | 29,227,659 | | | | | |
| | | | | | | | | | | | |
| | | |
Shares | | | Registered Investment Companies (3.3%) | | | | | | |
| Equity Funds/ETFs (2.6%) | | | | | | | | |
| | 418,500 | | | Alerian MLP ETF | | | 5,042,925 | | | | 0.7 | % |
| | 63,010 | | | Materials Select Sector SPDR Fund | | | 2,735,894 | | | | 0.4 | % |
| | 153,400 | | | SPDR S&P Oil & Gas Exploration & Production ETF | | | 4,635,748 | | | | 0.7 | % |
| | 56,370 | | | Utilities Select Sector SPDR Fund | | | 2,439,694 | | | | 0.4 | % |
| | | | Other Securities^ | | | 2,774,054 | | | | 0.4 | % |
| | | | | | | | | | | | |
| | | | Total | | | 17,628,315 | | | | | |
| | | | | | | | | | | | |
| | |
| Fixed Income Funds/ETFs (0.7%) | | | | | | | | |
| | 37,700 | | | Vanguard Short-Term Corporate Bond ETF | | | 2,977,923 | | | | 0.4 | % |
| | | | Other Securities^ | | | 1,726,123 | | | | 0.3 | % |
| | | | | | | | | | | | |
| | | | Total | | | 4,704,046 | | | | | |
| | | | | | | | | | | | |
| | | | Total Registered Investment Companies
(cost $26,373,380) | | | 22,332,361 | | | | | |
| | | | | | | | | | | | |
| | | |
Shares | | | Collateral Held for Securities Loaned (0.1%) | | | | | | |
| | 714,690 | | | Thrivent Cash Management Trust | | | 714,690 | | | | 0.1 | % |
| | | | | | | | | | | | |
| | | | Total Collateral Held for Securities Loaned (cost $714,690) | | | 714,690 | | | | | |
| | | | | | | | | | | | |
| | | |
Shares or
Principal
Amount | | | Short-Term Investments (5.3%)i | | | | | | |
| | | | Federal National Mortgage Association Discount Notes | | | | | | | | |
| | 1,200,000 | | | 0.090% - 0.180%, 1/20/2016 – 2/8/2016j | | | 1,199,929 | | | | 0.1 | % |
| | | | Thrivent Cash Management Trust | | | | | | | | |
| | 33,870,084 | | | 0.220% | | | 33,870,084 | | | | 4.9 | % |
| | | | Other Securities^ | | | 1,899,951 | | | | 0.3 | % |
| | | | | | | | | | | | |
| | | | Total Short-Term Investments (at amortized cost) | | | 36,969,964 | | | | | |
| | | | | | | | | | | | |
| | | | Total Investments (cost $722,278,847) 101.3% | | $ | 702,684,984 | | | | | |
| | | | | | | | | | | | |
| | | | Other Assets and Liabilities, Net (1.3%) | | | (8,869,457 | ) | | | | |
| | | | | | | | | | | | |
| | | | Total Net Assets 100.0% | | $ | 693,815,527 | | | | | |
| | | | | | | | | | | | |
| ^ | The Summary Schedule of Investments shows the 50 largest holdings in unaffiliated issuers, any holding or issuer that exceeds 1% of net assets and all affiliated holdings as of the report date. The remaining securities held are grouped by category as “Other securities”. |
| a | All or a portion of the loan is unfunded. |
| b | The stated interest rate represents the weighted average of all contracts within the bank loan facility. |
| c | Denotes investments purchased on a when-issued or delayed delivery basis. |
| d | Denotes variable rate securities. Variable rate securities are securities whose yields vary with a designated market index or market rate. The rate shown is as of December 31, 2015. |
| e | Denotes interest only security. Interest only securities represent the right to receive monthly interest payments on an underlying pool of mortgages or assets. The principal shown is the outstanding par amount of the pool as of the end of the period. The actual effective yield of the security is different than the stated coupon rate. |
| f | Denotes perpetual securities. Perpetual securities pay an indefinite stream of interest, but may be called by the issuer at an earlier date. |
| g | Denotes securities sold under Rule 144A of the Securities Act of 1933, which exempts them from registration. These securities have been deemed liquid and may be resold to other dealers in the program or to other qualified institutional buyers. As of December 31, 2015, the value of these investments was $72,628,921 or 10.5% of total net assets. |
| h | Non-income producing security. |
| i | The interest rate shown reflects the yield, coupon rate or the discount rate at the date of purchase. |
| j | All or a portion of the security is held on deposit with the counterparty and pledged as the initial margin deposit for open futures contracts. |
Diversified Income Plus Fund held restricted securities as of December 31, 2015. Restricted securities are investment securities which have been deemed illiquid and cannot be offered for public sale without first being registered under the Securities Act of 1933. As of December 31, 2015, the value of these investments was $16,418,737 or 2.4% of total net assets.
The following table presents the total amount of securities loaned with continuous maturity, by type, offset by the gross payable upon return of collateral for securities loaned by Thrivent Diversified Income Plus Fund as of December 31, 2015:
Securities Lending Transactions
| | | | |
Common Stock | | $ | 675,022 | |
| | | | |
Total lending | | $ | 675,022 | |
Gross amount payable upon return of collateral for securities loaned | | $ | 714,690 | |
| | | | |
Net amounts due to counterparty | | $ | 39,668 | |
| | | | |
Definitions:
| | | | |
| ADR | | - | | American Depositary Receipt, which are certificates for an underlying foreign security’s shares held by an issuing U.S. depository bank. |
| ETF | | - | | Exchange Traded Fund. |
The accompanying Notes to Financial Statements are an integral part of this schedule.
20
DIVERSIFIED INCOME PLUS FUND
Summary Schedule of Investments as of December 31, 2015
Unrealized Appreciation (Depreciation)
Gross unrealized appreciation and depreciation of investments, based on cost for federal income tax purposes, were as follows:
| | | | |
Gross unrealized appreciation | | $ | 19,871,984 | |
Gross unrealized depreciation | | | (40,517,122 | ) |
| | | | |
Net unrealized appreciation (depreciation) | | ($ | 20,645,138 | ) |
| |
Cost for federal income tax purposes | | $ | 723,330,122 | |
The accompanying Notes to Financial Statements are an integral part of this schedule.
21
DIVERSIFIED INCOME PLUS FUND
Summary Schedule of Investments as of December 31, 2015
Fair Valuation Measurements
The following table is a summary of the inputs used, as of December 31, 2015, in valuing Diversified Income Plus Fund’s assets carried at fair value.
| | | | | | | | | | | | | | | | |
Investments in Securities | | Total | | | Level 1 | | | Level 2 | | | Level 3 | |
Bank Loans | | | | | | | | | | | | | | | | |
Basic Materials | | | 5,072,793 | | | | — | | | | 4,438,869 | | | | 633,924 | |
Capital Goods | | | 3,204,525 | | | | — | | | | 3,204,525 | | | | — | |
Communications Services | | | 28,305,463 | | | | — | | | | 26,195,901 | | | | 2,109,562 | |
Consumer Cyclical | | | 16,696,225 | | | | — | | | | 16,696,225 | | | | — | |
Consumer Non-Cyclical | | | 12,495,931 | | | | — | | | | 10,671,976 | | | | 1,823,955 | |
Energy | | | 5,151,123 | | | | — | | | | 2,148,432 | | | | 3,002,691 | |
Financials | | | 6,464,805 | | | | — | | | | 6,464,805 | | | | — | |
Technology | | | 7,095,178 | | | | — | | | | 7,092,776 | | | | 2,402 | |
Transportation | | | 4,125,090 | | | | — | | | | 4,125,090 | | | | — | |
Utilities | | | 2,418,309 | | | | — | | | | 2,418,309 | | | | — | |
Long-Term Fixed Income | | | | | | | | | | | | | | | | |
Asset-Backed Securities | | | 26,890,128 | | | | — | | | | 26,890,128 | | | | — | |
Basic Materials | | | 4,155,884 | | | | — | | | | 4,155,884 | | | | — | |
Capital Goods | | | 9,590,065 | | | | — | | | | 9,590,065 | | | | — | |
Collateralized Mortgage Obligations | | | 100,999,587 | | | | — | | | | 100,999,587 | | | | — | |
Commercial Mortgage-Backed Securities | | | 2,788,122 | | | | — | | | | 2,788,122 | | | | — | |
Communications Services | | | 15,263,966 | | | | — | | | | 15,263,966 | | | | — | |
Consumer Cyclical | | | 14,660,081 | | | | — | | | | 14,660,081 | | | | — | |
Consumer Non-Cyclical | | | 14,534,830 | | | | — | | | | 14,534,830 | | | | — | |
Energy | | | 9,834,467 | | | | — | | | | 9,834,467 | | | | — | |
Financials | | | 58,289,319 | | | | — | | | | 54,358,485 | | | | 3,930,834 | |
Foreign Government | | | 21,430,419 | | | | — | | | | 21,430,419 | | | | — | |
Mortgage-Backed Securities | | | 8,147,957 | | | | — | | | | 8,147,957 | | | | — | |
Technology | | | 8,782,431 | | | | — | | | | 8,782,431 | | | | — | |
Transportation | | | 2,872,455 | | | | — | | | | 2,872,455 | | | | — | |
U.S. Government and Agencies | | | 1,595,486 | | | | — | | | | 1,595,486 | | | | — | |
Utilities | | | 12,622,728 | | | | — | | | | 12,622,728 | | | | — | |
Common Stock | | | | | | | | | | | | | | | | |
Consumer Discretionary | | | 30,012,118 | | | | 22,663,297 | | | | 7,348,821 | | | | — | |
Consumer Staples | | | 10,968,427 | | | | 4,414,391 | | | | 6,554,036 | | | | — | |
Energy | | | 14,628,962 | | | | 13,308,243 | | | | 1,320,719 | | | | — | |
Financials | | | 70,103,235 | | | | 55,670,366 | | | | 14,432,869 | | | | — | |
Health Care | | | 20,517,196 | | | | 16,294,143 | | | | 4,223,053 | | | | — | |
Industrials | | | 21,509,667 | | | | 13,791,164 | | | | 7,718,503 | | | | — | |
Information Technology | | | 27,887,901 | | | | 24,694,997 | | | | 3,192,904 | | | | — | |
Materials | | | 5,690,756 | | | | 1,706,556 | | | | 3,984,200 | | | | — | |
Telecommunications Services | | | 3,993,442 | | | | 635,767 | | | | 3,357,675 | | | | — | |
Utilities | | | 4,641,239 | | | | 3,460,090 | | | | 1,181,149 | | | | — | |
Preferred Stock | | | | | | | | | | | | | | | | |
Financials | | | 27,065,773 | | | | 23,389,597 | | | | 3,676,176 | | | | — | |
Materials | | | 2,161,886 | | | | 2,161,886 | | | | — | | | | — | |
Registered Investment Companies | | | | | | | | | | | | | | | | |
Equity Funds/ETFs | | | 17,628,315 | | | | 17,628,315 | | | | — | | | | — | |
Fixed Income Funds/ETF’s | | | 4,704,046 | | | | 4,704,046 | | | | — | | | | — | |
Collateral Held for Securities Loaned | | | 714,690 | | | | 714,690 | | | | — | | | | — | |
Short-Term Investments | | | 36,969,964 | | | | 33,870,084 | | | | 3,099,880 | | | | — | |
| | | | | | | | | | | | | | | | |
Total | | $ | 702,684,984 | | | $ | 239,107,632 | | | $ | 452,073,984 | | | $ | 11,503,368 | |
| | | | | | | | | | | | | | | | |
| | | | |
Other Financial Instruments | | Total | | | Level 1 | | | Level 2 | | | Level 3 | |
Asset Derivatives | | | | | | | | | | | | | | | | |
Futures Contracts | | | 101,197 | | | | 101,197 | | | | — | | | | — | |
| | | | | | | | | | | | | | | | |
Total Asset Derivatives | | $ | 101,197 | | | $ | 101,197 | | | $ | — | | | $ | — | |
| | | | | | | | | | | | | | | | |
Liability Derivatives | | | | | | | | | | | | | | | | |
Futures Contracts | | | 652,429 | | | | 652,429 | | | | — | | | | — | |
| | | | | | | | | | | | | | | | |
Total Liability Derivatives | | $ | 652,429 | | | $ | 652,429 | | | $ | — | | | $ | — | |
| | | | | | | | | | | | | | | | |
There were no significant transfers between Levels during the period ended December 31, 2015. Transfers between Levels are identified as of the end of the period.
The accompanying Notes to Financial Statements are an integral part of this schedule.
22
DIVERSIFIED INCOME PLUS FUND
Summary Schedule of Investments as of December 31, 2015
The following table presents Diversified Income Plus Fund’s futures contracts held as of December 31, 2015. Investments totaling $2,799,903 were pledged as the initial margin deposit for these contracts.
| | | | | | | | | | | | | | | | | | |
Futures Contracts | | Number of
Contracts
Long/(Short) | | | Expiration Date | | Notional
Principal
Amount | | | Value | | | Unrealized
Gain/(Loss) | |
2-Yr. U.S. Treasury Bond Futures | | | (278 | ) | | March 2016 | | ($ | 60,472,826 | ) | | ($ | 60,391,158 | ) | | $ | 81,668 | |
5-Yr. U.S. Treasury Bond Futures | | | 466 | | | March 2016 | | | 55,226,084 | | | | 55,137,264 | | | | (88,820 | ) |
10-Yr. U.S. Treasury Bond Futures | | | (88 | ) | | March 2016 | | | (11,098,040 | ) | | | (11,079,750 | ) | | | 18,290 | |
30-Yr. U.S. Treasury Bond Futures | | | (19 | ) | | March 2016 | | | (2,917,926 | ) | | | (2,921,250 | ) | | | (3,324 | ) |
S&P 500 Futures | | | (65 | ) | | March 2016 | | | (32,515,168 | ) | | | (33,075,250 | ) | | | (560,082 | ) |
S&P 500 Mini-Futures | | | 7 | | | March 2016 | | | 712,593 | | | | 712,390 | | | | (203 | ) |
Ultra Long Term U.S. Treasury Bond Futures | | | 1 | | | March 2016 | | | 157,448 | | | | 158,687 | | | | 1,239 | |
Total Futures Contracts | | | | | | | | | | | | | | | | ($ | 551,232 | ) |
The following table summarizes the fair value and Statement of Assets and Liabilities location, as of December 31, 2015, for Diversified Income Plus Fund’s investments in financial derivative instruments by primary risk exposure as discussed under item (2) Significant Accounting Policies of the Notes to Financial Statements.
| | | | | | |
Derivatives by risk category | | Statement of Assets and Liabilities Location | | Fair Value | |
Asset Derivatives | | | | | | |
Interest Rate Contracts | | | | | | |
Futures* | | Net Assets - Net unrealized appreciation/(depreciation) on Futures contracts | | $ | 101,197 | |
Total Interest Rate Contracts | | | | | 101,197 | |
| | | | | | |
Total Asset Derivatives | | | | $ | 101,197 | |
| | | | | | |
Liability Derivatives | | | | | | |
Interest Rate Contracts | | | | | | |
Futures* | | Net Assets - Net unrealized appreciation/(depreciation) on Futures contracts | | | 92,144 | |
Total Interest Rate Contracts | | | | | 92,144 | |
Equity Contracts | | | | | | |
Futures* | | Net Assets - Net unrealized appreciation/(depreciation) on Futures contracts | | | 560,285 | |
Total Equity Contracts | | | | | 560,285 | |
| | | | | | |
Total Liability Derivatives | | | | $ | 652,429 | |
| | | | | | |
| * | Includes cumulative appreciation/depreciation of futures contracts as reported in the Schedule of Investments. Only current day’s variation margin is reported within the Statement of Assets and Liabilities. |
The following table summarizes the net realized gains/(losses) and Statement of Operations location, for the period ended December 31, 2015, for Diversified Income Plus Fund’s investments in financial derivative instruments by primary risk exposure.
| | | | | | |
Derivatives by risk category | | Statement of Operations Location | | Realized Gains/(Losses)
recognized in Income | |
Interest Rate Contracts | | | | | | |
Futures | | Net realized gains/(losses) on Futures contracts | | | 1,043,359 | |
Total Interest Rate Contracts | | | | | 1,043,359 | |
Equity Contracts | | | | | | |
Futures | | Net realized gains/(losses) on Futures contracts | | | 488 | |
Total Equity Contracts | | | | | 488 | |
| | | | | | |
Total | | | | $ | 1,043,847 | |
| | | | | | |
The accompanying Notes to Financial Statements are an integral part of this schedule.
23
DIVERSIFIED INCOME PLUS FUND
Summary Schedule of Investments as of December 31, 2015
The following table summarizes the change in net unrealized appreciation/(depreciation) and Statement of Operations location, for the period ended December 31, 2015, for Diversified income Plus Fund’s investments in financial derivative instruments by primary risk exposure.
| | | | | | |
Derivatives by risk category | | Statement of Operations Location | | Change in unrealized
appreciation/(depreciation)
recognized in Income | |
Interest Rate Contracts | | | | | | |
Futures | | Change in net unrealized appreciation/(depreciation) on Futures contracts | | | (496,943 | ) |
Total Interest Rate Contracts | | | | | (496,943 | ) |
Equity Contracts | | | | | | |
Futures | | Change in net unrealized appreciation/(depreciation) on Futures contracts | | | (614,109 | ) |
Total Equity Contracts | | | | | (614,109 | ) |
| | | | | | |
Total | | | | ($ | 1,111,052 | ) |
| | | | | | |
The following table presents Diversified Income Plus Fund’s average volume of derivative activity during the period ended December 31, 2015.
| | | | | | | | |
Derivative Risk Category | | Futures
(Notional)* | | | Futures
(Percentage
of
Average
Net Assets) | |
Equity Contracts | | $ | 35,987,703 | | | | 5.1 | % |
Interest Rate | | | | | | | | |
Contracts | | | 160,311,101 | | | | 22.5 | |
| * | Notional amount represents long or short, or both, derivative positions held by the Fund. |
Investment in Affiliates
Affiliated issuers, as defined under the Investment Company Act of 1940, include those in which the Fund’s holdings of an issuer represent 5% or more of the outstanding voting securities of an issuer, any affiliated mutual fund, or a company which is under common ownership or control with the Fund.
A summary of transactions for the fiscal year to date, in Diversified Income Plus Fund, is as follows:
| | | | | | | | | | | | | | | | | | | | | | | | |
Fund | | Value
December 31,
2014 | | | Gross
Purchases | | | Gross
Sales | | | Shares Held
at
December 31,
2015 | | | Value
December 31,
2015 | | | Income Earned
January 1, 2015 -
December 31, 2015 | |
Cash Management Trust- Collateral Investment | | $ | 3,898,339 | | | $ | 35,143,713 | | | $ | 38,327,362 | | | | 714,690 | | | $ | 714,690 | | | $ | 56,405 | |
Cash Management Trust- Short Term Investment | | | 65,277,133 | | | | 347,030,623 | | | | 378,437,672 | | | | 33,870,084 | | | | 33,870,084 | | | | 33,059 | |
Total Value and Income Earned | | $ | 69,175,472 | | | | | | | | | | | | | | | $ | 34,584,774 | | | $ | 89,464 | |
The accompanying Notes to Financial Statements are an integral part of this schedule.
24
(This page intentionally left blank)
25
THRIVENT MUTUAL FUNDS
Statement of Assets and Liabilities
| | | | | | | | |
As of December 31, 2015 | | Growth and
Income Plus
Fund | | | Diversified
Income Plus
Fund | |
Assets | | | | | | | | |
Investments at cost | | $ | 77,679,111 | | | $ | 722,278,847 | |
Investments in securities at value | | | 71,233,258 | | | | 668,100,210 | |
Investments in affiliates at value | | | 4,226,851 | | | | 34,584,774 | |
Investments at Value | | | 75,460,109 | | | | 702,684,984 | |
Cash | | | 16,054 | (a) | | | 112,255 | (b) |
Dividends and interest receivable | | | 249,505 | | | | 3,981,385 | |
Prepaid expenses | | | 27,378 | | | | 39,115 | |
Receivable for investments sold | | | 65,715 | | | | 842,462 | |
Receivable for fund shares sold | | | 4,236 | | | | 250,661 | |
Receivable for expense reimbursements | | | 29,267 | | | | — | |
Receivable for variation margin | | | 5,018 | | | | 378,529 | |
Total Assets | | | 75,857,282 | | | | 708,289,391 | |
Liabilities | | | | | | | | |
Accrued expenses | | | 36,588 | | | | 98,129 | |
Payable for investments purchased | | | 2,091,927 | | | | 12,648,876 | |
Payable upon return of collateral for securities loaned | | | — | | | | 714,690 | |
Payable for fund shares redeemed | | | 10,525 | | | | 372,639 | |
Payable for variation margin | | | 5,552 | | | | 56,117 | |
Payable for investment advisory fees | | | 40,790 | | | | 325,256 | |
Payable for administrative fees | | | 6,963 | | | | 16,478 | |
Payable for distribution fees | | | 15,365 | | | | 124,602 | |
Payable for transfer agent fees | | | 6,784 | | | | 38,338 | |
Payable for trustee fees | | | 204 | | | | 755 | |
Payable for trustee deferred compensation | | | 16,508 | | | | 71,986 | |
Mortgage dollar roll deferred revenue | | | 1,250 | | | | 5,998 | |
Total Liabilities | | | 2,232,456 | | | | 14,473,864 | |
Net Assets | | | | | | | | |
Capital stock (beneficial interest) | | | 76,149,306 | | | | 713,436,628 | |
Accumulated undistributed net investment income/(loss) | | | (22,292 | ) | | | 1,603,766 | |
Accumulated undistributed net realized gain/(loss) | | | (292,699 | ) | | | (1,074,966 | ) |
Net unrealized appreciation/(depreciation) on: | | | | | | | | |
Investments | | | (2,219,002 | ) | | | (19,593,863 | ) |
Futures contracts | | | 5,286 | | | | (551,232 | ) |
Foreign currency transactions | | | (1,635 | ) | | | (4,806 | ) |
Swap agreements | | | 5,862 | | | | — | |
Total Net Assets | | $ | 73,624,826 | | | $ | 693,815,527 | |
Class A Share Capital | | $ | 72,119,678 | | | $ | 585,500,135 | |
Shares of beneficial interest outstanding (Class A) | | | 7,555,338 | | | | 86,172,999 | |
Net asset value per share | | $ | 9.55 | | | $ | 6.79 | |
Maximum public offering price | | $ | 10.11 | | | $ | 7.11 | |
Institutional Class Share Capital | | $ | 1,505,148 | | | $ | 108,315,392 | |
Shares of beneficial interest outstanding (Institutional Class) | | | 157,490 | | | | 16,077,691 | |
Net asset value per share | | $ | 9.56 | | | $ | 6.74 | |
| (a) | Includes foreign currency holdings of $15,545 (cost $15,758). |
| (b) | Includes foreign currency holdings of $59,450 (cost $60,122). |
The accompanying Notes to Financial Statements are an integral part of this statement.
26
THRIVENT MUTUAL FUNDS
Statement of Operations
| | | | | | | | |
For the year ended December 31, 2015 | | Growth and
Income Plus
Fund | | | Diversified
Income Plus
Fund | |
Investment Income | | | | | | | | |
Dividends | | $ | 1,552,026 | | | $ | 9,299,714 | |
Taxable interest | | | 835,437 | | | | 20,797,172 | |
Income from mortgage dollar rolls | | | 41,657 | | | | 368,271 | |
Income from securities loaned | | | — | | | | 56,405 | |
Income from affiliated investments | | | 3,381 | | | | 33,059 | |
Foreign tax withholding | | | (60,351 | ) | | | (233,072 | ) |
Total Investment Income | | | 2,372,150 | | | | 30,321,549 | |
Expenses | | | | | | | | |
Adviser fees | | | 501,921 | | | | 3,915,689 | |
Administrative service fees | | | 83,899 | | | | 198,150 | |
Audit and legal fees | | | 37,982 | | | | 43,794 | |
Custody fees | | | 93,180 | | | | 130,024 | |
Distribution expenses Class A | | | 188,510 | | | | 1,492,582 | |
Insurance expenses | | | 4,712 | | | | 7,614 | |
Printing and postage expenses Class A | | | 27,807 | | | | 166,595 | |
Printing and postage expenses Institutional Class | | | 433 | | | | 16,426 | |
SEC and state registration expenses | | | 33,664 | | | | 82,815 | |
Transfer agent fees Class A | | | 81,096 | | | | 450,601 | |
Transfer agent fees Institutional Class | | | 1,078 | | | | 57,833 | |
Trustees’ fees | | | 6,653 | | | | 26,664 | |
Other expenses | | | 45,466 | | | | 55,361 | |
Total Expenses Before Reimbursement | | | 1,106,401 | | | | 6,644,148 | |
Less: | | | | | | | | |
Reimbursement from adviser | | | (224,739 | ) | | | — | |
| Total Net Expenses | | | 881,662 | | | | 6,644,148 | |
| Net Investment Income/(Loss) | | | 1,490,488 | | | | 23,677,401 | |
Realized and Unrealized Gains/(Losses) | | | | | | | | |
Net realized gains/(losses) on: | | | | | | | | |
Investments | | | 1,095,823 | | | | 3,226,519 | |
Distributions of realized capital gains from affiliated investments | | | 2 | | | | 13 | |
Futures contracts | | | 158,777 | | | | 1,043,847 | |
Foreign currency and forward contract transactions | | | (4,796 | ) | | | (19,933 | ) |
Swap agreements | | | (2,875 | ) | | | — | |
Change in net unrealized appreciation/(depreciation) on: | | | | | | | | |
Investments | | | (3,469,727 | ) | | | (30,630,743 | ) |
Futures contracts | | | (88,126 | ) | | | (1,111,052 | ) |
Foreign currency transactions | | | (865 | ) | | | (2,117 | ) |
Swap agreements | | | 5,862 | | | | — | |
Net Realized and Unrealized Gains/(Losses) | | | (2,305,925 | ) | | | (27,493,466 | ) |
Net Increase/(Decrease) in Net Assets Resulting From Operations | | $ | (815,437 | ) | | $ | (3,816,065 | ) |
The accompanying Notes to Financial Statements are an integral part of this statement.
27
THRIVENT MUTUAL FUNDS
Statement of Changes in Net Assets
| | | | | | | | | | | | | | | | |
| | | Growth and Income Plus Fund | | | Diversified Income Plus Fund | |
For the periods ended | | 12/31/2015 | | | 12/31/2014 | | | 12/31/2015 | | | 12/31/2014 | |
Operations | | | | | | | | | | | | | | | | |
Net investment income/(loss) | | $ | 1,490,488 | | | $ | 1,260,491 | | | $ | 23,677,401 | | | $ | 21,600,846 | |
Net realized gains/(losses) | | | 1,246,931 | | | | 2,483,764 | | | | 4,250,446 | | | | 16,071,596 | |
Change in net unrealized appreciation/(depreciation) | | | (3,552,856 | ) | | | (2,717,308 | ) | | | (31,743,912 | ) | | | (16,079,293 | ) |
Net Change in Net Assets Resulting From Operations | | | (815,437 | ) | | | 1,026,947 | | | | (3,816,065 | ) | | | 21,593,149 | |
Distributions to Shareholders | | | | | | | | | | | | | | | | |
From net investment income Class A | | | (1,445,573 | ) | | | (1,239,236 | ) | | | (20,122,834 | ) | | | (16,473,470 | ) |
From net investment income Institutional Class | | | (41,967 | ) | | | (45,097 | ) | | | (4,220,503 | ) | | | (4,015,094 | ) |
| | | | | | | | | | | | | | | | |
Total From Net Investment Income | | | (1,487,540 | ) | | | (1,284,333 | ) | | | (24,343,337 | ) | | | (20,488,564 | ) |
| | | | | | | | | | | | | | | | |
From net realized gains Class A | | | (1,330,640 | ) | | | (2,558,410 | ) | | | (2,769,924 | ) | | | (14,073,235 | ) |
From net realized gains Institutional Class | | | (27,864 | ) | | | (59,140 | ) | | | (517,423 | ) | | | (2,849,616 | ) |
| | | | | | | | | | | | | | | | |
Total From Net Realized Gains | | | (1,358,504 | ) | | | (2,617,550 | ) | | | (3,287,347 | ) | | | (16,922,851 | ) |
| | | | | | | | | | | | | | | | |
From return of capital Class A | | | (41,792 | ) | | | — | | | | — | | | | — | |
From return of capital Institutional Class | | | (954 | ) | | | — | | | | — | | | | — | |
| | | | | | | | | | | | | | | | |
Total From Return of Capital | | | (42,746 | ) | | | — | | | | — | | | | — | |
| | | | | | | | | | | | | | | | |
Total Distributions to Shareholders | | | (2,888,790 | ) | | | (3,901,883 | ) | | | (27,630,684 | ) | | | (37,411,415 | ) |
Capital Stock Transactions Class A | | | | | | | | | | | | | | | | |
Sold | | | 11,176,229 | | | | 36,115,273 | | | | 98,370,305 | | | | 174,763,842 | |
Distributions reinvested | | | 2,701,932 | | | | 3,645,176 | | | | 20,547,070 | | | | 27,843,997 | |
Redeemed | | | (14,592,625 | ) | | | (10,313,535 | ) | | | (88,661,786 | ) | | | (66,659,322 | ) |
| | | | | | | | | | | | | | | | |
Total Class A Capital Stock Transactions | | | (714,464 | ) | | | 29,446,914 | | | | 30,255,589 | | | | 135,948,517 | |
| | | | | | | | | | | | | | | | |
Institutional Class | | | | | | | | | | | | | | | | |
Sold | | | 843,740 | | | | 733,901 | | | | 36,529,007 | | | | 48,466,474 | |
Distributions reinvested | | | 60,437 | | | | 98,237 | | | | 4,680,060 | | | | 6,789,078 | |
Redeemed | | | (1,085,378 | ) | | | (1,310,493 | ) | | | (44,105,282 | ) | | | (44,040,301 | ) |
| | | | | | | | | | | | | | | | |
Total Institutional Class Capital Stock Transactions | | | (181,201 | ) | | | (478,355 | ) | | | (2,896,215 | ) | | | 11,215,251 | |
| | | | | | | | | | | | | | | | |
Capital Stock Transactions | | | (895,665 | ) | | | 28,968,559 | | | | 27,359,374 | | | | 147,163,768 | |
Net Increase/(Decrease) in Net Assets | | | (4,599,892 | ) | | | 26,093,623 | | | | (4,087,375 | ) | | | 131,345,502 | |
Net Assets, Beginning of Period | | | 78,224,718 | | | | 52,131,095 | | | | 697,902,902 | | | | 566,557,400 | |
Net Assets, End of Period | | $ | 73,624,826 | | | $ | 78,224,718 | | | $ | 693,815,527 | | | $ | 697,902,902 | |
Accumulated Undistributed Net Investment Income/(Loss) | | $ | (22,292 | ) | | $ | (14,049 | ) | | $ | 1,603,766 | | | $ | 1,430,593 | |
Capital Stock Share Transactions | | | | | | | | | | | | | | | | |
Class A shares | | | | | | | | | | | | | | | | |
Sold | | | 1,106,202 | | | | 3,457,687 | | | | 13,863,237 | | | | 23,828,980 | |
Distributions reinvested | | | 277,376 | | | | 360,497 | | | | 2,924,247 | | | | 3,864,523 | |
Redeemed | | | (1,448,321 | ) | | | (997,017 | ) | | | (12,546,117 | ) | | | (9,116,870 | ) |
| | | | | | | | | | | | | | | | |
Total Class A shares | | | (64,743 | ) | | | 2,821,167 | | | | 4,241,367 | | | | 18,576,633 | |
| | | | | | | | | | | | | | | | |
Institutional Class shares | | | | | | | | | | | | | | | | |
Sold | | | 84,324 | | | | 70,275 | | | | 5,202,465 | | | | 6,683,564 | |
Distributions reinvested | | | 6,149 | | | | 9,661 | | | | 671,011 | | | | 948,339 | |
Redeemed | | | (108,898 | ) | | | (125,980 | ) | | | (6,290,858 | ) | | | (6,083,130 | ) |
| | | | | | | | | | | | | | | | |
Total Institutional Class shares | | | (18,425 | ) | | | (46,044 | ) | | | (417,382 | ) | | | 1,548,773 | |
| | | | | | | | | | | | | | | | |
The accompanying Notes to Financial Statements are an integral part of this statement.
28
THRIVENT MUTUAL FUNDS
NOTESTO FINANCIAL STATEMENTS
December 31, 2015
(1) ORGANIZATION
Thrivent Mutual Funds (the “Trust”) was organized as a Massachusetts Business Trust on March 10, 1987 and is registered as an open-end management investment company under the Investment Company Act of 1940 (the “1940 Act”). The Trust is divided into twenty-one separate series each with its own investment objective and policies. The Trust currently consists of four asset allocation funds, four income plus funds, seven equity funds, five fixed-income funds, and one money market fund.
This shareholder report includes Thrivent Growth and Income Plus Fund and Thrivent Diversified Income Plus Fund (each, a “Fund” and, collectively, the “Funds”), two of the Trust’s twenty-one Funds. The other Funds of the Trust have a fiscal year-end of October 31 and are presented under a separate shareholder report.
The Funds are each investment companies that follow the accounting and reporting guidance of the Financial Accounting Standards Board (FASB) Accounting Standard Codification Topic 946—Financial Services—Investment Companies.
(A) Share Classes – As of December 31, 2015, the Trust includes two classes of shares: Class A and Institutional Class. The classes of shares differ principally in their respective distribution expenses and other class-specific expenses and arrangements. Class A shares have a 0.25% annual 12b-1 fee and a maximum front-end sales load of 5.50% for equity funds and 4.50% for fixed-income funds, although some of the fixed-income funds have reduced 12b-1 fees and either a lower or no front-end sales load. Institutional Class shares are offered at net asset value and have no annual 12b-1 fees. The share classes have identical rights to earnings, assets and voting privileges, except for class-specific expenses and exclusive rights to vote on matters affecting only individual classes. All 21 Funds of the Trust offer Class A and Institutional Class shares. Effective February 1, 2016, Institutional Class shares were renamed Class S shares. Effective February 29, 2016, Class A Shares are closed to new shareholders and are open to current Class A shareholders and others who reside at the same mailing address (“household”). Effective February 29, 2016, the maximum front-end sales charge imposed on Class A Shares of equity funds has been changed from 5.50% to 4.50%. Please refer to the Supplement to Class A Shares Prospectus dated February 12, 2016 for additional information.
(B) Other – Under the Trust’s organizational documents, its officers and trustees are indemnified against certain liabilities arising out of the performance of their duties to the Trust. In addition, in the normal course of business, the Trust enters into contracts with vendors and others that provide general damage clauses. The Trust’s maximum exposure under these contracts is unknown, as this would involve future claims that may be made against the Trust. However, based on experience, the Trust expects the risk of loss to be remote.
(2) SIGNIFICANT ACCOUNTING POLICIES
(A) Valuation of Investments – Securities traded on U.S. or foreign securities exchanges or included in a national market system are valued at the official closing price at the close of each business day unless otherwise stated below. Over-the-counter securities and listed securities for which no price is readily available are valued at the current bid price considered best to represent the value at that time. Security prices are based on quotes that are obtained from an independent pricing service approved by the Trust’s Board of Trustees (“Board”). The pricing service, in determining values of fixed-income securities, takes into consideration such factors as current quotations by broker/dealers, coupon, maturity, quality, type of issue, trading characteristics, and other yield and risk factors it deems relevant in determining valuations. Securities which cannot be valued by the approved pricing service are valued using valuations obtained from dealers that make markets in the securities. Exchange-listed options and futures contracts are valued at the last quoted sales price. Swap agreements are valued at the latest bid quotation of the contract as furnished by an independent pricing service. Forward foreign currency exchange contracts are marked-to-market based upon foreign currency exchange rates provided by the pricing service. Investments in open-ended mutual funds are valued at the net asset value at the close of each business day. Short-term securities are valued at amortized cost (which approximates market value) to the extent it is not materially different than market value.
The Board has delegated responsibility for daily valuation of the Funds’ securities to the Adviser. The Adviser has formed a Valuation Committee (“Committee”) that is responsible for overseeing the Fund valuation policies in accordance with Valuation Policies and Procedures. The Committee meets on a monthly and on an as-needed basis to review price challenges, price overrides, stale prices, shadow prices, manual prices, money market pricing, international fair valuation, and other securities requiring fair valuation.
The Committee monitors for significant events occurring prior to the close of trading on the New York Stock Exchange that could have a material impact on the value of any securities that are held by the Funds. Examples of such events include trading halts, national news/events, and issuer-specific developments. If the Committee decides that such events warrant using fair value estimates, the Committee will take such events into consideration in determining the fair value of such securities. If market quotations or prices are not readily available or determined to be unreliable, the securities will be valued at fair value as determined in good faith pursuant to procedures adopted by the Board.
29
THRIVENT MUTUAL FUNDS
NOTESTO FINANCIAL STATEMENTS
December 31, 2015
In accordance with U.S. Generally Accepted Accounting Principles (“GAAP”), the various inputs used to determine the fair value of the Funds’ investments are summarized in three broad levels. Level 1 includes quoted prices in active markets for identical securities, typically included in this level are U.S. equity securities, futures, options and registered investment company funds. Level 2 includes other significant observable inputs such as quoted prices for similar securities, interest rates, prepayment speeds and credit risk, typically included in this level are fixed income securities, international securities, swaps and forward contracts. Level 3 includes significant unobservable inputs such as the Adviser’s own assumptions and broker evaluations in determining the fair value of investments. Of the Level 3 securities, those for which market values were not readily available or were deemed unreliable were fair valued as determined in good faith under procedures established by the Board. The valuation levels are not necessarily an indication of the risk associated with investing in these securities or other investments.
Valuation of International Securities – Because many foreign markets close before the U.S. markets, events may occur between the close of the foreign markets and the close of the U.S. markets that could have a material impact on the valuation of foreign securities. The Funds, under the supervision of the Board, evaluate the impacts of these events and may adjust the valuation of foreign securities to reflect fair value as of the close of the U.S. markets. The Board has authorized the Adviser to make fair valuation determinations pursuant to policies approved by the Board.
(B) Foreign Currency Translation – The accounting records of each Fund are maintained in U.S. dollars. Securities and other assets and liabilities that are denominated in foreign currencies are translated into U.S. dollars at the daily closing rates of exchange.
Foreign currency amounts related to the purchase or sale of securities and income and expenses are translated at the exchange rate on the transaction date. Net realized and unrealized currency gains and losses are recorded from closed currency contracts, disposition of foreign currencies, exchange gains or losses between the trade date and settlement date on securities transactions, and other translation gains or losses on dividends, interest income and foreign withholding taxes. The Funds do not separately report the effect of changes in foreign exchange rates from changes in prices on securities held. Such changes are included in net realized and unrealized gain or loss from investments in the Statement of Operations.
For federal income tax purposes, the Funds treat the effect of changes in foreign exchange rates arising from actual foreign currency transactions and the changes in foreign exchange rates between the trade date and settlement date as ordinary income.
(C) Foreign Denominated Investments – Foreign denominated assets and currency contracts may involve more risks than domestic transactions including currency risk, political and economic risk, regulatory risk, and market risk. Certain Funds may also invest in securities of companies located in emerging markets. Future economic or political developments could adversely affect the liquidity or value, or both, of such securities.
(D) Federal Income Taxes – No provision has been made for income taxes because each Fund’s policy is to qualify as a regulated investment company under the Internal Revenue Code and distribute substantially all investment company taxable income and net capital gain on a timely basis. It is also the intention of each Fund to distribute an amount sufficient to avoid imposition of any federal excise tax. The Funds, accordingly, anticipate paying no federal taxes and no federal tax provision was recorded. Each Fund is treated as a separate taxable entity for federal income tax purposes. Certain Funds may utilize earnings and profits distributed to shareholders on the redemption of shares as part of the dividends paid deduction.
GAAP requires management of the Funds (i.e., the Adviser) to make additional tax disclosures with respect to the tax effects of certain income tax positions, whether those positions were taken on previously filed tax returns or are expected to be taken on future returns. These positions must meet a “more likely than not” standard that, based on the technical merits of the position, would have a greater than 50 percent likelihood of being sustained upon examination. In evaluating whether a tax position has met the more-likely-than-not recognition threshold, the Adviser must presume that the position will be examined by the appropriate taxing authority that has full knowledge of all relevant information.
The Adviser analyzed all open tax years, as defined by the statute of limitations, for all major jurisdictions. Open tax years are those that are open for examination by taxing authorities. Major jurisdictions for the Funds include U.S. Federal, Minnesota, Wisconsin, and Massachusetts as well as certain foreign countries. As of December 31, 2015, open U.S. Federal, Minnesota, Wisconsin and Massachusetts tax years include the tax years ended December 31, 2012 through 2015. Additionally, as of December 31, 2015, the tax year ended December 31, 2011 is open for Wisconsin. The Funds have no examinations in progress and none are expected at this time.
As of December 31, 2015, the Adviser has reviewed all open tax years and major jurisdictions and concluded that there is no effect to the Funds’ tax liability, financial position or results of operations. There is no tax liability resulting from unrecognized tax benefits related to uncertain income tax positions taken or expected to be taken in future tax returns. The Funds are also not aware of any tax positions for which it is reasonably possible that the total amounts of unrecognized tax benefits will significantly change in the next 12 months.
30
THRIVENT MUTUAL FUNDS
NOTESTO FINANCIAL STATEMENTS
December 31, 2015
Foreign Income Taxes – Funds are subject to foreign income taxes imposed by certain countries in which they invest. Withholding taxes on foreign dividends have been provided for in accordance with the applicable country’s tax rules and rates. These amounts are shown as foreign tax withholding on the Statement of Operations. The Funds pay tax on foreign capital gains, where applicable.
(E) Expenses and Income – Estimated expenses are accrued daily. The Funds are charged for those expenses that are directly attributable to them. Expenses that are not directly attributable to a Fund are allocated among all appropriate Funds in proportion to their respective net assets, number of shareholder accounts or other reasonable basis. Net investment income, expenses which are not class-specific, and realized and unrealized gains and losses are allocated directly to each class based upon the relative net asset value of outstanding shares.
Interest income is recorded daily on all debt securities, as is accretion of market discount and original issue discount and amortization of premium. Paydown gains and losses on mortgage- and asset-backed securities are recorded as components of interest income. Dividend income is recorded on the ex-dividend date. However, in certain foreign market where declaration of the dividend follows the ex-dividend date, the dividend will be recorded as soon as the Fund is informed of the declaration date.
For certain securities, including real estate investment trusts, the Trust records distributions received in excess of income as a reduction of cost of investments and/or realized gain. Such amounts are based on estimates if actual amounts are not available. Actual amounts of income, realized gain and return of capital may differ from the estimated amounts. The Trust adjusts the estimated amounts of the components of distributions as adjustments to investment income, unrealized appreciation/depreciation and realized gain/ loss on investments as necessary, once the issuers provide information about the actual composition of the distributions.
(F) Distributions to Shareholders – Net investment income is distributed to each shareholder as a dividend. Dividends from Growth and Income Plus Fund are declared and paid quarterly. Dividends from Diversified Income Plus Fund are declared and paid monthly. Additionally, it is possible that such dividends may be reclassified as return of capital or capital gains after year end. Such determination cannot be made until tax information is received from the real estate investments of the Fund. Net realized gains from securities transactions, if any, are distributed at least annually.
(G) Derivative Financial Instruments – Each of the Funds may invest in derivatives. Derivatives, a category that includes options, futures, swaps and hybrid instruments, are financial instruments whose value is derived from another security, an index or a currency. Each Fund may use derivatives for hedging (attempting to offset a potential loss in one position by establishing an interest in an opposite position). This includes the use of currency-based derivatives to manage the risk of its positions in foreign securities. Each Fund may also use derivatives for replication of a certain asset class or speculation (investing for potential income or capital gain). These contracts may be transacted on an exchange or over-the-counter (OTC).
A derivative may incur a mark to market loss if the value of the derivative decreases due to an unfavorable change in the market rates or values of the underlying derivative. Losses can also occur if the counterparty does not perform under the derivative. A Fund’s risk of loss from the counterparty credit risk on OTC derivatives is generally limited to the aggregate unrealized gain netted against any collateral held by such Fund. With exchange traded futures and centrally cleared swaps, there is minimal counterparty credit risk to the Funds because the exchange’s clearinghouse, as counterparty to such derivatives, guarantees against a possible default. The clearinghouse stands between the buyer and the seller of the derivative; thus, the credit risk is limited to the failure of the clearinghouse. However, credit risk still exists in exchange traded futures and centrally cleared swaps with respect to initial and variation margin that is held in a broker’s customer accounts. While brokers are required to segregate customer margin from their own assets, in the event that a broker becomes insolvent or goes into bankruptcy and at that time there is a shortfall in the aggregate amount of margin held by the broker for all its clients, U.S. bankruptcy laws will typically allocate that shortfall on a pro-rata basis across all the broker’s customers, potentially resulting in losses to the Funds. Using derivatives to hedge can guard against potential risks, but it also adds to the Funds’ expenses and can eliminate some opportunities for gains. In addition, a derivative used for mitigating exposure or replication may not accurately track the value of the underlying asset. Another risk with derivatives is that some types can amplify a gain or loss, potentially earning or losing substantially more money than the actual cost of the derivative.
In order to define their contractual rights and to secure rights that will help the Funds mitigate their counterparty risk, the Funds may enter into an International Swaps and Derivatives Association, Inc. Master Agreement (“ISDA Master Agreement”) or similar agreement with its derivative contract counterparties. An ISDA Master Agreement is a bilateral agreement between a Fund and a counterparty that governs OTC derivatives and foreign exchange contracts and typically includes, among other things, collateral posting terms and netting provisions in the event of a default and/or termination event. Under an ISDA Master Agreement, each Fund may, under certain circumstances, offset with the counterparty
31
THRIVENT MUTUAL FUNDS
NOTESTO FINANCIAL STATEMENTS
December 31, 2015
certain derivatives’ payables and/or receivables with collateral held and/or posted and create one single net payment. The provisions of the ISDA Master Agreement typically permit a single net payment in the event of a default (close-out netting) including the bankruptcy or insolvency of the counterparty. Note, however, that bankruptcy and insolvency laws of a particular jurisdiction may impose restrictions on or prohibitions against the right of offset in bankruptcy, insolvency or other events.
Collateral and margin requirements vary by type of derivative. Margin requirements are established by the broker or clearing house for exchange traded and centrally cleared derivatives (futures, options, and centrally cleared swaps). Brokers can ask for margining in excess of the minimum in certain situations. Collateral terms are contract specific for OTC derivatives (foreign currency exchange contracts, options and swaps). For derivatives traded under an ISDA Master Agreement, the collateral requirements are typically calculated by netting the mark to market amount for each transaction under such agreement and comparing that amount to the value of any collateral currently pledged by the Fund and the counterparty. For financial reporting purposes, non-cash collateral that has been pledged to cover obligations of the Fund has been noted in the Schedule of Investments. To the extent amounts due to the Fund from its counterparties are not fully collateralized, contractually or otherwise, the Fund bears the risk of loss from counterparty nonperformance. The Funds attempt to mitigate counterparty risk by only entering into agreements with counterparties that they believe have the financial resources to honor their obligations and by monitoring the financial stability of those counterparties.
Options – Each of the Funds may buy put and call options and write put and covered call options. The Funds intend to use such derivative instruments as hedges to facilitate buying or selling securities or to provide protection against adverse movements in security prices or interest rates. The Funds may also enter into options contracts to protect against adverse foreign exchange rate fluctuations. Option contracts are valued daily and unrealized appreciation or depreciation is recorded. A Fund will realize a gain or loss upon expiration or closing of the option transaction. When an option is exercised, the proceeds upon sale for a written call option or the cost of a security for purchased put and call options is adjusted by the amount of premium received or paid.
Buying put options tends to decrease a Fund’s exposure to the underlying security while buying call options tends to increase a Fund’s exposure to the underlying security. The risk associated with purchasing put and call options is limited to the premium paid. There is no significant counterparty risk on exchange-traded options as the exchange guarantees the contract against default. Writing put options tends to increase a Fund’s exposure to the underlying security while writing call options tends to decrease a Fund’s exposure to the underlying security. The writer of an option has no control over whether the underlying security may be bought or sold, and therefore bears the market risk of an unfavorable change in the price of the underlying security. The counterparty risk for purchased options arises when a Fund has purchased an option, exercises that option, and the counterparty doesn’t buy from the Fund or sell to the Fund the underlying asset as required. In the case where a Fund has written an option, the Fund doesn’t have counterparty risk. Counterparty risk on purchased over-the-counter options is partially mitigated by the Fund’s collateral posting requirements. As the option increases in value to the Fund, the Fund receives collateral from the counterparty. Risks of loss may exceed amounts recognized on the Statement of Assets and Liabilities.
Futures Contracts – Each of the Funds may use futures contracts to manage the exposure to interest rate and market or currency fluctuations. Gains or losses on futures contracts can offset changes in the yield of securities. When a futures contract is opened, cash or other investments equal to the required “initial margin deposit” are held on deposit with and pledged to the broker. Additional securities held by the Funds may be earmarked to cover open futures contracts. The futures contract’s daily change in value (“variation margin”) is either paid to or received from the broker, and is recorded as an unrealized gain or loss. When the contract is closed, realized gain or loss is recorded equal to the difference between the value of the contract when opened and the value of the contract when closed. Futures contracts involve, to varying degrees, risk of loss in excess of the variation margin disclosed in the Statement of Assets and Liabilities. Exchange-traded futures have no significant counterparty risk as the exchange guarantees the contracts against default.
Foreign Currency Forward Contracts – In connection with purchases and sales of securities denominated in foreign currencies all Funds may enter into foreign currency forward contracts. Additionally, the Funds may enter into such contracts to mitigate currency and counterparty exposure to other foreign-currency-denominated investments. These contracts are recorded at value and the related realized and change in unrealized foreign exchange gains and losses are included in the Statement of Operations. In the event that counterparties fail to settle these forward contracts, the Funds could be exposed to foreign currency fluctuations. Foreign currency contracts are valued daily and unrealized appreciation or depreciation is recorded daily as the difference between the contract exchange rate and the closing forward rate applied to the face amount of the contract. A realized gain or loss is recorded at the time a forward contract is closed. These contracts are over-the-counter and the Fund is exposed to counterparty risk equal to the discounted net amount of payments to the Fund.
32
THRIVENT MUTUAL FUNDS
NOTESTO FINANCIAL STATEMENTS
December 31, 2015
Swap Agreements – Each of the Funds may enter into swap transactions, which involve swapping one or more investment characteristics of a security or a basket of securities with another party. Such transactions include market risk, risk of default by the other party to the transaction, risk of imperfect correlation and manager risk and may involve commissions or other costs. Swap transactions generally do not involve delivery of securities, other underlying assets or principal. Accordingly, the risk of loss with respect to swap transactions is generally limited to the net amount of payments that the Fund is contractually obligated to make, or in the case of the counterparty defaulting, the net amount of payments that the Fund is contractually entitled to receive. Risks of loss may exceed amounts recognized on the Statement of Assets and Liabilities. If there is a default by the counterparty, the Fund may have contractual remedies pursuant to the agreements related to the transaction. The contracts are valued daily and unrealized appreciation or depreciation is recorded. Swap agreements are valued at fair value of the contract as provided by an independent pricing service. The pricing service takes into account such factors as swap curves, default probabilities, recent trades, recovery rates and other factors it deems relevant in determining valuations. Daily fluctuations in the value of the centrally cleared credit default contracts are recorded in variation margin in the Statement of Assets and Liabilities and recorded as unrealized gain or loss. The Fund accrues for the periodic payment and amortizes upfront payments, if any, on swap agreements on a daily basis with the net amount recorded as realized gains or losses in the Statement of Operations. Receipts and payments received or made as a result of a credit event or termination of the contract are also recognized as realized gains or losses in the Statement of Operations. Collateral, in the form of cash or securities, may be required to be held with the Fund’s custodian, or a third party, in connection with these agreements. Certain swap agreements are over-the-counter and the Fund is exposed to counterparty risk, which is the discounted net amount of payments owed to the Fund. This risk is partially mitigated by the Fund’s collateral posting requirements. As the swap increases in value to the Fund, the Fund receives collateral from the counterparty. Certain interest rate and credit default index swaps must be cleared through a clearinghouse or central counterparty.
Credit Default Swaps – A credit default swap is a swap agreement between two parties to exchange the credit risk of a particular issuer, basket of securities or reference entity. In a credit default swap transaction, a buyer pays periodic fees in return for payment by the seller which is contingent upon an adverse credit event occurring in the underlying issuer or reference entity. The seller collects periodic fees from the buyer and profits if the credit of the underlying issuer or reference entity remains stable or improves while the swap is outstanding, but the seller in a credit default swap contract would be required to pay the amount of credit loss, determined as specified in the agreement, to the buyer in the event of an adverse credit event in the reference entity. A buyer of a credit default swap is said to buy protection whereas a seller of a credit default swap is said to sell protection. The Funds may be either the protection seller or the protection buyer.
Certain Funds enter into credit default derivative contracts directly through credit default swaps (CDS) or through credit default swap indices (CDX Indices). CDX indices are static pools of equally weighted credit default swaps referencing corporate bonds and/or loans designed to provide diversified credit exposure to these asset classes. Funds sell default protection and assume long-risk positions in individual credits or indices. Index positions are entered into to gain exposure to the corporate bond and/or loan markets in a cost-efficient and diversified structure. In the event that a position defaults, by going into bankruptcy and failing to pay interest or principal on borrowed money, within any given CDX Index held, the maximum potential amount of future payments required would be equal to the pro-rata share of that position within the index based on the notional amount of the index. In the event of a default under a CDS contract the maximum potential amount of future payments would be the notional amount. For CDS, the default events could be bankruptcy and failing to pay interest or principal on borrowed money or a restructuring. A restructuring is a change in the underlying obligations which would include reduction in interest or principal, maturity extension and subordination to other obligations.
For financial reporting purposes the Funds do not offset derivative assets and derivative liabilities that are subject to netting arrangements in the Statement of Assets and Liabilities.
33
THRIVENT MUTUAL FUNDS
NOTESTO FINANCIAL STATEMENTS
December 31, 2015
The amounts presented in the tables below are offset first by financial instruments that have the right to offset under master netting or similar arrangements, then any remaining amount is reduced by cash and non-cash collateral received/pledged. The actual amounts of collateral may be greater than the amounts presented in the tables.
The following table presents the gross and net information about assets subject to master netting arrangements, as presented in the Statement of Assets and Liabilities:
| | | | | | | | | | | | | | | | | | | | | | | | | | | | |
| | | | | | | | | | | | Gross Amounts Not Offset in the Statement of Assets and Liabilities | | | | |
Fund | | Gross Amounts
of Recognized
Assets | | | Gross
Amounts
Offset | | | Net Amounts
of
Recognized
Assets | | | Financial
Instruments | | | Cash
Collateral
Received | | | Non-Cash
Collateral
Received | | | Net
Amount | |
Growth and Income Plus | | | | | | | | | | | | | | | | | | | | | | | | | | | | |
Futures Contracts | | | 4,828 | | | | — | | | | 4,828 | | | | 4,828 | | | | — | | | | — | | | | — | |
Swap Credit Contracts | | | 190 | | | | — | | | | 190 | | | | — | | | | — | | | | — | | | | 190 | (*) |
Diversified income Pius | | | | | | | | | | | | | | | | | | | | | | | | | | | | |
Futures Contracts | | | 378,529 | | | | — | | | | 378,529 | | | | 56,117 | | | | — | | | | — | | | | 322,412 | (†) |
| (*) | Net swap credit contracts amount represents the net amount receivable from the counterparty in the event of a default. |
| (†) | Net futures amount represents the net amount receivable from the counterparty in the event of a default. |
The following table presents the gross and net information about liabilities subject to master netting arrangements, as presented in the Statement of Assets and Liabilities:
| | | | | | | | | | | | | | | | | | | | | | | | | | | | |
| | | | | | | | | | | | Gross Amounts Not Offset in the
Statement of Assets and Liabilities | | | | |
Fund | | Gross Amounts
of Recognized
Liabilities | | | Gross
Amounts
Offset | | | Net Amounts
of
Recognized
Liabilities | | | Financial
Instruments | | | Cash
Collateral
Pledged | | | Non-Cash
Collateral
Pledged** | | | Net
Amount | |
Growth and Income Plus | | | | | | | | | | | | | | | | | | | | | | | | | | | | |
Futures Contracts | | | 5,552 | | | | — | | | | 5,552 | | | | 4,828 | | | | — | | | | 724 | | | | — | |
Diversified income Pius | | | | | | | | | | | | | | | | | | | | | | | | | | | | |
Futures Contracts | | | 56,117 | | | | — | | | | 56,117 | | | | 56,117 | | | | — | | | | — | | | | — | |
Securities Lending | | | 714,690 | | | | — | | | | 714,690 | | | | 675,022 | | | | — | | | | — | | | | 39,668 | Ù |
| ** | Excess of collateral pledged to the counterparty may not be shown for financial reporting purposes. |
| Ù | Net securities lending amounts represent the net amount payable from the counterparty in the event of a default. |
(H) Mortgage Dollar Roll Transactions — Certain Funds enter into dollar roll transactions on securities issued or to be issued by the Government National Mortgage Association, Federal National Mortgage Association and Federal Home Loan Mortgage Corporation, in which the Funds sell mortgage securities and simultaneously agree to repurchase similar (same type and coupon) securities at a later date at an agreed upon price. The Funds must maintain liquid securities having a value at least equal to the repurchase price (including accrued interest) for such dollar rolls. In addition, the Funds are required to segregate collateral with the fund custodian—depending on market movements—on their mortgage dollar rolls. The value of the securities that the Funds are required to purchase may decline below the agreed upon repurchase price of those securities.
During the period between the sale and repurchase, the Funds forgo principal and interest paid on the mortgage securities sold. The Funds are compensated from negotiated fees paid by brokers offered as an inducement to the Funds to “roll over” their purchase commitments, thus enhancing the yield. Mortgage dollar rolls may be renewed with a new purchase and repurchase price and a cash settlement made on settlement date without physical delivery of the securities subject to the contract. The fees received are recognized over the roll period and are included in Income from mortgage dollar rolls in the Statement of Operations.
(I) Securities Lending — The Trust has entered into a Securities Lending Agreement (the “Agreement”) with Deutsche Bank AG (“Deutsche”). The Agreement authorizes Deutsche to lend securities to authorized borrowers on behalf of the Funds. Pursuant to the Agreement, all loaned securities are initially collateralized by cash equal to at least 102% of the value of the loaned securities. Daily market fluctuations could cause the value of loaned securities to be more or less that the value of the collateral received. Any additional collateral is adjusted and settled on the next business day. The Trust
34
THRIVENT MUTUAL FUNDS
NOTESTO FINANCIAL STATEMENTS
December 31, 2015
has the ability to recall the loans at any time and could do so in order to vote proxies or sell the loaned securities. All cash collateral received is invested in Thrivent Cash Management Trust. The Funds receive dividends and interest that would have been earned on the securities loaned while simultaneously seeking to earn income on the investment of cash collateral. Amounts earned on investments in Thrivent Cash Management Trust, net of rebates, fees paid to Deutsche for services provided and any other securities lending expenses, are included in Income from securities loaned on the Statement of Operations. By investing any cash collateral it receives in these transactions, a Portfolio could realize additional gains or losses. If the borrower fails to return the securities or the invested collateral has declined in value, the Fund could lose money. Generally, in the event of borrower default, the Portfolio has the right to use the collateral to offset any losses incurred. However, in the event the Fund is delayed or prevented from exercising its right to dispose of the collateral, there may be a potential loss. Some of these losses may be indemnified by the lending agent.
As of December 31, 2015, the value of securities on loan is as follows:
| | | | |
Fund | | Securities on
Loan | |
Diversified Income Plus | | $ | 675,022 | |
(J) When-Issued and Delayed Delivery Transactions —Each Fund may purchase or sell securities on a when-issued or delayed delivery basis. These transactions involve a commitment by a Fund to purchase or sell securities for a predetermined price or yield, with payment and delivery taking place beyond the customary settlement period. When delayed delivery purchases are outstanding, a Fund will designate liquid assets in an amount sufficient to meet the purchase price. When purchasing a security on a delayed delivery basis, a Fund assumes the rights and risks of ownership of the security, including the risk of price and yield fluctuations, and takes such fluctuations into account when determining its net asset value. A Fund may dispose of a delayed delivery transaction after it is entered into, and may sell when-issued securities before they are delivered, which may result in a capital gain or loss. When a Fund has sold a security on a delayed delivery basis, a Fund does not participate in future gains and losses with respect to the security.
(K) Treasury Inflation Protected Securities — Certain Funds may invest in treasury inflation protected securities (TIPS). These securities are fixed income securities whose principal value is periodically adjusted to the rate of inflation. The coupon interest rate is generally fixed at issuance. Interest is paid based on the principal value, which is adjusted for inflation. Any increase in the principal amount will be included as taxable interest in the Statement of Operations and received in cash upon maturity or sale of the security.
(L) Repurchase Agreements — Each Fund may engage in repurchase agreement transactions in pursuit of its investment objective. A repurchase agreement consists of a purchase and a simultaneous agreement to resell an investment for later delivery at an agreed upon price and rate of interest. The Fund uses a third-party custodian to maintain the collateral. If the original seller of a security subject to a repurchase agreement fails to repurchase the security at the agreed upon time, the Fund could incur a loss due to a drop in the value of the security during the time it takes the Fund to either sell the security or take action to enforce the original seller’s agreement to repurchase the security. Also, if a defaulting original seller filed for bankruptcy or became insolvent, disposition of such security might be delayed by pending legal action. The Fund may only enter into repurchase agreements with banks and other recognized financial institutions such as broker/dealers that are found by the Adviser or subadviser to be creditworthy. During the year ended December 31, 2015, none of the Funds engaged in these types of investments.
(M) Equity-Linked Structured Securities — Certain Funds may invest in equity-linked structured notes. Equity-linked structured notes are debt securities which combine the characteristics of common stock and the sale of an option. The return component is based upon the performance of a single equity security, a basket of equity securities, or an equity index and the sale of an option. There is no guaranteed return of principal with these securities. The appreciation potential of these securities may be limited by a maximum payment or call right and can be influenced by many unpredictable factors. In addition to the performance of the equity, the nature and credit of the issuer may also impact return. During the year ended, December 31, 2015, none of the Funds engaged in these types of transactions.
(N) Stripped Securities — Certain Funds may invest in Interest Only and Principal Only stripped mortgage or asset backed securities. These securities represent a participation in securities that are structured in classes with rights to receive different portions of the interest and principal. Interest only securities receive all the interest and principal only securities receive all the principal. If the underlying pool of mortgages or assets experience greater than anticipated prepayments of principal, the Fund may not fully recoup its initial investment in an interest only security. Principal only securities increase in value if prepayments are greater than anticipated and decline if prepayments are slower than anticipated. The market value of these securities is highly sensitive to changes in interest rates. As interest rates increase, the price of the principal only security decreases. Similarly, as interest rates decrease, the price of the principal only security increases. The principal only security represents the payment with the longest maturity, therefore making it the most sensitive to interest rate changes.
35
THRIVENT MUTUAL FUNDS
NOTESTO FINANCIAL STATEMENTS
December 31, 2015
(O) Credit Risk — The Funds may be susceptible to credit risk to the extent an issuer or counterparty defaults on its payment obligation. The Funds’ policy is to monitor the creditworthiness of issuers and counterparties. Interest receivable on defaulted securities is monitored for ability to collect payments in default and is adjusted accordingly.
(P) Accounting Estimates — The preparation of financial statements in conformity with GAAP requires management to make estimates and assumptions that affect the reported amounts of assets and liabilities and disclosure of contingent assets and liabilities at the date of the financial statements and the reported amounts of income and expenses during the reporting period. Actual results could differ from those estimates.
(Q) Loan Commitments — Certain Funds may enter into loan commitments, which generally have interest rates which are reset daily, monthly, quarterly or semi-annually by reference to a base lending rate, plus a premium. These base rates are primarily the London-Interbank Offered Rate (“LIBOR”), and secondarily the prime rate offered by one or more major United States banks (the “Prime Rate”) and the certificate of deposit (“CD”) rate or other base lending rates used by commercial lenders. Loan commitments often require prepayments from excess cash flows or allow the borrower to repay at its election. The rate at which the borrower repays cannot be predicted with accuracy. Therefore, the remaining maturity may be considerably less than the stated maturity shown in the Schedule of Investments.
All or a portion of these loan commitments may be unfunded. A Fund is obligated to fund these commitments at the borrower’s discretion. Therefore, the Fund must have funds sufficient to cover its contractual obligation. These unfunded loan commitments, which are marked to market daily, are presented in the Schedule of Investments.
(R) Recent Accounting Pronouncements —
Fair Value Measurement (Topic 820), Disclosure for Investments in Certain Entities That Calculate Net Asset Value per Share (or Its Equivalent).
In May 2015, the Financial Accounting Standards Board (FASB) issued Accounting Standards Update (ASU No. 2015-07, Fair Value Measurement (Topic 820), Disclosure for Investments in Certain Entities That Calculate Net Asset Value per Share (or Its Equivalent). ASU No. 2015-07 changes the disclosure requirements for investments for which fair value is measured using the net asset value per share practical expedient. The disclosure requirements are effective for annual periods beginning after December 15, 2015 and interim periods within those fiscal years. At this time, management is evaluating the implications of this guidance and the impact it will have on the financial statement amounts and footnote disclosures, if any.
(S) Litigation — Awards from class action litigation are recorded as realized gains on the payment date.
(T) Other — For financial statement purposes, investment security transactions are accounted for on the trade date. Realized gains and losses from investment transactions are determined on a specific cost identification basis, which is the same basis used for federal income tax purposes.
(3) FEES AND COMPENSATION PAID TO AFFILIATES
(A) Investment Advisory Fees — The Trust has entered into an Investment Advisory Agreement with Thrivent Asset Mgt. Under the Investment Advisory Agreement, each of the Funds pays a fee for investment advisory services. The fees are accrued daily and paid monthly. The annual rates of fees as a percent of average daily net assets under the Investment Advisory Agreement were as follows:
| | | | | | | | | | | | | | | | | | | | | | | | | | | | | | | | | | | | | | | | | | | | |
Fund (M - Millions) | | $0 to
$50M | | | Over $50
to $100M | | | Over
$100 to
$200M | | | Over
$200 to
$250M | | | Over
$250 to
$500M | | | Over
$500 to
$750M | | | Over
$750 to
$1,000M | | | Over
$1,000 to
$2,000M | | | Over
$2,000 to
$2,500M | | | Over
$2,500 to
$5,000M | | | Over
$5,000M | |
Growth and Income Plus | | | 0.650 | % | | | 0.650 | % | | | 0.650 | % | | | 0.650 | % | | | 0.600 | % | | | 0.600 | % | | | 0.600 | % | | | 0.600 | % | | | 0.600 | % | | | 0.600 | % | | | 0.600 | % |
Diversified Income Plus | | | 0.550 | % | | | 0.550 | % | | | 0.550 | % | | | 0.550 | % | | | 0.550 | % | | | 0.550 | % | | | 0.550 | % | | | 0.550 | % | | | 0.550 | % | | | 0.550 | % | | | 0.550 | % |
(B) Expense Reimbursements — For the period ended December 31, 2015, contractual expense reimbursements to limit expenses to the following percentages were in effect:
| | | | | | | | | | | | |
Fund | | Class A | | | Institutional
Class | | | Expiration
Date | |
Growth and Income Plus* | | | 1.15 | % | | | 0.80 | % | | | 2/28/2017 | |
Diversified Income Plus | | | 1.00 | % | | | N/A | | | | 2/1/2016 | |
| * | The Adviser has contractually agreed to limit expenses in Growth and |
Income Plus Class A to 1.10% effective 2/1/2016.
(C) Distribution Plan — Through December 31, 2015, Thrivent Investment Management, Inc. (“Thrivent Investment Mgt.”) was the Trust’s distributor. Effective January 1, 2016, Thrivent Distributors, LLC became the Trust’s distributor. The Trust has adopted a Distribution Plan pursuant to Rule 12b-1 under the 1940 Act. Class A shares generally have a Rule 12b-1 fee of up to 0.25% of average net assets.
36
THRIVENT MUTUAL FUNDS
NOTESTO FINANCIAL STATEMENTS
December 31, 2015
(D) Sales Charges and Other Fees — For the year ended December 31, 2015, Thrivent Investment Mgt. received $1,354,757 of aggregate underwriting concessions from the sales of the Trust’s Class A shares. Sales charges are not an expense of the Trust and are not reflected in the financial statements of any of the Funds.
The Trust has entered into an accounting and administrative services agreement with Thrivent Asset Mgt. pursuant to which Thrivent Asset Mgt. provides certain accounting and administrative personnel and services to the Funds. For the year ended December 31, 2015, Thrivent Asset Mgt. received aggregate fees for accounting and administrative personnel and services of $337,315 from the Funds covered in this shareholder report.
The Trust has entered into an agreement with Thrivent Financial Investor Services, Inc. (“Thrivent Investor Services”) to provide transfer agency and dividend payment services necessary to the Funds on a per-account basis. For the year ended December 31, 2015, Thrivent Investor Services received $606,306 for transfer agent services from the Funds covered in this shareholder report.
Each Trustee who is not affiliated with the Adviser receives an annual fee from the Trust for services as a Trustee and is eligible to participate in a deferred compensation plan with respect to fees received from the Funds. Participants in the plan may designate their deferred Trustee’s fees as if invested in a series of Thrivent Mutual Funds. The value of each Trustee’s deferred compensation account will increase or decrease as if invested in shares of that series. Their fees as well as the change in value are included in Trustee’s fees in the Statement of Operations. The deferred fees remain in the appropriate Fund until distribution in accordance with the plan. The Payable for trustee deferred compensation, located in the Statement of Assets and Liabilities, is unsecured.
Those Trustees not participating in the above plan received $18,036 in fees from the Funds covered in this shareholder report for the year ended December 31, 2015. In addition, the Trust reimbursed independent Trustees for reasonable expenses incurred in relation to attendance at the meetings and industry conferences.
Certain officers and non-independent Trustees of the Trust are officers and directors of Thrivent Asset Mgt., Thrivent Investment Mgt. and Thrivent Investor Services; however, they receive no compensation from the Funds.
(E) Indirect Expenses — Some Funds invest in other mutual funds. Fees and expenses of those underlying funds are not included in those Funds’ expense ratios. The Funds indirectly bear their proportionate share of the annualized weighted average expense ratio of the underlying funds in which they invest.
(4) TAX INFORMATION
Distributions are based on amounts calculated in accordance with the applicable federal income tax regulations, which may differ from GAAP. To the extent that these differences are permanent in nature, such amounts are reclassified within the capital accounts based on their federal tax-basis treatment; temporary differences do not require reclassifications.
On the Statement of Assets and Liabilities, as a result of permanent book-to-tax differences, reclassification adjustments were made as follows [Increase/(Decrease)]:
| | | | | | | | | | | | |
Fund | | Accumulated
Undistributed
Net
Investment
Income/(Loss) | | | Accumulated
Undistributed
Net Realized
Gain/(Loss) | | | Capital Stock | |
Growth and Income Plus | | ($ | 11,191 | ) | | ($ | 23,091 | ) | | $ | 34,282 | |
Diversified Income Plus | | | 839,109 | | | | (839,109 | ) | | | — | |
At December 31, 2015, the components of distributable earnings on a tax basis were as follows:
| | | | | | | | |
Fund | | Undistributed
Ordinary Incomea | | | Undistributed
Long-Term
Capital Gain | |
Diversified Income Plus | | $ | 1,503,291 | | | $ | — | |
| a | Undistributed Ordinary Income includes income derived from Short-Term Capital Gains. |
The tax character of distributions paid during the years ended December 31, 2015 and 2014 was as follows:
| | | | | | | | | | | | | | | | | | | | | | | | |
| | | Ordinary Income a | | | Long-Term Capital Gain | | | Return of Capital | |
Fund | | 12/31/15 | | | 12/31/14 | | | 12/31/15 | | | 12/31/14 | | | 12/31/15 | | | 12/31/14 | |
Growth and Income Plus | | $ | 1,487,540 | | | $ | 2,237,837 | | | $ | 1,358,504 | | | $ | 1,664,046 | | | $ | 42,746 | | | $ | — | |
Diversified Income Plus | | | 24,343,337 | | | | 26,345,647 | | | | 3,287,347 | | | | 11,065,768 | | | | — | | | | — | |
| a | Ordinary income includes income derived from Short-Term Capital Gains. |
(5) SECURITY TRANSACTIONS
(A) Purchases and Sales of Investment Securities — For the year ended December 31, 2015, the cost of purchases and the proceeds from sales of investment securities, other than U.S. Government and short-term securities, were as follows:
| | | | | | | | |
| | | In thousands | |
Fund | | Purchases | | | Sales | |
Growth and Income Plus | | $ | 112,476 | | | $ | 112,625 | |
Diversified Income Plus | | | 579,272 | | | | 529,643 | |
37
THRIVENT MUTUAL FUNDS
NOTESTO FINANCIAL STATEMENTS
December 31, 2015
Purchases and Sales of U.S. Government Securities were:
| | | | | | | | |
| | | In thousands | |
Fund | | Purchases | | | Sales | |
Growth and Income Plus | | $ | 22,249 | | | $ | 22,489 | |
Diversified Income Plus | | | 189,420 | | | | 207,662 | |
(B) Investments in High-Yielding Securities — The Funds may invest in high-yielding securities. These securities will typically be in lower rated categories or will be non-rated and generally will involve more risk than securities in higher rated categories. Lower rated or unrated securities are more likely to react to developments affecting market risk and credit risk than are more highly rated securities, which react primarily to movements in the general level of interest rates.
(C) Investments in Options and Futures Contracts — The movement in the price of the security underlying an option or futures contract may not correlate perfectly with the movement in the prices of the portfolio securities being hedged. A lack of correlation could render a Fund’s hedging strategy unsuccessful and could result in a loss to the Fund. In the event that a liquid secondary market would not exist, the Fund could be prevented from entering into a closing transaction, which could result in additional losses to the Fund.
(6) SECURITY TRANSACTIONS WITH AFFILIATED FUNDS
The Funds are permitted to purchase or sell securities from or to certain other Funds or affiliated Portfolios under specified conditions outlined in procedures adopted by the Board. The procedures have been designed to ensure that any purchase or sale of securities by a Fund from or to another Fund or Portfolio that is or could be considered an affiliate by virtue of having a common investment adviser (or affiliated investment advisers), common trustees and/or common officers complies with Rule 17a-7 of the 1940 Act. Further, as defined under the procedures, each transaction is executed at the current market price. During the year ended December 31, 2015, Growth and Income Plus Fund and Diversified Income Plus Fund engaged in purchase transactions that complied with Rule 17a-7 of the 1940 Act in the amounts of $7,677,104 and $30,708,389, respectively.
(7) SHAREHOLDER CONCENTRATION
As of December 31, 2015, no related parties held shares in excess of 5% of the Funds covered in this shareholder report.
(8) SUBSEQUENT EVENTS
The Adviser of the Funds has evaluated the impact of subsequent events through February 18, 2016, and, except as already included in the Notes to Financial Statements, has determined that no additional items require disclosure.
38
(This page intentionally left blank)
39
THRIVENT MUTUAL FUNDS
FINANCIAL HIGHLIGHTS
| | | | | | | | | | | | | | | | | | | | | | | | |
| | | FOR A SHARE OUTSTANDING THROUGHOUT EACH PERIOD* | |
| | | | | | Income from Investment Operations | | | Less Distributions From | |
| | | Net Asset
Value,
Beginning
of Period | | | Net
Investment
Income/
(Loss) | | | Net Realized
and Unrealized
Gain/(Loss) on
Investments(a) | | | Total from
Investment
Operations | | | Net
Investment
Income | | | Net Realized
Gain on
Investments | |
GROWTH AND INCOME PLUS FUND | |
Class A Shares | | | | | | | | | | | | | | | | | | | | | | | | |
Year Ended 12/31/2015 | | $ | 10.03 | | | $ | 0.19 | | | $ | (0.29 | ) | | $ | (0.10 | ) | | $ | (0.19 | ) | | $ | (0.18 | ) |
Year Ended 12/31/2014 | | | 10.38 | | | | 0.19 | | | | 0.01 | | | | 0.20 | | | | (0.20 | ) | | | (0.35 | ) |
Year Ended 12/31/2013 | | | 9.59 | | | | 0.18 | | | | 1.83 | | | | 2.01 | | | | (0.19 | ) | | | (1.03 | ) |
Year Ended 12/31/2012 | | | 8.70 | | | | 0.20 | | | | 0.89 | | | | 1.09 | | | | (0.20 | ) | | | — | |
Year Ended 12/31/2011 | | | 9.08 | | | | 0.13 | | | | (0.38 | ) | | | (0.25 | ) | | | (0.13 | ) | | | — | |
Institutional Class Shares | |
Year Ended 12/31/2015 | | | 10.05 | | | | 0.26 | | | | (0.33 | ) | | | (0.07 | ) | | | (0.23 | ) | | | (0.18 | ) |
Year Ended 12/31/2014 | | | 10.39 | | | | 0.29 | | | | (0.05 | ) | | | 0.24 | | | | (0.23 | ) | | | (0.35 | ) |
Year Ended 12/31/2013 | | | 9.60 | | | | 0.44 | | | | 1.61 | | | | 2.05 | | | | (0.23 | ) | | | (1.03 | ) |
Year Ended 12/31/2012 | | | 8.71 | | | | 0.24 | | | | 0.88 | | | | 1.12 | | | | (0.23 | ) | | | — | |
Year Ended 12/31/2011 | | | 9.08 | | | | 0.16 | | | | (0.37 | ) | | | (0.21 | ) | | | (0.16 | ) | | | — | |
| | | | | | | | | | | | | | | | | | | | | | | | |
DIVERSIFIED INCOME PLUS FUND | |
Class A Shares | |
Year Ended 12/31/2015 | | | 7.10 | | | | 0.23 | | | | (0.27 | ) | | | (0.04 | ) | | | (0.24 | ) | | | (0.03 | ) |
Year Ended 12/31/2014 | | | 7.25 | | | | 0.24 | | | | 0.02 | | | | 0.26 | | | | (0.23 | ) | | | (0.18 | ) |
Year Ended 12/31/2013 | | | 6.82 | | | | 0.23 | | | | 0.47 | | | | 0.70 | | | | (0.23 | ) | | | (0.04 | ) |
Year Ended 12/31/2012 | | | 6.22 | | | | 0.27 | | | | 0.59 | | | | 0.86 | | | | (0.26 | ) | | | — | |
Year Ended 12/31/2011 | | | 6.39 | | | | 0.27 | | | | (0.15 | ) | | | 0.12 | | | | (0.29 | ) | | | — | |
Institutional Class Shares | |
Year Ended 12/31/2015 | | | 7.04 | | | | 0.25 | | | | (0.26 | ) | | | (0.01 | ) | | | (0.26 | ) | | | (0.03 | ) |
Year Ended 12/31/2014 | | | 7.19 | | | | 0.26 | | | | 0.02 | | | | 0.28 | | | | (0.25 | ) | | | (0.18 | ) |
Year Ended 12/31/2013 | | | 6.77 | | | | 0.26 | | | | 0.46 | | | | 0.72 | | | | (0.26 | ) | | | (0.04 | ) |
Year Ended 12/31/2012 | | | 6.19 | | | | 0.30 | | | | 0.57 | | | | 0.87 | | | | (0.29 | ) | | | — | |
Year Ended 12/31/2011 | | | 6.36 | | | | 0.29 | | | | (0.15 | ) | | | 0.14 | | | | (0.31 | ) | | | — | |
| (a) | The amount shown may not correlate with the change in aggregate gains and losses of portfolio securities due to the timing of sales and redemptions of fund shares. |
| (b) | Total investment return assumes dividend reinvestment and does not reflect any deduction for applicable sales charges. Not annualized for periods less than one year. |
| * | All per share amounts have been rounded to the nearest cent. |
The accompanying Notes to Financial Statements are an integral part of this statement.
40
THRIVENT MUTUAL FUNDS
FINANCIAL HIGHLIGHTS –CONTINUED
| | | | | | | | | | | | | | | | | | | | | | | | | | | | | | | | | | | | | | |
| |
| | | | RATIOS/SUPPLEMENTAL DATA | |
| | | | | | | | | | | | | | | | Ratio to Average Net
Assets | | | Ratios to Average Net Assets
Before Expenses Waived,
Credited or Paid
Indirectly | | | | |
Return of Capital | | | Total Distributions | | | Net Asset
Value, End of
Period | | | Total
Return(b) | | | Net Assets,
End of Period
(in millions) | | | Expenses | | | Net Investment
Income/(Loss) | | | Expenses | | | Net Investment
Income/(Loss) | | | Portfolio
Turnover
Rate | |
| | | | | | | | | | | | | | | | | | | | | | | | | | | | | | | | | | | | | | | |
| | | | | | | | | | | | | | | | | | | | | | | | | | | | | | | | | | | | | | | |
| $ | (0.01 | ) | | $ | (0.38 | ) | | $ | 9.55 | | | | (1.03 | )% | | $ | 72.1 | | | | 1.15 | % | | | 1.92 | % | | | 1.44 | % | | | 1.63 | % | | | 181 | % |
| | — | | | | (0.55 | ) | | | 10.03 | | | | 1.89 | % | | | 76.5 | | | | 1.15 | % | | | 1.93 | % | | | 1.42 | % | | | 1.66 | % | | | 167 | % |
| | — | | | | (1.22 | ) | | | 10.38 | | | | 21.08 | % | | | 49.8 | | | | 1.15 | % | | | 1.69 | % | | | 1.50 | % | | | 1.34 | % | | | 162 | % |
| | — | | | | (0.20 | ) | | | 9.59 | | | | 12.60 | % | | | 25.6 | | | | 1.15 | % | | | 2.18 | % | | | 1.47 | % | | | 1.86 | % | | | 164 | % |
| | — | | | | (0.13 | ) | | | 8.70 | | | | (2.79 | )% | | | 21.0 | | | | 1.15 | % | | | 1.47 | % | | | 1.47 | % | | | 1.15 | % | | | 193 | % |
| | | | | | | | | | | | | | | | | | | | | | | | | | | | | | | | | | | | | | | |
| | (0.01 | ) | | | (0.42 | ) | | | 9.56 | | | | (0.77 | )% | | | 1.5 | | | | 0.80 | % | | | 2.26 | % | | | 1.13 | % | | | 1.93 | % | | | 181 | % |
| | — | | | | (0.58 | ) | | | 10.05 | | | | 2.34 | % | | | 1.8 | | | | 0.80 | % | | | 2.24 | % | | | 1.12 | % | | | 1.92 | % | | | 167 | % |
| | — | | | | (1.26 | ) | | | 10.39 | | | | 21.56 | % | | | 2.3 | | | | 0.80 | % | | | 2.02 | % | | | 0.92 | % | | | 1.90 | % | | | 162 | % |
| | — | | | | (0.23 | ) | | | 9.60 | | | | 12.97 | % | | | 35.3 | | | | 0.80 | % | | | 2.52 | % | | | 0.94 | % | | | 2.38 | % | | | 164 | % |
| | — | | | | (0.16 | ) | | | 8.71 | | | | (2.35 | )% | | | 30.6 | | | | 0.80 | % | | | 1.80 | % | | | 0.94 | % | | | 1.66 | % | | | 193 | % |
| | | | | | | | | | | | | | | | | | | | | | | | | | | | | | | | | | | | | | |
| | | | | | | | | | | | | | | | | | | | | | | | | | | | | | | | | | | | | | | |
| | | | | | | | | | | | | | | | | | | | | | | | | | | | | | | | | | | | | | | |
| | — | | | | (0.27 | ) | | | 6.79 | | | | (0.62 | )% | | | 585.5 | | | | 0.98 | % | | | 3.28 | % | | | 0.98 | % | | | 3.28 | % | | | 108 | % |
| | — | | | | (0.41 | ) | | | 7.10 | | | | 3.54 | % | | | 581.7 | | | | 0.98 | % | | | 3.33 | % | | | 0.98 | % | | | 3.33 | % | | | 137 | % |
| | — | | | | (0.27 | ) | | | 7.25 | | | | 10.40 | % | | | 459.1 | | | | 1.00 | % | | | 3.34 | % | | | 1.00 | % | | | 3.34 | % | | | 155 | % |
| | — | | | | (0.26 | ) | | | 6.82 | | | | 14.08 | % | | | 290.7 | | | | 0.99 | % | | | 4.14 | % | | | 1.03 | % | | | 4.10 | % | | | 153 | % |
| | — | | | | (0.29 | ) | | | 6.22 | | | | 1.78 | % | | | 200.5 | | | | 0.97 | % | | | 4.29 | % | | | 1.06 | % | | | 4.20 | % | | | 126 | % |
| | | | | | | | | | | | | | | | | | | | | | | | | | | | | | | | | | | | | | | |
| | — | | | | (0.29 | ) | | | 6.74 | | | | (0.19 | )% | | | 108.3 | | | | 0.69 | % | | | 3.56 | % | | | 0.69 | % | | | 3.56 | % | | | 108 | % |
| | — | | | | (0.43 | ) | | | 7.04 | | | | 3.90 | % | | | 116.2 | | | | 0.69 | % | | | 3.60 | % | | | 0.69 | % | | | 3.60 | % | | | 137 | % |
| | — | | | | (0.30 | ) | | | 7.19 | | | | 10.70 | % | | | 107.5 | | | | 0.70 | % | | | 3.66 | % | | | 0.70 | % | | | 3.66 | % | | | 155 | % |
| | — | | | | (0.29 | ) | | | 6.77 | | | | 14.23 | % | | | 54.2 | | | | 0.72 | % | | | 4.47 | % | | | 0.72 | % | | | 4.47 | % | | | 153 | % |
| | — | | | | (0.31 | ) | | | 6.19 | | | | 2.18 | % | | | 17.4 | | | | 0.74 | % | | | 4.53 | % | | | 0.74 | % | | | 4.52 | % | | | 126 | % |
The accompanying Notes to Financial Statements are an integral part of this statement.
41
ADDITIONAL INFORMATION
(unaudited)
Shareholder Notification of Federal Tax Information
The following information is provided solely to satisfy the requirements set forth by the Internal Revenue Code. Shareholders will be provided information regarding their distribution in February 2016.
The funds designate the percentage of dividends declared from net investment income as dividends qualifying for the 70% dividends received deduction for corporations and the percentage as qualified dividend income for individuals under the Jobs and Growth Tax Relief Reconciliation Act of 2003 as follows:
| | | | | | | | |
Fund | | Dividends
Received
Deduction
for
Corporations | | | Qualified
Dividend
Income for
Individuals | |
Growth and Income Plus | | | 29 | % | | | 68 | % |
Diversified Income Plus | | | 12 | % | | | 21 | % |
Pursuant to IRC 852(b)(3) of the Internal Revenue Code, the Funds hereby designate the following amounts as long-term capital gains distributed during the year ended December 31, 2015, or if subsequently determined to be different, the net capital gain of such year:
| | | | |
Fund | | Distributions of Long-Term
Capital Gains | |
Growth and Income Plus | | $ | 1,358,504 | |
Diversified Income Plus | | | 3,287,347 | |
These amounts may include earnings and profits distributed to shareholders on the redemption of shares as part of the dividend paid deduction.
Proxy Voting
The policies and procedures that the Trust uses to determine how to vote proxies relating to portfolio securities are attached to the Trust’s Statement of Additional Information. You may request a free copy of the Statement of Additional Information by calling 1-800-847-4836. You also may review the Statement of Additional Information or the report of how the Trust voted proxies relating to portfolio securities during the most recent 12-month period ended June 30 at ThriventFunds. com or www.sec.gov.
Quarterly Schedule of Investments
The Trust files its Schedule of Portfolio Holdings on Form N-Q with the SEC for the first and third quarters of each fiscal year. You may request a free copy of the Trust’s Forms N-Q by calling 1-800-847-4836. The Trust’s most recent Form N-Q Schedule of Investments also is at ThriventFunds.com or www.sec.gov. You also may review and copy the Forms N-Q for the Trust at the SEC’s Public Reference Room in Washington, DC. You may get information about the operation of the Public Reference Room by calling 1-800-SEC-0330.
Summary Schedule of Investments
The summary schedule of investments is designed to streamline the report and help investors better focus on a fund’s principal holdings. A complete listing of holdings for a fund in which the summary is included in the shareholder report is available free of charge by calling 1-800-847-4836. It is also available at ThriventFunds.com or sec.gov where it is part of form N-CSR.
42
ADDITIONAL INFORMATION
(unaudited)
Board Approval of Advisory Agreement and Subadvisory Agreements
Both the Investment Company Act of 1940 (the “Investment Company Act”) and the terms of the Advisory and Subadvisory Agreements of the Thrivent Mutual Funds (the “Trust”) require that these agreements be approved annually by the Board of Trustees (the “Board”), including a majority of the Trustees who are not “interested persons” of the Trust, as defined in the Investment Company Act (the “Independent Trustees”). The ten-member Board consists of eight Independent Trustees, including the Chairman.
At its meeting on November 17-18, 2015, the Board voted unanimously to renew the existing Advisory Agreement between the Trust and Thrivent Asset Management, LLC (the “Adviser”) for each series of the Trust other than the Asset Allocation Funds (each, a “Fund”). The Board also unanimously approved the Subadvisory Agreements for each of the Funds for which there is an investment subadviser (each a “Subadviser”). The Adviser and Subadvisers are referred to, collectively, as the “Advisory Organizations.” In connection with its evaluation of the agreements with the Advisory Organizations, the Board reviewed a broad range of information requested for this purpose and considered a variety of factors, including the following:
| | 1. | The nature, extent, and quality of the services provided by the Advisory Organizations; |
| | 2. | The performance of the Funds; |
| | 3. | The advisory fee and net operating expense ratio of each Fund compared to a peer group; |
| | 4. | The cost of services provided and profit realized by the Adviser; |
| | 5. | The extent to which economies of scale may be realized as the Funds grow; |
| | 6. | Whether fee levels reflect these economies of scale for the benefit of the Funds’ shareholders; |
| | 7. | Other benefits realized by the Adviser and its affiliates from their relationship with the Trust; and |
| | 8. | Any other factors that the Board deemed relevant to its consideration. |
In connection with the renewal process, the Contracts Committee of the Board (consisting of all of the Independent Trustees) met on six occasions from February 24 to November 17, 2015 to consider information relevant to the renewal process. The Independent Trustees also retained the services of Management Practice Inc. (“MPI”) as an independent consultant to assist in the compilation, organization, and evaluation of relevant information. This information included Fund-by-Fund statistical comparisons of the advisory fees, other fees, net operating expenses and performance of each of the Funds in comparison to a peer group of comparable funds; portfolio turnover percentages; brokerage costs; information with respect to services provided to the Funds and fees charged, including effective advisory fees that take into account breakpoints and fee waivers by the Adviser; asset and flow trends for the Funds; the cost of services and profit realized by the Adviser and its affiliates that provide services to the Funds; and information regarding the types of services furnished to the Funds. The Board received information from the Adviser regarding the personnel providing services to the Funds, including investment management, compliance and administrative personnel. The Board also received monthly reports from the Adviser’s investment management staff with respect to the performance of the Funds. In addition to its review of the information presented to the Board during the contract renewal process, the Board also considered information obtained from management throughout the course of the year.
The Independent Trustees were represented by independent counsel throughout the review process and during executive sessions without management present to consider reapproval of the agreements. Each Independent Trustee relied on his or her own business judgment in determining the weight to be given to each factor considered in evaluating the materials that were presented. The Contracts Committee’s and Board’s review and conclusions were based on a comprehensive consideration of all information presented to them and were not the result of any single controlling factor. In addition, each Trustee may have weighed individual factors differently. The key factors considered and the conclusions reached are described below.
Shareholders of the Asset Allocation Funds approved a new Advisory Agreement, including a new investment advisory fee schedule, in August 2015; therefore, the Board was not required to and did not include the Advisory Agreement with respect to the Asset Allocation Funds in its considerations to renew the Funds’ Advisory Agreement.
Nature, Extent and Quality of Services
At each of the Board’s regular quarterly meetings, management presented information describing the services furnished to the Funds by the Adviser and, as appropriate, the Subadvisers. During these meetings, management reported on the investment management, portfolio trading and compliance services provided to the Funds under the Advisory and Subadvisory Agreements. During the renewal process, the Board considered the specific services provided under the Advisory Agreement. The Board also considered information relating to the investment experience and qualifications of the Adviser’s portfolio managers and those of the Subadvisers.
43
ADDITIONAL INFORMATION
(unaudited)
The Board received reports at each of its quarterly meetings from the Adviser’s Head of Equity Investments and Head of Fixed Income Funds, as supplemented by the Adviser’s Chief Investment Officer, who was also present at all of the meetings. At each quarterly meeting, the Head of Equity Investments and Head of Fixed Income Funds presented information about each of the Funds. On several occasions, the Board received presentations from certain Subadvisers regarding their portfolio management services to certain Funds. These reports and presentations gave the Board the opportunity to evaluate the portfolio managers’ abilities and the quality of services they provide to the Funds. The Adviser also reviewed with the Board the services provided by the Subadvisers. Information was also presented to the Board describing the portfolio compliance functions performed by the Adviser. The Independent Trustees also met in-person with and received quarterly reports from the Trust’s Chief Compliance Officer.
The Board considered the depth and quality of the Adviser’s oversight of the Subadvisers. In addition, the Board noted the broad functions that the Adviser performed in support of the subadvised Funds, including, among other things, management of portfolio cash, subadviser expense management and payment and performance monitoring. The Board noted that investment management staff of the Adviser and the Trust’s Chief Compliance Officer conduct in-person oversight visits of each Subadviser, report the results of the visit to the Board and then follow through with additional inquiry on any questions or concerns that arise during the visit. The Board also noted that, as part of its oversight practice, the Adviser requires the Subadvisers to respond to a variety of compliance checklists and certifications to ensure their ongoing compliance with a subadvised Fund’s policies. The Board noted that the Adviser requires the Subadvisers to complete an annual questionnaire addressing a range of compliance topics. In addition, the Board noted that the Adviser has dedicated personnel responsible for daily monitoring of the Subadvisers’ activities pertaining to the subadvised Funds.
The Board considered the adequacy of the Advisory Organizations’ resources used to provide services to the Trust pursuant to the Advisory and Subadvisory Agreements. The Adviser reviewed with the Board the Adviser’s process for overseeing the portfolio management teams of the Funds, and explained similarities and differences for how it oversees the Adviser’s teams and the teams of the Subadvisers. In addition, the Adviser explained how its investments in technology and personnel have benefitted the Funds and discussed continued investments in these resources. The Adviser also discussed how it has continued to strengthen its compliance program. The Adviser reviewed with the Board its process for selecting and overseeing the Subadvisers, including the results of on-site compliance due diligence visits. The Board viewed these actions as a positive factor in reapproving the existing Advisory Agreement, as they demonstrated the Adviser’s commitment to provide the Funds with quality service and competitive investment performance. The Board concluded that, within the context of its full deliberations, the nature, extent and quality of the investment advisory services provided to the Funds by the Adviser and Subadvisers supported renewal of the Advisory Agreement and Subadvisory Agreements.
Performance of the Funds
In connection with each of its regular quarterly meetings, the Board received information on the performance of each Fund, including net performance, relative performance rankings within each Fund’s Lipper peer group, Morningstar ratings, and performance as compared to benchmark index returns. At each quarterly Board meeting, the Head of Equity Investments and Head of Fixed Income Funds reviewed with the Board the economic and market environment, risk management, and style consistency in connection with management of the Funds. The Board considered investment performance for each Fund, to the extent applicable, over the one-, two-, three-, five-, and ten-year periods. When evaluating investment performance, the Board considered longer-term performance and the trend of performance, and focused particularly upon the three-year performance record. Although the Board conducted its review on a Fund-by-Fund basis, it noted that, for the three-year period ended June 30, 2015, the average ranking of the Funds’ Class A shares against their Lipper categories was 44% (on a scale of 1-99%, with 1% being the best). The Board noted that, for the three-year period ended June 30, 2015, the average ranking of the Funds’ Institutional Class (now known as Class S) against their Lipper categories was 36% (excluding the Money Market Fund) (on a scale of 1-99%, with 1% being the best).
The Board noted that certain Funds did not fit well within a Lipper peer group because of differences between the principal investment strategies of these Funds and funds included in their respective Lipper peer group. In such cases, the Adviser provided additional information regarding these Funds’ performance compared to a customized benchmark that the Adviser believed better represented the investment strategies of such Funds. The Board concluded that the performance of each individual Fund was either satisfactory or that the Adviser had taken appropriate actions in an effort to improve performance.
44
ADDITIONAL INFORMATION
(unaudited)
Advisory Fees and Fund Expenses
The Board reviewed information prepared by MPI comparing each Fund’s advisory fee with the advisory fee of its peer group. The Board considered both the contractual and effective advisory fees for each of the Funds. The Board noted that the majority of the Funds’ advisory fees were at or below the medians of their peer groups. Although the Board conducted its review on a Fund-by-Fund basis, it noted that the average ranking of the Funds’ advisory fees for its Class A shares was 33% and the average ranking of the of the Funds’ advisory fees for its Institutional Class (now known as Class S) was 37% (on a scale of 1-99%, with 1% being the lowest fee). The Board viewed favorably the Adviser’s proposal to continue or extend fee waivers for certain Funds and considered the effect of the waivers in lowering the Funds’ expenses. On the basis of its review, the Board concluded that the advisory fees charged to the Funds for investment management services were reasonable.
The Board also reviewed information prepared by MPI comparing each Fund’s overall expense ratio with the expense ratio of its peer group. The Board conducted its review on a Fund-by-Fund basis and noted that all but three Funds (each of which is discussed below) had better total net expense ratios than their peer group medians. The Board further noted that the Funds’ Class A shares had an average ranking of 36% while the Funds’ Institutional Class (now known as Class S) had an average ranking of 26% (on a scale of 1-99%, with 1% being the lowest expenses). With respect to the Thrivent Money Market Fund, the Board noted that the Adviser, like many investment advisers in the industry, continued to waive fees in order to maintain a zero yield. With respect to Thrivent Partner Worldwide Allocation Fund and the Thrivent Large Cap Growth Fund, the Board viewed favorably management’s willingness to continue a contractual expense cap with respect to the Class A shares and noted that, although there were no expense caps in place, the net operating expenses for the Institutional Class shares were competitive.
The Board considered that, in response to reforms of the rules that govern money market funds, Thrivent Money Market Fund would change its principal investment strategies to qualify as a “government money market fund” effective February 1, 2016. In connection with this change, the Board approved a decrease to the Fund’s investment advisory fee.
Cost of Services and Profitability
The Board considered the Adviser’s estimates of its profitability, which included allocations by the Adviser of its costs in providing advisory services to the Funds. The internal audit department (i.e., Business Risk Management) of the Adviser conducted a review of such allocations and a department representative reported to the Board his views regarding the reasonableness and consistency of these allocations. The Board considered the profitability of the Adviser both overall and on a Fund-by-Fund basis. The Board also considered the expense reimbursements and waivers in effect. Based on its review of the data prepared by MPI and expense and profit information provided by the Adviser, the Board concluded that the profits earned by the Adviser from the Advisory Agreement were not excessive in light of the nature, extent and quality of services provided to the Funds.
With respect to fees paid to Subadvisers under the Subadvisory Agreements, the Board did not consider profitability information with respect to the Subadvisers, which are not affiliated with the Adviser. The Board considered that those contracts had been negotiated on an arm’s-length basis between the Adviser and each Subadviser, and that each Subadviser’s separate profitability from its relationship with the Funds was not a material factor in determining whether to renew the Subadvisory Agreements.
Economies of Scale and Breakpoints
The Board considered information regarding the extent to which economies of scale may be realized as a Fund’s assets increase and whether the fee levels reflect these economies of scale for the benefit of shareholders. The Adviser explained its general goal with respect to the employment of fee waivers, expense reimbursements and breakpoints. The Board considered information provided by the Adviser related to advisory fee rates, breakpoints in the advisory fee rates and fee waivers provided by the Adviser. The Board also considered management’s view that it is difficult to generalize as to whether, or to what extent, economies in the advisory function may be realized as a Fund’s assets increase. The Board noted that expected economies of scale, where they exist, may be shared through the use of fee breakpoints, fee waivers by the Adviser, and/or a lower overall fee rate.
45
ADDITIONAL INFORMATION
(unaudited)
Other Benefits to the Adviser and its Affiliates
The Board considered information regarding potential “fall-out” or ancillary benefits that the Adviser and its affiliates may receive as a result of their relationship with the Trust, both tangible and intangible, such as their ability to leverage investment professionals who manage other portfolios, an enhanced reputation as an investment adviser which may help in attracting other clients and investment personnel, and the engagement of affiliates as service providers to the Funds. The Board noted that such benefits were difficult to quantify but were consistent with benefits received by other mutual fund advisers. The Board also considered the research received by the Adviser generated from commission dollars spent on the Funds’ portfolio trading.
Based on the factors discussed above, the Contracts Committee unanimously recommended approval of the Advisory Agreement and the Subadvisory Agreements, and the Board, including all of the Independent Trustees voting separately, approved each of the agreements.
46
BOARDOF TRUSTEESAND OFFICERS
The following table provides information about the Trustees and Officers of the Trust. Each Trustee oversees each of the 21 series of the Trust and also serves as:
| | • | | Director of Thrivent Series Fund, Inc., a registered investment company consisting of 27 portfolios that serve as underlying funds for variable contracts issued by Thrivent Financial for Lutherans (“Thrivent Financial”) and Thrivent Life Insurance Company and investment options in the retirement plan offered by Thrivent Financial, and |
| | • | | Trustee of Thrivent Cash Management Trust, a registered investment company consisting of one portfolio that serves as a cash collateral fund for the securities lending program sponsored by Thrivent Financial. |
The 21 series of the Trust, the 27 portfolios of Thrivent Series Fund, Inc. and Thrivent Cash Management Trust are referred to herein as the “Fund Complex.” The Statement of Additional Information includes additional information about the Trustees and is available, without charge, by calling 1-800-847-4836.
Interested Trustee (1)(2)(3)(4)
| | |
Name (Year of Birth) Year Elected | | Principal Occupation(s) and Directorships of Public Companies and Other Investment Companies During the Past Five Years |
Russell W. Swansen (1957) 2009 | | Senior Vice President, Chief Investment Officer, Thrivent Financial since 2003. |
| |
David S. Royal (1971) 2015 | | President, Thrivent Mutual Funds, Thrivent Financial since 2015, Vice President and Deputy General Counsel from 2006 to 2015; Interim Investment Company and Investment Chief Compliance Officer from May 2010 until December 2010. |
Independent Trustees (2)(3)(4)(5)
| | |
Name (Year of Birth) Year Elected | | Principal Occupation(s) and Directorships of Public Companies and Other Investment Companies During the Past Five Years |
| |
Janice B. Case (1952) 2011 | | Retired. Independent Trustee of North American Electric Reliability Corporation (the electric reliability organization (“ERD”) for North America) since 2008. |
| |
Richard L. Gady (1943) 1987 | | Retired. |
| |
Richard A. Hauser (1943) 2004 | | Vice President and Assistant General Counsel, The Boeing Company since 2007. |
| |
Marc S. Joseph (1960) 2011 | | Managing Director of Granite Ridge LLP (consulting and advisory firm) since 2009; Managing Director of Triangle Crest (private investing and consulting firm) since 2004. |
| |
Paul R. Laubscher (1956) 2009 | | Portfolio Manager for U.S. private real estate portfolios of IBM Retirement Funds. |
| |
James A. Nussle (1960) 2011 | | President and Chief Executive Officer of Credit Union National Association since September 2014; President and Chief Operating Officer of Growth Energy (trade association) from 2010 through August 2014; Advisory Board member of AVISTA Capital Partners (private equity firm) since 2010; CEO of The Nussle Group LLC (consulting firm) since 2009. |
| |
Douglas D. Sims (1946) 2006 | | Retired. Currently, Director of Keystone Science School. Previously, Director of the Center for Corporate Excellence. |
| |
Constance L. Souders (1950) 2007 | | Retired. |
47
BOARDOF TRUSTEESAND OFFICERS
Executive Officers (4)
| | |
Name (Year of Birth) Position Held With Thrivent | | Principal Occupation(s) During the Past Five Years |
| |
David S. Royal (1971)
President | | Vice President, Thrivent Mutual Funds, Thrivent Financial since 2015, Vice President and Deputy General Counsel from 2006 to 2015. |
| |
Russell W. Swansen (1957) Chief Investment Officer | | Senior Vice President and Chief Investment Officer, Thrivent Financial since 2003. |
| |
Gerard V. Vaillancourt (1967) Treasurer and Principal Accounting Officer | | Vice President, Mutual Fund Accounting, Thrivent Financial since 2006. |
| |
Michael W. Kremenak (1978) Secretary and Chief Legal Officer | | Vice President, Thrivent Financial since 2015; Senior Counsel, Thrivent Financial from 2013 to 2015; Vice President and Assistant General Counsel at Nuveen Investments from 2011 to 2013. |
| |
Ted S. Dryden (1965) Chief Compliance Officer | | Investment Company and Investment Adviser Chief Compliance Officer, Thrivent Financial since December 2010. |
| |
Janice M. Guimond (1965) Vice President | | Vice President, Investment Operations, Thrivent Financial since 2004. |
| |
Kathleen M. Koelling (1977) Privacy and Identity Theft and Anti-Money Laundering Officer (6) | | Privacy and Identity Theft and Anti-Money Laundering Officer, Thrivent Financial since 2011; Senior Counsel, Thrivent Financial since 2002. |
| |
Mark D. Anema (1961) Vice President | | Vice President, New Product Management and Development, Thrivent Financial since 2007. |
| |
Kathryn A. Stelter (1962) Vice President | | Director, Mutual Fund Operations, Thrivent Financial since 2014; Director, Mutual Fund Operations at Hartford Funds from 2006 to 2014. |
| |
James M. Odland (1955) Assistant Secretary | | Vice President, Managing Counsel, Thrivent Financial since 2005. |
| |
Todd J. Kelly (1969) Assistant Treasurer (6) | | Director, Fund Accounting Operations, Thrivent Financial since 2002. |
| |
Sarah L. Bergstrom (1977) Assistant Treasurer | | Director, Fund Accounting Administration, Thrivent Financial since 2007. |
| (1) | “Interested Trustee” of the Fund as defined in the Investment Company Act of 1940 by virtue of positions with Thrivent Financial. Mr. Swansen and Mr. Royal are considered interested trustees because of their principal occupation with Thrivent Financial. |
| (2) | Each Trustee generally serves an indefinite term until her or his successor is duly elected and qualified. Trustees serve at the discretion of the board until their successors are duly appointed and qualified. |
| (3) | Each Trustee oversees 49 portfolios. |
| (4) | The address for each Trustee and Officer unless otherwise noted is 625 Fourth Avenue South, Minneapolis, MN 55415 |
| (5) | The Trustees other than Mr. Swansen and Mr. Royal are not “interested trustees” of the Fund and are referred to as “Independent Trustees.” |
| (6) | The address for this Officer is 4321 North Ballard Road, Appleton, Wl 54913 |
48


As of the end of the period covered by this report, registrant has adopted a code of ethics (as defined in Item 2 of Form N-CSR) applicable to registrant’s Principal Executive Officer, Principal Financial Officer and Principal Accounting Officer. No waivers were granted to such code of ethics during the period covered by this report. A copy of this code of ethics is filed as an exhibit to this Form N-CSR.
| Item 3. | Audit Committee Financial Expert |
Registrant’s Board of Trustees has determined that Constance L. Souders, an independent trustee, is the Audit Committee Financial Expert.
| Item 4. | Principal Accountant Fees and Services |
(a) through (d)
Thrivent Growth and Income Plus Fund, and Thrivent Diversified Income Plus Fund (each a “Fund” and collectively, the “Funds”) are each a series of Thrivent Mutual Funds, a Massachusetts business trust (the “Trust”). The Trust, as of the date of filing this Form N-CSR, contains a total of 21 series (the “Series”), including the Funds. This Form N-CSR relates to the annual report of each Fund.
The following table presents the aggregate fees billed to the Funds for the respective fiscal years ended December 31, 2015 and December 31, 2014 by the Funds’ independent public accountants, PricewaterhouseCoopers LLP (“PwC”), for professional services rendered for the audit of the Funds’ annual financial statements and fees billed for other services rendered by PwC during those periods.
| | | | | | | | |
Fiscal Years Ended | | 12/31/14 | | | 12/31/15 | |
Audit Fees | | $ | 40,489 | | | $ | 32,033 | |
Audit-Related Fees(1) | | $ | 0 | | | $ | 0 | |
Tax Fees(2) | | $ | 17,174 | | | $ | 20,484 | |
All Other Fees(3) | | $ | 0 | | | $ | 130,474 | |
| | | | | | | | |
Total | | $ | 57,663 | | | $ | 182,991 | |
| | | | | | | | |
(1) Audit-related fees consist of the aggregate fees billed for assurance and related services that are reasonably related to the performance of the audit of financial statements and are not reported under the category of audit fees.
(2) Tax fees consist of the aggregate fees billed for professional services rendered by the principal accountant relating to tax compliance, tax advice, and tax planning and specifically include fees for tax return preparation.
(3) All other fees consist of the aggregate fees billed for products and services provided by the principal accountant other than audit, audit-related, and tax services.
The following table presents the aggregate fees billed to all Series of the Trust (other than the Funds) with fiscal years ending on October 31 for the fiscal years ended October 31, 2014 and October 31, 2015 by PwC for professional services rendered for the audit of the annual financial statements of the applicable Series and fees billed for other services rendered by PwC during those periods.
| | | | | | | | |
Fiscal Years Ended | | 10/31/14 | | | 10/31/15 | |
Audit Fees | | $ | 371,291 | | | $ | 360,289 | |
Audit-Related Fees(1) | | $ | 0 | | | $ | 0 | |
Tax Fees(2) | | $ | 119,953 | | | $ | 145,851 | |
All Other Fees(3) | | $ | 3,600 | | | $ | 100,325 | |
| | | | | | | | |
Total | | $ | 491,244 | | | $ | 606,465 | |
| | | | | | | | |
(1) Audit-related fees consist of the aggregate fees billed for assurance and related services that are reasonably related to the performance of the audit of financial statements and are not reported under the category of audit fees.
(2) Tax fees consist of the aggregate fees billed for professional services rendered by the principal accountant relating to tax compliance, tax advice, and tax planning and specifically include fees for tax return preparation.
(3) All other fees consist of the aggregate fees billed for products and services provided by the principal accountant other than audit, audit-related, and tax services.
| | (e) | Registrant’s audit committee charter provides that the audit committee (comprised of the independent Trustees of registrant) is responsible for pre-approval of all auditing services performed for the registrant. The audit committee also is responsible for pre-approval (subject to the de minimis exceptions for non-audit services described in Section 10A(i)(1)(B) of the Securities Exchange Act of 1934) of all non-auditing services performed for the registrant or an affiliate of registrant. In addition, registrant’s audit committee charter permits a designated member of the audit committee to pre-approve, between meetings, one or more audit or non-audit service projects, subject to an expense limit and notification to the audit committee at the next committee meeting. Registrant’s audit committee pre-approved all fees described above that PwC billed to registrant. |
| | (f) | Less than 50% of the hours billed by PwC for auditing services to registrant for the fiscal year ended December 31, 2015 was for work performed by persons other than full-time permanent employees of PwC. |
| | (g) | The aggregate non-audit fees billed by PwC to registrant and to registrant’s investment adviser and any entity controlling, controlled by, or under common control with registrant’s investment adviser for the fiscal years set forth below are disclosed in the table below. The disclosed payments were for access to a PwC-sponsored online library that provides interpretive guidance regarding U.S. and foreign accounting standards. |
| | | | | | | | | | | | | | | | | | | | | | | | |
Fiscal Year Ended | | 10/31/13 | | | 12/31/13 | | | 10/31/14 | | | 12/31/14 | | | 10/31/15 | | | 12/31/15 | |
| Registrant(1) | | $ | 0 | | | $ | 0 | | | $ | 0 | | | $ | 0 | | | $ | 0 | | | $ | 0 | |
| Adviser | | $ | 1,800 | | | $ | 1,800 | | | $ | 3,600 | | | $ | 3,600 | | | $ | 100,325 | | | $ | 130,474 | |
| | (h) | Registrant’s audit committee has considered the non-audit services provided to the registrant and registrant’s investment adviser and any entity controlling, controlled by, or under common control with registrant’s investment adviser as described above and determined that these services do not compromise PwC’s independence. |
| Item 5. | Audit Committee of Listed Registrants |
Not applicable.
| Item 6. | Schedule of Investments |
(a) The summary schedule of investments for these funds; Growth and Income Plus Fund and Diversified Income Plus Fund, are included as part of the report to shareholders filed under Item 1 of this Form. The schedule of investments for said funds are filed under this Item.

Report of Independent Registered Public Accounting Firm
To the Trustees and Shareholders of Thrivent Diversified Income Plus Fund and Thrivent Growth and Income Plus Fund:
In our opinion, the accompanying statements of assets and liabilities, including the summary schedules of investments, and the related statements of operations and of changes in net assets and the financial highlights (included in Item 1 of this Form N-CSR) and the schedule of investments (included in Item 6 of this Form N-CSR) present fairly, in all material respects, the financial position of Thrivent Diversified Income Plus Fund and Thrivent Growth and Income Plus Fund (constituting part of the Thrivent Mutual Funds) (hereafter referred to as the “Funds”) at December 31, 2015, the results of each of their operations for the year then ended, the changes in each of their net assets for each of the two years in the period then ended and their financial highlights for each of the five years in the period then ended, in conformity with accounting principles generally accepted in the United States of America. These financial statements, financial highlights and schedules of investments (hereafter referred to as “financial statements”) are the responsibility of the Funds’ management. Our responsibility is to express an opinion on these financial statements based on our audits. We conducted our audits of these financial statements in accordance with the standards of the Public Company Accounting Oversight Board (United States). Those standards require that we plan and perform the audit to obtain reasonable assurance about whether the financial statements are free of material misstatement. An audit includes examining, on a test basis, evidence supporting the amounts and disclosures in the financial statements, assessing the accounting principles used and significant estimates made by management, and evaluating the overall financial statement presentation. We believe that our audits, which included confirmation of securities at December 31, 2015 by correspondence with the custodian, agent banks, transfer agent and brokers provides a reasonable basis for our opinion.

February 18, 2016
PricewaterhouseCoopers LLP, Suite 1400, 225 South Sixth Street, Minneapolis, MN 55402
T: (612) 596 6000, F: (612) 373 7160, www.pwc.com/us
GROWTHAND INCOME PLUS FUND
Schedule of Investments as of December 31, 2015
| | | | | | | | |
Principal
Amount | | | Bank Loans (10.2%)a | | Value | |
| Basic Materials (0.5%) | | | | |
| | | | Alpha Natural Resources, Inc., Term Loan | | | | |
| | $39,396 | | | 3.500%, 5/22/2020 | | $ | 16,973 | |
| | | | Fortescue Metals Group, Ltd., Term Loan | | | | |
| | 126,144 | | | 4.250%, 6/30/2019 | | | 93,202 | |
| | | | Ineos US Finance, LLC, Term Loan | | | | |
| | 89,278 | | | 3.750%, 12/15/2020 | | | 85,484 | |
| | | | NewPage Corporation, Term Loan | | | | |
| | 87,750 | | | 9.500%, 2/11/2021 | | | 31,316 | |
| | | | Tronox Pigments BV, Term Loan | | | | |
| | 83,361 | | | 4.500%, 3/19/2020 | | | 73,566 | |
| | | | Wausau Paper Corporation, Term Loan | | | | |
| | 73,698 | | | 6.500%, 7/30/2020 | | | 73,145 | |
| | | | | | | | |
| | | | Total | | | 373,686 | |
| | | | | | | | |
| |
| Capital Goods (0.5%) | | | | |
| | | | ADS Waste Holdings, Inc., Term Loan | | | | |
| | 86,581 | | | 3.750%, 10/9/2019 | | | 83,659 | |
| | | | Berry Plastics Group, Inc., Term Loan | | | | |
| | 118,708 | | | 3.500%, 2/8/2020 | | | 116,253 | |
| | | | Rexnord, LLC, Term Loan | | | | |
| | 89,930 | | | 4.000%, 8/21/2020 | | | 86,951 | |
| | | | Silver II Borrower, Term Loan | | | | |
| | 82,705 | | | 4.000%, 12/13/2019 | | | 69,762 | |
| | | | | | | | |
| | | | Total | | | 356,625 | |
| | | | | | | | |
| |
| Communications Services (3.6%) | | | | |
| | | | Altice Financing SA, Term Loan | | | | |
| | 87,063 | | | 5.250%, 2/4/2022 | | | 86,600 | |
| | | | Atlantic Broadband Penn, LLC, Term Loan | | | | |
| | 144,010 | | | 3.250%, 11/30/2019 | | | 142,525 | |
| | | | Birch Communication Inc., Term Loan | | | | |
| | 87,188 | | | 7.750%, 7/17/2020 | | | 83,264 | |
| | | | Cengage Learning Acquisitions, Term Loan | | | | |
| | 57,719 | | | 7.000%, 3/31/2020 | | | 56,132 | |
| | | | Charter Communications Operating, LLC, Term Loan | | | | |
| | 72,879 | | | 3.000%, 7/1/2020 | | | 71,436 | |
| | | | Cincinnati Bell, Inc., Term Loan | | | | |
| | 89,930 | | | 4.000%, 9/10/2020 | | | 86,595 | |
| | | | CommScope, Inc., Term Loan | | | | |
| | 109,725 | | | 3.827%, 12/29/2022b,c | | | 108,834 | |
| | | | CSC Holdings, LLC, Term Loan | | | | |
| | 37,500 | | | 5.000%, 10/9/2022 | | | 37,395 | |
| | | | Fairpoint Communications, Term Loan | | | | |
| | 89,694 | | | 7.500%, 2/14/2019 | | | 88,932 | |
| | | | Grande Communications Networks, LLC, Term Loan | | | | |
| | 89,702 | | | 4.500%, 5/29/2020 | | | 87,833 | |
| | | | Gray Television, Inc., Term Loan | | | | |
| | 151,351 | | | 3.750%, 6/13/2021 | | | 149,176 | |
| | | | Hargray Communications Group, Inc., Term Loan | | | | |
| | 146,597 | | | 5.250%, 6/26/2019 | | | 145,543 | |
| | | | Integra Telecom Holdings, Inc., Term Loan | | | | |
| | 89,708 | | | 5.250%, 8/14/2020 | | | 86,568 | |
| | | | Intelsat Jackson Holdings SA, Term Loan | | | | |
| | 119,444 | | | 3.750%, 6/30/2019 | | | 112,704 | |
| | | | Level 3 Communications, Inc., Term Loan | | | | |
| | 121,000 | | | 4.000%, 8/1/2019 | | | 120,697 | |
| | | | Liberty Cablevision of Puerto Rico, LLC, Term Loan | | | | |
| | 105,000 | | | 4.500%, 1/7/2022 | | | 101,456 | |
| | | | LTS Buyer, LLC, Term Loan | | | | |
| | 106,669 | | | 4.000%, 4/13/2020 | | | 103,629 | |
| | | | MCC Georgia, LLC, Term Loan | | | | |
| | 68,950 | | | 3.750%, 6/30/2021 | | | 68,067 | |
| | | | McGraw-Hill Global Education Holdings, LLC, Term Loan | | | | |
| | 76,771 | | | 4.750%, 3/22/2019 | | | 74,916 | |
| | | | NEP/NCP Holdco, Inc., Term Loan | | | | |
| | 89,939 | | | 4.250%, 1/22/2020 | | | 83,868 | |
| | | | NTelos, Inc., Term Loan | | | | |
| | 89,683 | | | 5.750%, 11/9/2019 | | | 88,786 | |
| | | | Numericable US, LLC, Term Loan | | | | |
| | 75,000 | | | 4.563%, 7/29/2022b,c | | | 71,543 | |
| | | | SBA Senior Finance II, LLC, Term Loan | | | | |
| | 98,500 | | | 3.250%, 3/24/2021 | | | 96,284 | |
| | | | TNS, Inc., Term Loan | | | | |
| | 39,713 | | | 5.000%, 2/14/2020 | | | 39,018 | |
| | | | Univision Communications, Inc., Term Loan | | | | |
| | 89,665 | | | 4.000%, 3/1/2020 | | | 87,603 | |
| | | | Virgin Media Investment Holdings, Ltd., Term Loan | | | | |
| | 46,459 | | | 3.500%, 6/30/2023 | | | 45,436 | |
| | | | WideOpenWest Finance, LLC, Term Loan | | | | |
| | 78,495 | | | 4.500%, 4/1/2019 | | | 75,527 | |
| | | | XO Communications, LLC, Term Loan | | | | |
| | 98,348 | | | 4.250%, 3/20/2021 | | | 95,841 | |
| | | | Yankee Cable Acquisition, LLC, Term Loan | | | | |
| | 85,667 | | | 4.250%, 3/1/2020 | | | 84,302 | |
| | | | Zayo Group, LLC, Term Loan | | | | |
| | 78,485 | | | 3.750%, 5/6/2021 | | | 77,069 | |
| | | | | | | | |
| | | | Total | | | 2,657,579 | |
| | | | | | | | |
| |
| Consumer Cyclical (1.9%) | | | | |
| | | | Amaya BV, Term Loan | | | | |
| | 135,786 | | | 5.000%, 8/1/2021 | | | 126,960 | |
| | | | Burlington Coat Factory Warehouse Corporation, Term Loan | | | | |
| | 117,246 | | | 4.250%, 8/13/2021 | | | 115,633 | |
| | | | Ceridian HCM Holding, Inc., Term Loan | | | | |
| | 44,112 | | | 4.500%, 9/15/2020 | | | 37,330 | |
| | | | Charter Communications Operating, LLC, Term Loan | | | | |
| | 44,850 | | | 3.000%, 1/3/2021 | | | 43,897 | |
| | | | Dollar Tree, Inc., Term Loan | | | | |
| | 62,344 | | | 3.500%, 7/6/2022 | | | 62,071 | |
The accompanying Notes to Financial Statements are an integral part of this schedule.
1
GROWTHAND INCOME PLUS FUND
Schedule of Investments as of December 31, 2015
| | | | | | | | |
Principal
Amount | | | Bank Loans (10.2%)a | | Value | |
| Consumer Cyclical (1.9%) - continued | | | | |
| | | | FCA US, LLC, Term Loan | | | | |
| $ | 58,950 | | | 3.250%, 12/31/2018 | | $ | 58,331 | |
| | | | Golden Nugget, Inc., Delayed Draw | | | | |
| | 10,152 | | | 5.500%, 11/21/2019 | | | 10,051 | |
| | | | Golden Nugget, Inc., Term Loan | | | | |
| | 23,688 | | | 5.500%, 11/21/2019 | | | 23,451 | |
| | | | Hilton Worldwide Finance, LLC, Term Loan | | | | |
| | 79,476 | | | 3.500%, 10/26/2020 | | | 79,253 | |
| | | | IMG Worldwide, Inc., Term Loan | | | | |
| | 83,911 | | | 5.250%, 5/6/2021 | | | 82,312 | |
| | | | J.C. Penney Corporation, Inc., Term Loan | | | | |
| | 89,700 | | | 6.000%, 5/22/2018 | | | 87,973 | |
| | | | Las Vegas Sands, LLC, Term Loan | | | | |
| | 19,600 | | | 3.250%, 12/19/2020 | | | 19,380 | |
| | | | Marina District Finance Company, Inc., Term Loan | | | | |
| | 474 | | | 6.500%, 8/15/2018b,c | | | 473 | |
| | 37,563 | | | 6.500%, 8/15/2018 | | | 37,469 | |
| | | | MGM Resorts International, Term Loan | | | | |
| | 127,187 | | | 3.500%, 12/20/2019 | | | 125,279 | |
| | | | Michaels Stores, Inc., Term Loan | | | | |
| | 56,772 | | | 4.000%, 1/28/2020 | | | 56,322 | |
| | | | Mohegan Tribal Gaming Authority, Term Loan | | | | |
| | 75,603 | | | 5.500%, 6/15/2018 | | | 73,794 | |
| | | | Pinnacle Entertainment, Inc., Term Loan | | | | |
| | 52,247 | | | 3.750%, 8/13/2020 | | | 52,035 | |
| | | | Scientific Games International, Inc., Term Loan | | | | |
| | 90,160 | | | 6.000%, 10/18/2020 | | | 82,271 | |
| | | | Seminole Hard Rock Entertainment, Inc., Term Loan | | | | |
| | 147,727 | | | 3.500%, 5/14/2020 | | | 144,403 | |
| | | | Seminole Indian Tribe of Florida, Term Loan | | | | |
| | 52,097 | | | 3.000%, 4/29/2020 | | | 51,706 | |
| | | | | | | | |
| | | | Total | | | 1,370,394 | |
| | | | | | | | |
| |
| Consumer Non-Cyclical (1.2%) | | | | |
| | | | Albertson’s, Inc., Term Loan | | | | |
| | 140,004 | | | 5.500%, 3/21/2019 | | | 139,409 | |
| | | | Albertson’s, LLC, Term Loan | | | | |
| | 15,000 | | | 0.000%, 12/22/2022b,c | | | 14,895 | |
| | | | Catalina Marketing Corporation, Term Loan | | | | |
| | 59,100 | | | 4.500%, 4/9/2021 | | | 46,985 | |
| | | | CHS/Community Health Systems, Inc., Term Loan | | | | |
| | 12,331 | | | 3.657%, 12/31/2018 | | | 12,141 | |
| | 11,573 | | | 3.750%, 1/27/2021 | | | 11,262 | |
| | 21,294 | | | 4.000%, 1/27/2021 | | | 20,929 | |
| | | | Endo Luxembourg Finance I Co Sarl, Term Loan | | | | |
| | 100,000 | | | 3.750%, 9/26/2022 | | | 98,542 | |
| | | | JBS USA, LLC, Term Loan | | | | |
| | 60,653 | | | 3.750%, 5/25/2018 | | | 60,273 | |
| | 39,395 | | | 3.750%, 9/18/2020 | | | 38,608 | |
| | 25,000 | | | 4.000%, 10/30/2022 | | | 24,906 | |
| | | | Libbey Glass, Inc., Term Loan | | | | |
| | 123,125 | | | 3.750%, 4/9/2021 | | | 120,816 | |
| | | | LTF Merger Sub, Inc., Term Loan | | | | |
| | 74,625 | | | 4.250%, 6/10/2022 | | | 72,620 | |
| | | | Ortho-Clinical Diagnostics, Inc., Term Loan | | | | |
| | 123,249 | | | 4.750%, 6/30/2021 | | | 103,991 | |
| | | | Supervalu, Inc., Term Loan | | | | |
| | 129,356 | | | 4.500%, 3/21/2019 | | | 127,443 | |
| | | | Valeant Pharmaceuticals International, Inc., Term Loan | | | | |
| | 30,922 | | | 4.000%, 4/1/2022b,c | | | 29,677 | |
| | | | | | | | |
| | | | Total | | | 922,497 | |
| | | | | | | | |
| |
| Energy (0.5%) | | | | |
| | | | Arch Coal, Inc., Term Loan | | | | |
| | 89,681 | | | 6.250%, 5/16/2018 | | | 39,485 | |
| | | | Aria Energy Operating, LLC, Term Loan | | | | |
| | 44,297 | | | 5.000%, 5/27/2022 | | | 40,975 | |
| | | | Energy Solutions, LLC, Term Loan | | | | |
| | 84,407 | | | 6.750%, 5/29/2020 | | | 63,305 | |
| | | | Exgen Renewables I, LLC, Term Loan | | | | |
| | 34,406 | | | 5.250%, 2/6/2021 | | | 34,406 | |
| | | | McJunkin Red Man Corporation, Term Loan | | | | |
| | 56,508 | | | 4.750%, 11/8/2019 | | | 51,705 | |
| | | | MEG Energy Corporation, Term Loan | | | | |
| | 74,227 | | | 3.750%, 3/31/2020 | | | 65,097 | |
| | | | Offshore Group Investment, Ltd., Term Loan | | | | |
| | 98,585 | | | 0.000%, 3/28/2019d | | | 19,799 | |
| | | | Pacific Drilling SA, Term Loan | | | | |
| | 67,275 | | | 4.500%, 6/3/2018 | | | 28,760 | |
| | | | | | | | |
| | | | Total | | | 343,532 | |
| | | | | | | | |
| |
| Financials (0.7%) | | | | |
| | | | Delos Finance Sarl, Term Loan | | | | |
| | 100,000 | | | 3.500%, 3/6/2021 | | | 99,482 | |
| | | | DJO Finance, LLC, Term Loan | | | | |
| | 59,850 | | | 4.250%, 6/7/2020 | | | 58,073 | |
| | | | Harland Clarke Holdings Corporation, Term Loan | | | | |
| | 86,250 | | | 7.000%, 5/22/2018 | | | 83,303 | |
| | | | MPH Acquisition Holdings, LLC, Term Loan | | | | |
| | 121,261 | | | 3.750%, 3/31/2021 | | | 117,826 | |
| | | | TransUnion, LLC, Term Loan | | | | |
| | 58,950 | | | 3.500%, 4/9/2021 | | | 57,157 | |
| | | | WaveDivision Holdings, LLC, Term Loan | | | | |
| | 110,218 | | | 4.000%, 10/15/2019 | | | 108,289 | |
| | | | | | | | |
| | | | Total | | | 524,130 | |
| | | | | | | | |
| |
| Technology (0.6%) | | | | |
| | | | Avago Technologies Cayman Finance, Ltd., Term Loan | | | | |
| | 80,000 | | | 0.000%, 11/13/2022b,c | | | 79,050 | |
| | | | Avago Technologies, Ltd., Term Loan | | | | |
| | 85,602 | | | 3.750%, 5/6/2021 | | | 85,317 | |
The accompanying Notes to Financial Statements are an integral part of this schedule.
2
GROWTHAND INCOME PLUS FUND
Schedule of Investments as of December 31, 2015
| | | | | | | | |
Principal
Amount | | | Bank Loans (10.2%)a | | Value | |
| Technology (0.6%) - continued | | | | |
| | | | BMC Software, Inc., Term Loan | | | | |
| $ | 86,965 | | | 5.000%, 9/10/2020 | | $ | 71,374 | |
| | | | First Data Corporation, Term Loan | | | | |
| | 92,000 | | | 3.918%, 3/23/2018 | | | 90,684 | |
| | 50,000 | | | 3.918%, 9/24/2018 | | | 49,250 | |
| | | | Merrill Communications, LLC, Term Loan | | | | |
| | 305 | | | 6.250%, 6/1/2022 | | | 259 | |
| | | | SS&C European Holdings SARL, Term Loan | | | | |
| | 42,421 | | | 4.007%, 7/8/2022 | | | 42,050 | |
| | 6,243 | | | 4.018%, 7/8/2022 | | | 6,188 | |
| | | | | | | | |
| | | | Total | | | 424,172 | |
| | | | | | | | |
| |
| Transportation (0.4%) | | | | |
| | | | American Airlines, Inc., Term Loan | | | | |
| | 90,390 | | | 3.250%, 6/27/2020 | | | 88,878 | |
| | | | Delta Airlines, Inc., Term Loan | | | | |
| | 99,750 | | | 3.250%, 8/24/2022 | | | 99,447 | |
| | | | OSG Bulk Ships, Inc., Term Loan | | | | |
| | 93,575 | | | 5.250%, 8/5/2019 | | | 89,598 | |
| | | | XPO Logistics, Inc., Term Loan | | | | |
| | 37,500 | | | 5.500%, 11/1/2021 | | | 37,297 | |
| | | | | | | | |
| | | | Total | | | 315,220 | |
| | | | | | | | |
| |
| Utilities (0.3%) | | | | |
| | | | Calpine Corporation, Term Loan | | | | |
| | 59,248 | | | 4.000%, 10/31/2020 | | | 57,618 | |
| | 88,438 | | | 3.500%, 5/27/2022 | | | 84,149 | |
| | | | Intergen NV, Term Loan | | | | |
| | 89,700 | | | 5.500%, 6/15/2020 | | | 80,842 | |
| | | | | | | | |
| | | | Total | | | 222,609 | |
| | | | | | | | |
| | | | Total Bank Loans (cost $8,031,853) | | | 7,510,444 | |
| | | | | | | | |
| | |
Shares | | | Common Stock (63.3%) | | | |
| Consumer Discretionary (10.0%) | | | | |
| | 1,500 | | | Aisan Industry Company, Ltd. | | | 15,403 | |
| | 500 | | | Aisin Seiki Company, Ltd. | | | 21,519 | |
| | 1,070 | | | Amazon.com, Inc.e | | | 723,202 | |
| | 820 | | | AutoZone, Inc.e | | | 608,366 | |
| | 200 | | | Bayerische Motoren Werke AG | | | 16,733 | |
| | 2,200 | | | Berkeley Group Holdings plc | | | 119,600 | |
| | 4,650 | | | Best Buy Company, Inc. | | | 141,592 | |
| | 3,320 | | | BorgWarner, Inc. | | | 143,524 | |
| | 500 | | | Brembo SPA | | | 24,157 | |
| | 1,200 | | | Bridgestone Corporation | | | 41,162 | |
| | 2,210 | | | Burlington Stores, Inc.e | | | 94,809 | |
| | 3,000 | | | Calsonic Kansei Corporation | | | 26,448 | |
| | 2,936 | | | Cedar Fair, LP | | | 163,946 | |
| | 1,500 | | | Cineworld Group plc | | | 12,436 | |
| | 13,288 | | | Comcast Corporation | | | 749,842 | |
| | 900 | | | Compass Group plc | | | 15,595 | |
| | 400 | | | Daimler AG | | | 33,422 | |
| | 10,000 | | | Debenhams plc | | | 10,782 | |
| | 1,900 | | | Denso Corporation | | | 90,792 | |
| | 10,230 | | | Discovery Communications, Inc., Class Ae | | | 272,936 | |
| | 7,900 | | | EDION Corporation | | | 59,650 | |
| | 1,100 | | | Electrolux AB | | | 26,540 | |
| | 1,200 | | | Eutelsat Communications | | | 35,929 | |
| | 4,660 | | | Ford Motor Company | | | 65,659 | |
| | 1,580 | | | General Motors Company | | | 53,736 | |
| | 2,900 | | | GKN plc | | | 13,160 | |
| | 6,000 | | | Gunze, Ltd. | | | 17,574 | |
| | 3,300 | | | Hakuhodo Dy Holdings, Inc. | | | 35,705 | |
| | 1,410 | | | Harman International Industries, Inc. | | | 132,836 | |
| | 200 | | | Hugo Boss AG | | | 16,502 | |
| | 5,800 | | | Inchcape plc | | | 66,919 | |
| | 2,500 | | | Informa plc | | | 22,594 | |
| | 900 | | | Intertek Group plc | | | 36,816 | |
| | 1,500 | | | Isuzu Motors, Ltd. | | | 16,159 | |
| | 19,000 | | | ITV plc | | | 77,356 | |
| | 4,910 | | | Jarden Corporatione | | | 280,459 | |
| | 9,400 | | | Lookers plc | | | 25,612 | |
| | 7,704 | | | MDC Partners, Inc. | | | 167,331 | |
| | 400 | | | Mitsuba Corporation | | | 6,184 | |
| | 9,380 | | | NIKE, Inc. | | | 586,250 | |
| | 2,800 | | | NOK Corporation | | | 65,410 | |
| | 100 | | | Paddy Power plc | | | 13,356 | |
| | 2,000 | | | PanaHome Corporation | | | 15,110 | |
| | 1,860 | | | Papa John’s International, Inc. | | | 103,918 | |
| | 5,800 | | | Persimmon plc | | | 173,034 | |
| | 190 | | | Priceline Group, Inc.e | | | 242,241 | |
| | 500 | | | ProSiebenSat.1 Media AG | | | 25,226 | |
| | 100 | | | Renault SA | | | 10,010 | |
| | 1,491 | | | Restoration Hardware Holdings, Inc.e | | | 118,460 | |
| | 390 | | | Schibsted ASA | | | 12,822 | |
| | 1,400 | | | Sekisui House, Ltd. | | | 23,539 | |
| | 1,500 | | | SHOWA Corporation | | | 13,918 | |
| | 2,100 | | | Sports Direct International plce | | | 17,846 | |
| | 600 | | | Stanley Electric Company, Ltd. | | | 13,163 | |
| | 4,000 | | | Star Entertainment Group, Ltd. | | | 14,678 | |
| | 6,734 | | | Starbucks Corporation | | | 404,242 | |
| | 5,000 | | | Sumitomo Forestry Company, Ltd. | | | 67,466 | |
| | 2,300 | | | Sumitomo Rubber Industries, Ltd. | | | 29,908 | |
| | 2,000 | | | Takashimaya Company, Ltd. | | | 18,011 | |
| | 500 | | | Tamron Company, Ltd. | | | 9,225 | |
| | 3,510 | | | Target Corporation | | | 254,861 | |
| | 4,700 | | | Tatts Group, Ltd. | | | 14,922 | |
| | 22,300 | | | Taylor Wimpey plc | | | 66,663 | |
| | 4,040 | | | Toll Brothers, Inc.e | | | 134,532 | |
| | 5,300 | | | UBM plc | | | 41,077 | |
| | 400 | | | Valora Holding AG | | | 83,218 | |
| | 2,000 | | | Wacoal Holdings Corporation | | | 23,917 | |
| | 3,800 | | | WH Smith plc | | | 98,739 | |
| | 2,500 | | | Wolters Kluwer NV | | | 83,959 | |
| | 3,500 | | | WPP plc | | | 80,507 | |
| | 700 | | | Yokohama Rubber Company, Ltd. | | | 10,750 | |
| | | | | | | | |
| | | | Total | | | 7,353,965 | |
| | | | | | | | |
| |
| Consumer Staples (3.7%) | | | | |
| | 800 | | | AarhusKarlshamn AB | | | 59,263 | |
| | 3,508 | | | Anheuser-Busch InBev NV ADR | | | 438,500 | |
| | 2,200 | | | Axfood AB | | | 38,105 | |
| | 502 | | | Bakkafrost PF | | | 14,789 | |
| | 200 | | | British American Tobacco plc | | | 11,107 | |
| | 1,900 | | | Britvic plc | | | 20,357 | |
| | 500 | | | Carrefour SA | | | 14,430 | |
| | 9,600 | | | Coca-Cola Company | | | 412,416 | |
| | 4,000 | | | Coca-Cola HBC AGe | | | 85,183 | |
| | 800 | | | Henkel AG & Company KGaA | | | 76,523 | |
| | 6,900 | | | Imperial Tobacco Group plc | | | 364,444 | |
| | 4,500 | | | Japan Tobacco, Inc. | | | 165,212 | |
| | 1,600 | | | Jeronimo Martins SGPS SA | | | 20,820 | |
| | 1,700 | | | Kao Corporation | | | 87,361 | |
| | 100 | | | Kerry Group plc | | | 8,274 | |
The accompanying Notes to Financial Statements are an integral part of this schedule.
3
GROWTHAND INCOME PLUS FUND
Schedule of Investments as of December 31, 2015
| | | | | | | | |
Shares | | | Common Stock (63.3%) | | Value | |
| Consumer Staples (3.7%) - continued | |
| | 11,800 | | | Koninklijke Ahold NV | | $ | 248,904 | |
| | 300 | | | KOSE Corporation | | | 27,738 | |
| | 1,600 | | | Marks and Spencer Group plc | | | 10,653 | |
| | 2,500 | | | Nestle SA | | | 185,588 | |
| | 1,000 | | | Nippon Meat Packers, Inc. | | | 19,600 | |
| | 2,900 | | | Nisshin Oillio Group, Ltd. | | | 11,814 | |
| | 2,190 | | | Philip Morris International, Inc. | | | 192,523 | |
| | 400 | | | Royal Unibrew AS | | | 16,257 | |
| | 1,000 | | | Suedzucker AG | | | 19,820 | |
| | 500 | | | Sugi Holdings Company, Ltd. | | | 27,586 | |
| | 200 | | | Sundrug Company, Ltd. | | | 12,859 | |
| | 600 | | | Svenska Cellulosa AB SCA | | | 17,388 | |
| | 2,800 | | | Swedish Match AB | | | 98,945 | |
| | | | | | | | |
| | | | Total | | | 2,706,459 | |
| | | | | | | | |
| |
| Energy (4.0%) | | | | |
| | 400 | | | Azrieli Group, Ltd. | | | 14,901 | |
| | 28,100 | | | BP plc | | | 146,028 | |
| | 560 | | | Cimarex Energy Company | | | 50,053 | |
| | 6,000 | | | EOG Resources, Inc. | | | 424,740 | |
| | 5,270 | | | EQT Corporation | | | 274,725 | |
| | 18,000 | | | Kinder Morgan, Inc. | | | 268,560 | |
| | 900 | | | OMV AG | | | 25,547 | |
| | 9,490 | | | Parsley Energy, Inc.e | | | 175,090 | |
| | 600 | | | Royal Dutch Shell plc | | | 13,684 | |
| | 6,700 | | | Royal Dutch Shell plc ADR | | | 306,793 | |
| | 1,545 | | | Royal Dutch Shell plc, Class B | | | 35,212 | |
| | 12,900 | | | Spectra Energy Corporation | | | 308,826 | |
| | 4,744 | | | Statoil ASA | | | 66,163 | |
| | 5,000 | | | TonenGeneral Sekiyu KK | | | 42,210 | |
| | 7,710 | | | Total SA ADR | | | 346,565 | |
| | 57,140 | | | Weatherford International, Ltd.e | | | 479,405 | |
| | | | | | | | |
| | | | Total | | | 2,978,502 | |
| | | | | | | | |
| |
| Financials (18.1%) | | | | |
| | 19,000 | | | Aberdeen Asset Management plc | | | 80,964 | |
| | 500 | | | Acadia Realty Trust | | | 16,575 | |
| | 700 | | | AEON Financial Service Company, Ltd. | | | 15,637 | |
| | 970 | | | Affiliated Managers Group, Inc.e | | | 154,967 | |
| | 700 | | | Agree Realty Corporation | | | 23,793 | |
| | 3,172 | | | Alexandria Real Estate Equities, Inc. | | | 286,622 | |
| | 2,900 | | | Allianz SE | | | 511,209 | |
| | 1,300 | | | American Capital Agency Corporation | | | 22,542 | |
| | 477 | | | American Farmland Company | | | 3,358 | |
| | 1,642 | | | American Realty Capital Properties, Inc. | | | 13,005 | |
| | 2,500 | | | Annaly Capital Management, Inc. | | | 23,450 | |
| | 1,400 | | | Apartment Investment & Management Company | | | 56,042 | |
| | 8,250 | | | Apollo Investment Corporation | | | 43,065 | |
| | 3,800 | | | Ares Capital Corporation | | | 54,150 | |
| | 8,300 | | | Australia & New Zealand Banking Group, Ltd. | | | 167,492 | |
| | 1,100 | | | AvalonBay Communities, Inc. | | | 202,543 | |
| | 29,900 | | | Banco Santander SA | | | 147,090 | |
| | 13,700 | | | Bank Hapoalim, Ltd. | | | 70,719 | |
| | 3,603 | | | Bank of Queensland, Ltd. | | | 36,346 | |
| | 24,000 | | | Bank of Yokohama, Ltd. | | | 147,110 | |
| | 8,400 | | | BinckBank NV | | | 72,395 | |
| | 2,000 | | | BioMed Realty Trust, Inc. | | | 47,380 | |
| | 400 | | | Bluerock Residential Growth REIT, Inc. | | | 4,740 | |
| | 300 | | | Bolsas y Mercados Espanoles SA | | | 10,110 | |
| | 2,106 | | | Boston Properties, Inc. | | | 268,599 | |
| | 2,600 | | | British Land Company plc | | | 30,084 | |
| | 8,358 | | | Brixmor Property Group, Inc. | | | 215,804 | |
| | 3,210 | | | Camden Property Trust | | | 246,400 | |
| | 3,602 | | | Capital Shopping Centres Group plc | | | 16,828 | |
| | 11,200 | | | CapitaMall Trust | | | 15,197 | |
| | 625 | | | Care Capital Properties, Inc. | | | 19,106 | |
| | 18,430 | | | Charles Schwab Corporation | | | 606,900 | |
| | 356 | | | Chesapeake Lodging Trust | | | 8,957 | |
| | 3,000 | | | Chiba Bank, Ltd. | | | 21,289 | |
| | 10,100 | | | Citigroup, Inc. | | | 522,675 | |
| | 3,500 | | | CNP Assurances | | | 47,213 | |
| | 250 | | | CoreSite Realty Corporation | | | 14,180 | |
| | 2,300 | | | CubeSmart | | | 70,426 | |
| | 400 | | | CyrusOne, Inc. | | | 14,980 | |
| | 1,300 | | | Daiwa House Industry Company, Ltd. | | | 37,370 | |
| | 10,560 | | | DDR Corporation | | | 177,830 | |
| | 200 | | | Derwent London plc | | | 10,818 | |
| | 16,400 | | | DEXUS Property Group | | | 88,956 | |
| | 950 | | | Digital Realty Trust, Inc. | | | 71,839 | |
| | 7,866 | | | Direct Line Insurance Group plc | | | 47,150 | |
| | 5,500 | | | Duke Realty Corporation | | | 115,610 | |
| | 300 | | | DuPont Fabros Technology, Inc. | | | 9,537 | |
| | 5,040 | | | Encore Capital Group, Inc.e | | | 146,563 | |
| | 700 | | | EPR Properties | | | 40,915 | |
| | 510 | | | Equinix, Inc. | | | 154,224 | |
| | 1,000 | | | Equity Lifestyle Properties, Inc. | | | 66,670 | |
| | 300 | | | Equity One, Inc. | | | 8,145 | |
| | 3,308 | | | Equity Residential | | | 269,900 | |
| | 550 | | | Essex Property Trust, Inc. | | | 131,676 | |
| | 450 | | | Extra Space Storage, Inc. | | | 39,695 | |
| | 200 | | | Federal Realty Investment Trust | | | 29,220 | |
| | 8,400 | | | FlexiGroup, Ltd. | | | 18,332 | |
| | 10,000 | | | Frasers Centrepoint Trust | | | 12,997 | |
| | 24,000 | | | Fukuoka Financial Group, Inc. | | | 119,007 | |
| | 4,439 | | | General Growth Properties, Inc. | | | 120,785 | |
| | 500 | | | GEO Group, Inc. | | | 14,455 | |
| | 1,400 | | | Hamborner REIT AG | | | 14,627 | |
| | 1,900 | | | Hammerson plc | | | 16,797 | |
| | 3,000 | | | Hang Seng Bank, Ltd. | | | 56,860 | |
| | 1,400 | | | Hannover Rueckversicherung SE | | | 159,866 | |
| | 2,700 | | | HCP, Inc. | | | 103,248 | |
| | 2,157 | | | Health Care REIT, Inc. | | | 146,741 | |
| | 2,100 | | | Healthcare Trust of America, Inc. | | | 56,637 | |
| | 6,000 | | | Henderson Group plc | | | 27,270 | |
| | 2,500 | | | Henderson Land Development Company, Ltd. | | | 15,250 | |
| | 1,300 | | | Highwoods Properties, Inc. | | | 56,680 | |
| | 6,000 | | | Hokuhoku Financial Group, Inc. | | | 12,231 | |
| | 1,000 | | | Hospitality Properties Trust | | | 26,150 | |
| | 9,180 | | | Host Hotels & Resorts, Inc. | | | 140,821 | |
| | 400 | | | Hudson Pacific Properties, Inc. | | | 11,256 | |
| | 3,100 | | | Hufvudstaden AB | | | 43,823 | |
| | 24,000 | | | Hysan Development Company, Ltd. | | | 98,056 | |
| | 900 | | | IG Group Holdings plc | | | 10,640 | |
| | 4,300 | | | ING Groep NV | | | 58,179 | |
| | 1,590 | | | Intercontinental Exchange, Inc. | | | 407,453 | |
| | 10,614 | | | Intermediate Capital Group plc | | | 97,846 | |
| | 1,650 | | | Invesco Mortgage Capital, Inc. | | | 20,444 | |
| | 7,000 | | | Investa Office Fund | | | 20,263 | |
| | 15,000 | | | Investec plc | | | 105,766 | |
| | 500 | | | Iron Mountain, Inc. | | | 13,505 | |
| | 600 | | | Kilroy Realty Corporation | | | 37,968 | |
| | 4,400 | | | Kimco Realty Corporation | | | 116,424 | |
| | 267 | | | Lamar Advertising Company | | | 16,015 | |
| | 700 | | | LaSalle Hotel Properties | | | 17,612 | |
| | 300 | | | Liberty Property Trust | | | 9,315 | |
The accompanying Notes to Financial Statements are an integral part of this schedule.
4
GROWTHAND INCOME PLUS FUND
Schedule of Investments as of December 31, 2015
| | | | | | | | |
Shares | | | Common Stock (63.3%) | | Value | |
| Financials (18.1%) - continued | |
| | 16,500 | | | Link REIT | | $ | 98,371 | |
| | 1,175 | | | Macerich Company | | | 94,811 | |
| | 200 | | | Macquarie Group, Ltd. | | | 11,965 | |
| | 2,100 | | | Medical Properties Trust, Inc. | | | 24,171 | |
| | 7,602 | | | MetLife, Inc. | | | 366,492 | |
| | 800 | | | Mid-America Apartment Communities, Inc. | | | 72,648 | |
| | 20,500 | | | Mitsubishi UFJ Financial Group, Inc. | | | 126,982 | |
| | 200 | | | Muenchener Rueckversicherungs-Gesellschaft AG | | | 39,848 | |
| | 500 | | | National Health Investors, Inc. | | | 30,435 | |
| | 1,800 | | | National Retail Properties, Inc. | | | 72,090 | |
| | 52,000 | | | New World Development Company, Ltd. | | | 51,061 | |
| | 850 | | | NorthStar Realty Finance Corporation | | | 14,476 | |
| | 4,000 | | | Ogaki Kyoritsu Bank, Ltd. | | | 16,127 | |
| | 4,200 | | | Old Mutual plc | | | 11,049 | |
| | 1,000 | | | Omega Healthcare Investors, Inc. | | | 34,980 | |
| | 500 | | | Outfront Media, Inc. | | | 10,915 | |
| | 4,024 | | | PacWest Bancorp | | | 173,434 | |
| | 1,200 | | | Parkway Properties, Inc. | | | 18,756 | |
| | 1,550 | | | Physicians Realty Trust | | | 26,133 | |
| | 3,900 | | | Poundland Group plc | | | 11,942 | |
| | 6,480 | | | Prologis, Inc. | | | 278,122 | |
| | 1,318 | | | Public Storage, Inc. | | | 326,469 | |
| | 2,230 | | | Raymond James Financial, Inc. | | | 129,273 | |
| | 1,000 | | | Realty Income Corporation | | | 51,630 | |
| | 700 | | | Regency Centers Corporation | | | 47,684 | |
| | 2,600 | | | Renasant Corporation | | | 89,466 | |
| | 2,800 | | | Resona Holdings, Inc. | | | 13,597 | |
| | 400 | | | Retail Opportunity Investments Corporation | | | 7,160 | |
| | 1,997 | | | RLJ Lodging Trust | | | 43,195 | |
| | 300 | | | Sampo Oyj | | | 15,235 | |
| | 2,000 | | | Schroders plc | | | 87,598 | |
| | 168 | | | Silver Bay Realty Trust Corporation REIT | | | 2,631 | |
| | 2,624 | | | Simon Property Group, Inc. | | | 510,211 | |
| | 500 | | | SL Green Realty Corporation | | | 56,490 | |
| | 3,250 | | | Solar Capital, Ltd. | | | 53,398 | |
| | 400 | | | Sompo Japan Nipponkoa Holdings, Inc. | | | 13,134 | |
| | 367 | | | Sovran Self Storage, Inc. | | | 39,383 | |
| | 5,300 | | | Spirit Realty Captial, Inc. | | | 53,106 | |
| | 40,800 | | | Stockland | | | 121,114 | |
| | 595 | | | Store Capital Corporation | | | 13,804 | |
| | 15,000 | | | Sumitomo Mitsui Trust Holdings, Inc. | | | 56,810 | |
| | 1,500 | | | Summit Hotel Properties, Inc. | | | 17,925 | |
| | 150 | | | Sun Communities, Inc. | | | 10,280 | |
| | 700 | | | Sunstone Hotel Investors, Inc. | | | 8,743 | |
| | 3,200 | | | Swiss Re AG | | | 312,532 | |
| | 13,250 | | | Synchrony Financiale | | | 402,933 | |
| | 500 | | | Talanx AG | | | 15,377 | |
| | 1,033 | | | Tanger Factory Outlet Centers, Inc. | | | 33,779 | |
| | 300 | | | Taubman Centers, Inc. | | | 23,016 | |
| | 300 | | | Tokio Marine Holdings, Inc. | | | 11,587 | |
| | 6,100 | | | UBS Group AG | | | 118,337 | |
| | 2,300 | | | UDR, Inc. | | | 86,411 | |
| | 9,300 | | | United Overseas Bank, Ltd. | | | 128,217 | |
| | 1,400 | | | Urban Edge Properties | | | 32,830 | |
| | 2,500 | | | Ventas, Inc. | | | 141,075 | |
| | 2,480 | | | Vornado Realty Trust | | | 247,901 | |
| | 1,600 | | | Wallenstam AB | | | 12,860 | |
| | 17,900 | | | Wing Tai Holdings, Ltd. | | | 22,111 | |
| | 600 | | | WP Carey, Inc. | | | 35,400 | |
| | 4,490 | | | XL Group plc | | | 175,918 | |
| | 5,880 | | | Zions Bancorporation | | | 160,524 | |
| | | | | | | | |
| | | | Total | | | 13,293,331 | |
| | | | | | | | |
| |
| Health Care (6.8%) | | | | |
| | 13,070 | | | Abbott Laboratories | | | 586,974 | |
| | 200 | | | Actelion, Ltd. | | | 27,789 | |
| | 3,670 | | | Akorn, Inc.e | | | 136,928 | |
| | 1,670 | | | Allergan plce | | | 521,875 | |
| | 2,030 | | | Amgen, Inc. | | | 329,530 | |
| | 1,500 | | | Astellas Pharmaceutical, Inc. | | | 21,354 | |
| | 400 | | | CSL, Ltd. | | | 30,496 | |
| | 2,200 | | | Essilor International SA | | | 274,201 | |
| | 200 | | | Fresenius Medical Care AG & Company KGaA | | | 16,807 | |
| | 200 | | | Gerresheimer AG | | | 15,628 | |
| | 2,500 | | | Hikma Pharmaceuticals plc | | | 84,749 | |
| | 4,530 | | | Hologic, Inc.e | | | 175,266 | |
| | 1,719 | | | ICON plce | | | 133,566 | |
| | 780 | | | Illumina, Inc.e | | | 149,717 | |
| | 900 | | | Kaken Pharmaceutical Company, Ltd. | | | 61,500 | |
| | 300 | | | Lonza Group AG | | | 48,790 | |
| | 8,630 | | | Medtronic, Inc. | | | 663,820 | |
| | 12,490 | | | Merck & Company, Inc. | | | 659,722 | |
| | 3,660 | | | Mylan NVe | | | 197,896 | |
| | 2,200 | | | Novartis AG | | | 189,242 | |
| | 2,400 | | | Novo Nordisk AS | | | 138,956 | |
| | 400 | | | Paramount Bed Holdings Company, Ltd. | | | 14,193 | |
| | 6,012 | | | Pfizer, Inc. | | | 194,067 | |
| | 500 | | | Recordati SPA | | | 13,045 | |
| | 1,500 | | | Sanofi | | | 127,833 | |
| | 700 | | | Suzuken Company, Ltd. | | | 26,601 | |
| | 1,250 | | | Waters Corporatione | | | 168,225 | |
| | | | | | | | |
| | | | Total | | | 5,008,770 | |
| | | | | | | | |
| |
| Industrials (6.8%) | | | | |
| | 700 | | | Aalberts Industries NV | | | 24,119 | |
| | 900 | | | Adecco SA | | | 61,598 | |
| | 4,730 | | | ADT Corporation | | | 155,995 | |
| | 1,300 | | | Aida Engineering, Ltd. | | | 13,399 | |
| | 16,700 | | | Air New Zealand, Ltd. | | | 33,682 | |
| | 900 | | | Airbus Group NV | | | 60,649 | |
| | 1,500 | | | Amada Holdings Company, Ltd. | | | 14,314 | |
| | 400 | | | Andritz AG | | | 19,467 | |
| | 8,000 | | | Asahi Glass Company, Ltd. | | | 45,831 | |
| | 500 | | | Atlas Copco Aktiebolag | | | 12,262 | |
| | 9,400 | | | BAE Systems plc | | | 69,208 | |
| | 5,690 | | | Boeing Company | | | 822,717 | |
| | 4,700 | | | Bollore SA | | | 21,900 | |
| | 4,400 | | | Central Glass Company, Ltd. | | | 20,181 | |
| | 700 | | | Central Japan Railway Company | | | 124,274 | |
| | 800 | | | Compagnie de Saint-Gobain | | | 34,668 | |
| | 500 | | | Croda International plc | | | 22,403 | |
| | 3,200 | | | CTT-Correios de Portugal SA | | | 30,755 | |
| | 2,000 | | | Dai Nippon Printing Company, Ltd. | | | 19,777 | |
| | 1,922 | | | Dart Group plc | | | 16,675 | |
| | 1,200 | | | Deutsche Post AG | | | 33,550 | |
| | 700 | | | DSV AS | | | 27,555 | |
| | 100 | | | East Japan Railway Company | | | 9,417 | |
| | 300 | | | Elbit Systems, Ltd. | | | 26,411 | |
| | 3,100 | | | EMCOR Group, Inc. | | | 148,924 | |
| | 2,000 | | | Ferrovial SA | | | 45,227 | |
| | 1,337 | | | Galliford Try plc | | | 30,042 | |
The accompanying Notes to Financial Statements are an integral part of this schedule.
5
GROWTHAND INCOME PLUS FUND
Schedule of Investments as of December 31, 2015
| | | | | | | | |
Shares | | | Common Stock (63.3%) | | Value | |
| Industrials (6.8%) - continued | |
| | 300 | | | GEA Group AG | | $ | 12,120 | |
| | 2,000 | | | Hankyu Hanshin Holdings, Inc. | | | 13,000 | |
| | 3,100 | | | HNI Corporation | | | 111,786 | |
| | 200 | | | Hochtief AG | | | 18,550 | |
| | 200 | | | Hoshizaki Electric Company, Ltd. | | | 12,433 | |
| | 800 | | | IBIDEN Company, Ltd. | | | 11,469 | |
| | 8,650 | | | Illinois Tool Works, Inc. | | | 801,682 | |
| | 1,000 | | | Inaba Denki Sangyo Company, Ltd. | | | 31,951 | |
| | 7,550 | | | Ingersoll-Rand plc | | | 417,440 | |
| | 3,200 | | | Intrum Justitia AB | | | 108,889 | |
| | 12,100 | | | ITOCHU Corporation | | | 143,124 | |
| | 600 | | | Jardine Matheson Holdings, Ltd. | | | 29,057 | |
| | 200 | | | Jungheinrich AG | | | 16,495 | |
| | 1,000 | | | Keisei Electric Railway Company, Ltd. | | | 12,758 | |
| | 4,400 | | | KITZ Corporation | | | 19,764 | |
| | 2,900 | | | KONE Oyj | | | 122,790 | |
| | 1,000 | | | Koninklijke Boskalis Westminster NV | | | 40,792 | |
| | 4,700 | | | Macquarie Infrastructure Corporation | | | 341,220 | |
| | 5,530 | | | Masco Corporation | | | 156,499 | |
| | 6,323 | | | Meggitt plc | | | 34,911 | |
| | 300 | | | MEITEC Corporation | | | 10,273 | |
| | 1,700 | | | MIRAIT Holdings Corporation | | | 14,006 | |
| | 2,000 | | | Mitsuboshi Belting, Ltd. | | | 15,944 | |
| | 1,900 | | | Nikkon Holdings Company, Ltd. | | | 37,870 | |
| | 3,000 | | | Nippon Express Company, Ltd. | | | 14,098 | |
| | 3,200 | | | Nitto Kogyo Corporation | | | 55,948 | |
| | 1,000 | | | Obayashi Corporation | | | 9,227 | |
| | 200 | | | Randstad Holding NV | | | 12,454 | |
| | 6,000 | | | Rentokil Initial plc | | | 14,078 | |
| | 200 | | | Rieter Holding AG | | | 37,591 | |
| | 593 | | | Saft Groupe SA | | | 18,074 | |
| | 6,300 | | | SIG plc | | | 13,313 | |
| | 1,000 | | | Teleperformance SA | | | 84,088 | |
| | 200 | | | Thales SA | | | 14,970 | |
| | 400 | | | TKH Group NV | | | 16,243 | |
| | 3,000 | | | Toppan Printing Company, Ltd. | | | 27,639 | |
| | 400 | | | Travis Perkins plc | | | 11,604 | |
| | 1,100 | | | Tsubakimoto Chain Company | | | 8,470 | |
| | 200 | | | Vestas Wind Systems AS | | | 13,968 | |
| | 1,350 | | | WABCO Holdings, Inc.e | | | 138,051 | |
| | 600 | | | Yuasa Trading Company, Ltd. | | | 14,822 | |
| | | | | | | | |
| | | | Total | | | 4,984,461 | |
| | | | | | | | |
| |
| Information Technology (9.1%) | | | | |
| | 4,720 | | | Alibaba Group Holding, Ltd. ADRe | | | 383,594 | |
| | 530 | | | Alphabet, Inc., Class Ae | | | 412,345 | |
| | 521 | | | Alphabet, Inc., Class Ce | | | 395,377 | |
| | 1,200 | | | Alps Electric Company, Ltd. | | | 32,542 | |
| | 400 | | | AMS AG | | | 13,371 | |
| | 4,780 | | | Apple, Inc. | | | 503,143 | |
| | 160 | | | AtoS | | | 13,432 | |
| | 2,530 | | | Autodesk, Inc.e | | | 154,153 | |
| | 1,700 | | | Canon, Inc. | | | 51,425 | |
| | 300 | | | Cap Gemini SA | | | 27,836 | |
| | 2,400 | | | Check Point Software Technologies, Ltd.e | | | 195,312 | |
| | 15,550 | | | Cisco Systems, Inc. | | | 422,260 | |
| | 1,400 | | | Dialog Semiconductor plce | | | 46,716 | |
| | 600 | | | DTS Corporation | | | 13,658 | |
| | 14,488 | | | EMC Corporation | | | 372,052 | |
| | 1,780 | | | Facebook, Inc.e | | | 186,295 | |
| | 6,100 | | | FUJIFILM Holdings NPV | | | 254,568 | |
| | 2,000 | | | Hitachi Kokusai Electric, Inc. | | | 27,189 | |
| | 900 | | | Hoya Corporation | | | 36,803 | |
| | 500 | | | Ingenico Group | | | 63,111 | |
| | 1,800 | | | IRESS, Ltd. | | | 13,032 | |
| | 800 | | | IT Holdings Corporation | | | 18,279 | |
| | 800 | | | ITOCHU Techno-Solutions Corporation | | | 15,940 | |
| | 5,190 | | | Juniper Networks, Inc. | | | 143,244 | |
| | 400 | | | Kyocera Corporation | | | 18,576 | |
| | 3,190 | | | MasterCard, Inc. | | | 310,578 | |
| | 7,906 | | | MaxLinear, Inc.e | | | 116,455 | |
| | 12,950 | | | Microsoft Corporation | | | 718,466 | |
| | 2,500 | | | NEC Networks & System Integration Corporation | | | 44,212 | |
| | 800 | | | NS Solutions Corporation | | | 18,229 | |
| | 2,790 | | | Plantronics, Inc. | | | 132,302 | |
| | 7,340 | | | Progress Software Corporatione | | | 176,160 | |
| | 5,100 | | | QLIK Technologies, Inc.e | | | 161,466 | |
| | 900 | | | SAP SE | | | 71,418 | |
| | 3,700 | | | Shinko Electric Industries Company, Ltd. | | | 23,720 | |
| | 200 | | | TDK Corporation | | | 12,809 | |
| | 680 | | | Ultimate Software Group, Inc.e | | | 132,947 | |
| | 8,250 | | | Visa, Inc. | | | 639,788 | |
| | 7,550 | | | Xilinx, Inc. | | | 354,624 | |
| | | | | | | | |
| | | | Total | | | 6,727,427 | |
| | | | | | | | |
| |
| Materials (1.8%) | | | | |
| | 550 | | | Ashland, Inc. | | | 56,485 | |
| | 100 | | | Aurubis AG | | | 5,064 | |
| | 4,800 | | | BHP Billiton plc | | | 53,529 | |
| | 10,700 | | | BHP Billiton, Ltd. | | | 137,704 | |
| | 5,200 | | | BillerudKorsnas AB | | | 96,234 | |
| | 4,400 | | | Boral, Ltd. | | | 18,812 | |
| | 1,200 | | | Buzzi Unicem SPA | | | 21,510 | |
| | 1,190 | | | Crown Holdings, Inc.e | | | 60,333 | |
| | 6,300 | | | Daicel Corporation | | | 93,756 | |
| | 1,510 | | | Domtar Corporation | | | 55,795 | |
| | 2,000 | | | DOWA Holdings Company, Ltd.e | | | 14,380 | |
| | 300 | | | Evonik Industries AG | | | 9,923 | |
| | 930 | | | FMC Corporation | | | 36,391 | |
| | 1,300 | | | Hexpol AB | | | 13,939 | |
| | 1,800 | | | Hokuetsu Kishu Paper Company, Ltd. | | | 10,607 | |
| | 700 | | | Holmen AB | | | 21,621 | |
| | 800 | | | JFE Holdings, Inc. | | | 12,562 | |
| | 200 | | | LafargeHolcim, Ltd. | | | 10,015 | |
| | 2,000 | | | Mitsubishi Chemical Holdings Corporation | | | 12,689 | |
| | 1,500 | | | Mondi plc | | | 29,401 | |
| | 800 | | | Nippon Paint Holdings Company, Ltd. | | | 19,362 | |
| | 1,800 | | | Nippon Steel & Sumitomo Metal Corporation | | | 35,608 | |
| | 1,200 | | | Novozymes AS | | | 57,455 | |
| | 3,000 | | | Oji Holdings Corporation | | | 12,057 | |
| | 2,310 | | | Owens-Illinois, Inc.e | | | 40,240 | |
| | 1,070 | | | Packaging Corporation of America | | | 67,464 | |
| | 640 | | | PPG Industries, Inc. | | | 63,245 | |
| | 800 | | | Rio Tinto plc | | | 23,292 | |
| | 300 | | | Rio Tinto, Ltd. | | | 9,702 | |
| | 3,010 | | | Steel Dynamics, Inc. | | | 53,789 | |
| | 3,000 | | | Sumitomo Seika Chemicals Company, Ltd. | | | 18,253 | |
| | 2,000 | | | Tosoh Corporation | | | 10,288 | |
| | 2,800 | | | UPM-Kymmene Oyj | | | 51,983 | |
| | 2,813 | | | Yara International ASA | | | 120,982 | |
| | | | | | | | |
| | | | Total | | | 1,354,470 | |
| | | | | | | | |
| |
| Telecommunications Services (1.4%) | | | | |
| | 12,655 | | | BT Group plc | | | 87,871 | |
The accompanying Notes to Financial Statements are an integral part of this schedule.
6
GROWTHAND INCOME PLUS FUND
Schedule of Investments as of December 31, 2015
| | | | | | | | |
Shares | | | Common Stock (63.3%) | | Value | |
| Telecommunications Services (1.4%) - continued | |
| | 3,500 | | | Elisa Oyj | | $ | 131,688 | |
| | 3,100 | | | Freenet AG | | | 104,610 | |
| | 49,200 | | | KCOM Group plc | | | 83,773 | |
| | 8,000 | | | Orange SA | | | 133,807 | |
| | 1,700 | | | Proximus SA | | | 55,320 | |
| | 5,000 | | | StarHub, Ltd. | | | 13,012 | |
| | 61,800 | | | Telstra Corporation, Ltd. | | | 251,136 | |
| | 1,400 | | | Vivendi SA | | | 30,068 | |
| | 6,060 | | | Zayo Group Holdings, Inc.e | | | 161,135 | |
| | | | | | | | |
| | | | Total | | | 1,052,420 | |
| | | | | | | | |
|
| Utilities (1.6%) | |
| | 29,400 | | | A2A SPA | | | 39,809 | |
| | 14,400 | | | Brookfield Infrastructure Partners, LP | | | 545,904 | |
| | 3,500 | | | CLP Holdings, Ltd. | | | 29,666 | |
| | 25,700 | | | Electricidade de Portugal SA | | | 92,606 | |
| | 8,214 | | | MDU Resources Group, Inc. | | | 150,481 | |
| | 2,836 | | | NorthWestern Corporation | | | 153,853 | |
| | 14,200 | | | Redes Energeticas Nacionais SGPS SA | | | 42,899 | |
| | 2,000 | | | Toho Gas Company, Ltd. | | | 12,917 | |
| | 6,500 | | | United Utilities Group plc | | | 89,501 | |
| | | | | | | | |
| | | | Total | | | 1,157,636 | |
| | | | | | | | |
| | | | Total Common Stock (cost $47,537,403) | | | 46,617,441 | |
| | | | | | | | |
| | |
Principal
Amount | | | Long-Term Fixed Income (16.7%) | | | |
| Asset-Backed Securities (0.1%) | |
| | | | Countrywide Asset-Backed Certificates | | | | |
| | $33,637 | | | 5.530%, 4/25/2047 | | | 36,642 | |
| | | | Vericrest Opportunity Loan Transferee | | | | |
| | 42,460 | | | 3.500%, 6/26/2045f | | | 41,814 | |
| | | | | | | | |
| | | | Total | | | 78,456 | |
| | | | | | | | |
|
| Basic Materials (0.2%) | |
| | | | Albemarle Corporation | | | | |
| | 14,000 | | | 3.000%, 12/1/2019 | | | 13,732 | |
| | | | Anglo American Capital plc | | | | |
| | 7,000 | | | 1.271%, 4/15/2016f,g | | | 6,932 | |
| | | | ArcelorMittal SA | | | | |
| | 45,000 | | | 6.500%, 3/1/2021 | | | 36,220 | |
| | | | Dow Chemical Company | | | | |
| | 8,000 | | | 8.550%, 5/15/2019 | | | 9,429 | |
| | | | First Quantum Minerals, Ltd. | | | | |
| | 60,000 | | | 7.000%, 2/15/2021f | | | 37,650 | |
| | | | Freeport-McMoRan, Inc. | | | | |
| | 7,000 | | | 2.300%, 11/14/2017 | | | 5,967 | |
| | 10,000 | | | 2.375%, 3/15/2018 | | | 7,800 | |
| | | | Glencore Funding, LLC | | | | |
| | 10,000 | | | 1.377%, 4/16/2018f,g | | | 8,438 | |
| | | | LyondellBasell Industries NV | | | | |
| | 8,000 | | | 5.000%, 4/15/2019 | | | 8,510 | |
| | | | NOVA Chemicals Corporation | | | | |
| | 35,516 | | | 5.250%, 8/1/2023f | | | 35,161 | |
| | | | | | | | |
| | | | Total | | | 169,839 | |
| | | | | | | | |
|
| Capital Goods (0.6%) | |
| | | | Berry Plastics Corporation | | | | |
| | 35,000 | | | 6.000%, 10/15/2022f | | | 35,612 | |
| | | | Building Materials Corporation of America | | | | |
| | 55,000 | | | 6.000%, 10/15/2025f | | | 56,100 | |
| | | | Cemex SAB de CV | | | | |
| | 60,000 | | | 5.700%, 1/11/2025f | | | 50,175 | |
| | | | CNH Industrial Capital, LLC | | | | |
| | 65,000 | | | 4.375%, 11/6/2020 | | | 61,263 | |
| | | | Crown Americas Capital Corporation IV | | | | |
| | 45,000 | | | 4.500%, 1/15/2023 | | | 43,987 | |
| | | | General Electric Company | | | | |
| | 16,000 | | | 4.200%, 12/15/2049h | | | 15,920 | |
| | | | L-3 Communications Corporation | | | | |
| | 10,000 | | | 1.500%, 5/28/2017 | | | 9,876 | |
| | | | Lockheed Martin Corporation | | | | |
| | 10,000 | | | 1.850%, 11/23/2018 | | | 9,982 | |
| | | | Martin Marietta Materials, Inc. | | | | |
| | 12,000 | | | 1.703%, 6/30/2017g | | | 11,917 | |
| | | | Nortek, Inc. | | | | |
| | 23,677 | | | 8.500%, 4/15/2021 | | | 24,567 | |
| | | | Owens-Brockway Glass Container, Inc. | | | | |
| | 60,000 | | | 5.000%, 1/15/2022f | | | 58,650 | |
| | | | Pentair Finance SA | | | | |
| | 10,000 | | | 3.625%, 9/15/2020 | | | 9,990 | |
| | | | Reynolds Group Issuer, Inc. | | | | |
| | 23,677 | | | 9.875%, 8/15/2019 | | | 23,855 | |
| | | | Roper Industries, Inc. | | | | |
| | 9,000 | | | 2.050%, 10/1/2018 | | | 8,942 | |
| | | | United Rentals North America, Inc. | | | | |
| | 60,000 | | | 5.500%, 7/15/2025 | | | 58,200 | |
| | | | | | | | |
| | | | Total | | | 479,036 | |
| | | | | | | | |
|
| Collateralized Mortgage Obligations (2.7%) | |
| | | | Alternative Loan Trust | | | | |
| | 125,020 | | | 5.500%, 10/25/2035 | | | 114,223 | |
| | | | Banc of America Alternative Loan Trust | | | | |
| | 59,819 | | | 6.000%, 11/25/2035 | | | 53,239 | |
| | | | CHL Mortgage Pass-Through Trust | | | | |
| | 84,285 | | | 4.325%, 1/25/2036 | | | 79,067 | |
| | | | Citigroup Mortgage Loan Trust, Inc. | | | | |
| | 23,579 | | | 2.751%, 3/25/2037 | | | 18,614 | |
| | | | CitiMortgage Alternative Loan Trust | | | | |
| | 92,731 | | | 5.750%, 4/25/2037 | | | 79,548 | |
| | | | Countrywide Alternative Loan Trust | | | | |
| | 78,761 | | | 6.500%, 8/25/2036 | | | 59,346 | |
| | | | Countrywide Home Loan Mortgage Pass Through Trust | | | | |
| | 139,934 | | | 2.706%, 11/25/2035 | | | 119,259 | |
| | | | Credit Suisse First Boston Mortgage Securities Corporation | | | | |
| | 55,789 | | | 5.250%, 10/25/2035 | | | 55,452 | |
| | | | Deutsche Alt-A Securities, Inc., Mortgage Loan Trust | | | | |
| | 59,076 | | | 5.500%, 11/25/2035 | | | 56,437 | |
| | | | HomeBanc Mortgage Trust | | | | |
| | 44,748 | | | 2.229%, 4/25/2037 | | | 33,733 | |
The accompanying Notes to Financial Statements are an integral part of this schedule.
7
GROWTHAND INCOME PLUS FUND
Schedule of Investments as of December 31, 2015
| | | | | | | | |
Principal
Amount | | | Long-Term Fixed Income (16.7%) | | Value | |
| Collateralized Mortgage Obligations (2.7%) - continued | |
| | | | J.P. Morgan Alternative Loan Trust | | | | |
| | $142,909 | | | 6.500%, 3/25/2036 | | $ | 123,632 | |
| | | | J.P. Morgan Mortgage Trust | | | | |
| | 78,775 | | | 2.327%, 6/25/2035 | | | 78,644 | |
| | 77,713 | | | 2.812%, 6/25/2035 | | | 78,514 | |
| | 66,341 | | | 2.872%, 8/25/2035 | | | 65,930 | |
| | 87,056 | | | 2.919%, 1/25/2037 | | | 76,432 | |
| | | | MortgageIT Trust | | | | |
| | 73,266 | | | 0.682%, 12/25/2035g | | | 66,327 | |
| | | | New York Mortgage Trust | | | | |
| | 77,263 | | | 2.671%, 5/25/2036 | | | 69,913 | |
| | | | Residential Accredit Loans, Inc. Trust | | | | |
| | 72,293 | | | 5.750%, 9/25/2035 | | | 65,122 | |
| | | | Residential Funding Mortgage Security I Trust | | | | |
| | 62,566 | | | 5.750%, 2/25/2036 | | | 58,417 | |
| | 85,104 | | | 6.000%, 7/25/2037 | | | 77,038 | |
| | | | Sequoia Mortgage Trust | | | | |
| | 43,721 | | | 2.822%, 9/20/2046 | | | 34,979 | |
| | | | Structured Adjustable Rate Mortgage Loan Trust | | | | |
| | 91,434 | | | 2.877%, 9/25/2035 | | | 77,258 | |
| | | | Structured Asset Mortgage Investments, Inc. | | | | |
| | 138,021 | | | 0.732%, 12/25/2035g | | | 99,925 | |
| | | | WaMu Mortgage Pass Through Certificates | | | | |
| | 131,013 | | | 0.997%, 1/25/2047g | | | 105,664 | |
| | | | Wells Fargo Mortgage Backed Securities Trust | | | | |
| | 68,266 | | | 2.763%, 3/25/2036 | | | 67,797 | |
| | 62,968 | | | 2.731%, 7/25/2036 | | | 61,699 | |
| | 53,113 | | | 6.000%, 7/25/2037 | | | 52,578 | |
| | | | | | | | |
| | | | Total | | | 1,928,787 | |
| | | | | | | | |
|
| Communications Services (1.0%) | |
| | | | 21st Century Fox America, Inc. | | | | |
| | 11,000 | | | 6.900%, 3/1/2019 | | | 12,494 | |
| | | | AMC Networks, Inc. | | | | |
| | 13,677 | | | 7.750%, 7/15/2021 | | | 14,361 | |
| | 20,000 | | | 4.750%, 12/15/2022 | | | 20,000 | |
| | | | America Movil SAB de CV | | | | |
| | 8,000 | | | 5.000%, 10/16/2019 | | | 8,641 | |
| | | | American Tower Corporation | | | | |
| | 10,000 | | | 2.800%, 6/1/2020 | | | 9,885 | |
| | | | AT&T, Inc. | | | | |
| | 10,000 | | | 1.533%, 6/30/2020g | | | 9,929 | |
| | | | British Sky Broadcasting Group plc | | | | |
| | 14,000 | | | 2.625%, 9/16/2019f | | | 13,935 | |
| | | | CC Holdings GS V, LLC | | | | |
| | 10,000 | | | 2.381%, 12/15/2017 | | | 10,011 | |
| | | | CCO Safari II, LLC | | | | |
| | 5,000 | | | 3.579%, 7/23/2020f | | | 4,970 | |
| | 5,000 | | | 4.464%, 7/23/2022f | | | 4,983 | |
| | | | CCOH Safari, LLC | | | | |
| | 60,000 | | | 5.750%, 2/15/2026f | | | 60,150 | |
| | | | CenturyLink, Inc. | | | | |
| | 30,000 | | | 6.450%, 6/15/2021 | | | 29,250 | |
| | | | Clear Channel Worldwide Holdings, Inc. | | | | |
| | 40,000 | | | 6.500%, 11/15/2022 | | | 39,000 | |
| | | | Columbus International, Inc. | | | | |
| | 50,000 | | | 7.375%, 3/30/2021f | | | 49,500 | |
| | | | Digicel, Ltd. | | | | |
| | 53,677 | | | 6.000%, 4/15/2021f | | | 45,223 | |
| | | | DIRECTV Holdings, LLC | | | | |
| | 8,000 | | | 5.875%, 10/1/2019 | | | 8,929 | |
| | | | FairPoint Communications, Inc. | | | | |
| | 60,000 | | | 8.750%, 8/15/2019f | | | 59,100 | |
| | | | Frontier Communications Corporation | | | | |
| | 40,000 | | | 8.875%, 9/15/2020f | | | 40,500 | |
| | | | Hughes Satellite Systems Corporation | | | | |
| | 27,000 | | | 6.500%, 6/15/2019 | | | 29,092 | |
| | | | Intelsat Jackson Holdings SA | | | | |
| | 23,677 | | | 7.250%, 10/15/2020 | | | 20,717 | |
| | | | Numericable-SFR | | | | |
| | 50,000 | | | 6.000%, 5/15/2022f | | | 48,500 | |
| | | | SBA Tower Trust | | | | |
| | 12,000 | | | 5.101%, 4/17/2017f | | | 12,149 | |
| | | | Sprint Corporation | | | | |
| | 60,000 | | | 7.625%, 2/15/2025 | | | 43,800 | |
| | | | Telefonica Emisiones SAU | | | | |
| | 9,000 | | | 3.192%, 4/27/2018 | | | 9,175 | |
| | | | T-Mobile USA, Inc. | | | | |
| | 25,000 | | | 6.633%, 4/28/2021 | | | 25,937 | |
| | | | Univision Communications, Inc. | | | | |
| | 40,000 | | | 5.125%, 5/15/2023f | | | 38,500 | |
| | | | UPCB Finance V, Ltd. | | | | |
| | 36,000 | | | 7.250%, 11/15/2021f | | | 38,250 | |
| | | | Verizon Communications, Inc. | | | | |
| | 27,000 | | | 2.625%, 2/21/2020 | | | 27,094 | |
| | 12,000 | | | 4.500%, 9/15/2020 | | | 12,893 | |
| | | | | | | | |
| | | | Total | | | 746,968 | |
| | | | | | | | |
| |
| Consumer Cyclical (1.1%) | | | | |
| | | | AMC Entertainment, Inc. | | | | |
| | 24,000 | | | 5.875%, 2/15/2022 | | | 24,360 | |
| | | | Brookfield Residential Properties, Inc. | | | | |
| | 25,000 | | | 6.125%, 7/1/2022f | | | 23,125 | |
| | | | Cinemark USA, Inc. | | | | |
| | 28,000 | | | 4.875%, 6/1/2023 | | | 27,300 | |
| | | | Corrections Corporation of America | | | | |
| | 40,000 | | | 5.000%, 10/15/2022 | | | 39,800 | |
| | | | CVS Health Corporation | | | | |
| | 60,000 | | | 4.750%, 12/1/2022f | | | 64,291 | |
| | | | Daimler Finance North America, LLC | | | | |
| | 7,000 | | | 1.875%, 1/11/2018f | | | 6,972 | |
| | | | ERAC USA Finance, LLC | | | | |
| | 12,000 | | | 2.350%, 10/15/2019f | | | 11,829 | |
| | | | Ford Motor Credit Company, LLC | | | | |
| | 13,000 | | | 5.000%, 5/15/2018 | | | 13,655 | |
| | 14,000 | | | 2.597%, 11/4/2019 | | | 13,746 | |
| | | | General Motors Financial Company, Inc. | | | | |
| | 23,677 | | | 3.250%, 5/15/2018 | | | 23,796 | |
| | 21,000 | | | 4.375%, 9/25/2021 | | | 21,295 | |
| | | | GLP Capital, LP | | | | |
| | 50,000 | | | 4.875%, 11/1/2020 | | | 49,000 | |
The accompanying Notes to Financial Statements are an integral part of this schedule.
8
GROWTHAND INCOME PLUS FUND
Schedule of Investments as of December 31, 2015
| | | | | | | | |
Principal
Amount | | | Long-Term Fixed Income (16.7%) | | Value | |
| Consumer Cyclical (1.1%) - continued | |
| | | | Hilton Worldwide Finance, LLC | | | | |
| | $45,000 | | | 5.625%, 10/15/2021 | | $ | 46,631 | |
| | | | Home Depot, Inc. | | | | |
| | 5,000 | | | 0.882%, 9/15/2017g | | | 5,007 | |
| | 10,000 | | | 2.625%, 6/1/2022 | | | 9,990 | |
| | | | Hyundai Capital America | | | | |
| | 9,000 | | | 1.450%, 2/6/2017f | | | 8,958 | |
| | | | Jaguar Land Rover Automotive plc | | | | |
| | 20,000 | | | 4.250%, 11/15/2019f | | | 20,150 | |
| | 30,000 | | | 5.625%, 2/1/2023f | | | 30,300 | |
| | | | KB Home | | | | |
| | 22,000 | | | 4.750%, 5/15/2019 | | | 21,340 | |
| | | | L Brands, Inc. | | | | |
| | 30,000 | | | 6.625%, 4/1/2021 | | | 33,225 | |
| | | | Lennar Corporation | | | | |
| | 60,000 | | | 4.750%, 11/15/2022 | | | 59,490 | |
| | | | Macy’s Retail Holdings, Inc. | | | | |
| | 10,000 | | | 7.450%, 7/15/2017 | | | 10,805 | |
| | | | MGM Resorts International | | | | |
| | 60,000 | | | 6.000%, 3/15/2023 | | | 59,550 | |
| | | | Ralph Lauren Corporation | | | | |
| | 10,000 | | | 2.625%, 8/18/2020 | | | 10,095 | |
| | | | Royal Caribbean Cruises, Ltd. | | | | |
| | 48,677 | | | 5.250%, 11/15/2022 | | | 49,894 | |
| | | | Six Flags Entertainment Corporation | | | | |
| | 40,000 | | | 5.250%, 1/15/2021f | | | 40,500 | |
| | | | Toll Brothers Finance Corporation | | | | |
| | 16,000 | | | 4.000%, 12/31/2018 | | | 16,320 | |
| | | | Visa, Inc. | | | | |
| | 10,000 | | | 2.200%, 12/14/2020 | | | 9,981 | |
| | | | West Corporation | | | | |
| | 50,000 | | | 5.375%, 7/15/2022f | | | 43,125 | |
| | | | | | | | |
| | | | Total | | | 794,530 | |
| | | | | | | | |
|
| Consumer Non-Cyclical (0.9%) | |
| | | | Actavis Funding SCS | | | | |
| | 7,000 | | | 1.757%, 3/12/2020g | | | 7,025 | |
| | | | Amgen, Inc. | | | | |
| | 10,000 | | | 2.125%, 5/1/2020 | | | 9,864 | |
| | | | B&G Foods, Inc. | | | | |
| | 45,000 | | | 4.625%, 6/1/2021 | | | 44,550 | |
| | | | BAT International Finance plc | | | | |
| | 10,000 | | | 1.022%, 6/15/2018f,g | | | 9,986 | |
| | | | Becton, Dickinson and Company | | | | |
| | 10,000 | | | 1.450%, 5/15/2017 | | | 9,958 | |
| | | | Boston Scientific Corporation | | | | |
| | 5,000 | | | 6.000%, 1/15/2020 | | | 5,552 | |
| | | | Bunge Limited Finance Corporation | | | | |
| | 10,000 | | | 3.500%, 11/24/2020 | | | 9,944 | |
| | | | Cardinal Health, Inc. | | | | |
| | 10,000 | | | 1.950%, 6/15/2018 | | | 9,974 | |
| | | | Celgene Corporation | | | | |
| | 10,000 | | | 3.550%, 8/15/2022 | | | 10,097 | |
| | | | CHS/Community Health Systems, Inc. | | | | |
| | 30,000 | | | 7.125%, 7/15/2020 | | | 29,888 | |
| | | | Cott Beverages, Inc. | | | | |
| | 55,000 | | | 5.375%, 7/1/2022 | | | 53,900 | |
| | | | CVS Health Corporation | | | | |
| | 8,000 | | | 2.250%, 12/5/2018 | | | 8,039 | |
| | | | EMD Finance, LLC | | | | |
| | 6,000 | | | 0.876%, 3/17/2017f,g | | | 5,982 | |
| | | | Envision Healthcare Corporation | | | | |
| | 50,000 | | | 5.125%, 7/1/2022f | | | 49,000 | |
| | | | Forest Laboratories, Inc. | | | | |
| | 12,000 | | | 4.375%, 2/1/2019f | | | 12,571 | |
| | | | Fresenius Medical Care US Finance, Inc. | | | | |
| | 23,677 | | | 5.750%, 2/15/2021f | | | 25,334 | |
| | | | Gilead Sciences, Inc. | | | | |
| | 10,000 | | | 3.250%, 9/1/2022 | | | 10,069 | |
| | | | Grifols Worldwide Operations, Ltd. | | | | |
| | 40,000 | | | 5.250%, 4/1/2022 | | | 40,200 | |
| | | | HCA, Inc. | | | | |
| | 23,677 | | | 4.750%, 5/1/2023 | | | 23,440 | |
| | | | JBS USA, LLC | | | | |
| | 60,000 | | | 5.750%, 6/15/2025f | | | 52,200 | |
| | | | Laboratory Corporation of America Holdings | | | | |
| | 5,000 | | | 2.625%, 2/1/2020 | | | 4,936 | |
| | | | Mead Johnson Nutrition Company | | | | |
| | 10,000 | | | 3.000%, 11/15/2020 | | | 9,997 | |
| | | | Merck & Company, Inc. | | | | |
| | 5,000 | | | 0.716%, 2/10/2020g | | | 4,969 | |
| | | | Mondelez International, Inc. | | | | |
| | 6,000 | | | 2.250%, 2/1/2019 | | | 5,998 | |
| | | | Mylan NV | | | | |
| | 5,000 | | | 3.750%, 12/15/2020f | | | 5,005 | |
| | | | PepsiCo, Inc. | | | | |
| | 10,000 | | | 1.850%, 4/30/2020 | | | 9,885 | |
| | | | Revlon Consumer Products Corporation | | | | |
| | 23,677 | | | 5.750%, 2/15/2021 | | | 22,908 | |
| | | | Reynolds American, Inc. | | | | |
| | 10,000 | | | 3.250%, 6/12/2020 | | | 10,163 | |
| | | | SABMiller plc | | | | |
| | 9,000 | | | 6.500%, 7/15/2018f | | | 9,930 | |
| | | | Safeway, Inc. | | | | |
| | 3,000 | | | 3.400%, 12/1/2016 | | | 2,970 | |
| | | | Spectrum Brands Escrow Corporation | | | | |
| | 30,000 | | | 6.375%, 11/15/2020 | | | 31,875 | |
| | | | Tenet Healthcare Corporation | | | | |
| | 45,000 | | | 8.125%, 4/1/2022 | | | 44,888 | |
| | | | TreeHouse Foods, Inc. | | | | |
| | 40,000 | | | 4.875%, 3/15/2022 | | | 38,100 | |
| | | | Valeant Pharmaceuticals International | | | | |
| | 23,677 | | | 7.250%, 7/15/2022f | | | 23,144 | |
| | | | Zoetis, Inc. | | | | |
| | 10,000 | | | 3.450%, 11/13/2020 | | | 10,012 | |
| | | | | | | | |
| | | | Total | | | 662,353 | |
| | | | | | | | |
|
| Energy (0.7%) | |
| | | | Anadarko Petroleum Corporation | | | | |
| | 9,000 | | | 8.700%, 3/15/2019 | | | 10,225 | |
| | | | Boardwalk Pipelines, Ltd. | | | | |
| | 11,000 | | | 5.875%, 11/15/2016 | | | 11,107 | |
| | | | Buckeye Partners, LP | | | | |
| | 13,000 | | | 2.650%, 11/15/2018 | | | 12,507 | |
The accompanying Notes to Financial Statements are an integral part of this schedule.
9
GROWTHAND INCOME PLUS FUND
Schedule of Investments as of December 31, 2015
| | | | | | | | |
Principal
Amount | | | Long-Term Fixed Income (16.7%) | | Value | |
| Energy (0.7%) - continued | |
| | | | Chevron Corporation | | | | |
| | $10,000 | | | 0.874%, 11/16/2018g | | $ | 10,003 | |
| | | | Concho Resources, Inc. | | | | |
| | 58,677 | | | 6.500%, 1/15/2022 | | | 56,330 | |
| | | | Crestwood Midstream Partners, LP | | | | |
| | 40,000 | | | 6.250%, 4/1/2023f | | | 27,900 | |
| | | | Enbridge, Inc. | | | | |
| | 6,000 | | | 0.866%, 6/2/2017g | | | 5,877 | |
| | | | EQT Corporation | | | | |
| | 8,000 | | | 8.125%, 6/1/2019 | | | 8,641 | |
| | | | Marathon Petroleum Corporation | | | | |
| | 10,000 | | | 3.400%, 12/15/2020 | | | 9,821 | |
| | | | MEG Energy Corporation | | | | |
| | 30,000 | | | 6.375%, 1/30/2023f | | | 20,550 | |
| | | | Noble Energy, Inc. | | | | |
| | 60,000 | | | 5.875%, 6/1/2022 | | | 57,078 | |
| | | | Pacific Drilling V, Ltd. | | | | |
| | 40,000 | | | 7.250%, 12/1/2017f | | | 20,600 | |
| | | | Petrobras International Finance Company | | | | |
| | 60,000 | | | 5.750%, 1/20/2020 | | | 47,100 | |
| | | | Petroleos Mexicanos | | | | |
| | 70,000 | | | 5.625%, 1/23/2046f | | | 53,564 | |
| | | | Pioneer Natural Resources Company | | | | |
| | 3,000 | | | 3.450%, 1/15/2021 | | | 2,770 | |
| | | | Regency Energy Partners, LP | | | | |
| | 45,000 | | | 5.000%, 10/1/2022 | | | 39,864 | |
| | | | Sabine Pass Liquefaction, LLC | | | | |
| | 60,000 | | | 5.625%, 3/1/2025f | | | 50,775 | |
| | | | Schlumberger Holdings Corporation | | | | |
| | 10,000 | | | 3.000%, 12/21/2020f | | | 9,871 | |
| | | | Shell International Finance BV | | | | |
| | 10,000 | | | 0.806%, 5/11/2020g | | | 9,853 | |
| | | | Southwestern Energy Company | | | | |
| | 14,000 | | | 7.500%, 2/1/2018 | | | 11,900 | |
| | | | Sunoco Logistics Partners Operations, LP | | | | |
| | 10,000 | | | 4.400%, 4/1/2021 | | | 9,691 | |
| | | | | | | | |
| | | | Total | | | 486,027 | |
| | | | | | | | |
|
| Financials (1.8%) | |
| | | | Abbey National Treasury Services plc | | | | |
| | 14,000 | | | 1.013%, 9/29/2017g | | | 13,883 | |
| | | | ACE INA Holdings, Inc. | | | | |
| | 10,000 | | | 2.875%, 11/3/2022 | | | 9,924 | |
| | | | Air Lease Corporation | | | | |
| | 14,000 | | | 2.125%, 1/15/2018 | | | 13,755 | |
| | 5,000 | | | 2.625%, 9/4/2018 | | | 4,942 | |
| | | | Ally Financial, Inc. | | | | |
| | 40,000 | | | 4.750%, 9/10/2018 | | | 40,950 | |
| | | | American Express Credit Corporation | | | | |
| | 5,000 | | | 1.552%, 9/14/2020g | | | 5,043 | |
| | | | Aviation Capital Group Corporation | | | | |
| | 6,000 | | | 3.875%, 9/27/2016f | | | 6,045 | |
| | | | Bank of America Corporation | | | | |
| | 14,000 | | | 5.700%, 5/2/2017 | | | 14,600 | |
| | 14,000 | | | 1.700%, 8/25/2017 | | | 13,960 | |
| | 24,000 | | | 1.656%, 3/22/2018g | | | 24,077 | |
| | 20,000 | | | 5.650%, 5/1/2018 | | | 21,506 | |
| | 12,000 | | | 8.000%, 12/29/2049h | | | 12,210 | |
| | | | BB&T Corporation | | | | |
| | 13,000 | | | 2.050%, 6/19/2018 | | | 13,074 | |
| | | | Bear Stearns Companies, LLC | | | | |
| | 15,000 | | | 6.400%, 10/2/2017 | | | 16,154 | |
| | | | BNP Paribas SA | | | | |
| | 9,000 | | | 2.375%, 9/14/2017 | | | 9,107 | |
| | | | Caisse Centrale Desjardins du Quebec | | | | |
| | 7,000 | | | 0.989%, 1/29/2018f,g | | | 6,986 | |
| | | | CIT Group, Inc. | | | | |
| | 25,000 | | | 3.875%, 2/19/2019 | | | 24,875 | |
| | | | Citigroup, Inc. | | | | |
| | 21,000 | | | 1.850%, 11/24/2017 | | | 20,969 | |
| | | | Credit Agricole SA | | | | |
| | 8,000 | | | 1.457%, 6/10/2020f,g | | | 7,983 | |
| | | | CyrusOne, LP | | | | |
| | 23,677 | | | 6.375%, 11/15/2022 | | | 24,387 | |
| | | | DDR Corporation | | | | |
| | 6,000 | | | 9.625%, 3/15/2016 | | | 6,094 | |
| | | | Discover Bank | | | | |
| | 3,000 | | | 8.700%, 11/18/2019 | | | 3,549 | |
| | | | Discover Financial Services | | | | |
| | 6,000 | | | 6.450%, 6/12/2017 | | | 6,339 | |
| | | | Duke Realty, LP | | | | |
| | 14,000 | | | 8.250%, 8/15/2019 | | | 16,561 | |
| | | | Fifth Third Bancorp | | | | |
| | 16,000 | | | 5.450%, 1/15/2017 | | | 16,587 | |
| | | | Goldman Sachs Group, Inc. | | | | |
| | 6,000 | | | 2.625%, 1/31/2019 | | | 6,043 | |
| | 9,000 | | | 7.500%, 2/15/2019 | | | 10,298 | |
| | 5,000 | | | 1.476%, 4/23/2020g | | | 5,007 | |
| | 10,000 | | | 2.012%, 11/29/2023g | | | 10,089 | |
| | | | Goldman Sachs Group, Inc. Convertible | | | | |
| | 375,000 | | | 0.500%, 9/24/2022 | | | 387,911 | |
| | | | Hartford Financial Services Group, Inc. | | | | |
| | 14,000 | | | 6.000%, 1/15/2019 | | | 15,397 | |
| | | | HCP, Inc. | | | | |
| | 9,000 | | | 3.750%, 2/1/2019 | | | 9,285 | |
| | | | Health Care REIT, Inc. | | | | |
| | 8,000 | | | 4.700%, 9/15/2017 | | | 8,363 | |
| | | | HSBC Holdings plc | | | | |
| | 7,000 | | | 6.375%, 12/29/2049h | | | 6,991 | |
| | | | Hutchison Whampoa Finance CI, Ltd. | | | | |
| | 15,000 | | | 1.625%, 10/31/2017f | | | 14,868 | |
| | | | Icahn Enterprises, LP | | | | |
| | 50,000 | | | 6.000%, 8/1/2020 | | | 50,420 | |
| | | | ING Capital Funding Trust III | | | | |
| | 8,000 | | | 4.207%, 12/29/2049g,h | | | 7,980 | |
| | | | International Lease Finance Corporation | | | | |
| | 8,000 | | | 2.462%, 6/15/2016g | | | 7,980 | |
| | 25,000 | | | 5.875%, 4/1/2019 | | | 26,500 | |
| | | | Intesa Sanpaolo SPA | | | | |
| | 3,000 | | | 3.875%, 1/16/2018 | | | 3,076 | |
| | 12,000 | | | 3.875%, 1/15/2019 | | | 12,356 | |
| | | | J.P. Morgan Chase & Company | | | | |
| | 6,000 | | | 6.300%, 4/23/2019 | | | 6,728 | |
| | 5,000 | | | 2.250%, 1/23/2020 | | | 4,919 | |
| | 12,000 | | | 7.900%, 4/29/2049h | | | 12,216 | |
The accompanying Notes to Financial Statements are an integral part of this schedule.
10
GROWTHAND INCOME PLUS FUND
Schedule of Investments as of December 31, 2015
| | | | | | | | |
Principal
Amount | | | Long-Term Fixed Income (16.7%) | | Value | |
| Financials (1.8%) - continued | |
| | | | KeyCorp | | | | |
| | $9,000 | | | 2.300%, 12/13/2018 | | $ | 9,013 | |
| | | | Liberty Mutual Group, Inc. | | | | |
| | 3,000 | | | 5.000%, 6/1/2021f | | | 3,209 | |
| | | | Lloyds Bank plc | | | | |
| | 7,000 | | | 1.038%, 3/16/2018g | | | 6,963 | |
| | | | MetLife, Inc. | | | | |
| | 14,000 | | | 1.903%, 12/15/2017 | | | 14,082 | |
| | | | Mizuho Corporate Bank, Ltd. | | | | |
| | 11,000 | | | 1.550%, 10/17/2017f | | | 10,913 | |
| | | | Morgan Stanley | | | | |
| | 12,000 | | | 6.625%, 4/1/2018 | | | 13,158 | |
| | 5,000 | | | 1.463%, 1/27/2020g | | | 5,011 | |
| | 8,000 | | | 4.875%, 11/1/2022 | | | 8,490 | |
| | | | MPT Operating Partnership, LP | | | | |
| | 40,000 | | | 5.500%, 5/1/2024 | | | 39,800 | |
| | | | Murray Street Investment Trust I | | | | |
| | 18,000 | | | 4.647%, 3/9/2017 | | | 18,545 | |
| | | | National City Corporation | | | | |
| | 6,000 | | | 6.875%, 5/15/2019 | | | 6,778 | |
| | | | New York Life Global Funding | | | | |
| | 10,000 | | | 1.550%, 11/2/2018f | | | 9,919 | |
| | | | Nomura Holdings, Inc. | | | | |
| | 6,000 | | | 2.750%, 3/19/2019 | | | 6,032 | |
| | | | Quicken Loans, Inc. | | | | |
| | 50,000 | | | 5.750%, 5/1/2025f | | | 47,625 | |
| | | | Realty Income Corporation | | | | |
| | 10,000 | | | 2.000%, 1/31/2018 | | | 10,006 | |
| | | | Regions Bank | | | | |
| | 5,000 | | | 7.500%, 5/15/2018 | | | 5,556 | |
| | | | Reinsurance Group of America, Inc. | | | | |
| | 12,000 | | | 5.625%, 3/15/2017 | | | 12,506 | |
| | | | Royal Bank of Scotland Group plc | | | | |
| | 7,000 | | | 1.543%, 3/31/2017g | | | 6,986 | |
| | | | Simon Property Group, LP | | | | |
| | 10,000 | | | 2.500%, 9/1/2020 | | | 10,008 | |
| | | | Societe Generale SA | | | | |
| | 9,000 | | | 5.750%, 4/20/2016f | | | 9,115 | |
| | | | State Street Corporation | | | | |
| | 10,000 | | | 1.264%, 8/18/2020g | | | 10,001 | |
| | | | Sumitomo Mitsui Banking Corporation | | | | |
| | 18,000 | | | 1.300%, 1/10/2017 | | | 17,956 | |
| | | | Synchrony Financial | | | | |
| | 18,000 | | | 1.875%, 8/15/2017 | | | 17,917 | |
| | 5,000 | | | 1.564%, 2/3/2020g | | | 4,921 | |
| | | | Toronto-Dominion Bank | | | | |
| | 10,000 | | | 1.432%, 12/14/2020g | | | 9,998 | |
| | | | UnitedHealth Group, Inc. | | | | |
| | 10,000 | | | 3.350%, 7/15/2022 | | | 10,228 | |
| | | | USB Realty Corporation | | | | |
| | 5,000 | | | 1.468%, 12/29/2049f,g,h | | | 4,500 | |
| | | | Voya Financial, Inc. | | | | |
| | 9,000 | | | 2.900%, 2/15/2018 | | | 9,097 | |
| | | | Wells Fargo & Company | | | | |
| | 7,000 | | | 1.002%, 1/30/2020g | | | 6,935 | |
| | | | | | | | |
| | | | Total | | | 1,305,255 | |
| | | | | | | | |
|
| Foreign Government (3.6%) | |
| | | | Brazil Government International Bond | | | | |
| | 60,000 | | | 5.875%, 1/15/2019 | | | 61,200 | |
| | 70,000 | | | 4.875%, 1/22/2021 | | | 64,750 | |
| | 117,000 | | | 2.625%, 1/5/2023 | | | 88,920 | |
| | 64,000 | | | 5.000%, 1/27/2045 | | | 42,720 | |
| | | | Colombia Government International Bond | | | | |
| | 40,000 | | | 2.625%, 3/15/2023 | | | 35,140 | |
| | 40,000 | | | 4.000%, 2/26/2024 | | | 38,100 | |
| | 85,000 | | | 5.000%, 6/15/2045 | | | 70,975 | |
| | | | Croatia Government International Bond | | | | |
| | 55,000 | | | 6.625%, 7/14/2020f | | | 58,935 | |
| | | | Hungary Government International Bond | | | | |
| | 68,000 | | | 5.750%, 11/22/2023 | | | 76,085 | |
| | 70,000 | | | 5.375%, 3/25/2024 | | | 76,650 | |
| | | | Indonesia Government International Bond | | | | |
| | 60,000 | | | 4.875%, 5/5/2021f | | | 62,149 | |
| | 65,000 | | | 3.375%, 4/15/2023f | | | 60,401 | |
| | 60,000 | | | 5.875%, 1/15/2024f | | | 64,279 | |
| | 60,000 | | | 4.125%, 1/15/2025f | | | 57,500 | |
| | 115,000 | | | 5.125%, 1/15/2045f | | | 104,000 | |
| | | | Mexico Government International Bond | | | | |
| | 50,000 | | | 3.625%, 3/15/2022 | | | 50,300 | |
| | 50,000 | | | 4.000%, 10/2/2023 | | | 50,650 | |
| | 40,000 | | | 3.600%, 1/30/2025 | | | 38,980 | |
| | 20,000 | | | 6.050%, 1/11/2040 | | | 21,900 | |
| | 50,000 | | | 4.750%, 3/8/2044 | | | 45,550 | |
| | 40,000 | | | 5.550%, 1/21/2045 | | | 41,000 | |
| | 70,000 | | | 4.600%, 1/23/2046 | | | 61,950 | |
| | | | Panama Government International Bond | | | | |
| | 32,000 | | | 4.000%, 9/22/2024 | | | 32,000 | |
| | 20,000 | | | 6.700%, 1/26/2036 | | | 23,750 | |
| | | | Peru Government International Bond | | | | |
| | 120,000 | | | 4.125%, 8/25/2027 | | | 117,600 | |
| | | | Philippines Government International Bond | | | | |
| | 40,000 | | | 7.750%, 1/14/2031 | | | 56,199 | |
| | 50,000 | | | 6.375%, 10/23/2034 | | | 65,189 | |
| | | | Romania Government International Bond | | | | |
| | 42,000 | | | 4.375%, 8/22/2023f | | | 43,720 | |
| | 20,000 | | | 4.875%, 1/22/2024f | | | 21,486 | |
| | | | Russia Government International Bond | | | | |
| | 40,000 | | | 3.500%, 1/16/2019f | | | 39,800 | |
| | 200,000 | | | 5.000%, 4/29/2020f | | | 206,400 | |
| | 80,000 | | | 4.875%, 9/16/2023f | | | 81,280 | |
| | 59,500 | | | 7.500%, 3/31/2030f | | | 71,286 | |
| | 60,000 | | | 5.625%, 4/4/2042f | | | 56,760 | |
| | | | South Africa Government International Bond | | | | |
| | 50,000 | | | 5.500%, 3/9/2020 | | | 51,317 | |
| | | | Turkey Government International Bond | | | | |
| | 60,000 | | | 7.500%, 11/7/2019 | | | 67,276 | |
| | 125,000 | | | 7.000%, 6/5/2020 | | | 139,082 | |
| | 80,000 | | | 5.125%, 3/25/2022 | | | 82,100 | |
| | 40,000 | | | 6.250%, 9/26/2022 | | | 43,424 | |
| | 20,000 | | | 5.750%, 3/22/2024 | | | 21,130 | |
The accompanying Notes to Financial Statements are an integral part of this schedule.
11
GROWTHAND INCOME PLUS FUND
Schedule of Investments as of December 31, 2015
| | | | | | | | |
Principal
Amount | | | Long-Term Fixed Income (16.7%) | | Value | |
| Foreign Government (3.6%) - continued | |
| | $67,000 | | | 4.250%, 4/14/2026 | | $ | 62,816 | |
| | 80,000 | | | 4.875%, 4/16/2043 | | | 70,400 | |
| | | | | | | | |
| | | | Total | | | 2,625,149 | |
| | | | | | | | |
|
| Mortgage-Backed Securities (2.6%) | |
| | | | Federal Home Loan Mortgage Corporation Gold 15-Yr. Pass Through | | | | |
| | 250,000 | | | 3.000%, 1/1/2031c | | | 257,618 | |
| | | | Federal Home Loan Mortgage Corporation Gold 30-Yr. Pass Through | | | | |
| | 150,000 | | | 4.000%, 1/1/2046c | | | 158,458 | |
| | | | Federal National Mortgage Association Conventional 30-Yr. Pass Through | | | | |
| | 705,000 | | | 3.500%, 1/1/2046c | | | 727,365 | |
| | 475,000 | | | 4.000%, 1/1/2046c | | | 502,632 | |
| | 250,000 | | | 4.500%, 1/1/2046c | | | 269,969 | |
| | | | | | | | |
| | | | Total | | | 1,916,042 | |
| | | | | | | | |
|
| Technology (0.5%) | |
| | | | Alliance Data Systems Corporation | | | | |
| | 25,000 | | | 5.375%, 8/1/2022f | | | 23,812 | |
| | | | Apple, Inc. | | | | |
| | 10,000 | | | 0.659%, 5/6/2020g | | | 9,925 | |
| | | | Automatic Data Processing, Inc. | | | | |
| | 5,000 | | | 2.250%, 9/15/2020 | | | 5,019 | |
| | | | Cisco Systems, Inc. | | | | |
| | 10,000 | | | 0.914%, 3/1/2019g | | | 9,991 | |
| | | | Denali Borrower, LLC | | | | |
| | 46,000 | | | 5.625%, 10/15/2020f | | | 48,185 | |
| | | | Equinix, Inc. | | | | |
| | 40,000 | | | 5.750%, 1/1/2025 | | | 40,900 | |
| | | | Fidelity National Information Services, Inc. | | | | |
| | 12,000 | | | 1.450%, 6/5/2017 | | | 11,838 | |
| | 10,000 | | | 3.625%, 10/15/2020 | | | 10,130 | |
| | | | First Data Corporation | | | | |
| | 40,000 | | | 5.375%, 8/15/2023f | | | 40,200 | |
| | | | Freescale Semiconductor, Inc. | | | | |
| | 30,000 | | | 6.000%, 1/15/2022f | | | 31,425 | |
| | | | Hewlett Packard Enterprise Company | | | | |
| | 10,000 | | | 3.600%, 10/15/2020f | | | 10,023 | |
| | | | IMS Health, Inc. | | | | |
| | 27,000 | | | 6.000%, 11/1/2020f | | | 27,810 | |
| | | | Intel Corporation | | | | |
| | 10,000 | | | 3.100%, 7/29/2022 | | | 10,197 | |
| | | | Iron Mountain, Inc. | | | | |
| | 23,677 | | | 6.000%, 8/15/2023 | | | 24,506 | |
| | | | Oracle Corporation | | | | |
| | 10,000 | | | 2.500%, 5/15/2022 | | | 9,815 | |
| | | | Sensata Technologies BV | | | | |
| | 60,000 | | | 4.875%, 10/15/2023f | | | 58,350 | |
| | | | Texas Instruments, Inc. | | | | |
| | 10,000 | | | 1.750%, 5/1/2020 | | | 9,741 | |
| | | | Tyco Electronics Group SA | | | | |
| | 13,000 | | | 6.550%, 10/1/2017 | | | 14,010 | |
| | | | | | | | |
| | | | Total | | | 395,877 | |
| | | | | | | | |
|
| Transportation (0.2%) | |
| | | | Air Canada Pass Through Trust | | | | |
| | 5,000 | | | 3.875%, 3/15/2023f | | | 4,850 | |
| | | | American Airlines Pass Through Trust | | | | |
| | 5,207 | | | 4.950%, 1/15/2023 | | | 5,493 | |
| | | | Avis Budget Car Rental, LLC | | | | |
| | 50,000 | | | 5.125%, 6/1/2022f | | | 49,375 | |
| | | | Continental Airlines, Inc. | | | | |
| | 17,678 | | | 6.250%, 4/11/2020 | | | 18,562 | |
| | | | Delta Air Lines, Inc. | | | | |
| | 6,988 | | | 4.950%, 5/23/2019 | | | 7,337 | |
| | 6,258 | | | 4.750%, 5/7/2020 | | | 6,602 | |
| | | | J.B. Hunt Transport Services, Inc. | | | | |
| | 10,000 | | | 3.300%, 8/15/2022 | | | 9,904 | |
| | | | Korea Expressway Corporation | | | | |
| | 10,000 | | | 1.625%, 4/28/2017f | | | 9,965 | |
| | | | United Airlines 2015-1 Class A Pass Through Trust | | | | |
| | 10,000 | | | 3.700%, 12/1/2022 | | | 9,975 | |
| | | | | | | | |
| | | | Total | | | 122,063 | |
| | | | | | | | |
|
| U.S. Government and Agencies (0.2%) | |
| | | | U.S. Treasury Notes | | | | |
| | 90,000 | | | 1.875%, 6/30/2020 | | | 90,629 | |
| | 60,000 | | | 2.125%, 6/30/2022 | | | 60,310 | |
| | | | | | | | |
| | | | Total | | | 150,939 | |
| | | | | | | | |
|
| Utilities (0.5%) | |
| | | | Access Midstream Partners, LP | | | | |
| | 40,000 | | | 4.875%, 5/15/2023 | | | 32,427 | |
| | | | AES Corporation | | | | |
| | 23,677 | | | 7.375%, 7/1/2021 | | | 24,151 | |
| | | | Ameren Corporation | | | | |
| | 10,000 | | | 2.700%, 11/15/2020 | | | 9,962 | |
| | | | Arizona Public Service Company | | | | |
| | 5,000 | | | 2.200%, 1/15/2020 | | | 4,953 | |
| | | | Berkshire Hathaway Energy Company | | | | |
| | 14,000 | | | 2.400%, 2/1/2020 | | | 13,869 | |
| | | | Calpine Corporation | | | | |
| | 45,000 | | | 5.375%, 1/15/2023 | | | 40,387 | |
| | | | DTE Energy Company | | | | |
| | 14,000 | | | 2.400%, 12/1/2019 | | | 13,941 | |
| | | | Dynegy Finance I, Inc. | | | | |
| | 60,000 | | | 7.375%, 11/1/2022 | | | 52,200 | |
| | | | EDP Finance BV | | | | |
| | 14,000 | | | 4.125%, 1/15/2020f | | | 14,032 | |
| | | | El Paso Corporation | | | | |
| | 7,000 | | | 7.000%, 6/15/2017 | | | 7,211 | |
| | | | Energy Transfer Equity, LP | | | | |
| | 60,000 | | | 5.500%, 6/1/2027 | | | 45,600 | |
| | | | Eversource Energy | | | | |
| | 5,000 | | | 1.600%, 1/15/2018 | | | 4,947 | |
| | | | Exelon Generation Company, LLC | | | | |
| | 6,000 | | | 5.200%, 10/1/2019 | | | 6,464 | |
| | 5,000 | | | 2.950%, 1/15/2020 | | | 4,982 | |
| | | | MPLX LP | | | | |
| | 60,000 | | | 4.875%, 12/1/2024f | | | 53,850 | |
| | | | NiSource Finance Corporation | | | | |
| | 5,000 | | | 6.400%, 3/15/2018 | | | 5,448 | |
The accompanying Notes to Financial Statements are an integral part of this schedule.
12
GROWTHAND INCOME PLUS FUND
Schedule of Investments as of December 31, 2015
| | | | | | | | |
Principal
Amount | | | Long-Term Fixed Income (16.7%) | | Value | |
| Utilities (0.5%) - continued | |
| | | | NRG Energy, Inc. | | | | |
| $ | 23,677 | | | 6.625%, 3/15/2023 | | $ | 20,540 | |
| | | | Pacific Gas & Electric Company | | | | |
| | 8,000 | | | 5.625%, 11/30/2017 | | | 8,551 | |
| | | | PG&E Corporation | | | | |
| | 6,000 | | | 2.400%, 3/1/2019 | | | 5,987 | |
| | | | Sempra Energy | | | | |
| | 14,000 | | | 6.150%, 6/15/2018 | | | 15,281 | |
| | 5,000 | | | 2.400%, 3/15/2020 | | | 4,900 | |
| | | | Southern California Edison Company | | | | |
| | 5,000 | | | 2.400%, 2/1/2022 | | | 4,903 | |
| | | | Xcel Energy, Inc. | | | | |
| | 10,000 | | | 1.200%, 6/1/2017 | | | 9,949 | |
| | | | | | | | |
| | | | Total | | | 404,535 | |
| | | | | | | | |
| | | | Total Long-Term Fixed Income (cost $12,568,855) | | | 12,265,856 | |
| | | | | | | | |
| | |
Shares | | | Registered Investment Companies (6.2%) | | | |
| Equity Funds/ETFs (3.9%) | |
| | 2,300 | | | BlackRock Resources & Commodities Strategy Trust | | | 16,353 | |
| | 2,000 | | | Cohen & Steers REIT and Preferred Income Fund, Inc. | | | 36,880 | |
| | 1,025 | | | Guggenheim Multi-Asset Income ETF | | | 18,635 | |
| | 4,775 | | | iShares FTSE NAREIT Mortgage Plus Capped Index Fund | | | 45,649 | |
| | 310 | | | iShares MSCI EAFE Index Fund | | | 18,212 | |
| | 11,514 | | | iShares S&P U.S. Preferred Stock Index Fund | | | 447,319 | |
| | 14,890 | | | Materials Select Sector SPDR Fund | | | 646,524 | |
| | 2,075 | | | NFJ Dividend Interest & Premium Strategy Fund | | | 25,709 | |
| | 34,200 | | | SPDR S&P Oil & Gas Exploration & Production ETF | | | 1,033,524 | |
| | 13,410 | | | Utilities Select Sector SPDR Fund | | | 580,385 | |
| | | | | | | | |
| | | | Total | | | 2,869,190 | |
| | | | | | | | |
|
| Fixed Income Funds/ETFs (2.3%) | |
| | 10,797 | | | Aberdeen Asia-Pacific Income Fund, Inc. | | | 49,342 | |
| | 3,250 | | | Doubleline Income Solutions Fund | | | 52,715 | |
| | 1,625 | | | First Trust High Income Long/Short Fund | | | 22,880 | |
| | 709 | | | iShares J.P. Morgan USD Emerging Markets Bond ETF | | | 74,998 | |
| | 10,029 | | | MFS Intermediate Income Trust | | | 45,832 | |
| | 4,227 | | | PIMCO Dynamic Credit Income Fund | | | 76,213 | |
| | 17,948 | | | PowerShares Preferred Portfolio | | | 268,323 | |
| | 11,300 | | | SPDR Barclays High Yield Bond ETF | | | 383,183 | |
| | 8,317 | | | Templeton Global Income Fund | | | 52,813 | |
| | 7,145 | | | Vanguard Short-Term Corporate Bond ETF | | | 564,384 | |
| | 3,796 | | | Western Asset Emerging Markets Debt Fund, Inc. | | | 52,119 | |
| | 5,878 | | | Western Asset High Income Opportunity Fund, Inc. | | | 27,568 | |
| | | | | | | | |
| | | | Total | | | 1,670,370 | |
| | | | | | | | |
| | | | Total Registered Investment Companies (cost $5,014,192) | | | 4,539,560 | |
| | | | | | | | |
| | |
Shares or
Principal
Amount | | | Short-Term Investments (6.1%)i | | | |
| | | | Federal Home Loan Mortgage Corporation Discount Notes | | | | |
| | 100,000 | | | 0.200%, 2/17/2016j | | | 99,974 | |
| | | | Federal National Mortgage Association Discount Notes | | | | |
| | 100,000 | | | 0.100%, 1/4/2016j | | | 99,999 | |
| | | | Thrivent Cash Management Trust | | | | |
| | 4,226,851 | | | 0.220% | | | 4,226,851 | |
| | | | U.S. Treasury Bills | | | | |
| | 100,000 | | | 0.175%, 2/4/2016k | | | 99,984 | |
| | | | | | | | |
| | | | Total Short-Term Investments (at amortized cost) | | | 4,526,808 | |
| | | | | | | | |
| | | | Total Investments (cost $77,679,111) 102.5% | | $ | 75,460,109 | |
| | | | | | | | |
| | | | Other Assets and Liabilities, Net (2.5%) | | | (1,835,283 | ) |
| | | | | | | | |
| | | | Total Net Assets 100.0% | | $ | 73,624,826 | |
| | | | | | | | |
| a | The stated interest rate represents the weighted average of all contracts within the bank loan facility. |
| b | All or a portion of the loan is unfunded. |
| c | Denotes investments purchased on a when-issued or delayed delivery basis. |
| d | Defaulted security. Interest is not being accrued. |
| e | Non-income producing security. |
| f | Denotes securities sold under Rule 144A of the Securities Act of 1933, which exempts them from registration. These securities have been deemed liquid and may be resold to other dealers in the program or to other qualified institutional buyers. As of December 31, 2015, the value of these investments was $2,792,990 or 3.8% of total net assets. |
| g | Denotes variable rate securities. Variable rate securities are securities whose yields vary with a designated market index or market rate. The rate shown is as of December 31, 2015. |
| h | Denotes perpetual securities. Perpetual securities pay an indefinite stream of interest, but may be called by the issuer at an earlier date. |
| i | The interest rate shown reflects the yield, coupon rate or the discount rate at the date of purchase. |
| j | All or a portion of the security is held on deposit with the counterparty and pledged as the initial margin deposit for open futures contracts. |
| k | All or a portion of the security is pledged as collateral under the agreement between the counterparty, the custodian and the fund for open swap contracts. |
The accompanying Notes to Financial Statements are an integral part of this schedule.
13
GROWTHAND INCOME PLUS FUND
Schedule of Investments as of December 31, 2015
Definitions:
| | | | |
| ADR | | - | | American Depositary Receipt, which are certificates for an underlying foreign security’s shares held by an issuing U.S. depository bank. |
| ETF | | - | | Exchange Traded Fund. |
| REIT | | - | | Real Estate Investment Trust is a company that buys, develops, manages and/or sells real estate assets. |
The accompanying Notes to Financial Statements are an integral part of this schedule.
14
DIVERSIFIED INCOME PLUS FUND
Schedule of Investments as of December 31, 2015
| | | | | | | | |
Principal
Amount | | | Bank Loans (13.1%)a | | Value | |
| Basic Materials (0.7%) | |
| | | | Alpha Natural Resources, Inc., Term Loan | | | | |
| $ | 1,149,422 | | | 3.500%, 5/22/2020 | | $ | 495,205 | |
| | | | Fortescue Metals Group, Ltd., Term Loan | | | | |
| | 1,503,265 | | | 4.250%, 6/30/2019 | | | 1,110,687 | |
| | | | Ineos US Finance, LLC, Term Loan | | | | |
| | 1,538,676 | | | 3.750%, 12/15/2020 | | | 1,473,283 | |
| | | | NewPage Corporation, Term Loan | | | | |
| | 1,608,750 | | | 9.500%, 2/11/2021 | | | 574,131 | |
| | | | PolyOne Corporation, Term Loan | | | | |
| | 400,000 | | | 3.750%, 11/11/2022 | | | 400,000 | |
| | | | Tronox Pigments BV, Term Loan | | | | |
| | 436,899 | | | 4.500%, 3/19/2020 | | | 385,563 | |
| | | | Wausau Paper Corporation, Term Loan | | | | |
| | 638,714 | | | 6.500%, 7/30/2020 | | | 633,924 | |
| | | | | | | | |
| | | | Total | | | 5,072,793 | |
| | | | | | | | |
|
| Capital Goods (0.5%) | |
| | | | ADS Waste Holdings, Inc., Term Loan | | | | |
| | 842,750 | | | 3.750%, 10/9/2019 | | | 814,307 | |
| | | | Berry Plastics Group, Inc., Term Loan | | | | |
| | 875,250 | | | 3.500%, 2/8/2020 | | | 857,150 | |
| | | | Rexnord, LLC, Term Loan | | | | |
| | 879,750 | | | 4.000%, 8/21/2020 | | | 850,613 | |
| | | | Silver II Borrower, Term Loan | | | | |
| | 809,075 | | | 4.000%, 12/13/2019 | | | 682,455 | |
| | | | | | | | |
| | | | Total | | | 3,204,525 | |
| | | | | | | | |
|
| Communications Services (4.1%) | |
| | | | Altice Financing SA, Term Loan | | | | |
| | 273,625 | | | 5.250%, 2/4/2022 | | | 272,172 | |
| | | | Atlantic Broadband Penn, LLC, Term Loan | | | | |
| | 854,459 | | | 3.250%, 11/30/2019 | | | 845,649 | |
| | | | Birch Communication Inc., Term Loan | | | | |
| | 1,017,187 | | | 7.750%, 7/17/2020 | | | 971,414 | |
| | | | Block Communications, Inc., Term Loan | | | | |
| | 1,209,688 | | | 4.000%, 11/7/2021 | | | 1,196,079 | |
| | | | Cengage Learning Acquisitions, Term Loan | | | | |
| | 1,077,421 | | | 7.000%, 3/31/2020 | | | 1,047,792 | |
| | | | Charter Communications Operating, LLC, Term Loan | | | | |
| | 433,333 | | | 3.000%, 7/1/2020 | | | 424,758 | |
| | | | Cincinnati Bell, Inc., Term Loan | | | | |
| | 986,669 | | | 4.000%, 9/10/2020 | | | 950,083 | |
| | | | CommScope, Inc., Term Loan | | | | |
| | 917,700 | | | 3.827%, 12/29/2022b,c | | | 910,248 | |
| | | | Fairpoint Communications, Term Loan | | | | |
| | 612,350 | | | 7.500%, 2/14/2019 | | | 607,145 | |
| | | | Grande Communications Networks, LLC, Term Loan | | | | |
| | 1,170,028 | | | 4.500%, 5/29/2020 | | | 1,145,656 | |
| | | | Gray Television, Inc., Term Loan | | | | |
| | 1,308,741 | | | 3.750%, 6/13/2021 | | | 1,289,934 | |
| | | | Hargray Communications Group, Inc., Term Loan | | | | |
| | 1,034,732 | | | 5.250%, 6/26/2019 | | | 1,027,292 | |
| | | | Integra Telecom Holdings, Inc., Term Loan | | | | |
| | 1,133,435 | | | 5.250%, 8/14/2020 | | | 1,093,765 | |
| | | | Intelsat Jackson Holdings SA, Term Loan | | | | |
| | 948,775 | | | 3.750%, 6/30/2019 | | | 895,236 | |
| | | | Level 3 Communications, Inc., Term Loan | | | | |
| | 1,450,000 | | | 4.000%, 1/15/2020 | | | 1,444,040 | |
| | | | Liberty Cablevision of Puerto Rico, LLC, Term Loan | | | | |
| | 1,025,000 | | | 4.500%, 1/7/2022 | | | 990,406 | |
| | | | LTS Buyer, LLC, Term Loan | | | | |
| | 963,087 | | | 4.000%, 4/13/2020 | | | 935,639 | |
| | | | McGraw-Hill Global Education Holdings, LLC, Term Loan | | | | |
| | 847,852 | | | 4.750%, 3/22/2019 | | | 827,360 | |
| | | | NEP/NCP Holdco, Inc., Term Loan | | | | |
| | 1,167,255 | | | 4.250%, 1/22/2020 | | | 1,088,465 | |
| | | | NTelos, Inc., Term Loan | | | | |
| | 1,149,644 | | | 5.750%, 11/9/2019 | | | 1,138,148 | |
| | | | Numericable US, LLC, Term Loan | | | | |
| | 790,000 | | | 4.563%, 7/29/2022b,c | | | 753,589 | |
| | 35,000 | | | 4.750%, 2/10/2023 | | | 33,563 | |
| | | | SBA Senior Finance II, LLC, Term Loan | | | | |
| | 1,083,500 | | | 3.250%, 3/24/2021 | | | 1,059,121 | |
| | 109,450 | | | 3.250%, 6/10/2022 | | | 106,611 | |
| | | | TNS, Inc., Term Loan | | | | |
| | 644,631 | | | 5.000%, 2/14/2020 | | | 633,350 | |
| | | | Univision Communications, Inc., Term Loan | | | | |
| | 1,545,715 | | | 4.000%, 3/1/2020 | | | 1,510,164 | |
| | | | Virgin Media Investment Holdings, Ltd., Term Loan | | | | |
| | 605,989 | | | 3.500%, 6/30/2023 | | | 592,639 | |
| | | | WideOpenWest Finance, LLC, Term Loan | | | | |
| | 836,747 | | | 4.500%, 4/1/2019 | | | 805,110 | |
| | | | WMG Acquisition Corporation, Term Loan | | | | |
| | 879,750 | | | 3.750%, 7/1/2020 | | | 830,994 | |
| | | | XO Communications, LLC, Term Loan | | | | |
| | 1,080,750 | | | 4.250%, 3/20/2021 | | | 1,053,191 | |
| | | | Yankee Cable Acquisition, LLC, Term Loan | | | | |
| | 822,473 | | | 4.250%, 3/1/2020 | | | 809,362 | |
| | | | Zayo Group, LLC, Term Loan | | | | |
| | 1,035,163 | | | 3.750%, 5/6/2021 | | | 1,016,488 | |
| | | | | | | | |
| | | | Total | | | 28,305,463 | |
| | | | | | | | |
|
| Consumer Cyclical (2.4%) | |
| | | | Amaya BV, Term Loan | | | | |
| | 1,204,796 | | | 5.000%, 8/1/2021 | | | 1,126,484 | |
| | | | Burlington Coat Factory Warehouse Corporation, Term Loan | | | | |
| | 860,432 | | | 4.250%, 8/13/2021 | | | 848,601 | |
| | | | Ceridian HCM Holding, Inc., Term Loan | | | | |
| | 431,531 | | | 4.500%, 9/15/2020 | | | 365,183 | |
The accompanying Notes to Financial Statements are an integral part of this schedule.
15
DIVERSIFIED INCOME PLUS FUND
Schedule of Investments as of December 31, 2015
| | | | | | | | |
Principal
Amount | | | Bank Loans (13.1%)a | | Value | |
| Consumer Cyclical (2.4%) - continued | |
| | | | Charter Communications Operating, LLC, Term Loan | | | | |
| $ | 877,500 | | | 3.000%, 1/3/2021 | | $ | 858,853 | |
| | | | Chrysler Group, LLC, Term Loan | | | | |
| | 729,008 | | | 3.500%, 5/24/2017 | | | 725,866 | |
| | | | Dollar Tree, Inc., Term Loan | | | | |
| | 659,846 | | | 3.500%, 7/6/2022 | | | 656,963 | |
| | | | FCA US, LLC, Term Loan | | | | |
| | 466,687 | | | 3.250%, 12/31/2018 | | | 461,787 | |
| | | | Golden Nugget, Inc., Delayed Draw | | | | |
| | 148,050 | | | 5.500%, 11/21/2019 | | | 146,570 | |
| | | | Golden Nugget, Inc., Term Loan | | | | |
| | 345,450 | | | 5.500%, 11/21/2019 | | | 341,996 | |
| | | | Hilton Worldwide Finance, LLC, Term Loan | | | | |
| | 870,943 | | | 3.500%, 10/26/2020 | | | 868,496 | |
| | | | IMG Worldwide, Inc., Term Loan | | | | |
| | 1,207,555 | | | 5.250%, 5/6/2021 | | | 1,184,539 | |
| | | | J.C. Penney Corporation, Inc., Term Loan | | | | |
| | 877,500 | | | 6.000%, 5/22/2018 | | | 860,608 | |
| | | | Las Vegas Sands, LLC, Term Loan | | | | |
| | 980,000 | | | 3.250%, 12/19/2020 | | | 968,975 | |
| | | | Marina District Finance Company, Inc., Term Loan | | | | |
| | 665,645 | | | 6.500%, 8/15/2018 | | | 663,981 | |
| | | | MGM Resorts International, Term Loan | | | | |
| | 350,955 | | | 3.500%, 12/20/2019 | | | 345,690 | |
| | | | Michaels Stores, Inc., Term Loan | | | | |
| | 847,526 | | | 4.000%, 1/28/2020 | | | 840,813 | |
| | | | Mohegan Tribal Gaming Authority, Term Loan | | | | |
| | 1,257,373 | | | 5.500%, 6/15/2018 | | | 1,227,284 | |
| | | | Pinnacle Entertainment, Inc., Term Loan | | | | |
| | 360,879 | | | 3.750%, 8/13/2020 | | | 359,414 | |
| | | | ROC Finance, LLC, Term Loan | | | | |
| | 879,750 | | | 5.000%, 6/20/2019 | | | 816,698 | |
| | | | Scientific Games International, Inc., Term Loan | | | | |
| | 882,000 | | | 6.000%, 10/18/2020 | | | 804,825 | |
| | 396,000 | | | 6.000%, 10/1/2021 | | | 359,794 | |
| | | | Seminole Hard Rock Entertainment, Inc., Term Loan | | | | |
| | 1,167,781 | | | 3.500%, 5/14/2020 | | | 1,141,506 | |
| | | | Seminole Indian Tribe of Florida, Term Loan | | | | |
| | 726,750 | | | 3.000%, 4/29/2020 | | | 721,299 | |
| | | | | | | | |
| | | | Total | | | 16,696,225 | |
| | | | | | | | |
|
| Consumer Non-Cyclical (1.8%) | |
| | | | Albertson’s, Inc., Term Loan | | | | |
| | 1,229,614 | | | 5.500%, 3/21/2019 | | | 1,224,389 | |
| | | | Albertson’s, LLC, Term Loan | | | | |
| | 420,000 | | | 0.000%, 12/22/2022b,c | | | 417,060 | |
| | | | Catalina Marketing Corporation, Term Loan | | | | |
| | 1,117,975 | | | 4.500%, 4/9/2021 | | | 888,790 | |
| | | | CHS/Community Health Systems, Inc., Term Loan | | | | |
| | 214,458 | | | 3.657%, 12/31/2018 | | | 211,151 | |
| | 244,515 | | | 3.750%, 1/27/2021 | | | 237,944 | |
| | 449,900 | | | 4.000%, 1/27/2021 | | | 442,189 | |
| | | | Endo Luxembourg Finance I Co Sarl, Term Loan | | | | |
| | 630,000 | | | 3.750%, 9/26/2022 | | | 620,815 | |
| | | | Hanesbrands, Inc., Term Loan | | | | |
| | 486,325 | | | 3.250%, 4/29/2022 | | | 487,337 | |
| | | | HCA, Inc., Term Loan | | | | |
| | 1,021,932 | | | 3.174%, 3/31/2017 | | | 1,020,082 | |
| | | | JBS USA, LLC, Term Loan | | | | |
| | 1,466,250 | | | 3.750%, 9/18/2020 | | | 1,436,925 | |
| | 130,000 | | | 4.000%, 10/30/2022 | | | 129,513 | |
| | | | Libbey Glass, Inc., Term Loan | | | | |
| | 558,987 | | | 3.750%, 4/9/2021 | | | 548,506 | |
| | | | LTF Merger Sub, Inc., Term Loan | | | | |
| | 791,025 | | | 4.250%, 6/10/2022 | | | 769,770 | |
| | | | Ortho-Clinical Diagnostics, Inc., Term Loan | | | | |
| | 1,267,235 | | | 4.750%, 6/30/2021 | | | 1,069,229 | |
| | | | Owens-Brockway Glass Container, Inc., Term Loan | | | | |
| | 837,900 | | | 3.500%, 9/1/2022 | | | 833,191 | |
| | | | Sterigenics-Nordion Holdings, LLC, Term Loan | | | | |
| | 399,000 | | | 4.250%, 5/16/2022 | | | 387,030 | |
| | | | Supervalu, Inc., Term Loan | | | | |
| | 1,167,000 | | | 4.500%, 3/21/2019 | | | 1,149,740 | |
| | | | Valeant Pharmaceuticals International, Inc., Term Loan | | | | |
| | 648,367 | | | 4.000%, 4/1/2022b,c | | | 622,270 | |
| | | | | | | | |
| | | | Total | | | 12,495,931 | |
| | | | | | | | |
| |
| Energy (0.7%) | | | | |
| | | | Arch Coal, Inc., Term Loan | | | | |
| | 1,391,251 | | | 6.250%, 5/16/2018 | | | 612,540 | |
| | | | Aria Energy Operating, LLC, Term Loan | | | | |
| | 489,117 | | | 5.000%, 5/27/2022 | | | 452,433 | |
| | | | Energy Solutions, LLC, Term Loan | | | | |
| | 1,219,214 | | | 6.750%, 5/29/2020 | | | 914,411 | |
| | | | Exgen Renewables I, LLC, Term Loan | | | | |
| | 632,207 | | | 5.250%, 2/6/2021 | | | 632,207 | |
| | | | McJunkin Red Man Corporation, Term Loan | | | | |
| | 695,562 | | | 4.750%, 11/8/2019 | | | 636,440 | |
| | | | MEG Energy Corporation, Term Loan | | | | |
| | 1,021,860 | | | 0.000%, 3/31/2020 | | | 896,171 | |
| | | | Offshore Group Investment, Ltd., Term Loan | | | | |
| | 1,317,484 | | | 0.000%, 3/28/2019d | | | 264,590 | |
| | | | Pacific Drilling SA, Term Loan | | | | |
| | 877,500 | | | 4.500%, 6/3/2018 | | | 375,131 | |
| | | | Targa Resources Partners, LP, Term Loan | | | | |
| | 379,535 | | | 5.750%, 2/27/2022 | | | 367,200 | |
| | | | | | | | |
| | | | Total | | | 5,151,123 | |
| | | | | | | | |
| |
| Financials (0.9%) | | | | |
| | | | Delos Finance Sarl, Term Loan | | | | |
| | 1,120,000 | | | 3.500%, 3/6/2021 | | | 1,114,198 | |
| | | | DJO Finance, LLC, Term Loan | | | | |
| | 548,625 | | | 4.250%, 6/7/2020 | | | 532,336 | |
The accompanying Notes to Financial Statements are an integral part of this schedule.
16
DIVERSIFIED INCOME PLUS FUND
Schedule of Investments as of December 31, 2015
| | | | | | | | |
Principal
Amount | | | Bank Loans (13.1%)a | | Value | |
| Financials (0.9%) - continued | |
| | | | Harland Clarke Holdings Corporation, Term Loan | | | | |
| $ | 843,750 | | | 7.000%, 5/22/2018 | | $ | 814,919 | |
| | | | MoneyGram International, Inc., Term Loan | | | | |
| | 957,765 | | | 4.250%, 3/27/2020 | | | 872,361 | |
| | | | MPH Acquisition Holdings, LLC, Term Loan | | | | |
| | 1,261,122 | | | 3.750%, 3/31/2021 | | | 1,225,394 | |
| | | | TransUnion, LLC, Term Loan | | | | |
| | 1,080,750 | | | 3.500%, 4/9/2021 | | | 1,047,874 | |
| | | | WaveDivision Holdings, LLC, Term Loan | | | | |
| | 873,000 | | | 4.000%, 10/15/2019 | | | 857,723 | |
| | | | | | | | |
| | | | Total | | | 6,464,805 | |
| | | | | | | | |
|
| Technology (1.0%) | |
| | | | Avago Technologies Cayman Finance, Ltd., Term Loan | | | | |
| | 2,250,000 | | | 0.000%, 11/13/2022b,c | | | 2,223,292 | |
| | | | Avago Technologies, Ltd., Term Loan | | | | |
| | 129,048 | | | 3.750%, 5/6/2021 | | | 128,618 | |
| | | | BMC Software, Inc., Term Loan | | | | |
| | 850,750 | | | 5.000%, 9/10/2020 | | | 698,219 | |
| | | | Booz Allen Hamilton, Inc., Term Loan | | | | |
| | 372,092 | | | 3.750%, 7/31/2019 | | | 372,465 | |
| | | | First Data Corporation, Term Loan | | | | |
| | 1,600,000 | | | 3.918%, 3/23/2018 | | | 1,577,104 | |
| | 220,000 | | | 4.168%, 7/8/2022 | | | 216,645 | |
| | | | Infor US, Inc., Term Loan | | | | |
| | 867,320 | | | 3.750%, 6/3/2020 | | | 812,392 | |
| | | | Merrill Communications, LLC, Term Loan | | | | |
| | 2,825 | | | 6.250%, 6/1/2022 | | | 2,402 | |
| | | | NXP BV, Term Loan | | | | |
| | 660,000 | | | 3.750%, 12/7/2020 | | | 656,205 | |
| | | | SS&C European Holdings SARL, Term Loan | | | | |
| | 358,655 | | | 4.007%, 7/8/2022 | | | 355,516 | |
| | 52,782 | | | 4.018%, 7/8/2022 | | | 52,320 | |
| | | | | | | | |
| | | | Total | | | 7,095,178 | |
| | | | | | | | |
|
| Transportation (0.6%) | |
| | | | American Airlines, Inc., Term Loan | | | | |
| | 1,400,062 | | | 3.250%, 6/27/2020 | | | 1,376,654 | |
| | | | Delta Airlines, Inc., Term Loan | | | | |
| | 1,077,300 | | | 3.250%, 8/24/2022 | | | 1,074,025 | |
| | | | OSG Bulk Ships, Inc., Term Loan | | | | |
| | 980,075 | | | 5.250%, 8/5/2019 | | | 938,422 | |
| | | | XPO Logistics, Inc., Term Loan | | | | |
| | 740,000 | | | 5.500%, 11/1/2021 | | | 735,989 | |
| | | | | | | | |
| | | | Total | | | 4,125,090 | |
| | | | | | | | |
|
| Utilities (0.4%) | |
| | | | Calpine Corporation, Term Loan | | | | |
| | 659,013 | | | 4.000%, 10/31/2020 | | | 640,890 | |
| | 1,036,860 | | | 3.500%, 5/27/2022 | | | 986,572 | |
| | | | Intergen NV, Term Loan | | | | |
| | 877,500 | | | 5.500%, 6/15/2020 | | | 790,847 | |
| | | �� | | | | | |
| | | | Total | | | 2,418,309 | |
| | | | | | | | |
| | | | Total Bank Loans (cost $98,368,414) | | | 91,029,442 | |
| | | | | | | | |
| | |
Principal
Amount | | | Long-Term Fixed Income (45.0%) | | | |
| Asset-Backed Securities (3.9%) | |
| | | | Asset Backed Securities Corporation Home Equity Loan Trust | | | | |
| | 961,088 | | | 0.562%, 7/25/2036e | | | 839,593 | |
| | 226,153 | | | 0.582%, 11/25/2036e | | | 204,052 | |
| | | | Bayview Opportunity Master Fund Trust | | | | |
| | 350,247 | | | 3.623%, 7/28/2019*f | | | 347,410 | |
| | 813,602 | | | 3.623%, 4/28/2030g | | | 802,387 | |
| | 540,501 | | | 3.228%, 7/28/2034*f | | | 539,568 | |
| | 1,468,452 | | | 3.721%, 2/28/2035* | | | 1,466,882 | |
| | 1,811,055 | | | 3.721%, 7/28/2035f,g | | | 1,809,596 | |
| | | | Countrywide Asset-Backed Certificates | | | | |
| | 525,581 | | | 5.530%, 4/25/2047 | | | 572,534 | |
| | | | GSAA Home Equity Trust | | | | |
| | 1,130,209 | | | 0.692%, 7/25/2037e | | | 975,482 | |
| | | | J.P. Morgan Mortgage Acquisition Trust | | | | |
| | 2,114,529 | | | 6.472%, 3/25/2047f | | | 1,597,062 | |
| | | | J.P. Morgan Mortgage Trust | | | | |
| | 1,870,048 | | | 2.746%, 2/25/2036 | | | 1,649,326 | |
| | | | Lehman XS Trust | | | | |
| | 2,062,300 | | | 5.440%, 8/25/2035f | | | 1,845,597 | |
| | | | Pretium Mortgage Credit Partners, LLC | | | | |
| | 1,221,860 | | | 4.125%, 10/27/2030* | | | 1,210,850 | |
| | 1,800,000 | | | 4.375%, 11/27/2030* | | | 1,793,931 | |
| | | | Renaissance Home Equity Loan Trust | | | | |
| | 576,776 | | | 5.746%, 5/25/2036f | | | 397,355 | |
| | 1,000,000 | | | 6.011%, 5/25/2036f | | | 695,616 | |
| | 1,393,716 | | | 5.797%, 8/25/2036f | | | 861,452 | |
| | | | Residential Asset Mortgage Products Trust | | | | |
| | 906,947 | | | 5.991%, 3/25/2033h | | | 909,361 | |
| | | | Sunset Mortgage Loan Company, LLC | | | | |
| | 1,624,965 | | | 4.459%, 9/16/2045*f | | | 1,618,546 | |
| | | | U.S. Residential Opportunity Fund III Trust | | | | |
| | 1,492,888 | | | 3.721%, 1/27/2035* | | | 1,483,189 | |
| | | | Vericrest Opportunity Loan Transferee | | | | |
| | 1,459,439 | | | 3.375%, 10/25/2058*f | | | 1,434,058 | |
| | 1,759,555 | | | 3.500%, 6/26/2045f,g | | | 1,733,859 | |
| | 1,366,581 | | | 3.625%, 7/25/2045f,g | | | 1,347,160 | |
| | 765,623 | | | 3.500%, 2/25/2055*f | | | 755,262 | |
| | | | | | | | |
| | | | Total | | | 26,890,128 | |
| | | | | | | | |
|
| Basic Materials (0.6%) | |
| | | | Anglo American Capital plc | | | | |
| | 200,000 | | | 1.271%, 4/15/2016e,g | | | 198,043 | |
| | | | ArcelorMittal SA | | | | |
| | 1,080,000 | | | 6.500%, 3/1/2021 | | | 869,281 | |
The accompanying Notes to Financial Statements are an integral part of this schedule.
17
DIVERSIFIED INCOME PLUS FUND
Schedule of Investments as of December 31, 2015
| | | | | | | | |
Principal
Amount | | | Long-Term Fixed Income (45.0%) | | Value | |
| Basic Materials (0.6%) - continued | |
| | | | BHP Billiton Finance USA, Ltd. | | | | |
| $ | 600,000 | | | 6.250%, 10/19/2075g | | $ | 587,250 | |
| | | | Dow Chemical Company | | | | |
| | 106,000 | | | 8.550%, 5/15/2019 | | | 124,937 | |
| | | | First Quantum Minerals, Ltd. | | | | |
| | 485,000 | | | 6.750%, 2/15/2020g | | | 312,825 | |
| | 770,000 | | | 7.000%, 2/15/2021g | | | 483,175 | |
| | | | Freeport-McMoRan, Inc. | | | | |
| | 85,000 | | | 2.375%, 3/15/2018 | | | 66,300 | |
| | | | Glencore Funding, LLC | | | | |
| | 95,000 | | | 1.377%, 4/16/2018e,g | | | 80,161 | |
| | | | INEOS Group Holdings SA | | | | |
| | 600,000 | | | 5.875%, 2/1/2019g | | | 582,000 | |
| | | | LyondellBasell Industries NV | | | | |
| | 110,000 | | | 5.000%, 4/15/2019 | | | 117,018 | |
| | | | Sappi Papier Holding GmbH | | | | |
| | 600,000 | | | 6.625%, 4/15/2021g | | | 606,000 | |
| | | | Yamana Gold, Inc. | | | | |
| | 152,000 | | | 4.950%, 7/15/2024 | | | 128,894 | |
| | | | | | | | |
| | | | Total | | | 4,155,884 | |
| | | | | | | | |
|
| Capital Goods (1.4%) | |
| | | | Berry Plastics Corporation | | | | |
| | 655,000 | | | 6.000%, 10/15/2022g | | | 666,463 | |
| | | | Building Materials Corporation of America | | | | |
| | 1,100,000 | | | 6.000%, 10/15/2025g | | | 1,122,000 | |
| | | | Cemex SAB de CV | | | | |
| | 1,290,000 | | | 5.700%, 1/11/2025g | | | 1,078,763 | |
| | | | CNH Industrial Capital, LLC | | | | |
| | 1,100,000 | | | 4.375%, 11/6/2020 | | | 1,036,750 | |
| | | | Crown Americas Capital Corporation IV | | | | |
| | 1,080,000 | | | 4.500%, 1/15/2023 | | | 1,055,700 | |
| | | | Crown Cork & Seal Company, Inc. | | | | |
| | 610,000 | | | 7.375%, 12/15/2026 | | | 655,750 | |
| | | | General Electric Company | | | | |
| | 153,000 | | | 4.200%, 12/15/2049i | | | 152,235 | |
| | | | Ingersoll-Rand Luxembourg Finance SA | | | | |
| | 310,000 | | | 2.625%, 5/1/2020 | | | 305,450 | |
| | | | L-3 Communications Corporation | | | | |
| | 205,000 | | | 1.500%, 5/28/2017 | | | 202,460 | |
| | | | Lockheed Martin Corporation | | | | |
| | 90,000 | | | 1.850%, 11/23/2018 | | | 89,841 | |
| | | | Pentair Finance SA | | | | |
| | 95,000 | | | 3.625%, 9/15/2020 | | | 94,906 | |
| | | | Reynolds Group Issuer, Inc. | | | | |
| | 250,000 | | | 5.750%, 10/15/2020 | | | 254,297 | |
| | 610,000 | | | 6.875%, 2/15/2021 | | | 628,300 | |
| | | | Sealed Air Corporation | | | | |
| | 800,000 | | | 4.875%, 12/1/2022g | | | 802,000 | |
| | | | Textron, Inc. | | | | |
| | 213,000 | | | 7.250%, 10/1/2019 | | | 242,350 | |
| | | | United Rentals North America, Inc. | | | | |
| | 1,240,000 | | | 5.500%, 7/15/2025 | | | 1,202,800 | |
| | | | | | | | |
| | | | Total | | | 9,590,065 | |
| | | | | | | | |
|
| Collateralized Mortgage Obligations (14.5%) | |
| | | | Alternative Loan Trust | | | | |
| | 1,719,387 | | | 5.500%, 5/25/2035 | | | 1,725,047 | |
| | 1,497,234 | | | 6.000%, 6/25/2036 | | | 1,362,487 | |
| | | | American Home Mortgage Assets Trust | | | | |
| | 2,695,192 | | | 0.612%, 12/25/2046e | | | 1,720,138 | |
| | 2,089,675 | | | 0.612%, 6/25/2047e | | | 1,426,924 | |
| | | | American Home Mortgage Investment Trust | | | | |
| | 2,137,802 | | | 6.250%, 12/25/2036 | | | 948,790 | |
| | | | Angel Oak Mortgage Trust | | | | |
| | 1,750,000 | | | 4.500%, 11/25/2045* | | | 1,746,924 | |
| | | | Banc of America Alternative Loan Trust | | | | |
| | 738,684 | | | 0.922%, 4/25/2035e | | | 572,730 | |
| | 1,794,558 | | | 6.000%, 11/25/2035 | | | 1,597,169 | |
| | 1,206,520 | | | 1.222%, 5/25/2046e | | | 834,750 | |
| | | | Banc of America Funding Corporation | | | | |
| | 546,009 | | | 4.725%, 5/20/2036 | | | 458,860 | |
| | | | BCAP, LLC Trust | | | | |
| | 1,936,828 | | | 0.602%, 3/25/2037e | | | 1,641,158 | |
| | | | Bear Stearns Adjustable Rate Mortgage Trust | | | | |
| | 849,109 | | | 2.660%, 10/25/2035e | | | 834,833 | |
| | 402,088 | | | 2.702%, 2/25/2036 | | | 317,865 | |
| | | | Citicorp Mortgage Securities Trust | | | | |
| | 584,632 | | | 6.000%, 5/25/2037 | | | 602,187 | |
| | | | Citigroup Mortgage Loan Trust, Inc. | | | | |
| | 501,154 | | | 5.500%, 11/25/2035 | | | 479,055 | |
| | | | CitiMortgage Alternative Loan Trust | | | | |
| | 1,215,811 | | | 5.750%, 4/25/2037 | | | 1,042,968 | |
| | | | Countrywide Alternative Loan Trust | | | | |
| | 504,287 | | | 0.822%, 2/25/2035e | | | 469,262 | |
| | 851,267 | | | 2.609%, 10/25/2035 | | | 748,258 | |
| | 393,123 | | | 5.500%, 2/25/2036 | | | 372,489 | |
| | 316,970 | | | 6.000%, 4/25/2036 | | | 280,749 | |
| | 1,116,305 | | | 6.500%, 8/25/2036 | | | 841,126 | |
| | 275,508 | | | 6.000%, 1/25/2037 | | | 253,196 | |
| | 1,043,730 | | | 5.500%, 5/25/2037 | | | 885,663 | |
| | | | Countrywide Home Loan Mortgage Pass Through Trust | | | | |
| | 2,154,703 | | | 2.706%, 11/25/2035 | | | 1,836,352 | |
| | 713,423 | | | 2.725%, 2/20/2036 | | | 622,946 | |
| | | | Credit Suisse First Boston Mortgage Securities Corporation | | | | |
| | 593,596 | | | 5.250%, 10/25/2035 | | | 590,013 | |
| | | | Deutsche Alt-A Securities, Inc., Mortgage Loan Trust | | | | |
| | 151,019 | | | 5.500%, 10/25/2021 | | | 146,184 | |
| | 1,409,548 | | | 1.899%, 8/25/2035 | | | 1,087,790 | |
| | 549,875 | | | 0.622%, 11/25/2035e | | | 365,462 | |
| | 945,214 | | | 5.500%, 11/25/2035 | | | 902,992 | |
| | 1,235,919 | | | 1.027%, 4/25/2047e | | | 1,053,912 | |
| | 2,163,030 | | | 0.441%, 8/25/2047e | | | 1,772,051 | |
| | | | Federal Home Loan Mortgage Corporation | | | | |
| | 9,199,004 | | | 2.500%, 12/15/2022j | | | 573,098 | |
| | 2,788,924 | | | 2.500%, 5/15/2027j | | | 224,007 | |
| | 3,412,826 | | | 2.500%, 2/15/2028j | | | 312,558 | |
| | 10,397,219 | | | 2.500%, 3/15/2028j | | | 987,386 | |
| | 5,527,093 | | | 3.000%, 4/15/2028j | | | 542,948 | |
| | 4,581,813 | | | 3.000%, 2/15/2033j | | | 563,721 | |
The accompanying Notes to Financial Statements are an integral part of this schedule.
18
DIVERSIFIED INCOME PLUS FUND
Schedule of Investments as of December 31, 2015
| | | | | | | | |
Principal
Amount | | | Long-Term Fixed Income (45.0%) | | Value | |
| Collateralized Mortgage Obligations (14.5%) - continued | | | | |
| | | | Federal National Mortgage Association | | | | |
| $ | 4,540,166 | | | 2.500%, 2/25/2028j | | $ | 423,934 | |
| | 3,440,941 | | | 3.000%, 4/25/2028j | | | 347,491 | |
| | 4,285,649 | | | 3.500%, 1/25/2033j | | | 577,099 | |
| | | | First Horizon Alternative Mortgage Securities Trust | | | | |
| | 1,302,700 | | | 2.318%, 3/25/2035 | | | 1,152,933 | |
| | 1,328,768 | | | 2.403%, 7/25/2035 | | | 1,213,531 | |
| | 1,357,109 | | | 6.000%, 8/25/2036e | | | 1,103,833 | |
| | | | First Horizon Mortgage Pass-Through Trust | | | | |
| | 1,766,789 | | | 2.698%, 8/25/2037 | | | 1,410,524 | |
| | | | GMAC Mortgage Corporation Loan Trust | | | | |
| | 1,967,304 | | | 3.149%, 5/25/2035 | | | 1,853,720 | |
| | | | Government National Mortgage Association | | | | |
| | 4,379,926 | | | 4.000%, 1/16/2027j | | | 448,537 | |
| | | | Greenpoint Mortgage Funding Trust | | | | |
| | 999,936 | | | 0.622%, 10/25/2045e | | | 785,391 | |
| | | | HomeBanc Mortgage Trust | | | | |
| | 1,073,943 | | | 2.229%, 4/25/2037 | | | 809,599 | |
| | | | IndyMac IMJA Mortgage Loan Trust | | | | |
| | 1,208,027 | | | 6.250%, 11/25/2037 | | | 1,006,012 | |
| | | | IndyMac INDX Mortgage Loan Trust | | | | |
| | 1,929,408 | | | 2.843%, 10/25/2035 | | | 1,601,813 | |
| | 1,533,427 | | | 1.062%, 7/25/2045e | | | 1,326,302 | |
| | | | J.P. Morgan Alternative Loan Trust | | | | |
| | 2,152,086 | | | 6.500%, 3/25/2036 | | | 1,861,793 | |
| | | | J.P. Morgan Mortgage Trust | | | | |
| | 250,169 | | | 6.500%, 1/25/2035 | | | 245,220 | |
| | 1,592,187 | | | 2.872%, 8/25/2035 | | | 1,582,313 | |
| | 588,600 | | | 2.691%, 10/25/2036 | | | 529,617 | |
| | 1,155,797 | | | 0.802%, 1/25/2037e | | | 708,376 | |
| | 851,652 | | | 2.919%, 1/25/2037 | | | 747,723 | |
| | 763,352 | | | 6.250%, 8/25/2037 | | | 591,777 | |
| | | | Lehman Mortgage Trust | | | | |
| | 883,754 | | | 1.172%, 12/25/2035e | | | 622,998 | |
| | | | Master Asset Securitization Trust | | | | |
| | 1,039,750 | | | 0.922%, 6/25/2036e | | | 593,793 | |
| | | | MASTR Alternative Loans Trust | | | | |
| | 317,052 | | | 6.500%, 7/25/2034 | | | 324,483 | |
| | 903,427 | | | 0.872%, 12/25/2035e | | | 452,268 | |
| | | | Merrill Lynch Alternative Note Asset Trust | | | | |
| | 716,792 | | | 6.000%, 3/25/2037 | | | 531,547 | |
| | 1,107,493 | | | 6.000%, 3/25/2037 | | | 997,138 | |
| | | | Morgan Stanley Mortgage Loan Trust | | | | |
| | 711,543 | | | 2.803%, 11/25/2035 | | | 522,884 | |
| | | | MortgageIT Trust | | | | |
| | 1,641,156 | | | 0.682%, 12/25/2035e | | | 1,485,731 | |
| | 1,282,943 | | | 0.622%, 4/25/2036e | | | 966,623 | |
| | | | New Century Alternative Mortgage Loan Trust | | | | |
| | 1,579,277 | | | 6.167%, 7/25/2036f | | | 966,619 | |
| | | | New York Mortgage Trust, Inc. | | | | |
| | 922 | | | 2.671%, 5/25/2036 | | | 15 | |
| | | | Oak Hill Advisors Residential Loan Trust | | | | |
| | 1,008,279 | | | 3.475%, 1/25/2055*f | | | 1,003,367 | |
| | | | RALI Trust | | | | |
| | 1,664,490 | | | 6.000%, 4/25/2036 | | | 1,420,189 | |
| | 2,590,023 | | | 0.602%, 11/25/2036e | | | 1,881,405 | |
| | 512,822 | | | 6.000%, 6/25/2037 | | | 429,030 | |
| | 2,265,148 | | | 0.612%, 7/25/2037e | | | 1,797,695 | |
| | | | Residential Accredit Loans, Inc. Trust | | | | |
| | 1,115,634 | | | 5.750%, 9/25/2035 | | | 1,004,973 | |
| | 1,171,714 | | | 6.000%, 1/25/2037 | | | 981,983 | |
| | 2,272,890 | | | 5.750%, 4/25/2037 | | | 1,834,411 | |
| | 1,211,635 | | | 6.250%, 4/25/2037 | | | 1,023,562 | |
| | | | Residential Asset Securitization Trust | | | | |
| | 1,781,919 | | | 6.236%, 8/25/2022 | | | 1,597,445 | |
| | 769,661 | | | 5.500%, 4/25/2035 | | | 779,462 | |
| | 1,209,269 | | | 0.802%, 8/25/2037e | | | 359,324 | |
| | | | Residential Funding Mortgage Security I Trust | | | | |
| | 1,178,648 | | | 5.750%, 2/25/2036 | | | 1,100,483 | |
| | 1,787,177 | | | 6.000%, 7/25/2037 | | | 1,617,798 | |
| | | | Sequoia Mortgage Trust | | | | |
| | 1,589,845 | | | 2.822%, 9/20/2046 | | | 1,271,942 | |
| | | | Structured Adjustable Rate Mortgage Loan Trust | | | | |
| | 381,885 | | | 2.761%, 12/25/2034 | | | 373,003 | |
| | 1,081,851 | | | 2.719%, 7/25/2035 | | | 925,242 | |
| | 601,209 | | | 2.877%, 9/25/2035 | | | 507,996 | |
| | 942,338 | | | 4.725%, 5/25/2036 | | | 723,792 | |
| | | | Structured Asset Mortgage Investments, Inc. | | | | |
| | 1,918,494 | | | 0.732%, 12/25/2035e | | | 1,388,952 | |
| | 1,430,966 | | | 0.632%, 5/25/2046e | | | 1,007,860 | |
| | | | Suntrust Alternative Loan Trust | | | | |
| | 1,436,784 | | | 5.750%, 12/25/2035 | | | 1,313,901 | |
| | | | WaMu Mortgage Pass Through Certificates | | | | |
| | 961,311 | | | 2.176%, 11/25/2036 | | | 832,828 | |
| | 1,946,699 | | | 1.825%, 1/25/2037 | | | 1,638,623 | |
| | 170,188 | | | 2.397%, 8/25/2046 | | | 145,663 | |
| | 1,260,302 | | | 1.177%, 9/25/2046e | | | 1,008,769 | |
| | 828,231 | | | 1.217%, 9/25/2046e | | | 688,869 | |
| | 2,242,504 | | | 1.063%, 12/25/2046e | | | 1,725,934 | |
| | 1,690,815 | | | 0.997%, 1/25/2047e | | | 1,363,670 | |
| | 887,777 | | | 1.901%, 3/25/2047e | | | 706,300 | |
| | | | Washington Mutual Mortgage Pass Through Certificates | | | | |
| | 946,110 | | | 1.022%, 6/25/2035e | | | 720,731 | |
| | 1,181,722 | | | 6.000%, 11/25/2035 | | | 1,078,727 | |
| | 2,751,932 | | | 1.007%, 2/25/2047e | | | 1,972,577 | |
| | | | Wells Fargo Mortgage Backed Securities Trust | | | | |
| | 2,130,204 | | | 2.731%, 7/25/2036 | | | 2,087,257 | |
| | 329,053 | | | 1.122%, 5/25/2037e | | | 286,341 | |
| | 715,743 | | | 6.000%, 7/25/2037 | | | 708,524 | |
| | 1,167,179 | | | 6.000%, 11/25/2037 | | | 1,155,274 | |
| | | | | | | | |
| | | | Total | | | 100,999,587 | |
| | | | | | | | |
| |
| Commercial Mortgage-Backed Securities (0.4%) | | | | |
| | | | Greenwich Capital Commercial Funding Corporation | | | | |
| | 1,350,000 | | | 5.867%, 12/10/2049 | | | 1,402,400 | |
The accompanying Notes to Financial Statements are an integral part of this schedule.
19
DIVERSIFIED INCOME PLUS FUND
Schedule of Investments as of December 31, 2015
| | | | | | | | |
Principal
Amount | | | Long-Term Fixed Income (45.0%) | | Value | |
| Commercial Mortgage-Backed Securities (0.4%) - continued | | | | |
| | | | Morgan Stanley Capital, Inc. | | | | |
| $ | 1,350,000 | | | 5.406%, 3/15/2044 | | $ | 1,385,722 | |
| | | | | | | | |
| | | | Total | | | 2,788,122 | |
| | | | | | | | |
|
| Communications Services (2.2%) | |
| | | | AMC Networks, Inc. | | | | |
| | 610,000 | | | 4.750%, 12/15/2022 | | | 610,000 | |
| | | | American Tower Corporation | | | | |
| | 95,000 | | | 2.800%, 6/1/2020 | | | 93,907 | |
| | 152,000 | | | 3.450%, 9/15/2021 | | | 152,745 | |
| | | | AT&T, Inc. | | | | |
| | 95,000 | | | 1.533%, 6/30/2020e | | | 94,321 | |
| | | | CC Holdings GS V, LLC | | | | |
| | 94,000 | | | 2.381%, 12/15/2017 | | | 94,103 | |
| | | | CCO Holdings, LLC | | | | |
| | 600,000 | | | 6.500%, 4/30/2021 | | | 624,000 | |
| | | | CCO Safari II, LLC | | | | |
| | 47,000 | | | 3.579%, 7/23/2020g | | | 46,718 | |
| | 47,000 | | | 4.464%, 7/23/2022g | | | 46,836 | |
| | | | CenturyLink, Inc. | | | | |
| | 600,000 | | | 6.450%, 6/15/2021 | | | 585,000 | |
| | | | Clear Channel Worldwide Holdings, Inc. | | | | |
| | 850,000 | | | 6.500%, 11/15/2022 | | | 828,750 | |
| | | | Columbus International, Inc. | | | | |
| | 1,400,000 | | | 7.375%, 3/30/2021g | | | 1,386,000 | |
| | | | Digicel, Ltd. | | | | |
| | 1,400,000 | | | 6.000%, 4/15/2021g | | | 1,179,500 | |
| | | | DIRECTV Holdings, LLC | | | | |
| | 176,000 | | | 5.875%, 10/1/2019 | | | 196,439 | |
| | | | FairPoint Communications, Inc. | | | | |
| | 1,100,000 | | | 8.750%, 8/15/2019g | | | 1,083,500 | |
| | | | Frontier Communications Corporation | | | | |
| | 855,000 | | | 8.875%, 9/15/2020g | | | 865,687 | |
| | | | Hughes Satellite Systems Corporation | | | | |
| | 774,000 | | | 6.500%, 6/15/2019 | | | 833,985 | |
| | | | Level 3 Escrow II, Inc. | | | | |
| | 600,000 | | | 5.375%, 8/15/2022 | | | 609,000 | |
| | | | Numericable-SFR | | | | |
| | 1,370,000 | | | 6.000%, 5/15/2022g | | | 1,328,900 | |
| | | | SBA Tower Trust | | | | |
| | 300,000 | | | 3.598%, 4/16/2043g | | | 298,921 | |
| | | | Sprint Corporation | | | | |
| | 1,230,000 | | | 7.625%, 2/15/2025 | | | 897,900 | |
| | | | Telefonica Emisiones SAU | | | | |
| | 211,000 | | | 3.192%, 4/27/2018 | | | 215,094 | |
| | | | T-Mobile USA, Inc. | | | | |
| | 1,230,000 | | | 6.125%, 1/15/2022 | | | 1,263,825 | |
| | | | Univision Communications, Inc. | | | | |
| | 860,000 | | | 5.125%, 5/15/2023g | | | 827,750 | |
| | | | UPCB Finance V, Ltd. | | | | |
| | 774,000 | | | 7.250%, 11/15/2021g | | | 822,375 | |
| | | | Verizon Communications, Inc. | | | | |
| | 115,000 | | | 2.625%, 2/21/2020 | | | 115,400 | |
| | 152,000 | | | 4.500%, 9/15/2020 | | | 163,310 | |
| | | | | | | | |
| | | | Total | | | 15,263,966 | |
| | | | | | | | |
|
| Consumer Cyclical (2.1%) | |
| | | | AMC Entertainment, Inc. | | | | |
| | 600,000 | | | 5.875%, 2/15/2022 | | | 609,000 | |
| | | | Brookfield Residential Properties, Inc. | | | | |
| | 850,000 | | | 6.500%, 12/15/2020g | | | 819,187 | |
| | | | Corrections Corporation of America | | | | |
| | 820,000 | | | 5.000%, 10/15/2022 | | | 815,900 | |
| | | | Ford Motor Credit Company, LLC | | | | |
| | 220,000 | | | 5.000%, 5/15/2018 | | | 231,087 | |
| | 155,000 | | | 2.597%, 11/4/2019 | | | 152,185 | |
| | | | General Motors Financial Company, Inc. | | | | |
| | 860,000 | | | 3.250%, 5/15/2018 | | | 864,305 | |
| | 167,000 | | | 4.375%, 9/25/2021 | | | 169,347 | |
| | | | GLP Capital, LP | | | | |
| | 1,400,000 | | | 4.875%, 11/1/2020 | | | 1,372,000 | |
| | | | Hilton Worldwide Finance, LLC | | | | |
| | 1,080,000 | | | 5.625%, 10/15/2021 | | | 1,119,150 | |
| | | | Home Depot, Inc. | | | | |
| | 95,000 | | | 0.882%, 9/15/2017e | | | 95,140 | |
| | 95,000 | | | 2.625%, 6/1/2022 | | | 94,901 | |
| | | | Jaguar Land Rover Automotive plc | | | | |
| | 500,000 | | | 4.125%, 12/15/2018g | | | 502,500 | |
| | 710,000 | | | 5.625%, 2/1/2023g | | | 717,100 | |
| | | | L Brands, Inc. | | | | |
| | 860,000 | | | 5.625%, 2/15/2022 | | | 913,750 | |
| | | | Lennar Corporation | | | | |
| | 610,000 | | | 12.250%, 6/1/2017 | | | 691,587 | |
| | 250,000 | | | 4.125%, 12/1/2018 | | | 251,250 | |
| | | | Macy’s Retail Holdings, Inc. | | | | |
| | 88,000 | | | 7.450%, 7/15/2017 | | | 95,082 | |
| | | | MGM Resorts International | | | | |
| | 1,255,000 | | | 6.000%, 3/15/2023 | | | 1,245,587 | |
| | | | Ralph Lauren Corporation | | | | |
| | 95,000 | | | 2.625%, 8/18/2020 | | | 95,905 | |
| | | | Royal Caribbean Cruises, Ltd. | | | | |
| | 1,400,000 | | | 5.250%, 11/15/2022 | | | 1,435,000 | |
| | | | Six Flags Entertainment Corporation | | | | |
| | 850,000 | | | 5.250%, 1/15/2021g | | | 860,625 | |
| | | | Toll Brothers Finance Corporation | | | | |
| | 208,000 | | | 4.000%, 12/31/2018 | | | 212,160 | |
| | | | Visa, Inc. | | | | |
| | 90,000 | | | 2.200%, 12/14/2020 | | | 89,833 | |
| | | | West Corporation | | | | |
| | 1,400,000 | | | 5.375%, 7/15/2022g | | | 1,207,500 | |
| | | | | | | | |
| | | | Total | | | 14,660,081 | |
| | | | | | | | |
|
| Consumer Non-Cyclical (2.1%) | |
| | | | Amgen, Inc. | | | | |
| | 95,000 | | | 2.125%, 5/1/2020 | | | 93,705 | |
| | | | B&G Foods, Inc. | | | | |
| | 500,000 | | | 4.625%, 6/1/2021 | | | 495,000 | |
| | | | BAT International Finance plc | | | | |
| | 95,000 | | | 1.022%, 6/15/2018e,g | | | 94,871 | |
| | | | Becton, Dickinson and Company | | | | |
| | 70,000 | | | 1.450%, 5/15/2017 | | | 69,704 | |
| | | | Boston Scientific Corporation | | | | |
| | 50,000 | | | 6.000%, 1/15/2020 | | | 55,521 | |
| | | | Bunge Limited Finance Corporation | | | | |
| | 90,000 | | | 3.500%, 11/24/2020 | | | 89,499 | |
The accompanying Notes to Financial Statements are an integral part of this schedule.
20
DIVERSIFIED INCOME PLUS FUND
Schedule of Investments as of December 31, 2015
| | | | | | | | |
Principal
Amount | | | Long-Term Fixed Income (45.0%) | | Value | |
| Consumer Non-Cyclical (2.1%) - continued | |
| | | | Cardinal Health, Inc. | | | | |
| $ | 95,000 | | | 1.950%, 6/15/2018 | | $ | 94,753 | |
| | | | Celgene Corporation | | | | |
| | 95,000 | | | 3.550%, 8/15/2022 | | | 95,924 | |
| | | | Cott Beverages, Inc. | | | | |
| | 1,400,000 | | | 5.375%, 7/1/2022 | | | 1,372,000 | |
| | | | CVS Health Corporation | | | | |
| | 106,000 | | | 2.250%, 12/5/2018 | | | 106,511 | |
| | | | EMD Finance, LLC | | | | |
| | 55,000 | | | 0.876%, 3/17/2017e,g | | | 54,831 | |
| | | | Envision Healthcare Corporation | | | | |
| | 1,400,000 | | | 5.125%, 7/1/2022g | | | 1,372,000 | |
| | | | Forest Laboratories, Inc. | | | | |
| | 153,000 | | | 4.375%, 2/1/2019g | | | 160,279 | |
| | | | Gilead Sciences, Inc. | | | | |
| | 95,000 | | | 3.250%, 9/1/2022 | | | 95,658 | |
| | | | Grifols Worldwide Operations, Ltd. | | | | |
| | 950,000 | | | 5.250%, 4/1/2022 | | | 954,750 | |
| | | | HCA, Inc. | | | | |
| | 925,000 | | | 3.750%, 3/15/2019 | | | 931,938 | |
| | | | JBS USA, LLC | | | | |
| | 610,000 | | | 5.875%, 7/15/2024g | | | 552,050 | |
| | 1,240,000 | | | 5.750%, 6/15/2025g | | | 1,078,800 | |
| | | | Laboratory Corporation of America Holdings | | | | |
| | 40,000 | | | 2.625%, 2/1/2020 | | | 39,490 | |
| | | | Land O’Lakes, Inc. | | | | |
| | 1,200,000 | | | 8.000%, 12/31/2049g,i | | | 1,246,500 | |
| | | | Mead Johnson Nutrition Company | | | | |
| | 90,000 | | | 3.000%, 11/15/2020 | | | 89,973 | |
| | | | Medtronic plc | | | | |
| | 310,000 | | | 4.375%, 3/15/2035 | | | 313,361 | |
| | | | Mondelez International, Inc. | | | | |
| | 136,000 | | | 2.250%, 2/1/2019 | | | 135,950 | |
| | | | Mylan NV | | | | |
| | 45,000 | | | 3.750%, 12/15/2020g | | | 45,047 | |
| | | | PepsiCo, Inc. | | | | |
| | 95,000 | | | 1.850%, 4/30/2020 | | | 93,910 | |
| | | | Pfizer, Inc. | | | | |
| | 870,000 | | | 5.200%, 8/12/2020 | | | 974,475 | |
| | | | Reynolds American, Inc. | | | | |
| | 95,000 | | | 3.250%, 6/12/2020 | | | 96,549 | |
| | | | SABMiller plc | | | | |
| | 75,000 | | | 6.500%, 7/15/2018g | | | 82,748 | |
| | | | Safeway, Inc. | | | | |
| | 63,000 | | | 3.400%, 12/1/2016 | | | 62,370 | |
| | | | Spectrum Brands Escrow Corporation | | | | |
| | 790,000 | | | 6.375%, 11/15/2020 | | | 839,375 | |
| | | | Tenet Healthcare Corporation | | | | |
| | 1,080,000 | | | 8.125%, 4/1/2022 | | | 1,077,300 | |
| | | | TreeHouse Foods, Inc. | | | | |
| | 850,000 | | | 4.875%, 3/15/2022 | | | 809,625 | |
| | | | Tyson Foods, Inc. | | | | |
| | 152,000 | | | 4.500%, 6/15/2022 | | | 161,783 | |
| | | | VPII Escrow Corporation | | | | |
| | 610,000 | | | 7.500%, 7/15/2021g | | | 608,475 | |
| | | | Zoetis, Inc. | | | | |
| | 90,000 | | | 3.450%, 11/13/2020 | | | 90,105 | |
| | | | | | | | |
| | | | Total | | | 14,534,830 | |
| | | | | | | | |
|
| Energy (1.4%) | |
| | | | Anadarko Petroleum Corporation | | | | |
| | 99,000 | | | 8.700%, 3/15/2019 | | | 112,479 | |
| | | | Buckeye Partners, LP | | | | |
| | 152,000 | | | 2.650%, 11/15/2018 | | | 146,231 | |
| | | | Chaparral Energy, Inc. | | | | |
| | 600,000 | | | 7.625%, 11/15/2022 | | | 138,000 | |
| | | | Chevron Corporation | | | | |
| | 90,000 | | | 0.874%, 11/16/2018e | | | 90,024 | |
| | | | Concho Resources, Inc. | | | | |
| | 860,000 | | | 5.500%, 10/1/2022 | | | 782,600 | |
| | | | Crestwood Midstream Partners, LP | | | | |
| | 850,000 | | | 6.250%, 4/1/2023g | | | 592,875 | |
| | | | Enbridge Energy Partners, LP | | | | |
| | 1,215,000 | | | 8.050%, 10/1/2037 | | | 996,300 | |
| | | | Enterprise Products Operating, LLC | | | | |
| | 1,390,000 | | | 7.034%, 1/15/2068 | | | 1,410,850 | |
| | | | EQT Corporation | | | | |
| | 105,000 | | | 5.150%, 3/1/2018 | | | 109,255 | |
| | 104,000 | | | 8.125%, 6/1/2019 | | | 112,339 | |
| | | | Kinder Morgan, Inc. | | | | |
| | 155,000 | | | 5.300%, 12/1/2034 | | | 122,146 | |
| | | | Marathon Petroleum Corporation | | | | |
| | 90,000 | | | 3.400%, 12/15/2020 | | | 88,388 | |
| | | | MEG Energy Corporation | | | | |
| | 250,000 | | | 6.500%, 3/15/2021g | | | 175,000 | |
| | 610,000 | | | 6.375%, 1/30/2023g | | | 417,850 | |
| | | | Noble Energy, Inc. | | | | |
| | 950,000 | | | 5.875%, 6/1/2022 | | | 903,735 | |
| | | | Pacific Drilling V, Ltd. | | | | |
| | 850,000 | | | 7.250%, 12/1/2017g | | | 437,750 | |
| | | | Petrobras International Finance Company | | | | |
| | 470,000 | | | 5.750%, 1/20/2020 | | | 368,950 | |
| | | | Petroleos Mexicanos | | | | |
| | 630,000 | | | 5.625%, 1/23/2046g | | | 482,076 | |
| | | | Pioneer Natural Resources Company | | | | |
| | 32,000 | | | 3.450%, 1/15/2021 | | | 29,547 | |
| | | | Regency Energy Partners, LP | | | | |
| | 1,080,000 | | | 5.000%, 10/1/2022 | | | 956,747 | |
| | | | Sabine Pass Liquefaction, LLC | | | | |
| | 1,290,000 | | | 5.625%, 3/1/2025g | | | 1,091,663 | |
| | | | Schlumberger Holdings Corporation | | | | |
| | 90,000 | | | 3.000%, 12/21/2020g | | | 88,837 | |
| | | | Shell International Finance BV | | | | |
| | 95,000 | | | 0.806%, 5/11/2020e | | | 93,609 | |
| | | | Sunoco Logistics Partners Operations, LP | | | | |
| | 90,000 | | | 4.400%, 4/1/2021 | | | 87,216 | |
| | | | | | | | |
| | | | Total | | | 9,834,467 | |
| | | | | | | | |
| |
| Financials (8.4%) | | | | |
| | | | Abbey National Treasury Services plc | | | | |
| | 110,000 | | | 3.050%, 8/23/2018 | | | 112,870 | |
| | | | ACE INA Holdings, Inc. | | | | |
| | 90,000 | | | 2.875%, 11/3/2022 | | | 89,317 | |
The accompanying Notes to Financial Statements are an integral part of this schedule.
21
DIVERSIFIED INCOME PLUS FUND
Schedule of Investments as of December 31, 2015
| | | | | | | | |
Principal
Amount | | | Long-Term Fixed Income (45.0%) | | Value | |
| Financials (8.4%) - continued | |
| | | | Aegon NV | | | | |
| $ | 1,080,000 | | | 2.142%, 7/29/2049e,i | | $ | 810,000 | |
| | | | AIG Life Holdings, Inc. | | | | |
| | 1,200,000 | | | 7.570%, 12/1/2045* | | | 1,566,000 | |
| | | | Air Lease Corporation | | | | |
| | 47,000 | | | 2.625%, 9/4/2018 | | | 46,458 | |
| | | | Ally Financial, Inc. | | | | |
| | 900,000 | | | 3.750%, 11/18/2019 | | | 887,625 | |
| | | | American Express Company | | | | |
| | 1,250,000 | | | 6.800%, 9/1/2066 | | | 1,259,375 | |
| | | | American Express Credit Corporation | | | | |
| | 95,000 | | | 1.552%, 9/14/2020e | | | 95,811 | |
| | | | Aviation Capital Group Corporation | | | | |
| | 162,000 | | | 3.875%, 9/27/2016g | | | 163,215 | |
| | | | Banco de Brasil SA | | | | |
| | 800,000 | | | 9.000%, 12/31/2049g,i | | | 524,000 | |
| | | | Bank of America Corporation | | | | |
| | 272,000 | | | 5.700%, 5/2/2017 | | | 283,662 | |
| | 107,000 | | | 5.650%, 5/1/2018 | | | 115,058 | |
| | 160,000 | | | 8.000%, 12/29/2049i | | | 162,800 | |
| | | | Bank of New York Mellon Corporation | | | | |
| | 720,000 | | | 4.500%, 12/31/2049i | | | 658,800 | |
| | | | Barclays Bank plc | | | | |
| | 150,000 | | | 5.140%, 10/14/2020 | | | 162,780 | |
| | | | BBVA Banco Continental SA | | | | |
| | 203,000 | | | 2.250%, 7/29/2016g | | | 203,508 | |
| | | | BBVA International Preferred SA Unipersonal | | | | |
| | 1,545,000 | | | 5.919%, 12/29/2049i | | | 1,560,450 | |
| | | | BPCE SA | | | | |
| | 625,000 | | | 5.150%, 7/21/2024g | | | 630,253 | |
| | | | Caisse Centrale Desjardins du Quebec | | | | |
| | 50,000 | | | 0.989%, 1/29/2018e,g | | | 49,902 | |
| | | | Capital One Financial Corporation | | | | |
| | 1,200,000 | | | 5.550%, 12/29/2049i | | | 1,194,000 | |
| | | | CIT Group, Inc. | | | | |
| | 850,000 | | | 5.000%, 8/15/2022 | | | 872,848 | |
| | | | Citigroup, Inc. | | | | |
| | 153,000 | | | 1.850%, 11/24/2017 | | | 152,774 | |
| | | | Cooperatieve Centrale Raiffeisen-Boerenleenbank BA | | | | |
| | 975,000 | | | 11.000%, 12/29/2049g,i | | | 1,203,637 | |
| | | | Credit Agricole SA | | | | |
| | 70,000 | | | 1.457%, 6/10/2020e,g | | | 69,850 | |
| | 620,000 | | | 6.625%, 9/29/2049g,i | | | 609,460 | |
| | | | Credit Suisse Group AG | | | | |
| | 600,000 | | | 7.500%, 12/11/2049g,i | | | 629,899 | |
| | 1,240,000 | | | 6.250%, 12/29/2049g,i | | | 1,239,068 | |
| | | | CyrusOne, LP | | | | |
| | 860,000 | | | 6.375%, 11/15/2022 | | | 885,800 | |
| | | | DDR Corporation | | | | |
| | 136,000 | | | 9.625%, 3/15/2016 | | | 138,123 | |
| | | | Discover Bank | | | | |
| | 68,000 | | | 8.700%, 11/18/2019 | | | 80,446 | |
| | | | Discover Financial Services | | | | |
| | 150,000 | | | 6.450%, 6/12/2017 | | | 158,479 | |
| | | | Duke Realty, LP | | | | |
| | 155,000 | | | 4.375%, 6/15/2022 | | | 159,726 | |
| | | | Fifth Third Bancorp | | | | |
| | 925,000 | | | 4.900%, 12/29/2049i | | | 836,431 | |
| | | | GE Capital Trust I | | | | |
| | 620,000 | | | 6.375%, 11/15/2067 | | | 644,412 | |
| | | | General Electric Company | | | | |
| | 1,421,000 | | | 4.100%, 12/15/2049i | | | 1,417,448 | |
| | | | Goldman Sachs Group, Inc. | | | | |
| | 144,000 | | | 2.625%, 1/31/2019 | | | 145,030 | |
| | 205,000 | | | 7.500%, 2/15/2019 | | | 234,574 | |
| | 50,000 | | | 1.476%, 4/23/2020e | | | 50,074 | |
| | 95,000 | | | 2.012%, 11/29/2023e | | | 95,843 | |
| | | | Goldman Sachs Group, Inc. Convertible | | | | |
| | 3,800,000 | | | 0.500%, 9/24/2022 | | | 3,930,834 | |
| | | | Hartford Financial Services Group, Inc. | | | | |
| | 185,000 | | | 6.000%, 1/15/2019 | | | 203,458 | |
| | | | HCP, Inc. | | | | |
| | 107,000 | | | 3.750%, 2/1/2019 | | | 110,386 | |
| | | | Health Care REIT, Inc. | | | | |
| | 186,000 | | | 4.700%, 9/15/2017 | | | 194,432 | |
| | | | HSBC Holdings plc | | | | |
| | 625,000 | | | 5.625%, 12/29/2049i | | | 625,781 | |
| | 1,085,000 | | | 6.375%, 12/29/2049i | | | 1,083,644 | |
| | 620,000 | | | 6.375%, 12/29/2049i | | | 612,250 | |
| | | | Icahn Enterprises, LP | | | | |
| | 1,350,000 | | | 6.000%, 8/1/2020 | | | 1,361,340 | |
| | | | ILFC E-Capital Trust II | | | | |
| | 2,550,000 | | | 4.740%, 12/21/2065e,g | | | 2,346,000 | |
| | | | ING Bank NV | | | | |
| | 200,000 | | | 4.125%, 11/21/2023 | | | 203,702 | |
| | | | ING Capital Funding Trust III | | | | |
| | 1,420,000 | | | 4.207%, 12/29/2049e,i | | | 1,416,450 | |
| | | | International Lease Finance Corporation | | | | |
| | 110,000 | | | 2.462%, 6/15/2016e | | | 109,725 | |
| | 610,000 | | | 5.875%, 8/15/2022 | | | 649,650 | |
| | | | Intesa Sanpaolo SPA | | | | |
| | 70,000 | | | 3.875%, 1/16/2018 | | | 71,779 | |
| | 156,000 | | | 3.875%, 1/15/2019 | | | 160,622 | |
| | | | J.P. Morgan Chase & Company | | | | |
| | 144,000 | | | 6.300%, 4/23/2019 | | | 161,467 | |
| | 40,000 | | | 2.250%, 1/23/2020 | | | 39,351 | |
| | 128,000 | | | 7.900%, 4/29/2049i | | | 130,304 | |
| | 1,250,000 | | | 6.750%, 8/29/2049i | | | 1,362,500 | |
| | | | Liberty Mutual Group, Inc. | | | | |
| | 975,000 | | | 10.750%, 6/15/2058* | | | 1,452,750 | |
| | 42,000 | | | 5.000%, 6/1/2021g | | | 44,920 | |
| | | | Lincoln National Corporation | | | | |
| | 1,120,000 | | | 6.050%, 4/20/2067 | | | 873,600 | |
| | | | Lloyds Banking Group plc | | | | |
| | 1,200,000 | | | 6.413%, 1/29/2049g,i | | | 1,344,000 | |
| | | | MetLife Capital Trust IV | | | | |
| | 1,422,000 | | | 7.875%, 12/15/2037g | | | 1,734,840 | |
| | | | MetLife, Inc. | | | | |
| | 600,000 | | | 6.400%, 12/15/2036 | | | 655,500 | |
| | | | Morgan Stanley | | | | |
| | 50,000 | | | 1.463%, 1/27/2020e | | | 50,107 | |
| | 110,000 | | | 4.875%, 11/1/2022 | | | 116,738 | |
| | | | MPT Operating Partnership, LP | | | | |
| | 850,000 | | | 5.500%, 5/1/2024 | | | 845,750 | |
| | | | Murray Street Investment Trust I | | | | |
| | 157,000 | | | 4.647%, 3/9/2017 | | | 161,757 | |
The accompanying Notes to Financial Statements are an integral part of this schedule.
22
DIVERSIFIED INCOME PLUS FUND
Schedule of Investments as of December 31, 2015
| | | | | | | | |
Principal Amount | | | Long-Term Fixed Income (45.0%) | | Value | |
| Financials (8.4%) - continued | |
| | | | National City Corporation | | | | |
| $ | 136,000 | | | 6.875%, 5/15/2019 | | $ | 153,642 | |
| | | | National Westminster Bank plc | | | | |
| | 1,860,000 | | | 0.688%, 11/29/2049e,i | | | 1,131,635 | |
| | | | New York Life Global Funding | | | | |
| | 90,000 | | | 1.550%, 11/2/2018g | | | 89,267 | |
| | | | Nomura Holdings, Inc. | | | | |
| | 141,000 | | | 2.750%, 3/19/2019 | | | 141,761 | |
| | | | Prudential Financial, Inc. | | | | |
| | 620,000 | | | 5.875%, 9/15/2042 | | | 644,490 | |
| | 1,225,000 | | | 5.625%, 6/15/2043 | | | 1,252,563 | |
| | | | Quicken Loans, Inc. | | | | |
| | 850,000 | | | 5.750%, 5/1/2025g | | | 809,625 | |
| | | | Realty Income Corporation | | | | |
| | 131,000 | | | 2.000%, 1/31/2018 | | | 131,075 | |
| | | | Regions Bank | | | | |
| | 43,000 | | | 7.500%, 5/15/2018 | | | 47,779 | |
| | | | Reinsurance Group of America, Inc. | | | | |
| | 175,000 | | | 5.625%, 3/15/2017 | | | 182,379 | |
| | | | Royal Bank of Scotland Group plc | | | | |
| | 136,000 | | | 1.543%, 3/31/2017e | | | 135,735 | |
| | 625,000 | | | 7.648%, 8/29/2049i | | | 774,219 | |
| | 1,020,000 | | | 7.500%, 12/29/2049i | | | 1,062,075 | |
| | | | Simon Property Group, LP | | | | |
| | 95,000 | | | 2.500%, 9/1/2020 | | | 95,073 | |
| | | | Societe Generale SA | | | | |
| | 208,000 | | | 5.750%, 4/20/2016g | | | 210,649 | |
| | 1,240,000 | | | 8.250%, 9/29/2049i | | | 1,314,400 | |
| | 1,200,000 | | | 8.000%, 12/31/2049g,i | | | 1,222,880 | |
| | | | Standard Chartered plc | | | | |
| | 1,240,000 | | | 6.500%, 12/29/2049g,i | | | 1,198,064 | |
| | | | State Street Corporation | | | | |
| | 95,000 | | | 1.264%, 8/18/2020e | | | 95,010 | |
| | | | Synchrony Financial | | | | |
| | 156,000 | | | 1.875%, 8/15/2017 | | | 155,285 | |
| | 35,000 | | | 1.564%, 2/3/2020e | | | 34,447 | |
| | 156,000 | | | 3.750%, 8/15/2021 | | | 155,829 | |
| | | | Synovus Financial Corporation | | | | |
| | 600,000 | | | 5.750%, 12/15/2025 | | | 612,000 | |
| | | | Toronto-Dominion Bank | | | | |
| | 90,000 | | | 1.432%, 12/14/2020e | | | 89,979 | |
| | | | UnitedHealth Group, Inc. | | | | |
| | 95,000 | | | 3.350%, 7/15/2022 | | | 97,170 | |
| | | | USB Realty Corporation | | | | |
| | 1,240,000 | | | 1.468%, 12/29/2049e,g,i | | | 1,116,000 | |
| | | | Voya Financial, Inc. | | | | |
| | 204,000 | | | 2.900%, 2/15/2018 | | | 206,205 | |
| | | | Wells Fargo & Company | | | | |
| | 50,000 | | | 1.002%, 1/30/2020e | | | 49,534 | |
| | 600,000 | | | 5.900%, 12/29/2049i | | | 605,250 | |
| | 620,000 | | | 5.875%, 12/31/2049i | | | 652,550 | |
| | | | ZFS Finance USA Trust II | | | | |
| | 1,553,000 | | | 6.450%, 12/15/2065g | | | 1,569,306 | |
| | | | | | | | |
| | | | Total | | | 58,289,319 | |
| | | | | | | | |
| |
| Foreign Government (3.1%) | | | | |
| | | | Brazil Government International Bond | | | | |
| | 390,000 | | | 5.875%, 1/15/2019 | | | 397,800 | |
| | 505,000 | | | 4.875%, 1/22/2021 | | | 467,125 | |
| | 935,000 | | | 2.625%, 1/5/2023 | | | 710,600 | |
| | 624,000 | | | 5.000%, 1/27/2045 | | | 416,520 | |
| | | | Colombia Government International Bond | | | | |
| | 300,000 | | | 2.625%, 3/15/2023 | | | 263,550 | |
| | 400,000 | | | 4.000%, 2/26/2024 | | | 381,000 | |
| | 705,000 | | | 5.000%, 6/15/2045 | | | 588,675 | |
| | | | Croatia Government International Bond | | | | |
| | 560,000 | | | 6.625%, 7/14/2020g | | | 600,068 | |
| | | | Hungary Government International Bond | | | | |
| | 640,000 | | | 5.750%, 11/22/2023 | | | 716,096 | |
| | 598,000 | | | 5.375%, 3/25/2024 | | | 654,810 | |
| | | | Indonesia Government International Bond | | | | |
| | 450,000 | | | 4.875%, 5/5/2021g | | | 466,118 | |
| | 460,000 | | | 3.375%, 4/15/2023g | | | 427,451 | |
| | 390,000 | | | 5.875%, 1/15/2024g | | | 417,813 | |
| | 350,000 | | | 4.125%, 1/15/2025g | | | 335,419 | |
| | 312,000 | | | 4.750%, 1/8/2026g | | | 308,151 | |
| | 1,100,000 | | | 5.125%, 1/15/2045g | | | 994,782 | |
| | | | Mexico Government International Bond | | | | |
| | 400,000 | | | 3.625%, 3/15/2022 | | | 402,400 | |
| | 444,000 | | | 4.000%, 10/2/2023 | | | 449,772 | |
| | 260,000 | | | 3.600%, 1/30/2025 | | | 253,370 | |
| | 130,000 | | | 6.050%, 1/11/2040 | | | 142,350 | |
| | 400,000 | | | 4.750%, 3/8/2044 | | | 364,400 | |
| | 260,000 | | | 5.550%, 1/21/2045 | | | 266,500 | |
| | 455,000 | | | 4.600%, 1/23/2046 | | | 402,675 | |
| | | | Panama Government International Bond | | | | |
| | 320,000 | | | 4.000%, 9/22/2024 | | | 320,000 | |
| | 435,000 | | | 3.750%, 3/16/2025 | | | 426,300 | |
| | 130,000 | | | 6.700%, 1/26/2036 | | | 154,375 | |
| | | | Peru Government International Bond | | | | |
| | 920,000 | | | 4.125%, 8/25/2027 | | | 901,600 | |
| | | | Philippines Government International Bond | | | | |
| | 375,000 | | | 7.750%, 1/14/2031 | | | 526,864 | |
| | 390,000 | | | 6.375%, 10/23/2034 | | | 508,471 | |
| | | | Romania Government International Bond | | | | |
| | 314,000 | | | 4.375%, 8/22/2023g | | | 326,858 | |
| | 150,000 | | | 4.875%, 1/22/2024g | | | 161,145 | |
| | | | Russia Government International Bond | | | | |
| | 260,000 | | | 3.500%, 1/16/2019g | | | 258,700 | |
| | 1,200,000 | | | 5.000%, 4/29/2020g | | | 1,238,400 | |
| | 800,000 | | | 4.875%, 9/16/2023g | | | 812,800 | |
| | 386,750 | | | 7.500%, 3/31/2030g | | | 463,360 | |
| | 390,000 | | | 5.625%, 4/4/2042g | | | 368,940 | |
| | | | South Africa Government International Bond | | | | |
| | 400,000 | | | 5.500%, 3/9/2020 | | | 410,539 | |
| | 340,000 | | | 5.875%, 5/30/2022 | | | 355,027 | |
| | | | Turkey Government International Bond | | | | |
| | 390,000 | | | 7.500%, 11/7/2019 | | | 437,295 | |
| | 1,100,000 | | | 7.000%, 6/5/2020 | | | 1,223,919 | |
| | 615,000 | | | 5.125%, 3/25/2022 | | | 631,144 | |
| | 260,000 | | | 6.250%, 9/26/2022 | | | 282,256 | |
| | 130,000 | | | 5.750%, 3/22/2024 | | | 137,348 | |
| | 640,000 | | | 4.250%, 4/14/2026 | | | 600,033 | |
The accompanying Notes to Financial Statements are an integral part of this schedule.
23
DIVERSIFIED INCOME PLUS FUND
Schedule of Investments as of December 31, 2015
| | | | | | | | |
Principal Amount | | | Long-Term Fixed Income (45.0%) | | Value | |
| Foreign Government (3.1%) - continued | | | | |
| $ | 520,000 | | | 4.875%, 4/16/2043 | | $ | 457,600 | |
| | | | | | | | |
| | | | Total | | | 21,430,419 | |
| | | | | | | | |
|
| Mortgage-Backed Securities (1.2%) | |
| | | | Federal National Mortgage Association Conventional 30-Yr. Pass Through | | | | |
| | 6,000,000 | | | 3.500%, 1/1/2046c | | | 6,190,339 | |
| | 1,850,000 | | | 4.000%, 1/1/2046c | | | 1,957,618 | |
| | | | | | | | |
| | | | Total | | | 8,147,957 | |
| | | | | | | | |
|
| Technology (1.3%) | |
| | | | Alliance Data Systems Corporation | | | | |
| | 650,000 | | | 5.375%, 8/1/2022g | | | 619,125 | |
| | | | Amkor Technology, Inc. | | | | |
| | 860,000 | | | 6.625%, 6/1/2021 | | | 853,550 | |
| | | | Apple, Inc. | | | | |
| | 95,000 | | | 0.659%, 5/6/2020e | | | 94,284 | |
| | | | Automatic Data Processing, Inc. | | | | |
| | 95,000 | | | 2.250%, 9/15/2020 | | | 95,360 | |
| | | | Cisco Systems, Inc. | | | | |
| | 95,000 | | | 0.914%, 3/1/2019e | | | 94,915 | |
| | | | CommScope Technologies Finance, LLC | | | | |
| | 905,000 | | | 6.000%, 6/15/2025g | | | 871,062 | |
| | | | Denali Borrower, LLC | | | | |
| | 1,370,000 | | | 5.625%, 10/15/2020g | | | 1,435,075 | |
| | | | Equinix, Inc. | | | | |
| | 810,000 | | | 5.750%, 1/1/2025 | | | 828,225 | |
| | | | Fidelity National Information Services, Inc. | | | | |
| | 90,000 | | | 3.625%, 10/15/2020 | | | 91,172 | |
| | | | First Data Corporation | | | | |
| | 850,000 | | | 5.375%, 8/15/2023g | | | 854,250 | |
| | | | Freescale Semiconductor, Inc. | | | | |
| | 860,000 | | | 6.000%, 1/15/2022g | | | 900,850 | |
| | | | Hewlett Packard Enterprise Company | | | | |
| | 90,000 | | | 3.600%, 10/15/2020g | | | 90,207 | |
| | | | IMS Health, Inc. | | | | |
| | 490,000 | | | 6.000%, 11/1/2020g | | | 504,700 | |
| | | | Intel Corporation | | | | |
| | 95,000 | | | 3.100%, 7/29/2022 | | | 96,873 | |
| | | | Oracle Corporation | | | | |
| | 95,000 | | | 2.500%, 5/15/2022 | | | 93,244 | |
| | | | Sensata Technologies BV | | | | |
| | 1,200,000 | | | 4.875%, 10/15/2023g | | | 1,167,000 | |
| | | | Texas Instruments, Inc. | | | | |
| | 95,000 | | | 1.750%, 5/1/2020 | | | 92,539 | |
| | | | | | | | |
| | | | Total | | | 8,782,431 | |
| | | | | | | | |
|
| Transportation (0.4%) | |
| | | | American Airlines Pass Through Trust | | | | |
| | 118,025 | | | 4.950%, 1/15/2023 | | | 124,516 | |
| | | | Avis Budget Car Rental, LLC | | | | |
| | 1,415,000 | | | 5.125%, 6/1/2022g | | | 1,397,312 | |
| | | | Delta Air Lines, Inc. | | | | |
| | 90,845 | | | 4.950%, 5/23/2019 | | | 95,387 | |
| | 81,353 | | | 4.750%, 5/7/2020 | | | 85,827 | |
| | | | J.B. Hunt Transport Services, Inc. | | | | |
| | 95,000 | | | 3.300%, 8/15/2022 | | | 94,084 | |
| | | | Korea Expressway Corporation | | | | |
| | 200,000 | | | 1.625%, 4/28/2017g | | | 199,304 | |
| | | | United Airlines 2015-1 Class A Pass Through Trust | | | | |
| | 90,000 | | | 3.700%, 12/1/2022 | | | 89,775 | |
| | | | XPO Logistics, Inc. | | | | |
| | 850,000 | | | 6.500%, 6/15/2022g | | | 786,250 | |
| | | | | | | | |
| | | | Total | | | 2,872,455 | |
| | | | | | | | |
|
| U.S. Government and Agencies (0.2%) | |
| | | | U.S. Treasury Notes | | | | |
| | 1,260,000 | | | 1.875%, 6/30/2020 | | | 1,268,810 | |
| | 325,000 | | | 2.125%, 6/30/2022 | | | 326,676 | |
| | | | | | | | |
| | | | Total | | | 1,595,486 | |
| | | | | | | | |
|
| Utilities (1.8%) | |
| | | | Access Midstream Partners, LP | | | | |
| | 610,000 | | | 4.875%, 5/15/2023 | | | 494,506 | |
| | | | AES Corporation | | | | |
| | 610,000 | | | 7.375%, 7/1/2021 | | | 622,200 | |
| | | | Ameren Corporation | | | | |
| | 90,000 | | | 2.700%, 11/15/2020 | | | 89,657 | |
| | | | Calpine Corporation | | | | |
| | 870,000 | | | 6.000%, 1/15/2022g | | | 898,005 | |
| | 1,080,000 | | | 5.375%, 1/15/2023 | | | 969,300 | |
| | | | DCP Midstream, LLC | | | | |
| | 450,000 | | | 5.850%, 5/21/2043g | | | 344,250 | |
| | | | Dynegy Finance I, Inc. | | | | |
| | 1,200,000 | | | 7.375%, 11/1/2022 | | | 1,044,000 | |
| | | | Electricite de France SA | | | | |
| | 1,860,000 | | | 5.250%, 12/29/2049g,i | | | 1,748,400 | |
| | | | Energy Transfer Equity, LP | | | | |
| | 1,240,000 | | | 5.500%, 6/1/2027 | | | 942,400 | |
| | | | Exelon Generation Company, LLC | | | | |
| | 144,000 | | | 5.200%, 10/1/2019 | | | 155,129 | |
| | | | MPLX LP | | | | |
| | 1,285,000 | | | 4.875%, 12/1/2024g | | | 1,153,288 | |
| | | | NRG Energy, Inc. | | | | |
| | 610,000 | | | 6.625%, 3/15/2023 | | | 529,175 | |
| | | | Southern California Edison Company | | | | |
| | 2,800,000 | | | 6.250%, 8/1/2049i | | | 3,084,900 | |
| | | | TransCanada PipeLines, Ltd. | | | | |
| | 600,000 | | | 6.350%, 5/15/2067 | | | 453,000 | |
| | | | Xcel Energy, Inc. | | | | |
| | 95,000 | | | 1.200%, 6/1/2017 | | | 94,518 | |
| | | | | | | | |
| | | | Total | | | 12,622,728 | |
| | | | | | | | |
| | | | Total Long-Term Fixed Income (cost $314,302,944) | | | 312,457,925 | |
| | | | | | | | |
| | |
Shares | | | Common Stock (30.3%) | | | |
| Consumer Discretionary (4.3%) | |
| | 5,500 | | | Aisan Industry Company, Ltd. | | | 56,478 | |
| | 1,600 | | | Aisin Seiki Company, Ltd. | | | 68,861 | |
| | 4,520 | | | Amazon.com, Inc.k | | | 3,055,023 | |
| | 3,470 | | | AutoZone, Inc.k | | | 2,574,428 | |
| | 800 | | | Bayerische Motoren Werke AG | | | 66,933 | |
| | 8,200 | | | Berkeley Group Holdings plc | | | 445,783 | |
| | 18,410 | | | Best Buy Company, Inc. | | | 560,584 | |
| | 13,140 | | | BorgWarner, Inc. | | | 568,042 | |
The accompanying Notes to Financial Statements are an integral part of this schedule.
24
DIVERSIFIED INCOME PLUS FUND
Schedule of Investments as of December 31, 2015
| | | | | | | | |
Shares | | | Common Stock (30.3%) | | Value | |
| Consumer Discretionary (4.3%) - continued | | | | |
| | 1,700 | | | Brembo SPA | | $ | 82,132 | |
| | 4,700 | | | Bridgestone Corporation | | | 161,217 | |
| | 8,770 | | | Burlington Stores, Inc.k | | | 376,233 | |
| | 8,000 | | | Calsonic Kansei Corporation | | | 70,528 | |
| | 11,614 | | | Cedar Fair, LP | | | 648,526 | |
| | 6,000 | | | Cineworld Group plc | | | 49,745 | |
| | 55,902 | | | Comcast Corporation | | | 3,154,550 | |
| | 3,200 | | | Compass Group plc | | | 55,451 | |
| | 200 | | | Continental AG | | | 48,382 | |
| | 1,600 | | | Daimler AG | | | 133,687 | |
| | 38,200 | | | Debenhams plc | | | 41,186 | |
| | 7,400 | | | Denso Corporation | | | 353,613 | |
| | 43,680 | | | Discovery Communications, Inc., Class Ak | | | 1,165,382 | |
| | 30,200 | | | EDION Corporationl | | | 228,028 | |
| | 3,500 | | | Electrolux AB | | | 84,446 | |
| | 4,900 | | | Eutelsat Communications | | | 146,709 | |
| | 19,640 | | | Ford Motor Company | | | 276,728 | |
| | 6,680 | | | General Motors Company | | | 227,187 | |
| | 11,200 | | | GKN plc | | | 50,824 | |
| | 22,000 | | | Gunze, Ltd. | | | 64,439 | |
| | 12,200 | | | Hakuhodo Dy Holdings, Inc. | | | 131,999 | |
| | 5,610 | | | Harman International Industries, Inc. | | | 528,518 | |
| | 700 | | | Hugo Boss AG | | | 57,757 | |
| | 22,200 | | | Inchcape plc | | | 256,138 | |
| | 10,000 | | | Informa plc | | | 90,375 | |
| | 3,500 | | | Intertek Group plc | | | 143,174 | |
| | 5,900 | | | Isuzu Motors, Ltd. | | | 63,559 | |
| | 73,400 | | | ITV plc | | | 298,839 | |
| | 19,440 | | | Jarden Corporationk | | | 1,110,413 | |
| | 36,200 | | | Lookers plc | | | 98,633 | |
| | 30,525 | | | MDC Partners, Inc. | | | 663,003 | |
| | 1,800 | | | Mitsuba Corporation | | | 27,828 | |
| | 39,700 | | | NIKE, Inc. | | | 2,481,250 | |
| | 10,500 | | | NOK Corporation | | | 245,289 | |
| | 500 | | | Paddy Power plc | | | 66,779 | |
| | 9,000 | | | PanaHome Corporation | | | 67,993 | |
| | 7,380 | | | Papa John’s International, Inc. | | | 412,321 | |
| | 22,400 | | | Persimmon plc | | | 668,271 | |
| | 830 | | | Priceline Group, Inc.k | | | 1,058,208 | |
| | 2,100 | | | ProSiebenSat.1 Media AG | | | 105,948 | |
| | 400 | | | Renault SA | | | 40,038 | |
| | 5,919 | | | Restoration Hardware Holdings, Inc.k | | | 470,265 | |
| | 1,508 | | | Schibsted ASA | | | 49,578 | |
| | 5,500 | | | Sekisui House, Ltd. | | | 92,476 | |
| | 5,700 | | | SHOWA Corporation | | | 52,888 | |
| | 8,200 | | | Sports Direct International plck | | | 69,685 | |
| | 2,600 | | | Stanley Electric Company, Ltd. | | | 57,038 | |
| | 15,200 | | | Star Entertainment Group, Ltd. | | | 55,775 | |
| | 28,726 | | | Starbucks Corporation | | | 1,724,422 | |
| | 17,800 | | | Sumitomo Forestry Company, Ltd. | | | 240,177 | |
| | 8,700 | | | Sumitomo Rubber Industries, Ltd. | | | 113,129 | |
| | 9,000 | | | Takashimaya Company, Ltd. | | | 81,049 | |
| | 1,900 | | | Tamron Company, Ltd. | | | 35,053 | |
| | 14,820 | | | Target Corporation | | | 1,076,080 | |
| | 18,000 | | | Tatts Group, Ltd. | | | 57,148 | |
| | 85,500 | | | Taylor Wimpey plc | | | 255,592 | |
| | 15,980 | | | Toll Brothers, Inc.k | | | 532,134 | |
| | 20,300 | | | UBM plc | | | 157,334 | |
| | 1,500 | | | Valora Holding AG | | | 312,067 | |
| | 8,000 | | | Wacoal Holdings Corporation | | | 95,668 | |
| | 14,600 | | | WH Smith plc | | | 379,368 | |
| | 9,900 | | | Wolters Kluwer NV | | | 332,479 | |
| | 13,100 | | | WPP plc | | | 301,325 | |
| | 2,600 | | | Yokohama Rubber Company, Ltd. | | | 39,930 | |
| | | | | | | | |
| | | | Total | | | 30,012,118 | |
| | | | | | | | |
| |
| Consumer Staples (1.6%) | | | | |
| | 3,100 | | | AarhusKarlshamn AB | | | 229,645 | |
| | 14,832 | | | Anheuser-Busch InBev NV ADR | | | 1,854,000 | |
| | 8,300 | | | Axfood AB | | | 143,758 | |
| | 1,901 | | | Bakkafrost PF | | | 56,005 | |
| | 1,000 | | | British American Tobacco plc | | | 55,534 | |
| | 7,100 | | | Britvic plc | | | 76,071 | |
| | 2,200 | | | Carrefour SA | | | 63,491 | |
| | 40,630 | | | Coca-Cola Company | | | 1,745,465 | |
| | 15,200 | | | Coca-Cola HBC AGk | | | 323,696 | |
| | 3,300 | | | Henkel AG & Company KGaA | | | 315,655 | |
| | 26,600 | | | Imperial Tobacco Group plc | | | 1,404,958 | |
| | 17,900 | | | Japan Tobacco, Inc. | | | 657,177 | |
| | 6,400 | | | Jeronimo Martins SGPS SA | | | 83,280 | |
| | 6,800 | | | Kao Corporation | | | 349,443 | |
| | 700 | | | Kerry Group plc | | | 57,918 | |
| | 45,400 | | | Koninklijke Ahold NV | | | 957,648 | |
| | 1,100 | | | KOSE Corporation | | | 101,707 | |
| | 6,300 | | | Marks and Spencer Group plc | | | 41,947 | |
| | 9,400 | | | Nestle SA | | | 697,811 | |
| | 7,000 | | | Nippon Meat Packers, Inc. | | | 137,199 | |
| | 9,400 | | | Nisshin Oillio Group, Ltd. | | | 38,292 | |
| | 9,270 | | | Philip Morris International, Inc. | | | 814,926 | |
| | 1,800 | | | Royal Unibrew AS | | | 73,155 | |
| | 3,700 | | | Suedzucker AG | | | 73,336 | |
| | 2,200 | | | Sugi Holdings Company, Ltd. | | | 121,380 | |
| | 800 | | | Sundrug Company, Ltd. | | | 51,437 | |
| | 2,500 | | | Svenska Cellulosa AB SCA | | | 72,450 | |
| | 10,500 | | | Swedish Match AB | | | 371,043 | |
| | | | | | | | |
| | | | Total | | | 10,968,427 | |
| | | | | | | | |
| |
| Energy (2.1%) | | | | |
| | 1,300 | | | Azrieli Group, Ltd. | | | 48,428 | |
| | 110,300 | | | BP plc | | | 573,198 | |
| | 2,220 | | | Cimarex Energy Company | | | 198,424 | |
| | 25,390 | | | EOG Resources, Inc. | | | 1,797,358 | |
| | 22,220 | | | EQT Corporation | | | 1,158,329 | |
| | 74,000 | | | Kinder Morgan, Inc. | | | 1,104,080 | |
| | 3,800 | | | OMV AG | | | 107,865 | |
| | 37,600 | | | Parsley Energy, Inc.k | | | 693,720 | |
| | 2,300 | | | Royal Dutch Shell plc | | | 52,457 | |
| | 44,200 | | | Royal Dutch Shell plc ADR | | | 2,023,918 | |
| | 5,603 | | | Royal Dutch Shell plc, Class B | | | 127,698 | |
| | 84,000 | | | Spectra Energy Corporation | | | 2,010,960 | |
| | 18,579 | | | Statoil ASA | | | 259,117 | |
| | 18,000 | | | TonenGeneral Sekiyu KK | | | 151,956 | |
| | 51,031 | | | Total SA ADR | | | 2,293,843 | |
| | 241,670 | | | Weatherford International, Ltd.k | | | 2,027,611 | |
| | | | | | | | |
| | | | Total | | | 14,628,962 | |
| | | | | | | | |
| |
| Financials (10.1%) | | | | |
| | 74,500 | | | Aberdeen Asset Management plc | | | 317,463 | |
| | 2,100 | | | Acadia Realty Trust | | | 69,615 | |
| | 2,900 | | | AEON Financial Service Company, Ltd. | | | 64,782 | |
| | 3,860 | | | Affiliated Managers Group, Inc.k | | | 616,674 | |
| | 2,800 | | | Agree Realty Corporation | | | 95,172 | |
| | 12,518 | | | Alexandria Real Estate Equities, Inc. | | | 1,131,126 | |
| | 11,400 | | | Allianz SE | | | 2,009,580 | |
| | 105,000 | | | American Capital Agency Corporation | | | 1,820,700 | |
| | 2,134 | | | American Farmland Company | | | 15,023 | |
The accompanying Notes to Financial Statements are an integral part of this schedule.
25
DIVERSIFIED INCOME PLUS FUND
Schedule of Investments as of December 31, 2015
| | | | | | | | |
Shares | | | Common Stock (30.3%) | | Value | |
| Financials (10.1%) - continued | | | | |
| | 6,578 | | | American Realty Capital Properties, Inc. | | $ | 52,098 | |
| | 204,000 | | | Annaly Capital Management, Inc. | | | 1,913,520 | |
| | 5,550 | | | Apartment Investment & Management Company | | | 222,166 | |
| | 300,000 | | | Apollo Investment Corporation | | | 1,566,000 | |
| | 183,600 | | | Ares Capital Corporation | | | 2,616,300 | |
| | 31,500 | | | Australia & New Zealand Banking Group, Ltd. | | | 635,662 | |
| | 4,300 | | | AvalonBay Communities, Inc. | | | 791,759 | |
| | 117,300 | | | Banco Santander SA | | | 577,045 | |
| | 52,400 | | | Bank Hapoalim, Ltd. | | | 270,489 | |
| | 13,693 | | | Bank of Queensland, Ltd. | | | 138,130 | |
| | 93,000 | | | Bank of Yokohama, Ltd. | | | 570,053 | |
| | 31,600 | | | BinckBank NV | | | 272,342 | |
| | 8,100 | | | BioMed Realty Trust, Inc. | | | 191,889 | |
| | 1,700 | | | Bluerock Residential Growth REIT, Inc. | | | 20,145 | |
| | 1,300 | | | Bolsas y Mercados Espanoles SA | | | 43,810 | |
| | 8,514 | | | Boston Properties, Inc. | | | 1,085,876 | |
| | 10,100 | | | British Land Company plc | | | 116,866 | |
| | 33,040 | | | Brixmor Property Group, Inc. | | | 853,093 | |
| | 12,750 | | | Camden Property Trust | | | 978,690 | |
| | 14,204 | | | Capital Shopping Centres Group plc | | | 66,360 | |
| | 42,700 | | | CapitaMall Trust | | | 57,939 | |
| | 2,475 | | | Care Capital Properties, Inc. | | | 75,661 | |
| | 78,420 | | | Charles Schwab Corporation | | | 2,582,371 | |
| | 1,438 | | | Chesapeake Lodging Trust | | | 36,180 | |
| | 13,000 | | | Chiba Bank, Ltd. | | | 92,251 | |
| | 42,700 | | | Citigroup, Inc. | | | 2,209,725 | |
| | 13,500 | | | CNP Assurances | | | 182,107 | |
| | 950 | | | CoreSite Realty Corporation | | | 53,884 | |
| | 9,300 | | | CubeSmart | | | 284,766 | |
| | 2,500 | | | CyrusOne, Inc. | | | 93,625 | |
| | 4,900 | | | Daiwa House Industry Company, Ltd. | | | 140,857 | |
| | 42,190 | | | DDR Corporation | | | 710,480 | |
| | 800 | | | Derwent London plc | | | 43,270 | |
| | 62,700 | | | DEXUS Property Group | | | 340,095 | |
| | 3,700 | | | Digital Realty Trust, Inc. | | | 279,794 | |
| | 29,866 | | | Direct Line Insurance Group plc | | | 179,021 | |
| | 21,700 | | | Duke Realty Corporation | | | 456,134 | |
| | 900 | | | DuPont Fabros Technology, Inc. | | | 28,611 | |
| | 19,980 | | | Encore Capital Group, Inc.k | | | 581,018 | |
| | 3,100 | | | EPR Properties | | | 181,195 | |
| | 2,043 | | | Equinix, Inc. | | | 617,803 | |
| | 4,100 | | | Equity Lifestyle Properties, Inc. | | | 273,347 | |
| | 1,200 | | | Equity One, Inc. | | | 32,580 | |
| | 13,562 | | | Equity Residential | | | 1,106,524 | |
| | 2,200 | | | Essex Property Trust, Inc. | | | 526,702 | |
| | 1,950 | | | Extra Space Storage, Inc. | | | 172,009 | |
| | 800 | | | Federal Realty Investment Trust | | | 116,880 | |
| | 32,400 | | | FlexiGroup, Ltd.l | | | 70,711 | |
| | 38,700 | | | Frasers Centrepoint Trust | | | 50,300 | |
| | 91,000 | | | Fukuoka Financial Group, Inc. | | | 451,234 | |
| | 17,627 | | | General Growth Properties, Inc. | | | 479,631 | |
| | 1,900 | | | GEO Group, Inc. | | | 54,929 | |
| | 180,000 | | | Golub Capital BDC, Inc. | | | 2,993,400 | |
| | 5,400 | | | Hamborner REIT AG | | | 56,420 | |
| | 7,500 | | | Hammerson plc | | | 66,303 | |
| | 11,500 | | | Hang Seng Bank, Ltd. | | | 217,964 | |
| | 5,200 | | | Hannover Rueckversicherung SE | | | 593,789 | |
| | 10,700 | | | HCP, Inc. | | | 409,168 | |
| | 8,557 | | | Health Care REIT, Inc. | | | 582,133 | |
| | 8,350 | | | Healthcare Trust of America, Inc. | | | 225,200 | |
| | 23,300 | | | Henderson Group plc | | | 105,900 | |
| | 9,000 | | | Henderson Land Development Company, Ltd. | | | 54,900 | |
| | 5,200 | | | Highwoods Properties, Inc. | | | 226,720 | |
| | 22,000 | | | Hokuhoku Financial Group, Inc. | | | 44,848 | |
| | 4,000 | | | Hospitality Properties Trust | | | 104,600 | |
| | 37,432 | | | Host Hotels & Resorts, Inc. | | | 574,207 | |
| | 1,550 | | | Hudson Pacific Properties, Inc. | | | 43,617 | |
| | 11,900 | | | Hufvudstaden AB | | | 168,226 | |
| | 89,000 | | | Hysan Development Company, Ltd. | | | 363,624 | |
| | 3,100 | | | IG Group Holdings plc | | | 36,650 | |
| | 16,900 | | | ING Groep NV | | | 228,659 | |
| | 6,730 | | | Intercontinental Exchange, Inc. | | | 1,724,630 | |
| | 40,142 | | | Intermediate Capital Group plc | | | 370,053 | |
| | 134,000 | | | Invesco Mortgage Capital, Inc. | | | 1,660,260 | |
| | 26,600 | | | Investa Office Fund | | | 77,001 | |
| | 56,800 | | | Investec plc | | | 400,499 | |
| | 2,100 | | | Iron Mountain, Inc. | | | 56,721 | |
| | 2,300 | | | Kilroy Realty Corporation | | | 145,544 | |
| | 17,200 | | | Kimco Realty Corporation | | | 455,112 | |
| | 1,070 | | | Lamar Advertising Company | | | 64,179 | |
| | 3,000 | | | LaSalle Hotel Properties | | | 75,480 | |
| | 1,300 | | | Liberty Property Trust | | | 40,365 | |
| | 63,000 | | | Link REIT | | | 375,599 | |
| | 4,600 | | | Macerich Company | | | 371,174 | |
| | 800 | | | Macquarie Group, Ltd. | | | 47,858 | |
| | 8,650 | | | Medical Properties Trust, Inc. | | | 99,562 | |
| | 31,988 | | | MetLife, Inc. | | | 1,542,141 | |
| | 3,400 | | | Mid-America Apartment Communities, Inc. | | | 308,754 | |
| | 80,400 | | | Mitsubishi UFJ Financial Group, Inc. | | | 498,018 | |
| | 700 | | | Muenchener Rueckversicherungs-Gesellschaft AG | | | 139,467 | |
| | 2,000 | | | National Health Investors, Inc. | | | 121,740 | |
| | 7,700 | | | National Retail Properties, Inc. | | | 308,385 | |
| | 197,000 | | | New World Development Company, Ltd.l | | | 193,442 | |
| | 3,250 | | | NorthStar Realty Finance Corporation | | | 55,347 | |
| | 14,000 | | | Ogaki Kyoritsu Bank, Ltd. | | | 56,444 | |
| | 15,800 | | | Old Mutual plc | | | 41,565 | |
| | 3,950 | | | Omega Healthcare Investors, Inc. | | | 138,171 | |
| | 2,300 | | | Outfront Media, Inc. | | | 50,209 | |
| | 15,966 | | | PacWest Bancorp | | | 688,135 | |
| | 4,700 | | | Parkway Properties, Inc. | | | 73,461 | |
| | 6,950 | | | Physicians Realty Trust | | | 117,177 | |
| | 15,300 | | | Poundland Group plc | | | 46,848 | |
| | 25,910 | | | Prologis, Inc. | | | 1,112,057 | |
| | 5,412 | | | Public Storage, Inc. | | | 1,340,552 | |
| | 8,830 | | | Raymond James Financial, Inc. | | | 511,875 | |
| | 3,900 | | | Realty Income Corporation | | | 201,357 | |
| | 3,000 | | | Regency Centers Corporation | | | 204,360 | |
| | 10,600 | | | Renasant Corporation | | | 364,746 | |
| | 10,600 | | | Resona Holdings, Inc. | | | 51,476 | |
| | 1,900 | | | Retail Opportunity Investments Corporation | | | 34,010 | |
| | 7,691 | | | RLJ Lodging Trust | | | 166,356 | |
| | 1,300 | | | Sampo Oyj | | | 66,017 | |
| | 7,700 | | | Schroders plc | | | 337,254 | |
| | 727 | | | Silver Bay Realty Trust Corporation REIT | | | 11,385 | |
| | 10,526 | | | Simon Property Group, Inc. | | | 2,046,675 | |
| | 1,800 | | | SL Green Realty Corporation | | | 203,364 | |
| | 140,000 | | | Solar Capital, Ltd. | | | 2,300,200 | |
| | 1,600 | | | Sompo Japan Nipponkoa Holdings, Inc. | | | 52,536 | |
| | 1,580 | | | Sovran Self Storage, Inc. | | | 169,550 | |
The accompanying Notes to Financial Statements are an integral part of this schedule.
26
DIVERSIFIED INCOME PLUS FUND
Schedule of Investments as of December 31, 2015
| | | | | | | | |
Shares | | | Common Stock (30.3%) | | Value | |
| Financials (10.1%) - continued | | | | |
| | 20,900 | | | Spirit Realty Captial, Inc. | | $ | 209,418 | |
| | 154,200 | | | Stockland | | | 457,739 | |
| | 2,731 | | | Store Capital Corporation | | | 63,359 | |
| | 61,000 | | | Sumitomo Mitsui Trust Holdings, Inc. | | | 231,027 | |
| | 5,800 | | | Summit Hotel Properties, Inc. | | | 69,310 | |
| | 750 | | | Sun Communities, Inc. | | | 51,397 | |
| | 2,800 | | | Sunstone Hotel Investors, Inc. | | | 34,972 | |
| | 12,100 | | | Swiss Re AG | | | 1,181,762 | |
| | 56,610 | | | Synchrony Financialk | | | 1,721,510 | |
| | 1,800 | | | Talanx AG | | | 55,358 | |
| | 3,963 | | | Tanger Factory Outlet Centers, Inc. | | | 129,590 | |
| | 1,100 | | | Taubman Centers, Inc. | | | 84,392 | |
| | 1,300 | | | Tokio Marine Holdings, Inc. | | | 50,212 | |
| | 359,100 | | | Two Harbors Investment Corporation | | | 2,908,710 | |
| | 23,200 | | | UBS Group AG | | | 450,068 | |
| | 8,900 | | | UDR, Inc. | | | 334,373 | |
| | 35,400 | | | United Overseas Bank, Ltd. | | | 488,053 | |
| | 5,570 | | | Urban Edge Properties | | | 130,617 | |
| | 9,900 | | | Ventas, Inc. | | | 558,657 | |
| | 9,900 | | | Vornado Realty Trust | | | 989,604 | |
| | 6,600 | | | Wallenstam AB | | | 53,048 | |
| | 67,900 | | | Wing Tai Holdings, Ltd. | | | 83,875 | |
| | 2,300 | | | WP Carey, Inc. | | | 135,700 | |
| | 17,780 | | | XL Group plc | | | 696,620 | |
| | 23,310 | | | Zions Bancorporation | | | 636,363 | |
| | | | | | | | |
| | | | Total | | | 70,103,235 | |
| | | | | | | | |
| |
| Health Care (3.0%) | | | | |
| | 55,740 | | | Abbott Laboratories | | | 2,503,284 | |
| | 800 | | | Actelion, Ltd. | | | 111,155 | |
| | 14,560 | | | Akorn, Inc.k | | | 543,234 | |
| | 6,590 | | | Allergan plck | | | 2,059,375 | |
| | 8,660 | | | Amgen, Inc. | | | 1,405,778 | |
| | 5,900 | | | Astellas Pharmaceutical, Inc. | | | 83,991 | |
| | 300 | | | Bayer AG | | | 37,467 | |
| | 1,300 | | | CSL, Ltd. | | | 99,111 | |
| | 8,400 | | | Essilor International SA | | | 1,046,948 | |
| | 700 | | | Fresenius Medical Care AG & Company KGaA | | | 58,825 | |
| | 700 | | | Gerresheimer AG | | | 54,700 | |
| | 9,400 | | | Hikma Pharmaceuticals plc | | | 318,657 | |
| | 17,960 | | | Hologic, Inc.k | | | 694,872 | |
| | 6,503 | | | ICON plck | | | 505,283 | |
| | 3,140 | | | Illumina, Inc.k | | | 602,707 | |
| | 3,500 | | | Kaken Pharmaceutical Company, Ltd. | | | 239,166 | |
| | 1,300 | | | Lonza Group AG | | | 211,425 | |
| | 36,620 | | | Medtronic, Inc. | | | 2,816,810 | |
| | 53,330 | | | Merck & Company, Inc. | | | 2,816,891 | |
| | 15,760 | | | Mylan NVk | | | 852,143 | |
| | 8,300 | | | Novartis AG | | | 713,960 | |
| | 9,300 | | | Novo Nordisk AS | | | 538,453 | |
| | 1,200 | | | Paramount Bed Holdings Company, Ltd. | | | 42,578 | |
| | 25,638 | | | Pfizer, Inc. | | | 827,595 | |
| | 2,200 | | | Recordati SPA | | | 57,400 | |
| | 5,900 | | | Sanofi | | | 502,811 | |
| | 2,800 | | | Suzuken Company, Ltd. | | | 106,406 | |
| | 4,950 | | | Waters Corporationk | | | 666,171 | |
| | | | | | | | |
| | | | Total | | | 20,517,196 | |
| | | | | | | | |
| |
| Industrials (3.1%) | | | | |
| | 2,700 | | | Aalberts Industries NV | | | 93,031 | |
| | 3,500 | | | Adecco SA | | | 239,550 | |
| | 18,730 | | | ADT Corporation | | | 617,715 | |
| | 5,100 | | | Aida Engineering, Ltd. | | | 52,565 | |
| | 64,400 | | | Air New Zealand, Ltd. | | | 129,886 | |
| | 3,600 | | | Airbus Group NV | | | 242,596 | |
| | 5,700 | | | Amada Holdings Company, Ltd. | | | 54,393 | |
| | 1,600 | | | Andritz AG | | | 77,870 | |
| | 30,000 | | | Asahi Glass Company, Ltd. | | | 171,866 | |
| | 1,900 | | | Atlas Copco Aktiebolag | | | 46,597 | |
| | 36,000 | | | BAE Systems plc | | | 265,052 | |
| | 24,430 | | | Boeing Company | | | 3,532,334 | |
| | 18,200 | | | Bollore SA | | | 84,806 | |
| | 15,200 | | | Central Glass Company, Ltd. | | | 69,716 | |
| | 2,500 | | | Central Japan Railway Company | | | 443,835 | |
| | 3,400 | | | Compagnie de Saint-Gobain | | | 147,341 | |
| | 1,900 | | | Croda International plc | | | 85,130 | |
| | 12,000 | | | CTT-Correios de Portugal SA | | | 115,331 | |
| | 8,000 | | | Dai Nippon Printing Company, Ltd. | | | 79,109 | |
| | 7,506 | | | Dart Group plc | | | 65,120 | |
| | 5,200 | | | Deutsche Post AG | | | 145,381 | |
| | 2,800 | | | DSV AS | | | 110,218 | |
| | 700 | | | East Japan Railway Company | | | 65,916 | |
| | 1,300 | | | Elbit Systems, Ltd. | | | 114,446 | |
| | 12,300 | | | EMCOR Group, Inc. | | | 590,892 | |
| | 8,000 | | | Ferrovial SA | | | 180,907 | |
| | 200 | | | Flughafen Zuerich AG | | | 150,062 | |
| | 5,159 | | | Galliford Try plc | | | 115,922 | |
| | 1,200 | | | GEA Group AG | | | 48,481 | |
| | 100 | | | Georg Fischer AG | | | 67,890 | |
| | 9,000 | | | Hankyu Hanshin Holdings, Inc. | | | 58,499 | |
| | 12,260 | | | HNI Corporation | | | 442,096 | |
| | 1,000 | | | Hochtief AG | | | 92,748 | |
| | 900 | | | Hoshizaki Electric Company, Ltd. | | | 55,949 | |
| | 3,300 | | | IBIDEN Company, Ltd. | | | 47,310 | |
| | 37,130 | | | Illinois Tool Works, Inc. | | | 3,441,208 | |
| | 3,600 | | | Inaba Denki Sangyo Company, Ltd. | | | 115,024 | |
| | 31,660 | | | Ingersoll-Rand plc | | | 1,750,481 | |
| | 12,200 | | | Intrum Justitia AB | | | 415,138 | |
| | 45,900 | | | ITOCHU Corporation | | | 542,926 | |
| | 2,300 | | | Jardine Matheson Holdings, Ltd. | | | 111,383 | |
| | 900 | | | Jungheinrich AG | | | 74,227 | |
| | 4,000 | | | Keisei Electric Railway Company, Ltd. | | | 51,033 | |
| | 16,800 | | | KITZ Corporation | | | 75,463 | |
| | 11,600 | | | KONE Oyj | | | 491,159 | |
| | 3,800 | | | Koninklijke Boskalis Westminster NV | | | 155,011 | |
| | 31,000 | | | Macquarie Infrastructure Corporation | | | 2,250,600 | |
| | 21,900 | | | Masco Corporation | | | 619,770 | |
| | 24,401 | | | Meggitt plc | | | 134,725 | |
| | 1,400 | | | MEITEC Corporation | | | 47,942 | |
| | 6,600 | | | MIRAIT Holdings Corporation | | | 54,377 | |
| | 9,000 | | | Mitsuboshi Belting, Ltd. | | | 71,747 | |
| | 7,200 | | | Nikkon Holdings Company, Ltd. | | | 143,508 | |
| | 12,000 | | | Nippon Express Company, Ltd. | | | 56,391 | |
| | 11,900 | | | Nitto Kogyo Corporation | | | 208,057 | |
| | 6,000 | | | Obayashi Corporation | | | 55,363 | |
| | 800 | | | Randstad Holding NV | | | 49,817 | |
| | 22,940 | | | Rentokil Initial plc | | | 53,823 | |
| | 700 | | | Rieter Holding AG | | | 131,570 | |
| | 2,319 | | | Saft Groupe SA | | | 70,680 | |
| | 300 | | | Schindler Holding AG | | | 50,190 | |
| | 24,600 | | | SIG plc | | | 51,985 | |
| | 3,800 | | | Teleperformance SA | | | 319,534 | |
| | 1,100 | | | Thales SA | | | 82,335 | |
| | 2,100 | | | TKH Group NV | | | 85,276 | |
| | 12,000 | | | Toppan Printing Company, Ltd. | | | 110,558 | |
| | 1,700 | | | Travis Perkins plc | | | 49,318 | |
| | 5,200 | | | Tsubakimoto Chain Company | | | 40,040 | |
| | 900 | | | Vestas Wind Systems AS | | | 62,855 | |
The accompanying Notes to Financial Statements are an integral part of this schedule.
27
DIVERSIFIED INCOME PLUS FUND
Schedule of Investments as of December 31, 2015
| | | | | | | | |
Shares | | | Common Stock (30.3%) | | Value | |
| Industrials (3.1%) - continued | | | | |
| | 5,340 | | | WABCO Holdings, Inc.k | | $ | 546,068 | |
| | 1,600 | | | Yuasa Trading Company, Ltd. | | | 39,525 | |
| | | | | | | | |
| | | | Total | | | 21,509,667 | |
| | | | | | | | |
| |
| Information Technology (4.0%) | | | | |
| | 20,310 | | | Alibaba Group Holding, Ltd. ADRk | | | 1,650,594 | |
| | 2,230 | | | Alphabet, Inc., Class Ak | | | 1,734,962 | |
| | 2,197 | | | Alphabet, Inc., Class Ck | | | 1,667,259 | |
| | 4,700 | | | Alps Electric Company, Ltd. | | | 127,455 | |
| | 1,500 | | | AMS AG | | | 50,143 | |
| | 20,180 | | | Apple, Inc. | | | 2,124,147 | |
| | 800 | | | AtoS | | | 67,162 | |
| | 10,010 | | | Autodesk, Inc.k | | | 609,909 | |
| | 6,400 | | | Canon, Inc. | | | 193,600 | |
| | 1,100 | | | Cap Gemini SA | | | 102,065 | |
| | 9,200 | | | Check Point Software Technologies, Ltd.k,l | | | 748,696 | |
| | 65,780 | | | Cisco Systems, Inc. | | | 1,786,256 | |
| | 5,700 | | | Dialog Semiconductor plck,l | | | 190,202 | |
| | 2,300 | | | DTS Corporation | | | 52,356 | |
| | 61,272 | | | EMC Corporation | | | 1,573,465 | |
| | 7,630 | | | Facebook, Inc.k | | | 798,556 | |
| | 23,100 | | | FUJIFILM Holdings NPV | | | 964,021 | |
| | 5,000 | | | Hitachi Kokusai Electric, Inc. | | | 67,972 | |
| | 3,600 | | | Hoya Corporation | | | 147,213 | |
| | 2,200 | | | Ingenico Group | | | 277,688 | |
| | 6,900 | | | IRESS, Ltd. | | | 49,958 | |
| | 3,000 | | | IT Holdings Corporation | | | 68,547 | |
| | 2,700 | | | ITOCHU Techno-Solutions Corporation | | | 53,796 | |
| | 20,520 | | | Juniper Networks, Inc. | | | 566,352 | |
| | 1,700 | | | Kyocera Corporation | | | 78,949 | |
| | 13,170 | | | MasterCard, Inc. | | | 1,282,231 | |
| | 31,252 | | | MaxLinear, Inc.k | | | 460,342 | |
| | 55,660 | | | Microsoft Corporation | | | 3,088,017 | |
| | 9,300 | | | NEC Networks & System Integration Corporation | | | 164,468 | |
| | 3,600 | | | NS Solutions Corporation | | | 82,029 | |
| | 11,010 | | | Plantronics, Inc. | | | 522,094 | |
| | 29,090 | | | Progress Software Corporationk | | | 698,160 | |
| | 20,200 | | | QLIK Technologies, Inc.k | | | 639,532 | |
| | 3,400 | | | SAP SE | | | 269,802 | |
| | 14,300 | | | Shinko Electric Industries Company, Ltd. | | | 91,675 | |
| | 800 | | | TDK Corporation | | | 51,235 | |
| | 200 | | | U-Blox AGk | | | 42,568 | |
| | 2,700 | | | Ultimate Software Group, Inc.k | | | 527,877 | |
| | 34,730 | | | Visa, Inc. | | | 2,693,311 | |
| | 32,430 | | | Xilinx, Inc. | | | 1,523,237 | |
| | | | | | | | |
| | | | Total | | | 27,887,901 | |
| | | | | | | | |
| |
| Materials (0.8%) | | | | |
| | 1,980 | | | Ashland, Inc. | | | 203,346 | |
| | 700 | | | Aurubis AG | | | 35,446 | |
| | 18,800 | | | BHP Billiton plc | | | 209,655 | |
| | 42,100 | | | BHP Billiton, Ltd. | | | 541,807 | |
| | 19,700 | | | BillerudKorsnas AB | | | 364,580 | |
| | 16,500 | | | Boral, Ltd. | | | 70,546 | |
| | 4,200 | | | Buzzi Unicem SPA | | | 75,287 | |
| | 4,850 | | | Crown Holdings, Inc.k | | | 245,895 | |
| | 24,300 | | | Daicel Corporation | | | 361,630 | |
| | 6,020 | | | Domtar Corporation | | | 222,439 | |
| 9,000 | | | DOWA Holdings Company, Ltd.k | | | 64,711 | |
| | 1,400 | | | Evonik Industries AG | | | 46,308 | |
| | 3,660 | | | FMC Corporation | | | 143,216 | |
| | 200 | | | Givaudan SA | | | 362,992 | |
| | 5,000 | | | Hexpol AB | | | 53,611 | |
| | 7,000 | | | Hokuetsu Kishu Paper Company, Ltd. | | | 41,250 | |
| | 2,600 | | | Holmen AB | | | 80,307 | |
| | 3,100 | | | JFE Holdings, Inc. | | | 48,678 | |
| | 800 | | | LafargeHolcim, Ltd. | | | 40,060 | |
| | 200 | | | Linde AG | | | 28,892 | |
| | 7,900 | | | Mitsubishi Chemical Holdings Corporation | | | 50,123 | |
| | 5,700 | | | Mondi plc | | | 111,725 | |
| | 3,400 | | | Nippon Paint Holdings Company, Ltd. | | | 82,287 | |
| | 7,000 | | | Nippon Steel & Sumitomo Metal Corporation | | | 138,477 | |
| | 4,900 | | | Novozymes AS | | | 234,607 | |
| | 9,000 | | | Oji Holdings Corporation | | | 36,171 | |
| | 9,110 | | | Owens-Illinois, Inc.k | | | 158,696 | |
| | 4,260 | | | Packaging Corporation of America | | | 268,593 | |
| | 2,540 | | | PPG Industries, Inc. | | | 251,003 | |
| | 3,400 | | | Rio Tinto plc | | | 98,993 | |
| | 1,500 | | | Rio Tinto, Ltd. | | | 48,509 | |
| | 11,940 | | | Steel Dynamics, Inc. | | | 213,368 | |
| | 9,000 | | | Sumitomo Seika Chemicals Company, Ltd. | | | 54,758 | |
| | 9,000 | | | Tosoh Corporation | | | 46,296 | |
| | 10,400 | | | UPM-Kymmene Oyj | | | 193,080 | |
| | 10,775 | | | Yara International ASA | | | 463,414 | |
| | | | | | | | |
| | | | Total | | | 5,690,756 | |
| | | | | | | | |
| |
| Telecommunications Services (0.6%) | | | | |
| | 49,126 | | | BT Group plc | | | 341,112 | |
| | 13,100 | | | Elisa Oyj | | | 492,888 | |
| | 12,000 | | | Freenet AG | | | 404,940 | |
| | 180,980 | | | KCOM Group plc | | | 308,157 | |
| | 30,600 | | | Orange SA | | | 511,810 | |
| | 5,900 | | | Proximus SA | | | 191,992 | |
| | 19,100 | | | StarHub, Ltd. | | | 49,706 | |
| | 233,700 | | | Telstra Corporation, Ltd. | | | 949,684 | |
| | 5,000 | | | Vivendi SA | | | 107,386 | |
| | 23,910 | | | Zayo Group Holdings, Inc.k | | | 635,767 | |
| | | | | | | | |
| | | | Total | | | 3,993,442 | |
| | | | | | | | |
| |
| Utilities (0.7%) | | | | |
| | 113,200 | | | A2A SPA | | | 153,280 | |
| | 59,000 | | | Brookfield Infrastructure Partners, LP | | | 2,236,690 | |
| | 13,500 | | | CLP Holdings, Ltd. | | | 114,426 | |
| | 98,100 | | | Electricidade de Portugal SA | | | 353,490 | |
| | 32,506 | | | MDU Resources Group, Inc. | | | 595,510 | |
| | 11,574 | | | NorthWestern Corporation | | | 627,890 | |
| | 54,900 | | | Redes Energeticas Nacionais SGPS SA | | | 165,856 | |
| | 9,000 | | | Toho Gas Company, Ltd. | | | 58,124 | |
| | 24,400 | | | United Utilities Group plc | | | 335,973 | |
| | | | | | | | |
| | | | Total | | | 4,641,239 | |
| | | | | | | | |
| | | | Total Common Stock (cost $216,739,368) | | | 209,952,943 | |
| | | | | | | | |
| | |
Shares | | | Preferred Stock (4.2%) | | | |
| |
| Financials (3.9%) | | | | |
| | 9,375 | | | Agribank FCB, 6.875%i | | | 991,114 | |
| | 63,000 | | | Allstate Corporation, 5.100% | | | 1,555,470 | |
| | 64,790 | | | Annaly Capital Management, Inc., 7.500%i | | | 1,500,536 | |
The accompanying Notes to Financial Statements are an integral part of this schedule.
28
DIVERSIFIED INCOME PLUS FUND
Schedule of Investments as of December 31, 2015
| | | | | | | | |
Shares | | | Preferred Stock (4.2%) | | Value | |
| Financials (3.9%) - continued | | | | |
| | 1,200 | | | Bank of America Corporation, Convertible, 7.250%i | | $ | 1,311,924 | |
| | 35,980 | | | Citigroup, Inc., 6.6919% | | | 935,120 | |
| | 61,780 | | | Citigroup, Inc., 6.875%i | | | 1,721,191 | |
| | 20,070 | | | Cobank ACB, 6.250%g,i | | | 2,060,312 | |
| | 24,000 | | | Countrywide Capital V, 7.000% | | | 615,120 | |
| | 6,000 | | | Farm Credit Bank of Texas, 6.750%g,i | | | 624,750 | |
| | 86,800 | | | GMAC Capital Trust I, 8.125% | | | 2,201,248 | |
| | 78,200 | | | Goldman Sachs Group, Inc., 5.500%i | | | 2,024,598 | |
| | 72,000 | | | HSBC USA, Inc., 6.500%i | | | 1,874,160 | |
| | 47,580 | | | Morgan Stanley, 6.875%i | | | 1,320,345 | |
| | 44,100 | | | Morgan Stanley, 7.125%i | | | 1,261,260 | |
| | 24,500 | | | PNC Financial Services Group, Inc., 6.125%i | | | 699,230 | |
| | 93,000 | | | RBS Capital Funding Trust V, 5.900%i | | | 2,282,220 | |
| | 52,000 | | | U.S. Bancorp, 6.500%i | | | 1,492,400 | |
| | 24,000 | | | Wells Fargo & Company, 5.850%i | | | 626,880 | |
| | 1,695 | | | Wells Fargo & Company, Convertible, 7.500%i | | | 1,967,895 | |
| | | | | | | | |
| | | | Total | | | 27,065,773 | |
| | | | | | | | |
| |
| Materials (0.3%) | | | | |
| | 31,000 | | | CHS, Inc., 6.750%i | | | 831,110 | |
| | 48,800 | | | CHS, Inc., 7.100%i | | | 1,330,776 | |
| | | | | | | | |
| | | | Total | | | 2,161,886 | |
| | | | | | | | |
| | | | Total Preferred Stock (cost $28,810,087) | | | 29,227,659 | |
| | | | | | | | |
| | |
Shares | | | Registered Investment Companies (3.3%) | | | |
| Equity Funds/ETFs (2.6%) | | | | |
| | 418,500 | | | Alerian MLP ETF | | | 5,042,925 | |
| | 186,000 | | | iShares FTSE NAREIT Mortgage Plus Capped Index Fund | | | 1,778,160 | |
| | 15,730 | | | iShares MSCI EAFE Index Fund | | | 924,137 | |
| | 63,010 | | | Materials Select Sector SPDR Fund | | | 2,735,894 | |
| | 153,400 | | | SPDR S&P Oil & Gas Exploration & Production ETF | | | 4,635,748 | |
| | 56,370 | | | Utilities Select Sector SPDR Fund | | | 2,439,694 | |
| | 900 | | | Vanguard REIT ETF | | | 71,757 | |
| | | | | | | | |
| | | | Total | | | 17,628,315 | |
| | | | | | | | |
| |
| Fixed Income Funds/ETFs (0.7%) | | | | |
| | 9,100 | | | iShares Intermediate Credit Bond ETF | | | 976,248 | |
| | 7,089 | | | iShares J.P. Morgan USD Emerging Markets Bond ETF | | | 749,875 | |
| | 37,700 | | | Vanguard Short-Term Corporate Bond ETF | | | 2,977,923 | |
| | | | | | | | |
| | | | Total | | | 4,704,046 | |
| | | | | | | | |
| | | | Total Registered Investment Companies (cost $26,373,380) | | | 22,332,361 | |
| | | | | | | | |
| | |
Shares | | | Collateral Held for Securities Loaned (0.1%) | | | |
| | 714,690 | | | Thrivent Cash Management Trust | | | 714,690 | |
| | | | | | | | |
| | | | Total Collateral Held for Securities Loaned (cost $714,690) | | | 714,690 | |
| | | | | | | | |
| | |
Shares or
Principal
Amount | | | Short-Term Investments (5.3%)m | | | |
| | | | Federal Home Loan Mortgage Corporation Discount Notes | | | | |
| | 1,800,000 | | | 0.082%, 1/8/2016n | | | 1,799,971 | |
| | 100,000 | | | 0.210%, 2/4/2016 | | | 99,980 | |
| | | | Federal National Mortgage Association Discount Notes | | | | |
| | 1,100,000 | | | 0.090%, 1/20/2016n | | | 1,099,948 | |
| 100,000 | | | 0.180%, 2/8/2016n | | | 99,981 | |
| | | | Thrivent Cash Management Trust | | | | |
| | 33,870,084 | | | 0.220% | | | 33,870,084 | |
| | | | | | | | |
| | | | Total Short-Term Investments (at amortized cost) | | | 36,969,964 | |
| | | | | | | | |
| | | | Total Investments (cost $722,278,847) 101.3% | | $ | 702,684,984 | |
| | | | | | | | |
| | | | Other Assets and Liabilities, Net (1.3%) | | | (8,869,457 | ) |
| | | | | | | | |
| | | | Total Net Assets 100.0% | | $ | 693,815,527 | |
| | | | | | | | |
| a | The stated interest rate represents the weighted average of all contracts within the bank loan facility. |
| b | All or a portion of the loan is unfunded. |
| c | Denotes investments purchased on a when-issued or delayed delivery basis. |
| d | Defaulted security. Interest is not being accrued. |
| e | Denotes variable rate securities. Variable rate securities are securities whose yields vary with a designated market index or market rate. The rate shown is as of December 31, 2015. |
| f | Denotes step coupon securities. Step coupon securities pay an initial coupon rate for the first period and then different coupon rates for following periods. The rate shown is as of December 31, 2015. |
| g | Denotes securities sold under Rule 144A of the Securities Act of 1933, which exempts them from registration. These securities have been deemed liquid and may be resold to other dealers in the program or to other qualified institutional buyers. As of December 31, 2015, the value of these investments was $72,628,921 or 10.5% of total net assets. |
| h | All or a portion of the security is insured or guaranteed. |
| i | Denotes perpetual securities. Perpetual securities pay an indefinite stream of interest, but may be called by the issuer at an earlier date. |
| j | Denotes interest only security. Interest only securities represent the right to receive monthly interest payments on an underlying pool of mortgages or assets. The principal shown is the outstanding par amount of the pool as of the end of the period. |
The actual effective yield of the security is different than the stated coupon rate.
| k | Non-income producing security. |
| l | All or a portion of the security is on loan. |
| m | The interest rate shown reflects the yield, coupon rate or the discount rate at the date of purchase. |
| n | All or a portion of the security is held on deposit with the counterparty and pledged as the initial margin deposit for open futures contracts. |
| * | Denotes restricted securities. Restricted securities are investment securities which have been deemed illiquid and cannot be offered for public sale without first being registered under the Securities Act of 1933. The value of all restricted securities held in Diversified Income Plus Fund as of December 31, 2015 was $16,418,737 or 2.4% of total net assets. The following table indicates the acquisition date and cost of restricted securities shown in the schedule as of December 31, 2015. |
The accompanying Notes to Financial Statements are an integral part of this schedule.
29
DIVERSIFIED INCOME PLUS FUND
Schedule of Investments as of December 31, 2015
| | | | | | | | |
Security | | Acquisition
Date | | | Cost | |
AIG Life Holdings, Inc., 12/1/2045 | | | 7/19/2012 | | | $ | 1,258,266 | |
Angel Oak Mortgage Trust, 11/25/2045 | | | 12/10/2015 | | | | 1,746,316 | |
Bayview Opportunity Master Fund Trust, 7/28/2019 | | | 7/30/2014 | | | | 350,247 | |
Bayview Opportunity Master Fund Trust, 2/28/2035 | | | 2/27/2015 | | | | 1,467,840 | |
Bayview Opportunity Master Fund Trust, 7/28/2034 | | | 3/19/2015 | | | | 539,150 | |
Liberty Mutual Group, Inc., 6/15/2058 | | | 1/12/2009 | | | | 1,048,739 | |
Oak Hill Advisors Residential Loan Trust, 1/25/2055 | | | 3/5/2015 | | | | 1,008,279 | |
Pretium Mortgage Credit Partners, LLC, 11/27/2030 | | | 11/6/2015 | | | | 1,798,295 | |
Pretium Mortgage Credit Partners, LLC, 10/27/2030 | | | 10/6/2015 | | | | 1,220,792 | |
Sunset Mortgage Loan Company, LLC, 9/16/2045 | | | 10/2/2015 | | | | 1,624,965 | |
U.S. Residential Opportunity Fund III Trust, 1/27/2035 | | | 2/6/2015 | | | | 1,492,888 | |
Vericrest Opportunity Loan Transferee, 10/25/2058 | | | 2/6/2015 | | | | 1,457,863 | |
Vericrest Opportunity Loan Transferee, 2/25/2055 | | | 2/25/2015 | | | | 764,815 | |
The following table presents the total amount of securities loaned with continuous maturity, by type, offset by the gross payable upon return of collateral for securities loaned by Thrivent Diversified Income Plus Fund as of December 31, 2015:
| | | | |
Securities Lending Transactions | | | |
Common Stock | | $ | 675,022 | |
| | | | |
Total lending | | $ | 675,022 | |
Gross amount payable upon return of collateral for securities loaned | | $ | 714,690 | |
| | | | |
Net amounts due to counterparty | | $ | 39,668 | |
| | | | |
Definitions:
| | | | |
ADR | | - | | American Depositary Receipt, which are certificates for an underlying foreign security’s shares held by an issuing U.S. depository bank. |
ETF | | - | | Exchange Traded Fund. |
REIT | | - | | Real Estate Investment Trust is a company that buys, develops, manages and/or sells real estate assets. |
The accompanying Notes to Financial Statements are an integral part of this schedule.
30
| Item 7. | Disclosure of Proxy Voting Policies and Procedures for Closed-End Management Investment Companies |
Not applicable.
| Item 8. | Portfolio Managers of Closed-End Management Investment Companies |
Not applicable.
| Item 9. | Purchases of Equity Securities by Closed-End Management Investment Company and Affiliated Purchasers. |
Not applicable.
| Item 10. | Submission of Matters to a Vote of Security Holders |
There have been no material changes to the procedures by which shareholders may recommend nominees to registrant’s board of trustees.
| Item 11. | Controls and Procedures |
(a)(i) Registrant’s President and Treasurer have concluded that registrant’s disclosure controls and procedures (as defined in Rule 30a-3(c) under the Investment Company Act of 1940) are effective, based on their evaluation of these controls and procedures as of a date within 90 days of the filing date of this report.
(a)(ii) Registrant’s President and Treasurer are aware of no change in registrant’s internal control over financial reporting (as defined in Rule 30a-3(d) under the Investment Company Act of 1940) that occurred during registrant’s most recent fiscal quarter that has materially affected, or is reasonably likely to materially affect, registrant’s internal control over financial reporting.
(a) The code of ethics pursuant to Item 2 is attached hereto.
(b) Certifications pursuant to Rules 30a-2(a) and 30a-2(b) under the Investment Company Act of 1940 are attached hereto.
SIGNATURES
Pursuant to the requirements of the Securities Exchange Act of 1934 and the Investment Company Act of 1940, the registrant has duly caused this report to be signed on its behalf by the undersigned, thereunto duly authorized.
| | | | |
| Date: February 26, 2016 | | THRIVENT MUTUAL FUNDS |
| | | | |
| | |
| | By: | | |
| | | | /s/ David S. Royal |
| | | | David S. Royal |
| | | | President |
Pursuant to the requirements of the Securities Exchange Act of 1934 and the Investment Company Act of 1940, this report has been signed below by the following persons on behalf of the registrant and in the capacities and on the dates indicated.
| | | | |
| Date: February 26, 2016 | | By: | | |
| | | | | /s/ David S. Royal |
| | | | David S. Royal |
| | | | President |
| | | | |
| Date: February 26, 2016 | | By: | | |
| | | | | /s/ Gerard V. Vaillancourt |
| | | | Gerard V. Vaillancourt |
| | | | Treasurer |