UNITED STATES
SECURITIES AND EXCHANGE COMMISSION
Washington, D.C. 20549
FORM N-CSR
CERTIFIED SHAREHOLDER REPORT OF REGISTERED
MANAGEMENT INVESTMENT COMPANIES
Investment Company Act file number: 811-05075
Thrivent Mutual Funds
(Exact name of registrant as specified in charter)
625 Fourth Avenue South
Minneapolis, Minnesota 55415
(Address of principal executive offices) (Zip code)
Michael W. Kremenak, Secretary and Chief Legal Officer
625 Fourth Avenue South
Minneapolis, Minnesota 55415
(Name and address of agent for service)
Registrant’s telephone number, including area code: (612) 844-4198
Date of fiscal year end: December 31
Date of reporting period: December 31, 2014

TABLEOF CONTENTS
Dear Shareholder:
U.S. financial markets turned in a strong performance in 2014 as an improving U.S. economy finally broke from the lingering grasp of the 2008 financial crisis. With interest rates and inflation both low, the investment outlook remained generally favorable heading into 2015.
Economic Review
After contracting in the first quarter amid unusually harsh winter weather, the U.S. economy accelerated smartly in 2014, bolstered by strong spending by consumers and businesses. The nation’s gross domestic product (GDP)—the sum of all goods and services produced—expanded at a 4.6% annual rate in the second quarter and a 5% rate in the third quarter, the latter marking its fastest pace in 11 years.
The economy’s strength translated into solid corporate profits and a healthier job market. Nearly 3 million new jobs were created over the course of the year, the most since 1999. The unemployment rate fell to 5.6%, its lowest level since June 2008, from 6.7% a year earlier. Nonetheless, many people who would like to be working full time remain trapped in part-time jobs.
With the economy on sounder footing, the Federal Reserve followed through with plans to wind down quantitative easing, the program in which it had sought to stimulate the economy by purchasing tens of billions of dollars of bonds each month to push long-term interest rates low. The Fed continued to hold short-term rates near 0%, however, and pledged to be patient in raising them. Economists and market analysts widely anticipate that will begin sometime in 2015.
In Europe and China, which are important to the U.S. economy and its financial markets, the picture was less bright. In the Euro area, the economy eked out a scant quarter-over-quarter gain of just 0.2% in the third quarter, while in China, the economy grew 7.4% for the year, a seemingly robust pace that nonetheless marked its weakest annual expansion since 1990. China is attempting a delicate transition from an economy based on government investment in industry and infrastructure to one that, as in the U.S., is based more on consumer spending.
Market Review
Enthused by the improving U.S. economic outlook, investors drove several major U.S. stock market indexes to a succession of record highs over the course of the year. The Dow Jones Industrial Average broke above 18,000 for the first time late in the year, and the Standard & Poor’s 500 Index recorded its first breach above 2,000.
The S&P 500, which tracks large-company stocks, finished the year with a total return of 13.7%, its sixth consecutive annual advance and its third consecutive year of double-digit gains. Small-company stocks delivered more modest returns of 4.9%, as measured by the Russell 2000® Index, as investors worried that valuations in that sector of the market may have gotten overextended. In 2013, the index posted a total return of 38.8%.
Reflecting the bleaker economic picture in many overseas markets, international stocks struggled. The MSCI All Country World Index, ex-USA, posted a total return of -3.4%, and the MSCI Emerging Markets Index posted a total return of -1.8%.
Contrary to widespread expectations, bond markets also delivered strong results in 2014, particularly in the Treasury sector. Many analysts and investors had assumed that with the Fed winding down its bond-buying program and looking to raise short-term rates in 2015, interest rates would float higher. When rates go up, bond prices fall.
Instead, the weak economic outlook in Europe, nervousness over Russia’s incursion into Ukraine, slowing economic growth in China, a strengthening U.S. dollar, and paltry returns on sovereign bonds outside the U.S. prompted investors to flock to the perceived safety of U.S. Treasury bonds, especially at the longer end of the yield curve where yields still exceeded inflation. Their buying pushed the yield on the 10-year Treasury note down to 2.2% by year-end from 3.0% at the end of 2013, driving a total return for that slice of the Treasury market of 10.8%. The return on 30-year Treasuries was even better at 29.4%. In the private sector, investor appetite for yield and credit quality also translated into gains for longer-term investment-grade corporate bonds. The net result was that despite tepid returns for shorter-maturity bonds, the broad Barclays U.S. Aggregate Bond Index was able to deliver a total return of just under 6.0%.
High-yield bonds participated in the rally during the first half of the year, but gave up much of their gains in the second half as a steep slide in oil prices shook the market. Crude oil prices in New York fell nearly 50% over the second half of the year, calling into question the credit quality of bonds issued by energy companies, which make up about 15% of the high-yield debt market. The Barclays U.S. Corporate High Yield Bond Index finished the year with a total return of 2.5%.
Our Outlook
The U.S. economy looks poised to continue growing, although it is unlikely to maintain the torrid pace established in the second and third quarters of 2014. Leading economic indicators are mostly positive, and low energy prices should boost economic activity by making more money available to consumers to spend on other goods and services. Those gains should offset the negative impact of lower oil prices on the energy sector, including the companies that cater to that sector’s infrastructure needs.
Our models suggest near-term GDP growth in the range of 2.5% to 3.0% in 2015, slightly faster than the average rate of expansion since the recovery began in 2009.
We expect similar results in the U.K., but growth of only about 1.0% for the Euro area. We have tempered our expectations for China, but still anticipate that its economy will be able to grow at about a 6% rate.
2
Threats to the U.S. economy are not insignificant. If Europe continues to struggle, it will act as a damper on global economic activity, as would any further deceleration of China’s economic growth.
We also have yet to see how the Fed’s transition from the extraordinarily accommodative monetary policy of the past several years to one that returns interest rates to more historically normal levels will play out. The absence of any significant pressure on wages thus far, and inflation levels that have stayed a measure below the Fed’s target of 2%, should allow the Fed to proceed cautiously. That may help to moderate reactions in the financial markets. Average hourly earnings at year-end 2014 were only 1.7% higher than they were at year-end 2013, a gain that barely outpaced the 1.3% rate of inflation as measured by the Consumer Price Index.
If Europe is able to avoid slipping into a recession, perhaps aided by further monetary easing by the European Central Bank, and if oil prices stabilize and perhaps begin some recovery, continued economic growth in the U.S. should allow U.S. equities to post additional gains in 2015. However, with stock valuations at the higher end of their historically normal range, it would be surprising if the S&P 500 Index notches a fourth consecutive year of double-digit gains, something it has managed only four other times since 1926, including two overlapping periods between 1995 and 1999.
For stocks to advance, it will be important for corporate profits to remain strong. While the outlook there is reasonably good, we would note that any additional strengthening of the U.S. dollar against foreign currencies would further diminish the value of profits U.S. companies earn overseas when those profits are translated back to dollars. It also would make U.S. exports less competitive.
We continue to prefer the risk/reward outlook for stocks, particularly large-company stocks, over bonds. We anticipate that continued low energy prices and low inflation, combined with weak economic conditions abroad and a search for yield by fixed-income investors, will again limit potential rate increases at the long end of the yield curve. That may allow bonds to once again deliver positive but modest returns that outpace inflation but likely fall short of the results generated in 2014.
International stocks may have trouble keeping pace with U.S. stocks again in 2015, although lower valuations in those markets could be attractive to long-term investors with an appetite for risk, and could prove particularly rewarding when economic conditions outside the U.S. begin to show signs of improvement.
To ensure that your portfolio is positioned to negotiate the shifting investment environment, we encourage you to meet with your Thrivent Financial representative. He or she can help you keep your portfolio aligned with your financial goals and tolerance for risk.
As always, thank you for the trust you have placed in our entire team of professionals at Thrivent Asset Management.
|
| Sincerely, |
 |
| Russell W. Swansen |
President Thrivent Mutual Funds |
3
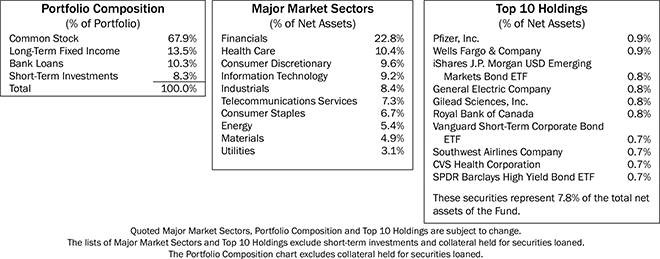
THRIVENT GROWTHAND INCOME PLUS FUND
David R. Spangler, CFA and Stephen D. Lowe, CFA, Portfolio Co-Managers
Thrivent Growth and Income Plus Fund seeks income plus long-term capital growth.
The Fund invests in equity securities and debt securities. The value of the Fund is influenced by factors impacting the overall market, certain asset classes, certain investment styles, and specific issuers. The Fund may incur losses due to incorrect assessments of investments by its investment adviser. Bond prices generally fall as interest rates rise. Credit risk is the risk that an issuer of a debt security may not pay its debt, and high yield securities are subject to increased credit risk as well as liquidity risk. Leveraged loans, preferred securities, sovereign debt, and mortgage-related and other asset-backed securities are subject to additional risks. Foreign investments involve additional risks, including currency fluctuations, liquidity, political, economic and market instability, and different legal and accounting standards; these risks are magnified for investments in emerging markets. Writing options is a highly specialized activity that can lead to losses and transaction costs.
How did the Fund perform during the 12-month period ended December 31, 2014?
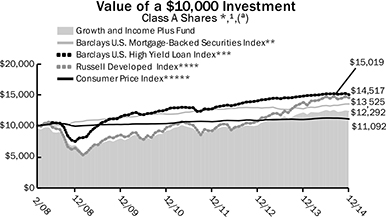
Thrivent Growth and Income Plus Fund earned a return of 1.89%, compared with the median return of its peer group, the Lipper Mixed-Asset Target Allocation Growth Funds category, of 6.17%. The Fund’s market benchmarks, the Russell Developed Index, the Barclays U.S. High Yield Loan Index and the Barclays U.S. Mortgage-Backed Securities Index, earned returns of 5.27%, 1.54% and 6.08%, respectively.
What factors affected the Fund’s performance?
Strengthening economic conditions in the U.S. drove the domestic stock market to record highs for a second consecutive year. At the same time, deteriorating economic conditions abroad hurt returns for international stocks but helped domestic bond markets.
The Fund lagged its peer group largely due to weaker performance by its equity portfolio. For the full year, the equity portfolio returned 3.92%, underperforming its benchmark. During the first quarter of the year, however, the Fund repositioned its equity holdings to adopt a global rather than domestic equity mandate, funneling about 45% of its equity assets into international shares. The equity portfolio underperformed its benchmark index during this period as stocks in a number of industries that had been performing well at the end of 2013, including energy, materials, industrials and consumer discretionary, reversed course.
Thereafter, the equity portfolio outpaced its benchmark. Top performers included information technology stocks, in which the portfolio was overweighted. Other top performers included consumer staples stocks and consumer discretionary stocks. In all cases, those returns exceeded what those industry groups delivered in the stock market at large. The equity portfolio’s weakest performers included energy, health care, utilities and materials stocks.
The fixed-income portion of the Fund generated a return of 4.11% before expenses. Long-term interest rates were widely expected to rise in 2014, hurting bond prices, as the Federal Reserve wound down a massive bond-buying program it had been pursuing to stimulate the economy. Instead, rates declined. Investors looked past growing strength in the U.S. economy, which expanded at a 5.0% annual rate in the third quarter, and focused instead on slowing economic growth in China and weak growth in Europe. In response, they piled into U.S. Treasury bonds, which offered significantly higher yields than safe-haven bonds in other countries. The consequent decline in interest rates was a boon for several other sectors of the fixed-income markets, including investment-grade corporate bonds, which generated a return of 2.86% before expenses for the Fund. Aided by improving fundamentals in the housing market, mortgage-backed securities did even better, earning 6.33%. Combined, those two groups accounted for about a quarter of the Fund’s assets.
High-yield bonds initially participated in the rally but later gave back much of their gains after a global oil glut, combined with demand concerns, helped drive crude prices sharply lower during the second half of the year. Investors worried that the slide in oil prices would lead to higher rates of default in the high-yield sector, where energy issues account for about 15% of the market. Meanwhile, because they are floating-rate securities, bank loans did not benefit much from the general decline in longer-term interest rates. Combined, those two sectors accounted for about 65% of the Fund’s fixed-income portfolio and generated a return of 2.21%.
What is your outlook?
The U.S. economy accelerated during 2014, growing at an annual rate of 5.0% during the third quarter. We anticipate that growth will continue in 2015, but at a more moderate pace. That should create a favorable environment for equities, assuming conditions in Europe and China do not worsen materially. We believe that single-digit returns for stocks in both U.S. and international markets are possible. We anticipate that domestic shares will perform slightly better than overseas shares.
The Federal Reserve is widely expected to nudge short-term interest rates higher sometime in 2015, but the sluggish economic conditions in Europe and slowing growth in China, combined with low inflation in the U.S., should moderate the Fed’s pace in raising rates. Assuming these conditions hold, we feel that fixed-income assets could generate modestly positive returns in 2015, outpacing inflation but likely trailing the returns delivered in 2014.
Quoted Fund performance is for Class A shares and does not reflect a sales charge.
The returns shown do not reflect taxes a shareholder would pay on distributions or redemptions.
4
Average Annual Total Returns1
As of December 31, 2014
| | | | | | |
Class A2 | | 1-Year | | 5 Years | | From
Inception
2/29/2008 |
without sales charge | | 1.89% | | 9.36% | | 3.92% |
with sales charge | | -3.68% | | 8.14% | | 3.07% |
| | | |
Institutional Class3 | | 1-Year | | 5 Years | | From
Inception
2/29/2008 |
Net Asset Value | | 2.34% | | 9.79% | | 4.30% |
| 1 | Past performance is not an indication of future results. Average annual total returns represent past performance and reflect changes in share prices, the reinvestment of all dividends and capital gains, and the effects of compounding. The prospectus contains more complete information on the investment objectives, risks, charges and expenses of the investment company, which investors should read and consider carefully before investing. To obtain a prospectus, contact a registered representative or visit www.thrivent.com. At various times, the Fund’s adviser waived its management fee and/or reimbursed Fund expenses. Had the adviser not done so, the Fund’s total returns would have been lower. The returns shown do not reflect taxes a shareholder would pay on distributions or redemptions. Total investment return and principal value of your investment will fluctuate, and your shares, when redeemed, may be worth more or less than their original cost. Current performance may be higher or lower than the performance data quoted. Call 800-THRIVENT or visit www.thrivent.com for performance results current to the most recent month-end. |
| 2 | Class A performance with sales charge reflects the maximum sales charge of 5.5%. |
| 3 | Institutional Class shares have no sales load and are available to institutional shareholders and certain Thrivent sponsored programs. |
| (a) | Performance of other classes will be greater or less than the line shown based on the differences in loads and fees paid by shareholders investing in the different classes. |
| * | As you compare performance, please note that the Fund’s performance reflects the maximum 5.5% sales charge, while the Barclays U.S. Mortgage-Backed Securities Index, the Barclays U.S. High Yield Loan Index, the Russell Developed Index and the Consumer Price Index do not reflect any such charges, deductions for fees, expenses or taxes. If you were to purchase any of the above individual stocks or funds represented in those indices, any charges you would pay would reduce your total return as well. |
| ** | The Barclays U.S. Mortgage-Backed Securities Index (MBS) is formed by grouping the universe of over 600,000 individual fixed-rate U.S. government agency MBS pools into approximately 3,500 generic types of securities. It is not possible to invest directly in the Index. |
| *** | The Barclays U.S. High Yield Loan Index measures U.S. Dollar denominated syndicated term loans. It is not possible to invest directly in the Index. |
| **** | The Russell Developed Index measures the performance of the investable securities in developed countries globally. It is not possible to invest directly in the Index. |
| ***** | The Consumer Price Index is an inflationary indicator that measures the change in the cost of a fixed basket of products and services, including housing, electricity, food and transportation. It is not possible to invest directly in the Index. |
5
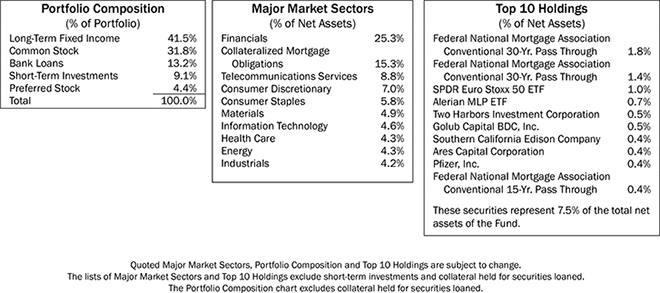
THRIVENT DIVERSIFIED INCOME PLUS FUND
Mark L. Simenstad, CFA, Paul J. Ocenasek, CFA and David R. Spangler, CFA, Portfolio Co-Managers
Thrivent Diversified Income Plus Fund seeks to maximize income while maintaining prospects for capital appreciation.
The Fund invests in debt securities and equity securities. The value of the Fund is influenced by factors impacting the overall market, certain asset classes, certain investment styles, and specific issuers. The Fund may incur losses due to incorrect assessments of investments by its investment adviser. Bond prices generally fall as interest rates rise. Credit risk is the risk that an issuer of a debt security may not pay its debt, and high yield securities are subject to increased credit risk as well as liquidity risk. Leveraged loans and mortgage-related and other asset-backed securities are subject to additional risks.
How did the Fund perform during the 12-month period ended December 31, 2014?
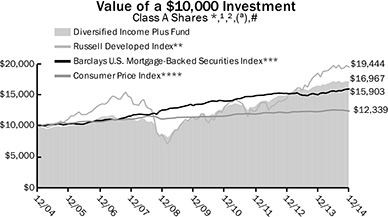
Thrivent Diversified Income Plus Fund earned a return of 3.54%, compared with the median return of its peer group, the Lipper Mixed-Asset Target Allocation Conservative category, of 4.00%. The Fund’s market benchmarks, the Russell Developed Index, the Barclays U.S. High Yield Loan Index and the Barclays U.S. Mortgage-Backed Securities Index, returned 5.27%, 1.54% and 6.08%, respectively.
What factors affected the Fund’s performance?
Strengthening economic conditions in the U.S. drove the domestic stock market to record highs for a second consecutive year. At the same time, deteriorating economic conditions abroad hurt returns for international stocks but helped domestic bond markets.
For the full year, the equity portfolio returned 3.95%, underperforming its benchmark. During the first quarter of the year, however, the Fund repositioned its equity holdings to adopt a global rather than domestic equity mandate, funneling about 45% of its equity assets into international shares. The equity portfolio underperformed its benchmark index during this period as stocks in a number of industries that had been performing well at the end of 2013, including energy, materials, industrials and consumer discretionary, reversed course.
Thereafter, the equity portfolio outpaced its benchmark. Top performers included information technology stocks, in which the portfolio was overweighted. Other top performers included consumer staples stocks and consumer discretionary stocks. In all cases, those returns exceeded what those industry groups delivered in the stock market at large. The equity portfolio’s weakest performers included energy, health care, utilities and materials stocks.
The fixed-income portion of the Fund generated a return of 5.1% before expenses as weak economic growth in Europe, slowing growth in China, nervousness over a Russian incursion into Ukraine, and a strengthening dollar prompted investors to plow money into U.S. Treasury bonds, which they perceived to be a safe haven. This drove down longer-term interest rates, which benefited several other sectors of the bond markets, including investment-grade corporate bonds and mortgage-backed securities.
The impact of declining interest rates on the Fund’s fixed-income holdings was muted because the Fund had a higher allocation to shorter-duration assets, which are less sensitive to rate changes, and no allocation to Treasuries. The Fund’s top performers included investment-grade corporate bonds, which generated a return of about 5% before expenses, and mortgage-backed securities, which earned about 5.8%. Weaker performers included high-yield bonds and leveraged loans. High-yield bonds rallied during the first half of the year but gave back much of those gains in the second half when a sharp decline in oil prices led investors to worry that it would boost default rates on energy company bonds, which make up about 15% of the high-yield market. Because they are floating-rate securities, leveraged loans did not benefit materially from the decline in interest rates.
What is your outlook?
The U.S. economy accelerated during 2014, growing at an annual rate of 5.0% during the third quarter. We anticipate that growth will continue in 2015, but at a more moderate pace, which should create a favorable environment for equities, assuming conditions in Europe and China do not worsen materially. We believe that single-digit returns for stocks in both U.S. and international markets are possible. We anticipate that domestic shares will perform slightly better than overseas shares.
The Federal Reserve is widely expected to nudge short-term interest rates higher sometime in 2015, but the sluggish economic conditions in Europe and slowing growth in China, combined with low inflation in the U.S., should moderate the Fed’s pace in raising rates. Assuming these conditions hold, fixed-income assets could generate modestly positive returns in 2015, outpacing inflation but likely trailing the returns delivered in 2014.
Quoted Fund performance is for Class A shares and does not reflect a sales charge.
The returns shown do not reflect taxes a shareholder would pay on distributions or redemptions.
6
Average Annual Total Returns1,2
As of December 31, 2014
| | | | | | |
Class A3 | | 1-Year | | 5 Years | | 10 Years |
without sales charge | | 3.54% | | 8.87% | | 5.92% |
with sales charge | | -1.10% | | 7.89% | | 5.43% |
| | | |
Institutional Class4 | | 1-Year | | 5 Years | | 10 Years |
Net Asset Value | | 3.90% | | 9.18% | | 6.29% |
| 1 | Past performance is not an indication of future results. Average annual total returns represent past performance and reflect changes in share prices, the reinvestment of all dividends and capital gains, and the effects of compounding. The prospectus contains more complete information on the investment objectives, risks, charges and expenses of the investment company, which investors should read and consider carefully before investing. To obtain a prospectus, contact a registered representative or visit www.thrivent.com. At various times, the Fund’s adviser waived its management fee and/or reimbursed Fund expenses. Had the adviser not done so, the Fund’s total returns would have been lower. The returns shown do not reflect taxes a shareholder would pay on distributions or redemptions. Total investment return and principal value of your investment will fluctuate, and your shares, when redeemed, may be worth more or less than their original cost. Current performance may be higher or lower than the performance data quoted. Call 800-THRIVENT or visit www.thrivent.com for performance results current to the most recent month-end. |
| 2 | Prior to July 3, 2006, the Fund, as a high yield fund, invested primarily in junk bonds. |
| 3 | Class A performance with sales charge reflects the maximum sales charge of 4.5%. |
| 4 | Institutional Class shares have no sales load and are available to institutional shareholders and certain Thrivent sponsored programs. |
| (a) | Performance of other classes will be greater or less than the line shown based on the differences in loads and fees paid by shareholders investing in the different classes. |
| * | As you compare performance, please note that the Fund’s performance reflects the maximum 4.5% sales charge, while the Russell Developed Index, the Barclays U.S. Mortgage-Backed Securities Index and the Consumer Price Index do not reflect any such charges, deductions for fees, expenses or taxes. If you were to purchase any of .the above individual stocks or funds represented in those indices, any charges you would pay would reduce your total return as well. |
| ** | The Russell Developed Index measures the performance of the investable securities in the developed countries globally. It is not possible to invest directly in the Index. |
| *** | The Barclays U.S. Mortgage-Backed Securities Index (MBS) is formed by grouping the universe of over 600,000 individual fixed-rate U.S. government agency MBS pools into approximately 3,500 generic types of securities. It is not possible to invest directly in the Index. |
| **** | The Consumer Price Index is an inflationary indicator that measures the change in the cost of a fixed basket of products and services, including housing, electricity, food and transportation. It is not possible to invest directly in the Index. |
| # | The Barclays U.S. High Yield Loan Index incepted in January 2006. This Index is not shown in the chart because it does not have 10 years of history and thus an accurate comparison of a $10,000 investment over 10 years cannot be shown. It is not possible to invest directly in the Index. |
7
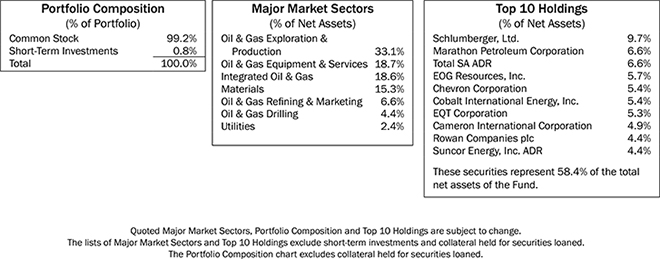
THRIVENT NATURAL RESOURCES FUND
David C. Francis, CFA and Darren M. Bagwell, CFA, Portfolio Co-Managers
Thrivent Natural Resources Fund seeks long-term capital growth.
The Fund primarily invests in natural resource investments, which historically have been very volatile and are subject to risks that particularly affect the precious metals, oil, gas, mining, energy, chemicals, paper, steel or agricultural sectors. Real estate investment trusts are subject to numerous risks and can be affected by interest rates, the values of the properties they own, and the credit quality of mortgage loans they hold. The value of the Fund is influenced by factors impacting the overall market, certain asset classes, certain investment styles, and specific issuers. The Fund may incur losses due to incorrect assessments of investments by its investment adviser. Small and medium-sized companies often have greater price volatility and less liquidity than larger companies. Foreign investments involve additional risks, including currency fluctuations, liquidity, political, economic and market instability, and different legal and accounting standards; these risks are magnified for investments in emerging markets. The Fund is non-diversified, which means that it may invest a greater percentage of its assets in the securities of any single issuer compared with diversified funds.
How did the Fund perform during the 12-month period ended December 31, 2014?
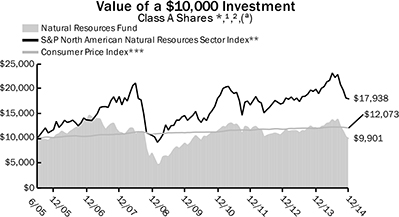
Thrivent Natural Resources Fund earned a return of -18.47%, compared with the median return of its peer group, the Lipper Natural Resources Funds category, of -14.17%. The Fund’s market benchmark, the S&P North American Natural Resources Sector Index, earned a return of -9.77%.
What factors affected the Fund’s performance?
Oil prices declined during the second half of 2014 at a pace and magnitude that has occurred only twice in the past 20 years. Global oil demand increases in 2014 were subpar given global gross domestic product (GDP) growth levels, while non-OPEC supply growth was the highest it has been in more than 30 years.
Our Fund invested in companies that successfully grew production and that provide the tools and services used in field development. To a degree, these companies and investments were victims of their own successes, driving a supply and demand imbalance in the latter stages of 2014.
Over full investment cycles, our bias is toward energy sub-sectors that grow value; however, during 2014, defensive sectors outperformed. Overweighting positions in exploration and production, and in equipment and services, as well as underweighting positions in refiners and integrated companies, detracted from returns. Additionally, stock selection overall did not benefit performance. Exploration and production company investments were most challenged. While low-cost producers with good balance sheets, such as EOG Resources, EQT Corporation and Concho Resources, benefited the Fund, this was more than offset by higher volatility operators including Oasis Petroleum and Cobalt International.
Stock selection also lagged within the major integrated oil company category. Because major integrateds are the largest companies in the oil industry—and among the largest in the world—it is difficult for them to grow, or more generally, to change and provide a positive investment thesis. The holdings we own in the Fund do have theses for value creation, but in 2014, the sole driver of success among these stocks was defensiveness. As an example, although oil prices dropped by 50% over the second half of 2014, Exxon Mobil, the largest and most defensive company, and which the Fund does not own, declined by just 8% during that time frame.
Holdings in steel and coal producers, which were modest exposures when held, were eliminated during 2014. However, during the time we owned these positions, they materially lagged and detracted from the Fund’s returns.
What is your outlook?
Commodity industries are cyclical with oil and natural gas prices reverting to norms where industry earns a fair return on capital employed. High prices incent too much exploration and development activity, driving supply up and prices down. Conversely, low commodity prices lead to cuts in activity, less supply and price recovery. At the end of this period, industry was in the low price and activity cut—or more accurately, activity slash—part of the cycle. In 2015, we expect supply growth to slow and possibly contract. Assuming a normalized demand year, we believe that supply and demand will tighten and oil prices will rise. Our investment disciplines are unchanged and will be applied to a growing opportunity set after a tumultuous and unusually volatile 2014.
Quoted Fund performance is for Class A shares and does not reflect a sales charge.
The returns shown do not reflect taxes a shareholder would pay on distributions or redemptions.
8
Average Annual Total Returns1,2
As of December 31, 2014
| | | | | | |
Class A3 | | 1-Year | | 5 Years | | From
Inception
6/30/2005 |
without sales charge | | -18.47% | | 1.88% | | 0.49% |
with sales charge | | -22.96% | | 0.74% | | -0.10% |
| | | |
Institutional Class4 | | 1-Year | | 5 Years | | From
Inception
6/30/2005 |
Net Asset Value | | -18.25% | | 2.20% | | 0.83% |
| 1 | Past performance is not an indication of future results. Average annual total returns represent past performance and reflect changes in share prices, the reinvestment of all dividends and capital gains, and the effects of compounding. The prospectus contains more complete information on the investment objectives, risks, charges and expenses of the investment company, which investors should read and consider carefully before investing. To obtain a prospectus, contact a registered representative or visit www.thrivent.com. At various times, the Fund’s adviser waived its management fee and/or reimbursed Fund expenses. Had the adviser not done so, the Fund’s total returns would have been lower. The returns shown do not reflect taxes a shareholder would pay on distributions or redemptions. Total investment return and principal value of your investment will fluctuate, and your shares, when redeemed, may be worth more or less than their original cost. Current performance may be higher or lower than the performance data quoted. Call 800-THRIVENT or visit www.thrivent.com for performance results current to the most recent month-end. |
| 2 | Prior to October 10, 2010, the Fund, as a real estate securities fund, invested primarily in real estate-related securities. |
| 3 | Class A performance with sales charge reflects the maximum sales charge of 5.5%. |
| 4 | Institutional Class shares have no sales load and are available to institutional shareholders and certain Thrivent sponsored programs. |
| (a) | Performance of other classes will be greater or less than the line shown based on the differences in loads and fees paid by shareholders investing in the different classes. |
| * | As you compare performance, please note that the Fund’s performance reflects the maximum 5.5% sales charge, while the benchmark indices do not reflect any such charges, deductions for fees, expenses or taxes. It is not possible to invest directly in the indices shown. If you were to purchase any of the above individual stocks or funds represented in those indices, any charges you would pay would reduce your total return as well. |
| ** | The S&P North American Natural Resources Sector Index is an index of selected U.S. traded natural resource related stocks. The product is not sponsored, endorsed or promoted by Standard & Poor’s, and Standard & Poor’s makes no representation regarding the advisability of investing in the product. |
| *** | The Consumer Price Index is an inflationary indicator that measures the change in the cost of a fixed basket of products and services, including housing, electricity, food and transportation. |
9
SHAREHOLDER EXPENSE EXAMPLE
(unaudited)
As a shareholder of a Fund, you incur, depending on the Fund and share class, two types of costs: (1) transaction costs, including sales charges (loads) on purchase payments; and (2) ongoing costs, including management fees, distribution (12b-1) fees and other Fund expenses. This Example is intended to help you understand your ongoing costs (in dollars) of investing in your Fund and to compare these costs with the ongoing costs of investing in other mutual funds. The Example is based on an investment of $1,000 invested at the beginning of the period and held for the entire period from July 1, 2014 through December 31, 2014.
Actual Expenses
In the table below, the first section, labeled “Actual,” provides information about actual account values and actual expenses. You may use the information in this section, together with the amount you invested, to estimate the expenses that you paid over the period. Simply divide your account value by $1,000 (for example, an $8,600 account value divided by $1,000 = 8.6), then multiply the result by the number from the appropriate Class line under the heading entitled “Expenses Paid During Period” to estimate the expenses you paid. A small account fee of $12 may be charged to Class A shareholder accounts if the value falls to an amount of $2,000 or less, in the case of a non-qualified account, and $1,000 or less, in the case of a qualified account. This fee is not included in the table below. If it were and you were assessed such a fee, the expenses you paid during the period would have been higher and the ending account value would have been lower.
Hypothetical Example for Comparison Purposes
In the table below, the second section, labeled “Hypothetical,” provides information about hypothetical account values and hypothetical expenses based on the Fund’s actual expense ratio and an assumed rate of return of 5% per year before expenses, which is not the Fund’s actual return. The hypothetical account values and expenses may not be used to estimate the actual ending account balance or expenses you paid for the period. You may use this information to compare the ongoing costs of investing in the Fund and other funds. To do so, compare this 5% hypothetical example with the 5% hypothetical examples that appear in the shareholder reports of the other funds. A small account fee of $12 may be charged to Class A shareholder accounts if the value falls to an amount of $2,000 or less, in the case of a non-qualified account, and $1,000 or less, in the case of a qualified account. This fee is not included in the table below. If it were and you were assessed such a fee, the expenses you paid during the period would have been higher and the ending account value would have been lower.
Please note that the expenses shown in the table are meant to highlight your ongoing costs only and do not reflect any transactional costs, such as sales charges (loads). Therefore, the second section of the table is useful in comparing ongoing costs only, and will not help you determine the relative total costs of owning different funds. In addition, if these transactional costs were included, your costs would have been higher.
10
| | | | | | | | | | | | | | | | |
| | | Beginning
Account
Value
7/1/2014 | | | Ending
Account
Value
12/31/2014 | | | Expenses
Paid
During
Period
7/1/2014-
12/31/2014* | | | Annualized
Expense
Ratio | |
Thrivent Growth and Income Plus Fund | | | | | | | | | |
Actual | | | | | | | | | | | | | | | | |
Class A | | $ | 1,000 | | | $ | 988 | | | $ | 5.76 | | | | 1.15 | % |
Institutional Class | | $ | 1,000 | | | $ | 990 | | | $ | 4.01 | | | | 0.80 | % |
Hypothetical** | | | | | | | | | | | | | | | | |
Class A | | $ | 1,000 | | | $ | 1,019 | | | $ | 5.85 | | | | 1.15 | % |
Institutional Class | | $ | 1,000 | | | $ | 1,021 | | | $ | 4.08 | | | | 0.80 | % |
Thrivent Diversified Income Plus Fund | | | | | | | | | |
Actual | | | | | | | | | | | | | | | | |
Class A | | $ | 1,000 | | | $ | 994 | | | $ | 4.88 | | | | 0.97 | % |
Institutional Class | | $ | 1,000 | | | $ | 996 | | | $ | 3.43 | | | | 0.68 | % |
Hypothetical** | | | | | | | | | | | | | | | | |
Class A | | $ | 1,000 | | | $ | 1,020 | | | $ | 4.94 | | | | 0.97 | % |
Institutional Class | | $ | 1,000 | | | $ | 1,022 | | | $ | 3.47 | | | | 0.68 | % |
Thrivent Natural Resources Fund | | | | | | | | | |
Actual | | | | | | | | | | | | | | | | |
Class A | | $ | 1,000 | | | $ | 720 | | | $ | 5.64 | | | | 1.30 | % |
Institutional Class | | $ | 1,000 | | | $ | 721 | | | $ | 4.18 | | | | 0.96 | % |
Hypothetical** | | | | | | | | | | | | | | | | |
Class A | | $ | 1,000 | | | $ | 1,019 | | | $ | 6.61 | | | | 1.30 | % |
Institutional Class | | $ | 1,000 | | | $ | 1,020 | | | $ | 4.90 | | | | 0.96 | % |
| * | Expenses are equal to the Fund’s annualized expense ratio, multiplied by the average account value over the period, multiplied by 184/365 to reflect the one-half year period. |
| ** | Assuming 5% annualized total return before expenses. |
11

Report of Independent Registered Public Accounting Firm
To the Shareholders of Thrivent Diversified Income Plus Fund, Thrivent Natural Resources Fund and Thrivent Growth and Income Plus Fund and Trustees of the Thrivent Mutual Funds:
In our opinion, the accompanying statements of assets and liabilities, including the schedules of investments, and the related statements of operations and of changes in net assets and the financial highlights present fairly, in all material respects, the financial position of Thrivent Diversified Income Plus Fund, Thrivent Natural Resources Fund and Thrivent Growth and Income Plus Fund (three of the Thrivent Mutual Funds, hereafter referred to as the “Funds”) at December 31, 2014, the results of each of their operations for the year then ended, the changes in each of their net assets for each of the two years in the period then ended and their financial highlights for each of the periods presented, in conformity with accounting principles generally accepted in the United States of America. These financial statements and financial highlights (hereafter referred to as “financial statements”) are the responsibility of the Funds’ management. Our responsibility is to express an opinion on these financial statements based on our audits. We conducted our audits of these financial statements in accordance with the standards of the Public Company Accounting Oversight Board (United States). Those standards require that we plan and perform the audit to obtain reasonable assurance about whether the financial statements are free of material misstatement. An audit includes examining, on a test basis, evidence supporting the amounts and disclosures in the financial statements, assessing the accounting principles used and significant estimates made by management, and evaluating the overall financial statement presentation. We believe that our audits, which included confirmation of securities at December 31, 2014 by correspondence with the custodian, agent banks, transfer agent and brokers provides a reasonable basis for our opinion.
February 18, 2015
PricewaterhouseCoopers LLP, Suite 1400, 225 South Sixth Street, Minneapolis, MN 55402
T: (612) 596 6000, F: (612) 373 7160, www.pwc.com/us
12
GROWTHAND INCOME PLUS FUND
Schedule of Investments as of December 31, 2014
| | | | | | | | |
Principal Amount | | | Bank Loans (10.6%)a | | Value | |
| Basic Materials (0.8%) | | | | |
| | | | Alpha Natural Resources, Inc., Term Loan | | | | |
| | $39,597 | | | 3.500%, 5/22/2020 | | $ | 31,306 | |
| | | | Crown Americas, LLC, Term Loan | | | | |
| | 187,500 | | | 0.000%, 10/20/2021b,c | | | 187,266 | |
| | | | Fortescue Metals Group, Ltd., Term Loan | | | | |
| | 127,435 | | | 3.750%, 6/30/2019 | | | 115,456 | |
| | | | Ineos Group Holdings, Ltd., Term Loan | | | | |
| | 90,618 | | | 3.750%, 5/4/2018 | | | 87,663 | |
| | | | NewPage Corporation, Term Loan | | | | |
| | 90,000 | | | 9.500%, 2/11/2021 | | | 85,350 | |
| | | | Tronox Pigments BV, Term Loan | | | | |
| | 84,216 | | | 4.000%, 3/19/2020 | | | 82,672 | |
| | | | Wausau Paper Corporation, Term Loan | | | | |
| | 74,625 | | | 6.500%, 7/30/2020 | | | 73,879 | |
| | | | | | | | |
| | | | Total | | | 663,592 | |
| | | | | | | | |
| |
| Capital Goods (0.7%) | | | | |
| | | | ADS Waste Holdings, Inc., Term Loan | | | | |
| | 89,843 | | | 3.750%, 10/9/2019 | | | 87,063 | |
| | | | Berry Plastics Group, Inc., Term Loan | | | | |
| | 119,929 | | | 3.500%, 2/8/2020 | | | 115,816 | |
| | | | Rexnord, LLC, Term Loan | | | | |
| | 90,850 | | | 4.000%, 8/21/2020 | | | 88,851 | |
| | | | Silver II Borrower, Term Loan | | | | |
| | 84,637 | | | 4.000%, 12/13/2019 | | | 78,475 | |
| | | | STHI Holding Corporation, Term Loan | | | | |
| | 149,625 | | | 4.500%, 8/6/2021 | | | 148,253 | |
| | | | | | | | |
| | | | Total | | | 518,458 | |
| | | | | | | | |
| |
| Communications Services (3.5%) | | | | |
| | | | Atlantic Broadband Penn, LLC, Term Loan | | | | |
| | 146,709 | | | 3.250%, 11/30/2019 | | | 143,408 | |
| | | | Birch Communication Inc., Term Loan | | | | |
| | 87,438 | | | 7.750%, 7/17/2020 | | | 85,689 | |
| | | | Cengage Learning Aquisitions, Term Loan | | | | |
| | 59,550 | | | 7.000%, 3/31/2020 | | | 58,880 | |
| | | | Charter Communications Operating, LLC, Term Loan | | | | |
| | 73,626 | | | 3.000%, 7/1/2020 | | | 72,108 | |
| | 45,310 | | | 3.000%, 1/3/2021 | | | 44,357 | |
| | | | Cincinnati Bell, Inc., Term Loan | | | | |
| | 90,850 | | | 4.000%, 9/10/2020 | | | 89,714 | |
| | | | Clear Channel Communications, Inc., Term Loan | | | | |
| | 92,000 | | | 6.919%, 1/30/2019 | | | 86,545 | |
| | | | Cumulus Media Holdings, Inc., Term Loan | | | | |
| | 79,763 | | | 4.250%, 12/23/2020 | | | 77,237 | |
| | | | Fairpoint Communications, Term Loan | | | | |
| | 90,617 | | | 7.500%, 2/14/2019 | | | 89,654 | |
| | | | Grande Communications Networks, LLC, Term Loan | | | | |
| | 90,621 | | | 4.500%, 5/29/2020 | | | 89,375 | |
| | | | Gray Television, Inc., Term Loan | | | | |
| | 151,351 | | | 3.750%, 6/13/2021 | | | 148,702 | |
| | | | Hargray Communications Group, Inc., Term Loan | | | | |
| | 148,388 | | | 5.250%, 6/26/2019 | | | 147,275 | |
| | | | IMG Worldwide, Inc., Term Loan | | | | |
| | 59,700 | | | 5.250%, 5/6/2021 | | | 57,574 | |
| | | | Integra Telecom Holdings, Inc., Term Loan | | | | |
| | 90,617 | | | 5.250%, 2/22/2019 | | | 87,955 | |
| | | | Intelsat Jackson Holdings SA, Term Loan | | | | |
| | 119,444 | | | 3.750%, 6/30/2019 | | | 117,503 | |
| | | | Level 3 Communications, Inc., Term Loan | | | | |
| | 121,000 | | | 4.000%, 8/1/2019 | | | 120,018 | |
| | | | Liberty Cablevision of Puerto Rico, LLC, Term Loan | | | | |
| | 25,000 | | | 0.000%, 1/7/2022b,c | | | 24,250 | |
| | 80,000 | | | 4.500%, 1/7/2022 | | | 77,800 | |
| | | | LTS Buyer, LLC, Term Loan | | | | |
| | 107,763 | | | 4.000%, 4/13/2020 | | | 105,272 | |
| | | | MCC Georgia, LLC, Term Loan | | | | |
| | 69,650 | | | 3.750%, 6/30/2021 | | | 67,967 | |
| | | | McGraw-Hill Global Education, LLC, Term Loan | | | | |
| | 77,547 | | | 5.750%, 3/22/2019 | | | 77,135 | |
| | | | NEP/NCP Holdco, Inc., Term Loan | | | | |
| | 90,852 | | | 4.250%, 1/22/2020 | | | 88,733 | |
| | | | NTelos, Inc., Term Loan | | | | |
| | 90,610 | | | 5.750%, 11/9/2019 | | | 78,830 | |
| | | | Puerto Rico Cable Acquisition Company, Inc., Term Loan | | | | |
| | 68,180 | | | 5.500%, 7/31/2018 | | | 67,669 | |
| | | | SBA Senior Finance II, LLC, Term Loan | | | | |
| | 99,500 | | | 3.250%, 3/24/2021 | | | 97,240 | |
| | | | TNS, Inc., Term Loan | | | | |
| | 64,102 | | | 5.000%, 2/14/2020 | | | 63,381 | |
| | | | Univision Communications, Inc., Term Loan | | | | |
| | 90,615 | | | 4.000%, 3/1/2020 | | | 88,485 | |
| | | | Virgin Media Investment Holdings, Ltd., Term Loan | | | | |
| | 69,000 | | | 3.500%, 6/7/2020 | | | 67,662 | |
| | | | WideOpenWest Finance, LLC, Term Loan | | | | |
| | 79,289 | | | 4.750%, 4/1/2019 | | | 78,646 | |
| | | | XO Communications, LLC, Term Loan | | | | |
| | 99,350 | | | 4.250%, 3/20/2021b,c | | | 97,363 | |
| | | | Yankee Cable Acquisition, LLC, Term Loan | | | | |
| | 88,884 | | | 4.500%, 3/1/2020 | | | 88,328 | |
| | | | Zayo Group, LLC, Term Loan | | | | |
| | 79,281 | | | 4.000%, 7/2/2019 | | | 78,322 | |
| | | | | | | | |
| | | | Total | | | 2,763,077 | |
| | | | | | | | |
| |
| Consumer Cyclical (1.8%) | | | | |
| | | | Amaya Gaming Group, Inc., Term Loan | | | | |
| | 137,156 | | | 5.000%, 8/1/2021 | | | 135,682 | |
The accompanying Notes to Financial Statements are an integral part of this schedule.
13
GROWTHAND INCOME PLUS FUND
Schedule of Investments as of December 31, 2014
| | | | | | | | |
Principal Amount | | | Bank Loans (10.6%)a | | Value | |
| Consumer Cyclical (1.8%) - continued | | | | |
| | | | Burlington Coat Factory Warehouse Corporation, Term Loan | | | | |
| | $125,643 | | | 4.250%, 8/13/2021 | | $ | 123,837 | |
| | | | Ceridian HCM Holding, Inc., Term Loan | | | | |
| | 44,558 | | | 4.500%, 9/15/2020 | | | 43,750 | |
| | | | Chrysler Group, LLC, Term Loan | | | | |
| | 59,550 | | | 3.250%, 12/31/2018 | | | 58,880 | |
| | | | Golden Nugget, Inc., Delayed Draw | | | | |
| | 10,692 | | | 5.500%, 11/21/2019 | | | 10,538 | |
| | | | Golden Nugget, Inc., Term Loan | | | | |
| | 24,948 | | | 5.500%, 11/21/2019 | | | 24,590 | |
| | | | Hilton Worldwide Finance, LLC, Term Loan | | | | |
| | 94,055 | | | 3.500%, 10/26/2020 | | | 92,840 | |
| | | | J.C. Penney Corporation, Inc., Term Loan | | | | |
| | 90,620 | | | 6.000%, 5/22/2018 | | | 88,732 | |
| | | | Las Vegas Sands, LLC, Term Loan | | | | |
| | 19,800 | | | 3.250%, 12/19/2020 | | | 19,660 | |
| | | | Marina District Finance Company, Inc., Term Loan | | | | |
| | 54,900 | | | 6.750%, 8/15/2018 | | | 54,408 | |
| | | | MGM Resorts International, Term Loan | | | | |
| | 128,498 | | | 3.500%, 12/20/2019 | | | 124,884 | |
| | | | Michaels Stores, Inc., Term Loan | | | | |
| | 69,825 | | | 4.000%, 1/28/2020 | | | 68,516 | |
| | | | Mohegan Tribal Gaming Authority, Term Loan | | | | |
| | 53,460 | | | 5.500%, 11/19/2019 | | | 51,274 | |
| | | | Pinnacle Entertainment, Inc., Term Loan | | | | |
| | 135,220 | | | 3.750%, 8/13/2020 | | | 133,023 | |
| | | | ROC Finance, LLC, Term Loan | | | | |
| | 90,850 | | | 5.000%, 6/20/2019 | | | 84,036 | |
| | | | Scientific Games International, Inc., Term Loan | | | | |
| | 91,080 | | | 6.000%, 10/18/2020 | | | 89,646 | |
| | | | Seminole Hard Rock Entertainment, Inc., Term Loan | | | | |
| | 149,242 | | | 3.500%, 5/14/2020 | | | 143,646 | |
| | | | Seminole Indian Tribe of Florida, Term Loan | | | | |
| | 56,613 | | | 3.000%, 4/29/2020 | | | 56,283 | |
| | | | | | | | |
| | | | Total | | | 1,404,225 | |
| | | | | | | | |
| |
| Consumer Non-Cyclical (1.3%) | | | | |
| | | | Albertsons, Inc., Term Loan | | | | |
| | 141,061 | | | 4.750%, 3/21/2019 | | | 140,004 | |
| | | | Biomet, Inc., Term Loan | | | | |
| | 92,964 | | | 3.670%, 7/25/2017 | | | 92,399 | |
| | | | Catalina Marketing Corporation, Term Loan | | | | |
| | 59,700 | | | 4.500%, 4/9/2021 | | | 56,678 | |
| | | | CHS/Community Health Systems, Inc., Term Loan | | | | |
| | 12,425 | | | 3.486%, 1/25/2017 | | | 12,342 | |
| | 33,116 | | | 4.250%, 1/27/2021 | | | 32,998 | |
| | | | Del Monte Corporation, Term Loan | | | | |
| | 85,455 | | | 3.500%, 3/9/2020 | | | 81,609 | |
| | | | JBS USA, LLC, Term Loan | | | | |
| | 60,652 | | | 3.750%, 5/25/2018 | | | 59,743 | |
| | 39,798 | | | 3.750%, 9/18/2020 | | | 38,853 | |
| | | | Libbey Glass, Inc., Term Loan | | | | |
| | 124,375 | | | 3.750%, 4/9/2021 | | | 122,277 | |
| | | | Ortho-Clinical Diagnostics, Inc., Term Loan | | | | |
| | 99,500 | | | 4.750%, 6/30/2021 | | | 97,734 | |
| | | | Roundy’s Supermarkets, Inc., Term Loan | | | | |
| | 68,967 | | | 5.750%, 3/3/2021 | | | 64,541 | |
| | | | Supervalu, Inc., Term Loan | | | | |
| | 130,517 | | | 4.500%, 3/21/2019 | | | 127,980 | |
| | | | Visant Corporation, Term Loan | | | | |
| | 56,511 | | | 7.000%, 9/23/2021 | | | 54,816 | |
| | | | | | | | |
| | | | Total | | | 981,974 | |
| | | | | | | | |
| |
| Energy (0.6%) | | | | |
| | | | Arch Coal, Inc., Term Loan | | | | |
| | 90,609 | | | 6.250%, 5/16/2018 | | | 74,790 | |
| | | | Energy Solutions, LLC, Term Loan | | | | |
| | 89,550 | | | 6.750%, 5/29/2020 | | | 89,130 | |
| | | | Exgen Renewables I, LLC, Term Loan | | | | |
| | 37,541 | | | 5.250%, 2/6/2021 | | | 37,542 | |
| | | | McJunkin Red Man Corporation, Term Loan | | | | |
| | 84,236 | | | 5.000%, 11/8/2019 | | | 77,287 | |
| | | | Offshore Group Investment, Ltd., Term Loan | | | | |
| | 99,343 | | | 5.750%, 3/28/2019 | | | 74,010 | |
| | | | Pacific Drilling SA, Term Loan | | | | |
| | 67,965 | | | 4.500%, 6/3/2018 | | | 55,845 | |
| | | | TerraForm Power Operating, LLC, Term Loan | | | | |
| | 89,550 | | | 4.750%, 7/23/2019 | | | 89,102 | |
| | | | | | | | |
| | | | Total | | | 497,706 | |
| | | | | | | | |
| |
| Financials (0.8%) | | | | |
| | | | Delos Finance Sarl, Term Loan | | | | |
| | 100,000 | | | 3.500%, 3/6/2021 | | | 98,958 | |
| | | | DJO Finance, LLC, Term Loan | | | | |
| | 119,935 | | | 4.250%, 9/15/2017 | | | 117,036 | |
| | | | Harland Clarke Holdings Corporation, Term Loan | | | | |
| | 88,550 | | | 7.000%, 5/22/2018 | | | 88,639 | |
| | | | MPH Acquisition Holdings, LLC, Term Loan | | | | |
| | 140,187 | | | 3.750%, 3/31/2021 | | | 136,051 | |
| | | | TransUnion, LLC, Term Loan | | | | |
| | 59,550 | | | 4.000%, 4/9/2021 | | | 58,582 | |
| | | | WaveDivision Holdings, LLC, Term Loan | | | | |
| | 111,354 | | | 4.000%, 10/15/2019 | | | 109,498 | |
| | | | | | | | |
| | | | Total | | | 608,764 | |
| | | | | | | | |
| |
| Technology (0.6%) | | | | |
| | | | Avago Technologies, Ltd., Term Loan | | | | |
| | 99,500 | | | 3.750%, 5/6/2021 | | | 99,044 | |
| | | | BMC Software, Inc., Term Loan | | | | |
| | 87,886 | | | 5.000%, 9/10/2020 | | | 85,304 | |
| | | | First Data Corporation, Term Loan | | | | |
| | 92,000 | | | 3.667%, 3/23/2018 | | | 90,103 | |
The accompanying Notes to Financial Statements are an integral part of this schedule.
14
GROWTHAND INCOME PLUS FUND
Schedule of Investments as of December 31, 2014
| | | | | | | | |
Principal Amount | | | Bank Loans (10.6%)a | | Value | |
| Technology (0.6%) - continued | | | | |
| | | | Freescale Semiconductor, Inc., Term Loan | | | | |
| | $90,623 | | | 4.250%, 2/28/2020 | | $ | 88,302 | |
| | | | Infor US, Inc., Term Loan | | | | |
| | 84,568 | | | 3.750%, 6/3/2020 | | | 81,831 | |
| | | | | | | | |
| | | | Total | | | 444,584 | |
| | | | | | | | |
| |
| Transportation (0.3%) | | | | |
| | | | American Airlines, Inc., Term Loan | | | | |
| | 90,620 | | | 3.750%, 6/27/2019 | | | 89,525 | |
| | | | Delta Air Lines, Inc., Term Loan | | | | |
| | 79,383 | | | 3.250%, 4/20/2017b,c | | | 78,391 | |
| | | | OSG Bulk Ships, Inc., Term Loan | | | | |
| | 94,525 | | | 5.250%, 8/5/2019 | | | 91,926 | |
| | | | | | | | |
| | | | Total | | | 259,842 | |
| | | | | | | | |
| |
| Utilities (0.2%) | | | | |
| | | | Calpine Corporation, Term Loan | | | | |
| | 33,971 | | | 4.000%, 4/1/2018 | | | 33,554 | |
| | 29,700 | | | 4.000%, 10/31/2020 | | | 29,201 | |
| | | | Intergen NV, Term Loan | | | | |
| | 90,620 | | | 5.500%, 6/15/2020 | | | 89,789 | |
| | | | | | | | |
| | | | Total | | | 152,544 | |
| | | | | | | | |
| | | | Total Bank Loans (cost $8,519,092) | | | 8,294,766 | |
| | | | | | | | |
| | |
Shares | | | Common Stock (69.9%) | | | |
| Consumer Discretionary (7.0%) | |
| | 6,700 | | | Barnes & Noble, Inc.d | | | 155,574 | |
| | 1,800 | | | Bayerische Motoren Werke AG | | | 194,253 | |
| | 13,650 | | | Best Buy Company, Inc. | | | 532,077 | |
| | 4,700 | | | Canon Marketing Japan, Inc. | | | 79,654 | |
| | 4,300 | | | Coach, Inc. | | | 161,508 | |
| | 9,145 | | | Comcast Corporation | | | 530,501 | |
| | 22,200 | | | Dixons Carphone plc | | | 159,995 | |
| | 7,550 | | | Dollar Tree, lnc.d | | | 531,369 | |
| | 11,300 | | | EDION Corporation | | | 79,040 | |
| | 3,500 | | | Gap, Inc. | | | 147,385 | |
| | 8,600 | | | Hakuhodo Dy Holdings, Inc. | | | 82,301 | |
| | 3,200 | | | Hennes & Mauritz AB | | | 132,944 | |
| | 2,900 | | | Hilton Worldwide Holdings, Inc.d | | | 75,661 | |
| | 24,028 | | | Home Retail Group plc | | | 77,436 | |
| | 9,900 | | | Honda Motor Company, Ltd. | | | 290,449 | |
| | 25,777 | | | ITV plc | | | 85,985 | |
| | 4,500 | | | Kohl’s Corporation | | | 274,680 | |
| | 7,650 | | | Lowe’s Companies, Inc. | | | 526,320 | |
| | 38,000 | | | Luk Fook Holdings International, Ltd. | | | 142,505 | |
| | 2,350 | | | Madison Square Garden Companyd | | | 176,861 | |
| | 900 | | | RTL Group SA | | | 85,821 | |
| | 6,000 | | | Ruth’s Hospitality Group, Inc. | | | 90,000 | |
| | 11,500 | | | Sekisui House, Ltd. | | | 151,317 | |
| | 38,000 | | | SJM Holdings, Ltd. | | | 60,074 | |
| | 21,800 | | | Sky Network Television, Ltd. | | | 102,344 | |
| | 5,200 | | | Stage Stores, Inc. | | | 107,640 | |
| | 7,400 | | | Sumitomo Forestry Company, Ltd. | | | 72,369 | |
| | 11,100 | | | Suzuki Motor Corporation | | | 332,638 | |
| | | | | | | | |
| | | | Total | | | 5,438,701 | |
| | | | | | | | |
| |
| Consumer Staples (4.3%) | | | | |
| | 5,600 | | | Associated British Foods plc | | | 273,779 | |
| | 1,413 | | | British American Tobacco plc | | | 76,572 | |
| | 9,199 | | | Coca-Cola Company | | | 388,382 | |
| | 3,950 | | | Coca-Cola Enterprises, Inc. | | | 174,669 | |
| | 5,750 | | | CVS Health Corporation | | | 553,783 | |
| | 8,095 | | | Imperial Tobacco Group plc | | | 356,338 | |
| | 5,000 | | | Japan Tobacco, Inc. | | | 137,614 | |
| | 1,700 | | | Nestle SA | | | 123,932 | |
| | 25,500 | | | Rite Aid Corporationd | | | 191,760 | |
| | 6,200 | | | Tyson Foods, Inc. | | | 248,558 | |
| | 2,776 | | | Wal-Mart Stores, Inc. | | | 238,403 | |
| | 2,969 | | | Wesfarmers, Ltd. | | | 100,523 | |
| | 4,550 | | | WhiteWave Foods Companyd | | | 159,205 | |
| | 4,100 | | | Whole Foods Market, Inc. | | | 206,722 | |
| | 47,000 | | | Wilmar International, Ltd. | | | 114,522 | |
| | | | | | | | |
| | | | Total | | | 3,344,762 | |
| | | | | | | | |
| |
| Energy (4.0%) | | | | |
| | 61,692 | | | BP plc | | | 391,595 | |
| | 10,507 | | | BW LPG, Ltd. | | | 73,178 | |
| | 2,450 | | | Cabot Oil & Gas Corporation | | | 72,544 | |
| | 4,700 | | | CAT Oil AG | | | 83,088 | |
| | 14,500 | | | Eni SPA | | | 253,990 | |
| | 5,450 | | | EOG Resources, Inc. | | | 501,782 | |
| | 11,200 | | | ERG SPA | | | 125,429 | |
| | 12,800 | | | Halliburton Company | | | 503,424 | |
| | 20,500 | | | Patterson-UTI Energy, Inc. | | | 340,095 | |
| | 12,700 | | | Pioneer Energy Services Corporationd | | | 70,358 | |
| | 9,016 | | | Royal Dutch Shell plc, Class B | | | 311,513 | |
| | 3,350 | | | Southwestern Energy Companyd | | | 91,422 | |
| | 4,700 | | | Total SA | | | 240,791 | |
| | 2,300 | | | Whiting Petroleum Corporationd | | | 75,900 | |
| | | | | | | | |
| | | | Total | | | 3,135,109 | |
| | | | | | | | |
| |
| Financials (20.3%) | | | | |
| | 10,797 | | | Aberdeen Asia-Pacific Income Fund, Inc. | | | 59,923 | |
| | 100 | | | Acadia Realty Trust | | | 3,203 | |
| | 3,026 | | | Aflac, Inc. | | | 184,858 | |
| | 200 | | | Agree Realty Corporation | | | 6,218 | |
| | 700 | | | Alexandria Real Estate Equities, Inc. | | | 62,118 | |
| | 1,800 | | | Allianz SE | | | 298,128 | |
| | 9,650 | | | AmTrust Financial Services, Inc. | | | 542,812 | |
| | 1,000 | | | Apartment Investment & Management Company | | | 37,150 | |
| | 3,464 | | | Australia & New Zealand Banking Group, Ltd. | | | 90,133 | |
| | 600 | | | AvalonBay Communities, Inc. | | | 98,034 | |
| | 3,400 | | | AXA SA | | | 78,347 | |
| | 19,400 | | | Banco Santander SA | | | 162,827 | |
| | 43,600 | | | Bank Leumi Le-lsrael BMd | | | 148,947 | |
| | 27,000 | | | Bank of America Corporation | | | 483,030 | |
| | 1,934 | | | Bank of Nova Scotia | | | 110,383 | |
| | 800 | | | BioMed Realty Trust, Inc. | | | 17,232 | |
| | 800 | | | Boston Properties, Inc. | | | 102,952 | |
| | 1,600 | | | Brixmor Property Group, Inc. | | | 39,744 | |
| | 500 | | | Camden Property Trust | | | 36,920 | |
| | 3,100 | | | Cash America International, Inc. | | | 70,122 | |
| | 8,150 | | | Charles Schwab Corporation | | | 246,048 | |
| | 23,000 | | | Cheung Kong Holdings, Ltd. | | | 385,177 | |
| | 9,850 | | | Citigroup, Inc. | | | 532,983 | |
| | 94 | | | City Office REIT, Inc. | | | 1,203 | |
| | 2,000 | | | Cohen & Steers REIT and Preferred Income Fund, Inc. | | | 37,980 | |
| | 900 | | | CubeSmart | | | 19,863 | |
| | 8,000 | | | DBSGroup Holdings, Ltd. | | | 123,851 | |
| | 300 | | | Digital Realty Trust, Inc. | | | 19,890 | |
The accompanying Notes to Financial Statements are an integral part of this schedule.
15
GROWTHAND INCOME PLUS FUND
Schedule of Investments as of December 31, 2014
| | | | | | | | |
Shares | | | Common Stock (69.9%) | | Value | |
| Financials (20.3%) - continued | | | | |
| | 5,100 | | | Discover Financial Services | | $ | 333,999 | |
| | 3,250 | | | Doubleline Income Solutions Fund | | | 64,675 | |
| | 4,200 | | | Duke Realty Corporation | | | 84,840 | |
| | 3,600 | | | Employers Holdings, Inc. | | | 84,636 | |
| | 3,204 | | | Enova International, Inc.d | | | 71,321 | |
| | 500 | | | EPR Properties | | | 28,815 | |
| | 400 | | | Equity Lifestyle Properties, Inc. | | | 20,620 | |
| | 1,100 | | | Equity Residential | | | 79,024 | |
| | 1,400 | | | Erie Indemnity Company | | | 127,078 | |
| | 200 | | | Essex Property Trust, Inc. | | | 41,320 | |
| | 9,900 | | | F.N.B. Corporation | | | 131,868 | |
| | 7,250 | | | First Financial Bancorp | | | 134,777 | |
| | 1,625 | | | First Trust High Income Long/Short Fund | | | 26,000 | |
| | 9,700 | | | Forestar Real Estate Group, Inc.d | | | 149,380 | |
| | 2,439 | | | General Growth Properties, Inc. | | | 68,609 | |
| | 200 | | | Geo Group, Inc. | | | 8,072 | |
| | 2,900 | | | Hancock Holding Company | | | 89,030 | |
| | 11,600 | | | Hang Seng Bank, Ltd. | | | 192,797 | |
| | 1,800 | | | HCP, Inc. | | | 79,254 | |
| | 400 | | | Health Care REIT, Inc. | | | 30,268 | |
| | 1,600 | | | Healthcare Trust of America, Inc. | | | 43,104 | |
| | 900 | | | Highwoods Properties, Inc. | | | 39,852 | |
| | 3,000 | | | Horace Mann Educators Corporation | | | 99,540 | |
| | 3,900 | | | Host Hotels & Resorts, Inc. | | | 92,703 | |
| | 46,992 | | | HSBC Holdings plc | | | 444,064 | |
| | 16,050 | | | Huntington Bancshares, Inc. | | | 168,846 | |
| | 5,525 | | | iShares J.P. Morgan USD Emerging Markets Bond ETF | | | 606,148 | |
| | 2,285 | | | iShares MSCI Emerging Markets Minimum Volatility ETF | | | 129,400 | |
| | 11,514 | | | iShares S&P U.S. Preferred Stock Index Fund | | | 454,112 | |
| | 14,100 | | | KeyCorp | | | 195,990 | |
| | 4,000 | | | Kimco Realty Corporation | | | 100,560 | |
| | 50 | | | LaSalle Hotel Properties | | | 2,023 | |
| | 3,050 | | | Lazard, Ltd. | | | 152,591 | |
| | 10,150 | | | MetLife, Inc. | | | 549,013 | |
| | 10,029 | | | MFS Intermediate Income Trust | | | 47,939 | |
| | 600 | | | Mid-America Apartment Communities, Inc. | | | 44,808 | |
| | 600 | | | Muenchener Rueckversicherungs- GesellschaftAG | | | 119,483 | |
| | 10,400 | | | National Australia Bank, Ltd. | | | 283,611 | |
| | 300 | | | National Health Investors, Inc. | | | 20,988 | |
| | 700 | | | National Retail Properties, Inc. | | | 27,559 | |
| | 6,122 | | | Nuveen Quality Preferred Income Fund II | | | 54,486 | |
| | 5,500 | | | OFG Bancorp | | | 91,575 | |
| | 200 | | | Omega Healthcare Investors, Inc. | | | 7,814 | |
| | 300 | | | Parkway Properties, Inc. | | | 5,517 | |
| | 4,227 | | | PIMCO Dynamic Credit Income Fund | | | 87,288 | |
| | 17,948 | | | PowerShares Preferred Portfolio | | | 263,836 | |
| | 3,450 | | | Principal Financial Group, Inc. | | | 179,193 | |
| | 2,400 | | | Prologis, Inc. | | | 103,272 | |
| | 4,150 | | | Prudential Financial, Inc. | | | 375,409 | |
| | 500 | | | Public Storage, Inc. | | | 92,425 | |
| | 10,100 | | | Regions Financial Corporation | | | 106,656 | |
| | 1,200 | | | RLJ Lodging Trust | | | 40,236 | |
| | 8,599 | | | Royal Bank of Canada | | | 593,892 | |
| | 400 | | | Sabra Healthcare REIT, Inc. | | | 12,148 | |
| | 1,000 | | | Simon Property Group, Inc. | | | 182,110 | |
| | 117 | | | Sovran Self Storage, Inc. | | | 10,205 | |
| | 14,300 | | | SPDR Barclays High Yield Bond ETF | | | 552,123 | |
| | 3,800 | | | Spirit Realty Captial, Inc. | | | 45,182 | |
| | 145 | | | Store Capital Corporation | | | 3,133 | |
| | 25,747 | | | Summit Hotel Properties, Inc. | | | 320,293 | |
| | 1,300 | | | Swiss Re AG | | | 108,903 | |
| | 1,050 | | | T. Rowe Price Group, Inc. | | | 90,153 | |
| | 733 | | | Tanger Factory Outlet Centers, Inc. | | | 27,092 | |
| | 221 | | | Taubman Centers, Inc. | | | 16,889 | |
| | 8,317 | | | Templeton Global Income Fund | | | 59,799 | |
| | 150 | | | Terreno Realty Corporation | | | 3,095 | |
| | 8,476 | | | Toronto-Dominion Bank | | | 404,977 | |
| | 7,703 | | | U.S. Bancorp | | | 346,250 | |
| | 300 | | | UDR, Inc. | | | 9,246 | |
| | 3,180 | | | Vanguard MSCI Emerging Markets ETF | | | 127,264 | |
| | 300 | | | Vanguard REIT ETF | | | 24,300 | |
| | 7,120 | | | Vanguard Short-Term Corporate Bond ETF | | | 566,966 | |
| | 1,400 | | | Ventas, Inc. | | | 100,380 | |
| | 900 | | | Vornado Realty Trust | | | 105,939 | |
| | 3,200 | | | W.R. Berkley Corporation | | | 164,032 | |
| | 12,185 | | | Wells Fargo & Company | | | 667,982 | |
| | 3,796 | | | Western Asset Emerging Markets Debt Fund, Inc. | | | 59,825 | |
| | 5,878 | | | Western Asset High Income Opportunity Fund, Inc. | | | 31,565 | |
| | 1,200 | | | Zurich Insurance Group AGd | | | 375,003 | |
| | | | | | | | |
| | | | Total | | | 15,885,246 | |
| | | | | | | | |
| |
| Health Care (10.4%) | | | | |
| | 2,500 | | | Abaxis, Inc. | | | 142,075 | |
| | 1,500 | | | AbbVie, Inc. | | | 98,160 | |
| | 1,100 | | | Actelion, Ltd. | | | 126,633 | |
| | 5,200 | | | Aetna, Inc. | | | 461,916 | |
| | 2,469 | | | AmerisourceBergen Corporation | | | 222,605 | |
| | 5,720 | | | AMN Healthcare Services, Inc.d | | | 112,112 | |
| | 2,900 | | | Anthem, Inc. | | | 364,443 | |
| | 9,200 | | | Astellas Pharmaceutical, Inc. | | | 128,083 | |
| | 1,400 | | | Bayer AG | | | 190,832 | |
| | 1,150 | | | Biogen Idec, Inc.d | | | 390,367 | |
| | 1,266 | | | Boiron SA | | | 106,956 | |
| | 17,550 | | | Boston Scientific Corporation | | | 232,538 | |
| | 6,000 | | | Bruker Corporationd | | | 117,720 | |
| | 2,450 | | | Centene Corporationd | | | 254,433 | |
| | 2,300 | | | CSL, Ltd. | | | 161,565 | |
| | 1,400 | | | Cyberonics, Inc.d | | | 77,952 | |
| | 2,673 | | | Eli Lilly and Company | | | 184,410 | |
| | 20,470 | | | Fisher & Paykel Healthcare Corporation, Ltd. | | | 99,798 | |
| | 6,350 | | | Gilead Sciences, Inc.d | | | 598,551 | |
| | 6,336 | | | GlaxoSmithKline plc | | | 135,930 | |
| | 4,050 | | | HCA Holdings, Inc.d | | | 297,230 | |
| | 12,700 | | | Healthways, Inc.d | | | 252,476 | |
| | 4,259 | | | ICON plcd | | | 217,166 | |
| | 4,498 | | | Johnson & Johnson | | | 470,356 | |
| | 800 | | | Lonza Group AG | | | 90,073 | |
| | 750 | | | McKesson Corporation | | | 155,685 | |
| | 6,650 | | | Merck & Company, Inc. | | | 377,654 | |
| | 7,100 | | | Otsuka Holdings Company, Ltd. | | | 212,867 | |
| | 4,350 | | | PAREXEL International Corporationd | | | 241,686 | |
| | 23,800 | | | Pfizer, Inc. | | | 741,370 | |
| | 2,500 | | | Quintiles Transnational Holdings, Inc.d | | | 147,175 | |
| | 6,000 | | | Recordati SPA | | | 93,020 | |
| | 500 | | | Roche Holding AG - BR | | | 134,711 | |
| | 400 | | | Roche Holding AG - Genusschein | | | 108,377 | |
| | 5,300 | | | Sagent Pharmaceuticals, Inc.d | | | 133,083 | |
| | 1,700 | | | Sanofi | | | 154,990 | |
The accompanying Notes to Financial Statements are an integral part of this schedule.
16
GROWTHAND INCOME PLUS FUND
Schedule of Investments as of December 31, 2014
| | | | | | | | |
Shares | | | Common Stock (69.9%) | | Value | |
| Health Care (10.4%) - continued | |
| | 6,300 | | | Sonic Healthcare, Ltd. | | $ | 94,781 | |
| | | | | | | | |
| | | | Total | | | 8,129,779 | |
| | | | | | | | |
| Industrials (8.4%) | | | | |
| | 3,500 | | | Abertis Infraestructuras SA | | | 69,404 | |
| | 4,300 | | | Allison Transmission Holdings, Inc. | | | 145,770 | |
| | 3,800 | | | Caterpillar, Inc. | | | 347,814 | |
| | 4,900 | | | COMSYS Holdings Corporation | | | 67,031 | |
| | 7,700 | | | Con-way, Inc. | | | 378,686 | |
| | 7,450 | | | Delta Air Lines, Inc. | | | 366,466 | |
| | 3,500 | | | easyJet plc | | | 90,577 | |
| | 7,900 | | | Flowserve Corporation | | | 472,657 | |
| | 23,750 | | | General Electric Company | | | 600,162 | |
| | 20,000 | | | Hutchison Whampoa, Ltd. | | | 228,631 | |
| | 18,900 | | | ITOCHU Corporation | | | 201,759 | |
| | 2,700 | | | Jacobs Engineering Group, Inc.d | | | 120,663 | |
| | 8,450 | | | KAR Auction Services, Inc. | | | 292,793 | |
| | 4,800 | | | KONE OYJ | | | 218,534 | |
| | 1,500 | | | Lockheed Martin Corporation | | | 288,855 | |
| | 1,800 | | | Mabuchi Motor Company, Ltd. | | | 71,446 | |
| | 8,300 | | | Meritor, Inc.d | | | 125,745 | |
| | 7,400 | | | Pentair, Ltd. | | | 491,508 | |
| | 12,000 | | | Performant Financial Corporationd | | | 79,800 | |
| | 4,350 | | | Quad/Graphics, Inc. | | | 99,876 | |
| | 2,900 | | | Safran SA | | | 178,916 | |
| | 3,400 | | | Siemens AG | | | 381,494 | |
| | 13,150 | | | Southwest Airlines Company | | | 556,508 | |
| | 3,748 | | | Stantec, Inc. | | | 103,007 | |
| | 18,000 | | | Toda Corporation | | | 70,992 | |
| | 10,000 | | | TOTO, Ltd. | | | 116,327 | |
| | 7,502 | | | Wajax Corporation | | | 198,689 | |
| | 2,050 | | | Woodward, Inc. | | | 100,921 | |
| | 5,877 | | | WS Atkins plc | | | 124,467 | |
| | | | | | | | |
| | | | Total | | | 6,589,498 | |
| | | | | | | | |
| |
| Information Technology (8.3%) | | | | |
| | 1,300 | | | Accenture plc | | | 116,103 | |
| | 8,100 | | | Akamai Technologies, Inc.d | | | 509,976 | |
| | 7,300 | | | Aspen Technology, Inc.d | | | 255,646 | |
| | 12,300 | | | Broadcom Corporation | | | 532,959 | |
| | 38,400 | | | Brocade Communications Systems, Inc. | | | 454,656 | |
| | 2,773 | | | CGI Group, Inc.d | | | 105,712 | |
| | 13,800 | | | Cirrus Logic, Inc.d | | | 325,266 | |
| | 19,161 | | | Cisco Systems, Inc. | | | 532,963 | |
| | 2,250 | | | Computer Sciences Corporation | | | 141,862 | |
| | 461 | | | Constellation Software, Inc. | | | 137,070 | |
| | 14,350 | | | Corning, Inc. | | | 329,046 | |
| | 5,200 | | | Electronic Arts, Inc.d | | | 244,478 | |
| | 17,750 | | | EMC Corporation | | | 527,885 | |
| | 600 | | | F5 Networks, Inc.d | | | 78,279 | |
| | 9,100 | | | FUJIFILM Holdings NPV | | | 277,673 | |
| | 22,900 | | | Global Cash Access Holdings, Inc.d | | | 163,735 | |
| | 4,400 | | | Hoya Corporation | | | 148,829 | |
| | 7,700 | | | Juniper Networks, Inc. | | | 171,864 | |
| | 2,500 | | | Lexmark International, Inc. | | | 103,175 | |
| | 10,400 | | | Marvell Technology Group, Ltd. | | | 150,800 | |
| | 2,716 | | | Melexis NV | | | 122,898 | |
| | 5,100 | | | NetApp, Inc. | | | 211,395 | |
| | 1,645 | | | Newport Corporationd | | | 31,436 | |
| | 1,600 | | | NXP Semiconductors NVd | | | 122,240 | |
| | 5,250 | | | Pegasystems, Inc. | | | 109,043 | |
| | 6,200 | | | Skyworks Solutions, Inc. | | | 450,802 | |
| | 8,800 | | | Vishay Intertechnology, Inc. | | | 124,520 | |
| | | | | | | | |
| | | | Total | | | 6,480,311 | |
| | | | | | | | |
| |
| Materials (2.5%) | | | | |
| | 20,200 | | | Acacia Mining plc | | | 80,028 | |
| | 185,300 | | | Centamin plc | | | 170,140 | |
| | 7,350 | | | Dow Chemical Company | | | 335,233 | |
| | 7,400 | | | James Hardie Industries plc | | | 78,997 | |
| | 86,000 | | | Kobe Steel, Ltd. | | | 148,135 | |
| | 4,900 | | | LyondellBasell Industries NV | | | 389,011 | |
| | 1,300 | | | Nitto Denko Corporation | | | 72,638 | |
| | 5,905 | | | Rio Tinto plc | | | 272,204 | |
| | 2,950 | | | Southern Copper Corporation | | | 83,190 | |
| | 2,500 | | | Voestalpine AG | | | 98,783 | |
| | 3,300 | | | Westlake Chemical Corporation | | | 201,597 | |
| | | | | | | | |
| | | | Total | | | 1,929,956 | |
| | | | | | | | |
| |
| Telecommunications Services (2.5%) | | | | |
| | 226,200 | | | Bezeq Israel Telecommunication Corporation, Ltd. | | | 401,237 | |
| | 39,804 | | | BT Group plc | | | 247,584 | |
| | 8,400 | | | KDDI Corporation | | | 527,722 | |
| | 7,900 | | | Nippon Telegraph & Telephone Corporation | | | 403,553 | |
| | 104,000 | | | Singapore Telecommunications, Ltd. | | | 305,272 | |
| | 27,100 | | | Vonage Holdings Corporationd | | | 103,251 | |
| | | | | | | | |
| | | | Total | | | 1,988,619 | |
| | | | | | | | |
| |
| Utilities (2.2%) | | | | |
| | 106,500 | | | A2A SPA | | | 107,915 | |
| | 108,400 | | | Electricidade de Portugal SA | | | 420,338 | |
| | 9,000 | | | Endesa SA | | | 180,174 | |
| | 25,600 | | | Enel SPA | | | 114,113 | |
| | 7,200 | | | Fortum OYJ | | | 156,323 | |
| | 6,000 | | | Gas Natural SDG SA | | | 150,724 | |
| | 12,600 | | | GDF Suez | | | 293,821 | |
| | 33,600 | | | Iberdrola SA | | | 226,490 | |
| | 5,000 | | | Verbund AG | | | 92,595 | |
| | | | | | | | |
| | | | Total | | | 1,742,493 | |
| | | | | | | | |
| | | | Total Common Stock (cost $53,208,450) | | | 54,664,474 | |
| | | | | | | | |
| | |
Principal
Amount | | | Long-Term Fixed Income (13.8%) | | | |
| Asset-Backed Securities (0.1%) | | | | |
| | | | Bayview Opportunity Master Fund Trust IIB, LP | | | | |
| | $77,660 | | | 3.950%, 1/28/2034*e | | | 78,045 | |
| | | | Countrywide Asset-Backed Certificates | | | | |
| | 52,953 | | | 5.530%, 4/25/2047 | | | 52,068 | |
| | | | | | | | |
| | | | Total | | | 130,113 | |
| | | | | | | | |
| |
| Basic Materials (0.4%) | | | | |
| | | | Albemarle Corporation | | | | |
| | 14,000 | | | 3.000%, 12/1/2019 | | | 14,002 | |
| | | | Anglo American Capital plc | | | | |
| | 7,000 | | | 1.181%, 4/15/2016f,g | | | 7,007 | |
| | | | ArcelorMittal | | | | |
| | 45,000 | | | 6.000%, 3/1/2021 | | | 46,800 | |
| | | | Dow Chemical Company | | | | |
| | 8,000 | | | 8.550%, 5/15/2019 | | | 9,946 | |
The accompanying Notes to Financial Statements are an integral part of this schedule.
17
GROWTHAND INCOME PLUS FUND
Schedule of Investments as of December 31, 2014
| | | | | | | | |
Principal Amount | | | Long-Term Fixed Income (13.8%) | | Value | |
| Basic Materials (0.4%) - continued | | | | |
| | | | First Quantum Minerals, Ltd. | | | | |
| $ | 60,000 | | | 7.000%, 2/15/2021f | | $ | 54,000 | |
| | | | FMG Resources August 2006 Pty., Ltd. | | | | |
| | 10,523 | | | 6.875%, 2/1/2018f | | | 9,550 | |
| | | | Freeport-McMoRan, Inc. | | | | |
| | 7,000 | | | 2.300%, 11/14/2017 | | | 7,008 | |
| | 10,000 | | | 2.375%, 3/15/2018 | | | 9,890 | |
| | | | Goldcorp, Inc. | | | | |
| | 14,000 | | | 2.125%, 3/15/2018 | | | 13,837 | |
| | | | Hexion US Finance Corporation/
Hexion Nova Scotia Finance ULC | | | | |
| | 23,677 | | | 8.875%, 2/1/2018 | | | 21,073 | |
| | | | Ineos Finance plc | | | | |
| | 28,000 | | | 7.500%, 5/1/2020f | | | 29,400 | |
| | | | LyondellBasell Industries NV | | | | |
| | 8,000 | | | 5.000%, 4/15/2019 | | | 8,726 | |
| | | | Mosaic Company | | | | |
| | 6,000 | | | 3.750%, 11/15/2021 | | | 6,245 | |
| | | | NOVA Chemicals Corporation | | | | |
| | 35,516 | | | 5.250%, 8/1/2023f | | | 35,871 | |
| | | | Vale Overseas, Ltd. | | | | |
| | 9,000 | | | 6.250%, 1/23/2017 | | | 9,599 | |
| | | | | | | | |
| | | | Total | | | 282,954 | |
| | | | | | | | |
| |
| Capital Goods (0.5%) | | | | |
| | | | BAE Systems plc | | | | |
| | 12,000 | | | 3.500%, 10/11/2016f | | | 12,465 | |
| | | | Brand Energy & Infrastructure Services, Inc. | | | | |
| | 25,000 | | | 8.500%, 12/1/2021f | | | 22,500 | |
| | | | Cemex SAB de CV | | | | |
| | 60,000 | | | 5.700%, 1/11/2025f | | | 58,200 | |
| | | | CNH Capital, LLC | | | | |
| | 23,677 | | | 3.625%, 4/15/2018 | | | 23,322 | |
| | | | Crown Americas Capital Corporation IV | | | | |
| | 45,000 | | | 4.500%, 1/15/2023 | | | 43,650 | |
| | | | Harsco Corporation | | | | |
| | 9,000 | | | 2.700%, 10/15/2015 | | | 8,989 | |
| | | | Hutchison Whampoa Finance CI, Ltd. | | | | |
| | 15,000 | | | 1.625%, 10/31/2017f | | | 14,876 | |
| | | | Ingersoll-Rand Global Holding Company, Ltd. | | | | |
| | 12,000 | | | 6.875%, 8/15/2018 | | | 13,930 | |
| | | | L-3 Communications Corporation | | | | |
| | 10,000 | | | 1.500%, 5/28/2017 | | | 9,902 | |
| | | | Martin Marietta Materials, Inc. | | | | |
| | 12,000 | | | 1.357%, 6/30/2017g | | | 12,132 | |
| | | | Nortek, Inc. | | | | |
| | 23,677 | | | 8.500%, 4/15/2021 | | | 25,334 | |
| | | | Owens-Brockway Glass Container, Inc. | | | | |
| | 60,000 | | | 5.000%, 1/15/2022f | | | 61,200 | |
| | | | Reynolds Group Issuer, Inc. | | | | |
| | 23,677 | | | 9.875%, 8/15/2019 | | | 25,098 | |
| | | | Roper Industries, Inc. | | | | |
| | 9,000 | | | 2.050%, 10/1/2018 | | | 8,926 | |
| | | | Textron, Inc. | | | | |
| | 12,000 | | | 4.625%, 9/21/2016 | | | 12,696 | |
| | | | United Rentals North America, Inc. | | | | |
| | 30,000 | | | 7.375%, 5/15/2020 | | | 32,400 | |
| | | | | | | | |
| | | | Total | | | 385,620 | |
| | | | | | | | |
| |
| Collateralized Mortgage Obligations (2.9%) | | | | |
| | | | Alternative Loan Trust | | | | |
| | 154,412 | | | 5.500%, 10/25/2035 | | | 140,608 | |
| | | | Banc of America Alternative Loan Trust | | | | |
| | 71,792 | | | 6.000%, 11/25/2035 | | | 62,742 | |
| | | | CHL Mortgage Pass-Through Trust | | | | |
| | 114,291 | | | 4.966%, 1/25/2036 | | | 106,744 | |
| | | | Citigroup Mortgage Loan Trust, Inc. | | | | |
| | 33,734 | | | 2.778%, 3/25/2037 | | | 26,077 | |
| | | | CitiMortgage Alternative Loan Trust | | | | |
| | 108,795 | | | 5.750%, 4/25/2037 | | | 93,417 | |
| | | | Countrywide Alternative Loan Trust | | | | |
| | 90,433 | | | 6.500%, 8/25/2036 | | | 68,868 | |
| | | | Countrywide Home Loan Mortgage Pass Through Trust | | | | |
| | 160,724 | | | 2.465%, 11/25/2035 | | | 135,922 | |
| | | | Credit Suisse First Boston Mortgage Securities Corporation | | | | |
| | 69,028 | | | 5.250%, 10/25/2035 | | | 68,688 | |
| | | | Deutsche Alt-A Securities, Inc., Mortgage Loan Trust | | | | |
| | 74,783 | | | 5.500%, 11/25/2035 | | | 70,718 | |
| | | | HomeBanc Mortgage Trust | | | | |
| | 50,613 | | | 2.197%, 4/25/2037 | | | 37,662 | |
| | | | J.P. Morgan Alternative Loan Trust | | | | |
| | 165,863 | | | 6.500%, 3/25/2036 | | | 146,276 | |
| | | | J.P. Morgan Mortgage Trust | | | | |
| | 87,655 | | | 2.253%, 6/25/2035 | | | 87,685 | |
| | 104,835 | | | 2.658%, 6/25/2035 | | | 106,086 | |
| | 78,846 | | | 2.653%, 8/25/2035 | | | 78,433 | |
| | 97,376 | | | 2.695%, 1/25/2037 | | | 88,899 | |
| | | | MortgageIT Trust | | | | |
| | 82,401 | | | 0.430%, 12/25/2035g | | | 75,588 | |
| | | | New York Mortgage Trust | | | | |
| | 91,227 | | | 2.630%, 5/25/2036 | | | 82,296 | |
| | | | Residential Accredit Loans, Inc. | | | | |
| | 87,549 | | | 5.750%, 9/25/2035 | | | 79,161 | |
| | | | RFMSI Trust | | | | |
| | 71,857 | | | 5.750%, 2/25/2036 | | | 66,413 | |
| | 103,112 | | | 6.000%, 7/25/2037 | | | 93,376 | |
| | | | Sequoia Mortgage Trust | | | | |
| | 49,978 | | | 2.657%, 9/20/2046 | | | 41,429 | |
| | | | Structured Adjustable Rate Mortgage Loan Trust | | | | |
| | 101,546 | | | 2.633%, 9/25/2035 | | | 86,327 | |
| | | | Structured Asset Mortgage Investments, Inc. | | | | |
| | 145,927 | | | 0.480%, 12/25/2035g | | | 111,562 | |
| | | | WaMu Mortgage Pass Through Certificates | | | | |
| | 145,607 | | | 0.853%, 1/25/2047g | | | 119,506 | |
| | | | Wells Fargo Mortgage Backed Securities Trust | | | | |
| | 83,553 | | | 2.612%, 3/25/2036 | | | 83,207 | |
| | 73,084 | | | 2.609%, 7/25/2036 | | | 71,277 | |
The accompanying Notes to Financial Statements are an integral part of this schedule.
18
GROWTHAND INCOME PLUS FUND
Schedule of Investments as of December 31, 2014
| | | | | | | | |
Principal Amount | | | Long-Term Fixed Income (13.8%) | | Value | |
| Collateralized Mortgage Obligations (2.9%) - continued | |
| $ | 69,848 | | | 6.000%, 7/25/2037 | | $ | 69,119 | |
| | | | | | | | |
| | | | Total | | | 2,298,086 | |
| | | | | | | | |
|
| Communications Services (1.3%) | |
| | | | 21st Century Fox America, Inc. | | | | |
| | 11,000 | | | 6.900%, 3/1/2019 | | | 12,971 | |
| | | | AMC Networks, Inc. | | | | |
| | 53,677 | | | 7.750%, 7/15/2021 | | | 57,434 | |
| | | | America Movil SAB de CV | | | | |
| | 8,000 | | | 5.000%, 10/16/2019 | | | 8,831 | |
| | | | American Tower Corporation | | | | |
| | 13,000 | | | 7.000%, 10/15/2017 | | | 14,677 | |
| | | | British Sky Broadcasting Group plc | | | | |
| | 14,000 | | | 2.625%, 9/16/2019f | | | 14,005 | |
| | | | British Telecommunications plc | | | | |
| | 9,000 | | | 1.250%, 2/14/2017 | | | 8,955 | |
| | | | CC Holdings GS V, LLC | | | | |
| | 18,000 | | | 2.381%, 12/15/2017 | | | 18,160 | |
| | | | CCO Holdings, LLC | | | | |
| | 23,677 | | | 7.000%, 1/15/2019 | | | 24,565 | |
| | | | CenturyLink, Inc. | | | | |
| | 30,000 | | | 6.450%, 6/15/2021 | | | 32,175 | |
| | | | Cequel Communications Escrow 1, LLC | | | | |
| | 55,000 | | | 6.375%, 9/15/2020f | | | 56,925 | |
| | | | Columbus International, Inc. | | | | |
| | 50,000 | | | 7.375%, 3/30/2021f | | | 52,000 | |
| | | | Cox Communications, Inc. | | | | |
| | 9,000 | | | 9.375%, 1/15/2019f | | | 11,327 | |
| | | | Digicel, Ltd. | | | | |
| | 53,677 | | | 6.000%, 4/15/2021f | | | 50,188 | |
| | | | DIRECTV Holdings, LLC | | | | |
| | 9,000 | | | 3.500%, 3/1/2016 | | | 9,235 | |
| | 8,000 | | | 5.875%, 10/1/2019 | | | 9,151 | |
| | | | DISH DBS Corporation | | | | |
| | 50,000 | | | 5.000%, 3/15/2023 | | | 48,375 | |
| | | | Equinix, Inc. | | | | |
| | 40,000 | | | 5.750%, 1/1/2025 | | | 40,350 | |
| | | | FairPoint Communications, Inc. | | | | |
| | 60,000 | | | 8.750%, 8/15/2019f | | | 60,300 | |
| | | | Frontier Communications Corporation | | | | |
| | 65,000 | | | 6.875%, 1/15/2025 | | | 65,000 | |
| | | | Hughes Satellite Systems Corporation | | | | |
| | 30,000 | | | 6.500%, 6/15/2019 | | | 32,175 | |
| | | | Intelsat Jackson Holdings SA | | | | |
| | 23,677 | | | 7.250%, 10/15/2020 | | | 25,009 | |
| | | | Level 3 Financing, Inc. | | | | |
| | 30,000 | | | 8.625%, 7/15/2020 | | | 32,363 | |
| | | | Numericable-SFR | | | | |
| | 50,000 | | | 6.000%, 5/15/2022f | | | 50,275 | |
| | | | SBA Tower Trust | | | | |
| | 12,000 | | | 5.101%, 4/17/2017f | | | 12,631 | |
| | | | Sprint Communications, Inc. | | | | |
| | 23,677 | | | 9.000%, 11/15/2018f | | | 26,930 | |
| | | | Telefonica Emisiones SAU | | | | |
| | 8,000 | | | 3.992%, 2/16/2016 | | | 8,228 | |
| | 9,000 | | | 3.192%, 4/27/2018 | | | 9,255 | |
| | | | Time Warner Cable, Inc. | | | | |
| | 7,000 | | | 8.250%, 4/1/2019 | | | 8,569 | |
| | 20,000 | | | 5.000%, 2/1/2020 | | | 22,040 | |
| | | | T-Mobile USA, Inc. | | | | |
| | 25,000 | | | 6.633%, 4/28/2021 | | | 25,656 | |
| | | | Univision Communications, Inc. | | | | |
| | 40,000 | | | 7.875%, 11/1/2020f | | | 42,600 | |
| | | | UPCB Finance V, Ltd. | | | | |
| | 40,000 | | | 7.250%, 11/15/2021f | | | 43,750 | |
| | | | Verizon Communications, Inc. | | | | |
| | 27,000 | | | 2.625%, 2/21/2020f | | | 26,691 | |
| | 12,000 | | | 4.500%, 9/15/2020 | | | 13,029 | |
| | | | West Corporation | | | | |
| | 50,000 | | | 5.375%, 7/15/2022f | | | 47,875 | |
| | | | Wind Acquisition Finance SA | | | | |
| | 30,000 | | | 4.750%, 7/15/2020f | | | 28,050 | |
| | 5,000 | | | 7.375%, 4/23/2021f | | | 4,719 | |
| | | | | | | | |
| | | | Total | | | 1,054,469 | |
| | | | | | | | |
|
| Consumer Cyclical (0.8%) | |
| | | | AMC Entertainment, Inc. | | | | |
| | 24,000 | | | 5.875%, 2/15/2022 | | | 24,360 | |
| | | | Brookfield Residential Properties, Inc. | | | | |
| | 25,000 | | | 6.125%, 7/1/2022f | | | 26,000 | |
| | | | Chrysler Group, LLC | | | | |
| | 23,677 | | | 8.250%, 6/15/2021 | | | 26,222 | |
| | | | Cinemark USA, Inc. | | | | |
| | 28,000 | | | 4.875%, 6/1/2023 | | | 26,460 | |
| | | | Daimler Finance North America, LLC | | | | |
| | 7,000 | | | 1.875%, 1/11/2018f | | | 7,024 | |
| | | | Delphi Corporation | | | | |
| | 9,000 | | | 6.125%, 5/15/2021 | | | 9,810 | |
| | | | ERAC USA Finance, LLC | | | | |
| | 12,000 | | | 2.350%, 10/15/2019f | | | 11,910 | |
| | | | Ford Motor Credit Company, LLC | | | | |
| | 28,000 | | | 1.684%, 9/8/2017 | | | 27,777 | |
| | 13,000 | | | 5.000%, 5/15/2018 | | | 14,125 | |
| | 14,000 | | | 2.597%, 11/4/2019 | | | 13,925 | |
| | | | General Motors Financial Company, Inc. | | | | |
| | 23,677 | | | 3.250%, 5/15/2018 | | | 23,707 | |
| | 21,000 | | | 4.375%, 9/25/2021 | | | 21,919 | |
| | | | GLP Capital, LP | | | | |
| | 50,000 | | | 4.875%, 11/1/2020 | | | 50,625 | |
| | | | Hilton Worldwide Finance, LLC | | | | |
| | 45,000 | | | 5.625%, 10/15/2021 | | | 47,025 | |
| | | | Hyundai Capital America | | | | |
| | 9,000 | | | 1.450%, 2/6/2017f | | | 8,966 | |
| | | | Jaguar Land Rover Automotive plc | | | | |
| | 20,000 | | | 4.250%, 11/15/2019f | | | 20,150 | |
| | 30,000 | | | 5.625%, 2/1/2023f | | | 31,575 | |
| | | | KB Home | | | | |
| | 22,000 | | | 4.750%, 5/15/2019 | | | 21,670 | |
| | | | L Brands, Inc. | | | | |
| | 30,000 | | | 6.625%, 4/1/2021 | | | 33,750 | |
| | | | Lennar Corporation | | | | |
| | 60,000 | | | 4.750%, 11/15/2022 | | | 58,800 | |
| | | | Macy’s Retail Holdings, Inc. | | | | |
| | 10,000 | | | 7.450%, 7/15/2017 | | | 11,369 | |
The accompanying Notes to Financial Statements are an integral part of this schedule.
19
GROWTHAND INCOME PLUS FUND
Schedule of Investments as of December 31, 2014
| | | | | | | | |
Principal Amount | | | Long-Term Fixed Income (13.8%) | | Value | |
| Consumer Cyclical (0.8%) - continued | | | | |
| | | | Nissan Motor Acceptance Corporation | | | | |
| | $6,000 | | | 0.785%, 3/3/2017f,g | | $ | 6,019 | |
| | | | Royal Caribbean Cruises, Ltd. | | | | |
| | 48,677 | | | 5.250%, 11/15/2022 | | | 51,111 | |
| | | | Toll Brothers Finance Corporation | | | | |
| | 16,000 | | | 4.000%, 12/31/2018 | | | 16,080 | |
| | | | TRW Automotive, Inc. | | | | |
| | 7,000 | | | 7.250%, 3/15/2017f | | | 7,735 | |
| | | | Volkswagen Group of America Finance, LLC | | | | |
| | 14,000 | | | 0.672%, 11/20/2017f,g | | | 13,980 | |
| | | | Walgreens Boots Alliance, Inc. | | | | |
| | 14,000 | | | 2.700%, 11/18/2019 | | | 14,071 | |
| | | | Wynn Las Vegas, LLC | | | | |
| | 30,000 | | | 5.375%, 3/15/2022 | | | 30,450 | |
| | | | | | | | |
| | | | Total | | | 656,615 | |
| | | | | | | | |
| |
| Consumer Non-Cyclical (1.1%) | | | | |
| | | | AbbVie, Inc. | | | | |
| | 14,000 | | | 2.000%, 11/6/2018 | | | 13,953 | |
| | | | Altria Group, Inc. | | | | |
| | 15,000 | | | 9.700%, 11/10/2018 | | | 19,047 | |
| | | | Beam, Inc. | | | | |
| | 8,000 | | | 5.375%, 1/15/2016 | | | 8,364 | |
| | | | Becton, Dickinson and Company | | | | |
| | 14,000 | | | 2.675%, 12/15/2019 | | | 14,184 | |
| | | | Boston Scientific Corporation | | | | |
| | 14,000 | | | 2.650%, 10/1/2018 | | | 14,017 | |
| | | | CareFusion Corporation | | | | |
| | 10,000 | | | 1.450%, 5/15/2017 | | | 9,929 | |
| | | | Celgene Corporation | | | | |
| | 16,000 | | | 1.900%, 8/15/2017 | | | 16,056 | |
| | | | CHS/Community Health Systems, Inc. | | | | |
| | 30,000 | | | 7.125%, 7/15/2020 | | | 31,988 | |
| | | | ConAgra Foods, Inc. | | | | |
| | 20,000 | | | 2.100%, 3/15/2018 | | | 19,935 | |
| | | | Cott Beverages, Inc. | | | | |
| | 55,000 | | | 5.375%, 7/1/2022f | | | 50,463 | |
| | | | Coventry Health Care, Inc. | | | | |
| | 6,000 | | | 5.950%, 3/15/2017 | | | 6,562 | |
| | | | CVS Health Corporation | | | | |
| | 8,000 | | | 2.250%, 12/5/2018 | | | 8,072 | |
| | | | Envision Healthcare Corporation | | | | |
| | 50,000 | | | 5.125%, 7/1/2022f | | | 49,625 | |
| | | | Express Scripts Holding Company | | | | |
| | 9,000 | | | 2.650%, 2/15/2017 | | | 9,203 | |
| | | | Forest Laboratories, Inc. | | | | |
| | 12,000 | | | 4.375%, 2/1/2019f | | | 12,676 | |
| | 15,000 | | | 5.000%, 12/15/2021f | | | 16,242 | |
| | | | Fresenius Medical Care US Finance, Inc. | | | | |
| | 23,677 | | | 5.750%, 2/15/2021f | | | 25,246 | |
| | | | Gilead Sciences, Inc. | | | | |
| | 6,000 | | | 3.050%, 12/1/2016 | | | 6,226 | |
| | 14,000 | | | 2.350%, 2/1/2020 | | | 14,075 | |
| | | | Hawk Acquisition Sub, Inc. | | | | |
| | 30,000 | | | 4.250%, 10/15/2020 | | | 30,300 | |
| | | | HCA, Inc. | | | | |
| | 23,677 | | | 4.750%, 5/1/2023 | | | 24,091 | |
| | | | IMS Health, Inc. | | | | |
| | 27,000 | | | 6.000%, 11/1/2020f | | | 27,810 | |
| | | | JBS Finance II, Ltd. | | | | |
| | 23,677 | | | 8.250%, 1/29/2018* | | | 24,210 | |
| | | | Kroger Company | | | | |
| | 16,000 | | | 1.200%, 10/17/2016 | | | 15,965 | |
| | | | Lorillard Tobacco Company | | | | |
| | 9,000 | | | 8.125%, 6/23/2019 | | | 10,911 | |
| | | | McKesson Corporation | | | | |
| | 14,000 | | | 1.292%, 3/10/2017 | | | 13,929 | |
| | | | Medco Health Solutions, Inc. | | | | |
| | 6,000 | | | 7.125%, 3/15/2018 | | | 6,927 | |
| | | | Medtronic, Inc. | | | | |
| | 14,000 | | | 2.500%, 3/15/2020f | | | 14,037 | |
| | | | Mondelez International, Inc. | | | | |
| | 6,000 | | | 2.250%, 2/1/2019 | | | 5,975 | |
| | | | Omnicare, Inc. | | | | |
| | 60,000 | | | 4.750%, 12/1/2022 | | | 60,750 | |
| | | | Ortho-Clinical Diagnostics, Inc. | | | | |
| | 55,000 | | | 6.625%, 5/15/2022f | | | 49,431 | |
| | | | Pernod Ricard SA | | | | |
| | 8,000 | | | 2.950%, 1/15/2017f | | | 8,185 | |
| | 8,000 | | | 5.750%, 4/7/2021f | | | 9,189 | |
| | | | Perrigo Company, Ltd. | | | | |
| | 5,000 | | | 1.300%, 11/8/2016 | | | 4,978 | |
| | | | Revlon Consumer Products Corporation | | | | |
| | 23,677 | | | 5.750%, 2/15/2021 | | | 23,677 | |
| | | | SABMiller plc | | | | |
| | 9,000 | | | 6.500%, 7/15/2018f | | | 10,275 | |
| | | | Safeway, Inc. | | | | |
| | 3,000 | | | 3.400%, 12/1/2016 | | | 3,048 | |
| | | | Spectrum Brands Escrow Corporation | | | | |
| | 30,000 | | | 6.375%, 11/15/2020 | | | 31,275 | |
| | | | Sysco Corporation | | | | |
| | 21,000 | | | 2.350%, 10/2/2019 | | | 21,114 | |
| | | | Tenet Healthcare Corporation | | | | |
| | 45,000 | | | 8.125%, 4/1/2022 | | | 50,288 | |
| | | | Thermo Fisher Scientific, Inc. | | | | |
| | 9,000 | | | 2.400%, 2/1/2019 | | | 9,013 | |
| | | | Tyson Foods, Inc. | | | | |
| | 12,000 | | | 2.650%, 8/15/2019 | | | 12,109 | |
| | | | Valeant Pharmaceuticals International | | | | |
| | 23,677 | | | 7.250%, 7/15/2022f | | | 25,246 | |
| | | | Whirlpool Corporation | | | | |
| | 14,000 | | | 1.650%, 11/1/2017 | | | 13,954 | |
| | | | | | | | |
| | | | Total | | | 852,550 | |
| | | | | | | | |
| |
| Energy (0.8%) | | | | |
| | | | Boardwalk Pipelines, Ltd. | | | | |
| | 11,000 | | | 5.875%, 11/15/2016 | | | 11,679 | |
| | | | BP Capital Markets plc | | | | |
| | 9,000 | | | 0.652%, 11/7/2016g | | | 9,002 | |
| | | | Buckeye Partners, LP | | | | |
| | 13,000 | | | 2.650%, 11/15/2018 | | | 12,804 | |
The accompanying Notes to Financial Statements are an integral part of this schedule.
20
GROWTHAND INCOME PLUS FUND
Schedule of Investments as of December 31, 2014
| | | | | | | | |
Principal
Amount | | | Long-Term Fixed Income (13.8%) | | Value | |
| Energy (0.8%) - continued | | | | |
| | | | Calumet Specialty Products Partners, LP | | | | |
| $ | 45,000 | | | 6.500%, 4/15/2021f | | $ | 40,050 | |
| | | | Canadian Natural Resources, Ltd. | | | | |
| | 14,000 | | | 1.750%, 1/15/2018 | | | 13,918 | |
| | | | CNOOC Nexen Finance 2014 ULC | | | | |
| | 8,000 | | | 1.625%, 4/30/2017 | | | 7,961 | |
| | | | CNPC General Capital, Ltd. | | | | |
| | 10,000 | | | 2.750%, 4/19/2017f | | | 10,116 | |
| | | | Concho Resources, Inc. | | | | |
| | 58,677 | | | 6.500%, 1/15/2022 | | | 61,317 | |
| | | | Continental Resources, Inc. | | | | |
| | 12,000 | | | 7.125%, 4/1/2021 | | | 12,900 | |
| | | | Enbridge, Inc. | | | | |
| | 6,000 | | | 0.684%, 6/2/2017g | | | 5,974 | |
| | | | Energy Transfer Partners, LP | | | | |
| | 8,000 | | | 6.700%, 7/1/2018 | | | 8,996 | |
| | | | Energy XXI Gulf Coast, Inc. | | | | |
| | 50,000 | | | 7.500%, 12/15/2021 | | | 27,000 | |
| | | | Enterprise Products Operating, LLC | | | | |
| | 21,000 | | | 2.550%, 10/15/2019 | | | 20,789 | |
| | | | EQT Corporation | | | | |
| | 8,000 | | | 8.125%, 6/1/2019 | | | 9,645 | |
| | | | Harvest Operations Corporation | | | | |
| | 23,677 | | | 6.875%, 10/1/2017 | | | 22,819 | |
| | | | Hess Corporation | | | | |
| | 6,000 | | | 8.125%, 2/15/2019 | | | 7,139 | |
| | | | Kinder Morgan, Inc. | | | | |
| | 8,000 | | | 3.050%, 12/1/2019 | | | 7,936 | |
| | 14,000 | | | 5.000%, 2/15/2021f | | | 14,565 | |
| | | | Kodiak Oil & Gas Corporation | | | | |
| | 23,677 | | | 5.500%, 1/15/2021 | | | 23,736 | |
| | | | Linn Energy, LLC | | | | |
| | 23,677 | | | 8.625%, 4/15/2020 | | | 20,599 | |
| | | | MEG Energy Corporation | | | | |
| | 30,000 | | | 6.375%, 1/30/2023f | | | 26,775 | |
| | | | Offshore Group Investment, Ltd. | | | | |
| | 40,000 | | | 7.500%, 11/1/2019 | | | 29,800 | |
| | | | Petrobras Global Finance BV | | | | |
| | 9,000 | | | 2.000%, 5/20/2016 | | | 8,596 | |
| | | | Petroleos Mexicanos | | | | |
| | 30,000 | | | 4.250%, 1/15/2025f | | | 29,805 | |
| | | | Regency Energy Partners, LP | | | | |
| | 45,000 | | | 5.000%, 10/1/2022 | | | 42,525 | |
| | | | Rosetta Resources, Inc. | | | | |
| | 60,000 | | | 5.875%, 6/1/2022 | | | 54,000 | |
| | | | Sabine Pass Liquefaction, LLC | | | | |
| | 45,000 | | | 5.750%, 5/15/2024 | | | 44,156 | |
| | | | Southwestern Energy Company | | | | |
| | 14,000 | | | 7.500%, 2/1/2018 | | | 15,771 | |
| | | | Suncor Energy, Inc. | | | | |
| | 6,000 | | | 6.100%, 6/1/2018 | | | 6,730 | |
| | | | Transocean, Inc. | | | | |
| | 10,000 | | | 6.000%, 3/15/2018 | | | 9,619 | |
| | | | Weatherford International, Ltd. | | | | |
| | 9,000 | | | 6.000%, 3/15/2018 | | | 9,608 | |
| | 5,000 | | | 9.625%, 3/1/2019 | | | 5,930 | |
| | | | | | | | |
| | | | Total | | | 632,260 | |
| | | | | | | | |
| Financials (1.7%) | | | | |
| | | | Abbey National Treasury Services plc | | | | |
| | 14,000 | | | 0.665%, 9/29/2017g | | | 13,965 | |
| | 8,000 | | | 3.050%, 8/23/2018 | | | 8,283 | |
| | | | ABN AMRO Bank NV | | | | |
| | 9,000 | | | 2.500%, 10/30/2018f | | | 9,090 | |
| | | | Air Lease Corporation | | | | |
| | 14,000 | | | 2.125%, 1/15/2018 | | | 13,755 | |
| | | | Ally Financial, Inc. | | | | |
| | 40,000 | | | 4.750%, 9/10/2018 | | | 41,400 | |
| | | | ANZ New Zealand International, Ltd. | | | | |
| | 9,000 | | | 1.400%, 4/27/2017f | | | 8,982 | |
| | | | Aviation Capital Group Corporation | | | | |
| | 6,000 | | | 3.875%, 9/27/2016f | | | 6,151 | |
| | | | Bank of America Corporation | | | | |
| | 14,000 | | | 5.700%, 5/2/2017 | | | 15,134 | |
| | 14,000 | | | 1.700%, 8/25/2017 | | | 14,003 | |
| | 15,000 | | | 5.750%, 12/1/2017 | | | 16,573 | |
| | 24,000 | | | 1.317%, 3/22/2018g | | | 24,175 | |
| | 20,000 | | | 5.650%, 5/1/2018 | | | 22,219 | |
| | 12,000 | | | 8.000%, 12/29/2049h | | | 12,885 | |
| | | | Banque Federative du Credit Mutuel SA | | | | |
| | 9,000 | | | 1.081%, 1/20/2017f,g | | | 9,062 | |
| | | | Barclays Bank plc | | | | |
| | 6,000 | | | 5.140%, 10/14/2020 | | | 6,453 | |
| | | | Barclays plc | | | | |
| | 14,000 | | | 2.750%, 11/8/2019 | | | 13,914 | |
| | | | BB&T Corporation | | | | |
| | 13,000 | | | 2.050%, 6/19/2018 | | | 13,086 | |
| | | | BBVA Banco Continental SA | | | | |
| | 13,000 | | | 2.250%, 7/29/2016f | | | 12,967 | |
| | | | Bear Stearns Companies, LLC | | | | |
| | 15,000 | | | 6.400%, 10/2/2017 | | | 16,799 | |
| | | | BNP Paribas SA | | | | |
| | 9,000 | | | 2.375%, 9/14/2017 | | | 9,154 | |
| | | | BPCE SA | | | | |
| | 9,000 | | | 1.625%, 2/10/2017 | | | 9,019 | |
| | | | Branch Banking and Trust Company | | | | |
| | 9,000 | | | 0.664%, 12/1/2016g | | | 9,008 | |
| | | | Caixa Economica Federal | | | | |
| | 30,000 | | | 4.250%, 5/13/2019f | | | 29,250 | |
| | | | Capital One Financial Corporation | | | | |
| | 12,000 | | | 6.150%, 9/1/2016 | | | 12,896 | |
| | | | CIT Group, Inc. | | | | |
| | 25,000 | | | 3.875%, 2/19/2019 | | | 24,937 | |
| | | | Citigroup, Inc. | | | | |
| | 21,000 | | | 5.500%, 2/15/2017 | | | 22,575 | |
| | 12,000 | | | 6.000%, 8/15/2017 | | | 13,276 | |
| | 21,000 | | | 1.850%, 11/24/2017 | | | 20,976 | |
| | 9,000 | | | 8.500%, 5/22/2019 | | | 11,215 | |
| | | | Compass Bank | | | | |
| | 14,000 | | | 1.850%, 9/29/2017 | | | 13,940 | |
| | | | Credit Agricole SA | | | | |
| | 14,000 | | | 6.625%, 9/29/2049f,h | | | 13,569 | |
| | | | CyrusOne, LP | | | | |
| | 23,677 | | | 6.375%, 11/15/2022 | | | 25,275 | |
| | | | DDR Corporation | | | | |
| | 6,000 | | | 9.625%, 3/15/2016 | | | 6,587 | |
| | | | Denali Borrower, LLC | | | | |
| | 46,000 | | | 5.625%, 10/15/2020f | | | 47,863 | |
The accompanying Notes to Financial Statements are an integral part of this schedule.
21
GROWTHAND INCOME PLUS FUND
Schedule of Investments as of December 31, 2014
| | | | | | | | |
Principal
Amount | | | Long-Term Fixed Income (13.8%) | | Value | |
| Financials (1.7%) - continued | |
| | | | Deutsche Bank AG | | | | |
| | $12,000 | | | 1.350%, 5/30/2017 | | $ | 11,899 | |
| | | | Discover Bank | | | | |
| | 3,000 | | | 8.700%, 11/18/2019 | | | 3,710 | |
| | | | Discover Financial Services | | | | |
| | 6,000 | | | 6.450%, 6/12/2017 | | | 6,629 | |
| | | | Duke Realty, LP | | | | |
| | 14,000 | | | 8.250%, 8/15/2019 | | | 17,272 | |
| | | | Fifth Third Bancorp | | | | |
| | 16,000 | | | 5.450%, 1/15/2017 | | | 17,170 | |
| | | | General Electric Capital Corporation | | | | |
| | 14,000 | | | 0.512%, 5/15/2017g | | | 13,976 | |
| | 10,000 | | | 5.625%, 9/15/2017 | | | 11,100 | |
| | 6,000 | | | 1.625%, 4/2/2018 | | | 6,009 | |
| | | | Genworth Financial, Inc. | | | | |
| | 10,000 | | | 7.700%, 6/15/2020 | | | 9,975 | |
| | | | Goldman Sachs Group, Inc. | | | | |
| | 9,000 | | | 6.250%, 9/1/2017 | | | 10,014 | |
| | 12,000 | | | 2.375%, 1/22/2018 | | | 12,121 | |
| | 6,000 | | | 2.625%, 1/31/2019 | | | 6,037 | |
| | 9,000 | | | 7.500%, 2/15/2019 | | | 10,705 | |
| | 14,000 | | | 2.550%, 10/23/2019 | | | 13,949 | |
| | | | Hartford Financial Services Group, Inc. | | | | |
| | 14,000 | | | 6.000%, 1/15/2019 | | | 15,877 | |
| | | | HBOS plc | | | | |
| | 12,000 | | | 6.750%, 5/21/2018f | | | 13,374 | |
| | | | HCP, Inc. | | | | |
| | 6,000 | | | 3.750%, 2/1/2016 | | | 6,166 | |
| | 9,000 | | | 3.750%, 2/1/2019 | | | 9,446 | |
| | | | Health Care REIT, Inc. | | | | |
| | 8,000 | | | 4.700%, 9/15/2017 | | | 8,596 | |
| | | | HSBC Holdings plc | | | | |
| | 21,000 | | | 5.625%, 12/29/2049h | | | 21,073 | |
| | | | Huntington National Bank | | | | |
| | 5,000 | | | 1.300%, 11/20/2016 | | | 4,979 | |
| | | | Icahn Enterprises, LP | | | | |
| | 50,000 | | | 6.000%, 8/1/2020 | | | 51,510 | |
| | | | ING Capital Funding Trust III | | | | |
| | 8,000 | | | 3.855%, 12/29/2049g,h | | | 7,980 | |
| | | | International Lease Finance Corporation | | | | |
| | 8,000 | | | 2.191%, 6/15/2016g | | | 7,990 | |
| | 25,000 | | | 5.875%, 4/1/2019 | | | 26,937 | |
| | | | Intesa Sanpaolo SPA | | | | |
| | 6,000 | | | 3.625%, 8/12/2015f | | | 6,081 | |
| | 3,000 | | | 3.875%, 1/16/2018 | | | 3,123 | |
| | 12,000 | | | 3.875%, 1/15/2019 | | | 12,425 | |
| | | | J.P. Morgan Chase & Company | | | | |
| | 12,000 | | | 3.450%, 3/1/2016 | | | 12,317 | |
| | 6,000 | | | 0.752%, 2/15/2017g | | | 5,985 | |
| | 6,000 | | | 2.000%, 8/15/2017 | | | 6,057 | |
| | 6,000 | | | 6.300%, 4/23/2019 | | | 6,969 | |
| | 12,000 | | | 7.900%, 4/29/2049h | | | 12,916 | |
| | | | KeyCorp | | | | |
| | 9,000 | | | 2.300%, 12/13/2018 | | | 9,031 | |
| | | | Kookmin Bank | | | | |
| | 9,000 | | | 1.109%, 1/27/2017f,g | | | 9,060 | |
| | | | Liberty Mutual Group, Inc. | | | | |
| | 3,000 | | | 5.000%, 6/1/2021f | | | 3,268 | |
| | | | Liberty Property, LP | | | | |
| | 14,000 | | | 5.500%, 12/15/2016 | | | 15,032 | |
| | | | Macquarie Bank, Ltd. | | | | |
| | 7,000 | | | 5.000%, 2/22/2017f | | | 7,466 | |
| | | | MetLife, Inc. | | | | |
| | 14,000 | | | 1.903%, 12/15/2017 | | | 14,032 | |
| | | | Mizuho Corporate Bank, Ltd. | | | | |
| | 11,000 | | | 1.550%, 10/17/2017f | | | 10,896 | |
| | | | Morgan Stanley | | | | |
| | 12,000 | | | 1.750%, 2/25/2016 | | | 12,065 | |
| | 15,000 | | | 6.250%, 8/28/2017 | | | 16,663 | |
| | 14,000 | | | 1.875%, 1/5/2018 | | | 13,949 | |
| | 12,000 | | | 6.625%, 4/1/2018 | | | 13,668 | |
| | 8,000 | | | 4.875%, 11/1/2022 | | | 8,497 | |
| | | | Murray Street Investment Trust I | | | | |
| | 18,000 | | | 4.647%, 3/9/2017 | | | 18,997 | |
| | | | National City Corporation | | | | |
| | 6,000 | | | 6.875%, 5/15/2019 | | | 7,049 | |
| | | | Nomura Holdings, Inc. | | | | |
| | 9,000 | | | 2.000%, 9/13/2016 | | | 9,073 | |
| | 6,000 | | | 2.750%, 3/19/2019 | | | 6,066 | |
| | | | PNC Bank NA | | | | |
| | 12,000 | | | 1.150%, 11/1/2016 | | | 12,016 | |
| | | | Pricoa Global Funding I | | | | |
| | 12,000 | | | 1.350%, 8/18/2017f | | | 11,951 | |
| | | | Realty Income Corporation | | | | |
| | 10,000 | | | 2.000%, 1/31/2018 | | | 10,018 | |
| | | | Regions Bank | | | | |
| | 12,000 | | | 7.500%, 5/15/2018 | | | 13,931 | |
| | | | Reinsurance Group of America, Inc. | | | | |
| | 12,000 | | | 5.625%, 3/15/2017 | | | 12,977 | |
| | | | Royal Bank of Scotland Group plc | | | | |
| | 9,000 | | | 5.050%, 1/8/2015 | | | 9,002 | |
| | 7,000 | | | 1.197%, 3/31/2017g | | | 7,022 | |
| | | | Societe Generale SA | | | | |
| | 9,000 | | | 5.750%, 4/20/2016f | | | 9,424 | |
| | | | Sumitomo Mitsui Banking Corporation | | | | |
| | 18,000 | | | 1.300%, 1/10/2017 | | | 17,966 | |
| | | | Suncorp-Metway, Ltd. | | | | |
| | 6,000 | | | 0.955%, 3/28/2017f,g | | | 6,009 | |
| | | | Swiss RE Capital I, LP | | | | |
| | 9,000 | | | 6.854%, 5/29/2049f,h | | | 9,427 | |
| | | | Synchrony Financial | | | | |
| | 18,000 | | | 1.875%, 8/15/2017 | | | 18,035 | |
| | | | Ventas Realty, LP | | | | |
| | 7,000 | | | 1.250%, 4/17/2017 | | | 6,935 | |
| | | | Voya Financial, Inc. | | | | |
| | 9,000 | | | 2.900%, 2/15/2018 | | | 9,214 | |
| | | | WEA Finance, LLC | | | | |
| | 14,000 | | | 1.750%, 9/15/2017f | | | 13,925 | |
| | | | Wells Fargo & Company | | | | |
| | 32,000 | | | 1.400%, 9/8/2017 | | | 31,974 | |
| | | | | | | | |
| | | | Total | | | 1,313,441 | |
| | | | | | | | |
The accompanying Notes to Financial Statements are an integral part of this schedule.
22
GROWTHAND INCOME PLUS FUND
Schedule of Investments as of December 31, 2014
| | | | | | | | |
Principal
Amount | | | Long-Term Fixed Income (13.8%) | | Value | |
| Foreign Government (<0.1%) | |
| | | | Uruguay Government International Bond | | | | |
| | $19,000 | | | 5.100%, 6/18/2050 | | $ | 19,285 | |
| | | | | | | | |
| | | | Total | | | 19,285 | |
| | | | | | | | |
|
| Mortgage-Backed Securities (2.6%) | |
| | | | Federal Home Loan Mortgage Corporation Gold 15-Yr. Pass Through | | | | |
| | 250,000 | | | 3.000%, 1/1/2030c | | | 259,478 | |
| | | | Federal Home Loan Mortgage Corporation Gold 30-Yr. Pass Through | | | | |
| | 150,000 | | | 4.000%, 1/1/2045c | | | 159,891 | |
| | | | Federal National Mortgage Association Conventional 15-Yr. Pass Through | | | | |
| | 150,000 | | | 3.500%, 1/1/2030c | | | 158,461 | |
| | | | Federal National Mortgage Association Conventional 30-Yr. Pass Through | | | | |
| | 475,000 | | | 3.500%, 1/1/2045c | | | 495,150 | |
| | 475,000 | | | 4.000%, 1/1/2045c | | | 506,946 | |
| | 405,000 | | | 4.500%, 1/1/2045c | | | 439,615 | |
| | | | | | | | |
| | | | Total | | | 2,019,541 | |
| | | | | | | | |
|
| Technology (0.3%) | |
| | | | Alibaba Group Holding, Ltd. | | | | |
| | 15,000 | | | 2.500%, 11/28/2019f | | | 14,798 | |
| | | | Alliance Data Systems Corporation | | | | |
| | 25,000 | | | 5.375%, 8/1/2022f | | | 24,687 | |
| | | | EMC Corporation | | | | |
| | 6,000 | | | 1.875%, 6/1/2018 | | | 5,980 | |
| | | | Fidelity National Information Services, Inc. | | | | |
| | 12,000 | | | 1.450%, 6/5/2017 | | | 11,933 | |
| | | | First Data Corporation | | | | |
| | 23,677 | | | 7.375%, 6/15/2019f | | | 24,920 | |
| | | | Freescale Semiconductor, Inc. | | | | |
| | 30,000 | | | 6.000%, 1/15/2022f | | | 31,350 | |
| | | | Hewlett-Packard Company | | | | |
| | 9,000 | | | 5.400%, 3/1/2017 | | | 9,716 | |
| | | | Iron Mountain, Inc. | | | | |
| | 23,677 | | | 6.000%, 8/15/2023 | | | 24,624 | |
| | | | Sensata Technologies BV | | | | |
| | 60,000 | | | 4.875%, 10/15/2023f | | | 59,700 | |
| | | | Tyco Electronics Group SA | | | | |
| | 13,000 | | | 6.550%, 10/1/2017 | | | 14,633 | |
| | | | Xerox Corporation | | | | |
| | 13,000 | | | 7.200%, 4/1/2016 | | | 13,920 | |
| | | | | | | | |
| | | | Total | | | 236,261 | |
| | | | | | | | |
|
| Transportation (0.2%) | |
| | | | American Airlines Pass Through Trust | | | | |
| | 5,664 | | | 4.950%, 1/15/2023 | | | 6,046 | |
| | | | Avis Budget Car Rental, LLC | | | | |
| | 50,000 | | | 5.125%, 6/1/2022f | | | 50,500 | |
| | | | Continental Airlines, Inc. | | | | |
| | 20,077 | | | 6.250%, 4/11/2020 | | | 21,094 | |
| | | | Delta Air Lines, Inc. | | | | |
| | 12,000 | | | 6.750%, 5/23/2017 | | | 12,510 | |
| | 8,139 | | | 4.950%, 5/23/2019 | | | 8,709 | |
| | 6,919 | | | 4.750%, 5/7/2020 | | | 7,360 | |
| | | | Korea Expressway Corporation | |
| | 10,000 | | | 1.625%, 4/28/2017f | | | 9,944 | |
| | | | Southwest Airlines Company | |
| | 14,000 | | | 2.750%, 11/6/2019 | | | 14,064 | |
| | | | United Air Lines, Inc. | |
| | 5,743 | | | 10.400%, 11/1/2016 | | | 6,389 | |
| | | | | | | | |
| | | | Total | | | 136,616 | |
| | | | | | | | |
|
| U.S. Government and Agencies (0.4%) | |
| | | | U.S. Treasury Notes | |
| | 205,000 | | | 1.875%, 6/30/2020 | | | 206,378 | |
| | 93,000 | | | 3.625%, 2/15/2044 | | | 109,442 | |
| | | | | | | | |
| | | | Total | | | 315,820 | |
| | | | | | | | |
|
| Utilities (0.7%) | |
| | | | Access Midstream Partners, LP | |
| | 40,000 | | | 4.875%, 5/15/2023 | | | 40,600 | |
| | | | AES Corporation | |
| | 23,677 | | | 7.375%, 7/1/2021 | | | 26,755 | |
| | | | Atlas Pipeline Partners, LP | |
| | 30,000 | | | 4.750%, 11/15/2021 | | | 28,500 | |
| | | | Berkshire Hathaway Energy Company | |
| | 14,000 | | | 2.400%, 2/1/2020f | | | 13,939 | |
| | | | Calpine Corporation | |
| | 45,000 | | | 5.375%, 1/15/2023 | | | 45,450 | |
| | | | Commonwealth Edison Company | |
| | 7,000 | | | 6.950%, 7/15/2018 | | | 8,091 | |
| | | | DCP Midstream Operating, LP | |
| | 8,000 | | | 2.500%, 12/1/2017 | | | 7,991 | |
| | | | DTE Energy Company | |
| | 14,000 | | | 2.400%, 12/1/2019 | | | 14,002 | |
| | | | Dynegy Finance I, Inc. | |
| | 60,000 | | | 7.375%, 11/1/2022f | | | 61,050 | |
| | | | EDP Finance BV | |
| | 14,000 | | | 4.125%, 1/15/2020f | | | 14,078 | |
| | | | El Paso Corporation | |
| | 7,000 | | | 7.000%, 6/15/2017 | | | 7,718 | |
| | | | Electricite de France SA | |
| | 9,000 | | | 0.691%, 1/20/2017f,g | | | 9,025 | |
| | | | Enel Finance International NV | | | | |
| | 8,000 | | | 5.125%, 10/7/2019f | | | 8,840 | |
| | | | Exelon Generation Company, LLC | | | | |
| | 6,000 | | | 5.200%, 10/1/2019 | | | 6,630 | |
| | | | MarkWest Energy Partners, LP | | | | |
| | 60,000 | | | 4.875%, 12/1/2024 | | | 58,650 | |
| | | | MidAmerican Energy Holdings Company | | | | |
| | 13,000 | | | 1.100%, 5/15/2017 | | | 12,867 | |
| | 6,000 | | | 5.750%, 4/1/2018 | | | 6,724 | |
| | | | NiSource Finance Corporation | | | | |
| | 12,000 | | | 6.400%, 3/15/2018 | | | 13,667 | |
| | | | NRG Energy, Inc. | | | | |
| | 23,677 | | | 6.625%, 3/15/2023 | | | 24,624 | |
| | | | ONEOK Partners, LP | | | | |
| | 8,000 | | | 2.000%, 10/1/2017 | | | 7,955 | |
| | | | Pacific Gas & Electric Company | | | | |
| | 8,000 | | | 5.625%, 11/30/2017 | | | 8,892 | |
The accompanying Notes to Financial Statements are an integral part of this schedule.
23
GROWTHAND INCOME PLUS FUND
Schedule of Investments as of December 31, 2014
| | | | | | | | |
Principal
Amount | | | Long-Term Fixed Income (13.8%) | | Value | |
| Utilities (0.7%) - continued | | | | |
| | | | Panhandle Eastern Pipe Line Company, LP | | | | |
| $ | 9,000 | | | 6.200%, 11/1/2017 | | $ | 10,002 | |
| | | | PG&E Corporation | | | | |
| | 6,000 | | | 2.400%, 3/1/2019 | | | 6,009 | |
| | | | PPL Capital Funding, Inc. | | | | |
| | 12,000 | | | 1.900%, 6/1/2018 | | | 11,980 | |
| | | | Sempra Energy | | | | |
| | 14,000 | | | 6.150%, 6/15/2018 | | | 15,866 | |
| | | | Southern Company | | | | |
| | 14,000 | | | 1.300%, 8/15/2017 | | | 13,943 | |
| | | | TransAlta Corporation | | | | |
| | 12,000 | | | 1.900%, 6/3/2017 | | | 11,949 | |
| | | | Williams Companies, Inc. | | | | |
| | 12,000 | | | 7.875%, 9/1/2021 | | | 13,862 | |
| | | | | | | | |
| | | | Total | | | 509,659 | |
| | | | | | | | |
| | | | Total Long-Term Fixed Income (cost $10,824,263) | | | 10,843,290 | |
| | | | | | | | |
| | |
Shares or
Principal
Amount | | | Short-Term Investments (8.5%)i | | | |
| | | | Federal Home Loan Bank Discount Notes | | | | |
| | 100,000 | | | 0.080%, 1/21/2015j | | | 99,996 | |
| | 200,000 | | | 0.090%, 4/24/2015j | | | 199,943 | |
| | | | Thrivent Cash Management Trust | | | | |
| | 6,347,729 | | | 0.060% | | | 6,347,729 | |
| | | | | | | | |
| | | | Total Short-Term Investments (at amortized cost) | | | 6,647,668 | |
| | | | | | | | |
| | | | Total Investments (cost $79,199,473) 102.8% | | $ | 80,450,198 | |
| | | | | | | | |
| | | | Other Assets and Liabilities, Net (2.8%) | | | (2,225,480 | ) |
| | | | | | | | |
| | | | Total Net Assets 100.0% | | $ | 78,224,718 | |
| | | | | | | | |
| a | The stated interest rate represents the weighted average of all contracts within the bank loan facility. |
| b | All or a portion of the loan is unfunded. |
| c | Denotes investments purchased on a when-issued or delayed delivery basis. |
| d | Non-income producing security. |
| e | Denotes step coupon securities. Step coupon securities pay an initial coupon rate for the first period and then different coupon rates for following periods. The rate shown is as of December 31, 2014. |
| f | Denotes securities sold under Rule 144A of the Securities Act of 1933, which exempts them from registration. These securities have been deemed liquid and may be resold to other dealers in the program or to other qualified institutional buyers. As of December 31, 2014, the value of these investments was $1,947,076 or 2.5% of total net assets. |
| g | Denotes variable rate securities. Variable rate securities are securities whose yields vary with a designated market index or market rate. The rate shown is as of December 31, 2014. |
| h | Denotes perpetual securities. Perpetual securities pay an indefinite stream of interest, but may be called by the issuer at an earlier date. |
| i | The interest rate shown reflects the yield, coupon rate or the discount rate at the date of purchase. |
| j | At December 31, 2014, $299,939 of investments were held on deposit with the counterparty and pledged as the initial margin deposit for open futures contracts. |
| * | Denotes restricted securities. Restricted securities are investment securities which have been deemed illiquid and cannot be offered for public sale without first being registered under the Securities Act of 1933. The following table indicates the acquisition date and cost of restricted securities Growth and Income Plus Fund owned as of December 31, 2014. |
| | | | | | | | |
Security | | Acquisition
Date | | | Cost | |
Bayview Opportunity Master Fund Trust IIB, LP, 1/28/2034 | | | 1/17/2014 | | | $ | 77,661 | |
JBS Finance II, Ltd., 1/29/2018 | | | 8/19/2013 | | | | 24,656 | |
Definitions:
| | | | | | |
ETF - Exchange Traded Fund. |
REIT - Real Estate Investment Trust is a company that buys, develops, manages and/or sells real estate assets. |
Unrealized Appreciation (Depreciation)
Gross unrealized appreciation and depreciation of investments, based on cost for federal income tax purposes, were as follows:
| | | | |
Gross unrealized appreciation | | $ | 4,180,119 | |
Gross unrealized depreciation | | | (2,986,508 | ) |
| | | | |
Net unrealized appreciation (depreciation) | | $ | 1,193,611 | |
Cost for federal income tax purposes | | $ | 79,256,587 | |
The accompanying Notes to Financial Statements are an integral part of this schedule.
24
GROWTHAND INCOME PLUS FUND
Schedule of Investments as of December 31, 2014
Fair Valuation Measurements
The following table is a summary of the inputs used, as of December 31, 2014, in valuing Growth and Income Plus Fund’s assets carried at fair value.
| | | | | | | | | | | | | | | | |
Investments in Securities | | Total | | | Level 1 | | | Level 2 | | | Level 3 | |
Bank Loans | | | | | | | | | | | | | | | | |
Basic Materials | | | 663,592 | | | | — | | | | 663,592 | | | | — | |
Capital Goods | | | 518,458 | | | | — | | | | 518,458 | | | | — | |
Communications Services | | | 2,763,077 | | | | — | | | | 2,506,639 | | | | 256,438 | |
Consumer Cyclical | | | 1,404,225 | | | | — | | | | 1,404,225 | | | | — | |
Consumer Non-Cyclical | | | 981,974 | | | | — | | | | 840,622 | | | | 141,352 | |
Energy | | | 497,706 | | | | — | | | | 460,164 | | | | 37,542 | |
Financials | | | 608,764 | | | | — | | | | 608,764 | | | | — | |
Technology | | | 444,584 | | | | — | | | | 444,584 | | | | — | |
Transportation | | | 259,842 | | | | — | | | | 167,916 | | | | 91,926 | |
Utilities | | | 152,544 | | | | — | | | | 152,544 | | | | — | |
Common Stock | | | | | | | | | | | | | | | | |
Consumer Discretionary | | | 5,438,701 | | | | 3,309,576 | | | | 2,129,125 | | | | — | |
Consumer Staples | | | 3,344,762 | | | | 2,161,482 | | | | 1,183,280 | | | | — | |
Energy | | | 3,135,109 | | | | 1,655,525 | | | | 1,479,584 | | | | — | |
Financials | | | 15,885,246 | | | | 11,964,723 | | | | 3,920,523 | | | | — | |
Health Care | | | 8,129,779 | | | | 6,291,163 | | | | 1,838,616 | | | | — | |
Industrials | | | 6,589,498 | | | | 4,468,224 | | | | 2,121,274 | | | | — | |
Information Technology | | | 6,480,311 | | | | 5,688,129 | | | | 792,182 | | | | — | |
Materials | | | 1,929,956 | | | | 1,009,031 | | | | 920,925 | | | | — | |
Telecommunications Services | | | 1,988,619 | | | | 103,251 | | | | 1,885,368 | | | | — | |
Utilities | | | 1,742,493 | | | | — | | | | 1,742,493 | | | | — | |
Long-Term Fixed Income | | | | | | | | | | | | | | | | |
Asset-Backed Securities | | | 130,113 | | | | — | | | | 130,113 | | | | — | |
Basic Materials | | | 282,954 | | | | — | | | | 282,954 | | | | — | |
Capital Goods | | | 385,620 | | | | — | | | | 385,620 | | | | — | |
Collateralized Mortgage Obligations | | | 2,298,086 | | | | — | | | | 2,298,086 | | | | — | |
Communications Services | | | 1,054,469 | | | | — | | | | 1,054,469 | | | | — | |
Consumer Cyclical | | | 656,615 | | | | — | | | | 656,615 | | | | — | |
Consumer Non-Cyclical | | | 852,550 | | | | — | | | | 852,550 | | | | — | |
Energy | | | 632,260 | | | | — | | | | 632,260 | | | | — | |
Financials | | | 1,313,441 | | | | — | | | | 1,313,441 | | | | — | |
Foreign Government | | | 19,285 | | | | — | | | | 19,285 | | | | — | |
Mortgage-Backed Securities | | | 2,019,541 | | | | — | | | | 2,019,541 | | | | — | |
Technology | | | 236,261 | | | | — | | | | 236,261 | | | | — | |
Transportation | | | 136,616 | | | | — | | | | 136,616 | | | | — | |
U.S. Government and Agencies | | | 315,820 | | | | — | | | | 315,820 | | | | — | |
Utilities | | | 509,659 | | | | — | | | | 509,659 | | | | — | |
Short-Term Investments | | | 6,647,668 | | | | 6,347,729 | | | | 299,939 | | | | — | |
| | | | | | | | | | | | | | | | |
Total | | $ | 80,450,198 | | | $ | 42,998,833 | | | $ | 36,924,107 | | | $ | 527,258 | |
| | | | | | | | | | | | | | | | |
| | | | |
Other Financial Instruments | | Total | | | Level 1 | | | Level 2 | | | Level 3 | |
Asset Derivatives | | | | | | | | | | | | | | | | |
Futures Contracts | | | 93,412 | | | | 93,412 | | | | — | | | | — | |
| | | | | | | | | | | | | | | | |
Total Asset Derivatives | | $ | 93,412 | | | $ | 93,412 | | | $ | — | | | $ | — | |
| | | | | | | | | | | | | | | | |
There were no significant transfers between Levels during the period ended December 31, 2014. Transfers between Levels are identified as of the end of the period.
| | | | | | | | | | | | | | | | | | | | |
Futures Contracts | | Number of
Contracts
Long/(Short) | | | Expiration
Date | | | Notional
Principal
Amount | | | Value | | | Unrealized
Gain/(Loss) | |
2-Yr. U.S. Treasury Bond Futures | | | (26 | ) | | | March 2015 | | | ($ | 5,689,858 | ) | | ($ | 5,683,437 | ) | | $ | 6,421 | |
5-Yr. U.S. Treasury Bond Futures | | | 13 | | | | March 2015 | | | | 1,544,602 | | | | 1,546,086 | | | | 1,484 | |
30-Yr. U.S. Treasury Bond Futures | | | 1 | | | | March 2015 | | | | 140,573 | | | | 144,562 | | | | 3,989 | |
Mini MSCI EAFE Index Futures | | | 10 | | | | March 2015 | | | | 870,837 | | | | 878,950 | | | | 8,113 | |
S&P 500 Index Mini-Futures | | | 16 | | | | March 2015 | | | | 1,591,428 | | | | 1,641,920 | | | | 50,492 | |
Ultra Long Term U.S. Treasury Bond Futures | | | 3 | | | | March 2015 | | | | 472,650 | | | | 495,563 | | | | 22,913 | |
Total Futures Contracts | | | | | | | | | | | | | | | | | | $ | 93,412 | |
The accompanying Notes to Financial Statements are an integral part of this schedule.
25
GROWTHAND INCOME PLUS FUND
Schedule of Investments as of December 31, 2014
The following table summarizes the fair value and Statement of Assets and Liabilities location, as of December 31, 2014, for Growth and Income Plus Fund’s investments in financial derivative instruments by primary risk exposure as discussed under item (2) Significant Accounting Policies of the Notes to Financial Statements.
| | | | | | |
Derivatives by risk category | | Statement of Assets and Liabilities Location | | Fair Value | |
Asset Derivatives | | | | | | |
Interest Rate Contracts | | | | | | |
Futures* | | Net Assets - Net unrealized appreciation/(depreciation) on Futures contracts | | $ | 34,807 | |
Total Interest Rate Contracts | | | 34,807 | |
Equity Contracts | | | | | | |
Futures* | | Net Assets - Net unrealized appreciation/(depreciation) on Futures contracts | | | 58,605 | |
Total Equity Contracts | | | 58,605 | |
| | | | | | |
Total Asset Derivatives | | | | $ | 93,412 | |
| | | | | | |
| * | Includes cumulative appreciation/depreciation of futures contracts as reported in the Schedule of Investments. Only current day’s variation margin is reported within the Statement of Assets and Liabilities. |
The following table summarizes the net realized gains/(losses) and Statement of Operations location, for the period ended December 31, 2014, for Growth and Income Plus Fund’s investments in financial derivative instruments by primary risk exposure.
| | | | | | |
Derivatives by risk category | | Statement of Operations Location | | Realized Gains/(Losses)
recognized in Income | |
| Interest Rate Contracts | | | | | | |
Futures | | Net realized gains/(losses) on Futures contracts | | | 52,239 | |
Total Interest Rate Contracts | | | | | 52,239 | |
| Equity Contracts | | | | | | |
Futures | | Net realized gains/(losses) on Futures contracts | | | 83,443 | |
Total Equity Contracts | | | | | 83,443 | |
| | | | | | |
Total | | | | $ | 135,682 | |
| | | | | | |
The following table summarizes the change in net unrealized appreciation/(depreciation) and Statement of Operations location, for the period ended December 31, 2014, for Growth and Income Plus Fund’s investments in financial derivative instruments by primary risk exposure.
| | | | | | |
Derivatives by risk category | | Statement of Operations Location | | Change in unrealized
appreciation/(depreciation)
recognized in Income | |
| Interest Rate Contracts | | | | | | |
Futures | | Change in net unrealized appreciation/(depreciation) on Futures contracts | | | 34,807 | |
Total Interest Rate Contracts | | | | | 34,807 | |
| Equity Contracts | | | | | | |
Futures | | Change in net unrealized appreciation/(depreciation) on Futures contracts | | | 21,392 | |
Total Equity Contracts | | | | | 21,392 | |
| | | | | | |
Total | | | | $ | 56,199 | |
| | | | | | |
The following table presents Growth and Income Plus Fund’s average volume of derivative activity during the period ended December 31, 2014.
| | | | | | | | |
Derivative Risk Category | | Futures
(Notional)* | | | Futures
(Percentage of
Average Net Assets) | |
Equity Contracts | | $ | 3,807,090 | | | | 5.8 | % |
Interest Rate | | | | | | | | |
Contracts | | | 3,856,719 | | | | 5.9 | |
| * | Notional amount represents long or short, or both, derivative positions held by the Fund. |
The accompanying Notes to Financial Statements are an integral part of this schedule.
26
GROWTHAND INCOME PLUS FUND
Schedule of Investments as of December 31, 2014
Investment in Affiliates
Affiliated issuers, as defined under the Investment Company Act of 1940, include those in which the Fund’s holdings of an issuer represent 5% or more of the outstanding voting securities of an issuer, or any affiliated mutual fund.
A summary of transactions for the fiscal year to date, in Growth and Income Plus Fund, is as follows
| | | | | | | | | | | | | | | | | | | | | | | | |
Fund | | Value
December 31,
2013 | | | Gross
Purchases | | | Gross Sales | | | Shares Held at
December 31,
2014 | | | Value
December 31,
2014 | | | Income Earned
January 1, 2014 -
December 31, 2014 | |
Cash Management Trust-
Short Term Investment | | $ | 2,877,246 | | | $ | 51,412,380 | | | $ | 47,941,897 | | | | 6,347,729 | | | $ | 6,347,729 | | | $ | 3,827 | |
Total Value and Income Earned | | | 2,877,246 | | | | | | | | | | | | | | | | 6,347,729 | | | | 3,827 | |
The accompanying Notes to Financial Statements are an integral part of this schedule.
27
DIVERSIFIED INCOME PLUS FUND
Schedule of Investments as of December 31, 2014
| | | | | | | | |
Principal Amount | | | Bank Loans (13.8%)a | | Value | |
| Basic Materials (1.1%) | | | | |
| | | | Alpha Natural Resources, Inc., Term Loan | | | | |
| $ | 1,155,302 | | | 3.500%, 5/22/2020 | | $ | 913,416 | |
| | | | Crown Americas, LLC, Term Loan | | | | |
| | 1,210,000 | | | 0.000%, 10/20/2021b,c | | | 1,208,488 | |
| | | | Fortescue Metals Group, Ltd., Term Loan | | | | |
| | 1,518,643 | | | 3.750%, 6/30/2019 | | | 1,375,891 | |
| | | | Ineos Group Holdings, Ltd., Term Loan | | | | |
| | 1,561,775 | | | 3.750%, 5/4/2018 | | | 1,510,846 | |
| | | | NewPage Corporation, Term Loan | | | | |
| | 1,650,000 | | | 9.500%, 2/11/2021 | | | 1,564,744 | |
| | | | Tronox Pigments BV, Term Loan | | | | |
| | 441,380 | | | 0.000%, 3/19/2020b,c | | | 433,289 | |
| | | | Wausau Paper Corporation, Term Loan | | | | |
| | 646,750 | | | 6.500%, 7/30/2020 | | | 640,282 | |
| | | | | | | | |
| | | | Total | | | 7,646,956 | |
| | | | | | | | |
| |
| Capital Goods (0.7%) | | | | |
| | | | ADS Waste Holdings, Inc., Term Loan | | | | |
| | 874,500 | | | 3.750%, 10/9/2019 | | | 847,443 | |
| | | | Berry Plastics Group, Inc., Term Loan | | | | |
| | 884,250 | | | 3.500%, 2/8/2020 | | | 853,929 | |
| | | | Rexnord, LLC, Term Loan | | | | |
| | 888,750 | | | 4.000%, 8/21/2020 | | | 869,197 | |
| | | | Silver II Borrower, Term Loan | | | | |
| | 827,976 | | | 4.000%, 12/13/2019 | | | 767,691 | |
| | | | STHI Holding Corporation, Term Loan | | | | |
| | 1,271,812 | | | 4.500%, 8/6/2021 | | | 1,260,150 | |
| | | | | | | | |
| | | | Total | | | 4,598,410 | |
| | | | | | | | |
| |
| Communications Services (4.6%) | | | | |
| | | | Atlantic Broadband Penn, LLC, Term Loan | | | | |
| | 870,476 | | | 3.250%, 11/30/2019 | | | 850,890 | |
| | | | Birch Communication Inc., Term Loan | | | | |
| | 1,020,104 | | | 7.750%, 7/17/2020 | | | 999,702 | |
| | | | Block Communications, Inc., Term Loan | | | | |
| | 1,221,937 | | | 5.750%, 11/7/2021 | | | 1,213,543 | |
| | | | Cable & Wireless Communications plc, Term Loan | | | | |
| | 496,000 | | | 0.000%, 11/25/2016b,c | | | 493,520 | |
| | | | Cengage Learning Aquisitions, Term Loan | | | | |
| | 1,111,600 | | | 7.000%, 3/31/2020 | | | 1,099,094 | |
| | | | Charter Communications Operating, LLC, Term Loan | | | | |
| | 437,778 | | | 3.000%, 7/1/2020 | | | 428,751 | |
| | 886,500 | | | 3.000%, 1/3/2021 | | | 867,848 | |
| | | | Cincinnati Bell, Inc., Term Loan | | | | |
| | 996,762 | | | 4.000%, 9/10/2020b,c | | | 984,303 | |
| | | | Clear Channel Communications, Inc., Term Loan | | | | |
| | 5,986 | | | 3.819%, 1/29/2016 | | | 5,917 | |
| | 949,467 | | | 6.919%, 1/30/2019 | | | 893,174 | |
| | 228,177 | | | 7.669%, 7/30/2019 | | | 217,053 | |
| | | | Cumulus Media Holdings, Inc., Term Loan | | | | |
| | 1,019,373 | | | 4.250%, 12/23/2020b,c | | | 987,089 | |
| | | | Fairpoint Communications, Term Loan | | | | |
| | 88,646 | | | 7.500%, 2/14/2019 | | | 87,705 | |
| | | | Grande Communications Networks, LLC, Term Loan | | | | |
| | 1,182,012 | | | 4.500%, 5/29/2020 | | | 1,165,759 | |
| | | | Gray Television, Inc., Term Loan | | | | |
| | 1,308,741 | | | 3.750%, 6/13/2021 | | | 1,285,838 | |
| | | | Hargray Communications Group, Inc., Term Loan | | | | |
| | 1,047,372 | | | 5.250%, 6/26/2019 | | | 1,039,516 | |
| | | | IMG Worldwide, Inc., Term Loan | | | | |
| | 1,094,500 | | | 5.250%, 5/6/2021 | | | 1,055,514 | |
| | | | Integra Telecom Holdings, Inc., Term Loan | | | | |
| | 884,250 | | | 5.250%, 2/22/2019 | | | 858,280 | |
| | | | Intelsat Jackson Holdings SA, Term Loan | | | | |
| | 948,775 | | | 3.750%, 6/30/2019 | | | 933,358 | |
| | | | Level 3 Communications, Inc., Term Loan | | | | |
| | 1,450,000 | | | 4.000%, 1/15/2020 | | | 1,437,312 | |
| | | | Liberty Cablevision of Puerto Rico, LLC, Term Loan | | | | |
| | 250,000 | | | 0.000%, 1/7/2022b,c | | | 242,500 | |
| | 775,000 | | | 4.500%, 1/7/2022 | | | 753,687 | |
| | | | LTS Buyer, LLC, Term Loan | | | | |
| | 972,965 | | | 4.000%, 4/13/2020 | | | 950,470 | |
| | | | McGraw-Hill Global Education, LLC, Term Loan | | | | |
| | 856,422 | | | 5.750%, 3/22/2019 | | | 851,874 | |
| | | | NEP/NCP Holdco, Inc., Term Loan | | | | |
| | 1,179,105 | | | 4.250%, 1/22/2020 | | | 1,151,596 | |
| | | | NTelos, Inc., Term Loan | | | | |
| | 1,161,527 | | | 5.750%, 11/9/2019 | | | 1,010,528 | |
| | | | Puerto Rico Cable Acquisition Company, Inc., Term Loan | | | | |
| | 909,069 | | | 5.500%, 7/31/2018 | | | 902,251 | |
| | | | SBA Senior Finance II, LLC, Term Loan | | | | |
| | 1,094,500 | | | 3.250%, 3/24/2021 | | | 1,069,644 | |
| | | | TNS, Inc., Term Loan | | | | |
| | 1,040,533 | | | 5.000%, 2/14/2020 | | | 1,028,827 | |
| | | | Univision Communications, Inc., Term Loan | | | | |
| | 1,562,087 | | | 4.000%, 3/1/2020 | | | 1,525,378 | |
| | | | Virgin Media Investment Holdings, Ltd., Term Loan | | | | |
| | 900,000 | | | 3.500%, 6/7/2020 | | | 882,549 | |
| | | | WideOpenWest Finance, LLC, Term Loan | | | | |
| | 845,221 | | | 4.750%, 4/1/2019 | | | 838,358 | |
| | | | WMG Acquisition Corporation, Term Loan | | | | |
| | 888,750 | | | 3.750%, 7/1/2020 | | | 853,200 | |
| | | | XO Communications, LLC, Term Loan | | | | |
| | 1,091,750 | | | 4.250%, 3/20/2021 | | | 1,069,915 | |
| | | | Yankee Cable Acquisition, LLC, Term Loan | | | | |
| | 853,350 | | | 4.500%, 3/1/2020 | | | 848,017 | |
The accompanying Notes to Financial Statements are an integral part of this schedule.
28
DIVERSIFIED INCOME PLUS FUND
Schedule of Investments as of December 31, 2014
| | | | | | | | |
Principal Amount | | | Bank Loans (13.8%)a | | Value | |
| Communications Services (4.6%) - continued | | | | |
| | | | Zayo Group, LLC, Term Loan | | | | |
| $ | 1,045,663 | | | 4.000%, 7/2/2019 | | $ | 1,033,011 | |
| | | | | | | | |
| | | | Total | | | 31,915,971 | |
| | | | | | | | |
| |
| Consumer Cyclical (2.3%) | | | | |
| | | | Amaya Gaming Group, Inc., Term Loan | | | | |
| | 1,216,950 | | | 5.000%, 8/1/2021 | | | 1,203,868 | |
| | | | Booz Allen Hamilton, Inc., Term Loan | | | | |
| | 372,093 | | | 3.750%, 7/31/2019 | | | 369,923 | |
| | | | Burlington Coat Factory Warehouse Corporation, Term Loan | | | | |
| | 922,056 | | | 4.250%, 8/13/2021 | | | 908,806 | |
| | | | Ceridian HCM Holding, Inc., Term Loan | | | | |
| | 435,890 | | | 4.500%, 9/15/2020 | | | 427,991 | |
| | | | Chrysler Group, LLC, Term Loan | | | | |
| | 736,641 | | | 3.500%, 5/24/2017 | | | 731,249 | |
| | 471,437 | | | 3.250%, 12/31/2018 | | | 466,134 | |
| | | | Golden Nugget, Inc., Delayed Draw | | | | |
| | 155,925 | | | 5.500%, 11/21/2019 | | | 153,684 | |
| | | | Golden Nugget, Inc., Term Loan | | | | |
| | 363,825 | | | 5.500%, 11/21/2019 | | | 358,597 | |
| | | | Hilton Worldwide Finance, LLC, Term Loan | | | | |
| | 1,030,702 | | | 3.500%, 10/26/2020 | | | 1,017,385 | |
| | | | J.C. Penney Corporation, Inc., Term Loan | | | | |
| | 886,500 | | | 6.000%, 5/22/2018 | | | 868,034 | |
| | | | Las Vegas Sands, LLC, Term Loan | | | | |
| | 990,000 | | | 3.250%, 12/19/2020 | | | 982,991 | |
| | | | Marina District Finance Company, Inc., Term Loan | | | | |
| | 960,750 | | | 6.750%, 8/15/2018 | | | 952,142 | |
| | | | MGM Resorts International, Term Loan | | | | |
| | 354,573 | | | 3.500%, 12/20/2019 | | | 344,602 | |
| | | | Michaels Stores, Inc., Term Loan | | | | |
| | 1,042,387 | | | 4.000%, 1/28/2020 | | | 1,022,843 | |
| | | | Mohegan Tribal Gaming Authority, Term Loan | | | | |
| | 1,039,500 | | | 5.500%, 11/19/2019 | | | 996,995 | |
| | | | Pinnacle Entertainment, Inc., Term Loan | | | | |
| | 933,989 | | | 3.750%, 8/13/2020b,c | | | 918,811 | |
| | | | ROC Finance, LLC, Term Loan | | | | |
| | 888,750 | | | 5.000%, 6/20/2019 | | | 822,094 | |
| | | | Scientific Games International, Inc., Term Loan | | | | |
| | 891,000 | | | 6.000%, 10/18/2020 | | | 876,967 | |
| | 400,000 | | | 6.000%, 10/1/2021 | | | 393,668 | |
| | | | Seminole Hard Rock Entertainment, Inc., Term Loan | | | | |
| | 1,179,758 | | | 3.500%, 5/14/2020b,c | | | 1,135,517 | |
| | | | Seminole Indian Tribe of Florida, Term Loan | | | | |
| | 789,750 | | | 3.000%, 4/29/2020 | | | 785,146 | |
| | | | | | | | |
| | | | Total | | | 15,737,447 | |
| | | | | | | | |
| |
| Consumer Non-Cyclical (1.7%) | | | | |
| | | | Albertsons, Inc., Term Loan | | | | |
| | 1,238,906 | | | 4.750%, 3/21/2019 | | | 1,229,614 | |
| | | | Catalina Marketing Corporation, Term Loan | | | | |
| | 1,129,325 | | | 4.500%, 4/9/2021 | | | 1,072,159 | |
| | | | CHS/Community Health Systems, Inc., Term Loan | | | | |
| | 216,079 | | | 3.486%, 1/25/2017 | | | 214,637 | |
| | 699,671 | | | 4.250%, 1/27/2021 | | | 697,194 | |
| | | | Del Monte Corporation, Term Loan | | | | |
| | 885,539 | | | 3.500%, 3/9/2020 | | | 845,690 | |
| | | | HCA, Inc., Term Loan | | | | |
| | 1,032,386 | | | 0.000%, 3/31/2017b,c | | | 1,023,353 | |
| | | | JBS USA, LLC, Term Loan | | | | |
| | 1,481,250 | | | 3.750%, 9/18/2020 | | | 1,446,070 | |
| | | | Libbey Glass, Inc., Term Loan | | | | |
| | 564,663 | | | 3.750%, 4/9/2021 | | | 555,137 | |
| | | | Ortho-Clinical Diagnostics, Inc., Term Loan | | | | |
| | 1,174,100 | | | 4.750%, 6/30/2021 | | | 1,153,260 | |
| | | | Roundy’s Supermarkets, Inc., Term Loan | | | | |
| | 1,132,320 | | | 5.750%, 3/3/2021 | | | 1,059,659 | |
| | | | Supervalu, Inc., Term Loan | | | | |
| | 1,177,473 | | | 4.500%, 3/21/2019 | | | 1,154,583 | |
| | | | Visant Corporation, Term Loan | | | | |
| | 1,491,602 | | | 7.000%, 9/23/2021 | | | 1,446,854 | |
| | | | | | | | |
| | | | Total | | | 11,898,210 | |
| | | | | | | | |
| |
| Energy (0.9%) | | | | |
| | | | Arch Coal, Inc., Term Loan | | | | |
| | 1,405,634 | | | 6.250%, 5/16/2018 | | | 1,160,239 | |
| | | | Energy Solutions, LLC, Term Loan | | | | |
| | 1,293,500 | | | 6.750%, 5/29/2020 | | | 1,287,434 | |
| | | | Exgen Renewables I, LLC, Term Loan | | | | |
| | 689,828 | | | 5.250%, 2/6/2021 | | | 689,828 | |
| | | | McJunkin Red Man Corporation, Term Loan | | | | |
| | 1,036,875 | | | 5.000%, 11/8/2019 | | | 951,333 | |
| | | | Offshore Group Investment, Ltd., Term Loan | | | | |
| | 1,327,619 | | | 5.750%, 3/28/2019 | | | 989,076 | |
| | | | Pacific Drilling SA, Term Loan | | | | |
| | 886,500 | | | 4.500%, 6/3/2018 | | | 728,410 | |
| | | | TerraForm Power Operating, LLC, Term Loan | | | | |
| | 477,600 | | | 4.750%, 7/23/2019 | | | 475,212 | |
| | | | | | | | |
| | | | Total | | | 6,281,532 | |
| | | | | | | | |
| |
| Financials (1.0%) | | | | |
| | | | Delos Finance Sarl, Term Loan | | | | |
| | 1,120,000 | | | 3.500%, 3/6/2021 | | | 1,108,330 | |
| | | | DJO Finance, LLC, Term Loan | | | | |
| | 1,143,330 | | | 4.250%, 9/15/2017 | | | 1,115,696 | |
| | | | Harland Clarke Holdings Corporation, Term Loan | | | | |
| | 866,250 | | | 7.000%, 5/22/2018 | | | 867,116 | |
| | | | MoneyGram International, Inc., Term Loan | | | | |
| | 967,614 | | | 4.250%, 3/27/2020 | | | 884,883 | |
| | | | MPH Acquisition Holdings, LLC, Term Loan | | | | |
| | 1,457,944 | | | 3.750%, 3/31/2021 | | | 1,414,934 | |
The accompanying Notes to Financial Statements are an integral part of this schedule.
29
DIVERSIFIED INCOME PLUS FUND
Schedule of Investments as of December 31, 2014
| | | | | | | | |
Principal Amount | | | Bank Loans (13.8%)a | | Value | |
| Financials (1.0%) - continued | | | | |
| | | | TransUnion, LLC, Term Loan | | | | |
| $ | 1,091,750 | | | 4.000%, 4/9/2021 | | $ | 1,074,009 | |
| | | | WaveDivision Holdings, LLC, Term Loan | | | | |
| | 882,000 | | | 4.000%, 10/15/2019 | | | 867,297 | |
| | | | | | | | |
| | | | Total | | | 7,332,265 | |
| | | | | | | | |
| |
| Technology (0.6%) | | | | |
| | | | Avago Technologies, Ltd., Term Loan | | | | |
| | 150,000 | | | 0.000%, 5/6/2021b,c | | | 149,313 | |
| | | | BMC Software, Inc., Term Loan | | | | |
| | 859,750 | | | 5.000%, 9/10/2020 | | | 834,499 | |
| | | | First Data Corporation, Term Loan | | | | |
| | 1,600,000 | | | 3.667%, 3/23/2018 | | | 1,567,008 | |
| | | | Freescale Semiconductor, Inc., Term Loan | | | | |
| | 884,317 | | | 4.250%, 2/28/2020 | | | 861,661 | |
| | | | Infor US, Inc., Term Loan | | | | |
| | 1,168,837 | | | 3.750%, 6/3/2020 | | | 1,132,393 | |
| | | | | | | | |
| | | | Total | | | 4,544,874 | |
| | | | | | | | |
| |
| Transportation (0.5%) | | | | |
| | | | American Airlines, Inc., Term Loan | | | | |
| | 1,403,625 | | | 3.750%, 6/27/2019 | | | 1,386,669 | |
| | | | Delta Air Lines, Inc., Term Loan | | | | |
| | 1,370,633 | | | 3.250%, 4/20/2017b,c | | | 1,353,500 | |
| | | | OSG Bulk Ships, Inc., Term Loan | | | | |
| | 990,025 | | | 5.250%, 8/5/2019 | | | 962,800 | |
| | | | | | | | |
| | | | Total | | | 3,702,969 | |
| | | | | | | | |
| |
| Utilities (0.4%) | | | | |
| | | | Calpine Corporation, Term Loan | | | | |
| | 781,726 | | | 4.000%, 4/1/2018 | | | 772,150 | |
| | 173,250 | | | 4.000%, 10/31/2020 | | | 170,337 | |
| | | | Intergen NV, Term Loan | | | | |
| | 886,500 | | | 5.500%, 6/15/2020 | | | 878,371 | |
| | | | NGPL PipeCo, LLC, Term Loan | | | | |
| | 683,463 | | | 6.750%, 9/15/2017 | | | 662,105 | |
| | | | | | | | |
| | | | Total | | | 2,482,963 | |
| | | | | | | | |
| | | | Total Bank Loans
(cost $99,008,035) | | | 96,141,597 | |
| | | | | | | | |
| | |
Principal Amount | | | Long-Term Fixed Income (43.3%) | | | |
| Asset-Backed Securities (1.2%) | | | | |
| | | | Asset Backed Securities Corporation Home Equity Loan Trust | | | | |
| | 1,098,203 | | | 0.310%, 7/25/2036d | | | 983,091 | |
| | 271,080 | | | 0.330%, 11/25/2036d | | | 233,832 | |
| | | | Bayview Opportunity Master Fund Trust IIB, LP | | | | |
| | 1,295,140 | | | 3.623%, 7/28/2019* | | | 1,286,513 | |
| | | | Countrywide Asset-Backed Certificates | | | | |
| | 827,386 | | | 5.530%, 4/25/2047 | | | 813,557 | |
| | | | GSAA Home Equity Trust | | | | |
| | 1,381,310 | | | 0.440%, 7/25/2037d | | | 1,166,172 | |
| | | | J.P. Morgan Mortgage Trust | | | | |
| | 883,649 | | | 2.651%, 2/25/2036 | | | 797,837 | |
| | | | Renaissance Home Equity Loan Trust | | | | |
| | 656,598 | | | 5.746%, 5/25/2036e | | | 477,729 | |
| | 1,000,000 | | | 6.011%, 5/25/2036e | | | 707,555 | |
| | 1,421,374 | | | 5.797%, 8/25/2036e | | | 911,067 | |
| | | | Residential Asset Mortgage Products Trust | | | | |
| | 946,793 | | | 5.991%, 3/25/2033f | | | 916,241 | |
| | | | | | | | |
| | | | Total | | | 8,293,594 | |
| | | | | | | | |
| |
| Basic Materials (0.8%) | | | | |
| | | | Anglo American Capital plc | | | | |
| | 200,000 | | | 1.181%, 4/15/2016d,g | | | 200,201 | |
| | | | ArcelorMittal | | | | |
| | 1,080,000 | | | 6.000%, 3/1/2021 | | | 1,123,200 | |
| | | | Dow Chemical Company | | | | |
| | 106,000 | | | 8.550%, 5/15/2019 | | | 131,784 | |
| | | | First Quantum Minerals, Ltd. | | | | |
| | 485,000 | | | 6.750%, 2/15/2020g | | | 438,925 | |
| | 770,000 | | | 7.000%, 2/15/2021g | | | 693,000 | |
| | | | FMG Resources August 2006 Pty., Ltd. | | | | |
| | 222,222 | | | 6.875%, 2/1/2018g | | | 201,667 | |
| | | | Freeport-McMoRan, Inc. | | | | |
| | 85,000 | | | 2.375%, 3/15/2018 | | | 84,065 | |
| | | | Hexion US Finance Corporation/ Hexion Nova Scotia Finance ULC | | | | |
| | 860,000 | | | 8.875%, 2/1/2018 | | | 765,400 | |
| | | | INEOS Group Holdings SA | | | | |
| | 600,000 | | | 5.875%, 2/1/2019g | | | 568,500 | |
| | | | LyondellBasell Industries NV | | | | |
| | 110,000 | | | 5.000%, 4/15/2019 | | | 119,984 | |
| | | | Mosaic Company | | | | |
| | 144,000 | | | 3.750%, 11/15/2021 | | | 149,875 | |
| | | | Sappi Papier Holding GmbH | | | | |
| | 600,000 | | | 6.625%, 4/15/2021g | | | 615,000 | |
| | | | Vale Overseas, Ltd. | | | | |
| | 73,000 | | | 6.250%, 1/23/2017 | | | 77,863 | |
| | | | Yamana Gold, Inc. | | | | |
| | 152,000 | | | 4.950%, 7/15/2024 | | | 148,349 | |
| | | | | | | | |
| | | | Total | | | 5,317,813 | |
| | | | | | | | |
| |
| Capital Goods (1.0%) | | | | |
| | | | Brand Energy& Infrastructure Services, Inc. | | | | |
| | 575,000 | | | 8.500%, 12/1/2021g | | | 517,500 | |
| | | | Cemex SAB de CV | | | | |
| | 1,290,000 | | | 5.700%, 1/11/2025g | | | 1,251,300 | |
| | | | Crown Americas Capital Corporation IV | | | | |
| | 1,080,000 | | | 4.500%, 1/15/2023 | | | 1,047,600 | |
| | | | Crown Cork & Seal Company, Inc. | | | | |
| | 610,000 | | | 7.375%, 12/15/2026 | | | 674,050 | |
| | | | Harsco Corporation | | | | |
| | 216,000 | | | 2.700%, 10/15/2015 | | | 215,730 | |
| | | | Ingersoll-Rand Luxembourg Finance SA | | | | |
| | 310,000 | | | 2.625%, 5/1/2020 | | | 307,993 | |
| | | | L-3 Communications Corporation | | | | |
| | 205,000 | | | 1.500%, 5/28/2017 | | | 202,983 | |
| | | | Reynolds Group Issuer, Inc. | | | | |
| | 250,000 | | | 5.750%, 10/15/2020 | | | 256,250 | |
The accompanying Notes to Financial Statements are an integral part of this schedule.
30
DIVERSIFIED INCOME PLUS FUND
Schedule of Investments as of December 31, 2014
| | | | | | | | |
Principal Amount | | | Long-Term Fixed Income (43.3%) | | Value | |
| Capital Goods (1.0%) - continued | | | | |
| $ | 610,000 | | | 6.875%, 2/15/2021 | | $ | 636,688 | |
| | | | RSC Equipment Rental, Inc. | | | | |
| | 250,000 | | | 8.250%, 2/1/2021 | | | 272,500 | |
| | | | Sealed Air Corporation | | | | |
| | 800,000 | | | 4.875%, 12/1/2022g | | | 794,000 | |
| | | | Textron, Inc. | | | | |
| | 213,000 | | | 7.250%, 10/1/2019 | | | 252,842 | |
| | | | United Rentals North America, Inc. | | | | |
| | 610,000 | | | 7.375%, 5/15/2020 | | | 658,800 | |
| | | | | | | | |
| | | | Total | | | 7,088,236 | |
| | | | | | | | |
| |
| Collateralized Mortgage Obligations (15.3%) | | | | |
| | | | Alternative Loan Trust | | | | |
| | 1,725,676 | | | 6.000%, 6/25/2036 | | | 1,546,929 | |
| | | | American Home Mortgage Assets Trust | | | | |
| | 2,212,077 | | | 6.250%, 12/25/2036 | | | 1,047,370 | |
| | 2,914,203 | | | 0.360%, 12/25/2046d | | | 2,037,660 | |
| | 2,381,002 | | | 0.360%, 6/25/2047d | | | 1,608,055 | |
| | | | Banc of America Alternative Loan Trust | | | | |
| | 880,773 | | | 0.670%, 4/25/2035d | | | 761,634 | |
| | 2,153,754 | | | 6.000%, 11/25/2035 | | | 1,882,251 | |
| | 1,409,778 | | | 0.970%, 5/25/2046d | | | 975,056 | |
| | | | Banc of America Funding Corporation | | | | |
| | 614,453 | | | 4.828%, 5/20/2036 | | | 502,047 | |
| | | | BCAP, LLC Trust | | | | |
| | 2,098,560 | | | 0.350%, 3/25/2037d | | | 1,744,590 | |
| | | | Bear Stearns Adjustable Rate Mortgage Trust | | | | |
| | 1,094,955 | | | 2.430%, 10/25/2035d | | | 1,079,514 | |
| | 484,242 | | | 2.557%, 2/25/2036 | | | 377,531 | |
| | | | Citicorp Mortgage Securities Trust | | | | |
| | 757,863 | | | 6.000%, 5/25/2037 | | | 781,716 | |
| | | | Citigroup Mortgage Loan Trust, Inc. | | | | |
| | 603,170 | | | 5.500%, 11/25/2035 | | | 556,481 | |
| | | | CitiMortgage Alternative Loan Trust | | | | |
| | 1,426,425 | | | 5.750%, 4/25/2037 | | | 1,224,806 | |
| | | | Countrywide Alternative Loan Trust | | | | |
| | 748,274 | | | 0.570%, 2/25/2035d | | | 688,411 | |
| | 1,132,538 | | | 5.220%, 10/25/2035 | | | 961,792 | |
| | 466,766 | | | 5.500%, 2/25/2036 | | | 434,039 | |
| | 367,188 | | | 6.000%, 4/25/2036 | | | 317,190 | |
| | 1,281,731 | | | 6.500%, 8/25/2036 | | | 976,093 | |
| | 316,230 | | | 6.000%, 1/25/2037 | | | 291,783 | |
| | 1,222,315 | | | 5.500%, 5/25/2037 | | | 1,059,452 | |
| | | | Countrywide Home Loan Mortgage Pass Through Trust | | | | |
| | 2,474,838 | | | 2.465%, 11/25/2035 | | | 2,092,931 | |
| | 872,820 | | | 4.932%, 2/20/2036 | | | 780,822 | |
| | | | Credit Suisse First Boston Mortgage Securities Corporation | | | | |
| | 734,460 | | | 5.250%, 10/25/2035 | | | 730,840 | |
| | | | Deutsche Alt-A Securities Mortgage Loan Trust | | | | |
| | 1,367,373 | | | 0.883%, 4/25/2047d | | | 1,170,435 | |
| | 2,416,867 | | | 0.390%, 8/25/2047d | | | 2,045,866 | |
| | | | Deutsche Alt-A Securities, Inc., Mortgage Loan Trust | | | | |
| | 195,653 | | | 5.500%, 10/25/2021 | | | 188,099 | |
| | 683,290 | | | 0.370%, 11/25/2035d | | | 441,395 | |
| | 1,196,526 | | | 5.500%, 11/25/2035 | | | 1,131,495 | |
| | | | Federal Home Loan Mortgage Corporation | | | | |
| | 11,506,073 | | | 2.500%, 12/15/2022h | | | 838,928 | |
| | 3,300,988 | | | 2.500%, 5/15/2027h | | | 288,678 | |
| | 3,965,100 | | | 2.500%, 2/15/2028h | | | 397,837 | |
| | 11,838,333 | | | 2.500%, 3/15/2028h | | | 1,188,648 | |
| | 6,477,962 | | | 3.000%, 4/15/2028h | | | 723,571 | |
| | 5,173,311 | | | 3.000%, 2/15/2033h | | | 698,097 | |
| | | | Federal National Mortgage Association | | | | |
| | 5,101,188 | | | 2.500%, 2/25/2028h | | | 513,202 | |
| | 4,036,523 | | | 3.000%, 4/25/2028h | | | 497,194 | |
| | 4,994,155 | | | 3.500%, 1/25/2033h | | | 713,288 | |
| | | | First Horizon Alternative Mortgage Securities Trust | | | | |
| | 1,514,025 | | | 2.250%, 3/25/2035 | | | 1,356,199 | |
| | | | First Horizon Alternative Mortgage Securities Trust 2006-FA4 | | | | |
| | 1,690,611 | | | 6.000%, 8/25/2036d | | | 1,409,485 | |
| | | | First Horizon Mortgage Pass-Through Trust | | | | |
| | 1,593,773 | | | 2.582%, 8/25/2037 | | | 1,306,416 | |
| | | | GMACM Mortgage Loan Trust | | | | |
| | 2,487,038 | | | 4.566%, 5/25/2035 | | | 2,388,014 | |
| | | | Government National Mortgage Association | | | | |
| | 5,703,734 | | | 4.000%, 1/16/2027h | | | 729,084 | |
| | | | Greenpoint Mortgage Funding Trust | | | | |
| | 1,082,365 | | | 0.370%, 10/25/2045d | | | 852,130 | |
| | | | GSR Mortgage Loan Trust | | | | |
| | 322,487 | | | 0.360%, 8/25/2046d | | | 309,690 | |
| | | | HomeBanc Mortgage Trust | | | | |
| | 1,214,723 | | | 2.197%, 4/25/2037 | | | 903,893 | |
| | | | IndyMac IMJA Mortgage Loan Trust | | | | |
| | 1,348,079 | | | 6.250%, 11/25/2037 | | | 1,204,815 | |
| | | | IndyMac INDX Mortgage Loan Trust | | | | |
| | 2,266,850 | | | 4.654%, 10/25/2035 | | | 1,920,763 | |
| | | | J.P. Morgan Alternative Loan Trust | | | | |
| | 2,497,752 | | | 6.500%, 3/25/2036 | | | 2,202,788 | |
| | | | J.P. Morgan Mortgage Trust | | | | |
| | 285,235 | | | 6.500%, 1/25/2035 | | | 283,709 | |
| | 1,892,303 | | | 2.653%, 8/25/2035 | | | 1,882,381 | |
| | 688,974 | | | 2.537%, 10/25/2036 | | | 618,443 | |
| | 1,385,501 | | | 0.550%, 1/25/2037d | | | 899,190 | |
| | 952,606 | | | 2.695%, 1/25/2037 | | | 869,676 | |
| | 867,578 | | | 6.250%, 8/25/2037 | | | 716,881 | |
| | | | Lehman Mortgage Trust | | | | |
| | 1,057,688 | | | 0.920%, 12/25/2035d | | | 766,073 | |
| | | | Master Asset Securitization Trust | | | | |
| | 1,140,610 | | | 0.670%, 6/25/2036d | | | 683,843 | |
| | | | MASTR Alternative Loans Trust | | | | |
| | 337,395 | | | 6.500%, 7/25/2034 | | | 345,642 | |
| | 1,041,071 | | | 0.620%, 12/25/2035d | | | 567,424 | |
| | | | Merrill Lynch Alternative Note Asset Trust | | | | |
| | 803,720 | | | 6.000%, 3/25/2037 | | | 647,476 | |
| | 1,328,437 | | | 6.000%, 3/25/2037 | | | 1,235,893 | |
| | | | Morgan Stanley Mortgage Loan Trust | | | | |
| | 835,859 | | | 5.241%, 11/25/2035 | | | 644,409 | |
| | | | MortgageIT Trust | | | | |
| | 1,845,789 | | | 0.430%, 12/25/2035d | | | 1,693,168 | |
| | 1,387,753 | | | 0.370%, 4/25/2036d | | | 1,048,371 | |
The accompanying Notes to Financial Statements are an integral part of this schedule.
31
DIVERSIFIED INCOME PLUS FUND
Schedule of Investments as of December 31, 2014
| | | | | | | | |
Principal Amount | | | Long-Term Fixed Income (43.3%) | | Value | |
| Collateralized Mortgage Obligations (15.3%) - continued | | | | |
| | | | New Century Alternative Mortgage Loan Trust | | | | |
| $ | 1,804,558 | | | 6.167%, 7/25/2036e | | $ | 1,234,733 | |
| | | | RALI Trust | | | | |
| | 1,927,655 | | | 6.000%, 4/25/2036 | | | 1,595,516 | |
| | 2,851,012 | | | 0.350%, 11/25/2036d | | | 2,054,345 | |
| | 2,649,602 | | | 5.750%, 4/25/2037 | | | 2,119,685 | |
| | 1,412,453 | | | 6.250%, 4/25/2037 | | | 1,169,695 | |
| | 597,796 | | | 6.000%, 6/25/2037 | | | 493,577 | |
| | 2,551,492 | | | 0.360%, 7/25/2037d | | | 2,142,542 | |
| | | | Residential Accredit Loans, Inc. | | | | |
| | 1,351,073 | | | 5.750%, 9/25/2035 | | | 1,221,623 | |
| | 1,365,112 | | | 6.000%, 1/25/2037 | | | 1,161,938 | |
| | | | Residential Asset Securitization Trust | | | | |
| | 2,138,669 | | | 5.407%, 8/25/2022 | | | 1,941,935 | |
| | 908,048 | | | 5.500%, 4/25/2035 | | | 911,188 | |
| | 1,268,269 | | | 0.550%, 8/25/2037d | | | 465,310 | |
| | | | RFMSI Trust | | | | |
| | 1,353,660 | | | 5.750%, 2/25/2036 | | | 1,251,115 | |
| | 2,165,354 | | | 6.000%, 7/25/2037 | | | 1,960,902 | |
| | | | Sequoia Mortgage Trust | | | | |
| | 1,817,392 | | | 2.657%, 9/20/2046 | | | 1,506,518 | |
| | | | Structured Adjustable Rate Mortgage Loan Trust | | | | |
| | 460,314 | | | 5.500%, 12/25/2034 | | | 447,016 | |
| | 1,399,100 | | | 5.081%, 7/25/2035 | | | 1,206,086 | |
| | 667,700 | | | 2.633%, 9/25/2035 | | | 567,629 | |
| | 1,128,027 | | | 4.956%, 5/25/2036 | | | 849,007 | |
| | | | Structured Asset Mortgage Investments, Inc. | | | | |
| | 2,028,379 | | | 0.480%, 12/25/2035d | | | 1,550,708 | |
| | 1,578,961 | | | 0.380%, 5/25/2046d | | | 1,152,145 | |
| | | | Suntrust Alternative Loan Trust | | | | |
| | 1,759,375 | | | 5.750%, 12/25/2035 | | | 1,570,566 | |
| | | | WaMu Mortgage Pass Through Certificates | | | | |
| | 1,096,007 | | | 1.957%, 11/25/2036 | | | 967,261 | |
| | 2,239,520 | | | 1.822%, 1/25/2037 | | | 1,899,147 | |
| | 189,879 | | | 2.239%, 8/25/2046 | | | 164,371 | |
| | 934,590 | | | 1.073%, 9/25/2046d | | | 798,273 | |
| | 1,879,159 | | | 0.853%, 1/25/2047d | | | 1,542,316 | |
| | 1,258,309 | | | 1.913%, 3/25/2047d | | | 1,016,210 | |
| | | | Washington Mutual Alternative Mortgage Pass Through Certificates | | | | |
| | 1,274,447 | | | 0.770%, 6/25/2035d | | | 954,310 | |
| | 1,373,060 | | | 6.000%, 11/25/2035 | | | 1,247,645 | |
| | 2,313,827 | | | 0.863%, 2/25/2047d | | | 1,623,598 | |
| | | | Wells Fargo Mortgage Backed Securities Trust | | | | |
| | 2,472,419 | | | 2.609%, 7/25/2036 | | | 2,411,276 | |
| | 462,807 | | | 0.870%, 5/25/2037d | | | 401,181 | |
| | 941,256 | | | 6.000%, 7/25/2037 | | | 931,427 | |
| | 1,492,647 | | | 6.000%, 11/25/2037 | | | 1,484,955 | |
| | | | | | | | |
| | | | Total | | | 106,797,331 | |
| | | | | | | | |
| |
| Commercial Mortgage-Backed Securities (0.5%) | | | | |
| | | | Credit Suisse Mortgage Capital Certificates | | | | |
| | 500,000 | | | 5.509%, 9/15/2039 | | | 528,788 | |
| | | | Greenwich Capital Commercial Funding Corporation | | | | |
| | 1,350,000 | | | 5.867%, 12/10/2049 | | | 1,463,204 | |
| | | | Morgan Stanley Capital, Inc. | | | | |
| | 1,350,000 | | | 5.406%, 3/15/2044 | | | 1,436,857 | |
| | | | | | | | |
| | | | Total | | | 3,428,849 | |
| | | | | | | | |
| |
| Communications Services (3.1%) | | | | |
| | | | 21st Century Fox America, Inc. | | | | |
| | 170,000 | | | 3.700%, 9/15/2024g | | | 174,866 | |
| | | | AMC Networks, Inc. | | | | |
| | 610,000 | | | 4.750%, 12/15/2022 | | | 591,700 | |
| | | | American Tower Corporation | | | | |
| | 189,000 | | | 7.000%, 10/15/2017 | | | 213,388 | |
| | 152,000 | | | 3.450%, 9/15/2021 | | | 149,437 | |
| | | | CC Holdings GS V, LLC | | | | |
| | 270,000 | | | 2.381%, 12/15/2017 | | | 272,394 | |
| | | | CCO Holdings, LLC | | | | |
| | 600,000 | | | 6.500%, 4/30/2021 | | | 630,000 | |
| | | | CenturyLink, Inc. | | | | |
| | 600,000 | | | 6.450%, 6/15/2021 | | | 643,500 | |
| | | | Cequel Communications Escrow 1, LLC | | | | |
| | 1,400,000 | | | 6.375%, 9/15/2020g | | | 1,449,000 | |
| | | | Columbus International, Inc. | | | | |
| | 1,400,000 | | | 7.375%, 3/30/2021g | | | 1,456,000 | |
| | | | Digicel, Ltd. | | | | |
| | 1,400,000 | | | 6.000%, 4/15/2021g | | | 1,309,000 | |
| | | | DIRECTV Holdings, LLC | | | | |
| | 176,000 | | | 5.875%, 10/1/2019 | | | 201,314 | |
| | | | DISH DBS Corporation | | | | |
| | 700,000 | | | 5.000%, 3/15/2023 | | | 677,250 | |
| | | | Equinix, Inc. | | | | |
| | 810,000 | | | 5.750%, 1/1/2025 | | | 817,088 | |
| | | | FairPoint Communications, Inc. | | | | |
| | 1,100,000 | | | 8.750%, 8/15/2019g | | | 1,105,500 | |
| | | | Frontier Communications Corporation | | | | |
| | 1,255,000 | | | 6.875%, 1/15/2025 | | | 1,255,000 | |
| | | | Hughes Satellite Systems Corporation | | | | |
| | 860,000 | | | 6.500%, 6/15/2019 | | | 922,350 | |
| | | | Level 3 Escrow II, Inc. | | | | |
| | 600,000 | | | 5.375%, 8/15/2022g | | | 603,000 | |
| | | | Numericable-SFR | | | | |
| | 1,370,000 | | | 6.000%, 5/15/2022g | | | 1,377,535 | |
| | | | SBA Tower Trust | | | | |
| | 300,000 | | | 3.598%, 4/16/2043g | | | 300,734 | |
| | | | Sprint Communications, Inc. | | | | |
| | 850,000 | | | 9.000%, 11/15/2018g | | | 966,790 | |
| | | | Telefonica Emisiones SAU | | | | |
| | 211,000 | | | 3.192%, 4/27/2018 | | | 216,980 | |
| | | | Time Warner Cable, Inc. | | | | |
| | 408,000 | | | 5.000%, 2/1/2020 | | | 449,610 | |
| | | | T-Mobile USA, Inc. | | | | |
| | 1,230,000 | | | 6.125%, 1/15/2022 | | | 1,248,450 | |
| | | | Univision Communications, Inc. | | | | |
| | 250,000 | | | 6.875%, 5/15/2019g | | | 260,313 | |
| | 610,000 | | | 7.875%, 11/1/2020g | | | 649,650 | |
| | | | UPCB Finance V, Ltd. | | | | |
| | 860,000 | | | 7.250%, 11/15/2021g | | | 940,625 | |
The accompanying Notes to Financial Statements are an integral part of this schedule.
32
DIVERSIFIED INCOME PLUS FUND
Schedule of Investments as of December 31, 2014
| | | | | | | | |
Principal Amount | | | Long-Term Fixed Income (43.3%) | | Value | |
| Communications Services (3.1%) - continued | | | | |
| | | | Verizon Communications, Inc. | | | | |
| $ | 115,000 | | | 2.625%, 2/21/2020g | | $ | 113,685 | |
| | 152,000 | | | 4.500%, 9/15/2020 | | | 165,035 | |
| | 152,000 | | | 5.150%, 9/15/2023 | | | 167,843 | |
| | | | West Corporation | | | | |
| | 1,400,000 | | | 5.375%, 7/15/2022g | | | 1,340,500 | |
| | | | Wind Acquisition Finance SA | | | | |
| | 720,000 | | | 4.750%, 7/15/2020g | | | 673,200 | |
| | 120,000 | | | 7.375%, 4/23/2021g | | | 113,256 | |
| | | | | | | | |
| | | | Total | | | 21,454,993 | |
| | | | | | | | |
| |
| Consumer Cyclical (1.8%) | | | | |
| | | | AMC Entertainment, Inc. | | | | |
| | 600,000 | | | 5.875%, 2/15/2022 | | | 609,000 | |
| | | | Brookfield Residential Properties, Inc. | | | | |
| | 850,000 | | | 6.500%, 12/15/2020g | | | 888,250 | |
| | | | Chrysler Group, LLC | | | | |
| | 840,000 | | | 8.000%, 6/15/2019 | | | 883,050 | |
| | | | Delphi Corporation | | | | |
| | 216,000 | | | 6.125%, 5/15/2021 | | | 235,440 | |
| | | | Ford Motor Credit Company, LLC | | | | |
| | 220,000 | | | 5.000%, 5/15/2018 | | | 239,041 | |
| | 155,000 | | | 2.597%, 11/4/2019 | | | 154,166 | |
| | | | General Motors Company | | | | |
| | 152,000 | | | 6.250%, 10/2/2043 | | | 181,579 | |
| | | | General Motors Financial Company, Inc. | | | | |
| | 860,000 | | | 3.250%, 5/15/2018 | | | 861,075 | |
| | 167,000 | | | 4.375%, 9/25/2021 | | | 174,306 | |
| | | | GLP Capital, LP | | | | |
| | 1,400,000 | | | 4.875%, 11/1/2020 | | | 1,417,500 | |
| | | | Hilton Worldwide Finance, LLC | | | | |
| | 1,080,000 | | | 5.625%, 10/15/2021 | | | 1,128,600 | |
| | | | Jaguar Land Rover Automotive plc | | | | |
| | 500,000 | | | 4.125%, 12/15/2018g | | | 502,500 | |
| | 710,000 | | | 5.625%, 2/1/2023g | | | 747,275 | |
| | | | L Brands, Inc. | | | | |
| | 860,000 | | | 5.625%, 2/15/2022 | | | 924,500 | |
| | | | Lennar Corporation | | | | |
| | 610,000 | | | 12.250%, 6/1/2017 | | | 725,900 | |
| | 250,000 | | | 4.125%, 12/1/2018 | | | 247,500 | |
| | | | Macy’s Retail Holdings, Inc. | | | | |
| | 88,000 | | | 7.450%, 7/15/2017 | | | 100,047 | |
| | | | Royal Caribbean Cruises, Ltd. | | | | |
| | 1,400,000 | | | 5.250%, 11/15/2022 | | | 1,470,000 | |
| | | | Toll Brothers Finance Corporation | | | | |
| | 208,000 | | | 4.000%, 12/31/2018 | | | 209,040 | |
| | | | TRW Automotive, Inc. | | | | |
| | 136,000 | | | 7.250%, 3/15/2017g | | | 150,280 | |
| | | | Wynn Las Vegas, LLC | | | | |
| | 860,000 | | | 5.375%, 3/15/2022 | | | 872,900 | |
| | | | | | | | |
| | | | Total | | | 12,721,949 | |
| | | | | | | | |
| |
| Consumer Non-Cyclical (2.3%) | | | | |
| | | | Actavis Funding SCS | | | | |
| | 155,000 | | | 4.850%, 6/15/2044 | | | 157,284 | |
| | | | Altria Group, Inc. | | | | |
| | 191,000 | | | 9.700%, 11/10/2018 | | | 242,533 | |
| | | | Aviv Healthcare Properties, LP | | | | |
| | 600,000 | | | 6.000%, 10/15/2021 | | | 624,000 | |
| | | | CareFusion Corporation | | | | |
| | 70,000 | | | 1.450%, 5/15/2017 | | | 69,505 | |
| | | | ConAgra Foods, Inc. | | | | |
| | 218,000 | | | 2.100%, 3/15/2018 | | | 217,293 | |
| | | | Cott Beverages, Inc. | | | | |
| | 1,400,000 | | | 5.375%, 7/1/2022g | | | 1,284,500 | |
| | | | CVS Health Corporation | | | | |
| | 106,000 | | | 2.250%, 12/5/2018 | | | 106,949 | |
| | | | Endo Finance LLC & Endo Finco, Inc. | | | | |
| | 250,000 | | | 7.000%, 7/15/2019g | | | 260,938 | |
| | 610,000 | | | 7.000%, 12/15/2020g | | | 640,500 | |
| | | | Envision Healthcare Corporation | | | | |
| | 1,400,000 | | | 5.125%, 7/1/2022g | | | 1,389,500 | |
| | | | Forest Laboratories, Inc. | | | | |
| | 153,000 | | | 4.375%, 2/1/2019g | | | 161,625 | |
| | | | Hawk Acquisition Sub, Inc. | | | | |
| | 860,000 | | | 4.250%, 10/15/2020 | | | 868,600 | |
| | | | HCA, Inc. | | | | |
| | 925,000 | | | 3.750%, 3/15/2019 | | | 926,156 | |
| | | | Hospira, Inc. | | | | |
| | 870,000 | | | 5.200%, 8/12/2020 | | | 933,359 | |
| | | | IMS Health, Inc. | | | | |
| | 490,000 | | | 6.000%, 11/1/2020g | | | 504,700 | |
| | | | JBS Finance II, Ltd. | | | | |
| | 1,080,000 | | | 8.250%, 1/29/2018* | | | 1,104,300 | |
| | | | JBS USA, LLC | | | | |
| | 610,000 | | | 5.875%, 7/15/2024g | | | 599,325 | |
| | | | Lorillard Tobacco Company | | | | |
| | 204,000 | | | 8.125%, 6/23/2019 | | | 247,315 | |
| | | | Medco Health Solutions, Inc. | | | | |
| | 170,000 | | | 7.125%, 3/15/2018 | | | 196,275 | |
| | | | Medtronic, Inc. | | | | |
| | 310,000 | | | 4.375%, 3/15/2035g | | | 328,865 | |
| | | | Mondelez International, Inc. | | | | |
| | 136,000 | | | 2.250%, 2/1/2019 | | | 135,441 | |
| | | | Ortho-Clinical Diagnostics, Inc. | | | | |
| | 1,375,000 | | | 6.625%, 5/15/2022g | | | 1,235,781 | |
| | | | Pernod Ricard SA | | | | |
| | 110,000 | | | 5.750%, 4/7/2021g | | | 126,354 | |
| | | | SABMiller plc | | | | |
| | 75,000 | | | 6.500%, 7/15/2018g | | | 85,625 | |
| | | | Safeway, Inc. | | | | |
| | 63,000 | | | 3.400%, 12/1/2016 | | | 64,002 | |
| | | | Spectrum Brands Escrow Corporation | | | | |
| | 860,000 | | | 6.375%, 11/15/2020 | | | 896,550 | |
| | | | Tenet Healthcare Corporation | | | | |
| | 1,080,000 | | | 8.125%, 4/1/2022 | | | 1,206,900 | |
| | | | Thermo Fisher Scientific, Inc. | | | | |
| | 212,000 | | | 2.400%, 2/1/2019 | | | 212,316 | |
| | | | Tyson Foods, Inc. | | | | |
| | 152,000 | | | 4.500%, 6/15/2022 | | | 164,568 | |
| | | | Valeant Pharmaceuticals International | | | | |
| | 132,000 | | | 6.875%, 12/1/2018g | | | 136,158 | |
The accompanying Notes to Financial Statements are an integral part of this schedule.
33
DIVERSIFIED INCOME PLUS FUND
Schedule of Investments as of December 31, 2014
| | | | | | | | |
Principal Amount | | | Long-Term Fixed Income (43.3%) | | Value | |
| | Consumer Non-Cyclical (2.3%) - continued | | | | |
| | | | VPII Escrow Corporation | | | | |
| $ | 610,000 | | | 7.500%, 7/15/2021g | | $ | 658,800 | |
| | | | | | | | |
| | | | Total | | | 15,786,017 | |
| | | | | | | | |
| |
| | Energy (1.7%) | | | | |
| | | | Buckeye Partners, LP | | | | |
| | 152,000 | | | 2.650%, 11/15/2018 | | | 149,710 | |
| | | | Calumet Specialty Products Partners, LP | | | | |
| | 600,000 | | | 6.500%, 4/15/2021g | | | 534,000 | |
| | | | Chaparral Energy, Inc. | | | | |
| | 600,000 | | | 7.625%, 11/15/2022 | | | 393,000 | |
| | | | CNPC General Capital, Ltd. | | | | |
| | 205,000 | | | 2.750%, 4/19/2017g | | | 207,376 | |
| | | | Concho Resources, Inc. | | | | |
| | 860,000 | | | 5.500%, 10/1/2022 | | | 868,600 | |
| | | | El Paso, LLC | | | | |
| | 170,000 | | | 7.800%, 8/1/2031 | | | 206,997 | |
| | | | Enbridge Energy Partners, LP | | | | |
| | 1,215,000 | | | 8.050%, 10/1/2037 | | | 1,318,275 | |
| | | | Energy Transfer Partners, LP | | | | |
| | 104,000 | | | 6.700%, 7/1/2018 | | | 116,946 | |
| | | | Energy XXI Gulf Coast, Inc. | | | | |
| | 1,400,000 | | | 7.500%, 12/15/2021 | | | 756,000 | |
| | | | Ensco plc | | | | |
| | 167,000 | | | 4.500%, 10/1/2024 | | | 162,320 | |
| | | | Enterprise Products Operating, LLC | | | | |
| | 167,000 | | | 2.550%, 10/15/2019 | | | 165,319 | |
| | | | EQT Corporation | | | | |
| | 105,000 | | | 5.150%, 3/1/2018 | | | 112,167 | |
| | 104,000 | | | 8.125%, 6/1/2019 | | | 125,380 | |
| | | | EQT Midstream Partners, LP | | | | |
| | 152,000 | | | 4.000%, 8/1/2024 | | | 150,520 | |
| | | | Hess Corporation | | | | |
| | 155,000 | | | 8.125%, 2/15/2019 | | | 184,418 | |
| | | | Kinder Morgan, Inc. | | | | |
| | 155,000 | | | 5.300%, 12/1/2034 | | | 157,334 | |
| | | | Linn Energy, LLC | | | | |
| | 860,000 | | | 6.250%, 11/1/2019 | | | 726,700 | |
| | | | Marathon Petroleum Corporation | | | | |
| | 125,000 | | | 3.625%, 9/15/2024 | | | 122,500 | |
| | | | MEG Energy Corporation | | | | |
| | 250,000 | | | 6.500%, 3/15/2021g | | | 228,125 | |
| | 610,000 | | | 6.375%, 1/30/2023g | | | 544,425 | |
| | | | Offshore Group Investment, Ltd. | | | | |
| | 860,000 | | | 7.500%, 11/1/2019 | | | 640,700 | |
| | | | Petrobras Global Finance BV | | | | |
| | 245,000 | | | 2.000%, 5/20/2016 | | | 234,012 | |
| | | | Plains All American Pipeline, LP | | | | |
| | 156,000 | | | 3.600%, 11/1/2024 | | | 153,148 | |
| | | | Regency Energy Partners, LP | | | | |
| | 1,080,000 | | | 5.000%, 10/1/2022 | | | 1,020,600 | |
| | | | Rosetta Resources, Inc. | | | | |
| | 950,000 | | | 5.875%, 6/1/2022 | | | 855,000 | |
| | | | Sabine Pass Liquefaction, LLC | | | | |
| | 1,080,000 | | | 5.750%, 5/15/2024 | | | 1,059,750 | |
| | | | Suncor Energy, Inc. | | | | |
| | 136,000 | | | 6.100%, 6/1/2018 | | | 152,552 | |
| | 125,000 | | | 3.600%, 12/1/2024 | | | 123,519 | |
| | | | Transocean, Inc. | | | | |
| | 205,000 | | | 6.000%, 3/15/2018 | | | 197,181 | |
| | | | Weatherford International, Ltd. | | | | |
| | 170,000 | | | 6.000%, 3/15/2018 | | | 181,477 | |
| | 104,000 | | | 9.625%, 3/1/2019 | | | 123,352 | |
| | | | Williams Companies, Inc. | | | | |
| | 152,000 | | | 3.700%, 1/15/2023 | | | 136,509 | |
| | | | | | | | |
| | | | Total | | | 12,107,912 | |
| | | | | | | | |
| |
| | Financials (8.1%) | | | | |
| | | | Abbey National Treasury Services plc | | | | |
| | 110,000 | | | 3.050%, 8/23/2018 | | | 113,885 | |
| | | | ABN AMRO Bank NV | | | | |
| | 216,000 | | | 2.500%, 10/30/2018g | | | 218,163 | |
| | | | Aegon NV | | | | |
| | 1,080,000 | | | 2.549%, 7/29/2049d,i | | | 891,000 | |
| | | | AGI Life Holdings, Inc. | | | | |
| | 1,200,000 | | | 7.570%, 12/1/2045* | | | 1,585,734 | |
| | | | Ally Financial, Inc. | | | | |
| | 900,000 | | | 3.750%, 11/18/2019 | | | 886,500 | |
| | | | American Express Company | | | | |
| | 1,250,000 | | | 6.800%, 9/1/2066 | | | 1,309,375 | |
| | | | Aviation Capital Group Corporation | | | | |
| | 162,000 | | | 3.875%, 9/27/2016g | | | 166,079 | |
| | | | Banco de Brasil SA | | | | |
| | 1,860,000 | | | 9.000%, 12/31/2049g,i | | | 1,729,800 | |
| | | | Bank of America Corporation | | | | |
| | 272,000 | | | 5.700%, 5/2/2017 | | | 294,034 | |
| | 237,000 | | | 5.650%, 5/1/2018 | | | 263,301 | |
| | 620,000 | | | 6.250%, 9/29/2049i | | | 612,831 | |
| | 160,000 | | | 8.000%, 12/29/2049i | | | 171,800 | |
| | | | Bank of New York Mellon Corporation | | | | |
| | 720,000 | | | 4.500%, 12/31/2049i | | | 663,750 | |
| | | | Barclays Bank plc | | | | |
| | 150,000 | | | 5.140%, 10/14/2020 | | | 161,323 | |
| | | | BBVA Banco Continental SA | | | | |
| | 203,000 | | | 2.250%, 7/29/2016g | | | 202,493 | |
| | | | BBVA International Preferred SA Unipersonal | | | | |
| | 1,545,000 | | | 5.919%, 12/29/2049i | | | 1,572,501 | |
| | | | BNP Paribas SA | | | | |
| | 1,250,000 | | | 5.186%, 6/29/2049g,i | | | 1,250,000 | |
| | | | BPCE SA | | | | |
| | 625,000 | | | 5.150%, 7/21/2024g | | | 644,044 | |
| | | | Citigroup, Inc. | | | | |
| | 153,000 | | | 1.850%, 11/24/2017 | | | 152,824 | |
| | 212,000 | | | 8.500%, 5/22/2019 | | | 264,166 | |
| | 155,000 | | | 3.750%, 6/16/2024 | | | 158,293 | |
| | | | Cooperatieve Centrale Raiffeisen-Boerenleenbank BA | | | | |
| | 975,000 | | | 11.000%, 12/29/2049g,i | | | 1,254,825 | |
| | | | Credit Agricole SA | | | | |
| | 620,000 | | | 6.625%, 9/29/2049gi | | | 600,935 | |
| | | | Credit Suisse Group AG | | | | |
| | 600,000 | | | 7.500%, 12/11/2049g,i | | | 624,000 | |
| | 1,240,000 | | | 6.250%, 12/29/2049g,i | | | 1,192,570 | |
| | | | CyrusOne, LP | | | | |
| | 860,000 | | | 6.375%, 11/15/2022 | | | 918,050 | |
| | | | DDR Corporation | | | | |
| | 136,000 | | | 9.625%, 3/15/2016 | | | 149,295 | |
The accompanying Notes to Financial Statements are an integral part of this schedule.
34
DIVERSIFIED INCOME PLUS FUND
Schedule of Investments as of December 31, 2014
| | | | | | | | |
Principal Amount | | | Long-Term Fixed Income (43.3%) | | Value | |
| | Financials (8.1%) - continued | | | | |
| | | | Denali Borrower, LLC | | | | |
| $ | 1,370,000 | | | 5.625%, 10/15/2020g | | $ | 1,425,485 | |
| | | | Discover Bank | | | | |
| | 68,000 | | | 8.700%, 11/18/2019 | | | 84,092 | |
| | | | Discover Financial Services | | | | |
| | 150,000 | | | 6.450%, 6/12/2017 | | | 165,733 | |
| | | | Duke Realty, LP | | | | |
| | 155,000 | | | 4.375%, 6/15/2022 | | | 164,077 | |
| | | | Fifth Third Bancorp | | | | |
| | 925,000 | | | 4.900%, 12/29/2049i | | | 894,938 | |
| | 900,000 | | | 5.100%, 12/31/2049i | | | 833,625 | |
| | | | GE Capital Trust I | | | | |
| | 620,000 | | | 6.375%, 11/15/2067 | | | 667,773 | |
| | | | General Electric Capital Corporation | | | | |
| | 1,200,000 | | | 6.250%, 12/15/2049i | | | 1,306,500 | |
| | | | Genworth Financial, Inc. | | | | |
| | 205,000 | | | 7.700%, 6/15/2020 | | | 204,482 | |
| | | | Goldman Sachs Group, Inc. | | | | |
| | 70,000 | | | 6.250%, 9/1/2017 | | | 77,885 | |
| | 68,000 | | | 2.375%, 1/22/2018 | | | 68,687 | |
| | 144,000 | | | 2.625%, 1/31/2019 | | | 144,879 | |
| | 205,000 | | | 7.500%, 2/15/2019 | | | 243,840 | |
| | | | Hartford Financial Services Group, Inc. | | | | |
| | 185,000 | | | 6.000%, 1/15/2019 | | | 209,809 | |
| | | | HBOS plc | | | | |
| | 188,000 | | | 6.750%, 5/21/2018g | | | 209,525 | |
| | | | HCP, Inc. | | | | |
| | 107,000 | | | 3.750%, 2/1/2019 | | | 112,302 | |
| | | | Health Care REIT, Inc. | | | | |
| | 186,000 | | | 4.700%, 9/15/2017 | | | 199,848 | |
| | | | HSBC Holdings plc | | | | |
| | 1,250,000 | | | 5.625%, 12/29/2049i | | | 1,254,375 | |
| | 620,000 | | | 6.375%, 12/29/2049i | | | 626,200 | |
| | | | Icahn Enterprises, LP | | | | |
| | 1,350,000 | | | 6.000%, 8/1/2020 | | | 1,390,770 | |
| | | | ILFC E-Capital Trust II | | | | |
| | 2,550,000 | | | 6.250%, 12/21/2065d,g | | | 2,460,750 | |
| | | | ING Bank NV | | | | |
| | 200,000 | | | 4.125%, 11/21/2023 | | | 203,215 | |
| | | | ING Capital Funding Trust III | | | | |
| | 1,420,000 | | | 3.855%, 12/29/2049d,i | | | 1,416,450 | |
| | | | International Lease Finance Corporation | | | | |
| | 110,000 | | | 2.191%, 6/15/2016d | | | 109,863 | |
| | 610,000 | | | 5.875%, 8/15/2022 | | | 661,850 | |
| | | | Intesa Sanpaolo SPA | | | | |
| | 70,000 | | | 3.875%, 1/16/2018 | | | 72,881 | |
| | 156,000 | | | 3.875%, 1/15/2019 | | | 161,521 | |
| | | | J.P. Morgan Chase & Company | | | | |
| | 144,000 | | | 6.300%, 4/23/2019 | | | 167,267 | |
| | 155,000 | | | 3.625%, 5/13/2024 | | | 158,658 | |
| | 334,000 | | | 3.875%, 9/10/2024 | | | 334,284 | |
| | 128,000 | | | 7.900%, 4/29/2049i | | | 137,766 | |
| | 1,250,000 | | | 6.750%, 8/29/2049i | | | 1,318,750 | |
| | 310,000 | | | 5.000%, 12/29/2049i | | | 303,315 | |
| | 300,000 | | | 6.000%, 12/29/2049i | | | 296,250 | |
| | | | Liberty Mutual Group, Inc. | | | | |
| | 975,000 | | | 10.750%, 6/15/2058g | | | 1,505,027 | |
| | 42,000 | | | 5.000%, 6/1/2021g | | | 45,751 | |
| | | | Lincoln National Corporation | | | | |
| | 1,120,000 | | | 6.050%, 4/20/2067 | | | 1,120,000 | |
| | | | Lloyds Banking Group plc | | | | |
| | 1,200,000 | | | 6.413%, 1/29/2049g,i | | | 1,278,000 | |
| | 1,310,000 | | | 5.920%, 9/29/2049g,i | | | 1,300,175 | |
| | | | MetLife Capital Trust IV | | | | |
| | 1,422,000 | | | 7.875%, 12/15/2037g | | | 1,816,605 | |
| | | | MetLife, Inc. | | | | |
| | 600,000 | | | 6.400%, 12/15/2036 | | | 669,000 | |
| | | | Morgan Stanley | | | | |
| | 143,000 | | | 6.250%, 8/28/2017 | | | 158,854 | |
| | 110,000 | | | 4.875%, 11/1/2022 | | | 116,829 | |
| | | | Murray Street Investment Trust I | | | | |
| | 157,000 | | | 4.647%, 3/9/2017 | | | 165,697 | |
| | | | National City Corporation | | | | |
| | 136,000 | | | 6.875%, 5/15/2019 | | | 159,767 | |
| | | | Nomura Holdings, Inc. | | | | |
| | 141,000 | | | 2.750%, 3/19/2019 | | | 142,544 | |
| | | | Prudential Financial, Inc. | | | | |
| | 620,000 | | | 5.875%, 9/15/2042 | | | 654,100 | |
| | 1,225,000 | | | 5.625%, 6/15/2043 | | | 1,252,317 | |
| | | | QBE Capital Funding III, Ltd. | | | | |
| | 600,000 | | | 7.250%, 5/24/2041g | | | 654,000 | |
| | | | RBS Capital Trust III | | | | |
| | 1,500,000 | | | 2.095%, 9/29/2049d,i | | | 1,491,750 | |
| | | | Realty Income Corporation | | | | |
| | 131,000 | | | 2.000%, 1/31/2018 | | | 131,241 | |
| | | | Regions Bank | | | | |
| | 105,000 | | | 7.500%, 5/15/2018 | | | 121,894 | |
| | | | Reinsurance Group of America, Inc. | | | | |
| | 175,000 | | | 5.625%, 3/15/2017 | | | 189,244 | |
| | | | Royal Bank of Scotland Group plc | | | | |
| | 136,000 | | | 1.197%, 3/31/2017d | | | 136,420 | |
| | 167,000 | | | 5.125%, 5/28/2024 | | | 169,871 | |
| | 625,000 | | | 7.648%, 8/29/2049i | | | 728,125 | |
| | | | Societe Generale SA | | | | |
| | 208,000 | | | 5.750%, 4/20/2016g | | | 217,797 | |
| | 1,240,000 | | | 6.000%, 12/31/2049g,i | | | 1,128,400 | |
| | 600,000 | | | 7.875%, 12/31/2049g,i | | | 581,250 | |
| | | | Swiss RE Capital I, LP | | | | |
| | 1,350,000 | | | 6.854%, 5/29/2049g,i | | | 1,414,125 | |
| | | | Synchrony Financial | | | | |
| | 156,000 | | | 1.875%, 8/15/2017 | | | 156,303 | |
| | 156,000 | | | 3.750%, 8/15/2021 | | | 159,352 | |
| | | | Voya Financial, Inc. | | | | |
| | 204,000 | | | 2.900%, 2/15/2018 | | | 208,846 | |
| | 300,000 | | | 5.650%, 5/15/2053 | | | 297,000 | |
| | | | Wells Fargo & Company | | | | |
| | 600,000 | | | 5.900%, 12/29/2049i | | | 604,500 | |
| | | | ZFS Finance USA Trust II | | | | |
| | 1,553,000 | | | 6.450%, 12/15/2065g | | | 1,636,350 | |
| | | | | | | | |
| | | | Total | | | 56,550,350 | |
| | | | | | | | |
| |
| | Foreign Government (0.2%) | | | | |
| | | | Mexico Government International Bond | | | | |
| | 1,570,000 | | | 4.000%, 10/2/2023 | | | 1,628,875 | |
| | | | | | | | |
| | | | Total | | | 1,628,875 | |
| | | | | | | | |
The accompanying Notes to Financial Statements are an integral part of this schedule.
35
DIVERSIFIED INCOME PLUS FUND
Schedule of Investments as of December 31, 2014
| | | | | | | | |
Principal
Amount | | | Long-Term Fixed Income (43.3%) | | Value | |
| Mortgage-Backed Securities (3.9%) | | | | |
| | | | Federal National Mortgage Association Conventional 15-Yr. Pass Through | | | | |
| $ | 2,600,000 | | | 3.500%, 1/1/2030c | | $ | 2,746,656 | |
| | | | Federal National Mortgage Association Conventional 30-Yr. Pass Through | | | | |
| | 2,500,000 | | | 3.500%, 1/1/2045c | | | 2,606,055 | |
| | 11,850,000 | | | 4.000%, 1/1/2045c | | | 12,646,959 | |
| | 8,850,000 | | | 4.500%, 1/1/2045c | | | 9,606,399 | |
| | | | | | | | |
| | | | Total | | | 27,606,069 | |
| | | | | | | | |
| |
| Technology (0.6%) | | | | |
| | | | Alliance Data Systems Corporation | | | | |
| | 650,000 | | | 5.375%, 8/1/2022g | | | 641,875 | |
| | | | Amkor Technology, Inc. | | | | |
| | 860,000 | | | 6.625%, 6/1/2021 | | | 851,400 | |
| | | | First Data Corporation | | | | |
| | 860,000 | | | 7.375%, 6/15/2019g | | | 905,150 | |
| | | | Freescale Semiconductor, Inc. | | | | |
| | 860,000 | | | 6.000%, 1/15/2022g | | | 898,700 | |
| | | | Sensata Technologies BV | | | | |
| | 1,200,000 | | | 4.875%, 10/15/2023g | | | 1,194,000 | |
| | | | | | | | |
| | | | Total | | | 4,491,125 | |
| | | | | | | | |
| |
| Transportation (0.4%) | | | | |
| | | | American Airlines Pass Through Trust | | | | |
| | 128,380 | | | 4.950%, 1/15/2023 | | | 137,045 | |
| | | | Avis Budget Car Rental, LLC | | | | |
| | 1,415,000 | | | 5.125%, 6/1/2022g | | | 1,429,150 | |
| | | | Burlington Northern Santa Fe, LLC | | | | |
| | 156,000 | | | 3.400%, 9/1/2024 | | | 158,848 | |
| | | | Delta Air Lines, Inc. | | | | |
| | 105,810 | | | 4.950%, 5/23/2019 | | | 113,217 | |
| | 89,943 | | | 4.750%, 5/7/2020 | | | 95,681 | |
| | | | Korea Expressway Corporation | | | | |
| | 200,000 | | | 1.625%, 4/28/2017g | | | 198,882 | |
| | | | Southwest Airlines Company | | | | |
| | 155,000 | | | 2.750%, 11/6/2019 | | | 155,713 | |
| | | | United Air Lines, Inc. | | | | |
| | 126,016 | | | 10.400%, 11/1/2016 | | | 140,193 | |
| | | | | | | | |
| | | | Total | | | 2,428,729 | |
| | | | | | | | |
| |
| U.S. Government and Agencies (0.1%) | | | | |
| | | | U.S. Treasury Notes | | | | |
| | 500,000 | | | 0.500%, 7/31/2016 | | | 500,234 | |
| | | | | | | | |
| | | | Total | | | 500,234 | |
| | | | | | | | |
| |
| Utilities (2.3%) | | | | |
| | | | Access Midstream Partners, LP | | | | |
| | 610,000 | | | 4.875%, 5/15/2023 | | | 619,150 | |
| | | | AES Corporation | | | | |
| | 610,000 | | | 7.375%, 7/1/2021 | | | 689,300 | |
| | | | Atlas Pipeline Partners, LP | | | | |
| | 860,000 | | | 4.750%, 11/15/2021 | | | 817,000 | |
| | | | Calpine Corporation | | | | |
| | 870,000 | | | 6.000%, 1/15/2022g | | | 926,550 | |
| | 1,080,000 | | | 5.375%, 1/15/2023 | | | 1,090,800 | |
| | 136,000 | | | 6.950%, 7/15/2018 | | | 157,200 | |
| | | | DCP Midstream Operating, LP | | | | |
| | 216,000 | | | 2.500%, 12/1/2017 | | | 215,752 | |
| | | | DCP Midstream, LLC | | | | |
| | 450,000 | | | 5.850%, 5/21/2043g | | | 436,500 | |
| | | | Dynegy Finance l, Inc. | | | | |
| | 1,200,000 | | | 7.375%, 11/1/2022g | | | 1,221,000 | |
| | | | Electricite de France SA | | | | |
| | 1,860,000 | | | 5.250%, 12/29/2049g,i | | | 1,906,500 | |
| | | | Enel Finance International NV | | | | |
| | 110,000 | | | 5.125%, 10/7/2019g | | | 121,544 | |
| | | | Enterprise Products Operating, LLC | | | | |
| | 1,390,000 | | | 7.034%, 1/15/2068 | | | 1,524,656 | |
| | | | Exelon Generation Company, LLC | | | | |
| | 144,000 | | | 5.200%, 10/1/2019 | | | 159,123 | |
| | | | MarkWest Energy Partners, LP | | | | |
| | 1,285,000 | | | 4.875%, 12/1/2024 | | | 1,256,088 | |
| | | | MidAmerican Energy Holdings Company | | | | |
| | 144,000 | | | 5.750%, 4/1/2018 | | | 161,373 | |
| | | | NRG Energy, Inc. | | | | |
| | 610,000 | | | 6.625%, 3/15/2023 | | | 634,400 | |
| | | | ONEOK Partners, LP | | | | |
| | 104,000 | | | 2.000%, 10/1/2017 | | | 103,419 | |
| | | | PPL Capital Funding, Inc. | | | | |
| | 270,000 | | | 1.900%, 6/1/2018 | | | 269,541 | |
| | | | Southern California Edison Company | | | | |
| | 2,800,000 | | | 6.250%, 8/1/2049i | | | 3,104,500 | |
| | | | TransCanada PipeLines, Ltd. | | | | |
| | 600,000 | | | 6.350%, 5/15/2067 | | | 582,000 | |
| | | | | | | | |
| | | | Total | | | 15,996,396 | |
| | | | | | | | |
| | | | Total Long-Term Fixed Income
(cost $295,484,595) | | | 302,198,472 | |
| | | | | | | | |
| | |
Shares | | | Common Stock (33.2%) | | | |
| Consumer Discretionary (2.9%) | | | | |
| | 24,700 | | | Barnes & Noble, Inc.j | | | 573,534 | |
| | 6,700 | | | Bayerische Motoren Werke AG | | | 723,054 | |
| | 50,600 | | | Best Buy Company, Inc. | | | 1,972,388 | |
| | 17,500 | | | Canon Marketing Japan, Inc. | | | 296,584 | |
| | 16,100 | | | Coach, Inc. | | | 604,716 | |
| | 33,900 | | | Comcast Corporation | | | 1,966,539 | |
| | 82,300 | | | Dixons Carphone plc | | | 593,135 | |
| | 28,000 | | | Dollar Tree, Inc.j | | | 1,970,640 | |
| | 41,800 | | | EDION Corporation | | | 292,377 | |
| | 13,100 | | | Gap, Inc. | | | 551,641 | |
| | 31,900 | | | Hakuhodo Dy Holdings, Inc. | | | 305,281 | |
| | 11,700 | | | Hennes & Mauritz AB | | | 486,077 | |
| | 10,800 | | | Hilton Worldwide Holdings, Inc.j | | | 281,772 | |
| | 89,202 | | | Home Retail Group plc | | | 287,476 | |
| | 36,800 | | | Honda Motor Company, Ltd. | | | 1,079,649 | |
| | 95,455 | | | ITV plc | | | 318,411 | |
| | 16,700 | | | Kohl’s Corporation | | | 1,019,368 | |
| | 27 | | | Lear Corporation | | | 2,648 | |
| | 28,200 | | | Lowe’s Companies, Inc. | | | 1,940,160 | |
| | 139,000 | | | Luk Fook Holdings International, Ltd. | | | 521,268 | |
| | 8,500 | | | Madison Square Garden Companyj | | | 639,710 | |
| | 3,500 | | | RTL Group SA | | | 333,747 | |
| | 22,400 | | | Ruth’s Hospitality Group, Inc. | | | 336,000 | |
| | 42,500 | | | Sekisui House, Ltd. | | | 559,214 | |
The accompanying Notes to Financial Statements are an integral part of this schedule.
36
DIVERSIFIED INCOME PLUS FUND
Schedule of Investments as of December 31, 2014
| | | | | | | | |
Shares | | | Common Stock (33.2%) | | Value | |
| Consumer Discretionary (2.9%) - continued | |
| | 139,000 | | | SJM Holdings, Ltd. | | $ | 219,745 | |
| | 80,600 | | | Sky Network Television, Ltd. | | | 378,390 | |
| | 19,300 | | | Stage Stores, Inc. | | | 399,510 | |
| | 27,500 | | | Sumitomo Forestry Company, Ltd. | | | 268,938 | |
| | 41,400 | | | Suzuki Motor Corporation | | | 1,240,648 | |
| | | | | | | | |
| | | | Total | | | 20,162,620 | |
| | | | | | | | |
| |
| Consumer Staples (1.8%) | | | | |
| | 20,700 | | | Associated British Foods plc | | | 1,012,006 | |
| | 5,462 | | | British American Tobacco plc | | | 295,991 | |
| | 34,050 | | | Coca-Cola Company | | | 1,437,591 | |
| | 14,650 | | | Coca-Cola Enterprises, Inc. | | | 647,823 | |
| | 21,450 | | | CVS Health Corporation | | | 2,065,849 | |
| | 30,027 | | | Imperial Tobacco Group plc | | | 1,321,776 | |
| | 18,500 | | | Japan Tobacco, Inc. | | | 509,172 | |
| | 6,400 | | | Nestle SA | | | 466,566 | |
| | 94,600 | | | Rite Aid Corporationj | | | 711,392 | |
| | 23,200 | | | Tyson Foods, Inc. | | | 930,088 | |
| | 10,000 | | | Wal-Mart Stores, Inc. | | | 858,800 | |
| | 11,152 | | | Wesfarmers, Ltd. | | | 377,581 | |
| | 16,800 | | | WhiteWave Foods Companyj | | | 587,832 | |
| | 15,100 | | | Whole Foods Market, Inc. | | | 761,342 | |
| | 174,000 | | | Wilmar International, Ltd. | | | 423,975 | |
| | | | | | | | |
| | | | Total | | | 12,407,784 | |
| | | | | | | | |
| |
| Energy (1.7%) | | | | |
| | 229,024 | | | BP plc | | | 1,453,750 | |
| | 38,991 | | | BW LPG, Ltd. | | | 271,561 | |
| | 8,850 | | | Cabot Oil & Gas Corporation | | | 262,048 | |
| | 17,500 | | | CAT Oil AG | | | 309,371 | |
| | 53,700 | | | Eni SPA | | | 940,638 | |
| | 20,100 | | | EOG Resources, Inc. | | | 1,850,607 | |
| | 41,500 | | | ERG SPA | | | 464,760 | |
| | 47,600 | | | Halliburton Company | | | 1,872,108 | |
| | 75,900 | | | Patterson-UTI Energy, Inc. | | | 1,259,181 | |
| | 47,200 | | | Pioneer Energy Services Corporationj | | | 261,488 | |
| | 33,127 | | | Royal Dutch Shell plc, Class B | | | 1,144,575 | |
| | 12,300 | | | Southwestern Energy Companyj | | | 335,667 | |
| | 17,100 | | | Total SA | | | 876,070 | |
| | 8,450 | | | Whiting Petroleum Corporationj | | | 278,850 | |
| | | | | | | | |
| | | | Total | | | 11,580,674 | |
| | | | | | | | |
| |
| Financials (11.9%) | | | | |
| | 800 | | | Acadia Realty Trust | | | 25,624 | |
| | 11,200 | | | Aflac, Inc. | | | 684,208 | |
| | 1,300 | | | Agree Realty Corporation | | | 40,417 | |
| | 6,300 | | | Alexandria Real Estate Equities, Inc. | | | 559,062 | |
| | 6,800 | | | Allianz SE | | | 1,126,261 | |
| | 35,650 | | | AmTrust Financial Services, Inc.k | | | 2,005,313 | |
| | 9,500 | | | Apartment Investment & Management Company | | | 352,925 | |
| | 300,000 | | | Apollo Investment Corporation | | | 2,226,000 | |
| | 183,600 | | | Ares Capital Corporation | | | 2,865,078 | |
| | 12,789 | | | Australia & New Zealand Banking Group, Ltd. | | | 332,769 | |
| | 5,200 | | | AvalonBay Communities, Inc. | | | 849,628 | |
| | 12,600 | | | AXA SA | | | 290,343 | |
| | 72,300 | | | Banco Santander SA | | | 606,824 | |
| | 161,500 | | | Bank Leumi Le-lsrael BMj | | | 551,718 | |
| | 100,450 | | | Bank of America Corporation | | | 1,797,050 | |
| | 7,168 | | | Bank of Nova Scotia | | | 409,115 | |
| | 7,100 | | | BioMed Realty Trust, Inc. | | | 152,934 | |
| | 7,000 | | | Boston Properties, Inc. | | | 900,830 | |
| | 14,700 | | | Brixmor Property Group, Inc. | | | 365,148 | |
| | 4,000 | | | Camden Property Trust | | | 295,360 | |
| | 11,550 | | | Cash America International, Inc. | | | 261,261 | |
| | 30,200 | | | Charles Schwab Corporation | | | 911,738 | |
| | 86,000 | | | Cheung Kong Holdings, Ltd. | | | 1,440,227 | |
| | 36,550 | | | Citigroup, Inc. | | | 1,977,720 | |
| | 690 | | | City Office REIT, Inc. | | | 8,832 | |
| | 8,200 | | | CubeSmart | | | 180,974 | |
| | 30,000 | | | DBS Group Holdings, Ltd. | | | 464,440 | |
| | 2,900 | | | Digital Realty Trust, Inc. | | | 192,270 | |
| | 18,850 | | | Discover Financial Services | | | 1,234,487 | |
| | 36,900 | | | Duke Realty Corporation | | | 745,380 | |
| | 13,600 | | | Employers Holdings, Inc. | | | 319,736 | |
| | 12,031 | | | Enova International, Inc.j | | | 267,810 | |
| | 4,600 | | | EPR Properties | | | 265,098 | |
| | 3,600 | | | Equity Lifestyle Properties, Inc. | | | 185,580 | |
| | 9,500 | | | Equity Residential | | | 682,480 | |
| | 5,250 | | | Erie Indemnity Company | | | 476,543 | |
| | 1,700 | | | Essex Property Trust, Inc. | | | 351,220 | |
| | 36,650 | | | F.N.B. Corporation | | | 488,178 | |
| | 26,800 | | | First Financial Bancorp | | | 498,212 | |
| | 36,000 | | | Forestar Real Estate Group, Inc.j | | | 554,400 | |
| | 21,227 | | | General Growth Properties, Inc. | | | 597,116 | |
| | 1,700 | | | Geo Group, Inc. | | | 68,612 | |
| | 180,000 | | | Golub Capital BDC, Inc. | | | 3,227,400 | |
| | 10,700 | | | Hancock Holding Company | | | 328,490 | |
| | 42,900 | | | Hang Seng Bank, Ltd. | | | 713,018 | |
| | 16,200 | | | HCP, Inc. | | | 713,286 | |
| | 3,500 | | | Health Care REIT, Inc. | | | 264,845 | |
| | 14,050 | | | Healthcare Trust of America, Inc. | | | 378,507 | |
| | 8,300 | | | Highwoods Properties, Inc. | | | 367,524 | |
| | 11,000 | | | Horace Mann Educators Corporation | | | 364,980 | |
| | 33,900 | | | Host Hotels & Resorts, Inc. | | | 805,803 | |
| | 174,353 | | | HSBC Holdings plc | | | 1,647,597 | |
| | 59,450 | | | Huntington Bancshares, Inc. | | | 625,414 | |
| | 9,100 | | | iShares Intermediate Credit Bond ETF | | | 994,903 | |
| | 21,600 | | | iShares J.P. Morgan USD Emerging Markets Bond ETF | | | 2,369,736 | |
| | 21,600 | | | iShares MSCI Emerging Markets Minimum Volatility ETF | | | 1,223,208 | |
| | 52,200 | | | KeyCorp | | | 725,580 | |
| | 35,100 | | | Kimco Realty Corporation | | | 882,414 | |
| | 500 | | | LaSalle Hotel Properties | | | 20,235 | |
| | 11,300 | | | Lazard, Ltd. | | | 565,339 | |
| | 37,800 | | | MetLife, Inc. | | | 2,044,602 | |
| | 6,000 | | | Mid-America Apartment Communities, Inc. | | | 448,080 | |
| | 2,500 | | | Muenchener Rueckversicherungs-Gesellschaft AG | | | 497,845 | |
| | 38,500 | | | National Australia Bank, Ltd. | | | 1,049,906 | |
| | 2,700 | | | National Health Investors, Inc. | | | 188,892 | |
| | 7,000 | | | National Retail Properties, Inc. | | | 275,590 | |
| | 20,400 | | | OFG Bancorpk | | | 339,660 | |
| | 1,800 | | | Omega Healthcare Investors, Inc. | | | 70,326 | |
| | 2,800 | | | Parkway Properties, Inc. | | | 51,492 | |
| | 12,850 | | | Principal Financial Group, Inc. | | | 667,429 | |
| | 21,200 | | | Prologis, Inc. | | | 912,236 | |
| | 15,250 | | | Prudential Financial, Inc. | | | 1,379,515 | |
| | 4,600 | | | Public Storage, Inc. | | | 850,310 | |
| | 37,550 | | | Regions Financial Corporation | | | 396,528 | |
| | 10,800 | | | RLJ Lodging Trust | | | 362,124 | |
| | 31,909 | | | Royal Bank of Canada | | | 2,203,803 | |
| | 4,000 | | | Sabra Healthcare REIT, Inc. | | | 121,480 | |
| | 8,600 | | | Simon Property Group, Inc. | | | 1,566,146 | |
| | 140,000 | | | Solar Capital, Ltd. | | | 2,521,400 | |
| | 1,230 | | | Sovran Self Storage, Inc. | | | 107,281 | |
| | 181,000 | | | SPDR EuroStoxx 50 ETF | | | 6,671,660 | |
The accompanying Notes to Financial Statements are an integral part of this schedule.
37
DIVERSIFIED INCOME PLUS FUND
Schedule of Investments as of December 31, 2014
| | | | | | | | |
Shares | | | Common Stock (33.2%) | | Value | |
| Financials (11.9%) - continued | |
| | 33,500 | | | Spirit Realty Captial, Inc. | | $ | 398,315 | |
| | 1,181 | | | Store Capital Corporation | | | 25,521 | |
| | 104,502 | | | Summit Hotel Properties, Inc. | | | 1,300,005 | |
| | 4,900 | | | Swiss Re AG | | | 410,481 | |
| | 3,900 | | | T. Rowe Price Group, Inc. | | | 334,854 | |
| | 6,463 | | | Tanger Factory Outlet Centers, Inc. | | | 238,872 | |
| | 1,890 | | | Taubman Centers, Inc. | | | 144,434 | |
| | 1,350 | | | Terreno Realty Corporation | | | 27,851 | |
| | 31,425 | | | Toronto-Dominion Bankk | | | 1,501,465 | |
| | 359,100 | | | Two Harbors Investment Corporation | | | 3,598,182 | |
| | 28,350 | | | U.S. Bancorp | | | 1,274,332 | |
| | 2,800 | | | UDR, Inc. | | | 86,296 | |
| | 12,400 | | | Ventas, Inc. | | | 889,080 | |
| | 8,000 | | | Vornado Realty Trust | | | 941,680 | |
| | 11,850 | | | W.R. Berkley Corporation | | | 607,431 | |
| | 45,250 | | | Wells Fargo & Company | | | 2,480,605 | |
| | 4,500 | | | Zurich Insurance Group AGj | | | 1,406,261 | |
| | | | | | | | |
| | | | Total | | | 83,219,170 | |
| | | | | | | | |
| |
| Health Care (4.3%) | | | | |
| | 9,400 | | | Abaxis, Inc. | | | 534,202 | |
| | 5,350 | | | AbbVie, Inc. | | | 350,104 | |
| | 4,100 | | | Actelion, Ltd. | | | 471,996 | |
| | 19,350 | | | Aetna, Inc. | | | 1,718,860 | |
| | 9,100 | | | AmerisourceBergen Corporation | | | 820,456 | |
| | 21,332 | | | AMN Healthcare Services, Inc.j | | | 418,107 | |
| | 10,650 | | | Anthem, Inc. | | | 1,338,386 | |
| | 34,000 | | | Astellas Pharmaceutical, Inc. | | | 473,352 | |
| | 5,000 | | | Bayer AG | | | 681,544 | |
| | 4,350 | | | Biogen Idec, Inc.j | | | 1,476,607 | |
| | 4,693 | | | Boiron SA | | | 396,482 | |
| | 65,000 | | | Boston Scientific Corporationj | | | 861,250 | |
| | 22,100 | | | Bruker Corporationj | | | 433,602 | |
| | 8,950 | | | Centene Corporationj | | | 929,458 | |
| | 8,500 | | | CSL, Ltd. | | | 597,089 | |
| | 5,400 | | | Cyberonics, Inc.j | | | 300,672 | |
| | 9,850 | | | Eli Lilly and Company | | | 679,551 | |
| | 75,981 | | | Fisher & Paykel Healthcare Corporation, Ltd. | | | 370,431 | |
| | 23,450 | | | Gilead Sciences, Inc.j | | | 2,210,397 | |
| | 23,364 | | | GlaxoSmithKline plc | | | 501,243 | |
| | 15,350 | | | HCA Holdings, Inc.j | | | 1,126,537 | |
| | 47,100 | | | Healthways, Inc.j | | | 936,348 | |
| | 15,693 | | | ICON plci | | | 800,186 | |
| | 16,650 | | | Johnson & Johnson | | | 1,741,090 | |
| | 2,800 | | | Lonza Group AG | | | 315,257 | |
| | 2,700 | | | McKesson Corporation | | | 560,466 | |
| | 24,700 | | | Merck & Company, Inc. | | | 1,402,713 | |
| | 26,500 | | | Otsuka Holdings Company, Ltd. | | | 794,502 | |
| | 16,000 | | | PAREXEL International Corporationj | | | 888,960 | |
| | 88,300 | | | Pfizer, Inc. | | | 2,750,545 | |
| | 9,100 | | | Quintiles Transnational Holdings, Inc.j | | | 535,717 | |
| | 22,100 | | | Recordati SPA | | | 342,625 | |
| | 2,100 | | | Roche Holding AG - BR | | | 565,784 | |
| | 1,700 | | | Roche Holding AG - Genusschein | | | 460,602 | |
| | 19,800 | | | Sagent Pharmaceuticals, Inc.j | | | 497,178 | |
| | 6,600 | | | Sanofi | | | 601,727 | |
| | 23,600 | | | Sonic Healthcare, Ltd. | | | 355,052 | |
| | | | | | | | |
| | | | Total | | | 30,239,078 | |
| | | | | | | | |
| |
| Industrials (4.2%) | | | | |
| | 12,800 | | | Abertis Infraestructuras SA | | | 253,822 | |
| | 294,500 | | | Alerian MLP ETF | | | 5,159,640 | |
| | 16,200 | | | Allison Transmission Holdings, Inc. | | | 549,180 | |
| | 13,950 | | | Caterpillar, Inc. | | | 1,276,843 | |
| | 18,500 | | | COMSYS Holdings Corporation | | | 253,076 | |
| | 28,300 | | | Con-way, Inc. | | | 1,391,794 | |
| | 27,550 | | | Delta Air Lines, Inc. | | | 1,355,185 | |
| | 13,000 | | | easyJet plc | | | 336,429 | |
| | 29,600 | | | Flowserve Corporation | | | 1,770,968 | |
| | 88,000 | | | General Electric Company | | | 2,223,760 | |
| | 74,000 | | | Hutchison Whampoa, Ltd. | | | 845,936 | |
| | 70,100 | | | ITOCHU Corporation | | | 748,324 | |
| | 10,200 | | | Jacobs Engineering Group, Inc.j | | | 455,838 | |
| | 31,150 | | | KAR Auction Services, Inc. | | | 1,079,348 | |
| | 17,900 | | | KONE OYJ | | | 814,949 | |
| | 5,450 | | | Lockheed Martin Corporation | | | 1,049,507 | |
| | 7,000 | | | Mabuchi Motor Company, Ltd. | | | 277,847 | |
| | 30,500 | | | Meritor, Inc.j | | | 462,075 | |
| | 27,500 | | | Pentair, Ltd. | | | 1,826,550 | |
| | 44,600 | | | Performant Financial Corporationj | | | 296,590 | |
| | 15,950 | | | Quad/Graphics, Inc. | | | 366,212 | |
| | 10,600 | | | Safran SA | | | 653,968 | |
| | 12,400 | | | Siemens AG | | | 1,391,331 | |
| | 48,500 | | | Southwest Airlines Company | | | 2,052,520 | |
| | 13,906 | | | Stantec, Inc. | | | 382,182 | |
| | 67,000 | | | Toda Corporation | | | 264,247 | |
| | 38,000 | | | TOTO, Ltd. | | | 442,043 | |
| | 27,839 | | | Wajax Corporation | | | 737,309 | |
| | 7,650 | | | Woodward, Inc. | | | 376,609 | |
| | 21,652 | | | WS Atkins plc | | | 458,559 | |
| | | | | | | | |
| | | | Total | | | 29,552,641 | |
| | | | | | | | |
| |
| Information Technology (3.4%) | | | | |
| | 4,650 | | | Accenture plc | | | 415,291 | |
| | 29,950 | | | Akamai Technologies, Inc.j | | | 1,885,652 | |
| | 26,950 | | | Aspen Technology, Inc.j | | | 943,789 | |
| | 45,350 | | | Broadcom Corporation | | | 1,965,016 | |
| | 142,600 | | | Brocade Communications Systems, Inc. | | | 1,688,384 | |
| | 10,288 | | | CGI Group, Inc.i | | | 392,198 | |
| | 51,500 | | | Cirrus Logic, Inc.j | | | 1,213,855 | |
| | 71,050 | | | Cisco Systems, Inc. | | | 1,976,256 | |
| | 8,250 | | | Computer Sciences Corporation | | | 520,162 | |
| | 1,708 | | | Constellation Software, Inc. | | | 507,843 | |
| | 53,000 | | | Corning, Inc. | | | 1,215,290 | |
| | 19,200 | | | Electronic Arts, Inc.j | | | 902,688 | |
| | 65,950 | | | EMC Corporation | | | 1,961,353 | |
| | 2,200 | | | F5 Networks, Inc.j | | | 287,023 | |
| | 33,500 | | | FUJIFILM Holdings NPV | | | 1,022,204 | |
| | 85,300 | | | Global Cash Access Holdings, Inc.j | | | 609,895 | |
| | 16,000 | | | Hoya Corporation | | | 541,197 | |
| | 28,500 | | | Juniper Networks, Inc. | | | 636,120 | |
| | 9,200 | | | Lexmark International, Inc. | | | 379,684 | |
| | 38,650 | | | Marvell Technology Group, Ltd. | | | 560,425 | |
| | 9,799 | | | Melexis NV | | | 443,400 | |
| | 18,900 | | | NetApp, Inc. | | | 783,405 | |
| | 6,151 | | | Newport Corporationj | | | 117,546 | |
| | 6,000 | | | NXP Semiconductors NVj | | | 458,400 | |
| | 19,400 | | | Pegasystems, Inc. | | | 402,938 | |
| | 22,800 | | | Skyworks Solutions, Inc. | | | 1,657,788 | |
| | 32,900 | | | Vishay Intertechnology, Inc. | | | 465,535 | |
| | | | | | | | |
| | | | Total | | | 23,953,337 | |
| | | | | | | | |
| |
| Materials (1.0%) | | | | |
| | 74,700 | | | Acacia Mining plc | | | 295,945 | |
| | 687,928 | | | Centamin plc | | | 631,648 | |
| | 27,150 | | | Dow Chemical Company | | | 1,238,312 | |
| | 27,400 | | | James Hardie Industries plc | | | 292,502 | |
The accompanying Notes to Financial Statements are an integral part of this schedule.
38
DIVERSIFIED INCOME PLUS FUND
Schedule of Investments as of December 31, 2014
| | | | | | | | |
Shares | | | Common Stock (33.2%) | | Value | |
| Materials (1.0%) - continued | |
| | 320,000 | | | Kobe Steel, Ltd. | | $ | 551,199 | |
| | 18,150 | | | LyondellBasell Industries NV | | | 1,440,929 | |
| | 5,100 | | | Nitto Denko Corporation | | | 284,965 | |
| | 21,878 | | | Rio Tinto plc | | | 1,008,513 | |
| | 10,900 | | | Southern Copper Corporation | | | 307,380 | |
| | 9,100 | | | Voestalpine AG | | | 359,570 | |
| | 12,200 | | | Westlake Chemical Corporation | | | 745,29 8 | |
| | | | | | | | |
| | | | Total | | | 7,156,261 | |
| | | | | | | | |
| |
| Telecommunications Services (1.1%) | | | | |
| | 839,600 | | | Bezeq Israel Telecommunication Corporation, Ltd. | | | 1,489,296 | |
| | 147,820 | | | BT Group plc | | | 919,452 | |
| | 31,000 | | | KDDI Corporation | | | 1,947,545 | |
| | 29,300 | | | Nippon Telegraph & Telephone Corporation | | | 1,496,721 | |
| | 387,000 | | | Singapore Telecommunications, Ltd. | | | 1,135,963 | |
| | 100,850 | | | Vonage Holdings Corporationj | | | 384,239 | |
| | | | | | | | |
| | | | Total | | | 7,373,216 | |
| | | | | | | | |
| |
| Utilities (0.9%) | | | | |
| | 394,900 | | | A2A SPA | | | 400,148 | |
| | 402,500 | | | Electricidade de Portugal SA | | | 1,560,756 | |
| | 33,500 | | | Endesa SA | | | 670,648 | |
| | 95,200 | | | Enel SPA | | | 424,357 | |
| | 26,600 | | | Fortum OYJ | | | 577,529 | |
| | 22,100 | | | Gas Natural SDG SA | | | 555,166 | |
| | 46,800 | | | GDF Suez | | | 1,091,334 | |
| | 124,800 | | | Iberdrola SA | | | 841,247 | |
| | 18,500 | | | Verbund AGk | | | 342,602 | |
| | | | | | | | |
| | | | Total | | | 6,463,787 | |
| | | | | | | | |
| | | | Total Common Stock
(cost $225,379,360) | | | 232,108,568 | |
| | | | | | | | |
| | |
| | | | Preferred Stock (4.6%) | | | |
| Financials (4.3%) | | | | |
| | 50,000 | | | Affiliated Managers Group, Inc., 5.250% | | | 1,293,500 | |
| | 9,375 | | | Agribank FCB, 6.875%i | | | 985,254 | |
| | 63,000 | | | Allstate Corporation, 5.100% | | | 1,595,790 | |
| | 64,790 | | | Annaly Capital Management, Inc., 7.500%i | | | 1,610,032 | |
| | 1,200 | | | Bank of America Corporation, Convertible, 7.250%i | | | 1,395,564 | |
| | 61,780 | | | Citigroup, Inc., 6.875%i | | | 1,642,112 | |
| | 35,980 | | | Citigroup, Inc., 7.875% | | | 956,348 | |
| | 20,070 | | | Cobank ACB, 6.250%i | | | 2,022,681 | |
| | 24,000 | | | Countrywide Capital V, 7.000% | | | 618,000 | |
| | 6,000 | | | Farm Credit Bank of Texas, 6.750%g,i | | | 620,813 | |
| | 46,500 | | | GMAC Capital Trust I, 8.125% | | | 1,226,670 | |
| | 78,200 | | | Goldman Sachs Group, Inc., 5.500%i | | | 1,908,080 | |
| | 72,000 | | | HSBC USA, Inc., 6.500%i | | | 1,820,160 | |
| | 375 | | | M&T Bank Corporation, 6.375%i | | | 387,422 | |
| | 47,580 | | | Morgan Stanley, 6.875%i | | | 1,266,104 | |
| | 44,100 | | | Morgan Stanley, 7.125%i | | | 1,214,073 | |
| | 40,500 | | | PNC Financial Services Group, Inc., 6.125%i | | | 1,124,280 | |
| | 18,000 | | | Principal Financial Group, Inc., 5.563%i | | | 1,812,375 | |
| | 62,000 | | | RBS Capital Funding Trust V, 5.900%i | | | 1,506,600 | |
| | 15,000 | | | Royal Bank of Scotland Group plc, 7.250%i | | | 382,350 | |
| | 52,000 | | | U.S. Bancorp 6.500%i | | | 1,531,400 | |
| | 24,000 | | | Wells Fargo & Company, 5.850%i | | | 615,600 | |
| 1,695 | | | Wells Fargo & Company, Convertible, 7.500%i | | | 2,044,170 | |
| | | | | | | | |
| | | | Total | | | 29,579,378 | |
| | | | | | | | |
| |
| Materials (0.3%) | | | | |
| | 31,000 | | | CHS, Inc., 6.750%i | | | 788,020 | |
| | 48,800 | | | CHS, Inc., 7.100%i | | | 1,281,488 | |
| | | | | | | | |
| | | | Total | | | 2,069,508 | |
| | | | | | | | |
| |
| Utilities (<0.1%) | | | | |
| | 2,190 | | | Southern California Edison Company, 4.510%i | | | 220,026 | |
| | | | | | | | |
| | | | Total | | | 220,026 | |
| | | | | | | | |
| | | | Total Preferred Stock
(cost $31,408,679) | | | 31,868,912 | |
| | | | | | | | |
| | |
| | | | Collateral Held for Securities Loaned (0.5%) | | | |
| | 3,898,339 | | | Thrivent Cash Management Trust | | | 3,898,339 | |
| | | | | | | | |
| | | | Total Collateral Held for Securities Loaned
(cost $3,898,339) | | | 3,898,339 | |
| | | | | | | | |
| | |
Shares or
Principal
Amount | | | Short-Term Investments (9.5%)l | | | |
| | | | Federal Home Loan Bank Discount Notes | | | | |
| | 500,000 | | | 0.064%, 1/21/2015m | | | 499,982 | |
| | 100,000 | | | 0.100%, 3/6/2015m | | | 99,982 | |
| | | | Federal Home Loan Mortgage Corporation Discount Notes | | | | |
| | 300,000 | | | 0.060%, 2/6/2015m | | | 299,982 | |
| | | | Thrivent Cash Management Trust | | | | |
| | 65,277,133 | | | 0.060% | | | 65,277,133 | |
| | | | | | | | |
| | | | Total Short-Term Investments (at amortized cost) | | | 66,177,079 | |
| | | | | | | | |
| | | | Total Investments (cost $721,356,087) 104.9% | | $ | 732,392,967 | |
| | | | | | | | |
| | | | Other Assets and Liabilities, Net (4.9%) | | | (34,490,065 | ) |
| | | | | | | | |
| | | | Total Net Assets 100.0% | | $ | 697,902,902 | |
| | | | | | | | |
| a | The stated interest rate represents the weighted average of all contracts within the bank loan facility. |
| b | All or a portion of the loan is unfunded, |
| c | Denotes investments purchased on a when-issued or delayed delivery basis. |
| d | Denotes variable rate securities. Variable rate securities are securities whose yields vary with a designated market index or market rate. The rate shown is as of December 31, 2014. |
| e | Denotes step coupon securities. Step coupon securities pay an initial coupon rate for the first period and then different coupon rates for following periods. The rate shown is as of December 31, 2014. |
| f | All or a portion of the security is insured or guaranteed. |
| g | Denotes securities sold under Rule 144A of the Securities Act of 1933, which exempts them from registration. These securities have been deemed liquid and may be resold to other dealers in the program or to other qualified institutional buyers. As of December 31, 2014, the value of these investments was $63,385,462 or 9.1% of total net assets. |
The accompanying Notes to Financial Statements are an integral part of this schedule.
39
DIVERSIFIED INCOME PLUS FUND
Schedule of Investments as of December 31, 2014
| h | Denotes interest only security. Interest only securities represent the right to receive monthly interest payments on an underlying pool of mortgages or assets. The principal shown is the outstanding par amount of the pool as of the end of the period. The actual effective yield of the security is different than the stated coupon rate. |
| i | Denotes perpetual securities. Perpetual securities pay an indefinite stream of interest, but may be called by the issuer at an earlier date. |
| j | Non-income producing security. |
| k | All or a portion of the security is on loan. |
| l | The interest rate shown reflects the yield, coupon rate or the discount rate at the date of purchase. |
| m | At December 31, 2014, $899,946 of investments were held on deposit with the counterparty and pledged as the initial margin deposit for open futures contracts. |
| * | Denotes restricted securities. Restricted securities are investment securities which have been deemed illiquid and cannot be offered for public sale without first being registered under the Securities Act of 1933. The following table indicates the acquisition date and cost of restricted securities Diversified Income Plus Fund owned as of December 31, 2014. |
| | | | | | | | |
Security | | Acquisition
Date | | | Cost | |
AGI Life Holdings, Inc., 12/1/2045 | | | 7/19/2012 | | | $ | 1,258,813 | |
Bayview Opportunity Master Fund | | | | | | | | |
Trust IIB, LP, 7/28/2019 | | | 7/30/2014 | | | | 1,295,140 | |
JBS Finance II, Ltd., 1/29/2018 | | | 8/11/2014 | | | | 1,128,543 | |
Definitions:
| | | | |
ETF | | - | | Exchange Traded Fund. |
REIT | | - | | Real Estate Investment Trust is a company that buys, develops, manages and/or sells real estate assets. |
Unrealized Appreciation (Depreciation)
Gross unrealized appreciation and depreciation of investments, based on cost for federal income tax purposes, were as follows:
| | | | |
Gross unrealized appreciation | | $ | 29,317,266 | |
Gross unrealized depreciation | | | (18,728,229 | ) |
| | | | |
Net unrealized appreciation (depreciation) | | $ | 10,589,037 | |
| |
Cost for federal income tax purposes | | $ | 721,803,930 | |
The accompanying Notes to Financial Statements are an integral part of this schedule.
40
DIVERSIFIED INCOME PLUS FUND
Schedule of Investments as of December 31, 2014
Fair Valuation Measurements
The following table is a summary of the inputs used, as of December 31, 2014, in valuing Diversified Income Plus Fund’s assets carried at fair value.
| | | | | | | | | | | | | | | | |
Investments in Securities | | Total | | | Level 1 | | | Level 2 | | | Level 3 | |
Bank Loans | | | | | | | | | | | | | | | | |
Basic Materials | | | 7,646,956 | | | | — | | | | 7,646,956 | | | | — | |
Capital Goods | | | 4,598,410 | | | | — | | | | 4,598,410 | | | | — | |
Communications Services | | | 31,915,971 | | | | — | | | | 28,267,470 | | | | 3,648,501 | |
Consumer Cyclical | | | 15,737,447 | | | | — | | | | 15,737,447 | | | | — | |
Consumer Non-Cyclical | | | 11,898,210 | | | | — | | | | 11,052,520 | | | | 845,690 | |
Energy | | | 6,281,532 | | | | — | | | | 5,591,704 | | | | 689,828 | |
Financials | | | 7,332,265 | | | | — | | | | 7,332,265 | | | | — | |
Technology | | | 4,544,874 | | | | — | | | | 4,544,874 | | | | — | |
Transportation | | | 3,702,969 | | | | — | | | | 2,740,169 | | | | 962,800 | |
Utilities | | | 2,482,963 | | | | — | | | | 2,482,963 | | | | — | |
Long-Term Fixed Income | | | | | | | | | | | | | | | | |
Asset-Backed Securities | | | 8,293,594 | | | | — | | | | 8,293,594 | | | | — | |
Basic Materials | | | 5,317,813 | | | | — | | | | 5,317,813 | | | | — | |
Capital Goods | | | 7,088,236 | | | | — | | | | 7,088,236 | | | | — | |
Collateralized Mortgage Obligations | | | 106,797,331 | | | | — | | | | 106,797,331 | | | | — | |
Commercial Mortgage-Backed Securities | | | 3,428,849 | | | | — | | | | 3,428,849 | | | | — | |
Communications Services | | | 21,454,993 | | | | — | | | | 21,454,993 | | | | — | |
Consumer Cyclical | | | 12,721,949 | | | | — | | | | 12,721,949 | | | | — | |
Consumer Non-Cyclical | | | 15,786,017 | | | | — | | | | 15,786,017 | | | | — | |
Energy | | | 12,107,912 | | | | — | | | | 12,107,912 | | | | — | |
Financials | | | 56,550,350 | | | | — | | | | 56,550,350 | | | | — | |
Foreign Government | | | 1,628,875 | | | | — | | | | 1,628,875 | | | | — | |
Mortgage-Backed Securities | | | 27,606,069 | | | | — | | | | 27,606,069 | | | | — | |
Technology | | | 4,491,125 | | | | — | | | | 4,491,125 | | | | — | |
Transportation | | | 2,428,729 | | | | — | | | | 2,428,729 | | | | — | |
U.S. Government and Agencies | | | 500,234 | | | | — | | | | 500,234 | | | | — | |
Utilities | | | 15,996,396 | | | | — | | | | 15,996,396 | | | | — | |
Common Stock | | | | | | | | | | | | | | | | |
Consumer Discretionary | | | 20,162,620 | | | | 12,258,626 | | | | 7,903,994 | | | | — | |
Consumer Staples | | | 12,407,784 | | | | 8,000,717 | | | | 4,407,067 | | | | — | |
Energy | | | 11,580,674 | | | | 6,119,949 | | | | 5,460,725 | | | | — | |
Financials | | | 83,219,170 | | | | 68,567,097 | | | | 14,652,073 | | | | — | |
Health Care | | | 30,239,078 | | | | 23,311,392 | | | | 6,927,686 | | | | — | |
Industrials | | | 29,552,641 | | | | 21,692,619 | | | | 7,860,022 | | | | — | |
Information Technology | | | 23,953,337 | | | | 21,046,495 | | | | 2,906,842 | | | | — | |
Materials | | | 7,156,261 | | | | 3,731,919 | | | | 3,424,342 | | | | — | |
Telecommunications Services | | | 7,373,216 | | | | 384,239 | | | | 6,988,977 | | | | — | |
Utilities | | | 6,463,787 | | | | — | | | | 6,463,787 | | | | — | |
Preferred Stock | | | | | | | | | | | | | | | | |
Financials | | | 29,579,378 | | | | 25,950,630 | | | | 3,628,748 | | | | — | |
Materials | | | 2,069,508 | | | | 2,069,508 | | | | — | | | | — | |
Utilities | | | 220,026 | | | | — | | | | 220,026 | | | | — | |
Collateral Held for Securities Loaned | | | 3,898,339 | | | | 3,898,339 | | | | — | | | | — | |
Short-Term Investments | | | 66,177,079 | | | | 65,277,133 | | | | 899,946 | | | | — | |
| | | | | | | | | | | | | | | | |
Total | | $ | 732,392,967 | | | $ | 262,308,663 | | | $ | 463,937,485 | | | $ | 6,146,819 | |
| | | | | | | | | | | | | | | | |
| | | | |
Other Financial Instruments | | Total | | | Level 1 | | | Level 2 | | | Level 3 | |
Asset Derivatives | | | | | | | | | | | | | | | | |
Futures Contracts | | | 571,506 | | | | 571,506 | | | | — | | | | — | |
| | | | | | | | | | | | | | | | |
Total Asset Derivatives | | $ | 571,506 | | | $ | 571,506 | | | $ | — | | | $ | — | |
| | | | | | | | | | | | | | | | |
Liability Derivatives | | | | | | | | | | | | | | | | |
Futures Contracts | | | 11,686 | | | | 11,686 | | | | — | | | | — | |
| | | | | | | | | | | | | | | | |
Total Liability Derivatives | | $ | 11,686 | | | $ | 11,686 | | | $ | — | | | $ | — | |
| | | | | | | | | | | | | | | | |
There were no significant transfers between Levels during the period ended December 31, 2014. Transfers between Levels are identified as of the end of the period.
The accompanying Notes to Financial Statements are an integral part of this schedule.
41
DIVERSIFIED INCOME PLUS FUND
Schedule of Investments as of December 31, 2014
| | | | | | | | | | | | | | | | | | | | |
Futures Contracts | | Number of
Contracts
Long/(Short) | | | Expiration Date | | | Notional
Principal
Amount | | | Value | | | Unrealized
Gain/(Loss) | |
2-Yr. U.S. Treasury Bond Futures | | | (405 | ) | | | March 2015 | | | ($ | 88,630,484 | ) | | ($ | 88,530,469 | ) | | $ | 100,015 | |
5-Yr. U.S. Treasury Bond Futures | | | 345 | | | | March 2015 | | | | 40,991,365 | | | | 41,030,743 | | | | 39,378 | |
Mini MSCI EAFE Index Futures | | | 2 | | | | March 2015 | | | | 174,167 | | | | 175,790 | | | | 1,623 | |
S&P 500 Index Futures | | | (15 | ) | | | March 2015 | | | | (7,684,814 | ) | | | (7,696,500 | ) | | | (11,686 | ) |
S&P 500 Index Mini-Futures | | | 24 | | | | March 2015 | | | | 2,398,993 | | | | 2,462,880 | | | | 63,887 | |
Ultra Long Term U.S. Treasury Bond Futures | | | 48 | | | | March 2015 | | | | 7,562,397 | | | | 7,929,000 | | | | 366,603 | |
Total Futures Contracts | | | | | | | | | | | | | | | | | | $ | 559,820 | |
The following table summarizes the fair value and Statement of Assets and Liabilities location, as of December 31, 2014, for Diversified Income Plus Fund’s investments in financial derivative instruments by primary risk exposure as discussed under item (2) Significant Accounting Policies of the Notes to Financial Statements.
| | | | | | |
Derivatives by risk category | | Statement of Assets and Liabilities Location | | Fair Value | |
Asset Derivatives | | | | | | |
Interest Rate Contracts | | | | | | |
Futures* | | Net Assets - Net unrealized appreciation/(depreciation) on Futures contracts | | $ | 505,996 | |
Total Interest Rate Contracts | | | | | 505,996 | |
Equity Contracts | | | | | | |
Futures* | | Net Assets - Net unrealized appreciation/(depreciation) on Futures contracts | | | 65,510 | |
Total Equity Contracts | | | | | 65,510 | |
| | | | | | |
Total Asset Derivatives | | | | $ | 571,506 | |
| | | | | | |
Liability Derivatives | | | | | | |
Equity Contracts | | | | | | |
Futures* | | Net Assets - Net unrealized appreciation/(depreciation) on Futures contracts | | | 11,686 | |
Total Equity Contracts | | | | | 11,686 | |
| | | | | | |
Total Liability Derivatives | | | | $ | 11,686 | |
| | | | | | |
| * | Includes cumulative appreciation/depreciation of futures contracts as reported in the Schedule of Investments. Only current day’s variation margin is reported within the Statement of Assets and Liabilities. |
The following table summarizes the net realized gains/(losses) and Statement of Operations location, for the period ended December 31, 2014, for Diversified Income Plus Fund’s investments in financial derivative instruments by primary risk exposure.
| | | | | | |
Derivatives by risk category | | Statement of Operations Location | | Realized Gains/(Losses)
recognized in Income | |
Interest Rate Contracts | | | | | | |
Futures | | Net realized gains/(losses) on Futures contracts | | | 852,702 | |
Total Interest Rate Contracts | | | | | 852,702 | |
Equity Contracts | | | | | | |
Futures | | Net realized gains/(losses) on Futures contracts | | | 1,239,763 | |
Total Equity Contracts | | | | | 1,239,763 | |
Credit Contracts | | | | | | |
Credit Default Swaps | | Net realized gains/(losses) on Swap agreements | | | 3,324 | |
Total Credit Contracts | | | | | 3,324 | |
| | | | | | |
Total | | | | $ | 2,095,789 | |
| | | | | | |
The accompanying Notes to Financial Statements are an integral part of this schedule.
42
DIVERSIFIED INCOME PLUS FUND
Schedule of Investments as of December 31, 2014
The following table summarizes the change in net unrealized appreciation/(depreciation) and Statement of Operations location, for the period ended December 31, 2014, for Diversified Income Plus Fund’s investments in financial derivative instruments by primary risk exposure.
| | | | | | |
Derivatives by risk category | | Statement of Operations Location | | Change in unrealized
appreciation/depreciation)
recognized in Income | |
Interest Rate Contracts | | | | | | |
Futures | | Change in net unrealized appreciation/(depreciation) on Futures contracts | | | 263,371 | |
Total Interest Rate Contracts | | | | | 263,371 | |
Equity Contracts | | | | | | |
Futures | | Change in net unrealized appreciation/(depreciation) on Futures contracts | | | (139,951 | ) |
Total Equity Contracts | | | | | (139,951 | ) |
Credit Contracts | | | | | | |
Credit Default Swaps | | Change in net unrealized appreciation/(depreciation) on Swap agreements | | | (8,860 | ) |
Total Credit Contracts | | | | | (8,860 | ) |
| | | | | | |
Total | | | | $ | 114,560 | |
| | | | | | |
The following table presents Diversified Income Plus Fund’s average volume of derivative activity during the period ended December 31, 2014.
| | | | | | | | | | | | |
Derivative Risk Category | | Futures
(Notional)* | | | Futures
(Percentage
of
Average
Net Assets) | | | Swaps
(Notional)* | |
Equity Contracts | | $ | 15,420,823 | | | | 2.4 | % | | | N/A | |
Interest Rate Contracts | | | 68,615,615 | | | | 10.7 | | | | N/A | |
Credit Contracts | | | N/A | | | | N/A | | | $ | 3,527 | |
| * | Notional amount represents long or short, or both, derivative positions held by the Fund. |
Investment in Affiliates
Affiliated issuers, as defined under the Investment Company Act of 1940, include those in which the Fund’s holdings of an issuer represent 5% or more of the outstanding voting securities of an issuer, or any affiliated mutual fund.
A summary of transactions for the fiscal year to date, in Diversified Income Plus Fund, is as follows:
| | | | | | | | | | | | | | | | | | | | | | | | |
Fund | | Value
December 31,
2013 | | | Gross
Purchases | | | Gross
Sales | | | Shares Held
at
December 31,
2014 | | | Value
December 31,
2014 | | | Income Earned
January 1, 2014 -
December 31, 2014 | |
Cash Management Trust- Collateral Investment | | $ | 5,220,211 | | | $ | 67,914,564 | | | $ | 69,236,436 | | | | 3,898,339 | | | $ | 3,898,339 | | | $ | 204,889 | |
Cash Management Trust- Short Term Investment | | | 52,295,269 | | | | 361,339,074 | | | | 348,357,210 | | | | 65,277,133 | | | | 65,277,133 | | | | 34,186 | |
Total Value and Income Earned | | | 57,515,480 | | | | | | | | | | | | | | | | 69,175,472 | | | | 239,075 | |
The accompanying Notes to Financial Statements are an integral part of this schedule.
43
NATURAL RESOURCES FUND
Schedule of Investments as of December 31, 2014
| | | | | | | | |
Shares | | | Common Stock (99.1%) | | Value | |
| Integrated Oil & Gas (18.6%) | | | | |
| | 41,800 | | | Chevron Corporation | | $ | 4,689,124 | |
| | 270,000 | | | Petroleo Brasileiro SA ADR | | | 1,971,000 | |
| | 118,700 | | | Suncor Energy, Inc. ADR | | | 3,772,286 | |
| | 110,650 | | | Total SA ADRa | | | 5,665,280 | |
| | | | | | | | |
| | | | Total | | | 16,097,690 | |
| | | | | | | | |
| Materials (15.3%) | | | | |
| | 9,950 | | | Agnico Eagle Mines, Ltd.a | | | 247,656 | |
| | 60,800 | | | Alcoa, Inc. | | | 960,032 | |
| | 7,050 | | | Avery Dennison Corporation | | | 365,754 | |
| | 9,800 | | | Ball Corporation | | | 668,066 | |
| | 59,400 | | | Barrick Gold Corporation | | | 638,550 | |
| | 10,900 | | | Crown Holdings, Inc.b | | | 554,810 | |
| | 2,350 | | | Eagle Materials, Inc. | | | 178,670 | |
| | 34,050 | | | Eldorado Gold Corporation | | | 207,024 | |
| | 7,700 | | | Franco-Nevada Corporation | | | 378,763 | |
| | 60,800 | | | Freeport-McMoRan, Inc. | | | 1,420,288 | |
| | 41,300 | | | Goldcorp, Inc. | | | 764,876 | |
| | 29,700 | | | International Paper Company | | | 1,591,326 | |
| | 56,000 | | | Kinross Gold Corporationb | | | 157,920 | |
| | 3,100 | | | Martin Marietta Materials, Inc. | | | 341,992 | |
| | 10,550 | | | MeadWestvaco Corporation | | | 468,314 | |
| | 25,100 | | | Newmont Mining Corporation | | | 474,390 | |
| | 14,600 | | | Owens-Illinois, lnc.b | | | 394,054 | |
| | 6,800 | | | Packaging Corporation of America | | | 530,740 | |
| | 9,500 | | | Rock-Tenn Company | | | 579,310 | |
| | 3,550 | | | Royal Gold, Inc. | | | 222,585 | |
| | 12,900 | | | Sealed Air Corporation | | | 547,347 | |
| | 19,750 | | | Silver Wheaton Corporation | | | 401,518 | |
| | 34,300 | | | Teck Resources, Ltd.a | | | 467,852 | |
| | 6,400 | | | Vulcan Materials Company | | | 420,672 | |
| | 45,250 | | | Yamana Gold, Inc. | | | 181,905 | |
| | | | | | | | |
| | | | Total | | | 13,164,414 | |
| | | | | | | | |
| Oil & Gas Drilling (4.4%) | | | | |
| | 162,150 | | | Rowan Companies plc | | | 3,781,338 | |
| | | | | | | | |
| | | | Total | | | 3,781,338 | |
| | | | | | | | |
| Oil & Gas Equipment & Services (18.7%) | | | | |
| | 84,400 | | | Cameron International Corporationb | | | 4,215,780 | |
| | 97,800 | | | Schlumberger, Ltd. | | | 8,353,098 | |
| | 315,500 | | | Weatherford International, Ltd.b | | | 3,612,475 | |
| | | | | | | | |
| | | | Total | | | 16,181,353 | |
| | | | | | | | |
| Oil & Gas Exploration & Production (33.1%) | | | | |
| | 116,050 | | | Canadian Natural Resources, Ltd. | | | 3,583,624 | |
| | 520,850 | | | Cobalt International Energy, Inc.b | | | 4,630,357 | |
| | 23,200 | | | Concho Resources, Inc.b | | | 2,314,200 | |
| | 53,450 | | | EOG Resources, Inc. | | | 4,921,141 | |
| | 59,900 | | | EQT Corporation | | | 4,534,430 | |
| | 121,700 | | | Marathon Oil Corporation | | | 3,442,893 | |
| | 113,750 | | | Oasis Petroleum, Inc.b | | | 1,881,425 | |
| | 118,350 | | | Southwestern Energy Companyb | | | 3,229,771 | |
| | | | | | | | |
| | | | Total | | | 28,537,841 | |
| | | | | | | | |
| Oil & Gas Refining & Marketing (6.6%) | | | | |
| | 63,150 | | | Marathon Petroleum Corporation | | | 5,699,919 | |
| | | | | | | | |
| | | | Total | | | 5,699,919 | |
| | | | | | | | |
| Utilities (2.4%) | | | | |
| | 53,550 | | | iShares North American Natural Resources ETF | | | 2,052,036 | |
| | | | | | | | |
| | | | Total | | | 2,052,036 | |
| | | | | | | | |
| | | | Total Common Stock (cost $101,657,678) | | | 85,514,591 | |
| | | | | | | | |
| | |
| | | | Collateral Held for Securities Loaned (7.4%) | | | |
| | 6,344,325 | | | Thrivent Cash Management Trust | | | 6,344,325 | |
| | | | | | | | |
| | | | Total Collateral Held for Securities Loaned (cost $6,344,325) | | | 6,344,325 | |
| | | | | | | | |
Shares or
Principal
Amount | | | Short-Term Investments (0.8%)c | | | |
| | 706,893 | | | Thrivent Cash Management Trust 0.060% | | | 706,893 | |
| | | | | | | | |
| | | | Total Short-Term Investments (at amortized cost) | | | 706,893 | |
| | | | | | | | |
| | | | Total Investments (cost $108,708,896) 107.3% | | $ | 92,565,809 | |
| | | | | | | | |
| | | | Other Assets and Liabilities, Net (7.3%) | | | (6,269,754 | ) |
| | | | | | | | |
| | | | Total Net Assets 100.0% | | $ | 86,296,055 | |
| | | | | | | | |
| a | All or a portion of the security is on loan. |
| b | Non-income producing security. |
| c | The interest rate shown reflects the yield, coupon rate or the discount rate at the date of purchase. |
Definitions:
| | | | |
| ADR | | - | | American Depositary Receipt, which are certificates for an underlying foreign security’s shares held by an issuing U.S. depository bank. |
| ETF | | - | | Exchange Traded Fund. |
Unrealized Appreciation (Depreciation)
Gross unrealized appreciation and depreciation of investments, based on cost for federal income tax purposes, were as follows:
| | | | |
Gross unrealized appreciation | | $ | 4,117,037 | |
Gross unrealized depreciation | | | (20,260,124 | ) |
| | | | |
Net unrealized appreciation (depreciation) | | ($ | 16,143,087 | ) |
| |
Cost for federal income tax purposes | | $ | 108,708,896 | |
The accompanying Notes to Financial Statements are an integral part of this schedule.
44
NATURAL RESOURCES FUND
Schedule of Investments as of December 31, 2014
Fair Valuation Measurements
The following table is a summary of the inputs used, as of December 31, 2014, in valuing Natural Resources Fund’s assets carried at fair value.
| | | | | | | | | | | | | | | | |
Investments in Securities | | Total | | | Level 1 | | | Level 2 | | | Level 3 | |
Common Stock | | | | | | | | | | | | | | | | |
Integrated Oil & Gas | | | 16,097,690 | | | | 16,097,690 | | | | — | | | | — | |
Materials | | | 13,164,414 | | | | 13,164,414 | | | | — | | | | — | |
Oil & Gas Drilling | | | 3,781,338 | | | | 3,781,338 | | | | — | | | | — | |
Oil & Gas Equipment & Services | | | 16,181,353 | | | | 16,181,353 | | | | — | | | | — | |
Oil & Gas Exploration & Production | | | 28,537,841 | | | | 28,537,841 | | | | — | | | | — | |
Oil & Gas Refining & Marketing | | | 5,699,919 | | | | 5,699,919 | | | | — | | | | — | |
Utilities | | | 2,052,036 | | | | 2,052,036 | | | | — | | | | — | |
Collateral Held for Securities Loaned | | | 6,344,325 | | | | 6,344,325 | | | | — | | | | — | |
Short-Term Investments | | | 706,893 | | | | 706,893 | | | | — | | | | — | |
| | | | | | | | | | | | | | | | |
Total | | $ | 92,565,809 | | | $ | 92,565,809 | | | $ | — | | | $ | — | |
| | | | | | | | | | | | | | | | |
There were no significant transfers between Levels during the period ended December 31, 2014. Transfers between Levels are identified as of the end of the period.
Investment in Affiliates
Affiliated issuers, as defined under the Investment Company Act of 1940, include those in which the Fund’s holdings of an issuer represent 5% or more of the outstanding voting securities of an issuer, or any affiliated mutual fund.
A summary of transactions for the fiscal year to date, in Natural Resources Fund, is as follows:
| | | | | | | | | | | | | | | | | | | | | | | | |
Fund | | Value
December 31,
2013 | | | Gross
Purchases | | | Gross
Sales | | | Shares Held at
December 31,
2014 | | | Value
December 31,
2014 | | | Income Earned
January 1, 2014 -
December 31, 2014 | |
Cash Management Trust- Collateral Investment | | $ | 5,291,600 | | | $ | 71,657,599 | | | $ | 70,604,874 | | | | 6,344,325 | | | $ | 6,344,325 | | | $ | 46,301 | |
Cash Management Trust- Short Term Investment | | | 4,661,263 | | | | 7,072,440 | | | | 11,026,810 | | | | 706,893 | | | | 706,893 | | | | 657 | |
Total Value and Income Earned | | | 9,952,863 | | | | | | | | | | | | | | | | 7,051,218 | | | | 46,958 | |
The accompanying Notes to Financial Statements are an integral part of this schedule.
45
THRIVENT MUTUAL FUNDS
Statement of Assets and Liabilities
| | | | | | | | | | | | |
As of December 31, 2014 | | Growth and
Income Plus
Fund | | | Diversified
Income Plus
Fund | | | Natural
Resources Fund | |
Assets | | | | | | | | | | | | |
Investments at cost | | $ | 79,199,473 | | | $ | 721,356,087 | | | $ | 108,708,896 | |
Investments in securities at value | | | 74,102,469 | | | | 663,217,495 | | | | 85,514,591 | |
Investments in affiliates at value | | | 6,347,729 | | | | 69,175,472 | | | | 7,051,218 | |
Investments at Value | | | 80,450,198 | | | | 732,392,967 | | | | 92,565,809 | |
Cash | | | 2,256 | (a) | | | 128,925 | (b) | | | — | |
Dividends and interest receivable | | | 188,563 | | | | 3,657,681 | | | | 147,894 | |
Prepaid expenses | | | 26,842 | | | | 37,859 | | | | 11,781 | |
Receivable for investments sold | | | 26,625 | | | | 328,491 | | | | — | |
Receivable for fund shares sold | | | 34,818 | | | | 434,967 | | | | 29,988 | |
Receivable for variation margin | | | 3,344 | | | | 161,531 | | | | — | |
Total Assets | | | 80,732,646 | | | | 737,142,421 | | | | 92,755,472 | |
Liabilities | | | | | | | | | | | | |
Distributions payable | | | 107,405 | | | | 850,931 | | | | — | |
Accrued expenses | | | 32,831 | | | | 121,155 | | | | 30,230 | |
Payable for investments purchased | | | 2,275,465 | | | | 32,654,110 | | | | — | |
Payable upon return of collateral for securities loaned | | | — | | | | 3,898,339 | | | | 6,344,325 | |
Payable for fund shares redeemed | | | 3,390 | | | | 1,115,731 | | | | 17,270 | |
Payable for variation margin | | | 26,009 | | | | 49,212 | | | | — | |
Payable to affiliate | | | 61,194 | | | | 528,380 | | | | 67,592 | |
Mortgage dollar roll deferred revenue | | | 1,634 | | | | 21,661 | | | | — | |
Total Liabilities | | | 2,507,928 | | | | 39,239,519 | | | | 6,459,417 | |
Net Assets | | | | | | | | | | | | |
Capital stock (beneficial interest) | | | 77,053,435 | | | | 686,077,254 | | | | 108,600,021 | |
Accumulated undistributed net investment income/(loss) | | | (14,049 | ) | | | 1,430,593 | | | | (21,520 | ) |
Accumulated undistributed net realized gain/(loss) | | | (158,035 | ) | | | (1,198,956 | ) | | | (6,139,226 | ) |
Net unrealized appreciation/(depreciation) on: | | | | | | | | | | | | |
Investments | | | 1,250,725 | | | | 11,036,880 | | | | (16,143,087 | ) |
Futures contracts | | | 93,412 | | | | 559,820 | | | | — | |
Foreign currency transactions | | | (770 | ) | | | (2,689 | ) | | | (133 | ) |
Total Net Assets | | $ | 78,224,718 | | | $ | 697,902,902 | | | $ | 86,296,055 | |
Class A Share Capital | | $ | 76,457,418 | | | $ | 581,734,812 | | | $ | 15,670,699 | |
Shares of beneficial interest outstanding (Class A) | | | 7,620,081 | | | | 81,931,632 | | | | 1,940,242 | |
Net asset value per share | | $ | 10.03 | | | $ | 7.10 | | | $ | 8.08 | |
Maximum public offering price | | $ | 10.61 | | | $ | 7.43 | | | $ | 8.55 | |
Institutional Class Share Capital | | $ | 1,767,300 | | | $ | 116,168,090 | | | $ | 70,625,356 | |
Shares of beneficial interest outstanding (Institutional Class) | | | 175,915 | | | | 16,495,073 | | | | 8,745,324 | |
Net asset value per share | | $ | 10.05 | | | $ | 7.04 | | | $ | 8.08 | |
| (a) | Includes foreign currency holdings of $216 (cost $213). |
| (b) | Includes foreign currency holdings of $-232 (cost $-244). |
The accompanying Notes to Financial Statements are an integral part of this schedule.
46
THRIVENT MUTUAL FUNDS
Statements of Operations
| | | | | | | | | | | | |
For the year ended December 31, 2014 | | Growth and
Income Plus
Fund | | | Diversified
Income Plus
Fund | | | Natural
Resources Fund | |
Investment Income | | | | | | | | | | | | |
Dividends | | $ | 1,406,619 | | | $ | 9,032,125 | | | $ | 1,573,795 | |
Taxable interest | | | 617,148 | | | | 17,768,665 | | | | 199 | |
Income from mortgage dollar rolls | | | 50,619 | | | | 785,301 | | | | — | |
Income from securities loaned | | | — | | | | 204,889 | | | | 46,301 | |
Income from affiliated investments | | | 3,827 | | | | 34,186 | | | | 657 | |
Foreign tax withholding | | | (75,929 | ) | | | (312,230 | ) | | | (65,737 | ) |
Total Investment Income | | | 2,002,284 | | | | 27,512,936 | | | | 1,555,215 | |
Expenses | | | | | | | | | | | | |
Adviser fees | | | 423,313 | | | | 3,518,024 | | | | 837,463 | |
Administrative service fees | | | 82,048 | | | | 188,334 | | | | 89,366 | |
Audit and legal fees | | | 24,862 | | | | 29,179 | | | | 25,839 | |
Custody fees | | | 57,528 | | | | 105,093 | | | | 5,040 | |
Distribution expenses Class A | | | 157,708 | | | | 1,309,906 | | | | 41,988 | |
Insurance expenses | | | 4,477 | | | | 7,051 | | | | 4,707 | |
Printing and postage expenses Class A | | | 16,966 | | | | 113,749 | | | | 14,922 | |
Printing and postage expenses Institutional Class | | | 499 | | | | 10,956 | | | | 379 | |
SEC and state registration expenses | | | 35,312 | | | | 91,103 | | | | 26,082 | |
Transfer agent fees Class A | | | 71,085 | | | | 413,179 | | | | 88,827 | |
Transfer agent fees Institutional Class | | | 1,311 | | | | 57,765 | | | | 408 | |
Trustees’ fees | | | 6,637 | | | | 26,031 | | | | 7,117 | |
Other expenses | | | 35,602 | | | | 41,720 | | | | 9,972 | |
Total Expenses Before Reimbursement | | | 917,348 | | | | 5,912,090 | | | | 1,152,110 | |
Less: | | | | | | | | | | | | |
Reimbursement from adviser | | | (175,555 | ) | | | — | | | | (88,835 | ) |
Total Net Expenses | | | 741,793 | | | | 5,912,090 | | | | 1,063,275 | |
Net Investment Income/(Loss) | | | 1,260,491 | | | | 21,600,846 | | | | 491,940 | |
Realized and Unrealized Gains/(Losses) | | | | | | | | | | | | |
Net realized gains/(losses) on: | | | | | | | | | | | | |
Investments | | | 2,364,752 | | | | 14,041,169 | | | | 6,119,604 | |
Distributions of realized capital gains from affiliated investments | | | — | | | | 3 | | | | 1 | |
Futures contracts | | | 135,682 | | | | 2,092,465 | | | | — | |
Foreign currency and forward contract transactions | | | (16,670 | ) | | | (65,365 | ) | | | — | |
Swap agreements | | | — | | | | 3,324 | | | | — | |
Change in net unrealized appreciation/(depreciation) on: | | | | | | | | | | | | |
Investments | | | (2,772,737 | ) | | | (16,191,164 | ) | | | (25,759,059 | ) |
Futures contracts | | | 56,199 | | | | 123,420 | | | | — | |
Foreign currency transactions | | | (770 | ) | | | (2,689 | ) | | | (79 | ) |
Swap agreements | | | — | | | | (8,860 | ) | | | — | |
Net Realized and Unrealized Gains/(Losses) | | | (233,544 | ) | | | (7,697 | ) | | | (19,639,533 | ) |
Net Increase/(Decrease) in Net Assets Resulting From Operations | | $ | 1,026,947 | | | $ | 21,593,149 | | | $ | (19,147,593 | ) |
The accompanying Notes to Financial Statements are an integral part of this schedule.
47
THRIVENT MUTUAL FUNDS
Statement of Changes in Net Assets
| | | | | | | | | | | | | | | | |
| | | Growth and Income Plus Fund | | | Diversified Income Plus Fund | |
For the periods ended | | 12/31/2014 | | | 12/31/2013 | | | 12/31/2014 | | | 12/31/2013 | |
Operations | | | | | | | | | | | | | | | | |
Net investment income/(loss) | | $ | 1,260,491 | | | $ | 1,112,319 | | | $ | 21,600,846 | | | $ | 15,901,086 | |
Net realized gains/(losses) | | | 2,483,764 | | | | 10,048,155 | | | | 16,071,596 | | | | 14,666,245 | |
Change in net unrealized appreciation/(depreciation) | | | (2,717,308 | ) | | | 1,151,908 | | | | (16,079,293 | ) | | | 13,404,202 | |
Net Change in Net Assets Resulting From Operations | | | 1,026,947 | | | | 12,312,382 | | | | 21,593,149 | | | | 43,971,533 | |
Distributions to Shareholders | | | | | | | | | | | | | | | | |
From net investment income Class A | | | (1,239,236 | ) | | | (670,542 | ) | | | (16,473,470 | ) | | | (12,832,895 | ) |
From net investment income Institutional Class | | | (45,097 | ) | | | (437,400 | ) | | | (4,015,094 | ) | | | (3,288,301 | ) |
| | | | | | | | | | | | | | | | |
Total From Net Investment Income | | | (1,284,333 | ) | | | (1,107,942 | ) | | | (20,488,564 | ) | | | (16,121,196 | ) |
| | | | | | | | | | | | | | | | |
From net realized gains Class A | | | (2,558,410 | ) | | | (4,500,101 | ) | | | (14,073,235 | ) | | | (1,969,970 | ) |
From net realized gains Institutional Class | | | (59,140 | ) | | | (210,357 | ) | | | (2,849,616 | ) | | | (464,187 | ) |
| | | | | | | | | | | | | | | | |
Total From Net Realized Gains | | | (2,617,550 | ) | | | (4,710,458 | ) | | | (16,922,851 | ) | | | (2,434,157 | ) |
| | | | | | | | | | | | | | | | |
Total Distributions to Shareholders | | | (3,901,883 | ) | | | (5,818,400 | ) | | | (37,411,415 | ) | | | (18,555,353 | ) |
Capital Stock Transactions | | | | | | | | | | | | | | | | |
Class A | | | | | | | | | | | | | | | | |
Sold | | | 36,115,273 | | | | 26,107,853 | | | | 174,763,842 | | | | 183,195,143 | |
Distributions reinvested | | | 3,645,176 | | | | 4,903,364 | | | | 27,843,997 | | | | 12,815,201 | |
Redeemed | | | (10,313,535 | ) | | | (8,377,483 | ) | | | (66,659,322 | ) | | | (48,766,325 | ) |
| | | | | | | | | | | | | | | | |
Total Class A Capital Stock Transactions | | | 29,446,914 | | | | 22,633,734 | | | | 135,948,517 | | | | 147,244,019 | |
| | | | | | | | | | | | | | | | |
Institutional Class | | | | | | | | | | | | | | | | |
Sold | | | 733,901 | | | | 439,809 | | | | 48,466,474 | | | | 68,700,486 | |
Distributions reinvested | | | 98,237 | | | | 640,661 | | | | 6,789,078 | | | | 3,705,854 | |
Redeemed | | | (1,310,493 | ) | | | (2,309,705 | ) | | | (44,040,301 | ) | | | (23,395,235 | ) |
In-kind redemptions | | | — | | | | (36,694,752 | ) | | | — | | | | — | |
| | | | | | | | | | | | | | | | |
Total Institutional Class Capital Stock Transactions | | | (478,355 | ) | | | (37,923,987 | ) | | | 11,215,251 | | | | 49,011,105 | |
| | | | | | | | | | | | | | | | |
Capital Stock Transactions | | | 28,968,559 | | | | (15,290,253 | ) | | | 147,163,768 | | | | 196,255,124 | |
Net Increase/(Decrease) in Net Assets | | | 26,093,623 | | | | (8,796,271 | ) | | | 131,345,502 | | | | 221,671,304 | |
Net Assets, Beginning of Period | | | 52,131,095 | | | | 60,927,366 | | | | 566,557,400 | | | | 344,886,096 | |
Net Assets, End of Period | | $ | 78,224,718 | | | $ | 52,131,095 | | | $ | 697,902,902 | | | $ | 566,557,400 | |
Accumulated Undistributed Net Investment Income/(Loss) | | $ | (14,049 | ) | | $ | 49,084 | | | $ | 1,430,593 | | | $ | 724,056 | |
Capital Stock Share Transactions | | | | | | | | | | | | | | | | |
Class A shares | | | | | | | | | | | | | | | | |
Sold | | | 3,457,687 | | | | 2,424,516 | | | | 23,828,980 | | | | 25,783,352 | |
Distributions reinvested | | | 360,497 | | | | 472,405 | | | | 3,864,523 | | | | 1,798,667 | |
Redeemed | | | (997,017 | ) | | | (768,818 | ) | | | (9,116,870 | ) | | | (6,861,853 | ) |
| | | | | | | | | | | | | | | | |
Total Class A shares | | | 2,821,167 | | | | 2,128,103 | | | | 18,576,633 | | | | 20,720,166 | |
| | | | | | | | | | | | | | | | |
Institutional Class shares | | | | | | | | | | | | | | | | |
Sold | | | 70,275 | | | | 41,140 | | | | 6,683,564 | | | | 9,737,266 | |
Distributions reinvested | | | 9,661 | | | | 61,321 | | | | 948,339 | | | | 524,096 | |
Redeemed | | | (125,980 | ) | | | (217,765 | ) | | | (6,083,130 | ) | | | (3,311,239 | ) |
In-kind redemptions | | | — | | | | (3,341,963 | ) | | | — | | | | — | |
| | | | | | | | | | | | | | | | |
Total Institutional Class shares | | | (46,044 | ) | | | (3,457,267 | ) | | | 1,548,773 | | | | 6,950,123 | |
| | | | | | | | | | | | | | | | |
The accompanying Notes to Financial Statements are an integral part of this schedule.
48
THRIVENT MUTUAL FUNDS
Statement of Changes in Net Assets – continued
| | | | | | | | |
| | | Natural Resources Fund | |
For the periods ended | | 12/31/2014 | | | 12/31/2013 | |
Operations | | | | | | | | |
Net investment income/(loss) | | $ | 491,940 | | | $ | 499,344 | |
Net realized gains/(losses) | | | 6,119,605 | | | | 4,532,728 | |
Change in net unrealized appreciation/(depreciation) | | | (25,759,138 | ) | | | 4,128,220 | |
Net Change in Net Assets Resulting From Operations | | | (19,147,593 | ) | | | 9,160,292 | |
Distributions to Shareholders | | | | | | | | |
From net investment income Class A | | | (63,317 | ) | | | (31,840 | ) |
From net investment income Institutional Class | | | (540,358 | ) | | | (453,034 | ) |
| | | | | | | | |
Total From Net Investment Income | | | (603,675 | ) | | | (484,874 | ) |
| | | | | | | | |
From return of capital Class A | | | — | | | | (32,514 | ) |
From return of capital Institutional Class | | | — | | | | (177,408 | ) |
| | | | | | | | |
Total From Return of Capital | | | — | | | | (209,922 | ) |
| | | | | | | | |
Total Distributions to Shareholders | | | (603,675 | ) | | | (694,796 | ) |
Capital Stock Transactions | | | | | | | | |
Class A | | | | | | | | |
Sold | | | 6,252,193 | | | | 3,144,273 | |
Distributions reinvested | | | 61,740 | | | | 63,177 | |
Redeemed | | | (2,998,700 | ) | | | (3,620,443 | ) |
| | | | | | | | |
Total Class A Capital Stock Transactions | | | 3,315,233 | | | | (412,993 | ) |
| | | | | | | | |
Institutional Class | | | | | | | | |
Sold | | | 70,488 | | | | 106,541 | |
Distributions reinvested | | | 538,185 | | | | 627,542 | |
Redeemed | | | (258,768 | ) | | | (366,481 | ) |
| | | | | | | | |
Total Institutional Class Capital Stock Transactions | | | 349,905 | | | | 367,602 | |
| | | | | | | | |
Capital Stock Transactions | | | 3,665,138 | | | | (45,391 | ) |
Net Increase/(Decrease) in Net Assets | | | (16,086,130 | ) | | | 8,420,105 | |
Net Assets, Beginning of Period | | | 102,382,185 | | | | 93,962,080 | |
Net Assets, End of Period | | $ | 86,296,055 | | | $ | 102,382,185 | |
Accumulated Undistributed Net Investment Income/(Loss) | | $ | (21,520 | ) | | $ | (18,471 | ) |
Capital Stock Share Transactions | | | | | | | | |
Class A shares | | | | | | | | |
Sold | | | 646,846 | | | | 328,157 | |
Distributions reinvested | | | 7,604 | | | | 6,375 | |
Redeemed | | | (301,752 | ) | | | (376,063 | ) |
| | | | | | | | |
Total Class A shares | | | 352,698 | | | | (41,531 | ) |
| | | | | | | | |
Institutional Class shares | | | | | | | | |
Sold | | | 6,907 | | | | 11,352 | |
Distributions reinvested | | | 66,279 | | | | 63,324 | |
Redeemed | | | (24,991 | ) | | | (37,794 | ) |
| | | | | | | | |
Total Institutional Class shares | | | 48,195 | | | | 36,882 | |
| | | | | | | | |
The accompanying Notes to Financial Statements are an integral part of this schedule.
49
THRIVENT MUTUAL FUNDS
NOTESTO FINANCIAL STATEMENTS
December 31, 2014
(1) ORGANIZATION
Thrivent Mutual Funds (the “Trust”) was organized as a Massachusetts Business Trust on March 10, 1987 and is registered as an open-end management investment company under the Investment Company Act of 1940 (the “1940 Act”). The Trust is divided into twenty-six separate series (each, a “Fund” and, collectively, the “Funds”), each with its own investment objective and policies. The Trust currently consists of four asset allocation funds, four income plus funds, twelve equity funds, five fixed-income funds, and one money market fund.
This shareholder report includes Thrivent Growth and Income Plus Fund, Thrivent Diversified Income Plus Fund and Thrivent Natural Resources Fund, three of the Trust’s twenty-six Funds. The other Funds of the Trust have a fiscal year-end of October 31 and are presented under a separate shareholder report.
The Funds are each investment companies that follow the accounting and reporting guidance of the Financial Accounting Standards Board (FASB) Accounting Standard Codification Topic 946—Financial Services—Investment Companies.
(A) Share Classes – As of December 31, 2014, the Trust includes two classes of shares: Class A and Institutional Class. The classes of shares differ principally in their respective distribution expenses and other class-specific expenses and arrangements. Class A shares have a 0.25% annual 12b-1 fee and a maximum front-end sales load of 5.50% for equity funds and 4.50% for fixed-income funds, although some of the fixed-income funds have reduced 12b-1 fees and either a lower or no front-end sales load. Institutional Class shares are offered at net asset value and have no annual 12b-1 fees. The share classes have identical rights to earnings, assets and voting privileges, except for class-specific expenses and exclusive rights to vote on matters affecting only individual classes. All 26 Funds of the Trust offer Class A and Institutional Class shares.
(B) Other – Under the Trust’s organizational documents, its officers and trustees are indemnified against certain liabilities arising out of the performance of their duties to the Trust. In addition, in the normal course of business, the Trust enters into contracts with vendors and others that provide general damage clauses. The Trust’s maximum exposure under these contracts is unknown, as this would involve future claims that may be made against the Trust. However, based on experience, the Trust expects the risk of loss to be remote.
(2) SIGNIFICANT ACCOUNTING POLICIES
(A) Valuation of Investments – Securities traded on U.S. or foreign securities exchanges or included in a national market system are valued at the official closing price at the close of each business day unless otherwise stated below. Over-the counter securities and listed securities for which no price is readily available are valued at the current bid price considered best to represent the value at that time. Swap agreements are valued at the latest bid quotation of the contract as furnished by an independent pricing service. Security prices are based on quotes that are obtained from an independent pricing service approved by the Trust’s Board of Trustees (“Board”). The pricing service, in determining values of fixed-income securities, takes into consideration such factors as current quotations by broker/dealers, coupon, maturity, quality, type of issue, trading characteristics, and other yield and risk factors it deems relevant in determining valuations. Securities which cannot be valued by the approved pricing service are valued using valuations obtained from dealers that make markets in the securities. Exchange-listed options and futures contracts are valued at the last quoted sales price. Forward foreign currency exchange contracts are marked-to-market based upon foreign currency exchange rates provided by a pricing service. Investments in mutual funds are valued at the net asset value at the close of each business day. Short-term securities are valued at amortized cost (which approximates market value) to the extent it is not materially different than market value.
The Board has delegated responsibility for daily valuation of the Funds’ securities to the Adviser. The Adviser has formed a Valuation Committee (“Committee”) that is responsible for overseeing the Fund valuation policies in accordance with Valuation Policies and Procedures. The Committee meets on a monthly and on an as-needed basis to review price challenges, price overrides, stale prices, shadow prices, manual prices, money market pricing, international fair valuation, and other securities requiring fair valuation.
The Committee monitors for significant events occurring prior to the close of trading on the New York Stock Exchange that could have a material impact on the value of any securities that are held by the Funds. Examples of such events include trading halts, national news/events, and issuer-specific developments. If the Committee decides that such events warrant using fair value estimates, the Committee will take such events into consideration in determining the fair value of such securities. If market quotations or prices are not readily available or determined to be unreliable, the securities will be valued at fair value as determined in good faith pursuant to procedures adopted by the Board.
Financial Accounting Standards Board (FASB) guidelines require increased fair value disclosure intended to improve the consistency and comparability of fair value measurements used in financial reporting. The guidelines define fair value, establish a framework for measuring fair value in U.S. Generally Accepted Accounting Principles (“GAAP”) and expand disclosures about fair value requirements. The various inputs used to determine the fair value of the Funds’ investments are summarized in three broad levels: Level 1 includes quoted prices in active markets for identical securities,
50
THRIVENT MUTUAL FUNDS
NOTESTO FINANCIAL STATEMENTS
December 31, 2014
typically included in this level are U.S. equity securities, futures, options and registered investment company funds; Level 2 includes other significant observable inputs such as quoted prices for similar securities, interest rates, prepayment speeds and credit risk, typically included in this level are fixed income securities, international securities, swaps and forward contracts; and Level 3 includes significant unobservable inputs such as the Adviser’s own assumptions and broker evaluations in determining the fair value of investments. Of the Level 3 securities, those for which market values were not readily available or were deemed unreliable were fair valued as determined in good faith under procedures established by the Board. The valuation levels are not necessarily an indication of the risk associated with investing in these securities or other investments.
Valuation of International Securities – Because many foreign markets close before the U.S. markets, events may occur between the close of the foreign markets and the close of the U.S. markets that could have a material impact on the valuation of foreign securities. The Funds, under the supervision of the Board, evaluate the impacts of these events and may adjust the valuation of foreign securities to reflect fair value as of the close of the U.S. markets. The Board has authorized the Adviser to make fair valuation determinations pursuant to policies approved by the Board.
(B) Foreign Currency Translation – The accounting records of each Fund are maintained in U.S. dollars. Securities and other assets and liabilities that are denominated in foreign currencies are translated into U.S. dollars at the daily closing rates of exchange.
Foreign currency amounts related to the purchase or sale of securities and income and expenses are translated at the exchange rate on the transaction date. Net realized and unrealized currency gains and losses are recorded from closed foreign contracts, disposition of foreign currencies, exchange gains or losses between the trade date and settlement date on securities transactions, and other translation gains or losses on dividends, interest income and foreign withholding taxes. The Funds do not separately report the effect of changes in foreign exchange rates from changes in prices on securities held. Such changes are included in net realized and unrealized gain or loss from investments in the Statement of Operations.
For federal income tax purposes, the Funds treat the effect of changes in foreign exchange rates arising from actual foreign currency transactions and the changes in foreign exchange rates between the trade date and settlement date as ordinary income.
(C) Foreign Denominated Investments – Foreign denominated assets and currency contracts may involve more risks than domestic transactions including currency risk, political and economic risk, regulatory risk, and market risk. Certain Funds may also invest in securities of companies located in emerging markets. Future economic or political developments could adversely affect the liquidity or value, or both, of such securities.
(D) Federal Income Taxes – No provision has been made for income taxes because each Fund’s policy is to qualify as a regulated investment company under the Internal Revenue Code and distribute substantially all investment company taxable income and net capital gain on a timely basis. It is also the intention of each Fund to distribute an amount sufficient to avoid imposition of any federal excise tax. The Funds, accordingly, anticipate paying no federal taxes and no federal tax provision was recorded. Each Fund is treated as a separate taxable entity for federal income tax purposes. Certain Funds may utilize earnings and profits distributed to shareholders on the redemption of shares as part of the dividends paid deduction.
GAAP requires management of the Funds (i.e., the Adviser) to make additional tax disclosures with respect to the tax effects of certain income tax positions, whether those positions were taken on previously filed tax returns or are expected to be taken on future returns. These positions must meet a “more likely than not” standard that, based on the technical merits of the position, would have a greater than 50 percent likelihood of being sustained upon examination. In evaluating whether a tax position has met the more-likely-than-not recognition threshold, the Adviser must presume that the position will be examined by the appropriate taxing authority that has full knowledge of all relevant information.
The Adviser analyzed all open tax years, as defined by the statute of limitations, for all major jurisdictions. Open tax years are those that are open for examination by taxing authorities. Major jurisdictions for the Funds include U.S. Federal, Minnesota, Wisconsin, and Massachusetts as well as certain foreign countries. As of December 31, 2014, open U.S. Federal, Minnesota, Wisconsin and Massachusetts tax years include the tax years ended December 31, 2011 through 2014. Additionally, as of December 31, 2014, the tax year ended December 31, 2010 is open for Wisconsin. The Funds have no examinations in progress and none are expected at this time.
As of December 31, 2014, the Adviser has reviewed all open tax years and major jurisdictions and concluded that there is no effect to the Funds’ tax liability, financial position or results of operations. There is no tax liability resulting from unrecognized tax benefits related to uncertain income tax positions taken or expected to be taken in future tax returns. The Funds are also not aware of any tax positions for which it is reasonably possible that the total amounts of unrecognized tax benefits will significantly change in the next 12 months.
Foreign Income Taxes – Certain Funds are subject to foreign income taxes imposed by certain countries in which they invest. Withholding taxes on foreign dividends have been provided for in accordance with the applicable country’s tax rules and rates. These amounts are shown as foreign dividend tax withholding on the Statement of Operations. The Funds pay tax on foreign capital gains, where applicable.
51
THRIVENT MUTUAL FUNDS
NOTESTO FINANCIAL STATEMENTS
December 31, 2014
(E) Expenses and Income – Estimated expenses are accrued daily. The Funds are charged for those expenses that are directly attributable to them. Expenses that are not directly attributable to a Fund are allocated among all appropriate Funds in proportion to their respective net assets, number of shareholder accounts or other reasonable basis. Net investment income, expenses which are not class-specific, and realized and unrealized gains and losses are allocated directly to each class based upon the relative net asset value of outstanding shares.
Interest income is recorded daily on all debt securities, as is accretion of market discount and original issue discount and amortization of premium. Paydown gains and losses on mortgage- and asset-backed securities are recorded as components of interest income. Dividend income is recorded on the ex-dividend date.
For certain securities, including real estate investment trusts, the Trust records distributions received in excess of income as a reduction of cost of investments and/or realized gain. Such amounts are based on estimates if actual amounts are not available. Actual amounts of income, realized gain and return of capital may differ from the estimated amounts. The Trust adjusts the estimated amounts of the components of distributions as adjustments to investment income, unrealized appreciation/depreciation and realized gain/ loss on investments as necessary, once the issuers provide information about the actual composition of the distributions.
(F) Distributions to Shareholders – Net investment income is distributed to each shareholder as a dividend. Dividends from Natural Resources Fund and Growth and Income Plus Fund are declared and paid quarterly. Dividends from Diversified Income Plus Fund are declared and paid monthly. Additionally, it is possible that such dividends may be reclassified as return of capital or capital gains after year end. Such determination cannot be made until tax information is received from the real estate investments of the Fund. Net realized gains from securities transactions, if any, are distributed at least annually.
(G) Derivative Financial Instruments – Each of the Funds, with the exception of Money Market Fund, may invest in derivatives. Derivatives, a category that includes options, futures, swaps and hybrid instruments, are financial instruments whose value derives from another security, an index or a currency. Each Fund may use derivatives for hedging (attempting to offset a potential loss in one position by establishing an interest in an opposite position). This includes the use of currency-based derivatives for hedging its positions in foreign securities. Each Fund may also use derivatives for replication of a certain asset class or speculation (investing for potential income or capital gain). These contracts may be transacted on an exchange or over-the-counter (OTC).
A derivative may incur a mark to market loss if the value of the derivative decreases due to an unfavorable change in the market rates or values of the underlying derivative. Losses can also occur if the counterparty does not perform under the derivative. A Fund’s risk of loss from the counterparty credit risk on OTC derivatives is generally limited to the aggregate unrealized gain netted against any collateral held by such Fund. With exchange traded futures and centrally cleared swaps, there is minimal counterparty credit risk to the Funds because the exchange’s clearinghouse, as counterparty to such derivatives, guarantees against a possible default. The clearing house stands between the buyer and the seller of the derivative; thus, the credit risk is limited to the failure of the clearinghouse. However, credit risk still exists in exchange traded futures and centrally cleared swaps with respect to initial and variation margin that is held in a broker’s customer accounts. While brokers are required to segregate customer margin from their own assets, in the event that a broker becomes insolvent or goes into bankruptcy and at that time there is a shortfall in the aggregate amount of margin held by the broker for all its clients, U.S. bankruptcy laws will typically allocate that shortfall on a pro-rata basis across all the broker’s customers, potentially resulting in losses in the Funds. Using derivatives to hedge can guard against potential risks, but it also adds to the Funds’ expenses and can eliminate some opportunities for gains. In addition, a derivative used for hedging or replication may not accurately track the value of the underlying asset. Another risk with derivatives is that some types can amplify a gain or loss, potentially earning or losing substantially more money than the actual cost of the derivative.
In order to define their contractual rights and to secure rights that will help the Funds mitigate their counterparty risk, the Funds may enter into an International Swaps and Derivatives Association, Inc. Master Agreement (“ISDA Master Agreement”) or similar agreement with its derivative contract counterparties. An ISDA Master Agreement is a bilateral agreement between a Fund and a counterparty that governs OTC derivatives and foreign exchange contracts and typically includes, among other things, collateral posting terms and netting provisions in the event of a default and/or termination event. Under an ISDA Master Agreement, each Fund may, under certain circumstances, offset with the counterparty certain derivative’s payables and/or receivables with collateral held and/or posted and create one single net payment. The provisions of the ISDA Master Agreement typically permit a single net payment in the event of a default (close-out netting) including the bankruptcy or insolvency of the counterparty. Note, however, that bankruptcy and insolvency laws of a particular jurisdiction may impose restrictions on or prohibitions against the right of offset in bankruptcy, insolvency or other events.
52
THRIVENT MUTUAL FUNDS
NOTESTO FINANCIAL STATEMENTS
December 31, 2014
Collateral and margin requirements vary by type of derivative. Margin requirements are established by the broker or clearing house for exchange traded and centrally cleared derivatives (futures, options, and centrally cleared swaps). Brokers can ask for margining in excess of the minimum in certain situations. Collateral terms are contract specific for OTC derivatives (foreign currency exchange contracts, options, swaps). For derivatives traded under an ISDA Master Agreement, the collateral requirements are typically calculated by netting the mark to market amount for each transaction under such agreement and comparing that amount to the value of any collateral currently pledged by the Fund and the counterparty. For financial reporting purposes, non-cash collateral that has been pledged to cover obligations of the Fund has been noted in the Schedule of Investments. To the extent amounts due to the Fund from its counterparties are not fully collateralized, contractually or otherwise, the Fund bears the risk of loss from counterparty nonperformance. The Funds attempt to mitigate counterparty risk by only entering into agreements with counterparties that they believe have the financial resources to honor their obligations and by monitoring the financial stability of those counterparties.
Options – Each of the Funds, with the exception of Money Market Fund, may buy put and call options and write put and covered call options. The Funds intend to use such derivative instruments as hedges to facilitate buying or selling securities or to provide protection against adverse movements in security prices or interest rates. The Funds may also enter into options contracts to protect against adverse foreign exchange rate fluctuations. Option contracts are valued daily and unrealized appreciation or depreciation is recorded. A Fund will realize a gain or loss upon expiration or closing of the option transaction. When an option is exercised, the proceeds upon sale for a written call option or the cost of a security for purchased put and call options is adjusted by the amount of premium received or paid.
Buying put options tends to decrease a Fund’s exposure to the underlying security while buying call options tends to increase a Fund’s exposure to the underlying security. The risk associated with purchasing put and call options is limited to the premium paid. There is no significant counterparty risk on exchange-traded options as the exchange guarantees the contract against default. Writing put options tends to increase a Fund’s exposure to the underlying security while writing call options tends to decrease a Fund’s exposure to the underlying security. The writer of an option has no control over whether the underlying security may be bought or sold, and therefore bears the market risk of an unfavorable change in the price of the underlying security. The counterparty risk for purchased options arises when a Fund has purchased an option, exercises that option, and the counterparty doesn’t buy from the Fund or sell to the Fund the underlying asset as required. In the case where a Fund has written an option, the Fund doesn’t have counterparty risk. Counterparty risk on purchased over-the-counter options is partially mitigated by the Fund’s collateral posting requirements. As the option increases in value to the Fund, the Fund receives collateral from the counterparty. Risks of loss may exceed amounts recognized on the Statement of Assets and Liabilities.
Futures Contracts – Each of the Funds, with the exception of Money Market Fund, may use futures contracts to manage the exposure to interest rate and market or currency fluctuations. Gains or losses on futures contracts can offset changes in the yield of securities. When a futures contract is opened, cash or other investments equal to the required “initial margin deposit” are held on deposit with and pledged to the broker. Additional securities held by the Funds may be earmarked to cover open futures contracts. The futures contract’s daily change in value (“variation margin”) is either paid to or received from the broker, and is recorded as an unrealized gain or loss. When the contract is closed, realized gain or loss is recorded equal to the difference between the value of the contract when opened and the value of the contract when closed. Futures contracts involve, to varying degrees, risk of loss in excess of the variation margin disclosed in the Statement of Assets and Liabilities. Exchange-traded futures have no significant counterparty risk as the exchange guarantees the contracts against default.
Foreign Currency Forward Contracts – In connection with purchases and sales of securities denominated in foreign currencies all Funds may enter into foreign currency forward contracts. Additionally, the Funds may enter into such contracts to hedge certain other foreign-currency-denominated investments. These contracts are recorded at value and the related realized and unrealized foreign exchange gains and losses are included in the Statement of Operations. In the event that counterparties fail to settle these forward contracts, the Funds could be exposed to foreign currency fluctuations. Foreign currency contracts are valued daily and unrealized appreciation or depreciation is recorded daily as the difference between the contract exchange rate and the closing forward rate applied to the face amount of the contract. A realized gain or loss is recorded at the time a forward contract is closed. These contracts are over-the-counter and the Fund is exposed to counterparty risk equal to the discounted net amount of payments to the Fund. This risk is partially mitigated by the Fund’s collateral posting requirements.
Swap Agreements – Each of the Funds, with the exception of Money Market Fund, may enter into swap transactions, which involve swapping one or more investment characteristics of a security or a basket of securities with another party. Such transactions include market risk, risk of default by the other party to the transaction, risk of imperfect correlation and manager risk and may involve commissions or other costs. Swap transactions generally do not involve delivery of
53
THRIVENT MUTUAL FUNDS
NOTESTO FINANCIAL STATEMENTS
December 31, 2014
securities, other underlying assets or principal. Accordingly, the risk of loss with respect to swap transactions is generally limited to the net amount of payments that the Fund is contractually obligated to make, or in the case of the counterparty defaulting, the net amount of payments that the Fund is contractually entitled to receive. Risks of loss may exceed amounts recognized on the Statement of Assets and Liabilities. If there is a default by the counterparty, the Fund may have contractual remedies pursuant to the agreements related to the transaction. The contracts are valued daily and unrealized appreciation or depreciation is recorded. Swap agreements are valued at fair value of the contract as provided by an independent pricing service. The pricing service takes into account such factors as swap curves, default probabilities, recent trades, recovery rates and other factors it deems relevant in determining valuations. Daily fluctuations in the value of the centrally cleared credit default contracts are recorded in variation margin in the Statement of Assets and Liabilities and recorded as unrealized gain or loss. The Fund accrues for the periodic payment and amortizes upfront payments, if any, on swap agreements on a daily basis with the net amount recorded as realized gains or losses in the Statement of Operations. Receipts and payments received or made as a result of a credit event or termination of the contract are also recognized as realized gains or losses in the Statement of Operations. Collateral, in the form of cash or securities, may be required to be held with the Fund’s custodian, or a third party, in connection with these agreements. Certain swap agreements are over-the-counter and the Fund is exposed to counterparty risk, which is the discounted net amount of payments owed to the Fund. This risk is partially mitigated by the Fund’s collateral posting requirements. As the swap increases in value to the Fund, the Fund receives collateral from the counterparty. Certain interest rate and credit default index swaps must be cleared through a clearinghouse or central counterparty.
Credit Default Swaps – A credit default swap is a swap agreement between two parties to exchange the credit risk of a particular issuer, basket of securities or reference entity.
In a credit default swap transaction, a buyer pays periodic fees in return for payment by the seller which is contingent upon an adverse credit event occurring in the underlying issuer or reference entity. The seller collects periodic fees from the buyer and profits if the credit of the underlying issuer or reference entity remains stable or improves while the swap is outstanding, but the seller in a credit default swap contract would be required to pay the amount of credit loss, determined as specified in the agreement, to the buyer in the event of an adverse credit event in the reference entity. A buyer of a credit default swap is said to buy protection whereas a seller of a credit default swap is said to sell protection. The Funds may be either the protection seller or the protection buyer.
Certain Funds enter into credit default derivative contracts directly through credit default swaps (CDS) or through credit default swap indices (CDX Indices). CDX indices are static pools of equally weighted credit default swaps referencing corporate bonds and/or loans designed to provide diversified credit exposure to these asset classes. Funds sell default protection and assume long-risk positions in individual credits or indices. Index positions are entered into to gain exposure to the corporate bond and/or loan markets in a cost-efficient and diversified structure. In the event that a position defaults, by going into bankruptcy and failing to pay interest or principal on borrowed money, within any given CDX Index held, the maximum potential amount of future payments required would be equal to the pro-rata share of that position within the index based on the notional amount of the index. In the event of a default under a CDS contract the maximum potential amount of future payments would be the notional amount. For CDS, the default events could be bankruptcy and failing to pay interest or principal on borrowed money or a restructuring. A restructuring is a change in the underlying obligations which would include reduction in interest or principal, maturity extension and subordination to other obligations.
For financial reporting purposes the Funds do not offset derivative assets and derivative liabilities that are subject to netting arrangements in the Statement of Assets and Liabilities
The amounts presented in the tables below are offset first by financial instruments that have the right of offset under master netting or similar arrangements, then any remaining amount is reduced by cash and non-cash collateral pledged. The actual amounts of collateral may be greater than amounts presented in the tables.
| | | | | | | | | | | | | | | | | | | | | | | | | | | | |
| | | | | | | | | | | | Gross Amounts Not Offset in the
Statement of Assets and Liabilities | | | | |
Fund | | Gross Amounts
of Recognized
Assets | | | Gross
Amounts
Offset | | | Net Amounts
of
Recognized
Assets | | | Financial
Instruments | | | Cash
Collateral
Received | | | Non-Cash
Collateral
Received | | | Net Amount | |
Growth and Income Plus | | | | | | | | | | | | | | | | | | | | | | | | | | | | |
Futures Contracts | | | 3,344 | | | | — | | | | 3,344 | | | | 3,344 | | | | — | | | | — | | | | — | |
Diversified Income Plus | | | | | | | | | | | | | | | | | | | | | | | | | | | | |
Futures Contracts | | | 161,531 | | | | — | | | | 161,531 | | | | 49,212 | | | | — | | | | — | | | | 112,319 | (*) |
| (*) | Net futures amount represents the net amount receivable from the counterparty in the event of a default. |
54
THRIVENT MUTUAL FUNDS
NOTESTO FINANCIAL STATEMENTS
December 31, 2014
The following table presents the gross and net information about liabilities subject to master netting arrangements, as presented in our Statement of Assets and Liabilities:
| | | | | | | | | | | | | | | | | | | | | | | | | | | | |
| | | | | | | | | | | | Gross Amounts Not Offset in the
Statement of Assets and Liabilities | | | | |
Fund | | Gross Amounts
of Recognized
Liabilities | | | Gross
Amounts
Offset | | | Net Amounts
of
Recognized
Liabilities | | | Financial
Instruments | | | Cash
Collateral
Pledged | | | Non-Cash
Collateral
Pledged** | | | Net Amount | |
Growth and Income Plus | | | | | | | | | | | | | | | | | | | | | | | | | | | | |
Futures Contracts | | | 26,009 | | | | — | | | | 26,009 | | | | 3,344 | | | | — | | | | 22,665 | | | | — | |
Diversified Income Plus | | | | | | | | | | | | | | | | | | | | | | | | | | | | |
Futures Contracts | | | 49,212 | | | | — | | | | 49,212 | | | | 49,212 | | | | — | | | | — | | | | — | |
Securities Lending | | | 3,898,339 | | | | — | | | | 3,898,339 | | | | 3,805,643 | | | | — | | | | — | | | | 92,696^ | |
Natural Resources | | | | | | | | | | | | | | | | | | | | | | | | | | | | |
Securities Lending | | | 6,344,325 | | | | — | | | | 6,344,325 | | | | 6,150,339 | | | | — | | | | — | | | | 193,986^ | |
| ** | Excess of collateral pledged to the counterparty may not be shown for financial reporting purposes. |
| ^ | Net securities lending amounts represent the net amount payable from the counterparty in the event of a default. |
(H) Mortgage Dollar Roll Transactions – Certain Funds enter into dollar roll transactions on securities issued or to be issued by the Government National Mortgage Association, Federal National Mortgage Association and Federal Home Loan Mortgage Corporation, in which the Funds sell mortgage securities and simultaneously agree to repurchase similar (same type and coupon) securities at a later date at an agreed upon price. The Funds must maintain liquid securities having a value at least equal to the repurchase price (including accrued interest) for such dollar rolls. In addition, the Funds are required to post or receive margin—depending on market movements—on their mortgage dollar rolls. The value of the securities that the Funds are required to purchase may decline below the agreed upon repurchase price of those securities.
During the period between the sale and repurchase, the Funds forgo principal and interest paid on the mortgage securities sold. The Funds are compensated from negotiated fees paid by brokers offered as an inducement to the Funds to “roll over” their purchase commitments, thus enhancing the yield. Mortgage dollar rolls may be renewed with a new purchase and repurchase price and a cash settlement made on settlement date without physical delivery of the securities subject to the contract. The fees received are recognized over the roll period and are included in Income from mortgage dollar rolls in the Statement of Operations.
(I) Securities Lending – The Trust has entered into a Securities Lending Agreement (the “Agreement”) with Deutsche Bank AG (“Deutsche”). The Agreement authorizes Deutsche to lend securities to authorized borrowers on behalf of the Funds. Pursuant to the Agreement, all loaned securities are initially collateralized by cash equal to at least 102% of the value of the loaned securities. All cash collateral received is invested in Thrivent Cash Management Trust. The Funds receive dividends and interest that would have been earned on the securities loaned while simultaneously seeking to earn income on the investment of cash collateral. Amounts earned on investments in Thrivent Cash Management Trust, net of rebates, fees paid to Deutsche for services provided and any other securities lending expenses, are included in Income from securities loaned on the Statement of Operations. By investing any cash collateral it receives in these transactions, a Fund could realize additional gains or losses. If the borrower fails to return the securities or the invested collateral has declined in value, the Fund could lose money.
As of December 31, 2014, the value of securities on loan is as follows:
| | | | |
Fund | | Securities on
Loan | |
Diversified Income Plus | | $ | 3,805,643 | |
Natural Resources | | | 6,150,339 | |
(J) When-Issued and Delayed Delivery Transactions – Each Fund may purchase or sell securities on a when-issued or delayed delivery basis. These transactions involve a commitment by a Fund to purchase or sell securities for a predetermined price or yield, with payment and delivery taking place beyond the customary settlement period. When delayed delivery purchases are outstanding, a Fund will designate liquid assets in an amount sufficient to meet the purchase price. When purchasing a security on a delayed delivery basis, a Fund assumes the rights and risks of ownership of the security, including the risk of price and yield fluctuations, and takes such fluctuations into account when determining its net asset value. A Fund may dispose of a delayed delivery transaction after it is entered into, and may sell when-issued securities before they are delivered, which may result in a capital gain or loss. When a Fund has sold a security on a delayed delivery basis, a Fund does not participate in future gains and losses with respect to the security.
55
THRIVENT MUTUAL FUNDS
NOTESTO FINANCIAL STATEMENTS
December 31, 2014
(K) Treasury Inflation Protected Securities – Each Funds may invest in treasury inflation protected securities (TIPS). These securities are fixed income securities whose principal value is periodically adjusted to the rate of inflation. The coupon interest rate is generally fixed at issuance. Interest is paid based on the principal value, which is adjusted for inflation. Any increase in the principal amount will be included as taxable interest in the Statement of Operations and received in cash upon maturity or sale of the security.
(L) Repurchase Agreements – Each Fund may engage in repurchase agreement transactions in pursuit of its investment objective. A repurchase agreement consists of a purchase and a simultaneous agreement to resell an investment for later delivery at an agreed upon price and rate of interest. The Fund uses a third-party custodian to maintain the collateral. If the original seller of a security subject to a repurchase agreement fails to repurchase the security at the agreed upon time, the Fund could incur a loss due to a drop in the value of the security during the time it takes the Fund to either sell the security or take action to enforce the original seller’s agreement to repurchase the security. Also, if a defaulting original seller filed for bankruptcy or became insolvent, disposition of such security might be delayed by pending legal action. The Fund may only enter into repurchase agreements with banks and other recognized financial institutions such as broker/dealers that are found by the Adviser or subadviser to be creditworthy. During the year ended December 31, 2014, none of the Funds engaged in these types of investments.
(M) Equity-Linked Structured Securities – Certain Funds may invest in equity-linked structured notes. Equity-linked structured notes are debt securities which combine the characteristics of common stock and the sale of an option. The return component is based upon the performance of a single equity security, a basket of equity securities, or an equity index and the sale of an option. There is no guaranteed return of principal with these securities. The appreciation potential of these securities may be limited by a maximum payment or call right and can be influenced by many unpredictable factors. In addition to the performance of the equity, the nature and credit of the issuer may also impact return.
(N) Stripped Securities – Certain Funds may invest in Interest Only and Principal Only stripped mortgage or asset backed securities. These securities represent a participation in securities that are structured in classes with rights to receive different portions of the interest and principal. Interest only securities receive all the interest and principal only securities receive all the principal. If the underlying pool of mortgages or assets experience greater than anticipated prepayments of principal, the Fund may not fully recoup its initial investment in an interest only security. Principal only securities increase in value if prepayments are greater than anticipated and decline if prepayments are slower than anticipated. The market value of these securities is highly sensitive to changes in interest rates.
(O) Credit Risk – The Funds may be susceptible to credit risk to the extent an issuer or counterparty defaults on its payment obligation. The Funds’ policy is to monitor the creditworthiness of issuers and counterparties. Interest receivable on defaulted securities is monitored for ability to collect payments in default and is adjusted accordingly.
(P) Accounting Estimates – The preparation of financial statements in conformity with GAAP requires management to make estimates and assumptions that affect the reported amounts of assets and liabilities and disclosure of contingent assets and liabilities at the date of the financial statements and the reported amounts of income and expenses during the reporting period. Actual results could differ from those estimates.
(Q) Loan Commitments – Certain Funds may enter into loan commitments, which generally have interest rates which are reset daily, monthly, quarterly or semi-annually by reference to a base lending rate, plus a premium. These base rates are primarily the London-Interbank Offered Rate (“LIBOR”), and secondarily the prime rate offered by one or more major United States banks (the “Prime Rate”) and the certificate of deposit (“CD”) rate or other base lending rates used by commercial lenders. Loan commitments often require prepayments from excess cash flows or allow the borrower to repay at its election. The rate at which the borrower repays cannot be predicted with accuracy. Therefore, the remaining maturity may be considerably less than the stated maturity shown in the Schedule of Investments.
All or a portion of these loan commitments may be unfunded. A Fund is obligated to fund these commitments at the borrower’s discretion. Therefore, the Fund must have funds sufficient to cover its contractual obligation. These unfunded loan commitments, which are marked to market daily, are presented in the Schedule of Investments.
(R) Litigation – Awards from class action litigation are recorded as realized gains on the payment date.
(S) Other – For financial statement purposes, investment security transactions are accounted for on the trade date. Realized gains and losses from investment transactions are determined on a specific cost identification basis, which is the same basis used for federal income tax purposes.
(T) In-kind Redemptions – During the year ended December 31, 2013, the Thrivent Asset Allocation Funds, as the shareholders of underlying funds of Thrivent Mutual Funds, (the “underlying funds”), redeemed their shares in-kind (“in-kind redemption”). The underlying funds distributed fund securities and cash as payment for the redemption of these fund shares. For financial
56
THRIVENT MUTUAL FUNDS
NOTESTO FINANCIAL STATEMENTS
December 31, 2014
reporting purposes, the underlying funds recognize gain on these transactions to the extent the value of the distributed securities on the date of redemption exceeds the cost of those securities; they recognize a loss if the cost exceeds the value. Gains or losses on in-kind redemptions are not recognized for tax purposes. The realized gains or losses below are included in the Statement of Operations of the underlying funds as net realized gains/losses on in-kind redemptions. The in-kind amounts and shares redeemed are included in the Capital Stock Transactions of the Statement of Changes in Net Assets of the underlying funds. These in-kind transactions were conducted at market value. The transactions were as follows:
| | | | | | | | | | | | | | | | | | |
| | | Underlying Fund | | Underlying
Shares
Redeemed | | | Date | | | In-kind
Amount | | | Realized
Gain/(Loss) | |
Aggressive Allocation Fund | | Growth and Income Plus | | | 475,273 | | | | 8/6/2013 | | | $ | 5,218,501 | | | $ | 628,200 | |
Moderately Aggressive Allocation Fund | | Growth and Income Plus | | | 1,204,539 | | | | 8/6/2013 | | | $ | 13,225,838 | | | $ | 1,625,645 | |
Moderate Allocation Fund | | Growth and Income Plus | | | 1,176,442 | | | | 8/6/2013 | | | $ | 12,917,331 | | | $ | 1,561,715 | |
Moderately Conservative Allocation Fund | | Growth and Income Plus | | | 485,709 | | | | 8/6/2013 | | | $ | 5,333,082 | | | $ | 647,224 | |
(3) FEES AND COMPENSATION PAID TO AFFILIATES
(A) Investment Advisory Fees – The Trust has entered into an Investment Advisory Agreement with Thrivent Asset Mgt. Under the Investment Advisory Agreement, each of the Funds pays a fee for investment advisory services. The fees are accrued daily and paid monthly. The annual rates of fees as a percent of average daily net assets under the Investment Advisory Agreement were as follows:
| | | | | | | | | | | | | | | | | | | | | | | | | | | | | | | | | | | | | | | | | | | | |
Fund (M - Millions) | | $0 to
$50M | | | Over $50
to $100M | | | Over
$100 to
$200M | | | Over
$200 to
$250M | | | Over
$250 to
$500M | | | Over
$500 to
$750M | | | Over
$750 to
$1,000M | | | Over
$1,000 to
$2,000M | | | Over
$2,000 to
$2,500M | | | Over
$2,500 to
$5,000M | | | Over
$5,000M | |
Growth and Income Plus | | | 0.650 | % | | | 0.650 | % | | | 0.650 | % | | | 0.650 | % | | | 0.600 | % | | | 0.600 | % | | | 0.600 | % | | | 0.600 | % | | | 0.600 | % | | | 0.600 | % | | | 0.600 | % |
Diversified Income Plus | | | 0.550 | % | | | 0.550 | % | | | 0.550 | % | | | 0.550 | % | | | 0.550 | % | | | 0.550 | % | | | 0.550 | % | | | 0.550 | % | | | 0.550 | % | | | 0.550 | % | | | 0.550 | % |
Natural Resources | | | 0.800 | % | | | 0.800 | % | | | 0.800 | % | | | 0.800 | % | | | 0.800 | % | | | 0.750 | % | | | 0.750 | % | | | 0.750 | % | | | 0.750 | % | | | 0.750 | % | | | 0.750 | % |
(B) Expense Reimbursements – As of December 31, 2014, contractual expense reimbursements to limit expenses to the following percentages were in effect:
| | | | | | | | | | | | |
Fund | | Class A | | | Institutional
Class | | | Expiration
Date | |
Growth and Income Plus | | | 1.15 | % | | | 0.80 | % | | | 2/28/2015 | �� |
Diversified Income Plus | | | 1.00 | % | | | N/A | | | | 2/28/2015 | |
Natural Resources | | | 1.30 | % | | | N/A | | | | 2/28/2015 | |
The Funds covered in this shareholder report may invest cash in High Yield Fund, Money Market Fund and Thrivent Cash Management Trust, subject to certain limitations. During the year ended December 31, 2014, none of the Funds covered in this shareholder report invested in High Yield Fund. During the year ended December 31, 2014, none of the Funds covered in this shareholder report invested in Money Market Fund. During the year ended December 31, 2014, all Funds covered in this shareholder report invested in Thrivent Cash Management Trust. These related-party transactions are subject to the same terms as non-related party transactions except that, to avoid duplicate investment advisory fees, Thrivent Asset Mgt. reimburses an amount equal to the advisory fee which is charged to the Fund for its investment in High Yield Fund or Money Market Fund.
(C) Distribution Plan – Thrivent Investment Management, Inc. (“Thrivent Investment Mgt.”) is the Trust’s distributor. The Trust has adopted a Distribution Plan pursuant to Rule 12b-1 under the 1940 Act. Class A shares generally have a Rule 12b-1 fee of up to 0.25% of average net assets.
(D) Sales Charges and Other Fees – For the year ended December 31, 2014, Thrivent Investment Mgt. received $1,607,951 of aggregate underwriting concessions from the sales of the Trust’s Class A shares. Sales charges are not an expense of the Trust and are not reflected in the financial statements of any of the Funds.
57
THRIVENT MUTUAL FUNDS
NOTESTO FINANCIAL STATEMENTS
December 31, 2014
The Trust has entered into an accounting and administrative services agreement with Thrivent Asset Mgt. pursuant to which Thrivent Asset Mgt. provides certain accounting and administrative personnel and services to the Funds. For the year ended December 31, 2014, Thrivent Asset Mgt. received aggregate fees for accounting and administrative personnel and services of $359,748 from the Funds covered in this shareholder report.
The Trust has entered into an agreement with Thrivent Financial Investor Services, Inc. (“Thrivent Investor Services”) to provide the Funds with transfer agent services. For the year ended December 31, 2014, Thrivent Investor Services received $583,305 for transfer agent services from the Funds covered in this shareholder report.
Each Trustee who is not affiliated with the Adviser receives an annual fee from the Trust for services as a Trustee and is eligible to participate in a deferred compensation plan with respect to fees received from the Funds. Participants in the plan may designate their deferred Trustee’s fees as if invested in a series of Thrivent Mutual Funds. The value of each Trustee’s deferred compensation account will increase or decrease as if invested in shares of that series. Their fees as well as the change in value are included in Trustee’s fees in the Statement of Operations. The deferred fees remain in the appropriate Fund until distribution in accordance with the plan. The deferred fee liability, included in accrued expenses in the Statement of Assets and Liabilities, is unsecured.
Those Trustees not participating in the above plan received $16,889 in fees from the Funds covered in this shareholder report for the year ended December 31, 2014. In addition, the Trust reimbursed independent Trustees for reasonable expenses incurred in relation to attendance at the meetings and industry conferences.
Certain officers and non-independent Trustees of the Trust are officers and directors of Thrivent Asset Mgt., Thrivent Investment Mgt. and Thrivent Investor Services; however, they receive no compensation from the Funds.
(E) Indirect Expenses — Some Funds invest in other mutual funds. Fees and expenses of those underlying funds are not included in those Funds’ expense ratios. The Funds indirectly bear their proportionate share of the annualized weighted average expense ratio of the underlying funds in which they invest.
(4) TAX INFORMATION
Distributions are based on amounts calculated in accordance with the applicable federal income tax regulations, which may differ from GAAP. To the extent that these differences are permanent in nature, such amounts are reclassified within the capital accounts based on their federal tax-basis treatment; temporary differences do not require reclassifications.
On the Statement of Assets and Liabilities, as a result of permanent book-to-tax differences, reclassification adjustments were made as follows [Increase/(Decrease)]:
| | | | | | | | | | | | |
Fund | | Accumulated
Undistributed
Net
Investment
Income/(Loss) | | | Accumulated
Undistributed
Net Realized
Gain/(Loss) | | | Capital Stock | |
Growth and Income Plus | | ($ | 39,291 | ) | | $ | 73,573 | | | ($ | 34,282 | ) |
Diversified Income Plus | | | (405,745 | ) | | | 405,745 | | | | — | |
Natural Resources | | | 108,686 | | | | 21,654 | | | | (130,340 | ) |
At December 31, 2014, the components of distributable earnings on a tax basis were as follows:
| | | | | | | | |
Fund | | Undistributed
Ordinary Incomea | | | Undistributed
Long-Term
Capital Gain | |
Diversified Income Plus | | $ | 1,493,811 | | | $ | — | |
| a | Undistributed Ordinary Income includes income derived from Short-Term Capital Gains, if any. |
At December 31, 2014, the following Funds had accumulated net realized capital loss carryovers expiring as follows:
| | | | | | | | |
Fund | | Capital Loss
Carryover | | | Expiration Year | |
Natural Resources | | $ | 6,139,226 | | | | 2017 | |
| | | | | | | | |
| | $ | 6,139,226 | | | | | |
| | | | | | | | |
To the extent that these Funds realize future net capital gains, taxable distributions will be reduced by any unused capital loss carryovers as permitted by the Internal Revenue Code. Unlimited capital loss carryovers will be utilized before capital loss carryovers with expiration dates.
During the calendar year 2014, capital loss carryovers utilized by the Funds were as follows: Natural Resources Fund, $6,084,182.
The tax character of distributions paid during the years ended December 31, 2014 and 2013 was as follows:
| | | | | | | | | | | | | | | | | | | | | | | | |
| | | Ordinary Incomea | | | Long-term Capital Gain | | | Return of Capital | |
Fund | | 12/31/2014 | | | 12/31/2013 | | | 12/31/2014 | | | 12/31/2013 | | | 12/31/2014 | | | 12/31/2013 | |
Growth and Income Plus | | $ | 2,237,837 | | | $ | 2,046,124 | | | $ | 1,664,046 | | | $ | 3,772,276 | | | $ | — | | | $ | — | |
Diversified Income Plus | | | 26,345,647 | | | | 16,121,196 | | | | 11,065,768 | | | | 2,434,157 | | | | — | | | | — | |
Natural Resources | | | 603,675 | | | | 484,874 | | | | — | | | | — | | | | — | | | | 209,922 | |
| a | Ordinary Income includes income derived from Short-Term Capital Gains, if any. |
58
THRIVENT MUTUAL FUNDS
NOTESTO FINANCIAL STATEMENTS
December 31, 2014
(5) SECURITY TRANSACTIONS
(A) Purchases and Sales of Investment Securities – For the year ended December 31, 2014, the cost of purchases and the proceeds from sales of investment securities, other than U.S. Government and short-term securities, were as follows:
| | | | | | | | |
| | | In thousands | |
Fund | | Purchases | | | Sales | |
Growth and Income Plus | | $ | 101,916 | | | $ | 78,924 | |
Diversified Income Plus | | | 624,847 | | | | 498,191 | |
Natural Resources | | | 67,128 | | | | 59,451 | |
Purchases and Sales of U.S. Government Securities were:
| | | | | | | | |
| | | In thousands | |
Fund | | Purchases | | | Sales | |
Growth and Income Plus | | $ | 20,754 | | | $ | 19,760 | |
Diversified Income Plus | | | 330,114 | | | | 319,780 | |
(B) Investments in Restricted Securities – Certain Funds may own restricted securities that have been deemed illiquid and were purchased in private placement transactions without registration under the Securities Act of 1933. Unless such securities subsequently become registered, they generally may be resold only in privately negotiated transactions with a limited number of purchasers. As of December 31, 2014, the following Funds held restricted securities:
| | | | | | | | |
Fund | | Number of
Securities | | | Percent of Fund’s
Net Assets | |
Growth and Income Plus | | | 2 | | | | 0.13 | % |
Diversified Income Plus | | | 3 | | | | 0.57 | % |
The Funds have no right to require registration of unregistered securities.
(C) Investments in High-Yielding Securities – The Funds may invest in high-yielding securities. These securities will typically be in lower rated categories or will be non-rated and generally will involve more risk than securities in higher rated categories. Lower rated or unrated securities are more likely to react to developments affecting market risk and credit risk than are more highly rated securities, which react primarily to movements in the general level of interest rates.
(D) Investments in Options and Futures Contracts – The movement in the price of the security underlying an option or futures contract may not correlate perfectly with the movement in the prices of the portfolio securities being hedged. A lack of correlation could render a Fund’s hedging strategy unsuccessful and could result in a loss to the Fund. In the event that a liquid secondary market would not exist, the Fund could be prevented from entering into a closing transaction, which could result in additional losses to the Fund.
(6) SECURITY TRANSACTIONS WITH AFFILIATED FUNDS
The Funds are permitted to purchase or sell securities from or to certain other Funds under specified conditions outlined in procedures adopted by the Board. The procedures have been designed to ensure that any purchase or sale of securities by a Fund from or to another fund or portfolio that is or could be considered an affiliate by virtue of having a common investment adviser (or affiliated investment advisers), common Trustees and/or common officers complies with Rule 17a-7 of the 1940 Act. Further, as defined under the procedures, each transaction is executed at the current market price.
(7) RELATED PARTY TRANSACTIONS
As of December 31, 2014, no related parties held shares in excess of 5% of the Funds covered in this shareholder report.
(8) SUBSEQUENT EVENTS
The Adviser of the Funds has evaluated the impact of subsequent events, and, except as already included in the Notes to Financial Statements, has determined that no additional items require disclosure.
59
THRIVENT MUTUAL FUNDS
FINANCIAL HIGHLIGHTS
| | | | | | | | | | | | | | | | | | | | | | | | | | | | |
| | | FOR A SHARE OUTSTANDING THROUGHOUT EACH PERIOD* | |
| | | | | | Income from Investment Operations | | | Less Distributions From | |
| | | Net Asset
Value,
Beginning
of Period | | | Net
Investment
Income/
(Loss) | | | Net Realized
and Unrealized
Gain/(Loss) on
Investments(a) | | | Total from
Investment
Operations | | | Net
Investment
Income | | | Net Realized
Gain on
Investments | | | Return of
Capital | |
GROWTH AND INCOME PLUS FUND | |
Class A Shares | | | | | | | | | | | | | | | | | | | | | | | | | | | | |
Year Ended 12/31/2014 | | $ | 10.38 | | | $ | 0.19 | | | $ | 0.01 | | | $ | 0.20 | | | $ | (0.20 | ) | | $ | (0.35 | ) | | $ | — | |
Year Ended 12/31/2013 | | | 9.59 | | | | 0.18 | | | | 1.83 | | | | 2.01 | | | | (0.19 | ) | | | (1.03 | ) | | | — | |
Year Ended 12/31/2012 | | | 8.70 | | | | 0.20 | | | | 0.89 | | | | 1.09 | | | | (0.20 | ) | | | — | | | | — | |
Year Ended 12/31/2011 | | | 9.08 | | | | 0.13 | | | | (0.38 | ) | | | (0.25 | ) | | | (0.13 | ) | | | — | | | | — | |
Year Ended 12/31/2010 | | | 7.98 | | | | 0.13 | | | | 1.12 | | | | 1.25 | | | | (0.15 | ) | | | — | | | | — | |
Institutional Class Shares | |
Year Ended 12/31/2014 | | | 10.39 | | | | 0.29 | | | | (0.05 | ) | | | 0.24 | | | | (0.23 | ) | | | (0.35 | ) | | | — | |
Year Ended 12/31/2013 | | | 9.60 | | | | 0.44 | | | | 1.61 | | | | 2.05 | | | | (0.23 | ) | | | (1.03 | ) | | | — | |
Year Ended 12/31/2012 | | | 8.71 | | | | 0.24 | | | | 0.88 | | | | 1.12 | | | | (0.23 | ) | | | — | | | | — | |
Year Ended 12/31/2011 | | | 9.08 | | | | 0.16 | | | | (0.37 | ) | | | (0.21 | ) | | | (0.16 | ) | | | — | | | | — | |
Year Ended 12/31/2010 | | | 7.98 | | | | 0.17 | | | | 1.11 | | | | 1.28 | | | | (0.18 | ) | | | — | | | | — | |
| | | | | | | | | | | | | | | | | | | | | | | | | | | | |
DIVERSIFIED INCOME PLUS FUND | |
Class A Shares | | | | | | | | | | | | | | | | | | | | | | | | | | | | |
Year Ended 12/31/2014 | | | 7.25 | | | | 0.24 | | | | 0.02 | | | | 0.26 | | | | (0.23 | ) | | | (0.18 | ) | | | — | |
Year Ended 12/31/2013 | | | 6.82 | | | | 0.23 | | | | 0.47 | | | | 0.70 | | | | (0.23 | ) | | | (0.04 | ) | | | — | |
Year Ended 12/31/2012 | | | 6.22 | | | | 0.27 | | | | 0.59 | | | | 0.86 | | | | (0.26 | ) | | | — | | | | — | |
Year Ended 12/31/2011 | | | 6.39 | | | | 0.27 | | | | (0.15 | ) | | | 0.12 | | | | (0.29 | ) | | | — | | | | — | |
Year Ended 12/31/2010 | | | 5.83 | | | | 0.33 | | | | 0.54 | | | | 0.87 | | | | (0.31 | ) | | | — | | | | — | |
Institutional Class Shares | |
Year Ended 12/31/2014 | | | 7.19 | | | | 0.26 | | | | 0.02 | | | | 0.28 | | | | (0.25 | ) | | | (0.18 | ) | | | — | |
Year Ended 12/31/2013 | | | 6.77 | | | | 0.26 | | | | 0.46 | | | | 0.72 | | | | (0.26 | ) | | | (0.04 | ) | | | — | |
Year Ended 12/31/2012 | | | 6.19 | | | | 0.30 | | | | 0.57 | | | | 0.87 | | | | (0.29 | ) | | | — | | | | — | |
Year Ended 12/31/2011 | | | 6.36 | | | | 0.29 | | | | (0.15 | ) | | | 0.14 | | | | (0.31 | ) | | | — | | | | — | |
Year Ended 12/31/2010 | | | 5.81 | | | | 0.36 | | | | 0.52 | | | | 0.88 | | | | (0.33 | ) | | | — | | | | — | |
| | | | | | | | | | | | | | | | | | | | | | | | | | | | |
NATURAL RESOURCES FUND(c) | |
Class A Shares | | | | | | | | | | | | | | | | | | | | | | | | | | | | |
Year Ended 12/31/2014 | | | 9.95 | | | | 0.02 | | | | (1.86 | ) | | | (1.84 | ) | | | (0.03 | ) | | | — | | | | — | |
Year Ended 12/31/2013 | | | 9.13 | | | | 0.02 | | | | 0.84 | | | | 0.86 | | | | (0.02 | ) | | | — | | | | (0.02 | ) |
Year Ended 12/31/2012 | | | 9.57 | | | | 0.04 | | | | (0.43 | ) | | | (0.39 | ) | | | (0.04 | ) | | | — | | | | (0.01 | ) |
Year Ended 12/31/2011 | | | 9.66 | | | | 0.08 | | | | 0.01 | | | | 0.09 | | | | (0.09 | ) | | | — | | | | (0.09 | ) |
Year Ended 12/31/2010 | | | 7.79 | | | | 0.11 | | | | 1.98 | | | | 2.09 | | | | (0.18 | ) | | | — | | | | (0.04 | ) |
Institutional Class Shares | |
Year Ended 12/31/2014 | | | 9.96 | | | | 0.05 | | | | (1.87 | ) | | | (1.82 | ) | | | (0.06 | ) | | | — | | | | — | |
Year Ended 12/31/2013 | | | 9.13 | | | | 0.05 | | | | 0.85 | | | | 0.90 | | | | (0.05 | ) | | | — | | | | (0.02 | ) |
Year Ended 12/31/2012 | | | 9.57 | | | | 0.07 | | | | (0.43 | ) | | | (0.36 | ) | | | (0.07 | ) | | | — | | | | (0.01 | ) |
Year Ended 12/31/2011 | | | 9.66 | | | | 0.12 | | | | — | | | | 0.12 | | | | (0.12 | ) | | | — | | | | (0.09 | ) |
Year Ended 12/31/2010 | | | 7.80 | | | | 0.13 | | | | 1.98 | | | | 2.11 | | | | (0.21 | ) | | | — | | | | (0.04 | ) |
| (a) | The amount shown may not correlate with the change in aggregate gains and losses of portfolio securities due to the timing of sales and redemptions of fund shares. |
| (b) | Total investment return assumes dividend reinvestment and does not reflect any deduction for applicable sales charges. Not annualized for periods less than one year. |
| (c) | Prior to October 10, 2011, Fund was the “Real Estate Securities Fund” and invested at least 80% of its net assets in issuers primarily engaged in the U.S. real estate industry. |
| * | All per share amounts have been rounded to the nearest cent. |
| ** | Computed on an annualized basis for periods less than one year. |
The accompanying Notes to Financial Statements are an integral part of this statement.
60
THRIVENT MUTUAL FUNDS
FINANCIAL HIGHLIGHTS – continued
| | | | | | | | | | | | | | | | | | | | | | | | | | | | | | | | | | |
|
| RATIOS/SUPPLEMENTAL DATA | |
| | | | | | | | | | | | | Ratio to Average Net
Assets** | | | Ratios to Average Net Assets
Before Expenses Waived,
Credited or Paid
Indirectly** | | | | |
Total
Distributions | | | Net Asset
Value, End of
Period | | | Total
Return(b) | | | Net Assets,
End of Period
(in millions) | | | Expenses | | | Net Investment
Income/(Loss) | | | Expenses | | | Net Investment
Income/(Loss) | | | Portfolio
Turnover
Rate | |
| | | | | | | | | | | | | | | | | | | | | | | | | | | | | | | | | | |
| | | | | | | | | | | | | | | | | | | | | | | | | | | | | | | | | | |
| | $(0.55) | | | $ | 10.03 | | | | 1.89 | % | | $ | 76.5 | | | | 1.15 | % | | | 1.93 | % | | | 1.42 | % | | | 1.66 | % | | | 167 | % |
| | (1.22) | | | | 10.38 | | | | 21.08 | % | | | 49.8 | | | | 1.15 | % | | | 1.69 | % | | | 1.50 | % | | | 1.34 | % | | | 162 | % |
| | (0.20) | | | | 9.59 | | | | 12.60 | % | | | 25.6 | | | | 1.15 | % | | | 2.18 | % | | | 1.47 | % | | | 1.86 | % | | | 164 | % |
| | (0.13) | | | | 8.70 | | | | (2.79 | )% | | | 21.0 | | | | 1.15 | % | | | 1.47 | % | | | 1.47 | % | | | 1.15 | % | | | 193 | % |
| | (0.15) | | | | 9.08 | | | | 15.83 | % | | | 11.7 | | | | 1.16 | % | | | 1.90 | % | | | 1.76 | % | | | 1.29 | % | | | 360 | % |
| | | | | | | | | | | | | | | | | | | | | | | | | | | | | | | | | | |
| | (0.58) | | | | 10.05 | | | | 2.34 | % | | | 1.8 | | | | 0.80 | % | | | 2.24 | % | | | 1.12 | % | | | 1.92 | % | | | 167 | % |
| | (1.26) | | | | 10.39 | | | | 21.56 | % | | | 2.3 | | | | 0.80 | % | | | 2.02 | % | | | 0.92 | % | | | 1.90 | % | | | 162 | % |
| | (0.23) | | | | 9.60 | | | | 12.97 | % | | | 35.3 | | | | 0.80 | % | | | 2.52 | % | | | 0.94 | % | | | 2.38 | % | | | 164 | % |
| | (0.16) | | | | 8.71 | | | | (2.35 | )% | | | 30.6 | | | | 0.80 | % | | | 1.80 | % | | | 0.94 | % | | | 1.66 | % | | | 193 | % |
| | (0.18) | | | | 9.08 | | | | 16.23 | % | | | 29.9 | | | | 0.81 | % | | | 2.09 | % | | | 1.19 | % | | | 1.70 | % | | | 360 | % |
| | | | | | | | | | | | | | | | | | | | | | | | | | | | | | | | | | |
| | | | | | | | | | | | | | | | | | | | | | | | | | | | | | | | | | |
| | | | | | | | | | | | | | | | | | | | | | | | | | | | | | | | | | |
| | (0.41) | | | | 7.10 | | | | 3.54 | % | | | 581.7 | | | | 0.98 | % | | | 3.33 | % | | | 0.98 | % | | | 3.33 | % | | | 137 | % |
| | (0.27) | | | | 7.25 | | | | 10.40 | % | | | 459.1 | | | | 1.00 | % | | | 3.34 | % | | | 1.00 | % | | | 3.34 | % | | | 155 | % |
| | (0.26) | | | | 6.82 | | | | 14.08 | % | | | 290.7 | | | | 0.99 | % | | | 4.14 | % | | | 1.03 | % | | | 4.10 | % | | | 153 | % |
| | (0.29) | | | | 6.22 | | | | 1.78 | % | | | 200.5 | | | | 0.97 | % | | | 4.29 | % | | | 1.06 | % | | | 4.20 | % | | | 126 | % |
| | (0.31) | | | | 6.39 | | | | 15.24 | % | | | 171.5 | | | | 1.12 | % | | | 5.62 | % | | | 1.12 | % | | | 5.61 | % | | | 112 | % |
| | | | | | | | | | | | | | | | | | | | | | | | | | | | | | | | | | |
| | (0.43) | | | | 7.04 | | | | 3.90 | % | | | 116.2 | | | | 0.69 | % | | | 3.60 | % | | | 0.69 | % | | | 3.60 | % | | | 137 | % |
| | (0.30) | | | | 7.19 | | | | 10.70 | % | | | 107.5 | | | | 0.70 | % | | | 3.66 | % | | | 0.70 | % | | | 3.66 | % | | | 155 | % |
| | (0.29) | | | | 6.77 | | | | 14.23 | % | | | 54.2 | | | | 0.72 | % | | | 4.47 | % | | | 0.72 | % | | | 4.47 | % | | | 153 | % |
| | (0.31) | | | | 6.19 | | | | 2.18 | % | | | 17.4 | | | | 0.74 | % | | | 4.53 | % | | | 0.74 | % | | | 4.52 | % | | | 126 | % |
| | (0.33) | | | | 6.36 | | | | 15.57 | % | | | 7.7 | | | | 0.76 | % | | | 5.92 | % | | | 0.77 | % | | | 5.92 | % | | | 112 | % |
| | | | | | | | | | | | | | | | | | | | | | | | | | | | | | | | | | |
| | | | | | | | | | | | | | | | | | | | | | | | | | | | | | | | | | |
| | | | | | | | | | | | | | | | | | | | | | | | | | | | | | | | | | |
| | (0.03) | | | | 8.08 | | | | (18.47 | )% | | | 15.7 | | | | 1.30 | % | | | 0.19 | % | | | 1.83 | % | | | (0.34 | )% | | | 58 | % |
| | (0.04) | | | | 9.95 | | | | 9.43 | % | | | 15.8 | | | | 1.30 | % | | | 0.22 | % | | | 1.81 | % | | | (0.28 | )% | | | 36 | % |
| | (0.05) | | | | 9.13 | | | | (4.05 | )% | | | 14.9 | | | | 1.30 | % | | | 0.46 | % | | | 1.77 | % | | | (0.01 | )% | | | 30 | % |
| | (0.18) | | | | 9.57 | | | | 0.85 | % | | | 15.4 | | | | 1.30 | % | | | 0.77 | % | | | 1.70 | % | | | 0.37 | % | | | 92 | % |
| | (0.22) | | | | 9.66 | | | | 27.15 | % | | | 14.8 | | | | 1.29 | % | | | 1.17 | % | | | 1.81 | % | | | 0.66 | % | | | 18 | % |
| | | | | | | | | | | | | | | | | | | | | | | | | | | | | | | | | | |
| | (0.06) | | | | 8.08 | | | | (18.25 | )% | | | 70.6 | | | | 0.96 | % | | | 0.52 | % | | | 0.96 | % | | | 0.52 | % | | | 58 | % |
| | (0.07) | | | | 9.96 | | | | 9.89 | % | | | 86.6 | | | | 0.97 | % | | | 0.56 | % | | | 0.97 | % | | | 0.56 | % | | | 36 | % |
| | (0.08) | | | | 9.13 | | | | (3.71 | )% | | | 79.1 | | | | 0.97 | % | | | 0.78 | % | | | 0.97 | % | | | 0.78 | % | | | 30 | % |
| | (0.21) | | | | 9.57 | | | | 1.21 | % | | | 96.8 | | | | 0.94 | % | | | 1.15 | % | | | 0.94 | % | | | 1.15 | % | | | 92 | % |
| | (0.25) | | | | 9.66 | | | | 27.38 | % | | | 95.4 | | | | 0.97 | % | | | 1.47 | % | | | 0.97 | % | | | 1.47 | % | | | 18 | % |
The accompanying Notes to Financial Statements are an integral part of this statement.
61
ADDITIONAL INFORMATION
(unaudited)
Shareholder Notification of Federal Tax Information
The following information is provided solely to satisfy the requirements set forth by the Internal Revenue Code. Shareholders will be provided information regarding their distribution in February 2015.
The funds designate the percentage of dividends declared from net investment income as dividends qualifying for the 70% dividends received deduction for corporations and the percentage as qualified dividend income for individuals under the Jobs and Growth Tax Relief Reconciliation Act of 2003 as follows:
| | | | | | | | |
Fund | | Dividends
Received
Deduction
for
Corporations | | | Qualified
Dividend
Income for
Individuals | |
Growth and Income Plus | | | 21 | % | | | 54 | % |
Diversified Income Plus | | | 11 | % | | | 19 | % |
Natural Resources | | | 100 | % | | | 100 | % |
Pursuant to IRC 852(b)(3) of the Internal Revenue Code, the Funds hereby designate the following amounts as long-term capital gains distributed during the year ended December 31, 2014, or if subsequently determined to be different, the net capital gain of such year:
| | | | |
Fund | | Distributions of Long-Term
Capital Gains | |
Growth and Income Plus | | $ | 1,664,046 | |
Diversified Income Plus | | $ | 11,065,768 | |
These amounts may include earnings and profits distributed to shareholders on the redemption of shares as part of the dividend paid deduction.
Proxy Voting
The policies and procedures that the Trust uses to determine how to vote proxies relating to portfolio securities are attached to the Trust’s Statement of Additional Information. You may request a free copy of the Statement of Additional Information by calling 1-800-847-4836. You also may review the Statement of Additional Information or the report of how the Trust voted proxies relating to portfolio securities during the most recent 12-month period ended June 30 at Thrivent.com or www.sec.gov.
Quarterly Schedule of Portfolio Holdings
The Trust files its Schedule of Portfolio Holdings on Form N-Q with the SEC for the first and third quarters of each fiscal year. You may request a free copy of the Trust’s Forms N-Q by calling 1-800-847-4836. The Trust’s most recent Form N-Q Schedule of Investments also is at Thrivent.com or www.sec.gov. You also may review and copy the Forms N-Q for the Trust at the SEC’s Public Reference Room in Washington, DC. You may get information about the operation of the Public Reference Room by calling 1-800-SEC-0330.
Board Approval of Advisory Agreement and Subadvisory Agreements
Both the Investment Company Act of 1940 (the “Investment Company Act”) and the terms of the Advisory and Subadvisory Agreements of the Thrivent Mutual Funds (the “Trust”) require that these agreements be approved annually by the Board of Trustees (the “Board”), including a majority of the Trustees who are not “interested persons” of the Trust, as defined in the Investment Company Act (the “Independent Trustees”). The nine-member Board consists of eight Independent Trustees, including the Chairman.
62
ADDITIONAL INFORMATION
(unaudited)
At its meeting on October 28-29, 2014, the Board voted unanimously to renew the existing Advisory Agreement between the Trust and Thrivent Asset Management, LLC (the “Adviser”) for each series (each, a “Fund”) of the Trust. The Board also unanimously approved the Subadvisory Agreements for each of the Funds for which there is an investment subadviser (each a “Subadviser”). The Adviser and Subadvisers are referred to, collectively, as the “Advisory Organizations.” In connection with its evaluation of the agreements with the Advisory Organizations, the Board reviewed a broad range of information requested for this purpose and considered a variety of factors, including the following:
| | 1. | The nature, extent, and quality of the services provided by the Advisory Organizations; |
| | 2. | The performance of the Funds; |
| | 3. | The advisory fee and net operating expense ratio of each Fund compared to a peer group; |
| | 4. | The cost of services provided and profit realized by the Adviser; |
| | 5. | The extent to which economies of scale may be realized as the Funds grow; |
| | 6. | Whether fee levels reflect these economies of scale for the benefit of the Funds’ shareholders; |
| | 7. | Other benefits realized by the Adviser and its affiliates from their relationship with the Trust; and |
| | 8. | Any other factors that the Board deemed relevant to its consideration. |
In connection with the renewal process, the Contracts Committee of the Board (consisting of all of the Independent Trustees) met on six occasions from February 25 to October 28, 2014 to consider information relevant to the renewal process. The Independent Trustees also retained the services of Management Practice, Inc. (“MPI”) as an independent consultant to assist in the compilation, organization, and evaluation of relevant information. This information included Fund-by-Fund statistical comparisons of the advisory fees, other fees, net operating expenses and performance of each of the Funds in comparison to a peer group of comparable funds; portfolio turnover percentages; information with respect to services provided to the Funds and fees charged, including effective advisory fees that take into account breakpoints and fee waivers by the Adviser; asset and flow trends for the Funds; the cost of services and profit realized by the Adviser and its affiliates that provide services to the Funds; and information regarding the types of services furnished to the Funds. The Board received information from the investment management staff of the Adviser regarding the personnel providing services to the Funds, as well as changes in staff and systems and compliance enhancements. The Board also received periodic reports from the Adviser’s investment management staff with respect to the performance of the Funds. In addition to its review of the information presented to the Board during the contract renewal process, the Board also considered information obtained from management throughout the course of the year.
The Independent Trustees were represented by independent counsel throughout the review process and during executive sessions without management present to consider reapproval of the agreements. Each Independent Trustee relied on his or her own business judgment in determining the weight to be given to each factor considered in evaluating the materials that were presented. The Contracts Committee’s and Board’s review and conclusions were based on a comprehensive consideration of all information presented to them and were not the result of any single controlling factor. In addition, each Trustee may have weighed individual factors differently. The key factors considered and the conclusions reached are described below.
Nature, Extent and Quality of Services
At each of the Board’s regular quarterly meetings, management presented information describing the services furnished to the Funds by the Adviser and, as appropriate, the Subadvisers. During these meetings, management reported on the investment management, portfolio trading and compliance services provided to the Funds under the Advisory and Subadvisory Agreements. During the renewal process, the Board considered the specific services provided under the Advisory Agreement. The Board also considered information relating to the investment experience and qualifications of the Adviser’s portfolio managers and those of the Subadvisers.
The Board received reports at each of its quarterly meetings from the Adviser’s Head of Equity Investments and Head of Fixed Income Funds, as supplemented by the Adviser’s Chief Investment Officer, who was also present at all of the meetings. At each quarterly meeting, the Head of Equity Investments and Head of Fixed Income Funds presented information about each of the Funds. These reports and presentations gave the Board the opportunity to evaluate the portfolio managers’ abilities and the quality of services they provide to the Funds. The Adviser also reviewed with the Board the services provided by the Subadvisers. Information was also presented to the Board describing the portfolio compliance functions performed by the Adviser. The Independent Trustees also met in-person with and received quarterly reports from the Trust’s Chief Compliance Officer.
63
ADDITIONAL INFORMATION
(unaudited)
The Board considered the depth and quality of the Adviser’s oversight of the Subadvisers to the Trust. In addition, the Board noted the broad functions that the Adviser performed in support of the subadvised Funds, including, among other things, management of portfolio cash, subadviser expense management and payment and performance monitoring. The Board noted that investment management staff of the Adviser and the Trust’s Chief Compliance Officer conduct in-person oversight visits of each Subadviser, report the results of the visit to the Board and then follow through with additional inquiry on any questions or concerns that arise during the visit. The Board also noted that, as part of its oversight practice, the Adviser requires the Subadvisers to respond to a variety of compliance checklists and certifications to ensure their ongoing compliance with a subadvised Fund’s investment parameters. The Board noted that the Adviser requires the Subadvisers to complete an annual questionnaire addressing a range of compliance topics. In addition, the Board noted that the Adviser has dedicated personnel responsible for daily monitoring of the Subadvisers’ activities pertaining to the subadvised Funds.
The Board considered the adequacy of the Advisory Organizations’ resources used to provide services to the Trust pursuant to the Advisory and Subadvisory Agreements. The Adviser reviewed with the Board the Adviser’s process for overseeing the portfolio management teams of the Funds, and explained similarities and differences for how it oversees the Adviser’s teams and the teams of the Subadvisers. In addition, the Adviser explained how its investments in technology and personnel have benefitted the Funds and discussed continued investments in these resources. The Adviser also discussed how it has continued to strengthen its compliance program. The Adviser reviewed with the Board its process for selecting and overseeing the Subadvisers, including the results of on-site compliance due diligence visits. The Board viewed these actions as a positive factor in reapproving the existing Advisory Agreement, as they demonstrated the Adviser’s commitment to provide the Funds with quality service and competitive investment performance. The Board concluded that, within the context of its full deliberations, the nature, extent and quality of the investment advisory services provided to the Funds by the Adviser and Subadvisers supported renewal of the Advisory Agreement and Subadvisory Agreements.
Performance of the Funds
In connection with each of its regular quarterly meetings, the Board received information on the performance of each Fund, including net performance, relative performance rankings within each Fund’s Lipper peer group, Morningstar ratings, and performance as compared to benchmark index returns. At each quarterly Board meeting, the Head of Equity Investments and Head of Fixed Income Funds reviewed with the Board the economic and market environment, risk management, and style consistency in connection with management of the Funds. The Board considered investment performance for each Fund, to the extent applicable, over the one-, two-, three-, five-, and ten-year periods. When evaluating investment performance, the Board considered longer-term performance and the trend of performance, and focused particularly upon the three-year performance record. Although the Board conducted its review on a Fund-by-Fund basis, it noted that, for the three-year period ended June 30, 2014, the average ranking of the Class A Funds against their Lipper categories was 55% (on a scale of 1-99%, with 1% being the best). The Board noted that, for the three-year period ended June 30, 2014, the average ranking of the Institutional Class Funds against their Lipper categories was 48% (on a scale of 1-99%, with 1% being the best).
The Board noted that certain Funds did not fit well within a Lipper peer group because of differences between the principal investment strategies of these Funds and funds included in their respective Lipper peer group. In such cases, the Adviser provided additional information regarding these Funds’ performance compared to a customized benchmark that the Adviser believed better represented the investment strategies of such Funds. The Board received from the Adviser additional information about certain Funds which had faced performance challenges, and how the Adviser was addressing such challenges. The Board concluded that the performance of each individual Fund was either satisfactory or that the Adviser had taken appropriate actions in an effort to improve performance.
Advisory Fees and Fund Expenses
The Board reviewed information prepared by MPI comparing each Fund’s advisory fee with the advisory fee of its peer group. The Board considered both the contractual and effective advisory fees for each of the Funds. The Board noted that the majority of the Funds’ advisory fees were at or below the medians of their peer groups, with many in the lowest (i.e., least expensive) quartile. Although the Board conducted its review on a Fund-by-Fund basis, it noted that the average ranking of the Class A Funds’ advisory fees was 30% and the average ranking of the Institutional Class Funds’ fees was 32% (on a scale of 1-99%, with 1% being the lowest fee). The Board viewed favorably the Adviser’s proposal to continue or extend fee waivers for certain Funds and considered the effect of the waivers in lowering the Funds’ expenses.
64
ADDITIONAL INFORMATION
(unaudited)
On the basis of its review, the Board concluded that the advisory fees charged to the Funds for investment management services were reasonable.
The Board also reviewed information prepared by MPI comparing each Fund’s overall expense ratio with the expense ratio of its peer group. The Board conducted its review on a Fund-by-Fund basis and noted that all but two of the Funds had better total net expense ratios than their peer group medians. The Board further noted that the Class A Funds had an average ranking of 35% while the Institutional Class Funds had an average ranking of 24% (on a scale of 1-99%, with 1% being the lowest expenses).
Cost of Services and Profitability
The Board considered the Adviser’s estimates of its profitability, which included allocations by the Adviser of its costs in providing advisory services to the Funds. The internal audit department (i.e., Business Risk Management) of the Adviser conducted a review of such allocations and a department representative reported to the Board his views regarding the reasonableness and consistency of these allocations. The Board considered the profitability of the Adviser both overall and on a Fund-by-Fund basis. The Board also considered the expense reimbursements and waivers in effect. Based on its review of the data prepared by MPI and expense and profit information provided by the Adviser, the Board concluded that the profits earned by the Adviser from the Advisory Agreement were not excessive in light of the nature, extent and quality of services provided to the Funds.
With respect to fees paid to Subadvisers under the Subadvisory Agreements, the Board did not consider profitability information with respect to the Subadvisers, which are not affiliated with the Adviser. The Board considered that those contracts had been negotiated on an arm’s-length basis between the Adviser and each Subadviser, and that each Subadviser’s separate profitability from its relationship with the Funds was not a material factor in determining whether to renew the Subadvisory Agreements.
Economies of Scale and Breakpoints
The Board considered information regarding the extent to which economies of scale may be realized as a Fund’s assets increase and whether the fee levels reflect these economies of scale for the benefit of shareholders. The Adviser explained its general goal with respect to the employment of fee waivers, expense reimbursements and breakpoints. The Board considered information provided by the Adviser related to advisory fee rates, breakpoints in the advisory fee rates and fee waivers provided by the Adviser. The Board also considered management’s view that it is difficult to generalize as to whether, or to what extent, economies in the advisory function may be realized as a Fund’s assets increase. The Board noted that expected economies of scale, where they exist, may be shared through the use of fee breakpoints, fee waivers by the Adviser, and/or a lower overall fee rate. The Board viewed favorably that the Adviser would be implementing additional breakpoints for certain Funds effective January 1, 2015.
Other Benefits to the Adviser and its Affiliates
The Board considered information regarding potential “fall-out” or ancillary benefits that the Adviser and its affiliates may receive as a result of their relationship with the Trust, both tangible and intangible, such as their ability to leverage investment professionals who manage other portfolios, reputational benefits in the investment advisory community and the engagement of affiliates as service providers to the Funds. The Board noted that such benefits were difficult to quantify but were consistent with benefits received by other mutual fund advisers.
The Board also considered other potential benefits to the Adviser and its affiliates derived from its relationship with the Trust, including, among other things, research received by the Adviser generated from commission dollars spent on the Funds’ portfolio trading. The Board reviewed with the Adviser these arrangements and the reasonableness of the costs relative to the services performed. The Board considered the Adviser’s brokerage reports and representations that it evaluates any soft-dollar arrangements for compliance with applicable requirements, particularly with respect to the safe harbor contained in Section 28(e) of the Securities Exchange Act of 1934, and for compliance with the Adviser’s duty to seek best execution.
Based on the factors discussed above, the Contracts Committee unanimously recommended approval of the Advisory Agreement and the Subadvisory Agreements, and the Board, including all of the Independent Trustees voting separately, approved each of the agreements.
65
BOARDOF TRUSTEESAND OFFICERS
The following table provides information about the Trustees and Officers of the Trust. Each Trustee oversees each of the 26 series of the Trust and also serves as:
| | • | | Director of Thrivent Series Fund, Inc., a registered investment company consisting of 33 portfolios that serve as underlying funds for variable contracts issued by Thrivent Financial for Lutherans (“Thrivent Financial”) and Thrivent Life Insurance Company and investment options in the retirement plan offered by Thrivent Financial, and |
| | • | | Trustee of Thrivent Cash Management Trust, a registered investment company consisting of one portfolio that serves as a cash collateral fund for the securities lending program sponsored by Thrivent Financial. |
The 26 series of the Trust, the 33 portfolios of Thrivent Series Fund, Inc. and Thrivent Cash Management Trust are referred to herein as the “Fund Complex.” The Statement of Additional Information includes additional information about the Trustees and is available, without charge, by calling 1-800-847-4836.
Interested Trustee (1)(2)(3)(4)
| | |
Name (Year of Birth) Year Elected | | Principal Occupation(s) and Directorships of Public Companies and Other Investment Companies During the Past Five Years |
Russell W. Swansen (1957) 2008 | | Senior Vice President and Chief Investment Officer, Thrivent Financial since 2003. |
Independent Trustees (2)(3)(4)(5)
| | |
Name (Year of Birth) Year Elected | | Principal Occupation(s) and Directorships of Public Companies and Other Investment Companies During the
Past Five Years |
| |
Janice B. Case (1952) 2011 | | Independent Trustee of North American Electric Reliability Corporation (self-regulatory organization) since 2008. |
| |
Richard L. Gady (1943) 1987 | | Retired. |
| |
Richard A. Hauser (1943) 2004 | | Vice President and Assistant General Counsel, The Boeing Company since 2007. |
| |
Marc S. Joseph (1960) 2011 | | Managing Director of Granite Ridge LLP (consulting and advisory firm) since 2009; Managing Director of Triangle Crest (private investing and consulting firm) since 2004. |
| |
Paul R. Laubscher (1956) 2009 | | Portfolio Manager for U.S. private real estate portfolios of IBM Retirement Funds. |
| |
James A. Nussle (1960) 2011 | | President and Chief Executive Officer of Credit Union National Association since September 2014; President and Chief Operating Officer of Growth Energy (trade association) from 2010 through August 2014; Advisory Board member of AVISTA Capital Partners (private equity firm) since 2010; Contributor on CNBC (media) since 2010; CEO of The Nussle Group LLC (consulting firm) since 2009. |
| |
Douglas D. Sims (1946) 2006 | | Currently, Director of Keystone Science School. Previously, Director of the Center for Corporate Excellence. |
| |
Constance L. Souders (1950) 2007 | | Retired. |
66
BOARDOF TRUSTEESAND OFFICERS
Executive Officers (4)
| | |
Name (Year of Birth) Position Held With Thrivent | | Principal Occupation(s) During the Past Five Years |
Russell W. Swansen (1957) President | | Senior Vice President and Chief Investment Officer, Thrivent Financial since 2003. |
| |
David S. Royal (1971) Secretary and Chief Legal Officer | | Vice President, Deputy General Counsel since 2006; Interim Investment Company and Investment Adviser Chief Compliance Officer from May 2010 until December 2010. |
| |
Gerard V. Vaillancourt (1967) Treasurer and Principal Accounting Officer | | Vice President, Mutual Fund Accounting since 2006. |
| |
Ted S. Dryden (1965) Chief Compliance Officer | | Investment Company and Investment Adviser Chief Compliance Officer, Thrivent Financial since December 2010; Chief Compliance Officer, OptumHealth Financial Services from 2009 to 2010; Vice President, Asset Management Compliance, Ameriprise Financial from 2006 to 2009. |
| |
Janice M. Guimond (1965) Vice President | | Vice President, Investment Operations, Thrivent Financial since 2004. |
| |
Kathleen M. Koelling (1977) Anti-Money Laundering Officer (6) | | Privacy and Anti-Money Laundering Officer, Thrivent Financial since 2011; Senior Counsel, Thrivent Financial since 2002. |
| |
Mark D. Anema (1961) Vice President | | Vice President, New Product Management and Development, Thrivent Financial since 2007. |
| |
Karen L. Larson (1965) Assistant Vice President | | Vice President, Member and Field Support Services, Thrivent Financial since 2010; Vice President, Thrivent Brokerage Managed Accounts from 2009 to 2010. |
| |
Michael W. Kremenak (1978) Assistant Secretary | | Senior Counsel, Thrivent Financial since January 2013; Vice President and Assistant General Counsel at Nuveen Investments 2011 until 2013; Attorney at FAF Advisors 2009 to 2010; Associate at Skadden, Arps, Slate, Meagher & Flom 2005 to 2009. |
| |
James M. Odland (1955) Assistant Secretary | | Vice President and Managing Counsel, Thrivent Financial since 2005. |
| |
Todd J. Kelly (1969) Assistant Treasurer (6) | | Director, Fund Accounting Operations, Thrivent Financial since 2002. |
| |
Sarah L. Bergstrom (1977) Assistant Treasurer | | Director, Fund Accounting Administration, Thrivent Financial since 2007. |
| (1) | “Interested Trustee” of the Fund as defined in the Investment Company Act of 1940 by virtue of positions with Thrivent Financial. Mr. Swansen is considered an interested trustee because of his principal occupation with Thrivent Financial. |
| (2) | Each Trustee generally serves an indefinite term until her or his successor is duly elected and qualified. Trustees serve at the discretion of the board until their successors are duly appointed and qualified. |
| (3) | Each Trustee oversees 60 portfolios. |
| (4) | The address for each Trustee and Officer unless otherwise noted is 625 Fourth Avenue South, Minneapolis, MN 55415 |
| (5) | The Trustees other than Mr. Swansen are not “interested trustees” of the Fund and are referred to as “Independent Trustees.” |
| (6) | The address for this Officer is 4321 North Ballard Road, Appleton, Wl 54913 |
67
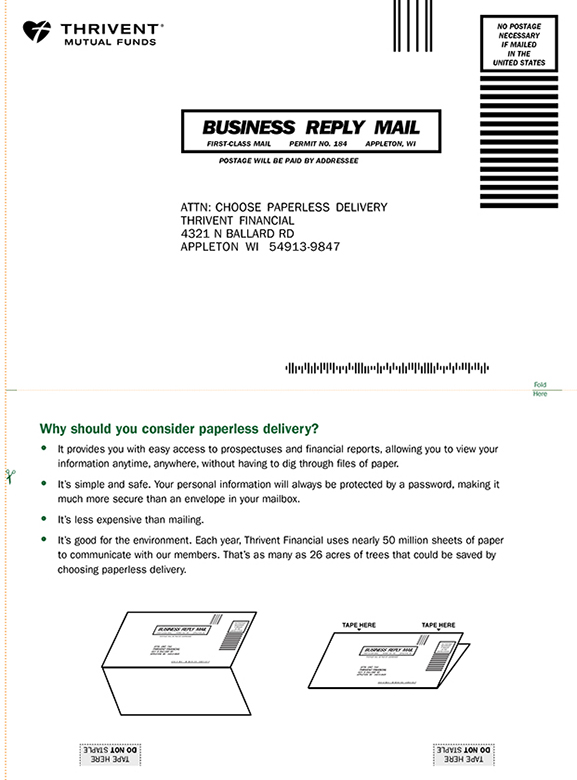

| Item 1. | Report to Stockholders |
As of the end of the period covered by this report, registrant has adopted a code of ethics (as defined in Item 2 of Form N-CSR) applicable to registrant’s Principal Executive Officer, Principal Financial Officer and Principal Accounting Officer. No waivers were granted to such code of ethics during the period covered by this report. A copy of this code of ethics is filed as an exhibit to this Form N-CSR.
| Item 3. | Audit Committee Financial Expert |
Registrant’s Board of Trustees has determined that Constance L. Souders, an independent trustee, is the Audit Committee Financial Expert.
| Item 4. | Principal Accountant Fees and Services |
(a) through (d)
Thrivent Natural Resources Fund, Thrivent Growth and Income Plus Fund, and Thrivent Diversified Income Plus Fund (each a “Fund” and collectively, the “Funds”) are each a series of Thrivent Mutual Funds, a Massachusetts business trust (the “Trust”). The Trust, as of the date of filing this Form N-CSR, contains a total of 26 series (the “Series”), including the Funds. This Form N-CSR relates to the annual report of each Fund.
The following table presents the aggregate fees billed to the Funds for the respective fiscal years ended December 31, 2014 and December 31, 2013 by the Funds’ independent public accountants, PricewaterhouseCoopers LLP (“PwC”), for professional services rendered for the audit of the Funds’ annual financial statements and fees billed for other services rendered by PwC during those periods.
| | | | | | | | |
Fiscal Years Ended | | 12/31/13 | | | 12/31/14 | |
Audit Fees | | $ | 29,185 | | | $ | 40,489 | |
Audit-Related Fees(1) | | $ | 297 | | | $ | 0 | |
Tax Fees(2) | | $ | 23,995 | | | $ | 17,174 | |
All Other Fees(3) | | $ | 0 | | | $ | 0 | |
| | | | | | | | |
Total | | $ | 53,477 | | | $ | 57,663 | |
| | | | | | | | |
(1) Audit-related fees consist of the aggregate fees billed for assurance and related services that are reasonably related to the performance of the audit of financial statements and are not reported under the category of audit fees.
(2) Tax fees consist of the aggregate fees billed for professional services rendered by the principal accountant relating to tax compliance, tax advice, and tax planning and specifically include fees for tax return preparation.
(3) All other fees consist of the aggregate fees billed for products and services provided by the principal accountant other than audit, audit-related, and tax services.
The following table presents the aggregate fees billed to all Series of the Trust (other than the Funds) with fiscal years ending on October 31 for the fiscal years ended October 31, 2013 and October 31, 2014 by PwC for professional services rendered for the audit of the annual financial statements of the applicable Series and fees billed for other services rendered by PwC during those periods.
| | | | | | | | |
Fiscal Years Ended | | 10/31/13 | | | 10/31/14 | |
Audit Fees | | $ | 357,151 | | | $ | 371,291 | |
Audit-Related Fees(1) | | $ | 3,621 | | | $ | 0 | |
Tax Fees(2) | | $ | 113,967 | | | $ | 119,953 | |
All Other Fees(3) | | $ | 0 | | | $ | 0 | |
| | | | | | | | |
Total | | $ | 474,739 | | | $ | 491,244 | |
| | | | | | | | |
(1) Audit-related fees consist of the aggregate fees billed for assurance and related services that are reasonably related to the performance of the audit of financial statements and are not reported under the category of audit fees.
(2) Tax fees consist of the aggregate fees billed for professional services rendered by the principal accountant relating to tax compliance, tax advice, and tax planning and specifically include fees for tax return preparation.
(3) All other fees consist of the aggregate fees billed for products and services provided by the principal accountant other than audit, audit-related, and tax services.
| | (e) | Registrant’s audit committee charter, adopted in February 2010, provides that the audit committee (comprised of the independent Trustees of registrant) is responsible for pre-approval of all auditing services performed for the registrant. The audit committee also is responsible for pre-approval (subject to the de minimis exceptions for non-audit services described in Section 10A(i)(1)(B) of the Securities Exchange Act of 1934) of all non-auditing services performed for the registrant or an affiliate of registrant. In addition, registrant’s audit committee charter permits a designated member of the audit committee to pre-approve, between meetings, one or more audit or non-audit service projects, subject to an expense limit and notification to the audit committee at the next committee meeting. Registrant’s audit committee pre-approved all fees described above that PwC billed to registrant. |
| | (f) | Less than 50% of the hours billed by PwC for auditing services to registrant for the fiscal year ended December 31, 2014 was for work performed by persons other than full-time permanent employees of PwC. |
| | (g) | The aggregate non-audit fees billed by PwC to registrant and to registrant’s investment adviser and any entity controlling, controlled by, or under common control with registrant’s investment adviser for the fiscal years set forth below are disclosed in the table below. The disclosed payments were for access to a PwC-sponsored online library that provides interpretive guidance regarding U.S. and foreign accounting standards. |
| | | | | | | | | | | | | | | | |
Fiscal Year Ended | | 10/31/13 | | | 12/31/13 | | | 10/31/14 | | | 12/31/14 | |
| Registrant(1) | | $ | 0 | | | $ | 0 | | | $ | 0 | | | $ | 0 | |
| Adviser | | $ | 1,800 | | | $ | 1,800 | | | $ | 3,600 | | | $ | 3,600 | |
| | (h) | Registrant’s audit committee has considered the non-audit services provided to the registrant and registrant’s investment adviser and any entity controlling, controlled by, or under common control with registrant’s investment adviser as described above and determined that these services do not compromise PwC’s independence. |
| Item 5. | Audit Committee of Listed Registrants |
Not applicable.
| Item 6. | Schedule of Investments |
(a) Registrant’s Schedule of Investments is included in the report to shareholders filed under Item 1.
(b) Not applicable to this filing.
| Item 7. | Disclosure of Proxy Voting Policies and Procedures for Closed-End Management Investment Companies |
Not applicable.
| Item 8. | Portfolio Managers of Closed-End Management Investment Companies |
Not applicable.
| Item 9. | Purchases of Equity Securities by Closed-End Management Investment Company and Affiliated Purchasers. |
Not applicable.
| Item 10. | Submission of Matters to a Vote of Security Holders |
There have been no material changes to the procedures by which shareholders may recommend nominees to registrant’s board of trustees.
| Item 11. | Controls and Procedures |
(a)(i) Registrant’s President and Treasurer have concluded that registrant’s disclosure controls and procedures (as defined in Rule 30a-3(c) under the Investment Company Act of 1940) are effective, based on their evaluation of these controls and procedures as of a date within 90 days of the filing date of this report.
(a)(ii) Registrant’s President and Treasurer are aware of no change in registrant’s internal control over financial reporting (as defined in Rule 30a-3(d) under the Investment Company Act of 1940) that occurred during registrant’s most recent fiscal quarter that has materially affected, or is reasonably likely to materially affect, registrant’s internal control over financial reporting.
(a) The code of ethics pursuant to Item 2 is attached hereto.
(b) Certifications pursuant to Rules 30a-2(a) and 30a-2(b) under the Investment Company Act of 1940 are attached hereto.
SIGNATURES
Pursuant to the requirements of the Securities Exchange Act of 1934 and the Investment Company Act of 1940, the registrant has duly caused this report to be signed on its behalf by the undersigned, thereunto duly authorized.
| | | | |
| Date: February 26, 2015 | | THRIVENT MUTUAL FUNDS |
| | | | |
| | |
| | By: | | |
| | | | /s/ David S. Royal |
| | | | David S. Royal |
| | | | President |
Pursuant to the requirements of the Securities Exchange Act of 1934 and the Investment Company Act of 1940, this report has been signed below by the following persons on behalf of the registrant and in the capacities and on the dates indicated.
| | | | |
| Date: February 26, 2015 | | By: | | |
| | | | | /s/ David S. Royal |
| | | | David S. Royal |
| | | | President |
| | | | |
| Date: February 26, 2015 | | By: | | |
| | | | | /s/ Gerard V. Vaillancourt |
| | | | Gerard V. Vaillancourt |
| | | | Treasurer |