UNITED STATES
SECURITIES AND EXCHANGE COMMISSION
Washington, D.C. 20549
FORM N-CSR
CERTIFIED SHAREHOLDER REPORT OF REGISTERED
MANAGEMENT INVESTMENT COMPANIES
Investment Company Act file number: 811-05075
Thrivent Mutual Funds
(Exact name of registrant as specified in charter)
625 Fourth Avenue South
Minneapolis, Minnesota 55415
(Address of principal executive offices) (Zip code)
Michael W. Kremenak
625 Fourth Avenue South
Minneapolis, Minnesota 55415
(Name and address of agent for service)
Registrant’s telephone number, including area code: (612) 844-4198
Date of fiscal year end: October 31
Date of reporting period: October 31, 2014
| Item 1. | Report to Stockholders |

TABLEOF CONTENTS
1
Dear Shareholder:
Financial markets turned in a strong performance during the fiscal year ending October 31, 2014, as the tepid U.S. economic recovery showed signs of accelerating.
Economic Review
The U.S. economy began the reporting period on an upswing, with gross domestic product (GDP)—the sum of all goods and services produced—expanding at an average annual rate of 4.0% during the final two quarters of 2013, according to the Bureau of Economic Analysis (BEA). That marked the first time the economy grew that fast over two quarters since the last half of 2003. It also was double the average rate of growth during the prior 17 quarters, dating back to the start of the recovery in the third quarter of 2009.
Momentum stalled briefly in the first quarter of 2014 when severe cold weather crippled commerce across much of the country, causing GDP to contract at a 2.1% annual rate. But activity surged again during the second and third quarters amid renewed strength in the housing sector, increased government and consumer spending, rising exports and a buildup of inventories by businesses. GDP grew at an average annual rate of 4.1% for the two-quarter period.
The improving economic climate translated into improvements in the job market, where more than 2.1 million nonfarm jobs were created in the last nine months of the reporting period—the biggest nine-month gain in at least a decade. By May, this increase had pushed the number of nonfarm jobs in the U.S. above prerecession levels. The unemployment rate fell sharply during the fiscal year as well, to 5.8% from 7.2% a year earlier.
Conditions in Europe and China, which are important to the U.S. economy, were mixed. In the Euro Area, the economy grew only about 0.2%. China’s economy grew about 7.5%, which looks impressive relative to what most other major countries are doing, but its economic output has been trending lower since early 2010.
Market Review
Continued economic growth along with low interest rates, rising consumer confidence and improving corporate profits translated into strong performances by both the stock and bond markets.
The Standard & Poor’s 500 Index of large-company stocks posted a total return of 17.3%, its third consecutive year of double-digit gains. The index hit a series of record highs over the course of the fiscal year, closing above 2,000 for the first time in August. Small-company stocks posted smaller but still healthy gains—the Russell 2000® Index earned 8.1%—after Federal Reserve Chair Janet Yellen cautioned in July that valuations in that sector appeared stretched.
The lackluster economic climate outside the U.S. led to lackluster returns in international stock markets. The MSCI EAFE Index, which tracks developed markets in Europe, Australasia and the Far East, lost 0.6%. Roiled by Russia’s incursion into Ukraine and concerns about slower growth in China, emerging markets fared only slightly better, with the MSCI Emerging Markets Index earning 1.0%.
Trading in bond markets was dominated by speculation about U.S. monetary policy and its likely impact on interest rates. During the first 10 months of 2014, the Federal Reserve wound down its quantitative easing program in which it had been buying $85 billion of bonds each month to help keep long-term interest rates low. Many analysts assumed that move, paired with an improving economic picture, would depress bond prices and drive interest rates higher. But the economy’s first-quarter stumble, coupled with the Fed’s pledge to keep short-term rates low well past the end of its bond-buying program, allowed interest rates to fall instead. By the close of the reporting period, the yield on the 10-year Treasury bond had tumbled to 2.4%, down from just over 3.0% at the end of 2013. That helped propel the broad Barclays U.S. Aggregate Bond Index to a total return of 4.14% for the reporting period. Municipal bonds did even better amid a tight supply of new issues, with the Barclays Municipal Bond Index posting a total return of 7.8%.
Our Outlook
The outlook for the U.S. economy and its financial markets remains generally favorable. The Conference Board’s Leading Economic Index for the U.S. rose 0.8% in September, and strength among its component sectors was widespread. Meanwhile, the Conference Board Consumer Confidence Index jumped to 94.5 in October, its highest level in seven years. That is favorable for future growth, since personal consumption is by far the largest driver of GDP.
Near-term, we anticipate that the U.S. economy will grow in the 2% to 3% range. We expect similar results in the U.K., but growth of only about 1.0% for the Euro Area. We have tempered our expectations for China, but still anticipate that its economy will be able to grow at about a 6% rate.
The creation of nearly 10 million new jobs since the beginning of 2010 has not translated thus far into meaningfully higher wages, but that could change. Weekly initial unemployment claims have been running at levels comparable on average to the lows of the last cycle in 2006, and the average workweek has held steady at about 34.5 hours for three years. If the economy continues to improve, these trends suggest that employers may be inclined to hire more workers rather than assign additional hours to existing workers. That ultimately could lead to higher wages, increased consumer confidence, increased consumer spending and increased economic activity—all of which are usually positive for the stock market.
Against this backdrop, several issues bear monitoring:
Corporate profits and stock valuations: Stocks in the S&P 500 were trading on average at about 19 times their per-share earnings at the end of the fiscal year. That is not extraordinary, but it is near the high end of their normal range. To justify still higher stock prices, corporate profits
2
will have to continue growing. They have been trending upward during the recovery, but much of the improvement has been attributable to cost-cutting, a lever with finite limits. At some point, companies will need to find ways to grow revenues at a more robust clip. The recent slump in energy and commodities prices could serve as a tailwind for consumer-driven companies but act as a headwind for energy and materials companies.
U.S. economic growth: U.S. GDP was estimated to have grown at a 3.5% annual rate in the third quarter of 2014, according to the BEA’s initial or “advance” estimate, following a gain of 4.6% in the second quarter. However, two key sectors of the economy were notably weaker than the latest headline number: personal consumption, which grew just 1.8%, and domestic investment, up only 1%. Those figures will need to improve in the year ahead if the economy is going to maintain the momentum it seemed to be establishing in fiscal 2014.
International economic conditions: The U.S. economy has thus far been relatively immune to the slowing growth trends in Europe and China, but should those regions worsen significantly it is unlikely that the U.S. could escape unscathed. Meanwhile, any loosening of monetary policy in Europe, combined with relatively low interest rates there, would likely keep upward pressure on an already strong dollar. That could further diminish the value of profits U.S. companies earn overseas when those profits are translated back to dollars.
Monetary policy and inflation: Financial markets have been bolstered in recent years by the Federal Reserve’s extraordinarily expansive monetary policy, which has swollen the Fed’s balance sheet to about four times the size it would be under normal circumstances. As the economy continues to improve, the Fed eventually will look to unwind its position. Because its stimulus programs have been so much larger than anything tried before, we cannot know with certainty how this will play out. One danger is that if loan demand rises and banks act to meet it, the excess reserves now on the Fed’s balance sheet could flow too quickly back into the banking system and ignite inflation, which has been modest throughout the recovery.
Our near-term expectation is that the U.S. will continue to grow at a relatively moderate pace, that inflation will remain at reasonable levels and that corporate profits will continue to grow, but at a more modest pace. While this should provide a good foundation for U.S. financial markets, it would be unusual to see a fourth consecutive year of double-digit gains for the S&P 500, a feat the index has managed on a calendar-year basis only four other times since 1926, including two overlapping periods between 1995 and 1999.
In the U.S., we continue to prefer the risk/reward outlook for stocks, particularly large-company stocks, over bonds. The prospect for stock gains overseas is less clear, but for long-term risk-tolerant portfolios we see attractive opportunities in Europe.
If you are uncertain about how your portfolio is positioned to weather the months ahead, we encourage you to meet with your Thrivent Financial representative. He or she can help you keep your portfolio aligned with your financial goals and tolerance for risk.
As always, thank you for the trust you have placed in our entire team of professionals at Thrivent Asset Management.
Sincerely,

Russell W. Swansen
President
Thrivent Mutual Funds
3
THRIVENT AGGRESSIVE ALLOCATION FUND
Russell W. Swansen, David C. Francis, CFA and Mark L. Simenstad, CFA, Portfolio Co-Managers
The Fund seeks long-term capital growth.
The Fund invests in other Thrivent mutual funds and in directly held equity and debt instruments. The Fund is subject to its own operating expenses and the operating expenses of the other funds in which it invests, and is subject to all of the risks of the other funds in which it invests. The value of the Fund is influenced by factors impacting the overall market, certain asset classes, certain investment styles, and specific issuers. The Fund may incur losses due to incorrect assessments of investments by its investment adviser. Foreign investments involve additional risks, including currency fluctuations, liquidity, political, economic and market instability, and different legal and accounting standards. Bond prices generally fall as interest rates rise. Credit risk is the risk that an issuer of a debt security may not pay its debt, and high yield securities are subject to increased credit risk as well as liquidity risk. The use of equity index futures involves transaction costs and the loss from investing in them can exceed the initial investment.
How did the Fund perform during the 12-month period ended October 31, 2014?
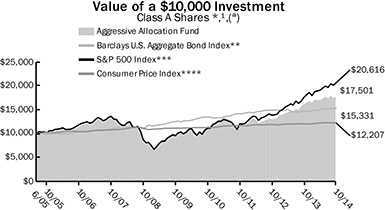
Thrivent Aggressive Allocation Fund earned a return of 9.34%, compared with the median return of its peer group, the Lipper Mixed-Asset Target Allocation Aggressive Growth Funds category, of 8.80%. The Fund’s market benchmarks, the S&P 500 Index and the Barclays U.S. Aggregate Bond Index, earned returns of 17.27% and 4.14%, respectively.
What factors affected the Fund’s performance?
The Fund’s fixed-income and equity allocations are dominant performance factors versus the respective public indexes in any given period. Over this past year, the Fund’s allocations to fixed income averaged approximately 8% while equity allocations, both domestic and non-U.S., averaged 92%. Allocations within sectors and market segments in the U.S. equity portion of the Fund had a positive impact on returns, as did our positioning of fixed-income assets. However, exposure to markets outside the U.S. limited the Fund’s returns as non-U.S. equity markets generally did not keep pace with strong U.S. returns on a dollar basis. In fixed income, our tactical positioning for a below-benchmark duration offset some of the gains in other positions as interest rates in the U.S. generally declined over the period.
In the U.S. equity portfolio, our tactical decision to overweight large-capitalization stocks and underweight mid and small caps favorably impacted returns. In the second half of the period, investors’ attitudes toward risk shifted dramatically and small-cap stocks in particular began to meaningfully underperform large-cap indexes. Our small-cap stock allocation performed well versus its benchmark, but that benchmark lagged large-cap indexes by a meaningful margin.
Large-cap growth outperformed other major domestic benchmarks for the period, and our allocation performed well within its peer group of large-cap growth managers. In large-cap value, however, we did not keep pace and thus offset those results. In mid and small cap, results were mixed, with mid-cap stock, small-cap stock and mid-cap value performing well, but mid-cap growth, small-cap growth and small-cap value trailing their respective benchmarks.
Our international exposure limited returns as non-U.S. developed markets did not advance as strongly as U.S. large-cap indexes. This distinction was exacerbated in places like Europe by the weakness of the euro versus the dollar. Japanese equities did advance in line with large-cap U.S. stocks, but that advance was offset by a sharp decline in the yen relative to the dollar. We also had allocations within our international segment to emerging market debt and equities that did not keep pace.
In fixed income, we had a tactical allocation to shorter durations, which limited our advance as interest rates generally declined over the period. We were overweighted in credit relative to the fixed-income benchmark and that aided results against all but the longest-maturity Treasury bonds. We also had positioned the fixed-income segment to benefit from a flattening of the yield curve, which happens when shorter-term interest rates rise while longer-term rates decline. Yield curve flattening did, in fact, take place over the period, so our positioning aided results. We also continued to benefit from our unique positioning in select mortgage-backed securities since they outperformed.
What is your outlook?
We believe the most likely outcome for the next fiscal year is continued growth that will be below trend versus history. Interest rates, particularly for developed market sovereign debt, are being artificially depressed by the actions of central banks in order to stimulate faster growth and avoid deflation. Should that strategy prove successful, then interest rates must inevitably rise. While it does not necessarily derail an advance in stock prices, it will likely cause the contour of that advance to be more in line with earnings growth and less with the expansion of valuation metrics.
While fiscal and monetary policies across the globe were in alignment during most of the recovery from the financial crisis, going forward, we expect more regional variations as different economies will require more customized approaches. Energy prices have declined significantly, which is generally positive for global growth because the beneficiaries of lower energy prices far outnumber those that are negatively impacted. That being said, many of the countries that would be negatively affected are also characterized by less stable regimes, increasing the risk of geopolitical consequences. While risk assets are still favored, an overly aggressive posture is not warranted.
Quoted Fund performance is for Class A shares and does not reflect a sales charge.
The returns shown do not reflect taxes a shareholder would pay on distributions or redemptions.
4
| | | | |
| Portfolio Composition | | | | |
| (% of Portfolio) | | | | |
Large Cap | | | 51.9 | % |
International | | | 19.2 | % |
Small Cap | | | 12.9 | % |
Short-Term Investments | | | 9.0 | % |
Mid Cap | | | 3.9 | % |
Natural Resources | | | 1.7 | % |
Investment Grade Debt | | | 0.9 | % |
High Yield | | | 0.5 | % |
| | | | |
Total | | | 100.0 | % |
Top 10 Holdings | | | | |
| (% of Net Assets) | | | | |
Thrivent Partner Worldwide Allocation Fund | | | 13.3 | % |
Thrivent Large Cap Growth Fund | | | 7.3 | % |
Thrivent Large Cap Value Fund | | | 6.1 | % |
Thrivent Mid Cap Stock Fund | | | 5.9 | % |
Thrivent Mid Cap Growth Fund | | | 4.9 | % |
Thrivent Partner Mid Cap Value Fund | | | 3.5 | % |
Thrivent Large Cap Stock Fund | | | 3.4 | % |
Thrivent Small Cap Stock Fund | | | 2.9 | % |
Thrivent Partner Small Cap Value Fund | | | 1.9 | % |
Thrivent Natural Resources Fund | | | 1.8 | % |
These securities represent 51.0% of the total net assets of the Fund. | | | | |
Portfolio Composition illustrates market exposure of all asset classes, including derivatives.
The list of Top 10 Holdings excludes short-term investments.
Quoted Portfolio Composition and Top 10 Holdings are subject to change.
| | | | | | | | | | | | |
Average Annual Total Returns1 | |
As of October 31, 2014 | |
Class A2 | | | 1-Year | | | | 5 Years | | |
| From
Inception
6/30/2005 |
|
| | |
without sales charge | | | 9.34 | % | | | 12.67 | % | | | 6.82 | % |
with sales charge | | | 3.35 | % | | | 11.40 | % | | | 6.18 | % |
| | | |
Institutional Class3 | | | 1-Year | | | | 5 Years | | |
| From
Inception
6/30/2005 |
|
| | |
Net Asset Value | | | 9.73 | % | | | 13.09 | % | | | 7.22 | % |
1 | Past performance is not an indication of future results. Average annual total returns represent past performance and reflect changes in share prices, the reinvestment of all dividends and capital gains, and the effects of compounding. The prospectus contains more complete information on the investment objectives, risks, charges and expenses of the investment company, which investors should read and consider carefully before investing. To obtain a prospectus, contact a registered representative or visit www.thrivent.com. At various times, the Fund’s adviser waived its management fee and/or reimbursed Fund expenses. Had the adviser not done so, the Fund’s total returns would have been lower. The returns shown do not reflect taxes a shareholder would pay on distributions or redemptions. Total investment return and principal value of your investment will fluctuate, and your shares, when redeemed, may be worth more or less than their original cost. Current performance may be higher or lower than the performance data quoted. Call 800-THRIVENT or visit www.thrivent.com for performance results current to the most recent month-end. |
2 | Class A performance with sales charge reflects the maximum sales charge of 5.5%. |
3 | Institutional Class shares have no sales load and are available to institutional shareholders and certain Thrivent sponsored programs. |
(a) | Performance of other classes will be greater or less than the line shown based on the differences in loads and fees paid by shareholders investing in the different classes. |
* | As you compare performance, please note that the Fund’s performance reflects the maximum 5.5% sales charge, while the Consumer Price Index, the S&P 500 Index and the Barclays U.S. Aggregate Bond Index do not reflect any such charges. If you were to purchase any of the above individual securities represented in those Indexes, any charges you would pay would reduce your total return as well. |
** | The Barclays U.S. Aggregate Bond Index is an index that measures the performance of U.S. investment grade bonds. It is not possible to invest directly in the Index. The performance of the Index does not reflect deductions for fees, expenses or taxes. |
*** | The S&P 500 Index is an index that represents the average performance of a group of 500 widely held, publicly traded stocks. “S&P 500®” is a trademark of The McGraw-Hill Companies, Inc. and has been licensed for use by Thrivent Financial for Lutherans. The product is not sponsored, endorsed or promoted by Standard & Poor’s and Standard & Poor’s makes no representation regarding the advisability of investing in the product. It is not possible to invest directly in the Index. The performance of the Index does not reflect deductions for fees, expenses or taxes. |
**** | The Consumer Price Index is an inflationary indicator that measures the change in the cost of a fixed basket of products and services, including housing, electricity, food and transportation. It is not possible to invest directly in the Index. |
5
THRIVENT MODERATELY AGGRESSIVE ALLOCATION FUND
Russell W. Swansen, David C. Francis, CFA and Mark L. Simenstad, CFA, Portfolio Co-Managers
The Fund seeks long-term capital growth.
The Fund invests in other Thrivent mutual funds and in directly held equity and debt instruments. The Fund is subject to its own operating expenses and the operating expenses of the other funds in which it invests, and is subject to all of the risks of the other funds in which it invests. The value of the Fund is influenced by factors impacting the overall market, certain asset classes, certain investment styles, and specific issuers. The Fund may incur losses due to incorrect assessments of investments by its investment adviser. Foreign investments involve additional risks, including currency fluctuations, liquidity, political, economic and market instability, and different legal and accounting standards. Bond prices generally fall as interest rates rise. Credit risk is the risk that an issuer of a debt security may not pay its debt, and high yield securities are subject to increased credit risk as well as liquidity risk. The use of equity index futures involves transaction costs and the loss from investing in them can exceed the initial investment.
How did the Fund perform during the 12-month period ended October 31, 2014?
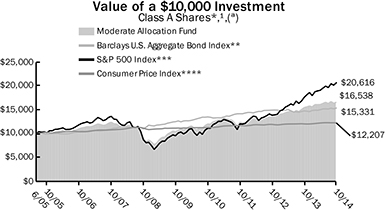
Thrivent Moderately Aggressive Allocation Fund earned a return of 8.29%, compared with the median return of its peer group, the Lipper Mixed-Asset Target Allocation Growth Funds category, of 8.65%. The Fund’s market benchmarks, the S&P 500 Index and the Barclays U.S. Aggregate Bond Index, earned returns of 17.27% and 4.14%, respectively.
What factors affected the Fund’s performance?
The Fund’s fixed-income and equity allocations are dominant performance factors versus the respective public indexes in any given period. Over this past year, the Fund’s allocations to fixed income averaged approximately 24% while equity allocations, both domestic and non-U.S., averaged 76%. Allocations within sectors and market segments in the U.S. equity portion of the Fund had a positive impact on returns, as did our positioning of fixed-income assets. However, exposure to markets outside the U.S. limited the Fund’s returns since non-U.S. equity markets generally did not keep pace with strong U.S. returns on a dollar basis. In fixed income, our tactical positioning for a below-benchmark duration offset some of the gains in other positions as interest rates in the U.S. generally declined over the period.
In the U.S. equity portfolio, our tactical decision to overweight large-capitalization stocks and underweight mid and small caps favorably impacted returns. In the second half of the period, investors’ attitudes toward risk shifted dramatically and small-cap stocks in particular began to meaningfully underperform large-cap indexes. Our small-cap stock allocation performed well versus its benchmark, but that benchmark lagged large-cap indexes by a meaningful margin.
Large-cap growth outperformed other major domestic benchmarks for the period, and our allocation performed well within its peer group of large-cap growth managers. In large-cap value, however, we did not keep pace and thus offset those results. In mid and small cap, results were mixed, with mid-cap stock, small-cap stock and mid-cap value performing well, but mid-cap growth, small-cap growth and small-cap value trailing their respective benchmarks.
Our international exposure limited returns as non-U.S. developed markets did not advance as strongly as U.S. large-cap indexes. This distinction was exacerbated in places like Europe by the weakness of the euro versus the dollar. Japanese equities did advance in line with large-cap U.S. stocks, but that advance was offset by a sharp decline in the yen relative to the dollar. We also had allocations within our international segment to emerging market debt and equities that did not keep pace.
In fixed income, we had a tactical allocation to shorter durations, which limited our advance as interest rates generally declined over the period. We were overweighted in credit relative to the fixed-income benchmark and that aided results against all but the longest-maturity Treasury bonds. We also had positioned the fixed-income segment to benefit from a flattening of the yield curve, which happens when shorter-term interest rates rise while longer-term bond rates decline. Yield curve flattening did, in fact, take place over the period, so our positioning aided results. We also continued to benefit from our unique positioning in select mortgage-backed securities since they outperformed.
What is your outlook?
We believe the most likely outcome for the next fiscal year is continued growth that will be below trend versus history. Interest rates, particularly for developed market sovereign debt, are being artificially depressed by the actions of central banks in order to stimulate faster growth and avoid deflation. Should that strategy prove successful, then interest rates must inevitably rise. While it does not necessarily derail an advance in stock prices, it will likely cause the contour of that advance to be more in line with earnings growth and less with the expansion of valuation metrics.
While fiscal and monetary policies across the globe were in alignment during most of the recovery from the financial crisis, going forward we expect more regional variations as different economies will require more customized approaches. Energy prices have declined significantly, which is generally positive for global growth because the beneficiaries of lower energy prices far outnumber those that are negatively impacted. That being said, many of the countries that would be negatively affected are also characterized by less stable regimes, increasing the risk of geopolitical consequences. While risk assets are still favored, an overly aggressive posture is not warranted.
Quoted Fund performance is for Class A shares and does not reflect a sales charge.
The returns shown do not reflect taxes a shareholder would pay on distributions or redemptions.
6
| | | | |
Portfolio Composition | | | | |
(% of Portfolio) | | | | |
Large Cap | | | 42.9 | % |
International | | | 15.3 | % |
Investment Grade Debt | | | 9.5 | % |
Short-Term Investments | | | 8.7 | % |
Small Cap | | | 8.6 | % |
Mid Cap | | | 5.8 | % |
Floating Rate Debt | | | 3.9 | % |
High Yield | | | 3.8 | % |
Natural Resources | | | 1.5 | % |
| | | | |
Total | | | 100.0 | % |
| | | | |
Top 10 Holdings | | | | |
(% of Net Assets) | | | | |
Thrivent Partner Worldwide Allocation Fund | | | 11.0 | % |
Thrivent Large Cap Value Fund | | | 8.6 | % |
Thrivent Large Cap Growth Fund | | | 6.9 | % |
Thrivent Mid Cap Stock Fund | | | 5.5 | % |
Thrivent Large Cap Stock Fund | | | 5.2 | % |
Thrivent Income Fund | | | 3.9 | % |
Thrivent Partner Mid Cap Value Fund | | | 3.1 | % |
Thrivent High Yield Fund | | | 3.1 | % |
Thrivent Mid Cap Growth Fund | | | 2.8 | % |
Thrivent Partner Small Cap Value Fund | | | 1.9 | % |
These securities represent 52.0% of the total net assets of the Fund. | | | | |
Portfolio Composition illustrates market exposure of all asset classes, including derivatives.
The list of Top 10 Holdings excludes short-term investments.
Quoted Portfolio Composition and Top 10 Holdings are subject to change.
| | | | | | |
Average Annual Total Returns1 |
As of October 31, 2014 |
Class A2 | | 1-Year | | 5 Years | | From
Inception
6/30/2005 |
| |
without sales charge | | 8.29% | | 11.32% | | 6.52% |
with sales charge | | 2.31% | | 10.06% | | 5.88% |
| | | |
Institutional Class3 | | 1-Year | | 5 Years | | From
Inception 6/30/2005 |
| |
Net Asset Value | | 8.73% | | 11.72% | | 6.90% |

1 | Past performance is not an indication of future results. Average annual total returns represent past performance and reflect changes in share prices, the reinvestment of all dividends and capital gains, and the effects of compounding. The prospectus contains more complete information on the investment objectives, risks, charges and expenses of the investment company, which investors should read and consider carefully before investing. To obtain a prospectus, contact a registered representative or visit www.thrivent.com. At various times, the Fund’s adviser waived its management fee and/or reimbursed Fund expenses. Had the adviser not done so, the Fund’s total returns would have been lower. The returns shown do not reflect taxes a shareholder would pay on distributions or redemptions. Total investment return and principal value of your investment will fluctuate, and your shares, when redeemed, may be worth more or less than their original cost. Current performance may be higher or lower than the performance data quoted. Call 800-THRIVENT or visit www.thrivent.com for performance results current to the most recent month-end. |
2 | Class A performance with sales charge reflects the maximum sales charge of 5.5%. |
3 | Institutional Class shares have no sales load and are available to institutional shareholders and certain Thrivent sponsored programs. |
(a) | Performance of other classes will be greater or less than the line shown based on the differences in loads and fees paid by shareholders investing in the different classes. |
* | As you compare performance, please note that the Fund’s performance reflects the maximum 5.5% sales charge, while the Consumer Price Index, the S&P 500 Index and the Barclays U.S. Aggregate Bond Index do not reflect any such charges. If you were to purchase any of the above individual securities represented in those Indexes, any charges you would pay would reduce your total return as well. |
** | The Barclays U.S. Aggregate Bond Index is an index that measures the performance of U.S. investment grade bonds. It is not possible to invest directly in the Index. The performance of the Index does not reflect deductions for fees, expenses or taxes. |
*** | The S&P 500 Index is an index that represents the average performance of a group of 500 widely held, publicly traded stocks. “S&P 500®” is a trademark of The McGraw-Hill Companies, Inc. and has been licensed for use by Thrivent Financial for Lutherans. The product is not sponsored, endorsed or promoted by Standard & Poor’s and Standard & Poor’s makes no representation regarding the advisability of investing in the product. It is not possible to invest directly in the Index. The performance of the Index does not reflect deductions for fees, expenses or taxes. |
**** | The Consumer Price Index is an inflationary indicator that measures the change in the cost of a fixed basket of products and services, including housing, electricity, food and transportation. It is not possible to invest directly in the Index. |
7
THRIVENT MODERATE ALLOCATION FUND
Russell W. Swansen, David C. Francis, CFA and Mark L. Simenstad, CFA, Portfolio Co-Managers
The Fund seeks long-term capital growth while providing reasonable stability of principal.
The Fund invests in other Thrivent mutual funds and in directly held equity and debt instruments. The Fund is subject to its own operating expenses and the operating expenses of the other funds in which it invests, and is subject to all of the risks of the other funds in which it invests. The value of the Fund is influenced by factors impacting the overall market, certain asset classes, certain investment styles, and specific issuers. The Fund may incur losses due to incorrect assessments of investments by its investment adviser. Foreign investments involve additional risks, including currency fluctuations, liquidity, political, economic and market instability, and different legal and accounting standards. Bond prices generally fall as interest rates rise. Credit risk is the risk that an issuer of a debt security may not pay its debt, and high yield securities are subject to increased credit risk as well as liquidity risk. The use of equity index futures involves transaction costs and the loss from investing in them can exceed the initial investment.
How did the Fund perform during the 12-month period ended October 31, 2014?
Thrivent Moderate Allocation Fund earned a return of 7.22%, compared with the median return of its peer group, the Lipper Mixed-Asset Target Allocation Moderate Funds category, of 7.05%. The Fund’s market benchmarks, the S&P 500 Index and the Barclays U.S. Aggregate Bond Index, earned returns of 17.27% and 4.14%, respectively.
What factors affected the Fund’s performance?
The Fund’s fixed-income and equity allocations are dominant performance factors versus the respective public indexes in any given period. Over this past year, the Fund’s allocations to fixed income averaged approximately 43% while equity allocations, both domestic and non-U.S., averaged 57%. Allocations within sectors and market segments in the U.S. equity portion of the Fund had a positive impact on returns, as did our positioning of fixed-income assets. However, exposure to markets outside the U.S. limited the Fund’s returns as non-U.S. equity markets generally did not keep pace with strong U.S. returns on a dollar basis. In fixed income, our tactical positioning for a below-benchmark duration offset some of the gains in other positions as interest rates in the U.S. generally declined over the period.
In the U.S. equity portfolio, our tactical decision to overweight large-capitalization stocks and underweight mid and small caps favorably impacted returns. In the second half of the period, investors’ attitudes toward risk shifted dramatically and small-cap stocks in particular began to meaningfully underperform large-cap indexes. Our small-cap stock allocation performed well versus its benchmark, but that benchmark lagged large-cap indexes by a meaningful margin.
Large-cap growth outperformed other major domestic benchmarks for the period, and our allocation performed well within its peer group of large-cap growth managers. In large-cap value, however, we did not keep pace and thus offset those results. In mid and small cap, results were mixed, with mid-cap stock, small-cap stock and mid-cap value performing well, but mid-cap growth, small-cap growth and small-cap value trailing their respective benchmarks.
Our international exposure limited returns as non-U.S. developed markets did not advance as strongly as U.S. large-cap indexes. This distinction was exacerbated in places like Europe by the weakness of the euro versus the dollar. Japanese equities did advance in line with large-cap U.S. stocks, but that advance was offset by a sharp decline in the yen relative to the dollar. We also had allocations within our international segment to emerging market debt and equities that did not keep pace.
In fixed income, we had a tactical allocation to shorter durations, which limited our advance as interest rates generally declined over the period. We were overweighted in credit relative to the fixed-income benchmark and that aided results against all but the longest-maturity Treasury bonds. We also had positioned the fixed-income segment to benefit from a flattening of the yield curve, which happens when shorter-term interest rates rise while longer-term rates decline. Yield curve flattening did, in fact, take place over the period, so our positioning aided results. We also continued to benefit from our unique positioning in select mortgage-backed securities as they outperformed.
What is your outlook?
We believe the most likely outcome for the next fiscal year is continued growth that will be below trend versus history. Interest rates, particularly for developed market sovereign debt, are being artificially depressed by the actions of central banks in order to stimulate faster growth and avoid deflation. Should that strategy prove successful, then interest rates must inevitably rise. While it does not necessarily derail the advance in stock prices, it will likely cause the contour of that advance to be more in line with earnings growth and less with the expansion of valuation metrics.
While fiscal and monetary policies across the globe were in alignment during most of the recovery from the financial crisis, going forward we expect more regional variations as different economies will require more customized approaches. Energy prices have declined significantly, which is generally positive for global growth because the beneficiaries of lower energy prices far outnumber those that are negatively impacted. That being said, many of the countries that would be negatively affected are also characterized by less stable regimes, increasing the risk of geopolitical consequences. While risk assets are still favored, an overly aggressive posture is not warranted.
Quoted Fund performance is for Class A shares and does not reflect a sales charge.
The returns shown do not reflect taxes a shareholder would pay on distributions or redemptions.
8
| | | | |
Portfolio Composition | | | | |
(% of Portfolio) | | | | |
Large Cap | | | 32.8 | % |
Investment Grade Debt | | | 26.3 | % |
International | | | 12.7 | % |
Short-Term Investments | | | 7.7 | % |
Small Cap | | | 7.0 | % |
Floating Rate Debt | | | 6.7 | % |
High Yield | | | 3.7 | % |
Mid Cap | | | 1.7 | % |
Natural Resources | | | 1.4 | % |
| | | | |
Total | | | 100.0 | % |
| | | | |
Top 10 Holdings | | | | |
(% of Net Assets) | | | | |
Thrivent Income Fund | | | 9.7 | % |
Thrivent Partner Worldwide Allocation Fund | | | 8.8 | % |
Thrivent Large Cap Value Fund | | | 7.7 | % |
Thrivent Limited Maturity Bond Fund | | | 6.3 | % |
Thrivent Large Cap Growth Fund | | | 5.7 | % |
Thrivent Mid Cap Stock Fund | | | 3.8 | % |
Thrivent High Yield Fund | | | 2.8 | % |
Thrivent Partner Mid Cap Value Fund | | | 2.2 | % |
Thrivent Large Cap Stock Fund | | | 2.2 | % |
Thrivent Partner Small Cap Value Fund | | | 1.9 | % |
These securities represent 51.1% of the total net assets of the Fund. | | | | |
Portfolio Composition illustrates market exposure of all asset classes, including derivatives.
The list of Top 10 Holdings excludes short-term investments.
Quoted Portfolio Composition and Top 10 Holdings are subject to change.
| | | | | | | | | | | | |
Average Annual Total Returns1 | |
As of October 31, 2014 | |
Class A2 | | | 1-Year | | | | 5 Years | | |
| From
Inception
6/30/2005 |
|
| | |
without sales charge | | | 7.22 | % | | | 9.75 | % | | | 6.17 | % |
with sales charge | | | 1.32 | % | | | 8.51 | % | | | 5.53 | % |
| | | |
Institutional Class3 | | | 1-Year | | | | 5 Years | | |
| From
Inception
6/30/2005 |
|
| | |
Net Asset Value | | | 7.56 | % | | | 10.12 | % | | | 6.52 | % |
1 | Past performance is not an indication of future results. Average annual total returns represent past performance and reflect changes in share prices, the reinvestment of all dividends and capital gains, and the effects of compounding. The prospectus contains more complete information on the investment objectives, risks, charges and expenses of the investment company, which investors should read and consider carefully before investing. To obtain a prospectus, contact a registered representative or visit www.thrivent.com. At various times, the Fund’s adviser waived its management fee and/or reimbursed Fund expenses. Had the adviser not done so, the Fund’s total returns would have been lower. The returns shown do not reflect taxes a shareholder would pay on distributions or redemptions. Total investment return and principal value of your investment will fluctuate, and your shares, when redeemed, may be worth more or less than their original cost. Current performance may be higher or lower than the performance data quoted. Call 800-THRIVENT or visit www.thrivent.com for performance results current to the most recent month-end. |
2 | Class A performance with sales charge reflects the maximum sales charge of 5.5%. |
3 | Institutional Class shares have no sales load and are available to institutional shareholders and certain Thrivent sponsored programs. |
(a) | Performance of other classes will be greater or less than the line shown based on the differences in loads and fees paid by shareholders investing in the different classes. |
* | As you compare performance, please note that the Fund’s performance reflects the maximum 5.5% sales charge, while the Consumer Price Index, the S&P 500 Index and the Barclays U.S. Aggregate Bond Index do not reflect any such charges. If you were to purchase any of the above individual securities represented in those Indexes, any charges you would pay would reduce your total return as well. |
** | The Barclays U.S. Aggregate Bond Index is an index that measures the performance of U.S. investment grade bonds. It is not possible to invest directly in the Index. The performance of the Index does not reflect deductions for fees, expenses or taxes. |
*** | The S&P 500 Index is an index that represents the average performance of a group of 500 widely held, publicly traded stocks. “S&P 500®” is a trademark of The McGraw-Hill Companies, Inc. and has been licensed for use by Thrivent Financial for Lutherans. The product is not sponsored, endorsed or promoted by Standard & Poor’s and Standard & Poor’s makes no representation regarding the advisability of investing in the product. It is not possible to invest directly in the Index. The performance of the Index does not reflect deductions for fees, expenses or taxes. |
**** | The Consumer Price Index is an inflationary indicator that measures the change in the cost of a fixed basket of products and services, including housing, electricity, food and transportation. It is not possible to invest directly in the Index. |
9
THRIVENT MODERATELY CONSERVATIVE ALLOCATION FUND
Russell W. Swansen, David C. Francis, CFA and Mark L. Simenstad, CFA, Portfolio Co-Managers
The Fund seeks long-term capital growth while providing reasonable stability of principal.
The Fund invests in other Thrivent mutual funds and in directly held equity and debt instruments. The Fund is subject to its own operating expenses and the operating expenses of the other funds in which it invests, and is subject to all of the risks of the other funds in which it invests. The value of the Fund is influenced by factors impacting the overall market, certain asset classes, certain investment styles, and specific issuers. The Fund may incur losses due to incorrect assessments of investments by its investment adviser. Foreign investments involve additional risks, including currency fluctuations, liquidity, political, economic and market instability, and different legal and accounting standards. Bond prices generally fall as interest rates rise. Credit risk is the risk that an issuer of a debt security may not pay its debt, and high yield securities are subject to increased credit risk as well as liquidity risk. The use of equity index futures involves transaction costs and the loss from investing in them can exceed the initial investment.
How did the Fund perform during the 12-month period ended October 31, 2014?
Thrivent Moderately Conservative Allocation Fund earned a return of 5.86%, compared with the median return of its peer group, the Lipper Mixed-Asset Target Allocation Conservative Funds category, of 5.45%. The Fund’s market benchmarks, the S&P 500 Index and the Barclays U.S. Aggregate Bond Index, earned returns of 17.27% and 4.14%, respectively.
What factors affected the Fund’s performance?
The Fund’s fixed-income and equity allocations are dominant performance factors versus the respective public indexes in any given period. Over this past year, the Fund’s allocations to fixed income averaged approximately 64% while equity allocations, both domestic and non-U.S., averaged 36%. Allocations within sectors and market segments in the U.S. equity portion of the Fund had a positive impact on returns, as did our positioning of fixed-income assets. However, exposure to markets outside the U.S. limited the Fund’s returns as non-U.S. equity markets generally did not keep pace with strong U.S. returns on a dollar basis. In fixed income, our tactical positioning for a below-benchmark duration offset some of the gains in other positions as interest rates in the U.S. generally declined over the period.
In fixed income, we had a tactical allocation to shorter durations, which limited our advance as interest rates generally declined over the period. We were overweighted in credit relative to the benchmark and that aided results against all but the longest-maturity Treasury bonds. We also had positioned the fixed-income segment to benefit from a flattening of the yield curve, which happens when shorter-term interest rates rise while longer-term rates decline. Yield curve flattening did, in fact, take place over the period, so our positioning aided results. We also continued to benefit from our unique positioning in select mortgage-backed securities as they outperformed.
In the U.S. equity portfolio, our tactical decision to overweight large-capitalization stocks and underweight mid and small caps favorably impacted returns. In the second half of the period, investors’ attitudes toward risk shifted dramatically and small-cap stocks in particular began to meaningfully underperform large-cap indexes. Our small-cap stock allocation performed well versus its benchmark, but that benchmark lagged large-cap indexes by a meaningful margin.
Large-cap growth outperformed other major domestic benchmarks for the period and our allocation performed well within its peer group of large-cap growth managers. In large-cap value, however, we did not keep pace and thus offset those results. In mid and small cap, results were mixed, with mid-cap stock, small-cap stock and mid-cap value performing well, but mid-cap growth, small-cap growth and small-cap value trailing their respective benchmarks.
Our international exposure limited returns as non-U.S. developed markets did not advance as strongly as U.S. large-cap indexes. This distinction was exacerbated in places like Europe by the weakness of the euro versus the dollar. Japanese equities did advance in line with large-cap U.S. stocks, but that advance was offset by a sharp decline in the yen relative to the dollar. We also had allocations within our international segment to emerging market debt and equities that did not keep pace.
What is your outlook?
We believe the most likely outcome for the next fiscal year is continued growth that will be below trend versus history. Interest rates, particularly for developed market sovereign debt, are being artificially depressed by the actions of central banks in order to stimulate faster growth and avoid deflation. Should that strategy prove successful, then interest rates must inevitably rise. While it does not necessarily derail an advance in stock prices, it will likely cause the contour of that advance to be more in line with earnings growth and less with the expansion of valuation metrics.
While fiscal and monetary policies across the globe were in alignment during most of the recovery from the financial crisis, going forward we expect more regional variations as different economies will require more customized approaches. Energy prices have declined significantly, which is generally positive for global growth because the beneficiaries of lower energy prices far outnumber those that are negatively impacted. That being said, many of the countries that would be negatively affected are also characterized by less stable regimes, increasing the risk of geopolitical consequences. While risk assets are still favored, an overly aggressive posture is not warranted.
Quoted Fund performance is for Class A shares and does not reflect a sales charge.
The returns shown do not reflect taxes a shareholder would pay on distributions or redemptions.
10
| | | | |
| Portfolio Composition | | | | |
| (% of Portfolio) | | | | |
Investment Grade Debt | | | 36.3 | % |
Large Cap | | | 21.6 | % |
Short-Term Investments | | | 11.6 | % |
Floating Rate Debt | | | 10.5 | % |
International | | | 9.3 | % |
High Yield | | | 5.5 | % |
Small Cap | | | 3.6 | % |
Natural Resources | | | 1.4 | % |
Mid Cap | | | 0.2 | % |
| | | | |
Total | | | 100.0 | % |
| | | | |
| Top 10 Holdings | | | | |
| (% of Net Assets) | | | | |
Thrivent Limited Maturity Bond Fund | | | 10.4 | % |
Thrivent Income Fund | | | 8.2 | % |
Thrivent Partner Worldwide Allocation Fund | | | 6.1 | % |
Thrivent Large Cap Value Fund | | | 6.0 | % |
Thrivent High Yield Fund | | | 3.2 | % |
Thrivent Partner Mid Cap Value Fund | | | 2.8 | % |
Thrivent Large Cap Growth Fund | | | 2.7 | % |
Federal National Mortgage Association Conventional 30-Yr. Pass Through | | | 2.5 | % |
Federal National Mortgage Association Conventional 30-Yr. Pass Through | | | 2.5 | % |
Federal National Mortgage Association Conventional 30-Yr. Pass Through | | | 2.5 | % |
These securities represent 46.9% of the total net assets of the Fund.
Portfolio Composition illustrates market exposure of all asset classes, including derivatives.
The list of Top 10 Holdings excludes short-term investments.
Quoted Portfolio Composition and Top 10 Holdings are subject to change.
| | | | | | | | | | | | |
| Average Annual Total Returns1 | |
| As of October 31, 2014 | |
Class A2 | | 1-Year | | | 5 Years | | | From
Inception
6/30/2005 | |
| |
without sales charge | | | 5.86 | % | | | 7.59 | % | | | 5.41 | % |
with sales charge | | | 0.02 | % | | | 6.38 | % | | | 4.78 | % |
| | | |
Institutional Class3 | | 1-Year | | | 5 Years | | | From
Inception
6/30/2005 | |
| |
Net Asset Value | | | 6.20 | % | | | 7.90 | % | | | 5.72 | % |

1 | Past performance is not an indication of future results. Average annual total returns represent past performance and reflect changes in share prices, the reinvestment of all dividends and capital gains, and the effects of compounding. The prospectus contains more complete information on the investment objectives, risks, charges and expenses of the investment company, which investors should read and consider carefully before investing. To obtain a prospectus, contact a registered representative or visit www.thrivent.com. At various times, the Fund’s adviser waived its management fee and/or reimbursed Fund expenses. Had the adviser not done so, the Fund’s total returns would have been lower. The returns shown do not reflect taxes a shareholder would pay on distributions or redemptions. Total investment return and principal value of your investment will fluctuate, and your shares, when redeemed, may be worth more or less than their original cost. Current performance may be higher or lower than the performance data quoted. Call 800-THRIVENT or visit www.thrivent.com for performance results current to the most recent month-end. |
2 | Class A performance with sales charge reflects the maximum sales charge of 5.5%. |
3 | Institutional Class shares have no sales load and are available to institutional shareholders and certain Thrivent sponsored programs. |
(a) | Performance of other classes will be greater or less than the line shown based on the differences in loads and fees paid by shareholders investing in the different classes. |
* | As you compare performance, please note that the Fund’s performance reflects the maximum 5.5% sales charge, while the Consumer Price Index, the S&P 500 Index and the Barclays U.S. Aggregate Bond Index do not reflect any such charges. If you were to purchase any of the above individual securities represented in those Indexes, any charges you would pay would reduce your total return as well. |
** | The Barclays U.S. Aggregate Bond Index is an index that measures the performance of U.S. investment grade bonds. It is not possible to invest directly in the Index. The performance of the Index does not reflect deductions for fees, expenses or taxes. |
*** | The S&P 500 Index is an index that represents the average performance of a group of 500 widely held, publicly traded stocks. “S&P 500®” is a trade-mark of The McGraw-Hill Companies, Inc. and has been licensed for use by Thrivent Financial for Lutherans. The product is not sponsored, endorsed or promoted by Standard & Poor’s and Standard & Poor’s makes no representation regarding the advisability of investing in the product. It is not possible to invest directly in the Index. The performance of the Index does not reflect deductions for fees, expenses or taxes. |
**** | The Consumer Price Index is an inflationary indicator that measures the change in the cost of a fixed basket of products and services, including housing, electricity, food and transportation. It is not possible to invest directly in the Index. |
11
THRIVENT BALANCED INCOME PLUS FUND
Darren M. Bagwell, CFA, Michael G. Landreville, CFA and CPA (inactive), and Stephen D. Lowe, CFA, Portfolio Co-Managers
The Fund seeks long-term total return through a balance between income and the potential for long-term capital growth.
The Fund invests in equity securities and debt securities. The value of the Fund is influenced by factors impacting the overall market, certain asset classes, certain investment styles, and specific issuers. The Fund may incur losses due to incorrect assessments of investments by its investment adviser. Bond prices generally fall as interest rates rise. Credit risk is the risk that an issuer of a debt security may not pay its debt, and high yield securities are subject to increased credit risk as well as liquidity risk. Leveraged loans, preferred securities, sovereign debt, and mortgage-related and other asset-backed securities are subject to additional risks. Foreign investments involve additional risks, including currency fluctuations, liquidity, political, economic and market instability, and different legal and accounting standards; these risks are magnified for investments in emerging markets.
How did the Fund perform during the 12-month period ended October 31, 2014?
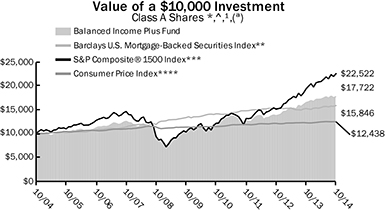
Thrivent Balanced Income Plus Fund earned a return of 7.60%, compared with the median return of its peer group, the Lipper Mixed-Asset Target Allocation Moderate Funds category, of 7.05%. The Fund’s market benchmarks, the S&P Composite® 1500 Index, the Barclays U.S. High Yield Loan Index and the Barclays U.S. Mortgage-Backed Securities Index, earned returns of 16.51%, 3.33% and 4.08%, respectively.
What factors affected the Fund’s performance?
In December of 2013, the Federal Reserve announced plans to gradually taper its quantitative easing program (QE3) by $10 billion per month starting in January 2014. With the U.S. economy averaging mid-2% GDP growth and the job market showing steady improvement, bond markets began pricing in a Fed interest rate tightening cycle commencing in 2015. Not surprisingly, shorter-term rates increased, with five-year Treasuries rising 0.28%. However, the market did not anticipate a fairly substantial decline in longer-term rates as 30-year Treasuries fell by 0.59%. The result was a significant flattening of the Treasury yield curve and outperformance for longer-duration fixed-income assets.
As noted last year, our focus in the Fund’s fixed-income portfolio has shifted to enhancing yield by taking more credit risk. At the same time, we are reducing overall interest rate risk by shortening the average duration to under three years. Our fixed-income portfolio outpaced both Barclays indexes primarily due to strong results from its corporate bond exposure, including positions in floating-rate leveraged bank loans, investment-grade corporate bonds and high-yield bonds. The Fund’s securitized holdings, which were primarily comprised of nonagency collateralized mortgage obligations (CMOs), also proved beneficial as these lower-quality, higher-yielding securities outperformed the broader market. The only detractors in the fixed-income portfolio over this period were a lack of exposure to longer-duration, lower-yielding U.S. Treasuries and an underweighting in emerging market debt versus our peers.
The fiscal year was generally strong for U.S. equities. Bolstered by continued loose monetary policies by the Fed, stock market gains were driven primarily by improving earnings as U.S. companies were able to significantly boost profitability in the face of moderate top-line growth. We continued to focus on driving equity returns through individual security selection, while generally remaining sector neutral versus the S&P Composite 1500 Index. The Fund’s equity portfolio slightly underperformed the benchmark, primarily because of security selection in the information technology and consumer sectors. In technology, security software firm Symantec, cloud-based software networking solutions provider E2open, and programmable chip manufacturer Xilinx all disappointed relative to expectations. Some consumer holdings also struggled as their growth rates slowed and Internet competition increased, including discount retailer Walmart and health-related product provider GNC Holdings. Conversely, stock selection was stronger in the health care sector with holdings such as biopharmaceutical firm Gilead Sciences, medical device and supply company Covidien, and life sciences diagnostics firm Illumina delivering meaningful outperformance.
What is your outlook?
We expect U.S. economic growth to remain positive but muted in the 2% to 3% range and inflation to be well contained. U.S. interest rates are likely to remain range bound as the yield curve continues to flatten. We believe the Fed may begin to raise its benchmark federal funds rate in mid-to-late 2015, but at a very gradual pace.
On the heels of strong performance, we plan to shift the fixed-income portfolio to a slightly more conservative posture. We are reducing exposure to leveraged bank loans as they tend to be somewhat less liquid than corporate bonds or mortgage-backed securities. We will redeploy those assets into investment-grade, high-yield and mortgage-backed securities with an eye toward slightly higher credit quality in the corporate segments. We plan to maintain the fixed-income portfolio’s shorter duration (interest-rate sensitivity) going forward to mitigate the effects of interest-rate volatility. We may add exposure to emerging markets, while avoiding troubled areas such as Argentina and Russia.
We expect the dollar to remain strong, which would be bullish for domestic equities, especially small caps. We do not believe stocks are expensive and there remains room for positive returns in 2015 that are driven by earnings growth. That being said, we believe strong stock selection will become increasingly important at this extended stage of the current bull market cycle. We will likely continue to emphasize more cyclically oriented equities over defensives.
Quoted Fund performance is for Class A shares and does not reflect a sales charge.
The returns shown do not reflect taxes a shareholder would pay on distributions or redemptions.
12
| | | | |
| Portfolio Composition | | | | |
| (% of Portfolio) | | | | |
Common Stock | | | 44.5 | % |
Long-Term Fixed Income | | | 24.9 | % |
Bank Loans | | | 17.5 | % |
Short-Term Investments | | | 11.4 | % |
Preferred Stock | | | 1.7 | % |
Discount Debt Instrument | | | < 0.1 | % |
| | | | |
Total | | | 100.0 | % |
| | | | |
| Major Market Sectors | | | | |
| (% of Net Assets) | | | | |
Financials | | | 18.3 | % |
Consumer Discretionary | | | 11.6 | % |
Information Technology | | | 9.2 | % |
Telecommunications Services | | | 7.9 | % |
Consumer Staples | | | 7.8 | % |
Energy | | | 6.9 | % |
Materials | | | 5.8 | % |
Health Care | | | 5.7 | % |
Mortgage-Backed Securities | | | 5.0 | % |
Industrials | | | 4.9 | % |
| | | | |
| Top 10 Holdings | | | | |
| (% of Net Assets) | | | | |
Apple, Inc. | | | 2.2 | % |
Johnson & Johnson | | | 1.6 | % |
Federal National Mortgage Association Conventional 30-Yr. Pass Through | | | 1.5 | % |
Total SA ADR | | | 1.5 | % |
Pfizer, Inc. | | | 1.5 | % |
Comcast Corporation | | | 1.4 | % |
PepsiCo, Inc. | | | 1.3 | % |
Blackstone Group, LP | | | 1.3 | % |
Union Pacific Corporation | | | 1.3 | % |
Federal National Mortgage Association Conventional 30-Yr. Pass Through | | | 1.2 | % |
These securities represent 14.8% of the total net assets of the Fund.
Quoted Major Market Sectors, Portfolio Composition and Top 10 Holdings are subject to change.
The lists of Major Market Sectors and Top 10 Holdings exclude short-term investments and collateral held for securities loaned.
The Portfolio Composition chart excludes collateral held for securities loaned.
| | | | | | | | | | | | |
| Average Annual Total Returns1 | |
| As of October 31, 2014 | |
Class A2 | | 1-Year | | | 5 Years | | | 10 Years | |
| |
without sales charge | | | 7.60 | % | | | 11.21 | % | | | 6.49 | % |
with sales charge | | | 1.66 | % | | | 9.97 | % | | | 5.89 | % |
| | | |
Institutional Class3 | | 1-Year | | | 5 Years | | | 10 Years | |
| |
Net Asset Value | | | 7.95 | % | | | 11.70 | % | | | 6.99 | % |
1 | Past performance is not an indication of future results. Average annual total returns represent past performance and reflect changes in share prices, the reinvestment of all dividends and capital gains, and the effects of compounding. The prospectus contains more complete information on the investment objectives, risks, charges and expenses of the investment company, which investors should read and consider carefully before investing. To obtain a prospectus, contact a registered representative or visit www.thrivent.com. At various times, the Fund’s adviser waived its management fee and/or reimbursed Fund expenses. Had the adviser not done so, the Fund’s total returns would have been lower. The returns shown do not reflect taxes a shareholder would pay on distributions or redemptions. Total investment return and principal value of your investment will fluctuate, and your shares, when redeemed, may be worth more or less than their original cost. Current performance may be higher or lower than the performance data quoted. Call 800-THRIVENT or visit www.thrivent.com for performance results current to the most recent month-end. |
2 | Class A performance with sales charge reflects the maximum sales charge of 5.5%. |
3 | Institutional Class shares have no sales load and are available to institutional shareholders and certain Thrivent sponsored programs. |
(a) | Performance of other classes will be greater or less than the line shown based on the differences in loads and fees paid by shareholders investing in the different classes. |
* | As you compare performance, please note that the Fund’s performance reflects the maximum 5.5% sales charge, while the benchmark indices do not reflect any such charges. If you were to purchase any of the above individual securities represented in those Indexes, any charges you would pay would reduce your total return as well. |
** | The Barclays U.S. Mortgage-Backed Securities Index (MBS) is formed by grouping the universe of over 600,000 individual fixed-rate U.S. government agency MBS pools into approximately 3,500 generic types of securities. |
*** | The S&P Composite® 1500 Index measures the performance of 1,500 publicly traded stocks. “S&P 1500®” is a trademark of The McGraw-Hill Companies, Inc. and has been licensed for use by Thrivent Financial for Lutherans. The product is not sponsored, endorsed or promoted by Standard & Poor’s and Standard & Poor’s makes no representation regarding the advisability of investing in the product. |
**** | The Consumer Price Index is an inflationary indicator that measures the change in the cost of a fixed basket of products and services, including housing, electricity, food and transportation. |
^ | The Barclays U.S. High Yield Loan Index is a benchmark index that incepted in January 2006. This index is not shown in the chart because it does not have 10 years of history and thus an accurate comparison of a $10,000 investment over 10 years cannot be shown. |
13
THRIVENT OPPORTUNITY INCOME PLUS FUND
Michael G. Landreville, CFA and CPA (inactive), Gregory R. Anderson, CFA, and Conrad E. Smith, CFA, Portfolio Co-Managers
The Fund seeks a high level of current income consistent with capital preservation.
The Fund primarily invests in a broad range of debt securities. The value of the Fund is influenced by factors impacting the overall market, certain asset classes, certain investment styles, and specific issuers. The Fund may incur losses due to incorrect assessments of investments by its investment adviser. Bond prices generally fall as interest rates rise. Credit risk is the risk that an issuer of a debt security may not pay its debt, and high yield securities are subject to increased credit risk as well as liquidity risk. Leveraged loans, sovereign debt, and mortgage-related and other asset-backed securities are subject to additional risks. Foreign investments involve additional risks, including currency fluctuations, liquidity, political, economic and market instability, and different legal and accounting standards; these risks are magnified for investments in emerging markets. The prices of futures contracts can be highly volatile and the loss from investing in them can exceed the initial investment.
How did the Fund perform during the 12-month period ended October 31, 2014?
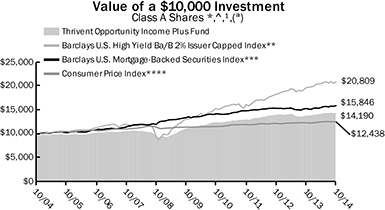
Thrivent Opportunity Income Plus Fund earned a return of 4.13%, compared with the median return of its peer group, the Lipper Multi-Sector Income Funds category, of 4.35%. The Fund’s market benchmarks, the Barclays U.S. High Yield Loan Index, the Barclays U.S. High Yield Ba/B 2% Issuer Cap Index and the Barclays U.S. Mortgage-Backed Securities Index, earned returns of 3.33%, 6.19% and 4.08%, respectively.
What factors affected the Fund’s performance?
In December of 2013, the Federal Reserve (Fed) officially announced plans to begin gradually tapering its quantitative easing program (QE3) by $10 billion per month starting in January 2014. With the U.S. economy averaging mid-2% GDP growth and the job market showing steady improvement, bond markets began pricing in the Fed interest-rate tightening cycle commencing in 2015. Not surprisingly, shorter-term rates increased, for example, as five-year Treasuries rose by 0.28%. However, the market did not anticipate a fairly substantial decline in longer-term rates as 30-year Treasuries fell by 0.59%. The result was a significant flattening of the Treasury yield curve and outperformance for longer-duration fixed-income assets.
As noted last year, the Fund’s focus has shifted to enhancing yield by taking more credit risk. At the same time, we are reducing overall interest-rate risk by shortening the average duration to less than three years. The Fund is now comprised of primarily corporate bonds, with approximately 40% in floating-rate leveraged bank loans, 15% in investment-grade corporate bonds and 15% in high-yield corporate bonds. Approximately 20% of the Fund is invested in securitized assets with the remaining 10% divided between emerging market (EM) debt and alternative securities, such as preferred stock and exchange-traded funds (ETFs).
The Fund modestly underperformed the median return of its Lipper peers due to a lack of exposure to longer-duration U.S. Treasuries, an underweighting in EM debt and an overweighting in leveraged loans. Over the fiscal year period, 30-year Treasuries advanced 15.44% as long-term rates declined. EM bonds made a comeback after the segment’s significant sell off in 2013, gaining 8.24% over the fiscal year, as measured by the Barclays Emerging Markets Index. Also, our large weighting in leveraged loans kept the Fund from fully participating in the interest rate rally of longer-duration securities. While leveraged loans offer attractive coupon income, they have floating interest rates that adjust based on the three-month LIBOR (London Interbank Offered Rate), making their prices less sensitive to rate changes. Underperformance versus the Barclays U.S. High Yield Ba/B 2% Issuer Cap Index was due to the Fund’s shorter overall duration, which averaged around 2.75 years.
The Fund outpaced the Barclays U.S. High Yield Loan Index primarily due to strong results from our investment-grade and high-yield corporate bonds. The investment-grade corporate segment performed well as these securities tend to be more rate sensitive and get a boost when longer-term rates, in particular, go down. The yield spread between investment-grade bonds and Treasuries also narrowed moderately, helping to drive stronger performance for this asset class. High-yield corporates, which typically have shorter maturities, also performed well owing to their higher coupons; however, they modestly trailed investment-grade corporates as spreads remained largely unchanged over the period as a whole. In addition, the Fund’s securitized holdings, which were primarily comprised of nonagency collateralized mortgage obligations (CMOs), proved beneficial as these lower-quality, higher-yielding securities outpaced the broader market.
What is your outlook?
We expect U.S. economic growth to remain positive but muted in the 2% to 3% range and inflation to be well contained. U.S. interest rates are likely to remain range-bound as the yield curve continues to flatten. We believe the Fed may begin to raise its benchmark federal funds rate in mid-to-late 2015, but at a very gradual pace.
On the heels of strong performance, we plan to shift the Fund to a modestly more conservative posture. We are reducing exposure to leveraged bank loans as they tend to be somewhat less liquid than corporate bonds or mortgage-backed securities. We will redeploy those assets into investment-grade, high-yield and mortgage-backed securities with an eye toward slightly higher credit quality in the corporate segments. We plan to maintain the Fund’s shorter duration (interest-rate sensitivity) going forward to mitigate the effects of interest-rate volatility. We may add exposure to emerging markets, while avoiding troubled areas such as Argentina and Russia.
Quoted Fund performance is for Class A shares and does not reflect a sales charge.
The returns shown do not reflect taxes a shareholder would pay on distributions or redemptions.
14
| | | | |
| Major Market Sectors | | | | |
| (% of Net Assets) | | | | |
Communications Services | | | 17.8 | % |
Financials | | | 16.5 | % |
Mortgage-Backed Securities | | | 10.4 | % |
Consumer Cyclical | | | 9.6 | % |
Collateralized Mortgage Obligations | | | 8.1 | % |
Consumer Non-Cyclical | | | 6.8 | % |
Basic Materials | | | 5.4 | % |
Energy | | | 5.0 | % |
Technology | | | 4.0 | % |
Capital Goods | | | 3.7 | % |
| | | | |
| Top 10 Holdings | | | | |
| (% of Net Assets) | | | | |
Federal National Mortgage Association Conventional 30-Yr. Pass Through | | | 2.7 | % |
Federal National Mortgage Association Conventional 30-Yr. Pass Through | | | 2.7 | % |
Federal National Mortgage Association Conventional 30-Yr. Pass Through | | | 2.7 | % |
iShares J.P. Morgan USD Emerging Markets Bond ETF | | | 1.4 | % |
American Airlines, Inc., Term Loan | | | 1.1 | % |
Federal National Mortgage Association Conventional 15-Yr. Pass Through | | | 0.9 | % |
NEP/NCP Holdco, Inc., Term Loan | | | 0.8 | % |
Federal Home Loan Mortgage Corporation Gold 30-Yr. Pass Through | | | 0.7 | % |
Fortescue Metals Group, Ltd., Term Loan | | | 0.7 | % |
NewPage Corporation, Term Loan | | | 0.7 | % |
These securities represent 14.4% of the total net assets of the Fund.
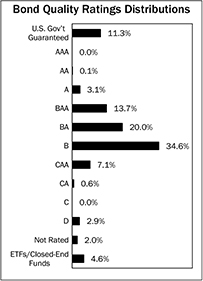
Bond quality ratings are obtained from Moody’s Investors Service, Inc. (“Moody’s”) and Standard & Poor’s Ratings Services (“S&P”). Ratings from S&P, when
used, are converted into their equivalent Moody’s ratings. If Moody’s and S&P have assigned different ratings to a security, the lowest rating for the security is
used. Investments in derivatives and short-term investments are not reflected in the table.
Quoted Major Market Sectors, Bond Quality Ratings Distributions and Top 10 Holdings are subject to change.
The lists of Major Market Sectors and Top 10 Holdings exclude short-term investments and collateral held for securities loaned.
| | | | | | | | | | | | |
| Average Annual Total Returns1 | |
| As of October 31, 2014 | |
Class A2 | | 1-Year | | | 5 Years | | | 10 Years | |
| |
without sales charge | | | 4.13 | % | | | 5.39 | % | | | 4.04 | % |
with sales charge | | | -0.59 | % | | | 4.42 | % | | | 3.56 | % |
| | | |
Institutional Class3 | | 1-Year | | | 5 Years | | | 10 Years | |
| |
Net Asset Value | | | 4.35 | % | | | 5.71 | % | | | 4.39 | % |
1 | Past performance is not an indication of future results. Average annual total returns represent past performance and reflect changes in share prices, the reinvestment of all dividends and capital gains, and the effects of compounding. The prospectus contains more complete information on the investment objectives, risks, charges and expenses of the investment company, which investors should read and consider carefully before investing. To obtain a prospectus, contact a registered representative or visit www.thrivent.com. At various times, the Fund’s adviser waived its management fee and/or reimbursed Fund expenses. Had the adviser not done so, the Fund’s total returns would have been lower. The returns shown do not reflect taxes a shareholder would pay on distributions or redemptions. Total investment return and principal value of your investment will fluctuate, and your shares, when redeemed, may be worth more or less than their original cost. Current performance may be higher or lower than the performance data quoted. Call 800-THRIVENT or visit www.thrivent.com for performance results current to the most recent month-end. |
2 | Class A performance with sales charge reflects the maximum sales charge of 4.5%. |
3 | Institutional Class shares have no sales load and are available to institutional shareholders and certain Thrivent sponsored programs. |
(a) | Performance of other classes will be greater or less than the line shown based on the differences in loads and fees paid by shareholders investing in the different classes. |
* | As you compare performance, please note that the Fund’s performance reflects the maximum 4.5% sales charge, while the benchmark indices do not reflect any such charges, deductions for fees, expenses or taxes. It is not possible to invest directly in the indices shown. If you were to purchase any of the above individual securities represented in those indices, any charges you would pay would reduce your total return as well. |
** | The Barclays U.S. High-Yield Ba/B 2% Issuer Capped Index covers the USD denominated, non-investment grade, Ba or B rated, fixed-rate, taxable corporate bond market. The Index limits issuer exposures to a maximum 2%, redistributing excess market value index-wide on a pro-rata basis. |
*** | The Barclays U.S. Mortgage-Backed Securities Index (MBS) is formed by grouping the universe of over 600,000 individual fixed-rate U.S. government agency MBS pools into approximately 3,500 generic types of securities. |
**** | The Consumer Price Index is an inflationary indicator that measures the change in the cost of a fixed basket of products and services, including housing, electricity, food and transportation. |
^ | The Barclays U.S. High Yield Loan Index is a benchmark index that incepted in January 2006. This index is not shown in the chart because it does not have 10 years of history and thus an accurate comparison of a $10,000 investment over 10 years cannot be shown. |
15
THRIVENT PARTNER EMERGING MARKETS EQUITY FUND

Subadvised by DuPont Capital Management Corporation
The Fund seeks long-term capital growth.
The Fund primarily invests in emerging markets equities. Foreign investments involve additional risks, including currency fluctuations, liquidity, political, economic and market instability, and different legal and accounting standards; these risks are magnified for investments in emerging markets. The value of the Fund is influenced by factors impacting the overall market, certain asset classes, certain investment styles, and specific issuers. The Fund may incur losses due to incorrect assessments of investments by its investment advisers. Small and medium-sized companies often have greater price volatility and less liquidity than larger companies. Large cap companies may be unable to respond quickly to new competitive challenges and may not be able to attain a high growth rate.
How did the Fund perform during the 12-month period ended October 31, 2014?
Thrivent Partner Emerging Markets Equity Fund earned a return of -9.17%, compared with the median return of its peer group, the Lipper Emerging Markets Funds category, of 1.15%. The Fund’s market benchmark, the MSCI Emerging Markets Index, earned a return of 0.98%.
What factors affected the Fund’s performance?
Emerging market equity returns were driven by a combination of economic growth concerns and a continuation of low interest rate policies by global central banks. While economic growth was moderately positive in the U.S., Europe struggled to report consistently positive economic growth, and China showed signs of slowing from its historically high growth rates. However, slower global economic growth expectations were offset by the continuation of low interest rate policies by global central banks, causing share prices for emerging market equities to remain at levels similar to the beginning of the period.
The Fund was overweighted in industries tied to economic growth such as automobile manufacturing, heavy machinery and steel due to the very attractive valuation opportunities we found in these industries. However, this positioning proved detrimental as these industries fell during the period because of economic growth concerns. Conversely, sectors seen as offering growth in the current economic environment, such as health care and technology, outperformed the overall market. The Fund was underweighted in these industries due to the lack of attractive valuation opportunities.
Within the financial sector, the Fund’s positions in strongly capitalized eastern European banks underperformed based on economic growth concerns in developed Europe. We believe these concerns are overstated due to the domestic focus of these institutions coupled with their superior financial strength.
From a country perspective, stock selection in Korea hindered relative performance as the Fund’s Korean holdings were negatively impacted by a combination of slowing economic growth in China and stock-specific events. Also, the Fund’s underweighting in countries that are seen as benefiting from lower interest rates, such as South Africa, negatively affected relative results as they outperformed.
What is your outlook?
We have a positive outlook for emerging market equities as we believe they have attractive valuations, similar profitability levels as developed markets and good long-term growth prospects. We believe valuations within economically sensitive industries such as automobile manufacturing and steel are particularly attractive, especially relative to defensive or growth-oriented sectors such as consumer staples, health care and technology. We believe these economically sensitive positions will benefit as emerging economies continue to grow.
Quoted Fund performance is for Class A shares and does not reflect a sales charge.
The returns shown do not reflect taxes a shareholder would pay on distributions or redemptions.
16
| | | | |
| Portfolio Composition | | | | |
| (% of Portfolio) | | | | |
Common Stock | | | 96.2 | % |
Preferred Stock | | | 2.1 | % |
Short-Term Investments | | | 1.7 | % |
| | | | |
Total | | | 100.0 | % |
| | | | |
| Major Market Sectors | | | | |
| (% of Net Assets) | | | | |
Financials | | | 27.5 | % |
Materials | | | 14.3 | % |
Consumer Discretionary | | | 12.2 | % |
Industrials | | | 11.9 | % |
Energy | | | 10.4 | % |
Information Technology | | | 10.0 | % |
Telecommunications Services | | | 9.1 | % |
Utilities | | | 2.0 | % |
Consumer Staples | | | 1.3 | % |
| | | | |
| Top 10 Countries | | | | |
| (% of Net Assets) | | | | |
South Korea | | | 18.7 | % |
China | | | 12.3 | % |
Brazil | | | 7.9 | % |
Taiwan | | | 7.8 | % |
Hong Kong | | | 6.7 | % |
Malaysia | | | 5.9 | % |
Poland | | | 4.4 | % |
Czech Republic | | | 4.0 | % |
Russia | | | 3.9 | % |
Mexico | | | 3.7 | % |
Investments in securities in these countries represent 75.3% of the total net assets of the Fund.
Quoted Portfolio Composition, Major Market Sectors and Top 10 Countries are subject to change.
Portfolio Composition excludes collateral held for securities loaned.
The lists of Major Market Sectors and Top 10 Countries exclude short-term investments and collateral held for securities loaned.
| | | | | | | | |
| Average Annual Total Returns1 | |
| As of October 31, 2014 | |
Class A2 | | | 1-Year | | |
| From
Inception
8/31/2012 |
|
| |
without sales charge | | | -9.17 | % | | | -1.71 | % |
with sales charge | | | -14.15 | % | | | - 4.24 | % |
| | |
Institutional Class3 | | | 1-Year | | |
| From
Inception
8/31/2012 |
|
| |
Net Asset Value | | | -8.90 | % | | | -1.36 | % |
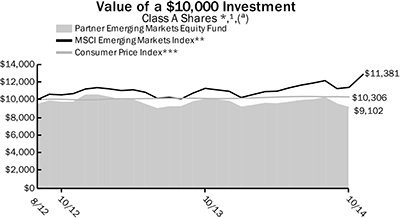
1 | Past performance is not an indication of future results. Average annual total returns represent past performance and reflect changes in share prices, the reinvestment of all dividends and capital gains, and the effects of compounding. The prospectus contains more complete information on the investment objectives, risks, charges and expenses of the investment company, which investors should read and consider carefully before investing. To obtain a prospectus, contact a registered representative or visit www.thrivent.com. At various times, the Fund’s adviser waived its management fee and/or reimbursed Fund expenses. Had the adviser not done so, the Fund’s total returns would have been lower. The returns shown do not reflect taxes a shareholder would pay on distributions or redemptions. Total investment return and principal value of your investment will fluctuate, and your shares, when redeemed, may be worth more or less than their original cost. Current performance may be higher or lower than the performance data quoted. Call 800-THRIVENT or visit www.thrivent.com for performance results current to the most recent month-end. |
2 | Class A performance with sales charge reflects the maximum sales charge of 5.5%. |
3 | Institutional Class shares have no sales load and are available to institutional shareholders and certain Thrivent sponsored programs. |
(a) | Performance of other classes will be greater or less than the line shown based on the differences in loads and fees paid by shareholders investing in the different classes. |
* | As you compare performance, please note that the Fund’s performance reflects the maximum 5.5% sales charge, while the MSCI Emerging Markets Index and the Consumer Price Index do not reflect any such charges. If you were to purchase any of the above individual securities represented in the Index, any charges you would pay would reduce your total return as well. |
** | The MSCI Emerging Markets Index is a modified capitalization-weighted index of selected emerging economies from around the world. It is not possible to invest directly in the Index. The performance of the Index does not reflect deductions for fees, expenses or taxes. |
*** | The Consumer Price Index is an inflationary indicator that measures the change in the cost of a fixed basket of products and services, including housing, electricity, food and transportation. It is not possible to invest directly in the Index. |
17
THRIVENT PARTNER SMALL CAP GROWTH FUND
Matthew D. Finn, CFA and David J. Lettenberger, CFA, Portfolio Co-Managers*
The Fund seeks long-term growth of capital.
The Fund primarily invests in securities of small companies. Smaller, less seasoned companies often have greater price volatility, lower trading volume, and less liquidity than larger, more established companies. The value of the Fund is influenced by factors impacting the overall market, certain asset classes, certain investment styles, and specific issuers. The Fund may incur losses due to incorrect assessments of investments by its investment advisers.
* | Effective May 27, 2014, Matthew D. Finn and David J. Lettenberger replaced Turner Investments, L.P. as the Portfolio Co-Managers. |
How did the Fund perform during the 12-month period ended October 31, 2014?
Thrivent Partner Small Cap Growth Fund earned a return of 3.24%, compared with the median return of its peer group, the Lipper Small Cap Growth Funds category, of 5.84%. The Fund’s market benchmark, the Russell 2000® Growth Index, earned a return of 8.26%.
What factors affected the Fund’s performance?
Poor stock selection was the primary reason for the Fund’s underperformance during the period, particularly in the technology, energy and consumer sectors. Within technology, shares of Applied Micro Circuits, a designer of semiconductors, struggled as the ramp-up of its new X-Gene product was slower than expected. Also, in the software industry, Infoblox, A10 Networks and Cornerstone OnDemand underperformed as revenue and booking trends slowed. Within energy, the Fund was overweighted in high-growth exploration and production companies. Several of these holdings, including Rex Energy and Penn Virginia, declined sharply as oil prices retreated late in the period. In the consumer sector, disappointing results from both Natural Grocers by Vitamin Cottage and Chuy’s Holdings deflated what were once high-expectation, high-multiple stocks.
Not all was negative from a stock selection standpoint as several holdings in the health care sector partially offset the above-mentioned disappointments. Within the health care services space, Team Health, LifePoint Hospitals and Centene all generated strong returns as they benefited from the implementation of the Affordable Care Act. Akorn, a specialty pharmaceutical company, outperformed based on strength in its core business as well as several strategic acquisitions that enhanced its competitive position. Within biotechnology, shares of Puma Biotechnology advanced significantly as the company reported favorable clinical trial results for its drug to be used in the treatment of breast cancer.
What is your outlook?
We believe there is never a shortage of new growth ideas in the small-cap universe, regardless of what is happening from a macroeconomic perspective. Our goal is to identify companies that are not only growing at a rate faster than their peers, but that have the ability to sustain that growth over an extended period of time. With these guideposts, we continue to make progress in repositioning the Fund’s portfolio. We have eliminated many positions that do not fit our sustainable growth mandate, while adding several new securities that exhibit our desired growth and quality characteristics. However, this repositioning process will take some time. Our goal remains to build a diversified portfolio of fewer than 100 companies that offer excellent long-term growth potential.
Quoted Fund performance is for Class A shares and does not reflect a sales charge.
The returns shown do not reflect taxes a shareholder would pay on distributions or redemptions.
18
| | | | |
| Portfolio Composition | | | | |
| (% of Portfolio) | | | | |
Common Stock | | | 97.1 | % |
Short-Term Investments | | | 2.9 | % |
| | | | |
Total | | | 100.0 | % |
| | | | |
| Major Market Sectors | | | | |
| (% of Net Assets) | | | | |
Information Technology | | | 22.3 | % |
Health Care | | | 21.8 | % |
Consumer Discretionary | | | 15.8 | % |
Industrials | | | 15.5 | % |
Financials | | | 10.3 | % |
Materials | | | 4.4 | % |
Energy | | | 3.7 | % |
Consumer Staples | | | 3.3 | % |
| | | | |
| Top 10 Holdings | | | | |
| (% of Net Assets) | | | | |
iShares Russell 2000 Growth Index Fund | | | 3.3 | % |
Proofpoint, Inc. | | | 2.0 | % |
Guidewire Software, Inc. | | | 1.9 | % |
NuVasive, Inc. | | | 1.8 | % |
Akorn, Inc. | | | 1.7 | % |
DST Systems, Inc. | | | 1.7 | % |
ExamWorks Group, Inc. | | | 1.6 | % |
Multimedia Games Holding Company, Inc. | | | 1.5 | % |
Spirit Airlines, Inc. | | | 1.4 | % |
Teleflex, Inc. | | | 1.4 | % |
These securities represent 18.3% of the total net assets of the Fund.
Quoted Major Market Sectors, Portfolio Composition and Top 10 Holdings are subject to change.
The lists of Major Market Sectors and Top 10 Holdings exclude short-term investments and collateral held for securities loaned.
The Portfolio Composition chart excludes collateral held for securities loaned.
| | | | | | | | | | | | |
| Average Annual Total Returns1 | |
| As of October 31, 2014 | |
Class A2 | | 1-Year | | | 5 Years | | | From
Inception
6/30/2005 | |
| |
without sales charge | | | 3.24 | % | | | 16.87 | % | | | 7.10 | % |
with sales charge | | | -2.43 | % | | | 15.57 | % | | | 6.45 | % |
| | | |
Institutional Class3 | | 1-Year | | | 5 Years | | | From
Inception 6/30/2005 | |
| |
Net Asset Value | | | 3.51 | % | | | 17.34 | % | | | 7.49 | % |
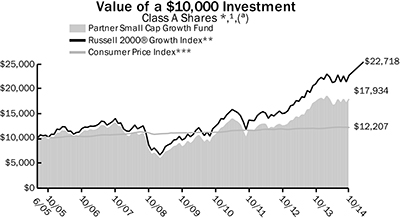
1 | Past performance is not an indication of future results. Average annual total returns represent past performance and reflect changes in share prices, the reinvestment of all dividends and capital gains, and the effects of compounding. The prospectus contains more complete information on the investment objectives, risks, charges and expenses of the investment company, which investors should read and consider carefully before investing. To obtain a prospectus, contact a registered representative or visit www.thrivent.com. At various times, the Fund’s adviser waived its management fee and/or reimbursed Fund expenses. Had the adviser not done so, the Fund’s total returns would have been lower. The returns shown do not reflect taxes a shareholder would pay on distributions or redemptions. Total investment return and principal value of your investment will fluctuate, and your shares, when redeemed, may be worth more or less than their original cost. Current performance may be higher or lower than the performance data quoted. Call 800-THRIVENT or visit www.thrivent.com for performance results current to the most recent month-end. |
2 | Class A performance with sales charge reflects the maximum sales charge of 5.5%. |
3 | Institutional Class shares have no sales load and are available to institutional shareholders and certain Thrivent sponsored programs. |
(a) | Performance of other classes will be greater or less than the line shown based on the differences in loads and fees paid by shareholders investing in the different classes. |
* | As you compare performance, please note that the Fund’s performance reflects the maximum 5.5% sales charge, while the Consumer Price Index and the Russell 2000® Growth Index do not reflect any such charges. If you were to purchase any of the above individual securities represented in the Index, any charges you would pay would reduce your total return as well. |
** | The Russell 2000® Growth Index is an index comprised of companies with a greater-than-average growth orientation. It is not possible to invest directly in the Index. The performance of the Index does not reflect deductions for fees, expenses or taxes. |
*** | The Consumer Price Index is an inflationary indicator that measures the change in the cost of a fixed basket of products and services, including housing, electricity, food and transportation. It is not possible to invest directly in the Index. |
19
THRIVENT PARTNER SMALL CAP VALUE FUND

Subadvised by T. Rowe Price Associates, Inc.
The Fund seeks long-term capital appreciation.
The Fund primarily invests in securities of small companies. Smaller, less seasoned companies often have greater price volatility, lower trading volume, and less liquidity than larger, more established companies. The value of the Fund is influenced by factors impacting the overall market, certain asset classes, certain investment styles, and specific issuers. The Fund may incur losses due to incorrect assessments of investments by its investment advisers. Foreign investments involve additional risks, including currency fluctuations, liquidity, political, economic and market instability, and different legal and accounting standards.
How did the Fund perform during the 12-month period ended October 31, 2014?
Thrivent Partner Small Cap Value Fund earned a return of 5.65%, compared with the median return of its peer group, the Lipper Small Cap Value Funds category, of 7.57%. The Fund’s market benchmark, the Russell 2000® Value Index, earned a return of 7.89%.
What factors affected the Fund’s performance?
At the overall sector level, sector allocation was the primary driver of the Fund’s relative underperformance versus its Lipper median and benchmark for the year. Several of our holdings in consumer discretionary significantly underperformed the broader sector — most notably, Quiksilver. Shares of this surfing and skateboarding apparel maker plunged to near a five-year low in September after reporting an unexpected fiscal third-quarter loss and missing sales expectations by a wide margin. These results were preceded by weaker-than-expected sales and earnings figures for the first and second quarters. With a recent change to the leadership team and additional licensing agreements announced in July, we believe that Quiksilver is positioned for a successful turnaround in the next 12 to 18 months.
Our underweighted position in financials coupled with stock selection further weighed on the Fund’s relative results. Our position in Employers Holdings generated negative returns for the year. Shares of the company dropped in the first quarter of 2014 after it reported a fourth-quarter operating loss in 2013, well below expectations. While the stock price has yet to recover, results have gradually improved in 2014 and have been broadly in line with expectations. Employers Holdings has beat estimates in the past two quarters and is expected to continue this streak in the near term.
Stock selection in the industrials sector was a notable positive contributor for the period. Shares of Greenbrier Companies advanced strongly for the year, driven by strong railcar demand amid the U.S. energy boom and an improving economy. Our position in Alaska Air Group also boosted results. This rapidly growing airline expanded routes from the Pacific Northwest to various U.S. cities and to Mexico and ordered 10 new Boeing jets to accommodate increased traffic.
What is your outlook?
We were not surprised to see the underperformance of small caps in recent months as their valuations had grown extended relative to large caps. It may take some further underperformance by small-cap stocks for the relative valuations of the two asset classes to resume their typical patterns.
Somewhat more surprising has been the continued trailing performance of value stocks, which typically fare better than their growth-oriented counterparts in a down market. However, we believe some perseverance may be warranted in this regard as well. While value stocks have lagged growth shares for several years now, they are still somewhat expensive on a relative basis.
Despite this generally challenging environment for our asset class, we continue to find many attractive opportunities among companies poised to benefit from better business conditions. We continue to invest across a range of industries in order to maintain a highly diversified portfolio while maintaining a patient and long-term approach, which remains the hallmark of our strategy.
Quoted Fund performance is for Class A shares and does not reflect a sales charge.
The returns shown do not reflect taxes a shareholder would pay on distributions or redemptions.
20
| | | | |
| Portfolio Composition | | | | |
| (% of Portfolio) | | | | |
Common Stock | | | 96.9 | % |
Short-Term Investments | | | 2.9 | % |
Preferred Stock | | | 0.2 | % |
| | | | |
Total | | | 100.0 | % |
| | | | |
| Major Market Sectors | | | | |
| (% of Net Assets) | | | | |
Industrials | | | 26.6 | % |
Financials | | | 26.6 | % |
Consumer Discretionary | | | 12.5 | % |
Information Technology | | | 10.5 | % |
Materials | | | 7.4 | % |
Utilities | | | 5.1 | % |
Health Care | �� | | 4.1 | % |
Energy | | | 3.1 | % |
Consumer Staples | | | 1.0 | % |
Telecommunications Services | | | 0.1 | % |
| | | | |
| Top 10 Holdings | | | | |
| (% of Net Assets) | | | | |
Alaska Air Group, Inc. | | | 2.4 | % |
ProAssurance Corporation | | | 1.7 | % |
West Pharmaceutical Services, Inc. | | | 1.7 | % |
East West Bancorp, Inc. | | | 1.7 | % |
Cleco Corporation | | | 1.5 | % |
Aaron’s, Inc. | | | 1.4 | % |
CoBiz Financial, Inc. | | | 1.3 | % |
Landstar System, Inc. | | | 1.3 | % |
A.O. Smith Corporation | | | 1.3 | % |
Synnex Corporation | | | 1.2 | % |
These securities represent 15.5% of the total net assets of the Fund.
Quoted Major Market Sectors, Portfolio Composition and Top 10 Holdings are subject to change.
The lists of Major Market Sectors and Top 10 Holdings exclude short-term investments and collateral held for securities loaned.
The Portfolio Composition chart excludes collateral held for securities loaned.
| | | | | | | | | | | | |
| Average Annual Total Returns1 | |
| As of October 31, 2014 | |
Class A2 | | 1-Year | | | 5 Years | | | 10 Years | |
| |
without sales charge | | | 5.65 | % | | | 15.43 | % | | | 9.16 | % |
with sales charge | | | -0.16 | % | | | 14.12 | % | | | 8.55 | % |
| | | |
Institutional Class3 | | 1-Year | | | 5 Years | | | 10 Years | |
| |
Net Asset Value | | | 6.12 | % | | | 16.01 | % | | | 9.81 | % |
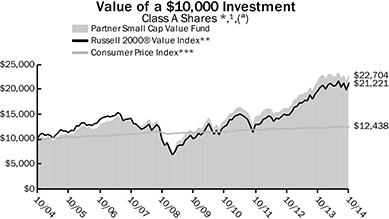
1 | Past performance is not an indication of future results. Average annual total returns represent past performance and reflect changes in share prices, the reinvestment of all dividends and capital gains, and the effects of compounding. The prospectus contains more complete information on the investment objectives, risks, charges and expenses of the investment company, which investors should read and consider carefully before investing. To obtain a prospectus, contact a registered representative or visit www.thrivent.com. At various times, the Fund’s adviser waived its management fee and/or reimbursed Fund expenses. Had the adviser not done so, the Fund’s total returns would have been lower. The returns shown do not reflect taxes a shareholder would pay on distributions or redemptions. Total investment return and principal value of your investment will fluctuate, and your shares, when redeemed, may be worth more or less than their original cost. Current performance may be higher or lower than the performance data quoted. Call 800-THRIVENT or visit www.thrivent.com for performance results current to the most recent month-end. |
2 | Class A performance with sales charge reflects the maximum sales charge of 5.5%. |
3 | Institutional Class shares have no sales load and are available to institutional shareholders and certain Thrivent sponsored programs. |
(a) | Performance of other classes will be greater or less than the line shown based on the differences in loads and fees paid by shareholders investing in the different classes. |
* | As you compare performance, please note that the Fund’s performance reflects the maximum 5.5% sales charge, while the Russell 2000® Value Index and the Consumer Price Index do not reflect any such charges. If you were to purchase any of the above individual securities represented in the Index, any charges you would pay would reduce your total return as well. |
** | The Russell 2000® Value Index measures the performance of small cap value stocks. It is not possible to invest directly in the Index. The performance of the Index does not reflect deductions for fees, expenses or taxes. |
*** | The Consumer Price Index is an inflationary indicator that measures the change in the cost of a fixed basket of products and services, including housing, electricity, food and transportation. It is not possible to invest directly in the Index. |
21
THRIVENT SMALL CAP STOCK FUND
Matthew D. Finn, CFA, Portfolio Manager
The Fund seeks long-term capital growth.
The Fund primarily invests in securities of small companies. Smaller, less seasoned companies often have greater price volatility, lower trading volume, and less liquidity than larger, more established companies. The value of the Fund is influenced by factors impacting the overall market, certain asset classes, certain investment styles, and specific issuers. The Fund may incur losses due to incorrect assessments of investments by its investment adviser.
How did the Fund perform during the 12-month period ended October 31, 2014?
Thrivent Small Cap Stock Fund earned a return of 9.48%, compared with the median return of its peer group, the Lipper Small Cap Core Funds category, of 8.18%. The Fund’s market benchmark, the Russell 2000® Index, earned a return of 8.06%.
What factors affected the Fund’s performance?
Stock selection drove the Fund’s outperformance during the period, particularly in the industrials, health care, consumer staples and financials sectors. Positions in trucking company Landstar System and mechanical and electrical construction firm EMCOR Group added the most in the industrials sector. In health care, NuVasive, a developer of medical products for spine surgery, and ExamWorks Group, a provider of independent medical exams, appreciated significantly. In consumer staples, shares of WhiteWave Foods, the maker of organic milk and produce, creamers and plant-based beverages, advanced strongly. In the financials sector, two banks helped the Fund’s performance: Hanmi Financial and SVB Financial. While all of these holdings remained in the Fund’s portfolio as of the fiscal year end, we reduced the position sizes of WhiteWave Foods and SVB Financial.
Stock selection detracted in the energy sector, with particular weakness in our holdings of Oasis Petroleum, Rex Energy and Rosetta Resources.
What is your outlook?
At the end of last year, we were in the process of repositioning the Fund in an effort to improve its performance through our stock selection process. The Fund’s poor relative results in the previous fiscal year were caused by unfavorable sector weighting decisions and stock selection. Over the course of this fiscal year, we have increased the diversification of the Fund and raised the quality of the companies we own. We sold 35 of the original 50 stocks and added new positions to increase the total number of holdings in the Fund to more than 70. By investing in companies that have strong competitive advantages and a long runway for growth and operational improvement at attractive prices, we believe the Fund can outperform its peer group and benchmark over time.
Quoted Fund performance is for Class A shares and does not reflect a sales charge.
The returns shown do not reflect taxes a shareholder would pay on distributions or redemptions.
22
| | | | |
| Portfolio Composition | | | | |
| (% of Portfolio) | | | | |
Common Stock | | | 97.0 | % |
Short-Term Investments | | | 3.0 | % |
| | | | |
Total | | | 100.0 | % |
| | | | |
| Major Market Sectors | | | | |
| (% of Net Assets) | | | | |
Industrials | | | 24.1 | % |
Financials | | | 20.6 | % |
Information Technology | | | 14.4 | % |
Consumer Discretionary | | | 11.9 | % |
Health Care | | | 10.2 | % |
Materials | | | 4.3 | % |
Energy | | | 4.2 | % |
Utilities | | | 3.7 | % |
Consumer Staples | | | 2.8 | % |
Telecommunications Services | | | 1.0 | % |
| | | | |
| Top 10 Holdings | | | | |
| (% of Net Assets) | | | | |
EMCOR Group, Inc. | | | 3.0 | % |
DST Systems, Inc. | | | 2.7 | % |
NorthWestern Corporation | | | 2.6 | % |
ExamWorks Group, Inc. | | | 2.5 | % |
Landstar System, Inc. | | | 2.4 | % |
Broadridge Financial Solutions, Inc. | | | 2.4 | % |
NuVasive, Inc. | | | 2.2 | % |
CLARCOR, Inc. | | | 2.2 | % |
Tuesday Morning Corporation | | | 2.2 | % |
Materials Select Sector SPDR Fund | | | 2.2 | % |
These securities represent 24.4% of the total net assets of the Fund. | | | | |
Quoted Major Market Sectors, Portfolio Composition and Top 10 Holdings are subject to change.
The lists of Major Market Sectors and Top 10 Holdings exclude short-term investments and collateral held for securities loaned.
The Portfolio Composition chart excludes collateral held for securities loaned.
| | | | | | | | | | | | |
Average Annual Total Returns1 | |
As of October 31, 2014 | |
Class A2 | | 1-Year | | | 5 Years | | | 10 Years | |
| | |
without sales charge | | | 9.48 | % | | | 14.60 | % | | | 6.41 | % |
with sales charge | | | 3.45 | % | | | 13.30 | % | | | 5.82 | % |
| | | |
Institutional Class3 | | 1-Year | | | 5 Years | | | 10 Years | |
| | |
Net Asset Value | | | 10.00 | % | | | 15.25 | % | | | 7.06 | % |
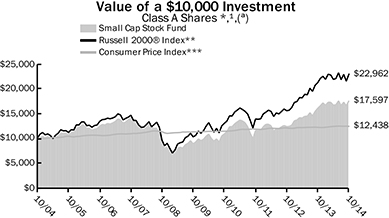
1 | Past performance is not an indication of future results. Average annual total returns represent past performance and reflect changes in share prices, the reinvestment of all dividends and capital gains, and the effects of compounding. The prospectus contains more complete information on the investment objectives, risks, charges and expenses of the investment company, which investors should read and consider carefully before investing. To obtain a prospectus, contact a registered representative or visit www.thrivent.com. At various times, the Fund’s adviser waived its management fee and/or reimbursed Fund expenses. Had the adviser not done so, the Fund’s total returns would have been lower. The returns shown do not reflect taxes a shareholder would pay on distributions or redemptions. Total investment return and principal value of your investment will fluctuate, and your shares, when redeemed, may be worth more or less than their original cost. Current performance may be higher or lower than the performance data quoted. Call 800-THRIVENT or visit www.thrivent.com for performance results current to the most recent month-end. |
2 | Class A performance with sales charge reflects the maximum sales charge of 5.5%. |
3 | Institutional Class shares have no sales load and are available to institutional shareholders and certain Thrivent sponsored programs. |
(a) | Performance of other classes will be greater or less than the line shown based on the differences in loads and fees paid by shareholders investing in the different classes. |
* | As you compare performance, please note that the Fund’s performance reflects the maximum 5.5% sales charge, while the Russell 2000® Index and the Consumer Price Index do not reflect any such charges. If you were to purchase any of the above individual securities represented in the Index, any charges you would pay would reduce your total return as well. |
** | The Russell 2000® Index measures the performance of small cap stocks. It is not possible to invest directly in the Index. The performance of the Index does not reflect deductions for fees, expenses or taxes. |
*** | The Consumer Price Index is an inflationary indicator that measures the change in the cost of a fixed basket of products and services, including housing, electricity, food and transportation. It is not possible to invest directly in the Index. |
23
THRIVENT MID CAP GROWTH FUND
Andrea J. Thomas, CFA, Portfolio Manager
The Fund seeks long-term growth of capital.
The Fund primarily invests in securities of mid-sized companies, which often have greater price volatility, lower trading volume, and less liquidity than larger, more established companies. The value of the Fund is influenced by factors impacting the overall market, certain asset classes, certain investment styles, and specific issuers. The Fund may incur losses due to incorrect assessments of investments by its investment adviser.
How did the Fund perform during the 12-month period ended October 31, 2014?
Thrivent Mid Cap Growth Fund earned a return of 9.22%, compared with the median return of its peer group, the Lipper Mid Cap Growth Funds category, of 10.49%. The Fund’s market benchmark, the Russell Midcap® Growth Index, earned a return of 14.59%.
What factors affected the Fund’s performance?
Although the Fund was up on an absolute basis for the year, our underweighted position in high-multiple health care stocks was a drag on performance relative to our peer group and benchmark. These high-multiple, momentum stocks vastly outperformed most other stocks in the benchmark, especially in the first half of the Fund’s fiscal year. The Russell Midcap® Growth Index advanced more than both our Fund and our peers over the period due to its even heavier weighting in a select group of these momentum names. We began to see this trend reverse, however, in the second quarter of 2014 and continuing through the summer. While we believe the reversal was primarily due to many of these companies reporting poorer fundamentals, we also saw increasing concern among investors that a curtailment of the Federal Reserve’s quantitative easing program would cap risk premiums on some of these stocks going forward.
Conversely, the Fund’s performance benefited from both allocation and security selection in the technology, consumer and industrial sectors. In industrials, United Rentals was our most significant contributor to performance. This equipment rental company benefited from a steady, but not rapidly expanding economy as companies chose to rent instead of buy equipment. Another strong contributor to performance was NXP Semiconductors, which sells semiconductors into several high-growth segments of the economy such as mobile communications, security applications and networking equipment. Finally, we saw positive results from two consumer companies, Marriott International and Monster Beverage, as both had secular trends that allowed them to grow earnings despite a rather tepid economy.
What is your outlook?
We are increasingly concerned about geopolitical events and their effect on global growth and therefore U.S. growth. The sanctions levied on Russia are taking a heavy toll on the European economy. The Chinese economy has been slowing as Europe is a major trading partner and the country is trying to manage its own credit bubble. Japan, in an attempt to stave off deflation, announced it was embarking on an even bigger quantitative easing program just as the Federal Reserve ended quantitative easing here. While the U.S. economy appears to be marginally better, we do not see a rapid, broad-based expansion unfolding in the face of these global headwinds. We believe this may result in an increase in volatility in the coming year. We remain focused on growth sectors within the economy, while within each sector, we remain committed to buying solid growth businesses with reasonable valuations.
Quoted Fund performance is for Class A shares and does not reflect a sales charge.
The returns shown do not reflect taxes a shareholder would pay on distributions or redemptions.
24
| | | | |
Portfolio Composition | | | | |
(% of Portfolio) | | | | |
Common Stock | | | 96.2 | % |
Short-Term Investments | | | 3.8 | % |
| | | | |
Total | | | 100.0 | % |
| | | | |
| Major Market Sectors | | | | |
| (% of Net Assets) | | | | |
Consumer Discretionary | | | 20.0 | % |
Information Technology | | | 18.7 | % |
Industrials | | | 16.4 | % |
Health Care | | | 16.2 | % |
Financials | | | 10.7 | % |
Consumer Staples | | | 4.9 | % |
Energy | | | 3.6 | % |
Materials | | | 3.4 | % |
Telecommunications Services | | | 1.7 | % |
| | | | |
| Top 10 Holdings | | | | |
| (% of Net Assets) | | | | |
Perrigo Company plc | | | 2.3 | % |
Stericycle, Inc. | | | 2.2 | % |
United Rentals, Inc. | | | 2.2 | % |
Affiliated Managers Group, Inc. | | | 2.1 | % |
NXP Semiconductors NV | | | 2.0 | % |
Robert Half International, Inc. | | | 2.0 | % |
Monster Beverage Corporation | | | 1.9 | % |
First Republic Bank | | | 1.9 | % |
Amphenol Corporation | | | 1.7 | % |
Marriott International, Inc. | | | 1.7 | % |
These securities represent 20.0% of the total net assets of the Fund. | | | | |
Quoted Major Market Sectors, Portfolio Composition and Top 10 Holdings are subject to change.
The lists of Major Market Sectors and Top 10 Holdings exclude short-term investments and collateral held for securities loaned.
The Portfolio Composition chart excludes collateral held for securities loaned.
| | | | | | | | | | | | |
Average Annual Total Returns1 | |
As of October 31, 2014 | |
Class A2 | | | 1-Year | | | | 5 Years | | | | 10 Years | |
| | |
without sales charge | | | 9.22 | % | | | 14.74 | % | | | 9.46 | % |
with sales charge | | | 3.21 | % | | | 13.45 | % | | | 8.85 | % |
| | | |
Institutional Class3 | | | 1-Year | | | | 5 Years | | | | 10 Years | |
| | |
Net Asset Value | | | 9.74 | % | | | 15.35 | % | | | 10.17 | % |
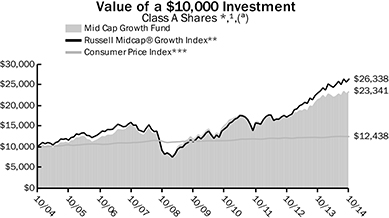
1 | Past performance is not an indication of future results. Average annual total returns represent past performance and reflect changes in share prices, the reinvestment of all dividends and capital gains, and the effects of compounding. The prospectus contains more complete information on the investment objectives, risks, charges and expenses of the investment company, which investors should read and consider carefully before investing. To obtain a prospectus, contact a registered representative or visit www.thrivent.com. At various times, the Fund’s adviser waived its management fee and/or reimbursed Fund expenses. Had the adviser not done so, the Fund’s total returns would have been lower. The returns shown do not reflect taxes a shareholder would pay on distributions or redemptions. Total investment return and principal value of your investment will fluctuate, and your shares, when redeemed, may be worth more or less than their original cost. Current performance may be higher or lower than the performance data quoted. Call 800-THRIVENT or visit www.thrivent.com for performance results current to the most recent month-end. |
2 | Class A performance with sales charge reflects the maximum sales charge of 5.5%. |
3 | Institutional Class shares have no sales load and are available to institutional shareholders and certain Thrivent sponsored programs. |
(a) | Performance of other classes will be greater or less than the line shown based on the differences in loads and fees paid by shareholders investing in the different classes. |
* | As you compare performance, please note that the Fund’s performance reflects the maximum 5.5% sales charge, while the Russell Midcap® Growth Index and the Consumer Price Index do not reflect any such charges. If you were to purchase any of the above individual securities represented in the Index, any charges you would pay would reduce your total return as well. |
** | The Russell Midcap® Growth Index measures the performance of mid-cap growth stocks. It is not possible to invest directly in the Index. The performance of the Index does not reflect deductions for fees, expenses, or taxes. |
*** | The Consumer Price Index is an inflationary indicator that measures the change in the cost of a fixed basket of products and services, including housing, electricity, food and transportation. It is not possible to invest directly in the Index. |
25
THRIVENT PARTNER MID CAP VALUE FUND

Subadvised by Goldman Sachs Asset Management, L.P.
The Fund seeks to achieve long-term capital appreciation.
The Fund primarily invests in securities of mid-cap issuers, which often have greater price volatility, lower trading volume, and less liquidity than larger, more established companies. The value of the Fund is influenced by factors impacting the overall market, certain asset classes, certain investment styles, and specific issuers. The Fund may incur losses due to incorrect assessments of investments by its investment advisers. Foreign investments involve additional risks, including currency fluctuations, liquidity, political, economic and market instability, and different legal and accounting standards; these risks are magnified for investments in emerging markets.
How did the Fund perform during the 12-month period ended October 31, 2014?
Thrivent Partner Mid Cap Value Fund generated a return of 14.38%, compared with the median return of its peer group, the Lipper Mid Cap Value Funds category, of 12.51%. The Fund’s market benchmark, the Russell Midcap® Value Index, earned a return of 16.18%.
What factors affected the Fund’s performance?
Our investments within the information technology and consumer discretionary sectors detracted from results, whereas our holdings in the consumer staples and financials sectors contributed favorably to performance.
Within information technology, semiconductor designer and manufacturer Atmel was a top detractor from performance. Atmel’s shares fell in September 2014 after the company guided fourth-quarter revenues lower than consensus expectations. The company attributed the decline to weaker demand in its mobile and gaming businesses.
Within the consumer discretionary sector, branded apparel company PVH weighed on the Fund’s results. The company, which owns brands such as Tommy Hilfiger, Calvin Klein and IZOD, provided disappointing results for consecutive quarters, largely due to last year’s inclement winter weather. PVH’s shares also retreated when the firm cut its full-year 2014 guidance due to concerns regarding inventory pressures in the overall North American market.
Within the consumer staples sector, coffee roaster and K-cup maker Keurig Green Mountain was the top contributor to performance. Shares of Keurig Green Mountain rallied after the announcement that Coca-Cola would purchase a 10% stake in the company, while also entering into a 10-year agreement to explore producing Coca-Cola products for use with its new Keurig Cold beverage system.
Within financials, Navient, the former loan servicing unit of Sallie Mae, was also a strong contributor. Its shares rose in October 2014 after the company reported better-than-expected third-quarter earnings and raised its full-year 2014 guidance.
What is your outlook?
We continue to believe U.S. equities have further upside potential as the domestic economy accelerates and as real earnings growth serves as a fundamental driver of performance going forward. We believe U.S. corporate fundamentals are strong, evidenced by both healthy balance sheets and earnings resilience, and could provide companies with a number of options to increase shareholder value.
Looking forward, we believe that as the U.S. economy improves, companies will reinvest for future growth by increasing capital expenditures, research and development and hiring, as well as through merger and acquisition activity, rather than keeping excess cash on their balance sheets. In our view, equity valuations are fair considering the positive macro environment and are inexpensive relative to fixed-income securities. Regardless of the market direction, our fundamental, bottom-up stock selection continues to drive our investment process, rather than headlines or sentiment.
Quoted Fund performance is for Class A shares and does not reflect a sales charge.
The returns shown do not reflect taxes a shareholder would pay on distributions or redemptions.
26
| | | | |
| Portfolio Composition | | | | |
| (% of Portfolio) | | | | |
Common Stock | | | 96.8 | % |
Short-Term Investments | | | 3.2 | % |
| | | | |
Total | | | 100.0 | % |
| | | | |
| Major Market Sectors | | | | |
| (% of Net Assets) | | | | |
Financials | | | 27.0 | % |
Consumer Discretionary | | | 13.4 | % |
Information Technology | | | 12.8 | % |
Industrials | | | 9.8 | % |
Health Care | | | 9.3 | % |
Utilities | | | 6.9 | % |
Consumer Staples | | | 6.1 | % |
Energy | | | 5.9 | % |
Materials | | | 5.7 | % |
| | | | |
| Top 10 Holdings | | | | |
| (% of Net Assets) | | | | |
CIGNA Corporation | | | 2.4 | % |
Sempra Energy | | | 2.0 | % |
FirstEnergy Corporation | | | 2.0 | % |
Lincoln National Corporation | | | 1.8 | % |
Maxim Integrated Products, Inc. | | | 1.8 | % |
Principal Financial Group, Inc. | | | 1.7 | % |
Fifth Third Bancorp | | | 1.7 | % |
Endo International plc | | | 1.7 | % |
Navient Corporation | | | 1.7 | % |
Triumph Group, Inc. | | | 1.6 | % |
These securities represent 18.4% of the total net assets of the Fund. | | | | |
Quoted Major Market Sectors, Portfolio Composition and Top 10 Holdings are subject to change.
The lists of Major Market Sectors and Top 10 Holdings exclude short-term investments and collateral held for securities loaned.
The Portfolio Composition chart excludes collateral held for securities loaned.
| | | | | | | | | | | | |
Average Annual Total Returns1 | |
As of October 31, 2014 | |
Class A2 | | | 1-Year | | | | 5 Years | | |
| From
Inception
6/30/2005 |
|
| | |
without sales charge | | | 14.38 | % | | | 16.72 | % | | | 8.45 | % |
with sales charge | | | 8.06 | % | | | 15.42 | % | | | 7.80 | % |
| | | |
Institutional Class3 | | | 1-Year | | | | 5 Years | | |
| From
Inception
6/30/2005 |
|
| | |
Net Asset Value | | | 14.78 | % | | | 17.13 | % | | | 8.80 | % |
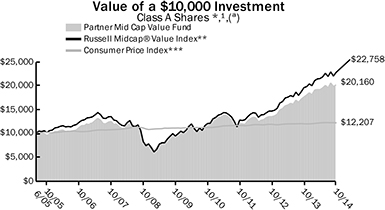
1 | Past performance is not an indication of future results. Average annual total returns represent past performance and reflect changes in share prices, the reinvestment of all dividends and capital gains, and the effects of compounding. The prospectus contains more complete information on the investment objectives, risks, charges and expenses of the investment company, which investors should read and consider carefully before investing. To obtain a prospectus, contact a registered representative or visit www.thrivent.com. At various times, the Fund’s adviser waived its management fee and/or reimbursed Fund expenses. Had the adviser not done so, the Fund’s total returns would have been lower. The returns shown do not reflect taxes a shareholder would pay on distributions or redemptions. Total investment return and principal value of your investment will fluctuate, and your shares, when redeemed, may be worth more or less than their original cost. Current performance may be higher or lower than the performance data quoted. Call 800-THRIVENT or visit www.thrivent.com for performance results current to the most recent month-end. |
2 | Class A performance with sales charge reflects the maximum sales charge of 5.5%. |
3 | Institutional Class shares have no sales load and are available to institutional shareholders and certain Thrivent sponsored programs. |
(a) | Performance of other classes will be greater or less than the line shown based on the differences in loads and fees paid by shareholders investing in the different classes. |
* | As you compare performance, please note that the Fund’s performance reflects the maximum 5.5% sales charge, while the Russell Midcap® Value Index and the Consumer Price Index do not reflect any such charges. If you were to purchase any of the above individual securities represented in the Index, any charges you would pay would reduce your total return as well. |
** | The Russell Midcap® Value Index is an index comprised of mid-cap companies with lower than average price-to-book ratios and lower forecasted growth values. It is not possible to invest directly in the Index. The performance of the Index does not reflect deductions for fees, expenses or taxes. |
*** | The Consumer Price Index is an inflationary indicator that measures the change in the cost of a fixed basket of products and services, including housing, electricity, food and transportation. It is not possible to invest directly in the Index. |
27
THRIVENT MID CAP STOCK FUND
Brian J. Flanagan, CFA, Portfolio Manager
The Fund seeks long-term capital growth.
The Fund primarily invests in securities of mid-sized companies, which often have greater price volatility, lower trading volume, and less liquidity than larger, more established companies. The value of the Fund is influenced by factors impacting the overall market, certain asset classes, certain investment styles, and specific issuers. The Fund may incur losses due to incorrect assessments of investments by its investment adviser.
How did the Fund perform during the 12-month period ended October 31, 2014?
Thrivent Mid Cap Stock Fund earned a return of 15.55%, compared with the median return of its peer group, the Lipper Mid Cap Core Funds category, of 11.11%. The Fund’s market benchmark, the Russell Midcap® Index, earned a return of 15.32%.
What factors affected the Fund’s performance?
The Fund benefited primarily from sound security selection during the past year that was broad-based among sectors. Only the Fund’s energy holdings lagged the peer group. Performance within consumer staples was particularly notable, including an investment in coffee roaster and K-cup maker Keurig Green Mountain. The company benefited from increased product penetration, incremental licensing captures, anticipation of its new cold beverage system and a significant equity investment by Coca-Cola. Organic beverage and food producer WhiteWave Foods enjoyed better-than-expected customer acceptance of its plant-based foods and drinks, plus the positive impact of increased volumes on profitability.
Industrial sector performance continued to benefit from airline capacity discipline through an investment in Southwest Airlines. A position in Illumina drove health care sector returns as momentum grew in the next-generation sequencing market for the company’s sequencing instruments and consumables. Finally, within information technology, TriQuint Semiconductor appreciated dramatically on the back of strong content wins for the company’s products, significant associated margin expansion and an agreement to merge with RF Micro Devices.
The Fund experienced relatively few detractors at the security level during the period. Most notably, wireless networking product provider Ubiquiti Networks, glass container manufacturer Owens-Illinois and staffing company ManpowerGroup lagged due to weakness in international demand and, to a lesser extent, because of company-specific operational issues.
What is your outlook?
Market risks have arguably increased over the course of the past year. While opportunities do exist, a mixed macro backdrop warrants a prudent level of caution. Domestic economic growth remains steady, but not spectacular, averaging slightly more than 2.20% since the recovery began in late-2009. Conversely, economic growth in regions outside of the U.S., including Europe, China, Russia and Brazil, has slowed. Currencies have become increasingly volatile as regional levels of monetary stimulus diverge and these currency shifts will impact trade flows. Importantly, the Federal Reserve recently removed a level of policy accommodation when it concluded its latest iteration of quantitative easing in late October. Positively, global monetary policy does remain accommodative with interest rates pegged at generational lows, while inflation is benign.
Almost six years into the market’s recovery from the Great Recession, outsized investment opportunities have become fewer and market leadership has narrowed. Valuation spreads continue to compress and capital expenditures have accelerated. In this environment, we believe security selection will drive relative performance. As the cycle matures, growth factors should begin to dominate over those more tilted toward valuation. We will increasingly emphasize these growth factors in the Fund with a focus on relative revenue growth, above-consensus incremental margins and free cash flow as well as improving returns on capital.
Quoted Fund performance is for Class A shares and does not reflect a sales charge.
The returns shown do not reflect taxes a shareholder would pay on distributions or redemptions.
28
| | | | |
| Portfolio Composition | | | | |
| (% of Portfolio) | | | | |
Common Stock | | | 95.7 | % |
Short-Term Investments | | | 4.3 | % |
| | | | |
Total | | | 100.0 | % |
| | | | |
| Major Market Sectors | | | | |
| (% of Net Assets) | | | | |
Financials | | | 22.7 | % |
Information Technology | | | 18.4 | % |
Industrials | | | 14.8 | % |
Health Care | | | 14.5 | % |
Consumer Discretionary | | | 9.1 | % |
Energy | | | 5.6 | % |
Consumer Staples | | | 5.0 | % |
Materials | | | 4.2 | % |
Utilities | | | 1.5 | % |
| | | | |
| Top 10 Holdings | | | | |
| (% of Net Assets) | | | | |
Alliance Data Systems Corporation | | | 3.5 | % |
Southwest Airlines Company | | | 3.3 | % |
NVIDIA Corporation | | | 3.1 | % |
Applied Materials, Inc. | | | 2.8 | % |
Illumina, Inc. | | | 2.4 | % |
ADT Corporation | | | 2.3 | % |
Oshkosh Corporation | | | 2.2 | % |
Huntington Bancshares, Inc. | | | 2.2 | % |
NASDAQ OMX Group, Inc. | | | 2.2 | % |
DISH Network Corporation | | | 2.2 | % |
These securities represent 26.2% of the total net assets of the Fund. | | | | |
Quoted Major Market Sectors, Portfolio Composition and Top 10 Holdings are subject to change.
The lists of Major Market Sectors and Top 10 Holdings exclude short-term investments and collateral held for securities loaned.
The Portfolio Composition chart excludes collateral held for securities loaned.
| | | | | | | | | | | | |
Average Annual Total Returns1 | |
As of October 31, 2014 | |
Class A2 | | | 1-Year | | | | 5 Years | | | | 10 Years | |
| | |
without sales charge | | | 15.55 | % | | | 16.68 | % | | | 9.48 | % |
with sales charge | | | 9.18 | % | | | 15.38 | % | | | 8.86 | % |
| | | |
Institutional Class3 | | | 1-Year | | | | 5 Years | | | | 10 Years | |
| | |
Net Asset Value | | | 16.01 | % | | | 17.21 | % | | | 10.01 | % |
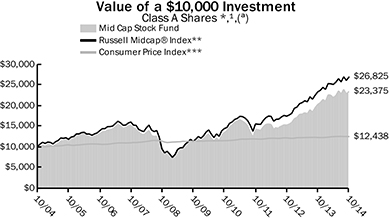
1 | Past performance is not an indication of future results. Average annual total returns represent past performance and reflect changes in share prices, the reinvestment of all dividends and capital gains, and the effects of compounding. The prospectus contains more complete information on the investment objectives, risks, charges and expenses of the investment company, which investors should read and consider carefully before investing. To obtain a prospectus, contact a registered representative or visit www.thrivent.com. At various times, the Fund’s adviser waived its management fee and/or reimbursed Fund expenses. Had the adviser not done so, the Fund’s total returns would have been lower. The returns shown do not reflect taxes a shareholder would pay on distributions or redemptions. Total investment return and principal value of your investment will fluctuate, and your shares, when redeemed, may be worth more or less than their original cost. Current performance may be higher or lower than the performance data quoted. Call 800-THRIVENT or visit www.thrivent.com for performance results current to the most recent month-end. |
2 | Class A performance with sales charge reflects the maximum sales charge of 5.5%. |
3 | Institutional Class shares have no sales load and are available to institutional shareholders and certain Thrivent sponsored programs. |
(a) | Performance of other classes will be greater or less than the line shown based on the differences in loads and fees paid by shareholders investing in the different classes. |
* | As you compare performance, please note that the Fund’s performance reflects the maximum 5.5% sales charge, while the Russell Midcap® Index and the Consumer Price Index do not reflect any such charges. If you were to purchase any of the above individual securities represented in the Index, any charges you would pay would reduce your total return as well. |
** | The Russell Midcap® Index is an index that measures the performance of the smallest 800 securities in the Russell 1000® Index, as ranked by total market capitalization. It is not possible to invest directly in these Indexes. The performance of these Indexes does not reflect deductions for fees, expenses or taxes. |
*** | The Consumer Price Index is an inflationary indicator that measures the change in the cost of a fixed basket of products and services, including housing, electricity, food and transportation. It is not possible to invest directly in the Index. |
29
THRIVENT PARTNER WORLDWIDE ALLOCATION FUND

Subadvised by Mercator Asset Management, LP, Principal Global Investors, LLC, Aberdeen Asset Managers Limited, DuPont Capital Management Corporation, and Goldman Sachs Asset Management, L.P.
The Fund seeks long-term capital growth.
The Fund primarily invests in equity and debt securities of issuers throughout the world. Foreign investments involve additional risks, including currency fluctuations, liquidity, political, economic and market instability, and different legal and accounting standards; these risks are magnified for investments in emerging markets. The value of the Fund is influenced by factors impacting the overall market, certain asset classes, certain investment styles, and specific issuers. The Fund may incur losses due to incorrect assessments of investments by its investment advisers. Small and medium-sized companies often have greater price volatility and less liquidity than larger companies. Large cap companies may be unable to respond quickly to new competitive challenges and may not be able to attain a high growth rate. Bond prices generally fall as interest rates rise. Credit risk is the risk that an issuer of a debt security may not pay its debt, and high yield securities are subject to increased credit risk as well as liquidity risk. The investment styles employed by the Fund’s sub-advisers may not be complementary.
How did the Fund perform during the 12-month period ended October 31, 2014?
Thrivent Partner Worldwide Allocation Fund earned a return of -0.89%, compared with the median return of its peer group, the Lipper International Multi-Cap Core Funds category, of 0.11%. The Fund’s market benchmark, the Morgan Stanley Capital International (MSCI) All Country World Index ex-USA, earned a return of 0.49%.
What factors affected the Fund’s performance?
Our investment process incorporates five distinct strategies, which allows the Fund to diversify its exposure across markets outside of the United States. Approximately 60% of the Fund’s assets are allocated to large-cap developed markets and split evenly between a growth-oriented manager and a value-oriented manager. An additional 15% of the Fund’s portfolio is allocated to small-cap European, Asian and Australian markets, otherwise known as EAFE markets. The remaining 25% of the Fund is allocated to emerging markets, of which 15% is invested in equities and the balance is invested in fixed-income securities. While the interplay among these markets has the most significant impact on the Fund’s returns, the performance of the respective management teams versus their sub-benchmarks also affects the Fund’s results against its benchmark and peer group.
During the period, the Fund’s large-cap growth manager provided excellent results relative to its benchmark; however, the large-cap value manager underperformed its category owing to an overweighting in the financial sector, particularly in Europe. Our emerging markets equity manager did not keep pace with its benchmark, while the manager of the emerging market debt segment provided a significant premium over its benchmark. Also, emerging market debt as a category outperformed both emerging and developed market equities during the period.
Generally speaking, all of the major international segments did not perform as well as the major indexes in the United States. The strength of the U.S. dollar versus most major currencies was an additional headwind for non-U.S. markets.
What is your outlook?
We believe the relative valuations of equities in non-U.S. markets are better than those found in the United States, where we have experienced excellent stock market returns since the end of the financial crisis in 2009. While most non-U.S. markets have moved higher, they have not kept pace with U.S. markets. Some of this underperformance is warranted due to the lack of a strong fundamental recovery in some foreign markets, uneven fiscal policies or shifts in economic fundamentals.
Generally, concerns about growth are a common theme both in terms of real economic growth as well as deflation, which the eurozone is flirting with and Japan has already encountered. China’s growth has also downshifted from the period of extremely high growth in the early 2000s to a more moderate mid-to-high single-digit level. While this growth level is more sustainable in the long run, the adjustment process has heightened concerns about chronic overinvestment. Many of these variables are likely to be resolved favorably over time, but in the near term present a period of heightened policy risks. While the fundamentals of corporate America are at their cyclical peaks, in many cases they are still at cyclically low levels outside the U.S., allowing much more room for improvement.
Quoted Fund performance is for Class A shares and does not reflect a sales charge.
The returns shown do not reflect taxes a shareholder would pay on distributions or redemptions.
30
| | | | |
| Portfolio Composition | | | | |
| (% of Portfolio) | | | | |
Common Stock | | | 88.0 | % |
Long-Term Fixed Income | | | 10.3 | % |
Short-Term Investments | | | 1.6 | % |
Preferred Stock | | | 0.1 | % |
| | | | |
Total | | | 100.0 | % |
| | | | |
| Major Market Sectors | | | | |
| (% of Net Assets) | | | | |
Financials | | | 23.2 | % |
Industrials | | | 14.9 | % |
Consumer Discretionary | | | 12.3 | % |
Materials | | | 8.2 | % |
Consumer Staples | | | 7.5 | % |
Health Care | | | 6.8 | % |
Information Technology | | | 6.7 | % |
Foreign Government | | | 6.5 | % |
Energy | | | 6.0 | % |
Telecommunications Services | | | 2.4 | % |
| | | | |
| Top 10 Countries | | | | |
| (% of Net Assets) | | | | |
Japan | | | 15.3 | % |
United Kingdom | | | 9.0 | % |
Switzerland | | | 7.7 | % |
France | | | 5.8 | % |
Germany | | | 4.5 | % |
Hong Kong | | | 3.7 | % |
Canada | | | 3.7 | % |
Australia | | | 3.6 | % |
Italy | | | 3.3 | % |
Netherlands | | | 3.3 | % |
Investments in securities in these countries represent 59.9% of the total net assets of the Fund. | | | | |
Quoted Major Market Sectors, Portfolio Composition and Top 10 Countries are subject to change.
The lists of Major Market Sectors and Top 10 Countries exclude short-term investments and collateral held for securities loaned.
The Portfolio Composition chart excludes collateral held for securities loaned.
| | | | | | | | | | | | |
Average Annual Total Returns1 | |
As of October 31, 2014 | |
Class A2 | | | 1-Year | | | | 5 Years | | |
| From
Inception
2/29/2008 |
|
| | |
without sales charge | | | -0.89 | % | | | 6.95 | % | | | 1.39 | % |
with sales charge | | | -6.35 | % | | | 5.74 | % | | | 0.53 | % |
| | | |
Institutional Class3 | | | 1-Year | | | | 5 Years | | |
| From
Inception
2/29/2008 |
|
| | |
Net Asset Value | | | -0.40 | % | | | 7.35 | % | | | 1.75 | % |
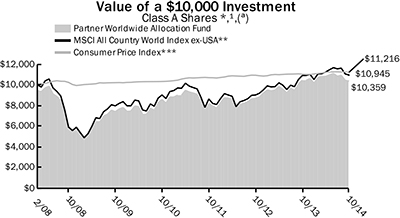
1 | Past performance is not an indication of future results. Average annual total returns represent past performance and reflect changes in share prices, the reinvestment of all dividends and capital gains, and the effects of compounding. The prospectus contains more complete information on the investment objectives, risks, charges and expenses of the investment company, which investors should read and consider carefully before investing. To obtain a prospectus, contact a registered representative or visit www.thrivent.com. At various times, the Fund’s adviser waived its management fee and/or reimbursed Fund expenses. Had the adviser not done so, the Fund’s total returns would have been lower. The returns shown do not reflect taxes a shareholder would pay on distributions or redemptions. Total investment return and principal value of your investment will fluctuate, and your shares, when redeemed, may be worth more or less than their original cost. Current performance may be higher or lower than the performance data quoted. Call 800-THRIVENT or visit www.thrivent.com for performance results current to the most recent month-end. |
2 | Class A performance with sales charge reflects the maximum sales charge of 5.5%. |
3 | Institutional Class shares have no sales load and are available to institutional shareholders and certain Thrivent sponsored programs. |
(a) | Performance of other classes will be greater or less than the line shown based on the differences in loads and fees paid by shareholders investing in the different classes. |
* | As you compare performance, please note that the Fund’s performance reflects the maximum 5.5% sales charge, while the MSCI All Country World Index ex-USA and the Consumer Price Index do not reflect any such charges. If you were to purchase any of the above individual securities represented in the Index, any charges you would pay would reduce your total return as well. |
** | The MSCI All Country World Index ex-USA is an unmanaged market capitalization-weighted index that is designed to represent the performance of developed and emerging stock markets throughout the world. It is not possible to invest directly in the Index. The performance of the Index does not reflect deductions for fees, expenses or taxes. |
*** | The Consumer Price Index is an inflationary indicator that measures the change in the cost of a fixed basket of products and services, including housing, electricity, food and transportation. It is not possible to invest directly in the Index. |
31
THRIVENT LARGE CAP GROWTH FUND
David C. Francis, CFA, Portfolio Manager
The Fund seeks long-term capital appreciation.
The Fund primarily invests in securities of large companies, which may be unable to respond quickly to new competitive challenges and may not be able to attain a high growth rate. The value of the Fund is influenced by factors impacting the overall market, certain asset classes, certain investment styles, and specific issuers. The Fund may incur losses due to incorrect assessments of investments by its investment adviser. Foreign investments involve additional risks, including currency fluctuations, liquidity, political, economic and market instability, and different legal and accounting standards.
How did the Fund perform during the 12-month period ended October 31, 2014?
Thrivent Large Cap Growth Fund earned a return of 17.10%, compared with the median return for its peer group, the Lipper Large Cap Growth Funds category, of 15.58%. The Fund’s market benchmark, the Russell 1000® Growth Index, earned a return of 17.11%.
What factors affected the Fund’s performance?
The primary factor benefiting the Fund’s performance over the period was good stock selection, with an additional contribution from modest sector and industry allocation decisions. Specifically, the Fund achieved strong returns from our positions in information technology, enhanced by an overweighting in the group as our holdings outperformed both the sector and the overall index. In the software and services industry, Facebook and LinkedIn were two strong performers, while our holding in Apple in the hardware segment also performed quite well. The information technology services industry also added to results with favorable performance from our positions in Visa and MasterCard. Both firms are often thought of as financial services companies, but are in fact categorized as technology companies. Offsetting some of those positive results were disappointing returns from our position in VMware.
Stock selection in the health care sector was the next most significant positive contributor to results. In biotechnology, our holding in Gilead Sciences performed extremely well due to the success of its new drug that provides a cure for hepatitis C. Covidien, in the health care equipment industry, also aided returns as it was the target of a merger offer from Medtronic. In the health care technology industry, Cerner also performed well over the period. However, our position in pharmaceutical manufacturer Perrigo did not perform well and we have since eliminated that position.
The Fund was underweighted in consumer staples as many of the companies in that sector, in our opinion, were fully valued or expensive. This underweighting aided the Fund’s return as the staples group underperformed the overall index.
Offsetting those positives were subpar returns from our holdings in the consumer discretionary sector. Amazon.com provided disappointing returns as the company’s significant spending on infrastructure build-out negatively impacted near-term earnings and cash flow expectations. We continue to believe Amazon.com will dominate the important eCommerce space and maintain our position. Las Vegas Sands also disappointed on the back of weakness in its Macau casino operations as China’s growth has slowed and other disruptive policies were put in place in that country.
In the retail sector, Kohl’s also disappointed as its new strategy has been slow to bring improved results to the company’s bottom line. Retail is an increasingly difficult industry and execution by Kohl’s within the space has been disappointing. New senior managers have been appointed from outside the company, but the expected turnaround has been slow to materialize. In the financial sector, we briefly held a position in Genworth Financial that declined sharply on the basis of increased reserves required to support its poorly designed long-term care business. It became apparent to us that this would be an ongoing issue and we quickly sold the position.
What is your outlook?
Equity markets have rallied strongly over the past two years on the back of modest earnings growth and the significant expansion of P/E ratios. We believe that valuations are at best full and in certain segments are quite high. Further stock market advances would most likely be a function of sustained earnings growth at the aggregate level, which we believe could occur, but will become incrementally more challenging. This is particularly true for the large-cap segment as so many of these companies’ sales are outside the U.S., and recent dollar strength has the potential to impede both sales and earnings growth. Profit margins are also extremely high. Some of that is a function of continued business model discipline, which can be sustained, while some of it is a function of low interest rates and low tax rates in offshore operations. Those have likely reached the limit of their contributions.
We believe the recovery will be sustained both in the U.S. and globally, aided by the recent declines in oil prices, but the risks are high. We continue to invest in companies that we believe have strong business models and excellent management teams that have been prudent shepherds of investors’ capital. The macroeconomic environment in the U.S. is better than most other countries, while geopolitical risks outside the U.S. are elevated.
Quoted Fund performance is for Class A shares and does not reflect a sales charge.
The returns shown do not reflect taxes a shareholder would pay on distributions or redemptions.
32
| | | | |
| Portfolio Composition | | | | |
| (% of Portfolio) | | | | |
Common Stock | | | 94.6 | % |
Short-Term Investments | | | 5.4 | % |
| | | | |
Total | | | 100.0 | % |
| | | | |
| Major Market Sectors | | | | |
| (% of Net Assets) | | | | |
Information Technology | | | 36.8 | % |
Consumer Discretionary | | | 19.9 | % |
Health Care | | | 16.5 | % |
Industrials | | | 10.4 | % |
Energy | | | 6.4 | % |
Financials | | | 3.5 | % |
Consumer Staples | | | 1.2 | % |
| | | | |
| Top 10 Holdings | | | | |
| (% of Net Assets) | | | | |
Apple, Inc. | | | 8.4 | % |
Gilead Sciences, Inc. | | | 5.1 | % |
Amazon.com, Inc. | | | 3.9 | % |
Facebook, Inc. | | | 3.8 | % |
Visa, Inc. | | | 3.5 | % |
QUALCOMM, Inc. | | | 3.3 | % |
Cerner Corporation | | | 3.2 | % |
Delta Air Lines, Inc. | | | 3.2 | % |
Union Pacific Corporation | | | 3.2 | % |
Google, Inc., Class A | | | 3.1 | % |
These securities represent 40.7% of the total net assets of the Fund. | | | | |
Quoted Major Market Sectors, Portfolio Composition and Top 10 Holdings are subject to change.
The lists of Major Market Sectors and Top 10 Holdings exclude short-term investments and collateral held for securities loaned.
The Portfolio Composition chart excludes collateral held for securities loaned.
| | | | | | | | | | | | |
Average Annual Total Returns1 | |
As of October 31, 2014 | |
Class A2 | | | 1-Year | | | | 5 Years | | | | 10 Years | |
| | |
without sales charge | | | 17.10 | % | | | 14.44 | % | | | 7.32 | % |
with sales charge | | | 10.71 | % | | | 13.14 | % | | | 6.71 | % |
| | | |
Institutional Class3 | | | 1-Year | | | | 5 Years | | | | 10 Years | |
| | |
Net Asset Value | | | 17.53 | % | | | 14.90 | % | | | 7.81 | % |
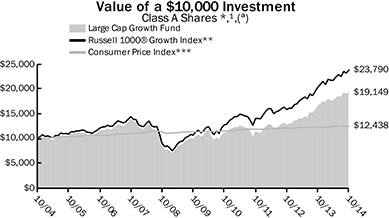
1 | Past performance is not an indication of future results. Average annual total returns represent past performance and reflect changes in share prices, the reinvestment of all dividends and capital gains, and the effects of compounding. The prospectus contains more complete information on the investment objectives, risks, charges and expenses of the investment company, which investors should read and consider carefully before investing. To obtain a prospectus, contact a registered representative or visit www.thrivent.com. At various times, the Fund’s adviser waived its management fee and/or reimbursed Fund expenses. Had the adviser not done so, the Fund’s total returns would have been lower. The returns shown do not reflect taxes a shareholder would pay on distributions or redemptions. Total investment return and principal value of your investment will fluctuate, and your shares, when redeemed, may be worth more or less than their original cost. Current performance may be higher or lower than the performance data quoted. Call 800-THRIVENT or visit www.thrivent.com for performance results current to the most recent month-end. |
2 | Class A performance with sales charge reflects the maximum sales charge of 5.5%. |
3 | Institutional Class shares have no sales load and are available to institutional shareholders and certain Thrivent sponsored programs. |
(a) | Performance of other classes will be greater or less than the line shown based on the differences in loads and fees paid by shareholders investing in the different classes. |
* | As you compare performance, please note that the Fund’s performance reflects the maximum 5.5% sales charge, while the Russell 1000® Growth Index and the Consumer Price Index do not reflect any such charges. If you were to purchase any of the above individual securities represented in the Index, any charges you would pay would reduce your total return as well. |
** | The Russell 1000® Growth Index measures the performance of large cap growth stocks. It is not possible to invest directly in the Index. The performance of the Index does not reflect deductions for fees, expenses or taxes. |
*** | The Consumer Price Index is an inflationary indicator that measures the change in the cost of a fixed basket of products and services, including housing, electricity, food and transportation. It is not possible to invest directly in the Index. |
33
THRIVENT LARGE CAP VALUE FUND
Kurt J. Lauber, CFA, Portfolio Manager
The Fund seeks to achieve long-term growth of capital.
The Fund primarily invests in securities of large companies, which may be unable to respond quickly to new competitive challenges and may not be able to attain a high growth rate. The value of the Fund is influenced by factors impacting the overall market, certain asset classes, certain investment styles, and specific issuers. The Fund may incur losses due to incorrect assessments of investments by its investment adviser. Foreign investments involve additional risks, including currency fluctuations, liquidity, political, economic and market instability, and different legal and accounting standards.
How did the Fund perform during the 12-month period ended October 31, 2014?
Thrivent Large Cap Value Fund earned a return of 12.00%, compared with the median return of its peer group, the Lipper Large Cap Value Funds category, of 14.41%. The Fund’s market benchmark, the Russell 1000® Value Index, earned a return of 16.46%.
What factors affected the Fund’s performance?
Stock selection was the cause of the Fund’s underperformance relative to its peer group and benchmark, as asset allocation decisions were slightly positive. Stock selection detracted in the technology, financial and industrial sectors, while results were favorable in utilities, consumer discretionary and energy.
In technology, the Fund benefited from an overweighting in the sector, especially in attractively valued, mature companies such as Microsoft, Cisco Systems and Texas Instruments. However, their favorable performance was not enough to offset the strong results from stocks we did not hold such as Hewlett-Packard, Apple and Intel. Furthermore, we held a position in security software firm Symantec in anticipation of a potential turnaround, which was derailed by the abrupt firing of the company’s CEO who was instrumental in the turnaround process.
In financials, our ownership of Bank of America was beneficial. However, an attempt to replicate a similar asset improvement story in Europe by buying Deutsche Bank detracted from returns. Also, the Fund briefly held Genworth Financial in order to benefit from an anticipated turnaround in its long-term care and mortgage insurance businesses, but this thesis was incorrect and we sold the stock quickly. Industrial performance was hurt by owning two construction and engineering companies, Jacobs Engineering Group and Fluor, as large capital infrastructure projects have been taking longer to materialize.
Our positive results in utilities were driven by outperformance from NiSource and Pacific Gas and Electric Company. NiSource benefited from the need for natural gas infrastructure in the Marcellus shale region, while its shares received an additional boost from the company’s announcement to spin off its natural gas pipeline business into a master limited partnership (MLP). In consumer discretionary, our general avoidance of auto manufacturers helped results, as did our position in auto parts company Delphi Automotive. Finally, the Fund benefited from our holding of medical device and supply firm Covidien as Medtronic made a bid for the company, which could create even greater shareholder value if completed.
What is your outlook?
As always, our focus is on stock selection and improving our execution in this area. Valuation is our first guide, but as differences in companies’ valuations have narrowed, we are placing more emphasis on improvements in corporate operating performance and incremental returns on invested capital. We believe our deep fundamental analysis approach will help identify companies that have improving operating performance and the catalysts to unlock value.
The two sectors where valuations remain low and company valuation spreads remain wide, thereby providing greater potential for stock selection, are technology and energy. Large, mature technology companies have low valuations because of below-normal technology spending, but also due to the fear of secular demise resulting from products becoming obsolete with the introduction of new technologies, such as cloud computing.
With low natural gas and oil prices driving shares lower, the energy sector has the potential to be an area of absolute positive performance, as well as favorable stock selection due to the wide valuation spreads among energy companies. We will continue to emphasize companies in poorly performing areas, such as exploration and production firms and equipment and services providers, so the fund continues to hold these names.
Quoted Fund performance is for Class A shares and does not reflect a sales charge.
The returns shown do not reflect taxes a shareholder would pay on distributions or redemptions.
34
| | | | |
| Portfolio Composition | | | | |
| (% of Portfolio) | | | | |
Common Stock | | | 97.0 | % |
Short-Term Investments | | | 3.0 | % |
| | | | |
Total | | | 100.0 | % |
| | | | |
| Major Market Sectors | | | | |
| (% of Net Assets) | | | | |
Financials | | | 22.9 | % |
Health Care | | | 14.7 | % |
Information Technology | | | 14.1 | % |
Energy | | | 12.4 | % |
Industrials | | | 9.1 | % |
Consumer Discretionary | | | 8.6 | % |
Consumer Staples | | | 6.6 | % |
Utilities | | | 3.6 | % |
Materials | | | 3.0 | % |
Telecommunications Services | | | 1.9 | % |
| | | | |
| Top 10 Holdings | | | | |
| (% of Net Assets) | | | | |
Citigroup, Inc. | | | 3.8 | % |
Cisco Systems, Inc. | | | 3.8 | % |
Merck & Company, Inc. | | | 3.6 | % |
Lowe’s Companies, Inc. | | | 3.1 | % |
CVS Health Corporation | | | 3.0 | % |
Bank of America Corporation | | | 3.0 | % |
MetLife, Inc. | | | 2.7 | % |
PG&E Corporation | | | 2.6 | % |
Total SA ADR | | | 2.5 | % |
Oracle Corporation | | | 2.4 | % |
These securities represent 30.5% of the total net assets of the Fund. | | | | |
Quoted Major Market Sectors, Portfolio Composition and Top 10 Holdings are subject to change.
The lists of Major Market Sectors and Top 10 Holdings exclude short-term investments and collateral held for securities loaned.
The Portfolio Composition chart excludes collateral held for securities loaned.
| | | | | | | | | | | | |
Average Annual Total Returns1 | |
As of October 31, 2014 | |
Class A2 | | | 1-Year | | | | 5 Years | | | | 10 Years | |
| | |
without sales charge | | | 12.00 | % | | | 13.64 | % | | | 7.14 | % |
with sales charge | | | 5.85 | % | | | 12.36 | % | | | 6.54 | % |
| | | |
Institutional Class3 | | | 1-Year | | | | 5 Years | | | | 10 Years | |
| | |
Net Asset Value | | | 12.47 | % | | | 14.21 | % | | | 7.71 | % |

1 | Past performance is not an indication of future results. Average annual total returns represent past performance and reflect changes in share prices, the reinvestment of all dividends and capital gains, and the effects of compounding. The prospectus contains more complete information on the investment objectives, risks, charges and expenses of the investment company, which investors should read and consider carefully before investing. To obtain a prospectus, contact a registered representative or visit www.thrivent.com. At various times, the Fund’s adviser waived its management fee and/or reimbursed Fund expenses. Had the adviser not done so, the Fund’s total returns would have been lower. The returns shown do not reflect taxes a shareholder would pay on distributions or redemptions. Total investment return and principal value of your investment will fluctuate, and your shares, when redeemed, may be worth more or less than their original cost. Current performance may be higher or lower than the performance data quoted. Call 800-THRIVENT or visit www.thrivent.com for performance results current to the most recent month-end. |
2 | Class A performance with sales charge reflects the maximum sales charge of 5.5%. |
3 | Institutional Class shares have no sales load and are available to institutional shareholders and certain Thrivent sponsored programs. |
(a) | Performance of other classes will be greater or less than the line shown based on the differences in loads and fees paid by shareholders investing in the different classes. |
* | As you compare performance, please note that the Fund’s performance reflects the maximum 5.5% sales charge, while the Russell 1000® Value Index and the Consumer Price Index do not reflect any such charges. If you were to purchase any of the above individual securities represented in the Index, any charges you would pay would reduce your total return as well. |
** | The Russell 1000® Value Index measures the performance of large cap value stocks. It is not possible to invest directly in the Index. The performance of the Index does not reflect deductions for fees, expenses or taxes. |
*** | The Consumer Price Index is an inflationary indicator that measures the change in the cost of a fixed basket of products and services, including housing electricity, food and transportation. It is not possible to invest directly in the Index. |
35
THRIVENT LARGE CAP STOCK FUND
David C. Francis, CFA, and Kurt J. Lauber, CFA, Portfolio Co-Managers
The Fund seeks long-term capital growth.
The Fund primarily invests in securities of large companies, which may be unable to respond quickly to new competitive challenges and may not be able to attain a high growth rate. The value of the Fund is influenced by factors impacting the overall market, certain asset classes, certain investment styles, and specific issuers. The Fund may incur losses due to incorrect assessments of investments by its investment adviser. Foreign investments involve additional risks, including currency fluctuations, liquidity, political, economic and market instability, and different legal and accounting standards.
How did the Fund perform during the 12-month period ended October 31, 2014?
Thrivent Large Cap Stock Fund earned a return of 11.06%, compared with the median return of its peer group, the Lipper Global Large Cap Core Funds category, of 8.55%. The Fund’s market benchmarks, the S&P 500 Index and the Russell Developed Large Cap Index, earned returns of 17.27% and 9.50%, respectively.
What factors affected the Fund’s performance?
Stock selection benefited the Fund’s performance over the reporting period. Allocations within both the domestic and non-U.S. segments of the Fund were neutral to their respective benchmarks; however, our active repositioning of the Fund’s portfolio into global large-cap companies was not rewarded in the reporting period as U.S. equities provided better returns than large-cap non-U.S. equities.
Information technology (IT) stocks provided the most positive contribution to returns. In the hardware industry, our overweighting in Apple was the most significant factor aiding results. In the IT services industry, holdings in both Twitter and Facebook proved beneficial. Positions within the health care sector were also significant positive contributors to results. We had particularly good returns from our holdings in the biotechnology industry, including Gilead Sciences, due to strong sales of its new drug that provides a cure for the hepatitis C disease. Amgen and Vertex Pharmaceuticals also provided positive contribution versus both the peer group and the Russell Developed Large Cap Index. Our holding in Australian company CSL Limited, which develops products derived from human plasma, performed well. In the health care services industry, our position in Express Scripts, a pharmacy benefit management company, achieved good results. In addition, health care equipment provider Covidian lifted returns as it was the target of a merger offer from Medtronic. However, a holding in pharmaceutical manufacturer Perrigo based in Ireland did not perform up to expectations and was sold.
In the financial sector, our holdings in the banking industry, specifically Wells Fargo and JPMorgan Chase, added to results as they both provided strong returns versus their sector and the Russell benchmark. Asset manager Invesco also performed well, lifted by the strong returns of equities over the past two years. However, some of these favorable results were offset by disappointing returns from our positions in Deutsche Bank in Germany and Genworth Financial in the insurance industry.
Our holdings in the utilities and materials segments also contributed positively during the period. In the former, strong returns were realized by our positions in NiSource, an East Coast-based energy holding company, and Pacific Gas and Electric Company on the West Coast, also providing energy services within its markets in California. In materials, Dow Chemical provided a strong return relative to its group and the Fund’s benchmarks. Two Japanese companies, Nippon Paint Holdings and NOK Corporation, also performed well. Additionally, an underweighted position in mining helped as the group performed quite poorly.
The Fund’s exposure to non-U.S. markets limited performance relative to U.S. indexes as overseas markets generally did not keep pace, particularly in Europe. Japan performed in line with the U.S. on a local currency basis, but that appreciation was all offset by yen weakness. Europe underperformed on both a euro and dollar basis.
What is your outlook?
We strongly believe that relative values favor large-cap non-U.S. companies. While many developed economies outside the U.S. are faced with challenges on the domestic front, the types of companies we purchase—large-cap global companies with significant sales outside domestic markets—should be beneficiaries of the strong dollar versus their respective currencies. We believe this will help to improve the global competitiveness of these companies. Additionally, many of these companies potentially may have far more room to recover profit margins and earnings, while the U.S. will increasingly face headwinds. Thus, our plan is to opportunistically increase our holdings in non-U.S. companies to take advantage of the valuation disparities.
Quoted Fund performance is for Class A shares and does not reflect a sales charge.
The returns shown do not reflect taxes a shareholder would pay on distributions or redemptions.
36
| | | | |
| Portfolio Composition | | | | |
| (% of Portfolio) | | | | |
Common Stock | | | 95.2 | % |
Short-Term Investments | | | 4.8 | % |
| | | | |
Total | | | 100.0 | % |
| | | | |
| Major Market Sectors | | | | |
| (% of Net Assets) | | | | |
Information Technology | | | 19.1 | % |
Financials | | | 16.5 | % |
Health Care | | | 14.4 | % |
Consumer Discretionary | | | 11.2 | % |
Energy | | | 9.1 | % |
Industrials | | | 8.8 | % |
Consumer Staples | | | 8.4 | % |
Utilities | | | 3.9 | % |
Materials | | | 2.7 | % |
Telecommunications Services | | | 1.1 | % |
| | | | |
| Top 10 Holdings | | | | |
| (% of Net Assets) | | | | |
Apple, Inc. | | | 5.0 | % |
Merck & Company, Inc. | | | 2.8 | % |
J.P. Morgan Chase & Company | | | 2.7 | % |
Johnson & Johnson | | | 2.7 | % |
Union Pacific Corporation | | | 2.6 | % |
Kimberly-Clark Corporation | | | 2.3 | % |
EMC Corporation | | | 2.2 | % |
Starbucks Corporation | | | 2.1 | % |
Citigroup, Inc. | | | 2.0 | % |
Philip Morris International, Inc. | | | 1.9 | % |
These securities represent 26.3% of the total net assets of the Fund. | | | | |
Quoted Major Market Sectors, Portfolio Composition and Top 10 Holdings are subject to change.
The lists of Major Market Sectors and Top 10 Holdings exclude short-term investments and collateral held for securities loaned.
The Portfolio Composition chart excludes collateral held for securities loaned.
| | | | | | | | | | | | |
| Average Annual Total Returns1 | |
| As of October 31, 2014 | |
Class A2 | | 1-Year | | | 5 Years | | | 10 Years | |
| |
without sales charge | | | 11.06 | % | | | 11.97 | % | | | 5.64 | % |
with sales charge | | | 4.96 | % | | | 10.71 | % | | | 5.04 | % |
| | | |
Institutional Class3 | | 1-Year | | | 5 Years | | | 10 Years | |
| |
Net Asset Value | | | 11.53 | % | | | 12.49 | % | | | 6.14 | % |
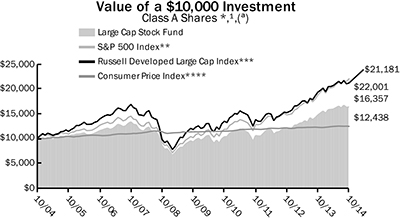
1 | Past performance is not an indication of future results. Average annual total returns represent past performance and reflect changes in share prices, the reinvestment of all dividends and capital gains, and the effects of compounding. The prospectus contains more complete information on the investment objectives, risks, charges and expenses of the investment company, which investors should read and consider carefully before investing. To obtain a prospectus, contact a registered representative or visit www.thrivent.com. At various times, the Fund’s adviser waived its management fee and/or reimbursed Fund expenses. Had the adviser not done so, the Fund’s total returns would have been lower. The returns shown do not reflect taxes a shareholder would pay on distributions or redemptions. Total investment return and principal value of your investment will fluctuate, and your shares, when redeemed, may be worth more or less than their original cost. Current performance may be higher or lower than the performance data quoted. Call 800-THRIVENT or visit www.thrivent.com for performance results current to the most recent month-end. |
2 | Class A performance with sales charge reflects the maximum sales charge of 5.5%. |
3 | Institutional Class shares have no sales load and are available to institutional shareholders and certain Thrivent sponsored programs. |
(a) | Performance of other classes will be greater or less than the line shown based on the differences in loads and fees paid by shareholders investing in the different classes. |
* | As you compare performance, please note that the Fund’s performance reflects the maximum 5.5% sales charge, while the S&P 500 Index, the Russell Developed Large Cap Index and the Consumer Price Index do not reflect any such charges. If you were to purchase any of the above individual securities represented in the Index, any charges you would pay would reduce your total return as well. |
** | The S&P 500 Index is an index that represents the average performance of a group of 500 widely held, publicly traded stocks. “S&P 500®” is a trademark of The McGraw-Hill Companies, Inc. and has been licensed for use by Thrivent Financial. The product is not sponsored, endorsed or promoted by Standard & Poor’s and Standard & Poor’s makes no representation regarding the advisability of investing in the product. It is not possible to invest directly in the Index. The performance of the Index does not reflect deductions for fees, expenses or taxes. |
*** | The Russell Developed Large Cap Index measures the large-cap segment of the developed equity universe. It is not possible to invest directly in the Index. The performance of the Index does not reflect deductions for fees, expenses or taxes. |
**** | The Consumer Price Index is an inflationary indicator that measures the change in the cost of a fixed basket of products and services, including housing, electricity, food and transportation. It is not possible to invest directly in the Index. |
37
THRIVENT HIGH YIELD FUND
Paul J. Ocenasek, CFA, Portfolio Manager
The Fund seeks high current income and, secondarily, growth of capital.
The Fund primarily invests in high-yield, high-risk bonds, notes, debentures and other debt obligations, or preferred stocks. Credit risk is the risk that an issuer of a debt security may not pay its debt, and high yield securities are subject to increased credit risk as well as liquidity risk. Bond prices generally fall as interest rates rise. Leveraged loans are subject to numerous risks, including liquidity, credit, declines in the value of collateral underlying them, and detrimental legal actions against them. The value of the Fund is influenced by factors impacting the overall market, certain asset classes, certain investment styles, and specific issuers. The Fund may incur losses due to incorrect assessments of investments by its investment adviser. Foreign investments involve additional risks, including currency fluctuations, liquidity, political, economic and market instability, and different legal and accounting standards.
How did the Fund perform during the 12-month period ended October 31, 2014?
Thrivent High Yield Fund earned a return of 4.72%, compared with the median return of its peer group, the Lipper U.S. High Current Yield Funds category, of 4.63%. The Fund’s market benchmark, the Barclays U.S. Corporate High Yield Bond Index, earned a return of 5.82%.
What factors affected the Fund’s performance?
The high-yield market performed well for the first seven months of the fiscal year as the yield spread between high-yield bonds and Treasuries tightened from 4.15% to 3.23% by June. However, in early summer, a confluence of factors caused a spike in market volatility, including: concerns about a sooner-than-expected Federal Reserve (Fed) rate hike; signs of economic deceleration in Europe and China; and geopolitical issues in the Middle East and Africa. The U.S. dollar strengthened dramatically while the price of oil and other commodities dropped significantly. As risk aversion surged, investors exited the high-yield market, and the yield spread widened out to 4.90% by mid-October. In the final two weeks of the fiscal year, spreads tightened back to where they started a year ago as investors returned to both equities and high yield.
With the dramatic decline in oil and commodity prices, the entire energy sector performed poorly, particularly drillers, oil services and exploration and production companies. Likewise, the metals and mining industry underperformed, particularly coal and iron ore. The gaming sector was also weak mainly due to a large bond issuer in distress.
In a reversal from last year, the higher-quality segments of high yield outperformed lower quality. BB-rated bonds posted an average return of 7.18%, while B-rated and CCC-rated securities gained 5.17% and 4.78%, respectively. BB-rated securities, which tend to have longer durations, benefited as longer-term interest rates fell and risk aversion increased.
The Fund ended the fiscal year slightly above the median return of its peer group. While the Fund’s CCC-underweighting hindered relative results through June, this positioning served the Fund well later in the period as many lower-rated securities in the market never recovered from the sell off. Performance also benefited from an underweighted position in retail, including no exposure to several large retailers in distress. Security selection was also favorable in technology as fairly sizable positions in First Data and Dell Computer performed well. In addition, we added value by avoiding securities that ran into problems in the energy and mining industries.
Much of the Fund’s underperformance versus the Barclays benchmark was the result of its lower exposure to BB-rated securities versus the index. The Fund’s overweighted position and credit selection in gaming was also detrimental. Although we had no exposure to Caesars Entertainment, a large issuer in distress, the Fund had other credit problems in the gaming industry. Underweightings in electric utilities and financials were also modest drags on results as both sectors outperformed the index.
What is your outlook?
Despite the slowdowns in Europe and China, we expect to see U.S. GDP growth around 2.5% to 3.0%, which should provide a fairly solid fundamental backdrop for the high-yield market. We believe high-yield default rates may tick up slightly from last year’s historic lows that were in the 2% to 3% range, but not materially higher. With spreads versus Treasuries back to around 4%, there is not a lot of room for further tightening. Therefore, high-yield returns over the next few years will likely be more coupon-like and lower than the past five years.
We are positioning the Fund somewhat defensively with a 5% to 6% underweighting in the CCC-rated market tier. We believe this underweighting is prudent given that we are six years into the current bull market and investors appear more cautious regarding lower quality. We also remain fairly defensive in energy as the situation with oil prices plays out; however, we will watch for attractive opportunities among names that have sold off in that sector. The Fund continues to have a bias toward the health care sector, while remaining underweighted in consumer cyclicals. Given how much rates have rallied, we continue to position the Fund with a slightly shorter duration, or level of interest-rate sensitivity, than its peers. We are also maintaining an approximately 5% weighting in floating-rate bank loans to protect against potentially higher rates.
Quoted Fund performance is for Class A shares and does not reflect a sales charge.
The returns shown do not reflect taxes a shareholder would pay on distributions or redemptions.
38
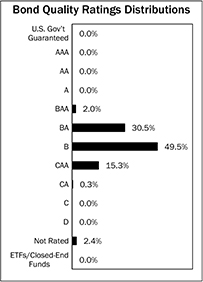
| | | | |
| Major Market Sectors | | | | |
| (% of Net Assets) | | | | |
Communications Services | | | 20.6 | % |
Consumer Cyclical | | | 13.4 | % |
Energy | | | 12.1 | % |
Consumer Non-Cyclical | | | 9.9 | % |
Capital Goods | | | 8.4 | % |
Financials | | | 8.4 | % |
Basic Materials | | | 7.0 | % |
Technology | | | 5.9 | % |
Transportation | | | 4.7 | % |
Utilities | | | 4.1 | % |
| |
| Top 10 Holdings | | | | |
| (% of Net Assets) | | | | |
Sprint Communications, Inc. | | | 1.1 | % |
Icahn Enterprises, LP | | | 0.9 | % |
Intelsat Jackson Holdings SA | | | 0.9 | % |
Clear Channel Communications, Inc., Term Loan | | | 0.9 | % |
WideOpenWest Finance, LLC | | | 0.8 | % |
Choice Hotels International, Inc. | | | 0.8 | % |
Hexion US Finance Corporation/Hexion Nova Scotia Finance ULC | | | 0.7 | % |
First Data Corporation, Term Loan | | | 0.7 | % |
Eldorado Resorts, LLC | | | 0.7 | % |
McGraw-Hill Global Education Holdings, LLC | | | 0.7 | % |
These securities represent 8.2% of the total net assets of the Fund.
Bond quality ratings are obtained from Moody’s Investors Service, Inc. (“Moody’s”) and Standard & Poor’s Ratings Services (“S&P”). Ratings from S&P, when used, are converted into their equivalent Moody’s ratings. If Moody’s and S&P have assigned different ratings to a security, the lowest rating for the security is used. Investments in derivatives and short-term investments are not reflected in the table.
Quoted Major Market Sectors, Bond Quality Ratings Distributions and Top 10 Holdings are subject to change.
The lists of Major Market Sectors and Top 10 Holdings exclude short-term investments and collateral held for securities loaned.
| | | | | | | | | | | | |
| Average Annual Total Returns1 | |
| As of October 31, 2014 | |
Class A2 | | 1-Year | | | 5 Years | | | 10 Years | |
| |
without sales charge | | | 4.72 | % | | | 9.59 | % | | | 7.20 | % |
with sales charge | | | 0.00 | % | | | 8.58 | % | | | 6.71 | % |
| | | |
Institutional Class3 | | 1-Year | | | 5 Years | | | 10 Years | |
| |
Net Asset Value | | | 5.05 | % | | | 10.02 | % | | | 7.65 | % |
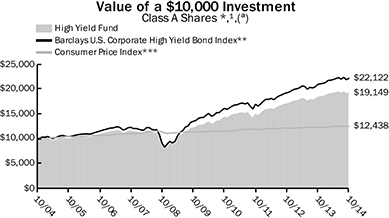
1 | Past performance is not an indication of future results. Average annual total returns represent past performance and reflect changes in share prices, the reinvestment of all dividends and capital gains, and the effects of compounding. The prospectus contains more complete information on the investment objectives, risks, charges and expenses of the investment company, which investors should read and consider carefully before investing. To obtain a prospectus, contact a registered representative or visit www.thrivent.com. At various times, the Fund’s adviser waived its management fee and/or reimbursed Fund expenses. Had the adviser not done so, the Fund’s total returns would have been lower. The returns shown do not reflect taxes a shareholder would pay on distributions or redemptions. Total investment return and principal value of your investment will fluctuate, and your shares, when redeemed, may be worth more or less than their original cost. Current performance may be higher or lower than the performance data quoted. Call 800-THRIVENT or visit www.thrivent.com for performance results current to the most recent month-end. |
2 | Class A performance with sales charge reflects the maximum sales charge of 4.5%. |
3 | Institutional Class shares have no sales load and are available to institutional shareholders and certain Thrivent sponsored programs. |
(a) | Performance of other classes will be greater or less than the line shown based on the differences in loads and fees paid by shareholders investing in the different classes. |
* | As you compare performance, please note that the Fund’s performance reflects the maximum 4.5% sales charge, while the Barclays U.S. Corporate High Yield Bond Index and the Consumer Price Index do not reflect any such charges. If you were to purchase any of the above individual securities represented in the Index, any charges you would pay would reduce your total return as well. |
** | The Barclays U.S. Corporate High Yield Bond Index is an index which measures the performance of fixed-rate non-investment grade bonds. It is not possible to invest directly in the Index. The performance of the Index does not reflect deductions for fees, expenses or taxes. |
*** | The Consumer Price Index is an inflationary indicator that measures the change in the cost of a fixed basket of products and services, including housing, electricity, food and transportation. It is not possible to invest directly in the Index. |
39
THRIVENT INCOME FUND
Stephen D. Lowe, CFA, Portfolio Manager
The Fund seeks high current income while preserving principal and, secondarily, long-term growth of capital.
The Fund primarily invests in investment-grade corporate bonds, government bonds, asset-backed securities and mortgage-backed securities. The value of the Fund is influenced by factors impacting the overall market, certain asset classes, certain investment styles, and specific issuers. The Fund may incur losses due to incorrect assessments of investments by its investment adviser. Bond prices generally fall as interest rates rise. Credit risk is the risk that an issuer of a debt security may not pay its debt, and high yield securities are subject to increased credit risk as well as liquidity risk. The value of mortgage-related and other asset-backed securities will be influenced by the factors affecting the housing market and the assets underlying such securities. Foreign investments involve additional risks, including currency fluctuations, liquidity, political, economic and market instability, and different legal and accounting standards. The prices of futures contracts can be highly volatile and the loss from investing in them can exceed the initial investment.
How did the Fund perform during the 12-month period ended October 31, 2014?
Thrivent Income Fund earned a return of 5.79%, compared with the median return of its peer group, the Lipper Corporate Debt Funds BBB-Rated category, of 5.57%. The Fund’s market benchmark, the Barclays U.S. Aggregate Bond Index, earned a return of 4.14%.
What factors affected the Fund’s performance?
With a backdrop of falling U.S. unemployment and economic growth of around 2.5%, the bond market began to price in future interest rate hikes by the Federal Reserve (Fed). Not surprisingly, short-term rates inched up, for example, as five-year Treasury rates rose 0.28% over the fiscal year period. At the same time, however, a fairly substantial decline in longer-term rates was not anticipated by the market as rates on 30-year Treasuries fell 0.59% over the same time frame. The result was a significant flattening of the Treasury yield curve and outperformance for longer-duration fixed-income assets. Investment-grade corporates performed well as these securities tend to be more rate sensitive and get a boost when longer-term rates, in particular, go down. The yield spread between investment-grade bonds and Treasuries also narrowed moderately, helping to drive outperformance for the segment. High-yield corporates, which typically have shorter maturities, also performed well owing to their higher coupons; however, they modestly trailed investment-grade corporates as spreads remained largely unchanged for the period as a whole.
The one area that detracted over the fiscal year was the Fund’s approximately 4% weight in leveraged loans, which we hold as a hedge in case short-term rates rise. Leveraged loans have floating interest rates that adjust based on LIBOR (London Interbank Offered Rate), making their prices less sensitive to rate increases. However, these securities underperformed during this period as LIBOR barely moved and the asset class suffered from mutual fund outflows.
The Fund outpaced both the peer group and benchmark primarily due to our corporate bond exposure. An overweighted position in investment-grade corporates, which comprised about 67% of the Fund’s portfolio, was the primary driver of outperformance. The Fund also benefited from industry and credit selection within investment grade, including strongly performing positions in the financial sector. In addition, performance was helped by our emphasis on higher-quality, BB-rated securities within the Fund’s high-yield exposure of around 15%. BB-rated bonds, which tend to have longer durations, outperformed lower-quality BB and CCC securities due to the market’s general risk aversion and their greater degree of interest-rate sensitivity.
Within the Fund’s securitized holdings, our approximately 3% weighting in government-backed agency mortgages, which is about half of the peer group’s weight, proved beneficial as this segment underperformed the broader market. Also, on the margin, the Fund’s small exposure to nonagency residential mortgages helped results as these securities once again appreciated significantly more than the market over this time frame. An underweighted position in short maturity Treasuries also aided results.
What is your outlook?
We expect the U.S. to remain the bright spot with its moderate economic growth in the otherwise lackluster global growth environment in Europe, China and emerging markets. With the Fed’s QE3 program officially ending in October, we would expect policymakers to begin raising rates in mid-2015. We believe slowing global growth plus a stronger dollar will keep inflation in check and well below the Fed’s unofficial 2% target. While short-term rates are likely to go up, we do not expect a sharp increase, especially at the longer end of the yield curve.
As liquidity is withdrawn from the system, we will likely see increased bouts of volatility as the markets adjust to a different environment. We are positioning the Fund for further yield curve flattening with a short to neutral duration (interest-rate sensitivity). We are also maintaining the Fund’s overweightings in the corporate bond segments and will use any sell offs to add to our exposure.That being said, we expect to see more coupon-like returns in the corporate markets that are lower than the past few years.
Quoted Fund performance is for Class A shares and does not reflect a sales charge.
The returns shown do not reflect taxes a shareholder would pay on distributions or redemptions.
40
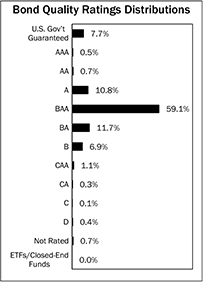
| | | | |
| Major Market Sectors | | | | |
| (% of Net Assets) | | | | |
Financials | | | 31.0 | % |
Communications Services | | | 13.2 | % |
Energy | | | 8.5 | % |
Consumer Non-Cyclical | | | 8.4 | % |
Utilities | | | 6.2 | % |
Consumer Cyclical | | | 5.8 | % |
Basic Materials | | | 4.9 | % |
U.S. Government and Agencies | | | 4.3 | % |
Transportation | | | 3.2 | % |
Mortgage-Backed Securities | | | 3.2 | % |
| | | | |
| Top 10 Holdings | | | | |
| (% of Net Assets) | | | | |
Federal National Mortgage Association Conventional 30-Yr. Pass Through | | | 1.2 | % |
Federal National Mortgage Association Conventional 30-Yr. Pass Through | | | 0.9 | % |
U.S. Treasury Notes | | | 0.8 | % |
U.S. Treasury Bonds | | | 0.6 | % |
U.S. Treasury Notes | | | 0.6 | % |
U.S. Treasury Notes | | | 0.5 | % |
Verizon Communications, Inc. | | | 0.4 | % |
DIRECTV Holdings, LLC | | | 0.4 | % |
American Tower Corporation | | | 0.4 | % |
U.S. Treasury Bonds, TIPS | | | 0.4 | % |
These securities represent 6.2% of the total net assets of the Fund.
Bond quality ratings are obtained from Moody’s Investors Service, Inc. (“Moody’s”) and Standard & Poor’s Ratings Services (“S&P”). Ratings from S&P, when used, are converted into their equivalent Moody’s ratings. If Moody’s and S&P have assigned different ratings to a security, the lowest rating for the security is
used. Investments in derivatives and short-term investments are not reflected in the table.
Quoted Major Market Sectors, Bond Quality Ratings Distributions and Top 10 Holdings are subject to change.
The lists of Major Market Sectors and Top 10 Holdings exclude short-term investments and collateral held for securities loaned.
| | | | | | | | | | | | |
| Average Annual Total Returns1 | |
| As of October 31, 2014 | |
Class A2 | | 1-Year | | | 5 Years | | | 10 Years | |
| |
without sales charge | | | 5.79 | % | | | 6.83 | % | | | 5.03 | % |
with sales charge | | | 1.01 | % | | | 5.86 | % | | | 4.54 | % |
| | | |
Institutional Class3 | | 1-Year | | | 5 Years | | | 10 Years | |
| |
Net Asset Value | | | 6.29 | % | | | 7.27 | % | | | 5.46 | % |
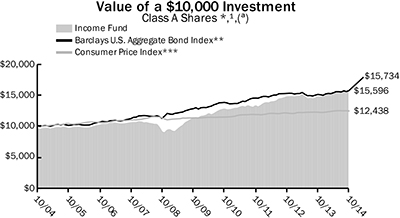
1 | Past performance is not an indication of future results. Average annual total returns represent past performance and reflect changes in share prices, the reinvestment of all dividends and capital gains, and the effects of compounding. The prospectus contains more complete information on the investment objectives, risks, charges and expenses of the investment company, which investors should read and consider carefully before investing. To obtain a prospectus, contact a registered representative or visit www.thrivent.com. At various times, the Fund’s adviser waived its management fee and/or reimbursed Fund expenses. Had the adviser not done so, the Fund’s total returns would have been lower. The returns shown do not reflect taxes a shareholder would pay on distributions or redemptions. Total investment return and principal value of your investment will fluctuate, and your shares, when redeemed, may be worth more or less than their original cost. Current performance may be higher or lower than the performance data quoted. Call 800-THRIVENT or visit www.thrivent.com for performance results current to the most recent month-end. |
2 | Class A performance with sales charge reflects the maximum sales charge of 4.5%. |
3 | Institutional Class shares have no sales load and are available to institutional shareholders and certain Thrivent sponsored programs. |
(a) | Performance of other classes will be greater or less than the line shown based on the differences in loads and fees paid by shareholders investing in the different classes. |
* | As you compare performance, please note that the Fund’s performance reflects the maximum 4.5% sales charge, while the Barclays U.S. Aggregate Bond Index and the Consumer Price Index do not reflect any such charges. If you were to purchase any of the above individual securities represented in the Index, any charges you would pay would reduce your total return as well. |
** | The Barclays U.S. Aggregate Bond Index is an index that measures the performance of U.S. investment grade bonds. It is not possible to invest directly in the Index. The performance of the Index does not reflect deductions for fees, expenses or taxes. |
*** | The Consumer Price Index is an inflationary indicator that measures the change in the cost of a fixed basket of products and services, including housing, electricity, food and transportation. It is not possible to invest directly in the Index. |
41
THRIVENT MUNICIPAL BOND FUND
Janet I. Grangaard, CFA, Portfolio Manager
The Fund seeks a high level of current income exempt from federal income taxes, consistent with capital preservation.*
The Fund primarily invests in municipal bonds, the income of which is exempt from federal income taxation. Municipal bonds are subject to credit risk, which is the risk that an issuer of a bond to which the Fund is exposed may no longer be able to pay its debt. Bond prices generally fall as interest rates rise. Changes in federal income tax laws or rates may affect both the net asset value of the Fund and the taxable equivalent interest generated from securities in the Fund. The value of the Fund is influenced by factors impacting the overall market, municipal bonds, and specific issuers. The Fund may incur losses due to incorrect assessments of investments by its investment adviser.
How did the Fund perform during the 12-month period ended October 31, 2014?
Thrivent Municipal Bond Fund earned a return of 8.33%, compared with the median return of its peer group, the Lipper General Municipal Debt Funds category, of 9.00%. The Fund’s market benchmark, the Barclays Municipal Bond Index, earned a return of 7.82%.
What factors affected the Fund’s performance?
The municipal market reversed course again this fiscal year as inflows returned to the segment, albeit not as heavy as two years ago. Interest rates on long-maturity bonds retraced almost all of last year’s increase as yields for AAA-rated, 30-year municipal bonds fell from 4.04% to 2.98%. At the same time, yields on similarly rated municipal securities with maturities of less than five years remained anchored and rose less than 0.10%. The result was a flattening of the municipal yield curve, which positively impacted returns for bonds, especially those with longer maturities. Municipal bonds also outperformed Treasuries as yields fell further in the municipal market. As credit spreads narrowed, lower-grade municipal securities generally outperformed higher-quality bonds.
Bond prices were further supported by the ongoing decrease in new issue supply in the face of increasing demand. The total supply of municipal bonds was down in 2013 compared to 2012 and is projected to fall even further for calendar year 2014. Local governments and municipalities continued to be reluctant to issue new debt for projects, but instead refinanced existing debt at lower rates.
The Fund underperformed the Lipper median due to our underweighting in BBB-rated securities, which outperformed higher-rated bonds. An overweighting to pre-refunded bonds also hindered results because of the short duration and very high-quality nature of these securities. In addition, we sold the Fund’s remaining Puerto Rico position, which represented less than 0.50% of its assets, at a disadvantageous time.
The Fund outperformed its benchmark as the Fund benefited from holdings in the toll road, higher education and airport sectors. In these revenue bond sectors, we typically own longer-duration securities that benefit more from narrowing credit spreads. Massachusetts and Ohio were the Fund’s best-performing states because we owned a number of long-duration and noncallable bonds from issuers such as the Massachusetts Institute of Technology and the Ohio Turnpike. The Fund’s exposure to zero-coupon bonds was also beneficial due to their long durations. Because zero-coupon bonds were particularly inexpensive at the beginning of the period, they gained more from price appreciation as rates fell.
What is your outlook?
We expect the U.S. economy will continue to grow, unemployment will steadily improve, and inflation will not be a problem, at least in the near term. We believe the Federal Reserve will increase short-term rates sometime in 2015. At this stage, the implications of recent mid-term elections are unclear as the Republican Party now controls both the House and Senate. Republicans could attempt to reform the tax code or change the Affordable Care Act, which could negatively impact the entire market or the health care sector in particular; however, it remains questionable whether any such measures could pass. We expect the transportation sector to perform well, particularly toll roads, airports and ports, in light of the recent dramatic decrease in fuel costs combined with ongoing economic growth.
We see the potential for municipal bond supply to increase next year as budgets continue to improve at state and local levels. Voters also appeared to be more receptive to a number of new bond proposals on recent election ballots across the country. In addition, pre-refunding activity has started to increase as bonds issued at higher rates in 2008 and 2009, which typically cannot be called yet, are being escrowed with U.S. Treasuries to their first call date, immediately increasing their credit quality and price.
We will continue to carefully monitor all states and municipalities as we have seen quite a divergence in performance over the past year. Credit agencies upgraded California as it made significant improvements in its budgeting practices and rainy day fund, while New Jersey and Illinois continued to struggle with downgrades due to their mismanagement of state budgets and pension costs. Recent events in the municipal bond market emphasize the importance of rigorous bottom-up credit selection as bondholders may be forced to take less than they are owed in the rare event of a default. We remain focused on finding attractive credits to hold for the long term that can generate consistent, competitive tax-exempt income for our shareholders.
*Investors may be subject to state taxes, the federal alternative minimum tax and capital gains taxes.
Quoted Fund performance is for Class A shares and does not reflect a sales charge.
The returns shown do not reflect taxes a shareholder would pay on distributions or redemptions.
42
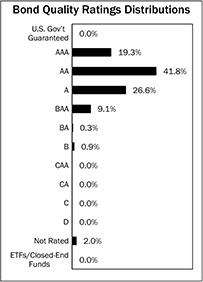
| | | | |
| Major Market Sectors | | | | |
| (% of Net Assets) | | | | |
Transportation | | | 17.2 | % |
General Obligation | | | 17.0 | % |
Other Revenue | | | 15.3 | % |
Education | | | 13.1 | % |
Health Care | | | 11.2 | % |
Escrowed/Pre-refunded | | | 9.9 | % |
Water & Sewer | | | 4.9 | % |
Tax Revenue | | | 3.8 | % |
Electric Revenue | | | 3.2 | % |
Industrial Development Revenue | | | 2.8 | % |
| | | | |
| Top 10 States | | | | |
| (% of Net Assets) | | | | |
California | | | 13.2 | % |
Texas | | | 11.2 | % |
Illinois | | | 8.0 | % |
New York | | | 6.9 | % |
Washington | | | 4.7 | % |
Florida | | | 4.7 | % |
Ohio | | | 4.6 | % |
Massachusetts | | | 4.5 | % |
Colorado | | | 4.3 | % |
Pennsylvania | | �� | 3.8 | % |
Investments in securities in these States represent 65.9% of the total net assets of the Fund.
Bond quality ratings are obtained from Moody’s Investors Service, Inc. (“Moody’s”) and Standard & Poor’s Ratings Services (“S&P”). Ratings from S&P, when used, are converted into their equivalent Moody’s ratings. If Moody’s and S&P have assigned different ratings to a security, the lowest rating for the security is used. Investments in derivatives and short-term investments are not reflected in the table.
Quoted Major Market Sectors, Bond Quality Ratings Distributions and Top 10 States are subject to change.
The lists of Major Market Sectors and Top 10 States exclude short-term investments.
| | | | | | |
| Average Annual Total Returns1 |
| As of October 31, 2014 |
Class A2 | | 1-Year | | 5 Years | | 10 Years |
|
without sales charge | | 8.33% | | 5.00% | | 4.38% |
with sales charge | | 3.43% | | 4.04% | | 3.90% |
| | | |
Institutional Class3 | | 1-Year | | 5 Years | | 10 Years |
|
Net Asset Value | | 8.61% | | 5.27% | | 4.66% |
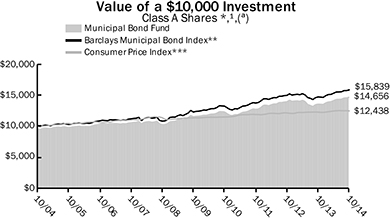
1 | Past performance is not an indication of future results. Average annual total returns represent past performance and reflect changes in share prices, the reinvestment of all dividends and capital gains, and the effects of compounding. The prospectus contains more complete information on the investment objectives, risks, charges and expenses of the investment company, which investors should read and consider carefully before investing. To obtain a prospectus, contact a registered representative or visit www.thrivent.com. At various times, the Fund’s adviser waived its management fee and/or reimbursed Fund expenses. Had the adviser not done so, the Fund’s total returns would have been lower. The returns shown do not reflect taxes a shareholder would pay on distributions or redemptions. Total investment return and principal value of your investment will fluctuate, and your shares, when redeemed, may be worth more or less than their original cost. Current performance may be higher or lower than the performance data quoted. Call 800-THRIVENT or visit www.thrivent.com for performance results current to the most recent month-end. |
2 | Class A performance with sales charge reflects the maximum sales charge of 4.5%. |
3 | Institutional Class shares have no sales load and are available to institutional shareholders and certain Thrivent sponsored programs. |
(a) | Performance of other classes will be greater or less than the line shown based on the differences in loads and fees paid by shareholders investing in the different classes. |
* | As you compare performance, please note that the Fund’s performance reflects the maximum 4.5% sales charge, while the Barclays Municipal Bond Index and the Consumer Price Index do not reflect any such charges. If you were to purchase any of the above individual securities represented in the Index, any charges you would pay would reduce your total return as well. |
** | The Barclays Municipal Bond Index is a market-value-weighted index of investment-grade municipal bonds with maturities of one year or more. It is not possible to invest directly in the Index. The performance of the Index does not reflect deductions for fees, expenses or taxes. |
*** | The Consumer Price Index is an inflationary indicator that measures the change in the cost of a fixed basket of products and services, including housing, electricity, food and transportation. It is not possible to invest directly in the Index. |
43
THRIVENT GOVERNMENT BOND FUND
Michael G. Landreville, CFA and CPA (inactive), Portfolio Manager
The Fund seeks total return, consistent with preservation of capital.
The Fund primarily invests in securities issued or guaranteed by the U.S. government or its agencies and instrumentalities. The value of the Fund is influenced by factors impacting the overall market, debt securities in particular, and the U.S. government. The Fund may incur losses due to incorrect assessments of investments by its investment adviser. The value of U.S. government securities may be affected by changes in the credit rating of the U.S. government. Certain U.S. government securities are not backed by the full faith and credit of the U.S. government. Bond prices generally fall as interest rates rise. Inflation-linked debt securities, such as TIPS, are subject to the effects of changes in market interest rates caused by factors other than inflation (real interest rates). The value of mortgage-related and other asset-backed securities will be influenced by the factors affecting the housing market and the assets underlying such securities.
How did the Fund perform during the 12-month period ended October 31, 2014?
Thrivent Government Bond Fund earned a return of 2.56%, compared with the median return of its peer group, the Lipper General U.S. Government Funds category, of 2.85%. The Fund’s market benchmarks, the Barclays U.S. Agency Index and the Barclays U.S. Treasury Index, earned returns of 2.45% and 2.78%, respectively.
What factors affected the Fund’s performance?
After months of “taper tantrums” in the financial markets brought about by Federal Reserve (Fed) discussions surrounding the tapering of its quantitative easing (QE3) program, the reductions in monthly asset purchases officially began in January 2014. While this marked the first step in the Central Bank’s plan to slowly normalize U.S. monetary policy, Fed policymakers kept reiterating the need to keep short-term rates low throughout the reporting period. U.S. gross domestic product (GDP) numbers averaged around the mid-2% range where they have been since the recovery began in 2009. This economic growth combined with gradually falling unemployment caused the bond market to begin pricing in a Fed interest-rate tightening cycle commencing in 2015.
Not surprisingly, short-term rates increased, for example, as five-year Treasury yields went from 1.33% to 1.61% over the Fund’s fiscal year. At the same time, however, a fairly substantial decline in longer-term rates was not anticipated by the market as yields on 10-year Treasuries dropped from 2.56% to 2.34% and 30-year Treasuries fell even further from 3.64% to 3.07%. The result was a significant flattening of the Treasury yield curve and outperformance for longer-duration Treasuries. Generally speaking, however, interest-rate volatility was fairly muted throughout the fiscal year relative to historical averages.
Treasury Inflation Protected Securities (TIPS) struggled during the period as the stronger dollar, the significant drop in oil and commodity prices, and a more hawkish tone by the Fed led to concerns about lower inflation. Signs of disinflation also appeared overseas in the U.K. and the eurozone. As a result, the demand for inflation protection decreased resulting in significant outflows from the TIPS asset class. The Barclays TIPS Index returned 2.00% over the reporting period.
The Fund is comprised solely of U.S. government and agency securities, with approximately 40% of the portfolio in U.S. Treasuries, 40% in government agency debt issued primarily by Fannie Mae, Freddie Mac and other agencies, 10% in agency mortgage-backed securities, and 10% in TIPS. The main factor that hindered the Fund’s relative results versus its Lipper peer group and the Barclays U.S. Treasury Index was its TIPS exposure, due to that segment’s underperformance over the period. The Fund’s results were modestly higher than the Barclays U.S. Agency Index as our exposure to higher-yielding agency mortgage-backed holdings outperformed other agency debt. The Fund also benefited from its slightly higher weighting in longer-maturity assets.
What is your outlook?
We expect U.S. economic growth to remain positive but muted around the 2% level, while weaker global growth and the stronger dollar will help keep inflation well contained. If we see another year of growth and U.S. unemployment falling to 5%, the Fed will have met its objective of full employment in a low inflationary environment. With the QE3 program officially ending in October, we anticipate the Fed will begin raising the federal funds rate in mid-to-late 2015, but at a very gradual and measured pace.
Based on our outlook, we believe the Treasury yield curve will flatten further as rates for 10-year-and-longer maturities stay range-bound, while two-to-five-year rates move higher. This will likely result in a more difficult environment for shorter-maturity assets, while securities with maturities longer than five years will likely outperform. Despite the end of the Fed’s monthly purchases, we expect the agency mortgage-backed securities segment to continue to perform well in the coming year. We also believe that energy prices and the TIPS market have likely bottomed and will start rebounding in the coming months.
Because this Fund is intended to serve as a conservative and defensive investment, we do not attempt to make significant shifts in its composition to take advantage of specific market conditions. We expect to maintain a fairly consistent investment profile and good liquidity in case the market experiences a period where risk assets suffer.
Quoted Fund performance is for Class A shares and does not reflect a sales charge.
The returns shown do not reflect taxes a shareholder would pay on distributions or redemptions.
44
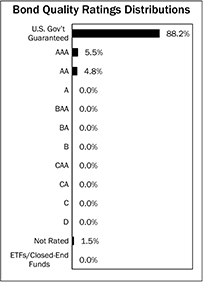
| | | | |
| Major Market Sectors | | | | |
| (% of Net Assets) | | | | |
U.S. Government and Agencies | | | 76.7 | % |
Mortgage-Backed Securities | | | 6.1 | % |
Foreign Government | | | 5.9 | % |
Financials | | | 4.3 | % |
Asset-Backed Securities | | | 1.8 | % |
Commercial Mortgage-Backed Securities | | | 1.4 | % |
Utilities | | | 1.0 | % |
Technology | | | 0.5 | % |
Energy | | | 0.5 | % |
Collateralized Mortgage Obligations | | | 0.5 | % |
| | | | |
| Top 10 Holdings | | | | |
| (% of Net Assets) | | | | |
U.S. Treasury Notes | | | 8.8 | % |
Federal National Mortgage Association | | | 5.8 | % |
Federal National Mortgage Association | | | 5.7 | % |
Federal Home Loan Bank | | | 5.4 | % |
U.S. Treasury Notes | | | 5.4 | % |
U.S. Treasury Notes, TIPS | | | 3.7 | % |
U.S. Treasury Notes | | | 3.6 | % |
U.S. Treasury Bonds, TIPS | | | 3.0 | % |
Federal Home Loan Mortgage Corporation | | | 2.9 | % |
U.S. Treasury Notes | | | 2.7 | % |
These securities represent 47.0% of the total net assets of the Fund.
Bond quality ratings are obtained from Moody’s Investors Service, Inc. (“Moody’s”) and Standard & Poor’s Ratings Services (“S&P”). Ratings from S&P, when used, are converted into their equivalent Moody’s ratings. If Moody’s and S&P have assigned different ratings to a security, the lowest rating for the security is
used. Investments in derivatives and short-term investments are not reflected in the table.
Quoted Major Market Sectors, Bond Quality Ratings Distributions and Top 10 Holdings are subject to change.
The lists of Major Market Sectors and Top 10 Holdings exclude short-term investments and collateral held for securities loaned.
| | | | | | | | |
| Average Annual Total Returns1 | |
| As of October 31, 2014 | |
Class A2 | | 1-Year | | | From
Inception
2/26/2010 | |
without sales charge | | | 2.56% | | | | 3.13 | % |
with sales charge | | | 0.55% | | | | 2.69 | % |
| | |
Institutional Class3 | | 1-Year | | | From
Inception
2/26/2010 | |
Net Asset Value | | | 2.90% | | | | 3.47 | % |
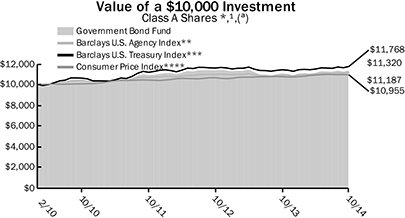
1 | Past performance is not an indication of future results. Average annual total returns represent past performance and reflect changes in share prices, the reinvestment of all dividends and capital gains, and the effects of compounding. The prospectus contains more complete information on the investment objectives, risks, charges and expenses of the investment company, which investors should read and consider carefully before investing. To obtain a prospectus, contact a registered representative or visit www.thrivent.com. At various times, the Fund’s adviser waived its management fee and/or reimbursed Fund expenses. Had the adviser not done so, the Fund’s total returns would have been lower. The returns shown do not reflect taxes a shareholder would pay on distributions or redemptions. Total investment return and principal value of your investment will fluctuate, and your shares, when redeemed, may be worth more or less than their original cost. Current performance may be higher or lower than the performance data quoted. Call 800-THRIVENT or visit www.thrivent.com for performance results current to the most recent month-end. |
2 | Class A performance with sales charge reflects the maximum sales charge of 2%. |
3 | Institutional Class shares have no sales load and are available to institutional shareholders and certain Thrivent sponsored programs. |
(a) | Performance of other classes will be greater or less than the line shown based on the differences in loads and fees paid by shareholders investing in the different classes. |
* | As you compare performance, please note that the Fund’s performance reflects the maximum 2.0% sales charge, while the Barclays U.S. Treasury Index, the Barclays U.S. Agency Index and the Consumer Price Index do not reflect any such charges. If you were to purchase any of the above individual securities represented in the Index, any charges you would pay would reduce your total return as well. |
** | The Barclays U.S. Agency Index is an index that measures the performance of the U.S. investment-grade fixed-income securities market. It is not possible to invest directly in the Index. The performance of the Index does not reflect deductions for fees, expenses or taxes. |
*** | The Barclays U.S. Treasury Index is an index that measures the performance of the U.S. Treasury bond market. It is not possible to invest directly in the Index. The performance of the Index does not reflect deductions for fees, expenses or taxes. |
**** | The Consumer Price Index is an inflationary indicator that measures the change in the cost of a fixed basket of products and services, including housing, electricity, food and transportation. It is not possible to invest directly in the Index. |
45
THRIVENT LIMITED MATURITY BOND FUND
Michael G. Landreville, CFA and CPA (inactive) and Gregory R. Anderson, CFA, Portfolio Co-Managers
The Fund seeks a high level of current income consistent with stability of principal.
The Fund primarily invests in investment-grade debt securities. The value of the Fund is influenced by factors impacting the overall market, debt securities in particular, and specific issuers. The Fund may incur losses due to incorrect assessments of investments by its investment adviser. Bond prices generally fall as interest rates rise. Credit risk is the risk that an issuer of a debt security may not pay its debt. The value of mortgage-related and other asset-backed securities will be influenced by the factors affecting the housing market and the assets underlying such securities. Foreign investments involve additional risks, including currency fluctuations, liquidity, political, economic and market instability, and different legal and accounting standards. The prices of futures contracts can be highly volatile and the loss from investing in them can exceed the initial investment.
How did the Fund perform during the 12-month period ended October 31, 2014?
Thrivent Limited Maturity Bond Fund earned a return of 1.27%, compared with the median return of its peer group, the Lipper Short Investment Grade Debt Funds category, of 1.04%. The Fund’s market benchmark, the Barclays Government/Credit 1-3 Year Bond Index, earned a return of 0.89%.
What factors affected the Fund’s performance?
After months of “taper tantrums” in the financial markets, the Federal Reserve (Fed) officially announced plans to begin gradually reducing its quantitative easing (QE3) program by $10 billion per month starting in January 2014. U.S. economic growth was solid over the reporting period, averaging around the mid-2% range where it has been since the recovery began in 2009. As the job market improved and the U.S. unemployment rate fell to less than 6%, the bond market began to price in Fed interest rate hikes starting sometime in 2015.
The result was a flattening of the yield curve as rates moved higher for Treasury securities with maturities of five years and under, while rates unexpectedly declined for Treasuries with maturities of 10 years and longer. Three-year Treasury rates, for example, rose 0.23% over the fiscal year period, while 30-year Treasuries fell by 0.59%. Generally speaking, however, interest-rate volatility was fairly low throughout the period relative to historical averages. With this backdrop, longer-duration fixed-income assets significantly outperformed shorter-term securities. Because securities with shorter maturities did not benefit from price appreciation in the rising rate environment, the majority of their return was from yield.
The Fund’s outperformance versus both its Lipper peer group and benchmark was primarily the result of its significant overweighting in spread-related securities, particularly three-year to five-year corporate bonds, but also securitized assets. Spread-related assets represented approximately 75% of the Fund, of which 43% was invested mainly in investment-grade corporate bonds with some additional high-yield corporate exposure. The Fund’s securitized weight averaged around 32% and included mortgage-backed securities, asset-backed securities and commercial mortgage-backed securities. The remaining 25% of the Fund was invested in Treasury and agency securities. By comparison, the Barclays index is comprised of about 80% Treasury and agency securities and has only 20% in spread-related assets. Both corporate bonds and securitized assets substantially outperformed shorter-term Treasuries and agencies over the period. The higher coupons from these sectors provided the Fund with a yield advantage over both its peer group and benchmark.
The Fund also benefited from its positioning for a flattening yield curve by holding a higher percentage—compared to the index—of securities with maturities longer than three years. Given that interest rates went down and prices went up for longer-maturity bonds, this posture helped the Fund’s results.
What is your outlook?
We expect the U.S. economy to continue to grow in the 2.0% to 3.0% range. If we see another year of solid growth combined with the U.S. unemployment rate falling to 5%, the Fed will have met its objective of full employment while keeping inflation in check. Therefore, we anticipate the Fed will begin raising rates in 2015; however, we believe the pace will be measured and the increases may be later in the year than the consensus view is predicting.
Based on our outlook, we believe the Treasury yield curve will flatten further as rates for 10-year-and-longer maturities stay range-bound, while two-to-five-year rates potentially move much higher. Although this ultimately is a difficult environment for a fund focused on shorter-maturity assets, we believe our portfolio is well positioned to weather the storm.
We are positioning the Fund for further yield curve flattening by increasing its allocation to floating-rate securities and to bonds with maturities longer than three years. Floating-rate bonds, which now represent 26% of the Fund, have coupons that reset monthly as rates go up so their prices tend not to drop like a regular bond. We also continue to believe the underlying fundamentals of the U.S. economy, including housing prices and the unemployment rate, are strong enough to warrant an overweight to spread products. Therefore, we are maintaining the Fund’s overweightings in the corporate bond and securitized asset segments, which should provide additional yield to help cushion the negative impact of falling market prices.
Quoted Fund performance is for Class A shares.
The returns shown do not reflect taxes a shareholder would pay on distributions or redemptions.
46
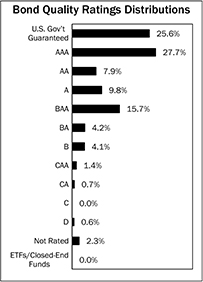
| | | | |
| Major Market Sectors | | | | |
| (% of Net Assets) | | | | |
Financials | | | 20.2 | % |
U.S. Government and Agencies | | | 16.8 | % |
Asset-Backed Securities | | | 13.7 | % |
Collateralized Mortgage Obligations | | | 8.6 | % |
Mortgage-Backed Securities | | | 6.3 | % |
Commercial Mortgage-Backed Securities | | | 5.9 | % |
Foreign Government | | | 5.4 | % |
Communications Services | | | 4.7 | % |
Consumer Non-Cyclical | | | 3.4 | % |
Energy | | | 2.6 | % |
| | | | |
| Top 10 Holdings | | | | |
| (% of Net Assets) | | | | |
U.S. Treasury Notes | | | 2.5 | % |
U.S. Treasury Notes | | | 2.3 | % |
U.S. Treasury Bonds, TIPS | | | 2.2 | % |
Federal National Mortgage Association Conventional 15-Yr. Pass Through | | | 1.9 | % |
U.S. Treasury Notes | | | 1.3 | % |
U.S. Treasury Notes | | | 1.2 | % |
U.S. Treasury Notes | | | 1.0 | % |
U.S. Treasury Notes | | | 1.0 | % |
Federal Home Loan Mortgage Corporation Gold 30-Yr. Pass Through | | | 0.9 | % |
Master Credit Card Trust | | | 0.8 | % |
These securities represent 15.1% of the total net assets of the Fund.
Bond quality ratings are obtained from Moody’s Investors Service, Inc. (“Moody’s”) and Standard & Poor’s Ratings Services (“S&P”). Ratings from S&P, when used, are converted into their equivalent Moody’s ratings. If Moody’s and S&P have assigned different ratings to a security, the lowest rating for the security is
used. Investments in derivatives and short-term investments are not reflected in the table.
Quoted Major Market Sectors, Bond Quality Ratings Distributions and Top 10 Holdings are subject to change.
The lists of Major Market Sectors and Top 10 Holdings exclude short-term investments and collateral held for securities loaned.
| | | | | | | | | | | | |
| Average Annual Total Returns1 | |
| As of October 31, 2014 | |
Class A2 | | 1-Year | | | 5 Years | | | 10 Years | |
Net Asset Value | | | 1.27% | | | | 2.33% | | | | 2.66 | % |
| | | |
Institutional Class3 | | 1-Year | | | 5 Years | | | 10 Years | |
Net Asset Value | | | 1.52% | | | | 2.61% | | | | 2.99 | % |
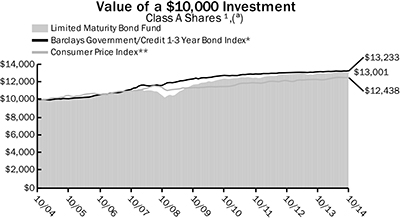
1 | Past performance is not an indication of future results. Average annual total returns represent past performance and reflect changes in share prices, the reinvestment of all dividends and capital gains, and the effects of compounding. The prospectus contains more complete information on the investment objectives, risks, charges and expenses of the investment company, which investors should read and consider carefully before investing. To obtain a prospectus, contact a registered representative or visit www.thrivent.com. At various times, the Fund’s adviser waived its management fee and/or reimbursed Fund expenses. Had the adviser not done so, the Fund’s total returns would have been lower. The returns shown do not reflect taxes a shareholder would pay on distributions or redemptions. Total investment return and principal value of your investment will fluctuate, and your shares, when redeemed, may be worth more or less than their original cost. Current performance may be higher or lower than the performance data quoted. Call 800-THRIVENT or visit www.thrivent.com for performance results current to the most recent month-end. |
2 | Class A shares have no sales load. |
3 | Institutional Class shares have no sales load and are available to institutional shareholders and certain Thrivent sponsored programs. |
(a) | Performance of other classes will be greater or less than the line shown based on the differences in loads and fees paid by shareholders investing in the different classes. |
* | The Barclays Government/Credit 1-3 Year Bond Index is an index that measures the performance of government and fixed-rate debt securities with maturities of 1-3 years. It is not possible to invest directly in the Index. The performance of the Index does not reflect deductions for fees, expenses or taxes. |
** | The Consumer Price Index is an inflationary indicator that measures the change in the cost of a fixed basket of products and services, including housing, electricity, food and transportation. It is not possible to invest directly in the Index. |
47
THRIVENT MONEY MARKET FUND
William D. Stouten, Portfolio Manager
The Fund seeks a high level of current income, while maintaining liquidity and a constant net asset value of $1.00 per share.
The Fund invests in high quality, short-term money market instruments. Although the Fund seeks to preserve the value of your investment at $1.00 per share, it is possible to lose money by investing in the Fund. Credit risk is the risk that an issuer of a debt security may not pay its debt. Low or declining short-term interest rates can negatively impact the Fund. The financial services industry is particularly vulnerable to certain factors, such as the availability and cost of borrowing and raising additional capital, changes in interest rates, the rate of corporate and consumer debt defaults, and price competition. The Fund could experience a loss when selling portfolio securities to meet redemption requests.
How did the Fund perform during the 12-month period ended October 31, 2014?
Thrivent Money Market Fund earned a return of 0.00%, compared with the median net return of its peer group, the Lipper Money Market Funds category, of 0.01%.
What factors affected the Fund’s performance?
The low-yield environment that has persisted since 2009 continued during this fiscal year period. The Federal Reserve (Fed) maintained its accommodative monetary policy with a zero to 0.25% federal funds rate, while the continued decline in money market securities helped drive down rates further out the curve. Since the financial crisis began, the overall low supply/high demand imbalance of money market securities has reached trillions of dollars, while at the same time money market funds are now required to hold at least 30% in liquid assets. The supply of short-term commercial paper has declined as corporations have termed out their funding needs and maintained higher cash balances.
The Fed took the first step in its plan to slowly normalize U.S. monetary policy by ending its quantitative easing program (QE3). The Central Bank also began testing its ability to better control the federal funds rate by entering directly into reverse repurchase (repo) agreements with money market funds. The program has helped put a floor on overnight interest rates and prevented yields from falling into negative territory. Due to the significant lack of supply of securities with zero-to-seven day maturities, demand for the program has at times approached or exceeded the Fed’s $300 billion cap. At the time of this report, the Fed had not clarified the role this repo program will play going forward.
In light of the ongoing low rates, the Fund continued to waive certain fees and expenses to manage its return. We also kept the Fund’s very conservative posture to help maintain credit quality and liquidity, including significant exposure to U.S. government-supported securities, a shorter weighted average maturity (WAM), and more exposure to floating-rate agency notes than our peers. Floating-rate notes are desirable because the coupons will adjust higher if interest rates move, providing protection against such movements.
We also maintained lower exposure in foreign securities versus our peers. The Fund’s foreign weighting is limited to 25% of assets, whereas many of our competitors have much higher limits. In addition, we did not invest in repo agreements with maturities beyond seven days or those backed by nongovernment securities. Many money market funds are increasingly trying to capture yield by investing in longer-dated or nontraditional repos, which are secured by assets other than government securities. Our Fund has avoided exposure to these transactions because of their poor liquidity and additional risk.
What is your outlook?
After several years of debate, the SEC approved Rule 2a-7 reforms in July 2014 that will need to be enacted by money market industry participants over the next two years. The goal of the new rules is to make money market funds more resilient during periods of market stress. Retail money market funds will be required to ensure that each shareholder is an individual and not an institution. Both retail and institutional money market funds will be subject to new rules regarding liquidity fees and redemption gates. These features give funds the ability to impose liquidity fees or suspend redemptions temporarily if liquid assets fall below a certain threshold. Also, institutional funds will need to convert to a floating net asset value (NAV), which will allow their daily share price to fluctuate with changes in the market value of the underlying assets. Retail money market funds, however, will be allowed to maintain stable $1.00 NAVs.
The Fed forecasts economic growth to remain positive but muted in the 2% to 3% range next year. Another year of growth, low inflation and U.S. unemployment falling to 5% may mean that the Central Bank’s accommodative stance has met its objective. With QE3 officially ending in October, many market observers expect the Fed to begin raising rates in 2015.
With spreads tight and rates low, we will not take additional credit or liquidity risks. The Fund is likely to continue returning zero, or close to zero, until the Fed raises the target federal funds rate above the current zero to 0.25% level. Therefore, our near-term plan is to maintain the Fund’s liquidity, emphasize securities with very short maturities, and keep our higher exposure to floating rates in anticipation of higher rates.
An investment in the Thrivent Money Market Fund is not insured or guaranteed by the FDIC or any other government agency.
Although the Fund seeks to preserve the value of your investment at $1.00 per share, it is possible to lose money by investing in the Fund.
Quoted Fund performance is for Class A shares.
The returns shown do not reflect taxes a shareholder would pay on distributions or redemptions.
48
| | | | |
| Portfolio Composition | | | | |
| (% of Portfolio) | | | | |
Government Agency Debt | | | 29.2 | % |
Asset Backed Commercial Paper | | | 19.3 | % |
Other Commercial Paper | | | 14.5 | % |
Other Note | | | 10.4 | % |
Certificate of Deposit | | | 9.8 | % |
Financial Company Commercial Paper | | | 9.1 | % |
Investment Company | | | 7.7 | % |
| | | | |
Total | | | 100.0 | % |
Quoted Portfolio Composition is subject to change.
| | | | | | | | | | | | |
| Average Annual Total Returns1 | |
| As of October 31, 2014 | |
Class A2 | | 1-Year | | | 5 Years | | | 10 Years | |
Net Asset Value | | | 0.00% | | | | 0.00% | | | | 1.50 | % |
| | | |
Institutional Class3 | | 1-Year | | | 5 Years | | | 10 Years | |
Net Asset Value | | | 0.00% | | | | 0.00% | | | | 1.63 | % |
| | | | | | | | | | |
| Money Market Portfolio Yields* | |
| As of October 31, 2014 | |
| | | | | Class A | | | Institutional
Class | |
7-Day Yield | | | | | 0.00% | | | | 0.00 | % |
7-Day Yield Gross of Waivers | | | | | -0.76% | | | | -0.42 | % |
7-Day Effective Yield | | | | | 0.00% | | | | 0.00 | % |
7-Day Effective Yield Gross of Waivers | | | | | -0.76% | | | | -0.42 | % |
1 | Past performance is not an indication of future results. Average annual total returns represent past performance and reflect changes in share prices, the reinvestment of all dividends and capital gains, and the effects of compounding. The prospectus contains more complete information on the investment objectives, risks, charges and expenses of the investment company, which investors should read and consider carefully before investing. To obtain a prospectus, contact a registered representative or visit www.thrivent.com. At various times, the Fund’s adviser waived its management fee and/or reimbursed Fund expenses. Had the adviser not done so, the Fund’s total returns would have been lower. The returns shown do not reflect taxes a shareholder would pay on distributions or redemptions. Total investment return and principal value of your investment will fluctuate, and your shares, when redeemed, may be worth more or less than their original cost. Current performance may be higher or lower than the performance data quoted. Call 800-THRIVENT or visit www.thrivent.com for performance results current to the most recent month-end. |
2 | Class A shares have no sales load. |
3 | Institutional Class shares have no sales load and are available to institutional shareholders and certain Thrivent sponsored programs. |
* | Seven-day yields of Thrivent Money Market Fund refer to the income generated by an investment in the Fund over a specified seven-day period. Effective yields reflect the reinvestment of income. A yield gross of waivers represents what the yield would have been if the Adviser were not waiving or reimbursing certain expenses associated with the Fund. Yields are subject to daily fluctuation and should not be considered an indication of future results. |
49
SHAREHOLDER EXPENSE EXAMPLE
(unaudited)
As a shareholder of a Fund, you incur, depending on the Fund and share class, two types of costs: (1) transaction costs, including sales charges (loads) on purchase payments; and (2) ongoing costs, including management fees, distribution (12b-1) fees and other Fund expenses. This Example is intended to help you understand your ongoing costs (in dollars) of investing in your Fund and to compare these costs with the ongoing costs of investing in other mutual funds. The Example is based on an investment of $1,000 invested at the beginning of the period and held for the entire period from May 1, 2014 through October 31, 2014.
Actual Expenses
In the table below, the first section, labeled “Actual,” provides information about actual account values and actual expenses. You may use the information in this section, together with the amount you invested, to estimate the expenses that you paid over the period. Simply divide your account value by $1,000 (for example, an $8,600 account value divided by $1,000 = 8.6), then multiply the result by the number from the appropriate Class line under the heading entitled “Expenses Paid During Period” to estimate the expenses you paid. A small account fee of $12 may be charged to Class A shareholder accounts if the value falls to an amount of $2,000 or less, in the case of a non-qualified account, and $1,000 or less, in the case of a qualified account. This fee is not included in the table below. If it were and you were assessed such a fee, the expenses you paid during the period would have been higher and the ending account value would have been lower.
Hypothetical Example for Comparison Purposes
In the table below, the second section, labeled “Hypothetical,” provides information about hypothetical account values and hypothetical expenses based on the Fund’s actual expense ratio and an assumed rate of return of 5% per year before expenses, which is not the Fund’s actual return. The hypothetical account values and expenses may not be used to estimate the actual ending account balance or expenses you paid for the period. You may use this information to compare the ongoing costs of investing in the Fund and other funds. To do so, compare this 5% hypothetical example with the 5% hypothetical examples that appear in the shareholder reports of the other funds. A small account fee of $12 may be charged to Class A shareholder accounts if the value falls to an amount of $2,000 or less, in the case of a non-qualified account, and $1,000 or less, in the case of a qualified account. This fee is not included in the table below. If it were and you were assessed such a fee, the expenses you paid during the period would have been higher and the ending account value would have been lower.
Please note that the expenses shown in the table are meant to highlight your ongoing costs only and do not reflect any transactional costs, such as sales charges (loads). Therefore, the second section of the table is useful in comparing ongoing costs only, and will not help you determine the relative total costs of owning different funds. In addition, if these transactional costs were included, your costs would have been higher.
| | | | | | | | | | | | |
| | | Beginning Account
Value 5/1/2014 | | | Ending Account Value
10/31/2014 | | | Expenses Paid During Period 5/1/2014 -
10/31/2014* | | Annualized Expense Ratio |
Thrivent Aggressive Allocation Fund |
| | | | |
Actual | | | | | | | | | | | | |
Class A | | | $1,000 | | | | $1,040 | | | $4.20 | | 0.82% |
Institutional Class | | | $1,000 | | | | $1,042 | | | $2.15 | | 0.42% |
| | | | |
Hypothetical** | | | | | | | | | | | | |
Class A | | | $1,000 | | | | $1,021 | | | $4.17 | | 0.82% |
Institutional Class | | | $1,000 | | | | $1,023 | | | $2.13 | | 0.42% |
Thrivent Moderately Aggressive Allocation Fund |
| | | | |
Actual | | | | | | | | | | | | |
Class A | | | $1,000 | | | | $1,033 | | | $3.87 | | 0.76% |
Institutional Class | | | $1,000 | | | | $1,035 | | | $2.00 | | 0.39% |
| | | | |
Hypothetical** | | | | | | | | | | | | |
Class A | | | $1,000 | | | | $1,021 | | | $3.85 | | 0.76% |
Institutional Class | | | $1,000 | | | | $1,023 | | | $1.99 | | 0.39% |
Thrivent Moderate Allocation Fund |
| | | | |
Actual | | | | | | | | | | | | |
Class A | | | $1,000 | | | | $1,029 | | | $3.70 | | 0.72% |
Institutional Class | | | $1,000 | | | | $1,031 | | | $1.96 | | 0.38% |
| | | | |
Hypothetical** | | | | | | | | | | | | |
Class A | | | $1,000 | | | | $1,022 | | | $3.68 | | 0.72% |
Institutional Class | | | $1,000 | | | | $1,023 | | | $1.96 | | 0.38% |
50
SHAREHOLDER EXPENSE EXAMPLE
(unaudited)
| | | | | | | | | | |
| | | Beginning Account Value 5/1/2014 | | Ending Account Value
10/31/2014 | | | Expenses Paid During Period 5/1/2014 -
10/31/2014* | | Annualized Expense Ratio |
Thrivent Moderately Conservative Allocation Fund |
| | | | |
Actual | | | | | | | | | | |
Class A | | $1,000 | | | $1,024 | | | $3.93 | | 0.77% |
Institutional Class | | $1,000 | | | $1,025 | | | $2.26 | | 0.44% |
| | | | |
Hypothetical** | | | | | | | | | | |
Class A | | $1,000 | | | $1,021 | | | $3.93 | | 0.77% |
Institutional Class | | $1,000 | | | $1,023 | | | $2.26 | | 0.44% |
Thrivent Balanced Income Plus Fund |
| | | | |
Actual | | | | | | | | | | |
Class A | | $1,000 | | | $1,030 | | | $5.35 | | 1.05% |
Institutional Class | | $1,000 | | | $1,032 | | | $3.33 | | 0.65% |
| | | | |
Hypothetical** | | | | | | | | | | |
Class A | | $1,000 | | | $1,020 | | | $5.32 | | 1.05% |
Institutional Class | | $1,000 | | | $1,022 | | | $3.31 | | 0.65% |
Thrivent Opportunity Income Plus Fund |
| | | | |
Actual | | | | | | | | | | |
Class A | | $1,000 | | | $1,015 | | | $4.32 | | 0.85% |
Institutional Class | | $1,000 | | | $1,017 | | | $3.21 | | 0.63% |
| | | | |
Hypothetical** | | | | | | | | | | |
Class A | | $1,000 | | | $1,021 | | | $4.33 | | 0.85% |
Institutional Class | | $1,000 | | | $1,022 | | | $3.22 | | 0.63% |
Thrivent Partner Emerging Markets Equity Fund |
| | | | |
Actual | | | | | | | | | | |
Class A | | $1,000 | | | $956 | | | $8.13 | | 1.65% |
Institutional Class | | $1,000 | | | $958 | | | $6.51 | | 1.32% |
| | | | |
Hypothetical** | | | | | | | | | | |
Class A | | $1,000 | | | $1,017 | | | $8.39 | | 1.65% |
Institutional Class | | $1,000 | | | $1,019 | | | $6.72 | | 1.32% |
Thrivent Partner Small Cap Growth Fund |
| | | | |
Actual | | | | | | | | | | |
Class A | | $1,000 | | | $1,075 | | | $7.23 | | 1.38% |
Institutional Class | | $1,000 | | | $1,076 | | | $5.30 | | 1.01% |
| | | | |
Hypothetical** | | | | | | | | | | |
Class A | | $1,000 | | | $1,018 | | | $7.03 | | 1.38% |
Institutional Class | | $1,000 | | | $1,020 | | | $5.15 | | 1.01% |
Thrivent Partner Small Cap Value Fund |
| | | | |
Actual | | | | | | | | | | |
Class A | | $1,000 | | | $1,011 | | | $6.55 | | 1.29% |
Institutional Class | | $1,000 | | | $1,014 | | | $4.31 | | 0.85% |
| | | | |
Hypothetical** | | | | | | | | | | |
Class A | | $1,000 | | | $1,019 | | | $6.58 | | 1.29% |
Institutional Class | | $1,000 | | | $1,021 | | | $4.33 | | 0.85% |
Thrivent Small Cap Stock Fund |
| | | | |
Actual | | | | | | | | | | |
Class A | | $1,000 | | | $1,053 | | | $6.45 | | 1.25% |
Institutional Class | | $1,000 | | | $1,056 | | | $3.89 | | 0.75% |
| | | | |
Hypothetical** | | | | | | | | | | |
Class A | | $1,000 | | | $1,019 | | | $6.34 | | 1.25% |
Institutional Class | | $1,000 | | | $1,021 | | | $3.82 | | 0.75% |
51
SHAREHOLDER EXPENSE EXAMPLE
(unaudited)
| | | | | | | | | | |
| | | Beginning Account
Value 5/1/2014 | | Ending Account Value
10/31/2014 | | | Expenses Paid During Period 5/1/2014 -
10/31/2014* | | Annualized Expense Ratio |
Thrivent Mid Cap Growth Fund |
| | | | |
Actual | | | | | | | | | | |
Class A | | $1,000 | | | $1,066 | | | $4.95 | | 0.95% |
Institutional Class | | $1,000 | | | $1,069 | | | $2.68 | | 0.51% |
| | | | |
Hypothetical** | | | | | | | | | | |
Class A | | $1,000 | | | $1,020 | | | $4.84 | | 0.95% |
Institutional Class | | $1,000 | | | $1,023 | | | $2.62 | | 0.51% |
Thrivent Partner Mid Cap Value Fund |
| | | | |
Actual | | | | | | | | | | |
Class A | | $1,000 | | | $1,052 | | | $6.47 | | 1.25% |
Institutional Class | | $1,000 | | | $1,053 | | | $4.54 | | 0.88% |
| | | | |
Hypothetical** | | | | | | | | | | |
Class A | | $1,000 | | | $1,019 | | | $6.36 | | 1.25% |
Institutional Class | | $1,000 | | | $1,021 | | | $4.47 | | 0.88% |
Thrivent Mid Cap Stock Fund |
| | | | |
Actual | | | | | | | | | | |
Class A | | $1,000 | | | $1,069 | | | $5.76 | | 1.10% |
Institutional Class | | $1,000 | | | $1,071 | | | $3.68 | | 0.70% |
| | | | |
Hypothetical** | | | | | | | | | | |
Class A | | $1,000 | | | $1,020 | | | $5.62 | | 1.10% |
Institutional Class | | $1,000 | | | $1,022 | | | $3.59 | | 0.70% |
Thrivent Partner Worldwide Allocation Fund |
| | | | |
Actual | | | | | | | | | | |
Class A | | $1,000 | | | $958 | | | $6.91 | | 1.40% |
Institutional Class | | $1,000 | | | $960 | | | $4.84 | | 0.98% |
| | | | |
Hypothetical** | | | | | | | | | | |
Class A | | $1,000 | | | $1,018 | | | $7.12 | | 1.40% |
Institutional Class | | $1,000 | | | $1,020 | | | $4.99 | | 0.98% |
Thrivent Large Cap Growth Fund |
| | | | |
Actual | | | | | | | | | | |
Class A | | $1,000 | | | $1,095 | | | $6.34 | | 1.20% |
Institutional Class | | $1,000 | | | $1,097 | | | $4.26 | | 0.81% |
| | | | |
Hypothetical** | | | | | | | | | | |
Class A | | $1,000 | | | $1,019 | | | $6.11 | | 1.20% |
Institutional Class | | $1,000 | | | $1,021 | | | $4.11 | | 0.81% |
Thrivent Large Cap Value Fund |
| | | | |
Actual | | | | | | | | | | |
Class A | | $1,000 | | | $1,046 | | | $4.81 | | 0.93% |
Institutional Class | | $1,000 | | | $1,048 | | | $2.65 | | 0.51% |
| | | | |
Hypothetical** | | | | | | | | | | |
Class A | | $1,000 | | | $1,021 | | | $4.75 | | 0.93% |
Institutional Class | | $1,000 | | | $1,023 | | | $2.62 | | 0.51% |
Thrivent Large Cap Stock Fund |
| | | | |
Actual | | | | | | | | | | |
Class A | | $1,000 | | | $1,028 | | | $5.20 | | 1.02% |
Institutional Class | | $1,000 | | | $1,030 | | | $3.11 | | 0.61% |
| | | | |
Hypothetical** | | | | | | | | | | |
Class A | | $1,000 | | | $1,020 | | | $5.18 | | 1.02% |
Institutional Class | | $1,000 | | | $1,022 | | | $3.10 | | 0.61% |
52
SHAREHOLDER EXPENSE EXAMPLE
(unaudited)
| | | | | | | | | | |
| | | Beginning Account Value 5/1/2014 | | Ending Account Value
10/31/2014 | | | Expenses Paid During Period 5/1/2014 - 10/31/2014* | | Annualized Expense Ratio |
Thrivent High Yield Fund |
| | | | |
Actual | | | | | | | | | | |
Class A | | $1,000 | | | $1,004 | | | $4.05 | | 0.80% |
Institutional Class | | $1,000 | | | $1,007 | | | $2.47 | | 0.49% |
| | | | |
Hypothetical** | | | | | | | | | | |
Class A | | $1,000 | | | $1,021 | | | $4.08 | | 0.80% |
Institutional Class | | $1,000 | | | $1,023 | | | $2.49 | | 0.49% |
Thrivent Income Fund |
| | | | |
Actual | | | | | | | | | | |
Class A | | $1,000 | | | $1,022 | | | $3.90 | | 0.76% |
Institutional Class | | $1,000 | | | $1,023 | | | $2.05 | | 0.40% |
| | | | |
Hypothetical** | | | | | | | | | | |
Class A | | $1,000 | | | $1,021 | | | $3.89 | | 0.76% |
Institutional Class | | $1,000 | | | $1,023 | | | $2.05 | | 0.40% |
Thrivent Municipal Bond Fund |
| | | | |
Actual | | | | | | | | | | |
Class A | | $1,000 | | | $1,039 | | | $3.82 | | 0.74% |
Institutional Class | | $1,000 | | | $1,041 | | | $2.51 | | 0.49% |
| | | | |
Hypothetical** | | | | | | | | | | |
Class A | | $1,000 | | | $1,021 | | | $3.79 | | 0.74% |
Institutional Class | | $1,000 | | | $1,023 | | | $2.49 | | 0.49% |
Thrivent Government Bond Fund |
| | | | |
Actual | | | | | | | | | | |
Class A | | $1,000 | | | $1,020 | | | $4.58 | | 0.90% |
Institutional Class | | $1,000 | | | $1,021 | | | $2.89 | | 0.57% |
| | | | |
Hypothetical** | | | | | | | | | | |
Class A | | $1,000 | | | $1,021 | | | $4.58 | | 0.90% |
Institutional Class | | $1,000 | | | $1,022 | | | $2.89 | | 0.57% |
Thrivent Limited Maturity Bond Fund |
| | | | |
Actual | | | | | | | | | | |
Class A | | $1,000 | | | $1,005 | | | $3.13 | | 0.62% |
Institutional Class | | $1,000 | | | $1,007 | | | $1.89 | | 0.37% |
| | | | |
Hypothetical** | | | | | | | | | | |
Class A | | $1,000 | | | $1,022 | | | $3.16 | | 0.62% |
Institutional Class | | $1,000 | | | $1,023 | | | $1.91 | | 0.37% |
Thrivent Money Market Fund |
| | | | |
Actual | | | | | | | | | | |
Class A | | $1,000 | | | $1,000 | | | $0.88 | | 0.17% |
Institutional Class | | $1,000 | | | $1,000 | | | $0.88 | | 0.17% |
| | | | |
Hypothetical** | | | | | | | | | | |
Class A | | $1,000 | | | $1,024 | | | $0.89 | | 0.17% |
Institutional Class | | $1,000 | | | $1,024 | | | $0.89 | | 0.17% |
* | Expenses are equal to the Fund’s annualized expense ratio, multiplied by the average account value over the period, multiplied by 184/365 to reflect the one-half year period. |
** | Assuming 5% annualized total return before expenses. |
53
| | | | | | |

| | Report of Independent Registered Public Accounting Firm | | |
To the Shareholders and Trustees of the Thrivent Mutual Funds:
In our opinion, the accompanying statements of assets and liabilities, including the schedules of investments, and the related statements of operations and of changes in net assets and the financial highlights present fairly, in all material respects, the financial position of Thrivent Aggressive Allocation Fund, Thrivent Moderately Aggressive Allocation Fund, Thrivent Moderate Allocation Fund, Thrivent Moderately Conservative Allocation Fund, Thrivent Balanced Income Plus Fund, Thrivent Opportunity Income Plus Fund, Thrivent Partner Emerging Markets Equity Fund, Thrivent Partner Small Cap Growth Fund, Thrivent Partner Small Cap Value Fund, Thrivent Small Cap Stock Fund, Thrivent Mid Cap Growth Fund, Thrivent Partner Mid Cap Value Fund, Thrivent Mid Cap Stock Fund, Thrivent Partner Worldwide Allocation Fund, Thrivent Large Cap Growth Fund, Thrivent Large Cap Value Fund, Thrivent Large Cap Stock Fund, Thrivent High Yield Fund, Thrivent Income Fund, Thrivent Municipal Bond Fund, Thrivent Government Bond Fund, Thrivent Limited Maturity Bond Fund and Thrivent Money Market Fund (twenty-three of the Thrivent Mutual Funds, hereafter referred to as the “Funds”) at October 31, 2014, the results of each of their operations for the year then ended, the changes in each of their net assets for each of the two years in the period then ended and their financial highlights for each of the periods presented, in conformity with accounting principles generally accepted in the United States of America. These financial statements and financial highlights (hereafter referred to as “financial statements”) are the responsibility of the Fund’s management. Our responsibility is to express an opinion on these financial statements based on our audits. We conducted our audits of these financial statements in accordance with the standards of the Public Company Accounting Oversight Board (United States). Those standards require that we plan and perform the audit to obtain reasonable assurance about whether the financial statements are free of material misstatement. An audit includes examining, on a test basis, evidence supporting the amounts and disclosures in the financial statements, assessing the accounting principles used and significant estimates made by management, and evaluating the overall financial statement presentation. We believe that our audits, which included confirmation of securities at October 31, 2014 by correspondence with the custodian, agent banks, transfer agent and brokers provides a reasonable basis for our opinion.
December 17, 2014
|
PricewaterhouseCoopers LLP, Suite 1400, 225 South Sixth Street, Minneapolis, MN 55402 |
T: (612) 596 6000, F: (612) 373 7160, www.pwc.com/us |
54
AGGRESSIVE ALLOCATION FUND
Schedule of Investments as of October 31, 2014
| | | | | | | | |
| Shares | | | Mutual Funds (53.3%) | | Value | |
| Equity Mutual Funds (51.0%) | |
| | 1,530,785 | | | Thrivent Natural Resources Fund | | | $14,343,455 | |
| | 698,214 | | | Thrivent Partner Small Cap Value Fund | | | 15,577,160 | |
| | 1,011,313 | | | Thrivent Small Cap Stock Fund | | | 23,179,304 | |
| | 1,613,534 | | | Thrivent Mid Cap Growth Fund | | | 38,886,157 | |
| | 1,859,855 | | | Thrivent Partner Mid Cap Value Fund | | | 28,362,791 | |
| | 1,842,031 | | | Thrivent Mid Cap Stock Fund | | | 47,045,471 | |
| | 10,540,808 | | | Thrivent Partner Worldwide Allocation Fund | | | 106,567,566 | |
| | 6,475,568 | | | Thrivent Large Cap Growth Fund | | | 58,021,094 | |
| | 2,353,715 | | | Thrivent Large Cap Value Fund | | | 48,957,264 | |
| | 978,449 | | | Thrivent Large Cap Stock Fund | | | 27,386,779 | |
| | | | | |
| | | | Total | | | 408,327,041 | |
| | | | | |
| |
| Fixed Income Mutual Funds (2.3%) | | | | |
| | 895,552 | | | Thrivent High Yield Fund | | | 4,522,539 | |
| | 393,991 | | | Thrivent Income Fund | | | 3,660,180 | |
| | 432,236 | | | Thrivent Opportunity Income Plus Fund | | | 4,486,611 | |
| | 466,300 | | | Thrivent Limited Maturity Bond Fund | | | 5,800,776 | |
| | | | | |
| | | | Total | | | 18,470,106 | |
| | | | | |
| | | | | | | | |
| | | | | |
| | | | Total Mutual Funds (cost $323,042,627) | | | 426,797,147 | |
| | | | | |
| | |
| Shares | | | Common Stock (35.1%) | | Value | |
| Consumer Discretionary (5.0%) | | | | |
| | 2,250 | | | Aaron’s, Inc. | | | 55,710 | |
| | 5,800 | | | Amazon.com, Inc.a | | | 1,771,668 | |
| | 7,543 | | | ANN, Inc.a | | | 289,576 | |
| | 13,450 | | | Apollo Group, Inc.a | | | 385,477 | |
| | 2,950 | | | AutoZone, Inc.a | | | 1,632,884 | |
| | 2,750 | | | Bank Mandiri Persero Tbk PTa | | | 66,825 | |
| | 13,700 | | | Barnes & Noble, Inc.a | | | 298,934 | |
| | 7,400 | | | Best Buy Company, Inc. | | | 252,636 | |
| | 1,400 | | | Big Lots, Inc. | | | 63,910 | |
| | 2,400 | | | BJ’s Restaurants, Inc.a | | | 105,648 | |
| | 1,800 | | | BorgWarner, Inc. | | | 102,636 | |
| | 1,200 | | | Brinker International, Inc. | | | 64,368 | |
| | 17,357 | | | Brunswick Corporation | | | 812,308 | |
| | 15,428 | | | Burlington Stores, Inc.a | | | 647,050 | |
| | 3,050 | | | Carnival Corporation | | | 122,457 | |
| | 8,100 | | | Cato Corporation | | | 288,927 | |
| | 7,440 | | | CBS Corporation | | | 403,397 | |
| | 23,680 | | | Cheesecake Factory, Inc. | | | 1,087,859 | |
| | 5,179 | | | Chuy’s Holdings, Inc.a | | | 154,904 | |
| | 4,050 | | | Coinstar, Inc.a | | | 256,243 | |
| | 58,000 | | | Comcast Corporationb | | | 3,210,300 | |
| | 9,396 | | | Core-Mark Holding Company, Inc. | | | 545,250 | |
| | 22,286 | | | Del Frisco’s Restaurant Group, Inc.a | | | 517,481 | |
| | 11,698 | | | Delphi Automotive plc | | | 806,928 | |
| | 1,800 | | | DeVry Education Group, Inc. | | | 87,138 | |
| | 10,350 | | | DISH Network Corporationa | | | 658,777 | |
| | 8,950 | | | Dollar Tree, Inc.a | | | 542,101 | |
| | 12,132 | | | Five Below, Inc.a | | | 483,703 | |
| | 23,400 | | | Ford Motor Company | | | 329,706 | |
| | 16,394 | | | G-III Apparel Group, Ltd.a | | | 1,300,864 | |
| | 4,475 | | | Harman International Industries, Inc. | | | 480,346 | |
| | 15,700 | | | Home Depot, Inc.b | | | 1,531,064 | |
| | 15,364 | | | HomeAway, Inc.a | | | 536,204 | |
| | 35,740 | | | Houghton Mifflin Harcourt Companya | | | 715,157 | |
| | 21,844 | | | Ignite Restaurant Group, Inc.a | | | 150,505 | |
| | 12,907 | | | Imax Corporationa | | | 380,240 | |
| | 2,650 | | | iRobot Corporationa | | | 94,658 | |
| | 16,125 | | | Kate Spade & Companya | | | 437,471 | |
| | 4,800 | | | Kirkland’s, Inc.a | | | 85,440 | |
| | 19,250 | | | Kohl’s Corporation | | | 1,043,735 | |
| | 21,787 | | | Las Vegas Sands Corporation | | | 1,356,459 | |
| | 6,650 | | | Liberty Interactive Corporationa | | | 173,831 | |
| | 945 | | | Liberty Venturesa | | | 33,170 | |
| | 1,311 | | | Lithia Motors, Inc. | | | 101,760 | |
| | 15,550 | | | Lowe’s Companies, Inc. | | | 889,460 | |
| | 10,550 | | | Macy’s, Inc. | | | 610,001 | |
| | 950 | | | Marriott Vacations Worldwide Corporation | | | 65,968 | |
| | 39,962 | | | MDC Partners, Inc. | | | 827,213 | |
| | 350 | | | Michael Kors Holdings, Ltd.a | | | 27,507 | |
| | 25,135 | | | Multimedia Games Holding Company, Inc.a | | | 877,212 | |
| | 5,500 | | | Nautilus, Inc.a | | | 73,590 | |
| | 15,350 | | | NIKE, Inc. | | | 1,427,089 | |
| | 43,530 | | | NutriSystem, Inc. | | | 733,045 | |
| | 7,000 | | | Omnicom Group, Inc. | | | 503,020 | |
| | 7,550 | | | Orbitz Worldwide, Inc.a | | | 62,439 | |
| | 17,763 | | | Oxford Industries, Inc. | | | 1,087,984 | |
| | 9,880 | | | Papa John’s International, Inc. | | | 461,989 | |
| | 7,404 | | | Red Robin Gourmet Burgers, Inc.a | | | 406,998 | |
| | 3,908 | | | Restoration Hardware Holdings, Inc.a | | | 313,891 | |
| | 1,350 | | | Royal Caribbean Cruises, Ltd. | | | 91,759 | |
| | 9,450 | | | Ruby Tuesday, Inc.a | | | 72,576 | |
| | 6,400 | | | Scientific Games Corporationa | | | 75,328 | |
| | 5,700 | | | Scripps Networks Interactive, Inc. | | | 440,268 | |
| | 9,250 | | | Select Comfort Corporationa | | | 237,632 | |
| | 2,466 | | | Shutterfly, Inc.a | | | 103,153 | |
| | 9,847 | | | Skechers USA, Inc.a | | | 539,123 | |
| | 19,850 | | | Starbucks Corporation | | | 1,499,866 | |
| | 11,325 | | | Tenneco, Inc.a | | | 592,977 | |
| | 3,760 | | | Time Warner Cable, Inc. | | | 553,510 | |
| | 12,200 | | | Toll Brothers, Inc.a | | | 389,790 | |
| | 50,600 | | | Tuesday Morning Corporationa | | | 1,031,734 | |
| | 2,950 | | | Ulta Salon Cosmetics & Fragrance, Inc.a | | | 356,390 | |
| | 4,774 | | | Vail Resorts, Inc. | | | 412,283 | |
| | 5,800 | | | Wyndham Worldwide Corporation | | | 450,486 | |
| | | | | |
| | | | Total | | | 39,679,986 | |
| | | | | |
| |
| Consumer Staples (1.3%) | | | | |
| | 7,650 | | | Anheuser-Busch InBev NV ADR | | | 848,997 | |
| | 3,550 | | | Archer-Daniels-Midland Company | | | 166,850 | |
| | 5,710 | | | B&G Foods, Inc. | | | 168,217 | |
| | 3,466 | | | Boston Beer Company, Inc.a | | | 863,034 | |
| | 1,250 | | | Coca-Cola Enterprises, Inc. | | | 54,187 | |
| | 1,500 | | | Colgate-Palmolive Company | | | 100,320 | |
| | 24,070 | | | CVS Health Corporation | | | 2,065,447 | |
| | 3,450 | | | Green Mountain Coffee Roasters, Inc. | | | 523,538 | |
| | 4,600 | | | Ingredion, Inc. | | | 355,350 | |
| | 2,630 | | | Kimberly-Clark Corporation | | | 300,530 | |
| | 1,500 | | | Kroger Company | | | 83,565 | |
| | 4,050 | | | Molson Coors Brewing Company | | | 301,239 | |
| | 21,823 | | | Mondelez International, Inc. | | | 769,479 | |
| | 9,621 | | | Natural Grocers by Vitamin Cottage, Inc.a | | | 174,236 | |
| | 2,630 | | | Pantry, Inc.a | | | 67,775 | |
| | 2,903 | | | Philip Morris International, Inc.b | | | 258,396 | |
| | 1,950 | | | Pilgrim’s Pride Corporationa | | | 55,400 | |
| | 8,500 | | | Pinnacle Foods, Inc. | | | 287,300 | |
| | 42,500 | | | Rite Aid Corporationa | | | 223,125 | |
| | 5,680 | | | TreeHouse Foods, Inc.a | | | 483,766 | |
| | 12,473 | | | United Natural Foods, Inc.a | | | 848,413 | |
| | 1,500 | | | Wal-Mart Stores, Inc. | | | 114,405 | |
The accompanying Notes to Financial Statements are an integral part of this schedule.
55
AGGRESSIVE ALLOCATION FUND
Schedule of Investments as of October 31, 2014
| | | | | | | | |
| Shares | | | Common Stock (35.1%) | | Value | |
| Consumer Staples (1.3%) - continued | | | | |
| | 33,230 | | | WhiteWave Foods Companya | | | $1,237,153 | |
| | 4,650 | | | Whole Foods Market, Inc. | | | 182,884 | |
| | | | | |
| | | | Total | | | 10,533,606 | |
| | | | | |
| |
| Energy (2.4%) | | | | |
| | 1,775 | | | Atwood Oceanics, Inc.a | | | 72,154 | |
| | 2,000 | | | Baker Hughes, Inc. | | | 105,920 | |
| | 1,890 | | | Bonanza Creek Energy, Inc.a | | | 85,504 | |
| | 20,600 | | | Cabot Oil & Gas Corporation | | | 640,660 | |
| | 23,130 | | | Cameron International Corporationa | | | 1,377,391 | |
| | 3,100 | | | Chesapeake Energy Corporation | | | 68,758 | |
| | 3,480 | | | Chevron Corporationb | | | 417,426 | |
| | 850 | | | Cimarex Energy Company | | | 96,619 | |
| | 6,950 | | | Comstock Resources, Inc. | | | 82,288 | |
| | 635 | | | Concho Resources, Inc.a | | | 69,234 | |
| | 1,200 | | | ConocoPhillips | | | 86,580 | |
| | 5,100 | | | Denbury Resources, Inc. | | | 63,240 | |
| | 1,975 | | | Diamondback Energy, Inc.a | | | 135,169 | |
| | 650 | | | Energen Corporation | | | 44,005 | |
| | 1,200 | | | Ensco plc | | | 48,708 | |
| | 13,720 | | | EOG Resources, Inc. | | | 1,304,086 | |
| | 5,621 | | | EQT Corporation | | | 528,599 | |
| | 1,350 | | | Exterran Holdings, Inc. | | | 53,096 | |
| | 20,150 | | | Exxon Mobil Corporation | | | 1,948,706 | |
| | 2,500 | | | Green Plains, Inc. | | | 85,500 | |
| | 1,450 | | | Gulfmark Offshore, Inc. | | | 43,732 | |
| | 700 | | | Gulfport Energy Corporationa | | | 35,126 | |
| | 2,950 | | | Helix Energy Solutions Group, Inc.a | | | 78,588 | |
| | 1,200 | | | Helmerich & Payne, Inc. | | | 104,184 | |
| | 1,350 | | | Hess Corporation | | | 114,493 | |
| | 1,925 | | | HollyFrontier Corporation | | | 87,357 | |
| | 37,684 | | | Kodiak Oil & Gas Corporationa | | | 406,610 | |
| | 5,950 | | | Kosmos Energy, Ltd.a | | | 55,514 | |
| | 46,464 | | | Marathon Oil Corporation | | | 1,644,826 | |
| | 17,880 | | | Market Vectors Oil Service ETF | | | 808,176 | |
| | 21,300 | | | Nabors Industries, Ltd. | | | 380,205 | |
| | 1,050 | | | National Oilwell Varco, Inc. | | | 76,272 | |
| | 1,700 | | | Newfield Exploration Companya | | | 55,437 | |
| | 2,020 | | | Noble Corporation | | | 42,258 | |
| | 1,365 | | | Noble Energy, Inc. | | | 78,665 | |
| | 36,468 | | | Oasis Petroleum, Inc.a | | | 1,092,581 | |
| | 1,265 | | | Oceaneering International, Inc. | | | 88,892 | |
| | 1,125 | | | Oil States International, Inc.a | | | 67,208 | |
| | 10,350 | | | Patterson-UTI Energy, Inc. | | | 238,360 | |
| | 1,777 | | | PDC Energy, Inc.a | | | 77,690 | |
| | 35,017 | | | Penn Virginia Corporationa | | | 300,096 | |
| | 380 | | | Pioneer Natural Resources Company | | | 71,843 | |
| | 1,700 | | | QEP Resources, Inc. | | | 42,619 | |
| | 38,080 | | | Rex Energy Corporationa | | | 298,547 | |
| | 8,780 | | | Rosetta Resources, Inc.a | | | 333,903 | |
| | 1,880 | | | Rowan Companies plc | | | 45,628 | |
| | 15,930 | | | Schlumberger, Ltd. | | | 1,571,654 | |
| | 3,400 | | | Seadrill, Ltd. | | | 78,200 | |
| | 6,276 | | | SemGroup Corporation | | | 481,683 | |
| | 990 | | | SM Energy Company | | | 55,737 | |
| | 13,450 | | | Southwestern Energy Companya | | | 437,259 | |
| | 7,850 | | | Superior Energy Services, Inc. | | | 197,427 | |
| | 11,600 | | | Total SA ADR | | | 694,724 | |
| | 36,706 | | | Trinidad Drilling, Ltd. | | | 239,051 | |
| | 78,500 | | | Weatherford International, Ltd.a | | | 1,288,970 | |
| | 2,850 | | | Whiting Petroleum Corporationa | | | 174,534 | |
| | 2,750 | | | WPX Energy, Inc.a | | | 52,580 | |
| | | | | |
| | | | Total | | | 19,254,272 | |
| | | | | |
| |
| Financials (5.9%) | | | | |
| | 2,890 | | | ACE, Ltd. | | | 315,877 | |
| | 4,064 | | | Affiliated Managers Group, Inc.a | | | 811,947 | |
| | 9,680 | | | Allied World Assurance Company Holdings AG | | | 367,840 | |
| | 5,150 | | | Allstate Corporation | | | 333,977 | |
| | 7,600 | | | American Assets Trust, Inc. | | | 291,384 | |
| | 3,550 | | | American Express Company | | | 319,322 | |
| | 1,850 | | | American Financial Group, Inc. | | | 110,686 | |
| | 10,800 | | | American International Group, Inc. | | | 578,556 | |
| | 6,400 | | | AmTrust Financial Services, Inc. | | | 287,168 | |
| | 5,901 | | | Argo Group International Holdings, Ltd. | | | 329,276 | |
| | 1,650 | | | Assurant, Inc. | | | 112,563 | |
| | 15,780 | | | Assured Guaranty, Ltd. | | | 364,202 | |
| | 70,480 | | | Bank of America Corporation | | | 1,209,437 | |
| | 18,789 | | | Bank of the Ozarks, Inc. | | | 662,124 | |
| | 2,450 | | | Banner Corporation | | | 105,889 | |
| | 24,840 | | | BBCN Bancorp, Inc. | | | 351,238 | |
| | 12,050 | | | Berkshire Hathaway, Inc.a | | | 1,688,928 | |
| | 8,800 | | | Blackstone Group, LP | | | 265,056 | |
| | 4,500 | | | Boston Private Financial Holdings, Inc. | | | 59,175 | |
| | 5,050 | | | Camden Property Trust | | | 387,184 | |
| | 6,100 | | | Capital One Financial Corporation | | | 504,897 | |
| | 1,850 | | | CBRE Group, Inc.a | | | 59,200 | |
| | 14,563 | | | Chesapeake Lodging Trust | | | 481,162 | |
| | 31,920 | | | Citigroup, Inc. | | | 1,708,678 | |
| | 1,702 | | | CNA Financial Corporation | | | 66,514 | |
| | 53,580 | | | CNO Financial Group, Inc. | | | 971,405 | |
| | 10,450 | | | Comerica, Inc. | | | 498,883 | |
| | 3,200 | | | Corporate Office Properties Trust | | | 87,488 | |
| | 3,950 | | | Crown Castle International Corporation | | | 308,574 | |
| | 3,150 | | | DDR Corporation | | | 57,141 | |
| | 6,644 | | | Deutsche Bank AG | | | 208,090 | |
| | 5,850 | | | Digital Realty Trust, Inc. | | | 403,592 | |
| | 4,800 | | | Discover Financial Services | | | 306,144 | |
| | 18,900 | | | Duke Realty Corporation | | | 358,344 | |
| | 23,310 | | | Education Realty Trust, Inc. | | | 262,471 | |
| | 1,950 | | | Equity Lifestyle Properties, Inc. | | | 95,745 | |
| | 22,675 | | | Essent Group, Ltd.a | | | 551,910 | |
| | 10,268 | | | Evercore Partners, Inc. | | | 531,574 | |
| | 4,600 | | | Extra Space Storage, Inc. | | | 267,536 | |
| | 4,300 | | | FBR & Companya | | | 103,802 | |
| | 10,800 | | | First Horizon National Corporation | | | 138,888 | |
| | 23,950 | | | First Niagara Financial Group, Inc. | | | 179,386 | |
| | 11,200 | | | First Republic Bank | | | 570,416 | |
| | 14,700 | | | Fulton Financial Corporation | | | 174,636 | |
| | 9,015 | | | Gaming and Leisure Properties, Inc. | | | 281,719 | |
| | 2,400 | | | General Growth Properties, Inc. | | | 62,184 | |
| | 10,400 | | | Government Properties Income Trust | | | 237,328 | |
| | 4,350 | | | Green Dot Corporationa | | | 103,965 | |
| | 46,401 | | | Hanmi Financial Corporation | | | 995,301 | |
| | 1,650 | | | Hanover Insurance Group, Inc. | | | 110,451 | |
| | 15,341 | | | HCC Insurance Holdings, Inc. | | | 800,647 | |
| | 23,068 | | | Host Hotels & Resorts, Inc. | | | 537,715 | |
| | 119,150 | | | Huntington Bancshares, Inc. | | | 1,180,776 | |
| | 1,300 | | | Intercontinental Exchange, Inc. | | | 270,777 | |
| | 19,420 | | | Invesco, Ltd. | | | 785,927 | |
| | 14,653 | | | iShares Russell 2000 Growth Index Fund | | | 2,016,692 | |
| | 12,820 | | | iShares Russell 2000 Index Fund | | | 1,494,299 | |
| | 15,901 | | | J.P. Morgan Chase & Company | | | 961,692 | |
| | 21,542 | | | Kennedy-Wilson Holdings, Inc. | | | 583,573 | |
| | 30,250 | | | KeyCorp | | | 399,300 | |
| | 11,468 | | | Lazard, Ltd. | | | 564,340 | �� |
The accompanying Notes to Financial Statements are an integral part of this schedule.
56
AGGRESSIVE ALLOCATION FUND
Schedule of Investments as of October 31, 2014
| | | | | | | | |
| Shares | | | Common Stock (35.1%) | | Value | |
| Financials (5.9%) - continued | |
| | 3,750 | | | M&T Bank Corporation | | | $458,175 | |
| | 7,400 | | | MBIA, Inc.a | | | 72,224 | |
| | 15,610 | | | MetLife, Inc. | | | 846,686 | |
| | 1,050 | | | Mid-America Apartment Communities, Inc. | | | 74,193 | |
| | 23,920 | | | Morgan Stanley | | | 836,004 | |
| | 15,250 | | | NASDAQ OMX Group, Inc. | | | 659,715 | |
| | 8,350 | | | Northern Trust Corporation | | | 553,605 | |
| | 25,839 | | | PacWest Bancorp | | | 1,102,292 | |
| | 12,400 | | | Parkway Properties, Inc. | | | 248,620 | |
| | 14,620 | | | Pebblebrook Hotel Trust | | | 622,812 | |
| | 9,050 | | | Popular, Inc.a | | | 288,514 | |
| | 2,772 | | | ProShares Ultra S&P 500 | | | 340,512 | |
| | 6,800 | | | Prudential Financial, Inc. | | | 602,072 | |
| | 2,500 | | | RLJ Lodging Trust | | | 80,550 | |
| | 700 | | | Sovran SelfStorage, Inc. | | | 59,563 | |
| | 43,200 | | | SPDR Euro Stoxx 50 ETF | | | 1,653,264 | |
| | 25,209 | | | SPDR S&P 500 ETF Trust | | | 5,083,647 | |
| | 4,050 | | | Sunstone Hotel Investors, Inc. | | | 62,006 | |
| | 4,120 | | | SVB Financial Groupa | | | 461,399 | |
| | 34,500 | | | Synovus Financial Corporation | | | 874,920 | |
| | 19,440 | | | Terreno Realty Corporation | | | 409,406 | |
| | 4,290 | | | Texas Capital Bancshares, Inc.a | | | 262,334 | |
| | 5,000 | | | United Community Banks, Inc. | | | 90,150 | |
| | 2,400 | | | Unum Group | | | 80,304 | |
| | 3,750 | | | W.R. Berkley Corporation | | | 193,275 | |
| | 4,250 | | | Wells Fargo & Company | | | 225,632 | |
| | 37,086 | | | Western Alliance Bancorpa | | | 987,229 | |
| | 2,100 | | | Weyerhaeuser Company | | | 71,106 | |
| | 19,650 | | | Zions Bancorporation | | | 569,261 | |
| | | | | |
| | | | Total | | | 47,104,461 | |
| | | | | |
| |
| Health Care (5.7%) | | | | |
| | 1,150 | | | Abaxis, Inc. | | | 60,559 | |
| | 2,450 | | | Abbott Laboratories | | | 106,795 | |
| | 12,594 | | | Acadia Healthcare Company, Inc.a | | | 781,458 | |
| | 1,850 | | | Acceleron Pharma, Inc.a | | | 68,413 | |
| | 18,750 | | | Acorda Therapeutics, Inc.a | | | 652,875 | |
| | 5,900 | | | Actavis, Inc.a | | | 1,432,166 | |
| | 11,700 | | | Aetna, Inc. | | | 965,367 | |
| | 17,850 | | | Affymetrix, Inc.a | | | 160,828 | |
| | 34,133 | | | Akorn, Inc.a | | | 1,520,625 | |
| | 1,200 | | | Alexion Pharmaceuticals, Inc.a | | | 229,632 | |
| | 14,607 | | | Align Technology, Inc.a | | | 768,620 | |
| | 31,750 | | | Allscripts Healthcare Solutions, Inc.a | | | 435,610 | |
| | 8,750 | | | Amgen, Inc. | | | 1,419,075 | |
| | 5,750 | | | AMN Healthcare Services, Inc.a | | | 98,613 | |
| | 1,550 | | | AmSurg Corporationa | | | 83,716 | |
| | 8,250 | | | Baxter International, Inc. | | | 578,655 | |
| | 700 | | | Biogen Idec, Inc.a | | | 224,756 | |
| | 23,520 | | | BioScrip, Inc.a | | | 151,939 | |
| | 60,200 | | | Boston Scientific Corporationa | | | 799,456 | |
| | 20,536 | | | Bruker Corporationa | | | 425,711 | |
| | 3,426 | | | C.R. Bard, Inc. | | | 561,761 | |
| | 17,500 | | | Cambrex Corporationa | | | 368,900 | |
| | 7,550 | | | Cardinal Health, Inc. | | | 592,524 | |
| | 14,584 | | | Cardiovascular Systems, Inc.a | | | 452,104 | |
| | 14,816 | | | Centene Corporationa | | | 1,372,999 | |
| | 30,850 | | | Cerner Corporationa | | | 1,954,039 | |
| | 1,600 | | | Charles River Laboratories International, Inc.a | | | 101,056 | |
| | 5,890 | | | Covidien plc | | | 544,472 | |
| | 7,397 | | | Cubist Pharmaceuticals, Inc.a | | | 534,729 | |
| | 11,549 | | | Cyberonics, Inc.a | | | 606,322 | |
| | 44,645 | | | Depomed, Inc.a | | | 687,533 | |
| | 3,700 | | | Endo International plca | | | 247,604 | |
| | 51,303 | | | ExamWorks Group, Inc.a | | | 1,989,530 | |
| | 4,000 | | | Express Scripts Holding Companya | | | 307,280 | |
| | 26,450 | | | Gilead Sciences, Inc.a | | | 2,962,400 | |
| | 1,150 | | | Greatbatch, Inc.a | | | 57,719 | |
| | 2,200 | | | HCA Holdings, Inc.a | | | 154,110 | |
| | 28,579 | | | Healthcare Services Group, Inc. | | | 851,083 | |
| | 22,800 | | | Hologic, Inc.a | | | 597,132 | |
| | 4,400 | | | Illumina, Inc.a | | | 847,352 | |
| | 24,272 | | | Impax Laboratories, Inc.a | | | 703,160 | |
| | 40,179 | | | Ironwood Pharmaceuticals, Inc.a | | | 563,310 | |
| | 22,346 | | | Johnson & Johnson | | | 2,408,452 | |
| | 7,327 | | | LifePoint Hospitals, Inc.a | | | 512,890 | |
| | 3,100 | | | Mallinckrodt, LLCa | | | 285,758 | |
| | 3,000 | | | McKesson Corporation | | | 610,230 | |
| | 17,920 | | | Merck & Company, Inc.b | | | 1,038,285 | |
| | 42,667 | | | Neurocrine Biosciences, Inc.a | | | 790,193 | |
| | 13,100 | | | Novavax, Inc.a | | | 73,360 | |
| | 10,788 | | | NPS Pharmaceuticals, Inc.a | | | 295,591 | |
| | 50,942 | | | NuVasive, Inc.a | | | 2,083,528 | |
| | 7,400 | | | PAREXEL International Corporationa | | | 401,894 | |
| | 24,250 | | | Pfizer, Inc. | | | 726,287 | |
| | 2,650 | | | PharMerica Corporationa | | | 76,029 | |
| | 1,500 | | | Providence Service Corporationa | | | 66,270 | |
| | 2,424 | | | Puma Biotechnology, Inc.a | | | 607,454 | |
| | 2,350 | | | Qiagen NVa | | | 55,131 | |
| | 1,600 | | | Quintiles Transnational Holdings, Inc.a | | | 93,664 | |
| | 8,050 | | | Spectrum Pharmaceuticals, Inc.a | | | 61,019 | |
| | 12,403 | | | Team Health Holdings, Inc.a | | | 775,684 | |
| | 15,920 | | | Teleflex, Inc. | | | 1,816,790 | |
| | 550 | | | Thermo Fisher Scientific, Inc. | | | 64,663 | |
| | 13,600 | | | UnitedHealth Group, Inc. | | | 1,292,136 | |
| | 5,300 | | | Universal Health Services, Inc. | | | 549,663 | |
| | 15,750 | | | Vertex Pharmaceuticals, Inc.a | | | 1,774,080 | |
| | 6,800 | | | Volcano Corporationa | | | 68,816 | |
| | 3,700 | | | Waters Corporationa | | | 409,960 | |
| | 3,500 | �� | | WellPoint, Inc. | | | 443,415 | |
| | | | | |
| | | | Total | | | 45,403,230 | |
| | | | | |
| |
| Industrials (4.9%) | | | | |
| | 1,500 | | | 3M Company | | | 230,655 | |
| | 2,100 | | | AAR Corporation | | | 55,650 | |
| | 19,700 | | | ADT Corporation | | | 706,048 | |
| | 11,060 | | | Apogee Enterprises, Inc. | | | 485,534 | |
| | 2,550 | | | Argan, Inc. | | | 88,766 | |
| | 11,200 | | | Boeing Companyb | | | 1,398,992 | |
| | 3,177 | | | Briggs & Stratton Corporation | | | 64,207 | |
| | 3,500 | | | Caterpillar, Inc. | | | 354,935 | |
| | 1,523 | | | Chart Industries, Inc.a | | | 70,896 | |
| | 15,550 | | | CLARCOR, Inc. | | | 1,041,228 | |
| | 17,600 | | | CSX Corporationb | | | 627,088 | |
| | 8,760 | | | Curtiss-Wright Corporation | | | 606,280 | |
| | 66,900 | | | Delta Air Lines, Inc. | | | 2,691,387 | |
| | 26,553 | | | EMCOR Group, Inc. | | | 1,171,784 | |
| | 6,180 | | | Esterline Technologies Corporationa | | | 723,740 | |
| | 7,250 | | | Federal Signal Corporation | | | 102,950 | |
| | 6,800 | | | Flowserve Corporation | | | 462,332 | |
| | 21,100 | | | Fluor Corporation | | | 1,399,774 | |
| | 8,830 | | | GATX Corporation | | | 559,822 | |
| | 6,615 | | | Generac Holdings, Inc.a | | | 299,924 | |
| | 25,564 | | | Granite Construction, Inc. | | | 943,567 | |
| | 11,549 | | | H&E Equipment Services, Inc. | | | 431,817 | |
| | 9,714 | | | Heico Corporation | | | 526,887 | |
| | 8,450 | | | Hertz Global Holdings, Inc.a | | | 185,224 | |
| | 26,800 | | | HNI Corporation | | | 1,250,220 | |
| | 5,039 | | | Honeywell International, Inc. | | | 484,349 | |
The accompanying Notes to Financial Statements are an integral part of this schedule.
57
AGGRESSIVE ALLOCATION FUND
Schedule of Investments as of October 31, 2014
| | | | | | | | |
| Shares | | | Common Stock (35.1%) | | Value | |
| | 4,550 | | | Huntington Ingalls Industries, Inc. | | | $481,481 | |
| | 6,398 | | | Huron Consulting Group, Inc.a | | | 445,365 | |
| | 11,200 | | | Ingersoll-Rand plc | | | 701,344 | |
| | 5,750 | | | Insperity, Inc. | | | 181,470 | |
| | 80,847 | | | Interface, Inc. | | | 1,295,977 | |
| | 5,130 | | | Jacobs Engineering Group, Inc.a | | | 243,419 | |
| | 8,900 | | | KAR Auction Services, Inc. | | | 270,204 | |
| | 2,151 | | | Kimball International, Inc. | | | 38,675 | |
| | 38,680 | | | Korn/Ferry Internationala | | | 1,080,332 | |
| | 17,100 | | | Landstar System, Inc. | | | 1,265,571 | |
| | 4,250 | | | Manpower, Inc. | | | 283,688 | |
| | 15,399 | | | MasTec, Inc.a | | | 441,027 | |
| | 4,350 | | | Meritor, Inc.a | | | 49,982 | |
| | 8,401 | | | Middleby Corporationa | | | 743,489 | |
| | 4,100 | | | Mistras Group, Inc.a | | | 67,609 | |
| | 1,200 | | | Old Dominion Freight Line, Inc.a | | | 87,444 | |
| | 24,330 | | | On Assignment, Inc.a | | | 708,003 | |
| | 15,112 | | | Oshkosh Corporation | | | 676,413 | |
| | 4,532 | | | Parker Hannifin Corporation | | | 575,700 | |
| | 4,270 | | | Pentair, Ltd. | | | 286,303 | |
| | 21,129 | | | PGT, Inc.a | | | 198,718 | |
| | 31,640 | | | Progressive Waste Solutions, Ltd. | | | 924,837 | |
| | 14,282 | | | Proto Labs, Inc.a | | | 933,614 | |
| | 5,100 | | | Quanta Services, Inc.a | | | 173,808 | |
| | 39,035 | | | Ritchie Brothers Auctioneers, Inc. | | | 952,064 | |
| | 15,926 | | | Saia, Inc.a | | | 780,693 | |
| | 56,300 | | | Southwest Airlines Company | | | 1,941,224 | |
| | 1,650 | | | Spirit Aerosystems Holdings, Inc.a | | | 64,911 | |
| | 15,894 | | | Spirit Airlines, Inc.a | | | 1,162,010 | |
| | 20,988 | | | Swift Transportation Companya | | | 518,404 | |
| | 9,740 | | | Tennant Company | | | 718,130 | |
| | 10,946 | | | Tutor Perini Corporationa | | | 306,597 | |
| | 17,800 | | | Union Pacific Corporation | | | 2,072,810 | |
| | 5,600 | | | United Continental Holdings, Inc.a | | | 295,736 | |
| | 1,250 | | | United Technologies Corporation | | | 133,750 | |
| | 3,750 | | | WABCO Holdings, Inc.a | | | 365,175 | |
| | 2,047 | | | WageWorks, Inc.a | | | 116,699 | |
| | 5,013 | | | Watsco, Inc. | | | 509,421 | |
| | 5,811 | | | Watts Water Technologies, Inc. | | | 352,321 | |
| | | | | |
| | | | Total | | | 39,408,474 | |
| | | | | |
| |
| Information Technology (8.0%) | | | | |
| | 19,009 | | | A10 Networks, Inc.a | | | 83,640 | |
| | 10,050 | | | Akamai Technologies, Inc.a | | | 606,015 | |
| | 5,790 | | | Alibaba Group Holding, Ltd. ADRa | | | 570,894 | |
| | 3,700 | | | Alliance Data Systems Corporationa | | | 1,048,395 | |
| | 6,188 | | | Ambarella, Inc.a | | | 274,067 | |
| | 5,800 | | | Amdocs, Ltd. | | | 275,732 | |
| | 66,089 | | | Apple, Inc.b | | | 7,137,612 | |
| | 38,994 | | | Applied Materials, Inc. | | | 861,377 | |
| | 62,986 | | | Applied Micro Circuits Corporationa | | | 407,519 | |
| | 9,850 | | | Applied Optoelectronics, Inc.a | | | 158,979 | |
| | 4,000 | | | Arris Group, Inc.a | | | 120,080 | |
| | 23,795 | | | Aspen Technology, Inc.a | | | 878,749 | |
| | 130,500 | | | Atmel Corporationa | | | 968,310 | |
| | 3,250 | | | AVG Technologies NVa | | | 58,240 | |
| | 6,404 | | | Belden, Inc. | | | 455,901 | |
| | 2,600 | | | Booz Allen Hamilton Holding Corporation | | | 68,510 | |
| | 16,900 | | | Broadcom Corporation | | | 707,772 | |
| | 25,120 | | | Broadridge Financial Solutions, Inc. | | | 1,103,522 | |
| | 28,950 | | | Brocade Communications Systems, Inc. | | | 310,633 | |
| | 3,805 | | | CalAmp Corporationa | | | 73,360 | |
| | 14,885 | | | Cardtronics, Inc.a | | | 571,435 | |
| | 8,987 | | | Cavium, Inc.a | | | 461,123 | |
| | 5,600 | | | CDW Corporation | | | 172,704 | |
| | 15,334 | | | ChannelAdvisor Corporationa | | | 212,989 | |
| | 3,050 | | | Cirrus Logic, Inc.a | | | 58,865 | |
| | 49,330 | | | Cisco Systems, Inc. | | | 1,207,105 | |
| | 4,250 | | | Citrix Systems, Inc.a | | | 272,977 | |
| | 10,874 | | | Cognex Corporationa | | | 430,175 | |
| | 5,639 | | | Coherent, Inc.a | | | 367,381 | |
| | 6,550 | | | Computer Sciences Corporation | | | 395,620 | |
| | 14,439 | | | Constant Contact, Inc.a | | | 510,563 | |
| | 17,327 | | | Cornerstone OnDemand, Inc.a | | | 628,450 | |
| | 43,250 | | | Corning, Inc. | | | 883,597 | |
| | 10,182 | | | Dealertrack Technologies, Inc.a | | | 479,063 | |
| | 11,869 | | | Demandware, Inc.a | | | 711,547 | |
| | 5,650 | | | Digital River, Inc.a | | | 144,470 | |
| | 3,200 | | | Diodes, Inc.a | | | 82,656 | |
| | 23,872 | | | DST Systems, Inc. | | | 2,300,067 | |
| | 27,524 | | | eBay, Inc.a | | | 1,445,010 | |
| | 7,150 | | | Electronic Arts, Inc.a | | | 292,935 | |
| | 7,228 | | | Electronics for Imaging, Inc.a | | | 330,464 | |
| | 92,900 | | | EMC Corporation | | | 2,669,017 | |
| | 27,650 | | | Facebook, Inc.a | | | 2,073,474 | |
| | 8,950 | | | Fairchild Semiconductor International, Inc.a | | | 137,383 | |
| | 7,060 | | | FEI Company | | | 595,017 | |
| | 2,625 | | | Google, Inc.a | | | 1,467,585 | |
| | 3,000 | | | Google, Inc., Class Aa | | | 1,703,610 | |
| | 34,668 | | | Guidewire Software, Inc.a | | | 1,731,320 | |
| | 1,600 | | | iGATE Corporationa | | | 59,280 | |
| | 1,500 | | | International Business Machines Corporation | | | 246,600 | |
| | 26,511 | | | Juniper Networks, Inc. | | | 558,587 | |
| | 7,655 | | | Lexmark International, Inc. | | | 330,390 | |
| | 4,550 | | | LinkedIn Corporationa | | | 1,041,768 | |
| | 4,050 | | | Liquidity Services, Inc.a | | | 51,759 | |
| | 7,604 | | | Manhattan Associates, Inc.a | | | 304,996 | |
| | 17,650 | | | Marvell Technology Group, Ltd. | | | 237,216 | |
| | 14,950 | | | MasterCard, Inc. | | | 1,252,063 | |
| | 49,357 | | | MaxLinear, Inc.a | | | 349,941 | |
| | 6,271 | | | Methode Electronics, Inc. | | | 246,952 | |
| | 10,850 | | | Microsoft Corporation | | | 509,407 | |
| | 9,907 | | | Monolithic Power Systems, Inc. | | | 437,790 | |
| | 60,300 | | | NetApp, Inc. | | | 2,580,840 | |
| | 47,748 | | | NVIDIA Corporation | | | 932,996 | |
| | 16,900 | | | Oracle Corporation | | | 659,945 | |
| | 18,605 | | | Plantronics, Inc. | | | 965,041 | |
| | 4,750 | | | Polycom, Inc.a | | | 62,130 | |
| | 27,763 | | | Proofpoint, Inc.a | | | 1,222,683 | |
| | 29,500 | | | QUALCOMM, Inc.b | | | 2,316,045 | |
| | 9,150 | | | Red Hat, Inc.a | | | 539,118 | |
| | 25,950 | | | Salesforce.com, Inc.a | | | 1,660,541 | |
| | 6,050 | | | Sanmina Corporationa | | | 151,674 | |
| | 25,536 | | | Sonus Networks, Inc.a | | | 88,610 | |
| | 1,361 | | | SPS Commerce, Inc.a | | | 79,346 | |
| | 5,469 | | | SunPower Corporationa | | | 174,133 | |
| | 7,500 | | | Symantec Corporation | | | 186,150 | |
| | 3,308 | | | Synaptics, Inc.a | | | 226,366 | |
| | 3,000 | | | Take-Two Interactive Software, Inc.a | | | 79,350 | |
| | 9,700 | | | Teradata Corporationa | | | 410,504 | |
| | 23,439 | | | Teradyne, Inc. | | | 431,278 | |
| | 9,950 | | | Texas Instruments, Inc. | | | 494,117 | |
| | 15,790 | | | Textura Corporationa | | | 420,646 | |
| | 2,080 | | | Tyler Technologies, Inc.a | | | 232,794 | |
| | 19,550 | | | Ubiquiti Networks, Inc. | | | 699,304 | |
| | 4,081 | | | Ultimate Software Group, Inc.a | | | 614,231 | |
| | 2,550 | | | Unisys Corporationa | | | 65,382 | |
| | 39,871 | | | Virtusa Corporationa | | | 1,633,914 | |
The accompanying Notes to Financial Statements are an integral part of this schedule.
58
AGGRESSIVE ALLOCATION FUND
Schedule of Investments as of October 31, 2014
| | | | | | | | |
| Shares | | | Common Stock (35.1%) | | Value | |
| Information Technology (8.0%) - continued | | | | |
| | 5,350 | | | Visa, Inc. | | | $1,291,651 | |
| | 13,800 | | | VMware, Inc.a | | | 1,153,266 | |
| | 2,350 | | | Workday, Inc.a | | | 224,378 | |
| | 36,550 | | | Xerox Corporation | | | 485,384 | |
| | | | | |
| | | | Total | | | 64,214,475 | |
| | | | | |
| |
| Materials (1.2%) | | | | |
| | 4,420 | | | Celanese Corporation | | | 259,587 | |
| | 17,401 | | | Chemtura Corporationa | | | 405,269 | |
| | 1,250 | | | Clearwater Paper Corporationa | | | 80,438 | |
| | 800 | | | Compass Minerals International, Inc. | | | 68,544 | |
| | 2,550 | | | Crown Holdings, Inc.a | | | 122,221 | |
| | 6,650 | | | Dow Chemical Company | | | 328,510 | |
| | 8,600 | | | Eagle Materials, Inc. | | | 751,898 | |
| | 2,700 | | | Eastman Chemical Company | | | 218,106 | |
| | 5,750 | | | Ferro Corporationa | | | 75,440 | |
| | 54,962 | | | Graphic Packaging Holding Companya | | | 666,689 | |
| | 31,320 | | | Horsehead Holding Corporationa | | | 492,037 | |
| | 1,500 | | | Innophos Holdings, Inc. | | | 85,500 | |
| | 6,513 | | | KapStone Paper and Packaging Corporationa | | | 200,340 | |
| | 800 | | | LyondellBasell Industries NV | | | 73,304 | |
| | 19,620 | | | Materials Select Sector SPDR Fund | | | 949,608 | |
| | 4,950 | | | Nucor Corporation | | | 267,597 | |
| | 12,000 | | | Owens-Illinois, Inc.a | | | 309,240 | |
| | 3,900 | | | Packaging Corporation of America | | | 281,112 | |
| | 16,570 | | | PolyOne Corporation | | | 613,256 | |
| | 5,350 | | | Royal Gold, Inc. | | | 305,752 | |
| | 35,901 | | | Senomyx, Inc.a | | | 284,336 | |
| | 7,994 | | | Silgan Holdings, Inc. | | | 392,985 | |
| | 1,400 | | | Sonoco Products Company | | | 57,218 | |
| | 9,550 | | | Southern Copper Corporation | | | 274,849 | |
| | 27,994 | | | Steel Dynamics, Inc. | | | 644,142 | |
| | 2,100 | | | Tronox, Ltd. | | | 50,778 | |
| | 14,768 | | | U.S. Silica Holdings, Inc. | | | 663,083 | |
| | 1,300 | | | Westlake Chemical Corporation | | | 91,715 | |
| | 1,400 | | | Worthington Industries, Inc. | | | 54,110 | |
| | | | | |
| | | | Total | | | 9,067,664 | |
| | | | | |
| |
| Telecommunications Services (0.2%) | | | | |
| | 13,600 | | | AT&T, Inc. | | | 473,824 | |
| | 13,120 | | | Cogent Communications Holdings | | | 445,293 | |
| | 10,994 | | | Verizon Communications, Inc. | | | 552,448 | |
| | 16,000 | | | Vonage Holdings Corporationa | | | 55,680 | |
| | | | | |
| | | | Total | | | 1,527,245 | |
| | | | | |
| |
| Utilities (0.5%) | | | | |
| | 2,300 | | | Atmos Energy Corporation | | | 121,900 | |
| | 5,700 | | | Edison International, Inc. | | | 356,706 | |
| | 4,950 | | | Laclede Group, Inc. | | | 251,311 | |
| | 7,210 | | | NiSource, Inc. | | | 303,253 | |
| | 22,650 | | | NorthWestern Corporation | | | 1,196,826 | |
| | 14,530 | | | PG&E Corporation | | | 731,150 | |
| | 6,970 | | | Portland General Electric Company | | | 253,778 | |
| | 10,850 | | | Public Service Enterprise Group, Inc. | | | 448,213 | |
| | 3,750 | | | Southern Company | | | 173,850 | |
| | 2,050 | | | Vectren Corporation | | | 92,147 | |
| | 5,700 | | | Wisconsin Energy Corporation | | | 283,062 | |
| | | | | |
| | | | Total | | | 4,212,196 | |
| | | | | |
| | | | | | | | |
| | | | | |
| | | | Total Common Stock (cost $232,900,897) | | | 280,405,609 | |
| | | | | |
| | |
Principal Amount | | | Long-Term Fixed Income (2.1%) | | Value | |
| Asset-Backed Securities (0.1%) | | | | |
| | | | Renaissance Home Equity Loan Trust | | | | |
| $ | 650,000 | | | 6.011%, 5/25/2036c | | | 464,836 | |
| | | | | |
| | | | Total | | | 464,836 | |
| | | | | |
| |
| Collateralized Mortgage Obligations (0.1%) | | | | |
| | | | MASTR Alternative Loans Trust | | | | |
| | 56,691 | | | 0.602%, 12/25/2035d | | | 31,304 | |
| | | | Residential Asset Securitization Trust | | | | |
| | 75,496 | | | 0.532%, 8/25/2037d | | | 29,759 | |
| | | | Sequoia Mortgage Trust | | | | |
| | 22,016 | | | 2.664%, 9/20/2046 | | | 914 | |
| | 150,541 | | | 2.664%, 9/20/2046 | | | 127,582 | |
| | | | WaMu Mortgage Pass Through Certificates | | | | |
| | 68,777 | | | 2.237%, 9/25/2036 | | | 61,592 | |
| | 101,546 | | | 2.293%, 10/25/2036 | | | 87,089 | |
| | | | | |
| | | | Total | | | 338,240 | |
| | | | | |
| |
| Commercial Mortgage-Backed Securities (<0.1%) | | | | |
| | | | Credit Suisse Mortgage Capital Certificates | | | | |
| | 250,000 | | | 5.509%, 9/15/2039 | | | 267,006 | |
| | | | | |
| | | | Total | | | 267,006 | |
| | | | | |
| |
| Mortgage-Backed Securities (0.8%) | | | | |
| | | | Federal Home Loan Mortgage Corporation Gold 15-Yr. Pass Through | | | | |
| | 750,000 | | | 3.000%, 11/1/2029e | | | 776,602 | |
| | | | Federal Home Loan Mortgage Corporation Gold 30-Yr. Pass Through | | | | |
| | 750,000 | | | 4.000%, 11/1/2044e | | | 795,644 | |
| | | | Federal National Mortgage Association Conventional 15-Yr. Pass Through | | | | |
| | 950,000 | | | 3.500%, 11/1/2029e | | | 1,003,734 | |
| | | | Federal National Mortgage Association Conventional 30-Yr. Pass Through | | | | |
| | 1,450,000 | | | 3.500%, 11/1/2044e | | | 1,499,390 | |
| | 1,325,000 | | | 4.000%, 11/1/2044e | | | 1,406,777 | |
| | 1,225,000 | | | 4.500%, 11/1/2044e | | | 1,327,594 | |
| | | | | |
| | | | Total | | | 6,809,741 | |
| | | | | |
| |
| U.S. Government and Agencies (1.1%) | | | | |
| | | | U.S. Treasury Bonds | | | | |
| | 3,710,000 | | | 3.000%, 5/15/2042 | | | 3,678,116 | |
| | | | U.S. Treasury Notes | | | | |
| | 75,000 | | | 0.625%, 10/15/2016 | | | 75,170 | |
| | 175,000 | | | 1.625%, 4/30/2019 | | | 175,779 | |
| | 250,000 | | | 2.125%, 9/30/2021 | | | 251,406 | |
| | 2,550,000 | | | 3.625%, 2/15/2044 | | | 2,829,904 | |
| | | | U.S. Treasury Notes, TIPS | | | | |
| | 2,058,000 | | | 0.125%, 4/15/2018 | | | 2,083,404 | |
| | | | | |
| | | | Total | | | 9,093,779 | |
| | | | | |
| | | | | | | | |
| | | | | |
| | | | Total Long-Term Fixed Income (cost $16,667,238) | | | 16,973,602 | |
| | | | | |
The accompanying Notes to Financial Statements are an integral part of this schedule.
59
AGGRESSIVE ALLOCATION FUND
Schedule of Investments as of October 31, 2014
| | | | | | | | |
Shares or
Principal
Amount | | | Short-Term Investments (9.6%)f | | Value | |
| | | | Federal Home Loan Bank Discount Notes | | | | |
| | 200,000 | | | 0.080%, 11/5/2014b | | | $199,998 | |
| | 2,000,000 | | | 0.055%, 11/12/2014 | | | 1,999,966 | |
| | 3,000,000 | | | 0.035%, 11/14/2014 | | | 2,999,962 | |
| | 2,000,000 | | | 0.055%, 11/21/2014 | | | 1,999,939 | |
| | 38,000,000 | | | 0.020%, 11/26/2014 | | | 37,999,472 | |
| | 2,000,000 | | | 0.047%, 12/3/2014 | | | 1,999,916 | |
| | 2,000,000 | | | 0.070%, 12/5/2014b | | | 1,999,868 | |
| | 100,000 | | | 0.055%, 12/12/2014b | | | 99,994 | |
| | 6,000,000 | | | 0.070%, 12/24/2014 | | | 5,999,382 | |
| | 2,000,000 | | | 0.040%, 1/2/2015 | | | 1,999,862 | |
| | 4,000,000 | | | 0.055%, 1/21/2015 | | | 3,999,505 | |
| | 2,000,000 | | | 0.063%, 1/23/2015 | | | 1,999,710 | |
| | 1,900,000 | | | 0.090%, 4/24/2015b | | | 1,899,174 | |
| | | | Federal Home Loan Mortgage Corporation Discount Notes | | | | |
| | 8,400,000 | | | 0.065%, 11/20/2014b | | | 8,399,712 | |
| | | | Federal National Mortgage Association Discount Notes | | | | |
| | 3,000,000 | | | 0.045%, 1/5/2015b | | | 2,999,756 | |
| | | | | |
| | | | Total Short-Term Investments (at amortized cost) | | | 76,596,216 | |
| | | | | |
| | | | Total Investments (cost $649,206,978) 100.1% | | $ | 800,772,574 | |
| | | | | |
| | | | Other Assets and Liabilities, Net (0.1%) | | | (929,687 | ) |
| | | | | |
| | | | Total Net Assets 100.0% | | $ | 799,842,887 | |
| | | | | |
a | Non-income producing security. |
b | At October 31, 2014, $17,058,005 of investments were held on deposit with the counterparty and pledged as the initial margin deposit for open futures contracts. |
c | Denotes step coupon securities. Step coupon securities pay an initial coupon rate for the first period and then different coupon rates for following periods. The rate shown is as of October 31, 2014. |
d | Denotes variable rate securities. Variable rate securities are securities whose yields vary with a designated market index or market rate. The rate shown is as of October 31, 2014. |
e | Denotes investments purchased on a when-issued or delayed delivery basis. |
f | The interest rate shown reflects the yield, coupon rate or the discount rate at the date of purchase. |
Definitions:
| | | | |
ADR | | - | | American Depositary Receipt, which are certificates for an underlying foreign security’s shares held by an issuing U.S. depository bank. |
ETF | | - | | Exchange Traded Fund. |
TIPS | | - | | Treasury Inflation Protected Security. |
Unrealized Appreciation (Depreciation)
Gross unrealized appreciation and depreciation of investments, based on cost for federal income tax purposes, were as follows:
| | | | |
Gross unrealized appreciation | | $ | 152,130,012 | |
Gross unrealized depreciation | | | (5,214,807 | ) |
| | | | |
Net unrealized appreciation (depreciation) | | $ | 146,915,205 | |
| |
Cost for federal income tax purposes | | $ | 653,857,369 | |
The accompanying Notes to Financial Statements are an integral part of this schedule.
60
AGGRESSIVE ALLOCATION FUND
Schedule of Investments as of October 31, 2014
Fair Valuation Measurements
The following table is a summary of the inputs used, as of October 31, 2014, in valuing Aggressive Allocation Fund’s assets carried at fair value.
| | | | | | | | | | | | | | | | |
Investments in Securities | | Total | | | Level 1 | | | Level 2 | | | Level 3 | |
| | | | |
Mutual Funds | | | | | | | | | | | | | | | | |
Equity Mutual Funds | | | 408,327,041 | | | | 408,327,041 | | | | – | | | | – | |
Fixed Income Mutual Funds | | | 18,470,106 | | | | 18,470,106 | | | | – | | | | – | |
| | | | |
Common Stock | | | | | | | | | | | | | | | | |
Consumer Discretionary | | | 39,679,986 | | | | 39,679,986 | | | | – | | | | – | |
Consumer Staples | | | 10,533,606 | | | | 10,533,606 | | | | – | | | | – | |
Energy | | | 19,254,272 | | | | 19,015,221 | | | | 239,051 | | | | – | |
Financials | | | 47,104,461 | | | | 47,104,461 | | | | – | | | | – | |
Health Care | | | 45,403,230 | | | | 45,403,230 | | | | – | | | | – | |
Industrials | | | 39,408,474 | | | | 39,408,474 | | | | – | | | | – | |
Information Technology | | | 64,214,475 | | | | 64,214,475 | | | | – | | | | – | |
Materials | | | 9,067,664 | | | | 9,067,664 | | | | – | | | | – | |
Telecommunications Services | | | 1,527,245 | | | | 1,527,245 | | | | – | | | | – | |
Utilities | | | 4,212,196 | | | | 4,212,196 | | | | – | | | | – | |
| | | | |
Long-Term Fixed Income | | | | | | | | | | | | | | | | |
Asset-Backed Securities | | | 464,836 | | | | – | | | | 464,836 | | | | – | |
Collateralized Mortgage Obligations | | | 338,240 | | | | – | | | | 338,240 | | | | – | |
Commercial Mortgage-Backed Securities | | | 267,006 | | | | – | | | | 267,006 | | | | – | |
Mortgage-Backed Securities | | | 6,809,741 | | | | – | | | | 6,809,741 | | | | – | |
U.S. Government and Agencies | | | 9,093,779 | | | | – | | | | 9,093,779 | | | | – | |
Short-Term Investments | | | 76,596,216 | | | | – | | | | 76,596,216 | | | | – | |
| |
Total | | $ | 800,772,574 | | | $ | 706,963,705 | | | $ | 93,808,869 | | | | $– | |
| |
| |
| | | | |
Other Financial Instruments | | Total | | | Level 1 | | | Level 2 | | | Level 3 | |
| | | | |
Asset Derivatives | | | | | | | | | | | | | | | | |
Futures Contracts | | | 4,767,907 | | | | 4,767,907 | | | | – | | | | – | |
| |
Total Asset Derivatives | | | $4,767,907 | | | | $4,767,907 | | | | $– | | | | $– | |
| |
| |
| | | | |
Liability Derivatives | | | | | | | | | | | | | | | | |
Futures Contracts | | | 4,636,572 | | | | 4,636,572 | | | | – | | | | – | |
| |
Total Liability Derivatives | | | $4,636,572 | | | | $4,636,572 | | | | $– | | | | $– | |
| |
| |
There were no significant transfers between Levels during the period ended October 31, 2014. Transfers between Levels are identified as of the end of the period.
| | | | | | | | | | | | | | | | | | |
Futures Contracts | | Number of Contracts Long/(Short) | | Expiration
Date | | | Notional Principal Amount | | | Value | | | Unrealized Gain/ (Loss) | |
2-Yr. U.S. Treasury Bond Futures | | (67) | | | December 2014 | | | | ($14,668,608 | ) | | | ($14,710,687 | ) | | | ($42,079 | ) |
5-Yr. U.S. Treasury Bond Futures | | (117) | | | December 2014 | | | | (13,863,657 | ) | | | (13,973,274 | ) | | | (109,617 | ) |
10-Yr. U.S. Treasury Bond Futures | | (60) | | | December 2014 | | | | (7,531,692 | ) | | | (7,581,563 | ) | | | (49,871 | ) |
30-Yr. U.S. Treasury Bond Futures | | 30 | | | December 2014 | | | | 4,146,155 | | | | 4,232,813 | | | | 86,658 | |
Eurex EURO STOXX 50 Futures | | 1,189 | | | December 2014 | | | | 47,795,924 | | | | 46,353,701 | | | | (1,442,223 | ) |
Mini MSCI EAFE Index Futures | | 118 | | | December 2014 | | | | 11,075,924 | | | | 10,832,400 | | | | (243,524 | ) |
Russell 2000 Index Mini-Futures | | (317) | | | December 2014 | | | | (36,170,556 | ) | | | (37,120,700 | ) | | | (950,144 | ) |
S&P 400 Index Mini-Futures | | (781) | | | December 2014 | | | | (108,743,626 | ) | | | (110,542,740 | ) | | | (1,799,114 | ) |
S&P 500 Index Futures | | 327 | | | December 2014 | | | | 159,940,836 | | | | 164,431,950 | | | | 4,491,114 | |
Ultra Long Term U.S. Treasury Bond Futures | | 58 | | | December 2014 | | | | 8,904,989 | | | | 9,095,124 | | | | 190,135 | |
Total Futures Contracts | | | | | | | | | | | | | | | | | $131,335 | |
The accompanying Notes to Financial Statements are an integral part of this schedule.
61
AGGRESSIVE ALLOCATION FUND
Schedule of Investments as of October 31, 2014
The following table summarizes the fair value and Statement of Assets and Liabilities location, as of October 31, 2014, for Aggressive Allocation Fund’s investments in financial derivative instruments by primary risk exposure as discussed under item (2) Significant Accounting Policies of the Notes to Financial Statements.
| | | | | | |
Derivatives by risk category | | Statement of Assets and Liabilities Location | | Fair Value | |
| | |
Asset Derivatives | | | | | | |
Interest Rate Contracts | | | | | | |
Futures* | | Net Assets - Net unrealized appreciation/(depreciation) on Futures contracts | | | $276,793 | |
Total Interest Rate Contracts | | | | | 276,793 | |
| | |
Equity Contracts | | | | | | |
Futures* | | Net Assets - Net unrealized appreciation/(depreciation) on Futures contracts | | | 4,491,114 | |
Total Equity Contracts | | | | | 4,491,114 | |
Total Asset Derivatives | | | | | $4,767,907 | |
| | | | | | | |
| | |
Liability Derivatives | | | | | | |
| | |
Interest Rate Contracts | | | | | | |
Futures* | | Net Assets - Net unrealized appreciation/(depreciation) on Futures contracts | | | 201,567 | |
Total Interest Rate Contracts | | | | | 201,567 | |
| | |
Equity Contracts | | | | | | |
Futures* | | Net Assets - Net unrealized appreciation/(depreciation) on Futures contracts | | | 4,435,005 | |
Total Equity Contracts | | | | | 4,435,005 | |
Total Liability Derivatives | | | | | $4,636,572 | |
| | | | | | | |
* | Includes cumulative appreciation/depreciation of futures contracts as reported in the Schedule of Investments. Only current day’s variation margin is reported within the Statement of Assets and Liabilities. |
The following table summarizes the net realized gains/(losses) and Statement of Operations location, for the period ended October 31, 2014, for Aggressive Allocation Fund’s investments in financial derivative instruments by primary risk exposure.
| | | | | | |
Derivatives by risk category | | Statement of Operations Location | | Realized Gains/(Losses) recognized in Income | |
| | |
Interest Rate Contracts | | | | | | |
Futures | | Net realized gains/(losses) on Futures contracts | | | 617,825 | |
| | |
Total Interest Rate Contracts | | | | | 617,825 | |
| | |
Equity Contracts | | | | | | |
Futures | | Net realized gains/(losses) on Futures contracts | | | 7,694,325 | |
| | |
Total Equity Contracts | | | | | 7,694,325 | |
| | |
Credit Contracts | | | | | | |
Credit Default Swaps | | Net realized gains/(losses) on Swap agreements | | | (31,184 | ) |
| | |
Total Credit Contracts | | | | | (31,184 | ) |
| |
Total | | | | | $8,280,966 | |
| |
| |
The following table summarizes the change in net unrealized appreciation/(depreciation) and Statement of Operations location, for the period ended October 31, 2014, for Aggressive Allocation Fund’s investments in financial derivative instruments by primary risk exposure.
| | | | | | |
Derivatives by risk category | | Statement of Operations Location | | Change in unrealized appreciation/
(depreciation) recognized in Income | |
| | |
Interest Rate Contracts | | | | | | |
Futures | | Change in net unrealized appreciation/(depreciation) on Futures contracts | | | 293,837 | |
| | |
Total Interest Rate Contracts | | | | | 293,837 | |
| | |
Equity Contracts | | | | | | |
Futures | | Change in net unrealized appreciation/(depreciation) on Futures contracts | | | (1,840,786 | ) |
| | |
Total Equity Contracts | | | | | (1,840,786 | ) |
| | |
Credit Contracts | | | | | | |
Credit Default Swaps | | Change in net unrealized appreciation/(depreciation) on Swap agreements | | | (5,670 | ) |
| | |
Total Credit Contracts | | | | | (5,670 | ) |
| |
Total | | | | | ($1,552,619 | ) |
| |
| |
The accompanying Notes to Financial Statements are an integral part of this schedule.
62
AGGRESSIVE ALLOCATION FUND
Schedule of Investments as of October 31, 2014
The following table presents Aggressive Allocation Fund’s average volume of derivative activity during the period ended October 31, 2014.
| | | | | | | | | | | | |
Derivative Risk Category | | Futures
(Notional)* | | | Futures
(Percentage
of Average
Net Assets) | | | Swaps
(Notional)* | |
Equity Contracts | | | $306,839,992 | | | | 40.5 | % | | | N/A | |
Interest Rate Contracts | | | 34,395,519 | | | | 4.5 | | | | N/A | |
Credit Contracts | | | N/A | | | | N/A | | | | $22,166 | |
* | Notional amount represents long or short, or both, derivative positions held by the Fund. |
Investment in Affiliates
Affiliated issuers, as defined under the Investment Company Act of 1940, include those in which the Fund’s holdings of an issuer represent 5% or more of the outstanding voting securities of an issuer, or any affiliated mutual fund.
A summary of transactions for the fiscal year to date, in Aggressive Allocation Fund, is as follows:
| | | | | | | | | | | | | | | | | | | | | | | | |
Fund | | Value October 31, 2013 | | | Gross Purchases | | | Gross Sales | | | Shares Held at October 31, 2014 | | | Value October 31, 2014 | | | Income Earned November 1, 2013 -
October 31, 2014 | |
Opportunity Income Plus | | | $7,089,536 | | | | $256,265 | | | | $2,900,000 | | | | 432,236 | | | | $4,486,611 | | | | $256,833 | |
Natural Resources | | | 15,606,171 | | | | 110,960 | | | | – | | | | 1,530,785 | | | | 14,343,455 | | | | 110,960 | |
Partner Small Cap Growth | | | 58,790,709 | | | | 7,888,596 | | | | 58,769,680 | | | | – | | | | – | | | | – | |
Partner Small Cap Value | | | 14,679,292 | | | | 467,934 | | | | – | | | | 698,214 | | | | 15,577,160 | | | | 54,742 | |
Small Cap Stock | | | 21,072,973 | | | | 145,997 | | | | – | | | | 1,011,313 | | | | 23,179,304 | | | | – | |
Mid Cap Growth | | | 35,434,050 | | | | 3,919,149 | | | | – | | | | 1,613,534 | | | | 38,886,157 | | | | – | |
Partner Mid Cap Value | | | 24,710,652 | | | | 4,666,691 | | | | – | | | | 1,859,855 | | | | 28,362,791 | | | | 128,783 | |
Mid Cap Stock | | | 40,553,646 | | | | 144,003 | | | | – | | | | 1,842,031 | | | | 47,045,471 | | | | 144,003 | |
Partner Worldwide Allocation | | | 106,995,683 | | | | 2,191,870 | | | | – | | | | 10,540,808 | | | | 106,567,566 | | | | 2,191,870 | |
Large Cap Growth | | | 49,365,412 | | | | 182,168 | | | | – | | | | 6,475,568 | | | | 58,021,094 | | | | 182,168 | |
Large Cap Value | | | 43,527,269 | | | | 576,568 | | | | – | | | | 2,353,715 | | | | 48,957,264 | | | | 576,568 | |
Large Cap Stock | | | 24,556,029 | | | | 2,395,199 | | | | – | | | | 978,449 | | | | 27,386,779 | | | | 202,943 | |
High Yield | | | 8,654,617 | | | | 1,244,198 | | | | 5,327,364 | | | | 895,552 | | | | 4,522,539 | | | | 463,065 | |
Income | | | 5,859,319 | | | | 2,137,735 | | | | 4,496,138 | | | | 393,991 | | | | 3,660,180 | | | | 231,598 | |
Limited Maturity Bond | | | – | | | | 12,899,105 | | | | 7,044,256 | | | | 466,300 | | | | 5,800,776 | | | | 158,011 | |
Cash Management Trust- Collateral Investment | | | – | | | | 5,766,219 | | | | 5,766,219 | | | | – | | | | – | | | | 125 | |
Total Value and Income Earned | | | 456,895,358 | | | | | | | | | | | | | | | | 426,797,147 | | | | 4,701,669 | |
The accompanying Notes to Financial Statements are an integral part of this schedule.
63
MODERATELY AGGRESSIVE ALLOCATION FUND
Schedule of Investments as of October 31, 2014
| | | | | | | | |
Principal
Amount | | | Bank Loans (2.3%)a | | Value | |
| Basic Materials (0.2%) | | | | |
| | | | Axalta Coating Systems US Holdings, Inc.,Term Loan | | | | |
| | $358,728 | | | 3.750%, 2/1/2020 | | | $352,677 | |
| | | | Fortescue Metals Group, Ltd., Term Loan | | | | |
| | 2,033,707 | | | 3.750%, 6/30/2019 | | | 1,982,173 | |
| | | | Ineos Group Holdings, Ltd., Term Loan | | | | |
| | 624,454 | | | 3.750%, 5/4/2018 | | | 615,867 | |
| | | | NewPage Corporation, Term Loan | | | | |
| | 600,000 | | | 9.500%, 2/11/2021 | | | 581,400 | |
| | | | Wausau Paper Corporation, Term Loan | | | | |
| | 523,688 | | | 6.500%, 7/30/2020 | | | 517,142 | |
| | | | | |
| | | | Total | | | 4,049,259 | |
| | | | | |
| |
| Capital Goods (0.1%) | | | | |
| | | | ADS Waste Holdings, Inc., Term Loan | | | | |
| | 677,925 | | | 3.750%, 10/9/2019 | | | 662,841 | |
| | | | Berry Plastics Group, Inc., Term Loan | | | | |
| | 812,625 | | | 3.500%, 2/8/2020 | | | 794,853 | |
| | | | Silver II Borrower, Term Loan | | | | |
| | 207,399 | | | 4.000%, 12/13/2019 | | | 203,597 | |
| | | | STHI Holding Corporation, Term Loan | | | | |
| | 185,000 | | | 4.500%, 8/6/2021 | | | 183,844 | |
| | | | | |
| | | | Total | | | 1,845,135 | |
| | | | | |
| |
| Communications Services (0.7%) | | | | |
| | | | Atlantic Broadband Penn, LLC, Term Loan | | | | |
| | 264,517 | | | 3.250%, 11/30/2019 | | | 261,012 | |
| | | | Birch Communication Inc., Term Loan | | | | |
| | 525,000 | | | 7.750%, 7/17/2020 | | | 504,000 | |
| | | | Cengage Learning Aquisitions, Term Loan | | | | |
| | 1,303,450 | | | 7.000%, 3/31/2020 | | | 1,304,102 | |
| | | | Cequel Communications, LLC, Term Loan | | | | |
| | 258,027 | | | 3.500%, 2/14/2019 | | | 255,158 | |
| | | | Charter Communications Operating, LLC, Term Loan | | | | |
| | 108,625 | | | 3.000%, 7/1/2020 | | | 106,588 | |
| | | | Clear Channel Communications, Inc., Term Loan | | | | |
| | 5,456 | | | 3.804%, 1/29/2016 | | | 5,406 | |
| | 646,736 | | | 6.904%, 1/30/2019 | | | 609,652 | |
| | 208,001 | | | 7.654%, 7/30/2019 | | | 199,746 | |
| | | | Cumulus Media Holdings, Inc., Term Loan | | | | |
| | 402,004 | | | 4.250%, 12/23/2020 | | | 397,313 | |
| | | | Fairpoint Communications, Term Loan | | | | |
| | 541,750 | | | 7.500%, 2/14/2019 | | | 545,477 | |
| | | | Grande Communications Networks, LLC, Term Loan | | | | |
| | 325,877 | | | 4.500%, 5/29/2020 | | | 322,416 | |
| | | | Hargray Communications Group, Inc., Term Loan | | | | |
| | 624,313 | | | 5.250%, 6/26/2019b,c | | | 623,014 | |
| | | | Integra Telecom Holdings, Inc., Term Loan | | | | |
| | 320,125 | | | 5.250%, 2/22/2019 | | | 318,764 | |
| | 105,000 | | | 9.750%, 2/21/2020 | | | 103,162 | |
| | | | Intelsat Jackson Holdings SA, Term Loan | | | | |
| | 518,469 | | | 3.750%, 6/30/2019 | | | 513,933 | |
| | | | Level 3 Communications, Inc., Term Loan | | | | |
| | 715,000 | | | 4.000%, 1/15/2020 | | | 711,425 | |
| | | | Level 3 Financing, Inc., Term Loan | | | | |
| | 240,000 | | | 0.000%, 1/31/2022b,c | | | 240,974 | |
| | | | Liberty Cablevision of Puerto Rico, LLC, Term Loan | | | | |
| | 295,000 | | | 4.500%, 1/7/2022 | | | 292,605 | |
| | | | LTS Buyer, LLC, Term Loan | | | | |
| | 241,937 | | | 4.000%, 4/13/2020 | | | 238,913 | |
| | 17,078 | | | 8.000%, 4/12/2021 | | | 16,921 | |
| | | | McGraw-Hill Global Education, LLC, Term Loan | | | | |
| | 505,865 | | | 5.750%, 3/22/2019 | | | 506,341 | |
| | | | Mediacom Broadband, LLC, Term Loan | | | | |
| | 289,100 | | | 4.000%, 1/20/2020 | | | 284,041 | |
| | | | NEP Broadcasting, LLC, Term Loan | | | | |
| | 31,429 | | | 9.500%, 7/22/2020 | | | 31,350 | |
| | | | NEP/NCP Holdco, Inc., Term Loan | | | | |
| | 812,671 | | | 4.250%, 1/22/2020 | | | 792,355 | |
| | | | NTelos, Inc., Term Loan | | | | |
| | 161,700 | | | 5.750%, 11/9/2019 | | | 161,430 | |
| | | | Syniverse Holdings, Inc., Term Loan | | | | |
| | 426,589 | | | 4.000%, 4/23/2019 | | | 418,326 | |
| | | | TNS, Inc., Term Loan | | | | |
| | 322,895 | | | 5.000%, 2/14/2020 | | | 319,466 | |
| | | | Univision Communications, Inc., Term Loan | | | | |
| | 765,233 | | | 4.000%, 3/1/2020 | | | 756,945 | |
| | | | Virgin Media Investment Holdings, Ltd., Term Loan | | | | |
| | 675,000 | | | 3.500%, 6/7/2020 | | | 665,064 | |
| | | | WideOpenWest Finance, LLC, Term Loan | | | | |
| | 719,050 | | | 4.750%, 4/1/2019 | | | 717,813 | |
| | | | XO Communications, LLC, Term Loan | | | | |
| | 139,300 | | | 4.250%, 3/20/2021 | | | 137,848 | |
| | | | Yankee Cable Acquisition, LLC, Term Loan | | | | |
| | 418,255 | | | 4.500%, 3/1/2020 | | | 415,850 | |
| | | | Zayo Group, LLC, Term Loan | | | | |
| | 649,220 | | | 4.000%, 7/2/2019 | | | 643,033 | |
| | | | | |
| | | | Total | | | 13,420,443 | |
| | | | | |
| |
| Consumer Cyclical (0.4%) | | | | |
| | | | Amaya Gaming Group, Inc., Term Loan | | | | |
| | 350,000 | | | 5.000%, 8/1/2021 | | | 347,011 | |
| | | | Bally Technologies, Inc., Term Loan | | | | |
| | 253,565 | | | 4.250%, 11/25/2020 | | | 252,457 | |
| | | | Burlington Coat Factory Warehouse Corporation, Term Loan | | | | |
| | 416,712 | | | 4.250%, 8/13/2021 | | | 413,795 | |
| | | | Ceridian Corporation, Term Loan | | | | |
| | 232,665 | | | 4.121%, 5/9/2017 | | | 232,316 | |
| | 232,665 | | | 4.500%, 5/9/2017 | | | 230,557 | |
| | | | Chrysler Group, LLC, Term Loan | | | | |
| | 359,427 | | | 3.500%, 5/24/2017 | | | 357,332 | |
The accompanying Notes to Financial Statements are an integral part of this schedule.
64
MODERATELY AGGRESSIVE ALLOCATION FUND
Schedule of Investments as of October 31, 2014
| | | | | | | | |
Principal
Amount | | | Bank Loans (2.3%)a | | Value | |
| Consumer Cyclical (0.4%) - continued | |
| | | | Golden Nugget, Inc., Delayed Draw | | | | |
| | $65,505 | | | 5.500%, 11/21/2019 | | | $65,804 | |
| | | | Golden Nugget, Inc., Term Loan | | | | |
| | 152,845 | | | 5.500%, 11/21/2019 | | | 153,544 | |
| | | | Hilton Worldwide Finance, LLC, Term Loan | | | | |
| | 346,667 | | | 3.500%, 10/26/2020 | | | 343,027 | |
| | | | J.C. Penney Corporation, Inc., Term Loan | | | | |
| | 158,000 | | | 6.000%, 5/22/2018 | | | 155,894 | |
| | | | Las Vegas Sands, LLC, Term Loan | | | | |
| | 967,688 | | | 3.250%, 12/19/2020 | | | 964,330 | |
| | | | Marina District Finance Company, Inc., Term Loan | | | | |
| | 778,245 | | | 6.750%, 8/15/2018 | | | 775,817 | |
| | | | MGM Resorts International, Term Loan | | | | |
| | 343,875 | | | 3.500%, 12/20/2019 | | | 339,577 | |
| | | | Mohegan Tribal Gaming Authority, Term Loan | | | | |
| | 893,250 | | | 5.500%, 11/19/2019 | | | 866,453 | |
| | | | Rite Aid Corporation, Term Loan | | | | |
| | 83,941 | | | 3.500%, 2/21/2020 | | | 82,870 | |
| | 165,000 | | | 5.750%, 8/21/2020 | | | 165,825 | |
| | | | ROC Finance, LLC, Term Loan | | | | |
| | 598,950 | | | 5.000%, 6/20/2019 | | | 572,560 | |
| | | | Scientific Games International, Inc., Term Loan | | | | |
| | 169,148 | | | 4.250%, 10/18/2020 | | | 165,394 | |
| | | | Seminole Indian Tribe of Florida, Term Loan | | | | |
| | 183,475 | | | 3.000%, 4/29/2020 | | | 182,673 | |
| | | | Seven Seas Cruises S de RL, LLC, Term Loan | | | | |
| | 543,572 | | | 3.750%, 12/21/2018 | | | 542,213 | |
| | | | Toys “R” Us, Inc., Term Loan | | | | |
| | 141,239 | | | 5.250%, 5/25/2018 | | | 112,815 | |
| | 368,025 | | | 9.750%, 4/24/2020b,c | | | 334,288 | |
| | | | | |
| | | | Total | | | 7,656,552 | |
| | | | | |
| |
| Consumer Non-Cyclical (0.3%) | | | | |
| | | | Albertsons, Inc., Term Loan | | | | |
| | 773,468 | | | 4.750%, 3/21/2019 | | | 771,534 | |
| | | | Biomet, Inc., Term Loan | | | | |
| | 464,819 | | | 3.652%, 7/25/2017 | | | 463,341 | |
| | | | Catalina Marketing Corporation, Term Loan | | | | |
| | 134,662 | | | 4.500%, 4/9/2021 | | | 131,044 | |
| | | | CHS/Community Health Systems, Inc., Term Loan | | | | |
| | 98,835 | | | 3.485%, 1/25/2017 | | | 98,506 | |
| | 263,428 | | | 4.250%, 1/27/2021 | | | 263,509 | |
| | | | Del Monte Corporation, Term Loan | | | | |
| | 67,546 | | | 3.500%, 3/9/2020 | | | 64,887 | |
| | | | Hologic, Inc., Term Loan | | | | |
| | 348,499 | | | 3.250%, 8/1/2019 | | | 346,408 | |
| | | | JBS USA, LLC, Term Loan | | | | |
| | 362,970 | | | 3.750%, 5/25/2018 | | | 357,525 | |
| | | | Ortho-Clinical Diagnostics, Inc., Term Loan | | | | |
| | 768,075 | | | 4.750%, 6/30/2021 | | | 759,626 | |
| | | | Roundy’s Supermarkets, Inc., Term Loan | | | | |
| | 762,123 | | | 5.750%, 3/3/2021 | | | 676,384 | |
| | | | Supervalu, Inc., Term Loan | | | | |
| | 500,129 | | | 4.500%, 3/21/2019 | | | 493,343 | |
| | | | Visant Corporation, Term Loan | | | | |
| | 836,141 | | | 7.000%, 9/23/2021 | | | 823,599 | |
| | | | | |
| | | | Total | | | 5,249,706 | |
| | | | | |
| |
| Energy (0.2%) | | | | |
| | | | Arch Coal, Inc., Term Loan | |
| | 870,452 | | | 6.250%, 5/16/2018 | | | 767,242 | |
| | | | Energy Solutions, LLC, Term Loan | | | | |
| | 164,588 | | | 6.750%, 5/29/2020 | | | 165,205 | |
| | | | Expro Holdings UK 2, Ltd., Term Loan | | | | |
| | 300,000 | | | 0.000%, 9/2/2021b,c | | | 293,499 | |
| | | | Fieldwood Energy, LLC, Term Loan | | | | |
| | 46,798 | | | 8.375%, 9/30/2020 | | | 44,956 | |
| | | | Houston Fuel Oil Terminal, LLC, Term Loan | | | | |
| | 240,000 | | | 4.250%, 8/19/2021 | | | 235,500 | |
| | | | McJunkin Red Man Corporation, Term Loan | | | | |
| | 262,350 | | | 5.000%, 11/8/2019 | | | 262,678 | |
| | | | Offshore Group Investment, Ltd., Term Loan | | | | |
| | 453,100 | | | 5.750%, 3/28/2019 | | | 410,055 | |
| | | | Pacific Drilling SA, Term Loan | | | | |
| | 212,312 | | | 4.500%, 6/3/2018 | | | 202,958 | |
| | | | TerraForm Power Operating, LLC, Term Loan | | | | |
| | 169,575 | | | 4.750%, 7/23/2019 | | | 169,575 | |
| | | | | |
| | | | Total | | | 2,551,668 | |
| | | | | |
| |
| Financials (0.1%) | | | | |
| | | | DJO Finance, LLC, Term Loan | | | | |
| | 519,096 | | | 4.250%, 9/15/2017 | | | 516,241 | |
| | | | GEO Group, Inc., Term Loan | | | | |
| | 107,365 | | | 3.250%, 4/3/2020 | | | 106,023 | |
| | | | Harland Clarke Holdings Corporation, Term Loan | | | | |
| | 68,688 | | | 6.000%, 8/4/2019 | | | 68,830 | |
| | | | MoneyGram International, Inc., Term Loan | | | | |
| | 433,400 | | | 4.250%, 3/27/2020 | | | 418,955 | |
| | | | WaveDivision Holdings, LLC, Term Loan | | | | |
| | 668,100 | | | 4.000%, 10/15/2019 | | | 661,139 | |
| | | | | |
| | | | Total | | | 1,771,188 | |
| | | | | |
| |
| Technology (0.1%) | | | | |
| | | | First Data Corporation, Term Loan | | | | |
| | 720,000 | | | 3.653%, 3/23/2018 | | | 712,800 | |
| | 295,000 | | | 3.653%, 9/24/2018 | | | 292,050 | |
| | | | Freescale Semiconductor, Inc., Term Loan | | | | |
| | 394,022 | | | 4.250%, 2/28/2020 | | | 388,254 | |
| | 255,420 | | | 5.000%, 1/15/2021 | | | 254,828 | |
The accompanying Notes to Financial Statements are an integral part of this schedule.
65
MODERATELY AGGRESSIVE ALLOCATION FUND
Schedule of Investments as of October 31, 2014
| | | | | | | | |
Principal
Amount | | | Bank Loans (2.3%)a | | Value | |
| Technology (0.1%) - continued | |
| | | | Infor US, Inc., Term Loan | | | | |
| $ | 454,051 | | | 3.750%, 6/3/2020 | | | $447,580 | |
| | | | | |
| | | | Total | | | 2,095,512 | |
| | | | | |
| |
| Transportation (0.1%) | | | | |
| | | | American Airlines, Inc., Term Loan | | | | |
| | 454,250 | | | 3.750%, 6/27/2019 | | | 448,004 | |
| | | | Delta Air Lines, Inc., Term Loan | | | | |
| | 572,858 | | | 3.250%, 4/20/2017 | | | 568,115 | |
| | | | OSG Bulk Ships, lnc., Term Loan | | | | |
| | 369,075 | | | 5.250%, 8/5/2019 | | | 366,152 | |
| | | | United Airlines, Inc., Term Loan | | | | |
| | 265,950 | | | 3.500%, 4/1/2019 | | | 259,966 | |
| | 90,000 | | | 3.750%, 9/15/2021 | | | 88,875 | |
| | | | | |
| | | | Total | | | 1,731,112 | |
| | | | | |
| |
| Utilities (0.1%) | | | | |
| | | | Calpine Corporation, Term Loan | | | | |
| | 83,486 | | | 4.000%, 4/1/2018 | | | 83,094 | |
| | 573,300 | | | 4.000%, 10/9/2019 | | | 567,773 | |
| | | | Intergen NV, Term Loan | | | | |
| | 207,375 | | | 5.500%, 6/15/2020 | | | 206,857 | |
| | | | NGPL PipeCo, LLC, Term Loan | | | | |
| | 489,524 | | | 6.750%, 9/15/2017 | | | 487,894 | |
| | | | | |
| | | | Total | | | 1,345,618 | |
| | | | | |
| | | | Total Bank Loans (cost $42,327,318) | | | 41,716,193 | |
| | | | | |
| | |
| Shares | | | Mutual Funds (57.5%) | | Value | |
| Equity Mutual Funds (48.3%) | | | | |
| | 3,092,268 | | | Thrivent Natural Resources Fund | | | 28,974,552 | |
| | 1,628,108 | | | Thrivent Partner Small Cap Value Fund | | | 36,323,082 | |
| | 1,353,925 | | | Thrivent Small Cap Stock Fund | | | 31,031,959 | |
| | 2,132,075 | | | Thrivent Mid Cap Growth Fund | | | 51,383,009 | |
| | 3,844,932 | | | Thrivent Partner Mid Cap Value Fund | | | 58,635,213 | |
| | 4,047,495 | | | Thrivent Mid Cap Stock Fund | | | 103,373,034 | |
| | 20,291,180 | | | Thrivent Partner Worldwide Allocation Fund | | | 205,143,826 | |
| | 14,406,776 | | | Thrivent Large Cap Growth Fund | | | 129,084,714 | |
| | 7,692,182 | | | Thrivent Large Cap Value Fund | | | 159,997,378 | |
| | 3,491,822 | | | Thrivent Large Cap Stock Fund | | | 97,736,096 | |
| | | | | |
| | | | Total | | | 901,682,863 | |
| | | | | |
| |
| Fixed Income Mutual Funds (9.2%) | | | | |
| | 11,439,906 | | | Thrivent High Yield Fund | | | 57,771,526 | |
| | 7,875,189 | | | Thrivent Income Fund | | | 73,160,508 | |
| | 2,313,767 | | | Thrivent Government Bond Fund | | | 23,253,358 | |
| | 1,451,773 | | | Thrivent Limited Maturity Bond Fund | | | 18,060,055 | |
| | | | | |
| | | | Total | | | 172,245,447 | |
| | | | | |
| | | | | | | | |
| | | | | |
| | | | Total Mutual Funds (cost $838,527,085) | | | 1,073,928,310 | |
| | | | | |
| | |
| Shares | | | Common Stock (22.5%) | | Value | |
| Consumer Discretionary (3.0%) | | | | |
| | 4,000 | | | Aaron’s, Inc. | | | 99,040 | |
| | 7,000 | | | Amazon.com, Inc.d | | | 2,138,220 | |
| | 6,746 | | | ANN, Inc.d | | | 258,979 | |
| | 1,800 | | | Aoyama Trading Company, Ltd. | | | 42,813 | |
| | 23,700 | | | Apollo Group, Inc.d | | | 679,242 | |
| | 3,550 | | | AutoZone, Inc.d | | | 1,964,996 | |
| | 4,850 | | | Bank Mandiri Persero Tbk PTd | | | 117,855 | |
| | 24,100 | | | Barnes & Noble, Inc.d | | | 525,862 | |
| | 400 | | | Bayerische Motoren Werke AG | | | 32,074 | |
| | 12,950 | | | Best Buy Company, Inc. | | | 442,113 | |
| | 2,450 | | | Big Lots, Inc. | | | 111,843 | |
| | 4,300 | | | BJ’s Restaurants, Inc.d | | | 189,286 | |
| | 3,150 | | | BorgWarner, Inc. | | | 179,613 | |
| | 400 | | | Brembo SPA | | | 13,265 | |
| | 800 | | | Bridgestone Corporation | | | 26,734 | |
| | 2,150 | | | Brinker International, Inc. | | | 115,326 | |
| | 15,523 | | | Brunswick Corporation | | | 726,476 | |
| | 13,798 | | | Burlington Stores, Inc.d | | | 578,688 | |
| | 5,400 | | | Carnival Corporation | | | 216,810 | |
| | 14,250 | | | Cato Corporation | | | 508,297 | |
| | 16,010 | | | CBS Corporation | | | 868,062 | |
| | 34,660 | | | Cheesecake Factory, Inc. | | | 1,592,280 | |
| | 700 | | | Chiyoda Company, Ltd. | | | 13,850 | |
| | 4,632 | | | Chuy’s Holdings, Inc.d | | | 138,543 | |
| | 7,100 | | | Coinstar, Inc.d | | | 449,217 | |
| | 82,600 | | | Comcast Corporatione | | | 4,571,910 | |
| | 8,403 | | | Core-Mark Holding Company, Inc. | | | 487,626 | |
| | 200 | | | Daimler AG | | | 15,594 | |
| | 19,931 | | | Del Frisco’s Restaurant Group, Inc.d | | | 462,798 | |
| | 28,432 | | | Delphi Automotive plc | | | 1,961,239 | |
| | 3,200 | | | DeVry Education Group, Inc. | | | 154,912 | |
| | 320 | | | Discovery Communications, Inc., Class Ad | | | 11,312 | |
| | 17,900 | | | DISH Network Corporationd | | | 1,139,335 | |
| | 16,710 | | | Dollar Tree, Inc.d | | | 1,012,125 | |
| | 650 | | | Dunkin’ Brands Group, Inc. | | | 29,562 | |
| | 9,000 | | | EDION Corporation | | | 64,213 | |
| | 10,850 | | | Five Below, Inc.d | | | 432,590 | |
| | 100 | | | Forbo Holding AG | | | 103,778 | |
| | 41,150 | | | Ford Motor Company | | | 579,803 | |
| | 17,064 | | | G-III Apparel Group, Ltd.d | | | 1,354,028 | |
| | 4,500 | | | Hakuhodo Dy Holdings, Inc. | | | 44,503 | |
| | 5,671 | | | Halfords Group plc | | | 45,018 | |
| | 7,775 | | | Harman International Industries, Inc. | | | 834,568 | |
| | 8,100 | | | Haseko Corporation | | | 59,372 | |
| | 700 | | | Heiwa Corporation | | | 14,333 | |
| | 19,000 | | | Home Depot, Inc.e | | | 1,852,880 | |
| | 7,745 | | | Home Retail Group plc | | | 22,728 | |
| | 14,401 | | | HomeAway, Inc.d | | | 502,595 | |
| | 47,490 | | | Houghton Mifflin Harcourt Companyd | | | 950,275 | |
| | 29,294 | | | Ignite Restaurant Group, Inc.d | | | 201,836 | |
| | 11,543 | | | Imax Corporationd | | | 340,057 | |
| | 4,650 | | | iRobot Corporationd | | | 166,098 | |
| | 840 | | | Jarden Corporationd | | | 54,676 | |
| | 2,800 | | | JM AB | | | 90,502 | |
| | 14,421 | | | Kate Spade & Companyd | | | 391,242 | |
| | 8,500 | | | Kirkland’s, Inc.d | | | 151,300 | |
| | 22,900 | | | Kohl’s Corporation | | | 1,241,638 | |
| | 19,505 | | | Kongsberg Automotive ASAd | | | 18,664 | |
| | 25,913 | | | Las Vegas Sands Corporation | | | 1,613,343 | |
| | 22,000 | | | Li & Fung, Ltd. | | | 26,812 | |
| | 11,700 | | | Liberty Interactive Corporationd | | | 305,838 | |
| | 1,663 | | | Liberty Venturesd | | | 58,371 | |
| | 770 | | | Limited Brands, Inc. | | | 55,532 | |
| | 1,172 | | | Lithia Motors, Inc. | | | 90,971 | |
| | 32,670 | | | Lowe’s Companies, Inc. | | | 1,868,724 | |
| | 31,000 | | | Luk Fook Holdings International, Ltd. | | | 92,432 | |
| | 18,550 | | | Macy’s, Inc. | | | 1,072,561 | |
| | 800 | | | Marriott International, Inc. | | | 60,600 | |
The accompanying Notes to Financial Statements are an integral part of this schedule.
66
MODERATELY AGGRESSIVE ALLOCATION FUND
Schedule of Investments as of October 31, 2014
| | | | | | | | |
| Shares | | | Common Stock (22.5%) | | Value | |
| Consumer Discretionary (3.0%) - continued | | | | |
| | 1,650 | | | Marriott Vacations Worldwide Corporation | | | $114,576 | |
| | 53,098 | | | MDC Partners, Inc. | | | 1,099,129 | |
| | 550 | | | Michael Kors Holdings, Ltd.d | | | 43,225 | |
| | 22,479 | | | Multimedia Games Holding Company, Inc.d | | | 784,517 | |
| | 9,700 | | | Nautilus, Inc.d | | | 129,786 | |
| | 1,200 | | | Next plc | | | 123,884 | |
| | 18,300 | | | NIKE, Inc. | | | 1,701,351 | |
| | 4,600 | | | NOK Corporation | | | 116,539 | |
| | 57,850 | | | NutriSystem, Inc. | | | 974,194 | |
| | 12,050 | | | Omnicom Group, Inc. | | | 865,913 | |
| | 13,250 | | | Orbitz Worldwide, Inc.d | | | 109,578 | |
| | 300 | | | O’Reilly Automotive, Inc.d | | | 52,764 | |
| | 19,589 | | | Oxford Industries, Inc. | | | 1,199,826 | |
| | 13,120 | | | Papa John’s International, Inc. | | | 613,491 | |
| | 4,200 | | | Persimmon plc | | | 98,637 | |
| | 1,734 | | | Publicis Groupe SA | | | 120,266 | |
| | 420 | | | PVH Corporation | | | 48,027 | |
| | 100 | | | Ralph Lauren Corporation | | | 16,484 | |
| | 6,543 | | | Red Robin Gourmet Burgers, Inc.d | | | 359,669 | |
| | 3,495 | | | Restoration Hardware Holdings, Inc.d | | | 280,718 | |
| | 200 | | | Rinnai Corporation | | | 17,765 | |
| | 630 | | | Ross Stores, Inc. | | | 50,854 | |
| | 2,400 | | | Royal Caribbean Cruises, Ltd. | | | 163,128 | |
| | 16,600 | | | Ruby Tuesday, Inc.d | | | 127,488 | |
| | 11,250 | | | Scientific Games Corporationd | | | 132,413 | |
| | 9,950 | | | Scripps Networks Interactive, Inc. | | | 768,538 | |
| | 16,250 | | | Select Comfort Corporationd | | | 417,462 | |
| | 2,205 | | | Shutterfly, Inc.d | | | 92,235 | |
| | 8,806 | | | Skechers USA, Inc.d | | | 482,129 | |
| | 4,871 | | | Slater & Gordon, Ltd. | | | 26,318 | |
| | 23,550 | | | Starbucks Corporation | | | 1,779,438 | |
| | 660 | | | Starwood Hotels & Resorts Worldwide, Inc. | | | 50,596 | |
| | 4,800 | | | Sumitomo Forestry Company, Ltd. | | | 50,438 | |
| | 3,600 | | | Suzuki Motor Corporation | | | 120,667 | |
| | 10,129 | | | Tenneco, Inc.d | | | 530,354 | |
| | 7,820 | | | Time Warner Cable, Inc. | | | 1,151,182 | |
| | 21,710 | | | Toll Brothers, Inc.d | | | 693,634 | |
| | 320 | | | Tractor Supply Company | | | 23,430 | |
| | 67,240 | | | Tuesday Morning Corporationd | | | 1,371,024 | |
| | 5,350 | | | Ulta Salon Cosmetics & Fragrance, Inc.d | | | 646,334 | |
| | 430 | | | Under Armour, Inc.d | | | 28,199 | |
| | 4,270 | | | Vail Resorts, Inc. | | | 368,757 | |
| | 100 | | | Valora Holding AG | | | 20,713 | |
| | 560 | | | VF Corporation | | | 37,901 | |
| | 2,600 | | | WH Smith plc | | | 46,942 | |
| | 800 | | | Wolters Kluwer NV | | | 21,359 | |
| | 800 | | | WPP plc | | | 15,626 | |
| | 10,200 | | | Wyndham Worldwide Corporation | | | 792,234 | |
| | 100 | | | Wynn Resorts, Ltd. | | | 19,001 | |
| | | | | |
| | | | Total | | | 55,536,511 | |
| | | | | |
| |
| Consumer Staples (0.9%) | | | | |
| | 9,200 | | | Anheuser-Busch InBev NV ADR | | | 1,021,016 | |
| | 6,250 | | | Archer-Daniels-Midland Company | | | 293,750 | |
| | 5,106 | | | B&G Foods, Inc. | | | 150,423 | |
| | 3,032 | | | Boston Beer Company, Inc.d | | | 754,968 | |
| | 5,842 | | | Britvic plc | | | 63,695 | |
| | 2,150 | | | Coca-Cola Enterprises, Inc. | | | 93,203 | |
| | 2,700 | | | Colgate-Palmolive Company | | | 180,576 | |
| | 45,880 | | | CVS Health Corporation | | | 3,936,963 | |
| | 5,950 | | | Green Mountain Coffee Roasters, Inc. | | | 902,913 | |
| | 6,997 | | | Greencore Group plc | | | 29,359 | |
| | 560 | | | Hain Celestial Group, Inc.d | | | 60,620 | |
| | 8,000 | | | Ingredion, Inc. | | | 618,000 | |
| | 3,500 | | | J Sainsbury plc | | | 13,788 | |
| | 1,700 | | | Kesko Oyj | | | 64,473 | |
| | 5,520 | | | Kimberly-Clark Corporation | | | 630,770 | |
| | 700 | | | KOSE Corporation | | | 28,607 | |
| | 2,600 | | | Kroger Company | | | 144,846 | |
| | 1,200 | | | Matsumotokiyoshi Holdings Company, Ltd. | | | 34,898 | |
| | 7,050 | | | Molson Coors Brewing Company | | | 524,379 | |
| | 41,747 | | | Mondelez International, Inc. | | | 1,471,999 | |
| | 660 | | | Monster Beverage Corporationd | | | 66,581 | |
| | 8,605 | | | Natural Grocers by Vitamin Cottage, Inc.d | | | 155,837 | |
| | 900 | | | Nestle SA | | | 66,001 | |
| | 4,684 | | | Pantry, Inc.d | | | 120,707 | |
| | 8,200 | | | Parmalat SPA | | | 24,641 | |
| | 6,179 | | | Philip Morris International, Inc. | | | 549,993 | |
| | 3,400 | | | Pilgrim’s Pride Corporationd | | | 96,594 | |
| | 15,000 | | | Pinnacle Foods, Inc. | | | 507,000 | |
| | 500 | | | Rallye SA | | | 19,378 | |
| | 2,730 | | | Reckitt Benckiser Group plc | | | 229,929 | |
| | 74,800 | | | Rite Aid Corporationd | | | 392,700 | |
| | 2,266 | | | SalMar ASA | | | 40,826 | |
| | 2,300 | | | Suedzucker AG | | | 32,025 | |
| | 4,300 | | | Tate & Lyle plc | | | 41,616 | |
| | 7,550 | | | TreeHouse Foods, Inc.d | | | 643,034 | |
| | 11,665 | | | United Natural Foods, Inc.d | | | 793,453 | |
| | 3,300 | | | Wal-Mart Stores, Inc. | | | 251,691 | |
| | 48,480 | | | WhiteWave Foods Companyd | | | 1,804,910 | |
| | 8,410 | | | Whole Foods Market, Inc. | | | 330,765 | |
| | | | | |
| | | | Total | | | 17,186,927 | |
| | | | | |
| |
| Energy (1.7%) | | | | |
| | 3,050 | | | Atwood Oceanics, Inc.d | | | 123,982 | |
| | 3,550 | | | Baker Hughes, Inc. | | | 188,008 | |
| | 1,691 | | | Bonanza Creek Energy, Inc.d | | | 76,501 | |
| | 36,525 | | | BP plc | | | 262,793 | |
| | 19,617 | | | BW Offshore, Ltd. | | | 24,084 | |
| | 36,250 | | | Cabot Oil & Gas Corporation | | | 1,127,375 | |
| | 34,967 | | | Cameron International Corporationd | | | 2,082,285 | |
| | 5,450 | | | Chesapeake Energy Corporation | | | 120,881 | |
| | 7,210 | | | Chevron Corporation | | | 864,839 | |
| | 1,490 | | | Cimarex Energy Company | | | 169,368 | |
| | 12,250 | | | Comstock Resources, Inc. | | | 145,040 | |
| | 1,460 | | | Concho Resources, Inc.d | | | 159,184 | |
| | 2,150 | | | ConocoPhillips | | | 155,122 | |
| | 8,800 | | | Denbury Resources, Inc. | | | 109,120 | |
| | 1,766 | | | Diamondback Energy, Inc.d | | | 120,865 | |
| | 1,100 | | | Energen Corporation | | | 74,470 | |
| | 1,300 | | | Eni SPA | | | 27,696 | |
| | 6,230 | | | Ensco plc | | | 252,876 | |
| | 22,146 | | | EOG Resources, Inc. | | | 2,104,977 | |
| | 11,330 | | | EQT Corporation | | | 1,065,473 | |
| | 6,000 | | | ERG SPA | | | 68,760 | |
| | 2,350 | | | Exterran Holdings, Inc. | | | 92,426 | |
| | 35,450 | | | Exxon Mobil Corporation | | | 3,428,369 | |
| | 4,450 | | | Green Plains, Inc. | | | 152,190 | |
| | 2,550 | | | Gulfmark Offshore, Inc. | | | 76,908 | |
| | 1,200 | | | Gulfport Energy Corporationd | | | 60,216 | |
| | 5,200 | | | Helix Energy Solutions Group, Inc.d | | | 138,528 | |
| | 2,130 | | | Helmerich & Payne, Inc. | | | 184,927 | |
| | 2,350 | | | Hess Corporation | | | 199,303 | |
| | 3,590 | | | HollyFrontier Corporation | | | 162,914 | |
| | 33,702 | | | Kodiak Oil & Gas Corporationd | | | 363,645 | |
The accompanying Notes to Financial Statements are an integral part of this schedule.
67
MODERATELY AGGRESSIVE ALLOCATION FUND
Schedule of Investments as of October 31, 2014
| | | | | | | | |
| Shares | | | Common Stock (22.5%) | | Value | |
| Energy (1.7%) - continued | | | | |
| | 10,500 | | | Kosmos Energy, Ltd.d | | | $97,965 | |
| | 71,724 | | | Marathon Oil Corporation | | | 2,539,030 | |
| | 23,760 | | | Market Vectors Oil Service ETF | | | 1,073,952 | |
| | 37,450 | | | Nabors Industries, Ltd. | | | 668,482 | |
| | 1,830 | | | National Oilwell Varco, Inc. | | | 132,931 | |
| | 4,300 | | | Neste Oil Oyj | | | 92,952 | |
| | 3,000 | | | Newfield Exploration Companyd | | | 97,830 | |
| | 3,550 | | | Noble Corporation | | | 74,266 | |
| | 2,390 | | | Noble Energy, Inc. | | | 137,736 | |
| | 41,280 | | | Oasis Petroleum, Inc.d | | | 1,236,749 | |
| | 2,250 | | | Oceaneering International, Inc. | | | 158,107 | |
| | 1,975 | | | Oil States International, Inc.d | | | 117,986 | |
| | 18,250 | | | Patterson-UTI Energy, Inc. | | | 420,297 | |
| | 1,589 | | | PDC Energy, Inc.d | | | 69,471 | |
| | 31,317 | | | Penn Virginia Corporationd | | | 268,387 | |
| | 690 | | | Pioneer Natural Resources Company | | | 130,451 | |
| | 3,050 | | | QEP Resources, Inc. | | | 76,464 | |
| | 39,515 | | | Rex Energy Corporationd | | | 309,798 | |
| | 11,660 | | | Rosetta Resources, Inc.d | | | 443,430 | |
| | 3,280 | | | Rowan Companies plc | | | 79,606 | |
| | 9,700 | | | Royal Dutch Shell plc | | | 346,876 | |
| | 6,600 | | | Royal Dutch Shell plc, Class B | | | 243,839 | |
| | 23,960 | | | Schlumberger, Ltd. | | | 2,363,894 | |
| | 6,000 | | | Seadrill, Ltd. | | | 138,000 | |
| | 5,613 | | | SemGroup Corporation | | | 430,798 | |
| | 7,900 | | | Showa Shell Sekiyu KK | | | 67,784 | |
| | 2,075 | | | SM Energy Company | | | 116,822 | |
| | 24,600 | | | Southwestern Energy Companyd | | | 799,746 | |
| | 1,120 | | | Statoil ASA | | | 25,632 | |
| | 13,700 | | | Superior Energy Services, Inc. | | | 344,555 | |
| | 1,400 | | | Total SA | | | 83,585 | |
| | 24,800 | | | Total SA ADR | | | 1,485,272 | |
| | 48,777 | | | Trinidad Drilling, Ltd. | | | 317,664 | |
| | 93,350 | | | Weatherford International, Ltd.d | | | 1,532,807 | |
| | 4,990 | | | Whiting Petroleum Corporationd | | | 305,588 | |
| | 5,100 | | | Woodside Petroleum, Ltd. | | | 181,155 | |
| | 4,850 | | | WPX Energy, Inc.d | | | 92,732 | |
| | | | | |
| | | | Total | | | 31,285,764 | |
| | | | | |
| |
| Financials (4.3%) | | | | |
| | 6,010 | | | ACE, Ltd. | | | 656,893 | |
| | 5,715 | | | Affiliated Managers Group, Inc.d | | | 1,141,800 | |
| | 2,000 | | | Allianz SE | | | 318,044 | |
| | 14,310 | | | Allied World Assurance Company Holdings AG | | | 543,780 | |
| | 11,070 | | | Allstate Corporation | | | 717,889 | |
| | 10,010 | | | American Assets Trust, Inc. | | | 383,783 | |
| | 6,250 | | | American Express Company | | | 562,187 | |
| | 3,250 | | | American Financial Group, Inc. | | | 194,447 | |
| | 19,050 | | | American International Group, Inc. | | | 1,020,508 | |
| | 430 | | | Ameriprise Financial, Inc. | | | 54,253 | |
| | 2,953 | | | Amlin plc | | | 21,552 | |
| | 11,250 | | | AmTrust Financial Services, Inc. | | | 504,788 | |
| | 7,845 | | | Argo Group International Holdings, Ltd. | | | 437,751 | |
| | 7,600 | | | Assicurazioni Generali SPA | | | 155,955 | |
| | 2,900 | | | Assurant, Inc. | | | 197,838 | |
| | 20,970 | | | Assured Guaranty, Ltd. | | | 483,988 | |
| | 1,300 | | | AXA SA | | | 30,028 | |
| | 13,300 | | | Banco Santander SA | | | 117,512 | |
| | 6,400 | | | Bank Leumi Le-Israel BMd | | | 22,871 | |
| | 141,430 | | | Bank of America Corporation | | | 2,426,939 | |
| | 16,804 | | | Bank of the Ozarks, Inc. | | | 592,173 | |
| | 4,300 | | | Banner Corporation | | | 185,846 | |
| | 33,010 | | | BBCN Bancorp, Inc. | | | 466,761 | |
| | 21,200 | | | Berkshire Hathaway, Inc.d | | | 2,971,392 | |
| | 18,800 | | | Blackstone Group, LP | | | 566,256 | |
| | 300 | | | Bolsas y Mercados Espanoles SA | | | 11,414 | |
| | 7,900 | | | Boston Private Financial Holdings, Inc. | | | 103,885 | |
| | 8,750 | | | Camden Property Trust | | | 670,862 | |
| | 13,200 | | | Capital One Financial Corporation | | | 1,092,564 | |
| | 10,000 | | | Catlin Group, Ltd. | | | 85,908 | |
| | 3,250 | | | CBRE Group, Inc.d | | | 104,000 | |
| | 10,300 | | | Challenger, Ltd. | | | 63,352 | |
| | 13,024 | | | Chesapeake Lodging Trust | | | 430,313 | |
| | 15,000 | | | Cheung Kong Holdings, Ltd. | | | 266,284 | |
| | 56,790 | | | Citigroup, Inc. | | | 3,039,969 | |
| | 3,009 | | | CNA Financial Corporation | | | 117,592 | |
| | 71,210 | | | CNO Financial Group, Inc. | | | 1,291,037 | |
| | 2,500 | | | CNP Assurances | | | 46,738 | |
| | 21,800 | | | Comerica, Inc. | | | 1,040,732 | |
| | 3,000 | | | Commonwealth Bank of Australia | | | 213,329 | |
| | 5,700 | | | Corporate Office Properties Trust | | | 155,838 | |
| | 6,275 | | | Credit Agricole SA | | | 92,859 | |
| | 6,950 | | | Crown Castle International Corporation | | | 542,934 | |
| | 1,100 | | | Daito Trust Construction Company, Ltd. | | | 137,061 | |
| | 26,000 | | | Daiwa Securities Group, Inc. | | | 205,477 | |
| | 5,600 | | | DDR Corporation | | | 101,584 | |
| | 716 | | | Delta Lloyd NV | | | 16,320 | |
| | 14,055 | | | Deutsche Bank AG | | | 440,203 | |
| | 10,100 | | | Digital Realty Trust, Inc. | | | 696,799 | |
| | 13,600 | | | Direct Line Insurance Group plc | | | 60,162 | |
| | 9,300 | | | Discover Financial Services | | | 593,154 | |
| | 32,750 | | | Duke Realty Corporation | | | 620,940 | |
| | 31,110 | | | Education Realty Trust, Inc. | | | 350,299 | |
| | 3,400 | | | Equity Lifestyle Properties, Inc. | | | 166,940 | |
| | 20,279 | | | Essent Group, Ltd.d | | | 493,591 | |
| | 9,183 | | | Evercore Partners, Inc. | | | 475,404 | |
| | 6,080 | | | Extra Space Storage, Inc. | | | 353,613 | |
| | 7,550 | | | FBR & Companyd | | | 182,257 | |
| | 19,050 | | | First Horizon National Corporation | | | 244,983 | |
| | 42,100 | | | First Niagara Financial Group, Inc. | | | 315,329 | |
| | 20,690 | | | First Republic Bank | | | 1,053,742 | |
| | 8,000 | | | FlexiGroup, Ltd. | | | 25,266 | |
| | 100 | | | Friends Life Group, Ltd. | | | 519 | |
| | 18,000 | | | Fukuoka Financial Group, Inc. | | | 92,107 | |
| | 25,850 | | | Fulton Financial Corporation | | | 307,098 | |
| | 800 | | | GAM Holding AGd | | | 13,662 | |
| | 15,598 | | | Gaming and Leisure Properties, Inc. | | | 487,438 | |
| | 4,200 | | | General Growth Properties, Inc. | | | 108,822 | |
| | 18,250 | | | Government Properties Income Trust | | | 416,465 | |
| | 7,650 | | | Green Dot Corporationd | | | 182,835 | |
| | 55,969 | | | Hanmi Financial Corporation | | | 1,200,535 | |
| | 200 | | | Hannover Rueckversicherung SE | | | 16,693 | |
| | 2,950 | | | Hanover Insurance Group, Inc. | | | 197,473 | |
| | 24,412 | | | HCC Insurance Holdings, Inc. | | | 1,274,062 | |
| | 2,082 | | | Hiscox, Ltd. | | | 22,708 | |
| | 39,885 | | | Host Hotels & Resorts, Inc. | | | 929,719 | |
| | 207,400 | | | Huntington Bancshares, Inc. | | | 2,055,334 | |
| | 3,000 | | | Intercontinental Exchange, Inc. | | | 624,870 | |
| | 13,326 | | | Intermediate Capital Group plc | | | 87,601 | |
| | 29,381 | | | Intesa Sanpaolo SPA | | | 75,121 | |
| | 38,790 | | | Invesco, Ltd. | | | 1,569,831 | |
| | 16,200 | | | Investec plc | | | 148,545 | |
| | 16,000 | | | iShares Barclays 1-3 Year Credit Bond Fund | | | 1,687,520 | |
| | 6,400 | | | iShares iBoxx $ High Yield Corporate Bond ETF | | | 592,192 | |
The accompanying Notes to Financial Statements are an integral part of this schedule.
68
MODERATELY AGGRESSIVE ALLOCATION FUND
Schedule of Investments as of October 31, 2014
| | | | | | | | |
| Shares | | | Common Stock (22.5%) | | Value | |
| Financials (4.3%) - continued | |
| | 2,400 | | | iShares iBoxx $ Investment Grade Corporate Bond ETF | | | $286,416 | |
| | 3,600 | | | iShares Intermediate Credit Bond ETF | | | 395,676 | |
| | 13,105 | | | iShares Russell 2000 Growth Index Fund | | | 1,803,641 | |
| | 16,990 | | | iShares Russell 2000 Index Fund | | | 1,980,354 | |
| | 18,935 | | | J.P. Morgan Chase & Company | | | 1,145,189 | |
| | 19,266 | | | Kennedy-Wilson Holdings, Inc. | | | 521,916 | |
| | 52,300 | | | KeyCorp | | | 690,360 | |
| | 19,886 | | | Lazard, Ltd. | | | 978,590 | |
| | 9,000 | | | Link REIT | | | 52,925 | |
| | 6,500 | | | M&T Bank Corporation | | | 794,170 | |
| | 30,800 | | | Man Group plc | | | 61,069 | |
| | 13,000 | | | MBIA, Inc.d | | | 126,880 | |
| | 32,340 | | | MetLife, Inc. | | | 1,754,122 | |
| | 1,850 | | | Mid-America Apartment Communities, Inc. | | | 130,721 | |
| | 18,900 | | | Mizuho Financial Group, Inc. | | | 34,442 | |
| | 48,440 | | | Morgan Stanley | | | 1,692,978 | |
| | 800 | | | Muenchener Rueckversicherungs-Gesellschaft AG | | | 157,510 | |
| | 26,400 | | | NASDAQ OMX Group, Inc. | | | 1,142,064 | |
| | 700 | | | National Australia Bank, Ltd. | | | 21,655 | |
| | 5,400 | | | Natixis | | | 37,171 | |
| | 14,450 | | | Northern Trust Corporation | | | 958,035 | |
| | 7,000 | | | Old Mutual plc | | | 21,739 | |
| | 7,138 | | | Oversea-Chinese Banking Corporation, Ltd. | | | 54,985 | |
| | 28,301 | | | PacWest Bancorp | | | 1,207,321 | |
| | 16,480 | | | Parkway Properties, Inc. | | | 330,424 | |
| | 19,430 | | | Pebblebrook Hotel Trust | | | 827,718 | |
| | 6,100 | | | Phoenix Group Holdings | | | 73,653 | |
| | 15,950 | | | Popular, Inc.d | | | 508,486 | |
| | 4,851 | | | ProShares Ultra S&P 500 | | | 595,897 | |
| | 11,950 | | | Prudential Financial, Inc. | | | 1,058,053 | |
| | 4,450 | | | RLJ Lodging Trust | | | 143,379 | |
| | 800 | | | Sampo Oyj | | | 38,334 | |
| | 600 | | | SCOR SE | | | 18,385 | |
| | 1,250 | | | Sovran Self Storage, Inc. | | | 106,363 | |
| | 51,400 | | | SPDR Euro Stoxx 50 ETF | | | 1,967,078 | |
| | 44,112 | | | SPDR S&P 500 ETF Trust | | | 8,895,626 | |
| | 1,800 | | | Standard Chartered plc | | | 27,095 | |
| | 1,000 | | | Sun Hung Kai Properties, Ltd. | | | 14,921 | |
| | 7,100 | | | Sunstone Hotel Investors, Inc. | | | 108,701 | |
| | 7,140 | | | SVB Financial Groupd | | | 799,609 | |
| | 100 | | | Swiss Life Holding AGd | | | 22,944 | |
| | 400 | | | Swiss Re AG | | | 32,344 | |
| | 45,840 | | | Synovus Financial Corporation | | | 1,162,502 | |
| | 1,410 | | | TD Ameritrade Holding Corporation | | | 47,573 | |
| | 27,110 | | | Terreno Realty Corporation | | | 570,937 | |
| | 5,710 | | | Texas Capital Bancshares, Inc.d | | | 349,167 | |
| | 5,500 | | | UnipolSai Assicurazioni SPA | | | 14,788 | |
| | 8,800 | | | United Community Banks, Inc. | | | 158,664 | |
| | 9,256 | | | United Overseas Bank, Ltd. | | | 165,828 | |
| | 4,250 | | | Unum Group | | | 142,205 | |
| | 6,650 | | | W.R. Berkley Corporation | | | 342,741 | |
| | 7,500 | | | Wells Fargo & Company | | | 398,175 | |
| | 41,400 | | | Western Alliance Bancorpd | | | 1,102,068 | |
| | 7,619 | | | Westpac Banking Corporation | | | 233,860 | |
| | 3,700 | | | Weyerhaeuser Company | | | 125,282 | |
| | 34,680 | | | Zions Bancorporation | | | 1,004,680 | |
| | 1,400 | | | Zurich Insurance Group AGd | | | 423,680 | |
| | | | | |
| | | | Total | | | 80,630,207 | |
| | | | | |
| |
| Health Care (3.4%) | | | | |
| | 2,000 | | | Abaxis, Inc. | | | 105,320 | |
| | 4,300 | | | Abbott Laboratories | | | 187,437 | |
| | 11,263 | | | Acadia Healthcare Company, Inc.d | | | 698,869 | |
| | 3,250 | | | Acceleron Pharma, Inc.d | | | 120,185 | |
| | 28,800 | | | Acorda Therapeutics, Inc.d | | | 1,002,816 | |
| | 7,200 | | | Actavis, Inc.d | | | 1,747,728 | |
| | 1,100 | | | Actelion, Ltd. | | | 131,005 | |
| | 20,600 | | | Aetna, Inc. | | | 1,699,706 | |
| | 31,400 | | | Affymetrix, Inc.d | | | 282,914 | |
| | 35,103 | | | Akorn, Inc.d | | | 1,563,839 | |
| | 2,150 | | | Alexion Pharmaceuticals, Inc.d | | | 411,424 | |
| | 16,185 | | | Align Technology, Inc.d | | | 851,655 | |
| | 54,850 | | | Allscripts Healthcare Solutions, Inc.d | | | 752,542 | |
| | 560 | | | AmerisourceBergen Corporation | | | 47,830 | |
| | 16,650 | | | Amgen, Inc. | | | 2,700,297 | |
| | 10,150 | | | AMN Healthcare Services, Inc.d | | | 174,073 | |
| | 2,700 | | | AmSurg Corporationd | | | 145,827 | |
| | 17,730 | | | Baxter International, Inc. | | | 1,243,582 | |
| | 1,200 | | | Biogen Idec, Inc.d | | | 385,296 | |
| | 780 | | | BioMarin Pharmaceutical, Inc.d | | | 64,350 | |
| | 31,260 | | | BioScrip, Inc.d | | | 201,940 | |
| | 105,850 | | | Boston Scientific Corporationd | | | 1,405,688 | |
| | 21,320 | | | Bruker Corporationd | | | 441,964 | |
| | 5,951 | | | C.R. Bard, Inc. | | | 975,785 | |
| | 30,750 | | | Cambrex Corporationd | | | 648,210 | |
| | 13,250 | | | Cardinal Health, Inc. | | | 1,039,860 | |
| | 13,126 | | | Cardiovascular Systems, Inc.d | | | 406,906 | |
| | 730 | | | Catamaran Corporationd | | | 34,799 | |
| | 20,564 | | | Centene Corporationd | | | 1,905,666 | |
| | 37,570 | | | Cerner Corporationd | | | 2,379,684 | |
| | 2,800 | | | Charles River Laboratories International, Inc.d | | | 176,848 | |
| | 200 | | | Cooper Companies, Inc. | | | 32,780 | |
| | 300 | | | Covance, Inc.d | | | 23,970 | |
| | 12,370 | | | Covidien plc | | | 1,143,483 | |
| | 1,100 | | | CSL, Ltd. | | | 77,663 | |
| | 6,816 | | | Cubist Pharmaceuticals, Inc.d | | | 492,729 | |
| | 10,329 | | | Cyberonics, Inc.d | | | 542,272 | |
| | 39,928 | | | Depomed, Inc.d | | | 614,891 | |
| | 6,550 | | | Endo International plcd | | | 438,326 | |
| | 660 | | | Envision Healthcare Holdings, Inc.d | | | 23,067 | |
| | 57,472 | | | ExamWorks Group, Inc.d | | | 2,228,764 | |
| | 8,500 | | | Express Scripts Holding Companyd | | | 652,970 | |
| | 31,400 | | | Gilead Sciences, Inc.d | | | 3,516,800 | |
| | 8,024 | | | GlaxoSmithKline plc | | | 181,454 | |
| | 2,050 | | | Greatbatch, Inc.d | | | 102,889 | |
| | 1,900 | | | H. Lundbeck AS | | | 40,290 | |
| | 3,850 | | | HCA Holdings, Inc.d | | | 269,693 | |
| | 25,576 | | | Healthcare Services Group, Inc. | | | 761,653 | |
| | 2,300 | | | Hikma Pharmaceuticals plc | | | 69,760 | |
| | 39,350 | | | Hologic, Inc.d | | | 1,030,576 | |
| | 2,032 | | | ICON plcd | | | 106,904 | |
| | 7,600 | | | Illumina, Inc.d | | | 1,463,608 | |
| | 21,708 | | | Impax Laboratories, Inc.d | | | 628,881 | |
| | 35,934 | | | Ironwood Pharmaceuticals, Inc.d | | | 503,795 | |
| | 30,591 | | | Johnson & Johnson | | | 3,297,098 | |
| | 1,000 | | | Kaken Pharmaceutical Company, Ltd. | | | 25,054 | |
| | 3,000 | | | KYORIN Holdings, Inc. | | | 63,203 | |
| | 6,552 | | | LifePoint Hospitals, Inc.d | | | 458,640 | |
| | 5,450 | | | Mallinckrodt, LLCd | | | 502,381 | |
| | 5,300 | | | McKesson Corporation | | | 1,078,073 | |
| | 37,740 | | | Merck & Company, Inc. | | | 2,186,656 | |
| | 200 | | | Mettler-Toledo International, Inc.d | | | 51,694 | |
| | 300 | | | Mylan, Inc.d | | | 16,065 | |
| | 45,322 | | | Neurocrine Biosciences, Inc.d | | | 839,363 | |
The accompanying Notes to Financial Statements are an integral part of this schedule.
69
MODERATELY AGGRESSIVE ALLOCATION FUND
Schedule of Investments as of October 31, 2014
| | | | | | | | |
| Shares | | | Common Stock (22.5%) | | Value | |
| Health Care (3.4%) - continued | | | | |
| | 3,700 | | | Novartis AG | | | $343,371 | |
| | 23,050 | | | Novavax, Inc.d | | | 129,080 | |
| | 9,678 | | | NPS Pharmaceuticals, Inc.d | | | 265,177 | |
| | 55,817 | | | NuVasive, Inc.d | | | 2,282,915 | |
| | 13,000 | | | PAREXEL International Corporationd | | | 706,030 | |
| | 560 | | | Perrigo Company plc | | | 90,412 | |
| | 46,700 | | | Pfizer, Inc. | | | 1,398,665 | |
| | 4,650 | | | PharMerica Corporationd | | | 133,409 | |
| | 2,650 | | | Providence Service Corporationd | | | 117,077 | |
| | 2,225 | | | Puma Biotechnology, Inc.d | | | 557,585 | |
| | 4,150 | | | Qiagen NVd | | | 97,359 | |
| | 2,800 | | | Quintiles Transnational Holdings, Inc.d | | | 163,912 | |
| | 14,200 | | | Spectrum Pharmaceuticals, Inc.d | | | 107,636 | |
| | 11,523 | | | Team Health Holdings, Inc.d | | | 720,648 | |
| | 18,198 | | | Teleflex, Inc. | | | 2,076,756 | |
| | 400 | | | Teva Pharmaceutical Industries, Ltd. | | | 22,579 | |
| | 950 | | | Thermo Fisher Scientific, Inc. | | | 111,691 | |
| | 25,741 | | | UnitedHealth Group, Inc.e | | | 2,445,652 | |
| | 9,250 | | | Universal Health Services, Inc. | | | 959,317 | |
| | 18,850 | | | Vertex Pharmaceuticals, Inc.d | | | 2,123,264 | |
| | 12,000 | | | Volcano Corporationd | | | 121,440 | |
| | 6,400 | | | Waters Corporationd | | | 709,120 | |
| | 6,150 | | | WellPoint, Inc. | | | 779,143 | |
| | | | | |
| | | | Total | | | 63,861,728 | |
| | | | | |
| |
| Industrials (3.0%) | | | | |
| | 2,600 | | | 3M Company | | | 399,802 | |
| | 3,650 | | | AAR Corporation | | | 96,725 | |
| | 1,600 | | | Actividades de Construccion y Servicios SA | | | 59,389 | |
| | 300 | | | Adecco SA | | | 20,334 | |
| | 34,050 | | | ADT Corporation | | | 1,220,352 | |
| | 1,100 | | | Aica Kogyo Company, Ltd. | | | 22,769 | |
| | 15,959 | | | Air New Zealand, Ltd. | | | 25,265 | |
| | 400 | | | AMETEK, Inc. | | | 20,860 | |
| | 14,710 | | | Apogee Enterprises, Inc. | | | 645,769 | |
| | 1,734 | | | Arcadis NV | | | 53,343 | |
| | 4,550 | | | Argan, Inc. | | | 158,386 | |
| | 500 | | | Atlas Copco AB | | | 13,244 | |
| | 450 | | | B/E Aerospace, Inc.d | | | 33,502 | |
| | 5,200 | | | Berendsen plc | | | 84,204 | |
| | 15,350 | | | Boeing Company | | | 1,917,368 | |
| | 7,300 | | | Bradken, Ltd. | | | 24,902 | |
| | 5,596 | | | Briggs & Stratton Corporation | | | 113,095 | |
| | 100 | | | Bucher Industries AG | | | 25,401 | |
| | 4,000 | | | Cardno, Ltd. | | | 19,643 | |
| | 2,900 | | | Carillion plc | | | 15,450 | |
| | 6,150 | | | Caterpillar, Inc. | | | 623,671 | |
| | 1,362 | | | Chart Industries, Inc.d | | | 63,401 | |
| | 20,670 | | | CLARCOR, Inc. | | | 1,384,063 | |
| | 5,700 | | | COMSYS Holdings Corporation | | | 101,760 | |
| | 37,400 | | | CSX Corporation | | | 1,332,562 | |
| | 1,500 | | | CTT-Correios de Portugal SA | | | 13,902 | |
| | 11,640 | | | Curtiss-Wright Corporation | | | 805,604 | |
| | 3,100 | | | Daifuku Company, Ltd. | | | 35,904 | |
| | 95,950 | | | Delta Air Lines, Inc. | | | 3,860,069 | |
| | 1,900 | | | Deutsche Lufthansa AG | | | 28,144 | |
| | 5,500 | | | Downer EDI, Ltd. | | | 23,226 | |
| | 300 | | | Duerr AG | | | 21,073 | |
| | 716 | | | Elbit Systems, Ltd. | | | 43,551 | |
| | 35,063 | | | EMCOR Group, Inc. | | | 1,547,330 | |
| | 8,210 | | | Esterline Technologies Corporationd | | | 961,473 | |
| | 230 | | | Fastenal Company | | | 10,129 | |
| | 12,750 | | | Federal Signal Corporation | | | 181,050 | |
| | 12,020 | | | Flowserve Corporation | | | 817,240 | |
| | 29,200 | | | Fluor Corporation | | | 1,937,128 | |
| | 890 | | | Fortune Brands Home and Security, Inc. | | | 38,493 | |
| | 12,180 | | | GATX Corporation | | | 772,212 | |
| | 5,916 | | | Generac Holdings, Inc.d | | | 268,231 | |
| | 600 | | | Go-Ahead Group plc | | | 23,624 | |
| | 440 | | | Graco, Inc. | | | 34,540 | |
| | 30,550 | | | Granite Construction, Inc. | | | 1,127,601 | |
| | 10,328 | | | H&E Equipment Services, Inc. | | | 386,164 | |
| | 8,687 | | | Heico Corporation | | | 471,183 | |
| | 14,900 | | | Hertz Global Holdings, Inc.d | | | 326,608 | |
| | 1,700 | | | Hino Motors, Ltd. | | | 24,876 | |
| | 35,420 | | | HNI Corporation | | | 1,652,343 | |
| | 10,766 | | | Honeywell International, Inc. | | | 1,034,828 | |
| | 800 | | | Hoshizaki Electric Company, Ltd. | | | 38,750 | |
| | 7,800 | | | Huntington Ingalls Industries, Inc. | | | 825,396 | |
| | 5,722 | | | Huron Consulting Group, Inc.d | | | 398,308 | |
| | 400 | | | Implenia AG | | | 21,566 | |
| | 500 | | | Inaba Denki Sangyo Company, Ltd. | | | 17,429 | |
| | 21,850 | | | Ingersoll-Rand plc | | | 1,368,247 | |
| | 10,100 | | | Insperity, Inc. | | | 318,756 | |
| | 93,425 | | | Interface, Inc. | | | 1,497,603 | |
| | 3,400 | | | Intrum Justitia AB | | | 101,258 | |
| | 7,700 | | | ITOCHU Corporation | | | 93,082 | |
| | 10,540 | | | Jacobs Engineering Group, Inc.d | | | 500,123 | |
| | 402 | | | Jardine Matheson Holdings, Ltd. | | | 24,091 | |
| | 310 | | | JB Hunt Transport Services, Inc. | | | 24,729 | |
| | 400 | | | Kanamoto Company, Ltd. | | | 14,600 | |
| | 15,700 | | | KAR Auction Services, Inc. | | | 476,652 | |
| | 3,775 | | | Kimball International, Inc. | | | 67,875 | |
| | 4,100 | | | KITZ Corporation | | | 18,789 | |
| | 4,400 | | | Komatsu, Ltd. | | | 103,881 | |
| | 56,190 | | | Korn/Ferry Internationald | | | 1,569,387 | |
| | 23,590 | | | Landstar System, Inc. | | | 1,745,896 | |
| | 1,300 | | | Legrand SA | | | 69,953 | |
| | 2,700 | | | Leighton Holdings, Ltd. | | | 52,566 | |
| | 7,350 | | | Manpower, Inc. | | | 490,613 | |
| | 13,772 | | | MasTec, Inc.d | | | 394,430 | |
| | 7,700 | | | Meritor, Inc.d | | | 88,473 | |
| | 7,514 | | | Middleby Corporationd | | | 664,989 | |
| | 102 | | | Mineral Resources, Ltd. | | | 765 | |
| | 7,250 | | | Mistras Group, Inc.d | | | 119,553 | |
| | 8,358 | | | Mitie Group plc | | | 40,325 | |
| | 780 | | | Nielsen NV | | | 33,142 | |
| | 2,600 | | | Nitto Kogyo Corporation | | | 45,455 | |
| | 2,300 | | | Old Dominion Freight Line, Inc.d | | | 167,601 | |
| | 21,759 | | | On Assignment, Inc.d | | | 633,187 | |
| | 26,124 | | | Oshkosh Corporation | | | 1,169,310 | |
| | 7,814 | | | Parker Hannifin Corporation | | | 992,612 | |
| | 9,010 | | | Pentair, Ltd. | | | 604,121 | |
| | 18,897 | | | PGT, Inc.d | | | 177,726 | |
| | 42,040 | | | Progressive Waste Solutions, Ltd. | | | 1,228,829 | |
| | 13,441 | | | Proto Labs, Inc.d | | | 878,638 | |
| | 8,950 | | | Quanta Services, Inc.d | | | 305,016 | |
| | 44,329 | | | Ritchie Brothers Auctioneers, Inc. | | | 1,081,184 | |
| | 1,340 | | | Robert Half International, Inc. | | | 73,405 | |
| | 310 | | | Roper Industries, Inc. | | | 49,073 | |
| | 14,243 | | | Saia, Inc.d | | | 698,192 | |
| | 2,000 | | | Securitas AB | | | 22,131 | |
| | 3,700 | | | Seven Group Holdings, Ltd. | | | 22,320 | |
| | 2,000 | | | Siemens AG | | | 225,587 | |
| | 99,580 | | | Southwest Airlines Company | | | 3,433,518 | |
| | 2,950 | | | Spirit Aerosystems Holdings, Inc.d | | | 116,053 | |
| | 17,687 | | | Spirit Airlines, Inc.d | | | 1,293,097 | |
| | 660 | | | Stericycle, Inc.d | | | 83,160 | |
| | 2,700 | | | Sumitomo Corporation | | | 28,808 | |
The accompanying Notes to Financial Statements are an integral part of this schedule.
70
MODERATELY AGGRESSIVE ALLOCATION FUND
Schedule of Investments as of October 31, 2014
| | | | | | | | |
| Shares | | | Common Stock (22.5%) | | Value | |
| Industrials (3.0%) - continued | | | | |
| | 18,771 | | | Swift Transportation Companyd | | | $463,644 | |
| | 1,100 | | | Takasago Thermal Engineering Company, Ltd. | | | 14,197 | |
| | 900 | | | Teleperformance SA | | | 56,713 | |
| | 12,940 | | | Tennant Company | | | 954,066 | |
| | 3,000 | | | Toppan Printing Company, Ltd. | | | 20,413 | |
| | 9,790 | | | Tutor Perini Corporationd | | | 274,218 | |
| | 21,100 | | | Union Pacific Corporation | | | 2,457,095 | |
| | 9,850 | | | United Continental Holdings, Inc.d | | | 520,179 | |
| | 670 | | | United Rentals, Inc.d | | | 73,740 | |
| | 2,200 | | | United Technologies Corporation | | | 235,400 | |
| | 6,450 | | | WABCO Holdings, Inc.d | | | 628,101 | |
| | 1,831 | | | WageWorks, Inc.d | | | 104,385 | |
| | 4,483 | | | Watsco, Inc. | | | 455,562 | |
| | 5,197 | | | Watts Water Technologies, Inc. | | | 315,094 | |
| | 1,816 | | | WS Atkins plc | | | 39,482 | |
| | | | | |
| | | | Total | | | 56,044,325 | |
| | | | | |
| |
| Information Technology (4.8%) | | | | |
| | 17,000 | | | A10 Networks, Inc.d | | | 74,800 | |
| | 820 | | | Agilent Technologies, Inc. | | | 45,330 | |
| | 17,700 | | | Akamai Technologies, Inc.d | | | 1,067,310 | |
| | 6,939 | | | Alibaba Group Holding, Ltd. ADRd | | | 684,185 | |
| | 6,350 | | | Alliance Data Systems Corporationd | | | 1,799,273 | |
| | 5,534 | | | Ambarella, Inc.d | | | 245,101 | |
| | 10,200 | | | Amdocs, Ltd. | | | 484,908 | |
| | 1,130 | | | Amphenol Corporation | | | 57,155 | |
| | 430 | | | ANSYS, Inc.d | | | 33,781 | |
| | 96,014 | | | Apple, Inc. | | | 10,369,512 | |
| | 67,328 | | | Applied Materials, Inc. | | | 1,487,276 | |
| | 56,331 | | | Applied Micro Circuits Corporationd | | | 364,462 | |
| | 8,810 | | | Applied Optoelectronics, Inc.d | | | 142,193 | |
| | 7,000 | | | Arris Group, Inc.d | | | 210,140 | |
| | 27,536 | | | Aspen Technology, Inc.d | | | 1,016,904 | |
| | 172,540 | | | Atmel Corporationd | | | 1,280,247 | |
| | 320 | | | Autodesk, Inc.d | | | 18,413 | |
| | 5,750 | | | AVG Technologies NVd | | | 103,040 | |
| | 5,727 | | | Belden, Inc. | | | 407,705 | |
| | 4,600 | | | Booz Allen Hamilton Holding Corporation | | | 121,210 | |
| | 29,750 | | | Broadcom Corporation | | | 1,245,930 | |
| | 33,390 | | | Broadridge Financial Solutions, Inc. | | | 1,466,823 | |
| | 50,950 | | | Brocade Communications Systems, Inc. | | | 546,693 | |
| | 800 | | | Brother Industries, Ltd. | | | 14,244 | |
| | 3,403 | | | CalAmp Corporationd | | | 65,610 | |
| | 300 | | | Cap Gemini SA | | | 19,739 | |
| | 13,312 | | | Cardtronics, Inc.d | | | 511,048 | |
| | 8,041 | | | Cavium, Inc.d | | | 412,584 | |
| | 9,850 | | | CDW Corporation | | | 303,774 | |
| | 13,714 | | | ChannelAdvisor Corporationd | | | 190,487 | |
| | 2,550 | | | Check Point Software Technologies, Ltd.d | | | 189,338 | |
| | 1,067 | | | Ciena Corporationd | | | 17,883 | |
| | 5,350 | | | Cirrus Logic, Inc.d | | | 103,255 | |
| | 102,610 | | | Cisco Systems, Inc.e | | | 2,510,867 | |
| | 7,450 | | | Citrix Systems, Inc.d | | | 478,513 | |
| | 9,725 | | | Cognex Corporationd | | | 384,721 | |
| | 5,043 | | | Coherent, Inc.d | | | 328,551 | |
| | 11,550 | | | Computer Sciences Corporation | | | 697,620 | |
| | 12,913 | | | Constant Contact, Inc.d | | | 456,604 | |
| | 15,496 | | | Cornerstone OnDemand, Inc.d | | | 562,040 | |
| | 76,050 | | | Corning, Inc. | | | 1,553,701 | |
| | 9,106 | | | Dealertrack Technologies, Inc.d | | | 428,437 | |
| | 10,615 | | | Demandware, Inc.d | | | 636,369 | |
| | 1,300 | | | Dialog Semiconductor plcd | | | 44,891 | |
| | 9,900 | | | Digital River, Inc.d | | | 253,143 | |
| | 5,600 | | | Diodes, Inc.d | | | 144,648 | |
| | 27,110 | | | DST Systems, Inc. | | | 2,612,048 | |
| | 48,199 | | | eBay, Inc.d | | | 2,530,448 | |
| | 2,400 | | | Econocom Group | | | 15,504 | |
| | 12,600 | | | Electronic Arts, Inc.d | | | 516,222 | |
| | 6,464 | | | Electronics for Imaging, Inc.d | | | 295,534 | |
| | 141,800 | | | EMC Corporation | | | 4,073,914 | |
| | 440 | | | F5 Networks, Inc.d | | | 54,111 | |
| | 32,900 | | | Facebook, Inc.d | | | 2,467,171 | |
| | 15,700 | | | Fairchild Semiconductor International, Inc.d | | | 240,995 | |
| | 9,420 | | | FEI Company | | | 793,918 | |
| | 1,730 | | | Fortinet, Inc.d | | | 45,067 | |
| | 6,700 | | | FUJIFILM Holdings NPV | | | 224,910 | |
| | 640 | | | Gartner, Inc.d | | | 51,654 | |
| | 3,087 | | | Google, Inc.d | | | 1,725,880 | |
| | 3,527 | | | Google, Inc., Class Ad | | | 2,002,877 | |
| | 36,276 | | | Guidewire Software, Inc.d | | | 1,811,623 | |
| | 5,000 | | | Hitachi Kokusai Electric, Inc. | | | 74,895 | |
| | 900 | | | Hitachi Maxell, Ltd. | | | 13,581 | |
| | 2,700 | | | Hoya Corporation | | | 95,544 | |
| | 200 | | | IAC InterActiveCorp | | | 13,538 | |
| | 2,800 | | | iGATE Corporationd | | | 103,740 | |
| | 430 | | | Imperva, Inc.d | | | 17,617 | |
| | 2,700 | | | International Business Machines Corporation | | | 443,880 | |
| | 46,121 | | | Juniper Networks, Inc. | | | 971,769 | |
| | 13,537 | | | Lexmark International, Inc. | | | 584,257 | |
| | 5,550 | | | LinkedIn Corporationd | | | 1,270,728 | |
| | 7,150 | | | Liquidity Services, Inc.d | | | 91,377 | |
| | 6,800 | | | Manhattan Associates, Inc.d | | | 272,748 | |
| | 31,100 | | | Marvell Technology Group, Ltd. | | | 417,984 | |
| | 17,800 | | | MasterCard, Inc. | | | 1,490,750 | |
| | 44,142 | | | MaxLinear, Inc.d | | | 312,967 | |
| | 5,593 | | | Methode Electronics, Inc. | | | 220,252 | |
| | 24,170 | | | Microsoft Corporation | | | 1,134,781 | |
| | 8,870 | | | Monolithic Power Systems, Inc. | | | 391,965 | |
| | 900 | | | NEC Networks & System Integration Corporation | | | 19,555 | |
| | 92,380 | | | NetApp, Inc. | | | 3,953,864 | |
| | 300 | | | Nice Systems, Ltd. ADR | | | 12,204 | |
| | 660 | | | Nuance Communications, Inc.d | | | 10,184 | |
| | 83,737 | | | NVIDIA Corporation | | | 1,636,221 | |
| | 2,660 | | | NXP Semiconductors NVd | | | 182,636 | |
| | 23,000 | | | Oki Electric Industry Company, Ltd. | | | 53,440 | |
| | 3,300 | | | Optimal Payments plcd | | | 23,434 | |
| | 36,200 | | | Oracle Corporation | | | 1,413,610 | |
| | 900 | | | Orbotech, Ltd.d | | | 14,436 | |
| | 300 | | | Otsuka Corporation | | | 11,155 | |
| | 14,586 | | | Pace plc | | | 81,090 | |
| | 24,720 | | | Plantronics, Inc. | | | 1,282,226 | |
| | 8,350 | | | Polycom, Inc.d | | | 109,218 | |
| | 24,804 | | | Proofpoint, Inc.d | | | 1,092,368 | |
| | 1,630 | | | QLIK Technologies, Inc.d | | | 46,211 | |
| | 41,550 | | | QUALCOMM, Inc. | | | 3,262,090 | |
| | 15,900 | | | Red Hat, Inc.d | | | 936,828 | |
| | 500 | | | Rohm Company, Ltd. | | | 30,435 | |
| | 30,900 | | | Salesforce.com, Inc.d | | | 1,977,291 | |
| | 10,650 | | | Sanmina Corporationd | | | 266,996 | |
| | 800 | | | Seiko Epson Corporation | | | 37,124 | |
| | 807 | | | ServiceNow, Inc.d | | | 54,820 | |
| | 300 | | | Skyworks Solutions, Inc. | | | 17,472 | |
| | 44,906 | | | Sonus Networks, Inc.d | | | 155,824 | |
| | 1,217 | | | SPS Commerce, Inc.d | | | 70,951 | |
| | 4,891 | | | SunPower Corporationd | | | 155,729 | |
The accompanying Notes to Financial Statements are an integral part of this schedule.
71
MODERATELY AGGRESSIVE ALLOCATION FUND
Schedule of Investments as of October 31, 2014
| | | | | | | | |
| Shares | | | Common Stock (22.5%) | | Value | |
| Information Technology (4.8%) - continued | | | | |
| | 13,250 | | | Symantec Corporation | | | $328,865 | |
| | 2,959 | | | Synaptics, Inc.d | | | 202,484 | |
| | 450 | | | Synopsys, Inc.d | | | 18,441 | |
| | 5,350 | | | Take-Two Interactive Software, Inc.d | | | 141,508 | |
| | 2,000 | | | TE Connectivity, Ltd. | | | 122,260 | |
| | 15,000 | | | Telefonaktiebolaget LM Ericsson | | | 177,246 | |
| | 20,700 | | | Teradata Corporationd | | | 876,024 | |
| | 40,446 | | | Teradyne, Inc. | | | 744,206 | |
| | 21,030 | | | Texas Instruments, Inc. | | | 1,044,350 | |
| | 20,990 | | | Textura Corporationd | | | 559,174 | |
| | 1,861 | | | Tyler Technologies, Inc.d | | | 208,283 | |
| | 29,060 | | | Ubiquiti Networks, Inc. | | | 1,039,476 | |
| | 3,776 | | | Ultimate Software Group, Inc.d | | | 568,326 | |
| | 1,200 | | | ULVAC, Inc.d | | | 14,943 | |
| | 4,550 | | | Unisys Corporationd | | | 116,662 | |
| | 680 | | | VeriFone Systems, Inc.d | | | 25,337 | |
| | 45,319 | | | Virtusa Corporationd | | | 1,857,173 | |
| | 6,400 | | | Visa, Inc. | | | 1,545,152 | |
| | 16,500 | | | VMware, Inc.d | | | 1,378,905 | |
| | 900 | | | Wincor Nixdorf AG | | | 41,391 | |
| | 4,100 | | | Workday, Inc.d | | | 391,468 | |
| | 64,250 | | | Xerox Corporation | | | 853,240 | |
| | | | | |
| | | | Total | | | 90,127,033 | |
| | | | | |
| |
| Materials (0.8%) | | | | |
| | 310 | | | Airgas, Inc. | | | 34,577 | |
| | 300 | | | Albemarle Corporation | | | 17,514 | |
| | 600 | | | APERAMd | | | 17,263 | |
| | 9,650 | | | Celanese Corporation | | | 566,745 | |
| | 18,724 | | | Centamin plc | | | 15,336 | |
| | 15,563 | | | Chemtura Corporationd | | | 362,462 | |
| | 2,250 | | | Clearwater Paper Corporationd | | | 144,788 | |
| | 1,450 | | | Compass Minerals International, Inc. | | | 124,236 | |
| | 4,550 | | | Crown Holdings, Inc.d | | | 218,081 | |
| | 14,160 | | | Dow Chemical Company | | | 699,504 | |
| | 11,400 | | | Eagle Materials, Inc. | | | 996,702 | |
| | 4,750 | | | Eastman Chemical Company | | | 383,705 | |
| | 10,150 | | | Ferro Corporationd | | | 133,168 | |
| | 660 | | | FMC Corporation | | | 37,851 | |
| | 58,833 | | | Graphic Packaging Holding Companyd | | | 713,644 | |
| | 2,000 | | | Hitachi Metals, Ltd. | | | 33,766 | |
| | 600 | | | Holmen AB | | | 19,859 | |
| | 41,630 | | | Horsehead Holding Corporationd | | | 654,007 | |
| | 2,600 | | | Innophos Holdings, Inc. | | | 148,200 | |
| | 5,825 | | | KapStone Paper and Packaging Corporationd | | | 179,177 | |
| | 4,000 | | | Kureha Corporation | | | 19,839 | |
| | 1,400 | | | LyondellBasell Industries NV | | | 128,282 | |
| | 1,000 | | | Maruichi Steel Tube, Ltd. | | | 23,615 | |
| | 26,080 | | | Materials Select Sector SPDR Fund | | | 1,262,272 | |
| | 1,800 | | | Nihon Nohyaku Company, Ltd. | | | 18,320 | |
| | 16,000 | | | Nippon Light Metal Holdings Company, Ltd. | | | 23,630 | |
| | 10,500 | | | Nucor Corporation | | | 567,630 | |
| | 12,000 | | | Oji Holdings Corporation | | | 43,387 | |
| | 2,300 | | | Orica, Ltd. | | | 41,985 | |
| | 20,750 | | | Owens-Illinois, Inc.d | | | 534,728 | |
| | 6,900 | | | Packaging Corporation of America | | | 497,352 | |
| | 6,700 | | | Petra Diamonds, Ltd.d | | | 17,792 | |
| | 14,819 | | | PolyOne Corporation | | | 548,451 | |
| | 9,450 | | | Royal Gold, Inc. | | | 540,068 | |
| | 32,107 | | | Senomyx, Inc.d | | | 254,287 | |
| | 13,800 | | | Silgan Holdings, Inc. | | | 678,408 | |
| | 560 | | | Silver Wheaton Corporation | | | 9,727 | |
| | 2,450 | | | Sonoco Products Company | | | 100,132 | |
| | 16,850 | | | Southern Copper Corporation | | | 484,943 | |
| | 48,338 | | | Steel Dynamics, Inc. | | | 1,112,257 | |
| | 3,100 | | | Stora Enso OYJ | | | 25,600 | |
| | 5,000 | | | Sumitomo Metal Mining Company, Ltd. | | | 69,363 | |
| | 2,000 | | | Sumitomo Seika Chemicals Company, Ltd. | | | 12,269 | |
| | 5,000 | | | Toagosei Company, Ltd. | | | 21,852 | |
| | 18,000 | | | Tosoh Corporation | | | 78,274 | |
| | 3,700 | | | Tronox, Ltd. | | | 89,466 | |
| | 14,060 | | | U.S. Silica Holdings, Inc. | | | 631,294 | |
| | 4,100 | | | UPM-Kymmene Oyj | | | 65,036 | |
| | 2,300 | | | Westlake Chemical Corporation | | | 162,265 | |
| | 2,450 | | | Worthington Industries, Inc. | | | 94,693 | |
| | | | | |
| | | | Total | | | 13,657,802 | |
| | | | | |
| |
| Telecommunications Services (0.2%) | | | | |
| | 23,900 | | | AT&T, Inc. | | | 832,676 | |
| | 60,400 | | | Bezeq Israel Telecommunication Corporation, Ltd. | | | 103,231 | |
| | 11,975 | | | BT Group plc | | | 70,596 | |
| | 17,438 | | | Cogent Communications Holdings | | | 591,846 | |
| | 3,700 | | | Elisa Oyj | | | 101,640 | |
| | 2,900 | | | Freenet AG | | | 76,089 | |
| | 2,700 | | | iiNet, Ltd. | | | 19,054 | |
| | 5,000 | | | Nippon Telegraph & Telephone Corporation | | | 311,094 | |
| | 410 | | | SBA Communications Corporationd | | | 46,055 | |
| | 9,000 | | | Singapore Telecommunications, Ltd. | | | 26,490 | |
| | 64,400 | | | Telecom Italia SPAd | | | 72,984 | |
| | 9,700 | | | Telstra Corporation, Ltd. | | | 48,269 | |
| | 340 | | | TW Telecom, Inc.d | | | 14,545 | |
| | 23,053 | | | Verizon Communications, Inc. | | | 1,158,413 | |
| | 28,200 | | | Vonage Holdings Corporationd | | | 98,136 | |
| | | | | |
| | | | Total | | | 3,571,118 | |
| | | | | |
| |
| Utilities (0.4%) | | | | |
| | 100,300 | | | A2A SPA | | | 100,573 | |
| | 4,100 | | | Atmos Energy Corporation | | | 217,300 | |
| | 2,400 | | | E.ON SE | | | 41,376 | |
| | 10,050 | | | Edison International, Inc. | | | 628,929 | |
| | 36,600 | | | Electricidade de Portugal SA | | | 157,502 | |
| | 1,400 | | | Electricite de France | | | 41,340 | |
| | 1,400 | | | Endesa SA | | | 27,311 | |
| | 30,100 | | | Enel SPA | | | 153,808 | |
| | 4,400 | | | Fortum Oyj | | | 102,044 | |
| | 11,200 | | | IREN SPA | | | 13,543 | |
| | 6,580 | | | Laclede Group, Inc. | | | 334,067 | |
| | 14,880 | | | NiSource, Inc. | | | 625,853 | |
| | 30,100 | | | NorthWestern Corporation | | | 1,590,484 | |
| | 30,720 | | | PG&E Corporation | | | 1,545,830 | |
| | 9,270 | | | Portland General Electric Company | | | 337,521 | |
| | 18,750 | | | Public Service Enterprise Group, Inc. | | | 774,562 | |
| | 200 | | | Red Electrica Corporacion SA | | | 17,476 | |
| | 4,700 | | | Redes Energeticas Nacionais SGPS SA | | | 14,569 | |
| | 6,600 | | | Southern Company | | | 305,976 | |
| | 11,700 | | | United Utilities Group plc | | | 160,386 | |
| | 3,600 | | | Vectren Corporation | | | 161,820 | |
| | 10,050 | | | Wisconsin Energy Corporation | | | 499,083 | |
| | | | | |
| | | | Total | | | 7,851,353 | |
| | | | | |
| | | | | | | | |
| | | | | |
| | | | Total Common Stock (cost $346,683,687) | | | 419,752,768 | |
| | | | | |
The accompanying Notes to Financial Statements are an integral part of this schedule.
72
MODERATELY AGGRESSIVE ALLOCATION FUND
Schedule of Investments as of October 31, 2014
| | | | | | | | |
Principal Amount | | | Long-Term Fixed Income (10.1%) | | Value | |
| Asset-Backed Securities (0.8%) | | | | |
| | | | Access Group, Inc. | | | | |
| $ | 236,277 | | | 0.652%, 2/25/2036f,g | | | $235,050 | |
| | | | Ally Auto Receivables Trust 2013-SN1 | | | | |
| | 276,323 | | | 0.720%, 5/20/2016 | | | 276,467 | |
| | | | BA Credit Card Trust | | | | |
| | 250,000 | | | 0.533%, 6/15/2021g | | | 249,797 | |
| | | | Barclays Dryrock Issuance Trust | | | | |
| | 500,000 | | | 0.513%, 12/16/2019g | | | 500,463 | |
| | | | Capital One Multi-Asset Execution Trust | | | | |
| | 500,000 | | | 0.533%, 1/18/2022g | | | 499,204 | |
| | | | Chase Issuance Trust | | | | |
| | 325,000 | | | 1.150%, 1/15/2019 | | | 325,933 | |
| | | | Chesapeake Funding, LLC | | | | |
| | 176,142 | | | 0.603%, 1/7/2025f,g | | | 175,922 | |
| | | | Citibank Credit Card Issuance Trust | | | | |
| | 500,000 | | | 1.020%, 2/22/2019 | | | 499,321 | |
| | | | Countrywide Asset-Backed Certificates | | | | |
| | 243,790 | | | 5.530%, 4/25/2047 | | | 237,812 | |
| | | | Edlinc Student Loan Funding Trust | | | | |
| | 172,274 | | | 3.160%, 10/1/2025*,g | | | 174,428 | |
| | | | Enterprise Fleet Financing, LLC | | | | |
| | 123,406 | | | 1.060%, 3/20/2019f | | | 123,812 | |
| | 500,000 | | | 0.870%, 9/20/2019f | | | 500,380 | |
| | | | FirstEnergy Ohio PIRB Special Purpose Trust | | | | |
| | 171,075 | | | 0.679%, 1/15/2019 | | | 171,198 | |
| | | | FNA Trust | | | | |
| | 100,015 | | | 1.980%, 1/10/2018* | | | 100,266 | |
| | | | Ford Credit Auto Owner Trust | | | | |
| | 175,000 | | | 2.260%, 11/15/2025f | | | 175,919 | |
| | | | GE Equipment Transportation, LLC | | | | |
| | 300,000 | | | 0.690%, 11/25/2016 | | | 300,424 | |
| | | | Golden Credit Card Trust | | | | |
| | 240,000 | | | 0.403%, 2/15/2018f,g | | | 239,906 | |
| | 250,000 | | | 0.583%, 9/15/2018f,g | | | 250,615 | |
| | | | GoldenTree Loan Opportunities IX, Ltd. | | | | |
| | 150,000 | | | 1.829%, 10/29/2026*,c,g | | | 149,126 | |
| | | | GreatAmerica Leasing Receivables | | | | |
| | 450,000 | | | 0.610%, 5/15/2016f | | | 450,090 | |
| | | | Hertz Fleet Lease Funding, LP | | | | |
| | 475,000 | | | 0.702%, 12/10/2027f,g | | | 475,733 | |
| | | | Hyundai Floorplan Master Owner Trust | | | | |
| | 405,000 | | | 0.503%, 5/15/2018f,g | | | 405,587 | |
| | | | Master Credit Card Trust | | | | |
| | 244,200 | | | 0.780%, 4/21/2017f | | | 244,398 | |
| | | | Morgan Stanley Capital, Inc. | | | | |
| | 552,090 | | | 0.302%, 2/25/2037g | | | 351,289 | |
| | | | Motor plc | | | | |
| | 204,000 | | | 0.652%, 2/15/2021f | | | 204,147 | |
| | 366,067 | | | 0.632%, 8/25/2021f,g | | | 366,479 | |
| | | | OZLM VIII, Ltd. | | | | |
| | 140,000 | | | 1.715%, 10/17/2026*,g | | | 138,501 | |
| | | | Penarth Master Issuer plc | | | | |
| | 480,000 | | | 0.547%, 11/18/2017f,g | | | 480,151 | |
| | | | Renaissance Home Equity Loan Trust | | | | |
| | 2,662,796 | | | 5.746%, 5/25/2036h | | | 1,963,402 | |
| | 1,780,000 | | | 6.011%, 5/25/2036h | | | 1,272,935 | |
| | | | SLM Student Loan Trust | | | | |
| | 627,866 | | | 0.753%, 8/15/2022f,g | | | 628,557 | |
| | 343,001 | | | 0.634%, 4/25/2023f,g | | | 343,286 | |
| | 200,000 | | | 1.203%, 5/17/2027f,g | | | 201,232 | |
| | | | Vericrest Opportunity Loan Transferee | | | | |
| | 639,976 | | | 3.125%, 4/27/2054f | | | 640,002 | |
| | | | Volvo Financial Equipment, LLC | | | | |
| | 300,000 | | | 0.740%, 3/15/2017f | | | 300,380 | |
| | | | World Financial Network Credit Card Master Trust | | | | |
| | 75,000 | | | 0.533%, 12/15/2019g | | | 75,049 | |
| | 300,000 | | | 0.910%, 3/16/2020 | | | 300,331 | |
| | | | World Omni Automobile Lease Securitization Trust | | | | |
| | 275,000 | | | 1.400%, 2/15/2019 | | | 277,179 | |
| | | | World Omni Master Owner Trust | | | | |
| | 240,000 | | | 0.503%, 2/15/2018f,g | | | 240,220 | |
| | | | | |
| | | | Total | | | 14,544,991 | |
| | | | | |
| |
| Basic Materials (0.1%) | | | | |
| | | | ArcelorMittal | | | | |
| | 275,000 | | | 6.000%, 3/1/2021 | | | 294,937 | |
| | | | FMG Resources August 2006 Pty., Ltd. | | | | |
| | 122,222 | | | 6.875%, 2/1/2018f,i | | | 125,278 | |
| | | | Freeport-McMoRan Copper & Gold, Inc. | | | | |
| | 231,000 | | | 2.375%, 3/15/2018 | | | 232,236 | |
| | | | Glencore Funding, LLC | | | | |
| | 90,000 | | | 1.700%, 5/27/2016f | | | 90,589 | |
| | | | Goldcorp, Inc. | | | | |
| | 115,000 | | | 2.125%, 3/15/2018 | | | 114,948 | |
| | | | Hexion US Finance Corporation/Hexion Nova Scotia Finance ULC | | | | |
| | 275,000 | | | 8.875%, 2/1/2018 | | | 271,906 | |
| | | | Ineos Finance plc | | | | |
| | 275,000 | | | 7.500%, 5/1/2020f | | | 294,250 | |
| | | | LyondellBasell Industries NV | | | | |
| | 120,000 | | | 6.000%, 11/15/2021 | | | 140,502 | |
| | | | Mosaic Company | | | | |
| | 102,000 | | | 5.450%, 11/15/2033 | | | 113,874 | |
| | | | Sappi Papier Holding GmbH | | | | |
| | 160,000 | | | 6.625%, 4/15/2021f | | | 166,400 | |
| | | | Trinseo Materials Operating SCA | | | | |
| | 275,000 | | | 8.750%, 2/1/2019 | | | 290,813 | |
| | | | Vale Overseas, Ltd. | | | | |
| | 112,000 | | | 6.250%, 1/23/2017 | | | 122,704 | |
| | | | Yamana Gold, Inc. | | | | |
| | 135,000 | | | 4.950%, 7/15/2024f | | | 132,041 | |
| | | | | |
| | | | Total | | | 2,390,478 | |
| | | | | |
| |
| Capital Goods (0.1%) | | | | |
| | | | BAE Systems plc | | | | |
| | 46,000 | | | 3.500%, 10/11/2016f | | | 48,038 | |
| | | | CNH Capital, LLC | | | | |
| | 275,000 | | | 3.625%, 4/15/2018 | | | 275,000 | |
The accompanying Notes to Financial Statements are an integral part of this schedule.
73
MODERATELY AGGRESSIVE ALLOCATION FUND
Schedule of Investments as of October 31, 2014
| | | | | | | | |
Principal
Amount | | | Long-Term Fixed Income (10.1%) | | Value | |
| Capital Goods (0.1%) - continued | | | | |
| | | | Crown Americas Capital Corporation IV | | | | |
| | $275,000 | | | 4.500%, 1/15/2023 | | | $270,188 | |
| | | | Eaton Corporation | | | | |
| | 72,000 | | | 4.000%, 11/2/2032 | | | 71,904 | |
| | | | Harsco Corporation | | | | |
| | 107,000 | | | 2.700%, 10/15/2015 | | | 106,910 | |
| | | | Hutchison Whampoa Finance CI, Ltd. | | | | |
| | 88,000 | | | 1.625%, 10/31/2017f | | | 87,851 | |
| | | | Ingersoll-Rand Global Holding Company, Ltd. | | | | |
| | 144,000 | | | 6.875%, 8/15/2018 | | | 168,763 | |
| | | | L-3 Communications Corporation | | | | |
| | 144,000 | | | 1.500%, 5/28/2017 | | | 143,124 | |
| | | | Martin Marietta Materials, Inc. | | | | |
| | 90,000 | | | 1.333%, 6/30/2017f,g | | | 90,376 | |
| | | | Reynolds Group Issuer, Inc. | | | | |
| | 273,154 | | | 5.750%, 10/15/2020 | | | 284,080 | |
| | | | Roper Industries, Inc. | | | | |
| | 144,000 | | | 2.050%, 10/1/2018 | | | 143,256 | |
| | | | RSC Equipment Rental, Inc. | | | | |
| | 275,000 | | | 8.250%, 2/1/2021 | | | 299,750 | |
| | | | Textron, Inc. | | | | |
| | 60,000 | | | 5.600%, 12/1/2017 | | | 66,473 | |
| | | | | |
| | | | Total | | | 2,055,713 | |
| | | | | |
| |
| Collateralized Mortgage Obligations (0.5%) | | | | |
| | | | Alm Loan Funding CLO | | | | |
| | 140,000 | | | 1.664%, 10/17/2026*,g | | | 138,424 | |
| | | | Apidos CLO XVIII | | | | |
| | 135,000 | | | 1.646%, 7/22/2026*,g | | | 133,402 | |
| | | | Babson CLO, Ltd. | | | | |
| | 140,000 | | | 1.656%, 10/17/2026*,g | | | 138,139 | |
| | | | Birchwood Park CLO, Ltd. | | | | |
| | 140,000 | | | 1.674%, 7/15/2026*,g | | | 138,481 | |
| | | | BlueMountain CLO, Ltd. | | | | |
| | 140,000 | | | 1.480%, 10/15/2026*,g | | | 138,731 | |
| | | | Carlyle Global Market Strategies CLO, Ltd. | | | | |
| | 150,000 | | | 1.531%, 7/20/2023*,g | | | 148,658 | |
| | 150,000 | | | 1.733%, 10/15/2026*,g | | | 148,820 | |
| | | | Cent CLO 16, LP | | | | |
| | 140,000 | | | 1.710%, 8/1/2024*,g | | | 138,711 | |
| | | | Cent CLO 22, Ltd. | | | | |
| | 150,000 | | | 1.713%, 11/7/2026*,g | | | 149,393 | |
| | | | Citigroup Mortgage Loan Trust, Inc. | | | | |
| | 274,654 | | | 5.500%, 11/25/2035 | | | 253,751 | |
| | | | CitiMortgage Alternative Loan Trust | | | | |
| | 895,706 | | | 5.750%, 4/25/2037 | | | 769,163 | |
| | | | Countrywide Alternative Loan Trust | | | | |
| | 268,983 | | | 5.263%, 10/25/2035 | | | 222,665 | |
| | 153,799 | | | 6.500%, 8/25/2036 | | | 119,335 | |
| | 172,415 | | | 6.000%, 1/25/2037 | | | 156,459 | |
| | 783,105 | | | 5.500%, 5/25/2037 | | | 679,945 | |
| | 625,276 | | | 7.000%, 10/25/2037 | | | 464,338 | |
| | | | Countrywide Home Loans, Inc. | | | | |
| | 317,882 | | | 5.750%, 4/25/2037 | | | 288,766 | |
| | | | Deutsche Alt-A Securities Mortgage Loan Trust | | | | |
| | 248,640 | | | 6.000%, 10/25/2021 | | | 219,161 | |
| | | | Deutsche Alt-A Securities, Inc., Mortgage Loan Trust | | | | |
| | 103,066 | | | 5.500%, 10/25/2021 | | | 99,057 | |
| | | | Dryden 34 Senior Loan Fund CLO | | | | |
| | 140,000 | | | 1.717%, 10/15/2026*,g | | | 138,426 | |
| | | | Federal Home Loan Mortgage Corporation | | | | |
| | 524,847 | | | 3.000%, 2/15/2033j | | | 69,874 | |
| | | | Federal National Mortgage Association | | | | |
| | 1,146,258 | | | 3.500%, 1/25/2033j | | | 169,622 | |
| | | | J.P. Morgan Mortgage Trust | | | | |
| | 81,414 | | | 2.535%, 10/25/2036 | | | 72,379 | |
| | 711,516 | | | 0.532%, 1/25/2037g | | | 441,810 | |
| | 795,070 | | | 6.250%, 8/25/2037 | | | 648,615 | |
| | | | Limerock CLO III, LLC | | | | |
| | 450,000 | | | 1.759%, 10/20/2026*,c,g,k | | | 450,000 | |
| | | | Madison Park Funding XIV CLO, Ltd. | | | | |
| | 150,000 | | | 1.681%, 7/20/2026*,g | | | 148,510 | |
| | | | MASTR Alternative Loans Trust | | | | |
| | 195,370 | | | 6.500%, 7/25/2034 | | | 200,172 | |
| | 415,733 | | | 0.602%, 12/25/2035g | | | 229,562 | |
| | | | Merrill Lynch Alternative Note Asset Trust | | | | |
| | 207,746 | | | 6.000%, 3/25/2037 | | | 193,872 | |
| | | | Neuberger Berman CLO, Ltd. | | | | |
| | 100,000 | | | 1.701%, 8/4/2025*,g | | | 99,102 | |
| | | | Octagon Investment Partners XX CLO, Ltd. | | | | |
| | 140,000 | | | 1.675%, 8/12/2026*,g | | | 138,407 | |
| | | | Residential Asset Securitization Trust | | | | |
| | 603,968 | | | 0.532%, 8/25/2037g | | | 238,070 | |
| | | | Sequoia Mortgage Trust | | | | |
| | 479,432 | | | 2.664%, 9/20/2046 | | | 406,311 | |
| | 58,184 | | | 2.664%, 9/20/2046 | | | 2,414 | |
| | | | Symphony CLO XV, Ltd. | | | | |
| | 450,000 | | | 1.678%, 10/17/2026*,c,g | | | 446,625 | |
| | | | Symphony CLO, Ltd. | | | | |
| | 140,000 | | | 1.335%, 1/9/2023*,g | | | 139,083 | |
| | | | Voya CLO 2014-3, Ltd. | | | | |
| | 140,000 | | | 1.649%, 7/25/2026*,g | | | 138,397 | |
| | | | WaMu Mortgage Pass Through Certificates | | | | |
| | 134,428 | | | 2.237%, 9/25/2036 | | | 120,385 | |
| | 277,558 | | | 2.293%, 10/25/2036 | | | 238,043 | |
| | | | | |
| | | | Total | | | 9,275,078 | |
| | | | | |
| |
| Commercial Mortgage-Backed Securities (0.7%) | | | | |
| | | | Banc of America Commercial Mortgage, Inc. | | | | |
| | 1,400,000 | | | 5.612%, 4/10/2049 | | | 1,517,328 | |
| | 2,200,000 | | | 5.563%, 6/10/2049 | | | 2,383,621 | |
| | | | Bear Stearns Commercial Mortgage Securities, Inc. | | | | |
| | 1,306,348 | | | 5.331%, 2/11/2044 | | | 1,404,136 | |
| | | | CGBAM Commercial Mortgage Trust | | | | |
| | 210,000 | | | 1.254%, 5/15/2030f,g | | | 209,920 | |
| | | | Commercial Mortgage Pass-Through Certificates | | | | |
| | 360,000 | | | 1.203%, 6/8/2030f,g | | | 359,660 | |
The accompanying Notes to Financial Statements are an integral part of this schedule.
74
MODERATELY AGGRESSIVE ALLOCATION FUND
Schedule of Investments as of October 31, 2014
| | | | | | | | |
Principal Amount | | | Long-Term Fixed Income (10.1%) | | Value | |
| Commercial Mortgage-Backed Securities (0.7%) - continued | | | | |
| | | | Credit Suisse First Boston Mortgage Securities | | | | |
| $ | 1,300,000 | | | 5.542%, 1/15/2049 | | | $1,399,800 | |
| | | | Credit Suisse Mortgage Capital Certificates | | | | |
| | 1,625,000 | | | 5.509%, 9/15/2039 | | | 1,735,539 | |
| | | | Federal Home Loan Mortgage Corporation Multi Family Structured Pass Thru Certificates | | | | |
| | 334,556 | | | 0.727%, 12/25/2016 | | | 333,993 | |
| | | | Federal National Mortgage Association | | | | |
| | 300,000 | | | 1.272%, 1/25/2017 | | | 302,251 | |
| | | | Greenwich Capital Commercial Funding Corporation | | | | |
| | 900,000 | | | 5.867%, 12/10/2049 | | | 979,914 | |
| | | | J.P. Morgan Chase Commercial Mortgage Securities Corporation | | | | |
| | 94,487 | | | 0.853%, 4/15/2028f,g | | | 94,397 | |
| | 300,000 | | | 1.104%, 12/15/2028f,g | | | 299,628 | |
| | 750,000 | | | 5.703%, 2/12/2049 | | | 794,755 | |
| | | | LSTAR Commercial Mortgage Trust | | | | |
| | 308,649 | | | 1.519%, 1/20/2041f | | | 308,528 | |
| | | | Morgan Stanley Capital, Inc. | | | | |
| | 450,000 | | | 5.406%, 3/15/2044 | | | 483,008 | |
| | | | SCG Trust 2013-SRP1 | | | | |
| | 150,000 | | | 1.553%, 11/15/2026f,g | | | 150,156 | |
| | | | Wachovia Bank Commercial Mortgage Trust | | | | |
| | 1,050,000 | | | 5.603%, 10/15/2048 | | | 1,127,298 | |
| | | | | |
| | | | Total | | | 13,883,932 | |
| | | | | |
| |
| Communications Services (0.4%) | | | | |
| | | | 21st Century Fox America, Inc. | | | | |
| | 120,000 | | | 6.900%, 3/1/2019 | | | 142,699 | |
| | | | AMC Networks, Inc. | | | | |
| | 275,000 | | | 4.750%, 12/15/2022 | | | 272,937 | |
| | | | America Movil SAB de CV | | | | |
| | 90,000 | | | 5.000%, 10/16/2019 | | | 100,907 | |
| | | | American Tower Corporation | | | | |
| | 68,000 | | | 7.000%, 10/15/2017 | | | 76,999 | |
| | 120,000 | | | 3.450%, 9/15/2021 | | | 117,388 | |
| | | | AT&T, Inc. | | | | |
| | 112,000 | | | 3.875%, 8/15/2021 | | | 117,435 | |
| | | | British Sky Broadcasting Group plc | | | | |
| | 110,000 | | | 2.625%, 9/16/2019f | | | 110,305 | |
| | | | CBS Corporation | | | | |
| | 65,000 | | | 2.300%, 8/15/2019 | | | 64,147 | |
| | | | CC Holdings GS V, LLC | | | | |
| | 52,000 | | | 2.381%, 12/15/2017 | | | 52,683 | |
| | | | CCO Holdings, LLC | | | | |
| | 275,000 | | | 7.375%, 6/1/2020 | | | 294,766 | |
| | | | CenturyLink, Inc. | | | | |
| | 210,000 | | | 6.450%, 6/15/2021 | | | 229,950 | |
| | | | Columbus International, Inc. | | | | |
| | 150,000 | | | 7.375%, 3/30/2021f | | | 159,000 | |
| | | | Comcast Corporation | | | | |
| | 58,000 | | | 4.650%, 7/15/2042 | | | 61,018 | |
| | 78,000 | | | 4.750%, 3/1/2044 | | | 83,808 | |
| | | | Cox Communications, Inc. | | | | |
| | 68,000 | | | 9.375%, 1/15/2019f | | | 86,881 | |
| | | | Crown Castle Towers, LLC | | | | |
| | 45,000 | | | 4.174%, 8/15/2017f | | | 47,223 | |
| | | | Digicel, Ltd. | | | | |
| | 275,000 | | | 6.000%, 4/15/2021f | | | 277,750 | |
| | | | DIRECTV Holdings, LLC | | | | |
| | 78,000 | | | 1.750%, 1/15/2018 | | | 77,640 | |
| | 65,000 | | | 5.875%, 10/1/2019 | | | 74,651 | |
| | 54,000 | | | 4.450%, 4/1/2024 | | | 56,340 | |
| | | | Frontier Communications Corporation | | | | |
| | 185,000 | | | 6.875%, 1/15/2025 | | | 187,312 | |
| | | | Hughes Satellite Systems Corporation | | | | |
| | 275,000 | | | 6.500%, 6/15/2019 | | | 297,687 | |
| | | | Intelsat Jackson Holdings SA | | | | |
| | 275,000 | | | 7.250%, 4/1/2019 | | | 288,750 | |
| | | | Level 3 Financing, Inc. | | | | |
| | 275,000 | | | 8.625%, 7/15/2020 | | | 302,500 | |
| | | | Nippon Telegraph & Telephone Corporation | | | | |
| | 51,000 | | | 1.400%, 7/18/2017 | | | 51,062 | |
| | | | Numericable Group SA | | | | |
| | 275,000 | | | 6.000%, 5/15/2022f | | | 281,187 | |
| | | | SBA Tower Trust | | | | |
| | 50,000 | | | 5.101%, 4/17/2017f | | | 53,015 | |
| | | | SES Global Americas Holdings GP | | | | |
| | 135,000 | | | 2.500%, 3/25/2019f | | | 134,672 | |
| | | | Sprint Communications, Inc. | | | | |
| | 273,154 | | | 9.000%, 11/15/2018f | | | 321,297 | |
| | | | Telefonica Emisiones SAU | | | | |
| | 126,000 | | | 3.992%, 2/16/2016 | | | 130,742 | |
| | 122,000 | | | 3.192%, 4/27/2018 | | | 126,632 | |
| | | | Time Warner Cable, Inc. | | | | |
| | 65,000 | | | 5.000%, 2/1/2020 | | | 72,749 | |
| | | | T-Mobile USA, Inc. | | | | |
| | 275,000 | | | 6.125%, 1/15/2022 | | | 284,969 | |
| | | | Unitymedia Hessen GmbH & Company KG | | | | |
| | 165,000 | | | 5.500%, 1/15/2023f | | | 172,012 | |
| | | | Univision Communications, Inc. | | | | |
| | 275,000 | | | 6.875%, 5/15/2019f | | | 289,094 | |
| | | | UPCB Finance V, Ltd. | | | | |
| | 275,000 | | | 7.250%, 11/15/2021f | | | 302,500 | |
| | | | Verizon Communications, Inc. | | | | |
| | 41,000 | | | 1.100%, 11/1/2017 | | | 40,554 | |
| | 130,000 | | | 1.005%, 6/17/2019g | | | 130,940 | |
| | 25,000 | | | 2.625%, 2/21/2020f | | | 24,866 | |
| | 85,000 | | | 4.500%, 9/15/2020 | | | 92,286 | |
| | 190,000 | | | 3.000%, 11/1/2021 | | | 188,544 | |
| | 102,000 | | | 5.150%, 9/15/2023 | | | 114,229 | |
| | 107,000 | | | 6.400%, 9/15/2033 | | | 130,333 | |
| | 60,000 | | | 5.050%, 3/15/2034 | | | 63,509 | |
| | 24,000 | | | 6.550%, 9/15/2043 | | | 30,255 | |
| | | | Viacom, Inc. | | | | |
| | 72,000 | | | 2.500%, 9/1/2018 | | | 73,108 | |
| | | | Wind Acquisition Finance SA | | | | |
| | 190,000 | | | 7.375%, 4/23/2021f | | | 185,725 | |
| | | | Windstream Corporation | | | | |
| | 275,000 | | | 7.750%, 10/1/2021 | | | 294,250 | |
| | | | | |
| | | | Total | | | 7,169,306 | |
| | | | | |
The accompanying Notes to Financial Statements are an integral part of this schedule.
75
MODERATELY AGGRESSIVE ALLOCATION FUND
Schedule of Investments as of October 31, 2014
| | | | | | | | |
Principal
Amount | | | Long-Term Fixed Income (10.1%) | | Value | |
| Consumer Cyclical (0.2%) | |
| | | | Chrysler Group, LLC | | | | |
| $ | 275,000 | | | 8.000%, 6/15/2019 | | | $294,594 | |
| | | | Cinemark USA, Inc. | | | | |
| | 275,000 | | | 4.875%, 6/1/2023 | | | 270,875 | |
| | | | CVS Health Corporation | | | | |
| | 40,000 | | | 2.250%, 8/12/2019 | | | 39,822 | |
| | | | Delphi Corporation | | | | |
| | 126,000 | | | 6.125%, 5/15/2021 | | | 137,025 | |
| | | | Ford Motor Company | | | | |
| | 56,000 | | | 7.450%, 7/16/2031 | | | 75,002 | |
| | | | Ford Motor Credit Company, LLC | | | | |
| | 135,000 | | | 1.684%, 9/8/2017 | | | 134,368 | |
| | 70,000 | | | 5.000%, 5/15/2018 | | | 76,596 | |
| | 95,000 | | | 2.597%, 11/4/2019c | | | 94,684 | |
| | | | General Motors Company | | | | |
| | 46,000 | | | 3.500%, 10/2/2018 | | | 47,380 | |
| | 120,000 | | | 6.250%, 10/2/2043 | | | 142,800 | |
| | | | General Motors Financial Company, Inc. | | | | |
| | 275,000 | | | 3.250%, 5/15/2018 | | | 281,188 | |
| | | | Hilton Worldwide Finance, LLC | | | | |
| | 275,000 | | | 5.625%, 10/15/2021f | | | 289,781 | |
| | | | Home Depot, Inc. | | | | |
| | 75,000 | | | 4.875%, 2/15/2044 | | | 84,483 | |
| | | | Hyundai Capital America | | | | |
| | 85,000 | | | 1.450%, 2/6/2017f | | | 85,066 | |
| | | | Jaguar Land Rover Automotive plc | | | | |
| | 275,000 | | | 5.625%, 2/1/2023f | | | 286,000 | |
| | | | KB Home | | | | |
| | 140,000 | | | 4.750%, 5/15/2019 | | | 138,950 | |
| | | | L Brands, Inc. | | | | |
| | 275,000 | | | 5.625%, 2/15/2022 | | | 294,937 | |
| | | | Lennar Corporation | | | | |
| | 275,000 | | | 4.125%, 12/1/2018 | | | 278,781 | |
| | | | Macy’s Retail Holdings, Inc. | | | | |
| | 40,000 | | | 4.375%, 9/1/2023 | | | 42,634 | |
| | 95,000 | | | 3.625%, 6/1/2024 | | | 94,656 | |
| | | | Nissan Motor Acceptance Corporation | | | | |
| | 100,000 | | | 0.784%, 3/3/2017f,g | | | 100,208 | |
| | | | Toll Brothers Finance Corporation | | | | |
| | 42,000 | | | 8.910%, 10/15/2017 | | | 49,035 | |
| | 74,000 | | | 4.000%, 12/31/2018 | | | 74,925 | |
| | | | TRW Automotive, Inc. | | | | |
| | 83,000 | | | 7.250%, 3/15/2017f | | | 91,300 | |
| | | | Wynn Las Vegas, LLC | | | | |
| | 275,000 | | | 5.375%, 3/15/2022 | | | 289,438 | |
| | | | | |
| | | | Total | | | 3,794,528 | |
| | | | | |
|
| Consumer Non-Cyclical (0.3%) | |
| | | | AbbVie, Inc. | | | | |
| | 165,000 | | | 2.000%, 11/6/2018 | | | 163,626 | |
| | | | Altria Group, Inc. | | | | |
| | 90,000 | | | 9.700%, 11/10/2018 | | | 116,002 | |
| | 126,000 | | | 4.000%, 1/31/2024 | | | 130,427 | |
| | | | Anheuser-Busch InBev Finance, Inc. | | | | |
| | 109,000 | | | 0.640%, 2/1/2019g | | | 108,911 | |
| | | | Anheuser-Busch InBev Worldwide, Inc. | | | | |
| | 111,000 | | | 7.750%, 1/15/2019 | | | 134,612 | |
| | | | Bunge Limited Finance Corporation | |
| | 108,000 | | | 8.500%, 6/15/2019 | | | 133,614 | |
| | | | CareFusion Corporation | | | | |
| | 108,000 | | | 6.375%, 8/1/2019 | | | 125,337 | |
| | | | Celgene Corporation | | | | |
| | 144,000 | | | 1.900%, 8/15/2017 | | | 145,311 | |
| | 24,000 | | | 2.300%, 8/15/2018 | | | 24,157 | |
| | | | CHS/Community Health Systems, Inc. | | | | |
| | 275,000 | | | 7.125%, 7/15/2020 | | | 297,687 | |
| | | | ConAgra Foods, Inc. | | | | |
| | 126,000 | | | 1.900%, 1/25/2018 | | | 125,379 | |
| | | | Coventry Health Care, Inc. | | | | |
| | 126,000 | | | 5.950%, 3/15/2017 | | | 139,370 | |
| | | | CVS Health Corporation | | | | |
| | 72,000 | | | 6.125%, 9/15/2039 | | | 90,143 | |
| | | | Endo Finance LLC & Endo Finco, Inc. | | | | |
| | 275,000 | | | 7.000%, 7/15/2019f | | | 289,438 | |
| | | | Express Scripts Holding Company | | | | |
| | 72,000 | | | 2.650%, 2/15/2017 | | | 74,070 | |
| | | | Forest Laboratories, Inc. | | | | |
| | 150,000 | | | 4.375%, 2/1/2019f | | | 157,119 | |
| | | | Fresenius Medical Care US Finance II, Inc. | | | | |
| | 275,000 | | | 5.875%, 1/31/2022f | | | 299,750 | |
| | | | Hawk Acquisition Sub, Inc. | | | | |
| | 273,154 | | | 4.250%, 10/15/2020 | | | 275,831 | |
| | | | HCA, Inc. | | | | |
| | 275,000 | | | 3.750%, 3/15/2019 | | | 275,688 | |
| | | | IMS Health, Inc. | | | | |
| | 360,000 | | | 6.000%, 11/1/2020f | | | 373,500 | |
| | | | JBS Finance II, Ltd. | | | | |
| | 275,000 | | | 8.250%, 1/29/2018* | | | 289,437 | |
| | | | Kroger Company | | | | |
| | 48,000 | | | 1.200%, 10/17/2016 | | | 48,069 | |
| | | | Lorillard Tobacco Company | | | | |
| | 90,000 | | | 2.300%, 8/21/2017i | | | 91,015 | |
| | 90,000 | | | 8.125%, 6/23/2019 | | | 110,252 | |
| | | | Mattel, Inc. | | | | |
| | 90,000 | | | 1.700%, 3/15/2018 | | | 89,527 | |
| | | | Medco Health Solutions, Inc. | | | | |
| | 91,000 | | | 7.125%, 3/15/2018 | | | 105,911 | |
| | | | Mondelez International, Inc. | | | | |
| | 91,000 | | | 0.760%, 2/1/2019g | | | 91,114 | |
| | | | Mylan, Inc. | | | | |
| | 90,000 | | | 7.875%, 7/15/2020f | | | 96,869 | |
| | | | Pernod Ricard SA | | | | |
| | 50,000 | | | 2.950%, 1/15/2017f | | | 51,515 | |
| | 72,000 | | | 5.750%, 4/7/2021f | | | 82,378 | |
| | | | Perrigo Company, Ltd. | | | | |
| | 72,000 | | | 1.300%, 11/8/2016 | | | 71,850 | |
| | | | Safeway, Inc. | | | | |
| | 4,000 | | | 3.400%, 12/1/2016 | | | 4,041 | |
| | | | Spectrum Brands Escrow Corporation | | | | |
| | 275,000 | | | 6.375%, 11/15/2020 | | | 291,500 | |
| | | | Sysco Corporation | | | | |
| | 45,000 | | | 2.350%, 10/2/2019 | | | 45,269 | |
| | 30,000 | | | 4.350%, 10/2/2034 | | | 30,812 | |
| | | | Tenet Healthcare Corporation | | | | |
| | 275,000 | | | 8.125%, 4/1/2022 | | | 315,219 | |
The accompanying Notes to Financial Statements are an integral part of this schedule.
76
MODERATELY AGGRESSIVE ALLOCATION FUND
Schedule of Investments as of October 31, 2014
| | | | | | | | |
Principal
Amount | | | Long-Term Fixed Income (10.1%) | | Value | |
| Consumer Non-Cyclical (0.3%) - continued | |
| | | | Thermo Fisher Scientific, Inc. | | | | |
| $ | 108,000 | | | 1.300%, 2/1/2017 | | | $107,873 | |
| | 108,000 | | | 2.400%, 2/1/2019 | | | 108,612 | |
| | | | Tyson Foods, Inc. | | | | |
| | 76,000 | | | 4.500%, 6/15/2022 | | | 81,328 | |
| | | | Valeant Pharmaceuticals International | | | | |
| | 275,000 | | | 6.875%, 12/1/2014f | | | 284,625 | |
| | | | Whirlpool Corporation | | | | |
| | 75,000 | | | 1.650%, 11/1/2017 | | | 75,014 | |
| | | | WM Wrigley Jr. Company | | | | |
| | 60,000 | | | 2.000%, 10/20/2017f | | | 60,615 | |
| | | | | |
| | | | Total | | | 6,012,817 | |
| | | | | |
|
| Energy (0.3%) | |
| | | | Boardwalk Pipelines, Ltd. | | | | |
| | 112,000 | | | 5.875%, 11/15/2016 | | | 120,477 | |
| | | | Buckeye Partners, LP | | | | |
| | 107,000 | | | 2.650%, 11/15/2018 | | | 106,883 | |
| | | | Calumet Specialty Products Partners, LP | | | | |
| | 275,000 | | | 6.500%, 4/15/2021f | | | 266,750 | |
| | | | CNOOC Nexen Finance 2014 ULC | | | | |
| | 108,000 | | | 1.625%, 4/30/2017 | | | 108,030 | |
| | | | CNPC General Capital, Ltd. | | | | |
| | 72,000 | | | 1.450%, 4/16/2016f | | | 71,979 | |
| | 72,000 | | | 2.750%, 4/19/2017f | | | 73,284 | |
| | | | Concho Resources, Inc. | | | | |
| | 273,154 | | | 5.500%, 10/1/2022 | | | 288,177 | |
| | | | Continental Resources, Inc. | | | | |
| | 144,000 | | | 5.000%, 9/15/2022 | | | 152,640 | |
| | | | Crestwood Midstream Partners, LP | | | | |
| | 155,000 | | | 6.125%, 3/1/2022 | | | 156,550 | |
| | | | Devon Energy Corporation | | | | |
| | 162,000 | | | 1.200%, 12/15/2016 | | | 163,847 | |
| | | | El Paso, LLC | | | | |
| | 85,000 | | | 7.800%, 8/1/2031 | | | 104,550 | |
| | | | Enbridge, Inc. | | | | |
| | 157,000 | | | 0.684%, 6/2/2017g | | | 157,040 | |
| | | | Ensco plc | | | | |
| | 75,000 | | | 4.500%, 10/1/2024 | | | 75,955 | |
| | | | Enterprise Products Operating, LLC | | | | |
| | 120,000 | | | 2.550%, 10/15/2019 | | | 120,007 | |
| | | | EQT Corporation | | | | |
| | 53,000 | | | 5.150%, 3/1/2018 | | | 57,048 | |
| | 55,000 | | | 8.125%, 6/1/2019 | | | 67,569 | |
| | | | Hess Corporation | | | | |
| | 112,000 | | | 8.125%, 2/15/2019 | | | 137,307 | |
| | | | Kinder Morgan, Inc. | | | | |
| | 75,000 | | | 5.000%, 2/15/2021f | | | 79,125 | |
| | | | Linn Energy, LLC | | | | |
| | 273,154 | | | 6.250%, 11/1/2019 | | | 251,302 | |
| | | | Marathon Petroleum Corporation | | | | |
| | 30,000 | | | 3.625%, 9/15/2024 | | | 29,888 | |
| | 60,000 | | | 4.750%, 9/15/2044 | | | 60,371 | |
| | | | MEG Energy Corporation | | | | |
| | 275,000 | | | 6.500%, 3/15/2021f | | | 272,250 | |
| | | | Offshore Group Investment, Ltd. | | | | |
| | 275,000 | | | 7.500%, 11/1/2019i | | | 234,438 | |
| | | | Petrobras Global Finance BV | | | | |
| | 162,000 | | | 2.000%, 5/20/2016 | | | 161,475 | |
| | 110,000 | | | 3.115%, 3/17/2020g | | | 110,990 | |
| | | | Petroleos Mexicanos | | | | |
| | 75,000 | | | 3.500%, 7/18/2018 | | | 77,625 | |
| | 80,000 | | | 2.378%, 4/15/2025 | | | 79,769 | |
| | | | Plains All American Pipeline, LP | | | | |
| | 115,000 | | | 3.600%, 11/1/2024 | | | 114,322 | |
| | | | Regency Energy Partners, LP | | | | |
| | 275,000 | | | 5.000%, 10/1/2022 | | | 280,500 | |
| | | | Sabine Pass Liquefaction, LLC | | | | |
| | 275,000 | | | 5.750%, 5/15/2024f | | | 284,281 | |
| | | | Sinopec Capital 2013, Ltd. | | | | |
| | 59,000 | | | 1.250%, 4/24/2016f | | | 58,906 | |
| | | | Southwestern Energy Company | | | | |
| | 75,000 | | | 7.500%, 2/1/2018 | | | 87,286 | |
| | | | Suncor Energy, Inc. | | | | |
| | 69,000 | | | 6.100%, 6/1/2018 | | | 79,146 | |
| | | | Transocean, Inc. | | | | |
| | 121,000 | | | 6.000%, 3/15/2018 | | | 129,009 | |
| | | | Weatherford International, Ltd. | | | | |
| | 108,000 | | | 9.625%, 3/1/2019 | | | 138,013 | |
| | | | Williams Companies, Inc. | | | | |
| | 57,000 | | | 3.700%, 1/15/2023 | | | 53,621 | |
| | | | | |
| | | | Total | | | 4,810,410 | |
| | | | | |
|
| Financials (0.9%) | |
| | | | Abbey National Treasury Services plc | | | | |
| | 105,000 | | | 0.644%, 9/29/2017g | | | 105,000 | |
| | 48,000 | | | 3.050%, 8/23/2018 | | | 49,927 | |
| | | | ABN AMRO Bank NV | | | | |
| | 112,000 | | | 2.500%, 10/30/2018f | | | 113,217 | |
| | | | Air Lease Corporation | | | | |
| | 75,000 | | | 2.125%, 1/15/2018 | | | 74,156 | |
| | | | American Express Credit Corporation | | | | |
| | 130,000 | | | 0.784%, 3/18/2019g | | | 130,335 | |
| | | | American International Group, Inc. | | | | |
| | 55,000 | | | 2.300%, 7/16/2019 | | | 55,296 | |
| | | | ANZ New Zealand International, Ltd. | | | | |
| | 91,000 | | | 1.400%, 4/27/2017f | | | 91,055 | |
| | | | Australia and New Zealand Banking Group, Ltd. | | | | |
| | 130,000 | | | 0.494%, 6/13/2017f,g | | | 129,932 | |
| | | | Aviation Capital Group Corporation | | | | |
| | 48,000 | | | 3.875%, 9/27/2016f | | | 49,309 | |
| | | | Banco Santander Chile | | | | |
| | 155,000 | | | 1.130%, 4/11/2017f,g | | | 154,258 | |
| | | | Bank of America Corporation | | | | |
| | 90,000 | | | 1.700%, 8/25/2017 | | | 90,015 | |
| | 160,000 | | | 5.750%, 12/1/2017 | | | 178,101 | |
| | 210,000 | | | 1.303%, 3/22/2018g | | | 213,018 | |
| | 166,000 | | | 5.650%, 5/1/2018 | | | 185,318 | |
| | 110,000 | | | 1.105%, 4/1/2019g | | | 110,568 | |
| | 60,000 | | | 4.000%, 4/1/2024 | | | 61,996 | |
| | 63,000 | | | 5.875%, 2/7/2042 | | | 76,971 | |
| | 111,000 | | | 8.000%, 12/29/2049l | | | 119,464 | |
| | | | Bank of Tokyo-Mitsubishi UFJ, Ltd. | | | | |
| | 130,000 | | | 0.644%, 3/10/2017f,g | | | 130,001 | |
| | 55,000 | | | 2.850%, 9/8/2021f | | | 54,401 | |
The accompanying Notes to Financial Statements are an integral part of this schedule.
77
MODERATELY AGGRESSIVE ALLOCATION FUND
Schedule of Investments as of October 31, 2014
| | | | | | | | |
Principal
Amount | | | Long-Term Fixed Income (10.1%) | | Value | |
| Financials (0.9%) - continued | |
| | | | Barclays Bank plc | | | | |
| $ | 90,000 | | | 10.179%, 6/12/2021f | | $ | 120,840 | |
| | | | BBVA Banco Continental SA | |
| | 109,000 | | | 2.250%, 7/29/2016f | | | 109,272 | |
| | | | Berkshire Hathaway Finance Corporation | |
| | 60,000 | | | 1.600%, 5/15/2017 | | | 60,733 | |
| | | | BioMed Realty, LP | |
| | 108,000 | | | 2.625%, 5/1/2019 | | | 107,893 | |
| | | | BNP Paribas SA | |
| | 73,000 | | | 1.250%, 12/12/2016 | | | 73,128 | |
| | 117,000 | | | 2.375%, 9/14/2017 | | | 119,248 | |
| | | | BPCE SA | |
| | 110,000 | | | 1.083%, 2/10/2017g | | | 110,988 | |
| | 117,000 | | | 1.625%, 2/10/2017 | | | 117,899 | |
| | | | Capital One Financial Corporation | |
| | 95,000 | | | 6.150%, 9/1/2016 | | | 103,385 | |
| | 90,000 | | | 2.450%, 4/24/2019 | | | 90,267 | |
| | | | Citigroup, Inc. | |
| | 96,000 | | | 5.500%, 2/15/2017 | | | 104,331 | |
| | 73,000 | | | 6.000%, 8/15/2017 | | | 81,451 | |
| | 90,000 | | | 1.003%, 4/8/2019g | | | 90,351 | |
| | 122,000 | | | 8.500%, 5/22/2019 | | | 153,076 | |
| | 89,000 | | | 4.050%, 7/30/2022 | | | 91,559 | |
| | | | CoBank ACB | |
| | 50,000 | | | 0.834%, 6/15/2022*,g | | | 47,316 | |
| | | | Compass Bank | |
| | 105,000 | | | 1.850%, 9/29/2017 | | | 105,421 | |
| | 90,000 | | | 2.750%, 9/29/2019 | | | 90,653 | |
| | | | Cooperatieve Centrale Raiffeisen-Boerenleenbank BA | |
| | 72,000 | | | 3.950%, 11/9/2022 | | | 73,188 | |
| | | | Credit Agricole SA | |
| | 100,000 | | | 1.625%, 4/15/2016f | | | 101,009 | |
| | 110,000 | | | 1.031%, 4/15/2019f,g | | | 110,632 | |
| | 115,000 | | | 6.625%, 9/29/2049f,i | | | 112,194 | |
| | | | Credit Suisse AG | |
| | 73,000 | | | 5.400%, 1/14/2020 | | | 81,758 | |
| | | | CyrusOne, LP | |
| | 275,000 | | | 6.375%, 11/15/2022 | | | 289,437 | |
| | | | DDR Corporation | |
| | 144,000 | | | 9.625%, 3/15/2016 | | | 160,399 | |
| | | | Denali Borrower, LLC | |
| | 275,000 | | | 5.625%, 10/15/2020f | | | 291,672 | |
| | | | Deutsche Bank AG | |
| | 100,000 | | | 1.350%, 5/30/2017 | | | 99,414 | |
| | | | Discover Bank | |
| | 90,000 | | | 8.700%, 11/18/2019 | | | 111,771 | |
| | | | Discover Financial Services | |
| | 72,000 | | | 6.450%, 6/12/2017 | | | 80,370 | |
| | | | DnB Boligkreditt AS | |
| | 224,000 | | | 1.450%, 3/21/2018f | | | 223,264 | |
| | | | Eksportfinans ASA | |
| | 35,000 | | | 3.000%, 11/17/2014 | | | 35,016 | |
| | 52,000 | | | 5.500%, 5/25/2016 | | | 54,535 | |
| | | | Fifth Third Bancorp | |
| | 93,000 | | | 5.450%, 1/15/2017 | | | 100,916 | |
| | 55,000 | | | 2.875%, 10/1/2021 | | | 54,608 | |
| | | | General Electric Capital Corporation | |
| | 268,000 | | | 6.000%, 8/7/2019 | | | 314,282 | |
| | 180,000 | | | 1.234%, 3/15/2023g | | | 181,869 | |
| | 132,000 | | | 6.750%, 3/15/2032 | | | 175,520 | |
| | | | Genworth Financial, Inc. | | | | |
| | 104,000 | | | 7.700%, 6/15/2020 | | | 124,849 | |
| | | | Goldman Sachs Group, Inc. | | | | |
| | 100,000 | | | 2.375%, 1/22/2018 | | | 100,933 | |
| | 180,000 | | | 1.433%, 4/30/2018g | | | 182,729 | |
| | 95,000 | | | 1.334%, 11/15/2018g | | | 95,973 | |
| | 86,000 | | | 7.500%, 2/15/2019 | | | 102,687 | |
| | 110,000 | | | 2.550%, 10/23/2019 | | | 109,295 | |
| | 117,000 | | | 5.375%, 3/15/2020 | | | 131,194 | |
| | 136,000 | | | 5.250%, 7/27/2021 | | | 151,616 | |
| | | | Hartford Financial Services Group, Inc. | | | | |
| | 81,000 | | | 4.000%, 10/15/2017 | | | 86,536 | |
| | 84,000 | | | 5.125%, 4/15/2022 | | | 93,868 | |
| | | | HBOS plc | | | | |
| | 108,000 | | | 6.750%, 5/21/2018f | | | 121,293 | |
| | | | Health Care REIT, Inc. | | | | |
| | 96,000 | | | 4.700%, 9/15/2017 | | | 104,367 | |
| | 27,000 | | | 2.250%, 3/15/2018 | | | 27,325 | |
| | | | HSBC Bank plc | | | | |
| | 180,000 | | | 0.874%, 5/15/2018f,g | | | 181,508 | |
| | | | HSBC Holdings plc | | | | |
| | 62,000 | | | 5.250%, 3/14/2044 | | | 67,392 | |
| | 150,000 | | | 5.625%, 12/29/2049i | | | 152,438 | |
| | | | HSBC USA, Inc. | | | | |
| | 80,000 | | | 1.625%, 1/16/2018 | | | 79,953 | |
| | | | Huntington Bancshares, Inc. | | | | |
| | 24,000 | | | 2.600%, 8/2/2018 | | | 24,362 | |
| | | | Huntington National Bank | | | | |
| | 108,000 | | | 1.350%, 8/2/2016 | | | 108,646 | |
| | | | Icahn Enterprises, LP | | | | |
| | 215,000 | | | 6.000%, 8/1/2020 | | | 225,750 | |
| | | | ING Bank NV | | | | |
| | 200,000 | | | 4.125%, 11/21/2023 | | | 204,886 | |
| | | | ING Capital Funding Trust III | | | | |
| | 90,000 | | | 3.833%, 12/29/2049g,i | | | 89,775 | |
| | | | International Lease Finance Corporation | | | | |
| | 162,000 | | | 2.184%, 6/15/2016g | | | 161,392 | |
| | | | Intesa Sanpaolo SPA | | | | |
| | 108,000 | | | 3.125%, 1/15/2016 | | | 110,269 | |
| | 54,000 | | | 3.875%, 1/16/2018 | | | 56,404 | |
| | 109,000 | | | 3.875%, 1/15/2019 | | | 113,478 | |
| | | | J.P. Morgan Chase & Company | | | | |
| | 65,000 | | | 0.754%, 2/15/2017g | | | 65,191 | |
| | 188,000 | | | 2.000%, 8/15/2017 | | | 190,221 | |
| | 75,000 | | | 1.800%, 1/25/2018 | | | 74,979 | |
| | 126,000 | | | 6.300%, 4/23/2019 | | | 146,223 | |
| | 23,000 | | | 3.200%, 1/25/2023 | | | 22,819 | |
| | 60,000 | | | 3.875%, 9/10/2024 | | | 59,610 | |
| | 120,000 | | | 7.900%, 4/29/2049i | | | 130,050 | |
| | | | Kookmin Bank | | | | |
| | 112,000 | | | 1.109%, 1/27/2017f,g | | | 112,806 | |
| | | | Liberty Mutual Group, Inc. | | | | |
| | 28,000 | | | 4.950%, 5/1/2022f | | | 30,347 | |
| | 25,000 | | | 6.500%, 5/1/2042f | | | 30,057 | |
| | | | Liberty Property, LP | | | | |
| | 59,000 | | | 5.500%, 12/15/2016 | | | 63,904 | |
| | | | Lloyds Banking Group plc | | | | |
| | 108,000 | | | 5.920%, 9/29/2049f,i | | | 108,000 | |
The accompanying Notes to Financial Statements are an integral part of this schedule.
78
MODERATELY AGGRESSIVE ALLOCATION FUND
Schedule of Investments as of October 31, 2014
| | | | | | | | |
Principal
Amount | | | Long-Term Fixed Income (10.1%) | | Value | |
| Financials (0.9%) - continued | |
| | | | Macquarie Bank, Ltd. | |
| | $115,000 | | | 5.000%, 2/22/2017f | | | $123,908 | |
| | | | Merrill Lynch & Company, Inc. | |
| | 210,000 | | | 6.050%, 5/16/2016 | | | 224,817 | |
| | 92,000 | | | 6.400%, 8/28/2017 | | | 103,644 | |
| | | | MetLife, Inc. | |
| | 75,000 | | | 1.903%, 12/15/2017 | | | 75,682 | |
| | | | Metropolitan Life Global Funding I | |
| | 108,000 | | | 1.300%, 4/10/2017f | | | 108,226 | |
| | | | Mizuho Bank, Ltd. | |
| | 108,000 | | | 1.850%, 3/21/2018f | | | 107,412 | |
| | | | Morgan Stanley | |
| | 131,000 | | | 4.750%, 3/22/2017 | | | 140,763 | |
| | 80,000 | | | 6.250%, 8/28/2017 | | | 89,539 | |
| | 180,000 | | | 6.625%, 4/1/2018 | | | 206,128 | |
| | 120,000 | | | 1.514%, 4/25/2018g | | | 122,678 | |
| | 65,000 | | | 4.875%, 11/1/2022 | | | 69,223 | |
| | 126,000 | | | 4.100%, 5/22/2023 | | | 127,176 | |
| | | | Murray Street Investment Trust I | |
| | 195,000 | | | 4.647%, 3/9/2017 | | | 208,186 | |
| | | | National City Corporation | |
| | 87,000 | | | 6.875%, 5/15/2019 | | | 102,958 | |
| | | | Nomura Holdings, Inc. | |
| | 75,000 | | | 2.750%, 3/19/2019 | | | 75,815 | |
| | | | PNC Bank NA | |
| | 72,000 | | | 1.150%, 11/1/2016 | | | 72,251 | |
| | | | Pricoa Global Funding I | |
| | 136,000 | | | 1.350%, 8/18/2017f | | | 135,838 | |
| | | | Prologis, LP | |
| | 135,000 | | | 7.375%, 10/30/2019 | | | 164,549 | |
| | | | Prudential Financial, Inc. | |
| | 55,000 | | | 2.350%, 8/15/2019 | | | 54,978 | |
| | | | RBS Capital Trust III | |
| | 40,000 | | | 2.073%, 9/29/2049g,i | | | 39,200 | |
| | | | Realty Income Corporation | |
| | 27,000 | | | 2.000%, 1/31/2018 | | | 27,122 | |
| | | | Regions Bank | |
| | 173,000 | | | 7.500%, 5/15/2018 | | | 202,681 | |
| | | | Reinsurance Group of America, Inc. | |
| | 50,000 | | | 5.625%, 3/15/2017 | | | 54,518 | |
| | 81,000 | | | 5.000%, 6/1/2021 | | | 89,377 | |
| | | | Reliance Standard Life Global Funding II | |
| | 85,000 | | | 2.500%, 4/24/2019f | | | 85,543 | |
| | | | Royal Bank of Canada | |
| | 126,000 | | | 2.200%, 7/27/2018 | | | 127,905 | |
| | | | Royal Bank of Scotland Group plc | |
| | 110,000 | | | 1.173%, 3/31/2017g | | | 110,365 | |
| | 210,000 | | | 5.125%, 5/28/2024 | | | 212,767 | |
| | | | Simon Property Group, LP | |
| | 42,000 | | | 10.350%, 4/1/2019 | | | 55,595 | |
| | | | Skandinaviska Enskilda Banken AB | |
| | 135,000 | | | 2.375%, 3/25/2019f | | | 136,304 | |
| | | | SLM Corporation | |
| | 35,000 | | | 3.875%, 9/10/2015 | | | 35,350 | |
| | | | SpareBank 1 Boligkreditt AS | |
| | 224,000 | | | 1.250%, 5/2/2018f | | | 221,154 | |
| | | | Sumitomo Mitsui Banking Corporation | |
| | 170,000 | | | 1.300%, 1/10/2017 | | | 170,060 | |
| | | | Suncorp-Metway, Ltd. | | | | |
| | 256,000 | | | 0.934%, 3/28/2017f,g | | | 256,910 | |
| | | | Svenska Handelsbanken AB | | | | |
| | 108,000 | | | 1.625%, 3/21/2018 | | | 107,792 | |
| | 120,000 | | | 0.725%, 6/17/2019g | | | 120,600 | |
| | | | Swedbank Hypotek AB | | | | |
| | 224,000 | | | 1.375%, 3/28/2018f | | | 222,285 | |
| | | | Swiss RE Capital I, LP | | | | |
| | 55,000 | | | 6.854%, 5/29/2049f,I | | | 57,750 | |
| | | | Synchrony Financial | | | | |
| | 55,000 | | | 3.000%, 8/15/2019 | | | 55,604 | |
| | 60,000 | | | 3.750%, 8/15/2021 | | | 61,172 | |
| | | | Toronto-Dominion Bank | | | | |
| | 70,000 | | | 0.792%, 11/5/2019c,g | | | 69,931 | |
| | | | UBS AG/Stamford, Connecticut | | | | |
| | 54,000 | | | 5.875%, 12/20/2017 | | | 60,826 | |
| | | | Voya Financial, Inc. | | | | |
| | 109,000 | | | 2.900%, 2/15/2018 | | | 112,065 | |
| | | | WEA Finance, LLC | | | | |
| | 105,000 | | | 1.750%, 9/15/2017f | | | 105,223 | |
| | | | Wells Fargo & Company | | | | |
| | 103,000 | | | 2.100%, 5/8/2017 | | | 105,224 | |
| | 90,000 | | | 1.400%, 9/8/2017 | | | 90,003 | |
| | | | | |
| | | | Total | | | 15,952,225 | |
| | | | | |
|
| Foreign Government (<0.1%) | |
| | | | European Investment Bank | | | | |
| | 165,000 | | | 1.875%, 3/15/2019 | | | 166,889 | |
| | 120,000 | | | 2.125%, 10/15/2021 | | | 119,790 | |
| | | | Kommunalbanken AS | | | | |
| | 125,000 | | | 1.500%, 10/22/2019f | | | 122,420 | |
| | | | | |
| | | | Total | | | 409,099 | |
| | | | | |
|
| Mortgage-Backed Securities (2.1%) | |
| | | | Federal Home Loan Mortgage Corporation Gold 15-Yr. Pass Through | | | | |
| | 3,225,000 | | | 3.000%, 11/1/2029c | | | 3,339,387 | |
| | | | Federal Home Loan Mortgage Corporation Gold 30-Yr. Pass Through | | | | |
| | 243,755 | | | 1.961%, 6/1/2043g | | | 249,224 | |
| | 3,675,000 | | | 4.000%, 11/1/2044c | | | 3,898,658 | |
| | | | Federal National Mortgage Association Conventional 15-Yr. Pass Through | | | | |
| | 3,725,000 | | | 3.500%, 11/1/2029c | | | 3,935,694 | |
| | | | Federal National Mortgage Association Conventional 30-Yr. Pass Through | | | | |
| | 382,438 | | | 2.078%, 1/1/2043g | | | 396,473 | |
| | 630,287 | | | 2.055%, 3/1/2043g | | | 652,522 | |
| | 613,119 | | | 1.738%, 7/1/2043g | | | 624,619 | |
| | 444,731 | | | 2.012%, 7/1/2043g | | | 455,926 | |
| | 398,205 | | | 2.107%, 8/1/2043g | | | 409,402 | |
| | 8,475,000 | | | 3.500%, 11/1/2044c | | | 8,763,675 | |
| | 7,300,000 | | | 4.000%, 11/1/2044c | | | 7,750,547 | |
| | 7,500,000 | | | 4.500%, 11/1/2044c | | | 8,128,125 | |
| | | | | |
| | | | Total | | | 38,604,252 | |
| | | | | |
The accompanying Notes to Financial Statements are an integral part of this schedule.
79
MODERATELY AGGRESSIVE ALLOCATION FUND
Schedule of Investments as of October 31, 2014
| | | | | | | | |
Principal Amount | | | Long-Term Fixed Income (10.1%) | | Value | |
| Technology (0.1%) | | | | |
| | | | Amphenol Corporation | | | | |
| $ | 69,000 | | | 2.550%, 1/30/2019 | | | $69,765 | |
| | | | Apple, Inc. | | | | |
| | 165,000 | | | 0.537%, 5/6/2019g | | | 165,147 | |
| | | | EMC Corporation | | | | |
| | 87,000 | | | 1.875%, 6/1/2018 | | | 86,482 | |
| | | | Fidelity National Information Services, Inc. | | | | |
| | 126,000 | | | 1.450%, 6/5/2017 | | | 125,565 | |
| | | | First Data Corporation | | | | |
| | 275,000 | | | 7.375%, 6/15/2019f | | | 291,500 | |
| | | | Freescale Semiconductor, Inc. | | | | |
| | 275,000 | | | 6.000%, 1/15/2022f | | | 281,875 | |
| | | | Hewlett-Packard Company | | | | |
| | 124,000 | | | 5.400%, 3/1/2017 | | | 134,864 | |
| | | | Iron Mountain, Inc. | | | | |
| | 275,000 | | | 6.000%, 8/15/2023 | | | 290,125 | |
| | | | Micron Semiconductor Asia Pte, Ltd. | | | | |
| | 76,500 | | | 1.258%, 1/15/2019 | | | 76,339 | |
| | | | Samsung Electronics America, Inc. | | | | |
| | 44,000 | | | 1.750%, 4/10/2017f | | | 44,259 | |
| | | | Tyco Electronics Group SA | | | | |
| | 128,000 | | | 6.550%, 10/1/2017 | | | 145,706 | |
| | | | Xerox Corporation | | | | |
| | 90,000 | | | 7.200%, 4/1/2016 | | | 97,734 | |
| | | | Xilinx, Inc. | | | | |
| | 90,000 | | | 2.125%, 3/15/2019 | | | 89,971 | |
| | | | | |
| | | | Total | | | 1,899,332 | |
| | | | | |
| |
| Transportation (<0.1%) | | | | |
| | | | American Airlines Pass Through Trust | | | | |
| | 56,638 | | | 4.950%, 1/15/2023 | | | 60,603 | |
| | | | Avis Budget Car Rental, LLC | | | | |
| | 160,000 | | | 5.125%, 6/1/2022f | | | 158,080 | |
| | | | Canadian Pacific Railway Company | | | | |
| | 30,000 | | | 7.125%, 10/15/2031 | | | 41,454 | |
| | 36,000 | | | 5.750%, 3/15/2033 | | | 42,882 | |
| | | | Continental Airlines, Inc. | | | | |
| | 60,201 | | | 4.150%, 4/11/2024 | | | 61,405 | |
| | | | CSX Corporation | | | | |
| | 42,000 | | | 3.700%, 11/1/2023 | | | 43,673 | |
| | | | Delta Air Lines, Inc. | | | | |
| | 83,000 | | | 6.750%, 5/23/2017 | | | 86,320 | |
| | 36,255 | | | 4.950%, 5/23/2019 | | | 38,612 | |
| | 12,555 | | | 4.750%, 5/7/2020 | | | 13,371 | |
| | | | ERAC USA Finance, LLC | | | | |
| | 54,000 | | | 1.400%, 4/15/2016f | | | 54,367 | |
| | 30,000 | | | 2.800%, 11/1/2018f | | | 30,743 | |
| | | | Korea Expressway Corporation | | | | |
| | 108,000 | | | 1.625%, 4/28/2017f | | | 107,669 | |
| | | | Virgin Australia Holdings, Ltd. | | | | |
| | 40,276 | | | 5.000%, 10/23/2023f | | | 41,637 | |
| | | | | |
| | | | Total | | | 780,816 | |
| | | | | |
| |
| U.S. Government and Agencies (3.4%) | | | | |
| | | | U.S. Treasury Bonds | | | | |
| | 550,000 | | | 5.250%, 11/15/2028 | | | 719,469 | |
| | 1,175,000 | | | 4.375%, 5/15/2040 | | | 1,471,871 | |
| | 16,030,000 | | | 3.000%, 5/15/2042 | | | 15,892,238 | |
| | | | U.S. Treasury Notes | | | | |
| | 375,000 | | | 0.625%, 10/15/2016 | | | 375,850 | |
| | 100,000 | | | 0.625%, 12/15/2016 | | | 100,109 | |
| | 2,085,000 | | | 1.000%, 5/31/2018 | | | 2,068,875 | |
| | 80,000 | | | 1.250%, 10/31/2018 | | | 79,631 | |
| | 1,000,000 | | | 1.625%, 6/30/2019 | | | 1,003,203 | |
| | 7,125,000 | | | 1.875%, 6/30/2020 | | | 7,151,719 | |
| | 6,700,000 | | | 3.625%, 2/15/2044 | | | 7,435,432 | |
| | | | U.S. Treasury Notes, TIPS | | | | |
| | 12,245,100 | | | 0.125%, 4/15/2018 | | | 12,396,253 | |
| | 14,530,191 | | | 0.125%, 1/15/2023 | | | 14,222,558 | |
| | | | | |
| | | | Total | | | 62,917,208 | |
| | | | | |
| |
| Utilities (0.2%) | | | | |
| | | | AES Corporation | | | | |
| | 275,000 | | | 7.375%, 7/1/2021 | | | 313,758 | |
| | | | American Electric Power Company, Inc. | | | | |
| | 54,000 | | | 1.650%, 12/15/2017 | | | 54,125 | |
| | | | Atlas Pipeline Partners, LP | | | | |
| | 275,000 | | | 4.750%, 11/15/2021 | | | 274,313 | |
| | | | Calpine Corporation | | | | |
| | 275,000 | | | 5.375%, 1/15/2023 | | | 277,750 | |
| | | | Commonwealth Edison Company | | | | |
| | 45,000 | | | 6.950%, 7/15/2018 | | | 52,354 | |
| | | | Dayton Power and Light Company | | | | |
| | 48,000 | | | 1.875%, 9/15/2016 | | | 48,536 | |
| | | | DCP Midstream Operating, LP | | | | |
| | 108,000 | | | 2.500%, 12/1/2017 | | | 110,108 | |
| | | | Duke Energy Corporation | | | | |
| | 90,000 | | | 0.613%, 4/3/2017g | | | 90,302 | |
| | 75,000 | | | 2.100%, 6/15/2018 | | | 75,892 | |
| | | | Dynegy Finance I, Inc./ Dynegy Finance II, Inc. | | | | |
| | 180,000 | | | 6.750%, 11/1/2019f | | | 186,300 | |
| | | | Enel Finance International NV | | | | |
| | 37,000 | | | 6.250%, 9/15/2017f | | | 41,622 | |
| | | | Energy Transfer Partners, LP | | | | |
| | 21,000 | | | 9.700%, 3/15/2019 | | | 26,900 | |
| | 136,000 | | | 4.650%, 6/1/2021 | | | 145,150 | |
| | | | Enterprise Products Operating, LLC | | | | |
| | 65,000 | | | 7.034%, 1/15/2068 | | | 72,312 | |
| | 78,000 | | | 5.100%, 2/15/2045 | | | 82,573 | |
| | | | Exelon Generation Company, LLC | | | | |
| | 123,000 | | | 5.200%, 10/1/2019 | | | 137,585 | |
| | | | ITC Holdings Corporation | | | | |
| | 30,000 | | | 4.050%, 7/1/2023 | | | 31,370 | |
| | | | MidAmerican Energy Holdings Company | | | | |
| | 44,000 | | | 1.100%, 5/15/2017 | | | 43,829 | |
| | 99,000 | | | 5.750%, 4/1/2018 | | | 112,075 | |
| | 90,000 | | | 6.500%, 9/15/2037 | | | 118,466 | |
| | | | NiSource Finance Corporation | | | | |
| | 74,000 | | | 6.400%, 3/15/2018 | | | 84,586 | |
| | 75,000 | | | 6.800%, 1/15/2019 | | | 88,653 | |
| | | | Northeast Utilities | | | | |
| | 31,000 | | | 1.450%, 5/1/2018 | | | 30,538 | |
| | | | Northern States Power Company | | | | |
| | 180,000 | | | 4.125%, 5/15/2044 | | | 184,335 | |
| | | | NRG Energy, Inc. | | | | |
| | 275,000 | | | 6.625%, 3/15/2023 | | | 290,125 | |
The accompanying Notes to Financial Statements are an integral part of this schedule.
80
MODERATELY AGGRESSIVE ALLOCATION FUND
Schedule of Investments as of October 31, 2014
| | | | | | | | |
Principal Amount | | | Long-Term Fixed Income (10.1%) | | Value | |
| Utilities (0.2%) - continued | | | | |
| | | | ONEOK Partners, LP | | | | |
| $ | 51,000 | | | 8.625%, 3/1/2019 | | | $63,155 | |
| | | | Pacific Gas & Electric Company | | | | |
| | 121,000 | | | 5.625%, 11/30/2017 | | | 135,723 | |
| | | | PG&E Corporation | | | | |
| | 45,000 | | | 2.400%, 3/1/2019 | | | 45,168 | |
| | | | PPL Capital Funding, Inc. | | | | |
| | 155,000 | | | 1.900%, 6/1/2018 | | | 154,740 | |
| | 54,000 | | | 3.500%, 12/1/2022 | | | 54,568 | |
| | | | Sempra Energy | | | | |
| | 150,000 | | | 6.150%, 6/15/2018 | | | 171,699 | |
| | | | Southern Company | | | | |
| | 75,000 | | | 1.300%, 8/15/2017 | | | 74,779 | |
| | | | TransAlta Corporation | | | | |
| | 125,000 | | | 1.900%, 6/3/2017 | | | 124,863 | |
| | | | Williams Companies, Inc. | | | | |
| | 72,000 | | | 7.875%, 9/1/2021 | | | 86,932 | |
| | | | Williams Partners, LP | | | | |
| | 28,000 | | | 7.250%, 2/1/2017 | | | 31,331 | |
| | | | | |
| | | | Total | | | 3,916,515 | |
| | | | | |
| | | | | | | | |
| | | | | |
| | | | Total Long-Term Fixed Income (cost $185,736,750) | | | 188,416,700 | |
| | | | | |
| | |
| Shares | | | Collateral Held for Securities Loaned (<0.1%) | | Value | |
| | 601,444 | | | Thrivent Cash Management Trust | | | 601,444 | |
| | | | | |
| | | | Total Collateral Held for Securities Loaned (cost $601,444) | | | 601,444 | |
| | | | | |
| | |
Shares or
Principal
Amount | | | Short-Term Investments (9.3%)m | | Value | |
| | | | Federal Home Loan Bank Discount Notes | | | | |
| | 6,000,000 | | | 0.055%, 11/12/2014 | | | 5,999,899 | |
| | 10,000,000 | | | 0.042%, 11/14/2014 | | | 9,999,848 | |
| | 4,000,000 | | | 0.035%, 11/21/2014 | | | 3,999,911 | |
| | 59,000,000 | | | 0.020%, 11/26/2014 | | | 58,999,181 | |
| | 2,000,000 | | | 0.070%, 12/3/2014e | | | 1,999,876 | |
| | 32,000,000 | | | 0.064%, 12/5/2014e | | | 31,998,073 | |
| | 2,000,000 | | | 0.055%, 12/12/2014 | | | 1,999,875 | |
| | 3,000,000 | | | 0.050%, 12/17/2014 | | | 2,999,808 | |
| | 2,000,000 | | | 0.040%, 1/12/2015 | | | 1,999,840 | |
| | 7,000,000 | | | 0.055%, 1/21/2015 | | | 6,999,134 | |
| | 5,000,000 | | | 0.063%, 1/23/2015 | | | 4,999,274 | |
| | 13,000,000 | | | 0.065%, 1/30/2015 | | | 12,997,887 | |
| | 3,800,000 | | | 0.090%, 4/24/2015e | | | 3,798,347 | |
| | | | Federal Home Loan Mortgage Corporation Discount Notes | | | | |
| | 8,000,000 | | | 0.065%, 11/24/2014e | | | 7,999,668 | |
| | 3,000,000 | | | 0.030%, 12/10/2014 | | | 2,999,902 | |
| | 14,000,000 | | | 0.037%, 1/12/2015e | | | 13,998,964 | |
| | | | U.S. Treasury Bills | | | | |
| | 100,000 | | | 0.000%, 11/28/2014n | | | 100,000 | |
| | | | | |
| | | | Total Short-Term Investments (at amortized cost) | | | 173,889,487 | |
| | | | | |
| | | | Total Investments (cost $1,587,765,771) 101.7% | | $ | 1,898,304,902 | |
| | | | | |
| | | | Other Assets and Liabilities, Net (1.7%) | | | (31,369,655 | ) |
| | | | | |
| | | | Total Net Assets 100.0% | | $ | 1,866,935,247 | |
| | | | | |
a | The stated interest rate represents the weighted average of all contracts within the bank loan facility. |
b | All or a portion of the loan is unfunded. |
c | Denotes investments purchased on a when-issued or delayed delivery basis. |
d | Non-income producing security. |
e | At October 31, 2014, $15,541,445 of investments were held on deposit with the counterparty and pledged as the initial margin deposit for open futures contracts. |
f | Denotes securities sold under Rule 144A of the Securities Act of 1933, which exempts them from registration. These securities have been deemed liquid and may be resold to other dealers in the program or to other qualified institutional buyers. As of October 31, 2014, the value of these investments was $20,535,336 or 1.1% of total net assets. |
g | Denotes variable rate securities. Variable rate securities are securities whose yields vary with a designated market index or market rate. The rate shown is as of October 31, 2014. |
h | Denotes step coupon securities. Step coupon securities pay an initial coupon rate for the first period and then different coupon rates for following periods. The rate shown is as of October 31, 2014. |
i | All or a portion of the security is on loan. |
j | Denotes interest only security. Interest only securities represent the right to receive monthly interest payments on an underlying pool of mortgages or assets. The principal shown is the outstanding par amount of the pool as of the end of the period. The actual effective yield of the security is different than the stated coupon rate. |
k | Security is fair valued. |
l | Denotes perpetual securities. Perpetual securities pay an indefinite stream of interest, but may be called by the issuer at an earlier date. |
m | The interest rate shown reflects the yield, coupon rate or the discount rate at the date of purchase. |
n | At October 31, 2014, $100,000 of investments were pledged as collateral with the custodian under the agreement between the counterparty, the custodian and the fund for open swap contracts. |
The accompanying Notes to Financial Statements are an integral part of this schedule.
81
MODERATELY AGGRESSIVE ALLOCATION FUND
Schedule of Investments as of October 31, 2014
* | Denotes restricted securities. Restricted securities are investment securities which have been deemed illiquid and cannot be offered for public sale without first being registered under the Securities Act of 1933. The following table indicates the acquisition date and cost of restricted securities Moderately Aggressive Allocation Fund owned as of October 31, 2014. |
| | | | | | | | |
Security | | Acquisition
Date | | | Cost | |
Alm Loan Funding CLO, 10/17/2026 | | | 7/31/2014 | | | | $139,930 | |
Apidos CLO XVIII, 7/22/2026 | | | 6/25/2014 | | | | 134,662 | |
Babson CLO, Ltd., 10/17/2026 | | | 8/15/2014 | | | | 139,930 | |
Birchwood Park CLO, Ltd., 7/15/2026 | | | 7/31/2014 | | | | 140,000 | |
BlueMountain CLO, Ltd., 10/15/2026 | | | 8/27/2014 | | | | 139,859 | |
Carlyle Global Market Strategies CLO, Ltd., 7/20/2023 | | | 7/3/2014 | | | | 150,000 | |
Carlyle Global Market Strategies CLO, Ltd., 10/15/2026 | | | 9/19/2014 | | | | 150,000 | |
CentCLO 16, LP, 8/1/2024 | | | 9/5/2014 | | | | 140,000 | |
Cent CLO 22, Ltd., 11/7/2026 | | | 9/19/2014 | | | | 150,000 | |
CoBank ACB, 6/15/2022 | | | 10/18/2013 | | | | 46,406 | |
Dryden 34 Senior Loan Fund CLO, 10/15/2026 | | | 7/21/2014 | | | | 140,000 | |
Edlinc Student Loan Funding Trust, 10/1/2025 | | | 2/28/2013 | | | | 173,616 | |
FNA Trust, 1/10/2018 | | | 4/29/2013 | | | | 100,011 | |
GoldenTree Loan Opportunities IX, Ltd., 10/29/2026 | | | 10/3/2014 | | | | 149,850 | |
JBS Finance II, Ltd., 1/29/2018 | | | 8/11/2014 | | | | 291,391 | |
Limerock CLO III, LLC, 10/20/2026 | | | 10/16/2014 | | | | 450,000 | |
Madison Park Funding XIV CLO, Ltd., 7/20/2026 | | | 7/3/2014 | | | | 149,820 | |
Neuberger Berman CLO, Ltd., 8/4/2025 | | | 6/19/2014 | | | | 100,000 | |
Octagon Investment Partners XX CLO, Ltd., 8/12/2026 | | | 7/10/2014 | | | | 140,000 | |
OZLM VIII, Ltd., 10/17/2026 | | | 8/7/2014 | | | | 139,202 | |
Symphony CLO XV, Ltd., 10/17/2026 | | | 10/17/2014 | | | | 446,625 | |
Symphony CLO, Ltd., 1/9/2023 | | | 9/15/2014 | | | | 140,000 | |
Voya CLO 2014-3, Ltd., 7/25/2026 | | | 7/10/2014 | | | | 139,790 | |
Definitions:
| | | | |
ADR | | - | | American Depositary Receipt, which are certificates for an underlying foreign security’s shares held by an issuing U.S. depository bank. |
CLO | | - | | Collateralized Loan Obligation |
ETF | | - | | Exchange Traded Fund. |
REIT | | - | | Real Estate Investment Trust is a company that buys, develops, manages and/or sells real estate assets. |
TIPS | | - | | Treasury Inflation Protected Security. |
Unrealized Appreciation (Depreciation)
Gross unrealized appreciation and depreciation of investments, based on cost for federal income tax purposes, were as follows:
| | | | |
Gross unrealized appreciation | | | $308,088,711 | |
Gross unrealized depreciation | | | (10,218,413) | |
| | | | |
Net unrealized appreciation (depreciation) | | | $297,870,298 | |
| |
Cost for federal income tax purposes | | | $1,600,434,604 | |
The accompanying Notes to Financial Statements are an integral part of this schedule.
82
MODERATELY AGGRESSIVE ALLOCATION FUND
Schedule of Investments as of October 31, 2014
Fair Valuation Measurements
The following table is a summary of the inputs used, as of October 31, 2014, in valuing Moderately Aggressive Allocation Fund’s assets carried at fair value.
| | | | | | | | | | | | | | | | |
Investments in Securities | | Total | | | Level 1 | | | Level 2 | | | Level 3 | |
| | | | |
Bank Loans | | | | | | | | | | | | | | | | |
Basic Materials | | | 4,049,259 | | | | – | | | | 4,049,259 | | | | – | |
Capital Goods | | | 1,845,135 | | | | – | | | | 1,845,135 | | | | – | |
Communications Services | | | 13,420,443 | | | | – | | | | 12,813,281 | | | | 607,162 | |
Consumer Cyclical | | | 7,656,552 | | | | – | | | | 7,114,339 | | | | 542,213 | |
Consumer Non-Cyclical | | | 5,249,706 | | | | – | | | | 4,892,181 | | | | 357,525 | |
Energy | | | 2,551,668 | | | | – | | | | 2,551,668 | | | | – | |
Financials | | | 1,771,188 | | | | – | | | | 1,771,188 | | | | – | |
Technology | | | 2,095,512 | | | | – | | | | 2,095,512 | | | | – | |
Transportation | | | 1,731,112 | | | | – | | | | 1,283,108 | | | | 448,004 | |
Utilities | | | 1,345,618 | | | | – | | | | 1,345,618 | | | | – | |
| | | | |
Mutual Funds | | | | | | | | | | | | | | | | |
Equity Mutual Funds | | | 901,682,863 | | | | 901,682,863 | | | | – | | | | – | |
Fixed Income Mutual Funds | | | 172,245,447 | | | | 172,245,447 | | | | – | | | | – | |
| | | | |
Common Stock | | | | | | | | | | | | | | | | |
Consumer Discretionary | | | 55,536,511 | | | | 54,030,672 | | | | 1,505,839 | | | | – | |
Consumer Staples | | | 17,186,927 | | | | 16,497,691 | | | | 689,236 | | | | – | |
Energy | | | 31,285,764 | | | | 29,542,944 | | | | 1,742,820 | | | | – | |
Financials | | | 80,630,207 | | | | 76,775,791 | | | | 3,854,416 | | | | – | |
Health Care | | | 63,861,728 | | | | 62,907,349 | | | | 954,379 | | | | – | |
Industrials | | | 56,044,325 | | | | 54,292,160 | | | | 1,752,165 | | | | – | |
Information Technology | | | 90,127,033 | | | | 89,133,912 | | | | 993,121 | | | | – | |
Materials | | | 13,657,802 | | | | 13,110,616 | | | | 547,186 | | | | – | |
Telecommunications Services | | | 3,571,118 | | | | 2,741,671 | | | | 829,447 | | | | – | |
Utilities | | | 7,851,353 | | | | 7,021,425 | | | | 829,928 | | | | – | |
| | | | |
Long-Term Fixed Income | | | | | | | | | | | | | | | | |
Asset-Backed Securities | | | 14,544,991 | | | | – | | | | 14,270,297 | | | | 274,694 | |
Basic Materials | | | 2,390,478 | | | | – | | | | 2,390,478 | | | | – | |
Capital Goods | | | 2,055,713 | | | | – | | | | 2,055,713 | | | | – | |
Collateralized Mortgage Obligations | | | 9,275,078 | | | | – | | | | 8,378,453 | | | | 896,625 | |
Commercial Mortgage-Backed Securities | | | 13,883,932 | | | | – | | | | 13,883,932 | | | | – | |
Communications Services | | | 7,169,306 | | | | – | | | | 7,169,306 | | | | – | |
Consumer Cyclical | | | 3,794,528 | | | | – | | | | 3,794,528 | | | | – | |
Consumer Non-Cyclical | | | 6,012,817 | | | | – | | | | 6,012,817 | | | | – | |
Energy | | | 4,810,410 | | | | – | | | | 4,810,410 | | | | – | |
Financials | | | 15,952,225 | | | | – | | | | 15,952,225 | | | | – | |
Foreign Government | | | 409,099 | | | | – | | | | 409,099 | | | | – | |
Mortgage-Backed Securities | | | 38,604,252 | | | | – | | | | 38,604,252 | | | | – | |
Technology | | | 1,899,332 | | | | – | | | | 1,899,332 | | | | – | |
Transportation | | | 780,816 | | | | – | | | | 780,816 | | | | – | |
U.S. Government and Agencies | | | 62,917,208 | | | | – | | | | 62,917,208 | | | | – | |
Utilities | | | 3,916,515 | | | | – | | | | 3,916,515 | | | | – | |
Collateral Held for Securities Loaned | | | 601,444 | | | | 601,444 | | | | – | | | | – | |
Short-Term Investments | | | 173,889,487 | | | | – | | | | 173,889,487 | | | | – | |
| |
Total | | $ | 1,898,304,902 | | | $ | 1,480,583,985 | | | $ | 414,594,694 | | | $ | 3,126,223 | |
| |
| |
| | | | |
Other Financial Instruments | | Total | | | Level 1 | | | Level 2 | | | Level 3 | |
| | | | |
Asset Derivatives | | | | | | | | | | | | | | | | |
Futures Contracts | | | 10,489,867 | | | | 10,489,867 | | | | – | | | | – | |
Credit Default Swaps | | | 5,842 | | | | – | | | | 5,842 | | | | – | |
| |
Total Asset Derivatives | | $ | 10,495,709 | | | $ | 10,489,867 | | | $ | 5,842 | | | $ | – | |
| |
| |
Liability Derivatives | | | | | | | | | | | | | | | | |
Futures Contracts | | | 6,776,508 | | | | 6,776,508 | | | | – | | | | – | |
| |
Total Liability Derivatives | | $ | 6,776,508 | | | $ | 6,776,508 | | | $ | – | | | $ | – | |
| |
| |
There were no significant transfers between Levels during the period ended October 31, 2014. Transfers between Levels are identified as of the end of the period.
The accompanying Notes to Financial Statements are an integral part of this schedule.
83
MODERATELY AGGRESSIVE ALLOCATION FUND
Schedule of Investments as of October 31, 2014
| | | | | | | | | | | | | | | | | | | | |
Futures Contracts | | Number of
Contracts
Long/(Short) | | | Expiration
Date | | | Notional
Principal
Amount | | | Value | | | Unrealized
Gain/(Loss) | |
2-Yr. U.S. Treasury Bond Futures | | | (479 | ) | | | December 2014 | | | | ($104,869,064 | ) | | | ($105,170,437 | ) | | | ($301,373) | |
5-Yr. U.S. Treasury Bond Futures | | | (241 | ) | | | December 2014 | | | | (28,506,898 | ) | | | (28,782,555 | ) | | | (275,657) | |
10-Yr. U.S. Treasury Bond Futures | | | 88 | | | | December 2014 | | | | 10,934,143 | | | | 11,119,625 | | | | 185,482 | |
30-Yr. U.S. Treasury Bond Futures | | | 350 | | | | December 2014 | | | | 48,523,978 | | | | 49,382,812 | | | | 858,834 | |
Eurex EURO STOXX 50 Futures | | | 2,192 | | | | December 2014 | | | | 88,116,240 | | | | 85,456,108 | | | | (2,660,132) | |
Russell 2000 Index Mini-Futures | | | (142 | ) | | | December 2014 | | | | (16,202,583 | ) | | | (16,628,199 | ) | | | (425,616) | |
S&P 400 Index Mini-Futures | | | (1,072 | ) | | | December 2014 | | | | (148,617,150 | ) | | | (151,730,880 | ) | | | (3,113,730) | |
S&P 500 Index Futures | | | 468 | | | | December 2014 | | | | 226,117,723 | | | | 235,333,800 | | | | 9,216,077 | |
Ultra Long Term U.S. Treasury Bond Futures | | | 70 | | | | December 2014 | | | | 10,747,401 | | | | 10,976,875 | | | | 229,474 | |
Total Futures Contracts | | | | | | | | | | | | | | | | | | | $3,713,359 | |
| | | | | | | | | | | | | | | | | | |
Credit Default Swaps and Counterparty | | Buy/Sell Protection1 | | Termination
Date | | | Notional
Principal
Amount2 | | | Value3 | | | Unrealized Gain/(Loss) | |
CDX HY 5 Year, at
5.00%; Morgan Stanley and Co. | | Sell | | | 12/20/2019 | | | | ($500,000 | ) | | | $4,602 | | | | $4,602 | |
CDX IG 5 Year, at
1.00%; Morgan Stanley and Co. | | Sell | | | 12/20/2019 | | | | (600,000 | ) | | | 1,240 | | | | 1,240 | |
Total Credit Default Swaps | | | | | | | | | | | | | $5,842 | | | | $5,842 | |
1 | As the buyer of protection, Moderately Aggressive Allocation Fund pays periodic fees in return for payment by the seller which is contingent upon an adverse credit event occurring in the underlying issuer or reference entity. As the seller of protection, Moderately Aggressive Allocation Fund collects periodic fees from the buyer and profits if the credit of the underlying issuer or reference entity remains stable or improves while the swap is outstanding, but the seller in a credit default swap contract would be required to pay the amount of credit loss, determined as specified in the agreement, to the buyer in the event of an adverse credit event in the reference entity. |
2 | The maximum potential amount of future payments Moderately Aggressive Allocation Fund could be required to make as the seller or receive as the buyer of protection. |
3 | The values for credit indexes (CDX or LCDX) serve as an indicator of the current status of the payment/performance risk and represent the liability or profit for the credit default swap contract had the contract been closed as of the reporting date. When protection has been sold, the value of the swap will increase when the swap spread declines representing an improvement in the reference entity’s credit worthiness. The value of the swap will decrease when the swap spread increases representing a deterioration in the reference entity’s credit worthiness. When protection has been purchased, the value of the swap will increase when the swap spread increases representing a deterioration in the reference entity’s credit worthiness. The value of the swap will decrease when the swap spread declines representing an improvement in the reference entity’s credit worthiness. |
The accompanying Notes to Financial Statements are an integral part of this schedule.
84
MODERATELY AGGRESSIVE ALLOCATION FUND
Schedule of Investments as of October 31, 2014
The following table summarizes the fair value and Statement of Assets and Liabilities location, as of October 31, 2014, for Moderately Aggressive Allocation Fund’s investments in financial derivative instruments by primary risk exposure as discussed under item (2) Significant Accounting Policies of the Notes to Financial Statements.
| | | | | | |
Derivatives by risk category | | Statement of Assets and Liabilities Location | | Fair Value | |
| | |
Asset Derivatives | | | | | | |
| | |
Interest Rate Contracts | | | | | | |
Futures* | | Net Assets - Net unrealized appreciation/(depreciation) on Futures contracts | | | $1,273,790 | |
Total Interest Rate Contracts | | | | | 1,273,790 | |
| | |
Equity Contracts | | | | | | |
Futures* | | Net Assets - Net unrealized appreciation/(depreciation) on Futures contracts | | | 9,216,077 | |
Total Equity Contracts | | | | | 9,216,077 | |
| | |
Credit Contracts | | | | | | |
Credit Default Swaps | | Net Assets - Net unrealized appreciation/(depreciation) on Swap agreements | | | 5,842 | |
Total Credit Contracts | | | | | 5,842 | |
Total Asset Derivatives | | | | $ | 10,495,709 | |
| | | | | | | |
| | |
Liability Derivatives | | | | | | |
| | |
Interest Rate Contracts | | | | | | |
Futures* | | Net Assets - Net unrealized appreciation/(depreciation) on Futures contracts | | | 577,030 | |
Total Interest Rate Contracts | | | | | 577,030 | |
| | |
Equity Contracts | | | | | | |
Futures* | | Net Assets - Net unrealized appreciation/(depreciation) on Futures contracts | | | 6,199,478 | |
Total Equity Contracts | | | | | 6,199,478 | |
Total Liability Derivatives | | | | $ | 6,776,508 | |
| | | | | | | |
* | Includes cumulative appreciation/depreciation of futures contracts as reported in the Schedule of Investments. Only current day’s variation margin is reported within the Statement of Assets and Liabilities. |
The following table summarizes the net realized gains/(losses) and Statement of Operations location, for the period ended October 31, 2014, for Moderately Aggressive Allocation Fund’s investments in financial derivative instruments by primary risk exposure.
| | | | | | |
Derivatives by risk category | | Statement of Operations Location | | Realized Gains/(Losses) recognized in Income | |
| | |
Interest Rate Contracts | | | | | | |
Futures | | Net realized gains/(losses) on Futures contracts | | | 3,273,194 | |
Total Interest Rate Contracts | | | | | 3,273,194 | |
| | |
Equity Contracts | | | | | | |
Futures | | Net realized gains/(losses) on Futures contracts | | | 9,660,117 | |
Total Equity Contracts | | | | | 9,660,117 | |
| | |
Credit Contracts | | | | | | |
Credit Default Swaps | | Net realized gains/(losses) on Swap agreements | | | (216,854 | ) |
Total Credit Contracts | | | | | (216,854 | ) |
Total | | | | | $12,716,457 | |
| | | | | | | |
The following table summarizes the change in net unrealized appreciation/(depreciation) and Statement of Operations location, for the period ended October 31, 2014, for Moderately Aggressive Allocation Fund’s investments in financial derivative instruments by primary risk exposure.
| | | | | | |
Derivatives by risk category | | Statement of Operations Location | | Change in unrealized
appreciation/(depreciation)
recognized in Income | |
| | |
Interest Rate Contracts | | | | | | |
Futures | | Change in net unrealized appreciation/(depreciation) on Futures contracts | | | 1,048,734 | |
Total Interest Rate Contracts | | | | | 1,048,734 | |
| | |
Equity Contracts | | | | | | |
Futures | | Change in net unrealized appreciation/(depreciation) on Futures contracts | | | (2,093,905 | ) |
Total Equity Contracts | | | | | (2,093,905 | ) |
| | |
Credit Contracts | | | | | | |
Credit Default Swaps | | Change in net unrealized appreciation/(depreciation) on Swap agreements | | | (33,845 | ) |
Total Credit Contracts | | | | | (33,845 | ) |
Total | | | | | ($1,079,016 | ) |
| | | | | | | |
The accompanying Notes to Financial Statements are an integral part of this schedule.
85
MODERATELY AGGRESSIVE ALLOCATION FUND
Schedule of Investments as of October 31, 2014
The following table presents Moderately Aggressive Allocation Fund’s average volume of derivative activity during the period ended October 31, 2014.
| | | | | | | | | | | | | | | | |
Derivative Risk Category | | Futures
(Notional)* | | | Futures
(Percentage
of Average Net Assets) | | | Forwards
(Notional)* | | | Swaps
(Notional)* | |
Equity Contracts | | $ | 355,880,104 | | | | 20.0 | % | | | N/A | | | | N/A | |
Interest Rate Contracts | | | 146,219,362 | | | | 8.2 | | | | N/A | | | | N/A | |
Foreign Exchange Contracts | | | N/A | | | | N/A | | | $ | 84,323 | | | | N/A | |
Credit Contracts | | | N/A | | | | N/A | | | | N/A | | | | 157,639 | |
* | Notional amount represents long or short, or both, derivative positions held by the Fund. |
Investment in Affiliates
Affiliated issuers, as defined under the Investment Company Act of 1940, include those in which the Fund’s holdings of an issuer represent 5% or more of the outstanding voting securities of an issuer, or any affiliated mutual fund.
A summary of transactions for the fiscal year to date, in Moderately Aggressive Allocation Fund, is as follows:
| | | | | | | | | | | | | | | | | | | | | | | | |
Fund | | Value October 31, 2013 | | | Gross
Purchases | | | Gross
Sales | | | Shares Held at
October 31, 2014 | | | Value October 31,
2014 | | | Income Earned
November 1, 2013 -
October 31, 2014 | |
Natural Resources | | | $31,525,305 | | | | $224,146 | | | | $– | | | | 3,092,268 | | | | $28,974,552 | | | | $224,146 | |
Partner Small Cap Growth | | | 52,578,884 | | | | 7,055,087 | | | | 52,560,077 | | | | – | | | | – | | | | – | |
Partner Small Cap Value | | | 34,229,418 | | | | 1,091,135 | | | | – | | | | 1,628,108 | | | | 36,323,082 | | | | 127,648 | |
Small Cap Stock | | | 28,212,048 | | | | 195,457 | | | | – | | | | 1,353,925 | | | | 31,031,959 | | | | – | |
Mid Cap Growth | | | 46,821,497 | | | | 5,178,647 | | | | – | | | | 2,132,075 | | | | 51,383,009 | | | | – | |
Partner Mid Cap Value | | | 51,085,043 | | | | 9,647,584 | | | | – | | | | 3,844,932 | | | | 58,635,213 | | | | 266,237 | |
Mid Cap Stock | | | 89,108,543 | | | | 316,418 | | | | – | | | | 4,047,495 | | | | 103,373,034 | | | | 316,418 | |
Partner Worldwide Allocation | | | 205,967,957 | | | | 4,219,957 | | | | – | | | | 20,291,180 | | | | 205,143,826 | | | | 4,219,957 | |
Large Cap Growth | | | 109,827,646 | | | | 405,286 | | | | – | | | | 14,406,776 | | | | 129,084,714 | | | | 405,286 | |
Large Cap Value | | | 142,251,596 | | | | 1,884,283 | | | | – | | | | 7,692,182 | | | | 159,997,378 | | | | 1,884,283 | |
Large Cap Stock | | | 87,633,904 | | | | 8,547,824 | | | | – | | | | 3,491,822 | | | | 97,736,096 | | | | 724,248 | |
High Yield | | | 56,648,574 | | | | 3,418,626 | | | | 1,717,715 | | | | 11,439,906 | | | | 57,771,526 | | | | 3,418,659 | |
Income | | | 72,287,718 | | | | 2,803,170 | | | | 3,611,846 | | | | 7,875,189 | | | | 73,160,508 | | | | 2,803,144 | |
Government Bond | | | 23,310,870 | | | | 589,171 | | | | 719,637 | | | | 2,313,767 | | | | 23,253,358 | | | | 326,941 | |
Limited Maturity Bond | | | 18,893,910 | | | | 413,828 | | | | 1,113,767 | | | | 1,451,773 | | | | 18,060,055 | | | | 305,978 | |
Cash Management Trust-Collateral Investment | | | 1,305,947 | | | | 57,101,074 | | | | 57,805,577 | | | | 601,444 | | | | 601,444 | | | | 8,371 | |
Total Value and Income Earned | | | 1,051,688,860 | | | | | | | | | | | | | | | | 1,074,529,754 | | | | 15,031,316 | |
The accompanying Notes to Financial Statements are an integral part of this schedule.
86
MODERATE ALLOCATION FUND
Schedule of Investments as of October 31, 2014
| | | | | | | | |
Principal Amount | | | Bank Loans (3.9%)a | | Value | |
| Basic Materials (0.3%) | |
| | | | Axalta Coating Systems US Holdings, Inc.,Term Loan | | | | |
| | $731,617 | | | 3.750%, 2/1/2020 | | | $719,275 | |
| | | | Fortescue Metals Group, Ltd., Term Loan | | | | |
| | 2,744,280 | | | 3.750%, 6/30/2019 | | | 2,674,740 | |
| | | | Ineos Group Holdings, Ltd., Term Loan | | | | |
| | 956,860 | | | 3.750%, 5/4/2018 | | | 943,703 | |
| | | | NewPage Corporation, Term Loan | | | | |
| | 950,000 | | | 9.500%, 2/11/2021 | | | 920,550 | |
| | | | Wausau Paper Corporation, Term Loan | | | | |
| | 498,750 | | | 6.500%, 7/30/2020 | | | 492,516 | |
| | | | | |
| | | | Total | | | 5,750,784 | |
| | | | | |
| |
| Capital Goods (0.1%) | | | | |
| | | | ADS Waste Holdings, Inc., Term Loan | | | | |
| | 501,075 | | | 3.750%, 10/9/2019 | | | 489,926 | |
| | | | Berry Plastics Group, Inc., Term Loan | | | | |
| | 1,635,100 | | | 3.500%, 2/8/2020 | | | 1,599,340 | |
| | | | Silver II Borrower, Term Loan | | | | |
| | 419,512 | | | 4.000%, 12/13/2019 | | | 411,823 | |
| | | | STHI Holding Corporation, Term Loan | | | | |
| | 215,000 | | | 4.500%, 8/6/2021 | | | 213,656 | |
| | | | | |
| | | | Total | | | 2,714,745 | |
| | | | | |
| |
| Communications Services (1.5%) | | | | |
| | | | Atlantic Broadband Penn, LLC, Term Loan | | | | |
| | 354,183 | | | 3.250%, 11/30/2019 | | | 349,490 | |
| | | | Birch Communication Inc., Term Loan | | | | |
| | 800,000 | | | 7.750%, 7/17/2020 | | | 768,000 | |
| | | | Cengage Learning Aquisitions, Term Loan | | | | |
| | 1,303,450 | | | 7.000%, 3/31/2020 | | | 1,304,102 | |
| | | | Cequel Communications, LLC, Term Loan | | | | |
| | 525,610 | | | 3.500%, 2/14/2019 | | | 519,765 | |
| | | | Charter Communications Operating, LLC, Term Loan | | | | |
| | 217,250 | | | 3.000%, 7/1/2020 | | | 213,177 | |
| | | | Clear Channel Communications, Inc., Term Loan | | | | |
| | 8,241 | | | 3.804%, 1/29/2016 | | | 8,166 | |
| | 976,825 | | | 6.904%, 1/30/2019 | | | 920,814 | |
| | 314,163 | | | 7.654%, 7/30/2019 | | | 301,694 | |
| | | | Cumulus Media Holdings, Inc., Term Loan | | | | |
| | 808,426 | | | 4.250%, 12/23/2020 | | | 798,991 | |
| | | | Fairpoint Communications, Term Loan | | | | |
| | 1,093,350 | | | 7.500%, 2/14/2019 | | | 1,100,872 | |
| | | | Grande Communications Networks, LLC, Term Loan | | | | |
| | 641,879 | | | 4.500%, 5/29/2020 | | | 635,062 | |
| | | | Hargray Communications Group, Inc., Term Loan | | | | |
| | 1,158,563 | | | 5.250%, 6/26/2019 b,c | | | 1,156,153 | |
| | | | Integra Telecom Holdings, Inc., Term Loan | | | | |
| | 640,250 | | | 5.250%, 2/22/2019 | | | 637,529 | |
| | 220,000 | | | 9.750%, 2/21/2020 | | | 216,150 | |
| | | | Intelsat Jackson Holdings SA, Term Loan | | | | |
| | 633,591 | | | 3.750%, 6/30/2019 | | | 628,047 | |
| | | | Level 3 Communications, Inc., Term Loan | | | | |
| | 960,000 | | | 4.000%, 1/15/2020 | | | 955,200 | |
| | | | Level 3 Financing, Inc., Term Loan | | | | |
| | 400,000 | | | 0.000%, 1/31/2022 b,c | | | 401,624 | |
| | | | Liberty Cablevision of Puerto Rico, LLC, Term Loan | | | | |
| | 355,000 | | | 4.500%, 1/7/2022 | | | 352,117 | |
| | | | LTS Buyer, LLC, Term Loan | | | | |
| | 488,813 | | | 4.000%, 4/13/2020 | | | 482,702 | |
| | 34,788 | | | 8.000%, 4/12/2021 | | | 34,468 | |
| | | | McGraw-Hill Global Education, LLC, Term Loan | | | | |
| | 876,750 | | | 5.750%, 3/22/2019 | | | 877,574 | |
| | | | Mediacom Broadband, LLC, Term Loan | | | | |
| | 387,100 | | | 4.000%, 1/20/2020 | | | 380,326 | |
| | | | NEP Broadcasting, LLC, Term Loan | | | | |
| | 62,857 | | | 9.500%, 7/22/2020 | | | 62,700 | |
| | | | NEP/NCP Holdco, Inc., Term Loan | | | | |
| | 2,620,249 | | | 4.250%, 1/22/2020 | | | 2,554,743 | |
| | | | NTelos, Inc., Term Loan | | | | |
| | 333,200 | | | 5.750%, 11/9/2019 | | | 332,644 | |
| | | | Syniverse Holdings, Inc., Term Loan | | | | |
| | 862,874 | | | 4.000%, 4/23/2019 | | | 846,160 | |
| | | | TNS, Inc., Term Loan | | | | |
| | 650,471 | | | 5.000%, 2/14/2020 | | | 643,563 | |
| | | | Univision Communications, Inc., Term Loan | | | | |
| | 1,050,845 | | | 4.000%, 3/1/2020 | | | 1,039,465 | |
| | | | Virgin Media Investment Holdings, Ltd., Term Loan | | | | |
| | 2,355,000 | | | 3.500%, 6/7/2020 | | | 2,320,334 | |
| | | | WideOpenWest Finance, LLC, Term Loan | | | | |
| | 1,433,175 | | | 4.750%, 4/1/2019 | | | 1,430,710 | |
| | | | XO Communications, LLC, Term Loan | | | | |
| | 273,625 | | | 4.250%, 3/20/2021 | | | 270,774 | |
| | | | Yankee Cable Acquisition, LLC, Term Loan | | | | |
| | 836,510 | | | 4.500%, 3/1/2020 | | | 831,700 | |
| | | | Zayo Group, LLC, Term Loan | | | | |
| | 2,865,329 | | | 4.000%, 7/2/2019 | | | 2,838,023 | |
| | | | | |
| | | | Total | | | 26,212,839 | |
| | | | | |
| |
| Consumer Cyclical (0.7%) | | | | |
| | | | Amaya Gaming Group, Inc., Term Loan | | | | |
| | 410,000 | | | 5.000%, 8/1/2021 | | | 406,499 | |
| | | | Bally Technologies, Inc., Term Loan | | | | |
| | 499,672 | | | 4.250%, 11/25/2020 | | | 497,488 | |
| | | | Burlington Coat Factory Warehouse Corporation, Term Loan | | | | |
| | 531,663 | | | 4.250%, 8/13/2021 | | | 527,942 | |
| | | | Ceridian Corporation, Term Loan | | | | |
| | 271,443 | | | 4.121%, 5/9/2017 | | | 271,036 | |
| | 271,443 | | | 4.500%, 5/9/2017 | | | 268,984 | |
| | | | Chrysler Group, LLC, Term Loan | | | | |
| | 718,855 | | | 3.500%, 5/24/2017 | | | 714,664 | |
The accompanying Notes to Financial Statements are an integral part of this schedule.
87
MODERATE ALLOCATION FUND
Schedule of Investments as of October 31, 2014
| | | | | | | | |
Principal Amount | | | Bank Loans (3.9%)a | | Value | |
| Consumer Cyclical (0.7%) - continued | |
| | | | Golden Nugget, Inc., Delayed Draw | | | | |
| | $126,544 | | | 5.500%, 11/21/2019 | | | $127,122 | |
| | | | Golden Nugget, Inc., Term Loan | | | | |
| | 295,269 | | | 5.500%, 11/21/2019 | | | 296,618 | |
| | | | Hilton Worldwide Finance, LLC, Term Loan | | | | |
| | 556,491 | | | 3.500%, 10/26/2020 | | | 550,648 | |
| | | | J.C. Penney Corporation, Inc., Term Loan | | | | |
| | 320,937 | | | 6.000%, 5/22/2018 | | | 316,659 | |
| | | | Las Vegas Sands, LLC, Term Loan | | | | |
| | 1,414,312 | | | 3.250%, 12/19/2020 | | | 1,409,405 | |
| | | | Marina District Finance Company, Inc., Term Loan | | | | |
| | 1,148,386 | | | 6.750%, 8/15/2018 | | | 1,144,803 | |
| | | | MGM Resorts International, Term Loan | | | | |
| | 707,400 | | | 3.500%, 12/20/2019 | | | 698,557 | |
| | | | Mohegan Tribal Gaming Authority, Term Loan | | | | |
| | 1,488,750 | | | 5.500%, 11/19/2019 | | | 1,444,088 | |
| | | | Rite Aid Corporation, Term Loan | | | | |
| | 162,944 | | | 3.500%, 2/21/2020 | | | 160,866 | |
| | 330,000 | | | 5.750%, 8/21/2020 | | | 331,650 | |
| | | | ROC Finance, LLC, Term Loan | | | | |
| | 1,197,900 | | | 5.000%, 6/20/2019 | | | 1,145,121 | |
| | | | Scientific Games International, Inc., Term Loan | | | | |
| | 273,622 | | | 4.250%, 10/18/2020 | | | 267,550 | |
| | | | Seminole Indian Tribe of Florida, Term Loan | | | | |
| | 366,950 | | | 3.000%, 4/29/2020 | | | 365,346 | |
| | | | Seven Seas Cruises S de RL, LLC, Term Loan | | | | |
| | 728,654 | | | 3.750%, 12/21/2018 | | | 726,832 | |
| | | | Toys “R” Us, Inc., Term Loan | | | | |
| | 178,320 | | | 5.250%, 5/25/2018 | | | 142,433 | |
| | 464,646 | | | 9.750%, 4/24/2020 b,c | | | 422,052 | |
| | | | | |
| | | | Total | | | 12,236,363 | |
| | | | | |
| |
| Consumer Non-Cyclical (0.4%) | | | | |
| | | | Albertsons, Inc., Term Loan | | | | |
| | 955,380 | | | 4.750%, 3/21/2019 | | | 952,992 | |
| | | | Biomet, Inc., Term Loan | | | | |
| | 650,746 | | | 3.652%, 7/25/2017 | | | 648,677 | |
| | | | Catalina Marketing Corporation, Term Loan | | | | |
| | 204,487 | | | 4.500%, 4/9/2021 | | | 198,993 | |
| | | | CHS/Community Health Systems, Inc., Term Loan | | | | |
| | 134,036 | | | 3.485%, 1/25/2017 | | | 133,590 | |
| | 357,251 | | | 4.250%, 1/27/2021 | | | 357,362 | |
| | | | Del Monte Corporation, Term Loan | | | | |
| | 139,917 | | | 3.500%, 3/9/2020 | | | 134,408 | |
| | | | Hologic, Inc., Term Loan | | | | |
| | 467,306 | | | 3.250%, 8/1/2019 | | | 464,502 | |
| | | | JBS USA, LLC, Term Loan | | | | |
| | 725,940 | | | 3.750%, 5/25/2018 | | | 715,050 | |
| | | | Ortho-Clinical Diagnostics, Inc., Term Loan | | | | |
| | 1,256,850 | | | 4.750%, 6/30/2021 | | | 1,243,025 | |
| | | | Roundy’s Supermarkets, Inc., Term Loan | | | | |
| | 859,348 | | | 5.750%, 3/3/2021 | | | 762,671 | |
| | | | Supervalu, Inc., Term Loan | | | | |
| | 1,005,162 | | | 4.500%, 3/21/2019 | | | 991,522 | |
| | | | Visant Corporation, Term Loan | | | | |
| | 1,235,252 | | | 7.000%, 9/23/2021 | | | 1,216,723 | |
| | | | | |
| | | | Total | | | 7,819,515 | |
| | | | | |
| |
| Energy (0.2%) | | | | |
| | | | Arch Coal, Inc., Term Loan | | | | |
| | 1,362,664 | | | 6.250%, 5/16/2018 | | | 1,201,092 | |
| | | | Energy Solutions, LLC, Term Loan | | | | |
| | 438,900 | | | 6.750%, 5/29/2020 | | | 440,546 | |
| | | | Expro Holdings UK 2, Ltd., Term Loan | | | | |
| | 350,000 | | | 0.000%, 9/2/2021 b,c | | | 342,415 | |
| | | | Fieldwood Energy, LLC, Term Loan | | | | |
| | 24,631 | | | 8.375%, 9/30/2020 | | | 23,661 | |
| | | | Houston Fuel Oil Terminal, LLC, Term Loan | | | | |
| | 280,000 | | | 4.250%, 8/19/2021 | | | 274,750 | |
| | | | McJunkin Red Man Corporation, Term Loan | | | | |
| | 519,750 | | | 5.000%, 11/8/2019 | | | 520,400 | |
| | | | Offshore Group Investment, Ltd., Term Loan | | | | |
| | 856,950 | | | 5.750%, 3/28/2019 | | | 775,540 | |
| | | | Pacific Drilling SA, Term Loan | | | | |
| | 429,562 | | | 4.500%, 6/3/2018 | | | 410,636 | |
| | | | TerraForm Power Operating, LLC, Term Loan | | | | |
| | 199,500 | | | 4.750%, 7/23/2019 | | | 199,500 | |
| | | | | |
| | | | Total | | | 4,188,540 | |
| | | | | |
| |
| Financials (0.2%) | | | | |
| | | | DJO Finance, LLC, Term Loan | | | | |
| | 808,447 | | | 4.250%, 9/15/2017 | | | 804,001 | |
| | | | GEO Group, Inc., Term Loan | | | | |
| | 216,700 | | | 3.250%, 4/3/2020 | | | 213,991 | |
| | | | Harland Clarke Holdings Corporation, Term Loan | | | | |
| | 117,750 | | | 6.000%, 8/4/2019 | | | 117,995 | |
| | | | MoneyGram International, Inc., Term Loan | | | | |
| | 866,800 | | | 4.250%, 3/27/2020 | | | 837,909 | |
| | | | WaveDivision Holdings, LLC, Term Loan | | | | |
| | 1,002,150 | | | 4.000%, 10/15/2019 | | | 991,708 | |
| | | | | |
| | | | Total | | | 2,965,604 | |
| | | | | |
| |
| Technology (0.2%) | | | | |
| | | | First Data Corporation, Term Loan | | | | |
| | 1,095,000 | | | 3.653%, 3/23/2018 | | | 1,084,050 | |
| | 395,000 | | | 3.653%, 9/24/2018 | | | 391,050 | |
| | | | Freescale Semiconductor, Inc., Term Loan | | | | |
| | 792,970 | | | 4.250%, 2/28/2020 | | | 781,361 | |
| | 501,930 | | | 5.000%, 1/15/2021 | | | 500,766 | |
The accompanying Notes to Financial Statements are an integral part of this schedule.
88
MODERATE ALLOCATION FUND
Schedule of Investments as of October 31, 2014
| | | | | | | | |
Principal
Amount | | | Bank Loans (3.9%)a | | Value | |
| Technology (0.2%) - continued | |
| | | | Infor US, Inc., Term Loan | | | | |
| | $570,836 | | | 3.750%, 6/3/2020 | | | $562,701 | |
| | | | | |
| | | | Total | | | 3,319,928 | |
| | | | | |
|
| Transportation (0.2%) | |
| | | | American Airlines, Inc., Term Loan | | | | |
| | 903,563 | | | 3.750%, 6/27/2019 | | | 891,139 | |
| | | | Delta Air Lines, Inc., Term Loan | | | | |
| | 819,543 | | | 3.250%, 4/20/2017 | | | 812,757 | |
| | | | OSG Bulk Ships, Inc., Term Loan | | | | |
| | 478,800 | | | 5.250%, 8/5/2019 | | | 475,008 | |
| | | | United Airlines, Inc., Term Loan | | | | |
| | 541,750 | | | 3.500%, 4/1/2019 | | | 529,561 | |
| | 105,000 | | | 3.750%, 9/15/2021 | | | 103,687 | |
| | | | | |
| | | | Total | | | 2,812,152 | |
| | | | | |
|
| Utilities (0.1%) | |
| | | | Calpine Corporation, Term Loan | | | | |
| | 162,061 | | | 4.000%, 4/1/2018 | | | 161,301 | |
| | 769,300 | | | 4.000%, 10/9/2019 | | | 761,884 | |
| | | | Intergen NV, Term Loan | | | | |
| | 419,687 | | | 5.500%, 6/15/2020 | | | 418,638 | |
| | | | NGPL PipeCo, LLC, Term Loan | | | | |
| | 658,632 | | | 6.750%, 9/15/2017 | | | 656,439 | |
| | | | | |
| | | | Total | | | 1,998,262 | |
| | | | | |
| | | | | | | | |
| | | | | |
| | | | Total Bank Loans (cost $71,033,439) | | | 70,018,732 | |
| | | | | |
| | |
| Shares | | | Mutual Funds (56.0%) | | Value | |
| Equity Mutual Funds (36.0%) | |
| | 2,784,907 | | | Thrivent Natural Resources Fund | | | 26,094,578 | |
| | 1,548,575 | | | Thrivent Partner Small Cap Value Fund | | | 34,548,712 | |
| | 888,631 | | | Thrivent Small Cap Stock Fund | | | 20,367,428 | |
| | 744,157 | | | Thrivent Mid Cap Growth Fund | | | 17,934,192 | |
| | 2,538,489 | | | Thrivent Partner Mid Cap Value Fund | | | 38,711,952 | |
| | 2,637,150 | | | Thrivent Mid Cap Stock Fund | | | 67,352,823 | |
| | 15,509,964 | | | Thrivent Partner Worldwide Allocation Fund | | | 156,805,733 | |
| | 11,340,537 | | | Thrivent Large Cap Growth Fund | | | 101,611,209 | |
| | 6,548,778 | | | Thrivent Large Cap Value Fund | | | 136,214,577 | |
| | 1,365,743 | | | Thrivent Large Cap Stock Fund | | | 38,227,137 | |
| | | | | |
| | | | Total | | | 637,868,341 | |
| | | | | |
|
| Fixed Income Mutual Funds (20.0%) | |
| | 9,683,266 | | | Thrivent High Yield Fund | | | 48,900,495 | |
| | 18,464,184 | | | Thrivent Income Fund | | | 171,532,271 | |
| | 2,366,570 | | | Thrivent Government Bond Fund | | | 23,784,028 | |
| | 8,925,424 | | | Thrivent Limited Maturity Bond Fund | | | 111,032,275 | |
| | | | | |
| | | | Total | | | 355,249,069 | |
| | | | | |
| | | | | | | | |
| | | | | |
| | | | Total Mutual Funds (cost $799,014,376) | | | 993,117,410 | |
| | | | | |
| | |
| Shares | | | Common Stock (18.1%) | | Value | |
| Consumer Discretionary (2.3%) | |
| | 3,250 | | | Aaron’s, Inc. | | | 80,470 | |
| | 5,500 | | | Amazon.com, Inc.d,e | | | 1,680,030 | |
| | 4,447 | | | ANN, Inc.d | | | 170,720 | |
| | 1,400 | | | Aoyama Trading Company, Ltd. | | | 33,299 | |
| | 19,350 | | | Apollo Group, Inc.d | | | 554,571 | |
| | 2,800 | | | AutoZone, Inc.d | | | 1,549,856 | |
| | 3,950 | | | Bank Mandiri Persero Tbk PTd | | | 95,985 | |
| | 19,650 | | | Barnes & Noble, Inc.d | | | 428,763 | |
| | 300 | | | Bayerische Motoren Werke AG | | | 24,055 | |
| | 10,600 | | | Best Buy Company, Inc. | | | 361,884 | |
| | 2,000 | | | Big Lots, Inc. | | | 91,300 | |
| | 3,500 | | | BJ’s Restaurants, Inc.d | | | 154,070 | |
| | 2,600 | | | BorgWarner, Inc. | | | 148,252 | |
| | 300 | | | Brembo SPA | | | 9,948 | |
| | 600 | | | Bridgestone Corporation | | | 20,051 | |
| | 1,750 | | | Brinker International, Inc. | | | 93,870 | |
| | 10,233 | | | Brunswick Corporation | | | 478,904 | |
| | 9,096 | | | Burlington Stores, Inc.d | | | 381,486 | |
| | 4,400 | | | Carnival Corporation | | | 176,660 | |
| | 11,600 | | | Cato Corporation | | | 413,772 | |
| | 16,710 | | | CBS Corporatione | | | 906,016 | |
| | 20,450 | | | Cheesecake Factory, Inc. | | | 939,473 | |
| | 500 | | | Chiyoda Company, Ltd. | | | 9,893 | |
| | 3,053 | | | Chuy’s Holdings, Inc.d | | | 91,315 | |
| | 5,800 | | | Coinstar, Inc.d | | | 366,966 | |
| | 66,400 | | | Comcast Corporation | | | 3,675,240 | |
| | 5,540 | | | Core-Mark Holding Company, Inc. | | | 321,486 | |
| | 200 | | | Daimler AG | | | 15,594 | |
| | 13,139 | | | Del Frisco’s Restaurant Group, Inc.d | | | 305,088 | |
| | 26,512 | | | Delphi Automotive plc | | | 1,828,798 | |
| | 2,600 | | | DeVry Education Group, Inc. | | | 125,866 | |
| | 10,700 | | | DISH Network Corporationd | | | 681,055 | |
| | 12,800 | | | Dollar Tree, Inc.d | | | 775,296 | |
| | 6,900 | | | EDION Corporation | | | 49,230 | |
| | 7,153 | | | Five Below, Inc.d | | | 285,190 | |
| | 100 | | | Forbo Holding AG | | | 103,778 | |
| | 33,600 | | | Ford Motor Company | | | 473,424 | |
| | 10,705 | | | G-III Apparel Group, Ltd.d | | | 849,442 | |
| | 3,500 | | | Hakuhodo Dy Holdings, Inc. | | | 34,613 | |
| | 4,332 | | | Halfords Group plc | | | 34,388 | |
| | 5,050 | | | Harman International Industries, Inc. | | | 542,067 | |
| | 6,200 | | | Haseko Corporation | | | 45,446 | |
| | 500 | | | Heiwa Corporation | | | 10,238 | |
| | 15,100 | | | Home Depot, Inc. | | | 1,472,552 | |
| | 5,866 | | | Home Retail Group plc | | | 17,214 | |
| | 9,059 | | | HomeAway, Inc.d | | | 316,159 | |
| | 27,820 | | | Houghton Mifflin Harcourt Companyd | | | 556,678 | |
| | 17,009 | | | Ignite Restaurant Group, Inc.d | | | 117,192 | |
| | 7,610 | | | Imax Corporationd | | | 224,191 | |
| | 3,800 | | | iRobot Corporationd | | | 135,736 | |
| | 2,200 | | | JM AB | | | 71,109 | |
| | 9,507 | | | Kate Spade & Companyd | | | 257,925 | |
| | 6,900 | | | Kirkland’s, Inc.d | | | 122,820 | |
| | 18,100 | | | Kohl’s Corporation | | | 981,382 | |
| | 15,000 | | | Kongsberg Automotive ASAd | | | 14,353 | |
| | 20,560 | | | Las Vegas Sands Corporation | | | 1,280,066 | |
| | 18,000 | | | Li & Fung, Ltd. | | | 21,937 | |
| | 9,550 | | | Liberty Interactive Corporationd | | | 249,637 | |
| | 1,357 | | | Liberty Venturesd | | | 47,631 | |
| | 773 | | | Lithia Motors, Inc. | | | 60,000 | |
| | 33,900 | | | Lowe’s Companies, Inc. | | | 1,939,080 | |
| | 23,000 | | | Luk Fook Holdings International, Ltd. | | | 68,579 | |
| | 15,150 | | | Macy’s, Inc. | | | 875,973 | |
| | 1,350 | | | Marriott Vacations Worldwide Corporation | | | 93,744 | |
| | 31,101 | | | MDC Partners, Inc. | | | 643,791 | |
| | 350 | | | Michael Kors Holdings, Ltd.d | | | 27,507 | |
| | 14,819 | | | Multimedia Games Holding Company, Inc.d | | | 517,183 | |
The accompanying Notes to Financial Statements are an integral part of this schedule.
89
MODERATE ALLOCATION FUND
Schedule of Investments as of October 31, 2014
| | | | | | | | |
| Shares | | | Common Stock (18.1%) | | Value | |
| Consumer Discretionary (2.3%) - continued | |
| | 7,950 | | | Nautilus, Inc.d | | | $106,371 | |
| | 1,000 | | | Next plc | | | 103,236 | |
| | 14,400 | | | NIKE, Inc. | | | 1,338,768 | |
| | 3,500 | | | NOK Corporation | | | 88,671 | |
| | 33,880 | | | NutriSystem, Inc. | | | 570,539 | |
| | 7,200 | | | Omnicom Group, Inc. | | | 517,392 | |
| | 10,800 | | | Orbitz Worldwide, Inc.d | | | 89,316 | |
| | 12,083 | | | Oxford Industries, Inc. | | | 740,084 | |
| | 7,690 | | | Papa John’s International, Inc. | | | 359,584 | |
| | 3,200 | | | Persimmon plc | | | 75,152 | |
| | 1,327 | | | Publicis Groupe SA | | | 92,038 | |
| | 4,327 | | | Red Robin Gourmet Burgers, Inc.d | | | 237,855 | |
| | 2,304 | | | Restoration Hardware Holdings, Inc.d | | | 185,057 | |
| | 100 | | | Rinnai Corporation | | | 8,883 | |
| | 1,950 | | | Royal Caribbean Cruises, Ltd. | | | 132,541 | |
| | 13,550 | | | Ruby Tuesday, Inc.d | | | 104,064 | |
| | 9,150 | | | Scientific Games Corporationd | | | 107,695 | |
| | 5,950 | | | Scripps Networks Interactive, Inc. | | | 459,578 | |
| | 13,250 | | | Select Comfort Corporationd | | | 340,392 | |
| | 1,454 | | | Shutterfly, Inc.d | | | 60,821 | |
| | 5,806 | | | Skechers USA, Inc.d | | | 317,879 | |
| | 3,753 | | | Slater & Gordon, Ltd. | | | 20,277 | |
| | 18,650 | | | Starbucks Corporation | | | 1,409,194 | |
| | 3,700 | | | Sumitomo Forestry Company, Ltd. | | | 38,880 | |
| | 2,700 | | | Suzuki Motor Corporation | | | 90,500 | |
| | 6,677 | | | Tenneco, Inc.d | | | 349,608 | |
| | 8,200 | | | Time Warner Cable, Inc. | | | 1,207,122 | |
| | 12,650 | | | Toll Brothers, Inc.d | | | 404,167 | |
| | 39,380 | | | Tuesday Morning Corporationd | | | 802,958 | |
| | 4,250 | | | Ulta Salon Cosmetics & Fragrance, Inc.d | | | 513,443 | |
| | 2,815 | | | Vail Resorts, Inc. | | | 243,103 | |
| | 100 | | | Valora Holding AG | | | 20,713 | |
| | 2,000 | | | WH Smith plc | | | 36,109 | |
| | 600 | | | Wolters Kluwer NV | | | 16,019 | |
| | 600 | | | WPP plc | | | 11,720 | |
| | 8,350 | | | Wyndham Worldwide Corporation | | | 648,545 | |
| | | | | |
| | | | Total | | | 41,378,561 | |
| | | | | |
|
| Consumer Staples (0.8%) | |
| | 7,200 | | | Anheuser-Busch InBev NV ADR | | | 799,056 | |
| | 5,100 | | | Archer-Daniels-Midland Company | | | 239,700 | |
| | 3,366 | | | B&G Foods, Inc. | | | 99,162 | |
| | 1,967 | | | Boston Beer Company, Inc.d | | | 489,783 | |
| | 4,532 | | | Britvic plc | | | 49,412 | |
| | 1,750 | | | Coca-Cola Enterprises, Inc. | | | 75,863 | |
| | 2,200 | | | Colgate-Palmolive Company | | | 147,136 | |
| | 42,150 | | | CVS Health Corporatione | | | 3,616,891 | |
| | 3,550 | | | Green Mountain Coffee Roasters, Inc. | | | 538,713 | |
| | 5,383 | | | Greencore Group plc | | | 22,587 | |
| | 4,750 | | | Ingredion, Inc. | | | 366,937 | |
| | 2,700 | | | J Sainsbury plc | | | 10,637 | |
| | 1,300 | | | Kesko Oyj | | | 49,303 | |
| | 5,740 | | | Kimberly-Clark Corporation | | | 655,910 | |
| | 500 | | | KOSE Corporation | | | 20,434 | |
| | 2,100 | | | Kroger Company | | | 116,991 | |
| | 900 | | | Matsumotokiyoshi Holdings Company, Ltd. | | | 26,174 | |
| | 4,150 | | | Molson Coors Brewing Company | | | 308,677 | |
| | 38,597 | | | Mondelez International, Inc. | | | 1,360,930 | |
| | 5,673 | | | Natural Grocers by Vitamin Cottage, Inc.d | | | 102,738 | |
| | 700 | | | Nestle SA | | | 51,334 | |
| | 3,830 | | | Pantry, Inc.d | | | 98,699 | |
| | 6,300 | | | Parmalat SPA | | | 18,932 | |
| | 6,589 | | | Philip Morris International, Inc. | | | 586,487 | |
| | 2,800 | | | Pilgrim’s Pride Corporationd | | | 79,548 | |
| | 12,250 | | | Pinnacle Foods, Inc. | | | 414,050 | |
| | 400 | | | Rallye SA | | | 15,503 | |
| | 2,123 | | | Reckitt Benckiser Group plc | | | 178,806 | |
| | 61,000 | | | Rite Aid Corporationd | | | 320,250 | |
| | 1,742 | | | SalMar ASA | | | 31,385 | |
| | 1,800 | | | Suedzucker AG | | | 25,063 | |
| | 3,300 | | | Tate & Lyle plc | | | 31,938 | |
| | 4,420 | | | TreeHouse Foods, Inc.d | | | 376,451 | |
| | 7,354 | | | United Natural Foods, Inc.d | | | 500,219 | |
| | 3,400 | | | Wal-Mart Stores, Inc. | | | 259,318 | |
| | 29,370 | | | WhiteWave Foods Companyd | | | 1,093,445 | |
| | 6,650 | | | Whole Foods Market, Inc. | | | 261,544 | |
| | | | | |
| | | | Total | | | 13,440,006 | |
| | | | | |
|
| Energy (1.4%) | |
| | 1,830 | | | Atwood Oceanics, Inc.d | | | 74,389 | |
| | 2,900 | | | Baker Hughes, Inc. | | | 153,584 | |
| | 1,115 | | | Bonanza Creek Energy, Inc.d | | | 50,443 | |
| | 28,127 | | | BP plc | | | 202,370 | |
| | 15,086 | | | BW Offshore, Ltd. | | | 18,522 | |
| | 29,550 | | | Cabot Oil & Gas Corporation | | | 919,005 | |
| | 30,225 | | | Cameron International Corporationd | | | 1,799,899 | |
| | 4,450 | | | Chesapeake Energy Corporation | | | 98,701 | |
| | 7,560 | | | Chevron Corporation | | | 906,822 | |
| | 850 | | | Cimarex Energy Company | | | 96,620 | |
| | 10,000 | | | Comstock Resources, Inc. | | | 118,400 | |
| | 685 | | | Concho Resources, Inc.d | | | 74,686 | |
| | 1,750 | | | ConocoPhillips | | | 126,262 | |
| | 5,300 | | | Denbury Resources, Inc. | | | 65,720 | |
| | 1,164 | | | Diamondback Energy, Inc.d | | | 79,664 | |
| | 650 | | | Energen Corporation | | | 44,005 | |
| | 1,000 | | | Eni SPA | | | 21,305 | |
| | 4,450 | | | Ensco plc | | | 180,625 | |
| | 20,378 | | | EOG Resources, Inc. | | | 1,936,929 | |
| | 11,288 | | | EQT Corporation | | | 1,061,524 | |
| | 4,600 | | | ERG SPA | | | 52,716 | |
| | 1,900 | | | Exterran Holdings, Inc. | | | 74,727 | |
| | 28,950 | | | Exxon Mobil Corporation | | | 2,799,754 | |
| | 3,650 | | | Green Plains, Inc. | | | 124,830 | |
| | 2,050 | | | Gulfmark Offshore, Inc. | | | 61,828 | |
| | 700 | | | Gulfport Energy Corporationd | | | 35,126 | |
| | 3,100 | | | Helix Energy Solutions Group, Inc.d | | | 82,584 | |
| | 1,250 | | | Helmerich & Payne, Inc. | | | 108,525 | |
| | 1,950 | | | Hess Corporation | | | 165,379 | |
| | 2,035 | | | HollyFrontier Corporation | | | 92,348 | |
| | 22,218 | | | Kodiak Oil & Gas Corporationd | | | 239,732 | |
| | 8,550 | | | Kosmos Energy, Ltd.d | | | 79,772 | |
| | 64,935 | | | Marathon Oil Corporation | | | 2,298,699 | |
| | 13,920 | | | Market Vectors Oil Service ETF | | | 629,184 | |
| | 30,550 | | | Nabors Industries, Ltd. | | | 545,317 | |
| | 1,100 | | | National Oilwell Varco, Inc. | | | 79,904 | |
| | 3,400 | | | Neste Oil Oyj | | | 73,497 | |
| | 1,750 | | | Newfield Exploration Companyd | | | 57,068 | |
| | 2,070 | | | Noble Corporation | | | 43,304 | |
| | 1,410 | | | Noble Energy, Inc. | | | 81,258 | |
| | 25,269 | | | Oasis Petroleum, Inc.d | | | 757,059 | |
| | 1,325 | | | Oceaneering International, Inc. | | | 93,108 | |
| | 1,215 | | | Oil States International, Inc.d | | | 72,584 | |
| | 14,900 | | | Patterson-UTI Energy, Inc. | | | 343,147 | |
| | 1,048 | | | PDC Energy, Inc.d | | | 45,819 | |
| | 20,646 | | | Penn Virginia Corporationd | | | 176,936 | |
| | 390 | | | Pioneer Natural Resources Company | | | 73,733 | |
| | 2,450 | | | QEP Resources, Inc. | | | 61,422 | |
| | 24,820 | | | Rex Energy Corporationd | | | 194,589 | |
The accompanying Notes to Financial Statements are an integral part of this schedule.
90
MODERATE ALLOCATION FUND
Schedule of Investments as of October 31, 2014
| | | | | | | | |
| Shares | | | Common Stock (18.1%) | | Value | |
| Energy (1.4%) - continued | |
| | 6,830 | | | Rosetta Resources, Inc.d | | | $259,745 | |
| | 1,935 | | | Rowan Companies plc | | | 46,962 | |
| | 7,454 | | | Royal Dutch Shell plc | | | 266,558 | |
| | 5,100 | | | Royal Dutch Shell plc, Class B | | | 188,421 | |
| | 21,640 | | | Schlumberger, Ltd. | | | 2,135,002 | |
| | 4,900 | | | Seadrill, Ltd. | | | 112,700 | |
| | 3,700 | | | SemGroup Corporation | | | 283,975 | |
| | 6,000 | | | Showa Shell Sekiyu KK | | | 51,482 | |
| | 1,060 | | | SM Energy Company | | | 59,678 | |
| | 19,250 | | | Southwestern Energy Companyd | | | 625,818 | |
| | 861 | | | Statoil ASA | | | 19,704 | |
| | 9,490 | | | Superior Energy Services, Inc. | | | 238,674 | |
| | 1,100 | | | Total SA | | | 65,674 | |
| | 25,700 | | | Total SA ADR | | | 1,539,173 | |
| | 28,567 | | | Trinidad Drilling, Ltd. | | | 186,045 | |
| | 73,850 | | | Weatherford International, Ltd.d | | | 1,212,617 | |
| | 3,650 | | | Whiting Petroleum Corporationd | | | 223,526 | |
| | 3,900 | | | Woodside Petroleum, Ltd. | | | 138,530 | |
| | 3,950 | | | WPX Energy, Inc.d | | | 75,524 | |
| | | | | |
| | | | Total | | | 25,303,232 | |
| | | | | |
|
| Financials (3.7%) | |
| | 6,250 | | | ACE, Ltd. | | | 683,125 | |
| | 3,171 | | | Affiliated Managers Group, Inc.d | | | 633,534 | |
| | 1,500 | | | Allianz SE | | | 238,533 | |
| | 9,780 | | | Allied World Assurance Company Holdings AG | | | 371,640 | |
| | 11,420 | | | Allstate Corporatione | | | 740,587 | |
| | 5,820 | | | American Assets Trust, Inc. | | | 223,139 | |
| | 5,100 | | | American Express Company | | | 458,745 | |
| | 2,650 | | | American Financial Group, Inc. | | | 158,549 | |
| | 15,500 | | | American International Group, Inc. | | | 830,335 | |
| | 2,240 | | | Amlin plc | | | 16,349 | |
| | 9,150 | | | AmTrust Financial Services, Inc. | | | 410,561 | |
| | 4,595 | | | Argo Group International Holdings, Ltd. | | | 256,401 | |
| | 5,800 | | | Assicurazioni Generali SPA | | | 119,018 | |
| | 2,350 | | | Assurant, Inc. | | | 160,317 | |
| | 12,240 | | | Assured Guaranty, Ltd. | | | 282,499 | |
| | 1,000 | | | AXA SA | | | 23,099 | |
| | 10,200 | | | Banco Santander SA | | | 90,122 | |
| | 4,900 | | | Bank Leumi Le-Israel BMd | | | 17,511 | |
| | 138,590 | | | Bank of America Corporation | | | 2,378,204 | |
| | 11,078 | | | Bank of the Ozarks, Inc. | | | 390,389 | |
| | 3,500 | | | Banner Corporation | | | 151,270 | |
| | 19,320 | | | BBCN Bancorp, Inc. | | | 273,185 | |
| | 17,300 | | | Berkshire Hathaway, Inc.d | | | 2,424,768 | |
| | 19,500 | | | Blackstone Group, LP | | | 587,340 | |
| | 200 | | | Bolsas y Mercados Espanoles SA | | | 7,609 | |
| | 6,450 | | | Boston Private Financial Holdings, Inc. | | | 84,817 | |
| | 5,250 | | | Camden Property Trust | | | 402,517 | |
| | 13,900 | | | Capital One Financial Corporation | | | 1,150,503 | |
| | 7,700 | | | Catlin Group, Ltd. | | | 66,149 | |
| | 2,650 | | | CBRE Group, Inc.d | | | 84,800 | |
| | 7,900 | | | Challenger, Ltd. | | | 48,590 | |
| | 8,586 | | | Chesapeake Lodging Trust | | | 283,681 | |
| | 12,000 | | | Cheung Kong Holdings, Ltd. | | | 213,027 | |
| | 55,550 | | | Citigroup, Inc. | | | 2,973,591 | |
| | 2,431 | | | CNA Financial Corporation | | | 95,003 | |
| | 41,710 | | | CNO Financial Group, Inc. | | | 756,202 | |
| | 1,900 | | | CNP Assurances | | | 35,521 | |
| | 22,250 | | | Comerica, Inc. | | | 1,062,215 | |
| | 2,300 | | | Commonwealth Bank of Australia | | | 163,552 | |
| | 4,650 | | | Corporate Office Properties Trust | | | 127,131 | |
| | 4,889 | | | Credit Agricole SA | | | 72,349 | |
| | 5,700 | | | Crown Castle International Corporation | | | 445,284 | |
| | 900 | | | Daito Trust Construction Company, Ltd. | | | 112,141 | |
| | 20,000 | | | Daiwa Securities Group, Inc. | | | 158,059 | |
| | 4,550 | | | DDR Corporation | | | 82,537 | |
| | 511 | | | Delta Lloyd NV | | | 11,647 | |
| | 14,566 | | | Deutsche Bank AG | | | 456,207 | |
| | 6,050 | | | Digital Realty Trust, Inc. | | | 417,390 | |
| | 10,500 | | | Direct Line Insurance Group plc | | | 46,448 | |
| | 6,850 | | | Discover Financial Services | | | 436,893 | |
| | 19,600 | | | Duke Realty Corporation | | | 371,616 | |
| | 18,410 | | | Education Realty Trust, Inc. | | | 207,297 | |
| | 2,800 | | | Equity Lifestyle Properties, Inc. | | | 137,480 | |
| | 13,369 | | | Essent Group, Ltd.d | | | 325,401 | |
| | 6,054 | | | Evercore Partners, Inc. | | | 313,416 | |
| | 3,530 | | | Extra Space Storage, Inc. | | | 205,305 | |
| | 6,150 | | | FBR & Companyd | | | 148,461 | |
| | 15,550 | | | First Horizon National Corporation | | | 199,973 | |
| | 34,350 | | | First Niagara Financial Group, Inc. | | | 257,282 | |
| | 12,150 | | | First Republic Bank | | | 618,800 | |
| | 6,100 | | | FlexiGroup, Ltd. | | | 19,265 | |
| | 77 | | | Friends Life Group, Ltd. | | | 399 | |
| | 13,000 | | | Fukuoka Financial Group, Inc. | | | 66,522 | |
| | 21,100 | | | Fulton Financial Corporation | | | 250,668 | |
| | 600 | | | GAM Holding AGd | | | 10,247 | |
| | 9,335 | | | Gaming and Leisure Properties, Inc. | | | 291,719 | |
| | 3,400 | | | General Growth Properties, Inc. | | | 88,094 | |
| | 14,900 | | | Government Properties Income Trust | | | 340,018 | |
| | 6,250 | | | Green Dot Corporationd | | | 149,375 | |
| | 33,642 | | | Hanmi Financial Corporation | | | 721,621 | |
| | 200 | | | Hannover Rueckversicherung SE | | | 16,693 | |
| | 2,400 | | | Hanover Insurance Group, Inc. | | | 160,656 | |
| | 14,531 | | | HCC Insurance Holdings, Inc. | | | 758,373 | |
| | 1,553 | | | Hiscox, Ltd. | | | 16,938 | |
| | 23,857 | | | Host Hotels & Resorts, Inc. | | | 556,107 | |
| | 143,850 | | | Huntington Bancshares, Inc. | | | 1,425,553 | |
| | 2,900 | | | Intercontinental Exchange, Inc. | | | 604,041 | |
| | 10,228 | | | Intermediate Capital Group plc | | | 67,235 | |
| | 22,591 | | | Intesa Sanpaolo SPA | | | 57,760 | |
| | 37,840 | | | Invesco, Ltd. | | | 1,531,385 | |
| | 12,400 | | | Investec plc | | | 113,701 | |
| | 22,000 | | | iShares Barclays 1-3 Year Credit Bond Fund | | | 2,320,340 | |
| | 12,800 | | | iShares iBoxx $ High Yield Corporate Bond ETF | | | 1,184,384 | |
| | 5,800 | | | iShares iBoxx $ Investment Grade Corporate Bond ETF | | | 692,172 | |
| | 19,900 | | | iShares Intermediate Credit Bond ETF | | | 2,187,209 | |
| | 8,639 | | | iShares Russell 2000 Growth Index Fund | | | 1,188,986 | |
| | 10,040 | | | iShares Russell 2000 Index Fund | | | 1,170,262 | |
| | 14,976 | | | J.P. Morgan Chase & Company | | | 905,748 | |
| | 12,701 | | | Kennedy-Wilson Holdings, Inc. | | | 344,070 | |
| | 31,350 | | | KeyCorp | | | 413,820 | |
| | 11,891 | | | Lazard, Ltd. | | | 585,156 | |
| | 7,000 | | | Link REIT | | | 41,164 | |
| | 3,850 | | | M&T Bank Corporation | | | 470,393 | |
| | 23,700 | | | Man Group plc | | | 46,992 | |
| | 10,600 | | | MBIA, Inc.d | | | 103,456 | |
| | 33,020 | | | MetLife, Inc. | | | 1,791,005 | |
| | 1,500 | | | Mid-America Apartment Communities, Inc. | | | 105,990 | |
| | 14,500 | | | Mizuho Financial Group, Inc. | | | 26,424 | |
| | 48,000 | | | Morgan Stanley | | | 1,677,600 | |
The accompanying Notes to Financial Statements are an integral part of this schedule.
91
MODERATE ALLOCATION FUND
Schedule of Investments as of October 31, 2014
| | | | | | | | |
| Shares | | | Common Stock (18.1%) | | Value | |
| Financials (3.7%) - continued | |
| | 600 | | | Muenchener Rueckversicherungs- Gesellschaft AG | | | $118,133 | |
| | 15,800 | | | NASDAQ OMXGroup, Inc. | | | 683,508 | |
| | 500 | | | National Australia Bank, Ltd. | | | 15,468 | |
| | 4,100 | | | Natixis | | | 28,222 | |
| | 8,600 | | | Northern Trust Corporation | | | 570,180 | |
| | 5,400 | | | Old Mutual plc | | | 16,770 | |
| | 5,099 | | | Oversea-Chinese Banking Corporation, Ltd. | | | 39,278 | |
| | 17,489 | | | PacWest Bancorp | | | 746,081 | |
| | 9,650 | | | Parkway Properties, Inc. | | | 193,483 | |
| | 11,380 | | | Pebblebrook Hotel Trust | | | 484,788 | |
| | 4,700 | | | Phoenix Group Holdings | | | 56,749 | |
| | 13,000 | | | Popular, Inc.d | | | 414,440 | |
| | 3,469 | | | ProShares Ultra S&P 500 | | | 426,132 | |
| | 9,750 | | | Prudential Financial, Inc. | | | 863,265 | |
| | 3,600 | | | RLJ Lodging Trust | | | 115,992 | |
| | 600 | | | Sampo Oyj | | | 28,750 | |
| | 500 | | | SCOR SE | | | 15,321 | |
| | 1,000 | | | Sovran Self Storage, Inc. | | | 85,090 | |
| | 40,700 | | | SPDR Euro Stoxx 50 ETF | | | 1,557,589 | |
| | 31,606 | | | SPDR S&P 500 ETF Trust | | | 6,373,666 | |
| | 1,400 | | | Standard Chartered plc | | | 21,074 | |
| | 1,000 | | | Sun Hung Kai Properties, Ltd. | | | 14,921 | |
| | 5,800 | | | Sunstone Hotel Investors, Inc. | | | 88,798 | |
| | 6,130 | | | SVB Financial Groupd | | | 686,499 | |
| | 300 | | | Swiss Re AG | | | 24,258 | |
| | 26,840 | | | Synovus Financial Corporation | | | 680,662 | |
| | 17,064 | | | Terreno Realty Corporation | | | 359,368 | |
| | 3,340 | | | Texas Capital Bancshares, Inc.d | | | 204,241 | |
| | 4,300 | | | UnipolSai Assicurazioni SPA | | | 11,562 | |
| | 7,200 | | | United Community Banks, Inc. | | | 129,816 | |
| | 7,204 | | | United Overseas Bank, Ltd. | | | 129,065 | |
| | 3,450 | | | Unum Group | | | 115,437 | |
| | 5,400 | | | W.R. Berkley Corporation | | | 278,316 | |
| | 6,100 | | | Wells Fargo & Company | | | 323,849 | |
| | 25,443 | | | Western Alliance Bancorpd | | | 677,293 | |
| | 5,870 | | | Westpac Banking Corporation | | | 180,176 | |
| | 3,050 | | | Weyerhaeuser Company | | | 103,273 | |
| | 20,300 | | | Zions Bancorporation | | | 588,091 | |
| | 1,100 | | | Zurich Insurance Group AGd | | | 332,892 | |
| | | | | |
| | | | Total | | | 64,782,151 | |
| | | | | |
|
| Health Care (2.7%) | |
| | 1,650 | | | Abaxis, Inc. | | | 86,889 | |
| | 3,500 | | | Abbott Laboratories | | | 152,565 | |
| | 7,425 | | | Acadia Healthcare Company, Inc.d | | | 460,721 | |
| | 2,650 | | | Acceleron Pharma, Inc.d | | | 97,997 | |
| | 17,100 | | | Acorda Therapeutics, Inc.d | | | 595,422 | |
| | 5,550 | | | Actavis, Inc.d | | | 1,347,207 | |
| | 800 | | | Actelion, Ltd. | | | 95,276 | |
| | 16,800 | | | Aetna, Inc. | | | 1,386,168 | |
| | 25,600 | | | Affymetrix, Inc.d | | | 230,656 | |
| | 22,111 | | | Akorn, Inc.d | | | 985,045 | |
| | 1,750 | | | Alexion Pharmaceuticals, Inc.d | | | 334,880 | |
| | 9,924 | | | Align Technology, Inc.d | | | 522,201 | |
| | 32,850 | | | Allscripts Healthcare Solutions, Inc.d | | | 450,702 | |
| | 14,950 | | | Amgen, Inc. | | | 2,424,591 | |
| | 8,300 | | | AMN Healthcare Services, Inc.d | | | 142,345 | |
| | 2,200 | | | AmSurg Corporationd | | | 118,822 | |
| | 18,470 | | | Baxter International, Inc. | | | 1,295,486 | |
| | 950 | | | Biogen Idec, Inc.d | | | 305,026 | |
| | 18,310 | | | BioScrip, Inc.d | | | 118,283 | |
| | 86,350 | | | Boston Scientific Corporationd | | | 1,146,728 | |
| | 14,982 | | | Bruker Corporationd | | | 310,577 | |
| | 3,517 | | | C.R. Bard, Inc. | | | 576,682 | |
| | 25,100 | | | Cambrex Corporationd | | | 529,108 | |
| | 10,800 | | | Cardinal Health, Inc. | | | 847,584 | |
| | 8,616 | | | Cardiovascular Systems, Inc.d | | | 267,096 | |
| | 14,035 | | | Centene Corporationd | | | 1,300,623 | |
| | 29,050 | | | Cerner Corporationd | | | 1,840,027 | |
| | 2,250 | | | Charles River Laboratories International, Inc.d | | | 142,110 | |
| | 12,880 | | | Covidien plc | | | 1,190,627 | |
| | 800 | | | CSL, Ltd. | | | 56,483 | |
| | 4,361 | | | Cubist Pharmaceuticals, Inc.d | | | 315,257 | |
| | 6,809 | | | Cyberonics, Inc.d | | | 357,472 | |
| | 26,322 | | | Depomed, Inc.d | | | 405,359 | |
| | 5,350 | | | Endo International plcd | | | 358,022 | |
| | 35,232 | | | ExamWorks Group, Inc.d | | | 1,366,297 | |
| | 8,800 | | | Express Scripts Holding Companyd | | | 676,016 | |
| | 24,950 | | | Gilead Sciences, Inc.d | | | 2,794,400 | |
| | 6,224 | | | GlaxoSmithKline plc | | | 140,749 | |
| | 1,650 | | | Greatbatch, Inc.d | | | 82,813 | |
| | 1,400 | | | H. Lundbeck AS | | | 29,688 | |
| | 3,150 | | | HCA Holdings, Inc.d | | | 220,657 | |
| | 16,850 | | | Healthcare Services Group, Inc. | | | 501,793 | |
| | 1,800 | | | Hikma Pharmaceuticals plc | | | 54,595 | |
| | 23,550 | | | Hologic, Inc.d | | | 616,774 | |
| | 1,564 | | | ICON plcd | | | 82,282 | |
| | 4,800 | | | Illumina, Inc.d | | | 924,384 | |
| | 14,311 | | | Impax Laboratories, Inc.d | | | 414,590 | |
| | 23,689 | | | Ironwood Pharmaceuticals, Inc.d | | | 332,120 | |
| | 25,915 | | | Johnson & Johnson | | | 2,793,119 | |
| | 2,300 | | | KYORIN Holdings, Inc. | | | 48,456 | |
| | 4,320 | | | LifePoint Hospitals, Inc.d | | | 302,400 | |
| | 3,250 | | | Mallinckrodt, LLCd | | | 299,585 | |
| | 4,350 | | | McKesson Corporation | | | 884,833 | |
| | 39,240 | | | Merck & Company, Inc. | | | 2,273,566 | |
| | 28,207 | | | Neurocrine Biosciences, Inc.d | | | 522,394 | |
| | 2,800 | | | Novartis AG | | | 259,848 | |
| | 18,800 | | | Novavax, Inc.d | | | 105,280 | |
| | 6,344 | | | NPS Pharmaceuticals, Inc.d | | | 173,826 | |
| | 34,416 | | | NuVasive, Inc.d | | | 1,407,614 | |
| | 10,600 | | | PAREXEL International Corporationd | | | 575,686 | |
| | 43,400 | | | Pfizer, Inc. | | | 1,299,830 | |
| | 3,800 | | | PharMerica Corporationd | | | 109,022 | |
| | 2,150 | | | Providence Service Corporationd | | | 94,987 | |
| | 1,465 | | | Puma Biotechnology, Inc.d | | | 367,129 | |
| | 3,350 | | | Qiagen NVd | | | 78,591 | |
| | 2,300 | | | Quintiles Transnational Holdings, Inc.d | | | 134,642 | |
| | 11,550 | | | Spectrum Pharmaceuticals, Inc.d | | | 87,549 | |
| | 7,251 | | | Team Health Holdings, Inc.d | | | 453,478 | |
| | 10,976 | | | Teleflex, Inc. | | | 1,252,581 | |
| | 300 | | | Teva Pharmaceutical Industries, Ltd. | | | 16,934 | |
| | 800 | | | Thermo Fisher Scientific, Inc. | | | 94,056 | |
| | 23,631 | | | UnitedHealth Group, Inc.e | | | 2,245,181 | |
| | 5,500 | | | Universal Health Services, Inc. | | | 570,405 | |
| | 14,850 | | | Vertex Pharmaceuticals, Inc.d | | | 1,672,704 | |
| | 9,750 | | | Volcano Corporationd | | | 98,670 | |
| | 3,800 | | | Waters Corporationd | | | 421,040 | |
| | 5,050 | | | WellPoint, Inc. | | | 639,784 | |
| | | | | |
| | | | Total | | | 48,314,385 | |
| | | | | |
|
| Industrials (2.2%) | |
| | 2,100 | | | 3M Company | | | 322,917 | |
| | 3,000 | | | AAR Corporation | | | 79,500 | |
| | 1,200 | | | Actividades de Construccion y Servicios SA | | | 44,541 | |
| | 200 | | | Adecco SA | | | 13,556 | |
| | 20,400 | | | ADT Corporation | | | 731,136 | |
The accompanying Notes to Financial Statements are an integral part of this schedule.
92
MODERATE ALLOCATION FUND
Schedule of Investments as of October 31, 2014
| | | | | | | | |
| Shares | | | Common Stock (18.1%) | | Value | |
| Industrials (2.2%) - continued | |
| | 800 | | | Aica Kogyo Company, Ltd. | | | $16,559 | |
| | 12,225 | | | Air New Zealand, Ltd. | | | 19,353 | |
| | 8,610 | | | Apogee Enterprises, Inc. | | | 377,979 | |
| | 1,326 | | | Arcadis NV | | | 40,792 | |
| | 3,700 | | | Argan, Inc. | | | 128,797 | |
| | 400 | | | Atlas Copco AB | | | 10,595 | |
| | 4,000 | | | Berendsen plc | | | 64,772 | |
| | 13,350 | | | Boeing Companye | | | 1,667,548 | |
| | 5,600 | | | Bradken, Ltd. | | | 19,103 | |
| | 4,595 | | | Briggs & Stratton Corporation | | | 92,865 | |
| | 100 | | | Bucher Industries AG | | | 25,401 | |
| | 3,077 | | | Cardno, Ltd. | | | 15,111 | |
| | 2,200 | | | Carillion plc | | | 11,721 | |
| | 5,000 | | | Caterpillar, Inc. | | | 507,050 | |
| | 898 | | | Chart Industries, Inc.d | | | 41,802 | |
| | 12,100 | | | CLARCOR, Inc. | | | 810,216 | |
| | 4,300 | | | COMSYS Holdings Corporation | | | 76,766 | |
| | 39,000 | | | CSX Corporation | | | 1,389,570 | |
| | 1,100 | | | CTT-Correios de Portugal SA | | | 10,195 | |
| | 6,820 | | | Curtiss-Wright Corporation | | | 472,012 | |
| | 2,400 | | | Daifuku Company, Ltd. | | | 27,797 | |
| | 77,150 | | | Delta Air Lines, Inc. | | | 3,103,745 | |
| | 1,500 | | | Deutsche Lufthansa AG | | | 22,219 | |
| | 4,200 | | | Downer EDI, Ltd. | | | 17,736 | |
| | 300 | | | Duerr AG | | | 21,073 | |
| | 585 | | | Elbit Systems, Ltd. | | | 35,583 | |
| | 20,342 | | | EMCOR Group, Inc. | | | 897,692 | |
| | 4,810 | | | Esterline Technologies Corporationd | | | 563,299 | |
| | 10,400 | | | Federal Signal Corporation | | | 147,680 | |
| | 7,050 | | | Flowserve Corporation | | | 479,330 | |
| | 25,350 | | | Fluor Corporation | | | 1,681,719 | |
| | 6,880 | | | GATX Corporation | | | 436,192 | |
| | 3,900 | | | Generac Holdings, Inc.d | | | 176,826 | |
| | 500 | | | Go-Ahead Group plc | | | 19,686 | |
| | 18,407 | | | Granite Construction, Inc. | | | 679,402 | |
| | 6,809 | | | H&E Equipment Services, Inc. | | | 254,589 | |
| | 5,727 | | | Heico Corporation | | | 310,632 | |
| | 12,150 | | | Hertz Global Holdings, Inc.d | | | 266,328 | |
| | 1,300 | | | Hino Motors, Ltd. | | | 19,023 | |
| | 20,530 | | | HNI Corporation | | | 957,725 | |
| | 11,246 | | | Honeywell International, Inc. | | | 1,080,966 | |
| | 700 | | | Hoshizaki Electric Company, Ltd. | | | 33,906 | |
| | 4,900 | | | Huntington Ingalls Industries, Inc. | | | 518,518 | |
| | 3,772 | | | Huron Consulting Group, Inc.d | | | 262,569 | |
| | 300 | | | Implenia AG | | | 16,175 | |
| | 400 | | | Inaba Denki Sangyo Company, Ltd. | | | 13,943 | |
| | 20,700 | | | Ingersoll-Rand plc | | | 1,296,234 | |
| | 8,250 | | | Insperity, Inc. | | | 260,370 | |
| | 56,852 | | | Interface, Inc. | | | 911,338 | |
| | 2,600 | | | Intrum Justitia AB | | | 77,432 | |
| | 5,900 | | | ITOCHU Corporation | | | 71,322 | |
| | 11,040 | | | Jacobs Engineering Group, Inc.d | | | 523,848 | |
| | 402 | | | Jardine Matheson Holdings, Ltd. | | | 24,091 | |
| | 300 | | | Kanamoto Company, Ltd. | | | 10,950 | |
| | 12,800 | | | KAR Auction Services, Inc. | | | 388,608 | |
| | 3,089 | | | Kimball International, Inc. | | | 55,540 | |
| | 3,100 | | | KITZ Corporation | | | 14,206 | |
| | 3,400 | | | Komatsu, Ltd. | | | 80,272 | |
| | 37,420 | | | Korn/Ferry Internationald | | | 1,045,141 | |
| | 14,820 | | | Landstar System, Inc. | | | 1,096,828 | |
| | 1,000 | | | Legrand SA | | | 53,810 | |
| | 2,100 | | | Leighton Holdings, Ltd. | | | 40,885 | |
| | 4,350 | | | Manpower, Inc. | | | 290,363 | |
| | 9,079 | | | MasTec, Inc.d | | | 260,023 | |
| | 6,250 | | | Meritor, Inc.d | | | 71,812 | |
| | 4,953 | | | Middleby Corporationd | | | 438,341 | |
| | 78 | | | Mineral Resources, Ltd. | | | 585 | |
| | 5,900 | | | Mistras Group, Inc.d | | | 97,291 | |
| | 6,422 | | | Mitie Group plc | | | 30,984 | |
| | 2,000 | | | Nitto Kogyo Corporation | | | 34,966 | |
| | 1,700 | | | Old Dominion Freight Line, Inc.d | | | 123,879 | |
| | 14,344 | | | On Assignment, Inc.d | | | 417,410 | |
| | 15,666 | | | Oshkosh Corporation | | | 701,210 | |
| | 4,659 | | | Parker Hannifin Corporation | | | 591,833 | |
| | 9,360 | | | Pentair, Ltd. | | | 627,588 | |
| | 12,457 | | | PGT, Inc.d | | | 117,158 | |
| | 24,580 | | | Progressive Waste Solutions, Ltd. | | | 718,473 | |
| | 8,676 | | | Proto Labs, Inc.d | | | 567,150 | |
| | 7,300 | | | Quanta Services, Inc.d | | | 248,784 | |
| | 27,104 | | | Ritchie Brothers Auctioneers, Inc. | | | 661,067 | |
| | 9,390 | | | Saia, Inc.d | | | 460,298 | |
| | 1,500 | | | Securitas AB | | | 16,598 | |
| | 2,900 | | | Seven Group Holdings, Ltd. | | | 17,494 | |
| | 1,500 | | | Siemens AG | | | 169,190 | |
| | 69,500 | | | Southwest Airlines Company | | | 2,396,360 | |
| | 2,400 | | | Spirit Aerosystems Holdings, Inc.d | | | 94,416 | |
| | 12,763 | | | Spirit Airlines, Inc.d | | | 933,103 | |
| | 2,000 | | | Sumitomo Corporation | | | 21,339 | |
| | 12,374 | | | Swift Transportation Companyd | | | 305,638 | |
| | 900 | | | Takasago Thermal Engineering Company, Ltd. | | | 11,616 | |
| | 800 | | | Teleperformance SA | | | 50,412 | |
| | 7,580 | | | Tennant Company | | | 558,873 | |
| | 3,000 | | | Toppan Printing Company, Ltd. | | | 20,413 | |
| | 6,454 | | | Tutor Perini Corporationd | | | 180,777 | |
| | 16,700 | | | Union Pacific Corporation | | | 1,944,715 | |
| | 8,050 | | | United Continental Holdings, Inc.d | | | 425,121 | |
| | 1,800 | | | United Technologies Corporation | | | 192,600 | |
| | 3,850 | | | WABCO Holdings, Inc.d | | | 374,913 | |
| | 1,207 | | | WageWorks, Inc.d | | | 68,811 | |
| | 2,955 | | | Watsco, Inc. | | | 300,287 | |
| | 3,426 | | | Watts Water Technologies, Inc. | | | 207,718 | |
| | 1,313 | | | WS Atkins plc | | | 28,546 | |
| | | | | |
| | | | Total | | | 39,763,240 | |
| | | | | |
|
| Information Technology (3.8%) | |
| | 11,207 | | | A10 Networks, Inc.d | | | 49,311 | |
| | 14,450 | | | Akamai Technologies, Inc.d | | | 871,335 | |
| | 5,471 | | | Alibaba Group Holding, Ltd. ADRd | | | 539,441 | |
| | 3,800 | | | Alliance Data Systems Corporationd | | | 1,076,730 | |
| | 3,648 | | | Ambarella, Inc.d | | | 161,570 | |
| | 8,300 | | | Amdocs, Ltd. | | | 394,582 | |
| | 77,214 | | | Apple, Inc. | | | 8,339,112 | |
| | 40,326 | | | Applied Materials, Inc. | | | 890,801 | |
| | 37,135 | | | Applied Micro Circuits Corporationd | | | 240,263 | |
| | 5,808 | | | Applied Optoelectronics, Inc.d | | | 93,741 | |
| | 5,750 | | | Arris Group, Inc.d | | | 172,615 | |
| | 20,114 | | | Aspen Technology, Inc.d | | | 742,810 | |
| | 100,260 | | | Atmel Corporationd | | | 743,929 | |
| | 4,700 | | | AVG Technologies NVd | | | 84,224 | |
| | 3,776 | | | Belden, Inc. | | | 268,813 | |
| | 3,750 | | | Booz Allen Hamilton Holding Corporation | | | 98,813 | |
| | 24,300 | | | Broadcom Corporation | | | 1,017,684 | |
| | 19,550 | | | Broadridge Financial Solutions, Inc. | | | 858,832 | |
| | 41,550 | | | Brocade Communications Systems, Inc. | | | 445,831 | |
| | 600 | | | Brother Industries, Ltd. | | | 10,683 | |
| | 2,243 | | | CalAmp Corporationd | | | 43,245 | |
| | 200 | | | Cap Gemini SA | | | 13,159 | |
| | 8,776 | | | Cardtronics, Inc.d | | | 336,911 | |
| | 5,370 | | | Cavium, Inc.d | | | 275,535 | |
The accompanying Notes to Financial Statements are an integral part of this schedule.
93
MODERATE ALLOCATION FUND
Schedule of Investments as of October 31, 2014
| | | | | | | | |
| Shares | | | Common Stock (18.1%) | | Value | |
| Information Technology (3.8%) - continued | | | | |
| | 8,050 | | | CDW Corporation | | | $248,262 | |
| | 9,041 | | | ChannelAdvisor Corporationd | | | 125,579 | |
| | 1,950 | | | Check Point Software Technologies, Ltd.d | | | 144,788 | |
| | 4,350 | | | Cirrus Logic, Inc.d | | | 83,955 | |
| | 104,140 | | | Cisco Systems, Inc. | | | 2,548,306 | |
| | 6,100 | | | Citrix Systems, Inc.d | | | 391,803 | |
| | 6,411 | | | Cognex Corporationd | | | 253,619 | |
| | 3,325 | | | Coherent, Inc.d | | | 216,624 | |
| | 9,450 | | | Computer Sciences Corporation | | | 570,780 | |
| | 8,513 | | | Constant Contact, Inc.d | | | 301,020 | |
| | 10,216 | | | Cornerstone OnDemand, Inc.d | | | 370,534 | |
| | 62,050 | | | Corning, Inc. | | | 1,267,681 | |
| | 6,003 | | | Dealertrack Technologies, Inc.d | | | 282,441 | |
| | 6,998 | | | Demandware, Inc.d | | | 419,530 | |
| | 1,000 | | | Dialog Semiconductor plcd | | | 34,532 | |
| | 8,100 | | | Digital River, Inc.d | | | 207,117 | |
| | 4,550 | | | Diodes, Inc.d | | | 117,527 | |
| | 16,575 | | | DST Systems, Inc. | | | 1,597,001 | |
| | 36,699 | | | eBay, Inc.d | | | 1,926,697 | |
| | 1,800 | | | Econocom Group | | | 11,628 | |
| | 10,300 | | | Electronic Arts, Inc.d | | | 421,991 | |
| | 4,262 | | | Electronics for Imaging, Inc.d | | | 194,859 | |
| | 120,750 | | | EMC Corporation | | | 3,469,147 | |
| | 26,050 | | | Facebook, Inc.d | | | 1,953,490 | |
| | 12,800 | | | Fairchild Semiconductor International, Inc.d | | | 196,480 | |
| | 5,500 | | | FEI Company | | | 463,540 | |
| | 5,200 | | | FUJIFILM Holdings NPV | | | 174,557 | |
| | 2,564 | | | Google, Inc.d | | | 1,433,481 | |
| | 2,834 | | | Google, Inc., Class Ad | | | 1,609,344 | |
| | 22,734 | | | Guidewire Software, Inc.d | | | 1,135,336 | |
| | 4,000 | | | Hitachi Kokusai Electric, Inc. | | | 59,916 | |
| | 700 | | | Hitachi Maxell, Ltd. | | | 10,563 | |
| | 2,100 | | | Hoya Corporation | | | 74,312 | |
| | 2,300 | | | iGATE Corporationd | | | 85,215 | |
| | 2,200 | | | International Business Machines Corporation | | | 361,680 | |
| | 30,964 | | | Juniper Networks, Inc. | | | 652,411 | |
| | 11,008 | | | Lexmark International, Inc. | | | 475,105 | |
| | 4,300 | | | LinkedIn Corporationd | | | 984,528 | |
| | 5,800 | | | Liquidity Services, Inc.d | | | 74,124 | |
| | 4,483 | | | Manhattan Associates, Inc.d | | | 179,813 | |
| | 25,350 | | | Marvell Technology Group, Ltd. | | | 340,704 | |
| | 14,100 | | | MasterCard, Inc. | | | 1,180,875 | |
| | 29,100 | | | MaxLinear, Inc.d | | | 206,319 | |
| | 3,605 | | | Methode Electronics, Inc. | | | 141,965 | |
| | 23,620 | | | Microsoft Corporatione | | | 1,108,959 | |
| | 5,902 | | | Monolithic Power Systems, Inc. | | | 260,809 | |
| | 700 | | | NEC Networks & System Integration Corporation | | | 15,209 | |
| | 74,390 | | | NetApp, Inc. | | | 3,183,892 | |
| | 49,406 | | | NVIDIA Corporation | | | 965,393 | |
| | 1,250 | | | NXP Semiconductors NVd | | | 85,825 | |
| | 18,000 | | | Oki Electric Industry Company, Ltd. | | | 41,822 | |
| | 2,600 | | | Optimal Payments plcd | | | 18,463 | |
| | 37,700 | | | Oracle Corporation | | | 1,472,185 | |
| | 700 | | | Orbotech, Ltd.d | | | 11,228 | |
| | 300 | | | Otsuka Corporation | | | 11,155 | |
| | 11,142 | | | Pace plc | | | 61,943 | |
| | 14,474 | | | Plantronics, Inc. | | | 750,766 | |
| | 6,800 | | | Polycom, Inc.d | | | 88,944 | |
| | 16,335 | | | Proofpoint, Inc.d | | | 719,393 | |
| | 33,300 | | | QUALCOMM, Inc. | | | 2,614,383 | |
| | 9,500 | | | Red Hat, Inc.d | | | 559,740 | |
| | 400 | | | Rohm Company, Ltd. | | | 24,348 | |
| | 24,400 | | | Salesforce.com, Inc.d | | | 1,561,356 | |
| | 8,700 | | | Sanmina Corporationd | | | 218,109 | |
| | 600 | | | Seiko Epson Corporation | | | 27,843 | |
| | 36,660 | | | Sonus Networks, Inc.d | | | 127,210 | |
| | 802 | | | SPS Commerce, Inc.d | | | 46,757 | |
| | 3,224 | | | SunPower Corporationd | | | 102,652 | |
| | 10,800 | | | Symantec Corporation | | | 268,056 | |
| | 1,950 | | | Synaptics, Inc.d | | | 133,439 | |
| | 4,350 | | | Take-Two Interactive Software, Inc.d | | | 115,058 | |
| | 1,550 | | | TE Connectivity, Ltd. | | | 94,752 | |
| | 11,500 | | | Telefonaktiebolaget LM Ericsson | | | 135,889 | |
| | 21,600 | | | Teradata Corporationd | | | 914,112 | |
| | 24,255 | | | Teradyne, Inc. | | | 446,292 | |
| | 21,680 | | | Texas Instruments, Inc. | | | 1,076,629 | |
| | 12,290 | | | Textura Corporationd | | | 327,406 | |
| | 1,227 | | | Tyler Technologies, Inc.d | | | 137,326 | |
| | 17,160 | | | Ubiquiti Networks, Inc. | | | 613,813 | |
| | 2,398 | | | Ultimate Software Group, Inc.d | | | 360,923 | |
| | 900 | | | ULVAC, Inc.d | | | 11,207 | |
| | 3,700 | | | Unisys Corporationd | | | 94,868 | |
| | 27,702 | | | Virtusa Corporationd | | | 1,135,228 | |
| | 5,050 | | | Visa, Inc. | | | 1,219,222 | |
| | 13,050 | | | VMware, Inc.d | | | 1,090,589 | |
| | 700 | | | Wincor Nixdorf AG | | | 32,193 | |
| | 2,450 | | | Workday, Inc.d | | | 233,926 | |
| | 52,450 | | | Xerox Corporation | | | 696,536 | |
| | | | | |
| | | | Total | | | 67,984,997 | |
| | | | | |
| |
| Materials (0.6%) | | | | |
| | 400 | | | APERAMd | | | 11,509 | |
| | 9,780 | | | Celanese Corporation | | | 574,379 | |
| | 14,467 | | | Centamin plc | | | 11,849 | |
| | 10,259 | | | Chemtura Corporationd | | | 238,932 | |
| | 1,800 | | | Clearwater Paper Corporationd | | | 115,830 | |
| | 1,150 | | | Compass Minerals International, Inc. | | | 98,532 | |
| | 3,700 | | | Crown Holdings, Inc.d | | | 177,341 | |
| | 14,760 | | | Dow Chemical Companye | | | 729,144 | |
| | 6,570 | | | Eagle Materials, Inc. | | | 574,415 | |
| | 3,900 | | | Eastman Chemical Company | | | 315,042 | |
| | 8,300 | | | Ferro Corporationd | | | 108,896 | |
| | 41,831 | | | Graphic Packaging Holding Companyd | | | 507,410 | |
| | 2,000 | | | Hitachi Metals, Ltd. | | | 33,766 | |
| | 500 | | | Holmen AB | | | 16,549 | |
| | 24,380 | | | Horsehead Holding Corporationd | | | 383,010 | |
| | 2,150 | | | Innophos Holdings, Inc. | | | 122,550 | |
| | 3,840 | | | KapStone Paper and Packaging Corporationd | | | 118,118 | |
| | 3,000 | | | Kureha Corporation | | | 14,879 | |
| | 1,150 | | | LyondellBasell Industries NV | | | 105,374 | |
| | 800 | | | Maruichi Steel Tube, Ltd. | | | 18,892 | |
| | 15,280 | | | Materials Select Sector SPDR Fund | | | 739,552 | |
| | 1,400 | | | Nihon Nohyaku Company, Ltd. | | | 14,249 | |
| | 12,300 | | | Nippon Light Metal Holdings Company, Ltd. | | | 18,166 | |
| | 10,980 | | | Nucor Corporation | | | 593,579 | |
| | 9,000 | | | Oji Holdings Corporation | | | 32,540 | |
| | 1,800 | | | Orica, Ltd. | | | 32,858 | |
| | 12,450 | | | Owens-Illinois, Inc.d | | | 320,836 | |
| | 5,650 | | | Packaging Corporation of America | | | 407,252 | |
| | 5,100 | | | Petra Diamonds, Ltd.d | | | 13,543 | |
| | 9,769 | | | PolyOne Corporation | | | 361,551 | |
| | 7,700 | | | Royal Gold, Inc. | | | 440,055 | |
| | 21,166 | | | Senomyx, Inc.d | | | 167,635 | |
| | 8,718 | | | Silgan Holdings, Inc. | | | 428,577 | |
| | 2,000 | | | Sonoco Products Company | | | 81,740 | |
The accompanying Notes to Financial Statements are an integral part of this schedule.
94
MODERATE ALLOCATION FUND
Schedule of Investments as of October 31, 2014
| | | | | | | | |
| Shares | | | Common Stock (18.1%) | | Value | |
| Materials (0.6%) - continued | | | | |
| | 13,750 | | | Southern Copper Corporation | | | $395,725 | |
| | 28,959 | | | Steel Dynamics, Inc. | | | 666,347 | |
| | 2,400 | | | Stora Enso OYJ | | | 19,819 | |
| | 4,000 | | | Sumitomo Metal Mining Company, Ltd. | | | 55,490 | |
| | 1,000 | | | Sumitomo Seika Chemicals Company, Ltd. | | | 6,135 | |
| | 4,000 | | | Toagosei Company, Ltd. | | | 17,482 | |
| | 14,000 | | | Tosoh Corporation | | | 60,880 | |
| | 3,000 | | | Tronox, Ltd. | | | 72,540 | |
| | 9,446 | | | U.S. Silica Holdings, Inc. | | | 424,125 | |
| | 3,200 | | | UPM-Kymmene Oyj | | | 50,760 | |
| | 1,900 | | | Westlake Chemical Corporation | | | 134,045 | |
| | 2,000 | | | Worthington Industries, Inc. | | | 77,300 | |
| | | | | |
| | | | Total | | | 9,909,198 | |
| | | | | |
| |
| Telecommunications Services (0.2%) | | | | |
| | 19,500 | | | AT&T, Inc. | | | 679,380 | |
| | 46,400 | | | Bezeq Israel Telecommunication Corporation, Ltd. | | | 79,303 | |
| | 9,174 | | | BT Group plc | | | 54,083 | |
| | 10,217 | | | Cogent Communications Holdings | | | 346,765 | |
| | 2,900 | | | Elisa Oyj | | | 79,664 | |
| | 2,300 | | | Freenet AG | | | 60,347 | |
| | 2,000 | | | iiNet, Ltd. | | | 14,114 | |
| | 3,800 | | | Nippon Telegraph & Telephone Corporation | | | 236,432 | |
| | 7,000 | | | Singapore Telecommunications, Ltd. | | | 20,603 | |
| | 49,500 | | | Telecom Italia SPAd | | | 56,097 | |
| | 7,400 | | | Telstra Corporation, Ltd. | | | 36,824 | |
| | 24,012 | | | Verizon Communications, Inc. | | | 1,206,603 | |
| | 23,000 | | | Vonage Holdings Corporationd | | | 80,040 | |
| | | | | |
| | | | Total | | | 2,950,255 | |
| | | | | |
| |
| Utilities (0.4%) | | | | |
| | 77,100 | | | A2A SPA | | | 77,310 | |
| | 3,350 | | | Atmos Energy Corporation | | | 177,550 | |
| | 1,800 | | | E.ON SE | | | 31,032 | |
| | 8,200 | | | Edison International, Inc. | | | 513,156 | |
| | 28,100 | | | Electricidade de Portugal SA | | | 120,924 | |
| | 1,100 | | | Electricite de France | | | 32,481 | |
| | 1,000 | | | Endesa SA | | | 19,508 | |
| | 23,100 | | | Enel SPA | | | 118,039 | |
| | 3,400 | | | Fortum Oyj | | | 78,852 | |
| | 8,600 | | | IREN SPA | | | 10,399 | |
| | 3,850 | | | Laclede Group, Inc. | | | 195,465 | |
| | 15,450 | | | NiSource, Inc. | | | 649,827 | |
| | 17,630 | | | NorthWestern Corporation | | | 931,569 | |
| | 31,910 | | | PG&E Corporation | | | 1,605,711 | |
| | 5,430 | | | Portland General Electric Company | | | 197,706 | |
| | 11,200 | | | Public Service Enterprise Group, Inc. | | | 462,672 | |
| | 200 | | | Red Electrica Corporacion SA | | | 17,476 | |
| | 3,600 | | | Redes Energeticas Nacionais SGPS SA | | | 11,159 | |
| | 5,350 | | | Southern Company | | | 248,026 | |
| | 9,000 | | | United Utilities Group plc | | | 123,374 | |
| | 2,900 | | | Vectren Corporation | | | 130,355 | |
| | 8,200 | | | Wisconsin Energy Corporation | | | 407,212 | |
| | | | | |
| | | | Total | | | 6,159,803 | |
| | | | | |
| | | | | | | | |
| | | | | |
| | | | Total Common Stock (cost $264,281,856) | | | 319,985,828 | |
| | | | | |
| | |
Principal
Amount | | | Long-Term Fixed Income (17.7%) | | Value | |
| Asset-Backed Securities (1.0%) | | | | |
| | | | Access Group, Inc. | | | | |
| | $196,897 | | | 0.655%, 2/25/2036f,g | | | 195,875 | |
| | | | Ally Auto Receivables Trust 2013-SN1 | | | | |
| | 230,269 | | | 0.720%, 5/20/2016 | | | 230,389 | |
| | | | BA Credit Card Trust | | | | |
| | 300,000 | | | 0.532%, 6/15/2021g | | | 299,757 | |
| | | | Barclays Dryrock Issuance Trust | | | | |
| | 700,000 | | | 0.513%, 12/16/2019g | | | 700,648 | |
| | | | Capital One Multi-Asset Execution Trust | | | | |
| | 400,000 | | | 0.533%, 1/18/2022g | | | 399,363 | |
| | | | Chase Issuance Trust | | | | |
| | 425,000 | | | 1.150%, 1/15/2019 | | | 426,221 | |
| | | | Chesapeake Funding, LLC | | | | |
| | 440,356 | | | 0.603%, 1/7/2025f,g | | | 439,804 | |
| | | | Citibank Credit Card Issuance Trust | | | | |
| | 700,000 | | | 1.020%, 2/22/2019 | | | 699,050 | |
| | | | Countrywide Asset-Backed Certificates | | | | |
| | 487,581 | | | 5.530%, 4/25/2047 | | | 475,624 | |
| | | | Edlinc Student Loan Funding Trust | | | | |
| | 66,039 | | | 3.160%, 10/1/2025*,g | | | 66,864 | |
| | | | Enterprise Fleet Financing, LLC | | | | |
| | 575,894 | | | 1.060%, 3/20/2019f | | | 577,789 | |
| | 500,000 | | | 0.870%, 9/20/2019f | | | 500,380 | |
| | | | FirstEnergy Ohio PIRB Special Purpose Trust | | | | |
| | 142,562 | | | 0.679%, 1/15/2019 | | | 142,665 | |
| | | | FNA Trust | | | | |
| | 83,346 | | | 1.980%, 1/10/2018* | | | 83,555 | |
| | | | Ford Credit Auto Owner Trust | | | | |
| | 225,000 | | | 2.260%, 11/15/2025f | | | 226,182 | |
| | | | GE Equipment Transportation, LLC | | | | |
| | 250,000 | | | 0.690%, 11/25/2016 | | | 250,353 | |
| | | | Golden Credit Card Trust | | | | |
| | 90,000 | | | 0.403%, 2/15/2018f,g | | | 89,965 | |
| | 100,000 | | | 0.583%, 9/15/2018f,g | | | 100,246 | |
| | | | GoldenTree Loan Opportunities IX, Ltd. | | | | |
| | 200,000 | | | 1.829%, 10/29/2026*,c,g | | | 198,835 | |
| | | | GreatAmerica Leasing Receivables | | | | |
| | 600,000 | | | 0.610%, 5/15/2016f | | | 600,119 | |
| | | | Hertz Fleet Lease Funding, LP | | | | |
| | 600,000 | | | 0.702%, 12/10/2027f,g | | | 600,926 | |
| | | | Hyundai Floorplan Master Owner Trust | | | | |
| | 337,500 | | | 0.503%, 5/15/2018f,g | | | 337,989 | |
| | | | Master Credit Card Trust | | | | |
| | 203,500 | | | 0.780%, 4/21/2017f | | | 203,665 | |
| | | | Morgan Stanley Capital, Inc. | | | | |
| | 1,029,860 | | | 0.302%, 2/25/2037g | | | 655,290 | |
| | | | Motor plc | | | | |
| | 170,000 | | | 0.652%, 2/15/2021f | | | 170,123 | |
| | 366,067 | | | 0.632%, 8/25/2021f,g | | | 366,479 | |
| | | | Ohio Phase-ln-Recovery Funding, LLC | | | | |
| | 788,135 | | | 0.958%, 7/2/2018 | | | 790,290 | |
| | | | OZLM VIII, Ltd. | | | | |
| | 210,000 | | | 1.715%, 10/17/2026*,g | | | 207,751 | |
| | | | Penarth Master Issuer plc | | | | |
| | 620,000 | | | 0.547%, 11/18/2017f,g | | | 620,195 | |
The accompanying Notes to Financial Statements are an integral part of this schedule.
95
MODERATE ALLOCATION FUND
Schedule of Investments as of October 31, 2014
| | | | | | | | |
Principal Amount | | | Long-Term Fixed Income (17.7%) | | Value | |
| Asset-Backed Securities (1.0%) - continued | | | | |
| | | | Renaissance Home Equity Loan Trust | | | | |
| | $2,280,000 | | | 6.011%, 5/25/2036h | | | $1,630,501 | |
| | | | SLM Student Loan Trust | | | | |
| | 409,744 | | | 0.753%, 7/15/2022f,g | | | 409,446 | |
| | 472,552 | | | 0.753%, 8/15/2022f,g | | | 473,072 | |
| | 436,547 | | | 0.634%, 4/25/2023f,g | | | 436,910 | |
| | 75,000 | | | 1.203%, 5/17/2027f,g | | | 75,462 | |
| | | | Vericrest Opportunity Loan Transferee | | | | |
| | 984,578 | | | 3.125%, 4/27/2054f | | | 984,618 | |
| | | | Volvo Financial Equipment, LLC | | | | |
| | 250,000 | | | 0.740%, 3/15/2017f | | | 250,317 | |
| | 750,000 | | | 0.820%, 4/16/2018f | | | 749,677 | |
| | | | World Financial Network Credit Card Master Trust | | | | |
| | 225,000 | | | 0.533%, 12/15/2019g | | | 225,147 | |
| | 250,000 | | | 0.910%, 3/16/2020 | | | 250,275 | |
| | | | World Omni Automobile Lease Securitization Trust | | | | |
| | 450,000 | | | 1.400%, 2/15/2019 | | | 453,565 | |
| | | | World Omni Master Owner Trust | | | | |
| | 90,000 | | | 0.503%, 2/15/2018f,g | | | 90,083 | |
| | | | | |
| | | | Total | | | 16,685,465 | |
| | | | | |
| |
| Basic Materials(0.2%) | | | | |
| | | | ArcelorMittal | | | | |
| | 325,000 | | | 6.000%, 3/1/2021 | | | 348,562 | |
| | | | FMG Resources August 2006 Pty., Ltd. | | | | |
| | 144,444 | | | 6.875%, 2/1/2018f,j | | | 148,056 | |
| | | | Freeport-McMoRan Copper & Gold, Inc. | | | | |
| | 404,000 | | | 2.375%, 3/15/2018 | | | 406,161 | |
| | | | Glencore Funding, LLC | | | | |
| | 180,000 | | | 1.700%, 5/27/2016f | | | 181,178 | |
| | | | Goldcorp, Inc. | | | | |
| | 255,000 | | | 2.125%, 3/15/2018 | | | 254,885 | |
| | | | Hexion US Finance Corporation/Hexion Nova Scotia Finance ULC | | | | |
| | 270,000 | | | 8.875%, 2/1/2018 | | | 266,962 | |
| | | | Ineos Finance plc | | | | |
| | 270,000 | | | 7.500%, 5/1/2020f | | | 288,900 | |
| | | | LyondellBasell Industries NV | | | | |
| | 293,000 | | | 6.000%, 11/15/2021 | | | 343,060 | |
| | | | Mosaic Company | | | | |
| | 210,000 | | | 5.450%, 11/15/2033 | | | 234,447 | |
| | | | Sappi Papier Holding GmbH | | | | |
| | 155,000 | | | 6.625%, 4/15/2021f | | | 161,200 | |
| | | | Trinseo Materials Operating SCA | | | | |
| | 325,000 | | | 8.750%, 2/1/2019 | | | 343,687 | |
| | | | Vale Overseas, Ltd. | | | | |
| | 276,000 | | | 6.250%, 1/23/2017 | | | 302,377 | |
| | | | Yamana Gold, Inc. | | | | |
| | 260,000 | | | 4.950%, 7/15/2024f | | | 254,302 | |
| | | | | |
| | | | Total | | | 3,533,777 | |
| | | | | |
| |
| Capital Goods (0.2%) | | | | |
| | | | BAE Systems plc | | | | |
| | 144,000 | | | 3.500%, 10/11/2016f | | | 150,380 | |
| | | | Brand Energy& Infrastructure Services, Inc. | | | | |
| | 150,000 | | | 8.500%, 12/1/2021f | | | 149,438 | |
| | | | CNH Capital, LLC | | | | |
| | 270,000 | | | 3.625%, 4/15/2018 | | | 270,000 | |
| | | | Crown Americas Capital Corporation IV | | | | |
| | 325,000 | | | 4.500%, 1/15/2023 | | | 319,312 | |
| | | | Eaton Corporation | | | | |
| | 144,000 | | | 4.000%, 11/2/2032 | | | 143,808 | |
| | | | Harsco Corporation | | | | |
| | 291,000 | | | 2.700%, 10/15/2015 | | | 290,756 | |
| | | | Hutchison Whampoa Finance CI, Ltd. | | | | |
| | 210,000 | | | 1.625%, 10/31/2017f | | | 209,644 | |
| | | | Ingersoll-Rand Global Holding Company, Ltd. | | | | |
| | 280,000 | | | 6.875%, 8/15/2018 | | | 328,150 | |
| | | | L-3 Communications Corporation | | | | |
| | 280,000 | | | 1.500%, 5/28/2017 | | | 278,297 | |
| | | | Martin Marietta Materials, Inc. | | | | |
| | 210,000 | | | 1.333%, 6/30/2017f,g | | | 210,877 | |
| | | | Reynolds Group Issuer, Inc. | | | | |
| | 269,675 | | | 5.750%, 10/15/2020 | | | 280,462 | |
| | | | Roper Industries, Inc. | | | | |
| | 288,000 | | | 2.050%, 10/1/2018 | | | 286,511 | |
| | | | RSC Equipment Rental, Inc. | | | | |
| | 270,000 | | | 8.250%, 2/1/2021 | | | 294,300 | |
| | | | Textron, Inc. | | | | |
| | 190,000 | | | 5.600%, 12/1/2017 | | | 210,499 | |
| | | | | |
| | | | Total | | | 3,422,434 | |
| | | | | |
| |
| Collateralized Mortgage Obligations (0.9%) | | | | |
| | | | Alm Loan Funding CLO | | | | |
| | 210,000 | | | 1.664%, 10/17/2026*,g | | | 207,636 | |
| | | | Alternative Loan Trust | | | | |
| | 356,281 | | | 6.000%, 6/25/2036 | | | 318,613 | |
| | | | Apidos CLO XVIII | | | | |
| | 215,000 | | | 1.646%, 7/22/2026*,g | | | 212,455 | |
| | | | Babson CLO, Ltd. | | | | |
| | 210,000 | | | 1.656%, 10/17/2026*,g | | | 207,208 | |
| | | | Birchwood Park CLO, Ltd. | | | | |
| | 210,000 | | | 1.674%, 7/15/2026*,g | | | 207,721 | |
| | | | BlueMountain CLO, Ltd. | | | | |
| | 210,000 | | | 1.480%, 10/15/2026*,g | | | 208,097 | |
| | | | Carlyle Global Market Strategies CLO, Ltd. | | | | |
| | 215,000 | | | 1.531%, 7/20/2023*,g | | | 213,076 | |
| | 200,000 | | | 1.733%, 10/15/2026*,g | | | 198,426 | |
| | | | Cent CLO 16, LP | | | | |
| | 210,000 | | | 1.710%, 8/1/2024*,g | | | 208,066 | |
| | | | Cent CLO 22, Ltd. | | | | |
| | 200,000 | | | 1.713%, 11/7/2026*,g | | | 199,191 | |
| | | | Citigroup Mortgage Loan Trust, Inc. | | | | |
| | 514,975 | | | 5.500%, 11/25/2035 | | | 475,783 | |
| | | | CitiMortgage Alternative Loan Trust | | | | |
| | 1,741,650 | | | 5.750%, 4/25/2037 | | | 1,495,595 | |
| | | | Countrywide Alternative Loan Trust | | | | |
| | 638,835 | | | 5.263%, 10/25/2035 | | | 528,829 | |
| | 547,679 | | | 6.000%, 4/25/2036 | | | 475,539 | |
| | 323,278 | | | 6.000%, 1/25/2037 | | | 293,361 | |
| | 1,597,535 | | | 5.500%, 5/25/2037 | | | 1,387,088 | |
The accompanying Notes to Financial Statements are an integral part of this schedule.
96
MODERATE ALLOCATION FUND
Schedule of Investments as of October 31, 2014
| | | | | | | | |
Principal Amount | | | Long-Term Fixed Income (17.7%) | | Value | |
| Collateralized Mortgage Obligations (0.9%) - continued | | | | |
| | $1,297,921 | | | 7.000%, 10/25/2037 | | | $963,853 | |
| | | | Countrywide Home Loans, Inc. | | | | |
| | 635,764 | | | 5.750%, 4/25/2037 | | | 577,533 | |
| | | | Deutsche Alt-A Securities Mortgage Loan Trust | | | | |
| | 497,280 | | | 6.000%, 10/25/2021 | | | 438,322 | |
| | | | Deutsche Alt-A Securities, Inc., Mortgage Loan Trust | | | | |
| | 193,248 | | | 5.500%, 10/25/2021 | | | 185,731 | |
| | | | Dryden 34 Senior Loan Fund CLO | | | | |
| | 210,000 | | | 1.717%, 10/15/2026*,g | | | 207,639 | |
| | | | Federal Home Loan Mortgage Corporation | | | | |
| | 1,180,906 | | | 3.000%, 2/15/2033j | | | 157,216 | |
| | | | Federal National Mortgage Association | | | | |
| | 2,547,241 | | | 3.500%, 1/25/2033j | | | 376,937 | |
| | | | GSR Mortgage Loan Trust | | | | |
| | 729,866 | | | 0.342%, 8/25/2046g | | | 700,573 | |
| | | | J.P. Morgan Mortgage Trust | | | | |
| | 308,248 | | | 2.585%, 6/25/2036 | | | 259,660 | |
| | 152,651 | | | 2.535%, 10/25/2036 | | | 135,711 | |
| | 1,138,426 | | | 0.532%, 1/25/2037g | | | 706,897 | |
| | 1,403,065 | | | 6.250%, 8/25/2037 | | | 1,144,615 | |
| | | | Limerock CLO III, LLC | | | | |
| | 650,000 | | | 1.759%, 10/20/2026*,c,g,k | | | 650,000 | |
| | | | Madison Park Funding XIV CLO, Ltd. | | | | |
| | 230,000 | | | 1.681%, 7/20/2026*,g | | | 227,716 | |
| | | | MASTR Alternative Loans Trust | | | | |
| | 367,755 | | | 6.500%, 7/25/2034 | | | 376,794 | |
| | 755,879 | | | 0.602%, 12/25/2035g | | | 417,386 | |
| | | | Merrill Lynch Alternative Note Asset Trust | | | | |
| | 389,523 | | | 6.000%, 3/25/2037 | | | 363,509 | |
| | | | Neuberger Berman CLO, Ltd. | | | | |
| | 150,000 | | | 1.701%, 8/4/2025*,g | | | 148,653 | |
| | | | Octagon Investment Partners XX CLO, Ltd. | | | | |
| | 210,000 | | | 1.675%, 8/12/2026*,g | | | 207,611 | |
| | | | Residential Asset Securitization Trust | | | | |
| | 1,031,778 | | | 0.532%, 8/25/2037g | | | 406,703 | |
| | | | Sequoia Mortgage Trust | | | | |
| | 103,788 | | | 2.664%, 9/20/2046 | | | 4,306 | |
| | | | Symphony CLO XV, Ltd. | | | | |
| | 650,000 | | | 1.678%, 10/17/2026*,c,g | | | 645,125 | |
| | | | Symphony CLO, Ltd. | | | | |
| | 210,000 | | | 1.335%, 1/9/2023*,g | | | 208,624 | |
| | | | Voya CLO 2014-3, Ltd. | | | | |
| | 210,000 | | | 1.649%, 7/25/2026*,g | | | 207,596 | |
| | | | WaMu Mortgage Pass Through Certificates | | | | |
| | 134,428 | | | 2.237%, 9/25/2036 | | | 120,385 | |
| | 511,113 | | | 2.293%, 10/25/2036 | | | 438,347 | |
| | | | | |
| | | | Total | | | 17,114,126 | |
| | | | | |
|
| Commercial Mortgage-Backed Securities (1.1%) | |
| | | | Banc of America Commercial Mortgage, Inc. | | | | |
| | 2,400,000 | | | 5.612%, 4/10/2049 | | | 2,601,134 | |
| | 1,000,000 | | | 5.565%, 6/10/2049 | | | 1,083,464 | |
| | | | Bear Stearns Commercial Mortgage Securities, Inc. | | | | |
| | 1,306,348 | | | 5.331%, 2/11/2044 | | | 1,404,136 | |
| | | | CGBAM Commercial Mortgage Trust | | | | |
| | 980,000 | | | 1.254%, 5/15/2030f,g | | | 979,628 | |
| | | | Commercial Mortgage Pass-Through Certificates | | | | |
| | 300,000 | | | 1.203%, 6/8/2030f,g | | | 299,716 | |
| | | | Credit Suisse First Boston Mortgage Securities | | | | |
| | 2,400,000 | | | 5.542%, 1/15/2049 | | | 2,584,246 | |
| | | | Credit Suisse Mortgage Capital Certificates | | | | |
| | 3,000,000 | | | 5.509%, 9/15/2039 | | | 3,204,072 | |
| | | | Federal Home Loan Mortgage Corporation Multi Family Structured Pass Thru Certificates | | | | |
| | 125,458 | | | 0.727%, 12/25/2016 | | | 125,247 | |
| | | | Federal National Mortgage Association | | | | |
| | 250,000 | | | 1.272%, 1/25/2017 | | | 251,876 | |
| | | | Greenwich Capital Commercial Funding Corporation | | | | |
| | 1,600,000 | | | 5.867%, 12/10/2049 | | | 1,742,069 | |
| | | | J.P. Morgan Chase Commercial Mortgage Securities Corporation | | | | |
| | 78,739 | | | 0.853%, 4/15/2028f,g | | | 78,665 | |
| | 400,000 | | | 1.104%, 12/15/2028f,g | | | 399,504 | |
| | 1,200,000 | | | 5.703%, 2/12/2049 | | | 1,271,608 | |
| | | | LSTAR Commercial Mortgage Trust | | | | |
| | 324,082 | | | 1.519%, 1/20/2041f | | | 323,954 | |
| | | | Morgan Stanley Capital, Inc. | | | | |
| | 750,000 | | | 5.406%, 3/15/2044 | | | 805,013 | |
| | | | SCG Trust 2013-SRP1 | | | | |
| | 200,000 | | | 1.553%, 11/15/2026f,g | | | 200,208 | |
| | | | Wachovia Bank Commercial Mortgage Trust | | | | |
| | 1,800,000 | | | 5.603%, 10/15/2048 | | | 1,932,511 | |
| | | | | |
| | | | Total | | | 19,287,051 | |
| | | | | |
|
| Communications Services (0.7%) | |
| | | | 21st Century Fox America, Inc. | | | | |
| | 280,000 | | | 6.900%, 3/1/2019 | | | 332,964 | |
| | | | AMC Networks, Inc. | | | | |
| | 270,000 | | | 4.750%, 12/15/2022 | | | 267,975 | |
| | | | America Movil SAB de CV | | | | |
| | 252,000 | | | 5.000%, 10/16/2019 | | | 282,540 | |
| | | | American Tower Corporation | | | | |
| | 140,000 | | | 7.000%, 10/15/2017 | | | 158,527 | |
| | 280,000 | | | 3.450%, 9/15/2021 | | | 273,906 | |
| | | | AT&T, Inc. | | | | |
| | 286,000 | | | 3.875%, 8/15/2021 | | | 299,879 | |
| | | | British Sky Broadcasting Group plc | | | | |
| | 255,000 | | | 2.625%, 9/16/2019f | | | 255,708 | |
| | | | CBS Corporation | | | | |
| | 100,000 | | | 2.300%, 8/15/2019 | | | 98,687 | |
| | | | CC Holdings GS V, LLC | | | | |
| | 150,000 | | | 2.381%, 12/15/2017 | | | 151,971 | |
| | | | CCO Holdings, LLC | | | | |
| | 270,000 | | | 7.375%, 6/1/2020 | | | 289,406 | |
The accompanying Notes to Financial Statements are an integral part of this schedule.
97
MODERATE ALLOCATION FUND
Schedule of Investments as of October 31, 2014
| | | | | | | | |
Principal Amount | | | Long-Term Fixed Income (17.7%) | | Value | |
| Communications Services (0.7%) - continued | |
| | | | CenturyLink, Inc. | | | | |
| | $200,000 | | | 6.450%, 6/15/2021 | | | $219,000 | |
| | | | Cequel Communications Escrow 1, LLC | | | | |
| | 325,000 | | | 6.375%, 9/15/2020f | | | 338,812 | |
| | | | Columbus International, Inc. | | | | |
| | 325,000 | | | 7.375%, 3/30/2021f | | | 344,500 | |
| | | | Comcast Corporation | | | | |
| | 145,000 | | | 4.650%, 7/15/2042 | | | 152,545 | |
| | 198,000 | | | 4.750%, 3/1/2044 | | | 212,743 | |
| | | | Cox Communications, Inc. | | | | |
| | 140,000 | | | 9.375%, 1/15/2019f | | | 178,873 | |
| | | | Crown Castle Towers, LLC | | | | |
| | 135,000 | | | 4.174%, 8/15/2017f | | | 141,668 | |
| | | | Digicel, Ltd. | | | | |
| | 325,000 | | | 6.000%, 4/15/2021f | | | 328,250 | |
| | | | DIRECTV Holdings, LLC | | | | |
| | 198,000 | | | 1.750%, 1/15/2018 | | | 197,086 | |
| | 164,000 | | | 5.875%, 10/1/2019 | | | 188,349 | |
| | 108,000 | | | 4.450%, 4/1/2024 | | | 112,680 | |
| | | | Frontier Communications Corporation | | | | |
| | 215,000 | | | 6.875%, 1/15/2025 | | | 217,688 | |
| | | | Hughes Satellite Systems Corporation | | | | |
| | 270,000 | | | 6.500%, 6/15/2019 | | | 292,275 | |
| | | | Intelsat Jackson Holdings SA | | | | |
| | 270,000 | | | 7.250%, 4/1/2019 | | | 283,500 | |
| | | | Level 3 Financing, Inc. | | | | |
| | 270,000 | | | 8.625%, 7/15/2020 | | | 297,000 | |
| | | | Nippon Telegraph & Telephone Corporation | | | | |
| | 156,000 | | | 1.400%, 7/18/2017 | | | 156,191 | |
| | | | Numericable Group SA | | | | |
| | 325,000 | | | 6.000%, 5/15/2022f | | | 332,312 | |
| | | | SBA Tower Trust | | | | |
| | 145,000 | | | 5.101%, 4/17/2017f | | | 153,744 | |
| | | | SES Global Americas Holdings GP | | | | |
| | 175,000 | | | 2.500%, 3/25/2019f | | | 174,574 | |
| | | | Sprint Communications, Inc. | | | | |
| | 269,675 | | | 9.000%, 11/15/2018f | | | 317,205 | |
| | | | Telefonica Emisiones SAU | | | | |
| | 250,000 | | | 3.992%, 2/16/2016 | | | 259,408 | |
| | 252,000 | | | 3.192%, 4/27/2018 | | | 261,567 | |
| | | | Time Warner Cable, Inc. | | | | |
| | 165,000 | | | 5.000%, 2/1/2020 | | | 184,670 | |
| | | | T-Mobile USA, Inc. | | | | |
| | 325,000 | | | 6.125%, 1/15/2022 | | | 336,781 | |
| | | | Unitymedia Hessen GmbH & Company KG | | | | |
| | 160,000 | | | 5.500%, 1/15/2023f | | | 166,800 | |
| | | | Univision Communications, Inc. | | | | |
| | 270,000 | | | 6.875%, 5/15/2019f | | | 283,837 | |
| | | | UPCB Finance V, Ltd. | | | | |
| | 270,000 | | | 7.250%, 11/15/2021f | | | 297,000 | |
| | | | Verizon Communications, Inc. | | | | |
| | 121,000 | | | 1.100%, 11/1/2017 | | | 119,683 | |
| | 165,000 | | | 1.005%, 6/17/2019g | | | 166,194 | |
| | 77,000 | | | 2.625%, 2/21/2020f | | | 76,589 | |
| | 175,000 | | | 4.500%, 9/15/2020 | | | 190,001 | |
| | 390,000 | | | 3.000%, 11/1/2021 | | | 387,011 | |
| | 210,000 | | | 5.150%, 9/15/2023 | | | 235,176 | |
| | 266,000 | | | 6.400%, 9/15/2033 | | | 324,005 | |
| | 144,000 | | | 5.050%, 3/15/2034 | | | 152,421 | |
| | 72,000 | | | 6.550%, 9/15/2043 | | | 90,764 | |
| | | | Viacom, Inc. | | | | |
| | 144,000 | | | 2.500%, 9/1/2018 | | | 146,216 | |
| | | | West Corporation | | | | |
| | 325,000 | | | 5.375%, 7/15/2022f | | | 315,250 | |
| | | | Wind Acquisition Finance SA | | | | |
| | 180,000 | | | 7.375%, 4/23/2021f | | | 175,950 | |
| | | | Windstream Corporation | | | | |
| | 325,000 | | | 7.750%, 10/1/2021 | | | 347,750 | |
| | | | | |
| | | | Total | | | 11,567,631 | |
| | | | | |
|
| Consumer Cyclical (0.3%) | |
| | | | Chrysler Group, LLC | | | | |
| | 275,000 | | | 8.000%, 6/15/2019 | | | 294,594 | |
| | | | Cinemark USA, Inc. | | | | |
| | 270,000 | | | 4.875%, 6/1/2023 | | | 265,950 | |
| | | | CVS Health Corporation | | | | |
| | 60,000 | | | 2.250%, 8/12/2019 | | | 59,734 | |
| | | | Delphi Corporation | | | | |
| | 252,000 | | | 6.125%, 5/15/2021 | | | 274,050 | |
| | | | Ford Motor Company | | | | |
| | 146,000 | | | 7.450%, 7/16/2031 | | | 195,541 | |
| | | | Ford Motor Credit Company, LLC | | | | |
| | 315,000 | | | 1.684%, 9/8/2017 | | | 313,526 | |
| | 190,000 | | | 5.000%, 5/15/2018 | | | 207,904 | |
| | 300,000 | | | 2.597%, 11/4/2019c | | | 299,001 | |
| | | | General Motors Company | | | | |
| | 128,000 | | | 3.500%, 10/2/2018 | | | 131,840 | |
| | 280,000 | | | 6.250%, 10/2/2043 | | | 333,200 | |
| | | | General Motors Financial Company, Inc. | | | | |
| | 270,000 | | | 3.250%, 5/15/2018 | | | 276,075 | |
| | | | Hilton Worldwide Finance, LLC | | | | |
| | 325,000 | | | 5.625%, 10/15/2021f | | | 342,469 | |
| | | | Home Depot, Inc. | | | | |
| | 170,000 | | | 4.875%, 2/15/2044 | | | 191,495 | |
| | | | Hyundai Capital America | | | | |
| | 215,000 | | | 1.450%, 2/6/2017f | | | 215,167 | |
| | | | Jaguar Land Rover Automotive plc | | | | |
| | 270,000 | | | 5.625%, 2/1/2023f | | | 280,800 | |
| | | | KB Home | | | | |
| | 138,000 | | | 4.750%, 5/15/2019 | | | 136,965 | |
| | | | L Brands, Inc. | | | | |
| | 270,000 | | | 5.625%, 2/15/2022 | | | 289,575 | |
| | | | Lennar Corporation | | | | |
| | 270,000 | | | 4.125%, 12/1/2018 | | | 273,712 | |
| | | | Macy’s Retail Holdings, Inc. | | | | |
| | 82,000 | | | 4.375%, 9/1/2023 | | | 87,399 | |
| | 260,000 | | | 3.625%, 6/1/2024 | | | 259,058 | |
| | | | Nissan Motor Acceptance Corporation | | | | |
| | 254,000 | | | 0.784%, 3/3/2017f,g | | | 254,528 | |
| | | | Royal Caribbean Cruises, Ltd. | | | | |
| | 325,000 | | | 5.250%, 11/15/2022 | | | 339,625 | |
| | | | Toll Brothers Finance Corporation | | | | |
| | 128,000 | | | 8.910%, 10/15/2017 | | | 149,440 | |
| | 172,000 | | | 4.000%, 12/31/2018 | | | 174,150 | |
| | | | TRW Automotive, Inc. | | | | |
| | 200,000 | | | 7.250%, 3/15/2017f | | | 220,000 | |
The accompanying Notes to Financial Statements are an integral part of this schedule.
98
MODERATE ALLOCATION FUND
Schedule of Investments as of October 31, 2014
| | | | | | | | |
Principal Amount | | | Long-Term Fixed Income (17.7%) | | Value | |
| Consumer Cyclical (0.3%) - continued | |
| | | | Wynn Las Vegas, LLC | | | | |
| | $270,000 | | | 5.375%, 3/15/2022 | | | $284,175 | |
| | | | | |
| | | | Total | | | 6,149,973 | |
| | | | | |
|
| Consumer Non-Cyclical (0.6%) | |
| | | | AbbVie, Inc. | | | | |
| | 385,000 | | | 2.000%, 11/6/2018 | | | 381,793 | |
| | | | Altria Group, Inc. | | | | |
| | 180,000 | | | 9.700%, 11/10/2018 | | | 232,004 | |
| | 252,000 | | | 4.000%, 1/31/2024 | | | 260,854 | |
| | | | Anheuser-Busch InBev Finance, Inc. | | | | |
| | 141,000 | | | 0.640%, 2/1/2019g | | | 140,885 | |
| | | | Anheuser-Busch InBev Worldwide, Inc. | | | | |
| | 265,000 | | | 7.750%, 1/15/2019 | | | 321,372 | |
| | | | Bunge Limited Finance Corporation | | | | |
| | 216,000 | | | 8.500%, 6/15/2019 | | | 267,229 | |
| | | | CareFusion Corporation | | | | |
| | 210,000 | | | 6.375%, 8/1/2019 | | | 243,711 | |
| | | | Celgene Corporation | | | | |
| | 338,000 | | | 1.900%, 8/15/2017 | | | 341,077 | |
| | 72,000 | | | 2.300%, 8/15/2018 | | | 72,471 | |
| | | | CHS/Community Health Systems, Inc. | | | | |
| | 270,000 | | | 7.125%, 7/15/2020 | | | 292,275 | |
| | | | ConAgra Foods, Inc. | | | | |
| | 252,000 | | | 1.900%, 1/25/2018 | | | 250,757 | |
| | | | Cott Beverages, Inc. | | | | |
| | 325,000 | | | 5.375%, 7/1/2022f | | | 321,750 | |
| | | | Coventry Health Care, Inc. | | | | |
| | 252,000 | | | 5.950%, 3/15/2017 | | | 278,739 | |
| | | | CVS Health Corporation | | | | |
| | 144,000 | | | 6.125%, 9/15/2039 | | | 180,286 | |
| | | | Endo Finance LLC & Endo Finco, Inc. | | | | |
| | 270,000 | | | 7.000%, 7/15/2019f | | | 284,175 | |
| | | | Express Scripts Holding Company | | | | |
| | 144,000 | | | 2.650%, 2/15/2017 | | | 148,140 | |
| | | | Forest Laboratories, Inc. | | | | |
| | 290,000 | | | 4.375%, 2/1/2019f | | | 303,763 | |
| | | | Fresenius Medical Care US Finance II, Inc. | | | | |
| | 270,000 | | | 5.875%, 1/31/2022f | | | 294,300 | |
| | | | Hawk Acquisition Sub, Inc. | | | | |
| | 269,675 | | | 4.250%, 10/15/2020 | | | 272,318 | |
| | | | HCA, Inc. | | | | |
| | 325,000 | | | 3.750%, 3/15/2019 | | | 325,813 | |
| | | | IMS Health, Inc. | | | | |
| | 363,000 | | | 6.000%, 11/1/2020f | | | 376,613 | |
| | | | JBS Finance II, Ltd. | | | | |
| | 325,000 | | | 8.250%, 1/29/2018* | | | 342,062 | |
| | | | Kroger Company | | | | |
| | 144,000 | | | 1.200%, 10/17/2016 | | | 144,207 | |
| | | | Lorillard Tobacco Company | | | | |
| | 166,000 | | | 2.300%, 8/21/2017i | | | 167,872 | |
| | 180,000 | | | 8.125%, 6/23/2019 | | | 220,504 | |
| | | | Mattel, Inc. | | | | |
| | 165,000 | | | 1.700%, 3/15/2018 | | | 164,134 | |
| | | | Medco Health Solutions, Inc. | | | | |
| | 217,000 | | | 7.125%, 3/15/2018 | | | 252,557 | |
| | | | Mondelez International, Inc. | | | | |
| | 118,000 | | | 0.760%, 2/1/2019g | | | 118,148 | |
| | | | Mylan, Inc. | | | | |
| | 180,000 | | | 7.875%, 7/15/2020f | | | 193,737 | |
| | | | Pernod Ricard SA | | | | |
| | 144,000 | | | 2.950%, 1/15/2017f | | | 148,363 | |
| | 144,000 | | | 5.750%, 4/7/2021f | | | 164,757 | |
| | | | Perrigo Company, Ltd. | | | | |
| | 344,000 | | | 1.300%, 11/8/2016 | | | 343,286 | |
| | | | Safeway, Inc. | | | | |
| | 13,000 | | | 3.400%, 12/1/2016 | | | 13,133 | |
| | | | Spectrum Brands Escrow Corporation | | | | |
| | 270,000 | | | 6.375%, 11/15/2020 | | | 286,200 | |
| | | | Sysco Corporation | | | | |
| | 105,000 | | | 2.350%, 10/2/2019 | | | 105,628 | |
| | 70,000 | | | 4.350%, 10/2/2034 | | | 71,894 | |
| | | | Tenet Healthcare Corporation | | | | |
| | 325,000 | | | 8.125%, 4/1/2022 | | | 372,531 | |
| | | | Thermo Fisher Scientific, Inc. | | | | |
| | 216,000 | | | 1.300%, 2/1/2017 | | | 215,745 | |
| | 216,000 | | | 2.400%, 2/1/2019 | | | 217,225 | |
| | | | Tyson Foods, Inc. | | | | |
| | 158,000 | | | 4.500%, 6/15/2022 | | | 169,077 | |
| | | | Valeant Pharmaceuticals International | | | | |
| | 270,000 | | | 6.875%, 12/1/2014f | | | 279,450 | |
| | | | Whirlpool Corporation | | | | |
| | 175,000 | | | 1.650%, 11/1/2017 | | | 175,033 | |
| | | | WM Wrigley Jr. Company | | | | |
| | 180,000 | | | 2.000%, 10/20/2017f | | | 181,845 | |
| | | | | |
| | | | Total | | | 9,937,713 | |
| | | | | |
|
| Energy (0.5%) | |
| | | | Boardwalk Pipelines, Ltd. | | | | |
| | 263,000 | | | 5.875%, 11/15/2016 | | | 282,905 | |
| | | | Buckeye Partners, LP | | | | |
| | 266,000 | | | 2.650%, 11/15/2018 | | | 265,710 | |
| | | | Calumet Specialty Products Partners, LP | | | | |
| | 325,000 | | | 6.500%, 4/15/2021f | | | 315,250 | |
| | | | CNOOC Nexen Finance 2014 ULC | | | | |
| | 216,000 | | | 1.625%, 4/30/2017 | | | 216,060 | |
| | | | CNPC General Capital, Ltd. | | | | |
| | 140,000 | | | 1.450%, 4/16/2016f | | | 139,960 | |
| | 140,000 | | | 2.750%, 4/19/2017f | | | 142,496 | |
| | | | Concho Resources, Inc. | | | | |
| | 269,675 | | | 5.500%, 10/1/2022 | | | 284,507 | |
| | | | Continental Resources, Inc. | | | | |
| | 280,000 | | | 5.000%, 9/15/2022 | | | 296,800 | |
| | | | Crestwood Midstream Partners, LP | | | | |
| | 150,000 | | | 6.125%, 3/1/2022 | | | 151,500 | |
| | | | Devon Energy Corporation | | | | |
| | 324,000 | | | 1.200%, 12/15/2016 | | | 327,694 | |
| | | | El Paso, LLC | | | | |
| | 195,000 | | | 7.800%, 8/1/2031 | | | 239,850 | |
| | | | Enbridge, Inc. | | | | |
| | 255,000 | | | 0.684%, 6/2/2017g | | | 255,065 | |
| | | | Energy XXI Gulf Coast, Inc. | | | | |
| | 325,000 | | | 7.500%, 12/15/2021 | | | 269,750 | |
The accompanying Notes to Financial Statements are an integral part of this schedule.
99
MODERATE ALLOCATION FUND
Schedule of Investments as of October 31, 2014
| | | | | | | | |
Principal Amount | | | Long-Term Fixed Income (17.7%) | | Value | |
| Energy (0.5%) - continued | |
| | | | Ensco plc | |
| | $175,000 | | | 4.500%, 10/1/2024 | | | $177,229 | |
| | | | Enterprise Products Operating, LLC | |
| | 280,000 | | | 2.550%, 10/15/2019 | | | 280,016 | |
| | | | EQT Corporation | |
| | 165,000 | | | 5.150%, 3/1/2018 | | | 177,601 | |
| | 160,000 | | | 8.125%, 6/1/2019 | | | 196,564 | |
| | | | Hess Corporation | |
| | 256,000 | | | 8.125%, 2/15/2019 | | | 313,844 | |
| | | | Kinder Morgan, Inc. | |
| | 175,000 | | | 5.000%, 2/15/2021f | | | 184,625 | |
| | | | Linn Energy, LLC | |
| | 269,675 | | | 6.250%, 11/1/2019 | | | 248,101 | |
| | | | Marathon Petroleum Corporation | |
| | 70,000 | | | 3.625%, 9/15/2024 | | | 69,739 | |
| | 140,000 | | | 4.750%, 9/15/2044 | | | 140,865 | |
| | | | MEG Energy Corporation | |
| | 270,000 | | | 6.500%, 3/15/2021f | | | 267,300 | |
| | | | Offshore Group Investment, Ltd. | |
| | 270,000 | | | 7.500%, 11/1/2019i | | | 230,175 | |
| | | | Petrobras Global Finance BV | |
| | 288,000 | | | 2.000%, 5/20/2016 | | | 287,067 | |
| | 140,000 | | | 3.115%, 3/17/2020g | | | 141,260 | |
| | | | Petroleos Mexicanos | |
| | 126,000 | | | 3.500%, 7/18/2018 | | | 130,410 | |
| | 120,000 | | | 2.378%, 4/15/2025 | | | 119,654 | |
| | | | Plains All American Pipeline, LP | |
| | 270,000 | | | 3.600%, 11/1/2024 | | | 268,408 | |
| | | | Regency Energy Partners, LP | |
| | 325,000 | | | 5.000%, 10/1/2022 | | | 331,500 | |
| | | | Sabine Pass Liquefaction, LLC | |
| | 325,000 | | | 5.750%, 5/15/2024f | | | 335,969 | |
| | | | Sinopec Capital 2013, Ltd. | |
| | 252,000 | | | 1.250%, 4/24/2016f | | | 251,597 | |
| | | | Southwestern Energy Company | |
| | 175,000 | | | 7.500%, 2/1/2018 | | | 203,668 | |
| | | | Suncor Energy, Inc. | |
| | 165,000 | | | 6.100%, 6/1/2018 | | | 189,262 | |
| | | | Transocean, Inc. | |
| | 296,000 | | | 6.000%, 3/15/2018 | | | 315,593 | |
| | | | Weatherford International, Ltd. | |
| | 210,000 | | | 9.625%, 3/1/2019 | | | 268,358 | |
| | | | Williams Companies, Inc. | |
| | 140,000 | | | 3.700%, 1/15/2023 | | | 131,700 | |
| | | | | |
| | | | Total | | | 8,448,052 | |
| | | | | |
|
| Financials (1.8%) | |
| | | | Abbey National Treasury Services plc | |
| | 245,000 | | | 0.644%, 9/29/2017g | | | 244,999 | |
| | 144,000 | | | 3.050%, 8/23/2018 | | | 149,780 | |
| | | | ABN AMRO Bank NV | |
| | 286,000 | | | 2.500%, 10/30/2018f | | | 289,109 | |
| | | | Air Lease Corporation | |
| | 175,000 | | | 2.125%, 1/15/2018 | | | 173,031 | |
| | | | American Express Credit Corporation | |
| | 165,000 | | | 0.784%, 3/18/2019g | | | 165,425 | |
| | | | American International Group, Inc. | |
| | 80,000 | | | 2.300%, 7/16/2019 | | | 80,430 | |
| | | | ANZ New Zealand International, Ltd. | |
| | 231,000 | | | 1.400%, 4/27/2017f | | | 231,140 | |
| | | | Australia and New Zealand Banking Group, Ltd. | | | | |
| | 200,000 | | | 0.494%, 6/13/2017f,g | | | 199,896 | |
| | | | Aviation Capital Group Corporation | | | | |
| | 144,000 | | | 3.875%, 9/27/2016f | | | 147,927 | |
| | | | Banco Santander Chile | | | | |
| | 200,000 | | | 1.134%, 4/11/2017f,g | | | 199,043 | |
| | | | Bank of America Corporation | | | | |
| | 210,000 | | | 1.700%, 8/25/2017 | | | 210,036 | |
| | 365,000 | | | 5.750%, 12/1/2017 | | | 406,294 | |
| | 380,000 | | | 1.303%, 3/22/2018g | | | 385,461 | |
| | 390,000 | | | 5.650%, 5/1/2018 | | | 435,385 | |
| | 140,000 | | | 1.105%, 4/1/2019g | | | 140,723 | |
| | 144,000 | | | 4.000%, 4/1/2024 | | | 148,791 | |
| | 154,000 | | | 5.875%, 2/7/2042 | | | 188,151 | |
| | 280,000 | | | 8.000%, 12/29/2049l | | | 301,350 | |
| | | | Bank of Tokyo-Mitsubishi UFJ, Ltd. | | | | |
| | 330,000 | | | 0.644%, 3/10/2017f,g | | | 330,002 | |
| | 80,000 | | | 2.850%, 9/8/2021f | | | 79,129 | |
| | | | Barclays Bank plc | | | | |
| | 220,000 | | | 10.179%, 6/12/2021f | | | 295,388 | |
| | | | BBVA Banco Continental SA | | | | |
| | 266,000 | | | 2.250%, 7/29/2016f | | | 266,665 | |
| | | | Berkshire Hathaway Finance Corporation | | | | |
| | 190,000 | | | 1.600%, 5/15/2017 | | | 192,322 | |
| | | | BioMed Realty, LP | | | | |
| | 216,000 | | | 2.625%, 5/1/2019 | | | 215,785 | |
| | | | BNP Paribas SA | | | | |
| | 174,000 | | | 1.250%, 12/12/2016 | | | 174,305 | |
| | 298,000 | | | 2.375%, 9/14/2017 | | | 303,725 | |
| | | | BPCE SA | | | | |
| | 140,000 | | | 1.083%, 2/10/2017g | | | 141,257 | |
| | 297,000 | | | 1.625%, 2/10/2017 | | | 299,281 | |
| | | | Capital One Financial Corporation | | | | |
| | 288,000 | | | 6.150%, 9/1/2016 | | | 313,421 | |
| | 180,000 | | | 2.450%, 4/24/2019 | | | 180,533 | |
| | | | Citigroup, Inc. | | | | |
| | 350,000 | | | 5.500%, 2/15/2017 | | | 380,375 | |
| | 184,000 | | | 6.000%, 8/15/2017 | | | 205,301 | |
| | 115,000 | | | 1.003%, 4/8/2019g | | | 115,448 | |
| | 292,000 | | | 8.500%, 5/22/2019 | | | 366,378 | |
| | 188,000 | | | 4.050%, 7/30/2022 | | | 193,405 | |
| | | | CoBank ACB | | | | |
| | 85,000 | | | 0.834%, 6/15/2022*,g | | | 80,437 | |
| | | | Compass Bank | | | | |
| | 245,000 | | | 1.850%, 9/29/2017 | | | 245,983 | |
| | 210,000 | | | 2.750%, 9/29/2019 | | | 211,524 | |
| | | | Cooperatieve Centrale Raiffeisen- Boerenleenbank BA | | | | |
| | 182,000 | | | 3.950%, 11/9/2022 | | | 185,004 | |
| | | | Credit Agricole SA | | | | |
| | 235,000 | | | 1.625%, 4/15/2016f | | | 237,370 | |
| | 140,000 | | | 1.031%, 4/15/2019f,g | | | 140,805 | |
| | 255,000 | | | 6.625%, 9/29/2049f,l | | | 248,778 | |
| | | | Credit Suisse AG | | | | |
| | 184,000 | | | 5.400%, 1/14/2020 | | | 206,075 | |
| | | | CyrusOne, LP | | | | |
| | 270,000 | | | 6.375%, 11/15/2022 | | | 284,175 | |
| | | | DDR Corporation | | | | |
| | 280,000 | | | 9.625%, 3/15/2016 | | | 311,887 | |
The accompanying Notes to Financial Statements are an integral part of this schedule.
100
MODERATE ALLOCATION FUND
Schedule of Investments as of October 31, 2014
| | | | | | | | |
Principal Amount | | | Long-Term Fixed Income (17.7%) | | Value | |
| Financials (1.8%) - continued | | | | |
| | | | Denali Borrower, LLC | | | | |
| $ | 325,000 | | | 5.625%, 10/15/2020f | | $ | 344,703 | |
| | | | Deutsche Bank AG | | | | |
| | 250,000 | | | 1.350%, 5/30/2017 | | | 248,536 | |
| | | | Discover Bank | | | | |
| | 180,000 | | | 8.700%, 11/18/2019 | | | 223,542 | |
| | | | Discover Financial Services | | | | |
| | 144,000 | | | 6.450%, 6/12/2017 | | | 160,740 | |
| | | | DnB Boligkreditt AS | | | | |
| | 288,000 | | | 1.450%, 3/21/2018f | | | 287,054 | |
| | | | Eksportfinans ASA | | | | |
| | 104,000 | | | 3.000%, 11/17/2014 | | | 104,049 | |
| | 154,000 | | | 5.500%, 5/25/2016 | | | 161,508 | |
| | | | Fifth Third Bancorp | | | | |
| | 228,000 | | | 5.450%, 1/15/2017 | | | 247,406 | |
| | 80,000 | | | 2.875%, 10/1/2021 | | | 79,430 | |
| | | | General Electric Capital Corporation | | | | |
| | 595,000 | | | 6.000%, 8/7/2019 | | | 697,752 | |
| | 150,000 | | | 1.234%, 3/15/2023g | | | 151,557 | |
| | 280,000 | | | 6.750%, 3/15/2032 | | | 372,315 | |
| | | | Genworth Financial, Inc. | | | | |
| | 264,000 | | | 7.700%, 6/15/2020 | | | 316,923 | |
| | | | Goldman Sachs Group, Inc. | | | | |
| | 245,000 | | | 2.375%, 1/22/2018 | | | 247,286 | |
| | 150,000 | | | 1.433%, 4/30/2018g | | | 152,274 | |
| | 120,000 | | | 1.334%, 11/15/2018g | | | 121,229 | |
| | 219,000 | | | 7.500%, 2/15/2019 | | | 261,494 | |
| | 250,000 | | | 2.550%, 10/23/2019 | | | 248,398 | |
| | 286,000 | | | 5.375%, 3/15/2020 | | | 320,696 | |
| | 292,000 | | | 5.250%, 7/27/2021 | | | 325,529 | |
| | | | Hartford Financial Services Group, Inc. | | | | |
| | 245,000 | | | 4.000%, 10/15/2017 | | | 261,746 | |
| | 208,000 | | | 5.125%, 4/15/2022 | | | 232,435 | |
| | | | HBOS plc | | | | |
| | 210,000 | | | 6.750%, 5/21/2018f | | | 235,848 | |
| | | | Health Care REIT, Inc. | | | | |
| | 240,000 | | | 4.700%, 9/15/2017 | | | 260,917 | |
| | 80,000 | | | 2.250%, 3/15/2018 | | | 80,963 | |
| | | | HSBC Bank plc | | | | |
| | 275,000 | | | 0.874%, 5/15/2018f,g | | | 277,304 | |
| | | | HSBC Holdings plc | | | | |
| | 139,000 | | | 5.250%, 3/14/2044 | | | 151,088 | |
| | 350,000 | | | 5.625%, 12/29/2049i,l | | | 355,688 | |
| | | | HSBC USA, Inc. | | | | |
| | 200,000 | | | 1.625%, 1/16/2018 | | | 199,883 | |
| | | | Huntington Bancshares, Inc. | | | | |
| | 72,000 | | | 2.600%, 8/2/2018 | | | 73,086 | |
| | | | Huntington National Bank | | | | |
| | 216,000 | | | 1.350%, 8/2/2016 | | | 217,292 | |
| | | | Icahn Enterprises, LP | | | | |
| | 325,000 | | | 6.000%, 8/1/2020 | | | 341,250 | |
| | | | ING Bank NV | | | | |
| | 216,000 | | | 4.125%, 11/21/2023 | | | 221,277 | |
| | | | ING Capital Funding Trust III | | | | |
| | 200,000 | | | 3.833%, 12/29/2049g,l | | | 199,500 | |
| | | | International Lease Finance Corporation | | | | |
| | 219,000 | | | 2.184%, 6/15/2016g | | | 218,179 | |
| | | | Intesa Sanpaolo SPA | | | | |
| | 216,000 | | | 3.125%, 1/15/2016 | | | 220,537 | |
| | 108,000 | | | 3.875%, 1/16/2018 | | | 112,808 | |
| | 210,000 | | | 3.875%, 1/15/2019 | | | 218,627 | |
| | | | J.P. Morgan Chase & Company | | | | |
| | 165,000 | | | 0.754%, 2/15/2017g | | | 165,485 | |
| | 350,000 | | | 2.000%, 8/15/2017 | | | 354,134 | |
| | 115,000 | | | 1.800%, 1/25/2018 | | | 114,968 | |
| | 292,000 | | | 6.300%, 4/23/2019 | | | 338,866 | |
| | 72,000 | | | 3.200%, 1/25/2023 | | | 71,432 | |
| | 140,000 | | | 3.875%, 9/10/2024 | | | 139,089 | |
| | 269,000 | | | 7.900%, 4/29/2049l | | | 291,529 | |
| | | | Kookmin Bank | | | | |
| | 216,000 | | | 1.109%, 1/27/2017f,g | | | 217,555 | |
| | | | Liberty Mutual Group, Inc. | | | | |
| | 83,000 | | | 4.950%, 5/1/2022f | | | 89,958 | |
| | 72,000 | | | 6.500%, 5/1/2042f | | | 86,565 | |
| | | | Liberty Property, LP | | | | |
| | 193,000 | | | 5.500%, 12/15/2016 | | | 209,042 | |
| | | | Lloyds Banking Group plc | | | | |
| | 210,000 | | | 5.920%, 9/29/2049f,l | | | 210,000 | |
| | | | Macquarie Bank, Ltd. | | | | |
| | 265,000 | | | 5.000%, 2/22/2017f | | | 285,528 | |
| | | | Merrill Lynch & Company, Inc. | | | | |
| | 490,000 | | | 6.050%, 5/16/2016 | | | 524,572 | |
| | 203,000 | | | 6.400%, 8/28/2017 | | | 228,693 | |
| | | | MetLife, Inc. | | | | |
| | 175,000 | | | 1.903%, 12/15/2017 | | | 176,591 | |
| | | | Metropolitan Life Global FundingI | | | | |
| | 216,000 | | | 1.300%, 4/10/2017f | | | 216,452 | |
| | | | Mizuho Bank, Ltd. | | | | |
| | 216,000 | | | 1.850%, 3/21/2018f | | | 214,824 | |
| | | | Morgan Stanley | | | | |
| | 302,000 | | | 4.750%, 3/22/2017 | | | 324,507 | |
| | 195,000 | | | 6.250%, 8/28/2017 | | | 218,251 | |
| | 420,000 | | | 6.625%, 4/1/2018 | | | 480,966 | |
| | 100,000 | | | 1.514%, 4/25/2018g | | | 102,232 | |
| | 180,000 | | | 4.875%, 11/1/2022 | | | 191,693 | |
| | 252,000 | | | 4.100%, 5/22/2023 | | | 254,352 | |
| | | | Murray Street Investment TrustI | | | | |
| | 455,000 | | | 4.647%, 3/9/2017 | | | 485,767 | |
| | | | National City Corporation | | | | |
| | 236,000 | | | 6.875%, 5/15/2019 | | | 279,289 | |
| | | | Nomura Holdings, Inc. | | | | |
| | 180,000 | | | 2.750%, 3/19/2019 | | | 181,955 | |
| | | | PNC Bank NA | | | | |
| | 216,000 | | | 1.150%, 11/1/2016 | | | 216,752 | |
| | | | Pricoa Global FundingI | | | | |
| | 280,000 | | | 1.350%, 8/18/2017f | | | 279,667 | |
| | | | Prologis, LP | | | | |
| | 270,000 | | | 7.375%, 10/30/2019 | | | 329,098 | |
| | | | Prudential Financial, Inc. | | | | |
| | 80,000 | | | 2.350%, 8/15/2019 | | | 79,968 | |
| | | | RBS Capital Trust III | | | | |
| | 65,000 | | | 2.073%, 9/29/2049g,l | | | 63,700 | |
| | | | Realty Income Corporation | | | | |
| | 81,000 | | | 2.000%, 1/31/2018 | | | 81,366 | |
| | | | Regions Bank | | | | |
| | 394,000 | | | 7.500%, 5/15/2018 | | | 461,597 | |
| | | | Reinsurance Group of America, Inc. | | | | |
| | 120,000 | | | 5.625%, 3/15/2017 | | | 130,843 | |
| | 209,000 | | | 5.000%, 6/1/2021 | | | 230,614 | |
The accompanying Notes to Financial Statements are an integral part of this schedule.
101
MODERATE ALLOCATION FUND
Schedule of Investments as of October 31, 2014
| | | | | | | | |
Principal
Amount | | | Long-Term Fixed Income (17.7%) | | Value | |
| Financials (1.8%) - continued | |
| | | | Reliance Standard Life Global Funding II | | | | |
| | $110,000 | | | 2.500%, 4/24/2019f | | | $110,702 | |
| | | | Royal Bank of Canada | | | | |
| | 252,000 | | | 2.200%, 7/27/2018 | | | 255,811 | |
| | | | Royal Bank of Scotland Group plc | | | | |
| | 140,000 | | | 1.173%, 3/31/2017g | | | 140,464 | |
| | 490,000 | | | 5.125%, 5/28/2024 | | | 496,456 | |
| | | | Simon Property Group, LP | | | | |
| | 128,000 | | | 10.350%, 4/1/2019 | | | 169,433 | |
| | | | Skandinaviska Enskilda Banken AB | | | | |
| | 175,000 | | | 2.375%, 3/25/2019f | | | 176,691 | |
| | | | SLM Corporation | | | | |
| | 108,000 | | | 3.875%, 9/10/2015 | | | 109,080 | |
| | | | SpareBank 1 Boligkreditt AS | | | | |
| | 288,000 | | | 1.250%, 5/2/2018f | | | 284,341 | |
| | | | Sumitomo Mitsui Banking Corporation | | | | |
| | 420,000 | | | 1.300%, 1/10/2017 | | | 420,147 | |
| | | | Suncorp-Metway, Ltd. | | | | |
| | 417,000 | | | 0.934%, 3/28/2017f,g | | | 418,482 | |
| | | | Svenska Handelsbanken AB | | | | |
| | 216,000 | | | 1.625%, 3/21/2018 | | | 215,585 | |
| | 180,000 | | | 0.725%, 6/17/2019g | | | 180,900 | |
| | | | Swedbank Hypotek AB | | | | |
| | 288,000 | | | 1.375%, 3/28/2018f | | | 285,795 | |
| | | | Swiss RE Capital I, LP | | | | |
| | 170,000 | | | 6.854%, 5/29/2049f,l | | | 178,500 | |
| | | | Synchrony Financial | | | | |
| | 85,000 | | | 3.000%, 8/15/2019 | | | 85,934 | |
| | 130,000 | | | 3.750%, 8/15/2021 | | | 132,539 | |
| | | | Toronto-Dominion Bank | | | | |
| | 105,000 | | | 0.792%, 11/5/2019c,g | | | 104,897 | |
| | | | UBS AG/Stamford, Connecticut | | | | |
| | 162,000 | | | 5.875%, 12/20/2017 | | | 182,478 | |
| | | | Voya Financial, Inc. | | | | |
| | 280,000 | | | 2.900%, 2/15/2018 | | | 287,874 | |
| | | | WEA Finance, LLC | | | | |
| | 245,000 | | | 1.750%, 9/15/2017f | | | 245,520 | |
| | | | Wells Fargo & Company | | | | |
| | 265,000 | | | 2.100%, 5/8/2017 | | | 270,721 | |
| | 210,000 | | | 1.400%, 9/8/2017 | | | 210,008 | |
| | | | | |
| | | | Total | | | 32,542,836 | |
| | | | | |
| |
| Foreign Government (<0.1%) | | | | |
| | | | European Investment Bank | | | | |
| | 215,000 | | | 1.875%, 3/15/2019 | | | 217,462 | |
| | 180,000 | | | 2.125%, 10/15/2021 | | | 179,685 | |
| | | | Kommunalbanken AS | | | | |
| | 190,000 | | | 1.500%, 10/22/2019f | | | 186,078 | |
| | | | | |
| | | | Total | | | 583,225 | |
| | | | | |
| |
| Mortgage-Backed Securities (4.5%) | | | | |
| | | | Federal Home Loan Mortgage Corporation Gold 15-Yr. Pass Through | | | | |
| | 4,287,500 | | | 3.000%, 11/1/2029c | | | 4,439,573 | |
| | | | Federal Home Loan Mortgage Corporation Gold 30-Yr. Pass Through | | | | |
| | 1,137,524 | | | 1.961%, 6/1/2043g | | | 1,163,046 | |
| | 4,787,500 | | | 4.000%, 11/1/2044c | | | 5,078,864 | |
| | | | Federal National Mortgage Association Conventional 15-Yr. Pass Through | | | | |
| | 7,525,000 | | | 3.500%, 11/1/2029c | | | 7,950,631 | |
| | | | Federal National Mortgage Association Conventional 30-Yr. Pass Through | | | | |
| | 573,657 | | | 2.078%, 1/1/2043g | | | 594,710 | |
| | 948,680 | | | 2.055%, 3/1/2043g | | | 982,146 | |
| | 875,884 | | | 1.738%, 7/1/2043g | | | 892,312 | |
| | 2,117,764 | | | 2.012%, 7/1/2043g | | | 2,171,075 | |
| | 1,858,290 | | | 2.107%, 8/1/2043g | | | 1,910,541 | |
| | 18,250,000 | | | 3.500%, 11/1/2044c | | | 18,871,632 | |
| | 16,350,000 | | | 4.000%, 11/1/2044c | | | 17,359,102 | |
| | 17,104,000 | | | 4.500%, 11/1/2044c | | | 18,536,460 | |
| | | | | |
| | | | Total | | | 79,950,092 | |
| | | | | |
| |
| Technology (0.2%) | | | | |
| | | | Amphenol Corporation | | | | |
| | 90,000 | | | 2.550%, 1/30/2019 | | | 90,998 | |
| | | | Apple, Inc. | | | | |
| | 210,000 | | | 0.537%, 5/6/2019g | | | 210,187 | |
| | | | Baidu, Inc. | | | | |
| | 200,000 | | | 2.750%, 6/9/2019 | | | 200,731 | |
| | | | EMC Corporation | | | | |
| | 252,000 | | | 1.875%, 6/1/2018 | | | 250,499 | |
| | | | Fidelity National Information Services, Inc. | | | | |
| | 245,000 | | | 1.450%, 6/5/2017 | | | 244,154 | |
| | | | First Data Corporation | | | | |
| | 270,000 | | | 7.375%, 6/15/2019f | | | 286,200 | |
| | | | Freescale Semiconductor, Inc. | | | | |
| | 325,000 | | | 6.000%, 1/15/2022f | | | 333,125 | |
| | | | Hewlett-Packard Company | | | | |
| | 252,000 | | | 5.400%, 3/1/2017 | | | 274,080 | |
| | | | Iron Mountain, Inc. | | | | |
| | 270,000 | | | 6.000%, 8/15/2023 | | | 284,850 | |
| | | | Micron Semiconductor Asia Pte, Ltd. | | | | |
| | 99,000 | | | 1.258%, 1/15/2019 | | | 98,792 | |
| | | | Samsung Electronics America, Inc. | | | | |
| | 128,000 | | | 1.750%, 4/10/2017f | | | 128,753 | |
| | | | Tyco Electronics Group SA | | | | |
| | 252,000 | | | 6.550%, 10/1/2017 | | | 286,859 | |
| | | | Xerox Corporation | | | | |
| | 166,000 | | | 7.200%, 4/1/2016 | | | 180,265 | |
| | | | Xilinx, Inc. | | | | |
| | 110,000 | | | 2.125%, 3/15/2019 | | | 109,964 | |
| | | | | |
| | | | Total | | | 2,979,457 | |
| | | | | |
| |
| Transportation (0.1%) | | | | |
| | | | American Airlines Pass Through Trust | | | | |
| | 151,035 | | | 4.950%, 1/15/2023 | | | 161,607 | |
| | | | Avis Budget Car Rental, LLC | | | | |
| | 325,000 | | | 5.125%, 6/1/2022f | | | 321,100 | |
| | | | Canadian Pacific Railway Company | | | | |
| | 90,000 | | | 7.125%, 10/15/2031 | | | 124,363 | |
| | 104,000 | | | 5.750%, 3/15/2033 | | | 123,882 | |
| | | | Continental Airlines, Inc. | | | | |
| | 175,973 | | | 4.150%, 4/11/2024 | | | 179,492 | |
The accompanying Notes to Financial Statements are an integral part of this schedule.
102
MODERATE ALLOCATION FUND
Schedule of Investments as of October 31, 2014
| | | | | | | | |
Principal
Amount | | | Long-Term Fixed Income (17.7%) | | Value | |
| Transportation (0.1%) - continued | |
| | | | CSX Corporation | | | | |
| $ | 126,000 | | | 3.700%, 11/1/2023 | | | $131,018 | |
| | | | Delta Air Lines, Inc. | | | | |
| | 250,000 | | | 6.750%, 5/23/2017 | | | 260,000 | |
| | 94,263 | | | 4.950%, 5/23/2019 | | | 100,390 | |
| | 38,562 | | | 4.750%, 5/7/2020 | | | 41,069 | |
| | | | ERAC USA Finance, LLC | | | | |
| | 162,000 | | | 1.400%, 4/15/2016f | | | 163,101 | |
| | 84,000 | | | 2.800%, 11/1/2018f | | | 86,081 | |
| | | | Korea Expressway Corporation | | | | |
| | 216,000 | | | 1.625%, 4/28/2017f | | | 215,337 | |
| | | | Virgin Australia Holdings, Ltd. | | | | |
| | 67,126 | | | 5.000%, 10/23/2023f | | | 69,395 | |
| | | | | |
| | | | Total | | | 1,976,835 | |
| | | | | |
| |
| U.S. Government and Agencies (5.2%) | | | | |
| | | | U.S. Treasury Bonds | | | | |
| | 550,000 | | | 5.250%, 11/15/2028 | | | 719,469 | |
| | 1,175,000 | | | 4.375%, 5/15/2040 | | | 1,471,871 | |
| | 10,630,000 | | | 3.000%, 5/15/2042 | | | 10,538,646 | |
| | | | U.S. Treasury Notes | | | | |
| | 10,500,000 | | | 0.375%, 3/31/2016 | | | 10,512,306 | |
| | 3,620,000 | | | 0.625%, 12/15/2016 | | | 3,623,960 | |
| | 4,550,000 | | | 0.875%, 7/15/2017 | | | 4,556,752 | |
| | 6,035,000 | | | 1.000%, 5/31/2018 | | | 5,988,325 | |
| | 11,605,000 | | | 1.250%, 10/31/2018 | | | 11,551,513 | |
| | 1,220,000 | | | 1.625%, 4/30/2019 | | | 1,225,433 | |
| | 1,200,000 | | | 1.625%, 6/30/2019 | | | 1,203,844 | |
| | 5,690,000 | | | 1.875%, 6/30/2020 | | | 5,711,337 | |
| | 1,000,000 | | | 2.125%, 9/30/2021 | | | 1,005,625 | |
| | 1,685,000 | | | 1.625%, 8/15/2022 | | | 1,623,787 | |
| | 5,200,000 | | | 2.500%, 8/15/2023 | | | 5,306,844 | |
| | 12,900,000 | | | 3.625%, 2/15/2044 | | | 14,315,981 | |
| | | | U.S. Treasury Notes, TIPS | | | | |
| | 6,071,100 | | | 0.125%, 4/15/2018 | | | 6,146,042 | |
| | 7,110,519 | | | 0.125%, 1/15/2023 | | | 6,959,975 | |
| | | | | |
| | | | Total | | | 92,461,710 | |
| | | | | |
| |
| Utilities (0.4%) | | | | |
| | | | AES Corporation | | | | |
| | 270,000 | | | 7.375%, 7/1/2021 | | | 308,053 | |
| | | | American Electric Power Company, Inc. | | | | |
| | 160,000 | | | 1.650%, 12/15/2017 | | | 160,370 | |
| | | | Atlas Pipeline Partners, LP | | | | |
| | 270,000 | | | 4.750%, 11/15/2021 | | | 269,325 | |
| | | | Calpine Corporation | | | | |
| | 325,000 | | | 5.375%, 1/15/2023 | | | 328,250 | |
| | | | Commonwealth Edison Company | | | | |
| | 105,000 | | | 6.950%, 7/15/2018 | | | 122,159 | |
| | | | Dayton Power and Light Company | | | | |
| | 144,000 | | | 1.875%, 9/15/2016 | | | 145,609 | |
| | | | DCP Midstream Operating, LP | | | | |
| | 216,000 | | | 2.500%, 12/1/2017 | | | 220,215 | |
| | | | Duke Energy Corporation | | | | |
| | 180,000 | | | 0.613%, 4/3/2017g | | | 180,603 | |
| | 216,000 | | | 2.100%, 6/15/2018 | | | 218,568 | |
| | | | Dynegy Finance I, Inc./ Dynegy Finance II, Inc. | | | | |
| | 200,000 | | | 6.750%, 11/1/2019f | | | 207,000 | |
| | | | Enel Finance International NV | | | | |
| | 108,000 | | | 6.250%, 9/15/2017f | | | 121,491 | |
| | | | Energy Transfer Partners, LP | | | | |
| | 64,000 | | | 9.700%, 3/15/2019 | | | 81,981 | |
| | 280,000 | | | 4.650%, 6/1/2021 | | | 298,838 | |
| | | | Enterprise Products Operating, LLC | | | | |
| | 100,000 | | | 7.034%, 1/15/2068 | | | 111,250 | |
| | 198,000 | | | 5.100%, 2/15/2045 | | | 209,610 | |
| | | | Exelon Generation Company, LLC | | | | |
| | 247,000 | | | 5.200%, 10/1/2019 | | | 276,288 | |
| | | | ITC Holdings Corporation | | | | |
| | 84,000 | | | 4.050%, 7/1/2023 | | | 87,837 | |
| | | | MidAmerican Energy Holdings Company | | | | |
| | 131,000 | | | 1.100%, 5/15/2017 | | | 130,490 | |
| | 198,000 | | | 5.750%, 4/1/2018 | | | 224,150 | |
| | 180,000 | | | 6.500%, 9/15/2037 | | | 236,931 | |
| | | | NiSource Finance Corporation | | | | |
| | 157,000 | | | 6.400%, 3/15/2018 | | | 179,460 | |
| | 216,000 | | | 6.800%, 1/15/2019 | | | 255,322 | |
| | | | Northeast Utilities | | | | |
| | 96,000 | | | 1.450%, 5/1/2018 | | | 94,569 | |
| | | | Northern States Power Company | | | | |
| | 350,000 | | | 4.125%, 5/15/2044 | | | 358,430 | |
| | | | NRG Energy, Inc. | | | | |
| | 270,000 | | | 6.625%, 3/15/2023 | | | 284,850 | |
| | | | ONEOK Partners, LP | | | | |
| | 141,000 | | | 8.625%, 3/1/2019 | | | 174,606 | |
| | | | Pacific Gas & Electric Company | | | | |
| | 315,000 | | | 5.625%, 11/30/2017 | | | 353,328 | |
| | | | PG&E Corporation | | | | |
| | 110,000 | | | 2.400%, 3/1/2019 | | | 110,410 | |
| | | | PPL Capital Funding, Inc. | | | | |
| | 379,000 | | | 1.900%, 6/1/2018 | | | 378,365 | |
| | 105,000 | | | 3.500%, 12/1/2022 | | | 106,105 | |
| | | | Sempra Energy | | | | |
| | 350,000 | | | 6.150%, 6/15/2018 | | | 400,632 | |
| | | | Southern Company | | | | |
| | 175,000 | | | 1.300%, 8/15/2017 | | | 174,484 | |
| | | | TransAlta Corporation | | | | |
| | 245,000 | | | 1.900%, 6/3/2017 | | | 244,732 | |
| | | | Williams Companies, Inc. | | | | |
| | 140,000 | | | 7.875%, 9/1/2021 | | | 169,034 | |
| | | | Williams Partners, LP | | | | |
| | 83,000 | | | 7.250%, 2/1/2017 | | | 92,873 | |
| | | | | |
| | | | Total | | | 7,316,218 | |
| | | | | |
| | | | | |
| | | | | |
| | | | Total Long-Term Fixed Income (cost $308,081,228) | | | 313,956,595 | |
| | | | | |
| | |
| Shares | | | Collateral Held for Securities Loaned (0.1%) | | Value | |
| | 880,533 | | | Thrivent Cash Management Trust | | | 880,533 | |
| | | | | |
| | | | Total Collateral Held for Securities Loaned (cost $880,533) | | | 880,533 | |
| | | | | |
The accompanying Notes to Financial Statements are an integral part of this schedule.
103
MODERATE ALLOCATION FUND
Schedule of Investments as of October 31, 2014
| | | | | | | | |
Shares or
Principal
Amount | | | Short-Term Investments (8.1%)m | | Value | |
| | | | Federal Home Loan Bank Discount Notes | | | | |
| | 2,600,000 | | | 0.075%, 11/5/2014e | | | $2,599,978 | |
| | 19,000,000 | | | 0.055%, 11/12/2014 | | | 18,999,681 | |
| | 5,000,000 | | | 0.045%, 11/14/2014 | | | 4,999,919 | |
| | 8,000,000 | | | 0.025%, 11/21/2014 | | | 7,999,889 | |
| | 12,000,000 | | | 0.020%, 11/26/2014 | | | 11,999,833 | |
| | 7,000,000 | | | 0.064%, 12/3/2014 | | | 6,999,603 | |
| | 2,000,000 | | | 0.070%, 12/5/2014e | | | 1,999,868 | |
| | 9,535,000 | | | 0.055%, 12/12/2014 | | | 9,534,403 | |
| | 22,000,000 | | | 0.050%, 12/17/2014 | | | 21,998,594 | |
| | 12,000,000 | | | 0.070%, 12/24/2014 | | | 11,998,763 | |
| | 2,000,000 | | | 0.040%, 1/2/2015 | | | 1,999,862 | |
| | 3,000,000 | | | 0.040%, 1/12/2015 | | | 2,999,760 | |
| | 7,000,000 | | | 0.055%, 1/21/2015 | | | 6,999,134 | |
| | 12,000,000 | | | 0.065%, 1/23/2015 | | | 11,998,202 | |
| | 14,000,000 | | | 0.065%, 1/30/2015 | | | 13,997,725 | |
| | 1,100,000 | | | 0.090%, 4/24/2015e | | | 1,099,521 | |
| | | | Federal Home Loan Mortgage Corporation Discount Notes | | | | |
| | 4,000,000 | | | 0.030%, 12/10/2014e | | | 3,999,870 | |
| | | | Federal National Mortgage Association Discount Notes | | | | |
| | 2,000,000 | | | 0.045%, 1/5/2015e | | | 1,999,838 | |
| | | | U.S. Treasury Bills | | | | |
| | 100,000 | | | 0.000%, 11/28/2014n | | | 100,000 | |
| | | | | |
| | | | Total Short-Term Investments (at amortized cost) | | | 144,324,443 | |
| | | | | |
| | | | Total Investments (cost $1,587,615,875) 103.9% | | $ | 1,842,283,541 | |
| | | | | |
| | | | Other Assets and Liabilities, Net (3.9%) | | | (69,504,283 | ) |
| | | | | |
| | | | Total Net Assets 100.0% | | $ | 1,772,779,258 | |
| | | | | |
a | The stated interest rate represents the weighted average of all contracts within the bank loan facility. |
b | All or a portion of the loan is unfunded. |
c | Denotes investments purchased on a when-issued or delayed delivery basis. |
d | Non-income producing security. |
e | At October 31, 2014, $14,604,703 of investments were held on deposit with the counterparty and pledged as the initial margin deposit for open futures contracts. |
f | Denotes securities sold under Rule 144A of the Securities Act of 1933, which exempts them from registration. These securities have been deemed liquid and may be resold to other dealers in the program or to other qualified institutional buyers. As of October 31, 2014, the value of these investments was $31,143,360 or 1.8% of total net assets. |
g | Denotes variable rate securities. Variable rate securities are securities whose yields vary with a designated market index or market rate. The rate shown is as of October 31, 2014. |
h | Denotes step coupon securities. Step coupon securities pay an initial coupon rate for the first period and then different coupon rates for following periods. The rate shown is as of October 31, 2014. |
i | All or a portion of the security is on loan. |
j | Denotes interest only security. Interest only securities represent the right to receive monthly interest payments on an underlying pool of mortgages or assets. The principal shown is the outstanding par amount of the pool as of the end of the period. The actual effective yield of the security is different than the stated coupon rate. |
k | Security is fair valued. |
l | Denotes perpetual securities. Perpetual securities pay an indefinite stream of interest, but may be called by the issuer at an earlier date. |
m | The interest rate shown reflects the yield, coupon rate or the discount rate at the date of purchase. |
n | At October 31, 2014, $100,000 of investments were pledged as collateral with the custodian under the agreement between the counterparty, the custodian and the fund for open swap contracts. |
* | Denotes restricted securities. Restricted securities are investment securities which have been deemed illiquid and cannot be offered for public sale without first being registered under the Securities Act of 1933. The following table indicates the acquisition date and cost of restricted securities Moderate Allocation Fund owned as of October 31, 2014. |
| | | | | | | | |
Security | | Acquisition
Date | | | Cost | |
Alm Loan Funding CLO, 10/17/2026 | | | 7/31/2014 | | | $ | 209,895 | |
Apidos CLO XVIII, 7/22/2026 | | | 6/25/2014 | | | | 214,463 | |
Babson CLO, Ltd., 10/17/2026 | | | 8/15/2014 | | | | 209,895 | |
Birchwood Park CLO, Ltd., 7/15/2026 | | | 7/31/2014 | | | | 210,000 | |
BlueMountain CLO, Ltd., 10/15/2026 | | | 8/27/2014 | | | | 209,788 | |
Carlyle Global Market Strategies CLO, Ltd., 7/20/2023 | | | 7/3/2014 | | | | 215,000 | |
Carlyle Global Market Strategies CLO, Ltd., 10/15/2026 | | | 9/19/2014 | | | | 200,000 | |
Cent CLO 16, LP, 8/1/2024 | | | 9/5/2014 | | | | 210,000 | |
Cent CLO 22, Ltd., 11/7/2026 | | | 9/19/2014 | | | | 200,000 | |
CoBank ACB, 6/15/2022 | | | 10/18/2013 | | | | 79,983 | |
Dryden 34 Senior Loan Fund CLO, 10/15/2026 | | | 7/21/2014 | | | | 210,000 | |
Edlinc Student Loan Funding Trust, 10/1/2025 | | | 2/28/2013 | | | | 66,553 | |
FNA Trust, 1/10/2018 | | | 4/29/2013 | | | | 83,343 | |
GoldenTree Loan Opportunities IX, Ltd., 10/29/2026 | | | 10/3/2014 | | | | 199,800 | |
JBS Finance II, Ltd., 1/29/2018 | | | 8/11/2014 | | | | 342,216 | |
Limerock CLO III, LLC, 10/20/2026 | | | 10/16/2014 | | | | 650,000 | |
Madison Park Funding XIV CLO, Ltd., 7/20/2026 | | | 7/3/2014 | | | | 229,724 | |
Neuberger Berman CLO, Ltd., 8/4/2025 | | | 6/19/2014 | | | | 150,000 | |
Octagon Investment Partners XX CLO, Ltd., 8/12/2026 | | | 7/10/2014 | | | | 210,000 | |
OZLM VIII, Ltd., 10/17/2026 | | | 8/7/2014 | | | | 208,803 | |
Symphony CLO XV, Ltd., 10/17/2026 | | | 10/17/2014 | | | | 645,125 | |
Symphony CLO, Ltd., 1/9/2023 | | | 9/15/2014 | | | | 210,000 | |
Voya CLO 2014-3, Ltd., 7/25/2026 | | | 7/10/2014 | | | | 209,685 | |
Definitions:
| | |
ADR | | - American Depositary Receipt, which are certificates for an underlying foreign security’s shares held by an issuing U.S. depository bank. |
CLO | | - Collateralized Loan Obligation |
ETF | | - Exchange Traded Fund. |
REIT | | - Real Estate Investment Trust is a company that buys, develops, manages and/or sells real estate assets. |
TIPS | | - Treasury Inflation Protected Security. |
The accompanying Notes to Financial Statements are an integral part of this schedule.
104
MODERATE ALLOCATION FUND
Schedule of Investments as of October 31, 2014
Unrealized Appreciation (Depreciation)
Gross unrealized appreciation and depreciation of investments, based on cost for federal income tax purposes, were as follows:
| | | | |
Gross unrealized appreciation | | | $250,941,859 | |
Gross unrealized depreciation | | | (7,970,453 | ) |
| | | | |
Net unrealized appreciation (depreciation) | | | $242,971,406 | |
| |
Cost for federal income tax purposes | | | $1,599,312,135 | |
The accompanying Notes to Financial Statements are an integral part of this schedule.
105
MODERATE ALLOCATION FUND
Schedule of Investments as of October 31, 2014
Fair Valuation Measurements
The following table is a summary of the inputs used, as of October 31, 2014, in valuing Moderate Allocation Fund’s assets carried at fair value.
| | | | | | | | | | | | | | | | |
Investments in Securities | | Total | | | Level 1 | | | Level 2 | | | Level 3 | |
| | | | |
Bank Loans | | | | | | | | | | | | | | | | |
Basic Materials | | | 5,750,784 | | | | – | | | | 5,750,784 | | | | – | |
Capital Goods | | | 2,714,745 | | | | – | | | | 2,714,745 | | | | – | |
Communications Services | | | 26,212,839 | | | | – | | | | 25,228,689 | | | | 984,150 | |
Consumer Cyclical | | | 12,236,363 | | | | – | | | | 11,509,531 | | | | 726,832 | |
Consumer Non-Cyclical | | | 7,819,515 | | | | – | | | | 7,104,465 | | | | 715,050 | |
Energy | | | 4,188,540 | | | | – | | | | 4,188,540 | | | | – | |
Financials | | | 2,965,604 | | | | – | | | | 2,965,604 | | | | – | |
Technology | | | 3,319,928 | | | | – | | | | 3,319,928 | | | | – | |
Transportation | | | 2,812,152 | | | | – | | | | 1,921,013 | | | | 891,139 | |
Utilities | | | 1,998,262 | | | | – | | | | 1,998,262 | | | | – | |
| | | | |
Mutual Funds | | | | | | | | | | | | | | | | |
Equity Mutual Funds | | | 637,868,341 | | | | 637,868,341 | | | | – | | | | – | |
Fixed Income Mutual Funds | | | 355,249,069 | | | | 355,249,069 | | | | – | | | | – | |
| | | | |
Common Stock | | | | | | | | | | | | | | | | |
Consumer Discretionary | | | 41,378,561 | | | | 40,192,638 | | | | 1,185,923 | | | | – | |
Consumer Staples | | | 13,440,006 | | | | 12,908,498 | | | | 531,508 | | | | – | |
Energy | | | 25,303,232 | | | | 24,018,408 | | | | 1,284,824 | | | | – | |
Financials | | | 64,782,151 | | | | 61,826,448 | | | | 2,955,703 | | | | – | |
Health Care | | | 48,314,385 | | | | 47,612,356 | | | | 702,029 | | | | – | |
Industrials | | | 39,763,240 | | | | 38,392,523 | | | | 1,370,717 | | | | – | |
Information Technology | | | 67,984,997 | | | | 67,215,575 | | | | 769,422 | | | | – | |
Materials | | | 9,909,198 | | | | 9,479,832 | | | | 429,366 | | | | – | |
Telecommunications Services | | | 2,950,255 | | | | 2,312,788 | | | | 637,467 | | | | – | |
Utilities | | | 6,159,803 | | | | 5,519,249 | | | | 640,554 | | | | – | |
| | | | |
Long-Term Fixed Income | | | | | | | | | | | | | | | | |
Asset-Backed Securities | | | 16,685,465 | | | | – | | | | 16,535,046 | | | | 150,419 | |
Basic Materials | | | 3,533,777 | | | | – | | | | 3,533,777 | | | | – | |
Capital Goods | | | 3,422,434 | | | | – | | | | 3,422,434 | | | | – | |
Collateralized Mortgage Obligations | | | 17,114,126 | | | | – | | | | 15,819,001 | | | | 1,295,125 | |
Commercial Mortgage-Backed Securities | | | 19,287,051 | | | | – | | | | 19,287,051 | | | | – | |
Communications Services | | | 11,567,631 | | | | – | | | | 11,567,631 | | | | – | |
Consumer Cyclical | | | 6,149,973 | | | | – | | | | 6,149,973 | | | | – | |
Consumer Non-Cyclical | | | 9,937,713 | | | | – | | | | 9,937,713 | | | | – | |
Energy | | | 8,448,052 | | | | – | | | | 8,448,052 | | | | – | |
Financials | | | 32,542,836 | | | | – | | | | 32,542,836 | | | | – | |
Foreign Government | | | 583,225 | | | | – | | | | 583,225 | | | | – | |
Mortgage-Backed Securities | | | 79,950,092 | | | | – | | | | 79,950,092 | | | | – | |
Technology | | | 2,979,457 | | | | – | | | | 2,979,457 | | | | – | |
Transportation | | | 1,976,835 | | | | – | | | | 1,976,835 | | | | – | |
U.S. Government and Agencies | | | 92,461,710 | | | | – | | | | 92,461,710 | | | | – | |
Utilities | | | 7,316,218 | | | | – | | | | 7,316,218 | | | | – | |
Collateral Held for Securities Loaned | | | 880,533 | | | | 880,533 | | | | – | | | | – | |
Short-Term Investments | | | 144,324,443 | | | | – | | | | 144,324,443 | | | | – | |
| |
Total | | | $ 1,842,283,541 | | | | $ 1,303,476,258 | | | | $ 534,044,568 | | | | $ 4,762,715 | |
| |
| | | | |
Other Financial Instruments | | Total | | | Level 1 | | | Level 2 | | | Level 3 | |
| | | | |
Asset Derivatives | | | | | | | | | | | | | | | | |
Futures Contracts | | | 11,046,184 | | | | 11,046,184 | | | | – | | | | – | |
Credit Default Swaps | | | 8,416 | | | | – | | | | 8,416 | | | | – | |
| |
Total Asset Derivatives | | | $11,054,600 | | | | $11,046,184 | | | | $8,416 | | | | $– | |
| |
| |
| | | | |
Liability Derivatives | | | | | | | | | | | | | | | | |
Futures Contracts | | | 6,811,534 | | | | 6,811,534 | | | | – | | | | – | |
| |
Total Liability Derivatives | | | $6,811,534 | | | | $6,811,534 | | | | $– | | | | $– | |
| |
| |
There were no significant transfers between Levels during the period ended October 31, 2014. Transfers between Levels are identified as of the end of the period.
The accompanying Notes to Financial Statements are an integral part of this schedule.
106
MODERATE ALLOCATION FUND
Schedule of Investments as of October 31, 2014
| | | | | | | | | | | | | | | | | | | | |
Futures Contracts | | Number of
Contracts
Long/(Short) | | | Expiration
Date | | | Notional
Principal
Amount | | | Value | | | Unrealized
Gain/
(Loss) | |
2-Yr. U.S. Treasury Bond Futures | | | (787 | ) | | | December 2014 | | | | ($172,299,800 | ) | | | ($172,795,687 | ) | | | ($495,887 | ) |
5-Yr. U.S. Treasury Bond Futures | | | (189 | ) | | | December 2014 | | | | (22,336,247 | ) | | | (22,572,211 | ) | | | (235,964 | ) |
10-Yr. U.S. Treasury Bond Futures | | | 293 | | | | December 2014 | | | | 36,497,151 | | | | 37,023,298 | | | | 526,147 | |
30-Yr. U.S. Treasury Bond Futures | | | 630 | | | | December 2014 | | | | 87,379,030 | | | | 88,889,062 | | | | 1,510,032 | |
Eurex EURO STOXX 50 Futures | | | 1,725 | | | | December 2014 | | | | 69,346,840 | | | | 67,249,903 | | | | (2,096,937 | ) |
Mini MSCI EAFE Index Futures | | | 41 | | | | December 2014 | | | | 3,510,185 | | | | 3,763,800 | | | | 253,615 | |
Russell 2000 Index Mini-Futures | | | 28 | | | | December 2014 | | | | 2,995,782 | | | | 3,278,800 | | | | 283,018 | |
S&P 400 Index Mini-Futures | | | (840 | ) | | | December 2014 | | | | (114,910,854 | ) | | | (118,893,600 | ) | | | (3,982,746 | ) |
S&P 500 Index Futures | | | 278 | | | | December 2014 | | | | 131,630,791 | | | | 139,792,300 | | | | 8,161,509 | |
Ultra Long Term U.S. Treasury Bond Futures | | | 96 | | | | December 2014 | | | | 14,742,137 | | | | 15,054,000 | | | | 311,863 | |
Total Futures Contracts | | | | | | | | | | | | | | | | | | | $4,234,650 | |
| | | | | | | | | | | | | | | | | | |
Credit Default Swaps and Counterparty | | Buy/Sell Protection1 | | Termination
Date | | | Notional
Principal
Amount2 | | | Value3 | | | Unrealized Gain/(Loss) | |
CDX HY 5 Year, at 5.00%; Morgan Stanley and Co. | | Sell | | | 12/20/2019 | | | | ($600,000 | ) | | | $5,522 | | | | $5,522 | |
CDX IG 5 Year, at 1.00%; Morgan Stanley and Co. | | Sell | | | 12/20/2019 | | | | (1,400,000 | ) | | | 2,894 | | | | 2,894 | |
Total Credit Default Swaps | | | | | | | | | | | | | $8,416 | | | | $8,416 | |
1 | As the buyer of protection, Moderate Allocation Fund pays periodic fees in return for payment by the seller which is contingent upon an adverse credit event occurring in the underlying issuer or reference entity. As the seller of protection, Moderate Allocation Fund collects periodic fees from the buyer and profits if the credit of the underlying issuer or reference entity remains stable or improves while the swap is outstanding, but the seller in a credit default swap contract would be required to pay the amount of credit loss, determined as specified in the agreement, to the buyer in the event of an adverse credit event in the reference entity. |
2 | The maximum potential amount of future payments Moderate Allocation Fund could be required to make as the seller or receive as the buyer of protection. |
3 | The values for credit indexes (CDX or LCDX) serve as an indicator of the current status of the payment/performance risk and represent the liability or profit for the credit default swap contract had the contract been closed as of the reporting date. When protection has been sold, the value of the swap will increase when the swap spread declines representing an improvement in the reference entity’s credit worthiness. The value of the swap will decrease when the swap spread increases representing a deterioration in the reference entity’s credit worthiness. When protection has been purchased, the value of the swap will increase when the swap spread increases representing a deterioration in the reference entity’s credit worthiness. The value of the swap will decrease when the swap spread declines representing an improvement in the reference entity’s credit worthiness. |
The accompanying Notes to Financial Statements are an integral part of this schedule.
107
MODERATE ALLOCATION FUND
Schedule of Investments as of October 31, 2014
The following table summarizes the fair value and Statement of Assets and Liabilities location, as of October 31, 2014, for Moderate Allocation Fund’s investments in financial derivative instruments by primary risk exposure as discussed under item (2) Significant Accounting Policies of the Notes to Financial Statements.
| | | | | | |
Derivatives by risk category | | Statement of Assets and Liabilities Location | | Fair Value | |
| | |
Asset Derivatives | | | | | | |
| | |
Interest Rate Contracts | | | | | | |
Futures* | | Net Assets - Net unrealized appreciation/(depreciation) on Futures contracts | | | $2,348,042 | |
Total Interest Rate Contracts | | | | | 2,348,042 | |
| | |
Equity Contracts | | | | | | |
Futures* | | Net Assets - Net unrealized appreciation/(depreciation) on Futures contracts | | | 8,698,142 | |
Total Equity Contracts | | | | | 8,698,142 | |
| | |
Credit Contracts | | | | | | |
Credit Default Swaps | | Net Assets - Net unrealized appreciation/(depreciation) on Swap agreements | | | 8,416 | |
Total Credit Contracts | | | | | 8,416 | |
| |
Total Asset Derivatives | | | | | $11,054,600 | |
| |
| |
| | |
Liability Derivatives | | | | | | |
| | |
Interest Rate Contracts | | | | | | |
Futures* | | Net Assets - Net unrealized appreciation/(depreciation) on Futures contracts | | | 731,851 | |
Total Interest Rate Contracts | | | | | 731,851 | |
| | |
Equity Contracts | | | | | | |
Futures* | | Net Assets - Net unrealized appreciation/(depreciation) on Futures contracts | | | 6,079,683 | |
Total Equity Contracts | | | | | 6,079,683 | |
| |
Total Liability Derivatives | | | | | $6,811,534 | |
| |
| |
* | Includes cumulative appreciation/depreciation of futures contracts as reported in the Schedule of Investments. Only current day’s variation margin is reported within the Statement of Assets and Liabilities. |
The following table summarizes the net realized gains/(losses) and Statement of Operations location, for the period ended October 31, 2014, for Moderate Allocation Fund’s investments in financial derivative instruments by primary risk exposure.
| | | | | | |
Derivatives by risk category | | Statement of Operations Location | | Realized Gains/(Losses)
recognized in Income | |
| | |
Interest Rate Contracts | | | | | | |
Futures | | Net realized gains/(losses) on Futures contracts | | | 7,098,588 | |
| | |
Total Interest Rate Contracts | | | | | 7,098,588 | |
| | |
Equity Contracts | | | | | | |
Futures | | Net realized gains/(losses) on Futures contracts | | | 5,017,350 | |
| | |
Total Equity Contracts | | | | | 5,017,350 | |
| | |
Credit Contracts | | | | | | |
Credit Default Swaps | | Net realized gains/(losses) on Swap agreements | | | (257,880) | |
| | |
Total Credit Contracts | | | | | (257,880) | |
| |
Total | | | | | $11,858,058 | |
| |
| |
The following table summarizes the change in net unrealized appreciation/(depreciation) and Statement of Operations location, for the period ended October 31, 2014, for Moderate Allocation Fund’s investments in financial derivative instruments by primary risk exposure.
| | | | | | |
Derivatives by risk category | | Statement of Operations Location | | Change in unrealized
appreciation/(depreciation)
recognized in Income | |
| | |
Interest Rate Contracts | | | | | | |
Futures | | Change in net unrealized appreciation/(depreciation) on Futures contracts | | | 1,143,206 | |
| | |
Total Interest Rate Contracts | | | | | 1,143,206 | |
| | |
Equity Contracts | | | | | | |
Futures | | Change in net unrealized appreciation/(depreciation) on Futures contracts | | | (1,613,848) | |
| | |
Total Equity Contracts | | | | | (1,613,848) | |
| | |
Credit Contracts | | | | | | |
Credit Default Swaps | | Change in net unrealized appreciation/(depreciation) on Swap agreements | | | (38,841) | |
| | |
Total Credit Contracts | | | | | (38,841) | |
| |
Total | | | | | ($509,483) | |
| |
| |
The accompanying Notes to Financial Statements are an integral part of this schedule.
108
MODERATE ALLOCATION FUND
Schedule of Investments as of October 31, 2014
The following table presents Moderate Allocation Fund’s average volume of derivative activity during the period ended October 31, 2014.
| | | | | | |
Derivative Risk Category | | Futures
(Notional)* | | Futures
(Percentage of
Average Net
Assets) | | Swaps
(Notional)* |
Equity Contracts | | $194,826,564 | | 11.4% | | N/A |
Interest Rate Contracts | | 222,232,523 | | 13.0 | | N/A |
Credit Contracts | | N/A | | N/A | | $188,378 |
* | Notional amount represents long or short, or both, derivative positions held by the Fund. |
Investment in Affiliates
Affiliated issuers, as defined under the Investment Company Act of 1940, include those in which the Fund’s holdings of an issuer represent 5% or more of the outstanding voting securities of an issuer, or any affiliated mutual fund.
A summary of transactions for the fiscal year to date, in Moderate Allocation Fund, is as follows:
| | | | | | | | | | | | | | | | | | | | | | | | |
Fund | | Value
October 31, 2013 | | | Gross
Purchases | | | Gross Sales | | | Shares Held at October 31, 2014 | | | Value
October 31, 2014 | | | Income Earned
November 1, 2013 -
October 31, 2014 | |
Natural Resources | | | $28,391,795 | | | | $201,866 | | | | $– | | | | 2,784,907 | | | | $26,094,578 | | | | $201,866 | |
Partner Small Cap Growth | | | 34,662,005 | | | | 4,650,982 | | | | 34,649,606 | | | | – | | | | – | | | | – | |
Partner Small Cap Value | | | 32,557,322 | | | | 1,037,834 | | | | – | | | | 1,548,575 | | | | 34,548,712 | | | | 121,413 | |
Small Cap Stock | | | 18,516,616 | | | | 128,286 | | | | – | | | | 888,631 | | | | 20,367,428 | | | | – | |
Mid Cap Growth | | | 16,342,089 | | | | 1,807,501 | | | | – | | | | 744,157 | | | | 17,934,192 | | | | – | |
Partner Mid Cap Value | | | 33,727,203 | | | | 6,369,497 | | | | – | | | | 2,538,489 | | | | 38,711,952 | | | | 175,774 | |
Mid Cap Stock | | | 58,058,777 | | | | 206,163 | | | | – | | | | 2,637,150 | | | | 67,352,823 | | | | 206,162 | |
Partner Worldwide Allocation | | | 157,435,673 | | | | 3,225,608 | | | | – | | | | 15,509,964 | | | | 156,805,733 | | | | 3,225,608 | |
Large Cap Growth | | | 86,452,682 | | | | 319,027 | | | | – | | | | 11,340,537 | | | | 101,611,209 | | | | 319,027 | |
Large Cap Value | | | 121,106,616 | | | | 1,604,194 | | | | – | | | | 6,548,778 | | | | 136,214,577 | | | | 1,604,194 | |
Large Cap Stock | | | 34,275,906 | | | | 3,343,277 | | | | – | | | | 1,365,743 | | | | 38,227,137 | | | | 283,272 | |
High Yield | | | 48,237,443 | | | | 2,906,166 | | | | 1,754,426 | | | | 9,683,266 | | | | 48,900,495 | | | | 2,906,224 | |
Income | | | 168,298,285 | | | | 6,546,451 | | | | 7,236,492 | | | | 18,464,184 | | | | 171,532,271 | | | | 6,546,392 | |
Government Bond | | | 23,726,175 | | | | 600,234 | | | | 618,237 | | | | 2,366,570 | | | | 23,784,028 | | | | 333,431 | |
Limited Maturity Bond | | | 114,167,422 | | | | 2,521,689 | | | | 4,845,610 | | | | 8,925,424 | | | | 111,032,275 | | | | 1,868,257 | |
Cash Management Trust-Collateral Investment | | | 2,115,760 | | | | 61,151,832 | | | | 62,387,059 | | | | 880,533 | | | | 880,533 | | | | 9,147 | |
Total Value and Income Earned | | | 978,071,769 | | | | | | | | | | | | | | | | 993,997,943 | | | | 17,800,767 | |
The accompanying Notes to Financial Statements are an integral part of this schedule.
109
MODERATELY CONSERVATIVE ALLOCATION FUND
Schedule of Investments as of October 31, 2014
| | | | | | | | |
Principal Amount | | | Bank Loans (5.2%)a | | Value | |
| Basic Materials (0.3%) | | | | |
| | | | Axalta Coating Systems US Holdings, Inc., Term Loan | | | | |
| | $349,288 | | | 3.750%, 2/1/2020 | | | $343,396 | |
| | | | Fortescue Metals Group, Ltd., Term Loan | | | | |
| | 1,342,737 | | | 3.750%, 6/30/2019 | | | 1,308,712 | |
| | | | Ineos Group Holdings, Ltd., Term Loan | | | | |
| | 598,987 | | | 3.750%, 5/4/2018 | | | 590,751 | |
| | | | Wausau Paper Corporation, Term Loan | | | | |
| | 324,187 | | | 6.500%, 7/30/2020 | | | 320,135 | |
| | | | | |
| | | | Total | | | 2,562,994 | |
| | | | | |
|
| Capital Goods (0.2%) | |
| | | | ADS Waste Holdings, Inc., Term Loan | | | | |
| | 476,513 | | | 3.750%, 10/9/2019 | | | 465,910 | |
| | | | Berry Plastics Group, Inc., Term Loan | | | | |
| | 778,150 | | | 3.500%, 2/8/2020 | | | 761,132 | |
| | | | Silver II Borrower, Term Loan | | | | |
| | 197,972 | | | 4.000%, 12/13/2019 | | | 194,343 | |
| | | | STHI Holding Corporation, Term Loan | | | | |
| | 95,000 | | | 4.500%, 8/6/2021 | | | 94,406 | |
| | | | | |
| | | | Total | | | 1,515,791 | |
| | | | | |
|
| Communications Services (2.5%) | |
| | | | Atlantic Broadband Penn, LLC, Term Loan | | | | |
| | 246,583 | | | 3.250%, 11/30/2019 | | | 243,316 | |
| | | | Birch Communication Inc., Term Loan | | | | |
| | 400,000 | | | 7.750%, 7/17/2020 | | | 384,000 | |
| | | | Cengage Learning Aquisitions, Term Loan | | | | |
| | 1,139,275 | | | 7.000%, 3/31/2020 | | | 1,139,845 | |
| | | | Cequel Communications, LLC, Term Loan | | | | |
| | 248,470 | | | 3.500%, 2/14/2019 | | | 245,707 | |
| | | | Charter Communications Operating, LLC, Term Loan | | | | |
| | 103,688 | | | 3.000%, 7/1/2020 | | | 101,743 | |
| | | | Clear Channel Communications, Inc., Term Loan | | | | |
| | 4,158 | | | 3.804%, 1/29/2016 | | | 4,120 | |
| | 492,893 | | | 6.904%, 1/30/2019 | | | 464,631 | |
| | 158,523 | | | 7.654%, 7/30/2019 | | | 152,231 | |
| | | | Cumulus Media Holdings, Inc., Term Loan | | | | |
| | 384,334 | | | 4.250%, 12/23/2020 | | | 379,848 | |
| | | | Fairpoint Communications, Term Loan | | | | |
| | 517,125 | | | 7.500%, 2/14/2019 | | | 520,683 | |
| | | | Grande Communications Networks, LLC, Term Loan | | | | |
| | 301,190 | | | 4.500%, 5/29/2020 | | | 297,991 | |
| | | | Hargray Communications Group, Inc., Term Loan | | | | |
| | 554,625 | | | 5.250%, 6/26/2019b,c | | | 553,471 | |
| | | | IMG Worldwide, Inc., Term Loan | | | | |
| | 6,832,875 | | | 5.250%, 5/6/2021 | | | 6,715,008 | |
| | | | Integra Telecom Holdings, Inc., Term Loan | | | | |
| | 300,425 | | | 5.250%, 2/22/2019 | | | 299,148 | |
| | 105,000 | | | 9.750%, 2/21/2020 | | | 103,163 | |
| | | | Intelsat Jackson Holdings SA, Term Loan | | | | |
| | 336,057 | | | 3.750%, 6/30/2019 | | | 333,117 | |
| | | | Level 3 Communications, Inc., Term Loan | | | | |
| | 675,000 | | | 4.000%, 1/15/2020 | | | 671,625 | |
| | | | Level 3 Financing, Inc., Term Loan | | | | |
| | 200,000 | | | 0.000%, 1/31/2022b,c | | | 200,812 | |
| | | | Liberty Cablevision of Puerto Rico, LLC, Term Loan | | | | |
| | 180,000 | | | 4.500%, 1/7/2022 | | | 178,538 | |
| | | | LTS Buyer, LLC, Term Loan | | | | |
| | 227,125 | | | 4.000%, 4/13/2020 | | | 224,286 | |
| | 16,445 | | | 8.000%, 4/12/2021 | | | 16,294 | |
| | | | McGraw-Hill Global Education, LLC, Term Loan | | | | |
| | 468,912 | | | 5.750%, 3/22/2019 | | | 469,353 | |
| | | | Mediacom Broadband, LLC, Term Loan | | | | |
| | 269,500 | | | 4.000%, 1/20/2020 | | | 264,784 | |
| | | | NEP Broadcasting, LLC, Term Loan | | | | |
| | 31,429 | | | 9.500%, 7/22/2020 | | | 31,350 | |
| | | | NEP/NCP Holdco, Inc., Term Loan | | | | |
| | 773,269 | | | 4.250%, 1/22/2020 | | | 753,937 | |
| | | | NTelos, Inc., Term Loan | | | | |
| | 161,700 | | | 5.750%, 11/9/2019 | | | 161,430 | |
| | | | Syniverse Holdings, Inc., Term Loan | | | | |
| | 407,199 | | | 4.000%, 4/23/2019 | | | 399,312 | |
| | | | TNS, Inc., Term Loan | | | | |
| | 304,177 | | | 5.000%, 2/14/2020 | | | 300,947 | |
| | | | Univision Communications, Inc., Term Loan | | | | |
| | 762,283 | | | 4.000%, 3/1/2020 | | | 754,027 | |
| | | | Virgin Media Investment Holdings, Ltd., Term Loan | | | | |
| | 640,000 | | | 3.500%, 6/7/2020 | | | 630,579 | |
| | | | WideOpenWest Finance, LLC, Term Loan | | | | |
| | 679,650 | | | 4.750%, 4/1/2019 | | | 678,481 | |
| | | | XO Communications, LLC, Term Loan | | | | |
| | 139,300 | | | 4.250%, 3/20/2021 | | | 137,849 | |
| | | | Yankee Cable Acquisition, LLC, Term Loan | | | | |
| | 394,490 | | | 4.500%, 3/1/2020 | | | 392,222 | |
| | | | Zayo Group, LLC, Term Loan | | | | |
| | 604,899 | | | 4.000%, 7/2/2019 | | | 599,134 | |
| | | | | |
| | | | Total | | | 18,802,982 | |
| | | | | |
|
| Consumer Cyclical (0.7%) | |
| | | | Amaya Gaming Group, Inc., Term Loan | | | | |
| | 175,000 | | | 5.000%, 8/1/2021 | | | 173,506 | |
| | | | Bally Technologies, Inc., Term Loan | | | | |
| | 231,192 | | | 4.250%, 11/25/2020 | | | 230,181 | |
| | | | Burlington Coat Factory Warehouse Corporation, Term Loan | | | | |
| | 312,787 | | | 4.250%, 8/13/2021 | | | 310,598 | |
| | | | Ceridian Corporation, Term Loan | | | | |
| | 116,333 | | | 4.121%, 5/9/2017 | | | 116,158 | |
| | 116,333 | | | 4.500%, 5/9/2017 | | | 115,279 | |
| | | | Chrysler Group, LLC, Term Loan | | | | |
| | 334,809 | | | 3.500%, 5/24/2017 | | | 332,857 | |
The accompanying Notes to Financial Statements are an integral part of this schedule.
110
MODERATELY CONSERVATIVE ALLOCATION FUND
Schedule of Investments as of October 31, 2014
| | | | | | | | |
Principal Amount | | | Bank Loans (5.2%)a | | Value | |
| Consumer Cyclical (0.7%) - continued | |
| | | | Golden Nugget, Inc., Delayed Draw | | | | |
| | $58,061 | | | 5.500%, 11/21/2019 | | | $58,327 | |
| | | | Golden Nugget, Inc., Term Loan | | | | |
| | 135,476 | | | 5.500%, 11/21/2019 | | | 136,095 | |
| | | | J.C. Penney Corporation, Inc., Term Loan | | | | |
| | 148,125 | | | 6.000%, 5/22/2018 | | | 146,150 | |
| | | | Las Vegas Sands, LLC, Term Loan | | | | |
| | 694,750 | | | 3.250%, 12/19/2020 | | | 692,339 | |
| | | | Marina District Finance Company, Inc., Term Loan | | | | |
| | 578,938 | | | 6.750%, 8/15/2018 | | | 577,132 | |
| | | | MGM Resorts International, Term Loan | | | | |
| | 329,138 | | | 3.500%, 12/20/2019 | | | 325,023 | |
| | | | Mohegan Tribal Gaming Authority, Term Loan | | | | |
| | 744,375 | | | 5.500%, 11/19/2019 | | | 722,044 | |
| | | | Rite Aid Corporation, Term Loan | | | | |
| | 79,003 | | | 3.500%, 2/21/2020 | | | 77,996 | |
| | 160,000 | | | 5.750%, 8/21/2020 | | | 160,800 | |
| | | | ROC Finance, LLC, Term Loan | | | | |
| | 564,300 | | | 5.000%, 6/20/2019 | | | 539,437 | |
| | | | Seminole Indian Tribe of Florida, Term Loan | | | | |
| | 174,525 | | | 3.000%, 4/29/2020 | | | 173,762 | |
| | | | Seven Seas Cruises S de RL, LLC, Term Loan | | | | |
| | 511,058 | | | 3.750%, 12/21/2018 | | | 509,780 | |
| | | | Toys “R” Us, Inc., Term Loan | | | | |
| | 104,336 | | | 5.250%, 5/25/2018 | | | 83,339 | |
| | 271,868 | | | 9.750%, 4/24/2020b,c | | | 246,946 | |
| | | | | |
| | | | Total | | | 5,727,749 | |
| | | | | |
|
| Consumer Non-Cyclical (0.4%) | |
| | | | Albertsons, Inc., Term Loan | | | | |
| | 465,315 | | | 4.750%, 3/21/2019 | | | 464,151 | |
| | | | Biomet, Inc., Term Loan | | | | |
| | 371,855 | | | 3.652%, 7/25/2017 | | | 370,673 | |
| | | | CHS/Community Health Systems, Inc., Term Loan | | | | |
| | 93,420 | | | 3.485%, 1/25/2017 | | | 93,108 | |
| | 248,993 | | | 4.250%, 1/27/2021 | | | 249,070 | |
| | | | Del Monte Corporation, Term Loan | | | | |
| | 62,721 | | | 3.500%, 3/9/2020 | | | 60,252 | |
| | | | Hologic, Inc., Term Loan | | | | |
| | 324,738 | | | 3.250%, 8/1/2019 | | | 322,790 | |
| | | | JBS USA, LLC, Term Loan | | | | |
| | 341,104 | | | 3.750%, 5/25/2018 | | | 335,988 | |
| | | | Roundy’s Supermarkets, Inc., Term Loan | | | | |
| | 509,080 | | | 5.750%, 3/3/2021 | | | 451,809 | |
| | | | Supervalu, Inc., Term Loan | | | | |
| | 470,710 | | | 4.500%, 3/21/2019 | | | 464,322 | |
| | | | Visant Corporation, Term Loan | | | | |
| | 617,736 | | | 7.000%, 9/23/2021 | | | 608,470 | |
| | | | | |
| | | | Total | | | 3,420,633 | |
| | | | | |
|
| Energy (0.3%) | |
| | | | Arch Coal, Inc., Term Loan | | | | |
| | 751,850 | | | 6.250%, 5/16/2018 | | | 662,703 | |
| | | | Energy Solutions, LLC, Term Loan | | | | |
| | 164,588 | | | 6.750%, 5/29/2020 | | | 165,205 | |
| | | | Expro Holdings UK 2, Ltd., Term Loan | | | | |
| | 150,000 | | | 0.000%, 9/2/2021b,c | | | 146,749 | |
| | | | Fieldwood Energy, LLC, Term Loan | | | | |
| | 29,557 | | | 8.375%, 9/30/2020 | | | 28,393 | |
| | | | Houston Fuel Oil Terminal, LLC, Term Loan | | | | |
| | 120,000 | | | 4.250%, 8/19/2021 | | | 117,750 | |
| | | | McJunkin Red Man Corporation, Term Loan | | | | |
| | 237,600 | | | 5.000%, 11/8/2019 | | | 237,897 | |
| | | | Offshore Group Investment, Ltd., Term Loan | | | | |
| | 423,550 | | | 5.750%, 3/28/2019 | | | 383,313 | |
| | | | Pacific Drilling SA, Term Loan | | | | |
| | 202,437 | | | 4.500%, 6/3/2018 | | | 193,518 | |
| | | | TerraForm Power Operating, LLC, Term Loan | | | | |
| | 99,750 | | | 4.750%, 7/23/2019 | | | 99,750 | |
| | | | | |
| | | | Total | | | 2,035,278 | |
| | | | | |
|
| Financials (0.2%) | |
| | | | DJO Finance, LLC, Term Loan | | | | |
| | 489,705 | | | 4.250%, 9/15/2017 | | | 487,012 | |
| | | | GEO Group, Inc., Term Loan | | | | |
| | 102,440 | | | 3.250%, 4/3/2020 | | | 101,159 | |
| | | | Harland Clarke Holdings Corporation, Term Loan | | | | |
| | 58,875 | | | 6.000%, 8/4/2019 | | | 58,997 | |
| | | | MoneyGram International, Inc., Term Loan | | | | |
| | 408,775 | | | 4.250%, 3/27/2020 | | | 395,151 | |
| | | | WaveDivision Holdings, LLC, Term Loan | | | | |
| | 628,800 | | | 4.000%, 10/15/2019 | | | 622,248 | |
| | | | | |
| | | | Total | | | 1,664,567 | |
| | | | | |
|
| Technology (0.2%) | |
| | | | First Data Corporation, Term Loan | | | | |
| | 530,000 | | | 3.653%, 3/23/2018 | | | 524,700 | |
| | 275,000 | | | 3.653%, 9/24/2018 | | | 272,250 | |
| | | | Freescale Semiconductor, Inc., Term Loan | | | | |
| | 374,321 | | | 4.250%, 2/28/2020 | | | 368,842 | |
| | 230,670 | | | 5.000%, 1/15/2021 | | | 230,135 | |
| | | | Infor US, Inc., Term Loan | | | | |
| | 306,000 | | | 3.750%, 6/3/2020 | | | 301,639 | |
| | | | | |
| | | | Total | | | 1,697,566 | |
| | | | | |
|
| Transportation (0.2%) | |
| | | | American Airlines, Inc., Term Loan | | | | |
| | 424,625 | | | 3.750%, 6/27/2019 | | | 418,786 | |
| | | | Delta Air Lines, Inc., Term Loan | | | | |
| | 397,928 | | | 3.250%, 4/20/2017 | | | 394,633 | |
| | | | OSG Bulk Ships, lnc.,Term Loan | | | | |
| | 239,400 | | | 5.250%, 8/5/2019 | | | 237,504 | |
| | | | United Airlines, Inc., Term Loan | | | | |
| | 256,100 | | | 3.500%, 4/1/2019 | | | 250,338 | |
The accompanying Notes to Financial Statements are an integral part of this schedule.
111
MODERATELY CONSERVATIVE ALLOCATION FUND
Schedule of Investments as of October 31, 2014
| | | | | | | | |
Principal Amount | | | Bank Loans (5.2%)a | | Value | |
| Transportation (0.2%) - continued | | | | |
| | $50,000 | | | 3.750%, 9/15/2021 | | | $49,375 | |
| | | | | |
| | | | Total | | | 1,350,636 | |
| | | | | |
|
| Utilities (0.2%) | |
| | | | Calpine Corporation, Term Loan | | | | |
| | 78,575 | | | 4.000%, 4/1/2018 | | | 78,207 | |
| | 543,900 | | | 4.000%, 10/9/2019 | | | 538,657 | |
| | | | Intergen NV, Term Loan | | | | |
| | 197,500 | | | 5.500%, 6/15/2020 | | | 197,006 | |
| | | | NGPL PipeCo, LLC, Term Loan | | | | |
| | 462,822 | | | 6.750%, 9/15/2017 | | | 461,281 | |
| | | | | |
| | | | Total | | | 1,275,151 | |
| | | | | |
| | | | | | | | |
| | | | | |
| | | | Total Bank Loans (cost $40,582,021) | | | 40,053,347 | |
| | | | | |
| | |
| Shares | | | Mutual Funds (45.5%) | | Value | |
| Equity Mutual Funds (22.2%) | |
| | 1,217,132 | | | Thrivent Natural Resources Fund | | | 11,404,524 | |
| | 370,738 | | | Thrivent Partner Small Cap Value Fund | | | 8,271,156 | |
| | 168,977 | | | Thrivent Small Cap Stock Fund | | | 3,872,953 | |
| | 1,385,262 | | | Thrivent Partner Mid Cap Value Fund | | | 21,125,242 | |
| | 429,488 | | | Thrivent Mid Cap Stock Fund | | | 10,969,133 | |
| | 4,589,806 | | | Thrivent Partner Worldwide Allocation Fund | | | 46,402,937 | |
| | 2,270,005 | | | Thrivent Large Cap Growth Fund | | | 20,339,243 | |
| | 2,212,214 | | | Thrivent Large Cap Value Fund | | | 46,014,057 | |
| | 35,454 | | | Thrivent Large Cap Stock Fund | | | 992,359 | |
| | | | | |
| | | | Total | | | 169,391,604 | |
| | | | | |
|
| Fixed Income Mutual Funds (23.3%) | |
| | 4,836,835 | | | Thrivent High Yield Fund | | | 24,426,017 | |
| | 6,762,201 | | | Thrivent Income Fund | | | 62,820,849 | |
| | 1,086,045 | | | Thrivent Government Bond Fund | | | 10,914,748 | |
| | 6,390,309 | | | Thrivent Limited Maturity Bond Fund | | | 79,495,445 | |
| | | | | |
| | | | Total | | | 177,657,059 | |
| | | | | |
| | | | | | | | |
| | | | | |
| | | | Total Mutual Funds (cost $289,661,361) | | | 347,048,663 | |
| | | | | |
| | |
Principal Amount | | | Long-Term Fixed Income (32.4%) | | Value | |
| Asset-Backed Securities (1.7%) | |
| | | | Access Group, Inc. | | | | |
| | 354,415 | | | 0.652%, 2/25/2036d,e | | | 352,575 | |
| | | | Ally Auto Receivables Trust 2013-SN1 | | | | |
| | 414,484 | | | 0.720%, 5/20/2016 | | | 414,700 | |
| | | | BA Credit Card Trust | | | | |
| | 220,000 | | | 0.533%, 6/15/2021e | | | 219,822 | |
| | | | Capital One Multi-Asset Execution Trust | | | | |
| | 300,000 | | | 0.533%, 1/18/2022e | | | 299,522 | |
| | | | Chase Issuance Trust | | | | |
| | 300,000 | | | 1.150%, 1/15/2019 | | | 300,862 | |
| | | | Chesapeake Funding, LLC | | | | |
| | 440,356 | | | 0.603%, 1/7/2025d,e | | | 439,804 | |
| | | | Countrywide Asset-Backed Certificates | | | | |
| | 487,581 | | | 5.530%, 4/25/2047 | | | 475,624 | |
| | | | Edlinc Student Loan Funding Trust | | | | |
| | 264,154 | | | 3.160%, 10/1/2025*,e | | | 267,456 | |
| | | | FirstEnergy Ohio PIRB Special Purpose Trust | | | | |
| | 256,612 | | | 0.679%, 1/15/2019 | | | 256,797 | |
| | | | FNA Trust | | | | |
| | 150,023 | | | 1.980%, 1/10/2018* | | | 150,398 | |
| | | | Ford Credit Auto Owner Trust | | | | |
| | 170,000 | | | 2.260%, 11/15/2025d | | | 170,893 | |
| | | | GE Equipment Transportation, LLC | | | | |
| | 450,000 | | | 0.690%, 11/25/2016 | | | 450,635 | |
| | | | Golden Credit Card Trust | | | | |
| | 360,000 | | | 0.403%, 2/15/2018d,e | | | 359,858 | |
| | 400,000 | | | 0.583%, 9/15/2018d,e | | | 400,985 | |
| | | | GoldenTree Loan Opportunities IX, Ltd. | | | | |
| | 175,000 | | | 1.829%, 10/29/2026*,c,e | | | 173,981 | |
| | | | GreatAmerica Leasing Receivables | | | | |
| | 450,000 | | | 0.610%, 5/15/2016d | | | 450,090 | |
| | | | Hertz Fleet Lease Funding, LP | | | | |
| | 450,000 | | | 0.702%, 12/10/2027d,e | | | 450,695 | |
| | | | Hyundai Floorplan Master Owner Trust | | | | |
| | 607,500 | | | 0.503%, 5/15/2018d,e | | | 608,380 | |
| | | | Master Credit Card Trust | | | | |
| | 366,300 | | | 0.780%, 4/21/2017d | | | 366,597 | |
| | | | Morgan Stanley Capital, Inc. | | | | |
| | 711,347 | | | 0.302%, 2/25/2037e | | | 452,623 | |
| | | | Motor plc | | | | |
| | 306,000 | | | 0.652%, 2/15/2021d | | | 306,221 | |
| | | | OZLM VIII, Ltd. | | | | |
| | 170,000 | | | 1.715%, 10/17/2026*,e | | | 168,179 | |
| | | | Penarth Master Issuer plc | | | | |
| | 460,000 | | | 0.547%, 11/18/2017d,e | | | 460,145 | |
| | | | Renaissance Home Equity Loan Trust | | | | |
| | 2,300,000 | | | 6.011%, 5/25/2036f | | | 1,644,804 | |
| | | | SLM Student Loan Trust | | | | |
| | 198,274 | | | 0.753%, 8/15/2022d,e | | | 198,491 | |
| | 311,819 | | | 0.634%, 4/25/2023d,e | | | 312,079 | |
| | 300,000 | | | 1.203%, 5/17/2027d,e | | | 301,848 | |
| | | | Vericrest Opportunity Loan Transferee | | | | |
| | 910,734 | | | 3.125%, 4/27/2054d | | | 910,772 | |
| | | | Volvo Financial Equipment, LLC | | | | |
| | 450,000 | | | 0.740%, 3/15/2017d | | | 450,570 | |
| | | | World Financial Network Credit Card Master Trust | | | | |
| | 450,000 | | | 0.910%, 3/16/2020 | | | 450,496 | |
| | | | World Omni Automobile Lease Securitization Trust | | | | |
| | 425,000 | | | 1.400%, 2/15/2019 | | | 428,367 | |
| | | | World Omni Master Owner Trust | | | | |
| | 360,000 | | | 0.503%, 2/15/2018d,e | | | 360,330 | |
| | | | | |
| | | | Total | | | 13,054,599 | |
| | | | | |
|
| Basic Materials (0.4%) | |
| | | | ArcelorMittal | | | | |
| | 310,000 | | | 6.000%, 3/1/2021 | | | 332,475 | |
| | | | FMG Resources August 2006 Pty., Ltd. | | | | |
| | 137,778 | | | 6.875%, 2/1/2018d,g | | | 141,222 | |
The accompanying Notes to Financial Statements are an integral part of this schedule.
112
MODERATELY CONSERVATIVE ALLOCATION FUND
Schedule of Investments as of October 31, 2014
| | | | | | | | |
Principal Amount | | | Long-Term Fixed Income (32.4%) | | Value | |
| Basic Materials (0.4%) - continued | | | | |
| | | | Freeport-McMoRan Copper & Gold, Inc. | | | | |
| | $359,000 | | | 2.375%, 3/15/2018 | | | $360,920 | |
| | | | Glencore Funding, LLC | | | | |
| | 135,000 | | | 1.700%, 5/27/2016d | | | 135,883 | |
| | | | Goldcorp, Inc. | | | | |
| | 185,000 | | | 2.125%, 3/15/2018 | | | 184,917 | |
| | | | Hexion US Finance Corporation/Hexion Nova Scotia Finance ULC | | | | |
| | 315,000 | | | 8.875%, 2/1/2018 | | | 311,456 | |
| | | | Ineos Finance plc | | | | |
| | 315,000 | | | 7.500%, 5/1/2020d | | | 337,050 | |
| | | | LyondellBasell Industries NV | | | | |
| | 190,000 | | | 6.000%, 11/15/2021 | | | 222,462 | |
| | | | Mosaic Company | | | | |
| | 156,000 | | | 5.450%, 11/15/2033 | | | 174,161 | |
| | | | Sappi Papier Holding GmbH | | | | |
| | 180,000 | | | 6.625%, 4/15/2021d | | | 187,200 | |
| | | | Trinseo Materials Operating SCA | | | | |
| | 310,000 | | | 8.750%, 2/1/2019 | | | 327,825 | |
| | | | Vale Overseas, Ltd. | | | | |
| | 168,000 | | | 6.250%, 1/23/2017 | | | 184,056 | |
| | | | Yamana Gold, Inc. | | | | |
| | 190,000 | | | 4.950%, 7/15/2024 d | | | 185,836 | |
| | | | | |
| | | | Total | | | 3,085,463 | |
| | | | | |
| |
| Capital Goods (0.4%) | | | | |
| | | | BAE Systems plc | | | | |
| | 100,000 | | | 3.500%, 10/11/2016d | | | 104,430 | |
| | | | CNH Capital, LLC | | | | |
| | 315,000 | | | 3.625%, 4/15/2018 | | | 315,000 | |
| | | | Crown Americas Capital Corporation IV | | | | |
| | 310,000 | | | 4.500%, 1/15/2023 | | | 304,575 | |
| | | | Eaton Corporation | | | | |
| | 108,000 | | | 4.000%, 11/2/2032 | | | 107,856 | |
| | | | Harsco Corporation | | | | |
| | 168,000 | | | 2.700%, 10/15/2015 | | | 167,859 | |
| | | | Hutchison Whampoa Finance CI, Ltd. | | | | |
| | 146,000 | | | 1.625%, 10/31/2017d | | | 145,752 | |
| | | | Ingersoll-Rand Global Holding Company, Ltd. | | | | |
| | 208,000 | | | 6.875%, 8/15/2018 | | | 243,769 | |
| | | | L-3 Communications Corporation | | | | |
| | 208,000 | | | 1.500%, 5/28/2017 | | | 206,735 | |
| | | | Martin Marietta Materials, Inc. | | | | |
| | 150,000 | | | 1.333%, 6/30/2017d,e | | | 150,626 | |
| | | | Reynolds Group Issuer, Inc. | | | | |
| | 314,086 | | | 5.750%, 10/15/2020 | | | 326,650 | |
| | | | Roper Industries, Inc. | | | | |
| | 216,000 | | | 2.050%, 10/1/2018 | | | 214,884 | |
| | | | RSC Equipment Rental, Inc. | | | | |
| | 315,000 | | | 8.250%, 2/1/2021 | | | 343,350 | |
| | | | Textron, Inc. | | | | |
| | 135,000 | | | 5.600%, 12/1/2017 | | | 149,565 | |
| | | | | |
| | | | Total | | | 2,781,051 | |
| | | | | |
| |
| Collateralized Mortgage Obligations (1.7%) | | | | |
| | | | Alm Loan Funding CLO | | | | |
| | 170,000 | | | 1.664%, 10/17/2026*,e | | | 168,086 | |
| | | | Alternative Loan Trust | | | | |
| | 385,970 | | | 6.000%, 6/25/2036 | | | 345,164 | |
| | | | Apidos CLO XVIII | | | | |
| | 175,000 | | | 1.646%, 7/22/2026*,e | | | 172,929 | |
| | | | Babson CLO, Ltd. | | | | |
| | 170,000 | | | 1.656%, 10/17/2026 *,e | | | 167,740 | |
| | | | Birchwood Park CLO, Ltd. | | | | |
| | 170,000 | | | 1.674%, 7/15/2026*,e | | | 168,155 | |
| | | | BlueMountain CLO, Ltd. | | | | |
| | 170,000 | | | 1.480%, 10/15/2026*,e | | | 168,459 | |
| | | | Carlyle Global Market Strategies CLO, Ltd. | | | | |
| | 175,000 | | | 1.531%, 7/20/2023*,e | | | 173,434 | |
| | 175,000 | | | 1.733%, 10/15/2026*,e | | | 173,623 | |
| | | | Cent CLO 16, LP | | | | |
| | 170,000 | | | 1.710%, 8/1/2024*,e | | | 168,435 | |
| | | | Cent CLO 22, Ltd. | | | | |
| | 175,000 | | | 1.713%, 11/7/2026*,e | | | 174,292 | |
| | | | Citigroup Mortgage Loan Trust, Inc. | | | | |
| | 274,653 | | | 5.500%, 11/25/2035 | | | 253,751 | |
| | | | CitiMortgage Alternative Loan Trust | | | | |
| | 895,706 | | | 5.750%, 4/25/2037 | | | 769,163 | |
| | | | Countrywide Alternative Loan Trust | | | | |
| | 622,024 | | | 5.263%, 10/25/2035 | | | 514,912 | |
| | 307,598 | | | 6.500%, 8/25/2036 | | | 238,669 | |
| | 172,415 | | | 6.000%, 1/25/2037 | | | 156,459 | |
| | 1,065,023 | | | 5.500%, 5/25/2037 | | | 924,726 | |
| | 862,123 | | | 7.000%, 10/25/2037 | | | 640,224 | |
| | | | Countrywide Home Loans, Inc. | | | | |
| | 317,882 | | | 5.750%, 4/25/2037 | | | 288,766 | |
| | | | Deutsche Alt-A Securities Mortgage Loan Trust | | | | |
| | 271,244 | | | 6.000%, 10/25/2021 | | | 239,085 | |
| | | | Deutsche Alt-A Securities, Inc., Mortgage Loan Trust | | | | |
| | 103,066 | | | 5.500%, 10/25/2021 | | | 99,056 | |
| | | | Dryden 34 Senior Loan Fund CLO | | | | |
| | 170,000 | | | 1.717%, 10/15/2026*,e | | | 168,089 | |
| | | | Federal Home Loan Mortgage Corporation | | | | |
| | 1,650,921 | | | 3.000%, 4/15/2028h | | | 183,919 | |
| | 1,224,643 | | | 3.000%, 2/15/2033h | | | 163,039 | |
| | | | Federal National Mortgage Association | | | | |
| | 2,632,149 | | | 3.500%, 1/25/2033h | | | 389,501 | |
| | | | Greenpoint Mortgage Funding Trust | | | | |
| | 907,319 | | | 0.352%, 10/25/2045e | | | 713,588 | |
| | | | J.P. Morgan Mortgage Trust | | | | |
| | 81,414 | | | 2.535%, 10/25/2036 | | | 72,379 | |
| | 782,668 | | | 0.532%, 1/25/2037e | | | 485,991 | |
| | 935,377 | | | 6.250%, 8/25/2037 | | | 763,077 | |
| | | | Limerock CLO III, LLC | | | | |
| | 500,000 | | | 1.759%, 10/20/2026*,c,e,i | | | 500,000 | |
| | | | Madison Park Funding XIV CLO, Ltd. | | | | |
| | 190,000 | | | 1.681%, 7/20/2026*,e | | | 188,113 | |
| | | | MASTR Alternative Loans Trust | | | | |
| | 195,370 | | | 6.500%, 7/25/2034 | | | 200,172 | |
| | 566,909 | | | 0.602%, 12/25/2035e | | | 313,040 | |
The accompanying Notes to Financial Statements are an integral part of this schedule.
113
MODERATELY CONSERVATIVE ALLOCATION FUND
Schedule of Investments as of October 31, 2014
| | | | | | | | |
Principal Amount | | | Long-Term Fixed Income (32.4%) | | Value | |
| Collateralized Mortgage Obligations (1.7%) - continued | |
| | | | Merrill Lynch Alternative Note Asset Trust | | | | |
| | $207,746 | | | 6.000%, 3/25/2037 | | | $193,871 | |
| | | | Neuberger Berman CLO, Ltd. | | | | |
| | 150,000 | | | 1.701%, 8/4/2025*,e | | | 148,653 | |
| | | | Octagon Investment Partners XX CLO, Ltd. | | | | |
| | 170,000 | | | 1.675%, 8/12/2026*,e | | | 168,066 | |
| | | | Residential Accredit Loans, Inc. | | | | |
| | 183,107 | | | 5.750%, 9/25/2035 | | | 165,731 | |
| | | | Residential Asset Securitization Trust | | | | |
| | 780,125 | | | 0.532%, 8/25/2037e | | | 307,507 | |
| | | | Sequoia Mortgage Trust | | | | |
| | 37,741 | | | 2.664%, 9/20/2046 | | | 1,566 | |
| | 1,288,074 | | | 2.664%, 9/20/2046 | | | 1,091,623 | |
| | | | Symphony CLO XV, Ltd. | | | | |
| | 500,000 | | | 1.678%, 10/17/2026*,c,e | | | 496,250 | |
| | | | Symphony CLO, Ltd. | | | | |
| | 170,000 | | | 1.335%, 1/9/2023*,e | | | 168,886 | |
| | | | Voya CLO 2014-3, Ltd. | | | | |
| | 170,000 | | | 1.649%, 7/25/2026*,e | | | 168,053 | |
| | | | WaMu Mortgage Pass Through Certificates | | | | |
| | 200,079 | | | 2.237%, 9/25/2036 | | | 179,178 | |
| | 182,647 | | | 2.293%, 10/25/2036 | | | 156,644 | |
| | | | | |
| | | | Total | | | 13,392,064 | |
| | | | | |
|
| Commercial Mortgage-Backed Securities (1.9%) | |
| | | | Banc of America Commercial Mortgage, Inc. | | | | |
| | 1,600,000 | | | 5.612%, 4/10/2049 | | | 1,734,090 | |
| | 1,950,000 | | | 5.563%, 6/10/2049 | | | 2,112,755 | |
| | | | Bear Stearns Commercial Mortgage Securities, Inc. | | | | |
| | 870,899 | | | 5.331%, 2/11/2044 | | | 936,091 | |
| | | | Commercial Mortgage Pass-Through Certificates | | | | |
| | 540,000 | | | 1.203%, 6/8/2030d,e | | | 539,490 | |
| | | | Credit Suisse First Boston Mortgage Securities | | | | |
| | 1,700,000 | | | 5.542%, 1/15/2049 | | | 1,830,507 | |
| | | | Credit Suisse Mortgage Capital Certificates | | | | |
| | 1,850,000 | | | 5.509%, 9/15/2039 | | | 1,975,844 | |
| | | | Federal Home Loan Mortgage Corporation Multi Family Structured Pass Thru Certificates | | | | |
| | 501,834 | | | 0.727%, 12/25/2016 | | | 500,989 | |
| | | | Federal National Mortgage Association | | | | |
| | 450,000 | | | 1.272%, 1/25/2017 | | | 453,377 | |
| | | | Greenwich Capital Commercial Funding Corporation | | | | |
| | 1,000,000 | | | 5.867%, 12/10/2049 | | | 1,088,793 | |
| | | | J.P. Morgan Chase Commercial Mortgage Securities Corporation | | | | |
| | 141,730 | | | 0.853%, 4/15/2028d,e | | | 141,596 | |
| | 300,000 | | | 1.104%, 12/15/2028d,e | | | 299,628 | |
| | 800,000 | | | 5.703%, 2/12/2049 | | | 847,738 | |
| | | | Morgan Stanley Capital, Inc. | | | | |
| | 500,000 | | | 5.406%, 3/15/2044 | | | 536,676 | |
| | | | SCG Trust 2013-SRP1 | | | | |
| | 150,000 | | | 1.553%, 11/15/2026d,e | | | 150,156 | |
| | | | Wachovia Bank Commercial Mortgage Trust | | | | |
| | 1,200,000 | | | 5.603%, 10/15/2048 | | | 1,288,341 | |
| | | | | |
| | | | Total | | | 14,436,071 | |
| | | | | |
|
| Communications Services (1.2%) | |
| | | | 21st Century Fox America, Inc. | | | | |
| | 190,000 | | | 6.900%, 3/1/2019 | | | 225,940 | |
| | | | AMC Networks, Inc. | | | | |
| | 315,000 | | | 4.750%, 12/15/2022 | | | 312,637 | |
| | | | America Movil SAB de CV | | | | |
| | 164,000 | | | 5.000%, 10/16/2019 | | | 183,875 | |
| | | | American Tower Corporation | | | | |
| | 104,000 | | | 7.000%, 10/15/2017 | | | 117,763 | |
| | 195,000 | | | 3.450%, 9/15/2021 | | | 190,756 | |
| | | | AT&T, Inc. | | | | |
| | 168,000 | | | 3.875%, 8/15/2021 | | | 176,153 | |
| | | | British Sky Broadcasting Group plc | | | | |
| | 180,000 | | | 2.625%, 9/16/2019d | | | 180,499 | |
| | | | CBS Corporation | | | | |
| | 80,000 | | | 2.300%, 8/15/2019 | | | 78,950 | |
| | | | CC Holdings GS V, LLC | | | | |
| | 116,000 | | | 2.381%, 12/15/2017 | | | 117,524 | |
| | | | CCO Holdings, LLC | | | | |
| | 315,000 | | | 7.375%, 6/1/2020 | | | 337,641 | |
| | | | CenturyLink, Inc. | | | | |
| | 250,000 | | | 6.450%, 6/15/2021 | | | 273,750 | |
| | | | Columbus International, Inc. | | | | |
| | 175,000 | | | 7.375%, 3/30/2021d | | | 185,500 | |
| | | | Comcast Corporation | | | | |
| | 100,000 | | | 4.650%, 7/15/2042 | | | 105,204 | |
| | 132,000 | | | 4.750%, 3/1/2044 | | | 141,828 | |
| | | | Cox Communications, Inc. | | | | |
| | 104,000 | | | 9.375%, 1/15/2019d | | | 132,877 | |
| | | | Crown Castle Towers, LLC | | | | |
| | 100,000 | | | 4.174%, 8/15/2017d | | | 104,939 | |
| | | | Digicel, Ltd. | | | | |
| | 310,000 | | | 6.000%, 4/15/2021d | | | 313,100 | |
| | | | DIRECTV Holdings, LLC | | | | |
| | 132,000 | | | 1.750%, 1/15/2018 | | | 131,390 | |
| | 112,000 | | | 5.875%, 10/1/2019 | | | 128,629 | |
| | 81,000 | | | 4.450%, 4/1/2024 | | | 84,510 | |
| | | | Frontier Communications Corporation | | | | |
| | 210,000 | | | 6.875%, 1/15/2025 | | | 212,625 | |
| | | | Hughes Satellite Systems Corporation | | | | |
| | 315,000 | | | 6.500%, 6/15/2019 | | | 340,987 | |
| | | | Intelsat Jackson Holdings SA | | | | |
| | 315,000 | | | 7.250%, 4/1/2019 | | | 330,750 | |
| | | | Level 3 Financing, Inc. | | | | |
| | 315,000 | | | 8.625%, 7/15/2020 | | | 346,500 | |
| | | | Nippon Telegraph & Telephone Corporation | | | | |
| | 120,000 | | | 1.400%, 7/18/2017 | | | 120,147 | |
| | | | Numericable Group SA | | | | |
| | 310,000 | | | 6.000%, 5/15/2022d | | | 316,975 | |
The accompanying Notes to Financial Statements are an integral part of this schedule.
114
MODERATELY CONSERVATIVE ALLOCATION FUND
Schedule of Investments as of October 31, 2014
| | | | | | | | |
Principal Amount | | | Long-Term Fixed Income (32.4%) | | Value | |
| Communications Services (1.2%) - continued | |
| | | | SBA Tower Trust | | | | |
| | $110,000 | | | 5.101%, 4/17/2017d | | | $116,633 | |
| | | | SES Global Americas Holdings GP | | | | |
| | 130,000 | | | 2.500%, 3/25/2019d | | | 129,684 | |
| | | | Sprint Communications, Inc. | | | | |
| | 314,086 | | | 9.000%, 11/15/2018d | | | 369,444 | |
| | | | Telefonica Emisiones SAU | | | | |
| | 168,000 | | | 3.992%, 2/16/2016 | | | 174,323 | |
| | 189,000 | | | 3.192%, 4/27/2018 | | | 196,175 | |
| | | | Time Warner Cable, Inc. | | | | |
| | 110,000 | | | 5.000%, 2/1/2020 | | | 123,113 | |
| | | | T-Mobile USA, Inc. | | | | |
| | 310,000 | | | 6.125%, 1/15/2022 | | | 321,237 | |
| | | | Unitymedia Hessen GmbH & Company KG | | | | |
| | 190,000 | | | 5.500%, 1/15/2023d | | | 198,075 | |
| | | | Univision Communications, Inc. | | | | |
| | 315,000 | | | 6.875%, 5/15/2019d | | | 331,144 | |
| | | | UPCB Finance V, Ltd. | | | | |
| | 315,000 | | | 7.250%, 11/15/2021d | | | 346,500 | |
| | | | Verizon Communications, Inc. | | | | |
| | 93,000 | | | 1.100%, 11/1/2017 | | | 91,988 | |
| | 125,000 | | | 1.005%, 6/17/2019e | | | 125,904 | |
| | 60,000 | | | 2.625%, 2/21/2020d | | | 59,680 | |
| | 130,000 | | | 4.500%, 9/15/2020 | | | 141,143 | |
| | 290,000 | | | 3.000%, 11/1/2021 | | | 287,777 | |
| | 156,000 | | | 5.150%, 9/15/2023 | | | 174,703 | |
| | 168,000 | | | 6.400%, 9/15/2033 | | | 204,635 | |
| | 100,000 | | | 5.050%, 3/15/2034 | | | 105,848 | |
| | 56,000 | | | 6.550%, 9/15/2043 | | | 70,594 | |
| | | | Viacom, Inc. | | | | |
| | 108,000 | | | 2.500%, 9/1/2018 | | | 109,662 | |
| | | | Wind Acquisition Finance SA | | | | |
| | 215,000 | | | 7.375%, 4/23/2021d | | | 210,162 | |
| | | | Windstream Corporation | | | | |
| | 310,000 | | | 7.750%, 10/1/2021 | | | 331,700 | |
| | | | | |
| | | | Total | | | 9,411,573 | |
| | | | | |
|
| Consumer Cyclical (0.6%) | |
| | | | Chrysler Group, LLC | | | | |
| | 320,000 | | | 8.000%, 6/15/2019 | | | 342,800 | |
| | | | Cinemark USA, Inc. | | | | |
| | 315,000 | | | 4.875%, 6/1/2023 | | | 310,275 | |
| | | | CVS Health Corporation | | | | |
| | 50,000 | | | 2.250%, 8/12/2019 | | | 49,778 | |
| | | | Delphi Corporation | | | | |
| | 168,000 | | | 6.125%, 5/15/2021 | | | 182,700 | |
| | | | Ford Motor Company | | | | |
| | 95,000 | | | 7.450%, 7/16/2031 | | | 127,235 | |
| | | | Ford Motor Credit Company, LLC | | | | |
| | 225,000 | | | 1.684%, 9/8/2017 | | | 223,947 | |
| | 130,000 | | | 5.000%, 5/15/2018 | | | 142,250 | |
| | 155,000 | | | 2.597%, 11/4/2019c | | | 154,484 | |
| | | | General Motors Company | | | | |
| | 84,000 | | | 3.500%, 10/2/2018 | | | 86,520 | |
| | 208,000 | | | 6.250%, 10/2/2043 | | | 247,520 | |
| | | | General Motors Financial Company, Inc. | | | | |
| | 315,000 | | | 3.250%, 5/15/2018 | | | 322,088 | |
| | | | Hilton Worldwide Finance, LLC | | | | |
| | 310,000 | | | 5.625%, 10/15/2021d | | | 326,663 | |
| | | | Home Depot, Inc. | | | | |
| | 115,000 | | | 4.875%, 2/15/2044 | | | 129,540 | |
| | | | Hyundai Capital America | | | | |
| | 143,000 | | | 1.450%, 2/6/2017d | | | 143,111 | |
| | | | Jaguar Land Rover Automotive plc | | | | |
| | 315,000 | | | 5.625%, 2/1/2023d | | | 327,600 | |
| | | | KB Home | | | | |
| | 160,000 | | | 4.750%, 5/15/2019 | | | 158,800 | |
| | | | L Brands, Inc. | | | | |
| | 315,000 | | | 5.625%, 2/15/2022 | | | 337,838 | |
| | | | Lennar Corporation | | | | |
| | 315,000 | | | 4.125%, 12/1/2018 | | | 319,331 | |
| | | | Macy’s Retail Holdings, Inc. | | | | |
| | 55,000 | | | 4.375%, 9/1/2023 | | | 58,621 | |
| | 150,000 | | | 3.625%, 6/1/2024 | | | 149,457 | |
| | | | Nissan Motor Acceptance Corporation | | | | |
| | 168,000 | | | 0.784%, 3/3/2017d,e | | | 168,349 | |
| | | | Toll Brothers Finance Corporation | | | | |
| | 100,000 | | | 8.910%, 10/15/2017 | | | 116,750 | |
| | 111,000 | | | 4.000%, 12/31/2018 | | | 112,388 | |
| | | | TRW Automotive, Inc. | | | | |
| | 140,000 | | | 7.250%, 3/15/2017d | | | 154,000 | |
| | | | Wynn Las Vegas, LLC | | | | |
| | 315,000 | | | 5.375%, 3/15/2022 | | | 331,538 | |
| | | | | |
| | | | Total | | | 5,023,583 | |
| | | | | |
|
| Consumer Non-Cyclical (1.1%) | |
| | | | AbbVie, Inc. | | | | |
| | 275,000 | | | 2.000%, 11/6/2018 | | | 272,710 | |
| | | | Altria Group, Inc. | | | | |
| | 135,000 | | | 9.700%, 11/10/2018 | | | 174,003 | |
| | 189,000 | | | 4.000%, 1/31/2024 | | | 195,641 | |
| | | | Anheuser-Busch InBev Finance, Inc. | | | | |
| | 105,000 | | | 0.640%, 2/1/2019e | | | 104,914 | |
| | | | Anheuser-Busch InBev Worldwide, Inc. | | | | |
| | 189,000 | | | 7.750%, 1/15/2019 | | | 229,205 | |
| | | | Bunge Limited Finance Corporation | | | | |
| | 162,000 | | | 8.500%, 6/15/2019 | | | 200,422 | |
| | | | CareFusion Corporation | | | | |
| | 156,000 | | | 6.375%, 8/1/2019 | | | 181,043 | |
| | | | Celgene Corporation | | | | |
| | 216,000 | | | 1.900%, 8/15/2017 | | | 217,967 | |
| | 56,000 | | | 2.300%, 8/15/2018 | | | 56,366 | |
| | | | CHS/Community Health Systems, Inc. | | | | |
| | 315,000 | | | 7.125%, 7/15/2020 | | | 340,987 | |
| | | | ConAgra Foods, Inc. | | | | |
| | 174,000 | | | 1.900%, 1/25/2018 | | | 173,142 | |
| | | | Coventry Health Care, Inc. | | | | |
| | 198,000 | | | 5.950%, 3/15/2017 | | | 219,009 | |
| | | | CVS Health Corporation | | | | |
| | 108,000 | | | 6.125%, 9/15/2039 | | | 135,215 | |
| | | | Endo Finance LLC & Endo Finco, Inc. | | | | |
| | 315,000 | | | 7.000%, 7/15/2019d | | | 331,537 | |
| | | | Express Scripts Holding Company | | | | |
| | 108,000 | | | 2.650%, 2/15/2017 | | | 111,105 | |
| | | | Forest Laboratories, Inc. | | | | |
| | 225,000 | | | 4.375%, 2/1/2019d | | | 235,678 | |
The accompanying Notes to Financial Statements are an integral part of this schedule.
115
MODERATELY CONSERVATIVE ALLOCATION FUND
Schedule of Investments as of October 31, 2014
| | | | | | | | |
Principal Amount | | | Long-Term Fixed Income (32.4%) | | Value | |
| Consumer Non-Cyclical (1.1%) - continued | |
| | | | Fresenius Medical Care US Finance II, Inc. | | | | |
| | $315,000 | | | 5.875%, 1/31/2022d | | | $343,350 | |
| | | | Hawk Acquisition Sub, Inc. | | | | |
| | 314,086 | | | 4.250%, 10/15/2020 | | | 317,164 | |
| | | | HCA, Inc. | | | | |
| | 310,000 | | | 3.750%, 3/15/2019 | | | 310,775 | |
| | | | IMS Health, Inc. | | | | |
| | 413,000 | | | 6.000%, 11/1/2020d | | | 428,487 | |
| | | | JBS Finance II, Ltd. | | | | |
| | 310,000 | | | 8.250%, 1/29/2018* | | | 326,275 | |
| | | | Kroger Company | | | | |
| | 112,000 | | | 1.200%, 10/17/2016 | | | 112,161 | |
| | | | Lorillard Tobacco Company | | | | |
| | 130,000 | | | 2.300%, 8/21/2017g | | | 131,466 | |
| | 108,000 | | | 8.125%, 6/23/2019 | | | 132,302 | |
| | | | Mattel, Inc. | | | | |
| | 135,000 | | | 1.700%, 3/15/2018 | | | 134,291 | |
| | | | Medco Health Solutions, Inc. | | | | |
| | 141,000 | | | 7.125%, 3/15/2018 | | | 164,104 | |
| | | | Mondelez International, Inc. | | | | |
| | 87,000 | | | 0.760%, 2/1/2019e | | | 87,109 | |
| | | | Mylan, Inc. | | | | |
| | 122,000 | | | 7.875%, 7/15/2020d | | | 131,311 | |
| | | | Pernod Ricard SA | | | | |
| | 112,000 | | | 2.950%, 1/15/2017d | | | 115,394 | |
| | 108,000 | | | 5.750%, 4/7/2021d | | | 123,568 | |
| | | | Perrigo Company, Ltd. | | | | |
| | 308,000 | | | 1.300%, 11/8/2016 | | | 307,360 | |
| | | | Safeway, Inc. | | | | |
| | 10,000 | | | 3.400%, 12/1/2016 | | | 10,103 | |
| | | | Spectrum Brands Escrow Corporation | | | | |
| | 315,000 | | | 6.375%, 11/15/2020 | | | 333,900 | |
| | | | Sysco Corporation | | | | |
| | 75,000 | | | 2.350%, 10/2/2019 | | | 75,448 | |
| | 50,000 | | | 4.350%, 10/2/2034 | | | 51,353 | |
| | | | Tenet Healthcare Corporation | | | | |
| | 310,000 | | | 8.125%, 4/1/2022 | | | 355,337 | |
| | | | Thermo Fisher Scientific, Inc. | | | | |
| | 162,000 | | | 1.300%, 2/1/2017 | | | 161,809 | |
| | 162,000 | | | 2.400%, 2/1/2019 | | | 162,918 | |
| | | | Tyson Foods, Inc. | | | | |
| | 117,000 | | | 4.500%, 6/15/2022 | | | 125,202 | |
| | | | Valeant Pharmaceuticals International | | | | |
| | 315,000 | | | 6.875%, 12/1/2014d | | | 326,025 | |
| | | | Whirlpool Corporation | | | | |
| | 125,000 | | | 1.650%, 11/1/2017 | | | 125,024 | |
| | | | WM Wrigley Jr. Company | | | | |
| | 140,000 | | | 2.000%, 10/20/2017d | | | 141,435 | |
| | | | | |
| | | | Total | | | 8,212,615 | |
| | | | | |
|
| Energy (0.9%) | |
| | | | Boardwalk Pipelines, Ltd. | | | | |
| | 187,000 | | | 5.875%, 11/15/2016 | | | 201,153 | |
| | | | Buckeye Partners, LP | | | | |
| | 168,000 | | | 2.650%, 11/15/2018 | | | 167,817 | |
| | | | Calumet Specialty Products Partners, LP | | | | |
| | 310,000 | | | 6.500%, 4/15/2021d | | | 300,700 | |
| | | | CNOOC Nexen Finance 2014 ULC | | | | |
| | 168,000 | | | 1.625%, 4/30/2017 | | | 168,047 | |
| | | | CNPC General Capital, Ltd. | | | | |
| | 104,000 | | | 1.450%, 4/16/2016d | | | 103,970 | |
| | 104,000 | | | 2.750%, 4/19/2017d | | | 105,855 | |
| | | | Concho Resources, Inc. | | | | |
| | 314,086 | | | 5.500%, 10/1/2022 | | | 331,361 | |
| | | | Continental Resources, Inc. | | | | |
| | 208,000 | | | 5.000%, 9/15/2022 | | | 220,480 | |
| | | | Crestwood Midstream Partners, LP | | | | |
| | 170,000 | | | 6.125%, 3/1/2022 | | | 171,700 | |
| | | | Devon Energy Corporation | | | | |
| | 243,000 | | | 1.200%, 12/15/2016 | | | 245,770 | |
| | | | El Paso, LLC | | | | |
| | 140,000 | | | 7.800%, 8/1/2031 | | | 172,200 | |
| | | | Enbridge, Inc. | | | | |
| | 184,000 | | | 0.684%, 6/2/2017e | | | 184,047 | |
| | | | Ensco plc | | | | |
| | 125,000 | | | 4.500%, 10/1/2024 | | | 126,592 | |
| | | | Enterprise Products Operating, LLC | | | | |
| | 200,000 | | | 2.550%, 10/15/2019 | | | 200,011 | |
| | | | EQT Corporation | | | | |
| | 99,000 | | | 5.150%, 3/1/2018 | | | 106,561 | |
| | 118,000 | | | 8.125%, 6/1/2019 | | | 144,966 | |
| | | | Hess Corporation | | | | |
| | 200,000 | | | 8.125%, 2/15/2019 | | | 245,191 | |
| | | | Kinder Morgan, Inc. | | | | |
| | 125,000 | | | 5.000%, 2/15/2021d | | | 131,875 | |
| | | | Linn Energy, LLC | | | | |
| | 314,086 | | | 6.250%, 11/1/2019 | | | 288,959 | |
| | | | Marathon Petroleum Corporation | | | | |
| | 50,000 | | | 3.625%, 9/15/2024 | | | 49,813 | |
| | 100,000 | | | 4.750%, 9/15/2044 | | | 100,618 | |
| | | | MEG Energy Corporation | | | | |
| | 315,000 | | | 6.500%, 3/15/2021d | | | 311,850 | |
| | | | Offshore Group Investment, Ltd. | | | | |
| | 315,000 | | | 7.500%, 11/1/2019g | | | 268,537 | |
| | | | Petrobras Global Finance BV | | | | |
| | 224,000 | | | 2.000%, 5/20/2016 | | | 223,274 | |
| | 105,000 | | | 3.115%, 3/17/2020e | | | 105,945 | |
| | | | Petroleos Mexicanos | | | | |
| | 139,000 | | | 3.500%, 7/18/2018 | | | 143,865 | |
| | 95,000 | | | 2.378%, 4/15/2025 | | | 94,726 | |
| | | | Plains All American Pipeline, LP | | | | |
| | 195,000 | | | 3.600%, 11/1/2024 | | | 193,850 | |
| | | | Regency Energy Partners, LP | | | | |
| | 310,000 | | | 5.000%, 10/1/2022 | | | 316,200 | |
| | | | Sabine Pass Liquefaction, LLC | | | | |
| | 310,000 | | | 5.750%, 5/15/2024d | | | 320,462 | |
| | | | Sinopec Capital 2013, Ltd. | | | | |
| | 170,000 | | | 1.250%, 4/24/2016d | | | 169,728 | |
| | | | Southwestern Energy Company | | | | |
| | 125,000 | | | 7.500%, 2/1/2018 | | | 145,477 | |
| | | | Suncor Energy, Inc. | | | | |
| | 114,000 | | | 6.100%, 6/1/2018 | | | 130,763 | |
| | | | Transocean, Inc. | | | | |
| | 200,000 | | | 6.000%, 3/15/2018 | | | 213,239 | |
| | | | Weatherford International, Ltd. | | | | |
| | 156,000 | | | 9.625%, 3/1/2019 | | | 199,352 | |
The accompanying Notes to Financial Statements are an integral part of this schedule.
116
MODERATELY CONSERVATIVE ALLOCATION FUND
Schedule of Investments as of October 31, 2014
| | | | | | | | |
Principal Amount | | | Long-Term Fixed Income (32.4%) | | Value | |
| Energy (0.9%) - continued | | | | |
| | | | Williams Companies, Inc. | | | | |
| | $104,000 | | | 3.700%, 1/15/2023 | | | $97,835 | |
| | | | | |
| | | | Total | | | 6,702,789 | |
| | | | | |
| |
| Financials (3.1%) | | | | |
| | | | Abbey National Treasury Services plc | | | | |
| | 175,000 | | | 0.644%, 9/29/2017e | | | 174,999 | |
| | 112,000 | | | 3.050%, 8/23/2018 | | | 116,495 | |
| | | | ABN AMRO Bank NV | | | | |
| | 193,000 | | | 2.500%, 10/30/2018d | | | 195,098 | |
| | | | Air Lease Corporation | | | | |
| | 125,000 | | | 2.125%, 1/15/2018 | | | 123,594 | |
| | | | American Express Credit Corporation | | | | |
| | 125,000 | | | 0.784%, 3/18/2019e | | | 125,322 | |
| | | | American International Group, Inc. | | | | |
| | 65,000 | | | 2.300%, 7/16/2019 | | | 65,349 | |
| | | | ANZ New Zealand International, Ltd. | | | | |
| | 154,000 | | | 1.400%, 4/27/2017d | | | 154,094 | |
| | | | Australia and New Zealand Banking Group, Ltd. | | | | |
| | 160,000 | | | 0.494%, 6/13/2017d,e | | | 159,917 | |
| | | | Aviation Capital Group Corporation | | | | |
| | 112,000 | | | 3.875%, 9/27/2016d | | | 115,054 | |
| | | | Banco Santander Chile | | | | |
| | 150,000 | | | 1.130%, 4/11/2017d,e | | | 149,282 | |
| | | | Bank of America Corporation | | | | |
| | 150,000 | | | 1.700%, 8/25/2017 | | | 150,026 | |
| | 265,000 | | | 5.750%, 12/1/2017 | | | 294,980 | |
| | 290,000 | | | 1.303%, 3/22/2018e | | | 294,168 | |
| | 272,000 | | | 5.650%, 5/1/2018 | | | 303,653 | |
| | 105,000 | | | 1.105%, 4/1/2019e | | | 105,542 | |
| | 86,000 | | | 4.000%, 4/1/2024 | | | 88,861 | |
| | 112,000 | | | 5.875%, 2/7/2042 | | | 136,837 | |
| | 208,000 | | | 8.000%, 12/29/2049j | | | 223,860 | |
| | | | Bank of Tokyo-Mitsubishi UFJ, Ltd. | | | | |
| | 220,000 | | | 0.644%, 3/10/2017d,e | | | 220,001 | |
| | 65,000 | | | 2.850%, 9/8/2021d | | | 64,292 | |
| | | | Barclays Bank plc | | | | |
| | 142,000 | | | 10.179%, 6/12/2021d | | | 190,659 | |
| | | | BBVA Banco Continental SA | | | | |
| | 180,000 | | | 2.250%, 7/29/2016d | | | 180,450 | |
| | | | Berkshire Hathaway Finance Corporation | | | | |
| | 150,000 | | | 1.600%, 5/15/2017 | | | 151,833 | |
| | | | BioMed Realty, LP | | | | |
| | 162,000 | | | 2.625%, 5/1/2019 | | | 161,839 | |
| | | | BNP Paribas SA | | | | |
| | 112,000 | | | 1.250%, 12/12/2016 | | | 112,196 | |
| | 187,000 | | | 2.375%, 9/14/2017 | | | 190,592 | |
| | | | BPCE SA | | | | |
| | 105,000 | | | 1.083%, 2/10/2017e | | | 105,943 | |
| | 198,000 | | | 1.625%, 2/10/2017 | | | 199,521 | |
| | | | Capital One Financial Corporation | | | | |
| | 194,000 | | | 6.150%, 9/1/2016 | | | 211,124 | |
| | 115,000 | | | 2.450%, 4/24/2019 | | | 115,341 | |
| | | | Citigroup, Inc. | | | | |
| | 250,000 | | | 5.500%, 2/15/2017 | | | 271,696 | |
| | 112,000 | | | 6.000%, 8/15/2017 | | | 124,966 | |
| | 90,000 | | | 1.003%, 4/8/2019e | | | 90,350 | |
| | 185,000 | | | 8.500%, 5/22/2019 | | | 232,123 | |
| | 139,000 | | | 4.050%, 7/30/2022 | | | 142,996 | |
| | | | CoBank ACB | | | | |
| | 80,000 | | | 0.834%, 6/15/2022*,e | | | 75,705 | |
| | | | Compass Bank | | | | |
| | 175,000 | | | 1.850%, 9/29/2017 | | | 175,702 | |
| | 150,000 | | | 2.750%, 9/29/2019 | | | 151,089 | |
| | | | Cooperatieve Centrale Raiffeisen-Boerenleenbank BA | | | | |
| | 133,000 | | | 3.950%, 11/9/2022 | | | 135,195 | |
| | | | Credit Agricole SA | | | | |
| | 120,000 | | | 1.625%, 4/15/2016d | | | 121,210 | |
| | 105,000 | | | 1.031%, 4/15/2019d,e | | | 105,604 | |
| | 185,000 | | | 6.625%, 9/29/2049d,j | | | 180,486 | |
| | | | Credit Suisse AG | | | | |
| | 112,000 | | | 5.400%, 1/14/2020 | | | 125,437 | |
| | | | CyrusOne, LP | | | | |
| | 315,000 | | | 6.375%, 11/15/2022 | | | 331,537 | |
| | | | DDR Corporation | | | | |
| | 208,000 | | | 9.625%, 3/15/2016 | | | 231,687 | |
| | | | Denali Borrower, LLC | | | | |
| | 310,000 | | | 5.625%, 10/15/2020d | | | 328,794 | |
| | | | Deutsche Bank AG | | | | |
| | 175,000 | | | 1.350%, 5/30/2017 | | | 173,975 | |
| | | | Discover Bank | | | | |
| | 135,000 | | | 8.700%, 11/18/2019 | | | 167,656 | |
| | | | Discover Financial Services | | | | |
| | 108,000 | | | 6.450%, 6/12/2017 | | | 120,555 | |
| | | | DnB Boligkreditt AS | | | | |
| | 215,000 | | | 1.450%, 3/21/2018d | | | 214,293 | |
| | | | Eksportfinans ASA | | | | |
| | 81,000 | | | 3.000%, 11/17/2014 | | | 81,038 | |
| | 120,000 | | | 5.500%, 5/25/2016 | | | 125,850 | |
| | | | Fifth Third Bancorp | | | | |
| | 147,000 | | | 5.450%, 1/15/2017 | | | 159,512 | |
| | 65,000 | | | 2.875%, 10/1/2021 | | | 64,537 | |
| | | | General Electric Capital Corporation | | | | |
| | 421,000 | | | 6.000%, 8/7/2019 | | | 493,704 | |
| | 270,000 | | | 1.234%, 3/15/2023e | | | 272,803 | |
| | 204,000 | | | 6.750%, 3/15/2032 | | | 271,258 | |
| | | | Genworth Financial, Inc. | | | | |
| | 176,000 | | | 7.700%, 6/15/2020 | | | 211,282 | |
| | | | Goldman Sachs Group, Inc. | | | | |
| | 175,000 | | | 2.375%, 1/22/2018 | | | 176,633 | |
| | 270,000 | | | 1.433%, 4/30/2018e | | | 274,094 | |
| | 90,000 | | | 1.334%, 11/15/2018e | | | 90,921 | |
| | 134,000 | | | 7.500%, 2/15/2019 | | | 160,001 | |
| | 180,000 | | | 2.550%, 10/23/2019 | | | 178,846 | |
| | 193,000 | | | 5.375%, 3/15/2020 | | | 216,414 | |
| | 211,000 | | | 5.250%, 7/27/2021 | | | 235,228 | |
| | | | Hartford Financial Services Group, Inc. | | | | |
| | 191,000 | | | 4.000%, 10/15/2017 | | | 204,055 | |
| | 134,000 | | | 5.125%, 4/15/2022 | | | 149,742 | |
| | | | HBOS plc | | | | |
| | 156,000 | | | 6.750%, 5/21/2018d | | | 175,201 | |
| | | | Health Care REIT, Inc. | | | | |
| | 155,000 | | | 4.700%, 9/15/2017 | | | 168,509 | |
| | 61,000 | | | 2.250%, 3/15/2018 | | | 61,734 | |
| | | | HSBC Bank plc | | | | |
| | 220,000 | | | 0.874%, 5/15/2018d,e | | | 221,843 | |
| | | | HSBC Holdings plc | | | | |
| | 104,000 | | | 5.250%, 3/14/2044 | | | 113,044 | |
The accompanying Notes to Financial Statements are an integral part of this schedule.
117
MODERATELY CONSERVATIVE ALLOCATION FUND
Schedule of Investments as of October 31, 2014
| | | | | | | | |
Principal Amount | | | Long-Term Fixed Income (32.4%) | | Value | |
| Financials (3.1%) - continued | | | | |
| | $250,000 | | | 5.625%, 12/29/2049j | | | $254,062 | |
| | | | HSBC USA, Inc. | | | | |
| | 122,000 | | | 1.625%, 1/16/2018 | | | 121,929 | |
| | | | Huntington Bancshares, Inc. | | | | |
| | 56,000 | | | 2.600%, 8/2/2018 | | | 56,845 | |
| | | | Huntington National Bank | | | | |
| | 130,000 | | | 1.350%, 8/2/2016 | | | 130,778 | |
| | | | Icahn Enterprises, LP | | | | |
| | 250,000 | | | 6.000%, 8/1/2020 | | | 262,500 | |
| | | | ING Bank NV | | | | |
| | 200,000 | | | 4.125%, 11/21/2023 | | | 204,886 | |
| | | | ING Capital Funding Trust III | | | | |
| | 140,000 | | | 3.833%, 12/29/2049e,j | | | 139,650 | |
| | | | International Lease Finance Corporation | | | | |
| | 243,000 | | | 2.184%, 6/15/2016e | | | 242,089 | |
| | | | Intesa Sanpaolo SPA | | | | |
| | 162,000 | | | 3.125%, 1/15/2016 | | | 165,403 | |
| | 81,000 | | | 3.875%, 1/16/2018 | | | 84,606 | |
| | 156,000 | | | 3.875%, 1/15/2019 | | | 162,409 | |
| | | | J.P. Morgan Chase & Company | | | | |
| | 110,000 | | | 0.754%, 2/15/2017e | | | 110,323 | |
| | 262,000 | | | 2.000%, 8/15/2017 | | | 265,095 | |
| | 108,000 | | | 1.800%, 1/25/2018 | | | 107,970 | |
| | 191,000 | | | 6.300%, 4/23/2019 | | | 221,656 | |
| | 50,000 | | | 3.200%, 1/25/2023 | | | 49,606 | |
| | 100,000 | | | 3.875%, 9/10/2024 | | | 99,349 | |
| | 189,000 | | | 7.900%, 4/29/2049j | | | 204,829 | |
| | | | Kookmin Bank | | | | |
| | 168,000 | | | 1.109%, 1/27/2017d,e | | | 169,210 | |
| | | | Liberty Mutual Group, Inc. | | | | |
| | 65,000 | | | 4.950%, 5/1/2022d | | | 70,449 | |
| | 56,000 | | | 6.500%, 5/1/2042d | | | 67,328 | |
| | | | Liberty Property, LP | | | | |
| | 149,000 | | | 5.500%, 12/15/2016 | | | 161,385 | |
| | | | Lloyds Banking Group plc | | | | |
| | 156,000 | | | 5.920%, 9/29/2049d,j | | | 156,000 | |
| | | | Macquarie Bank, Ltd. | | | | |
| | 150,000 | | | 5.000%, 2/22/2017d | | | 161,620 | |
| | | | Merrill Lynch & Company, Inc. | | | | |
| | 350,000 | | | 6.050%, 5/16/2016 | | | 374,695 | |
| | 150,000 | | | 6.400%, 8/28/2017 | | | 168,985 | |
| | | | MetLife, Inc. | | | | |
| | 125,000 | | | 1.903%, 12/15/2017 | | | 126,136 | |
| | | | Metropolitan Life Global Funding I | | | | |
| | 162,000 | | | 1.300%, 4/10/2017d | | | 162,339 | |
| | | | Mizuho Bank, Ltd. | | | | |
| | 200,000 | | | 1.850%, 3/21/2018d | | | 198,911 | |
| | | | Morgan Stanley | | | | |
| | 221,000 | | | 4.750%, 3/22/2017 | | | 237,471 | |
| | 130,000 | | | 6.250%, 8/28/2017 | | | 145,501 | |
| | 300,000 | | | 6.625%, 4/1/2018 | | | 343,547 | |
| | 180,000 | | | 1.514%, 4/25/2018e | | | 184,017 | |
| | 135,000 | | | 4.875%, 11/1/2022 | | | 143,770 | |
| | 189,000 | | | 4.100%, 5/22/2023 | | | 190,764 | |
| | | | Murray Street Investment Trust I | | | | |
| | 333,000 | | | 4.647%, 3/9/2017 | | | 355,517 | |
| | | | National City Corporation | | | | |
| | 168,000 | | | 6.875%, 5/15/2019 | | | 198,815 | |
| | | | Nomura Holdings, Inc. | | | | |
| | 125,000 | | | 2.750%, 3/19/2019 | | | 126,358 | |
| | | | PNC Bank NA | | | | |
| | 168,000 | | | 1.150%, 11/1/2016 | | | 168,585 | |
| | | | Pricoa Global Funding I | | | | |
| | 208,000 | | | 1.350%, 8/18/2017 d | | | 207,753 | |
| | | | Prologis, LP | | | | |
| | 202,000 | | | 7.375%, 10/30/2019 | | | 246,214 | |
| | | | Prudential Financial, Inc. | | | | |
| | 65,000 | | | 2.350%, 8/15/2019 | | | 64,974 | |
| | | | RBS Capital Trust III | | | | |
| | 50,000 | | | 2.073%, 9/29/2049e,j | | | 49,000 | |
| | | | Realty Income Corporation | | | | |
| | 62,000 | | | 2.000%, 1/31/2018 | | | 62,280 | |
| | | | Regions Bank | | | | |
| | 265,000 | | | 7.500%, 5/15/2018 | | | 310,465 | |
| | | | Reinsurance Group of America, Inc. | | | | |
| | 75,000 | | | 5.625%, 3/15/2017 | | | 81,777 | |
| | 139,000 | | | 5.000%, 6/1/2021 | | | 153,375 | |
| | | | Reliance Standard Life Global Funding II | | | | |
| | 85,000 | | | 2.500%, 4/24/2019d | | | 85,543 | |
| | | | Royal Bank of Canada | | | | |
| | 198,000 | | | 2.200%, 7/27/2018 | | | 200,994 | |
| | | | Royal Bank of Scotland Group plc | | | | |
| | 105,000 | | | 1.173%, 3/31/2017e | | | 105,348 | |
| | 350,000 | | | 5.125%, 5/28/2024 | | | 354,612 | |
| | | | Simon Property Group, LP | | | | |
| | 100,000 | | | 10.350%, 4/1/2019 | | | 132,370 | |
| | | | Skandinaviska Enskilda Banken AB | | | | |
| | 130,000 | | | 2.375%, 3/25/2019d | | | 131,256 | |
| | | | SLM Corporation | | | | |
| | 75,000 | | | 3.875%, 9/10/2015 | | | 75,750 | |
| | | | SpareBank 1 Boligkreditt AS | | | | |
| | 215,000 | | | 1.250%, 5/2/2018d | | | 212,269 | |
| | | | Sumitomo Mitsui Banking Corporation | | | | |
| | 280,000 | | | 1.300%, 1/10/2017 | | | 280,098 | |
| | | | Suncorp-Metway, Ltd. | | | | |
| | 314,000 | | | 0.934%, 3/28/2017d,e | | | 315,116 | |
| | | | Svenska Handelsbanken AB | | | | |
| | 162,000 | | | 1.625%, 3/21/2018 | | | 161,689 | |
| | 150,000 | | | 0.725%, 6/17/2019e | | | 150,750 | |
| | | | Swedbank Hypotek AB | | | | |
| | 215,000 | | | 1.375%, 3/28/2018d | | | 213,354 | |
| | | | Swiss RE Capital I, LP | | | | |
| | 125,000 | | | 6.854%, 5/29/2049d,j | | | 131,250 | |
| | | | Synchrony Financial | | | | |
| | 70,000 | | | 3.000%, 8/15/2019 | | | 70,769 | |
| | 95,000 | | | 3.750%, 8/15/2021 | | | 96,856 | |
| | | | Toronto-Dominion Bank | | | | |
| | 85,000 | | | 0.792%, 11/5/2019c,e | | | 84,917 | |
| | | | UBS AG/Stamford, Connecticut | | | | |
| | 124,000 | | | 5.875%, 12/20/2017 | | | 139,674 | |
| | | | Voya Financial, Inc. | | | | |
| | 194,000 | | | 2.900%, 2/15/2018 | | | 199,456 | |
| | | | WEA Finance, LLC | | | | |
| | 175,000 | | | 1.750%, 9/15/2017d | | | 175,372 | |
| | | | Wells Fargo & Company | | | | |
| | 186,000 | | | 2.100%, 5/8/2017 | | | 190,015 | |
The accompanying Notes to Financial Statements are an integral part of this schedule.
118
MODERATELY CONSERVATIVE ALLOCATION FUND
Schedule of Investments as of October 31, 2014
| | | | | | | | |
Principal Amount | | | Long-Term Fixed Income (32.4%) | | Value | |
| Financials (3.1%) - continued | | | | |
| | $150,000 | | | 1.400%, 9/8/2017 | | | $150,006 | |
| | | | | |
| | | | Total | | | 24,116,917 | |
| | | | | |
| |
| Foreign Government (0.1%) | | | | |
| | | | European Investment Bank | | | | |
| | 160,000 | | | 1.875%, 3/15/2019 | | | 161,832 | |
| | 145,000 | | | 2.125%, 10/15/2021 | | | 144,746 | |
| | | | Kommunalbanken AS | | | | |
| | 150,000 | | | 1.500%, 10/22/2019d | | | 146,904 | |
| | | | | |
| | | | Total | | | 453,482 | |
| | | | | |
| |
| Mortgage-Backed Securities (10.7%) | | | | |
| | | | Federal Home Loan Mortgage Corporation Gold 15-Yr. Pass Through | | | | |
| | 4,320,000 | | | 3.000%, 11/1/2029c | | | 4,473,225 | |
| | | | Federal Home Loan Mortgage Corporation Gold 30-Yr. Pass Through | | | | |
| | 4,245,000 | | | 4.000%, 11/1/2044c | | | 4,503,348 | |
| | | | Federal National Mortgage Association Conventional 15-Yr. Pass Through | | | | |
| | 7,840,000 | | | 3.500%, 11/1/2029c | | | 8,283,448 | |
| | | | Federal National Mortgage Association Conventional 30-Yr. Pass Through | | | | |
| | 1,515,322 | | | 2.078%, 1/1/2043e | | | 1,570,932 | |
| | 2,534,144 | | | 2.055%, 3/1/2043e | | | 2,623,540 | |
| | 2,408,681 | | | 1.738%, 7/1/2043e | | | 2,453,858 | |
| | 18,825,000 | | | 3.500%, 11/1/2044c | | | 19,466,217 | |
| | 17,800,000 | | | 4.000%, 11/1/2044c | | | 18,898,595 | |
| | 17,425,000 | | | 4.500%, 11/1/2044c | | | 18,884,344 | |
| | | | | |
| | | | Total | | | 81,157,507 | |
| | | | | |
| |
| Technology (0.3%) | | | | |
| | | | Amphenol Corporation | | | | |
| | 66,000 | | | 2.550%, 1/30/2019 | | | 66,731 | |
| | | | Apple, Inc. | | | | |
| | 155,000 | | | 0.537%, 5/6/2019e | | | 155,138 | |
| | | | Baidu, Inc. | | | | |
| | 200,000 | | | 2.750%, 6/9/2019 | | | 200,731 | |
| | | | EMC Corporation | | | | |
| | 196,000 | | | 1.875%, 6/1/2018 | | | 194,833 | |
| | | | Fidelity National Information Services, Inc. | | | | |
| | 182,000 | | | 1.450%, 6/5/2017 | | | 181,372 | |
| | | | First Data Corporation | | | | |
| | 315,000 | | | 7.375%, 6/15/2019d | | | 333,900 | |
| | | | Freescale Semiconductor, Inc. | | | | |
| | 310,000 | | | 6.000%, 1/15/2022d | | | 317,750 | |
| | | | Hewlett-Packard Company | | | | |
| | 168,000 | | | 5.400%, 3/1/2017 | | | 182,720 | |
| | | | Iron Mountain, Inc. | | | | |
| | 315,000 | | | 6.000%, 8/15/2023 | | | 332,325 | |
| | | | Micron Semiconductor Asia Pte, Ltd. | | | | |
| | 72,000 | | | 1.258%, 1/15/2019 | | | 71,849 | |
| | | | Samsung Electronics America, Inc. | | | | |
| | 94,000 | | | 1.750%, 4/10/2017d | | | 94,553 | |
| | | | Tyco Electronics Group SA | | | | |
| | 191,000 | | | 6.550%, 10/1/2017 | | | 217,421 | |
| | | | Xerox Corporation | | | | |
| | 130,000 | | | 7.200%, 4/1/2016 | | | 141,171 | |
| | | | Xilinx, Inc. | | | | |
| | 85,000 | | | 2.125%, 3/15/2019 | | | 84,972 | |
| | | | | |
| | | | Total | | | 2,575,466 | |
| | | | | |
| |
| Transportation (0.2%) | | | | |
| | | | American Airlines Pass Through Trust | | | | |
| | 122,716 | | | 4.950%, 1/15/2023 | | | 131,306 | |
| | | | Avis Budget Car Rental, LLC | | | | |
| | 180,000 | | | 5.125%, 6/1/2022d | | | 177,840 | |
| | | | Canadian Pacific Railway Company | | | | |
| | 65,000 | | | 7.125%, 10/15/2031 | | | 89,818 | |
| | 76,000 | | | 5.750%, 3/15/2033 | | | 90,529 | |
| | | | Continental Airlines, Inc. | | | | |
| | 134,295 | | | 4.150%, 4/11/2024 | | | 136,981 | |
| | | | CSX Corporation | | | | |
| | 98,000 | | | 3.700%, 11/1/2023 | | | 101,902 | |
| | | | Delta Air Lines, Inc. | | | | |
| | 196,000 | | | 6.750%, 5/23/2017 | | | 203,840 | |
| | 79,761 | | | 4.950%, 5/23/2019 | | | 84,946 | |
| | 29,594 | | | 4.750%, 5/7/2020 | | | 31,518 | |
| | | | ERAC USA Finance, LLC | | | | |
| | 124,000 | | | 1.400%, 4/15/2016d | | | 124,842 | |
| | 66,000 | | | 2.800%, 11/1/2018d | | | 67,635 | |
| | | | Korea Expressway Corporation | | | | |
| | 162,000 | | | 1.625%, 4/28/2017d | | | 161,503 | |
| | | | Virgin Australia Holdings, Ltd. | | | | |
| | 62,651 | | | 5.000%, 10/23/2023d | | | 64,769 | |
| | | | | |
| | | | Total | | | 1,467,429 | |
| | | | | |
| |
| U.S. Government and Agencies (7.3%) | | | | |
| | | | U.S. Treasury Bonds | | | | |
| | 550,000 | | | 4.375%, 5/15/2040 | | | 688,961 | |
| | | | U.S. Treasury Notes | | | | |
| | 6,500,000 | | | 0.375%, 3/31/2016 | | | 6,507,618 | |
| | 1,950,000 | | | 0.625%, 10/15/2016 | | | 1,954,419 | |
| | 980,000 | | | 0.625%, 12/15/2016 | | | 981,072 | |
| | 2,000,000 | | | 1.000%, 3/31/2017 | | | 2,014,218 | |
| | 150,000 | | | 0.875%, 7/15/2017 | | | 150,223 | |
| | 3,090,000 | | | 1.000%, 5/31/2018 | | | 3,066,102 | |
| | 2,380,000 | | | 1.250%, 10/31/2018 | | | 2,369,031 | |
| | 375,000 | | | 1.625%, 4/30/2019 | | | 376,670 | |
| | 1,000,000 | | | 1.625%, 6/30/2019 | | | 1,003,203 | |
| | 1,200,000 | | | 1.375%, 1/31/2020 | | | 1,180,126 | |
| | 8,115,000 | | | 1.875%, 6/30/2020 | | | 8,145,431 | |
| | 2,610,000 | | | 1.625%, 8/15/2022 | | | 2,515,184 | |
| | 150,000 | | | 1.750%, 5/15/2023 | | | 144,375 | |
| | 2,200,000 | | | 2.500%, 8/15/2023 | | | 2,245,203 | |
| | 11,400,000 | | | 3.625%, 2/15/2044 | | | 12,651,332 | |
| | | | U.S. Treasury Notes, TIPS | | | | |
| | 5,968,200 | | | 0.125%, 4/15/2018 | | | 6,041,871 | |
| | 3,606,785 | | | 0.125%, 1/15/2023 | | | 3,530,422 | |
| | | | | |
| | | | Total | | | 55,565,461 | |
| | | | | |
| |
| Utilities (0.8%) | | | | |
| | | | AES Corporation | | | | |
| | 315,000 | | | 7.375%, 7/1/2021 | | | 359,395 | |
| | | | American Electric Power Company, Inc. | | | | |
| | 122,000 | | | 1.650%, 12/15/2017 | | | 122,282 | |
The accompanying Notes to Financial Statements are an integral part of this schedule.
119
MODERATELY CONSERVATIVE ALLOCATION FUND
Schedule of Investments as of October 31, 2014
| | | | | | | | |
Principal Amount | | | Long-Term Fixed Income (32.4%) | | Value | |
| Utilities (0.8%) - continued | | | | |
| | | | Atlas Pipeline Partners, LP | | | | |
| | $315,000 | | | 4.750%, 11/15/2021 | | | $314,212 | |
| | | | Calpine Corporation | | | | |
| | 310,000 | | | 5.375%, 1/15/2023 | | | 313,100 | |
| | | | Commonwealth Edison Company | | | | |
| | 75,000 | | | 6.950%, 7/15/2018 | | | 87,256 | |
| | | | Dayton Power and Light Company | | | | |
| | 112,000 | | | 1.875%, 9/15/2016 | | | 113,252 | |
| | | | DCP Midstream Operating, LP | | | | |
| | 162,000 | | | 2.500%, 12/1/2017 | | | 165,162 | |
| | | | Duke Energy Corporation | | | | |
| | 135,000 | | | 0.613%, 4/3/2017e | | | 135,452 | |
| | 168,000 | | | 2.100%, 6/15/2018 | | | 169,997 | |
| | | | Dynegy Finance I, Inc./ Dynegy Finance II, Inc. | | | | |
| | 200,000 | | | 6.750%, 11/1/2019d | | | 207,000 | |
| | | | Enel Finance International NV | | | | |
| | 84,000 | | | 6.250%, 9/15/2017 d | | | 94,493 | |
| | | | Energy Transfer Partners, LP | | | | |
| | 50,000 | | | 9.700%, 3/15/2019 | | | 64,047 | |
| | 208,000 | | | 4.650%, 6/1/2021 | | | 221,994 | |
| | | | Enterprise Products Operating, LLC | | | | |
| | 80,000 | | | 7.034%, 1/15/2068 | | | 89,000 | |
| | 132,000 | | | 5.100%, 2/15/2045 | | | 139,740 | |
| | | | Exelon Generation Company, LLC | | | | |
| | 189,000 | | | 5.200%, 10/1/2019 | | | 211,411 | |
| | | | ITC Holdings Corporation | | | | |
| | 66,000 | | | 4.050%, 7/1/2023 | | | 69,015 | |
| | | | MidAmerican Energy Holdings Company | | | | |
| | 102,000 | | | 1.100%, 5/15/2017 | | | 101,603 | |
| | 148,000 | | | 5.750%, 4/1/2018 | | | 167,546 | |
| | 130,000 | | | 6.500%, 9/15/2037 | | | 171,117 | |
| | | | NiSource Finance Corporation | | | | |
| | 86,000 | | | 6.400%, 3/15/2018 | | | 98,303 | |
| | 168,000 | | | 6.800%, 1/15/2019 | | | 198,584 | |
| | | | Northeast Utilities | | | | |
| | 75,000 | | | 1.450%, 5/1/2018 | | | 73,882 | |
| | | | Northern States Power Company | | | | |
| | 260,000 | | | 4.125%, 5/15/2044 | | | 266,262 | |
| | | | NRG Energy, Inc. | | | | |
| | 315,000 | | | 6.625%, 3/15/2023 | | | 332,325 | |
| | | | ONEOK Partners, LP | | | | |
| | 109,000 | | | 8.625%, 3/1/2019 | | | 134,979 | |
| | | | Pacific Gas & Electric Company | | | | |
| | 191,000 | | | 5.625%, 11/30/2017 | | | 214,240 | |
| | | | PG&E Corporation | | | | |
| | 75,000 | | | 2.400%, 3/1/2019 | | | 75,279 | |
| | | | PPL Capital Funding, Inc. | | | | |
| | 230,000 | | | 1.900%, 6/1/2018 | | | 229,615 | |
| | 78,000 | | | 3.500%, 12/1/2022 | | | 78,821 | |
| | | | Sempra Energy | | | | |
| | 250,000 | | | 6.150%, 6/15/2018 | | | 286,166 | |
| | | | Southern Company | | | | |
| | 125,000 | | | 1.300%, 8/15/2017 | | | 124,632 | |
| | | | TransAlta Corporation | | | | |
| | 182,000 | | | 1.900%, 6/3/2017 | | | 181,801 | |
| | | | Williams Companies, Inc. | | | | |
| | 104,000 | | | 7.875%, 9/1/2021 | | | 125,568 | |
| | | | Williams Partners, LP | | | | |
| | 65,000 | | | 7.250%, 2/1/2017 | | | 72,732 | |
| | | | | |
| | | | Total | | | 5,810,263 | |
| | | | | |
| | | | | | | | |
| | | | | |
| | | | Total Long-Term Fixed Income (cost $243,005,909) | | | 247,246,333 | |
| | | | | |
| | |
| Shares | | | Common Stock (13.5%) | | Value | |
| Consumer Discretionary (1.7%) | | | | |
| | 1,050 | | | Aaron’s, Inc. | | | 25,998 | |
| | 2,475 | | | Amazon.com, Inc.k | | | 756,014 | |
| | 6,400 | | | Apollo Group, Inc.k | | | 183,424 | |
| | 1,225 | | | AutoZone, Inc.k | | | 678,062 | |
| | 1,300 | | | Bank Mandiri Persero Tbk PTk | | | 31,590 | |
| | 6,500 | | | Barnes & Noble, Inc.k | | | 141,830 | |
| | 3,550 | | | Best Buy Company, Inc. | | | 121,197 | |
| | 700 | | | Big Lots, Inc. | | | 31,955 | |
| | 1,150 | | | BJ’s Restaurants, Inc.k | | | 50,623 | |
| | 850 | | | BorgWarner, Inc. | | | 48,467 | |
| | 550 | | | Brinker International, Inc. | | | 29,502 | |
| | 1,450 | | | Carnival Corporation | | | 58,217 | |
| | 3,850 | | | Cato Corporation | | | 137,329 | |
| | 7,610 | | | CBS Corporation | | | 412,614 | |
| | 5,360 | | | Cheesecake Factory, Inc. | | | 246,238 | |
| | 1,900 | | | Coinstar, Inc.k | | | 120,213 | |
| | 25,950 | | | Comcast Corporation | | | 1,436,333 | |
| | 10,338 | | | Delphi Automotive plc | | | 713,115 | |
| | 850 | | | DeVry Education Group, Inc. | | | 41,148 | |
| | 1,800 | | | DISH Network Corporationk | | | 114,570 | |
| | 4,300 | | | Dollar Tree, Inc.k | | | 260,451 | |
| | 11,150 | | | Ford Motor Company | | | 157,103 | |
| | 1,400 | | | G-III Apparel Group, Ltd.k | | | 111,090 | |
| | 1,100 | | | Harman International Industries, Inc. | | | 118,074 | |
| | 6,700 | | | Home Depot, Inc. | | | 653,384 | |
| | 8,880 | | | Houghton Mifflin Harcourt Companyk | | | 177,689 | |
| | 5,276 | | | Ignite Restaurant Group, Inc.k | | | 36,352 | |
| | 1,250 | | | iRobot Corporationk | | | 44,650 | |
| | 2,300 | | | Kirkland’s, Inc.k | | | 40,940 | |
| | 8,150 | | | Kohl’s Corporation | | | 441,893 | |
| | 9,308 | | | Las Vegas Sands Corporation | | | 579,516 | |
| | 3,150 | | | Liberty Interactive Corporationk | | | 82,341 | |
| | 447 | | | Liberty Venturesk | | | 15,690 | |
| | 16,010 | | | Lowe’s Companies, Inc. | | | 915,772 | |
| | 5,000 | | | Macy’s, Inc. | | | 289,100 | |
| | 450 | | | Marriott Vacations Worldwide Corporation | | | 31,248 | |
| | 9,928 | | | MDC Partners, Inc. | | | 205,510 | |
| | 100 | | | Michael Kors Holdings, Ltd.k | | | 7,859 | |
| | 2,600 | | | Nautilus, Inc.k | | | 34,788 | |
| | 6,500 | | | NIKE, Inc. | | | 604,305 | |
| | 10,810 | | | NutriSystem, Inc. | | | 182,040 | |
| | 1,200 | | | Omnicom Group, Inc. | | | 86,232 | |
| | 3,600 | | | Orbitz Worldwide, Inc.k | | | 29,772 | |
| | 2,070 | | | Oxford Industries, Inc. | | | 126,787 | |
| | 2,460 | | | Papa John’s International, Inc. | | | 115,030 | |
| | 650 | | | Royal Caribbean Cruises, Ltd. | | | 44,181 | |
| | 4,500 | | | Ruby Tuesday, Inc.k | | | 34,560 | |
| | 3,050 | | | Scientific Games Corporationk | | | 35,899 | |
| | 1,000 | | | Scripps Networks Interactive, Inc. | | | 77,240 | |
| | 4,400 | | | Select Comfort Corporationk | | | 113,036 | |
| | 8,400 | | | Starbucks Corporation | | | 634,704 | |
| | 3,850 | | | Time Warner Cable, Inc. | | | 566,759 | |
| | 2,200 | | | Toll Brothers, Inc.k | | | 70,290 | |
| | 12,560 | | | Tuesday Morning Corporationk | | | 256,098 | |
The accompanying Notes to Financial Statements are an integral part of this schedule.
120
MODERATELY CONSERVATIVE ALLOCATION FUND
Schedule of Investments as of October 31, 2014
| | | | | | | | |
| Shares | | | Common Stock (13.5%) | | Value | |
| Consumer Discretionary (1.7%) - continued | |
| | 1,400 | | | Ulta Salon Cosmetics & Fragrance, Inc.k | | | $169,134 | |
| | 2,750 | | | Wyndham Worldwide Corporation | | | 213,593 | |
| | | | | |
| | | | Total | | | 12,941,549 | |
| | | | | |
|
| Consumer Staples (0.6%) | |
| | 3,250 | | | Anheuser-Busch InBev NV ADR | | | 360,685 | |
| | 1,700 | | | Archer-Daniels-Midland Company | | | 79,900 | |
| | 600 | | | Coca-Cola Enterprises, Inc. | | | 26,010 | |
| | 750 | | | Colgate-Palmolive Company | | | 50,160 | |
| | 16,930 | | | CVS Health Corporation | | | 1,452,763 | |
| | 600 | | | Green Mountain Coffee Roasters, Inc. | | | 91,050 | |
| | 800 | | | Ingredion, Inc. | | | 61,800 | |
| | 2,660 | | | Kimberly-Clark Corporation | | | 303,958 | |
| | 700 | | | Kroger Company | | | 38,997 | |
| | 700 | | | Molson Coors Brewing Company | | | 52,066 | |
| | 15,741 | | | Mondelez International, Inc. | | | 555,028 | |
| | 1,249 | | | Pantry, Inc.k | | | 32,187 | |
| | 2,953 | | | Philip Morris International, Inc. | | | 262,847 | |
| | 950 | | | Pilgrim’s Pride Corporationk | | | 26,989 | |
| | 4,050 | | | Pinnacle Foods, Inc. | | | 136,890 | |
| | 20,250 | | | Rite Aid Corporationk | | | 106,312 | |
| | 1,410 | | | TreeHouse Foods, Inc.k | | | 120,090 | |
| | 1,600 | | | Wal-Mart Stores, Inc. | | | 122,032 | |
| | 8,130 | | | WhiteWave Foods Companyk | | | 302,680 | |
| | 2,200 | | | Whole Foods Market, Inc. | | | 86,526 | |
| | | | | |
| | | | Total | | | 4,268,970 | |
| | | | | |
|
| Energy (1.1%) | |
| | 310 | | | Atwood Oceanics, Inc.k | | | 12,601 | |
| | 1,000 | | | Baker Hughes, Inc. | | | 52,960 | |
| | 9,800 | | | Cabot Oil & Gas Corporation | | | 304,780 | |
| | 13,280 | | | Cameron International Corporationk | | | 790,824 | |
| | 1,450 | | | Chesapeake Energy Corporation | | | 32,161 | |
| | 3,600 | | | Chevron Corporation | | | 431,820 | |
| | 135 | | | Cimarex Energy Company | | | 15,345 | |
| | 3,300 | | | Comstock Resources, Inc. | | | 39,072 | |
| | 100 | | | Concho Resources, Inc.k | | | 10,903 | |
| | 550 | | | ConocoPhillips | | | 39,682 | |
| | 885 | | | Denbury Resources, Inc. | | | 10,974 | |
| | 100 | | | Energen Corporation | | | 6,770 | |
| | 210 | | | Ensco plc | | | 8,524 | |
| | 8,936 | | | EOG Resources, Inc. | | | 849,367 | |
| | 5,104 | | | EQT Corporation | | | 479,980 | |
| | 650 | | | Exterran Holdings, Inc. | | | 25,565 | |
| | 9,600 | | | Exxon Mobil Corporation | | | 928,416 | |
| | 1,200 | | | Green Plains, Inc. | | | 41,040 | |
| | 650 | | | Gulfmark Offshore, Inc. | | | 19,604 | |
| | 115 | | | Gulfport Energy Corporationk | | | 5,771 | |
| | 500 | | | Helix Energy Solutions Group, Inc.k | | | 13,320 | |
| | 185 | | | Helmerich & Payne, Inc. | | | 16,062 | |
| | 600 | | | Hess Corporation | | | 50,886 | |
| | 340 | | | HollyFrontier Corporation | | | 15,429 | |
| | 2,850 | | | Kosmos Energy, Ltd.k | | | 26,591 | |
| | 29,161 | | | Marathon Oil Corporation | | | 1,032,299 | |
| | 4,450 | | | Market Vectors Oil Service ETF | | | 201,140 | |
| | 10,150 | | | Nabors Industries, Ltd. | | | 181,177 | |
| | 160 | | | National Oilwell Varco, Inc. | | | 11,622 | |
| | 300 | | | Newfield Exploration Companyk | | | 9,783 | |
| | 355 | | | Noble Corporation | | | 7,427 | |
| | 210 | | | Noble Energy, Inc. | | | 12,102 | |
| | 4,490 | | | Oasis Petroleum, Inc.k | | | 134,520 | |
| | 195 | | | Oceaneering International, Inc. | | | 13,703 | |
| | 170 | | | Oil States International, Inc.k | | | 10,156 | |
| | 4,950 | | | Patterson-UTI Energy, Inc. | | | 113,999 | |
| | 60 | | | Pioneer Natural Resources Company | | | 11,344 | |
| | 850 | | | QEP Resources, Inc. | | | 21,310 | |
| | 3,130 | | | Rex Energy Corporationk | | | 24,539 | |
| | 2,180 | | | Rosetta Resources, Inc.k | | | 82,905 | |
| | 290 | | | Rowan Companies plc | | | 7,038 | |
| | 9,830 | | | Schlumberger, Ltd. | | | 969,828 | |
| | 1,600 | | | Seadrill, Ltd. | | | 36,800 | |
| | 160 | | | SM Energy Company | | | 9,008 | |
| | 6,400 | | | Southwestern Energy Companyk | | | 208,064 | |
| | 2,390 | | | Superior Energy Services, Inc. | | | 60,109 | |
| | 12,000 | | | Total SA ADR | | | 718,680 | |
| | 9,117 | | | Trinidad Drilling, Ltd. | | | 59,375 | |
| | 33,400 | | | Weatherford International, Ltd.k | | | 548,428 | |
| | 985 | | | Whiting Petroleum Corporationk | | | 60,321 | |
| | 1,300 | | | WPX Energy, Inc.k | | | 24,856 | |
| | | | | |
| | | | Total | | | 8,798,980 | |
| | | | | |
|
| Financials (3.1%) | |
| | 2,910 | | | ACE, Ltd. | | | 318,063 | |
| | 1,016 | | | Affiliated Managers Group, Inc.k | | | 202,987 | |
| | 3,180 | | | Allied World Assurance Company Holdings AG | | | 120,840 | |
| | 5,330 | | | Allstate Corporation | | | 345,650 | |
| | 1,820 | | | American Assets Trust, Inc. | | | 69,779 | |
| | 1,700 | | | American Express Company | | | 152,915 | |
| | 850 | | | American Financial Group, Inc. | | | 50,855 | |
| | 5,150 | | | American International Group, Inc. | | | 275,885 | |
| | 3,050 | | | AmTrust Financial Services, Inc. | | | 136,854 | |
| | 1,464 | | | Argo Group International Holdings, Ltd. | | | 81,691 | |
| | 800 | | | Assurant, Inc. | | | 54,576 | |
| | 3,900 | | | Assured Guaranty, Ltd. | | | 90,012 | |
| | 61,080 | | | Bank of America Corporation | | | 1,048,133 | |
| | 1,150 | | | Banner Corporation | | | 49,703 | |
| | 6,160 | | | BBCN Bancorp, Inc. | | | 87,102 | |
| | 5,750 | | | Berkshire Hathaway, Inc.k | | | 805,920 | |
| | 9,100 | | | Blackstone Group, LP | | | 274,092 | |
| | 2,150 | | | Boston Private Financial Holdings, Inc. | | | 28,272 | |
| | 850 | | | Camden Property Trust | | | 65,170 | |
| | 6,400 | | | Capital One Financial Corporation | | | 529,728 | |
| | 850 | | | CBRE Group, Inc.k | | | 27,200 | |
| | 25,810 | | | Citigroup, Inc. | | | 1,381,609 | |
| | 811 | | | CNA Financial Corporation | | | 31,694 | |
| | 13,310 | | | CNO Financial Group, Inc. | | | 241,310 | |
| | 10,050 | | | Comerica, Inc. | | | 479,787 | |
| | 1,500 | | | Corporate Office Properties Trust | | | 41,010 | |
| | 1,850 | | | Crown Castle International Corporation | | | 144,522 | |
| | 1,500 | | | DDR Corporation | | | 27,210 | |
| | 6,772 | | | Deutsche Bank AG | | | 212,099 | |
| | 1,000 | | | Digital Realty Trust, Inc. | | | 68,990 | |
| | 2,250 | | | Discover Financial Services | | | 143,505 | |
| | 3,350 | | | Duke Realty Corporation | | | 63,516 | |
| | 5,960 | | | Education Realty Trust, Inc. | | | 67,110 | |
| | 900 | | | Equity Lifestyle Properties, Inc. | | | 44,190 | |
| | 1,130 | | | Extra Space Storage, Inc. | | | 65,721 | |
| | 2,050 | | | FBR & Companyk | | | 49,487 | |
| | 5,150 | | | First Horizon National Corporation | | | 66,229 | |
| | 11,400 | | | First Niagara Financial Group, Inc. | | | 85,386 | |
| | 2,350 | | | First Republic Bank | | | 119,686 | |
| | 7,000 | | | Fulton Financial Corporation | | | 83,160 | |
| | 1,585 | | | Gaming and Leisure Properties, Inc. | | | 49,531 | |
| | 1,100 | | | General Growth Properties, Inc. | | | 28,501 | |
| | 4,950 | | | Government Properties Income Trust | | | 112,959 | |
The accompanying Notes to Financial Statements are an integral part of this schedule.
121
MODERATELY CONSERVATIVE ALLOCATION FUND
Schedule of Investments as of October 31, 2014
| | | | | | | | |
| Shares | | | Common Stock (13.5%) | | Value | |
| Financials (3.1%) - continued | |
| | 2,100 | | | Green Dot Corporationk | | | $50,190 | |
| | 8,270 | | | Hanmi Financial Corporation | | | 177,392 | |
| | 800 | | | Hanover Insurance Group, Inc. | | | 53,552 | |
| | 3,040 | | | HCC Insurance Holdings, Inc. | | | 158,658 | |
| | 4,039 | | | Host Hotels & Resorts, Inc. | | | 94,149 | |
| | 36,400 | | | Huntington Bancshares, Inc. | | | 360,724 | |
| | 1,300 | | | Intercontinental Exchange, Inc. | | | 270,777 | |
| | 16,650 | | | Invesco, Ltd. | | | 673,826 | |
| | 16,000 | | | iShares Barclays 1-3 Year Credit Bond Fund | | | 1,687,520 | |
| | 10,700 | | | iShares iBoxx $ High Yield Corporate Bond ETF | | | 990,071 | |
| | 6,200 | | | iShares iBoxx $ Investment Grade Corporate Bond ETF | | | 739,908 | |
| | 13,100 | | | iShares Intermediate Credit Bond ETF | | | 1,439,821 | |
| | 3,190 | | | iShares Russell 2000 Index Fund | | | 371,826 | |
| | 6,745 | | | J.P. Morgan Chase & Company | | | 407,938 | |
| | 5,350 | | | KeyCorp | | | 70,620 | |
| | 2,073 | | | Lazard, Ltd. | | | 102,012 | |
| | 650 | | | M&T Bank Corporation | | | 79,417 | |
| | 3,500 | | | MBIA, Inc.k | | | 34,160 | |
| | 15,130 | | | MetLife, Inc. | | | 820,651 | |
| | 500 | | | Mid-America Apartment Communities, Inc. | | | 35,330 | |
| | 21,450 | | | Morgan Stanley | | | 749,677 | |
| | 2,700 | | | NASDAQ OMX Group, Inc. | | | 116,802 | |
| | 1,450 | | | Northern Trust Corporation | | | 96,135 | |
| | 2,970 | | | PacWest Bancorp | | | 126,700 | |
| | 3,080 | | | Parkway Properties, Inc. | | | 61,754 | |
| | 3,640 | | | Pebblebrook Hotel Trust | | | 155,064 | |
| | 4,300 | | | Popular, Inc.k | | | 137,084 | |
| | 1,352 | | | ProShares Ultra S&P 500 | | | 166,080 | |
| | 3,250 | | | Prudential Financial, Inc. | | | 287,755 | |
| | 1,200 | | | RLJ Lodging Trust | | | 38,664 | |
| | 300 | | | Sovran Self Storage, Inc. | | | 25,527 | |
| | 18,400 | | | SPDR Euro Stoxx 50 ETF | | | 704,168 | |
| | 12,611 | | | SPDR S&P 500 ETF Trust | | | 2,543,134 | |
| | 1,900 | | | Sunstone Hotel Investors, Inc. | | | 29,089 | |
| | 2,670 | | | SVB Financial Groupk | | | 299,013 | |
| | 8,550 | | | Synovus Financial Corporation | | | 216,828 | |
| | 6,166 | | | Terreno Realty Corporation | | | 129,856 | |
| | 1,070 | | | Texas Capital Bancshares, Inc.k | | | 65,431 | |
| | 2,350 | | | United Community Banks, Inc. | | | 42,371 | |
| | 1,150 | | | Unum Group | | | 38,479 | |
| | 1,800 | | | W.R. Berkley Corporation | | | 92,772 | |
| | 2,000 | | | Wells Fargo & Company | | | 106,180 | |
| | 4,700 | | | Western Alliance Bancorpk | | | 125,114 | |
| | 1,000 | | | Weyerhaeuser Company | | | 33,860 | |
| | 3,450 | | | Zions Bancorporation | | | 99,946 | |
| | | | | |
| | | | Total | | | 23,528,664 | |
| | | | | |
|
| Health Care (1.9%) | |
| | 550 | | | Abaxis, Inc. | | | 28,963 | |
| | 1,150 | | | Abbott Laboratories | | | 50,128 | |
| | 850 | | | Acceleron Pharma, Inc.k | | | 31,433 | |
| | 3,900 | | | Acorda Therapeutics, Inc.k | | | 135,798 | |
| | 2,500 | | | Actavis, Inc.k | | | 606,850 | |
| | 5,550 | | | Aetna, Inc. | | | 457,930 | |
| | 8,500 | | | Affymetrix, Inc.k | | | 76,585 | |
| | 2,670 | | | Akorn, Inc.k | | | 118,949 | |
| | 550 | | | Alexion Pharmaceuticals, Inc.k | | | 105,248 | |
| | 1,820 | | | Align Technology, Inc.k | | | 95,768 | |
| | 5,600 | | | Allscripts Healthcare Solutions, Inc.k | | | 76,832 | |
| | 5,800 | | | Amgen, Inc. | | | 940,644 | |
| | 2,750 | | | AMN Healthcare Services, Inc.k | | | 47,163 | |
| | 700 | | | AmSurg Corporationk | | | 37,807 | |
| | 8,660 | | | Baxter International, Inc. | | | 607,412 | |
| | 350 | | | Biogen Idec, Inc.k | | | 112,378 | |
| | 5,850 | | | BioScrip, Inc.k | | | 37,791 | |
| | 28,700 | | | Boston Scientific Corporationk | | | 381,136 | |
| | 1,600 | | | Bruker Corporationk | | | 33,168 | |
| | 592 | | | C.R. Bard, Inc. | | | 97,070 | |
| | 8,300 | | | Cambrex Corporationk | | | 174,964 | |
| | 3,600 | | | Cardinal Health, Inc. | | | 282,528 | |
| | 2,600 | | | Centene Corporationk | | | 240,942 | |
| | 13,100 | | | Cerner Corporationk | | | 829,754 | |
| | 750 | | | Charles River Laboratories International, Inc.k | | | 47,370 | |
| | 6,100 | | | Covidien plc | | | 563,884 | |
| | 1,800 | | | Endo International plck | | | 120,456 | |
| | 6,611 | | | ExamWorks Group, Inc.k | | | 256,375 | |
| | 4,100 | | | Express Scripts Holding Companyk | | | 314,962 | |
| | 11,300 | | | Gilead Sciences, Inc.k | | | 1,265,600 | |
| | 550 | | | Greatbatch, Inc.k | | | 27,604 | |
| | 1,050 | | | HCA Holdings, Inc.k | | | 73,553 | |
| | 4,000 | | | Hologic, Inc.k | | | 104,760 | |
| | 950 | | | Illumina, Inc.k | | | 182,951 | |
| | 11,488 | | | Johnson & Johnson | | | 1,238,177 | |
| | 500 | | | Mallinckrodt, LLCk | | | 46,090 | |
| | 1,450 | | | McKesson Corporation | | | 294,944 | |
| | 18,540 | | | Merck & Company, Inc. | | | 1,074,208 | |
| | 4,040 | | | Neurocrine Biosciences, Inc.k | | | 74,821 | |
| | 6,250 | | | Novavax, Inc.k | | | 35,000 | |
| | 5,783 | | | NuVasive, Inc.k | | | 236,525 | |
| | 3,500 | | | PAREXEL International Corporationk | | | 190,085 | |
| | 17,800 | | | Pfizer, Inc. | | | 533,110 | |
| | 1,250 | | | PharMerica Corporationk | | | 35,863 | |
| | 700 | | | Providence Service Corporationk | | | 30,926 | |
| | 1,100 | | | Qiagen NVk | | | 25,806 | |
| | 750 | | �� | Quintiles Transnational Holdings, Inc.k | | | 43,905 | |
| | 3,850 | | | Spectrum Pharmaceuticals, Inc.k | | | 29,183 | |
| | 2,090 | | | Teleflex, Inc. | | | 238,511 | |
| | 300 | | | Thermo Fisher Scientific, Inc. | | | 35,271 | |
| | 9,340 | | | UnitedHealth Group, Inc. | | | 887,393 | |
| | 900 | | | Universal Health Services, Inc. | | | 93,339 | |
| | 6,700 | | | Vertex Pharmaceuticals, Inc.k | | | 754,688 | |
| | 3,250 | | | Volcano Corporationk | | | 32,890 | |
| | 650 | | | Waters Corporationk | | | 72,020 | |
| | 1,650 | | | WellPoint, Inc. | | | 209,038 | |
| | | | | |
| | | | Total | | | 14,776,549 | |
| | | | | |
|
| Industrials (1.5%) | |
| | 700 | | | 3M Company | | | 107,639 | |
| | 1,000 | | | AAR Corporation | | | 26,500 | |
| | 3,500 | | | ADT Corporation | | | 125,440 | |
| | 2,750 | | | Apogee Enterprises, Inc. | | | 120,725 | |
| | 1,200 | | | Argan, Inc. | | | 41,772 | |
| | 5,950 | | | Boeing Company | | | 743,214 | |
| | 1,522 | | | Briggs & Stratton Corporation | | | 30,760 | |
| | 1,650 | | | Caterpillar, Inc. | | | 167,326 | |
| | 3,860 | | | CLARCOR, Inc. | | | 258,466 | |
| | 18,200 | | | CSX Corporation | | | 648,466 | |
| | 2,170 | | | Curtiss-Wright Corporation | | | 150,186 | |
| | 29,900 | | | Delta Air Lines, Inc. | | | 1,202,877 | |
| | 6,471 | | | EMCOR Group, Inc. | | | 285,565 | |
| | 1,530 | | | Esterline Technologies Corporationk | | | 179,178 | |
| | 3,450 | | | Federal Signal Corporation | | | 48,990 | |
| | 1,200 | | | Flowserve Corporation | | | 81,588 | |
| | 11,500 | | | Fluor Corporation | | | 762,910 | |
| | 2,200 | | | GATX Corporation | | | 139,480 | |
The accompanying Notes to Financial Statements are an integral part of this schedule.
122
MODERATELY CONSERVATIVE ALLOCATION FUND
Schedule of Investments as of October 31, 2014
| | | | | | | | |
| Shares | | | Common Stock (13.5%) | | Value | |
| Industrials (1.5%) - continued | |
| | 4,391 | | | Granite Construction, Inc. | | | $162,072 | |
| | 4,000 | | | Hertz Global Holdings, Inc.k | | | 87,680 | |
| | 6,440 | | | HNI Corporation | | | 300,426 | |
| | 5,239 | | | Honeywell International, Inc. | | | 503,573 | |
| | 950 | | | Huntington Ingalls Industries, Inc. | | | 100,529 | |
| | 8,800 | | | Ingersoll-Rand plc | | | 551,056 | |
| | 2,700 | | | Insperity, Inc. | | | 85,212 | |
| | 12,083 | | | Interface, Inc. | | | 193,690 | |
| | 5,200 | | | Jacobs Engineering Group, Inc.k | | | 246,740 | |
| | 4,250 | | | KAR Auction Services, Inc. | | | 129,030 | |
| | 1,016 | | | Kimball International, Inc. | | | 18,268 | |
| | 12,120 | | | Korn/Ferry Internationalk | | | 338,512 | |
| | 4,770 | | | Landstar System, Inc. | | | 353,028 | |
| | 750 | | | Manpower, Inc. | | | 50,062 | |
| | 2,050 | | | Meritor, Inc.k | | | 23,554 | |
| | 1,950 | | | Mistras Group, Inc.k | | | 32,156 | |
| | 600 | | | Old Dominion Freight Line, Inc.k | | | 43,722 | |
| | 2,704 | | | Oshkosh Corporation | | | 121,031 | |
| | 777 | | | Parker Hannifin Corporation | | | 98,702 | |
| �� | 4,370 | | | Pentair, Ltd. | | | 293,008 | |
| | 7,870 | | | Progressive Waste Solutions, Ltd. | | | 230,040 | |
| | 360 | | | Proto Labs, Inc.k | | | 23,533 | |
| | 2,400 | | | Quanta Services, Inc.k | | | 81,792 | |
| | 5,380 | | | Ritchie Brothers Auctioneers, Inc. | | | 131,218 | |
| | 18,200 | | | Southwest Airlines Company | | | 627,536 | |
| | 800 | | | Spirit Aerosystems Holdings, Inc.k | | | 31,472 | |
| | 1,900 | | | Spirit Airlines, Inc.k | | | 138,909 | |
| | 2,420 | | | Tennant Company | | | 178,427 | |
| | 7,500 | | | Union Pacific Corporation | | | 873,375 | |
| | 2,650 | | | United Continental Holdings, Inc.k | | | 139,947 | |
| | 600 | | | United Technologies Corporation | | | 64,200 | |
| | 650 | | | WABCO Holdings, Inc.k | | | 63,297 | |
| | | | | |
| | | | Total | | | 11,436,879 | |
| | | | | |
|
| Information Technology (2.9%) | |
| | 4,800 | | | Akamai Technologies, Inc.k | | | 289,440 | |
| | 2,465 | | | Alibaba Group Holding, Ltd. ADRk | | | 243,049 | |
| | 650 | | | Alliance Data Systems Corporationk | | | 184,177 | |
| | 2,750 | | | Amdocs, Ltd. | | | 130,735 | |
| | 29,719 | | | Apple, Inc. | | | 3,209,652 | |
| | 6,882 | | | Applied Materials, Inc. | | | 152,023 | |
| | 1,900 | | | Arris Group, Inc.k | | | 57,038 | |
| | 3,400 | | | Aspen Technology, Inc.k | | | 125,562 | |
| | 31,550 | | | Atmel Corporationk | | | 234,101 | |
| | 1,550 | | | AVG Technologies NVk | | | 27,776 | |
| | 1,250 | | | Booz Allen Hamilton Holding Corporation | | | 32,938 | |
| | 8,050 | | | Broadcom Corporation | | | 337,134 | |
| | 6,240 | | | Broadridge Financial Solutions, Inc. | | | 274,123 | |
| | 13,800 | | | Brocade Communications Systems, Inc. | | | 148,074 | |
| | 2,650 | | | CDW Corporation | | | 81,726 | |
| | 1,450 | | | Cirrus Logic, Inc.k | | | 27,985 | |
| | 47,320 | | | Cisco Systems, Inc. | | | 1,157,920 | |
| | 2,050 | | | Citrix Systems, Inc.k | | | 131,671 | |
| | 3,100 | | | Computer Sciences Corporation | | | 187,240 | |
| | 20,600 | | | Corning, Inc. | | | 420,858 | |
| | 2,650 | | | Digital River, Inc.k | | | 67,760 | |
| | 1,500 | | | Diodes, Inc.k | | | 38,745 | |
| | 3,280 | | | DST Systems, Inc. | | | 316,028 | |
| | 10,975 | | | eBay, Inc.k | | | 576,187 | |
| | 3,400 | | | Electronic Arts, Inc.k | | | 139,298 | |
| | 49,450 | | | EMC Corporation | | | 1,420,698 | |
| | 11,800 | | | Facebook, Inc.k | | | 884,882 | |
| | 4,300 | | | Fairchild Semiconductor International, Inc.k | | | 66,005 | |
| | 1,700 | | | FEI Company | | | 143,276 | |
| | 1,152 | | | Google, Inc.k | | | 644,060 | |
| | 1,302 | | | Google, Inc., Class Ak | | | 739,367 | |
| | 3,020 | | | Guidewire Software, Inc.k | | | 150,819 | |
| | 750 | | | iGATE Corporationk | | | 27,788 | |
| | 750 | | | International Business Machines Corporation | | | 123,300 | |
| | 7,354 | | | Juniper Networks, Inc. | | | 154,949 | |
| | 3,668 | | | Lexmark International, Inc. | | | 158,311 | |
| | 1,950 | | | LinkedIn Corporationk | | | 446,472 | |
| | 1,900 | | | Liquidity Services, Inc.k | | | 24,282 | |
| | 8,400 | | | Marvell Technology Group, Ltd. | | | 112,896 | |
| | 6,350 | | | MasterCard, Inc. | | | 531,813 | |
| | 11,360 | | | Microsoft Corporation | | | 533,352 | |
| | 28,770 | | | NetApp, Inc. | | | 1,231,356 | |
| | 8,452 | | | NVIDIA Corporation | | | 165,152 | |
| | 17,500 | | | Oracle Corporation | | | 683,375 | |
| | 4,614 | | | Plantronics, Inc. | | | 239,328 | |
| | 2,250 | | | Polycom, Inc.k | | | 29,430 | |
| | 13,100 | | | QUALCOMM, Inc. | | | 1,028,481 | |
| | 1,600 | | | Red Hat, Inc.k | | | 94,272 | |
| | 10,950 | | | Salesforce.com, Inc.k | | | 700,691 | |
| | 2,850 | | | Sanmina Corporationk | | | 71,450 | |
| | 12,139 | | | Sonus Networks, Inc.k | | | 42,122 | |
| | 3,550 | | | Symantec Corporation | | | 88,111 | |
| | 1,450 | | | Take-Two Interactive Software, Inc.k | | | 38,352 | |
| | 10,000 | | | Teradata Corporationk | | | 423,200 | |
| | 4,181 | | | Teradyne, Inc. | | | 76,930 | |
| | 10,340 | | | Texas Instruments, Inc. | | | 513,484 | |
| | 3,920 | | | Textura Corporationk | | | 104,429 | |
| | 4,275 | | | Ubiquiti Networks, Inc. | | | 152,917 | |
| | 1,200 | | | Unisys Corporationk | | | 30,768 | |
| | 5,516 | | | Virtusa Corporationk | | | 226,046 | |
| | 2,250 | | | Visa, Inc. | | | 543,218 | |
| | 5,950 | | | VMware, Inc.k | | | 497,242 | |
| | 400 | | | Workday, Inc.k | | | 38,192 | |
| | 17,400 | | | Xerox Corporation | | | 231,072 | |
| | | | | |
| | | | Total | | | 22,003,128 | |
| | | | | |
|
| Materials (0.3%) | |
| | 4,630 | | | Celanese Corporation | | | 271,920 | |
| | 600 | | | Clearwater Paper Corporationk | | | 38,610 | |
| | 350 | | | Compass Minerals International, Inc. | | | 29,988 | |
| | 1,200 | | | Crown Holdings, Inc.k | | | 57,516 | |
| | 6,870 | | | Dow Chemical Company | | | 339,378 | |
| | 2,030 | | | Eagle Materials, Inc. | | | 177,483 | |
| | 1,300 | | | Eastman Chemical Company | | | 105,014 | |
| | 2,750 | | | Ferro Corporationk | | | 36,080 | |
| | 5,300 | | | Graphic Packaging Holding Companyk | | | 64,289 | |
| | 7,780 | | | Horsehead Holding Corporationk | | | 122,224 | |
| | 700 | | | Innophos Holdings, Inc. | | | 39,900 | |
| | 350 | | | LyondellBasell Industries NV | | | 32,071 | |
| | 4,880 | | | Materials Select Sector SPDR Fund | | | 236,192 | |
| | 5,110 | | | Nucor Corporation | | | 276,247 | |
| | 2,150 | | | Owens-Illinois, Inc.k | | | 55,405 | |
| | 1,850 | | | Packaging Corporation of America | | | 133,348 | |
| | 2,550 | | | Royal Gold, Inc. | | | 145,732 | |
| | 1,748 | | | Silgan Holdings, Inc. | | | 85,932 | |
| | 650 | | | Sonoco Products Company | | | 26,565 | |
| | 4,550 | | | Southern Copper Corporation | | | 130,949 | |
| | 4,965 | | | Steel Dynamics, Inc. | | | 114,245 | |
| | 1,000 | | | Tronox, Ltd. | | | 24,180 | |
| | 450 | | | U.S. Silica Holdings, Inc. | | | 20,205 | |
| | 600 | | | Westlake Chemical Corporation | | | 42,330 | |
The accompanying Notes to Financial Statements are an integral part of this schedule.
123
MODERATELY CONSERVATIVE ALLOCATION FUND
Schedule of Investments as of October 31, 2014
| | | | | | | | |
| Shares | | | Common Stock (13.5%) | | Value | |
| Materials (0.3%) - continued | | | | |
| | 650 | | | Worthington Industries, Inc. | | | $25,122 | |
| | | | | |
| | | | Total | | | 2,630,925 | |
| | | | | |
|
| Telecommunications Services (0.1%) | |
| | 6,450 | | | AT&T, Inc. | | | 224,718 | |
| | 3,264 | | | Cogent Communications Holdings | | | 110,780 | |
| | 11,363 | | | Verizon Communications, Inc. | | | 570,991 | |
| | 7,650 | | | Vonage Holdings Corporationk | | | 26,622 | |
| | | | | |
| | | | Total | | | 933,111 | |
| | | | | |
|
| Utilities (0.3%) | |
| | 1,100 | | | Atmos Energy Corporation | | | 58,300 | |
| | 2,700 | | | Edison International, Inc. | | | 168,966 | |
| | 1,230 | | | Laclede Group, Inc. | | | 62,447 | |
| | 7,570 | | | NiSource, Inc. | | | 318,394 | |
| | 5,620 | | | NorthWestern Corporation | | | 296,961 | |
| | 14,980 | | | PG&E Corporation | | | 753,794 | |
| | 1,730 | | | Portland General Electric Company | | | 62,989 | |
| | 1,900 | | | Public Service Enterprise Group, Inc. | | | 78,489 | |
| | 1,750 | | | Southern Company | | | 81,130 | |
| | 950 | | | Vectren Corporation | | | 42,703 | |
| | 2,700 | | | Wisconsin Energy Corporation | | | 134,082 | |
| | | | | |
| | | | Total | | | 2,058,255 | |
| | | | | |
| | | | | | | | |
| | | | | |
| | | | Total Common Stock (cost $82,435,409) | | | 103,377,010 | |
| | | | | |
| | |
| Shares | | | Collateral Held for Securities Loaned (0.1%) | | Value | |
| | | | 752,392 Thrivent Cash Management Trust | | | 752,392 | |
| | | | | |
| | | | Total Collateral Held for Securities Loaned (cost $752,392) | | | 752,392 | |
| | | | | |
| | |
Shares or
Principal
Amount | | | Short-Term Investments (12.5%)l | | Value | |
| | | | Federal Home Loan Bank Discount Notes | | | | |
| | 4,000,000 | | | 0.055%, 11/12/2014 | | | 3,999,933 | |
| | 17,000,000 | | | 0.044%, 11/14/2014 | | | 16,999,731 | |
| | 2,000,000 | | | 0.025%, 11/21/2014 | | | 1,999,972 | |
| | 4,400,000 | | | 0.047%, 11/26/2014m | | | 4,399,856 | |
| | 2,000,000 | | | 0.047%, 12/3/2014 | | | 1,999,916 | |
| | 16,000,000 | | | 0.070%, 12/5/2014m | | | 15,998,942 | |
| | 10,000,000 | | | 0.060%, 12/10/2014 | | | 9,999,350 | |
| | 5,000,000 | | | 0.040%, 1/7/2015 | | | 4,999,628 | |
| | 2,000,000 | | | 0.040%, 1/12/2015 | | | 1,999,840 | |
| | 2,000,000 | | | 0.055%, 1/21/2015 | | | 1,999,753 | |
| | 16,000,000 | | | 0.063%, 1/23/2015 | | | 15,997,676 | |
| | 12,000,000 | | | 0.065%, 1/30/2015 | | | 11,998,050 | |
| | 1,100,000 | | | 0.090%, 4/24/2015m | | | 1,099,521 | |
| | | | Federal Home Loan Mortgage Corporation Discount Notes | | | | |
| | 2,000,000 | | | 0.062%, 11/24/2014 | | | 1,999,921 | |
| | | | U.S. Treasury Bills | | | | |
| | 100,000 | | | 0.000%, 11/28/2014n | | | 100,000 | |
| | | | | |
| | | | Total Short-Term Investments (at amortized cost) | | | 95,592,089 | |
| | | | | |
| | | | Total Investments (cost $752,029,181) 109.2% | | | $834,069,834 | |
| | | | | |
| | | | Other Assets and Liabilities, Net (9.2%) | | | (70,360,441 | ) |
| | | | | |
| | | | Total Net Assets 100.0% | | | $763,709,393 | |
| | | | | |
a | The stated interest rate represents the weighted average of all contracts within the bank loan facility. |
b | All or a portion of the loan is unfunded. |
c | Denotes investments purchased on a when-issued or delayed delivery basis. |
d | Denotes securities sold under Rule 144A of the Securities Act of 1933, which exempts them from registration. These securities have been deemed liquid and may be resold to other dealers in the program orto other qualified institutional buyers. As of October 31, 2014, the value of these investments was $24,180,599 or 3.2% of total net assets. |
e | Denotes variable rate securities. Variable rate securities are securities whose yields vary with a designated market index or market rate. The rate shown is as of October 31, 2014. |
f | Denotes step coupon securities. Step coupon securities pay an initial coupon rate for the first period and then different coupon rates for following periods. The rate shown is as of October 31, 2014. |
g | All or a portion of the security is on loan. |
h | Denotes interest only security. Interest only securities represent the right to receive monthly interest payments on an underlying pool of mortgages or assets. The principal shown is the outstanding paramount of the pool as of the end of the period. The actual effective yield of the security is different than the stated coupon rate. |
i | Security is fair valued. |
j | Denotes perpetual securities. Perpetual securities pay an indefinite stream of interest, but may be called by the issuer at an earlier date. |
k | Non-income producing security. |
l | The interest rate shown reflects the yield, coupon rate or the discount rate at the date of purchase. |
m | At October 31, 2014, $5,099,337 of investments were held on deposit with the counterparty and pledged as the initial margin deposit for open futures contracts. |
n | At October 31, 2014, $100,000 of investments were pledged as collateral with the custodian under the agreement between the counterparty, the custodian and the fund for open swap contracts. |
* | Denotes restricted securities. Restricted securities are investment securities which have been deemed illiquid and cannot be offered for public sale without first being registered under the Securities Act of 1933. The following table indicates the acquisition date and cost of restricted securities Moderately Conservative Allocation Fund owned as of October 31, 2014. |
| | | | | | | | |
Security | | Acquisition
Date | | | Cost | |
Alm Loan Funding CLO, 10/17/2026 | | | 7/31/2014 | | | $ | 169,915 | |
Apidos CLO XVIII, 7/22/2026 | | | 6/25/2014 | | | | 174,563 | |
Babson CLO, Ltd., 10/17/2026 | | | 8/15/2014 | | | | 169,915 | |
Birchwood Park CLO, Ltd., 7/15/2026 | | | 7/31/2014 | | | | 170,000 | |
BlueMountain CLO, Ltd., 10/15/2026 | | | 8/27/2014 | | | | 169,828 | |
Carlyle Global Market Strategies CLO, Ltd., 7/20/2023 | | | 7/3/2014 | | | | 175,000 | |
Carlyle Global Market Strategies CLO, Ltd., 10/15/2026 | | | 9/19/2014 | | | | 175,000 | |
Cent CLO 16, LP, 8/1/2024 | | | 9/5/2014 | | | | 170,000 | |
Cent CLO 22, Ltd., 11/7/2026 | | | 9/19/2014 | | | | 175,000 | |
CoBank ACB, 6/15/2022 | | | 10/18/2013 | | | | 75,279 | |
Dryden 34 Senior Loan Fund CLO, 10/15/2026 | | | 7/21/2014 | | | | 170,000 | |
Edlinc Student Loan Funding Trust, 10/1/2025 | | | 2/28/2013 | | | | 266,211 | |
FNA Trust, 1/10/2018 | | | 4/29/2013 | | | | 150,017 | |
GoldenTree Loan Opportunities IX, Ltd., 10/29/2026 | | | 10/3/2014 | | | | 174,825 | |
The accompanying Notes to Financial Statements are an integral part of this schedule.
124
MODERATELY CONSERVATIVE ALLOCATION FUND
Schedule of Investments as of October 31, 2014
| | | | | | | | |
Security | | Acquisition
Date | | | Cost | |
JBS Finance II, Ltd., 1/29/2018 | | | 8/11/2014 | | | | $326,423 | |
Limerock CLO III, LLC, 10/20/2026 | | | 10/16/2014 | | | | 500,000 | |
Madison Park Funding XIV CLO, Ltd., 7/20/2026 | | | 7/3/2014 | | | | 189,772 | |
Neuberger Berman CLO, Ltd., 8/4/2025 | | | 6/19/2014 | | | | 150,000 | |
Octagon Investment Partners XX CLO, Ltd., 8/12/2026 | | | 7/10/2014 | | | | 170,000 | |
OZLM VIII, Ltd., 10/17/2026 | | | 8/7/2014 | | | | 169,031 | |
Symphony CLO XV, Ltd., 10/17/2026 | | | 10/17/2014 | | | | 496,250 | |
Symphony CLO, Ltd., 1/9/2023 | | | 9/15/2014 | | | | 170,000 | |
Voya CLO 2014-3, Ltd., 7/25/2026 | | | 7/10/2014 | | | | 169,745 | |
Definitions:
| | |
ADR | | - American Depositary Receipt, which are certificates for an underlying foreign security’s shares held by an issuing U.S. depository bank. |
CLO | | - Collateralized Loan Obligation |
ETF | | - Exchange Traded Fund. |
REIT | | - Real Estate Investment Trust is a company that buys, develops, manages and/or sells real estate assets. |
TIPS | | - Treasury Inflation Protected Security. |
Unrealized Appreciation (Depreciation)
Gross unrealized appreciation and depreciation of investments, based on cost for federal income tax purposes, were as follows:
| | | | |
Gross unrealized appreciation | | | $81,749,381 | |
Gross unrealized depreciation | | | (3,494,698 | ) |
| | | | |
Net unrealized appreciation (depreciation) | | | $78,254,683 | |
| |
Cost for federal income tax purposes | | | $755,815,151 | |
The accompanying Notes to Financial Statements are an integral part of this schedule.
125
MODERATELY CONSERVATIVE ALLOCATION FUND
Schedule of Investments as of October 31, 2014
Fair Valuation Measurements
The following table is a summary of the inputs used, as of October 31, 2014, in valuing Moderately Conservative Allocation Fund’s assets carried at fair value.
| | | | | | | | | | | | | | | | |
Investments in Securities | | Total | | | Level 1 | | | Level 2 | | | Level 3 | |
| | | | |
Bank Loans | | | | | | | | | | | | | | | | |
Basic Materials | | | 2,562,994 | | | | – | | | | 2,562,994 | | | | – | |
Capital Goods | | | 1,515,791 | | | | – | | | | 1,515,791 | | | | – | |
Communications Services | | | 18,802,982 | | | | – | | | | 18,315,819 | | | | 487,163 | |
Consumer Cyclical | | | 5,727,749 | | | | – | | | | 5,217,969 | | | | 509,780 | |
Consumer Non-Cyclical | | | 3,420,633 | | | | – | | | | 3,084,645 | | | | 335,988 | |
Energy | | | 2,035,278 | | | | – | | | | 2,035,278 | | | | – | |
Financials | | | 1,664,567 | | | | – | | | | 1,664,567 | | | | – | |
Technology | | | 1,697,566 | | | | – | | | | 1,697,566 | | | | – | |
Transportation | | | 1,350,636 | | | | – | | | | 931,850 | | | | 418,786 | |
Utilities | | | 1,275,151 | | | | – | | | | 1,275,151 | | | | – | |
| | | | |
Mutual Funds | | | | | | | | | | | | | | | | |
Equity Mutual Funds | | | 169,391,604 | | | | 169,391,604 | | | | – | | | | – | |
Fixed Income Mutual Funds | | | 177,657,059 | | | | 177,657,059 | | | | – | | | | – | |
| | | | |
Long-Term Fixed Income | | | | | | | | | | | | | | | | |
Asset-Backed Securities | | | 13,054,599 | | | | – | | | | 12,636,745 | | | | 417,854 | |
Basic Materials | | | 3,085,463 | | | | – | | | | 3,085,463 | | | | – | |
Capital Goods | | | 2,781,051 | | | | – | | | | 2,781,051 | | | | – | |
Collateralized Mortgage Obligations | | | 13,392,064 | | | | – | | | | 12,395,814 | | | | 996,250 | |
Commercial Mortgage-Backed Securities | | | 14,436,071 | | | | – | | | | 14,436,071 | | | | – | |
Communications Services | | | 9,411,573 | | | | – | | | | 9,411,573 | | | | – | |
Consumer Cyclical | | | 5,023,583 | | | | – | | | | 5,023,583 | | | | – | |
Consumer Non-Cyclical | | | 8,212,615 | | | | – | | | | 8,212,615 | | | | – | |
Energy | | | 6,702,789 | | | | – | | | | 6,702,789 | | | | – | |
Financials | | | 24,116,917 | | | | – | | | | 24,116,917 | | | | – | |
Foreign Government | | | 453,482 | | | | – | | | | 453,482 | | | | – | |
Mortgage-Backed Securities | | | 81,157,507 | | | | – | | | | 81,157,507 | | | | – | |
Technology | | | 2,575,466 | | | | – | | | | 2,575,466 | | | | – | |
Transportation | | | 1,467,429 | | | | – | | | | 1,467,429 | | | | – | |
U.S. Government and Agencies | | | 55,565,461 | | | | – | | | | 55,565,461 | | | | – | |
Utilities | | | 5,810,263 | | | | – | | | | 5,810,263 | | | | – | |
| | | | |
Common Stock | | | | | | | | | | | | | | | | |
Consumer Discretionary | | | 12,941,549 | | | | 12,941,549 | | | | – | | | | – | |
Consumer Staples | | | 4,268,970 | | | | 4,268,970 | | | | – | | | | – | |
Energy | | | 8,798,980 | | | | 8,739,605 | | | | 59,375 | | | | – | |
Financials | | | 23,528,664 | | | | 23,528,664 | | | | – | | | | – | |
Health Care | | | 14,776,549 | | | | 14,776,549 | | | | – | | | | – | |
Industrials | | | 11,436,879 | | | | 11,436,879 | | | | – | | | | – | |
Information Technology | | | 22,003,128 | | | | 22,003,128 | | | | – | | | | – | |
Materials | | | 2,630,925 | | | | 2,630,925 | | | | – | | | | – | |
Telecommunications Services | | | 933,111 | | | | 933,111 | | | | – | | | | – | |
Utilities | | | 2,058,255 | | | | 2,058,255 | | | | – | | | | – | |
Collateral Held for Securities Loaned | | | 752,392 | | | | 752,392 | | | | – | | | | – | |
Short-Term Investments | | | 95,592,089 | | | | – | | | | 95,592,089 | | | | – | |
| |
Total | | | $834,069,834 | | | | $451,118,690 | | | | $379,785,323 | | | | $3,165,821 | |
| |
| | | | |
Other Financial Instruments | | Total | | | Level 1 | | | Level 2 | | | Level 3 | |
Asset Derivatives | | | | | | | | | | | | | | | | |
Futures Contracts | | | 3,325,940 | | | | 3,325,940 | | | | – | | | | – | |
Credit Default Swaps | | | 9,543 | | | | – | | | | 9,543 | | | | – | |
| |
Total Asset Derivatives | | | $3,335,483 | | | | $3,325,940 | | | | $9,543 | | | | $– | |
| |
Liability Derivatives | | | | | | | | | | | | | | | | |
Futures Contracts | | | 2,684,546 | | | | 2,684,546 | | | | – | | | | – | |
| |
Total Liability Derivatives | | | $2,684,546 | | | | $2,684,546 | | | | $– | | | | $– | |
| |
There were no significant transfers between Levels during the period ended October 31, 2014. Transfers between Levels are identified as of the end of the period.
The accompanying Notes to Financial Statements are an integral part of this schedule.
126
MODERATELY CONSERVATIVE ALLOCATION FUND
Schedule of Investments as of October 31, 2014
| | | | | | | | | | | | | | | | | | | | |
Futures Contracts | | Number of
Contracts
Long/(Short) | | | Expiration Date | | | Notional Principal Amount | | | Value | | | Unrealized Gain/(Loss) | |
2-Yr. U.S. Treasury Bond Futures | | | (512 | ) | | | December 2014 | | | | ($112,092,826 | ) | | | ($112,416,000 | ) | | | ($323,174 | ) |
5-Yr. U.S. Treasury Bond Futures | | | (14 | ) | | | December 2014 | | | | (1,647,966 | ) | | | (1,672,016 | ) | | | (24,050 | ) |
10-Yr. U.S. Treasury Bond Futures | | | 173 | | | | December 2014 | | | | 21,670,340 | | | | 21,860,173 | | | | 189,833 | |
30-Yr. U.S. Treasury Bond Futures | | | 330 | | | | December 2014 | | | | 45,721,832 | | | | 46,560,938 | | | | 839,106 | |
Eurex EURO STOXX 50 Futures | | | 702 | | | | December 2014 | | | | 28,231,000 | | | | 27,367,786 | | | | (863,214 | ) |
Mini MSCI EAFE Index Futures | | | 31 | | | | December 2014 | | | | 2,793,813 | | | | 2,845,800 | | | | 51,987 | |
Russell 2000 Index Mini-Futures | | | 48 | | | | December 2014 | | | | 5,604,110 | | | | 5,620,800 | | | | 16,690 | |
S&P 400 Index Mini-Futures | | | (244 | ) | | | December 2014 | | | | (33,061,652 | ) | | | (34,535,760 | ) | | | (1,474,108 | ) |
S&P 500 Index Futures | | | 55 | | | | December 2014 | | | | 25,546,876 | | | | 27,656,750 | | | | 2,109,874 | |
Ultra Long Term U.S. Treasury Bond Futures | | | 37 | | | | December 2014 | | | | 5,683,613 | | | | 5,802,063 | | | | 118,450 | |
Total Futures Contracts | | | | | | | | | | | | | | | | | | | $641,394 | |
| | | | | | | | | | | | | | | | | | | | |
Credit Default Swaps and Counterparty | | Buy/Sell
Protection1 | | | Termination Date | | | Notional Principal Amount2 | | | Value3 | | | Unrealized Gain/(Loss) | |
CDX HY 5 Year, at 5.00%; Morgan Stanley and Co. | | | Sell | | | | 12/20/2019 | | | | ($700,000 | ) | | | $6,443 | | | | $6,443 | |
CDX IG 5 Year, at 1.00%; Morgan Stanley and Co. | | | Sell | | | | 12/20/2019 | | | | (1,500,000 | ) | | | 3,100 | | | | 3,100 | |
Total Credit Default Swaps | | | | | | | | | | | | | | | $9,543 | | | | $9,543 | |
1 | As the buyer of protection, Moderately Conservative Allocation Fund pays periodic fees in return for payment by the seller which is contingent upon an adverse credit event occurring in the underlying issuer or reference entity. As the seller of protection, Moderately Conservative Allocation Fund collects periodic fees from the buyer and profits if the credit of the underlying issuer or reference entity remains stable or improves while the swap is outstanding, but the seller in a credit default swap contract would be required to pay the amount of credit loss, determined as specified in the agreement, to the buyer in the event of an adverse credit event in the reference entity. |
2 | The maximum potential amount of future payments Moderately Conservative Allocation Fund could be required to make as the seller or receive as the buyer of protection. |
3 | The values for credit indexes (CDX or LCDX) serve as an indicator of the current status of the payment/performance risk and represent the liability or profit for the credit default swap contract had the contract been closed as of the reporting date. When protection has been sold, the value of the swap will increase when the swap spread declines representing an improvement in the reference entity’s credit worthiness. The value of the swap will decrease when the swap spread increases representing a deterioration in the reference entity’s credit worthiness. When protection has been purchased, the value of the swap will increase when the swap spread increases representing a deterioration in the reference entity’s credit worthiness The value of the swap will decrease when the swap spread declines representing an improvement in the reference entity’s credit worthiness. |
The accompanying Notes to Financial Statements are an integral part of this schedule.
127
MODERATELY CONSERVATIVE ALLOCATION FUND
Schedule of Investments as of October 31, 2014
The following table summarizes the fair value and Statement of Assets and Liabilities location, as of October 31, 2014, for Moderately Conservative Allocation Fund’s investments in financial derivative instruments by primary risk exposure as discussed under item (2) Significant Accounting Policies of the Notes to Financial Statements.
| | | | | | |
Derivatives by risk category | | Statement of Assets and Liabilities Location | | Fair Value | |
| | |
Asset Derivatives | | | | | | |
| | |
Interest Rate Contracts | | | | | | |
Futures* | | Net Assets - Net unrealized appreciation/(depreciation) on Futures contracts | | | $1,147,389 | |
Total Interest Rate Contracts | | | | | 1,147,389 | |
| | |
Equity Contracts | | | | | | |
Futures* | | Net Assets - Net unrealized appreciation/(depreciation) on Futures contracts | | | 2,178,551 | |
Total Equity Contracts | | | | | 2,178,551 | |
| | |
Credit Contracts | | | | | | |
Credit Default Swaps | | Net Assets - Net unrealized appreciation/(depreciation) on Swap agreements | | | 9,543 | |
Total Credit Contracts | | | | | 9,543 | |
| |
Total Asset Derivatives | | | | | $3,335,483 | |
| |
Liability Derivatives | | | | | | |
| | |
Interest Rate Contracts | | | | | | |
Futures* | | Net Assets - Net unrealized appreciation/(depreciation) on Futures contracts | | | 347,224 | |
Total Interest Rate Contracts | | | | | 347,224 | |
| | |
Equity Contracts | | | | | | |
Futures* | | Net Assets - Net unrealized appreciation/(depreciation) on Futures contracts | | | 2,337,322 | |
Total Equity Contracts | | | | | 2,337,322 | |
| |
Total Liability Derivatives | | | | | $2,684,546 | |
| |
* | Includes cumulative appreciation/depreciation of futures contracts as reported in the Schedule of Investments. Only current day’s variation margin is reported within the Statement of Assets and Liabilities. |
The following table summarizes the net realized gains/(losses) and Statement of Operations location, for the period ended October 31, 2014, for Moderately Conservative Allocation Fund’s investments in financial derivative instruments by primary risk exposure.
| | | | | | |
Derivatives by risk category | | Statement of Operations Location | | Realized Gains/(Losses)
recognized in Income | |
| | |
Interest Rate Contracts | | | | | | |
Futures | | Net realized gains/(losses) on Futures contracts | | | 3,802,487 | |
| | |
Total Interest Rate Contracts | | | | | 3,802,487 | |
| | |
Equity Contracts | | | | | | |
Futures | | Net realized gains/(losses) on Futures contracts | | | 2,540,230 | |
| | |
Total Equity Contracts | | | | | 2,540,230 | |
| | |
Credit Contracts | | | | | | |
Credit Default Swaps | | Net realized gains/(losses) on Swap agreements | | | (143,213 | ) |
| | |
Total Credit Contracts | | | | | (143,213 | ) |
| |
Total | | | | | $6,199,504 | |
| |
The following table summarizes the change in net unrealized appreciation/(depreciation) and Statement of Operations location, for the period ended October 31, 2014, for Moderately Conservative Allocation Fund’s investments in financial derivative instruments by primary risk exposure.
| | | | | | |
Derivatives by risk category | | Statement of Operations Location | | Change in unrealized
appreciation/(depreciation)
recognized in Income | |
| | |
Interest Rate Contracts | | | | | | |
Futures | | Change in net unrealized appreciation/(depreciation) on Futures contracts | | | 375,579 | |
Total Interest Rate Contracts | | | | | 375,579 | |
| | |
Equity Contracts | | | | | | |
Futures | | Change in net unrealized appreciation/(depreciation) on Futures contracts | | | (2,291,505 | ) |
Total Equity Contracts | | | | | (2,291,505 | ) |
| | |
Credit Contracts | | | | | | |
Credit Default Swaps | | Change in net unrealized appreciation/(depreciation) on Swap agreements | | | (16,905 | ) |
Total Credit Contracts | | | | | (16,905 | ) |
| |
Total | | | | | ($1,932,831 | ) |
| |
The accompanying Notes to Financial Statements are an integral part of this schedule.
128
MODERATELY CONSERVATIVE ALLOCATION FUND
Schedule of Investments as of October 31, 2014
The following table presents Moderately Conservative Allocation Fund’s average volume of derivative activity during the period ended October 31, 2014.
| | | | | | | | | | | | |
Derivative Risk Category | | Futures (Notional)* | | | Futures
(Percentage
of Average
Net Assets) | | | Swaps (Notional)* | |
Equity Contracts | | | $58,698,842 | | | | 7.8 | % | | | N/A | |
Interest Rate Contracts | | | 129,448,320 | | | | 17.3 | | | | N/A | |
Credit Contracts | | | N/A | | | | N/A | | | | $107,536 | |
* | Notional amount represents long or short, or both, derivative positions held by the Fund. |
Investment in Affiliates
Affiliated issuers, as defined under the investment Company Act of 1940, include those in which the Fund’s holdings of an issuer represent 5% or more of the outstanding voting securities of an issuer, or any affiliated mutual fund.
A summary of transactions for the fiscal year to date, in Moderately Conservative Allocation Fund, is as follows:
| | | | | | | | | | | | | | | | | | | | | | | | |
Fund | | Value
October 31, 2013 | | | Gross Purchases | | | Gross Sales | | | Shares Held at
October 31,
2014 | | | Value
October 31, 2014 | | | Income Earned
November 1, 2013 -
October 31, 2014 | |
Natural Resources | | | $12,408,513 | | | | $88,225 | | | | $– | | | | 1,217,132 | | | | $11,404,524 | | | | $88,225 | |
Partner Small Cap Value | | | 7,794,407 | | | | 248,463 | | | | – | | | | 370,738 | | | | 8,271,156 | | | | 29,067 | |
Small Cap Stock | | | 3,521,013 | | | | 24,394 | | | | – | | | | 168,977 | | | | 3,872,953 | | | | – | |
Partner Mid Cap Value | | | 18,405,047 | | | | 3,475,856 | | | | – | | | | 1,385,262 | | | | 21,125,242 | | | | 95,920 | |
Mid Cap Stock | | | 9,455,498 | | | | 33,576 | | | | – | | | | 429,488 | | | | 10,969,133 | | | | 33,576 | |
Partner Worldwide Allocation | | | 46,589,353 | | | | 954,542 | | | | – | | | | 4,589,806 | | | | 46,402,937 | | | | 954,542 | |
Large Cap Growth | | | 17,305,001 | | | | 63,859 | | | | – | | | | 2,270,005 | | | | 20,339,243 | | | | 63,859 | |
Large Cap Value | | | 40,910,501 | | | | 541,906 | | | | – | | | | 2,212,214 | | | | 46,014,057 | | | | 541,906 | |
Large Cap Stock | | | 889,787 | | | | 86,790 | | | | – | | | | 35,454 | | | | 992,359 | | | | 7,354 | |
High Yield | | | 25,291,209 | | | | 1,481,340 | | | | 2,106,452 | | | | 4,836,835 | | | | 24,426,017 | | | | 1,480,956 | |
Income | | | 65,804,736 | | | | 2,475,301 | | | | 6,950,411 | | | | 6,762,201 | | | | 62,820,849 | | | | 2,475,382 | |
Government Bond | | | 11,376,247 | | | | 282,511 | | | | 773,490 | | | | 1,086,045 | | | | 10,914,748 | | | | 155,558 | |
Limited Maturity Bond | | | 90,376,014 | | | | 1,904,601 | | | | 12,161,820 | | | | 6,390,309 | | | | 79,495,445 | | | | 1,396,026 | |
Cash Management Trust-Collateral Investment | | | 3,018,707 | | | | 14,905,204 | | | | 17,171,519 | | | | 752,392 | | | | 752,392 | | | | 7,007 | |
Total Value and Income Earned | | | 353,146,033 | | | | | | | | | | | | | | | | 347,801,055 | | | | 7,329,378 | |
The accompanying Notes to Financial Statements are an integral part of this schedule.
129
BALANCED INCOME PLUS FUND
Schedule of Investments as of October 31, 2014
| | | | | | | | |
Principal Amount | | | Bank Loans (18.4%)a | | Value | |
| Basic Materials (1.5%) | |
| | | | Alpha Natural Resources, Inc., Term Loan | | | | |
| | $401,940 | | | 3.500%, 5/22/2020 | | | $342,987 | |
| | | | Crown Americas, LLC, Term Loan | | | | |
| | 480,000 | | | 0.000%, 10/20/2021b,c | | | 479,702 | |
| | | | Fortescue Metals Group, Ltd., Term Loan | | | | |
| | 896,386 | | | 3.750%, 6/30/2019 | | | 873,672 | |
| | | | HCA, Inc., Term Loan | | | | |
| | 435,600 | | | 2.904%, 3/31/2017 | | | 433,832 | |
| | | | Ineos Group Holdings, Ltd., Term Loan | | | | |
| | 567,719 | | | 3.750%, 5/4/2018 | | | 559,913 | |
| | | | NewPage Corporation, Term Loan | | | | |
| | 900,000 | | | 9.500%, 2/11/2021 | | | 872,100 | |
| | | | Tronox Pigments BV, Term Loan | | | | |
| | 670,472 | | | 4.000%, 3/19/2020 | | | 663,351 | |
| | | | | |
| | | | Total | | | 4,225,557 | |
| | | | | |
|
| Capital Goods (1.0%) | |
| | | | ADS Waste Holdings, Inc., Term Loan | | | | |
| | 527,958 | | | 3.750%, 10/9/2019 | | | 516,211 | |
| | | | Berry Plastics Group, Inc., Term Loan | | | | |
| | 498,511 | | | 3.500%, 2/8/2020 | | | 487,609 | |
| | | | Rexnord, LLC, Term Loan | | | | |
| | 504,900 | | | 4.000%, 8/21/2020 | | | 497,453 | |
| | | | Silver II Borrower, Term Loan | | | | |
| | 473,731 | | | 4.000%, 12/13/2019 | | | 465,047 | |
| | | | STHI Holding Corporation, Term Loan | | | | |
| | 950,000 | | | 4.500%, 8/6/2021 | | | 944,062 | |
| | | | | |
| | | | Total | | | 2,910,382 | |
| | | | | |
|
| Communications Services (5.6%) | |
| | | | Atlantic Broadband Penn, LLC, Term Loan | | | | |
| | 578,387 | | | 3.250%, 11/30/2019 | | | 570,724 | |
| | | | Birch Communication Inc., Term Loan | | | | |
| | 690,000 | | | 7.750%, 7/17/2020 | | | 662,400 | |
| | | | Cengage Learning Aquisitions, Term Loan | | | | |
| | 572,125 | | | 7.000%, 3/31/2020 | | | 572,411 | |
| | | | Charter Communications Operating, LLC, Term Loan | | | | |
| | 493,750 | | | 3.000%, 1/3/2021 | | | 484,956 | |
| | | | Cincinnati Bell, Inc., Term Loan | | | | |
| | 420,750 | | | 4.000%, 9/10/2020 | | | 413,736 | |
| | | | Clear Channel Communications, Inc., Term Loan | | | | |
| | 378 | | | 3.804%, 1/29/2016 | | | 374 | |
| | 519,808 | | | 6.904%, 1/30/2019 | | | 490,003 | |
| | 14,411 | | | 7.654%, 7/30/2019 | | | 13,839 | |
| | | | Cumulus Media Holdings, Inc., Term Loan | | | | |
| | 463,699 | | | 4.250%, 12/23/2020 | | | 458,288 | |
| | | | Fairpoint Communications, Term Loan | | | | |
| | 503,609 | | | 7.500%, 2/14/2019 | | | 507,074 | |
| | | | Grande Communications Networks, LLC, Term Loan | | | | |
| | 567,816 | | | 4.500%, 5/29/2020 | | | 561,786 | |
| | | | Gray Television, Inc., Term Loan | | | | |
| | 374,063 | | | 3.750%, 6/13/2021 | | | 368,829 | |
| | | | Hargray Communications Group, Inc., Term Loan | | | | |
| | 603,813 | | | 5.250%, 6/26/2019b,c | | | 602,557 | |
| | | | IMG Worldwide, Inc., Term Loan | | | | |
| | 548,625 | | | 5.250%, 5/6/2021 | | | 539,161 | |
| | | | Integra Telecom Holdings, Inc., Term Loan | | | | |
| | 538,010 | | | 5.250%, 2/22/2019 | | | 535,723 | |
| | | | Intelsat Jackson Holdings SA, Term Loan | | | | |
| | 502,409 | | | 3.750%, 6/30/2019 | | | 498,013 | |
| | | | Level 3 Communications, Inc., Term Loan | | | | |
| | 490,000 | | | 4.000%, 8/1/2019 | | | 486,732 | |
| | | | Liberty Cablevision of Puerto Rico, LLC, Term Loan | | | | |
| | 335,000 | | | 4.500%, 1/7/2022 | | | 332,280 | |
| | | | LTS Buyer, LLC, Term Loan | | | | |
| | 543,125 | | | 4.000%, 4/13/2020 | | | 536,336 | |
| | | | MCC Georgia, LLC, Term Loan | | | | |
| | 379,050 | | | 3.750%, 6/30/2021 | | | 372,299 | |
| | | | McGraw-Hill Global Education, LLC, Term Loan | | | | |
| | 500,945 | | | 5.750%, 3/22/2019 | | | 501,416 | |
| | | | NEP/NCP Holdco, Inc., Term Loan | | | | |
| | 499,631 | | | 4.250%, 1/22/2020 | | | 487,141 | |
| | | | NTelos, Inc., Term Loan | | | | |
| | 296,222 | | | 5.750%, 11/9/2019 | | | 295,727 | |
| | | | Puerto Rico Cable Acquisition Company, Inc., Term Loan | | | | |
| | 544,436 | | | 5.500%, 7/31/2018 | | | 540,353 | |
| | | | SBA Senior Finance II, LLC, Term Loan | | | | |
| | 573,563 | | | 3.250%, 3/24/2021 | | | 563,066 | |
| | | | TNS, Inc., Term Loan | | | | |
| | 559,866 | | | 5.000%, 2/14/2020 | | | 553,921 | |
| | | | Univision Communications, Inc., Term Loan | | | | |
| | 538,041 | | | 4.000%, 3/1/2020 | | | 532,214 | |
| | | | Virgin Media Investment Holdings, Ltd., Term Loan | | | | |
| | 535,000 | | | 3.500%, 6/7/2020 | | | 527,125 | |
| | | | WideOpenWest Finance, LLC, Term Loan | | | | |
| | 547,885 | | | 4.750%, 4/1/2019 | | | 546,942 | |
| | | | WMG Acquisition Corporation, Term Loan | | | | |
| | 460,350 | | | 3.750%, 7/1/2020 | | | 445,315 | |
| | | | XO Communications, LLC, Term Loan | | | | |
| | 447,750 | | | 4.250%, 3/20/2021 | | | 443,084 | |
| | | | Yankee Cable Acquisition, LLC, Term Loan | | | | |
| | 536,394 | | | 4.500%, 3/1/2020 | | | 533,310 | |
| | | | Zayo Group, LLC, Term Loan | | | | |
| | 592,447 | | | 4.000%, 7/2/2019 | | | 586,801 | |
| | | | | |
| | | | Total | | | 15,563,936 | |
| | | | | |
|
| Consumer Cyclical (3.7%) | |
| | | | Amaya Gaming Group, Inc., Term Loan | | | | |
| | 950,000 | | | 5.000%, 8/1/2021 | | | 941,887 | |
The accompanying Notes to Financial Statements are an integral part of this schedule.
130
BALANCED INCOME PLUS FUND
Schedule of Investments as of October 31, 2014
| | | | | | | | |
Principal Amount | | | Bank Loans (18.4%)a | | Value | |
| Consumer Cyclical (3.7%) - continued | |
| | | | Bally Technologies, Inc., Term Loan | | | | |
| | $428,823 | | | 4.250%, 11/25/2020 | | | $426,949 | |
| | | | Booz Allen Hamilton, Inc., Term Loan | | | | |
| | 281,137 | | | 3.750%, 7/31/2019 | | | 279,644 | |
| | | | Burlington Coat Factory Warehouse Corporation, Term Loan | | | | |
| | 467,224 | | | 4.250%, 8/13/2021 | | | 463,953 | |
| | | | Ceridian Corporation, Term Loan | | | | |
| | 247,004 | | | 4.121%, 5/9/2017 | | | 246,634 | |
| | 247,004 | | | 4.500%, 5/9/2017 | | | 244,766 | |
| | | | Chrysler Group, LLC, Term Loan | | | | |
| | 64,008 | | | 3.500%, 5/24/2017 | | | 63,634 | |
| | 572,125 | | | 3.250%, 12/31/2018 | | | 565,975 | |
| | | | Golden Nugget, Inc., Delayed Draw | | | | |
| | 71,460 | | | 5.500%, 11/21/2019 | | | 71,787 | |
| | | | Golden Nugget, Inc., Term Loan | | | | |
| | 166,740 | | | 5.500%, 11/21/2019 | | | 167,502 | |
| | | | Hilton Worldwide Finance, LLC, Term Loan | | | | |
| | 784,561 | | | 3.500%, 10/26/2020 | | | 776,323 | |
| | | | J.C. Penney Corporation, Inc., Term Loan | | | | |
| | 548,062 | | | 6.000%, 5/22/2018 | | | 540,757 | |
| | | | Las Vegas Sands, LLC, Term Loan | | | | |
| | 471,437 | | | 3.250%, 12/19/2020 | | | 469,802 | |
| | | | Marina District Finance Company, Inc., Term Loan | | | | |
| | 427,086 | | | 6.750%, 8/15/2018 | | | 425,753 | |
| | | | MGM Resorts International, Term Loan | | | | |
| | 444,347 | | | 3.500%, 12/20/2019 | | | 438,792 | |
| | | | Michaels Stores, Inc. Term Loan | | | | |
| | 588,525 | | | 4.000%, 1/28/2020 | | | 580,957 | |
| | | | Mohegan Tribal Gaming Authority, Term Loan | | | | |
| | 476,400 | | | 5.500%, 11/19/2019 | | | 462,108 | |
| | | | Pinnacle Entertainment, Inc., Term Loan | | | | |
| | 551,426 | | | 3.750%, 8/13/2020 | | | 545,222 | |
| | | | ROC Finance, LLC, Term Loan | | | | |
| | 559,350 | | | 5.000%, 6/20/2019 | | | 534,705 | |
| | | | Scientific Games International, Inc., Term Loan | | | | |
| | 550,837 | | | 4.250%, 10/18/2020 | | | 538,614 | |
| | | | Seminole Hard Rock Entertainment, Inc., Term Loan | | | | |
| | 608,160 | | | 3.500%, 5/14/2020 | | | 593,716 | |
| | | | Seminole Indian Tribe of Florida, Term Loan | | | | |
| | 437,318 | | | 3.000%, 4/29/2020 | | | 435,407 | |
| | | | Toys “R” Us, Inc., Term Loan | | | | |
| | 119,049 | | | 5.250%, 5/25/2018 | | | 95,090 | |
| | 310,203 | | | 9.750%, 4/24/2020b,c | | | 281,767 | |
| | | | | |
| | | | Total | | | 10,191,744 | |
| | | | | |
|
| Consumer Non-Cyclical (2.0%) | |
| | | | Albertsons, Inc., Term Loan | | | | |
| | 764,584 | | | 4.750%, 3/21/2019 | | | 762,673 | |
| | | | Biomet, Inc., Term Loan | | | | |
| | 371,855 | | | 3.652%, 7/25/2017 | | | 370,673 | |
| | | | Catalina Marketing Corporation, Term Loan | | | | |
| | 558,600 | | | 4.500%, 4/9/2021 | | | 543,590 | |
| | | | CHS/Community Health Systems, Inc., Term Loan | | | | |
| | 135,390 | | | 3.485%, 1/25/2017 | | | 134,939 | |
| | 360,860 | | | 4.250%, 1/27/2021 | | | 360,972 | |
| | | | Del Monte Corporation, Term Loan | | | | |
| | 447,449 | | | 3.500%, 3/9/2020 | | | 429,833 | |
| | | | JBS USA, LLC, Term Loan | | | | |
| | 439,511 | | | 3.750%, 5/25/2018 | | | 432,918 | |
| | | | Libbey Glass, Inc., Term Loan | | | | |
| | 279,300 | | | 3.750%, 4/9/2021 | | | 274,761 | |
| | | | Ortho-Clinical Diagnostics, Inc., Term Loan | | | | |
| | 598,500 | | | 4.750%, 6/30/2021 | | | 591,917 | |
| | | | Roundy’s Supermarkets, Inc., Term Loan | | | | |
| | 537,769 | | | 5.750%, 3/3/2021 | | | 477,270 | |
| | | | Supervalu, Inc., Term Loan | | | | |
| | 540,753 | | | 4.500%, 3/21/2019 | | | 533,415 | |
| | | | Visant Corporation, Term Loan | | | | |
| | 541,898 | | | 7.000%, 9/23/2021 | | | 533,769 | |
| | | | | |
| | | | Total | | | 5,446,730 | |
| | | | | |
|
| Energy (1.2%) | |
| | | | Arch Coal, Inc., Term Loan | | | | |
| | 493,699 | | | 6.250%, 5/16/2018 | | | 435,161 | |
| | | | Energy Solutions, LLC, Term Loan | | | | |
| | 673,312 | | | 6.750%, 5/29/2020 | | | 675,838 | |
| | | | Exgen Renewables I, LLC, Term Loan | | | | |
| | 356,646 | | | 5.250%, 2/6/2021 | | | 360,212 | |
| | | | McJunkin Red Man Corporation, Term Loan | | | | |
| | 564,300 | | | 5.000%, 11/8/2019 | | | 565,005 | |
| | | | Offshore Group Investment, Ltd., Term Loan | | | | |
| | 712,262 | | | 5.750%, 3/28/2019 | | | 644,597 | |
| | | | Pacific Drilling SA, Term Loan | | | | |
| | 538,187 | | | 4.500%, 6/3/2018 | | | 514,475 | |
| | | | | |
| | | | Total | | | 3,195,288 | |
| | | | | |
|
| Financials (1.4%) | |
| | | | Delos Finance Sarl, Term Loan | | | | |
| | 580,000 | | | 3.500%, 3/6/2021 | | | 576,619 | |
| | | | DJO Finance, LLC, Term Loan | | | | |
| | 434,500 | | | 4.250%, 9/15/2017 | | | 432,110 | |
| | | | Harland Clarke Holdings Corporation, Term Loan | | | | |
| | 527,969 | | | 7.000%, 5/22/2018 | | | 532,810 | |
| | | | MPH Acquisition Holdings, LLC, Term Loan | | | | |
| | 1,132,336 | | | 3.750%, 3/31/2021 | | | 1,113,732 | |
| | | | TransUnion, LLC, Term Loan | | | | |
| | 547,250 | | | 4.000%, 4/9/2021 | | | 540,070 | |
| | | | WaveDivision Holdings, LLC, Term Loan | | | | |
| | 557,581 | | | 4.000%, 10/15/2019 | | | 551,771 | |
| | | | | |
| | | | Total | | | 3,747,112 | |
| | | | | |
The accompanying Notes to Financial Statements are an integral part of this schedule.
131
BALANCED INCOME PLUS FUND
Schedule of Investments as of October 31, 2014
| | | | | | | | |
Principal Amount | | | Bank Loans (18.4%)a | | Value | |
| Technology (1.0%) | |
| | | | Avago Technologies, Ltd., Term Loan | | | | |
| | $698,250 | | | 3.750%, 5/6/2021 | | | $695,722 | |
| | | | BMC Software, Inc., Term Loan | | | | |
| | 431,000 | | | 5.000%, 9/10/2020 | | | 426,018 | |
| | | | First Data Corporation, Term Loan | | | | |
| | 595,000 | | | 3.653%, 3/23/2018 | | | 589,050 | |
| | | | Freescale Semiconductor, Inc., Term Loan | | | | |
| | 567,666 | | | 4.250%, 2/28/2020 | | | 559,356 | |
| | | | Infor US, Inc., Term Loan | | | | |
| | 487,929 | | | 3.750%, 6/3/2020 | | | 480,815 | |
| | | | SunGard Data Systems, Inc., Term Loan | | | | |
| | 26,151 | | | 4.000%, 3/8/2020 | | | 26,031 | |
| | | | | |
| | | | Total | | | 2,776,992 | |
| | | | | |
|
| Transportation (0.6%) | |
| | | | American Airlines, Inc., Term Loan | | | | |
| | 933,187 | | | 3.750%, 6/27/2019 | | | 920,356 | |
| | | | Delta Air Lines, Inc., Term Loan | | | | |
| | 557,121 | | | 3.250%, 4/20/2017 | | | 552,508 | |
| | | | OSG Bulk Ships, lnc., Term Loan | | | | |
| | 329,175 | | | 5.250%, 8/5/2019 | | | 326,568 | |
| | | | | |
| | | | Total | | | 1,799,432 | |
| | | | | |
|
| Utilities (0.4%) | |
| | | | Calpine Corporation, Term Loan | | | | |
| | 498,216 | | | 4.000%, 4/1/2018 | | | 495,879 | |
| | | | Intergen NV, Term Loan | | | | |
| | 538,187 | | | 5.500%, 6/15/2020 | | | 536,842 | |
| | | | | |
| | | | Total | | | 1,032,721 | |
| | | | | |
| | | | | | | | |
| | | | | |
| | | | Total Bank Loans (cost $51,686,469) | | | 50,889,894 | |
| | | | | |
| | |
| Shares | | | Common Stock (46.8%) | | Value | |
|
| Consumer Discretionary (6.7%) | |
| | 3,850 | | | Amazon.com, Inc.d | | | 1,176,021 | |
| | 2,300 | | | AutoZone, Inc.d | | | 1,273,096 | |
| | 18,000 | | | Best Buy Company, Inc. | | | 614,520 | |
| | 9,850 | | | BorgWarner, Inc. | | | 561,647 | |
| | 14,100 | | | CBS Corporation | | | 764,502 | |
| | 70,668 | | | Comcast Corporation | | | 3,911,474 | |
| | 11,272 | | | Dollar Tree, Inc.d | | | 682,745 | |
| | 45,900 | | | Kohl’s Corporation | | | 2,488,698 | |
| | 45,800 | | | Las Vegas Sands Corporation | | | 2,851,508 | |
| | 7,950 | | | Marriott International, Inc. | | | 602,213 | |
| | 37,429 | | | MDC Partners, Inc. | | | 774,780 | |
| | 13,700 | | | Papa John’s International, Inc. | | | 640,612 | |
| | 15,000 | | | Starbucks Corporation | | | 1,133,400 | |
| | 16,700 | | | Toll Brothers, Inc.d | | | 533,565 | |
| | 30,100 | | | Tuesday Morning Corporationd,e | | | 613,739 | |
| | | | | |
| | | | Total | | | 18,622,520 | |
| | | | | |
|
| Consumer Staples (4.0%) | |
| | 25,929 | | | Anheuser-Busch InBev NV ADR | | | 2,877,600 | |
| | 38,600 | | | Coca-Cola Company | | | 1,616,568 | |
| | 37,550 | | | PepsiCo, Inc. | | | 3,611,183 | |
| | 31,650 | | | Wal-Mart Stores, Inc. | | | 2,413,946 | |
| | 16,200 | | | WhiteWave Foods Companyd | | | 603,126 | |
| | | | | |
| | | | Total | | | 11,122,423 | |
| | | | | |
|
| Energy (4.1%) | |
| | 20,300 | | | Cameron International Corporationd | | | 1,208,865 | |
| | 6,050 | | | Concho Resources, Inc.d | | | 659,632 | |
| | 14,000 | | | EOG Resources, Inc. | | | 1,330,700 | |
| | 69,100 | | | Marathon Oil Corporation | | | 2,446,140 | |
| | 12,850 | | | Schlumberger, Ltd. | | | 1,267,781 | |
| | 7,700 | | | SM Energy Company | | | 433,510 | |
| | 68,150 | | | Total SA ADRe | | | 4,081,503 | |
| | | | | |
| | | | Total | | | 11,428,131 | |
| | | | | |
|
| Financials (11.0%) | |
| | 58,273 | | | Aberdeen Asia-Pacific Income Fund, Inc. | | | 342,645 | |
| | 3,100 | | | Affiliated Managers Group, Inc.d | | | 619,349 | |
| | 13,650 | | | Alexandria Real Estate Equities, Inc. | | | 1,132,950 | |
| | 28,300 | | | Assured Guaranty, Ltd. | | | 653,164 | |
| | 67,900 | | | Bank of America Corporation | | | 1,165,164 | |
| | 118,850 | | | Blackstone Group, LP | | | 3,579,762 | |
| | 3,500 | | | Boston Properties, Inc. | | | 443,625 | |
| | 7,250 | | | Camden Property Trust | | | 555,858 | |
| | 16,350 | | | Capital One Financial Corporation | | | 1,353,289 | |
| | 23,450 | | | Citigroup, Inc. | | | 1,255,278 | |
| | 28,350 | | | CNO Financial Group, Inc. | | | 513,986 | |
| | 13,600 | | | Cohen & Steers REIT and Preferred Income Fund, Inc. | | | 257,040 | |
| | 30,500 | | | DDR Corporation | | | 553,270 | |
| | 9,500 | | | Doubleline Income Solutions Fund | | | 202,350 | |
| | 5,400 | | | Equity Residential | | | 375,624 | |
| | 11,232 | | | First Trust High Income Long/Short Fund | | | 193,078 | |
| | 8,000 | | | Host Hotels & Resorts, Inc. | | | 186,480 | |
| | 74,600 | | | Invesco, Ltd. | | | 3,019,062 | |
| | 24,200 | | | iShares FTSE NAREIT Mortgage Plus Capped Index Fund | | | 299,354 | |
| | 19,675 | | | iShares J.P. Morgan USD Emerging Markets Bond ETF | | | 2,256,329 | |
| | 8,120 | | | iShares MSCI Emerging Markets Minimum Volatility ETFe | | | 491,747 | |
| | 102,450 | | | KeyCorp | | | 1,352,340 | |
| | 20,731 | | | Lazard, Ltd. | | | 1,020,173 | |
| | 18,050 | | | Macerich Company | | | 1,272,525 | |
| | 27,000 | | | MetLife, Inc. | | | 1,464,480 | |
| | 66,849 | | | MFS Intermediate Income Trust | | | 337,587 | |
| | 40,817 | | | Nuveen Quality Preferred Income Fund II | | | 364,088 | |
| | 15,500 | | | PacWest Bancorp | | | 661,230 | |
| | 24,364 | | | PIMCO Dynamic Credit Income Fund | | | 539,175 | |
| | 3,850 | | | Prologis, Inc. | | | 160,353 | |
| | 2,600 | | | Public Storage, Inc. | | | 479,284 | |
| | 2,950 | | | Simon Property Group, Inc. | | | 528,670 | |
| | 45,098 | | | Templeton Global Income Fund | | | 353,117 | |
| | 11,350 | | | Vanguard MSCI Emerging Markets ETF | | | 483,964 | |
| | 6,525 | | | Vanguard Short-Term Corporate Bond ETF | | | 522,848 | |
| | 1,450 | | | Vornado Realty Trust | | | 158,746 | |
| | 20,453 | | | Western Asset Emerging Markets Debt Fund, Inc. | | | 352,610 | |
| | 38,627 | | | Western Asset High Income Opportunity Fund, Inc. | | | 221,719 | |
The accompanying Notes to Financial Statements are an integral part of this schedule.
132
BALANCED INCOME PLUS FUND
Schedule of Investments as of October 31, 2014
| | | | | | | | |
| Shares | | | Common Stock (46.8%) | | Value | |
| Financials (11.0%) - continued | |
| | 18,925 | | | Zions Bancorporation | | | $548,257 | |
| | | | | |
| | | | Total | | | 30,270,570 | |
| | | | | |
|
| Health Care (5.7%) | |
| | 29,450 | | | Abbott Laboratories | | | 1,283,725 | |
| | 3,298 | | | Actavis, Inc.d | | �� | 800,557 | |
| | 11,950 | | | Amgen, Inc. | | | 1,938,051 | |
| | 6,050 | | | Gilead Sciences, Inc.d | | | 677,600 | |
| | 26,300 | | | Hologic, Inc.d | | | 688,797 | |
| | 3,200 | | | Illumina, Inc.d | | | 616,256 | |
| | 41,600 | | | Johnson & Johnson | | | 4,483,648 | |
| | 135,950 | | | Pfizer, Inc. | | | 4,071,703 | |
| | 6,200 | | | Vertex Pharmaceuticals, Inc.d | | | 698,368 | |
| | 4,800 | | | Waters Corporationd | | | 531,840 | |
| | | | | |
| | | | Total | | | 15,790,545 | |
| | | | | |
|
| Industrials (4.9%) | |
| | 15,250 | | | ADT Corporatione | | | 546,560 | |
| | 14,400 | | | Boeing Company | | | 1,798,704 | |
| | 12,800 | | | Caterpillar, Inc. | | | 1,298,048 | |
| | 44,800 | | | Delta Air Lines, Inc. | | | 1,802,304 | |
| | 12,888 | | | EMCOR Group, Inc. | | | 568,747 | |
| | 8,000 | | | Flowserve Corporation | | | 543,920 | |
| | 12,700 | | | HNI Corporation | | | 592,455 | |
| | 5,200 | | | Huntington Ingalls Industries, Inc. | | | 550,264 | |
| | 26,800 | | | Ingersoll-Rand plc | | | 1,678,216 | |
| | 30,700 | | | Union Pacific Corporation | | | 3,575,015 | |
| | 6,050 | | | WABCO Holdings, Inc.d | | | 589,149 | |
| | | | | |
| | | | Total | | | 13,543,382 | |
| | | | | |
|
| Information Technology (7.7%) | |
| | 4,256 | | | Alibaba Group Holding, Ltd. ADRd | | | 419,642 | |
| | 55,383 | | | Apple, Inc. | | | 5,981,364 | |
| | 8,200 | | | Autodesk, Inc.d | | | 471,828 | |
| | 70,427 | | | E2open, Inc.d,e | | | 411,294 | |
| | 38,250 | | | EMC Corporation | | | 1,098,922 | |
| | 25,450 | | | Facebook, Inc.d | | | 1,908,495 | |
| | 1,275 | | | Google, Inc.d | | | 712,827 | |
| | 1,300 | | | Google, Inc., Class Ad | | | 738,231 | |
| | 34,150 | | | Juniper Networks, Inc. | | | 719,540 | |
| | 4,050 | | | LinkedIn Corporationd | | | 927,288 | |
| | 12,500 | | | MasterCard, Inc. | | | 1,046,875 | |
| | 20,800 | | | NetApp, Inc. | | | 890,240 | |
| | 26,885 | | | QLIK Technologies, Inc.d | | | 762,190 | |
| | 23,700 | | | QUALCOMM, Inc. | | | 1,860,687 | |
| | 18,700 | | | Salesforce.com, Inc.d | | | 1,196,613 | |
| | 8,650 | | | ServiceNow, Inc.d | | | 587,595 | |
| | 11,700 | | | Teradata Corporationd | | | 495,144 | |
| | 16,950 | | | Ubiquiti Networks, Inc.e | | | 606,302 | |
| | 3,600 | | | Ultimate Software Group, Inc.d | | | 541,836 | |
| | | | | |
| | | | Total | | | 21,376,913 | |
| | | | | |
|
| Materials (1.5%) | |
| | 2,000 | | | Airgas, Inc. | | | 223,080 | |
| | 2,150 | | | Ashland, Inc. | | | 232,350 | |
| | 4,750 | | | Crown Holdings, Inc.d | | | 227,667 | |
| | 9,700 | | | Domtar Corporation | | | 398,379 | |
| | 3,900 | | | FMC Corporation | | | 223,665 | |
| | 45,700 | | | Materials Select Sector SPDR Fund | | | 2,211,880 | |
| | 8,250 | | | Owens-Illinois, Inc.d | | | 212,603 | |
| | 1,150 | | | PPG Industries, Inc. | | | 234,243 | |
| | 10,350 | | | Steel Dynamics, Inc. | | | 238,154 | |
| | | | | |
| | | | Total | | | 4,202,021 | |
| | | | | |
|
| Utilities (1.2%) | |
| | 17,500 | | | MDU Resources Group, Inc. | | | 493,150 | |
| | 18,650 | | | NorthWestern Corporation | | | 985,466 | |
| | 41,450 | | | Utilities Select Sector SPDR Fund | | | 1,884,731 | |
| | | | | |
| | | | Total | | | 3,363,347 | |
| | | | | |
| | | | | | | | |
| | | | | |
| | | | Total Common Stock (cost $108,265,758) | | | 129,719,852 | |
| | | | | |
| | |
Principal
Amount | | | Long-Term Fixed Income (26.2%) | | Value | |
| Asset-Backed Securities (0.9%) | |
| | | | Bayview Opportunity Master Fund Trust IIB, LP | | | | |
| | 425,728 | | | 3.950%, 1/28/2034*,f | | | 428,087 | |
| | | | Conseco Financial Corporation | | | | |
| | 112,921 | | | 6.330%, 11/1/2029 | | | 116,448 | |
| | | | Countrywide Asset-Backed Certificates | | | | |
| | 86,823 | | | 5.859%, 10/25/2046 | | | 67,404 | |
| | | | GMAC Mortgage Corporation Loan Trust | | | | |
| | 340,313 | | | 0.332%, 8/25/2035g,h | | | 298,449 | |
| | 322,327 | | | 0.332%, 12/25/2036g,h | | | 280,059 | |
| | | | Popular ABS Mortgage Pass-Through Trust | | | | |
| | 250,000 | | | 5.297%, 11/25/2035f | | | 213,008 | |
| | | | Renaissance Home Equity Loan Trust | | | | |
| | 340,804 | | | 5.608%, 5/25/2036f | | | 237,815 | |
| | 487,011 | | | 5.285%, 1/25/2037f | | | 280,296 | |
| | | | Vericrest Opportunity Loan Transferee | | | | |
| | 252,266 | | | 3.625%, 3/25/2054* | | | 253,188 | |
| | | | Wachovia Asset Securitization, Inc. | | | | |
| | 447,441 | | | 0.292%, 7/25/2037*,g,h | | | 393,322 | |
| | | | | |
| | | | Total | | | 2,568,076 | |
| | | | | |
|
| Basic Materials (0.9%) | |
| | | | Anglo American Capital plc | | | | |
| | 55,000 | | | 1.181%, 4/15/2016h,i | | | 55,220 | |
| | | | ArcelorMittal | | | | |
| | 260,000 | | | 6.000%, 3/1/2021 | | | 278,850 | |
| | | | Dow Chemical Company | | | | |
| | 66,000 | | | 8.550%, 5/15/2019 | | | 83,126 | |
| | | | First Quantum Minerals, Ltd. | | | | |
| | 310,000 | | | 7.000%, 2/15/2021i | | | 304,187 | |
| | | | FMG Resources August 2006 Pty., Ltd. | | | | |
| | 83,445 | | | 6.875%, 2/1/2018e,i | | | 85,531 | |
| | | | Freeport-McMoRan Copper & Gold, Inc. | | | | |
| | 68,000 | | | 2.375%, 3/15/2018 | | | 68,364 | |
| | | | Goldcorp, Inc. | | | | |
| | 92,000 | | | 2.125%, 3/15/2018 | | | 91,959 | |
| | | | Groupe Office Cherifien des Phosphates SA | | | | |
| | 140,000 | | | 5.625%, 4/25/2024i | | | 146,853 | |
| | | | Hexion US Finance Corporation/Hexion Nova Scotia Finance ULC | | | | |
| | 187,750 | | | 8.875%, 2/1/2018 | | | 185,638 | |
| | | | Ineos Finance plc | | | | |
| | 204,000 | | | 7.500%, 5/1/2020i | | | 218,280 | |
The accompanying Notes to Financial Statements are an integral part of this schedule.
133
BALANCED INCOME PLUS FUND
Schedule of Investments as of October 31, 2014
| | | | | | | | |
Principal
Amount | | | Long-Term Fixed Income (26.2%) | | Value | |
| Basic Materials (0.9%) - continued | |
| | | | LyondellBasell Industries NV | | | | |
| | $62,000 | | | 5.000%, 4/15/2019 | | | $68,347 | |
| | | | Minsur SA | | | | |
| | 153,000 | | | 6.250%, 2/7/2024 i | | | 169,065 | |
| | | | Mosaic Company | | | | |
| | 44,000 | | | 3.750%, 11/15/2021 | | | 46,049 | |
| | | | NOVA Chemicals Corporation | | | | |
| | 281,626 | | | 5.250%, 8/1/2023 i | | | 294,299 | |
| | | | Samarco Mineracao SA | | | | |
| | 145,000 | | | 5.375%, 9/26/2024 i | | | 145,283 | |
| | | | Trinseo Materials Operating SCA | | | | |
| | 177,000 | | | 8.750%, 2/1/2019 | | | 187,177 | |
| | | | Vale Overseas, Ltd. | | | | |
| | 68,000 | | | 6.250%, 1/23/2017 | | | 74,499 | |
| | | | Xstrata Finance Canada, Ltd. | | | | |
| | 36,000 | | | 2.050%, 10/23/2015 i | | | 36,325 | |
| | | | | |
| | | | Total | | | 2,539,052 | |
| | | | | |
|
| Capital Goods (0.8%) | |
| | | | BAE Systems plc | | | | |
| | 102,000 | | | 3.500%, 10/11/2016i | | | 106,519 | |
| | | | Brand Energy & Infrastructure Services, Inc. | | | | |
| | 140,000 | | | 8.500%, 12/1/2021i | | | 139,475 | |
| | | | Cemex SAB de CV | | | | |
| | 310,000 | | | 5.700%, 1/11/2025i | | | 303,707 | |
| | | | CNH Capital, LLC | | | | |
| | 187,750 | | | 3.625%, 4/15/2018 | | | 187,750 | |
| | | | Crown Americas Capital Corporation IV | | | | |
| | 260,000 | | | 4.500%, 1/15/2023 | | | 255,450 | |
| | | | Harsco Corporation | | | | |
| | 66,000 | | | 2.700%, 10/15/2015 | | | 65,945 | |
| | | | Hutchison Whampoa Finance CI, Ltd. | | | | |
| | 91,000 | | | 1.625%, 10/31/2017i | | | 90,846 | |
| | | | Ingersoll-Rand Global Holding Company, Ltd. | | | | |
| | 88,000 | | | 6.875%, 8/15/2018 | | | 103,133 | |
| | | | L-3 Communications Corporation | | | | |
| | 75,000 | | | 1.500%, 5/28/2017 | | | 74,544 | |
| | | | Martin Marietta Materials, Inc. | | | | |
| | 88,000 | | | 1.333%, 6/30/2017h,i | | | 88,367 | |
| | | | Nortek, Inc. | | | | |
| | 187,750 | | | 8.500%, 4/15/2021 | | | 201,831 | |
| | | | Reynolds Group Issuer, Inc. | | | | |
| | 187,750 | | | 9.875%, 8/15/2019 | | | 203,943 | |
| | | | Roper Industries, Inc. | | | | |
| | 60,000 | | | 2.050%, 10/1/2018 | | | 59,690 | |
| | | | Textron, Inc. | | | | |
| | 102,000 | | | 4.625%, 9/21/2016 | | | 108,495 | |
| | | | United Rentals North America, Inc. | | | | |
| | 211,000 | | | 7.375%, 5/15/2020 | | | 228,935 | |
| | | | | |
| | | | Total | | | 2,218,630 | |
| | | | | |
|
| Collateralized Mortgage Obligations (4.1%) | |
| | | | Banc of America Alternative Loan Trust | | | | |
| | 669,088 | | | 6.000%, 11/25/2035 | | | 583,820 | |
| | | | Countrywide Alternative Loan Trust | | | | |
| | 553,677 | | | 6.500%, 8/25/2036 | | | 429,605 | |
| | | | Countrywide Home Loan Mortgage Pass Through Trust | | | | |
| | 469,780 | | | 2.479%, 11/25/2035 | | | 397,836 | |
| | | | Credit Suisse First Boston Mortgage Securities Corporation | | | | |
| | 422,286 | | | 5.250%, 10/25/2035 | | | 420,210 | |
| | | | Deutsche Alt-A Securities Mortgage Loan Trust | | | | |
| | 415,634 | | | 0.885%, 4/25/2047h | | | 365,381 | |
| | | | Deutsche Alt-A Securities, Inc., Mortgage Loan Trust | | | | |
| | 771,334 | | | 5.500%, 11/25/2035 | | | 729,170 | |
| | | | GMACM Mortgage Loan Trust | | | | |
| | 448,631 | | | 4.590%, 5/25/2035 | | | 431,038 | |
| | | | HarborView Mortgage Loan Trust | | | | |
| | 302,827 | | | 2.661%, 12/19/2035 | | | 267,346 | |
| | | | HomeBanc Mortgage Trust | | | | |
| | 409,801 | | | 2.290%, 4/25/2037 | | | 302,751 | |
| | | | J.P. Morgan Alternative Loan Trust | | | | |
| | 313,071 | | | 2.779%, 3/25/2036 | | | 245,523 | |
| | 770,737 | | | 6.500%, 3/25/2036 | | | 681,344 | |
| | | | J.P. Morgan Mortgage Trust | | | | |
| | 635,251 | | | 2.656%, 8/25/2035 | | | 632,561 | |
| | 631,707 | | | 2.607%, 1/25/2037 | | | 563,940 | |
| | | | Lehman Mortgage Trust | | | | |
| | 77,297 | | | 6.000%, 1/25/2036 | | | 71,834 | |
| | | | Master Asset Securitization Trust | | | | |
| | 119,665 | | | 0.652%, 6/25/2036h | | | 72,279 | |
| | | | MortgageIT Trust | | | | |
| | 667,775 | | | 0.412%, 12/25/2035h | | | 613,398 | |
| | 862,548 | | | 0.352%, 4/25/2036h | | | 650,750 | |
| | | | Residential Accredit Loans, Inc. | | | | |
| | 466,374 | | | 5.750%, 9/25/2035 | | | 422,117 | |
| | | | RFMSI Trust | | | | |
| | 848,506 | | | 6.000%, 7/25/2037 | | | 769,371 | |
| | | | Structured Adjustable Rate Mortgage Loan Trust | | | | |
| | 372,993 | | | 5.122%, 7/25/2035 | | | 322,679 | |
| | 452,603 | | | 2.617%, 9/25/2035 | | | 382,068 | |
| | | | Structured Asset Mortgage Investments, Inc. | | | | |
| | 948,522 | | | 0.462%, 12/25/2035h | | | 725,422 | |
| | | | WaMu Mortgage Pass Through Certificates | | | | |
| | 350,403 | | | 0.855%, 1/25/2047h | | | 285,283 | |
| | | | Wells Fargo Mortgage Backed Securities Trust | | | | |
| | 597,750 | | | 2.609%, 7/25/2036 | | | 581,198 | |
| | 488,398 | | | 6.000%, 7/25/2037 | | | 483,311 | |
| | | | | |
| | | | Total | | | 11,430,235 | |
| | | | | |
|
| Commercial Mortgage-Backed Securities (<0.1%) | |
| | | | Government National Mortgage Association | | | | |
| | 30,473 | | | 3.214%, 1/16/2040 | | | 30,656 | |
| | | | | |
| | | | Total | | | 30,656 | |
| | | | | |
|
| Communications Services (2.3%) | |
| | | | 21st Century Fox America, Inc. | | | | |
| | 82,000 | | | 6.900%, 3/1/2019 | | | 97,511 | |
The accompanying Notes to Financial Statements are an integral part of this schedule.
134
BALANCED INCOME PLUS FUND
Schedule of Investments as of October 31, 2014
| | | | | | | | |
Principal
Amount | | | Long-Term Fixed Income (26.2%) | | Value | |
| Communications Services (2.3%) - continued | |
| | | | AMC Networks, Inc. | | | | |
| | $187,750 | | | 7.750%, 7/15/2021 | | | $204,647 | |
| | | | America Movil SAB de CV | | | | |
| | 56,000 | | | 5.000%, 10/16/2019 | | | 62,787 | |
| | | | American Tower Corporation | | | | |
| | 101,000 | | | 7.000%, 10/15/2017 | | | 114,366 | |
| | | | British Sky Broadcasting Group plc | | | | |
| | 94,000 | | | 2.625%, 9/16/2019i | | | 94,261 | |
| | | | British Telecommunications plc | | | | |
| | 74,000 | | | 1.250%, 2/14/2017 | | | 73,810 | |
| | | | CC Holdings GS V, LLC | | | | |
| | 153,000 | | | 2.381%, 12/15/2017 | | | 155,010 | |
| | | | CCO Holdings, LLC | | | | |
| | 187,750 | | | 7.000%, 1/15/2019 | | | 195,729 | |
| | | | CenturyLink, Inc. | | | | |
| | 200,000 | | | 6.450%, 6/15/2021 | | | 219,000 | |
| | | | Cequel Communications Escrow 1, LLC | | | | |
| | 300,000 | | | 6.375%, 9/15/2020i | | | 312,750 | |
| | | | Columbus International, Inc. | | | | |
| | 175,000 | | | 7.375%, 3/30/2021i | | | 185,500 | |
| | | | Cox Communications, Inc. | | | | |
| | 72,000 | | | 9.375%, 1/15/2019i | | | 91,992 | |
| | | | Digicel, Ltd. | | | | |
| | 287,750 | | | 6.000%, 4/15/2021i | | | 290,627 | |
| | | | DIRECTV Holdings, LLC | | | | |
| | 73,000 | | | 3.500%, 3/1/2016 | | | 75,444 | |
| | 66,000 | | | 5.875%, 10/1/2019 | | | 75,799 | |
| | | | DISH DBS Corporation | | | | |
| | 220,000 | | | 5.000%, 3/15/2023 | | | 219,175 | |
| | | | Frontier Communications Corporation | | | | |
| | 310,000 | | | 6.875%, 1/15/2025 | | | 313,875 | |
| | | | Hughes Satellite Systems Corporation | | | | |
| | 211,000 | | | 6.500%, 6/15/2019 | | | 228,407 | |
| | | | Intelsat Jackson Holdings SA | | | | |
| | 187,750 | | | 7.250%, 10/15/2020 | | | 200,423 | |
| | | | Level 3 Financing, Inc. | | | | |
| | 211,000 | | | 8.625%, 7/15/2020 | | | 232,100 | |
| | | | NBC Universal Enterprise, Inc. | | | | |
| | 102,000 | | | 1.662%, 4/15/2018i | | | 101,930 | |
| | | | Numericable Group SA | | | | |
| | 290,000 | | | 6.000%, 5/15/2022i | | | 296,525 | |
| | | | SBA Tower Trust | | | | |
| | 72,000 | | | 5.101%, 4/17/2017i | | | 76,342 | |
| | | | Sprint Communications, Inc. | | | | |
| | 187,750 | | | 9.000%, 11/15/2018i | | | 220,841 | |
| | | | Telefonica Emisiones SAU | | | | |
| | 77,000 | | | 3.992%, 2/16/2016 | | | 79,898 | |
| | 66,000 | | | 3.192%, 4/27/2018 | | | 68,506 | |
| | | | Time Warner Cable, Inc. | | | | |
| | 154,000 | | | 5.000%, 2/1/2020 | | | 172,359 | |
| | | | T-Mobile USA, Inc. | | | | |
| | 210,000 | | | 6.633%, 4/28/2021 | | | 221,288 | |
| | | | Univision Communications, Inc. | | | | |
| | 245,000 | | | 7.875%, 11/1/2020i | | | 264,906 | |
| | | | UPCB Finance V, Ltd. | | | | |
| | 245,000 | | | 7.250%, 11/15/2021i | | | 269,500 | |
| | | | Verizon Communications, Inc. | | | | |
| | 187,000 | | | 2.625%, 2/21/2020i | | | 186,001 | |
| | 88,000 | | | 4.500%, 9/15/2020 | | | 95,543 | |
| | | | West Corporation | | | | |
| | 305,000 | | | 5.375%, 7/15/2022i | | | 295,850 | |
| | | | WideOpenWest Finance, LLC | | | | |
| | 245,000 | | | 10.250%, 7/15/2019 | | | 268,887 | |
| | | | Wind Acquisition Finance SA | | | | |
| | 165,000 | | | 7.375%, 4/23/2021i | | | 161,288 | |
| | | | Windstream Corporation | | | | |
| | 250,000 | | | 7.750%, 10/1/2021 | | | 267,500 | |
| | | | | |
| | | | Total | | | 6,490,377 | |
| | | | | |
|
| Consumer Cyclical (1.2%) | |
| | | | AMC Entertainment, Inc. | | | | |
| | 190,000 | | | 5.875%, 2/15/2022 | | | 193,800 | |
| | | | Chrysler Group, LLC | | | | |
| | 187,750 | | | 8.250%, 6/15/2021 | | | 209,811 | |
| | | | Cinemark USA, Inc. | | | | |
| | 204,000 | | | 4.875%, 6/1/2023 | | | 200,940 | |
| | | | Daimler Finance North America, LLC | | | | |
| | 48,000 | | | 1.875%, 1/11/2018i | | | 48,164 | |
| | | | Delphi Corporation | | | | |
| | 66,000 | | | 6.125%, 5/15/2021 | | | 71,775 | |
| | | | ERAC USA Finance, LLC | | | | |
| | 88,000 | | | 2.350%, 10/15/2019i | | | 87,395 | |
| | | | Ford Motor Credit Company, LLC | | | | |
| | 140,000 | | | 1.684%, 9/8/2017 | | | 139,345 | |
| | 100,000 | | | 5.000%, 5/15/2018 | | | 109,423 | |
| | 85,000 | | | 2.597%, 11/4/2019c | | | 84,717 | |
| | | | General Motors Financial Company, Inc. | | | | |
| | 187,750 | | | 3.250%, 5/15/2018 | | | 191,974 | |
| | 138,000 | | | 4.375%, 9/25/2021 | | | 144,569 | |
| | | | Hilton Worldwide Finance, LLC | | | | |
| | 260,000 | | | 5.625%, 10/15/2021i | | | 273,975 | |
| | | | Hyundai Capital America | | | | |
| | 72,000 | | | 1.450%, 2/6/2017i | | | 72,056 | |
| | | | Jaguar Land Rover Automotive plc | | | | |
| | 75,000 | | | 4.125%, 12/15/2018i | | | 76,313 | |
| | 211,000 | | | 5.625%, 2/1/2023i | | | 219,440 | |
| | | | KB Home | | | | |
| | 160,000 | | | 4.750%, 5/15/2019 | | | 158,800 | |
| | | | L Brands, Inc. | | | | |
| | 211,000 | | | 6.625%, 4/1/2021 | | | 238,957 | |
| | | | Macy’s Retail Holdings, Inc. | | | | |
| | 60,000 | | | 7.450%, 7/15/2017 | | | 68,938 | |
| | | | Nissan Motor Acceptance Corporation | | | | |
| | 48,000 | | | 0.784%, 3/3/2017h,i | | | 48,100 | |
| | | | Royal Caribbean Cruises, Ltd. | | | | |
| | 287,750 | | | 5.250%, 11/15/2022 | | | 300,699 | |
| | | | Toll Brothers Finance Corporation | | | | |
| | 136,000 | | | 4.000%, 12/31/2018 | | | 137,700 | |
| | | | TRW Automotive, Inc. | | | | |
| | 51,000 | | | 7.250%, 3/15/2017i | | | 56,100 | |
| | | | Wynn Las Vegas, LLC | | | | |
| | 211,000 | | | 5.375%, 3/15/2022 | | | 222,077 | |
| | | | | |
| | | | Total | | | 3,355,068 | |
| | | | | |
The accompanying Notes to Financial Statements are an integral part of this schedule.
135
BALANCED INCOME PLUS FUND
Schedule of Investments as of October 31, 2014
| | | | | | | | |
Principal Amount | | | Long-Term Fixed Income (26.2%) | | Value | |
| Consumer Non-Cyclical (1.8%) | | | | |
| | | | AbbVie, Inc. | | | | |
| | $184,000 | | | 2.000%, 11/6/2018 | | | $182,467 | |
| | | | Altria Group, Inc. | | | | |
| | 109,000 | | | 9.700%, 11/10/2018 | | | 140,491 | |
| | | | Anheuser-Busch InBev Worldwide, Inc. | | | | |
| | 66,000 | | | 7.750%, 1/15/2019 | | | 80,040 | |
| | | | Beam, Inc. | | | | |
| | 62,000 | | | 5.375%, 1/15/2016 | | | 65,228 | |
| | | | CareFusion Corporation | | | | |
| | 68,000 | | | 1.450%, 5/15/2017 | | | 67,871 | |
| | | | Celgene Corporation | | | | |
| | 93,000 | | | 1.900%, 8/15/2017 | | | 93,847 | |
| | | | CHS/Community Health Systems, Inc. | | | | |
| | 211,000 | | | 7.125%, 7/15/2020 | | | 228,407 | |
| | | | ConAgra Foods, Inc. | | | | |
| | 88,000 | | | 2.100%, 3/15/2018 | | | 88,442 | |
| | | | Cott Beverages, Inc. | | | | |
| | 290,000 | | | 5.375%, 7/1/2022i | | | 287,100 | |
| | | | Coventry Health Care, Inc. | | | | |
| | 44,000 | | | 5.950%, 3/15/2017 | | | 48,669 | |
| | | | CVS Health Corporation | | | | |
| | 66,000 | | | 2.250%, 12/5/2018 | | | 66,711 | |
| | | | Envision Healthcare Corporation | | | | |
| | 300,000 | | | 5.125%, 7/1/2022i | | | 303,750 | |
| | | | Express Scripts Holding Company | | | | |
| | 66,000 | | | 2.650%, 2/15/2017 | | | 67,897 | |
| | | | Forest Laboratories, Inc. | | | | |
| | 91,000 | | | 4.375%, 2/1/2019i | | | 95,319 | |
| | | | Fresenius Medical Care US Finance, Inc. | | | | |
| | 187,750 | | | 5.750%, 2/15/2021i | | | 201,597 | |
| | | | Gilead Sciences, Inc. | | | | |
| | 44,000 | | | 3.050%, 12/1/2016 | | | 45,817 | |
| | | | Grupo Bimbo SAB de CV | | | | |
| | 140,000 | | | 3.875%, 6/27/2024i | | | 139,342 | |
| | | | Hawk Acquisition Sub, Inc. | | | | |
| | 211,000 | | | 4.250%, 10/15/2020 | | | 213,068 | |
| | | | HCA, Inc. | | | | |
| | 187,750 | | | 4.750%, 5/1/2023 | | | 190,801 | |
| | | | IMS Health, Inc. | | | | |
| | 193,000 | | | 6.000%, 11/1/2020i | | | 200,238 | |
| | | | JBS Finance II, Ltd. | | | | |
| | 187,750 | | | 8.250%, 1/29/2018* | | | 197,607 | |
| | | | Kroger Company | | | | |
| | 124,000 | | | 1.200%, 10/17/2016 | | | 124,178 | |
| | | | Lorillard Tobacco Company | | | | |
| | 72,000 | | | 8.125%, 6/23/2019 | | | 88,202 | |
| | | | McKesson Corporation | | | | |
| | 100,000 | | | 1.292%, 3/10/2017 | | | 99,793 | |
| | | | Medco Health Solutions, Inc. | | | | |
| | 40,000 | | | 7.125%, 3/15/2018 | | | 46,554 | |
| | | | Mondelez International, Inc. | | | | |
| | 48,000 | | | 2.250%, 2/1/2019 | | | 47,906 | |
| | | | Pernod Ricard SA | | | | |
| | 24,000 | | | 2.950%, 1/15/2017i | | | 24,727 | |
| | 62,000 | | | 5.750%, 4/7/2021i | | | 70,937 | |
| | | | Perrigo Company, Ltd. | | | | |
| | 30,000 | | | 1.300%, 11/8/2016 | | | 29,938 | |
| | | | Revlon Consumer Products Corporation | | | | |
| | 187,750 | | | 5.750%, 2/15/2021 | | | 187,750 | |
| | | | SABMiller plc | | | | |
| | 66,000 | | | 6.500%, 7/15/2018i | | | 76,043 | |
| | | | Safeway, Inc. | | | | |
| | 15,000 | | | 3.400%, 12/1/2016 | | | 15,154 | |
| | | | Spectrum Brands Escrow Corporation | | | | |
| | 211,000 | | | 6.375%, 11/15/2020 | | | 223,660 | |
| | | | Sysco Corporation | | | | |
| | 138,000 | | | 2.350%, 10/2/2019 | | | 138,825 | |
| | | | Tenet Healthcare Corporation | | | | |
| | 260,000 | | | 8.125%, 4/1/2022 | | | 298,025 | |
| | | | Thermo Fisher Scientific, Inc. | | | | |
| | 67,000 | | | 1.300%, 2/1/2017 | | | 66,921 | |
| | 67,000 | | | 2.400%, 2/1/2019 | | | 67,380 | |
| | | | Tyson Foods, Inc. | | | | |
| | 88,000 | | | 2.650%, 8/15/2019 | | | 88,839 | |
| | | | Valeant Pharmaceuticals International, Inc. | | | | |
| | 187,750 | | | 7.250%, 7/15/2022i | | | 198,076 | |
| | | | Whirlpool Corporation | | | | |
| | 88,000 | | | 1.650%, 11/1/2017 | | | 88,017 | |
| | | | WM Wrigley Jr. Company | | | | |
| | 44,000 | | | 2.000%, 10/20/2017i | | | 44,451 | |
| | | | | |
| | | | Total | | | 5,030,085 | |
| | | | | |
|
| Energy (1.6%) | |
| | | | Boardwalk Pipelines, Ltd. | | | | |
| | 72,000 | | | 5.875%, 11/15/2016 | | | 77,449 | |
| | | | BP Capital Markets plc | | | | |
| | 58,000 | | | 0.657%, 11/7/2016h | | | 58,185 | |
| | | | Buckeye Partners, LP | | | | |
| | 80,000 | | | 2.650%, 11/15/2018 | | | 79,913 | |
| | | | Calumet Specialty Products Partners, LP | | | | |
| | 260,000 | | | 6.500%, 4/15/2021i | | | 252,200 | |
| | | | CNOOC Nexen Finance 2014 ULC | | | | |
| | 53,000 | | | 1.625%, 4/30/2017 | | | 53,015 | |
| | | | CNPC General Capital, Ltd. | | | | |
| | 75,000 | | | 2.750%, 4/19/2017i | | | 76,337 | |
| | 140,000 | | | 2.750%, 5/14/2019i | | | 139,794 | |
| | | | Concho Resources, Inc. | | | | |
| | 252,750 | | | 6.500%, 1/15/2022 | | | 272,970 | |
| | | | Continental Resources, Inc. | | | | |
| | 93,000 | | | 7.125%, 4/1/2021 | | | 102,416 | |
| | | | Devon Energy Corporation | | | | |
| | 66,000 | | | 1.200%, 12/15/2016 | | | 66,752 | |
| | | | Enbridge, Inc. | | | | |
| | 45,000 | | | 0.684%, 6/2/2017h | | | 45,011 | |
| | | | Energy Transfer Partners, LP | | | | |
| | 68,000 | | | 6.700%, 7/1/2018 | | | 78,022 | |
| | | | Energy XXI Gulf Coast, Inc. | | | | |
| | 185,000 | | | 7.750%, 6/15/2019e | | | 166,500 | |
| | | | Enterprise Products Operating, LLC | | | | |
| | 138,000 | | | 2.550%, 10/15/2019 | | | 138,008 | |
| | | | EQT Corporation | | | | |
| | 68,000 | | | 8.125%, 6/1/2019 | | | 83,540 | |
The accompanying Notes to Financial Statements are an integral part of this schedule.
136
BALANCED INCOME PLUS FUND
Schedule of Investments as of October 31, 2014
| | | | | | | | |
Principal Amount | | | Long-Term Fixed Income (26.2%) | | Value | |
| Energy (1.6%) - continued | |
| | | | Harvest Operations Corporation | | | | |
| | $187,750 | | | 6.875%, 10/1/2017 | | | $191,505 | |
| | | | Hess Corporation | | | | |
| | 36,000 | | | 8.125%, 2/15/2019 | | | 44,134 | |
| | | | Kinder Morgan, Inc. | | | | |
| | 92,000 | | | 5.000%, 2/15/2021i | | | 97,060 | |
| | | | Kodiak Oil & Gas Corporation | | | | |
| | 187,750 | | | 5.500%, 1/15/2021 | | | 190,566 | |
| | | | Linn Energy, LLC | | | | |
| | 187,750 | | | 8.625%, 4/15/2020 | | | 188,219 | |
| | | | MEG Energy Corporation | | | | |
| | 211,000 | | | 6.375%, 1/30/2023i | | | 208,890 | |
| | | | Offshore Group Investment, Ltd. | | | | |
| | 245,000 | | | 7.500%, 11/1/2019e | | | 208,863 | |
| | | | Petrobras Global Finance BV | | | | |
| | 58,000 | | | 2.000%, 5/20/2016 | | | 57,812 | |
| | 185,000 | | | 3.115%, 3/17/2020h | | | 186,665 | |
| | | | Petroleos Mexicanos | | | | |
| | 85,000 | | | 4.250%, 1/15/2025i | | | 86,046 | |
| | | | Regency Energy Partners, LP | | | | |
| | 260,000 | | | 5.000%, 10/1/2022 | | | 265,200 | |
| | | | Rosetta Resources, Inc. | | | | |
| | 230,000 | | | 5.875%, 6/1/2022 | | | 220,800 | |
| | | | Sabine Pass Liquefaction, LLC | | | | |
| | 260,000 | | | 5.750%, 5/15/2024i | | | 268,775 | |
| | | | Southwestern Energy Company | | | | |
| | 92,000 | | | 7.500%, 2/1/2018 | | | 107,071 | |
| | | | Suncor Energy, Inc. | | | | |
| | 48,000 | | | 6.100%, 6/1/2018 | | | 55,058 | |
| | | | Transocean, Inc. | | | | |
| | 75,000 | | | 6.000%, 3/15/2018 | | | 79,965 | |
| | | | Weatherford International, Ltd. | | | | |
| | 66,000 | | | 6.000%, 3/15/2018 | | | 74,355 | |
| | 43,000 | | | 9.625%, 3/1/2019 | | | 54,950 | |
| | | | | |
| | | | Total | | | 4,276,046 | |
| | | | | |
|
| Financials (4.4%) | |
| | | | Abbey National Treasury Services plc | | | | |
| | 92,000 | | | 0.644%, 9/29/2017h | | | 92,000 | |
| | 62,000 | | | 3.050%, 8/23/2018 | | | 64,488 | |
| | | | ABN AMRO Bank NV | | | | |
| | 66,000 | | | 2.500%, 10/30/2018i | | | 66,717 | |
| | | | Air Lease Corporation | | | | |
| | 92,000 | | | 2.125%, 1/15/2018 | | | 90,965 | |
| | | | Ally Financial, Inc. | | | | |
| | 245,000 | | | 4.750%, 9/10/2018 | | | 257,250 | |
| | | | ANZ New Zealand International, Ltd. | | | | |
| | 68,000 | | | 1.400%, 4/27/2017i | | | 68,041 | |
| | | | Aviation Capital Group Corporation | | | | |
| | 44,000 | | | 3.875%, 9/27/2016i | | | 45,200 | |
| | | | Bank of America Corporation | | | | |
| | 100,000 | | | 5.700%, 5/2/2017 | | | 109,068 | |
| | 88,000 | | | 1.700%, 8/25/2017 | | | 88,015 | |
| | 125,000 | | | 5.750%, 12/1/2017 | | | 139,142 | |
| | 176,000 | | | 1.303%, 3/22/2018h | | | 178,529 | |
| | 155,000 | | | 5.650%, 5/1/2018 | | | 173,038 | |
| | 89,000 | | | 8.000%, 12/29/2049j | | | 95,786 | |
| | | | Bank of New York Mellon Corporation | | | | |
| | 40,000 | | | 4.500%, 12/31/2049j | | | 37,850 | |
| | | | Bank of Tokyo-Mitsubishi UFJ, Ltd. | | | | |
| | 94,000 | | | 0.644%, 3/10/2017h,i | | | 94,001 | |
| | | | Banque Federative du Credit Mutuel SA | | | | |
| | 64,000 | | | 1.081%, 1/20/2017h,i | | | 64,505 | |
| | | | Barclays Bank plc | | | | |
| | 58,000 | | | 5.140%, 10/14/2020 | | | 63,034 | |
| | | | BB&T Corporation | | | | |
| | 101,000 | | | 2.050%, 6/19/2018 | | | 101,717 | |
| | | | BBVA Banco Continental SA | | | | |
| | 101,000 | | | 2.250%, 7/29/2016i | | | 101,253 | |
| | | | BBVA International Preferred SA Unipersonal | | | | |
| | 530,000 | | | 5.919%, 12/29/2049j | | | 540,600 | |
| | | | Bear Stearns Companies, LLC | | | | |
| | 103,000 | | | 6.400%, 10/2/2017 | | | 116,479 | |
| | | | BNP Paribas SA | | | | |
| | 72,000 | | | 1.250%, 12/12/2016 | | | 72,126 | |
| | 72,000 | | | 2.375%, 9/14/2017 | | | 73,383 | |
| | | | BPCE SA | | | | |
| | 69,000 | | | 1.625%, 2/10/2017 | | | 69,530 | |
| | 265,000 | | | 5.150%, 7/21/2024i | | | 272,736 | |
| | | | Branch Banking and Trust Company | | | | |
| | 57,000 | | | 0.664%, 12/1/2016h | | | 57,223 | |
| | | | Caixa Economica Federal | | | | |
| | 180,000 | | | 4.250%, 5/13/2019i | | | 181,530 | |
| | | | Capital One Financial Corporation | | | | |
| | 72,000 | | | 6.150%, 9/1/2016 | | | 78,355 | |
| | | | CIT Group, Inc. | | | | |
| | 190,000 | | | 3.875%, 2/19/2019 | | | 191,188 | |
| | | | Citigroup, Inc. | | | | |
| | 138,000 | | | 5.500%, 2/15/2017 | | | 149,977 | |
| | 84,000 | | | 6.000%, 8/15/2017 | | | 93,724 | |
| | 81,000 | | | 8.500%, 5/22/2019 | | | 101,632 | |
| | | | Compass Bank | | | | |
| | 89,000 | | | 1.850%, 9/29/2017 | | | 89,357 | |
| | | | Cooperatieve Centrale Raiffeisen-Boerenleenbank BA | | | | |
| | 90,000 | | | 4.625%, 12/1/2023 | | | 94,592 | |
| | | | Credit Agricole SA | | | | |
| | 66,000 | | | 1.625%, 4/15/2016i | | | 66,666 | |
| | 92,000 | | | 6.625%, 9/29/2049i,j | | | 89,755 | |
| | | | Credit Suisse Group AG | | | | |
| | 265,000 | | | 7.500%, 12/11/2049i,j | | | 281,642 | |
| | | | CyrusOne, LP | | | | |
| | 187,750 | | | 6.375%, 11/15/2022 | | | 197,607 | |
| | | | DDR Corporation | | | | |
| | 48,000 | | | 9.625%, 3/15/2016 | | | 53,466 | |
| | | | Denali Borrower, LLC | | | | |
| | 355,000 | | | 5.625%, 10/15/2020i | | | 376,522 | |
| | | | Deutsche Bank AG | | | | |
| | 92,000 | | | 1.350%, 5/30/2017 | | | 91,461 | |
| | | | Discover Bank | | | | |
| | 24,000 | | | 8.700%, 11/18/2019 | | | 29,806 | |
| | | | Discover Financial Services | | | | |
| | 41,000 | | | 6.450%, 6/12/2017 | | | 45,766 | |
| | | | Fifth Third Bancorp | | | | |
| | 128,000 | | | 5.450%, 1/15/2017 | | | 138,895 | |
| | | | General Electric Capital Corporation | | | | |
| | 92,000 | | | 0.514%, 5/15/2017h | | | 92,046 | |
| | 82,000 | | | 5.625%, 9/15/2017 | | | 91,673 | |
The accompanying Notes to Financial Statements are an integral part of this schedule.
137
BALANCED INCOME PLUS FUND
Schedule of Investments as of October 31, 2014
| | | | | | | | |
Principal Amount | | | Long-Term Fixed Income (26.2%) | | Value | |
| Financials (4.4%) - continued | |
| | $43,000 | | | 1.625%, 4/2/2018 | | | $43,023 | |
| | | | Genworth Financial, Inc. | | | | |
| | 77,000 | | | 7.700%, 6/15/2020 | | | 92,436 | |
| | | | Goldman Sachs Group, Inc. | | | | |
| | 68,000 | | | 6.250%, 9/1/2017 | | | 76,221 | |
| | 83,000 | | | 2.375%, 1/22/2018 | | | 83,775 | |
| | 44,000 | | | 2.625%, 1/31/2019 | | | 44,327 | |
| | 66,000 | | | 7.500%, 2/15/2019 | | | 78,806 | |
| | 92,000 | | | 2.550%, 10/23/2019 | | | 91,410 | |
| | | | Hartford Financial Services Group, Inc. | | | | |
| | 100,000 | | | 6.000%, 1/15/2019 | | | 114,157 | |
| | | | HBOS plc | | | | |
| | 88,000 | | | 6.750%, 5/21/2018i | | | 98,832 | |
| | | | HCP, Inc. | | | | |
| | 51,000 | | | 3.750%, 2/1/2016 | | | 52,809 | |
| | 68,000 | | | 3.750%, 2/1/2019 | | | 71,661 | |
| | | | Health Care REIT, Inc. | | | | |
| | 68,000 | | | 4.700%, 9/15/2017 | | | 73,927 | |
| | | | HSBC Holdings plc | | | | |
| | 138,000 | | | 5.625%, 12/29/2049j | | | 140,243 | |
| | | | Huntington National Bank | | | | |
| | 62,000 | | | 1.300%, 11/20/2016 | | | 62,118 | |
| | | | Icahn Enterprises, LP | | | | |
| | 250,000 | | | 6.000%, 8/1/2020 | | | 262,500 | |
| | | | ING Bank NV | | | | |
| | 265,000 | | | 5.800%, 9/25/2023i | | | 294,924 | |
| | | | ING Capital Funding Trust III | | | | |
| | 56,000 | | | 3.833%, 12/29/2049h,j | | | 55,860 | |
| | | | International Lease Finance Corporation | | | | |
| | 62,000 | | | 2.184%, 6/15/2016h | | | 61,768 | |
| | 250,000 | | | 5.875%, 8/15/2022 | | | 271,250 | |
| | | | Intesa Sanpaolo SPA | | | | |
| | 54,000 | | | 3.625%, 8/12/2015i | | | 54,965 | |
| | 24,000 | | | 3.875%, 1/16/2018 | | | 25,069 | |
| | 102,000 | | | 3.875%, 1/15/2019 | | | 106,190 | |
| | | | J.P. Morgan Chase & Company | | | | |
| | 85,000 | | | 3.450%, 3/1/2016 | | | 87,815 | |
| | 48,000 | | | 0.754%, 2/15/2017h | | | 48,141 | |
| | 44,000 | | | 2.000%, 8/15/2017 | | | 44,520 | |
| | 44,000 | | | 6.300%, 4/23/2019 | | | 51,062 | |
| | 88,000 | | | 7.900%, 4/29/2049j | | | 95,370 | |
| | 275,000 | | | 6.750%, 8/29/2049j | | | 289,740 | |
| | | | KeyCorp | | | | |
| | 58,000 | | | 2.300%, 12/13/2018 | | | 58,158 | |
| | | | Kookmin Bank | | | | |
| | 66,000 | | | 1.109%, 1/27/2017h,i | | | 66,475 | |
| | | | Liberty Mutual Group, Inc. | | | | |
| | 27,000 | | | 5.000%, 6/1/2021i | | | 29,641 | |
| | | | Liberty Property, LP | | | | |
| | 102,000 | | | 5.500%, 12/15/2016 | | | 110,478 | |
| | | | Macquarie Bank, Ltd. | | | | |
| | 50,000 | | | 5.000%, 2/22/2017i | | | 53,873 | |
| | | | MetLife, Inc. | | | | |
| | 92,000 | | | 1.903%, 12/15/2017 | | | 92,836 | |
| | | | Metropolitan Life Global Funding I | | | | |
| | 50,000 | | | 1.300%, 4/10/2017i | | | 50,105 | |
| | | | Mizuho Corporate Bank, Ltd. | | | | |
| | 50,000 | | | 1.550%, 10/17/2017i | | | 49,802 | |
| | 92,000 | | | 1.750%, 2/25/2016 | | | 92,826 | |
| | 140,000 | | | 6.250%, 8/28/2017 | | | 156,693 | |
| | 88,000 | | | 6.625%, 4/1/2018 | | | 100,774 | |
| | 57,000 | | | 4.875%, 11/1/2022 | | | 60,703 | |
| | | | Murray Street Investment Trust I | | | | |
| | 144,000 | | | 4.647%, 3/9/2017 | | | 153,737 | |
| | | | National City Corporation | | | | |
| | 48,000 | | | 6.875%, 5/15/2019 | | | 56,804 | |
| | | | Nomura Holdings, Inc. | | | | |
| | 59,000 | | | 2.000%, 9/13/2016 | | | 59,738 | |
| | 48,000 | | | 2.750%, 3/19/2019 | | | 48,521 | |
| | | | Oversea-Chinese Banking Corporation, Ltd. | | | | |
| | 145,000 | | | 4.250%, 6/19/2024i | | | 146,941 | |
| | | | PNC Bank NA | | | | |
| | 92,000 | | | 1.150%, 11/1/2016 | | | 92,320 | |
| | | | Pricoa Global Funding I | | | | |
| | 88,000 | | | 1.350%, 8/18/2017i | | | 87,895 | |
| | | | Realty Income Corporation | | | | |
| | 75,000 | | | 2.000%, 1/31/2018 | | | 75,339 | |
| | | | Regions Bank | | | | |
| | 88,000 | | | 7.500%, 5/15/2018 | | | 103,098 | |
| | | | Reinsurance Group of America, Inc. | | | | |
| | 88,000 | | | 5.625%, 3/15/2017 | | | 95,951 | |
| | | | Royal Bank of Scotland Group plc | | | | |
| | 59,000 | | | 5.050%, 1/8/2015 | | | 59,449 | |
| | 50,000 | | | 1.173%, 3/31/2017h | | | 50,166 | |
| | 265,000 | | | 7.640%, 3/29/2049j | | | 280,238 | |
| | 265,000 | | | 7.648%, 8/29/2049j | | | 311,706 | |
| | | | SLM Corporation | | | | |
| | 30,000 | | | 4.625%, 9/25/2017 | | | 30,525 | |
| | | | Societe Generale SA | | | | |
| | 60,000 | | | 5.750%, 4/20/2016i | | | 63,454 | |
| | | | State Bank of India | | | | |
| | 140,000 | | | 3.622%, 4/17/2019i | | | 142,906 | |
| | | | Sumitomo Mitsui Banking Corporation | | | | |
| | 132,000 | | | 1.300%, 1/10/2017 | | | 132,046 | |
| | | | Suncorp-Metway, Ltd. | | | | |
| | 37,000 | | | 0.934%, 3/28/2017h,i | | | 37,132 | |
| | | | Swiss RE Capital I, LP | | | | |
| | 69,000 | | | 6.854%, 5/29/2049i,j | | | 72,450 | |
| | | | Synchrony Financial | | | | |
| | 132,000 | | | 1.875%, 8/15/2017 | | | 132,455 | |
| | | | Ventas Realty, LP | | | | |
| | 47,000 | | | 1.250%, 4/17/2017 | | | 46,916 | |
| | | | Voya Financial, Inc. | | | | |
| | 72,000 | | | 2.900%, 2/15/2018 | | | 74,025 | |
| | | | WEA Finance, LLC | | | | |
| | 92,000 | | | 1.750%, 9/15/2017i | | | 92,195 | |
| | | | Wells Fargo & Company | | | | |
| | 34,000 | | | 1.250%, 7/20/2016 | | | 34,230 | |
| | 176,000 | | | 1.400%, 9/8/2017 | | | 176,007 | |
| | | | | |
| | | | Total | | | 12,119,863 | |
| | | | | |
|
| Foreign Government (0.5%) | |
| | | | Brazil Government International Bond | | | | |
| | 140,000 | | | 5.000%, 1/27/2045 | | | 137,200 | |
The accompanying Notes to Financial Statements are an integral part of this schedule.
138
BALANCED INCOME PLUS FUND
Schedule of Investments as of October 31, 2014
| | | | | | | | |
Principal
Amount | | | Long-Term Fixed Income (26.2%) | | Value | |
| Foreign Government (0.5%) - continued | |
| | | | Colombia Government International Bond | | | | |
| | $100,000 | | | 2.625%, 3/15/2023 | | | $93,350 | |
| | 145,000 | | | 4.000%, 2/26/2024 | | | 148,770 | |
| | | | Costa Rica Government International Bond | | | | |
| | 140,000 | | | 7.000%, 4/4/2044i | | | 144,550 | |
| | | | Hungary Government International Bond | | | | |
| | 200,000 | | | 4.000%, 3/25/2019 | | | 204,900 | |
| | | | Poland Government International Bond | | | | |
| | 89,000 | | | 4.000%, 1/22/2024 | | | 93,522 | |
| | | | Slovenia Government International Bond | | | | |
| | 155,000 | | | 4.125%, 2/18/2019i | | | 163,138 | |
| | | | South Africa Government International Bond | | | | |
| | 140,000 | | | 5.375%, 7/24/2044 | | | 144,900 | |
| | | | Uruguay Government International Bond | | | | |
| | 110,000 | | | 5.100%, 6/18/2050 | | | 109,042 | |
| | | | | |
| | | | Total | | | 1,239,372 | |
| | | | | |
|
| Mortgage-Backed Securities (5.0%) | |
| | | | Federal Home Loan Mortgage Corporation Gold 15-Yr. Pass Through | | | | |
| | 500,000 | | | 3.000%, 11/1/2029c | | | 517,734 | |
| | | | Federal Home Loan Mortgage Corporation Gold 30-Yr. Pass Through | | | | |
| | 1,000,000 | | | 4.000%, 11/1/2044c | | | 1,060,859 | |
| | | | Federal National Mortgage Association Conventional 15-Yr. Pass Through | | | | |
| | 1,250,000 | | | 3.500%, 11/1/2029c | | | 1,320,703 | |
| | | | Federal National Mortgage Association Conventional 30-Yr. Pass Through | | | | |
| | 3,250,000 | | | 3.500%, 11/1/2044c | | | 3,360,702 | |
| | 3,150,000 | | | 4.000%, 11/1/2044c | | | 3,344,414 | |
| | 3,850,000 | | | 4.500%, 11/1/2044c | | | 4,172,438 | |
| | | | | |
| | | | Total | | | 13,776,850 | |
| | | | | |
|
| Technology (0.5%) | |
| | | | Alliance Data Systems Corporation | | | | |
| | 165,000 | | | 5.375%, 8/1/2022i | | | 167,475 | |
| | | | EMC Corporation | | | | |
| | 45,000 | | | 1.875%, 6/1/2018 | | | 44,732 | |
| | | | Fidelity National Information Services, Inc. | | | | |
| | 91,000 | | | 1.450%, 6/5/2017 | | | 90,686 | |
| | | | First Data Corporation | | | | |
| | 187,750 | | | 7.375%, 6/15/2019i | | | 199,015 | |
| | | | Freescale Semiconductor, Inc. | | | | |
| | 200,000 | | | 6.000%, 1/15/2022i | | | 205,000 | |
| | | | Hewlett-Packard Company | | | | |
| | 78,000 | | | 5.400%, 3/1/2017 | | | 84,834 | |
| | | | Iron Mountain, Inc. | | | | |
| | 187,750 | | | 6.000%, 8/15/2023 | | | 198,076 | |
| | | | Sensata Technologies BV | | | | |
| | 290,000 | | | 4.875%, 10/15/2023i | | | 286,375 | |
| | | | Tyco Electronics Group SA | | | | |
| | 101,000 | | | 6.550%, 10/1/2017 | | | 114,971 | |
| | | | Xerox Corporation | | | | |
| | 101,000 | | | 7.200%, 4/1/2016 | | | 109,680 | |
| | | | | |
| | | | Total | | | 1,500,844 | |
| | | | | |
|
| Transportation (0.4%) | |
| | | | A.P. Meoller - Maersk A/S | | | | |
| | 92,000 | | | 2.550%, 9/22/2019i | | | 92,764 | |
| | | | American Airlines Pass Through Trust | | | | |
| | 45,310 | | | 4.950%, 1/15/2023 | | | 48,482 | |
| | | | Avis Budget Car Rental, LLC | | | | |
| | 290,000 | | | 5.125%, 6/1/2022i | | | 286,520 | |
| | | | Continental Airlines, Inc. | | | | |
| | 159,207 | | | 6.250%, 4/11/2020 | | | 169,873 | |
| | | | Delta Air Lines, Inc. | | | | |
| | 90,000 | | | 6.750%, 5/23/2017 | | | 93,600 | |
| | 72,510 | | | 4.950%, 5/23/2019 | | | 77,223 | |
| | 60,982 | | | 4.750%, 5/7/2020 | | | 64,946 | |
| | | | Korea Expressway Corporation | | | | |
| | 78,000 | | | 1.625%, 4/28/2017 i | | | 77,761 | |
| | | | United Air Lines, Inc. | | | | |
| | 55,091 | | | 10.400%, 11/1/2016 | | | 61,206 | |
| | | | US Airways Pass Through Trust | | | | |
| | 100,000 | | | 3.950%, 11/15/2025 | | | 101,250 | |
| | | | | |
| | | | Total | | | 1,073,625 | |
| | | | | |
|
| U.S. Government and Agencies (0.5%) | |
| | | | U.S. Treasury Notes | | | | |
| | 750,000 | | | 0.875%, 8/15/2017 | | | 750,176 | |
| | 450,000 | | | 1.875%, 6/30/2020 | | | 451,687 | |
| | 75,000 | | | 3.625%, 2/15/2044 | | | 83,232 | |
| | | | | |
| | | | Total | | | 1,285,095 | |
| | | | | |
|
| Utilities (1.3%) | |
| | | | Access Midstream Partners, LP | | | | |
| | 245,000 | | | 4.875%, 5/15/2023 | | | 256,025 | |
| | | | AES Corporation | | | | |
| | 187,750 | | | 7.375%, 7/1/2021 | | | 214,211 | |
| | | | Atlas Pipeline Partners, LP | | | | |
| | 211,000 | | | 4.750%, 11/15/2021 | | | 210,472 | |
| | | | Calpine Corporation | | | | |
| | 180,000 | | | 5.375%, 1/15/2023 | | | 181,800 | |
| | | | Commonwealth Edison Company | | | | |
| | 50,000 | | | 6.950%, 7/15/2018 | | | 58,171 | |
| | | | DCP Midstream Operating, LP | | | | |
| | 66,000 | | | 2.500%, 12/1/2017 | | | 67,288 | |
| | | | Dynegy Finance I, Inc. | | | | |
| | 160,000 | | | 7.375%, 11/1/2022i | | | 169,200 | |
| | | | El Paso Corporation | | | | |
| | 46,000 | | | 7.000%, 6/15/2017 | | | 51,175 | |
| | | | Electricite de France SA | | | | |
| | 66,000 | | | 0.691%, 1/20/2017h,i | | | 66,192 | |
| | 100,000 | | | 5.250%, 12/29/2049i,j | | | 103,750 | |
| | 265,000 | | | 5.625%, 12/29/2049i,j | | | 280,900 | |
| | | | Enel Finance International NV | | | | |
| | 62,000 | | | 5.125%, 10/7/2019i | | | 68,845 | |
| | | | Enterprise Products Operating, LLC | | | | |
| | 330,000 | | | 7.000%, 6/1/2067 | | | 346,913 | |
The accompanying Notes to Financial Statements are an integral part of this schedule.
139
BALANCED INCOME PLUS FUND
Schedule of Investments as of October 31, 2014
| | | | | | | | |
Principal
Amount | | | Long-Term Fixed Income (26.2%) | | Value | |
| Utilities (1.3%) - continued | |
| | | | Exelon Generation Company, LLC | | | | |
| | $44,000 | | | 5.200%, 10/1/2019 | | | $49,217 | |
| | | | Fermaca Enterprises S de RL de CV | | | | |
| | 140,000 | | | 6.375%, 3/30/2038i | | | 147,525 | |
| | | | MidAmerican Energy Holdings Company | | | | |
| | 84,000 | | | 1.100%, 5/15/2017 | | | 83,673 | |
| | 39,000 | | | 5.750%, 4/1/2018 | | | 44,151 | |
| | | | NiSource Finance Corporation | | | | |
| | 88,000 | | | 6.400%, 3/15/2018 | | | 100,589 | |
| | | | NRG Energy, Inc. | | | | |
| | 187,750 | | | 6.625%, 3/15/2023 | | | 198,076 | |
| | | | Oleoducto Central SA | | | | |
| | 145,000 | | | 4.000%, 5/7/2021i | | | 146,813 | |
| | | | ONEOK Partners, LP | | | | |
| | 68,000 | | | 2.000%, 10/1/2017 | | | 68,482 | |
| | | | Pacific Gas & Electric Company | | | | |
| | 57,000 | | | 5.625%, 11/30/2017 | | | 63,936 | |
| | | | Panhandle Eastern Pipe Line Company, LP | | | | |
| | 66,000 | | | 6.200%, 11/1/2017 | | | 74,541 | |
| | | | PG&E Corporation | | | | |
| | 49,000 | | | 2.400%, 3/1/2019 | | | 49,182 | |
| | | | PPL Capital Funding, Inc. | | | | |
| | 88,000 | | | 1.900%, 6/1/2018 | | | 87,853 | |
| | | | Sempra Energy | | | | |
| | 92,000 | | | 6.150%, 6/15/2018 | | | 105,309 | |
| | | | Southern Company | | | | |
| | 88,000 | | | 1.300%, 8/15/2017 | | | 87,741 | |
| | | | TransAlta Corporation | | | | |
| | 91,000 | | | 1.900%, 6/3/2017 | | | 90,901 | |
| | | | Transelec SA | | | | |
| | 140,000 | | | 4.250%, 1/14/2025i | | | 140,461 | |
| | | | Williams Companies, Inc. | | | | |
| | 88,000 | | | 7.875%, 9/1/2021 | | | 106,250 | |
| | | | | |
| | | | Total | | | 3,719,642 | |
| | | | | |
| | | | | | | | |
| | | | | |
| | | | Total Long-Term Fixed Income (cost $72,033,475) | | | 72,653,516 | |
| | | | | |
| | |
| Shares | | | Preferred Stock (1.7%) | | Value | |
| Financials (1.5%) | |
| | 13,250 | | | Affiliated Managers Group, Inc., 5.250% | | | 338,140 | |
| | 3,975 | | | Agribank FCB, 6.875%j | | | 407,934 | |
| | 1,000 | | | Allstate Corporation, 5.100% | | | 24,580 | |
| | 238 | | | Bank of America Corporation, Convertible, 7.250%j | | | 272,084 | |
| | 21,465 | | | Citigroup, Inc., 6.875%j | | | 574,403 | |
| | 2,600 | | | Discover Financial Services, 6.500%j | | | 66,742 | |
| | 5,175 | | | Farm Credit Bank of Texas, 6.750%i,j | | | 551,300 | |
| | 12,400 | | | Goldman Sachs Group, Inc., 5.500%j | | | 296,732 | |
| | 14,700 | | | HSBC USA, Inc., 6.500%j | | | 374,409 | |
| | 430 | | | M&T Bank Corporation, 6.375%j | | | 426,372 | |
| | 10,600 | | | Morgan Stanley, 7.125%j | | | 288,956 | |
| | 7,155 | | | U.S. Bancorp 6.500%j | | | 209,713 | |
| | 265 | | | Wells Fargo & Company, Convertible, 7.500%j | | | 319,060 | |
| | | | | |
| | | | Total | | | 4,150,425 | |
| | | | | |
|
| Materials (0.1%) | |
| | 10,600 | | | CHS, Inc., 7.100%j | | | 284,716 | |
| | | | | |
| | | | Total | | | 284,716 | |
| | | | | |
|
| Utilities (0.1%) | |
| | 3,975 | | | Southern California Edison Company, 4.670%j | | | 405,078 | |
| | | | | |
| | | | Total | | | 405,078 | |
| | | | | |
| | | | | | | | |
| | | | | |
| | | | Total Preferred Stock (cost $4,694,995) | | | 4,840,219 | |
| | | | | |
| | |
| Shares | | | Collateral Held for Securities Loaned (1.2%) | | Value | |
| | 3,335,702 | | | Thrivent Cash Management Trust | | | 3,335,702 | |
| | | | | |
| | | | Total Collateral Held for Securities Loaned (cost $3,335,702) | | | 3,335,702 | |
| | | | | |
| | |
Shares or
Principal
Amount | | | Short-Term Investments (12.0%)k | | Value | |
| | | | Federal Home Loan Bank Discount Notes | | | | |
| | 200,000 | | | 0.067%, 11/19/2014l | | | 199,993 | |
| | 100,000 | | | 0.050%, 1/9/2015l | | | 99,990 | |
| | 100,000 | | | 0.090%, 4/24/2015l | | | 99,957 | |
| | 32,752,028 | | | Thrivent Cash Management Trust 0.050% | | | 32,752,028 | |
| | | | | |
| | | | Total Short-Term Investments (at amortized cost) | | | 33,151,968 | |
| | | | | |
| | | | Total Investments (cost $273,168,367) 106.3% | | | $294,591,151 | |
| | | | | |
| | | | Other Assets and Liabilities, Net (6.3%) | | | (17,548,243 | ) |
| | | | | |
| | | | Total Net Assets 100.0% | | | $277,042,908 | |
| | | | | |
a | The stated interest rate represents the weighted average of all contracts within the bank loan facility. |
b | All or a portion of the loan is unfunded. |
c | Denotes investments purchased on a when-issued or delayed delivery basis. |
d | Non-income producing security. |
e | All or a portion of the security is on loan. |
f | Denotes step coupon securities. Step coupon securities pay an initial coupon rate for the first period and then different coupon rates for following periods. The rate shown is as of October 31, 2014. |
g | All or a portion of the security is insured or guaranteed. |
h | Denotes variable rate securities. Variable rate securities are securities whose yields vary with a designated market index or market rate. The rate shown is as of October 31, 2014. |
i | Denotes securities sold under Rule 144A of the Securities Act of 1933, which exempts them from registration. These securities have been deemed liquid and may be resold to other dealers in the program or to other qualified institutional buyers. As of October 31, 2014, the value of these investments was $15,032,237 or 5.4% of total net assets. |
j | Denotes perpetual securities. Perpetual securities pay an indefinite stream of interest, but may be called by the issuer at an earlier date. |
k | The interest rate shown reflects the yield, coupon rate or the discount rate at the date of purchase. |
The accompanying Notes to Financial Statements are an integral part of this schedule.
140
BALANCED INCOME PLUS FUND
Schedule of Investments as of October 31, 2014
l | At October 31, 2014, $399,940 of investments were held on deposit with the counterparty and pledged as the initial margin deposit for open futures contracts. |
* | Denotes restricted securities. Restricted securities are investment securities which have been deemed illiquid and cannot be offered for public sale without first being registered under the Securities Act of 1933. The following table indicates the acquisition date and cost of restricted securities Balanced Income Plus Fund owned as of October 31, 2014. |
| | | | | | | | |
Security | | Acquisition
Date | | | Cost | |
Bayview Opportunity Master Fund Trust IIB, LP, 1/28/2034 | | | 1/17/2014 | | | $ | 425,728 | |
JBS Finance II, Ltd., 1/29/2018 | | | 8/19/2013 | | | | 195,558 | |
Vericrest Opportunity Loan Transferee, 3/25/2054 | | | 12/11/2013 | | | | 251,173 | |
Wachovia Asset Securitization, Inc., 7/25/2037 | | | 3/16/2007 | | | | 440,018 | |
Definitions:
| | |
ADR | | - American Depositary Receipt, which are certificates for an underlying foreign security’s shares held by an issuing U.S. depository bank. |
ETF | | - Exchange Traded Fund. |
REIT | | - Real Estate Investment Trust is a company that buys, develops, manages and/or sells real estate assets. |
Unrealized Appreciation (Depreciation)
Gross unrealized appreciation and depreciation of investments, based on cost for federal income tax purposes, were as follows:
| | | | |
Gross unrealized appreciation | | | $23,744,985 | |
Gross unrealized depreciation | | | (2,991,541 | ) |
| | | | |
Net unrealized appreciation (depreciation) | | | $20,753,444 | |
| |
Cost for federal income tax purposes | | | $273,837,707 | |
The accompanying Notes to Financial Statements are an integral part of this schedule.
141
BALANCED INCOME PLUS FUND
Schedule of Investments as of October 31, 2014
Fair Valuation Measurements
The following table is a summary of the inputs used, as of October 31, 2014, in valuing Balanced Income Plus Fund’s assets carried at fair value.
| | | | | | | | | | | | | | | | |
Investments in Securities | | Total | | | Level 1 | | | Level 2 | | | Level 3 | |
| | | |
Bank Loans | | | | | | | | | | | | |
Basic Materials | | | 4,225,557 | | | | – | | | | 4,225,557 | | | | – | |
Capital Goods | | | 2,910,382 | | | | – | | | | 2,910,382 | | | | – | |
Communications Services | | | 15,563,936 | | | | – | | | | 14,361,183 | | | | 1,202,753 | |
Consumer Cyclical | | | 10,191,744 | | | | – | | | | 10,191,744 | | | | – | |
Consumer Non-Cyclical | | | 5,446,730 | | | | – | | | | 4,739,051 | | | | 707,679 | |
Energy | | | 3,195,288 | | | | – | | | | 2,835,076 | | | | 360,212 | |
Financials | | | 3,747,112 | | | | – | | | | 3,747,112 | | | | – | |
Technology | | | 2,776,992 | | | | – | | | | 2,776,992 | | | | – | |
Transportation | | | 1,799,432 | | | | – | | | | 879,076 | | | | 920,356 | |
Utilities | | | 1,032,721 | | | | – | | | | 1,032,721 | | | | – | |
| | | |
Common Stock | | | | | | | | | | | | |
Consumer Discretionary | | | 18,622,520 | | | | 18,622,520 | | | | – | | | | – | |
Consumer Staples | | | 11,122,423 | | | | 11,122,423 | | | | – | | | | – | |
Energy | | | 11,428,131 | | | | 11,428,131 | | | | – | | | | – | |
Financials | | | 30,270,570 | | | | 30,270,570 | | | | – | | | | – | |
Health Care | | | 15,790,545 | | | | 15,790,545 | | | | – | | | | – | |
Industrials | | | 13,543,382 | | | | 13,543,382 | | | | – | | | | – | |
Information Technology | | | 21,376,913 | | | | 21,376,913 | | | | – | | | | – | |
Materials | | | 4,202,021 | | | | 4,202,021 | | | | – | | | | – | |
Utilities | | | 3,363,347 | | | | 3,363,347 | | | | – | | | | – | |
| | | |
Long-Term Fixed Income | | | | | | | | | | | | |
Asset-Backed Securities | | | 2,568,076 | | | | – | | | | 2,568,076 | | | | – | |
Basic Materials | | | 2,539,052 | | | | – | | | | 2,539,052 | | | | – | |
Capital Goods | | | 2,218,630 | | | | – | | | | 2,218,630 | | | | – | |
Collateralized Mortgage Obligations | | | 11,430,235 | | | | – | | | | 11,430,235 | | | | – | |
Commercial Mortgage-Backed Securities | | | 30,656 | | | | – | | | | 30,656 | | | | – | |
Communications Services | | | 6,490,377 | | | | – | | | | 6,490,377 | | | | – | |
Consumer Cyclical | | | 3,355,068 | | | | – | | | | 3,355,068 | | | | – | |
Consumer Non-Cyclical | | | 5,030,085 | | | | – | | | | 5,030,085 | | | | – | |
Energy | | | 4,276,046 | | | | – | | | | 4,276,046 | | | | – | |
Financials | | | 12,119,863 | | | | – | | | | 12,119,863 | | | | – | |
Foreign Government | | | 1,239,372 | | | | – | | | | 1,239,372 | | | | – | |
Mortgage-Backed Securities | | | 13,776,850 | | | | – | | | | 13,776,850 | | | | – | |
Technology | | | 1,500,844 | | | | – | | | | 1,500,844 | | | | – | |
Transportation | | | 1,073,625 | | | | – | | | | 1,073,625 | | | | – | |
U.S. Government and Agencies | | | 1,285,095 | | | | – | | | | 1,285,095 | | | | – | |
Utilities | | | 3,719,642 | | | | – | | | | 3,719,642 | | | | – | |
| | | |
Preferred Stock | | | | | | | | | | | | |
Financials | | | 4,150,425 | | | | 3,599,125 | | | | 551,300 | | | | – | |
Materials | | | 284,716 | | | | 284,716 | | | | – | | | | – | |
Utilities | | | 405,078 | | | | – | | | | 405,078 | | | | – | |
Collateral Held for Securities Loaned | | | 3,335,702 | | | | 3,335,702 | | | | – | | | | – | |
Short-Term Investments | | | 33,151,968 | | | | 32,752,028 | | | | 399,940 | | | | – | |
| |
Total | | | $294,591,151 | | | | $169,691,423 | | | | $121,708,728 | | | | $3,191,000 | |
| |
| | | | |
Other Financial Instruments | | Total | | | Level 1 | | | Level 2 | | | Level 3 | |
Asset Derivatives | | | | | | | | | | | | |
Futures Contracts | | | 193,237 | | | | 193,237 | | | | – | | | | – | |
| |
Total Asset Derivatives | | | $193,237 | | | | $193,237 | | | | $– | | | | $– | |
| |
Liability Derivatives | | | | | | | | | | | | |
Futures Contracts | | | 122,470 | | | | 122,470 | | | | – | | | | – | |
| |
Total Liability Derivatives | | | $122,470 | | | | $122,470 | | | | $– | | | | $– | |
| |
There were no significant transfers between Levels during the period ended October 31, 2014. Transfers between Levels are identified as of the end of the period.
The accompanying Notes to Financial Statements are an integral part of this schedule.
142
BALANCED INCOME PLUS FUND
Schedule of Investments as of October 31, 2014
| | | | | | | | | | | | | | | | | | | | |
Futures Contracts | | Number of
Contracts
Long/(Short) | | | Expiration Date | | | Notional Principal Amount | | | Value | | | Unrealized Gain/(Loss) | |
2-Yr. U.S. Treasury Bond Futures | | | (195 | ) | | | December 2014 | | | | ($42,692,218 | ) | | | ($42,814,688 | ) | | | ($122,470 | ) |
5-Yr. U.S. Treasury Bond Futures | | | 65 | | | | December 2014 | | | | 7,705,745 | | | | 7,762,930 | | | | 57,185 | |
30-Yr. U.S. Treasury Bond Futures | | | 2 | | | | December 2014 | | | | 278,584 | | | | 282,187 | | | | 3,603 | |
S&P 500 Index Futures | | | 5 | | | | December 2014 | | | | 2,427,696 | | | | 2,514,250 | | | | 86,554 | |
Ultra Long Term U.S. Treasury Bond Futures | | | 14 | | | | December 2014 | | | | 2,149,480 | | | | 2,195,375 | | | | 45,895 | |
Total Futures Contracts | | | | | | | | | | | | | | | | | | | $70,767 | |
The following table summarizes the fair value and Statement of Assets and Liabilities location, as of October 31, 2014, for Balanced Income Plus Fund’s investments in financial derivative instruments by primary risk exposure as discussed under item (2) Significant Accounting Policies of the Notes to Financial Statements.
| | | | | | |
Derivatives by risk category | | Statement of Assets and Liabilities Location | | Fair Value | |
| | |
Asset Derivatives | | | | | | |
| | |
Interest Rate Contracts | | | | | | |
Futures* | | Net Assets - Net unrealized appreciation/(depreciation) on Futures contracts | | | $106,683 | |
Total Interest Rate Contracts | | | | | 106,683 | |
| | |
Equity Contracts | | | | | | |
Futures* | | Net Assets - Net unrealized appreciation/(depreciation) on Futures contracts | | | 86,554 | |
Total Equity Contracts | | | | | 86,554 | |
| |
Total Asset Derivatives | | | | | $193,237 | |
| |
| | |
Liability Derivatives | | | | | | |
| | |
Interest Rate Contracts | | | | | | |
Futures* | | Net Assets - Net unrealized appreciation/(depreciation) on Futures contracts | | | 122,470 | |
Total Interest Rate Contracts | | | | | 122,470 | |
| |
Total Liability Derivatives | | | | | $122,470 | |
| |
* | Includes cumulative appreciation/depreciation of futures contracts as reported in the Schedule of Investments. Only current day’s variation margin is reported within the Statement of Assets and Liabilities. |
The following table summarizes the net realized gains/(losses) and Statement of Operations location, for the period ended October 31, 2014, for Balanced Income Plus Fund’s investments in financial derivative instruments by primary risk exposure.
| | | | | | |
Derivatives by risk category | | Statement of Operations Location | | Realized Gains/(Losses)
recognized in Income | |
| | |
Interest Rate Contracts | | | | | | |
Futures | | Net realized gains/(losses) on Futures contracts | | | 164,630 | |
Total Interest Rate Contracts | | | | | 164,630 | |
| | |
Equity Contracts | | | | | | |
Futures | | Net realized gains/(losses) on Futures contracts | | | 565,101 | |
Total Equity Contracts | | | | | 565,101 | |
| |
Total | | | | | $729,731 | |
| |
The following table summarizes the change in net unrealized appreciation/(depreciation) and Statement of Operations location, for the period ended October 31, 2014, for Balanced Income Plus Fund’s investments in financial derivative instruments by primary risk exposure.
| | | | | | |
Derivatives by risk category | | Statement of Operations Location | | Change in unrealized
appreciation/(depreciation)
recognized in Income | |
| | |
Interest Rate Contracts | | | | | | |
Futures | | Change in net unrealized appreciation/(depreciation) on Futures contracts | | | (50,522 | ) |
Total Interest Rate Contracts | | | | | (50,522 | ) |
| | |
Equity Contracts | | | | | | |
Futures | | Change in net unrealized appreciation/(depreciation) on Futures contracts | | | 27,349 | |
Total Equity Contracts | | | | | 27,349 | |
| |
Total | | | | | ($23,173 | ) |
| |
The accompanying Notes to Financial Statements are an integral part of this schedule.
143
BALANCED INCOME PLUS FUND
Schedule of Investments as of October 31, 2014
The following table presents Balanced Income Plus Fund’s average volume of derivative activity during the period ended October 31, 2014.
| | | | | | | | |
Derivative Risk Category | | Futures
(Notional)* | | | Futures
(Percentage
of Average Net
Assets) | |
Equity Contracts | | | $5,265,814 | | | | 2.1 | % |
Interest Rate Contracts | | | 18,587,676 | | | | 7.6 | |
* | Notional amount represents long or short, or both, derivative positions held by the Fund. |
Investment in Affiliates
Affiliated issuers, as defined under the Investment Company Act of 1940, include those in which the Fund’s holdings of an issuer represent 5% or more of the outstanding voting securities of an issuer, or any affiliated mutual fund.
A summary of transactions for the fiscal year to date, in Balanced Income Plus Fund, is as follows:
| | | | | | | | | | | | | | | | | | | | | | | | |
Fund | | Value
October 31, 2013 | | | Gross Purchases | | | Gross Sales | | | Shares Held at
October 31, 2014 | | | Value
October 31, 2014 | | | Income Earned
November 1, 2013 -
October 31, 2014 | |
Cash Management Trust- Collateral Investment | | | $– | | | | $20,580,343 | | | | $17,244,641 | | | | 3,335,702 | | | | $3,335,702 | | | | $13,039 | |
Cash Management Trust- Short Term Investment | | | 24,239,009 | | | | 138,944,810 | | | | 130,431,791 | | | | 32,752,028 | | | | 32,752,028 | | | | 11,180 | |
Total Value and Income Earned | | | 24,239,009 | | | | | | | | | | | | | | | | 36,087,730 | | | | 24,219 | |
The accompanying Notes to Financial Statements are an integral part of this schedule.
144
OPPORTUNITY INCOME PLUS FUND
Schedule of Investments as of October 31, 2014
| | | | | | | | |
Principal Amount | | | Bank Loans (38.9%)a | | Value | |
| Basic Materials (3.4%) | | | | |
| | | | Alpha Natural Resources, Inc., Term Loan | | | | |
| | $1,546,466 | | | 3.500%, 5/22/2020 | | | $1,319,646 | |
| | | | Crown Americas, LLC, Term Loan | | | | |
| | 1,760,000 | | | 4.000%, 10/20/2021b,c | | | 1,758,909 | |
| | | | Fortescue Metals Group, Ltd., Term Loan | | | | |
| | 2,720,131 | | | 3.750%, 6/30/2019 | | | 2,651,203 | |
| | | | Ineos Group Holdings, Ltd., Term Loan | | | | |
| | 2,256,063 | | | 3.750%, 5/4/2018 | | | 2,225,042 | |
| | | | NewPage Corporation, Term Loan | | | | |
| | 2,580,000 | | | 9.500%, 2/11/2021 | | | 2,500,020 | |
| | | | Tronox Pigments BV, Term Loan | | | | |
| | 968,459 | | | 4.000%, 3/19/2020 | | | 958,174 | |
| | | | Wausau Paper Corporation, Term Loan | | | | |
| | 1,496,250 | | | 6.500%, 7/30/2020 | | | 1,477,547 | |
| | | | | |
| | | | Total | | | 12,890,541 | |
| | | | | |
| |
| Capital Goods (2.3%) | | | | |
| | | | ADS Waste Holdings, Inc., Term Loan | | | | |
| | 2,230,324 | | | 3.750%, 10/9/2019 | | | 2,180,700 | |
| | | | Berry Plastics Group, Inc., Term Loan | | | | |
| | 256,100 | | | 3.500%, 2/8/2020 | | | 250,499 | |
| | | | Rexnord, LLC, Term Loan | | | | |
| | 2,227,500 | | | 4.000%, 8/21/2020 | | | 2,194,644 | |
| | | | Silver II Borrower, Term Loan | | | | |
| | 2,131,788 | | | 4.000%, 12/13/2019 | | | 2,092,712 | |
| | | | STHI Holding Corporation, Term Loan | | | | |
| | 2,230,000 | | | 4.500%, 8/6/2021 | | | 2,216,063 | |
| | | | | |
| | | | Total | | | 8,934,618 | |
| | | | | |
| |
| Communications Services (13.4%) | | | | |
| | | | Atlantic Broadband Penn, LLC, Term Loan | | | | |
| | 543,485 | | | 3.250%, 11/30/2019 | | | 536,284 | |
| | | | Birch Communication Inc., Term Loan | | | | |
| | 1,825,000 | | | 7.750%, 7/17/2020 | | | 1,752,000 | |
| | | | Cengage Learning Aquisitions, Term Loan | | | | |
| | 1,766,125 | | | 7.000%, 3/31/2020 | | | 1,767,008 | |
| | | | Charter Communications Operating, LLC, Term Loan | | | | |
| | 2,244,318 | | | 3.000%, 7/1/2020 | | | 2,202,237 | |
| | | | Cincinnati Bell, Inc., Term Loan | | | | |
| | 1,113,750 | | | 4.000%, 9/10/2020 | | | 1,095,184 | |
| | | | Clear Channel Communications, Inc., Term Loan | | | | |
| | 1,638 | | | 3.804%, 1/29/2016 | | | 1,623 | |
| | 2,219,170 | | | 6.904%, 1/30/2019 | | | 2,091,923 | |
| | 62,448 | | | 7.654%, 7/30/2019 | | | 59,970 | |
| | | | Fairpoint Communications, Term Loan | | | | |
| | 1,999,624 | | | 7.500%, 2/14/2019 | | | 2,013,381 | |
| | | | Grande Communications Networks, LLC, Term Loan | | | | |
| | 2,256,453 | | | 4.500%, 5/29/2020 | | | 2,232,489 | |
| | | | Hargray Communications Group, Inc., Term Loan | | | | |
| | 2,256,437 | | | 5.250%, 6/26/2019 | | | 2,251,744 | |
| | | | IMG Worldwide, Inc., Term Loan | | | | |
| | 1,122,188 | | | 5.250%, 5/6/2021 | | | 1,102,830 | |
| | | | Integra Telecom Holdings, Inc., Term Loan | | | | |
| | 2,255,724 | | | 5.250%, 2/22/2019 | | | 2,246,137 | |
| | | | Intelsat Jackson Holdings SA, Term Loan | | | | |
| | 1,090,000 | | | 3.750%, 6/30/2019 | | | 1,080,462 | |
| | | | Level 3 Communications, Inc., Term Loan | | | | |
| | 2,250,000 | | | 4.000%, 8/1/2019 | | | 2,234,992 | |
| | | | Liberty Cablevision of Puerto Rico, LLC, Term Loan | | | | |
| | 1,200,000 | | | 4.500%, 1/7/2022 | | | 1,190,256 | |
| | | | LTS Buyer, LLC, Term Loan | | | | |
| | 2,221,875 | | | 4.000%, 4/13/2020 | | | 2,194,102 | |
| | | | McGraw-Hill Global Education, LLC, Term Loan | | | | |
| | 1,990,431 | | | 5.750%, 3/22/2019 | | | 1,992,302 | |
| | | | NEP/NCP Holdco, Inc., Term Loan | | | | |
| | 3,241,133 | | | 4.250%, 1/22/2020 | | | 3,160,105 | |
| | | | NTelos, Inc., Term Loan | | | | |
| | 2,441,103 | | | 5.750%, 11/9/2019 | | | 2,437,026 | |
| | | | Puerto Rico Cable Acquisition Company, Inc., Term Loan | | | | |
| | 2,108,537 | | | 5.500%, 7/31/2018 | | | 2,092,723 | |
| | | | SBA Senior Finance II, LLC, Term Loan | | | | |
| | 1,745,625 | | | 3.250%, 3/24/2021 | | | 1,713,680 | |
| | | | TNS, Inc., Term Loan | | | | |
| | 2,126,210 | | | 5.000%, 2/14/2020 | | | 2,103,630 | |
| | | | Univision Communications, Inc., Term Loan | | | | |
| | 2,255,853 | | | 4.000%, 3/1/2020 | | | 2,231,422 | |
| | | | Virgin Media Investment Holdings, Ltd., Term Loan | | | | |
| | 2,285,000 | | | 3.500%, 6/7/2020 | | | 2,251,365 | |
| | | | WideOpenWest Finance, LLC, Term Loan | | | | |
| | 2,255,724 | | | 4.750%, 4/1/2019 | | | 2,251,844 | |
| | | | WMG Acquisition Corporation, Term Loan | | | | |
| | 257,400 | | | 3.750%, 7/1/2020 | | | 248,993 | |
| | | | XO Communications, LLC, Term Loan | | | | |
| | 547,250 | | | 4.250%, 3/20/2021 | | | 541,548 | |
| | | | Yankee Cable Acquisition, LLC, Term Loan | | | | |
| | 2,208,534 | | | 4.500%, 3/1/2020 | | | 2,195,835 | |
| | | | Zayo Group, LLC, Term Loan | | | | |
| | 2,254,884 | | | 4.000%, 7/2/2019 | | | 2,233,395 | |
| | | | | |
| | | | Total | | | 51,506,490 | |
| | | | | |
| |
| Consumer Cyclical (7.0%) | | | | |
| | | | Amaya Gaming Group, Inc., Term Loan | | | | |
| | 2,140,000 | | | 5.000%, 8/1/2021 | | | 2,121,724 | |
| | | | Bally Technologies, Inc., Term Loan | | | | |
| | 1,525,118 | | | 4.250%, 11/25/2020 | | | 1,518,453 | |
| | | | Booz Allen Hamilton, Inc., Term Loan | | | | |
| | 930,231 | | | 3.750%, 7/31/2019 | | | 925,292 | |
| | | | Burlington Coat Factory Warehouse Corporation, Term Loan | | | | |
| | 2,145,415 | | | 4.250%, 8/13/2021 | | | 2,130,397 | |
The accompanying Notes to Financial Statements are an integral part of this schedule.
145
OPPORTUNITY INCOME PLUS FUND
Schedule of Investments as of October 31, 2014
| | | | | | | | |
Principal Amount | | | Bank Loans (38.9%)a | | Value | |
| Consumer Cyclical (7.0%) - continued | | | | |
| | | | Ceridian Corporation, Term Loan | | | | |
| | $1,089,724 | | | 4.121%, 5/9/2017 | | | $1,088,090 | |
| | 1,089,724 | | | 4.500%, 5/9/2017 | | | 1,079,851 | |
| | | | Chrysler Group, LLC, Term Loan | | | | |
| | 256,031 | | | 3.500%, 5/24/2017 | | | 254,538 | |
| | 2,338,250 | | | 3.250%, 12/31/2018 | | | 2,313,114 | |
| | | | Golden Nugget, Inc., Delayed Draw | | | | |
| | 238,200 | | | 5.500%, 11/21/2019 | | | 239,288 | |
| | | | Golden Nugget, Inc., Term Loan | | | | |
| | 555,800 | | | 5.500%, 11/21/2019 | | | 558,340 | |
| | | | Hilton Worldwide Finance, LLC, Term Loan | | | | |
| | 524,815 | | | 3.500%, 10/26/2020 | | | 519,304 | |
| | | | J.C. Penney Corporation, Inc., Term Loan | | | | |
| | 2,256,437 | | | 6.000%, 5/22/2018 | | | 2,226,359 | |
| | | | Las Vegas Sands, LLC, Term Loan | | | | |
| | 2,357,188 | | | 3.250%, 12/19/2020 | | | 2,349,008 | |
| | | | Marina District Finance Company, Inc., Term Loan | | | | |
| | 2,021,538 | | | 6.750%, 8/15/2018 | | | 2,015,231 | |
| | | | Mohegan Tribal Gaming Authority, Term Loan | | | | |
| | 1,736,875 | | | 5.500%, 11/19/2019 | | | 1,684,769 | |
| | | | Pinnacle Entertainment, Inc., Term Loan | | | | |
| | 518,150 | | | 3.750%, 8/13/2020 | | | 512,321 | |
| | | | ROC Finance, LLC, Term Loan | | | | |
| | 257,400 | | | 5.000%, 6/20/2019 | | | 246,059 | |
| | | | Scientific Games International, Inc., Term Loan | | | | |
| | 2,267,863 | | | 4.250%, 10/18/2020 | | | 2,217,539 | |
| | | | Seminole Hard Rock Entertainment, Inc., Term Loan | | | | |
| | 941,317 | | | 3.500%, 5/14/2020 | | | 918,961 | |
| | | | Seminole Indian Tribe of Florida, Term Loan | | | | |
| | 232,700 | | | 3.000%, 4/29/2020 | | | 231,683 | |
| | | | Toys “R” Us, Inc., Term Loan | | | | |
| | 546,652 | | | 5.250%, 5/25/2018 | | | 436,638 | |
| | 1,424,403 | | | 9.750%, 4/24/2020b,c | | | 1,293,828 | |
| | | | | |
| | | | Total | | | 26,880,787 | |
| | | | | |
| |
| Consumer Non-Cyclical (3.1%) | | | | |
| | | | Albertsons, Inc., Term Loan | | | | |
| | 2,490,561 | | | 4.750%, 3/21/2019 | | | 2,484,335 | |
| | | | CHS/Community Health Systems, Inc., Term Loan | | | | |
| | 2,481,250 | | | 4.250%, 1/27/2021 | | | 2,482,019 | |
| | | | Del Monte Corporation, Term Loan | | | | |
| | 582,232 | | | 3.500%, 3/9/2020 | | | 559,309 | |
| | | | Roundy’s Supermarkets, Inc., Term Loan | | | | |
| | 2,283,252 | | | 5.750%, 3/3/2021 | | | 2,026,386 | |
| | | | Supervalu, Inc., Term Loan | | | | |
| | 2,281,077 | | | 4.500%, 3/21/2019 | | | 2,250,123 | |
| | | | Visant Corporation, Term Loan | | | | |
| | 2,216,854 | | | 7.000%, 9/23/2021 | | | 2,183,601 | |
| | | | | |
| | | | Total | | | 11,985,773 | |
| | | | | |
| |
| Energy (2.1%) | | | | |
| | | | Arch Coal, Inc., Term Loan | | | | |
| | 2,221,645 | | | 6.250%, 5/16/2018 | | | 1,958,224 | |
| | | | Exgen Renewables I, LLC, Term Loan | | | | |
| | 1,267,031 | | | 5.250%, 2/6/2021 | | | 1,279,701 | |
| | | | McJunkin Red Man Corporation, Term Loan | | | | |
| | 1,336,500 | | | 5.000%, 11/8/2019 | | | 1,338,171 | |
| | | | Offshore Group Investment, Ltd., Term Loan | | | | |
| | 1,424,759 | | | 5.750%, 3/28/2019 | | | 1,289,407 | |
| | | | Pacific Drilling SA, Term Loan | | | | |
| | 2,256,437 | | | 4.500%, 6/3/2018 | | | 2,157,019 | |
| | | | | |
| | | | Total | | | 8,022,522 | |
| | | | | |
| |
| Financials (2.2%) | | | | |
| | | | Delos Finance Sarl, Term Loan | | | | |
| | 2,375,000 | | | 3.500%, 3/6/2021 | | | 2,361,154 | |
| | | | Harland Clarke Holdings Corporation, Term Loan | | | | |
| | 2,213,594 | | | 7.000%, 5/22/2018 | | | 2,233,892 | |
| | | | MPH Acquisition Holdings, LLC, Term Loan | | | | |
| | 2,114,018 | | | 3.750%, 3/31/2021 | | | 2,079,285 | |
| | | | TransUnion, LLC, Term Loan | | | | |
| | 1,119,375 | | | 4.000%, 4/9/2021 | | | 1,104,689 | |
| | | | WaveDivision Holdings, LLC, Term Loan | | | | |
| | 799,067 | | | 4.000%, 10/15/2019 | | | 790,741 | |
| | | | | |
| | | | Total | | | 8,569,761 | |
| | | | | |
| |
| Technology (2.8%) | | | | |
| | | | Avago Technologies, Ltd., Term Loan | | | | |
| | 1,870,312 | | | 3.750%, 5/6/2021 | | | 1,863,542 | |
| | | | BMC Software, Inc., Term Loan | | | | |
| | 2,155,000 | | | 5.000%, 9/10/2020 | | | 2,130,088 | |
| | | | First Data Corporation, Term Loan | | | | |
| | 2,285,000 | | | 3.653%, 3/23/2018 | | | 2,262,150 | |
| | | | Freescale Semiconductor, Inc., Term Loan | | | | |
| | 2,255,853 | | | 4.250%, 2/28/2020 | | | 2,222,827 | |
| | | | Infor US, Inc., Term Loan | | | | |
| | 2,019,682 | | | 3.750%, 6/3/2020 | | | 1,990,902 | |
| | | | SunGard Data Systems, Inc., Term Loan | | | | |
| | 113,320 | | | 4.000%, 3/8/2020 | | | 112,801 | |
| | | | | |
| | | | Total | | | 10,582,310 | |
| | | | | |
| |
| Transportation (1.6%) | | | | |
| | | | American Airlines, Inc., Term Loan | | | | |
| | 4,478,313 | | | 3.750%, 6/27/2019 | | | 4,416,736 | |
| | | | OSG Bulk Ships, lnc., Term Loan | | | | |
| | 1,845,375 | | | 5.250%, 8/5/2019 | | | 1,830,759 | |
| | | | | |
| | | | Total | | | 6,247,495 | |
| | | | | |
| |
| Utilities (1.0%) | | | | |
| | | | Calpine Corporation, Term Loan | | | | |
| | 255,369 | | | 4.000%, 4/1/2018 | | | 254,171 | |
| | 1,488,750 | | | 4.000%, 10/31/2020 | | | 1,473,863 | |
The accompanying Notes to Financial Statements are an integral part of this schedule.
146
OPPORTUNITY INCOME PLUS FUND
Schedule of Investments as of October 31, 2014
| | | | | | | | |
Principal Amount | | | Bank Loans (38.9%)a | | Value | |
| Utilities (1.0%) - continued | | | | |
| | | | Intergen NV, Term Loan | | | | |
| | $2,256,437 | | | 5.500%, 6/15/2020 | | | $2,250,796 | |
| | | | | |
| | | | Total | | | 3,978,830 | |
| | | | | |
| | | | | | | | |
| | | | | |
| | | | Total Bank Loans (cost $152,014,568) | | | 149,599,127 | |
| | | | | |
| | |
Principal
Amount | | | Long-Term Fixed Income (52.3%) | | Value | |
| Asset-Backed Securities (2.7%) | | | | |
| | | | Asset Backed Securities Corporation Home Equity Loan Trust | | | | |
| | 902,119 | | | 0.292%, 7/25/2036d | | | 804,839 | |
| | | | Bayview Opportunity Master Fund Trust IIB, LP | | | | |
| | 552,687 | | | 3.623%, 7/28/2019* | | | 553,382 | |
| | 567,637 | | | 3.950%, 1/28/2034*,e | | | 570,782 | |
| | | | Countrywide Asset-Backed Certificates | | | | |
| | 586,057 | | | 5.859%, 10/25/2046 | | | 454,976 | |
| | | | Credit Based Asset Servicing and Securitization, LLC | | | | |
| | 697,499 | | | 3.766%, 12/25/2036 | | | 481,066 | |
| | | | First Horizon ABS Trust | | | | |
| | 896,878 | | | 0.312%, 10/25/2034d,f | | | 787,701 | |
| | | | GMAC Mortgage Corporation Loan Trust | | | | |
| | 1,546,876 | | | 0.332%, 8/25/2035d,f | | | 1,356,586 | |
| | 1,289,308 | | | 0.332%, 12/25/2036d,f | | | 1,120,235 | |
| | | | Popular ABS Mortgage Pass-Through Trust | | | | |
| | 900,000 | | | 5.297%, 11/25/2035e | | | 766,830 | |
| | | | Renaissance Home Equity Loan Trust | | | | |
| | 1,389,723 | | | 5.608%, 5/25/2036e | | | 969,757 | |
| | 974,022 | | | 5.285%, 1/25/2037e | | | 560,593 | |
| | | | Vericrest Opportunity Loan Transferee | | | | |
| | 264,879 | | | 3.625%, 3/25/2054* | | | 265,847 | |
| | | | Wachovia Asset Securitization, Inc. | | | | |
| | 1,623,943 | | | 0.292%, 7/25/2037*,d,f | | | 1,427,523 | |
| | | | | |
| | | | Total | | | 10,120,117 | |
| | | | | |
| |
| Basic Materials (1.9%) | | | | |
| | | | Anglo American Capital plc | | | | |
| | 200,000 | | | 1.181%, 4/15/2016d,g | | | 200,802 | |
| | | | ArcelorMittal | | | | |
| | 675,000 | | | 6.000%, 3/1/2021 | | | 723,937 | |
| | | | Dow Chemical Company | | | | |
| | 136,000 | | | 8.550%, 5/15/2019 | | | 171,291 | |
| | | | First Quantum Minerals, Ltd. | | | | |
| | 269,000 | | | 6.750%, 2/15/2020g | | | 260,257 | |
| | 559,000 | | | 7.000%, 2/15/2021g | | | 548,519 | |
| | | | FMG Resources August 2006 Pty., Ltd. | | | | |
| | 208,479 | | | 6.875%, 2/1/2018g,h | | | 213,692 | |
| | | | Freeport-McMoRan Copper & Gold, Inc. | | | | |
| | 162,000 | | | 2.375%, 3/15/2018 | | | 162,866 | |
| | | | Goldcorp, Inc. | | | | |
| | 237,000 | | | 2.125%, 3/15/2018 | | | 236,893 | |
| | | | Groupe Office Cherifien des Phosphates SA | | | | |
| | 375,000 | | | 5.625%, 4/25/2024g | | | 393,356 | |
| | | | Hexion US Finance Corporation/Hexion Nova Scotia Finance ULC | | | | |
| | 469,079 | | | 8.875%, 2/1/2018 | | | 463,802 | |
| | | | Ineos Finance plc | | | | |
| | 394,000 | | | 7.500%, 5/1/2020g | | | 421,580 | |
| | | | Inmet Mining Corporation | | | | |
| | 79 | | | 8.750%, 6/1/2020* | | | 82 | |
| | | | LyondellBasell Industries NV | | | | |
| | 140,000 | | | 5.000%, 4/15/2019 | | | 154,333 | |
| | | | Minsur SA | | | | |
| | 370,000 | | | 6.250%, 2/7/2024g | | | 408,850 | |
| | | | Mosaic Company | | | | |
| | 138,000 | | | 3.750%, 11/15/2021 | | | 144,425 | |
| | | | NOVA Chemicals Corporation | | | | |
| | 703,617 | | | 5.250%, 8/1/2023g | | | 735,280 | |
| | | | Samarco Mineracao SA | | | | |
| | 380,000 | | | 5.375%, 9/26/2024g,h | | | 380,741 | |
| | | | Sappi Papier Holding GmbH | | | | |
| | 470,000 | | | 6.625%, 4/15/2021g | | | 488,800 | |
| | | | Trinseo Materials Operating SCA | | | | |
| | 674,000 | | | 8.750%, 2/1/2019 | | | 712,755 | |
| | | | Vale Overseas, Ltd. | | | | |
| | 182,000 | | | 6.250%, 1/23/2017 | | | 199,394 | |
| | | | Xstrata Finance Canada, Ltd. | | | | |
| | 137,000 | | | 2.050%, 10/23/2015g | | | 138,236 | |
| | | | | |
| | | | Total | | | 7,159,891 | |
| | | | | |
| |
| Capital Goods (1.4%) | | | | |
| | | | BAE Systems plc | | | | |
| | 202,000 | | | 3.500%, 10/11/2016g | | | 210,949 | |
| | | | Brand Energy & Infrastructure Services, Inc. | | | | |
| | 380,000 | | | 8.500%, 12/1/2021g | | | 378,575 | |
| | | | Cemex SAB de CV | | | | |
| | 830,000 | | | 5.700%, 1/11/2025g | | | 813,151 | |
| | | | CNH Capital, LLC | | | | |
| | 469,079 | | | 3.625%, 4/15/2018 | | | 469,079 | |
| | | | Crown Americas Capital Corporation IV | | | | |
| | 675,000 | | | 4.500%, 1/15/2023 | | | 663,187 | |
| | | | Harsco Corporation | | | | |
| | 207,000 | | | 2.700%, 10/15/2015 | | | 206,826 | |
| | | | Hutchison Whampoa Finance CI, Ltd. | | | | |
| | 234,000 | | | 1.625%, 10/31/2017g | | | 233,603 | |
| | | | Ingersoll-Rand Global Holding Company, Ltd. | | | | |
| | 238,000 | | | 6.875%, 8/15/2018 | | | 278,928 | |
| | | | L-3 Communications Corporation | | | | |
| | 201,000 | | | 1.500%, 5/28/2017 | | | 199,777 | |
| | | | Martin Marietta Materials, Inc. | | | | |
| | 238,000 | | | 1.333%, 6/30/2017d,g | | | 238,994 | |
| | | | Nortek, Inc. | | | | |
| | 469,079 | | | 8.500%, 4/15/2021 | | | 504,260 | |
| | | | Reynolds Group Issuer, Inc. | | | | |
| | 469,079 | | | 9.875%, 8/15/2019 | | | 509,537 | |
| | | | Roper Industries, Inc. | | | | |
| | 215,000 | | | 2.050%, 10/1/2018 | | | 213,889 | |
The accompanying Notes to Financial Statements are an integral part of this schedule.
147
OPPORTUNITY INCOME PLUS FUND
Schedule of Investments as of October 31, 2014
| | | | | | | | |
Principal
Amount | | | Long-Term Fixed Income (52.3%) | | Value | |
| Capital Goods (1.4%) - continued | | | | |
| | | | Textron, Inc. | | | | |
| | $202,000 | | | 4.625%, 9/21/2016 | | | $214,863 | |
| | | | United Rentals North America, Inc. | | | | |
| | 376,000 | | | 7.375%, 5/15/2020 | | | 407,960 | |
| | | | | |
| | | | Total | | | 5,543,578 | |
| | | | | |
| |
| Collateralized Mortgage Obligations (8.1%) | | | | |
| | | | Banc of America Alternative Loan Trust | | | | |
| | 940,340 | | | 6.000%, 11/25/2035 | | | 820,504 | |
| | 678,115 | | | 0.952%, 5/25/2046d | | | 473,291 | |
| | | | Banc of America Mortgage Trust | | | | |
| | 489,737 | | | 2.644%, 7/25/2035 | | | 452,795 | |
| | | | BCAP, LLC Trust | | | | |
| | 1,030,973 | | | 0.332%, 3/25/2037d | | | 832,153 | |
| | | �� | Bear Stearns ALT-A Trust | | | | |
| | 455,242 | | | 2.537%, 6/25/2034 | | | 450,827 | |
| | | | CHL Mortgage Pass-Through Trust | | | | |
| | 371,076 | | | 6.250%, 9/25/2036 | | | 345,281 | |
| | 579,853 | | | 6.000%, 4/25/2037 | | | 533,975 | |
| | | | CitiMortgage Alternative Loan Trust | | | | |
| | 497,615 | | | 5.750%, 4/25/2037 | | | 427,313 | |
| | | | Countrywide Alternative Loan Trust | | | | |
| | 553,678 | | | 6.500%, 8/25/2036 | | | 429,605 | |
| | 1,193,910 | | | 6.000%, 11/25/2036 | | | 1,022,466 | |
| | 860,459 | | | 6.000%, 1/25/2037 | | | 780,830 | |
| | 626,484 | | | 5.500%, 5/25/2037 | | | 543,956 | |
| | 397,551 | | | 7.000%, 10/25/2037 | | | 295,227 | |
| | | | Countrywide Home Loan Mortgage Pass Through Trust | | | | |
| | 501,098 | | | 2.479%, 11/25/2035 | | | 424,358 | |
| | | | Countrywide Home Loans, Inc. | | | | |
| | 375,159 | | | 2.466%, 3/20/2036 | | | 312,161 | |
| | | | Credit Suisse First Boston Mortgage Securities Corporation | | | | |
| | 422,286 | | | 5.250%, 10/25/2035 | | | 420,210 | |
| | | | Deutsche Alt-A Securities Mortgage Loan Trust | | | | |
| | 415,634 | | | 0.885%, 4/25/2047d | | | 365,381 | |
| | | | Deutsche Alt-A Securities, Inc., Mortgage Loan Trust | | | | |
| | 771,334 | | | 5.500%, 11/25/2035 | | | 729,170 | |
| | | | GMAC Mortgage Corporation Loan Trust | | | | |
| | 449,954 | | | 4.569%, 9/19/2035 | | | 427,180 | |
| | | | GMACM Mortgage Loan Trust | | | | |
| | 672,947 | | | 4.590%, 5/25/2035 | | | 646,557 | |
| | | | Greenpoint Mortgage Funding Trust | | | | |
| | 392,688 | | | 0.352%, 10/25/2045d | | | 308,841 | |
| | | | HarborView Mortgage Loan Trust | | | | |
| | 720,169 | | | 2.613%, 7/19/2035 | | | 654,233 | |
| | 670,256 | | | 2.661%, 12/19/2035 | | | 591,726 | |
| | | | HomeBanc Mortgage Trust | | | | |
| | 1,434,304 | | | 2.290%, 4/25/2037 | | | 1,059,630 | |
| | | | IndyMac Index Mortgage Loan Trust | | | | |
| | 455,928 | | | 4.692%, 10/25/2035 | | | 388,140 | |
| | | | J.P. Morgan Alternative Loan Trust | | | | |
| | 1,565,355 | | | 2.779%, 3/25/2036 | | | 1,227,613 | |
| | 816,038 | | | 6.500%, 3/25/2036 | | | 721,391 | |
| | | | J.P. Morgan Mortgage Trust | | | | |
| | 635,251 | | | 2.656%, 8/25/2035 | | | 632,561 | |
| | 601,626 | | | 2.607%, 1/25/2037 | | | 537,086 | |
| | | | Lehman Mortgage Trust | | | | |
| | 309,186 | | | 6.000%, 1/25/2036 | | | 287,335 | |
| | | | Lehman XS Trust | | | | |
| | 1,065,563 | | | 0.312%, 3/25/2037d | | | 706,464 | |
| | | | Master Asset Securitization Trust | | | | |
| | 478,659 | | | 0.652%, 6/25/2036d | | | 289,117 | |
| | | | Merrill Lynch Mortgage Investors Trust | | | | |
| | 821,813 | | | 6.250%, 8/25/2036 | | | 675,980 | |
| | | | MortgageIT Trust | | | | |
| | 1,001,662 | | | 0.412%, 12/25/2035d | | | 920,097 | |
| | 862,548 | | | 0.352%, 4/25/2036d | | | 650,750 | |
| | | | RALI Series 2006-QA9 Trust | | | | |
| | 1,011,918 | | | 0.332%, 11/25/2036d | | | 727,126 | |
| | | | RALI Trust | | | | |
| | 399,548 | | | 0.372%, 7/25/2036d | | | 266,193 | |
| | 1,029,980 | | | 5.750%, 4/25/2037 | | | 822,979 | |
| | | | Residential Accredit Loans, Inc. | | | | |
| | 409,589 | | | 3.536%, 9/25/2035 | | | 342,019 | |
| | 952,158 | | | 5.750%, 9/25/2035 | | | 861,801 | |
| | | | Residential Asset Securitization Trust | | | | |
| | 727,026 | | | 5.417%, 8/25/2022 | | | 660,364 | |
| | | | RFMSI Trust | | | | |
| | 848,506 | | | 6.000%, 7/25/2037 | | | 769,371 | |
| | | | Sequoia Mortgage Trust | | | | |
| | 639,243 | | | 2.664%, 9/20/2046 | | | 541,749 | |
| | | | Structured Adjustable Rate Mortgage Loan Trust | | | | |
| | 745,985 | | | 5.122%, 7/25/2035 | | | 645,357 | |
| | | | Structured Asset Mortgage Investments, Inc. | | | | |
| | 1,206,812 | | | 0.462%, 12/25/2035d | | | 922,960 | |
| | 1,034,827 | | | 0.362%, 5/25/2046d | | | 793,857 | |
| | | | WaMu Mortgage Pass Through Certificates | | | 209,998 | |
| | 242,118 | | | 2.239%, 8/25/2046 | | | | |
| | 891,936 | | | 0.845%, 1/25/2047d | | | 806,160 | |
| | 849,463 | | | 0.855%, 1/25/2047d | | | 691,595 | |
| | | | Washington Mutual Alternative Mortgage Pass Through Certificates | | | | |
| | 516,567 | | | 0.865%, 2/25/2047d | | | 361,629 | |
| | | | Wells Fargo Mortgage Backed Securities Trust | | | | |
| | 554,143 | | | 2.592%, 3/25/2036 | | | 537,652 | |
| | 628,549 | | | 2.609%, 7/25/2036 | | | 611,143 | |
| | 305,249 | | | 6.000%, 7/25/2037 | | | 302,070 | |
| | | | | |
| | | | Total | | | 31,258,227 | |
| | | | | |
| |
| Commercial Mortgage-Backed Securities (<0.1%) | | | | |
| | | | Government National Mortgage Association | | | | |
| | 108,831 | | | 3.214%, 1/16/2040 | | | 109,486 | |
| | | | | |
| | | | Total | | | 109,486 | |
| | | | | |
| |
| Communications Services (4.4%) | | | | |
| | | | 21st Century Fox America, Inc. | | | | |
| | 225,000 | | | 6.900%, 3/1/2019 | | | 267,561 | |
| | | | AMC Networks, Inc. | | | | |
| | 469,079 | | | 7.750%, 7/15/2021 | | | 511,296 | |
The accompanying Notes to Financial Statements are an integral part of this schedule.
148
OPPORTUNITY INCOME PLUS FUND
Schedule of Investments as of October 31, 2014
| | | | | | | | |
Principal
Amount | | | Long-Term Fixed Income (52.3%) | | Value | |
| Communications Services (4.4%) - continued | | | | |
| | | | America Movil SAB de CV | | | | |
| | $134,000 | | | 5.000%, 10/16/2019 | | | $150,239 | |
| | | | American Tower Corporation | | | | |
| | 257,000 | | | 7.000%, 10/15/2017 | | | 291,010 | |
| | | | British Sky Broadcasting Group plc | | | | |
| | 240,000 | | | 2.625%, 9/16/2019g | | | 240,666 | |
| | | | British Telecommunications plc | | | | |
| | 189,000 | | | 1.250%, 2/14/2017 | | | 188,514 | |
| | | | CC Holdings GS V, LLC | | | | |
| | 363,000 | | | 2.381%, 12/15/2017 | | | 367,769 | |
| | | | CCO Holdings, LLC | | | | |
| | 469,079 | | | 7.000%, 1/15/2019 | | | 489,015 | |
| | | | CenturyLink, Inc. | | | | |
| | 500,000 | | | 6.450%, 6/15/2021 | | | 547,500 | |
| | | | Cequel Communications Escrow 1, LLC | | | | |
| | 920,000 | | | 6.375%, 9/15/2020g | | | 959,100 | |
| | | | Columbus International, Inc. | | | | |
| | 800,000 | | | 7.375%, 3/30/2021g | | | 848,000 | |
| | | | Cox Communications, Inc. | | | | |
| | 193,000 | | | 9.375%, 1/15/2019g | | | 246,589 | |
| | | | Digicel, Ltd. | | | | |
| | 779,079 | | | 6.000%, 4/15/2021g | | | 786,870 | |
| | | | DIRECTV Holdings, LLC | | | | |
| | 166,000 | | | 3.500%, 3/1/2016 | | | 171,558 | |
| | 171,000 | | | 5.875%, 10/1/2019 | | | 196,389 | |
| | | | DISH DBS Corporation | | | | |
| | 550,000 | | | 5.000%, 3/15/2023 | | | 547,938 | |
| | | | Frontier Communications Corporation | | | | |
| | 830,000 | | | 6.875%, 1/15/2025 | | | 840,375 | |
| | | | Hughes Satellite Systems Corporation | | | | |
| | 376,000 | | | 6.500%, 6/15/2019 | | | 407,020 | |
| | | | Intelsat Jackson Holdings SA | | | | |
| | 469,079 | | | 7.250%, 10/15/2020 | | | 5 00,742 | |
| | | | Level 3 Financing, Inc. | | | | |
| | 376,000 | | | 8.625%, 7/15/2020 | | | 413,600 | |
| | | | NBC Universal Enterprise, Inc. | | | | |
| | 201,000 | | | 1.662%, 4/15/2018g | | | 200,861 | |
| | | | Numericable Group SA | | | | |
| | 800,000 | | | 6.000%, 5/15/2022g | | | 818,000 | |
| | | | SBA Tower Trust | | | | |
| | 276,000 | | | 5.101%, 4/17/2017g | | | 292,643 | |
| | | | Sprint Communications, Inc. | | | | |
| | 469,079 | | | 9.000%, 11/15/2018g | | | 551,754 | |
| | | | Telefonica Emisiones SAU | | | | |
| | 145,000 | | | 3.992%, 2/16/2016 | | | 150,457 | |
| | 218,000 | | | 3.192%, 4/27/2018 | | | 226,276 | |
| | | | Time Warner Cable, Inc. | | | | |
| | 405,000 | | | 5.000%, 2/1/2020 | | | 453,281 | |
| | | | T-Mobile USA, Inc. | | | | |
| | 525,000 | | | 6.633%, 4/28/2021 | | | 553,219 | |
| | | | Univision Communications, Inc. | | | | |
| | 750,000 | | | 7.875%, 11/1/2020g | | | 810,937 | |
| | | | UPCB Finance V, Ltd. | | | | |
| | 750,000 | | | 7.250%, 11/15/2021g | | | 825,000 | |
| | | | Verizon Communications, Inc. | | | | |
| | 559,000 | | | 2.625%, 2/21/2020g | | | 556,015 | |
| | 238,000 | | | 4.500%, 9/15/2020 | | | 258,401 | |
| | | | West Corporation | | | | |
| | 800,000 | | | 5.375%, 7/15/2022g | | | 776,000 | |
| | | | WideOpenWest Finance, LLC | | | | |
| | 500,000 | | | 10.250%, 7/15/2019 | | | 548,750 | |
| | | | Wind Acquisition Finance SA | | | | |
| | 420,000 | | | 7.375%, 4/23/2021g | | | 410,550 | |
| | | | Windstream Corporation | | | | |
| | 675,000 | | | 7.750%, 10/1/2021 | | | 722,250 | |
| | | | | |
| | | | Total | | | 17,126,145 | |
| | | | | |
| |
| Consumer Cyclical (2.6%) | | | | |
| | | | AMC Entertainment, Inc. | | | | |
| | 448,000 | | | 5.875%, 2/15/2022 | | | 456,960 | |
| | | | Chrysler Group, LLC | | | | |
| | 469,079 | | | 8.250%, 6/15/2021 | | | 524,196 | |
| | | | Cinemark USA, Inc. | | | | |
| | 394,000 | | | 4.875%, 6/1/2023 | | | 388,090 | |
| | | | Daimler Finance North America, LLC | | | | |
| | 135,000 | | | 1.875%, 1/11/2018g | | | 135,462 | |
| | | | Delphi Corporation | | | | |
| | 207,000 | | | 6.125%, 5/15/2021 | | | 225,113 | |
| | | | ERAC USA Finance, LLC | | | | |
| | 238,000 | | | 2.350%, 10/15/2019g | | | 236,363 | |
| | | | Ford Motor Credit Company, LLC | | | | |
| | 488,000 | | | 1.684%, 9/8/2017 | | | 485,717 | |
| | 203,000 | | | 5.000%, 5/15/2018 | | | 222,129 | |
| | 250,000 | | | 2.597%, 11/4/2019c | | | 249,168 | |
| | | | General Motors Financial Company, Inc. | | | | |
| | 469,079 | | | 3.250%, 5/15/2018 | | | 479,633 | |
| | 364,000 | | | 4.375%, 9/25/2021 | | | 381,326 | |
| | | | GLP Capital, LP | | | | |
| | 800,000 | | | 4.875%, 11/1/2020 | | | 832,000 | |
| | | | Hilton Worldwide Finance, LLC | | | | |
| | 675,000 | | | 5.625%, 10/15/2021g | | | 711,281 | |
| | | | Hyundai Capital America | | | | |
| | 195,000 | | | 1.450%, 2/6/2017g | | | 195,152 | |
| | | | Jaguar Land Rover Automotive plc | | | | |
| | 425,000 | | | 4.125%, 12/15/2018g | | | 432,437 | |
| | 376,000 | | | 5.625%, 2/1/2023g | | | 391,040 | |
| | | | KB Home | | | | |
| | 412,000 | | | 4.750%, 5/15/2019 | | | 408,910 | |
| | | | L Brands, Inc. | | | | |
| | 376,000 | | | 6.625%, 4/1/2021 | | | 425,820 | |
| | | | Lennar Corporation | | | | |
| | 740,000 | | | 4.750%, 11/15/2022 | | | 728,900 | |
| | | | Macy’s Retail Holdings, Inc. | | | | |
| | 250,000 | | | 7.450%, 7/15/2017 | | | 287,240 | |
| | | | Nissan Motor Acceptance Corporation | | | | |
| | 108,000 | | | 0.784%, 3/3/2017d,g | | | 108,224 | |
| | | | Royal Caribbean Cruises, Ltd. | | | | |
| | 799,079 | | | 5.250%, 11/15/2022 | | | 835,038 | |
| | | | Toll Brothers Finance Corporation | | | | |
| | 268,000 | | | 4.000%, 12/31/2018 | | | 271,350 | |
| | | | TRW Automotive, Inc. | | | | |
| | 135,000 | | | 7.250%, 3/15/2017g | | | 148,500 | |
The accompanying Notes to Financial Statements are an integral part of this schedule.
149
OPPORTUNITY INCOME PLUS FUND
Schedule of Investments as of October 31, 2014
| | | | | | | | |
Principal Amount | | | Long-Term Fixed Income (52.3%) | | Value | |
| Consumer Cyclical (2.6%) - continued | | | | |
| | | | Wynn Las Vegas, LLC | | | | |
| | $376,000 | | | 5.375%, 3/15/2022 | | | $395,740 | |
| | | | | |
| | | | Total | | | 9,955,789 | |
| | | | | |
| |
| Consumer Non-Cyclical (3.7%) | | | | |
| | | | AbbVie, Inc. | | | | |
| | 488,000 | | | 2.000%, 11/6/2018 | | | 483,935 | |
| | | | Altria Group, Inc. | | | | |
| | 274,000 | | | 9.700%, 11/10/2018 | | | 353,162 | |
| | | | Anheuser-Busch InBev Worldwide, Inc. | | | | |
| | 207,000 | | | 7.750%, 1/15/2019 | | | 251,034 | |
| | | | Bayer U.S. Finance, LLC | | | | |
| | 250,000 | | | 1.500%, 10/6/2017g | | | 250,902 | |
| | | | Beam, Inc. | | | | |
| | 140,000 | | | 5.375%, 1/15/2016 | | | 147,288 | |
| | | | CareFusion Corporation | | | | |
| | 182,000 | | | 1.450%, 5/15/2017 | | | 181,655 | |
| | | | Celgene Corporation | | | | |
| | 255,000 | | | 1.900%, 8/15/2017 | | | 257,322 | |
| | | | CHS/Community Health Systems, Inc. | | | | |
| | 376,000 | | | 7.125%, 7/15/2020 | | | 407,020 | |
| | | | ConAgra Foods, Inc. | | | | |
| | 288,000 | | | 2.100%, 3/15/2018 | | | 289,448 | |
| | | | Cott Beverages, Inc. | | | | |
| | 815,000 | | | 5.375%, 7/1/2022g | | | 806,850 | |
| | | | Coventry Health Care, Inc. | | | | |
| | 120,000 | | | 5.950%, 3/15/2017 | | | 132,733 | |
| | | | CVS Health Corporation | | | | |
| | 136,000 | | | 2.250%, 12/5/2018 | | | 137,465 | |
| | | | Envision Healthcare Corporation | | | | |
| | 800,000 | | | 5.125%, 7/1/2022g | | | 810,000 | |
| | | | Express Scripts Holding Company | | | | |
| | 205,000 | | | 2.650%, 2/15/2017 | | | 210,893 | |
| | | | Forest Laboratories, Inc. | | | | |
| | 236,000 | | | 4.375%, 2/1/2019g | | | 247,200 | |
| | | | Fresenius Medical Care US Finance, Inc. | | | | |
| | 469,079 | | | 5.750%, 2/15/2021g | | | 503,674 | |
| | | | Gilead Sciences, Inc. | | | | |
| | 220,000 | | | 3.050%, 12/1/2016 | | | 229,086 | |
| | | | Grupo Bimbo SAB de CV | | | | |
| | 375,000 | | | 3.875%, 6/27/2024g | | | 373,237 | |
| | | | Hawk Acquisition Sub, Inc. | | | | |
| | 376,000 | | | 4.250%, 10/15/2020 | | | 379,685 | |
| | | | HCA, Inc. | | | | |
| | 469,079 | | | 4.750%, 5/1/2023 | | | 476,702 | |
| | | | IMS Health, Inc. | | | | |
| | 375,000 | | | 6.000%, 11/1/2020g | | | 389,062 | |
| | | | JBS Finance II, Ltd. | | | | |
| | 469,079 | | | 8.250%, 1/29/2018* | | | 493,706 | |
| | | | Kroger Company | | | | |
| | 280,000 | | | 1.200%, 10/17/2016 | | | 280,402 | |
| | | | Lorillard Tobacco Company | | | | |
| | 210,000 | | | 8.125%, 6/23/2019 | | | 257,255 | |
| | | | McKesson Corporation | | | | |
| | 270,000 | | | 1.292%, 3/10/2017 | | | 269,441 | |
| | | | Medco Health Solutions, Inc. | | | | |
| | 110,000 | | | 7.125%, 3/15/2018 | | | 128,024 | |
| | | | Mondelez International, Inc. | | | | |
| | 140,000 | | | 2.250%, 2/1/2019 | | | 139,724 | |
| | | | Ortho-Clinical Diagnostics, Inc. | | | | |
| | 770,000 | | | 6.625%, 5/15/2022g | | | 719,950 | |
| | | | Pernod Ricard SA | | | | |
| | 140,000 | | | 2.950%, 1/15/2017g | | | 144,242 | |
| | 140,000 | | | 5.750%, 4/7/2021g | | | 160,180 | |
| | | | Perrigo Company, Ltd. | | | | |
| | 117,000 | | | 1.300%, 11/8/2016 | | | 116,757 | |
| | | | Revlon Consumer Products Corporation | | | | |
| | 469,079 | | | 5.750%, 2/15/2021 | | | 469,079 | |
| | | | SABMiller plc | | | | |
| | 182,000 | | | 6.500%, 7/15/2018g | | | 209,695 | |
| | | | Safeway, Inc. | | | | |
| | 55,000 | | | 3.400%, 12/1/2016 | | | 55,565 | |
| | | | Spectrum Brands Escrow Corporation | | | | |
| | 376,000 | | | 6.375%, 11/15/2020 | | | 398,560 | |
| | | | Sysco Corporation | | | | |
| | 366,000 | | | 2.350%, 10/2/2019 | | | 368,189 | |
| | | | Tenet Healthcare Corporation | | | | |
| | 675,000 | | | 8.125%, 4/1/2022 | | | 773,719 | |
| | | | Thermo Fisher Scientific, Inc. | | | | |
| | 152,000 | | | 1.300%, 2/1/2017 | | | 151,821 | |
| | 212,000 | | | 2.400%, 2/1/2019 | | | 213,202 | |
| | | | Tyson Foods, Inc. | | | | |
| | 238,000 | | | 2.650%, 8/15/2019 | | | 240,269 | |
| | | | Valeant Pharmaceuticals International, Inc. | | | | |
| | 469,079 | | | 7.250%, 7/15/2022g | | | 494,878 | |
| | | | VPII Escrow Corporation | | | | |
| | 500,000 | | | 7.500%, 7/15/2021g | | | 535,000 | |
| | | | Whirlpool Corporation | | | | |
| | 242,000 | | | 1.650%, 11/1/2017 | | | 242,046 | |
| | | | WM Wrigley Jr. Company | | | | |
| | 138,000 | | | 2.000%, 10/20/2017g | | | 139,415 | |
| | | | | |
| | | | Total | | | 14,319,472 | |
| | | | | |
| |
| Energy (2.9%) | | | | |
| | | | Boardwalk Pipelines, Ltd. | | | | |
| | 192,000 | | | 5.875%, 11/15/2016 | | | 206,531 | |
| | | | BP Capital Markets plc | | | | |
| | 223,000 | | | 0.657%, 11/7/2016d | | | 223,712 | |
| | | | Buckeye Partners, LP | | | | |
| | 268,000 | | | 2.650%, 11/15/2018 | | | 267,708 | |
| | | | Calumet Specialty Products Partners, LP | | | | |
| | 675,000 | | | 6.500%, 4/15/2021g | | | 654,750 | |
| | | | CNOOC Nexen Finance 2014 ULC | | | | |
| | 200,000 | | | 1.625%, 4/30/2017 | | | 200,056 | |
| | | | CNPC General Capital, Ltd. | | | | |
| | 201,000 | | | 2.750%, 4/19/2017g | | | 204,584 | |
| | 370,000 | | | 2.750%, 5/14/2019g | | | 369,456 | |
| | | | Concho Resources, Inc. | | | | |
| | 719,079 | | | 6.500%, 1/15/2022 | | | 776,605 | |
| | | | Continental Resources, Inc. | | | | |
| | 235,000 | | | 7.125%, 4/1/2021 | | | 258,794 | |
| | | | Devon Energy Corporation | | | | |
| | 207,000 | | | 1.200%, 12/15/2016 | | | 209,360 | |
The accompanying Notes to Financial Statements are an integral part of this schedule.
150
OPPORTUNITY INCOME PLUS FUND
Schedule of Investments as of October 31, 2014
| | | | | | | | |
Principal Amount | | | Long-Term Fixed Income (52.3%) | | Value | |
| Energy (2.9%) - continued | | | | |
| | | | Enbridge, Inc. | | | | |
| | $118,000 | | | 0.684%, 6/2/2017d | | | $118,030 | |
| | | | Energy Transfer Partners, LP | | | | |
| | 134,000 | | | 6.700%, 7/1/2018 | | | 153,748 | |
| | | | Energy XXI Gulf Coast, Inc. | | | | |
| | 800,000 | | | 7.500%, 12/15/2021h | | | 664,000 | |
| | | | Enterprise Products Operating, LLC | | | | |
| | 366,000 | | | 2.550%, 10/15/2019 | | | 366,021 | |
| | | | EQT Corporation | | | | |
| | 52,000 | | | 5.150%, 3/1/2018 | | | 55,971 | |
| | 134,000 | | | 8.125%, 6/1/2019 | | | 164,622 | |
| | | | Harvest Operations Corporation | | | | |
| | 469,079 | | | 6.875%, 10/1/2017 | | | 478,461 | |
| | | | Hess Corporation | | | | |
| | 138,000 | | | 8.125%, 2/15/2019 | | | 169,182 | |
| | | | Kinder Morgan, Inc. | | | | |
| | 244,000 | | | 5.000%, 2/15/2021g | | | 257,420 | |
| | | | Kodiak Oil & Gas Corporation | | | | |
| | 469,079 | | | 5.500%, 1/15/2021 | | | 476,115 | |
| | | | Linn Energy, LLC | | | | |
| | 500,000 | | | 6.250%, 11/1/2019 | | | 460,000 | |
| | 469,079 | | | 8.625%, 4/15/2020 | | | 470,252 | |
| | | | MEG Energy Corporation | | | | |
| | 376,000 | | | 6.375%, 1/30/2023g | | | 372,240 | |
| | | | Offshore Group Investment, Ltd. | | | | |
| | 500,000 | | | 7.125%, 4/1/2023h | | | 412,500 | |
| | | | Petrobras Global Finance BV | | | | |
| | 207,000 | | | 2.000%, 5/20/2016 | | | 206,329 | |
| | 465,000 | | | 3.115%, 3/17/2020d | | | 469,185 | |
| | | | Petroleos Mexicanos | | | | |
| | 220,000 | | | 4.250%, 1/15/2025g | | | 222,706 | |
| | | | Regency Energy Partners, LP | | | | |
| | 675,000 | | | 5.000%, 10/1/2022 | | | 688,500 | |
| | | | Sabine Pass Liquefaction, LLC | | | | |
| | 675,000 | | | 5.750%, 5/15/2024g | | | 697,781 | |
| | | | Southwestern Energy Company | | | | |
| | 233,000 | | | 7.500%, 2/1/2018 | | | 271,170 | |
| | | | Suncor Energy, Inc. | | | | |
| | 140,000 | | | 6.100%, 6/1/2018 | | | 160,586 | |
| | | | Transocean, Inc. | | | | |
| | 205,000 | | | 6.000%, 3/15/2018 | | | 218,570 | |
| | | | Weatherford International, Ltd. | | | | |
| | 156,000 | | | 6.000%, 3/15/2018 | | | 175,749 | |
| | 114,000 | | | 9.625%, 3/1/2019 | | | 145,680 | |
| | | | | |
| | | | Total | | | 11,246,374 | |
| | | | | |
| |
| Financials (8.0%) | | | | |
| | | | Abbey National Treasury Services plc | | | | |
| | 240,000 | | | 0.644%, 9/29/2017d | | | 239,999 | |
| | 140,000 | | | 3.050%, 8/23/2018 | | | 145,619 | |
| | | | ABN AMRO Bank NV | | | | |
| | 207,000 | | | 2.500%, 10/30/2018g | | | 209,250 | |
| | | | Air Lease Corporation | | | | |
| | 244,000 | | | 2.125%, 1/15/2018 | | | 241,255 | |
| | | | ANZ New Zealand International, Ltd. | | | | |
| | 200,000 | | | 1.400%, 4/27/2017g | | | 200,122 | |
| | | | Aviation Capital Group Corporation | | | | |
| | 138,000 | | | 3.875%, 9/27/2016g | | | 141,763 | |
| | | | Bank of America Corporation | | | | |
| | 268,000 | | | 5.700%, 5/2/2017 | | | 292,303 | |
| | 240,000 | | | 1.700%, 8/25/2017 | | | 240,041 | |
| | 305,000 | | | 5.750%, 12/1/2017 | | | 339,506 | |
| | 484,000 | | | 1.303%, 3/22/2018d | | | 490,956 | |
| | 420,000 | | | 5.650%, 5/1/2018 | | | 468,876 | |
| | 242,000 | | | 8.000%, 12/29/2049i | | | 260,452 | |
| | | | Bank of New York Mellon Corporation | | | | |
| | 160,000 | | | 4.500%, 12/31/2049i | | | 151,400 | |
| | | | Bank of Tokyo-Mitsubishi UFJ, Ltd. | | | | |
| | 230,000 | | | 0.644%, 3/10/2017d,g | | | 230,002 | |
| | | | Banque Federative du Credit Mutuel SA | | | | |
| | 207,000 | | | 1.081%, 1/20/2017d,g | | | 208,635 | |
| | | | Barclays Bank plc | | | | |
| | 140,000 | | | 5.140%, 10/14/2020 | | | 152,151 | |
| | | | BB&T Corporation | | | | |
| | 202,000 | | | 2.050%, 6/19/2018 | | | 203,434 | |
| | | | BBVA Banco Continental SA | | | | |
| | 202,000 | | | 2.250%, 7/29/2016g | | | 202,505 | |
| | | | BBVA International Preferred SA Unipersonal | | | | |
| | 715,000 | | | 5.919%, 12/29/2049i | | | 729,300 | |
| | | | Bear Stearns Companies, LLC | | | | |
| | 295,000 | | | 6.400%, 10/2/2017 | | | 333,605 | |
| | | | BNP Paribas SA | | | | |
| | 189,000 | | | 1.250%, 12/12/2016 | | | 189,331 | |
| | 208,000 | | | 2.375%, 9/14/2017 | | | 211,996 | |
| | | | BPCE SA | | | | |
| | 250,000 | | | 1.625%, 2/10/2017 | | | 251,920 | |
| | 358,000 | | | 5.150%, 7/21/2024g | | | 368,451 | |
| | | | Branch Banking and Trust Company | | | | |
| | 223,000 | | | 0.664%, 12/1/2016d | | | 223,873 | |
| | | | Caixa Economica Federal | | | | |
| | 460,000 | | | 4.250%, 5/13/2019g,h | | | 463,910 | |
| | | | Capital One Financial Corporation | | | | |
| | 267,000 | | | 6.150%, 9/1/2016 | | | 290,567 | |
| | | | CIT Group, Inc. | | | | |
| | 450,000 | | | 3.875%, 2/19/2019 | | | 452,812 | |
| | | | Citigroup, Inc. | | | | |
| | 366,000 | | | 5.500%, 2/15/2017 | | | 397,764 | |
| | 229,000 | | | 6.000%, 8/15/2017 | | | 255,511 | |
| | 215,000 | | | 8.500%, 5/22/2019 | | | 269,765 | |
| | | | Compass Bank | | | | |
| | 250,000 | | | 1.850%, 9/29/2017 | | | 251,003 | |
| | | | Cooperatieve Centrale Raiffeisen-Boerenleenbank BA | | | | |
| | 240,000 | | | 4.625%, 12/1/2023 | | | 252,246 | |
| | 500,000 | | | 11.000%, 12/29/2049g,i | | | 652,500 | |
| | | | Credit Agricole SA | | | | |
| | 225,000 | | | 1.625%, 4/15/2016g | | | 227,270 | |
| | 242,000 | | | 6.625%, 9/29/2049g,i | | | 236,095 | |
| | | | Credit Suisse Group AG | | | | |
| | 358,000 | | | 7.500%, 12/11/2049g,i | | | 380,482 | |
| | | | CyrusOne, LP | | | | |
| | 469,079 | | | 6.375%, 11/15/2022 | | | 493,706 | |
| | | | DDR Corporation | | | | |
| | 140,000 | | | 9.625%, 3/15/2016 | | | 155,943 | |
| | | | Denali Borrower, LLC | | | | |
| | 800,000 | | | 5.625%, 10/15/2020g | | | 848,500 | |
| | | | Deutsche Bank AG | | | | |
| | 235,000 | | | 1.350%, 5/30/2017 | | | 233,623 | |
The accompanying Notes to Financial Statements are an integral part of this schedule.
151
OPPORTUNITY INCOME PLUS FUND
Schedule of Investments as of October 31, 2014
| | | | | | | | |
Principal Amount | | | Long-Term Fixed Income (52.3%) | | Value | |
| Financials (8.0%) - continued | | | | |
| | | | Discover Bank | | | | |
| | $70,000 | | | 8.700%, 11/18/2019 | | | $86,933 | |
| | | | Discover Financial Services | | | | |
| | 138,000 | | | 6.450%, 6/12/2017 | | | 154,042 | |
| | | | Fifth Third Bancorp | | | | |
| | 315,000 | | | 5.450%, 1/15/2017 | | | 341,811 | |
| | | | General Electric Capital Corporation | | | | |
| | 265,000 | | | 5.625%, 9/15/2017 | | | 296,261 | |
| | 94,000 | | | 1.625%, 4/2/2018 | | | 94,050 | |
| | | | Genworth Financial, Inc. | | | | |
| | 200,000 | | | 7.700%, 6/15/2020 | | | 240,093 | |
| | | | Goldman Sachs Group, Inc. | | | | |
| | 183,000 | | | 6.250%, 9/1/2017 | | | 205,125 | |
| | 238,000 | | | 2.375%, 1/22/2018 | | | 240,221 | |
| | 138,000 | | | 2.625%, 1/31/2019 | | | 139,027 | |
| | 228,000 | | | 7.500%, 2/15/2019 | | | 272,240 | |
| | 235,000 | | | 2.550%, 10/23/2019 | | | 233,494 | |
| | | | Hartford Financial Services Group, Inc. | | | | |
| | 263,000 | | | 6.000%, 1/15/2019 | | | 300,232 | |
| | | | HBOS plc | | | | |
| | 186,000 | | | 6.750%, 5/21/2018g | | | 208,894 | |
| | | | HCP, Inc. | | | | |
| | 100,000 | | | 3.750%, 2/1/2016 | | | 103,546 | |
| | 139,000 | | | 3.750%, 2/1/2019 | | | 146,484 | |
| | | | Health Care REIT, Inc. | | | | |
| | 134,000 | | | 4.700%, 9/15/2017 | | | 145,679 | |
| | | | HSBC Holdings plc | | | | |
| | 366,000 | | | 5.625%, 12/29/2049h,i | | | 371,947 | |
| | | | Huntington National Bank | | | | |
| | 223,000 | | | 1.300%, 11/20/2016 | | | 223,425 | |
| | | | Icahn Enterprises, LP | | | | |
| | 800,000 | | | 6.000%, 8/1/2020 | | | 840,000 | |
| | | | ING Bank NV | | | | |
| | 358,000 | | | 5.800%, 9/25/2023g | | | 398,426 | |
| | 200,000 | | | 4.125%, 11/21/2023 | | | 204,886 | |
| | | | ING Capital Funding Trust III | | | | |
| | 144,000 | | | 3.833%, 12/29/2049d,i | | | 143,640 | |
| | | | International Lease Finance Corporation | | | | |
| | 140,000 | | | 2.184%, 6/15/2016d | | | 139,475 | |
| | 420,000 | | | 5.875%, 4/1/2019 | | | 452,550 | |
| | | | Intesa Sanpaolo SPA | | | | |
| | 102,000 | | | 3.625%, 8/12/2015g | | | 103,823 | |
| | 68,000 | | | 3.875%, 1/16/2018 | | | 71,028 | |
| | 201,000 | | | 3.875%, 1/15/2019 | | | 209,257 | |
| | | | J.P. Morgan Chase & Company | | | | |
| | 246,000 | | | 3.450%, 3/1/2016 | | | 254,148 | |
| | 140,000 | | | 0.754%, 2/15/2017d | | | 140,412 | |
| | 119,000 | | | 2.000%, 8/15/2017 | | | 120,406 | |
| | 138,000 | | | 6.300%, 4/23/2019 | | | 160,149 | |
| | 276,000 | | | 7.900%, 4/29/2049i | | | 299,115 | |
| | 775,000 | | | 6.750%, 8/29/2049i | | | 816,540 | |
| | | | KeyCorp | | | | |
| | 223,000 | | | 2.300%, 12/13/2018 | | | 223,609 | |
| | | | Kookmin Bank | | | | |
| | 205,000 | | | 1.109%, 1/27/2017d,g | | | 206,476 | |
| | | | Liberty Mutual Group, Inc. | | | | |
| | 54,000 | | | 5.000%, 6/1/2021g | | | 59,283 | |
| | | | Liberty Property, LP | | | | |
| | 223,000 | | | 5.500%, 12/15/2016 | | | 241,536 | |
| | | | Lloyds Banking Group plc | | | | |
| | 125,000 | | | 5.920%, 9/29/2049g,i | | | 125,000 | |
| | | | Macquarie Bank, Ltd. | | | | |
| | 207,000 | | | 5.000%, 2/22/2017g | | | 223,035 | |
| | | | MetLife, Inc. | | | | |
| | 244,000 | | | 1.903%, 12/15/2017 | | | 246,218 | |
| | | | Metropolitan Life Global Fundingl | | | | |
| | 150,000 | | | 1.300%, 4/10/2017g | | | 150,314 | |
| | | | Mizuho Corporate Bank, Ltd. | | | | |
| | 191,000 | | | 1.550%, 10/17/2017g | | | 190,242 | |
| | | | Morgan Stanley | | | | |
| | 235,000 | | | 1.750%, 2/25/2016 | | | 237,110 | |
| | 345,000 | | | 6.250%, 8/28/2017 | | | 386,137 | |
| | 238,000 | | | 6.625%, 4/1/2018 | | | 272,547 | |
| | 150,000 | | | 4.875%, 11/1/2022 | | | 159,744 | |
| | | | Murray Street Investment Trust I | | | | |
| | 386,000 | | | 4.647%, 3/9/2017 | | | 412,101 | |
| | | | National City Corporation | | | | |
| | 140,000 | | | 6.875%, 5/15/2019 | | | 165,680 | |
| | | | Nomura Holdings, Inc. | | | | |
| | 207,000 | | | 2.000%, 9/13/2016 | | | 209,589 | |
| | 135,000 | | | 2.750%, 3/19/2019 | | | 136,466 | |
| | | | Oversea-Chinese Banking Corporation, Ltd. | | | | |
| | 365,000 | | | 4.250%, 6/19/2024g | | | 369,885 | |
| | | | PNC Bank NA | | | | |
| | 276,000 | | | 1.150%, 11/1/2016 | | | 276,961 | |
| | | | Pricoa Global Funding I | | | | |
| | 238,000 | | | 1.350%, 8/18/2017g | | | 237,717 | |
| | | | Realty Income Corporation | | | | |
| | 191,000 | | | 2.000%, 1/31/2018 | | | 191,862 | |
| | | | Regions Bank | | | | |
| | 268,000 | | | 7.500%, 5/15/2018 | | | 313,980 | |
| | | | Reinsurance Group of America, Inc. | | | | |
| | 305,000 | | | 5.625%, 3/15/2017 | | | 332,558 | |
| | | | Royal Bank of Scotland Group plc | | | | |
| | 207,000 | | | 5.050%, 1/8/2015 | | | 208,577 | |
| | 134,000 | | | 1.173%, 3/31/2017d | | | 134,444 | |
| | 358,000 | | | 7.640%, 3/29/2049i | | | 378,585 | |
| | 358,000 | | | 7.648%, 8/29/2049i | | | 421,097 | |
| | | | SLM Corporation | | | | |
| | 150,000 | | | 4.625%, 9/25/2017 | | | 152,625 | |
| | | | Societe Generale SA | | | | |
| | 207,000 | | | 5.750%, 4/20/2016g | | | 218,914 | |
| | | | State Bank of India | | | | |
| | 375,000 | | | 3.622%, 4/17/2019g | | | 382,783 | |
| | | | Sumitomo Mitsui Banking Corporation | | | | |
| | 360,000 | | | 1.300%, 1/10/2017 | | | 360,126 | |
| | | | Suncorp-Metway, Ltd. | | | | |
| | 138,000 | | | 0.934%, 3/28/2017d,g | | | 138,491 | |
| | | | Swiss RE Capital I, LP | | | | |
| | 202,000 | | | 6.854%, 5/29/2049g,i | | | 212,100 | |
| | | | Synchrony Financial | | | | |
| | 363,000 | | | 1.875%, 8/15/2017 | | | 364,250 | |
| | | | UBS AG | | | | |
| | 250,000 | | | 2.375%, 8/14/2019 | | | 250,461 | |
| | | | Ventas Realty, LP | | | | |
| | 134,000 | | | 1.250%, 4/17/2017 | | | 133,761 | |
| | | | Voya Financial, Inc. | | | | |
| | 210,000 | | | 2.900%, 2/15/2018 | | | 215,906 | |
The accompanying Notes to Financial Statements are an integral part of this schedule.
152
OPPORTUNITY INCOME PLUS FUND
Schedule of Investments as of October 31, 2014
| | | | | | | | |
Principal Amount | | | Long-Term Fixed Income (52.3%) | | Value | |
| Financials (8.0%) - continued | |
| | | | WEA Finance, LLC | | | | |
| | $244,000 | | | 1.750%, 9/15/2017g | | | $244,518 | |
| | | | Wells Fargo & Company | | | | |
| | 155,000 | | | 1.250%, 7/20/2016 | | | 156,048 | |
| | 484,000 | | | 1.400%, 9/8/2017 | | | 484,018 | |
| | | | | |
| | | | Total | | | 30,570,555 | |
| | | | | |
| |
| Foreign Government (1.0%) | | | | |
| | | | Azerbaijan Government International Bond | | | | |
| | 215,000 | | | 4.750%, 3/18/2024g | | | 223,869 | |
| | | | Bahama Government International Bond | | | | |
| | 200,000 | | | 5.750%, 1/16/2024g | | | 212,000 | |
| | | | Brazil Government International Bond | | | | |
| | 375,000 | | | 5.000%, 1/27/2045 | | | 367,500 | |
| | | | Colombia Government International Bond | | | | |
| | 250,000 | | | 2.625%, 3/15/2023 | | | 233,375 | |
| | 370,000 | | | 4.000%, 2/26/2024 | | | 379,620 | |
| | | | Costa Rica Government International Bond | | | | |
| | 375,000 | | | 7.000%, 4/4/2044g | | | 387,188 | |
| | | | Hungary Government International Bond | | | | |
| | 480,000 | | | 4.000%, 3/25/2019 | | | 491,760 | |
| | | | Mexico Government International Bond | | | | |
| | 50,000 | | | 3.500%, 1/21/2021 | | | 51,400 | |
| | | | Philippines Government International Bond | | | | |
| | 50,000 | | | 4.200%, 1/21/2024 | | | 53,937 | |
| | | | Poland Government International Bond | | | | |
| | 239,000 | | | 4.000%, 1/22/2024 | | | 251,144 | |
| | | | Slovenia Government International Bond | | | | |
| | 400,000 | | | 4.125%, 2/18/2019g | | | 421,000 | |
| | | | South Africa Government International Bond | | | | |
| | 375,000 | | | 5.375%, 7/24/2044 | | | 388,125 | |
| | | | Uruguay Government International Bond | | | | |
| | 290,000 | | | 5.100%, 6/18/2050 | | | 287,474 | |
| | | | | |
| | | | Total | | | 3,748,392 | |
| | | | | |
| |
| Mortgage-Backed Securities (10.4%) | | | | |
| | | | Federal Home Loan Mortgage Corporation Gold 15-Yr. Pass Through | | | | |
| | 2,250,000 | | | 3.000%, 11/1/2029c | | | 2,329,805 | |
| | | | Federal Home Loan Mortgage Corporation Gold 30-Yr. Pass Through | | | | |
| | 2,550,000 | | | 4.000%, 11/1/2044c | | | 2,705,192 | |
| | | | Federal National Mortgage Association Conventional 15-Yr. Pass Through | | | | |
| | 3,350,000 | | | 3.500%, 11/1/2029c | | | 3,539,483 | |
| | | | Federal National Mortgage Association Conventional 30-Yr. Pass Through | | | | |
| | 10,200,000 | | | 3.500%, 11/1/2044c | | | 10,547,432 | |
| | 9,662,500 | | | 4.000%, 11/1/2044c | | | 10,258,858 | |
| | 9,500,000 | | | 4.500%, 11/1/2044c | | | 10,295,625 | |
| | | | | |
| | | | Total | | | 39,676,395 | |
| | | | | |
| |
| Technology (1.2%) | | | | |
| | | | Alliance Data Systems Corporation | | | | |
| | 440,000 | | | 5.375%, 8/1/2022g | | | 446,600 | |
| | | | Amkor Technology, Inc. | | | | |
| | 500,000 | | | 6.625%, 6/1/2021 | | | 506,250 | |
| | | | Baidu, Inc. | | | | |
| | 200,000 | | | 2.750%, 6/9/2019 | | | 200,732 | |
| | | | EMC Corporation | | | | |
| | 140,000 | | | 1.875%, 6/1/2018 | | | 139,166 | |
| | | | Fidelity National Information Services, Inc. | | | | |
| | 236,000 | | | 1.450%, 6/5/2017 | | | 235,185 | |
| | | | First Data Corporation | | | | |
| | 469,079 | | | 7.375%, 6/15/2019g,h | | | 497,224 | |
| | | | Freescale Semiconductor, Inc. | | | | |
| | 500,000 | | | 6.000%, 1/15/2022g | | | 512,500 | |
| | | | Hewlett-Packard Company | | | | |
| | 276,000 | | | 5.400%, 3/1/2017 | | | 300,182 | |
| | | | Iron Mountain, Inc. | | | | |
| | 469,079 | | | 6.000%, 8/15/2023 | | | 494,878 | |
| | | | Sensata Technologies BV | | | | |
| | 765,000 | | | 4.875%, 10/15/2023g | | | 755,438 | |
| | | | Tyco Electronics Group SA | | | | |
| | 202,000 | | | 6.550%, 10/1/2017 | | | 229,943 | |
| | | | Xerox Corporation | | | | |
| | 202,000 | | | 7.200%, 4/1/2016 | | | 219,359 | |
| | | | | |
| | | | Total | | | 4,537,457 | |
| | | | | |
| |
| Transportation (0.8%) | | | | |
| | | | A.P. Meoller - Maersk A/S | | | | |
| | 243,000 | | | 2.550%, 9/22/2019g | | | 245,017 | |
| | | | American Airlines Pass Through Trust | | | | |
| | 132,156 | | | 4.950%, 1/15/2023 | | | 141,407 | |
| | | | Avis Budget Car Rental, LLC | | | | |
| | 800,000 | | | 5.125%, 6/1/2022g | | | 790,400 | |
| | | | Continental Airlines, Inc. | | | | |
| | 397,765 | | | 6.250%, 4/11/2020 | | | 424,416 | |
| | | | Delta Air Lines, Inc. | | | | |
| | 240,000 | | | 6.750%, 5/23/2017 | | | 249,600 | |
| | 147,196 | | | 4.950%, 5/23/2019 | | | 156,763 | |
| | 120,170 | | | 4.750%, 5/7/2020 | | | 127,981 | |
| | | | Korea Expressway Corporation | | | | |
| | 200,000 | | | 1.625%, 4/28/2017g | | | 199,386 | |
| | | | United Air Lines, Inc. | | | | |
| | 186,917 | | | 10.400%, 11/1/2016 | | | 207,665 | |
| | | | US Airways Pass Through Trust | | | | |
| | 400,000 | | | 3.950%, 11/15/2025 | | | 405,000 | |
| | | | | |
| | | | Total | | | 2,947,635 | |
| | | | | |
| |
| U.S. Government and Agencies (0.7%) | | | | |
| | | | U.S. Treasury Notes | | | | |
| | 1,750,000 | | | 0.875%, 10/15/2017 | | | 1,747,540 | |
| | 750,000 | | | 1.875%, 6/30/2020 | | | 752,812 | |
The accompanying Notes to Financial Statements are an integral part of this schedule.
153
OPPORTUNITY INCOME PLUS FUND
Schedule of Investments as of October 31, 2014
| | | | | | | | |
Principal Amount | | | Long-Term Fixed Income (52.3%) | | Value | |
| U.S. Government and Agencies (0.7%) - continued | | | | |
| | $205,000 | | | 3.625%, 2/15/2044 | | | $227,502 | |
| | | | | |
| | | | Total | | | 2,727,854 | |
| | | | | |
| |
| Utilities (2.5%) | | | | |
| | | | AES Corporation | | | | |
| | 469,079 | | | 7.375%, 7/1/2021 | | | 535,190 | |
| | | | Atlas Pipeline Partners, LP | | | | |
| | 376,000 | | | 4.750%, 11/15/2021 | | | 375,060 | |
| | | | Calpine Corporation | | | | |
| | 675,000 | | | 5.375%, 1/15/2023 | | | 681,750 | |
| | | | Chesapeake Midstream Partners, LP | | | | |
| | 500,000 | | | 6.125%, 7/15/2022 | | | 543,750 | |
| | | | Commonwealth Edison Company | | | | |
| | 134,000 | | | 6.950%, 7/15/2018 | | | 155,898 | |
| | | | DCP Midstream Operating, LP | | | | |
| | 206,000 | | | 2.500%, 12/1/2017 | | | 210,020 | |
| | | | Dynegy Finance I, Inc. | | | | |
| | 775,000 | | | 7.375%, 11/1/2022g | | | 819,563 | |
| | | | El Paso Corporation | | | | |
| | 122,000 | | | 7.000%, 6/15/2017 | | | 135,725 | |
| | | | Electricite de France SA | | | | |
| | 207,000 | | | 0.691%, 1/20/2017d,g | | | 207,604 | |
| | 400,000 | | | 5.250%, 12/29/2049g,i | | | 415,000 | |
| | 358,000 | | | 5.625%, 12/29/2049g,i | | | 379,480 | |
| | | | Enel Finance International NV | | | | |
| | 140,000 | | | 5.125%, 10/7/2019g | | | 155,456 | |
| | | | Enterprise Products Operating, LLC | | | | |
| | 450,000 | | | 7.000%, 6/1/2067 | | | 473,062 | |
| | | | Exelon Generation Company, LLC | | | | |
| | 138,000 | | | 5.200%, 10/1/2019 | | | 154,363 | |
| | | | Fermaca Enterprises S de RL de CV | | | | |
| | 370,000 | | | 6.375%, 3/30/2038g | | | 389,888 | |
| | | | MidAmerican Energy Holdings Company | | | | |
| | 245,000 | | | 1.100%, 5/15/2017 | | | 244,047 | |
| | 138,000 | | | 5.750%, 4/1/2018 | | | 156,226 | |
| | | | NiSource Finance Corporation | | | | |
| | 242,000 | | | 6.400%, 3/15/2018 | | | 276,621 | |
| | | | NRG Energy, Inc. | | | | |
| | 469,079 | | | 6.625%, 3/15/2023 | | | 494,878 | |
| | | | Oleoducto Central SA | | | | |
| | 370,000 | | | 4.000%, 5/7/2021g | | | 374,625 | |
| | | | ONEOK Partners, LP | | | | |
| | 134,000 | | | 2.000%, 10/1/2017 | | | 134,950 | |
| | | | Pacific Gas & Electric Company | | | | |
| | 134,000 | | | 5.625%, 11/30/2017 | | | 150,305 | |
| | | | Panhandle Eastern Pipe Line Company, LP | | | | |
| | 207,000 | | | 6.200%, 11/1/2017 | | | 233,788 | |
| | | | PG&E Corporation | | | | |
| | 136,000 | | | 2.400%, 3/1/2019 | | | 136,506 | |
| | | | PPL Capital Funding, Inc. | | | | |
| | 311,000 | | | 1.900%, 6/1/2018 | | | 310,479 | |
| | | | Sempra Energy | | | | |
| | 244,000 | | | 6.150%, 6/15/2018 | | | 279,298 | |
| | | | Southern Company | | | | |
| | 240,000 | | | 1.300%, 8/15/2017 | | | 239,292 | |
| | | | TransAlta Corporation | | | | |
| | 236,000 | | | 1.900%, 6/3/2017 | | | 235,742 | |
| | | | Transelec SA | | | | |
| | 375,000 | | | 4.250%, 1/14/2025g | | | 376,236 | |
| | | | Williams Companies, Inc. | | | | |
| | 238,000 | | | 7.875%, 9/1/2021 | | | 287,357 | |
| | | | | |
| | | | Total | | | 9,562,159 | |
| | | | | |
| | | | | | | | |
| | | | | |
| | | | Total Long-Term Fixed Income (cost $199,798,282) | | | 200,609,526 | |
| | | | | |
| | |
| Shares | | | Common Stock (4.7%) | | Value | |
| Financials (4.7%) | | | | |
| | 149,944 | | | Aberdeen Asia-Pacific Income Fund, Inc. | | | 881,671 | |
| | 34,000 | | | Cohen & Steers REIT and Preferred Income Fund, Inc. | | | 642,600 | |
| | 28,000 | | | Doubleline Income Solutions Fund | | | 596,400 | |
| | 29,204 | | | First Trust High Income Long/Short Fund | | | 502,017 | |
| | 60,500 | | | iShares FTSE NAREIT Mortgage Plus Capped Index Fund | | | 748,385 | |
| | 46,645 | | | iShares J.P. Morgan USD Emerging Markets Bond ETF | | | 5,349,249 | |
| | 26,955 | | | iShares MSCI Emerging Markets Minimum Volatility ETFh | | | 1,632,395 | |
| | 171,926 | | | MFS Intermediate Income Trust | | | 868,226 | |
| | 105,022 | | | Nuveen Quality Preferred Income Fund II | | | 936,796 | |
| | 61,304 | | | PIMCO Dynamic Credit Income Fund | | | 1,356,657 | |
| | 115,998 | | | Templeton Global Income Fund | | | 908,264 | |
| | 35,750 | | | Vanguard MSCI Emerging Markets ETF | | | 1,524,380 | |
| | 6,700 | | | Vanguard Short-Term Corporate Bond ETF | | | 536,871 | |
| | 52,636 | | | Western Asset Emerging Markets Debt Fund, Inc. | | | 907,445 | |
| | 100,767 | | | Western Asset High Income Opportunity Fund, Inc. | | | 578,402 | |
| | | | | |
| | | | Total | | | 17,969,758 | |
| | | | | |
| | | | | | | | |
| | | | | |
| | | | Total Common Stock (cost $17,535,531) | | | 17,969,758 | |
| | | | | |
| | |
| Shares | | | Preferred Stock (1.8%) | | Value | |
| Financials (1.6%) | | | | |
| | 17,900 | | | Affiliated Managers Group, Inc., 5.250% | | | 456,808 | |
| | 5,370 | | | Agribank FCB, 6.875%i | | | 551,096 | |
| | 4,400 | | | Allstate Corporation, 5.100% | | | 108,152 | |
| | 322 | | | Bank of America Corporation, Convertible, 7.250%i | | | 368,114 | |
| | 28,995 | | | Citigroup, Inc., 6.875%i | | | 775,906 | |
| | 10,000 | | | Discover Financial Services, 6.500%i | | | 256,700 | |
| | 6,965 | | | Farm Credit Bank of Texas, 6.750% g,i | | | 741,991 | |
| | 20,600 | | | Goldman Sachs Group, Inc., 5.500%i | | | 492,958 | |
| | 19,675 | | | HSBC USA, Inc., 6.500%i | | | 501,122 | |
| | 580 | | | M&T Bank Corporation, 6.375%i | | | 575,106 | |
| | 14,300 | | | Morgan Stanley, 7.125%i | | | 389,818 | |
| | 9,666 | | | U.S. Bancorp 6.500%i | | | 283,310 | |
| | 358 | | | Wells Fargo & Company, Convertible, 7.500%i | | | 431,032 | |
| | | | | |
| | | | Total | | | 5,932,113 | |
| | | | | |
The accompanying Notes to Financial Statements are an integral part of this schedule.
154
OPPORTUNITY INCOME PLUS FUND
Schedule of Investments as of October 31, 2014
| | | | | | | | |
| Shares | | | Preferred Stock (1.8%) | | Value | |
| Materials (0.1%) | | | | |
| | 14,320 | | | CHS, Inc., 7.100%i | | | $384,635 | |
| | | | | |
| | | | Total | | | 384,635 | |
| | | | | |
| |
| Utilities (0.1%) | | | | |
| | 5,362 | | | Southern California Edison Company, 4.670%i | | | 546,422 | |
| | | | | |
| | | | Total | | | 546,422 | |
| | | | | |
| | | | | | | | |
| | | | | |
| | | | Total Preferred Stock (cost $6,666,875) | | | 6,863,170 | |
| | | | | |
| | |
| Shares | | | Collateral Held for Securities Loaned (1.2%) | | Value | |
| | 4,698,528 | | | Thrivent Cash Management Trust | | | 4,698,528 | |
| | | | | |
| | | | Total Collateral Held for Securities Loaned (cost $4,698,528) | | | 4,698,528 | |
| | | | | |
Shares or
Principal
Amount | | | Short-Term Investments (13.8%)j | | Value | |
| | | | Federal Home Loan Bank Discount Notes | | | | |
| | 100,000 | | | 0.090%, 4/24/2015k | | | 99,957 | |
| | 53,096,934 | | | Thrivent Cash Management Trust 0.050% | | | 53,096,934 | |
| | | | | |
| | | | Total Short-Term Investments (at amortized cost) | | | 53,196,891 | |
| | | | | |
| | | | Total Investments (cost $433,910,675) 112.7% | | | $432,937,000 | |
| | | | | |
| | | | Other Assets and Liabilities, Net (12.7%) | | | (48,826,813 | ) |
| | | | | |
| | | | Total Net Assets 100.0% | | | $384,110,187 | |
| | | | | |
a | The stated interest rate represents the weighted average of all contracts within the bank loan facility. |
b | All or a portion of the loan is unfunded. |
c | Denotes investments purchased on a when-issued or delayed delivery basis. |
d | Denotes variable rate securities. Variable rate securities are securities whose yields vary with a designated market index or market rate. The rate shown is as of October 31, 2014. |
e | Denotes step coupon securities. Step coupon securities pay an initial coupon rate for the first period and then different coupon rates for following periods. The rate shown is as of October 31, 2014. |
f | All or a portion of the security is insured or guaranteed, |
g | Denotes securities sold under Rule 144A of the Securities Act of 1933, which exempts them from registration. These securities have been deemed liquid and may be resold to other dealers in the program or to other qualified institutional buyers. As of October 31, 2014, the value of these investments was $41,699,902 or 10.9% of total net assets. |
h | All or a portion of the security is on loan. |
i | Denotes perpetual securities. Perpetual securities pay an indefinite stream of interest, but may be called by the issuer at an earlier date. |
j | The interest rate shown reflects the yield, coupon rate or the discount rate at the date of purchase. |
k | At October 31, 2014, $99,957 of investments were held on deposit with the counterparty and pledged as the initial margin deposit for open futures contracts. |
* | Denotes restricted securities. Restricted securities are investment securities which have been deemed illiquid and cannot be offered for public sale without first being registered under the Securities Act of 1933. The following table indicates the acquisition date and cost of restricted securities Opportunity Income Plus Fund owned as of October 31, 2014. |
| | | | | | | | |
Security | | Acquisition
Date | | | Cost | |
Bayview Opportunity Master Fund Trust IIB, LP, 1/28/2034 | | | 1/17/2014 | | | | $567,637 | |
Bayview Opportunity Master Fund Trust IIB, LP, 7/28/2019 | | | 7/30/2014 | | | | 552,687 | |
Inmet Mining Corporation, 6/1/2020 | | | 8/19/2013 | | | | 83 | |
JBS Finance II, Ltd., 1/29/2018 | | | 8/19/2013 | | | | 488,586 | |
Vericrest Opportunity Loan Transferee, 3/25/2054 | | | 12/11/2013 | | | | 263,732 | |
Wachovia Asset Securitization, Inc., 7/25/2037 | | | 3/16/2007 | | | | 1,623,943 | |
Definitions:
| | | | |
ETF | | - | | Exchange Traded Fund. |
REIT | | - | | Real Estate Investment Trust is a company that buys, develops, manages and/or sells real estate assets. |
Unrealized Appreciation (Depreciation)
Gross unrealized appreciation and depreciation of investments, based on cost for federal income tax purposes, were as follows:
| | | | |
Gross unrealized appreciation | | | $4,831,397 | |
Gross unrealized depreciation | | | (5,813,208 | ) |
| | | | |
Net unrealized appreciation (depreciation) | | | ($981,811 | ) |
| |
Cost for federal income tax purposes | | | $433,918,811 | |
The accompanying Notes to Financial Statements are an integral part of this schedule.
155
OPPORTUNITY INCOME PLUS FUND
Schedule of Investments as of October 31, 2014
Fair Valuation Measurements
The following table is a summary of the inputs used, as of October 31, 2014, in valuing Opportunity Income Plus Fund’s assets carried at fair value.
| | | | | | | | | | | | | | | | |
Investments in Securities | | Total | | | Level 1 | | | Level 2 | | | Level 3 | |
| | | | |
Bank Loans | | | | | | | | | | | | | | | | |
Basic Materials | | | 12,890,541 | | | | – | | | | 12,890,541 | | | | – | |
Capital Goods | | | 8,934,618 | | | | – | | | | 8,934,618 | | | | – | |
Communications Services | | | 51,506,490 | | | | – | | | | 47,661,767 | | | | 3,844,723 | |
Consumer Cyclical | | | 26,880,787 | | | | – | | | | 26,880,787 | | | | – | |
Consumer Non-Cyclical | | | 11,985,773 | | | | – | | | | 11,985,773 | | | | – | |
Energy | | | 8,022,522 | | | | – | | | | 6,742,821 | | | | 1,279,701 | |
Financials | | | 8,569,761 | | | | – | | | | 8,569,761 | | | | – | |
Technology | | | 10,582,310 | | | | – | | | | 10,582,310 | | | | – | |
Transportation | | | 6,247,495 | | | | – | | | | 1,830,759 | | | | 4,416,736 | |
Utilities | | | 3,978,830 | | | | – | | | | 3,978,830 | | | | – | |
| | | | |
Long-Term Fixed Income | | | | | | | | | | | | | | | | |
Asset-Backed Securities | | | 10,120,117 | | | | – | | | | 10,120,117 | | | | – | |
Basic Materials | | | 7,159,891 | | | | – | | | | 7,159,891 | | | | – | |
Capital Goods | | | 5,543,578 | | | | – | | | | 5,543,578 | | | | – | |
Collateralized Mortgage Obligations | | | 31,258,227 | | | | – | | | | 31,258,227 | | | | – | |
Commercial Mortgage-Backed Securities | | | 109,486 | | | | – | | | | 109,486 | | | | – | |
Communications Services | | | 17,126,145 | | | | – | | | | 17,126,145 | | | | – | |
Consumer Cyclical | | | 9,955,789 | | | | – | | | | 9,955,789 | | | | – | |
Consumer Non-Cyclical | | | 14,319,472 | | | | – | | | | 14,319,472 | | | | – | |
Energy | | | 11,246,374 | | | | – | | | | 11,246,374 | | | | – | |
Financials | | | 30,570,555 | | | | – | | | | 30,570,555 | | | | – | |
Foreign Government | | | 3,748,392 | | | | – | | | | 3,748,392 | | | | – | |
Mortgage-Backed Securities | | | 39,676,395 | | | | – | | | | 39,676,395 | | | | – | |
Technology | | | 4,537,457 | | | | – | | | | 4,537,457 | | | | – | |
Transportation | | | 2,947,635 | | | | – | | | | 2,947,635 | | | | – | |
U.S. Government and Agencies | | | 2,727,854 | | | | – | | | | 2,727,854 | | | | – | |
Utilities | | | 9,562,159 | | | | – | | | | 9,562,159 | | | | – | |
| | | | |
Common Stock | | | | | | | | | | | | | | | | |
Financials | | | 17,969,758 | | | | 17,969,758 | | | | – | | | | – | |
| | | | |
Preferred Stock | | | | | | | | | | | | | | | | |
Financials | | | 5,932,113 | | | | 5,190,122 | | | | 741,991 | | | | – | |
Materials | | | 384,635 | | | | 384,635 | | | | – | | | | – | |
Utilities | | | 546,422 | | | | – | | | | 546,422 | | | | – | |
Collateral Held for Securities Loaned | | | 4,698,528 | | | | 4,698,528 | | | | – | | | | – | |
Short-Term Investments | | | 53,196,891 | | | | 53,096,934 | | | | 99,957 | | | | – | |
| |
Total | | | $432,937,000 | | | | $81,339,977 | | | | $342,055,863 | | | | $9,541,160 | |
| |
| | | | |
Other Financial Instruments | | Total | | | Level 1 | | | Level 2 | | | Level 3 | |
| | | | |
Asset Derivatives | | | | | | | | | | | | | | | | |
Futures Contracts | | | 342,420 | | | | 342,420 | | | | – | | | | – | |
| |
Total Asset Derivatives | | | $342,420 | | | | $342,420 | | | | $– | | | | $– | |
| |
| | | | |
Liability Derivatives | | | | | | | | | | | | | | | | |
Futures Contracts | | | 321,562 | | | | 321,562 | | | | – | | | | – | |
| |
Total Liability Derivatives | | | $321,562 | | | | $321,562 | | | | $– | | | | $– | |
| |
There were no significant transfers between Levels during the period ended October 31, 2014. Transfers between Levels are identified as of the end of the period.
| | | | | | | | | | | | | | | | | | | | |
Futures Contracts | | Number of
Contracts
Long/(Short) | | | Expiration
Date | | | Notional
Principal
Amount | | | Value | | | Unrealized
Gain/
(Loss) | |
2-Yr. U.S. Treasury Bond Futures | | | (512 | ) | | | December 2014 | | | | ($112,094,438 | ) | | | ($112,416,000 | ) | | | ($321,562 | ) |
5-Yr. U.S. Treasury Bond Futures | | | 221 | | | | December 2014 | | | | 26,199,535 | | | | 26,393,962 | | | | 194,427 | |
30-Yr. U.S. Treasury Bond Futures | | | 13 | | | | December 2014 | | | | 1,810,797 | | | | 1,834,218 | | | | 23,421 | |
Ultra Long Term U.S. Treasury Bond Futures | | | 38 | | | | December 2014 | | | | 5,834,303 | | | | 5,958,875 | | | | 124,572 | |
Total Futures Contracts | | | | | | | | | | | | | | | | | | | $20,858 | |
The accompanying Notes to Financial Statements are an integral part of this schedule.
156
OPPORTUNITY INCOME PLUS FUND
Schedule of Investments as of October 31, 2014
The following table summarizes the fair value and Statement of Assets and Liabilities location, as of October 31, 2014, for Opportunity Income Plus Fund’s investments in financial derivative instruments by primary risk exposure as discussed under item (2) Significant Accounting Policies of the Notes to Financial Statements.
| | | | | | | |
Derivatives by risk category | | Statement of Assets and Liabilities Location | | Fair Value |
| | |
Asset Derivatives | | | | | | | |
| | |
Interest Rate Contracts | | | | | | | |
Futures* | | Net Assets - Net unrealized appreciation/(depreciation) on Futures contracts | | | | $342,420 | |
Total Interest Rate Contracts | | | | | | 342,420 | |
Total Asset Derivatives | | | | | | $342,420 | |
| | | | | | | | |
| | | | | | | | |
| | |
Liability Derivatives | | | | | | | |
| | |
Interest Rate Contracts | | | | | | | |
Futures* | | Net Assets - Net unrealized appreciation/(depreciation) on Futures contracts | | | | 321,562 | |
Total Interest Rate Contracts | | | | | | 321,562 | |
Total Liability Derivatives | | | | | | $321,562 | |
| | | | | | | | |
| | | | | | | | |
* | Includes cumulative appreciation/depreciation of futures contracts as reported in the Schedule of Investments. Only current day’s variation margin is reported within the Statement of Assets and Liabilities. |
The following table summarizes the net realized gains/(losses) and Statement of Operations location, for the period ended October 31, 2014, for Opportunity Income Plus Fund’s investments in financial derivative instruments by primary risk exposure.
| | | | | | |
Derivatives by risk category | | Statement of Operations Location | | Realized Gains/(Losses)
recognized in Income | |
| | |
Interest Rate Contracts | | | | | | |
Futures | | Net realized gains/(losses) on Futures contracts | | | 504,107 | |
| | |
Total Interest Rate Contracts | | | | | 504,107 | |
| | |
Credit Contracts | | | | | | |
Credit Default Swaps | | Net realized gains/(losses) on Swap agreements | | | 20,816 | |
| | |
Total Credit Contracts | | | | | 20,816 | |
| |
Total | | | | | $524,923 | |
| |
The following table summarizes the change in net unrealized appreciation/(depreciation) and Statement of Operations location, for the period ended October 31, 2014, for Opportunity Income Plus Fund’s investments in financial derivative instruments by primary risk exposure.
| | | | | | |
Derivatives by risk category | | Statement of Operations Location | | Change in unrealized
appreciation/(depreciation)
recognized in Income | |
| | |
Interest Rate Contracts | | | | | | |
Futures | | Change in net unrealized appreciation/(depreciation) on Futures contracts | | | (118,082 | ) |
| |
Total Interest Rate Contracts | | | (118,082 | ) |
| |
Total | | | | | ($118,082 | ) |
| |
The following table presents Opportunity Income Plus Fund’s average volume of derivative activity during the period ended October 31, 2014.
| | | | | | | | | | | | |
Derivative Risk Category | | Futures
(Notional*) | | | Futures
(Percentage
of Average
Net Assets) | | | Swaps
(Notional*) | |
Interest Rate | | | | | | | | | | | | |
Contracts | | $ | 51,488,348 | | | | 16.0 | % | | | N/A | |
Credit Contracts | | | N/A | | | | N/A | | | $ | 31,109 | |
* | Notional amount represents long or short, or both, derivative positions held by the Fund. |
The accompanying Notes to Financial Statements are an integral part of this schedule.
157
OPPORTUNITY INCOME PLUS FUND
Schedule of Investments as of October 31, 2014
Investment in Affiliates
Affiliated issuers, as defined under the Investment Company Act of 1940, include those in which the Fund’s holdings of an issuer represent 5% or more of the outstanding voting securities of an issuer, or any affiliated mutual fund.
A summary of transactions for the fiscal year to date, in Opportunity Income Plus Fund, is as follows:
| | | | | | | | | | | | | | | | | | | | | | | | |
Fund | | Value
October 31, 2013 | | | Gross
Purchases | | | Gross
Sales | | | Shares Held at
October 31,
2014 | | | Value October 31, 2014 | | | Income Earned
November 1, 2013 -
October 31, 2014 | |
Cash Management Trust- Collateral Investment | | | $– | | | | $20,633,298 | | | | $15,934,770 | | | | 4,698,528 | | | | $4,698,528 | | | | $13,794 | |
Cash Management Trust- Short Term Investment | | | 40,150,617 | | | | 252,407,278 | | | | 239,460,961 | | | | 53,096,934 | | | | 53,096,934 | | | | 23,968 | |
Total Value and Income Earned | | | 40,150,617 | | | | | | | | | | | | | | | | 57,795,462 | | | | 37,762 | |
The accompanying Notes to Financial Statements are an integral part of this schedule.
158
PARTNER EMERGING MARKETS EQUITY FUND
Schedule of Investments as of October 31, 2014
| | | | | | | | |
| Shares | | | Common Stock (96.6%) | | Value | |
| Bermuda (0.4%) | | | | |
| | 109,000 | | | Pacific Basin Shipping, Ltd. | | | $52,454 | |
| | | | | |
| | | | Total | | | 52,454 | |
| | | | | |
| |
| Brazil (5.8%) | | | | |
| | 14,800 | | | Ambev SA | | | 97,981 | |
| | 11,100 | | | BR Properties SA | | | 56,081 | |
| | 28,200 | | | Embraer SA | | | 272,442 | |
| | 18,500 | | | Even Construtora e Incorporadora SA | | | 40,018 | |
| | 3,600 | | | Iochpe-Maxion SA | | | 24,779 | |
| | 9,600 | | | Itau Unibanco Holding SA | | | 142,379 | |
| | 4,700 | | | Natura Cosmeticos SA | | | 68,284 | |
| | 5,900 | | | WEG SA | | | 69,598 | |
| | | | | |
| | | | Total | | | 771,562 | |
| | | | | |
| |
| Chile (0.9%) | | | | |
| | 191,440 | | | Aguas Andinas SA | | | 115,501 | |
| | | | | |
| | | | Total | | | 115,501 | |
| | | | | |
| |
| China (12.3%) | | | | |
| | 222,000 | | | Air China, Ltd. | | | 143,767 | |
| | 61,500 | | | Anhui Conch Cement Company, Ltd. | | | 201,404 | |
| | 89,000 | | | China Construction Bank Corporation | | | 66,403 | |
| | 112,000 | | | China Shenhua Energy Company, Ltd. | | | 315,675 | |
| | 150,000 | | | CNOOC, Ltd. | | | 234,883 | |
| | 200,000 | | | Dongfeng Motor Group Company, Ltd. | | | 309,292 | |
| | 34,000 | | | Haitian International Holdings, Ltd. | | | 72,933 | |
| | 240,000 | | | PetroChina Company, Ltd. | | | 300,467 | |
| | | | | |
| | | | Total | | | 1,644,824 | |
| | | | | |
| |
| Colombia (2.0%) | | | | |
| | 1,575 | | | Bancolombia SA ADR | | | 89,098 | |
| | 13,244 | | | Bancolumbia SA | | | 180,620 | |
| | | | | |
| | | | Total | | | 269,718 | |
| | | | | |
| |
| Cyprus (0.4%) | | | | |
| | 6,606 | | | Globaltrans Investment plc | | | 48,950 | |
| | | | | |
| | | | Total | | | 48,950 | |
| | | | | |
| |
| Czech Republic (4.0%) | | | | |
| | 5,620 | | | CEZ AS | | | 155,461 | |
| | 1,741 | | | Komercni Banka AS | | | 372,995 | |
| | | | | |
| | | | Total | | | 528,456 | |
| | | | | |
| |
| Hong Kong (6.7%) | | | | |
| | 45,000 | | | China Mobile, Ltd. | | | 559,914 | |
| | 41,000 | | | Shenzhou International Group Holdings, Ltd. | | | 141,550 | |
| | 136,000 | | | Sinotruk Hong Kong, Ltd. | | | 70,495 | |
| | 32,000 | | | Weichai Power Company, Ltd. | | | 122,837 | |
| | | | | |
| | | | Total | | | 894,796 | |
| | | | | |
| |
| Hungary (2.3%) | | | | |
| | 18,696 | | | OTP Bank Nyrt | | | 309,636 | |
| | | | | |
| | | | Total | | | 309,636 | |
| | | | | |
| |
| India (1.6%) | | | | |
| | 6,526 | | | Reliance Industries, Ltd. GDRa | | | 210,935 | |
| | | | | |
| | | | Total | | | 210,935 | |
| | | | | |
| |
| Indonesia (3.4%) | | | | |
| | 32,200 | | | Astra International Tbk PT | | | 18,055 | |
| | 95,500 | | | Bank Mandiri Persero Tbk PT | | | 82,021 | |
| | 5,513 | | | Bank Rakyat Indonesia Persero Tbk PT ADR | | | 99,840 | |
| | 77,000 | | | Indo Tambangraya Megah Tbk PT | | | 135,106 | |
| | 11,300 | | | Indocement Tunggal Prakarsa Tbk PT | | | 22,396 | |
| | 64,700 | | | United Tractors Tbk PT | | | 98,279 | |
| | | | | |
| | | | Total | | | 455,697 | |
| | | | | |
| |
| Luxembourg (1.9%) | | | | |
| | 11,678 | | | Ternium SA ADR | | | 257,033 | |
| | | | | |
| | | | Total | | | 257,033 | |
| | | | | |
| |
| Malaysia (5.9%) | | | | |
| | 130,359 | | | CIMB Group Holdings Berhad | | | 257,412 | |
| | 77,800 | | | Genting Berhad | | | 230,651 | |
| | 100,358 | | | Malayan Banking Berhad | | | 296,069 | |
| | | | | |
| | | | Total | | | 784,132 | |
| | | | | |
| |
| Mexico (3.7%) | | | | |
| | 403,700 | | | America Movil SAB de CV | | | 493,748 | |
| | | | | |
| | | | Total | | | 493,748 | |
| | | | | |
| |
| Panama (1.1%) | | | | |
| | 1,272 | | | Copa Holdings SA | | | 148,722 | |
| | | | | |
| | | | Total | | | 148,722 | |
| | | | | |
| |
| Peru (0.8%) | | | | |
| | 11,899 | | | Cia de Minas Buenaventura SA ADR | | | 109,471 | �� |
| | | | | |
| | | | Total | | | 109,471 | |
| | | | | |
| |
| Poland (4.4%) | | | | |
| | 4,620 | | | Bank Handlowy w Warszawie SA | | | 156,209 | |
| | 5,372 | | | Bank Pekao SA | | | 281,162 | |
| | 3,833 | | | Grupa Lotos SAb | | | 29,611 | |
| | 39,708 | | | Orange Polska SA | | | 118,982 | |
| | | | | |
| | | | Total | | | 585,964 | |
| | | | | |
| |
| Russia (3.9%) | | | | |
| | 28,766 | | | Novolipetsk Steel OJSC GDR | | | 369,131 | |
| | 14,243 | | | Phosagro OAO | | | 151,446 | |
| | | | | |
| | | | Total | | | 520,577 | |
| | | | | |
| |
| South Africa (2.6%) | | | | |
| | 8,149 | | | AngloGold Ashanti, Ltd. ADRb | | | 67,392 | |
| | 6,315 | | | Barclays Africa Group, Ltd. | | | 99,804 | |
| | 13,142 | | | Impala Platinum Holdings, Ltd.b | | | 95,854 | |
| | 14,880 | | | Reunert, Ltd. | | | 78,534 | |
| | | | | |
| | | | Total | | | 341,584 | |
| | | | | |
| |
| South Korea (18.7%) | | | | |
| | 1,465 | | | Hyundai Department Store Company, Ltd. | | | 185,720 | |
| | 2,391 | | | Hyundai Heavy Industries Company, Ltd. | | | 222,155 | |
| | 1,458 | | | Hyundai Mobis | | | 341,120 | |
| | 862 | | | Hyundai Motor Company | | | 136,784 | |
| | 1,282 | | | LG Chem, Ltd. | | | 240,266 | |
| | 2,074 | | | POSCO ADR | | | 148,415 | |
| | 386 | | | Samsung Electronics Company, Ltd. | | | 450,131 | |
The accompanying Notes to Financial Statements are an integral part of this schedule.
159
PARTNER EMERGING MARKETS EQUITY FUND
Schedule of Investments as of October 31, 2014
| | | | | | | | |
| Shares | | | Common Stock (96.6%) | | Value | |
| South Korea (18.7%) - continued | | | | |
| | 3,649 | | | Samsung Heavy Industries Company, Ltd. | | | $88,934 | |
| | 2,518 | | | Samsung Life Insurance Company, Ltd. | | | 274,655 | |
| | 5,984 | | | Shinhan Financial Group Company, Ltd. | | | 281,642 | |
| | 641 | | | Shinsegae Company, Ltd. | | | 118,910 | |
| | | | | |
| | | | Total | | | 2,488,732 | |
| | | | | |
| |
| Taiwan (7.8%) | | | | |
| | 80,000 | | | Advanced Semiconductor Engineering, Inc. | | | 96,508 | |
| | 14,000 | | | Asustek Computer, Inc. | | | 142,943 | |
| | 41,090 | | | Chicony Electronics Company, Ltd. | | | 118,328 | |
| | 49,000 | | | Chipbond Technology Corporation | | | 90,350 | |
| | 87,000 | | | Compal Electronics, Inc. | | | 64,303 | |
| | 73,000 | | | Mega Financial Holding Company, Ltd. | | | 60,546 | |
| | 18,000 | | | Novatek Microelectronics Corporation | | | 93,169 | |
| | 13,000 | | | Richtek Technology Corporation | | | 62,732 | |
| | 46,000 | | | Taiwan Life Insurance Company, Ltd.b | | | 27,567 | |
| | 8,631 | | | Taiwan Semiconductor Manufacturing Company, Ltd. ADR | | | 190,055 | |
| | 65,000 | | | TECO Electric & Machinery Company, Ltd. | | | 72,324 | |
| | 14,000 | | | Vanguard International Semiconductor Corporation | | | 21,033 | |
| | | | | |
| | | | Total | | | 1,039,858 | |
| | | | | |
| |
| Thailand (2.9%) | | | | |
| | 17,100 | | | Bangkok Bank Public Company, Ltd. | | | 103,970 | |
| | 17,100 | | | Kasikornbank pcl | | | 123,890 | |
| | 14,300 | | | PTT pcl | | | 161,836 | |
| | | | | |
| | | | Total | | | 389,696 | |
| | | | | |
| |
| Turkey (0.7%) | | | | |
| | 6,817 | | | Ford Otomotiv Sanayi AS | | | 87,073 | |
| | | | | |
| | | | Total | | | 87,073 | |
| | | | | |
| |
| United States (2.4%) | | | | |
| | 3,124 | | | CTC Media, Inc. | | | 19,869 | |
| | 7,124 | | | iShares MSCI Emerging Markets Index Fund | | | 300,276 | |
| | | | | |
| | | | Total | | | 320,145 | |
| | | | | |
| | | | | | | | |
| | | | | |
| | | | Total Common Stock (cost $13,154,682) | | | 12,869,264 | |
| | | | | |
| | |
| Shares | | | Preferred Stock (2.1%) | | | |
| Brazil (2.1%) | | | | |
| | 70,504 | | | Oi SAb | | | 36,989 | |
| | 27,300 | | | Vale SA | | | 237,425 | |
| | | | | |
| | | | Total | | | 274,414 | |
| | | | | |
| | | | | | | | |
| | | | | |
| | | | Total Preferred Stock (cost $463,793) | | | 274,414 | |
| | | | | |
| | |
Shares or
Principal
Amount | | | Short-Term Investments (1.7%)c | | Value | |
| | 228,777 | | | Thrivent Cash Management Trust 0.050% | | $ | 228,777 | |
| | | | | |
| | | | Total Short-Term Investments (at amortized cost) | | | 228,777 | |
| | | | | |
| | | | Total Investments (cost $13,847,252) 100.4% | | $ | 13,372,455 | |
| | | | | |
| | | | Other Assets and Liabilities, Net (0.4%) | | | (50,334 | ) |
| | | | | |
| | | | Total Net Assets 100.0% | | $ | 13,322,121 | |
| | | | | |
a | Denotes securities sold under Rule 144A of the Securities Act of 1933, which exempts them from registration. These securities have been deemed liquid and may be resold to other dealers in the program or to other qualified institutional buyers. As of October 31, 2014, the value of these investments was $210,935 or 1.6% of total net assets, |
b | Non-income producing security. |
c | The interest rate shown reflects the yield, coupon rate or the discount rate at the date of purchase. |
Definitions:
| | | | |
ADR | | - | | American Depositary Receipt, which are certificates for an underlying foreign security’s shares held by an issuing U.S. depository bank. |
GDR | | - | | Global Depository Receipts, which are certificates for shares of an underlying foreign security’s shares held by an issuing depository bank from more than one country. |
Unrealized Appreciation (Depreciation)
Gross unrealized appreciation and depreciation of investments, based on cost for federal income tax purposes, were as follows:
| | | | |
Gross unrealized appreciation | | | $855,843 | |
Gross unrealized depreciation | | | (1,393,763 | ) |
| | | | |
Net unrealized appreciation (depreciation) | | | ($537,920 | ) |
| |
Cost for federal income tax purposes | | | $13,910,375 | |
The accompanying Notes to Financial Statements are an integral part of this schedule.
160
PARTNER EMERGING MARKETS EQUITY FUND
Schedule of Investments as of October 31, 2014
Fair Valuation Measurements
The following table is a summary of the inputs used, as of October 31, 2014, in valuing Partner Emerging Markets Equity Fund’s assets carried at fair value.
| | | | | | | | | | | | | | | | |
Investments in Securities | | Total | | | Level 1 | | | Level 2 | | | Level 3 | |
| | | | |
Common Stock | | | | | | | | | | | | | | | | |
Consumer Discretionary | | | 1,629,042 | | | | 19,869 | | | | 1,609,173 | | | | – | |
Consumer Staples | | | 166,265 | | | | – | | | | 166,265 | | | | – | |
Energy | | | 1,388,513 | | | | – | | | | 1,388,513 | | | | – | |
Financials | | | 3,662,275 | | | | 489,214 | | | | 3,173,061 | | | | – | |
Industrials | | | 1,587,203 | | | | 148,722 | | | | 1,438,481 | | | | – | |
Information Technology | | | 1,329,552 | | | | 190,055 | | | | 1,139,497 | | | | – | |
Materials | | | 1,662,808 | | | | 733,757 | | | | 929,051 | | | | – | |
Telecommunications Services | | | 1,172,644 | | | | – | | | | 1,172,644 | | | | – | |
Utilities | | | 270,962 | | | | – | | | | 270,962 | | | | – | |
| | | | |
Preferred Stock | | | | | | | | | | | | | | | | |
Materials | | | 237,425 | | | | – | | | | 237,425 | | | | – | |
Telecommunications Services | | | 36,989 | | | | – | | | | 36,989 | | | | – | |
Short-Term Investments | | | 228,777 | | | | 228,777 | | | | – | | | | – | |
| |
Total | | $ | 13,372,455 | | | $ | 1,810,394 | | | $ | 11,562,061 | | | | $– | |
| |
There were no significant transfers between Levels during the period ended October 31, 2014. Transfers between Levels are identified as of the end of the period.
Investment in Affiliates
Affiliated issuers, as defined under the Investment Company Act of 1940, include those in which the Fund’s holdings of an issuer represent 5% or more of the outstanding voting securities of an issuer, or any affiliated mutual fund.
A summary of transactions for the fiscal year to date, in Partner Emerging Markets Equity Fund, is as follows:
| | | | | | | | | | | | | | | | | | | | | | | | | | | | | | |
Fund | | Value
October 31, 2013 | | Gross Purchases | | Gross Sales | | Shares Held at
October 31, 2014 | | Value
October 31, 2014 | | Income Earned
November 1, 2013 -
October 31, 2014 |
Cash Management Trust- Short Term
Investment | | | $ | 257,720 | | | | $ | 4,497,720 | | | | $ | 4,526,663 | | | | | 228,777 | | | | $ | 228,777 | | | | $ | 110 | |
Total Value and Income Earned | | | | 257,720 | | | | | | | | | | | | | | | | | | | | 228,777 | | | | | 110 | |
The accompanying Notes to Financial Statements are an integral part of this schedule.
161
PARTNER SMALL CAP GROWTH FUND
Schedule of Investments as of October 31, 2014
| | | | | | | | |
| Shares | | | Common Stock (97.1%) | | Value | |
| Consumer Discretionary (15.8%) | |
| | 2,185 | | | ANN, Inc.a | | | $83,882 | |
| | 5,026 | | | Brunswick Corporation | | | 235,217 | |
| | 4,468 | | | Burlington Stores, Inc.a | | | 187,388 | |
| | 1,500 | | | Chuy’s Holdings, Inc.a | | | 44,865 | |
| | 2,721 | | | Core-Mark Holding Company, Inc. | | | 157,900 | |
| | 6,454 | | | Del Frisco’s Restaurant Group, Inc.a | | | 149,862 | |
| | 3,512 | | | Five Below, Inc.a,b | | | 140,023 | |
| | 3,097 | | | G-III Apparel Group, Ltd.a | | | 245,747 | |
| | 4,449 | | | HomeAway, Inc.a | | | 155,270 | |
| | 3,738 | | | Imax Corporationa | | | 110,121 | |
| | 4,670 | | | Kate Spade & Companya | | | 126,697 | |
| | 380 | | | Lithia Motors, Inc. | | | 29,496 | |
| | 7,278 | | | Multimedia Games Holding Company, Inc.a | | | 254,002 | |
| | 2,686 | | | Oxford Industries, Inc. | | | 164,517 | |
| | 2,036 | | | Red Robin Gourmet Burgers, Inc.a | | | 111,919 | |
| | 1,133 | | | Restoration Hardware Holdings, Inc.a | | | 91,003 | |
| | 714 | | | Shutterfly, Inc.a | | | 29,867 | |
| | 2,851 | | | Skechers USA, Inc.a | | | 156,092 | |
| | 3,280 | | | Tenneco, Inc.a | | | 171,741 | |
| | 1,382 | | | Vail Resorts, Inc. | | | 119,349 | |
| | | | | |
| | | | Total | | | 2,764,958 | |
| | | | | |
| |
| Consumer Staples (3.3%) | | | | |
| | 1,654 | | | B&G Foods, Inc. | | | 48,727 | |
| | 916 | | | Boston Beer Company, Inc.a | | | 228,084 | |
| | 2,786 | | | Natural Grocers by Vitamin Cottage, Inc.a | | | 50,455 | |
| | 3,611 | | | United Natural Foods, Inc.a | | | 245,620 | |
| | | | | |
| | | | Total | | | 572,886 | |
| | | | | |
| |
| Energy (3.7%) | | | | |
| | 547 | | | Bonanza Creek Energy, Inc.a | | | 24,746 | |
| | 572 | | | Diamondback Energy, Inc.a | | | 39,147 | |
| | 10,911 | | | Kodiak Oil & Gas Corporationa | | | 117,730 | |
| | 5,053 | | | Oasis Petroleum, Inc.a | | | 151,388 | |
| | 515 | | | PDC Energy, Inc.a | | | 22,516 | |
| | 10,140 | | | Penn Virginia Corporationa | | | 86,900 | |
| | 7,387 | | | Rex Energy Corporationa | | | 57,914 | |
| | 1,817 | | | SemGroup Corporation | | | 139,455 | |
| | | | | |
| | | | Total | | | 639,796 | |
| | | | | |
| |
| Financials (10.3%) | | | | |
| | 5,441 | | | Bank of the Ozarks, Inc. | | | 191,741 | |
| | 4,217 | | | Chesapeake Lodging Trust | | | 139,330 | |
| | 6,565 | | | Essent Group, Ltd.a | | | 159,792 | |
| | 2,974 | | | Evercore Partners, Inc. | | | 153,964 | |
| | 3,787 | | | Hanmi Financial Corporation | | | 81,231 | |
| | 4,243 | | | iShares Russell 2000 Growth Index Fund | | | 583,964 | |
| | 6,237 | | | Kennedy-Wilson Holdings, Inc. | | | 168,960 | |
| | 4,021 | | | PacWest Bancorp | | | 171,536 | |
| | 5,251 | | | Western Alliance Bancorpa | | | 139,782 | |
| | | | | |
| | | | Total | | | 1,790,300 | |
| | | | | |
| |
| Health Care (21.8%) | | | | |
| | 3,647 | | | Acadia Healthcare Company, Inc.a | | | 226,297 | |
| | 6,758 | | | Akorn, Inc.a | | | 301,069 | |
| | 2,030 | | | Align Technology, Inc.a | | | 106,819 | |
| | 4,976 | | | Bruker Corporationa | | | 103,153 | |
| | 4,130 | | | Cardiovascular Systems, Inc.a | | | 128,030 | |
| | 1,785 | | | Centene Corporationa | | | 165,416 | |
| | 2,142 | | | Cubist Pharmaceuticals, Inc.a | | | 154,845 | |
| | 3,344 | | | Cyberonics, Inc.a | | | 175,560 | |
| | 12,928 | | | Depomed, Inc.a | | | 199,091 | |
| | 7,135 | | | ExamWorks Group, Inc.a | | | 276,695 | |
| | 2,923 | | | Furiex Pharmaceuticals, Inc. Contigent Value Righta,c | | | 28,499 | |
| | 8,095 | | | Healthcare Services Group, Inc. | | | 241,069 | |
| | 7,028 | | | Impax Laboratories, Inc.a | | | 203,601 | |
| | 11,635 | | | Ironwood Pharmaceuticals, Inc.a | | | 163,123 | |
| | 2,121 | | | LifePoint Hospitals, Inc.a | | | 148,470 | |
| | 7,577 | | | Neurocrine Biosciences, Inc.a | | | 140,326 | |
| | 3,088 | | | NPS Pharmaceuticals, Inc.a | | | 84,611 | |
| | 7,851 | | | NuVasive, Inc.a | | | 321,106 | |
| | 717 | | | Puma Biotechnology, Inc.a | | | 179,680 | |
| | 3,470 | | | Team Health Holdings, Inc.a | | | 217,014 | |
| | 2,169 | | | Teleflex, Inc. | | | 247,526 | |
| | | | | |
| | | | Total | | | 3,812,000 | |
| | | | | |
| |
| Industrials (15.5%) | | | | |
| | 442 | | | Chart Industries, Inc.a | | | 20,575 | |
| | 1,915 | | | Generac Holdings, Inc.a | | | 86,826 | |
| | 2,276 | | | Granite Construction, Inc. | | | 84,007 | |
| | 3,344 | | | H&E Equipment Services, Inc. | | | 125,032 | |
| | 2,813 | | | Heico Corporation | | | 152,577 | |
| | 1,853 | | | Huron Consulting Group, Inc.a | | | 128,987 | |
| | 9,336 | | | Interface, Inc. | | | 149,656 | |
| | 4,459 | | | MasTec, Inc.a | | | 127,706 | |
| | 2,433 | | | Middleby Corporationa | | | 215,321 | |
| | 7,045 | | | On Assignment, Inc.a | | | 205,010 | |
| | 6,119 | | | PGT, Inc.a | | | 57,549 | |
| | 3,623 | | | Proto Labs, Inc.a | | | 236,836 | |
| | 5,032 | | | Ritchie Brothers Auctioneers, Inc. | | | 122,730 | |
| | 4,611 | | | Saia, Inc.a | | | 226,031 | |
| | 3,444 | | | Spirit Airlines, Inc.a | | | 251,791 | |
| | 6,078 | | | Swift Transportation Companya | | | 150,127 | |
| | 3,170 | | | Tutor Perini Corporationa | | | 88,792 | |
| | 592 | | | WageWorks, Inc.a | | | 33,750 | |
| | 1,452 | | | Watsco, Inc. | | | 147,552 | |
| | 1,683 | | | Watts Water Technologies, Inc. | | | 102,040 | |
| | | | | |
| | | | Total | | | 2,712,895 | |
| | | | | |
| |
| Information Technology (22.3%) | | | | |
| | 5,504 | | | A10 Networks, Inc.a | | | 24,218 | |
| | 1,791 | | | Ambarella, Inc.a,b | | | 79,323 | |
| | 18,238 | | | Applied Micro Circuits Corporationa | | | 118,000 | |
| | 2,852 | | | Applied Optoelectronics, Inc.a | | | 46,031 | |
| | 4,820 | | | Aspen Technology, Inc.a | | | 178,003 | |
| | 1,854 | | | Belden, Inc. | | | 131,986 | |
| | 1,101 | | | CalAmp Corporationa | | | 21,227 | |
| | 4,311 | | | Cardtronics, Inc.a | | | 165,499 | |
| | 2,664 | | | Cavium, Inc.a | | | 136,690 | |
| | 4,441 | | | Channel Advisor Corporationa | | | 61,685 | |
| | 3,148 | | | Cognex Corporationa | | | 124,535 | |
| | 1,633 | | | Coherent, Inc.a | | | 106,390 | |
| | 4,181 | | | Constant Contact, Inc.a | | | 147,840 | |
| | 5,017 | | | Cornerstone On Demand, Inc.a | | | 181,967 | |
| | 2,949 | | | Dealertrack Technologies, Inc.a | | | 138,750 | |
| | 3,437 | | | Demandware, Inc.a | | | 206,048 | |
| | 3,053 | | | DST Systems, Inc. | | | 294,157 | |
| | 2,093 | | | Electronics for Imaging, Inc.a | | | 95,692 | |
| | 6,529 | | | Guidewire Software, Inc.a | | | 326,058 | |
| | 2,202 | | | Manhattan Associates, Inc.a | | | 88,322 | |
| | 14,291 | | | MaxLinear, Inc.a | | | 101,323 | |
| | 1,734 | | | Methode Electronics, Inc. | | | 68,285 | |
| | 2,890 | | | Monolithic Power Systems, Inc. | | | 127,709 | |
| | 7,886 | | | Proofpoint, Inc.a | | | 347,299 | |
| | 395 | | | SPS Commerce, Inc.a | | | 23,029 | |
The accompanying Notes to Financial Statements are an integral part of this schedule.
162
PARTNER SMALL CAP GROWTH FUND
Schedule of Investments as of October 31, 2014
| | | | | | | | |
| Shares | | | Common Stock (97.1%) | | Value | |
| Information Technology (22.3%) - continued | | | | |
| | 1,583 | | | SunPower Corporationa | | | $50,403 | |
| | 958 | | | Synaptics, Inc.a | | | 65,556 | |
| | 602 | | | Tyler Technologies, Inc.a | | | 67,376 | |
| | 1,135 | | | Ultimate Software Group, Inc.a | | | 170,829 | |
| | 5,107 | | | Virtusa Corporationa | | | 209,285 | |
| | | | | |
| | | | Total | | | 3,903,515 | |
| | | | | |
| |
| Materials (4.4%) | | | | |
| | 5,039 | | | Chemtura Corporationa | | | 117,358 | |
| | 12,686 | | | Graphic Packaging Holding Companya | | | 153,881 | |
| | 1,887 | | | KapStone Paper and Packaging Corporationa | | | 58,044 | |
| | 4,798 | | | PolyOne Corporation | | | 177,574 | |
| | 10,396 | | | Senomyx, Inc.a,b | | | 82,336 | |
| | 3,926 | | | U.S. Silica Holdings, Inc. | | | 176,278 | |
| | | | | |
| | | | Total | | | 765,471 | |
| | | | | |
| | | | | | | | |
| | | | | |
| | | | Total Common Stock (cost $16,213,414) | | | 16,961,821 | |
| | | | | |
| | |
| Shares | | �� | Collateral Held for Securities Loaned (1.2%) | | Value | |
| | 217,215 | | | Thrivent Cash Management Trust | | | 217,215 | |
| | | | | |
| | | | Total Collateral Held for Securities Loaned (cost $217,215) | | | 217,215 | |
| | | | | |
| | |
Shares or
Principal
Amount | | | Short-Term Investments (2.9%)d | | Value | |
| | 501,403 | | | Thrivent Cash Management Trust 0.050% | | | 501,403 | |
| | | | | |
| | | | Total Short-Term Investments (at amortized cost) | | | 501,403 | |
| | | | | |
| | | | Total Investments (cost $16,932,032) 101.2% | | | $17,680,439 | |
| | | | | |
| | | | Other Assets and Liabilities, Net (1.2%) | | | (204,961 | ) |
| | | | | |
| | | | Total Net Assets 100.0% | | | $17,475,478 | |
| | | | | |
a | Non-income producing security. |
b | All or a portion of the security is on loan. |
c | Security is fair valued. |
d | The interest rate shown reflects the yield, coupon rate or the discount rate at the date of purchase. |
| | | | |
Unrealized Appreciation (Depreciation) | |
Gross unrealized appreciation and depreciation of investments, based on cost for federal income tax purposes, were as follows: | | | | |
Gross unrealized appreciation | | | $1,924,107 | |
Gross unrealized depreciation | | | (1,200,609 | ) |
| | | | |
Net unrealized appreciation (depreciation) | | | $723,498 | |
| |
Cost for federal income tax purposes | | | $16,956,941 | |
Fair Valuation Measurements
The following table is a summary of the inputs used, as of October 31, 2014, in valuing Partner Small Cap Growth Fund’s assets carried at fair value.
| | | | | | | | | | | | | | | | |
Investments in Securities | | Total | | | Level 1 | | | Level 2 | | | Level 3 | |
Common Stock | | | | | | | | | | | | | | | | |
Consumer Discretionary | | | 2,764,958 | | | | 2,764,958 | | | | – | | | | – | |
Consumer Staples | | | 572,886 | | | | 572,886 | | | | – | | | | – | |
Energy | | | 639,796 | | | | 639,796 | | | | – | | | | – | |
Financials | | | 1,790,300 | | | | 1,790,300 | | | | – | | | | – | |
Health Care | | | 3,812,000 | | | | 3,783,501 | | | | – | | | | 28,499 | |
Industrials | | | 2,712,895 | | | | 2,712,895 | | | | – | | | | – | |
Information Technology | | | 3,903,515 | | | | 3,903,515 | | | | – | | | | – | |
Materials | | | 765,471 | | | | 765,471 | | | | – | | | | – | |
Collateral Held for Securities Loaned | | | 217,215 | | | | 217,215 | | | | – | | | | – | |
Short-Term Investments | | | 501,403 | | | | 501,403 | | | | – | | | | – | |
| |
Total | | | $17,680,439 | | | | $17,651,940 | | | | $– | | | | $28,499 | |
| |
There were no significant transfers between Levels during the period ended October 31, 2014. Transfers between Levels are identified as of the end of the period.
The accompanying Notes to Financial Statements are an integral part of this schedule.
163
PARTNER SMALL CAP GROWTH FUND
Schedule of Investments as of October 31, 2014
Investment in Affiliates
Affiliated issuers, as defined under the Investment Company Act of 1940, include those in which the Fund’s holdings of an issuer represent 5% or more of the outstanding voting securities of an issuer, or any affiliated mutual fund.
A summary of transactions for the fiscal year to date, in Partner Small Cap Growth Fund, is as follows:
| | | | | | | | | | | | | | | | | | | | | | | | |
Fund | | Value
October 31, 2013 | | | Gross Purchases | | | Gross Sales | | | Shares Held at
October 31, 2014 | | | Value
October 31, 2014 | | | Income Earned
November 1, 2013 -
October 31, 2014 | |
Cash Management Trust-Collateral Investment | | | $17,412,554 | | | | $86,799,739 | | | | $103,995,078 | | | | 217,215 | | | | $217,215 | | | | $41,489 | |
Cash Management Trust-Short Term Investment | | | 8,052,231 | | | | 49,099,783 | | | | 56,650,611 | | | | 501,403 | | | | 501,403 | | | | 2,732 | |
Total Value and Income Earned | | | 25,464,785 | | | | | | | | | | | | | | | | 718,618 | | | | 44,221 | |
The accompanying Notes to Financial Statements are an integral part of this schedule.
164
PARTNER SMALL CAP VALUE FUND
Schedule of Investments as of October 31, 2014
| | | | | | | | |
| Shares | | | Common Stock (96.8%) | | Value | |
| Consumer Discretionary (12.5%) | | | | |
| | 146,600 | | | Aaron’s, Inc. | | | $3,629,816 | |
| | 26,000 | | | American Public Education, Inc.a | | | 805,740 | |
| | 11,500 | | | Ascent Capital Group, Inc.a | | | 739,450 | |
| | 28,300 | | | Brunswick Corporation | | | 1,324,440 | |
| | 42,500 | | | Crocs, Inc.a | | | 496,400 | |
| | 39,200 | | | CSS Industries, Inc. | | | 1,119,552 | |
| | 41,100 | | | Dorman Products, Inc.a,b | | | 1,905,396 | |
| | 56,300 | | | Drew Industries, Inc. | | | 2,705,778 | |
| | 44,300 | | | Ethan Allen Interiors, Inc.b | | | 1,253,690 | |
| | 58,900 | | | Fred’s, Inc. | | | 924,730 | |
| | 68,200 | | | Haverty Furniture Companies, Inc. | | | 1,501,082 | |
| | 30,800 | | | Hooker Furniture Corporation | | | 470,932 | |
| | 46,100 | | | M/I Homes, Inc.a | | | 992,994 | |
| | 10,700 | | | MarineMax, Inc.a | | | 205,119 | |
| | 54,300 | | | Meritage Homes Corporationa | | | 1,997,697 | |
| | 99,600 | | | Modine Manufacturing Companya | | | 1,277,868 | |
| | 10,900 | | | National CineMedia, Inc. | | | 173,310 | |
| | 59,300 | | | New Media Investment Group, Inc. | | | 1,130,258 | |
| | 74,400 | | | Orient-Express Hotels, Ltd.a | | | 852,624 | |
| | 109,550 | | | Pier1 Imports, Inc. | | | 1,413,195 | |
| | 205,800 | | | Quiksilver, Inc.a,b | | | 360,150 | |
| | 11,200 | | | Red Robin Gourmet Burgers, Inc.a | | | 615,664 | |
| | 94,900 | | | Shiloh Industries, Inc.a | | | 1,617,096 | |
| | 127,600 | | | Sportsman’s Warehouse Holdings,Inc.a,b | | | 891,924 | |
| | 119,500 | | | Stein Mart, Inc. | | | 1,598,910 | |
| | 29,750 | | | Steven Madden, Ltd.a | | | 932,662 | |
| | 51,800 | | | Winnebago Industries, Inc.a | | | 1,098,678 | |
| | | | | |
| | | | Total | | | 32,035,155 | |
| | | | | |
| |
| Consumer Staples (1.0%) | | | | |
| | | | | | | | |
| | 168,300 | | | Alliance One International, Inc.a | | | 341,649 | |
| | 19,900 | | | Pinnacle Foods, Inc. | | | 672,620 | |
| | 64,100 | | | Spartannash Company | | | 1,436,481 | |
| | | | | |
| | | | Total | | | 2,450,750 | |
| | | | | |
| |
| Energy (3.1%) | | | | |
| | 17,000 | | | Atwood Oceanics, Inc.a | | | 691,050 | |
| | 5,600 | | | CARBO Ceramics, Inc.b | | | 289,352 | |
| | 82,500 | | | Cloud Peak Energy, Inc.a | | | 987,525 | |
| | 16,600 | | | Contango Oil & Gas Companya | | | 607,062 | |
| | 30,700 | | | Energy XXI, Ltd.b | | | 236,083 | |
| | 64,600 | | | Gulf Island Fabrication, Inc. | | | 1,365,644 | |
| | 140,100 | | | Hercules Offshore, Inc.a,b | | | 231,165 | |
| | 11,300 | | | PDC Energy, Inc.a | | | 494,036 | |
| | 268,500 | | | Teekay Tankers, Ltd.b | | | 1,138,440 | |
| | 54,500 | | | Tesco Corporation | | | 1,037,680 | |
| | 104,200 | | | Tetra Technologies, Inc.a | | | 993,026 | |
| | | | | |
| | | | Total | | | 8,071,063 | |
| | | | | |
| |
| Financials (26.6%) | | | | |
| | 99,900 | | | Ares Capital Corporation | | | 1,597,401 | |
| | 51,600 | | | Associated Estates Realty Corporation | | | 1,007,748 | |
| | 24,200 | | | Assured Guaranty, Ltd. | | | 558,536 | |
| | 8,400 | | | Bank of Kentucky Financial Corporation | | | 394,044 | |
| | 69,200 | | | BBCN Bancorp, Inc. | | | 978,488 | |
| | 43,140 | | | Catchmark Timber Trust, Inc. | | | 504,738 | |
| | 109,000 | | | CBL & Associates Properties, Inc. | | | 2,085,170 | |
| | 141,900 | | | Cedar Realty Trust, Inc. | | | 976,272 | |
| | 282,500 | | | CoBiz Financial, Inc. | | | 3,395,650 | |
| | 59,200 | | | Columbia Banking System, Inc. | | | 1,644,576 | |
| | 66,500 | | | Compass Diversified Holdings | | | 1,226,925 | |
| | 116,200 | | | East West Bancorp, Inc. | | | 4,271,512 | |
| | 65,460 | | | Employers Holdings, Inc. | | | 1,334,729 | |
| | 2,300 | | | Enstar Group, Ltd.a | | | 340,561 | |
| | 134,000 | | | First Potomac Realty Trust | | | 1,675,000 | |
| | 17,800 | | | Forestar Real Estate Group, Inc.a | | | 310,610 | |
| | 90,900 | | | Glacier Bancorp, Inc. | | | 2,607,921 | |
| | 66,400 | | | Golub Capital BDC, Inc. | | | 1,150,712 | |
| | 81,100 | | | Hatteras Financial Corporation | | | 1,544,144 | |
| | 135,000 | | | Hercules Technology Growth Capital, Inc. | | | 2,127,600 | |
| | 75,400 | | | Home Bancshares, Inc. | | | 2,406,768 | |
| | 14,600 | | | iShares Russell 2000 Value Index Fund | | | 1,461,168 | |
| | 55,500 | | | Janus Capital Group, Inc. | | | 831,945 | |
| | 46,800 | | | JMP Group, Inc. | | | 341,640 | |
| | 18,000 | | | Kilroy Realty Corporation | | | 1,219,320 | |
| | 62,775 | | | Kite Realty Group Trust | | | 1,625,245 | |
| | 61,400 | | | LaSalle Hotel Properties | | | 2,407,494 | |
| | 19,800 | | | Main Street Capital Corporation | | | 629,244 | |
| | 142,600 | | | Meadowbrook Insurance Group, Inc. | | | 908,362 | |
| | 52,400 | | | National Interstate Corporation | | | 1,490,256 | |
| | 13,500 | | | Piper Jaffray Companiesa | | | 762,210 | |
| | 41,500 | | | Potlatch Corporation | | | 1,825,585 | |
| | 95,500 | | | ProAssurance Corporation | | | 4,467,490 | |
| | 9,800 | | | PS Business Parks, Inc. | | | 825,356 | |
| | 80,500 | | | Radian Group, Inc.b | | | 1,356,425 | |
| | 144,400 | | | Redwood Trust, Inc. | | | 2,713,276 | |
| | 65,100 | | | Safeguard Scientifics, Inc.a | | | 1,298,745 | |
| | 4,300 | | | Safety Insurance Group, Inc. | | | 268,234 | |
| | 85,600 | | | Sandy Spring Bancorp, Inc. | | | 2,208,480 | |
| | 35,000 | | | State Auto Financial Corporation | | | 732,550 | |
| | 20,100 | | | Strategic Hotels & Resorts, Inc.a | | | 258,285 | |
| | 26,100 | | | SVB Financial Groupa | | | 2,922,939 | |
| | 45,400 | | | TCP Capital Corporation | | | 766,806 | |
| | 61,200 | | | THL Credit, Inc. | | | 787,032 | |
| | 48,400 | | | Washington Real Estate Investment Trust | | | 1,367,784 | |
| | 56,500 | | | Wintrust Financial Corporation | | | 2,617,080 | |
| | | | | |
| | | | Total | | | 68,232,056 | |
| | | | | |
| |
| Health Care (3.9%) | | | | |
| | 11,900 | | | Analogic Corporation | | | 867,986 | |
| | 4,900 | | | Atrion Corporation | | | 1,617,049 | |
| | 29,800 | | | National Healthcare Corporation | | | 1,797,238 | |
| | 65,500 | | | Triple-S Management Corporationa | | | 1,450,170 | |
| | 85,200 | | | West Pharmaceutical Services, Inc. | | | 4,366,500 | |
| | | | | |
| | | | Total | | | 10,098,943 | |
| | | | | |
| |
| Industrials (26.6%) | | | | |
| | 61,500 | | | A.O. Smith Corporation | | | 3,281,025 | |
| | 69,100 | | | Aegion Corporationa | | | 1,265,912 | |
| | 118,200 | | | Alaska Air Group, Inc. | | | 6,291,786 | |
| | 28,000 | | | Applied Industrial Technologies, Inc. | | | 1,366,680 | |
| | 28,700 | | | Astec Industries, Inc. | | | 1,088,017 | |
| | 99,400 | | | Beacon Roofing Supply, Inc.a | | | 2,750,398 | |
| | 59,600 | | | Celadon Group, Inc. | | | 1,159,816 | |
| | 28,300 | | | Circor International, Inc. | | | 2,126,745 | |
| | 71,900 | | | Comfort Systems USA, Inc. | | | 1,104,384 | |
| | 54,400 | | | ESCO Technologies, Inc. | | | 2,068,288 | |
| | 38,100 | | | Franklin Electric Company, Inc. | | | 1,422,654 | |
| | 36,800 | | | FTI Consulting, Inc.a | | | 1,485,984 | |
| | 45,200 | | | G & K Services, Inc. | | | 2,850,764 | |
| | 31,300 | | | Genesee & Wyoming, Inc.a | | | 3,011,060 | |
| | 55,600 | | | Gibraltar Industries, Inc.a | | | 847,900 | |
| | 21,200 | | | Greenbrier Companies, Inc.b | | | 1,325,848 | |
| | 7,920 | | | Hillenbrand, Inc. | | | 263,657 | |
The accompanying Notes to Financial Statements are an integral part of this schedule.
165
PARTNER SMALL CAP VALUE FUND
Schedule of Investments as of October 31, 2014
| | | | | | | | |
| Shares | | | Common Stock (96.8%) | | Value | |
| Industrials (26.6%) - continued | | | | |
| | 30,100 | | | Hub Group, Inc.a | | | $1,092,329 | |
| | 35,000 | | | Kaman Corporation | | | 1,507,100 | |
| | 91,400 | | | Kforce, Inc. | | | 2,115,910 | |
| | 28,900 | | | Kirby Corporationa | | | 3,195,762 | |
| | 96,900 | | | Kratos Defense & Security Solutions, Inc.a | | | 675,393 | |
| | 45,700 | | | Landstar System, Inc. | | | 3,382,257 | |
| | 33,500 | | | Luxfer Holdings plc ADR | | | 533,655 | |
| | 53,100 | | | Matson, Inc. | | | 1,512,819 | |
| | 52,500 | | | Matthews International Corporation | | | 2,419,200 | |
| | 83,900 | | | McGrath Rentcorp | | | 3,064,867 | |
| | 29,400 | | | Mine Safety Appliances Company | | | 1,689,618 | |
| | 102,000 | | | Navigant Consulting, Inc.a | | | 1,569,780 | |
| | 22,600 | | | Nordson Corporation | | | 1,730,030 | |
| | 55,300 | | | Pike Corporationa | | | 660,282 | |
| | 39,200 | | | Quanex Building Products Corporation | | | 784,784 | |
| | 10,300 | | | RBC Bearings, Inc. | | | 625,725 | |
| | 24,300 | | | Sun Hydraulics Corporation | | | 967,383 | |
| | 34,100 | | | Universal Forest Products, Inc. | | | 1,703,977 | |
| | 42,700 | | | Universal Truckload Services, Inc. | | | 1,123,864 | |
| | 69,100 | | | UTI Worldwide, Inc.a | | | 755,263 | |
| | 30,900 | | | Waste Connections, Inc. | | | 1,541,910 | |
| | 40,780 | | | Woodward, Inc. | | | 2,088,344 | |
| | | | | |
| | | | Total | | | 68,451,170 | |
| | | | | |
| |
| Information Technology (10.5%) | | | | |
| | 47,500 | | | Advanced Energy Industries, Inc.a | | | 939,550 | |
| | 6,700 | | | Badger Meter, Inc. | | | 381,364 | |
| | 39,700 | | | Belden, Inc. | | | 2,826,243 | |
| | 75,400 | | | Brooks Automation, Inc. | | | 929,682 | |
| | 46,100 | | | Cabot Microelectronics Corporationa | | | 2,223,403 | |
| | 15,900 | | | Cognex Corporationa | | | 629,004 | |
| | 47,300 | | | Cohu, Inc. | | | 482,460 | |
| | 91,200 | | | Electro Rent Corporation | | | 1,389,888 | |
| | 103,100 | | | Electro Scientific Industries, Inc. | | | 732,010 | |
| | 45,700 | | | Entegris, Inc.a | | | 620,606 | |
| | 68,900 | | | Fabrineta | | | 1,254,669 | |
| | 27,600 | | | Intersil Corporation | | | 366,804 | |
| | 122,400 | | | Intevac, Inc.a | | | 905,760 | |
| | 113,500 | | | Ixiaa | | | 1,093,005 | |
| | 14,600 | | | Littelfuse, Inc. | | | 1,424,084 | |
| | 59,100 | | | Methode Electronics, Inc. | | | 2,327,358 | |
| | 27,800 | | | Newport Corporationa | | | 497,342 | |
| | 76,000 | | | Progress Software Corporationa | | | 1,968,400 | |
| | 137,400 | | | ShoreTel, Inc.a | | | 1,111,566 | |
| | 224,200 | | | Sonus Networks, Inc.a | | | 777,974 | |
| | 46,200 | | | Synnex Corporation | | | 3,196,116 | |
| | 53,800 | | | Teradyne, Inc. | | | 989,920 | |
| | | | | |
| | | | Total | | | 27,067,208 | |
| | | | | |
| |
| Materials (7.4%) | | | | |
| | 42,400 | | | American Vanguard Corporationb | | | 489,296 | |
| | 49,800 | | | AptarGroup, Inc. | | | 3,099,552 | |
| | 12,600 | | | Carpenter Technology Corporation | | | 630,630 | |
| | 45,400 | | | Clearwater Paper Corporationa | | | 2,921,490 | |
| | 16,800 | | | Franco-Nevada Corporation | | | 786,450 | |
| | 78,000 | | | Innospec, Inc. | | | 3,148,860 | |
| | 37,600 | | | Minerals Technologies, Inc. | | | 2,884,296 | |
| | 86,800 | | | Myers Industries, Inc. | | | 1,296,792 | |
| | 30,200 | | | Ryerson Holding Corporationa | | | 385,956 | |
| | 140,400 | | | Sandstorm Gold, Ltd.a,b | | | 405,756 | |
| | 29,100 | | | Schnitzer Steel Industries, Inc. | | | 685,305 | |
| | 51,200 | | | Stillwater Mining Companya | | | 672,256 | |
| | 150,100 | | | Wausau Paper Corporation | | | 1,484,489 | |
| | | | | |
| | | | Total | | | 18,891,128 | |
| | | | | |
| |
| Telecommunications Services (0.1%) | | | | |
| | 36,700 | | | Premiere Global Services, Inc.a | | | 384,249 | |
| | | | | |
| | | | Total | | | 384,249 | |
| | | | | |
| |
| Utilities (5.1%) | | | | |
| | 22,200 | | | Black Hills Corporation | | | 1,215,006 | |
| | 71,100 | | | Cleco Corporation | | | 3,822,336 | |
| | 47,400 | | | El Paso Electric Company | | | 1,793,616 | |
| | 39,200 | | | NorthWestern Corporation | | | 2,071,328 | |
| | 52,400 | | | PNM Resources, Inc. | | | 1,511,740 | |
| | 46,600 | | | Southwest Gas Corporation | | | 2,706,994 | |
| | | | | |
| | | | Total | | | 13,121,020 | |
| | | | | |
| | | | Total Common Stock (cost $151,348,670) | | | 248,802,742 | |
| | | | | |
| | |
| Shares | | | Preferred Stock (0.2%) | | Value | |
| Health Care (0.2%) | | | | |
| | 30,846 | | | National Healthcare Corporation, Convertiblec | | | 473,486 | |
| | | | | |
| | | | Total | | | 473,486 | |
| | | | | |
| | | | | |
| | | | | |
| | | | Total Preferred Stock (cost $416,153) | | | 473,486 | |
| | | | | |
| | |
| Shares | | | Collateral Held for Securities Loaned (3.4%) | | Value | |
| | 8,739,961 | | | Thrivent Cash Management Trust | | | 8,739,961 | |
| | | | | |
| | | | Total Collateral Held for Securities Loaned (cost $8,739,961) | | | 8,739,961 | |
| | | | | |
| | |
Shares or
Principal
Amount | | | Short-Term Investments (2.9%)d | | Value | |
| | 7,402,448 | | | Thrivent Cash Management Trust 0.050% | | | 7,402,448 | |
| | | | | |
| | | | Total Short-Term Investments (at amortized cost) | | | 7,402,448 | |
| | | | | |
| | | | Total Investments (cost $167,907,232) 103.3% | | | $265,418,637 | |
| | | | | |
| | | | Other Assets and Liabilities, Net (3.3%) | | | (8,466,916 | ) |
| | | | | |
| | | | Total Net Assets 100.0% | | | $256,951,721 | |
| | | | | |
a | Non-income producing security. |
b | All or a portion of the security is on loan, |
c | Denotes perpetual securities. Perpetual securities pay an indefinite stream of interest, but may be called by the issuer at an earlier date. |
d | The interest rate shown reflects the yield, coupon rate or the discount rate at the date of purchase. |
ADR - American Depositary Receipt, which are certificates for an underlying foreign security’s shares held by an issuing U.S. depository bank.
The accompanying Notes to Financial Statements are an integral part of this schedule.
166
PARTNER SMALL CAP VALUE FUND
Schedule of Investments as of October 31, 2014
Unrealized Appreciation (Depreciation)
Gross unrealized appreciation and depreciation of investments, based on cost for federal income tax purposes, were as follows:
| | | | |
Gross unrealized appreciation | | | $104,019,878 | |
Gross unrealized depreciation | | | (6,950,848 | ) |
| | | | |
Net unrealized appreciation (depreciation) | | | $97,069,030 | |
| |
Cost for federal income tax purposes | | | $168,349,607 | |
Fair Valuation Measurements
The following table is a summary of the inputs used, as of October 31, 2014, in valuing Partner Small Cap Value Fund’s assets carried at fair value.
| | | | | | | | | | | | | | | | |
Investments in Securities | | Total | | | Level 1 | | | Level 2 | | | Level 3 | |
| | | | |
Common Stock | | | | | | | | | | | | | | | | |
Consumer Discretionary | | | 32,035,155 | | | | 32,035,155 | | | | – | | | | – | |
Consumer Staples | | | 2,450,750 | | | | 2,450,750 | | | | – | | | | – | |
Energy | | | 8,071,063 | | | | 8,071,063 | | | | – | | | | – | |
Financials | | | 68,232,056 | | | | 68,232,056 | | | | – | | | | – | |
Health Care | | | 10,098,943 | | | | 10,098,943 | | | | – | | | | – | |
Industrials | | | 68,451,170 | | | | 68,451,170 | | | | – | | | | – | |
Information Technology | | | 27,067,208 | | | | 27,067,208 | | | | – | | | | – | |
Materials | | | 18,891,128 | | | | 18,104,678 | | | | 786,450 | | | | – | |
Telecommunications Services | | | 384,249 | | | | 384,249 | | | | – | | | | – | |
Utilities | | | 13,121,020 | | | | 13,121,020 | | | | – | | | | – | |
| | | | |
Preferred Stock | | | | | | | | | | | | | | | | |
Health Care | | | 473,486 | | | | 473,486 | | | | – | | | | – | |
Collateral Held for Securities Loaned | | | 8,739,961 | | | | 8,739,961 | | | | – | | | | – | |
Short-Term Investments | | | 7,402,448 | | | | 7,402,448 | | | | – | | | | – | |
| |
Total | | | $265,418,637 | | | | $264,632,187 | | | | $786,450 | | | | $– | |
| |
There were no significant transfers between Levels during the period ended October 31, 2014. Transfers between Levels are identified as of the end of the period.
Investment in Affiliates
Affiliated issuers, as defined under the Investment Company Act of 1940, include those in which the Fund’s holdings of an issuer represent 5% or more of the outstanding voting securities of an issuer, or any affiliated mutual fund.
A summary of transactions for the fiscal year to date, in Partner Small Cap Value Fund, is as follows:
| | | | | | | | | | | | | | | | | | | | | | | | |
Fund | | Value
October 31, 2013 | | | Gross Purchases | | | Gross Sales | | | Shares Held at
October 31, 2014 | | | Value
October 31, 2014 | | | Income Earned
November 1, 2013 -
October 31, 2014 | |
Cash Management Trust-Collateral Investment | | | $4,609,450 | | | $ | 67,313,953 | | | $ | 63,183,442 | | | | 8,739,961 | | | | $8,739,961 | | | | $44,645 | |
Cash Management Trust-Short Term Investment | | | 7,881,847 | | | | 28,436,401 | | | | 28,915,800 | | | | 7,402,448 | | | | 7,402,448 | | | | 3,358 | |
Total Value and Income Earned | | | 12,491,297 | | | | | | | | | | | | | | | | 16,142,409 | | | | 48,003 | |
The accompanying Notes to Financial Statements are an integral part of this schedule.
167
SMALL CAP STOCK FUND
Schedule of Investments as of October 31, 2014
| | | | | | | | |
| Shares | | | Common Stock (97.2%) | | Value | |
| Consumer Discretionary (11.9%) | | | | |
| | 116,360 | | | Cheesecake Factory, Inc. | | | $5,345,578 | |
| | 42,200 | | | G-III Apparel Group, Ltd.a | | | 3,348,570 | |
| | 272,500 | | | Houghton Mifflin Harcourt Companya | | | 5,452,725 | |
| | 166,621 | | | Ignite Restaurant Group, Inc.a,b | | | 1,148,019 | |
| | 294,817 | | | MDC Partners, Inc. | | | 6,102,712 | |
| | 323,690 | | | NutriSystem, Inc. | | | 5,450,939 | |
| | 61,340 | | | Oxford Industries, Inc. | | | 3,757,075 | |
| | 74,050 | | | Papa John’s International, Inc. | | | 3,462,578 | |
| | 379,500 | | | Tuesday Morning Corporationa,b | | | 7,738,005 | |
| | | | | |
| | | | Total | | | 41,806,201 | |
| | | | | |
| |
| Consumer Staples (2.8%) | | | | |
| | 41,880 | | | TreeHouse Foods, Inc.a | | | 3,566,920 | |
| | 170,950 | | | WhiteWave Foods Companya | | | 6,364,468 | |
| | | | | |
| | | | Total | | | 9,931,388 | |
| | | | | |
| |
| Energy (4.2%) | | | | |
| | 131,270 | | | Market Vectors Oil Service ETF | | | 5,933,404 | |
| | 129,470 | | | Oasis Petroleum, Inc.a | | | 3,878,921 | |
| | 93,550 | | | Rex Energy Corporationa,b | | | 733,432 | |
| | 65,490 | | | Rosetta Resources, Inc.a | | | 2,490,585 | |
| | 269,591 | | | Trinidad Drilling, Ltd. | | | 1,755,732 | |
| | | | | |
| | | | Total | | | 14,792,074 | |
| | | | | |
| |
| Financials (20.6%) | | | | |
| | 29,622 | | | Affiliated Managers Group, Inc.a | | | 5,918,179 | |
| | 46,780 | | | Allied World Assurance Company Holdings AG | | | 1,777,640 | |
| | 74,800 | | | American Assets Trust, Inc. | | | 2,867,832 | |
| | 43,413 | | | Argo Group International Holdings, Ltd. | | | 2,422,445 | |
| | 116,310 | | | Assured Guaranty, Ltd. | | | 2,684,435 | |
| | 186,200 | | | BBCN Bancorp, Inc. | | | 2,632,868 | |
| | 403,160 | | | CNO Financial Group, Inc. | | | 7,309,291 | |
| | 179,800 | | | Education Realty Trust, Inc. | | | 2,024,548 | |
| | 36,560 | | | Extra Space Storage, Inc. | | | 2,126,330 | |
| | 246,270 | | | Hanmi Financial Corporation | | | 5,282,492 | |
| | 57,870 | | | HCC Insurance Holdings, Inc. | | | 3,020,235 | |
| | 57,020 | | | iShares Russell 2000 Index Fund | | | 6,646,251 | |
| | 91,150 | | | PacWest Bancorp | | | 3,888,459 | |
| | 103,400 | | | Parkway Properties, Inc. | | | 2,073,170 | |
| | 107,580 | | | Pebblebrook Hotel Trust | | | 4,582,908 | |
| | 15,520 | | | SVB Financial Groupa | | | 1,738,085 | |
| | 254,440 | | | Synovus Financial Corporation | | | 6,452,599 | |
| | 150,490 | | | Terreno Realty Corporation | | | 3,169,319 | |
| | 31,660 | | | Texas Capital Bancshares, Inc.a | | | 1,936,009 | |
| | 143,370 | | | Western Alliance Bancorpa | | | 3,816,509 | |
| | | | | |
| | | | Total | | | 72,369,604 | |
| | | | | |
| |
| Health Care (10.2%) | | | | |
| | 70,100 | | | Acorda Therapeutics, Inc.a | | | 2,440,882 | |
| | 77,280 | | | Akorn, Inc.a | �� | | 3,442,824 | |
| | 55,330 | | | Align Technology, Inc.a | | | 2,911,465 | |
| | 173,070 | | | BioScrip, Inc.a,b | | | 1,118,032 | |
| | 222,172 | | | ExamWorks Group, Inc.a,b | | | 8,615,830 | |
| | 130,900 | | | Neurocrine Biosciences, Inc.a | | | 2,424,268 | |
| | 190,723 | | | NuVasive, Inc.a | | | 7,800,571 | |
| | 61,950 | | | Teleflex, Inc. | | | 7,069,734 | |
| | | | | |
| | | | Total | | | 35,823,606 | |
| | | | | |
| |
| Industrials (24.1%) | | | | |
| | 86,570 | | | Apogee Enterprises, Inc. | | | 3,800,423 | |
| | 115,690 | | | CLARCOR, Inc. | | | 7,746,602 | |
| | 64,420 | | | Curtiss-Wright Corporation | | | 4,458,508 | |
| | 241,711 | | | EMCOR Group, Inc. | | | 10,666,707 | |
| | 46,060 | | | Esterline Technologies Corporationa | | | 5,394,087 | |
| | 60,030 | | | GATX Corporation | | | 3,805,902 | |
| | 130,275 | | | Granite Construction, Inc. | | | 4,808,450 | |
| | 143,800 | | | HNI Corporation | | | 6,708,270 | |
| | 357,380 | | | Interface, Inc. | | | 5,728,801 | |
| | 211,400 | | | Korn/Ferry Internationala | | | 5,904,402 | |
| | 115,800 | | | Landstar System, Inc. | | | 8,570,358 | |
| | 233,440 | | | Progressive Waste Solutions, Ltd. | | | 6,823,451 | |
| | 10,790 | | | Proto Labs, Inc.a | | | 705,342 | |
| | 161,000 | | | Ritchie Brothers Auctioneers, Inc. | | | 3,926,790 | |
| | 72,390 | | | Tennant Company | | | 5,337,315 | |
| | | | | |
| | | | Total | | | 84,385,408 | |
| | | | | |
| |
| Information Technology (14.4%) | | | | |
| | 405,100 | | | Atmel Corporationa | | | 3,005,842 | |
| | 191,580 | | | Broadridge Financial Solutions, Inc. | | | 8,416,109 | |
| | 99,220 | | | DST Systems, Inc. | | | 9,559,847 | |
| | 52,330 | | | FEI Company | | | 4,410,372 | |
| | 90,350 | | | Guidewire Software, Inc.a | | | 4,512,079 | |
| | 139,696 | | | Plantronics, Inc. | | | 7,246,032 | |
| | 119,180 | | | Textura Corporationa,b | | | 3,174,955 | |
| | 90,900 | | | Ubiquiti Networks, Inc.b | | | 3,251,493 | |
| | 165,267 | | | Virtusa Corporationa | | | 6,772,642 | |
| | | | | |
| | | | Total | | | 50,349,371 | |
| | | | | |
| |
| Materials (4.3%) | | | | |
| | 44,400 | | | Eagle Materials, Inc. | | | 3,881,892 | |
| | 230,170 | | | Horsehead Holding Corporationa | | | 3,615,971 | |
| | 155,770 | | | Materials Select Sector SPDR Fund | | | 7,539,268 | |
| | | | | |
| | | | Total | | | 15,037,131 | |
| | | | | |
| |
| Telecommunications Services (1.0%) | | | | |
| | 97,803 | | | Cogent Communications Holdings | | | 3,319,434 | |
| | | | | |
| | | | Total | | | 3,319,434 | |
| | | | | |
| |
| Utilities (3.7%) | | | | |
| | 36,930 | | | Laclede Group, Inc. | | | 1,874,936 | |
| | 172,740 | | | NorthWestern Corporation | | | 9,127,582 | |
| | 51,990 | | | Portland General Electric Company | | | 1,892,956 | |
| | | | | |
| | | | Total | | | 12,895,474 | |
| | | | | |
| | | | | | | | |
| | | | | |
| | | | Total Common Stock (cost $283,287,256) | | | 340,709,691 | |
| | | | | |
| | |
| Shares | | | Collateral Held for Securities Loaned (3.8%) | | Value | |
| | | | | | | | |
| | 13,527,930 | | | Thrivent Cash Management Trust | | | 13,527,930 | |
| | | | | |
| | | | Total Collateral Held for Securities Loaned (cost $13,527,930) | | | 13,527,930 | |
| | | | | |
The accompanying Notes to Financial Statements are an integral part of this schedule.
168
SMALL CAP STOCK FUND
Schedule of Investments as of October 31, 2014
| | | | | | | | |
| | |
Shares or
Principal
Amount | | | Short-Term Investments (3.0%)c | | Value | |
| | 10,468,825 | | | Thrivent Cash Management Trust 0.050% | | | $10,468,825 | |
| | | | | |
| | | | Total Short-Term Investments (at amortized cost) | | | 10,468,825 | |
| | | | | |
| | | | Total Investments (cost $307,284,011) 104.0% | | | $364,706,446 | |
| | | | | |
| | | | Other Assets and Liabilities, Net (4.0%) | | | (14,076,622 | ) |
| | | | | |
| | | | Total Net Assets 100.0% | | | $350,629,824 | |
| | | | | |
a | Non-income producing security. |
b | All or a portion of the security is on loan. |
c | The interest rate shown reflects the yield, coupon rate or the discount rate at the date of purchase. |
Definitions:
| | | | |
ETF | | - | | Exchange Traded Fund. |
Unrealized Appreciation (Depreciation)
Gross unrealized appreciation and depreciation of investments, based on cost for federal income tax purposes, were as follows:
| | | | |
Gross unrealized appreciation | | | $66,100,130 | |
Gross unrealized depreciation | | | (8,678,466 | ) |
| | | | |
Net unrealized appreciation (depreciation) | | | $57,421,664 | |
| |
Cost for federal income tax purposes | | | $307,284,782 | |
Fair Valuation Measurements
The following table is a summary of the inputs used, as of October 31, 2014, in valuing Small Cap Stock Fund’s assets carried at fair value.
| | | | | | | | | | | | | | | | |
Investments in Securities | | Total | | | Level 1 | | | Level 2 | | | Level 3 | |
| | | | |
Common Stock | | | | | | | | | | | | | | | | |
Consumer Discretionary | | | 41,806,201 | | | | 41,806,201 | | | | – | | | | – | |
Consumer Staples | | | 9,931,388 | | | | 9,931,388 | | | | – | | | | – | |
Energy | | | 14,792,074 | | | | 13,036,342 | | | | 1,755,732 | | | | – | |
Financials | | | 72,369,604 | | | | 72,369,604 | | | | – | | | | – | |
Health Care | | | 35,823,606 | | | | 35,823,606 | | | | – | | | | – | |
Industrials | | | 84,385,408 | | | | 84,385,408 | | | | – | | | | – | |
Information Technology | | | 50,349,371 | | | | 50,349,371 | | | | – | | | | – | |
Materials | | | 15,037,131 | | | | 15,037,131 | | | | – | | | | – | |
Telecommunications Services | | | 3,319,434 | | | | 3,319,434 | | | | – | | | | – | |
Utilities | | | 12,895,474 | | | | 12,895,474 | | | | – | | | | – | |
Collateral Held for Securities Loaned | | | 13,527,930 | | | | 13,527,930 | | | | – | | | | – | |
Short-Term Investments | | | 10,468,825 | | | | 10,468,825 | | | | – | | | | – | |
| |
Total | | | $364,706,446 | | | | $362,950,714 | | | | $1,755,732 | | | | $– | |
| |
There were no significant transfers between Levels during the period ended October 31, 2014. Transfers between Levels are identified as of the end of the period.
The following table summarizes the net realized gains/(losses) and Statement of Operations location, for the period ended October 31, 2014, for Small Cap Stock Fund’s investments in financial derivative instruments by primary risk exposure.
| | | | | | |
Derivatives by risk category | | Statement of Operations Location | | Realized Gains/(Losses)
recognized in Income | |
| | |
Equity Contracts | | | | | | |
Futures | | Net realized gains/(losses) on Futures contracts | | | 847,682 | |
Total Equity Contracts | | | | | 847,682 | |
| |
Total | | | | | $847,682 | |
| |
The following table summarizes the change in net unrealized appreciation/(depreciation) and Statement of Operations location, for the period ended October 31, 2014, for Small Cap Stock Fund’s investments in financial derivative instruments by primary risk exposure.
| | | | | | |
Derivatives by risk category | | Statement of Operations Location | | Change in unrealized
appreciation/
(depreciation)
recognized in
Income | |
| | |
Equity Contracts | | | | | | |
Futures | | Change in net unrealized appreciation/(depreciation) on Futures contracts | | | (870,806 | ) |
Total Equity Contracts | | | | | (870,806 | ) |
| |
Total | | | | | ($870,806 | ) |
| |
The accompanying Notes to Financial Statements are an integral part of this schedule.
169
SMALL CAP STOCK FUND
Schedule of Investments as of October 31, 2014
The following table presents Small Cap Stock Fund’s average volume of derivative activity during the period ended October 31, 2014.
| | | | | | | | |
Derivative Risk Category | | Futures
(Notional)* | | | Futures
(Percentage
of Average
Net Assets) | |
Equity Contracts | | $ | 10,060,362 | | | | 2.9 | % |
* | Notional amount represents long or short, or both, derivative positions held by the Fund. |
Investment in Affiliates
Affiliated issuers, as defined under the Investment Company Act of 1940, include those in which the Fund’s holdings of an issuer represent 5% or more of the outstanding voting securities of an issuer, or any affiliated mutual fund.
A summary of transactions for the fiscal year to date, in Small Cap Stock Fund, is as follows:
| | | | | | | | | | | | | | | | | | | | | | | | |
Fund | | Value
October 31, 2013 | | | Gross Purchases | | | Gross Sales | | | Shares Held at
October 31, 2014 | | | Value
October 31, 2014 | | | Income Earned
November 1, 2013 -
October 31, 2014 | |
Cash Management Trust-Collateral Investment | | | $26,183,357 | | | $ | 126,945,231 | | | | $139,600,658 | | | | 13,527,930 | | | | $13,527,930 | | | | $350,416 | |
Cash Management Trust-Short Term Investment | | | 24,933,198 | | | | 93,961,074 | | | | 108,425,447 | | | | 10,468,825 | | | | 10,468,825 | | | | 9,042 | |
Total Value and Income Earned | | | 51,116,555 | | | | | | | | | | | | | | | | 23,996,755 | | | | 359,458 | |
The accompanying Notes to Financial Statements are an integral part of this schedule.
170
MID CAP GROWTH FUND
Schedule of Investments as of October 31, 2014
| | | | | | | | |
| Shares | | | Common Stock (95.6%) | | Value | |
| Consumer Discretionary (20.0%) | | | | |
| | 64,840 | | | Delphi Automotive plc | | | $4,472,663 | |
| | 40,890 | | | Discovery Communications, Inc., Class Aa | | | 1,445,462 | |
| | 119,990 | | | Dollar Tree, Inc.a | | | 7,267,794 | |
| | 83,340 | | | Dunkin’ Brands Group, Inc. | | | 3,790,303 | |
| | 86,310 | | | HomeAway, Inc.a | | | 3,012,219 | |
| | 104,920 | | | Jarden Corporationa | | | 6,829,243 | |
| | 87,860 | | | Limited Brands, Inc. | | | 6,336,463 | |
| | 98,210 | | | Marriott International, Inc. | | | 7,439,408 | |
| | 39,150 | | | O’Reilly Automotive, Inc.a | | | 6,885,702 | |
| | 50,220 | | | PVH Corporation | | | 5,742,657 | |
| | 17,820 | | | Ralph Lauren Corporation | | | 2,937,449 | |
| | 80,140 | | | Ross Stores, Inc. | | | 6,468,901 | |
| | 77,990 | | | Starwood Hotels & Resorts Worldwide, Inc. | | | 5,978,713 | |
| | 62,940 | | | Toll Brothers, Inc.a | | | 2,010,933 | |
| | 47,360 | | | Tractor Supply Company | | | 3,467,699 | |
| | 17,840 | | | Ulta Salon Cosmetics & Fragrance, Inc.a | | | 2,155,250 | |
| | 53,070 | | | Under Armour, Inc.a | | | 3,480,331 | |
| | 72,200 | | | VF Corporation | | | 4,886,496 | |
| | 14,160 | | | Wynn Resorts, Ltd. | | | 2,690,542 | |
| | | | | |
| | | | Total | | | 87,298,228 | |
| | | | | |
| |
| Consumer Staples (4.9%) | | | | |
| | 68,520 | | | Hain Celestial Group, Inc.a | | | 7,417,290 | |
| | 83,560 | | | Monster Beverage Corporationa | | | 8,429,533 | |
| | 67,790 | | | United Natural Foods, Inc.a | | | 4,611,075 | |
| | 23,048 | | | Whole Foods Market, Inc. | | | 906,478 | |
| | | | | |
| | | | Total | | | 21,364,376 | |
| | | | | |
| |
| Energy (3.6%) | | | | |
| | 78,287 | | | Cameron International Corporationa | | | 4,661,991 | |
| | 33,260 | | | Concho Resources, Inc.a | | | 3,626,338 | |
| | 33,670 | | | HollyFrontier Corporation | | | 1,527,944 | |
| | 35,570 | | | SM Energy Company | | | 2,002,591 | |
| | 126,410 | | | Southwestern Energy Companya | | | 4,109,589 | |
| | | | | |
| | | | Total | | | 15,928,453 | |
| | | | | |
| |
| Financials (10.7%) | | | | |
| | 44,960 | | | Affiliated Managers Group, Inc.a | | | 8,982,558 | |
| | 57,150 | | | Ameriprise Financial, Inc. | | | 7,210,616 | |
| | 105,790 | | | Discover Financial Services | | | 6,747,286 | |
| | 159,360 | | | First Republic Bank | | | 8,116,205 | |
| | 24,820 | | | Intercontinental Exchange, Inc. | | | 5,169,758 | |
| | 17,570 | | | SVB Financial Groupa | | | 1,967,664 | |
| | 168,820 | | | TD Ameritrade Holding Corporation | | | 5,695,987 | |
| | 94,730 | | | Zions Bancorporation | | | 2,744,328 | |
| | | | | |
| | | | Total | | | 46,634,402 | |
| | | | | |
| |
| Health Care (16.2%) | | | | |
| | 29,370 | | | Actavis, Inc.a | | | 7,129,274 | |
| | 67,277 | | | AmerisourceBergen Corporation | | | 5,746,128 | |
| | 89,250 | | | BioMarin Pharmaceutical, Inc.a | | | 7,363,125 | |
| | 89,782 | | | Catamaran Corporationa | | | 4,279,908 | |
| | 101,350 | | | Cerner Corporationa | | | 6,419,509 | |
| | 22,310 | | | Cooper Companies, Inc. | | | 3,656,609 | |
| | 35,890 | | | Covance, Inc.a | | | 2,867,611 | |
| | 26,170 | | | Cubist Pharmaceuticals, Inc.a | | | 1,891,829 | |
| | 78,310 | | | Envision Healthcare Holdings, Inc.a | | | 2,736,934 | |
| | 20,970 | | | Mettler-Toledo International, Inc.a | | | 5,420,116 | |
| | 42,980 | | | Mylan, Inc.a | | | 2,301,579 | |
| | 63,260 | | | Perrigo Company plc | | | 10,213,327 | |
| | 48,730 | | | Team Health Holdings, Inc.a | | | 3,047,574 | |
| | 42,880 | | | Teleflex, Inc. | | | 4,893,466 | |
| | 14,480 | | | Universal Health Services, Inc. | | | 1,501,721 | |
| | 9,690 | | | Vertex Pharmaceuticals, Inc.a | | | 1,091,482 | |
| | | | | |
| | | | Total | | | 70,560,192 | |
| | | | | |
| |
| Industrials (16.4%) | | | | |
| | 47,157 | | | AMETEK, Inc. | | | 2,459,238 | |
| | 51,840 | | | B/E Aerospace, Inc.a | | | 3,859,488 | |
| | 28,480 | | | Fastenal Company | | | 1,254,259 | |
| | 24,055 | | | Flowserve Corporation | | | 1,635,499 | |
| | 113,150 | | | Fortune Brands Home and Security, Inc. | | | 4,893,738 | |
| | 48,630 | | | GATX Corporation | | | 3,083,142 | |
| | 61,880 | | | Graco, Inc. | | | 4,857,580 | |
| | 42,100 | | | JB Hunt Transport Services, Inc. | | | 3,358,317 | |
| | 95,680 | | | Nielsen NV | | | 4,065,443 | |
| | 30,510 | | | Old Dominion Freight Line, Inc.a | | | 2,223,264 | |
| | 157,030 | | | Robert Half International, Inc. | | | 8,602,103 | |
| | 46,090 | | | Roper Industries, Inc. | | | 7,296,047 | |
| | 136,100 | | | Southwest Airlines Company | | | 4,692,728 | |
| | 76,520 | | | Stericycle, Inc.a | | | 9,641,520 | |
| | 86,830 | | | United Rentals, Inc.a | | | 9,556,510 | |
| | | | | |
| | | | Total | | | 71,478,876 | |
| | | | | |
| |
| Information Technology (18.7%) | | | | |
| | 101,129 | | | Agilent Technologies, Inc. | | | 5,590,411 | |
| | 147,990 | | | Amphenol Corporation | | | 7,485,334 | |
| | 56,630 | | | ANSYS, Inc.a | | | 4,448,853 | |
| | 36,536 | | | Autodesk, Inc.a | | | 2,102,281 | |
| | 129,913 | | | Ciena Corporationa,b | | | 2,177,342 | |
| | 51,990 | | | F5 Networks, Inc.a | | | 6,393,730 | |
| | 215,370 | | | Fortinet, Inc.a | | | 5,610,389 | |
| | 80,400 | | | Gartner, Inc.a | | | 6,489,084 | |
| | 20,310 | | | IAC InterActiveCorp | | | 1,374,784 | |
| | 57,250 | | | Imperva, Inc.a,b | | | 2,345,533 | |
| | 8,210 | | | LinkedIn Corporationa | | | 1,879,762 | |
| | 45,680 | | | Nice Systems, Ltd. ADR | | | 1,858,262 | |
| | 88,329 | | | Nuance Communications, Inc.a | | | 1,362,916 | |
| | 154,460 | | | NVIDIA Corporation | | | 3,018,148 | |
| | 125,350 | | | NXP Semiconductors NVa | | | 8,606,531 | |
| | 196,950 | | | QLIK Technologies, Inc.a | | | 5,583,533 | |
| | 98,013 | | | ServiceNow, Inc.a | | | 6,658,023 | |
| | 40,750 | | | Skyworks Solutions, Inc. | | | 2,373,280 | |
| | 50,940 | | | Synopsys, Inc.a | | | 2,087,521 | |
| | 9,410 | | | Ultimate Software Group, Inc.a | | | 1,416,299 | |
| | 77,479 | | | VeriFone Systems, Inc.a | | | 2,886,868 | |
| | | | | |
| | | | Total | | | 81,748,884 | |
| | | | | |
| |
| Materials (3.4%) | | | | |
| | 44,100 | | | Airgas, Inc. | | | 4,918,914 | |
| | 38,200 | | | Albemarle Corporationb | | | 2,230,116 | |
| | 30,620 | | | Celanese Corporation | | | 1,798,313 | |
| | 84,300 | | | FMC Corporation | | | 4,834,605 | |
| | 71,370 | | | Silver Wheaton Corporation | | | 1,239,697 | |
| | | | | |
| | | | Total | | | 15,021,645 | |
| | | | | |
| |
| Telecommunications Services (1.7%) | | | | |
| | 51,240 | | | SBA Communications Corporationa | | | 5,755,789 | |
| | 42,570 | | | TW Telecom, Inc.a | | | 1,821,145 | |
| | | | | |
| | | | Total | | | 7,576,934 | |
| | | | | |
| | | | | |
| | | | | |
| | | | Total Common Stock (cost $296,543,523) | | | 417,611,990 | |
| | | | | |
The accompanying Notes to Financial Statements are an integral part of this schedule.
171
MID CAP GROWTH FUND
Schedule of Investments as of October 31, 2014
| | | | | | | | |
| Shares | | | Collateral Held for Securities Loaned (0.4%) | | Value | |
| | 1,575,210 | | | Thrivent Cash Management Trust | | | $1,575,210 | |
| | | | | |
| | | | Total Collateral Held for Securities Loaned (cost $1,575,210) | | | 1,575,210 | |
| | | | | |
| | |
Shares or
Principal
Amount | | | Short-Term Investments (3.7%)c | | Value | |
| | 16,400,100 | | | Thrivent Cash Management Trust 0.050% | | | 16,400,100 | |
| | | | | |
| | | | Total Short-Term Investments (at amortized cost) | | | 16,400,100 | |
| | | | | |
| | | | Total Investments (cost $314,518,833) 99.7% | | | $435,587,300 | |
| | | | | |
| | | | Other Assets and Liabilities, Net 0.3% | | | 1,302,159 | |
| | | | | |
| | | | Total Net Assets 100.0% | | | $436,889,459 | |
| | | | | |
a | Non-income producing security. |
b | All or a portion of the security is on loan. |
c | The interest rate shown reflects the yield, coupon rate or the discount rate at the date of purchase. |
Definitions:
| | | | |
ADR | | - | | American Depositary Receipt, which are certificates for an underlying foreign security’s shares held by an issuing U.S. depository bank. |
Unrealized Appreciation (Depreciation)
Gross unrealized appreciation and depreciation of investments, based on cost for federal income tax purposes, were as follows:
| | | | |
Gross unrealized appreciation | | $ | 125,398,855 | |
Gross unrealized depreciation | | | (4,537,453 | ) |
| | | | |
Net unrealized appreciation (depreciation) | | $ | 120,861,402 | |
| |
Cost for federal income tax purposes | | $ | 314,725,898 | |
The accompanying Notes to Financial Statements are an integral part of this schedule.
172
MID CAP GROWTH FUND
Schedule of Investments as of October 31, 2014
Fair Valuation Measurements
The following table is a summary of the inputs used, as of October 31, 2014, in valuing Mid Cap Growth Fund’s assets carried at fair value.
| | | | | | | | | | | | | | | | |
Investments in Securities | | Total | | | Level 1 | | | Level 2 | | | Level 3 | |
| | | | |
Common Stock | | | | | | | | | | | | | | | | |
Consumer Discretionary | | | 87,298,228 | | | | 87,298,228 | | | | – | | | | – | |
Consumer Staples | | | 21,364,376 | | | | 21,364,376 | | | | – | | | | – | |
Energy | | | 15,928,453 | | | | 15,928,453 | | | | – | | | | – | |
Financials | | | 46,634,402 | | | | 46,634,402 | | | | – | | | | – | |
Health Care | | | 70,560,192 | | | | 70,560,192 | | | | – | | | | – | |
Industrials | | | 71,478,876 | | | | 71,478,876 | | | | – | | | | – | |
Information Technology | | | 81,748,884 | | | | 81,748,884 | | | | – | | | | – | |
Materials | | | 15,021,645 | | | | 15,021,645 | | | | – | | | | – | |
Telecommunications Services | | | 7,576,934 | | | | 7,576,934 | | | | – | | | | – | |
Collateral Held for Securities Loaned | | | 1,575,210 | | | | 1,575,210 | | | | – | | | | – | |
Short-Term Investments | | | 16,400,100 | | | | 16,400,100 | | | | – | | | | – | |
| |
Total | | | $435,587,300 | | | | $435,587,300 | | | | $– | | | | $– | |
| |
There were no significant transfers between Levels during the period ended October 31, 2014. Transfers between Levels are identified as of the end of the period.
Investment in Affiliates
Affiliated issuers, as defined under the Investment Company Act of 1940, include those in which the Fund’s holdings of an issuer represent 5% or more of the outstanding voting securities of an issuer, or any affiliated mutual fund.
A summary of transactions for the fiscal year to date, in Mid Cap Growth Fund, is as follows:
| | | | | | | | | | | | | | | | | | | | | | | | |
Fund | | Value
October 31, 2013 | | | Gross Purchases | | | Gross Sales | | | Shares Held at
October 31, 2014 | | | Value
October 31, 2014 | | | Income Earned
November 1, 2013 –
October 31, 2014 | |
Cash Management
Trust-Collateral
Investment | | | $19,138,554 | | | | $121,916,092 | | | | $139,479,436 | | | | 1,575,210 | | | | $1,575,210 | | | | $16,613 | |
Cash Management
Trust-Short Term
Investment | | | 18,686,520 | | | | 101,397,345 | | | | 103,683,765 | | | | 16,400,100 | | | | 16,400,100 | | | | 9,481 | |
Total Value and
Income Earned | | | 37,825,074 | | | | | | | | | | | | | | | | 17,975,310 | | | | 26,094 | |
The accompanying Notes to Financial Statements are an integral part of this schedule.
173
PARTNER MID CAP VALUE FUND
Schedule of Investments as of October 31, 2014
| | | | | | | | |
| Shares | | | Common Stock (96.9%) | | Value | |
| Consumer Discretionary (13.4%) | | | | |
| | 29,657 | | | AMC Networks, Inc.a | | | $1,798,697 | |
| | 12,145 | | | Expedia, Inc. | | | 1,031,961 | |
| | 14,782 | | | Fossil, Inc.a | | | 1,502,738 | |
| | 68,062 | | | Gap, Inc. | | | 2,578,869 | |
| | 24,350 | | | GNC Holdings, Inc. | | | 1,012,230 | |
| | 46,316 | | | Liberty Interactive Corporationa | | | 1,210,700 | |
| | 17,079 | | | Liberty Media Corporation, Class Aa | | | 820,134 | |
| | 35,403 | | | Liberty Media Corporation, Class Ca | | | 1,696,866 | |
| | 6,584 | | | Liberty Venturesa | | | 231,098 | |
| | 80,322 | | | MGM Resorts Internationala | | | 1,867,486 | |
| | 11,875 | | | Mohawk Industries, Inc.a | | | 1,686,725 | |
| | 14,883 | | | PVH Corporation | | | 1,701,871 | |
| | 10,013 | | | Scripps Networks Interactive, Inc. | | | 773,404 | |
| | 135,429 | | | Staples, Inc. | | | 1,717,240 | |
| | 27,444 | | | Starwood Hotels & Resorts Worldwide, Inc. | | | 2,103,857 | |
| | 54,527 | | | Toll Brothers, Inc.a | | | 1,742,138 | |
| | | | | |
| | | | Total | | | 23,476,014 | |
| | | | | |
| |
| Consumer Staples (6.1%) | | | | |
| | 54,514 | | | ConAgra Foods, Inc. | | | 1,872,556 | |
| | 8,657 | | | Constellation Brands, Inc.a | | | 792,462 | |
| | 10,795 | | | Energizer Holdings, Inc. | | | 1,324,007 | |
| | 34,872 | | | Kroger Company | | | 1,942,719 | |
| | 10,664 | | | Molson Coors Brewing Company | | | 793,188 | |
| | 64,643 | | | Tyson Foods, Inc. | | | 2,608,345 | |
| | 33,700 | | | Whole Foods Market, Inc. | | | 1,325,421 | |
| | | | | |
| | | | Total | | | 10,658,698 | |
| | | | | |
| |
| Energy (5.9%) | | | | |
| | 20,323 | | | Cameron International Corporationa | | | 1,210,235 | |
| | 16,042 | | | Cimarex Energy Company | | | 1,823,494 | |
| | 30,868 | | | Oil States International, Inc.a | | | 1,844,054 | |
| | 53,708 | | | QEP Resources, Inc. | | | 1,346,460 | |
| | 73,044 | | | Southwestern Energy Companya | | | 2,374,660 | |
| | 24,612 | | | Tesoro Corporation | | | 1,757,543 | |
| | | | | |
| | | | Total | | | 10,356,446 | |
| | | | | |
| |
| Financials (27.0%) | | | | |
| | 34,325 | | | Arthur J. Gallagher & Company | | | 1,637,303 | |
| | 14,930 | | | AvalonBay Communities, Inc. | | | 2,326,691 | |
| | 44,492 | | | Brixmor Property Group, Inc. | | | 1,083,825 | |
| | 19,511 | | | Camden Property Trust | | | 1,495,908 | |
| | 86,038 | | | DDR Corporation | | | 1,560,729 | |
| | 12,489 | | | Everest Re Group, Ltd. | | | 2,131,248 | |
| | 149,257 | | | Fifth Third Bancorp | | | 2,983,647 | |
| | 211,091 | | | Huntington Bancshares, Inc. | | | 2,091,912 | |
| | 61,159 | | | Invesco, Ltd. | | | 2,475,105 | |
| | 57,681 | | | Lincoln National Corporation | | | 3,158,612 | |
| | 22,729 | | | M&T Bank Corporation | | | 2,777,029 | |
| | 31,472 | | | NASDAQ OMX Group, Inc. | | | 1,361,479 | |
| | 146,555 | | | Navient Corporation | | | 2,898,858 | |
| | 58,358 | | | Principal Financial Group, Inc. | | | 3,056,209 | |
| | 35,862 | | | Raymond James Financial, Inc. | | | 2,012,934 | |
| | 42,430 | | | RLJ Lodging Trust | | | 1,367,095 | |
| | 10,967 | | | Signature Banka | | | 1,328,433 | |
| | 205,482 | | | SLM Corporation | | | 1,962,353 | |
| | 76,031 | | | Starwood Property Trust, Inc. | | | 1,715,259 | |
| | 20,688 | | | Taubman Centers, Inc. | | | 1,573,322 | |
| | 35,366 | | | Unum Group | | | 1,183,346 | |
| | 34,171 | | | Validus Holdings, Ltd. | | | 1,359,322 | |
| | 39,297 | | | Voya Financial, Inc. | | | 1,542,407 | |
| | 68,711 | | | XL Group plc | | | 2,327,929 | |
| | | | | |
| | | | Total | | | 47,410,955 | |
| | | | | |
| |
| Health Care (9.3%) | | | | |
| | 27,091 | | | Cardinal Health, Inc. | | | 2,126,102 | |
| | 41,492 | | | CIGNA Corporation | | | 4,131,358 | |
| | 43,427 | | | Endo International plca | | | 2,906,135 | |
| | 24,796 | | | Envision Healthcare Holdings, Inc.a | | | 866,620 | |
| | 17,996 | | | Laboratory Corporation of America Holdingsa | | | 1,966,783 | |
| | 33,161 | | | Mylan, Inc.a | | | 1,775,772 | |
| | 23,347 | | | Zimmer Holdings, Inc. | | | 2,597,120 | |
| | | | | |
| | | | Total | | | 16,369,890 | |
| | | | | |
| |
| Industrials (9.8%) | | | | |
| | 14,540 | | | Alliant Techsystems, Inc. | | | 1,700,598 | |
| | 27,326 | | | Armstrong World Industries, Inc.a | | | 1,323,125 | |
| | 43,996 | | | Fortune Brands Home and Security, Inc. | | | 1,902,827 | |
| | 100,280 | | | Hertz Global Holdings, Inc.a | | | 2,198,138 | |
| | 9,850 | | | Kansas City Southern | | | 1,209,481 | |
| | 40,867 | | | Terex Corporation | | | 1,175,744 | |
| | 57,982 | | | Textron, Inc. | | | 2,407,992 | |
| | 18,700 | | | Timken Company | | | 803,913 | |
| | 40,119 | | | Triumph Group, Inc. | | | 2,793,486 | |
| | 30,843 | | | United Continental Holdings, Inc.a | | | 1,628,819 | |
| | | | | |
| | | | Total | | | 17,144,123 | |
| | | | | |
| |
| Information Technology (12.8%) | | | | |
| | 34,633 | | | Agilent Technologies, Inc. | | | 1,914,512 | |
| | 56,674 | | | Altera Corporation | | | 1,947,885 | |
| | 43,597 | | | Analog Devices, Inc. | | | 2,163,283 | |
| | 20,166 | | | AOL, Inc.a | | | 877,826 | |
| | 216,048 | | | Atmel Corporationa | | | 1,603,076 | |
| | 118,355 | | | Brocade Communications Systems, Inc. | | | 1,269,949 | |
| | 16,685 | | | Check Point Software Technologies, Ltd.a | | | 1,238,861 | |
| | 30,235 | | | Citrix Systems, Inc.a | | | 1,941,994 | |
| | 32,704 | | | Informatica Corporationa | | | 1,166,225 | |
| | 65,498 | | | Juniper Networks, Inc. | | | 1,380,043 | |
| | 105,260 | | | Maxim Integrated Products, Inc. | | | 3,088,328 | |
| | 30,516 | | | NetApp, Inc. | | | 1,306,085 | |
| | 14,993 | | | Red Hat, Inc.a | | | 883,388 | |
| | 124,159 | | | Xerox Corporation | | | 1,648,832 | |
| | | | | |
| | | | Total | | | 22,430,287 | |
| | | | | |
| |
| Materials (5.7%) | | | | |
| | 18,881 | | | Carpenter Technology Corporation | | | 944,994 | |
| | 26,786 | | | Celanese Corporation | | | 1,573,142 | |
| | 6,216 | | | CF Industries Holdings, Inc. | | | 1,616,160 | |
| | 28,649 | | | Packaging Corporation of America | | | 2,065,020 | |
| | 15,583 | | | Reliance Steel & Aluminum Company | | | 1,051,541 | |
| | 22,231 | | | Timkensteel Corporation | | | 902,134 | |
| | 21,991 | | | Valspar Corporation | | | 1,806,780 | |
| | | | | |
| | | | Total | | | 9,959,771 | |
| | | | | |
| |
| Utilities (6.9%) | | | | |
| | 93,399 | | | FirstEnergy Corporation | | | 3,487,519 | |
| | 59,893 | | | NRG Energy, Inc. | | | 1,795,592 | |
| | 39,541 | | | PG&E Corporation | | | 1,989,703 | |
| | 23,382 | | | SCANA Corporation | | | 1,283,438 | |
The accompanying Notes to Financial Statements are an integral part of this schedule.
174
PARTNER MID CAP VALUE FUND
Schedule of Investments as of October 31, 2014
| | | | | | | | |
| Shares | | | Common Stock (96.9%) | | Value | |
| Utilities (6.9%) - continued | | | | |
| | 31,989 | | | Sempra Energy | | | $3,518,790 | |
| | | | | |
| | | | Total | | | 12,075,042 | |
| | | | | |
| | | | | |
| | | | | |
| | | | Total Common Stock (cost $146,834,775) | | | 169,881,226 | |
| | | | | |
| | |
Shares or
Principal
Amount | | | Short-Term Investments (3.2%)b | | Value | |
| | 5,641,758 | | | Thrivent Cash Management Trust 0.050% | | | 5,641,758 | |
| | | | | |
| | | | Total Short-Term Investments (at amortized cost) | | | 5,641,758 | |
| | | | | |
| | | | Total Investments (cost $152,476,533) 100.1% | | | $175,522,984 | |
| | | | | |
| | | | Other Assets and Liabilities, Net (0.1%) | | | (256,365 | ) |
| | | | | |
| | | | Total Net Assets 100.0% | | | $175,266,619 | |
| | | | | |
a | Non-income producing security. |
b | The interest rate shown reflects the yield, coupon rate or the discount rate at the date of purchase. |
Unrealized Appreciation (Depreciation)
Gross unrealized appreciation and depreciation of investments, based on cost for federal income tax purposes, were as follows:
| | | | |
| |
Gross unrealized appreciation | | | $25,140,530 | |
Gross unrealized depreciation | | | (2,530,080 | ) |
| | | | |
Net unrealized appreciation (depreciation) | | | $22,610,450 | |
| |
Cost for federal income tax purposes | | | $152,912,534 | |
Fair Valuation Measurements
The following table is a summary of the inputs used, as of October 31, 2014, in valuing Partner Mid Cap Value Fund’s assets carried at fair value.
| | | | | | | | | | | | | | | | |
Investments in Securities | | Total | | | Level 1 | | | Level 2 | | | Level 3 | |
| | | | |
Common Stock | | | | | | | | | | | | | | | | |
Consumer Discretionary | | | 23,476,014 | | | | 23,476,014 | | | | – | | | | – | |
Consumer Staples | | | 10,658,698 | | | | 10,658,698 | | | | – | | | | – | |
Energy | | | 10,356,446 | | | | 10,356,446 | | | | – | | | | – | |
Financials | | | 47,410,955 | | | | 47,410,955 | | | | – | | | | – | |
Health Care | | | 16,369,890 | | | | 16,369,890 | | | | – | | | | – | |
Industrials | | | 17,144,123 | | | | 17,144,123 | | | | – | | | | – | |
Information Technology | | | 22,430,287 | | | | 22,430,287 | | | | – | | | | – | |
Materials | | | 9,959,771 | | | | 9,959,771 | | | | – | | | | – | |
Utilities | | | 12,075,042 | | | | 12,075,042 | | | | – | | | | – | |
Short-Term Investments | | | 5,641,758 | | | | 5,641,758 | | | | – | | | | – | |
| |
Total | | | $175,522,984 | | | | $175,522,984 | | | | $– | | | | $– | |
| |
There were no significant transfers between Levels during the period ended October 31, 2014. Transfers between Levels are identified as of the end of the period.
Investment in Affiliates
Affiliated issuers, as defined under the Investment Company Act of 1940, include those in which the Fund’s holdings of an issuer represent 5% or more of the outstanding voting securities of an issuer, or any affiliated mutual fund.
A summary of transactions for the fiscal year to date, in Partner Mid Cap Value Fund, is as follows:
| | | | | | | | | | | | | | | | | | | | | | | | |
Fund | | Value
October 31, 2013 | | | Gross Purchases | | | Gross Sales | | | Shares Held at
October 31, 2014 | | | Value
October 31, 2014 | | | Income Earned
November 1, 2013 -
October 31, 2014 | |
Cash Management Trust-Short Term Investment | | | $2,568,093 | | | | $45,128,500 | | | | $42,054,835 | | | | 5,641,758 | | | | $5,641,758 | | | | $1,448 | |
Total Value and Income
Earned | | | 2,568,093 | | | | | | | | | | | | | | | | 5,641,758 | | | | 1,448 | |
The accompanying Notes to Financial Statements are an integral part of this schedule.
175
MID CAP STOCK FUND
Schedule of Investments as of October 31, 2014
| | | | | | | | |
| Shares | | | Common Stock (95.8%) | | Value | |
| Consumer Discretionary (9.1%) | | | | |
| | 245,800 | | | Cheesecake Factory, Inc.a | | | $11,292,052 | |
| | 321,300 | | | DISH Network Corporationb | | | 20,450,745 | |
| | 107,350 | | | Harman International Industries, Inc. | | | 11,522,949 | |
| | 11,100 | | | Michael Kors Holdings, Ltd.b | | | 872,349 | |
| | 217,350 | | | Omnicom Group, Inc. | | | 15,618,771 | |
| | 179,350 | | | Scripps Networks Interactive, Inc. | | | 13,852,994 | |
| | 379,750 | | | Toll Brothers, Inc.b | | | 12,133,012 | |
| | | | | |
| | | | Total | | | 85,742,872 | |
| | | | | |
| |
| Consumer Staples (5.0%) | | | | |
| | 107,950 | | | Green Mountain Coffee Roasters, Inc. | | | 16,381,412 | |
| | 143,950 | | | Ingredion, Inc. | | | 11,120,137 | |
| | 128,550 | | | Molson Coors Brewing Company | | | 9,561,549 | |
| | 262,650 | | | WhiteWave Foods Companyb | | | 9,778,460 | |
| | | | | |
| | | | Total | | | 46,841,558 | |
| | | | | |
| |
| Energy (5.6%) | | | | |
| | 56,250 | | | Atwood Oceanics, Inc.b | | | 2,286,562 | |
| | 38,150 | | | Cameron International Corporationb | | | 2,271,832 | |
| | 27,200 | | | Cimarex Energy Company | | | 3,091,824 | |
| | 21,450 | | | Concho Resources, Inc.b | | | 2,338,694 | |
| | 159,200 | | | Danbury Resources, Inc. | | | 1,974,080 | |
| | 20,550 | | | Energen Corporation | | | 1,391,235 | |
| | 37,950 | | | Ensco plc | | | 1,540,390 | |
| | 22,850 | | | EQT Corporation | | | 2,148,814 | |
| | 22,650 | | | Gulfport Energy Corporationb | | | 1,136,577 | |
| | 95,750 | | | Helix Energy Solutions Group, Inc.b | | | 2,550,780 | |
| | 38,900 | | | Helmerich & Payne, Inc.a | | | 3,377,298 | |
| | 61,750 | | | HollyFrontier Corporation | | | 2,802,215 | |
| | 33,450 | | | National Oilwell Varco, Inc. | | | 2,429,808 | |
| | 55,350 | | | Newfield Exploration Companyb | | | 1,804,964 | |
| | 63,750 | | | Noble Corporation | | | 1,333,650 | |
| | 43,550 | | | Noble Energy, Inc. | | | 2,509,787 | |
| | 38,750 | | | Oasis Petroleum, Inc.b | | | 1,160,950 | |
| | 41,300 | | | Oceaneering International, Inc. | | | 2,902,151 | |
| | 36,800 | | | Oil States International, Inc.b | | | 2,198,432 | |
| | 13,300 | | | Pioneer Natural Resources Company | | | 2,514,498 | |
| | 59,850 | | | Rowan Companies plc | | | 1,452,559 | |
| | 32,200 | | | SM Energy Company | | | 1,812,860 | |
| | 138,250 | | | Superior Energy Services, Inc. | | | 3,476,988 | |
| | 37,000 | | | Whiting Petroleum Corporationb | | | 2,265,880 | |
| | | | | |
| | | | Total | | | 52,772,828 | |
| | | | | |
| |
| Financials (22.7%) | | | | |
| | 157,550 | | | Camden Property Trust | | | 12,079,359 | |
| | 182,750 | | | Digital Realty Trust, Inc. | | | 12,607,923 | |
| | 588,300 | | | Duke Realty Corporation | | | 11,154,168 | |
| | 299,400 | | | First Republic Bank | | | 15,248,442 | |
| | 281,103 | | | Gaming and Leisure Properties, Inc. | | | 8,784,469 | |
| | 319,076 | | | HCC Insurance Holdings, Inc. | | | 16,652,576 | |
| | 716,459 | | | Host Hotels & Resorts, Inc. | | | 16,700,659 | |
| | 2,101,850 | | | Huntington Bancshares, Inc. | | | 20,829,333 | |
| | 939,400 | | | KeyCorp | | | 12,400,080 | |
| | 357,832 | | | Lazard, Ltd. | | | 17,608,913 | |
| | 117,550 | | | M&T Bank Corporationa | | | 14,362,259 | |
| | 474,400 | | | NASDAQ OMX Group, Inc. | | | 20,522,544 | |
| | 259,890 | | | Northern Trust Corporation | | | 17,230,707 | |
| | 609,602 | | | Zions Bancorporation | | | 17,660,170 | |
| | | | | |
| | | | Total | | | 213,841,602 | |
| | | | | |
| |
| Health Care (14.5%) | | | | |
| | 306,700 | | | Acorda Therapeutics, Inc.b | | | 10,679,294 | |
| | 985,050 | | | Allscripts Healthcare Solutions, Inc.b | | | 13,514,886 | |
| | 107,564 | | | C.R. Bard, Inc. | | | 17,637,269 | |
| | 156,000 | | | Centene Corporationb | | | 14,456,520 | |
| | 706,750 | | | Hologic, Inc.b | | | 18,509,783 | |
| | 117,200 | | | Illumina, Inc.b | | | 22,570,376 | |
| | 100,400 | | | Mallinckrodt, LLCb | | | 9,254,872 | |
| | 165,600 | | | Universal Health Services, Inc. | | | 17,174,376 | |
| | 116,250 | | | Waters Corporationb | | | 12,880,500 | |
| | | | | |
| | | | Total | | | 136,677,876 | |
| | | | | |
| |
| Industrials (14.8%) | | | | |
| | 612,241 | | | ADT Corporationa | | | 21,942,717 | |
| | 212,200 | | | Flowserve Corporation | | | 14,427,478 | |
| | 121,850 | | | Huntington Ingalls Industries, Inc. | | | 12,894,167 | |
| | 132,248 | | | Manpower, Inc. | | | 8,827,554 | |
| | 469,644 | | | Oshkosh Corporation | | | 21,021,265 | |
| | 141,118 | | | Parker Hannifin Corporation | | | 17,926,220 | |
| | 896,550 | | | Southwest Airlines Company | | | 30,913,044 | |
| | 116,850 | | | WABCO Holdings, Inc.b | | | 11,378,853 | |
| | | | | |
| | | | Total | | | 139,331,298 | |
| | | | | |
| |
| Information Technology (18.4%) | | | | |
| | 115,300 | | | Alliance Data Systems Corporationb | | | 32,670,255 | |
| | 1,208,640 | | | Applied Materials, Inc. | | | 26,698,858 | |
| | 220,853 | | | eBay, Inc.b | | | 11,594,783 | |
| | 547,800 | | | Juniper Networks, Inc. | | | 11,542,146 | |
| | 374,850 | | | NetApp, Inc. | | | 16,043,580 | |
| | 1,480,412 | | | NVIDIA Corporation | | | 28,927,250 | |
| | 286,150 | | | Red Hat, Inc.b | | | 16,859,958 | |
| | 727,001 | | | Teradyne, Inc. | | | 13,376,818 | |
| | 241,300 | | | Ubiquiti Networks, Inc.a | | | 8,631,301 | |
| | 74,150 | | | Workday, Inc.b | | | 7,079,842 | |
| | | | | |
| | | | Total | | | 173,424,791 | |
| | | | | |
| |
| Materials (4.2%) | | | | |
| | 374,000 | | | Owens-Illinois, Inc.b | | | 9,637,980 | |
| | 212,914 | | | Silgan Holdings, Inc. | | | 10,466,852 | |
| | 868,894 | | | Steel Dynamics, Inc. | | | 19,993,251 | |
| | | | | |
| | | | Total | | | 40,098,083 | |
| | | | | |
| |
| Utilities (1.5%) | | | | |
| | 336,850 | | | Public Service Enterprise Group, Inc. | | | 13,915,274 | |
| | | | | |
| | | | Total | | | 13,915,274 | |
| | | | | |
| | | | | |
| | | | | |
| | | | Total Common Stock (cost $646,445,543) | | | 902,646,182 | |
| | | | | |
| | |
| Shares | | | Collateral Held for Securities Loaned (4.5%) | | Value | |
| | 42,247,150 | | | Thrivent Cash Management Trust | | | 42,247,150 | |
| | | | | |
| | | | Total Collateral Held for Securities Loaned (cost $42,247,150) | | | 42,247,150 | |
| | | | | |
The accompanying Notes to Financial Statements are an integral part of this schedule.
176
MID CAP STOCK FUND
Schedule of Investments as of October 31, 2014
| | | | | | | | |
Shares or
Principal
Amount | | | Short-Term Investments (4.3%)c | | Value | |
| | 40,850,015 | | | Thrivent Cash Management Trust 0.050% | | | $40,850,015 | |
| | | | | |
| | | | Total Short-Term Investments (at amortized cost) | | | 40,850,015 | |
| | | | | |
| | | | Total Investments (cost $729,542,708) 104.6% | | | $985,743,347 | |
| | | | | |
| | | | Other Assets and Liabilities, Net (4.6%) | | | (43,518,024 | ) |
| | | | | |
| | | | Total Net Assets 100.0% | | | $942,225,323 | |
| | | | | |
a | All or a portion of the security is on loan. |
b | Non-income producing security. |
c | The interest rate shown reflects the yield, coupon rate or the discount rate at the date of purchase. |
Unrealized Appreciation (Depreciation)
Gross unrealized appreciation and depreciation of investments, based on cost for federal income tax purposes, were as follows:
| | | | |
Gross unrealized appreciation | | | $267,214,009 | |
Gross unrealized depreciation | | | (11,035,181 | ) |
| | | | |
Net unrealized appreciation (depreciation) | | | $256,178,828 | |
| |
Cost for federal income tax purposes | | | $729,564,519 | |
Fair Valuation Measurements
The following table is a summary of the inputs used, as of October 31, 2014, in volving Mid Cap Stock Fund’s assets carried at fair value.
| | | | | | | | | | | | | | | | |
Investments in Securities | | Total | | | Level 1 | | | Level 2 | | | Level 3 | |
| | | | |
Common Stock | | | | | | | | | | | | | | | | |
Consumer Discretionary | | | 85,742,872 | | | | 85,742,872 | | | | – | | | | – | |
Consumer Staples | | | 46,841,558 | | | | 46,841,558 | | | | – | | | | – | |
Energy | | | 52,772,828 | | | | 52,772,828 | | | | – | | | | – | |
Financials | | | 213,841,602 | | | | 213,841,602 | | | | – | | | | – | |
Health Care | | | 136,677,876 | | | | 136,677,876 | | | | – | | | | – | |
Industrials | | | 139,331,298 | | | | 139,331,298 | | | | – | | | | – | |
Information Technology | | | 173,424,791 | | | | 173,424,791 | | | | – | | | | – | |
Materials | | | 40,098,083 | | | | 40,098,083 | | | | – | | | | – | |
Utilities | | | 13,915,274 | | | | 13,915,274 | | | | – | | | | – | |
Collateral Held for Securities Loaned | | | 42,247,150 | | | | 42,247,150 | | | | – | | | | – | |
Short-Term Investments | | | 40,850,015 | | | | 40,850,015 | | | | – | | | | – | |
| |
Total | | | $985,743,347 | | | | $985,743,347 | | | | $– | | | | $– | |
| |
There were no significant transfers between Levels during the period ended October 31, 2014. Transfers between Levels are identified as of the end of the period.
Investment in Affiliates
Affiliated issuers, as defined under the Investment Company Act of 1940, include those in which the Fund’s holdings of an issuer represent 5% or more of the outstanding voting securities of an issuer, or any affiliated mutual fund.
A summary of transactions for the fiscal year to date, in Mid Cap Stock Fund, is as follows:
| | | | | | | | | | | | | | | | | | | | | | | | |
Fund | | Value
October 31, 2013 | | | Gross Purchases | | | Gross Sales | | | Shares Held at
October 31, 2014 | | | Value
October 31, 2014 | | | Income Earned
November 1, 2013 –
October 31, 2014 | |
Cash Management Trust-Collateral Investment | | | $96,425,470 | | | | $394,507,597 | | | | $448,685,917 | | | | 42,247,150 | | | | $42,247,150 | | | | $347,781 | |
Cash Management Trust-Short Term Investment | | | 37,146,950 | | | | 156,229,512 | | | | 152,526,447 | | | | 40,850,015 | | | | 40,850,015 | | | | 26,878 | |
Total Value and Income Earned | | | 133,572,420 | | | | | | | | | | | | | | | | 83,097,165 | | | | 374,659 | |
The accompanying Notes to Financial Statements are an integral part of this schedule.
177
PARTNER WORLDWIDE ALLOCATION FUND
Schedule of Investments as of October 31, 2014
| | | | | | | | |
| Shares | | | Common Stock (86.5%) | | Value | |
| Australia (3.6%) | | | | |
| | 12,771 | | | Abacus Property Group | | | $30,410 | |
| | 29,759 | | | AWE, Ltd.a | | | 46,132 | |
| | 1,019,099 | | | Beach Energy, Ltd. | | | 1,054,158 | |
| | 181,278 | | | BHP Billiton, Ltd. | | | 5,423,285 | |
| | 13,729 | | | BT Investment Management, Ltd. | | | 75,634 | |
| | 50,168 | | | Cabcharge Australia, Ltd. | | | 218,781 | |
| | 256,255 | | | Challenger, Ltd. | | | 1,576,143 | |
| | 66,058 | | | Charter Hall Group | | | 254,292 | |
| | 69,884 | | | Cover-More Group, Ltd. | | | 136,476 | |
| | 595,921 | | | CSR, Ltd. | | | 1,823,900 | |
| | 15,825 | | | Domino’s Pizza Enterprises, Ltd. | | | 377,186 | |
| | 209,889 | | | Downer EDI, Ltd. | | | 886,331 | |
| | 194,263 | | | DuluxGroup, Ltd. | | | 918,066 | |
| | 310,834 | | | Echo Entertainment Group, Ltd. | | | 1,043,691 | |
| | 16,322 | | | GUD Holdings, Ltd. | | | 103,315 | |
| | 404,001 | | | Harvey Norman Holdings, Ltd. | | | 1,358,569 | |
| | 112,899 | | | iiNet, Ltd. | | | 796,711 | |
| | 976,080 | | | Incitec Pivot, Ltd. | | | 2,504,723 | |
| | 40,722 | | | Independence Group NL | | | 163,072 | |
| | 255,115 | | | Investa Office Fund | | | 804,917 | |
| | 3,688 | | | Invocare, Ltd. | | | 39,352 | |
| | 83,199 | | | M2 Telecommunications Group, Ltd. | | | 577,294 | |
| | 44,168 | | | Macquarie Group, Ltd. | | | 2,387,023 | |
| | 17,876 | | | Monadelphous Group, Ltd. | | | 198,275 | |
| | 573,072 | | | Mount Gibson Iron, Ltd. | | | 227,712 | |
| | 29,381 | | | Northern Star Resources, Ltd. | | | 28,336 | |
| | 53,254 | | | NRW Holdings, Ltd. | | | 35,646 | |
| | 10,103 | | | Premier Investment, Ltd. | | | 95,859 | |
| | 46,344 | | | Ramsay Health Care, Ltd. | | | 2,142,415 | |
| | 31,592 | | | RCR Tomlinson, Ltd. | | | 75,893 | |
| | 16,347 | | | SAI Global, Ltd. | | | 59,172 | |
| | 22,003 | | | Sandfire Resources NL | | | 109,183 | |
| | 86,752 | | | Shopping Centres Australasia Property Group | | | 138,470 | |
| | 160,293 | | | Sigma Pharmaceuticals, Ltd. | | | 109,211 | |
| | 56,021 | | | Slater & Gordon, Ltd. | | | 302,681 | |
| | 152,325 | | | Spark Infrastructure Group | | | 256,057 | |
| | 6,857 | | | Tassal Group, Ltd. | | | 22,273 | |
| | 11,222 | | | Village Roadshow, Ltd. | | | 69,513 | |
| | 107,901 | | | Woolworths, Ltd. | | | 3,424,314 | |
| | | | | |
| | | | Total | | | 29,894,471 | |
| | | | | |
| |
| Austria (0.7%) | | | | |
| | 87,881 | | | AMS AG | | | 3,151,326 | |
| | 25,747 | | | CA Immobilien Anlagen AGa | | | 493,841 | |
| | 2,323 | | | Flughafen Wien Aktiengesellschaft | | | 213,206 | |
| | 6,056 | | | Osterreichische Post AG | | | 295,405 | |
| | 41,544 | | | Voestalpine AG | | | 1,664,164 | |
| | | | | |
| | | | Total | | | 5,817,942 | |
| | | | | |
| |
| Belgium (0.7%) | | | | |
| | 42,597 | | | Anheuser-Busch InBev NV | | | 4,723,762 | |
| | 1,061 | | | Befimmo SA | | | 81,770 | |
| | 19,503 | | | bpost SA | | | 482,816 | |
| | 1,238 | | | Compagnie Maritime Belge | | | 24,246 | |
| | 10,798 | | | Exmar NV | | | 150,943 | |
| | 1,856 | | | Ion Beam Applications SAa | | | 32,423 | |
| | 4,375 | | | Kinepolis Group NV | | | 175,167 | |
| | 5,566 | | | Melexis NV | | | 253,856 | |
| | | | | |
| | | | Total | | | 5,924,983 | |
| | | | | |
| |
| Bermuda (0.8%) | | | | |
| | 116,284 | | | Catlin Group, Ltd. | | | 998,967 | |
| | 3,700 | | | Hoegh LNG Holdings, Ltd.a | | | 47,726 | |
| | 92,775 | | | Jardine Matheson Holdings, Ltd. | | | 5,559,817 | |
| | 9,000 | | | Orient Overseas International, Ltd. | | | 51,275 | |
| | 211,000 | | | Pacific Basin Shipping, Ltd. | | | 101,539 | |
| | | | | |
| | | | Total | | | 6,759,324 | |
| | | | | |
| |
| Brazil (1.4%) | | | | |
| | 30,900 | | | Ambev SA | | | 204,570 | |
| | 199,399 | | | Banco Bradesco SA ADR | | | 2,986,997 | |
| | 22,700 | | | BR Properties SA | | | 114,689 | |
| | 58,100 | | | Embraer SA | | | 561,308 | |
| | 39,800 | | | Even Construtora e Incorporadora SA | | | 86,092 | |
| | 8,400 | | | Iochpe-Maxion SA | | | 57,818 | |
| | 19,800 | | | Itau Unibanco Holding SA | | | 293,656 | |
| | 40,000 | | | Lojas Renner SA | | | 1,195,728 | |
| | 48,707 | | | Multiplan Empreendimentos Imobiliarios SA | | | 1,007,399 | |
| | 11,100 | | | Natura Cosmeticos SA | | | 161,266 | |
| | 118,500 | | | Souza Cruz SA | | | 957,411 | |
| | 102,412 | | | Ultrapar Participacoes SA | | | 2,233,895 | |
| | 153,032 | | | Vale SA ADRb | | | 1,544,093 | |
| | 12,300 | | | WEG SA | | | 145,094 | |
| | | | | |
| | | | Total | | | 11,550,016 | |
| | | | | |
| |
| Canada (3.6%) | | | | |
| | 82,712 | | | Alimentation Couche-Tard, Inc. | | | 2,807,093 | |
| | 236,400 | | | Bankers Petroleum, Ltd.a | | | 908,222 | |
| | 35,768 | | | Baytex Energy Corporation | | | 1,092,986 | |
| | 87,871 | | | Brookfield Asset Management, Inc. | | | 4,301,355 | |
| | 25,195 | | | Canadian Imperial Bank of Commerce | | | 2,300,087 | |
| | 56,848 | | | Canadian National Railway Company | | | 4,007,934 | |
| | 99,817 | | | Canadian Natural Resources, Ltd. | | | 3,483,256 | |
| | 11,100 | | | Canadian Tire Corporation, Ltd. | | | 1,217,006 | |
| | 29,350 | | | Entertainment One, Ltd. | | | 147,300 | |
| | 32,200 | | | Magna International, Inc. | | | 3,178,145 | |
| | 22,128 | | | Open Text Corporation | | | 1,222,189 | |
| | 35,278 | | | Royal Bank of Canada | | | 2,504,408 | |
| | 66,288 | | | Saputo, Inc. | | | 1,880,919 | |
| | 27,704 | | | Suncor Energy, Inc. | | | 983,731 | |
| | | | | |
| | | | Total | | | 30,034,631 | |
| | | | | |
| |
| Cayman Islands (<0.1%) | | | | |
| | 42,000 | | | Xinyi Glass Holdings Company, Ltd. | | | 24,816 | |
| | | | | |
| | | | Total | | | 24,816 | |
| | | | | |
| |
| Chile (0.2%) | | | | |
| | 421,686 | | | Aguas Andinas SA | | | 254,414 | |
| | 55,146 | | | Banco Santander Chile SA ADR | | | 1,168,544 | |
| | | | | |
| | | | Total | | | 1,422,958 | |
| | | | | |
| |
| China (1.0%) | | | | |
| | 454,000 | | | Air China, Ltd. | | | 294,010 | |
| | 121,500 | | | Anhui Conch Cement Company, Ltd.b | | | 397,896 | |
| | 185,000 | | | China Construction Bank Corporation | | | 138,028 | |
| | 232,000 | | | China Shenhua Energy Company, Ltd. | | | 653,900 | |
| | 312,000 | | | CNOOC, Ltd. | | | 488,557 | |
| | 312,000 | | | Dongfeng Motor Group Company, Ltd. | | | 482,495 | |
| | 977,000 | | | FIH Mobile, Ltd.a | | | 520,499 | |
| | 66,000 | | | Haitian International Holdings, Ltd. | | | 141,575 | |
| | 1,604,195 | | | Lenovo Group, Ltd. | | | 2,364,591 | |
| | 2,199,000 | | | PetroChina Company, Ltd. | | | 2,753,027 | |
| | | | | |
| | | | Total | | | 8,234,578 | |
| | | | | |
The accompanying Notes to Financial Statements are an integral part of this schedule.
178
PARTNER WORLDWIDE ALLOCATION FUND
Schedule of Investments as of October 31, 2014
| | | | | | | | |
| Shares | | | Common Stock (86.5%) | | Value | |
| Colombia (0.1%) | |
| | 9,879 | | | Bancolombia SA ADR | | | $558,855 | |
| | | | | |
| | | | Total | | | 558,855 | |
| | | | | |
| |
| Cyprus (<0.1%) | | | | |
| | 12,857 | | | Globaltrans Investment plc | | | 95,270 | |
| | | | | |
| | | | Total | | | 95,270 | |
| | | | | |
| |
| Czech Republic (0.1%) | | | | |
| | 11,967 | | | CEZ AS | | | 331,033 | |
| | 3,721 | | | Komercni Banka AS | | | 797,193 | |
| | | | | |
| | | | Total | | | 1,128,226 | |
| | | | | |
| |
| Denmark (1.3%) | | | | |
| | 880 | | | A P Moller - Maersk AS | | | 2,053,547 | |
| | 3,433 | | | Aktieselskabet Schouw & Company | | | 152,101 | |
| | 177,975 | | | Danske Bank AS | | | 4,887,246 | |
| | 22,874 | | | Novo Nordisk AS | | | 1,033,967 | |
| | 13,777 | | | Pandora AS | | | 1,161,560 | |
| | 7,238 | | | Royal Unibrew ASa | | | 1,183,149 | |
| | 1,628 | | | Zealand Pharma ASa | | | 18,646 | |
| | | | | |
| | | | Total | | | 10,490,216 | |
| | | | | |
| |
| Faroe Islands (0.1%) | | | | |
| | 17,038 | | | Bakkafrost PF | | | 416,597 | |
| | | | | |
| | | | Total | | | 416,597 | |
| | | | | |
| |
| Finland (0.4%) | | | | |
| | 7,895 | | | Cramo OYJ | | | 115,143 | |
| | 6,589 | | | Huhtamaki OYJ | | | 167,197 | |
| | 33,669 | | | Orion OYJ | | | 1,145,135 | |
| | 12,557 | | | Ramirent OYJ | | | 100,219 | |
| | 19,987 | | | Sponda OYJ | | | 91,511 | |
| | 204,283 | | | Stora Enso OYJ | | | 1,686,990 | |
| | 1,095 | | | Tieto OYJ | | | 27,763 | |
| | | | | |
| | | | Total | | | 3,333,958 | |
| | | | | |
| |
| France (5.8%) | | | | |
| | 5,061 | | | ABC Arbitrage | | | 30,506 | |
| | 33,144 | | | Air France-KLMa | | | 280,004 | |
| | 5,490 | | | Altamir | | | 68,798 | |
| | 6,158 | | | Assystem | | | 124,347 | |
| | 307,700 | | | AXA SA | | | 7,107,412 | |
| | 11,699 | | | Belvedere SAa | | | 163,314 | |
| | 3,360 | | | Boiron SA | | | 298,783 | |
| | 1,306 | | | Bourbon SA | | | 33,878 | |
| | 87,309 | | | Cap Gemini SA | | | 5,744,590 | |
| | 3,238 | | | Cegid Group | | | 119,175 | |
| | 28,900 | | | Christian Dior SA | | | 5,113,910 | |
| | 138,103 | | | Compagnie de Saint-Gobain | | | 5,936,333 | |
| | 6,939 | | | Etablissements Maurel et Proma | | | 82,936 | |
| | 1,523 | | | Euler Hermes Group | | | 149,192 | |
| | 192,775 | | | GDF Suez | | | 4,680,557 | |
| | 10,485 | | | Ingenico | | | 1,044,549 | |
| | 4,658 | | | Innate Pharma SAa | | | 42,919 | |
| | 11,933 | | | Ipsen SA | | | 586,560 | |
| | 3,273 | | | Korian Medica SA | | | 118,412 | |
| | 22,503 | | | Mercialys SA | | | 497,018 | |
| | 300,395 | | | Natixis | | | 2,067,761 | |
| | 13,012 | | | Neopost SA | | | 903,030 | |
| | 83,390 | | | Orange SA | | | 1,327,598 | |
| | 25,786 | | | Orpea | | | 1,573,262 | |
| | 7,064 | | | Saft Groupe SA | | | 210,124 | |
| | 1,012 | | | Societe de la Tour Eiffela | | | 56,938 | |
| | 134,466 | | | Technicolor SAa | | | 793,889 | |
| | 33,447 | | | Thales SA | | | 1,660,976 | |
| | 78,350 | | | Total SA | | | 4,677,748 | |
| | 12,921 | | | Valneva SEa | | | 71,271 | |
| | 2,188 | | | Vicat SA | | | 149,635 | |
| | 39,812 | | | Vinci SA | | | 2,272,398 | |
| | | | | |
| | | | Total | | | 47,987,823 | |
| | | | | |
| |
| Germany (4.5%) | | | | |
| | 11,261 | | | Allianz SE | | | 1,790,745 | |
| | 2,134 | | | Alstria Office REIT AGa | | | 26,494 | |
| | 7,115 | | | Aurelius AG | | | 247,973 | |
| | 35,432 | | | Balda AG | | | 121,660 | |
| | 16,856 | | | Bayer AG | | | 2,410,772 | |
| | 1,589 | | | Biotest AG | | | 160,734 | |
| | 48,041 | | | Borussia Dortmund GmbH & Company KGaA | | | 254,423 | |
| | 4,714 | | | Centrotec Sustainable AG | | | 76,349 | |
| | 10,031 | | | Continental AG | | | 1,975,762 | |
| | 7,629 | | | CTS Eventim AG & Company KGaA | | | 201,586 | |
| | 78,545 | | | Daimler AG | | | 6,124,065 | |
| | 2,124 | | | Deutsche Beteiligungs AG | | | 58,223 | |
| | 25,265 | | | Deutsche Boerse AG | | | 1,729,217 | |
| | 15,522 | | | Deutsche EuroShop AG | | | 694,463 | |
| | 101,129 | | | Deutsche Post AG | | | 3,184,529 | |
| | 34,817 | | | Duerr AG | | | 2,445,689 | |
| | 10,052 | | | Gerresheimer AG | | | 559,312 | |
| | 1,483 | | | Hamborner REIT AG | | | 15,251 | |
| | 17,358 | | | Hochtief AG | | | 1,284,469 | |
| | 3,393 | | | Homag Group AG | | | 119,560 | |
| | 4,273 | | | KUKA AG | | | 269,300 | |
| | 5,397 | | | MorphoSys AGa | | | 511,214 | |
| | 553 | | | Nemetschek AG | | | 55,119 | |
| | 895 | | | R. Stahl AB | | | 44,358 | |
| | 61,445 | | | Rhoen-Klinikum AG | | | 1,829,520 | |
| | 14,030 | | | Rhoen-Klinikum AG Rightsa | | | 11,815 | |
| | 3,891 | | | SAP SE ADRb | | | 265,115 | |
| | 19,449 | | | Siemens AG | | | 2,193,717 | |
| | 7,358 | | | Sixt SE | | | 238,034 | |
| | 284 | | | STRATEC Biomedical AG | | | 15,053 | |
| | 14,689 | | | Suedzucker AG | | | 204,530 | |
| | 23,335 | | | Symrise AG | | | 1,315,610 | |
| | 7,902 | | | Takkt AG | | | 123,241 | |
| | 187,975 | | | ThyssenKrupp AGa | | | 4,530,489 | |
| | 43,708 | | | United Internet AG | | | 1,714,156 | |
| | 623 | | | Wacker Chemie AG | | | 75,494 | |
| | 2,054 | | | Wacker Neuson SE | | | 39,968 | |
| | 2,471 | | | Wincor Nixdorf AG | | | 113,642 | |
| | | | | |
| | | | Total | | | 37,031,651 | |
| | | | | |
| |
| Hong Kong (3.6%) | | | | |
| | 504,400 | | | AIA Group, Ltd. | | | 2,814,766 | |
| | 427,000 | | | BOC Hong Kong (Holdings), Ltd. | | | 1,421,444 | |
| | 240,000 | | | Brightoil Petroleum Holdings, Ltd.a | | | 76,723 | |
| | 83,000 | | | Cheung Kong Holdings, Ltd. | | | 1,473,439 | |
| | 360,000 | | | China Mobile, Ltd. | | | 4,479,307 | |
| | 13,000 | | | Chow Sang Sang Holdings International, Ltd. | | | 32,139 | |
| | 17,200 | | | Dah Sing Banking Group, Ltd. | | | 31,251 | |
| | 60,669 | | | Dah Sing Financial Holdings, Ltd. | | | 377,769 | |
| | 76,840 | | | Dickson Concepts, Ltd. | | | 40,273 | |
| | 165,000 | | | Emperor Entertainment Hotel, Ltd. | | | 49,574 | |
| | 220,000 | | | Emperor International Holdings, Ltd. | | | 47,970 | |
| | 122,100 | | | Esprit Holdings, Ltd. | | | 152,951 | |
| | 23,000 | | | Great Eagle Holdings, Ltd. | | | 77,420 | |
The accompanying Notes to Financial Statements are an integral part of this schedule.
179
PARTNER WORLDWIDE ALLOCATION FUND
Schedule of Investments as of October 31, 2014
| | | | | | | | |
| Shares | | | Common Stock (86.5%) | | Value | |
| Hong Kong (3.6%) - continued | | | | |
| | 2,650,425 | | | Guangzhou Automobile Group Company, Ltd. | | | $2,358,156 | |
| | 57,000 | | | Guotai Junan International Holdings, Ltd. | | | 39,816 | |
| | 48,000 | | | Haitong International Securities Group, Ltd. | | | 28,525 | |
| | 393,000 | | | Hang Lung Group, Ltd. | | | 1,977,208 | |
| | 630,000 | | | HKT Trust and HKT, Ltd. | | | 767,487 | |
| | 337,175 | | | Hutchison Whampoa, Ltd. | | | 4,275,569 | |
| | 10,000 | | | Luk Fook Holdings International, Ltd. | | | 29,817 | |
| | 1,968,752 | | | New World Development Company, Ltd. | | | 2,474,736 | |
| | 272,000 | | | NewOcean Energy Holdings, Ltd. | | | 128,133 | |
| | 1,796,000 | | | PCCW, Ltd. | | | 1,141,747 | |
| | 161,000 | | | Samson Holding, Ltd. | | | 20,968 | |
| | 89,000 | | | Shenzhou International Group Holdings, Ltd. | | | 307,268 | |
| | 546,000 | | | Shun Tak Holdings, Ltd. | | | 278,178 | |
| | 145,500 | | | Sinotruk Hong Kong, Ltd. | | | 75,419 | |
| | 94,000 | | | Sunlight Real Estate Investment Trust | | | 40,854 | |
| | 150,500 | | | Swire Pacific, Ltd., Class A | | | 1,974,041 | |
| | 270,000 | | | Swire Pacific, Ltd., Class B | | | 654,646 | |
| | 166,950 | | | Swire Properties, Ltd. | | | 534,959 | |
| | 592,000 | | | Truly International Holdings, Ltd. | | | 300,911 | |
| | 256,000 | | | United Laboratories International Holdingsa | | | 196,388 | |
| | 17,700 | | | VTech Holdings, Ltd. | | | 221,617 | |
| | 54,000 | | | Weichai Power Company, Ltd. | | | 207,288 | |
| | 200,000 | | | Wheelock and Company, Ltd. | | | 964,024 | |
| | | | | |
| | | | Total | | | 30,072,781 | |
| | | | | |
| |
| Hungary (0.2%) | | | | |
| | 38,316 | | | OTP Bank Nyrt | | | 634,576 | |
| | 70,010 | | | Richter Gedeon Nyrt | | | 1,067,984 | |
| | | | | |
| | | | Total | | | 1,702,560 | |
| | | | | |
| |
| India (1.8%) | | | | |
| | 9,500 | | | Grasim Industries, Ltd. | | | 542,640 | |
| | 27,779 | | | Hero Motocorp, Ltd. | | | 1,387,239 | |
| | 129,000 | | | Hindustan Unilever, Ltd. | | | 1,550,206 | |
| | 167,191 | | | Housing Development Finance Corporation | | | 3,011,228 | |
| | 55,000 | | | ICICI Bank, Ltd. | | | 1,460,754 | |
| | 45,500 | | | Infosys, Ltd. | | | 3,016,222 | |
| | 339,864 | | | ITC, Ltd. | | | 1,965,222 | |
| | 13,539 | | | Reliance Industries, Ltd. GDRc | | | 437,612 | |
| | 31,428 | | | Ultra Tech Cement, Ltd. | | | 1,303,884 | |
| | | | | |
| | | | Total | | | 14,675,007 | |
| | | | | |
| |
| Indonesia (0.4%) | | | | |
| | 4,520,800 | | | Astra International Tbk PT | | | 2,534,863 | |
| | 210,200 | | | Bank Mandiri Persero Tbk PT | | | 180,531 | |
| | 227,000 | | | Bank Rakyat Indonesia Persero Tbk PT | | | 208,022 | |
| | 179,700 | | | Indo Tambangraya Megah Tbk PT | | | 315,305 | |
| | 24,200 | | | Indocement Tunggal Prakarsa Tbk PT | | | 47,964 | |
| | 133,400 | | | United Tractors Tbk PT | | | 202,634 | |
| | | | | |
| | | | Total | | | 3,489,319 | |
| | | | | |
| |
| Ireland (0.4%) | | | | |
| | 57,164 | | | Beazley plc | | | 240,100 | |
| | 18,366 | | | DCC plc | | | 1,029,240 | |
| | 8,359 | | | Grafton Group plc | | | 84,855 | |
| | 7,912 | | | Greencore Group plc | | | 33,199 | |
| | 141,785 | | | Henderson Group plc | | | 477,485 | |
| | 59,466 | | | Smurfit Kappa Group plc | | | 1,228,670 | |
| | | | | |
| | | | Total | | | 3,093,549 | |
| | | | | |
| |
| Israel (0.5%) | | | | |
| | 322,624 | | | Israel Chemicals, Ltd. | | | 2,175,091 | |
| | 11,132 | | | Plus500, Ltd. | | | 91,150 | |
| | 35,974 | | | Teva Pharmaceutical Industries, Ltd. ADR | | | 2,031,452 | |
| | | | | |
| | | | Total | | | 4,297,693 | |
| | | | | |
| |
| Italy (3.3%) | | | | |
| | 174,667 | | | A2A SPA | | | 175,143 | |
| | 9,543 | | | Acea SPA | | | 116,718 | |
| | 34,805 | | | Ascopiave SPA | | | 81,562 | |
| | 245,535 | | | Assicurazioni Generali SPA | | | 5,038,480 | |
| | 21,183 | | | ASTM SPA | | | 254,806 | |
| | 46,362 | | | Autogrill SPAa | | | 314,216 | |
| | 17,629 | | | Banca IFIS SPA | | | 310,483 | |
| | 166,414 | | | Banca Popolare di Milano SCRLa | | | 125,430 | |
| | 332,629 | | | Beni Stabili SPA | | | 229,355 | |
| | 5,121 | | | Brembo SPA | | | 169,819 | |
| | 7,555 | | | Cairo Communication SPA | | | 50,784 | |
| | 42,911 | | | Cementir Holding SPA | | | 257,833 | |
| | 2,176 | | | Cosmo Pharmaceuticals SPA | | | 342,025 | |
| | 29,491 | | | Credito Emiliano SPA | | | 227,246 | |
| | 4,824 | | | De’Longhi | | | 94,409 | |
| | 420,754 | | | Enel SPA | | | 2,150,016 | |
| | 262,117 | | | Eni SPA | | | 5,584,371 | |
| | 37,671 | | | ERG SPA | | | 431,711 | |
| | 228,067 | | | Hera SPA | | | 600,611 | |
| | 22,252 | | | Immobiliare Grande Distribuzione SPA | | | 18,584 | |
| | 36,252 | | | Indesit Company SPAa | | | 498,358 | |
| | 6,239 | | | Industria Macchine Automatiche SPA | | | 244,613 | |
| | 2,429,632 | | | Intesa Sanpaolo SPA | | | 7,142,526 | |
| | 243,810 | | | IREN SPA | | | 294,823 | |
| | 146,765 | | | Recordati SPA | | | 2,539,428 | |
| | 1,281 | | | Reply SPA | | | 94,527 | |
| | 3,007 | | | Societa Cattolica di Assicurazioni SCRL | | | 46,572 | |
| | 5,726 | | | Societa Iniziative Autostradali e Servizi SPA | | | 57,373 | |
| | | | | |
| | | | Total | | | 27,491,822 | |
| | | | | |
| |
| Japan (15.3%) | | | | |
| | 50,800 | | | Alpine Electronics, Inc. | | | 867,129 | |
| | 8,300 | | | AOKI Holdings, Inc. | | | 93,095 | |
| | 54,000 | | | Aoyama Trading Company, Ltd. | | | 1,284,389 | |
| | 12,900 | | | Asahi Diamond Industrial Company, Ltd. | | | 156,535 | |
| | 53,200 | | | Asahi Group Holdings, Ltd. | | | 1,650,203 | |
| | 4,400 | | | ASKA Pharmaceutical Company, Ltd. | | | 48,554 | |
| | 52,448 | | | Avex Group Holdings, Inc. | | | 779,038 | |
| | 64,400 | | | Bandai Namco Holdings, Inc. | | | 1,598,264 | |
| | 96,000 | | | Bridgestone Corporation | | | 3,208,104 | |
| | 60,800 | | | Brother Industries, Ltd. | | | 1,082,517 | |
| | 1,600 | | | C. Uyemura & Company, Ltd. | | | 76,099 | |
| | 12,500 | | | Canon Marketing Japan, Inc. | | | 255,553 | |
| | 14,700 | | | Century Tokyo Leasing Corporation | | | 384,948 | |
| | 7,900 | | | Chiyoda Integre Company, Ltd. | | | 136,201 | |
| | 22,000 | | | Chugoku Marine Paints, Ltd. | | | 173,860 | |
| | 31,100 | | | CKD Corporation | | | 272,835 | |
| | 202,000 | | | Clarion Company, Ltd.a | | | 664,755 | |
| | 4,500 | | | Colowide Company, Ltd. | | | 53,922 | |
| | 12,500 | | | COMSYS Holdings Corporation | | | 223,157 | |
The accompanying Notes to Financial Statements are an integral part of this schedule.
180
PARTNER WORLDWIDE ALLOCATION FUND
Schedule of Investments as of October 31, 2014
| | | | | | | | |
Shares | | | Common Stock (86.5%) | | Value | |
| Japan (15.3%) - continued | | | | |
| | 16,000 | | | Daido Metal Company, Ltd. | | | $187,995 | |
| | 69,000 | | | Daihen Corporation | | | 244,299 | |
| | 12,358 | | | Daiichikosho Company, Ltd. | | | 311,872 | |
| | 2,000 | | | Daiwa Industries, Ltd. | | | 15,250 | |
| | 506,189 | | | Daiwa Securities Group, Inc. | | | 4,000,392 | |
| | 6,600 | | | DCM Holdings Company, Ltd. | | | 44,216 | |
| | 4,000 | | | Denki Kogyo Company, Ltd. | | | 20,918 | |
| | 182,000 | | | DIC Corporation | | | 373,007 | |
| | 2,800 | | | Doshisha Company, Ltd. | | | 46,304 | |
| | 17,500 | | | Doutor Nichires Holdings Company, Ltd. | | | 260,703 | |
| | 1,400 | | | Dr. Ci:Labo Company, Ltd. | | | 44,470 | |
| | 16,590 | | | Eagle Industry Company, Ltd. | | | 318,207 | |
| | 70,900 | | | EDION Corporation | | | 505,853 | |
| | 11,118 | | | EIZO Corporation | | | 203,270 | |
| | 4,478 | | | EN-Japan, Inc. | | | 78,945 | |
| | 11,000 | | | Ezaki Glico Company, Ltd. | | | 356,085 | |
| | 25,027 | | | Fancl Corporation | | | 343,308 | |
| | 22,200 | | | Foster Electric Company, Ltd. | | | 351,708 | |
| | 34 | | | Frontier Real Estate Investment Corporation | | | 156,605 | |
| | 278,000 | | | Fuji Electric Company, Ltd. | | | 1,221,385 | |
| | 108,700 | | | Fuji Heavy Industries, Ltd. | | | 3,617,877 | |
| | 32,016 | | | Fuji Machine Manufacturing Company, Ltd. | | | 308,185 | |
| | 23,500 | | | Fuji Oil Company, Ltd. | | | 373,200 | |
| | 6,300 | | | Fuji Soft, Inc. | | | 155,962 | |
| | 47,231 | | | Fujitsu General, Ltd. | | | 591,257 | |
| | 220,000 | | | Fujitsu, Ltd. | | | 1,337,482 | |
| | 10,900 | | | Funai Electric Company, Ltd. | | | 97,753 | |
| | 5,100 | | | Fuyo General Lease Company, Ltd. | | | 201,355 | |
| | 152 | | | Global One Real Estate Investment Corporation | | | 470,968 | |
| | 13,300 | | | G-Tekt Corporation | | | 132,659 | |
| | 106,000 | | | Hakuhodo Dy Holdings, Inc. | | | 1,048,289 | |
| | 67 | | | Hankyu REIT, Inc. | | | 382,775 | |
| | 18,000 | | | Hanwa Company, Ltd. | | | 64,902 | |
| | 1,500 | | | HEIWADO Company, Ltd. | | | 27,924 | |
| | 35,900 | | | Hitachi Capital Corporation | | | 887,362 | |
| | 5,400 | | | Hitachi Koki Company, Ltd. | | | 46,430 | |
| | 39,300 | | | Hitachi Transport System, Ltd. | | | 520,080 | |
| | 6,700 | | | Hokkaido Electric Power Company, Inc.a | | | 56,249 | |
| | 23 | | | Hulic REIT, Inc. | | | 34,948 | |
| | 9,400 | | | IBJ Leasing Company, Ltd. | | | 222,729 | |
| | 24 | | | Ichigo Real Estate Investment Corporation | | | 18,056 | |
| | 2,000 | | | Iriso Electronics Company, Ltd. | | | 136,278 | |
| | 140,000 | | | Ishihara Sangyo Kaisha, Ltd.a | | | 115,064 | |
| | 49,800 | | | IT Holdings Corporation | | | 813,701 | |
| | 46,000 | | | Jaccs Company, Ltd. | | | 274,891 | |
| | 22,940 | | | JAFCO Company, Ltd. | | | 893,060 | |
| | 58,400 | | | Japan Airlines Company, Ltd. | | | 1,568,162 | |
| | 39,000 | | | Japan Aviation Electronics Industry, Ltd. | | | 772,700 | |
| | 2,900 | | | Japan Digital Laboratory Company, Ltd. | | | 51,652 | |
| | 447 | | | Japan Rental Housing Investments, Inc. | | | 309,656 | |
| | 8,000 | | | Japan Securities Finance Company, Ltd. | | | 45,844 | |
| | 30,400 | | | Japan Tobacco, Inc. | | | 1,037,219 | |
| | 22,778 | | | Japan Vilene Company, Ltd. | | | 126,490 | |
| | 85,700 | | | JTEKT Corporation | | | 1,378,329 | |
| | 153,500 | | | JVC Kenwood Corporationa | | | 293,467 | |
| | 2,000 | | | Kaken Pharmaceutical Company, Ltd. | | | 50,108 | |
| | 47,800 | | | Kao Corporation | | | 1,863,919 | |
| | 44,000 | | | Kato Works Company, Ltd. | | | 323,946 | |
| | 53,600 | | | KDDI Corporation | | | 3,519,883 | |
| | 10,400 | | | Keihin Corporation | | | 131,394 | |
| | 14 | | | Kenedix Realty Investment Corporation | | | 74,864 | |
| | 21,300 | | | Kissei Pharmaceutical Company, Ltd. | | | 556,787 | |
| | 61,200 | | | KITZ Corporation | | | 280,459 | |
| | 1,700 | | | Kiyo Bank, Ltd. | | | 24,442 | |
| | 715,000 | | | Kobe Steel, Ltd. | | | 1,136,027 | |
| | 28,879 | | | Koei Tecmo Holdings Company, Ltd. | | | 479,661 | |
| | 11,400 | | | Kohnan Shoji Company, Ltd. | | | 130,811 | |
| | 7,900 | | | Komori Corporation | | | 77,697 | |
| | 3,800 | | | Konoike Transport Company, Ltd. | | | 74,384 | |
| | 3,500 | | | KOSE Corporation | | | 143,036 | |
| | 7,000 | | | Kureha Corporation | | | 34,717 | |
| | 108,300 | | | Kuroda Electric Company, Ltd. | | | 1,522,776 | |
| | 1,700 | | | KYORIN Holdings, Inc. | | | 35,815 | |
| | 7,659 | | | Kyoritsu Maintenance Company, Ltd. | | | 308,221 | |
| | 250,285 | | | LIXIL Group Corporation | | | 5,488,845 | |
| | 1,600 | | | MACNICA, Inc. | | | 46,375 | |
| | 41,000 | | | Maeda Road Construction Company, Ltd. | | | 631,992 | |
| | 53,000 | | | Makino Milling Machine Company, Ltd. | | | 361,296 | |
| | 800 | | | Mandom Corporation | | | 26,837 | |
| | 146,000 | | | Marubeni Corporation | | | 938,700 | |
| | 8,000 | | | Marudai Food Company, Ltd. | | | 29,629 | |
| | 8,278 | | | Matsumotokiyoshi Holdings Company, Ltd. | | | 240,741 | |
| | 12,400 | | | Melco Holdings, Inc. | | | 177,693 | |
| | 12,700 | | | Micronics Japan Company ,Ltd. | | | 646,451 | |
| | 66 | | | MID REIT, Inc. | | | 165,134 | |
| | 82,000 | | | Minebea Company, Ltd. | | | 1,123,600 | |
| | 13,600 | | | MIRAIT Holdings Corporation | | | 152,236 | |
| | 4,400 | | | MISUMI Group, Inc. | | | 138,837 | |
| | 12,900 | | | Mito Securities Company, Ltd. | | | 48,502 | |
| | 166,800 | | | Mitsubishi UFJ Financial Group, Inc. | | | 972,313 | |
| | 523,000 | | | Mitsui Engineering & Shipbuilding Company, Ltd. | | | 1,136,985 | |
| | 13,100 | | | Mitsui High-tec, Inc. | | | 78,513 | |
| | 23,000 | | | Mitsui-Soko Holdings Company, Ltd. | | | 87,441 | |
| | 6,000 | | | Mizuno Corporation | | | 30,061 | |
| | 71,000 | | | Morinaga Milk Industry Company, Ltd. | | | 237,396 | |
| | 259,782 | | | MS and AD Insurance Group Holdings, Inc. | | | 5,615,649 | |
| | 44,000 | | | Nachi-Fujikoshi Corporation | | | 273,429 | |
| | 13,000 | | | NEC Networks & System Integration Corporation | | | 282,459 | |
| | 2,100 | | | Nifty Corporation | | | 25,268 | |
| | 6,500 | | | Nihon M&A Center, Inc. | | | 186,805 | |
| | 69,000 | | | NIPPO Corporation | | | 1,261,230 | |
| | 12,000 | | | Nippon Flour Mills Company, Ltd. | | | 60,232 | |
| | 201,000 | | | Nippon Light Metal Holdings Company, Ltd. | | | 296,857 | |
| | 67,000 | | | Nippon Meat Packers, Inc. | | | 1,545,000 | |
| | 17,000 | | | Nippon Road Company, Ltd. | | | 94,516 | |
| | 2,356,500 | | | Nippon Sheet Glass Companya | | | 2,259,139 | |
| | 91,700 | | | Nippon Suisan Kaisha, Ltd.a | | | 271,074 | |
| | 9,000 | | | Nippon Synthetic Chemical Industry Company, Ltd. | | | 54,951 | |
| | 21,400 | | | Nippon Telegraph & Telephone Corporation | | | 1,331,484 | |
| | 22,000 | | | Nippon Thompson Company, Ltd. | | | 92,206 | |
| | 2,286,725 | | | Nippon Yusen Kabushiki Kaisha | | | 5,928,471 | |
| | 9,000 | | | Nipro Corporation | | | 74,151 | |
The accompanying Notes to Financial Statements are an integral part of this schedule.
181
PARTNER WORLDWIDE ALLOCATION FUND
Schedule of Investments as of October 31, 2014
| | | | | | | | |
| Shares | | | Common Stock (86.5%) | | Value | |
| Japan (15.3%) - continued | | | | |
| | 593,775 | | | Nissan Motor Company, Ltd. | | | $5,416,240 | |
| | 34,000 | | | Nisshin Oillio Group, Ltd. | | | 121,849 | |
| | 8,000 | | | Nisshinbo Holdings, Inc. | | | 66,068 | |
| | 44,000 | | | Nissin Electric Company, Ltd. | | | 238,102 | |
| | 12,800 | | | Nissin Kogyo Company, Ltd. | | | 197,829 | |
| | 81 | | | Nomura Real Estate Office Fund, Inc. | | | 358,966 | |
| | 37 | | | Nomura Real Estate Residential Fund, Inc. | | | 195,013 | |
| | 30,000 | | | NS United Kaiun Kaisha, Ltd. | | | 74,873 | |
| | 214,000 | | | NTN Corporation | | | 925,287 | |
| | 500 | | | Ohsho Food Service Corporation | | | 18,061 | |
| | 2,100 | | | Okamura Corporation | | | 15,324 | |
| | 600 | | | Okinawa Electric Power Company, Inc. | | | 18,298 | |
| | 18,000 | | | Okuma Corporation | | | 129,242 | |
| | 31,800 | | | OMRON Corporation | | | 1,505,243 | |
| | 24 | | | Orix JREIT, Inc. | | | 31,998 | |
| | 25,000 | | | Pacific Metals Company, Ltd.a | | | 79,090 | |
| | 800 | | | PAL Company, Ltd. | | | 24,059 | |
| | 8,600 | | | Paltac Corporation | | | 104,794 | |
| | 1,200 | | | Paramount Bed Holdings Company, Ltd. | | | 34,131 | |
| | 2,700 | | | Pilot Corporation | | | 151,595 | |
| | 9,900 | | | Pola Orbis Holdings, Inc. | | | 406,570 | |
| | 5,481 | | | Riso Kagaku Corporation | | | 165,742 | |
| | 50,471 | | | ROHTO Pharmaceutical Company, Ltd. | | | 732,117 | |
| | 10,400 | | | Roland DG Corporation | | | 438,986 | |
| | 22,900 | | | Round One Corporation | | | 138,155 | |
| | 11,000 | | | Ryobi, Ltd. | | | 30,023 | |
| | 3,000 | | | Saint Marc Holdings Company, Ltd. | | | 156,845 | |
| | 7,700 | | | Sakata Seed Corporation | | | 114,196 | |
| | 3,100 | | | San-A Company, Ltd. | | | 104,497 | |
| | 119,000 | | | Sankyu, Inc. | | | 550,168 | |
| | 44,000 | | | Sanwa Holdings Corporation | | | 305,097 | |
| | 41,000 | | | Sanyo Special Steel Company, Ltd. | | | 140,716 | |
| | 136,000 | | | Sapporo Holdings, Ltd. | | | 588,583 | |
| | 1,000 | | | Sato Holdings Corporation | | | 26,338 | |
| | 46,200 | | | Seiko Epson Corporation | | | 2,143,898 | |
| | 9,000 | | | Seino Holdings Company, Ltd. | | | 70,567 | |
| | 403 | | | Sekisui House SI Investment Corporation | | | 393,679 | |
| | 90,000 | | | SENKO Company, Ltd. | | | 382,805 | |
| | 221,000 | | | Showa Denko KK | | | 292,457 | |
| | 36,000 | | | SMK Corporation | | | 144,638 | |
| | 17,900 | | | Sohgo Security Services Company, Ltd. | | | 418,601 | |
| | 5,700 | | | Star Micronics Company, Ltd. | | | 86,678 | |
| | 14,000 | | | Sumitomo Bakelite Company, Ltd | | | 55,096 | |
| | 464,695 | | | Sumitomo Corporation | | | 4,958,165 | |
| | 5,300 | | | Sumitomo Densetsu Company, Ltd. | | | 65,535 | |
| | 319,000 | | | Sumitomo Heavy Industries, Ltd. | | | 1,748,897 | |
| | 34,600 | | | Sumitomo Mitsui Financial Group, Inc. | | | 1,411,089 | |
| | 1,383,475 | | | Sumitomo Mitsui Trust Holdings, Inc. | | | 5,648,347 | |
| | 10,400 | | | Sumitomo Riko Company, Ltd. | | | 89,382 | |
| | 10,000 | | | Sumitomo Seika Chemicals Company, Ltd. | | | 61,346 | |
| | 4,100 | | | Tachi-S Company, Ltd. | | | 51,987 | |
| | 6,000 | | | Taihei Dengyo Kaisha, Ltd. | | | 48,982 | |
| | 13,700 | | | Taikisha, Ltd. | | | 304,448 | |
| | 14,200 | | | Tamron Company, Ltd. | | | 281,087 | |
| | 2,300 | | | TOCALO Company, Ltd. | | | 43,387 | |
| | 7,000 | | | Toei Company, Ltd. | | | 36,936 | |
| | 7,500 | | | Tokai Tokyo Financial Holdings, Inc. | | | 50,878 | |
| | 57,000 | | | Tokio Marine Holdings, Inc. | | | 1,827,883 | |
| | 12,000 | | | Tokuyama Corporation | | | 35,077 | |
| | 13,000 | | | Tokyo Seimitsu Company, Ltd. | | | 211,543 | |
| | 129 | | | Tokyu REIT, Inc. | | | 179,206 | |
| | 47 | | | Top REIT, Inc. | | | 193,996 | |
| | 4,100 | | | Topre Corporation | | | 58,057 | |
| | 1,600 | | | Torii Pharmaceutical Company, Ltd. | | | 45,914 | |
| | 7,100 | | | Towa Pharmaceutical Company, Ltd. | | | 313,468 | |
| | 82,000 | | | Toyota Motor Corporation | | | 4,934,530 | |
| | 2,900 | | | TPR Company, Ltd. | | | 68,747 | |
| | 300 | | | Trancom Company, Ltd. | | | 12,537 | |
| | 6,800 | | | ULVAC, Inc.a | | | 84,677 | |
| | 9,800 | | | Unipres Corporation | | | 195,019 | |
| | 18,700 | | | Wakita & Company, Ltd. | | | 186,861 | |
| | 3,200 | | | Warabeya Nichiyo Company, Ltd. | | | 56,114 | |
| | 30,900 | | | West Japan Railway Company | | | 1,472,860 | |
| | 2,100 | | | Yahagi Construction Company, Ltd. | | | 15,898 | |
| | 12,800 | | | Yokogawa Bridge Holdings Corporation | | | 164,560 | |
| | 5,300 | | | Yoshinoya Holdings Company, Ltd. | | | 60,721 | |
| | | | | |
| | | | Total | | | 126,198,998 | |
| | | | | |
| |
| Jersey (0.7%) | | | | |
| | 23,366 | | | Petra Diamonds, Ltd.a | | | 62,048 | |
| | 81,351 | | | Redefine International plc | | | 67,411 | |
| | 298,400 | | | WPP plc | | | 5,828,516 | |
| | | | | |
| | | | Total | | | 5,957,975 | |
| | | | | |
| |
| Luxembourg (0.3%) | | | | |
| | 53,000 | | | Tenaris SA ADR | | | 2,100,920 | |
| | 24,852 | | | Ternium SA ADR | | | 546,993 | |
| | | | | |
| | | | Total | | | 2,647,913 | |
| | | | | |
| |
| Malaysia (0.3%) | | | | |
| | 518,088 | | | CIMB Group Holdings Berhad | | | 1,023,038 | |
| | 167,000 | | | Genting Berhad | | | 495,099 | |
| | 205,915 | | | Malayan Banking Berhad | | | 607,475 | |
| | 135,500 | | | Public Bank Berhad | | | 763,752 | |
| | | | | |
| | | | Total | | | 2,889,364 | |
| | | | | |
| |
| Mexico (1.1%) | | | | |
| | 850,800 | | | America Movil SAB de CV | | | 1,040,577 | |
| | 168,000 | | | Consorcio ARA SAB de CVa | | | 76,600 | |
| | 30,000 | | | Fomento Economico Mexicano SAB de CV ADR | | | 2,887,200 | |
| | 11,100 | | | Grupo Aeroportuario del Sureste SAB de CV ADR | | | 1,494,948 | |
| | 406,813 | | | Grupo Financiero Banorte SAB de CV ADR | | | 2,607,108 | |
| | 271,000 | | | Organizacion Soriana SAB de CV | | | 887,687 | |
| | | | | |
| | | | Total | | | 8,994,120 | |
| | | | | |
| |
| Netherlands (3.3%) | | | | |
| | 11,465 | | | Aalberts Industries NV | | | 305,608 | |
| | 1,012,100 | | | Aegon NV | | | 8,249,061 | |
| | 5,956 | | | ASM International NV | | | 238,673 | |
| | 47,815 | | | ASML Holding NV | | | 4,767,742 | |
| | 25,942 | | | BE Semiconductor Industries NV | | | 494,124 | |
| | 34,156 | | | BinckBank NV | | | 338,509 | |
| | 3,951 | | | Eurocommercial Properties NV | | | 180,367 | |
| | 40,548 | | | Heineken NV | | | 3,029,100 | |
| | 89,750 | | | Koninklijke DSM NV | | | 5,623,550 | |
| | 10,811 | | | Nutreco NV | | | 541,494 | |
| | 210,015 | | | PostNL NVa | | | 892,636 | |
| | 99,630 | | | TomTom NVa | | | 723,739 | |
| | 21,575 | | | Unilever NV | | | 836,213 | |
| | 4,142 | | | Vastned Retail NV | | | 189,151 | |
The accompanying Notes to Financial Statements are an integral part of this schedule.
182
PARTNER WORLDWIDE ALLOCATION FUND
Schedule of Investments as of October 31, 2014
| | | | | | | | |
| Shares | | | Common Stock (86.5%) | | Value | |
| Netherlands (3.3%) - continued | |
| | 10,828 | | | Wereldhave NV | | | $887,708 | |
| | | | | |
| | | | Total | | | 27,297,675 | |
| | | | | |
| |
| New Zealand (0.1%) | | | | |
| | 376,822 | | | Air New Zealand, Ltd. | | | 596,542 | |
| | 4,771 | | | Sky Network Television, Ltd. | | | 23,690 | |
| | 37,198 | | | Summerset Group Holdings, Ltd. | | | 79,308 | |
| | | | | |
| | | | Total | | | 699,540 | |
| | | | | |
| |
| Norway (1.0%) | | | | |
| | 10,604 | | | Austevoll Seafood ASA | | | 68,957 | |
| | 11,579 | | | Borregaard ASA | | | 80,465 | |
| | 17,750 | | | BW LPG, Ltd.c | | | 168,240 | |
| | 9,951 | | | Cermaq ASA | | | 141,262 | |
| | 58,785 | | | DnB ASA | | | 1,080,014 | |
| | 6,162 | | | Leroy Seafood Group ASA | | | 233,105 | |
| | 78,361 | | | Marine Harvest ASA | | | 1,109,787 | |
| | 4,459 | | | Nordic Semiconductor ASAa | | | 25,120 | |
| | 265,580 | | | Norsk Hydro ASA | | | 1,486,960 | |
| | 21,096 | | | SalMar ASA | | | 380,077 | |
| | 12,194 | | | SpareBank 1 SMN | | | 108,432 | |
| | 74,813 | | | Statoil ASA | | | 1,712,128 | |
| | 55,169 | | | Storebrand ASAa | | | 282,874 | |
| | 31,780 | | | Yara International ASA | | | 1,459,381 | |
| | | | | |
| | | | Total | | | 8,336,802 | |
| | | | | |
| |
| Panama (<0.1%) | | | | |
| | 2,656 | | | Copa Holdings SA | | | 310,540 | |
| | | | | |
| | | | Total | | | 310,540 | |
| | | | | |
| |
| Peru (<0.1%) | | | | |
| | 24,264 | | | Cia de Minas Buenaventura SA ADR | | | 223,229 | |
| | | | | |
| | | | Total | | | 223,229 | |
| | | | | |
| |
| Philippines (0.4%) | | | | |
| | 2,575,500 | | | Ayala Land, Inc. | | | 1,924,473 | |
| | 746,364 | | | Bank of the Philippine Islands | | | 1,581,542 | |
| | | | | |
| | | | Total | | | 3,506,015 | |
| | | | | |
| |
| Poland (0.3%) | | | | |
| | 6,668 | | | Bank Handlowy w Warszawie SA | | | 225,455 | |
| | 42,805 | | | Bank Pekao SA | | | 2,240,347 | |
| | 3,766 | | | Grupa Lotos SAa | | | 29,093 | |
| | 53,705 | | | Orange Polska SA | | | 160,923 | |
| | | | | |
| | | | Total | | | 2,655,818 | |
| | | | | |
| |
| Portugal (0.2%) | | | | |
| | 2,978,379 | | | Banco Espirito Santo SAa,d | | | 373 | |
| | 83,827 | | | Jeronimo Martins SGPS SA | | | 733,621 | |
| | 69,488 | | | Mota-Engil Africa, SGPS SA Rightsa,d | | | 35,702 | |
| | 47,204 | | | Portucel SA | | | 175,685 | |
| | 234,706 | | | Portugal Telecom SGPS SA | | | 384,427 | |
| | 28,911 | | | Redes Energeticas Nacionais SGPS SA | | | 89,615 | |
| | | | | |
| | | | Total | | | 1,419,423 | |
| | | | | |
| |
| Russia (0.6%) | | | | |
| | 51,500 | | | Lukoil ADR | | | 2,524,498 | |
| | 6,451 | | | Magnit PJSC | | | 1,784,517 | |
| | 60,593 | | | Novolipetsk Steel OJSC GDR | | | 777,541 | |
| | 28,187 | | | Phosagro OAO | | | 299,712 | |
| | | | | |
| | | | Total | | | 5,386,268 | |
| | | | | |
| |
| Singapore (0.9%) | | | | |
| | 3,497 | | | Cape plc | | | 15,128 | |
| | 167,000 | | | DBS Group Holdings, Ltd. | | | 2,402,366 | |
| | 361,000 | | | Ezra Holdings, Ltd. | | | 229,386 | |
| | 34,000 | | | Ho Bee Land, Ltd. | | | 52,754 | |
| | 121,000 | | | Indofood Agri Resources, Ltd. | | | 78,727 | |
| | 488,310 | | | Keppel Corporation, Ltd. | | | 3,580,885 | |
| | 234,000 | | | Mapletree Logistics Trust | | | 214,234 | |
| | 3,155 | | | REC Solar ASAa | | | 42,187 | |
| | 87,000 | | | Wing Tai Holdings, Ltd. | | | 121,220 | |
| | 955,000 | | | Yangzijiang Shipbuilding Holdings, Ltd. | | | 840,654 | |
| | | | | |
| | | | Total | | | 7,577,541 | |
| | | | | |
| |
| South Africa (0.4%) | | | | |
| | 16,617 | | | AngloGold Ashanti, Ltd. ADRa | | | 137,423 | |
| | 13,014 | | | Barclays Africa Group, Ltd. | | | 205,677 | |
| | 27,294 | | | Impala Platinum Holdings, Ltd.a | | | 199,073 | |
| | 86,890 | | | Massmart Holdings, Ltd. | | | 939,306 | |
| | 26,990 | | | Reunert, Ltd. | | | 142,449 | |
| | 214,000 | | | Truworths International, Ltd. | | | 1,466,610 | |
| | | | | |
| | | | Total | | | 3,090,538 | |
| | | | | |
| |
| South Korea (2.0%) | | | | |
| | 6,003 | | | E-Mart Company, Ltd. | | | 1,113,850 | |
| | 3,027 | | | Hyundai Department Store Company, Ltd. | | | 383,737 | |
| | 4,959 | | | Hyundai Heavy Industries Company, Ltd. | | | 460,756 | |
| | 3,006 | | | Hyundai Mobis | | | 703,298 | |
| | 16,610 | | | Hyundai Motor Company | | | 2,635,702 | |
| | 93,125 | | | KB Financial Group, Inc. | | | 3,650,477 | |
| | 2,739 | | | LG Chem, Ltd. | | | 513,330 | |
| | 15,725 | | | POSCO | | | 4,541,963 | |
| | 4,245 | | | POSCO ADR | | | 303,772 | |
| | 841 | | | Samsung Electronics Company, Ltd. | | | 980,726 | |
| | 8,608 | | | Samsung Heavy Industries Company, Ltd. | | | 209,795 | |
| | 5,224 | | | Samsung Life Insurance Company, Ltd. | | | 569,816 | |
| | 12,214 | | | Shinhan Financial Group Company, Ltd. | | | 574,86 2 | |
| | 1,318 | | | Shinsegae Company, Ltd. | | | 244,498 | |
| | | | | |
| | | | Total | | | 16,886,582 | |
| | | | | |
| |
| Spain (2.3%) | | | | |
| | 38,252 | | | Abengoa SA | | | 169,539 | |
| | 12,838 | | | Acciona SAa | | | 897,228 | |
| | 47,946 | | | Actividades de Construccion y Servicios SA | | | 1,779,651 | |
| | 721,760 | | | Banco Popular Espanol SA | | | 4,145,936 | |
| | 524,658 | | | Banco Santander SA | | | 4,635,626 | |
| | 120,524 | | | Bankinter SA | | | 997,035 | |
| | 67,049 | | | Gas Natural SDG SA | | | 1,936,155 | |
| | 617,587 | | | Iberdrola SA | | | 4,371,842 | |
| | 4,443 | | | Let’s GOWEX SAa,d | | | 1 | |
| | 348,015 | | | Liberbank SAa | | | 297,300 | |
| | 6,162 | | | Prosegur Compania de Seguridad SA | | | 36,194 | |
| | | | | |
| | | | Total | | | 19,266,507 | |
| | | | | |
The accompanying Notes to Financial Statements are an integral part of this schedule.
183
PARTNER WORLDWIDE ALLOCATION FUND
Schedule of Investments as of October 31, 2014
| | | | | | | | |
| Shares | | | Common Stock (86.5%) | | Value | |
| Sweden (2.2%) | | | | |
| | 4,375 | | | B&B Tools Aktiebolag | | | $82,019 | |
| | 13,596 | | | Bilia AB | | | 385,944 | |
| | 3,157 | | | BioGaia AB | | | 80,377 | |
| | 86,866 | | | Boliden AB | | | 1,435,666 | |
| | 12,876 | | | Castellum AB | | | 197,455 | |
| | 3,878 | | | Clas Ohlson AB | | | 66,960 | |
| | 38,444 | | | Fabege AB | | | 493,493 | |
| | 19,033 | | | Fastighets AB Baldera | | | 247,989 | |
| | 10,541 | | | Haldex AB | | | 129,369 | |
| | 2,094 | | | Hexpol AB | | | 185,523 | |
| | 7,124 | | | Industrial and Financial Systems | | | 221,897 | |
| | 1,642 | | | Intrum Justitia AB | | | 48,902 | |
| | 56,961 | | | Investor AB | | | 2,044,479 | |
| | 28,866 | | | JM AB | | | 933,015 | |
| | 18,073 | | | Klovern AB | | | 92,012 | |
| | 54,295 | | | Loomis AB | | | 1,495,776 | |
| | 50,880 | | | Meda AB | | | 666,329 | |
| | 39,844 | | | NCC AB | | | 1,172,014 | |
| | 2,133 | | | Net Entertainment NE ABa | | | 65,912 | |
| | 25,083 | | | Nobia AB | | | 203,812 | |
| | 11,854 | | | Nolato AB | | | 274,107 | |
| | 2,976 | | | Peab AB | | | 20,204 | |
| | 8,287 | | | SAS ABa | | | 12,754 | |
| | 128,641 | | | Skandinaviska Enskilda Banken AB | | | 1,652,300 | |
| | 544,480 | | | Volvo AB | | | 6,283,538 | |
| | 8,865 | | | Wihlborgs Fastigheter AB | | | 155,477 | |
| | | | | |
| | | | Total | | | 18,647,323 | |
| | | | | |
| |
| Switzerland (7.7%) | | | | |
| | 25,510 | | | Actelion, Ltd. | | | 3,038,119 | |
| | 102,672 | | | Adecco SA | | | 6,959,276 | |
| | 17,640 | | | Aryzta AGa | | | 1,504,721 | |
| | 9,727 | | | Ascom Holding AG | | | 142,777 | |
| | 2,626 | | | Autoneum Holding AGa | | | 437,585 | |
| | 954 | | | Bossard Holding AGa | | | 96,696 | |
| | 177,728 | | | Credit Suisse Group AG | | | 4,735,350 | |
| | 461 | | | Flughafen Zuerich AG | | | 293,758 | |
| | 67 | | | Forbo Holding AG | | | 69,531 | |
| | 2,612 | | | Givaudan SAa | | | 4,361,969 | |
| | 1,992 | | | Helvetia Holding AG | | | 947,228 | |
| | 78,880 | | | Holcim, Ltd.a | | | 5,598,474 | |
| | 934 | | | Inficon Holding AGa | | | 291,223 | |
| | 300 | | | Kaba Holding AGa | | | 143,031 | |
| | 1,696 | | | Komax Holding AGa | | | 249,899 | |
| | 11,311 | | | Kudelski SA | | | 144,257 | |
| | 399 | | | Lindt & Spruengli AG | | | 2,002,571 | |
| | 71,793 | | | Logitech International SA | | | 1,016,429 | |
| | 93,211 | | | Nestle SA | | | 6,835,548 | |
| | 12,429 | | | Nobel Biocare Holding AGa | | | 220,129 | |
| | 98,480 | | | Novartis AG | | | 9,139,227 | |
| | 7,060 | | | PSP Swiss Property AGa | | | 605,937 | |
| | 45,392 | | | Roche Holding AG | | | 13,395,254 | |
| | 5,733 | | | Schweizerische National-Versicherungs-Gesellschaft AG | | | 478,084 | |
| | 644 | | | Siegfried Holding AGa | | | 98,986 | |
| | 2,046 | | | Straumann Holding AG | | | 503,736 | |
| | 3,676 | | | U-Blox AGa | | | 496,937 | |
| | 2,218 | | | Zehnder Group AG | | | 87,200 | |
| | | | | |
| | | | Total | | | 63,893,932 | |
| | | | | |
| |
| Taiwan (0.9%) | | | | |
| | 166,000 | | | Advanced Semiconductor Engineering, Inc. | | | 200,255 | |
| | 29,000 | | | Asustek Computer, Inc. | | | 296,095 | |
| | 88,275 | | | Chicony Electronics Company, Ltd. | | | 254,209 | |
| | 101,000 | | | Chipbond Technology Corporation | | | 186,232 | |
| | 177,000 | | | Compal Electronics, Inc. | | | 130,824 | |
| | 165,000 | | | Mega Financial Holding Company, Ltd. | | | 136,850 | |
| | 38,000 | | | Novatek Microelectronics Corporation | | | 196,690 | |
| | 29,000 | | | Richtek Technology Corporation | | | 139,940 | |
| | 53,000 | | | Taiwan Life Insurance Company, Ltd.a | | | 31,762 | |
| | 314,100 | | | Taiwan Mobile Company, Ltd. | | | 1,019,239 | |
| | 1,008,362 | | | Taiwan Semiconductor Manufacturing Company, Ltd. | | | 4,371,120 | |
| | 17,905 | | | Taiwan Semiconductor Manufacturing Company, Ltd. ADR | | | 394,268 | |
| | 142,000 | | | TECO Electric & Machinery Company, Ltd. | | | 158,000 | |
| | 20,000 | | | Vanguard International Semiconductor Corporation | | | 30,048 | |
| | | | | |
| | | | Total | | | 7,545,532 | |
| | | | | |
| |
| Thailand (2.1%) | | | | |
| | 456,900 | | | Bangkok Bank pcl | | | 2,833,543 | |
| | 34,900 | | | Bangkok Bank Public Company, Ltd. | | | 212,196 | |
| | 34,700 | | | Kasikornbank pcl | | | 251,401 | |
| | 8,448,135 | | | Krung Thai Bank pcl | | | 6,044,438 | |
| | 199,000 | | | PTT Exploration & Production pcl | | | 894,684 | |
| | 252,725 | | | PTT pcl | | | 2,860,144 | |
| | 133,100 | | | Siam Cement pcl | | | 1,848,751 | |
| | 367,700 | | | Siam Commercial Bank pcl | | | 2,005,081 | |
| | 226,300 | | | Thai Oil pcl | | | 310,497 | |
| | | | | |
| | | | Total | | | 17,260,735 | |
| | | | | |
| |
| Turkey (0.7%) | | | | |
| | 552,258 | | | Akbank TAS | | | 1,994,173 | |
| | 70,796 | | | BIM Birlesik Magazalar AS | | | 1,617,283 | |
| | 15,326 | | | Ford Otomotiv Sanayi AS | | | 195,757 | |
| | 411,000 | | | Turkiye Garanti Bankasi AS | | | 1,604,089 | |
| | | | | |
| | | | Total | | | 5,411,302 | |
| | | | | |
| |
| United Kingdom (9.0%) | | | | |
| | 127,787 | | | Amlin plc | | | 932,653 | |
| | 25,079 | | | AstraZeneca plc | | | 1,831,972 | |
| | 718,075 | | | BAE Systems plc | | | 5,288,067 | |
| | 15,310 | | | BankofGeorgia Holdings plc | | | 627,900 | |
| | 65,771 | | | Bellway plc | | | 1,844,942 | |
| | 27,408 | | | Berendsen plc | | | 443,818 | |
| | 15,119 | | | Berkeley Group Holdings plc | | | 552,919 | |
| | 34,000 | | | BHP Billiton plc | | | 876,020 | |
| | 26,633 | | | Big Yellow Group plc | | | 232,798 | |
| | 21,685 | | | Bodycote plc | | | 217,038 | |
| | 40,704 | | | British American Tobacco plc | | | 2,306,994 | |
| | 9,903 | | | Britvic plc | | | 107,972 | |
| | 223,747 | | | Cable & Wireless Communications plc | | | 172,905 | |
| | 18,585 | | | Carillion plc | | | 99,013 | |
| | 23,426 | | | Chesnara plc | | | 129,099 | |
| | 11,678 | | | Computacenter plc | | | 115,492 | |
| | 10,697 | | | Concentric AB | | | 130,888 | |
| | 5,810 | | | CSR plc | | | 78,082 | |
| | 1,201 | | | Daily Mail and General Trust plc | | | 15,197 | |
| | 6,566 | | | Dart Group plc | | | 27,452 | |
| | 18,561 | | | Diageo plc | | | 547,406 | |
| | 32,656 | | | Dialog Semiconductor plca | | | 1,127,670 | |
| | 24,704 | | | Diploma plc | | | 274,853 | |
| | 330,403 | | | Direct Line Insurance Group plc | | | 1,461,584 | |
| | 236,671 | | | DS Smith plc | | | 1,005,197 | |
| | 82,877 | | | Elementis plc | | | 350,995 | |
| | 47,001 | | | Fenner plc | | | 231,576 | |
| | 30,040 | | | Galliford Try plc | | | 587,925 | |
The accompanying Notes to Financial Statements are an integral part of this schedule.
184
PARTNER WORLDWIDE ALLOCATION FUND
Schedule of Investments as of October 31, 2014
| | | | | | | | |
| Shares | | | Common Stock (86.5%) | | Value | |
| United Kingdom (9.0%) - continued | |
| | 80,824 | | | GlaxoSmithKline plc | | | $1,827,743 | |
| | 118,671 | | | Globo plca | | | 81,630 | |
| | 9,238 | | | Go-Ahead Group plc | | | 363,724 | |
| | 13,245 | | | Great Portland Estates plc | | | 145,774 | |
| | 3,728 | | | Greggs plc | | | 36,161 | |
| | 93,973 | | | Halfords Group plc | | | 745,98 0 | |
| | 203,555 | | | Hansteen Holdings plc | | | 345,163 | |
| | 75,900 | | | Hikma Pharmaceuticals plc | | | 2,302,074 | |
| | 31,416 | | | Hiscox, Ltd. | | | 342,645 | |
| | 266,225 | | | Home Retail Group plc | | | 781,245 | |
| | 3,396 | | | HomeServe plc | | | 18,763 | |
| | 286,966 | | | Howden Joinery Group plc | | | 1,574,471 | |
| | 85,350 | | | HSBC Holdings plc ADRb | | | 4,354,558 | |
| | 10,114 | | | Hunting plc | | | 119,133 | |
| | 108,418 | | | IG Group Holdings plc | | | 1,044,869 | |
| | 34,406 | | | Imperial Tobacco Group plc | | | 1,494,654 | |
| | 132,191 | | | Inchcape plc | | | 1,472,643 | |
| | 81,257 | | | Intermediate Capital Group plc | | | 534,156 | |
| | 41,747 | | | Interserve plc | | | 423,844 | |
| | 740,964 | | | ITV plc | | | 2,407,148 | |
| | 5,997 | | | J D Wetherspoon plc | | | 80,824 | |
| | 59,858 | | | Jazztel plca | | | 956,983 | |
| | 16,076 | | | Keller Group plc | | | 214,801 | |
| | 45,984 | | | Lancashire Holdings, Ltd. | | | 492,892 | |
| | 79,260 | | | London Stock Exchange Group plc | | | 2,559,565 | |
| | 46,740 | | | LondonMetric Property plc | | | 110,210 | |
| | 20,108 | | | Lookers plc | | | 44,631 | |
| | 347,225 | | | Man Group plc | | | 688,466 | |
| | 32,618 | | | Marston’s plc | | | 78,686 | |
| | 35,863 | | | Micro Focus International plc | | | 571,340 | |
| | 37,673 | | | Mondi plc | | | 636,688 | |
| | 52,444 | | | Moneysupermarket.com Group plc | | | 168,474 | |
| | 1,465 | | | Morgan Sindall Group plc | | | 16,126 | |
| | 25,286 | | | Next plc | | | 2,610,433 | |
| | 21,801 | | | Northgate plc | | | 171,018 | |
| | 51,167 | | | Pace plc | | | 284,458 | |
| | 10,287 | | | Paragon Group of Companies plc | | | 59,586 | |
| | 83,581 | | | Pennon Group plc | | | 1,115,326 | |
| | 91,080 | | | Persimmon plc | | | 2,139,021 | |
| | 70,955 | | | Premier Oil plc | | | 292,992 | |
| | 124,332 | | | Prudential plc | | | 2,879,024 | |
| | 146,992 | | | QinetiQ Group plc | | | 476,414 | |
| | 9,819 | | | Restaurant Group plc | | | 106,383 | |
| | 41,584 | | | Royal Dutch Shell plc, Class A | | | 1,485,447 | |
| | 3,933 | | | RPC Group plc | | | 34,352 | |
| | 41,331 | | | SABMiller plc | | | 2,328,909 | |
| | 8,608 | | | Shanks Group plc | | | 13,407 | |
| | 34,534 | | | Shire plc | | | 2,317,115 | |
| | 35,585 | | | Soco International plca | | | 187,415 | |
| | 98,585 | | | Speedy Hire plc | | | 97,778 | |
| | 46,462 | | | Spirit Pub Company plc | | | 78,970 | |
| | 7,846 | | | Stagecoach Group plc | | | 48,632 | |
| | 106,851 | | | Standard Chartered plc | | | 1,608,385 | |
| | 14,770 | | | Stobart Group, Ltd. | | | 23,450 | |
| | 849 | | | Synergy Health plc | | | 25,394 | |
| | 1,026,771 | | | Taylor Wimpey plc | | | 1,950,408 | |
| | 22,817 | | | Trinity Mirror plca | | | 59,860 | |
| | 48,198 | | | TT Electronics plc | | | 129,234 | |
| | 273,364 | | | TUI Travel plc | | | 1,746,82 2 | |
| | 40,880 | | | Unilever plc | | | 1,644,411 | |
| | 54,640 | | | Vedanta Resources plc | | | 721,035 | |
| | 12,567 | | | Victrex plc | | | 341,367 | |
| | 44,885 | | | WH Smith plc | | | 810,385 | |
| | 4,953 | | | Workspace Group plc | | | 52,016 | |
| | 16,608 | | | WS Atkins plc | | | 361,074 | |
| | 10,903 | | | Xchanging plc | | | 33,058 | |
| | | | | |
| | | | Total | | | 74,888,070 | |
| | | | | |
|
| United States (0.2%) | |
| | 6,394 | | | CTC Media, Inc. | | | 40,666 | |
| | 17,961 | | | iShares MSCI Emerging Markets Index Fund | | | 757,056 | |
| | 17,600 | | | Yum! Brands, Inc. | | | 1,264,208 | |
| | | | | |
| | | | Total | | | 2,061,930 | |
| | | | | |
| | | | | | | | |
| | | | | |
| | | | Total Common Stock (cost $678,105,780) | | | 718,582,718 | |
| | | | | |
| | |
Principal Amount | | | Long-Term Fixed Income (10.3%) | | | |
| Argentina (0.2%) | |
| | | | Arcos Dorados BV | | | | |
| | $193,000 | | | 6.625%, 9/27/2023c | | | 191,553 | |
| | | | Argentina Government International Bond | | | | |
| | 70,000 | | | Zero Coupon, 6/2/2017 | | | 61,600 | |
| | 490,713 | | | 8.280%, 12/31/2033e | | | 433,054 | |
| | 6,854,000 | | | 0.000%, 12/15/2035f,g | | | 622,708 | |
| | 180,000 | | | 0.000%, 12/15/2035g | | | 13,050 | |
| | 4,214,000 | | | 0.000%, 12/15/2035g | | | 318,157 | |
| | | | | |
| | | | Total | | | 1,640,122 | |
| | | | | |
| |
| Azerbaijan (0.1%) | | | | |
| | | | Azerbaijan Government International Bond | | | | |
| | 290,000 | | | 4.750%, 3/18/2024c | | | 301,963 | |
| | | | State Oil Company of Azerbaijan Republic | | | | |
| | 200,000 | | | 5.450%, 2/9/2017 | | | 209,000 | |
| | 260,000 | | | 4.750%, 3/13/2023 | | | 258,206 | |
| | | | | |
| | | | Total | | | 769,169 | |
| | | | | |
| |
| Belarus (<0.1%) | | | | |
| | | | Belarus Government International Bond | | | | |
| | 216,000 | | | 8.750%, 8/3/2015 | | | 220,363 | |
| | | | | |
| | | | Total | | | 220,363 | |
| | | | | |
| |
| Belize (<0.1%) | | | | |
| | | | Belize Government International Bond | | | | |
| | 135,900 | | | 5.000%, 2/20/2038*,h | | | 102,605 | |
| | | | | |
| | | | Total | | | 102,605 | |
| | | | | |
| |
| Brazil (0.7%) | | | | |
| | | | Banco do Estado do Rio Grande do Sul SA | | | | |
| | 460,000 | | | 7.375%, 2/2/2022c | | | 481,652 | |
| | | | Brazil Government International Bond | | | | |
| | 322,000 | | | 6.000%, 8/15/2050i | | | 329,017 | |
| | 320,000 | | | 4.250%, 1/7/2025 | | | 325,120 | |
| | 120,000 | | | 7.125%, 1/20/2037 | | | 151,500 | |
| | 280,000 | | | 5.000%, 1/27/2045 | | | 274,400 | |
| | 703,000 | | | Brazil Letros do Tesouro Nacional Zero Coupon, 1/1/2015i | | | 278,537 | |
| | | | Brazil Loan Trust 1 | | | | |
| | 410,000 | | | 5.477%, 7/24/2023 | | | 425,375 | |
| | 640,000 | | | 5.477%, 7/24/2023* | | | 664,000 | |
The accompanying Notes to Financial Statements are an integral part of this schedule.
185
PARTNER WORLDWIDE ALLOCATION FUND
Schedule of Investments as of October 31, 2014
| | | | | | | | |
Principal Amount | | | Long-Term Fixed Income (10.3%) | | Value | |
| Brazil (0.7%) - continued | | | | |
| | | | Brazil Minas SPE via State of Minas Gerais | | | | |
| | $990,000 | | | 5.333%, 2/15/2028* | | | $994,949 | |
| | 400,000 | | | 5.333%, 2/15/2028 | | | 402,000 | |
| | | | Independencia International, Ltd. | | | | |
| | 95,246 | | | 12.000%, 12/30/2016*,d,e | | | 0 | |
| | | | Tupy SA | | | | |
| | 200,000 | | | 6.625%, 7/17/2024c | | | 202,500 | |
| | | | | |
| | | | Total | | | 4,529,050 | |
| | | | | |
| |
| Bulgaria (0.1%) | | | | |
| | | | Bulgaria Government International Bond | | | | |
| | 800,000 | | | 2.950%, 9/3/2024f | | | 1,002,519 | |
| | | | | |
| | | | Total | | | 1,002,519 | |
| | | | | |
| |
| Canada (0.1%) | | | | |
| | | | PTTEP Canada International Finance, Ltd. | | | | |
| | 400,000 | | | 5.692%, 4/5/2021 | | | 453,924 | |
| | | | | |
| | | | Total | | | 453,924 | |
| | | | | |
| |
| Chile (0.4%) | | | | |
| | | | AES Gener SA | | | | |
| | 330,000 | | | 8.375%, 12/18/2073c | | | 369,187 | |
| | 70,000 | | | 5.250%, 8/15/2021c | | | 74,680 | |
| | 280,000 | | | 5.250%, 8/15/2021 | | | 298,718 | |
| | | | Banco del Estado de Chile | | | | |
| | 290,000 | | | 4.125%, 10/7/2020 | | | 305,145 | |
| | 100,000 | | | 4.125%, 10/7/2020c | | | 105,223 | |
| | | | CFR International SPA | | | | |
| | 200,000 | | | 5.125%, 12/6/2022 | | | 216,052 | |
| | | | Corpbanca SA | | | | |
| | 286,000 | | | 3.875%, 9/22/2019c | | | 288,271 | |
| | | | E-CL SA | | | | |
| | 120,000 | | | 5.625%, 1/15/2021c | | | 129,876 | |
| | | | Empresa Nacional de Telecomunicaciones SA | | | | |
| | 340,000 | | | 4.875%, 10/30/2024c | | | 352,168 | |
| | | | GNL Quintero SA | | | | |
| | 710,000 | | | 4.634%, 7/31/2029c | | | 731,730 | |
| | | | Sociedad Quimica y Minera de Chile SA | | | | |
| | 200,000 | | | 3.625%, 4/3/2023 | | | 191,865 | |
| | 200,000 | | | 4.375%, 1/28/2025* | | | 198,465 | |
| | | | | |
| | | | Total | | | 3,261,380 | |
| | | | | |
| |
| China (0.2%) | | | | |
| | | | CITIC, Ltd. | | | | |
| | 200,000 | | | 6.875%, 1/21/2018 | | | 223,506 | |
| | 1,280,000 | | | 6.800%, 1/17/2023 | | | 1,472,051 | |
| | | | | |
| | | | Total | | | 1,695,557 | |
| | | | | |
| |
| Colombia (0.3%) | | | | |
| | | | Banco de Bogota SA | | | | |
| | 400,000 | | | 5.000%, 1/15/2017 | | | 426,000 | |
| | | | Bancolombia SA | | | | |
| | 100,000 | | | 5.950%, 6/3/2021 | | | 110,875 | |
| | | | Colombia Government International Bond | | | | |
| | 20,000 | | | 8.250%, 12/22/2014 | | | 20,190 | |
| | 240,000 | | | 7.375%, 3/18/2019 | | | 287,760 | |
| | 310,000 | | | 6.125%, 1/18/2041 | | | 372,000 | |
| | 610,000 | | | 5.625%, 2/26/2044 | | | 681,130 | |
| | | | Ecopetrol SA | | | | |
| | 60,000 | | | 7.375%, 9/18/2043 | | | 73,650 | |
| | | | Empresas Publicas de Medellin ESP | | | | |
| | 100,000 | | | 7.625%, 7/29/2019 | | | 119,250 | |
| | | | Pacific Rubiales Energy Corporation | | | | |
| | 150,000 | | | 5.375%, 1/26/2019c | | | 150,375 | |
| | 120,000 | | | 5.625%, 1/19/2025c | | | 114,114 | |
| | | | | |
| | | | Total | | | 2,355,344 | |
| | | | | |
| |
| Costa Rica (0.2%) | | | | |
| | | | Banco de Costa Rica | | | | |
| | 200,000 | | | 5.250%, 8/12/2018 | | | 205,680 | |
| | 220,000 | | | 5.250%, 8/12/2018c | | | 226,248 | |
| | | | Banco Nacional de Costa Rica | | | | |
| | 220,000 | | | 4.875%, 11/1/2018c | | | 224,400 | |
| | 480,000 | | | 6.250%, 11/1/2023c | | | 490,752 | |
| | | | Costa Rica Government International Bond | | | | |
| | 30,000 | | | 9.995%, 8/1/2020 | | | 38,625 | |
| | 210,000 | | | 5.625%, 4/30/2043c | | | 183,750 | |
| | 200,000 | | | 7.000%, 4/4/2044 | | | 206,500 | |
| | | | | |
| | | | Total | | | 1,575,955 | |
| | | | | |
| |
| Croatia (0.7%) | | | | |
| | | | Croatia Government International Bond | | | | |
| | 190,000 | | | 6.750%, 11/5/2019 | | | 210,663 | |
| | 660,000 | | | 6.375%, 3/24/2021 | | | 725,175 | |
| | 1,330,000 | | | 3.875%, 5/30/2022f | | | 1,685,437 | |
| | 1,899,000 | | | 6.000%, 1/26/2024 | | | 2,053,293 | |
| | | | | |
| | | | Total | | | 4,674,568 | |
| | | | | |
| |
| Dominican Republic (0.3%) | | | | |
| | | | Aeropuertos Dominicanos Siglo XXI SA | | | | |
| | 200,000 | | | 9.750%, 11/13/2019 | | | 191,000 | |
| | | | Dominican Republic Government International Bond | | | | |
| | 680,000 | | | 7.500%, 5/6/2021 | | | 773,500 | |
| | 1,400,000 | | | 14.500%, 2/10/202j | | | 35,988 | |
| | 190,000 | | | 8.625%, 4/20/2027 | | | 234,175 | |
| | 400,000 | | | 18.500%, 2/4/2028j | | | 12,206 | |
| | 9,200,000 | | | 18.500%, 2/4/2028c,j | | | 280,728 | |
| | 960,000 | | | 7.450%, 4/30/2044c | | | 1,072,800 | |
| | | | | |
| | | | Total | | | 2,600,397 | |
| | | | | |
| |
| Ecuador (0.1%) | | | | |
| | | | Ecuador Government International Bond | | | | |
| | 460,000 | | | 7.950%, 6/20/2024* | | | 481,850 | |
| | | | | |
| | | | Total | | | 481,850 | |
| | | | | |
The accompanying Notes to Financial Statements are an integral part of this schedule.
186
PARTNER WORLDWIDE ALLOCATION FUND
Schedule of Investments as of October 31, 2014
| | | | | | | | |
Principal Amount | | | Long-Term Fixed Income (10.3%) | | Value | |
| Egypt (0.1%) | | | | |
| | | | Egypt Government International Bond | | | | |
| | $450,000 | | | 5.750%, 4/29/2020 | | | $476,528 | |
| | | | | |
| | | | Total | | | 476,528 | |
| | | | | |
| |
| El Salvador (<0.1%) | | | | |
| | | | El Salvador Government International Bond | | | | |
| | 40,000 | | | 6.375%, 1/18/2027* | | | 41,000 | |
| | 60,000 | | | 8.250%, 4/10/2032 | | | 69,900 | |
| | 290,000 | | | 7.650%, 6/15/2035 | | | 316,100 | |
| | 50,000 | | | 7.650%, 6/15/2035c | | | 54,500 | |
| | 150,000 | | | 7.625%, 2/1/2041 | | | 162,000 | |
| | | | | |
| | | | Total | | | 643,500 | |
| | | | | |
| |
| Gabon (0.1%) | | | | |
| | | | Gabonese Republic Government International Bond | | | | |
| | 261,500 | | | 6.375%, 12/12/2024c | | | 277,190 | |
| | 600,000 | | | 6.375%, 12/12/2024 | | | 636,000 | |
| | | | | |
| | | | Total | | | 913,190 | |
| | | | | |
| |
| Ghana (<0.1%) | | | | |
| | | | Ghana Government International Bond | | | | |
| | 290,000 | | | 8.500%, 10/4/2017 | | | 306,733 | |
| | 390,000 | | | 8.125%, 1/18/2026* | | | 391,950 | |
| | | | | |
| | | | Total | | | 698,683 | |
| | | | | |
| |
| Guatemala (0.1%) | | | | |
| | | | Agromercantil Senior Trust | | | | |
| | 170,000 | | | 6.250%, 4/10/2019c | | | 176,205 | |
| | | | Guatemala Government International Bond | | | | |
| | 200,000 | | | 4.875%, 2/13/2028 | | | 204,500 | |
| | 210,000 | | | 4.875%, 2/13/2028c | | | 214,725 | |
| | | | | |
| | | | Total | | | 595,430 | |
| | | | | |
| |
| Honduras (0.1%) | | | | |
| | | | Honduras Government International Bond | | | | |
| | 200,000 | | | 8.750%, 12/16/2020 | | | 227,750 | |
| | 780,000 | | | 8.750%, 12/16/2020* | | | 888,225 | |
| | | | | |
| | | | Total | | | 1,115,975 | |
| | | | | |
| |
| Hong Kong (0.1%) | | | | |
| | | | China Unicom Hong Kong, Ltd. | | | | |
| | 1,480,000 | | | 4.000%, 4/16/2017k | | | 241,381 | |
| | | | Metropolitan Light International, Ltd. | | | | |
| | 200,000 | | | 5.250%, 1/17/2018 | | | 201,000 | |
| | | | Sun Hung Kai Properties Capital Market, Ltd. | | | | |
| | 200,000 | | | 3.625%, 1/16/2023 | | | 198,673 | |
| | | | | |
| | | | Total | | | 641,054 | |
| | | | | |
| |
| Hungary (<0.1%) | | | | |
| | | | Hungary Government International Bond | | | | |
| | 20,000 | | | 4.125%, 2/19/2018 | | | 20,655 | |
| | 150,000 | | | 4.000%, 3/25/2019 | | | 153,675 | |
| | 110,000 | | | 7.625%, 3/29/2041 | | | 142,175 | |
| | | | | |
| | | | Total | | | 316,505 | |
| | | | | |
| |
| India (<0.1%) | | | | |
| | | | Greenko Dutch BV | | | | |
| | 250,000 | | | 8.000%, 8/1/2019c | | | 246,875 | |
| | | | | |
| | | | Total | | | 246,875 | |
| | | | | |
| |
| Indonesia (0.6%) | | | | |
| | | | Bumi Investment Private, Ltd. | | | | |
| | 100,000 | | | 10.750%, 10/6/2017 | | | 37,750 | |
| | | | Indonesia Government International Bond | | | | |
| | 540,000 | | | 5.875%, 1/15/2024c | | | 614,250 | |
| | 200,000 | | | 5.875%, 1/15/2024 | | | 227,500 | |
| | 610,000 | | | 8.500%, 10/12/2035 | | | 850,949 | |
| | 180,000 | | | 6.625%, 2/17/2037 | | | 210,150 | |
| | 400,000 | | | 5.250%, 1/17/2042 | | | 401,000 | |
| | 400,000 | | | 6.750%, 1/15/2044 | | | 490,500 | |
| | | | Perusahaan Penerbit Surat Berharga Syariah Negara Indonesia | | | | |
| | 200,000 | | | 4.350%, 9/10/2024c | | | 200,500 | |
| | | | PT Pertamina Persero | | | | |
| | 200,000 | | | 5.625%, 5/20/2043 | | | 191,500 | |
| | 370,000 | | | 5.625%, 5/20/2043c | | | 354,275 | |
| | | | PT Perusahaan Gas Negara Persero Tbk | | | | |
| | 620,000 | | | 5.125%, 5/16/2024c | | | 636,275 | |
| | | | | |
| | | | Total | | | 4,214,649 | |
| | | | | |
| |
| Iraq (0.1%) | | | | |
| | | | Iraq Government International Bond | | | | |
| | 750,000 | | | 5.800%, 1/15/2028 | | | 661,875 | |
| | | | | |
| | | | Total | | | 661,875 | |
| | | | | |
| |
| Ireland (0.1%) | | | | |
| | | | Sibur Securities, Ltd. | | | | |
| | 280,000 | | | 3.914%, 1/31/2018c | | | 260,050 | |
| | | | Vimpel Communcations Via VIP Finance Ireland, Ltd. OJSC | | | | |
| | 170,000 | | | 9.125%, 4/30/2018 | | | 183,388 | |
| | | | | |
| | | | Total | | | 443,438 | |
| | | | | |
| |
| Israel (<0.1%) | | | | |
| | | | Delek and Avner Yam Tethys, Ltd. | | | | |
| | 60,000 | | | 2.803%, 12/30/2016c | | | 59,975 | |
| | 160,000 | | | 3.839%, 12/30/2018c | | | 161,258 | |
| | | | | |
| | | | Total | | | 221,233 | |
| | | | | |
| |
| Italy (<0.1%) | | | | |
| | | | Wind Acquisition Finance SA | | | | |
| | 190,000 | | | 7.000%, 4/23/2022f | | | 235,241 | |
| | | | | |
| | | | Total | | | 235,241 | |
| | | | | |
| |
| Jamaica (0.1%) | | | | |
| | | | Jamaica Government International Bond | | | | |
| | 420,000 | | | 7.625%, 7/9/2025 | | | 448,875 | |
| | | | | |
| | | | Total | | | 448,875 | |
| | | | | |
The accompanying Notes to Financial Statements are an integral part of this schedule.
187
PARTNER WORLDWIDE ALLOCATION FUND
Schedule of Investments as of October 31, 2014
| | | | | | | | |
Principal Amount | | | Long-Term Fixed Income (10.3%) | | Value | |
| Kazakhstan (0.2%) | | | | |
| | | | Kazakhstan Government International Bond | | | | |
| | $370,000 | | | 4.875%, 10/14/2044c | | | $357,050 | |
| | | | Kazatomprom Natsionalnaya Atomnaya KompaniyaAO | | | | |
| | 100,000 | | | 6.250%, 5/20/2015 | | | 101,636 | |
| | | | KazMunayGas National Company JSC | | | | |
| | 220,000 | | | 11.750%, 1/23/2015 | | | 224,539 | |
| | 200,000 | | | 4.875%, 5/7/2025 | | | 198,784 | |
| | 490,000 | | | 5.750%, 4/30/2043* | | | 476,525 | |
| | 590,000 | | | 6.000%, 11/7/2044 | | | 581,923 | |
| | | | | |
| | | | Total | | | 1,940,457 | |
| | | | | |
| |
| Lithuania (0.3%) | | | | |
| | | | Lithuania Government International Bond | | | | |
| | 480,000 | | | 7.375%, 2/11/2020 | | | 580,800 | |
| | 520,000 | | | 6.125%, 3/9/2021 | | | 605,800 | |
| | 800,000 | | | 6.625%, 2/1/2022 | | | 964,000 | |
| | | | | |
| | | | Total | | | 2,150,600 | |
| | | | | |
| |
| Luxembourg (0.2%) | | | | |
| | | | Gazprom Neft OAO Via GPN Capital SA | | | | |
| | 690,000 | | | 6.000%, 11/27/2023c | | | 667,575 | |
| | | | Millicom International Cellular SA | | | | |
| | 200,000 | | | 4.750%, 5/22/2020c | | | 197,500 | |
| | | | Wind Acquisition Finance SA | | | | |
| | 220,000 | | | 4.750%, 7/15/2020c | | | 215,050 | |
| | 440,000 | | | 7.375%, 4/23/2021c | | | 430,100 | |
| | | | | |
| | | | Total | | | 1,510,225 | |
| | | | | |
| |
| Macedonia, The Former Yugoslav Republic Of (<0.1%) | | | | |
| | | | Macedonia Government International Bond | | | | |
| | 230,000 | | | 3.975%, 7/24/2021*,f | | | 292,548 | |
| | | | | |
| | | | Total | | | 292,548 | |
| | | | | |
| |
| Mexico (0.7%) | | | | |
| | | | America Movil SAB de CV | | | | |
| | 2,010,000 | | | 6.000%, 6/9/2019l | | | 150,411 | |
| | | | Cemex SAB de CV | | | | |
| | 100,000 | | | 4.750%, 1/11/2022c’f | | | 125,472 | |
| | | | Metalsa SA de CV | | | | |
| | 190,000 | | | 4.900%, 4/24/2023c | | | 182,400 | |
| | | | Mexican Udibonos | | | | |
| | 2,459,988 | | | 5.000%, 6/16/2016l | | | 197,384 | |
| | | | Mexico Cetes | | | | |
| | 74,176,100 | | | Zero Coupon, 12/11/2014l | | | 549,028 | |
| | 35,115,100 | | | Zero Coupon, 12/18/2014l | | | 259,765 | |
| | 68,923,000 | | | Zero Coupon, 1/15/2015l | | | 508,693 | |
| | 53,478,600 | | | Zero Coupon, 1/22/2015l | | | 394,486 | |
| | 12,560,500 | | | Zero Coupon, 3/19/2015l | | | 92,214 | |
| | | | Mexico Government International Bond | | | | |
| | 10,000 | | | 6.625%, 3/3/2015 | | | 10,165 | |
| | 170,000 | | | 6.050%, 1/11/2040 | | | 205,275 | |
| | 780,000 | | | 4.750%, 3/8/2044 | | | 792,089 | |
| | 145,000 | | | 5.550%, 1/21/2045 | | | 164,575 | |
| | 60,000 | | | 5.750%, 10/12/2110 | | | 63,530 | |
| | | | Petroleos Mexicanos | | | | |
| | 47,000 | | | 6.500%, 6/2/2041 | | | 54,990 | |
| | 780,000 | | | 6.375%, 1/23/2045 | | | 894,972 | |
| | | | Trust F/1401 | | | | |
| | 200,000 | | | 6.950%, 1/30/2044* | | | 227,000 | |
| | | | | |
| | | | Total | | | 4,872,449 | |
| | | | | |
| |
| Mozambiaue (0.1%) | | | | |
| | | | Mozambique EMATUM Finance 2020 BV | | | | |
| | 600,000 | | | 6.305%, 9/11/2020 | | | 599,250 | |
| | | | | |
| | | | Total | | | 599,250 | |
| | | | | |
| |
| Netherlands (< 0.1%) | | | | |
| | | | Listrindo Capital BV | | | | |
| | 200,000 | | | 6.950%, 2/21/2019 | | | 213,000 | |
| | | | | |
| | | | Total | | | 213,000 | |
| | | | | |
| |
| Pakistan (0.1%) | | | | |
| | | | Pakistan Government International Bond | | | | |
| | 100,000 | | | 6.875%, 6/1/2017 | | | 102,250 | |
| | 360,000 | | | 8.250%, 4/15/2024c | | | 375,300 | |
| | 120,000 | | | 7.875%, 3/31/2036 | | | 108,000 | |
| | | | | |
| | | | Total | | | 585,550 | |
| | | | | |
| |
| Panama (0.2%) | | | | |
| | | | Panama Government International Bond | | | | |
| | 350,000 | | | 4.000%, 9/22/2024 | | | 357,875 | |
| | 507,000 | | | 8.875%, 9/30/2027 | | | 726,278 | |
| | 318,000 | | | 9.375%, 4/1/2029 | | | 475,410 | |
| | 610,000 | | | 6.700%, 1/26/2036 | | | 767,075 | |
| | | | Panama Notas del Tesoro | | | | |
| | 50,000 | | | 4.875%, 2/5/2021 | | | 52,872 | |
| | | | | |
| | | | Total | | | 2,379,510 | |
| | | | | |
| |
| Paraguay (0.3%) | | | | |
| | | | Banco Continental SAECA | | | | |
| | 150,000 | | | 8.875%, 10/15/2017 | | | 159,750 | |
| | 150,000 | | | 8.875%, 10/15/2017* | | | 159,750 | |
| | | | Banco Regional SAECA | | | | |
| | 150,000 | | | 8.125%, 1/24/2019 | | | 162,750 | |
| | 330,000 | | | 8.125%, 1/24/2019c | | | 358,050 | |
| | | | Paraguay Government International Bond | | | | |
| | 610,000 | | | 4.625%, 1/25/2023 | | | 622,810 | |
| | 590,000 | | | 4.625%, 1/25/2023c | | | 602,390 | |
| | 550,000 | | | 6.100%, 8/11/2044* | | | 589,188 | |
| | | | | |
| | | | Total | | | 2,654,688 | |
| | | | | |
| |
| Peru (0.3%) | | | | |
| | | | Abengoa Transmision Sur SA | | | | |
| | 320,000 | | | 6.875%, 4/30/2043* | | | 354,368 | |
| | | | Corporacion Financiera de Desarrollo SA | | | | |
| | 200,000 | | | 4.750%, 2/8/2022c | | | 209,000 | |
| | | | Corporacion Lindley SA | | | | |
| | 90,000 | | | 6.750%, 11/23/2021c | | | 98,325 | |
| | 240,000 | | | 6.750%, 11/23/2021 | | | 262,200 | |
The accompanying Notes to Financial Statements are an integral part of this schedule.
188
PARTNER WORLDWIDE ALLOCATION FUND
Schedule of Investments as of October 31, 2014
| | | | | | | | |
Principal Amount | | | Long-Term Fixed Income (10.3%) | | Value | |
| Peru (0.3%) - continued | | | | |
| | $80,000 | | | 4.625%, 4/12/2023c | | | $78,200 | |
| | | | Peru Government International Bond | | | | |
| | 450,000 | | | 5.625%, 11/18/2050m | | | 508,247 | |
| | 357,000 | | | 8.750%, 11/21/2033 | | | 548,888 | |
| | 40,000 | | | 6.550%, 3/14/2037 | | | 51,100 | |
| | | | | |
| | | | Total | | | 2,110,328 | |
| | | | | |
| |
| Philippines (0.2%) | | | | |
| | | | Alliance Global Group, Inc. | | | | |
| | 100,000 | | | 6.500%, 8/18/2017 | | | 107,500 | |
| | | | Energy Development Corporation | | | | |
| | 300,000 | | | 6.500%, 1/20/2021 | | | 325,500 | |
| | | | Philippines Government International Bond | | | | |
| | 595,000 | | | 4.200%, 1/21/2024 | | | 641,856 | |
| | 280,000 | | | 7.750%, 1/14/2031 | | | 397,600 | |
| | 100,000 | | | 6.375%, 10/23/2034 | | | 131,250 | |
| | | | San Miguel Corporation | | | | |
| | 220,000 | | | 4.875%, 4/26/2023 | | | 202,400 | |
| | | | | |
| | | | Total | | | 1,806,106 | |
| | | | | |
| |
| Romania (0.2%) | | | | |
| | | | Romania Government International Bond | | | | |
| | 187,000 | | | 6.500%, 6/18/2018f | | | 275,348 | |
| | 280,000 | | | 4.875%, 11/7/2019f | | | 399,093 | |
| | 290,000 | | | 4.625%, 9/18/2020f | | | 413,164 | |
| | 660,000 | | | 3.625%, 4/24/2024f | | | 882,443 | |
| | | | | |
| | | | Total | | | 1,970,048 | |
| | | | | |
| |
| Russia (0.2%) | | | | |
| | | | AHML Finance, Ltd. | | | | |
| | 5,700,000 | | | 7.750%, 2/13/2018*,n | | | 118,452 | |
| | | | EDC Finance, Ltd. | | | | |
| | 200,000 | | | 4.875%, 4/17/2020 | | | 181,000 | |
| | | | Gazprom Neft OAO Via GPN Capital SA | | | | |
| | 420,000 | | | 4.375%, 9/19/2022 | | | 371,175 | |
| | 200,000 | | | 6.000%, 11/27/2023 | | | 193,500 | |
| | | | Lukoil International Finance BV | | | | |
| | 200,000 | | | 6.125%, 11/9/2020 | | | 203,500 | |
| | | | Mobile Telesystems OJSC | | | | |
| | 200,000 | | | 5.000%, 5/30/2023 | | | 179,250 | |
| | | | Phosagro OAO via Phosagro Bond Funding, Ltd. | | | | |
| | 200,000 | | | 4.204%, 2/13/2018* | | | 193,000 | |
| | | | Russia Government International Bond | | | | |
| | 200,000 | | | 4.500%, 4/4/2022 | | | 198,250 | |
| | 200,000 | | | 5.875%, 9/16/2043c | | | 209,000 | |
| | | | | |
| | | | Total | | | 1,847,127 | |
| | | | | |
| |
| Serbia (<0.1%) | | | | |
| | | | Serbia Government International Bond | | | | |
| | 380,000 | | | 5.875%, 12/3/2018c | | | 402,564 | |
| | | | | |
| | | | Total | | | 402,564 | |
| | | | | |
| |
| Singapore (<0.1%) | | | | |
| | | | Olam International, Ltd. | | | | |
| | 290,000 | | | 6.750%, 1/29/2018 | | | 300,150 | |
| | | | | |
| | | | Total | | | 300,150 | |
| | | | | |
| |
| South Africa (0 3%) | | | | |
| | | | South Africa Government International Bond | | | | |
| | 710,000 | | | 5.875%, 5/30/2022 | | | 802,300 | |
| | 290,000 | | | 4.665%, 1/17/2024 | | | 301,600 | |
| | 580,000 | | | 5.875%, 9/16/2025 | | | 655,400 | |
| | 520,000 | | | 5.375%, 7/24/2044 | | | 538,200 | |
| | | | | |
| | | | Total | | | 2,297,500 | |
| | | | | |
| |
| Sri Lanka (0.1%) | | | | |
| | | | Sri Lanka Government International Bond | | | | |
| | 220,000 | | | 6.000%, 1/14/2019 | | | 233,200 | |
| | 310,000 | | | 6.000%, 1/14/2019c | | | 328,600 | |
| | 210,000 | | | 6.250%, 10/4/2020 | | | 223,650 | |
| | 210,000 | | | 5.875%, 7/25/2022 | | | 218,400 | |
| | | | | |
| | | | Total | | | 1,003,850 | |
| | | | | |
| |
| Supranational (0.1%) | | | | |
| | | | Corporacion Andina de Fomento | | | | |
| | 424,000 | | | 4.375%, 6/15/2022 | | | 455,641 | |
| | | | | |
| | | | Total | | | 455,641 | |
| | | | | |
| |
| Thailand (0.1%) | | | | |
| | | | PTT Exploration & Production pcl | | | | |
| | 500,000 | | | 4.875%, 12/29/2049c,o | | | 508,100 | |
| | | | | |
| | | | Total | | | 508,100 | |
| | | | | |
| |
| Turkey (0.4%) | | | | |
| | | | Export Credit Bank of Turkey | | | | |
| | 200,000 | | | 5.875%, 4/24/2019 | | | 212,660 | |
| | | | Turkey Government International Bond | | | | |
| | 820,000 | | | 7.000%, 6/5/2020 | | | 954,069 | |
| | 130,000 | | | 5.625%, 3/30/2021 | | | 142,347 | |
| | 200,000 | | | 6.250%, 9/26/2022 | | | 227,000 | |
| | 530,000 | | | 5.750%, 3/22/2024 | | | 585,279 | |
| | 220,000 | | | 7.375%, 2/5/2025 | | | 271,909 | |
| | 50,000 | | | 8.000%, 2/14/2034 | | | 67,375 | |
| | 340,000 | | | 6.875%, 3/17/2036 | | | 411,400 | |
| | 610,000 | | | 6.000%, 1/14/2041 | | | 676,002 | |
| | | | | |
| | | | Total | | | 3,548,041 | |
| | | | | |
| |
| Ukraine (0.2%) | | | | |
| | | | Ukraine Government International Bond | | | | |
| | 1,030,000 | | | 6.250%, 6/17/2016 | | | 916,700 | |
| | 400,000 | | | 6.580%, 11/21/2016 | | | 352,080 | |
| | 240,000 | | | 8.375%, 11/3/2017 | | | 196,800 | |
| | 160,000 | | | 6.750%, 11/14/2017 | | | 139,600 | |
| | 260,000 | | | 9.000%, 12/7/2017* | | | 222,300 | |
| | | | | |
| | | | Total | | | 1,827,480 | |
| | | | | |
| |
| United Arab Emlirates (<0.1%) | | | | |
| | | | Dolphin Energy, Ltd. | | | | |
| | 210,000 | | | 5.500%, 12/15/2021 | | | 239,663 | |
The accompanying Notes to Financial Statements are an integral part of this schedule.
189
PARTNER WORLDWIDE ALLOCATION FUND
Schedule of Investments as of October 31, 2014
| | | | | | | | |
Principal Amount | | | Long-Term Fixed Income (10.3%) | | Value | |
| United Arab Emirates (<0.1%) - continued | | | | |
| | | | Ruwais Power Company PJSC | | | | |
| | $360,000 | | | 6.000%, 8/31/2036c | | | $410,400 | |
| | | | | |
| | | | Total | | | 650,063 | |
| | | | | |
|
| United States (0.7%) | |
| | | | Comcel Trust | | | | |
| | 200,000 | | | 6.875%, 2/6/2024 | | | 214,000 | |
| | | | Commonwealth of Puerto Rico G.O. | | | | |
| | 1,240,000 | | | 8.000%, 7/1/2035 | | | 1,081,974 | |
| | | | HSBC Bank USA NA | | | | |
| | 901,000 | | | 10.000%, 1/5/2017 p | | | 359,395 | |
| | 600,000 | | | 6.000%, 8/15/2040 q | | | 610,275 | |
| | | | Puerto Rico Sales Tax Financing Corporation Rev. | | | | |
| | 55,000 | | | Zero Coupon, 8/1/2032 | | | 42,026 | |
| | | | Puerto Rico Sales Tax Financing Corporation Rev. Ser. A | | | | |
| | 95,000 | | | 5.500%, 8/1/2028 | | | 78,653 | |
| | 5,000 | | | 5.500%, 8/1/2037 | | | 3,771 | |
| | 35,000 | | | 5.375%, 8/1/2039 | | | 25,966 | |
| | 670,000 | | | 5.500%, 8/1/2042 | | | 498,400 | |
| | 320,000 | | | 6.000%, 8/1/2042 | | | 249,325 | |
| | | | Puerto Rico Sales Tax Financing Corporation Rev. Ser. C | | | | |
| | 10,000 | | | 5.375%, 8/1/2038 | | | 7,456 | |
| | 320,000 | | | 5.250%, 8/1/2041 | | | 229,696 | |
| | | | U.S. Treasury Notes | | | | |
| | 1,300,000 | | | 1.500%, 10/31/2019 | | | 1,293,094 | |
| | 1,400,000 | | | 2.000%, 10/31/2021 | | | 1,395,844 | |
| | | | | |
| | | | Total | | | 6,089,875 | |
| | | | | |
|
| Uruguay (0.2%) | |
| | | | Uruguay Government International Bond | | | | |
| | 1,050,396 | | | 5.100%, 6/18/2050 | | | 1,041,247 | |
| | 543,764 | | | 4.500%, 8/14/2024 | | | 573,671 | |
| | | | | |
| | | | Total | | | 1,614,918 | |
| | | | | |
|
| Venezuela (0.4%) | |
| | | | Petroleos de Venezuela SA | | | | |
| | 330,000 | | | 9.000%, 11/17/2021 | | | 209,138 | |
| | 1,160,000 | | | 6.000%, 5/16/2024 | | | 596,704 | |
| | 1,647,000 | | | 6.000%, 11/15/2026 | | | 805,382 | |
| | 107,000 | | | 9.750%, 5/17/2035 | | | 65,324 | |
| | | | Venezuela Government International Bond | | | | |
| | 210,000 | | | 6.000%, 12/9/2020 | | | 124,950 | |
| | 560,000 | | | 9.000%, 5/7/2023 | | | 359,800 | |
| | 819,000 | | | 8.250%, 10/13/2024 | | | 494,676 | |
| | 530,000 | | | 7.650%, 4/21/2025 | | | 318,000 | |
| | 172,000 | | | 9.250%, 9/15/2027 | | | 114,380 | |
| | 233,000 | | | 9.250%, 5/7/2028 | | | 147,955 | |
| | 95,000 | | | 11.950%, 8/5/2031 | | | 69,113 | |
| | 80,000 | | | 9.375%, 1/13/2034 | | | 51,200 | |
| | | | | |
| | | | Total | | | 3,356,622 | |
| | | | | |
| |
| Vietnam (<0.1%) | | | | |
| | | | Vietnam Government International Bond | | | | |
| | 220,000 | | | 6.875%, 1/15/2016 | | | 232,375 | |
| | | | | |
| | | | Total | | | 232,375 | |
| | | | | |
| |
| Virgin Islands, British (<0.1%) | | | | |
| | | | Central American Bottling Corporation | | | | |
| | 20,000 | | | 6.750%, 2/9/2022 | | | 21,150 | |
| | 150,000 | | | 6.750%, 2/9/2022c | | | 158,625 | |
| | | | | |
| | | | Total | | | 179,775 | |
| | | | | |
| |
| Zambia (<0.1%) | | | | |
| | | | Zambia Government International Bond | | | | |
| | 400,000 | | | 5.375%, 9/20/2022 | | | 382,840 | |
| | | | | |
| | | | Total | | | 382,840 | |
| | | | | |
| | | | | |
| | | | | |
| | | | Total Long-Term Fixed Income (cost $84,952,036) | | | 85,017,534 | |
| | | | | |
| | |
| Shares | | | Preferred Stock (0.9%) | | | |
| Brazil (0.3%) | |
| | 158,081 | | | Oi SAa | | | 82,935 | |
| | 138,000 | | | Petroleo Brasileiro SA ADR | | | 1,687,740 | |
| | 55,200 | | | Vale SA | | | 480,068 | |
| | 68,282 | | | Vale SA ADR | | | 598,150 | |
| | | | | |
| | | | Total | | | 2,848,893 | |
| | | | | |
|
| Germany (<0.1%) | |
| | 3,711 | | | Sixt SE | | | 103,743 | |
| | | | | |
| | | | Total | | | 103,743 | |
| | | | | |
|
| Italy (<0.1%) | |
| | 30,727 | | | Unipol Gruppo Finanziario SPA | | | 136,913 | |
| | | | | |
| | | | Total | | | 136,913 | |
| | | | | |
|
| South Korea (0.6%) | |
| | 4,898 | | | Samsung Electronics Company, Ltd. | | | 4,521,165 | |
| | | | | |
| | | | Total | | | 4,521,165 | |
| | | | | |
| | | | | |
| | | | | |
| | | | Total Preferred Stock (cost $8,826,967) | | | 7,610,714 | |
| | | | | |
| | |
| Shares | | | Collateral Held for Securities Loaned (0.8%) | | | |
| | 6,420,500 | | | Thrivent Cash Management Trust | | | 6,420,500 | |
| | | | | |
| | | | Total Collateral Held for Securities Loaned (cost $6,420,500) | | | 6,420,500 | |
| | | | | |
The accompanying Notes to Financial Statements are an integral part of this schedule.
190
PARTNER WORLDWIDE ALLOCATION FUND
Schedule of Investments as of October 31, 2014
| | | | | | | | |
Shares or
Principal
Amount | | | Short-Term Investments (1.6%)r | | Value | |
| | | | Federal Home Loan Bank Discount Notes | | | | |
| | 300,000 | | | 0.090%, 4/24/2015a | | | $299,870 | |
| | 13,034,173 | | | Thrivent Cash Management Trust 0.050% | | | 13,034,173 | |
| | | | | |
| | | | Total Short-Term Investments (at amortized cost) | | | 13,334,043 | |
| | | | | |
| | | | Total Investments (cost $791,639,326) 100.1% | | | $830,965,509 | |
| | | | | |
| | | | Other Assets and Liabilities, Net (0.1%) | | | (890,046 | ) |
| | | | | |
| | | | Total Net Assets 100.0% | | | $830,075,463 | |
| | | | | |
a | Non-income producing security. |
b | All or a portion of the security is on loan, |
c | Denotes securities sold under Rule 144A of the Securities Act of 1933, which exempts them from registration. These securities have been deemed liquid and may be resold to other dealers in the program or to other qualified institutional buyers. As of October 31, 2014, the value of these investments was $15,747,601 or 1.9% of total net assets. |
d | Security is fair valued. |
e | Denotes investments purchased on a when-issued or delayed delivery basis. |
f | Defaulted security. Interest is not being accrued. |
g | Principal amount is displayed in Euros. |
h | Denotes variable rate securities. Variable rate securities are securities whose yields vary with a designated market index or market rate. The rate shown is as of October 31, 2014. |
i | Denotes step coupon securities. Step coupon securities pay an initial coupon rate for the first period and then different coupon rates for following periods. The rate shown is as of October 31, 2014. |
j | Principal amount is displayed in Brazilian Real. |
k | Principal amount is displayed in Dominican Republic Pesos. |
l | Principal amount is displayed in Chinese Yuan. |
m | Principal amount is displayed in Mexican Pesos. |
n | Principal amount is displayed in Russian Rubles. |
o | Denotes perpetual securities. Perpetual securities pay an indefinite stream of interest, but may be called by the issuer at an earlier date. |
p | Principal amount is displayed in Brazilian Real. Security is linked to Brazilian Government Bonds due January 1, 2017. |
q | Principal amount is displayed in Brazilian Real. Security is linked to Brazilian Government Bonds due August 15, 2040. |
r | The interest rate shown reflects the yield, coupon rate or the discount rate at the date of purchase. |
s | At October 31, 2014, $299,870 of investments were held on deposit with the counterparty and pledged as the initial margin deposit for open futures contracts. |
* | Denotes restricted securities. Restricted securities are investment securities which have been deemed illiquid and cannot be offered for public sale without first being registered under the Securities Act of 1933. The following table indicates the acquisition date and cost of restricted securities Partner Worldwide Allocation Fund owned as of October 31, 2014. |
| | | | | | | | |
Security | | Acquisition
Date | | | Cost | |
Abengoa Transmision Sur SA, 4/30/2043 | | | 4/8/2014 | | | | $319,984 | |
AHML Finance, Ltd., 2/13/2018 | | | 1/31/2013 | | | | 189,924 | |
Banco Continental SAECA, 10/15/2017 | | | 10/10/2012 | | | | 150,000 | |
Belize Government International Bond, 8/20/2017 | | | 3/20/2013 | | | | 99,814 | |
Brazil Loan Trust 1, 7/24/2023 | | | 7/25/2013 | | | | 660,979 | |
Brazil Minas SPE via State of Minas Gerais, 2/15/2028 | | | 3/22/2013 | | | | 1,027,675 | |
Ecuador Government International Bond, 6/20/2024 | | | 6/17/2014 | | | | 460,000 | |
El Salvador Government International Bond, 1/18/2027 | | | 9/11/2014 | | | | 40,000 | |
Ghana Government International Bond, 1/18/2026 | | | 9/11/2014 | | | | 386,728 | |
Honduras Government International Bond, 12/16/2020 | | | 12/11/2013 | | | | 780,000 | |
Independencia International, Ltd., 12/30/2016 | | | 3/29/2010 | | | | 100,627 | |
KazMunayGas National Company JSC, 4/30/2043 | | | 5/21/2013 | | | | 488,775 | |
Macedonia Government International Bond, 7/24/2021 | | | 7/17/2014 | | | | 306,023 | |
Paraguay Government International Bond, 8/11/2044 | | | 8/4/2014 | | | | 550,312 | |
Phosagro OAO via Phosagro Bond Funding, Ltd., 2/13/2018 | | | 2/6/2013 | | | | 200,000 | |
Sociedad Quimica y Minera de Chile SA, 1/28/2025 | | | 10/23/2014 | | | | 198,820 | |
Trust F/1401, 1/30/2044 | | | 1/23/2014 | | | | 194,174 | |
Ukraine Government International Bond, 12/7/2017 | | | 11/30/2012 | | | | 260,000 | |
Definitions:
| | | | | | |
| ADR | | | - | | | American Depositary Receipt, which are certificates for an underlying foreign security’s shares held by an issuing U.S. depository bank. |
| GDR | | | - | | | Global Depository Receipts, which are certificates for shares of an underlying foreign security’s shares held by an issuing depository bank from more than one country. |
| G.O. | | | - | | | General Obligation |
| REIT | | | - | | | Real Estate Investment Trust is a company that buys, develops, manages and/or sells real estate assets. |
| Rev. | | | - | | | Revenue |
| | | | |
Unrealized Appreciation (Depreciation) | | | | |
Gross unrealized appreciation and depreciation of investments, based on cost for federal income tax purposes, were as follows: | | | | |
Gross unrealized appreciation | | | $87,915,968 | |
Gross unrealized depreciation | | | (51,978,764 | ) |
| | | | |
Net unrealized appreciation (depreciation) | | | $35,937,204 | |
| |
Cost for federal income tax purposes | | | $795,028,305 | |
The accompanying Notes to Financial Statements are an integral part of this schedule.
191
PARTNER WORLDWIDE ALLOCATION FUND
Schedule of Investments as of October 31, 2014
Fair Valuation Measurements
The following table is a summary of the inputs used, as of October 31, 2014, in valuing Partner Worldwide Allocation Fund’s assets carried at fair value.
| | | | | | | | | | | | | | | | |
Investments in Securities | | Total | | | Level 1 | | | Level 2 | | | Level 3 | |
| | | | |
Common Stock | | | | | | | | | | | | | | | | |
Consumer Discretionary | | | 101,644,213 | | | | 1,304,874 | | | | 100,339,339 | | | | – | |
Consumer Staples | | | 61,177,283 | | | | 2,887,200 | | | | 58,290,083 | | | | – | |
Energy | | | 38,579,527 | | | | 2,100,920 | | | | 36,478,607 | | | | – | |
Financials | | | 186,890,928 | | | | 9,826,010 | | | | 177,064,545 | | | | 373 | |
Health Care | | | 56,387,169 | | | | 2,031,452 | | | | 54,355,717 | | | | – | |
Industrials | | | 123,901,985 | | | | 1,805,488 | | | | 122,060,795 | | | | 35,702 | |
Information Technology | | | 50,404,587 | | | | 394,268 | | | | 50,010,319 | | | | – | |
Materials | | | 64,494,813 | | | | 3,055,222 | | | | 61,439,591 | | | | – | |
Telecommunications Services | | | 17,676,566 | | | | – | | | | 17,676,565 | | | | 1 | |
Utilities | | | 17,425,647 | | | | – | | | | 17,425,647 | | | | – | |
| | | | |
Long-Term Fixed Income | | | | | | | | | | | | | | | | |
Basic Materials | | | 2,481,387 | | | | – | | | | 2,481,387 | | | | – | |
Capital Goods | | | 326,472 | | | | – | | | | 326,472 | | | | – | |
Communications Services | | | 2,398,489 | | | | – | | | | 2,398,489 | | | | – | |
Consumer Cyclical | | | 373,953 | | | | – | | | | 373,953 | | | | – | |
Consumer Non-Cyclical^ | | | 1,242,202 | | | | – | | | | 1,242,202 | | | | 0 | |
Energy | | | 8,675,966 | | | | – | | | | 8,675,966 | | | | – | |
Financials | | | 6,282,553 | | | | – | | | | 6,282,553 | | | | – | |
Foreign Government | | | 53,808,278 | | | | – | | | | 53,479,356 | | | | 328,922 | |
Transportation | | | 922,730 | | | | – | | | | 922,730 | | | | – | |
U.S. Government and Agencies | | | 3,583,910 | | | | – | | | | 3,583,910 | | | | – | |
U.S. Municipal | | | 2,213,496 | | | | – | | | | 2,213,496 | | | | – | |
Utilities | | | 2,708,098 | | | | – | | | | 2,708,098 | | | | – | |
| | | | |
Preferred Stock | | | | | | | | | | | | | | | | |
Energy | | | 1,687,740 | | | | 1,687,740 | | | | – | | | | – | |
Financials | | | 136,913 | | | | – | | | | 136,913 | | | | – | |
Industrials | | | 103,743 | | | | – | | | | 103,743 | | | | – | |
Information Technology | | | 4,521,165 | | | | – | | | | 4,521,165 | | | | – | |
Materials | | | 1,078,218 | | | | 598,150 | | | | 480,068 | | | | – | |
Telecommunications Services | | | 82,935 | | | | – | | | | 82,935 | | | | – | |
Collateral Held for Securities Loaned | | | 6,420,500 | | | | 6,420,500 | | | | – | | | | – | |
Short-Term Investments | | | 13,334,043 | | | | 13,034,173 | | | | 299,870 | | | | – | |
| |
Total | | | $830,965,509 | | | | $45,145,997 | | | | $785,454,514 | | | | $364,998 | |
| |
| | | | |
Other Financial Instruments | | Total | | | Level 1 | | | Level 2 | | | Level 3 | |
| | | | |
Asset Derivatives | | | | | | | | | | | | | | | | |
Futures Contracts | | | 95,521 | | | | 95,521 | | | | – | | | | – | |
Foreign Currency Forward Contracts | | | 925,311 | | | | – | | | | 925,311 | | | | – | |
| |
Total Asset Derivatives | | | $1,020,832 | | | | $95,521 | | | | $925,311 | | | | $– | |
| |
| | | | |
Liability Derivatives | | | | | | | | | | | | | | | | |
Futures Contracts | | | 74,851 | | | | 74,851 | | | | – | | | | – | |
Foreign Currency Forward Contracts | | | 699,548 | | | | – | | | | 699,548 | | | | – | |
| |
Total Liability Derivatives | | | $774,399 | | | | $74,851 | | | | $699,548 | | | | $– | |
| |
There were no significant transfers between Levels during the period ended October 31, 2014. Transfers between Levels are identified as of the end of the period.
^ Level 3 security in this section is fair valued at <$1.
The accompanying Notes to Financial Statements are an integral part of this schedule.
192
PARTNER WORLDWIDE ALLOCATION FUND
Schedule of Investments as of October 31, 2014
| | | | | | | | | | | | | | | | | | |
Futures Contracts | | Number of
Contracts
Long/(Short) | | | Expiration Date | | Notional Principal Amount | | | Value | | | Unrealized Gain/ (Loss) | |
2-Yr. U.S. Treasury Bond Futures | | | 35 | | | December 2014 | | | $7,681,586 | | | | $7,684,688 | | | | $3,102 | |
5-Yr. U.S. Treasury Bond Futures | | | 70 | | | December 2014 | | | 8,362,517 | | | | 8,360,078 | | | | (2,439 | ) |
10-Yr. U.S. Treasury Bond Futures | | | (41 | ) | | December 2014 | | | (5,168,404 | ) | | | (5,180,735 | ) | | | (12,331 | ) |
30-Yr. U.S. Treasury Bond Futures | | | (11 | ) | | December 2014 | | | (1,550,347 | ) | | | (1,552,031 | ) | | | (1,684 | ) |
ASX SPI 200 Index Futures | | | 1 | | | December 2014 | | | 119,800 | | | | 121,397 | | | | 1,597 | |
CME 3 Month Eurodollar Futures | | | (36 | ) | | September 2016 | | | (8,836,151 | ) | | | (8,857,800 | ) | | | (21,649 | ) |
CME 3 Month Eurodollar Futures | | | (1 | ) | | March 2017 | | | (244,604 | ) | | | (244,900 | ) | | | (296 | ) |
Eurex 10 Year Euro BUND Futures | | | (22 | ) | | December 2014 | | | (4,181,359 | ) | | | (4,164,613 | ) | | | 16,746 | |
Eurex 5 Year Euro BOBL Futures | | | 4 | | | December 2014 | | | 640,410 | | | | 642,264 | | | | 1,854 | |
Eurex EURO STOXX 50 Futures | | | 19 | | | December 2014 | | | 764,430 | | | | 740,724 | | | | (23,706 | ) |
FTSE 100 Index Futures | | | 3 | | | December 2014 | | | 324,950 | | | | 312,204 | | | | (12,746 | ) |
Mini MSCI EAFE Index Futures | | | 26 | | | December 2014 | | | 2,330,270 | | | | 2,386,800 | | | | 56,530 | |
Tokyo Price Index Futures | | | 4 | | | December 2014 | | | 461,426 | | | | 476,118 | | | | 14,692 | |
Ultra Long Term U.S. Treasury Bond Futures | | | (10 | ) | | December 2014 | | | (1,569,125 | ) | | | (1,568,125 | ) | | | 1,000 | |
Total Futures Contracts | | | | | | | | | | | | | | | | | $20,670 | |
The accompanying Notes to Financial Statements are an integral part of this schedule.
193
PARTNER WORLDWIDE ALLOCATION FUND
Schedule of Investments as of October 31, 2014
| | | | | | | | | | | | | | | | | | | | |
Foreign Currency Forward Contracts | | Counterparty | | Contracts to Deliver/ Receive | | | Settlement Date | | Value on
Settlement Date | | | Value | | | Unrealized Gain/(Loss) | |
| | | | | | |
Purchases | | | | | | | | | | | | | | | | | | | | |
Australian Dollar | | CITI | | | 428,082 | | | 12/17/2014 | | | $376,053 | | | | $375,351 | | | | ($702 | ) |
Australian Dollar | | MSC | | | 142,000 | | | 12/17/2014 | | | 128,018 | | | | 124,509 | | | | (3,509 | ) |
Australian Dollar | | WBC | | | 1,102,500 | | | 12/17/2014 | | | 964,191 | | | | 966,696 | | | | 2,505 | |
Australian Dollar | | DB | | | 281,000 | | | 12/17/2014 | | | 254,212 | | | | 246,387 | | | | (7,825 | ) |
Australian Dollar | | SSB | | | 289,000 | | | 12/17/2014 | | | 253,716 | | | | 253,401 | | | | (315 | ) |
Australian Dollar | | BNP | | | 144,000 | | | 12/17/2014 | | | 127,476 | | | | 126,262 | | | | (1,214 | ) |
Brazilian Real | | MSC | | | 611,208 | | | 11/7/2014 | | | 248,000 | | | | 246,162 | | | | (1,838 | ) |
Brazilian Real | | ML | | | 308,453 | | | 11/28/2014 | | | 125,000 | | | | 123,468 | | | | (1,532 | ) |
Brazilian Real | | HSBC | | | 581,613 | | | 11/7/2014 | | | 238,513 | | | | 234,243 | | | | (4,270 | ) |
Brazilian Real | | UBS | | | 129,500 | | | 11/10/2014 | | | 53,444 | | | | 52,110 | | | | (1,334 | ) |
Chilean Peso | | CSFB | | | 368,394,199 | | | 11/10/2014 -11/28/2014 | | | 622,000 | | | | 639,537 | | | | 17,537 | |
Chinese Yuan | | SB | | | 6,382,394 | | | 12/17/2014 | | | 1,032,000 | | | | 1,039,844 | | | | 7,844 | |
Chinese Yuan | | BB | | | 472,492 | | | 12/17/2014 | | | 76,000 | | | | 76,980 | | | | 980 | |
Chinese Yuan | | DB | | | 6,130,991 | | | 12/17/2014 | | | 995,000 | | | | 998,885 | | | | 3,885 | |
Colombian Peso | | BOA | | | 255,791,500 | | | 11/20/2014 | | | 125,000 | | | | 124,101 | | | | (899 | ) |
Euro | | MSC | | | 1,286,500 | | | 12/17/2014 | | | 1,640,708 | | | | 1,612,471 | | | | (28,237 | ) |
Euro | | RBC | | | 201,000 | | | 12/17/2014 | | | 258,794 | | | | 251,929 | | | | (6,865 | ) |
Euro | | BNP | | | 794,000 | | | 12/17/2014 | | | 1,007,282 | | | | 995,183 | | | | (12,099 | ) |
Euro | | DB | | | 798,000 | | | 12/17/2014 | | | 1,022,590 | | | | 1,000,196 | | | | (22,394 | ) |
Euro | | SSB | | | 804,000 | | | 12/17/2014 | | | 1,020,518 | | | | 1,007,717 | | | | (12,801 | ) |
Euro | | HSBC | | | 497,000 | | | 12/17/2014 | | | 635,938 | | | | 622,929 | | | | (13,009 | ) |
Euro | | JPM | | | 521,045 | | | 11/4/2014 -12/9/2014 | | | 655,942 | | | | 653,017 | | | | (2,925 | ) |
Euro | | BB | | | 499,000 | | | 12/17/2014 | | | 644,405 | | | | 625,435 | | | | (18,970 | ) |
Euro | | BOA | | | 1,481,000 | | | 12/17/2014 | | | 1,882,835 | | | | 1,856,253 | | | | (26,582 | ) |
Hungarian Forint | | BB | | | 60,628,504 | | | 12/17/2014 | | | 250,263 | | | | 246,560 | | | | (3,703 | ) |
Hungarian Forint | | BOA | | | 61,902,080 | | | 12/17/2014 | | | 256,000 | | | | 251,739 | | | | (4,261 | ) |
Hungarian Forint | | DB | | | 60,958,896 | | | 12/17/2014 | | | 248,000 | | | | 247,903 | | | | (97 | ) |
Indian Rupee | | MSC | | | 48,717,577 | | | 11/20/2014 | | | 791,255 | | | | 790,214 | | | | (1,041 | ) |
Indian Rupee | | UBS | | | 14,283,185 | | | 11/20/2014 | | | 232,644 | | | | 231,677 | | | | (967 | ) |
Indian Rupee | | DB | | | 14,264,149 | | | 12/1/2014 | | | 231,674 | | | | 230,845 | | | | (829 | ) |
Indonesian Rupiah | | BB | | | 3,241,986,000 | | | 11/3/2014 - 12/4/2014 | | | 266,545 | | | | 267,539 | | | | 994 | |
Indonesian Rupiah | | DB | | | 3,128,886,299 | | | 11/3/2014 | | | 254,000 | | | | 258,796 | | | | 4,796 | |
Israel Shekel | | BNP | | | 1,398,647 | | | 12/17/2014 | | | 385,000 | | | | 368,235 | | | | (16,765 | ) |
Israel Shekel | | BB | | | 622,667 | | | 12/17/2014 | | | 174,339 | | | | 163,936 | | | | (10,403 | ) |
Israel Shekel | | CITI | | | 832,768 | | | 12/17/2014 | | | 232,000 | | | | 219,251 | | | | (12,749 | ) |
Japanese Yen | | RBC | | | 53,813,667 | | | 12/17/2014 | | | 507,000 | | | | 479,426 | | | | (27,574 | ) |
Japanese Yen | | BB | | | 13,573,315 | | | 12/17/2014 | | | 129,000 | | | | 120,925 | | | | (8,075 | ) |
Japanese Yen | | JPM | | | 54,685,584 | | | 12/17/2014 | | | 511,000 | | | | 487,194 | | | | (23,806 | ) |
Japanese Yen | | CITI | | | 41,631,870 | | | 12/17/2014 | | | 381,000 | | | | 370,898 | | | | (10,102 | ) |
Japanese Yen | | SB | | | 40,948,083 | | | 12/17/2014 | | | 387,000 | | | | 364,807 | | | | (22,193 | ) |
Japanese Yen | | BOA | | | 28,167,897 | | | 12/17/2014 | | | 251,000 | | | | 250,948 | | | | (52 | ) |
Malaysian Ringgit | | DB | | | 3,335,010 | | | 11/3/2014 - 11/20/2014 | | | 1,016,280 | | | | 1,013,139 | | | | (3,141 | ) |
Malaysian Ringgit | | CITI | | | 2,477,116 | | | 11/3/2014 - 11/14/2014 | | | 757,000 | | | | 752,765 | | | | (4,235 | ) |
Malaysian Ringgit | | BB | | | 590,026 | | | 11/20/2014 | | | 179,828 | | | | 179,142 | | | | (686 | ) |
Mexican Peso | | JPM | | | 6,903,865 | | | 12/17/2014 | | | 510,000 | | | | 511,315 | | | | 1,315 | |
Mexican Peso | | CITI | | | 8,037,537 | | | 12/17/2014 | | | 603,305 | | | | 595,277 | | | | (8,028 | ) |
Mexican Peso | | SB | | | 12,040,817 | | | 12/17/2014 | | | 911,472 | | | | 891,768 | | | | (19,704 | ) |
Mexican Peso | | HSBC | | | 11,316,288 | | | 12/17/2014 | | | 846,133 | | | | 838,108 | | | | (8,025 | ) |
Mexican Peso | | RBC | | | 15,564,629 | | | 12/17/2014 | | | 1,175,744 | | | | 1,152,748 | | | | (22,996 | ) |
Mexican Peso | | SSB | | | 3,353,781 | | | 12/17/2014 | | | 249,000 | | | | 248,388 | | | | (612 | ) |
Mexican Peso | | DB | | | 6,670,610 | | | 12/17/2014 | | | 497,000 | | | | 494,039 | | | | (2,961 | ) |
Philippines Peso | | UBS | | | 5,862,773 | | | 11/10/2014 | | | 130,690 | | | | 130,620 | | | | (70 | ) |
Philippines Peso | | SB | | | 5,736,832 | | | 11/10/2014 | | | 128,043 | | | | 127,814 | | | | (229 | ) |
Polish Zloty | | BOA | | | 830,793 | | | 12/17/2014 | | | 249,808 | | | | 246,173 | | | | (3,635 | ) |
Polish Zloty | | DB | | | 1,206,887 | | | 12/17/2014 | | | 371,002 | | | | 357,614 | | | | (13,388 | ) |
Polish Zloty | | SB | | | 997,597 | | | 12/17/2014 | | | 309,707 | | | | 295,598 | | | | (14,109 | ) |
Polish Zloty | | UBS | | | 1,067,339 | | | 12/17/2014 | | | 327,797 | | | | 316,264 | | | | (11,533 | ) |
Polish Zloty | | BNP | | | 1,063,563 | | | 12/17/2014 | | | 327,421 | | | | 315,145 | | | | (12,276 | ) |
Polish Zloty | | BB | | | 1,466,623 | | | 12/17/2014 | | | 452,353 | | | | 434,575 | | | | (17,778 | ) |
Russian Ruble | | DB | | | 5,030,847 | | | 11/17/2014 | | | 125,724 | | | | 116,458 | | | | (9,266 | ) |
Russian Ruble | | UBS | | | 8,813,819 | | | 11/17/2014 | | | 237,037 | | | | 204,030 | | | | (33,007 | ) |
The accompanying Notes to Financial Statements are an integral part of this schedule.
194
PARTNER WORLDWIDE ALLOCATION FUND
Schedule of Investments as of October 31, 2014
| | | | | | | | | | | | | | | | | | | | |
Foreign Currency
Forward Contracts | | Counterparty | | Contracts to Deliver/Receive | | | Settlement Date | | Value on Settlement Date | | | Value | | | Unrealized Gain/(Loss) | |
| | | | | | |
Purchases | | | | | | | | | | | | | | | | | | | | |
Russian Ruble | | CSFB | | | 31,809,113 | | | 11/10/2014 - 11/28/2014 | | | $765,000 | | | | $736,182 | | | | (28,818 | ) |
Russian Ruble | | BNP | | | 11,390,796 | | | 11/24/2014 | | | 276,000 | | | | 263,207 | | | | (12,793 | ) |
Russian Ruble | | JPM | | | 1,365,651 | | | 11/17/2014 | | | 35,592 | | | | 31,613 | | | | (3,979 | ) |
Singapore Dollar | | HSBC | | | 647,762 | | | 12/17/2014 | | | 512,000 | | | | 504,252 | | | | (7,748 | ) |
South African Rand | | DB | | | 1,377,653 | | | 12/17/2014 | | | 125,000 | | | | 124,015 | | | | (985 | ) |
South African Rand | | SB | | | 1,369,763 | | | 12/17/2014 | | | 125,000 | | | | 123,305 | | | | (1,695 | ) |
South African Rand | | UBS | | | 1,374,6 94 | | | 12/17/2014 | | | 124,000 | | | | 123,749 | | | | (251 | ) |
South African Rand | | BB | | | 6,892,106 | | | 12/17/2014 | | | 623,000 | | | | 620,422 | | | | (2,578 | ) |
South Korean Won | | UBS | | | 408,616,042 | | | 11/6/2014 | | | 386,654 | | | | 382,326 | | | | (4,328 | ) |
South Korean Won | | MSC | | | 263,010,540 | | | 11/20/2014 | | | 247,000 | | | | 246,070 | | | | (930 | ) |
South Korean Won | | BB | | | 529,941,160 | | | 11/14/2014 | | | 497,000 | | | | 495,824 | | | | (1,176 | ) |
South Korean Won | | BOA | | | 265,129,360 | | | 11/6/2014 | | | 248,000 | | | | 248,071 | | | | 71 | |
South Korean Won | | CSFB | | | 133,386,800 | | | 11/6/2014 | | | 124,000 | | | | 124,805 | | | | 805 | |
Turkish Lira | | SB | | | 583,332 | | | 12/17/2014 | | | 256,000 | | | | 259,699 | | | | 3,699 | |
Turkish Lira | | MSC | | | 563,054 | | | 12/17/2014 | | | 249,000 | | | | 250,671 | | | | 1,671 | |
Turkish Lira | | RBS | | | 4,861,735 | | | 12/17/2014 | | | 2,142,138 | | | | 2,164,440 | | | | 22,302 | |
Turkish Lira | | JPM | | | 1,066,047 | | | 12/17/2014 | | | 467,000 | | | | 474,604 | | | | 7,604 | |
Total Purchases | | | | | | | | | | | $36,483,083 | | | | $35,998,194 | | | | ($484,889 | ) |
| | | | | | |
Sales | | | | | | | | | | | | | | | | | | | | |
Australian Dollar | | SB | | | 271,017 | | | 12/17/2014 | | | $242,789 | | | | $237,634 | | | | $5,155 | |
Australian Dollar | | BNP | | | 569,000 | | | 12/17/2014 | | | 508,685 | | | | 498,911 | | | | 9,774 | |
Australian Dollar | | MSC | | | 48,727 | | | 12/17/2014 | | | 43,884 | | | | 42,725 | | | | 1,159 | |
Australian Dollar | | RBC | | | 292,000 | | | 12/17/2014 | | | 255,173 | | | | 256,032 | | | | (859 | ) |
Australian Dollar | | BB | | | 158,700 | | | 12/17/2014 | | | 143,850 | | | | 139,152 | | | | 4,698 | |
Australian Dollar | | DB | | | 143,000 | | | 12/17/2014 | | | 125,058 | | | | 125,385 | | | | (327 | ) |
Australian Dollar | | WBC | | | 176,056 | | | 12/17/2014 | | | 159,228 | | | | 154,369 | | | | 4,859 | |
Australian Dollar | | BOA | | | 140,973 | | | 12/17/2014 | | | 123,258 | | | | 123,608 | | | | (350 | ) |
Australian Dollar | | RBS | | | 141,000 | | | 12/17/2014 | | | 123,019 | | | | 123,632 | | | | (613 | ) |
Brazilian Real | | UBS | | | 1,387,886 | | | 11/7/2014 - 11/28/2014 | | | 551,944 | | | | 556,591 | | | | (4,647 | ) |
Brazilian Real | | CITI | | | 3,777,403 | | | 1/23/2015 | | | 1,478,435 | | | | 1,488,288 | | | | (9,853 | ) |
Brazilian Real | | HSBC | | | 610,302 | | | 11/7/2014 | | | 244,747 | | | | 245,797 | | | | (1,050 | ) |
Brazilian Real | | MSC | | | 931,154 | | | 11/7/2014 - 12/3/2014 | | | 374,000 | | | | 373,319 | | | | 681 | |
Brazilian Real | | BB | | | 314,686 | | | 11/28/2014 | | | 125,000 | | | | 125,963 | | | | (963 | ) |
Brazilian Real | | DB | | | 205,704 | | | 11/7/2014 | | | 82,473 | | | | 82,846 | | | | (373 | ) |
Chilean Peso | | CSFB | | | 72,221,250 | | | 11/20/2014 | | | 125,000 | | | | 125,371 | | | | (371 | ) |
Chinese Yuan | | SB | | | 6,352,868 | | | 12/17/2014 | | | 1,025,000 | | | | 1,035,035 | | | | (10,035 | ) |
Chinese Yuan | | HSBC | | | 6,348,173 | | | 12/17/2014 | | | 1,022,000 | | | | 1,034,270 | | | | (12,270 | ) |
Chinese Yuan | | DB | | | 7,799,339 | | | 12/17/2014 | | | 1,259,802 | | | | 1,270,700 | | | | (10,898 | ) |
Colombian Peso | | BOA | | | 765,557,234 | | | 11/10/2014 - 11/20/2014 | | | 373,000 | | | | 371,639 | | | | 1,361 | |
Euro | | WBC | | | 3,212,000 | | | 12/17/2014 | | | 4,155,339 | | | | 4,025,852 | | | | 129,487 | |
Euro | | BB | | | 585,000 | | | 12/17/2014 | | | 747,107 | | | | 733,226 | | | | 13,881 | |
Euro | | SSB | | | 97,000 | | | 12/17/2014 | | | 123,971 | | | | 121,578 | | | | 2,393 | |
Euro | | UBS | | | 197,000 | | | 12/17/2014 | | | 248,967 | | | | 246,916 | | | | 2,051 | |
Euro | | RBS | | | 99,000 | | | 12/17/2014 | | | 128,288 | | | | 124,084 | | | | 4,204 | |
Euro | | MSC | | | 395,000 | | | 12/17/2014 | | | 500,068 | | | | 495,084 | | | | 4,984 | |
Euro | | JPM | | | 5,124,203 | | | 12/9/2014 - 12/17/2014 | | | 6,508,054 | | | | 6,422,237 | | | | 85,817 | |
Euro | | DB | | | 1,383,000 | | | 12/17/2014 | | | 1,750,442 | | | | 1,733,421 | | | | 17,021 | |
Euro | | SB | | | 99,000 | | | 12/17/2014 | | | 128,536 | | | | 124,084 | | | | 4,452 | |
Euro | | BOA | | | 2,271,019 | | | 12/17/2014 | | | 2,956,478 | | | | 2,846,447 | | | | 110,031 | |
Hungarian Forint | | MSC | | | 31,737,000 | | | 12/17/2014 | | | 129,095 | | | | 129,066 | | | | 29 | |
Hungarian Forint | | UBS | | | 94,419,343 | | | 12/17/2014 | | | 392,768 | | | | 383,978 | | | | 8,790 | |
Indian Rupee | | BB | | | 7,722,906 | | | 11/20/2014 | | | 124,000 | | | | 125,268 | | | | (1,268 | ) |
Indian Rupee | | RBS | | | 15,299,970 | | | 11/20/2014 | | | 247,000 | | | | 248,170 | | | | (1,170 | ) |
Indonesian Rupiah | | BB | | | 1,620,993,000 | | | 11/3/2014 | | | 133,911 | | | | 134,076 | | | | (165 | ) |
Indonesian Rupiah | | DB | | | 3,128,886,301 | | | 11/3/2014 | | | 257,204 | | | | 258,796 | | | | (1,592 | ) |
Israel Shekel | | MSC | | | 1,708,379 | | | 12/17/2014 | | | 492,732 | | | | 449,782 | | | | 42,950 | |
Israel Shekel | | BB | | | 1,051,958 | | | 12/17/2014 | | | 305,695 | | | | 276,959 | | | | 28,736 | |
Japanese Yen | | JPM | | | 53,683,880 | | | 12/17/2014 | | | 511,933 | | | | 478,270 | | | | 33,663 | |
Japanese Yen | | WBC | | | 13,494,548 | | | 12/17/2014 | | | 124,000 | | | | 120,223 | | | | 3,777 | |
Japanese Yen | | BOA | | | 13,821,305 | | | 12/17/2014 | | | 129,000 | | | | 123,134 | | | | 5,866 | |
Japanese Yen | | SB | | | 27,225,688 | | | 12/17/2014 | | | 248,000 | | | | 242,554 | | | | 5,446 | |
The accompanying Notes to Financial Statements are an integral part of this schedule.
195
PARTNER WORLDWIDE ALLOCATION FUND
Schedule of Investments as of October 31, 2014
| | | | | | | | | | | | | | | | | | | | |
Foreign Currency
Forward Contracts | | Counterparty | | Contracts to
Deliver/Receive | | | Settlement Date | | Value on
Settlement Date | | | Value | | | Unrealized
Gain/(Loss) | |
| | | | | | |
Sales | | | | | | | | | | | | | | | | | | | | |
Japanese Yen | | SSB | | | 41,013,555 | | | 12/17/2014 | | | $383,000 | | | | $365,390 | | | | 17,610 | |
Japanese Yen | | RBC | | | 6,960,768 | | | 12/17/2014 | | | 64,000 | | | | 62,013 | | | | 1,987 | |
Japanese Yen | | RBS | | | 7,010,375 | | | 12/17/2014 | | | 64,247 | | | | 62,455 | | | | 1,792 | |
Japanese Yen | | DB | | | 13,481,776 | | | 12/17/2014 | | | 124,000 | | | | 120,109 | | | | 3,891 | |
Japanese Yen | | HSBC | | | 13,726,912 | | | 12/17/2014 | | | 128,000 | | | | 122,293 | | | | 5,707 | |
Japanese Yen | | BB | | | 125,018,920 | | | 12/17/2014 | | | 1,128,000 | | | | 1,113,794 | | | | 14,206 | |
Malaysian Ringgit | | CITI | | | 1,667,505 | | | 11/3/2014 | | | 507,072 | | | | 506,855 | | | | 217 | |
Malaysian Ringgit | | DB | | | 2,482,029 | | | 11/3/2014 - 11/20/2014 | | | 756,862 | | | | 754,159 | | | | 2,703 | |
Malaysian Ringgit | | RBC | | | 544,151 | | | 11/14/2014 | | | 166,348 | | | | 165,280 | | | | 1,068 | |
Mexican Peso | | RBC | | | 3,377,081 | | | 12/17/2014 | | | 249,000 | | | | 250,114 | | | | (1,114 | ) |
Mexican Peso | | JPM | | | 38,792,859 | | | 12/11/2014 - 12/17/2014 | | | 2,886,794 | | | | 2,873,276 | | | | 13,518 | |
Mexican Peso | | MSC | | | 3,364,800 | | | 12/17/2014 | | | 248,000 | | | | 249,204 | | | | (1,204 | ) |
Mexican Peso | | DB | | | 6,795,152 | | | 12/17/2014 | | | 510,000 | | | | 503,263 | | | | 6,737 | |
Mexican Peso | | CITI | | | 5,308,157 | | | 1/22/2015 | | | 389,962 | | | | 392,343 | | | | (2,381 | ) |
Mexican Peso | | BB | | | 21,543,664 | | | 12/8/2014 | | | 1,599,262 | | | | 1,596,420 | | | | 2,842 | |
Mexican Peso | | SSB | | | 6,722,571 | | | 12/17/2014 | | | 497,000 | | | | 497,887 | | | | (887 | ) |
Philippines Peso | | SB | | | 5,547,016 | | | 11/10/2014 | | | 124,000 | | | | 123,585 | | | | 415 | |
Philippines Peso | | UBS | | | 11,325,769 | | | 11/10/2014 | | | 252,963 | | | | 252,332 | | | | 631 | |
Philippines Peso | | BB | | | 5,615,125 | | | 11/28/2014 | | | 125,000 | | | | 125,055 | | | | (55 | ) |
Polish Zloty | | BNP | | | 838,204 | | | 12/17/2014 | | | 255,760 | | | | 248,368 | | | | 7,392 | |
Polish Zloty | | BOA | | | 4,981,777 | | | 12/17/2014 | | | 1,490,882 | | | | 1,476,152 | | | | 14,730 | |
Polish Zloty | | BB | | | 1,691,665 | | | 12/17/2014 | | | 516,380 | | | | 501,258 | | | | 15,122 | |
Russian Ruble | | CSFB | | | 20,779,959 | | | 11/14/2014 - 11/24/2014 | | | 498,500 | | | | 480,767 | | | | 17,733 | |
Russian Ruble | | DB | | | 10,137,985 | | | 11/17/2014 | | | 271,869 | | | | 234,682 | | | | 37,187 | |
Russian Ruble | | CITI | | | 10,076,532 | | | 11/10/2014 | | | 249,000 | | | | 233,680 | | | | 15,320 | |
Russian Ruble | | JPM | | | 9,926,961 | | | 11/17/2014 | | | 264,402 | | | | 229,797 | | | | 34,605 | |
Singapore Dollar | | CITI | | | 520,097 | | | 12/17/2014 | | | 414,511 | | | | 404,871 | | | | 9,640 | |
Singapore Dollar | | HSBC | | | 1,070,385 | | | 12/17/2014 | | | 849,458 | | | | 833,244 | | | | 16,214 | |
Singapore Dollar | | WBC | | | 654,046 | | | 12/17/2014 | | | 522,353 | | | | 509,144 | | | | 13,209 | |
South African Rand | | BB | | | 1,426,232 | | | 12/17/2014 | | | 124,000 | | | | 128,388 | | | | (4,388 | ) |
South Korean Won | | WBC | | | 453,034,560 | | | 11/6/2014 - 11/14/2014 | | | 425,345 | | | | 423,879 | | | | 1,466 | |
South Korean Won | | UBS | | | 408,616,042 | | | 11/20/2014 | | | 386,420 | | | | 382,297 | | | | 4,123 | |
South Korean Won | | CITI | | | 265,055,498 | | | 12/3/2014 | | | 251,000 | | | | 247,964 | | | | 3,036 | |
South Korean Won | | DB | | | 136,909,990 | | | 11/20/2014 | | | 129,700 | | | | 128,092 | | | | 1,608 | |
South Korean Won | | HSBC | | | 541,167,320 | | | 11/6/2014 | | | 508,000 | | | | 506,349 | | | | 1,651 | |
South Korean Won | | BNP | | | 79,925,582 | | | 11/14/2014 | | | 75,222 | | | | 74,780 | | | | 442 | |
Turkish Lira | | RBS | | | 2,916,402 | | | 12/17/2014 | | | 1,263,000 | | | | 1,298,380 | | | | (35,380 | ) |
Turkish Lira | | SB | | | 525,609 | | | 12/17/2014 | | | 237,961 | | | | 234,001 | | | | 3,960 | |
Turkish Lira | | CITI | | | 579,775 | | | 12/17/2014 | | | 258,000 | | | | 258,115 | | | | (115 | ) |
Turkish Lira | | HSBC | | | 574,377 | | | 12/17/2014 | | | 259,828 | | | | 255,712 | | | | 4,116 | |
Turkish Lira | | MSC | | | 833,111 | | | 12/17/2014 | | | 370,994 | | | | 370,900 | | | | 94 | |
Turkish Lira | | JPM | | | 1,153,944 | | | 12/17/2014 | | | 517,000 | | | | 513,735 | | | | 3,265 | |
Turkish Lira | | BNP | | | 539,187 | | | 12/17/2014 | | | 243,524 | | | | 240,046 | | | | 3,478 | |
Total Sales | | | | | | | | | | | $49,315,552 | | | | $48,604,900 | | | | $710,652 | |
Net Unrealized Gain/(Loss) on Foreign Currency Forward Contracts | | | | | | | | | | | $225,763 | |
The accompanying Notes to Financial Statements are an integral part of this schedule.
196
PARTNER WORLDWIDE ALLOCATION FUND
Schedule of Investments as of October 31, 2014
| | | | | | |
Counterparty |
BOA | | | - | | | Bank of America |
BB | | | - | | | Barclays Bank |
BNP | | | - | | | BNP Paribas |
CITI | | | - | | | Citibank |
CSFB | | | - | | | CS First Boston Corporation |
DB | | | - | | | Deutsche Bank |
HSBC | | | - | | | HSBC Securities, Inc. |
JPM | | | - | | | J.P. Morgan |
ML | | | - | | | Merrill Lynch |
MSC | | | - | | | Morgan Stanley & Company |
RBC | | | - | | | The Royal Bank of Canada |
RBS | | | - | | | The Royal Bank of Scotland |
SB | | | - | | | Standard Bank plc |
SSB | | | - | | | State Street Bank |
UBS | | | - | | | UBS Securities, Ltd. |
WBC | | | - | | | Westpac Banking Corporation |
The following table summarizes the fair value and Statement of Assets and Liabilities location, as of October 31, 2014, for Partner Worldwide Allocation Fund’s investments in financial derivative instruments by primary risk exposure as discussed under item (2) Significant Accounting Policies of the Notes to Financial Statements.
| | | | | | |
Derivatives by risk category | | Statement of Assets and Liabilities Location | | Fair Value | |
| |
Asset Derivatives | | | | |
| | |
Interest Rate Contracts | | | | | | |
Futures* | | Net Assets - Net unrealized appreciation/(depreciation) on Futures contracts | | | $22,702 | |
Total Interest Rate Contracts | | | | | 22,702 | |
| | |
Equity Contracts | | | | | | |
Futures* | | Net Assets - Net unrealized appreciation/(depreciation) on Futures contracts | | | 72,819 | |
Total Equity Contracts | | | | | 72,819 | |
| | |
Foreign Exchange Contracts | | | | | | |
Forward Contracts | | Net Assets - Net unrealized appreciation/(depreciation) on Foreign currency forward contracts | | | 925,311 | |
Total Foreign Exchange Contracts | | | | | 925,311 | |
| |
Total Asset Derivatives | | | | | $1,020,832 | |
| |
| | |
Liability Derivatives | | | | | | |
| | |
Interest Rate Contracts | | | | | | |
Futures* | | Net Assets - Net unrealized appreciation/(depreciation) on Futures contracts | | | 38,399 | |
Total Interest Rate Contracts | | | | | 38,399 | |
| | |
Equity Contracts | | | | | | |
Futures* | | Net Assets - Net unrealized appreciation/(depreciation) on Futures contracts | | | 36,452 | |
Total Equity Contracts | | | | | 36,452 | |
| | |
Foreign Exchange Contracts | | | | | | |
Forward Contracts | | Net Assets - Net unrealized appreciation/(depreciation) on Foreign currency forward contracts | | | 699,548 | |
Total Foreign Exchange Contracts | | | | | 699,548 | |
| |
Total Liability Derivatives | | | | | $774,399 | |
| |
* | Includes cumulative appreciation/depreciation of futures contracts as reported in the Schedule of Investments. Only current day’s variation margin is reported within the Statement of Assets and Liabilities. |
The accompanying Notes to Financial Statements are an integral part of this schedule.
197
PARTNER WORLDWIDE ALLOCATION FUND
Schedule of Investments as of October 31, 2014
The following table summarizes the net realized gains/(losses) and Statement of Operations location, for the period ended October 31, 2014, for Partner Worldwide Allocation Fund’s investments in financial derivative instruments by primary risk exposure.
| | | | | | |
Derivatives by risk category | | Statement of Operations Location | | Realized Gains/(Losses)
recognized in Income | |
| | |
Interest Rate Contracts | | | | | | |
Futures | | Net realized gains/(losses) on Futures contracts | | | (435,034 | ) |
Total Interest Rate Contracts | | | | | (435,034 | ) |
| | |
Equity Contracts | | | | | | |
Futures | | Net realized gains/(losses) on Futures contracts | | | (59,133 | ) |
Total Equity Contracts | | | | | (59,133 | ) |
| | |
Foreign Exchange Contracts | | | | | | |
Forward Contracts | | Net realized gains/(losses) on Foreign currency transactions | | | 642,087 | |
Total Foreign Exchange
Contracts | | | | | 642,087 | |
| |
Total | | | | | $147,920 | |
| |
The following table summarizes the change in net unrealized appreciation/(depreciation) and Statement of Operations location, for the period ended October 31, 2014, for Partner Worldwide Allocation Fund’s investments in financial derivative instruments by primary risk exposure.
| | | | | | |
Derivatives by risk category | | Statement of Operations Location | | Change in unrealized
appreciation/(depreciation)
recognized in Income | |
| | |
Interest Rate Contracts | | | | | | |
Futures | | Change in net unrealized appreciation/(depreciation) on Futures contracts | | | 63,173 | |
Total Interest Rate Contracts | | | | | 63,173 | |
| | |
Equity Contracts | | | | | | |
Futures | | Change in net unrealized appreciation/(depreciation) on Futures contracts | | | 35,283 | |
Total Equity Contracts | | | | | 35,283 | |
| | |
Foreign Exchange Contracts | | | | | | |
Forward Contracts | | Change in net unrealized appreciation/(depreciation) on Foreign currency forward contracts | | | 119,078 | |
Total Foreign Exchange Contracts | | | | | 119,078 | |
| |
Total | | | | | $217,534 | |
| |
The following table presents Partner Worldwide Allocation Fund’s average volume of derivative activity during the period ended October 31, 2014.
| | | | | | | | |
Derivative Risk Category | | Futures (Notional)* | | Futures (Percentage of Average Net Assets) | | Forwards (Notional)* | | Forwards
(Percentage of
Average Net Assets) |
Equity Contracts | | $3,847,687 | | 0.4% | | N/A | | N/A |
Interest Rate Contracts | | 51,509,812 | | 5.9 | | N/A | | N/A |
Foreign Exchange Contracts | | N/A | | N/A | | $69,248,387 | | 7.9% |
* | Notional amount represents long or short, or both, derivative positions held by the Fund. |
Investment in Affiliates
Affiliated issuers, as defined under the Investment Company Act of 1940, include those in which the Fund’s holdings of an issuer represent 5% or more of the outstanding voting securities of an issuer, or any affiliated mutual fund.
A summary of transactions for the fiscal year to date, in Partner Worldwide Allocation Fund, is as follows:
| | | | | | | | | | | | | | | | | | | | | | | | |
Fund | | Value
October 31, 2013 | | | Gross Purchases | | | Gross Sales | | | Shares Held at
October 31, 2014 | | | Value
October 31, 2014 | | | Income Earned
November 1, 2013 - October 31, 2014 | |
Cash Management Trust- Collateral Investment | | | $13,655,850 | | | | $112,784,671 | | | | $120,020,021 | | | | 6,420,500 | | | | $6,420,500 | | | | $18,667 | |
Cash Management Trust- Short Term Investment | | | 13,243,347 | | | | 257,848,134 | | | | 258,057,308 | | | | 13,034,173 | | | | 13,034,173 | | | | 9,637 | |
Total Value and Income Earned | | | 26,899,197 | | | | | | | | | | | | | | | | 19,454,673 | | | | 28,304 | |
The accompanying Notes to Financial Statements are an integral part of this schedule.
198
LARGE CAP GROWTH FUND
Schedule of Investments as of October 31, 2014
| | | | | | | | |
| Shares | | | Common Stock (94.7%) | | Value | |
| Consumer Discretionary (19.9%) | | | | |
| | 65,891 | | | Amazon.com, Inc.a | | | $20,127,065 | |
| | 20,850 | | | AutoZone, Inc.a | | | 11,540,892 | |
| | 239,900 | | | Comcast Corporation | | | 13,278,465 | |
| | 125,650 | | | Home Depot, Inc. | | | 12,253,388 | |
| | 166,550 | | | Kohl’s Corporation | | | 9,030,341 | |
| | 152,300 | | | Las Vegas Sands Corporation | | | 9,482,198 | |
| | 162,400 | | | NIKE, Inc. | | | 15,098,328 | |
| | 170,700 | | | Starbucks Corporation | | | 12,898,092 | |
| | | | | |
| | | | Total | | | 103,708,769 | |
| | | | | |
| |
| Consumer Staples (1.2%) | | | | |
| | 54,700 | | | Anheuser-Busch InBev NV ADR | | | 6,070,606 | |
| | | | | |
| | | | Total | | | 6,070,606 | |
| | | | | |
| |
| Energy (6.4%) | | | | |
| | 80,250 | | | Cameron International Corporationa | | | 4,778,887 | |
| | 73,500 | | | EOG Resources, Inc. | | | 6,986,175 | |
| | 97,400 | | | Marathon Oil Corporation | | | 3,447,960 | |
| | 105,500 | | | Schlumberger, Ltd. | | | 10,408,630 | |
| | 476,800 | | | Weatherford International, Ltd.a | | | 7,829,056 | |
| | | | | |
| | | | Total | | | 33,450,708 | |
| | | | | |
| |
| Financials (3.5%) | | | | |
| | 163,200 | | | Citigroup, Inc. | | | 8,736,096 | |
| | 157,789 | | | J.P. Morgan Chase & Company | | | 9,543,079 | |
| | | | | |
| | | | Total | | | 18,279,175 | |
| | | | | |
| |
| Health Care (16.5%) | | | | |
| | 47,400 | | | Actavis, Inc.a | | | 11,505,876 | |
| | 264,050 | | | Cerner Corporationa | | | 16,724,927 | |
| | 238,500 | | | Gilead Sciences, Inc.a | | | 26,712,000 | |
| | 145,550 | | | Johnson & Johnson | | | 15,687,379 | |
| | 136,650 | | | Vertex Pharmaceuticals, Inc.a | | | 15,392,256 | |
| | | | | |
| | | | Total | | | 86,022,438 | |
| | | | | |
| |
| Industrials (10.4 %) | | | | |
| | 95,450 | | | Boeing Company | | | 11,922,659 | |
| | 410,350 | | | Delta Air Lines, Inc. | | | 16,508,381 | |
| | 138,500 | | | Fluor Corporation | | | 9,188,090 | |
| | 141,600 | | | Union Pacific Corporation | | | 16,489,320 | |
| | | | | |
| | | | Total | | | 54,108,450 | |
| | | | | |
| |
| Information Technology (36.8%) | | | | |
| | 50,422 | | | Alibaba Group Holding, Ltd. ADRa | | | 4,971,609 | |
| | 407,314 | | | Apple, Inc. | | | 43,989,912 | |
| | 417,300 | | | EMC Corporation | | | 11,989,029 | |
| | 262,900 | | | Facebook, Inc.a | | | 19,714,871 | |
| | 23,053 | | | Google, Inc.a | | | 12,888,471 | |
| | 28,403 | | | Google, Inc., Class Aa | | | 16,129,212 | |
| | 32,800 | | | LinkedIn Corporationa | | | 7,509,888 | |
| | 75,250 | | | MasterCard, Inc. | | | 6,302,188 | |
| | 256,300 | | | NetApp, Inc. | | | 10,969,640 | |
| | 220,600 | | | QUALCOMM, Inc. | | | 17,319,306 | |
| | 200,000 | | | Salesforce.com, Inc.a | | | 12,798,000 | |
| | 76,200 | | | Visa, Inc. | | | 18,396,966 | |
| | 110,550 | | | VMware, Inc.a | | | 9,238,663 | |
| | | | | |
| | | | Total | | | 192,217,755 | |
| | | | | |
| | | | | | | | |
| | | | | |
| | | | Total Common Stock (cost $370,338,476) | | | 493,857,901 | |
| | | | | |
| | |
Shares or
Principal
Amount | | | Short-Term Investments (5.4%)b | | Value | |
| | | | Federal Home Loan Bank Discount Notes | | | | |
| | 680,000 | | | 0.079%, 11/5/2014c | | | 679,994 | |
| | 900,000 | | | 0.082%, 11/7/2014c | | | 899,988 | |
| | 26,710,284 | | | Thrivent Cash Management Trust 0.050% | | | 26,710,284 | |
| | | | | |
| | | | Total Short-Term Investments (at amortized cost) | | | 28,290,266 | |
| | | | | |
| | | | Total Investments (cost $398,628,742) 100.1% | | | $522,148,167 | |
| | | | | |
| | | | Other Assets and Liabilities, Net (0.1%) | | | (321,112 | ) |
| | | | | |
| | | | Total Net Assets 100.0% | | | $521,827,055 | |
| | | | | |
a | Non-income producing security. |
b | The interest rate shown reflects the yield, coupon rate or the discount rate at the date of purchase. |
c | At October 31, 2014, $1,579,982 of investments were held on deposit with the counterparty and pledged as the initial margin deposit for open futures contracts. |
Definitions:
| | | | |
ADR | | - | | American Depositary Receipt, which are certificates for an underlying foreign security’s shares held byan issuing U.S. depository bank. |
Unrealized Appreciation (Depreciation)
Gross unrealized appreciation and depreciation of investments, based on cost for federal income tax purposes, were as follows:
| | | | |
Gross unrealized appreciation | | $ | 126,250,448 | |
Gross unrealized depreciation | | | (2,735,844 | ) |
| | | | |
Net unrealized appreciation (depreciation) | | $ | 123,514,604 | |
| |
Cost for federal income tax purposes | | $ | 398,633,563 | |
The accompanying Notes to Financial Statements are an integral part of this schedule.
199
LARGE CAP GROWTH FUND
Schedule of Investments as of October 31, 2014
Fair Valuation Measurements
The following table is a summary of the inputs used, as of October 31, 2014, in valuing Large Cap Growth Fund’s assets carried at fair value.
| | | | | | | | | | | | | | | | |
Investments in Securities | | Total | | | Level 1 | | | Level 2 | | | Level 3 | |
| | | | |
Common Stock | | | | | | | | | | | | | | | | |
Consumer Discretionary | | | 103,708,769 | | | | 103,708,769 | | | | – | | | | – | |
Consumer Staples | | | 6,070,606 | | | | 6,070,606 | | | | – | | | | – | |
Energy | | | 33,450,708 | | | | 33,450,708 | | | | – | | | | – | |
Financials | | | 18,279,175 | | | | 18,279,175 | | | | – | | | | – | |
Health Care | | | 86,022,438 | | | | 86,022,438 | | | | – | | | | – | |
Industrials | | | 54,108,450 | | | | 54,108,450 | | | | – | | | | – | |
Information Technology | | | 192,217,755 | | | | 192,217,755 | | | | – | | | | – | |
Short-Term Investments | | | 28,290,266 | | | | 26,710,284 | | | | 1,579,982 | | | | – | |
| |
Total | | | $522,148,167 | | | | $520,568,185 | | | | $1,579,982 | | | | $– | |
| |
| | | | |
Other Financial Instruments | | Total | | | Level 1 | | | Level 2 | | | Level 3 | |
Liability Derivatives | | | | | | | | | | | | | | | | |
Futures Contracts | | | 546,312 | | | | 546,312 | | | | – | | | | – | |
| |
Total Liability Derivatives | | | $546,312 | | | | $546,312 | | | | $– | | | | $– | |
| |
There were no significant transfers between Levels during the period ended October 31, 2014. Transfers between Levels are identified as of the end of the period.
| | | | | | | | | | | | | | | | | | | | |
Futures Contracts | | Number of
Contracts
Long/(Short) | | | Expiration
Date | | | Notional
Principal
Amount | | | Value | | | Unrealized
Gain/(Loss) | |
Eurex EURO STOXX 50 Futures | | | 453 | | | | December 2014 | | | | $18,206,721 | | | | $17,660,409 | | | | ($546,312 | ) |
Total Futures Contracts | | | | | | | | | | | | | | | | | | | ($546,312 | ) |
The following table summarizes the fair value and Statement of Assets and Liabilities location, as of October 31, 2014, for Large Cap Growth Fund’s investments in financial derivative instruments by primary risk exposure as discussed under item (2) Significant Accounting Policies of the Notes to Financial Statements.
| | | | | | |
Derivatives by risk category | | Statement of Assets and Liabilities Location | | Fair Value | |
| | |
Liability Derivatives | | | | | | |
| | |
Equity Contracts | | | | | | |
Futures* | | Net Assets - Net unrealized appreciation/(depreciation) on Futures contracts | | | $546,312 | |
Total Equity Contracts | | | | | 546,312 | |
Total Liability Derivatives | | | | | $546,312 | |
| |
* | Includes cumulative appreciation/depreciation of futures contracts as reported in the Schedule of Investments. Only current day’s variation margin is reported within the Statement of Assets and Liabilities. |
The following table summarizes the net realized gains/(losses) and Statement of Operations location, for the period ended October 31, 2014, for Large Cap Growth Fund’s investments in financial derivative instruments by primary risk exposure.
| | | | | | |
Derivatives by risk category | | Statement of Operations Location | | Realized Gains/(Losses)
recognized in Income | |
| | |
Equity Contracts | | | | | | |
Futures | | Net realized gains/(losses) on Futures contracts | | | 1,426,243 | |
Total Equity Contracts | | | | | 1,426,243 | |
| |
Total | | | | | $1,426,243 | |
| |
The accompanying Notes to Financial Statements are an integral part of this schedule.
200
LARGE CAP GROWTH FUND
Schedule of Investments as of October 31, 2014
The following table summarizes the change in net unrealized appreciation/(depreciation) and Statement of Operations location, for the period ended October 31, 2014, for Large Cap Growth Fund’s investments in financial derivative instruments by primary risk exposure.
| | | | | | |
Derivatives by risk category | | Statement of Operations Location | | Change in unrealized appreciation/(depreciation) recognized in Income | |
| | |
Eauity Contracts | | | | | | |
Futures | | Change in net unrealized appreciation/(depreciation) on Futures contracts | | | (1,006,369 | ) |
Total Equity Contracts | | | | | (1,006,369 | ) |
| |
Total | | | | | ($1,006,369 | ) |
| |
The following table presents Large Cap Growth Fund’s average volume of derivative activity during the period ended October 31, 2014.
| | | | | | | | | | |
Derivative Risk Category | | | | Futures
(Notional)* | | | Futures
(Percentage
of Average
Net Assets) | |
Equity Contracts | | | | $ | 14,305,878 | | | | 2.9 | % |
* | Notional amount represents long or short, or both, derivative positions held by the Fund. |
Investment in Affiliates
Affiliated issuers, as defined under the Investment Company Act of 1940, include those in which the Fund’s holdings of an issuer represent 5% or more of the outstanding voting securities of an issuer, or any affiliated mutual fund.
A summary of transactions for the fiscal year to date, in Large Cap Growth Fund, is as follows:
| | | | | | | | | | | | | | | | | | | | | | | | |
Fund | | Value
October 31, 2013 | | | Gross Purchases | | | Gross Sales | | | Shares Held at
October 31, 2014 | | | Value
October 31, 2014 | | | Income Earned
November 1, 2013 - October 31, 2014 | |
Cash Management Trust-Collateral Investment | | | $6,510,000 | | | | $34,564,950 | | | | $41,074,950 | | | | – | | | | $– | | | | $3,109 | |
Cash Management Trust-Short Term Investment | | | 17,617,000 | | | | 56,808,493 | | | | 47,715,209 | | | | 26,710,284 | | | | 26,710,284 | | | | 13,673 | |
Total Value and Income Earned | | | 24,127,000 | | | | | | | | | | | | | | | | 26,710,284 | | | | 16,782 | |
The accompanying Notes to Financial Statements are an integral part of this schedule.
201
LARGE CAP VALUE FUND
Schedule of Investments as of October 31, 2014
| | | | | | | | |
| Shares | | | Common Stock (96.9%) | | Value | |
| Consumer Discretionary (8.6%) | | | | |
| | 213,920 | | | CBS Corporation | | | $11,598,742 | |
| | 239,764 | | | Delphi Automotive plc | | | 16,538,921 | |
| | 436,731 | | | Lowe’s Companies, Inc. | | | 24,981,013 | |
| | 104,490 | | | Time Warner Cable, Inc. | | | 15,381,973 | |
| | | | | |
| | | | Total | | | 68,500,649 | |
| | | | | |
| |
| Consumer Staples (6.6%) | | | | |
| | 277,340 | | | CVS Health Corporation | | | 23,798,545 | |
| | 73,650 | | | Kimberly-Clark Corporation | | | 8,415,986 | |
| | 273,476 | | | Mondelez International, Inc. | | | 9,642,764 | |
| | 82,837 | | | Philip Morris International, Inc. | | | 7,373,321 | |
| | 45,200 | | | Wal-Mart Stores, Inc. | | | 3,447,404 | |
| | | | | |
| | | | Total | | | 52,678,020 | |
| | | | | |
| |
| Energy (12.4%) | | | | |
| | 188,800 | | | Cameron International Corporationa | | | 11,243,040 | |
| | 96,559 | | | Chevron Corporation | | | 11,582,252 | |
| | 142,994 | | | EOG Resources, Inc. | | | 13,591,580 | |
| | 136,775 | | | EQT Corporation | | | 12,862,321 | |
| | 425,911 | | | Marathon Oil Corporation | | | 15,077,249 | |
| | 147,600 | | | Schlumberger, Ltd. | | | 14,562,216 | |
| | 333,100 | | | Total SA ADR | | | 19,949,359 | |
| | | | | |
| | | | Total | | | 98,868,017 | |
| | | | | |
| |
| Financials (22.9%) | | | | |
| | 76,367 | | | ACE, Ltd. | | | 8,346,913 | |
| | 147,790 | | | Allstate Corporation | | | 9,584,182 | |
| | 1,380,210 | | | Bank of America Corporation | | | 23,684,404 | |
| | 258,600 | | | Blackstone Group, LP | | | 7,789,032 | |
| | 183,500 | | | Capital One Financial Corporation | | | 15,188,295 | |
| | 570,540 | | | Citigroup, Inc. | | | 30,541,006 | |
| | 272,400 | | | Comerica, Inc. | | | 13,004,376 | |
| | 188,794 | | | Deutsche Bank AG | | | 5,913,028 | |
| | 38,700 | | | Intercontinental Exchange, Inc. | | | 8,060,823 | |
| | 375,960 | | | Invesco, Ltd. | | | 15,215,101 | |
| | 396,420 | | | MetLife, Inc. | | | 21,501,821 | |
| | 509,080 | | | Morgan Stanley | | | 17,792,346 | |
| | 55,663 | | | SVB Financial Groupa | | | 6,233,699 | |
| | | | | |
| | | | Total | | | 182,855,026 | |
| | | | | |
| |
| Health Care (14.7%) | | | | |
| | 84,900 | | | Amgen, Inc. | | | 13,769,082 | |
| | 238,740 | | | Baxter International, Inc. | | | 16,745,224 | |
| | 154,376 | | | Covidien plc | | | 14,270,517 | |
| | 114,700 | | | Express Scripts Holding Companya | | | 8,811,254 | |
| | 99,495 | | | Johnson & Johnson | | | 10,723,571 | |
| | 498,310 | | | Merck & Company, Inc. | | | 28,872,081 | |
| | 327,500 | | | Pfizer, Inc. | | | 9,808,625 | |
| | 149,653 | | | UnitedHealth Group, Inc. | | | 14,218,532 | |
| | | | | |
| | | | Total | | | 117,218,886 | |
| | | | | |
| |
| Industrials (9.1%) | | | | |
| | 65,300 | | | Boeing Company | | | 8,156,623 | |
| | 500,100 | | | CSX Corporation | | | 17,818,563 | |
| | 128,700 | | | Fluor Corporation | | | 8,537,958 | |
| | 135,326 | | | Honeywell International, Inc. | | | 13,007,535 | |
| | 174,700 | | | Ingersoll-Rand plc | | | 10,939,714 | |
| | 135,690 | | | Jacobs Engineering Group, Inc.a | | | 6,438,491 | |
| | 120,240 | | | Pentair, Ltd. | | | 8,062,092 | |
| | | | | |
| | | | Total | | | 72,960,976 | |
| | | | | |
| |
| Information Technology (14.1%) | | | | |
| | 1,228,430 | | | Cisco Systems, Inc. | | | 30,059,682 | |
| | 405,300 | | | EMC Corporation | | | 11,644,269 | |
| | 321,181 | | | Microsoft Corporation | | | 15,079,448 | |
| | 262,350 | | | NetApp, Inc. | | | 11,228,580 | |
| | 495,800 | | | Oracle Corporation | | | 19,360,990 | |
| | 281,900 | | | Teradata Corporationa | | | 11,930,008 | |
| | 268,750 | | | Texas Instruments, Inc. | | | 13,346,125 | |
| | | | | |
| | | | Total | | | 112,649,102 | |
| | | | | |
| |
| Materials (3.0%) | | | | |
| | 125,410 | | | Celanese Corporation | | | 7,365,330 | |
| | 187,900 | | | Dow Chemical Company | | | 9,282,260 | |
| | 139,750 | | | Nucor Corporation | | | 7,554,885 | |
| | | | | |
| | | | Total | | | 24,202,475 | |
| | | | | |
| |
| Telecommunications Services (1.9%) | | | | |
| | 311,449 | | | Verizon Communications, Inc. | | | 15,650,312 | |
| | | | | |
| | | | Total | | | 15,650,312 | |
| | | | | |
| |
| Utilities (3.6%) | | | | |
| | 196,540 | | | NiSource, Inc. | | | 8,266,472 | |
| | 410,790 | �� | | PG&E Corporation | | | 20,670,953 | |
| | | | | |
| | | | Total | | | 28,937,425 | |
| | | | | |
| | | | | | | | |
| | | | | |
| | | | Total Common Stock (cost $559,401,174) | | | 774,520,888 | |
| | | | | |
| | |
Shares or
Principal
Amount | | | Short-Term Investments (3.0%)b | | Value | |
| | 24,139,770 | | | Thrivent Cash Management Trust 0.050% | | | 24,139,770 | |
| | | | | |
| | | | Total Short-Term Investments (at amortized cost) | | | 24,139,770 | |
| | | | | |
| | | | Total Investments (cost $583,540,944) 99.9% | | | $798,660,658 | |
| | | | | |
| | | | Other Assets and Liabilities, Net 0.1% | | | 495,681 | |
| | | | | |
| | | | Total Net Assets 100.0% | | | $799,156,339 | |
| | | | | |
a | Non-income producing security. |
b | The interest rate shown reflects the yield, coupon rate or the discount rate at the date of purchase. |
Definitions:
| | | | |
ADR | | - | | American Depositary Receipt, which are certificates for an underlying foreign security’s shares held by an issuing U.S. depository bank. |
Unrealized Appreciation (Depreciation)
Gross unrealized appreciation and depreciation of investments, based on cost for federal income tax purposes, were as follows:
| | | | |
Gross unrealized appreciation | | $ | 220,507,754 | |
Gross unrealized depreciation | | | (5,533,547 | ) |
| | | | |
Net unrealized appreciation (depreciation) | | $ | 214,974,207 | |
| |
Cost for federal income tax purposes | | $ | 583,686,451 | |
The accompanying Notes to Financial Statements are an integral part of this schedule.
202
LARGE CAP VALUE FUND
Schedule of Investments as of October 31, 2014
Fair Valuation Measurements
The following table is a summary of the inputs used, as of October 31, 2014, in valuing Large Cap Value Fund’s assets carried at fair value.
| | | | | | | | | | | | | | | | |
Investments in Securities | | Total | | | Level 1 | | | Level 2 | | | Level 3 | |
Common Stock | | | | | | | | | | | | | | | | |
Consumer Discretionary | | | 68,500,649 | | | | 68,500,649 | | | | – | | | | – | |
Consumer Staples | | | 52,678,020 | | | | 52,678,020 | | | | – | | | | – | |
Energy | | | 98,868,017 | | | | 98,868,017 | | | | – | | | | – | |
Financials | | | 182,855,026 | | | | 182,855,026 | | | | – | | | | – | |
Health Care | | | 117,218,886 | | | | 117,218,886 | | | | – | | | | – | |
Industrials | | | 72,960,976 | | | | 72,960,976 | | | | – | | | | – | |
Information Technology | | | 112,649,102 | | | | 112,649,102 | | | | – | | | | – | |
Materials | | | 24,202,475 | | | | 24,202,475 | | | | – | | | | – | |
Telecommunications Services | | | 15,650,312 | | | | 15,650,312 | | | | – | | | | – | |
Utilities | | | 28,937,425 | | | | 28,937,425 | | | | – | | | | – | |
Short-Term Investments | | | 24,139,770 | | | | 24,139,770 | | | | – | | | | – | |
| |
Total | | | $798,660,658 | | | | $798,660,658 | | | | $– | | | | $– | |
| |
There were no significant transfers between Levels during the period ended October 31, 2014. Transfers between Levels are identified as of the end of the period.
Investment in Affiliates
Affiliated issuers, as defined under the Investment Company Act of 1940, include those in which the Fund’s holdings of an issuer represent 5% or more of the outstanding voting securities of an issuer, or any affiliated mutual fund.
A summary of transactions for the fiscal year to date, in Large Cap Value Fund, is as follows:
| | | | | | | | | | | | | | | | | | | | | | | | |
Fund | | Value
October 31, 2013 | | | Gross Purchases | | | Gross Sales | | | Shares Held at
October 31, 2014 | | | Value
October 31, 2014 | | | Income Earned
November 1, 2013 - October 31, 2014 | |
Cash Management Trust-Collateral Investment | | | $9,844,200 | | | | $168,966,640 | | | | $178,810,840 | | | | – | | | | $– | | | | $58,427 | |
Cash Management Trust-Short Term Investment | | | 18,459,046 | | | | 77,953,362 | | | | 72,272,638 | | | | 24,139,770 | | | | 24,139,770 | | | | 13,061 | |
Total Value and Income Earned | | | 28,303,246 | | | | | | | | | | | | | | | | 24,139,770 | | | | 71,488 | |
The accompanying Notes to Financial Statements are an integral part of this schedule.
203
LARGE CAP STOCK FUND
Schedule of Investments as of October 31, 2014
| | | | | | | | |
| Shares | | | Common Stock (95.2%) | | Value | |
| Consumer Discretionary (11.2%) | | | | |
| | 89,100 | | | Amazon.com, Inc.a | | | $27,216,486 | |
| | 40,200 | | | Aoyama Trading Company, Ltd. | | | 956,156 | |
| | 58,300 | | | AutoZone, Inc.a | | | 32,270,216 | |
| | 8,000 | | | Bayerische Motoren Werke AG | | | 641,471 | |
| | 10,200 | | | Brembo SPA | | | 338,246 | |
| | 19,700 | | | Bridgestone Corporation | | | 658,330 | |
| | 15,800 | | | Chiyoda Company, Ltd. | | | 312,617 | |
| | 568,300 | | | Comcast Corporationb | | | 31,455,405 | |
| | 5,800 | | | Daimler AG | | | 452,219 | |
| | 98,350 | | | Delphi Automotive plc | | | 6,784,183 | |
| | 203,600 | | | EDION Corporationb | | | 1,452,633 | |
| | 600 | | | Forbo Holding AG | | | 622,668 | |
| | 103,100 | | | Hakuhodo Dy Holdings, Inc. | | | 1,019,609 | |
| | 128,673 | | | Halfords Group plc | | | 1,021,437 | |
| | 183,000 | | | Haseko Corporation | | | 1,341,377 | |
| | 15,500 | | | Heiwa Corporation | | | 317,384 | |
| | 175,200 | | | Home Retail Group plc | | | 514,129 | |
| | 64,500 | | | JM AB | | | 2,084,786 | |
| | 459,442 | | | Kongsberg Automotive ASAa | | | 439,622 | |
| | 487,230 | | | Las Vegas Sands Corporation | | | 30,334,940 | |
| | 502,000 | | | Li & Fung, Ltd. | | | 611,807 | |
| | 701,000 | | | Luk Fook Holdings International, Ltd. | | | 2,090,163 | |
| | 27,600 | | | Next plc | | | 2,849,321 | |
| | 102,200 | | | NOK Corporation | | | 2,589,182 | |
| | 96,900 | | | Persimmon plc | | | 2,275,704 | |
| | 38,933 | | | Publicis Groupe SA | | | 2,700,305 | |
| | 5,200 | | | Rinnai Corporation | | | 461,900 | |
| | 111,554 | | | Slater & Gordon, Ltd. | | | 602,725 | |
| | 481,900 | | | Starbucks Corporation | | | 36,412,364 | |
| | 107,700 | | | Sumitomo Forestry Company, Ltd. | | | 1,131,710 | |
| | 86,700 | | | Suzuki Motor Corporation | | | 2,906,055 | |
| | 2,000 | | | Valora Holding AG | | | 414,258 | |
| | 60,800 | | | WH Smith plc | | | 1,097,726 | |
| | 18,200 | | | Wolters Kluwer NV | | | 485,916 | |
| | 17,600 | | | WPP plc | | | 343,773 | |
| | | | | |
| | | | Total | | | 197,206,823 | |
| | | | | |
| |
| Consumer Staples (8.4%) | | | | |
| | 258,550 | | | Anheuser-Busch InBev NV ADR | | | 28,693,879 | |
| | 134,445 | | | Britvic plc | | | 1,465,849 | |
| | 228,300 | | | CVS Health Corporation | | | 19,590,423 | |
| | 158,717 | | | Greencore Group plc | | | 665,974 | |
| | 80,300 | | | J Sainsbury plcb | | | 316,345 | |
| | 39,900 | | | Kesko Oyj | | | 1,513,228 | |
| | 360,400 | | | Kimberly-Clark Corporation | | | 41,182,908 | |
| | 14,200 | | | KOSE Corporation | | | 580,316 | |
| | 25,800 | | | Matsumotokiyoshi Holdings Company, Ltd. | | | 750,317 | |
| | 19,700 | | | Nestle SA | | | 1,444,683 | |
| | 185,600 | | | Parmalat SPA | | | 557,737 | |
| | 384,900 | | | Philip Morris International, Inc. | | | 34,259,949 | |
| | 12,400 | | | Rallye SA | | | 480,580 | |
| | 62,612 | | | Reckitt Benckiser Group plc | | | 5,273,379 | |
| | 51,215 | | | SalMar ASA | | | 922,717 | |
| | 52,600 | | | Suedzucker AGb | | | 732,402 | |
| | 98,100 | | | Tate & Lyle plc | | | 949,417 | |
| | 110,000 | | | Wal-Mart Stores, Inc. | | | 8,389,700 | |
| | | | | |
| | | | Total | | | 147,769,803 | |
| | | | | |
| |
| Energy (9.1%) | | | | |
| | 827,109 | | | BP plc | | | 5,950,944 | |
| | 443,273 | | | BW Offshore, Ltd. | | | 544,220 | |
| | 230,000 | | | Cameron International Corporationa | | | 13,696,500 | |
| | 27,200 | | | Eni SPA | | | 579,493 | |
| | 94,500 | | | Ensco plc | | | 3,835,755 | |
| | 184,730 | | | EOG Resources, Inc. | | | 17,558,586 | |
| | 135,400 | | | ERG SPA | | | 1,551,690 | |
| | 828,000 | | | Marathon Oil Corporation | | | 29,311,200 | |
| | 97,200 | | | Neste Oil Oyj | | | 2,101,154 | |
| | 220,615 | | | Royal Dutch Shell plc | | | 7,889,276 | |
| | 150,600 | | | Royal Dutch Shell plc, Class B | | | 5,563,955 | |
| | 214,720 | | | Schlumberger, Ltd. | | | 21,184,275 | |
| | 179,100 | | | Showa Shell Sekiyu KK | | | 1,536,733 | |
| | 25,312 | | | Statoil ASAb | | | 579,276 | |
| | 30,800 | | | Total SA | | | 1,838,860 | |
| | 232,150 | | | Total SA ADR | | | 13,903,464 | |
| | 1,818,450 | | | Weatherford International, Ltd.a | | | 29,858,949 | |
| | 116,800 | | | Woodside Petroleum, Ltd. | | | 4,148,794 | |
| | | | | |
| | | | Total | | | 161,633,124 | |
| | | | | |
| |
| Financials (16.5%) | | | | |
| | 216,300 | | | ACE, Ltd. | | | 23,641,590 | |
| | 45,500 | | | Allianz SE | | | 7,235,499 | |
| | 66,584 | | | Amlin plc | | | 485,963 | |
| | 172,400 | | | Assicurazioni Generali SPA | | | 3,537,719 | |
| | 29,100 | | | AXA SA | | | 672,167 | |
| | 302,000 | | | Banco Santander SA | | | 2,668,327 | |
| | 145,500 | | | Bank Leumi Le-Israel BMa | | | 519,959 | |
| | 499,467 | | | Bank of America Corporation | | | 8,570,854 | |
| | 404,400 | | | Blackstone Group, LP | | | 12,180,528 | |
| | 8,500 | | | Bolsas y Mercados Espanoles SA | | | 323,395 | |
| | 186,600 | | | Capital One Financial Corporation | | | 15,444,882 | |
| | 226,800 | | | Catlin Group, Ltd. | | | 1,948,383 | |
| | 234,700 | | | Challenger, Ltd. | | | 1,443,565 | |
| | 361,000 | | | Cheung Kong Holdings, Ltd. | | | 6,408,572 | |
| | 664,550 | | | Citigroup, Inc. | | | 35,573,361 | |
| | 57,000 | | | CNP Assurances | | | 1,065,623 | |
| | 291,350 | | | Comerica, Inc. | | | 13,909,049 | |
| | 67,900 | | | Commonwealth Bank of Australia | | | 4,828,351 | |
| | 143,845 | | | Credit Agricole SA | | | 2,128,655 | |
| | 25,100 | | | Daito Trust Construction Company, Ltd. | | | 3,127,480 | |
| | 607,000 | | | Daiwa Securities Group, Inc. | | | 4,797,097 | |
| | 15,416 | | | Delta Lloyd NV | | | 351,380 | |
| | 315,700 | | | Direct Line Insurance Group plc | | | 1,396,543 | |
| | 180,900 | | | FlexiGroup, Ltd. | | | 571,332 | |
| | 2,014 | | | Friends Life Group, Ltd. | | | 10,445 | |
| | 408,000 | | | Fukuoka Financial Group, Inc. | | | 2,087,758 | |
| | 19,000 | | | GAM Holding AGa | | | 324,480 | |
| | 5,800 | | | Hannover Rueckversicherung SE | | | 484,110 | |
| | 45,960 | | | Hiscox, Ltd. | | | 501,272 | |
| | 111,650 | | | Intercontinental Exchange, Inc. | | | 23,255,579 | |
| | 301,617 | | | Intermediate Capital Group plc | | | 1,982,728 | |
| | 666,160 | | | Intesa Sanpaolo SPA | | | 1,703,226 | |
| | 576,750 | | | Invesco, Ltd. | | | 23,341,073 | |
| | 367,000 | | | Investec plc | | | 3,365,183 | |
| | 779,974 | | | J.P. Morgan Chase & Company | | | 47,172,828 | |
| | 211,000 | | | Link REIT | | | 1,240,806 | |
| | 717,600 | | | Man Group plc | | | 1,422,833 | |
| | 427,000 | | | Mizuho Financial Group, Inc. | | | 778,129 | |
| | 18,700 | | | Muenchener Rueckversicherungs- Gesellschaft AG | | | 3,681,800 | |
| | 17,400 | | | National Australia Bank, Ltd. | | | 538,284 | |
| | 122,200 | | | Natixis | | | 841,160 | |
| | 159,600 | | | Old Mutual plc | | | 495,648 | |
| | 147,500 | | | Oversea-Chinese Banking Corporation, Ltd. | | | 1,136,209 | |
| | 139,000 | | | Phoenix Group Holdings | | | 1,678,333 | |
| | 18,200 | | | Sampo Oyj | | | 872,096 | |
| | 15,500 | | | SCOR SE | | | 474,957 | |
| | 800 | | | St. Galler Kantonalbank AG | | | 289,352 | |
The accompanying Notes to Financial Statements are an integral part of this schedule.
204
LARGE CAP STOCK FUND
Schedule of Investments as of October 31, 2014
| | | | | | | | |
| Shares | | | Common Stock (95.2%) | | Value | |
| Financials (16.5%) - continued | | | | |
| | 42,500 | | | Standard Chartered plc | | | $639,735 | |
| | 37,000 | | | Sun Hung Kai Properties, Ltd. | | | 552,081 | |
| | 2,400 | | | Swiss Life Holding AGa | | | 550,658 | |
| | 9,800 | | | Swiss Re AG | | | 792,436 | |
| | 126,400 | | | UnipolSai Assicurazioni SPA | | | 339,856 | |
| | 212,840 | | | United Overseas Bank, Ltd. | | | 3,813,175 | |
| | 174,080 | | | Westpac Banking Corporation | | | 5,343,276 | |
| | 32,500 | | | Zurich Insurance Group AGa | | | 9,835,432 | |
| | | | | |
| | | | Total | | | 292,375,212 | |
| | | | | |
| |
| Health Care (14.4%) | | | | |
| | 64,550 | | | Actavis, Inc.a | | | 15,668,867 | |
| | 26,200 | | | Actelion, Ltd. | | | 3,120,295 | |
| | 62,000 | | | Amgen, Inc. | | | 10,055,160 | |
| | 143,710 | | | Baxter International, Inc. | | | 10,079,819 | |
| | 264,500 | | | Cerner Corporationa | | | 16,753,430 | |
| | 26,200 | | | CSL, Ltd. | | | 1,849,803 | |
| | 304,400 | | | Gilead Sciences, Inc.a | | | 34,092,800 | |
| | 178,063 | | | GlaxoSmithKline plc | | | 4,026,693 | |
| | 43,700 | | | H. Lundbeck AS | | | 926,674 | |
| | 53,400 | | | Hikma Pharmaceuticals plc | | | 1,619,641 | |
| | 46,194 | | | ICON plca | | | 2,430,266 | |
| | 435,500 | | | Johnson & Johnson | | | 46,938,190 | |
| | 23,000 | | | Kaken Pharmaceutical Company, Ltd. | | | 576,242 | |
| | 68,100 | | | KYORIN Holdings, Inc. | | | 1,434,713 | |
| | 862,320 | | | Merck & Company, Inc. | | | 49,962,821 | |
| | 83,800 | | | Novartis AG | | | 7,776,881 | |
| | 894,250 | | | Pfizer, Inc. | | | 26,782,787 | |
| | 9,900 | | | Teva Pharmaceutical Industries, Ltd. | | | 558,829 | |
| | 180,759 | | | Vertex Pharmaceuticals, Inc.a | | | 20,360,694 | |
| | | | | |
| | | | Total | | | 255,014,605 | |
| | | | | |
| |
| Industrials (8.8%) | | | | |
| | 36,900 | | | Actividades de Construccion y Servicios SA | | | 1,369,648 | |
| | 6,800 | | | Adecco SA | | | 460,915 | |
| | 25,400 | | | Aica Kogyo Company, Ltd. | | | 525,757 | |
| | 360,799 | | | Air New Zealand, Ltd. | | | 571,177 | |
| | 40,614 | | | Arcadis NV | | | 1,249,416 | |
| | 13,000 | | | Atlas Copco AB | | | 344,342 | |
| | 118,600 | | | Berendsen plc | | | 1,920,489 | |
| | 267,450 | | | Boeing Company | | | 33,407,179 | |
| | 165,400 | | | Bradken, Ltd. | | | 564,214 | |
| | 2,900 | | | Bucher Industries AG | | | 736,637 | |
| | 92,441 | | | Cardno, Ltd.b | | | 453,960 | |
| | 64,700 | | | Carillion plc | | | 344,696 | |
| | 132,100 | | | COMSYS Holdings Corporation | | | 2,358,326 | |
| | 34,000 | | | CTT-Correios de Portugal SA | | | 315,120 | |
| | 71,000 | | | Daifuku Company, Ltd. | | | 822,324 | |
| | 658,850 | | | Delta Air Lines, Inc. | | | 26,505,535 | |
| | 42,600 | | | Deutsche Lufthansa AG | | | 631,019 | |
| | 126,000 | | | Downer EDI, Ltd. | | | 532,080 | |
| | 6,400 | | | Duerr AG | | | 449,562 | |
| | 16,577 | | | Elbit Systems, Ltd. | | | 1,008,297 | |
| | 127,661 | | | Fluor Corporation | | | 8,469,031 | |
| | 1,400 | | | Georg Fischer AG | | | 808,605 | |
| | 14,900 | | | Go-Ahead Group plc | | | 586,651 | |
| | 38,900 | | | Hino Motors, Ltd. | | | 569,227 | |
| | 18,600 | | | Hoshizaki Electric Company, Ltd. | | | 900,941 | |
| | 10,100 | | | Implenia AG | | | 544,545 | |
| | 10,500 | | | Inaba Denki Sangyo Company, Ltd. | | | 366,007 | |
| | 78,400 | | | Intrum Justitia AB | | | 2,334,886 | |
| | 175,600 | | | ITOCHU Corporation | | | 2,122,748 | |
| | 11,664 | | | Jardine Matheson Holdings, Ltd. | | | 699,000 | |
| | 8,100 | | | Kanamoto Company, Ltd. | | | 295,654 | |
| | 94,600 | | | KITZ Corporation | | | 433,520 | |
| | 100,900 | | | Komatsu, Ltd. | | | 2,382,184 | |
| | 27,300 | | | Legrand SA | | | 1,469,018 | |
| | 62,600 | | | Leighton Holdings, Ltd.b | | | 1,218,756 | |
| | 2,084 | | | Mineral Resources, Ltd.b | | | 15,622 | |
| | 189,476 | | | Mitie Group plc | | | 914,170 | |
| | 60,300 | | | Nitto Kogyo Corporation | | | 1,054,218 | |
| | 45,200 | | | Securitas AB | | | 500,166 | |
| | 85,400 | | | Seven Group Holdings, Ltd. | | | 515,180 | |
| | 45,000 | | | Siemens AG | | | 5,075,698 | |
| | 60,800 | | | Sumitomo Corporation | | | 648,719 | |
| | 26,800 | | | Takasago Thermal Engineering Company, Ltd. | | | 345,886 | |
| | 21,600 | | | Teleperformance SA | | | 1,361,113 | |
| | 64,000 | | | Toppan Printing Company, Ltd. | | | 435,471 | |
| | 400,550 | | | Union Pacific Corporation | | | 46,644,047 | |
| | 41,450 | | | WS Atkins plc | | | 901,163 | |
| | | | | |
| | | | Total | | | 156,182,919 | |
| | | | | |
| |
| Information Technology (19.1%) | | | | |
| | 139,273 | | | Alibaba Group Holding, Ltd. ADRa,b | | | 13,732,318 | |
| | 820,296 | | | Apple, Inc. | | | 88,591,968 | |
| | 19,300 | | | Brother Industries, Ltd. | | | 343,628 | |
| | 7,300 | | | Cap Gemini SA | | | 480,311 | |
| | 57,650 | | | Check Point Software Technologies, Ltd.a,b | | | 4,280,513 | |
| | 418,950 | | | Cisco Systems, Inc. | | | 10,251,707 | |
| | 29,109 | | | Dialog Semiconductor plca | | | 1,005,185 | |
| | 53,700 | | | Econocom Group | | | 346,901 | |
| | 1,368,950 | | | EMC Corporation | | | 39,329,934 | |
| | 216,000 | | | Facebook, Inc.a | | | 16,197,840 | |
| | 150,100 | | | FUJIFILM Holdings NPV | | | 5,038,645 | |
| | 40,242 | | | Google, Inc.a | | | 22,498,497 | |
| | 40,292 | | | Google, Inc., Class Aa | | | 22,880,618 | |
| | 102,000 | | | Hitachi Kokusai Electric, Inc. | | | 1,527,858 | |
| | 20,700 | | | Hitachi Maxell, Ltd. | | | 312,366 | |
| | 61,300 | | | Hoya Corporation | | | 2,169,213 | |
| | 19,900 | | | NEC Networks & System Integration Corporation | | | 432,380 | |
| | 409,350 | | | NetApp, Inc. | | | 17,520,180 | |
| | 38,100 | | | NXP Semiconductors NVa | | | 2,615,946 | |
| | 527,000 | | | Oki Electric Industry Company, Ltd. | | | 1,224,463 | |
| | 75,300 | | | Optimal Payments plca | | | 534,727 | |
| | 21,400 | | | Orbotech, Ltd.a | | | 343,256 | |
| | 9,200 | | | Otsuka Corporation | | | 342,086 | |
| | 329,979 | | | Pace plc | | | 1,834,489 | |
| | 359,600 | | | QUALCOMM, Inc. | | | 28,232,196 | |
| | 9,300 | | | Rohm Company, Ltd. | | | 566,098 | |
| | 295,800 | | | Salesforce.com, Inc.a | | | 18,928,242 | |
| | 18,000 | | | Seiko Epson Corporation | | | 835,285 | |
| | 45,400 | | | TE Connectivity, Ltd. | | | 2,775,302 | |
| | 340,100 | | | Telefonaktiebolaget LM Ericsson | | | 4,018,758 | |
| | 303,200 | | | Teradata Corporationa | | | 12,831,424 | |
| | 26,800 | | | ULVAC, Inc.a | | | 333,728 | |
| | 166,000 | | | VMware, Inc.a | | | 13,872,620 | |
| | 18,200 | | | Wincor Nixdorf AG | | | 837,022 | |
| | | | | |
| | | | Total | | | 337,065,704 | |
| | | | | |
| |
| Materials (2.7%) | | | | |
| | 14,400 | | | APERAMa | | | 414,315 | �� |
| | 314,600 | | | Celanese Corporation | | | 18,476,458 | |
| | 422,259 | | | Centamin plc | | | 345,848 | |
| | 342,050 | | | Dow Chemical Company | | | 16,897,270 | |
| | 60,000 | | | Hitachi Metals, Ltd. | | | 1,012,968 | |
The accompanying Notes to Financial Statements are an integral part of this schedule.
205
LARGE CAP STOCK FUND
Schedule of Investments as of October 31, 2014
| | | | | | | | |
| Shares | | | Common Stock (95.2%) | | Value | |
| Materials (2.7%) - continued | | | | |
| | 15,000 | | | Holmen AB | | | $496,464 | |
| | 98,000 | | | Kureha Corporation | | | 486,044 | |
| | 24,400 | | | Maruichi Steel Tube, Ltd. | | | 576,216 | |
| | 42,200 | | | Nihon Nohyaku Company, Ltd. | | | 429,509 | |
| | 361,600 | | | Nippon Light Metal Holdings Company, Ltd. | | | 534,047 | |
| | 264,000 | | | Oji Holdings Corporation | | | 954,503 | |
| | 53,600 | | | Orica, Ltd. | | | 978,431 | |
| | 152,100 | | | Petra Diamonds, Ltd.a | | | 403,900 | |
| | 70,500 | | | Stora Enso OYJ | | | 582,196 | |
| | 132,000 | | | Sumitomo Metal Mining Company, Ltd. | | | 1,831,173 | |
| | 58,000 | | | Sumitomo Seika Chemicals Company, Ltd. | | | 355,809 | |
| | 126,000 | | | Toagosei Company, Ltd. | | | 550,674 | |
| | 403,000 | | | Tosoh Corporation | | | 1,752,478 | |
| | 94,000 | | | UPM-Kymmene Oyj | | | 1,491,075 | |
| | | | | |
| | | | Total | | | 48,569,378 | |
| | | | | |
| |
| Telecommunications Services (1.1%) | | | | |
| | 1,365,300 | | | Bezeq Israel Telecommunication Corporation, Ltd. | | | 2,333,468 | |
| | 271,157 | | | BT Group plc | | | 1,598,553 | |
| | 85,400 | | | Elisa Oyj | | | 2,345,962 | |
| | 66,600 | | | Freenet AG | | | 1,747,427 | |
| | 61,600 | | | iiNet, Ltd. | | | 434,702 | |
| | 110,800 | | | Nippon Telegraph & Telephone Corporation | | | 6,893,850 | |
| | 203,000 | | | Singapore Telecommunications, Ltd. | | | 597,485 | |
| | 700 | | | Swisscom AG | | | 412,665 | |
| | 1,453,900 | | | Telecom Italia SPAa,b | | | 1,647,677 | |
| | 219,700 | | | Telstra Corporation, Ltd. | | | 1,093,265 | |
| | | | | |
| | | | Total | | | 19,105,054 | |
| | | | | |
| |
| Utilities (3.9%) | | | | |
| | 2,267,600 | | | A2A SPA | | | 2,273,783 | |
| | 53,800 | | | E.ON SE | | | 927,517 | |
| | 827,400 | | | Electricidade de Portugal SA | | | 3,560,571 | |
| | 32,400 | | | Electricite de France | | | 956,719 | |
| | 32,100 | | | Endesa SAb | | | 626,202 | |
| | 681,100 | | | Enel SPA | | | 3,480,362 | |
| | 99,700 | | | Fortum Oyj | | | 2,312,219 | |
| | 253,400 | | | IREN SPA | | | 306,420 | |
| | 652,180 | | | NiSource, Inc. | | | 27,430,691 | |
| | 454,200 | | | PG&E Corporation | | | 22,855,344 | |
| | 6,000 | | | Red Electrica Corporacion SA | | | 524,287 | |
| | 108,300 | | | Redes Energeticas Nacionais SGPS SA | | | 335,696 | |
| | 265,300 | | | United Utilities Group plc | | | 3,636,785 | |
| | | | | |
| | | | Total | | | 69,226,596 | |
| | | | | |
| | | | | |
| | | | | |
| | | | Total Common Stock (cost $1,302,263,326) | | | 1,684,149,218 | |
| | | | | |
| | |
| Shares | | | Collateral Held for Securities Loaned (1.5%) | | Value | |
| | 26,063,555 | | | Thrivent Cash Management Trust | | | 26,063,555 | |
| | | | | |
| | | | Total Collateral Held for Securities Loaned (cost $26,063,555) | | | 26,063,555 | |
| | | | | |
| | |
Shares or
Principal
Amount | | | Short-Term Investments (4.8%)c | | Value | |
| | | | Federal Home Loan Bank Discount Notes | | | | |
| | 11,800,000 | | | 0.051%, 1/16/2015d | | | $11,798,729 | |
| | 100,000 | | | 0.100%, 4/24/2015d | | | 99,952 | |
| | 72,608,318 | | | Thrivent Cash Management Trust 0.050% | | | 72,608,318 | |
| | | | | |
| | | | Total Short-Term Investments (at amortized cost) | | | 84,506,999 | |
| | | | | |
| | | | Total Investments (cost $1,412,833,880) 101.5% | | | $1,794,719,772 | |
| | | | | |
| | | | Other Assets and Liabilities, Net (1.5%) | | | (26,530,961 | ) |
| | | | | |
| | | | Total Net Assets 100.0% | | | $1,768,188,811 | |
| | | | | |
a | Non-income producing security. |
b | All or a portion of the security is on loan. |
c | The interest rate shown reflects the yield, coupon rate or the discount rate at the date of purchase. |
d | At October 31, 2014, $11,898,681 of investments were held on deposit with the counterparty and pledged as the initial margin deposit for open futures contracts. |
Definitions:
| | | | |
| ADR | | - | | American Depositary Receipt, which are certificates for an underlying foreign security’s shares held by an issuing U.S. depository bank. |
| REIT | | - | | Real Estate Investment Trust is a company that buys, develops, manages and/or sells real estate assets. |
| | | | |
Unrealized Appreciation (Depreciation) | | | | |
Gross unrealized appreciation and depreciation of investments, based on cost for federal income tax purposes, were as follows: | | | | |
Gross unrealized appreciation | | | $396,302,783 | |
Gross unrealized depreciation | | | (20,598,814 | ) |
| | | | |
Net unrealized appreciation (depreciation) | | | $375,703,969 | |
| |
Cost for federal income tax purposes | | | $1,419,015,803 | |
The accompanying Notes to Financial Statements are an integral part of this schedule.
206
LARGE CAP STOCK FUND
Schedule of Investments as of October 31, 2014
Fair Valuation Measurements
The following table is a summary of the inputs used, as of October 31, 2014, in valuing Large Cap Stock Fund’s assets carried at fair value.
| | | | | | | | | | | | | | | | |
Investments in Securities | | Total | | | Level 1 | | | Level 2 | | | Level 3 | |
Common Stock | | | | | | | | | | | | | | | | |
Consumer Discretionary | | | 197,206,823 | | | | 164,473,594 | | | | 32,733,229 | | | | – | |
Consumer Staples | | | 147,769,803 | | | | 132,116,859 | | | | 15,652,944 | | | | – | |
Energy | | | 161,633,124 | | | | 129,348,729 | | | | 32,284,395 | | | | – | |
Financials | | | 292,375,212 | | | | 203,089,744 | | | | 89,285,468 | | | | – | |
Health Care | | | 255,014,605 | | | | 233,124,834 | | | | 21,889,771 | | | | – | |
Industrials | | | 156,182,919 | | | | 115,025,792 | | | | 41,157,127 | | | | – | |
Information Technology | | | 337,065,704 | | | | 314,882,561 | | | | 22,183,143 | | | | – | |
Materials | | | 48,569,378 | | | | 35,373,728 | | | | 13,195,650 | | | | – | |
Telecommunications Services | | | 19,105,054 | | | | – | | | | 19,105,054 | | | | – | |
Utilities | | | 69,226,596 | | | | 50,286,035 | | | | 18,940,561 | | | | – | |
Collateral Held for Securities Loaned | | | 26,063,555 | | | | 26,063,555 | | | | – | | | | – | |
Short-Term Investments | | | 84,506,999 | | | | 72,608,318 | | | | 11,898,681 | | | | – | |
| |
Total | | | $1,794,719,772 | | | | $1,476,393,749 | | | | $318,326,023 | | | | $– | |
| |
| | | | |
Other Financial Instruments | | Total | | | Level 1 | | | Level 2 | | | Level 3 | |
Liability Derivatives | | | | | | | | | | | | | | | | |
Futures Contracts | | | 5,383,956 | | | | 5,383,956 | | | | – | | | | – | |
| |
Total Liability Derivatives | | | $5,383,956 | | | | $5,383,956 | | | | $– | | | | $– | |
| |
There were no significant transfers between Levels during the period ended October 31, 2014. Transfers between Levels are identified as of the end of the period.
| | | | | | | | | | | | | | | | | | | | |
Futures Contracts | | Number of
Contracts
Long/(Short) | | | Expiration
Date | | | Notional
Principal
Amount | | | Value | | | Unrealized
Gain/
(Loss) | |
Eurex EURO STOXX 50 Futures | | | 1,403 | | | | December 2014 | | | | $56,388,585 | | | | $54,696,587 | | | | ($1,691,998 | ) |
Mini MSCI EAFE Index Futures | | | 887 | | | | December 2014 | | | | 84,120,885 | | | | 81,426,601 | | | | (2,694,284 | ) |
S&P 500 Index Mini-Futures | | | (879 | ) | | | December 2014 | | | | (87,403,356 | ) | | | (88,401,030 | ) | | | (997,674 | ) |
Total Futures Contracts | | | | | | | | | | | | | | | | | | | ($5,383,956 | ) |
The following table summarizes the fair value and Statement of Assets and Liabilities location, as of October 31, 2014, for Large Cap Stock Fund’s investments in financial derivative instruments by primary risk exposure as discussed under item (2) Significant Accounting Policies of the Notes to Financial Statements.
| | | | | | |
Derivatives by risk category | | Statement of Assets and Liabilities Location | | Fair Value | |
Liability Derivatives | | | | | | |
| | |
Equity Contracts | | | | | | |
Futures* | | Net Assets - Net unrealized appreciation/(depreciation) on Futures contracts | | | $5,383,956 | |
Total Equity Contracts | | | | | 5,383,956 | |
Total Liability Derivatives | | | | | $5,383,956 | |
| |
* | Includes cumulative appreciation/depreciation of futures contracts as reported in the Schedule of Investments. Only current day’s variation margin is reported within the Statement of Assets and Liabilities. |
The following table summarizes the net realized gains/(losses) and Statement of Operations location, for the period ended October 31, 2014, for Large Cap Stock Fund’s investments in financial derivative instruments by primary risk exposure.
| | | | | | |
Derivatives by risk category | | Statement of Operations Location | | Realized Gains/(Losses)
recognized in Income | |
| | |
Equity Contracts | | | | | | |
Futures | | Net realized gains/(losses) on Futures contracts | | | 8,585,221 | |
Total Equity Contracts | | | | | 8,585,221 | |
| |
Total | | | | | $8,585,221 | |
| |
The accompanying Notes to Financial Statements are an integral part of this schedule.
207
LARGE CAP STOCK FUND
Schedule of Investments as of October 31, 2014
The following table summarizes the change in net unrealized appreciation/(depreciation) and Statement of Operations location, for the period ended October 31, 2014, for Large Cap Stock Fund’s investments in financial derivative instruments by primary risk exposure.
| | | | | | |
Derivatives by risk category | | Statement of Operations Location | | Change in unrealized appreciation/(depreciation) recognized in Income | |
| | |
Equity Contracts | | | | | | |
Futures | | Change in net unrealized appreciation/(depreciation) on Futures contracts | | | (9,680,602 | ) |
Total Equity Contracts | | | | | (9,680,602 | ) |
| |
Total | | | | | ($9,680,602 | ) |
| |
The following table presents Large Cap Stock Fund’s average volume of derivative activity during the period ended October 31, 2014.
| | | | | | | | | | |
Derivative Risk Category | | | | Futures
(Notional)* | | | Futures
(Percentage
of Average
Net Assets) | |
Equity Contracts | | | | $ | 117,805,121 | | | | 6.6 | % |
* | Notional amount represents long or short, or both, derivative positions held by the Fund. |
Investment in Affiliates
Affiliated issuers, as defined under the Investment Company Act of 1940, include those in which the Fund’s holdings of an issuer represent 5% or more of the outstanding voting securities of an issuer, or any affiliated mutual fund.
A summary of transactions for the fiscal year to date, in Large Cap Stock Fund, is as follows:
| | | | | | | | | | | | | | | | | | | | | | | | |
Fund | | Value
October 31, 2013 | | | Gross Purchases | | | Gross Sales | | | Shares Held at October 31, 2014 | | | Value
October 31, 2014 | | | Income Earned November 1, 2013 - October 31, 2014 | |
Cash Management Trust-Collateral Investment | | | $– | | | | $388,619,572 | | | | $362,556,017 | | | | 26,063,555 | | | | $26,063,555 | | | | $125,641 | |
Cash Management Trust-Short Term Investment | | | 104,494,057 | | | | 276,500,371 | | | | 308,386,110 | | | | 72,608,318 | | | | 72,608,318 | | | | 50,553 | |
Total Value and Income Earned | | | 104,494,057 | | | | | | | | | | | | | | | | 98,671,873 | | | | 176,194 | |
The accompanying Notes to Financial Statements are an integral part of this schedule.
208
HIGH YIELD FUND
Schedule of Investments as of October 31, 2014
| | | | | | | | |
Principal Amount | | | Bank Loans (5.9%)a | | Value | |
| Communication Services (2.8%) | | | | |
| | | | Birch Communication Inc., Term Loan | | | | |
| | $3,670,000 | | | 7.750%, 7/17/2020 | | | $3,523,200 | |
| | | | Cengage Learning Aquisitions, Term Loan | | | | |
| | 4,557,100 | | | 7.000%, 3/31/2020 | | | 4,559,379 | |
| | | | Clear Channel Communications, Inc., Term Loan | | | | |
| | 60,769 | | | 3.804%, 1/29/2016 | | | 60,212 | |
| | 7,202,963 | | | 6.904%, 1/30/2019 | | | 6,789,944 | |
| | 2,316,595 | | | 7.654%, 7/30/2019 | | | 2,224,649 | |
| | | | IMG Worldwide, Inc., Term Loan | | | | |
| | 2,750,000 | | | 8.250%, 5/6/2022 | | | 2,681,250 | |
| | | | McGraw-Hill Global Education, LLC, Term Loan | | | | |
| | 1,980,863 | | | 5.750%, 3/22/2019 | | | 1,982,725 | |
| | | | | |
| | | | Total | | | 21,821,359 | |
| | | | | |
| |
| Consumer Cyclical (1.1%) | | | | |
| | | | Amaya BV, Term Loan | | | | |
| | 2,305,000 | | | 8.000%, 8/1/2022 | | | 2,326,137 | |
| | | | Mohegan Tribal Gaming Authority, Term Loan | | | | |
| | 2,272,825 | | | 5.500%, 11/19/2019 | | | 2,204,640 | |
| | | | Scientific Games International, Inc., Term Loan | | | | |
| | 4,450,000 | | | 7.250%, 10/1/2021 | | | 4,353,569 | |
| | | | | |
| | | | Total | | | 8,884,346 | |
| | | | | |
| |
| Consumer Non- Cyclical (0.9%) | | | | |
| | | | Albertsons, Inc., Term Loan | | | | |
| | 2,970,094 | | | 4.750%, 3/21/2019 | | | 2,962,668 | |
| | | | HCA, Inc., Term Loan | | | | |
| | 4,227,749 | | | 2.983%, 5/1/2018 | | | 4,205,850 | |
| | | | | |
| | | | Total | | | 7,168,518 | |
| | | | | |
| |
| Financials (0.4%) | | | | |
| | | | DJO Finance, LLC, Term Loan | | | | |
| | 2,897,472 | | | 4.250%, 9/15/2017 | | | 2,881,536 | |
| | | | | |
| | | | Total | | | 2,881,536 | |
| | | | | |
| |
| Technology (0.7%) | | | | |
| | | | First Data Corporation, Term Loan | | | | |
| | 5,549,215 | | | 3.653%, 3/23/2018 | | | 5,493,723 | |
| | | | | |
| | | | Total | | | 5,493,723 | |
| | | | | |
| | | | | | | | |
| | | | | |
| | | | Total Bank Loans (cost $46,477,801) | | | 46,249,482 | |
| | | | | |
| | |
Principal Amount | | | Long-Term Fixed Income (88.3%) | | Value | |
| Asset-Backed Securities (0.3%) | | | | |
| | | | Renaissance Home Equity Loan Trust | | | | |
| | 1,775,198 | | | 5.746%, 5/25/2036b | | | 1,308,935 | |
| | 1,600,000 | | | 6.011%, 5/25/2036b | | | 1,144,211 | |
| | | | | |
| | | | Total | | | 2,453,146 | |
| | | | | |
| |
| Basic Materials(6.9%) | | | | |
| | | | APERAM | | | | |
| | 2,355,000 | | | 7.750%, 4/1/2018* | | | 2,437,425 | |
| | 1,410,000 | | | 7.125%, 5/1/2018* | | | 1,466,400 | |
| | | | First Quantum Minerals, Ltd. | | | | |
| | 3,136,000 | | | 6.750%, 2/15/2020c | | | 3,034,080 | |
| | 3,006,000 | | | 7.000%, 2/15/2021c | | | 2,949,638 | |
| | | | FMG Resources Pty. Ltd. | | | | |
| | 1,410,000 | | | 6.000%, 4/1/2017c,d | | | 1,438,200 | |
| | 4,700,000 | | | 8.250%, 11/1/2019c,d | | | 4,876,250 | |
| | | | Graphic Packaging International, Inc. | | | | |
| | 1,400,000 | | | 7.875%, 10/1/2018 | | | 1,458,800 | |
| | 710,000 | | | 4.750%, 4/15/2021 | | | 717,100 | |
| | | | Hexion US Finance Corporation/Hexion Nova Scotia Finance ULC | | | | |
| | 5,630,000 | | | 8.875%, 2/1/2018 | | | 5,566,662 | |
| | | | INEOS Group Holdings SA | | | | |
| | 2,755,000 | | | 6.125%, 8/15/2018c,d | | | 2,779,106 | |
| | | | Magnetation, LLC | | | | |
| | 3,280,000 | | | 11.000%, 5/15/2018* | | | 2,943,800 | |
| | | | Midwest Vanadium, Pty. Ltd. | | | | |
| | 3,070,000 | | | 11.500%, 2/15/2018* | | | 429,800 | |
| | | | Novelis, Inc. | | | | |
| | 3,550,000 | | | 8.750%, 12/15/2020 | | | 3,873,937 | |
| | | | Rayonier AM Products, Inc. | | | | |
| | 1,010,000 | | | 5.500%, 6/1/2024c | | | 954,450 | |
| | | | Resolute Forest Products, Inc. | | | | |
| | 4,190,000 | | | 5.875%, 5/15/2023 | | | 4,011,925 | |
| | | | Ryerson, Inc. | | | | |
| | 1,900,000 | | | 9.000%, 10/15/2017 | | | 1,999,750 | |
| | | | Sappi Papier Holding GmbH | | | | |
| | 2,355,000 | | | 8.375%, 6/15/2019c | | | 2,555,175 | |
| | | | Signode Industrial Group Lux SA | | | | |
| | 920,000 | | | 6.375%, 5/1/2022c | | | 892,400 | |
| | | | Tembec Industries, Inc. | | | | |
| | 2,340,000 | | | 9.000%, 12/15/2019c | | | 2,369,250 | |
| | | | Trinseo Materials Operating SCA | | | | |
| | 2,664,000 | | | 8.750%, 2/1/2019 | | | 2,817,180 | |
| | | | Westmoreland Coal Company | | | | |
| | 4,475,000 | | | 10.750%, 2/1/2018 | | | 4,687,563 | |
| | | | | |
| | | | Total | | | 54,258,891 | |
| | | | | |
| |
| Capital Goods (8.4%) | | | | |
| | | | Abengoa Finance SAU | | | | |
| | 2,750,000 | | | 7.750%, 2/1/2020c | | | 2,873,750 | |
| | | | Abengoa Greenfield SA | | | | |
| | 3,040,000 | | | 6.500%, 10/1/2019c | | | 3,047,600 | |
| | | | Berry Plastics Corporation | | | | |
| | 2,290,000 | | | 5.500%, 5/15/2022 | | | 2,298,588 | |
| | | | Brand Energy & Infrastructure Services, Inc. | | | | |
| | 1,830,000 | | | 8.500%, 12/1/2021c | | | 1,823,137 | |
| | | | Case New Holland, Inc. | | | | |
| | 2,210,000 | | | 7.875%, 12/1/2017 | | | 2,480,725 | |
| | | | Cemex Finance, LLC | | | | |
| | 2,305,000 | | | 9.375%, 10/12/2017c | | | 2,656,513 | |
| | | | Cemex SAB de CV | | | | |
| | 2,500,000 | | | 5.700%, 1/11/2025c | | | 2,449,250 | |
| | | | CNH Capital, LLC | | | | |
| | 1,850,000 | | | 3.625%, 4/15/2018 | | | 1,850,000 | |
The accompanying Notes to Financial Statements are an integral part of this schedule.
209
HIGH YIELD FUND
Schedule of Investments as of October 31, 2014
| | | | | | | | |
Principal Amount | | | Long-Term Fixed Income (88.3%) | | Value | |
| Capital Goods (8.4%) - continued | | | | |
| | | | CTP Transportation Products, LLC | | | | |
| $ | 2,755,000 | | | 8.250%, 12/15/2019* | | $ | 2,982,287 | |
| | | | Graphic Packaging International, Inc. | | | | |
| | 470,000 | | | 4.875%, 11/15/2022e | | | 472,350 | |
| | | | Manitowoc Company, Inc. | | | | |
| | 4,270,000 | | | 8.500%, 11/1/2020 | | | 4,622,275 | |
| | | | Milacron, LLC | | | | |
| | 2,360,000 | | | 7.750%, 2/15/2021c | | | 2,454,400 | |
| | | | Nortek, Inc. | | | | |
| | 2,750,000 | | | 10.000%, 12/1/2018 | | | 2,894,375 | |
| | 3,360,000 | | | 8.500%, 4/15/2021 | | | 3,612,000 | |
| | | | Owens-Illinois, Inc. | | | | |
| | 3,030,000 | | | 7.800%, 5/15/2018 | | | 3,423,900 | |
| | | | Reynolds Group Issuer, Inc. | | | | |
| | 1,420,000 | | | 9.000%, 4/15/2019 | | | 1,483,900 | |
| | 1,840,000 | | | 9.875%, 8/15/2019 | | | 1,998,700 | |
| | 1,900,000 | | | 5.750%, 10/15/2020 | | | 1,976,000 | |
| | 2,370,000 | | | 8.250%, 2/15/2021d | | | 2,547,750 | |
| | | | RSC Equipment Rental, Inc. | | | | |
| | 2,780,000 | | | 8.250%, 2/1/2021 | | | 3,030,200 | |
| | | | Safeway Group Holding, LLC | | | | |
| | 2,825,000 | | | 7.000%, 5/15/2018c | | | 2,916,812 | |
| | | | Silgan Holdings, Inc. | | | | |
| | 3,530,000 | | | 5.000%, 4/1/2020 | | | 3,600,600 | |
| | | | Tekni-Plex, Inc. | | | | |
| | 2,056,000 | | | 9.750%, 6/1/2019c | | | 2,246,180 | |
| | | | United Rentals North America, Inc. | | | | |
| | 930,000 | | | 7.375%, 5/15/2020 | | | 1,009,050 | |
| | 1,375,000 | | | 6.125%, 6/15/2023 | | | 1,479,844 | |
| | | | UR Financing Escrow Corporation | | | | |
| | 3,750,000 | | | 7.625%, 4/15/2022 | | | 4,181,250 | |
| | | | | |
| | | | Total | | | 66,411,436 | |
| | | | | |
| |
| Communications Services (18.2%) | | | | |
| | | | Altice Financing SA | | | | |
| | 920,000 | | | 6.500%, 1/15/2022c | | | 945,300 | |
| | | | Altice Finco SA | | | | |
| | 950,000 | | | 9.875%, 12/15/2020c | | | 1,059,250 | |
| | 460,000 | | | 8.125%, 1/15/2024c | | | 484,150 | |
| | | | Altice SA | | | | |
| | 2,750,000 | | | 7.750%, 5/15/2022c | | | 2,887,500 | |
| | | | AMC Networks, Inc. | | | | |
| | 4,190,000 | | | 7.750%, 7/15/2021 | | | 4,567,100 | |
| | | | CCO Holdings, LLC | | | | |
| | 1,390,000 | | | 7.000%, 1/15/2019 | | | 1,449,075 | |
| | 700,000 | | | 7.375%, 6/1/2020 | | | 750,312 | |
| | 1,835,000 | | | 5.250%, 3/15/2021 | | | 1,857,938 | |
| | 1,835,000 | | | 5.250%, 9/30/2022 | | | 1,846,469 | |
| | | | CenturyLink, Inc. | | | | |
| | 1,210,000 | | | 6.450%, 6/15/2021 | | | 1,324,950 | |
| | | | Cequel Communications Escrow 1, LLC | | | | |
| | 3,180,000 | | | 6.375%, 9/15/2020c | | | 3,315,150 | |
| | | | Clear Channel Worldwide Holdings, Inc. | | | | |
| | 5,000,000 | | | 6.500%, 11/15/2022 | | | 5,175,000 | |
| | | | Columbus International, Inc. | | | | |
| | 4,435,000 | | | 7.375%, 3/30/2021c | | | 4,701,100 | |
| | | | Digicel, Ltd. | | | | |
| | 3,790,000 | | | 8.250%, 9/1/2017c | | | 3,880,012 | |
| | 1,470,000 | | | 7.000%, 2/15/2020* | | | 1,525,125 | |
| | 2,780,000 | | | 6.000%, 4/15/2021c | | | 2,807,800 | |
| | | | DISH DBS Corporation | | | | |
| | 2,355,000 | | | 5.125%, 5/1/2020 | | | 2,449,200 | |
| | 2,290,000 | | | 5.000%, 3/15/2023 | | | 2,281,413 | |
| | | | Eileme 2 AB | | | | |
| | 3,740,000 | | | 11.625%, 1/31/2020* | | | 4,282,300 | |
| | | | Frontier Communications Corporation | | | | |
| | 2,745,000 | | | 8.125%, 10/1/2018 | | | 3,116,947 | |
| | 500,000 | | | 6.250%, 9/15/2021 | | | 516,563 | |
| | 1,000,000 | | | 6.875%, 1/15/2025 | | | 1,012,500 | |
| | | | Gray Television, Inc. | | | | |
| | 2,290,000 | | | 7.500%, 10/1/2020 | | | 2,395,912 | |
| | | | Hughes Satellite Systems Corporation | | | | |
| | 4,400,000 | | | 6.500%, 6/15/2019 | | | 4,763,000 | |
| | | | Intelsat Jackson Holdings SA | | | | |
| | 6,530,000 | | | 7.250%, 10/15/2020 | | | 6,970,775 | |
| | | | Level 3 Escrow II, Inc. | | | | |
| | 3,000,000 | | | 5.375%, 8/15/2022c | | | 3,052,500 | |
| | | | Level 3 Financing, Inc. | | | | |
| | 3,700,000 | | | 8.625%, 7/15/2020 | | | 4,070,000 | |
| | 1,380,000 | | | 6.125%, 1/15/2021c | | | 1,447,275 | |
| | | | McGraw-Hill Global Education Holdings, LLC | | | | |
| | 4,705,000 | | | 9.750%, 4/1/2021 | | | 5,316,650 | |
| | | | MDC Partners, Inc. | | | | |
| | 3,270,000 | | | 6.750%, 4/1/2020c | | | 3,392,625 | |
| | | | Nielsen Finance, LLC | | | | |
| | 1,150,000 | | | 5.000%, 4/15/2022c | | | 1,167,250 | |
| | | | Numericable Group SA | | | | |
| | 3,910,000 | | | 6.000%, 5/15/2022c | | | 3,997,975 | |
| | 2,290,000 | | | 6.250%, 5/15/2024c | | | 2,355,838 | |
| | | | Sprint Communications, Inc. | | | | |
| | 7,120,000 | | | 9.000%, 11/15/2018c | | | 8,374,900 | |
| | 2,530,000 | | | 7.000%, 3/1/2020c | | | 2,822,215 | |
| | | | Sprint Corporation | | | | |
| | 2,740,000 | | | 7.125%, 6/15/2024c | | | 2,815,350 | |
| | | | T-Mobile USA, Inc. | | | | |
| | 3,210,000 | | | 6.542%, 4/28/2020 | | | 3,386,550 | |
| | 690,000 | | | 6.633%, 4/28/2021 | | | 727,087 | |
| | 920,000 | | | 6.125%, 1/15/2022 | | | 953,350 | |
| | 690,000 | | | 6.731%, 4/28/2022 | | | 729,675 | |
| | 920,000 | | | 6.500%, 1/15/2024 | | | 963,700 | |
| | | | Unitymedia Hessen GmbH & Company KG | | | | |
| | 4,650,000 | | | 5.500%, 1/15/2023c | | | 4,847,625 | |
| | | | Univision Communications, Inc. | | | | |
| | 2,713,000 | | | 6.750%, 9/15/2022c | | | 3,011,430 | |
| | | | UPCB Finance V, Ltd. | | | | |
| | 1,400,000 | | | 7.250%, 11/15/2021c | | | 1,540,000 | |
| | | | Verizon Communications, Inc. | | | | |
| | 1,440,000 | | | 5.150%, 9/15/2023 | | | 1,612,639 | |
| | | | West Corporation | | | | |
| | 3,210,000 | | | 5.375%, 7/15/2022c | | | 3,113,700 | |
| | | | WideOpenWest Finance, LLC | | | | |
| | 5,800,000 | | | 10.250%, 7/15/2019 | | | 6,365,500 | |
| | | | Wind Acquisition Finance SA | | | | |
| | 3,940,000 | | | 4.750%, 7/15/2020c | | | 3,851,350 | |
| | 4,800,000 | | | 7.375%, 4/23/2021c | | | 4,692,000 | |
The accompanying Notes to Financial Statements are an integral part of this schedule.
210
HIGH YIELD FUND
Schedule of Investments as of October 31, 2014
| | | | | | | | |
Principal Amount | | | Long-Term Fixed Income (88.3%) | | Value | |
| Communications Services (18.2%) - continued | |
| | | | Windstream Corporation | | | | |
| | $1,830,000 | | | 7.750%, 10/1/2021 | | | $1,958,100 | |
| | | | | |
| | | | Total | | | 142,930,125 | |
| | | | | |
| |
| Consumer Cyclical (12.3%) | | | | |
| | | | AMC Entertainment, Inc. | | | | |
| | 2,290,000 | | | 5.875%, 2/15/2022 | | | 2,335,800 | |
| | | | Beazer Homes USA, Inc. | | | | |
| | 2,290,000 | | | 5.750%, 6/15/2019 | | | 2,192,675 | |
| | | | Brookfield Residential Properties, Inc. | | | | |
| | 2,370,000 | | | 6.500%, 12/15/2020c | | | 2,524,050 | |
| | 1,760,000 | | | 6.125%, 7/1/2022c | | | 1,870,000 | |
| | | | Choice Hotels International, Inc. | | | | |
| | 5,721,000 | | | 5.750%, 7/1/2022 | | | 6,164,378 | |
| | | | Chrysler Group, LLC | | | | |
| | 2,230,000 | | | 8.000%, 6/15/2019 | | | 2,388,887 | |
| | 1,900,000 | | | 8.250%, 6/15/2021 | | | 2,123,250 | |
| | | | Churchill Downs, Inc. | | | | |
| | 3,110,000 | | | 5.375%, 12/15/2021c | | | 3,187,750 | |
| | | | Cinemark USA, Inc. | | | | |
| | 4,205,000 | | | 4.875%, 6/1/2023 | | | 4,141,925 | |
| | | | CST Brands, Inc. | | | | |
| | 1,890,000 | | | 5.000%, 5/1/2023 | | | 1,875,825 | |
| | | | Drawbridge Special Opportunities Fund, LP | | | | |
| | 3,215,000 | | | 5.000%, 8/1/2021c | | | 3,198,925 | |
| | | | Eldorado Resorts, LLC | | | | |
| | 5,135,000 | | | 8.625%, 6/15/2019* | | | 5,455,937 | |
| | | | General Motors Financial Company, Inc. | | | | |
| | 1,190,000 | | | 6.750%, 6/1/2018 | | | 1,352,138 | |
| | | | GLP Capital, LP | | | | |
| | 2,755,000 | | | 5.375%, 11/1/2023 | | | 2,899,638 | |
| | | | Hilton Worldwide Finance, LLC | | | | |
| | 2,420,000 | | | 5.625%, 10/15/2021c | | | 2,550,075 | |
| | | | Jaguar Land Rover Automotive plc | | | | |
| | 2,110,000 | | | 4.125%, 12/15/2018c | | | 2,146,925 | |
| | 585,000 | | | 4.250%, 11/15/2019c | | | 587,925 | |
| | 950,000 | | | 5.625%, 2/1/2023c | | | 988,000 | |
| | | | KB Home | | | | |
| | 930,000 | | | 7.250%, 6/15/2018 | | | 1,006,725 | |
| | 920,000 | | | 4.750%, 5/15/2019 | | | 913,100 | |
| | 1,750,000 | | | 8.000%, 3/15/2020 | | | 1,951,250 | |
| | 1,420,000 | | | 7.500%, 9/15/2022 | | | 1,530,050 | |
| | | | L Brands, Inc. | | | | |
| | 1,430,000 | | | 6.625%, 4/1/2021 | | | 1,619,475 | |
| | 1,640,000 | | | 5.625%, 2/15/2022 | | | 1,758,900 | |
| | | | Lear Corporation | | | | |
| | 2,340,000 | | | 4.750%, 1/15/2023 | | | 2,345,850 | |
| | | | LKQ Corporation | | | | |
| | 2,590,000 | | | 4.750%, 5/15/2023 | | | 2,502,976 | |
| | | | Mohegan Tribal Gaming Authority | | | | |
| | 3,520,000 | | | 9.750%, 9/1/2021d | | | 3,625,600 | |
| | | | Neiman Marcus Group, Ltd., LLC | | | | |
| | 2,760,000 | | | 8.000%, 10/15/2021c | | | 2,944,053 | |
| | 1,840,000 | | | 8.750%, 10/15/2021c,d | | | 1,968,800 | |
| | | | New Cotai, LLC | | | | |
| | 4,356,682 | | | 10.625%, 5/1/2019c | | | 4,944,834 | |
| | | | Rite Aid Corporation | | | | |
| | 2,835,000 | | | 6.750%, 6/15/2021d | | | 3,026,363 | |
| | | | Scientific Games International, Inc. | | | | |
| | 3,895,000 | | | 6.625%, 5/15/2021c,d | | | 3,096,525 | |
| | | | Seminole Indian Tribe of Florida | | | | |
| | 3,345,000 | | | 7.804%, 10/1/2020* | | | 3,595,875 | |
| | | | Seven Seas Cruises S de RL, LLC | | | | |
| | 3,675,000 | | | 9.125%, 5/15/2019c | | | 3,904,687 | |
| | | | Studio City Finance, Ltd. | | | | |
| | 4,760,000 | | | 8.500%, 12/1/2020c | | | 5,164,600 | |
| | | | Tunica-Biloxi Gaming Authority | | | | |
| | 4,230,000 | | | 9.000%, 11/15/2015* | | | 2,538,000 | |
| | | | | |
| | | | Total | | | 96,421,766 | |
| | | | | |
| |
| Consumer Non- Cyclical (9.0%) | | | | |
| | | | Aviv Healthcare Properties, LP | | | | |
| | 2,760,000 | | | 6.000%, 10/15/2021 | | | 2,842,800 | |
| | | | B&G Foods, Inc. | | | | |
| | 3,300,000 | | | 4.625%, 6/1/2021 | | | 3,242,250 | |
| | | | Cott Beverages, Inc. | | | | |
| | 2,885,000 | | | 5.375%, 7/1/2022c | | | 2,856,150 | |
| | | | Envision Healthcare Corporation | | | | |
| | 3,205,000 | | | 5.125%, 7/1/2022c | | | 3,245,063 | |
| | | | Fresenius Medical Care US Finance, Inc. | | | | |
| | 2,340,000 | | | 6.500%, 9/15/2018c | | | 2,591,550 | |
| | 1,850,000 | | | 5.750%, 2/15/2021c | | | 1,986,438 | |
| | | | Grifols Worldwide Operations, Ltd. | | | | |
| | 2,290,000 | | | 5.250%, 4/1/2022c | | | 2,347,250 | |
| | | | HCA, Inc. | | | | |
| | 550,000 | | | 3.750%, 3/15/2019 | | | 551,375 | |
| | 2,355,000 | | | 6.500%, 2/15/2020 | | | 2,628,769 | |
| | 4,190,000 | | | 5.875%, 3/15/2022 | | | 4,598,525 | |
| | 1,640,000 | | | 4.750%, 5/1/2023 | | | 1,666,650 | |
| | | | JBS Finance II, Ltd. | | | | |
| | 3,950,000 | | | 8.250%, 1/29/2018* | | | 4,157,375 | |
| | | | JBS USA, LLC | | | | |
| | 2,750,000 | | | 5.875%, 7/15/2024c | | | 2,763,750 | |
| | | | MPH Acquisition Holdings, LLC | | | | |
| | 3,205,000 | | | 6.625%, 4/1/2022c | | | 3,353,231 | |
| | | | Ortho-Clinical Diagnostics, Inc. | | | | |
| | 3,900,000 | | | 6.625%, 5/15/2022c | | | 3,646,500 | |
| | | | Prestige Brands, Inc. | | | | |
| | 920,000 | | | 5.375%, 12/15/2021c | | | 890,100 | |
| | | | Revlon Consumer Products Corporation | | | | |
| | 4,240,000 | | | 5.750%, 2/15/2021d | | | 4,240,000 | |
| | | | Spectrum Brands Escrow Corporation | | | | |
| | 1,930,000 | | | 6.375%, 11/15/2020 | | | 2,045,800 | |
| | 1,820,000 | | | 6.625%, 11/15/2022 | | | 1,951,950 | |
| | | | Teleflex, Inc. | | | | |
| | 1,565,000 | | | 6.875%, 6/1/2019 | | | 1,678,462 | |
| | 2,225,000 | | | 5.250%, 6/15/2024c | | | 2,258,375 | |
| | | | Tenet Healthcare Corporation | | | | |
| | 2,750,000 | | | 6.000%, 10/1/2020 | | | 2,956,250 | |
| | 3,665,000 | | | 8.125%, 4/1/2022 | | | 4,201,006 | |
| | | | TreeHouse Foods, Inc. | | | | |
| | 1,835,000 | | | 4.875%, 3/15/2022d | | | 1,862,525 | |
| | | | Valeant Pharmaceuticals International, Inc. | | | | |
| | 2,400,000 | | | 7.250%, 7/15/2022c | | | 2,532,000 | |
The accompanying Notes to Financial Statements are an integral part of this schedule.
211
HIGH YIELD FUND
Schedule of Investments as of October 31, 2014
| | | | | | | | |
Principal Amount | | | Long-Term Fixed Income (88.3%) | | Value | |
| Consumer Non-Cyclical (9.0%) - continued | | | | |
| | | | Visant Corporation | | | | |
| $ | 1,830,000 | | | 10.000%, 10/1/2017 | | | $1,610,400 | |
| | 1,650,000 | | | VPII Escrow Corporation 7.500%, 7/15/2021 c | | | 1,765,500 | |
| | | | | |
| | | | Total | | | 70,470,044 | |
| | | | | |
| |
| Energy (12.1%) | | | | |
| | | | Bonanza Creek Energy, Inc. | | | | |
| | 4,415,000 | | | 6.750%, 4/15/2021 | | | 4,426,038 | |
| | | | Calumet Specialty Products Partners, LP | | | | |
| | 3,440,000 | | | 6.500%, 4/15/2021c | | | 3,336,800 | |
| | | | Chaparral Energy, Inc. | | | | |
| | 3,850,000 | | | 7.625%, 11/15/2022 | | | 3,753,750 | |
| | | | Concho Resources, Inc. | | | | |
| | 4,260,000 | | | 6.500%, 1/15/2022 | | | 4,600,800 | |
| | | | Crestwood Midstream Partners, LP | | | | |
| | 2,065,000 | | | 6.125%, 3/1/2022 | | | 2,085,650 | |
| | | | Diamondback Energy, Inc. | | | | |
| | 2,510,000 | | | 7.625%, 10/1/2021 | | | 2,666,875 | |
| | | | Energy XXI Gulf Coast, Inc. | | | | |
| | 1,830,000 | | | 7.750%, 6/15/2019d | | | 1,647,000 | |
| | 1,160,000 | | | 7.500%, 12/15/2021d | | | 962,800 | |
| | 1,140,000 | | | 6.875%, 3/15/2024c,d | | | 900,600 | |
| | | | Exterran Partners, LP | | | | |
| | 3,720,000 | | | 6.000%, 4/1/2021 | | | 3,589,800 | |
| | | | Hornbeck Offshore Services, Inc. | | | | |
| | 1,410,000 | | | 5.000%, 3/1/2021 | | | 1,254,900 | |
| | | | Jones Energy Holdings, LLC | | | | |
| | 4,205,000 | | | 6.750%, 4/1/2022c | | | 4,015,775 | |
| | | | Kodiak Oil & Gas Corporation | | | | |
| | 2,820,000 | | | 5.500%, 1/15/2021 | | | 2,862,300 | |
| | 1,420,000 | | | 5.500%, 2/1/2022 | | | 1,448,400 | |
| | | | Laredo Petroleum, Inc. | | | | |
| | 3,670,000 | | | 5.625%, 1/15/2022 | | | 3,614,950 | |
| | | | Linn Energy, LLC | | | | |
| | 1,750,000 | | | 8.625%, 4/15/2020 | | | 1,754,375 | |
| | 1,930,000 | | | 7.750%, 2/1/2021 | | | 1,891,400 | |
| | | | Markwest Energy Partners, LP | | | | |
| | 1,521,000 | | | 6.250%, 6/15/2022 | | | 1,638,877 | |
| | | | MEG Energy Corporation | | | | |
| | 945,000 | | | 6.500%, 3/15/2021c | | | 935,550 | |
| | 2,840,000 | | | 6.375%, 1/30/2023c | | | 2,811,600 | |
| | 1,200,000 | | | 7.000%, 3/31/2024c | | | 1,206,000 | |
| | | | Memorial Production Partners, LP | | | | |
| | 2,830,000 | | | 7.625%, 5/1/2021 | | | 2,741,563 | |
| | 1,840,000 | | | 6.875%, 8/1/2022c | | | 1,665,200 | |
| | | | Northern Tier Energy, LLC | | | | |
| | 2,980,000 | | | 7.125%, 11/15/2020 | | | 3,129,000 | |
| | | | Oasis Petroleum, Inc. | | | | |
| | 2,430,000 | | | 7.250%, 2/1/2019 | | | 2,502,900 | |
| | 1,410,000 | | | 6.500%, 11/1/2021 | | | 1,445,250 | |
| | 1,000,000 | | | 6.875%, 3/15/2022 | | | 1,040,000 | |
| | | | Offshore Group Investment, Ltd. | | | | |
| | 3,770,000 | | | 7.125%, 4/1/2023d | | | 3,110,250 | |
| | | | Pacific Drilling V, Ltd. | | | | |
| | 3,190,000 | | | 7.250%, 12/1/2017c | | | 3,162,087 | |
| | | | Precision Drilling Corporation | | | | |
| | 2,200,000 | | | 6.625%, 11/15/2020 | | | 2,266,000 | |
| | 940,000 | | | 6.500%, 12/15/2021 | | | 963,500 | |
| | 1,150,000 | | | 5.250%, 11/15/2024c | | | 1,069,500 | |
| | | | Rice Energy, Inc. | | | | |
| | 3,895,000 | | | 6.250%, 5/1/2022c,d | | | 3,765,978 | |
| | | | Rosetta Resources, Inc. | | | | |
| | 3,210,000 | | | 5.875%, 6/1/2024 | | | 3,081,600 | |
| | | | Sabine Pass Liquefaction, LLC | | | | |
| | 2,750,000 | | | 5.750%, 5/15/2024c | | | 2,842,813 | |
| | | | Samson Investment Company | | | | |
| | 3,440,000 | | | 9.750%, 2/15/2020 | | | 2,545,600 | |
| | | | Tesoro Logistics, LP | | | | |
| | 2,100,000 | | | 5.500%, 10/15/2019c | | | 2,157,750 | |
| | 1,870,000 | | | 6.250%, 10/15/2022c | | | 1,935,450 | |
| | | | United Refining Company | | | | |
| | 2,789,000 | | | 10.500%, 2/28/2018 | | | 2,970,285 | |
| | | | Western Refining, Inc. | | | | |
| | 940,000 | | | 6.250%, 4/1/2021 | | | 944,700 | |
| | | | | |
| | | | Total | | | 94,743,666 | |
| | | | | |
| |
| Financials (7.1%) | | | | |
| | | | AerCap Ireland Capital, Ltd. | | | | |
| | 2,810,000 | | | 5.000%, 10/1/2021c | | | 2,922,400 | |
| | | | Ally Financial, Inc. | | | | |
| | 2,910,000 | | | 7.500%, 9/15/2020 | | | 3,462,900 | |
| | | | Aviv Healthcare Properties, LP | | | | |
| | 4,730,000 | | | 7.750%, 2/15/2019 | | | 4,966,500 | |
| | | | Banco do Brasil SA/Cayman Islands | | | | |
| | 1,250,000 | | | 6.250%, 12/31/2049c,f | | | 981,250 | |
| | | | BBVA International Preferred SA Unipersonal | | | | |
| | 1,415,000 | | | 5.919%, 12/29/2049f | | | 1,443,300 | |
| | | | CIT Group, Inc. | | | | |
| | 3,205,000 | | | 3.875%, 2/19/2019 | | | 3,225,031 | |
| | | | Credit Agricole SA | | | | |
| | 935,000 | | | 6.625%, 9/29/2049 c,d,f | | | 912,186 | |
| | | | CyrusOne, LP | | | | |
| | 3,460,000 | | | 6.375%, 11/15/2022 | | | 3,641,650 | |
| | | | DDR Corporation | | | | |
| | 720,000 | | | 4.625%, 7/15/2022 | | | 763,952 | |
| | | | Denali Borrower, LLC | | | | |
| | 4,890,000 | | | 5.625%, 10/15/2020c | | | 5,186,456 | |
| | | | Developers Diversified Realty Corporation | | | | |
| | 2,810,000 | | | 7.875%, 9/1/2020 | | | 3,488,607 | |
| | | | HSBC Holdings plc | | | | |
| | 935,000 | | | 6.375%, 12/29/2049f | | | 953,700 | |
| | | | Icahn Enterprises, LP | | | | |
| | 3,500,000 | | | 4.875%, 3/15/2019 | | | 3,561,250 | |
| | 6,965,000 | | | 6.000%, 8/1/2020 | | | 7,313,250 | |
| | 2,760,000 | | | 5.875%, 2/1/2022 | | | 2,835,900 | |
| | | | ILFC E-Capital Trust II | | | | |
| | 1,605,000 | | | 6.250%, 12/21/2065c,g | | | 1,552,838 | |
| | | | International Lease Finance Corporation | | | | |
| | 1,400,000 | | | 8.875%, 9/1/2017 | | | 1,610,000 | |
| | | | Jefferies Finance, LLC | | | | |
| | 2,350,000 | | | 7.375%, 4/1/2020* | | | 2,338,250 | |
| | | | Lloyds Banking Group plc | | | | |
| | 920,000 | | | 6.657%, 1/29/2049c,f | | | 991,300 | |
| | | | Royal Bank of Scotland Group plc | | | | |
| | 1,885,000 | | | 7.640%, 3/29/2049f | | | 1,993,387 | |
The accompanying Notes to Financial Statements are an integral part of this schedule.
212
HIGH YIELD FUND
Schedule of Investments as of October 31, 2014
| | | | | | | | |
Principal Amount | | | Long-Term Fixed Income (88.3%) | | Value | |
| Financials (7.1%) - continued | | | | |
| | | | TMX Finance, LLC | | | | |
| | $1,415,000 | | | 8.500%, 9/15/2018c | | | $1,379,625 | |
| | | | | |
| | | | Total | | | 55,523,732 | |
| | | | | |
| |
| Technology (5.2%) | | | | |
| | | | AECOM Technology Corporation | | | | |
| | 2,340,000 | | | 5.750%, 10/15/2022c | | | 2,462,850 | |
| | | | Alliance Data Systems Corporation | | | | |
| | 3,810,000 | | | 5.250%, 12/1/2017c | | | 3,924,300 | |
| | 2,300,000 | | | 5.375%, 8/1/2022c | | | 2,334,500 | |
| | | | Amkor Technology, Inc. | | | | |
| | 2,870,000 | | | 6.625%, 6/1/2021 | | | 2,905,875 | |
| | | | Anixter, Inc. | | | | |
| | 3,045,000 | | | 5.125%, 10/1/2021 | | | 3,090,294 | |
| | | | Brocade Communications Systems, Inc. | | | | |
| | 3,410,000 | | | 4.625%, 1/15/2023 | | | 3,324,750 | |
| | | | First Data Corporation | | | | |
| | 500,000 | | | 7.375%, 6/15/2019c | | | 530,000 | |
| | 1,629,000 | | | 12.625%, 1/15/2021 | | | 1,967,018 | |
| | 1,788,000 | | | 11.750%, 8/15/2021 | | | 2,096,430 | |
| | | | Flextronics International, Ltd. | | | | |
| | 2,000,000 | | | 4.625%, 2/15/2020 | | | 2,030,000 | |
| | | | Freescale Semiconductor, Inc. | | | | |
| | 1,890,000 | | | 8.050%, 2/1/2020 | | | 1,993,950 | |
| | 2,089,000 | | | 10.750%, 8/1/2020 | | | 2,282,232 | |
| | | | Infor US, Inc. | | | | |
| | 2,910,000 | | | 9.375%, 4/1/2019 | | | 3,164,625 | |
| | | | Micron Technology, Inc. | | | | |
| | 1,375,000 | | | 5.875%, 2/15/2022c | | | 1,443,750 | |
| | | | NXP BV/NXP Funding, LLC | | | | |
| | 3,285,000 | | | 5.750%, 3/15/2023c | | | 3,473,888 | |
| | | | Sensata Technologies BV | | | | |
| | 4,130,000 | | | 4.875%, 10/15/2023c | | | 4,078,375 | |
| | | | | |
| | | | Total | | | 41,102,837 | |
| | | | | |
| |
| Transportation (4.7%) | | | | |
| | | | Algeco Scotsman Global Finance plc | | | | |
| | 3,320,000 | | | 8.500%, 10/15/2018c,d | | | 3,452,800 | |
| | | | American Airlines Pass Through Trust | | | | |
| | 3,542,033 | | | 5.600%, 7/15/2020c | | | 3,626,156 | |
| | | | Avis Budget Car Rental, LLC | | | | |
| | 3,100,000 | | | 5.125%, 6/1/2022c | | | 3,062,800 | |
| | 3,150,000 | | | 5.500%, 4/1/2023d | | | 3,165,750 | |
| | | | Continental Airlines, Inc. | | | | |
| | 1,440,000 | | | 6.125%, 4/29/2018 | | | 1,508,400 | |
| | | | Delta Air Lines Pass Through Trust | | | | |
| | 2,390,578 | | | 6.875%, 5/7/2019* | | | 2,635,613 | |
| | | | Dynagas LNG Partners, LP | | | | |
| | 1,870,000 | | | 6.250%, 10/30/2019d | | | 1,767,150 | |
| | | | Eletson Holdings, Inc. | | | | |
| | 1,830,000 | | | 9.625%, 1/15/2022* | | | 1,820,850 | |
| | | | Hornbeck Offshore Services, Inc. | | | | |
| | 1,885,000 | | | 5.875%, 4/1/2020 | | | 1,771,900 | |
| | | | Navios Maritime Holdings, Inc. | | | | |
| | 2,030,000 | | | 8.125%, 2/15/2019d | | | 1,964,025 | |
| | 1,605,000 | | | 8.125%, 11/15/2021c | | | 1,633,087 | |
| | | | Navios South American Logistics, Inc. | | | | |
| | 1,600,000 | | | 7.250%, 5/1/2022c | | | 1,612,000 | |
| | | | Teekay Offshore Partners, LP | | | | |
| | 3,210,000 | | | 6.000%, 7/30/2019 | | | 3,101,663 | |
| | | | Ultrapetrol Bahamas, Ltd. | | | | |
| | 3,280,000 | | | 8.875%, 6/15/2021 | | | 3,444,000 | |
| | | | United Airlines Pass Through Trust | | | | |
| | 1,440,000 | | | 5.375%, 8/15/2021 | | | 1,461,600 | |
| | | | XPO Logistics, Inc. | | | | |
| | 1,170,000 | | | 7.875%, 9/1/2019c | | | 1,225,575 | |
| | | | | |
| | | | Total | | | 37,253,369 | |
| | | | | |
| |
| Utilities (4.1%) | | | | |
| | | | Access Midstream Partners, LP | | | | |
| | 1,280,000 | | | 4.875%, 5/15/2023 | | | 1,337,600 | |
| | | | AES Corporation | | | | |
| | 2,350,000 | | | 7.375%, 7/1/2021 | | | 2,681,202 | |
| | | | Atlas Pipeline Partners, LP | | | | |
| | 3,770,000 | | | 4.750%, 11/15/2021 | | | 3,760,575 | |
| | | | Calpine Corporation | | | | |
| | 4,130,000 | | | 5.375%, 1/15/2023 | | | 4,171,300 | |
| | | | Chesapeake Midstream Partners, LP | | | | |
| | 810,000 | | | 6.125%, 7/15/2022 | | | 880,875 | |
| | | | Covanta Holding Corporation | | | | |
| | 2,400,000 | | | 7.250%, 12/1/2020 | | | 2,556,000 | |
| | 1,650,000 | | | 6.375%, 10/1/2022 | | | 1,757,250 | |
| | | | Dynegy Finance I, Inc. | | | | |
| | 2,340,000 | | | 7.625%, 11/1/2024c | | | 2,480,400 | |
| | | | Dynegy Finance I, Inc./ Dynegy Finance II, Inc. | | | | |
| | 935,000 | | | 6.750%, 11/1/2019c | | | 967,725 | |
| | | | Electricite de France SA | | | | |
| | 2,500,000 | | | 5.250%, 12/29/2049c,f | | | 2,593,750 | |
| | | | Holly Energy Partners, LP | | | | |
| | 820,000 | | | 6.500%, 3/1/2020 | | | 850,750 | |
| | | | Regency Energy Partners, LP | | | | |
| | 3,950,000 | | | 5.500%, 4/15/2023 | | | 4,088,250 | |
| | | | Targa Resources Partners, LP | | | | |
| | 4,280,000 | | | 5.250%, 5/1/2023 | | | 4,494,000 | |
| | | | | |
| | | | Total | | | 32,619,677 | |
| | | | | |
| | | | | | | | |
| | | | | |
| | | | Total Long-Term Fixed Income (cost $679,703,044) | | | 694,188,689 | |
| | | | | |
| | |
| Shares | | | Preferred Stock (1.0%) | | Value | |
| Financials (0.9%) | | | | |
| | 52,669 | | | Citigroup, Inc., 6.875%f | | | 1,409,422 | |
| | 48,000 | | | Discover Financial Services, 6.500%f | | | 1,232,160 | |
| | 74,979 | | | Goldman Sachs Group, Inc., 5.500%f | | | 1,794,248 | |
| | 16,984 | | | Morgan Stanley, 6.875%f | | | 450,416 | |
| | 17,280 | | | PNC Financial Services Group, Inc., 6.125%f | | | 470,707 | |
| | 1,440 | | | Wells Fargo & Company, Convertible, 7.500%f | | | 1,733,760 | |
| | | | | |
| | | | Total | | | 7,090,713 | |
| | | | | |
The accompanying Notes to Financial Statements are an integral part of this schedule.
213
HIGH YIELD FUND
Schedule of Investments as of October 31, 2014
| | | | | | | | |
| Shares | | | Preferred Stock (1.0%) | | Value | |
| Materials (0.1%) | | | | |
| | 36,650 | | | CHS, Inc., 7.100%f | | | $984,419 | |
| | | | | |
| | | | Total | | | 984,419 | |
| | | | | |
| | | | | |
| | | | | |
| | | | Total Preferred Stock (cost $8,214,056) | | | 8,075,132 | |
| | | | | |
| | |
| Shares | | | Common Stock (<0.1%) | | Value | |
| Consumer Discretionary (<0.1%) | | | | |
| | 153 | | | Lear Corporation, Warrants, $0.01, expires 11/11/2014h | | | 27,921 | |
| | 36,330 | | | TVMAX Holdings, Inc.h,i | | | 4 | |
| | | | | |
| | | | Total | | | 27,925 | |
| | | | | |
| |
| Financials (<0.1%) | | | | |
| | 10 | | | New Cotai, LLCh,i | | | 251,278 | |
| | | | | |
| | | | Total | | | 251,278 | |
| | | | | |
| | | | | | | | |
| | | | | |
| | | | Total Common Stock (cost $2,569,891) | | | 279,203 | |
| | | | | |
| | |
| Shares | | | Collateral Held for Securities Loaned (5.4%) | | Value | |
| | 42,383,027 | | | Thrivent Cash Management Trust | | | 42,383,027 | |
| | | | | |
| | | | Total Collateral Held for Securities Loaned (cost $42,383,027) | | | 42,383,027 | |
| | | | | |
| | |
Shares or
Principal
Amount | | | Short-Term Investments (3.4%)j | | Value | |
| | | | Federal Home Loan Bank Discount Notes | | | | |
| | 400,000 | | | 0.070%, 11/19/2014 | | | 399,986 | |
| | | | Thrivent Cash Management Trust | | | | |
| | 26,565,337 | | | 0.050% | | | 26,565,337 | |
| | | | | |
| | | | Total Short-Term Investments (at amortized cost) | | | 26,965,323 | |
| | | | | |
| | | | Total Investments (cost $806,313,142) 104.0% | | $ | 818,140,856 | |
| | | | | |
| | | | Other Assets and Liabilities, Net (4.0%) | | | (31,808,924 | ) |
| | | | | |
| | | | Total Net Assets 100.0% | | $ | 786,331,932 | |
| | | | | |
a | The stated interest rate represents the weighted average of all contracts within the bank loan facility. |
b | Denotes step coupon securities. Step coupon securities pay an initial coupon rate for the first period and then different coupon rates for following periods. The rate shown is as of October 31, 2014. |
c | Denotes securities sold under Rule 144A of the Securities Act of 1933, which exempts them from registration. These securities have been deemed liquid and may be resold to other dealers in the program or to other qualified institutional buyers. As of October 31, 2014, the value of these investments was $264,824,656 or 33.7% of total net assets. |
d | All or a portion of the security is on loan. |
e | Denotes investments purchased on a when-issued or delayed delivery basis. |
f | Denotes perpetual securities. Perpetual securities pay an indefinite stream of interest, but may be called by the issuer at an earlier date. |
g | Denotes variable rate securities. Variable rate securities are securities whose yields vary with a designated market index or market rate. The rate shown is as of October 31, 2014. |
h | Non-income producing security, |
i | Security is fair valued. |
j | The interest rate shown reflects the yield, coupon rate or the discount rate at the date of purchase. |
* | Denotes restricted securities. Restricted securities are investment securities which have been deemed illiquid and cannot be offered for public sale without first being registered under the Securities Act of 1933. The following table indicates the acquisition date and cost of restricted securities High Yield Fund owned as of October 31, 2014. |
| | | | | | | | |
Security | | Acquisition
Date | | | Cost | |
APERAM, 4/1/2018 | | | 3/25/2011 | | | $ | 2,346,506 | |
Bluescope Steel, Ltd., 5/1/2018 | | | 4/11/2013 | | | | 1,410,000 | |
CTP Transportation Products, LLC, 12/15/2019 | | | 12/13/2013 | | | | 2,865,937 | |
Delta Air Lines Pass Through Trust, 5/7/2019 | | | 5/3/2013 | | | | 2,530,768 | |
Digicel, Ltd., 2/15/2020 | | | 2/7/2012 | | | | 1,470,000 | |
Eileme 2 AB, 1/31/2020 | | | 1/19/2012 | | | | 3,668,940 | |
Eldorado Resorts, LLC, 6/15/2019 | | | 5/19/2011 | | | | 5,115,186 | |
Eletson Holdings, Inc., 1/15/2022 | | | 12/12/2013 | | | | 1,804,691 | |
JBS Finance II, Ltd., 1/29/2018 | | | 7/22/2010 | | | | 3,896,043 | |
Jefferies Finance, LLC, 4/1/2020 | | | 3/19/2013 | | | | 2,350,000 | |
Magnetation, LLC, 5/15/2018 | | | 5/15/2013 | | | | 3,364,287 | |
Midwest Vanadium, Pty. Ltd., 2/15/2018 | | | 2/9/2011 | | | | 2,908,916 | |
Seminole Indian Tribe of Florida, 10/1/2020 | | | 7/8/2010 | | | | 3,138,473 | |
Tunica-Biloxi Gaming Authority, 11/15/2015 | | | 11/8/2005 | | | | 4,224,408 | |
| | | | |
Unrealized Appreciation (Depreciation) | | | | |
Gross unrealized appreciation and depreciation of investments, based on cost for federal income tax purposes, were as follows: | | | | |
Gross unrealized appreciation | | | $26,901,116 | |
Gross unrealized depreciation | | | (15,362,094 | ) |
| | | | |
Net unrealized appreciation (depreciation) | | | $11,539,022 | |
| |
Cost for federal income tax purposes | | | $806,601,834 | |
The accompanying Notes to Financial Statements are an integral part of this schedule.
214
HIGH YIELD FUND
Schedule of Investments as of October 31, 2014
Fair Valuation Measurements
The following table is a summary of the inputs used, as of October 31, 2014, in valuing High Yield Fund’s assets carried at fair value.
| | | | | | | | | | | | | | | | |
Investments in Securities | | Total | | | Level 1 | | | Level 2 | | | Level 3 | |
| | | | |
Bank Loans | | | | | | | | | | | | | | | | |
Communications Services | | | 21,821,359 | | | | – | | | | 15,616,909 | | | | 6,204,450 | |
Consumer Cyclical | | | 8,884,346 | | | | – | | | | 8,884,346 | | | | – | |
Consumer Non-Cyclical | | | 7,168,518 | | | | – | | | | 7,168,518 | | | | – | |
Financials | | | 2,881,536 | | | | – | | | | 2,881,536 | | | | – | |
Technology | | | 5,493,723 | | | | – | | | | 5,493,723 | | | | – | |
| | | | |
Long-Term Fixed Income | | | | | | | | | | | | | | | | |
Asset-Backed Securities | | | 2,453,146 | | | | – | | | | 2,453,146 | | | | – | |
Basic Materials | | | 54,258,891 | | | | – | | | | 54,258,891 | | | | – | |
Capital Goods | | | 66,411,436 | | | | – | | | | 66,411,436 | | | | – | |
Communications Services | | | 142,930,125 | | | | – | | | | 142,930,125 | | | | – | |
Consumer Cyclical | | | 96,421,766 | | | | – | | | | 96,421,766 | | | | – | |
Consumer Non-Cyclical | | | 70,470,044 | | | | – | | | | 70,470,044 | | | | – | |
Energy | | | 94,743,66 6 | | | | – | | | | 94,743,666 | | | | – | |
Financials | | | 55,523,732 | | | | – | | | | 55,523,732 | | | | – | |
Technology | | | 41,102,837 | | | | – | | | | 41,102,837 | | | | – | |
Transportation | | | 37,253,369 | | | | – | | | | 37,253,369 | | | | – | |
Utilities | | | 32,619,677 | | | | – | | | | 32,619,677 | | | | – | |
| | | | |
Preferred Stock | | | | | | | | | | | | | | | | |
Financials | | | 7,090,713 | | | | 7,090,713 | | | | – | | | | – | |
Materials | | | 984,419 | | | | 984,419 | | | | – | | | | – | |
| | | | |
Common Stock | | | | | | | | | | | | | | | | |
Consumer Discretionary | | | 27,925 | | | | 27,921 | | | | – | | | | 4 | |
Financials | | | 251,278 | | | | – | | | | – | | | | 251,278 | |
Collateral Held for Securities Loaned | | | 42,383,027 | | | | 42,383,027 | | | | – | | | | – | |
Short-Term Investments | | | 26,965,323 | | | | 26,565,337 | | | | 399,986 | | | | – | |
| |
Total | | | $818,140,856 | | | | $77,051,417 | | | | $734,633,707 | | | | $6,455,732 | |
| |
There were no significant transfers between Levels during the period ended October 31, 2014. Transfers between Levels are identified as of the end of the period.
The following table summarizes the net realized gains/( losses) and Statement of Operations location, for the period ended October 31, 2014, for High Yield Fund’s investments in financial derivative instruments by primary risk exposure.
| | | | | | |
Derivatives by risk category | | Statement of Operations Location | | Realized Gains/(Losses)
recognized in Income | |
| | |
Eauity Contracts | | | | | | |
Futures | | Net realized gains/(losses) on Futures contracts | | | (34,753 | ) |
Total Equity Contracts | | | | | (34,753 | ) |
| |
Total | | | | | ($34,753 | ) |
| |
The following table presents High Yield Fund’s average volume of derivative activity during the period ended October 31, 2014.
| | | | | | | | |
Derivative Risk Category | | Futures
(Notional)* | | | Futures
(Percentage
of Average
Net Assets) | |
Equity Contracts | | $ | 4,864,154 | | | | 0.6 | % |
* | Notional amount represents long or short, or both, derivative positions held by the Fund. |
The accompanying Notes to Financial Statements are an integral part of this schedule.
215
HIGH YIELD FUND
Schedule of Investments as of October 31, 2014
Investment in Affiliates
Affiliated issuers, as defined under the Investment Company Act of 1940, include those in which the Fund’s holdings of an issuer represent 5% or more of the outstanding voting securities of an issuer, or any affiliated mutual fund.
A summary of transactions for the fiscal year to date, in High Yield Fund, is as follows:
| | | | | | | | | | | | | | | | | | | | | | | | |
Fund | | Value
October 31, 2013 | | | Gross Purchases | | | Gross Sales | | | Shares Held at
October 31, 2014 | | | Value
October 31, 2014 | | | Income Earned
November 1, 2013 - October 31, 2014 | |
Cash Management Trust- Collateral Investment | | | $46,006,909 | | | | $169,308,195 | | | | $172,932,077 | | | | 42,383,027 | | | | $42,383,027 | | | | $121,624 | |
Cash Management Trust- Short Term Investment | | | 16,048,038 | | | | 216,419,217 | | | | 205,901,918 | | | | 26,565,337 | | | | 26,565,337 | | | | 13,297 | |
Total Value and Income Earned | | | 62,054,947 | | | | | | | | | | | | | | | | 68,948,364 | | | | 134,921 | |
The accompanying Notes to Financial Statements are an integral part of this schedule.
216
INCOME FUND
Schedule of Investments as of October 31, 2014
| | | | | | | | |
Principal Amount | | | Bank Loans (4.0%)a | | Value | |
| Basic Materials (0.2%) | | | | |
| | | | Fortescue Metals Group, Ltd., Term Loan | | | | |
| | $1,323,135 | | | 3.750%, 6/30/2019 | | | $1,289,607 | |
| | | | Ineos Group Holdings, Ltd., Term Loan | | | | |
| | 873,478 | | | 3.750%, 5/4/2018 | | | 861,468 | |
| | | | | |
| | | | Total | | | 2,151,075 | |
| | | | | |
| |
| Capital Goods (0.2%) | | | | |
| | | | ADS Waste Holdings, Inc., Term Loan | | | | |
| | 884,250 | | | 3.750%, 10/9/2019 | | | 864,576 | |
| | | | Berry Plastics Group, Inc., Term Loan | | | | |
| | 886,500 | | | 3.500%, 2/8/2020 | | | 867,112 | |
| | | | | |
| | | | Total | | | 1,731,688 | |
| | | | | |
| |
| Communications Services (1.4%) | | | | |
| | | | Charter Communications Operating, LLC, Term Loan | | | | |
| | 533,250 | | | 3.000%, 1/3/2021 | | | 523,753 | |
| | | | Clear Channel Communications, Inc., Term Loan | | | | |
| | 5,671 | | | 3.804%, 1/29/2016 | | | 5,619 | |
| | 672,127 | | | 6.904%, 1/30/2019 | | | 633,587 | |
| | 216,167 | | | 7.654%, 7/30/2019 | | | 207,588 | |
| | | | Cumulus Media Holdings, Inc., Term Loan | | | | |
| | 795,173 | | | 4.250%, 12/23/2020 | | | 785,893 | |
| | | | Hargray Communications Group, Inc., Term Loan | | | | |
| | 908,500 | | | 5.250%, 6/26/2019 | | | 906,610 | |
| | | | Intelsat Jackson Holdings SA, Term Loan | | | | |
| | 1,051,101 | | | 3.750%, 6/30/2019 | | | 1,041,904 | |
| | | | Level 3 Communications, Inc., Term Loan | | | | |
| | 900,000 | | | 4.000%, 1/15/2020 | | | 895,500 | |
| | | | McGraw-Hill Global Education, LLC, Term Loan | | | | |
| | 379,314 | | | 5.750%, 3/22/2019 | | | 379,671 | |
| | | | NEP/NCP Holdco, Inc., Term Loan | | | | |
| | 886,551 | | | 4.250%, 1/22/2020 | | | 864,387 | |
| | | | TNS, Inc., Term Loan | | | | |
| | 832,977 | | | 5.000%, 2/14/2020 | | | 824,131 | |
| | | | Univision Communications, Inc., Term Loan | | | | |
| | 921,625 | | | 4.000%, 3/1/2020 | | | 911,644 | |
| | | | Virgin Media Investment Holdings, Ltd., Term Loan | | | | |
| | 900,000 | | | 3.500%, 6/7/2020 | | | 886,752 | |
| | | | WideOpenWest Finance, LLC, Term Loan | | | | |
| | 886,500 | | | 4.750%, 4/1/2019 | | | 884,975 | |
| | | | Yankee Cable Acquisition, LLC, Term Loan | | | | |
| | 855,521 | | | 4.500%, 3/1/2020 | | | 850,602 | |
| | | | Zayo Group, LLC, Term Loan | | | | |
| | 884,181 | | | 4.000%, 7/2/2019 | | | 875,754 | |
| | | | | |
| | | | Total | | | 11,478,370 | |
| | | | | |
| |
| Consumer Cyclical (0.4%) | | | | |
| | | | Bally Technologies, Inc., Term Loan | | | | |
| | 357,974 | | | 4.250%, 11/25/2020 | | | 356,410 | |
| | | | Burlington Coat Factory Warehouse Corporation, Term Loan | | | | |
| | 775,706 | | | 4.250%, 8/13/2021 | | | 770,275 | |
| | | | Chrysler Group, LLC, Term Loan | | | | |
| | 905,954 | | | 3.500%, 5/24/2017 | | | 900,672 | |
| | | | MGM Resorts International, Term Loan | | | | |
| | 530,550 | | | 3.500%, 12/20/2019 | | | 523,918 | |
| | | | ROC Finance, LLC, Term Loan | | | | |
| | 891,000 | | | 5.000%, 6/20/2019 | | | 851,743 | |
| | | | Toys “R” Us, Inc., Term Loan | | | | |
| | 202,338 | | | 5.250%, 5/25/2018 | | | 161,618 | |
| | | | | |
| | | | Total | | | 3,564,636 | |
| | | | | |
| |
| Consumer Non-Cyclical (0.5%) | | | | |
| | | | Albertsons, Inc., Term Loan | | | | |
| | 1,010,130 | | | 4.750%, 3/21/2019 | | | 1,007,604 | |
| | | | Biomet, Inc., Term Loan | | | | |
| | 790,192 | | | 3.652%, 7/25/2017 | | | 787,679 | |
| | | | CHS/Community Health Systems, Inc., Term Loan | | | | |
| | 243,702 | | | 3.485%, 1/25/2017 | | | 242,891 | |
| | 649,548 | | | 4.250%, 1/27/2021 | | | 649,749 | |
| | | | Roundy’s Supermarkets, Inc., Term Loan | | | | |
| | 754,960 | | | 5.750%, 3/3/2021 | | | 670,027 | |
| | | | Visant Corporation, Term Loan | | | | |
| | 679,288 | | | 7.000%, 9/23/2021 | | | 669,099 | |
| | | | | |
| | | | Total | | | 4,027,049 | |
| | | | | |
| |
| Energy (0.2%) | | | | |
| | | | Arch Coal, Inc., Term Loan | | | | |
| | 874,8 86 | | | 6.250%, 5/16/2018 | | | 771,151 | |
| | | | McJunkin Red Man Corporation, Term Loan | | | | |
| | 356,400 | | | 5.000%, 11/8/2019 | | | 356,846 | |
| | | | Offshore Group Investment, Ltd., Term Loan | | | | |
| | 443,250 | | | 5.750%, 3/28/2019 | | | 401,141 | |
| | | | | |
| | | | Total | | | 1,529,138 | |
| | | | | |
| |
| Financials (0.1%) | | | | |
| | | | WaveDivision Holdings, LLC, Term Loan | | | | |
| | 884,250 | | | 4.000%, 10/15/2019 | | | 875,036 | |
| | | | | |
| | | | Total | | | 875,036 | |
| | | | | |
| |
| Technology (0.4%) | | | | |
| | | | BMC Software, Inc., Term Loan | | | | |
| | 871,578 | | | 5.000%, 9/10/2020 | | | 861,502 | |
| | | | First Data Corporation, Term Loan | | | | |
| | 900,000 | | | 3.653%, 3/23/2018 | | | 891,000 | |
| | | | Freescale Semiconductor, Inc., Term Loan | | | | |
| | 886,551 | | | 4.250%, 2/28/2020 | | | 873,571 | |
| | | | Infor US, Inc., Term Loan | | | | |
| | 540,260 | | | 3.750%, 6/3/2020 | | | 532,561 | |
| | | | SunGard Data Systems, Inc., Term Loan | | | | |
| | 226,639 | | | 4.000%, 3/8/2020 | | | 225,602 | |
The accompanying Notes to Financial Statements are an integral part of this schedule.
217
INCOME FUND
Schedule of Investments as of October 31, 2014
| | | | | | | | |
Principal Amount | | | Bank Loans (4.0%)a | | Value | |
| Technology (0.4%) - continued | | | | |
| | | | Syniverse Holdings, Inc., Term Loan | | | | |
| | $345,537 | | | 4.000%, 4/23/2019 | | | $339,491 | |
| | | | | |
| | | | Total | | | 3,723,727 | |
| | | | | |
| |
| Transportation (0.3%) | | | | |
| | | | American Airlines, Inc., Term Loan | | | | |
| | 908,500 | | | 3.750%, 6/27/2019 | | | 896,008 | |
| | | | Delta Air Lines, Inc., Term Loan | | | | |
| | 1,360,789 | | | 3.250%, 4/20/2017 | | | 1,349,521 | |
| | | | | |
| | | | Total | | | 2,245,529 | |
| | | | | |
| |
| Utilities (0.3%) | | | | |
| | | | Calpine Corporation, Term Loan | | | | |
| | 696,481 | | | 4.000%, 4/1/2018 | | | 693,215 | |
| | 686,000 | | | 4.000%, 10/9/2019 | | | 679,387 | |
| | | | NGPL PipeCo, LLC, Term Loan | | | | |
| | 801,039 | | | 6.750%, 9/15/2017 | | | 798,371 | |
| | | | | |
| | | | Total | | | 2,170,973 | |
| | | | | |
| | | | | | | | |
| | | | | |
| | | | Total Bank Loans (cost $34,009,512) | | | 33,497,221 | |
| | | | | |
| | |
Principal Amount | | | Long-Term Fixed Income (90.5%) | | Value | |
| Asset-Backed Securities (1.1%) | | | | |
| | | | First Horizon ABS Trust | | | | |
| | 672,658 | | | 0.312%, 10/25/2034d,e | | | 590,776 | |
| | | | GMAC Mortgage Corporation Loan Trust | | | | |
| | 1,856,251 | | | 0.332%, 8/25/2035d,e | | | 1,627,903 | |
| | 2,095,126 | | | 0.332%, 12/25/2036d,e | | | 1,820,381 | |
| | | | IndyMac Seconds Asset-Backed Trust | | | | |
| | 1,150,287 | | | 0.492%, 10/25/2036d,e | | | 658,694 | |
| | | | Renaissance Home Equity Loan Trust | | | | |
| | 1,553,298 | | | 5.746%, 5/25/2036f | | | 1,145,318 | |
| | 1,400,000 | | | 6.011%, 5/25/2036f | | | 1,001,185 | |
| | | | Vericrest Opportunity Loan Transferee | | | | |
| | 1,211,993 | | | 3.625%, 10/27/2053g | | | 1,213,412 | |
| | 914,499 | | | 3.625%, 11/25/2053* | | | 915,942 | |
| | | | | |
| | | | Total | | | 8,973,611 | |
| | | | | |
| |
| Basic Materials (4.6%) | | | | |
| | | | Alcoa, Inc. | | | | |
| | 740,000 | | | 5.125%, 10/1/2024 | | | 781,231 | |
| | | | Anglo American Capital plc | | | | |
| | 1,090,000 | | | 4.125%, 4/15/2021g | | | 1,105,707 | |
| | | | ArcelorMittal | | | | |
| | 2,250,000 | | | 5.750%, 8/5/2020 | | | 2,387,812 | |
| | | | Barrick Gold Corporation | | | | |
| | 1,080,000 | | | 3.850% 4/1/2022 | | | 1,035,185 | |
| | 1,090,000 | | | 4.100%, 5/1/2023 | | | 1,053,543 | |
| | | | Dow Chemical Company | | | | |
| | 1,430,000 | | | 4.250%, 11/15/2020 | | | 1,537,803 | |
| | | | First Quantum Minerals, Ltd. | | | | |
| | 610,000 | | | 6.750%, 2/15/2020g | | | 590,175 | |
| | 610,000 | | | 7.000%, 2/15/2021g | | | 598,563 | |
| | | | Freeport-McMoRan, Inc. | | | | |
| | 2,530,000 | | | 3.550%, 3/1/2022 | | | 2,472,405 | |
| | 1,825,000 | | | 3.875%, 3/15/2023 | | | 1,803,753 | |
| | | | Georgia-Pacific, LLC | | | | |
| | 1,310,000 | | | 5.400%, 11/1/2020g | | | 1,496,703 | |
| | | | Glencore Funding, LLC | | | | |
| | 1,820,000 | | | 4.125%, 5/30/2023g | | | 1,812,816 | |
| | | | International Paper Company | | | | |
| | 1,810,000 | | | 4.800%, 6/15/2044 | | | 1,781,650 | |
| | | | Kinross Gold Corporation | | | | |
| | 720,000 | | | 5.950%, 3/15/2024g | | | 688,603 | |
| | | | LYB International Finance BV | | | | |
| | 1,445,000 | | | 4.000%, 7/15/2023 | | | 1,498,708 | |
| | 720,000 | | | 4.875%, 3/15/2044 | | | 744,536 | |
| | | | LyondellBasell Industries NV | | | | |
| | 1,830,000 | | | 6.000%, 11/15/2021 | | | 2,142,659 | |
| | | | Mosaic Company | | | | |
| | 1,230,000 | | | 4.250%, 11/15/2023 | | | 1,290,185 | |
| | 910,000 | | | 5.450%, 11/15/2033 | | | 1,015,936 | |
| | | | Rio Tinto Finance USA, Ltd. | | | | |
| | 1,965,000 | | | 6.500%, 7/15/2018 | | | 2,280,713 | |
| | | | Sappi Papier Holding GmbH | | | | |
| | 1,090,000 | | | 6.625%, 4/15/2021g | | | 1,133,600 | |
| | | | Teck Resources, Ltd. | | | | |
| | 2,130,000 | | | 3.750%, 2/1/2023h | | | 2,009,700 | |
| | | | Trinseo Materials Operating SCA | | | | |
| | 981,000 | | | 8.750%, 2/1/2019 | | | 1,037,407 | |
| | | | Vale Overseas, Ltd. | | | | |
| | 1,100,000 | | | 4.625%, 9/15/2020 | | | 1,160,577 | |
| | | | Vale SA | | | | |
| | 1,070,000 | | | 5.625%, 9/11/2042 | | | 1,057,374 | |
| | | | Weyerhaeuser Company | | | | |
| | 735,000 | | | 4.625%, 9/15/2023 | | | 781,940 | |
| | 1,430,000 | | | 7.375%, 3/15/2032 | | | 1,866,234 | |
| | | | Xstrata Finance Canada, Ltd. | | | | |
| | 1,440,000 | | | 4.250%, 10/25/2022g | | | 1,455,532 | |
| | | | | |
| | | | Total | | | 38,621,050 | |
| | | | | |
| |
| Capital Goods (1.8%) | | | | |
| | | | BAE Systems plc | | | | |
| | 2,120,000 | | | 4.750%, 10/11/2021g | | | 2,322,526 | |
| | | | CNH Capital, LLC | | | | |
| | 250,000 | | | 6.250%, 11/1/2016 | | | 264,375 | |
| | | | Hutchison Whampoa Finance CI, Ltd. | | | | |
| | 1,480,000 | | | 1.625%, 10/31/2017g | | | 1,477,488 | |
| | | | L-3 Communications Corporation | | | | |
| | 1,440,000 | | | 3.950%, 5/28/2024 | | | 1,443,396 | |
| | | | Masco Corporation | | | | |
| | 875,000 | | | 5.950%, 3/15/2022 | | | 962,500 | |
| | | | Republic Services, Inc. | | | | |
| | 370,000 | | | 5.500%, 9/15/2019 | | | 421,252 | |
| | 1,300,000 | | | 5.250%, 11/15/2021 | | | 1,468,277 | |
| | 1,830,000 | | | 3.550%, 6/1/2022 | | | 1,876,467 | |
| | | | Reynolds Group Issuer, Inc. | | | | |
| | 1,060,000 | | | 9.875%, 8/15/2019 | | | 1,151,425 | |
| | | | Textron, Inc. | | | | |
| | 1,311,000 | | | 5.600%, 12/1/2017 | | | 1,452,445 | |
| | 720,000 | | | 4.300%, 3/1/2024 | | | 750,776 | |
| | 370,000 | | | 3.875%, 3/1/2025c | | | 370,634 | |
| | | | United Rentals North America, Inc. | | | | |
| | 700,000 | | | 5.750%, 7/15/2018 | | | 733,250 | |
The accompanying Notes to Financial Statements are an integral part of this schedule.
218
INCOME FUND
Schedule of Investments as of October 31, 2014
| | | | | | | | |
Principal Amount | | | Long-Term Fixed Income (90.5%) | | Value | |
| Capital Goods (1.8%) - continued | | | | |
| | $180,000 | | | 6.125%, 6/15/2023 | | | $193,725 | |
| | | | | |
| | | | Total | | | 14,888,536 | |
| | | | | |
| |
| Collateralized Mortgage Obligations (0.8%) | | | | |
| | | | CitiMortgage Alternative Loan Trust | | | | |
| | 1,258,964 | | | 5.750%, 4/25/2037 | | | 1,081,101 | |
| | | | Countrywide Alternative Loan Trust | | | | |
| | 1,616,391 | | | 6.000%, 1/25/2037 | | | 1,466,807 | |
| | | | HomeBanc Mortgage Trust | | | | |
| | 1,434,304 | | | 2.290%, 4/25/2037 | | | 1,059,630 | |
| | | | Wachovia Mortgage Loan Trust, LLC | | | | |
| | 1,560,803 | | | 2.800%, 5/20/2036 | | | 1,357,495 | |
| | | | WaMu Mortgage Pass Through Certificates | | | | |
| | 996,300 | | | 0.442%, 10/25/2045e | | | 952,675 | |
| | | | Washington Mutual Alternative Mortgage Pass Through Certificates | | | | |
| | 2,266,839 | | | 0.865%, 2/25/2047e | | | 1,586,930 | |
| | | | | |
| | | | Total | | | 7,504,638 | |
| | | | | |
| |
| Commercial Mortgage-Backed Securities (0.7%) | | | | |
| | | | Bear Stearns Commercial Mortgage Securities, Inc. | | | | |
| | 2,177,246 | | | 5.331%, 2/11/2044 | | | 2,340,227 | |
| | | | Citigroup/Deutsche Bank Commercial Mortgage | | | | |
| | 1,300,000 | | | 5.322%, 12/11/2049 | | | 1,389,548 | |
| | | | Credit Suisse First Boston Mortgage Securities | | | | |
| | 1,800,000 | | | 5.542%, 1/15/2049 | | | 1,938,184 | |
| | | | | |
| | | | Total | | | 5,667,959 | |
| | | | | |
| |
| Communications Services (11.8%) | | | | |
| | | | 21st Century Fox America, Inc. | | | | |
| | 1,120,000 | | | 6.150%, 2/15/2041 | | | 1,379,034 | |
| | | | America Movil SAB de CV | | | | |
| | 2,400,000 | | | 1.235%, 9/12/2016e | | | 2,423,398 | |
| | 1,480,000 | | | 5.000%, 3/30/2020 | | | 1,631,478 | |
| | | | American Tower Corporation | | | | |
| | 2,180,000 | | | 4.500%, 1/15/2018 | | | 2,326,932 | |
| | 3,500,000 | | | 3.450%, 9/15/2021 | | | 3,423,819 | |
| | 1,450,000 | | | 3.500%, 1/31/2023 | | | 1,387,692 | |
| | | | AT&T, Inc. | | | | |
| | 1,830,000 | | | 3.000%, 2/15/2022 | | | 1,809,292 | |
| | 1,810,000 | | | 4.300%, 12/15/2042 | | | 1,688,138 | |
| | | | British Sky Broadcasting Group plc | | | | |
| | 560,000 | | | 2.625%, 9/16/2019g | | | 561,554 | |
| | 1,490,000 | | | 3.750%, 9/16/2024g | | | 1,494,844 | |
| | | | CBS Corporation | | | | |
| | 1,490,000 | | | 2.300%, 8/15/2019 | | | 1,470,436 | |
| | | | CC Holdings GS V, LLC | | | | |
| | 720,000 | | | 3.849%, 4/15/2023 | | | 716,346 | |
| | | | CenturyLink, Inc. | | | | |
| | 1,080,000 | | | 5.625%, 4/1/2020 | | | 1,144,800 | |
| | 1,400,000 | | | 5.800%, 3/15/2022 | | | 1,484,000 | |
| | | | Clear Channel Worldwide Holdings, Inc. | | | | |
| | 1,070,000 | | | 6.500%, 11/15/2022 | | | 1,107,450 | |
| | | | Columbus International, Inc. | | | | |
| | 1,090,000 | | | 7.375%, 3/30/2021g | | | 1,155,400 | |
| | | | Comcast Corporation | | | | |
| | 1,300,000 | | | 6.400%, 5/15/2038 | | | 1,667,282 | |
| | | | Cox Communications, Inc. | | | | |
| | 1,100,000 | | | 9.375%, 1/15/2019g | | | 1,405,429 | |
| | 1,080,000 | | | 3.250%, 12/15/2022g | | | 1,057,318 | |
| | | | Crown Castle Towers, LLC | | | | |
| | 2,950,000 | | | 4.174%, 8/15/2017g | | | 3,095,700 | |
| | | | DIRECTV Holdings, LLC | | | | |
| | 3,225,000 | | | 5.000%, 3/1/2021 | | | 3,550,877 | |
| | 1,815,000 | | | 3.800%, 3/15/2022 | | | 1,848,833 | |
| | 1,810,000 | | | 4.450%, 4/1/2024 | | | 1,888,431 | |
| | | | DISH DBS Corporation | | | | |
| | 1,080,000 | | | 5.000%, 3/15/2023 | | | 1,075,950 | |
| | | | Frontier Communications Corporation | | | | |
| | 1,120,000 | | | 6.875%, 1/15/2025 | | | 1,134,000 | |
| | | | Hughes Satellite Systems Corporation | | | | |
| | 1,420,000 | | | 6.500%, 6/15/2019 | | | 1,537,150 | |
| | | | Intelsat Jackson Holdings SA | | | | |
| | 740,0 00 | | | 7.500%, 4/1/2021 | | | 801,050 | |
| | | | NBC Universal Enterprise, Inc. | | | | |
| | 1,080,000 | | | 1.974%, 4/15/2019g | | | 1,070,683 | |
| | | | NBCUniversal Media, LLC | | | | |
| | 2,490,000 | | | 4.375%, 4/1/2021 | | | 2,735,322 | |
| | | | News America, Inc. | | | | |
| | 1,100,000 | | | 7.625%, 11/30/2028 | | | 1,441,844 | |
| | 1,350,000 | | | 6.400%, 12/15/2035 | | | 1,720,802 | |
| | | | Numericable Group SA | | | | |
| | 1,080,000 | | | 6.000%, 5/15/2022g | | | 1,104,300 | |
| | | | Omnicom Group, Inc. | | | | |
| | 2,380,000 | | | 4.450%, 8/15/2020 | | | 2,571,093 | |
| | 560,000 | | | 3.650%, 11/1/2024 | | | 556,292 | |
| | | | Qwest Corporation | | | | |
| | 1,800,000 | | | 6.500%, 6/1/2017 | | | 1,996,151 | |
| | | | SBA Tower Trust | | | | |
| | 109,000 | | | 5.101%, 4/17/2017g | | | 115,573 | |
| | | | SES Global Americas Holdings GP | | | | |
| | 1,820,000 | | | 2.500%, 3/25/2019g | | | 1,815,574 | |
| | | | Sprint Communications, Inc. | | | | |
| | 710,000 | | | 7.000%, 3/1/2020g | | | 792,005 | |
| | | | Sprint Corporation | | | | |
| | 720,000 | | | 7.125%, 6/15/2024g | | | 739,800 | |
| | | | Telefonica Emisiones SAU | | | | |
| | 2,530,000 | | | 5.462%, 2/16/2021 | | | 2,839,391 | |
| | 900,000 | | | 4.570%, 4/27/2023 | | | 951,495 | |
| | | | Time Warner Cable, Inc. | | | | |
| | 1,500,000 | | | 8.250%, 4/1/2019 | | | 1,862,692 | |
| | 1,450,000 | | | 4.125%, 2/15/2021 | | | 1,551,233 | |
| | | | Time Warner Entertainment Company, LP | | | | |
| | 2,000,000 | | | 8.375%, 3/15/2023 | | | 2,689,276 | |
| | | | Time Warner, Inc. | | | | |
| | 1,810,000 | | | 2.100%, 6/1/2019 | | | 1,783,621 | |
| | 1,400,000 | | | 7.700%, 5/1/2032 | | | 1,950,931 | |
| | | | T-Mobile USA, Inc. | | | | |
| | 1,090,000 | | | 6.633%, 4/28/2021 | | | 1,148,587 | |
| | | | Univision Communications, Inc. | | | | |
| | 1,080,000 | | | 6.750%, 9/15/2022g | | | 1,198,800 | |
| | | | UPCB Finance VI, Ltd. | | | | |
| | 1,400,000 | | | 6.875%, 1/15/2022g | | | 1,529,500 | |
The accompanying Notes to Financial Statements are an integral part of this schedule.
219
INCOME FUND
Schedule of Investments as of October 31, 2014
| | | | | | | | |
Principal
Amount | | | Long-Term Fixed Income (90.5%) | | Value | |
| Communications Services (11.8%) - continued | |
| | | | Verizon Communications, Inc. | | | | |
| | $2,124,000 | | | 2.625%, 2/21/2020g | | | $2,112,658 | |
| | 1,450,000 | | | 4.500%, 9/15/2020 | | | 1,574,293 | |
| | 2,170,000 | | | 3.450%, 3/15/2021 | | | 2,216,994 | |
| | 2,935,000 | | | 5.150%, 9/15/2023 | | | 3,286,871 | |
| | 2,970,000 | | | 3.500%, 11/1/2024 | | | 2,923,208 | |
| | 2,180,000 | | | 6.400%, 9/15/2033 | | | 2,655,379 | |
| | 1,090,000 | | | 5.050%, 3/15/2034 | | | 1,153,739 | |
| | 2,930,000 | | | 6.550%, 9/15/2043 | | | 3,693,576 | |
| | | | Windstream Corporation | | | | |
| | 1,090,000 | | | 7.750%, 10/1/2021 | | | 1,166,300 | |
| | | | | |
| | | | Total | | | 99,214,616 | |
| | | | | |
| |
| Consumer Cyclical (5.4%) | | | | |
| | | | American Honda Finance Corporation | | | | |
| | 2,600,000 | | | 3.875%, 9/21/2020g | | | 2,785,622 | |
| | | | Chrysler Group, LLC | | | | |
| | 1,100,000 | | | 8.000%, 6/15/2019 | | | 1,178,375 | |
| | | | CVS Health Corporation | | | | |
| | 1,810,000 | | | 2.750%, 12/1/2022 | | | 1,758,735 | |
| | 1,110,000 | | | 3.375%, 8/12/2024 | | | 1,106,763 | |
| | | | Daimler Finance North America, LLC | | | | |
| | 1,240,000 | | | 3.875%, 9/15/2021g | | | 1,313,118 | |
| | | | Ford Motor Credit Company, LLC | | | | |
| | 1,440,000 | | | 1.483%, 5/9/2016e | | | 1,457,747 | |
| | 370,000 | | | 6.625%, 8/15/2017 | | | 417,142 | |
| | 2,170,000 | | | 2.375%, 3/12/2019 | | | 2,166,973 | |
| | 1,425,000 | | | 4.250%, 9/20/2022 | | | 1,496,464 | |
| | 1,490,000 | | | 3.664%, 9/8/2024 | | | 1,481,309 | |
| | | | General Motors Company | | | | |
| | 1,830,000 | | | 3.500%, 10/2/2018 | | | 1,884,900 | |
| | | | General Motors Financial Company, Inc. | | | | |
| | 1,340,000 | | | 4.750%, 8/15/2017 | | | 1,430,450 | |
| | 725,000 | | | 3.500%, 7/10/2019 | | | 747,305 | |
| | 1,110,000 | | | 4.375%, 9/25/2021 | | | 1,162,836 | |
| | | | Hilton Worldwide Finance, LLC | | | | |
| | 1,090,000 | | | 5.625%, 10/15/2021g | | | 1,148,588 | |
| | | | Hyundai Capital America | | | | |
| | 1,185,000 | | | 2.875%, 8/9/2018g | | | 1,213,909 | |
| | | | Hyundai Motor Manufacturing Czech SRO | | | | |
| | 1,475,000 | | | 4.500%, 4/15/2015g | | | 1,499,255 | |
| | | | Jaguar Land Rover Automotive plc | | | | |
| | 1,090,000 | | | 4.125%, 12/15/2018g | | | 1,109,075 | |
| | | | Johnson Controls, Inc. | | | | |
| | 1,850,000 | | | 5.250%, 12/1/2041 | | | 2,021,125 | |
| | | | KIA Motors Corporation | | | | |
| | 1,740,000 | | | 3.625%, 6/14/2016g | | | 1,801,051 | |
| | | | L Brands, Inc. | | | | |
| | 1,100,000 | | | 5.625%, 2/15/2022 | | | 1,179,750 | |
| | | | Macy’s Retail Holdings, Inc. | | | | |
| | 1,930,000 | | | 3.875%, 1/15/2022 | | | 2,012,992 | |
| | 1,075,000 | | | 2.875%, 2/15/2023 | | | 1,030,793 | |
| | 1,810,000 | | | 3.625%, 6/1/2024 | | | 1,803,446 | |
| | | | Marriott International, Inc. | | | | |
| | 1,750,000 | | | 3.000%, 3/1/2019 | | | 1,796,770 | |
| | | | QVC, Inc. | | | | |
| | 1,265,000 | | | 4.375%, 3/15/2023 | | | 1,254,896 | |
| | | | Starwood Hotels & Resorts Worldwide, Inc. | | | | |
| | 1,150,000 | | | 6.750%, 5/15/2018 | | | 1,327,148 | |
| | 1,790,000 | | | 3.125%, 2/15/2023 | | | 1,732,045 | |
| | | | Toll Brothers Finance Corporation | | | | |
| | 1,000,000 | | | 6.750%, 11/1/2019 | | | 1,125,610 | |
| | 540,000 | | | 4.375%, 4/15/2023 | | | 529,200 | |
| | | | Wyndham Worldwide Corporation | | | | |
| | 360,000 | | | 2.500%, 3/1/2018 | | | 362,104 | |
| | 1,780,000 | | | 4.250%, 3/1/2022 | | | 1,796,241 | |
| | | | | |
| | | | Total | | | 45,131,737 | |
| | | | | |
| |
| Consumer Non-Cyclical (7.9%) | | | | |
| | | | AbbVie, Inc. | | | | |
| | 1,810,000 | | | 2.900%, 11/6/2022 | | | 1,760,696 | |
| | 1,110,000 | | | 4.400%, 11/6/2042 | | | 1,096,704 | |
| | | | Activis Funding SCS | | | | |
| | 1,445,000 | | | 3.850%, 6/15/2024g | | | 1,406,420 | |
| | | | Altria Group, Inc. | | | | |
| | 905,000 | | | 4.750%, 5/5/2021 | | | 996,781 | |
| | 1,825,000 | | | 4.000%, 1/31/2024 | | | 1,889,123 | |
| | 483,000 | | | 9.950%, 11/10/2038 | | | 810,113 | |
| | | | Boston Scientific Corporation | | | | |
| | 1,810,000 | | | 6.000%, 1/15/2020 | | | 2,075,987 | |
| | | | BRF SA | | | | |
| | 2,170,000 | | | 4.750%, 5/22/2024g | | | 2,172,713 | |
| | | | Bunge Limited Finance Corporation | | | | |
| | 1,470,000 | | | 8.500%, 6/15/2019 | | | 1,818,640 | |
| | | | Celgene Corporation | | | | |
| | 1,250,000 | | | 1.900%, 8/15/2017 | | | 1,261,381 | |
| | 2,230,000 | | | 3.950%, 10/15/2020 | | | 2,367,174 | |
| | | | ConAgra Foods, Inc. | | | | |
| | 1,105,000 | | | 2.100%, 3/15/2018 | | | 1,110,555 | |
| | 847,000 | | | 3.200%, 1/25/2023 | | | 821,283 | |
| | | | CVS Health Corporation | | | | |
| | 1,090,000 | | | 6.125%, 9/15/2039 | | | 1,364,667 | |
| | | | DaVita HealthCare Partners, Inc. | | | | |
| | 1,080,000 | | | 5.125%, 7/15/2024 | | | 1,101,600 | |
| | | | Edwards Lifesciences Corporation | | | | |
| | 1,375,000 | | | 2.875%, 10/15/2018 | | | 1,401,584 | |
| | | | Express Scripts Holding Company | | | | |
| | 1,765,000 | | | 4.750%, 11/15/2021 | | | 1,938,282 | |
| | 1,090,000 | | | 3.500%, 6/15/2024 | | | 1,080,309 | |
| | | | Forest Laboratories, Inc. | | | | |
| | 1,450,000 | | | 5.000%, 12/15/2021g | | | 1,553,752 | |
| | | | Fresenius Medical Care US Finance, Inc. | | | | |
| | 710,000 | | | 6.500%, 9/15/2018g | | | 786,325 | |
| | | | Gilead Sciences, Inc. | | | | |
| | 900,000 | | | 4.800%, 4/1/2044 | | | 975,519 | |
| | | | HCA, Inc. | | | | |
| | 1,440,000 | | | 4.750%, 5/1/2023 | | | 1,463,400 | |
| | | | Hospira, Inc. | | | | |
| | 1,460,000 | | | 5.200%, 8/12/2020 | | | 1,579,961 | |
| | | | JBS USA, LLC | | | | |
| | 1,090,000 | | | 7.250%, 6/1/2021g | | | 1,160,850 | |
| | | | Kroger Company | | | | |
| | 1,480,000 | | | 2.950%, 11/1/2021 | | | 1,465,685 | |
| | | | Lorillard Tobacco Company | | | | |
| | 1,830,000 | | | 8.125%, 6/23/2019 | | | 2,241,792 | |
The accompanying Notes to Financial Statements are an integral part of this schedule.
220
INCOME FUND
Schedule of Investments as of October 31, 2014
| | | | | | | | |
Principal Amount | | | Long-Term Fixed Income (90.5%) | | Value | |
| Consumer Non-Cyclical (7.9%) - continued | |
| | | | McKesson Corporation | | | | |
| | $1,450,000 | | | 4.883%, 3/15/2044 | | | $1,536,632 | |
| | | | Mondelez International, Inc. | | | | |
| | 2,910,000 | | | 4.000%, 2/1/2024 | | | 3,003,216 | |
| | | | Pernod Ricard SA | | | | |
| | 2,870,000 | | | 5.750%, 4/7/2021g | | | 3,283,696 | |
| | 1,090,000 | | | 4.450%, 1/15/2022g | | | 1,158,164 | |
| | | | Roche Holdings, Inc. | | | | |
| | 1,300,000 | | | 2.875%, 9/29/2021g | | | 1,312,095 | |
| | | | SABMiller Holdings, Inc. | | | | |
| | 2,960,000 | | | 3.750%, 1/15/2022g | | | 3,057,058 | |
| | | | Spectrum Brands Escrow Corporation | | | | |
| | 840,000 | | | 6.375%, 11/15/2020 | | | 890,400 | |
| | | | Tenet Healthcare Corporation | | | | |
| | 1,090,000 | | | 8.125%, 4/1/2022 | | | 1,249,413 | |
| | | | Thermo Fisher Scientific, Inc. | | | | |
| | 1,830,000 | | | 4.150%, 2/1/2024 | | | 1,915,772 | |
| | 370,000 | | | 5.300%, 2/1/2044 | | | 416,837 | |
| | | | Tyson Foods, Inc. | | | | |
| | 1,810,000 | | | 4.500%, 6/15/2022 | | | 1,936,890 | |
| | 540,000 | | | 3.950%, 8/15/2024 | | | 550,749 | |
| | | | Valeant Pharmaceuticals International | | | | |
| | 1,440,000 | | | 6.375%, 10/15/2020g | | | 1,477,800 | |
| | | | Watson Pharmaceuticals, Inc. | | | | |
| | 1,820,000 | | | 3.250%, 10/1/2022 | | | 1,748,549 | |
| | | | Whirlpool Corporation | | | | |
| | 1,873,000 | | | 3.700%, 3/1/2023 | | | 1,896,405 | |
| | 1,510,000 | | | 3.700%, 5/1/2025 | | | 1,503,516 | |
| | | | Zoetis, Inc. | | | | |
| | 1,810,000 | | | 3.250%, 2/1/2023 | | | 1,793,151 | |
| | | | | |
| | | | Total | | | 66,431,639 | |
| | | | | |
| |
| Energy (8.3%) | | | | |
| | | | Anadarko Petroleum Corporation | | | | |
| | 1,450,000 | | | 3.450%, 7/15/2024 | | | 1,429,361 | |
| | 1,810,000 | | | 6.450%, 9/15/2036 | | | 2,233,891 | |
| | | | Buckeye Partners, LP | | | | |
| | 1,090,000 | | | 4.150%, 7/1/2023 | | | 1,095,381 | |
| | 1,820,000 | | | 5.850%, 11/15/2043 | | | 1,863,296 | |
| | | | Calumet Specialty Products Partners, LP | | | | |
| | 1,090,000 | | | 6.500%, 4/15/2021g | | | 1,057,300 | |
| | | | Canadian Oil Sands, Ltd. | | | | |
| | 1,400,000 | | | 4.500%, 4/1/2022g | | | 1,483,104 | |
| | | | Chaparral Energy, Inc. | | | | |
| | 1,080,000 | | | 7.625%, 11/15/2022 | | | 1,053,000 | |
| | | | CNOOC Finance 2013, Ltd. | | | | |
| | 1,800,000 | | | 3.000%, 5/9/2023 | | | 1,707,460 | |
| | | | Concho Resources, Inc. | | | | |
| | 1,070,000 | | | 6.500%, 1/15/2022 | | | 1,155,600 | |
| | | | Continental Resources, Inc. | | | | |
| | 2,170,000 | | | 3.800%, 6/1/2024 | | | 2,144,220 | |
| | | | El Paso Pipeline Partners Operating Company, LLC | | | | |
| | 2,150,000 | | | 5.000%, 10/1/2021 | | | 2,294,985 | |
| | 2,200,000 | | | 4.300%, 5/1/2024 | | | 2,202,750 | |
| | | | Enbridge Energy Partners, LP | | | | |
| | 1,094,000 | | | 5.200%, 3/15/2020 | | | 1,218,718 | |
| | | | Energy Transfer Partners, LP | | | | |
| | 1,645,000 | | | 6.700%, 7/1/2018 | | | 1,887,434 | |
| | | | Energy XXI Gulf Coast, Inc. | | | | |
| | 900,000 | | | 6.875%, 3/15/2024g,h | | | 711,000 | |
| | | | Ensco plc | | | | |
| | 1,300,000 | | | 4.500%, 10/1/2024 | | | 1,316,558 | |
| | | | EQT Midstream Partners, LP | | | | |
| | 1,720,000 | | | 4.000%, 8/1/2024 | | | 1,711,691 | |
| | | | Hess Corporation | | | | |
| | 1,480,000 | | | 5.600%, 2/15/2041 | | | 1,677,145 | |
| | | | Key Energy Services, Inc. | | | | |
| | 1,175,000 | | | 6.750%, 3/1/2021 | | | 1,045,750 | |
| | | | Kinder Morgan Energy Partners, LP | | | | |
| | 900,000 | | | 3.450%, 2/15/2023 | | | 864,761 | |
| | | | Linn Energy, LLC | | | | |
| | 1,030,000 | | | 7.750%, 2/1/2021 | | | 1,009,400 | |
| | | | Marathon Oil Corporation | | | | |
| | 1,273,000 | | | 5.900%, 3/15/2018 | | | 1,437,622 | |
| | 1,080,000 | | | 2.800%, 11/1/2022 | | | 1,050,505 | |
| | | | Marathon Petroleum Corporation | | | | |
| | 560,000 | | | 3.625%, 9/15/2024 | | | 557,908 | |
| | 1,080,000 | | | 6.500%, 3/1/2041 | | | 1,306,479 | |
| | | | Nexen, Inc. | | | | |
| | 1,080,000 | | | 6.400%, 5/15/2037 | | | 1,345,545 | |
| | | | Noble Holding International, Ltd. | | | | |
| | 1,440,000 | | | 3.950%, 3/15/2022h | | | 1,389,030 | |
| | | | Offshore Group Investment, Ltd. | | | | |
| | 900,000 | | | 7.500%, 11/1/2019h | | | 767,250 | |
| | | | Petroleos Mexicanos | | | | |
| | 1,110,000 | | | 4.250%, 1/15/2025g | | | 1,123,653 | |
| | | | Pioneer Natural Resources Company | | | | |
| | 1,850,000 | | | 3.950%, 7/15/2022 | | | 1,864,852 | |
| | | | Plains All American Pipeline, LP | | | | |
| | 1,860,000 | | | 3.600%, 11/1/2024 | | | 1,849,030 | |
| | | | Regency Energy Partners, LP | | | | |
| | 360,000 | | | 5.000%, 10/1/2022 | | | 367,200 | |
| | | | Rosetta Resources, Inc. | | | | |
| | 1,080,000 | | | 5.875%, 6/1/2022 | | | 1,036,800 | |
| | | | Rowan Companies, Inc. | | | | |
| | 1,175,000 | | | 4.875%, 6/1/2022 | | | 1,205,940 | |
| | 1,080,000 | | | 4.750%, 1/15/2024 | | | 1,075,561 | |
| | | | Sabine Pass Liquefaction, LLC | | | | |
| | 1,090,000 | | | 5.750%, 5/15/2024g | | | 1,126,788 | |
| | | | Spectra Energy Partners, LP | | | | |
| | 1,800,000 | | | 4.600%, 6/15/2021 | | | 1,969,243 | |
| | | | Suncor Energy, Inc. | | | | |
| | 1,090,000 | | | 6.100%, 6/1/2018 | | | 1,250,275 | |
| | 1,060,000 | | | 6.850%, 6/1/2039 | | | 1,437,694 | |
| | | | Sunoco Logistics Partners Operations, LP | | | | |
| | 1,800,000 | | | 3.450%, 1/15/2023 | | | 1,767,132 | |
| | | | Tesoro Logistics, LP | | | | |
| | 1,120,000 | | | 5.500%, 10/15/2019g | | | 1,150,800 | |
| | | | Transocean, Inc. | | | | |
| | 1,080,000 | | | 7.375%, 4/15/2018 | | | 1,200,625 | |
| | 720,000 | | | 6.375%, 12/15/2021 | | | 756,617 | |
| | 1,450,000 | | | 3.800%, 10/15/2022h | | | 1,305,616 | |
| | | | Weatherford International, Ltd. | | | | |
| | 2,500,000 | | | 6.000%, 3/15/2018 | | | 2,816,493 | |
The accompanying Notes to Financial Statements are an integral part of this schedule.
221
INCOME FUND
Schedule of Investments as of October 31, 2014
| | | | | | | | |
Principal Amount | | | Long-Term Fixed Income (90.5%) | | Value | |
| Energy (8.3%) - continued | | | | |
| | | | Williams Companies, Inc. | | | | |
| | $1,440,000 | | | 3.700%, 1/15/2023 | | | $1,354,633 | |
| | 1,450,000 | | | 4.550%, 6/24/2024 | | | 1,420,582 | |
| | | | Williams Partners, LP | | | | |
| | 1,450,000 | | | 4.000%, 11/15/2021 | | | 1,509,040 | |
| | 2,190,000 | | | 4.500%, 11/15/2023 | | | 2,301,092 | |
| | 900,000 | | | 3.900%, 1/15/2025 | | | 892,849 | |
| | | | | |
| | | | Total | | | 69,799,659 | |
| | | | | |
| |
| Financials (29.0%) | | | | |
| | | | Abbey National Treasury Services plc | | | | |
| | 1,650,000 | | | 3.050%, 8/23/2018 | | | 1,716,224 | |
| | | | Aegon NV | | | | |
| | 1,400,000 | | | 2.549%, 7/29/2049e,i | | | 1,211,700 | |
| | | | Air Lease Corporation | | | | |
| | 740,000 | | | 2.125%, 1/15/2018 | | | 731,675 | |
| | 740,000 | | | 4.250%, 9/15/2024 | | | 741,850 | |
| | | | American International Group, Inc. | | | | |
| | 2,555,000 | | | 3.375%, 8/15/2020 | | | 2,650,979 | |
| | 2,075,000 | | | 4.125%, 2/15/2024 | | | 2,185,319 | |
| | | | American Tower Trust I | | | | |
| | 1,800,000 | | | 1.551%, 3/15/2018* | | | 1,787,299 | |
| | | | Ares Capital Corporation | | | | |
| | 1,810,000 | | | 4.875%, 11/30/2018 | | | 1,906,498 | |
| | | | Associated Banc Corporation | | | | |
| | 1,820,000 | | | 5.125%, 3/28/2016 | | | 1,916,884 | |
| | | | Associates Corporation of North America | | | | |
| | 2,200,000 | | | 6.950%, 11/1/2018 | | | 2,582,393 | |
| | | | Assured Guaranty US Holdings, Inc. | | | | |
| | 1,800,000 | | | 5.000%, 7/1/2024h | | | 1,873,321 | |
| | | | AXA SA | | | | |
| | 1,420,000 | | | 8.600%, 12/15/2030 | | | 1,911,675 | |
| | | | Axis Specialty Finance, LLC | | | | |
| | 1,430,000 | | | 5.875%, 6/1/2020 | | | 1,627,013 | |
| | | | Banco do Brasil SA | | | | |
| | 1,810,000 | | | 9.000%, 12/31/2049g,i | | | 1,779,230 | |
| | | | Banco Santander Mexico SA Institucion de Banca Multiple Grupo Financiero Santand | | | | |
| | 805,000 | | | 4.125%, 11/9/2022g | | | 815,062 | |
| | | | Bank of America Corporation | | | | |
| | 2,160,000 | | | 1.303%, 3/22/2018e | | | 2,191,041 | |
| | 2,220,000 | | | 7.625%, 6/1/2019 | | | 2,692,727 | |
| | 1,100,000 | | | 4.100%, 7/24/2023 | | | 1,148,346 | |
| | 2,170,000 | | | 4.125%, 1/22/2024 | | | 2,256,852 | |
| | 1,670,000 | | | 4.200%, 8/26/2024 | | | 1,681,959 | |
| | 1,050,000 | | | 5.875%, 2/7/2042 | | | 1,282,847 | |
| | 740,000 | | | 6.500%, 10/23/2049i | | | 760,350 | |
| | | | Barclays Bank plc | | | | |
| | 1,090,000 | | | 10.179%, 6/12/2021g | | | 1,463,512 | |
| | | | Barclays plc | | | | |
| | 1,110,000 | | | 4.375%, 9/11/2024 | | | 1,076,756 | |
| | | | BBVA Bancomer SA/Texas | | | | |
| | 1,965,000 | | | 6.750%, 9/30/2022g | | | 2,225,362 | |
| | | | BPCE SA | | | | |
| | 1,465,000 | | | 5.700%, 10/22/2023g | | | 1,573,205 | |
| | 1,810,000 | | | 5.150%, 7/21/2024g | | | 1,862,841 | |
| | | | Caixa Economica Federal | | | | |
| | 1,810,000 | | | 4.250%, 5/13/2019g | | | 1,825,385 | |
| | | | Camden Property Trust | | | | |
| | 1,860,000 | | | 3.500%, 9/15/2024 | | | 1,843,093 | |
| | | | Capital One Bank USA NA | | | | |
| | 3,075,000 | | | 2.250%, 2/13/2019 | | | 3,063,936 | |
| | | | Capital One Financial Corporation | | | | |
| | 540,000 | | | 2.450%, 4/24/2019 | | | 541,599 | |
| | | | Capital One NA | | | | |
| | 540,000 | | | 2.950%, 7/23/2021 | | | 536,172 | |
| | | | CIT Group, Inc. | | | | |
| | 1,780,000 | | | 5.250%, 3/15/2018 | | | 1,877,900 | |
| | 520,000 | | | 3.875%, 2/19/2019 | | | 523,250 | |
| | | | Citigroup, Inc. | | | | |
| | 2,000,000 | | | 8.500%, 5/22/2019 | | | 2,509,438 | |
| | 2,525,000 | | | 3.500%, 5/15/2023 | | | 2,472,058 | |
| | 2,195,000 | | | 5.500%, 9/13/2025 | | | 2,431,507 | |
| | 1,070,000 | | | 5.950%, 12/29/2049i | | | 1,063,312 | |
| | | | CNA Financial Corporation | | | | |
| | 2,225,000 | | | 7.350%, 11/15/2019 | | | 2,695,699 | |
| | 700,000 | | | 5.875%, 8/15/2020 | | | 804,249 | |
| | | | Comerica, Inc. | | | | |
| | 1,090,000 | | | 3.800%, 7/22/2026 | | | 1,089,961 | |
| | | | Compass Bank | | | | |
| | 925,000 | | | 2.750%, 9/29/2019 | | | 931,715 | |
| | | | Cooperatieve Centrale Raiffeisen-Boerenleenbank BA | | | | |
| | 1,090,000 | | | 5.750%, 12/1/2043 | | | 1,268,369 | |
| | 710,000 | | | 11.000%, 12/29/2049g,i | | | 926,550 | |
| | | | Credit Suisse Group AG | | | | |
| | 1,110,000 | | | 6.500%, 8/8/2023g | | | 1,223,775 | |
| | 740,000 | | | 7.500%, 12/11/2049g,i | | | 786,472 | |
| | | | Developers Diversified Realty Corporation | | | | |
| | 710,000 | | | 7.875%, 9/1/2020 | | | 881,463 | |
| | | | Discover Bank of Greenwood Delaware | | | | |
| | 1,300,000 | | | 7.000%, 4/15/2020 | | | 1,538,688 | |
| | 1,995,000 | | | 4.200%, 8/8/2023 | | | 2,090,271 | |
| | 900,000 | | | 4.250%, 3/13/2026 | | | 934,514 | |
| | | | Duke Realty, LP | | | | |
| | 1,780,000 | | | 3.875%, 10/15/2022 | | | 1,806,695 | |
| | | | Fairfax Financial Holdings, Ltd. | | | | |
| | 1,085,000 | | | 5.800%, 5/15/2021g | | | 1,171,644 | |
| | | | Fifth Third Bancorp | | | | |
| | 2,175,000 | | | 4.300%, 1/16/2024 | | | 2,263,170 | |
| | | | GE Capital Trust I | | | | |
| | 2,500,000 | | | 6.375%, 11/15/2067 | | | 2,674,217 | |
| | | | General Electric Capital Corporation | | | | |
| | 1,775,000 | | | 3.800%, 6/18/2019g | | | 1,886,321 | |
| | 1,800,000 | | | 1.234%, 3/15/2023e | | | 1,818,686 | |
| | 925,000 | | | 6.750%, 3/15/2032 | | | 1,229,970 | |
| | 1,800,000 | | | 7.125%, 12/15/2049i | | | 2,097,000 | |
| | | | Goldman Sachs Group, Inc. | | | | |
| | 1,750,000 | | | 6.250%, 9/1/2017 | | | 1,961,580 | |
| | 1,830,000 | | | 2.900%, 7/19/2018 | | | 1,871,973 | |
| | 1,600,000 | | | 5.375%, 3/15/2020 | | | 1,794,104 | |
| | 1,750,000 | | | 5.250%, 7/27/2021 | | | 1,950,947 | |
| | 1,810,000 | | | 4.000%, 3/3/2024 | | | 1,849,572 | |
| | 2,550,000 | | | 3.850%, 7/8/2024 | | | 2,576,145 | |
| | 740,0 00 | | | 6.750%, 10/1/2037 | | | 907,221 | |
| | | | Hartford Financial Services Group, Inc. | | | | |
| | 2,520,000 | | | 5.125%, 4/15/2022 | | | 2,816,045 | |
The accompanying Notes to Financial Statements are an integral part of this schedule.
222
INCOME FUND
Schedule of Investments as of October 31, 2014
| | | | | | | | |
Principal Amount | | | Long-Term Fixed Income (90.5%) | | Value | |
| Financials (29.0%) - continued | |
| | | | HCP, Inc. | | | | |
| | $1,250,000 | | | 2.625%, 2/1/2020 | | | $1,240,671 | |
| | 1,445,000 | | | 4.200%, 3/1/2024 | | | 1,476,741 | |
| | | | Health Care REIT, Inc. | | | | |
| | 720,000 | | | 6.125%, 4/15/2020 | | | 833,852 | |
| | 1,850,000 | | | 4.950%, 1/15/2021 | | | 2,030,540 | |
| | | | HSBC Finance Corporation | | | | |
| | 1,790,000 | | | 6.676%, 1/15/2021 | | | 2,109,485 | |
| | | | HSBC Holdings plc | | | | |
| | 1,800,000 | | | 4.875%, 1/14/2022 | | | 2,013,095 | |
| | 1,120,000 | | | 6.375%, 12/29/2049i | | | 1,142,400 | |
| | | | HSBC USA, Inc. | | | | |
| | 1,100,000 | | | 5.000%, 9/27/2020 | | | 1,205,030 | |
| | | | Huntington Bancshares, Inc. | | | | |
| | 1,650,000 | | | 7.000%, 12/15/2020 | | | 1,981,396 | |
| | | | Icahn Enterprises, LP | | | | |
| | 1,460,000 | | | 6.000%, 8/1/2020 | | | 1,533,000 | |
| | | | ILFC E-Capital Trust II | | | | |
| | 1,270,000 | | | 6.250%, 12/21/2065e,g | | | 1,228,725 | |
| | | | ING Bank NV | | | | |
| | 1,835,000 | | | 5.800%, 9/25/2023g | | | 2,042,212 | |
| | | | International Lease Finance Corporation | | | | |
| | 1,050,000 | | | 4.875%, 4/1/2015 | | | 1,062,311 | |
| | 900,000 | | | 5.750%, 5/15/2016 | | | 938,250 | |
| | 1,000,000 | | | 6.750%, 9/1/2016g | | | 1,060,000 | |
| | | | Intesa Sanpaolo SPA | | | | |
| | 1,450,000 | | | 5.017%, 6/26/2024g | | | 1,417,105 | |
| | | | J.P. Morgan Chase & Company | | | | |
| | 2,000,000 | | | 1.134%, 1/25/2018e | | | 2,025,754 | |
| | 1,800,000 | | | 3.375%, 5/1/2023 | | | 1,757,718 | |
| | 1,670,000 | | | 3.875%, 9/10/2024 | | | 1,659,133 | |
| | 1,850,000 | | | 5.500%, 10/15/2040 | | | 2,156,438 | |
| | 1,450,000 | | | 6.750%, 8/29/2049i | | | 1,527,720 | |
| | 1,440,000 | | | 6.000%, 12/29/2049i | | | 1,427,400 | |
| | | | J.P. Morgan Chase Bank NA | | | | |
| | 1,420,000 | | | 6.000%, 10/1/2017 | | | 1,590,281 | |
| | | | Kilroy Realty, LP | | | | |
| | 1,810,000 | | | 4.250%, 8/15/2029 | | | 1,803,991 | |
| | | | Liberty Mutual Group, Inc. | | | | |
| | 1,965,000 | | | 4.950%, 5/1/2022g | | | 2,129,734 | |
| | 1,810,000 | | | 4.850%, 8/1/2044g | | | 1,812,561 | |
| | | | Liberty Property, LP | | | | |
| | 1,125,000 | | | 4.750%, 10/1/2020 | | | 1,215,259 | |
| | | | Lincoln National Corporation | | | | |
| | 2,350,000 | | | 4.000%, 9/1/2023 | | | 2,433,025 | |
| | | | Lloyds Banking Group plc | | | | |
| | 560,000 | | | 4.500%, 11/4/2024c | | | 560,450 | |
| | 1,450,000 | | | 5.920%, 9/29/2049g,i | | | 1,450,000 | |
| | | | Macquarie Bank, Ltd. | | | | |
| | 1,785,000 | | | 1.650%, 3/24/2017g | | | 1,789,430 | |
| | | | Merrill Lynch & Company, Inc. | | | | |
| | 1,950,000 | | | 6.875%, 4/25/2018 | | | 2,255,705 | |
| | 2,000,000 | | | 7.750%, 5/14/2038 | | | 2,766,018 | |
| | | | MetLife Capital Trust IV | | | | |
| | 300,000 | | | 7.875%, 12/15/2037g | | | 383,250 | |
| | | | MetLife Capital Trust X | | | | |
| | 750,000 | | | 9.250%, 4/8/2038g | | | 1,072,500 | |
| | | | MetLife, Inc. | | | | |
| | 2,750,000 | | | 3.600%, 4/10/2024 | | | 2,802,935 | |
| | | | Mizuho Bank, Ltd. | | | | |
| | 2,600,000 | | | 3.600%, 9/25/2024g | | | 2,615,028 | |
| | | | Morgan Stanley | | | | |
| | 2,270,000 | | | 6.625%, 4/1/2018 | | | 2,599,504 | |
| | 1,805,000 | | | 2.125%, 4/25/2018 | | | 1,810,000 | |
| | 1,820,000 | | | 5.625%, 9/23/2019 | | | 2,061,649 | |
| | 1,600,000 | | | 5.500%, 1/26/2020 | | | 1,803,698 | |
| | 1,795,000 | | | 4.875%, 11/1/2022 | | | 1,911,609 | |
| | 740,000 | | | 3.700%, 10/23/2024 | | | 738,468 | |
| | 1,450,000 | | | 5.000%, 11/24/2025 | | | 1,541,151 | |
| | 1,490,000 | | | 4.350%, 9/8/2026 | | | 1,494,045 | |
| | | | National Retail Properties, Inc. | | | | |
| | 1,800,000 | | | 3.900%, 6/15/2024 | | | 1,819,010 | |
| | | | Nomura Holdings, Inc. | | | | |
| | 1,810,000 | | | 2.750%, 3/19/2019 | | | 1,829,662 | |
| | | | Nordea Bank AB | | | | |
| | 1,830,000 | | | 4.875%, 5/13/2021g | | | 1,981,140 | |
| | 1,110,000 | | | 5.500%, 9/29/2049g,h,i | | | 1,121,100 | |
| | | | Omega Healthcare Investors, Inc. | | | | |
| | 1,640,000 | | | 5.875%, 3/15/2024 | | | 1,763,000 | |
| | | | ORIX Corporation | | | | |
| | 2,550,000 | | | 5.000%, 1/12/2016 | | | 2,661,955 | |
| | | | Preferred Term Securities XXIII, Ltd. | | | | |
| | 2,089,986 | | | 0.434%, 12/22/2036*,e | | | 1,564,877 | |
| | | | ProLogis, LP | | | | |
| | 1,800,000 | | | 6.875%, 3/15/2020 | | | 2,122,936 | |
| | | | Prudential Financial, Inc. | | | | |
| | 1,085,000 | | | 3.500%, 5/15/2024 | | | 1,089,371 | |
| | 825,000 | | | 6.200%, 11/15/2040 | | | 1,018,237 | |
| | 1,070,000 | | | 5.875%, 9/15/2042 | | | 1,134,200 | |
| | | | RBS Capital Trust III | | | | |
| | 1,260,000 | | | 2.073%, 9/29/2049e,h,i | | | 1,234,800 | |
| | | | Realty Income Corporation | | | | |
| | 2,170,000 | | | 3.875%, 7/15/2024 | | | 2,179,342 | |
| | | | Regions Bank | | | | |
| | 1,090,000 | | | 7.500%, 5/15/2018 | | | 1,277,008 | |
| | | | Reinsurance Group of America, Inc. | | | | |
| | 1,070,000 | | | 6.450%, 11/15/2019 | | | 1,256,307 | |
| | 2,185,000 | | | 4.700%, 9/15/2023 | | | 2,348,720 | |
| | | | Royal Bank Of Scotland plc | | | | |
| | 1,480,000 | | | 6.000%, 12/19/2023 | | | 1,592,880 | |
| | | | Santander UK plc | | | | |
| | 540,000 | | | 5.000%, 11/7/2023g | | | 572,384 | |
| | | | Simon Property Group, LP | | | | |
| | 750,000 | | | 10.350%, 4/1/2019 | | | 992,773 | |
| | 2,825,000 | | | 2.750%, 2/1/2023 | | | 2,747,507 | |
| | | | SLM Corporation | | | | |
| | 1,370,000 | | | 6.250%, 1/25/2016 | | | 1,424,800 | |
| | 2,485,000 | | | 6.000%, 1/25/2017 | | | 2,621,675 | |
| | 576,000 | | | 4.625%, 9/25/2017 | | | 586,080 | |
| | | | Societe Generale SA | | | | |
| | 1,080,000 | | | 7.875%, 12/31/2049g,h,i | | | 1,080,000 | |
| | | | Sumitomo Mitsui Financial Group, Inc. | | | | |
| | 1,990,000 | | | 4.436%, 4/2/2024g | | | 2,071,688 | |
| | | | Swiss RE Capital I, LP | | | | |
| | 2,600,000 | | | 6.854%, 5/29/2049g,i | | | 2,730,000 | |
| | | | Synchrony Financial | | | | |
| | 1,150,000 | | | 3.750%, 8/15/2021 | | | 1,172,463 | |
| | 740,000 | | | 4.250%, 8/15/2024 | | | 752,177 | |
The accompanying Notes to Financial Statements are an integral part of this schedule.
223
INCOME FUND
Schedule of Investments as of October 31, 2014
| | | | | | | | |
Principal Amount | | | Long-Term Fixed Income (90.5%) | | Value | |
| Financials (29.0%) - continued | | | | |
| | | | UnionBanCal Corporation | | | | |
| | $1,420,000 | | | 3.500%, 6/18/2022 | | | $1,455,345 | |
| | | | Voya Financial, Inc. | | | | |
| | 990,000 | | | 2.900%, 2/15/2018 | | | 1,017,842 | |
| | 1,785,000 | | | 5.500%, 7/15/2022 | | | 2,012,355 | |
| | | | WEA Finance, LLC | | | | |
| | 2,230,000 | | | 2.700%, 9/17/2019g | | | 2,244,600 | |
| | | | Wells Fargo & Company | | | | |
| | 1,715,000 | | | 3.450%, 2/13/2023 | | | 1,712,498 | |
| | 1,090,000 | | | 4.100%, 6/3/2026 | | | 1,105,561 | |
| | 1,780,000 | | | 7.980%, 2/28/2049i | | | 1,961,893 | |
| | | | XLIT, Ltd. | | | | |
| | 1,810,000 | | | 5.250%, 12/15/2043 | | | 1,978,987 | |
| | | | | |
| | | | Total | | | 242,932,026 | |
| | | | | |
| |
| Foreign Government (1.2%) | | | | |
| | | | Brazil Government International Bond | | | | |
| | 730,000 | | | 5.000%, 1/27/2045 | | | 715,400 | |
| | | | Colombia Government International Bond | | | | |
| | 1,800,000 | | | 5.625%, 2/26/2044h | | | 2,009,891 | |
| | | | Corporacion Andina de Fomento | | | | |
| | 1,226,000 | | | 4.375%, 6/15/2022 | | | 1,317,490 | |
| | | | Export-Import Bank of Korea | | | | |
| | 1,420,000 | | | 4.375%, 9/15/2021 | | | 1,541,164 | |
| | | | Mexico Government International Bond | | | | |
| | 1,850,000 | | | 5.125%, 1/15/2020 | | | 2,067,375 | |
| | 2,020,000 | | | 4.000%, 10/2/2023 | | | 2,108,880 | |
| | | | | |
| | | | Total | | | 9,760,200 | |
| | | | | |
| |
| Mortgage-Backed Securities (3.2%) | | | | |
| | | | Federal Home Loan Mortgage Corporation Gold 15-Yr. Pass Through | | | | |
| | 1,675,000 | | | 3.000%, 11/1/2029c | | | 1,734,410 | |
| | | | Federal Home Loan Mortgage Corporation Gold 30-Yr. Pass Through | | | | |
| | 1,675,000 | | | 4.000%, 11/1/2044c | | | 1,776,940 | |
| | | | Federal National Mortgage Association Conventional 15-Yr. Pass Through | | | | |
| | 2,000,000 | | | 3.500%, 11/1/2029c | | | 2,113,124 | |
| | | | Federal National Mortgage Association Conventional 30-Yr. Pass Through | | | | |
| | 3,075,000 | | | 3.500%, 11/1/2044c | | | 3,179,741 | |
| | 9,675,000 | | | 4.000%, 11/1/2044c | | | 10,272,129 | |
| | 6,950,000 | | | 4.500%, 11/1/2044c | | | 7,532,063 | |
| | | | | |
| | | | Total | | | 26,608,407 | |
| | | | | |
| |
| Technology (1.4%) | | | | |
| | | | Amkor Technology, Inc. | | | | |
| | 1,090,000 | | | 6.375%, 10/1/2022 | | | 1,091,362 | |
| | | | Fidelity National Information Services, Inc. | | | | |
| | 1,810,000 | | | 3.875%, 6/5/2024 | | | 1,834,830 | |
| | | | Freescale Semiconductor, Inc. | | | | |
| | 1,090,000 | | | 5.000%, 5/15/2021g | | | 1,073,650 | |
| | | | Hewlett-Packard Company | | | | |
| | 1,110,000 | | | 2.750%, 1/14/2019 | | | 1,116,390 | |
| | | | Motorola Solutions, Inc. | | | | |
| | 2,500,000 | | | 3.750%, 5/15/2022 | | | 2,488,635 | |
| | | | Oracle Corporation | | | | |
| | 2,100,000 | | | 2.800%, 7/8/2021 | | | 2,107,319 | |
| | | | Sensata Technologies BV | | | | |
| | 1,110,000 | | | 4.875%, 10/15/2023g | | | 1,096,125 | |
| | | | Xerox Corporation | | | | |
| | 750,000 | | | 6.400%, 3/15/2016 | | | 804,867 | |
| | | | | |
| | | | Total | | | 11,613,178 | |
| | | | | |
| |
| Transportation (2.9%) | | | | |
| | | | American Airlines Pass Through Trust | | | | |
| | 1,360,516 | | | 5.600%, 7/15/2020g | | | 1,392,828 | |
| | 1,366,162 | | | 4.000%, 7/15/2025 | | | 1,381,531 | |
| | | | Avis Budget Car Rental, LLC | | | | |
| | 1,080,000 | | | 5.500%, 4/1/2023 | | | 1,085,400 | |
| | | | British Airways plc | | | | |
| | 2,484,371 | | | 4.625%, 6/20/2024g | | | 2,614,800 | |
| | | | Canadian Pacific Railway Company | | | | |
| | 1,440,000 | | | 7.125%, 10/15/2031 | | | 1,989,808 | |
| | | | Continental Airlines, Inc. | | | | |
| | 540,465 | | | 7.250%, 11/10/2019 | | | 622,886 | |
| | 743,197 | | | 4.000%, 10/29/2024 | | | 750,629 | |
| | | | CSX Corporation | | | | |
| | 1,275,000 | | | 3.700%, 11/1/2023 | | | 1,325,773 | |
| | 1,107,000 | | | 6.220%, 4/30/2040 | | | 1,403,792 | |
| | | | Delta Air Lines, Inc. | | | | |
| | 1,015,142 | | | 4.950%, 5/23/2019 | | | 1,081,126 | |
| | 641,206 | | | 4.750%, 5/7/2020 | | | 682,885 | |
| | | | ERAC USA Finance, LLC | | | | |
| | 2,050,000 | | | 5.250%, 10/1/2020g | | | 2,308,671 | |
| | 1,085,000 | | | 4.500%, 8/16/2021g | | | 1,180,672 | |
| | | | Navios South American Logistics, Inc. | | | | |
| | 175,000 | | | 7.250%, 5/1/2022g | | | 176,313 | |
| | | | Penske Truck Leasing Company, LP | | | | |
| | 1,055,000 | | | 2.500%, 3/15/2016g | | | 1,075,393 | |
| | | | United Airlines Pass Through Trust | | | | |
| | 910,000 | | | 3.750%, 9/3/2026 | | | 911,183 | |
| | | | United Airlines, Inc. | | | | |
| | 1,260,000 | | | 4.000%, 4/11/2026 | | | 1,275,750 | |
| | | | US Airways Pass Through Trust | | | | |
| | 1,800,000 | | | 3.950%, 11/15/2025 | | | 1,822,500 | |
| | | | Virgin Australia Holdings, Ltd. | | | | |
| | 1,467,823 | | | 5.000%, 10/23/2023g | | | 1,517,435 | |
| | | | | |
| | | | Total | | | 24,599,375 | |
| | | | | |
| |
| U.S. Government and Agencies (4.3%) | | | | |
| | | | U.S. Treasury Bonds | | | | |
| | 5,000,000 | | | 2.000%, 5/31/2021 | | | 4,998,045 | |
| | 1,860,000 | | | 3.125%, 2/15/2042 | | | 1,890,515 | |
| | 1,786,000 | | | 3.750%, 11/15/2043 | | | 2,026,272 | |
| | | | U.S. Treasury Bonds, TIPS | | | | |
| | 3,323,342 | | | 0.625%, 1/15/2024 | | | 3,377,346 | |
| | 1,853,163 | | | 0.125%, 7/15/2024 | | | 1,802,202 | |
| | | | U.S. Treasury Notes | | | | |
| | 3,590,000 | | | 2.875%, 3/31/2018 | | | 3,796,145 | |
| | 1,458,000 | | | 1.000%, 5/31/2018 | | | 1,446,724 | |
The accompanying Notes to Financial Statements are an integral part of this schedule.
224
INCOME FUND
Schedule of Investments as of October 31, 2014
| | | | | | | | |
Principal Amount | | | Long-Term Fixed Income (90.5%) | | Value | |
| U.S. Government and Agencies (4.3%) - continued | | | | |
| | $7,000,000 | | | 1.000%, 6/30/2019 | | | $6,821,171 | |
| | 2,840,000 | | | 3.625%, 2/15/2020 | | | 3,117,343 | |
| | 5,000,000 | | | 1.375%, 5/31/2020 | | | 4,888,670 | |
| | | | U.S. Treasury Notes, TIPS | | | | |
| | 1,910,238 | | | 0.625%, 7/15/2021 | | | 1,963,067 | |
| | | | | |
| | | | Total | | | 36,127,500 | |
| | | | | |
| |
| U.S. Municipals (0.2%) | | | | |
| | | | Denver, CO City & County Airport Rev. | | | | |
| | 1,450,000 | | | 5.250%, 11/15/2022, Ser. A, AMT | | | 1,702,460 | |
| | | | | |
| | | | Total | | | 1,702,460 | |
| | | | | |
| |
| Utilities (5.9%) | | | | |
| | | | American Electric Power Company, Inc. | | | | |
| | 1,435,000 | | �� | 2.950%, 12/15/2022 | | | 1,403,496 | |
| | | | Arizona Public Service Company | | | | |
| | 1,620,000 | | | 8.750%, 3/1/2019 | | | 2,057,546 | |
| | | | Atlas Pipeline Partners, LP | | | | |
| | 720,000 | | | 4.750%, 11/15/2021 | | | 718,200 | |
| | | | Calpine Corporation | | | | |
| | 1,080,000 | | | 5.375%, 1/15/2023 | | | 1,090,800 | |
| | | | Cleveland Electric Illuminating Company | | | | |
| | 554,000 | | | 5.700%, 4/1/2017 | | | 603,226 | |
| | | | Commonwealth Edison Company | | | | |
| | 1,000,000 | | | 6.150%, 9/15/2017 | | | 1,131,759 | |
| | | | DCP Midstream Operating, LP | | | | |
| | 1,440,000 | | | 3.875%, 3/15/2023 | | | 1,441,486 | |
| | 1,450,000 | | | 5.600%, 4/1/2044h | | | 1,599,818 | |
| | | | DCP Midstream, LLC | | | | |
| | 1,000,000 | | | 5.850%, 5/21/2043g | | | 987,500 | |
| | | | DPL, Inc. | | | | |
| | 311,000 | | | 6.500%, 10/15/2016 | | | 332,770 | |
| | | | Dynegy Finance I, Inc. | | | | |
| | 280,000 | | | 7.375%, 11/1/2022g | | | 296,100 | |
| | | | El Paso Pipeline Partners Operating Company, LLC | | | | |
| | 720,000 | | | 4.700%, 11/1/2042 | | | 639,100 | |
| | | | Electricite de France SA | | | | |
| | 1,800,000 | | | 5.250%, 12/29/2049g,i | | | 1,867,500 | |
| | | | Energy Transfer Partners, LP | | | | |
| | 1,995,000 | | | 4.650%, 6/1/2021 | | | 2,129,224 | |
| | | | Enterprise Products Operating, LLC | | | | |
| | 1,400,000 | | | 7.034%, 1/15/2068 | | | 1,557,500 | |
| | 1,070,000 | | | 6.650%, 4/15/2018 | | | 1,238,335 | |
| | | | Exelon Generation Company, LLC | | | | |
| | 600,000 | | | 5.200%, 10/1/2019 | | | 671,146 | |
| | 1,500,000 | | | 4.000%, 10/1/2020 | | | 1,585,708 | |
| | | | FirstEnergy Transmission, LLC | | | | |
| | 2,170,000 | | | 4.350%, 1/15/2025g | | | 2,220,073 | |
| | | | ITC Holdings Corporation | | | | |
| | 2,920,000 | | | 4.050%, 7/1/2023 | | | 3,053,386 | |
| | | | Kinder Morgan Energy Partners, LP | | | | |
| | 1,450,000 | | | 5.800%, 3/1/2021 | | | 1,632,356 | |
| | 1,065,000 | | | 5.000%, 8/15/2042 | | | 989,479 | |
| | | | MidAmerican Energy Holdings Company | | | | |
| | 2,550,000 | | | 3.750%, 11/15/2023 | | | 2,640,971 | |
| | | | Nevada Power Company | | | | |
| | 1,700,000 | | | 6.750%, 7/1/2037 | | | 2,338,622 | |
| | | | NiSource Finance Corporation | | | | |
| | 1,700,000 | | | 6.400%, 3/15/2018 | | | 1,943,202 | |
| | 1,800,000 | | | 5.450%, 9/15/2020 | | | 2,053,660 | |
| | | | Ohio Power Company | | | | |
| | 1,600,000 | | | 6.050%, 5/1/2018 | | | 1,821,461 | |
| | | | ONEOK Partners, LP | | | | |
| | 365,000 | | | 3.200%, 9/15/2018 | | | 377,630 | |
| | | | Pennsylvania Electric Company | | | | |
| | 2,300,000 | | | 5.200%, 4/1/2020 | | | 2,558,393 | |
| | | | PPL Capital Funding, Inc. | | | | |
| | 1,795,000 | | | 3.500%, 12/1/2022 | | | 1,813,883 | |
| | 1,810,000 | | | 3.950%, 3/15/2024 | | | 1,880,355 | |
| | | | PSEG Power, LLC | | | | |
| | 700,000 | | | 5.320%, 9/15/2016 | | | 754,595 | |
| | | | Southern California Edison Company | | | | |
| | 1,415,000 | | | 6.250%, 8/1/2049i | | | 1,557,680 | |
| | | | | |
| | | | Total | | | 48,986,960 | |
| | | | | |
| | | | | | | | |
| | | | | |
| | | | Total Long-Term Fixed Income (cost $730,472,487) | | | 758,563,551 | |
| | | | | |
| | |
| Shares | | | Preferred Stock (2.0%) | | Value | |
| Financials (1.9%) | | | | |
| | 44,925 | | | Allstate Corporation, 5.100% | | | 1,104,256 | |
| | 35,500 | | | Annaly Capital Management, Inc., 7.500%i | | | 871,880 | |
| | 57,878 | | | Citigroup, Inc., 7.875% | | | 1,540,712 | |
| | 12,500 | | | Cobank ACB, 6.250%g,i | | | 1,300,391 | |
| | 18,075 | | | Countrywide Capital V, 7.000% | | | 462,359 | |
| | 36,000 | | | DDR Corporation, 6.250%i | | | 898,920 | |
| | 72,000 | | | Discover Financial Services, 6.500%i | | | 1,848,240 | |
| | 46,410 | | | GMAC Capital Trust I, 8.125% | | | 1,240,539 | |
| | 54,060 | | | Goldman Sachs Group, Inc., 5.500%i | | | 1,293,656 | |
| | 57,878 | | | HSBC USA, Inc., 6.500%i | | | 1,474,153 | |
| | 51,800 | | | Morgan Stanley, 7.125%i | | | 1,412,068 | |
| | 36,389 | | | RBS Capital Funding Trust VII, 6.080%i | | | 880,250 | |
| | 58,500 | | | Wells Fargo & Company, 5.850%i | | | 1,518,660 | |
| | | | | |
| | | | Total | | | 15,846,084 | |
| | | | | |
| |
| Materials (0.1%) | | | | |
| | 43,424 | | | CHS, Inc., 7.100%i | | | 1,166,369 | |
| | | | | |
| | | | Total | | | 1,166,369 | |
| | | | | |
| | | | | | | | |
| | | | | |
| | | | Total Preferred Stock (cost $16,730,081) | | | 17,012,453 | |
| | | | | |
| | |
| Shares | | | Collateral Held for Securities Loaned (1.7%) | | Value | |
| | 14,386,483 | | | Thrivent Cash Management Trust | | | 14,386,483 | |
| | | | | |
| | | | Total Collateral Held for Securities Loaned (cost $14,386,483) | | | 14,386,483 | |
| | | | | |
| | |
Shares or
Principal
Amount | | | Short-Term Investments (6.1%)j | | Value | |
| | | | Federal Home Loan Bank Discount Notes | | | | |
| | 200,000 | | | 0.090%, 4/24/2015k | | | 199,913 | |
The accompanying Notes to Financial Statements are an integral part of this schedule.
225
INCOME FUND
Schedule of Investments as of October 31, 2014
| | | | | | | | |
Shares or
Principal
Amount | | | Short-Term Investments (6.1%)j | | Value | |
| | 50,878,788 | | | Thrivent Cash Management Trust 0.050% | | | $50,878,788 | |
| | | | | |
| | | | Total Short-Term Investments (at amortized cost) | | | 51,078,701 | |
| | | | | |
| | | | Total Investments (cost $846,677,264) 104.3% | | | $874,538,409 | |
| | | | | |
| | | | Other Assets and Liabilities, Net (4.3%) | | | (35,865,110 | ) |
| | | | | |
| | | | Total Net Assets 100.0% | | | $838,673,299 | |
| | | | | |
a | The stated interest rate represents the weighted average of all contracts within the bank loan facility. |
b | All or a portion of the loan is unfunded. |
c | Denotes investments purchased on a when-issued or delayed delivery basis. |
d | All or a portion of the security is insured or guaranteed. |
e | Denotes variable rate securities. Variable rate securities are securities whose yields vary with a designated market index or market rate. The rate shown is as of October 31, 2014. |
f | Denotes step coupon securities. Step coupon securities pay an initial coupon rate for the first period and then different coupon rates for following periods. The rate shown is as of October 31, 2014. |
g | Denotes securities sold under Rule 144A of the Securities Act of 1933, which exempts them from registration. These securities have been deemed liquid and may be resold to other dealers in the program or to other qualified institutional buyers. As of October 31, 2014, the value of these investments was $133,484,666 or 15.9% of total net assets. |
h | All or a portion of the security is on loan. |
i | Denotes perpetual securities. Perpetual securities pay an indefinite stream of interest, but may be called by the issuer at an earlier date. |
j | The interest rate shown reflects the yield, coupon rate or the discount rate at the date of purchase. |
k | At October 31, 2014, $199,913 of investments were held on deposit with the counterparty and pledged as the initial margin deposit for open futures contracts. |
* | Denotes restricted securities. Restricted securities are investment securities which have been deemed illiquid and cannot be offered for public sale without first being registered under the Securities Act of 1933. The following table indicates the acquisition date and cost of restricted securities Income Fund owned as of October 31, 2014. |
| | | | | | | | |
Security | | Acquisition
Date | | | Cost | |
American Tower Trust I, 3/15/2018 | | | 3/6/2013 | | | | $1,800,449 | |
Preferred Term Securities XXIII, Ltd., 12/22/2036 | | | 9/14/2006 | | | | 2,089,986 | |
Vericrest Opportunity Loan Transferee, 11/25/2053 | | | 12/18/2013 | | | | 910,876 | |
Definitions:
| | | | |
| AMT | | - Subject to Alternative Minimum Tax |
| REIT | | - Real Estate Investment Trust is a company that buys, develops, manages and/or sells real estate assets. |
| Rev. | | - Revenue |
| Ser. | | - Series |
| TIPS | | - Treasury Inflation Protected Security. |
Unrealized Appreciation (Depreciation)
Gross unrealized appreciation and depreciation of investments, based on cost for federal income tax purposes, were as follows:
| | | | |
Gross unrealized appreciation | | | $34,448,247 | |
Gross unrealized depreciation | | | (6,659,272 | ) |
| | | | |
Net unrealized appreciation (depreciation) | | | $27,788,975 | |
| |
Cost for federal income tax purposes | | | $846,749,434 | |
The accompanying Notes to Financial Statements are an integral part of this schedule.
226
INCOME FUND
Schedule of Investments as of October 31, 2014
Fair Valuation Measurements
The following table is a summary of the inputs used, as of October 31, 2014, in valuing Income Fund’s assets carried at fair value.
| | | | | | | | | | | | | | | | |
Investments in Securities | | Total | | | Level 1 | | | Level 2 | | | Level 3 | |
| | | | |
Bank Loans | | | | | | | | | | | | | | | | |
Basic Materials | | | 2,151,075 | | | | – | | | | 2,151,075 | | | | – | |
Capital Goods | | | 1,731,688 | | | | – | | | | 1,731,688 | | | | – | |
Communications Services | | | 11,478,370 | | | | – | | | | 11,478,370 | | | | – | |
Consumer Cyclical | | | 3,564,636 | | | | – | | | | 3,564,636 | | | | – | |
Consumer Non-Cyclical | | | 4,027,049 | | | | – | | | | 4,027,049 | | | | – | |
Energy | | | 1,529,138 | | | | – | | | | 1,529,138 | | | | – | |
Financials | | | 875,036 | | | | – | | | | 875,036 | | | | – | |
Technology | | | 3,723,727 | | | | – | | | | 3,723,727 | | | | – | |
Transportation | | | 2,245,529 | | | | – | | | | 1,349,521 | | | | 896,008 | |
Utilities | | | 2,170,973 | | | | – | | | | 2,170,973 | | | | – | |
Long-Term Fixed Income | | | | | | | | | | | | | | | | |
Asset-Backed Securities | | | 8,973,611 | | | | – | | | | 8,973,611 | | | | – | |
Basic Materials | | | 38,621,050 | | | | – | | | | 38,621,050 | | | | – | |
Capital Goods | | | 14,888,536 | | | | – | | | | 14,888,536 | | | | – | |
Collateralized Mortgage Obligations | | | 7,504,638 | | | | – | | | | 7,504,638 | | | | – | |
Commercial Mortgage-Backed Securities | | | 5,667,959 | | | | – | | | | 5,667,959 | | | | – | |
Communications Services | | | 99,214,616 | | | | – | | | | 99,214,616 | | | | – | |
Consumer Cyclical | | | 45,131,737 | | | | – | | | | 45,131,737 | | | | – | |
Consumer Non-Cyclical | | | 66,431,639 | | | | – | | | | 66,431,639 | | | | – | |
Energy | | | 69,799,659 | | | | – | | | | 69,799,659 | | | | – | |
Financials | | | 242,932,026 | | | | – | | | | 241,367,149 | | | | 1,564,877 | |
Foreign Government | | | 9,760,200 | | | | – | | | | 9,760,200 | | | | – | |
Mortgage-Backed Securities | | | 26,608,407 | | | | – | | | | 26,608,407 | | | | – | |
Technology | | | 11,613,178 | | | | – | | | | 11,613,178 | | | | – | |
Transportation | | | 24,599,375 | | | | – | | | | 24,599,375 | | | | – | |
U.S. Government and Agencies | | | 36,127,500 | | | | – | | | | 36,127,500 | | | | – | |
U.S. Municipals | | | 1,702,460 | | | | – | | | | 1,702,460 | | | | – | |
Utilities | | | 48,986,960 | | | | – | | | | 48,986,960 | | | | – | |
| | | | |
Preferred Stock | | | | | | | | | | | | | | | | |
Financials | | | 15,846,084 | | | | 14,545,693 | | | | 1,300,391 | | | | – | |
Materials | | | 1,166,369 | | | | 1,166,369 | | | | – | | | | – | |
Collateral Held for Securities Loaned | | | 14,386,483 | | | | 14,386,483 | | | | – | | | | – | |
Short-Term Investments | | | 51,078,701 | | | | 50,878,788 | | | | 199,913 | | | | – | |
| |
Total | | | $874,538,409 | | | | $80,977,333 | | | | $791,100,191 | | | | $2,460,885 | |
| |
| | | | |
Other Financial Instruments | | Total | | | Level 1 | | | Level 2 | | | Level 3 | |
| | | | |
Asset Derivatives | | | | | | | | | | | | | | | | |
Futures Contracts | | | 648,590 | | | | 648,590 | | | | – | | | | – | |
| |
Total Asset Derivatives | | | $648,590 | | | | $648,590 | | | | $– | | | | $– | |
| |
| | | | |
Liability Derivatives | | | | | | | | | | | | | | | | |
Futures Contracts | | | 775,154 | | | | 775,154 | | | | – | | | | – | |
| |
Total Liability Derivatives | | | $775,154 | | | | $775,154 | | | | $– | | | | $– | |
| |
There were no significant transfers between Levels during the period ended October 31, 2014. Transfers between Levels are identified as of the end of the period.
| | | | | | | | | | | | | | | | | | | | |
Futures Contracts | | Number of
Contracts
Long/(Short) | | | Expiration
Date | | | Notional
Principal
Amount | | | Value | | | Unrealized
Gain/(Loss) | |
5-Yr. U.S. Treasury Bond Futures | | | (335 | ) | | | December 2014 | | | | ($39,720,032 | ) | | | ($40,008,946 | ) | | | ($288,914 | ) |
10-Yr. U.S. Treasury Bond Futures | | | (585 | ) | | | December 2014 | | | | (73,433,997 | ) | | | (73,920,237 | ) | | | (486,240 | ) |
30-Yr. U.S. Treasury Bond Futures | | | 360 | | | | December 2014 | | | | 50,145,160 | | | | 50,793,750 | | | | 648,590 | |
Total Futures Contracts | | | | | | | | | | | | | | | | | | | ($126,564 | ) |
The accompanying Notes to Financial Statements are an integral part of this schedule.
227
INCOME FUND
Schedule of Investments as of October 31, 2014
The following table summarizes the fair value and Statement of Assets and Liabilities location, as of October 31, 2014, for Income Fund’s investments in financial derivative instruments by primary risk exposure as discussed under item (2) Significant Accounting Policies of the Notes to Financial Statements.
| | | | | | |
Derivatives by risk category | | Statement of Assets and Liabilities Location | | Fair Value | |
| | |
Asset Derivatives | | | | | | |
| | |
Interest Rate Contracts | | | | | | |
Futures* | | Net Assets - Net unrealized appreciation/(depreciation) on Futures contracts | | | $648,590 | |
Total Interest Rate Contracts | | | | | 648,590 | |
| |
Total Asset Derivatives | | | | | $648,590 | |
| |
| |
Liability Derivatives | | | | |
| | |
Interest Rate Contracts | | | | | | |
Futures* | | Net Assets - Net unrealized appreciation/(depreciation) on Futures contracts | | | 775,154 | |
Total Interest Rate Contracts | | | | | 775,154 | |
| |
Total Liability Derivatives | | | | | $775,154 | |
| |
* | Includes cumulative appreciation/depreciation of futures contracts as reported in the Schedule of Investments. Only current day’s variation margin is reported within the Statement of Assets and Liabilities. |
The following table summarizes the net realized gains/(losses) and Statement of Operations location, for the period ended October 31, 2014, for Income Fund’s investments in financial derivative instruments by primary risk exposure.
| | | | | | |
Derivatives by risk category | | Statement of Operations Location | | Realized Gains/(Losses)
recognized in Income | |
| | |
Interest Rate Contracts | | | | | | |
Futures | | Net realized gains/(losses) on Futures contracts | | | 610,057 | |
| | |
Total Interest Rate Contracts | | | | | 610,057 | |
| | |
Credit Contracts | | | | | | |
Credit Default Swaps | | Net realized gains/(losses) on Swap agreements | | | (206,281 | ) |
| | |
Total Credit Contracts | | | | | (206,281 | ) |
| |
Total | | | | | $403,776 | |
| |
The following table summarizes the change in net unrealized appreciation/(depreciation) and Statement of Operations location, for the period ended October 31, 2014, for Income Fund’s investments in financial derivative instruments by primary risk exposure.
| | | | | | |
Derivatives by risk category | | Statement of Operations Location | | Change in unrealized
appreciation/(depreciation)
recognized in Income | |
| | |
Interest Rate Contracts | | | | | | |
Futures | | Change in net unrealized appreciation/(depreciation) on Futures contracts | | | 1,160,432 | |
Total Interest Rate Contracts | | | | | 1,160,432 | |
| | |
Credit Contracts | | | | | | |
Credit Default Swaps | | Change in net unrealized appreciation/(depreciation) on Swap agreements | | | (13,918 | ) |
Total Credit Contracts | | | | | (13,918 | ) |
| |
Total | | | | | $1,146,514 | |
| |
The following table presents Income Fund’s average volume of derivative activity during the period ended October 31, 2014.
| | | | | | | | | | |
Derivative Risk Category | | Futures (Notional)* | | | Futures (Percentage of Average Net Assets) | | Swaps (Notional)* | |
Interest Rate Contracts | | | $186,580,329 | | | 22.7% | | | N/A | |
Credit Contracts | | | N/A | | | N/A | | | $322,219 | |
* | Notional amount represents long or short, or both, derivative positions held by the Fund. |
The accompanying Notes to Financial Statements are an integral part of this schedule.
228
INCOME FUND
Schedule of Investments as of October 31, 2014
Investment in Affiliates
Affiliated issuers, as defined under the Investment Company Act of 1940, include those in which the Fund’s holdings of an issuer represent 5% or more of the outstanding voting securities of an issuer, or any affiliated mutual fund.
A summary of transactions for the fiscal year to date, in Income Fund, is as follows:
| | | | | | | | | | | | | | | | | | | | | | | | |
Fund | | Value
October 31, 2013 | | | Gross Purchases | | | Gross Sales | | | Shares Held at
October 31, 2014 | | | Value
October 31, 2014 | | | Income Earned
November 1, 2013 -
October 31, 2014 | |
Cash Management Trust- Collateral Investment | | | $14,088,307 | | | | $84,991,984 | | | | $84,693,808 | | | | 14,386,483 | | | | $14,386,483 | | | | $17,170 | |
Cash Management Trust- Short Term Investment | | | 32,571,966 | | | | 222,234,594 | | | | 203,927,772 | | | | 50,878,788 | | | | 50,878,788 | | | | 21,006 | |
Total Value and Income Earned | | | 46,660,273 | | | | | | | | | | | | | | | | 65,265,271 | | | | 38,176 | |
The accompanying Notes to Financial Statements are an integral part of this schedule.
229
MUNICIPAL BOND FUND
Schedule of Investments as of October 31, 2014
| | | | | | | | |
Principal Amount | | | Long-Term Fixed Income (98.8%) | | Value | |
| Alabama (0.1%) | | | | |
| | | | Alabama Public School and College Auth. Capital Improvement Rev. Refg. | | | | |
| | $1,500,000 | | | 5.000%, 5/1/2029, Ser. Aa | | | $1,762,740 | |
| | | | | |
| | | | Total | | | 1,762,740 | |
| | | | | |
| |
| Arizona (1.0%) | | | | |
| | | | Arizona State Transportation Board Highway Rev. | | | | |
| | 1,500,000 | | | 5.000%, 7/1/2036, Ser. A | | | 1,693,230 | |
| | | | Glendale, AZ Industrial Development Auth. Rev. (Midwestern University) | | | | |
| | 2,515,000 | | | 5.000%, 5/15/2031 | | | 2,828,218 | |
| | | | Northern Arizona Capital Fac. Lease Rev. (Student & Academic Services, LLC) | | | | |
| | 750,000 | | | 5.000%, 6/1/2039 | | | 839,520 | |
| | | | Northern Arizona University Refg. C.O.P. | | | | |
| | 1,000,000 | | | 5.000%, 9/1/2022 | | | 1,171,160 | |
| | | | Phoenix, AZ Civic Improvement Corporation Airport Rev. | | | | |
| | 3,060,000 | | | 5.250%, 7/1/2033, Ser. A | | | 3,390,388 | |
| | | | Phoenix, AZ Civic Improvement Corporation Airport Rev. Refg. | | | | |
| | 3,000,000 | | | 5.000%, 7/1/2021, AMT | | | 3,558,150 | |
| | | | Phoenix-Mesa Gateway Airport Auth. Special Fac. Rev. | | | | |
| | 1,450,000 | | | 5.000%, 7/1/2038, AMT | | | 1,574,599 | |
| | | | | |
| | | | Total | | | 15,055,265 | |
| | | | | |
| |
| Arkansas (0.5%) | | | | |
| | | | Rogers, AR Sales and Use Tax Refg. and Improvement | | | | |
| | 2,975,000 | | | 4.000%, 11/1/2027, Ser. 2011 | | | 3,168,643 | |
| | 1,000,000 | | | 4.125%, 11/1/2031, Ser. 2011 | | | 1,014,780 | |
| | | | University of Arkansas Rev. Refg., Various Fac. Rev. (Pine Bluff Campus) | | | | |
| | 650,000 | | | 5.000%, 12/1/2029, Ser. A | | | 766,610 | |
| | | | University Of Arkansas Rev. Various Fac. (Fayetteville Campus) | | | | |
| | 1,135,000 | | | 5.000%, 11/1/2039, Ser. A | | | 1,306,396 | |
| | 825,000 | | | 5.000%, 11/1/2041, Ser. A | | | 945,788 | |
| | | | | |
| | | | Total | | | 7,202,217 | |
| | | | | |
| |
| California (13.2%) | | | | |
| | | | Anaheim Public Financing Auth. Lease Rev. (Anaheim Public Improvements) (AGM Insured) | | | | |
| | 3,950,000 | | | 6.000%, 9/1/2024, Ser. Ab | | | 4,685,648 | |
| | | | Beverly Hills Unified School District, Los Angeles County, CA G.O. (2008 Election) | | | | |
| | 10,000,000 | | | Zero Coupon, 8/1/2031 | | | 5,800,800 | |
| | | | California Educational Fac. Auth. Rev. (Stanford University) | | | | |
| | 6,000,000 | | | 5.250%, 4/1/2040 | | | 8,064,360 | |
| | | | California G.O. Refg. | | | | |
| | 2,765,000 | | | 5.000%, 9/1/2015 | | | 2,875,379 | |
| | | | California Health Fac. Financing Auth. Rev. | | | | |
| | 3,840,000 | | | 1.450%, 8/15/2033, Ser. Ac | | | 3,909,120 | |
| | | | California Infrastructure and Economic Development Bank Bay Area Toll Bridges Seismic Retrofit Rev. (FGIC Insured) | | | | |
| | 5,000,000 | | | 5.000%, 7/1/2025, Ser. Aa,b | | | 6,377,800 | |
| | | | California Infrastructure and Economic Development Bank Rev. (California Independent System Operator Corporation) | | | | |
| | 3,025,000 | | | 6.250%, 2/1/2039, Ser. Aa | | | 3,069,407 | |
| | | | California Municipal Finance Auth. Refg. Rev. (Biola University) | | | | |
| | 1,500,000 | | | 5.875%, 10/1/2034 | | | 1,669,965 | |
| | 1,250,000 | | | 5.000%, 10/1/2042 | | | 1,336,062 | |
| | | | California State Department of Water Resources Supply Rev. | | | | |
| | 6,250,000 | | | 5.000%, 5/1/2016, Ser. M | | | 6,678,312 | |
| | | | California Various Purpose G.O. | | | | |
| | 6,065,000 | | | 5.500%, 4/1/2024 | | | 7,207,221 | |
| | 10,000 | | | 5.250%, 4/1/2029 | | | 10,043 | |
| | 10,000,000 | | | 5.250%, 3/1/2038 | | | 10,935,100 | |
| | 10,000,000 | | | 6.000%, 4/1/2038 | | | 11,813,700 | |
| | 5,000,000 | | | 6.000%, 11/1/2039 | | | 6,069,750 | |
| | | | California Various Purpose G.O. (NATL-RE Insured) | | | | |
| | 300,000 | | | 6.000%, 8/1/2016b | | | 304,338 | |
| | | | Chula Vista Industrial Development Rev. Refg. (San Diego Gas & Electric Company) | | | | |
| | 2,010,000 | | | 5.875%, 2/15/2034, Ser. C | | | 2,398,151 | |
| | | | East Bay Municipal Utility District, Alameda and Contra Costa Counties, CA Water System Rev. Refg. (NATL-RE Insured) | | | | |
| | 10,000,000 | | | 5.000%, 6/1/2037, Ser. Ab | | | 10,871,800 | |
| | | | Foothill-De Anza, CA Community College District G.O. | | | | |
| | 5,000,000 | | | 5.000%, 8/1/2040, Ser. C | | | 5,573,500 | |
| | | | Golden West Schools Financing Auth. Rev. (NATL-RE Insured) | | | | |
| | 420,000 | | | 5.800%, 2/1/2022, Ser. Ab | | | 518,125 | |
| | | | Los Angeles Community College District, Los Angeles County, CA G.O. (Election 2008) | | | | |
| | 10,050,000 | | | 6.000%, 8/1/2033, Ser. A | | | 12,203,514 | |
| | | | Los Angeles Department of Airports Rev. (Los Angeles International Airport) | | | | |
| | 8,000,000 | | | 5.000%, 5/15/2040, Ser. A | | | 9,132,960 | |
| | | | Los Angeles Department of Water and Power System Rev. | | | | |
| | 7,000,000 | | | 5.000%, 7/1/2044, Ser. D | | | 7,902,650 | |
| | | | Los Angeles Unified School District, Los Angeles County, CA G.O. | | | | |
| | 5,000,000 | | | 5.000%, 1/1/2034, Ser. I | | | 5,687,350 | |
| | | | Pittsburg, CA Redevelopment Agency Tax Allocation (Los Medanos Community Development) (AMBAC Insured) | | | | |
| | 5,000,000 | | | Zero Coupon, 8/1/2024b | | | 3,297,600 | |
| | | | Pomona, CA Single Family Mortgage Rev. Refg. (GNMA/FNMA Collateralized) | | | | |
| | 2,815,000 | | | 7.600%, 5/1/2023, Ser. Aa | | | 3,508,053 | |
The accompanying Notes to Financial Statements are an integral part of this schedule.
230
MUNICIPAL BOND FUND
Schedule of Investments as of October 31, 2014
| | | | | | | | |
Principal Amount | | | Long-Term Fixed Income (98.8%) | | Value | |
| California (13.2%) - continued | |
| | | | San Bernardino, CA Single Family Mortgage Rev. Refg. (FHA/VA MTGS GNMA Collateralized) | | | | |
| | $1,000,000 | | | 7.500%, 5/1/2023, Ser. Aa | | | $1,246,180 | |
| | | | San Diego Community College District, San Diego County, CA G.O. (AGM Insured) | | | | |
| | 10,000,000 | | | 5.000%, 5/1/2030a,b | | | 10,239,400 | |
| | | | San Diego County, CA C.O.P. | | | | |
| | 5,000,000 | | | 5.250%, 7/1/2030 | | | 5,570,000 | |
| | 10,000,000 | | | San Diego Unified School District G.O. | | | | |
| | | | Zero Coupon, 7/1/2033, Ser. Ab,d | | | 9,300,400 | |
| | | | San Francisco, CA City & County Airport Commission Rev. (San Francisco International Airport) | | | | |
| | 4,000,000 | | | 5.500%, 5/1/2028, Ser. A, AMT | | | 4,741,200 | |
| | 7,030,000 | | | 6.000%, 5/1/2039, Ser. E | | | 8,334,487 | |
| | 7,000,000 | | | 5.000%, 5/1/2044, Ser. A, AMT | | | 7,710,850 | |
| | | | San Jose, CA Redevelopment Agency Tax Allocation Refg. (Merged Area Redevelopment) (NATL-RE Insured) | | | | |
| | 2,760,000 | | | 5.000%, 8/1/2025, Ser. Ab | | | 2,804,188 | |
| | | | Santa Monica Community College District, Los Angeles County, CA G.O. | | | | |
| | 5,000,000 | | | Zero Coupon, 8/1/2025, Ser. C | | | 3,631,550 | |
| | | | Tuolumne Wind Proj. Auth. Rev. (Tuolumne Company) | | | | |
| | 2,000,000 | | | 5.625%, 1/1/2029, Ser. A | | | 2,338,160 | |
| | | | University of California General Rev. | | | | |
| | 5,000,000 | | | 5.250%, 5/15/2039, Ser. 0 | | | 5,718,700 | |
| | | | | |
| | | | Total | | | 203,535,823 | |
| | | | | |
| |
| Colorado (4.3%) | | | | |
| | | | Colorado Educational and Cultural Fac. Auth. Charter School Refg. Rev. (Pinnacle Charter School, Inc. K-8 Fac.) | | | | |
| | 500,000 | | | 5.000%, 6/1/2019b | | | 553,000 | |
| | 200,000 | | | 5.000%, 6/1/2021b | | | 223,316 | |
| | | | Colorado Educational and Cultural Fac. Auth. Charter School Rev. (Cheyenne Mountain Charter Academy) | | | | |
| | 475,000 | | | 5.125%, 6/15/2032, Ser. A | | | 495,895 | |
| | 1,000,000 | | | 5.375%, 6/15/2038, Ser. A | | | 1,042,550 | |
| | | | Colorado Educational and Cultural Fac. Auth. Charter School Rev. (Crown Pointe Academy of Westminster) | | | | |
| | 1,000,000 | | | 5.000%, 7/15/2039 | | | 1,008,670 | |
| | | | Colorado Educational and Cultural Fac. Auth. Charter School Rev. (Pinnacle Charter School, Inc.) | | | | |
| | 3,000,000 | | | 5.125%, 12/1/2039 | | | 3,052,770 | |
| | | | Colorado Health Fac. Auth. Health Fac. Rev. (Evangelical Lutheran Good Samaritan Society) | | | | |
| | 2,110,000 | | | 5.000%, 12/1/2024 | | | 2,406,181 | |
| | 500,000 | | | 5.625%, 6/1/2043 | | | 564,260 | |
| | | | Colorado Health Fac. Auth. Hospital Rev. Refg. (Valley View Hospital Association) | | | | |
| | 3,000,000 | | | 5.750%, 5/15/2036 | | | 3,314,430 | |
| | | | Colorado Higher Education Capital Construction Lease Purchase Financing Program C.O.P. | | | | |
| | 405,000 | | | 5.500%, 11/1/2027a | | | 476,268 | |
| | 1,180,000 | | | 5.500%, 11/1/2027a | | | 1,387,645 | |
| | | | Denver, CO Airport System Rev. (XLCA Insured) | | | | |
| | 5,000,000 | | | 5.000%, 11/15/2022, Ser. Ab | | | 5,224,000 | |
| | | | Denver, CO Health and Hospital Auth. Healthcare Rev. | | | | |
| | 5,000,000 | | | 5.500%, 12/1/2030 | | | 5,656,450 | |
| | 2,000,000 | | | 5.250%, 12/1/2031, Ser. A | | | 2,152,020 | |
| | | | Jefferson County School District No. R-l, Jefferson and Broomfield Counties, CO G.O. Refg. (AGM Insured) | | | | |
| | 10,000,000 | | | 5.000%, 12/15/2016, Ser. Ab | | | 10,519,800 | |
| | | | Larimer County, CO Poudre School District R-l G.O. Improvement (NATL-RE-IBC Insured) | | | | |
| | 2,050,000 | | | 7.000%, 12/15/2016b | | | 2,200,880 | |
| | | | Northwest Parkway Public Highway Auth. Rev. (AMBAC Insured) | | | | |
| | 4,000,000 | | | 5.700%, 6/15/2021, Ser. Ca,b | | | 4,338,760 | |
| | | | Plaza Metropolitan District No. 1 Rev. Refg. (City of Lakewood) | | | | |
| | 1,000,000 | | | 5.000%, 12/1/2021 | | | 1,100,460 | |
| | 500,000 | | | 5.000%, 12/1/2022 | | | 550,855 | |
| | | | University of Colorado Enterprise Rev. | | | | |
| | 3,250,000 | | | 5.000%, 6/1/2033, Ser. A | | | 3,825,770 | |
| | 3,000,000 | | | 5.000%, 6/1/2034, Ser. A | | | 3,520,500 | |
| | | | University of Colorado University Enterprise Rev. | | | | |
| | 1,250,000 | | | 5.375%, 6/1/2032, Ser. A | | | 1,451,237 | |
| | 9,790,000 | | | 5.000%, 6/1/2033 | | | 10,962,255 | |
| | | | | |
| | | | Total | | | 66,027,972 | |
| | | | | |
| |
| District of Columbia (1.1%) | | | | |
| | | | District of Columbia Income Tax Secured Rev. Refg. | | | | |
| | 2,325,000 | | | 5.000%, 12/1/2017, Ser. A | | | 2,630,598 | |
| | 5,225,000 | | | 5.000%, 12/1/2028, Ser. C | | | 6,026,515 | |
| | | | District of Columbia Tobacco Settlement Financing Corporation Tobacco Settlement Rev. | | | | |
| | 2,365,000 | | | 6.250%, 5/15/2024 | | | 2,381,792 | |
| | | | Metropolitan Washington DC Airports Auth. Airport System Rev. Refg. | | | | |
| | 6,000,000 | | | 5.000%, 10/1/2038, Ser. A, AMT | | | 6,625,320 | |
| | | | | |
| | | | Total | | | 17,664,225 | |
| | | | | |
| |
| Florida (4.7%) | | | | |
| | | | Broward County, FL Water and Sewer Utility Rev. | | | | |
| | 3,115,000 | | | 5.250%, 10/1/2034, Ser. A | | | 3,468,646 | |
| | | | CityPlace Community Development District Special Assessment and Rev. | | | | |
| | 500,000 | | | 5.000%, 5/1/2017 | | | 537,025 | |
The accompanying Notes to Financial Statements are an integral part of this schedule.
231
MUNICIPAL BOND FUND
Schedule of Investments as of October 31, 2014
| | | | | | | | |
Principal
Amount | | | Long-Term Fixed Income (98.8%) | | Value | |
| Florida (4.7%) - continued | | | | |
| | $2,000,000 | | | 5.000%, 5/1/2026 | | | $2,251,520 | |
| | | | County of Broward, FL Fuel System Rev. (Fort Lauderdale Fuel Fac.) (AGM Insured) | | | | |
| | 1,155,000 | | | 5.000%, 4/1/2021, Ser. A, AMTb | | | 1,349,467 | |
| | 605,000 | | | 5.000%, 4/1/2022, Ser. A, AMTb | | | 710,682 | |
| | 700,000 | | | 5.000%, 4/1/2025, Ser. A, AMTb | | | 812,903 | |
| | | | Greater Orlando Aviation Auth. Airport Fac. Rev. | | | | |
| | 1,500,000 | | | 5.000%, 10/1/2039, Ser. C | | | 1,627,305 | |
| | | | Gulf Breeze, FL Rev. Refg. | | | | |
| | 2,020,000 | | | 5.000%, 12/1/2033 | | | 2,183,256 | |
| | | | Hillsborough County, FL Community Investment Tax Refg. Rev. | | | | |
| | 4,025,000 | | | 5.000%, 11/1/2017, Ser. B | | | 4,510,576 | |
| | | | Jacksonville FL Port Auth. Rev. | | | | |
| | 2,390,000 | | | 5.000%, 11/1/2038, Ser. A, AMT | | | 2,548,672 | |
| | | | Leon County Educational Fac. Auth. C.O.P. (Southgate Residence Hall) | | | | |
| | 1,145,000 | | | 8.500%, 9/1/2017a | | | 1,396,660 | |
| | | | Miami-Dade County Industrial Development Auth. (Pinecrest Academy, Inc.) | | | | |
| | 1,500,000 | | | 5.250%, 9/15/2044 | | | 1,551,255 | |
| | | | Miami-Dade County, FL Aviation Rev. (Miami International Airport-Hub of the Americas) | | | | |
| | 7,500,000 | | | 5.500%, 10/1/2036, Ser. B | | | 8,562,300 | |
| | 8,000,000 | | | 5.500%, 10/1/2041, Ser. A | | | 9,014,640 | |
| | | | Miami-Dade County, FL Public Fac. Rev. (Jackson Health System) (AGM Insured) | | | | |
| | 2,000,000 | | | 5.625%, 6/1/2034b | | | 2,225,420 | |
| | | | Orange County Health Fac. Auth. Hospital Rev. (Orlando Regional Healthcare System) (NATL-RE Insured) | | | | |
| | 2,700,000 | | | 6.250%, 10/1/2018, Ser. Ab | | | 3,151,116 | |
| | | | Orange County, FL Health Fac. Auth. Hospital Rev. (Orlando Health, Inc.) | | | | |
| | 5,010,000 | | | 5.125%, 10/1/2026 | | | 5,660,448 | |
| | | | Orange County, Orlando Expressway Auth. Rev. | | | | |
| | 3,600,000 | | | 5.000%, 7/1/2030, Ser. A | | | 3,973,788 | |
| | 4,095,000 | | | 5.000%, 7/1/2035, Ser. C | | | 4,509,004 | |
| | | | St. Johns County Industrial Development Auth. Rev. (Presbyterian Retirement Communities) | | | | |
| | 6,490,000 | | | 5.875%, 8/1/2040, Ser. A | | | 7,014,717 | |
| | | | Tallahassee, FL Consolidated Utility Systems Rev. | | | | |
| | 4,535,000 | | | 5.000%, 10/1/2032 | | | 5,011,855 | |
| | | | | |
| | | | Total | | | 72,071,255 | |
| | | | | |
| |
| Georgia (1.1%) | | | | |
| | | | Atlanta, GA Airport General Rev. | | | | |
| | 1,000,000 | | | 5.000%, 1/1/2033, Ser. C, AMT | | | 1,098,830 | |
| | 500,000 | | | 5.000%, 1/1/2034, Ser. C, AMT | | | 547,750 | |
| | 500,000 | | | 5.000%, 1/1/2037, Ser. C, AMT | | | 543,790 | |
| | | | Atlanta, GA Airport General Rev. Refg. | | | | |
| | 1,425,000 | | | 5.000%, 1/1/2033, Ser. B | | | 1,639,320 | |
| | | | Brunswick, GA Water and Sewer Rev. Refg. and Improvement (NATL-RE Insured) | | | | |
| | 1,500,000 | | | 6.100%, 10/1/2019a,b | | | 1,714,590 | |
| | | | Burke County Development Auth. Pollution Control Rev. (Oglethorpe Power Corporation Vogtle) | | | | |
| | 6,000,000 | | | 5.700%, 1/1/2043, Ser. C | | | 6,409,320 | |
| | | | Cherokee County, GA Water and Sewerage (NATL-RE Insured) | | | | |
| | 4,110,000 | | | 5.500%, 8/1/2018b | | | 4,408,304 | |
| | | | | |
| | | | Total | | | 16,361,904 | |
| | | | | |
| |
| Hawaii (1.5%) | | | | |
| | | | Hawaii Airports System Rev. | | | | |
| | 3,040,000 | | | 5.250%, 7/1/2030, Ser. A | | | 3,523,451 | |
| | | | Hawaii State Department of Budget and Finance Special Purpose Senior Living Rev. Refg. | | | | |
| | 1,000,000 | | | 5.125%, 11/15/2032 | | | 1,088,040 | |
| | 5,395,000 | | | 5.250%, 11/15/2037 | | | 5,819,533 | |
| | | | Hawaii State Department of Transportation Airport Division Lease Rev. C.O.P. | | | | |
| | 1,000,000 | | | 5.000%, 8/1/2028, AMT | | | 1,126,480 | |
| | | | Hawaii State Harbor System Rev. | | | | |
| | 6,000,000 | | | 5.250%, 7/1/2030, Ser. A | | | 6,790,560 | |
| | | | Honolulu, HI Board of Water Supply Water System Rev. (NATL-RE Insured) | | | | |
| | 5,000,000 | | | 5.000%, 7/1/2036, Ser. Ab | | | 5,286,700 | |
| | | | | |
| | | | Total | | | 23,634,764 | |
| | | | | |
| |
| Illinois (8.0%) | | | | |
| | | | Broadview, Cook County, IL Tax Increment Rev. | | | | |
| | 350,000 | | | 5.375%, 7/1/2015 | | | 350,409 | |
| | | | Chicago Metropolitan Water Reclamation District G.O. Refg. | | | | |
| | 8,700,000 | | | 5.250%, 12/1/2032, Ser. C | | | 11,008,893 | |
| | | | Chicago Tax Increment Allocation (Near South Redevelopment) (ACA Insured) | | | | |
| | 7,200,000 | | | Zero Coupon, 11/15/2014, Ser. Aa,b | | | 7,199,424 | |
| | | | Chicago, IL Midway International Airport Rev. | | | | |
| | 1,120,000 | | | 5.000%, 1/1/2026, Ser. A, AMT | | | 1,280,765 | |
| | 2,000,000 | | | 5.000%, 1/1/2034, Ser. Ba,c | | | 2,015,140 | |
| | | | Cook County, IL Community Consolidated School District No. 15 Limited Tax Capital Appreciation School G.O. (NATL-RE Insured) | | | | |
| | 1,000,000 | | | Zero Coupon, 12/1/2014a,b | | | 999,630 | |
| | | | Cook County, IL School District No. 99 (Cicero) G.O. School (NATL-RE Insured) | | | | |
| | 1,565,000 | | | 8.500%, 12/1/2014b | | | 1,573,060 | |
| | 1,815,000 | | | 8.500%, 12/1/2016b | | | 2,045,741 | |
| | | | Illinois Educational Fac. Auth. Rev. (Northwestern University) | | | | |
| | 4,900,000 | | | 5.250%, 11/1/2032a | | | 5,145,833 | |
The accompanying Notes to Financial Statements are an integral part of this schedule.
232
MUNICIPAL BOND FUND
Schedule of Investments as of October 31, 2014
| | | | | | | | |
Principal Amount | | | Long-Term Fixed Income (98.8%) | | Value | |
| Illinois (8.0%) - continued | | | | |
| | | | Illinois Finance Auth. Rev. (DePaul University) | | | | |
| | $4,075,000 | | | 6.000%, 10/1/2032, Ser. A | | | $4,818,973 | |
| | | | Illinois Finance Auth. Rev. (Rush University Medical Center) | | | | |
| | 5,000,000 | | | 7.250%, 11/1/2038, Ser. A | | | 5,913,000 | |
| | | | Illinois Finance Auth. Rev. (The Art Institute of Chicago) | | | | |
| | 2,390,000 | | | 5.000%, 3/1/2034, Ser. A | | | 2,652,279 | |
| | | | Illinois Finance Auth. Rev. Refg. (Rush University Medical Center) (NATL-RE Insured ) | | | | |
| | 2,020,000 | | | 5.250%, 11/1/2035, Ser. Bb | | | 2,227,212 | |
| | | | Illinois G.O. | | | | |
| | 5,000,000 | | | 5.000%, 3/1/2027 | | | 5,393,350 | |
| | 1,500,000 | | | 5.500%, 7/1/2033 | | | 1,682,985 | |
| | 1,750,000 | | | 5.500%, 7/1/2038 | | | 1,918,893 | |
| | | | Illinois Health Fac. Auth. Rev. Refg. (Lutheran General Health System) (AGM-CR Insured) | | | | |
| | 2,045,000 | | | 6.000%, 4/1/2018, Ser. Cb | | | 2,238,886 | |
| | | | Illinois Sales Tax Rev. (Build Illinois) (NATL-RE Insured) | | | | |
| | 7,975,000 | | | 5.750%, 6/15/2018, 2nd Ser.b | | | 9,321,339 | |
| | | | Joliet Regional Port District, IL Marine Terminal Rev. Refg. (Exxon) | | | | |
| | 1,850,000 | | | 0.060%, 10/1/2024c | | | 1,850,000 | |
| | | | McHenry and Lake Counties G.O. School (AGM Insured) | | | | |
| | 840,000 | | | 9.000%, 12/1/2017b | | | 938,616 | |
| | 2,195,000 | | | 9.000%, 12/1/2017a,b | | | 2,480,218 | |
| | | | Metropolitan Pier and Exposition Auth., IL Refg. (McCormick Place Expansion) (NATL-RE Insured) | | | | |
| | 885,000 | | | 5.500%, 6/15/2015, Ser. Ab | | | 908,532 | |
| | 17,605,000 | | | Zero Coupon, 6/15/2020, Ser. Ab | | | 15,407,720 | |
| | 7,000,000 | | | 5.500%, 6/15/2020, Ser. Bb | | | 7,726,320 | |
| | 3,100,000 | | | Zero Coupon, 6/15/2024, Ser. Ab | | | 2,229,334 | |
| | 2,000,000 | | | Zero Coupon, 12/15/2024, Ser. Ab | | | 1,409,600 | |
| | | | Railsplitter Tobacco Settlement Auth. Tobacco Settlement Rev. | | | | |
| | 6,340,000 | | | 5.000%, 6/1/2017 | | | 6,963,666 | |
| | | | Regional Transportation Auth., Cook, DuPage, Kane, Lake, McHenry and Will Counties, IL Rev. (NATL-RE Insured) | | | | |
| | 2,545,000 | | | 6.700%, 11/1/2021, Ser. Ab | | | 2,891,374 | |
| | | | State of Illinois G.O. Refg. | | | | |
| | 9,000,000 | | | 5.000%, 8/1/2017 | | | 9,882,720 | |
| | | | University of Illinois Auxiliary Fac. System Rev. | | | | |
| | 2,500,000 | | | 5.750%, 4/1/2038, Ser. A | | | 2,877,450 | |
| | | | | |
| | | | Total | | | 123,351,362 | |
| | | | | |
| |
| Indiana (2.2%) | | | | |
| | | | East Chicago Elementary School Building Corporation, Lake County, IN First Mortgage Refg. | | | | |
| | 295,000 | | | 6.250%, 1/5/2016 | | | 305,245 | |
| | | | Indiana Bond Bank Special Program Rev. (Clark Memorial Hospital) | | | | |
| | 7,000,000 | | | 5.500%, 8/1/2029, Ser. D | | | 7,863,380 | |
| | | | Indiana Finance Auth. Hospital Rev. (Deaconess Hospital) | | | | |
| | 1,500,000 | | | 6.750%, 3/1/2039, Ser. A | | | 1,756,890 | |
| | | | Indiana Finance Auth. Private Activity (Ohio River Bridges East End Crossing) | | | | |
| | 1,000,000 | | | 5.000%, 1/1/2019, Ser. B, AMT | | | 1,076,160 | |
| | | | Indiana Health and Educational Fac. Financing Auth. Health System Rev. Refg. (Sisters of St. Francis Health Services, Inc.) (AGM Insured) | | | | |
| | 450,000 | | | 5.250%, 5/15/2041, Ser. Eb | | | 484,384 | |
| | | | Indiana Municipal Power Agency Power Supply System Rev. | | | | |
| | 1,750,000 | | | 5.250%, 1/1/2034, Ser. A | | | 2,000,793 | |
| | 4,155,000 | | | 5.000%, 1/1/2042, Ser. A | | | 4,443,066 | |
| | | | Indiana Transportation Finance Auth. Highway Rev. | | | | |
| | 125,000 | | | 6.800%, 12/1/2016, Ser. A | | | 133,364 | |
| | | | Indiana Transportation Finance Auth. Highway Rev. (NATL-RE-IBC Insured) | | | | |
| | 710,000 | | | 7.250%, 6/1/2015, Ser. Ab | | | 738,904 | |
| | | | Indianapolis Local Public Improvement Bank Rev. (Waterworks) | | | | |
| | 5,000,000 | | | 5.750%, 1/1/2038, Ser. A | | | 5,684,000 | |
| | | | Knox County, IN Economic Development Rev. Refg. | | | | |
| | 2,850,000 | | | 5.000%, 4/1/2037, Ser. A | | | 2,986,316 | |
| | 6,965,000 | | | 5.000%, 4/1/2042, Ser. A | | | 7,275,639 | |
| | | | | |
| | | | Total | | | 34,748,141 | |
| | | | | |
| |
| Iowa (0.6%) | | | | |
| | | | Cedar Falls Community School District, Black Hawk County School Infrastructure Sales, Services and Use Tax Rev. | | | | |
| | 3,165,000 | | | 5.400%, 6/1/2029 | | | 3,591,389 | |
| | | | Des Moines, IA Airport Auth. Rev. Refg. | | | | |
| | 1,205,000 | | | 5.000%, 6/1/2024, AMT | | | 1,341,237 | |
| | | | Waterloo, IA Community School District Tax Rev. Refg. (School Infrastructure Sales, Services, and Use) | | | | |
| | 3,560,000 | | | 5.000%, 7/1/2029, Ser. A | | | 3,980,294 | |
| | | | | |
| | | | Total | | | 8,912,920 | |
| | | | | |
| |
| Kansas (0.2%) | | | | |
| | | | Kansas Development Finance Auth. Rev. | | | | |
| | 3,575,000 | | | 5.000%, 5/15/2030, Ser. S | | | 3,792,539 | |
| | | | Sedgwick and Shawnee Counties, KS Single Family Mortgage Rev. (GNMA Collateralized) | | | | |
| | 55,000 | | | 6.700%, 6/1/2029, Ser. A-2 | | | 57,101 | |
| | | | | |
| | | | Total | | | 3,849,640 | |
| | | | | |
The accompanying Notes to Financial Statements are an integral part of this schedule.
233
MUNICIPAL BOND FUND
Schedule of Investments as of October 31, 2014
| | | | | | | | |
Principal Amount | | | Long-Term Fixed Income (98.8%) | | Value | |
| Kentucky (1.6%) | |
| | | | Kentucky Economic Development Finance Auth. Hospital Rev. (Owensboro Medical Health System, Inc.) | | | | |
| | $5,880,000 | | | 6.375%, 6/1/2040, Ser. A | | | $6,783,580 | |
| | | | Kentucky Public Transportation Infrastructure Auth. Subordinate Toll Rev. (Downtown Crossing) | | | | |
| | 5,000,000 | | | 5.000%, 7/1/2017, Ser. A | | | 5,532,500 | |
| | | | Kentucky State Turnpike Auth. Economic Development Road Rev. | | | | |
| | 5,000,000 | | | 5.000%, 7/1/2028, Ser. A | | | 5,854,500 | |
| | | | Paducah, KY Electric Plant Board Rev. (AGM Insured) | | | | |
| | 2,500,000 | | | 5.250%, 10/1/2035, Ser. Ab | | | 2,786,150 | |
| | | | Pikeville, KY Hospital Rev. (Pikeville Medical Center, Inc.) | | | | |
| | 3,540,000 | | | 6.500%, 3/1/2041 | | | 4,057,477 | |
| | | | | |
| | | | Total | | | 25,014,207 | |
| | | | | |
| |
| Louisiana (2.5%) | | | | |
| | | | City of Alexandria, LA Utilities Rev. | | | | |
| | 5,000,000 | | | 5.000%, 5/1/2043, Ser. A | | | 5,458,400 | |
| | | | Lafayette Public Power Auth. Electric Rev. | | | | |
| | 375,000 | | | 5.000%, 11/1/2022 | | | 443,104 | |
| | 1,520,000 | | | 5.000%, 11/1/2031 | | | 1,699,025 | |
| | | | Louisiana Public Fac. Auth. Rev. (University of New Orleans Research and Technology Foundation, Inc.) (NATL-RE Insured) | | | | |
| | 4,745,000 | | | 5.250%, 3/1/2031a,b | | | 5,165,122 | |
| | | | Louisiana State Gas and Fuels Tax Rev. | | | | |
| | 5,000,000 | | | 5.000%, 5/1/2033, Ser. B | | | 5,670,300 | |
| | 7,000,000 | | | 5.000%, 5/1/2045, Ser. B | | | 7,786,030 | |
| | | | Louisiana State Public Facilities Auth. Rev. (University of New Orleans Research & Technology Foundation Student Housing) (AGM Insured) | | | | |
| | 1,355,000 | | | 5.000%, 9/1/2030b | | | 1,555,432 | |
| | 800,000 | | | 5.000%, 9/1/2031b | | | 915,432 | |
| | | | Louisiana Utilities Rev. (Parish of St. Tammany) | | | | |
| | 2,000,000 | | | 5.500%, 8/1/2035, Ser. B | | | 2,350,400 | |
| | | | Port of New Orleans Board of Commissioners Port Fac. Refg. Rev. | | | | |
| | 1,365,000 | | | 5.000%, 4/1/2030, Ser. B, AMT | | | 1,497,309 | |
| | 1,500,000 | | | 5.000%, 4/1/2031, Ser. B, AMT | | | 1,627,305 | |
| | 525,000 | | | 5.000%, 4/1/2033, Ser. B, AMT | | | 560,212 | |
| | | | Tobacco Settlement Financing Corporation Rev. | | | | |
| | 3,620,000 | | | 5.000%, 5/15/2024, Ser. A | | | 3,694,464 | |
| | | | | |
| | | | Total | | | 38,422,535 | |
| | | | | |
| |
| Maryland (0.1%) | | | | |
| | | | Maryland Health & Higher Educational Fac. Auth. Rev. (Loyola University) | | | | |
| | 1,000,000 | | | 5.000%, 10/1/2045 | | | 1,129,090 | |
| | | | Morgan State University Academic Fees and Auxiliary Fac. Fees Rev. Refg. (NATL-RE Insured) | | | | |
| | 1,010,000 | | | 6.050%, 7/1/2015b | | | 1,018,949 | |
| | | | | |
| | | | Total | | | 2,148,039 | |
| | | | | |
| |
| Massachusetts (4.5%) | | | | |
| | | | Massachusetts Bay Transportation Auth. Sales Tax Rev. | | | | |
| | 6,000,000 | | | 5.250%, 7/1/2031, Ser. A | | | 7,614,000 | |
| | | | Massachusetts Bay Transportation Auth. Sales Tax Rev. (NATL-RE Insured) | | | | |
| | 5,000,000 | | | 5.500%, 7/1/2025, Ser. Bb | | | 6,487,800 | |
| | | | Massachusetts Development Finance Agency Rev. | | | | |
| | 3,000,000 | | | 5.000%, 7/1/2042, Ser. J | | | 3,379,140 | |
| | | | Massachusetts Development Finance Agency Rev. (Northeastern University) | | | | |
| | 750,000 | | | 5.000%, 10/1/2031 | | | 846,968 | |
| | | | Massachusetts Health and Educational Fac. Auth. Rev. (Massachusetts Institute of Technology) | | | | |
| | 15,295,000 | | | 5.250%, 7/1/2033, Ser. L | | | 20,604,047 | |
| | | | Massachusetts Health and Educational Fac. Auth. Rev. (Tufts University) | | | | |
| | 5,400,000 | | | 5.500%, 2/15/2028, Ser. M | | | 6,937,866 | |
| | | | Massachusetts Port Auth. Rev. | | | | |
| | 8,300,000 | | | 5.000%, 7/1/2042, Ser. A, AMT | | | 9,076,880 | |
| | | | Massachusetts School Building Auth. Sales Tax Refg. | | | | |
| | 6,900,000 | | | 5.000%, 8/15/2029, Ser. B | | | 8,106,810 | |
| | | | Massachusetts Water Pollution Abatement Trust Pool Program Refg. | | | | |
| | 5,000,000 | | | 5.000%, 8/1/2024 | | | 6,250,950 | |
| | | | | |
| | | | Total | | | 69,304,461 | |
| | | | | |
| |
| Michigan (1.9%) | | | | |
| | | | East Lansing Building Auth., Ingham and Clinton Counties, MI Building Auth. Rev. (G.O. Limited Tax) | | | | |
| | 2,000,000 | | | 5.700%, 4/1/2020 | | | 2,241,940 | |
| | | | Flint Hospital Building Auth. Rev. Refg. (Hurley Medical Center) | | | | |
| | 3,000,000 | | | 5.000%, 7/1/2019, Ser. B | | | 3,099,090 | |
| | | | Grand Valley State University General Rev. | | | | |
| | 650,000 | | | 5.000%, 12/1/2029, Ser. B | | | 755,521 | |
| | 1,045,000 | | | 5.750%, 12/1/2034a | | | 1,159,334 | |
| | | | Kalamazoo Hospital Finance Auth. Hospital Rev. (AGM Insured) | | | | |
| | 4,000,000 | | | 5.250%, 5/15/2036b | | | 4,353,200 | |
| | | | Kalamazoo Hospital Finance Auth. Hospital Rev. Refg. (Bronson Methodist Hospital) (AGM Insured) | | | | |
| | 3,250,000 | | | 5.000%, 5/15/2026, Ser. Ab | | | 3,574,675 | |
| | | | Kent County, Ml G.O. | | | | |
| | 2,775,000 | | | 5.000%, 1/1/2024, AMT | | | 3,264,815 | |
The accompanying Notes to Financial Statements are an integral part of this schedule.
234
MUNICIPAL BOND FUND
Schedule of Investments as of October 31, 2014
| | | | | | | | |
Principal Amount | | | Long-Term Fixed Income (98.8%) | | Value | |
| Michigan (1.9%) - continued | |
| | | | Michigan State Trunk Line Fund Refg. (AGM Insured) | | | | |
| | $5,000,000 | | | 5.000%, 11/1/2022b | | | $5,218,100 | |
| | | | Rochester Community School District, Oakland and Macomb Counties, Ml School Building and Site G.O. (NATL-RE Q-SBLF Insured) | | | | |
| | 4,560,000 | | | 5.000%, 5/1/2019b | | | 5,280,434 | |
| | | | | |
| | | | Total | | | 28,947,109 | |
| | | | | |
| |
| Minnesota (2.4%) | | | | |
| | | | Baytown Township, MN Lease Rev. (St. Croix Preparatory Academy) | | | | |
| | 1,000,000 | | | 7.000%, 8/1/2038, Ser. A | | | 1,045,350 | |
| | | | Goodhue County, MN Education District No. 6051 C.O.P. | | | | |
| | 250,000 | | | 5.000%, 2/1/2029 | | | 284,663 | |
| | 500,000 | | | 5.000%, 2/1/2034 | | | 560,840 | |
| | 750,000 | | | 5.000%, 2/1/2039 | | | 826,905 | |
| | | | Minnesota Agricultural and Economic Development Board Health Care System Rev. (Fairview Hospital and Healthcare Services) (NATL-RE Insured) | | | | |
| | 85,000 | | | 5.750%, 11/15/2026, Ser. Ab | | | 85,271 | |
| | | | Minnesota Higher Education Fac. Auth. Rev. | | | | |
| | 1,575,000 | | | 5.250%, 12/1/2035, Ser. H | | | 1,716,561 | |
| | | | Minnesota Higher Education Fac. Auth. Rev. (College of St. Scholastica, Inc.) | | | | |
| | 1,800,000 | | | 6.300%, 12/1/2040, Ser. 7J | | | 1,979,622 | |
| | | | Minnesota State Municipal Power Agency Electric Rev. | | | | |
| | 200,000 | | | 5.000%, 10/1/2029 | | | 234,240 | |
| | 150,000 | | | 5.000%, 10/1/2030 | | | 175,119 | |
| | 200,000 | | | 5.000%, 10/1/2032 | | | 231,084 | |
| | 175,000 | | | 5.000%, 10/1/2033 | | | 201,395 | |
| | | | North Oaks, MN Senior Housing Rev. (Presbyterian Homes of North Oaks, Inc.) | | | | |
| | 2,000,000 | | | 6.125%, 10/1/2039 | | | 2,139,200 | |
| | | | Northern Municipal Power Agency, MN Electric System Rev. (AMBAC Insured) | | | | |
| | 2,000,000 | | | 5.000%, 1/1/2026, Ser. Ab | | | 2,181,260 | |
| | | | Rochester MN Health Care Fac. Rev. Olmsted Medical Center | | | | |
| | 1,000,000 | | | 5.875%, 7/1/2030 | | | 1,140,670 | |
| | | | Shakopee Independent School District No. 720 G.O. School Building Crossover Refg. | | | | |
| | 1,425,000 | | | 5.000%, 2/1/2018 | | | 1,613,998 | |
| | | | St. Cloud, MN Health Care Refg. Rev. (CentraCare Health System) | | | | |
| | 2,040,000 | | | 5.125%, 5/1/2030, Ser. A | | | 2,295,224 | �� |
| | | | St. Louis Park, MN Health Care Fac. Rev. Refg. (Park Nicollet Health Services) | | | | |
| | 1,000,000 | | | 5.750%, 7/1/2030, Ser. C | | | 1,117,280 | |
| | 5,745,000 | | | 5.750%, 7/1/2039 | | | 6,421,129 | |
| | | | St. Paul, MN Housing and Redevelopment Auth. Educational Fac. Rev. Refg. (Saint Paul Academy and Summit School) | | | | |
| | 4,000,000 | | | 5.000%, 10/1/2024 | | | 4,278,480 | |
| | | | St. Paul, MN Housing and Redevelopment Auth. Health Care Fac. Rev. (HealthPartners) | | | | |
| | 230,000 | | | 5.250%, 5/15/2019 | | | 250,886 | |
| | 1,500,000 | | | 5.250%, 5/15/2036 | | | 1,577,700 | |
| | | | University of Minnesota Rev. (State Supported Biomedical Science Research Fac. Funding) | | | | |
| | 1,655,000 | | | 5.000%, 8/1/2030, Ser. B | | | 1,897,921 | |
| | | | Western Minnesota Municipal Power Agency Rev. | | | | |
| | 1,000,000 | | | 5.000%, 1/1/2033, Ser. A | | | 1,169,510 | |
| | 1,000,000 | | | 5.000%, 1/1/2034, Ser. A | | | 1,165,140 | |
| | 300,000 | | | 5.000%, 1/1/2035, Ser. A | | | 348,234 | |
| | 1,000,000 | | | 5.000%, 1/1/2040, Ser. A | | | 1,144,400 | |
| | | | Winona, MN Health Care Fac. Rev. | | | | |
| | 500,000 | | | 5.000%, 7/1/2034 | | | 534,060 | |
| | | | | |
| | | | Total | | | 36,616,142 | |
| | | | | |
| |
| Mississippi (0.4%) | | | | |
| | | | D’Iberville Tax Increment Refg. (Gulf Coast Promenade) | | | | |
| | 1,750,000 | | | 5.000%, 4/1/2033 | | | 1,902,617 | |
| | | | Mississippi Development Bank S.O., Desoto County Highway Construction Project | | | | |
| | 3,180,000 | | | 5.000%, 1/1/2030 | | | 3,646,888 | |
| | | | | |
| | | | Total | | | 5,549,505 | |
| | | | | |
| |
| Missouri (1.1%) | | | | |
| | | | Jackson County, MO Special Obligation Rev. (Harry S. Truman Sports Complex) (AMBAC Insured) | | | | |
| | 7,500,000 | | | 5.000%, 12/1/2027a,b | | | 8,017,650 | |
| | | | Missouri State Environmental Improvement and Energy Resources Auth. Water Pollution Rev. | | | | |
| | 175,000 | | | 5.250%, 1/1/2018 | | | 175,555 | |
| | | | Missouri State Health and Educational Fac. Auth. Health Fac. Rev. (BJC Health System) | | | | |
| | 2,500,000 | | | 5.000%, 5/15/2020, Ser. A | | | 2,556,000 | |
| | | | Missouri State Health and Educational Fac. Auth. Health Fac. Rev. (Lake Regional Health System) | | | | |
| | 810,000 | | | 5.000%, 2/15/2019 | | | 909,484 | |
| | 925,000 | | | 5.000%, 2/15/2022 | | | 1,058,764 | |
| | 1,680,000 | | | 5.000%, 2/15/2034 | | | 1,781,808 | |
| | | | St. Louis, MO Airport Rev. Refg. (Lambert-St. Louis International Airport) | | | | |
| | 900,000 | | | 5.000%, 7/1/2016, AMT | | | 964,197 | |
| | 1,000,000 | | | 5.000%, 7/1/2032, AMT | | | 1,056,550 | |
| | | | | |
| | | | Total | | | 16,520,008 | |
| | | | | |
The accompanying Notes to Financial Statements are an integral part of this schedule.
235
MUNICIPAL BOND FUND
Schedule of Investments as of October 31, 2014
| | | | | | | | |
Principal Amount | | | Long-Term Fixed Income (98.8%) | | Value | |
| Montana (0.2%) | | | | |
| | | | Montana Fac. Finance Auth. Rev. (Providence Health & Services) | | | | |
| | $2,830,000 | | | 5.000%, 10/1/2024 | | | $3,044,231 | |
| | | | | |
| | | | Total | | | 3,044,231 | |
| | | | | |
| |
| Nebraska (0.8%) | | | | |
| | | | Douglas County, NE Hospital Auth. No. 3 Health Fac. Refg. Rev. (Nebraska Methodist Health System) | | | | |
| | 2,000,000 | | | 5.750%, 11/1/2048 | | | 2,144,620 | |
| | | | Lincoln, NE Lincoln Electric System Rev. Refg. | | | | |
| | 2,500,000 | | | 5.000%, 9/1/2037 | | | 2,840,600 | |
| | | | Nebraska Public Power District Rev. | | | | |
| | 1,325,000 | | | 5.000%, 1/1/2033, Ser. A | | | 1,499,926 | |
| | | | University of Nebraska Lincoln Student Fees and Fac. Rev. | | | | |
| | 1,000,000 | | | 5.000%, 7/1/2037 | | | 1,125,840 | |
| | | | University of Nebraska Lincoln Student Fees and Fac. Rev. Refg. | | | | |
| | 3,050,000 | | | 5.000%, 7/1/2038 | | | 3,422,222 | |
| | | | University of Nebraska Student Housing Rev. | | | | |
| | 1,680,000 | | | 5.000%, 5/15/2040, Ser. B | | | 1,830,310 | |
| | | | | |
| | | | Total | | | 12,863,518 | |
| | | | | |
| |
| New Hampshire (0.2%) | | | | |
| | | | New Hampshire State Turnpike System Rev. Refg. | | | | |
| | 1,000,000 | | | 5.000%, 2/1/2017, Ser. B | | | 1,097,230 | |
| | 2,000,000 | | | 5.000%, 10/1/2019 | | | 2,329,840 | |
| | | | | |
| | | | Total | | | 3,427,070 | |
| | | | | |
| |
| New Jersey (1.2%) | | | | |
| | | | Hudson County, NJ Refg. C.O.P. (NATL-RE Insured) | | | | |
| | 2,000,000 | | | 6.250%, 12/1/2015b | | | 2,122,140 | |
| | | | New Jersey Educational Fac. Auth. Rev. Refg. (Kean University) | | | | |
| | 1,000,000 | | | 5.500%, 9/1/2036, Ser. A | | | 1,125,770 | |
| | | | New Jersey G.O. (AMBAC Insured) | | | | |
| | 1,000,000 | | | 5.250%, 7/15/2018, Ser. Lb | | | 1,147,080 | |
| | | | New Jersey Transportation Trust Fund Auth. Rev. | | | | |
| | 1,500,000 | | | 5.000%, 6/15/2026, Ser. A | | | 1,672,935 | |
| | | | New Jersey Transportation Trust Fund Auth. Transportation System Rev. (AGM Insured) | | | | |
| | 5,000,000 | | | 5.500%, 12/15/2016, Ser. Ab | | | 5,494,250 | |
| | | | New Jersey Turnpike Auth. Turnpike Rev. (AMBAC-TCRS Insured) | | | | |
| | 485,000 | | | 6.500%, 1/1/2016, Ser. Cb | | | 518,896 | |
| | 260,000 | | | 6.500%, 1/1/2016, Ser. Ca,b | | | 278,486 | |
| | 1,285,000 | | | 6.500%, 1/1/2016, Ser. Ca,b | | | 1,306,871 | |
| | 260,000 | | | 6.500%, 1/1/2016, Ser. Ca,b | | | 278,642 | |
| | | | Ocean County, NJ Utilities Auth. Waste Water Rev. (NATL-RE Insured) | | | | |
| | 3,180,000 | | | 5.250%, 1/1/2025b | | | 3,982,632 | |
| | | | | |
| | | | Total | | | 17,927,702 | |
| | | | | |
| |
| New Mexico (0.8%) | | | | |
| | | | Jicarilla, NM Apache Nation Rev. | | | | |
| | 3,500,000 | | | 5.500%, 9/1/2023, Ser. A* | | | 3,504,795 | |
| | | | Sandoval County, NM Incentive Payment Refg. Rev. | | | | |
| | 9,000,000 | | | 5.000%, 6/1/2020a | | | 9,248,490 | |
| | | | | |
| | | | Total | | | 12,753,285 | |
| | | | | |
| |
| New York (6.9%) | | | | |
| | | | City Of New York G.O. | | | | |
| | 1,920,000 | | | 5.000%, 8/1/2032, Ser. A | | | 2,252,755 | |
| | | | Metropolitan Transportation Auth. State Service Contract Refg. | | | | |
| | 5,000,000 | | | 5.500%, 7/1/2017, Ser. A | | | 5,635,950 | |
| | | | New York City G.O. | | | | |
| | 40,000 | | | 5.250%, 8/1/2017 | | | 40,144 | |
| | | | New York City Municipal Water Finance Auth. Water and Sewer System Rev. | | | | |
| | 11,155,000 | | | 5.750%, 6/15/2040, Ser. A | | | 12,861,938 | |
| | 3,250,000 | | | 5.375%, 6/15/2043, Ser. EE | | | 3,820,700 | |
| | | | New York City Transitional Finance Auth. Future Tax Secured Rev. | | | | |
| | 12,505,000 | | | 5.000%, 11/1/2021 | | | 15,085,407 | |
| | 15,000,000 | | | 5.000%, 11/1/2033, Ser. D-1 | | | 17,245,650 | |
| | | | New York City Trust for Cultural Resources Refg. Rev. (The Museum of Modern Art) | | | | |
| | 2,030,000 | | | 5.000%, 4/1/2017, Ser. A | | | 2,247,636 | |
| | | | New York State Dormitory Auth. State Personal Income Tax Rev. | | | | |
| | 5,125,000 | | | 5.000%, 2/15/2029, Ser. A | | | 5,824,357 | |
| | 5,000,000 | | | 5.000%, 3/15/2039, Ser. C | | | 5,722,850 | |
| | | | New York State Dormitory Auth. State University Educational Fac. Rev. | | | | |
| | 5,000,000 | | | 5.875%, 5/15/2017, Ser. A | | | 5,500,350 | |
| | | | New York State Liberty Development Corporation Liberty Rev. | | | | |
| | 10,000,000 | | | 5.250%, 12/15/2043 | | | 11,369,200 | |
| | | | New York State Local Government Assistance Corporation Refg. (NATL-RE-IBC Insured) | | | | |
| | 2,000,000 | | | 5.250%, 4/1/2016, Ser. Eb | | | 2,082,420 | |
| | | | New York State Urban Development Corporation State Personal Income Tax Rev. (State Fac. and Equipment) | | | | |
| | 3,870,000 | | | 5.000%, 3/15/2036, Ser. B-1 | | | 4,333,549 | |
| | | | Port Auth. of New York & New Jersey Rev. | | | | |
| | 2,500,000 | | | 5.000%, 9/1/2035 | | | 2,913,275 | |
| | 2,500,000 | | | 5.000%, 9/1/2036 | | | 2,901,775 | |
| | 5,000,000 | | | 5.000%, 9/1/2039 | | | 5,753,200 | |
| | | | Port Authority of New York and New Jersey Consolidated Rev. | | | | |
| | 1,125,000 | | | 5.000%, 12/1/2024, AMT | | | 1,335,938 | |
| | | | | |
| | | | Total | | | 106,927,094 | |
| | | | | |
| |
| North Carolina (2.0%) | | | | |
| | | | North Carolina Capital Fac. Finance Agency Rev. Refg. (Johnson and Wales University) | | | | |
| | 1,000,000 | | | 5.000%, 4/1/2032 | | | 1,123,090 | |
| | 1,000,000 | | | 5.000%, 4/1/2033 | | | 1,119,200 | |
The accompanying Notes to Financial Statements are an integral part of this schedule.
236
MUNICIPAL BOND FUND
Schedule of Investments as of October 31, 2014
| | | | | | | | |
Principal Amount | | | Long-Term Fixed Income (98.8%) | | Value | |
| North Carolina (2.0%) - continued | | | | |
| | | | North Carolina Eastern Municipal Power Agency Power System Rev. | | | | |
| | $7,190,000 | | | 5.250%, 1/1/2020, Ser. A | | | $8,077,030 | |
| | 2,580,000 | | | 5.000%, 1/1/2021, Ser. A | | | 3,004,978 | |
| | 2,000,000 | | | 5.000%, 1/1/2026, Ser. B | | | 2,254,240 | |
| | 1,475,000 | | | 6.000%, 1/1/2026, Ser. Aa | | | 1,901,732 | |
| | | | North Carolina Eastern Municipal Power Agency Power System Rev. Refg. | | | | |
| | 2,500,000 | | | 5.000%, 1/1/2017, Ser. D | | | 2,719,425 | |
| | | | North Carolina Municipal Power Agency No. 1 Catawba Electric Rev. | | | | |
| | 3,200,000 | | | 5.000%, 1/1/2025, Ser. A | | | 3,667,616 | |
| | 1,250,000 | | | 5.000%, 1/1/2030, Ser. A | | | 1,409,438 | |
| | | | Raleigh Durham, NC Airport Auth. Rev. | | | | |
| | 4,895,000 | | | 5.000%, 5/1/2036, Ser. A | | | 5,415,779 | |
| | | | | |
| | | | Total | | | 30,692,528 | |
| | | | | |
| |
| North Dakota (0.4%) | | | | |
| | | | North Dakota Public Finance Auth. Rev. (State Revolving Fund) | | | | |
| | 1,495,000 | | | 5.000%, 10/1/2031, Ser. A | | | 1,722,464 | |
| | | | Ward County, ND Health Care Fac. Refg. Rev. (Trinity) | | | | |
| | 2,315,000 | | | 6.250%, 7/1/2021, Ser. B | | | 2,318,912 | |
| | | | Ward County, ND Health Care Fac. Rev. (Trinity) | | | | |
| | 2,895,000 | | | 5.125%, 7/1/2025 | | | 2,953,045 | |
| | | | | |
| | | | Total | | | 6,994,421 | |
| | | | | |
| |
| Ohio (4.6%) | | | | |
| | | | AMP Fremont Energy Center Rev. | | | | |
| | 3,000,000 | | | 5.000%, 2/15/2037, Ser. B | | | 3,290,790 | |
| | | | Buckeye Tobacco Settlement Financing Auth. Rev. | | | | |
| | 16,920,000 | | | 5.125%, 6/1/2024, Ser. A-2 | | | 14,096,898 | |
| | | | City of Toledo, OH Water System Rev. Improvements and Refg. | | | | |
| | 2,500,000 | | | 5.000%, 11/15/2038 | | | 2,817,600 | |
| | | | County of Fairfield, OH Hospital Rev. Refg. and Improvement (Fairfield Medical Center) | | | | |
| | 3,470,000 | | | 5.250%, 6/15/2043 | | | 3,687,014 | |
| | | | Cuyahoga County G.O. Capital Improvement and Refg. | | | | |
| | 2,540,000 | | | 5.000%, 12/1/2021, Ser. A | | | 2,992,730 | |
| | | | Kent State University General Receipts Rev. | | | | |
| | 350,000 | | | 5.000%, 5/1/2017, Ser. A | | | 384,510 | |
| | 1,500,000 | | | 5.000%, 5/1/2037, Ser. A | | | 1,673,235 | |
| | | | Lucas County, OH Health Care System Refg. Rev. (Sunset Retirement Communities) | | | | |
| | 1,250,000 | | | 5.125%, 8/15/2025 | | | 1,385,075 | |
| | 1,750,000 | | | 5.500%, 8/15/2030 | | | 1,947,190 | |
| | | | Miami University OH Rev. | | | | |
| | 1,600,000 | | | 5.000%, 9/1/2036 | | | 1,780,368 | |
| | | | Ohio Higher Educational Fac. Commission Rev. (Case Western Reserve University) | | | | |
| | 2,000,000 | | | 6.500%, 10/1/2020, Ser. B | | | 2,308,500 | |
| | | | Ohio Higher Educational Fac. Commission Rev. (Kenyon College) | | | | |
| | 4,740,000 | | | 5.250%, 7/1/2044 | | | 5,172,193 | |
| | | | Ohio Hospital Rev. (Cleveland Clinic Health System Obligated Group) | | | | |
| | 5,000,000 | | | 5.000%, 1/1/2034 | | | 5,747,050 | |
| | | | Ohio State Turnpike Commission Rev. | | | | |
| | 8,000,000 | | | Zero Coupon, 2/15/2034d | | | 6,410,240 | |
| | | | Ohio Turnpike Commission Turnpike Rev. Refg. (NATL-RE Insured) | | | | |
| | 2,000,000 | | | 5.500%, 2/15/2024, Ser. Ab | | | 2,495,880 | |
| | 10,000,000 | | | 5.500%, 2/15/2026, Ser. Ab | | | 12,661,700 | |
| | | | Port of Greater Cincinnati Development Auth. Economic Development Rev. (Sisters of Mercy of the Americas, Regional Community of
Cincinnati) | | | | |
| | 1,750,000 | | | 5.000%, 10/1/2025 | | | 1,864,275 | |
| | | | | |
| | | | Total | | | 70,715,248 | |
| | | | | |
| |
| Oklahoma (0.7%) | | | | |
| | | | | | | | |
| | | | Grand River, OK Dam Authority Rev. | | | | |
| | 4,000,000 | | | 5.000%, 6/1/2039, Ser. A | | | 4,561,200 | |
| | | | Oklahoma Agricultural and Mechanical Colleges General Rev. | | | | |
| | 3,000,000 | | | 5.000%, 8/1/2038, Ser. C | | | 3,350,490 | |
| | | | Oklahoma Municipal Power Auth. Power Supply System Rev. | | | | |
| | 1,620,000 | | | 6.000%, 1/1/2038, Ser. Aa | | | 1,819,795 | |
| | | | Oklahoma State Turnpike Auth. | | | | |
| | 500,000 | | | 5.000%, 1/1/2028, Ser. A | | | 569,970 | |
| | | | | |
| | | | Total | | | 10,301,455 | |
| | | | | |
| |
| Oregon (0.2%) | | | | |
| | | | Clackamas County, OR Hospital Fac. Auth. Rev. (Legacy Health Systems) | | | | |
| | 300,000 | | | 5.500%, 7/15/2035, Ser. A | | | 332,322 | |
| | | | Salem-Keizer School District No. 24J, Marion and Polk Counties, OR G.O. | | | | |
| | 5,000,000 | | | Zero Coupon, 6/15/2028, Ser. B | | | 3,126,300 | |
| | | | | |
| | | | Total | | | 3,458,622 | |
| | | | | |
| |
| Pennsylvania (3.8%) | | | | |
| | | | Allegheny County Hospital Development Auth. Rev. (University of Pittsburgh Medical Center) | | | | |
| | 3,000,000 | | | 5.000%, 6/15/2018, Ser. B | | | 3,425,670 | |
| | 2,100,000 | | | 5.625%, 8/15/2039 | | | 2,379,552 | |
| | | | Beaver County Industrial Development Auth. Pollution Control Rev. Refg. (FirstEnergy Generation) | | | | |
| | 3,000,000 | | | 2.700%, 4/1/2035, Ser. Ac | | | 3,056,880 | |
| | 5,000,000 | | | 2.500%, 12/1/2041, Ser. Bc | | | 5,100,450 | |
| | | | Cornwall-Lebanon School District, Lebanon County, PA G.O. Notes (AGM Insured) | | | | |
| | 2,000,000 | | | Zero Coupon, 3/15/2016b | | | 1,956,560 | |
| | 1,520,000 | | | Zero Coupon, 3/15/2017b | | | 1,455,324 | |
| | | | Cumberland County Municipal Auth. Rev. (Diakon Lutheran Social Ministries) | | | | |
| | 2,750,000 | | | 5.000%, 1/1/2027 | | | 2,847,542 | |
| | 2,065,000 | | | 6.125%, 1/1/2029 | | | 2,262,786 | |
| | 2,455,000 | | | 5.000%, 1/1/2036 | | | 2,501,031 | |
The accompanying Notes to Financial Statements are an integral part of this schedule.
237
MUNICIPAL BOND FUND
Schedule of Investments as of October 31, 2014
| | | | | | | | |
Principal Amount | | | Long-Term Fixed Income (98.8%) | | Value | |
| Pennsylvania (3.8%) - continued | |
| | | | Lycoming County Auth. Health System Rev. (Susquehanna Health System) | | | | |
| | $7,075,000 | | | 5.750%, 7/1/2039, Ser. A | | | $7,620,695 | |
| | | | Pennsylvania Economic Development Financing Auth. Unemployment Compensation Rev. | | | | |
| | 3,000,000 | | | 5.000%, 7/1/2020, Ser. B | | | 3,517,620 | |
| | | | Pennsylvania Turnpike Commission Turnpike Rev. (AGM Insured) | | | | |
| | 9,860,000 | | | Zero Coupon, 6/1/2033, Ser. Cb,d | | | 11,551,286 | |
| | 10,070,000 | | | 6.250%, 6/1/2038, Ser. Cb | | | 11,489,568 | |
| | | | | |
| | | | Total | | | 59,164,964 | |
| | | | | |
|
| South Carolina (2.6%) | |
| | | | Charleston County, SC Airport System Rev. | | | | |
| | 6,215,000 | | | 5.500%, 7/1/2031, Ser. A, AMT | | | 7,096,101 | |
| | | | County of Charleston, SC G.O. Transportation Sales Tax Refg. | | | | |
| | 10,005,000 | | | 5.000%, 11/1/2021 | | | 12,186,690 | |
| | | | Greenwood County, SC Hospital Fac. Refg. Rev. | | | | |
| | 1,120,000 | | | 5.000%, 10/1/2024, Ser. B | | | 1,293,454 | |
| | 2,890,000 | | | 5.000%, 10/1/2031, Ser. B | | | 3,234,546 | |
| | | | Greenwood County, SC Hospital Fac. Rev. (Self Regional Healthcare) | | | | |
| | 2,250,000 | | | 5.375%, 10/1/2039 | | | 2,477,992 | |
| | | | Piedmont, SC Municipal Power Agency Electric Rev. (NATL-RE Insured) | | | | |
| | 4,000,000 | | | 6.250%, 1/1/2021b | | | 4,961,520 | |
| | | | South Carolina Public Service Auth. Rev. Obligations (Santee Cooper) | | | | |
| | 3,855,000 | | | 5.500%, 1/1/2038, Ser. A | | | 4,395,317 | |
| | | | South Carolina State Public Service Auth. Rev. | | | | |
| | 4,500,000 | | | 5.000%, 12/1/2049, Ser. A | | | 4,948,785 | |
| | | | | |
| | | | Total | | | 40,594,405 | |
| | | | | |
|
| South Dakota (0.3%) | |
| | | | South Dakota Board Of Regents Housing & Auxiliary Fac. System Rev. | | | | |
| | 1,000,000 | | | 5.000%, 4/1/2033 | | | 1,160,960 | |
| | | | South Dakota Health and Educational Fac. Auth. Rev. (Regional Health) | | | | |
| | 1,000,000 | | | 5.000%, 9/1/2023 | | | 1,127,130 | |
| | 820,000 | | | 5.000%, 9/1/2025 | | | 934,702 | |
| | | | South Dakota Health and Educational Fac. Auth. Rev. (Sanford Health) | | | | |
| | 1,250,000 | | | 5.500%, 11/1/2040 | | | 1,377,962 | |
| | | | | |
| | | | Total | | | 4,600,754 | |
| | | | | |
|
| Tennessee (0.6%) | |
| | | | Jackson, TN Hospital Rev. Refg. and Improvement (Jackson-Madison County General Hospital) | | | | |
| | 2,060,000 | | | 5.625%, 4/1/2038 | | | 2,272,407 | |
| | 3,450,000 | | | 5.750%, 4/1/2041 | | | 3,810,214 | |
| | | | Tennessee State School Bond Auth. Rev. (2nd Program) | | | | |
| | 500,000 | | | 5.000%, 11/1/2031 | | | 600,095 | |
| | 450,000 | | | 5.000%, 11/1/2032 | | | 537,912 | |
| | 1,275,000 | | | 5.000%, 11/1/2034 | | | 1,511,831 | |
| | 250,000 | | | 5.000%, 11/1/2036 | | | 294,060 | |
| | | | | |
| | | | Total | | | 9,026,519 | |
| | | | | |
|
| Texas (11.2%) | |
| | | | Alliance Airport Auth., Inc. Special Fac. Rev. Refg. (Federal Express Corporation) | | | | |
| | 10,425,000 | | | 4.850%, 4/1/2021, AMT | | | 10,771,318 | |
| | | | Amarillo Health Fac. Corporation Hospital Rev. (Baptist St. Anthony’s Hospital Corporation) (AGM Insured) | | | | |
| | 2,000,000 | | | 5.500%, 1/1/2017a,b | | | 2,217,320 | |
| | | | Bexar County Housing Finance Corporation Multifamily Housing Rev. (Dymaxion and Marbach Park Apartments) (NATL-RE Insured) | | | | |
| | 1,930,000 | | | 6.000%, 8/1/2023, Ser. Ab | | | 1,927,201 | |
| | | | Clifton Higher Education Finance Corporation Education Rev. (Uplift Education) | | | | |
| | 4,000,000 | | | 6.250%, 12/1/2045, Ser. A | | | 4,606,360 | |
| | | | Clifton, TX Higher Education Finance Corporation Education Rev. (IDEA Public Schools) | | | | |
| | 1,000,000 | | | 5.000%, 8/15/2042 | | | 1,072,440 | |
| | 2,000,000 | | | 6.000%, 8/15/2043 | | | 2,358,380 | |
| | | | Clifton, TX Higher Education Finance Corporation Education Rev. (IDEA Public Schools) (PSF-GTD Insured) | | | | |
| | 2,605,000 | | | 5.000%, 8/15/2039b | | | 2,958,420 | |
| | | | Dallas and Fort Worth, TX International Airport Rev. Refg. | | | | |
| | 4,000,000 | | | 5.250%, 11/1/2033, Ser. F | | | 4,649,720 | |
| | | | Dallas Independent School District, Dallas County, TX Unlimited Tax School Building G.O. (PSF-GTD Insured) | | | | |
| | 10,000,000 | | | 6.375%, 2/15/2034a,b | | | 11,828,500 | |
| | | | Harris County Health Fac. Development Corporation Hospital Rev. Refg. (Memorial Hermann Healthcare System) | | | | |
| | 2,015,000 | | | 7.250%, 12/1/2035, Ser. Ba | | | 2,521,793 | |
| | | | Harris County Industrial Development Corporation Pollution Control Rev. (Exxon) | | | | |
| | 4,000,000 | | | 0.060%, 3/1/2024c | | | 4,000,000 | |
| | 1,400,000 | | | 0.060%, 3/1/2024c | | | 1,400,000 | |
| | | | Harris County, TX G.O. and Rev. Refg. (NATL-RE Insured) | | | | |
| | 7,000,000 | | | Zero Coupon, 8/15/2024b | | | 5,458,600 | |
| | | | Harris County, TX Toll Road Rev. Refg.Harris County, TX Toll Road Rev. Refg. | | | | |
| | 6,500,000 | | | 5.250%, 8/15/2047, Ser. B | | | 7,174,895 | |
| | | | Houston, TX Water and Sewer System Rev. Refg. (AGM Insured) | | | | |
| | 10,000,000 | | | 5.750%, 12/1/2032, Ser. Aa,b | | | 14,428,600 | |
| | | | Lewisville Independent School District, Denton County, TX Unlimited Tax School Building and Refg. (PSF-GTD Insured) | | | | |
| | 5,315,000 | | | Zero Coupon, 8/15/2019b | | | 4,972,289 | |
The accompanying Notes to Financial Statements are an integral part of this schedule.
238
MUNICIPAL BOND FUND
Schedule of Investments as of October 31, 2014
| | | | | | | | |
Principal Amount | | | Long-Term Fixed Income (98.8%) | | Value | |
| Texas (11.2%) - continued | | | | |
| | | | Lower Colorado River Auth. Rev. Refg. (AGM Insured) | | | | |
| | $215,000 | | | 5.875%, 5/15/2015, Ser. Ab | | | $215,869 | |
| | | | New Hope Cultural Education Facilities Corporation, TX Student Housing Rev. (Collegiate Housing College Station I LLC - Texas A&M University) | | | | |
| | 1,000,000 | | | 5.000%, 4/1/2029, Ser. A | | | 1,107,470 | |
| | | | North East Independent School District, Bexar County, TX Unlimited Tax Refg. (PSF-GTD Insured) | | | | |
| | 5,000,000 | | | 5.250%, 2/1/2028b | | | 6,443,400 | |
| | 2,000,000 | | | 5.250%, 2/1/2029b | | | 2,593,980 | |
| | | | North Texas Education Finance Corporation Education Rev. (Uplift Education) | | | | |
| | 4,500,000 | | | 5.125%, 12/1/2042, Ser. A | | | 4,839,975 | |
| | | | North Texas Tollway Auth. Rev. | | | | |
| | 5,000,000 | | | 5.000%, 1/1/2042, Ser. B | | | 5,424,750 | |
| | | | North Texas Tollway Auth. Rev. (Special Proj. System) | | | | |
| | 15,000,000 | | | 5.000%, 9/1/2030, Ser. D | | | 17,256,900 | |
| | | | North Texas Tollway Auth. System Rev. Refg. | | | | |
| | 1,000,000 | | | 5.625%, 1/1/2033, Ser. A | | | 1,107,380 | |
| | | | North Texas Tollway Auth. System Rev. Refg. (AGM Insured) | | | | |
| | 5,000,000 | | | Zero Coupon, 1/1/2028, Ser. Db | | | 3,078,800 | |
| | | | Northside Independent School District School Building G.O. (PSF-GTD Insured) | | | | |
| | 4,865,000 | | | 1.350%, 6/1/2033b,c | | | 4,892,147 | |
| | | | Northwest Independent School District G.O. (PSF-GTD Insured) | | | | |
| | 5,705,000 | | | 5.000%, 2/15/2038b | | | 6,637,882 | |
| | | | Pharr, TX Higher Education Finance Auth. Education Rev. (Idea Public Schools) | | | | |
| | 2,500,000 | | | 6.250%, 8/15/2029, Ser. A | | | 2,918,400 | |
| | 2,000,000 | | | 6.500%, 8/15/2039, Ser. A | | | 2,323,820 | |
| | | | San Juan Higher Education Finance Auth. Education Rev. (IDEA Public Schools) | | | | |
| | 2,000,000 | | | 6.700%, 8/15/2040, Ser. A | | | 2,394,440 | |
| | | | San Leanna Education Fac. Corporation Higher Education Rev. (Saint Edward’s University) | | | | |
| | 1,160,000 | | | 5.125%, 6/1/2024 | | | 1,234,785 | |
| | 1,000,000 | | | 5.125%, 6/1/2027 | | | 1,052,970 | |
| | | | Socorro, TX Independent School District G.O. Refg. (PSF-GTD Insured) | | | | |
| | 2,000,000 | | | 5.000%, 8/15/2034b | | | 2,253,600 | |
| | | | Southeast Texas Housing Finance Corporation Single Family Mortgage Rev. (NATL-RE Insured) | | | | |
| | 11,615,000 | | | Zero Coupon, 9/1/2017a,b | | | 11,362,606 | |
| | | | Southwest Higher Education Auth., Inc., Higher Education Rev. (Southern Methodist University) | | | | |
| | 1,700,000 | | | 5.000%, 10/1/2041 | | | 1,888,547 | |
| | | | Tarrant County Cultural Education Fac. Finance Corporation Hospital Rev. (Hendrick Medical Center) (AGM Insured) | | | | |
| | 1,250,000 | | | 5.250%, 9/1/2026, Ser. Bb | | | 1,401,575 | |
| | 2,000,000 | | | 5.250%, 9/1/2027, Ser. Bb | | | 2,234,820 | |
| | 1,000,000 | | | 5.250%, 9/1/2028, Ser. Bb | | | 1,114,540 | |
| | | | Tarrant County Cultural Education Fac. Finance Corporation Refg. Rev. (Texas Health Resources System) | | | | |
| | 2,000,000 | | | 5.000%, 2/15/2023, Ser. A | | | 2,177,800 | |
| | | | Texas College Student Loan G.O. | | | | |
| | 1,900,000 | | | 5.000%, 8/1/2017, AMT | | | 2,121,236 | |
| | | | Texas Transportation Commission Central Texas Turnpike System Rev. Refg. | | | | |
| | 2,000,000 | | | 1.250%, 8/15/2042, Ser. Bc | | | 2,004,540 | |
| | | | | |
| | | | Total | | | 172,428,068 | |
| | | | | |
| |
| Utah (1.1%) | | | | |
| | | | Riverton, UT Hospital Rev. | | | | |
| | 3,010,000 | | | 5.000%, 8/15/2041 | | | 3,288,575 | |
| | | | Utah Associated Municipal Power Systems Rev. Refg. (Central-St. George Transmission) | | | | |
| | 6,000,000 | | | 5.250%, 12/1/2027 | | | 6,711,540 | |
| | | | Utah County, UT Hospital Rev. (IHC Health Services, Inc.) | | | | |
| | 3,175,000 | | | 5.000%, 5/15/2043 | | | 3,505,295 | |
| | 1,610,000 | | | 5.000%, 5/15/2045, Ser. A | | | 1,819,542 | |
| | | | Utah State Charter School Finance Auth. Charter School Rev. (North Davis Preparatory) | | | | |
| | 1,000,000 | | | 6.250%, 7/15/2030 | | | 1,083,320 | |
| | | | | |
| | | | Total | | | 16,408,272 | |
| | | | | |
| |
| Virginia (1.5%) | | | | |
| | | | Fairfax County, VA Industrial Development Auth. Health Care Rev. (Inova Health System) | | | | |
| | 1,000,000 | | | 5.000%, 5/15/2025, Ser. C | | | 1,148,870 | |
| | | | Fairfax County, VA Industrial Development Auth. Hospital Rev. Refg. (Inova Health System Hospitals) | | | | |
| | 2,510,000 | | | 5.250%, 8/15/2019 | | | 2,828,218 | |
| | | | Virginia Commonwealth Transportation Board Rev. | | | | |
| | 10,000,000 | | | 5.000%, 5/15/2034 | | | 11,490,600 | |
| | | | Virginia Port Auth. Port Fac. Rev. | | | | |
| | 2,000,000 | | | 5.000%, 7/1/2040 | | | 2,187,980 | |
| | | | Virginia Small Business Financing Auth. Rev. (Elizabeth River Crossings Opco, LLC) | | | | |
| | 4,500,000 | | | 6.000%, 1/1/2037, AMT | | | 5,113,620 | |
| | | | | |
| | | | Total | | | 22,769,288 | |
| | | | | |
| |
| Washington (4.7%) | | | | |
| | | | Franklin County, WA Pasco School District No. 1 U.T.G.O. (NATL-RE Insured) | | | | |
| | 6,000,000 | | | 5.250%, 12/1/2022a,b | | | 6,458,580 | |
The accompanying Notes to Financial Statements are an integral part of this schedule.
239
MUNICIPAL BOND FUND
Schedule of Investments as of October 31, 2014
| | | | | | | | |
Principal Amount | | | Long-Term Fixed Income (98.8%) | | Value | |
| Washington (4.7%) - continued | | | | |
| | | | FYI Properties Lease Rev. (State of Washington DIS) | | | | |
| | $2,555,000 | | | 5.500%, 6/1/2034 | | | $2,893,640 | |
| | | | Port of Seattle Special Fac. Rev. Refg. (Seatac Fuel Fac., LLC) | | | | |
| | 670,000 | | | 5.000%, 6/1/2019, AMT | | | 762,427 | |
| | 1,000,000 | | | 5.000%, 6/1/2020, AMT | | | 1,150,030 | |
| | | | Snohomish County, WA Edmonds School District No. 15 | | | | |
| | 1,000,000 | | | 5.000%, 12/1/2033 | | | 1,184,510 | |
| | | | State of Washington Various Purpose G.O. | | | | |
| | 5,390,000 | | | 5.000%, 8/1/2021, Ser. A | | | 6,502,604 | |
| | 12,095,000 | | | 5.000%, 8/1/2030, Ser. A | | | 14,278,147 | |
| | | | Tobacco Settlement Auth. WA Rev. Refg. | | | | |
| | 3,645,000 | | | 5.000%, 6/1/2024 | | | 3,725,081 | |
| | | | Washington Economic Development Finance Auth. Lease Rev. (Washington Biomedical Research Properties II) (NATL-RE Insured) | | | | |
| | 5,620,000 | | | 5.000%, 6/1/2030a,b | | | 5,906,901 | |
| | | | Washington G.O. | | | | |
| | 1,140,000 | | | 6.750%, 2/1/2015, Ser. A | | | 1,158,103 | |
| | | | Washington G.O. (AGM Insured) | | | | |
| | | | 5.000%, 7/1/2021, Ser. | | | | |
| | 5,000,000 | | | 2007Aa,b | | | 5,381,700 | |
| | | | Washington Health Care Fac. Auth. Rev. | | | | |
| | 2,625,000 | | | 5.250%, 12/1/2030a | | | 3,137,006 | |
| | 5,000,000 | | | 5.250%, 10/1/2032, Ser. A | | | 5,653,250 | |
| | | | Washington Health Care Fac. Auth. Rev. (Seattle Cancer Care Alliance) | | | | |
| | 5,010,000 | | | 7.375%, 3/1/2038a | | | 6,357,640 | |
| | | | Washington Higher Education Fac. Auth. Refg. Rev. (Gonzaga University) | | | | |
| | 5,325,000 | | | 5.000%, 4/1/2029, Ser. B | | | 5,837,318 | |
| | | | Washington Higher Education Fac. Auth. Rev. and Refg. Rev. (Whitworth University) | | | | |
| | 1,290,000 | | | 5.875%, 10/1/2034 | | | 1,464,898 | |
| | 1,000,000 | | | 5.625%, 10/1/2040 | | | 1,074,000 | |
| | | | | |
| | | | Total | | | 72,925,835 | |
| | | | | |
| |
| Wisconsin (0.9%) | | | | |
| | | | Kaukauna, WI Electric System Rev. (AGM Insured) | | | | |
| | 3,000,000 | | | 5.000%, 12/15/2035, Ser. Ab | | | 3,302,910 | |
| | | | Monroe, WI Redevelopment Auth. Rev. (Monroe Clinic, Inc.) | | | | |
| | 3,520,000 | | | 5.875%, 2/15/2039 | | | 3,868,339 | |
| | | | Wisconsin Health and Educational Fac. Auth. Rev. (Marquette University) | | | | |
| | 1,125,000 | | | 5.000%, 10/1/2033, Ser. B-1 | | | 1,230,705 | |
| | | | Wisconsin Health and Educational Fac. Auth. Rev. (Thedacare, Inc.) | | | | |
| | 5,310,000 | | | 5.500%, 12/15/2038, Ser. A | | | 5,980,069 | |
| | | | | |
| | | | Total | | | 14,382,023 | |
| | | | | |
| |
| Wyoming (1.1%) | | | | |
| | | | Kemmerer, WY Pollution Control Rev. (Exxon) | | | | |
| | 2,900,000 | | | 0.060%, 11/1/2014c | | | 2,900,000 | |
| | | | Lincoln County, WY Pollution Control Rev. (Exxon) | | | | |
| | 4,355,000 | | | 0.060%, 11/1/2014, Ser. Dc | | | 4,355,000 | |
| | | | Lincoln County, Wyoming Pollution Control Revenue Bonds (Exxon) | | | | |
| | 1,200,000 | | | 0.060%, 11/1/2014, Series Bc | | | 1,200,000 | |
| | | | Wyoming Municipal Power Agency Power Supply System Rev. | | | | |
| | 3,270,000 | | | 5.375%, 1/1/2042, Ser. A | | | 3,565,935 | |
| | | | Wyoming State Farm Loan Board Capital Fac. Refg. Rev. | | | | |
| | 4,485,000 | | | 5.750%, 10/1/2020 | | | 4,882,550 | |
| | | | | |
| | | | Total | | | 16,903,485 | |
| | | | | |
| | | | Total Long-Term Fixed Income (cost $1,395,125,291) | | | 1,525,009,021 | |
| | | | | |
| | | | | |
| | | | | |
| | | | Total Investments (cost $1,395,125,291) 98.8% | | | $1,525,009,021 | |
| | | | | |
| | | | Other Assets and Liabilities, Net 1.2% | | | 18,525,056 | |
| | | | | |
| | | | Total Net Assets 100.0% | | | $1,543,534,077 | |
| | | | | |
a | Denotes securities that have been pre-refunded or escrowed to maturity. Under such an arrangement, money is deposited into an irrevocable escrow account and is used to purchase U.S. Treasury securities or government agency securities with maturing principal and interest earnings sufficient to pay all debt service requirements of the pre-refunded bonds. |
b | To reduce certain risks associated with securities issued by municipalities, which may include but are not limited to economic development in a specific industry or municipality, the principal and/or interest payments are guaranteed by the bond insurance company or government agency identified. |
c | Denotes variable rate securities. Variable rate securities are securities whose yields vary with a designated market index or market rate. The rate shown is as of October 31, 2014. |
d | Denotes step coupon securities. Step coupon securities pay an initial coupon rate for the first period and then different coupon rates for following periods. The rate shown is as of October 31, 2014. |
* | Denotes restricted securities. Restricted securities are investment securities which have been deemed illiquid and cannot be offered for public sale without first being registered under the Securities Act of 1933. The following table indicates the acquisition date and cost of restricted securities Municipal Bond Fund owned as of October 31, 2014. |
| | | | | | |
Security | | Acquisition
Date | | Cost | |
Jicarilla, NM Apache Nation Rev., 9/1/2023 | | 10/23/2003 | | | $3,531,800 | |
The accompanying Notes to Financial Statements are an integral part of this schedule.
240
MUNICIPAL BOND FUND
Schedule of Investments as of October 31, 2014
Definitions:
| | | | |
| ACA | | - | | American Capital Access Holding, Ltd. |
| AGM | | - | | Assured Guaranty Municipal Corporation |
| AMBAC | | - | | American Municipal Bond Insurance Corporation |
| AMT | | - | | Subject to Alternative Minimum Tax |
| Auth. | | - | | Authority |
| CR | | - | | Custodial Receipts |
| C.O.P. | | - | | Certificate of Participation |
| Fac. | | - | | Facility/Facilities |
| FGIC | | - | | Financial Guaranty Insurance Company |
| FHA | | - | | Federal Housing Administration |
| FNMA | | - | | Federal National Mortgage Association |
| GNMA | | - | | Government National Mortgage Association |
| G.O. | | - | | General Obligation |
| IBC | | - | | Insured Bond Certificate |
| NATL-RE | | - | | National Public Finance Guarantee Corporation |
| Proj. | | - | | Project |
| PSF-GTD | | - | | Permanent School Fund Guarantee Program |
| Q-SBLF | | - | | Qualified School Bond Loan Fund |
| Refg. | | - | | Refunding |
| Rev. | | - | | Revenue |
| Ser. | | - | | Series |
| U.T.G.O. | | - | | Unlimited Tax General Obligation |
| VA MTGS | | - | | Department of Veterans’ Affairs - Mortgages |
| XLCA | | - | | XL Capital Assurance |
Unrealized Appreciation (Depreciation)
Gross unrealized appreciation and depreciation of investments, based on cost for federal income tax purposes, were as follows:
| | | | |
Gross unrealized appreciation | | | $132,046,711 | |
Gross unrealized depreciation | | | (2,162,981 | ) |
| | | | |
Net unrealized appreciation (depreciation) | | | $129,883,730 | |
| |
Cost for federal income tax purposes | | | $1,395,125,291 | |
Fair Valuation Measurements
The following table is a summary of the inputs used, as of October 31, 2014, in valuing Municipal Bond Fund’s assets carried at fair value.
| | | | | | | | | | | | | | | | |
| | | | |
Investments in Securities | | Total | | | Level 1 | | | Level 2 | | | Level 3 | |
| | | | |
Long-Term Fixed Income Education | | | 203,035,489 | | | | – | | | | 203,035,489 | | | | – | |
Electric Revenue | | | 48,793,487 | | | | – | | | | 48,793,487 | | | | – | |
Escrowed/Pre-refunded | | | 152,134,516 | | | | – | | | | 152,134,516 | | | | – | |
General Obligation | | | 262,790,758 | | | | – | | | | 262,790,758 | | | | – | |
Health Care | | | 173,002,936 | | | | – | | | | 173,002,936 | | | | – | |
Housing Finance | | | 5,536,217 | | | | – | | | | 5,536,217 | | | | – | |
Industrial Development Revenue | | | 43,923,364 | | | | – | | | | 43,923,364 | | | | – | |
Other Revenue | | | 236,488,140 | | | | – | | | | 236,488,140 | | | | – | |
Tax Revenue | | | 58,421,431 | | | | – | | | | 58,421,431 | | | | – | |
Transportation | | | 265,716,427 | | | | – | | | | 265,716,427 | | | | – | |
Water & Sewer | | | 75,166,256 | | | | – | | | | 75,166,256 | | | | – | |
| |
Total | | | $1,525,009,021 | | | | $– | | | | $1,525,009,021 | | | | $– | |
| |
There were no significant transfers between Levels during the period ended October 31, 2014. Transfers between Levels are identified as of the end of the period.
The accompanying Notes to Financial Statements are an integral part of this schedule.
241
GOVERNMENT BOND FUND
Schedule of Investments as of October 31, 2014
| | | | | | | | |
Principal Amount | | | Long-Term Fixed Income (98.7%) | | Value | |
| Asset-Backed Securities (1.8%) | | | | |
| | | | Education Loan Asset-Backed Trust I | | | | |
| | $44,814 | | | 0.602%, 6/25/2022a,b | | | $44,805 | |
| | | | Northstar Education Finance, Inc. | | | | |
| | 754,991 | | | 0.852%, 12/26/2031a,b | | | 758,260 | |
| | | | U.S. Small Business Administration | | | | |
| | 998,996 | | | 3.191%, 3/10/2024 | | | 1,033,041 | |
| | | | | |
| | | | Total | | | 1,836,106 | |
| | | | | |
| |
| Collateralized Mortgage Obligations (0.5%) | | | | |
| | | | NCUA Guaranteed Notes | | | | |
| | 486,076 | | | 0.603%, 10/7/2020b | | | 489,034 | |
| | | | | |
| | | | Total | | | 489,034 | |
| | | | | |
| |
| Commercial Mortgage-Backed Securities (1.4%) | | | | |
| | | | Federal Home Loan Mortgage Corporation Multi Family Structured Pass Thru Certificates | | | | |
| | 418,195 | | | 0.727%, 12/25/2016 | | | 417,491 | |
| | | | Federal National Mortgage Association | | | | |
| | 766,531 | | | 0.953%, 11/25/2015 | | | 768,356 | |
| | | | Government National Mortgage Association | | | | |
| | 182,219 | | | 2.164%, 3/16/2033 | | | 182,956 | |
| | 43,533 | | | 3.214%, 1/16/2040 | | | 43,794 | |
| | | | | |
| | | | Total | | | 1,412,597 | |
| | | | | |
| |
| Energy (0.5%) | | | | |
| | | | Petroleos Mexicanos | | | | |
| | 500,000 | | | 2.378%, 4/15/2025 | | | 498,557 | |
| | | | | |
| | | | Total | | | 498,557 | |
| | | | | |
| |
| Financials (4.3%) | | | | |
| | | | Achmea Hypotheekbank NV | | | | |
| | 608,000 | | | 3.200%, 11/3/2014a | | | 608,000 | |
| | | | National Bank of Canada | | | | |
| | 500,000 | | | 2.200%, 10/19/2016a | | | 511,696 | |
| | | | North American Development Bank | | | | |
| | 500,000 | | | 2.300%, 10/10/2018 | | | 507,764 | |
| | | | Private Export Funding Corporation | | | | |
| | 1,000,000 | | | 1.375%, 2/15/2017 | | | 1,011,580 | |
| | 1,000,000 | | | 2.050%, 11/15/2022 | | | 946,727 | |
| | | | SpareBank 1 Boligkreditt AS | | | | |
| | 500,000 | | | 1.250%, 5/2/2018a | | | 493,648 | |
| | | | USAA Capital Corporation | | | | |
| | 350,000 | | | 2.125%, 6/3/2019a | | | 349,866 | |
| | | | | |
| | | | Total | | | 4,429,281 | |
| | | | | |
| |
| Foreign Government (5.9%) | | | | |
| | | | Bank of England | | | | |
| | 1,000,000 | | | 0.875%, 3/17/2017a | | | 1,001,454 | |
| | | | European Investment Bank | | | | |
| | 1,000,000 | | | 2.125%, 10/15/2021 | | | 998,250 | |
| | | | Export Development Canada | | | | |
| | 1,000,000 | | | 0.750%, 12/15/2017 | | | 987,872 | |
| | | | Hashemite Kingdom of Jordan | | | | |
| | 500,000 | | | 2.503%, 10/30/2020 | | | 506,846 | |
| | | | Inter-American Development Bank | | | | |
| | 1,000,000 | | | 0.875%, 3/15/2018 | | | 988,375 | |
| | $500,000 | | | 3.000%, 10/4/2023 | | | 527,337 | |
| | 600,000 | | | 4.375%, 1/24/2044 | | | 694,534 | |
| | | | Kommunalbanken AS | | | | |
| | 340,000 | | | 1.500%, 10/22/2019 a | | | 332,982 | |
| | | | | |
| | | | Total | | | 6,037,650 | |
| | | | | |
| |
| Mortgage-Backed Securities (6.1%) | | | | |
| | | | Federal Home Loan Mortgage Corporation Gold 15-Yr. Pass Through | | | | |
| | 350,000 | | | 3.000%, 11/1/2029c | | | 362,414 | |
| | | | Federal Home Loan Mortgage Corporation Gold 30-Yr. Pass Through | | | | |
| | 350,000 | | | 4.000%, 11/1/2044c | | | 371,301 | |
| | | | Federal National Mortgage Association Conventional 15-Yr. Pass Through | | | | |
| | 1,175,000 | | | 3.500%, 11/1/2029c | | | 1,241,460 | |
| | | | Federal National Mortgage Association Conventional 30-Yr. Pass Through | | | | |
| | 1,400,000 | | | 3.500%, 11/1/2044c | | | 1,447,687 | |
| | 1,125,000 | | | 4.000%, 11/1/2044c | | | 1,194,434 | |
| | 1,550,000 | | | 4.500%, 11/1/2044c | | | 1,679,812 | |
| | | | | |
| | | | Total | | | 6,297,108 | |
| | | | | |
| |
| Technology (0.5%) | | | | |
| | | | Micron Semiconductor Asia Pte, Ltd. | | | | |
| | 540,000 | | | 1.258%, 1/15/2019 | | | 538,864 | |
| | | | | |
| | | | Total | | | 538,864 | |
| | | | | |
| |
| U.S. Government and Agencies (76.7%) | | | | |
| | | | Federal Agricultural Mortgage Corporation | | | | |
| | 1,000,000 | | | 2.000%, 7/27/2016 | | | 1,025,306 | |
| | | | Federal Farm Credit Bank | | | | |
| | 500,000 | | | 2.210%, 8/1/2024 | | | 483,981 | |
| | | | Federal Home Loan Bank | | | | |
| | 5,575,000 | | | 0.875%, 5/24/2017 | | | 5,570,752 | |
| | | | Federal Home Loan Mortgage Corporation | | | | |
| | 1,000,000 | | | 1.250%, 8/1/2019 | | | 978,935 | |
| | 1,000,000 | | | 1.250%, 10/2/2019 | | | 975,336 | |
| | 3,000,000 | | | 2.375%, 1/13/2022 | | | 3,019,047 | |
| | | | Federal National Mortgage Association | | | | |
| | 1,500,000 | | | 1.000%, 9/27/2017 | | | 1,498,995 | |
| | 5,950,000 | | | 0.875%, 5/21/2018 | | | 5,857,519 | |
| | 2,000,000 | | | 1.875%, 2/19/2019 | | | 2,026,016 | |
| | 6,000,000 | | | 2.625%, 9/6/2024 | | | 5,975,904 | |
| | 1,250,000 | | | 6.250%, 5/15/2029 | | | 1,708,626 | |
| | | | Tennessee Valley Authority | | | | |
| | 1,225,000 | | | 5.250%, 9/15/2039 | | | 1,512,814 | |
| | | | U.S. Treasury Bonds | | | | |
| | 850,000 | | | 6.500%, 11/15/2026 | | | 1,203,945 | |
| | | | U.S. Treasury Bonds, TIPS | | | | |
| | 3,045,390 | | | 0.125%, 4/15/2019 | | | 3,066,802 | |
| | 347,022 | | | 2.375%, 1/15/2025 | | | 411,520 | |
| | 357,669 | | | 2.125%, 2/15/2040 | | | 454,407 | |
| | 1,579,020 | | | 0.750%, 2/15/2042 | | | 1,493,161 | |
The accompanying Notes to Financial Statements are an integral part of this schedule.
242
GOVERNMENT BOND FUND
Schedule of Investments as of October 31, 2014
| | | | | | | | |
Principal Amount | | | Long-Term Fixed Income (98.7%) | | Value | |
| U.S. Government and Agencies (76.7%) - continued | | | | |
| | | | U.S. Treasury Notes | | | | |
| | $425,000 | | | 0.625%, 10/15/2016 | | | $425,963 | |
| | 500,000 | | | 3.250%, 3/31/2017 | | | 530,312 | |
| | 50,000 | | | 0.750%, 6/30/2017 | | | 49,910 | |
| | 1,650,000 | | | 0.875%, 7/15/2017 | | | 1,652,449 | |
| | 2,000,000 | | | 0.750%, 2/28/2018 | | | 1,974,688 | |
| | 1,000,000 | | | 2.375%, 6/30/2018 | | | 1,039,922 | |
| | 500,000 | | | 1.250%, 10/31/2018 | | | 497,695 | |
| | 5,500,000 | | | 1.750%, 9/30/2019 | | | 5,536,526 | |
| | 1,000,000 | | | 1.125%, 4/30/2020 | | | 966,094 | |
| | 1,700,000 | | | 1.875%, 6/30/2020 | | | 1,706,375 | |
| | 9,000,000 | | | 2.000%, 7/31/2020 | | | 9,092,808 | |
| | 1,000,000 | | | 2.250%, 7/31/2021 | | | 1,014,609 | |
| | 1,500,000 | | | 2.125%, 9/30/2021 | | | 1,508,438 | |
| | 2,830,000 | | | 1.625%, 8/15/2022 | | | 2,727,192 | |
| | 3,800,000 | | | 1.750%, 5/15/2023 | | | 3,657,500 | |
| | 2,500,000 | | | 2.500%, 8/15/2023 | | | 2,551,367 | |
| | 1,750,000 | | | 3.625%, 2/15/2044 | | | 1,942,091 | |
| | | | U.S. Treasury Notes, TIPS | | | | |
| | 919,573 | | | 0.125%, 1/15/2022 | | | 906,713 | |
| | 3,859,260 | | | 0.125%, 1/15/2023 | | | 3,777,552 | |
| | | | | |
| | | | Total | | | 78,821,270 | |
| | | | | |
| |
| Utilities (1.0%) | | | | |
| | | | John Sevier Combined Cycle Generation, LLC | | | | |
| | 966,973 | | | 4.626%, 1/15/2042 | | | 1,065,667 | |
| | | | | |
| | | | Total | | | 1,065,667 | |
| | | | | |
| | | | | | | | |
| | | | | |
| | | | Total Long-Term Fixed Income (cost $100,148,113) | | | 101,426,134 | |
| | | | | |
| | |
Shares or
Principal
Amount | | | Short-Term Investments (7.1%)d | | Value | |
| | | | Thrivent Cash Management Trust | | | | |
| | 7,267,598 | | | 0.050% | | | 7,267,598 | |
| | | | | |
| | | | Total Short-Term Investments (at amortized cost) | | | 7,267,598 | |
| | | | | |
| | | | Total Investments (cost $107,415,711) 105.8% | | | $108,693,732 | |
| | | | | |
| | | | Other Assets and Liabilities, Net (5.8%) | | | (5,920,109 | ) |
| | | | | |
| | | | Total Net Assets 100.0% | | | $102,773,623 | |
| | | | | |
a | Denotes securities sold under Rule 144A of the Securities Act of 1933, which exempts them from registration. These securities have been deemed liquid and may be resold to other dealers in the program or to other qualified institutional buyers. As of October 31, 2014, the value of these investments was $4,100,711 or 4.0% of total net assets. |
b | Denotes variable rate securities. Variable rate securities are securities whose yields vary with a designated market index or market rate. The rate shown is as of October 31, 2014. |
c | Denotes investments purchased on a when-issued or delayed delivery basis. |
d | The interest rate shown reflects the yield, coupon rate or the discount rate at the date of purchase. |
Definitions:
TIPS - Treasury Inflation Protected Security.
Unrealized Appreciation (Depreciation)
Gross unrealized appreciation and depreciation of investments, based on cost for federal income tax purposes. were as follows:
| | | | |
Gross unrealized appreciation | | | $2,056,669 | |
Gross unrealized depreciation | | | (778,648 | ) |
| | | | |
Net unrealized appreciation (depreciation) | | | $1,278,021 | |
| | | | |
| |
Cost for federal income tax purposes | | | $107,415,711 | |
The accompanying Notes to Financial Statements are an integral part of this schedule.
243
GOVERNMENT BOND FUND
Schedule of Investments as of October 31, 2014
Fair Valuation Measurements
The following table is a summary of the inputs used, as of October 31, 2014, in valuing Government Bond Fund’s assets carried at fair value.
| | | | | | | | | | | | | | | | |
Investments in Securities | | Total | | | Level 1 | | | Level 2 | | | Level 3 | |
| | | | |
Long-Term Fixed Income | | | | | | | | | | | | | | | | |
Asset-Backed Securities | | | 1,836,106 | | | | – | | | | 1,836,106 | | | | – | |
Collateralized Mortgage Obligations | | | 489,034 | | | | – | | | | 489,034 | | | | – | |
Commercial Mortgage-Backed Securities | | | 1,412,597 | | | | – | | | | 1,412,597 | | | | – | |
Energy | | | 498,557 | | | | – | | | | 498,557 | | | | – | |
Financials | | | 4,429,281 | | | | – | | | | 4,429,281 | | | | – | |
Foreign Government | | | 6,037,650 | | | | – | | | | 6,037,650 | | | | – | |
Mortgage-Backed Securities | | | 6,297,108 | | | | – | | | | 6,297,108 | | | | – | |
Technology | | | 538,864 | | | | – | | | | 538,864 | | | | – | |
U.S. Government and Agencies | | | 78,821,270 | | | | – | | | | 78,821,270 | | | | – | |
Utilities | | | 1,065,667 | | | | – | | | | 1,065,667 | | | | – | |
Short-Term Investments | | | 7,267,598 | | | | 7,267,598 | | | | – | | | | – | |
| |
Total | | | $108,693,732 | | | | $7,267,598 | | | | $101,426,134 | | | | $– | |
| |
There were no significant transfers between Levels during the period ended October 31, 2014. Transfers between Levels are identified as of the end of the period.
The following table summarizes the net realized gains/(losses) and Statement of Operations location, for the period ended October 31, 2014, for Government Bond Fund’s investments in financial derivative instruments by primary risk exposure.
| | | | | | |
Derivatives by risk category | | Statement of Operations Location | | Realized Gains/(Losses)
recognized in Income | |
Equity Contracts | | | | | | |
Options Written | | Net realized gains/(losses) on Written option contracts | | | 4,760 | |
Options Purchased | | Net realized gains/(losses) on Investments | | | (40,841 | ) |
Total Equity Contracts | | | | | (36,081 | ) |
Total | | | | | ($36,081 | ) |
The following table presents Government Bond Fund’s average volume of derivative activity during the period ended October 31, 2014.
| | | | |
Derivative Risk Category | | Options
(Contracts) | |
Equity Contracts | | | 11 | |
Investment in Affiliates
Affiliated issuers, as defined under the Investment Company Act of 1940, include those in which the Fund’s holdings of an issuer represent 5% or more of the outstanding voting securities of an issuer, or any affiliated mutual fund.
A summary of transactions for the fiscal year to date, in Government Bond Fund, is as follows:
| | | | | | | | | | | | | | | | | | | | | | | | |
Fund | | Value
October 31, 2013 | | | Gross Purchases | | | Gross Sales | | | Shares Held at
October 31, 2014 | | | Value
October 31, 2014 | | | Income Earned
November 1, 2013 - October 31, 2014 | |
Cash Management Trust-Collateral
Investment | | | $6,897,500 | | | | $38,725,465 | | | | $45,622,965 | | | | – | | | | $– | | | | $11,988 | |
Cash Management Trust-Short Term
Investment | | | 5,744,452 | | | | 36,896,440 | | | | 35,373,294 | | | | 7,267,598 | | | | 7,267,598 | | | | 4,111 | |
Total Value and Income Earned | | | 12,641,952 | | | | | | | | | | | | | | | | 7,267,598 | | | | 16,099 | |
The accompanying Notes to Financial Statements are an integral part of this schedule.
244
LIMITED MATURITY BOND FUND
Schedule of Investments as of October 31, 2014
| | | | | | | | |
Principal Amount | | | Bank Loans (4.9%)a | | Value | |
| Basic Materials (0.2%) | | | | |
| | | | Fortescue Metals Group, Ltd., Term Loan | | | | |
| | $869,006 | | | 3.750%, 6/30/2019 | | | $846,985 | |
| | | | Ineos Group Holdings, Ltd., Term Loan | | | | |
| | 922,421 | | | 3.750%, 5/4/2018 | | | 909,738 | |
| | | | | |
| | | | Total | | | 1,756,723 | |
| | | | | |
| |
| Capital Goods (0.3%) | | | | |
| | | | ADS Waste Holdings, Inc., Term Loan | | | | |
| | 919,749 | | | 3.750%, 10/9/2019 | | | 899,284 | |
| | | | Berry Plastics Group, Inc., Term Loan | | | | |
| | 699,350 | | | 3.500%, 2/8/2020 | | | 684,055 | |
| | | | Rexnord, LLC, Term Loan | | | | |
| | 554,400 | | | 4.000%, 8/21/2020 | | | 546,222 | |
| | | | Silver II Borrower, Term Loan | | | | |
| | 530,578 | | | 4.000%, 12/13/2019 | | | 520,853 | |
| | | | | |
| | | | Total | | | 2,650,414 | |
| | | | | |
| |
| Communications Services (1.8%) | | | | |
| | | | Cincinnati Bell, Inc., Term Loan | | | | |
| | 277,200 | | | 4.000%, 9/10/2020 | | | 272,579 | |
| | | | Clear Channel Communications, Inc., Term Loan | | | | |
| | 4,473 | | | 3.804%, 1/29/2016 | | | 4,432 | |
| | 755,234 | | | 6.904%, 1/30/2019 | | | 711,929 | |
| | 170,532 | | | 7.654%, 7/30/2019 | | | 163,764 | |
| | | | Fairpoint Communications, Term Loan | | | | |
| | 222,179 | | | 7.500%, 2/14/2019 | | | 223,708 | |
| | | | Grande Communications Networks, LLC, Term Loan | | | | |
| | 701,130 | | | 4.500%, 5/29/2020 | | | 693,684 | |
| | | | Hargray Communications Group, Inc., Term Loan | | | | |
| | 923,312 | | | 5.250%, 6/26/2019 | | | 921,392 | |
| | | | Integra Telecom Holdings, Inc., Term Loan | | | | |
| | 896,844 | | | 5.250%, 2/22/2019 | | | 893,032 | |
| | | | Intelsat Jackson Holdings SA, Term Loan | | | | |
| | 826,076 | | | 3.750%, 6/30/2019 | | | 818,848 | |
| | | | Level 3 Communications, Inc., Term Loan | | | | |
| | 225,000 | | | 4.000%, 8/1/2019 | | | 223,499 | |
| | 340,000 | | | 4.000%, 1/15/2020 | | | 338,300 | |
| | | | LTS Buyer, LLC, Term Loan | | | | |
| | 553,000 | | | 4.000%, 4/13/2020 | | | 546,087 | |
| | | | McGraw-Hill Global Education, LLC, Term Loan | | | | |
| | 637,239 | | | 5.750%, 3/22/2019 | | | 637,838 | |
| | | | NEP/NCP Holdco, Inc., Term Loan | | | | |
| | 699,390 | | | 4.250%, 1/22/2020 | | | 681,905 | |
| | | | NTelos, Inc., Term Loan | | | | |
| | 552,947 | | | 5.750%, 11/9/2019 | | | 552,024 | |
| | | | Puerto Rico Cable Acquisition Company, Inc., Term Loan | | | | |
| | 1,213,447 | | | 5.500%, 7/31/2018 | | | 1,204,346 | |
| | | | TNS, Inc., Term Loan | | | | |
| | 857,044 | | | 5.000%, 2/14/2020 | | | 847,942 | |
| | | | Univision Communications, Inc., Term Loan | | | | |
| | 896,895 | | | 4.000%, 3/1/2020 | | | 887,182 | |
| | | | Virgin Media Investment Holdings, Ltd., Term Loan | | | | |
| | 910,000 | | | 3.500%, 6/7/2020 | | | 896,605 | |
| | | | WideOpenWest Finance, LLC, Term Loan | | | | |
| | 896,844 | | | 4.750%, 4/1/2019 | | | 895,301 | |
| | | | WMG Acquisition Corporation, Term Loan | | | | |
| | 702,900 | | | 3.750%, 7/1/2020 | | | 679,943 | |
| | | | Yankee Cable Acquisition, LLC, Term Loan | | | | |
| | 868,628 | | | 4.500%, 3/1/2020 | | | 863,634 | |
| | | | Zayo Group, LLC, Term Loan | | | | |
| | 894,997 | | | 4.000%, 7/2/2019 | | | 886,468 | |
| | | | | |
| | | | Total | | | 14,844,442 | |
| | | | | |
| |
| Consumer Cyclical (0.9%) | | | | |
| | | | Bally Technologies, Inc., Term Loan | | | | |
| | 216,276 | | | 4.250%, 11/25/2020 | | | 215,331 | |
| | | | Booz Allen Hamilton, Inc., Term Loan | | | | |
| | 281,137 | | | 3.750%, 7/31/2019 | | | 279,644 | |
| | | | Burlington Coat Factory Warehouse Corporation, Term Loan | | | | |
| | 533,970 | | | 4.250%, 8/13/2021 | | | 530,232 | |
| | | | Ceridian Corporation, Term Loan | | | | |
| | 544,862 | | | 4.121%, 5/9/2017 | | | 544,045 | |
| | 544,862 | | | 4.500%, 5/9/2017 | | | 539,926 | |
| | | | Chrysler Group, LLC, Term Loan | | | | |
| | 699,160 | | | 3.500%, 5/24/2017 | | | 695,084 | |
| | | | J.C. Penney Corporation, Inc., Term Loan | | | | |
| | 923,312 | | | 6.000%, 5/22/2018 | | | 911,005 | |
| | | | MGM Resorts International, Term Loan | | | | |
| | 777,557 | | | 3.500%, 12/20/2019 | | | 767,838 | |
| | | | ROC Finance, LLC, Term Loan | | | | |
| | 702,900 | | | 5.000%, 6/20/2019 | | | 671,930 | |
| | | | Scientific Games International, Inc., Term Loan | | | | |
| | 927,988 | | | 4.250%, 10/18/2020 | | | 907,395 | |
| | | | Seminole Hard Rock Entertainment, Inc., Term Loan | | | | |
| | 350,562 | | | 3.500%, 5/14/2020 | | | 342,237 | |
| | | | Seminole Indian Tribe of Florida, Term Loan | | | | |
| | 635,450 | | | 3.000%, 4/29/2020 | | | 632,673 | |
| | | | Toys “R” Us, Inc., Term Loan | | | | |
| | 136,056 | | | 5.250%, 5/25/2018 | | | 108,674 | |
| | | | | |
| | | | Total | | | 7,146,014 | |
| | | | | |
| |
| Consumer Non-Cyclical (0.6%) | | | | |
| | | | Albertsons, Inc., Term Loan | | | | |
| | 936,138 | | | 4.750%, 3/21/2019 | | | 933,797 | |
| | | | Biomet, Inc., Term Loan | | | | |
| | 1,045,842 | | | 3.652%, 7/25/2017 | | | 1,042,517 | |
| | | | Del Monte Corporation, Term Loan | | | | |
| | 110,968 | | | 3.500%, 3/9/2020 | | | 106,600 | |
| | | | JBS USA, LLC, Term Loan | | | | |
| | 492,252 | | | 3.750%, 5/25/2018 | | | 484,868 | |
The accompanying Notes to Financial Statements are an integral part of this schedule.
245
LIMITED MATURITY BOND FUND
Schedule of Investments as of October 31, 2014
| | | | | | | | |
Principal Amount | | | Bank Loans (4.9%)a | | Value | |
| | Consumer Non-Cyclical (0.6%) - continued | | | | |
| | | | Roundy’s Supermarkets, Inc., Term Loan | | | | |
| | $432,072 | | | 5.750%, 3/3/2021 | | | $383,464 | |
| | | | Supervalu, Inc., Term Loan | | | | |
| | 1,392,930 | | | 4.500%, 3/21/2019 | | | 1,374,028 | |
| | | | Visant Corporation, Term Loan | | | | |
| | 389,181 | | | 7.000%, 9/23/2021 | | | 383,343 | |
| | | | | |
| | | | Total | | | 4,708,617 | |
| | | | | |
| |
| Energy (0.2%) | | | | |
| | | | Arch Coal, Inc., Term Loan | | | | |
| | 552,943 | | | 6.250%, 5/16/2018 | | | 487,380 | |
| | | | Offshore Group Investment, Ltd., Term Loan | | | | |
| | 349,675 | | | 5.750%, 3/28/2019 | | | 316,456 | |
| | | | Pacific Drilling SA, Term Loan | | | | |
| | 898,625 | | | 4.500%, 6/3/2018 | | | 859,032 | |
| | | | | |
| | | | Total | | | 1,662,868 | |
| | | | | |
| |
| Financials (0.2%) | | | | |
| | | | Harland Clarke Holdings Corporation, Term Loan | | | | |
| | 905,781 | | | 7.000%, 5/22/2018 | | | 914,087 | |
| | | | WaveDivision Holdings, LLC, Term Loan | | | | |
| | 697,575 | | | 4.000%, 10/15/2019 | | | 690,306 | |
| | | | | |
| | | | Total | | | 1,604,393 | |
| | | | | |
| |
| Technology (0.4%) | | | | |
| | | | BMC Software, Inc., Term Loan | | | | |
| | 1,077,500 | | | 5.000%, 9/10/2020 | | | 1,065,044 | |
| | | | First Data Corporation, Term Loan | | | | |
| | 935,000 | | | 3.653%, 3/23/2018 | | | 925,650 | |
| | | | Freescale Semiconductor, Inc., Term Loan | | | | |
| | 896,895 | | | 4.250%, 2/28/2020 | | | 883,764 | |
| | | | SunGard Data Systems, Inc., Term Loan | | | | |
| | 305,092 | | | 4.000%, 3/8/2020 | | | 303,695 | |
| | | | | |
| | | | Total | | | 3,178,153 | |
| | | | | |
| |
| Transportation (0.1%) | | | | |
| | | | American Airlines, Inc., Term Loan | | | | |
| | 1,036,875 | | | 3.750%, 6/27/2019 | | | 1,022,618 | |
| | | | | |
| | | | Total | | | 1,022,618 | |
| | | | | |
| |
| Utilities (0.2%) | | | | |
| | | | Calpine Corporation, Term Loan | | | | |
| | 697,354 | | | 4.000%, 4/1/2018 | | | 694,083 | |
| | 158,800 | | | 4.000%, 10/31/2020 | | | 157,212 | |
| | | | Intergen NV, Term Loan | | | | |
| | 898,625 | | | 5.500%, 6/15/2020 | | | 896,378 | |
| | | | | |
| | | | Total | | | 1,747,673 | |
| | | | | |
| | | | | | | | |
| | | | | |
| | | | Total Bank Loans (cost $40,910,856) | | | 40,321,915 | |
| | | | | |
| | |
Principal Amount | | | Long-Term Fixed Income (90.4%) | | Value | |
| Asset-Backed Securities (13.7%) | | | | |
| | | | American Homes 4 Rent | | | | |
| | $2,683,933 | | | 1.250%, 6/17/2031d,e | | | $2,662,365 | |
| | | | BA Credit Card Trust | | | | |
| | 3,850,000 | | | 0.533%, 6/15/2021e | | | 3,846,882 | |
| | | | Bayview Opportunity Master Fund Trust IIB, LP | | | | |
| | 1,871,832 | | | 3.228%, 7/28/2034* | | | 1,876,970 | |
| | | | Capital One Multi-Asset Execution Trust | | | | |
| | 2,250,000 | | | 1.260%, 1/15/2020 | | | 2,257,562 | |
| | | | Chase Issuance Trust | | | | |
| | 5,200,000 | | | 1.150%, 1/15/2019 | | | 5,214,934 | |
| | | | Chesapeake Funding, LLC | | | | |
| | 1,221,500 | | | 0.603%, 5/7/2024d,e | | | 1,223,375 | |
| | 1,761,424 | | | 0.603%, 1/7/2025d,e | | | 1,759,215 | |
| | | | Citibank Credit Card Issuance Trust | | | | |
| | 4,275,000 | | | 1.020%, 2/22/2019 | | | 4,269,199 | |
| | | | Countrywide Home Loans, Inc. | | | | |
| | 296,615 | | | 6.085%, 6/25/2021f | | | 295,034 | |
| | | | Credit Based Asset Servicing and Securitization, LLC | | | | |
| | 732,374 | | | 3.766%, 12/25/2036 | | | 505,120 | |
| | | | Edlinc Student Loan Funding Trust | | | | |
| | 2,009,865 | | | 3.160%, 10/1/2025*,e | | | 2,034,989 | |
| | | | Education Loan Asset-Backed Trust I | | | | |
| | 627,391 | | | 0.602%, 6/25/2022d,e | | | 627,262 | |
| | | | Enterprise Fleet Financing, LLC | | | | |
| | 705,198 | | | 0.720%, 4/20/2018d | | | 705,557 | |
| | | | First Franklin Mortgage Loan Asset-Backed Certificates | | | | |
| | 86,028 | | | 5.500%, 3/25/2036 | | | 1 | |
| | | | Ford Credit Auto Owner Trust | | | | |
| | 2,875,000 | | | 2.260%, 11/15/2025d | | | 2,890,105 | |
| | | | FRS, LLC | | | | |
| | 2,799,808 | | | 1.800%, 4/15/2043* | | | 2,789,776 | |
| | | | GMAC Mortgage Corporation Loan Trust | | | | |
| | 464,063 | | | 0.332%, 8/25/2035e,f | | | 406,976 | |
| | 554,822 | | | 5.750%, 10/25/2036f | | | 527,644 | |
| | 966,981 | | | 0.332%, 12/25/2036e,f | | | 840,176 | |
| | | | GoldenCredit Card Trust | | | | |
| | 4,800,000 | | | 0.403%, 2/15/2018d,e | | | 4,798,114 | |
| | 1,500,000 | | | 0.583%, 9/15/2018d,e | | | 1,503,693 | |
| | | | GoldenTree Loan Opportunities IX, Ltd. | | | | |
| | 3,000,000 | | | 1.829%, 10/29/2026*,c,e | | | 2,982,528 | |
| | | | Great America Leasing Receivables | | | | |
| | 2,000,000 | | | 0.780%, 6/15/2016d | | | 2,002,240 | |
| | | | J.P. Morgan Mortgage Trust | | | | |
| | 884,382 | | | 2.693%, 2/25/2036 | | | 795,896 | |
| | | | Master Credit Card Trust | | | | |
| | 7,000,000 | | | 0.780%, 4/21/2017d | | | 7,005,677 | |
| | | | Mortgage Equity Conversion Asset Trust | | | | |
| | 1,987,350 | | | 0.600%, 1/25/2042*,e | | | 1,689,248 | |
| | 2,019,957 | | | 0.580%, 2/25/2042*,e | | | 1,615,965 | |
| | | | Motor plc | | | | |
| | 3,477,633 | | | 0.632%, 8/25/2021d,e | | | 3,481,551 | |
| | | | Nationstar Agency Advance Funding Trust | | | | |
| | 2,800,000 | | | 0.997%, 2/15/2045d | | | 2,797,956 | |
The accompanying Notes to Financial Statements are an integral part of this schedule.
246
LIMITED MATURITY BOND FUND
Schedule of Investments as of October 31, 2014
| | | | | | | | |
Principal Amount | | | Long-Term Fixed Income (90.4%) | | Value | |
| Asset-Backed Securities (13.7%) - continued | | | | |
| | | | Northstar Education Finance, Inc. | | | | |
| | $3,019,966 | | | 0.852%, 12/26/2031d,e | | | $3,033,040 | |
| | | | OZLM VIII, Ltd. | | | | |
| | 3,050,000 | | | 1.715%, 10/17/2026*,e | | | 3,017,338 | |
| | | | Penarth Master Issuer plc | | | | |
| | 4,500,000 | | | 0.547%, 11/18/2017d,e | | | 4,501,417 | |
| | | | Renaissance Home Equity Loan Trust | | | | |
| | 1,514,685 | | | 5.608%, 5/25/2036g | | | 1,056,956 | |
| | 730,517 | | | 5.285%, 1/25/2037g | | | 420,445 | |
| | | | Selene Non-Performing Loans, LLC | | | | |
| | 1,983,954 | | | 2.981%, 5/25/2054* | | | 1,966,152 | |
| | | | SLM Student Loan Trust | | | | |
| | 1,000,680 | | | 0.304%, 4/27/2020e | | | 1,000,274 | |
| | 888,351 | | | 1.253%, 12/15/2021d,e | | | 891,406 | |
| | 1,425,965 | | | 0.304%, 4/25/2022e | | | 1,424,576 | |
| | 1,454,007 | | | 0.753%, 8/15/2022d,e | | | 1,455,605 | |
| | 2,094,157 | | | 0.903%, 10/16/2023d,e | | | 2,100,213 | |
| | 1,415,999 | | | 0.552%, 3/25/2025e | | | 1,415,976 | |
| | 3,922,833 | | | 0.672%, 3/25/2026e | | | 3,947,605 | |
| | 1,800,000 | | | 1.203%, 5/17/2027d,e | | | 1,811,086 | |
| | | | U.S. Residential Opportunity Fund Trust | | | | |
| | 1,299,781 | | | 3.466%, 3/25/2034* | | | 1,301,149 | |
| | | | Vericrest Opportunity Loan Transferee | | | | |
| | 756,797 | | | 3.625%, 3/25/2054* | | | 759,563 | |
| | 3,766,010 | | | 3.125%, 4/27/2054d | | | 3,766,165 | |
| | 2,167,164 | | | 3.250%, 11/25/2053d | | | 2,170,265 | |
| | 783,856 | | | 3.625%, 11/25/2053* | | | 785,093 | |
| | 1,880,906 | | | 3.625%, 11/25/2053d | | | 1,891,970 | |
| | | | Wachovia Asset Securitization, Inc. | | | | |
| | 608,979 | | | 0.292%, 7/25/2037*,e,f | | | 535,321 | |
| | | | World Financial Network Credit Card Master Trust | | | | |
| | 1,800,000 | | | 0.533%, 12/15/2019e | | | 1,801,179 | |
| | 4,000,000 | | | 0.910%, 3/16/2020 | | | 4,004,408 | |
| | | | World Omni Auto Receivables Trust | | | | |
| | 1,250,000 | | | 1.330%, 1/15/2018 | | | 1,259,254 | |
| | | | World Omni Master Owner Trust | | | | |
| | 3,600,000 | | | 0.503%, 2/15/2018d,e | | | 3,603,301 | |
| | | | | |
| | | | Total | | | 113,325,767 | |
| | | | | |
| |
| Basic Materials (0.8%) | | | | |
| | | | Dow Chemical Company | | | | |
| | 1,500,000 | | | 2.500%, 2/15/2016 | | | 1,531,276 | |
| | | | Freeport-McMoRan Copper & Gold, Inc. | | | | |
| | 1,000,000 | | | 2.375%, 3/15/2018 | | | 1,005,349 | |
| | | | Goldcorp, Inc. | | | | |
| | 1,000,000 | | | 3.625%, 6/9/2021 | | | 1,001,440 | |
| | | | Kinross Gold Corporation | | | | |
| | 900,000 | | | 5.950%, 3/15/2024d | | | 860,754 | |
| | | | Mosaic Company | | | | |
| | 500,000 | | | 4.250%, 11/15/2023 | | | 524,466 | |
| | | | Xstrata Finance Canada, Ltd. | | | | |
| | 1,950,000 | | | 2.700%, 10/25/2017d | | | 1,985,601 | |
| | | | | |
| | | | Total | | | 6,908,886 | |
| | | | | |
| |
| Capital Goods (0.4%) | | | | |
| | | | Precision Castparts Corporation | | | | |
| | 1,600,000 | | | 1.250%, 1/15/2018 | | | 1,587,096 | |
| | | | Roper Industries, Inc. | | | | |
| | 1,600,000 | | | 1.850%, 11/15/2017 | | | 1,611,485 | |
| | | | Textron, Inc. | | | | |
| | 350,000 | | | 3.875%, 3/1/2025c | | | 350,599 | |
| | | | | |
| | | | Total | | | 3,549,180 | |
| | | | | |
| |
| Collateralized Mortgage Obligations (8.6%) | | | | |
| | | | Alm Loan Funding CLO | | | | |
| | 3,050,000 | | | 1.664%, 10/17/2026*,e | | | 3,015,664 | |
| | | | American Home Mortgage Assets Trust | | | | |
| | 1,271,560 | | | 1.035%, 11/25/2046e | | | 691,129 | |
| | | | Apidos CLO XVIII | | | | |
| | 3,000,000 | | | 1.646%, 7/22/2026*,e | | | 2,964,489 | |
| | | | Babson CLO, Ltd. | | | | |
| | 3,050,000 | | | 1.656%, 10/17/2026*,e | | | 3,009,457 | |
| | | | BCAP, LLC Trust | | | | |
| | 1,443,362 | | | 0.332%, 3/25/2037e | | | 1,165,014 | |
| | | | Bear Stearns Adjustable Rate Mortgage Trust | | | | |
| | 567,225 | | | 2.430%, 10/25/2035e | | | 558,318 | |
| | | | Birchwood Park CLO, Ltd. | | | | |
| | 3,050,000 | | | 1.674%, 7/15/2026*,e | | | 3,016,895 | |
| | | | BlueMountain CLO, Ltd. | | | | |
| | 3,050,000 | | | 1.480%, 10/15/2026*,e | | | 3,022,355 | |
| | | | Carlyle Global Market Strategies CLO, Ltd. | | | | |
| | 3,000,000 | | | 1.531%, 7/20/2023*,e | | | 2,973,160 | |
| | 3,000,000 | | | 1.733%, 10/15/2026*,e | | | 2,976,391 | |
| | | | Cent CLO 16, LP | | | | |
| | 3,050,000 | | | 1.710%, 8/1/2024*,e | | | 3,021,918 | |
| | | | Cent CLO 22, Ltd. | | | | |
| | 3,000,000 | | | 1.713%, 11/7/2026*,e | | | 2,987,859 | |
| | | | Countrywide Alternative Loan Trust | | | | |
| | 464,183 | | | 5.500%, 11/25/2035 | | | 465,893 | |
| | 378,027 | | | 5.500%, 2/25/2036 | | | 351,281 | |
| | 538,797 | | | 6.000%, 1/25/2037 | | | 488,936 | |
| | | | Countrywide Home Loans, Inc. | | | | |
| | 771,932 | | | 2.466%, 3/20/2036 | | | 642,306 | |
| | 746,170 | | | 2.362%, 9/20/2036 | | | 621,711 | |
| | | | Deutsche Alt-A Securities Mortgage Loan Trust | | | | |
| | 1,385,447 | | | 0.885%, 4/25/2047e | | | 1,217,938 | |
| | | | Dryden 34 Senior Loan Fund CLO | | | | |
| | 3,050,000 | | | 1.717%, 10/15/2026*,e | | | 3,015,712 | |
| | | | GSR Mortgage Loan Trust | | | | |
| | 1,372,444 | | | 0.342%, 8/25/2046e | | | 1,317,362 | |
| | | | HarborView Mortgage Loan Trust | | | | |
| | 1,319,257 | | | 2.101%, 6/19/2034 | | | 1,302,942 | |
| | | | HomeBanc Mortgage Trust | | | | |
| | 819,603 | | | 2.290%, 4/25/2037 | | | 605,503 | |
| | | | Impac CMB Trust | | | | |
| | 1,618,938 | | | 0.672%, 4/25/2035e | | | 1,478,668 | |
| | 594,277 | | | 0.792%, 8/25/2035e | | | 528,033 | |
| | | | J.P. Morgan Alternative Loan Trust | | | | |
| | 1,172,451 | | | 2.779%, 3/25/2036 | | | 919,482 | |
| | | | J.P. Morgan Mortgage Trust | | | | |
| | 493,469 | | | 2.535%, 10/25/2036 | | | 438,708 | |
| | | | Madison Park Funding XIV CLO, Ltd. | | | | |
| | 3,350,000 | | | 1.681%, 7/20/2026*,e | | | 3,316,729 | |
The accompanying Notes to Financial Statements are an integral part of this schedule.
247
LIMITED MATURITY BOND FUND
Schedule of Investments as of October 31, 2014
| | | | | | | | |
Principal Amount | | | Long-Term Fixed Income (90.4%) | | Value | |
| Collateralized Mortgage Obligations (8.6%) - continued | | | | |
| | | | Master Asset Securitization Trust | | | | |
| | $909,453 | | | 0.652%, 6/25/2036e | | | $549,323 | |
| | | | NCUA Guaranteed Notes | | | | |
| | 2,955,341 | | | 0.603%, 10/7/2020e | | | 2,973,327 | |
| | | | Neuberger Berman CLO, Ltd. | | | | |
| | 2,400,000 | | | 1.701%, 8/4/2025*,e | | | 2,378,455 | |
| | | | Octagon Investment Partners XX CLO, Ltd. | | | | |
| | 3,050,000 | | | 1.675%, 8/12/2026*,e | | | 3,015,301 | |
| | | | Residential Accredit Loans, Inc. | | | | |
| | 712,329 | | | 3.536%, 9/25/2035 | | | 594,815 | |
| | | | Sequoia Mortgage Trust | | | | |
| | 2,075,089 | | | 1.069%, 9/20/2034e | | | 2,007,107 | |
| | | | Symphony CLO, Ltd. | | | | |
| | 3,050,000 | | | 1.335%, 1/9/2023*,e | | | 3,030,017 | |
| | | | Voya CLO 2014-3, Ltd. | | | | |
| | 3,050,000 | | | 1.649%, 7/25/2026*,e | | | 3,015,080 | |
| | | | Wachovia Mortgage Loan Trust, LLC | | | | |
| | 594,591 | | | 2.800%, 5/20/2036 | | | 517,141 | |
| | | | WaMu Mortgage Pass Through Certificates | | | | |
| | 452,864 | | | 0.442%, 10/25/2045e | | | 433,034 | |
| | 1,186,524 | | | 0.995%, 10/25/2046e | | | 964,956 | |
| | 1,487,128 | | | 0.935%, 12/25/2046e | | | 1,220,405 | |
| | 1,380,377 | | | 0.855%, 1/25/2047e | | | 1,123,842 | |
| | | | Washington Mutual Alternative Mortgage Pass Through Certificates | | | | |
| | 914,293 | | | 1.035%, 9/25/2046e | | | 605,171 | |
| | 1,496,113 | | | 0.865%, 2/25/2047e | | | 1,047,374 | |
| | | | Wells Fargo Mortgage Backed Securities Trust | | | | |
| | 803,508 | | | 2.592%, 3/25/2036 | | | 779,596 | |
| | 932,037 | | | 2.615%, 3/25/2036 | | | 928,029 | |
| | | | | |
| | | | Total | | | 71,296,826 | |
| | | | | |
| |
| Commercial Mortgage-Backed Securities (5.9%) | | | | |
| | | | Bear Stearns Commercial Mortgage Securities, Inc. | | | | |
| | 142,238 | | | 5.655%, 6/11/2040 | | | 141,999 | |
| | 1,480,528 | | | 5.331%, 2/11/2044 | | | 1,591,354 | |
| | | | Citigroup Commercial Mortgage Trust | | | | |
| | 750,000 | | | 5.710%, 12/10/2049 | | | 822,609 | |
| | | | Citigroup/Deutsche Bank Commercial Mortgage | | | | |
| | 1,595,000 | | | 5.322%, 12/11/2049 | | | 1,704,868 | |
| | | | Commercial Mortgage Pass-Through Certificates | | | | |
| | 4,000,000 | | | 1.203%, 6/8/2030d,e | | | 3,996,220 | |
| | 981,042 | | | 5.306%, 12/10/2046 | | | 1,047,892 | |
| | | | Credit Suisse First Boston Mortgage Securities Corporation | | | | |
| | 1,067,077 | | | 4.691%, 4/15/2037 | | | 1,068,315 | |
| | | | Credit Suisse Mortgage Capital Certificates | | | | |
| | 1,510,378 | | | 5.467%, 9/15/2039 | | | 1,603,183 | |
| | | | Federal Home Loan Mortgage Corporation Multi Family Structured Pass Thru Certificates | | | | |
| | 3,515,346 | | | 0.727%, 12/25/2016 | | | 3,509,430 | |
| | | | Federal National Mortgage Association | | | | |
| | 3,066,125 | | | 0.953%, 11/25/2015 | | | 3,073,425 | |
| | 2,350,000 | | | 1.272%, 1/25/2017 | | | 2,367,637 | |
| | | | Government National Mortgage Association | | | | |
| | 364,489 | | | 2.870%, 3/16/2051 | | | 367,644 | |
| | 1,188,116 | | | 1.864%, 8/16/2031 | | | 1,191,920 | |
| | 1,248,203 | | | 2.164%, 3/16/2033 | | | 1,253,245 | |
| | 282,962 | | | 3.214%, 1/16/2040 | | | 284,662 | |
| | | | Greenwich Capital Commercial Funding Corporation | | | | |
| | 4,500,000 | | | 5.224%, 4/10/2037 | | | 4,597,902 | |
| | | | J.P. Morgan Chase Commercial Mortgage Securities Corporation | | | | |
| | 1,496,042 | | | 0.853%, 4/15/2028d,e | | | 1,494,628 | |
| | 3,600,000 | | | 1.104%, 12/15/2028d,e | | | 3,595,540 | |
| | 3,500,000 | | | 5.429%, 12/12/2043 | | | 3,716,650 | |
| | | | LSTAR Commercial Mortgage Trust | | | | |
| | 2,160,545 | | | 1.519%, 1/20/2041d | | | 2,159,696 | |
| | | | Morgan Stanley Capital I | | | | |
| | 2,179,098 | | | 3.224%, 7/15/2049 | | | 2,258,971 | |
| | | | Morgan Stanley Capital, Inc. | | | | |
| | 1,470,361 | | | 5.592%, 4/12/2049 | | | 1,486,983 | |
| | | | NCUA Guaranteed Notes | | | | |
| | 1,926,152 | | | 1.600%, 10/29/2020 | | | 1,934,502 | |
| | | | SCG Trust 2013-SRP1 | | | | |
| | 2,575,000 | | | 1.553%, 11/15/2026d,e | | | 2,577,673 | |
| | | | Wachovia Bank Commercial Mortgage Trust | | | | |
| | 1,170,603 | | | 5.765%, 7/15/2045 | | | 1,233,295 | |
| | | | | |
| | | | Total | | | 49,080,243 | |
| | | | | |
| |
| Communications Services (2.9%) | | | | |
| | | | America Movil SAB de CV | | | | |
| | 2,400,000 | | | 1.235%, 9/12/2016e | | | 2,423,398 | |
| | | | American Tower Corporation | | | | |
| | 1,800,000 | | | 3.450%, 9/15/2021 | | | 1,760,821 | |
| | | | AT&T, Inc. | | | | |
| | 1,625,000 | | | 1.400%, 12/1/2017 | | | 1,619,967 | |
| | | | British Telecommunications plc | | | | |
| | 1,500,000 | | | 1.625%, 6/28/2016 | | | 1,515,882 | |
| | 578,000 | | | 2.350%, 2/14/2019 | | | 580,132 | |
| | | | CBS Corporation | | | | |
| | 1,440,000 | | | 2.300%, 8/15/2019 | | | 1,421,093 | |
| | | | Crown Castle Towers, LLC | | | | |
| | 1,500,000 | | | 3.214%, 8/15/2015* | | | 1,529,575 | |
| | 850,000 | | | 4.174%, 8/15/2017d | | | 891,982 | |
| | | | DIRECTV Holdings, LLC | | | | |
| | 1,500,000 | | | 1.750%, 1/15/2018 | | | 1,493,073 | |
| | | | Moody’s Corporation | | | | |
| | 1,250,000 | | | 2.750%, 7/15/2019 | | | 1,269,369 | |
| | | | NBC Universal Enterprise, Inc. | | | | |
| | 1,750,000 | | | 1.662%, 4/15/2018d | | | 1,748,793 | |
| | | | SES Global Americas Holdings GP | | | | |
| | 1,125,000 | | | 2.500%, 3/25/2019d | | | 1,122,264 | |
| | | | Verizon Communications, Inc. | | | | |
| | 1,350,000 | | | 1.764%, 9/15/2016e | | | 1,380,479 | |
| | 1,000,000 | | | 0.632%, 6/9/2017e | | | 1,000,255 | |
| | 2,080,000 | | | 1.005%, 6/17/2019e | | | 2,095,047 | |
| | 1,425,000 | | | 3.000%, 11/1/2021 | | | 1,414,077 | |
The accompanying Notes to Financial Statements are an integral part of this schedule.
248
LIMITED MATURITY BOND FUND
Schedule of Investments as of October 31, 2014
| | | | | | | | |
Principal Amount | | | Long-Term Fixed Income (90.4%) | | Value | |
| Communications Services (2.9%) - continued | | | | |
| | | | Viacom, Inc. | | | | |
| | $1,000,000 | | | 2.500%, 9/1/2018 | | | $1,015,392 | |
| | | | | |
| | | | Total | | | 24,281,599 | |
| | | | | |
| |
| Consumer Cyclical (1.1%) | | | | |
| | | | CVS Health Corporation | | | | |
| | 870,000 | | | 2.250%, 8/12/2019 | | | 866,137 | |
| | | | Ford Motor Credit Company, LLC | | | | |
| | 1,250,000 | | | 4.207%, 4/15/2016 | | | 1,304,480 | |
| | 1,300,000 | | | 3.984%, 6/15/2016 | | | 1,357,879 | |
| | 500,000 | | | 3.000%, 6/12/2017 | | | 515,527 | |
| | | | Home Depot, Inc. | | | | |
| | 1,600,000 | | | 2.250%, 9/10/2018 | | | 1,626,750 | |
| | | | Hyundai Capital America | | | | |
| | 2,250,000 | | | 1.875%, 8/9/2016d | | | 2,278,858 | |
| | | | Yale University | | | | |
| | 1,250,000 | | | 2.086%, 4/15/2019 | | | 1,261,533 | |
| | | | | |
| | | | Total | | | 9,211,164 | |
| | | | | |
| |
| Consumer Non-Cyclical (2.8%) | | | | |
| | | | Allergan, Inc. | | | | |
| | 660,000 | | | 1.350%, 3/15/2018 | | | 635,688 | |
| | | | Altria Group, Inc. | | | | |
| | 500,000 | | | 2.850%, 8/9/2022 | | | 484,526 | |
| | | | Bayer U.S. Finance, LLC | | | | |
| | 1,000,000 | | | 2.375%, 10/8/2019d | | | 1,001,676 | |
| | | | Celgene Corporation | | | | |
| | 1,500,000 | | | 1.900%, 8/15/2017 | | | 1,513,657 | |
| | | | ConAgra Foods, Inc. | | | | |
| | 1,400,000 | | | 1.900%, 1/25/2018 | | | 1,393,095 | |
| | | | Edwards Lifesciences Corporation | | | | |
| | 1,100,000 | | | 2.875%, 10/15/2018 | | | 1,121,267 | |
| | | | Forest Laboratories, Inc. | | | | |
| | 2,250,000 | | | 4.375%, 2/1/2019d | | | 2,356,783 | |
| | | | Gilead Sciences, Inc. | | | | |
| | 1,500,000 | | | 2.050%, 4/1/2019 | | | 1,496,936 | |
| | | | Howard Hughes Medical Institute | | | | |
| | 1,500,000 | | | 3.500%, 9/1/2023 | | | 1,558,904 | |
| | | | Japan Tobacco, Inc. | | | | |
| | 2,500,000 | | | 2.100%, 7/23/2018d | | | 2,533,028 | |
| | | | Mondelez International, Inc. | | | | |
| | 1,484,000 | | | 0.760%, 2/1/2019e | | | 1,485,856 | |
| | 1,675,000 | | | 2.250%, 2/1/2019 | | | 1,671,704 | |
| | | | SABMiller Holdings, Inc. | | | | |
| | 2,000,000 | | | 2.450%, 1/15/2017d | | | 2,044,184 | |
| | | | Thermo Fisher Scientific, Inc. | | | | |
| | 1,400,000 | | | 1.300%, 2/1/2017 | | | 1,398,348 | |
| | | | Unilever Capital Corporation | | | | |
| | 2,000,000 | | | 2.200%, 3/6/2019 | | | 2,030,808 | |
| | | | | |
| | | | Total | | | 22,726,460 | |
| | | | | |
| |
| Energy (2.4%) | | | | |
| | | | Cameron International Corporation | | | | |
| | 1,275,000 | | | 1.400%, 6/15/2017 | | | 1,274,883 | |
| | | | Chevron Corporation | | | | |
| | 3,000,000 | | | 1.718%, 6/24/2018 | | | 3,027,885 | |
| | | | CNOOC Nexen Finance 2014 ULC | | | | |
| | 1,750,000 | | | 1.625%, 4/30/2017 | | | 1,750,490 | |
| | | | CNPC General Capital, Ltd. | | | | |
| | 1,000,000 | | | 2.750%, 5/14/2019d | | | 998,529 | |
| | | | DCP Midstream Operating, LP | | | | |
| | 1,350,000 | | | 2.700%, 4/1/2019 | | | 1,353,409 | |
| | | | Enable Midstream Partners, LP | | | | |
| | 1,250,000 | | | 2.400%, 5/15/2019d | | | 1,233,662 | |
| | | | Enbridge, Inc. | | | | |
| | 1,375,000 | | | 0.684%, 6/2/2017e | | | 1,375,348 | |
| | | | EQT Midstream Partners, LP | | | | |
| | 1,000,000 | | | 4.000%, 8/1/2024 | | | 995,169 | |
| | | | International Petroleum Investment Company, Ltd. | | | | |
| | 1,000,000 | | | 3.125%, 11/15/2015d | | | 1,019,380 | |
| | | | Petrobras Global Finance BV | | | | |
| | 1,780,000 | | | 3.115%, 3/17/2020e | | | 1,796,020 | |
| | | | Petroleos Mexicanos | | | | |
| | 1,500,000 | | | 2.251%, 7/18/2018e | | | 1,552,500 | |
| | 750,000 | | | 3.500%, 7/18/2018 | | | 776,250 | |
| | 1,700,000 | | | 2.378%, 4/15/2025 | | | 1,695,094 | |
| | | | Weatherford International, Ltd. | | | | |
| | 1,000,000 | | | 6.000%, 3/15/2018 | | | 1,126,597 | |
| | | | | |
| | | | Total | | | 19,975,216 | |
| | | | | |
| |
| Financials (19.4%) | | | | |
| | | | Achmea Hypotheekbank NV | | | | |
| | 443,000 | | | 3.200%, 11/3/2014d | | | 443,000 | |
| | | | American Express Credit Corporation | | | | |
| | 2,080,000 | | | 0.784%, 3/18/2019e | | | 2,085,358 | |
| | | | American International Group, Inc. | | | | |
| | 1,150,000 | | | 2.300%, 7/16/2019 | | | 1,156,185 | |
| | | | American Tower Trust I | | | | |
| | 1,000,000 | | | 1.551%, 3/15/2018* | | | 992,944 | |
| | | | Australia and New Zealand Banking Group, Ltd. | | | | |
| | 3,500,000 | | | 2.400%, 11/23/2016d | | | 3,602,403 | |
| | | | Aviation Capital Group Corporation | | | | |
| | 1,100,000 | | | 3.875%, 9/27/2016d | | | 1,129,995 | |
| | | | Bank of America Corporation | | | | |
| | 1,450,000 | | | 1.700%, 8/25/2017 | | | 1,450,248 | |
| | 1,000,000 | | | 1.303%, 3/22/2018e | | | 1,014,371 | |
| | 1,775,000 | | | 1.105%, 4/1/2019e | | | 1,784,166 | |
| | | | Bank Of America National Association | | | | |
| | 1,000,000 | | | 5.300%, 3/15/2017 | | | 1,084,321 | |
| | | | Bank of New York Mellon Corporation | | | | |
| | 1,600,000 | | | 1.085%, 11/24/2014e | | | 1,600,893 | |
| | 500,000 | | | 4.500%, 12/31/2049h | | | 473,125 | |
| | | | Bank of Nova Scotia | | | | |
| | 2,000,000 | | | 2.150%, 8/3/2016d | | | 2,047,538 | |
| | | | Bank of Tokyo-Mitsubishi UFJ, Ltd. | | | | |
| | 1,135,000 | | | 2.850%, 9/8/2021d | | | 1,122,638 | |
| | | | BBVA Banco Continental SA | | | | |
| | 2,000,000 | | | 2.250%, 7/29/2016d | | | 2,005,000 | |
| | | | Bear Stearns Companies, LLC | | | | |
| | 1,500,000 | | | 6.400%, 10/2/2017 | | | 1,696,297 | |
| | | | BNZ International Funding, Ltd. | | | | |
| | 2,500,000 | | | 2.350%, 3/4/2019d | | | 2,503,180 | |
| | | | Caisse Centrale Desjardins du Quebec | | | | |
| | 2,000,000 | | | 2.550%, 3/24/2016d | | | 2,050,488 | |
The accompanying Notes to Financial Statements are an integral part of this schedule.
249
LIMITED MATURITY BOND FUND
Schedule of Investments as of October 31, 2014
| | | | | | | | |
Principal Amount | | | Long-Term Fixed Income (90.4%) | | Value | |
| Financials (19.4%) - continued | | | | |
| | | | Caixa Economica Federal | | | | |
| | $1,250,000 | | | 4.250%, 5/13/2019d,i | | | $1,260,625 | |
| | | | Citigroup, Inc. | | | | |
| | 1,475,000 | | | 1.003%, 4/8/2019e | | | 1,480,745 | |
| | | | CNA Financial Corporation | | | | |
| | 2,000,000 | | | 6.500%, 8/15/2016 | | | 2,186,584 | |
| | | | CoBank ACB | | | | |
| | 1,560,000 | | | 0.834%, 6/15/2022*,e | | | 1,476,253 | |
| | | | Commonwealth Bank of Australia | | | | |
| | 3,500,000 | | | 0.750%, 1/15/2016d | | | 3,503,934 | |
| | | | Cooperatieve Centrale Raiffeisen-Boerenleenbank BA | | | | |
| | 655,000 | | | 4.625%, 12/1/2023 | | | 688,423 | |
| | | | Credit Agricole SA | | | | |
| | 1,350,000 | | | 1.031%, 4/15/2019d,e | | | 1,357,761 | |
| | | | Credit Suisse AG Guernsey | | | | |
| | 1,000,000 | | | 2.600%, 5/27/2016d | | | 1,030,074 | |
| | | | Credit Suisse Group AG | | | | |
| | 1,500,000 | | | 6.500%, 8/8/2023d | | | 1,653,750 | |
| | 810,000 | | | 7.500%, 12/11/2049d,h | | | 860,868 | |
| | | | DnB Boligkreditt AS | | | | |
| | 3,500,000 | | | 1.450%, 3/21/2018d | | | 3,488,499 | |
| | | | Fifth Third Bancorp | | | | |
| | 1,145,000 | | | 2.875%, 10/1/2021 | | | 1,136,848 | |
| | | | General Electric Capital Corporation | | | | |
| | 3,500,000 | | | 1.234%, 3/15/2023e | | | 3,536,334 | |
| | | | Goldman Sachs Group, Inc. | | | | |
| | 2,750,000 | | | 2.375%, 1/22/2018 | | | 2,775,660 | |
| | 1,525,000 | | | 1.334%, 11/15/2018e | | | 1,540,613 | |
| | 1,550,000 | | | 5.700%, 12/29/2049h,i | | | 1,584,875 | |
| | | | GTP Acquisition Partners I, LLC | | | | |
| | 1,500,000 | | | 4.347%, 6/15/2016* | | | 1,532,949 | |
| | | | HSBC USA, Inc. | | | | |
| | 1,530,000 | | | 0.533%, 6/23/2017e | | | 1,530,916 | |
| | | | ING Bank NV | | | | |
| | 3,500,000 | | | 2.500%, 1/14/2016d | | | 3,577,175 | |
| | 500,000 | | | 2.625%, 12/5/2022d | | | 497,081 | |
| | | | ING Capital Funding Trust III | | | | |
| | 715,000 | | | 3.833%, 12/29/2049e,h | | | 713,212 | |
| | | | International Lease Finance Corporation | | | | |
| | 700,000 | | | 8.625%, 9/15/2015 | | | 735,000 | |
| | | | Intesa Sanpaolo SPA | | | | |
| | 1,500,000 | | | 5.017%, 6/26/2024d | | | 1,465,971 | |
| | | | J.P. Morgan Chase & Company | | | | |
| | 3,100,000 | | | 1.134%, 1/25/2018e | | | 3,139,919 | |
| | 1,250,000 | | | 3.875%, 9/10/2024 | | | 1,241,866 | |
| | 1,075,000 | | | 7.900%, 4/29/2049h | | | 1,165,031 | |
| | 375,000 | | | 6.000%, 12/29/2049h | | | 371,719 | |
| | | | J.P. Morgan Chase Bank NA | | | | |
| | 1,000,000 | | | 5.875%, 6/13/2016 | | | 1,077,187 | |
| | | | Kilroy Realty, LP | | | | |
| | 700,000 | | | 3.800%, 1/15/2023 | | | 705,739 | |
| | | | Landwirtschaftliche Rentenbank | | | | |
| | 3,500,000 | | | 0.434%, 3/15/2016d,e | | | 3,507,427 | |
| | | | Lloyds Banking Group plc | | | | |
| | 700,000 | | | 4.500%, 11/4/2024c | | | 700,562 | |
| | | | Lloyds TSB Bank plc | | | | |
| | 300,000 | | | 6.500%, 9/14/2020d | | | 346,962 | |
| | | | Macquarie Bank, Ltd. | | | | |
| | 1,750,000 | | | 5.000%, 2/22/2017d | | | 1,885,562 | |
| | | | MassMutual Global Funding II | | | | |
| | 2,500,000 | | | 2.000%, 4/5/2017d | | | 2,547,882 | |
| | | | Metropolitan Life Global Funding I | | | | |
| | 2,250,000 | | | 3.650%, 6/14/2018d | | | 2,394,065 | |
| | | | Mizuho Financial Group Cayman 3, Ltd. | | | | |
| | 675,000 | | | 4.600%, 3/27/2024d | | | 702,677 | |
| | | | Morgan Stanley | | | | |
| | 825,000 | | | 4.100%, 5/22/2023 | | | 832,700 | |
| | 1,425,000 | | | 5.000%, 11/24/2025 | | | 1,514,580 | |
| | 900,000 | | | 4.350%, 9/8/2026 | | | 902,444 | |
| | 1,000,000 | | | 5.450%, 12/29/2049h | | | 1,004,688 | |
| | | | Morgan Stanley Mortgage Loan Trust | | | | |
| | 2,000,000 | | | 5.750%, 10/18/2016 | | | 2,170,224 | |
| | | | MUFG Union Bank NA | | | | |
| | 1,550,000 | | | 1.500%, 9/26/2016 | | | 1,560,645 | |
| | | | National Australia Bank, Ltd. | | | | |
| | 2,750,000 | | | 2.000%, 6/20/2017d | | | 2,806,422 | |
| | | | National Bank of Canada | | | | |
| | 1,750,000 | | | 2.200%, 10/19/2016d | | | 1,790,936 | |
| | | | NCUA Guaranteed Notes | | | | |
| | 1,931,805 | | | 0.503%, 12/7/2020e | | | 1,935,419 | |
| | | | Network Rail Infrastructure Finance plc | | | | |
| | 4,000,000 | | | 0.875%, 5/15/2018d | | | 3,936,344 | |
| | | | Nordea Bank AB | | | | |
| | 2,000,000 | | | 3.125%, 3/20/2017d | | | 2,084,824 | |
| | | | North American Development Bank | | | | |
| | 1,750,000 | | | 2.300%, 10/10/2018 | | | 1,777,174 | |
| | | | Prudential Financial, Inc. | | | | |
| | 1,150,000 | | | 2.350%, 8/15/2019 | | | 1,149,537 | |
| | | | RBS Capital Trust III | | | | |
| | 910,000 | | | 2.073%, 9/29/2049e,h | | | 891,800 | |
| | | | Realty Income Corporation | | | | |
| | 1,000,000 | | | 2.000%, 1/31/2018 | | | 1,004,514 | |
| | | | Reliance Standard Life Global Funding II | | | | |
| | 1,400,000 | | | 2.500%, 4/24/2019d | | | 1,408,938 | |
| | | | Royal Bank of Canada | | | | |
| | 3,000,000 | | | 1.200%, 9/19/2017 | | | 2,987,904 | |
| | | | Royal Bank of Scotland Group plc | | | | |
| | 1,765,000 | | | 1.173%, 3/31/2017e | | | 1,770,849 | |
| | 700,000 | | | 6.125%, 12/15/2022 | | | 757,762 | |
| | 1,350,000 | | | 5.125%, 5/28/2024 | | | 1,367,788 | |
| | | | Santander UK plc | | | | |
| | 500,000 | | | 5.000%, 11/7/2023d | | | 529,985 | |
| | | | Skandinaviska Enskilda Banken AB | | | | |
| | 1,700,000 | | | 1.750%, 3/19/2018d | | | 1,696,904 | |
| | 2,500,000 | | | 1.375%, 5/29/2018d | | | 2,478,970 | |
| | | | SLM Corporation | | | | |
| | 500,000 | | | 4.625%, 9/25/2017 | | | 508,750 | |
| | | | SpareBank 1 Boligkreditt AS | | | | |
| | 2,500,000 | | | 1.250%, 5/2/2018d | | | 2,468,240 | |
| | | | Stadshypotek AB | | | | |
| | 2,000,000 | | | 1.875%, 10/2/2019d | | | 1,975,704 | |
| | | | Standard Chartered plc | | | | |
| | 1,000,000 | | | 3.950%, 1/11/2023d | | | 981,268 | |
| | | | Sumitomo Mitsui Financial Group, Inc. | | | | |
| | 1,450,000 | | | 4.436%, 4/2/2024d | | | 1,509,521 | |
The accompanying Notes to Financial Statements are an integral part of this schedule.
250
LIMITED MATURITY BOND FUND
Schedule of Investments as of October 31, 2014
| | | | | | | | |
Principal Amount | | | Long-Term Fixed Income (90.4%) | | Value | |
| Financials (19.4%) - continued | | | | |
| | | | Suncorp-Metway, Ltd. | | | | |
| | $2,065,000 | | | 0.934%, 3/28/2017d,e | | | $2,072,341 | |
| | | | Svensk Exportkredit AB | | | | |
| | 2,500,000 | | | 0.531%, 1/23/2017e | | | 2,515,838 | |
| | | | Svenska Handelsbanken AB | | | | |
| | 2,250,000 | | | 0.683%, 3/21/2016e | | | 2,259,410 | |
| | 500,000 | | | 0.725%, 6/17/2019e | | | 502,501 | |
| | | | Swedbank AB | | | | |
| | 1,750,000 | | | 1.750%, 3/12/2018d | | | 1,748,672 | |
| | | | Synchrony Financial | | | | |
| | 1,230,000 | | | 3.000%, 8/15/2019 | | | 1,243,514 | |
| | | | Toronto-Dominion Bank | | | | |
| | 1,500,000 | | | 0.792%, 11/5/2019c,e | | | 1,498,532 | |
| | | | U.S. Bank National Association | | | | |
| | 3,000,000 | | | 3.778%, 4/29/2020 | | | 3,042,861 | |
| | | | UnitedHealth Group, Inc. | | | | |
| | 1,800,000 | | | 1.400%, 10/15/2017 | | | 1,809,680 | |
| | | | USAA Capital Corporation | | | | |
| | 2,075,000 | | | 2.125%, 6/3/2019d | | | 2,074,207 | |
| | | | Voya Financial, Inc. | | | | |
| | 500,000 | | | 5.650%, 5/15/2053 | | | 500,000 | |
| | 1,500,000 | | | 2.900%, 2/15/2018 | | | 1,542,184 | |
| | | | Wells Fargo & Company | | | | |
| | 2,500,000 | | | 2.625%, 12/15/2016 | | | 2,582,767 | |
| | 925,000 | | | 3.450%, 2/13/2023 | | | 923,650 | |
| | 900,000 | | | 4.100%, 6/3/2026 | | | 912,848 | |
| | | | Westpac Banking Corporation | | | | |
| | 2,500,000 | | | 1.250%, 12/15/2017d | | | 2,489,110 | |
| | | | | |
| | | | Total | | | 161,165,847 | |
| | | | | |
| |
| Foreign Government (5.4%) | | | | |
| | | | Bahama Government International Bond | | | | |
| | 225,000 | | | 5.750%, 1/16/2024d | | | 238,500 | |
| | | | Canada Government International Bond | | | | |
| | 5,500,000 | | | 0.875%, 2/14/2017 | | | 5,515,625 | |
| | | | Eksportfinans ASA | | | | |
| | 1,500,000 | | | 2.375%, 5/25/2016 | | | 1,499,250 | |
| | | | European Investment Bank | | | | |
| | 4,000,000 | | | 1.750%, 3/15/2017 | | | 4,090,600 | |
| | 2,570,000 | | | 2.125%, 10/15/2021 | | | 2,565,503 | |
| | | | Export Development Canada | | | | |
| | 3,500,000 | | | 0.750%, 12/15/2017 | | | 3,457,552 | |
| | | | Hydro Quebec | | | | |
| | 2,000,000 | | | 2.000%, 6/30/2016 | | | 2,046,010 | |
| | | | Inter-American Development Bank | | | | |
| | 2,750,000 | | | 0.193%, 2/11/2016e | | | 2,750,129 | |
| | | | Japan Bank for International Cooperation | | | | |
| | 3,000,000 | | | 1.750%, 7/31/2018 | | | 3,027,153 | |
| | | | Kommunalbanken AS | | | | |
| | 2,760,000 | | | 1.500%, 10/22/2019d | | | 2,703,031 | |
| | | | Kommuninvest I Sverige AB | | | | |
| | 2,500,000 | | | 1.000%, 10/24/2017d | | | 2,491,482 | |
| | | | Mexico Government International Bond | | | | |
| | 750,000 | | | 5.125%, 1/15/2020 | | | 838,125 | |
| | 275,000 | | | 3.500%, 1/21/2021 | | | 282,700 | |
| | | | Philippines Government International Bond | | | | |
| | 275,000 | | | 4.200%, 1/21/2024 | | | 296,656 | |
| | | | Poland Government International Bond | | | | |
| | 125,000 | | | 4.000%, 1/22/2024 | | | 131,352 | |
| | | | Province of British Columbia | | | | |
| | 3,500,000 | | | 2.100%, 5/18/2016 | | | 3,586,709 | |
| | | | Province of Manitoba | | | | |
| | 3,000,000 | | | 1.300%, 4/3/2017 | | | 3,027,633 | |
| | | | Province of Ontario | | | | |
| | 2,500,000 | | | 0.284%, 8/13/2015e | | | 2,500,588 | |
| | | | Slovenia Government International Bond | | | | |
| | 700,000 | | | 4.125%, 2/18/2019d | | | 736,750 | |
| | | | Sweden Government International Bond | | | | |
| | 3,150,000 | | | 0.375%, 3/29/2016d | | | 3,151,134 | |
| | | | | |
| | | | Total | | | 44,936,482 | |
| | | | | |
| |
| Mortgage-Backed Securities (6.3%) | | | | |
| | | | Federal Home Loan Mortgage Corporation Gold 15-Yr. Pass Through | | | | |
| | 6,670,000 | | | 3.000%, 11/1/2029c | | | 6,906,577 | |
| | | | Federal Home Loan Mortgage Corporation Gold 30-Yr. Pass Through | | | | |
| | 417,202 | | | 6.500%, 9/1/2037 | | | 477,263 | |
| | 7,170,000 | | | 4.000%, 11/1/2044c | | | 7,606,362 | |
| | | | Federal National Mortgage Association Conventional 15-Yr. Pass Through | | | | |
| | 2,970,934 | | | 2.250%, 6/25/2025 | | | 3,022,165 | |
| | 14,900,000 | | | 3.500%, 11/1/2029c | | | 15,742,777 | |
| | | | Federal National Mortgage Association Conventional 20-Yr. Pass Through | | | | |
| | 738,500 | | | 6.000%, 8/1/2024 | | | 834,776 | |
| | | | Federal National Mortgage Association Conventional 30-Yr. Pass Through | | | | |
| | 622,035 | | | 5.735%, 9/1/2037e | | | 666,017 | |
| | 189,494 | | | 5.196%, 10/1/2037e | | | 201,826 | |
| | 3,824,384 | | | 2.078%, 1/1/2043e | | | 3,964,733 | |
| | 6,302,873 | | | 2.055%, 3/1/2043e | | | 6,525,216 | |
| | 6,043,599 | | | 1.738%, 7/1/2043e | | | 6,156,953 | |
| | | | | |
| | | | Total | | | 52,104,665 | |
| | | | | |
| |
| Technology (0.9%) | | | | |
| | | | Amphenol Corporation | | | | |
| | 1,122,000 | | | 2.550%, 1/30/2019 | | | 1,134,436 | |
| | | | Apple, Inc. | | | | |
| | 2,650,000 | | | 0.537%, 5/6/2019e | | | 2,652,358 | |
| | 600,000 | | | 2.100%, 5/6/2019 | | | 603,382 | |
| | | | Micron Semiconductor Asia Pte, Ltd. | | | | |
| | 1,012,500 | | | 1.258%, 1/15/2019 | | | 1,010,371 | |
| | | | Oracle Corporation | | | | |
| | 325,000 | | | 1.200%, 10/15/2017 | | | 323,938 | |
The accompanying Notes to Financial Statements are an integral part of this schedule.
251
LIMITED MATURITY BOND FUND
Schedule of Investments as of October 31, 2014
| | | | | | | | |
Principal
Amount | | | Long-Term Fixed Income (90.4%) | | Value | |
| Technology (0.9%) - continued | | | | |
| | | | Xilinx, Inc. | | | | |
| | $1,410,000 | | | 2.125%, 3/15/2019 | | | $1,409,542 | |
| | | | | |
| | | | Total | | | 7,134,027 | |
| | | | | |
| |
| Transportation (1.3%) | | | | |
| | | | American Airlines Pass Through Trust | | | | |
| | 1,172,859 | | | 5.600%, 7/15/2020d | | | 1,200,714 | |
| | 1,415,952 | | | 4.950%, 1/15/2023 | | | 1,515,069 | |
| | | | British Airways plc | | | | |
| | 1,478,792 | | | 4.625%, 6/20/2024d | | | 1,556,429 | |
| | | | Continental Airlines, Inc. | | | | |
| | 1,852,344 | | | 4.150%, 4/11/2024 | | | 1,889,391 | |
| | | | CSX Corporation | | | | |
| | 400,000 | | | 3.700%, 11/1/2023 | | | 415,929 | |
| | | | Delta Air Lines, Inc. | | | | |
| | 672,594 | | | 4.750%, 5/7/2020 | | | 716,312 | |
| | | | TTX Company | | | | |
| | 650,000 | | | 4.125%, 10/1/2023* | | | 679,329 | |
| | | | US Airways Pass Through Trust | | | | |
| | 1,000,000 | | | 3.950%, 11/15/2025 | | | 1,012,500 | |
| | | | Virgin Australia Holdings, Ltd. | | | | |
| | 1,320,145 | | | 5.000%, 10/23/2023d | | | 1,364,766 | |
| | | | | |
| | | | Total | | | 10,350,439 | |
| | | | | |
| |
| U.S. Government and Agencies (16.8%) | | | | |
| | | | Federal Agricultural Mortgage Corporation | | | | |
| | 2,500,000 | | | 2.000%, 7/27/2016 | | | 2,563,265 | |
| | | | Federal Home Loan Bank | | | | |
| | 1,600,000 | | | 0.875%, 5/24/2017 | | | 1,598,781 | |
| | | | Federal Home Loan Mortgage Corporation | | | | |
| | 750,000 | | | 1.250%, 8/1/2019 | | | 734,201 | |
| | 3,050,000 | | | 1.250%, 10/2/2019 | | | 2,974,775 | |
| | | | Federal National Mortgage Association | | | | |
| | 2,500,000 | | | 1.000%, 9/27/2017 | | | 2,498,325 | |
| | 5,000,000 | | | 1.875%, 2/19/2019 | | | 5,065,040 | |
| | | | U.S. Treasury Bonds | | | | |
| | 690,000 | | | 3.000%, 5/15/2042 | | | 684,070 | |
| | | | U.S. Treasury Bonds, TIPS | | | | |
| | 17,764,775 | | | 0.125%, 4/15/2019 | | | 17,889,679 | |
| | | | U.S. Treasury Notes | | | | |
| | 1,250,000 | | | 0.250%, 12/31/2015 | | | 1,250,976 | |
| | 8,500,000 | | | 0.625%, 10/15/2016 | | | 8,519,261 | |
| | 10,775,000 | | | 0.625%, 12/15/2016 | | | 10,786,788 | |
| | 20,610,000 | | | 0.875%, 7/15/2017 | | | 20,640,585 | |
| | 19,400,000 | | | 0.875%, 1/31/2018 | | | 19,268,138 | |
| | 6,400,000 | | | 2.375%, 6/30/2018 | | | 6,655,501 | |
| | 4,000,000 | | | 1.250%, 10/31/2018 | | | 3,981,564 | |
| | 10,250,000 | | | 1.875%, 6/30/2020 | | | 10,288,438 | |
| | 7,100,000 | | | 3.625%, 2/15/2044 | | | 7,879,339 | |
| | | | U.S. Treasury Notes, TIPS | | | | |
| | 1,286,250 | | | 0.125%, 4/15/2018 | | | 1,302,127 | |
| | 2,446,583 | | | 1.125%, 1/15/2021 | | | 2,584,012 | |
| | 6,831,110 | | | 0.125%, 1/15/2022 | | | 6,735,584 | |
| | 5,152,550 | | | 0.125%, 1/15/2023 | | | 5,043,460 | |
| | | | | |
| | | | Total | | | 138,943,909 | |
| | | | | |
| |
| Utilities (1.7%) | | | | |
| | | | American Electric Power Company, Inc. | | | | |
| | 500,000 | | | 1.650%, 12/15/2017 | | | 501,155 | |
| | | | Dayton Power and Light Company | | | | |
| | 900,000 | | | 1.875%, 9/15/2016 | | | 910,057 | |
| | | | Electricite de France SA | | | | |
| | 1,000,000 | | | 5.250%, 12/29/2049d,h | | | 1,037,500 | |
| | | | Enterprise Products Operating, LLC | | | | |
| | 1,350,000 | | | 7.034%, 1/15/2068 | | | 1,501,875 | |
| | | | Kansas City Power & Light Company | | | | |
| | 175,000 | | | 3.150%, 3/15/2023 | | | 176,734 | |
| | | | National Rural Utilities Cooperative Finance Corporation | | | | |
| | 850,000 | | | 4.750%, 4/30/2043 | | | 841,763 | |
| | | | NextEra Energy Capital Holdings, Inc. | | | | |
| | 2,075,000 | | | 2.400%, 9/15/2019 | | | 2,079,845 | |
| | | | Northeast Utilities | | | | |
| | 1,250,000 | | | 1.450%, 5/1/2018 | | | 1,231,364 | |
| | | | PG&E Corporation | | | | |
| | 1,500,000 | | | 2.400%, 3/1/2019 | | | 1,505,586 | |
| | | | Public Service Electric And Gas Company | | | | |
| | 2,070,000 | | | 1.800%, 6/1/2019 | | | 2,058,025 | |
| | | | Sempra Energy | | | | |
| | 1,750,000 | | | 2.300%, 4/1/2017 | | | 1,794,221 | |
| | | | | |
| | | | Total | | | 13,638,125 | |
| | | | | |
| | | | | | | | |
| | | | | |
| | | | Total Long-Term Fixed Income (cost $747,619,286) | | | 748,628,835 | |
| | | | | |
| | |
| Shares | | | Preferred Stock (0.8%) | | Value | |
| Financials (0.6%) | | | | |
| | 14,000 | | | Allstate Corporation, 5.100% | | | 344,120 | |
| | 54,000 | | | Citigroup, Inc., 7.875% | | | 1,437,480 | |
| | 26,000 | | | Discover Financial Services, 6.500%h | | | 667,420 | |
| | 7,350 | | | Farm Credit Bank of Texas, 6.750%d,h | | | 783,005 | |
| | 17,000 | | | Goldman Sachs Group, Inc., 5.500%h | | | 406,810 | |
| | 39,000 | | | HSBC Holdings plc, 8.000%h | | | 1,045,200 | |
| | | | | |
| | | | Total | | | 4,684,035 | |
| | | | | |
| |
| Utilities (0.2%) | | | | |
| | 16,250 | | | Southern California Edison Company, 4.670%h | | | 1,655,977 | |
| | | | | |
| | | | Total | | | 1,655,977 | |
| | | | | |
| | | | | | | | |
| | | | | |
| | | | Total Preferred Stock (cost $6,237,173) | | | 6,340,012 | |
| | | | | |
| | |
| Shares | | | Collateral Held for Securities Loaned (0.3%) | | Value | |
| | 2,897,695 | | | Thrivent Cash Management Trust | | | 2,897,695 | |
| | | | | |
| | | | Total Collateral Held for Securities Loaned (cost $2,897,695) | | | 2,897,695 | |
| | | | | |
| | |
Shares or
Principal
Amount | | | Short-Term Investments (8.9%)i | | Value | |
| | | | Federal Home Loan Bank Discount Notes | | | | |
| | 300,000 | | | 0.055%, 12/12/2014k | | | 299,981 | |
| | 600,000 | | | 0.090%, 4/24/2015k | | | 599,739 | |
The accompanying Notes to Financial Statements are an integral part of this schedule.
252
LIMITED MATURITY BOND FUND
Schedule of Investments as of October 31, 2014
| | | | | | | | |
Shares or Principal Amount | | | Short-Term Investments (8.9%)j | | Value | |
| | | | Thrivent Cash Management Trust | | | | |
| | 71,677,565 | | | 0.050% | | | $71,677,565 | |
| | | | U.S. Treasury Bill | | | | |
| | 700,000 | | | 0.010%, 1/22/2015 | | | 699,984 | |
| | | | | |
| | | | Total Short-Term Investments (at amortized cost) | | | 73,277,269 | |
| | | | | |
| | | | Total Investments (cost $870,942,279) 105.3% | | | $871,465,726 | |
| | | | | |
| | | | Other Assets and Liabilities, Net (5.3%) | | | (43,968,290 | ) |
| | | | | |
| | | | Total Net Assets 100.0% | | | $827,497,436 | |
| | | | | |
a | The stated interest rate represents the weighted average of all contracts within the bank loan facility. |
b | All ora portion of the loan is unfunded. |
c | Denotes investments purchased on a when-issued or delayed delivery basis. |
d | Denotes securities sold under Rule 144A of the Securities Act of 1933, which exempts them from registration. These securities have been deemed liquid and may be resold to other dealers in the program or to other qualified institutional buyers. As of October 31, 2014, the value of these investments was $182,881,081 or 22.1% of total net assets. |
e | Denotes variable rate securities. Variable rate securities are securities whose yields vary with a designated market index or market rate. The rate shown is as of October 31, 2014. |
f | All or a portion of the security is insured or guaranteed. |
g | Denotes step coupon securities. Step coupon securities pay an initial coupon rate for the first period and then different coupon rates for following periods. The rate shown is as of October 31, 2014. |
h | Denotes perpetual securities. Perpetual securities pay an indefinite stream of interest, but may be called by the issuer at an earlier date. |
i | All or a portion of the security is on loan. |
j | The interest rate shown reflects the yield, coupon rate or the discount rate at the date of purchase. |
k | At October 31, 2014, $899,720 of investments were held on deposit with the counterparty and pledged as the initial margin deposit for open futures contracts. |
* | Denotes restricted securities. Restricted securities are investment securities which have been deemed illiquid and cannot be offered for public sale without first being registered under the Securities Act of 1933. The following table indicates the acquisition date and cost of restricted securities Limited Maturity Bond Fund owned as of October 31, 2014. |
| | | | | | | | |
Security | | Acquisition
Date | | | Cost | |
Alm Loan Funding CLO, 10/17/2026 | | | 7/31/2014 | | | | $3,048,475 | |
American Tower Trust I, 3/15/2018 | | | 3/6/2013 | | | | 1,000,000 | |
Apidos CLO XVIII, 7/22/2026 | | | 6/25/2014 | | | | 2,992,500 | |
Babson CLO, Ltd., 10/17/2026 | | | 8/15/2014 | | | | 3,048,475 | |
Bayview Opportunity Master Fund Trust IIB, LP, 7/28/2034 | | | 6/27/2014 | | | | 1,871,832 | |
Birchwood Park CLO, Ltd., 7/15/2026 | | | 7/31/2014 | | | | 3,050,000 | |
BlueMountain CLO, Ltd., 10/15/2026 | | | 8/27/2014 | | | | 3,046,920 | |
Carlyle Global Market Strategies CLO, Ltd., 10/15/2026 | | | 9/19/2014 | | | | 3,000,000 | |
Carlyle Global Market Strategies CLO, Ltd., 7/20/2023 | | | 7/3/2014 | | | | 3,000,000 | |
Cent CLO 16, LP, 8/1/2024 | | | 9/5/2014 | | | | 3,050,000 | |
Cent CLO 22, Ltd., 11/7/2026 | | | 9/19/2014 | | | | 3,000,000 | |
CoBank ACB, 6/15/2022 | | | 10/18/2013 | | | | 1,467,932 | |
Crown Castle Towers, LLC, 8/15/2015 | | | 7/29/2010 | | | | 1,500,000 | |
Dryden 34 Senior Loan Fund CLO, 10/15/2026 | | | 7/21/2014 | | | | 3,050,000 | |
Edlinc Student Loan Funding Trust, 10/1/2025 | | | 11/29/2012 | | | | 2,026,373 | |
FRS, LLC, 4/15/2043 | | | 4/10/2013 | | | | 2,799,458 | |
GoldenTree Loan Opportunities IX, Ltd., 10/29/2026 | | | 10/3/2014 | | | | 2,997,000 | |
GTP Acquisition Partners I, LLC, 6/15/2016 | | | 6/29/2011 | | | | 1,500,000 | |
Madison Park Funding XIV CLO, Ltd., 7/20/2026 | | | 7/3/2014 | | | | 3,345,980 | |
Mortgage Equity Conversion Asset Trust, 2/25/2042 | | | 2/14/2007 | | | | 2,019,957 | |
Mortgage Equity Conversion Asset Trust, 1/25/2042 | | | 1/18/2007 | | | | 1,987,350 | |
Neuberger Berman CLO, Ltd., 8/4/2025 | | | 6/19/2014 | | | | 2,400,000 | |
Octagon Investment Partners XX CLO, Ltd., 8/12/2026 | | | 7/10/2014 | | | | 3,050,000 | |
OZLM VIII, Ltd., 10/17/2026 | | | 8/7/2014 | | | | 3,032,615 | |
Selene Non-Performing Loans, LLC, 5/25/2054 | | | 5/23/2014 | | | | 1,983,954 | |
Symphony CLO, Ltd., 1/9/2023 | | | 9/15/2014 | | | | 3,050,000 | |
TTX Company, 10/1/2023 | | | 9/19/2013 | | | | 649,993 | |
U.S. Residential Opportunity Fund Trust, 3/25/2034 | | | 3/14/2014 | | | | 1,299,781 | |
Vericrest Opportunity Loan Transferee, 3/25/2054 | | | 12/11/2013 | | | | 753,520 | |
Vericrest Opportunity Loan Transferee, 11/25/2053 | | | 12/18/2013 | | | | 780,751 | |
Voya CLO 2014-3, Ltd., 7/25/2026 | | | 7/10/2014 | | | | 3,045,425 | |
Wachovia Asset Securitization, Inc., 7/25/2037 | | | 3/16/2007 | | | | 608,979 | |
Definitions:
| | | | |
| CLO | | - | | Collateralized Loan Obligation |
| TIPS | | - | | Treasury Inflation Protected Security. |
The accompanying Notes to Financial Statements are an integral part of this schedule.
253
LIMITED MATURITY BOND FUND
Schedule of Investments as of October 31, 2014
Unrealized Appreciation (Depreciation)
Gross unrealized appreciation and depreciation of investments, based on Cost for federal income tax purposes, were as follows:
| | | | |
Gross unrealized appreciation | | | $8,832,911 | |
Gross unrealized depreciation | | | (8,320,066 | ) |
| | | | |
Net unrealized appreciation (depreciation) | | | $512,845 | |
| |
Cost for federal income tax purposes | | | $870,952,881 | |
Fair Valuation Measurements
The following table is a summary of the inputs used, as of October 31, 2014, invaluing Limited Maturity Bond Fund’s assets carried at fair value.
| | | | | | | | | | | | | | | | |
Investments in Securities | | Total | | | Level 1 | | | Level 2 | | | Level 3 | |
| | | | |
Bank Loans | | | | | | | | | | | | | | | | |
Basic Materials | | | 1,756,723 | | | | – | | | | 1,756,723 | | | | – | |
Capital Goods | | | 2,650,414 | | | | – | | | | 2,650,414 | | | | – | |
Communications Services | | | 14,844,442 | | | | – | | | | 13,640,096 | | | | 1,204,346 | |
Consumer Cyclical | | | 7,146,014 | | | | – | | | | 7,146,014 | | | | – | |
Consumer Non-Cyclical | | | 4,708,617 | | | | – | | | | 4,223,749 | | | | 484,868 | |
Energy | | | 1,662,868 | | | | – | | | | 1,662,868 | | | | – | |
Financials | | | 1,604,393 | | | | – | | | | 1,604,393 | | | | – | |
Technology | | | 3,178,153 | | | | – | | | | 3,178,153 | | | | – | |
Transportation | | | 1,022,618 | | | | – | | | | – | | | | 1,022,618 | |
Utilities | | | 1,747,673 | | | | – | | | | 1,747,673 | | | | – | |
| | | | |
Long-Term Fixed Income | | | | | | | | | | | | | | | | |
Asset-Backed Securities | | | 113,325,767 | | | | – | | | | 105,187,609 | | | | 8,138,158 | |
Basic Materials | | | 6,908,886 | | | | – | | | | 6,908,886 | | | | – | |
Capital Goods | | | 3,549,180 | | | | – | | | | 3,549,180 | | | | – | |
Collateralized Mortgage Obligations | | | 71,296,826 | | | | – | | | | 71,296,826 | | | | – | |
Commercial Mortgage-Backed Securities | | | 49,080,243 | | | | – | | | | 49,080,243 | | | | – | |
Communications Services | | | 24,281,599 | | | | – | | | | 24,281,599 | | | | – | |
Consumer Cyclical | | | 9,211,164 | | | | – | | | | 9,211,164 | | | | – | |
Consumer Non-Cyclical | | | 22,726,460 | | | | – | | | | 22,726,460 | | | | – | |
Energy | | | 19,975,216 | | | | – | | | | 19,975,216 | | | | – | |
Financials | | | 161,165,847 | | | | – | | | | 161,165,847 | | | | – | |
Foreign Government | | | 44,936,482 | | | | – | | | | 44,936,482 | | | | – | |
Mortgage-Backed Securities | | | 52,104,665 | | | | – | | | | 52,104,665 | | | | – | |
Technology | | | 7,134,027 | | | | – | | | | 7,134,027 | | | | – | |
Transportation | | | 10,350,439 | | | | – | | | | 10,350,439 | | | | – | |
U.S. Government and Agencies | | | 138,943,909 | | | | – | | | | 138,943,909 | | | | – | |
Utilities | | | 13,638,125 | | | | – | | | | 13,638,125 | | | | – | |
| | | | |
Preferred Stock | | | | | | | | | | | | | | | | |
Financials | | | 4,684,035 | | | | 3,901,030 | | | | 783,005 | | | | – | |
Utilities | | | 1,655,977 | | | | – | | | | 1,655,977 | | | | – | |
Collateral Held for Securities Loaned | | | 2,897,695 | | | | 2,897,695 | | | | – | | | | – | |
Short-Term Investments | | | 73,277,269 | | | | 71,677,565 | | | | 1,599,704 | | | | – | |
| |
Total | | | $871,465,726 | | | | $78,476,290 | | | | $782,139,446 | | | | $10,849,990 | |
| |
| | | | |
Other Financial Instruments | | Total | | | Level 1 | | | Level 2 | | | Level 3 | |
| | | | |
Asset Derivatives | | | | | | | | | | | | | | | | |
Futures Contracts | | | 18,017 | | | | 18,017 | | | | – | | | | – | |
| |
Total Asset Derivatives | | | $18,017 | | | | $18,017 | | | | $– | | | | $– | |
| |
| | | | |
Liability Derivatives | | | | | | | | | | | | | | | | |
Futures Contracts | | | 679,226 | | | | 679,226 | | | | – | | | | – | |
| |
Total Liability Derivatives | | | $679,226 | | | | $679,226 | | | | $– | | | | $– | |
| |
There were no significant transfers between Levels during the period ended October 31, 2014. Transfers between Levels are identified as of the end of the period.
The accompanying Notes to Financial Statements are an integral part of this schedule.
254
LIMITED MATURITY BOND FUND
Schedule of Investments as of October 31, 2014
| | | | | | | | | | | | | | | | | | | | |
Futures Contracts | | Number of
Contracts
Long/(Short) | | | Expiration
Date | | | Notional
Principal
Amount | | | Value | | | Unrealized
Gain/(Loss) | |
5-Yr. U.S. Treasury Bond Futures | | | (590 | ) | | | December 2014 | | | | ($69,954,683 | ) | | | ($70,463,517 | ) | | | ($508,834 | ) |
10-Yr. U.S. Treasury Bond Futures | | | (205 | ) | | | December 2014 | | | | (25,733,281 | ) | | | (25,903,673 | ) | | | (170,392 | ) |
30-Yr. U.S. Treasury Bond Futures | | | 10 | | | | December 2014 | | | | 1,392,921 | | | | 1,410,938 | | | | 18,017 | |
Total Futures Contracts | | | | | | | | | | | | | | | | | | | ($661,209 | ) |
The following table summarizes the fair value and Statement of Assets and Liabilities location, as of October 31, 2014, for Limited Maturity Bond Fund’s investments in financial derivative instruments by primary risk exposure as discussed under item (2) Significant Accounting Policies of the Notes to Financial Statements.
| | | | | | |
Derivatives by risk category | | Statement of Assets and Liabilities Location | | Fair Value | |
| | |
Asset Derivatives | | | | | | |
| | |
Interest Rate Contracts | | | | | | |
Futures* | | Net Assets - Net unrealized appreciation/(depreciation) on Futures contracts | | | $18,017 | |
Total Interest Rate Contracts | | | | | 18,017 | |
| |
Total Asset Derivatives | | | | | $18,017 | |
| |
| | |
Liability Derivatives | | | | | | |
| | |
Interest Rate Contracts | | | | | | |
Futures* | | Net Assets - Net unrealized appreciation/(depreciation) on Futures contracts | | | 679,226 | |
Total Interest Rate Contracts | | | | | 679,226 | |
| |
Total Liability Derivatives | | | | | $679,226 | |
| |
* | Includes cumulative appreciation/depreciation of futures contracts as reported in the Schedule of Investments. Only current day’s variation margin is reported within the Statement of Assets and Liabilities. |
The following table summarizes the net realized gains/(losses) and Statement of Operations location, for the period ended October 31, 2014, for Limited Maturity Bond Fund’s investments in financial derivative instruments by primary risk exposure.
| | | | | | |
Derivatives by risk category | | Statement of Operations Location | | Realized Gains/(Losses)
recognized in Income | |
| | |
Interest Rate Contracts | | | | | | |
Futures | | Net realized gains/(losses) on Futures contracts | | | (2,774,423 | ) |
| | |
Total Interest Rate Contracts | | | | | (2,774,423 | ) |
| | |
Equity Contracts | | | | | | |
Options Written | | Net realized gains/(losses) on Written option contracts | | | 42,840 | |
Options Purchased | | Net realized gains/(losses) on Investments | | | (128,098 | ) |
| | |
Total Equity Contracts | | | | | (85,258 | ) |
| | |
Credit Contracts | | | | | | |
Credit Default Swaps | | Net realized gains/(losses) on Swap agreements | | | (469,480 | ) |
| | |
Total Credit Contracts | | | | | (469,480 | ) |
| |
Total | | | | | ($3,329,161 | ) |
| |
The following table summarizes the change in net unrealized appreciation/(depreciation) and Statement of Operations location, for the period ended October 31, 2014, for Limited Maturity Bond Fund’s investments in financial derivative instruments by primary risk exposure.
| | | | | | |
Derivatives by risk category | | Statement of Operations Location | | Change in unrealized
appreciation/(depreciation)
recognized in Income | |
| | |
Interest Rate Contracts | | | | | | |
Options Purchased | | Change in net unrealized appreciation/(depreciation) on Investments | | | (4,417 | ) |
Futures | | Change in net unrealized appreciation/(depreciation) on Futures contracts | | | 1,437,465 | |
Total Interest Rate Contracts | | | | | 1,433,048 | |
| | |
Credit Contracts | | | | | | |
Credit Default Swaps | | Change in net unrealized appreciation/(depreciation) on Swap agreements | | | (39,945 | ) |
Total Credit Contracts | | | | | (39,945 | ) |
| |
Total | | | | | $1,393,103 | |
| |
The accompanying Notes to Financial Statements are an integral part of this schedule.
255
LIMITED MATURITY BOND FUND
Schedule of Investments as of October 31, 2014
The following table presents Limited Maturity Bond Fund’s average volume of derivative activity during the period ended October 31, 2014.
| | | | | | | | | | | | | | | | | | | | |
Derivative Risk Category | | Futures (Notional)* | | | Futures
(Percentage
of Average
Net Assets) | | | Swaps (Notional)* | | | Swaps
(Percentage
of Average
Net Assets) | | | Options (Contracts) | |
Equity Contracts | | | N/A | | | | N/A | | | | N/A | | | | N/A | | | | 168 | |
Interest Rate Contracts | | | 104,740,482 | | | | 12.2 | | | | N/A | | | | N/A | | | | N/A | |
Credit Contracts | | | N/A | | | | N/A | | | | 1,284,411 | | | | 0.1 | % | | | N/A | |
* | Notional amount represents long or short, or both, derivative positions held by the Fund. |
Investment in Affiliates
Affiliated issuers, as defined under the Investment Company Act of 1940, include those in which the Fund’s holdings of an issuer represent 5% or more of the outstanding voting securities of an issuer, or any affiliated mutual fund.
A summary of transactions for the fiscal year to date, in Limited Maturity Bond Fund, is as follows:
| | | | | | | | | | | | | | | | | | | | | | | | |
Fund | | Value
October 31, 2013 | | | Gross Purchases | | | Gross Sales | | | Shares Held at
October 31, 2014 | | | Value
October 31, 2014 | | | Income Earned
November 1, 2013 - October 31, 2014 | |
Cash Management Trust-Collateral
Investment | | | $8,269,685 | | | | $253,600,228 | | | | $258,972,218 | | | | 2,897,695 | | | | $2,897,695 | | | | $27,078 | |
Cash Management Trust-Short Term
Investment | | | 42,812,455 | | | | 310,906,890 | | | | 282,041,780 | | | | 71,677,565 | | | | 71,677,565 | | | | 26,473 | |
Total Value and Income Earned | | | 51,082,140 | | | | | | | | | | | | | | | | 74,575,260 | | | | 53,551 | |
The accompanying Notes to Financial Statements are an integral part of this schedule.
256
MONEY MARKET FUND
Schedule of Investments as of October 31, 2014
| | | | | | | | |
Principal
Amount | | | Asset Backed Commercial Paper (19.5%)a | | Value | |
| | | | Dealers Capital Access Trust, LLC | | | | |
| $ | 10,150,000 | | | 0.150%, 11/4/2014b | | | $10,149,873 | |
| | 4,250,000 | | | 0.200%, 11/7/2014b | | | 4,249,858 | |
| | | | Golden Funding Corporation | | | | |
| | 8,500,000 | | | 0.100%, 11/7/2014b | | | 8,499,858 | |
| | 4,250,000 | | | 0.220%, 1/14/2015b | | | 4,248,078 | |
| | | | Kells Funding, LLC | | | | |
| | 4,730,000 | | | 0.235%, 11/17/2014b,c,d | | | 4,729,999 | |
| | | | Liberty Street Funding, LLC | | | | |
| | 5,000,000 | | | 0.120%, 11/5/2014b | | | 4,999,933 | |
| | 4,240,000 | | | 0.160%, 11/20/2014b | | | 4,239,642 | |
| | | | Old Line Funding, LLC | | | | |
| | 4,235,000 | | | 0.180%, 12/18/2014b | | | 4,234,005 | |
| | 4,270,000 | | | 0.193%, 4/23/2015b,c,d | | | 4,270,000 | |
| | | | Starbird Funding Corporation | | | | |
| | 21,000,000 | | | 0.060%, 11/3/2014b | | | 20,999,930 | |
| | | | Sydney Capital Corporation | | | | |
| | 4,220,000 | | | 0.180%, 12/24/2014b | | | 4,218,882 | |
| | | | Thunder Bay Funding, LLC | | | | |
| | 4,350,000 | | | 0.190%, 12/19/2014b | | | 4,348,898 | |
| | 4,255,000 | | | 0.239%, 4/14/2015b | | | 4,250,345 | |
| | | | | |
| | | | Total | | | 83,439,301 | |
| | | | | |
| | |
Principal
Amount | | | Certificate of Deposit (10.0%)a | | Value | |
| | | | Bank of Montreal Chicago | | | | |
| | 4,260,000 | | | 0.170%, 11/13/2014 | | | 4,260,000 | |
| | 4,680,000 | | | 0.233%, 4/9/2015d | | | 4,680,000 | |
| | | | Nederlandse Waterschapsbank NV | | | | |
| | 4,260,000 | | | 0.243%, 12/23/2014d | | | 4,260,688 | |
| | | | Rabobank Nederland NY | | | | |
| | 4,620,000 | | | 0.284%, 12/1/2014d | | | 4,620,000 | |
| | 2,340,000 | | | 0.282%, 5/20/2015d | | | 2,340,235 | |
| | 4,440,000 | | | 0.254%, 7/17/2015d | | | 4,440,000 | |
| | | | Skandinaviska Enskilda Banken AB | | | | |
| | 4,510,000 | | | 0.635%, 2/26/2015d | | | 4,515,679 | |
| | | | Toronto Dominion Bank of New York | | | | |
| | 4,750,000 | | | 0.217%, 11/18/2014d | | | 4,750,000 | |
| | | | US Bank NA | | | | |
| | 4,350,000 | | | 0.173%, 1/15/2015d | | | 4,350,000 | |
| | | | Wells Fargo Bank NA | | | | |
| | 4,230,000 | | | 0.263%, 9/4/2015d | | | 4,230,000 | |
| | | | | |
| | | | Total | | | 42,446,602 | |
| | | | | |
| | |
Principal
Amount | | | Financial Company Commercial Paper (9.1%)a | | Value | |
| | | | General Electric Capital Corporation | | | | |
| | 4,260,000 | | | 0.180%, 3/11/2015b | | | 4,257,231 | |
| | | | KFW | | | | |
| | 1,000,000 | | | 0.120%, 12/22/2014 | | | 999,830 | |
| | | | Nordea Bank AB | | | | |
| | 4,280,000 | | | 0.130%, 12/12/2014 | | | 4,279,397 | |
| | | | Prudential Funding, LLC | | | | |
| | 4,240,000 | | | 0.090%, 11/25/2014 | | | 4,239,746 | |
| | | | Skandinaviska Enskilda Banken AB | | | | |
| | 4,250,000 | | | 0.140%, 12/10/2014 | | | 4,249,355 | |
| | | | Svenska Handelsbanken AB | | | | |
| | 4,300,000 | | | 0.180%, 12/22/2014 | | | 4,298,904 | |
| | | | Toronto-Dominion Holdings USA, Inc. | | | | |
| | 4,260,000 | | | 0.160%, 1/13/2015 | | | 4,258,618 | |
| | | | US Bank NA | | | | |
| | 12,500,000 | | | 0.100%, 11/3/2014 | | | 12,500,000 | |
| | | | | |
| | | | Total | | | 39,083,081 | |
| | | | | |
| | |
Principal
Amount | | | Government Agency Debt (29.4%)a | | Value | |
| | | | Federal Agricultural Mortgage Corporation | | | | |
| | 4,800,000 | | | 0.350%, 7/1/2015d | | | 4,805,174 | |
| | | | Federal Farm Credit Bank | | | | |
| | 3,860,000 | | | 0.173%, 4/23/2015d | | | 3,861,123 | |
| | 3,860,000 | | | 0.152%, 8/3/2015d | | | 3,860,902 | |
| | | | Federal Home Loan Bank | | | | |
| | 4,470,000 | | | 0.132%, 12/9/2014d | | | 4,470,231 | |
| | 4,710,000 | | | 0.130%, 2/23/2015d | | | 4,710,000 | |
| | 6,825,000 | | | 0.100%, 3/10/2015 | | | 6,824,604 | |
| | 4,470,000 | | | 0.130%, 8/26/2015d | | | 4,470,210 | |
| | | | Federal Home Loan Mortgage Corporation | | | | |
| | 13,380,000 | | | 0.142%, 6/26/2015d | | | 13,382,815 | |
| | 2,280,000 | | | 0.144%, 7/17/2015d | | | 2,280,499 | |
| | | | Federal National Mortgage Association | | | | |
| | 4,420,000 | | | 0.340%, 1/27/2015d | | | 4,422,764 | |
| | | | Overseas Private Investment Corporation | | | | |
| | 3,421,058 | | | 0.110%, 11/5/2014d | | | 3,421,058 | |
| | 4,500,000 | | | 0.110%, 11/7/2014d | | | 4,500,000 | |
| | 4,510,000 | | | 0.110%, 11/7/2014d | | | 4,510,000 | |
| | 7,700,000 | | | 0.110%, 11/7/2014d | | | 7,700,000 | |
| | 5,275,000 | | | 0.110%, 11/7/2014d | | | 5,275,000 | |
| | 4,855,000 | | | 0.110%, 11/7/2014d | | | 4,855,000 | |
| | 9,500,000 | | | 0.300%, 12/9/2014 | | | 9,525,529 | |
| | 3,530,561 | | | 0.300%, 12/10/2014 | | | 3,540,025 | |
| | 5,042,839 | | | 0.420%, 4/15/2015 | | | 5,054,434 | |
| | 6,800,000 | | | 0.390%, 5/2/2015 | | | 6,813,297 | |
| | 3,000,000 | | | 0.405%, 7/7/2015 | | | 3,389,923 | |
| | 8,710,000 | | | 0.430%, 7/12/2015 | | | 8,721,283 | |
| | 2,620,000 | | | 0.205%, 9/7/2015 | | | 2,621,588 | |
| | 2,920,000 | | | 0.410%, 9/7/2015 | | | 2,921,770 | |
| | | | | |
| | | | Total | | | 125,937,229 | |
| | | | | |
| | |
| Shares | | | Investment Company (7.8%) | | Value | |
| | | | BlackRock Cash Funds | | | | |
| | 20,978,000 | | | 0.080% | | | 20,978,000 | |
| | | | Dreyfus Institutional Cash Advantage Fund | | | | |
| | 315,000 | | | 0.060% | | | 315,000 | |
| | | | Duetsche Money Market Series | | | | |
| | 12,182,025 | | | 0.050% | | | 12,182,025 | |
| | | | | |
| | | | Total | | | 33,475,025 | |
| | | | | |
| | |
Principal
Amount | | | Other Commercial Paper (14.5%)a | | Value | |
| | | | Caisse des Depots et Consignations | | | | |
| | 4,230,000 | | | 0.170%, 12/12/2014 | | | 4,229,181 | |
| | | | Cargill Global Funding plc | | | | |
| | 9,570,000 | | | 0.050%, 11/3/2014 | | | 9,569,974 | |
| | | | Chevron Corporation | | | | |
| | 3,451,000 | | | 0.090%, 12/16/2014 | | | 3,450,612 | |
| | | | Coca-Cola Company | | | | |
| | 4,240,000 | | | 0.170%, 2/9/2015 | | | 4,237,998 | |
The accompanying Notes to Financial Statements are an integral part of this schedule.
257
MONEY MARKET FUND
Schedule of Investments as of October 31, 2014
| | | | | | | | |
Principal Amount | | | Other Commercial Paper (14.5%)a | | Value | |
| | | | Emerson Electric Company | | | | |
| $ | 4,270,000 | | | 0.120%, 1/26/2015 | | | $4,268,776 | |
| | | | John Deere Financial, Inc. | | | | |
| | 3,880,000 | | | 0.080%, 11/17/2014 | | | 3,879,862 | |
| | | | Long Island Power Auth. | | | | |
| | 4,000,000 | | | 0.160%, 11/3/2014 | | | 4,000,000 | |
| | | | Praxair, Inc. | | | | |
| | 4,290,000 | | | 0.080%, 12/10/2014 | | | 4,289,628 | |
| | | | Reckitt Benckiser Treasury Services plc | | | | |
| | 3,500,000 | | | 0.170%, 2/6/2015 | | | 3,498,397 | |
| | 4,230,000 | | | 0.240%, 3/24/2015 | | | 4,225,967 | |
| | | | Roche Holdings, Inc. | | | | |
| | 2,125,000 | | | 0.090%, 11/17/2014 | | | 2,124,915 | |
| | 2,120,000 | | | 0.125%, 1/12/2015 | | | 2,119,470 | |
| | | | Schlumberger Investment SA | | | | |
| | 4,250,000 | | | 0.120%, 11/26/2014 | | | 4,249,646 | |
| | | | Society of New York Hospital Fund | | | | |
| | 4,000,000 | | | 0.150%, 11/14/2014 | | | 3,999,784 | |
| | | | Total Capital Canada, Ltd. | | | | |
| | 4,260,000 | | | 0.110%, 11/26/2014 | | | 4,259,674 | |
| | | | | |
| | | | Total | | | 62,403,884 | |
| | | | | |
| | |
Principal Amount | | | Other Note (10.3%)a | | Value | |
| | | | Bank of New York Mellon Corporation | | | | |
| | 8,320,000 | | | 1.085%, 11/24/2014d | | | 8,324,705 | |
| | 3,831,000 | | | 1.700%, 11/24/2014 | | | 3,831,000 | |
| | | | Boeing Company | | | | |
| | 4,000,000 | | | 0.249%, 11/3/2014d | | | 4,000,000 | |
| | | | Coca-Cola Company | | | | |
| | 4,250,000 | | | 0.244%, 9/1/2015d | | | 4,252,017 | |
| | | | General Electric Capital Corporation | | | | |
| | 4,470,000 | | | 1.000%, 8/11/2015b,d | | | 4,496,063 | |
| | | | John Deere Capital Corporation | | | | |
| | 4,270,000 | | | 0.300%, 1/12/2015d | | | 4,271,195 | |
| | | | Royal Bank of Canada | | | | |
| | 2,300,000 | | | 0.322%, 11/6/2015c,d | | | 2,300,000 | |
| | | | U.S. Bancorp | | | | |
| | 4,260,000 | | | 2.875%, 11/20/2014 | | | 4,265,801 | |
| | | | Wells Fargo Bank NA | | | | |
| | 4,600,000 | | | 0.324%, 11/13/2015d | | | 4,600,000 | |
| | | | Westpac Banking Corporation | | | | |
| | 4,430,000 | | | 1.028%, 7/17/2015c,d | | | 4,454,702 | |
| | | | | |
| | | | Total | | | 44,795,483 | |
| | | | | |
| | | | | |
| | | | | |
| | | | Total Investments (at amortized cost) 100.6% | | $ | 431,580,605 | |
| | | | | |
| | | | Other Assets and Liabilities, Net (0.6)% | | | (2,612,693 | ) |
| | | | | |
| | | | Total Net Assets 100.0% | | $ | 428,967,912 | |
| | | | | |
a | The interest rate shown reflects the yield, coupon rate or the discount rate at the date of purchase. |
b | Denotes investments that benefit from credit enhancement or liquidity support provided by a third party bank, institution or government. |
c | Denotes securities sold under Rule 144A of the Securities Act of 1933, which exempts them from registration. These securities have been deemed liquid and may be resold to other dealers in the program or to other qualified institutional buyers. As of October 31, 2014, the value of these investments was $15,754,701 or 3.7% of total net assets. |
d | Denotes variable rate securities. Variable rate securities are securities whose yields vary with a designated market index or market rate. The rate shown is as of October 31, 2014. |
Definitions:
| | |
Cost for federal income tax purposes | | $431,580,605 |
The accompanying Notes to Financial Statements are an integral part of this schedule.
258
MONEY MARKET FUND
Schedule of Investments as of October 31, 2014
Fair Valuation Measurements
The following table is a summary of the inputs used, as of October 31, 2014, in valuing Money Market Fund’s assets carried at fair value or amortized cost, which approximates fair value.
| | | | | | | | | | | | | | | | |
Investments in Securities | | Total | | | Level 1 | | | Level 2 | | | Level 3 | |
Asset Backed Commercial Paper | | | 83,439,301 | | | | – | | | | 83,439,301 | | | | – | |
Certificate of Deposit | | | 42,446,602 | | | | – | | | | 42,446,602 | | | | – | |
Financial Company Commercial Paper | | | 39,083,081 | | | | – | | | | 39,083,081 | | | | – | |
Government Agency Debt | | | 125,937,229 | | | | – | | | | 125,937,229 | | | | – | |
Investment Company | | | 33,475,025 | | | | 33,475,025 | | | | – | | | | – | |
Other Commercial Paper | | | 62,403,884 | | | | – | | | | 62,403,884 | | | | – | |
Other Note | | | 44,795,483 | | | | – | | | | 44,795,483 | | | | – | |
| |
Total | | | $431,580,605 | | | | $33,475,025 | | | | $398,105,580 | | | | $– | |
| |
There were no significant transfers between Levels during the period ended October 31, 2014. Transfers between Levels are identified as of the end of the period.
The accompanying Notes to Financial Statements are an integral part of this schedule.
259
THRIVENT MUTUAL FUNDS
STATEMENTOF ASSETSAND LIABILITIES
| | | | | | | | | | | | | | | | |
As of October 31, 2014 | | Aggressive Allocation Fund | | | Moderately
Aggressive
Allocation Fund | | | Moderate Allocation Fund | | | Moderately
Conservative
Allocation
Fund | |
Assets | | | | | | | | | | | | | | | | |
Investments at cost | | | $649,206,978 | | | | $1,587,765,771 | | | | $1,587,615,875 | | | | $752,029,181 | |
Investments in securities at value | | | 373,975,427 | | | | 823,775,148 | | | | 848,285,598 | | | | 486,268,779 | |
Investments in affiliates at value | | | 426,797,147 | | | | 1,074,529,754 | | | | 993,997,943 | | | | 347,801,055 | |
Investments at Value | | | 800,772,574 | | | | 1,898,304,902 | | | | 1,842,283,541 | | | | 834,069,834 | |
| | | | |
Cash | | | 4,385,518 | | | | 3,861,502 | (a) | | | 4,005,951 | (b) | | | 5,211,941 | |
Dividends and interest receivable | | | 167,004 | | | | 1,403,806 | | | | 1,969,441 | | | | 1,297,209 | |
Prepaid expenses | | | 21,140 | | | | 32,734 | | | | 32,020 | | | | 21,321 | |
Receivable for investments sold | | | 1,112,043 | | | | 1,608,289 | | | | 1,677,778 | | | | 617,691 | |
Receivable for fund shares sold | | | 506,454 | | | | 551,902 | | | | 458,773 | | | | 246,005 | |
Receivable for variation margin | | | 3,403,064 | | | | 5,130,204 | | | | 3,669,207 | | | | 1,254,506 | |
Total Assets | | | 810,367,797 | | | | 1,910,893,339 | | | | 1,854,096,711 | | | | 842,718,507 | |
| | | | |
Liabilities | | | | | | | | | | | | | | | | |
Distributions payable | | | – | | | | – | | | | – | | | | – | |
Accrued expenses | | | 114,232 | | | | 207,469 | | | | 182,203 | | | | 99,473 | |
Payable for investments purchased | | | 7,980,029 | | | | 39,164,321 | | | | 76,230,742 | | | | 76,689,379 | |
Payable upon return of collateral for securities loaned | | | – | | | | 601,444 | | | | 880,533 | | | | 752,392 | |
Payable for fund shares redeemed | | | 117,824 | | | | 738,580 | | | | 1,234,923 | | | | 354,717 | |
Payable for variation margin | | | 1,828,773 | | | | 2,159,778 | | | | 1,750,875 | | | | 603,322 | |
Payable to affiliate | | | 478,516 | | | | 1,057,530 | | | | 980,092 | | | | 450,086 | |
Mortgage dollar roll deferred revenue | | | 5,536 | | | | 28,970 | | | | 58,085 | | | | 59,745 | |
Total Liabilities | | | 10,524,910 | | | | 43,958,092 | | | | 81,317,453 | | | | 79,009,114 | |
| | | | |
Net Assets | | | | | | | | | | | | | | | | |
Capital stock (beneficial interest) | | | 598,390,530 | | | | 1,486,081,375 | | | | 1,475,681,395 | | | | 670,369,287 | |
Accumulated undistributed net investment income/(loss) | | | (587,926 | ) | | | 6,360,803 | | | | 731,018 | | | | 533,396 | |
Accumulated undistributed net realized gain/(loss) | | | 50,344,095 | | | | 60,237,499 | | | | 37,458,111 | | | | 10,115,403 | |
Net unrealized appreciation/(depreciation) on: | | | | | | | | | | | | | | | | |
Investments | | | 47,811,076 | | | | 75,137,906 | | | | 60,564,632 | | | | 24,653,351 | |
Affiliated investments | | | 103,754,520 | | | | 235,401,225 | | | | 194,103,034 | | | | 57,387,302 | |
Futures contracts | | | 131,335 | | | | 3,713,359 | | | | 4,234,650 | | | | 641,394 | |
Foreign currency transactions | | | (743 | ) | | | (2,762 | ) | | | (1,998 | ) | | | (283 | ) |
Swap agreements | | | – | | | | 5,842 | | | | 8,416 | | | | 9,543 | |
Total Net Assets | | | $799,842,887 | | | | $1,866,935,247 | | | | $1,772,779,258 | | | | $763,709,393 | |
| | | | |
Class A Share Capital | | | $687,591,799 | | | | $1,746,679,323 | | | | $1,683,760,097 | | | | $731,441,494 | |
Shares of beneficial interest outstanding (Class A) | | | 46,564,990 | | | | 123,233,665 | | | | 126,963,510 | | | | 60,026,591 | |
Net asset value per share | | | $14.77 | | | | $14.17 | | | | $13.26 | | | | $12.19 | |
Maximum public offering price | | | $15.63 | | | | $14.99 | | | | $14.03 | | | | $12.90 | |
Institutional Class Share Capital | | | $112,251,088 | | | | $120,255,924 | | | | $89,019,161 | | | | $32,267,899 | |
Shares of beneficial interest outstanding (Institutional Class) | | | 7,533,419 | | | | 8,412,728 | | | | 6,696,028 | | | | 2,640,741 | |
Net asset value per share | | | $14.90 | | | | $14.29 | | | | $13.29 | | | | $12.22 | |
(a) | Includes foreign currency holdings of $68,555 (cost $69,294). |
(b) | Includes foreign currency holdings of $46,688 (cost $47,159). |
(c) | Includes foreign currency holdings of $13,252 (cost $13,253). |
The accompanying Notes to Financial Statements are an integral part of this statement.
260
THRIVENT MUTUAL FUNDS
STATEMENTOF ASSETSAND LIABILITIES –CONTINUED
| | | | | | | | | | | | | | | | | | | | | | | | | | |
Balanced
Income Plus
Fund | | | Opportunity
Income Plus
Fund | | | Partner Emerging
Markets Equity
Fund | | | Partner
Small Cap
Growth Fund | | | Partner Small Cap Value Fund | | | Small Cap
Stock Fund | | | Mid Cap
Growth Fund | |
| | | | | | |
| | | | | | | | | | | | | | | | | | | | | | | | | | |
| | $273,168,367 | | | | $433,910,675 | | | | $13,847,252 | | | | $16,932,032 | | | | $167,907,232 | | | | $307,284,011 | | | | $314,518,833 | |
| | 258,503,421 | | | | 375,141,538 | | | | 13,143,678 | | | | 16,961,821 | | | | 249,276,228 | | | | 340,709,691 | | | | 417,611,990 | |
| | 36,087,730 | | | | 57,795,462 | | | | 228,777 | | | | 718,618 | | | | 16,142,409 | | | | 23,996,755 | | | | 17,975,310 | |
| | 294,591,151 | | | | 432,937,000 | | | | 13,372,455 | | | | 17,680,439 | | | | 265,418,637 | | | | 364,706,446 | | | | 435,587,300 | |
| | | | | | | | | | | | | | | | | | | | | | | | | | |
| | – | | | | 6,788 | | | | 13,252 | (c) | | | 4,822 | | | | – | | | | – | | | | – | |
| | 862,063 | | | | 2,171,798 | | | | 15,615 | | | | 298 | | | | 136,922 | | | | 116,505 | | | | 56,831 | |
| | 8,757 | | | | 11,654 | | | | 15,741 | | | | 11,645 | | | | 12,368 | | | | 10,711 | | | | 16,256 | |
| | 4,135,144 | | | | 483,328 | | | | 132,099 | | | | 112,899 | | | | 802,586 | | | | 697,418 | | | | 3,536,120 | |
| | 151,477 | | | | 324,266 | | | | 1,049 | | | | 19,592 | | | | 174,951 | | | | 34,798 | | | | 185,812 | |
| | 40,687 | | | | 32,000 | | | | – | | | | – | | | | – | | | | – | | | | – | |
| | 299,789,279 | | | | 435,966,834 | | | | 13,550,211 | | | | 17,829,695 | | | | 266,545,464 | | | | 365,565,878 | | | | 439,382,319 | |
| | | | | | | | | | | | | | | | | | | | | | | | | | |
| | – | | | | 83,900 | | | | – | | | | – | | | | – | | | | – | | | | – | |
| | 112,351 | | | | 142,588 | | | | 37,425 | | | | 41,814 | | | | 79,447 | | | | 140,652 | | | | 132,312 | |
| | 19,071,359 | | | | 46,468,187 | | | | 181,760 | | | | 83,195 | | | | 450,527 | | | | 918,837 | | | | 364,284 | |
| | 3,335,702 | | | | 4,698,528 | | | | – | | | | 217,215 | | | | 8,739,961 | | | | 13,527,930 | | | | 1,575,210 | |
| | 249 | | | | 154,652 | | | | 6,717 | | | | 5,026 | | | | 137,295 | | | | 70,658 | | | | 198,138 | |
| | 19,476 | | | | 63,726 | | | | – | | | | – | | | | – | | | | – | | | | – | |
| | 196,226 | | | | 214,649 | | | | 2,188 | | | | 6,967 | | | | 186,513 | | | | 277,977 | | | | 222,916 | |
| | 11,008 | | | | 30,417 | | | | – | | | | – | | | | – | | | | – | | | | – | |
| | 22,746,371 | | | | 51,856,647 | | | | 228,090 | | | | 354,217 | | | | 9,593,743 | | | | 14,936,054 | | | | 2,492,860 | |
| | | | | | | | | | | | | | | | | | | | | | | | | | |
| | 243,702,846 | | | | 390,744,214 | | | | 14,053,399 | | | | 14,959,530 | | | | 127,079,043 | | | | 256,563,779 | | | | 273,279,173 | |
| | 187,275 | | | | 62,519 | | | | 180,501 | | | | (26,040 | ) | | | 686,808 | | | | (97,003 | ) | | | (120,662 | ) |
| | 11,659,603 | | | | (5,743,729 | ) | | | (436,538 | ) | | | 1,793,581 | | | | 31,674,465 | | | | 36,740,575 | | | | 42,662,481 | |
| | 21,422,784 | | | | (973,675 | ) | | | (474,797 | ) | | | 748,407 | | | | 97,511,405 | | | | 57,422,435 | | | | 121,068,467 | |
| | – | | | | – | | | | – | | | | – | | | | – | | | | – | | | | – | |
| | 70,767 | | | | 20,858 | | | | – | | | | – | | | | – | | | | – | | | | – | |
| | (367) | | | | – | | | | (444 | ) | | | – | | | | – | | | | 38 | | | | – | |
| | – | | | | – | | | | – | | | | – | | | | – | | | | – | | | | – | |
| | $277,042,908 | | | | $384,110,187 | | | | $13,322,121 | | | | $17,475,478 | | | | $256,951,721 | | | | $350,629,824 | | | | $436,889,459 | |
| | | | | | | | | | | | | | | | | | | | | | | | | | |
| | $222,102,302 | | | | $271,058,427 | | | | $12,759,101 | | | | $17,237,097 | | | | $96,316,515 | | | | $259,839,518 | | | | $269,694,383 | |
| | 16,542,926 | | | | 26,124,699 | | | | 1,349,676 | | | | 1,139,712 | | | | 4,553,438 | | | | 12,913,722 | | | | 13,084,657 | |
| | $13.43 | | | | $10.38 | | | | $9.45 | | | | $15.12 | | | | $21.15 | | | | $20.12 | | | | $20.61 | |
| | $14.21 | | | | $10.87 | | | | $10.00 | | | | $16.00 | | | | $22.38 | | | | $21.29 | | | | $21.81 | |
| | $54,940,606 | | | | $113,051,760 | | | | $563,020 | | | | $238,381 | | | | $160,635,206 | | | | $90,790,306 | | | | $167,195,076 | |
| | 4,098,956 | | | | 10,896,221 | | | | 59,424 | | | | 15,165 | | | | 7,200,919 | | | | 3,960,533 | | | | 6,938,564 | |
| | $13.40 | | | | $10.38 | | | | $9.47 | | | | $15.72 | | | | $22.31 | | | | $22.92 | | | | $24.10 | |
The accompanying Notes to Financial Statements are an integral part of this statement.
261
THRIVENT MUTUAL FUNDS
STATEMENTOF ASSETSAND LIABILITIES –CONTINUED
| | | | | | | | | | | | | | | | |
As of October 31, 2014 | | Partner Mid
Cap Value
Fund | | | Mid Cap
Stock Fund | | | Partner
Worldwide
Allocation
Fund | | | Large Cap
Growth Fund | |
Assets | | | | | | | | | | | | | | | | |
Investments at cost | | | $152,476,533 | | | | $729,542,708 | | | | $791,639,326 | | | | $398,628,742 | |
Investments in securities at value | | | 169,881,226 | | | | 902,646,182 | | | | 811,510,836 | | | | 495,437,883 | |
Investments in affiliates at value | | | 5,641,758 | | | | 83,097,165 | | | | 19,454,673 | | | | 26,710,284 | |
Investments at Value | | | 175,522,984 | | | | 985,743,347 | | | | 830,965,509 | | | | 522,148,167 | |
| | | | |
Cash | | | – | | | | – | | | | 3,842,769 | (a) | | | – | |
Initial margin deposit on open future contracts | | | – | | | | – | | | | 195,421 | | | | – | |
Dividends and interest receivable | | | 45,990 | | | | 341,772 | | | | 3,480,123 | | | | 57,431 | |
Prepaid expenses | | | 11,983 | | | | 16,006 | | | | 12,880 | | | | 16,182 | |
Receivable for investments sold | | | 1,563,867 | | | | 2,181,546 | | | | 6,993,108 | | | | 7,075,317 | |
Receivable for fund shares sold | | | 70,216 | | | | 93,180 | | | | 107,767 | | | | 191,783 | |
Unrealized gain on forward contracts | | | – | | | | – | | | | 925,311 | | | | – | |
Receivable for variation margin | | | – | | | | – | | | | 620,790 | | | | 501,714 | |
Total Assets | | | 177,215,040 | | | | 988,375,851 | | | | 847,143,678 | | | | 529,990,594 | |
| | | | |
Liabilities | | | | | | | | | | | | | | | | |
Distributions payable | | | – | | | | – | | | | – | | | | – | |
Accrued expenses | | | 49,458 | | | | 250,649 | | | | 291,661 | | | | 121,604 | |
Cash overdraft | | | – | | | | – | | | | – | | | | – | |
Payable for investments purchased | | | 1,769,588 | | | | 2,811,506 | | | | 8,433,811 | | | | 7,461,171 | |
Payable upon return of collateral for securities loaned | | | – | | | | 42,247,150 | | | | 6,420,500 | | | | – | |
Payable for fund shares redeemed | | | 7,838 | | | | 128,628 | | | | 53,619 | | | | 211,277 | |
Unrealized loss on forward contracts | | | – | | | | – | | | | 699,548 | | | | – | |
Payable for variation margin | | | – | | | | – | | | | 521,746 | | | | – | |
Payable to affiliate | | | 121,537 | | | | 712,595 | | | | 647,330 | | | | 369,487 | |
Mortgage dollar roll deferred revenue | | | – | | | | – | | | | – | | | | – | |
Total Liabilities | | | 1,948,421 | | | | 46,150,528 | | | | 17,068,215 | | | | 8,163,539 | |
| | | | |
Net Assets | | | | | | | | | | | | | | | | |
Capital stock (beneficial interest) | | | 130,161,409 | | | | 580,408,572 | | | | 826,082,880 | | | | 391,040,266 | |
Accumulated undistributed net investment income/(loss) | | | 803,059 | | | | 2,770,224 | | | | 16,052,412 | | | | (76,209 | ) |
Accumulated undistributed net realized gain/(loss) | | | 21,255,700 | | | | 102,845,888 | | | | (51,507,293 | ) | | | 7,892,797 | |
Net unrealized appreciation/(depreciation) on: | | | | | | | | | | | | | | | | |
Investments | | | 23,046,451 | | | | 256,200,639 | | | | 39,326,183 | | | | 123,519,425 | |
Futures contracts | | | – | | | | – | | | | 20,670 | | | | (546,312 | ) |
Foreign currency forward contracts | | | – | | | | – | | | | 225,763 | | | | – | |
Foreign currency transactions | | | – | | | | – | | | | (125,152 | ) | | | (2,912 | ) |
Total Net Assets | | | $175,266,619 | | | | $942,225,323 | | | | $830,075,463 | | | | $521,827,055 | |
| | | | |
Class A Share Capital | | | $26,625,564 | | | | $678,209,883 | | | | $178,214,256 | | | | $183,553,435 | |
Shares of beneficial interest outstanding (Class A) | | | 1,756,204 | | | | 28,803,639 | | | | 17,762,538 | | | | 22,101,016 | |
Net asset value per share | | | $15.16 | | | | $23.55 | | | | $10.03 | | | | $8.31 | |
Maximum public offering price | | | $16.04 | | | | $24.92 | | | | $10.61 | | | | $8.79 | |
Institutional Class Share Capital | | | $148,641,055 | | | | $264,015,440 | | | | $651,861,207 | | | | $338,273,620 | |
Shares of beneficial interest outstanding (Institutional Class) | | | 9,744,146 | | | | 10,335,804 | | | | 64,485,152 | | | | 37,766,558 | |
Net asset value per share | | | $15.25 | | | | $25.54 | | | | $10.11 | | | | $8.96 | |
(a) | Includes foreign currency holdings of $3,836,117 (cost $3,903,272). |
(b) | Includes foreign currency holdings of $482,847 (cost $483,127). |
The accompanying Notes to Financial Statements are an integral part of this statement.
262
THRIVENT MUTUAL FUNDS
STATEMENTOF ASSETSAND LIABILITIES –CONTINUED
| | | | | | | | | | | | | | | | | | | | | | | | | | |
Large Cap
Value Fund | | | Large Cap
Stock Fund | | | High Yield Fund | | | Income Fund | | | Municipal
Bond Fund | | | Government
Bond Fund | | | Limited
Maturity
Bond Fund | |
| | | | | | |
| | $583,540,944 | | | | $1,412,833,880 | | | | $806,313,142 | | | | $846,677,264 | | | | $1,395,125,291 | | | | $107,415,711 | | | | $870,942,279 | |
| | 774,520,888 | | | | 1,696,047,899 | | | | 749,192,492 | | | | 809,273,138 | | | | 1,525,009,021 | | | | 101,426,134 | | | | 796,890,466 | |
| | 24,139,770 | | | | 98,671,873 | | | | 68,948,364 | | | | 65,265,271 | | | | – | | | | 7,267,598 | | | | 74,575,260 | |
| | 798,660,658 | | | | 1,794,719,772 | | | | 818,140,856 | | | | 874,538,409 | | | | 1,525,009,021 | | | | 108,693,732 | | | | 871,465,726 | |
| | | | | | |
| | 2,106 | | | | 482,847 | (b) | | | – | | | | – | | | | 306,030 | | | | – | | | | – | |
| | – | | | | – | | | | – | | | | – | | | | – | | | | – | | | | – | |
| | 854,953 | | | | 1,208,429 | | | | 12,192,903 | | | | 8,146,533 | | | | 20,459,131 | | | | 413,446 | | | | 2,549,112 | |
| | 13,815 | | | | 25,099 | | | | 19,351 | | | | 16,668 | | | | 21,260 | | | | 5,762 | | | | 29,513 | |
| | – | | | | 4,030,621 | | | | 247,800 | | | | 8,389,830 | | | | – | | | | – | | | | 595,525 | |
| | 507,515 | | | | 129,804 | | | | 529,926 | | | | 190,506 | | | | 959,102 | | | | 39,126 | | | | 1,258,073 | |
| | – | | | | – | | | | – | | | | – | | | | – | | | | – | | | | – | |
| | – | | | | 3,059,681 | | | | – | | | | 210,348 | | | | – | | | | – | | | | 151,248 | |
| | 800,039,047 | | | | 1,803,656,253 | | | | 831,130,836 | | | | 891,492,294 | | | | 1,546,754,544 | | | | 109,152,066 | | | | 876,049,197 | |
| | | | | | |
| | – | | | | – | | | | 711,171 | | | | 183,830 | | | | 698,458 | | | | 793 | | | | 22,718 | |
| | 160,798 | | | | 769,467 | | | | 191,527 | | | | 189,436 | | | | 346,217 | | | | 26,448 | | | | 168,997 | |
| | – | | | | – | | | | – | | | | – | | | | – | | | | – | | | | 8,766,302 | |
| | 132,344 | | | | 5,822,086 | | | | 473,133 | | | | 36,962,271 | | | | – | | | | 6,272,113 | | | | 35,729,747 | |
| | – | | | | 26,063,555 | | | | 42,383,027 | | | | 14,386,483 | | | | – | | | | – | | | | 2,897,695 | |
| | 208,812 | | | | 592,187 | | | | 623,918 | | | | 537,007 | | | | 1,277,441 | | | | 28,665 | | | | 643,865 | |
| | – | | | | – | | | | – | | | | – | | | | – | | | | – | | | | – | |
| | – | | | | 977,794 | | | | – | | | | 168,750 | | | | – | | | | – | | | | 4,688 | |
| | 380,754 | | | | 1,242,353 | | | | 416,128 | | | | 369,857 | | | | 898,351 | | | | 45,400 | | | | 292,349 | |
| | – | | | | – | | | | – | | | | 21,361 | | | | – | | | | 5,024 | | | | 25,400 | |
| | 882,708 | | | | 35,467,442 | | | | 44,798,904 | | | | 52,818,995 | | | | 3,220,467 | | | | 6,378,443 | | | | 48,551,761 | |
| | | | | | |
| | 549,432,551 | | | | 1,232,269,234 | | | | 810,279,345 | | | | 810,209,330 | | | | 1,424,982,931 | | | | 101,216,024 | | | | 831,546,732 | |
| | 7,663,367 | | | | 13,206,191 | | | | (97,150 | ) | | | (105,891 | ) | | | 34,963 | | | | (5,541 | ) | | | 88,070 | |
| | 26,940,707 | | | | 146,234,618 | | | | (35,677,977 | ) | | | 835,279 | | | | (11,367,547 | ) | | | 285,119 | | | | (3,999,604 | ) |
| | 215,119,714 | | | | 381,885,892 | | | | 11,827,714 | | | | 27,861,145 | | | | 129,883,730 | | | | 1,278,021 | | | | 523,447 | |
| | – | | | | (5,383,956 | ) | | | – | | | | (126,564 | ) | | | – | | | | – | | | | (661,209 | ) |
| | – | | | | – | | | | – | | | | – | | | | – | | | | – | | | | – | |
| | – | | | | (23,168 | ) | | | – | | | | – | | | | – | | | | – | | | | – | |
| | $799,156,339 | | | | $1,768,188,811 | | | | $786,331,932 | | | | $838,673,299 | | | | $1,543,534,077 | | | | $102,773,623 | | | | $827,497,436 | |
| | | | | | |
| | $237,143,767 | | | | $1,593,994,317 | | | | $540,086,220 | | | | $400,537,030 | | | | $1,446,288,538 | | | | $14,055,958 | | | | $360,214,468 | |
| | 11,482,190 | | | | 57,443,493 | | | | 107,058,928 | | | | 43,096,692 | | | | 123,827,755 | | | | 1,399,252 | | | | 28,958,593 | |
| | $20.65 | | | | $27.75 | | | | $5.04 | | | | $9.29 | | | | $11.68 | | | | $10.05 | | | | $12.44 | |
| | $21.85 | | | | $29.37 | | | | $5.28 | | | | $9.73 | | | | $12.23 | | | | $10.26 | | | | $12.44 | |
| | $562,012,572 | | | | $174,194,494 | | | | $246,245,712 | | | | $438,136,269 | | | | $97,245,539 | | | | $88,717,665 | | | | $467,282,968 | |
| | 27,016,162 | | | | 6,222,741 | | | | 48,783,732 | | | | 47,180,871 | | | | 8,325,922 | | | | 8,829,755 | �� | | | 37,574,757 | |
| | $20.80 | | | | $27.99 | | | | $5.05 | | | | $9.29 | | | | $11.68 | | | | $10.05 | | | | $12.44 | |
The accompanying Notes to Financial Statements are an integral part of this statement.
263
THRIVENT MUTUAL FUNDS
STATEMENTOF ASSETSAND LIABILITIES –CONTINUED
| | | | |
As of October 31, 2014 | | Money
Market
Fund | |
Assets | | | | |
Investments at cost | | | $431,580,605 | |
Investments in securities at value | | | 431,580,605 | |
Investments at Value | | | 431,580,605 | 1 |
Cash | | | 2,618 | |
Dividends and interest receivable | | | 148,754 | |
Prepaid expenses | | | 20,659 | |
Receivable for fund shares old | | | 3,471,654 | |
Receivable from affiliate | | | 23,215 | |
Total Assets | | | 435,247,505 | |
| |
Liabilities | | | | |
Accrued expenses | | | 74,538 | |
Payable for investments purchased | | | 4,279,397 | |
Payable for fund shares redeemed | | | 1,925,658 | |
Total Liabilities | | | 6,279,593 | |
| |
Net Assets | | | | |
Capital stock (beneficial interest) | | | 428,967,912 | |
Accumulated undistributed net investment income/(loss) | | | – | |
Accumulated undistributed net realized gain/(loss) | | | – | |
Total Net Assets | | | $428,967,912 | |
| |
Class A Share Capital | | | $422,745,936 | |
Shares of beneficial interest outstanding (Class A) | | | 422,745,936 | |
Net asset value per share | | | $1.00 | |
Maximum public offering price | | | $1.00 | |
Institutional Class Share Capital | | | $6,221,976 | |
Shares of beneficial interest outstanding (Institutional Class) | | | 6,221,975 | |
Net asset value per share | | | $1.00 | |
1 | Securities held by this fund are valued on the basis of amortized cost, which approximates market value |
The accompanying Notes to Financial Statements are an integral part of this statement.
264
(This page intentionally left blank)
265
THRIVENT MUTUAL FUNDS
STATEMENTOF OPERATIONS
| | | | | | | | | | | | | | | | |
For the year ended October 31, 2014 | | Aggressive
Allocation
Fund | | | Moderately
Aggressive
Allocation
Fund | | | Moderate
Allocation
Fund | | | Moderately
Conservative
Allocation
Fund | |
Investment Income | | | | | | | | | | | | | | | | |
Dividends | | | $2,908,511 | | | | $5,323,208 | | | | $4,218,377 | | | | $1,440,797 | |
Taxable interest | | | 434,176 | | | | 6,955,141 | | | | 10,308,006 | | | | 7,077,618 | |
Income from mortgage dollar rolls | | | 415,137 | | | | 1,409,527 | | | | 2,060,680 | | | | 2,214,742 | |
Income from securities loaned | | | 125 | | | | 8,371 | | | | 9,147 | | | | 7,007 | |
Income from affiliated investments | | | 4,701,544 | | | | 15,022,945 | | | | 17,791,620 | | | | 7,322,371 | |
Foreign tax withholding | | | (21,528 | ) | | | (73,476 | ) | | | (58,260 | ) | | | (11,828 | ) |
Total Investment Income | | | 8,437,965 | | | | 28,645,716 | | | | 34,329,570 | | | | 18,050,707 | |
| | | | |
Expenses | | | | | | | | | | | | | | | | |
Adviser fees | | | 2,695,497 | | | | 6,082,869 | | | | 5,695,940 | | | | 2,828,144 | |
Sub-Adviser fees | | | – | | | | – | | | | – | | | | – | |
Administrative service fees | | | 210,236 | | | | 399,692 | | | | 385,444 | | | | 208,640 | |
Audit and legal fees | | | 31,328 | | | | 38,813 | | | | 38,458 | | | | 31,570 | |
Custody fees | | | 59,142 | | | | 135,926 | | | | 126,396 | | | | 63,888 | |
Distribution expenses Class A | | | 1,640,767 | | | | 4,170,061 | | | | 4,057,670 | | | | 1,794,496 | |
Insurance expenses | | | 7,821 | | | | 12,844 | | | | 12,611 | | | | 7,964 | |
Printing and postage expenses Class A | | | 212,588 | | | | 418,341 | | | | 327,195 | | | | 132,619 | |
Printing and postage expenses Institutional Class | | | 436 | | | | 447 | | | | 512 | | | | 416 | |
SEC and state registration expenses | | | 60,962 | | | | 108,253 | | | | 103,259 | | | | 67,801 | |
Transfer agent fees Class A | | | 804,075 | | | | 1,579,568 | | | | 1,206,648 | | | | 474,852 | |
Transfer agent fees Institutional Class | | | 325 | | | | 382 | | | | 742 | | | | 807 | |
Trustees’ fees | | | 15,920 | | | | 28,706 | | | | 29,018 | | | | 19,679 | |
Other expenses | | | 14,700 | | | | 58,259 | | | | 58,086 | | | | 39,549 | |
Total Expenses Before Reimbursement | | | 5,753,797 | | | | 13,034,161 | | | | 12,041,979 | | | | 5,670,425 | |
Less: | | | | | | | | | | | | | | | | |
Reimbursement from adviser | | | – | | | | – | | | | – | | | | – | |
Total Net Expenses | | | 5,753,797 | | | | 13,034,161 | | | | 12,041,979 | | | | 5,670,425 | |
| | | | | | | | | | | | | | | | |
Net Investment Income/(Loss) | | | 2,684,168 | | | | 15,611,555 | | | | 22,287,591 | | | | 12,380,282 | |
Realized and Unrealized Gains/(Losses) | | | | | | | | | | | | | | | | |
Net realized gains/(losses) on: | | | | | | | | | | | | | | | | |
Investments | | | 20,290,988 | | | | 34,867,868 | | | | 26,291,181 | | | | 9,437,315 | |
Affiliated investments | | | 14,863,530 | | | | 11,140,460 | | | | 6,673,802 | | | | 73,954 | |
In-kind redemptions | | | | | | | | | | | | | | | | |
Distributions of realized capital gains from affiliated investments | | | 19,152,342 | | | | 30,967,595 | | | | 17,676,660 | | | | 4,338,617 | |
Futures contracts | | | 8,312,150 | | | | 12,933,311 | | | | 12,115,938 | | | | 6,342,717 | |
Foreign currency and forward contract transactions | | | 43,565 | | | | 75,949 | | | | 60,441 | | | | 26,515 | |
Swap agreements | | | (31,184 | ) | | | (216,854 | ) | | | (257,880 | ) | | | (143,213 | ) |
Change in net unrealized appreciation/(depreciation) on: | | | | | | | | | | | | | | | | |
Investments | | | 9,158,399 | | | | 11,116,107 | | | | 10,383,740 | | | | 4,816,195 | |
Affiliated investments | | | (5,651,043 | ) | | | 26,137,359 | | | | 24,123,195 | | | | 7,178,192 | |
Futures contracts | | | (1,546,949 | ) | | | (1,045,171 | ) | | | (470,642 | ) | | | (1,915,926 | ) |
Foreign currency transactions | | | (3,510 | ) | | | (8,205 | ) | | | (6,219 | ) | | | (1,895 | ) |
Swap agreements | | | (5,670 | ) | | | (33,845 | ) | | | (38,841 | ) | | | (16,905 | ) |
Net Realized and Unrealized Gains/(Losses) | | | 64,582,618 | | | | 125,934,574 | | | | 96,551,375 | | | | 30,135,566 | |
| | | | | | | | | | | | | | | | |
Net Increase/(Decrease) in Net Assets Resulting From Operations | | | $67,266,786 | | | | $141,546,129 | | | | $118,838,966 | | | | $42,515,848 | |
The accompanying Notes to Financial Statements are an integral part of this statement.
266
THRIVENT MUTUAL FUNDS
STATEMENTOF OPERATIONS –CONTINUED
| | | | | | | | | | | | | | | | | | | | | | | | | | |
Balanced Income
Plus Fund | | | Opportunity
Income Plus
Fund | | | Partner
Emerging
Markets Equity
Fund | | | Partner Small
Cap Growth
Fund | | | Partner Small
Cap Value
Fund | | | Small Cap
Stock Fund | | | Mid Cap
Growth
Fund | |
| | | | | | | | | | | | | | | | | | | | | | | | | | |
| | $2,565,560 | | | | $915,110 | | | | $485,736 | | | | $575,826 | | | | $4,557,720 | | | | $3,471,866 | | | | $3,058,004 | |
| | 4,199,571 | | | | 11,876,618 | | | | 21 | | | | 1,900 | | | | 1,019 | | | | 4,436 | | | | 3,047 | |
| | 386,242 | | | | 1,084,468 | | | | – | | | | – | | | | – | | | | – | | | | – | |
| | 13,039 | | | | 13,794 | | | | – | | | | 41,489 | | | | 44,645 | | | | 350,416 | | | | 16,613 | |
| | 11,180 | | | | 23,968 | | | | 110 | | | | 2,732 | | | | 3,358 | | | | 9,042 | | | | 9,481 | |
| | (47,633 | ) | | | – | | | | (48,712 | ) | | | (1,012 | ) | | | (3,399 | ) | | | (50,923 | ) | | | (18,894 | ) |
| | 7,127,959 | | | | 13,913,958 | | | | 437,155 | | | | 620,935 | | | | 4,603,343 | | | | 3,784,837 | | | | 3,068,251 | |
| | | | | | |
| | | | | | | | | | | | | | | | | | | | | | | | | | |
| | 1,347,555 | | | | 1,443,894 | | | | 74,668 | | | | 790,258 | | | | 276,226 | | | | 2,339,711 | | | | 1,670,547 | |
| | – | | | | – | | | | 101,060 | | | | 594,651 | | | | 1,651,721 | | | | – | | | | – | |
| | 115,327 | | | | 129,360 | | | | 72,709 | | | | 98,468 | | | | 120,953 | | | | 133,746 | | | | 149,050 | |
| | 27,245 | | | | 27,519 | | | | 25,439 | | | | 26,860 | | | | 27,662 | | | | 28,130 | | | | 28,801 | |
| | 30,128 | | | | 21,997 | | | | 87,573 | | | | 21,029 | | | | 17,967 | | | | 16,773 | | | | 16,420 | |
| | 472,507 | | | | 596,590 | | | | 34,539 | | | | 46,909 | | | | 245,533 | | | | 647,073 | | | | 669,903 | |
| | 5,317 | | | | 5,737 | | | | 4,221 | | | | 4,985 | | | | 5,582 | �� | | | 5,903 | | | | 6,347 | |
| | 54,811 | | | | 68,674 | | | | 3,747 | | | | 10,201 | | | | 37,506 | | | | 111,345 | | | | 121,795 | |
| | 344 | | | | 10,811 | | | | 134 | | | | 537 | | | | 14,963 | | | | 343 | | | | 14,260 | |
| | 44,799 | | | | 55,300 | | | | 30,327 | | | | 29,136 | | | | 35,509 | | | | 31,611 | | | | 46,934 | |
| | 233,322 | | | | 310,444 | | | | 16,116 | | | | 61,095 | | | | 209,103 | | | | 532,496 | | | | 547,058 | |
| | 672 | | | | 72,846 | | | | 496 | | | | 405 | | | | 88,621 | | | | 806 | | | | 82,137 | |
| | 17,659 | | | | 20,399 | | | | 5,947 | | | | 10,943 | | | | 17,150 | | | | 22,570 | | | | 23,712 | |
| | 28,690 | | | | 29,808 | | | | 13,685 | | | | 10,734 | | | | 11,076 | | | | 12,147 | | | | 11,189 | |
| | 2,378,376 | | | | 2,793,379 | | | | 470,661 | | | | 1,706,211 | | | | 2,759,572 | | | | 3,882,654 | | | | 3,388,153 | |
| | | | | | | | | | | | | | | | | | | | | | | | | | |
| | – | | | | (238,288 | ) | | | (228,989 | ) | | | (62,881 | ) | | | – | | | | – | | | | – | |
| | 2,378,376 | | | | 2,555,091 | | | | 241,672 | | | | 1,643,330 | | | | 2,759,572 | | | | 3,882,654 | | | | 3,388,153 | |
| | | | | | | | | | | | | | | | | | | | | | | | | | |
| | 4,749,583 | | | | 11,358,867 | | | | 195,483 | | | | (1,022,395 | ) | | | 1,843,771 | | | | (97,817 | ) | | | (319,902 | ) |
| | | | | | | | | | | | | | | | | | | | | | | | | | |
| | 11,272,212 | | | | 1,933,966 | | | | (341,995 | ) | | | 15,771,053 | | | | 35,020,018 | | | | 38,265,749 | | | | 43,811,423 | |
| | – | | | | – | | | | – | | | | – | | | | – | | | | – | | | | – | |
| | – | | | | – | | | | – | | | | 28,735,118 | | | | – | | | | – | | | | – | |
| | | | | | | | | | | | | | | | | | | | | | | | | | |
| | 23 | | | | 55 | | | | – | | | | 25 | | | | 12 | | | | 55 | | | | 39 | |
| | 729,731 | | | | 504,107 | | | | – | | | | – | | | | – | | | | 847,682 | | | | – | |
| | 1,216 | | | | – | | | | (10,399 | ) | | | – | | | | (2,664 | ) | | | (1,358 | ) | | | – | |
| | – | | | | 20,816 | | | | – | | | | – | | | | – | | | | – | | | | – | |
| | | | | | | | | | | | | | | | | | | | | | | | | | |
| | 815,779 | | | | (1,016,814 | ) | | | (1,222,840 | ) | | | (42,447,852 | ) | | | (21,116,579 | ) | | | (6,704,001 | ) | | | (4,974,334 | ) |
| | – | | | | – | | | | – | | | | – | | | | – | | | | – | | | | – | |
| | (23,173 | ) | | | (118,082 | ) | | | – | | | | – | | | | – | | | | (870,806 | ) | | | – | |
| | (687 | ) | | | – | | | | (355 | ) | | | – | | | | – | | | | 38 | | | | – | |
| | – | | | | – | | | | – | | | | – | | | | – | | | | – | | | | – | |
| | 12,795,101 | | | | 1,324,048 | | | | (1,575,589 | ) | | | 2,058,344 | | | | 13,900,787 | | | | 31,537,359 | | | | 38,837,128 | |
| | | | | | | | | | | | | | | | | | | | | | | | | | |
| | $17,544,684 | | | | $12,682,915 | | | | $(1,380,106 | ) | | | $1,035,949 | | | | $15,744,558 | | | | $31,439,542 | | | | $38,517,226 | |
The accompanying Notes to Financial Statements are an integral part of this statement.
267
THRIVENT MUTUAL FUNDS
STATEMENTOF OPERATIONS –CONTINUED
| | | | | | | | | | | | | | | | |
For the year ended October 31, 2014 | | Partner
Mid Cap
Value Fund | | | Mid Cap Stock Fund | | | Partner
Worldwide
Allocation
Fund | | | Large Cap Growth Fund | |
Investment Income | | | | | | | | | | | | | | | | |
Dividends | | | $2,574,720 | | | | $13,233,202 | | | | $23,359,196 | | | | $4,656,413 | |
Taxable interest | | | 281 | | | | 11,588 | | | | 4,527,761 | | | | (1,557 | ) |
Tax-Exempt interest | | | – | | | | – | | | | – | | | | – | |
Income from mortgage dollar rolls | | | – | | | | – | | | | – | | | | – | |
Income from securities loaned | | | – | | | | 347,781 | | | | 18,667 | | | | 3,109 | |
Income from affiliated investments | | | 1,448 | | | | 26,878 | | | | 9,637 | | | | 13,673 | |
Foreign tax withholding | | | – | | | | – | | | | (2,095,626 | ) | | | (49,810 | ) |
Total Investment Income | | | 2,576,449 | | | | 13,619,449 | | | | 25,819,635 | | | | 4,621,828 | |
| | | | |
Expenses | | | | | | | | | | | | | | | | |
Adviser fees | | | 470,530 | | | | 6,377,149 | | | | 3,637,215 | | | | 3,637,495 | |
Sub-Adviser fees | | | 784,266 | | | | – | | | | 3,894,179 | | | | – | |
Administrative service fees | | | 100,952 | | | | 248,725 | | | | 231,198 | | | | 159,768 | |
Audit and legal fees | | | 26,773 | | | | 32,647 | | | | 40,484 | | | | 28,962 | |
Custody fees | | | 33,014 | | | | 27,283 | | | | 576,208 | | | | 16,898 | |
Distribution expenses Class A | | | 66,235 | | | | 1,661,613 | | | | 460,641 | | | | 428,436 | |
Insurance expenses | | | 4,957 | | | | 9,030 | | | | 8,553 | | | | 6,443 | |
Printing and postage expenses Class A | | | 11,156 | | | | 170,910 | | | | 101,280 | | | | 74,080 | |
Printing and postage expenses Institutional Class | | | 811 | | | | 1,498 | | | | 5,014 | | | | 415 | |
SEC and state registration expenses | | | 28,930 | | | | 50,063 | | | | 52,007 | | | | 38,317 | |
Transfer agent fees Class A | | | 76,895 | | | | 866,592 | | | | 490,841 | | | | 399,653 | |
Transfer agent fees Institutional Class | | | 1,984 | | | | 7,034 | | | | 8,559 | | | | 1,076 | |
Trustees’ fees | | | 12,657 | | | | 47,351 | | | | 41,201 | | | | 26,040 | |
Other expenses | | | 10,185 | | | | 13,685 | | | | 88,785 | | | | 10,761 | |
Total Expenses Before Reimbursement | | | 1,629,345 | | | | 9,513,580 | | | | 9,636,165 | | | | 4,828,344 | |
Less: | | | | | | | | | | | | | | | | |
Reimbursement from adviser | | | (56,212 | ) | | | – | | | | (401,211 | ) | | | (231,787 | ) |
Total Net Expenses | | | 1,573,133 | | | | 9,513,580 | | | | 9,234,954 | | | | 4,596,557 | |
| | | | | | | | | | | | | | | | |
Net Investment Income/(Loss) | | | 1,003,316 | | | | 4,105,869 | | | | 16,584,681 | | | | 25,271 | |
Realized and Unrealized Gains/(Losses) | | | | | | | | | | | | | | | | |
Net realized gains/(losses) on: | | | | | | | | | | | | | | | | |
Investments | | | 21,604,559 | | | | 128,307,139 | | | | 53,310,023 | | | | 47,449,726 | |
In-kind redemptions | | | 2,285,789 | | | | – | | | | – | | | | – | |
Distributions of realized capital gains from affiliated investments | | | 3 | | | | 153 | | | | 26 | | | | 37 | |
Written option contracts | | | – | | | | – | | | | – | | | | – | |
Futures contracts | | | – | | | | – | | | | (494,167 | ) | | | 1,426,243 | |
Foreign currency and forward contract transactions | | | – | | | | – | | | | 126,766 | | | | 16,193 | |
Swap agreements | | | – | | | | – | | | | – | | | | – | |
Change in net unrealized appreciation/(depreciation) on: | | | | | | | | | | | | | | | | |
Investments | | | (2,014,131 | ) | | | 8,668,049 | | | | (72,484,249 | ) | | | 28,857,967 | |
Futures contracts | | | – | | | | – | | | | 98,456 | | | | (1,006,369 | ) |
Foreign currency forward contracts | | | – | | | | – | | | | 119,078 | | | | – | |
Foreign currency transactions | | | – | | | | – | | | | (120,905 | ) | | | (4,038 | ) |
Swap agreements | | | – | | | | – | | | | – | | | | – | |
Net Realized and Unrealized Gains/(Losses) | | | 21,876,220 | | | | 136,975,341 | | | | (19,444,972 | ) | | | 76,739,759 | |
| | | | | | | | | | | | | | | | |
Net Increase/(Decrease) in Net Assets Resulting From Operations | | | $22,879,536 | | | | $141,081,210 | | | | $(2,860,291 | ) | | | $76,765,030 | |
The accompanying Notes to Financial Statements are an integral part of this statement.
268
THRIVENT MUTUAL FUNDS
STATEMENTOF OPERATIONS –CONTINUED
| | | | | | | | | | | | | | | | | | | | | | | | | | |
Large Cap Value Fund | | | Large Cap
Stock Fund | | | High Yield Fund | | | Income Fund | | | Municipal
Bond Fund | | | Government
Bond Fund | | | Limited
Maturity Bond
Fund | |
| | | | | | | | | | | | | | | | | | | | | | | | | | |
| | $15,246,353 | | | | $33,986,304 | | | | $409,580 | | | | $944,822 | | | | $– | | | | $– | | | | $370,975 | |
| | 3,104 | | | | (7,105 | ) | | | 50,031,247 | | | | 32,945,130 | | | | 417,964 | | | | 1,842,123 | | | | 16,255,531 | |
| | – | | | | – | | | | – | | | | – | | | | 64,598,009 | | | | – | | | | – | |
| | – | | | | – | | | | – | | | | 923,499 | | | | – | | | | 201,230 | | | | 986,156 | |
| | 58,427 | | | | 125,641 | | | | 121,624 | | | | 17,170 | | | | – | | | | 11,988 | | | | 27,078 | |
| | 13,061 | | | | 50,553 | | | | 13,297 | | | | 21,006 | | | | – | | | | 4,111 | | | | 26,473 | |
| | (186,168 | ) | | | (985,894 | ) | | | – | | | | – | | | | – | | | | – | | | | – | |
| | 15,134,777 | | | | 33,169,499 | | | | 50,575,748 | | | | 34,851,627 | | | | 65,015,973 | | | | 2,059,452 | | | | 17,666,213 | |
| | | | | | |
| | | | | | | | | | | | | | | | | | | | | | | | | | |
| | 3,511,773 | | | | 10,116,482 | | | | 3,020,777 | | | | 2,795,949 | | | | 5,927,406 | | | | 416,546 | | | | 2,485,438 | |
| | – | | | | – | | | | – | | | | – | | | | – | | | | – | | | | – | |
| | 214,373 | | | | 402,685 | | | | 216,455 | | | | 222,039 | | | | 343,663 | | | | 89,265 | | | | 228,793 | |
| | 31,142 | | | | 39,222 | | | | 31,660 | | | | 32,028 | | | | 37,312 | | | | 26,195 | | | | 32,328 | |
| | 21,399 | | | | 122,132 | | | | 21,565 | | | | 30,823 | | | | 34,460 | | | | 8,470 | | | | 31,899 | |
| | 575,074 | | | | 4,003,879 | | | | 1,361,083 | | | | 1,014,223 | | | | 3,469,954 | | | | 16,624 | | | | 482,772 | |
| | 7,982 | | | | 13,322 | | | | 8,381 | | | | 8,579 | | | | 12,230 | | | | 4,691 | | | | 8,797 | |
| | 69,308 | | | | 551,876 | | | | 135,552 | | | | 106,907 | | | | 173,462 | | | | 5,885 | | | | 124,010 | |
| | 13,474 | | | | 695 | | | | 19,980 | | | | 7,796 | | | | 6,154 | | | | 389 | | | | 19,802 | |
| | 52,262 | | | | 82,059 | | | | 62,184 | | | | 53,334 | | | | 89,572 | | | | 29,277 | | | | 100,296 | |
| | 369,756 | | | | 2,135,804 | | | | 517,950 | | | | 407,482 | | | | 540,818 | | | | 44,626 | | | | 444,035 | |
| | 79,473 | | | | 1,536 | | | | 118,904 | | | | 44,655 | | | | 34,527 | | | | 605 | | | | 114,849 | |
| | 36,980 | | | | 98,459 | | | | 37,986 | | | | 39,431 | | | | 69,128 | | | | 6,491 | | | | 37,942 | |
| | 12,547 | | | | 29,375 | | | | 28,573 | | | | 33,200 | | | | 84,881 | | | | 12,558 | | | | 34,597 | |
| | 4,995,543 | | | | 17,597,526 | | | | 5,581,050 | | | | 4,796,446 | | | | 10,823,567 | | | | 661,622 | | | | 4,145,558 | |
| | | | | | | | | | | | | | | | | | | | | | | | | | |
| | – | | | | – | | | | – | | | | – | | | | – | | | | (23,235 | ) | | | – | |
| | 4,995,543 | | | | 17,597,526 | | | | 5,581,050 | | | | 4,796,446 | | | | 10,823,567 | | | | 638,387 | | | | 4,145,558 | |
| | | | | | | | | | | | | | | | | | | | | | | | | | |
| | 10,139,234 | | | | 15,571,973 | | | | 44,994,698 | | | | 30,055,181 | | | | 54,192,406 | | | | 1,421,065 | | | | 13,520,655 | |
| | | | | | | | | | | | | | | | | | | | | | | | | | |
| | | | | | | | | | | | | | | | | | | | | | | | | | |
| | 45,998,475 | | | | 156,412,137 | | | | 9,884,558 | | | | 13,961,637 | | | | (3,057,599 | ) | | | 294,381 | | | | (958,957 | ) |
| | – | | | | – | | | | – | | | | – | | | | – | | | | – | | | | – | |
| | 38 | | | | 161 | | | | 78 | | | | 47 | | | | – | | | | 8 | | | | 53 | |
| | – | | | | – | | | | – | | | | – | | | | – | | | | 4,760 | | | | 42,840 | |
| | – | | | | 8,585,221 | | | | (34,753 | ) | | | 610,057 | | | | – | | | | – | | | | (2,774,423 | ) |
| | – | | | | (257,667 | ) | | | – | | | | – | | | | – | | | | – | | | | – | |
| | – | | | | – | | | | – | | | | (206,281 | ) | | | – | | | | – | | | | (469,480 | ) |
| | | | | | | | | | | | | | | | | | | | | | | | | | |
| | 34,310,755 | | | | 19,069,971 | | | | (17,659,038 | ) | | | 2,326,155 | | | | 67,579,342 | | | | 1,123,062 | | | | 1,260,595 | |
| | – | | | | (9,680,602 | ) | | | – | | | | 1,160,432 | | | | – | | | | – | | | | 1,437,465 | |
| | – | | | | – | | | | – | | | | – | | | | – | | | | – | | | | – | |
| | – | | | | (27,612 | ) | | | – | | | | – | | | | – | | | | – | | | | – | |
| | – | | | | – | | | | – | | | | (13,918 | ) | | | – | | | | – | | | | (39,945 | ) |
| | | | | | | | | | | | | | | | | | | | | | | | | | |
| | 80,309,268 | | | | 174,101,609 | | | | (7,809,155 | ) | | | 17,838,129 | | | | 64,521,743 | | | | 1,422,211 | | | | (1,501,852 | ) |
| | | | | | | | | | | | | | | | | | | | | | | | | | |
| | $90,448,502 | | | | $189,673,582 | | | | $37,185,543 | | | | $47,893,310 | | | | $118,714,149 | | | | $2,843,276 | | | | $12,018,803 | |
The accompanying Notes to Financial Statements are an integral part of this statement.
269
THRIVENT MUTUAL FUNDS
STATEMENTOF OPERATIONS –CONTINUED
| | | | |
For the year ended October 31, 2014 | | Money Market
Fund | |
Investment Income | | | | |
Dividends | | | $24,062 | |
Taxable interest | | | 823,317 | |
Total Investment Income | | | 847,379 | |
| |
Expenses | | | | |
Adviser fees | | | 2,275,281 | |
Administrative service fees | | | 154,186 | |
Audit and legal fees | | | 28,661 | |
Custody fees | | | 26,637 | |
Distribution expenses Class A | | | 560,651 | |
Insurance expenses | | | 6,627 | |
Printing and postage expenses Class A | | | 273,012 | |
Printing and postage expenses Institutional Class | | | 486 | |
SEC and state registration expenses | | | 103,919 | |
Transfer agent fees Class A | | | 793,883 | |
Transfer agent fees Institutional Class | | | 1,398 | |
Trustees’ fees | | | 19,649 | |
Other expenses | | | 16,204 | |
Total Expenses Before Reimbursement | | | 4,260,594 | |
Less: | | | | |
Reimbursement from adviser | | | (3,400,392 | ) |
Total Net Expenses | | | 860,202 | |
| | | | |
Net Investment Income/(Loss) | | | (12,823 | ) |
Realized and Unrealized Gains/(Losses) | | | | |
Net realized gains/(losses) on: | | | | |
Investments | | | 12,823 | |
Net Realized and Unrealized Gains/(Losses) | | | 12,823 | |
| | | | |
Net Increase/(Decrease) in Net Assets Resulting From Operations | | | $– | |
The accompanying Notes to Financial Statements are an integral part of this statement.
270
(This page intentionally left blank)
271
THRIVENT MUTUAL FUNDS
STATEMENTOF CHANGESIN NET ASSETS
| | | | | | | | | | | | | | | | |
| | | Aggressive Allocation Fund | | | Moderately Aggressive
Allocation Fund | |
For the periods ended | | 10/31/2014 | | | 10/31/2013 | | | 10/31/2014 | | | 10/31/2013 | |
Operations | | | | | | | | | | | | | | | | |
Net investment income/(loss) | | | $2,684,168 | | | | $3,660,263 | | | | $15,611,555 | | | | $17,480,898 | |
Net realized gains/(losses) | | | 62,631,391 | | | | 27,651,836 | | | | 89,768,329 | | | | 51,524,765 | |
Change in net unrealized appreciation/(depreciation) | | | 1,951,227 | | | | 108,474,543 | | | | 36,166,245 | | | | 208,328,696 | |
Net Change in Net Assets Resulting From Operations | | | 67,266,786 | | | | 139,786,642 | | | | 141,546,129 | | | | 277,334,359 | |
Distributions to Shareholders | | | | | | | | | | | | | | | | |
From net investment income Class A | | | (4,806,424 | ) | | | (4,035,207 | ) | | | (18,478,712 | ) | | | (18,716,141 | ) |
From net investment income Institutional Class | | | (1,093,793 | ) | | | (974,138 | ) | | | (1,621,868 | ) | | | (1,621,402 | ) |
Total From Net Investment Income | | | (5,900,217 | ) | | | (5,009,345 | ) | | | (20,100,580 | ) | | | (20,337,543 | ) |
From net realized gains Class A | | | (23,324,492 | ) | | | (4,065,813 | ) | | | (51,681,360 | ) | | | (9,895,481 | ) |
From net realized gains Institutional Class | | | (3,602,729 | ) | | | (652,519 | ) | | | (3,552,646 | ) | | | (687,285 | ) |
Total From Net Realized Gains | | | (26,927,221 | ) | | | (4,718,332 | ) | | | (55,234,006 | ) | | | (10,582,766 | ) |
Total Distributions to Shareholders | | | (32,827,438 | ) | | | (9,727,677 | ) | | | (75,334,586 | ) | | | (30,920,309 | ) |
Capital Stock Transactions | | | | | | | | | | | | | | | | |
| | | | |
Class A | | | | | | | | | | | | | | | | |
Sold | | | 80,847,050 | | | | 64,770,567 | | | | 203,534,933 | | | | 176,333,831 | |
Distributions reinvested | | | 28,108,547 | | | | 8,084,704 | | | | 69,954,044 | | | | 28,517,101 | |
Redeemed | | | (63,308,597 | ) | | | (67,143,466 | ) | | | (147,562,776 | ) | | | (144,355,914 | ) |
Total Class A Capital Stock Transactions | | | 45,647,000 | | | | 5,711,805 | | | | 125,926,201 | | | | 60,495,018 | |
| | | | |
Institutional Class | | | | | | | | | | | | | | | | |
Sold | | | 21,530,951 | | | | 15,041,868 | | | | 20,583,578 | | | | 16,165,902 | |
Distributions reinvested | | | 4,696,519 | | | | 1,626,656 | | | | 5,172,711 | | | | 2,307,031 | |
Redeemed | | | (13,480,582 | ) | | | (20,912,544 | ) | | | (17,404,664 | ) | | | (17,265,702 | ) |
Total Institutional Class Capital Stock Transactions | | | 12,746,888 | | | | (4,244,020 | ) | | | 8,351,625 | | | | 1,207,231 | |
Capital Stock Transactions | | | 58,393,888 | | | | 1,467,785 | | | | 134,277,826 | | | | 61,702,249 | |
| | | | | | | | | | | | | | | | |
Net Increase/(Decrease) in Net Assets | | | 92,833,236 | | | | 131,526,750 | | | | 200,489,369 | | | | 308,116,299 | |
Net Assets, Beginning of Period | | | 707,009,651 | | | | 575,482,901 | | | | 1,666,445,878 | | | | 1,358,329,579 | |
Net Assets, End of Period | | | $799,842,887 | | | | $707,009,651 | | | | $1,866,935,247 | | | | $1,666,445,878 | |
Accumulated Undistributed Net Investment Income/(Loss) | | | $(587,926 | ) | | | $(955,659 | ) | | | $6,360,803 | | | | $4,825,376 | |
| | | | |
Capital Stock Share Transactions | | | | | | | | | | | | | | | | |
| | | | |
Class A shares | | | | | | | | | | | | | | | | |
Sold | | | 5,658,305 | | | | 5,126,052 | | | | 14,778,681 | | | | 14,095,887 | |
Distributions reinvested | | | 2,056,759 | | | | 697,566 | | | | 5,266,611 | | | | 2,447,007 | |
Redeemed | | | (4,422,249 | ) | | | (5,369,893 | ) | | | (10,694,718 | ) | | | (11,648,960 | ) |
Total Class A shares | | | 3,292,815 | | | | 453,725 | | | | 9,350,574 | | | | 4,893,934 | |
| | | | |
Institutional Class shares | | | | | | | | | | | | | | | | |
Sold | | | 1,494,618 | | | | 1,193,640 | | | | 1,479,954 | | | | 1,287,242 | |
Distributions reinvested | | | 339,999 | | | | 139,459 | | | | 386,100 | | | | 196,902 | |
Redeemed | | | (934,697 | ) | | | (1,678,319 | ) | | | (1,247,499 | ) | | | (1,380,109 | ) |
Total Institutional Class shares | | | 899,920 | | | | (345,220 | ) | | | 618,555 | | | | 104,035 | |
The accompanying Notes to Financial Statements are an integral part of this statement.
272
THRIVENT MUTUAL FUNDS
STATEMENTOF CHANGESIN NET ASSETS –CONTINUED
| | | | | | | | | | | | | | | | | | | | | | | | | | | | | | |
| Moderate Allocation Fund | | | Moderately Conservative Allocation Fund | | | Balanced Income Plus Fund | | | Opportunity Income Plus Fund | |
| 10/31/2014 | | | 10/31/2013 | | | 10/31/2014 | | | 10/31/2013 | | | 10/31/2014 | | | 10/31/2013 | | | 10/31/2014 | | | 10/31/2013 | |
| | | | | | | | | | | | | | | | | | | | | | | | | | | | | | |
| | $22,287,591 | | | | $22,667,028 | | | | $12,380,282 | | | | $12,004,379 | | | | $4,749,583 | | | | $2,417,018 | | | | $11,358,867 | | | | $6,703,018 | |
| | 62,560,142 | | | | 35,890,811 | | | | 20,075,905 | | | | 12,832,350 | | | | 12,003,182 | | | | 23,758,762 | | | | 2,458,944 | | | | 453,631 | |
| | 33,991,233 | | | | 147,362,638 | | | | 10,059,661 | | | | 37,335,125 | | | | 791,919 | | | | 10,875,044 | | | | (1,134,896 | ) | | | (11,219,462 | ) |
| | 118,838,966 | | | | 205,920,477 | | | | 42,515,848 | | | | 62,171,854 | | | | 17,544,684 | | | | 37,050,824 | | | | 12,682,915 | | | | (4,062,813 | ) |
| | | | | | | | | | | | | | | | | | | | | | | | | | | | | | |
| | (24,407,533 | ) | | | (22,192,737 | ) | | | (12,772,354 | ) | | | (11,592,083 | ) | | | (3,219,071 | ) | | | (1,708,602 | ) | | | (8,314,037 | ) | | | (5,586,159 | ) |
| | (1,495,196 | ) | | | (1,322,825 | ) | | | (665,555 | ) | | | (636,600 | ) | | | (1,150,336 | ) | | | (798,573 | ) | | | (3,058,052 | ) | | | (838,594 | ) |
| | (25,902,729 | ) | | | (23,515,562 | ) | | | (13,437,909 | ) | | | (12,228,683 | ) | | | (4,369,407 | ) | | | (2,507,175 | ) | | | (11,372,089 | ) | | | (6,424,753 | ) |
| | (38,605,041 | ) | | | (16,357,946 | ) | | | (14,970,639 | ) | | | (10,560,721 | ) | | | (18,145,078 | ) | | | (7,202,125 | ) | | | – | | | | – | |
| | (1,893,402 | ) | | | (812,294 | ) | | | (646,072 | ) | | | (485,386 | ) | | | (5,847,754 | ) | | | (2,491,936 | ) | | | – | | | | – | |
| | (40,498,443 | ) | | | (17,170,240 | ) | | | (15,616,711 | ) | | | (11,046,107 | ) | | | (23,992,832 | ) | | | (9,694,061 | ) | | | – | | | | – | |
| | (66,401,172 | ) | | | (40,685,802 | ) | | | (29,054,620 | ) | | | (23,274,790 | ) | | | (28,362,239 | ) | | | (12,201,236 | ) | | | (11,372,089 | ) | | | (6,424,753 | ) |
| | | | | | | | | | | | | | | | | | | | | | | | | | | | | | |
| | | | | | | |
| | | | | | | | | | | | | | | | | | | | | | | | | | | | | | |
| | 199,263,548 | | | | 203,404,011 | | | | 85,781,969 | | | | 113,743,617 | | | | 60,943,414 | | | | 16,695,910 | | | | 72,325,455 | | | | 28,357,443 | |
| | 62,589,168 | | | | 38,277,439 | | | | 27,495,954 | | | | 21,931,411 | | | | 20,980,745 | | | | 8,720,430 | | | | 7,499,269 | | | | 5,026,252 | |
| | (169,169,132 | ) | | | (174,335,354 | ) | | | (96,020,081 | ) | | | (104,514,093 | ) | | | (19,460,728 | ) | | | (17,244,645 | ) | | | (38,126,980 | ) | | | (45,358,825 | ) |
| | 92,683,584 | | | | 67,346,096 | | | | 17,257,842 | | | | 31,160,935 | | | | 62,463,431 | | | | 8,171,695 | | | | 41,697,744 | | | | (11,975,130 | ) |
| | | | | | | |
| | | | | | | | | | | | | | | | | | | | | | | | | | | | | | |
| | 20,514,794 | | | | 14,190,738 | | | | 5,792,806 | | | | 12,617,179 | | | | 1,361,032 | | | | 453,568 | | | | 101,695,367 | | | | 32,750,456 | |
| | 3,350,959 | | | | 2,109,660 | | | | 1,302,072 | | | | 1,110,469 | | | | 6,982,159 | | | | 3,283,026 | | | | 2,971,104 | | | | 717,873 | |
| | (12,672,206 | ) | | | (14,912,776 | ) | | | (7,042,510 | ) | | | (11,792,210 | ) | | | (5,359,841 | ) | | | (5,255,854 | ) | | | (16,798,837 | ) | | | (44,045,496 | ) |
| | 11,193,547 | | | | 1,387,622 | | | | 52,368 | | | | 1,935,438 | | | | 2,983,350 | | | | (1,519,260 | ) | | | 87,867,634 | | | | (10,577,167 | ) |
| | 103,877,131 | | | | 68,733,718 | | | | 17,310,210 | | | | 33,096,373 | | | | 65,446,781 | | | | 6,652,435 | | | | 129,565,378 | | | | (22,552,297 | ) |
| | | | | | | | | | | | | | | | | | | | | | | | | | | | | | |
| | 156,314,925 | | | | 233,968,393 | | | | 30,771,438 | | | | 71,993,437 | | | | 54,629,226 | | | | 31,502,023 | | | | 130,876,204 | | | | (33,039,863 | ) |
| | 1,616,464,333 | | | | 1,382,495,940 | | | | 732,937,955 | | | | 660,944,518 | | | | 222,413,682 | | | | 190,911,659 | | | | 253,233,983 | | | | 286,273,846 | |
| | $1,772,779,258 | | | | $1,616,464,333 | | | | $763,709,393 | | | | $732,937,955 | | | | $277,042,908 | | | | $222,413,682 | | | | $384,110,187 | | | | $253,233,983 | |
| | $731,018 | | | | $862,425 | | | | $533,396 | | | | $600,563 | | | | $187,275 | | | | $(73,010 | ) | | | $62,519 | | | | $62,530 | |
| | | | | | | |
| | | | | | | | | | | | | | | | | | | | | | | | | | | | | | |
| | | | | | | |
| | | | | | | | | | | | | | | | | | | | | | | | | | | | | | |
| | 15,363,790 | | | | 16,840,431 | | | | 7,149,045 | | | | 9,859,568 | | | | 4,558,822 | | | | 1,241,470 | | | | 6,941,658 | | | | 2,695,883 | |
| | 4,945,198 | | | | 3,275,507 | | | | 2,333,146 | | | | 1,935,275 | | | | 1,640,856 | | | | 711,310 | | | | 721,418 | | | | 480,534 | |
| | (13,023,385 | ) | | | (14,462,545 | ) | | | (8,004,868 | ) | | | (9,050,828 | ) | | | (1,459,524 | ) | | | (1,312,698 | ) | | | (3,672,071 | ) | | | (4,325,991 | ) |
| | 7,285,603 | | | | 5,653,393 | | | | 1,477,323 | | | | 2,744,015 | | | | 4,740,154 | | | | 640,082 | | | | 3,991,005 | | | | (1,149,574 | ) |
| | | | | | | |
| | | | | | | | | | | | | | | | | | | | | | | | | | | | | | |
| | 1,577,450 | | | | 1,169,002 | | | | 481,104 | | | | 1,094,679 | | | | 102,608 | | | | 33,212 | | | | 9,831,331 | | | | 3,136,192 | |
| | 263,493 | | | | 179,655 | | | | 110,000 | | | | 97,651 | | | | 546,710 | | | | 267,181 | | | | 285,502 | | | | 68,105 | |
| | (969,883 | ) | | | (1,229,944 | ) | | | (585,801 | ) | | | (1,020,151 | ) | | | (401,395 | ) | | | (405,146 | ) | | | (1,623,003 | ) | | | (4,261,035 | ) |
| | 871,060 | | | | 118,713 | | | | 5,303 | | | | 172,179 | | | | 247,923 | | | | (104,753 | ) | | | 8,493,830 | | | | (1,056,738 | ) |
The accompanying Notes to Financial Statements are an integral part of this statement.
273
THRIVENT MUTUAL FUNDS
STATEMENTOF CHANGESIN NET ASSETS –CONTINUED
| | | | | | | | | | | | | | | | |
| | | Partner Emerging Markets Equity Fund | | | Partner Small Cap Growth Fund | |
For the periods ended | | 10/31/2014 | | | 10/31/2013 | | | 10/31/2014 | | | 10/31/2013 | |
Operations | | | | | | | | | | | | | | | | |
Net investment income/(loss) | | | $195,483 | | | | $128,261 | | | | $(1,022,395 | ) | | | $(439,631 | ) |
Net realized gains/(losses) | | | (352,394 | ) | | | (102,908 | ) | | | 44,506,196 | | | | 24,746,226 | |
Change in net unrealized appreciation/(depreciation) | | | (1,223,195 | ) | | | 481,631 | | | | (42,447,852 | ) | | | 26,134,824 | |
Net Change in Net Assets Resulting From Operations | | | (1,380,106 | ) | | | 506,984 | | | | 1,035,949 | | | | 50,441,419 | |
Distributions to Shareholders | | | | | | | | | | | | | | | | |
From net investment income Class A | | | (143,213 | ) | | | – | | | | – | | | | – | |
From net investment income Institutional Class | | | (13,647 | ) | | | – | | | | – | | | | – | |
Total From Net Investment Income | | | (156,860 | ) | | | – | | | | – | | | | – | |
From net realized gains Class A | | | – | | | | (134,310 | ) | | | (3,684,592 | ) | | | (513,408 | ) |
From net realized gains Institutional Class | | | – | | | | (9,537 | ) | | | (19,611,554 | ) | | | (3,332,064 | ) |
Total From Net Realized Gains | | | – | | | | (143,847 | ) | | | (23,296,146 | ) | | | (3,845,472 | ) |
Total Distributions to Shareholders | | | (156,860 | ) | | | (143,847 | ) | | | (23,296,146 | ) | | | (3,845,472 | ) |
Capital Stock Transactions | | | | | | | | | | | | | | | | |
| | | | |
Class A | | | | | | | | | | | | | | | | |
Sold | | | 2,098,128 | | | | 4,705,192 | | | | 5,291,831 | | | | 3,734,163 | |
Distributions reinvested | | | 142,696 | | | | 134,309 | | | | 3,601,161 | | | | 510,885 | |
Redeemed | | | (2,667,214 | ) | | | (4,926,003 | ) | | | (3,538,068 | ) | | | (1,744,641 | ) |
In-kind redemptions | | | – | | | | – | | | | (11,519,768 | ) | | | – | |
Total Class A Capital Stock Transactions | | | (426,390 | ) | | | (86,502 | ) | | | (6,164,844 | ) | | | 2,500,407 | |
| | | | |
Institutional Class | | | | | | | | | | | | | | | | |
Sold | | | 20,762 | | | | 590,036 | | | | 144,892 | | | | 6,600 | |
Distributions reinvested | | | 13,647 | | | | 9,537 | | | | 19,611,546 | | | | 3,332,063 | |
Redeemed | | | (371,383 | ) | | | (668,391 | ) | | | (38,621 | ) | | | (12,546,105 | ) |
In-kind redemptions | | | – | | | | – | | | | (145,979,362 | ) | | | – | |
Total Institutional Class Capital Stock Transactions | | | (336,974 | ) | | | (68,818 | ) | | | (126,261,545 | ) | | | (9,207,442 | ) |
Capital Stock Transactions | | | (763,364 | ) | | | (155,320 | ) | | | (132,426,389 | ) | | | (6,707,035 | ) |
| | | | | | | | | | | | | | | | |
Net Increase/(Decrease) in Net Assets | | | (2,300,330 | ) | | | 207,817 | | | | (154,686,586 | ) | | | 39,888,912 | |
Net Assets, Beginning of Period | | | 15,622,451 | | | | 15,414,634 | | | | 172,162,064 | | | | 132,273,152 | |
Net Assets, End of Period | | | $13,322,121 | | | | $15,622,451 | | | | $17,475,478 | | | | $172,162,064 | |
Accumulated Undistributed Net Investment Income/(Loss) | | | $180,501 | | | | $150,744 | | | | $(26,040 | ) | | | $(70,035 | ) |
| | | | |
Capital Stock Share Transactions | | | | | | | | | | | | | | | | |
| | | | |
Class A shares | | | | | | | | | | | | | | | | |
Sold | | | 209,685 | | | | 448,247 | | | | 350,319 | | | | 248,681 | |
Distributions reinvested | | | 14,059 | | | | 12,611 | | | | 248,699 | | | | 41,621 | |
Redeemed | | | (267,212 | ) | | | (469,521 | ) | | | (239,312 | ) | | | (126,516 | ) |
In-kind redemptions | | | – | | | | – | | | | (748,037 | ) | | | – | |
Total Class A shares | | | (43,468 | ) | | | (8,663 | ) | | | (388,331 | ) | | | 163,786 | |
| | | | |
Institutional Class shares | | | | | | | | | | | | | | | | |
Sold | | | 2,127 | | | | 56,137 | | | | 9,217 | | | | 483 | |
Distributions reinvested | | | 1,345 | | | | 895 | | | | 1,305,695 | | | | 264,134 | |
Redeemed | | | (36,679 | ) | | | (63,924 | ) | | | (2,483 | ) | | | (806,356 | ) |
In-kind redemptions | | | – | | | | – | | | | (9,615,989 | ) | | | – | |
Total Institutional Class shares | | | (33,207 | ) | | | (6,892 | ) | | | (8,303,560 | ) | | | (541,739 | ) |
The accompanying Notes to Financial Statements are an integral part of this statement.
274
THRIVENT MUTUAL FUNDS
STATEMENTOF CHANGESIN NET ASSETS –CONTINUED
| | | | | | | | | | | | | | | | | | | | | | | | | | | | | | |
| Partner Small Cap Value Fund | | | Small Cap Stock Fund | | | Mid Cap Growth Fund | | | Partner Mid Cap Value Fund | |
| 10/31/2014 | | | 10/31/2013 | | | 10/31/2014 | | | 10/31/2013 | | | 10/31/2014 | | | 10/31/2013 | | | 10/31/2014 | | | 10/31/2013 | |
| | | | | | | | | | | | | | | | | | | | | | | | | | | | | | |
| | $1,843,771 | | | | $2,726,874 | | | | $(97,817 | ) | | | $(128,135 | ) | | | $(319,902 | ) | | | $162,115 | | | | $1,003,316 | | | | $1,180,272 | |
| | 35,017,366 | | | | 8,309,634 | | | | 39,112,128 | | | | 21,067,809 | | | | 43,811,462 | | | | 51,306,325 | | | | 23,890,351 | | | | 29,517,832 | |
| | (21,116,579 | ) | | | 61,737,279 | | | | (7,574,769 | ) | | | 58,746,157 | | | | (4,974,334 | ) | | | 44,497,684 | | | | (2,014,131 | ) | | | 8,215,225 | |
| | 15,744,558 | | | | 72,773,787 | | | | 31,439,542 | | | | 79,685,831 | | | | 38,517,226 | | | | 95,966,124 | | | | 22,879,536 | | | | 38,913,329 | |
| | | | | | | | | | | | | | | | | | | | | | | | | | | | | | |
| | – | | | | (1,353,499 | ) | | | – | | | | – | | | | – | | | | – | | | | (70,898 | ) | | | (154,671 | ) |
| | (659,633 | ) | | | (3,382,127 | ) | | | – | | | | – | | | | – | | | | – | | | | (675,426 | ) | | | (1,253,387 | ) |
| | (659,633 | ) | | | (4,735,626 | ) | | | – | | | | – | | | | – | | | | – | | | | (746,324 | ) | | | (1,408,058 | ) |
| | (2,847,524 | ) | | | (1,262,964 | ) | | | (1,983,524 | ) | | | – | | | | (33,389,609 | ) | | | (16,658,130 | ) | | | (5,781,954 | ) | | | (416,818 | ) |
| | (5,006,964 | ) | | | (2,497,826 | ) | | | (551,563 | ) | | | – | | | | (16,960,868 | ) | | | (9,707,644 | ) | | | (23,808,582 | ) | | | (2,374,599 | ) |
| | (7,854,488 | ) | | | (3,760,790 | ) | | | (2,535,087 | ) | | | – | | | | (50,350,477 | ) | | | (26,365,774 | ) | | | (29,590,536 | ) | | | (2,791,417 | ) |
| | (8,514,121 | ) | | | (8,496,416 | ) | | | (2,535,087 | ) | | | – | | | | (50,350,477 | ) | | | (26,365,774 | ) | | | (30,336,860 | ) | | | (4,199,475 | ) |
| | | | | | | | | | | | | | | | | | | | | | | | | | | | | | |
| | | | | | | |
| | | | | | | | | | | | | | | | | | | | | | | | | | | | | | |
| | 8,673,584 | | | | 11,562,595 | | | | 10,621,358 | | | | 8,423,992 | | | | 10,700,814 | | | | 11,045,500 | | | | 4,808,635 | | | | 7,918,395 | |
| | 2,822,433 | | | | 2,584,648 | | | | 1,969,702 | | | | – | | | | 32,996,677 | | | | 16,413,167 | | | | 5,789,477 | | | | 565,544 | |
| | (13,654,034 | ) | | | (11,471,235 | ) | | | (29,681,741 | ) | | | (30,180,020 | ) | | | (29,980,172 | ) | | | (32,656,945 | ) | | | (4,065,941 | ) | | | (2,659,808 | ) |
| | – | | | | – | | | | – | | | | – | | | | – | | | | – | | | | (8,795,826 | ) | | | – | |
| | (2,158,017 | ) | | | 2,676,008 | | | | (17,090,681 | ) | | | (21,756,028 | ) | | | 13,717,319 | | | | (5,198,278 | ) | | | (2,263,655 | ) | | | 5,824,131 | |
| | | | | | | |
| | | | | | | | | | | | | | | | | | | | | | | | | | | | | | |
| | 21,017,159 | | | | 19,261,067 | | | | 5,416,212 | | | | 242,014 | | | | 14,778,688 | | | | 11,031,998 | | | | 349,685 | | | | 453,391 | |
| | 5,665,438 | | | | 5,879,952 | | | | 545,887 | | | | – | | | | 16,884,519 | | | | 9,670,232 | | | | 24,483,999 | | | | 3,627,984 | |
| | (49,355,559 | ) | | | (38,462,728 | ) | | | (2,891,606 | ) | | | (2,456,365 | ) | | | (16,450,035 | ) | | | (45,021,488 | ) | | | (541,414 | ) | | | (14,435,380 | ) |
| | – | | | | – | | | | – | | | | – | | | | – | | | | – | | | | – | | | | – | |
| | (22,672,962 | ) | | | (13,321,709 | ) | | | 3,070,493 | | | | (2,214,351 | ) | | | 15,213,172 | | | | (24,319,258 | ) | | | 24,292,270 | | | | (10,354,005 | ) |
| | (24,830,979 | ) | | | (10,645,701 | ) | | | (14,020,188 | ) | | | (23,970,379 | ) | | | 28,930,491 | | | | (29,517,536 | ) | | | 22,028,615 | | | | (4,529,874 | ) |
| | | | | | | | | | | | | | | | | | | | | | | | | | | | | | |
| | (17,600,542 | ) | | | 53,631,670 | | | | 14,884,267 | | | | 55,715,452 | | | | 17,097,240 | | | | 40,082,814 | | | | 14,571,291 | | | | 30,183,980 | |
| | 274,552,263 | | | | 220,920,593 | | | | 335,745,557 | | | | 280,030,105 | | | | 419,792,219 | | | | 379,709,405 | | | | 160,695,328 | | | | 130,511,348 | |
| | $256,951,721 | | | | $274,552,263 | | | | $350,629,824 | | | | $335,745,557 | | | | $436,889,459 | | | | $419,792,219 | | | | $175,266,619 | | | | $160,695,328 | |
| | $686,808 | | | | $(959,385 | ) | | | $(97,003 | ) | | | $(560,955 | ) | | | $(120,662 | ) | | | $(65,150 | ) | | | $803,059 | | | | $722,753 | |
| | | | | | | |
| | | | | | | | | | | | | | | | | | | | | | | | | | | | | | |
| | | | | | | |
| | | | | | | | | | | | | | | | | | | | | | | | | | | | | | |
| | 414,962 | | | | 633,044 | | | | 548,495 | | | | 516,592 | | | | 537,849 | | | | 577,983 | | | | 327,298 | | | | 530,880 | |
| | 138,898 | | | | 163,505 | | | | 105,378 | | | | – | | | | 1,754,209 | | | | 950,937 | | | | 432,511 | | | | 44,241 | |
| | (653,730 | ) | | | (644,251 | ) | | | (1,536,133 | ) | | | (1,885,147 | ) | | | (1,503,344 | ) | | | (1,719,881 | ) | | | (279,882 | ) | | | (183,802 | ) |
| | – | | | | – | | | | – | | | | – | | | | – | | | | – | | | | (633,249 | ) | | | – | |
| | (99,870 | ) | | | 152,298 | | | | (882,260 | ) | | | (1,368,555 | ) | | | 788,714 | | | | (190,961 | ) | | | (153,322 | ) | | | 391,319 | |
| | | | | | | |
| | | | | | | | | | | | | | | | | | | | | | | | | | | | | | |
| | 955,877 | | | | 1,012,613 | | | | 244,664 | | | | 12,412 | | | | 637,712 | | | | 506,007 | | | | 23,896 | | | | 31,236 | |
| | 263,331 | | | | 354,513 | | | | 25,729 | | | | – | | | | 770,983 | | | | 492,124 | | | | 1,818,711 | | | | 282,966 | |
| | (2,248,201 | ) | | | (2,004,239 | ) | | | (132,064 | ) | | | (132,413 | ) | | | (710,248 | ) | | | (2,047,604 | ) | | | (37,402 | ) | | | (1,011,008 | ) |
| | – | | | | – | | | | – | | | | – | | | | – | | | | – | | | | – | | | | – | |
| | (1,028,993 | ) | | | (637,113 | ) | | | 138,329 | | | | (120,001 | ) | | | 698,447 | | | | (1,049,473 | ) | | | 1,805,205 | | | | (696,806 | ) |
The accompanying Notes to Financial Statements are an integral part of this statement.
275
THRIVENT MUTUAL FUNDS
STATEMENTOF CHANGESIN NET ASSETS –CONTINUED
| | | | | | | | | | | | | | | | |
| | | Mid Cap Stock Fund | | | Partner Worldwide Allocation Fund | |
For the periods ended | | 10/31/2014 | | | 10/31/2013 | | | 10/31/2014 | | | 10/31/2013 | |
Operations | | | | | | | | | | | | | | | | |
Net investment income/(loss) | | | $4,105,869 | | | | $1,637,149 | | | | $16,584,681 | | | | $14,917,634 | |
Net realized gains/(losses) | | | 128,307,292 | | | | 88,843,201 | | | | 52,942,648 | | | | 37,724,676 | |
Change in net unrealized appreciation/(depreciation) | | | 8,668,049 | | | | 143,065,706 | | | | (72,387,620 | ) | | | 93,871,912 | |
Net Change in Net Assets Resulting From Operations | | | 141,081,210 | | | | 233,546,056 | | | | (2,860,291 | ) | | | 146,514,222 | |
Distributions to Shareholders | | | | | | | | | | | | | | | | |
From net investment income Class A | | | – | | | | (29,944 | ) | | | (3,036,760 | ) | | | (3,225,457 | ) |
From net investment income Institutional Class | | | (1,030,040 | ) | | | (970,124 | ) | | | (13,766,689 | ) | | | (13,459,680 | ) |
Total From Net Investment Income | | | (1,030,040 | ) | | | (1,000,068 | ) | | | (16,803,449 | ) | | | (16,685,137 | ) |
From net realized gains Class A | | | – | | | | – | | | | – | | | | – | |
From net realized gains Institutional Class | | | – | | | | – | | | | – | | | | – | |
Total From Net Realized Gains | | | – | | | | – | | | | – | | | | – | |
Total Distributions to Shareholders | | | (1,030,040 | ) | | | (1,000,068 | ) | | | (16,803,449 | ) | | | (16,685,137 | ) |
Capital Stock Transactions | | | | | | | | | | | | | | | | |
| | | | |
Class A | | | | | | | | | | | | | | | | |
Sold | | | 24,470,926 | | | | 18,456,958 | | | | 19,155,874 | | | | 14,773,299 | |
Distributions reinvested | | | – | | | | 29,576 | | | | 2,990,535 | | | | 3,174,570 | |
Redeemed | | | (66,650,007 | ) | | | (71,349,629 | ) | | | (21,057,688 | ) | | | (23,655,967 | ) |
Total Class A Capital Stock Transactions | | | (42,179,081 | ) | | | (52,863,095 | ) | | | 1,088,721 | | | | (5,708,098 | ) |
| | | | |
Institutional Class | | | | | | | | | | | | | | | | |
Sold | | | 11,738,572 | | | | 8,927,276 | | | | 40,952,542 | | | | 27,875,874 | |
Distributions reinvested | | | 1,025,398 | | | | 964,440 | | | | 13,708,356 | | | | 13,394,077 | |
Redeemed | | | (83,800,453 | ) | | | (12,128,253 | ) | | | (59,145,656 | ) | | | (16,423,607 | ) |
Total Institutional Class Capital Stock Transactions | | | (71,036,483 | ) | | | (2,236,537 | ) | | | (4,484,758 | ) | | | 24,846,344 | |
Capital Stock Transactions | | | (113,215,564 | ) | | | (55,099,632 | ) | | | (3,396,037 | ) | | | 19,138,246 | |
| | | | | | | | | | | | | | | | |
Net Increase/(Decrease) in Net Assets | | | 26,835,606 | | | | 177,446,356 | | | | (23,059,777 | ) | | | 148,967,331 | |
Net Assets, Beginning of Period | | | 915,389,717 | | | | 737,943,361 | | | | 853,135,240 | | | | 704,167,909 | |
Net Assets, End of Period | | | $942,225,323 | | | | $915,389,717 | | | | $830,075,463 | | | | $853,135,240 | |
Accumulated Undistributed Net Investment Income/(Loss) | | | $2,770,224 | | | | $348,182 | | | | $16,052,412 | | | | $14,765,864 | |
| | | | |
Capital Stock Share Transactions | | | | | | | | | | | | | | | | |
| | | | |
Class A shares | | | | | | | | | | | | | | | | |
Sold | | | 1,092,657 | | | | 1,031,695 | | | | 1,860,355 | | | | 1,559,831 | |
Distributions reinvested | | | – | | | | 1,883 | | | | 291,760 | | | | 353,516 | |
Redeemed | | | (2,979,200 | ) | | | (4,084,043 | ) | | | (2,041,616 | ) | | | (2,531,950 | ) |
Total Class A shares | | | (1,886,543 | ) | | | (3,050,465 | ) | | | 110,499 | | | | (618,603 | ) |
| | | | |
Institutional Class shares | | | | | | | | | | | | | | | | |
Sold | | | 488,893 | | | | 461,543 | | | | 3,879,636 | | | | 3,082,665 | |
Distributions reinvested | | | 44,103 | | | | 56,899 | | | | 1,332,202 | | | | 1,486,579 | |
Redeemed | | | (3,325,855 | ) | | | (646,471 | ) | | | (5,543,699 | ) | | | (1,738,618 | ) |
Total Institutional Class shares | | | (2,792,859 | ) | | | (128,029 | ) | | | (331,861 | ) | | | 2,830,626 | |
The accompanying Notes to Financial Statements are an integral part of this statement.
276
THRIVENT MUTUAL FUNDS
STATEMENTOF CHANGESIN NET ASSETS –CONTINUED
| | | | | | | | | | | | | | | | | | | | | | | | | | | | | | |
| Large Cap Growth Fund | | | Large Cap Value Fund | | | Large Cap Stock Fund | | | High Yield Fund | |
| 10/31/2014 | | | 10/31/2013 | | | 10/31/2014 | | | 10/31/2013 | | | 10/31/2014 | | | 10/31/2013 | | | 10/31/2014 | | | 10/31/2013 | |
| | | | | | | | | | | | | | | | | | | | | | | | | | | | | | |
| | $25,271 | | | | $1,497,172 | | | | $10,139,234 | | | | $10,307,443 | | | | $15,571,973 | | | | $14,111,935 | | | | $44,994,698 | | | | $49,654,265 | |
| | 48,892,199 | | | | 29,928,964 | | | | 45,998,513 | | | | 34,214,015 | | | | 164,739,852 | | | | 160,219,793 | | | | 9,849,883 | | | | 20,155,611 | |
| | 27,847,560 | | | | 72,685,261 | | | | 34,310,755 | | | | 120,540,096 | | | | 9,361,757 | | | | 187,091,208 | | | | (17,659,038 | ) | | | (7,786,741 | ) |
| | 76,765,030 | | | | 104,111,397 | | | | 90,448,502 | | | | 165,061,554 | | | | 189,673,582 | | | | 361,422,936 | | | | 37,185,543 | | | | 62,023,135 | |
| | | | | | | | | | | | | | | | | | | | | | | | | | | | | | |
| | (79,236 | ) | | | (404,216 | ) | | | (1,977,572 | ) | | | (2,688,302 | ) | | | (6,268,961 | ) | | | (15,271,693 | ) | | | (30,537,625 | ) | | | (32,344,516 | ) |
| | (1,057,522 | ) | | | (1,479,199 | ) | | | (6,786,427 | ) | | | (8,417,513 | ) | | | (1,586,063 | ) | | | (2,714,556 | ) | | | (14,633,598 | ) | | | (16,976,987 | ) |
| | (1,136,758 | ) | | | (1,883,415 | ) | | | (8,763,999 | ) | | | (11,105,815 | ) | | | (7,855,024 | ) | | | (17,986,249 | ) | | | (45,171,223 | ) | | | (49,321,503 | ) |
| | – | | | | – | | | | – | | | | – | | | | (138,540,203 | ) | | | (73,722,998 | ) | | | – | | | | – | |
| | – | | | | – | | | | – | | | | – | | | | (17,159,773 | ) | | | (9,153,189 | ) | | | – | | | | – | |
| | – | | | | – | | | | – | | | | – | | | | (155,699,976 | ) | | | (82,876,187 | ) | | | – | | | | – | |
| | (1,136,758 | ) | | | (1,883,415 | ) | | | (8,763,999 | ) | | | (11,105,815 | ) | | | (163,555,000 | ) | | | (100,862,436 | ) | | | (45,171,223 | ) | | | (49,321,503 | ) |
| | | | | | | | | | | | | | | | | | | | | | | | | | | | | | |
| | | | | | | |
| | | | | | | | | | | | | | | | | | | | | | | | | | | | | | |
| | 21,233,691 | | | | 16,054,379 | | | | 23,523,468 | | | | 21,329,399 | | | | 41,209,016 | | | | 36,786,359 | | | | 53,000,114 | | | | 70,014,924 | |
| | 78,226 | | | | 398,326 | | | | 1,925,974 | | | | 2,608,342 | | | | 142,400,267 | | | | 87,422,326 | | | | 22,121,205 | | | | 23,378,734 | |
| | (21,310,295 | ) | | | (20,401,935 | ) | | | (26,771,050 | ) | | | (25,765,830 | ) | | | (168,560,029 | ) | | | (181,201,142 | ) | | | (69,655,325 | ) | | | (82,362,996 | ) |
| | 1,622 | | | | (3,949,230 | ) | | | (1,321,608 | ) | | | (1,828,089 | ) | | | 15,049,254 | | | | (56,992,457 | ) | | | 5,465,994 | | | | 11,030,662 | |
| | | | | | | |
| | | | | | | | | | | | | | | | | | | | | | | | | | | | | | |
| | 4,146,962 | | | | 549,797 | | | | 54,954,267 | | | | 36,419,442 | | | | 3,950,581 | | | | 6,505,878 | | | | 38,981,387 | | | | 39,509,667 | |
| | 1,051,557 | | | | 1,469,664 | | | | 6,764,529 | | | | 8,390,885 | | | | 18,652,382 | | | | 11,805,198 | | | | 14,249,742 | | | | 14,565,046 | |
| | (2,857,236 | ) | | | (6,327,076 | ) | | | (66,480,255 | ) | | | (47,570,098 | ) | | | (44,908,170 | ) | | | (25,319,710 | ) | | | (45,037,614 | ) | | | (102,888,237 | ) |
| | 2,341,283 | | | | (4,307,615 | ) | | | (4,761,459 | ) | | | (2,759,771 | ) | | | (22,305,207 | ) | | | (7,008,634 | ) | | | 8,193,515 | | | | (48,813,524 | ) |
| | 2,342,905 | | | | (8,256,845 | ) | | | (6,083,067 | ) | | | (4,587,860 | ) | | | (7,255,953 | ) | | | (64,001,091 | ) | | | 13,659,509 | | | | (37,782,862 | ) |
| | | | | | | | | | | | | | | | | | | | | | | | | | | | | | |
| | 77,971,177 | | | | 93,971,137 | | | | 75,601,436 | | | | 149,367,879 | | | | 18,862,629 | | | | 196,559,409 | | | | 5,673,829 | | | | (25,081,230 | ) |
| | 443,855,878 | | | | 349,884,741 | | | | 723,554,903 | | | | 574,187,024 | | | | 1,749,326,182 | | | | 1,552,766,773 | | | | 780,658,103 | | | | 805,739,333 | |
| | $521,827,055 | | | | $443,855,878 | | | | $799,156,339 | | | | $723,554,903 | | | | $1,768,188,811 | | | | $1,749,326,182 | | | | $786,331,932 | | | | $780,658,103 | |
| | $(76,209 | ) | | | $1,019,085 | | | | $7,663,367 | | | | $6,844,473 | | | | $13,206,191 | | | | $6,551,507 | | | | $(97,150 | ) | | | $69,740 | |
| | | | | | | |
| | | | | | | | | | | | | | | | | | | | | | | | | | | | | | |
| | | | | | | |
| | | | | | | | | | | | | | | | | | | | | | | | | | | | | | |
| | 2,748,186 | | | | 2,591,348 | | | | 1,198,577 | | | | 1,246,055 | | | | 1,525,975 | | | | 1,486,083 | | | | 10,344,996 | | | | 13,814,258 | |
| | 10,417 | | | | 72,423 | | | | 99,843 | | | | 177,922 | | | | 5,618,149 | | | | 3,906,794 | | | | 4,324,814 | | | | 4,619,204 | |
| | (2,755,946 | ) | | | (3,362,021 | ) | | | (1,354,948 | ) | | | (1,561,202 | ) | | | (6,221,856 | ) | | | (7,354,688 | ) | | | (13,613,988 | ) | | | (16,295,729 | ) |
| | 2,657 | | | | (698,250 | ) | | | (56,528 | ) | | | (137,225 | ) | | | 922,268 | | | | (1,961,811 | ) | | | 1,055,822 | | | | 2,137,733 | |
| | | | | | | |
| | | | | | | | | | | | | | | | | | | | | | | | | | | | | | |
| | 500,198 | | | | 81,133 | | | | 2,778,169 | | | | 2,146,274 | | | | 145,997 | | | | 260,982 | | | | 7,607,073 | | | | 7,785,866 | |
| | 130,304 | | | | 249,096 | | | | 349,407 | | | | 570,808 | | | | 728,490 | | | | 524,234 | | | | 2,784,408 | | | | 2,875,606 | |
| | (339,594 | ) | | | (937,745 | ) | | | (3,285,113 | ) | | | (2,842,955 | ) | | | (1,599,571 | ) | | | (987,156 | ) | | | (8,825,955 | ) | | | (20,475,127 | ) |
| | 290,908 | | | | (607,516 | ) | | | (157,537 | ) | | | (125,873 | ) | | | (725,084 | ) | | | (201,940 | ) | | | 1,565,526 | | | | (9,813,655 | ) |
The accompanying Notes to Financial Statements are an integral part of this statement.
277
THRIVENT MUTUAL FUNDS
STATEMENTOF CHANGESIN NET ASSETS –CONTINUED
| | | | | | | | |
| | | Income Fund | |
For the periods ended | | 10/31/2014 | | | 10/31/2013 | |
Operations | | | | | | | | |
Net investment income/(loss) | | | $30,055,181 | | | | $30,815,311 | |
Net realized gains/(losses) | | | 14,365,460 | | | | 15,545,122 | |
Change in net unrealized appreciation/(depreciation) | | | 3,472,669 | | | | (43,371,691 | ) |
Net Change in Net Assets Resulting From Operations | | | 47,893,310 | | | | 2,988,742 | |
Distributions to Shareholders | | | | | | | | |
From net investment income Class A | | | (14,043,704 | ) | | | (14,879,564 | ) |
From net investment income Institutional Class | | | (15,906,315 | ) | | | (15,646,286 | ) |
Total From Net Investment Income | | | (29,950,019 | ) | | | (30,525,850 | ) |
From net realized gains Class A | | | – | | | | – | |
From net realized gains Institutional Class | | | – | | | | – | |
Total From Net Realized Gains | | | – | | | | – | |
Total Distributions to Shareholders | | | (29,950,019 | ) | | | (30,525,850 | ) |
Capital Stock Transactions | | | | | | | | |
| | |
Class A | | | | | | | | |
Sold | | | 23,661,650 | | | | 48,916,747 | |
Distributions reinvested | | | 12,045,540 | | | | 12,699,603 | |
Redeemed | | | (63,555,320 | ) | | | (75,677,530 | ) |
Total Class A Capital Stock Transactions | | | (27,848,130 | ) | | | (14,061,180 | ) |
| | |
Institutional Class | | | | | | | | |
Sold | | | 80,664,707 | | | | 38,561,466 | |
Distributions reinvested | | | 15,580,951 | | | | 15,396,482 | |
Redeemed | | | (70,453,105 | ) | | | (93,699,471 | ) |
Total Institutional Class Capital Stock Transactions | | | 25,792,553 | | | | (39,741,523 | ) |
Capital Stock Transactions | | | (2,055,577 | ) | | | (53,802,703 | ) |
| | | | | | | | |
Net Increase/(Decrease) in Net Assets | | | 15,887,714 | | | | (81,339,811 | ) |
Net Assets, Beginning of Period | | | 822,785,585 | | | | 904,125,396 | |
Net Assets, End of Period | | | $838,673,299 | | | | $822,785,585 | |
Accumulated Undistributed Net Investment Income/(Loss) | | | $(105,891 | ) | | | $(105,936 | ) |
| | |
Capital Stock Share Transactions | | | | | | | | |
| | |
Class A shares | | | | | | | | |
Sold | | | 2,561,686 | | | | 5,276,778 | |
Distributions reinvested | | | 1,306,237 | | | | 1,382,689 | |
Redeemed | | | (6,918,699 | ) | | | (8,265,779 | ) |
Total Class A shares | | | (3,050,776 | ) | | | (1,606,312 | ) |
| | |
Institutional Class shares | | | | | | | | |
Sold | | | 8,750,066 | | | | 4,222,489 | |
Distributions reinvested | | | 1,689,886 | | | | 1,676,541 | |
Redeemed | | | (7,670,204 | ) | | | (10,151,692 | ) |
Total Institutional Class shares | | | 2,769,748 | | | | (4,252,662 | ) |
The accompanying Notes to Financial Statements are an integral part of this statement.
278
THRIVENT MUTUAL FUNDS
STATEMENTOF CHANGESIN NET ASSETS –CONTINUED
| | | | | | | | | | | | | | | | | | | | | | | | | | | | | | |
| Municipal Bond Fund | | | Government Bond Fund | | | Limited Maturity Bond Fund | | | Money Market Fund | |
| 10/31/2014 | | | 10/31/2013 | | | 10/31/2014 | | | 10/31/2013 | | | 10/31/2014 | | | 10/31/2013 | | | 10/31/2014 | | | 10/31/2013 | |
| | | | | | | | | | | | | | | | | | | | | | | | | | | | | | |
| | $54,192,406 | | | | $58,660,854 | | | | $1,421,065 | | | | $1,042,571 | | | | $13,520,655 | | | | $11,848,588 | | | | $(12,823 | ) | | | $(7,606 | ) |
| | (3,057,599 | ) | | | (8,035,549 | ) | | | 299,149 | | | | 1,214,424 | | | | (4,159,967 | ) | | | 6,755,078 | | | | 12,823 | | | | 7,606 | |
| | 67,579,342 | | | | (97,358,879 | ) | | | 1,123,062 | | | | (4,373,218 | ) | | | 2,658,115 | | | | (13,980,400 | ) | | | – | | | | – | |
| | 118,714,149 | | | | (46,733,574 | ) | | | 2,843,276 | | | | (2,116,223 | ) | | | 12,018,803 | | | | 4,623,266 | | | | – | | | | – | |
| | | | | | | | | | | | | | | | | | | | | | | | | | | | | | |
| | (50,580,657 | ) | | | (54,842,160 | ) | | | (143,364 | ) | | | (104,571 | ) | | | (5,436,026 | ) | | | (5,161,696 | ) | | | – | | | | – | |
| | (3,559,297 | ) | | | (3,773,232 | ) | | | (1,277,701 | ) | | | (979,000 | ) | | | (7,817,543 | ) | | | (6,417,807 | ) | | | – | | | | – | |
| | (54,139,954 | ) | | | (58,615,392 | ) | | | (1,421,065 | ) | | | (1,083,571 | ) | | | (13,253,569 | ) | | | (11,579,503 | ) | | | – | | | | – | |
| | – | | | | (547,348 | ) | | | (155,198 | ) | | | (561,671 | ) | | | (2,334,163 | ) | | | – | | | | – | | | | – | |
| | – | | | | (36,124 | ) | | | (1,073,256 | ) | | | (3,340,936 | ) | | | (2,665,218 | ) | | | – | | | | – | | | | – | |
| | – | | | | (583,472 | ) | | | (1,228,454 | ) | | | (3,902,607 | ) | | | (4,999,381 | ) | | | – | | | | – | | | | – | |
| | (54,139,954 | ) | | | (59,198,864 | ) | | | (2,649,519 | ) | | | (4,986,178 | ) | | | (18,252,950 | ) | | | (11,579,503 | ) | | | – | | | | – | |
| | | | | | | | | | | | | | | | | | | | | | | | | | | | | | |
| | | | | | | |
| | | | | | | | | | | | | | | | | | | | | | | | | | | | | | |
| | 125,492,609 | | | | 140,091,779 | | | | 5,451,092 | | | | 6,322,053 | | | | 152,227,958 | | | | 258,503,473 | | | | 568,621,646 | | | | 569,755,513 | |
| | 42,300,943 | | | | 46,416,103 | | | | 291,613 | | | | 655,868 | | | | 7,522,091 | | | | 4,977,407 | | | | – | | | | (66 | ) |
| | (179,255,251 | ) | | | (221,700,298 | ) | | | (4,669,500 | ) | | | (7,528,860 | ) | | | (212,224,232 | ) | | | (252,539,425 | ) | | | (614,890,853 | ) | | | (594,636,284 | ) |
| | (11,461,699 | ) | | | (35,192,416 | ) | | | 1,073,205 | | | | (550,939 | ) | | | (52,474,183 | ) | | | 10,941,455 | | | | (46,269,207 | ) | | | (24,880,837 | ) |
| | | | | | | |
| | | | | | | | | | | | | | | | | | | | | | | | | | | | | | |
| | 29,156,015 | | | | 29,774,716 | | | | 5,009,256 | | | | 22,720,675 | | | | 112,052,848 | | | | 89,771,765 | | | | 3,837,409 | | | | 3,561,959 | |
| | 3,274,181 | | | | 3,476,664 | | | | 2,333,993 | | | | 4,285,753 | | | | 10,342,968 | | | | 6,369,137 | | | | – | | | | – | |
| | (31,016,566 | ) | | | (37,618,353 | ) | | | (13,849,761 | ) | | | (23,917,684 | ) | | | (99,888,669 | ) | | | (117,298,195 | ) | | | (4,147,378 | ) | | | (9,556,929 | ) |
| | 1,413,630 | | | | (4,366,973 | ) | | | (6,506,512 | ) | | | 3,088,744 | | | | 22,507,147 | | | | (21,157,293 | ) | | | (309,969 | ) | | | (5,994,970 | ) |
| | (10,048,069 | ) | | | (39,559,389 | ) | | | (5,433,307 | ) | | | 2,537,805 | | | | (29,967,036 | ) | | | (10,215,838 | ) | | | (46,579,176 | ) | | | (30,875,807 | ) |
| | | | | | | | | | | | | | | | | | | | | | | | | | | | | | |
| | 54,526,126 | | | | (145,491,827 | ) | | | (5,239,550 | ) | | | (4,564,596 | ) | | | (36,201,183 | ) | | | (17,172,075 | ) | | | (46,579,176 | ) | | | (30,875,807 | ) |
| | 1,489,007,951 | | | | 1,634,499,778 | | | | 108,013,173 | | | | 112,577,769 | | | | 863,698,619 | | | | 880,870,694 | | | | 475,547,088 | | | | 506,422,895 | |
| | $1,543,534,077 | | | | $1,489,007,951 | | | | $102,773,623 | | | | $108,013,173 | | | | $827,497,436 | | | | $863,698,619 | | | | $428,967,912 | | | | $475,547,088 | |
| | $34,963 | | | | $(17,489 | ) | | | $(5,541 | ) | | | $(5,541 | ) | | | $88,070 | | | | $287,004 | | | | $ – | | | | $ – | |
| | | | | | | |
| | | | | | | | | | | | | | | | | | | | | | | | | | | | | | |
| | | | | | | |
| | | | | | | | | | | | | | | | | | | | | | | | | | | | | | |
| | 10,934,515 | | | | 11,932,896 | | | | 547,101 | | | | 616,692 | | | | 12,207,434 | | | | 20,522,700 | | | | 568,621,644 | | | | 569,755,511 | |
| | 3,704,883 | | | | 4,011,775 | | | | 29,595 | | | | 63,475 | | | | 603,987 | | | | 396,101 | | | | – | | | | (66 | ) |
| | (15,796,787 | ) | | | (19,357,370 | ) | | | (470,500 | ) | | | (738,898 | ) | | | (17,016,609 | ) | | | (20,096,511 | ) | | | (614,890,852 | ) | | | (594,636,282 | ) |
| | (1,157,389 | ) | | | (3,412,699 | ) | | | 106,196 | | | | (58,731 | ) | | | (4,205,188 | ) | | | 822,290 | | | | (46,269,208 | ) | | | (24,880,837 | ) |
| | | | | | | |
| | | | | | | | | | | | | | | | | | | | | | | | | | | | | | |
| | 2,550,119 | | | | 2,590,468 | | | | 500,356 | | | | 2,269,773 | | | | 8,985,136 | | | | 7,141,565 | | | | 3,837,409 | | | | 3,561,959 | |
| | 286,698 | | | | 300,402 | | | | 236,480 | | | | 415,357 | | | | 830,627 | | | | 506,916 | | | | – | | | | – | |
| | (2,726,484 | ) | | | (3,267,521 | ) | | | (1,396,827 | ) | | | (2,305,247 | ) | | | (8,013,762 | ) | | | (9,326,704 | ) | | | (4,147,378 | ) | | | (9,556,929 | ) |
| | 110,333 | | | | (376,651 | ) | | | (659,991 | ) | | | 379,883 | | | | 1,802,001 | | | | (1,678,223 | ) | | | (309,969 | ) | | | (5,994,970 | ) |
The accompanying Notes to Financial Statements are an integral part of this statement.
279
THRIVENT MUTUAL FUNDS
NOTESTO FINANCIAL STATEMENTS
October 31, 2014
(1) ORGANIZATION
Thrivent Mutual Funds (the “Trust”) was organized as a Massachusetts Business Trust on March 10, 1987 and is registered as an open-end management investment company under the Investment Company Act of 1940 (the “1940 Act”). The Trust is divided into twenty-six separate series (each, a “Fund” and, collectively, the “Funds”), each with its own investment objective and policies. The Trust currently consists of four allocation funds, twelve equity funds, four hybrid funds, five fixed-income funds and one money market fund. Thrivent Natural Resources Fund, Thrivent Growth and Income Plus Fund and Thrivent Diversified Income Plus Fund have a fiscal year end on a calendar-year basis and are presented under a separate shareholder report.
The Funds are each investment companies that follow the accounting and reporting guidance of the Financial Accounting Standards Board (FASB) Accounting Standard Codification Topic 946 - Financial Services - Investment Companies.
(A) Share Classes – As of October 31, 2014, the Trust includes two classes of shares: Class A and Institutional Class. The classes of shares differ principally in their respective distribution expenses and other class-specific expenses and arrangements. Class A shares have a 0.25% annual 12b-1 fee and a maximum front-end sales load of 5.50% for equity funds and 4.50% for fixed-income funds, although some of the fixed-income funds have lower 12b-1 fees and either a reduced or no front-end sales load. Institutional Class shares are offered at net asset value and have no annual 12b-1 fees. The share classes have identical rights to earnings, assets and voting privileges, except for class-specific expenses and exclusive rights to vote on matters affecting only individual classes. All 26 Funds of the Trust offer Class A and Institutional Class shares.
(B) Other – Under the Trust’s organizational documents, its officers and trustees are indemnified against certain liabilities arising out of the performance of their duties to the Trust. In addition, in the normal course of business, the Trust enters into contracts with vendors and others that provide general damage clauses. The Trust’s maximum exposure under these contracts is unknown, as this would involve future claims that may be made against the Trust. However, based on experience, the Trust expects the risk of loss to be remote.
(2) SIGNIFICANT ACCOUNTING POLICIES
(A) Valuation of Investments – Securities traded on U.S. or foreign securities exchanges or included in a national market system are valued at the official closing price at the close of each business day unless otherwise stated below. Over-the- counter securities and listed securities for which no price is readily available are valued at the current bid price considered best to represent the value at that time. Swap agreements are valued at the latest bid quotation of the contract as furnished by an independent pricing service. Security prices are based on quotes that are obtained from an independent pricing service approved by the Trust’s Board of Trustees (“Board”). The pricing service, in determining values of fixed-income securities, takes into consideration such factors as current quotations by broker/dealers, coupon, maturity, quality, type of issue, trading characteristics, and other yield and risk factors it deems relevant in determining valuations. Securities which cannot be valued by the approved pricing service are valued using valuations obtained from dealers that make markets in the securities. Exchange- listed options and futures contracts are valued at the last quoted sales price. Forward foreign currency exchange contracts are marked-to-market based upon foreign currency exchange rates provided by the pricing service. Investments in open-ended mutual funds are valued at the net asset value at the close of each business day. Short-term securities are valued at amortized cost (which approximates market value) to the extent it is not materially different than market value.
Securities held by Money Market Fund are valued on the basis of amortized cost (which approximates market value), whereby a portfolio security is valued at its cost initially and thereafter valued to reflect a constant amortization to maturity of any discount or premium. Money Market Fund and the Trust’s investment adviser, Thrivent Asset Management, LLC (“Thrivent Asset Mgt.” or the “Adviser”), follow procedures designed to help maintain a constant net asset value of $1.00 per share.
The Board has delegated responsibility for daily valuation of the Funds’ securities to the Adviser. The Adviser has formed a Valuation Committee (“Committee”) that is responsible for overseeing the Fund valuation policies in accordance with Valuation Policies and Procedures. The Committee meets on a monthly and on an as-needed basis to review price challenges, price overrides, stale prices, shadow prices, manual prices, money market pricing, international fair valuation, and other securities requiring fair valuation.
The Committee monitors for significant events occurring prior to the close of trading on the New York Stock Exchange that could have a material impact on the value of any securities that are held by the Funds. Examples of such events include trading halts, national news/events, and issuer-specific developments. If the Committee decides that such events warrant using fair value estimates, the Committee will take such events into consideration in determining the fair value of such securities. If market quotations or prices are not readily available or determined to be unreliable, the securities will be valued at fair value as determined in good faith pursuant to procedures adopted by the Board.
280
THRIVENT MUTUAL FUNDS
NOTESTO FINANCIAL STATEMENTS
October 31, 2014
Financial Accounting Standards Board (FASB) guidelines require increased fair value disclosure intended to improve the consistency and comparability of fair value measurements used in financial reporting. The guidelines define fair value, establish a framework for measuring fair value in U.S. Generally Accepted Accounting Principles (“GAAP”) and expand disclosures about fair value requirements. The various inputs used to determine the fair value of the Funds’ investments are summarized in three broad levels: Level 1 includes quoted prices in active markets for identical securities, typically included in this level are U.S. equity securities, futures, options and registered investment company funds; Level 2 includes other significant observable inputs such as quoted prices for similar securities, interest rates, prepayment speeds and credit risk, typically included in this level are fixed income securities, international securities, swaps and forward contracts; and Level 3 includes significant unobservable inputs such as the Adviser’s own assumptions and broker evaluations in determining the fair value of investments. Of the Level 3 securities, those for which market values were not readily available or were deemed unreliable were fair valued as determined in good faith under procedures established by the Board. The valuation levels are not necessarily an indication of the risk associated with investing in these securities or other investments.
Valuation of International Securities – Because many foreign markets close before the U.S. markets, events may occur between the close of the foreign markets and the close of the U.S. markets that could have a material impact on the valuation of foreign securities. The Funds, under the supervision of the Board, evaluate the impacts of these events and may adjust the valuation of foreign securities to reflect fair value as of the close of the U.S. markets. The Board has authorized the Adviser to make fair valuation determinations pursuant to policies approved by the Board.
(B) Foreign Currency Translation – The accounting records of each Fund are maintained in U.S. dollars. Securities and other assets and liabilities that are denominated in foreign currencies are translated into U.S. dollars at the daily closing rates of exchange.
Foreign currency amounts related to the purchase or sale of securities and income and expenses are translated at the exchange rate on the transaction date. Net realized and unrealized currency gains and losses are recorded from closed currency contracts, disposition of foreign currencies, exchange gains or losses between the trade date and settlement date on securities transactions, and other translation gains or losses on dividends, interest income and foreign withholding taxes. The Funds do not separately report the effect of changes in foreign exchange rates from changes in prices on securities held. Such changes are included in net realized and unrealized gain or loss from investments in the Statement of Operations.
For federal income tax purposes, the Funds treat the effect of changes in foreign exchange rates arising from actual foreign currency transactions and the changes in foreign exchange rates between the trade date and settlement date as ordinary income.
(C) Foreign Denominated Investments – Foreign denominated assets and currency contracts may involve more risks than domestic transactions including currency risk, political and economic risk, regulatory risk, and market risk. Certain Funds may also invest in securities of companies located in emerging markets. Future economic or political developments could adversely affect the liquidity or value, or both, of such securities.
(D) Federal Income Taxes – No provision has been made for income taxes because each Fund’s policy is to qualify as a regulated investment company under the Internal Revenue Code and distribute substantially all investment company taxable income and net capital gain on a timely basis. It is also the intention of each Fund to distribute an amount sufficient to avoid imposition of any federal excise tax. The Funds, accordingly, anticipate paying no federal taxes and no federal tax provision was recorded. Each Fund is treated as a separate taxable entity for federal income tax purposes. Certain Funds may utilize earnings and profits distributed to shareholders on the redemption of shares as part of the dividends paid deduction.
Foreign Income Taxes – Certain Funds are subject to foreign income taxes imposed by certain countries in which they invest. Withholding taxes on foreign dividends have been provided for in accordance with the applicable country’s tax rules and rates. These amounts are shown as foreign tax withholding on the Statement of Operations. The Funds pay tax on foreign capital gains, where applicable.
GAAP requires management of the Funds (i.e., the Adviser) to make additional tax disclosures with respect to the tax effects of certain income tax positions, whether those positions were taken on previously filed tax returns or are expected to be taken on future returns. These positions must meet a “more likely than not” standard that, based on the technical merits of the position, would have a greater than 50 percent likelihood of being sustained upon examination. In evaluating whether a tax position has met the more-likely-than-not recognition threshold, the Adviser must presume that the position will be examined by the appropriate taxing authority that has full knowledge of all relevant information.
The Adviser analyzed all open tax years, as defined by the statute of limitations, for all major jurisdictions. Open tax years are those that are open for examination by taxing authorities. Major jurisdictions for the Funds include U.S. Federal, Minnesota, Wisconsin, and Massachusetts as well as certain foreign countries. As of October 31, 2014, open U.S. Federal, Minnesota, Wisconsin and Massachusetts tax years include the tax years ended October 31, 2011 through 2014. Additionally, as of October 31, 2014, the tax year ended October 31, 2010 is open for Wisconsin. The Funds have no examinations in progress and none are expected at this time.
281
THRIVENT MUTUAL FUNDS
NOTESTO FINANCIAL STATEMENTS
October 31, 2014
As of October 31, 2014, the Adviser has reviewed all open tax years and major jurisdictions and concluded that there is no effect to the Funds’ tax liability, financial position or results of operations. There is no tax liability resulting from unrecognized tax benefits related to uncertain income tax positions taken or expected to be taken in future tax returns. The Funds are also not aware of any tax positions for which it is reasonably possible that the total amounts of unrecognized tax benefits will significantly change in the next 12 months.
(E) Expenses and Income – Estimated expenses are accrued daily. The Funds are charged for those expenses that are directly attributable to them. Expenses that are not directly attributable to a Fund are allocated among all appropriate Funds in proportion to their respective net assets, number of shareholder accounts or other reasonable basis. Net investment income, expenses which are not class-specific, and realized and unrealized gains and losses are allocated directly to each class based upon the relative net asset value of outstanding shares.
Interest income is recorded daily on all debt securities, as is accretion of market discount and original issue discount and amortization of premium. Paydown gains and losses on mortgage- and asset-backed securities are recorded as components of interest income. Dividend income is recorded on the ex-dividend date.
For certain securities, including real estate investment trusts, the Trust records distributions received in excess of income as a reduction of cost of investments and/or realized gain. Such amounts are based on estimates if actual amounts are not available. Actual amounts of income, realized gain and return of capital may differ from the estimated amounts. The Trust adjusts the estimated amounts of the components of distributions as adjustments to investment income, unrealized appreciation/depreciation and realized gain/ loss on investments as necessary, once the issuers provide information about the actual composition of the distributions.
(F) Distributions to Shareholders – Dividend and capital gain distributions are recorded on the ex-dividend date. With the exception of Money Market Fund, net realized gains from securities transactions, if any, are paid at least annually after the close of the fiscal year.
| | | | | | | | |
Fund | | Dividends Declared | | | Dividends Paid | |
Aggressive Allocation | | | Annually | | | | Annually | |
Moderately Aggressive Allocation | | | Annually | | | | Annually | |
Moderate Allocation | | | Quarterly | | | | Quarterly | |
Moderately Conservative Allocation | | | Quarterly | | | | Quarterly | |
Balanced Income Plus | | | Quarterly | | | | Quarterly | |
Opportunity Income Plus | | | Daily | | | | Monthly | |
Partner Emerging Markets Equity | | | Annually | | | | Annually | |
Partner Small Cap Growth | | | Annually | | | | Annually | |
Partner Small Cap Value | | | Annually | | | | Annually | |
Small Cap Stock | | | Annually | | | | Annually | |
Mid Cap Growth | | | Annually | | | | Annually | |
Partner Mid Cap Value | | | Annually | | | | Annually | |
Mid Cap Stock | | | Annually | | | | Annually | |
Partner Worldwide Allocation | | | Annually | | | | Annually | |
Large Cap Growth | | | Annually | | | | Annually | |
Large Cap Value | | | Annually | | | | Annually | |
Large Cap Stock | | | Annually | | | | Annually | |
High Yield | | | Daily | | | | Monthly | |
Income | | | Daily | | | | Monthly | |
Municipal Bond | | | Daily | | | | Monthly | |
Government Bond | | | Daily | | | | Monthly | |
Limited Maturity Bond | | | Daily | | | | Monthly | |
Money Market* | | | Daily | | | | Monthly | |
* | Dividends are net of any short-term realized gains or losses on the sale of securities. |
(G) Derivative Financial Instruments – Each of the Funds, except Money Market Fund, may invest in derivatives. Derivatives, a category that includes options, futures, swaps and hybrid instruments, are financial instruments whose value derives from another security, an index or a currency. Each applicable Fund may use derivatives for hedging (attempting to offset a potential loss in one position by establishing an interest in an opposite position). This includes the use of currency-based derivatives for hedging its positions in foreign securities. Each applicable Fund may also use derivatives for replication of a certain asset class or speculation (investing for potential income or capital gain). These contracts may be transacted on an exchange or over-the-counter (OTC).
A derivative may incur a mark to market loss if the value of the derivative decreases due to an unfavorable change in the market rates or values of the underlying derivative. Losses can also occur if the counterparty does not perform under the derivative. A Fund’s risk of loss from the counterparty credit risk on OTC derivatives is generally limited to the aggregate unrealized gain netted against any collateral held by such Fund. With exchange traded futures and centrally cleared swaps, there is minimal counterparty credit risk to the Funds because the exchange’s clearinghouse, as counterparty to such derivatives, guarantees against a possible default. The clearinghouse stands between the buyer and the seller of the derivative; thus, the credit risk is limited to the failure of the clearinghouse. However, credit risk still exists in exchange traded futures and centrally cleared swaps with respect to initial and variation margin that is held in a broker’s customer accounts. While brokers are required to segregate customer margin from their own assets, in the event that a broker becomes insolvent or goes into bankruptcy and at that time there is a shortfall in the aggregate amount of margin held by the broker for all its clients, U.S. bankruptcy laws will typically allocate that shortfall on a pro-rata basis across all the broker’s customers, potentially resulting in losses to the Funds. Using derivatives to hedge can guard against potential risks, but it also adds to the Funds’ expenses and can eliminate some opportunities for gains. In addition, a derivative used for hedging or replication may not accurately track the value of the underlying asset. Another risk with derivatives is that some types can amplify a gain or loss, potentially earning or losing substantially more money than the actual cost of the derivative.
282
THRIVENT MUTUAL FUNDS
NOTESTO FINANCIAL STATEMENTS
October 31, 2014
In order to define their contractual rights and to secure rights that will help the Funds mitigate their counterparty risk, the Funds may enter into an International Swaps and Derivatives Association, Inc. Master Agreement (“ISDA Master Agreement”) or similar agreement with its derivative contract counterparties. An ISDA Master Agreement is a bilateral agreement between a Fund and a counterparty that governs OTC derivatives and foreign exchange contracts and typically includes, among other things, collateral posting terms and netting provisions in the event of a default and/or termination event. Under an ISDA Master Agreement, each Fund may, under certain circumstances, offset with the counterparty certain derivative’s payables and/or receivables with collateral held and/or posted and create one single net payment. The provisions of the ISDA Master Agreement typically permit a single net payment in the event of a default (close-out netting) including the bankruptcy or insolvency of the counterparty. Note, however, that bankruptcy and insolvency laws of a particular jurisdiction may impose restrictions on or prohibitions against the right of offset in bankruptcy, insolvency or other events.
Collateral and margin requirements vary by type of derivative. Margin requirements are established by the broker or clearinghouse for exchange traded and centrally cleared derivatives (futures, options, and centrally cleared swaps). Brokers can ask for margining in excess of the minimum in certain situations. Collateral terms are contract specific for OTC derivatives (foreign currency exchange contracts, options, swaps). For derivatives traded under an ISDA Master Agreement, the collateral requirements are typically calculated by netting the mark to market amount for each transaction under such agreement and comparing that amount to the value of any collateral currently pledged by the Fund and the counterparty. For financial reporting purposes, non-cash collateral that has been pledged to cover obligations of the Fund has been noted in the Schedule of Investments. To the extent amounts due to the Fund from its counterparties are not fully collateralized, contractually or otherwise, the Fund bears the risk of loss from counterparty nonperformance. The Funds attempt to mitigate counterparty risk by only entering into agreements with counterparties that they believe have the financial resources to honor their obligations and by monitoring the financial stability of those counterparties.
Options – All Funds, except Money Market Fund, may buy put and call options and write put and covered call options. The Funds intend to use such derivative instruments as hedges to facilitate buying or selling securities or to provide protection against adverse movements in security prices or interest rates. The Funds may also enter into options contracts to protect against adverse foreign exchange rate fluctuations. Option contracts are valued daily and unrealized appreciation or depreciation is recorded. A Fund will realize a gain or loss upon expiration or closing of the option transaction. When an option is exercised, the proceeds upon sale for a written call option or the cost of a security for purchased put and call options is adjusted by the amount of premium received or paid.
Buying put options tends to decrease a Fund’s exposure to the underlying security while buying call options tends to increase a Fund’s exposure to the underlying security. The risk associated with purchasing put and call options is limited to the premium paid. There is no significant counterparty risk on exchange-traded options as the exchange guarantees the contract against default. Writing put options tends to increase a Fund’s exposure to the underlying security while writing call options tends to decrease a Fund’s exposure to the underlying security. The writer of an option has no control over whether the underlying security may be bought or sold, and therefore bears the market risk of an unfavorable change in the price of the underlying security. The counterparty risk for purchased options arises when a Fund has purchased an option, exercises that option, and the counterparty doesn’t buy from the Fund or sell to the Fund the underlying asset as required. In the case where a Fund has written an option, the Fund doesn’t have counterparty risk. Counterparty risk on purchased over-the-counter options is partially mitigated by the Fund’s collateral posting requirements. As the option increases in value to the Fund, the Fund receives collateral from the counterparty. Risks of loss may exceed amounts recognized on the Statement of Assets and Liabilities.
Futures Contracts – Certain Funds may use futures contracts to manage the exposure to interest rate and market or currency fluctuations. Gains or losses on futures contracts can offset changes in the yield of securities. When a futures contract is opened, cash or other investments equal to the required “initial margin deposit” are held on deposit with and pledged to the broker. Additional securities held by the Funds may be earmarked to cover open futures contracts. The futures contract’s daily change in value (“variation margin”) is either paid to or received from the broker, and is recorded as an unrealized gain or loss. When the contract is closed, realized gain or loss is recorded equal to the difference between the value of the contract when opened and the value of the contract when closed. Futures contracts involve, to varying degrees, risk of loss in excess of the variation margin disclosed in the Statement of Assets and Liabilities. Exchange-traded futures have no significant counterparty risk as the exchange guarantees the contracts against default.
283
THRIVENT MUTUAL FUNDS
NOTESTO FINANCIAL STATEMENTS
October 31, 2014
Foreign Currency Forward Contracts – In connection with purchases and sales of securities denominated in foreign currencies all Funds, except Money Market Fund, may enter into foreign currency contracts. Additionally, the Funds may enter into such contracts to hedge certain other foreign-currency-denominated investments. These contracts are recorded at value and the related realized and change in unrealized foreign exchange gains and losses are included in the Statement of Operations. In the event that counterparties fail to settle these currency contracts, the Funds could be exposed to foreign currency fluctuations. Foreign currency contracts are valued daily and unrealized appreciation or depreciation is recorded daily as the difference between the contract exchange rate and the closing forward rate applied to the face amount of the contract. A realized gain or loss is recorded at the time a forward contract is closed. These contracts are over-the-counter and the Fund is exposed to counterparty risk equal to the discounted net amount of payments to the Fund. This risk is partially mitigated by the Fund’s collateral posting requirements.
Swap Agreements – Certain Funds enter into swap transactions, which involve swapping one or more investment characteristics of a security or a basket of securities with another party. Such transactions include market risk, risk of default by the other party to the transaction, risk of imperfect correlation and manager risk and may involve commissions or other costs. Swap transactions generally do not involve delivery of securities, other underlying assets or principal. Accordingly, the risk of loss with respect to swap transactions is generally limited to the net amount of payments that the Fund is contractually obligated to make, or in the case of the counterparty defaulting, the net amount of payments that the Fund is contractually entitled to receive. Risks of loss may exceed amounts recognized on the Statement of Assets and Liabilities. If there is a default by the counterparty, the Fund may have contractual remedies pursuant to the agreements related to the transaction. The contracts are valued daily and unrealized appreciation or depreciation is recorded. Swap agreements are valued at fair value of the contract as provided by an independent pricing service. The pricing service takes into account such factors as swap curves, default probabilities, recent trades, recovery rates and other factors it deems relevant in determining valuations. Daily fluctuations in the value of the centrally cleared credit default contracts are recorded in variation margin in the Statement of Assets and Liabilities and recorded as unrealized gain or loss. The Fund accrues for the periodic payment and amortizes upfront payments, if any, on swap agreements on a daily basis with the net amount recorded as realized gains or losses in the Statement of Operations. Receipts and payments received or made as a result of a credit event or termination of the contract are also recognized as realized gains or losses in the Statement of Operations. Collateral, in the form of cash or securities, may be required to be held with the Fund’s custodian, or a third party, in connection with these agreements. Certain swap agreements are over-the-counter and the Fund is exposed to counterparty risk, which is the discounted net amount of payments owed to the Fund. This risk is partially mitigated by the Fund’s collateral posting requirements. As the swap increases in value to the Fund, the Fund receives collateral from the counterparty. Certain interest rate and credit default index swaps must be cleared through a clearinghouse or central counterparty (a “CCP”). A default or failure by a CCP or a futures commission merchant (a “FCM”), or the failure of a swap to be transferred from a swap execution facility or an executing dealer to the FCM for clearing, may expose the Fund to losses, increase its costs, or prevent the Fund from entering or exiting swap positions, accessing collateral or margin, or fully implementing its investment strategies.
Credit Default Swaps – A credit default swap is a swap agreement between two parties to exchange the credit risk of a particular issuer, basket of securities or reference entity. In a credit default swap transaction, a buyer pays periodic fees in return for payment by the seller which is contingent upon an adverse credit event occurring in the underlying issuer or reference entity. The seller collects periodic fees from the buyer and profits if the credit of the underlying issuer or reference entity remains stable or improves while the swap is outstanding, but the seller in a credit default swap contract would be required to pay the amount of credit loss, determined as specified in the agreement, to the buyer in the event of an adverse credit event in the reference entity. A buyer of a credit default swap is said to buy protection whereas a seller of a credit default swap is said to sell protection. The Funds may be either the protection seller or the protection buyer.
Certain Funds enter into credit default derivative contracts directly through credit default swaps (CDS) or through credit default swap indices (CDX Indices). CDX indices are static pools of equally weighted credit default swaps referencing corporate bonds and/or loans designed to provide diversified credit exposure to these asset classes. Funds sell default protection and assume long-risk positions in individual credits or indices. Index positions are entered into to gain exposure to the corporate bond and/or loan markets in a cost-efficient and diversified structure. In the event that a position defaults, by going into bankruptcy and failing to pay interest or principal on borrowed money, within any given CDX Index held, the maximum potential amount of future payments required would be equal to the pro-rata share of that position within the index based on the notional amount of the index. In the event of a default under a CDS contract the maximum potential amount of future payments would be the notional amount. For CDS, the default events could be bankruptcy and failing to pay interest or principal on borrowed money or a restructuring. A restructuring is a change in the underlying obligations which would include reduction in interest or principal, maturity extension and subordination to other obligations.
For financial reporting purposes, the Funds do not offset derivative assets and derivative liabilities that are subject to netting arrangements in the Statement of Assets and Liabilities. The amounts presented in the tables below are Thrivent Mutual Funds offset first by financial instruments that have the right of offset under master netting or similar arrangements, then any remaining amount is reduced by cash and non-cash collateral pledged. The actual amounts of collateral may be greater than amounts presented in the tables.
284
THRIVENT MUTUAL FUNDS
NOTESTO FINANCIAL STATEMENTS
October 31, 2014
The following table presents the gross and net information about assets subject to master netting arrangements, as presented in the Statement of Assets and Liabilities:
| | | | | | | | | | | | | | | | | | | | | | | | | | | | |
| | | | | | | | | | | | Gross Amounts Not Offset in the
Statement of Assets and Liabilities | | | | |
Portfolio | | Gross Amounts
of Recognized
Assets | | | Gross
Amounts
Offset | | | Net Amounts
of
Recognized
Assets | | | Financial Instruments | | | Cash
Collateral
Received | | | Non- Cash Collateral Received | | | Net Amount | |
Aggressive Allocation | | | | | | | | | | | | | | | | | | | | | | | | | | | | |
Futures Contracts | | | 3,403,064 | | | | – | | | | 3,403,064 | | | | 1,828,773 | | | | – | | | | – | | | | 1,574,291 | (*) |
Moderately Aggressive Allocation | | | | | | | | | | | | | | | | | | | | | | | | | | | | |
Futures Contracts | | | 5,127,599 | | | | – | | | | 5,127,599 | | | | 2,159,778 | | | | – | | | | – | | | | 2,967,821 | (*) |
Swap Credit Contracts | | | 2,605 | | | | – | | | | 2,605 | | | | – | | | | – | | | | – | | | | 2,605 | (†) |
Moderate Allocation | | | | | | | | | | | | | | | | | | | | | | | | | | | | |
Futures Contracts | | | 3,665,514 | | | | – | | | | 3,665,514 | | | | 1,750,875 | | | | – | | | | – | | | | 1,914,639 | (*) |
Swap Credit Contracts | | | 3,693 | | | | – | | | | 3,693 | | | | – | | | | – | | | | – | | | | 3,693 | (†) |
Moderately Conservative Allocation | | | | | | | | | | | | | | | | | | | | | | | | | | | | |
Futures Contracts | | | 1,250,352 | | | | – | | | | 1,250,352 | | | | 603,322 | | | | – | | | | – | | | | 647,030 | (*) |
Swap Credit Contracts | | | 4,154 | | | | – | | | | 4,154 | | | | – | | | | – | | | | – | | | | 4,154 | (†) |
Balanced Income Plus | | | | | | | | | | | | | | | | | | | | | | | | | | | | |
Futures Contracts | | | 40,687 | | | | – | | | | 40,687 | | | | 19,476 | | | | – | | | | – | | | | 21,211 | (*) |
Opportunity Income Plus | | | | | | | | | | | | | | | | | | | | | | | | | | | | |
Futures Contracts | | | 32,000 | | | | – | | | | 32,000 | | | | 32,000 | | | | – | | | | – | | | | – | |
Partner Worldwide Allocation | | | | | | | | | | | | | | | | | | | | | | | | | | | | |
Futures Contracts | | | 620,790 | | | | – | | | | 620,790 | | | | 521,746 | | | | – | | | | – | | | | 99,044 | (*) |
Exchange Contracts | | | 925,311 | | | | – | | | | 925,311 | | | | 482,568 | | | | – | | | | – | | | | 442,743 | (‡) |
Large Cap Growth | | | | | | | | | | | | | | | | | | | | | | | | | | | | |
Futures Contracts | | | 501,714 | | | | – | | | | 501,714 | | | | – | | | | – | | | | – | | | | 501,714 | (*) |
Large Cap Stock | | | | | | | | | | | | | | | | | | | | | | | | | | | | |
Futures Contracts | | | 3,059,681 | | | | – | | | | 3,059,681 | | | | 977,794 | | | | – | | | | – | | | | 2,081,887 | (*) |
Income | | | | | | | | | | | | | | | | | | | | | | | | | | | | |
Futures Contracts | | | 210,348 | | | | – | | | | 210,348 | | | | 168,750 | | | | – | | | | – | | | | 41,598 | (*) |
Limited Maturity Bond | | | | | | | | | | | | | | | | | | | | | | | | | | | | |
Futures Contracts | | | 151,248 | | | | – | | | | 151,248 | | | | 4,688 | | | | – | | | | – | | | | 146,560 | (*) |
(*) | Net futures amount represents the net amount receivable from the counterparty in the event of a default. |
(†) | Net swap credit contracts amount represents the net amount receivable from the counterparty in the event of a default. |
(‡) | Net exchange contract amount represents the net amount receivable from the counterparty in the event of a default. |
285
THRIVENT MUTUAL FUNDS
NOTESTO FINANCIAL STATEMENTS
October 31, 2014
The following table presents the gross and net information about liabilities subject to master netting arrangements, as presented in our Statement of Assets and Liabilities:
| | | | | | | | | | | | | | | | | | | | | | | | | | | | |
| | | | | | | | | | | | Gross Amounts Not Offset in the
Statement of Assets and Liabilities | | | | |
Portfolio | | Gross Amounts
of Recognized
Liabilities | | | Gross
Amounts
Offset | | | Net
Amounts
of Recognized
Liabilities | | | Financial
Instruments | | | Cash
Collateral
Pledged | | | Non-Cash
Collateral
Pledged** | | | Net Amount | |
Aggressive Allocation | | | | | | | | | | | | | | | | | | | | | | | | | | | | |
Futures Contracts | | | 1,828,773 | | | | – | | | | 1,828,773 | | | | 1,828,773 | | | | – | | | | – | | | | – | |
Moderately Aggressive Allocation | | | | | | | | | | | | | | | | | | | | | | | | | | | | |
Futures Contracts | | | 2,159,778 | | | | – | | | | 2,159,778 | | | | 2,159,778 | | | | – | | | | – | | | | – | |
Securities Lending | | | 601,444 | | | | – | | | | 601,444 | | | | 571,065 | | | | – | | | | – | | | | 30,379 | ^ |
Moderate Allocation | | | | | | | | | | | | | | | | | | | | | | | | | | | | |
Futures Contracts | | | 1,750,875 | | | | – | | | | 1,750,875 | | | | 1,750,875 | | | | – | | | | – | | | | – | |
Securities Lending | | | 880,533 | | | | – | | | | 880,533 | | | | 847,323 | | | | – | | | | – | | | | 33,210 | ^ |
Moderately Conservative Allocation | | | | | | | | | | | | | | | | | | | | | | | | | | | | |
Futures Contracts | | | 603,322 | | | | – | | | | 603,322 | | | | 603,322 | | | | – | | | | – | | | | – | |
Securities Lending | | | 752,392 | | | | – | | | | 752,392 | | | | 715,875 | | | | – | | | | – | | | | 36,517 | ^ |
Balanced Income Plus | | | | | | | | | | | | | | | | | | | | | | | | | | | | |
Futures Contracts | | | 19,476 | | | | – | | | | 19,476 | | | | 19,476 | | | | – | | | | – | | | | – | |
Securities Lending | | | 3,335,702 | | | | – | | | | 3,335,702 | | | | 3,264,259 | | | | – | | | | – | | | | 71,443 | ^ |
Opportunity Income Plus | | | | | | | | | | | | | | | | | | | | | | | | | | | | |
Futures Contracts | | | 63,726 | | | | – | | | | 63,726 | | | | 32,000 | | | | – | | | | 31,726 | | | | – | |
Securities Lending | | | 4,698,528 | | | | – | | | | 4,698,528 | | | | 4,523,134 | | | | – | | | | – | | | | 175,394 | ^ |
Partner Small Cap Growth | | | | | | | | | | | | | | | | | | | | | | | | | | | | |
Securities Lending | | | 217,215 | | | | – | | | | 217,215 | | | | 217,215 | | | | – | | | | – | | | | – | |
Partner Small Cap Value | | | | | | | | | | | | | | | | | | | | | | | | | | | | |
Securities Lending | | | 8,739,961 | | | | – | | | | 8,739,961 | | | | 8,654,315 | | | | – | | | | – | | | | 85,646 | ^ |
Small Cap Stock | | | | | | | | | | | | | | | | | | | | | | | | | | | | |
Securities Lending | | | 13,527,930 | | | | – | | | | 13,527,930 | | | | 13,486,028 | | | | – | | | | – | | | | 41,902 | ^ |
Mid Cap Growth | | | | | | | | | | | | | | | | | | | | | | | | | | | | |
Securities Lending | | | 1,575,210 | | | | – | | | | 1,575,210 | | | | 1,575,210 | | | | – | | | | – | | | | – | |
Mid Cap Stock | | | | | | | | | | | | | | | | | | | | | | | | | | | | |
Securities Lending | | | 42,247,150 | | | | – | | | | 42,247,150 | | | | 42,089,283 | | | | – | | | | – | | | | 157,867 | ^ |
Partner Worldwide Allocation | | | | | | | | | | | | | | | | | | | | | | | | | | | | |
Futures Contracts | | | 521,746 | | | | – | | | | 521,746 | | | | 521,746 | | | | – | | | | – | | | | – | |
Exchange Contracts | | | 699,548 | | | | – | | | | 699,548 | | | | 482,568 | | | | – | | | | – | | | | 216,980 | # |
Securities Lending | | | 6,420,500 | | | | – | | | | 6,420,500 | | | | 6,332,916 | | | | – | | | | – | | | | 87,584 | ^ |
Large Cap Stock | | | | | | | | | | | | | | | | | | | | | | | | | | | | |
Futures Contracts | | | 977,794 | | | | – | | | | 977,794 | | | | 977,794 | | | | – | | | | – | | | | – | |
Securities Lending | | | 26,063,555 | | | | – | | | | 26,063,555 | | | | 25,711,118 | | | | – | | | | – | | | | 352,437 | ^ |
High Yield | | | | | | | | | | | | | | | | | | | | | | | | | | | | |
Securities Lending | | | 42,383,027 | | | | – | | | | 42,383,027 | | | | 40,522,355 | | | | – | | | | – | | | | 1,860,672 | ^ |
Income | | | | | | | | | | | | | | | | | | | | | | | | | | | | |
Futures Contracts | | | 168,750 | | | | – | | | | 168,750 | | | | 168,750 | | | | – | | | | – | | | | – | |
Securities Lending | | | 14,386,483 | | | | – | | | | 14,386,483 | | | | 13,881,786 | | | | – | | | | – | | | | 504,697 | ^ |
Limited Maturity Bond | | | | | | | | | | | | | | | | | | | | | | | | | | | | |
Futures Contracts | | | 4,688 | | | | – | | | | 4,688 | | | | 4,688 | | | | – | | | | – | | | | – | |
Securities Lending | | | 2,897,695 | | | | – | | | | 2,897,695 | | | | 2,765,829 | | | | – | | | | – | | | | 131,866 | ^ |
** | Excess of collateral pledged to the counterparty may not be shown for financial reporting purposes. |
^ | Net securities lending amounts represent the net amount payable from the counterparty in the event of a default. |
# | Net exchange contract amounts represent the net amount payable from the counterparty in the event of a default. |
(H) Mortgage Dollar Roll Transactions – Certain Funds enter into dollar roll transactions on securities issued or to be issued by the Government National Mortgage Association, Federal National Mortgage Association and Federal Home Loan Mortgage Corporation, in which the Funds sell mortgage securities and simultaneously agree to repurchase similar (same type and coupon) securities at a later date at an agreed upon price. The Funds must maintain liquid securities
286
THRIVENT MUTUAL FUNDS
NOTESTO FINANCIAL STATEMENTS
October 31, 2014
having a value not less than the repurchase price (including accrued interest) for such dollar rolls. In addition, the Funds are required to post or receive margin - depending on market movements on their mortgage dollar rolls. The value of the securities that the Funds are required to purchase may decline below the agreed upon repurchase price of those securities.
During the period between the sale and repurchase, the Funds forgo principal and interest paid on the mortgage securities sold. The Funds are compensated from negotiated fees paid by brokers offered as an inducement to the Funds to “roll over” their purchase commitments, thus enhancing the yield. Mortgage dollar rolls may be renewed with a new purchase and repurchase price and a cash settlement made on settlement date without physical delivery of the securities subject to the contract. The fees received are recognized over the roll period and are included in Income from mortgage dollar rolls in the Statement of Operations.
(I) Securities Lending – The Trust has entered into a Securities Lending Agreement (the “Agreement”) with Deutsche Bank AG (“Deutsche”). The Agreement authorizes Deutsche to lend securities to authorized borrowers on behalf of the Funds. Pursuant to the Agreement, all loaned securities are initially collateralized by cash equal to at least 102% of the value of the loaned securities. All cash collateral received is invested in Thrivent Cash Management Trust. The Funds receive dividends and interest that would have been earned on the securities loaned while simultaneously seeking to earn income on the investment of cash collateral. Amounts earned on investments in Thrivent Cash Management Trust, net of rebates, fees paid to Deutsche for services provided and any other securities lending expenses, are included in Income from securities loaned on the Statement of Operations. By investing any cash collateral it receives in these transactions, a Fund could realize additional gains or losses. If the borrower fails to return the securities or the invested collateral has declined in value, the Fund could lose money.
As of October 31, 2014, the value of securities on loan is as follows:
| | | | |
Fund | | Securities
on Loan | |
Moderately Aggressive Allocation | | $ | 571,065 | |
Moderate Allocation | | | 847,323 | |
Moderately Conservative Allocation | | | 715,875 | |
Balanced Income Plus | | | 3,264,259 | |
Opportunity Income Plus | | | 4,523,134 | |
Partner Small Cap Growth | | | 221,244 | |
Partner Small Cap Value | | | 8,654,315 | |
Small Cap Stock | | | 13,486,028 | |
Mid Cap Growth | | | 1,861,913 | |
Mid Cap Stock | | | 42,089,283 | |
Partner Worldwide Allocation | | | 6,332,916 | |
Large Cap Stock | | | 25,711,118 | |
High Yield | | | 40,522,355 | |
Income | | | 13,881,786 | |
Limited Maturity Bond | | | 2,765,829 | |
(J) When-Issued and Delayed Delivery Transactions – Each Fund may purchase or sell securities on a when-issued or delayed delivery basis. These transactions involve a commitment by a Fund to purchase or sell securities for a predetermined price or yield, with payment and delivery taking place beyond the customary settlement period. When delayed delivery purchases are outstanding, a Fund will designate liquid assets in an amount sufficient to meet the purchase price. When purchasing a security on a delayed delivery basis, a Fund assumes the rights and risks of ownership of the security, including the risk of price and yield fluctuations, and takes such fluctuations into account when determining its net asset value. A Fund may dispose of a delayed delivery transaction after it is entered into, and may sell when-issued securities before they are delivered, which may result in a capital gain or loss. When a Fund has sold a security on a delayed delivery basis, a Fund does not participate in future gains and losses with respect to the security.
(K) Treasury Inflation Protected Securities – Certain Funds may invest in treasury inflation protected securities (TIPS). These securities are fixed income securities whose principal value is periodically adjusted to the rate of inflation. The coupon interest rate is generally fixed at issuance. Interest is paid based on the principal value, which is adjusted for inflation. Any increase in the principal amount will be included as taxable interest in the Statement of Operations and received in cash upon maturity or sale of the security.
(L) Repurchase Agreements – Each Fund may engage in repurchase agreement transactions in pursuit of its investment objective. A repurchase agreement consists of a purchase and a simultaneous agreement to resell an investment for later delivery at an agreed upon price and rate of interest. The Fund uses a third-party custodian to maintain the collateral. If the original seller of a security subject to a repurchase agreement fails to repurchase the security at the agreed upon time, the Fund could incur a loss due to a drop in the value of the security during the time it takes the Fund to either sell the security or take action to enforce the original seller’s agreement to repurchase the security. Also, if a defaulting original seller filed for bankruptcy or became insolvent, disposition of such security might be delayed by pending legal action. The Fund may only enter into repurchase agreements with banks and other recognized financial institutions such as broker/dealers that are found by the Adviser or subadviser to be creditworthy. During the year ended October 31, 2014, none of the Funds engaged in these types of investments.
287
THRIVENT MUTUAL FUNDS
NOTESTO FINANCIAL STATEMENTS
October 31, 2014
(M) Equity-Linked Structured Securities – Certain Funds may invest in equity-linked structured notes. Equity-linked structured notes are debt securities which combine the characteristics of common stock and the sale of an option. The return component is based upon the performance of a single equity security, a basket of equity securities, or an equity index and the sale of an option. There is no guaranteed return of principal with these securities. The appreciation potential of these securities may be limited by a maximum payment or call right and can be influenced by many unpredictable factors. In addition to the performance of the equity, the nature and credit of the issuer may also impact return.
(N) Stripped Securities – Certain Funds may invest in Interest Only and Principal Only stripped mortgage or asset backed securities. These securities represent a participation in securities that are structured in classes with rights to receive different portions of the interest and principal. Interest only securities receive all the interest and principal only securities receive all the principal. If the underlying pool of mortgages or assets experience greater than anticipated prepayments of principal, the Fund may not fully recoup its initial investment in an interest only security. Principal only securities increase in value if prepayments are greater than anticipated and decline if prepayments are slower than anticipated. The market value of these securities is highly sensitive to changes in interest rates.
(O) Credit Risk – The Funds may be susceptible to credit risk to the extent an issuer or counterparty defaults on its payment obligation. The Funds’ policy is to monitor the creditworthiness of issuers and counterparties. Interest receivable on defaulted securities is monitored for ability to collect payments in default and is adjusted accordingly.
(P) Accounting Estimates – The preparation of financial statements in conformity with GAAP requires management to make estimates and assumptions that affect the reported amounts of assets and liabilities and disclosure of contingent assets and liabilities at the date of the financial statements and the reported amounts of income and expenses during the reporting period. Actual results could differ from those estimates.
(Q) Loan Commitments – Certain Funds may enter into loan commitments, which generally have interest rates which are reset daily, monthly, quarterly or semi-annually by reference to a base lending rate, plus a premium. These base rates are primarily the London-Interbank Offered Rate (“LIBOR”), and secondarily the prime rate offered by one or more major United States banks (the “Prime Rate”) and the certificate of deposit (“CD”) rate or other base lending rates used by commercial lenders. Loan commitments often require prepayments from excess cash flows or allow the borrower to repay at its election. The rate at which the borrower repays cannot be predicted with accuracy. Therefore, the remaining maturity may be considerably less than the stated maturity shown in the Schedule of Investments.
All or a portion of these loan commitments may be unfunded. A Fund is obligated to fund these commitments at the borrower’s discretion. Therefore, the Fund must have funds sufficient to cover its contractual obligation. These unfunded loan commitments, which are marked to market daily, are presented in the Schedule of Investments.
(R) Unfunded Bridge Loan Commitment – The following Fund entered into a loan commitment with Dynegy, Inc. on September 15, 2014. Maturity of the commitment will be November 1, 2014. The Fund will receive a fee of 0.375%.
| | | | |
Fund | | Unfunded
Commitment | |
High Yield | | $ | 14,000,000 | |
(S) Loss Contingencies – High Yield Fund and Thrivent Income Fund are defendants in an adversary action filed on July 31, 2009 by the Official Committee of Unsecured Creditors of Motors Liquidation Company, formerly known as General Motors Corporation (GM), against prior and current holders of term loan debt of GM. The suit seeks to determine whether GM’s term loan facility was secured at the time it entered bankruptcy. High Yield Fund at one time held term loans in an original principal amount of at least $4,723,994 and, if the plaintiffs are successful, it is reasonably possible that the Fund will be required to make payments in some amount. This loss contingency has not been accrued as a liability because the amount of potential damages and the likelihood of loss cannot be reasonably estimated. Thrivent Income Fund is named as a defendant in this action, but we do not expect that the Fund’s assets will be subject to a loss contingency.
(T) Litigation – Awards from class action litigation are recorded as realized gains on the payment date.
(U) In-kind Redemptions – During the year ended October 31, 2014, the Thrivent Asset Allocation Funds, as the shareholders of the underlying funds of Thrivent Mutual Funds, Inc., (the “underlying fund”), redeemed their shares in-kind (“in-kind redemption”) of Thrivent Partner Small Cap Growth Fund (the “underlying fund”). The underlying fund distributed fund securities and cash as payment for the redemption of these fund shares. For financial reporting purposes, the underlying fund recognizes gain on these transactions to the extent the value of the distributed securities on the date of redemption exceeds the cost of those securities; they recognize a loss if the cost exceeds the value. Gains or losses on in-kind redemptions are not recognized for tax
288
THRIVENT MUTUAL FUNDS
NOTESTO FINANCIAL STATEMENTS
October 31, 2014
purposes. The realized gains or losses below are included in the Statement of Operations of the underlying fund as net realized gains/losses on in-kind redemptions. The in-kind amounts and shares redeemed are included in the Capital Stock Transactions of the Statement of Changes in Net Assets of the underlying fund. These in-kind transactions were conducted at market value. The transactions were as follows:
| | | | | | | | | | | | | | | | | | |
| | | Underlying
Fund | | Underlying Shares Redeemed | | | Date | | | In-kind Amount | | | Realized Gain/ (Loss) | |
Aggressive Allocation Fund | | Partner Small Cap Growth | | | 3,871,291 | | | | 9/29/2014 | | | | $58,769,679 | | | | $5,914,868 | |
Moderately Aggressive Allocation Fund | | Partner Small Cap Growth | | | 3,462,250 | | | | 9/29/2014 | | | | $52,560,077 | | | | $12,227,004 | |
Moderate Allocation Fund | | Partner Small Cap Growth | | | 2,282,448 | | | | 9/29/2014 | | | | $34,649,606 | | | | $6,525,180 | |
During the year ended October 31, 2014, Thrivent Financial for Lutherans redeemed their shares in-kind (“in-kind redemption”) of Thrivent Partner Mid Cap Value Fund and Thrivent Partner Small Cap Growth Fund (the “underlying funds”). The underlying funds distributed fund securities and cash as payment for the redemption of these fund shares. For financial reporting purposes, the underlying funds recognize gain on these transactions to the extent the value of the distributed securities on the date of redemption exceeds the cost of those securities; they recognize a loss if the cost exceeds the value. Gains or losses on in-kind redemptions are not recognized for tax purposes. The realized gains or losses below are included in the Statement of Operations of the underlying funds as net realized gains/losses on in-kind redemptions. The in-kind amounts and shares redeemed are included in the Capital Stock Transactions of the Statement of Changes in Net Assets of the underlying funds. These in-kind transactions were conducted at market value. The transactions were as follows:
| | | | | | | | | | | | | | | | | | |
| | | Underlying
Fund | | Underlying
Shares
Redeemed | | | Date | | | In-kind
Amount | | | Realized
Gain/(Loss) | |
Thrivent Financial for Lutherans | | Partner Mid Cap Value | | | 633,249 | | | | 1/8/2014 | | | | $8,795,826 | | | | $2,285,789 | |
Thrivent Financial for Lutherans | | Partner Small Cap Growth | | | 748,037 | | | | 1/15/2014 | | | | $11,519,768 | | | | $4,068,066 | |
(V) Other – For financial statement purposes, investment security transactions are accounted for on the trade date. Realized gains and losses from investment transactions are determined on a specific cost identification basis, which is the same basis used for federal income tax purposes.
(3) FEES AND COMPENSATION PAID TO AFFILIATES
(A) Investment Advisory Fees – The Trust has entered into an Investment Advisory Agreement with Thrivent Asset Mgt. Under the Investment Advisory Agreement, each of the Funds pays a fee for investment advisory services. The fees are accrued daily and paid monthly.
The four Asset Allocation Funds – Aggressive Allocation Fund, Moderately Aggressive Allocation Fund, Moderate Allocation Fund and Moderately Conservative Allocation Fund – pay investment advisory fees for asset allocation services. In addition, for investments (other than underlying Thrivent Funds) held directly by the Asset Allocation Funds, each Asset Allocation Fund will pay an additional advisory fee. The annual rates of fees as a percentage of average daily net assets under the Investment Advisory Agreement are as follows:
| | | | | | | | | | | | |
Fund (M – Millions) | | $0 to
$500M | | | Over
$500 to
$2,000M | | | Over
$2,000M | |
Aggressive Allocation | | | 0.150 | % | | | 0.125 | % | | | 0.100 | % |
Aggressive Allocation – Direct Holdings | | | 0.600 | % | | | 0.600 | % | | | 0.600 | % |
Moderately Aggressive Allocation | | | 0.150 | % | | | 0.125 | % | | | 0.100 | % |
Moderately Aggressive Allocation – Direct Holdings | | | 0.550 | % | | | 0.550 | % | | | 0.550 | % |
Moderate Allocation | | | 0.150 | % | | | 0.125 | % | | | 0.100 | % |
Moderate Allocation – Direct Holdings | | | 0.500 | % | | | 0.500 | % | | | 0.500 | % |
Moderately Conservative Allocation | | | 0.150 | % | | | 0.125 | % | | | 0.100 | % |
Moderately Conservative Allocation – Direct Holdings | | | 0.450 | % | | | 0.450 | % | | | 0.450 | % |
For all other Funds, the annual rates of fees as a percent of average daily net assets under the Investment Advisory Agreement were as follows:
289
THRIVENT MUTUAL FUNDS
NOTESTO FINANCIAL STATEMENTS
October 31, 2014
| | | | | | | | | | | | | | | | | | | | | | | | | | | | | | | | | | | | | | | | | | | | |
Fund (M – Millions) | | $0 to
$50M | | | Over
$50 to
$100M | | | Over
$100 to
$200M | | | Over
$200 to
$250M | | | Over
$250 to
$500M | | | Over
$500 to
$750M | | | Over
$750 to
$1,000M | | | Over
$1,000 to
$2,000M | | | Over
$2,000 to
$2,500M | | | Over
$2,500 to
$5,000M | | | Over $5,000M | |
Balanced Income Plus | | | 0.550 | % | | | 0.550 | % | | | 0.550 | % | | | 0.550 | % | | | 0.550 | % | | | 0.500 | % | | | 0.500 | % | | | 0.475 | % | | | 0.475 | % | | | 0.450 | % | | | 0.425 | % |
Opportunity Income Plus | | | 0.450 | % | | | 0.450 | % | | | 0.450 | % | | | 0.450 | % | | | 0.450 | % | | | 0.400 | % | | | 0.400 | % | | | 0.375 | % | | | 0.375 | % | | | 0.350 | % | | | 0.325 | % |
Partner Emerging Markets Equity | | | 1.200 | % | | | 1.070 | % | | | 1.070 | % | | | 1.070 | % | | | 1.070 | % | | | 1.070 | % | | | 1.070 | % | | | 1.070 | % | | | 1.070 | % | | | 1.070 | % | | | 1.070 | % |
Partner Small Cap Growth | | | 0.900 | % | | | 0.900 | % | | | 0.900 | % | | | 0.900 | % | | | 0.900 | % | | | 0.800 | % | | | 0.800 | % | | | 0.800 | % | | | 0.800 | % | | | 0.800 | % | | | 0.800 | % |
Partner Small Cap Value | | | 0.700 | % | | | 0.700 | % | | | 0.700 | % | | | 0.700 | % | | | 0.700 | % | | | 0.700 | % | | | 0.700 | % | | | 0.700 | % | | | 0.700 | % | | | 0.700 | % | | | 0.700 | % |
Small Cap Stock | | | 0.700 | % | | | 0.700 | % | | | 0.700 | % | | | 0.650 | % | | | 0.650 | % | | | 0.650 | % | | | 0.650 | % | | | 0.600 | % | | | 0.600 | % | | | 0.550 | % | | | 0.525 | % |
Mid Cap Growth | | | 0.450 | % | | | 0.450 | % | | | 0.400 | % | | | 0.400 | % | | | 0.350 | % | | | 0.300 | % | | | 0.300 | % | | | 0.250 | % | | | 0.250 | % | | | 0.250 | % | | | 0.250 | % |
Partner Mid Cap Value | | | 0.750 | % | | | 0.750 | % | | | 0.750 | % | | | 0.700 | % | | | 0.700 | % | | | 0.700 | % | | | 0.700 | % | | | 0.700 | % | | | 0.700 | % | | | 0.700 | % | | | 0.700 | % |
Mid Cap Stock | | | 0.700 | % | | | 0.700 | % | | | 0.700 | % | | | 0.650 | % | | | 0.650 | % | | | 0.650 | % | | | 0.650 | % | | | 0.600 | % | | | 0.600 | % | | | 0.550 | % | | | 0.525 | % |
Partner Worldwide Allocation | | | 0.900 | % | | | 0.900 | % | | | 0.900 | % | | | 0.900 | % | | | 0.850 | % | | | 0.850 | % | | | 0.850 | % | | | 0.800 | % | | | 0.800 | % | | | 0.800 | % | | | 0.800 | % |
Large Cap Growth | | | 0.750 | % | | | 0.750 | % | | | 0.750 | % | | | 0.750 | % | | | 0.750 | % | | | 0.700 | % | | | 0.700 | % | | | 0.650 | % | | | 0.650 | % | | | 0.600 | % | | | 0.575 | % |
Large Cap Value | | | 0.450 | % | | | 0.450 | % | | | 0.450 | % | | | 0.450 | % | | | 0.450 | % | | | 0.450 | % | | | 0.450 | % | | | 0.450 | % | | | 0.450 | % | | | 0.450 | % | | | 0.450 | % |
Large Cap Stock | | | 0.650 | % | | | 0.650 | % | | | 0.650 | % | | | 0.650 | % | | | 0.650 | % | | | 0.575 | % | | | 0.575 | % | | | 0.500 | % | | | 0.475 | % | | | 0.450 | % | | | 0.425 | % |
High Yield | | | 0.400 | % | | | 0.400 | % | | | 0.400 | % | | | 0.400 | % | | | 0.400 | % | | | 0.350 | % | | | 0.350 | % | | | 0.300 | % | | | 0.300 | % | | | 0.300 | % | | | 0.300 | % |
Income | | | 0.350 | % | | | 0.350 | % | | | 0.350 | % | | | 0.350 | % | | | 0.350 | % | | | 0.325 | % | | | 0.325 | % | | | 0.300 | % | | | 0.300 | % | | | 0.300 | % | | | 0.300 | % |
Municipal Bond | | | 0.450 | % | | | 0.450 | % | | | 0.450 | % | | | 0.450 | % | | | 0.450 | % | | | 0.400 | % | | | 0.400 | % | | | 0.350 | % | | | 0.350 | % | | | 0.325 | % | | | 0.300 | % |
Government Bond | | | 0.400 | % | | | 0.400 | % | | | 0.400 | % | | | 0.400 | % | | | 0.400 | % | | | 0.350 | % | | | 0.350 | % | | | 0.350 | % | | | 0.350 | % | | | 0.350 | % | | | 0.350 | % |
Limited Maturity Bond | | | 0.300 | % | | | 0.300 | % | | | 0.300 | % | | | 0.300 | % | | | 0.300 | % | | | 0.275 | % | | | 0.275 | % | | | 0.250 | % | | | 0.250 | % | | | 0.250 | % | | | 0.250 | % |
Money Market | | | 0.500 | % | | | 0.500 | % | | | 0.500 | % | | | 0.500 | % | | | 0.500 | % | | | 0.400 | % | | | 0.350 | % | | | 0.325 | % | | | 0.325 | % | | | 0.300 | % | | | 0.275 | % |
(B) Sub-Adviser Fees – The following subadviser fees are charged as part of the total investment advisory fees stated in the table above. The subadvisory fees are borne directly by the Adviser and do not increase the overall fees paid by the Fund.
Partner Emerging Markets Equity Fund
The Adviser has entered into subadvisory agreements with DuPont Capital Management Corporation (“DuPont Capital”) for the performance of subadvisory services. The fee payable for DuPont Capital is equal to 0.72% of the first $50 million of average daily net assets and 0.68% for assets over $50 million. Thrivent Partner Worldwide Allocation Fund and Thrivent Partner Worldwide Allocation Portfolio are included in determining breakpoints for the assets managed by DuPont Capital.
Partner Small Cap Growth Fund
The Adviser had entered into a subadvisory agreement with Turner Investments, L.P. (“Turner”) for performance of subadvisory services. For assets that were defined as microcap assets, the fee payable was equal to 0.80% of the average daily net assets in that microcap portion. For all other assets, the fee payable was equal to 0.65% of the average daily net assets when the entire portfolio assets (including the microcap portion) were no greater than $100 million, 0.60% of the average daily net assets when the entire portfolio assets were greater than $100 million but no greater than $350 million, and 0.575% of the average daily net assets when the entire portfolio assets were greater than $350 million. Thrivent Partner Small Cap Growth Portfolio (including the microcap portion of that Portfolio) was included in determining breakpoints for the assets managed by Turner. This agreement was terminated on May 27, 2014.
Partner Small Cap Value Fund
The Adviser has entered into a subadvisory agreement with T. Rowe Price Associates, Inc. for performance of subadvisory services. The fee payable is equal to 0.60% of average daily net assets.
Partner Mid Cap Value Fund
The Adviser has entered into a subadvisory agreement with Goldman Sachs Asset Management, L.P. (“GSAM”) for the performance of subadvisory services. The fee payable is equal to 0.50% of the first $200 million of average daily net assets and 0.45% for assets over $200 million. Thrivent Partner Mid Cap Value Portfolio is included in determining breakpoints for the assets managed by GSAM.
Partner Worldwide Allocation Fund
The Adviser has entered into subadvisory agreements with Mercator Asset Management, LP (“Mercator”), Principal Global Investors, LLC (“Principal”), Aberdeen Asset Managers Limited (“Aberdeen”), DuPont Capital and GSAM for the performance of subadvisory services.
The fee payable for Mercator is equal to 0.75% of the first $25 million of average daily net assets, 0.60% of the next $25 million, 0.55% of the next $25 million, 0.50% of the next $225 million, 0.40% of the next $200 million and 0.20% of average daily net assets over $500 million. Thrivent Partner Worldwide Allocation Portfolio is included in determining breakpoints for the assets managed by Mercator.
290
THRIVENT MUTUAL FUNDS
NOTESTO FINANCIAL STATEMENTS
October 31, 2014
The fee payable for Principal is equal to 0.35% of the first $500 million of average daily net assets, 0.30% of the next $500 million and 0.25% of average daily net assets over $1 billion. Thrivent Partner Worldwide Allocation Portfolio is included in determining breakpoints for the assets managed by Principal.
The fee payable for Aberdeen is equal to 0.85% of the first $50 million of average daily net assets, 0.72% of the next $50 million and 0.68% of average daily net assets over $100 million. Thrivent Partner Worldwide Allocation Portfolio and Thrivent Partner Emerging Markets Equity Portfolio are included in determining breakpoints for the assets managed by Aberdeen.
The fee payable for DuPont Capital is equal to 0.72% of the first $50 million of average daily net assets and 0.68% of average daily net assets over $50 million. Thrivent Partner Worldwide Allocation Portfolio and Thrivent Partner Emerging Markets Equity Fund are included in determining breakpoints for the assets managed by DuPont Capital.
The fee payable for GSAM for managing the emerging markets debt portion is equal to 0.50% of the first $200 million of average daily net assets, 0.45% of the next $200 million and 0.40% of average daily net assets over $400 million. The fee payable for GSAM for managing the international small- and mid-cap equities portion is equal to 0.58% of the first $250 million of average daily net assets; and 0.54% of average daily net assets in excess of $250 million. Thrivent Partner Worldwide Allocation Portfolio is included in determining breakpoints for the assets managed by GSAM.
(C) Expense Reimbursements – For the period ended October 31, 2014, the following contractual expense reimbursements, as a percentage of net assets, were in effect:
| | | | | | | | | | | | |
Fund | | Class A | | | Institutional
Class | | | Expiration
Date | |
Money Market* | | | 0.20 | % | | | 0.10 | % | | | 2/28/2015 | |
* | Thrivent Asset Management has voluntarily agreed to reimburse certain class-specific and fund level expenses of Thrivent Money Market Fund to the extent necessary in order to maintain a minimum annualized net yield of 0.00% for all classes of the Fund. |
For the period ended October 31, 2014, contractual expense reimbursements to limit expenses to the following percentages were in effect:
| | | | | | | | | | | | |
Fund | | Class A | | | Institutional Class | | | Expiration Date | |
Opportunity Income Plus | | | 0.85 | % | | | N/A | | | | 2/28/2015 | |
Partner Emerging Markets Equity | | | 1.65 | %1 | | | 1.32 | % | | | 2/28/2015 | |
Partner Mid Cap Value | | | 1.25 | % | | | N/A | | | | 2/28/2015 | |
Partner Worldwide Allocation | | | 1.40 | % | | | N/A | | | | 2/28/2015 | |
Large Cap Growth | | | 1.20 | % | | | N/A | | | | 2/28/2015 | |
Government Bond | | | 0.90 | % | | | N/A | | | | 2/28/2015 | |
1 | Prior contractual expense cap of 1.79% expired on 2/28/2014. |
For the period ended October 31, 2014, the following voluntary expense reimbursements to limit expenses to the following percentages were in effect:
| | | | | | | | | | | | |
Fund | | Class A | | | Institutional
Class | | | Expiration
Date | |
Partner Small Cap Growth | | | 1.30 | %1 | | | 1.00 | % | | | N/A | |
1 | The following voluntary expense caps became effective 9/29/2014. The class A voluntary expense cap replaced the contractual expense cap of 1.40%. |
Thrivent does not recoup amounts previously reimbursed or waived in prior fiscal years.
Each equity, hybrid and fixed income fund may invest cash in High Yield Fund, Money Market Fund and Thrivent Cash Management Trust, subject to certain limitations. During the year ended October 31, 2014, no Funds invested in High Yield Fund. During the year ended October 31, 2014, no funds invested in Money Market Fund. During the year ended October 31, 2014, all funds except Municipal Bond Fund and Money Market Fund invested in Thrivent Cash Management Trust. These related-party transactions are subject to the same terms as non-related party transactions except that, to avoid duplicate investment advisory fees, Thrivent Asset Mgt. reimburses an amount equal to the advisory fee that is charged to the equity, hybrid or fixed income fund for its investment in High Yield Fund, Money Market Fund or Thrivent Cash Management Trust.
(D) Distribution Plan – Thrivent Investment Management, Inc. (“Thrivent Investment Mgt.”) is the Trust’s distributor. The Trust has adopted a Distribution Plan pursuant to Rule 12b-1 under the 1940 Act. Class A shares have a Rule 12b-1 fee of up to 0.25% (up to 0.125% for Government Bond Fund, Limited Maturity Bond Fund and Money Market Fund) of average net assets.
(E) Sales Charges and Other Fees – For the year ended October 31, 2014, Thrivent Investment Mgt. received $11,781,760 of aggregate underwriting concessions from the sales of the Trust’s Class A shares. Sales charges are not an expense of the Trust and are not reflected in the financial statements of any of the Funds.
The Trust has entered into an accounting and administrative services agreement with Thrivent Asset Mgt. pursuant to which Thrivent Asset Mgt. provides certain accounting and administrative personnel and services to the Funds. For the year ended October 31, 2014, Thrivent Asset Mgt. received aggregate fees for accounting and administrative personnel and services of $4,635,726 from the Trust.
291
THRIVENT MUTUAL FUNDS
NOTESTO FINANCIAL STATEMENTS
October 31, 2014
The Trust has entered into an agreement with Thrivent Financial Investor Services Inc. (“Thrivent Investor Services”) to provide the Funds with transfer agent services. For the year ended October 31, 2014, Thrivent Investor Services received $14,237,728 for transfer agent services from the Trust.
Each Trustee who is not affiliated with the Adviser receives an annual fee from the Trust for services as a Trustee and is eligible to participate in a deferred compensation plan with respect to fees received from the Funds. Participants in the plan may designate their deferred Trustee’s fees as if invested in a series of the Thrivent Mutual Funds. The value of each Trustee’s deferred compensation account will increase or decrease as if invested in shares of that series. Their fees as well as the change in value are included in Trustee fees in the Statement of Operations. The deferred fees remain in the appropriate Fund until distribution in accordance with the plan. The deferred fee liability, included in accrued expenses in the Statement of Assets and Liabilities, is unsecured.
Those Trustees not participating in the above plan received $257,499 in fees from the Trust for the year ended October 31, 2014. In addition, the Trust reimbursed independent Trustees for reasonable expenses incurred in relation to attendance at meetings and industry conferences.
Certain officers and non-independent Trustees of the Trust are officers and directors of Thrivent Asset Mgt., Thrivent Investment Mgt. and Thrivent Investor Services; however, they receive no compensation from the Trust.
(F) Indirect Expenses – Some Funds invest in other mutual funds. Fees and expenses of those underlying funds are not included in those Funds’ expense ratios. The Funds indirectly bear their proportionate share of the annualized weighted average expense ratio of the underlying funds in which they invest.
(4) TAX INFORMATION
Distributions are based on amounts calculated in accordance with the applicable federal income tax regulations, which may differ from GAAP. To the extent that these differences are permanent in nature, such amounts are reclassified within the capital accounts based on their federal tax-basis treatment; temporary differences do not require reclassifications.
On the Statement of Assets and Liabilities, as a result of permanent book-to-tax differences, reclassification adjustments were made as follows [Increase/(Decrease)]:
| | | | | | | | | | | | |
Fund | | Accumulated
Undistributed
Net
Investment Income/(Loss) | | | Accumulated
Undistributed
Net Realized Gain/(Loss) | | | Capital Stock | |
Aggressive Allocation | | | $3,583,782 | | | | ($5,505,049 | ) | | | $1,921,267 | |
Moderately Aggressive Allocation | | | 6,024,452 | | | | (9,054,911 | ) | | | 3,030,459 | |
Moderate Allocation | | | 3,483,731 | | | | (5,502,816 | ) | | | 2,019,085 | |
Moderately Conservative Allocation | | | 990,460 | | | | (1,695,937 | ) | | | 705,477 | |
Balanced Income Plus | | | (119,891 | ) | | | 109,467 | | | | 10,424 | |
Opportunity Income Plus | | | 13,211 | | | | (13,211 | ) | | | – | |
Partner Emerging Markets Equity | | | (8,866 | ) | | | 8,866 | | | | – | |
Partner Small Cap Growth | | | 1,066,390 | | | | (42,427,765 | ) | | | 41,361,375 | |
Partner Small Cap Value | | | 462,055 | | | | (3,281,695 | ) | | | 2,819,640 | |
Small Cap Stock | | | 561,769 | | | | (1,360,276 | ) | | | 798,507 | |
Mid Cap Growth | | | 264,390 | | | | (1,064,390 | ) | | | 800,000 | |
Partner Mid Cap Value | | | (176,686 | ) | | | (2,171,549 | ) | | | 2,348,235 | |
Mid Cap Stock | | | (653,787 | ) | | | (6,978,213 | ) | | | 7,632,000 | |
Partner Worldwide Allocation | | | 1,505,316 | | | | (1,505,316 | ) | | | – | |
Large Cap Growth | | | 16,193 | | | | (16,193 | ) | | | – | |
Large Cap Value | | | (556,341 | ) | | | (643,659 | ) | | | 1,200,000 | |
Large Cap Stock | | | (1,062,265 | ) | | | (6,461,188 | ) | | | 7,523,453 | |
High Yield | | | 9,635 | | | | (9,635 | ) | | | – | |
Income | | | (105,117 | ) | | | 105,117 | | | | – | |
Limited Maturity Bond | | | (466,020 | ) | | | 466,020 | | | | – | |
Money Market | | | 12,823 | | | | (12,823 | ) | | | – | |
At October 31, 2014, the components of distributable earnings on a tax basis were as follows:
| | | | | | | | |
Fund | | Undistributed
Ordinary Incomea | | | Undistributed Long-
Term Capital Gain | |
Aggressive Allocation | | | $7,505,501 | | | | $48,147,611 | |
Moderately Aggressive Allocation | | | 19,992,301 | | | | 65,806,560 | |
Moderate Allocation | | | 13,019,726 | | | | 44,680,494 | |
Moderately Conservative Allocation | | | 5,025,130 | | | | 12,076,032 | |
Balanced Income Plus | | | 2,700,006 | | | | 10,155,050 | |
Opportunity Income Plus | | | 160,228 | | | | – | |
Partner Emerging Markets Equity | | | 183,373 | | | | – | |
Partner Small Cap Growth | | | 46,612 | | | | 1,771,878 | |
Partner Small Cap Value | | | 1,187,718 | | | | 31,659,907 | |
Small Cap Stock | | | 4,356,247 | | | | 32,385,099 | |
Mid Cap Growth | | | – | | | | 42,869,546 | |
Partner Mid Cap Value | | | 8,463,970 | | | | 14,058,786 | |
Mid Cap Stock | | | 2,962,295 | | | | 102,867,699 | |
Partner Worldwide Allocation | | | 18,429,975 | | | | – | |
Large Cap Growth | | | 13,622 | | | | 9,437,884 | |
Large Cap Value | | | 7,782,337 | | | | 27,086,214 | |
Large Cap Stock | | | 30,718,540 | | | | 130,090,993 | |
High Yield | | | 202,173 | | | | – | |
Income | | | 30,118 | | | | 3,747,392 | |
Municipal Bondb | | | 295,192 | | | | – | |
Government Bond | | | 6,232 | | | | 293,829 | |
Limited Maturity Bond | | | 191,868 | | | | – | |
a | Undistributed Ordinary Income includes income derived from Short-Term Capital Gains. |
b | Municipal Bond Fund undistributed ordinary income is primarily exempt from federal income taxes. |
292
THRIVENT MUTUAL FUNDS
NOTESTO FINANCIAL STATEMENTS
October 31, 2014
At October 31, 2014, the following Funds had accumulated net realized capital loss carryovers expiring as follows:
| | | | | | | | |
Fund | | Capital Loss
Carryover | | | Expiration
Year | |
Opportunity Income Plus | | $ | 5,295,036 | | | | 2017 | |
| | | | | | | | |
| | $ | 5,295,036 | | | | | |
| | | | | | | | |
| | |
Partner Emerging Markets Equity | | $ | 373,415 | | | | Unlimited | |
| | | | | | | | |
| | |
Partner Worldwide Allocation | | | 43,256,191 | | | | 2016 | |
| | | 6,799,658 | | | | 2017 | |
| | | | | | | | |
| | $ | 50,055,849 | | | | | |
| | | | | | | | |
| | |
Large Cap Growth | | | 1,041,797 | | | | 2015 | |
| | | 1,041,797 | | | | 2016 | |
| | | | | | | | |
| | $ | 2,083,594 | | | | | |
| | | | | | | | |
| | |
High Yield | | | 5,322,180 | | | | 2016 | |
| | | 30,243,630 | | | | 2017 | |
| | | | | | | | |
| | $ | 35,565,810 | | | | | |
| | | | | | | | |
| | |
Municipal Bond | | $ | 11,093,148 | | | | Unlimited | |
| | | | | | | | |
| | |
Limited Maturity Bond | | $ | 3,671,147 | | | | Unlimited | |
| | | | | | | | |
To the extent that these Funds realize future net capital gains, taxable distributions will be reduced by any unused capital loss carryovers as permitted by the Internal Revenue Code. Unlimited capital loss carryovers will be utilized before capital loss carryovers with expirations dates.
During the fiscal year 2014, capital loss carryovers utilized by the Funds were as follows:
| | | | |
Fund | | Capital Loss
Carryover | |
Opportunity Income Plus | | | $2,747,364 | |
Mid Cap Stock | | | 18,032,887 | |
Partner Worldwide Allocation | | | 51,844,096 | |
Large Cap Growth | | | 38,428,526 | |
Large Cap Value | | | 18,045,582 | |
High Yield | | | 9,849,600 | |
Income | | | 11,020,687 | |
The following funds deferred, on a tax basis, the following Late Year Ordinary Losses:
| | | | |
Fund | | Ordinary Losses | |
Aggressive Allocation | | | $877,289 | |
Mid Cap Growth | | | $47,097 | |
These amounts are deferred for tax purposes, and are deemed to occur on the first day of the following fiscal year.
293
THRIVENT MUTUAL FUNDS
NOTESTO FINANCIAL STATEMENTS
October 31, 2014
The tax character of distributions paid during the years ended October 31, 2014 and 2013 was as follows:
| | | | | | | | | | | | | | | | | | | | | | | | |
| | | Tax-Exempt Income | | | Ordinary Income(a) | | | Long-Term Capital Gain | |
Fund | | 10/31/2014 | | | 10/31/2013 | | | 10/31/2014 | | | 10/31/2013 | | | 10/31/2014 | | | 10/31/2013 | |
Aggressive Allocation | | | $– | | | | $– | | | | $14,806,755 | | | | $6,082,118 | | | | $18,020,683 | | | | $3,645,559 | |
Moderately Aggressive Allocation | | | – | | | | – | | | | 38,919,943 | | | | 20,337,543 | | | | 36,414,643 | | | | 10,582,766 | |
Moderate Allocation | | | – | | | | – | | | | 38,960,339 | | | | 32,723,709 | | | | 27,440,833 | | | | 7,962,093 | |
Moderately Conservative Allocation | | | – | | | | – | | | | 16,837,561 | | | | 17,364,734 | | | | 12,217,059 | | | | 5,910,056 | |
Balanced Income Plus | | | – | | | | – | | | | 13,993,221 | | | | 6,685,138 | | | | 14,369,018 | | | | 5,516,098 | |
Opportunity Income Plus | | | – | | | | – | | | | 11,372,089 | | | | 6,424,753 | | | | – | | | | – | |
Partner Emerging Markets Equity | | | – | | | | – | | | | 156,860 | | | | 143,847 | | | | – | | | | – | |
Partner Small Cap Growth | | | – | | | | – | | | | 4,393,398 | | | | – | | | | 18,902,748 | | | | 3,845,472 | |
Partner Small Cap Value | | | – | | | | – | | | | 673,907 | | | | 4,735,626 | | | | 7,840,214 | | | | 3,760,790 | |
Small Cap Stock | | | – | | | | – | | | | – | | | | – | | | | 2,535,087 | | | | – | |
Mid Cap Growth | | | – | | | | – | | | | 3,156,568 | | | | 484,142 | | | | 47,193,909 | | | | 25,881,632 | |
Partner Mid Cap Value | | | – | | | | – | | | | 9,912,782 | | | | 1,365,016 | | | | 20,424,078 | | | | 2,834,459 | |
Mid Cap Stock | | | – | | | | – | | | | 1,030,040 | | | | 1,000,068 | | | | – | | | | – | |
Partner Worldwide Allocation | | | – | | | | – | | | | 16,803,449 | | | | 16,685,137 | | | | – | | | | – | |
Large Cap Growth | | | – | | | | – | | | | 1,136,758 | | | | 1,883,415 | | | | – | | | | – | |
Large Cap Value | | | – | | | | – | | | | 8,763,999 | | | | 11,105,815 | | | | – | | | | – | |
Large Cap Stock | | | – | | | | – | | | | 43,040,554 | | | | 30,581,972 | | | | 120,514,446 | | | | 70,280,464 | |
High Yield | | | – | | | | – | | | | 45,171,223 | | | | 49,321,503 | | | | – | | | | – | |
Income | | | – | | | | – | | | | 29,950,019 | | | | 30,525,850 | | | | – | | | | – | |
Municipal Bond | | | 53,778,904 | | | | 58,294,692 | | | | 361,050 | | | | 321,074 | | | | – | | | | 583,098 | |
Government Bond | | | – | | | | – | | | | 1,421,065 | | | | 3,776,786 | | | | 1,228,454 | | | | 1,209,392 | |
Limited Maturity Bond | | | – | | | | – | | | | 13,253,941 | | | | 11,579,503 | | | | 4,999,009 | | | | – | |
(a) | Ordinary income includes income derived from short-term capital gains. |
(5) SECURITY TRANSACTIONS
(A) Purchases and Sales of Investment Securities – For the year ended October 31, 2014, the cost of purchases and the proceeds from sales of investment securities, other than U.S. Government and short-term securities, were as follows:
| | | | | | | | |
| | | In thousands | |
Fund | | Purchases | | | Sales | |
Aggressive Allocation | | | $195,560 | | | | $234,298 | |
Moderately Aggressive Allocation | | | 406,268 | | | | 412,333 | |
Moderate Allocation | | | 378,778 | | | | 386,502 | |
Moderately Conservative Allocation | | | 165,021 | | | | 184,243 | |
Balanced Income Plus | | | 176,576 | | | | 142,077 | |
Opportunity Income Plus | | | 241,720 | | | | 119,216 | |
Partner Emerging Markets Equity | | | 10,010 | | | | 10,679 | |
Partner Small Cap Growth | | | 131,262 | | | | 131,184 | |
Partner Small Cap Value | | | 52,742 | | | | 84,170 | |
Small Cap Stock | | | 184,362 | | | | 184,624 | |
Mid Cap Growth | | | 184,647 | | | | 206,567 | |
Partner Mid Cap Value | | | 150,715 | | | | 151,872 | |
Mid Cap Stock | | | 247,957 | | | | 361,674 | |
Partner Worldwide Allocation | | | 649,663 | | | | 659,174 | |
Large Cap Growth | | | 204,764 | | | | 210,649 | |
Large Cap Value | | | 179,489 | | | | 189,807 | |
Large Cap Stock | | | 1,101,413 | | | | 1,223,406 | |
High Yield | | | 331,316 | | | | 329,160 | |
Income | | | 392,561 | | | | 408,975 | |
Municipal Bond | | | 113,029 | | | | 127,666 | |
Government Bond | | | 12,177 | | | | 20,707 | |
Limited Maturity Bond | | | 292,817 | | | | 309,831 | |
Purchases and sales of U.S. Government securities were:
| | | | | | | | |
| | | In thousands | |
Fund | | Purchases | | | Sales | |
Aggressive Allocation | | | $176,307 | | | | $172,628 | |
Moderately Aggressive Allocation | | | 676,263 | | | | 629,206 | |
Moderate Allocation | | | 918,509 | | | | 830,271 | |
Moderately Conservative Allocation | | | 893,069 | | | | 838,469 | |
Balanced Income Plus | | | 145,074 | | | | 148,842 | |
Opportunity Income Plus | | | 412,091 | | | | 410,570 | |
Partner Worldwide Allocation | | | 4,575 | | | | 2,079 | |
Income | | | 385,901 | | | | 387,854 | |
Government Bond | | | 121,480 | | | | 120,049 | |
Limited Maturity Bond | | | 560,406 | | | | 603,905 | |
(B) Investments in Restricted Securities – Certain Funds may own restricted securities that have been deemed illiquid and were purchased in private placement transactions without registration under the Securities Act of 1933. Unless such securities subsequently become registered, they generally may be resold only in privately negotiated transactions with a limited number of purchasers. As of October 31, 2014, the following Funds held restricted securities:
| | | | | | | | |
Fund | | Number of
Securities | | | Percent of Fund’s
Net Assets | |
Moderately Aggressive Allocation | | | 23 | | | | 0.21 | % |
Moderate Allocation | | | 23 | | | | 0.30 | % |
Moderately Conservative Allocation | | | 23 | | | | 0.62 | % |
Balanced Income Plus | | | 4 | | | | 0.46 | % |
Opportunity Income Plus | | | 6 | | | | 0.86 | % |
Partner Worldwide Allocation | | | 18 | | | | 0.77 | % |
High Yield | | | 14 | | | | 4.91 | % |
Income | | | 3 | | | | 0.51 | % |
Municipal Bond | | | 1 | | | | 0.23 | % |
Limited Maturity Bond | | | 32 | | | | 8.74 | % |
294
THRIVENT MUTUAL FUNDS
NOTESTO FINANCIAL STATEMENTS
October 31, 2014
The Funds have no right to require registration of unregistered securities.
(C) Investments in High-Yielding Securities – High Yield Fund invests primarily in high-yielding fixed-income securities. Each of the other Funds, except Money Market Fund, may also invest in high-yielding securities. These securities will typically be in the lower rating categories or will be non-rated and generally will involve more risk than securities in the higher rating categories. Lower rated or unrated securities (e.g., junk bonds) are more likely to react to developments affecting market risk and credit risk than are more highly rated securities, which react primarily to movements in the general level of interest rates.
(D) Investments in Options and Futures Contracts – The movement in the price of the security underlying an option or futures contract may not correlate perfectly with the movement in the prices of the portfolio securities being hedged. A lack of correlation could render a Fund’s hedging strategy unsuccessful and could result in a loss to the Fund. In the event that a liquid secondary market would not exist, the Fund could be prevented from entering into a closing transaction, which could result in additional losses to the Fund.
(E) Written Option Contracts – The number of contracts and premium amounts associated with call option contracts written during the year ended October 31, 2014 were as follows:
| | | | | | | | |
| | | Number of
Contracts | | | Premium
Amount | |
Government Bond | | | | | | | | |
Balance at October 31, 2013 | | | – | | | | $ – | |
Opened | | | 40 | | | | 6,130 | |
Closed | | | (40 | ) | | | (6,130 | ) |
Expired | | | – | | | | – | |
Exercised | | | – | | | | – | |
| | | | | | | | |
Balance at October 31, 2014 | | | – | | | | $ – | |
| | | | | | | | |
Limited Maturity Bond | | | | | | | | |
Balance at October 31, 2013 | | | – | | | | $ – | |
Opened | | | 360 | | | | 55,170 | |
Closed | | | (360 | ) | | | (55,170 | ) |
Expired | | | – | | | | – | |
Exercised | | | – | | | | – | |
| | | | | | | | |
Balance at October 31, 2014 | | | – | | | | $ – | |
| | | | | | | | |
(6) SECURITY TRANSACTIONS WITH AFFILIATED FUNDS
The Funds are permitted to purchase or sell securities from or to certain other Funds under specified conditions outlined in procedures adopted by the Board. The procedures have been designed to ensure that any purchase or sale of securities by a Fund from or to another fund or portfolio that is or could be considered an affiliate by virtue of having a common investment adviser (or affiliated investment advisers), common Trustees and/or common officers complies with Rule 17a-7 of the 1940 Act. Further, as defined under the procedures, each transaction is executed at the current market price.
(7) RELATED PARTY TRANSACTIONS
As of October 31, 2014, related parties (other than the Thrivent Asset Allocation Funds) held the following shares in excess of 5% of Thrivent Mutual Funds:
| | | | | | | | |
Fund | | Shares | | | Percent of
Fund’s
Outstanding
Shares | |
Opportunity Income Plus | | | 2,617,552 | | | | 7.1 | % |
Partner Emerging Markets Equity | | | 858,540 | | | | 60.9 | % |
Partner Worldwide Allocation | | | 10,717,930 | | | | 13.0 | % |
Government Bond | | | 2,939,544 | | | | 28.7 | % |
As of October 31, 2014, retirement plans sponsored by Thrivent Financial for Lutherans held the following shares in excess of 5% of Thrivent Mutual Funds:
| | | | | | | | |
Fund | | Shares | | | Percent of
Fund’s
Outstanding
Shares | |
Aggressive Allocation | | | 7,367,416 | | | | 13.6 | % |
Moderately Aggressive Allocation | | | 8,201,309 | | | | 6.2 | % |
Balanced Income Plus | | | 3,887,524 | | | | 18.8 | % |
Income | | | 6,156,408 | | | | 6.8 | % |
(8) MONEY MARKET FUND REGULATORY REFORM
On July 23, 2014, the Securities and Exchange Commission adopted amendments to Rule 2a-7, which governs money market funds. The majority of the amendments, except for certain disclosure enhancements, will not take effect until 2016. The amendments are being made to address potential systemic risks associated with money markets and to improve transparency for money market fund investors. At this time, management is evaluating the impact of the amendments, including potential effects on the structure, operations and return potential of Thrivent Money Market Fund.
(9) SUBSEQUENT EVENTS
The Adviser of the Funds has evaluated the impact of subsequent events, and, except as already included in the Notes to Financial Statements and in the next paragraph, has determined that no additional items require disclosure.
295
THRIVENT MUTUAL FUNDS
NOTESTO FINANCIAL STATEMENTS
October 31, 2014
On November 24, 2014, a single investor redeemed $36.8 million from Thrivent Partner Small Cap Value Fund. This amount represented approximately 14% of the net assets of the Fund as of that date.
296
(This page intentionally left blank)
297
THRIVENT MUTUAL FUNDS
FINANCIAL HIGHLIGHTS
| | | | | | | | | | | | | | | | | | | | | | | | | | | | | | |
| | | FOR A SHARE OUTSTANDING THROUGHOUT EACH PERIOD* |
| | | | | Income from Investment Operations | | Less Distributions From |
| | | Net Asset
Value,
Beginning of
Period | | Net
Investment
Income/(Loss) | | Net Realized
and Unrealized
Gain/(Loss) on
Investments(a) | | Total from
Investment
Operations | | Net
Investment
Income | | Net Realized
Gain on
Investments |
AGGRESSIVE ALLOCATION FUND | | | | | | | | | | | | | | | | | | | | | | | | | | | | | | |
Class A Shares | | | | | | | | | | | | | | | | | | | | | | | | | | | | | | |
Year Ended 10/31/2014 | | | $ | 14.15 | | | | $ | 0.05 | | | | $ | 1.21 | | | | $ | 1.26 | | | | $ | (0.10 | ) | | | $ | (0.54 | ) |
Year Ended 10/31/2013 | | | | 11.54 | | | | | 0.07 | | | | | 2.73 | | | | | 2.80 | | | | | (0.09 | ) | | | | (0.10 | ) |
Year Ended 10/31/2012 | | | | 10.70 | | | | | 0.04 | | | | | 0.85 | | | | | 0.89 | | | | | (0.05 | ) | | | | – | |
Year Ended 10/31/2011 | | | | 10.35 | | | | | 0.07 | | | | | 0.33 | | | | | 0.40 | | | | | (0.05 | ) | | | | – | |
Year Ended 10/31/2010 | | | | 8.81 | | | | | 0.06 | | | | | 1.55 | | | | | 1.61 | | | | | (0.07 | ) | | | | – | |
| | | | | | |
Institutional Class Shares | | | | | | | | | | | | | | | | | | | | | | | | | | | | | | |
Year Ended 10/31/2014 | | | | 14.27 | | | | | 0.10 | | | | | 1.23 | | | | | 1.33 | | | | | (0.16 | ) | | | | (0.54 | ) |
Year Ended 10/31/2013 | | | | 11.64 | | | | | 0.12 | | | | | 2.75 | | | | | 2.87 | | | | | (0.14 | ) | | | | (0.10 | ) |
Year Ended 10/31/2012 | | | | 10.78 | | | | | 0.09 | | | | | 0.86 | | | | | 0.95 | | | | | (0.09 | ) | | | | – | |
Year Ended 10/31/2011 | | | | 10.43 | | | | | 0.11 | | | | | 0.33 | | | | | 0.44 | | | | | (0.09 | ) | | | | – | |
Year Ended 10/31/2010 | | | | 8.87 | | | | | 0.09 | | | | | 1.56 | | | | | 1.65 | | | | | (0.09 | ) | | | | – | |
MODERATELY AGGRESSIVE ALLOCATION FUND | |
Class A Shares | | | | | | | | | | | | | | | | | | | | | | | | | | | | | | |
Year Ended 10/31/2014 | | | | 13.69 | | | | | 0.12 | | | | | 0.97 | | | | | 1.09 | | | | | (0.16 | ) | | | | (0.45 | ) |
Year Ended 10/31/2013 | | | | 11.64 | | | | | 0.15 | | | | | 2.16 | | | | | 2.31 | | | | | (0.17 | ) | | | | (0.09 | ) |
Year Ended 10/31/2012 | | | | 10.83 | | | | | 0.11 | | | | | 0.84 | | | | | 0.95 | | | | | (0.14 | ) | | | | – | |
Year Ended 10/31/2011 | | | | 10.65 | | | | | 0.16 | | | | | 0.17 | | | | | 0.33 | | | | | (0.15 | ) | | | | – | |
Year Ended 10/31/2010 | | | | 9.25 | | | | | 0.16 | | | | | 1.39 | | | | | 1.55 | | | | | (0.15 | ) | | | | – | |
| | | | | | |
Institutional Class Shares | | | | | | | | | | | | | | | | | | | | | | | | | | | | | | |
Year Ended 10/31/2014 | | | | 13.79 | | | | | 0.17 | | | | | 0.98 | | | | | 1.15 | | | | | (0.20 | ) | | | | (0.45 | ) |
Year Ended 10/31/2013 | | | | 11.73 | | | | | 0.20 | | | | | 2.17 | | | | | 2.37 | | | | | (0.22 | ) | | | | (0.09 | ) |
Year Ended 10/31/2012 | | | | 10.92 | | | | | 0.16 | | | | | 0.83 | | | | | 0.99 | | | | | (0.18 | ) | | | | – | |
Year Ended 10/31/2011 | | | | 10.72 | | | | | 0.20 | | | | | 0.18 | | | | | 0.38 | | | | | (0.18 | ) | | | | – | |
Year Ended 10/31/2010 | | | | 9.31 | | | | | 0.20 | | | | | 1.39 | | | | | 1.59 | | | | | (0.18 | ) | | | | – | |
MODERATE ALLOCATION FUND | | | | | | | | | | | | | | | | | | | | | | | | | | | | | | |
Class A Shares | | | | | | | | | | | | | | | | | | | | | | | | | | | | | | |
Year Ended 10/31/2014 | | | | 12.88 | | | | | 0.17 | | | | | 0.73 | | | | | 0.90 | | | | | (0.20 | ) | | | | (0.32 | ) |
Year Ended 10/31/2013 | | | | 11.55 | | | | | 0.18 | | | | | 1.48 | | | | | 1.66 | | | | | (0.19 | ) | | | | (0.14 | ) |
Year Ended 10/31/2012 | | | | 10.80 | | | | | 0.16 | | | | | 0.77 | | | | | 0.93 | | | | | (0.17 | ) | | | | (0.01 | ) |
Year Ended 10/31/2011 | | | | 10.67 | | | | | 0.22 | | | | | 0.13 | | | | | 0.35 | | | | | (0.22 | ) | | | | – | |
Year Ended 10/31/2010 | | | | 9.46 | | | | | 0.23 | | | | | 1.20 | | | | | 1.43 | | | | | (0.22 | ) | | | | – | |
| | | | | | |
Institutional Class Shares | | | | | | | | | | | | | | | | | | | | | | | | | | | | | | |
Year Ended 10/31/2014 | | | | 12.91 | | | | | 0.21 | | | | | 0.73 | | | | | 0.94 | | | | | (0.24 | ) | | | | (0.32 | ) |
Year Ended 10/31/2013 | | | | 11.57 | | | | | 0.22 | | | | | 1.49 | | | | | 1.71 | | | | | (0.23 | ) | | | | (0.14 | ) |
Year Ended 10/31/2012 | | | | 10.82 | | | | | 0.20 | | | | | 0.77 | | | | | 0.97 | | | | | (0.21 | ) | | | | (0.01 | ) |
Year Ended 10/31/2011 | | | | 10.69 | | | | | 0.26 | | | | | 0.13 | | | | | 0.39 | | | | | (0.26 | ) | | | | – | |
Year Ended 10/31/2010 | | | | 9.48 | | | | | 0.26 | | | | | 1.20 | | | | | 1.46 | | | | | (0.25 | ) | | | | – | |
(a) | The amount shown may not correlate with the change in aggregate gains and losses of portfolio securities due to the timing of sales and redemptions of fund shares. |
* | All per share amounts have been rounded to the nearest cent. |
The accompanying Notes to Financial Statements are an integral part of this statement.
298
THRIVENT MUTUAL FUNDS
FINANCIAL HIGHLIGHTS –CONTINUED
| | | | | | | | | | | | | | | | | | | | | | |
| | | RATIOS/SUPPLEMENTAL DATA |
| | | | | | | | | | | | Ratio to Average Net
Assets** | | Ratios to Average Net
Assets Before Expenses
Waived, Credited or Paid
Indirectly** | | |
Total
Distributions | | Net Asset
Value, End of
Period | | | Total
Return(b) | | | Net Assets, End of Period
(in millions) | | | Expenses | | Net Investment
Income/(Loss) | | Expenses | | Net Investment
Income/(Loss) | | Portfolio
Turnover Rate |
| | | | | | | | | | | | | | | | | | | | | | |
| | | | | | | | | | | | | | | | | | | | | | |
$(0.64) | | | $14.77 | | | | 9.34% | | | | $687.6 | | | 0.81% | | 0.30% | | 0.81% | | 0.30% | | 51% |
(0.19) | | | 14.15 | | | | 24.64% | | | | 612.4 | | | 0.81% | | 0.52% | | 0.82% | | 0.51% | | 44% |
(0.05) | | | 11.54 | | | | 8.42% | | | | 494.3 | | | 0.82% | | 0.33% | | 0.86% | | 0.29% | | 66% |
(0.05) | | | 10.70 | | | | 3.87% | | | | 462.1 | | | 0.75% | | 0.64% | | 0.89% | | 0.51% | | 72% |
(0.07) | | | 10.35 | | | | 18.29% | | | | 435.5 | | | 0.70% | | 0.57% | | 0.90% | | 0.37% | | 52% |
| | | | | | | | |
| | | | | | | | | | | | | | | | | | | | | | |
(0.70) | | | 14.90 | | | | 9.73% | | | | 112.3 | | | 0.41% | | 0.70% | | 0.41% | | 0.70% | | 51% |
(0.24) | | | 14.27 | | | | 25.11% | | | | 94.6 | | | 0.40% | | 0.96% | | 0.40% | | 0.96% | | 44% |
(0.09) | | | 11.64 | | | | 8.94% | | | | 81.2 | | | 0.42% | | 0.73% | | 0.42% | | 0.73% | | 66% |
(0.09) | | | 10.78 | | | | 4.16% | | | | 80.0 | | | 0.40% | | 1.01% | | 0.41% | | 1.00% | | 72% |
(0.09) | | | 10.43 | | | | 18.73% | | | | 73.7 | | | 0.35% | | 0.94% | | 0.39% | | 0.90% | | 52% |
| | | | | | | | | | | | | | | | | | | | | | |
| | | | | | | | | | | | | | | | | | | | | | |
(0.61) | | | 14.17 | | | | 8.29% | | | | 1,746.7 | | | 0.76% | | 0.85% | | 0.76% | | 0.85% | | 61% |
(0.26) | | | 13.69 | | | | 20.28% | | | | 1,558.9 | | | 0.72% | | 1.15% | | 0.74% | | 1.13% | | 51% |
(0.14) | | | 11.64 | | | | 8.92% | | | | 1,268.2 | | | 0.77% | | 0.99% | | 0.77% | | 0.99% | | 78% |
(0.15) | | | 10.83 | | | | 3.06% | | | | 1,168.6 | | | 0.70% | | 1.44% | | 0.75% | | 1.39% | | 58% |
(0.15) | | | 10.65 | | | | 16.92% | | | | 1,085.3 | | | 0.62% | | 1.60% | | 0.75% | | 1.47% | | 39% |
| | | | | | | | |
| | | | | | | | | | | | | | | | | | | | | | |
(0.65) | | | 14.29 | | | | 8.73% | | | | 120.3 | | | 0.39% | | 1.22% | | 0.39% | | 1.22% | | 61% |
(0.31) | | | 13.79 | | | | 20.66% | | | | 107.5 | | | 0.35% | | 1.50% | | 0.35% | | 1.50% | | 51% |
(0.18) | | | 11.73 | | | | 9.29% | | | | 90.2 | | | 0.37% | | 1.39% | | 0.37% | | 1.39% | | 78% |
(0.18) | | | 10.92 | | | | 3.55% | | | | 85.1 | | | 0.32% | | 1.82% | | 0.33% | | 1.81% | | 58% |
(0.18) | | | 10.72 | | | | 17.24% | | | | 79.5 | | | 0.28% | | 1.94% | | 0.31% | | 1.92% | | 39% |
| | | | | | | | | | | | | | | | | | | | | | |
| | | | | | | | | | | | | | | | | | | | | | |
(0.52) | | | 13.26 | | | | 7.22% | | | | 1,683.8 | | | 0.72% | | 1.29% | | 0.72% | | 1.29% | | 73% |
(0.33) | | | 12.88 | | | | 14.74% | | | | 1,541.3 | | | 0.68% | | 1.51% | | 0.70% | | 1.48% | | 85% |
(0.18) | | | 11.55 | | | | 8.68% | | | | 1,316.5 | | | 0.71% | | 1.47% | | 0.71% | | 1.47% | | 94% |
(0.22) | | | 10.80 | | | | 3.27% | | | | 1,207.6 | | | 0.65% | | 2.02% | | 0.68% | | 1.99% | | 46% |
(0.22) | | | 10.67 | | | | 15.30% | | | | 1,118.6 | | | 0.60% | | 2.28% | | 0.68% | | 2.21% | | 30% |
| | | | | | | | |
| | | | | | | | | | | | | | | | | | | | | | |
(0.56) | | | 13.29 | | | | 7.56% | | | | 89.0 | | | 0.38% | | 1.62% | | 0.38% | | 1.62% | | 73% |
(0.37) | | | 12.91 | | | | 15.18% | | | | 75.2 | | | 0.35% | | 1.83% | | 0.35% | | 1.83% | | 85% |
(0.22) | | | 11.57 | | | | 9.05% | | | | 66.0 | | | 0.35% | | 1.83% | | 0.35% | | 1.83% | | 94% |
(0.26) | | | 10.82 | | | | 3.62% | | | | 59.7 | | | 0.30% | | 2.36% | | 0.31% | | 2.35% | | 46% |
(0.25) | | | 10.69 | | | | 15.64% | | | | 50.5 | | | 0.27% | | 2.60% | | 0.29% | | 2.58% | | 30% |
(b) | Total investment return assumes dividend reinvestment and does not reflect any deduction for applicable sales charges. Not annualized for periods less than one year. |
** | Computed on an annualized basis for periods less than one year. |
The accompanying Notes to Financial Statements are an integral part of this statement.
299
THRIVENT MUTUAL FUNDS
FINANCIAL HIGHLIGHTS –CONTINUED
| | | | | | | | | | | | | | | | | | | | | | | | | | | | | | |
| | | FOR A SHARE OUTSTANDING THROUGHOUT EACH PERIOD* |
| | | | | Income from Investment Operations | | Less Distributions From |
| | | Net Asset
Value,
Beginning of
Period | | Net
Investment
Income/(Loss) | | Net Realized
and Unrealized
Gain/(Loss) on
Investments(a) | | Total from
Investment
Operations | | Net
Investment
Income | | Net Realized
Gain on
Investments |
MODERATELY CONSERVATIVE ALLOCATION FUND | | | | | | | | | | | | | | | | | | | | | |
Class A Shares | | | | | | | | | | | | | | | | | | | | | | | | | | | | | | |
Year Ended 10/31/2014 | | | $ | 11.98 | | | | $ | 0.20 | | | | $ | 0.48 | | | | $ | 0.68 | | | | $ | (0.21 | ) | | | $ | (0.26 | ) |
Year Ended 10/31/2013 | | | | 11.34 | | | | | 0.20 | | | | | 0.83 | | | | | 1.03 | | | | | (0.20 | ) | | | | (0.19 | ) |
Year Ended 10/31/2012 | | | | 10.75 | | | | | 0.19 | | | | | 0.65 | | | | | 0.84 | | | | | (0.19 | ) | | | | (0.06 | ) |
Year Ended 10/31/2011 | | | | 10.73 | | | | | 0.25 | | | | | 0.02 | | | | | 0.27 | | | | | (0.25 | ) | | | | – | |
Year Ended 10/31/2010 | | | | 9.78 | | | | | 0.27 | | | | | 0.94 | | | | | 1.21 | | | | | (0.26 | ) | | | | – | |
| | | | | | |
Institutional Class Shares | | | | | | | | | | | | | | | | | | | | | | | | | | | | | | |
Year Ended 10/31/2014 | | | | 12.01 | | | | | 0.24 | | | | | 0.48 | | | | | 0.72 | | | | | (0.25 | ) | | | | (0.26 | ) |
Year Ended 10/31/2013 | | | | 11.37 | | | | | 0.23 | | | | | 0.83 | | | | | 1.06 | | | | | (0.23 | ) | | | | (0.19 | ) |
Year Ended 10/31/2012 | | | | 10.78 | | | | | 0.22 | | | | | 0.65 | | | | | 0.87 | | | | | (0.22 | ) | | | | (0.06 | ) |
Year Ended 10/31/2011 | | | | 10.75 | | | | | 0.28 | | | | | 0.03 | | | | | 0.31 | | | | | (0.28 | ) | | | | – | |
Year Ended 10/31/2010 | | | | 9.80 | | | | | 0.29 | | | | | 0.94 | | | | | 1.23 | | | | | (0.28 | ) | | | | – | |
BALANCED INCOME PLUS FUND | | | | | | | | | | | | | | | | | | | | | | | | | | | | | | |
Class A Shares | | | | | | | | | | | | | | | | | | | | | | | | | | | | | | |
Year Ended 10/31/2014 | | | | 14.21 | | | | | 0.24 | | | | | 0.72 | | | | | 0.96 | | | | | (0.22 | ) | | | | (1.52 | ) |
Year Ended 10/31/2013 | | | | 12.63 | | | | | 0.14 | | | | | 2.24 | | | | | 2.38 | | | | | (0.15 | ) | | | | (0.65 | ) |
Year Ended 10/31/2012 | | | | 12.11 | | | | | 0.13 | | | | | 0.83 | | | | | 0.96 | | | | | (0.13 | ) | | | | (0.31 | ) |
Year Ended 10/31/2011 | | | | 11.68 | | | | | 0.16 | | | | | 0.42 | | | | | 0.58 | | | | | (0.15 | ) | | | | – | |
Year Ended 10/31/2010 | | | | 10.20 | | | | | 0.15 | | | | | 1.48 | | | | | 1.63 | | | | | (0.15 | ) | | | | – | |
| | | | | | |
Institutional Class Shares | | | | | | | | | | | | | | | | | | | | | | | | | | | | | | |
Year Ended 10/31/2014 | | | | 14.19 | | | | | 0.30 | | | | | 0.70 | | | | | 1.00 | | | | | (0.27 | ) | | | | (1.52 | ) |
Year Ended 10/31/2013 | | | | 12.61 | | | | | 0.20 | | | | | 2.24 | | | | | 2.44 | | | | | (0.20 | ) | | | | (0.66 | ) |
Year Ended 10/31/2012 | | | | 12.09 | | | | | 0.19 | | | | | 0.82 | | | | | 1.01 | | | | | (0.18 | ) | | | | (0.31 | ) |
Year Ended 10/31/2011 | | | | 11.66 | | | | | 0.21 | | | | | 0.43 | | | | | 0.64 | | | | | (0.21 | ) | | | | – | |
Year Ended 10/31/2010 | | | | 10.19 | | | | | 0.20 | | | | | 1.47 | | | | | 1.67 | | | | | (0.20 | ) | | | | – | |
OPPORTUNITY INCOME PLUS FUND | | | | | | | | | | | | | | | | | | | | | | | | | | |
Class A Shares | | | | | | | | | | | | | | | | | | | | | | | | | | | | | | |
Year Ended 10/31/2014 | | | | 10.32 | | | | | 0.36 | | | | | 0.06 | | | | | 0.42 | | | | | (0.36 | ) | | | | – | |
Year Ended 10/31/2013 | | | | 10.70 | | | | | 0.26 | | | | | (0.39 | ) | | | | (0.13 | ) | | | | (0.25 | ) | | | | – | |
Year Ended 10/31/2012 | | | | 10.19 | | | | | 0.26 | | | | | 0.50 | | | | | 0.76 | | | | | (0.25 | ) | | | | – | |
Year Ended 10/31/2011 | | | | 10.11 | | | | | 0.37 | | | | | 0.08 | | | | | 0.45 | | | | | (0.37 | ) | | | | – | |
Year Ended 10/31/2010 | | | | 9.36 | | | | | 0.39 | | | | | 0.75 | | | | | 1.14 | | | | | (0.39 | ) | | | | – | |
| | | | | | |
Institutional Class Shares | | | | | | | | | | | | | | | | | | | | | | | | | | | | | | |
Year Ended 10/31/2014 | | | | 10.32 | | | | | 0.39 | | | | | 0.05 | | | | | 0.44 | | | | | (0.38 | ) | | | | – | |
Year Ended 10/31/2013 | | | | 10.71 | | | | | 0.29 | | | | | (0.40 | ) | | | | (0.11 | ) | | | | (0.28 | ) | | | | – | |
Year Ended 10/31/2012 | | | | 10.19 | | | | | 0.30 | | | | | 0.51 | | | | | 0.81 | | | | | (0.29 | ) | | | | – | |
Year Ended 10/31/2011 | | | | 10.11 | | | | | 0.40 | | | | | 0.08 | | | | | 0.48 | | | | | (0.40 | ) | | | | – | |
Year Ended 10/31/2010 | | | | 9.36 | | | | | 0.43 | | | | | 0.74 | | | | | 1.17 | | | | | (0.42 | ) | | | | – | |
(a) | The amount shown may not correlate with the change in aggregate gains and losses of portfolio securities due to the timing of sales and redemptions of fund shares. |
* | All per share amounts have been rounded to the nearest cent. |
The accompanying Notes to Financial Statements are an integral part of this statement.
300
THRIVENT MUTUAL FUNDS
FINANCIAL HIGHLIGHTS –CONTINUED
| | | | | | | | | | | | | | | | | | | | | | |
| | | RATIOS/SUPPLEMENTAL DATA |
| | | | | | | | | | | | Ratio to Average Net
Assets** | | Ratios to Average Net
Assets Before Expenses
Waived, Credited or Paid
Indirectly** | | |
Total
Distributions | | Net Asset
Value, End of
Period | | | Total
Return(b) | | | Net Assets, End of Period
(in millions) | | | Expenses | | Net Investment
Income/(Loss) | | Expenses | | Net Investment
Income/(Loss) | | Portfolio
Turnover Rate |
| | | | | | | | | | | | | | | | | | | | | | |
| | | | | | | | | | | | | | | | | | | | | | |
$(0.47) | | | $12.19 | | | | 5.86% | | | | $731.4 | | | 0.77% | | 1.64% | | 0.77% | | 1.64% | | 140% |
(0.39) | | | 11.98 | | | | 9.32% | | | | 701.3 | | | 0.71% | | 1.70% | | 0.75% | | 1.67% | | 166% |
(0.25) | | | 11.34 | | | | 7.92% | | | | 632.9 | | | 0.75% | | 1.70% | | 0.75% | | 1.70% | | 145% |
(0.25) | | | 10.75 | | | | 2.49% | | | | 559.7 | | | 0.64% | | 2.28% | | 0.69% | | 2.23% | | 46% |
(0.26) | | | 10.73 | | | | 12.53% | | | | 503.7 | | | 0.58% | | 2.61% | | 0.69% | | 2.50% | | 29% |
| | | | | | | | |
| | | | | | | | | | | | | | | | | | | | | | |
(0.51) | | | 12.22 | | | | 6.20% | | | | 32.3 | | | 0.44% | | 1.97% | | 0.44% | | 1.97% | | 140% |
(0.42) | | | 12.01 | | | | 9.62% | | | | 31.7 | | | 0.41% | | 2.01% | | 0.41% | | 2.01% | | 166% |
(0.28) | | | 11.37 | | | | 8.26% | | | | 28.0 | | | 0.41% | | 2.03% | | 0.41% | | 2.03% | | 145% |
(0.28) | | | 10.78 | | | | 2.88% | | | | 22.4 | | | 0.33% | | 2.59% | | 0.33% | | 2.59% | | 46% |
(0.28) | | | 10.75 | | | | 12.78% | | | | 21.7 | | | 0.32% | | 2.87% | | 0.33% | | 2.86% | | 29% |
| | | | | | | | | | | | | | | | | | | | | | |
�� | | | | | | | | | | | | | | | | | | | | | | |
(1.74) | | | 13.43 | | | | 7.60% | | | | 222.1 | | | 1.06% | | 1.85% | | 1.06% | | 1.85% | | 124% |
(0.80) | | | 14.21 | | | | 19.95% | | | | 167.8 | | | 1.09% | | 1.08% | | 1.10% | | 1.08% | | 236% |
(0.44) | | | 12.63 | | | | 8.22% | | | | 141.0 | | | 1.11% | | 1.06% | | 1.12% | | 1.06% | | 197% |
(0.15) | | | 12.11 | | | | 4.98% | | | | 141.0 | | | 1.12% | | 1.25% | | 1.13% | | 1.24% | | 211% |
(0.15) | | | 11.68 | | | | 16.04% | | | | 148.9 | | | 1.17% | | 1.30% | | 1.17% | | 1.30% | | 219% |
| | | | | | | | |
| | | | | | | | | | | | | | | | | | | | | | |
(1.79) | | | 13.40 | | | | 7.95% | | | | 54.9 | | | 0.66% | | 2.24% | | 0.66% | | 2.24% | | 124% |
(0.86) | | | 14.19 | | | | 20.49% | | | | 54.7 | | | 0.66% | | 1.52% | | 0.67% | | 1.51% | | 236% |
(0.49) | | | 12.61 | | | | 8.72% | | | | 49.9 | | | 0.66% | | 1.52% | | 0.67% | | 1.51% | | 197% |
(0.21) | | | 12.09 | | | | 5.50% | | | | 52.7 | | | 0.65% | | 1.73% | | 0.65% | | 1.72% | | 211% |
(0.20) | | | 11.66 | | | | 16.55% | | | | 56.6 | | | 0.67% | | 1.80% | | 0.67% | | 1.80% | | 219% |
| | | | | | | | | | | | | | | | | | | | | | |
| | | | | | | | | | | | | | | | | | | | | | |
(0.36) | | | 10.38 | | | | 4.13% | | | | 271.1 | | | 0.85% | | 3.48% | | 0.95% | | 3.38% | | 169% |
(0.25) | | | 10.32 | | | | (1.26)% | | | | 228.4 | | | 0.85% | | 2.42% | | 0.94% | | 2.33% | | 387% |
(0.25) | | | 10.70 | | | | 7.59% | | | | 249.2 | | | 0.85% | | 2.53% | | 0.94% | | 2.44% | | 355% |
(0.37) | | | 10.19 | | | | 4.53% | | | | 236.3 | | | 0.85% | | 3.64% | | 0.95% | | 3.54% | | 333% |
(0.39) | | | 10.11 | | | | 12.42% | | | | 245.0 | | | 0.86% | | 4.08% | | 0.97% | | 3.96% | | 307% |
| | | | | | | | |
| | | | | | | | | | | | | | | | | | | | | | |
(0.38) | | | 10.38 | | | | 4.35% | | | | 113.1 | | | 0.64% | | 3.72% | | 0.64% | | 3.72% | | 169% |
(0.28) | | | 10.32 | | | | (1.04)% | | | | 24.8 | | | 0.53% | | 2.58% | | 0.55% | | 2.56% | | 387% |
(0.29) | | | 10.71 | | | | 8.03% | | | | 37.0 | | | 0.53% | | 2.93% | | 0.54% | | 2.91% | | 355% |
(0.40) | | | 10.19 | | | | 4.88% | | | | 56.5 | | | 0.52% | | 3.97% | | 0.53% | | 3.95% | | 333% |
(0.42) | | | 10.11 | | | | 12.79% | | | | 50.1 | | | 0.53% | | 4.42% | | 0.55% | | 4.40% | | 307% |
(b) | Total investment return assumes dividend reinvestment and does not reflect any deduction for applicable sales charges. Not annualized for periods less than one year. |
** | Computed on an annualized basis for periods less than one year. |
The accompanying Notes to Financial Statements are an integral part of this statement.
301
THRIVENT MUTUAL FUNDS
FINANCIAL HIGHLIGHTS –CONTINUED
| | | | | | | | | | | | | | | | | | | | | | | | | | | | | | |
| | | FOR A SHARE OUTSTANDING THROUGHOUT EACH PERIOD* |
| | | | | Income from Investment Operations | | Less Distributions From |
| | | Net Asset
Value,
Beginning of
Period | | Net
Investment
Income/(Loss) | | Net Realized
and Unrealized
Gain/(Loss) on
Investments(a) | | Total from
Investment
Operations | | Net
Investment
Income | | Net Realized
Gain on
Investments |
PARTNER EMERGING MARKETS EQUITY FUND | | | | | | | | | | | | | | | | | | | | | | | | | | | | | | |
Class A Shares | | | | | | | | | | | | | | | | | | | | | | | | | | | | | | |
Year Ended 10/31/2014 | | | $ | 10.51 | | | | $ | 0.14 | | | | $ | (1.10 | ) | | | $ | (0.96 | ) | | | $ | (0.10 | ) | | | $ | – | |
Year Ended 10/31/2013 | | | | 10.27 | | | | | 0.08 | | | | | 0.26 | | | | | 0.34 | | | | | – | | | | | (0.10 | ) |
Year Ended 10/31/2012(c) | | | | 10.00 | | | | | 0.01 | | | | | 0.26 | | | | | 0.27 | | | | | – | | | | | – | |
| | | | | | |
Institutional Class Shares | | | | | | | | | | | | | | | | | | | | | | | | | | | | | | |
Year Ended 10/31/2014 | | | | 10.55 | | | | | 0.23 | | | | | (1.16 | ) | | | | (0.93 | ) | | | | (0.15 | ) | | | | – | |
Year Ended 10/31/2013 | | | | 10.27 | | | | | 0.12 | | | | | 0.26 | | | | | 0.38 | | | | | – | | | | | (0.10 | ) |
Year Ended 10/31/2012(c) | | | | 10.00 | | | | | 0.02 | | | | | 0.25 | | | | | 0.27 | | | | | – | | | | | – | |
PARTNER SMALL CAP GROWTH FUND | | | | | | | | | | | | | | | | | | | | | | | | | | | | | | |
Class A Shares | | | | | | | | | | | | | | | | | | | | | | | | | | | | | | |
Year Ended 10/31/2014 | | | | 17.03 | | | | | (0.25 | ) | | | | 0.70 | | | | | 0.45 | | | | | – | | | | | (2.36 | ) |
Year Ended 10/31/2013 | | | | 12.64 | | | | | (0.05 | ) | | | | 4.82 | | | | | 4.77 | | | | | – | | | | | (0.38 | ) |
Year Ended 10/31/2012 | | | | 11.72 | | | | | (0.17 | ) | | | | 1.09 | | | | | 0.92 | | | | | – | | | | | – | |
Year Ended 10/31/2011 | | | | 10.81 | | | | | (0.12 | ) | | | | 1.03 | | | | | 0.91 | | | | | – | | | | | – | |
Year Ended 10/31/2010 | | | | 8.31 | | | | | (0.11 | ) | | | | 2.61 | | | | | 2.50 | | | | | – | | | | | – | |
| | | | | | |
Institutional Class Shares | | | | | | | | | | | | | | | | | | | | | | | | | | | | | | |
Year Ended 10/31/2014 | | | | 17.57 | | | | | (32.98 | ) | | | | 33.49 | | | | | 0.51 | | | | | – | | | | | (2.36 | ) |
Year Ended 10/31/2013 | | | | 12.98 | | | | | (0.04 | ) | | | | 5.01 | | | | | 4.97 | | | | | – | | | | | (0.38 | ) |
Year Ended 10/31/2012 | | | | 11.99 | | | | | (0.07 | ) | | | | 1.06 | | | | | 0.99 | | | | | – | | | | | – | |
Year Ended 10/31/2011 | | | | 11.01 | | | | | (0.08 | ) | | | | 1.06 | | | | | 0.98 | | | | | – | | | | | – | |
Year Ended 10/31/2010 | | | | 8.42 | | | | | (0.07 | ) | | | | 2.66 | | | | | 2.59 | | | | | – | | | | | – | |
PARTNER SMALL CAP VALUE FUND | | | | | | | | | | | | | | | | | | | | | | | | | | | | | | |
Class A Shares | | | | | | | | | | | | | | | | | | | | | | | | | | | | | | |
Year Ended 10/31/2014 | | | | 20.62 | | | | | 0.08 | | | | | 1.06 | | | | | 1.14 | | | | | – | | | | | (0.61 | ) |
Year Ended 10/31/2013 | | | | 15.99 | | | | | 0.15 | | | | | 5.07 | | | | | 5.22 | | | | | (0.30 | ) | | | | (0.29 | ) |
Year Ended 10/31/2012 | | | | 14.47 | | | | | 0.09 | | | | | 1.60 | | | | | 1.69 | | | | | (0.01 | ) | | | | (0.16 | ) |
Year Ended 10/31/2011 | | | | 13.72 | | | | | 0.04 | | | | | 0.80 | | | | | 0.84 | | | | | (0.09 | ) | | | | – | |
Year Ended 10/31/2010 | | | | 11.26 | | | | | 0.02 | | | | | 2.47 | | | | | 2.49 | | | | | (0.03 | ) | | | | – | |
| | | | | | |
Institutional Class Shares | | | | | | | | | | | | | | | | | | | | | | | | | | | | | | |
Year Ended 10/31/2014 | | | | 21.70 | | | | | 0.18 | | | | | 1.12 | | | | | 1.30 | | | | | (0.08 | ) | | | | (0.61 | ) |
Year Ended 10/31/2013 | | | | 16.80 | | | | | 0.23 | | | | | 5.34 | | | | | 5.57 | | | | | (0.38 | ) | | | | (0.29 | ) |
Year Ended 10/31/2012 | | | | 15.19 | | | | | 0.18 | | | | | 1.69 | | | | | 1.87 | | | | | (0.10 | ) | | | | (0.16 | ) |
Year Ended 10/31/2011 | | | | 14.39 | | | | | 0.14 | | | | | 0.82 | | | | | 0.96 | | | | | (0.16 | ) | | | | – | |
Year Ended 10/31/2010 | | | | 11.81 | | | | | 0.09 | | | | | 2.59 | | | | | 2.68 | | | | | (0.10 | ) | | | | – | |
(a) | The amount shown may not correlate with the change in aggregate gains and losses of portfolio securities due to the timing of sales and redemptions of fund shares. |
(c) | Since fund inception, August 31, 2012. |
* | All per share amounts have been rounded to the nearest cent. |
The accompanying Notes to Financial Statements are an integral part of this statement.
302
THRIVENT MUTUAL FUNDS
FINANCIAL HIGHLIGHTS –CONTINUED
| | | | | | | | | | | | | | | | | | | | | | |
| | | RATIOS/SUPPLEMENTAL DATA |
| | | | | | | | | | | | Ratio to Average Net
Assets** | | Ratios to Average Net
Assets Before Expenses
Waived, Credited or Paid
Indirectly** | | |
Total
Distributions | | Net Asset
Value, End of
Period | | | Total
Return(b) | | | Net Assets, End of Period
(in millions) | | | Expenses | | Net Investment
Income/(Loss) | | Expenses | | Net Investment
Income/(Loss) | | Portfolio
Turnover Rate |
| | | | | | | | | | | | | | | | | | | | | | |
| | | | | | | | | | | | | | | | | | | | | | |
$(0.10) | | | $9.45 | | | | (9.17)% | | | | $12.8 | | | 1.67% | | 1.32% | | 3.23% | | (0.25)% | | 69% |
(0.10) | | | 10.51 | | | | 3.26% | | | | 14.6 | | | 1.64% | | 0.81% | | 3.41% | | (0.96)% | | 103% |
– | | | 10.27 | | | | 2.70% | | | | 14.4 | | | 1.61% | | 0.60% | | 3.02% | | (0.81)% | | 33% |
| | | | | | | | |
| | | | | | | | | | | | | | | | | | | | | | |
(0.15) | | | 9.47 | | | | (8.90)% | | | | 0.6 | | | 1.32% | | 1.64% | | 2.90% | | 0.06% | | 69% |
(0.10) | | | 10.55 | | | | 3.65% | | | | 1.0 | | | 1.32% | | 1.12% | | 3.14% | | (0.70)% | | 103% |
– | | | 10.27 | | | | 2.70% | | | | 1.0 | | | 1.32% | | 0.89% | | 2.75% | | (0.54)% | | 33% |
| | | | | | | | | | | | | | | | | | | | | | |
| | | | | | | | | | | | | | | | | | | | | | |
(2.36) | | | 15.12 | | | | 3.24% | | | | 17.2 | | | 1.39% | | (0.99)% | | 1.73% | | (1.33)% | | 438% |
(0.38) | | | 17.03 | | | | 38.86% | | | | 26.0 | | | 1.40% | | (0.62)% | | 1.55% | | (0.76)% | | 84% |
– | | | 12.64 | | | | 7.85% | | | | 17.2 | | | 1.42% | | (0.89)% | | 1.53% | | (1.01)% | | 100% |
– | | | 11.72 | | | | 8.42% | | | | 20.0 | | | 1.47% | | (1.10)% | | 1.51% | | (1.13)% | | 106% |
– | | | 10.81 | | | | 30.08% | | | | 17.3 | | | 1.56% | | (1.14)% | | 1.56% | | (1.14)% | | 102% |
| | | | | | | | |
| | | | | | | | | | | | | | | | | | | | | | |
(2.36) | | | 15.72 | | | | 3.51% | | | | 0.2 | | | 1.02% | | (0.62)% | | 1.02% | | (0.62)% | | 438% |
(0.38) | | | 17.57 | | | | 39.40% | | | | 146.1 | | | 1.04% | | (0.24)% | | 1.04% | | (0.24)% | | 84% |
– | | | 12.98 | | | | 8.26% | | | | 115.0 | | | 1.05% | | (0.53)% | | 1.05% | | (0.53)% | | 100% |
– | | | 11.99 | | | | 8.90% | | | | 104.4 | | | 1.05% | | (0.67)% | | 1.05% | | (0.67)% | | 106% |
– | | | 11.01 | | | | 30.76% | | | | 95.9 | | | 1.09% | | (0.67)% | | 1.09% | | (0.67)% | | 102% |
| | | | | | | | | | | | | | | | | | | | | | |
| | | | | | | | | | | | | | | | | | | | | | |
(0.61) | | | 21.15 | | | | 5.65% | | | | 96.3 | | | 1.29% | | 0.38% | | 1.29% | | 0.38% | | 20% |
(0.59) | | | 20.62 | | | | 33.79% | | | | 96.0 | | | 1.32% | | 0.76% | | 1.32% | | 0.76% | | 6% |
(0.17) | | | 15.99 | | | | 11.87% | | | | 72.0 | | | 1.36% | | 0.59% | | 1.37% | | 0.59% | | 11% |
(0.09) | | | 14.47 | | | | 6.08% | | | | 69.3 | | | 1.40% | | 0.28% | | 1.40% | | 0.28% | | 9% |
(0.03) | | | 13.72 | | | | 22.14% | | | | 71.7 | | | 1.40% | | 0.14% | | 1.47% | | 0.07% | | 17% |
| | | | | | | | |
| | | | | | | | | | | | | | | | | | | | | | |
(0.69) | | | 22.31 | | | | 6.12% | | | | 160.6 | | | 0.84% | | 0.83% | | 0.84% | | 0.83% | | 20% |
(0.67) | | | 21.70 | | | | 34.41% | | | | 178.6 | | | 0.84% | | 1.28% | | 0.84% | | 1.28% | | 6% |
(0.26) | | | 16.80 | | | | 12.51% | | | | 148.9 | | | 0.85% | | 1.10% | | 0.85% | | 1.10% | | 11% |
(0.16) | | | 15.19 | | | | 6.64% | | | | 143.4 | | | 0.84% | | 0.84% | | 0.84% | | 0.84% | | 9% |
(0.10) | | | 14.39 | | | | 22.78% | | | | 160.7 | | | 0.85% | | 0.70% | | 0.85% | | 0.70% | | 17% |
(b) | Total investment return assumes dividend reinvestment and does not reflect any deduction for applicable sales charges. Not annualized for periods less than one year. |
** | Computed on an annualized basis for periods less than one year. |
The accompanying Notes to Financial Statements are an integral part of this statement.
303
THRIVENT MUTUAL FUNDS
FINANCIAL HIGHLIGHTS – CONTINUED
| | | | | | | | | | | | | | | | | | | | | | | | | | | | | | |
| | | FOR A SHARE OUTSTANDING THROUGHOUT EACH PERIOD* |
| | | | | Income from Investment Operations | | Less Distributions From |
| | | Net Asset
Value,
Beginning of
Period | | Net
Investment
Income/(Loss) | | Net Realized
and Unrealized
Gain/(Loss) on
Investments(a) | | Total from
Investment
Operations | | Net
Investment
Income | | Net Realized
Gain on
Investments |
SMALL CAP STOCK FUND | | | | | | | | | | | | | | | | | | | | | | | | | | | | | | |
Class A Shares | | | | | | | | | | | | | | | | | | | | | | | | | | | | | | |
Year Ended 10/31/2014 | | | $ | 18.52 | | | | $ | (0.05 | ) | | | $ | 1.80 | | | | $ | 1.75 | | | | $ | – | | | | $ | (0.15 | ) |
Year Ended 10/31/2013 | | | | 14.28 | | | | | (0.05 | ) | | | | 4.29 | | | | | 4.24 | | | | | – | | | | | – | |
Year Ended 10/31/2012 | | | | 13.35 | | | | | (0.06 | ) | | | | 0.99 | | | | | 0.93 | | | | | – | | | | | – | |
Year Ended 10/31/2011 | | | | 12.56 | | | | | (0.11 | ) | | | | 0.90 | | | | | 0.79 | | | | | – | | | | | – | |
Year Ended 10/31/2010 | | | | 10.26 | | | | | (0.09 | ) | | | | 2.39 | | | | | 2.30 | | | | | – | | | | | – | |
| | | | | | |
Institutional Class Shares | | | | | | | | | | | | | | | | | | | | | | | | | | | | | | |
Year Ended 10/31/2014 | | | | 20.98 | | | | | 0.05 | | | | | 2.04 | | | | | 2.09 | | | | | – | | | | | (0.15 | ) |
Year Ended 10/31/2013 | | | | 16.09 | | | | | 0.09 | | | | | 4.80 | | | | | 4.89 | | | | | – | | | | | – | |
Year Ended 10/31/2012 | | | | 14.96 | | | | | 0.05 | | | | | 1.08 | | | | | 1.13 | | | | | – | | | | | – | |
Year Ended 10/31/2011 | | | | 13.99 | | | | | 0.07 | | | | | 0.90 | | | | | 0.97 | | | | | – | | | | | – | |
Year Ended 10/31/2010 | | | | 11.35 | | | | | 0.02 | | | | | 2.62 | | | | | 2.64 | | | | | – | | | | | – | |
MID CAP GROWTH FUND | | | | | | | | | | | | | | | | | | | | | | | | | | | | | | |
Class A Shares | | | | | | | | | | | | | | | | | | | | | | | | | | | | | | |
Year Ended 10/31/2014 | | | | 21.61 | | | | | (0.03 | ) | | | | 1.76 | | | | | 1.73 | | | | | – | | | | | (2.73 | ) |
Year Ended 10/31/2013 | | | | 18.34 | | | | | (0.03 | ) | | | | 4.66 | | | | | 4.63 | | | | | – | | | | | (1.36 | ) |
Year Ended 10/31/2012 | | | | 17.67 | | | | | (0.08 | ) | | | | 0.90 | | | | | 0.82 | | | | | – | | | | | (0.15 | ) |
Year Ended 10/31/2011 | | | | 16.62 | | | | | (0.08 | ) | | | | 1.13 | | | | | 1.05 | | | | | – | | | | | – | |
Year Ended 10/31/2010 | | | | 12.92 | | | | | (0.08 | ) | | | | 3.78 | | | | | 3.70 | | | | | – | | | | | – | |
| | | | | | |
Institutional Class Shares | | | | | | | | | | | | | | | | | | | | | | | | | | | | | | |
Year Ended 10/31/2014 | | | | 24.70 | | | | | (0.01 | ) | | | | 2.14 | | | | | 2.13 | | | | | – | | | | | (2.73 | ) |
Year Ended 10/31/2013 | | | | 20.68 | | | | | 0.15 | | | | | 5.23 | | | | | 5.38 | | | | | – | | | | | (1.36 | ) |
Year Ended 10/31/2012 | | | | 19.81 | | | | | 0.05 | | | | | 0.97 | | | | | 1.02 | | | | | – | | | | | (0.15 | ) |
Year Ended 10/31/2011 | | | | 18.53 | | | | | 0.05 | | | | | 1.23 | | | | | 1.28 | | | | | – | | | | | – | |
Year Ended 10/31/2010 | | | | 14.31 | | | | | (0.02 | ) | | | | 4.24 | | | | | 4.22 | | | | | – | | | | | – | |
PARTNER MID CAP VALUE FUND | | | | | | | | | | | | | | | | | | | | | | | | | | | | | | |
Class A Shares | | | | | | | | | | | | | | | | | | | | | | | | | | | | | | |
Year Ended 10/31/2014 | | | | 16.26 | | | | | 0.04 | | | | | 1.89 | | | | | 1.93 | | | | | (0.03 | ) | | | | (3.00 | ) |
Year Ended 10/31/2013 | | | | 12.81 | | | | | 0.06 | | | | | 3.77 | | | | | 3.83 | | | | | (0.10 | ) | | | | (0.28 | ) |
Year Ended 10/31/2012 | | | | 11.55 | | | | | 0.10 | | | | | 1.21 | | | | | 1.31 | | | | | (0.05 | ) | | | | – | |
Year Ended 10/31/2011 | | | | 11.19 | | | | | 0.05 | | | | | 0.35 | | | | | 0.40 | | | | | (0.04 | ) | | | | – | |
Year Ended 10/31/2010 | | | | 8.97 | | | | | 0.06 | | | | | 2.23 | | | | | 2.29 | | | | | (0.07 | ) | | | | – | |
| | | | | | |
Institutional Class Shares | | | | | | | | | | | | | | | | | | | | | | | | | | | | | | |
Year Ended 10/31/2014 | | | | 16.33 | | | | | 0.08 | | | | | 1.91 | | | | | 1.99 | | | | | (0.07 | ) | | | | (3.00 | ) |
Year Ended 10/31/2013 | | | | 12.86 | | | | | 0.13 | | | | | 3.76 | | | | | 3.89 | | | | | (0.14 | ) | | | | (0.28 | ) |
Year Ended 10/31/2012 | | | | 11.60 | | | | | 0.15 | | | | | 1.20 | | | | | 1.35 | | | | | (0.09 | ) | | | | – | |
Year Ended 10/31/2011 | | | | 11.23 | | | | | 0.10 | | | | | 0.35 | | | | | 0.45 | | | | | (0.08 | ) | | | | – | |
Year Ended 10/31/2010 | | | | 8.99 | | | | | 0.09 | | | | | 2.24 | | | | | 2.33 | | | | | (0.09 | ) | | | | – | |
(a) | The amount shown may not correlate with the change in aggregate gains and losses of portfolio securities due to the timing of sales and redemptions of fund shares. |
* | All per share amounts have been rounded to the nearest cent. |
The accompanying Notes to Financial Statements are an integral part of this statement.
304
THRIVENT MUTUAL FUNDS
FINANCIAL HIGHLIGHTS –CONTINUED
| | | | | | | | | | | | | | | | | | | | | | |
| | | RATIOS/SUPPLEMENTAL DATA |
| | | | | | | | | | | | Ratio to Average Net
Assets** | | Ratios to Average Net
Assets Before Expenses
Waived, Credited or Paid
Indirectly** | | |
Total
Distributions | | Net Asset
Value, End of
Period | | | Total
Return(b) | | | Net Assets, End of Period
(in millions) | | | Expenses | | Net Investment
Income/(Loss) | | Expenses | | Net Investment
Income/(Loss) | | Portfolio
Turnover Rate |
| | | | | | | | | | | | | | | | | | | | | | |
| | | | | | | | | | | | | | | | | | | | | | |
$(0.15) | | | $20.12 | | | | 9.48% | | | | $259.8 | | | 1.25% | | (0.15)% | | 1.25% | | (0.15)% | | 56% |
– | | | 18.52 | | | | 29.69% | | | | 255.6 | | | 1.29% | | (0.16)% | | 1.29% | | (0.16)% | | 66% |
– | | | 14.28 | | | | 6.97% | | | | 216.6 | | | 1.33% | | (0.31)% | | 1.33% | | (0.31)% | | 91% |
– | | | 13.35 | | | | 6.29% | | | | 226.3 | | | 1.37% | | (0.67)% | | 1.37% | | (0.67)% | | 99% |
– | | | 12.56 | | | | 22.42% | | | | 239.1 | | | 1.46% | | (0.62)% | | 1.46% | | (0.62)% | | 203% |
| | | | | | | | |
| | | | | | | | | | | | | | | | | | | | | | |
(0.15) | | | 22.92 | | | | 10.00% | | | | 90.8 | | | 0.75% | | 0.35% | | 0.75% | | 0.35% | | 56% |
– | | | 20.98 | | | | 30.39% | | | | 80.2 | | | 0.76% | | 0.36% | | 0.76% | | 0.36% | | 66% |
– | | | 16.09 | | | | 7.55% | | | | 63.4 | | | 0.77% | | 0.26% | | 0.77% | | 0.26% | | 91% |
– | | | 14.96 | | | | 6.93% | | | | 60.3 | | | 0.76% | | (0.05)% | | 0.76% | | (0.05)% | | 99% |
– | | | 13.99 | | | | 23.26% | | | | 68.6 | | | 0.78% | | 0.05% | | 0.78% | | 0.05% | | 203% |
| | | | | | | | | | | | | | | | | | | | | | |
| | | | | | | | | | | | | | | | | | | | | | |
(2.73) | | | 20.61 | | | | 9.22% | | | | 269.7 | | | 0.96% | | (0.24)% | | 0.96% | | (0.24)% | | 45% |
(1.36) | | | 21.61 | | | | 27.13% | | | | 265.7 | | | 1.00% | | (0.15)% | | 1.00% | | (0.15)% | | 37% |
(0.15) | | | 18.34 | | | | 4.72% | | | | 229.0 | | | 1.03% | | (0.36)% | | 1.03% | | (0.36)% | | 46% |
– | | | 17.67 | | | | 6.32% | | | | 238.0 | | | 1.07% | | (0.35)% | | 1.07% | | (0.35)% | | 68% |
– | | | 16.62 | | | | 28.64% | | | | 241.7 | | | 1.18% | | (0.51)% | | 1.18% | | (0.51)% | | 55% |
| | | | | | | | |
| | | | | | | | | | | | | | | | | | | | | | |
(2.73) | | | 24.10 | | | | 9.74% | | | | 167.2 | | | 0.52% | | 0.20% | | 0.52% | | 0.20% | | 45% |
(1.36) | | | 24.70 | | | | 27.72% | | | | 154.1 | | | 0.52% | | 0.34% | | 0.52% | | 0.34% | | 37% |
(0.15) | | | 20.68 | | | | 5.23% | | | | 150.7 | | | 0.53% | | 0.13% | | 0.53% | | 0.13% | | 46% |
– | | | 19.81 | | | | 6.91% | | | | 152.8 | | | 0.52% | | 0.21% | | 0.52% | | 0.21% | | 68% |
– | | | 18.53 | | | | 29.49% | | | | 147.6 | | | 0.53% | | 0.15% | | 0.53% | | 0.15% | | 55% |
| | | | | | | | | | | | | | | | | | | | | | |
| | | | | | | | | | | | | | | | | | | | | | |
(3.03) | | | 15.16 | | | | 14.38% | | | | 26.6 | | | 1.25% | | 0.31% | | 1.46% | | 0.10% | | 92% |
(0.38) | | | 16.26 | | | | 30.68% | | | | 31.1 | | | 1.25% | | 0.50% | | 1.43% | | 0.32% | | 109% |
(0.05) | | | 12.81 | | | | 11.41% | | | | 19.4 | | | 1.25% | | 0.85% | | 1.46% | | 0.64% | | 83% |
(0.04) | | | 11.55 | | | | 3.57% | | | | 17.8 | | | 1.25% | | 0.45% | | 1.43% | | 0.27% | | 78% |
(0.07) | | | 11.19 | | | | 25.63% | | | | 16.6 | | | 1.25% | | 0.60% | | 1.46% | | 0.38% | | 91% |
| | | | | | | | |
| | | | | | | | | | | | | | | | | | | | | | |
(3.07) | | | 15.25 | | | | 14.78% | | | | 148.6 | | | 0.88% | | 0.65% | | 0.88% | | 0.65% | | 92% |
(0.42) | | | 16.33 | | | | 31.14% | | | | 129.6 | | | 0.90% | | 0.88% | | 0.90% | | 0.88% | | 109% |
(0.09) | | | 12.86 | | | | 11.77% | | | | 111.1 | | | 0.91% | | 1.20% | | 0.91% | | 1.20% | | 83% |
(0.08) | | | 11.60 | | | | 3.94% | | | | 100.4 | | | 0.90% | | 0.81% | | 0.90% | | 0.81% | | 78% |
(0.09) | | | 11.23 | | | | 26.07% | | | | 104.2 | | | 0.93% | | 0.92% | | 0.93% | | 0.92% | | 91% |
(b) | Total investment return assumes dividend reinvestment and does not reflect any deduction for applicable sales charges. Not annualized for periods less than one year. |
** | Computed on an annualized basis for periods less than one year. |
The accompanying Notes to Financial Statements are an integral part of this statement.
305
THRIVENT MUTUAL FUNDS
FINANCIAL HIGHLIGHTS –CONTINUED
| | | | | | | | | | | | | | | | | | | | | | | | | | | | | | |
| | | FOR A SHARE OUTSTANDING THROUGHOUT EACH PERIOD* |
| | | | | Income from Investment Operations | | Less Distributions From |
| | | Net Asset
Value,
Beginning of
Period | | Net
Investment
Income/(Loss) | | Net Realized
and Unrealized
Gain/(Loss) on
Investments(a) | | Total from
Investment
Operations | | Net
Investment
Income | | Net Realized
Gain on
Investments |
MID CAP STOCK FUND | | | | | | | | | | | | | | | | | | | | | | | | | | | | | | |
Class A Shares | | | | | | | | | | | | | | | | | | | | | | | | | | | | | | |
Year Ended 10/31/2014 | | | $ | 20.38 | | | | $ | 0.07 | | | | $ | 3.10 | | | | $ | 3.17 | | | | $ | – | | | | $ | – | |
Year Ended 10/31/2013 | | | | 15.34 | | | | | 0.01 | | | | | 5.03 | | | | | 5.04 | | | | | – | | | | | – | |
Year Ended 10/31/2012 | | | | 14.30 | | | | | (0.01 | ) | | | | 1.05 | | | | | 1.04 | | | | | – | | | | | – | |
Year Ended 10/31/2011 | | | | 13.49 | | | | | (0.02 | ) | | | | 0.83 | | | | | 0.81 | | | | | – | | | | | – | |
Year Ended 10/31/2010 | | | | 10.89 | | | | | – | | | | | 2.60 | | | | | 2.60 | | | | | – | | | | | – | |
| | | | | | |
Institutional Class Shares | | | | | | | | | | | | | | | | | | | | | | | | | | | | | | |
Year Ended 10/31/2014 | | | | 22.09 | | | | | 0.22 | | | | | 3.31 | | | | | 3.53 | | | | | (0.08 | ) | | | | – | |
Year Ended 10/31/2013 | | | | 16.63 | | | | | 0.10 | | | | | 5.43 | | | | | 5.53 | | | | | (0.07 | ) | | | | – | |
Year Ended 10/31/2012 | | | | 15.43 | | | | | 0.07 | | | | | 1.13 | | | | | 1.20 | | | | | – | | | | | – | |
Year Ended 10/31/2011 | | | | 14.53 | | | | | 0.06 | | | | | 0.89 | | | | | 0.95 | | | | | (0.05 | ) | | | | – | |
Year Ended 10/31/2010 | | | | 11.71 | | | | | 0.07 | | | | | 2.79 | | | | | 2.86 | | | | | (0.04 | ) | | | | – | |
PARTNER WORLDWIDE ALLOCATION FUND | | | | | | | | | | | |
Class A Shares | | | | | | | | | | | | | | | | | | | | | | | | | | | | | | |
Year Ended 10/31/2014 | | | | 10.29 | | | | | 0.16 | | | | | (0.25 | ) | | | | (0.09 | ) | | | | (0.17 | ) | | | | – | |
Year Ended 10/31/2013 | | | | 8.73 | | | | | 0.16 | | | | | 1.58 | | | | | 1.74 | | | | | (0.18 | ) | | | | – | |
Year Ended 10/31/2012 | | | | 8.30 | | | | | 0.19 | | | | | 0.32 | | | | | 0.51 | | | | | (0.08 | ) | | | | – | |
Year Ended 10/31/2011 | | | | 8.80 | | | | | 0.10 | | | | | (0.50 | ) | | | | (0.40 | ) | | | | (0.10 | ) | | | | – | |
Year Ended 10/31/2010 | | | | 7.70 | | | | | 0.11 | | | | | 1.10 | | | | | 1.21 | | | | | (0.11 | ) | | | | – | |
| | | | | | |
Institutional Class Shares | | | | | | | | | | | | | | | | | | | | | | | | | | | | | | |
Year Ended 10/31/2014 | | | | 10.36 | | | | | 0.21 | | | | | (0.25 | ) | | | | (0.04 | ) | | | | (0.21 | ) | | | | – | |
Year Ended 10/31/2013 | | | | 8.79 | | | | | 0.19 | | | | | 1.59 | | | | | 1.78 | | | | | (0.21 | ) | | | | – | |
Year Ended 10/31/2012 | | | | 8.34 | | | | | 0.19 | | | | | 0.35 | | | | | 0.54 | | | | | (0.09 | ) | | | | – | |
Year Ended 10/31/2011 | | | | 8.83 | | | | | 0.08 | | | | | (0.45 | ) | | | | (0.37 | ) | | | | (0.12 | ) | | | | – | |
Year Ended 10/31/2010 | | | | 7.72 | | | | | 0.13 | | | | | 1.11 | | | | | 1.24 | | | | | (0.13 | ) | | | | – | |
LARGE CAP GROWTH FUND | | | | | | | | | | | | | | | | | | | | | | | | | | | | | | |
Class A Shares | | | | | | | | | | | | | | | | | | | | | | | | | | | | | | |
Year Ended 10/31/2014 | | | | 7.10 | | | | | (0.02 | ) | | | | 1.23 | | | | | 1.21 | | | | | – | | | | | – | |
Year Ended 10/31/2013 | | | | 5.48 | | | | | 0.01 | | | | | 1.63 | | | | | 1.64 | | | | | (0.02 | ) | | | | – | |
Year Ended 10/31/2012 | | | | 4.92 | | | | | 0.01 | | | | | 0.55 | | | | | 0.56 | | | | | – | | | | | – | |
Year Ended 10/31/2011 | | | | 4.80 | | | | | (0.01 | ) | | | | 0.13 | | | | | 0.12 | | | | | – | | | | | – | |
Year Ended 10/31/2010 | | | | 4.26 | | | | | (0.01 | ) | | | | 0.56 | | | | | 0.55 | | | | | (0.01 | ) | | | | – | |
| | | | | | |
Institutional Class Shares | | | | | | | | | | | | | | | | | | | | | | | | | | | | | | |
Year Ended 10/31/2014 | | | | 7.65 | | | | | 0.01 | | | | | 1.33 | | | | | 1.34 | | | | | (0.03 | ) | | | | – | |
Year Ended 10/31/2013 | | | | 5.91 | | | | | 0.04 | | | | | 1.74 | | | | | 1.78 | | | | | (0.04 | ) | | | | – | |
Year Ended 10/31/2012 | | | | 5.28 | | | | | 0.03 | | | | | 0.60 | | | | | 0.63 | | | | | – | | | | | – | |
Year Ended 10/31/2011 | | | | 5.13 | | | | | 0.01 | | | | | 0.14 | | | | | 0.15 | | | | | – | | | | | – | |
Year Ended 10/31/2010 | | | | 4.54 | | | | | 0.01 | | | | | 0.60 | | | | | 0.61 | | | | | (0.02 | ) | | | | – | |
(a) | The amount shown may not correlate with the change in aggregate gains and losses of portfolio securities due to the timing of sales and redemptions of fund shares. |
* | All per share amounts have been rounded to the nearest cent. |
The accompanying Notes to Financial Statements are an integral part of this statement.
306
THRIVENT MUTUAL FUNDS
FINANCIAL HIGHLIGHTS –CONTINUED
| | | | | | | | | | | | | | | | | | | | | | |
| | | RATIOS/SUPPLEMENTAL DATA |
| | | | | | | | | | | | Ratio to Average Net
Assets** | | Ratios to Average Net
Assets Before Expenses
Waived, Credited or Paid
Indirectly** | | |
Total
Distributions | | Net Asset
Value, End of
Period | | | Total
Return(b) | | | Net Assets, End of Period
(in millions) | | | Expenses | | Net Investment
Income/(Loss) | | Expenses | | Net Investment
Income/(Loss) | | Portfolio
Turnover Rate |
| | | | | | | | | | | | | | | | | | | | | | |
| | | | | | | | | | | | | | | | | | | | | | |
$– | | | $23.55 | | | | 15.55% | | | | $678.2 | | | 1.11% | | 0.30% | | 1.11% | | 0.30% | | 27% |
– | | | 20.38 | | | | 32.86% | | | | 625.4 | | | 1.15% | | 0.07% | | 1.15% | | 0.07% | | 39% |
– | | | 15.34 | | | | 7.27% | | | | 517.5 | | | 1.18% | | (0.08)% | | 1.18% | | (0.08)% | | 36% |
– | | | 14.30 | | | | 6.00% | | | | 538.7 | | | 1.20% | | (0.15)% | | 1.20% | | (0.15)% | | 35% |
– | | | 13.49 | | | | 23.88% | | | | 571.1 | | | 1.25% | | 0.01% | | 1.25% | | 0.01% | | 69% |
| | | | | | | | |
| | | | | | | | | | | | | | | | | | | | | | |
(0.08) | | | 25.54 | | | | 16.01% | | | | 264.0 | | | 0.71% | | 0.70% | | 0.71% | | 0.70% | | 27% |
(0.07) | | | 22.09 | | | | 33.41% | | | | 290.0 | | | 0.71% | | 0.50% | | 0.71% | | 0.50% | | 39% |
– | | | 16.63 | | | | 7.78% | | | | 220.4 | | | 0.72% | | 0.38% | | 0.72% | | 0.38% | | 36% |
(0.05) | | | 15.43 | | | | 6.51% | | | | 215.6 | | | 0.71% | | 0.33% | | 0.71% | | 0.33% | | 35% |
(0.04) | | | 14.53 | | | | 24.50% | | | | 216.6 | | | 0.73% | | 0.55% | | 0.73% | | 0.55% | | 69% |
| | | | | | | | | | | | | | | | | | | | | | |
| | | | | | | | | | | | | | | | | | | | | | |
(0.17) | | | 10.03 | | | | (0.89)% | | | | 178.2 | | | 1.40% | | 1.57% | | 1.55% | | 1.41% | | 77% |
(0.18) | | | 10.29 | | | | 20.26% | | | | 181.6 | | | 1.37% | | 1.60% | | 1.60% | | 1.37% | | 74% |
(0.08) | | | 8.73 | | | | 6.20% | | | | 159.5 | | | 1.30% | | 2.02% | | 1.61% | | 1.71% | | 57% |
(0.10) | | | 8.30 | | | | (4.60)% | | | | 179.9 | | | 1.30% | | 1.86% | | 1.61% | | 1.55% | | 101% |
(0.11) | | | 8.80 | | | | 15.88% | | | | 35.3 | | | 1.30% | | 1.61% | | 1.64% | | 1.27% | | 88% |
| | | | | | | | |
| | | | | | | | | | | | | | | | | | | | | | |
(0.21) | | | 10.11 | | | | (0.40)% | | | | 651.9 | | | 0.97% | | 1.99% | | 0.99% | | 1.98% | �� | 77% |
(0.21) | | | 10.36 | | | | 20.64% | | | | 671.5 | | | 0.98% | | 1.99% | | 0.98% | | 1.99% | | 74% |
(0.09) | | | 8.79 | | | | 6.58% | | | | 544.6 | | | 0.98% | | 2.31% | | 0.98% | | 2.31% | | 57% |
(0.12) | | | 8.34 | | | | (4.24)% | | | | 478.0 | | | 1.00% | | 2.16% | | 1.06% | | 2.10% | | 101% |
(0.13) | | | 8.83 | | | | 16.26% | | | | 219.2 | | | 0.99% | | 1.95% | | 1.19% | | 1.75% | | 88% |
| | | | | | | | | | | | | | | | | | | | | | |
| | | | | | | | | | | | | | | | | | | | | | |
– | | | 8.31 | | | | 17.10% | | | | 183.6 | | | 1.20% | | (0.25)% | | 1.34% | | (0.38)% | | 45% |
(0.02) | | | 7.10 | | | | 29.99% | | | | 157.0 | | | 1.20% | | 0.14% | | 1.41% | | (0.07)% | | 63% |
– | | | 5.48 | | | | 11.38% | | | | 125.0 | | | 1.20% | | 0.19% | | 1.48% | | (0.09)% | | 101% |
– | | | 4.92 | | | | 2.50% | | | | 117.7 | | | 1.20% | | (0.23)% | | 1.56% | | (0.59)% | | 249% |
(0.01) | | | 4.80 | | | | 12.94% | | | | 121.3 | | | 1.19% | | (0.22)% | | 1.64% | | (0.66)% | | 232% |
| | | | | | | | |
| | | | | | | | | | | | | | | | | | | | | | |
(0.03) | | | 8.96 | | | | 17.53% | | | | 338.3 | | | 0.81% | | 0.14% | | 0.81% | | 0.14% | | 45% |
(0.04) | | | 7.65 | | | | 30.30% | | | | 286.9 | | | 0.82% | | 0.52% | | 0.82% | | 0.52% | | 63% |
– | | | 5.91 | | | | 11.94% | | | | 224.9 | | | 0.83% | | 0.57% | | 0.83% | | 0.57% | | 101% |
– | | | 5.28 | | | | 2.92% | | | | 204.3 | | | 0.83% | | 0.14% | | 0.83% | | 0.14% | | 249% |
(0.02) | | | 5.13 | | | | 13.52% | | | | 200.0 | | | 0.84% | | 0.13% | | 0.84% | | 0.13% | | 232% |
(b) | Total investment return assumes dividend reinvestment and does not reflect any deduction for applicable sales charges. Not annualized for periods less than one year. |
** | Computed on an annualized basis for periods less than one year. |
The accompanying Notes to Financial Statements are an integral part of this statement.
307
THRIVENT MUTUAL FUNDS
FINANCIAL HIGHLIGHTS –CONTINUED
| | | | | | | | | | | | | | | | | | | | | | | | | | | | | | |
| | | FOR A SHARE OUTSTANDING THROUGHOUT EACH PERIOD* |
| | | | | Income from Investment Operations | | Less Distributions From |
| | | Net Asset
Value,
Beginning of
Period | | Net
Investment
Income/(Loss) | | Net Realized
and Unrealized
Gain/(Loss) on
Investments(a) | | Total from
Investment
Operations | | Net
Investment
Income | | Net Realized
Gain on
Investments |
LARGE CAP VALUE FUND | | | | | | | | | | | | | | | | | | | | | | | | | | | | | | |
Class A Shares | | | | | | | | | | | | | | | | | | | | | | | | | | | | | | |
Year Ended 10/31/2014 | | | $ | 18.60 | | | | $ | 0.20 | | | | $ | 2.02 | | | | $ | 2.22 | | | | $ | (0.17 | ) | | | $ | – | |
Year Ended 10/31/2013 | | | | 14.66 | | | | | 0.22 | | | | | 3.96 | | | | | 4.18 | | | | | (0.24 | ) | | | | – | |
Year Ended 10/31/2012 | | | | 12.94 | | | | | 0.22 | | | | | 1.67 | | | | | 1.89 | | | | | (0.17 | ) | | | | – | |
Year Ended 10/31/2011 | | | | 12.61 | | | | | 0.19 | | | | | 0.26 | | | | | 0.45 | | | | | (0.12 | ) | | | | – | |
Year Ended 10/31/2010 | | | | 11.55 | | | | | 0.13 | | | | | 1.07 | | | | | 1.20 | | | | | (0.14 | ) | | | | – | |
| | | | | | |
Institutional Class Shares | | | | | | | | | | | | | | | | | | | | | | | | | | | | | | |
Year Ended 10/31/2014 | | | | 18.73 | | | | | 0.29 | | | | | 2.03 | | | | | 2.32 | | | | | (0.25 | ) | | | | – | |
Year Ended 10/31/2013 | | | | 14.76 | | | | | 0.29 | | | | | 3.99 | | | | | 4.28 | | | | | (0.31 | ) | | | | – | |
Year Ended 10/31/2012 | | | | 13.04 | | | | | 0.27 | | | | | 1.70 | | | | | 1.97 | | | | | (0.25 | ) | | | | – | |
Year Ended 10/31/2011 | | | | 12.71 | | | | | 0.24 | | | | | 0.28 | | | | | 0.52 | | | | | (0.19 | ) | | | | – | |
Year Ended 10/31/2010 | | | | 11.64 | | | | | 0.18 | | | | | 1.10 | | | | | 1.28 | | | | | (0.21 | ) | | | | – | |
LARGE CAP STOCK FUND | | | | | | | | | | | | | | | | | | | | | | | | | | | | | | |
Class A Shares | | | | | | | | | | | | | | | | | | | | | | | | | | | | | | |
Year Ended 10/31/2014 | | | | 27.54 | | | | | 0.22 | | | | | 2.57 | | | | | 2.79 | | | | | (0.10 | ) | | | | (2.48 | ) |
Year Ended 10/31/2013 | | | | 23.64 | | | | | 0.19 | | | | | 5.24 | | | | | 5.43 | | | | | (0.25 | ) | | | | (1.28 | ) |
Year Ended 10/31/2012 | | | | 21.30 | | | | | 0.20 | | | | | 2.29 | | | | | 2.49 | | | | | (0.15 | ) | | | | – | |
Year Ended 10/31/2011 | | | | 20.87 | | | | | 0.13 | | | | | 0.37 | | | | | 0.50 | | | | | (0.07 | ) | | | | – | |
Year Ended 10/31/2010 | | | | 18.87 | | | | | 0.06 | | | | | 2.04 | | | | | 2.10 | | | | | (0.10 | ) | | | | – | |
| | | | | | |
Institutional Class Shares | | | | | | | | | | | | | | | | | | | | | | | | | | | | | | |
Year Ended 10/31/2014 | | | | 27.75 | | | | | 0.35 | | | | | 2.58 | | | | | 2.93 | | | | | (0.21 | ) | | | | (2.48 | ) |
Year Ended 10/31/2013 | | | | 23.82 | | | | | 0.30 | | | | | 5.27 | | | | | 5.57 | | | | | (0.36 | ) | | | | (1.28 | ) |
Year Ended 10/31/2012 | | | | 21.48 | | | | | 0.30 | | | | | 2.30 | | | | | 2.60 | | | | | (0.26 | ) | | | | – | |
Year Ended 10/31/2011 | | | | 21.05 | | | | | 0.24 | | | | | 0.38 | | | | | 0.62 | | | | | (0.19 | ) | | | | – | |
Year Ended 10/31/2010 | | | | 19.02 | | | | | 0.15 | | | | | 2.09 | | | | | 2.24 | | | | | (0.21 | ) | | | | – | |
HIGH YIELD FUND | | | | | | | | | | | | | | | | | | | | | | | | | | | | | | |
Class A Shares | | | | | | | | | | | | | | | | | | | | | | | | | | | | | | |
Year Ended 10/31/2014 | | | | 5.09 | | | | | 0.29 | | | | | (0.05 | ) | | | | 0.24 | | | | | (0.29 | ) | | | | – | |
Year Ended 10/31/2013 | | | | 5.01 | | | | | 0.31 | | | | | 0.07 | | | | | 0.38 | | | | | (0.30 | ) | | | | – | |
Year Ended 10/31/2012 | | | | 4.71 | | | | | 0.34 | | | | | 0.30 | | | | | 0.64 | | | | | (0.34 | ) | | | | – | |
Year Ended 10/31/2011 | | | | 4.86 | | | | | 0.36 | | | | | (0.15 | ) | | | | 0.21 | | | | | (0.36 | ) | | | | – | |
Year Ended 10/31/2010 | | | | 4.47 | | | | | 0.37 | | | | | 0.39 | | | | | 0.76 | | | | | (0.37 | ) | | | | – | |
| | | | | | |
Institutional Class Shares | | | | | | | | | | | | | | | | | | | | | | | | | | | | | | |
Year Ended 10/31/2014 | | | | 5.10 | | | | | 0.30 | | | | | (0.05 | ) | | | | 0.25 | | | | | (0.30 | ) | | | | – | |
Year Ended 10/31/2013 | | | | 5.01 | | | | | 0.32 | | | | | 0.09 | | | | | 0.41 | | | | | (0.32 | ) | | | | – | |
Year Ended 10/31/2012 | | | | 4.72 | | | | | 0.35 | | | | | 0.29 | | | | | 0.64 | | | | | (0.35 | ) | | | | – | |
Year Ended 10/31/2011 | | | | 4.86 | | | | | 0.38 | | | | | (0.14 | ) | | | | 0.24 | | | | | (0.38 | ) | | | | – | |
Year Ended 10/31/2010 | | | | 4.47 | | | | | 0.39 | | | | | 0.38 | | | | | 0.77 | | | | | (0.38 | ) | | | | – | |
(a) | The amount shown may not correlate with the change in aggregate gains and losses of portfolio securities due to the timing of sales and redemptions of fund shares. |
* | All per share amounts have been rounded to the nearest cent. |
The accompanying Notes to Financial Statements are an integral part of this statement.
308
THRIVENT MUTUAL FUNDS
FINANCIAL HIGHLIGHTS –CONTINUED
| | | | | | | | | | | | | | | | | | | | | | |
| | | RATIOS/SUPPLEMENTAL DATA |
| | | | | | | | | | | | Ratio to Average Net
Assets** | | Ratios to Average Net
Assets Before Expenses
Waived, Credited or Paid
Indirectly** | | |
Total
Distributions | | Net Asset
Value, End of
Period | | | Total
Return(b) | | | Net Assets, End of Period
(in millions) | | | Expenses | | Net Investment
Income/(Loss) | | Expenses | | Net Investment
Income/(Loss) | | Portfolio
Turnover Rate |
| | | | | | | | | | | | | | | | | | | | | | |
| | | | | | | | | | | | | | | | | | | | | | |
$(0.17) | | | $20.65 | | | | 12.00% | | | | $237.1 | | | 0.94% | | 1.00% | | 0.94% | | 1.00% | | 24% |
(0.24) | | | 18.60 | | | | 28.92% | | | | 214.6 | | | 0.98% | | 1.25% | | 0.98% | | 1.25% | | 39% |
(0.17) | | | 14.66 | | | | 14.82% | | | | 171.1 | | | 1.04% | | 1.42% | | 1.04% | | 1.42% | | 92% |
(0.12) | | | 12.94 | | | | 3.49% | | | | 164.5 | | | 1.06% | | 1.22% | | 1.06% | | 1.22% | | 74% |
(0.14) | | | 12.61 | | | | 10.45% | | | | 176.0 | | | 1.10% | | 0.91% | | 1.10% | | 0.91% | | 115% |
| | | | | | | | |
| | | | | | | | | | | | | | | | | | | | | | |
(0.25) | | | 20.80 | | | | 12.47% | | | | 562.0 | | | 0.52% | | 1.42% | | 0.52% | | 1.42% | | 24% |
(0.31) | | | 18.73 | | | | 29.57% | | | | 508.9 | | | 0.52% | | 1.72% | | 0.52% | | 1.72% | | 39% |
(0.25) | | | 14.76 | | | | 15.37% | | | | 403.0 | | | 0.53% | | 1.92% | | 0.53% | | 1.92% | | 92% |
(0.19) | | | 13.04 | | | | 4.03% | | | | 356.0 | | | 0.52% | | 1.76% | | 0.52% | | 1.76% | | 74% |
(0.21) | | | 12.71 | | | | 11.09% | | | | 331.2 | | | 0.53% | | 1.46% | | 0.53% | | 1.46% | | 115% |
| | | | | | | | | | | | | | | | | | | | | | |
| | | | | | | | | | | | | | | | | | | | | | |
(2.58) | | | 27.75 | | | | 11.06% | | | | 1,594.0 | | | 1.02% | | 0.82% | | 1.02% | | 0.82% | | 65% |
(1.53) | | | 27.54 | | | | 24.57% | | | | 1,556.5 | | | 1.05% | | 0.81% | | 1.05% | | 0.81% | | 66% |
(0.15) | | | 23.64 | | | | 11.75% | | | | 1,382.5 | | | 1.09% | | 0.84% | | 1.09% | | 0.84% | | 124% |
(0.07) | | | 21.30 | | | | 2.39% | | | | 1,393.5 | | | 1.11% | | 0.56% | | 1.11% | | 0.56% | | 146% |
(0.10) | | | 20.87 | | | | 11.16% | | | | 1,549.4 | | | 1.13% | | 0.29% | | 1.13% | | 0.29% | | 185% |
| | | | | | | | |
| | | | | | | | | | | | | | | | | | | | | | |
(2.69) | | | 27.99 | | | | 11.53% | | | | 174.2 | | | 0.61% | | 1.24% | | 0.61% | | 1.24% | | 65% |
(1.64) | | | 27.75 | | | | 25.10% | | | | 192.8 | | | 0.61% | | 1.25% | | 0.61% | | 1.25% | | 66% |
(0.26) | | | 23.82 | | | | 12.27% | | | | 170.3 | | | 0.62% | | 1.30% | | 0.62% | | 1.30% | | 124% |
(0.19) | | | 21.48 | | | | 2.89% | | | | 170.2 | | | 0.60% | | 1.06% | | 0.60% | | 1.06% | | 146% |
(0.21) | | | 21.05 | | | | 11.80% | | | | 176.4 | | | 0.61% | | 0.81% | | 0.61% | | 0.81% | | 185% |
| | | | | | | | | | | | | | | | | | | | | | |
| | | | | | | | | | | | | | | | | | | | | | |
(0.29) | | | 5.04 | | | | 4.72% | | | | 540.1 | | | 0.80% | | 5.59% | | 0.80% | | 5.59% | | 43% |
(0.30) | | | 5.09 | | | | 7.85% | | | | 540.0 | | | 0.81% | | 6.03% | | 0.81% | | 6.03% | | 61% |
(0.34) | | | 5.01 | | | | 13.96% | | | | 520.0 | | | 0.82% | | 6.95% | | 0.82% | | 6.95% | | 52% |
(0.36) | | | 4.71 | | | | 4.37% | | | | 445.3 | | | 0.84% | | 7.43% | | 0.84% | | 7.43% | | 63% |
(0.37) | | | 4.86 | | | | 17.65% | | | | 448.1 | | | 0.86% | | 7.96% | | 0.86% | | 7.96% | | 83% |
| | | | | | | | |
| | | | | | | | | | | | | | | | | | | | | | |
(0.30) | | | 5.05 | | | | 5.05% | | | | 246.2 | | | 0.49% | | 5.90% | | 0.49% | | 5.90% | | 43% |
(0.32) | | | 5.10 | | | | 8.42% | | | | 240.7 | | | 0.48% | | 6.36% | | 0.48% | | 6.36% | | 61% |
(0.35) | | | 5.01 | | | | 14.12% | | | | 285.7 | | | 0.47% | | 7.30% | | 0.47% | | 7.30% | | 52% |
(0.38) | | | 4.72 | | | | 4.98% | | | | 243.4 | | | 0.47% | | 7.80% | | 0.47% | | 7.80% | | 63% |
(0.38) | | | 4.86 | | | | 18.12% | | | | 254.6 | | | 0.46% | | 8.36% | | 0.46% | | 8.36% | | 83% |
(b) | Total investment return assumes dividend reinvestment and does not reflect any deduction for applicable sales charges. Not annualized for periods less than one year. |
** | Computed on an annualized basis for periods less than one year. |
The accompanying Notes to Financial Statements are an integral part of this statement.
309
THRIVENT MUTUAL FUNDS
FINANCIAL HIGHLIGHTS –CONTINUED
| | | | | | | | | | | | | | | | | | | | | | | | | | | | | | |
| | | FOR A SHARE OUTSTANDING THROUGHOUT EACH PERIOD* |
| | | | | Income from Investment Operations | | Less Distributions From |
| | | Net Asset
Value,
Beginning of
Period | | Net
Investment
Income/(Loss) | | Net Realized
and Unrealized
Gain/(Loss) on
Investments(a) | | Total from
Investment
Operations | | Net
Investment
Income | | Net Realized
Gain on
Investments |
INCOME FUND | | | | | | | | | | | | | | | | | | | | | | | | | | | | | | |
Class A Shares | | | | | | | | | | | | | | | | | | | | | | | | | | | | | | |
Year Ended 10/31/2014 | | | $ | 9.09 | | | | $ | 0.32 | | | | $ | 0.20 | | | | $ | 0.52 | | | | $ | (0.32 | ) | | | $ | – | |
Year Ended 10/31/2013 | | | | 9.38 | | | | | 0.31 | | | | | (0.29 | ) | | | | 0.02 | | | | | (0.31 | ) | | | | – | |
Year Ended 10/31/2012 | | | | 8.77 | | | | | 0.33 | | | | | 0.61 | | | | | 0.94 | | | | | (0.33 | ) | | | | – | |
Year Ended 10/31/2011 | | | | 8.80 | | | | | 0.38 | | | | | (0.03 | ) | | | | 0.35 | | | | | (0.38 | ) | | | | – | |
Year Ended 10/31/2010 | | | | 8.12 | | | | | 0.40 | | | | | 0.68 | | | | | 1.08 | | | | | (0.40 | ) | | | | – | |
| | | | | | |
Institutional Class Shares | | | | | | | | | | | | | | | | | | | | | | | | | | | | | | |
Year Ended 10/31/2014 | | | | 9.08 | | | | | 0.35 | | | | | 0.21 | | | | | 0.56 | | | | | (0.35 | ) | | | | – | |
Year Ended 10/31/2013 | | | | 9.37 | | | | | 0.35 | | | | | (0.30 | ) | | | | 0.05 | | | | | (0.34 | ) | | | | – | |
Year Ended 10/31/2012 | | | | 8.76 | | | | | 0.37 | | | | | 0.60 | | | | | 0.97 | | | | | (0.36 | ) | | | | – | |
Year Ended 10/31/2011 | | | | 8.79 | | | | | 0.42 | | | | | (0.03 | ) | | | | 0.39 | | | | | (0.42 | ) | | | | – | |
Year Ended 10/31/2010 | | | | 8.12 | | | | | 0.44 | | | | | 0.67 | | | | | 1.11 | | | | | (0.44 | ) | | | | – | |
MUNICIPAL BOND FUND | | | | | | | | | | | | | | | | | | | | | | | | | | | | | | |
Class A Shares | | | | | | | | | | | | | | | | | | | | | | | | | | | | | | |
Year Ended 10/31/2014 | | | | 11.18 | | | | | 0.42 | | | | | 0.50 | | | | | 0.92 | | | | | (0.42 | ) | | | | – | |
Year Ended 10/31/2013 | | | | 11.93 | | | | | 0.42 | | | | | (0.74 | ) | | | | (0.32 | ) | | | | (0.42 | ) | | | | (0.01 | ) |
Year Ended 10/31/2012 | | | | 11.30 | | | | | 0.44 | | | | | 0.63 | | | | | 1.07 | | | | | (0.44 | ) | | | | – | |
Year Ended 10/31/2011 | | | | 11.42 | | | | | 0.46 | | | | | (0.10 | ) | | | | 0.36 | | | | | (0.46 | ) | | | | (0.02 | ) |
Year Ended 10/31/2010 | | | | 11.15 | | | | | 0.47 | | | | | 0.27 | | | | | 0.74 | | | | | (0.47 | ) | | | | – | |
| | | | | | |
Institutional Class Shares | | | | | | | | | | | | | | | | | | | | | | | | | | | | | | |
Year Ended 10/31/2014 | | | | 11.18 | | | | | 0.44 | | | | | 0.50 | | | | | 0.94 | | | | | (0.44 | ) | | | | – | |
Year Ended 10/31/2013 | | | | 11.93 | | | | | 0.45 | | | | | (0.74 | ) | | | | (0.29 | ) | | | | (0.45 | ) | | | | (0.01 | ) |
Year Ended 10/31/2012 | | | | 11.30 | | | | | 0.47 | | | | | 0.63 | | | | | 1.10 | | | | | (0.47 | ) | | | | – | |
Year Ended 10/31/2011 | | | | 11.42 | | | | | 0.49 | | | | | (0.10 | ) | | | | 0.39 | | | | | (0.49 | ) | | | | (0.02 | ) |
Year Ended 10/31/2010 | | | | 11.15 | | | | | 0.50 | | | | | 0.27 | | | | | 0.77 | | | | | (0.50 | ) | | | | – | |
GOVERNMENT BOND FUND | | | | | | | | | | | | | | | | | | | | | | | | | | | | | | |
Class A Shares | | | | | | | | | | | | | | | | | | | | | | | | | | | | | | |
Year Ended 10/31/2014 | | | | 10.02 | | | | | 0.11 | | | | | 0.14 | | | | | 0.25 | | | | | (0.11 | ) | | | | (0.11 | ) |
Year Ended 10/31/2013 | | | | 10.76 | | | | | 0.07 | | | | | (0.33 | ) | | | | (0.26 | ) | | | | (0.08 | ) | | | | (0.40 | ) |
Year Ended 10/31/2012 | | | | 10.69 | | | | | 0.11 | | | | | 0.32 | | | | | 0.43 | | | | | (0.11 | ) | | | | (0.25 | ) |
Year Ended 10/31/2011 | | | | 10.56 | | | | | 0.19 | | | | | 0.21 | | | | | 0.40 | | | | | (0.19 | ) | | | | (0.08 | ) |
Year Ended 10/31/2010(c) | | | | 10.00 | | | | | 0.11 | | | | | 0.56 | | | | | 0.67 | | | | | (0.11 | ) | | | | – | |
| | | | | | |
Institutional Class Shares | | | | | | | | | | | | | | | | | | | | | | | | | | | | | | |
Year Ended 10/31/2014 | | | | 10.02 | | | | | 0.14 | | | | | 0.14 | | | | | 0.28 | | | | | (0.14 | ) | | | | (0.11 | ) |
Year Ended 10/31/2013 | | | | 10.76 | | | | | 0.11 | | | | | (0.34 | ) | | | | (0.23 | ) | | | | (0.11 | ) | | | | (0.40 | ) |
Year Ended 10/31/2012 | | | | 10.69 | | | | | 0.14 | | | | | 0.32 | | | | | 0.46 | | | | | (0.14 | ) | | | | (0.25 | ) |
Year Ended 10/31/2011 | | | | 10.57 | | | | | 0.23 | | | | | 0.20 | | | | | 0.43 | | | | | (0.23 | ) | | | | (0.08 | ) |
Year Ended 10/31/2010(c) | | | | 10.00 | | | | | 0.13 | | | | | 0.57 | | | | | 0.70 | | | | | (0.13 | ) | | | | – | |
(a) | The amount shown may not correlate with the change in aggregate gains and losses of portfolio securities due to the timing of sales and redemptions of fund shares. |
(c) | Since fund inception, February 26, 2010. |
* | All per share amounts have been rounded to the nearest cent. |
The accompanying Notes to Financial Statements are an integral part of this statement.
310
THRIVENT MUTUAL FUNDS
FINANCIAL HIGHLIGHTS –CONTINUED
| | | | | | | | | | | | | | | | | | | | | | |
| | | RATIOS/SUPPLEMENTAL DATA |
| | | | | | | | | | | | Ratio to Average Net
Assets** | | Ratios to Average Net
Assets Before Expenses
Waived, Credited or Paid
Indirectly** | | |
Total
Distributions | | Net Asset
Value, End of
Period | | | Total
Return(b) | | | Net Assets, End of Period
(in millions) | | | Expenses | | Net Investment
Income/(Loss) | | Expenses | | Net Investment
Income/(Loss) | | Portfolio
Turnover Rate |
| | | | | | | | | | | | | | | | | | | | | | |
| | | | | | | | | | | | | | | | | | | | | | |
$(0.32) | | | $9.29 | | | | 5.79% | | | | $400.5 | | | 0.77% | | 3.47% | | 0.77% | | 3.47% | | 97% |
(0.31) | | | 9.09 | | | | 0.23% | | | | 419.5 | | | 0.77% | | 3.40% | | 0.77% | | 3.40% | | 121% |
(0.33) | | | 9.38 | | | | 10.92% | | | | 448.0 | | | 0.77% | | 3.69% | | 0.77% | | 3.69% | | 117% |
(0.38) | | | 8.77 | | | | 4.11% | | | | 397.9 | | | 0.79% | | 4.38% | | 0.79% | | 4.38% | | 138% |
(0.40) | | | 8.80 | | | | 13.66% | | | | 405.1 | | | 0.80% | | 4.81% | | 0.81% | | 4.80% | | 146% |
| | | | | | | | |
| | | | | | | | | | | | | | | | | | | | | | |
(0.35) | | | 9.29 | | | | 6.29% | | | | 438.1 | | | 0.40% | | 3.83% | | 0.40% | | 3.83% | | 97% |
(0.34) | | | 9.08 | | | | 0.60% | | | | 403.3 | | | 0.40% | | 3.77% | | 0.40% | | 3.77% | | 121% |
(0.36) | | | 9.37 | | | | 11.34% | | | | 456.1 | | | 0.39% | | 4.07% | | 0.39% | | 4.07% | | 117% |
(0.42) | | | 8.76 | | | | 4.52% | | | | 401.1 | | | 0.39% | | 4.78% | | 0.39% | | 4.77% | | 138% |
(0.44) | | | 8.79 | | | | 13.99% | | | | 370.7 | | | 0.39% | | 5.23% | | 0.40% | | 5.22% | | 146% |
| | | | | | | | | | | | | | | | | | | | | | |
| | | | | | | | | | | | | | | | | | | | | | |
(0.42) | | | 11.68 | | | | 8.33% | | | | 1,446.3 | | | 0.75% | | 3.65% | | 0.75% | | 3.65% | | 8% |
(0.43) | | | 11.18 | | | | (2.76)% | | | | 1,397.2 | | | 0.74% | | 3.65% | | 0.74% | | 3.65% | | 24% |
(0.44) | | | 11.93 | | | | 9.61% | | | | 1,532.0 | | | 0.74% | | 3.76% | | 0.74% | | 3.76% | | 13% |
(0.48) | | | 11.30 | | | | 3.39% | | | | 1,339.6 | | | 0.76% | | 4.19% | | 0.76% | | 4.19% | | 8% |
(0.47) | | | 11.42 | | | | 6.79% | | | | 1,384.5 | | | 0.76% | | 4.20% | | 0.76% | | 4.20% | | 9% |
| | | | | | | | |
| | | | | | | | | | | | | | | | | | | | | | |
(0.44) | | | 11.68 | | | | 8.61% | | | | 97.2 | | | 0.49% | | 3.90% | | 0.49% | | 3.90% | | 8% |
(0.46) | | | 11.18 | | | | (2.51)% | | | | 91.8 | | | 0.49% | | 3.91% | | 0.49% | | 3.91% | | 24% |
(0.47) | | | 11.93 | | | | 9.89% | | | | 102.5 | | | 0.49% | | 4.02% | | 0.49% | | 4.02% | | 13% |
(0.51) | | | 11.30 | | | | 3.67% | | | | 86.5 | | | 0.49% | | 4.46% | | 0.49% | | 4.46% | | 8% |
(0.50) | | | 11.42 | | | | 7.08% | | | | 95.3 | | | 0.50% | | 4.46% | | 0.50% | | 4.46% | | 9% |
| | | | | | | | | | | | | | | | | | | | | | |
| | | | | | | | | | | | | | | | | | | | | | |
(0.22) | | | 10.05 | | | | 2.56% | | | | 14.1 | | | 0.90% | | 1.08% | | 1.07% | | 0.90% | | 130% |
(0.48) | | | 10.02 | | | | (2.51)% | | | | 13.0 | | | 0.90% | | 0.71% | | 1.03% | | 0.57% | | 184% |
(0.36) | | | 10.76 | | | | 4.08% | | | | 14.5 | | | 0.89% | | 1.02% | | 0.99% | | 0.93% | | 191% |
(0.27) | | | 10.69 | | | | 3.99% | | | | 7.3 | | | 0.92% | | 1.82% | | 1.00% | | 1.74% | | 183% |
(0.11) | | | 10.56 | | | | 6.73% | | | | 5.9 | | | 0.87% | | 1.61% | | 0.87% | | 1.61% | | 146% |
| | | | | | | | |
| | | | | | | | | | | | | | | | | | | | | | |
(0.25) | | | 10.05 | | | | 2.90% | | | | 88.7 | | | 0.57% | | 1.41% | | 0.57% | | 1.41% | | 130% |
(0.51) | | | 10.02 | | | | (2.18)% | | | | 95.1 | | | 0.57% | | 1.06% | | 0.57% | | 1.06% | | 184% |
(0.39) | | | 10.76 | | | | 4.44% | | | | 98.0 | | | 0.55% | | 1.38% | | 0.55% | | 1.38% | | 191% |
(0.31) | | | 10.69 | | | | 4.25% | | | | 94.6 | | | 0.57% | | 2.18% | | 0.57% | | 2.18% | | 183% |
(0.13) | | | 10.57 | | | | 7.04% | | | | 105.6 | | | 0.60% | | 1.94% | | 0.60% | | 1.94% | | 146% |
(b) | Total investment return assumes dividend reinvestment and does not reflect any deduction for applicable sales charges. Not annualized for periods less than one year. |
** | Computed on an annualized basis for periods less than one year. |
The accompanying Notes to Financial Statements are an integral part of this statement.
311
THRIVENT MUTUAL FUNDS
FINANCIAL HIGHLIGHTS –CONTINUED
| | | | | | | | | | | | | | | | | | | | | | | | | | | | | | |
| | | FOR A SHARE OUTSTANDING THROUGHOUT EACH PERIOD* |
| | | | | Income from Investment Operations | | Less Distributions From |
| | | Net Asset
Value,
Beginning of
Period | | Net
Investment
Income/(Loss) | | Net Realized
and Unrealized
Gain/(Loss) on
Investments(a) | | Total from
Investment
Operations | | Net
Investment
Income | | Net Realized
Gain on
Investments |
LIMITED MATURITY BOND FUND | | | | | | | | | | | | | | | | | | | | | | | | | | | | | | |
Class A Shares | | | | | | | | | | | | | | | | | | | | | | | | | | | | | | |
Year Ended 10/31/2014 | | | $ | 12.53 | | | | $ | 0.18 | | | | $ | (0.02 | ) | | | $ | 0.16 | | | | $ | (0.18 | ) | | | $ | (0.07 | ) |
Year Ended 10/31/2013 | | | | 12.62 | | | | | 0.15 | | | | | (0.09 | ) | | | | 0.06 | | | | | (0.15 | ) | | | | – | |
Year Ended 10/31/2012 | | | | 12.41 | | | | | 0.19 | | | | | 0.20 | | | | | 0.39 | | | | | (0.18 | ) | | | | – | |
Year Ended 10/31/2011 | | | | 12.58 | | | | | 0.28 | | | | | (0.17 | ) | | | | 0.11 | | | | | (0.28 | ) | | | | – | |
Year Ended 10/31/2010 | | | | 12.24 | | | | | 0.38 | | | | | 0.34 | | | | | 0.72 | | | | | (0.38 | ) | | | | – | |
| | | | | | |
Institutional Class Shares | | | | | | | | | | | | | | | | | | | | | | | | | | | | | | |
Year Ended 10/31/2014 | | | | 12.53 | | | | | 0.21 | | | | | (0.02 | ) | | | | 0.19 | | | | | (0.21 | ) | | | | (0.07 | ) |
Year Ended 10/31/2013 | | | | 12.62 | | | | | 0.18 | | | | | (0.09 | ) | | | | 0.09 | | | | | (0.18 | ) | | | | – | |
Year Ended 10/31/2012 | | | | 12.40 | | | | | 0.22 | | | | | 0.21 | | | | | 0.43 | | | | | (0.21 | ) | | | | – | |
Year Ended 10/31/2011 | | | | 12.58 | | | | | 0.31 | | | | | (0.18 | ) | | | | 0.13 | | | | | (0.31 | ) | | | | – | |
Year Ended 10/31/2010 | | | | 12.23 | | | | | 0.42 | | | | | 0.34 | | | | | 0.76 | | | | | (0.41 | ) | | | | – | |
MONEY MARKET FUND | | | | | | | | | | | | | | | | | | | | | | | | | | | | | | |
Class A Shares | | | | | | | | | | | | | | | | | | | | | | | | | | | | | | |
Year Ended 10/31/2014 | | | | 1.00 | | | | | – | | | | | – | | | | | – | | | | | – | | | | | – | |
Year Ended 10/31/2013 | | | | 1.00 | | | | | – | | | | | – | | | | | – | | | | | – | | | | | – | |
Year Ended 10/31/2012 | | | | 1.00 | | | | | – | | | | | – | | | | | – | | | | | – | | | | | – | |
Year Ended 10/31/2011 | | | | 1.00 | | | | | – | | | | | – | | | | | – | | | | | – | | | | | – | |
Year Ended 10/31/2010 | | | | 1.00 | | | | | – | | | | | – | | | | | – | | | | | – | | | | | – | |
| | | | | | |
Institutional Class Shares | | | | | | | | | | | | | | | | | | | | | | | | | | | | | | |
Year Ended 10/31/2014 | | | | 1.00 | | | | | – | | | | | – | | | | | – | | | | | – | | | | | – | |
Year Ended 10/31/2013 | | | | 1.00 | | | | | – | | | | | – | | | | | – | | | | | – | | | | | – | |
Year Ended 10/31/2012 | | | | 1.00 | | | | | – | | | | | – | | | | | – | | | | | – | | | | | – | |
Year Ended 10/31/2011 | | | | 1.00 | | | | | – | | | | | – | | | | | – | | | | | – | | | | | – | |
Year Ended 10/31/2010 | | | | 1.00 | | | | | – | | | | | – | | | | | – | | | | | – | | | | | – | |
(a) | The amount shown may not correlate with the change in aggregate gains and losses of portfolio securities due to the timing of sales and redemptions of fund shares. |
* | All per share amounts have been rounded to the nearest cent. |
The accompanying Notes to Financial Statements are an integral part of this statement.
312
THRIVENT MUTUAL FUNDS
FINANCIAL HIGHLIGHTS –CONTINUED
| | | | | | | | | | | | | | | | | | | | | | |
| | | RATIOS/SUPPLEMENTAL DATA |
| | | | | | | | | | | | Ratio to Average Net
Assets** | | Ratios to Average Net
Assets Before Expenses
Waived, Credited or Paid
Indirectly** | | |
Total
Distributions | | Net Asset
Value, End of
Period | | | Total
Return(b) | | | Net Assets, End of Period
(in millions) | | | Expenses | | Net Investment
Income/(Loss) | | Expenses | | Net Investment
Income/(Loss) | | Portfolio
Turnover Rate |
| | | | | | | | | | | | | | | | | | | | | | |
| | | | | | | | | | | | | | | | | | | | | | |
$(0.25) | | | $12.44 | | | | 1.27% | | | | $360.2 | | | 0.62% | | 1.44% | | 0.62% | | 1.44% | | 102% |
(0.15) | | | 12.53 | | | | 0.46% | | | | 415.6 | | | 0.60% | | 1.21% | | 0.61% | | 1.20% | | 121% |
(0.18) | | | 12.62 | | | | 3.18% | | | | 408.2 | | | 0.60% | | 1.51% | | 0.61% | | 1.50% | | 113% |
(0.28) | | | 12.41 | | | | 0.87% | | | | 344.8 | | | 0.61% | | 2.20% | | 0.61% | | 2.19% | | 109% |
(0.38) | | | 12.58 | | | | 5.97% | | | | 272.7 | | | 0.64% | | 3.09% | | 0.64% | | 3.09% | | 131% |
| | | | | | | | |
| | | | | | | | | | | | | | | | | | | | | | |
(0.28) | | | 12.44 | | | | 1.52% | | | | 467.3 | | | 0.37% | | 1.69% | | 0.37% | | 1.69% | | 102% |
(0.18) | | | 12.53 | | | | 0.70% | | | | 448.1 | | | 0.37% | | 1.44% | | 0.37% | | 1.44% | | 121% |
(0.21) | | | 12.62 | | | | 3.52% | | | | 472.6 | | | 0.36% | | 1.77% | | 0.36% | | 1.77% | | 113% |
(0.31) | | | 12.40 | | | | 1.05% | | | | 584.7 | | | 0.35% | | 2.45% | | 0.36% | | 2.45% | | 109% |
(0.41) | | | 12.58 | | | | 6.35% | | | | 530.8 | | | 0.36% | | 3.38% | | 0.37% | | 3.38% | | 131% |
| | | | | | | | | | | | | | | | | | | | | | |
| | | | | | | | | | | | | | | | | | | | | | |
– | | | 1.00 | | | | 0.00% | | | | 422.7 | | | 0.19% | | 0.00% | | 0.94% | | (0.75)% | | N/A |
– | | | 1.00 | | | | 0.00% | | | | 469.0 | | | 0.23% | | 0.00% | | 0.94% | | (0.71)% | | N/A |
– | | | 1.00 | | | | 0.00% | | | | 493.9 | | | 0.29% | | 0.00% | | 0.93% | | (0.64)% | | N/A |
– | | | 1.00 | | | | 0.00% | | | | 587.9 | | | 0.30% | | 0.00% | | 0.93% | | (0.63)% | | N/A |
– | | | 1.00 | | | | 0.00% | | | | 717.0 | | | 0.30% | | 0.00% | | 0.88% | | (0.57)% | | N/A |
| | | | | | | | |
| | | | | | | | | | | | | | | | | | | | | | |
– | | | 1.00 | | | | 0.00% | | | | 6.2 | | | 0.19% | | 0.00% | | 0.61% | | (0.42)% | | N/A |
– | | | 1.00 | | | | 0.00% | | | | 6.5 | | | 0.23% | | 0.00% | | 0.59% | | (0.37)% | | N/A |
– | | | 1.00 | | | | 0.00% | | | | 12.5 | | | 0.29% | | 0.00% | | 0.58% | | (0.29)% | | N/A |
– | | | 1.00 | | | | 0.00% | | | | 11.6 | | | 0.30% | | 0.00% | | 0.56% | | (0.27)% | | N/A |
– | | | 1.00 | | | | 0.00% | | | | 14.5 | | | 0.30% | | 0.00% | | 0.52% | | (0.22)% | | N/A |
(b) | Total investment return assumes dividend reinvestment and does not reflect any deduction for applicable sales charges. Not annualized for periods less than one year. |
** | Computed on an annualized basis for periods less than one year. |
The accompanying Notes to Financial Statements are an integral part of this statement.
313
ADDITIONAL INFORMATION
(unaudited)
Shareholder Notification of Federal Tax Information
The following information is provided solely to satisfy the requirements set forth by the Internal Revenue Code. Shareholders will be provided information regarding their distributions in January 2015.
The Funds designate the following percentages of dividends declared from net investment income as dividends qualifying for the 70% dividends received deduction for corporations or as qualified dividend income for individuals under the Jobs and Growth Tax Relief Reconciliation Act of 2003 for the tax period ending October 31, 2014:
| | | | | | | | |
Fund | | Dividends
Received
Deduction for
Corporations | | | Qualified
Dividend
Income for
Individuals | |
Aggressive Allocation | | | 39 | % | | | 50 | % |
Moderately Aggressive Allocation | | | 19 | % | | | 30 | % |
Moderate Allocation | | | 15 | % | | | 25 | % |
Moderately Conservative Allocation | | | 10 | % | | | 17 | % |
Balanced Income Plus | | | 15 | % | | | 19 | % |
Opportunity Income Plus | | | 2 | % | | | 2 | % |
Partner Emerging Markets Equity | | | 0 | % | | | 100 | % |
Partner Small Cap Growth | | | 20 | % | | | 21 | % |
Partner Small Cap Value | | | 100 | % | | | 100 | % |
Mid Cap Growth | | | 95 | % | | | 99 | % |
Partner Mid Cap Value | | | 15 | % | | | 16 | % |
Mid Cap Stock | | | 100 | % | | | 100 | % |
Partner Worldwide Allocation | | | 0 | % | | | 100 | % |
Large Cap Growth | | | 100 | % | | | 100 | % |
Large Cap Value | | | 100 | % | | | 100 | % |
Large Cap Stock | | | 51 | % | | | 58 | % |
High Yield | | | 1 | % | | | 1 | % |
Income | | | 2 | % | | | 2 | % |
Limited Maturity Bond | | | 1 | % | | | 2 | % |
The Municipal Bond Fund designates 99.33% of the dividends declared from net investment income as exempt from federal income tax for the tax period ended October 31, 2014.
Pursuant to IRC 852(b)(3) of the Internal Revenue Code, the Funds hereby designate the following amounts as long-term capital gains distributed during the year ended October 31, 2014, or if subsequently determined to be different, the net capital gain of such year:
| | | | |
Fund | | Distributions of Long-Term
Capital Gains | |
Aggressive Allocation | | | $19,664,445 | |
Moderately Aggressive Allocation | | | 38,715,603 | |
Moderate Allocation | | | 28,989,544 | |
Moderately Conservative Allocation | | | 12,711,369 | |
Balanced Income Plus | | | 14,369,018 | |
Partner Small Cap Growth | | | 31,569,531 | |
Partner Small Cap Value | | | 10,485,842 | |
Small Cap Stock | | | 3,239,087 | |
Mid Cap Growth | | | 47,993,909 | |
Partner Mid Cap Value | | | 20,424,078 | |
Mid Cap Stock | | | 7,232,000 | |
Large Cap Value | | | 886,503 | |
Large Cap Stock | | | 126,662,661 | |
Government Bond | | | 1,228,454 | |
Limited Maturity Bond | | | 4,999,009 | |
These amounts may include earnings and profits distributed to shareholders on the redemption of shares as part of the dividend paid deduction.
Proxy Voting
The policies and procedures that the Trust uses to determine how to vote proxies relating to portfolio securities are attached to the Trust’s Statement of Additional Information. You may request a free copy of the Statement of Additional Information or the report of how the Trust voted proxies relating to portfolio securities during the most recent 12-month period ended June 30 by calling 1-800-847-4836. You also may review the Statement of Additional Information or the report of how the Trust voted proxies relating to portfolio securities during the most recent 12-month period ended June 30 at www. thrivent.com or www.sec.gov.
Quarterly Schedule of Portfolio Holdings
The Trust files its Schedule of Portfolio Holdings on Form N-Q with the SEC for the first and third quarters of each fiscal year. You may request a free copy of the Trust’s Forms N-Q by calling 1-800-847-4836. The Trust’s most recent Form N-Q Schedule of Investments also is at www.thrivent.com or www. sec.gov. You also may review and copy the Forms N-Q for the Trust at the SEC’s Public Reference Room in Washington, DC. You may get information about the operation of the Public Reference Room by calling 1-800-SEC-0330.
314
BOARDOF TRUSTEESAND OFFICERS
The following table provides information about the Trustees and Officers of the Trust. Each Trustee oversees each of the 26 series of the Trust and also serves as:
| | • | | Director of Thrivent Series Fund, Inc., a registered investment company consisting of 33 portfolios that serve as underlying funds for variable contracts issued by Thrivent Financial for Lutherans (“Thrivent Financial”) and Thrivent Life Insurance Company and investment options in the retirement plan offered by Thrivent Financial, and |
| | • | | Trustee of Thrivent Cash Management Trust, a registered investment company consisting of one portfolio that serves as a cash collateral fund for a securities lending program sponsored by Thrivent Financial. |
The 26 series of the Trust, the 33 portfolios of Thrivent Series Fund, Inc. and Thrivent Cash Management Trust are referred to herein as the “Fund Complex.” The Statement of Additional Information includes additional information about the Trustees and is available, without charge, by calling 1-800-847-4836.
Interested Trustee (1)(2)(3)(4)
| | |
Name (Year of Birth) Year Elected | | Principal Occupation(s) and Directorships of Public Companies and Other Investment Companies
During the Past Five Years |
Russell W. Swansen (1957) 2008 | | Senior Vice President and Chief Investment Officer, Thrivent Financial since 2003. |
|
Independent Trustees (2)(3)(4)(5) |
| |
Name (Year of Birth) Year Elected | | Principal Occupation(s) and Directorships of Public Companies and Other Investment Companies
During the Past Five Years |
Janice B. Case (1952) 2011 | | Independent Trustee of North American Electric Reliability Corporation (self-regulatory organization) since 2008. |
Richard L. Gady (1943) 1987 | | Retired. |
Richard A. Hauser (1943) 2004 | | Vice President and Assistant General Counsel, The Boeing Company since 2007. |
Marc S. Joseph (1960) 2011 | | Managing Director of Granite Ridge LLP (consulting and advisory firm) since 2009; Managing Director of Triangle Crest (private investing and consulting firm) since 2004. |
Paul R. Laubscher (1956) 2009 | | Portfolio Manager for U.S. private real estate portfolios of IBM Retirement Funds. |
James A. Nussle (1960) 2011 | | President and Chief Operating Officer of Growth Energy (trade association) since 2010; Advisory Board member of VISTA Capital Partners (private equity firm) since 2010; Contributor on CNBC (media) since 2010; CEO of The Nussle Group LLC (consulting firm) since 2009. |
Douglas D. Sims (1946) 2006 | | Currently, Director of Keystone Science School. Previously, Director of the Center for Corporate Excellence. |
Constance L. Souders (1950) 2007 | | Retired. |
315
BOARDOF TRUSTEESAND OFFICERS
Executive Officers (4)
| | |
Name (Year of Birth) Position Held With Thrivent | | Principal Occupation(s) During the Past Five Years |
Russell W. Swansen (1957) President | | Senior Vice President and Chief Investment Officer, Thrivent Financial since 2003. |
David S. Royal (1971) Secretary and Chief Legal Officer | | Vice President, Deputy General Counsel since 2006; Interim Investment Company and Investment Adviser Chief Compliance Officer from May 2010 until December 2010. |
Gerard V. Vaillancourt (1967) Treasurer and Principal Accounting Officer | | Vice President, Mutual Fund Accounting since 2006. |
Ted S. Dryden (1965) Chief Compliance Officer | | Investment Company and Investment Adviser Chief Compliance Officer, Thrivent Financial since December 2010; Chief Compliance Officer, OptumHealth Financial Services from 2009 to 2010; Vice President, Asset Management Compliance, Ameriprise Financial from 2006 to 2009. |
Janice M. Guimond (1965) Vice President | | Vice President, Investment Operations, Thrivent Financial since 2004. |
Kathleen M. Koelling (1977) Anti-Money Laundering Officer (6) | | Privacy and Anti-Money Laundering Officer, Thrivent Financial since 2011; Senior Counsel, Thrivent Financial since 2002. |
Mark D. Anema (1961) Vice President | | Vice President, New Product Management and Development, Thrivent Financial since 2007. |
Karen L. Larson (1965) Assistant Vice President | | Vice President, Member and Field Support Services, Thrivent Financial since 2010; Vice President, Thrivent Brokerage Managed Accounts from 2009 to 2010. |
Michael W. Kremenak (1978) Assistant Secretary | | Senior Counsel, Thrivent Financial since January 2013; Vice President and Assistant General Counsel at Nuveen Investments 2011 until 2013; Attorney at FAF Advisors 2009 to 2010; Associate at Skadden, Arps, Slate, Meagher & Flom 2005 to 2009. |
James M. Odland (1955) Assistant Secretary | | Vice President and Managing Counsel, Thrivent Financial since 2005. |
Todd J. Kelly (1969) Assistant Treasurer (6) | | Director, Fund Accounting Operations, Thrivent Financial since 2002. |
Sarah L. Bergstrom (1977) Assistant Treasurer | | Director, Fund Accounting Administration, Thrivent Financial since 2007. |
(1) | “Interested Trustee” of the Fund as defined in the investment Company Act of 1940 by virtue of positions with Thrivent Financial. Mr. Swansen is considered an interested trustee because of his principal occupation with Thrivent Financial. |
(2) | Each Trustee serves an indefinite term until her or his successor is duly elected and qualified. Trustees serve at the discretion of the board until their successors are duly appointed and qualified. |
(3) | Each Trustee oversees 60 portfolios. |
(4) | The address for each Trustee and Officer unless otherwise noted is 625 Fourth Avenue South, Minneapolis, MN 55415 |
(5) | The Trustees other than Mr. Swansen are not “interested trustees” of the Fund and are referred to as “Independent Trustees.” |
(6) | The address for this Officer is 4321 North Ballard Road, Appleton, WI 54913 |
316
Thrivent Mutual Funds
Supplement to
Class A Shares Prospectus and
Institutional Class Shares Prospectus,
each dated February 28, 2014
with respect to
Thrivent Limited Maturity Bond Fund
The following changes are hereby made to the sections of the prospectus describing Thrivent Limited Maturity Bond Fund (the “Fund”):
1. The first two sentences under “Principal Strategies” in the “Summary Section” and in “More about Investment Strategies and Risks” describing the Fund are deleted and replaced with the following two sentences:
The principal strategies of the Fund are to invest in investment-grade corporate bonds, government bonds, mortgage-backed securities (including commercially backed ones), asset-backed securities, and collateralized debt obligations (including collateralized loan obligations). Asset-backed securities are securities backed by notes or receivables originated by banks, credit card companies, or other providers of credit; collateralized debt obligations are types of asset-backed securities.
2. The following risk is added under “Principal Risks” in the “Summary Section” describing the Fund and under “Glossary of Principal Risks:
Collateralized Debt Obligations Risk: The risks of an investment in a collateralized debt obligation (“CDO”) depend largely on the quality and type of the collateral and the tranche of the CDO in which the Fund invests. In addition to the typical risks associated with fixed income securities and asset-backed securities, CDOs carry additional risks including, but not limited to: (i) the possibility that distributions from collateral securities will not be adequate to make interest or other payments; (ii) the risk that the collateral may default, decline in value, and/or be downgraded; (iii) the Fund may invest in tranches of CDOs that are subordinate to other tranches; (iv) the structure and complexity of the transaction and the legal documents could lead to disputes among investors regarding the characterization of proceeds; (v) the investment return achieved by the Fund could be significantly different than those predicted by financial models; (vi) the lack of a readily available secondary market for CDOs; (vii) risk of forced “fire sale” liquidation due to technical defaults such as coverage test failures; and (viii) the CDO’s manager may perform poorly.
3. The following is inserted in “Other Securities and Investment Practices”:
Collateralized Debt Obligations: Thrivent Limited Maturity Bond Fund may invest in collateralized debt obligations (“CDOs”) as a principal strategy. CDOs are types of asset-backed securities. Collateralized loan obligations (“CLOs”) are ordinarily issued by a trust or other special purpose entity and are typically collateralized by a pool of loans, which may include, among others, domestic and non-U.S. senior secured loans, senior unsecured loans, and subordinate corporate loans, including loans that may be rated below investment grade or equivalent unrated loans, held by such issuer. Normally, collateralized bond obligations (“CBOs”), CLOs and other CDOs are privately offered and sold, and thus are not registered under the securities laws. As a result, investments in CDOs may be characterized by the Fund as illiquid securities.
The date of this Supplement is November 19, 2014.
Please include this Supplement with your Prospectus.
317

As of the end of the period covered by this report, registrant has adopted a code of ethics (as defined in Item 2 of Form N-CSR) applicable to registrant’s Principal Executive Officer, Principal Financial Officer and Principal Accounting Officer. No waivers were granted to such code of ethics during the period covered by this report. A copy of this code of ethics is filed as an exhibit to this Form N-CSR.
| Item 3. | Audit Committee Financial Expert |
Registrant’s Board of Trustees has determined that Constance L. Souders, an independent trustee, is the Audit Committee Financial Expert.
| Item 4. | Principal Accountant Fees and Services |
The aggregate fees billed by registrant’s independent public accountants, PricewaterhouseCoopers LLP (“PwC”), for the fiscal year ended October 31, 2013 and the fiscal year ended October 31, 2014, for professional services rendered in connection with the audit of registrant’s annual financial statements or services that are normally provided by the accountant in connection with statutory and regulatory filings or engagements were $357,150.67 and $371,291.02, respectively.
The aggregate fees PwC billed to registrant for the fiscal year ended October 31, 2013 and the fiscal year ended October 31, 2014, for assurance and other services that are reasonably related to the performance of registrant’s audit and are not reported under Item 4(a), were $3,620.52 for 2013 and $0 for 2014. The payments during the fiscal year ended October 31, 2013 were for testing of an accounting system conversion. The aggregate fees PwC billed to registrant’s investment adviser and any entity controlling, controlled by, or under common control with registrant’s investment adviser for the fiscal year ended October 31, 2013 and the fiscal year ended October 31, 2014, for assurance and other services directly related to the operations and financial reporting of registrant, were $0 for each respective period.
The aggregate tax fees PwC billed to registrant for the fiscal year ended October 31, 2013 and the fiscal year ended October 31, 2014, for tax compliance, tax advice and tax planning services, were $113,967.00 and $119,952.75, respectively. The aggregate tax fees PwC billed to registrant’s investment adviser and any entity controlling, controlled by, or under common control with registrant’s investment adviser for the fiscal year ended October 31, 2013 and the fiscal year ended October 31, 2014, for services directly related to the operations and financial reporting of registrant, were $0 for each respective period.
The aggregate fees PwC billed to registrant for the fiscal year ended October 31, 2013 and the fiscal year ended October 31, 2014 for products and services provided, other than the services reported in paragraphs (a) through (c) of this item, were $0 for each respective period. The aggregate fees PwC billed to registrant’s investment adviser and any entity controlling, controlled by, or under common control with registrant’s investment adviser for the fiscal year ended October 31, 2013 and the fiscal year ended October 31, 2014, for products and services provided, other than the services reported in paragraphs (a) through (c) of this item, were $6,450.00 and $3,600.00, respectively. These payments were for access to a PwC-sponsored online library that provides interpretive guidance regarding U.S. and foreign accounting standards. For 2013, these payments also included services provided related to the mergers of certain series of Thrivent Series Fund, Inc. These figures are also reported in response to Item 4(g) below.
| | (e) | Registrant’s audit committee charter provides that the audit committee (comprised of the independent Trustees of registrant) is responsible for pre-approval of all auditing services performed for the registrant. The audit committee also is responsible for pre-approval (subject to the de minimis exceptions for non-audit services described in Section 10A(i)(1)(B) of the Securities Exchange Act of 1934) of all non-auditing services performed for the registrant or an affiliate of registrant. In addition, registrant’s audit committee charter permits a designated member of the audit committee to pre-approve, between meetings, one or more audit or non-audit service projects, subject to an expense limit and notification to the audit committee at the next committee meeting. Registrant’s audit committee pre-approved all fees described above that PwC billed to registrant. |
| | (f) | Less than 50% of the hours billed by PwC for auditing services to registrant for the fiscal year ended October 31, 2014 were for work performed by persons other than full-time permanent employees of PwC. |
| | (g) | The aggregate non-audit fees billed by PwC to registrant and to registrant’s investment adviser and any entity controlling, controlled by, or under common control with registrant’s investment adviser for the fiscal year ended October 31, 2013 and the fiscal year ended October 31, 2014 were $6,450.00 and $3,600.00 for each respective period. These figures are also reported in response to Item 4(d) above. |
| | (h) | Registrant’s audit committee has considered the non-audit services provided to the registrant and registrant’s investment adviser and any entity controlling, controlled by, or under common control with registrant’s investment adviser as described above and determined that these services do not compromise PwC’s independence. |
| Item 5. | Audit Committee of Listed Registrants |
Not applicable.
| Item 6. | Schedule of Investments |
| | (a) | Registrant’s Schedule of Investments is included in the report to shareholders filed under Item 1. |
| | (b) | Not applicable to this filing. |
| Item 7. | Disclosure of Proxy Voting Policies and Procedures for Closed-End Management Investment Companies |
Not applicable.
| Item 8. | Portfolio Managers of Closed-End Management Investment Companies |
Not applicable.
| Item 9. | Purchases of Equity Securities by Closed-End Management Investment Company and Affiliated Purchasers. |
Not applicable.
| Item 10. | Submission of Matters to a Vote of Security Holders |
There have been no material changes to the procedures by which shareholders may recommend nominees to registrant’s board of trustees.
| Item 11. | Controls and Procedures |
(a)(i) Registrant’s President and Treasurer have concluded that registrant’s disclosure controls and procedures (as defined in Rule 30a-3(c) under the Investment Company Act of 1940) are effective, based on their evaluation of these controls and procedures as of a date within 90 days of the filing date of this report.
(a)(ii) Registrant’s President and Treasurer are aware of no change in registrant’s internal control over financial reporting (as defined in Rule 30a-3(d) under the Investment Company Act of 1940) that occurred during registrant’s most recent fiscal quarter that has materially affected, or is reasonably likely to materially affect, registrant’s internal control over financial reporting.
| | (a) | The code of ethics pursuant to Item 2 is attached hereto. |
| | (b) | Certifications pursuant to Rules 30a-2(a) and 30a-2(b) under the Investment Company Act of 1940 are attached hereto. |
SIGNATURES
Pursuant to the requirements of the Securities Exchange Act of 1934 and the Investment Company Act of 1940, the registrant has duly caused this report to be signed on its behalf by the undersigned, thereunto duly authorized.
| | | | |
| Date: December 29, 2014 | | THRIVENT MUTUAL FUNDS |
| | |
| | By: | | /s/ Russell W. Swansen |
| | | | Russell W. Swansen |
| | | | President |
Pursuant to the requirements of the Securities Exchange Act of 1934 and the Investment Company Act of 1940, this report has been signed below by the following persons on behalf of the registrant and in the capacities and on the dates indicated.
| | | | |
Date: December 29, 2014 | | | | |
| | By: | | /s/ Russell W. Swansen |
| | | | Russell W. Swansen |
| | | | President |
| | | | |
Date: December 29, 2014 | | | | |
| | By: | | /s/ Gerard V. Vaillancourt |
| | | | Gerard V. Vaillancourt |
| | | | Treasurer |