UNITED STATES
SECURITIES AND EXCHANGE COMMISSION
Washington, D.C. 20549
FORM N-CSR
CERTIFIED SHAREHOLDER REPORT OF REGISTERED MANAGEMENT INVESTMENT COMPANIES
| | |
| Investment Company Act file number: | | 811-05075 |
Thrivent Mutual Funds
(Exact name of registrant as specified in charter)
| | |
625 Fourth Avenue South Minneapolis, Minnesota | | 55415 |
| (Address of principal executive offices) | | (Zip code) |
Rebecca A. Paulzine
625 Fourth Avenue South
Minneapolis, Minnesota 55415
(Name and address of agent for service)
Registrant’s telephone number, including area code: (612) 844-5168
Date of fiscal year end: December 31
Date of reporting period: December 31, 2012
| Item 1. | Report to Stockholders |

Table of Contents
Dear Shareholder:
The financial markets turned in a strong performance in 2012, with virtually every asset class generating positive returns. In this letter, I will provide a brief review of the period, as well as our outlook for the coming year.
Economic Review
The U.S. economy continued to grow at a moderate pace in 2012, aided by the Federal Reserve’s policy of keeping interest rates at extraordinarily low levels to stimulate spending and lower borrowing costs.
While the economy’s gains were sufficient to encourage optimists, they were not enough to put the 2007-2009 recession finally and fully in the rearview mirror. The nation’s gross domestic product (GDP) has been growing at about a 2% average annual rate over the past three years. That is about half the rate that would be needed to close, in a three-year period, the gap between what the economy is producing and what it could be producing if the recession had not occurred.
Economic activity did accelerate in the third quarter of last year, according to the Commerce Department’s Bureau of Economic Analysis, with GDP rising at a revised annual rate of 3.1%, up from 2.0% and 1.3% in the first and second quarters, respectively. This marked the 13th consecutive quarter of economic growth, with third-quarter gains driven largely by higher levels of personal consumption spending along with improvements in private inventory investment, federal government spending, residential fixed investment and exports.
Still, progress on the unemployment front remained muted. By December 2012 the unemployment rate stood at 7.8%, according to the early estimate from the Bureau of Labor Statistics, down only modestly from 8.5% a year earlier. The economy has replaced only about half the 8.4 million jobs lost during the 2007-2009 recession, prompting many Americans to feel like the U.S. is still mired in a downturn even though technically it is not.
Contributing to the lackluster employment picture was the continued reluctance of businesses to invest in their operations. Usually one of the main drivers of economic growth during a recovery, domestic investment shrank dramatically in 2012. Business leaders blamed uncertainty about the direction of federal tax and spending policy heading into the 2012 presidential election, and uncertainty about whether the health care mandates required by the Patient Protection and Affordable Care Act would be implemented if Republicans regained control of the White House.
Even in the month after President Obama’s reelection, the outlook on fiscal policy remained cloudy; it was not until the first week of January 2013 that Congress and the White House signed off on an agreement to avoid part of the so-called fiscal cliff—the package of tax increases and automatic spending cuts that began to take effect on January 1, 2013. Even that agreement was seen as a stopgap measure since it failed to deliver the comprehensive tax reform many business leaders say they want and only postponed the automatic spending cuts for two months.
Economic conditions in Europe and China were not helpful to the U.S. economy for most of 2012. Both regions are important to the U.S., because many U.S. companies depend upon them for a significant portion of their sales and profits. Parts of Europe slipped into a recession last year. China grew strongly by international standards, even accelerating in the fourth quarter, when its GDP expanded at a 7.9% rate year-over-year. Still, that was slow in comparison to the 10% gains it has averaged over most of the past three decades.
Market Review
Stock and bond markets both performed well in 2012, bolstered by relatively strong corporate profits and the Federal Reserve’s accommodative monetary stance.
The S&P 500, an index of large-company stocks, posted a total return of 16.00%. The Russell 2000® Index, which tracks small-company shares, generated a total return of 16.35%. Value stocks—those perceived to be trading below their intrinsic worth based on their sales, profits, dividends and other fundamental factors—generally outperformed growth stocks, with investors apparently concluding that value stocks would perform better if the economy took a turn for the worse. Dividend-paying stocks also did well, attracting not only equity investors but fixed-income investors looking for new sources of income. The S&P 500 Dividend Aristocrats Index posted a total return of 16.94%.
Despite the concerns in Europe and China, international stocks posted double-digit returns in both developed and emerging markets, with most of the gains coming in the second half of the year. The MSCI All Country World Index, excluding the U.S., generated a total return of 17.39%, while the MSCI Emerging Markets Index, which focuses on developing countries, returned 18.63%. Contributing to investor enthusiasm, especially in the fourth quarter, were these factors: bond-buying programs undertaken by the European Central Bank to reduce borrowing costs in Europe; the return to power of the Liberal Democratic Party in Japan, which is expected to pursue a policy of fiscal stimulus in that country; and a perception that China’s economy was stabilizing.
In the fixed-income markets, the Fed’s accommodative monetary policy was favorable for bonds across the credit spectrum. High-yield bonds were standout performers, as strong corporate profits depressed default risk and emboldened investors eager to take advantage of the high yields those bonds were offering relative to investment-grade securities. While the broad Barclays U.S. Aggregate Bond Index generated a total return of 4.22%, the Barclays U.S. Corporate High Yield Bond Index posted a total return of 15.81%.
2
U.S. Treasury bonds and short-term securities generated modest results for the year. The Barclays Long-Term Treasury Index returned 3.56%, the Barclays Government/Credit 1-3 Year Bond Index returned 1.26%, and money market funds, as measured by the Lipper Money Market Funds category, returned 0%.
Our outlook
The U.S. economy may no longer be in a recession, but it remains in the shadow of one, and we expect that to present a challenge to financial markets in 2013—especially if, as is widely expected, corporate profits begin to soften as productivity gains slow. Economists on average have been forecasting GDP growth of about 2% for the year. Our assessment of leading economic indicators suggests there is at least a chance that growth could come in higher, perhaps in the 2.5% to 3% range. Among the encouraging signals are improving fundamentals in the housing sector, which last year saw home prices rise, housing starts increase and foreclosures decrease. Although housing accounts for a relatively small portion of the GDP, its ripple effects give it an outsized impact on the economy. A positive trend in the ratio of household debt to disposable income also bodes well for economic improvement.
Even if the economy does better than expected, however, financial assets will have a difficult time matching the returns they delivered in 2012. In the fixed-income markets, especially, valuations were so high at the beginning of 2013, and yields so low, that it would be mathematically impossible for a repeat performance absent some extraordinary development. The Fed, for its part, has expressed commitment to its expansive monetary policy. It has said it plans to keep interest rates low until the unemployment rate falls to 6.5%, or until core inflation reaches 2.5%. Neither appears likely to happen in 2013.
In the stock market, prices have recovered much of what they lost during the 2007-2009 downturn. They remain below their pre-crash peak, though, and continue to exhibit high levels of volatility. Their attractive valuations—price-to-earnings ratios remain moderate—suggest that stocks should be able to generate returns in the mid to low single digits.
The ultimate performance of the stock market in the year ahead—and to some extent the performance of the bond market—will depend to a large degree on how much success Congress and the president have in crafting long-term tax and spending policies that begin to address our annual deficits and growing federal debt.
Businesses and investors had been hoping last year’s presidential election would bring new accord to Washington and greater clarity on this front, but the outcome produced little change, at least on the surface. Democrats retained control of the White House and the Senate, while Republicans retained control of the House of Representatives.
The good news is that the economy has plenty of room to grow if Washington is able to reach agreement on a responsible fiscal plan. Doing so would erase much of the uncertainty that has been constraining business investment, which in turn could lead to a surge in stock prices. The challenge for investors will be to ride out the uncertainty and market volatility that is likely to persist until and if such a resolution materializes.
If you are uncertain about how your portfolio is positioned to weather the months ahead, we encourage you to meet with your Thrivent Financial representative. He or she can help you set an asset allocation policy and choose investments that are appropriate for your goals and your tolerance for risk.
As always, thank you for the trust you have placed in our team of professionals at Thrivent Asset Management.
|
| Sincerely, |
|
 |
| Russell W. Swansen |
President and Chief Investment Officer Thrivent Mutual Funds |
3
Thrivent Natural Resources Fund
David C. Francis, CFA and Darren M. Bagwell, CFA, Portfolio Co-Managers
Thrivent Natural Resources Fund seeks long-term capital growth. All historical performance information on these pages prior to October 10, 2011, pertains to the predecessor Thrivent Real Estate Securities Fund.
Prior to October 10, 2011, the Fund was named Thrivent Real Estate Securities and invested, under normal circumstances, at least 80% of its net assets in securities of companies that were primarily engaged in the real estate industry. On October 10, 2011, the Fund adopted its current name and strategy, which includes investments concentrated in issuers in the natural resources industry; therefore, the Fund is more vulnerable to price changes in the securities of issuers in this industry and factors specific to this industry than a more broadly diversified portfolio. In addition, as a non-diversified fund, the Fund is susceptible to the risk that events affecting a particular issuer will significantly affect the Fund’s performance. These and other risks are described in the Fund’s prospectus. Views expressed in this discussion of fund performance are the views of this particular Fund’s management team.
How did the Fund perform during the 12-month period ended December 31, 2012?
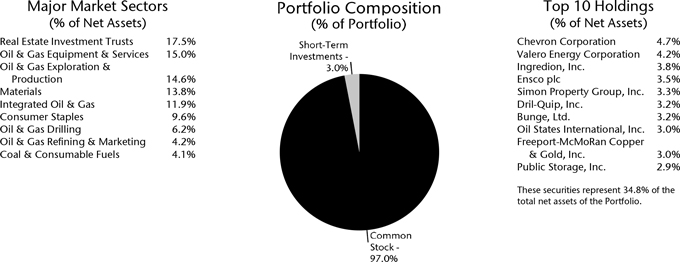
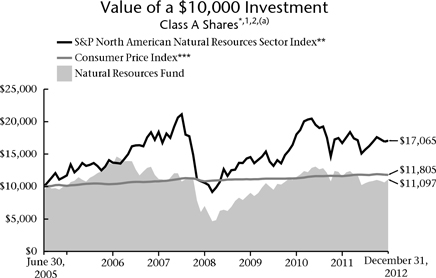
Thrivent Natural Resources Fund earned a return of -4.05%, compared with the median return of its peer group, the Lipper Natural Resources Funds category, of 2.20%. The Fund’s market benchmark, the S&P North American Natural Resources Sector Index, earned a return of 2.20%.
What factors affected the Fund’s performance?
Range-bound commodity prices caused investors to avoid most energy stocks during the year, particularly the more pro-cyclical holdings in the Fund. Oil prices fell, closing out the year at $92 per barrel, compared to prices of $99 at the start of the year. Natural gas prices finally found a bottom in April, trading as low as $1.80 per mcf (one thousand cubic feet) before rallying to finish the year at $3.30 per mcf. But even that was well below the $4.90 per mcf natural gas traded at as recently as 2011. The Fund was aggressively positioned to benefit from the success of the U.S. domestic oil and gas revolution, but to the degree many of these companies benefited from higher production volumes, they were often held back by low prices.
Some of the same macroeconomic concerns that weighed on oil prices also benefited more defensive integrated energy companies where the Fund was lightly positioned. And the Fund’s allocation to coal producers also detracted from performance, as persistent weakness in natural gas prices and fears of an economic slowdown in China caused coal equities to trade significantly below our estimates of asset value.
Somewhat mitigating the performance of energy equities was solid security selection in the Fund’s smaller exposures to consumer staples and REITs. Global food ingredient manufacturers Ingredion and Bunge enjoyed robust global demand in a very tight food and crop market that was exacerbated by historical drought conditions. The entire REIT sector enjoyed a positive re-rating as global uncertainty and risk aversion created demand for yield-focused equities.
What is your outlook?
We believe the U.S. oil and natural gas production revolution will continue in 2013 and create winners and
Quoted Fund performance is for Class A shares and does not reflect a sales charge.
The returns shown do not reflect taxes a shareholder would pay on distributions or redemptions.
Quoted Major Market Sectors, Portfolio Composition and Top 10 Holdings are subject to change.
The lists of Major Market Sectors and Top 10 Holdings exclude short-term investments and collateral held for securities loaned.
The Portfolio Composition chart excludes collateral held for securities loaned.
4
losers in the industry. We favor select investments in producers demonstrating the strongest and most efficient growth in oil and natural gas production. We are also investing in oil service companies positioned to benefit from the increasing number of oil and gas wells drilled in the U.S. each year. At the same time, the recovery in drilling in the Gulf of Mexico nearly three years after the Macondo disaster echoes growth in deepwater activity in other regions around the world. There appears to be strong momentum behind this activity, and the Fund has investments in companies poised to benefit.
More broadly, we remain cautious, believing domestic growth will not exceed 2% in real terms—in part due to fiscal and regulatory headwinds; recessionary conditions in Europe; and slower consumer spending. Exports to emerging markets and domestic housing are wild cards that could provide economic tailwinds, and prove our expectations too pessimistic; the Fund’s continued holdings in agricultural equities and REITs play to these potentials.
Portfolio Facts
As of December 31, 2012
| | | | |
| | | Class A | | Institutional Class |
Ticker | | TREFX | | TREIX |
Transfer Agent ID | | 069 | | 469 |
Net Assets | | $14,875,595 | | $79,086,485 |
NAV | | $9.13 | | $9.13 |
NAV - High† | | 2/6/2012 - $10.54 | | 2/6/2012 - $10.54 |
NAV - Low† | | 6/25/2012 - $8.14 | | 6/25/2012 - $8.16 |
Number of Holdings: 39 | | | | |
| | † | For the year ended December 31, 2012 |
Average Annual Total Returns1,2
As of December 31, 2012
| | | | | | |
Class A3 | | 1-Year | | 5 Years | | From Inception
6/30/2005 |
without sales charge | | -4.05% | | -0.12% | | 2.16% |
with sales charge | | -9.36% | | -1.24% | | 1.40% |
| | | |
Institutional Class4 | | 1-Year | | 5 Years | | From Inception
6/30/2005 |
Net Asset Value | | -3.71% | | 0.17% | | 2.51% |
| 1 | Past performance is not an indication of future results. Average annual total returns represent past performance and reflect changes in share prices, the reinvestment of all dividends and capital gains, and the effects of compounding. The prospectus contains more complete information on the investment objectives, risks, charges and expenses of the investment company, which investors should read and consider carefully before investing. To obtain a prospectus, contact a registered representative or visit www.thrivent.com. At various times, the Fund’s adviser waived its management fee and/or reimbursed Fund expenses. Had the adviser not done so, the Fund’s total returns would have been lower. The returns shown do not reflect taxes a shareholder would pay on distributions or redemptions. Total investment return and principal value of your investment will fluctuate, and your shares, when redeemed, may be worth more or less than their original cost. Current performance may be higher or lower than the performance data quoted. Call 800-THRIVENT or visit www.thrivent.com for performance results current to the most recent month-end. |
| 2 | Prior to October 10, 2011, the Fund, as a real estate securities fund, invested primarily in real estate-related securities. |
| 3 | Class A performance with sales charge reflects the maximum sales charge of 5.5%. |
| 4 | Institutional Class shares have no sales load and are for institutional shareholders only. |
| (a) | Performance of other classes will be greater or less than the line shown based on the differences in loads and fees paid by shareholders investing in the different classes. |
| * | As you compare performance, please note that the Fund’s performance reflects the maximum 5.5% sales charge, while the Consumer Price Index and the S&P North American Natural Resources Sector Index do not reflect any such charges. If you were to purchase any of the above individual stocks or funds represented in the Index, any charges you would pay would reduce your total return as well. |
| ** | The S&P North American Natural Resources Sector Index is an index of selected U.S. traded natural resource related stocks. The product is not sponsored, endorsed or promoted by Standard & Poor’s, and Standard & Poor’s makes no representation regarding the advisability of investing in the product. It is not possible to invest directly in the Index. The performance of this Index does not reflect deductions for fees, expenses or taxes. |
| *** | The Consumer Price Index is an inflationary indicator that measures the change in the cost of a fixed basket of products and services, including housing, electricity, food and transportation. It is not possible to invest directly in the Index. |
5
Thrivent Equity Income Plus Fund
David R. Spangler, CFA and Kevin R. Brimmer, FSA, Portfolio Co-Managers
The Fund seeks income plus long-term capital growth.
The Fund may invest in, among others, REITs, preferred stocks and foreign (including emerging market) stocks. These investments are subject to unique risks. The Fund may also sell covered options on any securities in which the Fund invests. Successful use of this strategy can augment Fund return but can also magnify losses if executed incorrectly. These and other risks are described in the Fund’s prospectus. Views expressed in this discussion of fund performance are the views of this particular Fund’s management team.
How did the Fund perform during the 12-month period ended December 31, 2012?
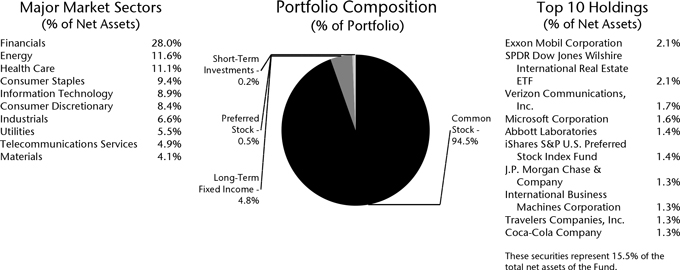
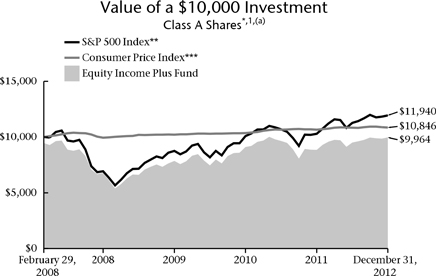
Thrivent Equity Income Plus Fund earned a return of 12.60%, compared with the median return of its peer group, the Lipper Equity Income Funds category, of 12.59%. The Fund’s market benchmark, the S&P 500 Index, earned a return of 16.00%.
What factors affected the Fund’s performance?
The Fund is constructed as a multi-asset class product in the same way as an asset allocation portfolio, with separate investment strategies for domestic and international dividend equity, domestic and international REITs, and preferred stocks. Together, these assets classes should provide greater diversification than any one asset class alone.
In 2012, domestic dividend equity trailed its benchmark with poor stock selection in consumer staples, utilities and financials. International relative performance was somewhat below benchmark, too, with both energy and financials lagging. The Fund was underweighted in European banks, which performed very well in the second half of the year, and overweighted in energy, which performed poorly.
Adding value to the Fund were preferred stocks and the portfolio’s options buy-write strategy. Within preferred stocks, domestic banks performed very well as overall credit performed well throughout the year. Finally, the Fund holds very little cash, which added relative performance versus the Fund’s peer group.
What is your outlook?
Lost in the headlines on the fiscal cliff and debt ceiling debates is that economic data has been improving, including housing, energy prices, durable goods orders, gross domestic product (GDP) and continuing jobless claims. We anticipate a positive year for equities relative to bonds. We see earnings and dividends driving equity returns with companies that generate free cash flow and have a history of capital allocation decisions that enhance shareholder values, such as dividend increases, net share buybacks and net debt reduction.
Additionally, while 2012 was a strong year for domestic equities relative to foreign, we expect 2013 to favor global equities. Combined with the U.S. economy moving toward a later-stage recovery, U.S. sectors that are more globally positioned may perform well on a relative basis, including industrials, materials, energy and technology.
Quoted Fund performance is for Class A shares and does not reflect a sales charge.
The returns shown do not reflect taxes a shareholder would pay on distributions or redemptions.
Quoted Major Market Sectors, Portfolio Composition and Top 10 Holdings are subject to change.
The lists of Major Market Sectors and Top 10 Holdings exclude short-term investments and collateral held for securities loaned.
The Portfolio Composition chart excludes collateral held for securities loaned.
6
Portfolio Facts
As of December 31, 2012
| | | | |
| | | Class A | | Institutional Class |
Ticker | | TEIAX | | TEIIX |
Transfer Agent ID | | 033 | | 050 |
Net Assets | | $25,610,646 | | $35,316,720 |
NAV | | $9.59 | | $9.60 |
NAV - High† | | 9/14/2012 - $9.87 | | 9/14/2012 - $9.89 |
NAV - Low† | | 6/4/2012 - $8.75 | | 6/4/2012 - $8.77 |
Number of Holdings: 247 | | | | |
| | † | For the year ended December 31, 2012 |
Average Annual Total Returns1
As of December 31, 2012
| | | | |
Class A2 | | 1-Year | | From Inception
2/29/2008 |
without sales charge | | 12.60% | | 1.10% |
with sales charge | | 6.37% | | -0.07% |
| | |
Institutional Class3 | | 1-Year | | From Inception
2/29/2008 |
Net Asset Value | | 12.97% | | 1.45% |
| 1 | Past performance is not an indication of future results. Average annual total returns represent past performance and reflect changes in share prices, the reinvestment of all dividends and capital gains, and the effects of compounding. The prospectus contains more complete information on the investment objectives, risks, charges and expenses of the investment company, which investors should read and consider carefully before investing. To obtain a prospectus, contact a registered representative or visit www.thrivent.com. At various times, the Fund’s adviser waived its management fee and/or reimbursed Fund expenses. Had the adviser not done so, the Fund’s total returns would have been lower. The returns shown do not reflect taxes a shareholder would pay on distributions or redemptions. Total investment return and principal value of your investment will fluctuate, and your shares, when redeemed, may be worth more or less than their original cost. Current performance may be higher or lower than the performance data quoted. Call 800-THRIVENT or visit www.thrivent.com for performance results current to the most recent month-end. |
| 2 | Class A performance with sales charge reflects the maximum sales charge of 5.5%. |
| 3 | Institutional Class shares have no sales load and are for institutional shareholders only. |
| (a) | Performance of other classes will be greater or less than the line shown based on the differences in loads and fees paid by shareholders investing in the different classes. |
| * | As you compare performance, please note that the Fund’s performance reflects the maximum 5.5% sales charge, while the Consumer Price Index and the S&P 500 Index do not reflect any such charges. If you were to purchase any of the above individual stocks or funds represented in the Index, any charges you would pay would reduce your total return as well. |
| ** | The S&P 500 Index is an index that represents the average performance of a group of 500 widely held, publicly traded stocks. “S&P 500” is a trademark of The McGraw-Hill Companies, Inc. and has been licensed for use by Thrivent Financial for Lutherans. The product is not sponsored, endorsed or promoted by Standard & Poor’s and Standard & Poor’s makes no representation regarding the advisability of investing in the product. It is not possible to invest directly in the Index. The performance of the Index does not reflect deductions for fees, expenses or taxes. |
| *** | The Consumer Price Index is an inflationary indicator that measures the change in the cost of a fixed basket of products and services, including housing, electricity, food and transportation. It is not possible to invest directly in the Index. |
7
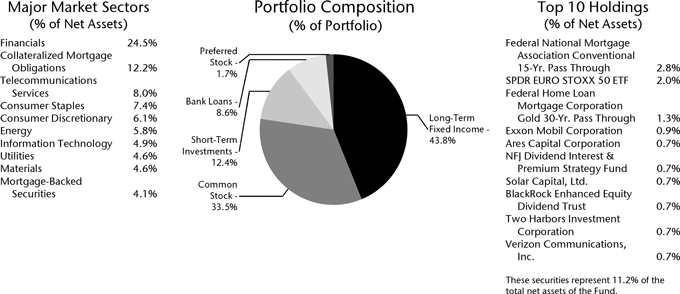
Thrivent Diversified Income Plus Fund
Mark L. Simenstad, CFA, Paul J. Ocenasek, CFA and David R. Spangler, CFA, Portfolio Co-Managers
Thrivent Diversified Income Plus Fund seeks to maximize income while maintaining prospects for capital appreciation. The Fund may invest in debt or equity securities. Debt securities include high-yield, high-risk securities commonly known as “junk bonds.” High-yield securities are subject to greater price fluctuations and increased risk of loss of principal than investment grade bonds. Debt securities also include mortgage-related and other asset-backed securities, the value of which will be influenced by factors affecting the housing market and the assets underlying such securities. Equity securities are subject to the basic market risk that a particular security, or securities in general, may decrease in value over short or even extended time periods. These and other risks are described in the Fund’s prospectus. Views expressed in this discussion of fund performance are the views of this particular Fund’s management team.
How did the Fund perform during the 12-month period ended December 31, 2012?
Thrivent Diversified Income Plus Fund earned a total return of 14.08%. The Fund’s market benchmarks, the S&P 500, Barclays U.S. Corporate High Yield Bond Index and Barclays U.S. Corporate Investment Grade Index, returned 16.00%, 15.81% and 9.82%, respectively.
What factors affected the Fund’s performance?
With yields on U.S. Treasury bonds at or near historic lows, investors looked elsewhere for income, driving positive results in virtually every sector of the market in which the Fund invests. Nonagency mortgage-backed securities performed particularly well amid improving fundamentals in the housing market: rising home prices, increased housing starts, and moderating foreclosure rates.
Preferred stocks and high-yield debt also performed well as the slowly growing U.S. economy proved sufficient to keep corporate profits healthy. Among preferred stocks, financials did particularly well as banks turned in strong profits.
On the downside, a hedging program aimed at minimizing the volatility of the Fund’s returns detracted from performance in 2012 when market volatility proved less than we anticipated.
What is your outlook?
We expect the U.S. economy to continue on its slow-growth trajectory in 2013. Against that backdrop, we are cautiously optimistic about the long-term prospects for the financial markets. We anticipate some near-term volatility in the equity market as policymakers in Washington debate federal tax and spending policy.
In the fixed-income sector, we considered high-yield bonds fully valued heading into 2013. We anticipate underweighting that sector of the market over the course of the year and slightly overweighting preferred stocks, floating-rate bank loans and nonagency mortgage-backed securities.
Because bond valuations rose so high in 2012, and bond yields dipped so low, it will be very difficult for the Fund to generate the same level of returns in 2013. Nonetheless, we anticipate that the Fund will have an opportunity to generate positive returns for the year.
Quoted Fund performance is for Class A shares and does not reflect a sales charge.
The returns shown do not reflect taxes a shareholder would pay on distributions or redemptions.
Quoted Major Market Sectors, Portfolio Composition and Top 10 Holdings are subject to change.
The lists of Major Market Sectors and Top 10 Holdings exclude short-term investments and collateral held for securities loaned.
The Portfolio Composition chart excludes collateral held for securities loaned.
8
Portfolio Facts
As of December 31, 2012
| | | | |
| | | Class A | | Institutional Class |
Ticker | | AAHYX | | THYFX |
Transfer Agent ID | | 025 | | 095 |
Net Assets | | $290,729,368 | | $54,156,728 |
NAV | | $6.82 | | $6.77 |
NAV - High† | | 10/17/2012 - $6.92 | | 10/17/2012 - $6.88 |
NAV - Low† | | 1/3/2012 - $6.25 | | 1/3/20120 - $6.22 |
Number of Holdings: 397 | | | | |
| | † | For the year ended December 31, 2012 |
Average Annual Total Returns1,2
As of December 31, 2012
| | | | | | |
Class A3 | | 1-Year | | 5 Years | | 10 Years |
without sales charge | | 14.08% | | 6.07% | | 7.80% |
with sales charge | | 9.00% | | 5.08% | | 7.31% |
| | | |
Institutional Class4 | | 1-Year | | 5 Years | | 10 Years |
Net Asset Value | | 14.23% | | 6.42% | | 8.20% |
| 1 | Past performance is not an indication of future results. Average annual total returns represent past performance and reflect changes in share prices, the reinvestment of all dividends and capital gains, and the effects of compounding. The prospectus contains more complete information on the investment objectives, risks, charges and expenses of the investment company, which investors should read and consider carefully before investing. To obtain a prospectus, contact a registered representative or visit www.thrivent.com. At various times, the Fund’s adviser waived its management fee and/or reimbursed Fund expenses. Had the adviser not done so, the Fund’s total returns would have been lower. The returns shown do not reflect taxes a shareholder would pay on distributions or redemptions. Total investment return and principal value of your investment will fluctuate, and your shares, when redeemed, may be worth more or less than their original cost. Current performance may be higher or lower than the performance data quoted. Call 800-THRIVENT or visit www.thrivent.com for performance results current to the most recent month-end. |
| 2 | Prior to July 3, 2006, the Fund, as a high yield fund, invested primarily in junk bonds. |
| 3 | Class A performance with sales charge reflects the maximum sales charge of 4.5%. |
| 4 | Institutional Class shares have no sales load and are for institutional shareholders only. |
| (a) | Performance of other classes will be greater or less than the line shown based on the differences in loads and fees paid by shareholders investing in the different classes. |
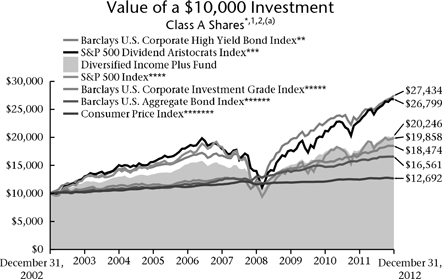
| * | Effective April 1, 2012, the Portfolio’s benchmark indices changed from the S&P Dividend Aristocrats Index and the Barclays Aggregate Bond Index to the S&P 500 Index, the Barclays U.S. Corporate High Yield Bond Index and the Barclays U.S. Corporate Investment Grade Index. The Adviser made these benchmark changes in light of the evolving asset mix of the Fund’s investment portfolio. As you compare performance, please note that the Fund’s performance reflects the maximum 4.5% sales charge, while the S&P 500 Dividend Aristocrats Index, the Barclays U.S. Aggregate Bond Index, Consumer Price Index, the Barclays U.S. Corporate High Yield Bond Index, the Barclays U.S. Corporate Investment Grade Index and the S&P 500 Index do not reflect any such charges. If you were to purchase any of the above individual stocks or funds represented in the S&P and Barclays Indexes, any charges you would pay would reduce your total return as well. |
| ** | The Barclays U.S. Corporate High Yield Bond Index is an index which measures the performance of fixed-rate non-investment grade bonds. It is not possible to invest directly in the Index. The performance of the Index does not reflect deductions for fees, expenses or taxes. |
| *** | The S&P 500 Dividend Aristocrats Index is an index which measures the performance of large-capitalization companies within the S&P 500 Index that have followed a managed dividends policy of consistently increasing dividends every year for at least 25 years. The Index has both capital growth and dividend income characteristics, is equal-weighted and is broadly diversified across sectors. “S&P 500” is a trademark of The McGraw-Hill Companies, Inc. and has been licensed for use by Thrivent Financial for Lutherans. The product is not sponsored, endorsed or promoted by Standard & Poor’s, and Standard & Poor’s makes no representation regarding the advisability of investing in the product. It is not possible to invest directly in each Index. The performance of each Index does not reflect deductions for fees, expenses or taxes. |
| **** | The S&P 500 Index is an index that represents the average performance of a group of 500 widely held, publicly traded stocks. “S&P 500” is a trademark of The McGraw-Hill Companies, Inc. and has been licensed for use by Thrivent Financial for Lutherans. The product is not sponsored, endorsed or promoted by Standard & Poor’s and Standard & Poor’s makes no representation regarding the advisability of investing in the product. It is not possible to invest directly in the Index. The performance of the Index does not reflect deductions for fees, expenses or taxes. |
| ***** | The Barclays U.S. Corporate Investment Grade Index is an index that measures the performance of investment grade corporate bonds. It is not possible to invest directly in the Index. The performance of the Index does not reflect deductions for fees, expenses or taxes. |
| ****** | The Barclays U.S. Aggregate Bond Index is an index that measures the performance of U.S. investment grade bonds. It is not possible to invest directly in the Index. The performance of the Index does not reflect deductions for fees, expenses or taxes. |
| ******* | The Consumer Price Index is an inflationary indicator that measures the change in the cost of a fixed basket of products and services, including housing, electricity, food and transportation. It is not possible to invest directly in the Index. |
9
Shareholder Expense Example
(unaudited)
As a shareholder of the Fund, you incur, depending on the fund and share class, two types of costs: (1) transaction costs, including sales charges (loads) on purchase payments; and (2) ongoing costs, including management fees, distribution (12b-1) fees and other Fund expenses. This Example is intended to help you understand your ongoing costs (in dollars) of investing in the Fund and to compare these costs with the ongoing costs of investing in other mutual funds. The Example is based on an investment of $1,000 invested at the beginning of the period and held for the entire period from July 1, 2012 through December 31, 2012.
Actual Expenses
In the table below, the first section, labeled “Actual,” provides information about actual account values and actual expenses. You may use the information in this section, together with the amount you invested, to estimate the expenses that you paid over the period. Simply divide your account value by $1,000 (for example, an $8,600 account value divided by $1,000 = 8.6), then multiply the result by the number from the appropriate Class line under the heading entitled “Expenses Paid During Period” to estimate the expenses you paid. A small account fee of $12 may be charged to Class A shareholder accounts if the value falls below the stated account minimum of $1,000. This fee is not included in the table below. If it were, the expenses you paid during the period would have been higher and the ending account value would have been lower.
Hypothetical Example for Comparison Purposes
In the table below, the second section, labeled “Hypothetical,” provides information about hypothetical account values and hypothetical expenses based on the Fund’s actual expense ratio and an assumed rate of return of 5% per year before expenses, which is not the Fund’s actual return. The hypothetical account values and expenses may not be used to estimate the actual ending account balance or expenses you paid for the period. You may use this information to compare the ongoing costs of investing in the Fund and other funds. To do so, compare this 5% hypothetical example with the 5% hypothetical examples that appear in the shareholder reports of the other funds. A small account fee of $12 may be charged to Class A shareholder accounts if the value falls below the stated account minimum of $1,000. This fee is not included in the table below. If it were, the expenses you paid during the period would have been higher and the ending account value would have been lower.
Please note that the expenses shown in the table are meant to highlight your ongoing costs only and do not reflect any transactional costs, such as sales charges (loads). Therefore, the second section of the table is useful in comparing ongoing costs only, and will not help you determine the relative total costs of owning different funds. In addition, if these transactional costs were included, your costs would have been higher.
| | | | | | | | | | | | | | | | |
| | | Beginning
Account
Value
7/1/2012 | | | Ending
Account
Value
12/31/2012 | | | Expenses
Paid
During
Period
7/1/2012-
12/31/2012* | | | Annualized
Expense
Ratio | |
Thrivent Natural Resources Fund | | | | | | | | | | | | | | | | |
Actual | | | | | | | | | | | | | | | | |
Class A | | $ | 1,000 | | | $ | 1,053 | | | $ | 6.74 | | | | 1.31 | % |
Institutional Class | | $ | 1,000 | | | $ | 1,054 | | | $ | 5.06 | | | | 0.98 | % |
Hypothetical** | | | | | | | | | | | | | | | | |
Class A | | $ | 1,000 | | | $ | 1,019 | | | $ | 6.63 | | | | 1.31 | % |
Institutional Class | | $ | 1,000 | | | $ | 1,020 | | | $ | 4.98 | | | | 0.98 | % |
Thrivent Equity Income Plus Fund | | | | | | | | | | | | | | | | |
Actual | | | | | | | | | | | | | | | | |
Class A | | $ | 1,000 | | | $ | 1,048 | | | $ | 5.94 | | | | 1.16 | % |
Institutional Class | | $ | 1,000 | | | $ | 1,049 | | | $ | 4.14 | | | | 0.80 | % |
Hypothetical** | | | | | | | | | | | | | | | | |
Class A | | $ | 1,000 | | | $ | 1,019 | | | $ | 5.86 | | | | 1.16 | % |
Institutional Class | | $ | 1,000 | | | $ | 1,021 | | | $ | 4.08 | | | | 0.80 | % |
Thrivent Diversified Income Plus Fund | | | | | | | | | | | | | | | | |
Actual | | | | | | | | | | | | | | | | |
Class A | | $ | 1,000 | | | $ | 1,059 | | | $ | 5.20 | | | | 1.00 | % |
Institutional Class | | $ | 1,000 | | | $ | 1,060 | | | $ | 3.68 | | | | 0.71 | % |
Hypothetical** | | | | | | | | | | | | | | | | |
Class A | | $ | 1,000 | | | $ | 1,020 | | | $ | 5.10 | | | | 1.00 | % |
Institutional Class | | $ | 1,000 | | | $ | 1,022 | | | $ | 3.61 | | | | 0.71 | % |
| * | Expenses are equal to the Fund’s annualized expense ratio, multiplied by the average account value over the period, multiplied by 184/366 to reflect the one-half year period. |
| ** | Assuming 5% annualized total return before expenses. |
10

Report of Independent Registered Public Accounting Firm
To the Shareholders and Trustees of the Thrivent Mutual Funds:
In our opinion, the accompanying statements of assets and liabilities, including the schedules of investments, and the related statements of operations and of changes in net assets and the financial highlights present fairly, in all material respects, the financial position of the Thrivent Natural Resources Fund, Thrivent Equity Income Plus Fund and Thrivent Diversified Income Plus Fund (hereafter referred to as the “Funds”) at December 31, 2012, the results of each of their operations for the year then ended, the changes in each of their net assets for each of the two years in the period then ended and their financial highlights for each of the periods presented, in conformity with accounting principles generally accepted in the United States of America. These financial statements and financial highlights (hereafter referred to as “financial statements”) are the responsibility of the Funds’ management; our responsibility is to express an opinion on these financial statements based on our audits. We conducted our audits of these financial statements in accordance with the standards of the Public Company Accounting Oversight Board (United States). Those standards require that we plan and perform the audit to obtain reasonable assurance about whether the financial statements are free of material misstatement. An audit includes examining, on a test basis, evidence supporting the amounts and disclosures in the financial statements, assessing the accounting principles used and significant estimates made by management, and evaluating the overall financial statement presentation. We believe that our audits, which included confirmation of securities at December 31, 2012 by correspondence with the custodian and brokers, provide a reasonable basis for our opinion.

February 20, 2013
PricewaterhouseCoopers LLP, Suite 1400, 225 South Sixth Street, Minneapolis, MN 55402
T: (612) 596 6000, F: (612) 373 7160, www.pwc.com/us
11
Natural Resources Fund
Schedule of Investments as of December 31, 2012
| | | | | | | | |
Shares | | | Common Stock (96.9%) | | Value | |
| Coal & Consumable Fuels (4.1%) | | | | |
| | 140,900 | | | Alpha Natural Resources, Inc.a,b | | $ | 1,372,366 | |
| | 91,200 | | | Peabody Energy Corporation | | | 2,426,832 | |
| | | | | | | | |
| | | | Total | | | 3,799,198 | |
| | | | | | | | |
| |
| Consumer Staples (9.6%) | | | | |
| | 89,700 | | | Archer-Daniels-Midland Company | | | 2,456,883 | |
| | 41,000 | | | Bunge, Ltd. | | | 2,980,290 | |
| | 55,900 | | | Ingredion, Inc. | | | 3,601,637 | |
| | | | | | | | |
| | | | Total | | | 9,038,810 | |
| | | | | | | | |
| |
| Integrated Oil & Gas (11.9%) | | | | |
| | 63,733 | | | BP plc ADR | | | 2,653,842 | |
| | 40,600 | | | Chevron Corporation | | | 4,390,484 | |
| | 28,700 | | | Occidental Petroleum Corporation | | | 2,198,707 | |
| | 99,600 | | | Petroleo Brasileiro SA ADR | | | 1,939,212 | |
| | | | | | | | |
| | | | Total | | | 11,182,245 | |
| | | | | | | | |
| |
| Materials (13.8%) | | | | |
| | 32,700 | | | BHP Billiton, Ltd. ADRa | | | 2,564,988 | |
| | 41,300 | | | Cliffs Natural Resources, Inc.a | | | 1,592,528 | |
| | 81,900 | | | Freeport-McMoRan Copper & Gold, Inc. | | | 2,800,980 | |
| | 37,300 | | | Mosaic Company | | | 2,112,299 | |
| | 44,200 | | | Rio Tinto plc ADRa | | | 2,567,578 | |
| | 38,100 | | | Walter Energy, Inc. | | | 1,367,028 | |
| | | | | | | | |
| | | | Total | | | 13,005,401 | |
| | | | | | | | |
| |
| Oil & Gas Drilling (6.2%) | | | | |
| | 54,900 | | | Ensco plc | | | 3,254,472 | |
| | 45,200 | | | Helmerich & Payne, Inc. | | | 2,531,652 | |
| | | | | | | | |
| | | | Total | | | 5,786,124 | |
| | | | | | | | |
| |
| Oil & Gas Equipment & Services (15.0%) | | | | |
| | 45,300 | | | Baker Hughes, Inc. | | | 1,850,052 | |
| | 41,000 | | | Dril-Quip, Inc.b | | | 2,995,050 | |
| | 34,900 | | | National Oilwell Varco, Inc. | | | 2,385,415 | |
| | 40,000 | | | Oil States International, Inc.b | | | 2,861,600 | |
| | 120,339 | | | Petroleum Geo-Services ASA | | | 2,095,991 | |
| | 170,000 | | | Weatherford International, Ltd.b | | | 1,902,300 | |
| | | | | | | | |
| | | | Total | | | 14,090,408 | |
| | | | | | | | |
| |
| Oil & Gas Exploration & Production (14.6%) | | | | |
| | 16,300 | | | Apache Corporation | | | 1,279,550 | |
| | 23,800 | | | Concho Resources, Inc.b | | | 1,917,328 | |
| | 21,500 | | | EOG Resources, Inc. | | | 2,596,985 | |
| | 88,300 | | | Marathon Oil Corporation | | | 2,707,278 | |
| | 53,200 | | | Oasis Petroleum, Inc.b | | | 1,691,760 | |
| | 39,000 | | | SM Energy Company | | | 2,036,190 | |
| | 81,900 | | | Ultra Petroleum Corporationa,b | | | 1,484,847 | |
| | | | | | | | |
| | | | Total | | | 13,713,938 | |
| | | | | | | | |
| |
| Oil & Gas Refining & Marketing (4.2%) | | | | |
| | 116,800 | | | Valero Energy Corporation | | | 3,985,216 | |
| | | | | | | | |
| | | | Total | | | 3,985,216 | |
| | | | | | | | |
| |
| Real Estate Investment Trusts (17.5%) | | | | |
| | 25,823 | | | Boston Properties, Inc. | | | 2,732,332 | |
| | 45,795 | | | Equity Residential | | | 2,595,203 | |
| | 141,800 | | | Kimco Realty Corporation | | | 2,739,576 | |
| | 19,010 | | | Public Storage, Inc. | | | 2,755,689 | |
| | 19,426 | | | Simon Property Group, Inc. | | | 3,071,056 | |
| | 31,847 | | | Vornado Realty Trust | | | 2,550,308 | |
| | | | | | | | |
| | | | Total | | | 16,444,164 | |
| | | | | | | | |
| | | | Total Common Stock
(cost $85,557,636) | | | 91,045,504 | |
| | | | | | | | |
| | |
| | | | Collateral Held for Securities Loaned (10.1%) | | | |
| | 9,494,200 | | | Thrivent Cash Management Trust | | | 9,494,200 | |
| | | | | | | | |
| | | | Total Collateral Held for Securities Loaned
(cost $9,494,200) | | | 9,494,200 | |
| | | | | | | | |
| | |
Shares or
Principal
Amount | | | Short-Term Investments (3.0%) | | | |
| | 2,775,481 | | | Thrivent Cash Management Trust | | | 2,775,481 | |
| | | | | | | | |
| | | | Total Short-Term Investments (at amortized cost) | | | 2,775,481 | |
| | | | | | | | |
| | | | Total Investments (cost $97,827,317) 110.0% | | $ | 103,315,185 | |
| | | | | | | | |
| | | | Other Assets and Liabilities, Net (10.0%) | | | (9,353,105 | ) |
| | | | | | | | |
| | | | Total Net Assets 100.0% | | $ | 93,962,080 | |
| | | | | | | | |
| a | All or a portion of the security is on loan. |
| b | Non-income producing security. |
Definitions:
| | | | |
| ADR | | - | | American Depositary Receipt, which are certificates for an underlying foreign security’s shares held by an issuing U.S. depository bank. |
Unrealized Appreciation (Depreciation)
Gross unrealized appreciation and depreciation of investments, based on cost for federal income tax purposes, were as follows:
| | | | |
Gross unrealized appreciation | | $ | 12,681,152 | |
Gross unrealized depreciation | | | (7,344,544 | ) |
| | | | |
Net unrealized appreciation (depreciation) | | $ | 5,336,608 | |
| |
Cost for federal income tax purposes | | $ | 97,978,577 | |
The accompanying Notes to Financial Statements are an integral part of this schedule.
12
Natural Resources Fund
Schedule of Investments as of December 31, 2012
Fair Valuation Measurements
The following table is a summary of the inputs used, as of December 31, 2012, in valuing Natural Resources Fund’s assets carried at fair value.
| | | | | | | | | | | | | | | | |
Investments in Securities | | Total | | | Level 1 | | | Level 2 | | | Level 3 | |
Common Stock | | | | | | | | | | | | | | | | |
Coal & Consumable Fuels | | | 3,799,198 | | | | 3,799,198 | | | | — | | | | — | |
Consumer Staples | | | 9,038,810 | | | | 9,038,810 | | | | — | | | | — | |
Integrated Oil & Gas | | | 11,182,245 | | | | 11,182,245 | | | | — | | | | — | |
Materials | | | 13,005,401 | | | | 13,005,401 | | | | — | | | | — | |
Oil & Gas Drilling | | | 5,786,124 | | | | 5,786,124 | | | | — | | | | — | |
Oil & Gas Equipment & Services | | | 14,090,408 | | | | 11,994,417 | | | | 2,095,991 | | | | — | |
Oil & Gas Exploration & Production | | | 13,713,938 | | | | 13,713,938 | | | | — | | | | — | |
Oil & Gas Refining & Marketing | | | 3,985,216 | | | | 3,985,216 | | | | — | | | | — | |
Real Estate Investment Trusts | | | 16,444,164 | | | | 16,444,164 | | | | — | | | | — | |
Collateral Held for Securities Loaned | | | 9,494,200 | | | | 9,494,200 | | | | — | | | | — | |
Short-Term Investments | | | 2,775,481 | | | | 2,775,481 | | | | — | | | | — | |
| | | | | | | | | | | | | | | | |
Total | | $ | 103,315,185 | | | $ | 101,219,194 | | | $ | 2,095,991 | | | $ | — | |
| | | | | | | | | | | | | | | | |
There were no significant transfers between Levels during the period ended December 31, 2012. Transfers between Levels are identified as of the end of the period.
The following table summarizes the net realized gains/(losses) and Statement of Operations location, for the period ended December 31, 2012, for Natural Resources Fund’s investments in financial derivative instruments by primary risk exposure.
| | | | | | |
Derivatives by risk category | | Statement of Operations Location | | Realized Gains/(Losses)
recognized in Income | |
Equity Contracts | | | | | | |
Futures | | Net realized gains/(losses) on Futures contracts | | | 327,863 | |
Total Equity Contracts | | | | | 327,863 | |
| | | | | | |
Total | | | | $ | 327,863 | |
| | | | | | |
The following table presents Natural Resources Fund’s average volume of derivative activity during the period ended December 31, 2012.
| | | | | | | | |
Derivative Risk Category | | Futures
(Notional*) | | | Futures
(Percentage of
Average Net Assets) | |
Equity Contracts | | $ | 213,914 | | | | 0.2 | % |
| * | Notional amount represents long or short, or both, derivative positions held by the Fund. |
Investment in Affiliates
Affiliated issuers, as defined under the Investment Company Act of 1940, include those in which the Fund’s holdings of an issuer represent 5% or more of the outstanding voting securities of an issuer, or any affiliated mutual fund.
A summary of transactions for the fiscal year to date, in Natural Resources Fund, is as follows:
| | | | | | | | | | | | | | | | | | | | | | | | |
Fund | | Value
December 31, 2011 | | | Gross
Purchases | | | Gross
Sales | | | Shares Held at
December 31, 2012 | | | Value
December 31, 2012 | | | Income Earned
January 1, 2012 -
December 31, 2012 | |
Cash Management Trust-Collateral Investment | | $ | 535,500 | | | $ | 68,656,641 | | | $ | 59,697,941 | | | | 9,494,200 | | | $ | 9,494,200 | | | $ | 10,046 | |
Cash Management Trust-Short Term Investment | | | — | | | | 6,401,159 | | | | 3,625,678 | | | | 2,775,481 | | | | 2,775,481 | | | | 857 | |
Total Value and Income Earned | | | 535,500 | | | | | | | | | | | | | | | | 12,269,681 | | | | 10,903 | |
The accompanying Notes to Financial Statements are an integral part of this schedule.
13
Equity Income Plus Fund
Schedule of Investments as of December 31, 2012
| | | | | | | | |
Shares | | | Common Stock (93.3%) | | Value | |
| Consumer Discretionary (8.4%) | | | | |
| | 2,000 | | | Advance Auto Parts, Inc. | | $ | 144,700 | |
| | 7,800 | | | Apollo Group, Inc.a | | | 163,176 | |
| | 7,500 | | | Comcast Corporation | | | 280,350 | |
| | 2,900 | | | DIRECTVa | | | 145,464 | |
| | 12,800 | | | Ford Motor Company | | | 165,760 | |
| | 4,100 | | | Hanesbrands, Inc.a | | | 146,862 | |
| | 10,400 | | | Home Depot, Inc. | | | 643,240 | |
| | 4,200 | | | Kohl’s Corporation | | | 180,516 | |
| | 4,100 | | | Lowe’s Companies, Inc. | | | 145,632 | |
| | 7,400 | | | Macy’s, Inc. | | | 288,748 | |
| | 3,700 | | | McDonald’s Corporation | | | 326,377 | |
| | 300 | | | Priceline.com, Inc.a | | | 186,360 | |
| | 9,800 | | | Reed Elsevier NV ADR | | | 289,884 | |
| | 7,200 | | | Ross Stores, Inc. | | | 389,880 | |
| | 1,500 | | | Sherwin-Williams Company | | | 230,730 | |
| | 3,800 | | | Target Corporation | | | 224,846 | |
| | 14,000 | | | Thomson Reuters Corporation | | | 406,840 | |
| | 11,000 | | | TJX Companies, Inc. | | | 466,950 | |
| | 3,200 | | | Toyota Motor Corporation ADR | | | 298,400 | |
| | | | | | | | |
| | | | Total | | | 5,124,715 | |
| | | | | | | | |
| |
| Consumer Staples (9.4%) | | | | |
| | 2,400 | | | Anheuser-Busch InBev NV ADR | | | 209,784 | |
| | 800 | | | British American Tobacco plc ADR | | | 81,000 | |
| | 3,550 | | | Brown-Forman Corporation | | | 224,538 | |
| | 5,500 | | | Campbell Soup Company | | | 191,895 | |
| | 21,500 | | | Coca-Cola Company | | | 779,375 | |
| | 4,100 | | | Colgate-Palmolive Company | | | 428,614 | |
| | 4,000 | | | Companhia de Bebidas das Americas ADR | | | 167,960 | |
| | 6,600 | | | Constellation Brands, Inc.a | | | 233,574 | |
| | 3,000 | | | Energizer Holdings, Inc. | | | 239,940 | |
| | 5,800 | | | General Mills, Inc. | | | 234,378 | |
| | 2,600 | | | Kellogg Company | | | 145,210 | |
| | 1,200 | | | Lorillard, Inc. | | | 140,004 | |
| | 6,300 | | | Molson Coors Brewing Company | | | 269,577 | |
| | 16,300 | | | Mondelez International, Inc. | | | 415,161 | |
| | 3,000 | | | PepsiCo, Inc. | | | 205,290 | |
| | 5,600 | | | Post Holdings, Inc.a | | | 191,800 | |
| | 7,100 | | | Prestige Brands Holdings, Inc.a | | | 142,213 | |
| | 3,300 | | | Reynolds American, Inc. | | | 136,719 | |
| | 3,700 | | | Spectrum Brands Holdings, Inc.a | | | 166,241 | |
| | 5,100 | | | Unilever NV ADR | | | 195,330 | |
| | 5,300 | | | Unilever plc ADR | | | 205,216 | |
| | 2,900 | | | Universal Corporation | | | 144,739 | |
| | 4,100 | | | Walgreen Company | | | 151,741 | |
| | 6,600 | | | Wal-Mart Stores, Inc. | | | 450,318 | |
| | | | | | | | |
| | | | Total | | | 5,750,617 | |
| | | | | | | | |
| |
| Energy (11.3%) | | | | |
| | 4,100 | | | BP plc ADR | | | 170,724 | |
| | 6,900 | | | C&J Energy Services, Inc.a | | | 147,936 | |
| | 3,600 | | | Canadian Natural Resources, Ltd. | | | 103,932 | |
| | 6,700 | | | Chevron Corporation | | | 724,538 | |
| | 1,600 | | | China Petroleum & Chemical Corporation | | | 183,872 | |
| | 600 | | | CNOOC, Ltd. ADR | | | 132,000 | |
| | 10,600 | | | ConocoPhillips | | | 614,694 | |
| | 2,100 | | | Diamond Offshore Drilling, Inc. | | | 142,716 | |
| | 2,700 | | | Ecopetrol SA ADR | | | 161,109 | |
| | 15,000 | | | Exxon Mobil Corporation | | | 1,298,250 | |
| | 4,000 | | | Golar LNG, Ltd. | | | 147,120 | |
| | 3,400 | | | HollyFrontier Corporation | | | 158,270 | |
| | 2,700 | | | Imperial Oil, Ltd. | | | 116,100 | |
| | 17,500 | | | Kinder Morgan, Inc. | | | 618,275 | |
| | 4,400 | | | Marathon Petroleum Corporation | | | 277,200 | |
| | 2,800 | | | PetroChina Company, Ltd. ADR | | | 402,584 | |
| | 9,000 | | | Petroleo Brasileiro SA ADR | | | 175,230 | |
| | 8,700 | | | Phillips 66 | | | 461,970 | |
| | 2,431 | | | Royal Dutch Shell plc ADR, Class A | | | 167,617 | |
| | 4,300 | | | Royal Dutch Shell plc ADR, Class B | | | 304,827 | |
| | 4,500 | | | Suncor Energy, Inc. ADR | | | 148,410 | |
| | 3,900 | | | Total SA ADR | | | 202,839 | |
| | | | | | | | |
| | | | Total | | | 6,860,213 | |
| | | | | | | | |
| |
| Financials (23.9%) | | | | |
| | 10,600 | | | Aflac, Inc. | | | 563,072 | |
| | 600 | | | Alexandria Real Estate Equities, Inc. | | | 41,592 | |
| | 5,400 | | | American Express Company | | | 310,392 | |
| | 6,700 | | | American Tower Corporation | | | 517,709 | |
| | 10,000 | | | Annaly Capital Management, Inc. | | | 140,400 | |
| | 1,300 | | | Apartment Investment & Management Company | | | 35,178 | |
| | 8,600 | | | Assurant, Inc. | | | 298,420 | |
| | 700 | | | AvalonBay Communities, Inc. | | | 94,913 | |
| | 22,039 | | | Banco Bilbao Vizcaya Argentaria SA ADR | | | 207,607 | |
| | 22,900 | | | Bank of America Corporation | | | 265,640 | |
| | 2,300 | | | Bank of Montreal | | | 140,990 | |
| | 1,700 | | | BioMed Realty Trust, Inc. | | | 32,861 | |
| | 1,100 | | | Boston Properties, Inc. | | | 116,391 | |
| | 700 | | | BRE Properties, Inc. | | | 35,581 | |
| | 700 | | | Camden Property Trust | | | 47,747 | |
| | 2,200 | | | Canadian Imperial Bank Of Commerce | | | 177,342 | |
| | 2,500 | | | Capital One Financial Corporation | | | 144,825 | |
| | 21,000 | | | CapitalSource, Inc. | | | 159,180 | |
| | 1,600 | | | CBL & Associates Properties, Inc. | | | 33,936 | |
| | 14,000 | | | CBOE Holdings, Inc. | | | 412,440 | |
| | 1,100 | | | CommonWealth REIT | | | 17,424 | |
| | 1,000 | | | Corporate Office Properties Trust | | | 24,980 | |
| | 2,600 | | | DDR Corporation | | | 40,716 | |
| | 2,100 | | | DiamondRock Hospitality Company | | | 18,900 | |
| | 800 | | | Digital Realty Trust, Inc. | | | 54,312 | |
| | 2,500 | | | Duke Realty Corporation | | | 34,675 | |
| | 500 | | | Equity Lifestyle Properties, Inc. | | | 33,645 | |
| | 4,900 | | | Equity Residential | | | 277,683 | |
| | 300 | | | Essex Property Trust, Inc. | | | 43,995 | |
| | 500 | | | Federal Realty Investment Trust | | | 52,010 | |
| | 3,700 | | | General Growth Properties, Inc. | | | 73,445 | |
| | 2,300 | | | Goldman Sachs Group, Inc. | | | 293,388 | |
| | 3,000 | | | HCP, Inc. | | | 135,540 | |
| | 1,500 | | | Health Care REIT, Inc. | | | 91,935 | |
| | 900 | | | Highwoods Properties, Inc. | | | 30,105 | |
| | 500 | | | Home Properties, Inc. | | | 30,655 | |
| | 1,300 | | | Hospitality Properties Trust | | | 30,446 | |
| | 5,500 | | | Host Hotels & Resorts, Inc. | | | 86,185 | |
| | 4,400 | | | HSBC Holdings plc ADR | | | 233,508 | |
| | 21,300 | | | iShares S&P U.S. Preferred Stock Index Fund | | | 843,906 | |
| | 10,000 | | | Itau Unibanco Holding SA ADR | | | 164,600 | |
| | 18,300 | | | J.P. Morgan Chase & Company | | | 804,651 | |
| | 700 | | | Kilroy Realty Corporation | | | 33,159 | |
| | 3,400 | | | Kimco Realty Corporation | | | 65,688 | |
| | 900 | | | LaSalle Hotel Properties | | | 22,851 | |
The accompanying Notes to Financial Statements are an integral part of this schedule.
14
Equity Income Plus Fund
Schedule of Investments as of December 31, 2012
| | | | | | | | |
Shares | | | Common Stock (93.3%) | | Value | |
| Financials (23.9%) - continued | | | | |
| | 1,100 | | | Liberty Property Trust | | $ | 39,347 | |
| | 1,100 | | | Macerich Company | | | 64,130 | |
| | 1,000 | | | Mack-Cali Realty Corporation | | | 26,110 | |
| | 10,400 | | | Manulife Financial Corporation | | | 141,336 | |
| | 6,400 | | | Marsh & McLennan Companies, Inc. | | | 220,608 | |
| | 34,200 | | | Mitsubishi UFJ Financial Group, Inc. ADR | | | 185,364 | |
| | 28,900 | | | New York Community Bancorp, Inc. | | | 378,590 | |
| | 1,200 | | | Omega Healthcare Investors, Inc. | | | 28,620 | |
| | 1,800 | | | Piedmont Office Realty Trust, Inc. | | | 32,490 | |
| | 1,400 | | | Plum Creek Timber Company, Inc. | | | 62,118 | |
| | 7,300 | | | Popular, Inc.a | | | 151,767 | |
| | 33,200 | | | PowerShares Preferred Portfolio | | | 487,376 | |
| | 17,100 | | | Progressive Corporation | | | 360,810 | |
| | 3,428 | | | Prologis, Inc. | | | 125,088 | |
| | 7,500 | | | Prudential plc ADR | | | 214,125 | |
| | 2,600 | | | Public Storage, Inc. | | | 376,896 | |
| | 1,100 | | | Rayonier, Inc. REIT | | | 57,013 | |
| | 1,200 | | | Realty Income Corporation | | | 48,252 | |
| | 900 | | | Regency Centers Corporation | | | 42,408 | |
| | 1,000 | | | RLJ Lodging Trust | | | 19,370 | |
| | 12,900 | | | Royal Bank of Scotland Group plc ADRa | | | 139,191 | |
| | 1,600 | | | Senior Housing Property Trust | | | 37,824 | |
| | 2,100 | | | Simon Property Group, Inc. | | | 331,989 | |
| | 700 | | | SL Green Realty Corporation | | | 53,655 | |
| | 8,600 | | | SLM Corporation | | | 147,318 | |
| | 31,330 | | | SPDR Dow Jones Wilshire International Real Estate ETF | | | 1,295,496 | |
| | 600 | | | Taubman Centers, Inc. | | | 47,232 | |
| | 11,000 | | | Travelers Companies, Inc. | | | 790,020 | |
| | 15,800 | | | UBS AG ADRa | | | 248,692 | |
| | 1,900 | | | UDR, Inc. | | | 45,182 | |
| | 7,500 | | | Vanguard Dividend Appreciation Index Fund ETF | | | 446,775 | |
| | 800 | | | Vanguard REIT ETF | | | 52,640 | |
| | 2,150 | | | Ventas, Inc. | | | 139,148 | |
| | 1,400 | | | Vornado Realty Trust | | | 112,112 | |
| | 1,300 | | | Weingarten Realty Investors | | | 34,801 | |
| | 4,400 | | | Wells Fargo & Company | | | 150,392 | |
| | 4,200 | | | Weyerhaeuser Company REIT | | | 116,844 | |
| | | | | | | | |
| | | | Total | | | 14,565,747 | |
| | | | | | | | |
| |
| Health Care (11.1%) | | | | |
| | 13,300 | | | Abbott Laboratories | | | 871,150 | |
| | 5,400 | | | Aetna, Inc. | | | 250,020 | |
| | 5,600 | | | Amgen, Inc. | | | 483,392 | |
| | 15,700 | | | Bristol-Myers Squibb Company | | | 511,663 | |
| | 10,300 | | | Eli Lilly and Company | | | 507,996 | |
| | 7,100 | | | Forest Laboratories, Inc.a | | | 250,772 | |
| | 3,100 | | | GlaxoSmithKline plc ADR | | | 134,757 | |
| | 6,800 | | | HealthSouth Corporationa | | | 143,548 | |
| | 3,100 | | | Johnson & Johnson | | | 217,310 | |
| | 1,800 | | | Laboratory Corporation of America Holdingsa | | | 155,916 | |
| | 15,400 | | | Medtronic, Inc. | | | 631,708 | |
| | 3,300 | | | Merck & Company, Inc. | | | 135,102 | |
| | 2,400 | | | Novartis AG ADR | | | 151,920 | |
| | 500 | | | Novo Nordisk A/S ADR | | | 81,605 | |
| | 27,100 | | | PDL BioPharma, Inc. | | | 191,055 | |
| | 25,800 | | | Pfizer, Inc. | | | 647,064 | |
| | 2,600 | | | Quest Diagnostics, Inc. | | | 151,502 | |
| | 4,600 | | | Sanofi ADR | | | 217,948 | |
| | 3,900 | | | Smith & Nephew plc ADR | | | 216,060 | |
| | 9,600 | | | UnitedHealth Group, Inc. | | | 520,704 | |
| | 12,700 | | | Warner Chilcott plc | | | 152,908 | |
| | 1,600 | | | Watson Pharmaceuticals, Inc.a | | | 137,600 | |
| | | | | | | | |
| | | | Total | | | 6,761,700 | |
| | | | | | | | |
| |
| Industrials (6.6%) | | | | |
| | 6,200 | | | 3M Company | | | 575,670 | |
| | 1,200 | | | Canadian National Railway Company | | | 109,212 | |
| | 3,600 | | | Danaher Corporation | | | 201,240 | |
| | 2,100 | | | Dun & Bradstreet Corporation | | | 165,165 | |
| | 16,000 | | | GenCorp, Inc.a | | | 146,400 | |
| | 3,600 | | | Huntington Ingalls Industries, Inc. | | | 156,024 | |
| | 5,000 | | | Lockheed Martin Corporation | | | 461,450 | |
| | 9,800 | | | Northrop Grumman Corporation | | | 662,284 | |
| | 13,300 | | | Pitney Bowes, Inc. | | | 141,512 | |
| | 1,500 | | | Siemens AG ADR | | | 164,205 | |
| | 1,900 | | | Union Pacific Corporation | | | 238,868 | |
| | 6,000 | | | United Parcel Service, Inc. | | | 442,380 | |
| | 10,700 | | | Verisk Analytics, Inc.a | | | 545,700 | |
| | | | | | | | |
| | | | Total | | | 4,010,110 | |
| | | | | | | | |
| |
| Information Technology (8.9%) | | | | |
| | 4,200 | | | Accenture plc | | | 279,300 | |
| | 15,000 | | | Activision Blizzard, Inc. | | | 159,300 | |
| | 4,600 | | | AOL, Inc.a | | | 136,206 | |
| | 500 | | | Apple, Inc. | | | 266,515 | |
| | 4,900 | | | Avnet, Inc.a | | | 149,989 | |
| | 3,600 | | | BMC Software, Inc.a | | | 142,776 | |
| | 2,700 | | | Canon, Inc. ADR | | | 105,867 | |
| | 5,700 | | | Comtech Telecommunications Corporation | | | 144,666 | |
| | 5,600 | | | GameStop Corporation | | | 140,504 | |
| | 22,100 | | | Intel Corporation | | | 455,923 | |
| | 4,200 | | | International Business Machines Corporation | | | 804,510 | |
| | 6,800 | | | j2 Global, Inc. | | | 207,944 | |
| | 1,100 | | | MasterCard, Inc. | | | 540,408 | |
| | 36,900 | | | Microsoft Corporation | | | 986,337 | |
| | 4,500 | | | Oracle Corporation | | | 149,940 | |
| | 2,700 | | | SAP AG ADR | | | 217,026 | |
| | 8,500 | | | Seagate Technology plc | | | 259,080 | |
| | 6,500 | | | Taiwan Semiconductor Manufacturing Company, Ltd. ADR | | | 111,540 | |
| | 4,000 | | | Western Digital Corporation | | | 169,960 | |
| | | | | | | | |
| | | | Total | | | 5,427,791 | |
| | | | | | | | |
| |
| Materials (4.1%) | | | | |
| | 4,400 | | | BHP Billiton plc ADR | | | 309,628 | |
| | 3,500 | | | BHP Billiton, Ltd. ADR | | | 274,540 | |
| | 1,300 | | | CF Industries Holdings, Inc. | | | 264,108 | |
| | 2,800 | | | Monsanto Company | | | 265,020 | |
| | 4,600 | | | PPG Industries, Inc. | | | 622,610 | |
| | 5,000 | | | Rio Tinto plc ADR | | | 290,450 | |
| | 8,300 | | | Southern Copper Corporation | | | 314,238 | |
| | 7,200 | | | Vale SA SP ADR | | | 150,912 | |
| | | | | | | | |
| | | | Total | | | 2,491,506 | |
| | | | | | | | |
| |
| Telecommunications Services (4.9%) | | | | |
| | 6,700 | | | America Movil SAB de CV ADR | | | 155,038 | |
The accompanying Notes to Financial Statements are an integral part of this schedule.
15
Equity Income Plus Fund
Schedule of Investments as of December 31, 2012
| | | | | | | | |
Shares | | | Common Stock (93.3%) | | Value | |
| Telecommunications Services (4.9%) - continued | | | | |
| | 19,600 | | | AT&T, Inc. | | $ | 660,716 | |
| | 4,900 | | | Atlantic Tele-Network, Inc. | | | 179,879 | |
| | 3,900 | | | CenturyLink, Inc. | | | 152,568 | |
| | 4,500 | | | China Mobile, Ltd. ADR | | | 264,240 | |
| | 9,400 | | | NTT DOCOMO, Inc. ADR | | | 135,454 | |
| | 7,900 | | | Telefonica SA ADR | | | 106,571 | |
| | 2,500 | | | TELUS Corporation | | | 162,850 | |
| | 23,700 | | | Verizon Communications, Inc. | | | 1,025,499 | |
| | 4,500 | | | Vodafone Group plc ADR | | | 113,355 | |
| | | | | | | | |
| | | | Total | | | 2,956,170 | |
| | | | | | | | |
| |
| Utilities (4.7%) | | | | |
| | 15,600 | | | American Electric Power Company, Inc. | | | 665,808 | |
| | 7,300 | | | CenterPoint Energy, Inc. | | | 140,525 | |
| | 8,100 | | | Consolidated Edison, Inc. | | | 449,874 | |
| | 2,200 | | | Empresa Nacional de Electricidad SA ADR | | | 107,382 | |
| | 8,400 | | | PNM Resources, Inc. | | | 172,284 | |
| | 19,100 | | | Public Service Enterprise Group, Inc. | | | 584,460 | |
| | 14,800 | | | Southern Company | | | 633,588 | |
| | 3,800 | | | Wisconsin Energy Corporation | | | 140,030 | |
| | | | | | | | |
| | | | Total | | | 2,893,951 | |
| | | | | | | | |
| | | | Total Common Stock
(cost $54,296,620) | | | 56,842,520 | |
| | | | | | | | |
| | |
Principal
Amount | | | Long-Term Fixed Income (4.7%) | | | |
| Energy (0.3%) | | | | |
| | | | Enbridge Energy Partners, LP | | | | |
| | $175,000 | | | 8.050%, 10/1/2037 | | | 198,768 | |
| | | | | | | | |
| | | | Total | | | 198,768 | |
| | | | | | | | |
| |
| Financials (3.7%) | | | | |
| | | | Aegon NV | | | | |
| | 300,000 | | | 1.867%, 7/29/2049b,c | | | 174,000 | |
| | | | American International Group, Inc. | | | | |
| | 100,000 | | | 8.175%, 5/15/2058 | | | 130,250 | |
| | | | Bank of America Corporation | | | | |
| | 215,000 | | | 7.625%, 6/1/2019 | | | 275,108 | |
| | | | BBVA International Preferred SA Unipersonal | | | | |
| | 150,000 | | | 5.919%, 12/29/2049c | | | 121,500 | |
| | | | J.P. Morgan Chase & Company | | | | |
| | 100,000 | | | 7.900%, 4/29/2049c | | | 113,301 | |
| | | | Liberty Mutual Group, Inc. | | | | |
| | 200,000 | | | 10.750%, 6/15/2058d | | | 298,000 | |
| | | | MetLife Capital Trust IV | | | | |
| | 220,000 | | | 7.875%, 12/15/2037d | | | 269,500 | |
| | | | Reinsurance Group of America, Inc. | | | | |
| | 225,000 | | | 6.750%, 12/15/2065 | | | 224,719 | |
| | | | Wachovia Capital Trust III | | | | |
| | 150,000 | | | 5.570%, 3/15/2042b,c | | | 149,250 | |
| | | | XL Group plc | | | | |
| | 250,000 | | | 6.500%, 12/31/2049c | | | 233,750 | |
| | | | ZFS Finance USA Trust II | | | | |
| | 230,000 | | | 6.450%, 12/15/2065d | | | 246,100 | |
| | | | | | | | |
| | | | Total | | | 2,235,478 | |
| | | | | | | | |
| |
| Utilities (0.7%) | | | | |
| | | | Enterprise Products Operating, LLC | | | | |
| | 225,000 | | | 7.034%, 1/15/2068 | | | 257,625 | |
| | | | Southern California Edison Company | | | | |
| | 185,000 | | | 6.250%, 8/1/2049c | | | 200,856 | |
| | | | | | | | |
| | | | Total | | | 458,481 | |
| | | | | | | | |
| | | | Total Long-Term Fixed Income
(cost $2,542,975) | | | 2,892,727 | |
| | | | | | | | |
| | |
Shares | | | Preferred Stock (0.5%) | | | |
| Financials (0.4%) | | | | |
| | 3,000 | | | Bank of America Corporationc | | | 76,680 | |
| | 2,500 | | | J.P. Morgan Chase Capital XXIX | | | 63,875 | |
| | 4,000 | | | U.S. Bancorpc | | | 114,560 | |
| | | | | | | | |
| | | | Total | | | 255,115 | |
| | | | | | | | |
| |
| Utilities (0.1%) | | | | |
| | 1,720 | | | Xcel Energy, Inc. | | | 43,516 | |
| | | | | | | | |
| | | | Total | | | 43,516 | |
| | | | | | | | |
| | | | Total Preferred Stock
(cost $281,136) | | | 298,631 | |
| | | | | | | | |
| | |
Shares or
Principal
Amount | | | Short-Term Investments (0.2%) | | | |
| | | | Federal Home Loan Bank Discount Notes | | | | |
| | 100,000 | | | 0.137%, 6/7/2013e,f | | | 99,940 | |
| | 2,942 | | | Thrivent Cash Management Trust | | | 2,942 | |
| | | | | | | | |
| | | | Total Short-Term Investments (at amortized cost) | | | 102,882 | |
| | | | | | | | |
| | | | Total Investments (cost $57,223,613) 98.7% | | $ | 60,136,760 | |
| | | | | | | | |
| | | | Other Assets and Liabilities, Net 1.3% | | | 790,606 | |
| | | | | | | | |
| | | | Total Net Assets 100.0% | | $ | 60,927,366 | |
| | | | | | | | |
| a | Non-income producing security. |
| b | Denotes variable rate securities. Variable rate securities are securities whose yields vary with a designated market index or market rate. The rate shown is as of December 31, 2012. |
| c | Denotes perpetual securities. Perpetual securities pay an indefinite stream of interest, but may be called by the issuer at an earlier date. |
| d | Denotes securities sold under Rule 144A of the Securities Act of 1933, which exempts them from registration. These securities have been deemed liquid and may be resold to other dealers in the program or to other qualified institutional buyers. As of December 31, 2012, the value of these investments was $813,600 or 1.3% of total net assets. |
| e | The interest rate shown reflects the yield, coupon rate or the discount rate at the date of purchase. |
| f | At December 31, 2012, $99,940 of investments were held on deposit with the counterparty and pledged as the initial margin deposit for open futures contracts. |
The accompanying Notes to Financial Statements are an integral part of this schedule.
16
Equity Income Plus Fund
Schedule of Investments as of December 31, 2012
Definitions:
| | | | |
| ADR | | - | | American Depositary Receipt, which are certificates for an underlying foreign security’s shares held by an issuing U.S. depository bank. |
| REIT | | - | | Real Estate Investment Trust is a company that buys, develops, manages and/or sells real estate assets. |
| ETF | | - | | Exchange Traded Fund. |
Unrealized Appreciation (Depreciation)
Gross unrealized appreciation and depreciation of investments, based on cost for federal income tax purposes, were as follows:
| | | | |
Gross unrealized appreciation | | $ | 3,976,641 | |
Gross unrealized depreciation | | | (1,147,593 | ) |
| | | | |
Net unrealized appreciation (depreciation) | | $ | 2,829,048 | |
| |
Cost for federal income tax purposes | | $ | 57,307,712 | |
Fair Valuation Measurements
The following table is a summary of the inputs used, as of December 31, 2012, in valuing Equity Income Plus Fund’s assets carried at fair value.
| | | | | | | | | | | | | | | | |
Investments in Securities | | Total | | | Level 1 | | | Level 2 | | | Level 3 | |
Common Stock | | | | | | | | | | | | | | | | |
Consumer Discretionary | | | 5,124,715 | | | | 5,124,715 | | | | — | | | | — | |
Consumer Staples | | | 5,750,617 | | | | 5,750,617 | | | | — | | | | — | |
Energy | | | 6,860,213 | | | | 6,860,213 | | | | — | | | | — | |
Financials | | | 14,565,747 | | | | 14,565,747 | | | | — | | | | — | |
Health Care | | | 6,761,700 | | | | 6,761,700 | | | | — | | | | — | |
Industrials | | | 4,010,110 | | | | 4,010,110 | | | | — | | | | — | |
Information Technology | | | 5,427,791 | | | | 5,427,791 | | | | — | | | | — | |
Materials | | | 2,491,506 | | | | 2,491,506 | | | | — | | | | — | |
Telecommunications Services | | | 2,956,170 | | | | 2,956,170 | | | | — | | | | — | |
Utilities | | | 2,893,951 | | | | 2,893,951 | | | | — | | | | — | |
Long-Term Fixed Income | | | | | | | | | | | | | | | | |
Energy | | | 198,768 | | | | — | | | | 198,768 | | | | — | |
Financials | | | 2,235,478 | | | | — | | | | 2,235,478 | | | | — | |
Utilities | | | 458,481 | | | | — | | | | 458,481 | | | | — | |
Preferred Stock | | | | | | | | | | | | | | | | |
Financials | | | 255,115 | | | | 255,115 | | | | — | | | | — | |
Utilities | | | 43,516 | | | | 43,516 | | | | — | | | | — | |
Short-Term Investments | | | 102,882 | | | | 2,942 | | | | 99,940 | | | | — | |
| | | | | | | | | | | | | | | | |
Total | | $ | 60,136,760 | | | $ | 57,144,093 | | | $ | 2,992,667 | | | $ | — | |
| | | | | | | | | | | | | | | | |
| | | | |
Other Financial Instruments | | Total | | | Level 1 | | | Level 2 | | | Level 3 | |
Liability Derivatives | | | | | | | | | | | | | | | | |
Futures Contracts | | | 4,380 | | | | 4,380 | | | | — | | | | — | |
| | | | | | | | | | | | | | | | |
Total Liability Derivatives | | $ | 4,380 | | | $ | 4,380 | | | $ | — | | | $ | — | |
| | | | | | | | | | | | | | | | |
There were no significant transfers between Levels during the period ended December 31, 2012. Transfers between Levels are identified as of the end of the period.
| | | | | | | | | | | | | | | | | | | | |
Futures Contracts | | Number of
Contracts
Long/(Short) | | | Expiration
Date | | | Notional
Principal
Amount | | | Value | | | Unrealized
Gain/(Loss) | |
S&P 500 Index Mini-Futures | | | 8 | | | | March 2013 | | | $ | 572,420 | | | $ | 568,040 | | | $ | (4,380 | ) |
Total Futures Contracts | | | | | | | | | | | | | | | | | | $ | (4,380 | ) |
The accompanying Notes to Financial Statements are an integral part of this schedule.
17
Equity Income Plus Fund
Schedule of Investments as of December 31, 2012
The following table summarizes the fair value and Statement of Assets and Liabilities location, as of December 31, 2012, for Equity Income Plus Fund’s investments in financial derivative instruments by primary risk exposure as discussed under item (2) Significant Accounting Policies of the Notes to Financial Statements.
| | | | | | |
Derivatives by risk category | | Statement of Assets and Liabilities Location | | Fair Value | |
Liability Derivatives | | | | | | |
Equity Contracts | | | | | | |
Futures* | | Net Assets - Net unrealized appreciation/(depreciation) on Futures contracts | | $ | 4,380 | |
Total Equity Contracts | | | | | 4,380 | |
| | | | | | |
Total Liability Derivatives | | | | $ | 4,380 | |
| | | | | | |
| * | Includes cumulative appreciation/depreciation of futures contracts as reported in the Schedule of Investments. Only current day’s variation margin is reported within the Statement of Assets and Liabilities. |
The following table summarizes the net realized gains/(losses) and Statement of Operations location, for the period ended December 31, 2012, for Equity Income Plus Fund’s investments in financial derivative instruments by primary risk exposure.
| | | | | | |
Derivatives by risk category | | Statement of Operations Location | | Realized Gains/(Losses)
recognized in Income | |
Equity Contracts | | | | | | |
Options Written | | Net realized gains/(losses) on Written option contracts | | | (120,738 | ) |
Options Purchased | | Net realized gains/(losses) on Investments | | | (75,002 | ) |
Futures | | Net realized gains/(losses) on Futures contracts | | | 618,124 | |
Total Equity Contracts | | | | | 422,384 | |
| | | | | | |
Total | | | | $ | 422,384 | |
| | | | | | |
The following table summarizes the change in net unrealized appreciation/(depreciation) and Statement of Operations location, for the period ended December 31, 2012, for Equity Income Plus Fund’s investments in financial derivative instruments by primary risk exposure.
| | | | | | |
Derivatives by risk category | | Statement of Operations Location | | Change in unrealized
appreciation/(depreciation)
recognized in Income | |
Equity Contracts | | | | | | |
Options Written | | Change in net unrealized appreciation/(depreciation) on Written option contracts | | | 49,715 | |
Options Purchased | | Change in net unrealized appreciation/(depreciation) on Investments | | | 58,510 | |
Futures | | Change in net unrealized appreciation/(depreciation) on Futures contracts | | | (100,218 | ) |
Total Equity Contracts | | | | | 8,007 | |
| | | | | | |
Total | | | | $ | 8,007 | |
| | | | | | |
The following table presents Equity Income Plus Fund’s average volume of derivative activity during the period ended December 31, 2012.
| | | | | | | | | | | | |
Derivative Risk Category | | Futures
(Notional*) | | | Futures
(Percentage of
Average Net Assets) | | | Options
(Contracts) | |
Equity Contracts | | $ | 2,323,043 | | | | 4.0 | % | | | 63 | |
| * | Notional amount represents long or short, or both, derivative positions held by the fund. |
The accompanying Notes to Financial Statements are an integral part of this schedule.
18
Equity Income Plus Fund
Schedule of Investments as of December 31, 2012
Investment in Affiliates
Affiliated issuers, as defined under the Investment Company Act of 1940, include those in which the Fund’s holdings of an issuer represent 5% or more of the outstanding voting securities of an issuer, or any affiliated mutual fund.
A summary of transactions for the fiscal year to date, in Equity Income Plus Fund, is as follows:
| | | | | | | | | | | | | | | | | | | | | | | | |
Fund | | Value
December 31, 2011 | | | Gross
Purchases | | | Gross
Sales | | | Shares Held at
December 31, 2012 | | | Value
December 31, 2012 | | | Income Earned
January 1, 2012 -
December 31, 2012 | |
Cash Management Trust-Short Term Investment | | $ | — | | | $ | 995,881 | | | $ | 992,939 | | | | 2,942 | | | $ | 2,942 | | | $ | 9 | |
Total Value and Income Earned | | | — | | | | | | | | | | | | | | | | 2,942 | | | | 9 | |
The accompanying Notes to Financial Statements are an integral part of this schedule.
19
Diversified Income Plus Fund
Schedule of Investments as of December 31, 2012
| | | | | | | | |
Principal
Amount | | | Bank Loans (9.0%)a | | Value | |
| | Basic Materials (1.2%) | | | | |
| | | | Arch Coal, Inc., Term Loan | | | | |
| | $1,436,350 | | | 3.148%, 5/16/2018b,c | | | $1,449,148 | |
| | | | FMG Resources August 2006 Pty., Ltd., Term Loan | | | | |
| | 1,097,250 | | | 5.250%, 10/18/2017 | | | 1,105,479 | |
| | | | Ineos US Finance, LLC, Term Loan | | | | |
| | 1,602,800 | | | 3.864%, 5/4/2018b,c | | | 1,618,379 | |
| | | | | | | | |
| | | | Total | | | 4,173,006 | |
| | | | | | | | |
| |
| | Communications Services (3.2%) | | | | |
| | | | Charter Communications Operating, LLC, Term Loan | | | | |
| | 317,600 | | | 4.000%, 5/15/2019 | | | 320,061 | |
| | | | Clear Channel Communications, Inc., Term Loan | | | | |
| | 800,000 | | | 3.862%, 1/29/2016 | | | 659,376 | |
| | | | Cumulus Media Holdings, Inc., Term Loan | | | | |
| | 750,000 | | | 0.000%, 9/17/2018b,c | | | 751,643 | |
| | | | Fairpoint Communications, Inc., Term Loan | | | | |
| | 650,000 | | | 4.500%, 1/25/2016b,c | | | 627,497 | |
| | | | Intelsat Jackson Holdings SA, Term Loan | | | | |
| | 797,980 | | | 4.500%, 4/2/2018 | | | 804,132 | |
| | | | Level 3 Financing, Inc., Term Loan | | | | |
| | 1,450,000 | | | 4.750%, 8/1/2019b,c | | | 1,456,047 | |
| | | | Toys R Us, Inc., Term Loan | | | | |
| | 1,610,925 | | | 5.250%, 5/25/2018 | | | 1,539,448 | |
| | | | Univision Communications, Inc., Term Loan | | | | |
| | 639,563 | | | 2.212%, 9/29/2014 | | | 638,367 | |
| | 800,000 | | | 4.462%, 3/31/2017 | | | 786,128 | |
| | | | Van Wagner Communications, Inc., Term Loan | | | | |
| | 650,000 | | | 8.250%, 8/3/2018 | | | 655,960 | |
| | | | WideOpenWest Finance, LLC, Term Loan | | | | |
| | 796,000 | | | 6.250%, 7/17/2018 | | | 804,143 | |
| | | | Zayo Group, LLC, Term Loan | | | | |
| | 1,892,121 | | | 5.250%, 7/2/2019 | | | 1,912,821 | |
| | | | | | | | |
| | | | Total | | | 10,955,623 | |
| | | | | | | | |
| |
| | Consumer Cyclical (0.5%) | | | | |
| | | | Burlington Coat Factory Warehouse Corporation, Term Loan | | | | |
| | 787,398 | | | 5.500%, 2/23/2017 | | | 792,878 | |
| | | | Chrysler Group, LLC, Term Loan | | | | |
| | 793,955 | | | 6.000%, 5/24/2017 | | | 809,612 | |
| | | | | | | | |
| | | | Total | | | 1,602,490 | |
| | | | | | | | |
| |
| | Consumer Non-Cyclical (1.3%) | | | | |
| | | | Bausch & Lomb, Inc., Term Loan | | | | |
| | 796,000 | | | 5.250%, 5/17/2019 | | | 801,683 | |
| | | | CHS/Community Health Systems, Inc., Term Loan | | | | |
| | 800,000 | | | 3.811%, 1/25/2017 | | | 804,296 | |
| | | | Roundy’s Supermarkets, Inc., Term Loan | | | | |
| | 794,000 | | | 5.750%, 2/13/2019 | | | 745,121 | |
| | | | SUPERVALU, Inc., Term Loan | | | | |
| | 820,000 | | | 6.750%, 8/10/2018b,c | | | 831,119 | |
| | | | Visant Corporation, Term Loan | | | | |
| | 1,533,669 | | | 5.250%, 12/22/2016 | | | 1,389,888 | |
| | | | | | | | |
| | | | Total | | | 4,572,107 | |
| | | | | | | | |
| |
| |
Energy (0.5%) | | | | |
| | | | Cheasapeake Energy Corporation, Term Loan | | | | |
| | 1,615,000 | | | 5.750%, 12/2/2017b,c | | | 1,615,404 | |
| | | | | | | | |
| | | | Total | | | 1,615,404 | |
| | | | | | | | |
| |
| | Financials (0.4%) | | | | |
| | | | Nuveen Investments, Inc., Term Loan | | | | |
| | 1,450,000 | | | 5.672%, 5/13/2017b,c | | | 1,455,438 | |
| | | | | | | | |
| | | | Total | | | 1,455,438 | |
| | | | | | | | |
| |
| | Technology (1.0%) | | | | |
| | | | First Data Corporation Extended, Term Loan | | | | |
| | 1,600,000 | | | 2.105%, 3/26/2018b,c | | | 1,519,824 | |
| | | | Freescale Semiconductor, Inc., Term Loan | | | | |
| | 1,422,417 | | | 6.000%, 2/28/2019 | | | 1,409,303 | |
| | | | Infor US, Inc., Term Loan | | | | |
| | 631,829 | | | 5.250%, 4/5/2018 | | | 637,016 | |
| | | | | | | | |
| | | | Total | | | 3,566,143 | |
| | | | | | | | |
| |
| | Transportation (0.4%) | | | | |
| | | | Delta Air Lines, Inc., Term Loan | | | | |
| | 1,443,955 | | | 5.500%, 4/20/2017b,c | | | 1,455,680 | |
| | | | | | | | |
| | | | Total | | | 1,455,680 | |
| | | | | | | | |
| |
| | Utilities (0.5%) | | | | |
| | | | Calpine Corporation, Term Loan | | | | |
| | 800,000 | | | 3.250%, 4/1/2018b,c | | | 806,864 | |
| | | | NGPL PipeCo, LLC, Term Loan | | | | |
| | 771,428 | | | 6.750%, 9/15/2017 | | | 787,821 | |
| | | | | | | | |
| | | | Total | | | 1,594,685 | |
| | | | | | | | |
| | | | Total Bank Loans (cost $30,967,834) | | | 30,990,576 | |
| | | | | | | | |
| | |
Principal
Amount | | | Long-Term Fixed Income (45.9%) | | | |
| | Asset-Backed Securities (1.2%) | | | | |
| | | | Asset Backed Securities Corporation Home Equity | | | | |
| | 320,000 | | | 0.370%, 11/25/2036d | | | 202,802 | |
| | | | Carrington Mortgage Loan Trust | | | | |
| | 1,700,000 | | | 0.360%, 8/25/2036d | | | 919,304 | |
| | | | J.P. Morgan Mortgage Trust | | | | |
| | 1,190,398 | | | 2.856%, 2/25/2036 | | | 1,006,783 | |
| | | | Renaissance Home Equity Loan Trust | | | | |
| | 841,068 | | | 5.746%, 5/25/2036 | | | 549,047 | |
| | 1,000,000 | | | 6.011%, 5/25/2036 | | | 606,870 | |
| | 1,450,000 | | | 5.797%, 8/25/2036 | | | 833,356 | |
| | | | | | | | |
| | | | Total | | | 4,118,162 | |
| | | | | | | | |
The accompanying Notes to Financial Statements are an integral part of this schedule.
20
Diversified Income Plus Fund
Schedule of Investments as of December 31, 2012
| | | | | | | | |
Principal
Amount | | | Long-Term Fixed Income (45.9%) | | Value | |
| Basic Materials (0.9%) | |
| | | | Dow Chemical Company | | | | |
| $ | 300,000 | | | 8.550%, 5/15/2019 | | $ | 405,023 | |
| | | | FMG Resources Property, Ltd. | | | | |
| | 800,000 | | | 6.000%, 4/1/2017e,f | | | 816,000 | |
| | | | Ineos Finance plc | | | | |
| | 1,080,000 | | | 7.500%, 5/1/2020e | | | 1,131,300 | |
| | | | Inmet Mining Corporation | | | | |
| | 610,000 | | | 7.500%, 6/1/2021e | | | 632,875 | |
| | | | | | | | |
| | | | Total | | | 2,985,198 | |
| | | | | | | | |
|
| Capital Goods (1.0%) | |
| | | | Case New Holland, Inc. | | | | |
| | 415,000 | | | 7.875%, 12/1/2017 | | | 490,738 | |
| | | | CNH Capital, LLC | | | | |
| | 385,000 | | | 3.875%, 11/1/2015e | | | 397,031 | |
| | | | Crown Cork & Seal Company, Inc. | | | | |
| | 190,000 | | | 7.375%, 12/15/2026 | | | 210,900 | |
| | | | Reynolds Group Issuer, Inc. | | | | |
| | 800,000 | | | 6.875%, 2/15/2021 | | | 862,000 | |
| | | | Textron, Inc. | | | | |
| | 450,000 | | | 7.250%, 10/1/2019 | | | 549,474 | |
| | | | UR Financing Escrow Corporation | | | | |
| | 800,000 | | | 7.375%, 5/15/2020e | | | 878,000 | |
| | | | | | | | |
| | | | Total | | | 3,388,143 | |
| | | | | | | | |
|
| Collateralized Mortgage Obligations (12.2%) | |
| | | | American Home Mortgage Investment Trust | | | | |
| | 2,587,238 | | | 6.250%, 12/25/2036 | | | 1,380,242 | |
| | | | Banc of America Alternative Loan Trust | | | | |
| | 1,218,592 | | | 0.710%, 4/25/2035d | | | 961,843 | |
| | | | Banc of America Funding Corporation | | | | |
| | 864,711 | | | 5.118%, 5/20/2036 | | | 676,453 | |
| | | | Bear Stearns Adjustable Rate Mortgage Trust | | | | |
| | 1,556,066 | | | 2.470%, 10/25/2035d | | | 1,498,358 | |
| | | | Citigroup Mortgage Loan Trust, Inc. | | | | |
| | 781,019 | | | 5.500%, 11/25/2035 | | | 689,879 | |
| | | | CitiMortgage Alternative Loan Trust | | | | |
| | 1,151,042 | | | 5.750%, 4/25/2037 | | | 959,035 | |
| | | | Countrywide Alternative Loan Trust | | | | |
| | 1,303,276 | | | 0.610%, 2/25/2035d | | | 1,067,745 | |
| | 633,437 | | | 5.500%, 2/25/2036 | | | 524,294 | |
| | 500,628 | | | 6.000%, 4/25/2036 | | | 388,400 | |
| | 1,165,399 | | | 6.500%, 8/25/2036 | | | 791,819 | |
| | 436,755 | | | 6.000%, 1/25/2037 | | | 361,604 | |
| | | | Countrywide Home Loan Mortgage Pass Through Trust | | | | |
| | 1,572,101 | | | 3.011%, 11/25/2035 | | | 1,243,413 | |
| | | | Deutsche Alt-A Securities, Inc. Alternative Loan Trust | | | | |
| | 354,749 | | | 5.500%, 10/25/2021 | | | 363,009 | |
| | 974,330 | | | 0.410%, 11/25/2035d | | | 539,095 | |
| | 1,673,767 | | | 0.936%, 4/25/2047d | | | 1,263,758 | |
| | | | First Horizon Mortgage Pass- Through Trust | | | | |
| | 1,399,125 | | | 5.553%, 8/25/2037 | | | 1,056,408 | |
| | | | Greenpoint Mortgage Funding Trust | | | | |
| | 1,262,517 | | | 0.410%, 10/25/2045d | | | 796,199 | |
| | | | GSR Mortgage Loan Trust | | | | |
| | 573,696 | | | 0.400%, 8/25/2046d | | | 543,924 | |
| | | | HomeBanc Mortgage Trust | | | | |
| | 1,440,971 | | | 2.650%, 4/25/2037 | | | 928,399 | |
| | | | J.P. Morgan Alternative Loan Trust | | | | |
| | 1,844,324 | | | 6.500%, 3/25/2036 | | | 1,633,018 | |
| | | | J.P. Morgan Mortgage Trust | | | | |
| | 358,550 | | | 6.500%, 1/25/2035 | | | 353,578 | |
| | 333,643 | | | 3.002%, 10/25/2036 | | | 261,515 | |
| | 947,905 | | | 2.904%, 1/25/2037 | | | 729,557 | |
| | 1,157,288 | | | 6.250%, 8/25/2037 | | | 800,772 | |
| | | | Lehman Mortgage Trust | | | | |
| | 1,484,406 | | | 0.960%, 12/25/2035d | | | 959,276 | |
| | | | Lehman XS Trust | | | | |
| | 1,200,000 | | | 5.500%, 9/25/2035 | | | 956,596 | |
| | | | Master Asset Securitization Trust | | | | |
| | 1,649,375 | | | 0.710%, 6/25/2036d | | | 1,054,878 | |
| | | | MASTR Alternative Loans Trust | | | | |
| | 482,723 | | | 6.500%, 7/25/2034 | | | 510,665 | |
| | 1,368,557 | | | 0.660%, 12/25/2035d | | | 725,376 | |
| | | | Morgan Stanley Mortgage Loan Trust | | | | |
| | 1,086,228 | | | 5.412%, 11/25/2035 | | | 727,771 | |
| | | | MortgageIT Trust | | | | |
| | 1,757,496 | | | 0.470%, 12/25/2035d | | | 1,487,802 | |
| | | | New Century Alternative Mortgage Loan Trust | | | | |
| | 1,007,800 | | | 6.167%, 7/25/2036 | | | 695,553 | |
| | | | New York Mortgage Trust, Inc. | | | | |
| | 347,816 | | | 2.988%, 5/25/2036 | | | 29,999 | |
| | | | RALI Trust | | | | |
| | 1,362,239 | | | 5.750%, 4/25/2037 | | | 1,015,802 | |
| | 1,901,387 | | | 6.250%, 4/25/2037 | | | 1,466,309 | |
| | 767,666 | | | 6.000%, 6/25/2037 | | | 580,094 | |
| | | | Residential Asset Securitization Trust | | | | |
| | 1,486,658 | | | 0.590%, 8/25/2037d | | | 475,133 | |
| | | | Sequoia Mortgage Trust | | | | |
| | 2,629,666 | | | 4.923%, 9/20/2046 | | | 2,166,471 | |
| | | | Structured Adjustable Rate Mortgage Loan Trust | | | | |
| | 1,112,112 | | | 5.500%, 12/25/2034 | | | 1,072,057 | |
| | 1,473,671 | | | 5.158%, 5/25/2036 | | | 1,072,436 | |
| | 404,199 | | | 5.121%, 9/25/2036 | | | 27,824 | |
| | | | Structured Asset Mortgage Investments, Inc. | | | | |
| | 1,194,292 | | | 0.520%, 12/25/2035d | | | 790,774 | |
| | 1,744,150 | | | 0.420%, 5/25/2046d | | | 1,004,470 | |
| | | | WaMu Mortgage Pass Through Certificates | | | | |
| | 1,156,729 | | | 2.423%, 11/25/2036 | | | 927,442 | |
| | 257,149 | | | 2.699%, 8/25/2046 | | | 204,206 | |
| | 1,154,377 | | | 1.125%, 9/25/2046d | | | 932,055 | |
| | | | Washington Mutual Alternative Mortgage Pass Through Certificates | | | | |
| | 1,617,448 | | | 0.810%, 6/25/2035d | | | 1,140,904 | |
| | 1,465,990 | | | 0.916%, 2/25/2047d | | | 751,392 | |
The accompanying Notes to Financial Statements are an integral part of this schedule.
21
Diversified Income Plus Fund
Schedule of Investments as of December 31, 2012
| | | | | | | | |
Principal
Amount | | | Long-Term Fixed Income (45.9%) | | Value | |
| Collateralized Mortgage Obligations (12.2%) - continued | | | | |
| | | | Wells Fargo Mortgage Backed Securities Trust | | | | |
| $ | 800,659 | | | 0.910%, 5/25/2037d | | $ | 646,185 | |
| | 805,299 | | | 6.000%, 7/25/2037 | | | 785,446 | |
| | | | | | | | |
| | | | Total | | | 42,019,233 | |
| | | | | | | | |
| |
| Commercial Mortgage-Backed Securities (1.0%) | | | | |
| | | | Credit Suisse Mortgage Capital Certificates | | | | |
| | 500,000 | | | 5.509%, 9/15/2039 | | | 540,672 | |
| | | | Greenwich Capital Commercial Funding Corporation | | | | |
| | 1,350,000 | | | 5.867%, 12/10/2049 | | | 1,509,257 | |
| | | | Morgan Stanley Capital, Inc. | | | | |
| | 1,350,000 | | | 5.406%, 3/15/2044 | | | 1,458,483 | |
| | | | | | | | |
| | | | Total | | | 3,508,412 | |
| | | | | | | | |
| |
| Communications Services (3.5%) | | | | |
| | | | AMC Networks, Inc. | | | | |
| | 610,000 | | | 4.750%, 12/15/2022 | | | 613,050 | |
| | | | British Telecommunications plc | | | | |
| | 300,000 | | | 2.000%, 6/22/2015 | | | 308,405 | |
| | | | Cablevision Systems Corporation | | | | |
| | 800,000 | | | 8.625%, 9/15/2017 | | | 933,000 | |
| | | | CenturyLink, Inc. | | | | |
| | 650,000 | | | 6.450%, 6/15/2021 | | | 718,249 | |
| | | | Cequel Communications Escrow 1, LLC | | | | |
| | 610,000 | | | 6.375%, 9/15/2020e | | | 635,163 | |
| | | | Clear Channel Worldwide Holdings, Inc. | | | | |
| | 610,000 | | | 6.500%, 11/15/2022e | | | 632,875 | |
| | | | Cox Communications, Inc. | | | | |
| | 300,000 | | | 3.250%, 12/15/2022e | | | 309,377 | |
| | | | Crown Castle International Corporation | | | | |
| | 800,000 | | | 5.250%, 1/15/2023e | | | 856,000 | |
| | | | Dish DBS Corporation | | | | |
| | 160,000 | | | 6.750%, 6/1/2021 | | | 182,400 | |
| | | | Hughes Satellite Systems Corporation | | | | |
| | 800,000 | | | 6.500%, 6/15/2019 | | | 882,000 | |
| | | | Intelsat Jackson Holdings SA | | | | |
| | 800,000 | | | 7.250%, 4/1/2019 | | | 860,000 | |
| | | | NBCUniversal Media, LLC | | | | |
| | 300,000 | | | 2.875%, 1/15/2023 | | | 301,276 | |
| | | | News America, Inc. | | | | |
| | 325,000 | | | 4.500%, 2/15/2021 | | | 371,295 | |
| | | | Priceline.com, Inc., Convertible | | | | |
| | 540,000 | | | 1.000%, 3/15/2018e | | | 576,788 | |
| | | | Sirius XM Radio, Inc. | | | | |
| | 610,000 | | | 5.250%, 8/15/2022e | | | 616,100 | |
| | | | Sprint Nextel Corporation | | | | |
| | 400,000 | | | 9.000%, 11/15/2018e | | | 494,000 | |
| | 400,000 | | | 6.000%, 11/15/2022 | | | 411,000 | |
| | | | Telecom Italia Capital SA | | | | |
| | 165,000 | | | 6.999%, 6/4/2018 | | | 188,595 | |
| | | | Telefonica Emisiones SAU | | | | |
| | 163,000 | | | 5.462%, 2/16/2021 | | | 173,799 | |
| | | | UPCB Finance V, Ltd. | | | | |
| | 800,000 | | | 7.250%, 11/15/2021e | | | 880,000 | |
| | | | Virgin Media Finance plc | | | | |
| | 610,000 | | | 5.250%, 2/15/2022 | | | 646,600 | |
| | | | Wind Acquisition Finance SA | | | | |
| | 210,000 | | | 11.750%, 7/15/2017e | | | 219,975 | |
| | 400,000 | | | 7.250%, 2/15/2018e | | | 405,000 | |
| | | | | | | | |
| | | | Total | | | 12,214,947 | |
| | | | | | | | |
| |
| Consumer Cyclical (2.6%) | | | | |
| | | | Chrysler Group, LLC | | | | |
| | 590,000 | | | 8.000%, 6/15/2019f | | | 643,100 | |
| | | | Ford Motor Company, Convertible | | | | |
| | 420,000 | | | 4.250%, 11/15/2016 | | | 665,700 | |
| | | | Ford Motor Credit Company, LLC | | | | |
| | 650,000 | | | 6.625%, 8/15/2017 | | | 759,503 | |
| | | | Home Depot, Inc. | | | | |
| | 300,000 | | | 3.950%, 9/15/2020 | | | 343,484 | |
| | | | Host Hotels and Resorts, LP | | | | |
| | 800,000 | | | 6.000%, 11/1/2020 | | | 880,000 | |
| | | | Lennar Corporation | | | | |
| | 800,000 | | | 12.250%, 6/1/2017 | | | 1,074,000 | |
| | | | Limited Brands, Inc. | | | | |
| | 800,000 | | | 5.625%, 2/15/2022 | | | 870,000 | |
| | | | Macy’s Retail Holdings, Inc. | | | | |
| | 490,000 | | | 6.700%, 7/15/2034 | | | 582,828 | |
| | | | MGM Resorts International | | | | |
| | 800,000 | | | 7.625%, 1/15/2017 | | | 856,000 | |
| | | | Royal Caribbean Cruises, Ltd. | | | | |
| | 800,000 | | | 5.250%, 11/15/2022 | | | 846,000 | |
| | | | Toll Brothers Finance Corporation, Convertible | | | | |
| | 600,000 | | | 0.500%, 9/15/2032e | | | 604,500 | |
| | | | Toys R Us Property Company II, LLC | | | | |
| | 800,000 | | | 8.500%, 12/1/2017 | | | 848,000 | |
| | | | | | | | |
| | | | Total | | | 8,973,115 | |
| | | | | | | | |
| |
| Consumer Non-Cyclical (2.9%) | | | | |
| | | | AbbVie, Inc. | | | | |
| | 300,000 | | | 2.000%, 11/6/2018e | | | 303,877 | |
| | 300,000 | | | 2.900%, 11/6/2022e | | | 305,514 | |
| | | | Beam, Inc. | | | | |
| | 325,000 | | | 5.375%, 1/15/2016 | | | 363,069 | |
| | | | Biomet, Inc. | | | | |
| | 610,000 | | | 6.500%, 8/1/2020e | | | 648,125 | |
| | | | Bunge Limited Finance Corporation | | | | |
| | 225,000 | | | 4.100%, 3/15/2016 | | | 241,701 | |
| | | | Community Health Systems, Inc. | | | | |
| | 800,000 | | | 8.000%, 11/15/2019 | | | 866,000 | |
| | | | Covidien International Finance SA | | | | |
| | 650,000 | | | 3.200%, 6/15/2022 | | | 680,483 | |
| | | | Gilead Sciences, Inc. | | | | |
| | 165,000 | | | 3.050%, 12/1/2016 | | | 176,719 | |
| | | | Grifols, Inc. | | | | |
| | 610,000 | | | 8.250%, 2/1/2018 | | | 671,763 | |
| | | | HCA, Inc. | | | | |
| | 610,000 | | | 5.875%, 3/15/2022 | | | 663,375 | |
| | | | Heineken NV | | | | |
| | 300,000 | | | 2.750%, 4/1/2023e | | | 294,566 | |
| | | | Hologic, Inc., Convertible | | | | |
| | 540,000 | | | 2.000%, 12/15/2037g | | | 602,100 | |
The accompanying Notes to Financial Statements are an integral part of this schedule.
22
Diversified Income Plus Fund
Schedule of Investments as of December 31, 2012
| | | | | | | | |
Principal
Amount | | | Long-Term Fixed Income (45.9%) | | Value | |
| Consumer Non-Cyclical (2.9%) - continued | | | | |
| | | | Kraft Foods, Inc. | | | | |
| $ | 330,000 | | | 3.500%, 6/6/2022e | | $ | 352,231 | |
| | | | Rite Aid Corporation | | | | |
| | 610,000 | | | 7.500%, 3/1/2017 | | | 626,775 | |
| | | | SABMiller Holdings, Inc. | | | | |
| | 300,000 | | | 3.750%, 1/15/2022e | | | 323,949 | |
| | 300,000 | | | 4.950%, 1/15/2042e | | | 340,058 | |
| | | | Safeway, Inc. | | | | |
| | 150,000 | | | 5.000%, 8/15/2019 | | | 161,382 | |
| | | | Spectrum Brands Escrow Corporation | | | | |
| | 610,000 | | | 6.375%, 11/15/2020e | | | 640,500 | |
| | | | Teva Pharmaceutical Finance IV BV | | | | |
| | 335,000 | | | 3.650%, 11/10/2021 | | | 358,528 | |
| | | | Tyson Foods, Inc. | | | | |
| | 325,000 | | | 4.500%, 6/15/2022 | | | 351,818 | |
| | | | Valeant Pharmaceuticals International | | | | |
| | 800,000 | | | 7.000%, 10/1/2020e | | | 870,000 | |
| | | | | | | | |
| | | | Total | | | 9,842,533 | |
| | | | | | | | |
| |
| Energy (2.1%) | | | | |
| | | | BP Capital Markets plc | | | | |
| | 325,000 | | | 4.750%, 3/10/2019 | | | 376,835 | |
| | | | Concho Resources, Inc. | | | | |
| | 800,000 | | | 5.500%, 10/1/2022 | | | 844,000 | |
| | | | Enbridge Energy Partners, LP | | | | |
| | 900,000 | | | 8.050%, 10/1/2037 | | | 1,022,237 | |
| | | | Hornbeck Offshore Services, Inc., Convertible | | | | |
| | 600,000 | | | 1.500%, 9/1/2019e | | | 603,000 | |
| | | | Marathon Oil Corporation | | | | |
| | 360,000 | | | 2.800%, 11/1/2022 | | | 362,230 | |
| | | | MEG Energy Corporation | | | | |
| | 610,000 | | | 6.375%, 1/30/2023e | | | 635,925 | |
| | | | Murphy Oil Corporation | | | | |
| | 240,000 | | | 3.700%, 12/1/2022 | | | 239,087 | |
| | | | Nexen, Inc. | | | | |
| | 325,000 | | | 6.400%, 5/15/2037 | | | 420,161 | |
| | | | Petrobras International Finance Company | | | | |
| | 335,000 | | | 3.500%, 2/6/2017 | | | 351,330 | |
| | | | Pioneer Natural Resources Company | | | | |
| | 260,000 | | | 3.950%, 7/15/2022 | | | 272,448 | |
| | | | Plains Exploration & Production Company | | | | |
| | 1,020,000 | | | 6.125%, 6/15/2019 | | | 1,111,800 | |
| | | | Weatherford International, Ltd. | | | | |
| | 390,000 | | | 6.000%, 3/15/2018 | | | 445,601 | |
| | 490,000 | | | 4.500%, 4/15/2022 | | | 520,017 | |
| | | | | | | | |
| | | | Total | | | 7,204,671 | |
| | | | | | | | |
| |
| Financials (11.1%) | | | | |
| | | | ABN Amro North American Holding Preferred Capital Repackage Trust I | | | | |
| | 650,000 | | | 3.407%, 12/29/2049d,e,h | | | 650,000 | |
| | | | Aegon NV | | | | |
| | 600,000 | | | 1.867%, 7/29/2049d,h | | | 348,000 | |
| | | | Ally Financial, Inc. | | | | |
| | 800,000 | | | 7.500%, 9/15/2020 | | | 966,000 | |
| | | | American Express Company | | | | |
| | 1,250,000 | | | 6.800%, 9/1/2066 | | | 1,342,187 | |
| | | | American General Institutional Capital A | | | | |
| | 1,200,000 | | | 7.570%, 12/1/2045e | | | 1,422,000 | |
| | | | American International Group, Inc. | | | | |
| | 325,000 | | | 8.250%, 8/15/2018 | | | 427,013 | |
| | | | Apollo Investment Corporation, Convertible | | | | |
| | 1,300,000 | | | 5.750%, 1/15/2016 | | | 1,345,500 | |
| | | | Bank of America Corporation | | | | |
| | 650,000 | | | 5.650%, 5/1/2018 | | | 756,238 | |
| | 495,000 | | | 8.000%, 12/29/2049h | | | 547,510 | |
| | | | Barclays Bank plc | | | | |
| | 300,000 | | | 6.050%, 12/4/2017e | | | 331,916 | |
| | | | BBVA International Preferred SA Unipersonal | | | | |
| | 975,000 | | | 5.919%, 12/29/2049h | | | 789,750 | |
| | | | BBVA US Senior SAU | | | | |
| | 150,000 | | | 4.664%, 10/9/2015 | | | 153,798 | |
| | | | BNP Paribas SA | | | | |
| | 163,000 | | | 3.600%, 2/23/2016 | | | 172,527 | |
| | 1,250,000 | | | 5.186%, 6/29/2049e,h | | | 1,206,250 | |
| | | | Capital One Capital IV | | | | |
| | 975,000 | | | 6.745%, 2/17/2037 | | | 975,000 | |
| | | | Capital One Capital V | | | | |
| | 325,000 | | | 10.250%, 8/15/2039 | | | 325,000 | |
| | | | Citigroup, Inc. | | | | |
| | 300,000 | | | 5.500%, 2/15/2017 | | | 332,560 | |
| | 1,240,000 | | | 5.950%, 12/29/2049h | | | 1,255,500 | |
| | | | CNA Financial Corporation | | | | |
| | 300,000 | | | 7.350%, 11/15/2019 | | | 376,273 | |
| | | | Cooperatieve Centrale Raiffeisen-Boerenleenbank BA | | | | |
| | 300,000 | | | 3.950%, 11/9/2022 | | | 307,210 | |
| | 975,000 | | | 11.000%, 12/29/2049e,h | | | 1,318,687 | |
| | | | Coventry Health Care, Inc. | | | | |
| | 165,000 | | | 5.450%, 6/15/2021 | | | 196,112 | |
| | | | CyrusOne, LP/CyrusOne Finance Corporation | | | | |
| | 800,000 | | | 6.375%, 11/15/2022e | | | 834,000 | |
| | | | Developers Diversified Realty Corporation | | | | |
| | 490,000 | | | 7.875%, 9/1/2020 | | | 628,146 | |
| | | | Discover Financial Services | | | | |
| | 600,000 | | | 3.850%, 11/21/2022e | | | 619,124 | |
| | | | Eksportfinans ASA | | | | |
| | 165,000 | | | 2.375%, 5/25/2016 | | | 157,411 | |
| | | | GE Capital Trust I | | | | |
| | 620,000 | | | 6.375%, 11/15/2067 | | | 653,325 | |
| | | | General Electric Capital Corporation | | | | |
| | 1,200,000 | | | 6.250%, 12/15/2049h | | | 1,306,776 | |
| | | | Hartford Financial Services Group, Inc. | | | | |
| | 330,000 | | | 5.125%, 4/15/2022 | | | 380,770 | |
| | | | Health Care REIT, Inc., Convertible | | | | |
| | 510,000 | | | 3.000%, 12/1/2029 | | | 625,706 | |
| | | | HSBC Finance Corporation | | | | |
| | 465,000 | | | 6.676%, 1/15/2021 | | | 551,663 | |
| | | | Icahn Enterprises, LP | | | | |
| | 800,000 | | | 8.000%, 1/15/2018 | | | 859,000 | |
The accompanying Notes to Financial Statements are an integral part of this schedule.
23
Diversified Income Plus Fund
Schedule of Investments as of December 31, 2012
| | | | | | | | |
Principal
Amount | | | Long-Term Fixed Income (45.9%) | | Value | |
| Financials (11.1%) - continued | | | | |
| | | | ING Bank NV | | | | |
| $ | 330,000 | | | 5.000%, 6/9/2021e | | $ | 371,755 | |
| | | | ING Capital Funding Trust III | | | | |
| | 1,270,000 | | | 3.911%, 12/29/2049d,h | | | 1,205,702 | |
| | | | J.P. Morgan Chase & Company | | | | |
| | 300,000 | | | 2.000%, 8/15/2017 | | | 306,449 | |
| | | | KeyCorp | | | | |
| | 190,000 | | | 5.100%, 3/24/2021 | | | 221,352 | |
| | | | Liberty Mutual Group, Inc. | | | | |
| | 975,000 | | | 10.750%, 6/15/2058e | | | 1,452,750 | |
| | 315,000 | | | 4.950%, 5/1/2022e | | | 343,314 | |
| | | | Lincoln National Corporation | | | | |
| | 1,120,000 | | | 6.050%, 4/20/2067 | | | 1,115,800 | |
| | | | Lloyds TSB Bank plc | | | | |
| | 300,000 | | | 6.500%, 9/14/2020e | | | 331,491 | |
| | | | MetLife Capital Trust IV | | | | |
| | 1,050,000 | | | 7.875%, 12/15/2037e | | | 1,286,250 | |
| | | | Morgan Stanley | | | | |
| | 300,000 | | | 4.875%, 11/1/2022 | | | 310,618 | |
| | | | Murray Street Investment Trust I | | | | |
| | 325,000 | | | 4.647%, 3/9/2017 | | | 351,535 | |
| | | | Northern Trust Corporation | | | | |
| | 325,000 | | | 3.375%, 8/23/2021 | | | 351,007 | |
| | | | Prudential Financial, Inc. | | | | |
| | 620,000 | | | 5.875%, 9/15/2042 | | | 651,000 | |
| | 925,000 | | | 5.625%, 6/15/2043 | | | 958,578 | |
| | | | Regions Bank | | | | |
| | 300,000 | | | 7.500%, 5/15/2018 | | | 361,875 | |
| | | | Reinsurance Group of America, Inc. | | | | |
| | 900,000 | | | 6.750%, 12/15/2065 | | | 898,875 | |
| | | | Royal Bank of Scotland Group plc | | | | |
| | 300,000 | | | 6.125%, 12/15/2022 | | | 316,645 | |
| | | | Santander US Debt SAU | | | | |
| | 325,000 | | | 3.724%, 1/20/2015e | | | 326,476 | |
| | | | Societe Generale SA | | | | |
| | 325,000 | | | 5.200%, 4/15/2021e | | | 360,206 | |
| | | | Swiss RE Capital I, LP | | | | |
| | 1,130,000 | | | 6.854%, 5/29/2049e,h | | | 1,184,355 | |
| | | | Ventas Realty, LP | | | | |
| | 170,000 | | | 4.250%, 3/1/2022 | | | 180,276 | |
| | | | WellPoint, Inc., Convertible | | | | |
| | 600,000 | | | 2.750%, 10/15/2042e | | | 645,375 | |
| | | | XL Group plc | | | | |
| | 900,000 | | | 6.500%, 12/31/2049f,h | | | 841,500 | |
| | | | ZFS Finance USA Trust II | | | | |
| | 1,175,000 | | | 6.450%, 12/15/2065e | | | 1,257,250 | |
| | | | ZFS Finance USA Trust V | | | | |
| | 620,000 | | | 6.500%, 5/9/2037e | | | 661,075 | |
| | | | | | | | |
| | | | Total | | | 38,452,461 | |
| | | | | | | | |
| |
| Foreign Government (0.1%) | | | | |
| | | | Costa Rica Government International Bond | | | | |
| | 300,000 | | | 4.250%, 1/26/2023e | | | 302,700 | |
| | | | | | | | |
| | | | Total | | | 302,700 | |
| | | | | | | | |
| |
| Mortgage-Backed Securities (4.1%) | | | | |
| | | | Federal Home Loan Mortgage Corporation Gold 30-Yr. Pass Through | | | | |
| | 4,350,000 | | | 3.000%, 1/1/2043c | | | 4,547,789 | |
| | | | Federal National Mortgage Association Conventional 15-Yr. Pass Through | | | | |
| | 9,300,000 | | | 2.500%, 1/1/2028c | | | 9,724,313 | |
| | | | | | | | |
| | | | Total | | | 14,272,102 | |
| | | | | | | | |
| |
| Technology (0.6%) | | | | |
| | | | First Data Corporation | | | | |
| | 800,000 | | | 7.375%, 6/15/2019e | | | 828,000 | |
| | | | Hewlett-Packard Company | | | | |
| | 165,000 | | | 4.650%, 12/9/2021f | | | 165,642 | |
| | | | Intel Corporation, Convertible | | | | |
| | 540,000 | | | 3.250%, 8/1/2039 | | | 632,812 | |
| | | | SanDisk Corporation, Convertible | | | | |
| | 540,000 | | | 1.500%, 8/15/2017 | | | 626,400 | |
| | | | | | | | |
| | | | Total | | | 2,252,854 | |
| | | | | | | | |
| |
| Transportation (0.4%) | | | | |
| | | | Delta Air Lines, Inc. | | | | |
| | 130,000 | | | 4.750%, 5/7/2020 | | | 138,450 | |
| | | | Hertz Corporation | | | | |
| | 800,000 | | | 6.750%, 4/15/2019 | | | 873,000 | |
| | | | United Air Lines, Inc. | | | | |
| | 206,623 | | | 10.400%, 11/1/2016 | | | 237,617 | |
| | | | | | | | |
| | | | Total | | | 1,249,067 | |
| | | | | | | | |
| |
| Utilities (2.2%) | | | | |
| | | | Access Midstream Partners, LP | | | | |
| | 180,000 | | | 4.875%, 5/15/2023 | | | 182,700 | |
| | | | AES Corporation | | | | |
| | 800,000 | | | 7.375%, 7/1/2021 | | | 888,000 | |
| | | | CenterPoint Energy, Inc. | | | | |
| | 255,000 | | | 6.500%, 5/1/2018 | | | 311,036 | |
| | | | DCP Midstream Operating, LP | | | | |
| | 300,000 | | | 2.500%, 12/1/2017 | | | 298,402 | |
| | | | Energy Transfer Partners, LP | | | | |
| | 170,000 | | | 5.200%, 2/1/2022 | | | 193,921 | |
| | 170,000 | | | 6.500%, 2/1/2042 | | | 208,137 | |
| | | | Enterprise Products Operating, LLC | | | | |
| | 1,000,000 | | | 7.034%, 1/15/2068 | | | 1,145,000 | |
| | | | MarkWest Energy Partners, LP | | | | |
| | 610,000 | | | 5.500%, 2/15/2023 | | | 661,850 | |
| | | | NiSource Finance Corporation | | | | |
| | 650,000 | | | 6.125%, 3/1/2022 | | | 778,985 | |
| | | | NRG Energy, Inc. | | | | |
| | 370,000 | | | 8.250%, 9/1/2020 | | | 414,400 | |
| | 240,000 | | | 6.625%, 3/15/2023e | | | 256,800 | |
| | | | Southern California Edison Company | | | | |
| | 1,300,000 | | | 6.250%, 8/1/2049h | | | 1,411,423 | |
| | | | Southern Union Company | | | | |
| | 300,000 | | | 3.330%, 11/1/2066d | | | 256,875 | |
| | | | TransCanada PipeLines, Ltd. | | | | |
| | 600,000 | | | 6.350%, 5/15/2067 | | | 643,129 | |
| | | | | | | | |
| | | | Total | | | 7,650,658 | |
| | | | | | | | |
| | | | Total Long-Term Fixed Income
(cost $148,488,954) | | | 158,434,256 | |
| | | | | | | | |
The accompanying Notes to Financial Statements are an integral part of this schedule.
24
Diversified Income Plus Fund
Schedule of Investments as of December 31, 2012
| | | | | | | | |
Shares | | | Common Stock (35.1%) | | Value | |
| Consumer Discretionary (3.0%) | | | | |
| | 4,600 | | | Advance Auto Parts, Inc. | | $ | 332,810 | |
| | 18,000 | | | Apollo Group, Inc.i | | | 376,560 | |
| | 17,100 | | | Comcast Corporation | | | 639,198 | |
| | 6,800 | | | DIRECTVi | | | 341,088 | |
| | 29,600 | | | Ford Motor Company | | | 383,320 | |
| | 9,300 | | | Hanesbrands, Inc.i | | | 333,126 | |
| | 24,300 | | | Home Depot, Inc. | | | 1,502,955 | |
| | 9,500 | | | Kohl’s Corporation | | | 408,310 | |
| | 9,500 | | | Lowe’s Companies, Inc. | | | 337,440 | |
| | 17,000 | | | Macy’s, Inc. | | | 663,340 | |
| | 8,300 | | | McDonald’s Corporation | | | 732,143 | |
| | 700 | | | Priceline.com, Inc.i | | | 434,840 | |
| | 16,600 | | | Ross Stores, Inc. | | | 898,890 | |
| | 3,500 | | | Sherwin-Williams Company | | | 538,370 | |
| | 8,700 | | | Target Corporation | | | 514,779 | |
| | 32,200 | | | Thomson Reuters Corporation | | | 935,732 | |
| | 25,500 | | | TJX Companies, Inc. | | | 1,082,475 | |
| | | | | | | | |
| | | | Total | | | 10,455,376 | |
| | | | | | | | |
| |
| Consumer Staples (3.2%) | | | | |
| | 7,850 | | | Brown-Forman Corporation | | | 496,513 | |
| | 12,600 | | | Campbell Soup Companyf | | | 439,614 | |
| | 50,000 | | | Coca-Cola Company | | | 1,812,500 | |
| | 9,300 | | | Colgate-Palmolive Company | | | 972,222 | |
| | 15,300 | | | Constellation Brands, Inc.i | | | 541,467 | |
| | 6,900 | | | Energizer Holdings, Inc. | | | 551,862 | |
| | 13,200 | | | General Mills, Inc. | | | 533,412 | |
| | 6,000 | | | Kellogg Company | | | 335,100 | |
| | 2,800 | | | Lorillard, Inc. | | | 326,676 | |
| | 14,400 | | | Molson Coors Brewing Company | | | 616,176 | |
| | 37,600 | | | Mondelez International, Inc. | | | 957,672 | |
| | 6,800 | | | PepsiCo, Inc. | | | 465,324 | |
| | 12,500 | | | Post Holdings, Inc.i | | | 428,125 | |
| | 16,500 | | | Prestige Brands Holdings, Inc.i | | | 330,495 | |
| | 7,700 | | | Reynolds American, Inc. | | | 319,011 | |
| | 8,400 | | | Spectrum Brands Holdings, Inc.i | | | 377,412 | |
| | 6,700 | | | Universal Corporation | | | 334,397 | |
| | 9,400 | | | Walgreen Company | | | 347,894 | |
| | 15,400 | | | Wal-Mart Stores, Inc. | | | 1,050,742 | |
| | | | | | | | |
| | | | Total | | | 11,236,614 | |
| | | | | | | | |
| |
| Energy (3.2%) | | | | |
| | 16,000 | | | C&J Energy Services, Inc.f,i | | | 343,040 | |
| | 15,600 | | | Chevron Corporation | | | 1,686,984 | |
| | 24,600 | | | ConocoPhillips | | | 1,426,554 | |
| | 4,900 | | | Diamond Offshore Drilling, Inc. | | | 333,004 | |
| | 34,900 | | | Exxon Mobil Corporation | | | 3,020,595 | |
| | 17,274 | | | First Trust Energy Income and Growth Fund | | | 529,448 | |
| | 9,000 | | | Golar LNG, Ltd. | | | 331,020 | |
| | 7,700 | | | HollyFrontier Corporation | | | 358,435 | |
| | 40,500 | | | Kinder Morgan, Inc. | | | 1,430,865 | |
| | 9,800 | | | Marathon Petroleum Corporation | | | 617,400 | |
| | 20,100 | | | Phillips 66 | | | 1,067,310 | |
| | | | | | | | |
| | | | Total | | | 11,144,655 | |
| | | | | | | | |
| |
| Financials (11.2%) | | | | |
| | 24,500 | | | Aflac, Inc. | | | 1,301,440 | |
| | 12,300 | | | American Express Company | | | 707,004 | |
| | 8,800 | | | American Tower Corporation | | | 679,976 | |
| | 23,211 | | | Annaly Capital Management, Inc. | | | 325,882 | |
| | 142,000 | | | Anworth Mortgage Asset Corporation | | | 820,760 | |
| | 147,600 | | | Ares Capital Corporation | | | 2,583,000 | |
| | 19,700 | | | Assurant, Inc. | | | 683,590 | |
| | 53,000 | | | Bank of America Corporation | | | 614,800 | |
| | 340,380 | | | BlackRock Enhanced Equity Dividend Trust | | | 2,443,928 | |
| | 5,900 | | | Capital One Financial Corporation | | | 341,787 | |
| | 48,700 | | | CapitalSource, Inc. | | | 369,146 | |
| | 32,100 | | | CBOE Holdings, Inc. | | | 945,666 | |
| | 127,500 | | | Eaton Vance Tax-Managed Global Diversified Equity Income Fund | | | 1,123,275 | |
| | 6,100 | | | Equity Residential | | | 345,687 | |
| | 5,100 | | | Goldman Sachs Group, Inc. | | | 650,556 | |
| | 42,200 | | | J.P. Morgan Chase & Company | | | 1,855,534 | |
| | 14,800 | | | Marsh & McLennan Companies, Inc. | | | 510,156 | |
| | 66,600 | | | New York Community Bancorp, Inc.f | | | 872,460 | |
| | 161,500 | | | NFJ Dividend Interest & Premium Strategy Fund | | | 2,519,400 | |
| | 16,900 | | | Popular, Inc.i | | | 351,351 | |
| | 39,600 | | | Progressive Corporation | | | 835,560 | |
| | 3,900 | | | Public Storage, Inc. | | | 565,344 | |
| | 19,900 | | | SLM Corporation | | | 340,887 | |
| | 104,500 | | | Solar Capital, Ltd. | | | 2,498,595 | |
| | 203,360 | | | SPDR EURO STOXX 50 ETF | | | 7,048,458 | |
| | 25,300 | | | Travelers Companies, Inc. | | | 1,817,046 | |
| | 217,100 | | | Two Harbors Investment Corporation | | | 2,405,468 | |
| | 16,100 | | | Vanguard Dividend Appreciation Index Fund ETF | | | 959,077 | |
| | 37,200 | | | Vanguard MSCI Emerging Markets ETF | | | 1,656,516 | |
| | 10,100 | | | Wells Fargo & Company | | | 345,218 | |
| | | | | | | | |
| | | | Total | | | 38,517,567 | |
| | | | | | | | |
| |
| Health Care (4.0%) | | | | |
| | 30,700 | | | Abbott Laboratories | | | 2,010,850 | |
| | 12,300 | | | Aetna, Inc. | | | 569,490 | |
| | 12,800 | | | Amgen, Inc. | | | 1,104,896 | |
| | 36,500 | | | Bristol-Myers Squibb Company | | | 1,189,535 | |
| | 23,800 | | | Eli Lilly and Company | | | 1,173,816 | |
| | 16,200 | | | Forest Laboratories, Inc.i | | | 572,184 | |
| | 15,800 | | | HealthSouth Corporationi | | | 333,538 | |
| | 7,100 | | | Johnson & Johnson | | | 497,710 | |
| | 4,000 | | | Laboratory Corporation of America Holdingsi | | | 346,480 | |
| | 35,600 | | | Medtronic, Inc. | | | 1,460,312 | |
| | 7,500 | | | Merck & Company, Inc. | | | 307,050 | |
| | 62,700 | | | PDL BioPharma, Inc.f | | | 442,035 | |
| | 59,528 | | | Pfizer, Inc. | | | 1,492,962 | |
| | 5,800 | | | Quest Diagnostics, Inc. | | | 337,966 | |
| | 22,200 | | | UnitedHealth Group, Inc. | | | 1,204,128 | |
| | 29,500 | | | Warner Chilcott plc | | | 355,180 | |
| | 3,800 | | | Watson Pharmaceuticals, Inc.i | | | 326,800 | |
| | | | | | | | |
| | | | Total | | | 13,724,932 | |
| | | | | | | | |
| |
| Industrials (2.5%) | | | | |
| | 14,200 | | | 3M Company | | | 1,318,470 | |
| | 8,100 | | | Danaher Corporation | | | 452,790 | |
| | 4,600 | | | Dun & Bradstreet Corporation | | | 361,790 | |
| | 37,100 | | | GenCorp, Inc.i | | | 339,465 | |
| | 8,300 | | | Huntington Ingalls Industries, Inc. | | | 359,722 | |
| | 11,200 | | | Lockheed Martin Corporation | | | 1,033,648 | |
| | 22,600 | | | Northrop Grumman Corporation | | | 1,527,308 | |
The accompanying Notes to Financial Statements are an integral part of this schedule.
25
Diversified Income Plus Fund
Schedule of Investments as of December 31, 2012
| | | | | | | | |
Shares | | | Common Stock (35.1%) | | Value | |
| Industrials (2.5%) - continued | | | | |
| | 30,800 | | | Pitney Bowes, Inc.f | | $ | 327,712 | |
| | 4,200 | | | Union Pacific Corporation | | | 528,024 | |
| | 13,500 | | | United Parcel Service, Inc. | | | 995,355 | |
| | 24,800 | | | Verisk Analytics, Inc.i | | | 1,264,800 | |
| | | | | | | | |
| | | | Total | | | 8,509,084 | |
| | | | | | | | |
| |
| Information Technology (3.3%) | | | | |
| | 9,400 | | | Accenture plc | | | 625,100 | |
| | 34,700 | | | Activision Blizzard, Inc. | | | 368,514 | |
| | 10,500 | | | AOL, Inc.i | | | 310,905 | |
| | 1,100 | | | Apple, Inc. | | | 586,333 | |
| | 11,200 | | | Avnet, Inc.i | | | 342,832 | |
| | 8,300 | | | BMC Software, Inc.i | | | 329,178 | |
| | 13,100 | | | Comtech Telecommunications Corporation | | | 332,478 | |
| | 12,900 | | | GameStop Corporationf | | | 323,661 | |
| | 51,100 | | | Intel Corporation | | | 1,054,193 | |
| | 9,400 | | | International Business Machines Corporation | | | 1,800,570 | |
| | 15,900 | | | j2 Global, Inc.f | | | 486,222 | |
| | 2,500 | | | MasterCard, Inc. | | | 1,228,200 | |
| | 85,400 | | | Microsoft Corporation | | | 2,282,742 | |
| | 10,500 | | | Oracle Corporation | | | 349,860 | |
| | 19,600 | | | Seagate Technology plc | | | 597,408 | |
| | 9,300 | | | Western Digital Corporation | | | 395,157 | |
| | | | | | | | |
| | | | Total | | | 11,413,353 | |
| | | | | | | | |
| |
| Materials (1.5%) | | | | |
| | 3,000 | | | CF Industries Holdings, Inc. | | | 609,480 | |
| | 6,200 | | | Monsanto Company | | | 586,830 | |
| | 39,000 | | | Newmont Mining Corporation | | | 1,811,160 | |
| | 10,300 | | | PPG Industries, Inc. | | | 1,394,105 | |
| | 19,000 | | | Southern Copper Corporation | | | 719,340 | |
| | | | | | | | |
| | | | Total | | | 5,120,915 | |
| | | | | | | | |
| |
| Telecommunications Services (1.3%) | | | | |
| | 45,400 | | | AT&T, Inc. | | | 1,530,434 | |
| | 11,200 | | | Atlantic Tele-Network, Inc. | | | 411,152 | |
| | 8,700 | | | CenturyLink, Inc. | | | 340,344 | |
| | 55,000 | | | Verizon Communications, Inc. | | | 2,379,850 | |
| | | | | | | | |
| | | | Total | | | 4,661,780 | |
| | | | | | | | |
| |
| Utilities (1.9%) | | | | |
| | 36,400 | | | American Electric Power Company, Inc. | | | 1,553,552 | |
| | 16,800 | | | CenterPoint Energy, Inc. | | | 323,400 | |
| | 18,700 | | | Consolidated Edison, Inc. | | | 1,038,598 | |
| | 19,500 | | | PNM Resources, Inc. | | | 399,945 | |
| | 44,200 | | | Public Service Enterprise Group, Inc. | | | 1,352,520 | |
| | 34,300 | | | Southern Company | | | 1,468,383 | |
| | 8,800 | | | Wisconsin Energy Corporation | | | 324,280 | |
| | | | | | | | |
| | | | Total | | | 6,460,678 | |
| | | | | | | | |
| | | | Total Common Stock
(cost $117,249,107) | | | 121,244,954 | |
| | | | | | | | |
| | |
| | | | Preferred Stock (1.8%) | | | |
| Financials (1.8%) | | | | |
| | 64,790 | | | Annaly Capital Management, Inc., 7.500%h | | | 1,611,327 | |
| | 8,500 | | | CoBank ACB, 6.250%h,i | | | 885,329 | |
| | 4,260 | | | Fifth Third Bancorp, Convertible, 8.500%h | | | 594,057 | |
| | 10,000 | | | ING Groep NV, 8.500%h | | | 255,900 | |
| | 19,500 | | | PNC Financial Services Group, Inc., 6.125%h | | | 540,345 | |
| | 15,000 | | | Royal Bank of Scotland Group plc, 7.250%h | | | 358,650 | |
| | 15,000 | | | State Street Corporation, 5.250%h | | | 381,150 | |
| | 52,000 | | | U.S. Bancorp, 6.500%h | | | 1,489,280 | |
| | | | | | | | |
| | | | Total | | | 6,116,038 | |
| | | | | | | | |
| | | | Total Preferred Stock
(cost $5,777,154) | | | 6,116,038 | |
| | | | | | | | |
| | |
| | | | Collateral Held for Securities Loaned (1.7%) | | | |
| | 5,762,100 | | | Thrivent Cash Management Trust | | | 5,762,100 | |
| | | | | | | | |
| | | | Total Collateral Held for Securities Loaned
(cost $5,762,100) | | | 5,762,100 | |
| | | | | | | | |
| | |
Shares or
Principal
Amount | | | Short-Term Investments (13.0%) | | | |
| | | | Federal Home Loan Bank Discount Notes | | | | |
| | 900,000 | | | 0.138%, 6/7/2013j,k | | | 899,461 | |
| | 43,832,825 | | | Thrivent Cash Management Trust | | | 43,832,825 | |
| | | | | | | | |
| | | | Total Short-Term Investments (at amortized cost) | | | 44,732,286 | |
| | | | | | | | |
| | | | Total Investments (cost $352,977,435) 106.5% | | $ | 367,280,210 | |
| | | | | | | | |
| | | | Other Assets and Liabilities, Net (6.5%) | | | (22,394,114 | ) |
| | | | | | | | |
| | | | Total Net Assets 100.0% | | $ | 344,886,096 | |
| | | | | | | | |
| a | The stated interest rate represents the weighted average of all contracts within the bank loan facility. |
| b | All or a portion of the loan is unfunded. |
| c | Denotes investments purchased on a when-issued or delayed delivery basis. |
| d | Denotes variable rate securities. Variable rate securities are securities whose yields vary with a designated market index or market rate. The rate shown is as of December 31, 2012. |
| e | Denotes securities sold under Rule 144A of the Securities Act of 1933, which exempts them from registration. These securities have been deemed liquid and may be resold to other dealers in the program or to other qualified institutional buyers. As of December 31, 2012, the value of these investments was $31,392,503 or 9.1% of total net assets. |
| f | All or a portion of the security is on loan. |
| g | Denotes step coupon securities. Step coupon securities pay an initial coupon rate for the first period and then different coupon rates for following periods. The rate shown is as of December 31, 2012. |
| h | Denotes perpetual securities. Perpetual securities pay an indefinite stream of interest, but may be called by the issuer at an earlier date. |
| i | Non-income producing security. |
| j | The interest rate shown reflects the yield, coupon rate or the discount rate at the date of purchase. |
| k | At December 31, 2012, $899,461 of investments were held on deposit with the counterparty and pledged as the initial margin deposit for open futures contracts. |
The accompanying Notes to Financial Statements are an integral part of this schedule.
26
Diversified Income Plus Fund
Schedule of Investments as of December 31, 2012
Definitions:
| | | | |
| REIT | | - | | Real Estate Investment Trust is a company that buys, develops, manages and/or sells real estate assets. |
| ETF | | - | | Exchange Traded Fund. |
Unrealized Appreciation (Depreciation)
Gross unrealized appreciation and depreciation of investments, based on cost for federal income tax purposes, were as follows:
| | | | |
Gross unrealized appreciation | | $ | 18,897,612 | |
Gross unrealized depreciation | | | (4,760,134 | ) |
| | | | |
Net unrealized appreciation (depreciation) | | $ | 14,137,478 | |
| |
Cost for federal income tax purposes | | $ | 353,142,732 | |
The accompanying Notes to Financial Statements are an integral part of this schedule.
27
Diversified Income Plus Fund
Schedule of Investments as of December 31, 2012
Fair Valuation Measurements
The following table is a summary of the inputs used, as of December 31, 2012, in valuing Diversified Income Plus Fund’s assets carried at fair value.
| | | | | | | | | | | | | | | | |
Investments in Securities | | Total | | | Level 1 | | | Level 2 | | | Level 3 | |
Bank Loans | | | | | | | | | | | | | | | | |
Basic Materials | | | 4,173,006 | | | | — | | | | 4,173,006 | | | | — | |
Communications Services | | | 10,955,623 | | | | — | | | | 10,955,623 | | | | — | |
Consumer Cyclical | | | 1,602,490 | | | | — | | | | 1,602,490 | | | | — | |
Consumer Non-Cyclical | | | 4,572,107 | | | | — | | | | 4,572,107 | | | | — | |
Energy | | | 1,615,404 | | | | — | | | | 1,615,404 | | | | — | |
Financials | | | 1,455,438 | | | | — | | | | 1,455,438 | | | | — | |
Technology | | | 3,566,143 | | | | — | | | | 3,566,143 | | | | — | |
Transportation | | | 1,455,680 | | | | — | | | | 1,455,680 | | | | — | |
Utilities | | | 1,594,685 | | | | — | | | | 1,594,685 | | | | — | |
Long-Term Fixed Income | | | | | | | | | | | | | | | | |
Asset-Backed Securities | | | 4,118,162 | | | | — | | | | 4,118,162 | | | | — | |
Basic Materials | | | 2,985,198 | | | | — | | | | 2,985,198 | | | | — | |
Capital Goods | | | 3,388,143 | | | | — | | | | 3,388,143 | | | | — | |
Collateralized Mortgage Obligations | | | 42,019,233 | | | | — | | | | 42,019,233 | | | | — | |
Commercial Mortgage-Backed Securities | | | 3,508,412 | | | | — | | | | 3,508,412 | | | | — | |
Communications Services | | | 12,214,947 | | | | — | | | | 12,214,947 | | | | — | |
Consumer Cyclical | | | 8,973,115 | | | | — | | | | 8,973,115 | | | | — | |
Consumer Non-Cyclical | | | 9,842,533 | | | | — | | | | 9,842,533 | | | | — | |
Energy | | | 7,204,671 | | | | — | | | | 7,204,671 | | | | — | |
Financials | | | 38,452,461 | | | | — | | | | 38,452,461 | | | | — | |
Foreign Government | | | 302,700 | | | | — | | | | 302,700 | | | | — | |
Mortgage-Backed Securities | | | 14,272,102 | | | | — | | | | 14,272,102 | | | | — | |
Technology | | | 2,252,854 | | | | — | | | | 2,252,854 | | | | — | |
Transportation | | | 1,249,067 | | | | — | | | | 1,249,067 | | | | — | |
Utilities | | | 7,650,658 | | | | — | | | | 7,650,658 | | | | — | |
Common Stock | | | | | | | | | | | | | | | | |
Consumer Discretionary | | | 10,455,376 | | | | 10,455,376 | | | | — | | | | — | |
Consumer Staples | | | 11,236,614 | | | | 11,236,614 | | | | — | | | | — | |
Energy | | | 11,144,655 | | | | 11,144,655 | | | | — | | | | — | |
Financials | | | 38,517,567 | | | | 38,517,567 | | | | — | | | | — | |
Health Care | | | 13,724,932 | | | | 13,724,932 | | | | — | | | | — | |
Industrials | | | 8,509,084 | | | | 8,509,084 | | | | — | | | | — | |
Information Technology | | | 11,413,353 | | | | 11,413,353 | | | | — | | | | — | |
Materials | | | 5,120,915 | | | | 5,120,915 | | | | — | | | | — | |
Telecommunications Services | | | 4,661,780 | | | | 4,661,780 | | | | — | | | | — | |
Utilities | | | 6,460,678 | | | | 6,460,678 | | | | — | | | | — | |
Preferred Stock | | | | | | | | | | | | | | | | |
Financials | | | 6,116,038 | | | | 5,230,709 | | | | 885,329 | | | | — | |
Collateral Held for Securities Loaned | | | 5,762,100 | | | | 5,762,100 | | | | — | | | | — | |
Short-Term Investments | | | 44,732,286 | | | | 43,832,825 | | | | 899,461 | | | | — | |
| | | | | | | | | | | | | | | | |
Total | | $ | 367,280,210 | | | $ | 176,070,588 | | | $ | 191,209,622 | | | $ | — | |
| | | | | | | | | | | | | | | | |
| | | | |
Other Financial Instruments | | Total | | | Level 1 | | | Level 2 | | | Level 3 | |
Asset Derivatives | | | | | | | | | | | | | | | | |
Futures Contracts | | | 12,995 | | | | 12,995 | | | | — | | | | — | |
| | | | | | | | | | | | | | | | |
Total Asset Derivatives | | $ | 12,995 | | | $ | 12,995 | | | $ | — | | | $ | — | |
| | | | | | | | | | | | | | | | |
Liability Derivatives | | | | | | | | | | | | | | | | |
Futures Contracts | | | 46,668 | | | | 46,668 | | | | — | | | | — | |
| | | | | | | | | | | | | | | | |
Total Liability Derivatives | | $ | 46,668 | | | $ | 46,668 | | | $ | — | | | $ | — | |
| | | | | | | | | | | | | | | | |
There were no significant transfers between Levels during the period ended December 31, 2012. Transfers between Levels are identified as of the end of the period.
The accompanying Notes to Financial Statements are an integral part of this schedule.
28
Diversified Income Plus Fund
Schedule of Investments as of December 31, 2012
| | | | | | | | | | | | | | | | | | | | |
Futures Contracts | | Number of
Contracts
Long/(Short) | | | Expiration Date | | | Notional
Principal
Amount | | | Value | | | Unrealized
Gain/(Loss) | |
5-Yr. U.S. Treasury Bond Futures | | | 39 | | | | March 2013 | | | $ | 4,858,361 | | | $ | 4,852,148 | | | ($ | 6,213 | ) |
10-Yr. U.S. Treasury Bond Futures | | | (10 | ) | | | March 2013 | | | | (1,334,032 | ) | | | (1,327,812 | ) | | | 6,220 | |
S&P 500 Index Futures | | | (37 | ) | | | March 2013 | | | | (13,142,700 | ) | | | (13,135,925 | ) | | | 6,775 | |
S&P 500 Index Mini-Futures | | | 55 | | | | March 2013 | | | | 3,945,730 | | | | 3,905,275 | | | | (40,455 | ) |
Total Futures Contracts | | | | | | | | | | | | | | | | | | ($ | 33,673 | ) |
The following table summarizes the fair value and Statement of Assets and Liabilities location, as of December 31, 2012, for Diversified Income Plus Fund’s investments in financial derivative instruments by primary risk exposure as discussed under item (2) Significant Accounting Policies of the Notes to Financial Statements.
| | | | | | |
Derivatives by risk category | | Statement of Assets and Liabilities Location | | Fair Value | |
Asset Derivatives | | | | | | |
Equity Contracts | | | | | | |
Futures* | | Net Assets - Net unrealized appreciation/(depreciation) on Futures contracts | | | 6,775 | |
Total Equity Contracts | | | | | 6,775 | |
Interest Rate Contracts | | | | | | |
Futures* | | Net Assets - Net unrealized appreciation/(depreciation) on Futures contracts | | | 6,220 | |
Total Interest Rate Contracts | | | | | 6,220 | |
| | | | | | |
Total Asset Derivatives | | | | $ | 12,995 | |
| | | | | | |
Liability Derivatives | | | | | | |
Equity Contracts | | | | | | |
Futures* | | Net Assets - Net unrealized appreciation/(depreciation) on Futures contracts | | | 40,455 | |
Total Equity Contracts | | | | | 40,455 | |
Interest Rate Contracts | | | | | | |
Futures* | | Net Assets - Net unrealized appreciation/(depreciation) on Futures contracts | | | 6,213 | |
Total Interest Rate Contracts | | | | | 6,213 | |
| | | | | | |
Total Liability Derivatives | | | | $ | 46,668 | |
| | | | | | |
| * | Includes cumulative appreciation/depreciation of futures contracts as reported in the Schedule of Investments. Only current day’s variation margin is reported within the Statement of Assets and Liabilities. |
The following table summarizes the net realized gains/(losses) and Statement of Operations location, for the period ended December 31, 2012, for Diversified Income Plus Fund’s investments in financial derivative instruments by primary risk exposure.
| | | | | | |
Derivatives by risk category | | Statement of Operations Location | | Realized Gains/(Losses)
recognized in Income | |
Equity Contracts | | | | | | |
Options Written | | Net realized gains/(losses) on Written option contracts | | | (128,584 | ) |
Futures | | Net realized gains/(losses) on Futures contracts | | | 405,955 | |
Total Equity Contracts | | | | | 277,371 | |
Interest Rate Contracts | | | | | | |
Futures | | Net realized gains/(losses) on Futures contracts | | | 30,446 | |
Total Interest Rate Contracts | | | | | 30,446 | |
| | | | | | |
Total | | | | $ | 307,817 | |
| | | | | | |
The accompanying Notes to Financial Statements are an integral part of this schedule.
29
Diversified Income Plus Fund
Schedule of Investments as of December 31, 2012
The following table summarizes the change in net unrealized appreciation/(depreciation) and Statement of Operations location, for the period ended December 31, 2012, for Diversified Income Plus Fund’s investments in financial derivative instruments by primary risk exposure.
| | | | | | |
Derivatives by risk category | | Statement of Operations Location | | Change in unrealized
appreciation/(depreciation)
recognized in Income | |
Equity Contracts | | | | | | |
Options Written | | Change in net unrealized appreciation/(depreciation) on Written option contracts | | | 28,200 | |
Futures | | Change in net unrealized appreciation/(depreciation) on Futures contracts | | | (152,740 | ) |
Total Equity Contracts | | | | | (124,540 | ) |
Interest Rate Contracts | | | | | | |
Futures | | Change in net unrealized appreciation/(depreciation) on Futures contracts | | | 3,493 | |
Total Interest Rate Contracts | | | | | 3,493 | |
| | | | | | |
Total | | | | ($ | 121,047 | ) |
| | | | | | |
The following table presents Diversified Income Plus Fund’s average volume of derivative activity during the period ended December 31, 2012.
| | | | | | | | | | | | |
Derivative Risk Category | | Futures
(Notional*) | | | Futures
(Percentage of
Average Net Assets) | | | Options
(Contracts) | |
Equity Contracts | | $ | 10,080,124 | | | | 3.7 | % | | | 10 | |
Interest Rate Contracts | | | 6,192,458 | | | | 2.3 | | | | N/A | |
| * | Notional amount represents long or short, or both, derivative positions held by the fund. |
Investment in Affiliates
Affiliated issuers, as defined under the Investment Company Act of 1940, include those in which the Fund’s holdings of an issuer represent 5% or more of the outstanding voting securities of an issuer, or any affiliated mutual fund.
A summary of transactions for the fiscal year to date, in Diversified Income Plus Fund, is as follows:
| | | | | | | | | | | | | | | | | | | | | | | | |
Fund | | Value
December 31, 2011 | | | Gross
Purchases | | | Gross
Sales | | | Shares Held at
December 31, 2012 | | | Value
December 31, 2012 | | | Income Earned
January 1, 2012 -
December 31, 2012 | |
Cash Management Trust-Collateral Investment | | $ | 7,698,775 | | | $ | 85,268,597 | | | $ | 87,205,272 | | | | 5,762,100 | | | $ | 5,762,100 | | | $ | 131,388 | |
Cash Management Trust-Short Term Investment | | | — | | | | 72,023,864 | | | | 28,191,039 | | | | 43,832,825 | | | | 43,832,825 | | | | 8,418 | |
Total Value and Income Earned | | | 7,698,775 | | | | | | | | | | | | | | | | 49,594,925 | | | | 139,806 | |
The accompanying Notes to Financial Statements are an integral part of this schedule.
30
Thrivent Mutual Funds
Statement of Assets and Liabilities
| | | | | | | | | | | | |
As of December 31, 2012 | | Natural
Resources Fund | | | Equity Income
Plus Fund | | | Diversified
Income Plus
Fund | |
Assets | | | | | | | | | | | | |
Investments at cost | | $ | 97,827,317 | | | $ | 57,223,613 | | | $ | 352,977,435 | |
Investments in securities at value | | | 91,045,504 | | | | 60,133,818 | | | | 317,685,285 | |
Investments in affiliates at value | | | 12,269,681 | | | | 2,942 | | | | 49,594,925 | |
Investments at Value | | | 103,315,185 | | | | 60,136,760 | | | | 367,280,210 | |
Cash | | | 100,000 | | | | 662,433 | | | | 1,004,456 | |
Dividends and interest receivable | | | 98,850 | | | | 129,695 | | | | 1,781,410 | |
Prepaid expenses | | | 6,071 | | | | 9,043 | | | | 22,313 | |
Receivable for investments sold | | | — | | | | — | | | | 2,511,248 | |
Receivable for fund shares sold | | | 48,385 | | | | 63,304 | | | | 1,092,473 | |
Receivable for variation margin | | | — | | | | 15,275 | | | | 99,823 | |
Total Assets | | | 103,568,491 | | | | 61,016,510 | | | | 373,791,933 | |
Liabilities | | | | | | | | | | | | |
Accrued expenses | | | 27,111 | | | | 20,505 | | | | 77,270 | |
Payable for investments purchased | | | — | | | | — | | | | 22,315,953 | |
Payable upon return of collateral for securities loaned | | | 9,494,200 | | | | — | | | | 5,762,100 | |
Payable for fund shares redeemed | | | 18,393 | | | | 35,494 | | | | 166,396 | |
Payable for variation margin | | | — | | | | — | | | | 333,925 | |
Payable to affiliate | | | 66,707 | | | | 33,145 | | | | 241,020 | |
Mortgage dollar roll deferred revenue | | | — | | | | — | | | | 9,173 | |
Total Liabilities | | | 9,606,411 | | | | 89,144 | | | | 28,905,837 | |
Net Assets | | | | | | | | | | | | |
Capital stock (beneficial interest) | | | 105,320,536 | | | | 58,959,858 | | | | 342,658,362 | |
Accumulated undistributed net investment income/(loss) | | | (15,078 | ) | | | (5,674 | ) | | | 467,656 | |
Accumulated undistributed net realized gain/(loss) | | | (16,831,076 | ) | | | (935,585 | ) | | | (12,509,024 | ) |
Net unrealized appreciation/(depreciation) on: | | | | | | | | | | | | |
Investments | | | 5,487,868 | | | | 2,913,147 | | | | 14,302,775 | |
Futures contracts | | | — | | | | (4,380 | ) | | | (33,673 | ) |
Foreign currency transactions | | | (170 | ) | | | — | | | | — | |
Total Net Assets | | $ | 93,962,080 | | | $ | 60,927,366 | | | $ | 344,886,096 | |
Class A Share Capital | | $ | 14,875,595 | | | $ | 25,610,646 | | | $ | 290,729,368 | |
Shares of beneficial interest outstanding (Class A) | | | 1,629,075 | | | | 2,670,811 | | | | 42,634,833 | |
Net asset value per share | | $ | 9.13 | | | $ | 9.59 | | | $ | 6.82 | |
Maximum public offering price | | $ | 9.66 | | | $ | 10.15 | | | $ | 7.14 | |
Institutional Class Share Capital | | $ | 79,086,485 | | | $ | 35,316,720 | | | $ | 54,156,728 | |
Shares of beneficial interest outstanding (Institutional Class) | | | 8,660,247 | | | | 3,679,226 | | | | 7,996,177 | |
Net asset value per share | | $ | 9.13 | | | $ | 9.60 | | | $ | 6.77 | |
The accompanying Notes to Financial Statements are an integral part of this schedule.
31
Thrivent Mutual Funds
Statement of Operations
| | | | | | | | | | | | |
For the year ended December 31, 2012 | | Natural
Resources Fund | | | Equity Income
Plus Fund | | | Diversified
Income Plus
Fund | |
Investment Income | | | | | | | | | | | | |
Dividends | | $ | 1,679,567 | | | $ | 1,780,357 | | | $ | 4,201,403 | |
Taxable interest | | | 2,461 | | | | 185,652 | | | | 9,577,265 | |
Income from mortgage dollar rolls | | | — | | | | — | | | | 200,327 | |
Income from securities loaned | | | 10,046 | | | | — | | | | 131,388 | |
Income from affiliated investments | | | 857 | | | | 9 | | | | 8,418 | |
Foreign tax withholding | | | (6,599 | ) | | | (28,394 | ) | | | (44,701 | ) |
Total Investment Income | | | 1,686,332 | | | | 1,937,624 | | | | 14,074,100 | |
Expenses | | | | | | | | | | | | |
Adviser fees | | | 769,258 | | | | 378,890 | | | | 1,505,487 | |
Administrative service fees | | | 89,231 | | | | 81,658 | | | | 124,745 | |
Audit and legal fees | | | 20,942 | | | | 19,370 | | | | 22,501 | |
Custody fees | | | 6,124 | | | | 14,420 | | | | 27,416 | |
Distribution expenses Class A | | | 38,656 | | | | 61,018 | | | | 603,456 | |
Insurance expenses | | | 4,019 | | | | 3,704 | | | | 4,752 | |
Printing and postage expenses Class A | | | 15,688 | | | | 13,347 | | | | 69,382 | |
Printing and postage expenses Institutional Class | | | 705 | | | | 1,187 | | | | 2,899 | |
SEC and state registration expenses | | | 26,139 | | | | 29,022 | | | | 57,888 | |
Transfer agent fees Class A | | | 69,231 | | | | 57,129 | | | | 251,123 | |
Transfer agent fees Institutional Class | | | 1,429 | | | | 2,517 | | | | 18,422 | |
Trustees’ fees | | | 6,387 | | | | 4,744 | | | | 16,336 | |
Other expenses | | | 8,617 | | | | 11,273 | | | | 19,375 | |
Total Expenses Before Reimbursement | | | 1,056,426 | | | | 678,279 | | | | 2,723,782 | |
Less: | | | | | | | | | | | | |
Reimbursement from adviser | | | (72,151 | ) | | | (125,637 | ) | | | (93,859 | ) |
Custody earnings credit | | | (826 | ) | | | (959 | ) | | | (1,345 | ) |
Total Net Expenses | | | 983,449 | | | | 551,683 | | | | 2,628,578 | |
Net Investment Income/(Loss) | | | 702,883 | | | | 1,385,941 | | | | 11,445,522 | |
Realized and Unrealized Gains/(Losses) | | | | | | | | | | | | |
Net realized gains/(losses) on: | | | | | | | | | | | | |
Investments | | | 93,617 | | | | 2,153,308 | | | | 5,562,325 | |
Distributions of realized capital gains from affiliated investments | | | 3 | | | | — | | | | 12 | |
Written option contracts | | | — | | | | (120,738 | ) | | | (128,584 | ) |
Futures contracts | | | 327,863 | | | | 618,124 | | | | 436,401 | |
Foreign currency transactions | | | 5,287 | | | | — | | | | — | |
Change in net unrealized appreciation/(depreciation) on: | | | | | | | | | | | | |
Investments | | | (4,201,657 | ) | | | 2,839,984 | | | | 16,843,782 | |
Written option contracts | | | — | | | | 49,715 | | | | 28,200 | |
Futures contracts | | | — | | | | (100,218 | ) | | | (149,247 | ) |
Foreign currency transactions | | | 35 | | | | — | | | | — | |
Net Realized and Unrealized Gains/(Losses) | | | (3,774,852 | ) | | | 5,440,175 | | | | 22,592,889 | |
Net Increase/(Decrease) in Net Assets Resulting From Operations | | $ | (3,071,969 | ) | | $ | 6,826,116 | | | $ | 34,038,411 | |
The accompanying Notes to Financial Statements are an integral part of this schedule.
32
Thrivent Mutual Funds
Statement of Changes in Net Assets
| | | | | | | | | | | | | | | | |
| | | Natural Resources Fund | | | Equity Income Plus Fund | |
For the periods ended | | 12/31/2012 | | | 12/31/2011 | | | 12/31/2012 | | | 12/31/2011 | |
Operations | | | | | | | | | | | | | | | | |
Net investment income/(loss) | | $ | 702,883 | | | $ | 1,285,012 | | | $ | 1,385,941 | | | $ | 827,304 | |
Net realized gains/(losses) | | | 426,770 | | | | (2,037,646 | ) | | | 2,650,694 | | | | 1,150,125 | |
Change in net unrealized appreciation/(depreciation) | | | (4,201,622 | ) | | | 1,908,080 | | | | 2,789,481 | | | | (3,578,395 | ) |
Net Change in Net Assets Resulting From Operations | | | (3,071,969 | ) | | | 1,155,446 | | | | 6,826,116 | | | | (1,600,966 | ) |
Distributions to Shareholders | | | | | | | | | | | | | | | | |
From net investment income Class A | | | (69,338 | ) | | | (126,370 | ) | | | (532,917 | ) | | | (283,040 | ) |
From net investment income Institutional Class | | | (640,309 | ) | | | (1,160,744 | ) | | | (850,648 | ) | | | (542,201 | ) |
| | | | | | | | | | | | | | | | |
Total From Net Investment Income | | | (709,647 | ) | | | (1,287,114 | ) | | | (1,383,565 | ) | | | (825,241 | ) |
| | | | | | | | | | | | | | | | |
From return of capital Class A | | | (13,007 | ) | | | (148,806 | ) | | | — | | | | — | |
From return of capital Institutional Class | | | (69,179 | ) | | | (949,444 | ) | | | — | | | | — | |
| | | | | | | | | | | | | | | | |
Total From Return of Capital | | | (82,186 | ) | | | (1,098,250 | ) | | | — | | | | — | |
| | | | | | | | | | | | | | | | |
Total Distributions to Shareholders | | | (791,833 | ) | | | (2,385,364 | ) | | | (1,383,565 | ) | | | (825,241 | ) |
Capital Stock Transactions | | | | | | | | | | | | | | | | |
Class A | | | | | | | | | | | | | | | | |
Sold | | | 4,210,350 | | | | 4,692,101 | | | | 7,622,174 | | | | 15,128,610 | |
Distributions reinvested | | | 81,131 | | | | 269,430 | | | | 509,900 | | | | 270,506 | |
Redeemed | | | (4,023,927 | ) | | | (4,112,595 | ) | | | (5,752,057 | ) | | | (4,998,131 | ) |
| | | | | | | | | | | | | | | | |
Total Class A Capital Stock Transactions | | | 267,554 | | | | 848,936 | | | | 2,380,017 | | | | 10,400,985 | |
| | | | | | | | | | | | | | | | |
Institutional Class | | | | | | | | | | | | | | | | |
Sold | | | 6,943,628 | | | | 1,516,978 | | | | 1,685,762 | | | | 2,178,331 | |
Distributions reinvested | | | 705,386 | | | | 2,101,521 | | | | 846,684 | | | | 540,182 | |
Redeemed | | | (22,325,806 | ) | | | (1,228,447 | ) | | | (951,520 | ) | | | (823,321 | ) |
| | | | | | | | | | | | | | | | |
Total Institutional Class Capital Stock Transactions | | | (14,676,792 | ) | | | 2,390,052 | | | | 1,580,926 | | | | 1,895,192 | |
| | | | | | | | | | | | | | | | |
Capital Stock Transactions | | | (14,409,238 | ) | | | 3,238,988 | | | | 3,960,943 | | | | 12,296,177 | |
Net Increase/(Decrease) in Net Assets | | | (18,273,040 | ) | | | 2,009,070 | | | | 9,403,494 | | | | 9,869,970 | |
Net Assets, Beginning of Period | | | 112,235,120 | | | | 110,226,050 | | | | 51,523,872 | | | | 41,653,902 | |
Net Assets, End of Period | | $ | 93,962,080 | | | $ | 112,235,120 | | | $ | 60,927,366 | | | $ | 51,523,872 | |
Accumulated Undistributed Net Investment Income/(Loss) | | $ | (15,078 | ) | | $ | (13,601 | ) | | $ | (5,674 | ) | | $ | (7,272 | ) |
Capital Stock Share Transactions | | | | | | | | | | | | | | | | |
Class A shares | | | | | | | | | | | | | | | | |
Sold | | | 444,569 | | | | 469,923 | | | | 814,442 | | | | 1,645,748 | |
Distributions reinvested | | | 9,095 | | | | 27,392 | | | | 53,801 | | | | 30,425 | |
Redeemed | | | (434,457 | ) | | | (419,807 | ) | | | (608,405 | ) | | | (555,496 | ) |
| | | | | | | | | | | | | | | | |
Total Class A shares | | | 19,207 | | | | 77,508 | | | | 259,838 | | | | 1,120,677 | |
| | | | | | | | | | | | | | | | |
Institutional Class shares | | | | | | | | | | | | | | | | |
Sold | | | 712,428 | | | | 151,459 | | | | 181,445 | | | | 242,529 | |
Distributions reinvested | | | 79,079 | | | | 214,073 | | | | 89,233 | | | | 60,458 | |
Redeemed | | | (2,246,295 | ) | | | (128,203 | ) | | | (101,406 | ) | | | (89,353 | ) |
| | | | | | | | | | | | | | | | |
Total Institutional Class shares | | | (1,454,788 | ) | | | 237,329 | | | | 169,272 | | | | 213,634 | |
| | | | | | | | | | | | | | | | |
The accompanying Notes to Financial Statements are an integral part of this schedule.
33
Thrivent Mutual Funds
Statement of Changes in Net Assets – continued
| | | | | | | | |
| | | Diversified Income Plus Fund | |
For the periods ended | | 12/31/2012 | | | 12/31/2011 | |
Operations | | | | | | | | |
Net investment income/(loss) | | $ | 11,445,522 | | | $ | 8,789,521 | |
Net realized gains/(losses) | | | 5,870,154 | | | | 4,770,603 | |
Change in net unrealized appreciation/(depreciation) | | | 16,722,735 | | | | (10,307,119 | ) |
Net Change in Net Assets Resulting From Operations | | | 34,038,411 | | | | 3,253,005 | |
Distributions to Shareholders | | | | | | | | |
From net investment income Class A | | | (9,729,680 | ) | | | (8,627,092 | ) |
From net investment income Institutional Class | | | (1,476,076 | ) | | | (627,818 | ) |
| | | | | | | | |
Total From Net Investment Income | | | (11,205,756 | ) | | | (9,254,910 | ) |
| | | | | | | | |
Total Distributions to Shareholders | | | (11,205,756 | ) | | | (9,254,910 | ) |
Capital Stock Transactions | | | | | | | | |
Class A | | | | | | | | |
Sold | | | 93,398,968 | | | | 56,792,312 | |
Distributions reinvested | | | 7,999,318 | | | | 6,974,619 | |
Redeemed | | | (31,625,945 | ) | | | (29,143,212 | ) |
| | | | | | | | |
Total Class A Capital Stock Transactions | | | 69,772,341 | | | | 34,623,719 | |
| | | | | | | | |
Institutional Class | | | | | | | | |
Sold | | | 39,483,169 | | | | 14,238,118 | |
Distributions reinvested | | | 1,456,365 | | | | 617,568 | |
Redeemed | | | (6,549,936 | ) | | | (4,792,748 | ) |
| | | | | | | | |
Total Institutional Class Capital Stock Transactions | | | 34,389,598 | | | | 10,062,938 | |
| | | | | | | | |
Capital Stock Transactions | | | 104,161,939 | | | | 44,686,657 | |
Net Increase/(Decrease) in Net Assets | | | 126,994,594 | | | | 38,684,752 | |
Net Assets, Beginning of Period | | | 217,891,502 | | | | 179,206,750 | |
Net Assets, End of Period | | $ | 344,886,096 | | | $ | 217,891,502 | |
Accumulated Undistributed Net Investment Income/(Loss) | | $ | 467,656 | | | $ | 200,238 | |
Capital Stock Share Transactions | | | | | | | | |
Class A shares | | | | | | | | |
Sold | | | 13,997,392 | | | | 8,858,447 | |
Distributions reinvested | | | 1,200,909 | | | | 1,095,674 | |
Redeemed | | | (4,770,795 | ) | | | (4,588,029 | ) |
| | | | | | | | |
Total Class A shares | | | 10,427,506 | | | | 5,366,092 | |
| | | | | | | | |
Institutional Class shares | | | | | | | | |
Sold | | | 5,957,144 | | | | 2,265,401 | |
Distributions reinvested | | | 219,226 | | | | 97,835 | |
Redeemed | | | (991,583 | ) | | | (765,349 | ) |
| | | | | | | | |
Total Institutional Class shares | | | 5,184,787 | | | | 1,597,887 | |
| | | | | | | | |
The accompanying Notes to Financial Statements are an integral part of this schedule.
34
Thrivent Mutual Funds
Notes to Financial Statements
December 31, 2012
(1) ORGANIZATION
Thrivent Mutual Funds (the “Trust”) was organized as a Massachusetts Business Trust on March 10, 1987 and is registered as an open-end management investment company under the Investment Company Act of 1940 (the “1940 Act”). The Trust is divided into twenty-six separate series (each, a “Fund” and, collectively, the “Funds”), each with its own investment objective and policies. The Trust currently consists of four allocation funds, thirteen equity funds, two hybrid funds, six fixed-income funds, and one money market fund.
This shareholder report includes Thrivent Natural Resources Fund, Thrivent Equity Income Plus Fund and Thrivent Diversified Income Plus Fund, three of the Trust’s twenty-six Funds. The other Funds of the Trust have a fiscal year-end of October 31 and are presented under a separate shareholder report.
(A) Share Classes – As of December 31, 2012, the Trust includes two classes of shares: Class A and Institutional Class. The classes of shares differ principally in their respective distribution expenses and other class-specific expenses and arrangements. Class A shares have a 0.25% annual 12b-1 fee and a maximum front-end sales load of 5.50% for equity funds and 4.50% for fixed-income funds, although some of the fixed-income funds have reduced 12b-1 fees and either a reduced or no front-end sales load. Institutional Class shares are offered at net asset value and have no annual 12b-1 fees. The share classes have identical rights to earnings, assets and voting privileges, except for class-specific expenses and exclusive rights to vote on matters affecting only individual classes. All 26 Funds of the Trust offer Class A and Institutional Class shares.
(B) Other – Under the Trust’s organizational documents, its officers and trustees are indemnified against certain liabilities arising out of the performance of their duties to the Trust. In addition, in the normal course of business, the Trust enters into contracts with vendors and others that provide general damage clauses. The Trust’s maximum exposure under these contracts is unknown, as this would involve future claims that may be made against the Trust. However, based on experience, the Trust expects the risk of loss to be remote.
(2) SIGNIFICANT ACCOUNTING POLICIES
(A) Valuation of Investments – Securities traded on U.S. or foreign securities exchanges or included in a national market system are valued at the official closing price at the close of each business day unless otherwise stated below. Over-the-counter securities and listed securities for which no price is readily available are valued at the current bid price considered best to represent the value at that time. Swap agreements are valued at the fair value of the contract as furnished by an independent pricing service. Security prices are based on quotes that are obtained from an independent pricing service approved by the Trust’s Board of Trustees (“Board”). The pricing service, in determining values of fixed-income securities, takes into consideration such factors as current quotations by broker/dealers, coupon, maturity, quality, type of issue, trading characteristics, and other yield and risk factors it deems relevant in determining valuations. Securities which cannot be valued by the approved pricing service are valued using valuations obtained from dealers that make markets in the securities. Exchange-listed options and futures contracts are valued at the last quoted sales price. Investments in mutual funds are valued at the net asset value at the close of each business day. Short-term securities are valued at amortized cost (which approximates market value) to the extent it is not materially different than market value.
Securities held by Money Market Fund are valued on the basis of amortized cost (which approximates market value), whereby a portfolio security is valued at its cost initially and thereafter valued to reflect a constant amortization to maturity of any discount or premium. Money Market Fund and the Trust’s investment adviser, Thrivent Asset Management, LLC (“Thrivent Asset Mgt.” or the “Adviser”), follow procedures designed to help maintain a constant net asset value of $1.00 per share.
The Board has delegated responsibility for daily valuation to the Adviser. The Adviser has formed a Portfolio Compliance and Valuation Committee (“Committee”) that is responsible for overseeing the Fund valuation policies in accordance with Valuation Policies and Procedures. The Committee meets on a monthly and on an as-needed basis to review price challenges, price overrides, stale prices, shadow prices, manual prices, money market pricing, international fair valuation, and other securities requiring fair valuation.
The Committee monitors for significant events occurring prior to the close of trading on the New York Stock Exchange that could have a material impact on the value of any securities that are held by the Funds. Examples of such events include trading halts, national news/events, and issuer-specific developments. If the Committee decides that such events warrant using fair value estimates, the Committee will take such events into consideration in determining the fair value of such securities. If market quotations or prices are not readily available or determined to be unreliable, the securities will be valued at fair value as determined in good faith pursuant to procedures adopted by the Board.
Financial Accounting Standards Board (FASB) guidelines require increased fair value disclosure intended to improve the consistency and comparability of fair value measurements used in financial reporting. The guidelines define fair value, establish a framework for measuring fair value in U.S. Generally Accepted Accounting Principles (“GAAP”) and expand disclosures about fair value requirements. The various inputs used to determine the fair value of the Funds’ investments are summarized in three broad levels: Level 1 includes quoted prices in active markets for identical securities, typically included in this level
35
Thrivent Mutual Funds
Notes to Financial Statements
December 31, 2012
are U.S. equity securities, futures and options; Level 2 includes other significant observable inputs such as quoted prices for similar securities, interest rates, prepayment speeds and credit risk, typically included in this level are fixed income securities, international securities, swaps and forward contracts; and Level 3 includes significant unobservable inputs such as the Adviser’s own assumptions and broker evaluations in determining the fair value of investments. Of the Level 3 securities, those for which market values were not readily available or were deemed unreliable were fair valued as determined in good faith under procedures established by the Board. As of December 31, 2012, no Funds held these types of Level 3 securities.
The valuation levels are not necessarily an indication of the risk associated with investing in these securities or other investments.
Valuation of International Securities – Because many foreign markets close before the U.S. markets, events may occur between the close of the foreign markets and the close of the U.S. markets that could have a material impact on the valuation of foreign securities. The Funds, under the supervision of the Board, evaluate the impacts of these events and may adjust the valuation of foreign securities to reflect fair value as of the close of the U.S. markets. The Board has authorized the Adviser to make fair valuation determinations pursuant to policies approved by the Board.
(B) Foreign Currency Translation – The accounting records of each Fund are maintained in U.S. dollars. Securities and other assets and liabilities that are denominated in foreign currencies are translated into U.S. dollars at the daily closing rates of exchange.
Foreign currency amounts related to the purchase or sale of securities and income and expenses are translated at the exchange rate on the transaction date. Net realized and unrealized currency gains and losses are recorded from sales of foreign currency, exchange gains or losses between the trade date and settlement date on securities transactions, and other translation gains or losses on dividends, interest income and foreign withholding taxes. The Funds do not separately report the effect of changes in foreign exchange rates from changes in market prices on securities held. Such changes are included in net realized and unrealized gain or loss from investments in the Statement of Operations.
For federal income tax purposes, the Funds treat the effect of changes in foreign exchange rates arising from actual foreign currency transactions and the changes in foreign exchange rates between the trade date and settlement date as ordinary income.
(C) Foreign Currency Forward Contracts – In connection with purchases and sales of securities denominated in foreign currencies all Funds, except Money Market Fund, may enter into foreign currency forward contracts. Additionally, the Funds may enter into such contracts to hedge certain other foreign-currency-denominated investments. These contracts are recorded at value and the related realized and unrealized foreign exchange gains and losses are included in the Statement of Operations. In the event that counterparties fail to settle these forward contracts, the Funds could be exposed to foreign currency fluctuations. Foreign currency contracts are valued daily and unrealized appreciation or depreciation is recorded daily as the difference between the contract exchange rate and the closing forward rate applied to the face amount of the contract. A realized gain or loss is recorded at the time a forward contract is closed. These contracts are over-the-counter and the Fund is exposed to counterparty risk equal to the discounted net amount of payments to the Fund. This risk is partially mitigated by the Fund’s collateral posting requirements.
(D) Foreign Denominated Investments – Foreign denominated assets and currency contracts may involve more risks than domestic transactions including currency risk, political and economic risk, regulatory risk, and market risk. Certain Funds may also invest in securities of companies located in emerging markets. Future economic or political developments could adversely affect the liquidity or value, or both, of such securities.
(E) Federal Income Taxes – No provision has been made for income taxes because each Fund’s policy is to qualify as a regulated investment company under the Internal Revenue Code and distribute substantially all investment company taxable income and net capital gain on a timely basis. It is also the intention of each Fund to distribute an amount sufficient to avoid imposition of any federal excise tax. The Funds, accordingly, anticipate paying no federal taxes and no federal tax provision was recorded. Each Fund is treated as a separate taxable entity for federal income tax purposes. Certain Funds may utilize earnings and profits distributed to shareholders on the redemption of shares as part of the dividends paid deduction.
Foreign Income Taxes – Certain Funds are subject to foreign income taxes imposed by certain countries in which they invest. Withholding taxes on foreign dividends have been provided for in accordance with the applicable country’s tax rules and rates. These amounts are shown as foreign dividend tax withholding on the Statement of Operations. The Funds pay tax on foreign capital gains, where applicable.
GAAP requires management of the Funds (i.e., the Adviser) to make additional tax disclosures with respect to the tax effects of certain income tax positions, whether those positions were taken on previously filed tax returns or are expected to be taken on future returns. These positions must meet a “more likely than not” standard that, based on the technical merits of the position, would have a greater than 50 percent likelihood of being sustained upon examination. In evaluating whether a tax position has met the more-likely-than-not recognition threshold, the Adviser must presume that the position will be examined by the appropriate taxing authority that has full knowledge of all relevant information.
36
Thrivent Mutual Funds
Notes to Financial Statements
December 31, 2012
The Adviser analyzed all open tax years, as defined by the statute of limitations, for all major jurisdictions. Open tax years are those that are open for examination by taxing authorities. Major jurisdictions for the Funds include U.S. Federal, Minnesota, Wisconsin, and Massachusetts as well as certain foreign countries. As of December 31, 2012, open U.S. Federal, Minnesota, Wisconsin and Massachusetts tax years include the tax years ended December 31, 2009 through 2012. Additionally, as of December 31, 2012, the tax year ended December 31, 2008 is open for Wisconsin. The Funds have no examinations in progress and none are expected at this time.
As of December 31, 2012, the Adviser has reviewed all open tax years and major jurisdictions and concluded that there is no effect to the Funds’ tax liability, financial position or results of operations. There is no tax liability resulting from unrecognized tax benefits related to uncertain income tax positions taken or expected to be taken in future tax returns. The Funds are also not aware of any tax positions for which it is reasonably possible that the total amounts of unrecognized tax benefits will significantly change in the next 12 months.
(F) Expenses and Income – Estimated expenses are accrued daily. The Funds are charged for those expenses that are directly attributable to them. Expenses that are not directly attributable to a Fund are allocated among all appropriate Funds in proportion to their respective net assets, number of shareholder accounts or other reasonable basis. Net investment income, expenses which are not class-specific, and realized and unrealized gains and losses are allocated directly to each class based upon the relative net asset value of outstanding shares.
Interest income is accrued daily and is determined on the basis of interest or discount earned on all debt securities, including accretion of market discount and original issue discount and amortization of premium. Paydown gains and losses on mortgage- and asset-backed securities are recorded as components of interest income. Dividend income is recorded on the ex-dividend date.
For certain securities, including real estate investment trusts, the Trust records distributions received in excess of income as a reduction of cost of investments and/or realized gain. Such amounts are based on estimates if actual amounts are not available. Actual amounts of income, realized gain and return of capital may differ from the estimated amounts. The Trust adjusts the estimated amounts of the components of distributions as adjustments to investment income, unrealized appreciation/depreciation and realized gain/loss on investments as necessary, once the issuers provide information about the actual composition of the distributions.
(G) Custody Earnings Credit – The Funds have a deposit arrangement with the custodian whereby interest earned on uninvested cash balances is used to pay a portion of custodian fees. This deposit arrangement is an alternative to overnight investments. Earnings credits are shown as a reduction of total expenses on the Statement of Operations.
(H) Distributions to Shareholders – Net investment income is distributed to each shareholder as a dividend. Dividends from Natural Resources Fund and Equity Income Plus Fund are declared and paid quarterly. Dividends from Diversified Income Plus Fund are declared and paid monthly. Additionally, it is possible that such dividends may be reclassified as return of capital or capital gains after year end. Such determination cannot be made until tax information is received from the real estate investments of the Fund. Net realized gains from securities transactions, if any, are distributed at least annually.
(I) Options – All Funds may buy put and call options and write put and covered call options. The Funds intend to use such derivative instruments as hedges to facilitate buying or selling securities or to provide protection against adverse movements in security prices or interest rates. The Funds may also enter into options contracts to protect against adverse foreign exchange rate fluctuations. Option contracts are valued daily and unrealized appreciation or depreciation is recorded. A Fund will realize a gain or loss upon expiration or closing of the option transaction. When an option is exercised, the proceeds upon sale for a written call option or the cost of a security for purchased put and call options is adjusted by the amount of premium received or paid.
Buying put options tends to decrease a Fund’s exposure to the underlying security while buying call options tends to increase a Fund’s exposure to the underlying security. The risk associated with purchasing put and call options is limited to the premium paid. There is no significant counterparty risk on exchange-traded options as the exchange guarantees the contract against default. Writing put options tends to increase a Fund’s exposure to the underlying security while writing call options tends to decrease a Fund’s exposure to the underlying security. The writer of an option has no control over whether the underlying security may be bought or sold, and therefore bears the market risk of an unfavorable change in the price of the underlying security. The counterparty risk for purchased options arises when a Fund has purchased an option, exercises that option, and the counterparty doesn’t buy from the Fund or sell to the Fund the underlying asset as required. In the case where a Fund has written an option, the Fund doesn’t have counterparty risk. Counterparty risk on purchased over-the-counter options is partially mitigated by the Fund’s collateral posting requirements. As the option increases in value to the Fund, the Fund receives collateral from the counterparty. Risks of loss may exceed amounts recognized on the Statement of Assets and Liabilities.
37
Thrivent Mutual Funds
Notes to Financial Statements
December 31, 2012
(J) Futures Contracts – Certain Funds may use futures contracts to manage the exposure to interest rate and market or currency fluctuations. Gains or losses on futures contracts can offset changes in the yield of securities. When a futures contract is opened, cash or other investments equal to the required “initial margin deposit” are held on deposit with and pledged to the broker. Additional securities held by the Funds may be earmarked to cover open futures contracts. The futures contract’s daily change in value (“variation margin”) is either paid to or received from the broker, and is recorded as an unrealized gain or loss. When the contract is closed, realized gain or loss is recorded equal to the difference between the value of the contract when opened and the value of the contract when closed. Futures contracts involve, to varying degrees, risk of loss in excess of the variation margin disclosed in the Statement of Assets and Liabilities. Exchange-traded futures have no significant counterparty risk as the exchange guarantees the contracts against default.
(K) Swap Agreements – Certain Funds enter into swap transactions, which involve swapping one or more investment characteristics of a security or a basket of securities with another party. Such transactions include market risk, risk of default by the other party to the transaction, risk of imperfect correlation and manager risk and may involve commissions or other costs. Swap transactions generally do not involve delivery of securities, other underlying assets or principal. Accordingly, the risk of loss with respect to swap transactions is generally limited to the net amount of payments that the Fund is contractually obligated to make, or in the case of the counterparty defaulting, the net amount of payments that the Fund is contractually entitled to receive. Risks of loss may exceed amounts recognized on the Statement of Assets and Liabilities. If there is a default by the counterparty, the Fund may have contractual remedies pursuant to the agreements related to the transaction. The contracts are valued daily and unrealized appreciation or depreciation is recorded. Swap agreements are valued at fair value of the contract as provided by an independent pricing service. The pricing service takes into account such factors as swap curves, default probabilities, recent trades, recovery rates and other factors it deems relevant in determining valuations. The Fund accrues for the periodic payment and amortizes upfront payments, if any, on swap agreements on a daily basis with the net amount recorded as realized gains or losses on the Statement of Operations. Receipts and payments received or made as a result of a credit event or termination of the contract are also recognized as realized gains or losses on the Statement of Operations. Collateral, in the form of cash or securities, may be required to be held with the Fund’s custodian, or a third party, in connection with these agreements. These swap agreements are over-the-counter and the Fund is exposed to counterparty risk, which is the discounted net amount of payments owed to the Fund. This risk is partially mitigated by the Fund’s collateral posting requirements. As the swap increases in value to the Fund, the Fund receives collateral from the counterparty.
Credit Default Swaps – A credit default swap is a swap agreement between two parties to exchange the credit risk of a particular issuer, basket of securities or reference entity. In a credit default swap transaction, a buyer pays periodic fees in return for payment by the seller which is contingent upon an adverse credit event occurring in the underlying issuer or reference entity. The seller collects periodic fees from the buyer and profits if the credit of the underlying issuer or reference entity remains stable or improves while the swap is outstanding, but the seller in a credit default swap contract would be required to pay the amount of credit loss, determined as specified in the agreement, to the buyer in the event of an adverse credit event in the reference entity. A buyer of a credit default swap is said to buy protection whereas a seller of a credit default swap is said to sell protection. The Funds may be either the protection seller or the protection buyer.
Certain Funds enter into credit default derivative contracts directly through credit default swaps (CDS) or through credit default swap indices (CDX Indices). CDX indices are static pools of equally weighted credit default swaps referencing corporate bonds and/or loans designed to provide diversified credit exposure to these asset classes. Funds sell default protection and assume long-risk positions in individual credits or indices. Index positions are entered into to gain exposure to the corporate bond and/or loan markets in a cost-efficient and diversified structure. In the event that a position defaults, by going into bankruptcy and failing to pay interest or principal on borrowed money, within any given CDX Index held, the maximum potential amount of future payments required would be equal to the pro-rata share of that position within the index based on the notional amount of the index. In the event of a default under a CDS contract the maximum potential amount of future payments would be the notional amount. For CDS, the default events could be bankruptcy and failing to pay interest or principal on borrowed money or a restructuring. A restructuring is a change in the underlying obligations which would include reduction in interest or principal, maturity extension and subordination to other obligations. Refer to the credit default swap tables located within the Funds’ Schedules of Investments for additional information as of December 31, 2012.
(L) Mortgage Dollar Roll Transactions – Certain Funds enter into dollar roll transactions on securities issued or to be issued by the Government National Mortgage Association, Federal National Mortgage Association and Federal Home Loan Mortgage Corporation, in which the Funds sell mortgage securities and simultaneously agree to repurchase similar (same type and coupon) securities at a later date at an agreed upon price. The Funds must maintain liquid securities having a value not less than the repurchase price (including accrued interest) for such dollar rolls. The value of the securities that the Funds are required to purchase may decline below the agreed upon repurchase price of those securities.
During the period between the sale and repurchase, the Funds forgo principal and interest paid on the mortgage securities sold. The Funds are compensated from negotiated fees
38
Thrivent Mutual Funds
Notes to Financial Statements
December 31, 2012
paid by brokers offered as an inducement to the Funds to “roll over” their purchase commitments, thus enhancing the yield. Mortgage dollar rolls may be renewed with a new purchase and repurchase price and a cash settlement made on settlement date without physical delivery of the securities subject to the contract. The fees received are recognized over the roll period and are included in Income from mortgage dollar rolls in the Statement of Operations.
(M) Securities Lending – The Trust has entered into a Securities Lending Agreement (the “Agreement”) with Deutsche Bank AG (“Deutsche”). The Agreement authorizes Deutsche to lend securities to authorized borrowers on behalf of the Funds. Pursuant to the Agreement, all loaned securities are initially collateralized by cash equal to at least 102% of the value of the loaned securities. All cash collateral received is invested in Thrivent Cash Management Trust. The Funds receive dividends and interest that would have been earned on the securities loaned while simultaneously seeking to earn income on the investment of cash collateral. Amounts earned on investments in Thrivent Cash Management Trust, net of rebates, fees paid to Deutsche for services provided and any other securities lending expenses, are included in Income from securities loaned on the Statement of Operations. By investing any cash collateral it receives in these transactions, a Fund could realize additional gains or losses. If the borrower fails to return the securities or the invested collateral has declined in value, the Fund could lose money.
During the year ended December 31, 2012, Natural Resources Fund and Diversified Income Plus Fund had securities on loan. As of December 31, 2012, the value of securities on loan is as follows:
| | | | |
Fund | | Securities on
Loan | |
Natural Resources | | $ | 9,573,541 | |
Diversified Income Plus | | | 5,376,899 | |
(N) When-Issued and Delayed Delivery Transactions – Certain Funds may purchase or sell securities on a when-issued or delayed delivery basis. These transactions involve a commitment by a Fund to purchase or sell securities for a predetermined price or yield, with payment and delivery taking place beyond the customary settlement period. When delayed delivery purchases are outstanding, a Fund will designate liquid assets in an amount sufficient to meet the purchase price. When purchasing a security on a delayed delivery basis, a Fund assumes the rights and risks of ownership of the security, including the risk of price and yield fluctuations, and takes such fluctuations into account when determining its net asset value. A Fund may dispose of a delayed delivery transaction after it is entered into, and may sell when-issued securities before they are delivered, which may result in a capital gain or loss. When a Fund has sold a security on a delayed delivery basis, a Fund does not participate in future gains and losses with respect to the security.
(O) Treasury Inflation Protected Securities – Certain Funds may invest in treasury inflation protected securities (TIPS). These securities are fixed income securities whose principal value is periodically adjusted to the rate of inflation. The coupon interest rate is generally fixed at issuance. Interest is paid based on the principal value, which is adjusted for inflation. Any increase in the principal amount will be included as taxable interest in the Statement of Operations and received in cash upon maturity or sale of the security.
(P) Repurchase Agreements – Each Fund may engage in repurchase agreement transactions in pursuit of its investment objective. A repurchase agreement consists of a purchase and a simultaneous agreement to resell an investment for later delivery at an agreed upon price and rate of interest. The Fund uses a third-party custodian to maintain the collateral. If the original seller of a security subject to a repurchase agreement fails to repurchase the security at the agreed upon time, the Fund could incur a loss due to a drop in the value of the security during the time it takes the Fund to either sell the security or take action to enforce the original seller’s agreement to repurchase the security. Also, if a defaulting original seller filed for bankruptcy or became insolvent, disposition of such security might be delayed by pending legal action. The Fund may only enter into repurchase agreements with banks and other recognized financial institutions such as broker/dealers that are found by the Adviser or subadviser to be creditworthy. During the year ended December 31, 2012, none of the Funds engaged in these types of investments.
(Q) Equity-Linked Structured Securities – Certain funds may invest in equity-linked structured notes. Equity-linked structured notes are debt securities which combine the characteristics of common stock and the sale of an option. The return component is based upon the performance of a single equity security, a basket of equity securities, or an equity index and the sale of an option. There is no guaranteed return of principal with these securities. The appreciation potential of these securities may be limited by a maximum payment or call right and can be influenced by many unpredictable factors. In addition to the performance of the equity, the nature and credit of the issuer may also impact return.
(R) Credit Risk – The Funds may be susceptible to credit risk to the extent an issuer or counterparty defaults on its payment obligation. The Funds’ policy is to monitor the creditworthiness of issuers and counterparties. Interest receivable on defaulted securities is monitored for ability to collect payments in default and is adjusted accordingly.
(S) Accounting Estimates – The preparation of financial statements in conformity with GAAP requires management to make estimates and assumptions that affect the reported amounts of assets and liabilities and disclosure of contingent assets and liabilities at the date of the financial statements and the reported amounts of income and expenses during the reporting period. Actual results could differ from those estimates.
39
Thrivent Mutual Funds
Notes to Financial Statements
December 31, 2012
(T) Loss Contingencies – Thrivent Diversified Income Plus Fund is a defendant in an adversary action filed on July 7, 2004 by the Official Committee of Asbestos Claimants of G-I Holdings, Inc. (G-I) against prior and current holders of secured debt of Building Materials Corporation of America (BMCA), a wholly owned subsidiary of G-I. The suit seeks to recover the value of assets G-I transferred to BMCA that later served as collateral for BMCA’s debt. The Fund at one time held secured notes in the amount of $1,650,000 and, if the plaintiffs are successful, it is reasonably possible that the Fund will be required to pay damages in some amount. Management does not believe it is possible at this time to predict with any reasonable certainty the amount or probability of any potential loss.
(U) Loan Commitments – Certain Funds may enter into loan commitments, which generally have interest rates which are reset daily, monthly, quarterly or semi-annually by reference to a base lending rate, plus a premium. These base rates are primarily the London-Interbank Offered Rate (“LIBOR”), and secondarily the prime rate offered by one or more major United States banks (the “Prime Rate”) and the certificate of deposit (“CD”) rate or other base lending rates used by commercial lenders. Loan commitments often require prepayments from excess cash flows or allow the borrower to repay at its election. The rate at which the borrower repays cannot be predicted with accuracy. Therefore, the remaining maturity may be considerably less than the stated maturity shown in the Schedule of Investments.
All or a portion of these loan commitments may be unfunded. A Fund is obligated to fund these commitments at the borrower’s discretion. Therefore, the Fund must have funds sufficient to cover its contractual obligation. These unfunded loan commitments, which are marked to market daily, are presented in the Schedule of Investments.
(V) Litigation – Awards from class action litigation are recorded as a reduction of cost if the Fund still owns the applicable securities on the payment date. If the Fund no longer owns the applicable securities, the proceeds are recorded as realized gains.
(W) Recent Accounting Pronouncements – In December 2011, FASB released Accounting Standards Update 2011-11 (ASU 2011-11), Balance Sheet (Topic 210), Disclosures about Offsetting Assets and Liabilities. This updated standard is a result of collaboration between FASB and the International Accounting Standards Board (IASB) to enhance current disclosures. The amendments include new disclosure requirements of gross and net information about instruments and transactions, such as derivatives, eligible for offset in the Statement of Assets and Liabilities or subject to a master netting arrangement or similar agreement. The disclosures required by ASU 2011-11 will be effective for any reporting period (annual or interim) beginning on or after January 1, 2013. Management is currently evaluating the application of ASU 2011-11 on the Fund’s financial statements.
(X) Other – For financial statement purposes, investment security transactions are accounted for on the trade date. Realized gains and losses from investment transactions are determined on a specific cost identification basis, which is the same basis used for federal income tax purposes.
(3) FEES AND COMPENSATION PAID TO AFFILIATES
(A) Investment Advisory Fees – The Trust has entered into an Investment Advisory Agreement with Thrivent Asset Mgt. Under the Investment Advisory Agreement, each of the Funds pays a fee for investment advisory services. The fees are accrued daily and paid monthly. The annual rates of fees as a percent of average daily net assets under the Investment Advisory Agreement were as follows:
| | | | | | | | | | | | | | | | | | | | | | | | | | | | | | | | | | | | | | | | | | | | |
Fund (M - Millions) | | $0 to
$50M | | | Over
$50 to
$100M | | | Over
$100 to
$200M | | | Over
$200 to
$250M | | | Over
$250 to
$500M | | | Over
$500 to
$750M | | | Over
$750 to
$1,000M | | | Over
$1,000 to
$2,000M | | | Over
$2,000 to
$2,500M | | | Over
$2,500 to
$5,000M | | | Over
$5,000M | |
Natural Resources | | | 0.800 | % | | | 0.800 | % | | | 0.800 | % | | | 0.800 | % | | | 0.800 | % | | | 0.750 | % | | | 0.750 | % | | | 0.750 | % | | | 0.750 | % | | | 0.750 | % | | | 0.750 | % |
Equity Income Plus | | | 0.650 | % | | | 0.650 | % | | | 0.650 | % | | | 0.650 | % | | | 0.600 | % | | | 0.600 | % | | | 0.600 | % | | | 0.600 | % | | | 0.600 | % | | | 0.600 | % | | | 0.600 | % |
Diversified Income Plus | | | 0.550 | % | | | 0.550 | % | | | 0.550 | % | | | 0.550 | % | | | 0.550 | % | | | 0.550 | % | | | 0.550 | % | | | 0.550 | % | | | 0.550 | % | | | 0.550 | % | | | 0.550 | % |
(B) Expense Reimbursements – As of December 31, 2012, contractual expense reimbursements to limit expenses to the following percentages were in effect:
| | | | | | | | | | | | |
Fund | | Class A | | | Institutional
Class | | | Expiration
Date | |
Natural Resources | | | 1.30 | % | | | N/A | | | | 2/28/2013 | |
Equity Income Plus | | | 1.15 | % | | | 0.80 | % | | | 2/28/2013 | |
Diversified Income Plus1 | | | 1.00 | % | | | N/A | | | | 2/28/2013 | |
| 1 | Prior contractual expense cap of 0.95% expired on February 28, 2012. |
The Funds covered in this shareholder report may invest cash in High Yield Fund, Money Market Fund and Thrivent Cash Management Trust, subject to certain limitations. During the year ended December 31, 2012, none of the Funds covered in this shareholder report invested in High Yield Fund. During the year ended December 31, 2012, none of the Funds covered in this shareholder report invested in Money Market Fund. During the year ended December 31, 2012, all Funds covered in this shareholder report invested in Cash Management Trust. These related-party transactions are subject to the same terms as
40
Thrivent Mutual Funds
Notes to Financial Statements
December 31, 2012
non-related party transactions except that, to avoid duplicate investment advisory fees, Thrivent Asset Mgt. reimburses an amount equal to the advisory fee which is charged to the Fund for its investment in High Yield Fund, Money Market Fund, or Thrivent Cash Management Trust.
(C) Distribution Plan – Thrivent Investment Management, Inc. (“Thrivent Investment Mgt.”) is the Trust’s distributor. The Trust has adopted a Distribution Plan pursuant to Rule 12b-1 under the 1940 Act. Class A shares generally have a Rule 12b-1 fee of up to 0.25% of average net assets.
(D) Sales Charges and Other Fees – For the year ended December 31, 2012, Thrivent Investment Mgt. received $1,066,389 of aggregate underwriting concessions from the sales of the Trust’s Class A shares. Sales charges are not an expense of the Trust and are not reflected in the financial statements of any of the Funds.
The Trust has entered into an accounting and administrative services agreement with Thrivent Asset Mgt. pursuant to which Thrivent Asset Mgt. provides certain accounting and administrative personnel and services to the Funds. For the year ended December 31, 2012, Thrivent Asset Mgt. received aggregate fees for accounting and administrative personnel and services of $295,635 from the Funds covered in this shareholder report.
The Trust has entered into an agreement with Thrivent Financial Investor Services, Inc. (“Thrivent Investor Services”) to provide the Funds with transfer agent services. For the year ended December 31, 2012, Thrivent Investor Services received $390,164 for transfer agent services from the Funds covered in this shareholder report.
Each Trustee is eligible to participate in a deferred compensation plan with respect to fees received from the Funds. Participants in the plan may designate their deferred Trustee’s fees as if invested in a series of Thrivent Mutual Funds. The value of each Trustee’s deferred compensation account will increase or decrease as if invested in shares of that series. Their fees as well as the change in value are included in Trustee’s fees in the Statement of Operations. The deferred fees remain in the appropriate Fund until distribution in accordance with the plan. The deferred fee liability, included in accrued expenses in the Statement of Assets and Liabilities, is unsecured.
Those Trustees not participating in the above plan received $16,283 in fees from the Funds covered in this shareholder report for the year ended December 31, 2012. In addition, the Trust reimbursed independent Trustees for reasonable expenses incurred in relation to attendance at the meetings and industry conferences.
Certain officers and non-independent Trustees of the Trust are officers and directors of Thrivent Asset Mgt., Thrivent Investment Mgt. and Thrivent Investor Services; however, they receive no compensation from the Funds.
(E) Indirect Expenses – Some Funds invest in other mutual funds. Fees and expenses of those underlying funds are not included in those Funds’ expense ratios. The Funds indirectly bear their proportionate share of the annualized weighted average expense ratio of the underlying funds in which they invest.
(4) TAX INFORMATION
Distributions are based on amounts calculated in accordance with applicable federal income tax regulations, which may differ from GAAP. To the extent that these differences are permanent in nature, such amounts are reclassified within the capital accounts based on their federal tax-basis treatment; temporary differences do not require reclassifications.
On the Statement of Assets and Liabilities, as a result of permanent book-to-tax differences, reclassification adjustments were made as follows [Increase/(Decrease)]:
| | | | | | | | | | | | |
Fund | | Accumulated
Net
Investment
Income/(Loss) | | | Accumulated
Net Realized
Gain/(Loss) | | | Capital
Stock | |
Natural Resources | | $ | 5,287 | | | ($ | 5,739 | ) | | $ | 452 | |
Equity Income Plus | | | (778 | ) | | | 23,478 | | | | (22,700 | ) |
Diversified Income Plus | | | 27,652 | | | | 19,649 | | | | (47,301 | ) |
At December 31, 2012, the components of distributable earnings on a tax basis were as follows:
| | | | | | | | |
Fund | | Undistributed
Ordinary Income | | | Undistributed
Long-Term
Capital Gain | |
Equity Income Plus | | $ | 2,647 | | | $ | — | |
Diversified Income Plus | | | 513,015 | | | | — | |
At December 31, 2012, the following Funds had accumulated net realized capital loss carryovers expiring as follows:
| | | | | | | | |
Fund | | Capital Loss
Carryover | | | Expiration
Year | |
Natural Resources | | $ | 3,770,133 | | | | 2016 | |
| | | 7,987,053 | | | | 2017 | |
| | | | | | | | |
| | $ | 11,757,186 | | | | | |
| | | | | | | | |
Equity Income Plus | | | 843,969 | | | | 2017 | |
| | | | | | | | |
| | $ | 843,969 | | | | | |
| | | | | | | | |
Diversified Income Plus | | | 5,965,236 | | | | 2016 | |
| | | 6,421,989 | | | | 2017 | |
| | | | | | | | |
| | $ | 12,387,225 | | | | | |
| | | | | | | | |
Capital losses generated during the year ending December 31, 2012, and later, are subject to the provisions of the Regulated Investment Company Modernization Act of 2010 (the “Act”).
41
Thrivent Mutual Funds
Notes to Financial Statements
December 31, 2012
The Act made several changes to the tax rules that impact the Funds. Under the Act, if capital losses are not reduced by gains, the losses will be carried forward with no expiration and with the short-term or long-term character of the loss retained. Additionally, these capital losses must be fully utilized before those capital loss carryovers listed with noted expiration dates in the table above, which may make them more likely to expire unused.
At December 31, 2012, the following Fund had accumulated net realized capital loss carryovers subject to the Act, as follows:
| | | | | | | | |
Fund | | Capital Loss
Carryover | | | Tax Character | |
Natural Resources | | $ | 3,303,760 | | | | Short-term | |
Natural Resources | | | 1,618,870 | | | | Long-term | |
| | | | | | | | |
| | $ | 4,922,630 | | | | | |
| | | | | | | | |
To the extent that this Fund realizes future net capital gains, taxable distributions will be reduced by any unused capital loss carryovers as permitted by the Internal Revenue Code.
During the calendar year 2012, capital loss carryovers utilized by the Funds were as follows: Natural Resources Fund, $333,708; Equity Income Plus Fund, $2,596,066; and Diversified Income Plus Fund, $5,458,618.
The tax character of distributions paid during the years ended December 31, 2012 and 2011 was as follows:
| | | | | | | | | | | | | | | | |
| | | Ordinary Income | | | Return of Capital | |
Fund | | 12/31/2012 | | | 12/31/2011 | | | 12/31/2012 | | | 12/31/2011 | |
Natural Resources | | $ | 709,647 | | | $ | 1,287,114 | | | $ | 82,186 | | | $ | 1,098,250 | |
Equity Income Plus | | | 1,383,565 | | | | 825,241 | | | | — | | | | — | |
Diversified Income Plus | | | 11,205,756 | | | | 9,254,910 | | | | — | | | | — | |
(5) SECURITY TRANSACTIONS
(A) Purchases and Sales of Investment Securities – For the year ended December 31, 2012, the cost of purchases and the proceeds from sales of investment securities, other than U.S. Government and short-term securities, were as follows:
| | | | | | | | |
| | | | In thousands | |
Fund | | Purchases | | | Sales | |
Natural Resources | | $ | 27,608 | | | $ | 39,341 | |
Equity Income Plus | | | 100,851 | | | | 90,926 | |
Diversified Income Plus | | | 363,042 | | | | 273,996 | |
Purchases and Sales of U.S. Government Securities were:
| | | | | | | | |
| | | In thousands | |
Fund | | Purchases | | | Sales | |
Diversified Income Plus | | $ | 118,918 | | | $ | 113,500 | |
(B) Investments in Restricted Securities – Certain Funds may own restricted securities that have been deemed illiquid and were purchased in private placement transactions without registration under the Securities Act of 1933. Unless such securities subsequently become registered, they generally may be resold only in privately negotiated transactions with a limited number of purchasers. As of December 31, 2012, no Funds held restricted securities.
The Funds have no right to require registration of unregistered securities.
(C) Investments in High-Yielding Securities – The Funds may invest in high-yielding securities. These securities will typically be in lower rated categories or will be non-rated and generally will involve more risk than securities in higher rated categories. Lower rated or unrated securities are more likely to react to developments affecting market risk and credit risk than are more highly rated securities, which react primarily to movements in the general level of interest rates.
42
Thrivent Mutual Funds
Notes to Financial Statements
December 31, 2012
(D) Investments in Options and Futures Contracts – The movement in the price of the security underlying an option or futures contract may not correlate perfectly with the movement in the prices of the portfolio securities being hedged. A lack of correlation could render a Fund’s hedging strategy unsuccessful and could result in a loss to the Fund. In the event that a liquid secondary market would not exist, the Fund could be prevented from entering into a closing transaction, which could result in additional losses to the Fund.
(E) Written Option Contracts – The number of contracts and premium amounts associated with covered call option contracts written during the year ended December 31, 2012, were as follows:
| | | | | | | | |
| | | Number of
Contracts | | | Premium
Amount | |
Equity Income Plus | | | | | | | | |
Balance at December 31, 2011 | | | 515 | | | $ | 100,933 | |
Opened | | | 278 | | | | 305,256 | |
Closed | | | (793 | ) | | | (406,189 | ) |
Expired | | | — | | | | — | |
Exercised | | | — | | | | — | |
| | | | | | | | |
Balance at December 31, 2012 | | | — | | | $ | — | |
| | | | | | | | |
Diversified Income Plus | | | | | | | | |
Balance at December 31, 2011 | | | 120 | | | $ | 68,200 | |
Opened | | | 200 | | | | 274,000 | |
Closed | | | (320 | ) | | | (342,200 | ) |
Expired | | | — | | | | — | |
Exercised | | | — | | | | — | |
| | | | | | | | |
Balance at December 31, 2012 | | | — | | | $ | — | |
| | | | | | | | |
(6) SECURITY TRANSACTIONS WITH AFFILIATED FUNDS
The Funds are permitted to purchase or sell securities from or to certain other Funds under specified conditions outlined in procedures adopted by the Board. The procedures have been designed to ensure that any purchase or sale of securities by a Fund from or to another fund or portfolio that is or could be considered an affiliate by virtue of having a common investment adviser (or affiliated investment advisers), common Trustees and/or common officers complies with Rule 17a-7 of the 1940 Act. Further, as defined under the procedures, each transaction is executed at the current market price.
(7) RELATED PARTY TRANSACTIONS
As of December 31, 2012, no related parties held shares in excess of 5% of the Funds covered in this shareholder report.
(8) SUBSEQUENT EVENTS
The Adviser of the Funds has evaluated the impact of subsequent events, and, except as already included in the Notes to Financial Statements, has determined that no additional items require disclosure.
43
Thrivent Mutual Funds
Financial Highlights
| | | | | | | | | | | | | | | | | | | | | | | | | | | | |
| | | FOR A SHARE OUTSTANDING THROUGHOUT EACH PERIOD* | |
| | | | | | Income from Investment Operations | | | Less Distributions from | |
| | | Net Asset
Value,
Beginning
of Period | | | Net
Investment
Income/(Loss) | | | Net Realized
and Unrealized
Gain/(Loss) on
Investments(a) | | | Total from
Investment
Operations | | | Net
Investment
Income | | | Return of
Capital | | | Total
Distributions | |
NATURAL RESOURCES FUND(c) | |
Class A Shares | | | | | | | | | | | | | | | | | | | | | | | | | | | | |
Year Ended 12/31/2012 | | $ | 9.57 | | | $ | 0.04 | | | $ | (0.43 | ) | | $ | (0.39 | ) | | $ | (0.04 | ) | | $ | (0.01 | ) | | $ | (0.05 | ) |
Year Ended 12/31/2011 | | | 9.66 | | | | 0.08 | | | | 0.01 | | | | 0.09 | | | | (0.09 | ) | | | (0.09 | ) | | | (0.18 | ) |
Year Ended 12/31/2010 | | | 7.79 | | | | 0.11 | | | | 1.98 | | | | 2.09 | | | | (0.18 | ) | | | (0.04 | ) | | | (0.22 | ) |
Year Ended 12/31/2009 | | | 6.36 | | | | 0.19 | | | | 1.50 | | | | 1.69 | | | | (0.18 | ) | | | (0.08 | ) | | | (0.26 | ) |
Year Ended 12/31/2008 | | | 10.56 | | | | 0.23 | | | | (4.05 | ) | | | (3.82 | ) | | | (0.22 | ) | | | (0.16 | ) | | | (0.38 | ) |
Institutional Class Shares | |
Year Ended 12/31/2012 | | | 9.57 | | | | 0.07 | | | | (0.43 | ) | | | (0.36 | ) | | | (0.07 | ) | | | (0.01 | ) | | | (0.08 | ) |
Year Ended 12/31/2011 | | | 9.66 | | | | 0.12 | | | | — | | | | 0.12 | | | | (0.12 | ) | | | (0.09 | ) | | | (0.21 | ) |
Year Ended 12/31/2010 | | | 7.80 | | | | 0.13 | | | | 1.98 | | | | 2.11 | | | | (0.21 | ) | | �� | (0.04 | ) | | | (0.25 | ) |
Year Ended 12/31/2009 | | | 6.34 | | | | 0.20 | | | | 1.53 | | | | 1.73 | | | | (0.19 | ) | | | (0.08 | ) | | | (0.27 | ) |
Year Ended 12/31/2008 | | | 10.56 | | | | 0.25 | | | | (4.06 | ) | | | (3.81 | ) | | | (0.25 | ) | | | (0.16 | ) | | | (0.41 | ) |
| | | | | | | | | | | | | | | | | | | | | | | | | | | | |
EQUITY INCOME PLUS FUND | |
Class A Shares | | | | | | | | | | | | | | | | | | | | | | | | | | | | |
Year Ended 12/31/2012 | | | 8.70 | | | | 0.20 | | | | 0.89 | | | | 1.09 | | | | (0.20 | ) | | | — | | | | (0.20 | ) |
Year Ended 12/31/2011 | | | 9.08 | | | | 0.13 | | | | (0.38 | ) | | | (0.25 | ) | | | (0.13 | ) | | | — | | | | (0.13 | ) |
Year Ended 12/31/2010 | | | 7.98 | | | | 0.13 | | | | 1.12 | | | | 1.25 | | | | (0.15 | ) | | | — | | | | (0.15 | ) |
Year Ended 12/31/2009 | | | 7.03 | | | | 0.13 | | | | 0.95 | | | | 1.08 | | | | (0.13 | ) | | | — | | | | (0.13 | ) |
Year Ended 12/31/2008 (d) | | | 10.00 | | | | 0.18 | | | | (2.97 | ) | | | (2.79 | ) | | | (0.17 | ) | | | (0.01 | ) | | | (0.18 | ) |
Institutional Class Shares | | | | | | | | | | | | | | | | | | | | | | | | | | | | |
Year Ended 12/31/2012 | | | 8.71 | | | | 0.24 | | | | 0.88 | | | | 1.12 | | | | (0.23 | ) | | | — | | | | (0.23 | ) |
Year Ended 12/31/2011 | | | 9.08 | | | | 0.16 | | | | (0.37 | ) | | | (0.21 | ) | | | (0.16 | ) | | | — | | | | (0.16 | ) |
Year Ended 12/31/2010 | | | 7.98 | | | | 0.17 | | | | 1.11 | | | | 1.28 | | | | (0.18 | ) | | | — | | | | (0.18 | ) |
Year Ended 12/31/2009 | | | 7.04 | | | | 0.16 | | | | 0.94 | | | | 1.10 | | | | (0.16 | ) | | | — | | | | (0.16 | ) |
Year Ended 12/31/2008 (d) | | | 10.00 | | | | 0.18 | | | | (2.94 | ) | | | (2.76 | ) | | | (0.19 | ) | | | (0.01 | ) | | | (0.20 | ) |
| | | | | | | | | | | | | | | | | | | | | | | | | | | | |
DIVERSIFIED INCOME PLUS FUND | |
Class A Shares | | | | | | | | | | | | | | | | | | | | | | | | | | | | |
Year Ended 12/31/2012 | | | 6.22 | | | | 0.27 | | | | 0.59 | | | | 0.86 | | | | (0.26 | ) | | | — | | | | (0.26 | ) |
Year Ended 12/31/2011 | | | 6.39 | | | | 0.27 | | | | (0.15 | ) | | | 0.12 | | | | (0.29 | ) | | | — | | | | (0.29 | ) |
Year Ended 12/31/2010 | | | 5.83 | | | | 0.33 | | | | 0.54 | | | | 0.87 | | | | (0.31 | ) | | | — | | | | (0.31 | ) |
Year Ended 12/31/2009 | | | 4.68 | | | | 0.32 | | �� | | 1.11 | | | | 1.43 | | | | (0.28 | ) | | | — | | | | (0.28 | ) |
Year Ended 12/31/2008 | | | 6.48 | | | | 0.30 | | | | (1.78 | ) | | | (1.48 | ) | | | (0.32 | ) | | | — | | | | (0.32 | ) |
Institutional Class Shares | | | | | | | | | | | | | | | | | | | | | | | | | | | | |
Year Ended 12/31/2012 | | | 6.19 | | | | 0.30 | | | | 0.57 | | | | 0.87 | | | | (0.29 | ) | | | — | | | | (0.29 | ) |
Year Ended 12/31/2011 | | | 6.36 | | | | 0.29 | | | | (0.15 | ) | | | 0.14 | | | | (0.31 | ) | | | — | | | | (0.31 | ) |
Year Ended 12/31/2010 | | | 5.81 | | | | 0.36 | | | | 0.52 | | | | 0.88 | | | | (0.33 | ) | | | — | | | | (0.33 | ) |
Year Ended 12/31/2009 | | | 4.67 | | | | 0.35 | | | | 1.09 | | | | 1.44 | | | | (0.30 | ) | | | — | | | | (0.30 | ) |
Year Ended 12/31/2008 | | | 6.47 | | | | 0.31 | | | | (1.76 | ) | | | (1.45 | ) | | | (0.35 | ) | | | — | | | | (0.35 | ) |
| (a) | The amount shown may not correlate with the change in aggregate gains and losses of portfolio securities due to the timing of sales and redemptions of fund shares. |
| (c) | Prior to October 10, 2011, Fund was the “Real Estate Securities Fund” and invested at least 80% of its net assets in issuers primarily engaged in the U.S. real estate industry. |
| (d) | Since fund inception, February 29, 2008. |
| * | All per share amounts have been rounded to the nearest cent. |
The accompanying Notes to Financial Statements are an integral part of this schedule.
44
Thrivent Mutual Funds
Financial Highlights – continued
| | | | | | | | | | | | | | | | | | | | | | | | | | | | | | |
| RATIOS / SUPPLEMENTAL DATA | |
| | | | | | | | | | Ratio to Average Net
Assets** | | | Ratios to Average Net Assets
Before Expenses Waived,
Credited or Paid
Indirectly** | | | | |
Net Asset
Value, End of
Period | | | Total Return(b) | | | Net Assets,
End of Period
(in millions) | | | Expenses | | | Net Investment
Income/(Loss) | | | Expenses | | | Net Investment
Income/(Loss) | | | Portfolio
Turnover
Rate | |
| | | | | | | | | | | | | | | | | | | | | | | | | | | | | | |
| | | | | | | | | | | | | | | | | | | | | | | | | | | | | | |
| $ | 9.13 | | | | (4.05 | )% | | $ | 14.9 | | | | 1.30 | % | | | 0.46 | % | | | 1.77 | % | | | (0.01 | )% | | | 30 | % |
| | 9.57 | | | | 0.85 | % | | | 15.4 | | | | 1.30 | % | | | 0.77 | % | | | 1.70 | % | | | 0.37 | % | | | 92 | % |
| | 9.66 | | | | 27.15 | % | | | 14.8 | | | | 1.29 | % | | | 1.17 | % | | | 1.81 | % | | | 0.66 | % | | | 18 | % |
| | 7.79 | | | | 28.55 | % | | | 10.8 | | | | 1.25 | % | | | 3.09 | % | | | 2.23 | % | | | 2.11 | % | | | 20 | % |
| | 6.36 | | | | (37.16 | )% | | | 8.4 | | | | 1.25 | % | | | 2.50 | % | | | 1.73 | % | | | 2.02 | % | | | 49 | % |
| | | | | | | | | | | | | | | | | | | | | | | | | | | | | | |
| | 9.13 | | | | (3.71 | )% | | | 79.1 | | | | 0.97 | % | | | 0.78 | % | | | 0.97 | % | | | 0.78 | % | | | 30 | % |
| | 9.57 | | | | 1.21 | % | | | 96.8 | | | | 0.94 | % | | | 1.15 | % | | | 0.94 | % | | | 1.15 | % | | | 92 | % |
| | 9.66 | | | | 27.38 | % | | | 95.4 | | | | 0.97 | % | | | 1.47 | % | | | 0.97 | % | | | 1.47 | % | | | 18 | % |
| | 7.80 | | | | 28.97 | % | | | 80.2 | | | | 1.03 | % | | | 3.24 | % | | | 1.04 | % | | | 3.23 | % | | | 20 | % |
| | 6.34 | | | | (37.00 | )% | | | 56.5 | | | | 0.91 | % | | | 2.73 | % | | | 0.93 | % | | | 2.72 | % | | | 49 | % |
| | | | | | | | | | | | | | | | | | | | | | | | | | | | | | |
| | | | | | | | | | | | | | | | | | | | | | | | | | | | | | |
| | | | | | | | | | | | | | | | | | | | | | | | | | | | | | |
| | 9.59 | | | | 12.60 | % | | | 25.6 | | | | 1.15 | % | | | 2.18 | % | | | 1.47 | % | | | 1.86 | % | | | 164 | % |
| | 8.70 | | | | (2.79 | )% | | | 21.0 | | | | 1.15 | % | | | 1.47 | % | | | 1.47 | % | | | 1.15 | % | | | 193 | % |
| | 9.08 | | | | 15.83 | % | | | 11.7 | | | | 1.16 | % | | | 1.90 | % | | | 1.76 | % | | | 1.29 | % | | | 360 | % |
| | 7.98 | | | | 15.74 | % | | | 4.1 | | | | 1.15 | % | | | 1.92 | % | | | 1.93 | % | | | 1.14 | % | | | 414 | % |
| | 7.03 | | | | (28.15 | )% | | | 2.9 | | | | 1.15 | % | | | 2.35 | % | | | 1.68 | % | | | 1.82 | % | | | 114 | % |
| | | | | | | | | | | | | | | | | | | | | | | | | | | | | | |
| | 9.60 | | | | 12.97 | % | | | 35.3 | | | | 0.80 | % | | | 2.52 | % | | | 0.94 | % | | | 2.38 | % | | | 164 | % |
| | 8.71 | | | | (2.35 | )% | | | 30.6 | | | | 0.80 | % | | | 1.80 | % | | | 0.94 | % | | | 1.66 | % | | | 193 | % |
| | 9.08 | | | | 16.23 | % | | | 29.9 | | | | 0.81 | % | | | 2.09 | % | | | 1.19 | % | | | 1.70 | % | | | 360 | % |
| | 7.98 | | | | 15.97 | % | | | 24.7 | | | | 0.80 | % | | | 2.28 | % | | | 1.35 | % | | | 1.73 | % | | | 414 | % |
| | 7.04 | | | | (27.90 | )% | | | 20.3 | | | | 0.80 | % | | | 2.56 | % | | | 1.08 | % | | | 2.28 | % | | | 114 | % |
| | | | | | | | | | | | | | | | | | | | | | | | | | | | | | |
| | | | | | | | | | | | | | | | | | | | | | | | | | | | | | |
| | | | | | | | | | | | | | | | | | | | | | | | | | | | | | |
| | 6.82 | | | | 14.08 | % | | | 290.7 | | | | 0.99 | % | | | 4.14 | % | | | 1.03 | % | | | 4.10 | % | | | 153 | % |
| | 6.22 | | | | 1.78 | % | | | 200.5 | | | | 0.97 | % | | | 4.29 | % | | | 1.06 | % | | | 4.20 | % | | | 126 | % |
| | 6.39 | | | | 15.24 | % | | | 171.5 | | | | 1.12 | % | | | 5.62 | % | | | 1.12 | % | | | 5.61 | % | | | 112 | % |
| | 5.83 | | | | 31.50 | % | | | 135.2 | | | | 1.18 | % | | | 6.32 | % | | | 1.20 | % | | | 6.30 | % | | | 94 | % |
| | 4.68 | | | | (23.69 | )% | | | 109.4 | | | | 1.06 | % | | | 5.02 | % | | | 1.11 | % | | | 4.97 | % | | | 114 | % |
| | | | | | | | | | | | | | | | | | | | | | | | | | | | | | |
| | 6.77 | | | | 14.23 | % | | | 54.2 | | | | 0.72 | % | | | 4.47 | % | | | 0.72 | % | | | 4.47 | % | | | 153 | % |
| | 6.19 | | | | 2.18 | % | | | 17.4 | | | | 0.74 | % | | | 4.53 | % | | | 0.74 | % | | | 4.52 | % | | | 126 | % |
| | 6.36 | | | | 15.57 | % | | | 7.7 | | | | 0.76 | % | | | 5.92 | % | | | 0.77 | % | | | 5.92 | % | | | 112 | % |
| | 5.81 | | | | 31.97 | % | | | 6.7 | | | | 0.76 | % | | | 6.71 | % | | | 0.79 | % | | | 6.69 | % | | | 94 | % |
| | 4.67 | | | | (23.32 | )% | | | 4.1 | | | | 0.63 | % | | | 5.42 | % | | | 0.68 | % | | | 5.37 | % | | | 114 | % |
| (b) | Total investment return assumes dividend reinvestment and does not reflect any deduction for applicable sales charges. Not annualized for periods less than one year. |
| ** | Computed on an annualized basis if less than one year. |
The accompanying Notes to Financial Statements are an integral part of this schedule.
45
Additional Information
(unaudited)
Shareholder Notification of Federal Tax Information
The following information is provided solely to satisfy the requirements set forth by the Internal Revenue Code. Shareholders will be provided information regarding their distribution in February 2013.
The funds designate the percentage of dividends declared from net investment income as dividends qualifying for the 70% dividends received deduction for corporations and the percentage as qualified dividend income for individuals under the Jobs and Growth Tax Relief Reconciliation Act of 2003 as follows:
| | | | | | | | |
Fund | | Dividends
Received
Deduction
for
Corporations | | | Qualified
Dividend
Income for
Individuals | |
Natural Resources | | | 100 | % | | | 100 | % |
Equity Income Plus | | | 84 | % | | | 94 | % |
Diversified Income Plus | | | 19 | % | | | 20 | % |
Proxy Voting
The policies and procedures that the Trust uses to determine how to vote proxies relating to portfolio securities are attached to the Trust’s Statement of Additional Information. You may request a free copy of the Statement of Additional Information or the report of how the Trust voted proxies relating to portfolio securities during the most recent 12-month period ended June 30 by calling 1-800-847-4836. You also may review the Statement of Additional Information or the report of how the Trust voted proxies relating to portfolio securities during the most recent 12-month period ended June 30 at Thrivent.com or www.sec.gov.
Quarterly Schedule of Portfolio Holdings
The Trust files its Schedule of Portfolio Holdings on Form N-Q with the SEC for the first and third quarters of each fiscal year. You may request a free copy of the Trust’s Forms N-Q by calling 1-800-847-4836. The Trust’s most recent Form N-Q Schedule of Investments also is at Thrivent.com or www.sec.gov. You also may review and copy the Forms N-Q for the Trust at the SEC’s Public Reference Room in Washington, DC. You may get information about the operation of the Public Reference Room by calling 1-800-SEC-0330.
Board Approval of Investment Advisory Agreement and Subadvisory Agreements
Both the Investment Company Act of 1940 (the “Investment Company Act”) and the terms of the Investment Advisory and Subadvisory Agreements of the Thrivent Mutual Funds (the “Trust”) require that these agreements be approved annually by the Board of Trustees (the “Board”), including a majority of the Trustees who are not “interested persons” of the Trust, as defined in the Investment Company Act (the “Independent Trustees”).
At its meeting on November 28, 2012, the Board voted unanimously to renew the existing Investment Advisory Agreement between the Trust and Thrivent Asset Management (the “Adviser”) for each series (each, a “Fund”) of the Trust. The Board also unanimously approved the Subadvisory Agreements for each of the Funds for which there is an investment subadviser (each a “Subadviser”). The Adviser and Subadvisers are referred to, collectively, as the “Advisory Organizations.” In connection with its evaluation of the agreements with the Advisory Organizations, the Board reviewed a broad range of information requested for this purpose and considered a variety of factors, including the following:
| | 1. | The nature, extent, and quality of the services provided by the Advisory Organizations; |
| | 2. | The performance of the Funds; |
| | 3. | The advisory fee and net operating expense ratio of each Fund compared to a peer group; |
| | 4. | The cost of services provided and profit realized by the Adviser; |
| | 5. | The extent to which economies of scale may be realized as the Funds grow; |
46
Additional Information
(unaudited)
| | 6. | Whether the breakpoint levels reflect these economies of scale for the benefit of the Funds’ shareholders; |
| | 7. | Other benefits realized by the Adviser or its affiliates from its relationship with the Trust; and |
| | 8. | Any other factors that the Board deemed relevant to its consideration. |
In connection with the renewal process, the Contracts Committee of the Board (consisting of each of the Independent Trustees) met on six occasions from February 21 to November 28, 2012 to consider information relevant to the renewal process. The Independent Trustees also retained the services of Management Practice, Inc. (“MPI”) as an independent consultant to assist in the compilation, organization, and evaluation of relevant information. This information included statistical comparisons of the advisory fees, total operating expenses and performance of each of the Funds in comparison to a peer group of comparable funds; detailed information prepared by management with respect to the cost of services provided to the Funds and fees charged, including effective advisory fees that take into account breakpoints and fee waivers by the Adviser; profit realized by the Adviser and its affiliates that provide services to the Funds; and information regarding the types of services furnished to the Funds. The Board received reports from the investment management staff of the Adviser regarding the personnel providing services to the Funds, as well as changes in staff, and systems improvements. The Board also received reports from the Adviser’s investment management staff with respect to the performance of the Funds. In addition to its review of the information presented to the Board during the contract renewal process, the Board also considered information obtained from management throughout the course of the year.
The Independent Trustees were represented by independent counsel throughout the review process and during executive sessions without management present to consider reapproval of the agreements. Each Independent Trustee relied on his or her own business judgment in determining the weight to be given to each factor considered in evaluating the materials that were presented. The Contract Committee’s and Board’s review and conclusions were based on a comprehensive consideration of all information presented to them and were not the result of any single controlling factor. In addition, each Trustee may have weighed individual factors differently. The key factors considered and the conclusions reached are described below.
Nature, Extent and Quality of Services
At each of the Board’s regular quarterly meetings, management presented information describing the services furnished to the Funds by the Adviser and, as appropriate, the Subadvisers. During these meetings, management reported on the investment management, portfolio trading and compliance services provided to the Funds under the Advisory and Subadvisory Agreements. During the renewal process, the Board considered the specific services provided under the Advisory Agreement. The Board also considered information relating to the investment experience and qualifications portfolio managers of the Adviser and the Subadvisers.
The Board received reports at each of its quarterly meetings from the Adviser’s Trustees of Equity and Fixed Income Investments, as supplemented by the Adviser’s Chief Investment Officer, who was also present at all of the meetings. At each quarterly meeting, the Trustees of Equity and Fixed Income Investments presented information about each of the Funds. Several portfolio managers and research analysts also met with the Trustees, from time to time, at the quarterly meetings to make more in-depth presentations on a variety of investment topics pertaining to the Funds. These reports and presentations gave the Board the opportunity to evaluate the portfolio managers’ abilities and the quality of services they provide to the Funds. Information was also presented to the Board describing the portfolio compliance functions performed by the Adviser and the Adviser’s oversight of the Subadvisers to the Trust. The Independent Trustees also met in-person with and received quarterly reports from the Trust’s Chief Compliance Officer.
The Board considered the adequacy of the Advisory Organizations’ resources used to provide services to the Trust pursuant to the Advisory and Subadvisory Agreements. The Adviser reviewed with the Board the Adviser’s ongoing program to enhance portfolio management capabilities, including recruitment and retention of portfolio managers, research analysts and other personnel, and investment in additional and updated technology systems and applications to improve investment research, trading and portfolio compliance, and investment reporting functions. The Adviser also discussed further refinements to certain compliance procedures and improved risk controls. The Adviser reviewed with the Board its process for selecting and overseeing the Subadvisers. The Adviser also reviewed with the Board the services provided by the Subadvisers. The Board viewed these actions as a positive factor in reapproving the existing Advisory Agreement, as they demonstrated the Adviser’s commitment to provide the Funds with quality service and competitive
47
Additional Information
(unaudited)
investment performance. The Board concluded that, within the context of its full deliberations, the nature, extent and quality of the investment advisory services provided to the Funds by the Adviser and Subadvisers supported renewal of the Advisory Agreement and Subadvisory Agreements.
Performance of the Funds
In connection with each of its regular quarterly meetings, the Board received information on the investment performance of each Fund, including net performance, relative performance rankings within each Fund’s Lipper peer group, Morningstar ratings, and performance as compared to benchmark index returns. At each quarterly Board meeting, the Directors of Equities and Fixed Income Investments reviewed with the Board the economic and market environment, risk management, and style consistency in connection with management of the Funds. The Board considered investment performance for each Fund, to the extent applicable, over the one-, two-, three-, five-, and ten-year periods. When evaluating investment performance, the Board considered longer-term performance and the trend of performance, and focused particularly upon the three-year performance record.
For the three-year period ended June 30, 2012, the Board noted the average ranking of the Funds against their Lipper categories with respect to Class A shares was 52% (with 1% being the best) and the average ranking of the Funds against their Lipper categories with respect to Institutional Class shares was 45%. The Board concluded that the performance of each individual Fund was either satisfactory compared to its peer group or that the Adviser had taken appropriate actions in an effort to improve performance.
Advisory Fees and Fund Expenses
The Board reviewed information prepared by MPI comparing each Fund’s advisory fee with the advisory fee of its peer group. The Board considered both the contractual and effective advisory fees for each of the Funds. The Board noted that the majority of the Funds’ advisory fees were at or below the medians of their peer groups. The Board observed that the average ranking of the Funds’ advisory fees with respect to Class A shares was 30% and the average ranking of the Funds’ fees with respect to Institutional Class shares was 33%. The Board also considered advisory fees after the voluntary and contractual fee waivers and expense reimbursements provided by the Adviser for several of the Funds. The Board viewed favorably the Adviser’s proposal to continue or extend fee waivers for certain Funds and considered the effect of the waivers in lowering the Funds’ expenses.
On the basis of its review, the Board concluded that the advisory fees charged to the Funds for investment management services were not excessive.
The Board also reviewed information prepared by MPI comparing each Fund’s overall expense ratio with the expense ratio of its peer group. The Board noted that 92% of the Funds had net operating expenses at or below the median of their peer groups, with an average ranking of the Funds with respect to Class A shares of 37% and an average ranking of the Funds with respect to Institutional Class shares of 22%.
Cost of Services and Profitability
The Board considered the Adviser’s estimates of its profitability, which included allocations by the Adviser of its costs in providing advisory services to the Funds. The internal audit department (i.e., Business Risk Management) of the Adviser conducted a review of such allocations and a department representative reported to the Board his views regarding the reasonableness and consistency of these allocations. The Board considered the profitability of the Adviser both overall and on a Fund-by-Fund basis. The Board also considered the expense reimbursements and waivers in effect. Based on its review of the data prepared by MPI and expense and profit information provided by the Adviser, the Board concluded that the profits earned by the Adviser from the Advisory Agreement were not excessive in light of the nature, extent and quality of services provided to the Funds.
With respect to fees paid to Subadvisers under the Subadvisory Agreements, the Board did not consider profitability information with respect to the Subadvisers, which are not affiliated with the Adviser. The Board considered that those
48
Additional Information
(unaudited)
contracts had been negotiated on an arm’s-length basis between the Adviser and each Subadviser, and that each Subadviser’s separate profitability from its relationship with the Funds was not a material factor in determining whether to renew the agreement.
Economies of Scale and Breakpoints
The Board considered information regarding the extent to which economies of scale may be realized as a Fund’s assets increase and whether the fee levels reflect these economies of scale for the benefit of shareholders. The Adviser explained its general goal with respect to the employment of fee waivers, expense reimbursements and breakpoints. The Board considered information provided by the Adviser related to advisory fee rates, breakpoints in the advisory fee rates and fee waivers provided by the Adviser. The Board also considered management’s view that it is difficult to generalize as to whether, or to what extent, economies in the advisory function may be realized as a Fund’s assets increase. The Board noted that expected economies of scale, where they exist, may be shared through the use of fee breakpoints, fee waivers by the Adviser, and/or a lower overall fee rate.
Other Benefits to the Adviser and its Affiliates
The Board considered information regarding potential “fall-out” or ancillary benefits that the Adviser and its affiliates may receive as a result of their relationship with the Trust, both tangible and intangible, such as their ability to leverage investment professionals who manage other portfolios, reputational benefits in the investment advisory community and the engagement of affiliates as service providers to the Funds. The Board noted that such benefits were difficult to quantify but were consistent with benefits received by other mutual fund advisers.
The Board also considered other potential benefits to the Adviser and its affiliates derived from its relationship with the Trust, including, among other things, research received by the Adviser generated from commission dollars spent on the Funds’ portfolio trading. The Board reviewed with the Adviser these arrangements and the reasonableness of the costs relative to the services performed. The Board considered the Adviser’s brokerage reports and representations that it evaluates any soft-dollar arrangements for compliance with applicable requirements, particularly with respect to the safe harbor contained in Section 28(e) of the Securities Exchange Act of 1934, and for compliance with the Adviser’s duty to seek best execution.
Based on the factors discussed above, the Contracts Committee unanimously recommended approval of the Advisory Agreement and the Subadvisory Agreements, and the Board, including all of the Independent Trustees voting separately, approved each of the agreements.
49
Board of Trustees and Officers
The following table provides information about the Trustees and Officers of the Trust. Each Trustee oversees each of the 26 series of the Trust and also serves as:
| | • | | Director of Thrivent Series Fund, Inc., a registered investment company consisting of 36 portfolios that serve as underlying funds for variable contracts issued by Thrivent Financial for Lutherans (“Thrivent Financial”) and Thrivent Life Insurance Company and investment options in the retirement plan offered by Thrivent Financial, and |
| | • | | Trustee of Thrivent Cash Management Trust, a registered investment company consisting of one portfolio that serves as a cash collateral fund for a securities lending program sponsored by Thrivent Financial. |
The 26 series of the Trust, the 36 portfolios of Thrivent Series Fund, Inc. and Thrivent Cash Management Trust are referred to herein as the “Fund Complex.” The Statement of Additional Information includes additional information about the Trustees and is available, without charge, by calling 1-800-847-4836.
Interested Trustee (1)(2)(3)(4)
| | |
Name (Year of Birth) Year Elected | | Principal Occupation(s) and Directorships of Public Companies and Other Investment Companies
During the Past Five Years |
Russell W. Swansen (1957) 2008 | | Senior Vice President, Chief Investment Officer, Thrivent Financial since 2003 |
Independent Trustees (2)(3)(4)(5)
| | |
Name (Year of Birth) Year Elected | | Principal Occupation(s) and Directorships of Public Companies and Other Investment Companies
During the Past Five Years |
| |
Janice B. Case (1952) 2011 | | Independent Trustee of North American Electric Reliability Corporation (self-regulatory organization) since 2008; Independent Director of Western Electricity Coordinating Council (nonprofit corporation coordinating and promoting bulk electric system reliability) from 2002 through 2008 |
| |
Richard L. Gady (1943) 1987 | | Retired |
| |
Richard A. Hauser (1943) 2004 | | Vice President and Assistant General Counsel, Boeing Company since 2007 |
| |
Marc S. Joseph (1960) 2011 | | Managing Director of GraniteRidgeLLP (consulting and advisory firm) since 2009; Managing Director of MJosephLLC (private investing and consulting firm) since 2004 |
| |
Paul R. Laubscher (1956) 2009 | | Portfolio Manager for U.S. and international equity portfolios and private real estate portfolios of IBM Retirement Funds |
| |
James A. Nussle (1960) 2011 | | President and Chief Operating Officer of Growth Energy (trade association) since 2010; Advisory Board member of AVISTA Capital Partners (private equity firm) since 2010; Contributor on CNBC (media) since 2010; CEO of The Nussle Group LLC (consulting firm) since 2009; Director of the Office of Management and Budget from 2007 through 2009 |
| |
Douglas D. Sims (1946) 2006 | | Currently, Director of Keystone Neighbourhood Company, Keystone Center and Keystone Science School. Previously, Director of the Center for Corporate Excellence |
| |
Constance L. Souders (1950) 2007 | | Retired |
50
Board of Trustees and Officers
Executive Officers (4)
| | |
Name (Year of Birth) Position Held With Thrivent | | Principal Occupation(s) During the Past Five Years |
Russell W. Swansen (1957) President | | Senior Vice President, Chief Investment Officer, Thrivent Financial since 2003 |
| |
David S. Royal (1971) Secretary and Chief Legal Officer | | Vice President and Managing Counsel since 2006; Interim Investment Company and Investment Adviser Chief Compliance Officer from May 2010 until December 2010 |
| |
Gerard V. Vaillancourt (1967) Treasurer and Principal Accounting Officer | | Vice President, Mutual Fund Accounting since 2006 |
| |
Ted S. Dryden (1965) Chief Compliance Officer | | Investment Company and Investment Adviser Chief Compliance Officer, Thrivent Financial since December 2010; Chief Compliance Officer, OptumHealth Financial Services from 2009 to 2010; Vice President, Asset Management Compliance, Ameriprise Financial from 2006 to 2009 |
| |
Janice M. Guimond (1965) Vice President | | Vice President, Investment Operations, Thrivent Financial since 2004 |
| |
Kathleen M. Koelling (1977) Anti-Money Laundering Officer (6) | | Privacy and Anti-Money Laundering Officer, Thrivent Financial since 2010; Senior Counsel, Thrivent Financial since 2002 |
| |
Mark D. Anema (1961) Vice President | | Vice President, Accumulation and Retirement Income Solutions, Thrivent Financial since 2007 |
| |
Jody L. Bancroft (1971) Assistant Vice President (6) | | Director, Investment Field Operations, Thrivent Financial since 2009; Director, Annuity & Settlement Option New Services, Thrivent Financial from 2007 until 2009 |
| |
James M. Odland (1955) Assistant Secretary | | Vice President and Managing Counsel, Thrivent Financial since 2005 |
| |
Rebecca A. Paulzine (1979) Assistant Secretary | | Senior Counsel, Thrivent Financial since January 2010; Associate, Faegre & Benson LLP from 2005 to December 2009 |
| |
Todd J. Kelly (1969) Assistant Treasurer (6) | | Director, Fund Accounting Operations, Thrivent Financial since 2002 |
| |
Sarah L. Bergstrom (1977) Assistant Treasurer | | Director, Fund Accounting Administration, Thrivent Financial since 2007 |
| (1) | “Interested Trustee” of the Trust as defined in the Investment Company Act of 1940 by virtue of positions with Thrivent Financial. Mr. Swansen is considered an interested trustee because of his principal occupation with Thrivent Financial. |
| (2) | Each Trustee generally serves an indefinite term until her or his successor is duly elected and qualified. Trustees serve at the discretion of the board until their successors are duly appointed and qualified. |
| (3) | Each Trustee oversees 63 portfolios. |
| (4) | The address for each Trustee and Officer unless otherwise noted is 625 Fourth Avenue South, Minneapolis, MN 55415 |
| (5) | The Trustees other than Mr. Swansen are not “interested trustees” of the Fund and are referred to as “Independent Trustees.” |
| (6) | The address for this Officer is 4321 North Ballard Road, Appleton, WI 54913 |
51

As of the end of the period covered by this report, registrant has adopted a code of ethics (as defined in Item 2 of Form N-CSR) applicable to registrant’s Principal Executive Officer, Principal Financial Officer and Principal Accounting Officer. No waivers were granted to such code of ethics during the period covered by this report. A copy of this code of ethics is filed as an exhibit to this Form N-CSR.
| Item 3. | Audit Committee Financial Expert |
Registrant’s Board of Trustees has determined that Constance L. Souders, an independent trustee, is the Audit Committee Financial Expert.
| Item 4. | Principal Accountant Fees and Services |
(a) through (d)
Thrivent Natural Resources Fund, Thrivent Equity Income Plus Fund, and Thrivent Diversified Income Plus Fund (each a “Fund” and collectively, the “Funds”) are each a series of Thrivent Mutual Funds, a Massachusetts business trust (the “Trust”). The Trust, as of the date of filing this Form N-CSR, contains a total of 26 series (the “Series”), including the Funds. This Form N-CSR relates to the annual report of each Fund.
The following table presents the aggregate fees billed to the Funds for the respective fiscal years ended December 31, 2012 and December 31, 2011 by the Funds’ independent public accountants, PricewaterhouseCoopers LLP (“PwC”), for professional services rendered for the audit of the Funds’ annual financial statements and fees billed for other services rendered by PwC during those periods.
| | | | | | | | |
Fiscal Years Ended | | 12/31/12 | | | 12/31/11 | |
| | |
Audit Fees | | $ | 28,700 | | | $ | 25,604 | (4) |
| | |
Audit-Related Fees(1) | | $ | 0 | | | $ | 0 | |
| | |
Tax Fees(2) | | $ | 7,859 | | | $ | 14,916 | |
| | |
All Other Fees(3) | | $ | 0 | | | $ | 0 | |
| | | | | | | | |
| | |
Total | | $ | 36,559 | | | $ | 40,520 | |
| | | | | | | | |
| (1) | Audit-related fees consist of the aggregate fees billed for assurance and related services that are reasonably related to the performance of the audit of financial statements and are not reported under the category of audit fees. |
| (2) | Tax fees consist of the aggregate fees billed for professional services rendered by the principal accountant relating to tax compliance, tax advice, and tax planning and specifically include fees for tax return preparation. |
| (3) | All other fees consist of the aggregate fees billed for products and services provided by the principal accountant other than audit, audit-related, and tax services. |
| (4) | In addition, the parent company of the Registrant’s investment adviser paid PwC $8,000 for services in connection with PwC’s review of the Registrant’s Registration Statement on Form N-14 (relating to the merger of two Series of the Registrant not covered by this report) and semiannual report to shareholders (of Series of the Registrant not covered by this report), to which the Registration Statement on Form N-14 incorporated by reference. |
The following table presents the aggregate fees billed to all Series of the Trust (other than the Funds) with fiscal years ending on October 31 for the fiscal years ended October 31, 2012 and October 31, 2011 by PwC for professional services rendered for the audit of the annual financial statements of the applicable Series and fees billed for other services rendered by PwC during those periods.
| | | | | | | | |
Fiscal Years Ended | | 12/31/12 | | | 12/31/11 | |
| | |
Audit Fees | | $ | 373,880 | | | $ | 381,489 | |
| | |
Audit-Related Fees(1) | | $ | 0 | | | $ | 0 | |
| | |
Tax Fees(2) | | $ | 55,548 | | | $ | 114,542 | |
| | |
All Other Fees(3) | | $ | 0 | | | $ | 0 | |
| | | | | | | | |
| | |
Total | | $ | 429,428 | | | $ | 496,031 | |
| | | | | | | | |
| (1) | Audit-related fees consist of the aggregate fees billed for assurance and related services that are reasonably related to the performance of the audit of financial statements and are not reported under the category of audit fees. |
| (2) | Tax fees consist of the aggregate fees billed for professional services rendered by the principal accountant relating to tax compliance, tax advice, and tax planning and specifically include fees for tax return preparation. |
| (3) | All other fees consist of the aggregate fees billed for products and services provided by the principal accountant other than audit, audit-related, and tax services. |
| | (e) | Registrant’s audit committee charter, adopted in February 2010, provides that the audit committee (comprised of the independent Trustees of registrant) is responsible for pre-approval of all auditing services performed for the registrant. The audit committee also is responsible for pre-approval (subject to the de minimis exceptions for non-audit services described in Section 10A(i)(1)(B) of the Securities Exchange Act of 1934) of all non-auditing services performed for the registrant or an affiliate of registrant. In addition, registrant’s audit committee charter permits a designated member of the audit committee to pre-approve, between meetings, one or more audit or non-audit service projects, subject to an expense limit and notification to the audit committee at the next committee meeting. Registrant’s audit committee pre-approved all fees described above that PwC billed to registrant. |
| | (f) | Less than 50% of the hours billed by PwC for auditing services to registrant for the fiscal year ended December 31, 2012 was for work performed by persons other than full-time permanent employees of PwC. |
| | (g) | The aggregate non-audit fees billed by PwC to registrant and to registrant’s investment adviser and any entity controlling, controlled by, or under common control with registrant’s investment adviser for the fiscal years set forth below are disclosed in the table below. The disclosed payments were for access to a PwC-sponsored online library that provides interpretive guidance regarding U.S. and foreign accounting standards. |
| | | | | | | | | | | | | | | | |
Fiscal Year Ended | | 10/31/12 | | | 12/31/12 | | | 10/31/11 | | | 12/31/11 | |
Registrant | | $ | 0 | | | $ | 0 | | | $ | 0 | | | $ | 0 | |
Adviser | | $ | 6,800 | | | $ | 6,800 | | | $ | 1,800 | | | $ | 1,800 | |
| | (h) | Registrant’s audit committee has considered the non-audit services provided to the registrant and registrant’s investment adviser and any entity controlling, controlled by, or under common control with registrant’s investment adviser as described above and determined that these services do not compromise PwC’s independence. |
| Item 5. | Audit Committee of Listed Registrants |
Not applicable.
| Item 6. | Schedule of Investments |
(a) Registrant’s Schedule of Investments is included in the report to shareholders filed under Item 1.
(b) Not applicable to this filing.
| Item 7. | Disclosure of Proxy Voting Policies and Procedures for Closed-End Management Investment Companies |
Not applicable.
| Item 8. | Portfolio Managers of Closed-End Management Investment Companies |
Not applicable.
| Item 9. | Purchases of Equity Securities by Closed-End Management Investment Company and Affiliated Purchasers. |
Not applicable.
| Item 10. | Submission of Matters to a Vote of Security Holders |
There have been no material changes to the procedures by which shareholders may recommend nominees to registrant’s board of trustees.
| Item 11. | Controls and Procedures |
(a)(i) Registrant’s President and Treasurer have concluded that registrant’s disclosure controls and procedures (as defined in Rule 30a-3(c) under the Investment Company Act of 1940) are effective, based on their evaluation of these controls and procedures as of a date within 90 days of the filing date of this report.
(a)(ii) Registrant’s President and Treasurer are aware of no change in registrant’s internal control over financial reporting (as defined in Rule 30a-3(d) under the Investment Company Act of 1940) that occurred during registrant’s most recent fiscal quarter that has materially affected, or is reasonably likely to materially affect, registrant’s internal control over financial reporting.
(a) The code of ethics pursuant to Item 2 is attached hereto.
(b) Certifications pursuant to Rules 30a-2(a) and 30a-2(b) under the Investment Company Act of 1940 are attached hereto.
SIGNATURES
Pursuant to the requirements of the Securities Exchange Act of 1934 and the Investment Company Act of 1940, the registrant has duly caused this report to be signed on its behalf by the undersigned, thereunto duly authorized.
| | | | |
| Date: February 28, 2013 | | THRIVENT MUTUAL FUNDS |
| | |
| | By: | | /s/Russell W. Swansen |
| | | | Russell W. Swansen |
| | | | President |
Pursuant to the requirements of the Securities Exchange Act of 1934 and the Investment Company Act of 1940, this report has been signed below by the following persons on behalf of the registrant and in the capacities and on the dates indicated.
| | | | |
| Date: February 28, 2013 | | By: | | /s/Russell W. Swansen |
| | | | Russell W. Swansen |
| | | | President |
| | | | |
Date: February 28, 2013 | | By: | | /s/Gerard V. Vaillancourt |
| | | | Gerard V. Vaillancourt |
| | | | Treasurer |