UNITED STATES
SECURITIES AND EXCHANGE COMMISSION
Washington, D.C. 20549
FORM N-CSR
CERTIFIED SHAREHOLDER REPORT OF REGISTERED MANAGEMENT INVESTMENT COMPANIES
| | |
| Investment Company Act file number: | | 811-05075 |
Thrivent Mutual Funds
(Exact name of registrant as specified in charter)
| | |
625 Fourth Avenue South Minneapolis, Minnesota | | 55415 |
| (Address of principal executive offices) | | (Zip code) |
Rebecca A. Paulzine
625 Fourth Avenue South
Minneapolis, Minnesota 55415
(Name and address of agent for service)
Registrant’s telephone number, including area code: (612) 844-5168
Date of fiscal year end: December 31
Date of reporting period: December 31, 2011
| Item 1. | Report to Stockholders |

Table of Contents
| | |
 | | Dear Shareholder: |
The financial markets entered 2011 on an uptrend, but a slew of negative developments slowed its momentum as the year progressed. In this letter I will provide a review of the period, as well as our outlook for the coming year.
A brief review of the economy
After starting the year on an upswing, U.S. economic growth slowed to an anemic pace. Final U.S. gross domestic product (GDP) growth rates for the first and second quarters of 2011 were revised downward to 0.4% and 1.3%, respectively.1 A number of issues eroded consumer confidence and diminished the pace of the recovery, raising concerns of a potential “double-dip” recession. Those factors included rising energy and food prices, continued job and housing market weakness, supply chain disruptions from the Japanese tsunami disaster, prolonged congressional debt-ceiling debates, and the resulting downgrade of the U.S. credit rating by Standard & Poor’s. Overseas, the European debt crisis resurfaced, and investors worried about the consequences to world economies. Although U.S. GDP grew at an estimated 2.0% annual rate in the third quarter of 2011, that was still lackluster by historical standards.
Unemployment figures improved over the course of the year, falling to 8.5% by year-end from 10.1% at year-end 2010, but they continued to weigh heavily on consumer sentiment.2 Companies slowly stepped up their pace of hiring as they looked for more signs of strength in the recovery. The housing market also continued to struggle as the backlog of distressed properties weighed on prices, which remained near mid-2003 levels.3
While rising energy and food prices affected consumers, overall inflation remained in check throughout the period, as measured by the core Consumer Price Index (CPI), which rose slightly more than 2% for the year.4 This metric is viewed as a worthy long-term gauge of inflation because it does not include volatile food and energy prices. It also is the measure the Federal Reserve focuses on when setting monetary policy.
The optimistic tone that characterized Federal Reserve meetings early in the year turned decidedly more pessimistic as 2011 unfolded. When the Fed’s second phase of quantitative easing, also known as QE2, wound down in June, it appeared that no more economic stimulus would be forthcoming. However, as conditions softened, the Fed committed to keep its target federal funds rate at the low level of 0% to 0.25% through mid-2013. In late September, it announced another stimulus program called Operation Twist in which it began replacing shorter-maturity Treasuries on its balance sheet with longer-maturity Treasuries. The Fed’s goal was to drive long-term rates lower in the hope that individuals and companies would borrow and spend more money.
A brief review of the markets
Despite the economic and political uncertainty, corporate earnings and sales growth remained strong. Year-over-year sales for companies in the S&P 500 Index grew by more than 10% in the third quarter, for example, and net income grew by more than 14%. Nevertheless, the unsettled environment led to volatile financial markets. After gaining double-digit returns in the first half of the fiscal year, equities declined sharply late in the summer. Stocks traded down for much of August and September, then gained back some of their losses in the fourth quarter as economic growth improved and the situation in Europe appeared to be stabilizing. Ultimately, U.S. equities finished the year with lackluster results. Large-capitalization stocks, as measured by the S&P 500 Index, produced a total return of 2.11%, while smaller stocks, as tracked by the Russell 2000® Index, lost 4.18%.
Weighed down by concerns about the European debt situation and slowing global growth, foreign stocks underperformed their U.S. counterparts. The most commonly quoted benchmark for large, high-quality international stocks—the Morgan Stanley Capital International Europe, Australasia and Far East (MSCI EAFE) Index—earned a total return of -11.73%. Emerging markets were hit even harder, with the MSCI Emerging Markets Index registering a total return of -18.17%.
Fixed-income markets earned 7.84% overall, as measured by the Barclays Capital U.S. Aggregate Bond Index. Similar to the equity markets, fixed-income markets were characterized by two distinctly different investment environments. In the earliest months of the fiscal year, interest rates rose as Treasury bond prices fell, with the longest maturity bonds selling off the most. Yields on 10-year Treasuries started the year at 3.30% and by early February were at 3.75%, while yields on two-year Treasuries rose from 0.61% to 0.86% over the same time period. Nongovernment sectors outpaced Treasuries. High-yield bonds performed particularly well, benefiting from the Federal Reserve’s liquidity measures, strong corporate earnings and a quest by investors for more yield.
The tide turned in the third quarter as growing concerns about Europe’s debt woes triggered a flight to quality and sent interest rates tumbling, especially among longer-
2
maturity Treasury securities. Yields on 10-year Treasuries fell as low as 1.72% before ending the year at 1.89%, while yields on two-year Treasuries ended at 0.25%. Treasuries, particularly longer maturities, strongly outpaced nongovernment bonds for the year, with the Barclays Capital 20+ Year Treasury Index generating a total return of 33.84%. The risk-averse environment that characterized the second half of the year, particularly the third quarter, also helped renew investor interest in higher-quality municipal bonds, which continued to benefit from significantly lower supply and low default rates. The Barclays Capital Municipal Bond Index posted a total return of 10.70% for the year.
Our outlook
Although it seems that economic data and leading indicators do not point to a “double-dip” recession in the U.S., we believe the global economy and political environment remain fragile. The U.S. economy grew at a faster pace in the second half of 2011 than it did in the first, and we expect it to expand at a 2% to 2.5% rate in the first half of 2012. That would still be below the normal rate of roughly 3% though, and well below the 4%-plus rate necessary for the U.S. economy to begin catching up to its potential and significantly improve the employment situation.
We expect the U.S. housing market to remain sluggish until the backlog of foreclosures subsides. Nationally, home values are likely to remain near their current levels, which is roughly where they have been for the past two and a half years. Housing construction also is likely to remain at historically low levels for the next year or two.
The economic outlook overseas is mixed. In Europe, we expect a modest recession next year as policies are implemented to rein in the continent’s debt problems. In China, the second-biggest economy in the world after the U.S., we expect economic growth to continue at about a 9% rate. International economies are important for U.S. investors because a significant share of the earnings of U.S. corporations comes from overseas—about 40% in the case of companies in the S&P 500.
The Federal Reserve has indicated that it expects to maintain short-term interest rates at current historically low levels through mid-2013, and we see no reason to doubt this. Further, it has recently implemented policies designed to reduce long-term interest rates. The resulting low-yield environment creates a dilemma for conservative, risk-averse investors whose portfolios are geared to generating income.
On a more positive note, corporate sales and earnings have strengthened since the beginning of the recovery, as have corporate balance sheets. Still, stock prices have not kept pace and remain below their peak 2007 levels. We expect corporate sales and earnings to continue to grow, although at a slower pace than the last couple of years.
Stock valuations remain attractive given this outlook, but fiscal and monetary policy risks remain significant both domestically and abroad. Until these issues are resolved, they will remain headwinds for the economy and the stock market, and contribute to market volatility. Investors should carefully evaluate their tolerance for risk.
While it is difficult to predict short-term market direction, history has taught us the best time to stay invested is often when things look the worst. Thrivent Mutual Fund portfolio managers focus on long-term returns.
We encourage you to approach your portfolio with a similar long-term view. If you have concerns about volatility, the value of your nest egg, or your portfolio’s yield, we urge you to meet with your Thrivent Financial representative to learn more about the broad spectrum of investment tools and products available to address your financial goals in accordance with your tolerance for risk.
As always, we appreciate the trust you have placed in Thrivent Financial’s team of investment professionals.
|
| Sincerely, |
|
 |
| Russell W. Swansen |
President and Chief Investment Officer Thrivent Mutual Funds |
| 1 | U.S. Bureau of Economic Analysis (3rd Quarter 2011 advance estimate released Oct. 27, 2011). |
| 2 | U.S. Bureau of Labor Statistics, “The Employment Situation—October 2011” (Nov. 4, 2011). |
| 3 | S&P/Case-Shiller Home Price Indices. |
| 4 | U.S. Bureau of Labor Statistics, “Consumer Price Index—October 2011” (Nov. 16, 2011). |
3
| | | | |

| | Thrivent Natural Resources Fund | |  |
| | (Formerly Thrivent Real Estate Securities Fund) | |
| | David C. Francis, CFA (left) and Darren M. Bagwell, CFA (right), Portfolio Co-Managers | |
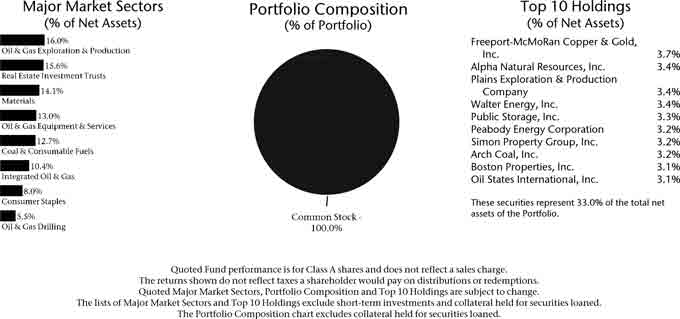
| | Thrivent Natural Resources Fund seeks long-term capital growth. All historical performance information on these pages prior to October 10, 2011, pertains to the predecessor Thrivent Real Estate Securities Fund. Prior to October 10, 2011, the Fund was named Thrivent Real Estate Securities and invested, under normal circumstances, at least 80% of its net assets in securities of companies that were primarily engaged in the real estate industry. On October 10, 2011, the Fund adopted its current name and strategy, which includes investments concentrated in issuers in the natural resources industry; therefore, the Fund is more vulnerable to price changes in the securities of issuers in this industry and factors specific to this industry than a more broadly diversified portfolio. In addition, as a non-diversified fund, the Fund is susceptible to the risk that events affecting a particular issuer will significantly affect the Fund’s performance. These and other risks are described in the Fund’s prospectus. Views expressed in this discussion of fund performance are the views of this particular Fund’s management team. | |
How did the Fund perform during the 12-month period ended December 31, 2011?
Thrivent Natural Resources Fund earned a return of 0.85%, compared with the median return of its peer group, the Lipper Natural Resources category, of -7.54%. The Fund’s market benchmark, the S&P North American Natural Resources Sector Index, earned a return of -7.35%.
Since transitioning to its current investment strategy, in the three-month period ended December 31, 2011, the Fund returned 7.36%, compared to the median of its peer group, the Lipper Natural Resources category, which delivered 15.96% for the same three-month time frame.
What factors affected the Fund’s performance?
The strong relative performance of the Fund was primarily attributable to the outperformance of the REIT sector in the first nine months of the year before its repurposing from a REIT fund to a natural resources fund. During all of 2011, REITs were among the strongest-performing sectors, while energy and materials were among the worst as the market gravitated toward higher-yielding defensive exposures in the midst of economic uncertainty.
Before the October repurpose, the best-performing sectors in the Fund were regional mall, self-storage and apartment REITs. The Portfolio’s largest positive contributors to performance were Simon Property Group, which develops, acquires and manages regional malls, outlet centers and community shopping centers in the U.S. and internationally, and Public Storage, which develops, acquires and manages self-storage facilities in the United States and Europe.
After the repurpose, the Fund was aggressively positioned to capitalize on high oil prices through overweightings in exploration and production (E&P) companies (whose revenues benefit directly from high oil prices) and oilfield services companies that help E&Ps drill wells. Macroeconomics and geopolitics, however, overwhelmed the bottom-up fundamentals that drive our investment process. Defensive integrated energy companies outdistanced E&P and oilfield service equities in a flight to safety.
The absolute performance of the materials and coal group was exceptionally poor within the sector, and our relative performance suffered further for the overt pro-cyclical focus on coal producers. Such positioning was out of sync
4
with the growing marketplace concerns about the European crisis and its impact on global growth, which overwhelmed what we believed to be exceptional asset values.
What is your outlook?
We believe growth in new oil supplies remains constrained and that it will cost more and more to produce whatever growth is achieved. The impact on oil demand from an economic slowdown in Europe and Asia represents the primary risk to oil prices. With this in mind, we favor select investments in global oil service companies where fear of an adverse outcome is already discounted in stock prices. We also expect continued success in development of unconventional oil fields within the United States. Finally, after four years of sharply falling prices, natural gas prices may have finally reached the point where drilling is not economical in most places. As a result, we are more sanguine about prices for this lighter-weight hydrocarbon rising in the future. We are monitoring data on drilling activity and production levels to confirm this trend.
Portfolio Facts
As of December 31, 2011
| | | | |
| | | Class A | | Institutional Class |
Ticker | | TREFX | | TREIX |
Transfer Agent ID | | 069 | | 469 |
Net Assets | | $15,405,556 | | $96,829,564 |
NAV | | $9.57 | | $9.57 |
NAV - High† | | 7/22/2011 - $11.09 | | 7/22/2011 - $11.10 |
NAV - Low† | | 10/3/2011 - $8.50 | | 10/3/2011 - $8.50 |
Number of Holdings: 35 | | | | |
| | † | For the year ended December 31, 2011 |
Average Annual Total Returns1,2
As of December 31, 2011
| | | | | | |
Class A3 | | 1-Year | | 5 Years | | From Inception
6/30/2005 |
without sales charge | | 0.85% | | -2.95% | | 3.15% |
with sales charge | | -4.68% | | -4.05% | | 2.26% |
| | | |
Institutional Class4 | | 1-Year | | 5 Years | | From Inception
6/30/2005 |
Net Asset Value | | 1.21% | | -2.66% | | 3.50% |

| 1 | Past performance is not an indication of future results. Average annual total returns represent past performance and reflect changes in share prices, the reinvestment of all dividends and capital gains, and the effects of compounding. The prospectus contains more complete information on the investment objectives, risks, charges and expenses of the investment company, which investors should read and consider carefully before investing. To obtain a prospectus, contact a registered representative or visit www.thrivent.com. At various times, the Fund’s adviser waived its management fee and/or reimbursed Fund expenses. Had the adviser not done so, the Fund’s total returns would have been lower. The returns shown do not reflect taxes a shareholder would pay on distributions or redemptions. Total investment return and principal value of your investment will fluctuate, and your shares, when redeemed, may be worth more or less than their original cost. Current performance may be higher or lower than the performance data quoted. Call 800-THRIVENT or visit www.thrivent.com for performance results current to the most recent month-end. |
| 2 | Prior to October 10, 2010, the Fund, as a real estate securities fund, invested primarily in real estate-related securities. |
| 3 | Class A performance with sales charge reflects the maximum sales charge of 5.5%. |
| 4 | Institutional Class shares have no sales load and are for institutional shareholders only. |
| (a) | Performance of other classes will be greater or less than the line shown based on the differences in loads and fees paid by shareholders investing in the different classes. |
| * | As you compare performance, please note that the Fund’s performance reflects the maximum 5.5% sales charge, while the Consumer Price Index, the S&P North American Natural Resources Sector Index and the FTSE NAREIT All Equity REITs Index do not reflect any such charges. If you were to purchase any of the above individual stocks or funds represented in the Index, any charges you would pay would reduce your total return as well. |
| ** | The S&P North American Natural Resources Sector Index is an index of selected U.S. traded natural resource related stocks. The product is not sponsored, endorsed or promoted by Standard & Poor’s, and Standard & Poor’s makes no representation regarding the advisability of investing in the product. It is not possible to invest directly in the Index. The performance of this Index does not reflect deductions for fees, expenses or taxes. |
| *** | The FTSE NAREIT All Equity REITs Index is an unmanaged capitalization-weighted index of all equity real estate investment trusts. It is not possible to invest directly in this Index. The performance of this Index does not reflect deductions for fees, expenses or taxes. Effective October 2011, the Fund’s benchmark index changed from the FTSE NAREIT All Equity REITs Index (the “FTSE”) to the S&P North American Natural Resources Sector Index as a result of a change in the Fund’s principal investment strategies. Thus, the FTSE will not be shown in shareholder reports of the Fund for fiscal periods ended December 31, 2012 and beyond (unless the Adviser changes back to this benchmark index). |
| **** | The Consumer Price Index is an inflationary indicator that measures the change in the cost of a fixed basket of products and services, including housing, electricity, food and transportation. It is not possible to invest directly in the Index. |
5
| | | | |
 | | Thrivent Equity Income Plus Fund | |  |
| | David R. Spangler, CFA (left) and Kevin R. Brimmer, FSA (right), Portfolio Co-Managers | |
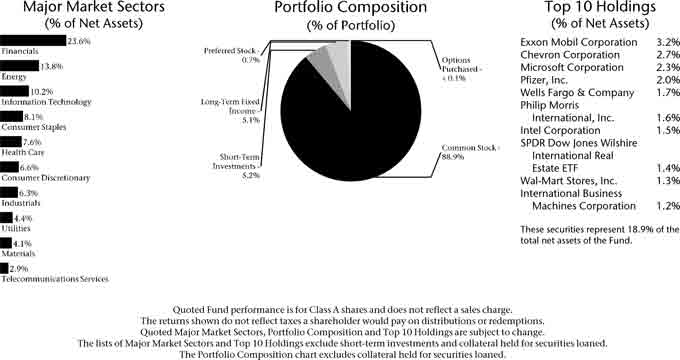
| | The Fund seeks income plus long-term capital growth. The Fund may invest in, among others, REITs, preferred stocks and foreign (including emerging market) stocks. These investments are subject to unique risks. The Fund may also sell covered options on any securities in which the Fund invests. Successful use of this strategy can augment Fund return but can also magnify losses if executed incorrectly. These and other risks are described in the Fund’s prospectus. Views expressed in this discussion of fund performance are the views of this particular Fund’s management team. | |
How did the Fund perform during the 12-month period ended December 31, 2011?
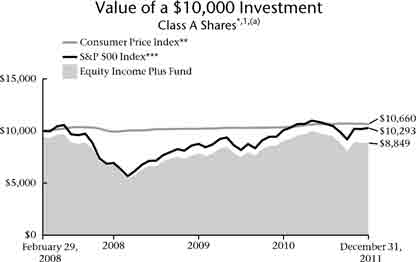
Thrivent Equity Income Plus Fund earned a return of -2.79%, compared with the median return of its peer group, the Lipper Equity Income category, of 3.28%. The Fund’s market benchmark, the S&P 500 Index, earned a return of 2.11%.
What factors affected the Fund’s performance?
The Fund is constructed as a multi-asset class product similar to an asset allocation fund, with separate investment strategies for domestic and international dividend equity, domestic and international REITs, preferreds and an options buy-write strategy. Together, these asset classes should provide greater diversification than any one asset class alone. However, as a multi-asset class product, the Fund does not fit well into a single-style peer group category or domestic-only benchmark, and this year performance versus its single style benchmarks was weak.
In the first half of the year, the Fund continued its strong performance from 2010. However, after the European debt crisis and U.S. debt downgrade negatively impacted markets, the Fund lost relative performance. Its investment process includes a momentum-based factor model. Factor models struggle when markets become highly volatile and stock correlations increase substantially, as they did in the second half of the year, which is when the Fund underperformed.
The Fund’s domestic dividend equity, representing 60% of the Fund, underperformed its benchmark. Both sector allocation and stock selection contributed to underperformance. The Fund’s strategic allocation to international markets is nearly 18% of Fund assets. In 2011, international markets significantly underperformed domestic markets, contributing to the Fund’s relative weakness in 2011 when compared to a domestic benchmark and peer group. Preferreds and the buy-write strategy also underperformed relative to the Fund’s benchmark index and peer group.
What is your outlook?
As in 2011, we approach 2012 with cautious optimism. The Fund continues a more conservative approach to
6
dividend equity that includes emphasis on dividend coverage, improving operating performance and quality balance sheets in addition to attractive valuations. As economic indicators, including job growth, continue to show improvement, we feel that equities appear to provide relative value when compared to historical valuations, which may provide opportunity for outperformance for the year.
At the sector level, the Fund remains overweighted in pro-cyclical sectors, but has reduced these overweightings while it continues to be underweighted in financials. Additionally, the Fund is underweighted in international markets, but if Europe shows improvement, the Fund may rebalance to its neutral strategic international weighting.
Portfolio Facts
As of December 31, 2011
| | | | |
| | | Class A | | Institutional Class |
Ticker | | TEIAX | | TEIIX |
Transfer Agent ID | | 033 | | 050 |
Net Assets | | $20,968,768 | | $30,555,104 |
NAV | | $8.70 | | $8.71 |
NAV - High† | | 4/29/2011 - $9.96 | | 4/29/2011 - $9.97 |
NAV - Low† | | 10/3/2011 - $7.72 | | 10/3/2011 - $7.73 |
Number of Holdings: 232 | | | | |
| | † | For the year ended December 31, 2011 |
Average Annual Total Returns1
As of December 31, 2011
| | | | |
Class A2 | | 1-Year | | From Inception
2/29/2008 |
without sales charge | | -2.79% | | -1.70% |
with sales charge | | -8.15% | | -3.13% |
| | |
Institutional Class3 | | 1-Year | | From Inception
2/29/2008 |
Net Asset Value | | -2.35% | | -1.36% |
| 1 | Past performance is not an indication of future results. Average annual total returns represent past performance and reflect changes in share prices, the reinvestment of all dividends and capital gains, and the effects of compounding. The prospectus contains more complete information on the investment objectives, risks, charges and expenses of the investment company, which investors should read and consider carefully before investing. To obtain a prospectus, contact a registered representative or visit www.thrivent.com. At various times, the Fund’s adviser waived its management fee and/or reimbursed Fund expenses. Had the adviser not done so, the Fund’s total returns would have been lower. The returns shown do not reflect taxes a shareholder would pay on distributions or redemptions. Total investment return and principal value of your investment will fluctuate, and your shares, when redeemed, may be worth more or less than their original cost. Current performance may be higher or lower than the performance data quoted. Call 800-THRIVENT or visit www.thrivent.com for performance results current to the most recent month-end. |
| 2 | Class A performance with sales charge reflects the maximum sales charge of 5.5%. |
| 3 | Institutional Class shares have no sales load and are for institutional shareholders only. |
| (a) | Performance of other classes will be greater or less than the line shown based on the differences in loads and fees paid by shareholders investing in the different classes. |
| * | As you compare performance, please note that the Fund’s performance reflects the maximum 5.5% sales charge, while the Consumer Price Index and the S&P 500 Index do not reflect any such charges. If you were to purchase any of the above individual stocks or funds represented in the Index, any charges you would pay would reduce your total return as well. |
| ** | The Consumer Price Index is an inflationary indicator that measures the change in the cost of a fixed basket of products and services, including housing, electricity, food and transportation. It is not possible to invest directly in the Index. |
| *** | The S&P 500 Index is an index that represents the average performance of a group of 500 widely held, publicly traded stocks. “S&P 500” is a trademark of The McGraw-Hill Companies, Inc. and has been licensed for use by Thrivent Financial for Lutherans. The product is not sponsored, endorsed or promoted by Standard & Poor’s and Standard & Poor’s makes no representation regarding the advisability of investing in the product. It is not possible to invest directly in the Index. The performance of the Index does not reflect deductions for fees, expenses or taxes. |
7
| | | | |
 | | Thrivent Diversified Income Plus Fund | |  |
| | Mark L. Simenstad, CFA (left), Paul J. Ocenasek, CFA (right) and David R. Spangler, CFA (far right), Portfolio Co-Managers | |
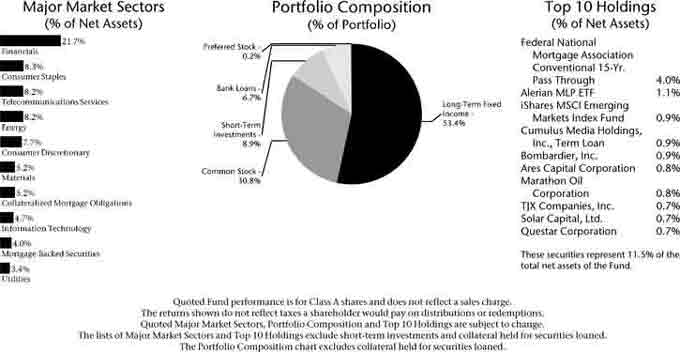
| | Thrivent Diversified Income Plus Fund seeks to maximize income while maintaining prospects for capital appreciation. The Fund may invest in debt or equity securities. Debt securities include high-yield, high-risk securities commonly known as “junk bonds.” High-yield securities are subject to greater price fluctuations and increased risk of loss of principal than investment grade bonds. Debt securities also include mortgage-related and other asset-backed securities, the value of which will be influenced by factors affecting the housing market and the assets underlying such securities. These and other risks are described in the Fund’s prospectus. Views expressed in this discussion of fund performance are the views of this particular Fund’s management team. | |
How did the Fund perform during the 12-month period ended December 31, 2011?
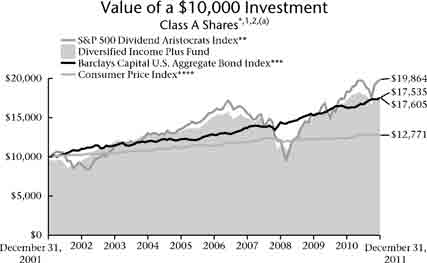
Thrivent Diversified Income Plus Fund earned a total return of 1.78%. By comparison, the Fund’s broad market benchmarks, the S&P 500 Dividend Aristocrats Index and the Barclays Capital U.S. Aggregate Bond Index, returned 8.33% and 7.84%, respectively.
What factors affected the Fund’s performance?
The Fund lagged its benchmark indexes, though we note that the S&P 500 Index was up only 2.1%. The Fund’s lagging performance was due principally to its higher allocation to higher-risk fixed-income securities, including a 10% stake in nonagency mortgage-backed securities that were down 2% for the year. Given the uncertain environment, cash was maintained at approximately 5% of the Fund, which also detracted from performance, as did a 13% allocation to preferred stocks and alternative income investments. With the European debt crisis weighing on the global financial markets, many investors pulled money out of risk assets and invested it in long-term U.S. Treasury securities. As Treasuries rallied—30-year Treasury bonds notched total returns exceeding 35%—risk assets failed to keep pace.
The Fund’s high-yield bond segment performed well under the circumstances, earning about 5% for the year. Its portfolio of preferred stocks and other alternative income investments lost 1.5%. However, with yields averaging about 7%, these investments generated income that was helpful in supporting the Fund’s dividend. Over the course of the year, the Fund pared its equity holdings to about 28% of assets from 35%, investing the difference in corporate bonds and preferred stocks to take advantage of relatively high yields.
Collectively, the bond portion of the Fund earned 4% for the year, as did the equity portion. Equity returns were led by utility stocks, which earned 31.59%, consumer staples, which earned 16.1%, and consumer discretionary stocks, which returned 15.95%. Materials stocks were the Fund’s worst equity performers, losing 19.23%, followed by industrials, which lost 13.21%, and financials, off 10.44%.
8
What is your outlook?
We are cautiously optimistic about the Fund’s prospects for 2012. Assuming continued moderate economic growth and strong corporate profits, the risk sectors of the fixed-income market, including high-yield bonds, preferred stocks and certain mortgage-backed securities, should perform well. We expect to maintain our underweighting in equities early in the year and will continue to monitor that decision. However, our allocation to higher-risk fixed-income sectors is somewhat of a proxy for equity risk. The potential failure by European politicians to resolve the continent’s debt crisis remains the biggest known risk to both the equity and fixed-income markets heading into 2012.
Portfolio Facts
As of December 31, 2011
| | | | |
| | | Class A | | Institutional Class |
Ticker | | AAHYX | | THYFX |
Transfer Agent ID | | 025 | | 095 |
Net Assets | | $200,488,524 | | $17,402,978 |
NAV | | $6.22 | | $6.19 |
NAV - High† | | 4/28/2011 - $6.67 | | 4/28/2011 - $6.64 |
NAV - Low† | | 10/4/2011 - $5.87 | | 10/4/2011 - $5.84 |
Number of Holdings: 280 | | | | |
| | † | For the year ended December 31, 2011 |
Average Annual Total Returns1,2
As of December 31, 2011
| | | | | | |
Class A3 | | 1-Year | | 5 Years | | 10 Years |
without sales charge | | 1.78% | | 3.07% | | 6.30% |
with sales charge | | -2.78% | | 2.14% | | 5.81% |
| | | |
Institutional Class4 | | 1-Year | | 5 Years | | 10 Years |
Net Asset Value | | 2.18% | | 3.46% | | 6.71% |
| 1 | Past performance is not an indication of future results. Average annual total returns represent past performance and reflect changes in share prices, the reinvestment of all dividends and capital gains, and the effects of compounding. The prospectus contains more complete information on the investment objectives, risks, charges and expenses of the investment company, which investors should read and consider carefully before investing. To obtain a prospectus, contact a registered representative or visit www.thrivent.com. At various times, the Fund’s adviser waived its management fee and/or reimbursed Fund expenses. Had the adviser not done so, the Fund’s total returns would have been lower. The returns shown do not reflect taxes a shareholder would pay on distributions or redemptions. Total investment return and principal value of your investment will fluctuate, and your shares, when redeemed, may be worth more or less than their original cost. Current performance may be higher or lower than the performance data quoted. Call 800-THRIVENT or visit www.thrivent.com for performance results current to the most recent month-end. |
| 2 | Prior to July 3, 2006, the Fund, as a high yield fund, invested primarily in junk bonds. |
| 3 | Class A performance with sales charge reflects the maximum sales charge of 4.5%. |
| 4 | Institutional Class shares have no sales load and are for institutional shareholders only. |
| (a) | Performance of other classes will be greater or less than the line shown based on the differences in loads and fees paid by shareholders investing in the different classes. |
| * | As you compare performance, please note that the Fund’s performance reflects the maximum 4.5% sales charge, while the S&P 500 Dividend Aristocrats Index, the Barclays Capital U.S. Aggregate Bond Index and the Consumer Price Index do not reflect any such charges. If you were to purchase any of the above individual stocks or funds represented in the S&P and Barclays Capital Indexes, any charges you would pay would reduce your total return as well. |
| ** | The S&P 500 Dividend Aristocrats Index is an index which measures the performance of large-capitalization companies within the S&P 500 Index that have followed a managed dividends policy of consistently increasing dividends every year for at least 25 years. The Index has both capital growth and dividend income characteristics, is equal-weighted and is broadly diversified across sectors. “S&P 500” is a trademark of The McGraw-Hill Companies, Inc. and has been licensed for use by Thrivent Financial for Lutherans. The product is not sponsored, endorsed or promoted by Standard & Poor’s, and Standard & Poor’s makes no representation regarding the advisability of investing in the product. It is not possible to invest directly in each Index. The performance of each Index does not reflect deductions for fees, expenses or taxes. |
| *** | The Barclays Capital U.S. Aggregate Bond Index is an index that measures the performance of U.S. investment grade bonds. It is not possible to invest directly in the Index. The performance of the Index does not reflect deductions for fees, expenses or taxes. |
| **** | The Consumer Price Index is an inflationary indicator that measures the change in the cost of a fixed basket of products and services, including housing, electricity, food and transportation. It is not possible to invest directly in the Index. |
9
Shareholder Expense Example
(unaudited)
As a shareholder of the Fund, you incur, depending on the fund and share class, two types of costs: (1) transaction costs, including sales charges (loads) on purchase payments; and (2) ongoing costs, including management fees, distribution (12b-1) fees and other Fund expenses. This Example is intended to help you understand your ongoing costs (in dollars) of investing in the Fund and to compare these costs with the ongoing costs of investing in other mutual funds. The Example is based on an investment of $1,000 invested at the beginning of the period and held for the entire period from July 1, 2011 through December 31, 2011.
Actual Expenses
In the table below, the first section, labeled “Actual,” provides information about actual account values and actual expenses. You may use the information in this section, together with the amount you invested, to estimate the expenses that you paid over the period. Simply divide your account value by $1,000 (for example, an $8,600 account value divided by $1,000 = 8.6), then multiply the result by the number from the appropriate Class line under the heading entitled “Expenses Paid During Period” to estimate the expenses you paid. A small account fee of $12 may be charged to Class A shareholder accounts if the value falls below the stated account minimum of $1,000. This fee is not included in the table below. If it were, the expenses you paid during the period would have been higher and the ending account value would have been lower.
Hypothetical Example for Comparison Purposes
In the table below, the second section, labeled “Hypothetical,” provides information about hypothetical account values and hypothetical expenses based on the Fund’s actual expense ratio and an assumed rate of return of 5% per year before expenses, which is not the Fund’s actual return. The hypothetical account values and expenses may not be used to estimate the actual ending account balance or expenses you paid for the period. You may use this information to compare the ongoing costs of investing in the Fund and other funds. To do so, compare this 5% hypothetical example with the 5% hypothetical examples that appear in the shareholder reports of the other funds. A small account fee of $12 may be charged to Class A shareholder accounts if the value falls below the stated account minimum of $1,000. This fee is not included in the table below. If it were, the expenses you paid during the period would have been higher and the ending account value would have been lower.
Please note that the expenses shown in the table are meant to highlight your ongoing costs only and do not reflect any transactional costs, such as sales charges (loads). Therefore, the second section of the table is useful in comparing ongoing costs only, and will not help you determine the relative total costs of owning different funds. In addition, if these transactional costs were included, your costs would have been higher.
| | | | | | | | | | | | | | | | |
| | | Beginning
Account
Value
7/1/2011 | | | Ending
Account
Value
12/31/2011 | | | Expenses
Paid
During
Period
7/1/2011-
12/31/2011* | | | Annualized
Expense
Ratio | |
Thrivent Natural Resources Fund | | | | | | | | | | | | | | | | |
Actual | | | | | | | | | | | | | | | | |
Class A | | $ | 1,000 | | | $ | 913 | | | $ | 6.27 | | | | 1.30 | % |
Institutional Class | | $ | 1,000 | | | $ | 915 | | | $ | 4.55 | | | | 0.94 | % |
Hypothetical** | | | | | | | | | | | | | | | | |
Class A | | $ | 1,000 | | | $ | 1,019 | | | $ | 6.61 | | | | 1.30 | % |
Institutional Class | | $ | 1,000 | | | $ | 1,020 | | | $ | 4.81 | | | | 0.94 | % |
Thrivent Equity Income Plus Fund | | | | | | | | | | | | | | | | |
Actual | | | | | | | | | | | | | | | | |
Class A | | $ | 1,000 | | | $ | 918 | | | $ | 5.57 | | | | 1.15 | % |
Institutional Class | | $ | 1,000 | | | $ | 920 | | | $ | 3.87 | | | | 0.80 | % |
Hypothetical** | | | | | | | | | | | | | | | | |
Class A | | $ | 1,000 | | | $ | 1,019 | | | $ | 5.86 | | | | 1.15 | % |
Institutional Class | | $ | 1,000 | | | $ | 1,021 | | | $ | 4.07 | | | | 0.80 | % |
Thrivent Diversified Income Plus Fund | | | | | | | | | | | | | | | | |
Actual | | | | | | | | | | | | | | | | |
Class A | | $ | 1,000 | | | $ | 983 | | | $ | 4.75 | | | | 0.95 | % |
Institutional Class | | $ | 1,000 | | | $ | 985 | | | $ | 3.67 | | | | 0.73 | % |
Hypothetical** | | | | | | | | | | | | | | | | |
Class A | | $ | 1,000 | | | $ | 1,020 | | | $ | 4.84 | | | | 0.95 | % |
Institutional Class | | $ | 1,000 | | | $ | 1,022 | | | $ | 3.74 | | | | 0.73 | % |
| * | Expenses are equal to the Fund’s annualized expense ratio, multiplied by the average account value over the period, multiplied by 184/365 to reflect the one-half year period. |
| ** | Assuming 5% annualized total return before expenses. |
10

Report of Independent Registered Public Accounting Firm
To the Shareholders and Trustees of the Thrivent Mutual Funds:
In our opinion, the accompanying statements of assets and liabilities, including the schedules of investments, and the related statements of operations and of changes in net assets and the financial highlights present fairly, in all material respects, the financial position of the Thrivent Natural Resources Fund (formerly Thrivent Real Estate Securities Fund), Thrivent Equity Income Plus Fund and Thrivent Diversified Income Plus Fund (hereafter referred to as the “Funds”) at December 31, 2011, the results of each of their operations for the year then ended, the changes in each of their net assets for each of the two years in the period then ended and their financial highlights for each of the periods presented, in conformity with accounting principles generally accepted in the United States of America. These financial statements and financial highlights (hereafter referred to as “financial statements”) are the responsibility of the Funds’ management; our responsibility is to express an opinion on these financial statements based on our audits. We conducted our audits of these financial statements in accordance with the standards of the Public Company Accounting Oversight Board (United States). Those standards require that we plan and perform the audit to obtain reasonable assurance about whether the financial statements are free of material misstatement. An audit includes examining, on a test basis, evidence supporting the amounts and disclosures in the financial statements, assessing the accounting principles used and significant estimates made by management, and evaluating the overall financial statement presentation. We believe that our audits, which included confirmation of securities at December 31, 2011 by correspondence with the custodian and brokers, provide a reasonable basis for our opinion.

February 16, 2012
PricewaterhouseCoopers LLP, Suite 1400, 225 South Sixth Street, Minneapolis, MN 55402
T: (612) 596 6000, F: (612) 373 7160, www.pwc.com/us
11
Natural Resources Fund
Schedule of Investments as of December 31, 2011
| | | | | | | | |
Shares | | | Common Stock (95.3%) | | Value | |
| Coal & Consumable Fuels (12.7%) | | | | |
| | 188,100 | | | Alpha Natural Resources, Inc.a | | $ | 3,842,883 | |
| | 244,200 | | | Arch Coal, Inc. | | | 3,543,342 | |
| | 384,700 | | | Patriot Coal Corporationa,b | | | 3,258,409 | |
| | 109,000 | | | Peabody Energy Corporation | | | 3,608,990 | |
| | | | | | | | |
| | | | Total Coal & Consumable Fuels | | | 14,253,624 | |
| | | | | | | | |
| |
| Consumer Staples (8.0%) | | | | |
| | 101,900 | | | Archer-Daniels-Midland Company | | | 2,914,340 | |
| | 46,600 | | | Bunge, Ltd. | | | 2,665,520 | |
| | 63,500 | | | Corn Products International, Inc. | | | 3,339,465 | |
| | | | | | | | |
| | | | Total Consumer Staples | | | 8,919,325 | |
| | | | | | | | |
| |
| Integrated Oil & Gas (10.4%) | | | | |
| | 69,856 | | | BP plc ADR | | | 2,985,646 | |
| | 27,000 | | | Chevron Corporation | | | 2,872,800 | |
| | 32,600 | | | Occidental Petroleum Corporation | | | 3,054,620 | |
| | 113,100 | | | Petroleo Brasileiro SA ADR | | | 2,810,535 | |
| | | | | | | | |
| | | | Total Integrated Oil & Gas | | | 11,723,601 | |
| | | | | | | | |
| |
| Materials (14.1%) | | | | |
| | 46,900 | | | Cliffs Natural Resources, Inc. | | | 2,924,215 | |
| | 111,100 | | | Freeport-McMoRan Copper & Gold, Inc. | | | 4,087,369 | |
| | 35,900 | | | Monsanto Company | | | 2,515,513 | |
| | 49,700 | | | Mosaic Company | | | 2,506,371 | |
| | 62,300 | | | Walter Energy, Inc. | | | 3,772,888 | |
| | | | | | | | |
| | | | Total Materials | | | 15,806,356 | |
| | | | | | | | |
| |
| Oil & Gas Drilling (5.5%) | | | | |
| | 62,400 | | | ENSCO International plc ADR | | | 2,927,808 | |
| | 188,800 | | | Nabors Industries, Ltd.a | | | 3,273,792 | |
| | | | | | | | |
| | | | Total Oil & Gas Drilling | | | 6,201,600 | |
| | | | | | | | |
| |
| Oil & Gas Equipment & Services (13.0%) | | | | |
| | 51,400 | | | Baker Hughes, Inc. | | | 2,500,096 | |
| | 56,200 | | | Cameron International Corporationa | | | 2,764,478 | |
| | 46,600 | | | Dril-Quip, Inc.a | | | 3,067,212 | |
| | 45,400 | | | Oil States International, Inc.a | | | 3,467,198 | |
| | 193,100 | | | Weatherford International, Ltd.a | | | 2,826,984 | |
| | | | | | | | |
| | | | Total Oil & Gas Equipment & Services | | | 14,625,968 | |
| | | | | | | | |
| |
| Oil & Gas Exploration & Production (16.0%) | | | | |
| | 30,100 | | | Apache Corporation | | | 2,726,458 | |
| | 30,400 | | | EOG Resources, Inc. | | | 2,994,704 | |
| | 61,800 | | | Newfield Exploration Companya | | | 2,331,714 | |
| | 104,500 | | | Plains Exploration & Production Companya | | | 3,837,240 | |
| | 109,500 | | | Swift Energy Companya | | | 3,254,340 | |
| | 93,000 | | | Ultra Petroleum Corporationa | | | 2,755,590 | |
| | | | | | | | |
| | | | Total Oil & Gas Exploration & Production | | | 17,900,046 | |
| | | | | | | | |
| |
| Real Estate Investment Trusts (15.6%) | | | | |
| | 35,423 | | | Boston Properties, Inc. | | | 3,528,131 | |
| | 58,695 | | | Equity Residential | | | 3,347,376 | |
| | 27,910 | | | Public Storage, Inc. | | | 3,752,779 | |
| | 27,926 | | | Simon Property Group, Inc. | | | 3,600,778 | |
| | 43,147 | | | Vornado Realty Trust | | | 3,316,278 | |
| | | | | | | | |
| | | | Total Real Estate Investment Trusts | | | 17,545,342 | |
| | | | | | | | |
| | | | Total Common Stock (cost $97,286,337) | | | 106,975,862 | |
| | | | | | | | |
| | |
| | | | Collateral Held for Securities Loaned (0.5%) | | | |
| | 535,500 | | | Thrivent Financial Securities Lending Trust | | | 535,500 | |
| | | | | | | | |
| | | | Total Collateral Held for Securities Loaned (cost $535,500) | | | 535,500 | |
| | | | | | | | |
| | | | Total Investments (cost $97,821,837) 95.8% | | $ | 107,511,362 | |
| | | | | | | | |
| | | | Other Assets and Liabilities, Net 4.2% | | | 4,723,758 | |
| | | | | | | | |
| | | | Total Net Assets 100.0% | | $ | 112,235,120 | |
| | | | | | | | |
| a | Non-income producing security. |
| b | All or a portion of the security is on loan. |
Definitions:
| | | | |
| ADR | | - | | American Depositary Receipt, which are certificates for an underlying foreign security’s shares held by an issuing U.S. depository bank. |
Unrealized Appreciation (Depreciation)
Gross unrealized appreciation and depreciation of investments, based on cost for federal income tax purposes, were as follows:
| | | | |
Gross unrealized appreciation | | $ | 12,060,199 | |
Gross unrealized depreciation | | | (2,609,709 | ) |
| | | | |
Net unrealized appreciation (depreciation) | | $ | 9,450,490 | |
| |
Cost for federal income tax purposes | | $ | 98,060,872 | |
The accompanying Notes to Financial Statements are an integral part of this schedule.
12
Natural Resources Fund
Schedule of Investments as of December 31, 2011
Fair Valuation Measurements
The following table is a summary of the inputs used, as of December 31, 2011, in valuing Natural Resources Fund’s assets carried at fair value.
| | | | | | | | | | | | | | | | |
Investments in Securities | | Total | | | Level 1 | | | Level 2 | | | Level 3 | |
Common Stock | | | | | | | | | | | | | | | | |
Coal & Consumable Fuels | | | 14,253,624 | | | | 14,253,624 | | | | — | | | | — | |
Consumer Staples | | | 8,919,325 | | | | 8,919,325 | | | | — | | | | — | |
Integrated Oil & Gas | | | 11,723,601 | | | | 11,723,601 | | | | — | | | | — | |
Materials | | | 15,806,356 | | | | 15,806,356 | | | | — | | | | — | |
Oil & Gas Drilling | | | 6,201,600 | | | | 6,201,600 | | | | — | | | | — | |
Oil & Gas Equipment & Services | | | 14,625,968 | | | | 14,625,968 | | | | — | | | | — | |
Oil & Gas Exploration & Production | | | 17,900,046 | | | | 17,900,046 | | | | — | | | | — | |
Real Estate Investment Trusts | | | 17,545,342 | | | | 17,545,342 | | | | — | | | | — | |
Collateral Held for Securities Loaned | | | 535,500 | | | | 535,500 | | | | — | | | | — | |
| | | | | | | | | | | | | | | | |
Total | | $ | 107,511,362 | | | $ | 107,511,362 | | | $ | — | | | $ | — | |
| | | | | | | | | | | | | | | | |
Investment in Affiliates
Affiliated issuers, as defined under the Investment Company Act of 1940, include those in which the Fund’s holdings of an issuer represent 5% or more of the outstanding voting securities of an issuer, or any affiliated mutual fund.
A summary of transactions for the fiscal year to date, in Natural Resources Fund, is as follows:
| | | | | | | | | | | | | | | | | | | | | | | | |
Fund | | Value
December 31, 2010 | | | Gross
Purchases | | | Gross
Sales | | | Shares Held at
December 31, 2011 | | | Value
December 31, 2011 | | | Income Earned
January 1, 2011 -
December 31, 2011 | |
Thrivent Financial Securities Lending Trust | | $ | 6,496,750 | | | $ | 63,721,313 | | | $ | 69,682,563 | | | | 535,500 | | | $ | 535,500 | | | $ | 14,522 | |
Total Value and Income Earned | | | 6,496,750 | | | | | | | | | | | | | | | | 535,500 | | | | 14,522 | |
The accompanying Notes to Financial Statements are an integral part of this schedule.
13
Equity Income Plus Fund
Schedule of Investments as of December 31, 2011
| | | | | | | | |
Shares | | | Common Stock (82.2%) | | Value | |
| Consumer Discretionary (6.6%) | | | | |
| | 8,500 | | | Arbitron, Inc. | | $ | 292,485 | |
| | 6,200 | | | Best Buy Company, Inc.a | | | 144,894 | |
| | 2,100 | | | Carnival plc ADR | | | 69,153 | |
| | 9,600 | | | CEC Entertainment, Inc. | | | 330,720 | |
| | 6,000 | | | Coach, Inc. | | | 366,240 | |
| | 22,000 | | | Comcast Corporation | | | 521,620 | |
| | 4,400 | | | Home Depot, Inc. | | | 184,976 | |
| | 5,400 | | | Polaris Industries, Inc. | | | 302,292 | |
| | 4,100 | | | Six Flags Entertainment Corporation | | | 169,084 | |
| | 300 | | | Starwood Hotels & Resorts Worldwide, Inc. | | | 14,391 | |
| | 3,300 | | | Strayer Education, Inc. | | | 320,727 | |
| | 2,700 | | | Tim Hortons, Inc. | | | 130,734 | |
| | 2,000 | | | Toyota Motor Corporation ADR | | | 132,260 | |
| | 7,100 | | | Yum! Brands, Inc. | | | 418,971 | |
| | | | | | | | |
| | | | Total Consumer Discretionary | | | 3,398,547 | |
| | | | | | | | |
| |
| | Consumer Staples (8.1%) | | | | |
| | 2,000 | | | Anheuser-Busch InBev NV ADR | | | 121,980 | |
| | 6,800 | | | Coca-Cola Companya | | | 475,796 | |
| | 3,200 | | | Colgate-Palmolive Company | | | 295,648 | |
| | 4,500 | | | Companhia de Bebidas das Americas ADR | | | 162,405 | |
| | 12,400 | | | CVS Caremark Corporation | | | 505,672 | |
| | 9,300 | | | Dr. Pepper Snapple Group, Inc.a | | | 367,164 | |
| | 5,700 | | | Herbalife, Ltd. | | | 294,519 | |
| | 4,800 | | | Mead Johnson Nutrition Company | | | 329,904 | |
| | 10,600 | | | Philip Morris International, Inc. | | | 831,888 | |
| | 4,500 | | | Unilever plc ADR | | | 150,840 | |
| | 10,900 | | | Wal-Mart Stores, Inc. | | | 651,384 | |
| | | | | | | | |
| | | | Total Consumer Staples | | | 4,187,200 | |
| | | | | | | | |
| |
| | Energy (13.0%) | | | | |
| | 2,700 | | | BP plc ADR | | | 115,398 | |
| | 2,900 | | | Cenovus Energy, Inc. | | | 96,280 | |
| | 13,300 | | | Chevron Corporationa | | | 1,415,120 | |
| | 400 | | | CNOOC, Ltd. ADR | | | 69,872 | |
| | 2,700 | | | Core Laboratories NV | | | 307,665 | |
| | 5,500 | | | Diamond Offshore Drilling, Inc. | | | 303,930 | |
| | 4,000 | | | Enbridge, Inc. | | | 149,640 | |
| | 19,700 | | | Exxon Mobil Corporationa | | | 1,669,772 | |
| | 5,800 | | | Helmerich & Payne, Inc. | | | 338,488 | |
| | 13,600 | | | Marathon Oil Corporation | | | 398,072 | |
| | 5,800 | | | National Oilwell Varco, Inc.a | | | 394,342 | |
| | 3,300 | | | Penn West Petroleum, Ltd. | | | 65,340 | |
| | 1,300 | | | PetroChina Company, Ltd. ADR | | | 161,603 | |
| | 6,000 | | | Petroleo Brasileiro SA PREF ADR | | | 140,940 | |
| | 1,900 | | | Royal Dutch Shell plc ADR, Class A | | | 138,871 | |
| | 2,600 | | | Royal Dutch Shell plc ADR, Class B | | | 197,626 | |
| | 2,600 | | | Suncor Energy, Inc. ADR | | | 74,958 | |
| | 2,500 | | | Total SA ADR | | | 127,775 | |
| | 15,800 | | | Valero Energy Corporation | | | 332,590 | |
| | 10,200 | | | W&T Offshore, Inc. | | | 216,342 | |
| | | | | | | | |
| | | | Total Energy | | | 6,714,624 | |
| | | | | | | | |
| |
| | Financials (19.4%) | | | | |
| | 14,800 | | | Aegon NV ADRb | | | 59,496 | |
| | 8,600 | | | Aflac, Inc. | | | 372,036 | |
| | 400 | | | Agree Realty Corporation | | | 9,752 | |
| | 200 | | | Alexandria Real Estate Equities, Inc. | | | 13,794 | |
| | 800 | | | American Campus Communities, Inc. | | | 33,568 | |
| | 600 | | | Ashford Hospitality Trust, Inc. | | | 4,800 | |
| | 800 | | | AvalonBay Communities, Inc. | | | 104,480 | |
| | 5,800 | | | Aviva plc ADR | | | 53,650 | |
| | 1,000 | | | BioMed Realty Trust, Inc. | | | 18,080 | |
| | 1,100 | | | Boston Properties, Inc. | | | 109,560 | |
| | 700 | | | Brandywine Realty Trust | | | 6,650 | |
| | 400 | | | BRE Properties, Inc. | | | 20,192 | |
| | 800 | | | Brookfield Office Properties, Inc. | | | 12,512 | |
| | 500 | | | Camden Property Trust | | | 31,120 | |
| | 6,700 | | | Cash America International, Inc.a | | | 312,421 | |
| | 600 | | | CBL & Associates Properties, Inc. | | | 9,420 | |
| | 11,900 | | | CBOE Holdings, Inc.a | | | 307,734 | |
| | 2,400 | | | China Life Insurance Company, Ltd. ADR | | | 88,728 | |
| | 200 | | | Corporate Office Properties Trust | | | 4,252 | |
| | 2,700 | | | Credit Suisse Group ADR | | | 63,396 | |
| | 300 | | | CubeSmart | | | 3,192 | |
| | 1,200 | | | DCT Industrial Trust, Inc. | | | 6,144 | |
| | 500 | | | DDR Corporation | | | 6,085 | |
| | 1,100 | | | DiamondRock Hospitality Company | | | 10,604 | |
| | 700 | | | Digital Realty Trust, Inc. | | | 46,669 | |
| | 400 | | | Duke Realty Corporation | | | 4,820 | |
| | 400 | | | DuPont Fabros Technology, Inc. | | | 9,688 | |
| | 100 | | | EastGroup Properties, Inc. | | | 4,348 | |
| | 800 | | | Education Realty Trust, Inc. | | | 8,184 | |
| | 100 | | | Entertainment Properties Trust | | | 4,371 | |
| | 750 | | | Equity One, Inc. | | | 12,735 | |
| | 1,700 | | | Equity Residential | | | 96,951 | |
| | 300 | | | Essex Property Trust, Inc. | | | 42,153 | |
| | 800 | | | Federal Realty Investment Trust | | | 72,600 | |
| | 400 | | | First Industrial Realty Trust, Inc.b | | | 4,092 | |
| | 400 | | | Forest City Enterprises, Inc.b | | | 4,728 | |
| | 1,500 | | | Franklin Street Properties Corporation | | | 14,925 | |
| | 600 | | | Getty Realty Corporation | | | 8,370 | |
| | 500 | | | Glimcher Realty Trust | | | 4,600 | |
| | 800 | | | Government Properties Income Trust | | | 18,040 | |
| | 1,600 | | | HCP, Inc. | | | 66,288 | |
| | 200 | | | Health Care REIT, Inc. | | | 10,906 | |
| | 600 | | | Highwoods Properties, Inc. | | | 17,802 | |
| | 200 | | | Hospitality Properties Trust | | | 4,596 | |
| | 4,200 | | | Host Hotels & Resorts, Inc. | | | 62,034 | |
| | 3,100 | | | HSBC Holdings plc ADR | | | 118,110 | |
| | 9,900 | | | ING Groep NV ADRb | | | 70,983 | |
| | 1,000 | | | iShares Dow Jones Select Dividend Index Fund ETF | | | 53,750 | |
| | 11,250 | | | iShares Dow Jones U.S. Real Estate Index Fund ETF | | | 638,887 | |
| | 11,600 | | | iShares MSCI EAFE Index Fund | | | 574,548 | |
| | 6,300 | | | iShares S&P U.S. Preferred Stock Index Fund | | | 224,406 | |
| | 5,300 | | | Itau Unibanco Holding SA ADR | | | 98,368 | |
| | 400 | | | Kilroy Realty Corporation | | | 15,228 | |
| | 2,400 | | | Kimco Realty Corporation | | | 38,976 | |
| | 1,000 | | | Kite Realty Group Trust | | | 4,510 | |
| | 600 | | | LaSalle Hotel Properties | | | 14,526 | |
| | 500 | | | Lexington Realty Trust | | | 3,745 | |
| | 1,000 | | | Liberty Property Trust | | | 30,880 | |
| | 300 | | | LTC Properties, Inc. | | | 9,258 | |
The accompanying Notes to Financial Statements are an integral part of this schedule.
14
Equity Income Plus Fund
Schedule of Investments as of December 31, 2011
| | | | | | | | |
Shares | | | Common Stock (82.2%) | | Value | |
| Financials (19.4%) - continued | | | | |
| | 600 | | | Macerich Company | | $ | 30,360 | |
| | 600 | | | Mack-Cali Realty Corporation | | | 16,014 | |
| | 4,900 | | | Manulife Financial Corporation | | | 52,038 | |
| | 400 | | | Medical Properties Trust, Inc. | | | 3,948 | |
| | 20,000 | | | Mitsubishi UFJ Financial Group, Inc. ADR | | | 83,800 | |
| | 600 | | | National Health Investors, Inc. | | | 26,388 | |
| | 900 | | | National Retail Properties, Inc. | | | 23,742 | |
| | 400 | | | Omega Healthcare Investors, Inc. | | | 7,740 | |
| | 500 | | | Post Properties, Inc. | | | 21,860 | |
| | 200 | | | Potlatch Corporation | | | 6,222 | |
| | 16,900 | | | PowerShares Preferred Portfolio | | | 231,361 | |
| | 2,328 | | | Prologis, Inc. | | | 66,558 | |
| | 7,800 | | | Prudential Financial, Inc. | | | 390,936 | |
| | 200 | | | PS Business Parks, Inc. | | | 11,086 | |
| | 1,000 | | | Public Storage, Inc. | | | 134,460 | |
| | 300 | | | Ramco-Gershenson Properties Trust | | | 2,949 | |
| | 11,000 | | | Raymond James Financial, Inc. | | | 340,560 | |
| | 450 | | | Rayonier, Inc. REIT | | | 20,083 | |
| | 400 | | | Realty Income Corporation | | | 13,984 | |
| | 800 | | | Regency Centers Corporation | | | 30,096 | |
| | 78,900 | | | Regions Financial Corporation | | | 339,270 | |
| | 1,200 | | | Senior Housing Property Trust | | | 26,928 | |
| | 1,700 | | | Simon Property Group, Inc. | | | 219,198 | |
| | 600 | | | SL Green Realty Corporation | | | 39,984 | |
| | 100 | | | Sovran Self Storage, Inc. | | | 4,267 | |
| | 23,150 | | | SPDR Dow Jones Wilshire International Real Estate ETF | | | 736,865 | |
| | 33,800 | | | Symetra Financial Corporation | | | 306,566 | |
| | 1,800 | | | Toronto-Dominion Bank | | | 134,658 | |
| | 18,100 | | | U.S. Bancorp | | | 489,605 | |
| | 400 | | | UDR, Inc. | | | 10,040 | |
| | 200 | | | Universal Health Realty Income Trust | | | 7,800 | |
| | 200 | | | Urstadt Biddle Properties, Inc. | | | 3,616 | |
| | 16,200 | | | Vanguard FTSE All-World Ex-US Index Fund ETF | | | 642,330 | |
| | 5,400 | | | Vanguard REIT ETF | | | 313,200 | |
| | 1,550 | | | Ventas, Inc. | | | 85,452 | |
| | 1,000 | | | Vornado Realty Trust | | | 76,860 | |
| | 100 | | | Washington Real Estate Investment Trust | | | 2,735 | |
| | 32,000 | | | Wells Fargo & Company | | | 881,920 | |
| | 1,000 | | | Westpac Banking Corporation ADR | | | 102,400 | |
| | | | | | | | |
| | | | Total Financials | | | 10,014,620 | |
| | | | | | | | |
| |
| | Health Care (7.6%) | | | | |
| | 8,100 | | | Amgen, Inc. | | | 520,101 | |
| | 3,700 | | | C.R. Bard, Inc.a | | | 316,350 | |
| | 5,700 | | | McKesson Corporation | | | 444,087 | |
| | 12,400 | | | Medtronic, Inc. | | | 474,300 | |
| | 2,800 | | | Novartis AG ADR | | | 160,076 | |
| | 900 | | | Novo Nordisk A/S ADR | | | 103,734 | |
| | 24,500 | | | PDL BioPharma, Inc. | | | 151,900 | |
| | 46,700 | | | Pfizer, Inc. | | | 1,010,588 | |
| | 3,900 | | | Sanofi ADR | | | 142,506 | |
| | 11,500 | | | UnitedHealth Group, Inc. | | | 582,820 | |
| | | | | | | | |
| | | | Total Health Care | | | 3,906,462 | |
| | | | | | | | |
| |
| | Industrials (6.3%) | | | | |
| | 4,450 | | | ABB, Ltd. ADRb | | | 83,793 | |
| | 1,900 | | | Caterpillar, Inc.a | | | 172,140 | |
| | 7,600 | | | Corporate Executive Board Company | | | 289,560 | |
| | 4,700 | | | Dun & Bradstreet Corporation | | | 351,701 | |
| | 3,100 | | | Emerson Electric Company | | | 144,429 | |
| | 6,500 | | | Fluor Corporationa | | | 326,625 | |
| | 20,800 | | | Knight Transportation, Inc. | | | 325,312 | |
| | 5,100 | | | L-3 Communications Holdings, Inc. | | | 340,068 | |
| | 7,000 | | | Nordson Corporation | | | 288,260 | |
| | 12,300 | | | Republic Services, Inc. | | | 338,865 | |
| | 1,100 | | | Siemens AG ADR | | | 105,171 | |
| | 2,000 | | | United Technologies Corporation | | | 146,180 | |
| | 9,800 | | | Waste Connections, Inc. | | | 324,772 | |
| | | | | | | | |
| | | | Total Industrials | | | 3,236,876 | |
| | | | | | | | |
| |
| | Information Technology (10.2%) | | | | |
| | 7,400 | | | Accenture plc | | | 393,902 | |
| | 16,100 | | | Cisco Systems, Inc. | | | 291,088 | |
| | 26,800 | | | Corning, Inc. | | | 347,864 | |
| | 31,900 | | | Intel Corporationa | | | 773,575 | |
| | 3,500 | | | International Business Machines Corporation | | | 643,580 | |
| | 11,700 | | | j2 Global, Inc. | | | 329,238 | |
| | 17,000 | | | Lender Processing Services, Inc. | | | 256,190 | |
| | 6,200 | | | Linear Technology Corporation | | | 186,186 | |
| | 45,100 | | | Microsoft Corporation | | | 1,170,796 | |
| | 10,700 | | | Nokia OYJ ADR | | | 51,574 | |
| | 22,500 | | | Oracle Corporation | | | 577,125 | |
| | 2,100 | | | SAP AG ADR | | | 111,195 | |
| | 10,000 | | | Taiwan Semiconductor Manufacturing Company, Ltd. ADR | | | 129,100 | |
| | | | | | | | |
| | | | Total Information Technology | | | 5,261,413 | |
| | | | | | | | |
| |
| | Materials (4.1%) | | | | |
| | 1,000 | | | Barrick Gold Corporation | | | 45,250 | |
| | 1,200 | | | BHP Billiton plc ADR | | | 70,068 | |
| | 2,000 | | | BHP Billiton, Ltd. ADR | | | 141,260 | |
| | 2,400 | | | CF Industries Holdings, Inc. | | | 347,952 | |
| | 5,100 | | | Cliffs Natural Resources, Inc.a | | | 317,985 | |
| | 4,100 | | | Domtar Corporation | | | 327,836 | |
| | 11,000 | | | Freeport-McMoRan Copper & Gold, Inc. | | | 404,690 | |
| | 53,100 | | | Hecla Mining Company | | | 277,713 | |
| | 800 | | | POSCO ADR | | | 65,680 | |
| | 5,300 | | | Vale SA SP PREF ADR | | | 109,180 | |
| | | | | | | | |
| | | | Total Materials | | | 2,107,614 | |
| | | | | | | | |
| |
| | Telecommunications Services (2.9%) | | | | |
| | 4,800 | | | America Movil SAB de CV ADR | | | 108,480 | |
| | 14,000 | | | AT&T, Inc.a | | | 423,360 | |
| | 3,500 | | | China Mobile, Ltd. ADR | | | 169,715 | |
| | 5,000 | | | Nippon Telegraph & Telephone Corporation ADR | | | 126,650 | |
| | 7,000 | | | NTT DOCOMO, INC. ADR | | | 128,450 | |
| | 5,100 | | | Telefonica SA ADR | | | 87,669 | |
| | 8,900 | | | Verizon Communications, Inc. | | | 357,068 | |
| | 3,500 | | | Vodafone Group plc ADR | | | 98,105 | |
| | | | | | | | |
| | | | Total Telecommunications Services | | | 1,499,497 | |
| | | | | | | | |
The accompanying Notes to Financial Statements are an integral part of this schedule.
15
Equity Income Plus Fund
Schedule of Investments as of December 31, 2011
| | | | | | | | |
Shares | | | Common Stock (82.2%) | | Value | |
| Utilities (4.0%) | | | | |
| | 9,400 | | | American Electric Power Company, Inc. | | $ | 388,314 | |
| | 2,700 | | | Consolidated Edison, Inc. | | | 167,481 | |
| | 8,000 | | | Laclede Group, Inc. | | | 323,760 | |
| | 2,300 | | | National Grid plc ADR | | | 111,504 | |
| | 12,900 | | | Portland General Electric Company | | | 326,241 | |
| | 4,900 | | | Public Service Enterprise Group, Inc. | | | 161,749 | |
| | 16,900 | | | Questar Corporation | | | 335,634 | |
| | 11,300 | | | TECO Energy, Inc. | | | 216,282 | |
| | | | | | | | |
| | | | Total Utilities | | | 2,030,965 | |
| | | | | | | | |
| | | | Total Common Stock (cost $42,112,373) | | | 42,357,818 | |
| | | | | | | | |
| | |
Principal
Amount | | | Long-Term Fixed Income (4.7%) | | | |
| | Energy (0.8%) | | | | |
| | | | Enbridge Energy Partners, LP | | | | |
| $ | 175,000 | | | 8.050%, 10/1/2037 | | | 184,905 | |
| | | | Enterprise Products Operating, LLC | | | | |
| | 225,000 | | | 7.034%, 1/15/2068 | | | 234,000 | |
| | | | | | | | |
| | | | Total Energy | | | 418,905 | |
| | | | | | | | |
| |
| | Financials (3.6%) | | | | |
| | | | Aegon NV | | | | |
| | 300,000 | | | 2.397%, 7/29/2049c,d | | | 129,450 | |
| | | | American International Group, Inc. | | | | |
| | 100,000 | | | 8.175%, 5/15/2058 | | | 89,000 | |
| | | | Bank of America Corporation | | | | |
| | 215,000 | | | 7.625%, 6/1/2019 | | | 222,357 | |
| | | | BBVA International Preferred SA Unipersonal | | | | |
| | 150,000 | | | 5.919%, 12/29/2049d | | | 99,305 | |
| | | | J.P. Morgan Chase & Company | | | | |
| | 100,000 | | | 7.900%, 4/29/2049d | | | 106,469 | |
| | | | Liberty Mutual Group, Inc. | | | | |
| | 200,000 | | | 10.750%, 6/15/2058e | | | 251,000 | |
| | | | MetLife Capital Trust IV | | | | |
| | 220,000 | | | 7.875%, 12/15/2037e | | | 228,250 | |
| | | | Reinsurance Group of America, Inc. | | | | |
| | 225,000 | | | 6.750%, 12/15/2065 | | | 195,057 | |
| | | | Wachovia Capital Trust III | | | | |
| | 150,000 | | | 5.570%, 3/15/2042c,d | | | 125,625 | |
| | | | XL Group plc | | | | |
| | 250,000 | | | 6.500%, 12/29/2049d | | | 195,625 | |
| | | | ZFS Finance USA Trust II | | | | |
| | 230,000 | | | 6.450%, 12/15/2065e | | | 209,300 | |
| | | | | | | | |
| | | | Total Financials | | | 1,851,438 | |
| | | | | | | | |
| |
| | Utilities (0.3%) | | | | |
| | | | Dominion Resources, Inc. | | | | |
| | 200,000 | | | 2.879%, 9/30/2066c | | | 168,074 | |
| | | | | | | | |
| | | | Total Utilities | | | 168,074 | |
| | | | | | | | |
| | | | Total Long-Term Fixed Income (cost $2,544,993) | | | 2,438,417 | |
| | | | | | | | |
| |
| | Financials (0.6%) | | | | |
| | 3,000 | | | Bank of America Corporationd | | | 65,880 | |
| | 4,700 | | | Citigroup Capital XII | | | 118,252 | |
| | 2,500 | | | J.P. Morgan Chase Capital XXIX | | | 63,800 | |
| | 2,000 | | | U.S. Bancorpd | | | 54,660 | |
| | | | | | | | |
| | | | Total Financials | | | 302,592 | |
| | | | | | | | |
| |
| | Utilities (0.1%) | | | | |
| | 1,720 | | | Xcel Energy, Inc. | | | 46,698 | |
| | | | | | | | |
| | | | Total Utilities | | | 46,698 | |
| | | | | | | | |
| | | | Total Preferred Stock (cost $356,486) | | | 349,290 | |
| | | | | | | | |
| | |
Contracts | | | Options Purchased (<0.1%) | | | |
| | | | Put on Caterpillar Inc. | | | | |
| | 19 | | | $82.50, expires 1/21/2012 | | | 1,178 | |
| | | | Put on Chevron Corporation | | | | |
| | 103 | | | $95.00, expires 1/21/2012 | | | 2,781 | |
| | | | Put on Cliffs Natural Resources, Inc. | | | | |
| | 51 | | | $57.50, expires 1/21/2012 | | | 5,814 | |
| | | | Put on Exxon Mobil Corporation | | | | |
| | 159 | | | $77.50, expires 1/21/2012 | | | 3,180 | |
| | | | Put on Fluor Corporation | | | | |
| | 65 | | | $45.00, expires 1/21/2012 | | | 1,625 | |
| | | | Put on National Oilwell Varco, Inc. | | | | |
| | 58 | | | $60.00, expires 1/21/2012 | | | 1,914 | |
| | | | | | | | |
| | | | Total Options Purchased (cost $75,002) | | | 16,492 | |
| | | | | | | | |
| | |
Principal
Amount | | | Short-Term Investments (4.9%)f | | | |
| | | | Federal Home Loan Bank Discount Notes | | | | |
| $ | 2,000,000 | | | 0.015%, 3/7/2012g | | | 1,999,945 | |
| | | | Federal National Mortgage Association Discount Notes | | | | |
| | 500,000 | | | 0.105%, 2/22/2012g,h | | | 499,925 | |
| | | | | | | | |
| | | | Total Short-Term Investments (at amortized cost) | | | 2,499,870 | |
| | | | | | | | |
| | | | Total Investments (cost $47,588,724) 92.5% | | $ | 47,661,887 | |
| | | | | | | | |
| | | | Other Assets and Liabilities, Net 7.5% | | | 3,861,985 | |
| | | | | | | | |
| | | | Total Net Assets 100.0% | | $ | 51,523,872 | |
| | | | | | | | |
| a | All or a portion of the security was earmarked to cover written options. |
| b | Non-income producing security. |
| c | Denotes variable rate securities. Variable rate securities are securities whose yields vary with a designated market index or market rate. The rate shown is as of December 31, 2011. |
| d | Denotes perpetual securities. Perpetual securities pay an indefinite stream of interest, but may be called by the issuer at an earlier date. |
| e | Denotes securities sold under Rule 144A of the Securities Act of 1933, which exempts them from registration. These securities have been deemed liquid and may be resold to other dealers in the program or to other qualified institutional buyers. As of December 31, 2011, the value of these investments was $688,550 or 1.3% of total net assets. |
The accompanying Notes to Financial Statements are an integral part of this schedule.
16
Equity Income Plus Fund
Schedule of Investments as of December 31, 2011
| f | The interest rate shown reflects the yield, coupon rate or the discount rate at the date of purchase. |
| g | Denotes investments that benefit from credit enhancement or liquidity support provided by a third party bank, institution or government. |
| h | At December 31, 2011, $499,925 of investments were held on deposit with the counterparty and pledged as the initial margin deposit for open futures contracts. |
Definitions:
| | | | |
| ADR | | - | | American Depositary Receipt, which are certificates for an underlying foreign security’s shares held by an issuing U.S. depository bank. |
| REIT | | - | | Real Estate Investment Trust is a company that buys, develops, manages and/or sells real estate assets. |
| ETF | | - | | Exchange Traded Fund. |
Unrealized Appreciation (Depreciation)
Gross unrealized appreciation and depreciation of investments, based on cost for federal income tax purposes, were as follows:
| | | | |
Gross unrealized appreciation | | $ | 2,418,456 | |
Gross unrealized depreciation | | | (2,465,035 | ) |
| | | | |
Net unrealized appreciation (depreciation) | | $ | (46,579 | ) |
| |
Cost for federal income tax purposes | | $ | 47,708,466 | |
The accompanying Notes to Financial Statements are an integral part of this schedule.
17
Equity Income Plus Fund
Schedule of Investments as of December 31, 2011
Fair Valuation Measurements
The following table is a summary of the inputs used, as of December 31, 2011, in valuing Equity Income Plus Fund’s assets carried at fair value.
| | | | | | | | | | | | | | | | |
Investments in Securities | | Total | | | Level 1 | | | Level 2 | | | Level 3 | |
Common Stock | | | | | | | | | | | | | | | | |
Consumer Discretionary | | | 3,398,547 | | | | 3,398,547 | | | | — | | | | — | |
Consumer Staples | | | 4,187,200 | | | | 4,187,200 | | | | — | | | | — | |
Energy | | | 6,714,624 | | | | 6,714,624 | | | | — | | | | — | |
Financials | | | 10,014,620 | | | | 10,014,620 | | | | — | | | | — | |
Health Care | | | 3,906,462 | | | | 3,906,462 | | | | — | | | | — | |
Industrials | | | 3,236,876 | | | | 3,236,876 | | | | — | | | | — | |
Information Technology | | | 5,261,413 | | | | 5,261,413 | | | | — | | | | — | |
Materials | | | 2,107,614 | | | | 2,107,614 | | | | — | | | | — | |
Telecommunications Services | | | 1,499,497 | | | | 1,499,497 | | | | — | | | | — | |
Utilities | | | 2,030,965 | | | | 2,030,965 | | | | — | | | | — | |
Long-Term Fixed Income | | | | | | | | | | | | | | | | |
Energy | | | 418,905 | | | | — | | | | 418,905 | | | | — | |
Financials | | | 1,851,438 | | | | — | | | | 1,851,438 | | | | — | |
Utilities | | | 168,074 | | | | — | | | | 168,074 | | | | — | |
Preferred Stock | | | | | | | | | | | | | | | | |
Financials | | | 302,592 | | | | 302,592 | | | | — | | | | — | |
Utilities | | | 46,698 | | | | 46,698 | | | | — | | | | — | |
Options Purchased | | | 16,492 | | | | 16,492 | | | | — | | | | — | |
Short-Term Investments | | | 2,499,870 | | | | — | | | | 2,499,870 | | | | — | |
| | | | | | | | | | | | | | | | |
Total | | $ | 47,661,887 | | | $ | 42,723,600 | | | $ | 4,938,287 | | | $ | — | |
| | | | | | | | | | | | | | | | |
| | | | |
Other Financial Instruments | | Total | | | Level 1 | | | Level 2 | | | Level 3 | |
Asset Derivatives | | | | | | | | | | | | | | | | |
Futures Contracts | | | 95,838 | | | | 95,838 | | | | — | | | | — | |
Call Options Written | | | 13,187 | | | | 13,187 | | | | — | | | | — | |
| | | | | | | | | | | | | | | | |
Total Asset Derivatives | | $ | 109,025 | | | $ | 109,025 | | | $ | — | | | $ | — | |
| | | | | | | | | | | | | | | | |
Liability Derivatives | | | | | | | | | | | | | | | | |
Call Options Written | | | 62,902 | | | | 62,902 | | | | — | | | | — | |
| | | | | | | | | | | | | | | | |
Total Liability Derivatives | | $ | 62,902 | | | $ | 62,902 | | | $ | — | | | $ | — | |
| | | | | | | | | | | | | | | | |
| | | | | | | | | | | | | | | | | | | | |
Futures Contracts | | Number of
Contracts
Long/(Short) | | | Expiration
Date | | | Notional
Principal
Amount | | | Value | | | Unrealized
Gain/(Loss) | |
S&P 500 Index Mini-Futures | | | 85 | | | | March 2012 | | | $ | 5,227,713 | | | $ | 5,323,551 | | | $ | 95,838 | |
Total Futures Contracts | | | | | | | | | | | | | | | | | | $ | 95,838 | |
| | | | | |
Call Options Written | | Number of
Contracts | | | Exercise
Price | | | Expiration
Date | | | Value | | | Unrealized
Gain/(Loss) | |
Caterpillar, Inc. Call Option | | | 19 | | | $ | 92.50 | | | | January 2012 | | | | ($3,401 | ) | | $ | 949 | |
Chevron Corporation Call Option | | | 103 | | | | 105.00 | | | | January 2012 | | | | (33,990 | ) | | | (16,998 | ) |
Cliffs Natural Resources, Inc. Call Option | | | 51 | | | | 67.50 | | | | January 2012 | | | | (4,896 | ) | | | 8,159 | |
Exxon Mobil Corporation Call Option | | | 159 | | | | 82.50 | | | | January 2012 | | | | (47,700 | ) | | | (31,804 | ) |
Fluor Corporation Call Option | | | 65 | | | | 52.50 | | | | January 2012 | | | | (4,225 | ) | | | 1,818 | |
National Oilwell Varco, Inc. Call Option | | | 58 | | | | 70.00 | | | | January 2012 | | | | (8,236 | ) | | | 2,261 | |
S&P 500 Mini-Futures Call Option | | | 40 | | | | 1,270.00 | | | | January 2012 | | | | (30,600 | ) | | | (8,700 | ) |
S&P 500 Mini-Futures Call Option | | | 20 | | | | 1,265.00 | | | | January 2012 | | | | (17,600 | ) | | | (5,400 | ) |
Total Call Options Written | | | | | | | | | | | | | | | ($150,648 | ) | | | ($49,715 | ) |
The accompanying Notes to Financial Statements are an integral part of this schedule.
18
Equity Income Plus Fund
Schedule of Investments as of December 31, 2011
The following table summarizes the fair value and Statement of Assets and Liabilities location, as of December 31, 2011, for Equity Income Plus Fund’s investments in financial derivative instruments by primary risk exposure as discussed under item (2) Significant Accounting Policies of the Notes to Financial Statements.
| | | | | | |
Derivatives by risk category | | Statement of Assets and Liabilities Location | | Fair Value | |
Asset Derivatives | | | | | | |
Equity Contracts | | | | | | |
Options Written | | Net Assets - Net unrealized appreciation/(depreciation) on Written option contracts | | $ | 13,187 | |
Options Purchased | | Investments in securities at value, Net Assets - Net unrealized appreciation/(depreciation) on Investments | | | 16,492 | |
Futures* | | Net Assets - Net unrealized appreciation/(depreciation) on Futures contracts | | | 95,838 | |
Total Equity Contracts | | | | | 125,517 | |
| | | | | | |
Total Asset Derivatives | | | | $ | 125,517 | |
| | | | | | |
Liability Derivatives | | | | | | |
Equity Contracts | | | | | | |
Options Written | | Net Assets - Net unrealized appreciation/(depreciation) on Written option contracts | | | 62,902 | |
Total Equity Contracts | | | | | 62,902 | |
| | | | | | |
Total Liability Derivatives | | | | $ | 62,902 | |
| | | | | | |
| * | Includes cumulative appreciation/depreciation of futures contracts as reported in the Schedule of Investments. Only current day’s variation margin is reported within the Statement of Assets and Liabilities. |
The following table summarizes the net realized gains/(losses) and Statement of Operations location, for the period ended December 31, 2011, for Equity Income Plus Fund’s investments in financial derivative instruments by primary risk exposure.
| | | | | | |
Derivatives by risk category | | Statement of Operations Location | | Realized Gains/(Losses)
recognized in Income | |
Equity Contracts | | | | | | |
Options Written | | Net realized gains/(losses) on Written option contracts | | | (79,637 | ) |
Futures | | Net realized gains/(losses) on Futures contracts | | | (78,420 | ) |
Total Equity Contracts | | | | | (158,057 | ) |
| | | | | | |
Total | | | | ($ | 158,057 | ) |
| | | | | | |
The following table summarizes the change in net unrealized appreciation/(depreciation) and Statement of Operations location, for the period ended December 31, 2011, for Equity Income Plus Fund’s investments in financial derivative instruments by primary risk exposure.
| | | | | | |
Derivatives by risk category | | Statement of Operations Location | | Change in unrealized
appreciation/(depreciation)
recognized in Income | |
Equity Contracts | | | | | | |
Options Written | | Change in net unrealized appreciation/(depreciation) on Written option contracts | | | (50,578 | ) |
Options Purchased | | Change in net unrealized appreciation/(depreciation) on Investments | | | (58,510 | ) |
Futures | | Change in net unrealized appreciation/(depreciation) on Futures contracts | | | 19,343 | |
Total Equity Contracts | | | | | (89,745 | ) |
| | | | | | |
Total | | | | ($ | 89,745 | ) |
| | | | | | |
The following table presents Equity Income Plus Fund’s average volume of derivative activity during the period ended December 31, 2011.
| | | | | | | | | | | | |
Derivative Risk Category | | Futures
(Notional*) | | | Futures
(Percentage of
Average Net Assets) | | | Options
(Contracts) | |
Equity Contracts | | $ | 5,334,601 | | | | 10.8 | % | | | 64 | |
| * | Notional amount represents long or short, or both, derivative positions held by the fund. |
The accompanying Notes to Financial Statements are an integral part of this schedule.
19
Diversified Income Plus Fund
Schedule of Investments as of December 31, 2011
| | | | | | | | |
Principal
Amount | | | Bank Loans (6.8%)a | | Value | |
| | Capital Goods (0.4%) | | | | |
| | | | Reynolds Group, Term Loan | | | | |
| | $947,323 | | | 6.500%, 8/9/2018 | | $ | 940,389 | |
| | | | | | | | |
| | | | Total Capital Goods | | | 940,389 | |
| | | | | | | | |
| |
| | Communications Services (1.7%) | | | | |
| | | | Cumulus Media Holdings, Inc., Term Loan | | | | |
| | 1,935,000 | | | 5.750%, 9/16/2018 | | | 1,894,229 | |
| | | | Towerco Finance, LLC, Term Loan | | | | |
| | 957,588 | | | 5.250%, 2/2/2017 | | | 953,595 | |
| | | | Univision Communications, Inc., Term Loan | | | | |
| | 960,000 | | | 2.296%, 9/29/2014 | | | 914,400 | |
| | | | | | | | |
| | | | Total Communications Services | | | 3,762,224 | |
| | | | | | | | |
| |
| | Consumer Cyclical (0.4%) | | | | |
| | | | Chrysler Group, LLC, Term Loan | | | | |
| | 970,125 | | | 6.000%, 5/24/2017 | | | 916,041 | |
| | | | | | | | |
| | | | Total Consumer Cyclical | | | 916,041 | |
| | | | | | | | |
| |
| | Consumer Non-Cyclical (0.8%) | | | | |
| | | | CHS/Community Health Systems, Inc., Term Loan | | | | |
| | 46,730 | | | 2.546%, 7/25/2014 | | | 45,212 | |
| | 911,400 | | | 2.757%, 7/25/2014 | | | 881,779 | |
| | | | Visant Corporation, Term Loan | | | | |
| | 922,948 | | | 5.260%, 12/22/2016 | | | 863,611 | |
| | | | | | | | |
| | | | Total Consumer Non-Cyclical | | | 1,790,602 | |
| | | | | | | | |
| |
| | Energy (0.5%) | | | | |
| | | | GenOn Energy, Inc., Term Loan | | | | |
| | 957,575 | | | 4.250%, 9/20/2017b,c | | | 953,468 | |
| | | | | | | | |
| | | | Total Energy | | | 953,468 | |
| | | | | | | | |
| |
| | Financials (0.8%) | | | | |
| | | | Nuveen Investments, Inc., Term Loan | | | | |
| | 975,000 | | | 6.013%, 5/13/2017 | | | 935,025 | |
| | | | Springleaf Financial Funding Company, Term Loan | | | | |
| | 975,000 | | | 5.500%, 5/10/2017 | | | 846,827 | |
| | | | | | | | |
| | | | Total Financials | | | 1,781,852 | |
| | | | | | | | |
| |
| | Technology (1.3%) | | | | |
| | | | First Data Corporation, Term Loan | | | | |
| | 975,000 | | | 4.294%, 3/26/2018 | | | 813,852 | |
| | | | Freescale Semiconductor, Term Loan | | | | |
| | 971,811 | | | 4.520%, 12/1/2016 | | | 927,594 | |
| | | | Intelsat Jackson Holdings SA, Term Loan | | | | |
| | 972,557 | | | 5.250%, 4/2/2018 | | | 964,046 | |
| | | | | | | | |
| | | | Total Technology | | | 2,705,492 | |
| | | | | | | | |
| |
| | Transportation (0.4%) | | | | |
| | | | Delta Air Lines, Inc., Term Loan | | | | |
| | 970,125 | | | 5.500%, 4/20/2017 | | | 914,343 | |
| | | | | | | | |
| | | | Total Transportation | | | 914,343 | |
| | | | | | | | |
| |
| | Utilities (0.5%) | | | | |
| | | | Calpine Corporation, Term Loan | | | | |
| | 970,113 | | | 4.500%, 4/1/2018 | | | 949,090 | |
| | | | | | | | |
| | | | Total Utilities | | | 949,090 | |
| | | | | | | | |
| | | | Total Bank Loans (cost $14,605,636) | | | 14,713,501 | |
| | | | | | | | |
| | |
| | | | Long-Term Fixed Income (53.6%) | | | |
| Asset-Backed Securities (1.8%) | | | | |
| | | | Carrington Mortgage Loan Trust | | | | |
| | 1,700,000 | | | 0.444%, 8/25/2036d | | | 527,328 | |
| | | | GSAMP Trust | | | | |
| | 1,070,335 | | | 0.474%, 2/25/2036d | | | 833,708 | |
| | 740,713 | | | 0.374%, 8/25/2036d | | | 673,550 | |
| | | | J.P. Morgan Mortgage Trust | | | | |
| | 587,231 | | | 2.806%, 2/25/2036 | | | 422,735 | |
| | | | Renaissance Home Equity Loan Trust | | | | |
| | 854,218 | | | 5.746%, 5/25/2036 | | | 385,949 | |
| | 1,000,000 | | | 6.011%, 5/25/2036 | | | 391,603 | |
| | 1,450,000 | | | 5.797%, 8/25/2036 | | | 592,937 | |
| | | | | | | | |
| | | | Total Asset-Backed Securities | | | 3,827,810 | |
| | | | | | | | |
| |
| | Basic Materials (2.1%) | | | | |
| | | | Alcoa, Inc. | | | | |
| | 310,000 | | | 6.150%, 8/15/2020 | | | 322,082 | |
| | | | ArcelorMittal | | | | |
| | 165,000 | | | 5.500%, 3/1/2021 | | | 151,455 | |
| | | | Arch Coal, Inc. | | | | |
| | 1,080,000 | | | 7.000%, 6/15/2019e,f | | | 1,101,600 | |
| | | | Dow Chemical Company | | | | |
| | 600,000 | | | 8.550%, 5/15/2019 | | | 784,997 | |
| | | | FMG Resources Property, Ltd. | | | | |
| | 1,080,000 | | | 7.000%, 11/1/2015e | | | 1,090,800 | |
| | | | Novelis, Inc. | | | | |
| | 1,080,000 | | | 8.375%, 12/15/2017 | | | 1,147,500 | |
| | | | | | | | |
| | | | Total Basic Materials | | | 4,598,434 | |
| | | | | | | | |
| |
| | Capital Goods (1.7%) | | | | |
| | | | Bombardier, Inc. | | | | |
| | 1,730,000 | | | 7.750%, 3/15/2020e | | | 1,885,700 | |
| | | | Case New Holland, Inc. | | | | |
| | 1,080,000 | | | 7.875%, 12/1/2017 | | | 1,220,400 | |
| | | | Textron, Inc. | | | | |
| | 450,000 | | | 7.250%, 10/1/2019 | | | 508,954 | |
| | | | | | | | |
| | | | Total Capital Goods | | | 3,615,054 | |
| | | | | | | | |
| |
| | Collateralized Mortgage Obligations (5.2%) | | | | |
| | | | Bear Stearns Adjustable Rate Mortgage Trust | | | | |
| | 1,754,342 | | | 2.400%, 10/25/2035d | | | 1,367,851 | |
| | | | Citigroup Mortgage Loan Trust, Inc. | | | | |
| | 869,900 | | | 5.500%, 11/25/2035 | | | 735,131 | |
| | | | CitiMortgage Alternative Loan Trust | | | | |
| | 1,304,753 | | | 5.750%, 4/25/2037 | | | 849,133 | |
| | | | Countrywide Alternative Loan Trust | | | | |
| | 560,644 | | | 6.000%, 4/25/2036 | | | 363,440 | |
| | 499,991 | | | 6.000%, 1/25/2037 | | | 328,413 | |
The accompanying Notes to Financial Statements are an integral part of this schedule.
20
Diversified Income Plus Fund
Schedule of Investments as of December 31, 2011
| | | | | | | | |
Principal
Amount | | | Long-Term Fixed Income (53.6%) | | Value | |
| Collateralized Mortgage Obligations (5.2%) - continued | | | | |
| | | | Deutsche Alt-A Securities, Inc. | | | | |
| | $485,364 | | | 5.500%, 10/25/2021 | | $ | 464,139 | |
| | 1,840,739 | | | 0.970%, 4/25/2047d | | | 1,056,919 | |
| | | | First Horizon Mortgage Pass- Through Trust | | | | |
| | 709,911 | | | 5.553%, 8/25/2037 | | | 468,532 | |
| | | | GSR Mortgage Loan Trust | | | | |
| | 754,526 | | | 0.484%, 8/25/2046d | | | 565,647 | |
| | | | HomeBanc Mortgage Trust | | | | |
| | 1,489,948 | | | 2.221%, 4/25/2037 | | | 795,617 | |
| | | | J.P. Morgan Mortgage Trust | | | | |
| | 396,661 | | | 6.500%, 1/25/2035 | | | 391,851 | |
| | 363,217 | | | 2.772%, 10/25/2036 | | | 264,795 | |
| | 1,186,132 | | | 4.441%, 1/25/2037 | | | 773,808 | |
| | | | MASTR Alternative Loans Trust | | | | |
| | 543,095 | | | 6.500%, 7/25/2034 | | | 567,715 | |
| | | | New York Mortgage Trust, Inc. | | | | |
| | 909,955 | | | 2.805%, 5/25/2036 | | | 105,790 | |
| | | | Structured Adjustable Rate Mortgage Loan Trust | | | | |
| | 714,479 | | | 5.394%, 9/25/2036 | | | 130,302 | |
| | | | WaMu Mortgage Pass Through Certificates | | | | |
| | 440,368 | | | 2.312%, 11/25/2036 | | | 312,743 | |
| | 276,885 | | | 2.567%, 8/25/2046 | | | 183,158 | |
| | | | Washington Mutual Alternative Mortgage Pass-Through Certificates | | | | |
| | 1,696,017 | | | 0.958%, 2/25/2047d | | | 621,685 | |
| | | | Wells Fargo Mortgage Backed Securities Trust | | | | |
| | 989,346 | | | 6.000%, 7/25/2037 | | | 904,021 | |
| | | | | | | | |
| | | | Total Collateralized Mortgage Obligations | | | 11,250,690 | |
| | | | | | | | |
| |
| | Commercial Mortgage-Backed Securities (2.9%) | | | | |
| | | | Banc of America Commercial Mortgage, Inc. | | | | |
| | 1,350,000 | | | 5.655%, 4/10/2049 | | | 1,260,060 | |
| | | | Greenwich Capital Commercial Funding Corporation | | | | |
| | 1,350,000 | | | 5.867%, 12/10/2049 | | | 1,197,464 | |
| | | | LB-UBS Commercial Mortgage Trust | | | | |
| | 1,350,000 | | | 6.167%, 9/15/2045 | | | 1,270,172 | |
| | | | Morgan Stanley Capital, Inc. | | | | |
| | 1,350,000 | | | 5.406%, 3/15/2044 | | | 1,257,923 | |
| | | | Wachovia Bank Commercial Mortgage Trust | | | | |
| | 1,600,000 | | | 0.398%, 9/15/2021d,g | | | 1,423,846 | |
| | | | | | | | |
| | | | Total Commercial Mortgage-Backed Securities | | | 6,409,465 | |
| | | | | | | | |
| |
| Communications Services (5.0%) | | | | |
| | | | Cablevision Systems Corporation | | | | |
| | 1,080,000 | | | 8.625%, 9/15/2017 | | | 1,196,100 | |
| | | | CBS Corporation | | | | |
| | 450,000 | | | 8.875%, 5/15/2019 | | | 577,976 | |
| | | | CCO Holdings, LLC | | | | |
| | 1,080,000 | | | 7.000%, 1/15/2019 | | | 1,125,900 | |
| | | | CenturyLink, Inc. | | | | |
| | 650,000 | | | 6.450%, 6/15/2021 | | | 651,197 | |
| | | | Clear Channel Worldwide Holdings, Inc. | | | | |
| | 1,080,000 | | | 9.250%, 12/15/2017 | | | 1,166,400 | |
| | | | Dish DBS Corporation | | | | |
| | 160,000 | | | 6.750%, 6/1/2021 | | | 172,400 | |
| | | | EH Holding Corporation | | | | |
| | 1,080,000 | | | 6.500%, 6/15/2019e | | | 1,125,900 | |
| | | | Intelsat Jackson Holdings SA | | | | |
| | 1,080,000 | | | 7.250%, 4/1/2019e | | | 1,096,200 | |
| | | | News America, Inc. | | | | |
| | 325,000 | | | 4.500%, 2/15/2021 | | | 340,766 | |
| | | | NII Capital Corporation | | | | |
| | 920,000 | | | 7.625%, 4/1/2021 | | | 913,100 | |
| | | | Sprint Nextel Corporation | | | | |
| | 1,080,000 | | | 9.000%, 11/15/2018e | | | 1,134,000 | |
| | | | Telecom Italia Capital SA | | | | |
| | 165,000 | | | 6.999%, 6/4/2018 | | | 154,258 | |
| | | | Telefonica Emisiones SAU | | | | |
| | 185,000 | | | 5.462%, 2/16/2021 | | | 176,539 | |
| | | | UPCB Finance V, Ltd. | | | | |
| | 1,080,000 | | | 7.250%, 11/15/2021e | | | 1,093,500 | |
| | | | | | | | |
| | | | Total Communications Services | | | 10,924,236 | |
| | | | | | | | |
| |
| | Consumer Cyclical (4.7%) | | | | |
| | | | Chrysler Group, LLC | | | | |
| | 1,065,000 | | | 8.000%, 6/15/2019e | | | 974,475 | |
| | | | Ford Motor Credit Company, LLC | | | | |
| | 650,000 | | | 6.625%, 8/15/2017 | | | 707,563 | |
| | | | Home Depot, Inc. | | | | |
| | 300,000 | | | 3.950%, 9/15/2020 | | | 326,870 | |
| | | | Lennar Corporation | | | | |
| | 1,080,000 | | | 12.250%, 6/1/2017 | | | 1,285,200 | |
| | | | Macy’s Retail Holdings, Inc. | | | | |
| | 490,000 | | | 6.700%, 7/15/2034 | | | 540,847 | |
| | | | MGM Resorts International | | | | |
| | 1,060,000 | | | 11.125%, 11/15/2017 | | | 1,208,400 | |
| | | | Rite Aid Corporation | | | | |
| | 1,080,000 | | | 7.500%, 3/1/2017 | | | 1,078,650 | |
| | | | Starwood Hotels & Resorts Worldwide, Inc. | | | | |
| | 1,080,000 | | | 6.750%, 5/15/2018 | | | 1,220,400 | |
| | | | Toys R Us Property Company II, LLC | | | | |
| | 1,080,000 | | | 8.500%, 12/1/2017 | | | 1,117,800 | |
| | | | Viacom, Inc. | | | | |
| | 200,000 | | | 3.875%, 12/15/2021 | | | 204,174 | |
| | | | West Corporation | | | | |
| | 445,000 | | | 7.875%, 1/15/2019 | | | 441,662 | |
| | | | WMG Acquisition Corporation | | | | |
| | 1,080,000 | | | 11.500%, 10/1/2018e | | | 1,071,900 | |
| | | | | | | | |
| | | | Total Consumer Cyclical | | | 10,177,941 | |
| | | | | | | | |
| |
| | Consumer Non-Cyclical (4.3%) | | | | |
| | | | Amgen, Inc. | | | | |
| | 170,000 | | | 2.500%, 11/15/2016 | | | 172,039 | |
| | | | Beam, Inc. | | | | |
| | 325,000 | | | 5.375%, 1/15/2016 | | | 356,841 | |
| | | | Bunge Limited Finance Corporation | | | | |
| | 225,000 | | | 4.100%, 3/15/2016 | | | 232,993 | |
The accompanying Notes to Financial Statements are an integral part of this schedule.
21
Diversified Income Plus Fund
Schedule of Investments as of December 31, 2011
| | | | | | | | |
Principal
Amount | | | Long-Term Fixed Income (53.6%) | | Value | |
| Consumer Non-Cyclical (4.3%) - continued | | | | |
| | | | Community Health Systems, Inc. | | | | |
| | $1,081,000 | | | 8.875%, 7/15/2015h | | $ | 1,116,132 | |
| | | | Gilead Sciences, Inc. | | | | |
| | 165,000 | | | 3.050%, 12/1/2016 | | | 168,875 | |
| | | | HCA, Inc. | | | | |
| | 1,080,000 | | | 7.500%, 2/15/2022 | | | 1,104,300 | |
| | | | JBS USA, LLC/JBS USA Finance, Inc. | | | | |
| | 1,100,000 | | | 11.625%, 5/1/2014 | | | 1,247,125 | |
| | | | Kinetic Concepts, Inc./KCI USA, Inc. | | | | |
| | 1,080,000 | | | 10.500%, 11/1/2018e | | | 1,058,400 | |
| | | | Reynolds Group Issuer, Inc. | | | | |
| | 1,080,000 | | | 6.875%, 2/15/2021e | | | 1,074,600 | |
| | | | Safeway, Inc. | | | | |
| | 165,000 | | | 4.750%, 12/1/2021 | | | 169,020 | |
| | | | Tenet Healthcare Corporation | | | | |
| | 1,080,000 | | | 8.875%, 7/1/2019 | | | 1,212,300 | |
| | | | Teva Pharmaceutical Finance IV BV | | | | |
| | 335,000 | | | 3.650%, 11/10/2021 | | | 340,740 | |
| | | | Valeant Pharmaceuticals International | | | | |
| | 1,080,000 | | | 6.875%, 12/1/2018e | | | 1,077,300 | |
| | | | | | | | |
| | | | Total Consumer Non-Cyclical | | | 9,330,665 | |
| | | | | | | | |
| |
| Energy (4.0%) | | | | |
| | | | BP Capital Markets plc | | | | |
| | 325,000 | | | 4.750%, 3/10/2019 | | | 360,985 | |
| | | | Chesapeake Energy Corporation | | | | |
| | 990,000 | | | 9.500%, 2/15/2015f | | | 1,133,550 | |
| | | | Denbury Resources, Inc. | | | | |
| | 1,080,000 | | | 6.375%, 8/15/2021 | | | 1,128,600 | |
| | | | Enbridge Energy Partners, LP | | | | |
| | 900,000 | | | 8.050%, 10/1/2037 | | | 950,942 | |
| | | | Enterprise Products Operating, LLC | | | | |
| | 1,000,000 | | | 7.034%, 1/15/2068 | | | 1,040,000 | |
| | | | Harvest Operations Corporation | | | | |
| | 1,080,000 | | | 6.875%, 10/1/2017e,f | | | 1,117,800 | |
| | | | Linn Energy, LLC | | | | |
| | 1,080,000 | | | 7.750%, 2/1/2021 | | | 1,123,200 | |
| | | | Markwest Energy Partners, LP/Markwest Energy Finance Corporation | | | | |
| | 1,080,000 | | | 6.500%, 8/15/2021 | | | 1,124,550 | |
| | | | Nexen, Inc. | | | | |
| | 325,000 | | | 6.400%, 5/15/2037 | | | 344,259 | |
| | | | Weatherford International, Ltd. | | | | |
| | 390,000 | | | 6.000%, 3/15/2018 | | | 433,927 | |
| | | | | | | | |
| | | | Total Energy | | | 8,757,813 | |
| | | | | | | | |
| |
| Financials (12.4%) | | | | |
| | | | Abbey National Capital Trust I | | | | |
| | 975,000 | | | 8.963%, 12/29/2049i | | | 877,500 | |
| | | | Abbey National Treasury Services plc | | | | |
| | 325,000 | | | 4.000%, 4/27/2016 | | | 291,575 | |
| | | | ABN Amro North American Holding Preferred Capital Repackage Trust I | | | | |
| | 650,000 | | | 6.523%, 12/29/2049e,i | | | 442,813 | |
| | | | Aegon NV | | | | |
| | 600,000 | | | 2.397%, 7/29/2049d,i | | | 258,900 | |
| | | | Ally Financial, Inc. | | | | |
| | 1,080,000 | | | 8.000%, 3/15/2020 | | | 1,107,000 | |
| | | | American Express Company | | | | |
| | 600,000 | | | 6.800%, 9/1/2066 | | | 597,000 | |
| | | | American International Group, Inc. | | | | |
| | 325,000 | | | 8.250%, 8/15/2018 | | | 344,013 | |
| | | | Apollo Investment Corporation, Convertible | | | | |
| | 1,300,000 | | | 5.750%, 1/15/2016e | | | 1,085,500 | |
| | | | Bank of America Corporation | | | | |
| | 975,000 | | | 5.875%, 1/5/2021 | | | 928,031 | |
| | 360,000 | | | 8.000%, 12/29/2049i | | | 322,358 | |
| | | | BB&T Capital Trust IV | | | | |
| | 300,000 | | | 6.820%, 6/12/2057 | | | 301,875 | |
| | | | BBVA International Preferred SA Unipersonal | | | | |
| | 975,000 | | | 5.919%, 12/29/2049h,i | | | 645,480 | |
| | | | BNP Paribas SA | | | | |
| | 163,000 | | | 3.600%, 2/23/2016 | | | 152,890 | |
| | | | CIT Group, Inc. | | | | |
| | 1,080,000 | | | 7.000%, 5/1/2017 | | | 1,080,000 | |
| | | | CNA Financial Corporation | | | | |
| | 600,000 | | | 7.350%, 11/15/2019f | | | 668,700 | |
| | | | Cooperatieve Centrale Raiffeisen-Boerenleenbank BA | | | | |
| | 975,000 | | | 11.000%, 12/29/2049e,i | | | 1,140,750 | |
| | | | Coventry Health Care, Inc. | | | | |
| | 165,000 | | | 5.450%, 6/15/2021 | | | 183,350 | |
| | | | Credit Suisse New York, NY | | | | |
| | 163,000 | | | 4.375%, 8/5/2020 | | | 159,817 | |
| | | | Developers Diversified Realty Corporation | | | | |
| | 490,000 | | | 7.875%, 9/1/2020 | | | 546,621 | |
| | | | Discover Bank | | | | |
| | 600,000 | | | 8.700%, 11/18/2019 | | | 684,111 | |
| | | | Eksportfinans ASA | | | | |
| | 165,000 | | | 2.375%, 5/25/2016 | | | 133,639 | |
| | | | Health Care REIT, Inc. | | | | |
| | 620,000 | | | 6.500%, 3/15/2041 | | | 621,216 | |
| | | | HSBC Finance Corporation | | | | |
| | 465,000 | | | 6.676%, 1/15/2021 | | | 480,995 | |
| | | | Huntington National Bank | | | | |
| | 600,000 | | | 6.600%, 6/15/2018 | | | 647,434 | |
| | | | Icahn Enterprises, LP | | | | |
| | 1,080,000 | | | 8.000%, 1/15/2018 | | | 1,123,200 | |
| | | | ING Bank NV | | | | |
| | 330,000 | | | 5.000%, 6/9/2021e | | | 319,787 | |
| | | | International Lease Finance Corporation | | | | |
| | 1,170,000 | | | 5.750%, 5/15/2016 | | | 1,085,224 | |
| | | | J.P. Morgan Chase & Company | | | | |
| | 330,000 | | | 3.150%, 7/5/2016 | | | 331,544 | |
| | | | J.P. Morgan Chase Capital XX | | | | |
| | 560,000 | | | 6.550%, 9/29/2036 | | | 560,000 | |
| | | | J.P. Morgan Chase Capital XXVII | | | | |
| | 650,000 | | | 7.000%, 11/1/2039 | | | 654,062 | |
| | | | KeyCorp | | | | |
| | 190,000 | | | 5.100%, 3/24/2021 | | | 197,307 | |
| | | | LBG Capital No. 1 plc | | | | |
| | 620,000 | | | 7.875%, 11/1/2020e | | | 469,960 | |
| | | | Lehman Brothers Holdings, Inc. | | | | |
| | 600,000 | | | 7.000%, 9/27/2027j | | | 153,750 | |
The accompanying Notes to Financial Statements are an integral part of this schedule.
22
Diversified Income Plus Fund
Schedule of Investments as of December 31, 2011
| | | | | | | | |
Principal
Amount | | | Long-Term Fixed Income (53.6%) | | Value | |
| Financials (12.4%) - continued | | | | |
| | | | Liberty Mutual Group, Inc. | | | | |
| | $975,000 | | | 10.750%, 6/15/2058e | | $ | 1,223,625 | |
| | | | Lincoln National Corporation | | | | |
| | 870,000 | | | 6.050%, 4/20/2067 | | | 724,275 | |
| | | | Lloyds TSB Bank plc | | | | |
| | 150,000 | | | 6.500%, 9/14/2020e | | | 125,514 | |
| | | | MetLife Capital Trust IV | | | | |
| | 1,050,000 | | | 7.875%, 12/15/2037e | | | 1,089,375 | |
| | | | Morgan Stanley | | | | |
| | 310,000 | | | 5.750%, 1/25/2021 | | | 289,170 | |
| | | | Northern Trust Corporation | | | | |
| | 325,000 | | | 3.375%, 8/23/2021 | | | 333,124 | |
| | | | Prudential Financial, Inc. | | | | |
| | 450,000 | | | 6.200%, 11/15/2040 | | | 470,882 | |
| | | | Regions Bank | | | | |
| | 600,000 | | | 7.500%, 5/15/2018 | | | 594,000 | |
| | | | Reinsurance Group of America, Inc. | | | | |
| | 900,000 | | | 6.750%, 12/15/2065 | | | 780,230 | |
| | | | Santander Holdings USA, Inc. | | | | |
| | 160,000 | | | 4.625%, 4/19/2016 | | | 153,649 | |
| | | | SLM Corporation | | | | |
| | 650,000 | | | 8.000%, 3/25/2020 | | | 656,500 | |
| | | | Swiss RE Capital I, LP | | | | |
| | 580,000 | | | 6.854%, 5/29/2049e,i | | | 492,918 | |
| | | | XL Group plc | | | | |
| | 900,000 | | | 6.500%, 12/29/2049i | | | 704,250 | |
| | | | ZFS Finance USA Trust II | | | | |
| | 850,000 | | | 6.450%, 12/15/2065e | | | 773,500 | |
| | | | | | | | |
| | | | Total Financials | | | 27,007,414 | |
| | | | | | | | |
| |
| Foreign Government (2.7%) | | | | |
| | | | Brazil Government International Bond | | | | |
| | 950,000 | | | 4.875%, 1/22/2021 | | | 1,061,625 | |
| | | | Colombia Government International Bond | | | | |
| | 325,000 | | | 4.375%, 7/12/2021 | | | 349,375 | |
| | | | Mexico Government International Bond | | | | |
| | 975,000 | | | 5.125%, 1/15/2020 | | | 1,113,937 | |
| | | | Panama Government International Bond | | | | |
| | 325,000 | | | 5.200%, 1/30/2020 | | | 368,062 | |
| | | | Peru Government International Bond | | | | |
| | 325,000 | | | 7.125%, 3/30/2019 | | | 408,688 | |
| | | | Philippines Government International Bond | | | | |
| | 650,000 | | | 4.000%, 1/15/2021 | | | 666,250 | |
| | | | Poland Government International Bond | | | | |
| | 330,000 | | | 5.000%, 3/23/2022 | | | 331,650 | |
| | | | Russia Government International Bond | | | | |
| | 650,000 | | | 5.000%, 4/29/2020e | | | 670,573 | |
| | | | Turkey Government International Bond | | | | |
| | 650,000 | | | 5.625%, 3/30/2021 | | | 657,313 | |
| | 300,000 | | | 5.125%, 3/25/2022 | | | 286,500 | |
| | | | | | | | |
| | | | Total Foreign Government | | | 5,913,973 | |
| | | | | | | | |
| |
| Mortgage-Backed Securities (4.0%) | | | | |
| | | | Federal National Mortgage Association Conventional 15- Yr. Pass Through | | | | |
| | 8,450,000 | | | 3.000%, 1/1/2027c | | | 8,725,943 | |
| | | | | | | | |
| | | | Total Mortgage-Backed Securities | | | 8,725,943 | |
| | | | | | | | |
| |
| Technology (0.6%) | | | | |
| | | | Hewlett-Packard Company | | | | |
| | 165,000 | | | 4.650%, 12/9/2021 | | | 174,088 | |
| | | | Seagate HDD Cayman | | | | |
| | 1,080,000 | | | 7.750%, 12/15/2018e | | | 1,148,850 | |
| | | | | | | | |
| | | | Total Technology | | | 1,322,938 | |
| | | | | | | | |
| |
| Transportation (0.8%) | | | | |
| | | | Avis Budget Car Rental, LLC/Avis Budget Finance, Inc. | | | | |
| | 1,080,000 | | | 8.250%, 1/15/2019 | | | 1,071,900 | |
| | | | Burlington Northern Santa Fe, LLC | | | | |
| | 325,000 | | | 3.450%, 9/15/2021 | | | 334,974 | |
| | | | CSX Corporation | | | | |
| | 165,000 | | | 4.750%, 5/30/2042 | | | 170,255 | |
| | | | United Air Lines, Inc. | | | | |
| | 249,553 | | | 10.400%, 11/1/2016 | | | 276,056 | |
| | | | | | | | |
| | | | Total Transportation | | | 1,853,185 | |
| | | | | | | | |
| |
| Utilities (1.4%) | | | | |
| | | | AES Corporation | | | | |
| | 1,080,000 | | | 7.375%, 7/1/2021e | | | 1,163,700 | |
| | | | CenterPoint Energy, Inc. | | | | |
| | 255,000 | | | 6.500%, 5/1/2018 | | | 297,691 | |
| | | | NiSource Finance Corporation | | | | |
| | 650,000 | | | 6.125%, 3/1/2022 | | | 748,321 | |
| | | | Southern Union Company | | | | |
| | 300,000 | | | 3.447%, 11/1/2066d | | | 279,750 | |
| | | | TransCanada PipeLines, Ltd. | | | | |
| | 600,000 | | | 6.350%, 5/15/2067 | | | 602,019 | |
| | | | | | | | |
| | | | Total Utilities | | | 3,091,481 | |
| | | | | | | | |
| | | | Total Long-Term Fixed Income (cost $119,786,262) | | | 116,807,042 | |
| | | | | | | | |
| | |
Shares | | | Common Stock (30.9%) | | | |
| Consumer Discretionary (2.6%) | | | | |
| | 21,900 | | | DIRECTVf,k | | | 936,444 | |
| | 14,900 | | | Gap, Inc. | | | 276,395 | |
| | 13,400 | | | McDonald’s Corporation | | | 1,344,422 | |
| | 10,400 | | | Strayer Education, Inc.h | | | 1,010,776 | |
| | 24,000 | | | TJX Companies, Inc. | | | 1,549,200 | |
| | 10,000 | | | Weight Watchers International, Inc. | | | 550,100 | |
| | | | | | | | |
| | | | Total Consumer Discretionary | | | 5,667,337 | |
| | | | | | | | |
| |
| Consumer Staples (3.2%) | | | | |
| | 12,100 | | | Coca-Cola Company | | | 846,637 | |
| | 7,000 | | | Colgate-Palmolive Company | | | 646,730 | |
| | 13,000 | | | Dr. Pepper Snapple Group, Inc. | | | 513,240 | |
| | 4,300 | | | Herbalife, Ltd. | | | 222,181 | |
| | 10,000 | | | Kimberly-Clark Corporation | | | 735,600 | |
| | 2,100 | | | Lorillard, Inc. | | | 239,400 | |
The accompanying Notes to Financial Statements are an integral part of this schedule.
23
Diversified Income Plus Fund
Schedule of Investments as of December 31, 2011
| | | | | | | | |
Shares | | | Common Stock (30.9%) | | Value | |
| Consumer Staples (3.2%) - continued | | | | |
| | 12,700 | | | PepsiCo, Inc. | | $ | 842,645 | |
| | 13,300 | | | Philip Morris International, Inc. | | | 1,043,784 | |
| | 4,340 | | | Procter & Gamble Company | | | 289,522 | |
| | 7,000 | | | Walgreen Company | | | 231,420 | |
| | 22,600 | | | Wal-Mart Stores, Inc. | | | 1,350,576 | |
| | | | | | | | |
| | | | Total Consumer Staples | | | 6,961,735 | |
| | | | | | | | |
| |
| | Energy (3.7%) | | | | |
| | 12,000 | | | Chevron Corporation | | | 1,276,800 | |
| | 200 | | | CNOOC, Ltd. ADR | | | 34,936 | |
| | 12,500 | | | ConocoPhillips | | | 910,875 | |
| | 6,100 | | | Core Laboratories NVh | | | 695,095 | |
| | 16,400 | | | Ecopetrol SA ADRh | | | 730,128 | |
| | 5,200 | | | Energen Corporation | | | 260,000 | |
| | 37,000 | | | Energy Income and Growth Fundf | | | 1,045,250 | |
| | 3,300 | | | Exxon Mobil Corporation | | | 279,708 | |
| | 59,200 | | | Marathon Oil Corporation | | | 1,732,784 | |
| | 6,800 | | | Marathon Petroleum Corporation | | | 226,372 | |
| | 4,600 | | | Murphy Oil Corporation | | | 256,404 | |
| | 4,100 | | | Occidental Petroleum Corporation | | | 384,170 | |
| | 15,500 | | | W&T Offshore, Inc. | | | 328,755 | |
| | | | | | | | |
| | | | Total Energy | | | 8,161,277 | |
| | | | | | | | |
| |
| | Financials (8.3%) | | | | |
| | 20,700 | | | Aflac, Inc. | | | 895,482 | |
| | 11,900 | | | Allstate Corporation | | | 326,179 | |
| | 6,900 | | | Ameriprise Financial, Inc. | | | 342,516 | |
| | 11,411 | | | Annaly Capital Management, Inc. | | | 182,120 | |
| | 142,000 | | | Anworth Mortgage Asset Corporation | | | 891,760 | |
| | 116,500 | | | Ares Capital Corporation | | | 1,799,925 | |
| | 9,200 | | | Axis Capital Holdings, Ltd. | | | 294,032 | |
| | 38,010 | | | Commerce Bancshares, Inc. | | | 1,448,941 | |
| | 2,400 | | | Goldman Sachs Group, Inc. | | | 217,032 | |
| | 50,750 | | | Invesco Mortgage Capital, Inc. | | | 713,037 | |
| | 32,500 | | | iPath S&P 500 VIX Short-Term Futures ETNh,k | | | 1,154,725 | |
| | 53,000 | | | iShares MSCI Emerging Markets Index Fund | | | 2,010,820 | |
| | 75,600 | | | MFA Financial, Inc. | | | 508,032 | |
| | 13,500 | | | Montpelier Re Holdings, Inc. | | | 239,625 | |
| | 84,500 | | | NFJ Dividend Interest & Premium Strategy Fundh | | | 1,353,690 | |
| | 69,500 | | | Solar Capital, Ltd. | | | 1,535,255 | |
| | 6,800 | | | Travelers Companies, Inc. | | | 402,356 | |
| | 93,100 | | | Two Harbors Investment Corporation | | | 860,244 | |
| | 16,800 | | | U.S. Bancorp | | | 454,440 | |
| | 13,700 | | | Validus Holdings, Ltd. | | | 431,550 | |
| | 29,200 | | | Wells Fargo & Company | | | 804,752 | |
| | 64,000 | | | Western Asset Emerging Markets Debt Fund, Inc. | | | 1,209,600 | |
| | | | | | | | |
| | | | Total Financials | | | 18,076,113 | |
| | | | | | | | |
| |
| | Health Care (3.2%) | | | | |
| | 18,600 | | | Abbott Laboratories | | | 1,045,878 | |
| | 2,300 | | | AstraZeneca plc ADR | | | 106,467 | |
| | 29,500 | | | Forest Laboratories, Inc.k | | | 892,670 | |
| | 10,500 | | | Johnson & Johnson | | | 688,590 | |
| | 29,500 | | | Medtronic, Inc. | | | 1,128,375 | |
| | 11,400 | | | Novo Nordisk A/S ADR | | | 1,313,964 | |
| | 117,000 | | | PDL BioPharma, Inc. | | | 725,400 | |
| | 40,028 | | | Pfizer, Inc. | | | 866,206 | |
| | 5,400 | | | UnitedHealth Group, Inc. | | | 273,672 | |
| | | | | | | | |
| | | | Total Health Care | | | 7,041,222 | |
| | | | | | | | |
| |
| | Industrials (3.1%) | | | | |
| | 6,000 | | | 3M Company | | | 490,380 | |
| | 140,500 | | | Alerian MLP ETFh | | | 2,335,110 | |
| | 10,800 | | | Allegiant Travel Companyk | | | 576,072 | |
| | 5,700 | | | Caterpillar, Inc. | | | 516,420 | |
| | 4,100 | | | Dun & Bradstreet Corporation | | | 306,803 | |
| | 11,000 | | | Emerson Electric Company | | | 512,490 | |
| | 8,000 | | | KBR, Inc. | | | 222,960 | |
| | 36,500 | | | Knight Transportation, Inc. | | | 570,860 | |
| | 17,400 | | | Nordson Corporation | | | 716,532 | |
| | 29,600 | | | Southwest Airlines Company | | | 253,376 | |
| | 7,000 | | | Verisk Analytics, Inc.k | | | 280,910 | |
| | | | | | | | |
| | | | Total Industrials | | | 6,781,913 | |
| | | | | | | | |
| |
| | Information Technology (2.8%) | | | | |
| | 22,200 | | | Accenture plc | | | 1,181,706 | |
| | 12,500 | | | BMC Software, Inc.k | | | 409,750 | |
| | 15,900 | | | Cisco Systems, Inc. | | | 287,472 | |
| | 30,000 | | | Intel Corporation | | | 727,500 | |
| | 5,800 | | | International Business Machines Corporation | | | 1,066,504 | |
| | 16,200 | | | Lender Processing Services, Inc. | | | 244,134 | |
| | 8,500 | | | Linear Technology Corporation | | | 255,255 | |
| | 1,700 | | | MasterCard, Inc. | | | 633,794 | |
| | 36,200 | | | Microsoft Corporation | | | 939,752 | |
| | 19,200 | | | Teradyne, Inc.k | | | 261,696 | |
| | | | | | | | |
| | | | Total Information Technology | | | 6,007,563 | |
| | | | | | | | |
| |
| | Materials (1.0%) | | | | |
| | 12,500 | | | E.I. du Pont de Nemours and Company | | | 572,250 | |
| | 7,400 | | | LyondellBasell Industries NV | | | 240,426 | |
| | 6,600 | | | Newmont Mining Corporation | | | 396,066 | |
| | 7,300 | | | Southern Copper Corporation | | | 220,314 | |
| | 33,100 | | | Vale SA SP ADR | | | 709,995 | |
| | | | | | | | |
| | | | Total Materials | | | 2,139,051 | |
| | | | | | | | |
| |
| | Telecommunications Services (1.5%) | | | | |
| | 24,000 | | | AT&T, Inc. | | | 725,760 | |
| | 21,600 | | | Nippon Telegraph & Telephone Corporation ADR | | | 547,128 | |
| | 21,100 | | | NTT DOCOMO, INC. ADRh | | | 387,185 | |
| | 5,000 | | | Philippine Long Distance Telephone Company ADR | | | 288,100 | |
| | 8,645 | | | Telefonica Brasil SA ADR | | | 236,268 | |
| | 27,900 | | | Verizon Communications, Inc. | | | 1,119,348 | |
| | | | | | | | |
| | | | Total Telecommunications Services | | | 3,303,789 | |
| | | | | | | | |
| |
| | Utilities (1.5%) | | | | |
| | 13,900 | | | Empire District Electric Company | | | 293,151 | |
| | 43,400 | | | Enersis SA ADR | | | 765,142 | |
| | 7,300 | | | Laclede Group, Inc. | | | 295,431 | |
| | 74,800 | | | Questar Corporation | | | 1,485,528 | |
| | 7,300 | | | Southern Company | | | 337,917 | |
| | | | | | | | |
| | | | Total Utilities | | | 3,177,169 | |
| | | | | | | | |
| | | | Total Common Stock (cost $66,961,093) | | | 67,317,169 | |
| | | | | | | | |
The accompanying Notes to Financial Statements are an integral part of this schedule.
24
Diversified Income Plus Fund
Schedule of Investments as of December 31, 2011
| | | | | | | | |
Shares | | | Preferred Stock (0.2%) | | Value | |
| Financials (0.2%) | | | | |
| | 19,200 | | | Citigroup Capital XII, 8.500% | | $ | 483,072 | |
| | | | | | | | |
| | | | Total Financials | | | 483,072 | |
| | | | | | | | |
| | | | Total Preferred Stock (cost $508,800) | | | 483,072 | |
| | | | | | | | |
| | |
| | | | Collateral Held for Securities Loaned (3.5%) | | | |
| | 7,698,775 | | | Thrivent Financial Securities Lending Trust | | | 7,698,775 | |
| | | | | | | | |
| | | | Total Collateral Held for Securities Loaned (cost $7,698,775) | | | 7,698,775 | |
| | | | | | | | |
| | |
Principal
Amount | | | Short-Term Investments (9.0%)l | | | |
| | | | Federal Home Loan Bank Discount Notes | | | | |
| $ | 5,000,000 | | | 0.015%, 1/20/2012m | | | 4,999,960 | |
| | 9,000,000 | | | 0.010%, 2/22/2012m | | | 8,999,870 | |
| | 3,000,000 | | | 0.015%, 3/7/2012m | | | 2,999,918 | |
| | | | Federal Home Loan Mortgage Corporation Discount Notes | | | | |
| | 400,000 | | | 0.010%, 2/23/2012m | | | 399,994 | |
| | | | Federal National Mortgage Association Discount Notes | | | | |
| | 2,100,000 | | | 0.105%, 2/22/2012m,n | | | 2,099,686 | |
| | | | | | | | |
| | | | Total Short-Term Investments (at amortized cost) | | | 19,499,428 | |
| | | | | | | | |
| | | | Total Investments (cost $229,059,994) 104.0% | | $ | 226,518,987 | |
| | | | | | | | |
| | | | Other Assets and Liabilities, Net (4.0%) | | | (8,627,485) | |
| | | | | | | | |
| | | | Total Net Assets 100.0% | | $ | 217,891,502 | |
| | | | | | | | |
| a | The stated interest rate represents the weighted average of all contracts within the bank loan facility. |
| b | All or a portion of the loan is unfunded. |
| c | Denotes investments purchased on a when-issued or delayed delivery basis. |
| d | Denotes variable rate securities. Variable rate securities are securities whose yields vary with a designated market index or market rate. The rate shown is as of December 31, 2011. |
| e | Denotes securities sold under Rule 144A of the Securities Act of 1933, which exempts them from registration. These securities have been deemed liquid and may be resold to other dealers in the program or to other qualified institutional buyers. As of December 31, 2011, the value of these investments was $25,049,040 or 11.5% of total net assets. |
| f | All or a portion of the security was earmarked to cover written options. |
| g | Denotes restricted securities. Restricted securities are investment securities which have been deemed illiquid and cannot be offered for public sale without first being registered under the Securities Act of 1933. The following table indicates the acquisition date and cost of restricted securities Diversified Income Plus Fund owned as of December 31, 2011. |
| | | | | | | | |
Security | | Acquisition
Date | | | Cost | |
Wachovia Bank Commercial Mortgage Trust | | | 4/25/2007 | | | $ | 1,576,098 | |
| h | All or a portion of the security is on loan. |
| i | Denotes perpetual securities. Perpetual securities pay an indefinite stream of interest, but may be called by the issuer at an earlier date. |
| j | In bankruptcy. Interest is not being accrued. |
| k | Non-income producing security. |
| l | The interest rate shown reflects the yield, coupon rate or the discount rate at the date of purchase. |
| m | Denotes investments that benefit from credit enhancement or liquidity support provided by a third party bank, institution or government. |
| n | At December 31, 2011, $2,099,686 of investments were held on deposit with the counterparty and pledged as the initial margin deposit for open futures contracts. |
Definitions:
| | | | |
| ADR | | - | | American Depositary Receipt, which are certificates for an underlying foreign security’s shares held by an issuing U.S. depository bank. |
| REIT | | - | | Real Estate Investment Trust is a company that buys, develops, manages and/or sells real estate assets. |
| ETF | | - | | Exchange Traded Fund. |
| ETN | | - | | Exchange Traded Note. |
Unrealized Appreciation (Depreciation)
Gross unrealized appreciation and depreciation of investments, based on cost for federal income tax purposes, were as follows:
| | | | |
Gross unrealized appreciation | | $ | 8,534,538 | |
Gross unrealized depreciation | | | (11,506,026 | ) |
| | | | |
Net unrealized appreciation (depreciation) | | ($ | 2,971,488 | ) |
| |
Cost for federal income tax purposes | | $ | 229,490,475 | |
The accompanying Notes to Financial Statements are an integral part of this schedule.
25
Diversified Income Plus Fund
Schedule of Investments as of December 31, 2011
Fair Valuation Measurements
The following table is a summary of the inputs used, as of December 31, 2011, in valuing Diversified Income Plus Fund’s assets carried at fair value.
| | | | | | | | | | | | | | | | |
Investments in Securities | | Total | | | Level 1 | | | Level 2 | | | Level 3 | |
Bank Loans | | | | | | | | | | | | | | | | |
Capital Goods | | | 940,389 | | | | — | | | | 940,389 | | | | — | |
Communications Services | | | 3,762,224 | | | | — | | | | 3,762,224 | | | | — | |
Consumer Cyclical | | | 916,041 | | | | — | | | | 916,041 | | | | — | |
Consumer Non-Cyclical | | | 1,790,602 | | | | — | | | | 1,790,602 | | | | — | |
Energy | | | 953,468 | | | | — | | | | 953,468 | | | | — | |
Financials | | | 1,781,852 | | | | — | | | | 1,781,852 | | | | — | |
Technology | | | 2,705,492 | | | | — | | | | 2,705,492 | | | | — | |
Transportation | | | 914,343 | | | | — | | | | 914,343 | | | | — | |
Utilities | | | 949,090 | | | | — | | | | 949,090 | | | | — | |
Long-Term Fixed Income | | | | | | | | | | | | | | | | |
Asset-Backed Securities | | | 3,827,810 | | | | — | | | | 3,827,810 | | | | — | |
Basic Materials | | | 4,598,434 | | | | — | | | | 4,598,434 | | | | — | |
Capital Goods | | | 3,615,054 | | | | — | | | | 3,615,054 | | | | — | |
Collateralized Mortgage Obligations | | | 11,250,690 | | | | — | | | | 11,250,690 | | | | — | |
Commercial Mortgage-Backed Securities | | | 6,409,465 | | | | — | | | | 6,409,465 | | | | — | |
Communications Services | | | 10,924,236 | | | | — | | | | 10,924,236 | | | | — | |
Consumer Cyclical | | | 10,177,941 | | | | — | | | | 10,177,941 | | | | — | |
Consumer Non-Cyclical | | | 9,330,665 | | | | — | | | | 9,330,665 | | | | — | |
Energy | | | 8,757,813 | | | | — | | | | 8,757,813 | | | | — | |
Financials | | | 27,007,414 | | | | — | | | | 27,007,414 | | | | — | |
Foreign Government | | | 5,913,973 | | | | — | | | | 5,913,973 | | | | — | |
Mortgage-Backed Securities | | | 8,725,943 | | | | — | | | | 8,725,943 | | | | — | |
Technology | | | 1,322,938 | | | | — | | | | 1,322,938 | | | | — | |
Transportation | | | 1,853,185 | | | | — | | | | 1,577,129 | | | | 276,056 | |
Utilities | | | 3,091,481 | | | | — | | | | 3,091,481 | | | | — | |
Common Stock | | | | | | | | | | | | | | | | |
Consumer Discretionary | | | 5,667,337 | | | | 5,667,337 | | | | — | | | | — | |
Consumer Staples | | | 6,961,735 | | | | 6,961,735 | | | | — | | | | — | |
Energy | | | 8,161,277 | | | | 8,161,277 | | | | — | | | | — | |
Financials | | | 18,076,113 | | | | 18,076,113 | | | | — | | | | — | |
Health Care | | | 7,041,222 | | | | 7,041,222 | | | | — | | | | — | |
Industrials | | | 6,781,913 | | | | 6,781,913 | | | | — | | | | — | |
Information Technology | | | 6,007,563 | | | | 6,007,563 | | | | — | | | | — | |
Materials | | | 2,139,051 | | | | 2,139,051 | | | | — | | | | — | |
Telecommunications Services | | | 3,303,789 | | | | 3,303,789 | | | | — | | | | — | |
Utilities | | | 3,177,169 | | | | 3,177,169 | | | | — | | | | — | |
Preferred Stock | | | | | | | | | | | | | | | | |
Financials | | | 483,072 | | | | 483,072 | | | | — | | | | — | |
Collateral Held for Securities Loaned | | | 7,698,775 | | | | 7,698,775 | | | | — | | | | — | |
Short-Term Investments | | | 19,499,428 | | | | — | | | | 19,499,428 | | | | — | |
| | | | | | | | | | | | | | | | |
Total | | $ | 226,518,987 | | | $ | 75,499,016 | | | $ | 150,743,915 | | | $ | 276,056 | |
| | | | | | | | | | | | | | | | |
| | | | |
Other Financial Instruments | | Total | | | Level 1 | | | Level 2 | | | Level 3 | |
Asset Derivatives | | | | | | | | | | | | | | | | |
Futures Contracts | | | 175,536 | | | | 175,536 | | | | — | | | | — | |
| | | | | | | | | | | | | | | | |
Total Asset Derivatives | | $ | 175,536 | | | $ | 175,536 | | | $ | — | | | $ | — | |
| | | | | | | | | | | | | | | | |
Liability Derivatives | | | | | | | | | | | | | | | | |
Futures Contracts | | | 59,962 | | | | 59,962 | | | | — | | | | — | |
Call Options Written | | | 28,200 | | | | 28,200 | | | | — | | | | — | |
| | | | | | | | | | | | | | | | |
Total Liability Derivatives | | $ | 88,162 | | | $ | 88,162 | | | $ | — | | | $ | — | |
| | | | | | | | | | | | | | | | |
The accompanying Notes to Financial Statements are an integral part of this schedule.
26
Diversified Income Plus Fund
Schedule of Investments as of December 31, 2011
The following table is a reconciliation of assets in which significant unobservable inputs (Level 3) were used in determining fair value for Diversified Income Plus Fund as discussed in item 2(A) of the Notes to Financial Statements.
| | | | | | | | | | | | | | | | | | | | | | | | | | | | | | | | |
Investments in Securities | | Value
December 31, 2010 | | | Realized
Gain/(Loss) | | | Change in
Unrealized
Appreciation/
(Depreciation)* | | | Purchases | | | Sales | | | Transfers
Into
Level 3 | | | Transfers
Out of
Level 3 | | | Value
December 31, 2011 | |
Long-Term Fixed Income | | | | | | | | | | | | | | | | | | | | | | | | | | | | | | | | |
Transportation | | | 648,689 | | | | 27,705 | | | | (34,194 | ) | | | 279,500 | | | | (645,644 | ) | | | — | | | | — | | | | 276,056 | |
| | | | | | | | | | | | | | | | | | | | | | | | | | | | | | | | |
Total | | $ | 648,689 | | | $ | 27,705 | | | | ($34,194 | ) | | $ | 279,500 | | | | ($645,644 | ) | | $ | — | | | $ | — | | | $ | 276,056 | |
| | | | | | | | | | | | | | | | | | | | | | | | | | | | | | | | |
| * | Includes the change in net unrealized appreciation/(depreciation) on level 3 securities held on December 31, 2011 of ($2,531). |
| | | | | | | | | | | | | | | | | | | | |
Futures Contracts | | Number of
Contracts
Long/(Short) | | | Expiration Date | | | Notional
Principal
Amount | | | Value | | | Unrealized
Gain/(Loss) | |
5-Yr. U.S. Treasury Note Futures | | | 39 | | | | March 2012 | | | $ | 4,789,806 | | | $ | 4,807,054 | | | $ | 17,248 | |
10-Yr. U.S. Treasury Note Futures | | | (10 | ) | | | March 2012 | | | | (1,290,516 | ) | | | (1,311,250 | ) | | | (20,734 | ) |
S&P 500 Index Futures | | | (7 | ) | | | March 2012 | | | | (2,152,822 | ) | | | (2,192,050 | ) | | | (39,228 | ) |
S&P 500 Index Mini-Futures | | | 140 | | | | March 2012 | | | | 8,609,913 | | | | 8,768,201 | | | | 158,288 | |
Total Futures Contracts | | | | | | | | | | | | | | | | | | $ | 115,574 | |
| | | | | |
Call Options Written | | Number of
Contracts | | | Exercise Price | | | Expiration
Date | | | Value | | | Unrealized
Gain/(Loss) | |
S&P 500 Mini-Futures Call Option | | | 40 | | | $ | 1,265.00 | | | | January 2012 | | | | ($35,200 | ) | | | ($10,800 | ) |
S&P 500 Mini-Futures Call Option | | | 80 | | | | 1,270.00 | | | | January 2012 | | | | (61,200 | ) | | | (17,400 | ) |
Total Call Options Written | | | | | | | | | | | | | | | ($96,400 | ) | | | ($28,200 | ) |
The following table summarizes the fair value and Statement of Assets and Liabilities location, as of December 31, 2011, for Diversified Income Plus Fund’s investments in financial derivative instruments by primary risk exposure as discussed under item (2) Significant Accounting Policies of the Notes to Financial Statements.
| | | | | | |
Derivatives by risk category | | Statement of Assets and Liabilities Location | | Fair Value | |
Asset Derivatives | | | | | | |
Interest Rate Contracts | | | | | | |
Futures* | | Net Assets - Net unrealized appreciation/(depreciation) on Futures contracts | | | 17,248 | |
Total Interest Rate Contracts | | | | | 17,248 | |
Equity Contracts | | | | | | |
Futures* | | Net Assets - Net unrealized appreciation/(depreciation) on Futures contracts | | | 158,288 | |
Total Equity Contracts | | | | | 158,288 | |
| | | | | | |
Total Asset Derivatives | | | | $ | 175,536 | |
| | | | | | |
Liability Derivatives | | | | | | |
Equity Contracts | | | | | | |
Options Written | | Net Assets - Net unrealized appreciation/(depreciation) on Written option contracts | | | 28,200 | |
Futures* | | Net Assets - Net unrealized appreciation/(depreciation) on Futures contracts | | | 39,228 | |
Total Equity Contracts | | | | | 67,428 | |
Interest Rate Contracts | | | | | | |
Futures* | | Net Assets - Net unrealized appreciation/(depreciation) on Futures contracts | | | 20,734 | |
Total Interest Rate Contracts | | | | | 20,734 | |
| | | | | | |
Total Liability Derivatives | | | | $ | 88,162 | |
| | | | | | |
| * | Includes cumulative appreciation/depreciation of futures contracts as reported in the Schedule of Investments. Only current day’s variation margin is reported within the Statement of Assets and Liabilities. |
The accompanying Notes to Financial Statements are an integral part of this schedule.
27
Diversified Income Plus Fund
Schedule of Investments as of December 31, 2011
The following table summarizes the net realized gains/(losses) and Statement of Operations location, for the period ended December 31, 2011, for Diversified Income Plus Fund’s investments in financial derivative instruments by primary risk exposure.
| | | | | | |
Derivatives by risk category | | Statement of Operations Location | | Realized Gains/(Losses)
recognized in Income | |
Equity Contracts | | | | | | |
Options Written | | Net realized gains/(losses) on Written option contracts | | | (170,143 | ) |
Futures | | Net realized gains/(losses) on Futures contracts | | | (675,295 | ) |
Total Equity Contracts | | | | | (845,438 | ) |
Foreign Exchange Contracts | | | | | | |
Forward Contracts | | Net realized gains/(losses) on Foreign currency transactions | | | (2,721 | ) |
Total Foreign Exchange Contracts | | | | | (2,721 | ) |
Interest Rate Contracts | | | | | | |
Futures | | Net realized gains/(losses) on Futures contracts | | | 165,523 | |
Total Interest Rate Contracts | | | | | 165,523 | |
Credit Contracts | | | | | | |
Credit Default Swaps | | Net realized gains/(losses) on Swap agreements | | | (434,682 | ) |
Total Credit Contracts | | | | | (434,682 | ) |
| | | | | | |
Total | | | | | ($1,117,318 | ) |
| | | | | | |
The following table summarizes the change in net unrealized appreciation/(depreciation) and Statement of Operations location, for the period ended December 31, 2011, for Diversified Income Plus Fund’s investments in financial derivative instruments by primary risk exposure.
| | | | | | |
Derivatives by risk category | | Statement of Operations Location | | Change in unrealized
appreciation/(depreciation)
recognized in Income | |
Equity Contracts | | | | | | |
Options Written | | Change in net unrealized appreciation/(depreciation) on Written option contracts | | | (29,638 | ) |
Futures | | Change in net unrealized appreciation/(depreciation) on Futures contracts | | | (15,661 | ) |
Total Equity Contracts | | | | | (45,299 | ) |
Interest Rate Contracts | | | | | | |
Futures | | Change in net unrealized appreciation/(depreciation) on Futures contracts | | | 32,421 | |
Total Interest Rate Contracts | | | | | 32,421 | |
Credit Contracts | | | | | | |
Credit Default Swaps | | Change in net unrealized appreciation/(depreciation) on Swap agreements | | | 510,033 | |
Total Credit Contracts | | | | | 510,033 | |
| | | | | | |
Total | | | | $ | 497,155 | |
| | | | | | |
The following table presents Diversified Income Plus Fund’s average volume of derivative activity during the period ended December 31, 2011.
| | | | | | | | | | | | | | | | | | | | | | | | | | | | |
Derivative Risk Category | | Futures
(Notional*) | | | Futures
(Percentage of
Average Net Assets) | | | Forwards
(Notional*) | | | Forwards
(Percentage
of Average
Net Assets) | | | Swaps
(Notional*) | | | Swaps
(Percentage of
Average Net Assets) | | | Options
(Contracts) | |
Equity Contracts | | $ | 17,152,782 | | | | 8.4 | % | | | N/A | | | | N/A | | | | N/A | | | | N/A | | | | 47 | |
Interest Rate Contracts | | | 5,969,497 | | | | 2.9 | | | | N/A | | | | N/A | | | | N/A | | | | N/A | | | | N/A | |
Foreign Exchange Contracts | | | N/A | | | | N/A | | | $ | 689 | | | | <0.1 | % | | | N/A | | | | N/A | | | | N/A | |
Credit Contracts | | | N/A | | | | N/A | | | | N/A | | | | N/A | | | $ | 5,728,585 | | | | 2.8 | % | | | N/A | |
| * | Notional amount represents long or short, or both, derivative positions held by the fund. |
The accompanying Notes to Financial Statements are an integral part of this schedule.
28
Diversified Income Plus Fund
Schedule of Investments as of December 31, 2011
Investment in Affiliates
Affiliated issuers, as defined under the Investment Company Act of 1940, include those in which the Fund’s holdings of an issuer represent 5% or more of the outstanding voting securities of an issuer, or any affiliated mutual fund.
A summary of transactions for the fiscal year to date, in Diversified Income Plus Fund, is as follows:
| | | | | | | | | | | | | | | | | | | | | | | | |
Fund | | Value
December 31, 2010 | | | Gross
Purchases | | | Gross
Sales | | | Shares Held at
December 31, 2011 | | | Value
December 31, 2011 | | | Income Earned
January 1, 2011 -
December 31, 2011 | |
High Yield | | $ | 2,246,684 | | | $ | — | | | $ | 2,293,103 | | | | — | | | $ | — | | | $ | 73,488 | |
Thrivent Financial Securities Lending Trust | | | 9,448,870 | | | | 106,087,710 | | | | 107,837,805 | | | | 7,698,775 | | | | 7,698,775 | | | | 57,670 | |
Total Value and Income Earned | | | 11,695,554 | | | | | | | | | | | | | | | | 7,698,775 | | | | 131,158 | |
The accompanying Notes to Financial Statements are an integral part of this schedule.
29
Thrivent Mutual Funds
Statement of Assets and Liabilities
| | | | | | | | | | | | |
As of December 31, 2011 | | Natural
Resources Fund | | | Equity Income
Plus Fund | | | Diversified
Income Plus
Fund | |
Assets | | | | | | | | | | | | |
Investments at cost | | $ | 97,821,837 | | | $ | 47,588,724 | | | $ | 229,059,994 | |
Investments in securities at value | | | 106,975,862 | | | | 47,661,887 | | | | 218,820,212 | |
Investments in affiliates at value | | | 535,500 | | | | — | | | | 7,698,775 | |
Investments at Value | | | 107,511,362 | | | | 47,661,887 | | | | 226,518,987 | |
Cash | | | 5,191,566 | | | | 3,808,051 | | | | 6,978,371 | |
Dividends and interest receivable | | | 81,658 | | | | 88,446 | | | | 1,866,326 | |
Prepaid expenses | | | 9,255 | | | | 24,256 | | | | 24,884 | |
Receivable for investments sold | | | — | | | | — | | | | 8,272 | |
Receivable for fund shares sold | | | 82,191 | | | | 160,935 | | | | 189,356 | |
Receivable for variation margin | | | — | | | | — | | | | 15,103 | |
Total Assets | | | 112,876,032 | | | | 51,743,575 | | | | 235,601,299 | |
Liabilities | | | | | | | | | | | | |
Accrued expenses | | | 22,626 | | | | 16,386 | | | | 71,254 | |
Payable for investments purchased | | | — | | | | — | | | | 9,610,396 | |
Payable upon return of collateral for securities loaned | | | 535,500 | | | | — | | | | 7,698,775 | |
Payable for fund shares redeemed | | | 3 | | | | 5,111 | | | | 43,056 | |
Open options written, at value | | | — | | | | 150,648 | | | | 96,400 | |
Payable for variation margin | | | — | | | | 20,383 | | | | 36,395 | |
Payable to affiliate | | | 82,783 | | | | 27,175 | | | | 148,221 | |
Mortgage dollar roll deferred revenue | | | — | | | | — | | | | 5,300 | |
Total Liabilities | | | 640,912 | | | | 219,703 | | | | 17,709,797 | |
Net Assets | | | | | | | | | | | | |
Capital stock (beneficial interest) | | | 119,811,508 | | | | 55,021,615 | | | | 238,543,724 | |
Accumulated undistributed net investment income/(loss) | | | (13,601 | ) | | | (7,272 | ) | | | 200,238 | |
Accumulated undistributed net realized gain/(loss) | | | (17,252,107 | ) | | | (3,609,757 | ) | | | (18,398,827 | ) |
Net unrealized appreciation/(depreciation) on: | | | | | | | | | | | | |
Investments | | | 9,689,525 | | | | 73,163 | | | | (2,541,007 | ) |
Written option contracts | | | — | | | | (49,715 | ) | | | (28,200 | ) |
Futures contracts | | | — | | | | 95,838 | | | | 115,574 | |
Foreign currency transactions | | | (205 | ) | | | — | | | | — | |
Total Net Assets | | $ | 112,235,120 | | | $ | 51,523,872 | | | $ | 217,891,502 | |
Class A Share Capital | | $ | 15,405,556 | | | $ | 20,968,768 | | | $ | 200,488,524 | |
Shares of beneficial interest outstanding (Class A) | | | 1,609,868 | | | | 2,410,973 | | | | 32,207,327 | |
Net asset value per share | | $ | 9.57 | | | $ | 8.70 | | | $ | 6.22 | |
Maximum public offering price | | $ | 10.13 | | | $ | 9.21 | | | $ | 6.51 | |
Institutional Class Share Capital | | $ | 96,829,564 | | | $ | 30,555,104 | | | $ | 17,402,978 | |
Shares of beneficial interest outstanding (Institutional Class) | | | 10,115,035 | | | | 3,509,954 | | | | 2,811,390 | |
Net asset value per share | | $ | 9.57 | | | $ | 8.71 | | | $ | 6.19 | |
The accompanying Notes to Financial Statements are an integral part of this schedule.
30
Thrivent Mutual Funds
Statement of Operations
| | | | | | | | | | | | |
For the year ended December 31, 2011 | | Natural
Resources Fund | | | Equity Income
Plus Fund | | | Diversified
Income Plus
Fund | |
Investment Income | | | | | | | | | | | | |
Dividends | | $ | 2,430,077 | | | $ | 1,102,898 | | | $ | 2,903,266 | |
Taxable interest | | | 3,533 | | | | 203,130 | | | | 7,722,614 | |
Income from mortgage dollar rolls | | | — | | | | — | | | | 24,356 | |
Income from securities loaned | | | 14,522 | | | | — | | | | 57,670 | |
Income from affiliated investments | | | — | | | | — | | | | 73,488 | |
Foreign tax withholding | | | (6,226 | ) | | | (16,992 | ) | | | (41,771 | ) |
Total Investment Income | | | 2,441,906 | | | | 1,289,036 | | | | 10,739,623 | |
Expenses | | | | | | | | | | | | |
Adviser fees | | | 932,538 | | | | 321,583 | | | | 1,122,911 | |
Administrative service fees | | | 93,313 | | | | 79,895 | | | | 110,833 | |
Audit and legal fees | | | 20,298 | | | | 18,742 | | | | 21,370 | |
Custody fees | | | 10,509 | | | | 11,816 | | | | 23,002 | |
Distribution expenses Class A | | | 39,338 | | | | 46,963 | | | | 478,949 | |
Insurance expenses | | | 3,877 | | | | 3,477 | | | | 4,359 | |
Printing and postage expenses Class A | | | 18,086 | | | | 11,763 | | | | 68,840 | |
Printing and postage expenses Institutional Class | | | 894 | | | | 572 | | | | 1,875 | |
SEC and state registration expenses | | | 19,758 | | | | 9,211 | | | | 24,639 | |
Transfer agent fees Class A | | | 62,214 | | | | 41,539 | | | | 222,090 | |
Transfer agent fees Institutional Class | | | 762 | | | | 1,407 | | | | 8,325 | |
Trustees’ fees | | | 8,733 | | | | 4,630 | | | | 12,560 | |
Other expenses | | | 10,302 | | | | 12,572 | | | | 18,462 | |
Total Expenses Before Reimbursement | | | 1,220,622 | | | | 564,170 | | | | 2,118,215 | |
Less: | | | | | | | | | | | | |
Reimbursement from adviser | | | (63,520 | ) | | | (101,678 | ) | | | (167,805 | ) |
Custody earnings credit | | | (208 | ) | | | (760 | ) | | | (308 | ) |
Total Net Expenses | | | 1,156,894 | | | | 461,732 | | | | 1,950,102 | |
Net Investment Income/(Loss) | | | 1,285,012 | | | | 827,304 | | | | 8,789,521 | |
Realized and Unrealized Gains/(Losses) | | | | | | | | | | | | |
Net realized gains/(losses) on: | | | | | | | | | | | | |
Investments | | | (2,037,646 | ) | | | 1,308,182 | | | | 5,344,625 | |
Affiliated investments | | | — | | | | — | | | | 543,104 | |
Written option contracts | | | — | | | | (79,637 | ) | | | (170,143 | ) |
Futures contracts | | | — | | | | (78,420 | ) | | | (509,772 | ) |
Foreign currency transactions | | | — | | | | — | | | | (2,529 | ) |
Swap agreements | | | — | | | | — | | | | (434,682 | ) |
Change in net unrealized appreciation/(depreciation) on: | | | | | | | | | | | | |
Investments | | | 1,908,101 | | | | (3,547,160 | ) | | | (10,307,590 | ) |
Affiliated investments | | | — | | | | — | | | | (496,684 | ) |
Written option contracts | | | — | | | | (50,578 | ) | | | (29,638 | ) |
Futures contracts | | | — | | | | 19,343 | | | | 16,760 | |
Foreign currency transactions | | | (21 | ) | | | — | | | | — | |
Swap agreements | | | — | | | | — | | | | 510,033 | |
Net Realized and Unrealized Gains/(Losses) | | | (129,566 | ) | | | (2,428,270 | ) | | | (5,536,516 | ) |
Net Increase/(Decrease) in Net Assets Resulting From Operations | | $ | 1,155,446 | | | $ | (1,600,966 | ) | | $ | 3,253,005 | |
The accompanying Notes to Financial Statements are an integral part of this schedule.
31
Thrivent Mutual Funds
Statement of Changes in Net Assets
| | | | | | | | | | | | | | | | |
| | | Natural Resources Fund | | | Equity Income Plus Fund | |
For the periods ended | | 12/31/2011 | | | 12/31/2010 | | | 12/31/2011 | | | 12/31/2010 | |
Operations | | | | | | | | | | | | | | | | |
Net investment income/(loss) | | $ | 1,285,012 | | | $ | 1,434,457 | | | $ | 827,304 | | | $ | 660,759 | |
Net realized gains/(losses) | | | (2,037,646 | ) | | | 1,784,506 | | | | 1,150,125 | | | | 1,405,759 | |
Change in net unrealized appreciation/(depreciation) | | | 1,908,080 | | | | 20,740,862 | | | | (3,578,395 | ) | | | 3,041,775 | |
Net Change in Net Assets Resulting From Operations | | | 1,155,446 | | | | 23,959,825 | | | | (1,600,966 | ) | | | 5,108,293 | |
Distributions to Shareholders | | | | | | | | | | | | | | | | |
From net investment income Class A | | | (126,370 | ) | | | (270,506 | ) | | | (283,040 | ) | | | (122,271 | ) |
From net investment income Institutional Class | | | (1,160,744 | ) | | | (2,097,919 | ) | | | (542,201 | ) | | | (566,184 | ) |
| | | | | | | | | | | | | | | | |
Total From Net Investment Income | | | (1,287,114 | ) | | | (2,368,425 | ) | | | (825,241 | ) | | | (688,455 | ) |
| | | | | | | | | | | | | | | | |
From return of capital Class A | | | (148,806 | ) | | | (56,118 | ) | | | — | | | | — | |
From return of capital Institutional Class | | | (949,444 | ) | | | (378,350 | ) | | | — | | | | — | |
| | | | | | | | | | | | | | | | |
Total From Return of Capital | | | (1,098,250 | ) | | | (434,468 | ) | | | — | | | | — | |
| | | | | | | | | | | | | | | | |
Total Distributions to Shareholders | | | (2,385,364 | ) | | | (2,802,893 | ) | | | (825,241 | ) | | | (688,455 | ) |
Capital Stock Transactions | | | | | | | | | | | | | | | | |
Class A | | | | | | | | | | | | | | | | |
Sold | | | 4,692,101 | | | | 4,006,567 | | | | 15,128,610 | | | | 8,026,821 | |
Distributions reinvested | | | 269,430 | | | | 326,253 | | | | 270,506 | | | | 115,501 | |
Redeemed | | | (4,112,595 | ) | | | (3,037,884 | ) | | | (4,998,131 | ) | | | (1,398,631 | ) |
| | | | | | | | | | | | | | | | |
Total Class A Capital Stock Transactions | | | 848,936 | | | | 1,294,936 | | | | 10,400,985 | | | | 6,743,691 | |
| | | | | | | | | | | | | | | | |
Institutional Class | | | | | | | | | | | | | | | | |
Sold | | | 1,516,978 | | | | 3,231,206 | | | | 2,178,331 | | | | 2,071,416 | |
Distributions reinvested | | | 2,101,521 | | | | 2,467,194 | | | | 540,182 | | | | 565,596 | |
Redeemed | | | (1,228,447 | ) | | | (9,006,306 | ) | | | (823,321 | ) | | | (924,971 | ) |
| | | | | | | | | | | | | | | | |
Total Institutional Class Capital Stock Transactions | | | 2,390,052 | | | | (3,307,906 | ) | | | 1,895,192 | | | | 1,712,041 | |
| | | | | | | | | | | | | | | | |
Capital Stock Transactions | | | 3,238,988 | | | | (2,012,970 | ) | | | 12,296,177 | | | | 8,455,732 | |
Net Increase/(Decrease) in Net Assets | | | 2,009,070 | | | | 19,143,962 | | | | 9,869,970 | | | | 12,875,570 | |
Net Assets, Beginning of Period | | | 110,226,050 | | | | 91,082,088 | | | | 41,653,902 | | | | 28,778,332 | |
Net Assets, End of Period | | $ | 112,235,120 | | | $ | 110,226,050 | | | $ | 51,523,872 | | | $ | 41,653,902 | |
Accumulated Undistributed Net Investment Income/(Loss) | | $ | (13,601 | ) | | $ | (11,499 | ) | | $ | (7,272 | ) | | $ | (6,347 | ) |
Capital Stock Share Transactions | | | | | | | | | | | | | | | | |
Class A shares | | | | | | | | | | | | | | | | |
Sold | | | 469,923 | | | | 453,249 | | | | 1,645,748 | | | | 933,400 | |
Distributions reinvested | | | 27,392 | | | | 36,852 | | | | 30,425 | | | | 13,613 | |
Redeemed | | | (419,807 | ) | | | (348,515 | ) | | | (555,496 | ) | | | (169,658 | ) |
| | | | | | | | | | | | | | | | |
Total Class A shares | | | 77,508 | | | | 141,586 | | | | 1,120,677 | | | | 777,355 | |
| | | | | | | | | | | | | | | | |
Institutional Class shares | | | | | | | | | | | | | | | | |
Sold | | | 151,459 | | | | 398,009 | | | | 242,529 | | | | 250,647 | |
Distributions reinvested | | | 214,073 | | | | 278,852 | | | | 60,458 | | | | 67,918 | |
Redeemed | | | (128,203 | ) | | | (1,090,271 | ) | | | (89,353 | ) | | | (114,328 | ) |
| | | | | | | | | | | | | | | | |
Total Institutional Class shares | | | 237,329 | | | | (413,410 | ) | | | 213,634 | | | | 204,237 | |
| | | | | | | | | | | | | | | | |
The accompanying Notes to Financial Statements are an integral part of this schedule.
32
Thrivent Mutual Funds
Statement of Changes in Net Assets – continued
| | | | | | | | |
| | | Diversified Income Plus Fund | |
For the periods ended | | 12/31/2011 | | | 12/31/2010 | |
Operations | | | | | | | | |
Net investment income/(loss) | | $ | 8,789,521 | | | $ | 8,767,971 | |
Net realized gains/(losses) | | | 4,770,603 | | | | 4,786,883 | |
Change in net unrealized appreciation/(depreciation) | | | (10,307,119 | ) | | | 8,790,881 | |
Net Change in Net Assets Resulting From Operations | | | 3,253,005 | | | | 22,345,735 | |
Distributions to Shareholders | | | | | | | | |
From net investment income Class A | | | (8,627,092 | ) | | | (7,576,233 | ) |
From net investment income Institutional Class | | | (627,818 | ) | | | (384,932 | ) |
| | | | | | | | |
Total From Net Investment Income | | | (9,254,910 | ) | | | (7,961,165 | ) |
| | | | | | | | |
Total Distributions to Shareholders | | | (9,254,910 | ) | | | (7,961,165 | ) |
Capital Stock Transactions | | | | | | | | |
Class A | | | | | | | | |
Sold | | | 56,792,312 | | | | 38,733,954 | |
Distributions reinvested | | | 6,974,619 | | | | 6,044,605 | |
Redeemed | | | (29,143,212 | ) | | | (22,225,705 | ) |
| | | | | | | | |
Total Class A Capital Stock Transactions | | | 34,623,719 | | | | 22,552,854 | |
| | | | | | | | |
Institutional Class | | | | | | | | |
Sold | | | 14,238,118 | | | | 3,111,206 | |
Distributions reinvested | | | 617,568 | | | | 380,344 | |
Redeemed | | | (4,792,748 | ) | | | (3,076,715 | ) |
| | | | | | | | |
Total Institutional Class Capital Stock Transactions | | | 10,062,938 | | | | 414,835 | |
| | | | | | | | |
Capital Stock Transactions | | | 44,686,657 | | | | 22,967,689 | |
Net Increase/(Decrease) in Net Assets | | | 38,684,752 | | | | 37,352,259 | |
Net Assets, Beginning of Period | | | 179,206,750 | | | | 141,854,491 | |
Net Assets, End of Period | | $ | 217,891,502 | | | $ | 179,206,750 | |
Accumulated Undistributed Net Investment Income/(Loss) | | $ | 200,238 | | | $ | 833,458 | |
Capital Stock Share Transactions | | | | | | | | |
Class A shares | | | | | | | | |
Sold | | | 8,858,447 | | | | 6,342,613 | |
Distributions reinvested | | | 1,095,674 | | | | 993,979 | |
Redeemed | | | (4,588,029 | ) | | | (3,667,972 | ) |
| | | | | | | | |
Total Class A shares | | | 5,366,092 | | | | 3,668,620 | |
| | | | | | | | |
Institutional Class shares | | | | | | | | |
Sold | | | 2,265,401 | | | | 511,739 | |
Distributions reinvested | | | 97,835 | | | | 62,838 | |
Redeemed | | | (765,349 | ) | | | (508,849 | ) |
| | | | | | | | |
Total Institutional Class shares | | | 1,597,887 | | | | 65,728 | |
| | | | | | | | |
The accompanying Notes to Financial Statements are an integral part of this schedule.
33
Thrivent Mutual Funds
Notes to Financial Statements
As of December 31, 2011
(1) ORGANIZATION
Thrivent Mutual Funds (the “Trust”) was organized as a Massachusetts Business Trust on March 10, 1987 and is registered as an open-end management investment company under the Investment Company Act of 1940 (the “1940 Act”). The Trust is divided into twenty-five separate series (each, a “Fund” and, collectively, the “Funds”), each with its own investment objective and policies. The Trust currently consists of four allocation funds, twelve equity funds, two hybrid funds, six fixed-income funds, and one money market fund.
This shareholder report includes Thrivent Natural Resources Fund (formerly Thrivent Real Estate Securities Fund), Thrivent Equity Income Plus Fund and Thrivent Diversified Income Plus Fund, three of the Trust’s twenty-five Funds. The other Funds of the Trust have a fiscal year-end of October 31 and are presented under a separate shareholder report.
(A) Share Classes – As of December 31, 2011, the Trust includes two classes of shares: Class A and Institutional Class. The classes of shares differ principally in their respective distribution expenses, other class-specific expenses and arrangements. Class A shares generally have a 0.25% annual 12b-1 fee and a maximum front-end sales load of 5.50% for equity funds and 4.50% for fixed-income funds, although some of the fixed-income funds have reduced 12b-1 fees and either a reduced or no front-end sales load. Institutional Class shares are offered at net asset value and have no annual 12b-1 fees. The share classes have identical rights to earnings, assets and voting privileges, except for class-specific expenses and exclusive rights to vote on matters affecting only individual classes. All Funds of the Trust offer Class A and Institutional Class shares.
(B) Other – Under the Trust’s organizational documents, its officers and trustees are indemnified against certain liabilities arising out of the performance of their duties to the Trust. In addition, in the normal course of business, the Trust enters into contracts with vendors and others that provide general damage clauses. The Trust’s maximum exposure under these contracts is unknown, as this would involve future claims that may be made against the Trust. However, based on experience, the Trust expects the risk of loss to be remote.
(2) SIGNIFICANT ACCOUNTING POLICIES
(A) Valuation of Investments – Securities traded on U.S. or foreign securities exchanges or included in a national market system are valued at the official closing price at the close of each business day unless otherwise stated below. Over-the-counter securities and listed securities for which no price is readily available are valued at the current bid price considered best to represent the value at that time. Swap agreements are valued at the fair value of the contract as furnished by an independent pricing service. Security prices are based on quotes that are obtained from an independent pricing service approved by the Board of Trustees. The pricing service, in determining values of fixed-income securities, takes into consideration such factors as current quotations by broker/dealers, coupon, maturity, quality, type of issue, trading characteristics, and other yield and risk factors it deems relevant in determining valuations. Securities which cannot be valued by the approved pricing service are valued using valuations obtained from dealers that make markets in the securities. Exchange-listed options and futures contracts are valued at the last quoted sales price. Investments in open-ended mutual funds are valued at the net asset value at the close of each business day. Short-term securities are valued at amortized cost (which approximates market value) to the extent it is not materially different than market value.
Financial Accounting Standards Board (FASB) standards require increased fair value disclosure intended to improve the consistency and comparability of fair value measurements used in financial reporting. The standards define fair value, establish a framework for measuring fair value in U.S. Generally Accepted Accounting Principles (“GAAP”) and expand disclosures about fair value requirements. The various inputs used to determine the fair value of the Funds’ investments are summarized in three broad levels: Level 1 includes quoted prices in active markets for identical securities, typically categorized in this level are U.S. equity securities, futures and options; Level 2 includes other significant observable inputs such as quoted prices for similar securities, interest rates, prepayment speeds and credit risk, typically categorized in this level are fixed-income securities, international equity securities, swaps and forward contracts; and Level 3 includes significant unobservable inputs such as the Adviser’s own assumptions and broker evaluations in determining the fair value of investments. Of the Level 3 securities, those for which market values were not readily available or were deemed unreliable were fair valued as determined in good faith under procedures established by the Board of Trustees. As of December 31, 2011, no Funds held these types of Level 3 securities.
The valuation levels are not necessarily an indication of the risk associated with investing in these securities or other investments.
Valuation of International Securities – Because many foreign markets close before the U.S. markets, events may occur between the close of the foreign market and the close of the U.S. markets that could have a material impact on the
34
Thrivent Mutual Funds
Notes to Financial Statements
As of December 31, 2011
valuation of foreign securities. The Funds, under the supervision of the Board of Trustees, evaluate the impacts of these events and may adjust the valuation of foreign securities to reflect fair value as of the close of the U.S. markets. The Board of Trustees has authorized the Funds’ investment adviser, Thrivent Asset Management, LLC (“Thrivent Asset Mgt.” or the “Adviser”), to make fair valuation determinations pursuant to policies approved by the Board of Trustees.
(B) Foreign Currency Translation – The accounting records of each Fund are maintained in U.S. dollars. Securities and other assets and liabilities that are denominated in foreign currencies are translated into U.S. dollars at the daily closing rates of exchange.
Foreign currency amounts related to the purchase or sale of securities and income and expenses are translated at the exchange rate on the transaction date. Net realized and unrealized currency gains and losses are recorded from sales of foreign currency, exchange gains or losses between the trade date and settlement dates on securities transactions, and other translation gains or losses on dividends, interest income and foreign withholding taxes. The Funds do not separately report the effect of changes in foreign exchange rates from changes in market prices on securities held. Such changes are included in net realized and unrealized gain or loss from investments in the Statement of Operations.
For federal income tax purposes, the Funds treat the effect of changes in foreign exchange rates arising from actual foreign currency transactions and the changes in foreign exchange rates between the trade date and settlement date as ordinary income.
(C) Foreign Currency Forward Contracts – In connection with purchases and sales of securities denominated in foreign currencies, the Funds may enter into foreign currency forward contracts. Additionally, the Funds may enter into such contracts to hedge certain other foreign-currency-denominated investments. These contracts are recorded at value and the related realized and unrealized foreign exchange gains and losses are included in the Statement of Operations. In the event that counterparties fail to settle these forward contracts, the Funds could be exposed to foreign currency fluctuations. Foreign currency contracts are valued daily and unrealized appreciation or depreciation is recorded daily as the difference between the contract exchange rate and the closing forward rate applied to the face amount of the contract. A realized gain or loss is recorded at the time a forward contract is closed. These contracts are over-the-counter and the Funds are exposed to counterparty risk equal to the discounted net amount of payments to the Funds. During the year ended December 31, 2011, Diversified Income Plus Fund engaged in this type of investment.
(D) Foreign Denominated Investments – Foreign denominated assets and currency contracts may involve more risks than domestic transactions including currency risk, political and economic risk, regulatory risk, and market risk. Certain Funds may also invest in securities of companies located in emerging markets. Future economic or political developments could adversely affect the liquidity or value, or both, of such securities.
(E) Federal Income Taxes – No provision has been made for income taxes because each Fund’s policy is to qualify as a regulated investment company under the Internal Revenue Code and distribute substantially all investment company taxable income and net capital gain on a timely basis. It is also the intention of each Fund to distribute an amount sufficient to avoid imposition of any federal excise tax. The Funds, accordingly, anticipate paying no federal taxes and no federal tax provision was recorded. Each Fund is treated as a separate taxable entity for federal income tax purposes. Certain Funds may utilize earnings and profits distributed to shareholders on the redemption of shares as part of the dividends paid deduction.
Foreign Income Taxes – Certain Funds are subject to foreign income taxes imposed by certain countries in which they invest. Withholding taxes on foreign dividends have been provided for in accordance with the applicable country’s tax rules and rates. These amounts are shown as foreign dividend tax withholding on the Statement of Operations. The Funds pay tax on foreign capital gains, where applicable. These amounts are shown as part of net realized gains/(losses) on investments in the Statement of Operations.
GAAP requires management of the Funds to make additional tax disclosures with respect to the tax effects of certain income tax positions, whether those positions were taken on previously filed tax returns or are expected to be taken on future returns. These positions must meet a “more likely than not” standard that, based on the technical merits of the position, would have a greater than 50 percent likelihood of being sustained upon examination. In evaluating whether a tax position has met the more-likely-than-not recognition threshold, management of the Funds must presume that the position will be examined by the appropriate taxing authority that has full knowledge of all relevant information.
Management of the Funds analyzed all open tax years, as defined by the statute of limitations, for all major jurisdictions. Open tax years are those that are open for examination by taxing authorities. Major jurisdictions for
35
Thrivent Mutual Funds
Notes to Financial Statements
As of December 31, 2011
the Funds include U.S. Federal, Minnesota, Wisconsin, and Massachusetts, as well as certain foreign countries. As of December 31, 2011, open U.S. Federal, Minnesota, Wisconsin, and Massachusetts tax years include the tax years ended December 31, 2008, through 2011. Additionally, as of December 31, 2011, the tax year ended December 31, 2007, is open for Wisconsin. The Funds have no examinations in progress and none are expected at this time.
As of December 31, 2011, management of the Funds has reviewed all open tax years and major jurisdictions and concluded that there is no effect to the Funds’ tax liability, financial position or results of operations. There is no tax liability resulting from unrecognized tax benefits related to uncertain income tax positions taken or expected to be taken in future tax returns. The Funds are also not aware of any tax positions for which it is reasonably possible that the total amounts of unrecognized tax benefits will significantly change in the next 12 months.
(F) Expenses and Income – Estimated expenses are accrued daily. The Funds are charged for those expenses that are directly attributable to them. Expenses that are not directly attributable to a Fund are allocated among all appropriate Funds in proportion to their respective net assets, number of shareholder accounts or other reasonable basis. Net investment income, expenses which are not class-specific, and realized and unrealized gains and losses are allocated directly to each class based upon the relative net asset value of outstanding shares.
Interest income is accrued daily and is determined on the basis of interest or discount earned on all debt securities, including accretion of market discount and original issue discount and amortization of premium. Paydown gains and losses on mortgage- and asset-backed securities are recorded as components of interest income. Dividend income is recorded on the ex-dividend date.
For certain securities, including real estate investment trusts, the Trust records distributions received in excess of income as a reduction of cost of investments and/or realized gain. Such amounts are based on estimates if actual amounts are not available. Actual amounts of income, realized gain and return of capital may differ from the estimated amounts. The Trust adjusts the estimated amounts of the components of distributions as adjustments to investment income, unrealized appreciation/depreciation and realized gain/loss on investments as necessary, once the issuers provide information about the actual composition of the distributions.
(G) Custody Earnings Credit – The Funds have a deposit arrangement with the custodian whereby interest earned on uninvested cash balances is used to pay a portion of custodian fees. This deposit arrangement is an alternative to overnight investments. Earnings credits are shown as a reduction of total expenses on the Statement of Operations.
(H) Distributions to Shareholders – Net investment income is distributed to each shareholder as a dividend. Dividends from Natural Resources Fund and Equity Income Plus Fund are declared and paid quarterly. Dividends from Diversified Income Plus Fund are declared and paid monthly. Additionally, it is possible that such dividends may be reclassified as return of capital or capital gains after year end. Such determination cannot be made until tax information is received from the real estate investments of the Fund. Net realized gains from securities transactions, if any, are distributed at least annually.
(I) Options – All Funds may buy put and call options and write put and covered call options. The Funds intend to use such derivative instruments as hedges to facilitate buying or selling securities or to provide protection against adverse movements in security prices or interest rates. The Funds may also enter into options contracts to protect against adverse foreign exchange rate fluctuations. Option contracts are valued daily and unrealized appreciation or depreciation is recorded. A Fund will realize a gain or loss upon expiration or closing of the option transaction. When an option is exercised, the proceeds upon sale for a written call option or the cost of a security for purchased put and call options is adjusted by the amount of premium received or paid.
Buying put options tends to decrease a Fund’s exposure to the underlying security while buying call options tends to increase a Fund’s exposure to the underlying security. The risk associated with purchasing put and call options is limited to the premium paid. There is no significant counterparty risk on exchange-traded options as the exchange guarantees the contract against default. Writing put options tends to increase a Fund’s exposure to the underlying security while writing call options tends to decrease a Fund’s exposure to the underlying security. The writer of an option has no control over whether the underlying security may be bought or sold, and therefore bears the market risk of an unfavorable change in the price of the underlying security. The counterparty risk for purchased options arises when the Fund has purchased an option, exercises that option, and the counterparty doesn’t buy from the Fund or sell to the Fund the underlying asset as required. In the case where the Fund has written an option, the Fund doesn’t have counterparty risk. Counterparty risk on purchased over-the-counter options is partially mitigated by the Fund’s collateral posting requirements. As the over-the-counter option increases in value to the Fund, the Fund receives collateral from the counterparty. Risks of loss may exceed amounts recognized on the Statement of Assets and Liabilities. During the year ended December 31, 2011,
36
Thrivent Mutual Funds
Notes to Financial Statements
As of December 31, 2011
Equity Income Plus Fund and Diversified Income Plus Fund engaged in exchange-traded options.
(J) Futures Contracts – Certain Funds may use futures contracts to manage the exposure to interest rate and market or currency fluctuations. Gains or losses on futures contracts can offset changes in the yield of securities. When a futures contract is opened, cash or other investments equal to the required “initial margin deposit” are held on deposit with and pledged to the broker. Additional securities held by the Funds may be earmarked to cover open futures contracts. The futures contract’s daily change in value (“variation margin”) is either paid to or received from the broker, and is recorded as an unrealized gain or loss. When the contract is closed, realized gain or loss is recorded equal to the difference between the value of the contract when opened and the value of the contract when closed. Futures contracts involve, to varying degrees, risk of loss in excess of the variation margin disclosed in the Statement of Assets and Liabilities. Exchange-traded futures have no significant counterparty risk as the exchange guarantees the contracts against default. During the year ended December 31, 2011, Equity Income Plus Fund and Diversified Income Plus Fund engaged in this type of investment.
(K) Swap Agreements – Certain Funds enter into swap transactions, which involve swapping one or more investment characteristics of a security or a basket of securities with another party. Such transactions include market risk, risk of default by the other party to the transaction, risk of imperfect correlation and manager risk and may involve commissions or other costs. Swap transactions generally do not involve delivery of securities, other underlying assets or principal. Accordingly, the risk of loss with respect to swap transactions is generally limited to the net amount of payments that the Fund is contractually obligated to make, or in the case of the counterparty defaulting, the net amount of payments that the Fund is contractually entitled to receive. Risks of loss may exceed amounts recognized on the Statement of Assets and Liabilities. If there is a default by the counterparty, the Fund may have contractual remedies pursuant to the agreements related to the transaction. The contracts are valued daily and unrealized appreciation or depreciation is recorded. Swap agreements are valued at fair value of the contract as provided by an independent pricing service. The pricing service takes into account such factors as swap curves, default probabilities, recent trades, recovery rates and other factors it deems relevant in determining valuations. The Fund accrues for the periodic payment and amortizes upfront payments, if any, on swap agreements on a daily basis with the net amount, recorded as realized gains or losses on the Statement of Operations. Receipts and payments received or made as a result of a credit event or termination of the contract are also recognized as realized gains or losses on the Statement of Operations. Collateral, in the form of cash or securities, may be required to be held with the Fund’s custodian, or a third party, in connection with these agreements. These swap agreements are over-the-counter and the Fund is exposed to counterparty risk, which is the discounted net amount of payments owed to the Fund. This risk is partially mitigated by the Fund’s collateral posting requirements. As the swap increases in value to the Fund, the Fund receives collateral from the counterparty.
Credit Default Swaps – A credit default swap is a swap agreement between two parties to exchange the credit risk of a particular issuer, basket of securities or reference entity. In a credit default swap transaction, a buyer pays periodic fees in return for payment by the seller which is contingent upon an adverse credit event occurring in the underlying issuer or reference entity. The seller collects periodic fees from the buyer and profits if the credit of the underlying issuer or reference entity remains stable or improves while the swap is outstanding, but the seller in a credit default swap contract would be required to pay the amount of credit loss, determined as specified in the agreement, to the buyer in the event of an adverse credit event in the reference entity. A buyer of a credit default swap is said to buy protection whereas a seller of a credit default swap is said to sell protection. The Funds may be either the protection buyer or the protection seller.
Certain Funds enter into credit default derivative contracts directly through credit default swaps (CDS) or through credit default swap indices (CDX Indices). CDX Indices are static pools of equally weighted credit default swaps referencing corporate bonds and/or loans designed to provide diversified credit exposure to these asset classes. Funds sell default protection and assume long-risk positions in individual credits or indices. Index positions are entered into to gain exposure to the corporate bond and/or loan markets in a cost-efficient and diversified structure. In the event that a position defaults, by going into bankruptcy and failing to pay interest or principal on borrowed money, within any given CDX Index held, the maximum potential amount of future payments required would be equal to the pro-rata share of that position within the index based on the notional amount of the index. In the event of a default under a CDS contract, the maximum potential amount of future payments would be the notional amount. For CDS, the default events could be bankruptcy and failing to pay interest or principal on borrowed money or a restructuring. A restructuring is a change in the underlying obligations which would include reduction in interest or principal, maturity extension and subordination to other obligations. Refer to the credit default swap tables located within the Funds’ Schedules of Investments for additional information as of December 31, 2011. During the year ended
37
Thrivent Mutual Funds
Notes to Financial Statements
As of December 31, 2011
December 31, 2011, Diversified Income Plus Fund engaged in this type of investment.
(L) Mortgage Dollar Roll Transactions – Certain Funds enter into dollar roll transactions on securities issued or to be issued by the Government National Mortgage Association, Federal National Mortgage Association and Federal Home Loan Mortgage Corporation, in which the Funds transfer mortgage securities to a counterparty and simultaneously agree to the return of similar (same type and coupon) securities at a later date at an agreed upon price. The Funds maintain liquid securities having a value not less than the agreed upon price (including accrued interest) for such dollar rolls. The value of the securities that the Funds are required to accept on return may decline below the agreed upon price of those securities.
During the term of the agreement, the Funds forgo principal and interest paid on the mortgage securities transferred. The Funds are compensated from negotiated fees paid by brokers offered as an inducement to the Funds to “roll over” their commitments, thus enhancing the yield. Mortgage dollar rolls may be renewed with a new return date and agreed upon price and a cash settlement made on settlement date without physical delivery of the securities subject to the contract. The fees received are recognized over the roll period and are included in Income from mortgage dollar rolls in the Statement of Operations. The recognition of the gains/losses are deferred until the closing of the roll and are included in Net realized gains/(losses) in the Statement of Operations. During the year ended December 31, 2011, Diversified Income Plus Fund engaged in this type of transaction.
(M) Securities Lending – The Trust has entered into a Securities Lending Agreement (the “Agreement”) with Deutsche Bank AG (“Deutsche”). The Agreement authorizes Deutsche to lend securities to authorized borrowers on behalf of the Funds. Pursuant to the Agreement, all loaned securities are initially collateralized by cash equal to at least 102% of the value of the loaned securities. All cash collateral received is invested in Thrivent Financial Securities Lending Trust. The Funds receive dividends and interest that would have been earned on the securities loaned while simultaneously seeking to earn income on the investment of cash collateral. Amounts earned on investments in Thrivent Financial Securities Lending Trust, net of rebates, fees paid to Deutsche for services provided and any other securities lending expenses, are included in Income from securities loaned on the Statement of Operations. By investing any cash collateral it receives in these transactions, a Fund could realize additional gains or losses. If the borrower fails to return the securities or the invested collateral has declined in value, the Fund could lose money.
During the year ended December 31, 2011, Natural Resources Fund and Diversified Income Plus Fund had securities on loan. As of December 31, 2011, the value of securities on loan is as follows:
| | | | |
Fund | | Securities on
Loan | |
Natural Resources | | $ | 533,610 | |
Diversified Income Plus | | | 7,477,243 | |
(N) When-Issued and Delayed Delivery Transactions Certain Funds may purchase or sell securities on a when-issued or delayed delivery basis. These transactions involve a commitment by a Fund to purchase or sell securities for a predetermined price or yield, with payment and delivery taking place beyond the customary settlement period. When delayed delivery purchases are outstanding, a Fund will designate liquid assets in an amount sufficient to meet the purchase price. When purchasing a security on a delayed delivery basis, a Fund assumes the rights and risks of ownership of the security, including the risk of price and yield fluctuations, and takes such fluctuations into account when determining its net asset value. A Fund may dispose of a delayed delivery transaction after it is entered into, and may sell when-issued securities before they are delivered, which may result in a capital gain or loss. When a Fund has sold a security on a delayed delivery basis, a Fund does not participate in future gains and losses with respect to the security.
(O) Treasury Inflation Protected Securities – Certain Funds may invest in treasury inflation protected securities (TIPS). These securities are fixed income securities whose principal value is periodically adjusted to the rate of inflation. The interest rate is generally fixed at issuance. Interest is paid based on the principal value, which is adjusted for inflation. Any increase in the principal amount will be included as taxable interest in the Statement of Operations and received upon maturity or sale of the security. During the year ended December 31, 2011, none of the Funds covered in this shareholder report engaged in this type of transaction.
(P) Repurchase Agreements – Each Fund may engage in repurchase agreement transactions in pursuit of its investment objective. A repurchase agreement consists of a purchase and a simultaneous agreement to resell an investment for later delivery at an agreed upon price and rate of interest. The Fund uses a third-party custodian to maintain the collateral. If the original seller of a security subject to a repurchase agreement fails to repurchase the security at the agreed upon time, the Fund could incur a loss due to a drop in the value of the security during the time it takes the Fund to either sell the security or take action to enforce the original seller’s agreement to repurchase the
38
Thrivent Mutual Funds
Notes to Financial Statements
As of December 31, 2011
security. Also, if a defaulting original seller filed for bankruptcy or became insolvent, disposition of such security might be delayed by pending legal action. The Fund may only enter into repurchase agreements with banks and other recognized financial institutions such as broker/dealers that are found by the adviser or subadviser to be creditworthy. During the year ended December 31, 2011, none of the Funds covered in this shareholder report engaged in this type of investment.
(Q) Equity-Linked Structured Securities – Certain funds may invest in equity-linked structured notes. Equity-linked structured notes are debt securities which combine the characteristics of common stock and the sale of an option. The return component is based upon the performance of a single equity security, a basket of equity securities, or an equity index and the sale of an option. There is no guaranteed return of principal with these securities. The appreciation potential of these securities may be limited by a maximum payment or call right and can be influenced by many unpredictable factors. In addition to the performance of the equity, the nature and credit of the issuer may also impact return. During the year ended December 31, 2011, Diversified Income Plus Fund engaged in this type of investment.
(R) Credit Risk – The Funds may be susceptible to credit risk to the extent an issuer or counterparty defaults on its payment obligation. The Funds’ policy is to monitor the creditworthiness of issuers and counterparties. Interest receivable on defaulted securities is monitored for ability to collect payments in default and is adjusted accordingly.
(S) Accounting Estimates – The preparation of financial statements in conformity with GAAP requires management to make estimates and assumptions that affect the reported amounts of assets and liabilities and disclosure of contingent assets and liabilities at the date of the financial statements and the reported amounts of income and expenses during the reporting period. Actual results could differ from those estimates.
(T) Loss Contingencies – Thrivent Diversified Income Plus Fund is a defendant in an adversary action filed on July 7, 2004 by the Official Committee of Asbestos Claimants of G-I Holdings, Inc. (G-I) against prior and current holders of secured debt of Building Materials Corporation of America (BMCA), a wholly owned subsidiary of G-I. The suit seeks to recover the value of assets G-I transferred to BMCA that later served as collateral for BMCA’s debt. The Fund at one time held secured notes in the amount of $1,650,000 and, if the plaintiffs are successful, it is reasonably possible that the Fund will be required to pay damages in some amount. Management does not believe it is possible at this time to predict with any reasonable certainty the amount or probability of any potential loss.
(U) Loan Commitments – Certain Funds may enter into loan commitments, which generally have interest rates which are reset daily, monthly, quarterly or semi-annually by reference to a base lending rate, plus a premium. These base rates are primarily the London-Interbank Offered Rate (“LIBOR”), and secondarily the prime rate offered by one or more major United States banks (the “Prime Rate”) and the certificate of deposit (“CD”) rate or other base lending rates used by commercial lenders. Loan commitments often require prepayments from excess cash flows or allow the borrower to repay at its election. The rate at which the borrower repays cannot be predicted with accuracy. Therefore, the remaining maturity may be considerably less than the stated maturity shown in the Schedule of Investments.
All or a portion of these loan commitments may be unfunded. The Fund is obligated to fund these commitments at the borrower’s discretion. Therefore, the Fund must have funds sufficient to cover its contractual obligation. These unfunded loan commitments, which are marked-to-market daily, are presented in the Schedule of Investments.
(V) Litigation – Awards from class action litigation are recorded as a reduction of cost if the Fund still owns the applicable securities on the payment date. If the Fund no longer owns the applicable securities, the proceeds are recorded as realized gains.
(W) Recent Accounting Pronouncements – In May 2011, FASB released Accounting Standards Update 2011-04 (ASU 2011-04), Fair Value Measurement (Topic 820), Amendments to Achieve Common Fair Value Measurement and Disclosure Requirements in U.S. GAAP and International Financial Reporting Standards (IFRSs). This updated standard is a collaboration between FASB and International Accounting Standards Board (IASB) to ensure that fair value has the same meaning in U.S. GAAP and in IFRSs and that their respective fair value measurement and disclosure requirements are materially the same. The amendments adopted include additional disclosures about transfers between Level 1 and Level 2 of the fair value hierarchy and information about the sensitivity of the fair value measurement of the Level 3 assets to changes in unobservable inputs and any interrelationships between those unobservable inputs. The disclosures required by ASU 2011-04 will be in effective for any reporting period (annual or quarterly interim) beginning after December 15, 2011. Management is currently evaluating the application of ASU 2011-04 and its impact, if any, on the Fund’s financial statements.
39
Thrivent Mutual Funds
Notes to Financial Statements
As of December 31, 2011
(X) Other – For financial statement purposes, investment security transactions are accounted for on the trade date. Realized gains and losses from investment transactions are determined on a specific cost identification basis, which is the same basis used for federal income tax purposes.
(3) FEES AND COMPENSATION PAID TO AFFILIATES
(A) Investment Advisory Fees – The Trust has entered into an Investment Advisory Agreement with Thrivent Asset Mgt. Under the Investment Advisory Agreement, each of the Funds pays a fee for investment advisory services. The fees are accrued daily and paid monthly. The annual rates of fees as a percent of average daily net assets under the Investment Advisory Agreement were as follows:
| | | | | | | | | | | | | | | | | | | | | | | | | | | | | | | | | | | | | | | | | | | | |
Fund (M - Millions) | | $0 to
$50M | | | $50 to
$100M | | | $100 to
$200M | | | $200 to
$250M | | | $250 to
$500M | | | $500 to
$750M | | | $750 to
$1,000M | | | $1,000 to
$2,000M | | | $2,000 to
$2,500M | | | $2,500 to
$5,000M | | | Over
$5,000M | |
Natural Resources | | | 0.800 | % | | | 0.800 | % | | | 0.800 | % | | | 0.800 | % | | | 0.800 | % | | | 0.750 | % | | | 0.750 | % | | | 0.750 | % | | | 0.750 | % | | | 0.750 | % | | | 0.750 | % |
Equity Income Plus | | | 0.650 | % | | | 0.650 | % | | | 0.650 | % | | | 0.650 | % | | | 0.600 | % | | | 0.600 | % | | | 0.600 | % | | | 0.600 | % | | | 0.600 | % | | | 0.600 | % | | | 0.600 | % |
Diversified Income Plus | | | 0.550 | % | | | 0.550 | % | | | 0.550 | % | | | 0.550 | % | | | 0.550 | % | | | 0.550 | % | | | 0.550 | % | | | 0.550 | % | | | 0.550 | % | | | 0.550 | % | | | 0.550 | % |
(B) Expense Reimbursements – As of December 31, 2011, contractual expense reimbursements to limit expenses to the following percentages were in effect:
| | | | | | | | | | | | |
Fund | | Class A | | | Institutional
Class | | | Expiration
Date | |
Natural Resources | | | 1.30 | % | | | N/A | | | | 2/28/2012 | |
Equity Income Plus | | | 1.15 | % | | | 0.80 | % | | | 2/28/2012 | |
Diversified Income Plus | | | 0.95 | %1 | | | N/A | | | | 2/28/2012 | |
| 1 | New contractual expense reimbursement of 0.95% became effective on March 1, 2011. |
The Funds covered in this shareholder report may invest cash in High Yield Fund and Money Market Fund, subject to certain limitations. During the year ended December 31, 2011, Diversified Income Plus Fund invested in High Yield Fund. During the year ended December 31, 2011, none of the Funds covered in this shareholder report invested in Money Market Fund. These related-party transactions are subject to the same terms as non-related party transactions except that, to avoid duplicate investment advisory fees, Thrivent Asset Mgt. reimburses an amount equal to the advisory fee which is charged to the Fund for its investment in High Yield Fund or Money Market Fund.
(C) Distribution Plan – Thrivent Investment Management, Inc. (“Thrivent Investment Mgt.”) is the Trust’s distributor. The Trust has adopted a Distribution Plan pursuant to Rule 12b-1 under the 1940 Act. Class A shares generally have a Rule 12b-1 fee of up to 0.25% of average net assets.
(D) Sales Charges and Other Fees – For the year ended December 31, 2011, Thrivent Investment Mgt. received $717,255 of aggregate underwriting concessions from the sales of the Trust’s Class A shares. Sales charges are not an expense of the Trust and are not reflected in the financial statements of any of the Funds.
The Trust has entered into an accounting and administrative services agreement with Thrivent Asset Mgt. pursuant to which Thrivent Asset Mgt. provides certain accounting and administrative personnel and services to the Funds. For the year ended December 31, 2011, Thrivent Asset Mgt. received aggregate fees for accounting and administrative personnel and services of $284,041 from the Funds covered in this shareholder report.
The Trust has entered into an agreement with Thrivent Financial Investor Services, Inc. (“Thrivent Investor Services”) to provide the Funds with transfer agent services. For the year ended December 31, 2011, Thrivent Investor Services received $336,491 for transfer agent services from the Funds covered in this shareholder report.
Each Trustee is eligible to participate in a deferred compensation plan with respect to fees received from the Funds. Participants in the plan may designate their deferred Trustee’s fees as if invested in a series of Thrivent Mutual Funds. The value of each Trustee’s deferred compensation account will increase or decrease as if invested in shares of that series. Their fees as well as the change in value are included in Trustee’s fees in the Statement of Operations. The deferred fees remain in the appropriate Fund until distribution in accordance with the plan. The deferred fee liability, included in accrued expenses in the Statement of Assets and Liabilities, is unsecured.
Those Trustees not participating in the above plan received $20,479 in fees from the Funds covered in this shareholder report for the year ended December 31, 2011. In addition, the Trust reimbursed independent Trustees for
40
Thrivent Mutual Funds
Notes to Financial Statements
As of December 31, 2011
reasonable expenses incurred in relation to attendance at the meetings and industry conferences.
Certain officers and non-independent Trustees of the Trust are officers and directors of Thrivent Asset Mgt., Thrivent Investment Mgt. and Thrivent Investor Services; however, they receive no compensation from the Funds.
(E) Indirect Expenses – Some Funds invest in other mutual funds. Fees and expenses of those underlying funds are not included in those Funds’ expense ratios. The Funds indirectly bear their proportionate share of the annualized weighted average expense ratio of the underlying funds in which they invest.
(4) TAX INFORMATION
Distributions are based on amounts calculated in accordance with applicable federal income tax regulations, which may differ from GAAP. To the extent that these differences are permanent in nature, such amounts are reclassified within the capital accounts based on their federal tax-basis treatment; temporary differences do not require reclassifications.
On the Statement of Assets and Liabilities, as a result of permanent book-to-tax differences, reclassification adjustments were made as follows [Increase/(Decrease)]:
| | | | | | | | | | | | |
Fund | | Accumulated
Net
Investment
Income/(Loss) | | | Accumulated
Net Realized
Gain/(Loss) | | | Capital
Stock | |
Natural Resources | | $ | — | | | $ | 443 | | | ($ | 443 | ) |
Equity Income Plus | | | (2,988 | ) | | | 10,138 | | | | (7,150 | ) |
Diversified Income Plus | | | (167,831 | ) | | | 167,831 | | | | — | |
At December 31, 2011, the components of distributable earnings on a tax basis were as follows:
| | | | | | | | |
Fund | | Undistributed
Ordinary Income | | | Undistributed
Long-Term
Capital Gain | |
Diversified Income Plus | | $ | 257,474 | | | $ | — | |
At December 31, 2011, the following Funds had accumulated net realized capital loss carryovers expiring as follows:
| | | | | | | | |
Fund | | Capital Loss
Carryover | | | Expiration
Year | |
Natural Resources | | $ | 3,770,133 | | | | 2016 | |
| | | 7,987,053 | | | | 2017 | |
| | | | | | | | |
| | $ | 11,757,186 | | | | | |
| | | | | | | | |
Equity Income Plus | | | 1,917,756 | | | | 2016 | |
| | | 1,490,521 | | | | 2017 | |
| | | | | | | | |
| | $ | 3,408,277 | | | | | |
| | | | | | | | |
Diversified Income Plus | | | 11,441,438 | | | | 2016 | |
| | | 6,421,989 | | | | 2017 | |
| | | | | | | | |
| | $ | 17,863,427 | | | | | |
| | | | | | | | |
Capital losses generated during the year ending December 31, 2011, and later, are subject to the provisions of the Regulated Investment Company Modernization Act of 2010 (the “Act”). The Act made several changes to the tax rules that impact the Funds. Under the Act, if capital losses are not reduced by gains, the losses will be carried forward with no expiration and with the short-term or long-term character of the loss retained. Additionally, these capital losses must be fully utilized before those capital loss carryovers listed with noted expiration dates in the table above, which may make them more likely to expire unused.
At December 31, 2011, the following Fund had accumulated net realized capital loss carryovers subject to the Act, as follows:
| | | | | | | | |
Fund | | Capital Loss
Carryover | | | Tax Character | |
Natural Resources | | $ | 1,452,445 | | | | Short-term | |
Natural Resources | | | 3,803,441 | | | | Long-term | |
| | | | | | | | |
| | $ | 5,255,886 | | | | | |
| | | | | | | | |
To the extent that these Funds realize future net capital gains, taxable distributions will be reduced by any unused capital loss carryovers as permitted by the Internal Revenue Code.
During the calendar year 2011, capital loss carryovers utilized by the Funds were as follows: Equity Income Plus Fund, $1,258,757; and Diversified Income Plus Fund, $4,853,691.
41
Thrivent Mutual Funds
Notes to Financial Statements
As of December 31, 2011
The tax character of distributions paid during the years ended December 31, 2011 and 2010 was as follows:
| | | | | | | | | | | | | | | | |
| | | Ordinary Income | | | Return of Capital | |
Fund | | 12/31/2011 | | | 12/31/2010 | | | 12/31/2011 | | | 12/31/2010 | |
Natural Resources | | $ | 1,287,114 | | | $ | 2,368,425 | | | $ | 1,098,250 | | | $ | 434,468 | |
Equity Income Plus | | | 825,241 | | | | 688,455 | | | | — | | | | — | |
Diversified Income Plus | | | 9,254,910 | | | | 7,961,165 | | | | — | | | | — | |
(5) SECURITY TRANSACTIONS
(A) Purchases and Sales of Investment Securities – For the year ended December 31, 2011, the cost of purchases and the proceeds from sales of investment securities, other than U.S. Government and short-term securities, were as follows:
| | | | | | | | |
| | | In thousands | |
Fund | | Purchases | | | Sales | |
Natural Resources | | $ | 107,073 | | | $ | 108,303 | |
Equity Income Plus | | | 96,059 | | | | 84,918 | |
Diversified Income Plus | | | 250,034 | | | | 219,231 | |
Purchases and Sales of U.S. Government Securities were:
| | | | | | | | |
| | | In thousands | |
Fund | | Purchases | | | Sales | |
Diversified Income Plus | | $ | 19,296 | | | $ | 10,669 | |
(B) Investments in Restricted Securities – Certain Funds may own restricted securities that have been deemed illiquid and were purchased in private placement transactions without registration under the Securities Act of 1933. Unless such securities subsequently become registered, they generally may be resold only in privately negotiated transactions with a limited number of purchasers. As of December 31, 2011, the following Fund held restricted securities:
| | | | | | | | |
Fund | | Number of
Securities | | | Percent of
Fund’s
Net Assets | |
Diversified Income Plus | | | 1 | | | | 0.65 | % |
The Funds have no right to require registration of unregistered securities.
(C) Investments in High-Yielding Securities – The Funds may invest in high-yielding securities. These securities will typically be in lower rated categories or will be non-rated and generally will involve more risk than securities in higher rated categories. Lower rated or unrated securities are more likely to react to developments affecting market risk and credit risk than are more highly rated securities, which react primarily to movements in the general level of interest rates.
(D) Investments in Options and Futures Contracts – The movement in the price of the security underlying an option or futures contract may not correlate perfectly with the movement in the prices of the portfolio securities being hedged. A lack of correlation could render the Fund’s hedging strategy unsuccessful and could result in a loss to the Fund. In the event that a liquid secondary market would not exist, the Fund could be prevented from entering into a closing transaction, which could result in additional losses to the Fund.
(E) Written Option Contracts – The number of contracts and premium amounts associated with covered call option contracts written during the year ended December 31, 2011, were as follows:
| | | | | | | | |
| | | Number of
Contracts | | | Premium
Amount | |
Equity Income Plus | | | | | | | | |
Balance at December 31, 2010 | | | 30 | | | $ | 12,675 | |
Opened | | | 2,026 | | | | 784,871 | |
Closed | | | (1,471 | ) | | | (673,747 | ) |
Expired | | | (70 | ) | | | (22,866 | ) |
Exercised | | | — | | | | — | |
| | | | | | | | |
Balance at December 31, 2011 | | | 515 | | | $ | 100,933 | |
| | | | | | | | |
Diversified Income Plus | | | | | | | | |
Balance at December 31, 2010 | | | 50 | | | $ | 21,125 | |
Opened | | | 2,965 | | | | 1,385,757 | |
Closed | | | (2,770 | ) | | | (1,300,788 | ) |
Expired | | | (125 | ) | | | (37,894 | ) |
Exercised | | | — | | | | — | |
| | | | | | | | |
Balance at December 31, 2011 | | | 120 | | | $ | 68,200 | |
| | | | | | | | |
(6) SECURITY TRANSACTIONS WITH AFFILIATED FUNDS
The Funds are permitted to purchase or sell securities from or to certain other Funds under specified conditions outlined in procedures adopted by the Board of Trustees of the Trust. The procedures have been designed to ensure that any purchase or sale of securities by the Fund from or to another fund or portfolio that is or could be considered an affiliate by virtue of having a common investment adviser
42
Thrivent Mutual Funds
Notes to Financial Statements
As of December 31, 2011
(or affiliated investment advisers), common Trustees and/or common officers complies with Rule 17a-7 of the 1940 Act. Further, as defined under the procedures, each transaction is executed at the current market price. Pursuant to these procedures, during the year ended December 31, 2011, the Funds covered in this shareholder report did not engage in these transactions.
(7) RELATED PARTY TRANSACTIONS
As of December 31, 2011, no related parties held shares in excess of 5% of the Funds covered in this shareholder report.
(8) SUBSEQUENT EVENTS
Management of the Funds has evaluated the impact of subsequent events and, except as already included in the Notes to Financial Statements, has determined that no additional items require disclosure.
43
Thrivent Mutual Funds
Financial Highlights
| | | | | | | | | | | | | | | | | | | | | | | | | | | | |
| | | FOR A SHARE OUTSTANDING THROUGHOUT EACH PERIOD* | |
| | | | | | Income from Investment Operations | | |
Less Distributions from | |
| | | Net Asset
Value,
Beginning
of Period | | | Net
Investment
Income/(Loss) | | | Net Realized
and Unrealized
Gain/(Loss) on
Investments(a) | | | Total from
Investment
Operations | | | Net
Investment
Income | | | Net Realized
Gain on
Investments | | | Return of
Capital | |
NATURAL RESOURCES FUND | |
Class A Shares | | | | | | | | | | | | | | | | | | | | | | | | | | | | |
Year Ended 12/31/2011 | | $ | 9.66 | | | $ | 0.08 | | | $ | 0.01 | | | $ | 0.09 | | | $ | (0.09 | ) | | $ | — | | | $ | (0.09 | ) |
Year Ended 12/31/2010 | | | 7.79 | | | | 0.11 | | | | 1.98 | | | | 2.09 | | | | (0.18 | ) | | | — | | | | (0.04 | ) |
Year Ended 12/31/2009 | | | 6.36 | | | | 0.19 | | | | 1.50 | | | | 1.69 | | | | (0.18 | ) | | | — | | | | (0.08 | ) |
Year Ended 12/31/2008 | | | 10.56 | | | | 0.23 | | | | (4.05 | ) | | | (3.82 | ) | | | (0.22 | ) | | | — | | | | (0.16 | ) |
Year Ended 12/31/2007 | | | 13.34 | | | | 0.12 | | | | (2.34 | ) | | | (2.22 | ) | | | (0.20 | ) | | | (0.35 | ) | | | (0.01 | ) |
Institutional Class Shares | | | | | | | | | | | | | | | | | | | | | | | | | | | | |
Year Ended 12/31/2011 | | | 9.66 | | | | 0.12 | | | | — | | | | 0.12 | | | | (0.12 | ) | | | — | | | | (0.09 | ) |
Year Ended 12/31/2010 | | | 7.80 | | | | 0.13 | | | | 1.98 | | | | 2.11 | | | | (0.21 | ) | | | — | | | | (0.04 | ) |
Year Ended 12/31/2009 | | | 6.34 | | | | 0.20 | | | | 1.53 | | | | 1.73 | | | | (0.19 | ) | | | — | | | | (0.08 | ) |
Year Ended 12/31/2008 | | | 10.56 | | | | 0.25 | | | | (4.06 | ) | | | (3.81 | ) | | | (0.25 | ) | | | — | | | | (0.16 | ) |
Year Ended 12/31/2007 | | | 13.35 | | | | 0.25 | | | | (2.43 | ) | | | (2.18 | ) | | | (0.25 | ) | | | (0.35 | ) | | | (0.01 | ) |
| | | | | | | | | | | | | | | | | | | | | | | | | | | | |
EQUITY INCOME PLUS FUND | |
Class A Shares | | | | | | | | | | | | | | | | | | | | | | | | | | | | |
Year Ended 12/31/2011 | | | 9.08 | | | | 0.13 | | | | (0.38 | ) | | | (0.25 | ) | | | (0.13 | ) | | | — | | | | — | |
Year Ended 12/31/2010 | | | 7.98 | | | | 0.13 | | | | 1.12 | | | | 1.25 | | | | (0.15 | ) | | | — | | | | — | |
Year Ended 12/31/2009 | | | 7.03 | | | | 0.13 | | | | 0.95 | | | | 1.08 | | | | (0.13 | ) | | | — | | | | — | |
Year Ended 12/31/2008 (c) | | | 10.00 | | | | 0.18 | | | | (2.97 | ) | | | (2.79 | ) | | | (0.17 | ) | | | — | | | | (0.01 | ) |
Institutional Class Shares | | | | | | | | | | | | | | | | | | | | | | | | | | | | |
Year Ended 12/31/2011 | | | 9.08 | | | | 0.16 | | | | (0.37 | ) | | | (0.21 | ) | | | (0.16 | ) | | | — | | | | — | |
Year Ended 12/31/2010 | | | 7.98 | | | | 0.17 | | | | 1.11 | | | | 1.28 | | | | (0.18 | ) | | | — | | | | — | |
Year Ended 12/31/2009 | | | 7.04 | | | | 0.16 | | | | 0.94 | | | | 1.10 | | | | (0.16 | ) | | | — | | | | — | |
Year Ended 12/31/2008 (c) | | | 10.00 | | | | 0.18 | | | | (2.94 | ) | | | (2.76 | ) | | | (0.19 | ) | | | — | | | | (0.01 | ) |
| | | | | | | | | | | | | | | | | | | | | | | | | | | | |
DIVERSIFIED INCOME PLUS FUND | |
Class A Shares | | | | | | | | | | | | | | | | | | | | | | | | | | | | |
Year Ended 12/31/2011 | | | 6.39 | | | | 0.27 | | | | (0.15 | ) | | | 0.12 | | | | (0.29 | ) | | | — | | | | — | |
Year Ended 12/31/2010 | | | 5.83 | | | | 0.33 | | | | 0.54 | | | | 0.87 | | | | (0.31 | ) | | | — | | | | — | |
Year Ended 12/31/2009 | | | 4.68 | | | | 0.32 | | | | 1.11 | | | | 1.43 | | | | (0.28 | ) | | | — | | | | — | |
Year Ended 12/31/2008 | | | 6.48 | | | | 0.30 | | | | (1.78 | ) | | | (1.48 | ) | | | (0.32 | ) | | | — | | | | — | |
Year Ended 12/31/2007 | | | 6.88 | | | | 0.32 | | | | (0.39 | ) | | | (0.07 | ) | | | (0.33 | ) | | | — | | | | — | |
Institutional Class Shares | | | | | | | | | | | | | | | | | | | | | | | | | | | | |
Year Ended 12/31/2011 | | | 6.36 | | | | 0.29 | | | | (0.15 | ) | | | 0.14 | | | | (0.31 | ) | | | — | | | | — | |
Year Ended 12/31/2010 | | | 5.81 | | | | 0.36 | | | | 0.52 | | | | 0.88 | | | | (0.33 | ) | | | — | | | | — | |
Year Ended 12/31/2009 | | | 4.67 | | | | 0.35 | | | | 1.09 | | | | 1.44 | | | | (0.30 | ) | | | — | | | | — | |
Year Ended 12/31/2008 | | | 6.47 | | | | 0.31 | | | | (1.76 | ) | | | (1.45 | ) | | | (0.35 | ) | | | — | | | | — | |
Year Ended 12/31/2007 | | | 6.88 | | | | 0.35 | | | | (0.40 | ) | | | (0.05 | ) | | | (0.36 | ) | | | — | | | | — | |
| (a) | The amount shown may not correlate with the change in aggregate gains and losses of portfolio securities due to the timing of sales and redemptions of fund shares. |
| (c) | Since fund inception, February 29, 2008. |
| * | All per share amounts have been rounded to the nearest cent. |
The accompanying Notes to Financial Statements are an integral part of this schedule.
44
Thrivent Mutual Funds
Financial Highlights – continued
| | | | | | | | | | | | | | | | | | | | | | | | | | | | | | | | | | |
| RATIOS / SUPPLEMENTAL DATA | |
| | | | | | | | | | | | | Ratio to Average Net
Assets** | | | Ratios to Average Net Assets
Before Expenses Waived,
Credited or Paid
Indirectly** | | | | |
Total
Distributions | | | Net Asset
Value, End of
Period | | | Total Return(b) | | |
Net Assets,
End of Period
(in millions) | | | Expenses | | | Net Investment
Income/(Loss) | | | Expenses | | | Net Investment
Income/(Loss) | | | Portfolio
Turnover
Rate | |
| | | | | | | | | | | | | | | | | | | | | | | | | | | | | | | | | | | |
| | | | | | | | | | | | | | | | | | | | | | | | | | | | | | | | | | | |
| $ | (0.18 | ) | | $ | 9.57 | | | | 0.85 | % | | $ | 15.4 | | | | 1.30 | % | | | 0.77 | % | | | 1.70 | % | | | 0.37 | % | | | 92 | % |
| | (0.22 | ) | | | 9.66 | | | | 27.15 | % | | | 14.8 | | | | 1.29 | % | | | 1.17 | % | | | 1.81 | % | | | 0.66 | % | | | 18 | % |
| | (0.26 | ) | | | 7.79 | | | | 28.55 | % | | | 10.8 | | | | 1.25 | % | | | 3.09 | % | | | 2.23 | % | | | 2.11 | % | | | 20 | % |
| | (0.38 | ) | | | 6.36 | | | | (37.16 | )% | | | 8.4 | | | | 1.25 | % | | | 2.50 | % | | | 1.73 | % | | | 2.02 | % | | | 49 | % |
| | (0.56 | ) | | | 10.56 | | | | (16.84 | )% | | | 14.6 | | | | 1.10 | % | | | 1.24 | % | | | 1.53 | % | | | 0.81 | % | | | 77 | % |
| | | | | | | | | | | | | | | | | | | | | | | | | | | | | | | | | | |
| | (0.21 | ) | | | 9.57 | | | | 1.21 | % | | | 96.8 | | | | 0.94 | % | | | 1.15 | % | | | 0.94 | % | | | 1.15 | % | | | 92 | % |
| | (0.25 | ) | | | 9.66 | | | | 27.38 | % | | | 95.4 | | | | 0.97 | % | | | 1.47 | % | | | 0.97 | % | | | 1.47 | % | | | 18 | % |
| | (0.27 | ) | | | 7.80 | | | | 28.97 | % | | | 80.2 | | | | 1.03 | % | | | 3.24 | % | | | 1.04 | % | | | 3.23 | % | | | 20 | % |
| | (0.41 | ) | | | 6.34 | | | | (37.00 | )% | | | 56.5 | | | | 0.91 | % | | | 2.73 | % | | | 0.93 | % | | | 2.72 | % | | | 49 | % |
| | (0.61 | ) | | | 10.56 | | | | (16.59 | )% | | | 75.2 | | | | 0.82 | % | | | 1.92 | % | | | 0.95 | % | | | 1.78 | % | | | 77 | % |
| | | | | | | | | | | | | | | | | | | | | | | | | | | | | | | | | | |
| | | | | | | | | | | | | | | | | | | | | | | | | | | | | | | | | | | |
| | | | | | | | | | | | | | | | | | | | | | | | | | | | | | | | | | | |
| | (0.13 | ) | | | 8.70 | | | | (2.79 | )% | | | 21.0 | | | | 1.15 | % | | | 1.47 | % | | | 1.47 | % | | | 1.15 | % | | | 193 | % |
| | (0.15 | ) | | | 9.08 | | | | 15.83 | % | | | 11.7 | | | | 1.16 | % | | | 1.90 | % | | | 1.76 | % | | | 1.29 | % | | | 360 | % |
| | (0.13 | ) | | | 7.98 | | | | 15.74 | % | | | 4.1 | | | | 1.15 | % | | | 1.92 | % | | | 1.93 | % | | | 1.14 | % | | | 414 | % |
| | (0.18 | ) | | | 7.03 | | | | (28.15 | )% | | | 2.9 | | | | 1.15 | % | | | 2.35 | % | | | 1.68 | % | | | 1.82 | % | | | 114 | % |
| | | | | | | | | | | | | | | | | | | | | | | | | | | | | | | | | | | |
| | (0.16 | ) | | | 8.71 | | | | (2.35 | )% | | | 30.6 | | | | 0.80 | % | | | 1.80 | % | | | 0.94 | % | | | 1.66 | % | | | 193 | % |
| | (0.18 | ) | | | 9.08 | | | | 16.23 | % | | | 29.9 | | | | 0.81 | % | | | 2.09 | % | | | 1.19 | % | | | 1.70 | % | | | 360 | % |
| | (0.16 | ) | | | 7.98 | | | | 15.97 | % | | | 24.7 | | | | 0.80 | % | | | 2.28 | % | | | 1.35 | % | | | 1.73 | % | | | 414 | % |
| | (0.20 | ) | | | 7.04 | | | | (27.90 | )% | | | 20.3 | | | | 0.80 | % | | | 2.56 | % | | | 1.08 | % | | | 2.28 | % | | | 114 | % |
| | | | | | | | | | | | | | | | | | | | | | | | | | | | | | | | | | |
| | | | | | | | | | | | | | | | | | | | | | | | | | | | | | | | | | | |
| | | | | | | | | | | | | | | | | | | | | | | | | | | | | | | | | | | |
| | (0.29 | ) | | | 6.22 | | | | 1.78 | % | | | 200.5 | | | | 0.97 | % | | | 4.29 | % | | | 1.06 | % | | | 4.20 | % | | | 126 | % |
| | (0.31 | ) | | | 6.39 | | | | 15.24 | % | | | 171.5 | | | | 1.12 | % | | | 5.62 | % | | | 1.12 | % | | | 5.61 | % | | | 112 | % |
| | (0.28 | ) | | | 5.83 | | | | 31.50 | % | | | 135.2 | | | | 1.18 | % | | | 6.32 | % | | | 1.20 | % | | | 6.30 | % | | | 94 | % |
| | (0.32 | ) | | | 4.68 | | | | (23.69 | )% | | | 109.4 | | | | 1.06 | % | | | 5.02 | % | | | 1.11 | % | | | 4.97 | % | | | 114 | % |
| | (0.33 | ) | | | 6.48 | | | | (1.12 | )% | | | 175.4 | | | | 0.90 | % | | | 4.82 | % | | | 1.08 | % | | | 4.64 | % | | | 171 | % |
| | | | | | | | | | | | | | | | | | | | | | | | | | | | | | | | | | | |
| | (0.31 | ) | | | 6.19 | | | | 2.18 | % | | | 17.4 | | | | 0.74 | % | | | 4.53 | % | | | 0.74 | % | | | 4.52 | % | | | 126 | % |
| | (0.33 | ) | | | 6.36 | | | | 15.57 | % | | | 7.7 | | | | 0.76 | % | | | 5.92 | % | | | 0.77 | % | | | 5.92 | % | | | 112 | % |
| | (0.30 | ) | | | 5.81 | | | | 31.97 | % | | | 6.7 | | | | 0.76 | % | | | 6.71 | % | | | 0.79 | % | | | 6.69 | % | | | 94 | % |
| | (0.35 | ) | | | 4.67 | | | | (23.32 | )% | | | 4.1 | | | | 0.63 | % | | | 5.42 | % | | | 0.68 | % | | | 5.37 | % | | | 114 | % |
| | (0.36 | ) | | | 6.47 | | | | (0.78 | )% | | | 9.6 | | | | 0.51 | % | | | 5.22 | % | | | 0.69 | % | | | 5.04 | % | | | 171 | % |
| (b) | Total investment return assumes dividend reinvestment and does not reflect any deduction for sales charges. Not annualized for periods less than one year. |
| ** | Computed on an annualized basis of less than one year. |
The accompanying Notes to Financial Statements are an integral part of this schedule.
45
Additional Information
(unaudited)
Shareholder Notification of Federal Tax Information
The following information is provided solely to satisfy the requirements set forth by the Internal Revenue Code. Shareholders will be provided information regarding their distribution in February 2012.
The funds designate the percentage of dividends declared from net investment income as dividends qualifying for the 70% dividends received deduction for corporations and the percentage as qualified dividend income for individuals under the Jobs and Growth Tax Relief Reconciliation Act of 2003 as follows:
| | | | | | | | |
Fund | | Dividends
Received
Deduction
for
Corporations | | | Qualified
Dividend
Income for
Individuals | |
Natural Resources | | | 14 | % | | | 20 | % |
Equity Income Plus | | | 86 | % | | | 100 | % |
Diversified Income Plus | | | 18 | % | | | 20 | % |
Proxy Voting
The policies and procedures that the Trust uses to determine how to vote proxies relating to portfolio securities are attached to the Trust’s Statement of Additional Information. You may request a free copy of the Statement of Additional Information or the report of how the Trust voted proxies relating to portfolio securities during the most recent 12-month period ended June 30 by calling 1-800-847-4836. You also may review the Statement of Additional Information or the report of how the Trust voted proxies relating to portfolio securities during the most recent 12-month period ended June 30 at Thrivent.com or www.sec.gov.
Quarterly Schedule of Portfolio Holdings
The Trust files its Schedule of Portfolio Holdings on Form N-Q with the SEC for the first and third quarters of each fiscal year. You may request a free copy of the Trust’s Forms N-Q by calling 1-800-847-4836. The Trust’s most recent Form N-Q Schedule of Investments also is at Thrivent.com or www.sec.gov. You also may review and copy the Forms N-Q for the Trust at the SEC’s Public Reference Room in Washington, DC. You may get information about the operation of the Public Reference Room by calling 1-800-SEC-0330.
Results of Special Shareholder Meeting
A special meeting of the shareholders of Thrivent Real Estate Securities Fund, now Thrivent Natural Resources Fund, convened on September 9, 2011 to approve (1) a change in the Fund’s classification and related fundamental investment restriction to make the Fund a non-diversified investment company and (2) a change in the Fund’s industry concentration policy and related fundamental investment restriction to require the Fund to concentrate its assets in issuers in the natural resources group of industries.
Shareholder votes rendered the following results:
| | | | | | | | | | | | |
Name | | For | | | Against | | | Abstain | |
Change to make Fund non-diversified | | | 8,967,841.594 | | | | 1,200,983.262 | | | | 201,070.475 | |
| | | |
Change in concentration policy | | | 9,079,852.284 | | | | 1,193,323.386 | | | | 105,719.661 | |
Board Approval of Investment Advisory Agreement and Subadvisory Agreements
Both the Investment Company Act of 1940 (the “Investment Company Act”) and the terms of the Investment Advisory and Subadvisory Agreements of the Thrivent Mutual Funds (the “Trust”) require that these agreements be approved annually by the Board of Trustees (the “Board”), including a majority of the Trustees who are not “interested persons” of the Trust, as defined in the Investment Company Act (the “Independent Trustees”).
46
Additional Information
(unaudited)
At its meeting on November 29, 2011, the Board voted unanimously to renew the existing Investment Advisory Agreement between the Trust and Thrivent Asset Management (the “Adviser”) for each series (each, a “Fund”) of the Trust. The Board also unanimously approved the Subadvisory Agreements for each of the Funds for which there is an investment subadviser (each a “Subadviser”). The Adviser and Subadvisers are referred to, collectively, as the “Advisory Organizations.” In connection with its evaluation of the agreements with the Advisory Organizations, the Board reviewed a broad range of information requested for this purpose and considered a variety of factors, including the following:
| | 1. | The nature, extent, and quality of the services provided by the Advisory Organizations; |
| | 2. | The performance of the Funds; |
| | 3. | The advisory fee and net operating expense ratio of each Fund compared to a peer group; |
| | 4. | The cost of services provided and profit realized by the Adviser; |
| | 5. | The extent to which economies of scale may be realized as the Funds grow; |
| | 6. | Whether the breakpoint levels reflect these economies of scale for the benefit of shareholders; |
| | 7. | Other benefits realized by the Adviser from its relationship with the Trust; and |
| | 8. | Any other factors that the Board deemed relevant to its consideration. |
In connection with the renewal process, the Contracts Committee of the Board (consisting of each of the Independent Trustees) met on six occasions from March 8 to November 29, 2011 to consider information relevant to the renewal process. The Independent Trustees also retained the services of Management Practice, Inc. (“MPI”) as an independent consultant to assist in the compilation, organization, and evaluation of relevant information. This information included statistical comparisons of the advisory fees, total operating expenses and performance of each of the Funds in comparison to a peer group of comparable funds; detailed information prepared by management with respect to the cost of services provided to the Funds and fees charged, including effective advisory fees that take into account breakpoints and fee waivers by the Adviser; profit realized by the Adviser and its affiliates that provide services to the Funds; and information regarding the types of services furnished to the Funds, the personnel providing the services, changes in staff and systems improvements. The Board also received reports from the Adviser’s investment management staff with respect to the performance of the Funds. In addition to its review of the information presented to the Board during the contract renewal process, the Board also considered information obtained from management throughout the course of the year.
The Independent Trustees were represented by independent counsel throughout the review process and during executive sessions without management present to consider reapproval of the agreements. Each Independent Trustee relied on his or her own business judgment in determining the weight to be given to each factor considered in evaluating the materials that were presented. The Contract Committee’s and Board’s review and conclusions were based on a comprehensive consideration of all information presented to them and were not the result of any single controlling factor. In addition, each Trustee may have weighed individual factors differently. The key factors considered and the conclusions reached are described below.
Nature, Extent and Quality of Services
At each of the Board’s regular quarterly meetings, management presented information describing the services furnished to the Funds by the Adviser and, as appropriate, the Subadvisers. During these meetings, management reported on the investment management, portfolio trading and compliance services provided to the Funds under the Advisory and Subadvisory Agreements. During the renewal process, the Board considered the specific services provided under the Advisory Agreement. The Board also considered information relating to the investment experience and qualifications of the Adviser’s portfolio managers and those of the Subadvisers.
The Board received reports at each of its quarterly meetings from the Adviser’s Directors of Equity and Fixed Income Investments, as supplemented by the Adviser’s Chief Investment Officer, who was also present at all of the meetings. At each quarterly meeting, the Directors of Equity and Fixed Income Investments presented information about each of the Funds. These reports and presentations gave the Board the opportunity to evaluate the portfolio managers’ abilities and the quality of services they provide to the Funds. Information was also presented to the Board describing the portfolio compliance functions performed by the Adviser and the Adviser’s oversight of the Subadvisers to the Trust. The Independent Trustees also met in-person with and received quarterly reports from the Trust’s Chief Compliance Officer.
47
Additional Information
(unaudited)
The Board considered the adequacy of the Advisory Organizations’ resources used to provide services to the Trust pursuant to the Advisory and Subadvisory Agreements. The Adviser reviewed with the Board the Adviser’s ongoing program to enhance portfolio management capabilities, including recruitment and retention of portfolio managers, research analysts, and other personnel, and investment in additional and updated technology systems and applications to improve investment research, trading, portfolio compliance, and investment reporting functions. The Adviser also discussed improved risk controls. The Board viewed these actions as a positive factor in reapproving the existing Advisory Agreement, as they demonstrated the Adviser’s commitment to provide the Funds with quality service and competitive investment performance. The Board concluded that, within the context of its full deliberations, the nature, extent and quality of the investment advisory services provided to the Funds by the Adviser and Subadvisers supported renewal of the Advisory Agreement and Subadvisory Agreements.
Performance of the Funds
In connection with each of its regular quarterly meetings, the Board received information on the performance of each Fund, including net performance, relative performance rankings within each Fund’s Lipper peer group, Morningstar ratings, and performance as compared to benchmark index returns. At each quarterly Board meeting, the Directors of Equities and Fixed Income Investments reviewed with the Board the economic and market environment, risk management, and style consistency in connection with management of the Funds. The Board considered investment performance for each Fund, to the extent applicable, over the one-, three-, five-, and ten-year periods. When evaluating investment performance, the Board considered longer-term performance and the trend of performance, and focused particularly upon the three-year performance record.
For the three-year period ended June 30, 2011, the Board noted the average ranking of the Funds against their Lipper categories was 48% (with 1% being the best) and that 60% of the Funds performed in the top two quartiles. The Board concluded that the performance of each individual Fund was either satisfactory compared to its peer group or that the Adviser had taken appropriate actions in an effort to improve performance.
Advisory Fees and Fund Expenses
The Board reviewed information prepared by MPI comparing each Fund’s advisory fee with the advisory fee of its peer group. The Board considered both the contractual and effective advisory fees for each of the Funds. The Board noted that the majority of the Funds’ advisory fees were at or below the medians of their peer groups. More specifically, the Board observed that 76.7% of the Funds comprising 73.7% of the Trust’s assets had gross advisory fees below their peer group medians. The Board also considered advisory fees after the voluntary and contractual fee waivers and expense reimbursements provided by the Adviser for several of the Funds, noting that 86.7% of the Funds, representing 82.3% of total Trust assets, had effective advisory fees at or below their peer group medians. The Board viewed favorably the Adviser’s proposal to continue or extend fee waivers for certain Funds and considered the effect of the waivers in lowering the Funds’ expenses.
On the basis of its review, the Board concluded that the advisory fees charged to the Funds for investment management services were not excessive.
The Board also reviewed information prepared by MPI comparing each Fund’s overall expense ratio with the expense ratio of its peer group. The Board noted that 88.5% of the Funds had net operating expenses at or below the median of their peer groups.
Cost of Services and Profitability
The Board considered the Adviser’s estimates of its profitability, which included allocations by the Adviser of its costs in providing advisory services to the Funds. The internal audit department (i.e., Business Risk Management) of the Adviser conducted a review of such allocations and a department representative reported to the Board his views regarding the reasonableness and consistency of these allocations. The Board considered the profitability of the Adviser both overall and on a Fund-by-Fund basis. The Board also considered the expense reimbursements and waivers in effect. Based on its review of the data prepared by MPI and expense and profit information provided by the Adviser, the Board
48
Additional Information
(unaudited)
concluded that the profits earned by the Adviser from the Advisory Agreement were not excessive in light of the nature, extent and quality of services provided to the Funds.
With respect to fees paid to Subadvisers under the Subadvisory Agreements, the Board did not consider profitability information with respect to the Subadvisers, which are not affiliated with the Adviser. The Board considered that those contracts had been negotiated on an arm’s-length basis between the Adviser and each Subadviser, and that each Subadviser’s separate profitability from its relationship with the Funds was not a material factor in determining whether to renew the agreement.
Economies of Scale and Breakpoints
The Board considered information regarding the extent to which economies of scale may be realized as a Fund’s assets increase and whether the fee levels reflect these economies of scale for the benefit of shareholders. The Adviser explained its general goal with respect to the employment of fee waivers, expense reimbursements and breakpoints. The Board considered information provided by the Adviser related to advisory fee rates, breakpoints in the advisory fee rates and fee waivers provided by the Adviser. The Board also considered management’s view that it is difficult to generalize as to whether, or to what extent, economies in the advisory function may be realized as a Fund’s assets increase. The Board noted that expected economies of scale, where they exist, may be shared through the use of fee breakpoints, fee waivers by the Adviser, and/or a lower overall fee rate.
Other Benefits to the Adviser and its Affiliates
The Board considered information regarding potential “fall-out” or ancillary benefits that the Adviser and its affiliates may receive as a result of their relationship with the Trust, both tangible and intangible, such as their ability to leverage investment professionals who manage other portfolios, reputational benefits in the investment advisory community and the engagement of affiliates as service providers to the Funds. The Board noted that such benefits were difficult to quantify but were consistent with benefits received by other mutual fund advisers.
The Board also considered other potential benefits to the Adviser and its affiliates derived from its relationship with the Trust, including, among other things, research received by the Adviser generated from commission dollars spent on the Funds’ portfolio trading. The Board reviewed with the Adviser these arrangements and the reasonableness of the costs relative to the services performed.
Based on the factors discussed above, the Contracts Committee unanimously recommended approval of the Advisory Agreement and the Subadvisory Agreements, and the Board, including all of the Independent Trustees voting separately, approved each of the agreements.
49
Board of Trustees and Officers
The following table provides information about the Trustees and Officers of the Trust. Each Trustee oversees each of the 25 series of the Trust and also serves as:
| | • | | Director of Thrivent Series Fund, Inc., a registered investment company consisting of 41 portfolios that serve as underlying funds for variable contracts issued by Thrivent Financial for Lutherans (“Thrivent Financial”) and Thrivent Life Insurance Company and investment options in the retirement plan offered by Thrivent Financial; and |
| | • | | Trustee of Thrivent Financial Securities Lending Trust, a registered investment company consisting of one portfolio that serves as a cash collateral fund for a securities lending program sponsored by Thrivent Financial. |
The 25 series of the Trust, the 41 portfolios of Thrivent Series Fund, Inc. and Thrivent Financial Securities Lending Trust are referred to herein as the “Fund Complex.” The Statement of Additional Information includes additional information about the Trustees and is available, without charge, by calling 1-800-847-4836.
Interested Trustee (1)
| | | | | | | | |
Name, Address and Age | | Position with Trust and Length of Service (2) | | Number of
Portfolios in
Fund
Complex
Overseen by
Trustee | | Principal Occupation During the Past 5 Years | | Other Directorships Held
Currently and Within Past 5 Years |
| Russell W. Swansen | | President since 2008; | | 67 | | Senior Vice President, | | None |
| 625 Fourth Avenue South | | Trustee since 2009; | | | | Chief Investment Officer, | | |
| Minneapolis, MN | | Vice President from | | | | Thrivent Financial since | | |
| Age 54 | | 2004 until 2008 | | | | 2003 | | |
Independent Trustees (3)
| | | | | | | | |
Name, Address and Age | | Position with Trust and Length of Service (2) | | Number of
Portfolios in
Fund
Complex
Overseen by
Trustee | | Principal Occupation
During the Past 5 Years | | Other Directorships Held Currently and Within Past 5 Years |
F. Gregory Campbell 625 Fourth Avenue South Minneapolis, MN Age 72 | | Trustee from 1992 until December 2011 | | 67 | | President, Carthage College | | Currently, Director of Optique Funds, Inc., an investment company consisting of one portfolio; Kenosha Hospital and Medical Center, Prairie School Board and United Health Systems Board. Previously, Director of the National Association of Independent Colleges and Universities |
50
Board of Trustees and Officers
| | | | | | | | |
Name, Address and Age | | Position with Trust and Length of Service (2) | | Number of
Portfolios in
Fund
Complex
Overseen by
Trustee | | Principal Occupation During the Past 5 Years | | Other Directorships Held
Currently and Within Past 5 Years |
Janice B. Case 625 Fourth Avenue South Minneapolis, MN Age 59 | | Trustee since 2011 | | 67 | | Independent Trustee of North American Electric Reliability Corporation (self-regulatory organization) since 2008; Independent Director of Western Electricity Coordinating Council (nonprofit corporation coordinating and promoting bulk electric system reliability) from 2002 through 2008; Independent Director/Trustee of three affiliated family of funds (AEGON/Transamerica Series Trust (consisted of 40 funds), Transamerica IDEX Funds (consisted of 53 funds) and Transamerica Income Shares, Inc. (consisted of one fund)) from 2001 through 2007; Independent Director of Central Vermont Public Service Corporation (electric utility) from 2001 through 2007; Advisory Board Director of AmSouth Bank, N.A. from 1997 through 2007 | | Please see principal occupation during the past 5 years |
| | | | |
Richard L. Gady 625 Fourth Avenue South Minneapolis, MN Age 68 | | Trustee since 1987 | | 67 | | Retired | | None |
| | | | |
Richard A. Hauser 625 Fourth Avenue South Minneapolis, MN Age 68 | | Trustee since 2004 | | 67 | | Vice President and Assistant General Counsel, Boeing Company since 2007; President, National Legal Center for the Public Interest from 2004 to 2007 | | Previously, Director of Washington Hospital Center |
| | | | |
Marc S. Joseph 625 Fourth Avenue South Minneapolis, MN Age 51 | | Trustee since 2011 | | 67 | | Managing Director of GraniteRidgeLLP (consulting and advisory firm) since 2009; Managing Director of MJosephLLC (private investing and consulting firm) since 2004 | | None |
51
Board of Trustees and Officers
| | | | | | | | |
Name, Address and Age | | Position with Trust and Length of Service (2) | | Number of
Portfolios in
Fund
Complex
Overseen by
Trustee | | Principal Occupation During the Past 5 Years | | Other Directorships Held
Currently and Within Past 5 Years |
Paul R. Laubscher 625 Fourth Avenue South Minneapolis, MN Age 55 | | Trustee since 2009 | | 67 | | Portfolio Manager for U.S. and international equity portfolios and private real estate portfolios of IBM Retirement Funds | | None |
| | | | |
Connie M. Levi 625 Fourth Avenue South Minneapolis, MN Age 72 | | Chair from 2009 until December 2011; Trustee from 2004 until December 2011 | | 67 | | Retired | | None |
| | | | |
James A. Nussle 625 Fourth Avenue South Minneapolis, MN Age 51 | | Trustee since 2011 | | 67 | | President and Chief Operating Officer of Growth Energy (trade association) since 2010; Advisory Board member of AVISTA Capital Partners (private equity firm) since 2010; Contributor on CNBC (media) since 2010; CEO of The Nussle Group LLC (consulting firm) since 2009; Director of the Office of Management and Budget from 2007 through 2009; CEO of The Nussle Group, Navigating Strategies LLC (consulting firm) from January 2007 through September 2007; and Member of Congress in U.S. House of Representatives from 1991 through 2007 | | Currently, Advisory Board member of AVISTA Capital Partners |
| | | | |
Douglas D. Sims 625 Fourth Avenue South Minneapolis, MN Age 65 | | Trustee since 2006 | | 67 | | Retired | | Currently, Director of Keystone Neighbourhood Company, Keystone Center and Keystone Science School. Previously, Director of the Center for Corporate Excellence |
52
Board of Trustees and Officers
| | | | | | | | |
Name, Address and Age | | Position with Trust and Length of Service (2) | | Number of
Portfolios in
Fund
Complex
Overseen by
Trustee | | Principal Occupation During the Past 5 Years | | Other Directorships Held
Currently and Within Past 5 Years |
Constance L. Souders 625 Fourth Avenue South Minneapolis, MN Age 61 | | Trustee since 2007 | | 67 | | Retired; previously Director from 1983 to 2007, Executive Vice President from 2001 to 2007 and AML Compliance Officer from 2003 to 2007 of Harbor Capital Advisors, Inc.; Director from 1992 to 2007, President from 2000 to 2007 and AML Compliance Officer from 2003 to 2007 of Harbor Services Group, Inc.; Director from 1992 to 2007, Executive Vice President from 2001 to 2007, Chief Compliance Officer from 2004 to 2007, AML Compliance Officer from 2003 to 2007, Supervisory Registered Principal from 2000 to 2007, of Harbor Funds Distributors, Inc.; Vice President from 2000 to 2007 of Harbor Funds | | None |
53
Board of Trustees and Officers
Executive Officers
| | | | |
Name, Address and Age | | Position with Trust and Length of Service (2) | | Principal Occupation During the Past 5 Years |
Russell W. Swansen 625 Fourth Avenue South Minneapolis, MN Age 54 | | President since 2008; Trustee since 2009; Vice President from 2004 until 2008 | | Senior Vice President, Chief Investment Officer, Thrivent Financial since 2003 |
| | |
David S. Royal 625 Fourth Avenue South Minneapolis, MN Age 40 | | Secretary and Chief Legal Officer since 2006 | | Vice President and Managing Counsel, since 2006 and Interim Investment Company and Investment Adviser Chief Compliance Officer from May 2010 until December 2010, Thrivent Financial |
| | |
Gerard V. Vaillancourt 625 Fourth Avenue South Minneapolis, MN Age 44 | | Treasurer and Principal Accounting Officer since 2005 | | Vice President, Mutual Fund Accounting, Thrivent Financial since 2006 |
| | |
Ted S. Dryden 625 Fourth Avenue South Minneapolis, MN Age 46 | | Chief Compliance Officer since 2010 | | Investment Company and Investment Adviser Chief Compliance Officer, Thrivent Financial since December 2010; Chief Compliance Officer, OptumHealth Financial Services from 2009 to 2010; Vice President, Asset Management Compliance, Ameriprise Financial from 2006 to 2009 |
| | |
Janice M. Guimond 625 Fourth Avenue South Minneapolis, MN Age 47 | | Vice President since 2005 | | Vice President, Investment Operations, Thrivent Financial since 2004 |
| | |
Karl D. Anderson 625 Fourth Avenue South Minneapolis, MN Age 50 | | Vice President since 2006 | | Vice President, Products, Thrivent Financial since 2005 |
| | |
Kathleen M. Koelling 4321 North Ballard Road Appleton, WI Age 34 | | Anti-Money Laundering Officer since 2011 | | Privacy and Anti-Money Laundering Officer, Thrivent Financial since 2010; Senior Counsel, Thrivent Financial since 2002 |
| | |
Mark D. Anema 625 Fourth Avenue South Minneapolis, MN Age 50 | | Assistant Vice President since 2007 | | Vice President, Accumulation and Retirement Income Solutions, Thrivent Financial since 2007; Vice President, Strategic Planning, Thrivent Financial from 2004 to 2007 |
| | |
James M. Odland 625 Fourth Avenue South Minneapolis, MN Age 56 | | Assistant Secretary since 2006 | | Vice President and Managing Counsel, Thrivent Financial since 2005 |
| | |
Rebecca A. Paulzine 625 Fourth Avenue South Minneapolis, MN Age 32 | | Assistant Secretary since 2010 | | Counsel, Thrivent Financial since January 2010; Associate, Faegre & Benson LLP from 2005 to December 2009 |
| | |
John L. Sullivan 625 Fourth Avenue South Minneapolis, MN Age 41 | | Assistant Secretary since 2007 | | Senior Counsel, Thrivent Financial since 2007; Senior Counsel, Division of Investment Management of the SEC from 2000 to 2007 |
54
Board of Trustees and Officers
| | | | |
Name, Address and Age | | Position with Trust and Length of Service (2) | | Principal Occupation During the Past 5 Years |
Todd J. Kelly 4321 North Ballard Road Appleton, WI Age 42 | | Assistant Treasurer since 1999 | | Director, Fund Accounting Operations, Thrivent Financial since 2002 |
| | |
Sarah L. Bergstrom 625 Fourth Avenue South Minneapolis, MN Age 34 | | Assistant Treasurer since 2007 | | Director, Fund Accounting Administration, Thrivent Financial since 2007; Manager, Fund Accounting Administration, Thrivent Financial from 2005 to 2007 |
| (1) | “Interested person” of the Trust as defined in the Investment Company Act of 1940 by virtue of positions with Thrivent Financial. Mr. Swansen is considered an interested person because of his principal occupation with Thrivent Financial. |
| (2) | Each Trustee generally serves an indefinite term until her or his successor is duly elected and qualified. Officers serve at the discretion of the board until their successors are duly appointed and qualified. |
| (3) | The Trustees other than Mr. Swansen are not “interested persons” of the Trust and are referred to as “Independent Trustees.” |
55
[THIS PAGE INTENTIONALLY LEFT BLANK]
56

As of the end of the period covered by this report, registrant has adopted a code of ethics (as defined in Item 2 of Form N-CSR) applicable to registrant’s Principal Executive Officer, Principal Financial Officer and Principal Accounting Officer. No waivers were granted to such code of ethics during the period covered by this report. A copy of this code of ethics is filed as an exhibit to this Form N-CSR.
| Item 3. | Audit Committee Financial Expert |
Registrant’s Board of Trustees has determined that Constance L. Souders, an independent trustee, is the Audit Committee Financial Expert.
| Item 4. | Principal Accountant Fees and Services |
(a) through (d)
Thrivent Natural Resources Fund, Thrivent Equity Income Plus Fund, and Thrivent Diversified Income Plus Fund (each a “Fund” and collectively, the “Funds”) are each a series of Thrivent Mutual Funds, a Massachusetts business trust (the “Trust”). The Trust, as of the date of filing this Form N-CSR, contains a total of 25 series (the “Series”), including the Funds. This Form N-CSR relates to the annual report of each Fund.
The following table presents the aggregate fees billed to the Funds for the respective fiscal years ended December 31, 2011 and December 31, 2010 by the Funds’ independent public accountants, PricewaterhouseCoopers LLP (“PwC”), for professional services rendered for the audit of the Funds’ annual financial statements and fees billed for other services rendered by PwC during those periods.
| | | | | | | | |
Fiscal Years Ended | | 12/31/11 | | | 12/31/10 | |
| | |
Audit Fees | | $ | 25,604 | (4) | | $ | 24,617 | |
| | |
Audit-Related Fees(1) | | $ | 0 | | | $ | 0 | |
| | |
Tax Fees(2) | | $ | 14,916 | | | $ | 15,466 | |
| | |
All Other Fees(3) | | $ | 0 | | | $ | 0 | |
| | | | | | | | |
| | |
Total | | $ | 40,520 | | | $ | 40,083 | |
| | | | | | | | |
| (1) | Audit-related fees consist of the aggregate fees billed for assurance and related services that are reasonably related to the performance of the audit of financial statements and are not reported under the category of audit fees. |
| (2) | Tax fees consist of the aggregate fees billed for professional services rendered by the principal accountant relating to tax compliance, tax advice, and tax planning and specifically include fees for tax return preparation. |
| (3) | All other fees consist of the aggregate fees billed for products and services provided by the principal accountant other than audit, audit-related, and tax services. |
| (4) | In addition, the parent company of the Registrant’s investment adviser paid PwC $8,000 for services in connection with PwC’s review of the Registrant’s Registration Statement on Form N-14 (relating to the merger of two Series of the Registrant not covered by this report) and semiannual report to shareholders (of Series of the Registrant not covered by this report), to which the Registration Statement on Form N-14 incorporated by reference. |
The following table presents the aggregate fees billed to all Series of the Trust (other than the Funds) with fiscal years ending on October 31 for the fiscal years ended October 31, 2011 and October 31, 2010 by PwC for professional services rendered for the audit of the annual financial statements of the applicable Series and fees billed for other services rendered by PwC during those periods.
| | | | | | | | |
Fiscal Years Ended | | 12/31/11 | | | 12/31/10 | |
| | |
Audit Fees | | $ | 381,489 | | | $ | 428,966 | |
| | |
Audit-Related Fees(1) | | $ | 0 | | | $ | 0 | |
| | |
Tax Fees(2) | | $ | 114,542 | | | $ | 105,388 | |
| | |
All Other Fees(3) | | $ | 0 | | | $ | 0 | |
| | | | | | | | |
| | |
Total | | $ | 496,031 | | | $ | 534,354 | |
| | | | | | | | |
| (1) | Audit-related fees consist of the aggregate fees billed for assurance and related services that are reasonably related to the performance of the audit of financial statements and are not reported under the category of audit fees. |
| (2) | Tax fees consist of the aggregate fees billed for professional services rendered by the principal accountant relating to tax compliance, tax advice, and tax planning and specifically include fees for tax return preparation. |
| (3) | All other fees consist of the aggregate fees billed for products and services provided by the principal accountant other than audit, audit-related, and tax services. |
| | (e) | Registrant’s audit committee charter, adopted in February 2010, provides that the audit committee (comprised of the independent Trustees of registrant) is responsible for pre-approval of all auditing services performed for the registrant. The audit committee also is responsible for pre-approval (subject to the de minimis exceptions for non-audit services described in Section 10A(i)(1)(B) of the Securities Exchange Act of 1934) of all non-auditing services performed for the registrant or an affiliate of registrant. In addition, registrant’s audit committee charter permits a designated member of the audit committee to pre-approve, between meetings, one or more audit or non-audit service projects, subject to an expense limit and notification to the audit committee at the next committee meeting. Registrant’s audit committee pre-approved all fees described above that PwC billed to registrant. |
| | (f) | Less than 50% of the hours billed by PwC for auditing services to registrant for the fiscal year ended December 31, 2011 was for work performed by persons other than full-time permanent employees of PwC. |
| | (g) | The aggregate non-audit fees billed by PwC to registrant and to registrant’s investment adviser and any entity controlling, controlled by, or under common control with registrant’s investment adviser for the fiscal years set forth below are disclosed in the table below. The disclosed payments were for access to a PwC-sponsored online library that provides interpretive guidance regarding U.S. and foreign accounting standards. |
| | | | | | | | | | | | | | | | |
Fiscal Year Ended | | 10/31/11 | | | 12/31/11 | | | 10/31/10 | | | 12/31/10 | |
Registrant(1) | | $ | 0 | | | $ | 0 | | | $ | 0 | | | $ | 0 | |
Adviser | | $ | 1,800 | | | $ | 1,800 | | | $ | 1,500 | | | $ | 1,500 | |
| | (h) | Registrant’s audit committee has considered the non-audit services provided to the registrant and registrant’s investment adviser and any entity controlling, controlled by, or under common control with registrant’s investment adviser as described above and determined that these services do not compromise PwC’s independence. |
| Item 5. | Audit Committee of Listed Registrants |
Not applicable.
| Item 6. | Schedule of Investments |
(a) Registrant’s Schedule of Investments is included in the report to shareholders filed under Item 1.
(b) Not applicable to this filing.
| Item 7. | Disclosure of Proxy Voting Policies and Procedures for Closed-End Management Investment Companies |
Not applicable.
| Item 8. | Portfolio Managers of Closed-End Management Investment Companies |
Not applicable.
| Item 9. | Purchases of Equity Securities by Closed-End Management Investment Company and Affiliated Purchasers. |
Not applicable.
| Item 10. | Submission of Matters to a Vote of Security Holders |
There have been no material changes to the procedures by which shareholders may recommend nominees to registrant’s board of trustees.
| Item 11. | Controls and Procedures |
(a)(i) Registrant’s President and Treasurer have concluded that registrant’s disclosure controls and procedures (as defined in Rule 30a-3(c) under the Investment Company Act of 1940) are effective, based on their evaluation of these controls and procedures as of a date within 90 days of the filing date of this report.
(a)(ii) Registrant’s President and Treasurer are aware of no change in registrant’s internal control over financial reporting (as defined in Rule 30a-3(d) under the Investment Company Act of 1940) that occurred during registrant’s most recent fiscal quarter that has materially affected, or is reasonably likely to materially affect, registrant’s internal control over financial reporting.
(a) The code of ethics pursuant to Item 2 is attached hereto.
(b) Certifications pursuant to Rules 30a-2(a) and 30a-2(b) under the Investment Company Act of 1940 are attached hereto.
SIGNATURES
Pursuant to the requirements of the Securities Exchange Act of 1934 and the Investment Company Act of 1940, the registrant has duly caused this report to be signed on its behalf by the undersigned, thereunto duly authorized.
| | | | |
| Date: February 27, 2012 | | THRIVENT MUTUAL FUNDS |
| | |
| | By: | | /s/Russell W. Swansen |
| | | | Russell W. Swansen |
| | | | President |
Pursuant to the requirements of the Securities Exchange Act of 1934 and the Investment Company Act of 1940, this report has been signed below by the following persons on behalf of the registrant and in the capacities and on the dates indicated.
| | | | |
| Date: February 27, 2012 | | By: | | /s/Russell W. Swansen |
| | | | Russell W. Swansen |
| | | | President |
| | | | |
Date: February 27, 2012 | | By: | | /s/Gerard V. Vaillancourt |
| | | | Gerard V. Vaillancourt |
| | | | Treasurer |