UNITED STATES
SECURITIES AND EXCHANGE COMMISSION
Washington, D.C. 20549
FORM N-CSR
CERTIFIED SHAREHOLDER REPORT OF REGISTERED MANAGEMENT INVESTMENT
COMPANIES
Investment Company Act file number: 811-05075
Thrivent Mutual Funds
(Exact name of registrant as specified in charter)
625 Fourth Avenue South
Minneapolis, Minnesota 55415
(Address of principal executive offices) (Zip code)
John L. Sullivan
625 Fourth Avenue South
Minneapolis, Minnesota 55415
(Name and address of agent for service)
Registrant’s telephone number, including area code: (612) 844-5704
Date of fiscal year end: October 31
Date of reporting period: October 31, 2011
| Item 1. | Report to Stockholders |

Table of Contents
| | |
 | | Dear Shareholder: |
The fiscal year ending October 31, 2011, began on a strengthening trajectory, but a convergence of events took the wind out of the sails as the period progressed. In this letter I will provide a review of the period, as well as our outlook for the coming year.
Economic Review
After starting the 12-month reporting period on the upswing, U.S. economic growth slowed to an anemic pace. Final U.S. gross domestic product (GDP) growth rates for the first and second quarters of 2011 were revised downward to 0.4% and 1.3%, respectively.1 A number of issues eroded consumer confidence and diminished the pace of the recovery, raising concerns of a potential “double-dip” recession. Those factors included rising energy and food prices, continued job and housing market weakness, supply chain disruptions from the Japanese tsunami disaster, prolonged congressional debt ceiling debates, and the resulting debt downgrade of the U.S. by Standard & Poor’s. Overseas, the European debt crisis continued to resurface as investors worried about the consequences to world economies. Although the U.S. GDP estimate for the third quarter of 2011 was 2.0%, growth was still lackluster by historical standards.
Unemployment figures continued to weigh heavily on consumer sentiment as they plateaued around the 9.0% level for the last half of the period.2 Companies were slow to step up the pace of hiring as they awaited signs of more strength in the recovery. The housing market continued to struggle with the backlog of distressed properties weighing on prices, which remained around mid-2003 levels.3
While rising energy and food prices affected consumers, overall inflation remained in check throughout the period, as measured by the core Consumer Price Index (CPI), which showed a 12-month change of 2.1%.4 This figure is typically considered to be a worthy long-term gauge of inflation because it does not include volatile food and energy prices. It is also the measure that the Federal Reserve focuses on when setting its monetary policy.
The Federal Reserve’s more optimistic tone at earlier meetings during the fiscal year turned decidedly more pessimistic. As its second phase of quantitative easing (also known as QE2) was ending in June, it appeared no
more economic stimulus was forthcoming. However, as conditions softened, the Fed committed to keep its target fed funds rate at the exceptionally low level of zero to 0.25% through mid-2013. In late September, the Federal Reserve announced another stimulus program called Operation Twist. With it, the Fed began replacing shorter-maturity Treasuries on its balance sheet with longer-maturity Treasuries to drive long-term rates lower in the hopes that individuals and companies would borrow and spend more money.
Market Review
Despite the economic and political uncertainty, corporate earnings and sales growth were strong. For example, third quarter sales for stocks in the S&P 500 grew by more than 10% over the prior year, and net income grew by more than 14%. Nevertheless, economic and political uncertainty caused high volatility in financial markets. After gaining double-digit returns in the first half of the fiscal year, equities declined sharply late in the summer. Stocks traded down for much of August and September and gained back some of their losses in October, as economic growth improved and the situation in Europe appeared to be stabilizing. Overall for the period, U.S. equities held on to some of the fiscal year’s earlier gains with large-capitalization stocks returning 8.09% as measured by the S&P 500 Index, and smaller companies returning 6.71% according to the Russell 2000® Index.
Weighed down by concerns about the European debt situation and slowing global growth, foreign stocks underperformed their U.S. counterparts. The most commonly quoted benchmark for large, high-quality international company stocks—the Morgan Stanley Capital International Europe, Australasia and Far East (MSCI EAFE) Index—posted a -3.64% return. Emerging markets were hit even harder, with the MSCI Emerging Markets Index registering a -7.72% return for the fiscal year.
Overall for the period, fixed-income markets returned 5.00% as measured by the Barclays Capital U.S. Aggregate Bond Index. Similar to the equity markets, the period was characterized by two distinctly different investment environments. In the first half of the fiscal year, rising interest rates caused Treasury bond prices to fall, with the longest maturity bonds selling off the most. Yields on 10-year Treasuries started the six-month
2
period at 2.66% and ended at 3.32%, while two-year Treasuries increased from 0.34% to 0.61% during that time. Meanwhile, non-government sectors outpaced Treasuries and produced solid results in the first half. High-yield bonds, in particular, benefited from the Federal Reserve’s liquidity, strong corporate earnings and investors’ quest for more yield.
The tide turned in the second half as a massive flight to quality caused rates to fall, especially in longer maturities. Yields on 10-year Treasuries fell as low as 1.72% before ending the fiscal year at 2.17%, and two-year Treasuries ended at 0.25%. Treasuries, particularly longer maturities, strongly outpaced non-government bonds during this period with the Barclays Capital 20+ Year Treasury Index advancing 19.38%. The risk-averse environment also helped renew investor interest in higher-quality municipal bonds, and the segment continued to benefit from significantly lower supply and low default rates. The Barclays Capital Municipal Bond Index posted a 3.78% gain.
Our Outlook
Although economic data and leading indicators do not point to a “double-dip” recession in the U.S., global conditions remain fragile. Economic growth should end 2011 slightly ahead of the 1% to 1.5% pace of the first half, and we expect U.S. GDP of 2% to 2.5% for the first half of 2012. This is below the normal rate of roughly 3%, and well below the 4% plus rate necessary for the U.S. economy to begin catching up to its potential and to significantly improve the employment situation.
We expect the U.S. housing market to remain sluggish until the backlog of foreclosures subsides. Values on a national average basis are likely to remain around their current levels—roughly where they have been for the last 2.5 years. Housing construction is also likely to remain at historically low levels for the next year or two.
The economic outlook overseas is mixed. In Europe we expect a modest recession next year, as policies are implemented to rein in the fiscal debt problem. In China, the second biggest economy in the world after the U.S., we expect economic growth to continue at about a 9% rate. A significant share of the earnings of U.S. stocks comes from overseas—about 40% for the S&P 500 for example.
The Federal Reserve has indicated that it expects to maintain short-term interest rates at the current historically low levels through mid-2013, and we see no reason to doubt this. Further, it has recently implemented policies designed to reduce long-term interest rates. In our view, the resulting low yields create a dilemma for conservative risk-averse investors.
Corporate sales and earnings have strengthened since the beginning of the recovery, as have corporate balance
sheets. Stock prices have not kept pace and remain below their peak 2007 levels. We expect corporate sales and earnings to continue to grow, although at a slower pace than the last couple of years. While stock valuations remain attractive given this outlook, we must acknowledge that fiscal and monetary policy risks remain significant both domestically and abroad. Until these issues are resolved, they will remain headwinds for likely economic growth and stock valuations, and will contribute to market volatility. Investors must carefully evaluate their tolerance for risk.
While it is difficult to predict short-term market direction, history has taught us the best time to stay invested is often when things look the worst. Thrivent Mutual Funds remain fully invested as our portfolio managers focus on long-term returns.
Similarly, we encourage you to approach your portfolio with a long-term view. If you have concerns about volatility, the value of your nest egg, or your portfolio’s yield, we urge you to meet with your Thrivent Financial representative to learn more about the broad spectrum of investment tools and products available to address your financial goals and match your risk tolerance.
As always, we are thankful for the trust you have placed with our entire team of Thrivent Financial investment professionals.
Sincerely,

Russell W. Swansen
President and Chief Investment Officer
Thrivent Mutual Funds
| 1 | U.S. Bureau of Economic Analysis (3rd Quarter 2011 advance estimate released October 27, 2011) |
| 2 | U.S. Bureau of Labor Statistics, “The Employment Situation—October 2011” (November 4, 2011) |
| 3 | S&P/Case-Shiller Home Price Indices |
| 4 | U.S. Bureau of Labor Statistics, “Consumer Price Index—October 2011” (November 16, 2011) |
3
| | | | |
 | | Thrivent Aggressive Allocation Fund | |  |
| | Russell W. Swansen (left), David C. Francis, CFA (right) and Mark L. Simenstad, CFA (far right), Portfolio Co-Managers | |
| | The Fund seeks long-term capital growth. | |
| | The Fund’s performance depends upon how its assets are allocated across broad asset | |
| categories and applicable sub-classes within such categories. Some broad asset categories and sub-classes may perform below expectations or below the securities markets generally over short or extended periods. Another risk of investing in the Fund is that its performance is dependent upon the performance of the underlying asset classes in which it invests. As a result, the Fund is subject to the same risks as those faced by the underlying asset classes. These and other risks are described in the Fund’s prospectus. Views expressed in this discussion of fund performance are the views of this particular Fund’s portfolio management team. |
How did the Fund perform during the 12-month period ended October 31, 2011?
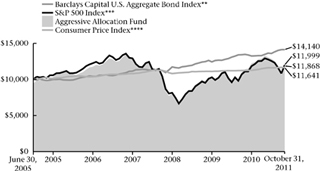
Thrivent Aggressive Allocation Fund earned a return of 3.87%, compared with the median return of its peer group, the Lipper Multi-Cap Core category, of 4.76%. The Fund’s market benchmarks, the S&P 500 Index and the Barclays Capital U.S. Aggregate Bond Index, earned returns of 8.09% and 5.00%, respectively.
What factors affected the Fund’s performance?
The Fund did not keep pace with either the S&P 500 Index or the Barclays Capital U.S. Aggregate Bond Index and was modestly below the median for its Lipper category owing to the following factors: a number of our managers in certain segments of the allocation accounts on the equity side did not keep pace with their respective benchmarks, and an allocation to overseas markets was not additive to results as non-U.S. markets underperformed the U.S., particularly in Europe and emerging markets. In addition, we had an average of 8% of the Fund invested in fixed-income securities that were concentrated in corporate bonds, which did not keep pace with the strong advance in government securities that occurred in the second half of the reporting period.
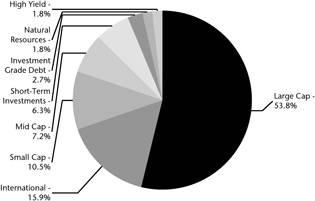
Our large-cap allocations in particular did not keep pace with their respective benchmarks. As the investment environment deteriorated in the second half of the year, investors opted for very conservative investment profiles, especially in the large-capitalization segments. We were more aligned with an outlook that favored ongoing growth and a more constructive cyclical environment, albeit still at a subpar pace when compared to prior periods.
International markets, particularly the euro area, came under severe selling pressure as policymakers in Europe struggled with finding an acceptable solution to the sovereign debt crisis that began in Greece but was quickly spreading to other southern European nations like Italy and Spain. The structure of the eurozone agreements are such that policymaking is a visible and tedious process, which proved unsettling to investors not only in Europe but in the U.S. and emerging markets as well.
What is your outlook?
Confidence in the outlook for continued economic growth has been depressed, in part, by the ongoing policy and political travails playing out on a seemingly endless basis through the summer and continuing into year-end. While a number of indicators suggest stabilization of the
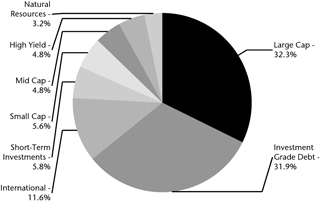
Portfolio Composition
(% of Portfolio)
Top 10 Holdings
(% of Net Assets)
| | | | |
Thrivent Partner Worldwide Allocation Fund | | | 15.3 | % |
Thrivent Partner Small Cap Growth Fund | | | 8.2 | % |
Thrivent Large Cap Growth Fund | | | 6.5 | % |
Thrivent Mid Cap Growth Fund | | | 6.0 | % |
Thrivent Large Cap Value Fund | | | 5.4 | % |
Thrivent Mid Cap Stock Fund | | | 5.2 | % |
Thrivent Large Cap Stock Fund | | | 5.1 | % |
Thrivent Partner Mid Cap Value Fund | | | 3.4 | % |
Thrivent Small Cap Stock Fund | | | 2.8 | % |
Thrivent Government Bond Fund | | | 2.2 | % |
|
These securities represent 60.1% of the total net assets of the Fund. | |
Quoted Fund performance is for Class A shares and does not reflect a sales charge.
The returns shown do not reflect taxes a shareholder would pay on distributions or redemptions.
Portfolio Composition illustrates market exposure of all asset classes, including derivatives.
The list of Top 10 Holdings excludes short-term investments.
Quoted Portfolio Composition and Top 10 Holdings are subject to change.
4
existing economic situation, consumer, corporate and investor confidence in the future outlook appears much more volatile. Fundamental data suggests that in the absence of policy-induced errors, economic growth is likely to recover from the slowdown that occurred over the summer. Employment growth is the key to seeing some acceleration in activity. Should unemployment
remain elevated, we believe that the recovery will be tepid at best. Any constructive resolution of some or all of the policy discussions currently in the headlines should be supportive of a strong rally in risk assets. A policy error could provide the catalyst for a further correction. We believe a benign or constructive outcome is more likely and are positioned as such in our accounts.
| | | | |
| |
Portfolio Facts As of October 31, 2011 |
| | | Class A | | Institutional Class |
Ticker | | TAAAX | | TAAIX |
Transfer Agent ID | | 038 | | 468 |
Net Assets | | $462,144,709 | | $80,010,940 |
NAV | | $10.70 | | $10.78 |
NAV - High† | | 4/29/2011 - $12.00 | | 4/29/2011 - $12.07 |
NAV - Low† | | 10/3/2011 - $9.32 | | 10/3/2011 - $9.39 |
Number of Holdings: 402 | | |
† For the year ended October 31, 2011 | | |
Average Annual Total Returns1
As of October 31, 2011
| | | | | | | | | | |
| Class A2 | | 1-Year | | | 5 Years | | | From Inception 6/30/2005 |
without sales charge | | | 3.87% | | | | 0.84% | | | 3.63% |
with sales charge | | | -1.82% | | | | -0.30% | | | 2.71% |
| | | |
Institutional Class3 | | | 1-Year | | | | 5 Years | | | From
Inception 6/30/2005 |
Net Asset Value | | | 4.16% | | | | 1.17% | | | 4.00% |
Value of a $10,000 Investment
Class A Shares*,1,(a)
| 1 | Past performance is not an indication of future results. Average annual total returns represent past performance and reflect changes in share prices, the reinvestment of all dividends and capital gains, and the effects of compounding. The prospectus contains more complete information on the investment objectives, risks, charges and expenses of the investment company, which investors should read and consider carefully before investing. To obtain a prospectus, contact a registered representative or visit www.thrivent.com. At various times, the Fund’s adviser waived its management fee and/or reimbursed Fund expenses. Had the adviser not done so, the Fund’s total returns would have been lower. The returns shown do not reflect taxes a shareholder would pay on distributions or redemptions. Total investment return and principal value of your investment will fluctuate, and your shares, when redeemed, may be worth more or less than their original cost. Current performance may be higher or lower than the performance data quoted. Call 800-THRIVENT or visit www.thrivent.com for performance results current to the most recent month-end. |
| 2 | Class A performance with sales charge reflects the maximum sales charge of 5.5%. |
| 3 | Institutional Class shares have no sales load and are for institutional shareholders only. |
| (a) | Performance of other classes will be greater or less than the line shown based on the differences in loads and fees paid by shareholders investing in the different classes. |
| * | As you compare performance, please note that the Fund’s performance reflects the maximum 5.5% sales charge, while the Consumer Price Index, the S&P 500 Index and the Barclays Capital U.S. Aggregate Bond Index do not reflect any such charges. If you were to purchase any of the above individual securities represented in those Indexes, any charges you would pay would reduce your total return as well. |
| ** | The Barclays Capital U.S. Aggregate Bond Index is an index that measures the performance of U.S. investment grade bonds. It is not possible to invest directly in the Index. The performance of the Index does not reflect deductions for fees, expenses or taxes. |
| *** | The S&P 500 Index is an index that represents the average performance of a group of 500 widely held, publicly traded stocks. “S&P 500®” is a trademark of The McGraw-Hill Companies, Inc. and has been licensed for use by Thrivent Financial for Lutherans. The product is not sponsored, endorsed or promoted by Standard & Poor’s and Standard & Poor’s makes no representation regarding the advisability of investing in the product. It is not possible to invest directly in the Index. The performance of the Index does not reflect deductions for fees, expenses or taxes. |
| **** | The Consumer Price Index is an inflationary indicator that measures the change in the cost of a fixed basket of products and services, including housing, electricity, food and transportation. It is not possible to invest directly in the Index. |
5
| | | | |
 | | Thrivent Moderately Aggressive Allocation Fund | |  |
| | Russell W. Swansen (left), David C. Francis, CFA (right) and Mark L. Simenstad, CFA (far right), Portfolio Co-Managers | |
| | The Fund seeks long-term capital growth. | |
| | The Fund’s performance depends upon how its assets are allocated across broad asset categories and | |
applicable sub-classes within such categories. Some broad asset categories and sub-classes may perform below expectations or below the securities markets generally over short or extended periods. Another risk of investing in the Fund is that its performance is dependent upon the performance of the underlying asset classes in which it invests. As a result, the Fund is subject to the same risks as those faced by the underlying asset classes. These and other risks are described in the Fund’s prospectus. Views expressed in this discussion of fund performance are the views of this particular Fund’s portfolio management team. |
How did the Fund perform during the 12-month period ended October 31, 2011?
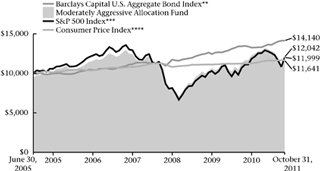
Thrivent Moderately Aggressive Allocation Fund earned a return of 3.06%, compared with the median return of its peer group, the Lipper Mixed-Asset Target Allocation Growth category, of 3.47%. The Fund’s market benchmarks, the S&P 500 Index and the Barclays Capital U.S. Aggregate Bond Index, earned returns of 8.09% and 5.00%, respectively.
What factors affected the Fund’s performance?
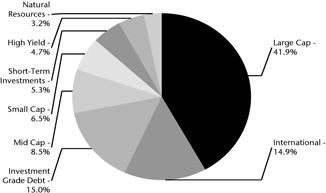
The Fund did not keep pace with either the S&P 500 Index or the Barclays Capital U.S. Aggregate Bond Index and was modestly below the median for its Lipper category owing to the following factors: a number of our managers in certain segments of the allocation accounts on the equity side did not keep pace with their respective benchmarks, and an allocation to overseas markets was not additive to results as non-U.S. markets underperformed the U.S., particularly in Europe and emerging markets. In addition, we had an average of 22% of the Fund invested in fixed-income securities that were concentrated in corporate bonds, which did not keep pace with the strong advance in government securities that occurred in the second half of the reporting period.
Our large-cap allocations in particular did not keep pace with their respective benchmarks. As the investment environment deteriorated in the second half of the year, investors opted for very conservative investment profiles, especially in the large-capitalization segments. We were more aligned with an outlook that favored ongoing growth and a more constructive cyclical environment, albeit still at a subpar pace when compared to prior periods.
International markets, particularly the euro area, came under severe selling pressure as policymakers in Europe struggled with finding an acceptable solution to the sovereign debt crisis that began in Greece but was quickly spreading to other southern European nations like Italy and Spain. The structure of the eurozone agreements are such that policymaking is a visible and tedious process, which proved unsettling to investors not only in Europe but in the U.S. and emerging markets as well.
What is your outlook?
Confidence in the outlook for continued economic growth has been depressed, in part, by the ongoing policy and political travails playing out on a seemingly endless basis through the summer and continuing into year-end. While a number of indicators suggest stabilization of the
Portfolio Composition
(% of Portfolio)
Top 10 Holdings
(% of Net Assets)
| | | | |
Thrivent Partner Worldwide Allocation Fund | | | 12.8 | % |
Thrivent Income Fund | | | 7.6 | % |
Thrivent Large Cap Value Fund | | | 7.6 | % |
Thrivent Large Cap Growth Fund | | | 6.0 | % |
Thrivent Large Cap Stock Fund | | | 5.6 | % |
Thrivent Mid Cap Stock Fund | | | 5.0 | % |
Thrivent High Yield Fund | | | 4.0 | % |
Thrivent Limited Maturity Bond Fund | | | 3.9 | % |
Thrivent Partner Mid Cap Value Fund | | | 3.3 | % |
Thrivent Natural Resources Fund | | | 3.3 | % |
|
| These securities represent 59.1% of the total net assets of the Fund. | |
Quoted Fund performance is for Class A shares and does not reflect a sales charge.
The returns shown do not reflect taxes a shareholder would pay on distributions or redemptions.
Portfolio Composition illustrates market exposure of all asset classes, including derivatives.
The list of Top 10 Holdings excludes short-term investments.
Quoted Portfolio Composition and Top 10 Holdings are subject to change.
6
existing economic situation, consumer, corporate and investor confidence in the future outlook appears much more volatile. Fundamental data suggests that in the absence of policy-induced errors, economic growth is likely to recover from the slowdown that occurred over the summer. Employment growth is the key to seeing some acceleration in activity. Should unemployment remain elevated, we believe that the recovery will be tepid
at best. Any constructive resolution of some or all of the policy discussions currently in the headlines should be supportive of a strong rally in risk assets. A policy error could provide the catalyst for a further correction. We believe a benign or constructive outcome is more likely and are positioned as such in our accounts.
| | | | |
Portfolio Facts As of October 31, 2011 |
| | | Class A | | Institutional Class |
Ticker | | TMAAX | | TMAFX |
Transfer Agent ID | | 037 | | 467 |
Net Assets | | $1,168,608,825 | | $85,074,057 |
NAV | | $10.83 | | $10.92 |
NAV - High† | | 4/29/2011 -$11.89 | | 4/29/2011 - $11.96 |
NAV - Low† | | 10/3/2011 -$9.60 | | 10/3/2011 - $9.67 |
Number of Holdings: 432 | | |
† For the year ended October 31, 2011 | | |
Average Annual Total Returns1
As of October 31, 2011
| | | | | | |
| Class A2 | | 1-Year | | 5 Years | | From Inception 6/30/2005 |
without sales charge | | 3.06% | | 1.41% | | 3.87% |
with sales charge | | -2.61% | | 0.27% | | 2.95% |
| | | |
| Institutional Class3 | | 1-Year | | 5 Years | | From Inception 6/30/2005 |
Net Asset Value | | 3.55% | | 1.76% | | 4.24% |
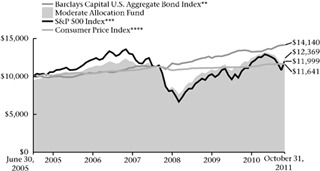
Value of a $10,000 Investment
Class A Shares*,1,(a)
| 1 | Past performance is not an indication of future results. Average annual total returns represent past performance and reflect changes in share prices, the reinvestment of all dividends and capital gains, and the effects of compounding. The prospectus contains more complete information on the investment objectives, risks, charges and expenses of the investment company, which investors should read and consider carefully before investing. To obtain a prospectus, contact a registered representative or visit www.thrivent.com. At various times, the Fund’s adviser waived its management fee and/or reimbursed Fund expenses. Had the adviser not done so, the Fund’s total returns would have been lower. The returns shown do not reflect taxes a shareholder would pay on distributions or redemptions. Total investment return and principal value of your investment will fluctuate, and your shares, when redeemed, may be worth more or less than their original cost. Current performance may be higher or lower than the performance data quoted. Call 800-THRIVENT or visit www.thrivent.com for performance results current to the most recent month-end. |
| 2 | Class A performance with sales charge reflects the maximum sales charge of 5.5%. |
| 3 | Institutional Class shares have no sales load and are for institutional shareholders only. |
| (a) | Performance of other classes will be greater or less than the line shown based on the differences in loads and fees paid by shareholders investing in the different classes. |
| * | As you compare performance, please note that the Fund’s performance reflects the maximum 5.5% sales charge, while the Consumer Price Index, the S&P 500 Index and the Barclays Capital U.S. Aggregate Bond Index do not reflect any such charges. If you were to purchase any of the above individual securities represented in those Indexes, any charges you would pay would reduce your total return as well. |
| ** | The Barclays Capital U.S. Aggregate Bond Index is an index that measures the performance of U.S. investment grade bonds. It is not possible to invest directly in the Index. The performance of the Index does not reflect deductions for fees, expenses or taxes. |
| *** | The S&P 500 Index is an index that represents the average performance of a group of 500 widely held, publicly traded stocks. “S&P 500®” is a trademark of The McGraw-Hill Companies, Inc. and has been licensed for use by Thrivent Financial for Lutherans. The product is not sponsored, endorsed or promoted by Standard & Poor’s and Standard & Poor’s makes no representation regarding the advisability of investing in the product. It is not possible to invest directly in the Index. The performance of the Index does not reflect deductions for fees, expenses or taxes. |
| **** | The Consumer Price Index is an inflationary indicator that measures the change in the cost of a fixed basket of products and services, including housing, electricity, food and transportation. It is not possible to invest directly in the Index. |
7
| | | | |
 | | Thrivent Moderate
Allocation Fund | |  |
| | Russell W. Swansen (left), David C. Francis, CFA (right) and Mark L. Simenstad, CFA (far right), Portfolio Co-Managers | |
| | The Fund seeks long-term capital growth while providing reasonable stability of principal. | |
The Fund’s performance depends upon how its assets are allocated across broad asset categories and applicable sub-classes within such categories. Some broad asset categories and sub-classes may perform below expectations or below the securities markets generally over short or extended periods. Another risk of investing in the Fund is that its performance is dependent upon the performance of the underlying asset classes in which it invests. As a result, the Fund is subject to the same risks as those faced by the underlying asset classes. These and other risks are described in the Fund’s prospectus. Views expressed in this discussion of fund performance are the views of this particular Fund’s portfolio management team.
How did the Fund perform during the 12-month period ended October 31, 2011?
Thrivent Moderate Allocation Fund earned a return of 3.27%, compared with the median return of its peer group, the Lipper Mixed-Asset Target Allocation Moderate category, of 3.69%. The Fund’s market benchmarks, the S&P 500 Index and the Barclays Capital U.S. Aggregate Bond Index, earned returns of 8.09% and 5.00%, respectively.
What factors affected the Fund’s performance?
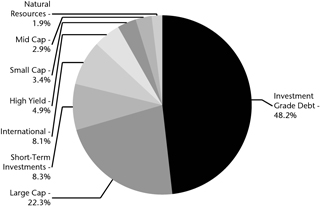
The Fund did not keep pace with either the S&P 500 Index or the Barclays Capital U.S. Aggregate Bond Index and was modestly below the median for its Lipper category owing to the following factors: a number of our managers in certain segments of the allocation accounts on the equity side did not keep pace with their respective benchmarks, and an allocation to overseas markets was not additive to results as non-U.S. markets underperformed the U.S., particularly in Europe and emerging markets. In addition, we had an average of 42% of the Fund invested in fixed-income securities that were concentrated in corporate bonds, which did not keep pace with the strong advance in government securities
that occurred in the second half of the reporting period.
Our large-cap allocations in particular did not keep pace with their respective benchmarks. As the investment environment deteriorated in the second half of the year, investors opted for very conservative investment profiles, especially in the large-capitalization segments. We were more aligned with an outlook that favored ongoing growth and a more constructive cyclical environment, albeit still at a subpar pace when compared to prior periods.
International markets, particularly the euro area, came under severe selling pressure as policymakers in Europe struggled with finding an acceptable solution to the sovereign debt crisis that began in Greece but was quickly spreading to other southern European nations like Italy and Spain. The structure of the eurozone agreements are such that policymaking is a visible and tedious process, which proved unsettling to investors not only in Europe but in the U.S. and emerging markets as well.
What is your outlook?
Confidence in the outlook for continued economic growth has been depressed, in part, by the ongoing
Portfolio Composition
(% of Portfolio)
Top 10 Holdings
(% of Net Assets)
| | | | |
Thrivent Income Fund | | | 14.8 | % |
Thrivent Limited Maturity Bond Fund | | | 14.5 | % |
Thrivent Partner Worldwide Allocation Fund | | | 10.0 | % |
Thrivent Large Cap Value Fund | | | 6.8 | % |
Thrivent Large Cap Growth Fund | | | 4.7 | % |
Thrivent High Yield Fund | | | 3.9 | % |
Thrivent Natural Resources Fund | | | 3.2 | % |
Thrivent Mid Cap Stock Fund | | | 3.2 | % |
Thrivent Large Cap Stock Fund | | | 2.9 | % |
Thrivent Partner Mid Cap Value Fund | | | 2.0 | % |
|
| These securities represent 66.0% of the total net assets of the Fund. | |
Quoted Fund performance is for Class A shares and does not reflect a sales charge.
The returns shown do not reflect taxes a shareholder would pay on distributions or redemptions.
Portfolio Composition illustrates market exposure of all asset classes, including derivatives.
The list of Top 10 Holdings excludes short-term investments.
Quoted Portfolio Composition and Top 10 Holdings are subject to change.
8
policy and political travails playing out on a seemingly endless basis through the summer and continuing into year-end. While a number of indicators suggest stabilization of the existing economic situation, consumer, corporate and investor confidence in the future outlook appears much more volatile. Fundamental data suggests that in the absence of policy-induced errors, economic growth is likely to recover from the slowdown that occurred over the
summer. Employment growth is the key to seeing some acceleration in activity. Should unemployment remain elevated, we believe that the recovery will be tepid at best. Any constructive resolution of some or all of the policy discussions currently in the headlines should be supportive of a strong rally in risk assets. A policy error could provide the catalyst for a further correction. We believe a benign or constructive outcome is more likely and are positioned as such in our accounts.
| | | | |
Portfolio Facts |
| As of October 31, 2011 |
| | | Class A | | Institutional Class |
Ticker | | THMAX | | TMAIX |
Transfer Agent ID | | 036 | | 466 |
Net Assets | | $1,207,559,771 | | $59,678,921 |
NAV | | $10.80 | | $10.82 |
NAV - High† | | 4/29/2011 - $11.64 | | 4/29/2011 - $11.66 |
NAV - Low† | | 10/3/2011 - $9.82 | | 10/3/2011 - $9.84 |
Number of Holdings: 439 | | | | |
† For the year ended October 31, 2011 | | |
| | | | | | |
| Average Annual Total Returns1 |
| As of October 31, 2011 |
| Class A2 | | 1-Year | | 5 Years | | From
Inception
6/30/2005 |
without sales charge | | 3.27% | | 2.43% | | 4.34% |
with sales charge | | -2.40% | | 1.27% | | 3.41% |
| | | |
| Institutional Class3 | | 1-Year | | 5 Years | | From
Inception
6/30/2005 |
Net Asset Value | | 3.62% | | 2.74% | | 4.67% |
| | | | | | |
| Value of a $10,000 Investment |
| Class A Shares*,1,(a) |
|
` |
| 1 | Past performance is not an indication of future results. Average annual total returns represent past performance and reflect changes in share prices, the reinvestment of all dividends and capital gains, and the effects of compounding. The prospectus contains more complete information on the investment objectives, risks, charges and expenses of the investment company, which investors should read and consider carefully before investing. To obtain a prospectus, contact a registered representative or visit www.thrivent.com. At various times, the Fund’s adviser waived its management fee and/or reimbursed Fund expenses. Had the adviser not done so, the Fund’s total returns would have been lower. The returns shown do not reflect taxes a shareholder would pay on distributions or redemptions. Total investment return and principal value of your investment will fluctuate, and your shares, when redeemed, may be worth more or less than their original cost. Current performance may be higher or lower than the performance data quoted. Call 800-THRIVENT or visit www.thrivent.com for performance results current to the most recent month-end. |
| 2 | Class A performance with sales charge reflects the maximum sales charge of 5.5%. |
| 3 | Institutional Class shares have no sales load and are for institutional shareholders only. |
| (a) | Performance of other classes will be greater or less than the line shown based on the differences in loads and fees paid by shareholders investing in the different classes. |
| * | As you compare performance, please note that the Fund’s performance reflects the maximum 5.5% sales charge, while the Consumer Price Index, the S&P 500 Index and the Barclays Capital U.S. Aggregate Bond Index do not reflect any such charges. If you were to purchase any of the above individual securities represented in those Indexes, any charges you would pay would reduce your total return as well. |
| ** | The Barclays Capital U.S. Aggregate Bond Index is an index that measures the performance of U.S. investment grade bonds. It is not possible to invest directly in the Index. The performance of the Index does not reflect deductions for fees, expenses or taxes. |
| *** | The S&P 500 Index is an index that represents the average performance of a group of 500 widely held, publicly traded stocks. “S&P 500®” is a trademark of The McGraw-Hill Companies, Inc. and has been licensed for use by Thrivent Financial for Lutherans. The product is not sponsored, endorsed or promoted by Standard & Poor’s and Standard & Poor’s makes no representation regarding the advisability of investing in the product. It is not possible to invest directly in the Index. The performance of the Index does not reflect deductions for fees, expenses or taxes. |
| **** | The Consumer Price Index is an inflationary indicator that measures the change in the cost of a fixed basket of products and services, including housing, electricity, food and transportation. It is not possible to invest directly in the Index. |
9
| | | | |

| | Thrivent Moderately Conservative Allocation Fund | |  |
| | Russell W. Swansen (left), David C. Francis, CFA (right) and Mark L. Simenstad, CFA (far right), Portfolio Co-Managers | |
The Fund seeks long-term capital growth while providing reasonable stability of principal.
The Fund’s performance depends upon how its assets are allocated across broad asset categories and applicable sub-classes within such categories. Some broad asset categories and sub-classes may perform below expectations or below the securities markets generally over short or extended periods. Another risk of investing in the Fund is that its performance is dependent upon the performance of the underlying asset classes in which it invests. As a result, the Fund is subject to the same risks as those faced by the underlying asset classes. These and other risks are described in the Fund’s prospectus. Views expressed in this discussion of fund performance are the views of this particular Fund’s portfolio management team.
How did the Fund perform during the 12-month period ended October 31, 2011?
Thrivent Moderately Conservative Allocation Fund earned a return of 2.49%, compared with the median return of its peer group, the Lipper Mixed-Asset Target Allocation Conservative category, of 3.33%. The Fund’s market benchmarks, the S&P 500 Index and the Barclays Capital U.S. Aggregate Bond Index, earned returns of 8.09% and 5.00%, respectively.
What factors affected the Fund’s performance?
The Fund did not keep pace with either the S&P 500 Index or the Barclays Capital U.S. Aggregate Bond Index and was modestly below the median for its Lipper category owing to the following factors: a number of our managers in certain segments of the allocation accounts on the equity side did not keep pace with their respective benchmarks, and an allocation to overseas markets was not additive to results as non-U.S. markets underperformed the U.S., particularly in Europe and emerging markets. In addition, we had an average of 58% of the Fund invested in fixed-income securities that were concentrated in corporate bonds, which did not keep pace with the strong advance in government securities that occurred in the second half
of the reporting period.
Our large-cap allocations in particular did not keep pace with their respective benchmarks. As the investment environment deteriorated in the second half of the year, investors opted for very conservative investment profiles, especially in the large-capitalization segments. We were more aligned with an outlook that favored ongoing growth and a more constructive cyclical environment, albeit still at a subpar pace when compared to prior periods.
International markets, particularly the euro area, came under severe selling pressure as policymakers in Europe struggled with finding an acceptable solution to the sovereign debt crisis that began in Greece but was quickly spreading to other southern European nations like Italy and Spain. The structure of the eurozone agreements are such that policymaking is a visible and tedious process, which proved unsettling to investors not only in Europe but in the U.S. and emerging markets as well.
What is your outlook?
Confidence in the outlook for continued economic growth has been depressed, in part, by the ongoing policy and political travails playing out on a seemingly endless
|
| Portfolio Composition |
| (% of Portfolio) |
|
 |
| | | | |
| Top 10 Holdings | |
| (% of Net Assets) | |
| |
Thrivent Limited Maturity Bond Fund | | | 29.8 | % |
Thrivent Income Fund | | | 13.5 | % |
Thrivent Partner Worldwide Allocation Fund | | | 6.2 | % |
Thrivent Large Cap Value Fund | | | 5.3 | % |
Thrivent High Yield Fund | | | 3.9 | % |
Thrivent Large Cap Growth Fund | | | 2.2 | % |
Thrivent Partner Mid Cap Value Fund | | | 2.2 | % |
Thrivent Government Bond Fund | | | 2.1 | % |
Thrivent Natural Resources Fund | | | 1.8 | % |
Thrivent Partner Small Cap Value Fund | | | 1.6 | % |
|
| These securities represent 68.6% of the total net assets of the Fund. | |
Quoted Fund performance is for Class A shares and does not reflect a sales charge.
The returns shown do not reflect taxes a shareholder would pay on distributions or redemptions.
Portfolio Composition illustrates market exposure of all asset classes, including derivatives.
The list of Top 10 Holdings excludes short-term investments.
Quoted Portfolio Composition and Top 10 Holdings are subject to change.
10
basis through the summer and continuing into year-end. While a number of indicators suggest stabilization of the existing economic situation, consumer, corporate and investor confidence in the future outlook appears much more volatile. Fundamental data suggests that in the absence of policy-induced errors, economic growth is likely to recover from the slowdown that occurred over the summer. A number of leading indicators of employment have started to improve. Employment
growth is the key to seeing some acceleration in activity. Should unemployment remain elevated, we believe that the recovery will be tepid at best. Any constructive resolution of some or all of the policy discussions currently in the headlines should be supportive of a strong rally in risk assets. A policy error could provide the catalyst for a further correction. We believe a benign or constructive outcome is more likely and are positioned as such in our accounts.
| | | | |
| |
Portfolio Facts As of October 31, 2011 |
| | | Class A | | Institutional Class |
Ticker | | TCAAX | | TCAIX |
Transfer Agent ID | | 035 | | 465 |
Net Assets | | $559,658,317 | | $22,421,115 |
NAV | | $10.75 | | $10.78 |
NAV - High† | | 4/29/2011 - $11.35 | | 4/29/2011 - $11.37 |
NAV - Low† | | 10/3/2011 - $10.07 | | 10/3/2011 - $10.09 |
Number of Holdings: 330 | | | | |
† For the year ended October 31, 2011 | | |
| | | | | | |
| Average Annual Total Returns1 |
| As of October 31, 2011 |
| Class A2 | | 1-Year | | 5 Years | | From
Inception
6/30/2005 |
without sales charge | | 2.49% | | 3.07% | | 4.35% |
with sales charge | | -3.11% | | 1.92% | | 3.43% |
| Institutional Class3 | | 1-Year | | 5 Years | | From
Inception
6/30/2005 |
Net Asset Value | | 2.88% | | 3.34% | | 4.65% |
|
| Value of a $10,000 Investment |
| Class A Shares*,1,(a) |
|
 |
| 1 | Past performance is not an indication of future results. Average annual total returns represent past performance and reflect changes in share prices, the reinvestment of all dividends and capital gains, and the effects of compounding. The prospectus contains more complete information on the investment objectives, risks, charges and expenses of the investment company, which investors should read and consider carefully before investing. To obtain a prospectus, contact a registered representative or visit www.thrivent.com. At various times, the Fund’s adviser waived its management fee and/or reimbursed Fund expenses. Had the adviser not done so, the Fund’s total returns would have been lower. The returns shown do not reflect taxes a shareholder would pay on distributions or redemptions. Total investment return and principal value of your investment will fluctuate, and your shares, when redeemed, may be worth more or less than their original cost. Current performance may be higher or lower than the performance data quoted. Call 800-THRIVENT or visit www.thrivent.com for performance results current to the most recent month-end. |
| 2 | Class A performance with sales charge reflects the maximum sales charge of 5.5%. |
| 3 | Institutional Class shares have no sales load and are for institutional shareholders only. |
| (a) | Performance of other classes will be greater or less than the line shown based on the differences in loads and fees paid by shareholders investing in the different classes. |
| * | As you compare performance, please note that the Fund’s performance reflects the maximum 5.5% sales charge, while the Consumer Price Index, the S&P 500 Index and the Barclays Capital U.S. Aggregate Bond Index do not reflect any such charges. If you were to purchase any of the above individual securities represented in those Indexes, any charges you would pay would reduce your total return as well. |
| ** | The Barclays Capital U.S. Aggregate Bond Index is an index that measures the performance of U.S. investment grade bonds. It is not possible to invest directly in the Index. The performance of the Index does not reflect deductions for fees, expenses or taxes. |
| *** | The S&P 500 Index is an index that represents the average performance of a group of 500 widely held, publicly traded stocks. “S&P 500®” is a trademark of The McGraw-Hill Companies, Inc. and has been licensed for use by Thrivent Financial for Lutherans. The product is not sponsored, endorsed or promoted by Standard & Poor’s and Standard & Poor’s makes no representation regarding the advisability of investing in the product. It is not possible to invest directly in the Index. The performance of the Index does not reflect deductions for fees, expenses or taxes. |
| **** | The Consumer Price Index is an inflationary indicator that measures the change in the cost of a fixed basket of products and services, including housing, electricity, food and transportation. It is not possible to invest directly in the Index. |
11
Thrivent Partner Small Cap Growth Fund
| | |
 | | Subadvised by Turner Investment Partners, Inc. |
| | The Fund seeks long-term growth of capital. |
| | The Fund is exposed to the risks of investing in equity securities of smaller companies, which may include, but are not limited to, lower trading volumes and less liquidity than larger, more established companies. Small company stock prices are generally more volatile than large company stock prices. These and other risks are described in the Fund’s prospectus. Views expressed in this discussion of fund performance are the views of this particular Fund’s portfolio management team. |
How did the Fund perform during the 12-month period ended October 31, 2011?
Thrivent Partner Small Cap Growth Fund earned a return of 8.42%, compared with the median return of its peer group, the Lipper Small Cap Growth category, of 8.99%. The Fund’s market benchmark, the Russell 2000® Growth Index, earned a return of 9.84%.
What factors affected the Fund’s performance?
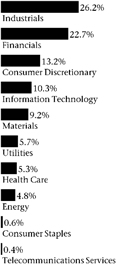
During the period, two of the Fund’s nine sectors beat their corresponding index sectors on a relative basis. Contributing the most to performance were holdings in the health care sector, while the consumer discretionary sector detracted the most from results.
Biopharmaceutical company Amarin rose after the company reported positive results in its trial for a fish-oil treatment aimed at lowering the risk of heart disease. Pharmasset also contributed strongly to results. Although the clinical stage pharmaceutical company has no active products on the market currently, the cure rate for its hepatitis C experimental drug study has far surpassed expectations. If the company were to receive FDA approval for its drug, we believe it will become the main
choice of drug for hepatitis C treatments.
The consumer discretionary sector was an area of underperformance for the Fund. Shares of Limelight, the second-largest global content delivery service company, traded lower based, in part, on news that larger competitor Akamai Technologies reported subpar results. However, in our view, the sub-par results were due to Limelight taking market share away from Akamai. We believe Limelight is well-positioned to capture further growth as demand for Internet traffic continues to grow. Staffing company Kforce also detracted from results. Kforce was negatively impacted by the cutback in government jobs as the company has roughly 10% of its revenues tied to the U.S. government labor market. Additionally, staffing companies are generally highly sensitive to the “risk on, risk off” trade, especially when there are concerns of an economic slowdown.
What is your outlook?
We believe that markets have overreacted and a global recession will likely not materialize for a few key reasons. First, the Treasury yield curve, which has historically been one of the most reliable economic indicators, is flashing no signs of a pending recession. The yield curve remains
| | | | | | | | |
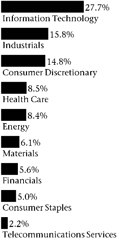
Major Market Sectors (% of Net Assets) 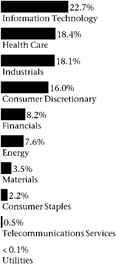
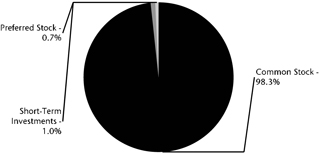
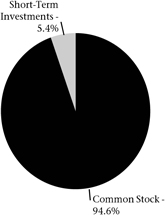
| | Portfolio Composition (% of Portfolio) 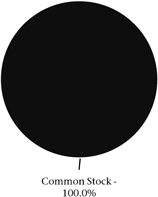
| | Top 10 Holdings | |
| | | (% of Net Assets) | |
| | | Clean Harbors, Inc. | | | 1.5 | % |
| | | Genesee & Wyoming, Inc. | | | 1.4 | % |
| | | Healthspring, Inc. | | | 1.3 | % |
| | | Questcor Pharmaceuticals, Inc. | | | 1.3 | % |
| | | Catalyst Health Solutions, Inc. | | | 1.3 | % |
| | | Taleo Corporation | | | 1.3 | % |
| | | Triumph Group, Inc. | | | 1.2 | % |
| | | Copa Holdings SA | | | 1.1 | % |
| | | NETGEAR, Inc. | | | 1.1 | % |
| | | Cirrus Logic, Inc. | | | 1.1 | % |
| | | These securities represent 12.6% of the total net assets of the Fund. | |
Quoted Fund performance is for Class A shares and does not reflect a sales charge.
The returns shown do not reflect taxes a shareholder would pay on distributions or redemptions.
Quoted Major Market Sectors, Portfolio Composition and Top 10 Holdings are subject to change.
The lists of Major Market Sectors and Top 10 Holdings exclude short-term investments and collateral held for securities loaned.
The Portfolio Composition chart excludes collateral held for securities loaned.
12
positively sloped, with 10-year yields more than 1.67% higher than two-year yields. Second, we believe that lower commodity prices will spur growth in emerging markets. Third, we expect the U.S. to avoid a recession and maintain slow-but-positive GDP growth in the near term and much better growth in the intermediate to long term.
Finally, corporate earnings continue to be solid, corporate balance sheets are in a position of strength and the global economy continues to operate below capacity. If earnings growth continues, we think the market can shake loose its current burdens and end the year on a positive note, positioned for a strong 2012.
| | | | | | |
| |
Portfolio Facts As of October 31, 2011 |
| | | | Class A | | | Institutional Class |
Ticker | | | TPSAX | | | TPGIX |
Transfer Agent ID | | | 063 | | | 463 |
Net Assets | | | $19,976,679 | | | $104,429,114 |
NAV | | | $11.72 | | | $11.9 |
NAV - High† | | | 4/29/2011 - $14.10 | | | 4/29/2011 - $14.4 |
NAV - Low† | | | 10/3/2011 - $9.60 | | | 10/3/2011 - $9.8 |
Number of Holdings: 193 | | | | | | |
† For the year ended October 31, 2011 | | | | | | |
| | | | | | |
Average Annual Total Returns1 As of October 31, 2011 |
| Class A2 | | 1-Year | | 5 Years | | From
Inception
6/30/2005 |
without sales charge | | 8.42% | | 0.98% | | 3.29% |
with sales charge | | 2.45% | | -0.15% | | 2.37% |
| | | |
| Institutional Class3 | | 1-Year | | 5 Years | | From
Inception
6/30/2005 |
Net Asset Value | | 8.90% | | 1.40% | | 3.68% |
| | | | | | |
Value of a $10,000 Investment Class A Shares*,1,(a) 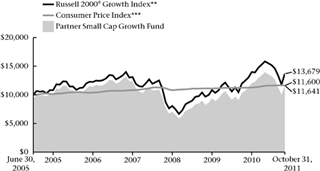
|
| 1 | Past performance is not an indication of future results. Average annual total returns represent past performance and reflect changes in share prices, the reinvestment of all dividends and capital gains, and the effects of compounding. The prospectus contains more complete information on the investment objectives, risks, charges and expenses of the investment company, which investors should read and consider carefully before investing. To obtain a prospectus, contact a registered representative or visit www.thrivent.com. At various times, the Fund’s adviser waived its management fee and/or reimbursed Fund expenses. Had the adviser not done so, the Fund’s total returns would have been lower. The returns shown do not reflect taxes a shareholder would pay on distributions or redemptions. Total investment return and principal value of your investment will fluctuate, and your shares, when redeemed, may be worth more or less than their original cost. Current performance may be higher or lower than the performance data quoted. Call 800-THRIVENT or visit www.thrivent.com for performance results current to the most recent month-end. |
| 2 | Class A performance with sales charge reflects the maximum sales charge of 5.5%. |
| 3 | Institutional Class shares have no sales load and are for institutional shareholders only. |
| (a) | Performance of other classes will be greater or less than the line shown based on the differences in loads and fees paid by shareholders investing in the different classes. |
| * | As you compare performance, please note that the Fund’s performance reflects the maximum 5.5% sales charge, while the Consumer Price Index and the Russell 2000® Growth Index do not reflect any such charges. If you were to purchase any of the above individual securities represented in the Index, any charges you would pay would reduce your total return as well. |
| ** | The Russell 2000® Growth Index is an index comprised of companies with a greater-than-average growth orientation. It is not possible to invest directly in the Index. The performance of the Index does not reflect deductions for fees, expenses or taxes. |
| *** | The Consumer Price Index is an inflationary indicator that measures the change in the cost of a fixed basket of products and services, including housing, electricity, food and transportation. It is not possible to invest directly in the Index. |
13
Thrivent Partner Small Cap Value Fund
| | |
 | | Subadvised by T. Rowe Price Associates, Inc. |
| | The Fund seeks long-term capital appreciation. |
| | The Fund is exposed to the risks of investing in equity securities of smaller companies, which may include, but are not limited to, lower trading volumes and less liquidity than larger, more established companies. Small company stock prices are generally more volatile than large company stock prices. These and other risks are described in the Fund’s prospectus. Views expressed in this discussion of fund performance are the views of this particular Fund’s portfolio management team. |
How did the Fund perform during the 12-month
period ended October 31, 2011?
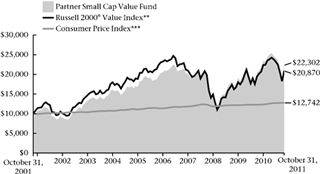
Thrivent Partner Small Cap Value Fund earned a return of 6.08%, compared with the median return of its peer group, the Lipper Small Cap Value category, of 4.87%. The Fund’s market benchmark, the Russell 2000® Value Index, earned a return of 3.54%.
What factors affected the Fund’s performance?
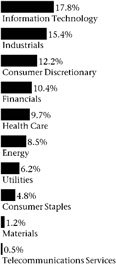
Stock selection drove significant outperformance in the Fund, while sector allocation modestly detracted from relative results.
Stock selection in the industrials sector was the largest contributor to relative outperformance by far; however, a detrimental overweighting in what was one of the weakest-performing sectors in the benchmark slightly weighed on relative results. Particularly beneficial names included nonbenchmark holdings Kirby and Genesee & Wyoming. Our overweighting to industrials was the result of bottom-up analysis as we believed that firms in this sector would likely rebound more quickly than consumer-dependent companies.
Stock selection and an underweighting in financials also contributed to relative performance. Our position in
medical malpractice insurer ProAssurance proved beneficial in the sector as the company showed solid revenue growth over the past year. Stock selection in materials also supported outperformance, led by holdings in chemicals companies Innospec and Arch Chemicals (now part of Lonza Group).
In consumer discretionary, stock selection helped relative returns. In the face of a challenging economic environment, specialty retailer Aaron’s continued to log impressive results via efficiencies and cost controls.
Stock selection in energy was the leading detractor from relative performance for the period. The Fund’s positions in Forest Oil and Penn Virginia held back results. Furthermore, an underweighting in energy added to underperformance as the sector was one of the top performers in the benchmark for the period. In addition, stock selection in consumer staples weighed on relative results.
What is your outlook?
Given the manic swing of the equity markets this summer and fall, predicting the market’s near-term direction is all the more difficult. Small-cap value stocks have fallen short of our hopes at the start of the year.
| | |
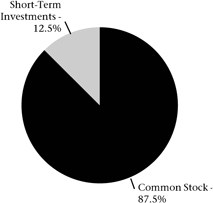
Major Market Sectors (% of Net Assets) | | Portfolio Composition (% of Portfolio) |
| | 
|
| | |
| Top 10 Holdings | | |
(% of Net Assets) | | |
| |
Aaron’s, Inc. | | 2.3% |
ProAssurance Corporation | | 2.2% |
Kirby Corporation | | 2.1% |
Genesee & Wyoming, Inc. | | 2.1% |
AptarGroup, Inc. | | 1.6% |
Cleco Corporation | | 1.5% |
Owens & Minor, Inc. | | 1.4% |
Robbins & Myers, Inc. | | 1.3% |
Ares Capital Corporation | | 1.3% |
McGrath Rentcorp | | 1.2% |
These securities represent 17.0% of the total net assets of the Fund. |
Quoted Fund performance is for Class A shares and does not reflect a sales charge.
The returns shown do not reflect taxes a shareholder would pay on distributions or redemptions.
Quoted Major Market Sectors, Portfolio Composition and Top 10 Holdings are subject to change.
The lists of Major Market Sectors and Top 10 Holdings exclude short-term investments and collateral held for securities loaned.
The Portfolio Composition chart excludes collateral held for securities loaned.
14
After selling off significantly, especially in the first three quarters of 2011, they have bounced back some recently.
In our experience, however, a recognition that tougher economic times are coming is not a reason to liquidate holdings in which we have long-term confidence. Indeed, given the tendency of markets to overreact, we believe the best time to invest is often when it feels worst to do so. Perhaps most important, downside support is compelling given exceptionally low
valuations that include reasonable dividend yields, which are higher in many instances than government bond rates. Historically, this trend has been a reliable indicator of equity value relative to other asset classes. In addition, corporate balance sheets are strong and are a source of potential returns through share buybacks for companies with excess cash and high free cash flow. Stronger balance sheets may act as a cushion should hard times prevail.
| | | | |
| |
Portfolio Facts As of October 31, 2011 |
| | | Class A | | Institutional Class |
Ticker | | AALVX | | TPSIX |
Transfer Agent ID | | 032 | | 099 |
Net Assets | | $69,292,565 | | $143,415,743 |
NAV | | $14.47 | | $15.19 |
NAV - High† | | 4/29/2011 - $16.46 | | 4/29/2011 - $17.24 |
NAV - Low† | | 10/3/2011 - $11.83 | | 10/3/2011 - $12.41 |
Number of Holdings: 165 | | | | |
† For the year ended October 31, 2011 |
| | | | | | |
Average Annual Total Returns1 As of October 31, 2011 |
| Class A2 | | 1-Year | | 5 Years | | 10 Years |
without sales charge | | 6.08% | | 2.62% | | 8.97% |
with sales charge | | 0.24% | | 1.46% | | 8.35% |
| | | |
| Institutional Class3 | | 1-Year | | 5 Years | | 10 Years |
Net Asset Value | | 6.64% | | 3.26% | | 9.73% |
|
Value of a $10,000 Investment Class A Shares*,1,(a) |
|
|
|
| 1 | Past performance is not an indication of future results. Average annual total returns represent past performance and reflect changes in share prices, the reinvestment of all dividends and capital gains, and the effects of compounding. The prospectus contains more complete information on the investment objectives, risks, charges and expenses of the investment company, which investors should read and consider carefully before investing. To obtain a prospectus, contact a registered representative or visit www.thrivent.com. At various times, the Fund’s adviser waived its management fee and/or reimbursed Fund expenses. Had the adviser not done so, the Fund’s total returns would have been lower. The returns shown do not reflect taxes a shareholder would pay on distributions or redemptions. Total investment return and principal value of your investment will fluctuate, and your shares, when redeemed, may be worth more or less than their original cost. Current performance may be higher or lower than the performance data quoted. Call 800-THRIVENT or visit www.thrivent.com for performance results current to the most recent month-end. |
| 2 | Class A performance with sales charge reflects the maximum sales charge of 5.5%. |
| 3 | Institutional Class shares have no sales load and are for institutional shareholders only. |
| (a) | Performance of other classes will be greater or less than the line shown based on the differences in loads and fees paid by shareholders investing in the different classes. |
| * | As you compare performance, please note that the Fund’s performance reflects the maximum 5.5% sales charge, while the Russell 2000® Value Index and the Consumer Price Index do not reflect any such charges. If you were to purchase any of the above individual securities represented in the Index, any charges you would pay would reduce your total return as well. |
| ** | The Russell 2000® Value Index measures the performance of small cap value stocks. It is not possible to invest directly in the Index. The performance of the Index does not reflect deductions for fees, expenses or taxes. |
| *** | The Consumer Price Index is an inflationary indicator that measures the change in the cost of a fixed basket of products and services, including housing, electricity, food and transportation. It is not possible to invest directly in the Index. |
15
| | |
| | | Thrivent Small Cap Stock Fund Darren M. Bagwell, CFA, Portfolio Manager The Fund seeks long-term capital growth. The Fund is exposed to the risks of investing in equity securities of smaller companies, which may include, but are not limited to,
lower trading volumes and less liquidity than larger, more established companies. Small company stock prices are generally
more volatile than large company stock prices. These and other risks are described in the Fund’s prospectus. Views expressed
in this discussion of fund performance are the views of this particular Fund’s portfolio management team. |

| |
How did the Fund perform during the 12-month period ended October 31, 2011?
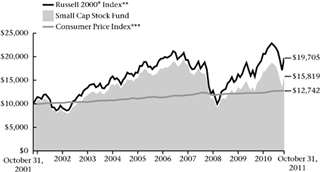
Thrivent Small Cap Stock Fund earned a return of 6.29%, compared with the median return of its peer group, the Lipper Small Cap Core Funds category, of 7.18%. The Fund’s market benchmark, the Russell 2000® Index, earned a return of 6.71%.
What factors affected the Fund’s performance?
The Fund’s underperformance during the period was due to our pro-cyclical positioning in the economically sensitive energy and industrial sectors. The deceleration in global economic growth, coupled with (and due to) the European debt crisis, resulted in a highly correlated market that was not ideal for our bottom-up, fundamental stock-picking focus and pro-cyclical bias. These headwinds overwhelmed strong security selection within the technology and consumer sectors.
Within energy, our focus on deep value in the oil and gas services and exploration industries was not matched by execution. The Fund owned too many companies rich in reserves and potential that failed to meet near-term expectations. In addition, weakening energy prices and a nervous market environment exacerbated the negative reactions. Swift Energy and Forest Oil both missed
production targets in the quarter. Additionally, the long-term value we see in coal producers was overwhelmed by concerns regarding a global economic slowdown and strengthening dollar.
Performance in industrials suffered from our incorrect belief that employment and construction/engineering markets would follow normal recovery paths. Monster Worldwide and engineering provider Shaw Group were meaningful laggards.
Partially offsetting poor performance in the cyclical areas was robust security selection in the technology and consumer sectors. Within technology, the Fund’s semiconductor and software investments were sources of outperformance. Specialty semiconductor manufacturers NetLogic and Atmel benefited from strong trends in the networking and touch-screen segments, respectively. In software, the business infrastructure products of TIBCO experienced tremendous market acceptance, and CommVault also benefited from resilient demand in storage markets. In consumer, our defensive positioning played well in a nervous market, and security selection was solid. Personal care products provider Herbalife and specialty retailers Pier 1 Imports and Foot Locker were outperformers and emblematic of our focus on companies with exposure to emerging markets or turnaround prospects.
| | |
Major Market Sectors (% of Net Assets) | | Portfolio Composition (% of Portfolio) |
| | 
|
| | | |
| | |
| | |
| | | | |
Top 10 Holdings (% of Net Assets) | | | |
| |
Align Technology, Inc. | | | 2.5 | % |
Corn Products International, Inc. | | | 2.4 | % |
Pier 1 Imports, Inc. | | | 2.3 | % |
Manitowoc Company, Inc. | | | 2.2 | % |
SuccessFactors, Inc. | | | 2.2 | % |
FTI Consulting, Inc. | | | 2.2 | % |
TIBCO Software, Inc. | | | 2.1 | % |
Texas Capital Bancshares, Inc. | | | 2.0 | % |
Foot Locker, Inc. | | | 2.0 | % |
GATX Corporation | | | 2.0 | % |
|
These securities represent 21.9% of the total net assets of the Fund. | |
Quoted Fund performance is for Class A shares and does not reflect a sales charge.
The returns shown do not reflect taxes a shareholder would pay on distributions or redemptions.
Quoted Major Market Sectors, Portfolio Composition and Top 10 Holdings are subject to change.
The lists of Major Market Sectors and Top 10 Holdings exclude short-term investments and collateral held for securities loaned.
The Portfolio Composition chart excludes collateral held for securities loaned
16
What is your outlook?
We are less optimistic about global growth than we were a year ago. We believe that domestic growth will have a hard time exceeding 2% in real terms, in part due to fiscal headwinds, persistent weakness in the housing and employment markets, consumer deleveraging and lower prospects for growth in Europe. We also worry that a
stronger dollar would be an unexpected, but very possible, negative development for 2012 corporate profits. We believe that expectations for corporate profits will likely continue to fall through year-end. Given our general trepidation regarding economic growth in 2012, we are emphasizing companies with strong new product cycles, emerging market exposure and productivity-enhancing technology offerings.
| | | | | | | | |
Portfolio Facts As of October 31, 2011 | |
| | | | Class A | | | | Institutional Class | |
Ticker | | | AASMX | | | | TSCSX | |
Transfer Agent ID | | | 024 | | | | 094 | |
Net Assets | | | $226,331,425 | | | | $60,283,050 | |
NAV | | | $13.35 | | | | $14.96 | |
NAV - High† | | | 4/29/2011 - $15.78 | | | | 4/29/2011-$17.62 | |
NAV - Low† | | | 10/3/2011 - $10.79 | | | | 10/3/2011 -$12.08 | |
Number of Holdings: 85 | | | | | | | | |
† For the year ended October 31, 2011 | |
Average Annual Total Returns1
As of October 31, 2011
| | | | | | |
| Class A2 | | 1-Year | | 5 Years | | 10 Years |
without sales charge | | 6.29% | | -1.48% | | 5.29% |
with sales charge | | 0.45% | | -2.59% | | 4.69% |
| | | |
| Institutional Class3 | | 1-Year | | 5 Years | | 10 Years |
Net Asset Value | | 6.93% | | -0.83% | | 5.96% |
Value of a $10,000 Investment
Class A Shares*,1,(a)
| 1 | Past performance is not an indication of future results. Average annual total returns represent past performance and reflect changes in share prices, the reinvestment of all dividends and capital gains, and the effects of compounding. The prospectus contains more complete information on the investment objectives, risks, charges and expenses of the investment company, which investors should read and consider carefully before investing. To obtain a prospectus, contact a registered representative or visit www.thrivent.com. At various times, the Fund’s adviser waived its management fee and/or reimbursed Fund expenses. Had the adviser not done so, the Fund’s total returns would have been lower. The returns shown do not reflect taxes a shareholder would pay on distributions or redemptions. Total investment return and principal value of your investment will fluctuate, and your shares, when redeemed, may be worth more or less than their original cost. Current performance may be higher or lower than the performance data quoted. Call 800-THRIVENT or visit www.thrivent.com for performance results current to the most recent month-end. |
| 2 | Class A performance with sales charge reflects the maximum sales charge of 5.5%. |
| 3 | Institutional Class shares have no sales load and are for institutional shareholders only. |
| (a) | Performance of other classes will be greater or less than the line shown based on the differences in loads and fees paid by shareholders investing in the different classes. |
| * | As you compare performance, please note that the Fund’s performance reflects the maximum 5.5% sales charge, while the Russell 2000® Index and the Consumer Price Index do not reflect any such charges. If you were to purchase any of the above individual securities represented in the Index, any charges you would pay would reduce your total return as well. |
| ** | The Russell 2000® Index measures the performance of small cap stocks. It is not possible to invest directly in the Index. The performance of the Index does not reflect deductions for fees, expenses or taxes. |
| *** | The Consumer Price Index is an inflationary indicator that measures the change in the cost of a fixed basket of products and services, including housing, electricity, food and transportation. It is not possible to invest directly in the Index. |
17
| | |

| | Thrivent Mid Cap Growth Fund Andrea J. Thomas, CFA, Portfolio Manager The Fund seeks long-term growth of capital. Mid-cap stocks offer the potential for long-term gains but can be subject to short-term price movements. Mid-sized company stock prices are generally more volatile than large company stock prices. These and other risks are described in the Fund’s prospectus. Views expressed in this discussion of fund performance are the views of this particular Fund’s portfolio management team. |
| |
How did the Fund perform during the 12-month period ended October 31, 2011?
Thrivent Mid Cap Growth Fund earned a return of 6.32%, compared with the median return of its peer group, the Lipper Mid Cap Growth Funds category, of 8.72%. The Fund’s market benchmark, the Russell Midcap® Growth Index, earned a return of 10.08%.
What factors affected the Fund’s performance?
The Fund lagged its competitors and the benchmark over the period as we increased our defensive positioning too early in anticipation of an end to the Federal Reserve’s quantitative easing policy. We did not own enough high-multiple consumer companies over the period, which negatively impacted returns. Investors were willing to pay enormous premiums for select growth companies for much of the year. Our late-cycle industrial holdings lagged as investors opted for high-beta, high-growth companies.
Our energy holdings did not fare well over the period, particularly our coal stocks. However, stock selection in the materials and information technology sectors was beneficial over the period. As we approached the second half of 2011, our defensive positioning helped us close some, but not all, of the performance gap.
What is your outlook?
As we enter the fourth quarter of 2011, we are concerned that many of the same problems that have plagued the economy for the past three years remain unsolved. The U.S. economy remains in a state of subpar growth, due primarily to the lackluster job market. The floundering housing market is contributing to the economic malaise. Recent pricing data is showing signs that housing may be entering another downturn. Turmoil in the European markets also remains a significant risk to the U.S. and world economies. As such, we will continue to follow a disciplined process, while remaining wary of the multiples we are willing to pay for stocks.
We believe the market volatility we have seen in the past few months will likely continue. Europe’s debt problems will likely be in the forefront of news headlines as we approach the end of the year; however, investors may soon turn their attention to the U.S. debt problems. We believe that, in the end, the Fed will again print money and continue to monetize the debt. If this happens, the value of the U.S. dollar will likely decline and inflation will likely increase as more money is pumped into the system.
In this environment, we remain invested in companies with definable product cycles that we expect will grow
| | |
| Major Market Sectors | | Portolio Composition |
| (% of Net Assets) | | (% of Net Assets) |
 | | 
|
Top 10 Holdings
(% of Net Assets)
| | | | |
| |
Teradata Corporation | | | 2.5 | % |
Dollar Tree, Inc. | | | 2.3 | % |
F5 Networks, Inc. | | | 2.1 | % |
Kansas City Southern, Inc. | | | 1.9 | % |
Whole Foods Market, Inc. | | | 1.9 | % |
Netlogic Microsystems, Inc. | | | 1.9 | % |
BE Aerospace, Inc. | | | 1.8 | % |
Roper Industries, Inc. | | | 1.8 | % |
Nuance Communications, Inc. | | | 1.8 | % |
Watson Pharmaceuticals, Inc. | | | 1.7 | % |
These securities represent 19.7% of the total net assets of the Fund.
Quoted Fund performance is for Class A shares and does not reflect a sales charge.
The returns shown do not reflect taxes a shareholder would pay on distributions or redemptions.
Quoted Major Market Sectors, Portfolio Composition and Top 10 Holdings are subject to change.
The lists of Major Market Sectors and Top 10 Holdings exclude short-term investments and collateral held for securities loaned.
The Portfolio Composition chart excludes collateral held for securities loaned.
18
despite economic cyclicality. We also remain invested in companies that have hard assets that will likely benefit from commodity inflation, especially in the energy and materials sectors. We remain extremely cautious on high-multiple consumer discretionary stocks.
| | | | | | | | |
| | | |
| | | Portfolio Facts | | |
| | | As of October 31, 2011 | | |
| | | | | Class A | | Institutional Class | | |
| | | Ticker | | LBMGX | | LBMIX | | |
| | | Transfer Agent ID | | 058 | | 458 | | |
| | | Net Assets | | $238,024,156 | | $152,751,888 | | |
| | | NAV | | $17.67 | | $19.81 | | |
| | | NAV - High† | | 7/7/2011 - $19.66 | | 7/7/2011 - $22.00 | | |
| | | NAV - Low† | | 10/3/2011 - $15.02 | | 10/3/2011 - $16.84 | | |
| | | Number of Holdings: 86 | | | | | | |
| | | † For the year ended October 31, 2011 | | |
Average Annual Total Returns1
As of October 31, 2011
| | | | | | | | | | | | |
Class A2 | | | 1-Year | | | | 5 Years | | | | 10 Years | |
without sales charge | | | 6.32% | | | | 6.02% | | | | 6.60% | |
with sales charge | | | 0.45% | | | | 4.83% | | | | 5.99% | |
| | | |
Institutional Class3 | | | 1-Year | | | | 5 Years | | | | 10 Years | |
Net Asset Value | | | 6.91% | | | | 6.77% | | | | 7.45% | |
Value of a $10,000 Investment
Class A Shares*,1,(a)
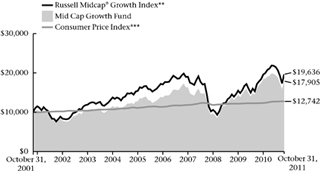
| 1 | Past performance is not an indication of future results. Average annual total returns represent past performance and reflect changes in share prices, the reinvestment of all dividends and capital gains, and the effects of compounding. The prospectus contains more complete information on the investment objectives, risks, charges and expenses of the investment company, which investors should read and consider carefully before investing. To obtain a prospectus, contact a registered representative or visit www.thrivent.com. At various times, the Fund’s adviser waived its management fee and/or reimbursed Fund expenses. Had the adviser not done so, the Fund’s total returns would have been lower. The returns shown do not reflect taxes a shareholder would pay on distributions or redemptions. Total investment return and principal value of your investment will fluctuate, and your shares, when redeemed, may be worth more or less than their original cost. Current performance may be higher or lower than the performance data quoted. Call 800-THRIVENT or visit www.thrivent.com for performance results current to the most recent month-end. |
| 2 | Class A performance with sales charge reflects the maximum sales charge of 5.5%. |
| 3 | Institutional Class shares have no sales load and are for institutional shareholders only. |
| (a) | Performance of other classes will be greater or less than the line shown based on the differences in loads and fees paid by shareholders investing in the different classes. |
| * | As you compare performance, please note that the Fund’s performance reflects the maximum 5.5% sales charge, while the Russell Midcap® Growth Index and the Consumer Price Index do not reflect any such charges. If you were to purchase any of the above individual securities represented in the Index, any charges you would pay would reduce your total return as well. |
| ** | The Russell Midcap® Growth Index measures the performance of mid-cap growth stocks. It is not possible to invest directly in the Index. The performance of the Index does not reflect deductions for fees, expenses, or taxes. |
| *** | The Consumer Price Index is an inflationary indicator that measures the change in the cost of a fixed basket of products and services, including housing, electricity, food and transportation. It is not possible to invest directly in the Index. |
19
| | |
 | | Thrivent Partner Mid Cap Value Fund |
| | Subadvised by Goldman Sachs Asset Management, L.P. |
| | The Fund seeks to achieve long-term capital appreciation. |
| | Mid-cap stocks offer the potential for long-term gains but can be subject to short-term price movements. Mid-sized company stock prices are generally more volatile than large company stock prices. These and other risks are described in the Fund’s prospectus. Views expressed in this discussion of fund performance are the views of this particular Fund’s portfolio management team. |
How did the Fund perform during the 12-month period ended October 31, 2011?
Thrivent Partner Mid Cap Value Fund earned a return of 3.57%, compared to the median return of its peer group, the Lipper Mid Cap Value Funds category, of 4.43 %. The Fund’s market benchmark, the Russell Midcap® Value Index, earned a return of 5.83%.
What factors affected the Fund’s performance?
Stock selection in the telecommunications services and materials sectors detracted from returns, whereas stock selection in the information technology and energy sectors was the strongest contributor to performance. Our holding in Sprint Nextel was a top detractor from returns. Its shares declined after the company reported disappointing results in the second quarter. With the capital markets again challenged, investors were also likely concerned about the company’s debt that is maturing in 2012/2013. We believe Sprint Nextel will benefit from carrying the iPhone, which will allow the company to take a bigger share of subscribers over the long term.
On the positive side, performance was helped by our investments in the energy sector, particularly select natural gas stocks. U.S. exploration and production
company Range Resources, which has extensive holdings in the Marcellus Shale, benefited performance. The company outperformed due to strong quarterly results driven, in part, by higher production volumes and rumors of a potential buyout.
What is your outlook?
While the macro environment is challenging, corporate balance sheets are stronger than ever. Cash to assets is at all-time highs, merger and acquisition activity remains healthy, and capital redeployment of excess cash appears to be on the horizon. We believe today’s issues are different from 2008, with U.S. companies more aware, better capitalized and better prepared to adapt. Fundamentals for U.S. companies appear strong, and valuations, in our view, should represent good risk/reward for long-term investors.
While risks remain about capital markets worsening and Europe contagion, we remain cautiously optimistic regarding the U.S. equity market. We believe future expected market conditions should favor our approach. We also believe the push toward yield is overdone, with higher-yielding, low-growth sectors trading at a premium. As always, we remain focused on the long-term performance of the Fund.
| | | | | | | | | | |
| Major Market Sectors | | Portfolio Composition | | | | Top 10 Holdings | |
| (% of Portfolio) | | (% of Portfolio) | | | | (% of Net Assets) | |

| | 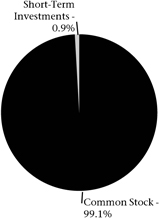
| | | | PPL Corporation | | | 2.3 | % |
| | | | Xcel Energy, Inc. | | | 2.1 | % |
| | | | J.M. Smucker Company | | | 2.0 | % |
| | | | Everest Re Group, Ltd. | | | 2.0 | % |
| | | | EQT Corporation | | | 2.0 | % |
| | | | Principal Financial Group, Inc. | | | 1.8 | % |
| | | | Liberty Interactive Corporation | | | 1.7 | % |
| | | | Lear Corporation | | | 1.6 | % |
| | | | Scripps Networks Interactive | | | 1.6 | % |
| | | | SLM Corporation | | | 1.4 | % |
| | | |
| | | | | | These securities represent 18.5% of the total net assets of the Fund. | |
Quoted Fund performance is for Class A shares and does not reflect a sales charge.
The returns shown do not reflect taxes a shareholder would pay on distributions or redemptions.
Quoted Major Market Sectors, Portfolio Composition and Top 10 Holdings are subject to change.
The lists of Major Market Sectors and Top 10 Holdings exclude short-term investments and collateral held for securities loaned.
The Portfolio Composition chart excludes collateral held for securities loaned.
20
| | | | |
Portfolio Facts As of October 31, 2011 |
| | | Class A | | Institutional Class |
Ticker | | TPMAX | | TPMIX |
Transfer Agent ID | | 086 | | 486 |
Net Assets | | $17,772,100 | | $100,367,582 |
NAV | | $11.55 | | $11.60 |
NAV - High† | | 5/2/2011 - $13.22 | | 5/2/2011 - $13.25 |
NAV - Low† | | 10/3/2011 - $9.82 | | 10/3/2011 - $9.85 |
Number of Holdings: 112 | | | | |
† For the year ended October 31, 2011 | | |
| | | | | | |
| Average Annual Total Returns1 |
| As of October 31, 2011 |
| Class A2 | | 1-Year | | 5 Years | | From
Inception
6/30/2005 |
| without sales charge | | 3.57% | | 1.54% | | 3.98% |
| with sales charge | | -2.12% | | 0.39% | | 3.06% |
| | | |
| Institutional Class3 | | 1-Year | | 5 Years | | From
Inception
6/30/2005 |
| Net Asset Value | | 3.94% | | 1.84% | | 4.31% |
|
Value of a $10,000 Investment |
Class A Shares*,1,(a) |
|
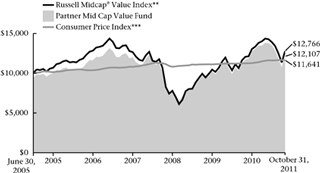 |
| 1 | Past performance is not an indication of future results. Average annual total returns represent past performance and reflect changes in share prices, the reinvestment of all dividends and capital gains, and the effects of compounding. The prospectus contains more complete information on the investment objectives, risks, charges and expenses of the investment company, which investors should read and consider carefully before investing. To obtain a prospectus, contact a registered representative or visit www.thrivent.com. At various times, the Fund’s adviser waived its management fee and/or reimbursed Fund expenses. Had the adviser not done so, the Fund’s total returns would have been lower. The returns shown do not reflect taxes a shareholder would pay on distributions or redemptions. Total investment return and principal value of your investment will fluctuate, and your shares, when redeemed, may be worth more or less than their original cost. Current performance may be higher or lower than the performance data quoted. Call 800-THRIVENT or visit www.thrivent.com for performance results current to the most recent month-end. |
| 2 | Class A performance with sales charge reflects the maximum sales charge of 5.5%. |
| 3 | Institutional Class shares have no sales load and are for institutional shareholders only. |
| (a) | Performance of other classes will be greater or less than the line shown based on the differences in loads and fees paid by shareholders investing in the different classes. |
| * | As you compare performance, please note that the Fund’s performance reflects the maximum 5.5% sales charge, while the Consumer Price Index and the Russell Midcap® Value Index do not reflect any such charges. If you were to purchase any of the above individual securities represented in the Index, any charges you would pay would reduce your total return as well. |
| ** | The Russell Midcap® Value Index is an index comprised of mid-cap companies with lower than average price-to-book ratios and lower forecasted growth values. It is not possible to invest directly in the Index. The performance of the Index does not reflect deductions for fees, expenses or taxes. |
| *** | The Consumer Price Index is an inflationary indicator that measures the change in the cost of a fixed basket of products and services, including housing, electricity, food and transportation. It is not possible to invest directly in the Index. |
21
| | |
 | | Thrivent Mid Cap Stock Fund Brian J. Flanagan, CFA, Portfolio Manager The Fund seeks long-term capital growth. Mid-cap stocks offer the potential for long-term gains but can be subject to short-term price movements. Mid-sized company stock prices are generally more volatile than large company stock prices. These and other risks are described in the Fund’s prospectus. Views expressed in this discussion of fund performance are the views of this particular Fund’s portfolio management team. |
| |
| |
| |
How did the Fund perform during the 12-month period ended October 31, 2011?
Thrivent Mid Cap Stock Fund earned a return of 6.00%, compared with the median return of its peer group, the Lipper Mid Cap Core Funds category, of 6.91%. The Fund’s market benchmark, the Russell Midcap® Index, earned a return of 7.85%.
What factors affected the Fund’s performance?
Poor stock selection within the energy, industrials and financials sectors was responsible for the majority of the underperformance. Solid returns within the information technology and health care sectors offset some of the underperformance. Exploration and production (E&P) and coal investments accounted for the energy sector’s underperformance as lower-than-expected production combined with cost overruns weighed on operations at Whiting Petroleum, Forest Oil, Alpha Natural Resources and Arch Coal.
Within the industrials sector, Shaw Group was also hurt by cost overruns in many of its engineering and construction projects. Oshkosh Corporation suffered from a money-losing government contract and low
government spending.
Northern Trust Corporation held back the financial sector’s performance. However, unlike the energy investments, the company suffered from a poor macro backdrop. The company is highly levered to a rising interest-rate environment. With rates continuing to decline during the period, results were lackluster.
Fund performance was buttressed by solid stock selection across the information technology sector, including timely investments within the services, software and semiconductor industries. Finally, stellar execution and an expanding market benefited Alexion Pharmaceuticals within the health care sector.
What is your outlook?
The Fund is positioned more aggressively as a slowly improving macro picture combined with an attractive micro backdrop are, in our view, setting up the market for a favorable risk/reward. While Europe will likely continue to weigh on the global economy, we believe that two other forces may start providing a tailwind.
First, the U.S. economy is slowly improving as housing is no longer a significant drag on GDP. We believe
| | |
| Major Market Sectors | | Portfolio Composition |
(% of Net Assets) | | (% of Portfolio) |
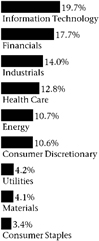 | |  |
| | | | |
| Top 10 Holdings | | | | |
(% of Net Assets) | | | | |
| |
| Alliance Data Systems Corporation | | | 2.6 | % |
| W.R. Berkley Corporation | | | 2.5 | % |
| TIBCO Software, Inc. | | | 2.5 | % |
| Teradyne, Inc. | | | 2.5 | % |
| HCC Insurance Holdings, Inc. | | | 2.0 | % |
| M&T Bank Corporation | | | 2.0 | % |
| National Oilwell Varco, Inc. | | | 2.0 | % |
| TreeHouse Foods, Inc. | | | 2.0 | % |
| Xilinx, Inc. | | | 1.9 | % |
| Panera Bread Company | | | 1.9 | % |
|
| These securities represent 21.9% of the total net assets of the Fund. | |
Quoted Fund performance is for Class A shares and does not reflect a sales charge.
The returns shown do not reflect taxes a shareholder would pay on distributions or redemptions.
Quoted Major Market Sectors, Portfolio Composition and Top 10 Holdings are subject to change.
The lists of Major Market Sectors and Top 10 Holdings exclude short-term investments and collateral held for securities loaned.
The Portfolio Composition chart excludes collateral held for securities loaned.
22
construction employment may actually increase, albeit slightly, this year. Second, China may follow many other emerging market economies in easing monetary or fiscal policy as its inflation rate declines. These factors—combined with attractive valuations, strong corporate cash flows and balance sheets, and negative sentiment
toward equities—provide the foundation for a more aggressive portfolio positioning. Therefore, as of the writing of this summary, the information technology, health care, industrials and energy sectors are all overweighted within the Fund.
| | | | |
| | | Portfolio Facts As of October 31, 2011 | | |
| | | | |
| | | Class A | | Institutional Class |
Ticker | | AASCX | | TMSIX |
Transfer Agent ID | | 021 | | 051 |
Net Assets | | $538,746,300 | | $215,641,895 |
NAV | | $14.30 | | $15.43 |
NAV - High† | | 4/29/2011 - $16.67 | | 4/29/2011 - $17.94 |
NAV - Low† | | 10/3/2011 - $11.82 | | 10/3/2011 - $12.75 |
Number of Holdings: 73 | | | | |
† For the year ended October 31, 2011 | | |
| | | | | | |
| Average Annual Total Returns1 |
| As of October 31, 2011 |
| | | |
Class A2 | | 1-Year | | 5 Years | | 10 Years |
without sales charge | | 6.00% | | 1.46% | | 6.69% |
with sales charge | | 0.14% | | 0.32% | | 6.10% |
| | | |
Institutional Class3 | | 1-Year | | 5 Years | | 10 Years |
Net Asset Value | | 6.51% | | 1.99% | | 7.26% |
|
| Value of a $10,000 Investment |
| Class A Shares*,1,(a) |
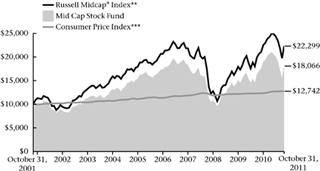
|
| 1 | Past performance is not an indication of future results. Average annual total returns represent past performance and reflect changes in share prices, the reinvestment of all dividends and capital gains, and the effects of compounding. The prospectus contains more complete information on the investment objectives, risks, charges and expenses of the investment company, which investors should read and consider carefully before investing. To obtain a prospectus, contact a registered representative or visit www.thrivent.com. At various times, the Fund’s adviser waived its management fee and/or reimbursed Fund expenses. Had the adviser not done so, the Fund’s total returns would have been lower. The returns shown do not reflect taxes a shareholder would pay on distributions or redemptions. Total investment return and principal value of your investment will fluctuate, and your shares, when redeemed, may be worth more or less than their original cost. Current performance may be higher or lower than the performance data quoted. Call 800-THRIVENT or visit www.thrivent.com for performance results current to the most recent month-end. |
| 2 | Class A performance with sales charge reflects the maximum sales charge of 5.5%. |
| 3 | Institutional Class shares have no sales load and are for institutional shareholders only. |
| (a) | Performance of other classes will be greater or less than the line shown based on the differences in loads and fees paid by shareholders investing in the different classes. |
| * | As you compare performance, please note that the Fund’s performance reflects the maximum 5.5% sales charge, while the Russell Midcap® Index and the Consumer Price Index do not reflect any such charges. If you were to purchase any of the above individual securities represented in the Index, any charges you would pay would reduce your total return as well. |
| ** | The Russell Midcap® Index is an index that measures the performance of the smallest 800 securities in the Russell 1000® Index, as ranked by total market capitalization. It is not possible to invest directly in these Indexes. The performance of these Indexes does not reflect deductions for fees, expenses or taxes. |
| *** | The Consumer Price Index is an inflationary indicator that measures the change in the cost of a fixed basket of products and services, including housing, electricity, food and transportation. It is not possible to invest directly in the Index. |
23
| | |
 | | Thrivent Partner Worldwide Allocation Fund |
| | Subadvised by Mercator Asset Management, LP, Principal Global Investors, LLC, Aberdeen Asset Management Investment Services Limited, Victory Capital Management Inc. and Goldman Sachs Asset Management, L.P. |
| | The Fund seeks long-term capital growth. |
| | Foreign investments, as compared to domestic ones, involve additional risks, including currency fluctuations, different accounting standards, and greater political, economic and market instability. These risks are magnified when the portfolio invests in emerging markets, which may be of relatively small size and less liquid than domestic markets. These and other risks are described in the Fund’s prospectus. Views expressed in this discussion of fund performance are the views of this particular Fund’s portfolio management team. |
How did the Fund perform during the 12-month period ended October 31, 2011?
Thrivent Partner Worldwide Allocation Fund earned a return of -4.60%, compared with the median return of its peer group, the Lipper International Multi-Cap Core Funds category, of -6.45%. The Fund’s market benchmark, the Morgan Stanley Capital International (MSCI) All Country World Index ex-USA, earned a return of -4.25%.
What factors affected the Fund’s performance?
The Fund modestly underperformed its benchmark index but nicely outpaced other funds in its Lipper category of international multi-cap core funds. The Fund uses a multi-manager allocation strategy to diversify its holdings and exposure over a number of market segments.
Our allocation to large-cap value in developed markets outside the U.S. did not keep pace with the index. Our allocation to large-cap growth in the developed market did outperform the respective index and thus offset the underperformance in the value segment. Our emerging market equity manager significantly outperformed its benchmark and was the most important contributing
factor to overall results.
Our small-cap Europe, Australasia and Far East (EAFE) manager also outperformed the benchmark, although that segment did not keep pace with developed market returns. Finally, there is an allocation to emerging debt in the Fund and that provided positive returns in the period, the only segment of the Fund to do so. Manager results were in line with the benchmark in this segment.
What is your outlook?
We believe that developed markets outside the U.S. are at significant discounts to long-term valuation measures. The reason for that is the ongoing political uncertainty surrounding the final resolution of the sovereign debt crisis embroiling the euro currency countries. Should a reasonable solution not be forthcoming, the financial and fiscal risks for both Europe and global growth are significant. Policymakers understand those risks and are working toward a solution, but the structure of the eurozone agreements make this a visible and torturous process, unsettling investors, consumers and corporations.
| | | | | | | | | | |
| Major Market Sectors | | Portfolio Composition | | | | Top 10 Countries | | | | |
| (% of Net Assets) | | (% of Portfolio) | | | | (% of Net Assets) | | | | |
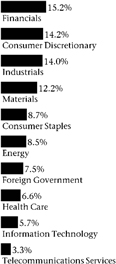
| | 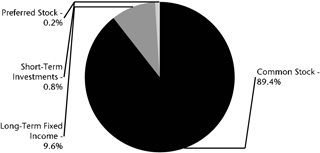
| | | | Japan | | | 15.7 | % |
| | | | United Kingdom | | | 12.2 | % |
| | | | Switzerland | | | 6.3 | % |
| | | | France | | | 5.8 | % |
| | | | Germany | | | 5.1 | % |
| | | | Australia | | | 4.6 | % |
| | | | Brazil | | | 3.9 | % |
| | | | Hong Kong | | | 3.5 | % |
| | | | Canada | | | 3.2 | % |
| | | | South Korea | | | 2.6 | % |
| | | | Investments in securities in these countries represent 62.9% of the total net assets of the Fund. | |
Quoted Fund performance is for Class A shares and does not reflect a sales charge.
The returns shown do not reflect taxes a shareholder would pay on distributions or redemptions.
Quoted Major Market Sectors, Portfolio Composition and Top 10 Countries are subject to change.
The lists of Major Market Sectors and Top 10 Countries exclude short-term investments and collateral held for securities loaned.
The Portfolio Composition chart excludes collateral held for securities loaned.
24
We believe a constructive outcome is most likely, but it will include some unpleasant realities for those countries on the wrong side of the debt-leverage divide. A recession is likely in certain euro countries in 2012, and modest
growth is most likely for the entire zone. That, we believe, is already priced into the markets. Should a more constructive outcome be forthcoming, a significant rally in risk assets would likely occur.
| | | | | | |
| | | Portfolio Facts As of October 31, 2011 | | | | |
| | | | | | |
| | | Class A | | Institutional Class | | |
Ticker | | TWAAX | | TWAIX | | |
Transfer Agent ID | | 034 | | 087 | | |
Net Assets | | $179,871,032 | | $477,952,116 | | |
NAV | | $8.30 | | $8.34 | | |
NAV - High† | | 5/2/2011 - $9.60 | | 5/2/2011 - $9.63 | | |
NAV - Low† | | 10/3/2011 - $7.44 | | 10/3/2011 - $7.47 | | |
Number of Holdings: 502 | | | | | | |
† For the year ended October 31, 2011 | | | | | | |
| | | | |
| Average Annual Total Returns1 |
| As of October 31, 2011 |
| Class A2 | | 1-Year | | From
Inception
2/29/2008 |
| without sales charge | | -4.60% | | -3.84% |
| with sales charge | | -9.83% | | -5.31% |
| | |
| Institutional Class3 | | 1-Year | | From
Inception
2/29/2008 |
| Net Asset Value | | -4.24% | | -3.51% |
|
| Value of a $10,000 Investment |
| Class A Shares*,1,(a) |
|
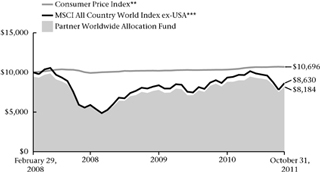 |
| 1 | Past performance is not an indication of future results. Average annual total returns represent past performance and reflect changes in share prices, the reinvestment of all dividends and capital gains, and the effects of compounding. The prospectus contains more complete information on the investment objectives, risks, charges and expenses of the investment company, which investors should read and consider carefully before investing. To obtain a prospectus, contact a registered representative or visit www.thrivent.com. At various times, the Fund’s adviser waived its management fee and/or reimbursed Fund expenses. Had the adviser not done so, the Fund’s total returns would have been lower. The returns shown do not reflect taxes a shareholder would pay on distributions or redemptions. Total investment return and principal value of your investment will fluctuate, and your shares, when redeemed, may be worth more or less than their original cost. Current performance may be higher or lower than the performance data quoted. Call 800-THRIVENT or visit www.thrivent.com for performance results current to the most recent month-end. |
| 2 | Class A performance with sales charge reflects the maximum sales charge of 5.5%. |
| 3 | Institutional Class shares have no sales load and are for institutional shareholders only. |
| (a) | Performance of other classes will be greater or less than the line shown based on the differences in loads and fees paid by shareholders investing in the different classes. |
| * | As you compare performance, please note that the Fund’s performance reflects the maximum 5.5% sales charge, while the MSCI All Country World Index ex-USA and the Consumer Price Index do not reflect any such charges. If you were to purchase any of the above individual securities represented in the Index, any charges you would pay would reduce your total return as well. |
| ** | The Consumer Price Index is an inflationary indicator that measures the change in the cost of a fixed basket of products and services, including housing, electricity, food and transportation. It is not possible to invest directly in the Index. |
| *** | The MSCI All Country World Index ex-USA is an unmanaged market capitalization-weighted index that is designed to represent the performance of developed and emerging stock markets throughout the world. It is not possible to invest directly in the Index. The performance of the Index does not reflect deductions for fees, expenses or taxes. |
25
| | |
 | | Thrivent Large Cap Growth Fund |
| | David C. Francis, CFA, Portfolio Manager* |
| | The Fund seeks long-term capital appreciation. |
| | Large-cap stocks are subject to the basic market risk that a particular security, or securities in general, may decrease in value over short or even extended time periods. These and other risks are described in the Fund’s prospectus. Views expressed in this discussion of fund performance are the views of this particular Fund’s portfolio management team. |
| | * Effective October 2011, David C. Francis became the Porfolio Manager. |
How did the Fund perform during the 12-month period ended October 31, 2011?
Thrivent Large Cap Growth Fund earned a return of 2.50%, compared with the median return for its peer group, the Lipper Large Cap Growth Funds category, of 7.00%. The Fund’s market benchmark, the Russell 1000® Growth Index, earned a return of 9.92%.
What factors affected the Fund’s performance?
The Fund underperformed its benchmark largely due to stock selection. Additionally, the Fund generally had a more cyclical bias reflecting a belief that the economic cycle would likely improve in 2011. For a variety of reasons, growth expectations deteriorated, particularly over the summer months, and the equity market experienced a sharp correction in the third quarter. We found performance results to be particularly difficult to achieve in that period.
Stock selection in the financial sector was a major detractor from performance. More specifically, holdings in the banking sector, like Citigroup and J.P. Morgan Chase, did not perform well. Ongoing challenges related to lending practices in the last housing cycle as well as renewed concerns about the evolving debt crisis in Europe
weighed on banks that have a global orientation.
Energy stocks in the Fund also did not keep pace with the market or other energy stocks in the group. Occidental Petroleum performed well in the Fund but was more than offset by weak returns to our holdings in coal companies Arch Coal and Peabody Energy.
In health care, our holding in McKesson Corp. performed well, but we did not have exposure to the very large-capitalization segments of the group. Those companies face severe challenges with patent expirations that call into question their long-term growth opportunities. That said, investors preferred the balance sheet safety and yields from those companies as market volatility increased in the second half of the year.
We were underweighted in the strong performance achieved in the consumer staples sector, a group that also became an investment refuge in the uncertain investment environment that prevailed in late summer. Specialty retail and a position in Ford Motor Company also did not perform well. NII Holdings was a position in the Fund that underperformed both its sector and the overall market. Holdings in CF Industries and Monsanto performed well in the period in the materials sector.
| | |
Major Market Sectors (% of Net Assets) | | Portfolio Composition (% of Portfolio) |
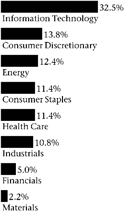 | | 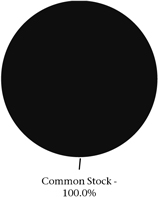 |
| | | | |
Top 10 Holdings (% of Net Assets) | | | |
Apple, Inc. | | | 7.1 | % |
Wal-Mart Stores, Inc. | | | 3.8 | % |
Google, Inc. | | | 3.7 | % |
Amazon.com, Inc. | | | 3.7 | % |
Oracle Corporation | | | 3.5 | % |
Las Vegas Sands Corporation | | | 3.2 | % |
Weatherford International, Ltd. | | | 3.0 | % |
Target Corporation | | | 2.9 | % |
Apache Corporation | | | 2.9 | % |
QUALCOMM, Inc. | | | 2.8 | % |
These securities represent 36.6% of the total net assets of the Fund.
Quoted Fund performance is for Class A shares and does not reflect a sales charge.
The returns shown do not reflect taxes a shareholder would pay on distributions or redemptions.
Quoted Major Market Sectors, Portfolio Composition and Top 10 Holdings are subject to change.
The lists of Major Market Sectors and Top 10 Holdings exclude short-term investments and collateral held for securities loaned.
The Portfolio Composition chart excludes collateral held for securities loaned.
26
What is your outlook?
We believe that volatility will remain high as a number of significant fiscal and monetary challenges remain to be addressed over the next 12 months. Fundamentally, while the economy hit a soft growth patch over the summer, we believe activity will improve in the second half. We do not expect a robust recovery but certainly enough growth to mitigate the risk of falling back into a second recession. Stocks appear to be discounting a rather pessimistic
outlook, so any progress on the issues in either the U.S. or Europe will likely result in a relief rally for risk assets. We have advanced beyond the recovery phase associated with the last downturn. Earnings have recovered sharply and companies, in our view, must now find sources of organic growth to sustain the earnings advance. We believe that is the most likely outcome and are positioned to benefit but acknowledge that risks to that prognosis have increased.
| | | | |
| | | Portfolio Facts As of October 31, 2011 | | |
| | | Class A | | Institutional Class |
Ticker | | AAAGX | | THLCX |
Transfer Agent ID | | 027 | | 060 |
Net Assets | | $117,669,519 | | $204,346,359 |
NAV | | $4.92 | | $5.28 |
NAV - High† | | 7/22/2011 -$5.45 | | 7/22/2011 -$5.84 |
NAV - Low† | | 10/3/2011 -$4.20 | | 10/3/2011 -$4.51 |
Number of Holdings: 47 | | | | |
† For the year ended October 31, 2011 |
| | | | | | | | | | | | |
Average Annual Total Returns1 As of October 31, 2011 | |
| Class A2 | | 1-Year | | | 5 Years | | | 10 Years | |
without sales charge | | | 2.50 | % | | | 0.01 | % | | | 1.64 | % |
with sales charge | | | -3.15 | % | | | -1.12 | % | | | 1.06 | % |
| | | |
| Institutional Class3 | | 1-Year | | | 5 Years | | | 10 Years | |
Net Asset Value | | | 2.92 | % | | | 0.41 | % | | | 2.35 | % |
Value of a $10,000 Investment
Class A Shares*,1,(a)
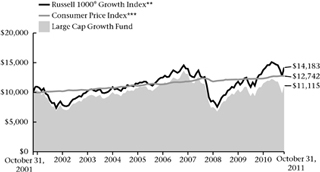
| 1 | Past performance is not an indication of future results. Average annual total returns represent past performance and reflect changes in share prices, the reinvestment of all dividends and capital gains, and the effects of compounding. The prospectus contains more complete information on the investment objectives, risks, charges and expenses of the investment company, which investors should read and consider carefully before investing. To obtain a prospectus, contact a registered representative or visit www.thrivent.com. At various times, the Fund’s adviser waived its management fee and/or reimbursed Fund expenses. Had the adviser not done so, the Fund’s total returns would have been lower. The returns shown do not reflect taxes a shareholder would pay on distributions or redemptions. Total investment return and principal value of your investment will fluctuate, and your shares, when redeemed, may be worth more or less than their original cost. Current performance may be higher or lower than the performance data quoted. Call 800-THRIVENT or visit www.thrivent.com for performance results current to the most recent month-end. |
| 2 | Class A performance with sales charge reflects the maximum sales charge of 5.5%. |
| 3 | Institutional Class shares have no sales load and are for institutional shareholders only. |
| (a) | Performance of other classes will be greater or less than the line shown based on the differences in loads and fees paid by shareholders investing in the different classes. |
| * | As you compare performance, please note that the Fund’s performance reflects the maximum 5.5% sales charge, while the Consumer Price Index and the Russell 1000® Growth Index do not reflect any such charges. If you were to purchase any of the above individual securities represented in the Index, any charges you would pay would reduce your total return as well. |
| ** | The Russell 1000® Growth Index measures the performance of large cap growth stocks. It is not possible to invest directly in the Index. The performance of the Index does not reflect deductions for fees, expenses or taxes. |
| *** | The Consumer Price Index is an inflationary indicator that measures the change in the cost of a fixed basket of products and services, including housing, electricity, food and transportation. It is not possible to invest directly in the Index. |
27
| | |
 | | Thrivent Large Cap Value Fund |
| | Matthew D. Finn, CFA, Portfolio Manager |
| | The Fund seeks to achieve long-term growth of capital. |
| | Large-cap stocks are subject to the basic market risk that a particular security, or securities in general, may decrease in value over short or even extended time periods. These and other risks are described in the Fund’s prospectus. Views expressed in this discussion of fund performance are the views of this particular Fund’s portfolio management team. |
How did the Fund perform during the 12-month period ended October 31, 2011?
Thrivent Large Cap Value Fund earned a return of 3.49%, compared with the median return of its peer group, the Lipper Large Cap Value Funds category, of 4.03%. The Fund’s market benchmark, the Russell 1000® Value Index, earned a return of 6.16%.
What factors affected the Fund’s performance?
Poor stock selection in the industrials, consumer discretionary and health care sectors was the reason for the Fund’s underperformance. However, selection in telecommunications services and consumer staples aided relative performance. In the industrials sector, the Fund’s position in industrial machinery company SPX hurt relative results. SPX’s businesses tend to do better later in the economic cycle as capital spending increases.
In the consumer discretionary sector, the media and entertainment industries were detrimental to results. We have recently changed the Fund’s positions in media with the belief that these changes should benefit shareholders over time.
What is your outlook?
Economic uncertainty and government debt and deficits have introduced an unprecedented level of volatility into the market over the past year. Our investment approach does not rely on precise economic forecasts or rapid-fire trading. The Fund is balanced between economically sensitive and stable companies. In the economically sensitive or cyclical areas, we prefer to purchase shares when they have attractive valuations on low/trough operating performance. We have found these situations in selected industrial companies, technology and, to a lesser degree, consumer cyclicals.
We believe that focusing on quality companies with attractive relative valuations whose prospects are not fully appreciated by investors should generate attractive returns over time.
| | |
Major Market Sectors (% of Net Assets) | | Portfolio Composition (% of Portfolio) |
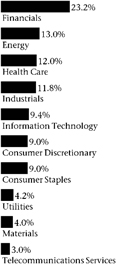
| | 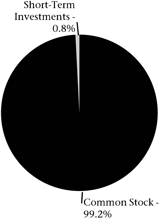
|
| | | | |
Top 10 Holdings (% of Net Assets) | |
| |
Pfizer, Inc. | | | 3.7 | % |
J.P. Morgan Chase & Company | | | 3.6 | % |
Wells Fargo & Company | | | 3.4 | % |
General Electric Company | | | 3.3 | % |
ConocoPhillips | | | 2.9 | % |
Chevron Corporation | | | 2.6 | % |
Kraft Foods, Inc. | | | 2.5 | % |
ACE, Ltd. | | | 2.4 | % |
Exelon Corporation | | | 2.4 | % |
Cisco Systems, Inc. | | | 2.3 | % |
These securities represent 29.1% of the total net assets of the Fund.
Quoted Fund performance is for Class A shares and does not reflect a sales charge.
The returns shown do not reflect taxes a shareholder would pay on distributions or redemptions.
Quoted Major Market Sectors, Portfolio Composition and Top 10 Holdings are subject to change.
The lists of Major Market Sectors and Top 10 Holdings exclude short-term investments and collateral held for securities loaned.
The Portfolio Composition chart excludes collateral held for securities loaned.
28
| | | | | | | | | | |
| | | Portfolio Facts | | |
| | | As of October 31, 2011 | | |
| | | | | Class A | | | | Institutional Class | | |
| | | Ticker | | AAUTX | | | | TLVIX | | |
| | | Transfer Agent ID | | 022 | | | | 092 | | |
| | | Net Assets | | $164,537,752 | | | | $356,045,941 | | |
| | | NAV | | $12.94 | | | | $13.04 | | |
| | | NAV - High† | | 4/29/2011 - $14.68 | | | | 4/29/2011 - $14.76 | | |
| | | NAV - Low† | | 10/3/2011 - $11.15 | | | | 10/3/2011 - $11.23 | | |
| | | Number of Holdings: 69 | | | | | | | | |
| | | † For the year ended October 31, 2011 | | | | | | |
| | | | | | | | | | | | |
| Average Annual Total Returns1 | |
| As of October 31, 2011 | |
| | | |
Class A2 | | | 1-Year | | | | 5 Years | | | | 10 Years | |
without sales charge | | | 3.49% | | | | -1.85% | | | | 2.86% | |
with sales charge | | | -2.17% | | | | -2.95% | | | | 2.28% | |
| | | |
Institutional Class3 | | | 1-Year | | | | 5 Years | | | | 10 Years | |
Net Asset Value | | | 4.03% | | | | -1.31% | | | | 3.51% | |
|
| Value of a $10,000 Investment |
| Class A Shares*,1,(a) |
|
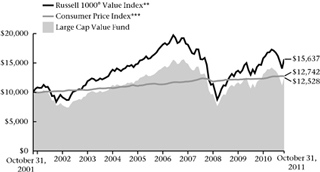 |
| 1 | Past performance is not an indication of future results. Average annual total returns represent past performance and reflect changes in share prices, the reinvestment of all dividends and capital gains, and the effects of compounding. The prospectus contains more complete information on the investment objectives, risks, charges and expenses of the investment company, which investors should read and consider carefully before investing. To obtain a prospectus, contact a registered representative or visit www.thrivent.com. At various times, the Fund’s adviser waived its management fee and/or reimbursed Fund expenses. Had the adviser not done so, the Fund’s total returns would have been lower. The returns shown do not reflect taxes a shareholder would pay on distributions or redemptions. Total investment return and principal value of your investment will fluctuate, and your shares, when redeemed, may be worth more or less than their original cost. Current performance may be higher or lower than the performance data quoted. Call 800-THRIVENT or visit www.thrivent.com for performance results current to the most recent month-end. |
| 2 | Class A performance with sales charge reflects the maximum sales charge of 5.5%. |
| 3 | Institutional Class shares have no sales load and are for institutional shareholders only. |
| (a) | Performance of other classes will be greater or less than the line shown based on the differences in loads and fees paid by shareholders investing in the different classes. |
| * | As you compare performance, please note that the Fund’s performance reflects the maximum 5.5% sales charge, while the Russell 1000® Value Index and the Consumer Price Index do not reflect any such charges. If you were to purchase any of the above individual securities represented in the Index, any charges you would pay would reduce your total return as well. |
| ** | The Russell 1000® Value Index measures the performance of large cap value stocks. It is not possible to invest directly in the Index. The performance of the Index does not reflect deductions for fees, expenses or taxes. |
| *** | The Consumer Price Index is an inflationary indicator that measures the change in the cost of a fixed basket of products and services, including housing, electricity, food and transportation. It is not possible to invest directly in the Index. |
29
| | | | |
 | | Thrivent Large Cap Stock Fund | |  |
| | David C. Francis, CFA (left), and Matthew D. Finn, CFA (right), Portfolio Co-Managers* | |
| | The Fund seeks long-term capital growth. | |
| | Large-cap stocks are subject to the basic market risk that a particular security, or securities in general, may decrease in value over short or even extended time periods. These and other risks are described in the Fund’s prospectus. Views expressed in this discussion of fund performance are the views of this particular Fund’s portfolio management team. | |
| | * Effective October 2011, David C. Francis became a Porfolio Co-Manager. | |
How did the Fund perform during the 12-month period ended October 31, 2011?
Thrivent Large Cap Stock Fund earned a return of 2.39%, compared with the median return of its peer group, the Lipper Large Cap Core Funds category, of 5.52%. The Fund’s market benchmark, the S&P 500 Index, earned a return of 8.09%.
What factors affected the Fund’s performance?
The Fund’s underperformance relative to its benchmark primarily resulted from poor stock selection. A secondary factor was the shift in risk preferences in the latter part of the reporting period. Following the European debt crisis and the debt ceiling debate in the U.S., which led to a downgrade of the governments credit status, markets fell sharply and companies most directly tied to economic growth were the most negatively impacted.
The Fund’s lack of exposure to holdings that would be considered to be more defensive was a disadvantage in that time frame. This was particularly evident in our underweighting in the large-cap, high-quality (but low-growth) segment of the pharmaceutical industry. We also did not have positions in some of the better-performing sectors of health care, like biotechnology companies Biogen and Cephalon.
In energy, again, we did not have enough exposure to the large defensive companies like ExxonMobil, but instead held positions in the more cyclically sensitive coal companies like Peabody Energy. We did own Baker Hughes in the oil service industry and that performed well in the Fund.
In the consumer staples sector, our position in Philip Morris International performed well. Again, we were underexposed in a number of the more stable companies that investors turn to in times of heightened uncertainty. An underweighting in staples detracted from overall results. Industrial stocks fell back as investors became concerned about economic growth and the Fund was overweighted in the group. In particular, our holdings in Boeing and Emerson Electric did not perform well in an atmosphere of heightened uncertainty. Goldman Sachs’ stock fell as trading results in the summer deteriorated with the decline in risk-oriented assets late in the reporting period.
What is your outlook?
We believe investors have over-discounted the risks that are apparent in the market as the reporting period draws to a close. We acknowledge that uncertainty will remain high, suggesting volatility will remain elevated as well. We believe long-term investors can find quite attractive
| | | | |
| Major Market Sectors | | Portfolio Composition | | |
| (% of Net Assets) | | (% of Portfolio) | | |
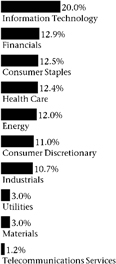
| | 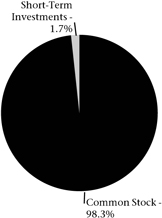
| | |
| | | | |
| Top 10 Holdings | | | |
| (% of Net Assets) | | | |
| |
| Apple, Inc. | | | 3.4 | % |
| Wal-Mart Stores, Inc. | | | 2.5 | % |
| J.P. Morgan Chase & Company | | | 2.4 | % |
| Wells Fargo & Company | | | 2.3 | % |
| ENSCO International plc ADR | | | 2.2 | % |
| Baxter International, Inc. | | | 2.1 | % |
| Oracle Corporation | | | 1.9 | % |
| UnitedHealth Group, Inc. | | | 1.9 | % |
| Weatherford International, Ltd. | | | 1.8 | % |
| Target Corporation | | | 1.8 | % |
| |
| These securities represent 22.3% of the total net assets of the Fund. | | | | |
Quoted Fund performance is for Class A shares and does not reflect a sales charge.
The returns shown do not reflect taxes a shareholder would pay on distributions or redemptions.
Quoted Major Market Sectors, Portfolio Composition and Top 10 Holdings are subject to change.
The lists of Major Market Sectors and Top 10 Holdings exclude short-term investments and collateral held for securities loaned.
The Portfolio Composition chart excludes collateral held for securities loaned.
30
companies at good prices in the current environment. We remain tilted to the likelihood of a continued economic recovery, albeit subpar when compared to past periods. Over the next 12 to 18 months, important policy issues must be decided in an environment that remains highly politicized. Additionally, the upcoming race for the presidency will become more focused and visible as the year progresses. We feel that the corporate sector remains in relatively good shape and there is substantive talk of
addressing some of the shortfalls in current corporate tax policy. If successful, it will provide an opportunity for companies to repatriate cash that is currently held offshore. This has the potential to lift investment in the U.S. and be constructive for employment. Those events would likely mitigate some of investors’ concerns and provide a more constructive investment environment.
| | | | | | | | | | |
| | |
| Portfolio Facts | | | |
As of October 31, 2011 | | | |
| | Class A | | | Institutional Class | | | |
Ticker | | | AALGX | | | | IILGX | | | |
Transfer Agent ID | | | 017 | | | | 090 | | | |
Net Assets | | $ | 1,393,492,775 | | | $ | 170,247,780 | | | |
NAV | | $ | 21.30 | | | $ | 21.48 | | | |
NAV - High† | | 4/29/2011 - $ | 23.91 | | | 4/29/2011 - $ | 24.05 | | | |
NAV - Low† | | 10/3/2011 - $ | 18.33 | | | 10/3/2011 - $ | 18.48 | | | |
Number of Holdings: 124 | | | | | | | | | | |
† For the year ended October 31, 2011 | | | | | | | | | | |
| | | | | | |
| Average Annual Total Returns1 |
As of October 31, 2011 |
| Class A2 | | 1-Year | | 5 Years | | 10 Years |
without sales charge | | 2.39% | | -1.75% | | 1.32% |
with sales charge | | -3.22% | | -2.86% | | 0.75% |
| | | |
| Institutional Class3 | | 1-Year | | 5 Years | | 10 Years |
Net Asset Value | | 2.89% | | -1.26% | | 1.81% |
| | | | | | |
| Value of a $10,000 Investment |
Class A Shares*,1,(a) |
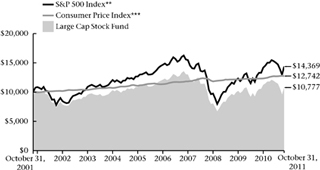
|
| 1 | Past performance is not an indication of future results. Average annual total returns represent past performance and reflect changes in share prices, the reinvestment of all dividends and capital gains, and the effects of compounding. The prospectus contains more complete information on the investment objectives, risks, charges and expenses of the investment company, which investors should read and consider carefully before investing. To obtain a prospectus, contact a registered representative or visit www.thrivent.com. At various times, the Fund’s adviser waived its management fee and/or reimbursed Fund expenses. Had the adviser not done so, the Fund’s total returns would have been lower. The returns shown do not reflect taxes a shareholder would pay on distributions or redemptions. Total investment return and principal value of your investment will fluctuate, and your shares, when redeemed, may be worth more or less than their original cost. Current performance may be higher or lower than the performance data quoted. Call 800-THRIVENT or visit www.thrivent.com for performance results current to the most recent month-end. |
| 2 | Class A performance with sales charge reflects the maximum sales charge of 5.5%. |
| 3 | Institutional Class shares have no sales load and are for institutional shareholders only. |
| (a) | Performance of other classes will be greater or less than the line shown based on the differences in loads and fees paid by shareholders investing in the different classes. |
| * | As you compare performance, please note that the Fund’s performance reflects the maximum 5.5% sales charge, while the S&P 500 Index and the Consumer Price Index do not reflect any such charges. If you were to purchase any of the above individual securities represented in the Index, any charges you would pay would reduce your total return as well. |
| ** | The S&P 500 Index is an index that represents the average performance of a group of 500 widely held, publicly traded stocks. “S&P 500®” is a trademark of The McGraw-Hill Companies, Inc. and has been licensed for use by Thrivent Financial for Lutherans. The product is not sponsored, endorsed or promoted by Standard & Poor’s and Standard & Poor’s makes no representation regarding the advisability of investing in the product. It is not possible to invest directly in the Index. The performance of the Index does not reflect deductions for fees, expenses or taxes. |
| *** | The Consumer Price Index is an inflationary indicator that measures the change in the cost of a fixed basket of products and services, including housing, electricity, food and transportation. It is not possible to invest directly in the Index. |
31
| | | | |
 | | Thrivent Balanced Fund Gregory R. Anderson, CFA (left), Darren M. Bagwell, CFA (right), and Michael
G. Landreville, CFA (far right), Portfolio Co-Managers The Fund seeks long-term total return through a balance between income and the
potential for long-term capital growth. The Fund is subject to interest rate risk, credit risk and volatility risk, which may result
in overall price fluctuations over short or even extended time periods. Common stocks
are subject to the basic market risk that a particular security, or securities in general, may
decrease in value over short or even extended time periods. These and other risks are
described in the Fund’s prospectus. Views expressed in this discussion of fund
performance are the views of this particular Fund’s portfolio management team. | |  |
| | |
How did the Fund perform during the 12-month period ended October 31, 2011?
Thrivent Balanced Fund earned a return of 4.98%, compared with the median return of its peer group, the Lipper Mixed-Asset Target Allocation Growth category, of 3.47%. The Fund’s market benchmarks, the S&P Supercomposite 1500 Index and the Barclays Capital U.S. Aggregate Bond Index, earned returns of 8.28% and 5.00%, respectively.
What factors affected the Fund’s performance?
During the period, we maintained the Fund’s ongoing investment allocation of approximately two-thirds in equities with the remainder in fixed-income securities. As equities fell in value in the second half of the period, we rebalanced to maintain the two-thirds exposure by selling Treasuries and buying equities. In the equity portfolio, technology was the best-performing sector due to strong stock selection in the semiconductor, services and software industries. Health care and consumer staples holdings also benefited performance. However, disappointing returns in the energy and materials sectors offset these areas of strength.
The fixed-income portfolio outperformed its Lipper peer group primarily due to its overweighting in Treasury inflation-protected securities (TIPS), corporate bonds and securitized products (asset-backed and mortgage-backed securities) during the first half of the period when these groups performed well. We also benefited from reducing the fixed-income portfolio’s overweighting in corporate bonds and securitized products during the first half’s market strength. This spared the Fund some of the underperformance of these risk assets during the second half of the period.
What is your outlook?
We expect the U.S. economy to remain sluggish during the first half of next year before improving. This slow-growth environment will likely prevent unemployment from falling materially in the coming months. While the Fed has announced its intent to keep rates low until at least mid-2013, we would not be surprised to see additional monetary-easing moves. Inflation pressures have modestly increased. However, we do not believe current levels pose an economic risk. We expect market volatility to persist but believe it will gradually subside to more muted levels than in 2011.
| | | | | | |
Major Market Sectors (% of Net Assets) 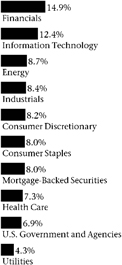
| | Portfolio Composition (% of Portfolio) 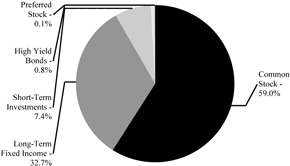
| | Top 10 Holdings (% of Net Assets) |
| | | Federal National Mortgage Association Conventional 30- Yr. Pass Through | | 3.6% |
| | | Federal National Mortgage Association Conventional 15- Yr. Pass Through | | 2.0% |
| | | Wal-Mart Stores, Inc. | | 1.8% |
| | | Comcast Corporation | | 1.8% |
| | | United Technologies Corporation | | 1.6% |
| | | iShares Nasdaq Biotechnology Index Fund | | 1.4% |
| | | British American Tobacco plc ADR | | 1.4% |
| | | Boeing Company | | 1.4% |
| | | Las Vegas Sands Corporation | | 1.4% |
| | | Altria Group, Inc. | | 1.4% |
| | | These securities represent 17.8% of the total net assets of the Fund. |
Quoted Fund performance is for Class A shares and does not reflect a sales charge.
The returns shown do not reflect taxes a shareholder would pay on distributions or redemptions.
Quoted Major Market Sectors, Portfolio Composition and Top 10 Holdings are subject to change.
The lists of Major Market Sectors and Top 10 Holdings exclude short-term investments and collateral held for securities loaned.
The Portfolio Composition chart excludes collateral held for securities loaned
32
Equity markets continue to face headwinds, including European debt, a domestic fiscal drag and a stronger dollar. Therefore, we intend to focus on companies that have strong product cycles, particularly in technology-oriented industries. We also intend to increase our emphasis on companies with greater exposure to emerging market regions, such as Latin America and Asia. As always, our goal is to allow stock selection to drive performance by keeping sector exposures at benchmark levels.
In the fixed-income portfolio, we will continue to look for opportunities to reduce our overweighting in risk assets during periods of market strength, while focusing on higher-quality securities within those segments. We will also consider modest increases in the Fund’s position in Treasuries. As always, we will monitor the economy and markets closely while maintaining a prudent balance of income and long-term capital growth potential.
| | | | | | | | |
| | | | | |
| | | Portfolio Facts | | |
| | | As of October 31, 2011 | | |
| | | | Class A | | Institutional Class | | |
| | | Ticker | | AABFX | | IBBFX | | |
| | | Transfer Agent ID | | 026 | | 056 | | |
| | | Net Assets | | $140,986,989 | | $52,732,642 | | |
| | | NAV | | $12.11 | | $12.09 | | |
| | | NAV - High† | | 5/2/2011 -$13.21 | | 5/2/2011 -$13.19 | | |
| | | NAV - Low† | | 10/3/2011 - $10.87 | | 10/3/2011 - $10.85 | | |
| | | Number of Holdings: 280 | | |
| | | † For the year ended October 31, 2011 | | |
| | | | | |
| | | | | | |
| Average Annual Total Returns1 |
| As of October 31, 2011 |
| | | |
Class A2 | | 1-Year | | 5 Years | | 10 Years |
without sales charge | | 4.98% | | 2.57% | | 3.78% |
with sales charge | | -0.80% | | 1.43% | | 3.20% |
| | | |
Institutional Class3 | | 1-Year | | 5 Years | | 10 Years |
Net Asset Value | | 5.50% | | 3.10% | | 4.28% |
|
| Value of a $10,000 Investment |
| Class A Shares*,1,(a) |
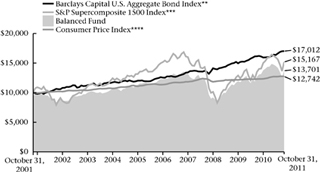
|
| 1 | Past performance is not an indication of future results. Average annual total returns represent past performance and reflect changes in share prices, the reinvestment of all dividends and capital gains, and the effects of compounding. The prospectus contains more complete information on the investment objectives, risks, charges and expenses of the investment company, which investors should read and consider carefully before investing. To obtain a prospectus, contact a registered representative or visit www.thrivent.com. At various times, the Fund’s adviser waived its management fee and/or reimbursed Fund expenses. Had the adviser not done so, the Fund’s total returns would have been lower. The returns shown do not reflect taxes a shareholder would pay on distributions or redemptions. Total investment return and principal value of your investment will fluctuate, and your shares, when redeemed, may be worth more or less than their original cost. Current performance may be higher or lower than the performance data quoted. Call 800-THRIVENT or visit www.thrivent.com for performance results current to the most recent month-end. |
| 2 | Class A performance with sales charge reflects the maximum sales charge of 5.5%. |
| 3 | Institutional Class shares have no sales load and are for institutional shareholders only. |
| (a) | Performance of other classes will be greater or less than the line shown based on the differences in loads and fees paid by shareholders investing in the different classes. |
| * | As you compare performance, please note that the Fund’s performance reflects the maximum 5.5% sales charge, while the Barclays Capital U.S. Aggregate Bond Index, the S&P Supercomposite 1500 Index and the Consumer Price Index do not reflect any such charges. If you were to purchase any of the above individual securities represented in these Indexes, any charges you would pay would reduce your total return as well. |
| ** | The Barclays Capital U.S. Aggregate Bond Index is an index that measures the performance of U.S. investment grade bonds. It is not possible to invest directly in the Index. The performance of the Index does not reflect deductions for fees, expenses or taxes. |
| *** | The S&P Supercomposite 1500 Index measures the performance of a group of 1500 publicly traded stocks. It is not possible to invest directly in the Index. The performance of the Index does not reflect deductions for fees, expenses or taxes. |
| **** | The Consumer Price Index is an inflationary indicator that measures the change in the cost of a fixed basket of products and services, including housing, electricity, food and transportation. It is not possible to invest directly in the Index. |
33
| | |
 | | Thrivent High Yield Fund Paul J. Ocenasek, CFA, Portfolio Manager The Fund seeks high current income and, secondarily, growth of capital. The Fund typically invests a majority of its assets in high-yield bonds (commonly referred to as junk bonds). Although high-yield bonds can
have a higher current yield than investment-grade bonds, high-yield bonds are also subject to greater price fluctuations and increased risk of
loss of principal than investment-grade bonds. These and other risks are described in the Fund’s prospectus. Views expressed in this
discussion of fund performance are the views of this particular Fund’s portfolio management team. |
| |
How did the Fund perform during the 12-month period ended October 31, 2011?
Thrivent High Yield Fund earned a return of 4.37%, compared with the median return of its peer group, the Lipper High Current Yield Funds category, of 3.83%. The Fund’s market benchmark, the Barclays Capital U.S. Corporate High Yield Bond Index, earned a return of 5.17%.
What factors affected the Fund’s performance?
The high-yield market rallied during the first half of the fiscal year, driven by the Federal Reserve’s continued quantitative easing, which fueled investors’ risk appetite. The yield premium, or spread, that high-yield bonds offered over Treasury securities tightened from 5.75% at the beginning of the period to 4.35% by the end of February. The high-yield market also benefited from a continued decline in default rates to around 2.0%, down from a peak of 13.5%.
The market reversed course as a confluence of negative events caused investor confidence to falter. This spurred a flight to quality, causing a high-yield market sell off. Spreads dramatically widened, peaking at 8.76% over Treasuries in early October as the market began to price in a possibility of a recession. In the final weeks of the period, however, spreads began to tighten as Europe
appeared to be making progress in resolving its debt issues. Money began flowing into high-yield funds as market uncertainty mitigated and investors again sought out higher yields.
The Fund outperformed its Lipper peer group during the period, benefiting from our relatively conservative profile during volatile market conditions. The Fund was positioned with an approximate 3.5% overweighting in BB-rated securities versus the Lipper peer group and a 3.0% underweighting in CCC-rated securities. Over the one-year period, BB-rated bonds gained 5.4%, while CCC-rated bonds returned 4.0%. In an environment where riskier assets significantly underperformed, some lower-rated credits owned by our peers traded down and never recovered. The Fund’s relative performance also was aided by strong security selection within the media, wireless telecommunications and paper industries.
Fund performance relative to its benchmark would have been better if we had carried a larger amount of BB-rated bonds than is typically carried by high-yield funds. These bonds performed better in a declining interest rate and uncertain economic environment, which caused our Fund and other high-yield funds in the Lipper universe to lag the index.
| | | | | | |
Major Market Sectors (% of Net Assets) 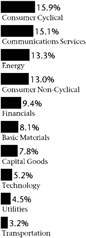
| | 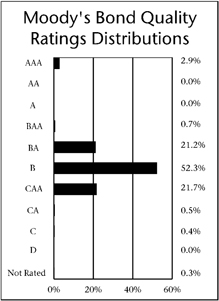 | | Top 10 Holdings (% of Net Assets) | | |
| | | Amkor Technology, Inc. | | 1.3% |
| | | Intelsat Luxembourg SA | | 1.0% |
| | | CIT Group, Inc. | | 1.0% |
| | | Intelsat Jackson Holdings SA | | 0.9% |
| | | Clear Channel Worldwide Holdings, Inc. | | 0.9% |
| | | Texas Competitive Electric Holdings, LLC, Term Loan | | 0.9% |
| | | AES Corporation | | 0.8% |
| | | NOVA Chemicals Corporation | | 0.8% |
| | | Hertz Corporation | | 0.8% |
| | | Icahn Enterprises, LP | | 0.8% |
| | | These securities represent 9.2% of the total net assets of the Fund. |
Quoted Fund performance is for Class A shares and does not reflect a sales charge.
The returns shown do not reflect taxes a shareholder would pay on distributions or redemptions.
Quoted Major Market Sectors, Moody’s Bond Quality Ratings Distributions and Top 10 Holdings are subject to change.
The lists of Major Market Sectors and Top 10 Holdings exclude short-term investments and collateral held for securities loaned.
34
What is your outlook?
We expect economic growth to be slow, and spreads, while remaining volatile, to tighten modestly over the next few quarters. Even with slow growth, we believe high-yield bonds look attractive from a fundamental and valuation standpoint. The financial health of issuing corporations appears solid as they continue to maintain significant cash on their balance sheets and decrease their debt burdens. Additionally, defaults among high-yield bond issuers are projected to remain around the 2% level
for the coming year. If interest rates begin to rise, we believe high-yield securities prices will hold up better than investment-grade bonds.
Therefore, we intend to keep the Fund fully invested with an emphasis on more stable, defensive industries, like health care, media/cable and telecommunications, and an underweight in CCC-rated bonds. We plan to continue to lighten the Fund’s exposure to highly leveraged, cyclical industries, such as retail, which tend to struggle in a slow-growth environment.
| | | | |
| | | Portfolio Facts As of October 31, 2011 Class A | | |
| | | | |
| | | | Institutional Class |
| Ticker | | LBHYX | | LBHIX |
| Transfer Agent ID | | 073 | | 473 |
| Net Assets | | $445,267,651 | | $243,426,113 |
| NAV | | $4.71 | | $4.72 |
| NAV - High† | | 5/16/2011 - $4.97 | | 5/16/2011 - $4.98 |
| NAV - Low† | | 10/4/2011 - $4.35 | | 10/4/2011 - $4.35 |
| Number of Holdings: 249 | | |
† For the year ended October 31, 2011 | | |
Average Annual Total Returns1
As of October 31, 2011
| | | | | | |
| Class A2 | | 1-Year | | 5 Years | | 10 Years |
without sales charge | | 4.37% | | 6.67% | | 7.36% |
with sales charge | | -0.35% | | 5.69% | | 6.86% |
| | | |
| Institutional Class3 | | 1-Year | | 5 Years | | 10 Years |
Net Asset Value | | 4.98% | | 7.12% | | 7.83% |
Value of a $10,000 Investment
Class A Shares*,1,(a)
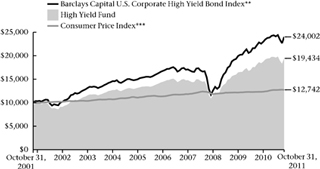
| 1 | Past performance is not an indication of future results. Average annual total returns represent past performance and reflect changes in share prices, the reinvestment of all dividends and capital gains, and the effects of compounding. The prospectus contains more complete information on the investment objectives, risks, charges and expenses of the investment company, which investors should read and consider carefully before investing. To obtain a prospectus, contact a registered representative or visit www.thrivent.com. At various times, the Fund’s adviser waived its management fee and/or reimbursed Fund expenses. Had the adviser not done so, the Fund’s total returns would have been lower. The returns shown do not reflect taxes a shareholder would pay on distributions or redemptions. Total investment return and principal value of your investment will fluctuate, and your shares, when redeemed, may be worth more or less than their original cost. Current performance may be higher or lower than the performance data quoted. Call 800-THRIVENT or visit www.thrivent.com for performance results current to the most recent month-end. |
| 2 | Class A performance with sales charge reflects the maximum sales charge of 4.5%. |
| 3 | Institutional Class shares have no sales load and are for institutional shareholders only. |
| (a) | Performance of other classes will be greater or less than the line shown based on the differences in loads and fees paid by shareholders investing in the different classes. |
| * | As you compare performance, please note that the Fund’s performance reflects the maximum 4.5% sales charge, while the Barclays Capital U.S. Corporate High Yield Bond Index and the Consumer Price Index do not reflect any such charges. If you were to purchase any of the above individual securities represented in the Index, any charges you would pay would reduce your total return as well. |
| ** | The Barclays Capital U.S. Corporate High Yield Bond Index is an index which measures the performance of fixed-rate non-investment grade bonds. It is not possible to invest directly in the Index. The performance of the Index does not reflect deductions for fees, expenses or taxes. |
| *** | The Consumer Price Index is an inflationary indicator that measures the change in the cost of a fixed basket of products and services, including housing, electricity, food and transportation. It is not possible to invest directly in the Index. |
35
| | |
 | | Thrivent Municipal Bond Fund Janet I. Grangaard, CFA, Portfolio Manager The Fund seeks a high level of current income exempt from federal income taxes, consistent with capital preservation.* The Fund is subject to interest rate risk, credit risk related to an underlying issuer’s financial position and volatility risk, which may result in overall price fluctuations over short or even extended time periods. These and other risks are described in the Fund’s prospectus. Views expressed in this discussion of fund performance are the views of this particular Fund’s portfolio management team. |
| |
How did the Fund perform during the 12-month period ended October 31, 2011?
Thrivent Municipal Bond Fund earned a return of 3.39%, compared with the median return of its peer group, the Lipper General Municipal Debt Funds category, of 2.95%. The Fund’s market benchmark, the Barclays Capital Municipal Bond Index, earned a return of 3.78%.
What factors affected the Fund’s performance?
The municipal bond market experienced quite a bit of volatility during the fiscal year. The period began on a weak note as intensely negative media coverage about the fiscal challenges of states and municipalities exacerbated investor concerns about possible defaults. This led to massive outflows from municipal bond funds. Adding to the downward pressure was an excess supply of municipal bonds as issuers rushed to market to take advantage of the favorable Build America Bond program before it expired.
The tide turned in early 2011 as crossover buyers—who do not normally purchase municipal bonds—sought out bargains in the marketplace. The rally picked up steam as the segment benefited from a flight to quality driven by a confluence of unsettling global events, including reports
of slower-than-expected U.S. economic growth and an escalation of the European debt crisis. While concerns about other risk assets grew and the threat of widespread defaults never materialized, investors returned to municipal bonds at the same time the segment was experiencing significantly lower supply. The result was a decline in yields across the municipal market, particularly intermediate and long-term bonds, and an increase in valuations.
The Fund outperformed its Lipper peer group due in part to our focus on A-rated bonds, which offered fairly attractive yields but not as much risk as the BBB category. The Fund’s best-performing sector was higher education as several of our AAA-rated bonds benefited from crossover-buyer interest. Fund results were also helped by our emphasis on two sectors where we held a lot of A-rated positions: hospitals and airports. Additionally, special tax revenue bonds—which have dedicated revenues backing them—performed well. In terms of yield curve positioning, results were aided by the Fund’s longer 20- to 25-year holdings.
| | | | | | | | | | |
Major Market Sectors (% of Net Assets) 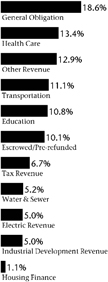
| | 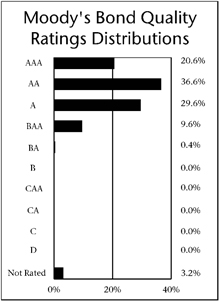 | | | | Top 10 States (% of Net Assets) | |
| | | | California | | | 12.7 | % |
| | | | Texas | | | 10.3 | % |
| | | | Illinois | | | 9.1 | % |
| | | | New York | | | 5.3 | % |
| | | | Colorado | | | 5.1 | % |
| | | | Washington | | | 4.9 | % |
| | | | Florida | | | 4.6 | % |
| | | | Massachusetts | | | 3.5 | % |
| | | | Louisiana | | | 3.1 | % |
| | | | Pennsylvania | | | 2.9 | % |
| | | | Investments in securities in these States represent 61.5% of the total net assets of the Fund. | |
*Investors may be subject to state taxes, the federal alternative minimum tax and capital gains taxes.
Quoted Fund performance is for Class A shares and does not reflect a sales charge.
The returns shown do not reflect taxes a shareholder would pay on distributions or redemptions.
Quoted Major Market Sectors, Moody’s Bond Quality Ratings Distributions and Top 10 States are subject to change.
The lists of Major Market Sectors and Top 10 States exclude short-term investments.
36
What is your outlook?
We expect the economic recovery will remain slow and uneven with very gradual improvements in unemployment. Although states have been experiencing improving revenues for about six quarters in a row, they are not back to the peak reached in 2008. Budget deficits are still forecast for municipalities and states over the next fiscal year; however, they are much smaller than a year ago. While politicians are making progress, further budget cuts will likely be a more contentious process as the obvious cutbacks have already been made. Also, cities and school districts, which are heavily reliant on property
taxes, need to see an improvement in the housing market. Although supply was extremely low earlier this year, the rate of issuance has begun to pick up in the last two months of the period. We believe the market will return to a more normalized level of supply as 2011 comes to a close. We are currently in somewhat uncertain times for the municipal market as various government officials have proposed changes that could have a significant impact on municipal bond tax status and, therefore, the overall market. We will continue to focus our efforts on bottom-up security selection while closely monitoring policy developments.
| | | | |
| | | Portfolio Facts As of October 31, 2011 Class A | | |
| | | | Institutional Class |
Ticker | | AAMBX | | TMBIX |
Transfer Agent ID | | 015 | | 088 |
Net Assets | | $1,339,612,174 | | $86,494,425 |
NAV | | $11.30 | | $11.30 |
NAV - High† | | 9/23/2011 - $11.47 | | 9/23/2011 - $11.47 |
NAV - Low† | | 1/14/2011 - $10.57 | | 1/14/2011 - $10.57 |
Number of Holdings: 431 | | |
† For the year ended October 31, 2011 | | |
Average Annual Total Returns1
As of October 31, 2011
| | | | | | | | |
| Class A2 | | 1-Year | | 5 Years | | 10 Years | | |
without sales charge | | 3.39% | | 4.30% | | 4.37% | | |
with sales charge | | -1.27% | | 3.34% | | 3.89% | | |
| | | | |
| Institutional Class3 | | 1-Year | | 5 Years | | 10 Years | | |
Net Asset Value | | 3.67% | | 4.60% | | 4.66% | | |
Value of a $10,000 Investment
Class A Shares*,1,(a)
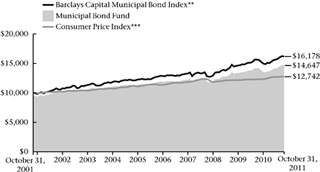
| 1 | Past performance is not an indication of future results. Average annual total returns represent past performance and reflect changes in share prices, the reinvestment of all dividends and capital gains, and the effects of compounding. The prospectus contains more complete information on the investment objectives, risks, charges and expenses of the investment company, which investors should read and consider carefully before investing. To obtain a prospectus, contact a registered representative or visit www.thrivent.com. At various times, the Fund’s adviser waived its management fee and/or reimbursed Fund expenses. Had the adviser not done so, the Fund’s total returns would have been lower. The returns shown do not reflect taxes a shareholder would pay on distributions or redemptions. Total investment return and principal value of your investment will fluctuate, and your shares, when redeemed, may be worth more or less than their original cost. Current performance may be higher or lower than the performance data quoted. Call 800-THRIVENT or visit www.thrivent.com for performance results current to the most recent month-end. |
| 2 | Class A performance with sales charge reflects the maximum sales charge of 4.5%. |
| 3 | Institutional Class shares have no sales load and are for institutional shareholders only. |
| (a) | Performance of other classes will be greater or less than the line shown based on the differences in loads and fees paid by shareholders investing in the different classes. |
| * | As you compare performance, please note that the Fund’s performance reflects the maximum 4.5% sales charge, while the Barclays Capital Municipal Bond Index and the Consumer Price Index do not reflect any such charges. If you were to purchase any of the above individual securities represented in the Index, any charges you would pay would reduce your total return as well. |
| ** | The Barclays Capital Municipal Bond Index is a market-value-weighted index of investment-grade municipal bonds with maturities of one year or more. It is not possible to invest directly in the Index. The performance of the Index does not reflect deductions for fees, expenses or taxes. |
| *** | The Consumer Price Index is an inflationary indicator that measures the change in the cost of a fixed basket of products and services, including housing, electricity, food and transportation. It is not possible to invest directly in the Index. |
37
| | |
 | | Thrivent Income Fund Stephen D. Lowe, CFA, Portfolio Manager The Fund seeks high current income while preserving principal and, secondarily, long-term growth of capital. The Fund is subject to interest rate risk, credit risk related to an underlying company’s financial position and volatility risk, which may result in overall price fluctuations over short or even extended time periods. These and other risks are described in the Fund’s prospectus. Views expressed in this discussion of fund performance are the views of this particular Fund’s portfolio management team. |
How did the Fund perform during the 12-month period ended October 31, 2011?
Thrivent Income Fund earned a return of 4.11%, compared with the median return of its peer group, the Lipper Corporate Debt BBB-Rated Funds category, of 4.31%. The Fund’s market benchmark, the Barclays Capital U.S. Aggregate Bond Index, earned a return of 5.00%.
What factors affected the Fund’s performance?
The yield premium, or spread, that corporate bonds offered over Treasury securities tightened significantly at the end of 2010 and the first part of 2011 as investors gained confidence in the economic recovery. As a result, high-yield and investment-grade corporates significantly outperformed Treasuries during the first half of the fiscal year. The environment shifted relatively quickly as a confluence of negative events created headwinds for risk assets, including an escalation of the European debt crisis, the U.S. budget deficit wrangling and reports of slower-than-expected rates of U.S. economic growth. The resulting uncertainty spurred a flight to quality, as spreads widened out and Treasuries outperformed all risk assets in the second half.
The Fund, which is predominantly made up of corporate bonds, produced solid returns through mid-summer and then lost ground to end the period roughly in line with its Lipper peer group and short of its benchmark. The primary reason for the shortfall was our slightly higher risk profile than our peers. Although we had trimmed the Fund’s exposure to corporate bonds as the period progressed, we still had an overweighting particularly in the lowest tier (BBB) of the investment-grade segment and the upper tier (BB) of the high-yield market. Together, the investment-grade and high-yield segments represented approximately 75% of the Fund’s portfolio at period end.
The Fund’s underweighted position in Treasuries—which we mainly use as a risk hedge and to manage interest rate sensitivity and liquidity—was also a modest negative as the segment gained roughly 9%. Approximately one-third of the benchmark index is composed of Treasuries.
Within investment grade, the Fund benefited from solid performance in the industrial sector. This was offset, however, by negative attribution from our financial sector overweighting. After starting out strong, financials were hit hard by concerns about new regulations, mortgage put-back risk, and the European situation.
| | | | | | | | | | |
Major Market Sectors (% of Net Assets) 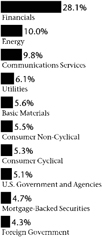
| | 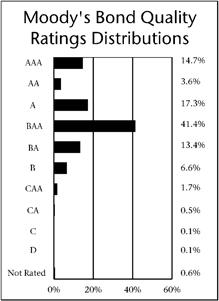 | | | | Top 10 Holdings (% of Net Assets) | |
| | | | Federal National Mortgage Association
Conventional 30-Yr. Pass Through | | | 2.0 | % |
| | | | Federal National Mortgage Association
Conventional 30-Yr. Pass Through | | | 1.2 | % |
| | | | Federal National Mortgage Association
Conventional 15-Yr. Pass Through | | | 0.6 | % |
| | | | U.S. Treasury Notes | | | 0.6 | % |
| | | | Province of Ontario | | | 0.6 | % |
| | | | Province of Ontario | | | 0.6 | % |
| | | | Wachovia Bank Commercial Mortgage Trust | | | 0.5 | % |
| | | | U.S. Treasury Notes | | | 0.5 | % |
| | | | CenterPoint Energy Resources | | | | |
| | | | Corporation | | | 0.5 | % |
| | | | U.S. Treasury Notes | | | 0.5 | % |
| | | | | | | | |
| | | | These securities represent 7.6% of the total net assets of the Fund. | |
Quoted Fund performance is for Class A shares and does not reflect a sales charge.
The returns shown do not reflect taxes a shareholder would pay on distributions or redemptions.
Quoted Major Market Sectors, Moody’s Bond Quality Ratings Distributions and Top 10 Holdings are subject to change.
The lists of Major Market Sectors and Top 10 Holdings exclude short-term investments and collateral held for securities loaned.
38
What is your outlook?
The financial markets are facing a lot of uncertainty, particularly surrounding the resolution of Europe’s debt crisis. Also, the U.S. economy is growing slowly while experiencing fiscal headwinds as budgets continue to be cut. To prop up the recovery, the Fed has made the unusual move of committing to hold short-term interest rates at record low levels until mid-2013.
At the end of the period, corporate valuations and spreads were pricing in a significant amount of bad news. While
the segment will likely see volatility in the short term, we believe the long-term outlook is attractive. We plan to moderate the Fund’s risk profile versus its peers with pared-back exposure to financials. Instead, we are favoring stable cash-flow industries such as pipelines, electric utilities, media, cable and energy. Within high yield, we plan to emphasize BB-rated bonds, which look attractive and tend to default at lower rates than the rest of the segment. As always, we intend to stay focused on bottom-up analysis of solid companies with predictable cash flows.
| | | | |
Portfolio Facts |
| As of October 31, 2011 |
| | | Class A | | Institutional Class |
Ticker | | LUBIX | | LBIIX |
Transfer Agent ID | | 055 | | 455 |
Net Assets | | $397,944,025 | | $401,082,328 |
NAV | | $8.77 | | $8.76 |
NAV - High† | | 8/4/2011 - $8.94 | | 8/4/2011 - $8.93 |
NAV - Low† | | 10/11/2011 - $8.54 | | 10/11/2011 - $8.53 |
Number of Holdings: 507 | | |
† For the year ended October 31, 2011 | | |
| | | | | | | | | | | | |
| Average Annual Total Returns1 | |
| As of October 31, 2011 | |
| Class A2 | | 1-Year | | | 5 Years | | | 10 Years | |
without sales charge | | | 4.11% | | | | 5.52% | | | | 4.84% | |
with sales charge | | | -0.53% | | | | 4.57% | | | | 4.36% | |
| | | |
| Institutional Class3 | | 1-Year | | | 5 Years | | | 10 Years | |
Net Asset Value | | | 4.52% | | | | 5.96% | | | | 5.25% | |
| | | | | | |
| Value of a $10,000 Investment |
| Class A Shares*,1,(a) |
|
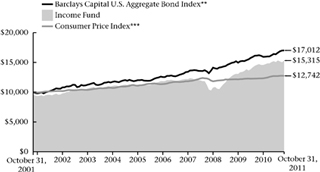 |
| 1 | Past performance is not an indication of future results. Average annual total returns represent past performance and reflect changes in share prices, the reinvestment of all dividends and capital gains, and the effects of compounding. The prospectus contains more complete information on the investment objectives, risks, charges and expenses of the investment company, which investors should read and consider carefully before investing. To obtain a prospectus, contact a registered representative or visit www.thrivent.com. At various times, the Fund’s adviser waived its management fee and/or reimbursed Fund expenses. Had the adviser not done so, the Fund’s total returns would have been lower. The returns shown do not reflect taxes a shareholder would pay on distributions or redemptions. Total investment return and principal value of your investment will fluctuate, and your shares, when redeemed, may be worth more or less than their original cost. Current performance may be higher or lower than the performance data quoted. Call 800-THRIVENT or visit www.thrivent.com for performance results current to the most recent month-end. |
| 2 | Class A performance with sales charge reflects the maximum sales charge of 4.5%. |
| 3 | Institutional Class shares have no sales load and are for institutional shareholders only. |
| (a) | Performance of other classes will be greater or less than the line shown based on the differences in loads and fees paid by shareholders investing in the different classes. |
| * | As you compare performance, please note that the Fund’s performance reflects the maximum 4.5% sales charge, while the Barclays Capital U.S. Aggregate Bond Index and the Consumer Price Index do not reflect any such charges. If you were to purchase any of the above individual securities represented in the Index, any charges you would pay would reduce your total return as well. |
| ** | The Barclays Capital U.S. Aggregate Bond Index is an index that measures the performance of U.S. investment grade bonds. It is not possible to invest directly in the Index. The performance of the Index does not reflect deductions for fees, expenses or taxes. |
| *** | The Consumer Price Index is an inflationary indicator that measures the change in the cost of a fixed basket of products and services, including housing, electricity, food and transportation. It is not possible to invest directly in the Index. |
39
| | | | |
 | | Thrivent Core Bond Fund Michael G. Landreville, CFA (left) and Gregory R. Anderson, CFA (right), Portfolio Co-Managers The Fund seeks a high level of current income consistent with capital preservation. The Fund is subject to interest rate risk, credit risk related to an underlying company’s financial
position and volatility risk, which may result in overall price fluctuations over short or even extended
time periods. These and other risks are described in the Fund’s prospectus. Views expressed in this
discussion of fund performance are the views of this particular Fund’s portfolio management team. | |  |
| | |
How did the Fund perform during the 12-month period ended October 31, 2011?
Thrivent Core Bond Fund earned a return of 4.53%, compared with the median return of its peer group, the Lipper Intermediate Investment Grade Debt Funds category, of 4.21%. The Fund’s market benchmark, the Barclays Capital U.S. Aggregate Bond Index, earned a return of 5.00%.
What factors affected the Fund’s performance?
During the first half of the fiscal year, the Fed’s second round of quantitative easing (QE2) helped restore confidence to the financial markets, which triggered a favorable tightening of the yield premium, or spread, that risk assets offer over Treasury securities. Risk assets in the Fund included corporate bonds and securitized products such as asset-backed and mortgage-backed securities. In spite of the Fed’s buying of Treasury securities, 10-year Treasury note yields increased from 2.60% at the beginning of November to 3.29% at the end of April. As a result, Treasuries underperformed risk assets during the first part of the fiscal year.
The environment reversed course in the second half of the period. A confluence of negative events created headwinds for risk assets, including uncertainty
surrounding the European sovereign debt situation, the U.S. budget impasse, the resulting credit downgrade and slowing U.S. economic growth. This confluence spurred a flight to quality, as spreads widened out dramatically. Ten-year Treasury rates fell sharply and ended the period at 2.11%. The Fund outperformed its Lipper peer group primarily because of its overweighting in corporate bonds and securitized products. Both of these groups performed well overall during the period. We also benefited from reducing the Fund’s overweighting in corporate bonds and securitized products during the market’s strength while increasing its weightings in Treasuries. This spared the Fund some of the underperformance of these risk assets during the second half of the period. The Fund’s overweighting in Treasury inflation-protected securities (TIPS) also produced solid results despite significant volatility in the segment.
Results fell short of the benchmark index as the Fund did not have as much exposure to Treasuries, despite our increase during the period. Treasuries comprised approximately one-third of the benchmark while our Fund had around 20%. Even though we reduced the Fund’s overweighting of risk assets during the year, it still owned a greater percentage of these assets than did the index.
| | | | | | | | | | |
Major Market Sectors (% of Net Assets) 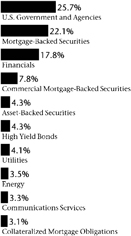
| | 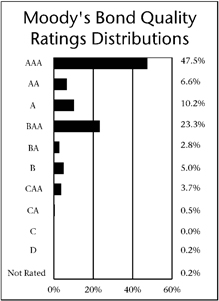 | | | | Top 10 Holdings (% of Net Assets) | |
| | | | Federal National Mortgage Association Conventional 30-Yr. Pass Through | | | 10.4 | % |
| | | | Federal National Mortgage Association Conventional 15-Yr. Pass Through | | | 5.7 | % |
| | | | Thrivent High Yield Fund | | | 4.3 | % |
| | | | Federal National Mortgage Association Conventional 30-Yr. Pass Through | | | 4.1 | % |
| | | | Federal Home Loan Banks | | | 3.4 | % |
| | | | U.S. Treasury Notes | | | 3.2 | % |
| | | | U.S. Treasury Bonds | | | 2.4 | % |
| | | | U.S. Treasury Notes | | | 2.3 | % |
| | | | U.S. Treasury Notes, TIPS | | | 2.3 | % |
| | | | U.S. Treasury Notes, TIPS | | | 2.3 | % |
| | | | These securities represent 40.4% of the total net assets of the Fund. | |
Quoted Fund performance is for Class A shares and does not reflect a sales charge.
The returns shown do not reflect taxes a shareholder would pay on distributions or redemptions.
Quoted Major Market Sectors, Moody’s Bond Quality Ratings Distributions and Top 10 Holdings are subject to change.
The lists of Major Market Sectors and Top 10 Holdings exclude short-term investments and collateral held for securities loaned.
40
What is your outlook?
We expect the U.S. economy will remain sluggish at best during the first half of next year and possibly pick up in the second half. The slow-growth environment will likely keep unemployment from falling materially in the coming months. While the Fed has announced it intends to keep rates low until at least mid-2013, we wouldn’t be surprised to see additional monetary easing moves.
Although we expect market volatility to persist, we believe it will gradually subside to more muted levels than we experienced in 2011.
We will continue to look for opportunities to reduce the Fund’s overweighting in risk assets during periods of market strength, while focusing on higher-quality assets within those segments. These moves should help bring the Fund’s risk profile more in line with its peer group.
| | | | |
Portfolio Facts |
| As of October 31, 2011 |
| | Class A | | Institutional Class |
Ticker | | AAINX | | IIINX |
Transfer Agent ID | | 016 | | 089 |
Net Assets | | $236,250,627 | | $56,487,118 |
NAV | | $10.19 | | $10.19 |
NAV - High† | | 8/4/2011 - $10.29 | | 8/4/2011 - $10.29 |
NAV - Low† | | 12/15/2010 - $9.85 | | 12/15/2010 - $9.85 |
Number of Holdings: 230 | | | | |
† For the year ended October 31, 2011 |
| | | | | | |
| Average Annual Total Returns1 |
As of October 31, 2011 |
| Class A2 | | 1-Year | | 5 Years | | 10 Years |
without sales charge | | 4.53% | | 5.01% | | 4.45% |
with sales charge | | -0.20% | | 4.04% | | 3.97% |
| | | |
| Institutional Class3 | | 1-Year | | 5 Years | | 10 Years |
Net Asset Value | | 4.88% | | 5.36% | | 4.84% |
| | | | | | |
| Value of a $10,000 Investment |
| Class A Shares*,1,(a) |
|
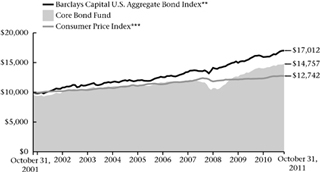 |
| 1 | Past performance is not an indication of future results. Average annual total returns represent past performance and reflect changes in share prices, the reinvestment of all dividends and capital gains, and the effects of compounding. The prospectus contains more complete information on the investment objectives, risks, charges and expenses of the investment company, which investors should read and consider carefully before investing. To obtain a prospectus, contact a registered representative or visit www.thrivent.com. At various times, the Fund’s adviser waived its management fee and/or reimbursed Fund expenses. Had the adviser not done so, the Fund’s total returns would have been lower. The returns shown do not reflect taxes a shareholder would pay on distributions or redemptions. Total investment return and principal value of your investment will fluctuate, and your shares, when redeemed, may be worth more or less than their original cost. Current performance may be higher or lower than the performance data quoted. Call 800-THRIVENT or visit www.thrivent.com for performance results current to the most recent month-end. |
| 2 | Class A performance with sales charge reflects the maximum sales charge of 4.5%. |
| 3 | Institutional Class shares have no sales load and are for institutional shareholders only. |
| (a) | Performance of other classes will be greater or less than the line shown based on the differences in loads and fees paid by shareholders investing in the different classes. |
| * | As you compare performance, please note that the Fund’s performance reflects the maximum 4.5% sales charge, while the Barclays Capital U.S. Aggregate Bond Index and the Consumer Price Index do not reflect any such charges. If you were to purchase any of the above individual securities represented in the Index, any charges you would pay would reduce your total return as well. |
| ** | The Barclays Capital U.S. Aggregate Bond Index is an index that measures the performance of U.S. investment grade bonds. It is not possible to invest directly in the Index. The performance of the Index does not reflect deductions for fees, expenses or taxes. |
| *** | The Consumer Price Index is an inflationary indicator that measures the change in the cost of a fixed basket of products and services, including housing, electricity, food and transportation. It is not possible to invest directly in the Index. |
41
| | |
 | | Thrivent Government Bond Fund |
| | Michael G. Landreville, CFA, Portfolio Manager The Fund seeks total return, consistent with preservation of capital. The Fund is subject to interest rate risk, government securities risk and inflation-linked security risk. These and other risks are described in the Fund’s prospectus. Views expressed in this discussion of fund performance are the views of this particular Fund’s portfolio management team. |
How did the Fund perform during the 12-month period ended October 31, 2011?
Thrivent Government Bond Fund earned a return of 3.99%, compared with the median return of its peer group, the Lipper General U.S. Government Funds category, of 4.10%. The Fund’s market benchmarks, the Barclays Capital U.S. Agency Index and the Barclays Capital U.S. Treasury Index, earned returns of 2.73% and 5.27%, respectively.
What factors affected the Fund’s performance?
The Federal Reserve kept its target federal funds rate at zero to 0.25% during the period while embarking on its second round of quantitative easing (QE2). While this program restored confidence to the equity market during the first half of the fiscal year, interest rates on Treasury securities actually rose in spite of the Fed’s buying. Ten-year Treasury note yields increased from 2.60% at the beginning of November to 3.29% at the end of April. However, the second half of the period saw a quick reversal of this trend as 10-year Treasury rates fell to 2.11% by the end of October 2011. Uncertainty surrounding the resolution of the European sovereign debt situation, the U.S. budget impasse and the Fed’s new “Operation Twist” program all contributed to this drop in yields.
Consequently, longer-maturity Treasuries produced
significantly higher returns over the period than shorter-term Treasuries. For example, the Barclays Capital 20+ year Treasury Index advanced 19.38%, compared to a return of 3.35% for the Barclays Capital Intermediate Treasury Index. Agency bonds reported more modest results of 2.73% due to the segment’s shorter duration, or interest rate sensitivity. The mortgage-backed securities (MBS) sector produced a return of 4.58%.
The Fund’s performance was helped by its longer duration and heavier weighting in U.S. Treasury securities than its Lipper peer group. However, this was offset by the Fund’s significantly higher weighting in U.S. agency debt and lower exposure to MBS debt than its Lipper peers. Also, the Fund owned debt guaranteed by Canada, Germany, the Netherlands, France, Belgium and Luxembourg. While these bonds were added as portfolio diversifiers, they underperformed U.S. bonds in 2011. The overall result was a slight underperformance of the Fund versus its Lipper peer group for the year. However, the Fund’s performance was in line with a 50%/50% blend of the Barclays Capital U.S. Treasury and U.S. Agency indexes despite the fact they incur no operating expenses. This was primarily due to the Fund’s 10% weighting in Treasury inflation-protected securities (TIPS) and MBS, which performed well during the period.
| | | | | | | | | | |
Major Market Sectors (% of Net Assets) 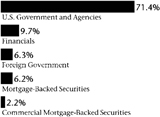
| | 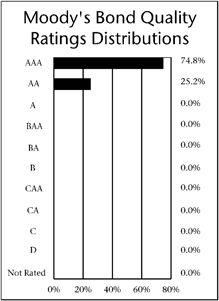 | | | | Top 10 Holdings | | | |
| | | | (% of Net Assets) | | | |
| | | | U.S. Treasury Notes | | | 7.8 | % |
| | | | U.S. Treasury Notes | | | 4.1 | % |
| | | | Federal Home Loan Banks | | | 4.0 | % |
| | | | U.S. Treasury Notes | | | 3.8 | % |
| | | | Federal Home Loan Mortgage Corporation | | | 3.6 | % |
| | | | Federal National Mortgage Association | | | 3.4 | % |
| | | | U.S. Treasury Notes | | | 3.3 | % |
| | | | Federal Home Loan Mortgage Corporation | | | 3.2 | % |
| | | | Federal National Mortgage Association Conventional 30-Yr. Pass Through | | | 3.1 | % |
| | | | U.S. Treasury Notes | | | 3.0 | % |
| | | | These securities represent 39.3% of the total net assets of the Fund. | |
| | | | | |
Quoted Fund performance is for Class A shares and does not reflect a sales charge.
The returns shown do not reflect taxes a shareholder would pay on distributions or redemptions.
Quoted Major Market Sectors, Moody’s Bond Quality Ratings Distributions and Top 10 Holdings are subject to change.
The lists of Major Market Sectors and Top 10 Holdings exclude short-term investments and collateral held for securities loaned.
42
What is your outlook?
Because we expect the U.S. economy to remain lackluster during the first half of next year, we anticipate the Fed will hold or even increase its monetary easing stance. The slow-growth environment will likely keep unemployment from falling materially in the coming months. While inflation pressures have modestly increased recently, we are not concerned with the levels we are seeing at this
point. Unfortunately, we expect market volatility to persist, albeit at more muted levels than we saw in 2011.
Because the Fund is intended to serve as a conservative and defensive investment vehicle, we will not attempt to aggressively seize investment opportunities in different market segments. We expect the Fund’s asset mix to remain largely unchanged on an ongoing basis.
| | | | | | | | |
Portfolio Facts | |
| As of October 31, 2011 | |
| | | Class A | | | Institutional Class | |
Ticker | | | TBFAX | | | | TBFIX | |
Transfer Agent ID | | | 039 | | | | 459 | |
Net Assets | | | $7,300,696 | | | | $94,574,522 | |
NAV | | | $10.69 | | | | $10.69 | |
NAV - High† | | | 9/22/2011 - $10.88 | | | | 9/22/2011 -$10.88 | |
NAV - Low† | | | 2/8/2011 - $9.95 | | | | 2/8/2011 - $9.96 | |
Number of Holdings: 61 | | | | | |
† For the period ended October 31, 2011 | | | | | |
| | | | |
| Average Annual Total Returns1 |
| As of October 31, 2011 |
| Class A2 | | 1-Year | | From
Inception
2/26/2010 |
without sales charge | | 3.99% | | 6.42% |
with sales charge | | 1.87% | | 5.17% |
| | |
| Institutional Class3 | | 1-Year | | From
Inception
2/26/2010 |
Net Asset Value | | 4.25% | | 6.76% |
|
| Value of a $10,000 Investment |
| Class A Shares*,1,(a) |
|
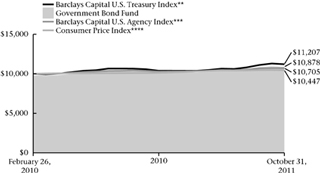 |
| 1 | Past performance is not an indication of future results. Average annual total returns represent past performance and reflect changes in share prices, the reinvestment of all dividends and capital gains, and the effects of compounding. The prospectus contains more complete information on the investment objectives, risks, charges and expenses of the investment company, which investors should read and consider carefully before investing. To obtain a prospectus, contact a registered representative or visit www.thrivent.com. At various times, the Fund’s adviser waived its management fee and/or reimbursed Fund expenses. Had the adviser not done so, the Fund’s total returns would have been lower. The returns shown do not reflect taxes a shareholder would pay on distributions or redemptions. Total investment return and principal value of your investment will fluctuate, and your shares, when redeemed, may be worth more or less than their original cost. Current performance may be higher or lower than the performance data quoted. Call 800-THRIVENT or visit www.thrivent.com for performance results current to the most recent month-end. |
| 2 | Class A performance with sales charge reflects the maximum sales charge of 2%. |
| 3 | Institutional Class shares have no sales load and are for institutional shareholders only. |
| (a) | Performance of other classes will be greater or less than the line shown based on the differences in loads and fees paid by shareholders investing in the different classes. |
| * | As you compare performance, please note that the Fund’s performance reflects the maximum 2.0% sales charge, while the Barclays Capital U.S. Treasury Index, the Barclays Capital U.S. Agency Index and the Consumer Price Index do not reflect any such charges. If you were to purchase any of the above individual securities represented in the Index, any charges you would pay would reduce your total return as well. |
| ** | The Barclays Capital U.S. Treasury Index is an index that measures the performance of the U.S. Treasury bond market. It is not possible to invest directly in the Index. The performance of the Index does not reflect deductions for fees, expenses or taxes. |
| *** | The Barclays Capital U.S. Agency Index is an index that measures the performance of the U.S. investment-grade fixed-income securities market. It is not possible to invest directly in the Index. The performance of the Index does not reflect deductions for fees, expenses or taxes. |
| **** | The Consumer Price Index is an inflationary indicator that measures the change in the cost of a fixed basket of products and services, including housing, electricity, food and transportation. It is not possible to invest directly in the Index |
43
| | | | |

| | Thrivent Limited Maturity Bond Fund Michael G. Landreville, CFA (left) and Gregory R. Anderson, CFA (right), Portfolio Co-Managers The Fund seeks a high level of current income consistent with stability of principal. The Fund is subject to interest rate risk, credit risk related to an underlying company’s financial position and volatility risk, which may result in overall price fluctuations over short or even extended time periods. These and other risks are described in the Fund’s prospectus. Views expressed in this discussion of fund performance are the views of this particular Fund’s portfolio management team. | | 
|
How did the Fund perform during the 12-month period ended October 31, 2011?
Thrivent Limited Maturity Bond Fund earned a return of 0.87%, compared with the median return of its peer group, the Lipper Short Investment Grade Debt Funds category, of 0.76%. The Fund’s market benchmark, the Barclays Capital Government/Credit 1-3 Year Bond Index, earned a return of 1.21%.
What factors affected the Fund’s performance?
Fixed-income markets were characterized by the terms “risk on/risk off” during the 12-month period. The tale of two markets began with the Federal Reserve’s announcement of its second round of quantitative easing (QE2) in late 2010, which fueled investors’ appetite for risk and drove a strong run of outperformance for all non-government sectors. Yields across the Treasury market rose significantly, causing prices to fall. Corporate bonds and securitized assets had modest positive returns during this half, whereas Treasuries and government securities experienced negative results.
Approximately halfway through the fiscal year, this market environment reversed course as a confluence of negative events created headwinds for risk assets. These
factors included the end of the QE2 program, the after-effects of Japan’s earthquake, an increase in oil prices, an escalation of the European debt crisis, reports of slower-than-expected rates of U.S. economic growth, the U.S. budget deficit wrangling, and the ensuing S&P credit downgrade. The resulting uncertainty spurred a flight to quality. Treasury yields declined significantly, more so in the longer maturities, as 10-year bonds fell by 117 basis points and two-year Treasuries dropped 36 basis points over the second half of the period. Meanwhile, spreads (or risk premium) widened dramatically. Treasuries and government securities strongly outpaced risk assets during this time frame.
The Fund’s outperformance of its Lipper peer group primarily occurred in the first half of the period as our emphasis on spread sectors, such as high-quality corporate bonds, mortgage-backed securities and asset-backed securities, benefited performance in the risk-on environment. Meanwhile, the Fund fell short of its benchmark index mostly in the second half because Treasuries and government agencies comprised about 80% of the benchmark, while our Fund had around 25% weighting in these segments.
| | | | | | | | | | |
| Major Market Sectors | | 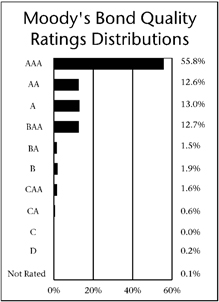
| | | | Top 10 Holdings | |
| (% of Net Assets) | | | | (% of Net Assets) | |
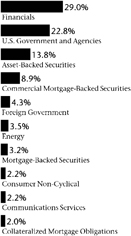
| | | | U.S. Treasury Notes | | | 3.4 | % |
| | | | U.S. Treasury Notes | | | 3.2 | % |
| | | | U.S. Treasury Notes | | | 1.9 | % |
| | | | Federal National Mortgage Association Conventional 30-Yr. Pass Through | | | 1.3 | % |
| | | | U.S. Treasury Notes, TIPS | | | 1.3 | % |
| | | | Thrivent High Yield Fund | | | 1.2 | % |
| | | | Federal Farm Credit Bank | | | 1.1 | % |
| | | | U.S. Treasury Notes | | | 1.1 | % |
| | | | SLM Student Loan Trust | | | 0.9 | % |
| | | | Federal National Mortgage Association Conventional 15-Yr. Pass Through | | | 0.8 | % |
| | | | These securities represent 16.2% of the total net assets of the Fund. | | | | |
| | | | | | | | |
Quoted Fund performance is for Class A shares.
The returns shown do not reflect taxes a shareholder would pay on distributions or redemptions.
Quoted Major Market Sectors, Moody’s Bond Quality Ratings Distributions and Top 10 Holdings are subject to change.
The lists of Major Market Sectors and Top 10 Holdings exclude short-term investments and collateral held for securities loaned.
44
What is your outlook?
As of the date of this writing, headline risks surrounding the European debt crisis are driving financial markets, and the resolution is somewhat unclear because of the politics involved. We believe concerns about an economic recession in the U.S. economy have been overblown as recent economic data has been exceeding expectations.
However, economic growth will likely remain plateaued in the 1-2% range. The Fed has made the unusual move of committing to hold short-term interest rates at record low levels until mid-2013 and announced “Operation Twist” to bring long-term interest rates down. We expect short- and intermediate-term interest rates to remain at low levels at least through the first half of 2012.
| | | | | | | | |
| | | | | | | | | |
| | | Portfolio Facts | | |
| | | As of October 31, 2011 | | |
| | | | Class A | | Institutional Class | | |
| | | Ticker | | LBLAX | | THLIX | | |
| | | Transfer Agent ID | | 076 | | 476 | | |
| | | Net Assets | | $344,802,184 | | $584,655,912 | | |
| | | NAV | | $12.41 | | $12.40 | | |
| | | NAV - High† | | 11/4/2010 - $12.60 | | 11/4/2010 - $12.60 | | |
| | | NAV - Low† | | 10/11/2011 - $12.35 | | 10/11/2011 - $12.34 | | |
| | | Number of Holdings: 357 | | |
| | | † For the year ended October 31, 2011 | | |
| | | | | |
| | | | | | |
| Average Annual Total Returns1 |
| As of October 31, 2011 |
| | | |
| Class A2 | | 1-Year | | 5 Years | | 10 Years |
| Net Asset Value | | 0.87% | | 3.36% | | 3.20% |
| | | |
| Institutional Class3 | | 1-Year | | 5 Years | | 10 Years |
| Net Asset Value | | 1.05% | | 3.67% | | 3.55% |
Value of a $10,000 Investment
Class A Shares1,(a)
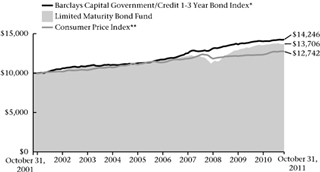
| 1 | Past performance is not an indication of future results. Average annual total returns represent past performance and reflect changes in share prices, the reinvestment of all dividends and capital gains, and the effects of compounding. The prospectus contains more complete information on the investment objectives, risks, charges and expenses of the investment company, which investors should read and consider carefully before investing. To obtain a prospectus, contact a registered representative or visit www.thrivent.com. At various times, the Fund’s adviser waived its management fee and/or reimbursed Fund expenses. Had the adviser not done so, the Fund’s total returns would have been lower. The returns shown do not reflect taxes a shareholder would pay on distributions or redemptions. Total investment return and principal value of your investment will fluctuate, and your shares, when redeemed, may be worth more or less than their original cost. Current performance may be higher or lower than the performance data quoted. Call 800-THRIVENT or visit www.thrivent.com for performance results current to the most recent month-end. |
| 2 | Class A shares have no sales load. |
| 3 | Institutional Class shares have no sales load and are for institutional shareholders only. |
| (a) | Performance of other classes will be greater or less than the line shown based on the differences in loads and fees paid by shareholders investing in the different classes. |
| * | The Barclays Capital Government/Credit 1-3 Year Bond Index is an index that measures the performance of government and fixed-rate debt securities with maturities of 1-3 years. It is not possible to invest directly in the Index. The performance of the Index does not reflect deductions for fees, expenses or taxes. | |
| ** | The Consumer Price Index is an inflationary indicator that measures the change in the cost of a fixed basket of products and services, including housing, electricity, food and transportation. It is not possible to invest directly in the Index. |
45
| | |

| | Thrivent Money Market Fund William D. Stouten, Portfolio Manager The Fund seeks a high level of current income, while maintaining liquidity and a constant net asset value of $1.00 per share. The principal risk of investing in the Fund is current income risk—that is, the income the Fund receives may fall as a result of a decline in
interest rates. This and other risks are described in the Fund’s prospectus. Views expressed in this discussion of fund performance are the
views of this particular Fund’s portfolio management team. |
How did the Fund perform during the 12-month period ended October 31, 2011?
Thrivent Money Market Fund earned a return of 0.00%, compared with the median net return of its peer group, the Lipper Money Market Funds category, of 0.01%.
What factors affected the Fund’s performance?
The low-yield environment that had persisted for most of 2009 and 2010 caused many money market funds to maintain or seek higher yields through an increased allocation to foreign banks. When the debt problem in Europe appeared to be worsening in July 2011, many money market funds were struggling to reduce exposure to European banks and increase their fund’s liquidity. The industry continued to shift assets away from the region, driving down yields of many domestic industrial and municipal securities. Yields offered for Canadian and Australian bank securities also declined as they benefited from the shift out of eurozone banks.
Fortunately, the Fund had maintained a substantially lower weighting in European securities than our peer group throughout the period given our conservative approach and concerns about the sector. As the industry shifted away from European banks and increased
liquidity, the Fund was able to quickly increase exposure to Canadian and Australian banks. We continued to structure the Fund conservatively in order to help maintain credit quality and liquidity, with significant exposure to U.S. government-supported securities and higher-quality municipal securities. The Fund has no direct exposure to the eurozone’s five most troubled economies: Greece, Portugal, Italy, Spain and Ireland. We also maintained a much shorter weighted-average maturity (WAM) in the Fund than our peers during most of the fiscal year. However, when spreads started to widen out in the European banking sector in August and September, we dramatically lengthened the Fund’s WAM to take advantage of the dislocation in the market. Toward the end of the period, the Fund’s WAM drifted lower again as we remained concerned about problems in Europe. In order to manage the Fund’s return for investors, we continued to waive certain Fund fees and expenses throughout the 12-month period.
What is your outlook?
Between now and the first quarter of 2012, we expect the Securities and Exchange Commission (SEC) will come out with new proposed regulations for money market funds
|
Portfolio Composition (% of Portfolio) |
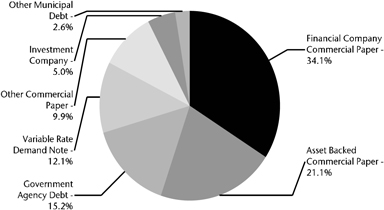
|
An investment in the Thrivent Money Market Fund is not insured
or guaranteed by the FDIC or any other government agency.
Although the Fund seeks to preserve the value of your investment at $1.00 per share,
it is possible to lose money by investing in the Fund.
Quoted Fund performance is for Class A shares.
The returns shown do not reflect taxes a shareholder would pay on distributions or redemptions.
Quoted Portfolio Composition is subject to change.
46
regarding the potential for a floating net asset value and/or capital reserve requirements. As usual, the SEC will solicit feedback from industry participants before implementing these anticipated proposed changes. We intend to monitor these developments and work with regulators, to the extent necessary, to support what we believe are positive reforms for the money market industry.
Recent indicators suggest that the U.S. economy may slow down slightly in the coming months, and there is increasing concern that Europe may experience a
recession. As a result, the Federal Reserve has stated its intent to keep the federal funds overnight target rate unchanged through mid-2013. At some point, the Fed may enter into repurchase agreements directly with money market funds. While this may add some supply and provide a slight boost to the fed funds rate, money market yields are expected to remain close to zero for an extended period of time.
| | | | |
Portfolio Facts |
As of October 31, 2011 |
| | | Class A | | Institutional Class |
| Ticker | | AMMXX | | AALXX |
| Transfer Agent ID | | 018 | | 091 |
| Net Assets | | $587,884,921 | | $11,562,348 |
| NAV | | $1.00 | | $1.00 |
| Number of Holdings: 91 |
| |
| | | | | | |
| Average Annual Total Returns1 |
| As of October 31, 2011 |
| | | |
| Class A2 | | 1-Year | | 5 Years | | 10 Years |
| Net Asset Value | | 0.00% | | 1.73% | | 1.71% |
| | | |
| Institutional Class3 | | 1-Year | | 5 Years | | 10 Years |
| Net Asset Value | | 0.00% | | 1.85% | | 1.94% |
| | | | |
| Money Market Portfolio Yields* |
| As of October 31, 2011 |
| | |
| | | Class A | | Institutional
Class |
| 7-Day Yield | | 0.00% | | 0.00% |
| 7-Day Yield Gross of Waivers | | -0.64% | | -0.25% |
| | |
| 7-Day Effective Yield | | 0.00% | | 0.00% |
| 7-Day Effective Yield Gross of Waivers | | -0.64% | | -0.25% |
| 1 | Past performance is not an indication of future results. Average annual total returns represent past performance and reflect changes in share prices, the reinvestment of all dividends and capital gains, and the effects of compounding. The prospectus contains more complete information on the investment objectives, risks, charges and expenses of the investment company, which investors should read and consider carefully before investing. To obtain a prospectus, contact a registered representative or visit www.thrivent.com. At various times, the Fund’s adviser waived its management fee and/or reimbursed Fund expenses. Had the adviser not done so, the Fund’s total returns would have been lower. The returns shown do not reflect taxes a shareholder would pay on distributions or redemptions. Current performance may be higher or lower than the performance data quoted. Call 800-THRIVENT or visit www.thrivent.com for performance results current to the most recent month-end. |
| 2 | Class A shares have no sales load. |
| 3 | Institutional Class shares have no sales load and are for institutional shareholders only. |
| * | Seven-day yields of Thrivent Money Market Fund refer to the income generated by an investment in the Fund over a specified seven-day period. Effective yields reflect the reinvestment of income. A yield gross of waivers represents what the yield would have been if the Adviser were not waiving or reimbursing certain expenses associated with the Fund. Yields are subject to daily fluctuation and should not be considered an indication of future results. |
47
Shareholder Expense Example
(unaudited)
As a shareholder of the Fund, you incur, depending on the fund and share class, two types of costs: (1) transaction costs, including sales charges (loads) on purchase payments; and (2) ongoing costs, including management fees, distribution (12b-1) fees and other Fund expenses. This Example is intended to help you understand your ongoing costs (in dollars) of investing in the Fund and to compare these costs with the ongoing costs of investing in other mutual funds. The Example is based on an investment of $1,000 invested at the beginning of the period and held for the entire period from May 1, 2011 through October 31, 2011.
Actual Expenses
In the table below, the first section, labeled “Actual,” provides information about actual account values and actual expenses. You may use the information in this section, together with the amount you invested, to estimate the expenses that you paid over the period. Simply divide your account value by $1,000 (for example, an $8,600 account value divided by $1,000 = 8.6), then multiply the result by the number from the appropriate Class line under the heading entitled “Expenses Paid During Period” to estimate the expenses you paid. A small account fee of $12 may be charged to Class A shareholder accounts if the value falls below stated account minimums ($2,500 for Thrivent Limited Maturity Bond Fund, $1,500 for Thrivent Money Market Fund and $1,000 for all other Funds). This fee is not included in the table below. If it were and you were assessed such a fee, the expenses you paid during the period would have been higher and the ending account value would have been lower.
Hypothetical Example for Comparison Purposes
In the table below, the second section, labeled “Hypothetical,” provides information about hypothetical account values and hypothetical expenses based on the Fund’s actual expense ratio and an assumed rate of return of 5% per year before expenses, which is not the Fund’s actual return. The hypothetical account values and expenses may not be used to estimate the actual ending account balance or expenses you paid for the period. You may use this information to compare the ongoing costs of investing in the Fund and other funds. To do so, compare this 5% hypothetical example with the 5% hypothetical examples that appear in the shareholder reports of the other funds. A small account fee of $12 may be charged to Class A shareholder accounts if the value falls below stated account minimums ($2,500 for Thrivent Limited Maturity Bond Fund, $1,500 for Thrivent Money Market Fund and $1,000 for all other Funds). This fee is not included in the table below. If it were and you were assessed such a fee, the expenses you paid during the period would have been higher and the ending account value would have been lower.
Please note that the expenses shown in the table are meant to highlight your ongoing costs only and do not reflect any transactional costs, such as sales charges (loads). Therefore, the second section of the table is useful in comparing ongoing costs only, and will not help you determine the relative total costs of owning different funds. In addition, if these transactional costs were included, your costs would have been higher.
| | | | | | | | |
| | | Beginning Account
Value 5/1/2011 | | Ending Account Value
10/31/2011 | | Expenses Paid During
Period 5/1/2011-
10/31/2011* | | Annualized Expense
Ratio |
Thrivent Aggressive Allocation Fund | | | | | | |
| | | | |
Actual | | | | | | | | |
Class A | | $1,000 | | $893 | | $3.76 | | 0.79% |
Institutional Class | | $1,000 | | $895 | | $2.01 | | 0.42% |
| | | | |
Hypothetical** | | | | | | | | |
Class A | | $1,000 | | $1,021 | | $4.01 | | 0.79% |
Institutional Class | | $1,000 | | $1,023 | | $2.14 | | 0.42% |
| | | |
Thrivent Moderately Aggressive Allocation Fund | | | | | | |
| | | | |
Actual | | | | | | | | |
Class A | | $1,000 | | $913 | | $3.64 | | 0.76% |
Institutional Class | | $1,000 | | $914 | | $1.65 | | 0.34% |
| | | | |
Hypothetical** | | | | | | | | |
Class A | | $1,000 | | $1,021 | | $3.85 | | 0.76% |
Institutional Class | | $1,000 | | $1,023 | | $1.75 | | 0.34% |
48
| | | | | | | | |
| | | Beginning Account Value 5/1/2011 | | Ending Account Value 10/31/2011 | | Expenses Paid During Period 5/1/2011- 10/31/2011* | | Annualized Expense Ratio |
Thrivent Moderate Allocation Fund | | | | | | |
| | | | |
Actual | | | | | | | | |
Class A | | $1,000 | | $936 | | $3.34 | | 0.68% |
Institutional Class | | $1,000 | | $939 | | $1.53 | | 0.31% |
| | | | |
Hypothetical** | | | | | | | | |
Class A | | $1,000 | | $1,022 | | $3.49 | | 0.68% |
Institutional Class | | $1,000 | | $1,024 | | $1.60 | | 0.31% |
| | | |
Thrivent Moderately Conservative Allocation Fund | | | | | | |
| | | | |
Actual | | | | | | | | |
Class A | | $1,000 | | $958 | | $3.39 | | 0.69% |
Institutional Class | | $1,000 | | $959 | | $1.67 | | 0.34% |
| | | | |
Hypothetical** | | | | | | | | |
Class A | | $1,000 | | $1,022 | | $3.50 | | 0.69% |
Institutional Class | | $1,000 | | $1,024 | | $1.72 | | 0.34% |
| | | |
Thrivent Partner Small Cap Growth Fund | | | | | | |
| | | | |
Actual | | | | | | | | |
Class A | | $1,000 | | $831 | | $6.73 | | 1.46% |
Institutional Class | | $1,000 | | $833 | | $4.86 | | 1.05% |
| | | | |
Hypothetical** | | | | | | | | |
Class A | | $1,000 | | $1,018 | | $7.41 | | 1.46% |
Institutional Class | | $1,000 | | $1,020 | | $5.36 | | 1.05% |
| | | |
Thrivent Partner Small Cap Value Fund | | | | | | |
| | | | |
Actual | | | | | | | | |
Class A | | $1,000 | | $879 | | $6.66 | | 1.41% |
Institutional Class | | $1,000 | | $881 | | $4.05 | | 0.85% |
| | | | |
Hypothetical** | | | | | | | | |
Class A | | $1,000 | | $1,018 | | $7.15 | | 1.41% |
Institutional Class | | $1,000 | | $1,021 | | $4.35 | | 0.85% |
| | | |
Thrivent Small Cap Stock Fund | | | | | | |
| | | | |
Actual | | | | | | | | |
Class A | | $1,000 | | $846 | | $6.33 | | 1.36% |
Institutional Class | | $1,000 | | $849 | | $3.54 | | 0.76% |
| | | | |
Hypothetical** | | | | | | | | |
Class A | | $1,000 | | $1,018 | | $6.93 | | 1.36% |
Institutional Class | | $1,000 | | $1,021 | | $3.86 | | 0.76% |
| | | |
Thrivent Mid Cap Growth Fund | | | | | | |
| | | | |
Actual | | | | | | | | |
Class A | | $1,000 | | $902 | | $5.11 | | 1.07% |
Institutional Class | | $1,000 | | $904 | | $2.52 | | 0.53% |
| | | | |
Hypothetical** | | | | | | | | |
Class A | | $1,000 | | $1,020 | | $5.43 | | 1.07% |
Institutional Class | | $1,000 | | $1,023 | | $2.68 | | 0.53% |
| | | |
Thrivent Partner Mid Cap Value Fund | | | | | | |
| | | | |
Actual | | | | | | | | |
Class A | | $1,000 | | $876 | | $5.94 | | 1.26% |
Institutional Class | | $1,000 | | $877 | | $4.27 | | 0.90% |
| | | | |
Hypothetical** | | | | | | | | |
Class A | | $1,000 | | $1,019 | | $6.39 | | 1.26% |
Institutional Class | | $1,000 | | $1,021 | | $4.60 | | 0.90% |
49
| | | | | | | | |
| | | Beginning Account Value 5/1/2011 | | Ending Account Value 10/31/2011 | | Expenses Paid During Period 5/1/2011- 10/31/2011* | | Annualized Expense Ratio |
Thrivent Mid Cap Stock Fund | | | | | | |
| | | | |
Actual | | | | | | | | |
Class A | | $1,000 | | $858 | | $5.62 | | 1.20% |
Institutional Class | | $1,000 | | $860 | | $3.35 | | 0.72% |
| | | | |
Hypothetical** | | | | | | | | |
Class A | | $1,000 | | $1,019 | | $6.11 | | 1.20% |
Institutional Class | | $1,000 | | $1,022 | | $3.65 | | 0.72% |
| | | |
Thrivent Partner Worldwide Allocation Fund | | | | | | |
| | | | |
Actual | | | | | | | | |
Class A | | $1,000 | | $865 | | $6.14 | | 1.31% |
Institutional Class | | $1,000 | | $866 | | $4.73 | | 1.00% |
| | | | |
Hypothetical** | | | | | | | | |
Class A | | $1,000 | | $1,019 | | $6.65 | | 1.31% |
Institutional Class | | $1,000 | | $1,020 | | $5.12 | | 1.00% |
| | | |
Thrivent Large Cap Growth Fund | | | | | | |
| | | | |
Actual | | | | | | | | |
Class A | | $1,000 | | $906 | | $5.80 | | 1.21% |
Institutional Class | | $1,000 | | $909 | | $3.98 | | 0.83% |
| | | | |
Hypothetical** | | | | | | | | |
Class A | | $1,000 | | $1,019 | | $6.14 | | 1.21% |
Institutional Class | | $1,000 | | $1,021 | | $4.21 | | 0.83% |
| | | |
Thrivent Large Cap Value Fund | | | | | | |
| | | | |
Actual | | | | | | | | |
Class A | | $1,000 | | $881 | | $5.04 | | 1.06% |
Institutional Class | | $1,000 | | $883 | | $2.47 | | 0.52% |
| | | | |
Hypothetical** | | | | | | | | |
Class A | | $1,000 | | $1,020 | | $5.41 | | 1.06% |
Institutional Class | | $1,000 | | $1,023 | | $2.65 | | 0.52% |
| | | |
Thrivent Large Cap Stock Fund | | | | | | |
| | | | |
Actual | | | | | | | | |
Class A | | $1,000 | | $891 | | $5.29 | | 1.11% |
Institutional Class | | $1,000 | | $893 | | $2.90 | | 0.61% |
| | | | |
Hypothetical** | | | | | | | | |
Class A | | $1,000 | | $1,020 | | $5.66 | | 1.11% |
Institutional Class | | $1,000 | | $1,022 | | $3.09 | | 0.61% |
| | | |
Thrivent Balanced Fund | | | | | | |
| | | | |
Actual | | | | | | | | |
Class A | | $1,000 | | $923 | | $5.43 | | 1.12% |
Institutional Class | | $1,000 | | $925 | | $3.12 | | 0.64% |
| | | | |
Hypothetical** | | | | | | | | |
Class A | | $1,000 | | $1,020 | | $5.70 | | 1.12% |
Institutional Class | | $1,000 | | $1,022 | | $3.27 | | 0.64% |
| | | |
Thrivent High Yield Fund | | | | | | |
| | | | |
Actual | | | | | | | | |
Class A | | $1,000 | | $984 | | $4.21 | | 0.84% |
Institutional Class | | $1,000 | | $988 | | $2.35 | | 0.47% |
| | | | |
Hypothetical** | | | | | | | | |
Class A | | $1,000 | | $1,021 | | $4.28 | | 0.84% |
Institutional Class | | $1,000 | | $1,023 | | $2.39 | | 0.47% |
50
| | | | | | | | |
| | | Beginning Account
Value 5/1/2011 | | Ending Account Value
10/31/2011 | | Expenses Paid During
Period 5/1/2011-
10/31/2011* | | Annualized Expense
Ratio |
Thrivent Municipal Bond Fund | | | | | | |
| | | | |
Actual | | | | | | | | |
Class A | | $1,000 | | $1,057 | | $3.93 | | 0.76% |
Institutional Class | | $1,000 | | $1,059 | | $2.55 | | 0.49% |
| | | | |
Hypothetical** | | | | | | | | |
Class A | | $1,000 | | $1,021 | | $3.86 | | 0.76% |
Institutional Class | | $1,000 | | $1,023 | | $2.51 | | 0.49% |
| | | |
Thrivent Income Fund | | | | | | |
| | | | |
Actual | | | | | | | | |
Class A | | $1,000 | | $1,017 | | $3.99 | | 0.78% |
Institutional Class | | $1,000 | | $1,019 | | $1.98 | | 0.39% |
| | | | |
Hypothetical** | | | | | | | | |
Class A | | $1,000 | | $1,021 | | $4.00 | | 0.78% |
Institutional Class | | $1,000 | | $1,023 | | $1.98 | | 0.39% |
| | | |
Thrivent Core Bond Fund | | | | | | |
| | | | |
Actual | | | | | | | | |
Class A | | $1,000 | | $1,026 | | $4.36 | | 0.85% |
Institutional Class | | $1,000 | | $1,028 | | $2.62 | | 0.51% |
| | | | |
Hypothetical** | | | | | | | | |
Class A | | $1,000 | | $1,021 | | $4.35 | | 0.85% |
Institutional Class | | $1,000 | | $1,023 | | $2.61 | | 0.51% |
| | | |
Thrivent Government Bond Fund | | | | | | |
| | | | |
Actual | | | | | | | | |
Class A | | $1,000 | | $1,056 | | $4.69 | | 0.90% |
Institutional Class | | $1,000 | | $1,058 | | $2.80 | | 0.54% |
| | | | |
Hypothetical** | | | | | | | | |
Class A | | $1,000 | | $1,021 | | $4.61 | | 0.90% |
Institutional Class | | $1,000 | | $1,022 | | $2.76 | | 0.54% |
| | | |
Thrivent Limited Maturity Bond Fund | | | | | | |
| | | | |
Actual | | | | | | | | |
Class A | | $1,000 | | $999 | | $3.04 | | 0.60% |
Institutional Class | | $1,000 | | $1,000 | | $1.76 | | 0.35% |
| | | | |
Hypothetical** | | | | | | | | |
Class A | | $1,000 | | $1,022 | | $3.08 | | 0.60% |
Institutional Class | | $1,000 | | $1,023 | | $1.78 | | 0.35% |
| | | |
Thrivent Money Market Fund | | | | | | |
| | | | |
Actual | | | | | | | | |
Class A | | $1,000 | | $1,000 | | $1.48 | | 0.29% |
Institutional Class | | $1,000 | | $1,000 | | $1.47 | | 0.29% |
| | | | |
Hypothetical** | | | | | | | | |
Class A | | $1,000 | | $1,024 | | $1.49 | | 0.29% |
Institutional Class | | $1,000 | | $1,024 | | $1.49 | | 0.29% |
| * | Expenses are equal to the Fund’s annualized expense ratio, multiplied by the average account value over the period, multiplied by 184/365 to reflect the one-half year period. |
| ** | Assuming 5% annualized total return before expenses. |
51

Report of Independent Registered Public Accounting Firm
To the Shareholders and Trustees of the Thrivent Mutual Funds:
In our opinion, the accompanying statements of assets and liabilities, including the schedules of investments, and the related statements of operations and of changes in net assets and the financial highlights present fairly, in all material respects, the financial position of the Thrivent Aggressive Allocation Fund, Thrivent Moderately Aggressive Allocation Fund, Thrivent Moderate Allocation Fund, Thrivent Moderately Conservative Allocation Fund, Thrivent Partner Small Cap Growth Fund, Thrivent Partner Small Cap Value Fund, Thrivent Small Cap Stock Fund, Thrivent Mid Cap Growth Fund, Thrivent Partner Mid Cap Value Fund, Thrivent Mid Cap Stock Fund, Thrivent Partner Worldwide Allocation Fund, Thrivent Large Cap Growth Fund, Thrivent Large Cap Value Fund, Thrivent Large Cap Stock Fund, Thrivent Balanced Fund, Thrivent High Yield Fund, Thrivent Municipal Bond Fund, Thrivent Income Fund, Thrivent Core Bond Fund, Thrivent Government Bond Fund, Thrivent Limited Maturity Bond Fund and Thrivent Money Market Fund (twenty-two of the Thrivent Mutual Funds, hereafter referred to as the “Funds”) at October 31, 2011, the results of each of their operations for the year then ended, the changes in each of their net assets and their financial highlights for each of the periods presented, in conformity with accounting principles generally accepted in the United States of America. These financial statements and financial highlights (hereafter referred to as “financial statements”) are the responsibility of the Funds’ management; our responsibility is to express an opinion on these financial statements based on our audits. We conducted our audits of these financial statements in accordance with the standards of the Public Company Accounting Oversight Board (United States). Those standards require that we plan and perform the audit to obtain reasonable assurance about whether the financial statements are free of material misstatement. An audit includes examining, on a test basis, evidence supporting the amounts and disclosures in the financial statements, assessing the accounting principles used and significant estimates made by management, and evaluating the overall financial statement presentation. We believe that our audits, which included confirmation of securities at October 31, 2011 by correspondence with the custodian and brokers, provide a reasonable basis for our opinion.
December 15, 2011
|
| PricewaterhouseCoopers LLP, Suite 1400, 225 South Sixth Street, Minneapolis, MN 55402 |
| T: (612) 596 6000, F: (612) 373 7160, www.pwc.com/us |
52
Aggressive Allocation Fund
Schedule of Investments as of October 31, 2011
| | | | | | |
| Shares | | Mutual Funds (65.7%) | | Value | |
Equity Mutual Funds (62.6%) | |
991,281 | | Thrivent Natural Resources Fund | | | $10,180,455 | |
3,699,566 | | Thrivent Partner Small Cap Growth Funda | | | 44,357,797 | |
752,160 | | Thrivent Partner Small Cap Value Fund | | | 11,425,311 | |
1,004,432 | | Thrivent Small Cap Stock Funda | | | 15,026,295 | |
1,656,139 | | Thrivent Mid Cap Growth Funda | | | 32,808,108 | |
1,587,827 | | Thrivent Partner Mid Cap Value Fund | | | 18,418,798 | |
1,827,872 | | Thrivent Mid Cap Stock Fund | | | 28,204,069 | |
9,977,936 | | Thrivent Partner Worldwide Allocation Fund | | | 83,215,986 | |
6,646,413 | | Thrivent Large Cap Growth Funda | | | 35,093,059 | |
2,232,910 | | Thrivent Large Cap Value Fund | | | 29,117,144 | |
1,281,260 | | Thrivent Large Cap Stock Fund | | | 27,521,460 | |
456,523 | | Thrivent Equity Income Plus Fund | | | 4,031,097 | |
| | | |
| | Total Equity Mutual Funds | | | 339,399,579 | |
| | | |
|
Fixed Income Mutual Funds (3.1%) | |
1,099,603 | | Thrivent High Yield Fund | | | 5,190,125 | |
1,108,458 | | Thrivent Government Bond Fund | | | 11,849,412 | |
| | | |
| | Total Fixed Income Mutual Funds | | | 17,039,537 | |
| | | |
| | | | | | |
| | | |
| | Total Mutual Funds (cost $358,648,568) | | | 356,439,116 | |
| | | |
| | |
| Shares | | Common Stock (25.2%) | | Value | |
Consumer Discretionary (3.2%) | |
4,900 | | Aeon Company, Ltd. | | | 64,086 | |
7,300 | | Amazon.com, Inc.a | | | 1,558,623 | |
700 | | Aryzta AG | | | 33,753 | |
5,369 | | Autoliv, Inc. | | | 310,167 | |
800 | | Bayerische Motoren Werke AG | | | 43,538 | |
900 | | Beiersdorf AG | | | 51,885 | |
26,100 | | Best Buy Company, Inc. | | | 684,603 | |
18,500 | | Big Lots, Inc.a | | | 697,265 | |
4,600 | | British Sky Broadcasting Group plc | | | 51,869 | |
10,310 | | Buffalo Wild Wings, Inc.a | | | 682,728 | |
2,860 | | CBS Corporation | | | 73,817 | |
5,000 | | Charter Communications, Inc.a | | | 229,700 | |
47,300 | | Comcast Corporation | | | 1,109,185 | |
800 | | Daito Trust Construction Company, Ltd. | | | 70,880 | |
14,769 | | Discovery Communications, Inc.a | | | 641,861 | |
3,885 | | Dollar Tree, Inc.a | | | 310,645 | |
13,100 | | Fiat SPA | | | 80,217 | |
35,576 | | Foot Locker, Inc. | | | 777,691 | |
3,690 | | Harley-Davidson, Inc. | | | 143,541 | |
500 | | Kabel Deutschland Holding AGa | | | 28,359 | |
28,887 | | Las Vegas Sands Corporationa | | | 1,356,245 | |
1,300 | | Lawson, Inc. | | | 73,151 | |
15,500 | | Life Time Fitness, Inc.a | | | 668,515 | |
8,500 | | Lifestyle International Holdings, Ltd. | | | 22,755 | |
6,860 | | Lowe’s Companies, Inc. | | | 144,197 | |
7,407 | | Macy’s, Inc. | | | 226,136 | |
19,100 | | McDonald’s Corporation | | | 1,773,435 | |
7,000 | | Mediaset SPA | | | 25,791 | |
33,000 | | Mitsubishi Motors Corporationa | | | 43,592 | |
6,490 | | News Corporation | | | 115,846 | |
8,240 | | Omnicom Group, Inc. | | | 366,515 | |
2,583 | | Panera Bread Companya | | | 345,321 | |
| | | | | | |
| Shares | | Common Stock (25.2%) | | Value | |
Consumer Discretionary (3.2%) - continued | |
71,659 | | Pier 1 Imports, Inc.a | | | $896,454 | |
1,100 | | Priceline.com, Inc.a | | | 558,492 | |
1,700 | | ProSiebenSat.1 Media AG | | | 36,237 | |
7,600 | | Sands China, Ltd.a | | | 22,839 | |
16,076 | | Signet Jewelers, Ltd. | | | 693,036 | |
39,000 | | SJM Holdings, Ltd. | | | 66,848 | |
25,240 | | Target Corporation | | | 1,381,890 | |
2,310 | | Time Warner Cable, Inc. | | | 147,124 | |
3,520 | | Viacom, Inc. | | | 154,352 | |
2,300 | | Vivendi SA | | | 51,397 | |
200 | | Volkswagen AG | | | 31,277 | |
8,700 | | Williams-Sonoma, Inc. | | | 326,598 | |
4,979 | | WMS Industries, Inc.a | | | 109,090 | |
29,200 | | Wynn Macau, Ltd. | | | 81,815 | |
| | | |
| | Total Consumer Discretionary | | | 17,363,361 | |
| | | |
|
Consumer Staples (2.2%) | |
44,190 | | Altria Group, Inc. | | | 1,217,435 | |
18,827 | | Anheuser-Busch InBev NV ADR | | | 1,044,334 | |
1,300 | | Autogrill SPA | | | 15,035 | |
1,400 | | British American Tobacco plc | | | 64,193 | |
13,777 | | British American Tobacco plc ADR | | | 1,270,928 | |
600 | | Casino Guichard Perrachon SA | | | 56,183 | |
23,942 | | Corn Products International, Inc. | | | 1,161,187 | |
28,200 | | CVS Caremark Corporation | | | 1,023,660 | |
200 | | Delhaize Group SA | | | 13,064 | |
3,780 | | Diageo plc ADR | | | 313,286 | |
600 | | Heineken Holding NV | | | 25,668 | |
1,000 | | Henkel AG & Company KGaA | | | 59,445 | |
10,698 | | Herbalife, Ltd. | | | 667,127 | |
1,800 | | Imperial Tobacco Group plc | | | 65,571 | |
1,900 | | Kao Corporation | | | 49,845 | |
10,453 | | Kraft Foods, Inc. | | | 367,737 | |
9,700 | | Marks and Spencer Group plc | | | 50,011 | |
600 | | Nestle SA | | | 34,703 | |
19,013 | | Philip Morris International, Inc. | | | 1,328,438 | |
2,800 | | Seven & I Holdings Company, Ltd. | | | 74,720 | |
5,906 | | TreeHouse Foods, Inc.a | | | 362,274 | |
42,090 | | Wal-Mart Stores, Inc. | | | 2,387,345 | |
| | | |
| | | Total Consumer Staples | | 11,652,189 | |
| | | |
|
Energy (2.8%) | |
12,057 | | Alpha Natural Resources, Inc.a | | | 289,850 | |
3,780 | | Anadarko Petroleum Corporation | | | 296,730 | |
12,418 | | Apache Corporation | | | 1,237,205 | |
33,445 | | Arch Coal, Inc. | | | 609,368 | |
15,228 | | Baker Hughes, Inc. | | | 883,072 | |
11,240 | | Chevron Corporation | | | 1,180,762 | |
6,190 | | ConocoPhillips | | | 431,134 | |
33,130 | | ENSCO International plc ADR | | | 1,645,236 | |
6,900 | | Exxon Mobil Corporation | | | 538,821 | |
16,200 | | Helix Energy Solutions Group, Inc.a | | | 292,572 | |
9 | | INPEX Holdings, Inc. | | | 59,419 | |
42,800 | | Marathon Oil Corporation | | | 1,114,084 | |
5,095 | | National Oilwell Varco, Inc. | | | 363,426 | |
4,600 | | Newfield Exploration Companya | | | 185,196 | |
1,540 | | Occidental Petroleum Corporation | | | 143,128 | |
10,252 | | Oil States International, Inc.a | | | 713,642 | |
54,559 | | Patriot Coal Corporationa | | | 685,261 | |
The accompanying Notes to Financial Statements are an integral part of this schedule.
53
Aggressive Allocation Fund
Schedule of Investments as of October 31, 2011
| | | | | | |
| Shares | | Common Stock (25.2%) | | Value | |
Energy (2.8%) - continued | |
21,647 | | Peabody Energy Corporation | | | $938,830 | |
3,900 | | Petrofac, Ltd. | | | 89,590 | |
51,726 | | Petroleum Geo-Services ASAa | | | 561,991 | |
3,600 | | Royal Dutch Shell plc | | | 129,167 | |
822 | | Royal Dutch Shell plc, Class A | | | 29,120 | |
6,300 | | Southwestern Energy Companya | | | 264,852 | |
20,033 | | Swift Energy Companya | | | 613,411 | |
110,360 | | Weatherford International, Ltd.a | | | 1,710,580 | |
| | | |
| | Total Energy | | | 15,006,447 | |
| | | |
|
Financials (2.8%) | |
4,860 | | ACE, Ltd. | | | 350,649 | |
7,454 | | Affiliated Managers Group, Inc.a | | | 690,315 | |
4,490 | | Aon Corporation | | | 209,324 | |
3,000 | | Assicurazioni Generali SPA | | | 53,676 | |
5,000 | | Atlantia SPA | | | 76,156 | |
20,000 | | Banco de Sabadell SA | | | 71,734 | |
17,900 | | Banco de Valencia SAa | | | 21,846 | |
2,000 | | Cheung Kong Holdings, Ltd. | | | 24,792 | |
17,160 | | Citigroup, Inc. | | | 542,084 | |
1,600 | | CME Group, Inc. | | | 440,896 | |
16,164 | | Duke Realty Corporation | | | 198,494 | |
5,500 | | Endurance Specialty Holdings, Ltd. | | | 204,600 | |
13,724 | | Equity One, Inc. | | | 235,367 | |
2,200 | | Experian plc | | | 28,581 | |
100,000 | | Fifth Third Bancorp | | | 1,201,000 | |
1,440 | | Goldman Sachs Group, Inc. | | | 157,752 | |
1,007 | | Hannover Rueckversicherung AG | | | 49,579 | |
14,141 | | HCC Insurance Holdings, Inc. | | | 376,292 | |
20,118 | | Host Hotels & Resorts, Inc. | | | 287,084 | |
1,499 | | IntercontinentalExchange, Inc.a | | | 194,690 | |
33,809 | | J.P. Morgan Chase & Company | | | 1,175,201 | |
12,500 | | Kerry Properties, Ltd. | | | 45,874 | |
12,380 | | KKR & Company, LP | | | 166,882 | |
7,118 | | Lazard, Ltd. | | | 194,606 | |
4,700 | | M&T Bank Corporation | | | 357,717 | |
3,620 | | MetLife, Inc. | | | 127,279 | |
3,500 | | Mitsui & Company, Ltd. | | | 51,081 | |
400 | | Muenchener Rueckversicherungs- Gesellschaft AG | | | 53,568 | |
10,600 | | NASDAQ OMX Group, Inc.a | | | 265,530 | |
5,800 | | Northern Trust Corporation | | | 234,726 | |
53,516 | | Ocwen Financial Corporationa | | | 775,982 | |
373,146 | | Popular, Inc.a | | | 694,052 | |
7,876 | | Principal Financial Group, Inc. | | | 203,043 | |
9,188 | | Prudential plc | | | 94,907 | |
6,549 | | Resolution, Ltd. | | | 28,822 | |
6,100 | | Standard Life plc | | | 21,041 | |
4,360 | | State Street Corporation | | | 176,100 | |
3,100 | | Sumitomo Mitsui Financial Group, Inc. | | | 86,650 | |
3,000 | | Sun Hung Kai Properties, Ltd. | | | 41,306 | |
3,410 | | SVB Financial Groupa | | | 156,655 | |
28,354 | | Texas Capital Bancshares, Inc.a | | | 793,912 | |
41,390 | | U.S. Bancorp | | | 1,059,170 | |
12,970 | | Unum Group | | | 309,205 | |
1,910 | | Vanguard REIT ETF | | | 111,047 | |
13,537 | | W.R. Berkley Corporation | | | 471,223 | |
42,820 | | Wells Fargo & Company | | | 1,109,466 | |
1,500 | | Westfield Group | | | 12,075 | |
8,000 | | Wheelock and Company, Ltd. | | | 23,505 | |
50,172 | | Zions Bancorporation | | | 870,986 | |
| | | | | | |
| Shares | | Common Stock (25.2%) | | Value | |
Financials (2.8%) - continued | |
200 | | Zurich Financial Services AGa | | | $46,089 | |
| | Total Financials | | | 15,172,611 | |
| | | |
|
Health Care (3.2%) | |
10,100 | | Abbott Laboratories | | | 544,087 | |
2,600 | | Alexion Pharmaceuticals, Inc.a | | | 175,526 | |
41,700 | | Align Technology, Inc.a | | | 960,351 | |
29,098 | | Amgen, Inc. | | | 1,666,442 | |
2,300 | | AstraZeneca plc | | | 110,426 | |
23,110 | | Baxter International, Inc. | | | 1,270,588 | |
3,076 | | C.R. Bard, Inc. | | | 264,382 | |
4,659 | | Celesio AG | | | 73,481 | |
17,272 | | Covance, Inc.a | | | 876,209 | |
7,105 | | Coventry Health Care, Inc.a | | | 226,010 | |
5,370 | | Covidien plc | | | 252,605 | |
14,100 | | Eli Lilly and Company | | | 523,956 | |
100 | | Fresenius SE & Company KGaA | | | 9,819 | |
19,200 | | Gilead Sciences, Inc.a | | | 799,872 | |
33,892 | | Health Net, Inc.a | | | 941,859 | |
12,110 | | Johnson & Johnson | | | 779,763 | |
12,616 | | McKesson Corporation | | | 1,028,835 | |
16,400 | | Merck & Company, Inc. | | | 565,800 | |
53,458 | | Mylan, Inc.a | | | 1,046,173 | |
400 | | Novartis AG | | | 22,534 | |
69,317 | | Pfizer, Inc. | | | 1,335,045 | |
30,680 | | PSS World Medical, Inc.a | | | 682,630 | |
200 | | Roche Holding AG | | | 32,814 | |
1,600 | | Suzuken Company, Ltd. | | | 38,280 | |
8,800 | | Thoratec Corporationa | | | 321,288 | |
20,308 | | United Therapeutics Corporationa | | | 888,069 | |
24,970 | | UnitedHealth Group, Inc. | | | 1,198,310 | |
2,871 | | Varian Medical Systems, Inc.a | | | 168,585 | |
4,093 | | Vertex Pharmaceuticals, Inc.a | | | 162,042 | |
2,500 | | Waters Corporationa | | | 200,300 | |
6,141 | | Zimmer Holdings, Inc.a | | | 323,201 | |
| | | |
| | Total Health Care | | | 17,489,282 | |
| | | |
|
Industrials (2.9%) | |
6,800 | | 3M Company | | | 537,336 | |
7 | | A P Moller - Maersk AS | | | 47,339 | |
4,700 | | Abertis Infraestructuras SA | | | 77,341 | |
9,700 | | Boeing Company | | | 638,163 | |
2,200 | | Bouygues SA | | | 82,167 | |
8,400 | | Caterpillar, Inc. | | | 793,464 | |
9 | | Central Japan Railway Company | | | 76,563 | |
6,256 | | Chicago Bridge and Iron Company | | | 228,844 | |
8,531 | | CSX Corporation | | | 189,473 | |
28,984 | | Deluxe Corporation | | | 684,602 | |
1,300 | | East Japan Railway Company | | | 78,817 | |
700 | | Eiffage SA | | | 23,742 | |
28,053 | | EMCOR Group, Inc. | | | 703,289 | |
4,996 | | Expeditors International of Washington, Inc. | | | 227,818 | |
700 | | Fraport AG | | | 44,073 | |
27,563 | | FTI Consulting, Inc.a | | | 1,086,258 | |
20,500 | | GATX Corporation | | | 778,590 | |
12,600 | | General Dynamics Corporation | | | 808,794 | |
27,674 | | General Electric Company | | | 462,433 | |
15,749 | | Honeywell International, Inc. | | | 825,248 | |
106,376 | | Manitowoc Company, Inc. | | | 1,178,646 | |
3,700 | | Manpower, Inc. | | | 159,618 | |
5,000 | | Orient Overseas International, Ltd. | | | 22,566 | |
12,212 | | Oshkosh Corporationa | | | 254,742 | |
The accompanying Notes to Financial Statements are an integral part of this schedule.
54
Aggressive Allocation Fund
Schedule of Investments as of October 31, 2011
| | | | | | |
| Shares | | Common Stock (25.2%) | | Value | |
Industrials (2.9%) - continued | | | | |
11,712 | | Parker Hannifin Corporation | | | $955,114 | |
9,200 | | PostNL NV | | | 46,583 | |
4,900 | | Precision Castparts Corporation | | | 799,435 | |
6,900 | | Republic Services, Inc. | | | 196,374 | |
700 | | Safran SA | | | 22,859 | |
30,554 | | Shaw Group, Inc.a | | | 710,686 | |
7,873 | | SPX Corporation | | | 429,945 | |
9,218 | | Teledyne Technologies, Inc.a | | | 502,104 | |
9,730 | | Textron, Inc. | | | 188,957 | |
86,200 | | Thomas Cook Group plc | | | 71,521 | |
5,700 | | Tyco International, Ltd. | | | 259,635 | |
10,661 | | Union Pacific Corporation | | | 1,061,516 | |
3,267 | | United Technologies Corporation | | | 254,761 | |
1,200 | | W.W. Grainger, Inc. | | | 205,572 | |
4,720 | | WESCO International, Inc.a | | | 228,731 | |
300 | | West Japan Railway Company | | | 12,712 | |
| | | |
| | Total Industrials | | | 15,956,431 | |
| | | |
| |
Information Technology (6.5%) | | | | |
6,632 | | ADTRAN, Inc. | | | 222,835 | |
22,662 | | Akamai Technologies, Inc.a | | | 610,514 | |
4,600 | | Alliance Data Systems Corporationa | | | 471,224 | |
12,177 | | Apple, Inc.a | | | 4,929,006 | |
65,800 | | Atmel Corporationa | | | 694,848 | |
2,600 | | Baidu.com, Inc. ADRa | | | 364,468 | |
14,250 | | Broadcom Corporationa | | | 514,282 | |
17,150 | | Cisco Systems, Inc. | | | 317,790 | |
13,326 | | Cognizant Technology Solutions Corporationa | | | 969,466 | |
1,600 | | Computershare, Ltd. | | | 12,644 | |
21,224 | | eBay, Inc.a | | | 675,560 | |
36,550 | | EMC Corporationa | | | 895,840 | |
4,401 | | F5 Networks, Inc.a | | | 457,484 | |
3,905 | | Google, Inc.a | | | 2,314,259 | |
30,100 | | Hewlett-Packard Company | | | 800,961 | |
74,600 | | Intel Corporation | | | 1,830,684 | |
1,606 | | International Business Machines Corporation | | | 296,516 | |
7,148 | | Ixiaa | | | 80,987 | |
11,411 | | Juniper Networks, Inc.a | | | 279,227 | |
6,600 | | Lam Research Corporationa | | | 283,734 | |
85,204 | | Microsoft Corporation | | | 2,268,983 | |
69,920 | | Monster Worldwide, Inc.a | | | 645,362 | |
8,800 | | Nokia Oyj | | | 59,216 | |
8 | | NTT Data Corporation | | | 26,819 | |
44,073 | | NVIDIA Corporationa | | | 652,280 | |
90,030 | | Oracle Corporation | | | 2,950,283 | |
23,275 | | Plantronics, Inc. | | | 777,618 | |
25,162 | | Plexus Corporationa | | | 646,663 | |
23,100 | | QUALCOMM, Inc. | | | 1,191,960 | |
38,671 | | Quest Software, Inc.a | | | 680,223 | |
6,781 | | Red Hat, Inc.a | | | 336,677 | |
4,869 | | Salesforce.com, Inc.a | | | 648,405 | |
39,400 | | SuccessFactors, Inc.a | | | 1,051,980 | |
8,200 | | Telefonaktiebolaget LM Ericsson | | | 85,472 | |
84,571 | | Teradyne, Inc.a | | | 1,211,057 | |
11,290 | | Texas Instruments, Inc. | | | 346,942 | |
45,192 | | TIBCO Software, Inc.a | | | 1,305,597 | |
16,124 | | ValueClick, Inc.a | | | 283,782 | |
24,100 | | VeriFone Systems, Inc.a | | | 1,017,261 | |
9,100 | | Visa, Inc. | | | 848,666 | |
7,709 | | VMware, Inc.a | | | 753,555 | |
| | | | | | |
| Shares | | Common Stock (25.2%) | | Value | |
Information Technology (6.5%) - continued | | | | |
16,062 | | Xilinx, Inc. | | | $537,435 | |
| | | |
| | Total Information Technology | | | 35,348,565 | |
| | | |
| |
Materials (0.8%) | | | | |
4,847 | | Albemarle Corporation | | | 258,297 | |
1,200 | | Bayer AG | | | 76,454 | |
3,700 | | BHP Billiton plc | | | 116,516 | |
1,700 | | BHP Billiton, Ltd. | | | 66,543 | |
3,700 | | CF Industries Holdings, Inc. | | | 600,399 | |
8,170 | | Dow Chemical Company | | | 227,779 | |
4,360 | | E.I. du Pont de Nemours and Company | | | 209,585 | |
37,546 | | Freeport-McMoRan Copper & Gold, Inc. | | | 1,511,602 | |
1,400 | | Henkel AG & Company KGaA | | | 68,362 | |
5,800 | | ITOCHU Corporation | | | 57,364 | |
2,000 | | Marubeni Corporation | | | 11,641 | |
2,700 | | Nippon Paper Group, Inc. | | | 61,880 | |
1,961 | | Rio Tinto plc | | | 106,093 | |
704 | | Rio Tinto, Ltd. | | | 50,541 | |
2,027 | | Sigma-Aldrich Corporation | | | 132,728 | |
6,818 | | Silgan Holdings, Inc. | | | 255,948 | |
19,344 | | Steel Dynamics, Inc. | | | 241,606 | |
17,000 | | Ube Industries, Ltd. | | | 49,839 | |
1,000 | | Walter Energy, Inc. | | | 75,650 | |
455 | | Yara International ASA | | | 21,517 | |
| | | |
| | Total Materials | | | 4,200,344 | |
| | | |
| |
Telecommunications Services (0.2%) | | | | |
23,000 | | AT&T, Inc. | | | 674,130 | |
2,100 | | Deutsche Telekom AG | | | 26,679 | |
6,755 | | Inmarsat plc | | | 50,961 | |
8 | | KDDI Corporation | | | 58,603 | |
1,900 | | Koninklijke (Royal) KPN NV | | | 24,876 | |
1,300 | | Nippon Telegraph & Telephone Corporation | | | 66,685 | |
29 | | NTT DoCoMo, Inc. | | | 51,505 | |
18,100 | | Telstra Corporation, Ltd. | | | 58,765 | |
7,434 | | Verizon Communications, Inc. | | | 274,909 | |
| | | |
| | Total Telecommunications Services | | | 1,287,113 | |
| | | |
| |
Utilities (0.6%) | | | | |
20,900 | | A2A SPA | | | 28,572 | |
12,800 | | CMS Energy Corporation | | | 266,496 | |
1,300 | | Enagas SA | | | 25,563 | |
7,640 | | Exelon Corporation | | | 339,140 | |
2,900 | | Gas Natural SDG SA | | | 53,905 | |
5,800 | | National Grid plc | | | 57,666 | |
12,160 | | NiSource, Inc. | | | 268,614 | |
17,513 | | NV Energy, Inc. | | | 280,908 | |
41,300 | | PNM Resources, Inc. | | | 742,574 | |
500 | | Red Electrica Corporacion SA | | | 24,087 | |
18,640 | | Southwest Gas Corporation | | | 735,907 | |
2,512 | | SSE plc | | | 54,277 | |
2,600 | | Tohoku Electric Power Company, Inc. | | | 28,728 | |
9,400 | | Tokyo Electric Power Company, Inc.a | | | 34,481 | |
The accompanying Notes to Financial Statements are an integral part of this schedule.
55
Aggressive Allocation Fund
Schedule of Investments as of October 31, 2011
| | | | | | |
| Shares | | Common Stock (25.2%) | | Value | |
Utilities (0.6%) - continued | | | | |
8,194 | | UGI Corporation | | | $234,922 | |
| | | |
| | Total Utilities | | | 3,175,840 | |
| | | |
| | | | | | |
| | | |
| | Total Common Stock (cost $130,287,475) | | | 136,652,183 | |
| | | |
| | |
Principal
Amount | | Long-Term Fixed Income (3.5%) | | Value | |
Asset-Backed Securities (0.2%) | | | | |
| | J.P. Morgan Mortgage Acquisition Corporation | | | | |
$1,000,000 | | 5.461%, 10/25/2036 | | | 759,740 | |
| | Renaissance Home Equity Loan Trust | | | | |
650,000 | | 6.011%, 5/25/2036 | | | 286,018 | |
| | | |
| | Total Asset-Backed Securities | | | 1,045,758 | |
| | | |
| |
Basic Materials (0.2%) | | | | |
| | ArcelorMittal | | | | |
100,000 | | 7.000%, 10/15/2039 | | | 99,861 | |
| | Arch Coal, Inc. | | | | |
120,000 | | 7.000%, 6/15/2019b | | | 124,200 | |
| | Dow Chemical Company | | | | |
100,000 | | 4.250%, 11/15/2020 | | | 102,834 | |
| | FMG Resources Property, Ltd. | | | | |
120,000 | | 7.000%, 11/1/2015b | | | 120,000 | |
| | Georgia-Pacific, LLC | | | | |
110,000 | | 8.000%, 1/15/2024 | | | 144,914 | |
| | Novelis, Inc. | | | | |
130,000 | | 8.375%, 12/15/2017 | | | 140,400 | |
| | | |
| | Total Basic Materials | | | 732,209 | |
| | | |
| |
Capital Goods (<0.1%) | | | | |
| | Case New Holland, Inc. | | | | |
120,000 | | 7.875%, 12/1/2017 | | | 135,300 | |
| | Danaher Corporation | | | | |
40,000 | | 0.603%, 6/21/2013c | | | 40,042 | |
| | | |
| | Total Capital Goods | | | 175,342 | |
| | | |
| |
Collateralized Mortgage Obligations (0.1%) | | | | |
| | Sequoia Mortgage Trust | | | | |
182,626 | | 5.372%, 9/20/2046 | | | 57,553 | |
| | WaMu Mortgage Pass Through Certificates | | | | |
108,388 | | 5.835%, 9/25/2036 | | | 84,303 | |
162,440 | | 5.932%, 10/25/2036 | | | 137,698 | |
| | | |
| | Total Collateralized Mortgage Obligations | | | 279,554 | |
| | | |
| |
Commercial Mortgage-Backed Securities (<0.1%) | | | | |
| | Credit Suisse Mortgage Capital Certificates | | | | |
250,000 | | 5.509%, 9/15/2039 | | | 207,414 | |
| | | |
| | Total Commercial Mortgage- Backed Securities | | | 207,414 | |
| | | |
| |
Communications Services (0.2%) | | | | |
| | Cablevision Systems Corporation | | | | |
130,000 | | 8.625%, 9/15/2017 | | | 141,050 | |
| | CBS Corporation | | | | |
50,000 | | 7.875%, 7/30/2030 | | | 66,024 | |
50,000 | | 5.900%, 10/15/2040 | | | 55,763 | |
| | | | | | |
Principal
Amount | | Long-Term Fixed Income (3.5%) | | Value | |
Communications Services (0.2%) - continued | | | | |
| | CCO Holdings, LLC | | | | |
$110,000 | | 7.000%, 1/15/2019 | | | $114,125 | |
| | Clear Channel Worldwide Holdings, Inc. | | | | |
120,000 | | 9.250%, 12/15/2017 | | | 130,200 | |
| | Cox Communications, Inc. | | | | |
100,000 | | 6.950%, 6/1/2038b | | | 118,844 | |
| | EH Holding Corporation | | | | |
130,000 | | 6.500%, 6/15/2019b | | | 132,925 | |
| | Frontier Communications Corporation | | | | |
130,000 | | 8.250%, 4/15/2017 | | | 138,775 | |
| | Intelsat Jackson Holdings SA | | | | |
130,000 | | 7.250%, 4/1/2019b | | | 130,650 | |
| | NII Capital Corporation | | | | |
80,000 | | 7.625%, 4/1/2021 | | | 82,400 | |
| | Virgin Media Finance plc | | | | |
110,000 | | 9.500%, 8/15/2016 | | | 122,650 | |
| | | |
| | Total Communications Services | | | 1,233,406 | |
| | | |
| |
Consumer Cyclical (0.2%) | | | | |
| | Chrysler Group, LLC | | | | |
200,000 | | 8.000%, 6/15/2019b | | | 184,000 | |
| | Home Depot, Inc. | | | | |
100,000 | | 5.875%, 12/16/2036 | | | 118,185 | |
| | Lennar Corporation | | | | |
120,000 | | 12.250%, 6/1/2017 | | | 141,300 | |
| | MGM Resorts International | | | | |
100,000 | | 11.125%, 11/15/2017 | | | 113,500 | |
| | Rite Aid Corporation | | | | |
120,000 | | 7.500%, 3/1/2017 | | | 119,400 | |
| | Starwood Hotels & Resorts Worldwide, Inc. | | | | |
130,000 | | 6.750%, 5/15/2018 | | | 144,300 | |
| | Toys R Us Property Company II, LLC | | | | |
120,000 | | 8.500%, 12/1/2017 | | | 126,750 | |
| | West Corporation | | | | |
60,000 | | 7.875%, 1/15/2019 | | | 60,900 | |
| | WMG Acquisition Corporation | | | | |
120,000 | | 11.500%, 10/1/2018b | | | 119,700 | |
| | | |
| | Total Consumer Cyclical | | | 1,128,035 | |
| | | |
| |
Consumer Non-Cyclical (0.3%) | | | | |
| | Altria Group, Inc. | | | | |
100,000 | | 9.950%, 11/10/2038 | | | 151,930 | |
| | Anheuser-Busch Companies, Inc. | | | | |
50,000 | | 6.450%, 9/1/2037 | | | 66,276 | |
| | Anheuser-Busch InBev Worldwide, Inc. | | | | |
70,000 | | 0.761%, 7/14/2014c | | | 69,807 | |
50,000 | | 8.200%, 1/15/2039 | | | 78,080 | |
| | Community Health Systems, Inc. | | | | |
130,000 | | 8.875%, 7/15/2015 | | | 133,087 | |
| | HCA, Inc. | | | | |
110,000 | | 7.500%, 2/15/2022 | | | 112,200 | |
| | JBS USA, LLC/JBS USA Finance, Inc. | | | | |
100,000 | | 11.625%, 5/1/2014 | | | 110,000 | |
| | Kinetic Concepts, Inc./KCI USA, Inc. | | | | |
110,000 | | 10.500%, 11/1/2018b,d | | | 111,237 | |
The accompanying Notes to Financial Statements are an integral part of this schedule.
56
Aggressive Allocation Fund
Schedule of Investments as of October 31, 2011
| | | | | | |
Principal
Amount | | Long-Term Fixed Income (3.5%) | | Value | |
Consumer Non-Cyclical (0.3%) - continued | | | | |
| | Kraft Foods, Inc. | | | | |
$50,000 | | 5.375%, 2/10/2020 | | | $57,628 | |
50,000 | | 7.000%, 8/11/2037 | | | 66,425 | |
| | Mylan, Inc. | | | | |
110,000 | | 7.875%, 7/15/2020b | | | 123,200 | |
| | Reynolds Group Issuer, Inc. | | | | |
120,000 | | 6.875%, 2/15/2021b | | | 121,200 | |
| | Tenet Healthcare Corporation | | | | |
110,000 | | 8.875%, 7/1/2019 | | | 124,300 | |
| | UnitedHealth Group, Inc. | | | | |
50,000 | | 6.875%, 2/15/2038 | | | 65,933 | |
50,000 | | 5.700%, 10/15/2040 | | | 59,101 | |
| | | |
| | Total Consumer Non-Cyclical | | | 1,450,404 | |
| | | |
| |
Energy (0.1%) | | | | |
| | Chesapeake Energy Corporation | | | | |
90,000 | | 9.500%, 2/15/2015 | | | 103,050 | |
| | Linn Energy, LLC | | | | |
120,000 | | 7.750%, 2/1/2021 | | | 128,100 | |
| | Newfield Exploration Company | | | | |
110,000 | | 5.750%, 1/30/2022 | | | 116,600 | |
| | Plains Exploration & Production Company | | | | |
130,000 | | 7.625%, 6/1/2018 | | | 139,100 | |
| | Weatherford International, Ltd. | | | | |
100,000 | | 6.750%, 9/15/2040 | | | 116,661 | |
| | | |
| | Total Energy | | | 603,511 | |
| | | |
| |
Financials (0.2%) | | | | |
| | Ally Financial, Inc. | | | | |
130,000 | | 8.000%, 3/15/2020 | | | 133,900 | |
| | AXA SA | | | | |
100,000 | | 6.379%, 12/29/2049b,e | | | 74,750 | |
| | BBVA International Preferred SA Unipersonal | | | | |
50,000 | | 5.919%, 12/29/2049e | | | 36,148 | |
| | CIT Group, Inc. | | | | |
120,000 | | 7.000%, 5/1/2017 | | | 120,000 | |
| | General Electric Capital Corporation | | | | |
100,000 | | 6.750%, 3/15/2032 | | | 116,942 | |
| | HCP, Inc. | | | | |
100,000 | | 6.750%, 2/1/2041 | | | 106,932 | |
| | Health Care REIT, Inc. | | | | |
40,000 | | 6.500%, 3/15/2041 | | | 38,327 | |
| | Icahn Enterprises, LP | | | | |
70,000 | | 8.000%, 1/15/2018 | | | 71,225 | |
| | International Lease Finance Corporation | | | | |
130,000 | | 5.750%, 5/15/2016 | | | 122,653 | |
| | MetLife Capital Trust IV | | | | |
100,000 | | 7.875%, 12/15/2037b | | | 105,865 | |
| | Prudential Financial, Inc. | | | | |
100,000 | | 6.200%, 11/15/2040 | | | 112,439 | |
| | Reinsurance Group of America, Inc. | | | | |
50,000 | | 6.750%, 12/15/2065 | | | 43,391 | |
| | XL Group plc | | | | |
100,000 | | 6.250%, 5/15/2027 | | | 103,515 | |
50,000 | | 6.500%, 12/31/2049e | | | 42,000 | |
| | | |
| | Total Financials | | | 1,228,087 | |
| | | |
| | | | | | |
Principal
Amount | | Long-Term Fixed Income (3.5%) | | Value | |
Mortgage-Backed Securities (1.1%) | | | | |
| | Federal National Mortgage Association Conventional 15- Yr. Pass Through | | | | |
$2,700,000 | | 3.000%, 12/1/2026d | | | $2,755,688 | |
| | Federal National Mortgage Association Conventional 30- Yr. Pass Through | | | | |
1,800,000 | | 4.500%, 11/1/2041d | | | 1,903,219 | |
1,000,000 | | 5.000%, 11/1/2041d | | | 1,075,625 | |
| | | |
| | Total Mortgage-Backed Securities | | | 5,734,532 | |
| | | |
| |
Technology (<0.1%) | | | | |
| | Seagate HDD Cayman | | | | |
100,000 | | 7.750%, 12/15/2018b | | | 104,500 | |
| | | |
| | Total Technology | | | 104,500 | |
| | | |
| |
Transportation (<0.1%) | | | | |
| | Avis Budget Car Rental, LLC/Avis Budget Finance, Inc. | | | | |
90,000 | | 8.250%, 1/15/2019 | | | 89,775 | |
| | | |
| | Total Transportation | | | 89,775 | |
| | | |
| |
U.S. Government and Agencies (0.8%) | | | | |
| | U.S. Treasury Notes | | | | |
2,150,000 | | 2.500%, 4/30/2015 | | | 2,294,957 | |
1,050,000 | | 3.125%, 5/15/2021 | | | 1,141,466 | |
550,000 | | 4.375%, 5/15/2040 | | | 673,750 | |
| | | |
| | Total U.S. Government and Agencies | | | 4,110,173 | |
| | | |
| |
Utilities (0.1%) | | | | |
| | AES Corporation | | | | |
110,000 | | 7.375%, 7/1/2021b | | | 117,700 | |
| | Dominion Resources, Inc. | | | | |
50,000 | | 2.669%, 9/30/2066c | | | 42,344 | |
| | Energy Transfer Partners, LP | | | | |
28,000 | | 6.625%, 10/15/2036 | | | 30,359 | |
50,000 | | 7.500%, 7/1/2038 | | | 57,402 | |
| | Markwest Energy Partners, LP/Markwest Energy Finance Corporation | | | | |
130,000 | | 6.500%, 8/15/2021 | | | 134,225 | |
| | Southern Union Company | | | | |
100,000 | | 7.200%, 11/1/2066 | | | 86,000 | |
| | | |
| | Total Utilities | | | 468,030 | |
| | | |
| | | | | | |
| | | |
| | Total Long-Term Fixed Income (cost $18,043,319) | | | 18,590,730 | |
| | | |
| | |
Principal
Amount | | Short-Term Investments (6.4%)f | | Value | |
| | Federal Home Loan Bank Discount Notes | | | | |
5,000,000 | | 0.023%, 11/16/2011g | | | 4,999,952 | |
9,000,000 | | 0.020%, 11/18/2011g | | | 8,999,915 | |
5,000,000 | | 0.020%, 11/23/2011g | | | 4,999,939 | |
| | Federal Home Loan Mortgage Corporation Discount Notes | | | | |
3,000,000 | | 0.025%, 11/14/2011g | | | 2,999,973 | |
| | Federal National Mortgage Association Discount Notes | | | | |
5,250,000 | | 0.098%, 2/22/2012g,h | | | 5,248,398 | |
The accompanying Notes to Financial Statements are an integral part of this schedule.
57
Aggressive Allocation Fund
Schedule of Investments as of October 31, 2011
| | | | | | |
Principal
Amount | | Short-Term Investments (6.4%)f | | Value | |
| | U.S. Treasury Bills | | | | |
$7,500,000 | | 0.045%, 2/9/2012h | | | $7,499,068 | |
| | | |
| | Total Short-Term Investments (at amortized cost) | | | 34,747,245 | |
| | | |
| | Total Investments (cost $541,726,607) 100.8% | | $ | 546,429,274 | |
| | | |
| | Other Assets and Liabilities, Net (0.8%) | | | (4,273,625 | ) |
| | | |
| | Total Net Assets 100.0% | | $ | 542,155,649 | |
| | | |
| a | Non-income producing security. |
| b | Denotes securities sold under Rule 144A of the Securities Act of 1933, which exempts them from registration. These securities have been deemed liquid and may be resold to other dealers in the program or to other qualified institutional buyers. As of October 31, 2011, the value of these investments was $1,688,771 or 0.3% of total net assets. |
| c | Denotes variable rate securities. Variable rate securities are securities whose yields vary with a designated market index or market rate. The rate shown is as of October 31, 2011. |
| d | Denotes investments purchased on a when-issued or delayed delivery basis. |
| e | Denotes perpetual securities. Perpetual securities pay an indefinite stream of interest, but may be called by the issuer at an earlier date. |
| f | The interest rate shown reflects the yield, coupon rate or the discount rate at the date of purchase. |
| g | Denotes investments that benefit from credit enhancement or liquidity support provided by a third party bank, institution or government. |
| h | At October 31, 2011, $12,747,466 of investments were held on deposit with the counterparty and pledged as the initial margin deposit for open futures contracts. |
Definitions:
| | | | |
| ADR | | - | | American Depositary Receipt, which are certificates for an underlying foreign security’s shares held by an issuing U.S. depository bank. |
| REIT | | - | | Real Estate Investment Trust is a company that buys, develops, manages and/or sells real estate assets. |
| ETF | | - | | Exchange Traded Fund. |
| | | | |
Unrealized Appreciation (Depreciation) | | | | |
Gross unrealized appreciation and depreciation of investments,based on cost for federal income tax purposes, were as follows: | |
Gross unrealized appreciation | | | $29,049,958 | |
Gross unrealized depreciation | | | (30,018,973 | ) |
| | | | |
Net unrealized appreciation (depreciation) | | | ($969,015 | ) |
| |
Cost for federal income tax purposes | | $ | 547,398,289 | |
The accompanying Notes to Financial Statements are an integral part of this schedule.
58
Aggressive Allocation Fund
Schedule of Investments as of October 31, 2011
Fair Valuation Measurements
The following table is a summary of the inputs used, as of October 31, 2011, in valuing Aggressive Allocation Fund’s assets carried at fair value.
| | | | | | | | | | | | | | | | |
| Investments in Securities | | Total | | | Level 1 | | | Level 2 | | | Level 3 | |
| | | | |
Mutual Funds | | | | | | | | | | | | | | | | |
Equity Mutual Funds | | | 339,399,579 | | | | 339,399,579 | | | | – | | | | – | |
Fixed Income Mutual Funds | | | 17,039,537 | | | | 17,039,537 | | | | – | | | | – | |
| | | | |
Common Stock | | | | | | | | | | | | | | | | |
Consumer Discretionary | | | 17,363,361 | | | | 16,483,072 | | | | 880,289 | | | | – | |
Consumer Staples | | | 11,652,189 | | | | 11,143,751 | | | | 508,438 | | | | – | |
Energy | | | 15,006,447 | | | | 14,137,160 | | | | 869,287 | | | | – | |
Financials | | | 15,172,611 | | | | 14,341,329 | | | | 831,282 | | | | – | |
Health Care | | | 17,489,282 | | | | 17,201,928 | | | | 287,354 | | | | – | |
Industrials | | | 15,956,431 | | | | 15,350,148 | | | | 606,283 | | | | – | |
Information Technology | | | 35,348,565 | | | | 35,164,414 | | | | 184,151 | | | | – | |
Materials | | | 4,200,344 | | | | 3,513,594 | | | | 686,750 | | | | – | |
Telecommunications Services | | | 1,287,113 | | | | 949,039 | | | | 338,074 | | | | – | |
Utilities | | | 3,175,840 | | | | 2,868,561 | | | | 307,279 | | | | – | |
| | | | |
Long-Term Fixed Income | | | | | | | | | | | | | | | | |
Asset-Backed Securities | | | 1,045,758 | | | | – | | | | 1,045,758 | | | | – | |
Basic Materials | | | 732,209 | | | | – | | | | 732,209 | | | | – | |
Capital Goods | | | 175,342 | | | | – | | | | 175,342 | | | | – | |
Collateralized Mortgage Obligations | | | 279,554 | | | | – | | | | 279,554 | | | | – | |
Commercial Mortgage-Backed Securities | | | 207,414 | | | | – | | | | 207,414 | | | | – | |
Communications Services | | | 1,233,406 | | | | – | | | | 1,233,406 | | | | – | |
Consumer Cyclical | | | 1,128,035 | | | | – | | | | 1,128,035 | | | | – | |
Consumer Non-Cyclical | | | 1,450,404 | | | | – | | | | 1,450,404 | | | | – | |
Energy | | | 603,511 | | | | – | | | | 603,511 | | | | – | |
Financials | | | 1,228,087 | | | | – | | | | 1,228,087 | | | | – | |
Mortgage-Backed Securities | | | 5,734,532 | | | | – | | | | 5,734,532 | | | | – | |
Technology | | | 104,500 | | | | – | | | | 104,500 | | | | – | |
Transportation | | | 89,775 | | | | – | | | | 89,775 | | | | – | |
U.S. Government and Agencies | | | 4,110,173 | | | | – | | | | 4,110,173 | | | | – | |
Utilities | | | 468,030 | | | | – | | | | 468,030 | | | | – | |
Short-Term Investments | | | 34,747,245 | | | | – | | | | 34,747,245 | | | | – | |
| | |
Total | | | $546,429,274 | | | | $487,592,112 | | | | $58,837,162 | | | | $– | |
| | | | | | | | | | | | | | | | | |
| | | | |
| Other Financial Instruments | | Total | | | Level 1 | | | Level 2 | | | Level 3 | |
Asset Derivatives | | | | | | | | | | | | | | | | |
Futures Contracts | | | 7,259,334 | | | | 7,259,334 | | | | – | | | | – | |
| | |
Total Asset Derivatives | | | $7,259,334 | | | | $7,259,334 | | | | $– | | | | $– | |
| | | | | | | | | | | | | | | | | |
Liability Derivatives | | | | | | | | | | | | | | | | |
Futures Contracts | | | 4,383,103 | | | | 4,383,103 | | | | – | | | | – | |
| | |
Total Liability Derivatives | | | $4,383,103 | | | | $4,383,103 | | | | $– | | | | $– | |
| | | | | | | | | | | | | | | | | |
| | | | | | | | | | | | | | | | |
| Futures Contracts | | Number of
Contracts
Long/(Short) | | Expiration Date | | Notional
Principal
Amount | | | Value | | | Unrealized
Gain/(Loss) | |
2-Yr. U.S. Treasury Bond Futures | | (10) | | December 2011 | | | ($2,204,345) | | | | ($2,202,813) | | | | $1,532 | |
5-Yr. U.S. Treasury Bond Futures | | (50) | | December 2011 | | | (6,118,207) | | | | (6,130,469) | | | | (12,262) | |
10-Yr. U.S. Treasury Bond Futures | | (15) | | December 2011 | | | (1,944,798) | | | | (1,935,937) | | | | 8,861 | |
Russell 2000 Index Mini-Futures | | (621) | | December 2011 | | | (43,754,232) | | | | (45,910,530) | | | | (2,156,298) | |
S&P 400 Index Mini-Futures | | (601) | | December 2011 | | | (51,040,068) | | | | (53,254,611) | | | | (2,214,543) | |
S&P 500 Index Futures | | 214 | | December 2011 | | | 63,839,742 | | | | 66,837,550 | | | | 2,997,808 | |
S&P 500 Index Mini-Futures | | 812 | | December 2011 | | | 46,470,447 | | | | 50,721,580 | | | | 4,251,133 | |
Total Futures Contracts | | | | | | | | | | | | | | | $2,876,231 | |
The accompanying Notes to Financial Statements are an integral part of this schedule.
59
Aggressive Allocation Fund
Schedule of Investments as of October 31, 2011
The following table summarizes the fair value and Statement of Assets and Liabilities location, as of October 31, 2011, for Aggressive Allocation Fund’s investments in financial derivative instruments by primary risk exposure as discussed under item (2) Significant Accounting Policies of the Notes to Financial Statements.
| | | | | | |
| Derivatives by risk category | | Statement of Assets and Liabilities Location | | Fair Value | |
| | |
Asset Derivatives | | | | | | |
| | |
Interest Rate Contracts | | | | | | |
Futures* | | Net Assets - Net unrealized appreciation/(depreciation) on Futures contracts | | | $10,393 | |
Total Interest Rate Contracts | | | | | 10,393 | |
| | |
Equity Contracts | | | | | | |
Futures* | | Net Assets - Net unrealized appreciation/(depreciation) on Futures contracts | | | 7,248,941 | |
Total Equity Contracts | | | | | 7,248,941 | |
Total Asset Derivatives | | | | | $7,259,334 | |
| | |
Liability Derivatives | | | | | | |
| | |
Equity Contracts | | | | | | |
Futures* | | Net Assets - Net unrealized appreciation/(depreciation) on Futures contracts | | | 4,370,841 | |
Total Equity Contracts | | | | | 4,370,841 | |
| | |
Interest Rate Contracts | | | | | | |
Futures* | | Net Assets - Net unrealized appreciation/(depreciation) on Futures contracts | | | 12,262 | |
Total Interest Rate Contracts | | | | | 12,262 | |
Total Liability Derivatives | | | | | $4,383,103 | |
| * | Includes cumulative appreciation/depreciation of futures contracts as reported in the Schedule of Investments. Only current day’s variation margin is reported within the Statement of Assets and Liabilities. |
The following table summarizes the net realized gains/(losses) and Statement of Operations location, for the period ended October 31, 2011, for Aggressive Allocation Fund’s investments in financial derivative instruments by primary risk exposure.
| | | | | | |
| Derivatives by risk category | | Statement of Operations location | | Realized Gains/(Losses) recognized in Income | |
| | |
| Interest Rate Contracts | | | | | | |
| Futures | | Net realized gains/(losses) on Futures contracts | | | (505,169 | ) |
| | |
Total Interest Rate Contracts | | | | | (505,169 | ) |
| | |
| Equity Contracts | | | | | | |
| Futures | | Net realized gains/(losses) on Futures contracts | | | 2,433,357 | |
| | |
Total Equity Contracts | | | | | 2,433,357 | |
| | |
| Foreign Exchange Contracts | | | | | | |
| Forward Contracts | | Net realized gains/(losses) on Foreign currency transactions | | | (50,330 | ) |
| | |
Total Foreign Exchange Contracts | | | | | (50,330 | ) |
| | |
| Credit Contracts | | | | | | |
| Credit Default Swaps | | Net realized gains/(losses) on Swap agreements | | | 130,243 | |
| | |
Total Credit Contracts | | | | | 130,243 | |
Total | | | | | $2,008,101 | |
The following table summarizes the change in net unrealized appreciation/(depreciation) and Statement of Operations location, for the period ended October 31, 2011, for Aggressive Allocation Fund’s investments in financial derivative instruments by primary risk exposure.
| | | | | | |
| Derivatives by risk category | | Statement of Operations Location | | Change in unrealized appreciation/(depreciation) recognized in Income | |
Interest Rate Contracts | | | | | | |
Futures | | Change in net unrealized appreciation/(depreciation) on Futures contracts | | | (1,869 | ) |
Total Interest Rate Contracts | | | | | (1,869 | ) |
Equity Contracts | | | | | | |
Futures | | Change in net unrealized appreciation/(depreciation) on Futures contracts | | | 2,878,100 | |
Total Equity Contracts | | | | | 2,878,100 | |
Total | | | | | $2,876,231 | |
The accompanying Notes to Financial Statements are an integral part of this schedule.
60
Aggressive Allocation Fund
Schedule of Investments as of October 31, 2011
The following table presents Aggressive Allocation Fund’s average volume of derivative activity during the period ended October 31, 2011.
| | | | | | | | | | | | | | | | | | | | | | | | |
Derivative Risk Category | | Futures
(Notional*) | | | Futures
(Percentage
of Average
Net Assets) | | | Forwards
(Notional*) | | | Forwards
(Percentage
of Average
Net Assets) | | | Swaps
(Notional*) | | | Swaps
(Percentage
of Average
Net Assets) | |
Equity Contracts | | | $126,172,890 | | | | 22.8 | % | | | N/A | | | | N/A | | | | N/A | | | | N/A | |
Interest Rate Contracts | | | 6,416,395 | | | | 1.2 | | | | N/A | | | | N/A | | | | N/A | | | | N/A | |
Foreign Exchange Contracts | | | N/A | | | | N/A | | | | $246,364 | | | | <0.1 | % | | | N/A | | | | N/A | |
Credit Contracts | | | N/A | | | | N/A | | | | N/A | | | | N/A | | | | $1,626,176 | | | | 0.3 | % |
* Notional amount represents long or short, or both, derivative positions held by the Fund.
Investment in Affiliates
Affiliated issuers, as defined under the Investment Company Act of 1940, include those in which the Fund’s holdings of an issuer represent 5% or more of the outstanding voting securities of an issuer, or any affiliated mutual fund.
A summary of transactions for the fiscal year to date, in Aggressive Allocation Fund, is as follows:
| | | | | | | | | | | | | | | | | | | | | | | | |
| Fund | | Value October 31, 2010 | | | Gross Purchases | | | Gross Sales | | | Shares Held at October 31, 2011 | | | Value October 31, 2011 | | | Income Earned November 1, 2010 - October 31, 2011 | |
Natural Resources | | | $9,151,727 | | | | $263,755 | | | | $– | | | | 991,281 | | | | $10,180,455 | | | | $263,755 | |
Partner Small Cap Growth | | | 40,732,222 | | | | – | | | | – | | | | 3,699,566 | | | | 44,357,797 | | | | – | |
Partner Small Cap Value | | | 13,523,290 | | | | 121,830 | | | | 3,000,000 | | | | 752,160 | | | | 11,425,311 | | | | 121,830 | |
Small Cap Stock | | | 21,256,955 | | | | – | | | | 8,100,000 | | | | 1,004,432 | | | | 15,026,295 | | | | – | |
Mid Cap Growth | | | 31,780,928 | | | | – | | | | 1,200,000 | | | | 1,656,139 | | | | 32,808,108 | | | | – | |
Partner Mid Cap Value | | | 18,664,105 | | | | 120,177 | | | | 1,000,000 | | | | 1,587,827 | | | | 18,418,798 | | | | 120,177 | |
Mid Cap Stock | | | 28,928,528 | | | | 95,964 | | | | 3,000,000 | | | | 1,827,872 | | | | 28,204,069 | | | | 95,964 | |
Partner Worldwide Allocation | | | 25,319,502 | | | | 6,234,457 | | | | – | | | | 9,977,936 | | | | 83,215,986 | | | | 434,457 | |
Partner International Stock | | | 59,639,238 | | | | 2,444,092 | | | | 3,000,000 | | | | – | | | | – | | | | 2,444,092 | |
Large Cap Growth | | | 34,096,097 | | | | – | | | | – | | | | 6,646,413 | | | | 35,093,059 | | | | – | |
Large Cap Value | | | 27,989,075 | | | | 417,986 | | | | – | | | | 2,232,910 | | | | 29,117,144 | | | | 417,986 | |
Large Cap Stock | | | 26,748,157 | | | | 235,778 | | | | – | | | | 1,281,260 | | | | 27,521,460 | | | | 235,778 | |
Equity Income Plus | | | 3,848,777 | | | | 76,580 | | | | – | | | | 456,523 | | | | 4,031,097 | | | | 76,580 | |
High Yield | | | 5,337,083 | | | | 1,097,022 | | | | 1,102,648 | | | | 1,099,603 | | | | 5,190,125 | | | | 406,297 | |
Government Bond | | | 11,081,911 | | | | 1,732,419 | | | | 1,119,322 | | | | 1,108,458 | | | | 11,849,412 | | | | 248,235 | |
Total Value and Income Earned | | | 358,097,595 | | | | | | | | | | | | | | | | 356,439,116 | | | | 4,865,151 | |
The accompanying Notes to Financial Statements are an integral part of this schedule.
61
Moderately Aggressive Allocation Fund
Schedule of Investments as of October 31, 2011
| | | | | | |
| Shares | | Mutual Funds (71.4%) | | Value | |
Equity Mutual Funds (53.8%) | | | | |
4,040,223 | | Thrivent Natural Resources Fund | | | $41,493,093 | |
3,151,900 | | Thrivent Partner Small Cap Growth Funda | | | 37,791,279 | |
1,643,111 | | Thrivent Partner Small Cap Value Fund | | | 24,958,861 | |
1,344,712 | | Thrivent Small Cap Stock Funda | | | 20,116,885 | |
1,758,617 | | Thrivent Mid Cap Growth Funda | | | 34,838,195 | |
3,609,996 | | Thrivent Partner Mid Cap Value Fund | | | 41,875,958 | |
4,016,385 | | Thrivent Mid Cap Stock Fund | | | 61,972,814 | |
19,207,645 | | Thrivent Partner Worldwide Allocation Fund | | | 160,191,758 | |
14,261,498 | | Thrivent Large Cap Growth Funda | | | 75,300,710 | |
7,297,379 | | Thrivent Large Cap Value Fund | | | 95,157,821 | |
3,257,272 | | Thrivent Large Cap Stock Fund | | | 69,966,193 | |
1,157,018 | | Thrivent Equity Income Plus Fund | | | 10,216,465 | |
| | | |
| | Total Equity Mutual Funds | | | 673,880,032 | |
| | | |
| |
Fixed Income Mutual Funds (17.6%) | | | | |
10,516,117 | | Thrivent High Yield Fund | | | 49,636,073 | |
10,913,845 | | Thrivent Income Fund | | | 95,605,280 | |
2,475,238 | | Thrivent Government Bond Fund | | | 26,460,294 | |
3,952,543 | | Thrivent Limited Maturity Bond Fund | | | 49,011,536 | |
| | | |
| | Total Fixed Income Mutual Funds | | | 220,713,183 | |
| | | |
| | | | | | |
| | | |
| | Total Mutual Funds (cost $915,069,563) | | | 894,593,215 | |
| | | |
| | |
| Shares | | Common Stock (18.4%) | | Value | |
Consumer Discretionary (2.3%) | | | | |
8,300 | | Aeon Company, Ltd. | | | 108,554 | |
9,600 | | Amazon.com, Inc.a | | | 2,049,696 | |
1,200 | | Aryzta AG | | | 57,862 | |
10,138 | | Autoliv, Inc. | | | 585,672 | |
1,300 | | Bayerische Motoren Werke AG | | | 70,750 | |
1,500 | | Beiersdorf AG | | | 86,474 | |
47,500 | | Best Buy Company, Inc. | | | 1,245,925 | |
26,500 | | Big Lots, Inc.a | | | 998,785 | |
7,800 | | British Sky Broadcasting Group plc | | | 87,952 | |
14,736 | | Buffalo Wild Wings, Inc.a | | | 975,818 | |
8,310 | | CBS Corporation | | | 214,481 | |
9,600 | | Charter Communications, Inc.a | | | 441,024 | |
62,200 | | Comcast Corporation | | | 1,458,590 | |
1,300 | | Daito Trust Construction Company, Ltd. | | | 115,181 | |
19,406 | | Discovery Communications, Inc.a | | | 843,385 | |
7,468 | | Dollar Tree, Inc.a | | | 597,141 | |
22,200 | | Fiat SPA | | | 135,940 | |
50,788 | | Foot Locker, Inc. | | | 1,110,226 | |
10,740 | | Harley-Davidson, Inc. | | | 417,786 | |
900 | | Kabel Deutschland Holding AGa | | | 51,047 | |
38,013 | | Las Vegas Sands Corporationa | | | 1,784,710 | |
2,100 | | Lawson, Inc. | | | 118,166 | |
22,200 | | Life Time Fitness, Inc.a | | | 957,486 | |
14,000 | | Lifestyle International Holdings, Ltd. | | | 37,478 | |
19,950 | | Lowe’s Companies, Inc. | | | 419,349 | |
21,542 | | Macy’s, Inc. | | | 657,677 | |
34,800 | | McDonald’s Corporation | | | 3,231,180 | |
11,800 | | Mediaset SPA | | | 43,476 | |
55,000 | | Mitsubishi Motors Corporationa | | | 72,654 | |
| | | | | | |
| Shares | | Common Stock (18.4%) | | Value | |
Consumer Discretionary (2.3%) - continued | | | | |
18,890 | | News Corporation | | | $337,187 | |
17,740 | | Omnicom Group, Inc. | | | 789,075 | |
4,865 | | Panera Bread Companya | | | 650,402 | |
102,179 | | Pier 1 Imports, Inc.a | | | 1,278,259 | |
2,100 | | Priceline.com, Inc.a | | | 1,066,212 | |
2,900 | | ProSiebenSat.1 Media AG | | | 61,817 | |
13,200 | | Sands China, Ltd.a | | | 39,668 | |
22,904 | | Signet Jewelers, Ltd. | | | 987,391 | |
67,000 | | SJM Holdings, Ltd. | | | 114,841 | |
37,180 | | Target Corporation | | | 2,035,605 | |
6,710 | | Time Warner Cable, Inc. | | | 427,360 | |
10,230 | | Viacom, Inc. | | | 448,586 | |
3,800 | | Vivendi SA | | | 84,916 | |
300 | | Volkswagen AG | | | 46,915 | |
16,500 | | Williams-Sonoma, Inc. | | | 619,410 | |
9,483 | | WMS Industries, Inc.a | | | 207,773 | |
49,600 | | Wynn Macau, Ltd. | | | 138,973 | |
| | | |
| | Total Consumer Discretionary | | | 28,308,855 | |
| | | |
| |
Consumer Staples (1.5%) | | | | |
68,400 | | Altria Group, Inc. | | | 1,884,420 | |
24,662 | | Anheuser-Busch InBev NV ADR | | | 1,368,001 | |
2,100 | | Autogrill SPA | | | 24,288 | |
2,400 | | British American Tobacco plc | | | 110,046 | |
18,056 | | British American Tobacco plc ADR | | | 1,665,666 | |
1,100 | | Casino Guichard Perrachon SA | | | 103,001 | |
36,752 | | Corn Products International, Inc. | | | 1,782,472 | |
51,400 | | CVS Caremark Corporation | | | 1,865,820 | |
300 | | Delhaize Group SA | | | 19,596 | |
10,990 | | Diageo plc ADR | | | 910,851 | |
1,000 | | Heineken Holding NV | | | 42,779 | |
1,700 | | Henkel AG & Company KGaA | | | 101,056 | |
15,190 | | Herbalife, Ltd. | | | 947,248 | |
3,000 | | Imperial Tobacco Group plc | | | 109,286 | |
3,200 | | Kao Corporation | | | 83,950 | |
30,377 | | Kraft Foods, Inc. | | | 1,068,663 | |
16,400 | | Marks and Spencer Group plc | | | 84,555 | |
1,000 | | Nestle SA | | | 57,838 | |
36,937 | | Philip Morris International, Inc. | | | 2,580,788 | |
4,700 | | Seven & I Holdings Company, Ltd. | | | 125,423 | |
11,411 | | TreeHouse Foods, Inc.a | | | 699,951 | |
66,250 | | Wal-Mart Stores, Inc. | | | 3,757,700 | |
| | | |
| | Total Consumer Staples | | | 19,393,398 | |
| | | |
| |
Energy (2.0%) | | | | |
23,614 | | Alpha Natural Resources, Inc.a | | | 567,681 | |
10,990 | | Anadarko Petroleum Corporation | | | 862,715 | |
16,290 | | Apache Corporation | | | 1,622,973 | |
47,725 | | Arch Coal, Inc. | | | 869,549 | |
23,548 | | Baker Hughes, Inc. | | | 1,365,549 | |
25,140 | | Chevron Corporation | | | 2,640,957 | |
17,970 | | ConocoPhillips | | | 1,251,610 | |
56,099 | | ENSCO International plc ADR | | | 2,785,876 | |
12,600 | | Exxon Mobil Corporation | | | 983,934 | |
30,500 | | Helix Energy Solutions Group, Inc.a | | | 550,830 | |
16 | | INPEX Holdings, Inc. | | | 105,633 | |
78,000 | | Marathon Oil Corporation | | | 2,030,340 | |
9,491 | | National Oilwell Varco, Inc. | | | 676,993 | |
8,800 | | Newfield Exploration Companya | | | 354,288 | |
The accompanying Notes to Financial Statements are an integral part of this schedule.
62
Moderately Aggressive Allocation Fund
Schedule of Investments as of October 31, 2011
| | | | | | |
| Shares | | Common Stock (18.4%) | | Value | |
Energy (2.0%) - continued | | | | |
4,490 | | Occidental Petroleum Corporation | | | $417,301 | |
14,539 | | Oil States International, Inc.a | | | 1,012,060 | |
77,753 | | Patriot Coal Corporationa | | | 976,578 | |
28,441 | | Peabody Energy Corporation | | | 1,233,486 | |
6,600 | | Petrofac, Ltd. | | | 151,614 | |
73,770 | | Petroleum Geo-Services ASAa | | | 801,494 | |
6,100 | | Royal Dutch Shell plc | | | 218,866 | |
1,337 | | Royal Dutch Shell plc, Class A | | | 47,365 | |
12,000 | | Southwestern Energy Companya | | | 504,480 | |
28,595 | | Swift Energy Companya | | | 875,579 | |
168,120 | | Weatherford International, Ltd.a | | | 2,605,860 | |
| | | |
| | Total Energy | | | 25,513,611 | |
| | | |
| |
Financials (2.3%) | | | | |
14,130 | | ACE, Ltd. | | | 1,019,480 | |
10,665 | | Affiliated Managers Group, Inc.a | | | 987,686 | |
13,050 | | Aon Corporation | | | 608,391 | |
5,100 | | Assicurazioni Generali SPA | | | 91,249 | |
8,400 | | Atlantia SPA | | | 127,942 | |
33,800 | | Banco de Sabadell SA | | | 121,230 | |
30,300 | | Banco de Valencia SAa | | | 36,979 | |
3,000 | | Cheung Kong Holdings, Ltd. | | | 37,188 | |
27,773 | | Citigroup, Inc. | | | 877,349 | |
2,100 | | CME Group, Inc. | | | 578,676 | |
30,129 | | Duke Realty Corporation | | | 369,984 | |
11,000 | | Endurance Specialty Holdings, Ltd. | | | 409,200 | |
25,847 | | Equity One, Inc. | | | 443,276 | |
3,700 | | Experian plc | | | 48,068 | |
182,200 | | Fifth Third Bancorp | | | 2,188,222 | |
4,160 | | Goldman Sachs Group, Inc. | | | 455,728 | |
1,740 | | Hannover Rueckversicherung AG | | | 85,668 | |
26,782 | | HCC Insurance Holdings, Inc. | | | 712,669 | |
37,735 | | Host Hotels & Resorts, Inc. | | | 538,478 | |
2,698 | | IntercontinentalExchange, Inc.a | | | 350,416 | |
68,148 | | J.P. Morgan Chase & Company | | | 2,368,824 | |
21,500 | | Kerry Properties, Ltd. | | | 78,903 | |
36,000 | | KKR & Company, LP | | | 485,280 | |
13,636 | | Lazard, Ltd. | | | 372,808 | |
9,200 | | M&T Bank Corporation | | | 700,212 | |
10,550 | | MetLife, Inc. | | | 370,938 | |
5,900 | | Mitsui & Company, Ltd. | | | 86,108 | |
700 | | Muenchener Rueckversicherungs- Gesellschaft AG | | | 93,744 | |
20,100 | | NASDAQ OMX Group, Inc.a | | | 503,505 | |
11,000 | | Northern Trust Corporation | | | 445,170 | |
76,346 | | Ocwen Financial Corporationa | | | 1,107,017 | |
532,070 | | Popular, Inc.a | | | 989,650 | |
22,907 | | Principal Financial Group, Inc. | | | 590,542 | |
15,634 | | Prudential plc | | | 161,491 | |
10,991 | | Resolution, Ltd. | | | 48,372 | |
10,400 | | Standard Life plc | | | 35,874 | |
12,650 | | State Street Corporation | | | 510,934 | |
5,300 | | Sumitomo Mitsui Financial Group, Inc. | | | 148,143 | |
5,000 | | Sun Hung Kai Properties, Ltd. | | | 68,844 | |
9,900 | | SVB Financial Groupa | | | 454,806 | |
40,500 | | Texas Capital Bancshares, Inc.a | | | 1,134,000 | |
80,180 | | U.S. Bancorp | | | 2,051,806 | |
37,860 | | Unum Group | | | 902,582 | |
5,540 | | Vanguard REIT ETF | | | 322,096 | |
25,473 | | W.R. Berkley Corporation | | | 886,715 | |
85,960 | | Wells Fargo & Company | | | 2,227,224 | |
2,600 | | Westfield Group | | | 20,930 | |
13,000 | | Wheelock and Company, Ltd. | | | 38,195 | |
| | | | | | |
| Shares | | Common Stock (18.4%) | | Value | |
Financials (2.3%) - continued | | | | |
77,698 | | Zions Bancorporation | | | $1,348,837 | |
300 | | Zurich Financial Services AGa | | | 69,133 | |
| | | |
| | Total Financials | | | 28,710,562 | |
| | | |
| |
Health Care (2.4%) | | | | |
18,500 | | Abbott Laboratories | | | 996,595 | |
4,800 | | Alexion Pharmaceuticals, Inc.a | | | 324,048 | |
59,500 | | Align Technology, Inc.a | | | 1,370,285 | |
45,019 | | Amgen, Inc. | | | 2,578,238 | |
3,900 | | AstraZeneca plc | | | 187,245 | |
39,130 | | Baxter International, Inc. | | | 2,151,367 | |
5,951 | | C.R. Bard, Inc. | | | 511,488 | |
7,922 | | Celesio AG | | | 124,944 | |
26,390 | | Covance, Inc.a | | | 1,338,765 | |
13,600 | | Coventry Health Care, Inc.a | | | 432,616 | |
15,600 | | Covidien plc | | | 733,824 | |
25,800 | | Eli Lilly and Company | | | 958,728 | |
200 | | Fresenius SE & Company KGaA | | | 19,638 | |
35,000 | | Gilead Sciences, Inc.a | | | 1,458,100 | |
52,063 | | Health Net, Inc.a | | | 1,446,831 | |
26,270 | | Johnson & Johnson | | | 1,691,525 | |
16,536 | | McKesson Corporation | | | 1,348,511 | |
30,000 | | Merck & Company, Inc. | | | 1,035,000 | |
70,350 | | Mylan, Inc.a | | | 1,376,750 | |
700 | | Novartis AG | | | 39,435 | |
155,756 | | Pfizer, Inc. | | | 2,999,861 | |
43,704 | | PSS World Medical, Inc.a | | | 972,414 | |
300 | | Roche Holding AG | | | 49,221 | |
2,700 | | Suzuken Company, Ltd. | | | 64,597 | |
16,500 | | Thoratec Corporationa | | | 602,415 | |
31,102 | | United Therapeutics Corporationa | | �� | 1,360,090 | |
41,101 | | UnitedHealth Group, Inc. | | | 1,972,437 | |
5,742 | | Varian Medical Systems, Inc.a | | | 337,170 | |
7,786 | | Vertex Pharmaceuticals, Inc.a | | | 308,248 | |
4,900 | | Waters Corporationa | | | 392,588 | |
14,592 | | Zimmer Holdings, Inc.a | | | 767,977 | |
| | | |
| | Total Health Care | | | 29,950,951 | |
| | | |
| |
Industrials (2.1%) | | | | |
12,500 | | 3M Company | | | 987,750 | |
10 | | A P Moller - Maersk AS | | | 67,628 | |
7,900 | | Abertis Infraestructuras SA | | | 129,998 | |
12,800 | | Boeing Company | | | 842,112 | |
3,700 | | Bouygues SA | | | 138,190 | |
10,950 | | Caterpillar, Inc. | | | 1,034,337 | |
16 | | Central Japan Railway Company | | | 136,112 | |
11,789 | | Chicago Bridge and Iron Company | | | 431,242 | |
16,265 | | CSX Corporation | | | 361,246 | |
41,370 | | Deluxe Corporation | | | 977,159 | |
2,200 | | East Japan Railway Company | | | 133,382 | |
1,200 | | Eiffage SA | | | 40,700 | |
40,023 | | EMCOR Group, Inc. | | | 1,003,377 | |
9,428 | | Expeditors International of Washington, Inc. | | | 429,917 | |
1,200 | | Fraport AG | | | 75,554 | |
42,331 | | FTI Consulting, Inc.a | | | 1,668,265 | |
29,200 | | GATX Corporation | | | 1,109,016 | |
23,000 | | General Dynamics Corporation | | | 1,476,370 | |
80,481 | | General Electric Company | | | 1,344,837 | |
26,416 | | Honeywell International, Inc. | | | 1,384,198 | |
164,424 | | Manitowoc Company, Inc. | | | 1,821,818 | |
7,200 | | Manpower, Inc. | | | 310,608 | |
The accompanying Notes to Financial Statements are an integral part of this schedule.
63
Moderately Aggressive Allocation Fund
Schedule of Investments as of October 31, 2011
| | | | | | |
| Shares | | Common Stock (18.4%) | | Value | |
Industrials (2.1%) - continued | | | | |
8,500 | | Orient Overseas International, Ltd. | | | $38,362 | |
23,124 | | Oshkosh Corporationa | | | 482,367 | |
20,014 | | Parker Hannifin Corporation | | | 1,632,142 | |
15,700 | | PostNL NV | | | 79,495 | |
6,400 | | Precision Castparts Corporation | | | 1,044,160 | |
13,200 | | Republic Services, Inc. | | | 375,672 | |
1,100 | | Safran SA | | | 35,922 | |
43,582 | | Shaw Group, Inc.a | | | 1,013,717 | |
19,416 | | SPX Corporation | | | 1,060,308 | |
13,180 | | Teledyne Technologies, Inc.a | | | 717,915 | |
28,290 | | Textron, Inc. | | | 549,392 | |
146,000 | | Thomas Cook Group plc | | | 121,138 | |
11,300 | | Tyco International, Ltd. | | | 514,715 | |
14,065 | | Union Pacific Corporation | | | 1,400,452 | |
9,480 | | United Technologies Corporation | | | 739,250 | |
1,600 | | W.W. Grainger, Inc. | | | 274,096 | |
13,780 | | WESCO International, Inc.a | | | 667,779 | |
500 | | West Japan Railway Company | | | 21,187 | |
| | | |
| | Total Industrials | | | 26,671,885 | |
| | | |
| |
Information Technology (4.5%) | | | | |
9,469 | | ADTRAN, Inc. | | | 318,158 | |
29,851 | | Akamai Technologies, Inc.a | | | 804,186 | |
8,700 | | Alliance Data Systems Corporationa | | | 891,228 | |
18,502 | | Apple, Inc.a | | | 7,489,240 | |
93,800 | | Atmel Corporationa | | | 990,528 | |
3,400 | | Baidu.com, Inc. ADRa | | | 476,612 | |
18,650 | | Broadcom Corporationa | | | 673,079 | |
49,870 | | Cisco Systems, Inc. | | | 924,091 | |
17,541 | | Cognizant Technology Solutions Corporationa | | | 1,276,108 | |
2,700 | | Computershare, Ltd. | | | 21,337 | |
32,749 | | eBay, Inc.a | | | 1,042,401 | |
48,000 | | EMC Corporationa | | | 1,176,480 | |
5,765 | | F5 Networks, Inc.a | | | 599,272 | |
5,677 | | Google, Inc.a | | | 3,364,417 | |
54,900 | | Hewlett-Packard Company | | | 1,460,889 | |
136,000 | | Intel Corporation | | | 3,337,440 | |
4,687 | | International Business Machines Corporation | | | 865,361 | |
10,207 | | Ixiaa | | | 115,645 | |
21,821 | | Juniper Networks, Inc.a | | | 533,960 | |
12,600 | | Lam Research Corporationa | | | 541,674 | |
157,823 | | Microsoft Corporation | | | 4,202,826 | |
99,800 | | Monster Worldwide, Inc.a | | | 921,154 | |
14,900 | | Nokia Oyj | | | 100,263 | |
13 | | NTT Data Corporation | | | 43,581 | |
68,303 | | NVIDIA Corporationa | | | 1,010,884 | |
143,990 | | Oracle Corporation | | | 4,718,552 | |
33,210 | | Plantronics, Inc. | | | 1,109,546 | |
35,946 | | Plexus Corporationa | | | 923,812 | |
30,300 | | QUALCOMM, Inc. | | | 1,563,480 | |
55,131 | | Quest Software, Inc.a | | | 969,754 | |
8,891 | | Red Hat, Inc.a | | | 441,438 | |
6,403 | | Salesforce.com, Inc.a | | | 852,688 | |
59,400 | | SuccessFactors, Inc.a | | | 1,585,980 | |
13,900 | | Telefonaktiebolaget LM Ericsson | | | 144,886 | |
135,085 | | Teradyne, Inc.a | | | 1,934,417 | |
32,800 | | Texas Instruments, Inc. | | | 1,007,944 | |
71,847 | | TIBCO Software, Inc.a | | | 2,075,660 | |
30,713 | | ValueClick, Inc.a | | | 540,549 | |
38,200 | | VeriFone Systems, Inc.a | | | 1,612,422 | |
16,500 | | Visa, Inc. | | | 1,538,790 | |
| | | | | | |
| Shares | | Common Stock (18.4%) | | Value | |
Information Technology (4.5%) - continued | | | | |
10,162 | | VMware, Inc.a | | | $993,336 | |
35,605 | | Xilinx, Inc. | | | 1,191,343 | |
| | | |
| | Total Information Technology | | | 56,385,411 | |
| | | |
| |
Materials (0.6%) | | | | |
9,393 | | Albemarle Corporation | | | 500,553 | |
2,100 | | Bayer AG | | | 133,795 | |
6,300 | | BHP Billiton plc | | | 198,393 | |
2,900 | | BHP Billiton, Ltd. | | | 113,514 | |
6,800 | | CF Industries Holdings, Inc. | | | 1,103,436 | |
23,760 | | Dow Chemical Company | | | 662,429 | |
12,689 | | E.I. du Pont de Nemours and Company | | | 609,960 | |
56,738 | | Freeport-McMoRan Copper & Gold, Inc. | | | 2,284,272 | |
2,300 | | Henkel AG & Company KGaA | | | 112,309 | |
9,900 | | ITOCHU Corporation | | | 97,915 | |
4,000 | | Marubeni Corporation | | | 23,282 | |
4,500 | | Nippon Paper Group, Inc. | | | 103,134 | |
3,324 | | Rio Tinto plc | | | 179,833 | |
1,208 | | Rio Tinto, Ltd. | | | 86,723 | |
5,978 | | Sigma-Aldrich Corporation | | | 391,440 | |
12,986 | | Silgan Holdings, Inc. | | | 487,494 | |
36,388 | | Steel Dynamics, Inc. | | | 454,486 | |
29,000 | | Ube Industries, Ltd. | | | 85,019 | |
1,500 | | Walter Energy, Inc. | | | 113,475 | |
771 | | Yara International ASA | | | 36,460 | |
| | | |
| | Total Materials | | | 7,777,922 | |
| | | |
| |
Telecommunications Services (0.2%) | | | | |
41,900 | | AT&T, Inc. | | | 1,228,089 | |
3,500 | | Deutsche Telekom AG | | | 44,464 | |
11,439 | | Inmarsat plc | | | 86,298 | |
14 | | KDDI Corporation | | | 102,555 | |
3,200 | | Koninklijke (Royal) KPN NV | | | 41,897 | |
2,200 | | Nippon Telegraph & Telephone Corporation | | | 112,851 | |
49 | | NTT DoCoMo, Inc. | | | 87,026 | |
30,600 | | Telstra Corporation, Ltd. | | | 99,349 | |
21,613 | | Verizon Communications, Inc. | | | 799,249 | |
| | | |
| | Total Telecommunications Services | | | 2,601,778 | |
| | | |
| |
Utilities (0.5%) | | | | |
35,400 | | A2A SPA | | | 48,395 | |
24,100 | | CMS Energy Corporation | | | 501,762 | |
2,200 | | Enagas SA | | | 43,260 | |
22,210 | | Exelon Corporation | | | 985,902 | |
4,900 | | Gas Natural SDG SA | | | 91,080 | |
9,900 | | National Grid plc | | | 98,430 | |
35,310 | | NiSource, Inc. | | | 779,998 | |
32,927 | | NV Energy, Inc. | | | 528,149 | |
58,900 | | PNM Resources, Inc. | | | 1,059,022 | |
900 | | Red Electrica Corporacion SA | | | 43,356 | |
26,482 | | Southwest Gas Corporation | | | 1,045,509 | |
4,289 | | SSE plc | | | 92,673 | |
4,400 | | Tohoku Electric Power Company, Inc. | | | 48,617 | |
15,900 | | Tokyo Electric Power Company, Inc.a | | | 58,324 | |
The accompanying Notes to Financial Statements are an integral part of this schedule.
64
Moderately Aggressive Allocation Fund
Schedule of Investments as of October 31, 2011
| | | | | | |
| Shares | | Common Stock (18.4%) | | Value | |
Utilities (0.5%) - continued | | | | |
15,588 | | UGI Corporation | | | $446,908 | |
| | | |
| | Total Utilities | | | 5,871,385 | |
| | | |
| | | | | | |
| | | |
| | Total Common Stock (cost $220,457,225) | | | 231,185,758 | |
| | | |
Principal
Amount | | Long-Term Fixed Income (6.2%) | | Value | |
Asset-Backed Securities (0.5%) | | | | |
| | Citigroup Mortgage Loan Trust, Inc. | | | | |
$885,600 | | 0.395%, 8/25/2036b | | | 661,523 | |
| | GSAMP Trust | | | | |
861,202 | | 0.425%, 2/25/2036b | | | 675,161 | |
| | J.P. Morgan Mortgage Acquisition Corporation | | | | |
2,000,000 | | 5.461%, 10/25/2036 | | | 1,519,480 | |
| | Morgan Stanley Capital, Inc. | | | | |
812,745 | | 0.395%, 2/25/2037b | | | 469,838 | |
| | Renaissance Home Equity Loan Trust | | | | |
3,418,790 | | 5.746%, 5/25/2036 | | | 1,945,900 | |
1,780,000 | | 6.011%, 5/25/2036 | | | 783,250 | |
| | | |
| | Total Asset-Backed Securities | | | 6,055,152 | |
| | | |
| |
Basic Materials (0.2%) | | | | |
| | ArcelorMittal | | | | |
650,000 | | 7.000%, 10/15/2039 | | | 649,094 | |
| | Arch Coal, Inc. | | | | |
270,000 | | 7.000%, 6/15/2019c | | | 279,450 | |
| | Dow Chemical Company | | | | |
650,000 | | 4.250%, 11/15/2020 | | | 668,421 | |
| | FMG Resources Property, Ltd. | | | | |
270,000 | | 7.000%, 11/1/2015c | | | 270,000 | |
| | Georgia-Pacific, LLC | | | | |
240,000 | | 8.000%, 1/15/2024 | | | 316,177 | |
| | Novelis, Inc. | | | | |
270,000 | | 8.375%, 12/15/2017 | | | 291,600 | |
| | | |
| | Total Basic Materials | | | 2,474,742 | |
| | | |
| |
Capital Goods (<0.1%) | | | | |
| | Case New Holland, Inc. | | | | |
260,000 | | 7.875%, 12/1/2017 | | | 293,150 | |
| | Danaher Corporation | | | | |
260,000 | | 0.603%, 6/21/2013b | | | 260,273 | |
| | | |
| | Total Capital Goods | | | 553,423 | |
| | | |
| |
Collateralized Mortgage Obligations (0.4%) | | | | |
| | Citigroup Mortgage Loan Trust, Inc. | | | | |
395,486 | | 5.500%, 11/25/2035 | | | 334,358 | |
| | CitiMortgage Alternative Loan Trust | | | | |
1,323,848 | | 5.750%, 4/25/2037 | | | 875,601 | |
| | Countrywide Alternative Loan Trust | | | | |
269,722 | | 6.000%, 1/25/2037 | | | 181,349 | |
1,163,702 | | 5.500%, 5/25/2037 | | | 826,085 | |
981,952 | | 7.000%, 10/25/2037 | | | 672,098 | |
| | Countrywide Home Loans, Inc. | | | | |
722,247 | | 5.750%, 4/25/2037 | | | 613,895 | |
| | Deutsche Alt-A Securities, Inc. | | | | |
252,291 | | 5.500%, 10/25/2021 | | | 241,854 | |
445,369 | | 6.000%, 10/25/2021 | | | 393,217 | |
| | | | | | |
Principal
Amount | | Long-Term Fixed Income (6.2%) | | Value | |
Collateralized Mortgage Obligations (0.4%) - continued | | | | |
| | J.P. Morgan Mortgage Trust | | | | |
$121,404 | | 4.935%, 10/25/2036 | | | $91,068 | |
| | MASTR Alternative Loans Trust | | | | |
312,631 | | 6.500%, 7/25/2034 | | | 330,339 | |
| | Merrill Lynch Alternative Note Asset Trust | | | | |
311,373 | | 6.000%, 3/25/2037 | | | 222,749 | |
| | Sequoia Mortgage Trust | | | | |
482,655 | | 5.372%, 9/20/2046 | | | 152,103 | |
| | WaMu Mortgage Pass Through Certificates | | | | |
211,848 | | 5.835%, 9/25/2036 | | | 164,775 | |
444,003 | | 5.932%, 10/25/2036 | | | 376,374 | |
| | | |
| | Total Collateralized Mortgage Obligations | | | 5,475,865 | |
| | | |
| |
Commercial Mortgage-Backed Securities (0.9%) | | | | |
| | Banc of America Commercial Mortgage, Inc. | | | | |
1,400,000 | | 5.647%, 4/10/2049 | | | 1,493,241 | |
2,550,000 | | 5.624%, 6/10/2049 | | | 2,690,635 | |
| | Bear Stearns Commercial Mortgage Securities, Inc. | | | | |
1,500,000 | | 5.331%, 2/11/2044 | | | 1,561,265 | |
| | Credit Suisse First Boston Mortgage Securities | | | | |
1,300,000 | | 5.542%, 1/15/2049 | | | 1,339,512 | |
| | Credit Suisse Mortgage Capital Certificates | | | | |
1,625,000 | | 5.509%, 9/15/2039 | | | 1,348,193 | |
| | Greenwich Capital Commercial Funding Corporation | | | | |
900,000 | | 5.867%, 12/10/2049 | | | 758,954 | |
| | J.P. Morgan Chase Commercial Mortgage Securities Corporation | | | | |
750,000 | | 5.742%, 2/12/2049 | | | 683,381 | |
| | Morgan Stanley Capital, Inc. | | | | |
450,000 | | 5.406%, 3/15/2044 | | | 407,057 | |
| | Wachovia Bank Commercial Mortgage Trust | | | | |
1,050,000 | | 5.603%, 10/15/2048 | | | 974,192 | |
| | | |
| | Total Commercial Mortgage-Backed Securities | | | 11,256,430 | |
| | | |
| |
Communications Services (0.3%) | | | | |
| | Cablevision Systems Corporation | | | | |
270,000 | | 8.625%, 9/15/2017 | | | 292,950 | |
| | CBS Corporation | | | | |
325,000 | | 7.875%, 7/30/2030 | | | 429,158 | |
325,000 | | 5.900%, 10/15/2040 | | | 362,461 | |
| | CCO Holdings, LLC | | | | |
270,000 | | 7.000%, 1/15/2019 | | | 280,125 | |
| | Clear Channel Worldwide Holdings, Inc. | | | | |
280,000 | | 9.250%, 12/15/2017 | | | 303,800 | |
| | Cox Communications, Inc. | | | | |
650,000 | | 6.950%, 6/1/2038c | | | 772,484 | |
| | EH Holding Corporation | | | | |
270,000 | | 6.500%, 6/15/2019c | | | 276,075 | |
The accompanying Notes to Financial Statements are an integral part of this schedule.
65
Moderately Aggressive Allocation Fund
Schedule of Investments as of October 31, 2011
| | | | | | |
Principal Amount | | Long-Term Fixed Income (6.2%) | | Value | |
Communications Services (0.3%) - continued | | | | |
| | Frontier Communications Corporation | | | | |
$270,000 | | 8.250%, 4/15/2017 | | | $288,225 | |
| | Intelsat Jackson Holdings SA | | | | |
270,000 | | 7.250%, 4/1/2019c | | | 271,350 | |
| | NII Capital Corporation | | | | |
230,000 | | 7.625%, 4/1/2021 | | | 236,900 | |
| | Virgin Media Finance plc | | | | |
250,000 | | 9.500%, 8/15/2016 | | | 278,750 | |
| | | |
| | Total Communications Services | | | 3,792,278 | |
| | | |
| |
Consumer Cyclical (0.2%) | | | | |
| | Chrysler Group, LLC | | | | |
200,000 | | 8.000%, 6/15/2019c | | | 184,000 | |
| | Home Depot, Inc. | | | | |
650,000 | | 5.875%, 12/16/2036 | | | 768,201 | |
| | Lennar Corporation | | | | |
280,000 | | 12.250%, 6/1/2017 | | | 329,700 | |
| | MGM Resorts International | | | | |
240,000 | | 11.125%, 11/15/2017 | | | 272,400 | |
| | Rite Aid Corporation | | | | |
280,000 | | 7.500%, 3/1/2017 | | | 278,600 | |
| | Starwood Hotels & Resorts Worldwide, Inc. | | | | |
270,000 | | 6.750%, 5/15/2018 | | | 299,700 | |
| | Toys R Us Property Company II, LLC | | | | |
270,000 | | 8.500%, 12/1/2017 | | | 285,187 | |
| | West Corporation | | | | |
150,000 | | 7.875%, 1/15/2019 | | | 152,250 | |
| | WMG Acquisition Corporation | | | | |
270,000 | | 11.500%, 10/1/2018c | | | 269,325 | |
| | | |
| | Total Consumer Cyclical | | | 2,839,363 | |
| | | |
| |
Consumer Non-Cyclical (0.5%) | | | | |
| | Altria Group, Inc. | | | | |
650,000 | | 9.950%, 11/10/2038 | | | 987,546 | |
| | Anheuser-Busch Companies, Inc. | | | | |
325,000 | | 6.450%, 9/1/2037 | | | 430,792 | |
| | Anheuser-Busch InBev Worldwide, Inc. | | | | |
455,000 | | 0.761%, 7/14/2014b | | | 453,747 | |
325,000 | | 8.200%, 1/15/2039 | | | 507,517 | |
| | Community Health Systems, Inc. | | | | |
270,000 | | 8.875%, 7/15/2015 | | | 276,413 | |
| | HCA, Inc. | | | | |
260,000 | | 7.500%, 2/15/2022 | | | 265,200 | |
| | JBS USA, LLC/JBS USA Finance, Inc. | | | | |
240,000 | | 11.625%, 5/1/2014 | | | 264,000 | |
| | Kinetic Concepts, Inc./KCI USA, Inc. | | | | |
270,000 | | 10.500%, 11/1/2018c,d | | | 273,037 | |
| | Kraft Foods, Inc. | | | | |
325,000 | | 5.375%, 2/10/2020 | | | 374,584 | |
325,000 | | 7.000%, 8/11/2037 | | | 431,761 | |
| | Mylan, Inc. | | | | |
250,000 | | 7.875%, 7/15/2020c | | | 280,000 | |
| | Reynolds Group Issuer, Inc. | | | | |
260,000 | | 6.875%, 2/15/2021c | | | 262,600 | |
| | Tenet Healthcare Corporation | | | | |
260,000 | | 8.875%, 7/1/2019 | | | 293,800 | |
| | | | | | |
Principal
Amount | | Long-Term Fixed Income (6.2%) | | Value | |
Consumer Non-Cyclical (0.5%) - continued | | | | |
| | UnitedHealth Group, Inc. | | | | |
$325,000 | | 6.875%, 2/15/2038 | | | $428,563 | |
325,000 | | 5.700%, 10/15/2040 | | | 384,156 | |
| | | |
| | Total Consumer Non-Cyclical | | | 5,913,716 | |
| | | |
| |
Energy (0.2%) | | | | |
| | Chesapeake Energy Corporation | | | | |
220,000 | | 9.500%, 2/15/2015 | | | 251,900 | |
| | Linn Energy, LLC | | | | |
280,000 | | 7.750%, 2/1/2021 | | | 298,900 | |
| | Newfield Exploration Company | | | | |
260,000 | | 5.750%, 1/30/2022 | | | 275,600 | |
| | Plains Exploration & Production Company | | | | |
280,000 | | 7.625%, 6/1/2018 | | | 299,600 | |
| | Weatherford International, Ltd. | | | | |
655,000 | | 6.750%, 9/15/2040 | | | 764,131 | |
| | | |
| | Total Energy | | | 1,890,131 | |
| | | |
| |
Financials (0.6%) | | | | |
| | Ally Financial, Inc. | | | | |
270,000 | | 8.000%, 3/15/2020 | | | 278,100 | |
| | AXA SA | | | | |
650,000 | | 6.379%, 12/29/2049c,e | | | 485,875 | |
| | BBVA International Preferred SA Unipersonal | | | | |
325,000 | | 5.919%, 12/29/2049e | | | 234,959 | |
| | CIT Group, Inc. | | | | |
270,000 | | 7.000%, 5/1/2017 | | | 270,000 | |
| | General Electric Capital Corporation | | | | |
650,000 | | 6.750%, 3/15/2032 | | | 760,125 | |
| | HCP, Inc. | | | | |
650,000 | | 6.750%, 2/1/2041 | | | 695,057 | |
| | Health Care REIT, Inc. | | | | |
260,000 | | 6.500%, 3/15/2041 | | | 249,126 | |
| | Icahn Enterprises, LP | | | | |
315,000 | | 8.000%, 1/15/2018 | | | 320,512 | |
| | International Lease Finance Corporation | | | | |
270,000 | | 5.750%, 5/15/2016 | | | 254,741 | |
| | MetLife Capital Trust IV | | | | |
650,000 | | 7.875%, 12/15/2037c | | | 688,120 | |
| | Prudential Financial, Inc. | | | | |
650,000 | | 6.200%, 11/15/2040 | | | 730,853 | |
| | QBE Capital Funding III, Ltd. | | | | |
650,000 | | 7.250%, 5/24/2041c | | | 610,306 | |
| | Reinsurance Group of America, Inc. | | | | |
325,000 | | 6.750%, 12/15/2065 | | | 282,044 | |
| | Stoneheath RE | | | | |
325,000 | | 3.523%, 12/29/2049b,e | | | 236,623 | |
| | XL Group plc | | | | |
650,000 | | 6.250%, 5/15/2027 | | | 672,847 | |
325,000 | | 6.500%, 12/31/2049e | | | 273,000 | |
| | | |
| | Total Financials | | | 7,042,288 | |
| | | |
| |
Mortgage-Backed Securities (1.5%) | | | | |
| | Federal National Mortgage Association Conventional 15- Yr. Pass Through | | | | |
6,500,000 | | 3.000%, 12/1/2026d | | | 6,634,063 | |
The accompanying Notes to Financial Statements are an integral part of this schedule.
66
Moderately Aggressive Allocation Fund
Schedule of Investments as of October 31, 2011
| | | | | | |
Principal
Amount | | Long-Term Fixed Income (6.2%) | | Value | |
Mortgage-Backed Securities (1.5%) - continued | | | | |
| | Federal National Mortgage Association Conventional 30-Yr. Pass Through | | | | |
$8,900,000 | | 4.500%, 11/1/2041d | | | $9,410,362 | |
2,300,000 | | 5.000%, 11/1/2041d | | | 2,473,937 | |
| | | |
| | Total Mortgage-Backed Securities | | | 18,518,362 | |
| | | |
| |
Technology (<0.1%) | | | | |
| | Seagate HDD Cayman | | | | |
250,000 | | 7.750%, 12/15/2018c | | | 261,250 | |
| | | |
| | Total Technology | | | 261,250 | |
| | | |
| |
Transportation (<0.1%) | | | | |
| | Avis Budget Car Rental, LLC/Avis Budget Finance, Inc. | | | | |
200,000 | | 8.250%, 1/15/2019 | | | 199,500 | |
| | | |
| | Total Transportation | | | 199,500 | |
| | | |
| |
U.S. Government and Agencies (0.7%) | | | | |
| | U.S. Treasury Notes | | | | |
4,725,000 | | 2.500%, 4/30/2015 | | | 5,043,569 | |
2,350,000 | | 3.125%, 5/15/2021 | | | 2,554,708 | |
1,175,000 | | 4.375%, 5/15/2040 | | | 1,439,375 | |
| | | |
| | Total U.S. Government and Agencies | | | 9,037,652 | |
| | | |
| |
Utilities (0.2%) | | | | |
| | AES Corporation | | | | |
250,000 | | 7.375%, 7/1/2021c | | | 267,500 | |
| | Dominion Resources, Inc. | | | | |
325,000 | | 2.669%, 9/30/2066b | | | 275,233 | |
| | Energy Transfer Partners, LP | | | | |
180,000 | | 6.625%, 10/15/2036 | | | 195,165 | |
325,000 | | 7.500%, 7/1/2038 | | | 373,116 | |
| | Markwest Energy Partners, LP/Markwest Energy Finance Corporation | | | | |
270,000 | | 6.500%, 8/15/2021 | | | 278,775 | |
| | Southern Union Company | | | | |
650,000 | | 7.200%, 11/1/2066 | | | 559,000 | |
| | | |
| | Total Utilities | | | 1,948,789 | |
| | | |
| | | | | | |
| | | |
| | Total Long-Term Fixed Income (cost $76,717,703) | | | 77,258,941 | |
| | | |
| | |
Principal
Amount | | Short-Term Investments (5.4%)f | | Value | |
| | Federal Home Loan Bank Discount Notes | | | | |
15,000,000 | | 0.023%, 11/16/2011g | | | 14,999,856 | |
15,740,000 | | 0.023%, 11/18/2011g | | | 15,739,827 | |
2,000,000 | | 0.020%, 11/23/2011g | | | 1,999,976 | |
6,000,000 | | 0.025%, 12/23/2011g | | | 5,999,783 | |
| | Federal Home Loan Mortgage Corporation Discount Notes | | | | |
5,000,000 | | 0.035%, 11/14/2011g | | | 4,999,937 | |
4,000,000 | | 0.030%, 1/9/2012g | | | 3,999,770 | |
| | Federal National Mortgage Association Discount Notes | | | | |
4,000,000 | | 0.020%, 11/10/2011g | | | 3,999,980 | |
12,200,000 | | 0.097%, 2/22/2012g,h | | | 12,196,323 | |
| | | | | | |
Principal
Amount | | Short-Term Investments (5.4%)f | | Value | |
| | U.S. Treasury Bills | | | | |
$3,900,000 | | 0.045%, 2/9/2012h | | | $3,899,516 | |
| | | |
| | Total Short-Term Investments (at amortized cost) | | | 67,834,968 | |
| | | |
| | Total Investments (cost $1,280,079,459) 101.4% | | $ | 1,270,872,882 | |
| | | |
| | Other Assets and Liabilities, Net (1.4%) | | | (17,190,000) | |
| | | |
| | Total Net Assets 100.0% | | $ | 1,253,682,882 | |
| | | |
| a | Non-income producing security. |
| b | Denotes variable rate securities. Variable rate securities are securities whose yields vary with a designated market index or market rate. The rate shown is as of October 31, 2011. |
| c | Denotes securities sold under Rule 144A of the Securities Act of 1933, which exempts them from registration. These securities have been deemed liquid and may be resold to other dealers in the program or to other qualified institutional buyers. As of October 31, 2011, the value of these investments was $5,451,372 or 0.4% of total net assets. |
| d | Denotes investments purchased on a when-issued or delayed delivery basis. |
| e | Denotes perpetual securities. Perpetual securities pay an indefinite stream of interest, but may be called by the issuer at an earlier date. |
| f | The interest rate shown reflects the yield, coupon rate or the discount rate at the date of purchase. |
| g | Denotes investments that benefit from credit enhancement or liquidity support provided by a third party bank, institution or government. |
| h | At October 31, 2011, $16,095,838 of investments were held on deposit with the counterparty and pledged as the initial margin deposit for open futures contracts. |
| | | | |
| | Definitions: | | |
| | ADR - | | American Depositary Receipt, which are certificates for an underlying foreign security’s shares held by an issuing U.S. depository bank. |
| | REIT - | | Real Estate Investment Trust is a company that buys, develops, manages and/or sells real estate assets. |
| | ETF - | | Exchange Traded Fund. |
Unrealized Appreciation (Depreciation)
| | | | |
Gross unrealized appreciation and depreciation of investments, based on cost for federal income tax purposes, were as follows: | |
Gross unrealized appreciation | | | $60,735,960 | |
Gross unrealized depreciation | | | (83,901,793 | ) |
| | | | |
Net unrealized appreciation (depreciation) | | | ($23,165,833 | ) |
| |
Cost for federal income tax purposes | | | $1,294,038,715 | |
The accompanying Notes to Financial Statements are an integral part of this schedule.
67
Moderately Aggressive Allocation Fund
Schedule of Investments as of October 31, 2011
Fair Valuation Measurements
The following table is a summary of the inputs used, as of October 31, 2011, in valuing Moderately Aggressive Allocation Fund’s assets carried at fair value.
| | | | | | | | | | | | | | | | |
| Investments in Securities | | Total | | | Level 1 | | | Level 2 | | | Level 3 | |
Mutual Funds | | | | | | | | | | | | | | | | |
Equity Mutual Funds | | | 673,880,032 | | | | 673,880,032 | | | | – | | | | – | |
Fixed Income Mutual Funds | | | 220,713,183 | | | | 220,713,183 | | | | – | | | | – | |
| | | | |
Common Stock | | | | | | | | | | | | | | | | |
Consumer Discretionary | | | 28,308,855 | | | | 26,836,191 | | | | 1,472,664 | | | | – | |
Consumer Staples | | | 19,393,398 | | | | 18,531,580 | | | | 861,818 | | | | – | |
Energy | | | 25,513,611 | | | | 24,188,639 | | | | 1,324,972 | | | | – | |
Financials | | | 28,710,562 | | | | 27,312,501 | | | | 1,398,061 | | | | – | |
Health Care | | | 29,950,951 | | | | 29,465,871 | | | | 485,080 | | | | – | |
Industrials | | | 26,671,885 | | | | 25,654,217 | | | | 1,017,668 | | | | – | |
Information Technology | | | 56,385,411 | | | | 56,075,344 | | | | 310,067 | | | | – | |
Materials | | | 7,777,922 | | | | 6,607,545 | | | | 1,170,377 | | | | – | |
Telecommunications Services | | | 2,601,778 | | | | 2,027,338 | | | | 574,440 | | | | – | |
Utilities | | | 5,871,385 | | | | 5,347,250 | | | | 524,135 | | | | – | |
| | | | |
Long-Term Fixed Income | | | | | | | | | | | | | | | | |
Asset-Backed Securities | | | 6,055,152 | | | | – | | | | 6,055,152 | | | | – | |
Basic Materials | | | 2,474,742 | | | | – | | | | 2,474,742 | | | | – | |
Capital Goods | | | 553,423 | | | | – | | | | 553,423 | | | | – | |
Collateralized Mortgage Obligations | | | 5,475,865 | | | | – | | | | 5,475,865 | | | | – | |
Commercial Mortgage-Backed Securities | | | 11,256,430 | | | | – | | | | 11,256,430 | | | | – | |
Communications Services | | | 3,792,278 | | | | – | | | | 3,792,278 | | | | – | |
Consumer Cyclical | | | 2,839,363 | | | | – | | | | 2,839,363 | | | | – | |
Consumer Non-Cyclical | | | 5,913,716 | | | | – | | | | 5,913,716 | | | | – | |
Energy | | | 1,890,131 | | | | – | | | | 1,890,131 | | | | – | |
Financials | | | 7,042,288 | | | | – | | | | 7,042,288 | | | | – | |
Mortgage-Backed Securities | | | 18,518,362 | | | | – | | | | 18,518,362 | | | | – | |
Technology | | | 261,250 | | | | – | | | | 261,250 | | | | – | |
Transportation | | | 199,500 | | | | – | | | | 199,500 | | | | – | |
U.S. Government and Agencies | | | 9,037,652 | | | | – | | | | 9,037,652 | | | | – | |
Utilities | | | 1,948,789 | | | | – | | | | 1,948,789 | | | | – | |
Short-Term Investments | | | 67,834,968 | | | | – | | | | 67,834,968 | | | | – | |
Total | | | $1,270,872,882 | | | | $1,116,639,691 | | | | $154,233,191 | | | | $– | |
| | | | |
| Other Financial Instruments | | Total | | | Level 1 | | | Level 2 | | | Level 3 | |
| | | | |
Asset Derivatives | | | | | | | | | | | | | | | | |
Futures Contracts | | | 9,185,685 | | | | 9,185,685 | | | | – | | | | – | |
Total Asset Derivatives | | | $9,185,685 | | | | $9,185,685 | | | | $– | | | | $– | |
| | | | |
Liability Derivatives | | | | | | | | | | | | | | | | |
Futures Contracts | | | 4,597,168 | | | | 4,597,168 | | | | – | | | | – | |
Total Liability Derivatives | | | $4,597,168 | | | | $4,597,168 | | | | $– | | | | $– | |
| | | | | | | | | | | | | | | | | | |
| Futures Contracts | | Number of
Contracts
Long/(Short) | | | Expiration Date | | Notional
Principal
Amount | | | Value | | | Unrealized Gain/(Loss) | |
2-Yr. U.S. Treasury Bond Futures | | | (60 | ) | | December 2011 | | | ($13,226,067 | ) | | | ($13,216,875 | ) | | | $9,192 | |
5-Yr. U.S. Treasury Bond Futures | | | (200 | ) | | December 2011 | | | (24,472,828 | ) | | | (24,521,876 | ) | | | (49,048 | ) |
10-Yr. U.S. Treasury Bond Futures | | | (75 | ) | | December 2011 | | | (9,723,990 | ) | | | (9,679,688 | ) | | | 44,302 | |
Mini MSCI EAFE Index Futures | | | 307 | | | December 2011 | | | 21,772,554 | | | | 22,731,815 | | | | 959,261 | |
Russell 2000 Index Mini-Futures | | | (651 | ) | | December 2011 | | | (45,867,963 | ) | | | (48,128,430 | ) | | | (2,260,467 | ) |
S&P 400 Index Mini-Futures | | | (621 | ) | | December 2011 | | | (52,739,158 | ) | | | (55,026,811 | ) | | | (2,287,653 | ) |
S&P 500 Index Futures | | | 268 | | | December 2011 | | | 79,948,835 | | | | 83,703,100 | | | | 3,754,265 | |
S&P 500 Index Mini-Futures | | | 844 | | | December 2011 | | | 48,301,795 | | | | 52,720,460 | | | | 4,418,665 | |
Total Futures Contracts | | | | | | | | | | | | | | | | | $4,588,517 | |
The accompanying Notes to Financial Statements are an integral part of this schedule.
68
Moderately Aggressive Allocation Fund
Schedule of Investments as of October 31, 2011
The following table summarizes the fair value and Statement of Assets and Liabilities location, as of October 31, 2011, for Moderately Aggressive Allocation Fund’s investments in financial derivative instruments by primary risk exposure as discussed under item (2) Significant Accounting Policies of the Notes to Financial Statements.
| | | | | | |
| Derivatives by risk category | | Statement of Assets and Liabilities Location | | Fair Value | |
Asset Derivatives | | | | | | |
Interest Rate Contracts | | | | | | |
Futures* | | Net Assets - Net unrealized appreciation/(depreciation) on Futures contracts | | | $53,494 | |
Total Interest Rate Contracts | | | | | 53,494 | |
Equity Contracts | | | | | | |
Futures* | | Net Assets - Net unrealized appreciation/(depreciation) on Futures contracts | | | 9,132,191 | |
Total Equity Contracts | | | | | 9,132,191 | |
Total Asset Derivatives | | | | | $9,185,685 | |
Liability Derivatives | | | | | | |
Equity Contracts | | | | | | |
Futures* | | Net Assets - Net unrealized appreciation/(depreciation) on Futures contracts | | | 4,548,120 | |
Total Equity Contracts | | | | | 4,548,120 | |
Interest Rate Contracts | | | | | | |
Futures* | | Net Assets - Net unrealized appreciation/(depreciation) on Futures contracts | | | 49,048 | |
Total Interest Rate Contracts | | | | | 49,048 | |
Total Liability Derivatives | | | | | $4,597,168 | |
| * | Includes cumulative appreciation/depreciation of futures contracts as reported in the Schedule of Investments. Only current day’s variation margin is reported within the Statement of Assets and Liabilities. |
The following table summarizes the net realized gains/(losses) and Statement of Operations location, for the period ended October 31, 2011, for Moderately Aggressive Allocation Fund’s investments in financial derivative instruments by primary risk exposure.
| | | | | | |
| Derivatives by risk category | | Statement of Operations location | | Realized Gains/(Losses) recognized in Income | |
Interest Rate Contracts | | | | | | |
| Futures | �� | Net realized gains/(losses) on Futures contracts | | | (2,473,461 | ) |
Total Interest Rate Contracts | | | | | (2,473,461 | ) |
Equity Contracts | | | | | | |
| Futures | | Net realized gains/(losses) on Futures contracts | | | (441,650 | ) |
Total Equity Contracts | | | | | (441,650 | ) |
Foreign Exchange Contracts | | | | | | |
| Forward Contracts | | Net realized gains/(losses) on Foreign currency transactions | | | (74,543 | ) |
Total Foreign Exchange Contracts | | | | | (74,543 | ) |
Credit Contracts | | | | | | |
| Credit Default Swaps | | Net realized gains/(losses) on Swap agreements | | | 816,285 | |
Total Credit Contracts | | | | | 816,285 | |
Total | | | | | ($2,173,369) | |
The accompanying Notes to Financial Statements are an integral part of this schedule.
69
Moderately Aggressive Allocation Fund
Schedule of Investments as of October 31, 2011
The following table summarizes the change in net unrealized appreciation/(depreciation) and Statement of Operations location, for the period ended October 31, 2011, for Moderately Aggressive Allocation Fund’s investments in financial derivative instruments by primary risk exposure.
| | | | | | |
| Derivatives by risk category | | Statement of Operations Location | | Change in unrealized appreciation/(depreciation) recognized in Income | |
Interest Rate Contracts | | | | | | |
Futures | | Change in net unrealized appreciation/(depreciation) on Futures contracts | | | 4,446 | |
Total Interest Rate Contracts | | | | | 4,446 | |
Equity Contracts | | | | | | |
Futures | | Change in net unrealized appreciation/(depreciation) on Futures contracts | | | 5,157,103 | |
Total Equity Contracts | | | | | 5,157,103 | |
Total | | | | | $5,161,549 | |
The following table presents Moderately Aggressive Allocation Fund’s average volume of derivative activity during the period ended October 31, 2011.
| | | | | | | | | | | | | | | | | | | | | | | | | | | | | | |
Derivative Risk Category | | Futures
(Notional*) | | Futures (Percentage of Average Net Assets) | | Forwards
(Notional*) | | Forwards
(Percentage of Average Net Assets) | | Swaps
(Notional*) | | Swaps (Percentage of Average Net Assets) |
Equity Contracts | | | | $198,021,783 | | | | | 15.7 | % | | | | N/A | | | | | N/A | | | | | N/A | | | | | N/A | |
Interest Rate Contracts | | | | 28,761,943 | | | | | 2.3 | | | | | N/A | | | | | N/A | | | | | N/A | | | | | N/A | |
Foreign Exchange Contracts | | | | N/A | | | | | N/A | | | | $ | 413,198 | | | | | <0.1 | % | | | | N/A | | | | | N/A | |
Credit Contracts | | | | N/A | | | | | N/A | | | | | N/A | | | | | N/A | | | | | $10,286,479 | | | | | 0.8 | % |
* Notional amount represents long or short, or both, derivative positions held by the Fund.
Investment in Affiliates
Affiliated issuers, as defined under the Investment Company Act of 1940, include those in which the Fund’s holdings of an issuer represent 5% or more of the outstanding voting securities of an issuer, or any affiliated mutual fund.
A summary of transactions for the fiscal year to date, in Moderately Aggressive Allocation Fund, is as follows:
| | | | | | | | | | | | | | | | | | | | | | | | |
| Fund | | Value October 31, 2010 | | | Gross
Purchases | | | Gross
Sales | | | Shares Held at October 31, 2011 | | | Value October 31, 2011 | | | Income Earned November 1, 2010 - October 31, 2011 | |
Natural Resources | | | $37,300,246 | | | | $1,075,003 | | | | $– | | | | 4,040,223 | | | | $41,493,093 | | | | $1,075,003 | |
Partner Small Cap Growth | | | 34,702,418 | | | | – | | | | – | | | | 3,151,900 | | | | 37,791,279 | | | | – | |
Partner Small Cap Value | | | 30,681,876 | | | | 266,141 | | | | 8,000,000 | | | | 1,643,111 | | | | 24,958,861 | | | | 266,141 | |
Small Cap Stock | | | 18,812,514 | | | | – | | | | – | | | | 1,344,712 | | | | 20,116,885 | | | | – | |
Mid Cap Growth | | | 32,587,165 | | | | – | | | | – | | | | 1,758,617 | | | | 34,838,195 | | | | – | |
Partner Mid Cap Value | | | 45,006,623 | | | | 273,227 | | | | 5,000,000 | | | | 3,609,996 | | | | 41,875,958 | | | | 273,228 | |
Mid Cap Stock | | | 62,218,251 | | | | 193,014 | | | | 4,500,000 | | | | 4,016,385 | | | | 61,972,814 | | | | 193,015 | |
Partner Worldwide Allocation | | | 72,381,652 | | | | 2,534,327 | | | | – | | | | 19,207,645 | | | | 160,191,758 | | | | 1,034,327 | |
Partner International Stock | | | 101,003,755 | | | | 3,993,345 | | | | 6,000,000 | | | | – | | | | – | | | | 3,993,345 | |
Large Cap Growth | | | 73,161,485 | | | | – | | | | – | | | | 14,261,498 | | | | 75,300,710 | | | | – | |
Large Cap Value | | | 91,471,178 | | | | 1,366,022 | | | | – | | | | 7,297,379 | | | | 95,157,821 | | | | 1,366,022 | |
Large Cap Stock | | | 68,000,268 | | | | 599,404 | | | | – | | | | 3,257,272 | | | | 69,966,193 | | | | 599,404 | |
Equity Income Plus | | | 9,754,392 | | | | 194,086 | | | | – | | | | 1,157,018 | | | | 10,216,465 | | | | 194,086 | |
High Yield | | | 50,328,487 | | | | 7,340,872 | | | | 6,652,913 | | | | 10,516,117 | | | | 49,636,073 | | | | 3,865,658 | |
Income | | | 88,540,345 | | | | 9,292,124 | | | | 1,955,900 | | | | 10,913,845 | | | | 95,605,280 | | | | 4,393,004 | |
Government Bond | | | 24,514,680 | | | | 2,148,320 | | | | 558,828 | | | | 2,475,238 | | | | 26,460,294 | | | | 552,040 | |
Limited Maturity Bond | | | 46,825,338 | | | | 3,996,998 | | | | 1,117,657 | | | | 3,952,543 | | | | 49,011,536 | | | | 1,197,501 | |
Total Value and Income Earned | | | 887,290,673 | | | | | | | | | | | | | | | | 894,593,215 | | | | 19,002,774 | |
The accompanying Notes to Financial Statements are an integral part of this schedule.
70
Moderate Allocation Fund
Schedule of Investments as of October 31, 2011
| | | | | | |
| Shares | | Mutual Funds (74.2%) | | Value | |
Equity Mutual Funds (39.4%) | | | | |
3,939,073 | | Thrivent Natural Resources Fund | | | $40,454,277 | |
1,851,274 | | Thrivent Partner Small Cap Growth Funda | | | 22,196,780 | |
1,555,328 | | Thrivent Partner Small Cap Value Fund | | | 23,625,437 | |
882,584 | | Thrivent Small Cap Stock Funda | | | 13,203,459 | |
735,772 | | Thrivent Mid Cap Growth Funda | | | 14,575,651 | |
2,185,388 | | Thrivent Partner Mid Cap Value Fund | | | 25,350,505 | |
2,616,880 | | Thrivent Mid Cap Stock Fund | | | 40,378,460 | |
15,201,166 | | Thrivent Partner Worldwide Allocation Fund | | | 126,777,721 | |
11,226,178 | | Thrivent Large Cap Growth Funda | | | 59,274,222 | |
6,636,735 | | Thrivent Large Cap Value Fund | | | 86,543,027 | |
1,698,477 | | Thrivent Large Cap Stock Fund | | | 36,483,289 | |
1,130,029 | | Thrivent Equity Income Plus Fund | | | 9,978,155 | |
| | | |
| | Total Equity Mutual Funds | | | 498,840,983 | |
| | | |
| |
Fixed Income Mutual Funds (34.8%) | | | | |
10,509,425 | | Thrivent High Yield Fund | | | 49,604,487 | |
21,358,864 | | Thrivent Income Fund | | | 187,103,647 | |
1,947,750 | | Thrivent Government Bond Fund | | | 20,821,448 | |
14,800,202 | | Thrivent Limited Maturity Bond Fund | | | 183,522,499 | |
| | | |
| | Total Fixed Income Mutual Funds | | | 441,052,081 | |
| | | |
| | | |
| | | |
| | Total Mutual Funds (cost $944,207,624) | | | 939,893,064 | |
| | | |
| | |
| Shares | | Common Stock (13.1%) | | Value | |
Consumer Discretionary (1.6%) | | | | |
5,900 | | Aeon Company, Ltd. | | | 77,165 | |
6,050 | | Amazon.com, Inc.a | | | 1,291,735 | |
900 | | Aryzta AG | | | 43,396 | |
7,326 | | Autoliv, Inc. | | | 423,223 | |
900 | | Bayerische Motoren Werke AG | | | 48,980 | |
1,100 | | Beiersdorf AG | | | 63,415 | |
33,000 | | Best Buy Company, Inc. | | | 865,590 | |
17,200 | | Big Lots, Inc.a | | | 648,268 | |
5,500 | | British Sky Broadcasting Group plc | | | 62,018 | |
9,517 | | Buffalo Wild Wings, Inc.a | | | 630,216 | |
7,970 | | CBS Corporation | | | 205,706 | |
6,900 | | Charter Communications, Inc.a | | | 316,986 | |
39,100 | | Comcast Corporation | | | 916,895 | |
900 | | Daito Trust Construction Company, Ltd. | | | 79,741 | |
12,138 | | Discovery Communications, Inc.a | | | 527,517 | |
5,430 | | Dollar Tree, Inc.a | | | 434,183 | |
15,600 | | Fiat SPA | | | 95,525 | |
32,936 | | Foot Locker, Inc. | | | 719,981 | |
10,290 | | Harley-Davidson, Inc. | | | 400,281 | |
600 | | Kabel Deutschland Holding AGa | | | 34,031 | |
23,910 | | Las Vegas Sands Corporationa | | | 1,122,574 | |
1,500 | | Lawson, Inc. | | | 84,405 | |
14,400 | | Life Time Fitness, Inc.a | | | 621,072 | |
10,000 | | Lifestyle International Holdings, Ltd. | | | 26,770 | |
19,090 | | Lowe’s Companies, Inc. | | | 401,272 | |
20,622 | | Macy’s, Inc. | | | 629,590 | |
24,200 | | McDonald’s Corporation | | | 2,246,970 | |
8,300 | | Mediaset SPA | | | 30,580 | |
39,000 | | Mitsubishi Motors Corporationa | | | 51,518 | |
| | | | | | |
| Shares | | Common Stock (13.1%) | | Value | |
Consumer Discretionary (1.6%) - continued | | | | |
18,100 | | News Corporation | | | $323,085 | |
14,020 | | Omnicom Group, Inc. | | | 623,610 | |
3,510 | | Panera Bread Companya | | | 469,252 | |
66,251 | | Pier 1 Imports, Inc.a | | | 828,800 | |
1,500 | | Priceline.com, Inc.a | | | 761,580 | |
2,100 | | ProSiebenSat.1 Media AG | | | 44,764 | |
9,200 | | Sands China, Ltd.a | | | 27,648 | |
14,835 | | Signet Jewelers, Ltd. | | | 639,537 | |
47,000 | | SJM Holdings, Ltd. | | | 80,560 | |
25,770 | | Target Corporation | | | 1,410,908 | |
6,430 | | Time Warner Cable, Inc. | | | 409,527 | |
9,810 | | Viacom, Inc. | | | 430,168 | |
2,700 | | Vivendi SA | | | 60,335 | |
200 | | Volkswagen AG | | | 31,277 | |
12,100 | | Williams-Sonoma, Inc. | | | 454,234 | |
6,784 | | WMS Industries, Inc.a | | | 148,637 | |
34,800 | | Wynn Macau, Ltd. | | | 97,505 | |
| | | |
| | Total Consumer Discretionary | | | 19,941,030 | |
| | | |
|
Consumer Staples (1.1%) | |
49,130 | | Altria Group, Inc. | | | 1,353,532 | |
15,574 | | Anheuser-Busch InBev NV ADR | | | 863,890 | |
1,500 | | Autogrill SPA | | | 17,348 | |
1,700 | | British American Tobacco plc | | | 77,949 | |
11,260 | | British American Tobacco plc ADR | | | 1,038,735 | |
800 | | Casino Guichard Perrachon SA | | | 74,910 | |
24,353 | | Corn Products International, Inc. | | | 1,181,121 | |
35,700 | | CVS Caremark Corporation | | | 1,295,910 | |
200 | | Delhaize Group SA | | | 13,064 | |
10,530 | | Diageo plc ADR | | | 872,726 | |
700 | | Heineken Holding NV | | | 29,945 | |
1,200 | | Henkel AG & Company KGaA | | | 71,334 | |
9,904 | | Herbalife, Ltd. | | | 617,613 | |
2,100 | | Imperial Tobacco Group plc | | | 76,500 | |
2,200 | | Kao Corporation | | | 57,716 | |
29,107 | | Kraft Foods, Inc. | | | 1,023,984 | |
11,600 | | Marks and Spencer Group plc | | | 59,807 | |
700 | | Nestle SA | | | 40,486 | |
27,256 | | Philip Morris International, Inc. | | | 1,904,377 | |
3,300 | | Seven & I Holdings Company, Ltd. | | | 88,063 | |
8,208 | | TreeHouse Foods, Inc.a | | | 503,479 | |
46,250 | | Wal-Mart Stores, Inc. | | | 2,623,300 | |
| | | |
| | Total Consumer Staples | | | 13,885,789 | |
| | | |
|
Energy (1.5%) | |
16,876 | | Alpha Natural Resources, Inc.a | | | 405,699 | |
10,530 | | Anadarko Petroleum Corporation | | | 826,605 | |
10,252 | | Apache Corporation | | | 1,021,407 | |
30,884 | | Arch Coal, Inc. | | | 562,706 | |
16,978 | | Baker Hughes, Inc. | | | 984,554 | |
20,720 | | Chevron Corporation | | | 2,176,636 | |
17,200 | | ConocoPhillips | | | 1,197,980 | |
42,285 | | ENSCO International plc ADR | | | 2,099,873 | |
8,800 | | Exxon Mobil Corporation | | | 687,192 | |
22,300 | | Helix Energy Solutions Group, Inc.a | | | 402,738 | |
11 | | INPEX Holdings, Inc. | | | 72,623 | |
54,200 | | Marathon Oil Corporation | | | 1,410,826 | |
6,961 | | National Oilwell Varco, Inc. | | | 496,528 | |
6,300 | | Newfield Exploration Companya | | | 253,638 | |
The accompanying Notes to Financial Statements are an integral part of this schedule.
71
Moderate Allocation Fund
Schedule of Investments as of October 31, 2011
| | | | | | |
| Shares | | Common Stock (13.1%) | | Value | |
Energy (1.5%) - continued | | | | |
4,300 | | Occidental Petroleum Corporation | | | $399,642 | |
9,438 | | Oil States International, Inc.a | | | 656,979 | |
50,362 | | Patriot Coal Corporationa | | | 632,547 | |
17,863 | | Peabody Energy Corporation | | | 774,718 | |
4,600 | | Petrofac, Ltd. | | | 105,671 | |
47,804 | | Petroleum Geo-Services ASAa | | | 519,380 | |
4,300 | | Royal Dutch Shell plc | | | 154,283 | |
925 | | Royal Dutch Shell plc, Class A | | | 32,769 | |
8,700 | | Southwestern Energy Companya | | | 365,748 | |
18,461 | | Swift Energy Companya | | | 565,276 | |
116,860 | | Weatherford International, Ltd.a | | | 1,811,330 | |
| | | |
| | Total Energy | | | 18,617,348 | |
| | | |
| |
Financials (1.7%) | | | | |
13,540 | | ACE, Ltd. | | | 976,911 | |
6,931 | | Affiliated Managers Group, Inc.a | | | 641,880 | |
12,510 | | Aon Corporation | | | 583,216 | |
3,600 | | Assicurazioni Generali SPA | | | 64,411 | |
5,900 | | Atlantia SPA | | | 89,864 | |
23,700 | | Banco de Sabadell SA | | | 85,005 | |
21,300 | | Banco de Valencia SAa | | | 25,995 | |
2,000 | | Cheung Kong Holdings, Ltd. | | | 24,792 | |
20,570 | | Citigroup, Inc. | | | 649,806 | |
1,300 | | CME Group, Inc. | | | 358,228 | |
21,919 | | Duke Realty Corporation | | | 269,165 | |
8,000 | | Endurance Specialty Holdings, Ltd. | | | 297,600 | |
18,798 | | Equity One, Inc. | | | 322,386 | |
2,600 | | Experian plc | | | 33,777 | |
126,600 | | Fifth Third Bancorp | | | 1,520,466 | |
3,990 | | Goldman Sachs Group, Inc. | | | 437,104 | |
1,282 | | Hannover Rueckversicherung AG | | | 63,119 | |
19,221 | | HCC Insurance Holdings, Inc. | | | 511,471 | |
27,457 | | Host Hotels & Resorts, Inc. | | | 391,811 | |
1,966 | | IntercontinentalExchange, Inc.a | | | 255,344 | |
57,069 | | J.P. Morgan Chase & Company | | | 1,983,718 | |
15,000 | | Kerry Properties, Ltd. | | | 55,049 | |
34,520 | | KKR & Company, LP | | | 465,330 | |
9,791 | | Lazard, Ltd. | | | 267,686 | |
6,500 | | M&T Bank Corporation | | | 494,715 | |
10,080 | | MetLife, Inc. | | | 354,413 | |
4,100 | | Mitsui & Company, Ltd. | | | 59,838 | |
500 | | Muenchener Rueckversicherungs- Gesellschaft AG | | | 66,960 | |
14,500 | | NASDAQ OMX Group, Inc.a | | | 363,225 | |
7,900 | | Northern Trust Corporation | | | 319,713 | |
49,427 | | Ocwen Financial Corporationa | | | 716,691 | |
344,792 | | Popular, Inc.a | | | 641,313 | |
21,957 | | Principal Financial Group, Inc. | | | 566,051 | |
11,009 | | Prudential plc | | | 113,717 | |
7,716 | | Resolution, Ltd. | | | 33,958 | |
7,300 | | Standard Life plc | | | 25,181 | |
12,130 | | State Street Corporation | | | 489,931 | |
3,700 | | Sumitomo Mitsui Financial Group, Inc. | | | 103,421 | |
4,000 | | Sun Hung Kai Properties, Ltd. | | | 55,075 | |
9,490 | | SVB Financial Groupa | | | 435,971 | |
26,206 | | Texas Capital Bancshares, Inc.a | | | 733,768 | |
58,960 | | U.S. Bancorp | | | 1,508,786 | |
36,330 | | Unum Group | | | 866,107 | |
5,320 | | Vanguard REIT ETF | | | 309,305 | |
18,482 | | W.R. Berkley Corporation | | | 643,358 | |
71,910 | | Wells Fargo & Company | | | 1,863,188 | |
1,800 | | Westfield Group | | | 14,490 | |
| | | | | | |
| Shares | | Common Stock (13.1%) | | Value | |
Financials (1.7%) - continued | | | | |
9,000 | | Wheelock and Company, Ltd. | | | $26,443 | |
52,316 | | Zions Bancorporation | | | 908,206 | |
200 | | Zurich Financial Services AGa | | | 46,089 | |
| | | |
| | Total Financials | | | 22,134,047 | |
| | | |
| |
Health Care (1.7%) | | | | |
12,800 | | Abbott Laboratories | | | 689,536 | |
3,500 | | Alexion Pharmaceuticals, Inc.a | | | 236,285 | |
38,500 | | Align Technology, Inc.a | | | 886,655 | |
29,905 | | Amgen, Inc. | | | 1,712,659 | |
2,700 | | AstraZeneca plc | | | 129,631 | |
29,860 | | Baxter International, Inc. | | | 1,641,703 | |
4,167 | | C.R. Bard, Inc. | | | 358,154 | |
5,591 | | Celesio AG | | | 88,180 | |
17,740 | | Covance, Inc.a | | | 899,950 | |
9,796 | | Coventry Health Care, Inc.a | | | 311,611 | |
14,960 | | Covidien plc | | | 703,718 | |
17,900 | | Eli Lilly and Company | | | 665,164 | |
200 | | Fresenius SE & Company KGaA | | | 19,638 | |
24,300 | | Gilead Sciences, Inc.a | | | 1,012,338 | |
34,818 | | Health Net, Inc.a | | | 967,592 | |
21,110 | | Johnson & Johnson | | | 1,359,273 | |
10,463 | | McKesson Corporation | | | 853,258 | |
20,800 | | Merck & Company, Inc. | | | 717,600 | |
44,288 | | Mylan, Inc.a | | | 866,716 | |
500 | | Novartis AG | | | 28,168 | |
128,973 | | Pfizer, Inc. | | | 2,484,020 | |
28,309 | | PSS World Medical, Inc.a | | | 629,875 | |
200 | | Roche Holding AG | | | 32,814 | |
1,900 | | Suzuken Company, Ltd. | | | 45,457 | |
12,100 | | Thoratec Corporationa | | | 441,771 | |
20,720 | | United Therapeutics Corporationa | | | 906,086 | |
30,791 | | UnitedHealth Group, Inc. | | | 1,477,660 | |
4,028 | | Varian Medical Systems, Inc.a | | | 236,524 | |
5,690 | | Vertex Pharmaceuticals, Inc.a | | | 225,267 | |
3,400 | | Waters Corporationa | | | 272,408 | |
12,360 | | Zimmer Holdings, Inc.a | | | 650,507 | |
| | | |
| | Total Health Care | | | 21,550,218 | |
| | | |
| |
Industrials (1.5%) | | | | |
8,700 | | 3M Company | | | 687,474 | |
8 | | A P Moller - Maersk AS | | | 54,102 | |
5,500 | | Abertis Infraestructuras SA | | | 90,505 | |
8,050 | | Boeing Company | | | 529,610 | |
2,600 | | Bouygues SA | | | 97,107 | |
6,950 | | Caterpillar, Inc. | | | 656,497 | |
11 | | Central Japan Railway Company | | | 93,577 | |
8,590 | | Chicago Bridge and Iron Company | | | 314,222 | |
11,709 | | CSX Corporation | | | 260,057 | |
26,858 | | Deluxe Corporation | | | 634,386 | |
1,600 | | East Japan Railway Company | | | 97,005 | |
900 | | Eiffage SA | | | 30,525 | |
25,972 | | EMCOR Group, Inc. | | | 651,118 | |
6,816 | | Expeditors International of Washington, Inc. | | | 310,810 | |
800 | | Fraport AG | | | 50,370 | |
28,173 | | FTI Consulting, Inc.a | | | 1,110,298 | |
18,900 | | GATX Corporation | | | 717,822 | |
16,000 | | General Dynamics Corporation | | | 1,027,040 | |
77,131 | | General Electric Company | | | 1,288,859 | |
19,976 | | Honeywell International, Inc. | | | 1,046,742 | |
110,446 | | Manitowoc Company, Inc. | | | 1,223,742 | |
5,200 | | Manpower, Inc. | | | 224,328 | |
The accompanying Notes to Financial Statements are an integral part of this schedule.
72
Moderate Allocation Fund
Schedule of Investments as of October 31, 2011
| | | | | | |
| Shares | | Common Stock (13.1%) | | Value | |
Industrials (1.5%) - continued | | | | |
6,000 | | Orient Overseas International, Ltd. | | | $27,079 | |
16,916 | | Oshkosh Corporationa | | | 352,868 | |
14,849 | | Parker Hannifin Corporation | | | 1,210,936 | |
11,000 | | PostNL NV | | | 55,697 | |
4,000 | | Precision Castparts Corporation | | | 652,600 | |
9,600 | | Republic Services, Inc. | | | 273,216 | |
800 | | Safran SA | | | 26,125 | |
28,266 | | Shaw Group, Inc.a | | | 657,467 | |
16,904 | | SPX Corporation | | | 923,127 | |
8,572 | | Teledyne Technologies, Inc.a | | | 466,917 | |
27,110 | | Textron, Inc. | | | 526,476 | |
102,500 | | Thomas Cook Group plc | | | 85,046 | |
8,000 | | Tyco International, Ltd. | | | 364,400 | |
8,826 | | Union Pacific Corporation | | | 878,805 | |
9,080 | | United Technologies Corporation | | | 708,058 | |
1,000 | | W.W. Grainger, Inc. | | | 171,310 | |
13,230 | | WESCO International, Inc.a | | | 641,126 | |
300 | | West Japan Railway Company | | | 12,712 | |
| | | |
| | Total Industrials | | | 19,230,161 | |
| | | |
| |
Information Technology (3.1%) | | | | |
6,136 | | ADTRAN, Inc. | | | 206,170 | |
18,729 | | Akamai Technologies, Inc.a | | | 504,559 | |
6,200 | | Alliance Data Systems Corporationa | | | 635,128 | |
12,202 | | Apple, Inc.a | | | 4,939,125 | |
60,800 | | Atmel Corporationa | | | 642,048 | |
2,200 | | Baidu.com, Inc. ADRa | | | 308,396 | |
11,750 | | Broadcom Corporationa | | | 424,057 | |
47,790 | | Cisco Systems, Inc. | | | 885,549 | |
11,078 | | Cognizant Technology Solutions Corporationa | | | 805,924 | |
1,900 | | Computershare, Ltd. | | | 15,015 | |
22,099 | | eBay, Inc.a | | | 703,411 | |
30,250 | | EMC Corporationa | | | 741,427 | |
3,654 | | F5 Networks, Inc.a | | | 379,833 | |
3,844 | | Google, Inc.a | | | 2,278,108 | |
38,100 | | Hewlett-Packard Company | | | 1,013,841 | |
94,500 | | Intel Corporation | | | 2,319,030 | |
4,487 | | International Business Machines Corporation | | | 828,435 | |
6,616 | | Ixiaa | | | 74,959 | |
15,814 | | Juniper Networks, Inc.a | | | 386,969 | |
9,000 | | Lam Research Corporationa | | | 386,910 | |
113,510 | | Microsoft Corporation | | | 3,022,771 | |
64,686 | | Monster Worldwide, Inc.a | | | 597,052 | |
10,400 | | Nokia Oyj | | | 69,982 | |
9 | | NTT Data Corporation | | | 30,172 | |
46,089 | | NVIDIA Corporationa | | | 682,117 | |
98,010 | | Oracle Corporation | | | 3,211,788 | |
21,524 | | Plantronics, Inc. | | | 719,117 | |
23,235 | | Plexus Corporationa | | | 597,139 | |
19,100 | | QUALCOMM, Inc. | | | 985,560 | |
35,737 | | Quest Software, Inc.a | | | 628,614 | |
5,541 | | Red Hat, Inc.a | | | 275,111 | |
4,022 | | Salesforce.com, Inc.a | | | 535,610 | |
39,500 | | SuccessFactors, Inc.a | | | 1,054,650 | |
9,800 | | Telefonaktiebolaget LM Ericsson | | | 102,150 | |
91,613 | | Teradyne, Inc.a | | | 1,311,898 | |
31,440 | | Texas Instruments, Inc. | | | 966,151 | |
48,773 | | TIBCO Software, Inc.a | | | 1,409,052 | |
22,101 | | ValueClick, Inc.a | | | 388,978 | |
25,800 | | VeriFone Systems, Inc.a | | | 1,089,018 | |
11,500 | | Visa, Inc. | | | 1,072,490 | |
6,382 | | VMware, Inc.a | | | 623,840 | |
| | | | | | |
| Shares | | Common Stock (13.1%) | | Value | |
Information Technology (3.1%) - continued | | | | |
29,360 | | Xilinx, Inc. | | | $982,386 | |
| | | |
| | Total Information Technology | | | 38,834,540 | |
| | | |
| |
Materials (0.4%) | | | | |
6,695 | | Albemarle Corporation | | | 356,776 | |
1,500 | | Bayer AG | | | 95,568 | |
4,400 | | BHP Billiton plc | | | 138,560 | |
2,000 | | BHP Billiton, Ltd. | | | 78,286 | |
4,700 | | CF Industries Holdings, Inc. | | | 762,669 | |
22,770 | | Dow Chemical Company | | | 634,828 | |
12,159 | | E.I. du Pont de Nemours and Company | | | 584,483 | |
37,378 | | Freeport-McMoRan Copper & Gold, Inc. | | | 1,504,838 | |
1,600 | | Henkel AG & Company KGaA | | | 78,128 | |
6,900 | | ITOCHU Corporation | | | 68,244 | |
3,000 | | Marubeni Corporation | | | 17,462 | |
3,200 | | Nippon Paper Group, Inc. | | | 73,339 | |
2,301 | | Rio Tinto plc | | | 124,487 | |
906 | | Rio Tinto, Ltd. | | | 65,042 | |
5,645 | | Sigma-Aldrich Corporation | | | 369,635 | |
9,392 | | Silgan Holdings, Inc. | | | 352,576 | |
26,559 | | Steel Dynamics, Inc. | | | 331,722 | |
21,000 | | Ube Industries, Ltd. | | | 61,565 | |
900 | | Walter Energy, Inc. | | | 68,085 | |
541 | | Yara International ASA | | | 25,584 | |
| | | |
| | Total Materials | | | 5,791,877 | |
| | | |
| |
Telecommunications Services (0.2%) | | | | |
29,100 | | AT&T, Inc. | | | 852,921 | |
2,500 | | Deutsche Telekom AG | | | 31,760 | |
8,016 | | Inmarsat plc | | | 60,474 | |
10 | | KDDI Corporation | | | 73,254 | |
2,300 | | Koninklijke (Royal) KPN NV | | | 30,113 | |
1,600 | | Nippon Telegraph & Telephone Corporation | | | 82,073 | |
34 | | NTT DoCoMo, Inc. | | | 60,385 | |
21,500 | | Telstra Corporation, Ltd. | | | 69,804 | |
20,722 | | Verizon Communications, Inc. | | | 766,300 | |
| | | |
| | Total Telecommunications Services | | | 2,027,084 | |
| | | |
| |
Utilities (0.3%) | | | | |
24,800 | | A2A SPA | | | 33,904 | |
17,600 | | CMS Energy Corporation | | | 366,432 | |
1,500 | | Enagas SA | | | 29,495 | |
21,290 | | Exelon Corporation | | | 945,063 | |
3,400 | | Gas Natural SDG SA | | | 63,199 | |
6,900 | | National Grid plc | | | 68,603 | |
33,870 | | NiSource, Inc. | | | 748,188 | |
23,618 | | NV Energy, Inc. | | | 378,833 | |
38,200 | | PNM Resources, Inc. | | | 686,836 | |
600 | | Red Electrica Corporacion SA | | | 28,904 | |
17,183 | | Southwest Gas Corporation | | | 678,385 | |
2,932 | | SSE plc | | | 63,352 | |
3,100 | | Tohoku Electric Power Company, Inc. | | | 34,253 | |
11,200 | | Tokyo Electric Power Company, Inc.a | | | 41,083 | |
The accompanying Notes to Financial Statements are an integral part of this schedule.
73
Moderate Allocation Fund
Schedule of Investments as of October 31, 2011
| | | | | | |
| Shares | | Common Stock (13.1%) | | Value | |
Utilities (0.3%) - continued | | | | |
11,325 | | UGI Corporation | | | $324,688 | |
| | | |
| | Total Utilities | | | 4,491,218 | |
| | | |
| | | | | | |
| | | |
| | Total Common Stock (cost $158,968,376) | | | 166,503,312 | |
| | | |
| | |
Principal
Amount | | Long-Term Fixed Income (8.1%) | | Value | |
Asset-Backed Securities (0.5%) | |
| | Citigroup Mortgage Loan Trust, Inc. | | | | |
$1,505,520 | | 0.395%, 8/25/2036b | | | 1,124,589 | |
| | GSAMP Trust | | | | |
1,832,344 | | 0.425%, 2/25/2036b | | | 1,436,513 | |
| | J.P. Morgan Mortgage Acquisition Corporation | | | | |
2,000,000 | | 5.461%, 10/25/2036 | | | 1,519,480 | |
| | Morgan Stanley Capital, Inc. | | | | |
1,516,082 | | 0.395%, 2/25/2037b | | | 876,429 | |
| | Renaissance Home Equity Loan Trust | | | | |
2,280,000 | | 6.011%, 5/25/2036 | | | 1,003,264 | |
| | | |
| | Total Asset-Backed Securities | | | 5,960,275 | |
| | | |
|
Basic Materials (0.3%) | |
| | ArcelorMittal | | | | |
1,200,000 | | 7.000%, 10/15/2039 | | | 1,198,327 | |
| | Arch Coal, Inc. | | | | |
280,000 | | 7.000%, 6/15/2019c | | | 289,800 | |
| | Dow Chemical Company | | | | |
1,200,000 | | 4.250%, 11/15/2020 | | | 1,234,008 | |
| | FMG Resources Property, Ltd. | | | | |
270,000 | | 7.000%, 11/1/2015c | �� | | 270,000 | |
| | Georgia-Pacific, LLC | | | | |
250,000 | | 8.000%, 1/15/2024 | | | 329,352 | |
| | Novelis, Inc. | | | | |
270,000 | | 8.375%, 12/15/2017 | | | 291,600 | |
| | | |
| | Total Basic Materials | | | 3,613,087 | |
| | | |
|
Capital Goods (0.1%) | |
| | Case New Holland, Inc. | | | | |
260,000 | | 7.875%, 12/1/2017 | | | 293,150 | |
| | Danaher Corporation | | | | |
480,000 | | 0.603%, 6/21/2013b | | | 480,504 | |
| | | |
| | Total Capital Goods | | | 773,654 | |
| | | |
| |
Collateralized Mortgage Obligations (1.0%) | | | | |
| | Citigroup Mortgage Loan Trust, Inc. | | | | |
741,535 | | 5.500%, 11/25/2035 | | | 626,922 | |
| | CitiMortgage Alternative Loan Trust | | | | |
2,574,149 | | 5.750%, 4/25/2037 | | | 1,702,558 | |
| | Countrywide Alternative Loan Trust | | | | |
833,798 | | 6.000%, 4/25/2036 | | | 593,163 | |
505,729 | | 6.000%, 1/25/2037 | | | 340,030 | |
2,373,952 | | 5.500%, 5/25/2037 | | | 1,685,214 | |
2,038,295 | | 7.000%, 10/25/2037 | | | 1,395,113 | |
| | Countrywide Home Loans, Inc. | | | | |
1,444,494 | | 5.750%, 4/25/2037 | | | 1,227,789 | |
| | Deutsche Alt-A Securities, Inc. | | | | |
473,045 | | 5.500%, 10/25/2021 | | | 453,476 | |
890,737 | | 6.000%, 10/25/2021 | | | 786,433 | |
| | | | | | |
Principal Amount | | Long-Term Fixed Income (8.1%) | | Value | |
| Collateralized Mortgage Obligations (1.0%) - continued | | | |
| | GSR Mortgage Loan Trust | | | | |
$1,714,117 | | 0.435%, 8/25/2046b | | | $1,418,744 | |
| | J.P. Morgan Mortgage Trust | | | | |
602,145 | | 5.737%, 6/25/2036 | | | 494,841 | |
227,633 | | 2.774%, 10/25/2036 | | | 170,752 | |
| | MASTR Alternative Loans Trust | | | | |
588,482 | | 6.500%, 7/25/2034 | | | 621,815 | |
| | Merrill Lynch Alternative Note Asset Trust | | | | |
583,824 | | 6.000%, 3/25/2037 | | | 417,655 | |
| | Sequoia Mortgage Trust | | | | |
860,953 | | 5.372%, 9/20/2046 | | | 271,319 | |
| | WaMu Mortgage Pass Through Certificates | | | | |
211,848 | | 5.835%, 9/25/2036 | | | 164,775 | |
817,616 | | 5.932%, 10/25/2036 | | | 693,078 | |
| | | |
| | Total Collateralized Mortgage Obligations | | | 13,063,677 | |
| | | |
| |
Commercial Mortgage-Backed Securities (1.3%) | | | | |
| | Banc of America Commercial Mortgage, Inc. | | | | |
2,400,000 | | 5.645%, 4/10/2049 | | | 2,559,842 | |
1,650,000 | | 5.624%, 6/10/2049 | | | 1,740,999 | |
| | Bear Stearns Commercial Mortgage Securities, Inc. | | | | |
1,500,000 | | 5.331%, 2/11/2044 | | | 1,561,265 | |
| | Credit Suisse First Boston Mortgage Securities | | | | |
2,400,000 | | 5.542%, 1/15/2049 | | | 2,472,946 | |
| | Credit Suisse Mortgage Capital Certificates | | | | |
3,000,000 | | 5.509%, 9/15/2039 | | | 2,488,971 | |
| | Greenwich Capital Commercial Funding Corporation | | | | |
1,600,000 | | 5.867%, 12/10/2049 | | | 1,349,251 | |
| | J.P. Morgan Chase Commercial Mortgage Securities Corporation | | | | |
1,200,000 | | 5.739%, 2/12/2049 | | | 1,093,410 | |
| | Morgan Stanley Capital, Inc. | | | | |
750,000 | | 5.406%, 3/15/2044 | | | 678,428 | |
| | Wachovia Bank Commercial Mortgage Trust | | | | |
1,800,000 | | 5.603%, 10/15/2048 | | | 1,670,044 | |
| | | |
| | Total Commercial Mortgage- Backed Securities | | | 15,615,156 | |
| | | |
|
Communications Services (0.4%) | |
| | Cablevision Systems Corporation | | | | |
270,000 | | 8.625%, 9/15/2017 | | | 292,950 | |
| | CBS Corporation | | | | |
600,000 | | 7.875%, 7/30/2030 | | | 792,291 | |
600,000 | | 5.900%, 10/15/2040 | | | 669,160 | |
| | CCO Holdings, LLC | | | | |
270,000 | | 7.000%, 1/15/2019 | | | 280,125 | |
| | Clear Channel Worldwide Holdings, Inc. | | | | |
270,000 | | 9.250%, 12/15/2017 | | | 292,950 | |
| | Cox Communications, Inc. | | | | |
1,200,000 | | 6.950%, 6/1/2038c | | | 1,426,124 | |
The accompanying Notes to Financial Statements are an integral part of this schedule.
74
Moderate Allocation Fund
Schedule of Investments as of October 31, 2011
| | | | | | |
Principal
Amount | | Long-Term Fixed Income (8.1%) | | Value | |
Communications Services (0.4%) - continued | | | | |
| | EH Holding Corporation | | | | |
$270,000 | | 6.500%, 6/15/2019c | | | $276,075 | |
| | Frontier Communications Corporation | | | | |
270,000 | | 8.250%, 4/15/2017 | | | 288,225 | |
| | Intelsat Jackson Holdings SA | | | | |
270,000 | | 7.250%, 4/1/2019c | | | 271,350 | |
| | NII Capital Corporation | | | | |
230,000 | | 7.625%, 4/1/2021 | | | 236,900 | |
| | Virgin Media Finance plc | | | | |
250,000 | | 9.500%, 8/15/2016 | | | 278,750 | |
| | | |
| | Total Communications Services | | | 5,104,900 | |
| | | |
| |
Consumer Cyclical (0.3%) | | | | |
| | Chrysler Group, LLC | | | | |
400,000 | | 8.000%, 6/15/2019c | | | 368,000 | |
| | Home Depot, Inc. | | | | |
1,200,000 | | 5.875%, 12/16/2036 | | | 1,418,216 | |
| | Lennar Corporation | | | | |
270,000 | | 12.250%, 6/1/2017 | | | 317,925 | |
| | MGM Resorts International | | | | |
240,000 | | 11.125%, 11/15/2017 | | | 272,400 | |
| | Rite Aid Corporation | | | | |
270,000 | | 7.500%, 3/1/2017 | | | 268,650 | |
| | Starwood Hotels & Resorts Worldwide, Inc. | | | | |
280,000 | | 6.750%, 5/15/2018 | | | 310,800 | |
| | Toys R Us Property Company II, LLC | | | | |
280,000 | | 8.500%, 12/1/2017 | | | 295,750 | |
| | West Corporation | | | | |
150,000 | | 7.875%, 1/15/2019 | | | 152,250 | |
| | WMG Acquisition Corporation | | | | |
280,000 | | 11.500%, 10/1/2018c | | | 279,300 | |
| | | |
| | Total Consumer Cyclical | | | 3,683,291 | |
| | | |
| |
Consumer Non-Cyclical (0.7%) | | | | |
| | Altria Group, Inc. | | | | |
1,200,000 | | 9.950%, 11/10/2038 | | | 1,823,161 | |
| | Anheuser-Busch Companies, Inc. | | | | |
600,000 | | 6.450%, 9/1/2037 | | | 795,308 | |
| | Anheuser-Busch InBev Worldwide, Inc. | | | | |
840,000 | | 0.761%, 7/14/2014b | | | 837,687 | |
600,000 | | 8.200%, 1/15/2039 | | | 936,955 | |
| | Community Health Systems, Inc. | | | | |
270,000 | | 8.875%, 7/15/2015 | | | 276,413 | |
| | HCA, Inc. | | | | |
260,000 | | 7.500%, 2/15/2022 | | | 265,200 | |
| | JBS USA, LLC/JBS USA Finance, Inc. | | | | |
240,000 | | 11.625%, 5/1/2014 | | | 264,000 | |
| | Kinetic Concepts, Inc./KCI USA, Inc. | | | | |
270,000 | | 10.500%, 11/1/2018c,d | | | 273,037 | |
| | Kraft Foods, Inc. | | | | |
600,000 | | 5.375%, 2/10/2020 | | | 691,540 | |
600,000 | | 7.000%, 8/11/2037 | | | 797,097 | |
| | Mylan, Inc. | | | | |
250,000 | | 7.875%, 7/15/2020c | | | 280,000 | |
| | Reynolds Group Issuer, Inc. | | | | |
260,000 | | 6.875%, 2/15/2021c | | | 262,600 | |
| | | | | | |
Principal
Amount | | Long-Term Fixed Income (8.1%) | | Value | |
Consumer Non-Cyclical (0.7%) - continued | | | | |
| | Tenet Healthcare Corporation | | | | |
$270,000 | | 8.875%, 7/1/2019 | | | $305,100 | |
| | UnitedHealth Group, Inc. | | | | |
600,000 | | 6.875%, 2/15/2038 | | | 791,194 | |
600,000 | | 5.700%, 10/15/2040 | | | 709,210 | |
| | | |
| | Total Consumer Non-Cyclical | | | 9,308,502 | |
| | | |
| |
Energy (0.2%) | | | | |
| | Chesapeake Energy Corporation | | | | |
230,000 | | 9.500%, 2/15/2015 | | | 263,350 | |
| | Linn Energy, LLC | | | | |
280,000 | | 7.750%, 2/1/2021 | | | 298,900 | |
| | Newfield Exploration Company | | | | |
270,000 | | 5.750%, 1/30/2022 | | | 286,200 | |
| | Plains Exploration & Production Company | | | | |
270,000 | | 7.625%, 6/1/2018 | | | 288,900 | |
| | Weatherford International, Ltd. | | | | |
1,200,000 | | 6.750%, 9/15/2040 | | | 1,399,934 | |
| | | |
| | Total Energy | | | 2,537,284 | |
| | | |
| |
Financials (0.9%) | | | | |
| | Ally Financial, Inc. | | | | |
270,000 | | 8.000%, 3/15/2020 | | | 278,100 | |
| | AXA SA | | | | |
1,200,000 | | 6.379%, 12/29/2049c,e | | | 897,000 | |
| | BBVA International Preferred SA Unipersonal | | | | |
600,000 | | 5.919%, 12/29/2049e | | | 433,770 | |
| | CIT Group, Inc. | | | | |
280,000 | | 7.000%, 5/1/2017 | | | 280,000 | |
| | General Electric Capital Corporation | | | | |
1,200,000 | | 6.750%, 3/15/2032 | | | 1,403,309 | |
| | HCP, Inc. | | | | |
1,200,000 | | 6.750%, 2/1/2041 | | | 1,283,182 | |
| | Health Care REIT, Inc. | | | | |
480,000 | | 6.500%, 3/15/2041 | | | 459,925 | |
| | Icahn Enterprises, LP | | | | |
305,000 | | 8.000%, 1/15/2018 | | | 310,338 | |
| | International Lease Finance Corporation | | | | |
270,000 | | 5.750%, 5/15/2016 | | | 254,741 | |
| | MetLife Capital Trust IV | | | | |
1,200,000 | | 7.875%, 12/15/2037c | | | 1,270,375 | |
| | Prudential Financial, Inc. | | | | |
1,200,000 | | 6.200%, 11/15/2040 | | | 1,349,267 | |
| | QBE Capital Funding III, Ltd. | | | | |
1,200,000 | | 7.250%, 5/24/2041c | | | 1,126,718 | |
| | Reinsurance Group of America, Inc. | | | | |
600,000 | | 6.750%, 12/15/2065 | | | 520,697 | |
| | Stoneheath RE | | | | |
600,000 | | 3.523%, 12/29/2049b,e | | | 436,842 | |
| | XL Group plc | | | | |
1,200,000 | | 6.250%, 5/15/2027 | | | 1,242,179 | |
600,000 | | 6.500%, 12/31/2049e | | | 504,000 | |
| | | |
| | Total Financials | | | 12,050,443 | |
| | | |
The accompanying Notes to Financial Statements are an integral part of this schedule.
75
Moderate Allocation Fund
Schedule of Investments as of October 31, 2011
| | | | | | |
Principal
Amount | | Long-Term Fixed Income (8.1%) | | Value | |
Mortgage-Backed Securities (1.4%) | | | | |
| | Federal National Mortgage Association Conventional 15- Yr. Pass Through | | | | |
$6,500,000 | | 3.000%, 12/1/2026d | | | $6,634,062 | |
| | Federal National Mortgage Association Conventional 30- Yr. Pass Through | | | | |
8,200,000 | | 4.500%, 11/1/2041d | | | 8,670,221 | |
2,300,000 | | 5.000%, 11/1/2041d | | | 2,473,938 | |
| | | |
| | Total Mortgage-Backed Securities | | | 17,778,221 | |
| | | |
| |
Technology (<0.1%) | | | | |
| | Seagate HDD Cayman | | | | |
250,000 | | 7.750%, 12/15/2018c | | | 261,250 | |
| | | |
| | Total Technology | | | 261,250 | |
| | | |
| |
Transportation (<0.1%) | | | | |
| | Avis Budget Car Rental, LLC/Avis Budget Finance, Inc. | | | | |
190,000 | | 8.250%, 1/15/2019 | | | 189,525 | |
| | | |
| | Total Transportation | | | 189,525 | |
| | | |
| |
U.S. Government and Agencies (0.7%) | | | | |
| | U.S. Treasury Notes | | | | |
4,725,000 | | 2.500%, 4/30/2015 | | | 5,043,569 | |
2,350,000 | | 3.125%, 5/15/2021 | | | 2,554,708 | |
1,175,000 | | 4.375%, 5/15/2040 | | | 1,439,375 | |
| | | |
| | Total U.S. Government and Agencies | | | 9,037,652 | |
| | | |
| |
Utilities (0.3%) | | | | |
| | AES Corporation | | | | |
270,000 | | 7.375%, 7/1/2021c | | | 288,900 | |
| | Dominion Resources, Inc. | | | | |
600,000 | | 2.669%, 9/30/2066b | | | 508,122 | |
| | Energy Transfer Partners, LP | | | | |
332,000 | | 6.625%, 10/15/2036 | | | 359,971 | |
600,000 | | 7.500%, 7/1/2038 | | | 688,829 | |
| | Markwest Energy Partners, LP/Markwest Energy Finance Corporation | | | | |
270,000 | | 6.500%, 8/15/2021 | | | 278,775 | |
| | Southern Union Company | | | | |
1,200,000 | | 7.200%, 11/1/2066 | | | 1,032,000 | |
| | | |
| | Total Utilities | | | 3,156,597 | |
| | | |
| | | | | | |
| | | |
| | Total Long-Term Fixed Income (cost $101,161,686) | | | 102,133,514 | |
| | | |
| | |
Principal
Amount | | Short-Term Investments (5.9%)f | | Value | |
| | Federal Home Loan Bank Discount Notes | | | | |
5,000,000 | | 0.010%, 11/4/2011g | | | 4,999,996 | |
15,000,000 | | 0.030%, 11/14/2011g | | | 14,999,838 | |
10,000,000 | | 0.023%, 11/16/2011g | | | 9,999,904 | |
2,100,000 | | 0.025%, 11/18/2011g | | | 2,099,975 | |
3,000,000 | | 0.015%, 12/9/2011g | | | 2,999,952 | |
| | | | | | |
Principal
Amount | | Short-Term Investments (5.9%)f | | Value | |
| | Federal Home Loan Mortgage Corporation Discount Notes | | | | |
$7,800,000 | | 0.035%, 11/14/2011g | | | $7,799,901 | |
3,000,000 | | 0.020%, 11/28/2011g | | | 2,999,955 | |
3,000,000 | | 0.030%, 1/9/2012g | | | 2,999,827 | |
3,000,000 | | 0.030%, 1/17/2012g | | | 2,999,808 | |
| | Federal National Mortgage Association Discount Notes | | | | |
5,000,000 | | 0.020%, 12/28/2011g | | | 4,999,842 | |
3,000,000 | | 0.040%, 1/11/2012g | | | 2,999,763 | |
3,000,000 | | 0.020%, 1/17/2012g | | | 2,999,872 | |
10,400,000 | | 0.100%, 2/22/2012g,h | | | 10,396,782 | |
| | U.S. Treasury Bills | | | | |
1,400,000 | | 0.045%, 2/9/2012h | | | 1,399,826 | |
| | | |
| | Total Short-Term Investments (at amortized cost) | | | 74,695,241 | |
| | | |
| | Total Investments (cost $1,279,032,927) 101.3% | | | $1,283,225,131 | |
| | | |
| | Other Assets and Liabilities, Net (1.3%) | | | (15,986,439 | ) |
| | | |
| | Total Net Assets 100.0% | | | $1,267,238,692 | |
| | | |
| a | Non-income producing security. |
| b | Denotes variable rate securities. Variable rate securities are securities whose yields vary with a designated market index or market rate. The rate shown is as of October 31, 2011. |
| c | Denotes securities sold under Rule 144A of the Securities Act of 1933, which exempts them from registration. These securities have been deemed liquid and may be resold to other dealers in the program or to other qualified institutional buyers. As of October 31, 2011, the value of these investments was $7,840,529 or 0.6% of total net assets. |
| d | Denotes investments purchased on a when-issued or delayed delivery basis. |
| e | Denotes perpetual securities. Perpetual securities pay an indefinite stream of interest, but may be called by the issuer at an earlier date. |
| f | The interest rate shown reflects the yield, coupon rate or the discount rate at the date of purchase. |
| g | Denotes investments that benefit from credit enhancement or liquidity support provided by a third party bank, institution or government. |
| h | At October 31, 2011, $11,796,608 of investments were held on deposit with the counterparty and pledged as the initial margin deposit for open futures contracts. |
| | | | |
| | Definitions: | | |
| | ADR - | | American Depositary Receipt, which are certificates for an underlying foreign security’s shares held by an issuing U.S. depository bank. |
| | REIT - | | Real Estate Investment Trust is a company that buys, develops, manages and/or sells real estate assets. |
| | ETF - | | Exchange Traded Fund. |
Unrealized Appreciation (Depreciation)
| | | | |
Gross unrealized appreciation and depreciation of investments,based on cost for federal income tax purposes, were as follows: | |
Gross unrealized appreciation | | | $36,237,576 | |
Gross unrealized depreciation | | | (44,334,217 | ) |
| | | | |
Net unrealized appreciation (depreciation) | | | ($8,096,641 | ) |
| |
Cost for federal income tax purposes | | | $1,291,321,772 | |
The accompanying Notes to Financial Statements are an integral part of this schedule.
76
Moderate Allocation Fund
Schedule of Investments as of October 31, 2011
Fair Valuation Measurements
The following table is a summary of the inputs used, as of October 31, 2011, in valuing Moderate Allocation Fund’s assets carried at fair value.
| | | | | | | | | | | | | | | | |
| Investments in Securities | | Total | | | Level 1 | | | Level 2 | | | Level 3 | |
Mutual Funds | | | | | | | | | | | | | | | | |
Equity Mutual Funds | | | 498,840,983 | | | | 498,840,983 | | | | – | | | | – | |
Fixed Income Mutual Funds | | | 441,052,081 | | | | 441,052,081 | | | | – | | | | – | |
Common Stock | | | | | | | | | | | | | | | | |
Consumer Discretionary | | | 19,941,030 | | | | 18,901,397 | | | | 1,039,633 | | | | – | |
Consumer Staples | | | 13,885,789 | | | | 13,278,667 | | | | 607,122 | | | | – | |
Energy | | | 18,617,348 | | | | 17,732,622 | | | | 884,726 | | | | – | |
Financials | | | 22,134,047 | | | | 21,146,863 | | | | 987,184 | | | | – | |
Health Care | | | 21,550,218 | | | | 21,206,330 | | | | 343,888 | | | | – | |
Industrials | | | 19,230,161 | | | | 18,510,311 | | | | 719,850 | | | | – | |
Information Technology | | | 38,834,540 | | | | 38,617,221 | | | | 217,319 | | | | – | |
Materials | | | 5,791,877 | | | | 4,965,612 | | | | 826,265 | | | | – | |
Telecommunications Services | | | 2,027,084 | | | | 1,619,221 | | | | 407,863 | | | | – | |
Utilities | | | 4,491,218 | | | | 4,128,425 | | | | 362,793 | | | | – | |
Long-Term Fixed Income | | | | | | | | | | | | | | | | |
Asset-Backed Securities | | | 5,960,275 | | | | – | | | | 5,960,275 | | | | – | |
Basic Materials | | | 3,613,087 | | | | – | | | | 3,613,087 | | | | – | |
Capital Goods | | | 773,654 | | | | – | | | | 773,654 | | | | – | |
Collateralized Mortgage Obligations | | | 13,063,677 | | | | – | | | | 13,063,677 | | | | – | |
Commercial Mortgage-Backed | | | | | | | | | | | | | | | | |
Securities | | | 15,615,156 | | | | – | | | | 15,615,156 | | | | – | |
Communications Services | | | 5,104,900 | | | | – | | | | 5,104,900 | | | | – | |
Consumer Cyclical | | | 3,683,291 | | | | – | | | | 3,683,291 | | | | – | |
Consumer Non-Cyclical | | | 9,308,502 | | | | – | | | | 9,308,502 | | | | – | |
Energy | | | 2,537,284 | | | | – | | | | 2,537,284 | | | | – | |
Financials | | | 12,050,443 | | | | – | | | | 12,050,443 | | | | – | |
Mortgage-Backed Securities | | | 17,778,221 | | | | – | | | | 17,778,221 | | | | – | |
Technology | | | 261,250 | | | | – | | | | 261,250 | | | | – | |
Transportation | | | 189,525 | | | | – | | | | 189,525 | | | | – | |
U.S. Government and Agencies | | | 9,037,652 | | | | – | | | | 9,037,652 | | | | – | |
Utilities | | | 3,156,597 | | | | – | | | | 3,156,597 | | | | – | |
Short-Term Investments | | | 74,695,241 | | | | – | | | | 74,695,241 | | | | – | |
Total | | $ | 1,283,225,131 | | | $ | 1,099,999,733 | | | $ | 183,225,398 | | | | $– | |
| | | | | | | | | | | | | | | | |
| Other Financial Instruments | | Total | | | Level 1 | | | Level 2 | | | Level 3 | |
Asset Derivatives | | | | | | | | | | | | | | | | |
Futures Contracts | | | 10,044,079 | | | | 10,044,079 | | | | – | | | | – | |
Total Asset Derivatives | | | $10,044,079 | | | | $10,044,079 | | | | $– | | | | $– | |
Liability Derivatives | | | | | | | | | | | | | | | | |
Futures Contracts | | | 2,584,499 | | | | 2,584,499 | | | | – | | | | – | |
Total Liability Derivatives | | | $2,584,499 | | | | $2,584,499 | | | | $– | | | | $– | |
| | | | | | | | | | | | | | | | | | | | | | | | | |
| Futures Contracts | | Number of
Contracts
Long/(Short) | | Expiration
Date | | Notional
Principal
Amount | | Value | | Unrealized
Gain/(Loss) |
2-Yr. U.S. Treasury Bond Futures | | | | (100 | ) | | December 2011 | | | | ($22,043,445 | ) | | | | ($22,028,125 | ) | | | | $15,320 | |
5-Yr. U.S. Treasury Bond Futures | | | | (345 | ) | | December 2011 | | | | (42,215,628 | ) | | | | (42,300,236 | ) | | | | (84,608 | ) |
10-Yr. U.S. Treasury Bond Futures | | | | (75 | ) | | December 2011 | | | | (9,723,990 | ) | | | | (9,679,687 | ) | | | | 44,303 | |
Mini MSCI EAFE Index Futures | | | | 205 | | | December 2011 | | | | 14,539,931 | | | | | 15,179,225 | | | | | 639,294 | |
Russell 2000 Index Mini-Futures | | | | (269 | ) | | December 2011 | | | | (18,953,121 | ) | | | | (19,887,170 | ) | | | | (934,049 | ) |
S&P 400 Index Mini-Futures | | | | (425 | ) | | December 2011 | | | | (36,093,408 | ) | | | | (37,659,250 | ) | | | | (1,565,842 | ) |
S&P 500 Index Mini-Futures | | | | 1,785 | | | December 2011 | | | | 102,154,863 | | | | | 111,500,025 | | | | | 9,345,162 | |
Total Futures Contracts | | | | | | | | | | | | | | | | | | | | | $7,459,580 | |
The accompanying Notes to Financial Statements are an integral part of this schedule.
77
Moderate Allocation Fund
Schedule of Investments as of October 31, 2011
The following table summarizes the fair value and Statement of Assets and Liabilities location, as of October 31, 2011, for Moderate Allocation Fund’s investments in financial derivative instruments by primary risk exposure as discussed under item (2) Significant Accounting Policies of the Notes to Financial Statements.
| | | | | | |
| Derivatives by risk category | | Statement of Assets and Liabilities Location | | Fair Value | |
| | |
Asset Derivatives | | | | | | |
Interest Rate Contracts | | | | | | |
Futures* | | Net Assets - Net unrealized appreciation/(depreciation) on Futures contracts | | | $59,623 | |
Total Interest Rate Contracts | | | | | 59,623 | |
Equity Contracts | | | | | | |
Futures* | | Net Assets - Net unrealized appreciation/(depreciation) on Futures contracts | | | 9,984,456 | |
Total Equity Contracts | | | | | 9,984,456 | |
Total Asset Derivatives | | | | $ | 10,044,079 | |
| | |
Liability Derivatives | | | | | | |
Equity Contracts | | | | | | |
Futures* | | Net Assets - Net unrealized appreciation/(depreciation) on Futures contracts | | | 2,499,891 | |
Total Equity Contracts | | | | | 2,499,891 | |
Interest Rate Contracts | | | | | | |
Futures* | | Net Assets - Net unrealized appreciation/(depreciation) on Futures contracts | | | 84,608 | |
Total Interest Rate Contracts | | | | | 84,608 | |
Total Liability Derivatives | | | | | $2,584,499 | |
| * | Includes cumulative appreciation/depreciation of futures contracts as reported in the Schedule of Investments. Only current day’s variation margin is reported within the Statement of Assets and Liabilities. |
The following table summarizes the net realized gains/(losses) and Statement of Operations location, for the period ended October 31, 2011, for Moderate Allocation Fund’s investments in financial derivative instruments by primary risk exposure.
| | | | | | |
| Derivatives by risk category | | Statement of Operations location | | Realized Gains/(Losses)
recognized in Income | |
| | |
Interest Rate Contracts | | | | | | |
Futures | | Net realized gains/(losses) on Futures contracts | | | (3,600,835 | ) |
Total Interest Rate Contracts | | | | | (3,600,835 | ) |
Equity Contracts | | | | | | |
Futures | | Net realized gains/(losses) on Futures contracts | | | 2,079,622 | |
Total Equity Contracts | | | | | 2,079,622 | |
Foreign Exchange Contracts | | | | | | |
Forward Contracts | | Net realized gains/(losses) on Foreign currency transactions | | | (49,919 | ) |
Total Foreign Exchange Contracts | | | | | (49,919 | ) |
Credit Contracts | | | | | | |
Credit Default Swaps | | Net realized gains/(losses) on Swap agreements | | | 816,285 | |
Total Credit Contracts | | | | | 816,285 | |
Total | | | | | ($754,847 | ) |
The following table summarizes the change in net unrealized appreciation/(depreciation) and Statement of Operations location, for the period ended October 31, 2011, for Moderate Allocation Fund’s investments in financial derivative instruments by primary risk exposure.
| | | | | | |
| Derivatives by risk category | | Statement of Operations Location | | Change in unrealized
appreciation/(depreciation)
recognized in Income | |
Interest Rate Contracts | | | | | | |
Futures | | Change in net unrealized appreciation/(depreciation) on Futures contracts | | | (24,985 | ) |
Total Interest Rate Contracts | | | | | (24,985 | ) |
Equity Contracts | | | | | | |
Futures | | Change in net unrealized appreciation/(depreciation) on Futures contracts | | | 5,965,274 | |
Total Equity Contracts | | | | | 5,965,274 | |
Total | | | | | $5,940,289 | |
The accompanying Notes to Financial Statements are an integral part of this schedule.
78
Moderate Allocation Fund
Schedule of Investments as of October 31, 2011
The following table presents Moderate Allocation Fund’s average volume of derivative activity during the period ended October 31, 2011.
| | | | | | | | | | | | | | | | | | | | | | | | |
Derivative Risk Category | | Futures (Notional*) | | | Futures (Percentage of Average Net Assets) | | | Forwards (Notional*) | | | Forwards (Percentage of Average Net Assets) | | | Swaps (Notional*) | | | Swaps (Percentage of Average Net Assets) | |
Equity Contracts | | | $136,235,718 | | | | 10.8 | % | | | N/A | | | | N/A | | | | N/A | | | | N/A | |
Interest Rate Contracts | | | 44,922,300 | | | | 3.6 | | | | N/A | | | | N/A | | | | N/A | | | | N/A | |
Foreign Exchange Contracts | | | N/A | | | | N/A | | | | $286,817 | | | | <0.1 | % | | | N/A | | | | N/A | |
Credit Contracts | | | N/A | | | | N/A | | | | N/A | | | | N/A | | | $ | 10,286,479 | | | | 0.8 | % |
| * | Notional amount represents long or short, or both, derivative positions held by the Fund. |
Investment in Affiliates
Affiliated issuers, as defined under the Investment Company Act of 1940, include those in which the Fund’s holdings of an issuer represent 5% or more of the outstanding voting securities of an issuer, or any affiliated mutual fund.
A summary of transactions for the fiscal year to date, in Moderate Allocation Fund, is as follows:
| | | | | | | | | | | | | | | | | | | | | | | | |
| Fund | | Value October 31, 2010 | | | Gross Purchases | | | Gross Sales | | | Shares Held at October 31, 2011 | | | Value October 31, 2011 | | | Income Earned November 1, 2010 - October 31, 2011 | |
Natural Resources | | | $36,366,401 | | | | $1,048,089 | | | | $– | | | | 3,939,073 | | | | $40,454,277 | | | | $1,048,089 | |
Partner Small Cap Growth | | | 20,382,531 | | | | – | | | | – | | | | 1,851,274 | | | | 22,196,780 | | | | – | |
Partner Small Cap Value | | | 29,431,466 | | | | 251,922 | | | | 8,000,000 | | | | 1,555,328 | | | | 23,625,437 | | | | 251,922 | |
Small Cap Stock | | | 12,347,353 | | | | – | | | | – | | | | 882,584 | | | | 13,203,459 | | | | – | |
Mid Cap Growth | | | 13,633,862 | | | | – | | | | – | | | | 735,772 | | | | 14,575,651 | | | | – | |
Partner Mid Cap Value | | | 27,220,376 | | | | 165,404 | | | | 3,000,000 | | | | 2,185,388 | | | | 25,350,505 | | | | 165,404 | |
Mid Cap Stock | | | 37,910,264 | | | | 125,759 | | | | – | | | | 2,616,880 | | | | 40,378,460 | | | | 125,759 | |
Partner Worldwide | | | | | | | | | | | | | | | | | | | | | | | | |
Allocation | | | 68,027,938 | | | | 952,699 | | | | – | | | | 15,201,166 | | | | 126,777,721 | | | | 952,699 | |
Partner International | | | | | | | | | | | | | | | | | | | | | | | | |
Stock | | | 66,483,433 | | | | 2,751,062 | | | | 1,000,000 | | | | – | | | | – | | | | 2,751,062 | |
Large Cap Growth | | | 57,590,296 | | | | – | | | | – | | | | 11,226,178 | | | | 59,274,222 | | | | – | |
Large Cap Value | | | 83,190,141 | | | | 1,242,354 | | | | – | | | | 6,636,735 | | | | 86,543,027 | | | | 1,242,354 | |
Large Cap Stock | | | 35,458,174 | | | | 312,554 | | | | – | | | | 1,698,477 | | | | 36,483,289 | | | | 312,554 | |
Equity Income Plus | | | 9,526,860 | | | | 189,559 | | | | – | | | | 1,130,029 | | | | 9,978,155 | | | | 189,559 | |
High Yield | | | 49,918,470 | | | | 7,576,606 | | | | 6,505,505 | | | | 10,509,425 | | | | 49,604,487 | | | | 3,851,587 | |
Income | | | 172,064,257 | | | | 19,106,570 | | | | 3,533,390 | | | | 21,358,864 | | | | 187,103,647 | | | | 8,574,541 | |
Government Bond | | | 23,982,951 | | | | 2,090,967 | | | | 5,500,245 | | | | 1,947,750 | | | | 20,821,448 | | | | 438,082 | |
Limited Maturity Bond | | | 174,144,828 | | | | 15,755,564 | | | | 3,785,775 | | | | 14,800,202 | | | | 183,522,499 | | | | 4,471,247 | |
Total Value and Income Earned | | | 917,679,601 | | | | | | | | | | | | | | | | 939,893,064 | | | | 24,374,859 | |
The accompanying Notes to Financial Statements are an integral part of this schedule.
79
Moderately Conservative Allocation Fund
Schedule of Investments as of October 31, 2011
| | | | | | |
| Shares | | Mutual Funds (70.9%) | | Value | |
Equity Mutual Funds (21.6%) | |
1,031,435 | | Thrivent Natural Resources Fund | | | $10,592,836 | |
615,493 | | Thrivent Partner Small Cap Value Fund | | | 9,349,338 | |
167,827 | | Thrivent Small Cap Stock Funda | | | 2,510,694 | |
1,082,397 | | Thrivent Partner Mid Cap Value Fund | | | 12,555,806 | |
426,187 | | Thrivent Mid Cap Stock Fund | | | 6,576,068 | |
4,344,713 | | Thrivent Partner Worldwide Allocation Fund | | | 36,234,910 | |
2,404,543 | | Thrivent Large Cap Growth Funda | | | 12,695,989 | |
2,341,000 | | Thrivent Large Cap Value Fund | | | 30,526,644 | |
29,494 | | Thrivent Large Cap Stock Fund | | | 633,535 | |
466,547 | | Thrivent Equity Income Plus Fund | | | 4,119,606 | |
| | | |
| | Total Equity Mutual Funds | | | 125,795,426 | |
| | | |
|
Fixed Income Mutual Funds (49.3%) | |
4,797,259 | | Thrivent High Yield Fund | | | 22,643,063 | |
8,980,360 | | Thrivent Income Fund | | | 78,667,958 | |
1,133,316 | | Thrivent Government Bond Fund | | | 12,115,144 | |
14,004,290 | | Thrivent Limited Maturity Bond Fund | | | 173,653,196 | |
| | | |
| | Total Fixed Income Mutual Funds | | | 287,079,361 | |
| | | |
| | | |
| | | |
| | Total Mutual Funds (cost $406,308,742) | | | 412,874,787 | |
| | | |
| | |
Principal
Amount | | Long-Term Fixed Income (10.8%) | | Value | |
Asset-Backed Securities (0.9%) | |
| | Citigroup Mortgage Loan Trust, Inc. | | | | |
$974,160 | | 0.395%, 8/25/2036b | | | 727,675 | |
| | GSAMP Trust | | | | |
861,202 | | 0.425%, 2/25/2036b | | | 675,161 | |
| | J.P. Morgan Mortgage Acquisition Corporation | | | | |
3,100,000 | | 5.461%, 10/25/2036 | | | 2,355,194 | |
| | Morgan Stanley Capital, Inc. | | | | |
1,047,191 | | 0.395%, 2/25/2037b | | | 605,369 | |
| | Renaissance Home Equity Loan Trust | | | | |
2,300,000 | | 6.011%, 5/25/2036 | | | 1,012,065 | |
| | | |
| | Total Asset-Backed Securities | | | 5,375,464 | |
| | | |
|
Basic Materials (0.4%) | |
| | ArcelorMittal | | | | |
800,000 | | 7.000%, 10/15/2039 | | | 798,885 | |
| | Arch Coal, Inc. | | | | |
110,000 | | 7.000%, 6/15/2019c | | | 113,850 | |
| | Dow Chemical Company | | | | |
800,000 | | 4.250%, 11/15/2020 | | | 822,672 | |
| | FMG Resources Property, Ltd. | | | | |
120,000 | | 7.000%, 11/1/2015c | | | 120,000 | |
| | Georgia-Pacific, LLC | | | | |
100,000 | | 8.000%, 1/15/2024 | | | 131,740 | |
| | Novelis, Inc. | | | | |
110,000 | | 8.375%, 12/15/2017 | | | 118,800 | |
| | | |
| | Total Basic Materials | | | 2,105,947 | |
| | | |
|
Capital Goods (0.1%) | |
| | Case New Holland, Inc. | | | | |
130,000 | | 7.875%, 12/1/2017 | | | 146,575 | |
| | | | | | |
| | |
Principal
Amount | | Long-Term Fixed Income (10.8%) | | Value | |
Capital Goods (0.1%) - continued | |
| | Danaher Corporation | | | | |
$320,000 | | 0.603%, 6/21/2013b | | | $320,336 | |
| | | |
| | Total Capital Goods | | | 466,911 | |
| | | |
|
Collateralized Mortgage Obligations (1.1%) | |
| | Citigroup Mortgage Loan Trust, Inc. | | | | |
395,486 | | 5.500%, 11/25/2035 | | | 334,358 | |
| | CitiMortgage Alternative Loan Trust | | | | |
1,323,848 | | 5.750%, 4/25/2037 | | | 875,601 | |
| | Countrywide Alternative Loan Trust | | | | |
269,722 | | 6.000%, 1/25/2037 | | | 181,349 | |
1,582,634 | | 5.500%, 5/25/2037 | | | 1,123,476 | |
1,353,904 | | 7.000%, 10/25/2037 | | | 926,681 | |
| | Countrywide Home Loans, Inc. | | | | |
722,247 | | 5.750%, 4/25/2037 | | | 613,895 | |
| | Deutsche Alt-A Securities, Inc. | | | | |
252,291 | | 5.500%, 10/25/2021 | | | 241,854 | |
485,856 | | 6.000%, 10/25/2021 | | | 428,964 | |
| | J.P. Morgan Mortgage Trust | | | | |
121,404 | | 2.774%, 10/25/2036 | | | 91,068 | |
| | MASTR Alternative Loans Trust | | | | |
312,631 | | 6.500%, 7/25/2034 | | | 330,339 | |
| | Merrill Lynch Alternative Note Asset Trust | | | | |
311,373 | | 6.000%, 3/25/2037 | | | 222,749 | |
| | Sequoia Mortgage Trust | | | | |
313,074 | | 5.372%, 9/20/2046 | | | 98,661 | |
| | WaMu Mortgage Pass Through Certificates | | | | |
315,309 | | 5.835%, 9/25/2036 | | | 245,246 | |
292,176 | | 5.932%, 10/25/2036 | | | 247,672 | |
| | | |
| | Total Collateralized Mortgage Obligations | | | 5,961,913 | |
| | | |
|
Commercial Mortgage-Backed Securities (2.0%) | |
| | Banc of America Commercial Mortgage, Inc. | | | | |
1,600,000 | | 5.645%, 4/10/2049 | | | 1,706,562 | |
2,450,000 | | 5.624%, 6/10/2049 | | | 2,585,120 | |
| | Bear Stearns Commercial Mortgage Securities, Inc. | | | | |
1,000,000 | | 5.331%, 2/11/2044 | | | 1,040,843 | |
| | Credit Suisse First Boston Mortgage Securities | | | | |
1,700,000 | | 5.542%, 1/15/2049 | | | 1,751,670 | |
| | Credit Suisse Mortgage Capital Certificates | | | | |
1,850,000 | | 5.509%, 9/15/2039 | | | 1,534,865 | |
| | Greenwich Capital Commercial Funding Corporation | | | | |
1,000,000 | | 5.867%, 12/10/2049 | | | 843,282 | |
| | J.P. Morgan Chase Commercial Mortgage Securities Corporation | | | | |
800,000 | | 5.739%, 2/12/2049 | | | 728,940 | |
| | Morgan Stanley Capital, Inc. | | | | |
500,000 | | 5.406%, 3/15/2044 | | | 452,286 | |
The accompanying Notes to Financial Statements are an integral part of this schedule.
80
Moderately Conservative Allocation Fund
Schedule of Investments as of October 31, 2011
| | | | | | |
Principal
Amount | | Long-Term Fixed Income (10.8%) | | Value | |
Commercial Mortgage-Backed Securities (2.0%) - continued | | | | |
| | Wachovia Bank Commercial Mortgage Trust | | | | |
$1,200,000 | | 5.603%, 10/15/2048 | | | $1,113,362 | |
| | | |
| | Total Commercial Mortgage- Backed Securities | | | 11,756,930 | |
| | | |
| |
Communications Services (0.5%) | | | | |
| | Cablevision Systems Corporation | | | | |
110,000 | | 8.625%, 9/15/2017 | | | 119,350 | |
| | CBS Corporation | | | | |
400,000 | | 7.875%, 7/30/2030 | | | 528,194 | |
400,000 | | 5.900%, 10/15/2040 | | | 446,106 | |
| | CCO Holdings, LLC | | | | |
150,000 | | 7.000%, 1/15/2019 | | | 155,625 | |
| | Clear Channel Worldwide Holdings, Inc. | | | | |
110,000 | | 9.250%, 12/15/2017 | | | 119,350 | |
| | Cox Communications, Inc. | | | | |
800,000 | | 6.950%, 6/1/2038c | | | 950,750 | |
| | EH Holding Corporation | | | | |
110,000 | | 6.500%, 6/15/2019c | | | 112,475 | |
| | Frontier Communications Corporation | | | | |
110,000 | | 8.250%, 4/15/2017 | | | 117,425 | |
| | Intelsat Jackson Holdings SA | | | | |
110,000 | | 7.250%, 4/1/2019c | | | 110,550 | |
| | NII Capital Corporation | | | | |
150,000 | | 7.625%, 4/1/2021 | | | 154,500 | |
| | Virgin Media Finance plc | | | | |
100,000 | | 9.500%, 8/15/2016 | | | 111,500 | |
| | | |
| | Total Communications Services | | | 2,925,825 | |
| | | |
| |
Consumer Cyclical (0.3%) | | | | |
| | Chrysler Group, LLC | | | | |
200,000 | | 8.000%, 6/15/2019c | | | 184,000 | |
| | Home Depot, Inc. | | | | |
800,000 | | 5.875%, 12/16/2036 | | | 945,478 | |
| | Lennar Corporation | | | | |
110,000 | | 12.250%, 6/1/2017 | | | 129,525 | |
| | MGM Resorts International | | | | |
95,000 | | 11.125%, 11/15/2017 | | | 107,825 | |
| | Rite Aid Corporation | | | | |
110,000 | | 7.500%, 3/1/2017 | | | 109,450 | |
| | Starwood Hotels & Resorts Worldwide, Inc. | | | | |
110,000 | | 6.750%, 5/15/2018 | | | 122,100 | |
| | Toys R Us Property Company II, LLC | | | | |
110,000 | | 8.500%, 12/1/2017 | | | 116,187 | |
| | West Corporation | | | | |
60,000 | | 7.875%, 1/15/2019 | | | 60,900 | |
| | WMG Acquisition Corporation | | | | |
110,000 | | 11.500%, 10/1/2018c | | | 109,725 | |
| | | |
| | Total Consumer Cyclical | | | 1,885,190 | |
| | | |
| |
Consumer Non-Cyclical (1.0%) | | | | |
| | Altria Group, Inc. | | | | |
800,000 | | 9.950%, 11/10/2038 | | | 1,215,441 | |
| | Anheuser-Busch Companies, Inc. | | | | |
400,000 | | 6.450%, 9/1/2037 | | | 530,206 | |
| | | | | | |
Principal
Amount | | Long-Term Fixed Income (10.8%) | | Value | |
Consumer Non-Cyclical (1.0%) - continued | | | | |
| | Anheuser-Busch InBev Worldwide, Inc. | | | | |
$560,000 | | 0.761%, 7/14/2014b | | | $558,458 | |
400,000 | | 8.200%, 1/15/2039 | | | 624,637 | |
| | Community Health Systems, Inc. | | | | |
110,000 | | 8.875%, 7/15/2015 | | | 112,612 | |
| | HCA, Inc. | | | | |
140,000 | | 7.500%, 2/15/2022 | | | 142,800 | |
| | JBS USA, LLC/JBS USA Finance, Inc. | | | | |
95,000 | | 11.625%, 5/1/2014 | | | 104,500 | |
| | Kinetic Concepts, Inc./KCI USA, Inc. | | | | |
120,000 | | 10.500%, 11/1/2018c,d | | | 121,350 | |
| | Kraft Foods, Inc. | | | | |
400,000 | | 5.375%, 2/10/2020 | | | 461,026 | |
400,000 | | 7.000%, 8/11/2037 | | | 531,398 | |
| | Mylan, Inc. | | | | |
100,000 | | 7.875%, 7/15/2020c | | | 112,000 | |
| | Reynolds Group Issuer, Inc. | | | | |
130,000 | | 6.875%, 2/15/2021c | | | 131,300 | |
| | Tenet Healthcare Corporation | | | | |
120,000 | | 8.875%, 7/1/2019 | | | 135,600 | |
| | UnitedHealth Group, Inc. | | | | |
400,000 | | 6.875%, 2/15/2038 | | | 527,462 | |
400,000 | | 5.700%, 10/15/2040 | | | 472,807 | |
| | | |
| | Total Consumer Non-Cyclical | | | 5,781,597 | |
| | | |
| |
Energy (0.3%) | | | | |
| | Chesapeake Energy Corporation | | | | |
130,000 | | 9.500%, 2/15/2015 | | | 148,850 | |
| | Linn Energy, LLC | | | | |
120,000 | | 7.750%, 2/1/2021 | | | 128,100 | |
| | Newfield Exploration Company | | | | |
120,000 | | 5.750%, 1/30/2022 | | | 127,200 | |
| | Plains Exploration & Production Company | | | | |
120,000 | | 7.625%, 6/1/2018 | | | 128,400 | |
| | Weatherford International, Ltd. | | | | |
800,000 | | 6.750%, 9/15/2040 | | | 933,289 | |
| | | |
| | Total Energy | | | 1,465,839 | |
| | | |
| |
Financials (1.3%) | | | | |
| | Ally Financial, Inc. | | | | |
110,000 | | 8.000%, 3/15/2020 | | | 113,300 | |
| | AXA SA | | | | |
800,000 | | 6.379%, 12/29/2049c,e | | | 598,000 | |
| | BBVA International Preferred SA Unipersonal | | | | |
400,000 | | 5.919%, 12/29/2049e | | | 289,180 | |
| | CIT Group, Inc. | | | | |
110,000 | | 7.000%, 5/1/2017 | | | 110,000 | |
| | General Electric Capital Corporation | | | | |
800,000 | | 6.750%, 3/15/2032 | | | 935,539 | |
| | HCP, Inc. | | | | |
800,000 | | 6.750%, 2/1/2041 | | | 855,454 | |
| | Health Care REIT, Inc. | | | | |
320,000 | | 6.500%, 3/15/2041 | | | 306,617 | |
| | Icahn Enterprises, LP | | | | |
105,000 | | 8.000%, 1/15/2018 | | | 106,838 | |
| | International Lease Finance Corporation | | | | |
110,000 | | 5.750%, 5/15/2016 | | | 103,783 | |
The accompanying Notes to Financial Statements are an integral part of this schedule.
81
Moderately Conservative Allocation Fund
Schedule of Investments as of October 31, 2011
| | | | | | |
Principal
Amount | | Long-Term Fixed Income (10.8%) | | Value | |
Financials (1.3%) - continued | | | | |
| | MetLife Capital Trust IV | | | | |
$800,000 | | 7.875%, 12/15/2037c | | | $846,917 | |
| | Prudential Financial, Inc. | | | | |
800,000 | | 6.200%, 11/15/2040 | | | 899,511 | |
| | QBE Capital Funding III, Ltd. | | | | |
800,000 | | 7.250%, 5/24/2041c | | | 751,146 | |
| | Reinsurance Group of America, Inc. | | | | |
400,000 | | 6.750%, 12/15/2065 | | | 347,132 | |
| | Stoneheath RE | | | | |
400,000 | | 3.523%, 12/29/2049b,e | | | 291,228 | |
| | XL Group plc | | | | |
800,000 | | 6.250%, 5/15/2027 | | | 828,119 | |
400,000 | | 6.500%, 12/31/2049e | | | 336,000 | |
| | | |
| | Total Financials | | | 7,718,764 | |
| | | |
| |
Mortgage-Backed Securities (1.9%) | | | | |
| | Federal National Mortgage Association Conventional 15- Yr. Pass Through | | | | |
2,700,000 | | 3.000%, 12/1/2026d | | | 2,755,688 | |
| | Federal National Mortgage Association Conventional 30- Yr. Pass Through | | | | |
6,750,000 | | 4.500%, 11/1/2041d | | | 7,137,072 | |
1,000,000 | | 5.000%, 11/1/2041d | | | 1,075,625 | |
| | | |
| | Total Mortgage-Backed Securities | | | 10,968,385 | |
| | | |
| |
Technology (<0.1%) | | | | |
| | Seagate HDD Cayman | | | | |
140,000 | | 7.750%, 12/15/2018c | | | 146,300 | |
| | | |
| | Total Technology | | | 146,300 | |
| | | |
| |
Transportation (<0.1%) | | | | |
| | Avis Budget Car Rental, LLC/Avis Budget Finance, Inc. | | | | |
80,000 | | 8.250%, 1/15/2019 | | | 79,800 | |
| | | |
| | Total Transportation | | | 79,800 | |
| | | |
| |
U.S. Government and Agencies (0.7%) | | | | |
| | U.S. Treasury Notes | | | | |
2,150,000 | | 2.500%, 4/30/2015 | | | 2,294,957 | |
1,050,000 | | 3.125%, 5/15/2021 | | | 1,141,466 | |
550,000 | | 4.375%, 5/15/2040 | | | 673,750 | |
| | | |
| | Total U.S. Government and Agencies | | | 4,110,173 | |
| | | |
| |
Utilities (0.3%) | | | | |
| | AES Corporation | | | | |
140,000 | | 7.375%, 7/1/2021c | | | 149,800 | |
| | Dominion Resources, Inc. | | | | |
400,000 | | 2.669%, 9/30/2066b | | | 338,748 | |
| | Energy Transfer Partners, LP | | | | |
222,000 | | 6.625%, 10/15/2036 | | | 240,704 | |
400,000 | | 7.500%, 7/1/2038 | | | 459,219 | |
| | Markwest Energy Partners, LP/Markwest Energy Finance Corporation | | | | |
110,000 | | 6.500%, 8/15/2021 | | | 113,575 | |
| | | | | | |
Principal
Amount | | Long-Term Fixed Income (10.8%) | | Value | |
Utilities (0.3%) - continued | | | | |
| | Southern Union Company | | | | |
$800,000 | | 7.200%, 11/1/2066 | | | $688,000 | |
| | | |
| | Total Utilities | | | 1,990,046 | |
| | | |
| | | | | | |
| | | |
| | Total Long-Term Fixed Income (cost $62,049,359) | | | 62,739,084 | |
| | | |
| | |
| Shares | | Common Stock (10.5%) | | Value | |
Consumer Discretionary (1.2%) | | | | |
3,200 | | Amazon.com, Inc.a | | | 683,232 | |
1,756 | | Autoliv, Inc. | | | 101,444 | |
10,100 | | Best Buy Company, Inc. | | | 264,923 | |
6,400 | | Big Lots, Inc.a | | | 241,216 | |
3,469 | | Buffalo Wild Wings, Inc.a | | | 229,717 | |
3,190 | | CBS Corporation | | | 82,334 | |
1,700 | | Charter Communications, Inc.a | | | 78,098 | |
20,700 | | Comcast Corporation | | | 485,415 | |
6,511 | | Discovery Communications, Inc.a | | | 282,968 | |
1,245 | | Dollar Tree, Inc.a | | | 99,550 | |
12,354 | | Foot Locker, Inc. | | | 270,058 | |
4,110 | | Harley-Davidson, Inc. | | | 159,879 | |
12,708 | | Las Vegas Sands Corporationa | | | 596,641 | |
5,300 | | Life Time Fitness, Inc.a | | | 228,589 | |
7,640 | | Lowe’s Companies, Inc. | | | 160,593 | |
8,257 | | Macy’s, Inc. | | | 252,086 | |
7,400 | | McDonald’s Corporation | | | 687,090 | |
7,230 | | News Corporation | | | 129,056 | |
4,160 | | Omnicom Group, Inc. | | | 185,037 | |
928 | | Panera Bread Companya | | | 124,064 | |
24,749 | | Pier 1 Imports, Inc.a | | | 309,610 | |
400 | | Priceline.com, Inc.a | | | 203,088 | |
5,646 | | Signet Jewelers, Ltd. | | | 243,399 | |
12,720 | | Target Corporation | | | 696,420 | |
2,570 | | Time Warner Cable, Inc. | | | 163,683 | |
3,920 | | Viacom, Inc. | | | 171,892 | |
3,000 | | Williams-Sonoma, Inc. | | | 112,620 | |
1,693 | | WMS Industries, Inc.a | | | 37,094 | |
| | | |
| | Total Consumer Discretionary | | | 7,279,796 | |
| | | |
| |
Consumer Staples (0.9%) | | | | |
23,720 | | Altria Group, Inc. | | | 653,486 | |
8,238 | | Anheuser-Busch InBev NV ADR | | | 456,962 | |
6,050 | | British American Tobacco plc ADR | | | 558,112 | |
7,912 | | Corn Products International, Inc. | | | 383,732 | |
10,900 | | CVS Caremark Corporation | | | 395,670 | |
4,210 | | Diageo plc ADR | | | 348,925 | |
3,692 | | Herbalife, Ltd. | | | 230,233 | |
11,631 | | Kraft Foods, Inc. | | | 409,178 | |
8,853 | | Philip Morris International, Inc. | | | 618,559 | |
1,802 | | TreeHouse Foods, Inc.a | | | 110,535 | |
20,380 | | Wal-Mart Stores, Inc. | | | 1,155,954 | |
| | | |
| | Total Consumer Staples | | | 5,321,346 | |
| | | |
| |
Energy (1.2%) | | | | |
3,719 | | Alpha Natural Resources, Inc.a | | | 89,405 | |
4,210 | | Anadarko Petroleum Corporation | | | 330,485 | |
5,480 | | Apache Corporation | | | 545,972 | |
11,590 | | Arch Coal, Inc. | | | 211,170 | |
8,216 | | Baker Hughes, Inc. | | | 476,446 | |
7,430 | | Chevron Corporation | | | 780,522 | |
6,880 | | ConocoPhillips | | | 479,192 | |
18,083 | | ENSCO International plc ADR | | | 898,002 | |
The accompanying Notes to Financial Statements are an integral part of this schedule.
82
Moderately Conservative Allocation Fund
Schedule of Investments as of October 31, 2011
| | | | | | |
| Shares | | Common Stock (10.5%) | | Value | |
Energy (1.2%) - continued | | | | |
2,700 | | Exxon Mobil Corporation | | | $210,843 | |
5,600 | | Helix Energy Solutions Group, Inc.a | | | 101,136 | |
16,600 | | Marathon Oil Corporation | | | 432,098 | |
1,665 | | National Oilwell Varco, Inc. | | | 118,764 | |
1,500 | | Newfield Exploration Companya | | | 60,390 | |
1,720 | | Occidental Petroleum Corporation | | | 159,857 | |
3,546 | | Oil States International, Inc.a | | | 246,837 | |
18,875 | | Patriot Coal Corporationa | | | 237,070 | |
9,513 | | Peabody Energy Corporation | | | 412,579 | |
17,900 | | Petroleum Geo-Services ASAa | | | 194,479 | |
2,100 | | Southwestern Energy Companya | | | 88,284 | |
6,952 | | Swift Energy Companya | | | 212,870 | |
52,560 | | Weatherford International, Ltd.a | | | 814,680 | |
| | | |
| | Total Energy | | | 7,101,081 | |
| | | |
| |
Financials (1.3%) | | | | |
5,410 | | ACE, Ltd. | | | 390,332 | |
2,576 | | Affiliated Managers Group, Inc.a | | | 238,563 | |
5,000 | | Aon Corporation | | | 233,100 | |
9,722 | | Citigroup, Inc. | | | 307,118 | |
700 | | CME Group, Inc. | | | 192,892 | |
5,955 | | Duke Realty Corporation | | | 73,127 | |
1,700 | | Endurance Specialty Holdings, Ltd. | | | 63,240 | |
4,875 | | Equity One, Inc. | | | 83,606 | |
38,700 | | Fifth Third Bancorp | | | 464,787 | |
1,590 | | Goldman Sachs Group, Inc. | | | 174,184 | |
5,180 | | HCC Insurance Holdings, Inc. | | | 137,840 | |
7,539 | | Host Hotels & Resorts, Inc. | | | 107,582 | |
466 | | IntercontinentalExchange, Inc.a | | | 60,524 | |
24,883 | | J.P. Morgan Chase & Company | | | 864,933 | |
13,790 | | KKR & Company, LP | | | 185,889 | |
2,373 | | Lazard, Ltd. | | | 64,878 | |
1,500 | | M&T Bank Corporation | | | 114,165 | |
4,030 | | MetLife, Inc. | | | 141,695 | |
3,600 | | NASDAQ OMX Group, Inc.a | | | 90,180 | |
2,000 | | Northern Trust Corporation | | | 80,940 | |
18,558 | | Ocwen Financial Corporationa | | | 269,091 | |
129,139 | | Popular, Inc.a | | | 240,199 | |
8,766 | | Principal Financial Group, Inc. | | | 225,987 | |
4,850 | | State Street Corporation | | | 195,892 | |
3,790 | | SVB Financial Groupa | | | 174,113 | |
9,812 | | Texas Capital Bancshares, Inc.a | | | 274,736 | |
19,180 | | U.S. Bancorp | | | 490,816 | |
14,420 | | Unum Group | | | 343,773 | |
2,120 | | Vanguard REIT ETF | | | 123,257 | |
4,846 | | W.R. Berkley Corporation | | | 168,689 | |
31,340 | | Wells Fargo & Company | | | 812,019 | |
17,430 | | Zions Bancorporation | | | 302,585 | |
| | | |
| | Total Financials | | | 7,690,732 | |
| | | |
| |
Health Care (1.4%) | | | | |
3,900 | | Abbott Laboratories | | | 210,093 | |
900 | | Alexion Pharmaceuticals, Inc.a | | | 60,759 | |
14,400 | | Align Technology, Inc.a | | | 331,632 | |
12,071 | | Amgen, Inc. | | | 691,306 | |
13,830 | | Baxter International, Inc. | | | 760,373 | |
992 | | C.R. Bard, Inc. | | | 85,262 | |
5,875 | | Covance, Inc.a | | | 298,039 | |
2,445 | | Coventry Health Care, Inc.a | | | 77,775 | |
5,980 | | Covidien plc | | | 281,299 | |
5,500 | | Eli Lilly and Company | | | 204,380 | |
7,400 | | Gilead Sciences, Inc.a | | | 308,284 | |
| | | | | | |
| Shares | | Common Stock (10.5%) | | Value | |
Health Care (1.4%) - continued | | | | |
11,631 | | Health Net, Inc.a | | | $323,226 | |
7,440 | | Johnson & Johnson | | | 479,062 | |
5,555 | | McKesson Corporation | | | 453,010 | |
6,400 | | Merck & Company, Inc. | | | 220,800 | |
23,504 | | Mylan, Inc.a | | | 459,973 | |
46,497 | | Pfizer, Inc. | | | 895,532 | |
10,575 | | PSS World Medical, Inc.a | | | 235,294 | |
3,000 | | Thoratec Corporationa | | | 109,530 | |
7,001 | | United Therapeutics Corporationa | | | 306,154 | |
14,440 | | UnitedHealth Group, Inc. | | | 692,976 | |
857 | | Varian Medical Systems, Inc.a | | | 50,323 | |
1,398 | | Vertex Pharmaceuticals, Inc.a | | | 55,347 | |
800 | | Waters Corporationa | | | 64,096 | |
4,247 | | Zimmer Holdings, Inc.a | | | 223,520 | |
| | | |
| | Total Health Care | | | 7,878,045 | |
| | | |
| |
Industrials (1.2%) | | | | |
2,600 | | 3M Company | | | 205,452 | |
4,300 | | Boeing Company | | | 282,897 | |
3,650 | | Caterpillar, Inc. | | | 344,779 | |
1,993 | | Chicago Bridge and Iron Company | | | 72,904 | |
2,978 | | CSX Corporation | | | 66,141 | |
10,091 | | Deluxe Corporation | | | 238,349 | |
9,751 | | EMCOR Group, Inc. | | | 244,458 | |
1,649 | | Expeditors International of Washington, Inc. | | | 75,194 | |
9,403 | | FTI Consulting, Inc.a | | | 370,572 | |
7,100 | | GATX Corporation | | | 269,658 | |
4,900 | | General Dynamics Corporation | | | 314,531 | |
30,814 | | General Electric Company | | | 514,902 | |
9,359 | | Honeywell International, Inc. | | | 490,412 | |
37,696 | | Manitowoc Company, Inc. | | | 417,672 | |
1,200 | | Manpower, Inc. | | | 51,768 | |
4,304 | | Oshkosh Corporationa | | | 89,781 | |
6,057 | | Parker Hannifin Corporation | | | 493,948 | |
2,100 | | Precision Castparts Corporation | | | 342,615 | |
2,400 | | Republic Services, Inc. | | | 68,304 | |
10,565 | | Shaw Group, Inc.a | | | 245,742 | |
5,881 | | SPX Corporation | | | 321,161 | |
3,413 | | Teledyne Technologies, Inc.a | | | 185,906 | |
10,840 | | Textron, Inc. | | | 210,513 | |
1,900 | | Tyco International, Ltd. | | | 86,545 | |
4,591 | | Union Pacific Corporation | | | 457,126 | |
3,627 | | United Technologies Corporation | | | 282,834 | |
500 | | W.W. Grainger, Inc. | | | 85,655 | |
5,260 | | WESCO International, Inc.a | | | 254,900 | |
| | | |
| | Total Industrials | | | 7,084,719 | |
| | | |
| |
Information Technology (2.6%) | | | | |
2,270 | | ADTRAN, Inc. | | | 76,272 | |
9,975 | | Akamai Technologies, Inc.a | | | 268,726 | |
1,400 | | Alliance Data Systems Corporationa | | | 143,416 | |
5,067 | | Apple, Inc.a | | | 2,051,020 | |
22,800 | | Atmel Corporationa | | | 240,768 | |
1,200 | | Baidu.com, Inc. ADRa | | | 168,216 | |
6,250 | | Broadcom Corporationa | | | 225,562 | |
19,090 | | Cisco Systems, Inc. | | | 353,738 | |
5,830 | | Cognizant Technology Solutions Corporationa | | | 424,132 | |
8,275 | | eBay, Inc.a | | | 263,393 | |
16,050 | | EMC Corporationa | | | 393,386 | |
1,923 | | F5 Networks, Inc.a | | | 199,896 | |
1,632 | | Google, Inc.a | | | 967,188 | |
The accompanying Notes to Financial Statements are an integral part of this schedule.
83
Moderately Conservative Allocation Fund
Schedule of Investments as of October 31, 2011
| | | | | | |
| Shares | | Common Stock (10.5%) | | Value | |
Information Technology (2.6%) - continued | | | | |
11,700 | | Hewlett-Packard Company | | | $311,337 | |
28,900 | | Intel Corporation | | | 709,206 | |
1,796 | | International Business Machines Corporation | | | 331,595 | |
2,469 | | Ixiaa | | | 27,974 | |
4,004 | | Juniper Networks, Inc.a | | | 97,978 | |
2,200 | | Lam Research Corporationa | | | 94,578 | |
37,834 | | Microsoft Corporation | | | 1,007,519 | |
24,259 | | Monster Worldwide, Inc.a | | | 223,911 | |
17,602 | | NVIDIA Corporationa | | | 260,510 | |
39,180 | | Oracle Corporation | | | 1,283,929 | |
8,014 | | Plantronics, Inc. | | | 267,748 | |
8,759 | | Plexus Corporationa | | | 225,106 | |
10,100 | | QUALCOMM, Inc. | | | 521,160 | |
13,375 | | Quest Software, Inc.a | | | 235,266 | |
2,944 | | Red Hat, Inc.a | | | 146,170 | |
2,110 | | Salesforce.com, Inc.a | | | 280,989 | |
13,500 | | SuccessFactors, Inc.a | | | 360,450 | |
29,241 | | Teradyne, Inc.a | | | 418,731 | |
12,560 | | Texas Instruments, Inc. | | | 385,969 | |
16,092 | | TIBCO Software, Inc.a | | | 464,898 | |
5,607 | | ValueClick, Inc.a | | | 98,683 | |
8,200 | | VeriFone Systems, Inc.a | | | 346,122 | |
3,500 | | Visa, Inc. | | | 326,410 | |
3,403 | | VMware, Inc.a | | | 332,643 | |
9,567 | | Xilinx, Inc. | | | 320,112 | |
| | | |
| | Total Information Technology | | | 14,854,707 | |
| | | |
| |
Materials (0.3%) | | | | |
1,449 | | Albemarle Corporation | | | 77,217 | |
1,400 | | CF Industries Holdings, Inc. | | | 227,178 | |
9,100 | | Dow Chemical Company | | | 253,708 | |
4,860 | | E.I. du Pont de Nemours and Company | | | 233,620 | |
15,751 | | Freeport-McMoRan Copper & Gold, Inc. | | | 634,135 | |
2,277 | | Sigma-Aldrich Corporation | | | 149,098 | |
2,348 | | Silgan Holdings, Inc. | | | 88,144 | |
6,715 | | Steel Dynamics, Inc. | | | 83,871 | |
300 | | Walter Energy, Inc. | | | 22,695 | |
| | | |
| | Total Materials | | | 1,769,666 | |
| | | |
| |
Telecommunications Services (0.1%) | | | | |
8,900 | | AT&T, Inc. | | | 260,859 | |
8,283 | | Verizon Communications, Inc. | | | 306,305 | |
| | | |
| | Total Telecommunications Services | | | 567,164 | |
| | | |
| |
Utilities (0.3%) | | | | |
4,700 | | CMS Energy Corporation | | | 97,854 | |
8,510 | | Exelon Corporation | | | 377,759 | |
13,520 | | NiSource, Inc. | | | 298,657 | |
6,604 | | NV Energy, Inc. | | | 105,928 | |
14,300 | | PNM Resources, Inc. | | | 257,114 | |
6,432 | | Southwest Gas Corporation | | | 253,935 | |
2,731 | | UGI Corporation | | | 78,298 | |
| | | |
| | Total Utilities | | | 1,469,545 | |
| | | |
| | | | | | |
| | | |
| | Total Common Stock (cost $58,420,789) | | | 61,016,801 | |
| | | |
| | | | | | |
Principal Amount | | Short-Term Investments (8.1%)f | | Value | |
| | Federal Home Loan Bank Discount Notes | | | | |
$15,000,000 | | 0.023%, 11/16/2011g | | | $14,999,856 | |
9,000,000 | | 0.020%, 11/18/2011g | | | 8,999,915 | |
2,000,000 | | 0.020%, 11/23/2011g | | | 1,999,976 | |
| | Federal Home Loan Mortgage Corporation Discount Notes | | | | |
7,000,000 | | 0.030%, 1/9/2012g | | | 6,999,597 | |
3,000,000 | | 0.030%, 1/17/2012g | | | 2,999,807 | |
| | Federal National Mortgage Association Discount Notes | | | | |
2,000,000 | | 0.020%, 12/2/2011g | | | 1,999,966 | |
5,000,000 | | 0.020%, 12/28/2011g | | | 4,999,842 | |
2,850,000 | | 0.088%, 2/22/2012g,h | | | 2,849,225 | |
| | U.S. Treasury Bills | | | | |
1,400,000 | | 0.045%, 2/9/2012h | | | 1,399,826 | |
| | | |
| | Total Short-Term Investments (at amortized cost) | | | 47,248,010 | |
| | | |
| | Total Investments (cost $574,026,900) 100.3% | | $ | 583,878,682 | |
| | | |
| | Other Assets and Liabilities, Net (0.3%) | | | (1,799,250 | ) |
| | | |
| | Total Net Assets 100.0% | | $ | 582,079,432 | |
| | | |
| a | Non-income producing security. |
| b | Denotes variable rate securities. Variable rate securities are securities whose yields vary with a designated market index or market rate. The rate shown is as of October 31, 2011. |
| c | Denotes securities sold under Rule 144A of the Securities Act of 1933, which exempts them from registration. These securities have been deemed liquid and may be resold to other dealers in the program or to other qualified institutional buyers. As of October 31, 2011, the value of these investments was $4,558,163 or 0.8% of total net assets. |
| d | Denotes investments purchased on a when-issued or delayed delivery basis. |
| e | Denotes perpetual securities. Perpetual securities pay an indefinite stream of interest, but may be called by the issuer at an earlier date. |
| f | The interest rate shown reflects the yield, coupon rate or the discount rate at the date of purchase. |
| g | Denotes investments that benefit from credit enhancement or liquidity support provided by a third party bank, institution or government. |
| h | At October 31, 2011, $4,249,051 of investments were held on deposit with the counterparty and pledged as the initial margin deposit for open futures contracts. |
| | | | | | |
| Definitions: |
| | ADR | | - American Depositary Receipt, which are certificates for an underlying foreign security’s shares held by an issuing U.S. depository bank. |
| | REIT | | - Real Estate Investment Trust is a company that buys, develops, manages and/or sells real estate assets. |
| | ETF | | - Exchange Traded Fund. |
The accompanying Notes to Financial Statements are an integral part of this schedule.
84
Moderately Conservative Allocation Fund
Schedule of Investments as of October 31, 2011
| | | | |
Unrealized Appreciation (Depreciation) | | | | |
Gross unrealized appreciation and depreciation of investments, based on cost for federal income tax purposes, were as follows: | |
Gross unrealized appreciation | | $ | 14,810,377 | |
Gross unrealized depreciation | | | (9,105,742 | ) |
| | | | |
Net unrealized appreciation (depreciation) | | $ | 5,704,635 | |
| |
Cost for federal income tax purposes | | $ | 578,174,047 | |
Fair Valuation Measurements
The following table is a summary of the inputs used, as of October 31, 2011, in valuing Moderately Conservative Allocation Fund’s assets carried at fair value.
| | | | | | | | | | | | | | | | |
| Investments in Securities | | Total | | | Level 1 | | | Level 2 | | | Level 3 | |
Mutual Funds | | | | | | | | | | | | | | | | |
Equity Mutual Funds | | | 125,795,426 | | | | 125,795,426 | | | | – | | | | – | |
Fixed Income Mutual Funds | | | 287,079,361 | | | | 287,079,361 | | | | – | | | | – | |
| | | | |
Long-Term Fixed Income | | | | | | | | | | | | | | | | |
Asset-Backed Securities | | | 5,375,464 | | | | – | | | | 5,375,464 | | | | – | |
Basic Materials | | | 2,105,947 | | | | – | | | | 2,105,947 | | | | – | |
Capital Goods | | | 466,911 | | | | – | | | | 466,911 | | | | – | |
Collateralized Mortgage Obligations | | | 5,961,913 | | | | – | | | | 5,961,913 | | | | – | |
Commercial Mortgage-Backed Securities | | | 11,756,930 | | | | – | | | | 11,756,930 | | | | – | |
Communications Services | | | 2,925,825 | | | | – | | | | 2,925,825 | | | | – | |
Consumer Cyclical | | | 1,885,190 | | | | – | | | | 1,885,190 | | | | – | |
Consumer Non-Cyclical | | | 5,781,597 | | | | – | | | | 5,781,597 | | | | – | |
Energy | | | 1,465,839 | | | | – | | | | 1,465,839 | | | | – | |
Financials | | | 7,718,764 | | | | – | | | | 7,718,764 | | | | – | |
Mortgage-Backed Securities | | | 10,968,385 | | | | – | | | | 10,968,385 | | | | – | |
Technology | | | 146,300 | | | | – | | | | 146,300 | | | | – | |
Transportation | | | 79,800 | | | | – | | | | 79,800 | | | | – | |
U.S. Government and Agencies | | | 4,110,173 | | | | – | | | | 4,110,173 | | | | – | |
Utilities | | | 1,990,046 | | | | – | | | | 1,990,046 | | | | – | |
| | | | |
Common Stock | | | | | | | | | | | | | | | | |
Consumer Discretionary | | | 7,279,796 | | | | 7,279,796 | | | | – | | | | – | |
Consumer Staples | | | 5,321,346 | | | | 5,321,346 | | | | – | | | | – | |
Energy | | | 7,101,081 | | | | 6,906,602 | | | | 194,479 | | | | – | |
Financials | | | 7,690,732 | | | | 7,690,732 | | | | – | | | | – | |
Health Care | | | 7,878,045 | | | | 7,878,045 | | | | – | | | | – | |
Industrials | | | 7,084,719 | | | | 7,084,719 | | | | – | | | | – | |
Information Technology | | | 14,854,707 | | | | 14,854,707 | | | | – | | | | – | |
Materials | | | 1,769,666 | | | | 1,769,666 | | | | – | | | | – | |
Telecommunications Services | | | 567,164 | | | | 567,164 | | | | – | | | | – | |
Utilities | | | 1,469,545 | | | | 1,469,545 | | | | – | | | | – | |
Short-Term Investments | | | 47,248,010 | | | | – | | | | 47,248,010 | | | | – | |
Total | | | $583,878,682 | | | | $473,697,109 | | | | $110,181,573 | | | | $– | |
| | | | |
| Other Financial Instruments | | Total | | | Level 1 | | | Level 2 | | | Level 3 | |
Asset Derivatives | | | | | | | | | | | | | | | | |
Futures Contracts | | | 3,195,339 | | | | 3,195,339 | | | | – | | | | – | |
Total Asset Derivatives | | | $3,195,339 | | | | $3,195,339 | | | | $– | | | | $– | |
Liability ‘Derivatives | | | | | | | | | | | | | | | | |
Futures Contracts | | | 514,719 | | | | 514,719 | | | | – | | | | – | |
Total Liability Derivatives | | | $514,719 | | | | $514,719 | | | | $– | | | | $– | |
The accompanying Notes to Financial Statements are an integral part of this schedule.
85
Moderately Conservative Allocation Fund
Schedule of Investments as of October 31, 2011
| | | | | | | | | | | | | | | | | | | | | | | | |
| Futures Contracts | | Number of Contracts Long/(Short) | | Expiration Date | | Notional Principal Amount | | Value | | Unrealized Gain/(Loss) | | |
2-Yr. U.S. Treasury Bond Futures | | (80) | | December 2011 | | | | ($17,634,756) | | | | | ($17,622,500) | | | | | $12,256 | | | |
5-Yr. U.S. Treasury Bond Futures | | (235) | | December 2011 | | | | (28,755,573 | ) | | | | (28,813,204 | ) | | | | (57,631 | ) | | |
10-Yr. U.S. Treasury Bond Futures | | (20) | | December 2011 | | | | (2,593,064 | ) | | | | (2,581,250 | ) | | | | 11,814 | | | |
Mini MSCI EAFE Index Futures | | 129 | | December 2011 | | | | 9,150,055 | | | | | 9,551,805 | | | | | 401,750 | | | |
Russell 2000 Index Mini-Futures | | (52) | | December 2011 | | | | (3,663,800 | ) | | | | (3,844,360 | ) | | | | (180,560 | ) | | |
S&P 400 Index Mini-Futures | | (75) | | December 2011 | | | | (6,369,223 | ) | | | | (6,645,751 | ) | | | | (276,528 | ) | | |
S&P 500 Index Mini-Futures | | 529 | | December 2011 | | | | 30,274,466 | | | | | 33,043,985 | | | | | 2,769,519 | | | |
Total Futures Contracts | | | | | | | | | | | | | | | | | | $2,680,620 | | | |
The following table summarizes the fair value and Statement of Assets and Liabilities location, as of October 31, 2011, for Moderately Conservative Allocation Fund’s investments in financial derivative instruments by primary risk exposure as discussed under item (2) Significant Accounting Policies of the Notes to Financial Statements.
| | | | | | |
| Derivatives by risk category | | Statement of Assets and Liabilities Location | | Fair Value | | |
| | | |
| Asset Derivatives | | | | | | |
| | | |
Interest Rate Contracts | | | | | | |
Futures* | | Net Assets - Net unrealized appreciation/(depreciation) on Futures contracts | | 24,070 | | |
Total Interest Rate Contracts | | | | 24,070 | | |
| | | |
Equity Contracts | | | | | | |
Futures* | | Net Assets - Net unrealized appreciation/(depreciation) on Futures contracts | | 3,171,269 | | |
Total Equity Contracts | | | | 3,171,269 | | |
Total Asset Derivatives | | | | $3,195,339 | | |
| | | |
Liability Derivatives | | | | | | |
| | | |
Equity Contracts | | | | | | |
Futures* | | Net Assets - Net unrealized appreciation/(depreciation) on Futures contracts | | 457,088 | | |
Total Equity Contracts | | | | 457,088 | | |
| | | |
Interest Rate Contracts | | | | | | |
Futures* | | Net Assets - Net unrealized appreciation/(depreciation) on Futures contracts | | 57,631 | | |
Total Interest Rate Contracts | | | | 57,631 | | |
Total Liability Derivatives | | | | $514,719 | | |
| * | Includes cumulative appreciation/depreciation of futures contracts as reported in the Schedule of Investments. Only current day’s variation margin is reported within the Statement of Assets and Liabilities. |
The following table summarizes the net realized gains/(losses) and Statement of Operations location, for the period ended October 31, 2011, for Moderately Conservative Allocation Fund’s investments in financial derivative instruments by primary risk exposure.
| | | | | | |
| Derivatives by risk category | | Statement of Operations location | | Realized Gains/(Losses) recognized in Income | | |
| | | |
Interest Rate Contracts | | | | | | |
Futures | | Net realized gains/(losses) on Futures contracts | | (2,142,797) | | |
| | | |
Total Interest Rate Contracts | | | | (2,142,797) | | |
| | | |
Equity Contracts | | | | | | |
Futures | | Net realized gains/(losses) on Futures contracts | | 729,481 | | |
| | | |
Total Equity Contracts | | | | 729,481 | | |
| | | |
Foreign Exchange Contracts | | | | | | |
Forward Contracts | | Net realized gains/(losses) on Foreign currency transactions | | (1,462) | | |
| | | |
Total Foreign Exchange Contracts | | | | (1,462) | | |
| | | |
Credit Contracts | | | | | | |
Credit Default Swaps | | Net realized gains/(losses) on Swap agreements | | 378,611 | | |
| | | |
Total Credit Contracts | | | | 378,611 | | |
Total | | | | ($1,036,167) | | |
The accompanying Notes to Financial Statements are an integral part of this schedule.
86
Moderately Conservative Allocation Fund
Schedule of Investments as of October 31, 2011
The following table summarizes the change in net unrealized appreciation/(depreciation) and Statement of Operations location, for the period ended October 31, 2011, for Moderately Conservative Allocation Fund’s investments in financial derivative instruments by primary risk exposure.
| | | | | | |
| Derivatives by risk category | | Statement of Operations Location | | Change in unrealized appreciation/(depreciation) recognized in Income | |
Interest Rate Contracts | | | | | | |
Futures | | Change in net unrealized appreciation/(depreciation) on Futures contracts | | | (33,561 | ) |
Total Interest Rate Contracts | | | | | (33,561 | ) |
Equity Contracts | | | | | | |
Futures | | Change in net unrealized appreciation/(depreciation) on Futures contracts | | | 1,872,581 | |
Total Equity Contracts | | | | | 1,872,581 | |
| | | | | | | |
Total | | | | | $1,839,020 | |
The following table presents Moderately Conservative Allocation Fund’s average volume of derivative activity during the period ended October 31, 2011.
| | | | | | | | | | | | | | | | | | | | | | | | |
Derivative Risk Category | | Futures
(Notional*) | | | Futures
(Percentage
of Average
Net Assets) | | | Forwards
(Notional*) | | | Forwards
(Percentage
of Average
Net Assets) | | | Swaps
(Notional*) | | | Swaps
(Percentage
of Average
Net Assets) | |
Equity Contracts | | | $40,387,464 | | | | 7.2 | % | | | N/A | | | | N/A | | | | N/A | | | | N/A | |
Interest Rate Contracts | | | 29,644,687 | | | | 5.3 | | | | N/A | | | | N/A | | | | N/A | | | | N/A | |
Foreign Exchange Contracts | | | N/A | | | | N/A | | | | $2,725 | | | | <0.1% | | | | N/A | | | | N/A | |
Credit Contracts | | | N/A | | | | N/A | | | | N/A | | | | N/A | | | $ | 4,765,062 | | | | 0.8% | |
| * | Notional amount represents long or short, or both, derivative positions held by the Fund. |
Investment in Affiliates
Affiliated issuers, as defined under the Investment Company Act of 1940, include those in which the Fund’s holdings of an issuer represent 5% or more of the outstanding voting securities of an issuer, or any affiliated mutual fund.
A summary of transactions for the fiscal year to date, in Moderately Conservative Allocation Fund, is as follows:
| | | | | | | | | | | | | | | | | | | | | | | | |
| Fund | | Value
October 31, 2010 | | | Gross
Purchases | | | Gross Sales | | | Shares Held at October 31, 2011 | | | Value October 31, 2011 | | | Income Earned November 1, 2010 - October 31, 2011 | |
Natural Resources | | | $9,522,437 | | | | $274,439 | | | | $– | | | | 1,031,435 | | | | $10,592,836 | | | | $274,439 | |
Partner Small Cap Value | | | 8,767,282 | | | | 99,694 | | | | – | | | | 615,493 | | | | 9,349,338 | | | | 99,694 | |
Small Cap Stock | | | 5,332,194 | | | | – | | | | 3,300,000 | | | | 167,827 | | | | 2,510,694 | | | | – | |
Partner Mid Cap Value | | | 12,079,724 | | | | 81,923 | | | | – | | | | 1,082,397 | | | | 12,555,806 | | | | 81,923 | |
Mid Cap Stock | | | 6,174,095 | | | | 20,481 | | | | – | | | | 426,187 | | | | 6,576,068 | | | | 20,481 | |
Partner Worldwide Allocation | | | 22,306,437 | | | | 312,391 | | | | – | | | | 4,344,713 | | | | 36,234,910 | | | | 312,391 | |
Partner International Stock | | | 16,795,766 | | | | 663,925 | | | | 1,000,000 | | | | – | | | | – | | | | 663,925 | |
Large Cap Growth | | | 12,335,307 | | | | – | | | | – | | | | 2,404,543 | | | | 12,695,989 | | | | – | |
Large Cap Value | | | 29,343,969 | | | | 438,220 | | | | – | | | | 2,341,000 | | | | 30,526,644 | | | | 438,220 | |
Large Cap Stock | | | 6,447,145 | | | | 56,830 | | | | 6,000,000 | | | | 29,494 | | | | 633,535 | | | | 56,830 | |
Equity Income Plus | | | 3,933,283 | | | | 78,262 | | | | – | | | | 466,547 | | | | 4,119,606 | | | | 78,262 | |
High Yield | | | 22,030,631 | | | | 4,268,390 | | | | 3,028,547 | | | | 4,797,259 | | | | 22,643,063 | | | | 1,721,911 | |
Income | | | 70,560,239 | | | | 10,256,146 | | | | 1,927,765 | | | | 8,980,360 | | | | 78,667,958 | | | | 3,549,756 | |
Government Bond | | | 10,876,656 | | | | 1,367,603 | | | | 296,579 | | | | 1,133,316 | | | | 12,115,144 | | | | 248,192 | |
Limited Maturity Bond | | | 160,527,930 | | | | 20,149,922 | | | | 4,596,979 | | | | 14,004,290 | | | | 173,653,196 | | | | 4,157,760 | |
Total Value and Income Earned | | | 397,033,095 | | | | | | | | | | | | | | | | 412,874,787 | | | | 11,703,784 | |
The accompanying Notes to Financial Statements are an integral part of this schedule.
87
Partner Small Cap Growth Fund
Schedule of Investments as of October 31, 2011
| | | | | | |
| Shares | | Common Stock (97.2%) | | Value | |
Consumer Discretionary (16.0%) | | | | |
3,600 | | Aeropostale, Inc.a | | | $49,176 | |
9,080 | | Ann, Inc.a | | | 241,891 | |
10,150 | | Asbury Automotive Group, Inc.a | | | 189,297 | |
14,130 | | BJ’s Restaurants, Inc.a | | | 747,901 | |
10,660 | | Body Central Corporationa | | | 223,860 | |
29,970 | | Bravo Brio Restaurant Group, Inc.a | | | 582,317 | |
42,050 | | Brunswick Corporation | | | 742,603 | |
4,110 | | Buffalo Wild Wings, Inc.a | | | 272,164 | |
5,710 | | Children’s Place Retail Stores, Inc.a | | | 268,084 | |
7,370 | | Cooper Tire & Rubber Company | | | 105,612 | |
5,930 | | Cracker Barrel Old Country Store, Inc. | | | 251,373 | |
49,900 | | Crocs, Inc.a | | | 881,733 | |
10,960 | | Deckers Outdoor Corporationa | | | 1,263,030 | |
3,140 | | DineEquity, Inc.a | | | 147,454 | |
17,230 | | DSW, Inc. | | | 901,818 | |
28,810 | | Express, Inc. | | | 650,818 | |
59,250 | | Finish Line, Inc. | | | 1,190,925 | |
34,050 | | Gaylord Entertainment Companya,b | | | 796,429 | |
26,370 | | GNC Holdings, Inc.a,b | | | 652,658 | |
4,830 | | Imax Corporationa | | | 92,881 | |
15,340 | | Jones Apparel Group, Inc. | | | 171,348 | |
3,965 | | Joseph A. Bank Clothiers, Inc.a,b | | | 211,890 | |
6,300 | | Krispy Kreme Doughnuts, Inc.a | | | 44,478 | |
3,370 | | Maidenform Brands, Inc.a | | | 82,835 | |
43,330 | | Meritage Homes Corporationa | | | 769,107 | |
5,520 | | Oxford Industries, Inc. | | | 218,040 | |
3,250 | | Polaris Industries, Inc. | | | 205,855 | |
76,900 | | Saks, Inc.a,b | | | 812,833 | |
104,420 | | Scientific Games Corporationa | | | 907,410 | |
11,600 | | Select Comfort Corporationa | | | 240,932 | |
8,010 | | Skullcandy, Inc.a,b | | | 126,157 | |
2,810 | | SodaStream International, Ltd.a,b | | | 95,765 | |
59,100 | | Sonic Automotive, Inc.b | | | 866,997 | |
26,750 | | Sotheby’s Holdings, Inc. | | | 942,135 | |
27,255 | | Steven Madden, Ltd.a | | | 1,005,710 | |
26,130 | | Tenneco, Inc.a | | | 854,974 | |
28,700 | | True Religion Apparel, Inc.a | | | 973,504 | |
3,760 | | Ulta Salon Cosmetics & Fragrance, Inc.a | | | 253,010 | |
6,450 | | Vitamin Shoppe, Inc.a | | | 243,230 | |
142,510 | | Wet Seal, Inc.a | | | 597,117 | |
| | | |
| | Total Consumer Discretionary | | | 19,875,351 | |
| | | |
| |
Consumer Staples (2.2%) | | | | |
790 | | Boston Beer Company, Inc.a,b | | | 69,899 | |
25,760 | | Hain Celestial Group, Inc.a | | | 864,506 | |
8,630 | | TreeHouse Foods, Inc.a | | | 529,364 | |
34,200 | | United Natural Foods, Inc.a | | | 1,248,642 | |
| | | |
| | Total Consumer Staples | | | 2,712,411 | |
| | | |
| |
Energy (7.6%) | | | | |
10,860 | | Basic Energy Services, Inc.a | | | 199,172 | |
11,190 | | Brigham Exploration Companya | | | 407,484 | |
37,210 | | Carrizo Oil & Gas, Inc.a | | | 1,012,112 | |
23,660 | | CVR Energy, Inc.a | | | 585,822 | |
14,750 | | Dril-Quip, Inc.a | | | 960,225 | |
32,340 | | Energy XXI, Ltd.a | | | 949,826 | |
5,850 | | GeoResources, Inc.a | | | 155,259 | |
36,330 | | Gulfport Energy Corporationa | | | 1,131,316 | |
12,810 | | James River Coal Companya,b | | | 132,583 | |
74,280 | | Key Energy Services, Inc.a | | | 960,440 | |
| | | | | | |
| Shares | | Common Stock (97.2%) | | Value | |
Energy (7.6%) - continued | | | | |
4,980 | | Kodiak Oil & Gas Corporationa | | | $34,412 | |
5,690 | | Lufkin Industries, Inc. | | | 336,222 | |
49,530 | | Northern Oil and Gas, Inc.a,b | | | 1,197,140 | |
14,410 | | Rex Energy Corporationa | | | 223,067 | |
37,890 | | Swift Energy Companya | | | 1,160,192 | |
| | | |
| | Total Energy | | | 9,445,272 | |
| | | |
| |
Financials (8.2%) | | | | |
21,340 | | Alterra Capital Holdings, Ltd. | | | 462,651 | |
28,280 | | Bank of the Ozarks, Inc. | | | 703,324 | |
39,140 | | DFC Global Corporationa | | | 857,949 | |
31,950 | | Extra Space Storage, Inc. | | | 719,834 | |
2,490 | | IBERIABANK Corporation | | | 128,783 | |
14,060 | | iShares Russell 2000 Growth Index Fundb | | | 1,195,241 | |
48,650 | | Knight Capital Group, Inc.a | | | 607,638 | |
39,620 | | LaSalle Hotel Properties | | | 947,314 | |
23,880 | | MarketAxess Holdings, Inc. | | | 698,012 | |
35,520 | | Ocwen Financial Corporationa | | | 515,040 | |
37,270 | | Oritani Financial Corporation | | | 483,019 | |
12,520 | | Signature Banka | | | 697,990 | |
4,300 | | Sovran Self Storage, Inc. | | | 190,060 | |
55,350 | | Symetra Financial Corporation | | | 513,094 | |
25,130 | | Tanger Factory Outlet Centers, Inc. | | | 707,661 | |
22,420 | | Texas Capital Bancshares, Inc.a | | | 627,760 | |
10,090 | | Umpqua Holdings Corporation | | | 115,531 | |
| | | |
| | Total Financials | | | 10,170,901 | |
| | | |
| |
Health Care (18.4%) | | | | |
15,770 | | Achillion Pharmaceuticals, Inc.a | | | 99,982 | |
4,240 | | Air Methods Corporationa | | | 342,677 | |
44,650 | | Akorn, Inc.a | | | 401,404 | |
5,360 | | AMERIGROUP Corporationa | | | 298,177 | |
70,870 | | ARIAD Pharmaceuticals, Inc.a | | | 824,218 | |
15,040 | | ArthroCare Corporationa | | | 453,456 | |
9,090 | | Aveo Pharmaceuticals, Inc.a,b | | | 145,985 | |
29,410 | | Catalyst Health Solutions, Inc.a | | | 1,616,668 | |
31,360 | | Cepheid, Inc.a | | | 1,125,197 | |
10,920 | | Chemed Corporation | | | 648,211 | |
4,240 | | Computer Programs and Systems, Inc. | | | 216,537 | |
21,380 | | Cubist Pharmaceuticals, Inc.a | | | 808,378 | |
7,680 | | Cyberonics, Inc.a | | | 221,184 | |
26,510 | | Healthsouth Corporationa | | | 468,167 | |
30,760 | | Healthspring, Inc.a | | | 1,659,194 | |
41,100 | | HMS Holdings Corporationa | | | 1,004,484 | |
28,350 | | Impax Laboratories, Inc.a | | | 536,099 | |
50,150 | | Incyte Corporationa,b | | | 690,565 | |
25,300 | | Ironwood Pharmaceuticals, Inc.a | | | 344,080 | |
24,760 | | Medicis Pharmaceutical Corporation | | | 948,060 | |
17,450 | | Medivation, Inc.a | | | 299,791 | |
8,760 | | Mednax, Inc.a | | | 576,408 | |
37,180 | | NxStage Medical, Inc.a | | | 854,768 | |
32,680 | | Onyx Pharmaceuticals, Inc.a | | | 1,337,592 | |
25,350 | | Optimer Pharmaceuticals, Inc.a,b | | | 361,744 | |
5,730 | | Orthofix International NVa | | | 201,180 | |
7,720 | | PAREXEL International Corporationa | | | 170,072 | |
26,480 | | PSS World Medical, Inc.a | | | 589,180 | |
2,900 | | QLT, Inc.a | | | 20,184 | |
27,860 | | Quality Systems, Inc.b | | | 1,084,033 | |
40,190 | | Questcor Pharmaceuticals, Inc.a | | | 1,632,116 | |
18,210 | | Salix Pharmaceuticals, Ltd.a | | | 623,784 | |
The accompanying Notes to Financial Statements are an integral part of this schedule.
88
Partner Small Cap Growth Fund
Schedule of Investments as of October 31, 2011
| | | | | | |
| Shares | | Common Stock (97.2%) | | Value | |
Health Care (18.4%) - continued | | | | |
15,030 | | Sirona Dental Systems, Inc.a | | | $719,937 | |
7,310 | | SXC Health Solutions Corporationa | | | 342,254 | |
4,870 | | Universal American Corporation | | | 56,005 | |
17,250 | | Volcano Corporationa | | | 430,042 | |
16,490 | | Wellcare Health Plans, Inc.a | | | 808,175 | |
| | | |
| | Total Health Care | | | 22,959,988 | |
| | | |
| |
Industrials (18.1%) | | | | |
44,350 | | Actuant Corporation | | | 997,875 | |
15,460 | | Alaska Air Group, Inc.a | | | 1,028,554 | |
69,430 | | Avis Budget Group, Inc.a | | | 978,963 | |
27,540 | | Belden, Inc. | | | 888,991 | |
16,380 | | Chart Industries, Inc.a | | | 925,634 | |
31,190 | | Clean Harbors, Inc.a | | | 1,817,441 | |
20,700 | | Copa Holdings SA | | | 1,429,749 | |
7,720 | | EnPro Industries, Inc.a | | | 265,877 | |
3,840 | | ESCO Technologies, Inc. | | | 117,389 | |
30,000 | | Genesee & Wyoming, Inc.a | | | 1,776,300 | |
72,090 | | GrafTech International, Ltd.a | | | 1,132,534 | |
15,860 | | Greenbrier Companies, Inc.a | | | 295,155 | |
13,650 | | Healthcare Services Group, Inc. | | | 236,827 | |
8,780 | | Heico Corporationb | | | 500,636 | |
21,690 | | Herman Miller, Inc. | | | 447,898 | |
44,690 | | Hexcel Corporationa | | | 1,104,290 | |
35,110 | | Hub Group, Inc.a | | | 1,097,539 | |
10,110 | | Huron Consulting Group, Inc.a | | | 364,061 | |
6,590 | | Kforce, Inc.a | | | 84,088 | |
3,830 | | Middleby Corporationa | | | 322,792 | |
20,780 | | Old Dominion Freight Line, Inc.a | | | 759,925 | |
16,140 | | Polypore International, Inc.a | | | 846,543 | |
1,980 | | RBC Bearings, Inc.a | | | 80,190 | |
5,511 | | Robbins & Myers, Inc. | | | 246,287 | |
7,660 | | Titan International, Inc. | | | 172,350 | |
26,560 | | Triumph Group, Inc. | | | 1,543,136 | |
65,450 | | TrueBlue, Inc.a | | | 865,249 | |
20,420 | | WESCO International, Inc.a | | | 989,553 | |
35,180 | | Woodward, Inc. | | | 1,191,898 | |
| | | |
| | Total Industrials | | | 22,507,724 | |
| | | |
| |
Information Technology (22.7%) | | | | |
30,100 | | ADTRAN, Inc. | | | 1,011,360 | |
16,540 | | Ancestry.com, Inc.a,b | | | 376,616 | |
18,130 | | Anixter International, Inc.a | | | 1,064,050 | |
6,500 | | ANSYS, Inc.a | | | 353,340 | |
42,050 | | Ariba, Inc.a | | | 1,332,144 | |
10,670 | | Bottomline Technologies, Inc.a | | | 259,174 | |
25,030 | | Broadsoft, Inc.a,b | | | 901,080 | |
40,340 | | Cavium, Inc.a | | | 1,318,714 | |
34,490 | | Ceva, Inc.a | | | 1,071,604 | |
81,870 | | Cirrus Logic, Inc.a | | | 1,362,317 | |
3,830 | | Coherent, Inc.a | | | 195,215 | |
16,480 | | Concur Technologies, Inc.a | | | 766,650 | |
13,340 | | Electronics for Imaging, Inc.a | | | 200,100 | |
55,750 | | Fairchild Semiconductor International, Inc.a | | | 834,577 | |
39,540 | | Finisar Corporationa | | | 810,175 | |
17,880 | | GSI Group, Inc.a | | | 174,688 | |
33,550 | | Heartland Payment Systems, Inc. | | | 730,048 | |
1,390 | | Hittite Microwave Corporationa | | | 73,114 | |
8,560 | | InterDigital, Inc.b | | | 371,932 | |
19,610 | | J2 Global Communication, Inc. | | | 603,596 | |
21,470 | | Jack Henry & Associates, Inc. | | | 695,843 | |
9,300 | | Kenexa Corporationa | | | 212,691 | |
39,350 | | NETGEAR, Inc.a | | | 1,395,351 | |
| | | | | | |
| Shares | | Common Stock (97.2%) | | Value | |
Information Technology (22.7%) - continued | | | | |
44,590 | | OmniVision Technologies, Inc.a | | | $727,263 | |
10,930 | | OpenTable, Inc.a,b | | | 479,390 | |
2,400 | | Opnet Technologies, Inc. | | | 104,976 | |
18,330 | | Plexus Corporationa | | | 471,081 | |
19,820 | | Power Integrations, Inc. | | | 706,187 | |
37,950 | | QLIK Technologies, Inc.a | | | 1,084,231 | |
21,590 | | RightNow Technologies, Inc.a | | | 928,586 | |
8,190 | | Rofin-Sinar Technologies, Inc.a | | | 212,940 | |
82,560 | | Sapient Corporation | | | 1,020,441 | |
36,000 | | Semtech Corporationa | | | 879,120 | |
48,510 | | SuccessFactors, Inc.a | | | 1,295,217 | |
32,040 | | Synchronoss Technologies, Inc.a,b | | | 963,122 | |
48,520 | | Taleo Corporationa | | | 1,572,048 | |
54,190 | | Teradyne, Inc.a | | | 776,001 | |
28,780 | | Ultratech, Inc.a | | | 627,404 | |
7,300 | | VeriFone Systems, Inc.a | | | 308,133 | |
| | | |
| | Total Information Technology | | | 28,270,519 | |
| | | |
| |
Materials (3.5%) | | | | |
27,170 | | Allied Nevada Gold Corporationa | | | 1,031,917 | |
53,600 | | Century Aluminum Companya | | | 598,176 | |
2,810 | | Domtar Corporation | | | 230,167 | |
9,640 | | KapStone Paper and Packaging Corporationa | | | 158,096 | |
85,340 | | Louisiana-Pacific Corporationa | | | 567,511 | |
10,950 | | LSB Industries, Inc.a | | | 387,959 | |
10,890 | | Noranda Aluminum Holding Corporationa | | | 100,841 | |
10,390 | | Rock-Tenn Company | | | 614,984 | |
87,270 | | Thompson Creek Metals Company, Inc.a | | | 622,235 | |
| | | |
| | Total Materials | | | 4,311,886 | |
| | | |
| |
Telecommunications Services (0.5%) | | | | |
36,700 | | Cogent Communications Group, Inc.a | | | 589,035 | |
| | | |
| | Total Telecommunications Services | | | 589,035 | |
| | | |
| |
Utilities (<0.1%) | | | | |
3,600 | | Artesian Resources Corporationb | | | 65,520 | |
| | | |
| | Total Utilities | | | 65,520 | |
| | | |
| | | | | | |
| | | |
| | Total Common Stock (cost $105,273,610) | | | 120,908,607 | |
| | | |
| | |
| Shares | | Collateral Held for Securities Loaned (9.0%) | | Value | |
11,198,490 | | Thrivent Financial Securities Lending Trust | | | 11,198,490 | |
| | | |
| | Total Collateral Held for Securities Loaned (cost $11,198,490) | | | 11,198,490 | |
| | | |
| | | | | | |
| | | |
| | Total Investments (cost $116,472,100) 106.2% | | | $132,107,097 | |
| | | |
| | Other Assets and Liabilities, Net (6.2%) | | | (7,701,304 | ) |
| | | |
| | Total Net Assets 100.0% | | | $124,405,793 | |
| | | |
The accompanying Notes to Financial Statements are an integral part of this schedule.
89
Partner Small Cap Growth Fund
Schedule of Investments as of October 31, 2011
| a | Non-income producing security. |
| b | All or a portion of the security is on loan. |
| | | | |
Unrealized Appreciation (Depreciation) | | | | |
Gross unrealized appreciation and depreciation of investments, based on cost for federal income tax purposes, were as follows: | |
Gross unrealized appreciation | | | $19,110,921 | |
Gross unrealized depreciation | | | (4,316,093 | ) |
| | | | |
Net unrealized appreciation (depreciation) | | | $14,794,828 | |
| |
Cost for federal income tax purposes | | | $117,312,269 | |
Fair Valuation Measurements
The following table is a summary of the inputs used, as of October 31, 2011, in valuing Partner Small Cap Growth Fund’s assets carried at fair value.
| | | | | | | | |
| Investments in Securities | | Total | | Level 1 | | Level 2 | | Level 3 |
Common Stock | | | | | | | | |
Consumer Discretionary | | 19,875,351 | | 19,875,351 | | – | | – |
Consumer Staples | | 2,712,411 | | 2,712,411 | | – | | – |
Energy | | 9,445,272 | | 9,445,272 | | – | | – |
Financials | | 10,170,901 | | 10,170,901 | | – | | – |
Health Care | | 22,959,988 | | 22,959,988 | | – | | – |
Industrials | | 22,507,724 | | 22,507,724 | | – | | – |
Information Technology | | 28,270,519 | | 28,270,519 | | – | | – |
Materials | | 4,311,886 | | 4,311,886 | | – | | – |
Telecommunications Services | | 589,035 | | 589,035 | | – | | – |
Utilities | | 65,520 | | 65,520 | | – | | – |
Collateral Held for Securities Loaned | | 11,198,490 | | 11,198,490 | | – | | – |
Total | | $132,107,097 | | $132,107,097 | | $– | | $– |
Investment in Affiliates
Affiliated issuers, as defined under the Investment Company Act of 1940, include those in which the Fund’s holdings of an issuer represent 5% or more of the outstanding voting securities of an issuer, or any affiliated mutual fund.
A summary of transactions for the fiscal year to date, in Partner Small Cap Growth Fund, is as follows:
| | | | | | | | | | | | | | | | | | | | | | | | |
| Fund | | Value October 31, 2010 | | | Gross Purchases | | | Gross Sales | | | Shares Held at October 31, 2011 | | | Value October 31, 2011 | | | Income Earned November 1, 2010 - October 31, 2011 | |
Thrivent Financial Securities Lending Trust | | | $16,835,133 | | | | $82,823,533 | | | | $88,460,176 | | | | 11,198,490 | | | | $11,198,490 | | | | $79,373 | |
Total Value and Income Earned | | | 16,835,133 | | | | | | | | | | | | | | | | 11,198,490 | | | | 79,373 | |
The accompanying Notes to Financial Statements are an integral part of this schedule.
90
Partner Small Cap Value Fund
Schedule of Investments as of October 31, 2011
| | | | | | |
| Shares | | Common Stock (97.7%) | | Value | |
Consumer Discretionary (13.2%) | | | | |
184,000 | | Aaron’s, Inc. | | | $4,923,840 | |
27,000 | | Ascent Capital Group, Inc., LLCa | | | 1,228,230 | |
26,800 | | Brunswick Corporation | | | 473,288 | |
46,000 | | CSS Industries, Inc. | | | 969,680 | |
52,000 | | Dorman Products, Inc.a | | | 1,981,720 | |
88,000 | | Drew Industries, Inc. | | | 2,114,640 | |
53,000 | | Ethan Allen Interiors, Inc.b | | | 1,049,400 | |
75,000 | | Fred’s, Inc.b | | | 914,250 | |
84,700 | | Haverty Furniture Companies, Inc. | | | 984,214 | |
36,400 | | Hooker Furniture Corporation | | | 353,080 | |
59,300 | | M/I Homes, Inc.a | | | 442,971 | |
78,100 | | MarineMax, Inc.a | | | 635,734 | |
49,200 | | Matthews International Corporation | | | 1,728,888 | |
65,500 | | Men’s Wearhouse, Inc. | | | 2,022,640 | |
93,000 | | Meritage Homes Corporationa | | | 1,650,750 | |
167,000 | | Orient-Express Hotels, Ltd.a | | | 1,424,510 | |
252,700 | | Sealy Corporationa,b | | | 391,685 | |
129,000 | | Shiloh Industries, Inc.a | | | 1,019,100 | |
57,000 | | Stanley Furniture Company, Inc.a | | | 176,130 | |
143,700 | | Stein Mart, Inc. | | | 1,041,825 | |
56,000 | | Steven Madden, Ltd.a | | | 2,066,400 | |
65,100 | | Winnebago Industries, Inc.a,b | | | 529,914 | |
| | | |
| | Total Consumer Discretionary | | | 28,122,889 | |
| | | |
| |
Consumer Staples (0.6%) | | | | |
216,400 | | Alliance One International, Inc.a | | | 577,788 | |
24,700 | | Nash Finch Company | | | 650,104 | |
| | | |
| | Total Consumer Staples | | | 1,227,892 | |
| | | |
| |
Energy (4.8%) | | | | |
7,600 | | Atwood Oceanics, Inc.a | | | 324,824 | |
7,600 | | Carbo Ceramics, Inc.b | | | 1,032,460 | |
80,200 | | Cloud Peak Energy, Inc.a | | | 1,840,590 | |
54,000 | | Forest Oil Corporationa | | | 629,640 | |
76,000 | | Gulf Island Fabrication, Inc. | | | 2,116,600 | |
121,300 | | Hercules Offshore, Inc.a | | | 459,727 | |
33,074 | | Lone Pine Resources, Inc.a | | | 249,047 | |
66,200 | | Penn Virginia Corporation | | | 403,158 | |
42,700 | | Swift Energy Companya | | | 1,307,474 | |
155,500 | | Tetra Technologies, Inc.a | | | 1,477,250 | |
38,500 | | Venoco, Inc.a | | | 374,990 | |
| | | |
| | Total Energy | | | 10,215,760 | |
| | | |
| |
Financials (22.2%) | | | | |
76,000 | | Alterra Capital Holdings, Ltd. | | | 1,647,680 | |
173,000 | | Ares Capital Corporation | | | 2,676,310 | |
164,000 | | CBL & Associates Properties, Inc. | | | 2,522,320 | |
113,900 | | Cedar Shopping Centers, Inc. | | | 418,013 | |
60,100 | | Columbia Banking System, Inc. | | | 1,146,107 | |
30,400 | | Compass Diversified Trustb | | | 397,024 | |
73,200 | | Cousins Properties, Inc. | | | 480,192 | |
96,300 | | East West Bancorp, Inc. | | | 1,874,961 | |
42,300 | | Employers Holdings, Inc. | | | 686,106 | |
32,900 | | First Opportunity Fund, Inc.a | | | 205,625 | |
66,800 | | First Potomac Realty Trust | | | 949,228 | |
86,400 | | Glacier Bancorp, Inc.b | | | 980,640 | |
67,000 | | Hatteras Financial Corporation | | | 1,721,900 | |
113,000 | | Hercules Technology Growth Capital, Inc. | | | 1,093,840 | |
71,000 | | Home Bancshares, Inc. | | | 1,664,950 | |
2,000 | | iShares Russell 2000 Value Index Fund | | | 130,560 | |
| | | | | | |
| Shares | | Common Stock (97.7%) | | Value | |
Financials (22.2%) - continued | | | | |
50,100 | | JMP Group, Inc. | | | $371,742 | |
50,800 | | Kilroy Realty Corporation | | | 1,863,852 | |
226,200 | | Kite Realty Group Trust | | | 934,206 | |
73,700 | | LaSalle Hotel Properties | | | 1,762,167 | |
3,300 | | Markel Corporationa | | | 1,275,450 | |
92,000 | | Meadowbrook Insurance Group, Inc. | | | 953,120 | |
65,000 | | National Interstate Corporation | | | 1,729,000 | |
38,000 | | Pebblebrook Hotel Trust | | | 723,140 | |
155,000 | | PennantPark Investment Corporationb | | | 1,661,600 | |
22,000 | | Piper Jaffray Companiesa | | | 456,720 | |
38,000 | | Potlatch Corporation | | | 1,234,240 | |
62,000 | | ProAssurance Corporation | | | 4,746,100 | |
135,000 | | Redwood Trust, Inc. | | | 1,568,700 | |
110,000 | | Safeguard Scientifics, Inc.a | | | 1,860,100 | |
100,000 | | Sandy Spring Bancorp, Inc. | | | 1,701,000 | |
45,800 | | SeaBright Holdings, Inc. | | | 328,844 | |
46,000 | | SVB Financial Groupa | | | 2,113,240 | |
258,000 | | Western Alliance Bancorpa | | | 1,677,000 | |
54,200 | | Wintrust Financial Corporationb | | | 1,565,296 | |
| | | |
| | Total Financials | | | 47,120,973 | |
| | | |
| |
Health Care (5.1%) | | | | |
33,900 | | Angiodynamics, Inc.a | | | 522,399 | |
5,900 | | Atrion Corporation | | | 1,327,500 | |
66,000 | | Infinity Pharmaceuticals, Inc.a,b | | | 499,620 | |
740,000 | | Lexicon Pharmaceuticals, Inc.a,b | | | 895,400 | |
31,000 | | National Healthcare Corporation | | | 1,187,610 | |
96,500 | | Owens & Minor, Inc. | | | 2,887,280 | |
79,000 | | Triple-S Management Corporationa | | | 1,501,000 | |
53,500 | | West Pharmaceutical Services, Inc. | | | 2,079,545 | |
| | | |
| | Total Health Care | | | 10,900,354 | |
| | | |
| |
| Industrials (26.2%) | | | | |
49,300 | | A.O. Smith Corporation | | | 1,831,988 | |
82,000 | | Aegion Corporationa | | | 1,212,780 | |
31,700 | | Alaska Air Group, Inc.a | | | 2,109,001 | |
33,700 | | Applied Industrial Technologies, Inc. | | | 1,132,994 | |
19,400 | | Astec Industries, Inc.a | | | 645,050 | |
129,000 | | Beacon Roofing Supply, Inc.a,b | | | 2,377,470 | |
49,100 | | Belden, Inc. | | | 1,584,948 | |
22,300 | | Cascade Corporation | | | 961,130 | |
17,000 | | Circor International, Inc. | | | 591,940 | |
29,500 | | Colfax Corporationa,b | | | 745,170 | |
76,000 | | Comfort Systems USA, Inc. | | | 836,000 | |
31,000 | | Courier Corporation | | | 269,390 | |
59,000 | | Dolan Companya | | | 516,250 | |
15,000 | | Franklin Electric Company, Inc. | | | 688,800 | |
21,600 | | FTI Consulting, Inc.a,b | | | 851,256 | |
53,900 | | G & K Services, Inc. | | | 1,636,404 | |
74,200 | | Genesee & Wyoming, Inc.a | | | 4,393,382 | |
94,000 | | Gibraltar Industries, Inc.a | | | 1,049,040 | |
99,000 | | Greenbrier Companies, Inc.a | | | 1,842,390 | |
56,000 | | Hub Group, Inc.a | | | 1,750,560 | |
47,500 | | IDEX Corporation | | | 1,683,875 | |
42,800 | | Kaman Corporation | | | 1,423,100 | |
84,000 | | Kforce, Inc.a | | | 1,071,840 | |
73,800 | | Kirby Corporationa | | | 4,541,652 | |
47,900 | | Kratos Defense & Security Solutions, Inc.a,b | | | 303,207 | |
98,500 | | McGrath Rentcorp | | | 2,631,920 | |
The accompanying Notes to Financial Statements are an integral part of this schedule.
91
Partner Small Cap Value Fund
Schedule of Investments as of October 31, 2011
| | | | | | |
| Shares | | Common Stock (97.7%) | | Value | |
Industrials (26.2%) - continued | | | | |
35,500 | | Mine Safety Appliances Company | | | $1,191,025 | |
105,000 | | Navigant Consulting, Inc.a | | | 1,189,650 | |
51,900 | | Nordson Corporation | | | 2,406,603 | |
23,200 | | Quanex Building Products Corporation | | | 342,200 | |
12,100 | | RBC Bearings, Inc.a | | | 490,050 | |
62,000 | | Robbins & Myers, Inc. | | | 2,770,780 | |
84,000 | | SkyWest, Inc. | | | 1,126,440 | |
25,000 | | Sterling Construction Company, Inc.a | | | 311,250 | |
38,000 | | Sun Hydraulics Corporation | | | 1,092,880 | |
30,500 | | Universal Forest Products, Inc. | | | 856,135 | |
70,600 | | Universal Truckload Services, Inc. | | | 1,095,712 | |
81,700 | | Vitran Corporation, Inc.a | | | 396,245 | |
57,000 | | Waste Connections, Inc. | | | 1,940,850 | |
57,000 | | Woodward, Inc. | | | 1,931,160 | |
| | | |
| | Total Industrials | | | 55,822,517 | |
| | | |
| |
Information Technology (10.3%) | | | | |
61,200 | | Accelrys, Inc.a | | | 405,756 | |
120,000 | | Advanced Energy Industries, Inc.a | | | 1,120,800 | |
31,500 | | ATMI, Inc.a | | | 642,600 | |
120,000 | | Brooks Automation, Inc. | | | 1,254,000 | |
23,500 | | Cabot Microelectronics Corporationa | | | 905,220 | |
57,500 | | Cognex Corporation | | | 1,948,675 | |
52,700 | | Cohu, Inc. | | | 584,443 | |
109,500 | | Electro Rent Corporation | | | 1,759,665 | |
33,000 | | Electro Scientific Industries, Inc.a | | | 405,570 | |
65,000 | | Intevac, Inc.a | | | 523,250 | |
55,600 | | Ixiaa | | | 629,948 | |
15,000 | | Littelfuse, Inc. | | | 734,400 | |
79,000 | | Methode Electronics, Inc. | | | 733,910 | |
102,900 | | Monotype Imaging Holdings, Inc.a | | | 1,396,353 | |
100,100 | | Progress Software Corporationa | | | 2,108,106 | |
135,600 | | ShoreTel, Inc.a | | | 793,260 | |
277,600 | | Sonus Networks, Inc.a,b | | | 735,640 | |
24,000 | | Standard Microsystems Corporationa | | | 594,240 | |
71,100 | | StarTek, Inc.a | | | 167,085 | |
58,700 | | Synnex Corporationa | | | 1,694,669 | |
66,000 | | Teradyne, Inc.a | | | 945,120 | |
59,300 | | Xyratex, Ltd. | | | 808,852 | |
68,000 | | Zygo Corporationa | | | 1,043,120 | |
| | | |
| | Total Information Technology | | | 21,934,682 | |
| | | |
| |
Materials (9.2%) | | | | |
34,300 | | AMCOL International Corporation | | | 1,035,517 | |
69,000 | | AptarGroup, Inc. | | | 3,309,930 | |
22,700 | | Carpenter Technology Corporation | | | 1,287,544 | |
79,400 | | Clearwater Paper Corporationa | | | 2,630,522 | |
52,500 | | Franco-Nevada Corporation | | | 2,079,881 | |
18,600 | | Haynes International, Inc. | | | 1,087,914 | |
77,500 | | Innospec, Inc.a | | | 2,340,500 | |
20,800 | | Minerals Technologies, Inc. | | | 1,140,672 | |
104,000 | | Myers Industries, Inc. | | | 1,270,880 | |
236,000 | | North American Palladium, Ltd.a,b | | | 785,880 | |
28,600 | | Schnitzer Steel Industries, Inc. | | | 1,338,480 | |
165,000 | | Wausau Paper Corporation | | | 1,237,500 | |
| | | |
| | Total Materials | | | 19,545,220 | |
| | | |
| | | | | | |
| Shares | | Common Stock (97.7%) | | Value | |
Telecommunications Services (0.4%) | | | | |
84,000 | | Premiere Global Services, Inc.a | | | $761,040 | |
| | | |
| | Total Telecommunications Services | | | 761,040 | |
| | | |
| |
Utilities (5.7%) | | | | |
34,900 | | Black Hills Corporationb | | | 1,176,479 | |
87,500 | | Cleco Corporation | | | 3,226,125 | |
71,700 | | El Paso Electric Company | | | 2,296,551 | |
46,600 | | NorthWestern Corporation | | | 1,605,370 | |
27,000 | | PNM Resources, Inc. | | | 485,460 | |
57,200 | | Southwest Gas Corporation | | | 2,258,256 | |
39,500 | | Vectren Corporation | | | 1,121,010 | |
| | | |
| | Total Utilities | | | 12,169,251 | |
| | | |
| | | | | | |
| | | |
| | Total Common Stock (cost $170,691,168) | | | 207,820,578 | |
| | | |
| | |
| Shares | | Preferred Stock (0.7%) | | Value | |
Financials (0.5%) | | | | |
705 | | East West Bancorp, Inc.c | | | 1,008,150 | |
| | | |
| | Total Financials | | | 1,008,150 | |
| | | |
| |
Health Care (0.2%) | | | | |
37,800 | | National Healthcare Corporation, Convertiblec | | | 502,740 | |
| | | |
| | Total Health Care | | | 502,740 | |
| | | |
| | | | | | |
| | | |
| | Total Preferred Stock (cost $1,186,284) | | | 1,510,890 | |
| | | |
| | |
| Shares | | Collateral Held for Securities Loaned (5.7%) | | Value | |
12,183,249 | | Thrivent Financial Securities Lending Trust | | | 12,183,249 | |
| | | |
| | Total Collateral Held for Securities Loaned (cost $12,183,249) | | | 12,183,249 | |
| | | |
| | |
Principal
Amount | | Short-Term Investments (1.0%)d | | Value | |
| | Federal National Mortgage Association Discount Notes | | | | |
$2,000,000 | | 0.020%, 12/21/2011e | | | 1,999,944 | |
| | | |
| | Total Short-Term Investments (at amortized cost) | | | 1,999,944 | |
| | | |
| | Total Investments (cost $186,060,645) 105.1% | | | $223,514,661 | |
| | | |
| | Other Assets and Liabilities, Net (5.1%) | | | (10,806,353 | ) |
| | | |
| | Total Net Assets 100.0% | | | $212,708,308 | |
| | | |
| a | Non-income producing security. |
| b | All or a portion of the security is on loan. |
| c | Denotes perpetual securities. Perpetual securities pay an indefinite stream of interest, but may be called by the issuer at an earlier date. |
| d | The interest rate shown reflects the yield, coupon rate or the discount rate at the date of purchase. |
| e | Denotes investments that benefit from credit enhancement or liquidity support provided by a third party bank, institution or government. |
The accompanying Notes to Financial Statements are an integral part of this schedule.
92
Partner Small Cap Value Fund
Schedule of Investments as of October 31, 2011
Unrealized Appreciation (Depreciation)
| | | | |
Gross unrealized appreciation and depreciation of investments,based on cost for federal income tax purposes, were as follows: | |
Gross unrealized appreciation | | | $54,056,205 | |
Gross unrealized depreciation | | | (17,736,141 | ) |
| | | | |
Net unrealized appreciation (depreciation) | | | $36,320,064 | |
| |
Cost for federal income tax purposes | | | $187,194,597 | |
Fair Valuation Measurements
The following table is a summary of the inputs used, as of October 31, 2011, in valuing Partner Small Cap Value Fund’s assets carried at fair value.
| | | | | | | | | | | | | | | | |
| Investments in Securities | | Total | | | Level 1 | | | Level 2 | | | Level 3 | |
| | | | |
Common Stock | | | | | | | | | | | | | | | | |
Consumer Discretionary | | | 28,122,889 | | | | 28,122,889 | | | | – | | | | – | |
Consumer Staples | | | 1,227,892 | | | | 1,227,892 | | | | – | | | | – | |
Energy | | | 10,215,760 | | | | 10,215,760 | | | | – | | | | – | |
Financials | | | 47,120,973 | | | | 47,120,973 | | | | – | | | | – | |
Health Care | | | 10,900,354 | | | | 10,900,354 | | | | – | | | | – | |
Industrials | | | 55,822,517 | | | | 55,822,517 | | | | – | | | | – | |
Information Technology | | | 21,934,682 | | | | 21,934,682 | | | | – | | | | – | |
Materials | | | 19,545,220 | | | | 17,465,339 | | | | 2,079,881 | | | | – | |
Telecommunications Services | | | 761,040 | | | | 761,040 | | | | – | | | | – | |
Utilities | | | 12,169,251 | | | | 12,169,251 | | | | – | | | | – | |
| | | | |
Preferred Stock | | | | | | | | | | | | | | | | |
Financials | | | 1,008,150 | | | | – | | | | 1,008,150 | | | | – | |
Health Care | | | 502,740 | | | | 502,740 | | | | – | | | | – | |
Collateral Held for Securities Loaned | | | 12,183,249 | | | | 12,183,249 | | | | – | | | | – | |
Short-Term Investments | | | 1,999,944 | | | | – | | | | 1,999,944 | | | | – | |
Total | | | $223,514,661 | | | | $218,426,686 | | | | $5,087,975 | | | | $– | |
The following table summarizes the net realized gains/(losses) and Statement of Operations location, for the period ended October 31, 2011, for Partner Small Cap Value Fund’s investments in financial derivative instruments by primary risk exposure.
| | | | | | |
| Derivatives by risk category | | Statement of Operations location | | Realized Gains/(Losses)
recognized in Income | |
| | |
Foreign Exchange Contracts | | | | | | |
Forward Contracts | | Net realized gains/(losses) on Foreign currency transactions | | | (151 | ) |
| | |
Total Foreign Exchange Contracts | | | | | (151 | ) |
| | |
Total | | | | | ($151 | ) |
The following table presents Partner Small Cap Value Fund’s average volume of derivative activity during the period ended October 31, 2011.
| | | | | | | | |
Derivative Risk Category | | Forwards
(Notional*) | | | Forwards
(Percentage
of Average
Net Assets) | |
Foreign Exchange Contracts | | | $106 | | | | <0.1 | % |
| * | Notional amount represents long or short, or both, derivative positions held by the Fund. |
The accompanying Notes to Financial Statements are an integral part of this schedule.
93
Partner Small Cap Value Fund
Schedule of Investments as of October 31, 2011
Investment in Affiliates
Affiliated issuers, as defined under the Investment Company Act of 1940, include those in which the Fund’s holdings of an issuer represent 5% or more of the outstanding voting securities of an issuer, or any affiliated mutual fund.
A summary of transactions for the fiscal year to date, in Partner Small Cap Value Fund, is as follows:
| | | | | | | | | | | | | | | | | | | | | | | | |
| Fund | | Value
October 31, 2010 | | | Gross
Purchases | | | Gross Sales | | | Shares Held at
October 31, 2011 | | | Value
October 31, 2011 | | | Income Earmed November 1, 2010 -
October 31, 2011 | |
Thrivent Financial | | | | | | | | | | | | | | | | | | | | | | | | |
Securities Lending Trust | | | $12,796,600 | | | | $97,287,905 | | | | $97,901,256 | | | | 12,183,249 | | | | $12,183,249 | | | | $23,086 | |
Total Value and Income Earned | | | 12,796,600 | | | | | | | | | | | | | | | | 12,183,249 | | | | 23,086 | |
The accompanying Notes to Financial Statements are an integral part of this schedule.
94
Small Cap Stock Fund
Schedule of Investments as of October 31, 2011
| | | | | | |
| Shares | | Common Stock (86.7%) | | Value | |
Consumer Discretionary (12.2%) | | | | |
137,000 | | Big Lots, Inc.a | | | $5,163,530 | |
76,291 | | Buffalo Wild Wings, Inc.a | | | 5,051,990 | |
14,800 | | DreamWorks Animation SKG, Inc.a,b | | | 274,540 | |
21,400 | | Finish Line, Inc. | | | 430,140 | |
262,807 | | Foot Locker, Inc. | | | 5,744,961 | |
75,200 | | Knology, Inc.a | | | 1,077,616 | |
112,100 | | Life Time Fitness, Inc.a | | | 4,834,873 | |
8,000 | | Penn National Gaming, Inc.a | | | 288,000 | |
528,780 | | Pier 1 Imports, Inc.a | | | 6,615,038 | |
119,050 | | Signet Jewelers, Ltd. | | | 5,132,245 | |
23,700 | | Toll Brothers, Inc.a | | | 413,328 | |
| | | |
| | Total Consumer Discretionary | | | 35,026,261 | |
| | | |
| |
Consumer Staples (4.8%) | | | | |
139,892 | | Corn Products International, Inc. | | | 6,784,762 | |
78,924 | | Herbalife, Ltd. | | | 4,921,701 | |
32,100 | | TreeHouse Foods, Inc.a | | | 1,969,014 | |
| | | |
| | Total Consumer Staples | | | 13,675,477 | |
| | | |
| |
Energy (8.5%) | | | | |
247,022 | | Arch Coal, Inc. | | | 4,500,741 | |
10,600 | | Helix Energy Solutions Group, Inc.a | | | 191,436 | |
75,305 | | Oil States International, Inc.a | | | 5,241,981 | |
402,422 | | Patriot Coal Corporationa,b | | | 5,054,420 | |
381,837 | | Petroleum Geo-Services ASAa | | | 4,148,572 | |
147,808 | | Swift Energy Companya | | | 4,525,881 | |
50,900 | | Tesco Corporationa | | | 787,423 | |
| | | |
| | Total Energy | | | 24,450,454 | |
| | | |
| |
Financials (10.4%) | | | | |
55,032 | | Affiliated Managers Group, Inc.a | | | 5,096,514 | |
87,000 | | Hercules Technology Growth Capital, Inc. | | | 842,160 | |
56,265 | | Nara Bancorp, Inc.a | | | 477,127 | |
395,074 | | Ocwen Financial Corporationa | | | 5,728,573 | |
2,754,190 | | Popular, Inc.a | | | 5,122,794 | |
85,500 | | Solar Capital, Ltd. | | | 1,898,100 | |
209,498 | | Texas Capital Bancshares, Inc.a | | | 5,865,944 | |
268,937 | | Zions Bancorporation | | | 4,668,746 | |
| | | |
| | Total Financials | | | 29,699,958 | |
| | | |
| |
Health Care (9.7%) | | | | |
307,700 | | Align Technology, Inc.a | | | 7,086,331 | |
99,518 | | Covance, Inc.a | | | 5,048,548 | |
190,882 | | Health Net, Inc.a | | | 5,304,611 | |
226,503 | | PSS World Medical, Inc.a | | | 5,039,692 | |
121,438 | | United Therapeutics Corporationa | | | 5,310,483 | |
| | | |
| | Total Health Care | | | 27,789,665 | |
| | | |
| |
Industrials (15.4%) | | | | |
3,900 | | Alaska Air Group, Inc.a | | | 259,467 | |
214,277 | | Deluxe Corporation | | | 5,061,223 | |
207,111 | | EMCOR Group, Inc. | | | 5,192,273 | |
159,029 | | FTI Consulting, Inc.a,b | | | 6,267,333 | |
151,100 | | GATX Corporation | | | 5,738,778 | |
12,800 | | Hub Group, Inc.a | | | 400,128 | |
10,840 | | Huron Consulting Group, Inc.a | | | 390,348 | |
16,500 | | Kforce, Inc.a | | | 210,540 | |
27,900 | | Landstar System, Inc. | | | 1,245,177 | |
577,532 | | Manitowoc Company, Inc. | | | 6,399,055 | |
54,900 | | Navigant Consulting, Inc.a | | | 622,017 | |
25,200 | | Old Dominion Freight Line, Inc.a | | | 921,564 | |
| | | | | | |
| Shares | | Common Stock (86.7%) | | Value | |
Industrials (15.4%) - continued | | | | |
225,235 | | Shaw Group, Inc.a | | | $5,238,966 | |
47,400 | | Steelcase, Inc. | | | 351,234 | |
67,996 | | Teledyne Technologies, Inc.a | | | 3,703,742 | |
9,500 | | UTI Worldwide, Inc. | | | 138,795 | |
58,100 | | Waste Connections, Inc. | | | 1,978,305 | |
| | | |
| | Total Industrials | | | 44,118,945 | |
| | | |
| |
Information Technology (17.8%) | | | | |
47,028 | | ADTRAN, Inc. | | | 1,580,141 | |
485,600 | | Atmel Corporationa | | | 5,127,936 | |
51,190 | | Ixiaa | | | 579,983 | |
516,459 | | Monster Worldwide, Inc.a | | | 4,766,916 | |
171,636 | | Plantronics, Inc. | | | 5,734,359 | |
185,858 | | Plexus Corporationa | | | 4,776,550 | |
285,527 | | Quest Software, Inc.a | | | 5,022,420 | |
239,000 | | SuccessFactors, Inc.a,b | | | 6,381,300 | |
399,850 | | Teradyne, Inc.a | | | 5,725,852 | |
211,483 | | TIBCO Software, Inc.a | | | 6,109,744 | |
120,700 | | VeriFone Systems, Inc.a | | | 5,094,747 | |
| | | |
| | Total Information Technology | | | 50,899,948 | |
| | | |
| |
Materials (1.2%) | | | | |
16,100 | | Packaging Corporation of America | | | 419,888 | |
35,200 | | Pan American Silver Corporation | | | 984,192 | |
30,000 | | Reliance Steel & Aluminum Company | | | 1,325,700 | |
7,900 | | Walter Energy, Inc. | | | 597,635 | |
| | | |
| | Total Materials | | | 3,327,415 | |
| | | |
| |
Telecommunications Services (0.5%) | | | | |
80,900 | | NTELOS Holdings Corporation | | | 1,538,718 | |
| | | |
| | Total Telecommunications Services | | | 1,538,718 | |
| | | |
| |
Utilities (6.2%) | | | | |
28,400 | | AGL Resources, Inc. | | | 1,191,096 | |
42,700 | | Avista Corporation | | | 1,086,715 | |
52,800 | | Cleco Corporation | | | 1,946,736 | |
14,700 | | IDACORP, Inc. | | | 593,586 | |
14,359 | | Laclede Group, Inc. | | | 576,083 | |
15,000 | | NV Energy, Inc. | | | 240,600 | |
304,900 | | PNM Resources, Inc. | | | 5,482,102 | |
137,291 | | Southwest Gas Corporation | | | 5,420,249 | |
51,100 | | Westar Energy, Inc. | | | 1,392,986 | |
| | | |
| | Total Utilities | | | 17,930,153 | |
| | | |
| | | | | | |
| | | |
| | Total Common Stock (cost $245,628,547) | | | 248,456,994 | |
| | | |
| | |
| Shares | | Collateral Held for Securities Loaned (1.9%) | | Value | |
5,560,875 | | Thrivent Financial Securities Lending Trust | | | 5,560,875 | |
| | | |
| | Total Collateral Held for Securities Loaned (cost $5,560,875) | | | 5,560,875 | |
| | | |
| | |
Principal
Amount | | Short-Term Investments (12.4%)c | | Value | |
| | Federal Home Loan Bank Discount Notes | | | | |
$7,000,000 | | 0.020%, 11/16/2011d | | | 6,999,942 | |
4,000,000 | | 0.015%, 12/7/2011d | | | 3,999,940 | |
The accompanying Notes to Financial Statements are an integral part of this schedule.
95
Small Cap Stock Fund
Schedule of Investments as of October 31, 2011
| | | | | | |
Principal
Amount | | Short-Term Investments (12.4%)c | | Value | |
| | Federal Home Loan Mortgage Corporation Discount Notes | | | | |
$5,000,000 | | 0.035%, 11/14/2011d | | | $4,999,937 | |
5,000,000 | | 0.030%, 12/6/2011d | | | 4,999,854 | |
10,000,000 | | 0.030%, 1/23/2012d | | | 9,999,308 | |
| | Federal National Mortgage Association Discount Notes | | | | |
2,000,000 | | 0.020%, 12/2/2011d | | | 1,999,966 | |
800,000 | | 0.088%, 2/22/2012d,e | | | 799,781 | |
| | U.S. Treasury Bills | | | | |
1,600,000 | | 0.045%, 2/9/2012e | | | 1,599,801 | |
| | Total Short-Term Investments (at amortized cost) | | | 35,398,529 | |
| | Total Investments (cost $286,587,951) 101.0% | | | $289,416,398 | |
| | Other Assets and Liabilities, Net (1.0%) | | | (2,801,923 | ) |
| | Total Net Assets 100.0% | | | $286,614,475 | |
| a | Non-income producing security. |
| b | All or a portion of the security is on loan. |
| c | The interest rate shown reflects the yield, coupon rate or the discount rate at the date of purchase. |
| d | Denotes investments that benefit from credit enhancement or liquidity support provided by a third party bank, institution or government. |
| e | At October 31, 2011, $2,399,582 of investments were held on deposit with the counterparty and pledged as the initial margin deposit for open futures contracts. |
| | | | |
| Unrealized Appreciation (Depreciation) | | | | |
| Gross unrealized appreciation and depreciation of investments, based on cost for federal income tax purposes, were as follows: | |
Gross unrealized appreciation | | | $25,343,024 | |
Gross unrealized depreciation | | | (22,612,671 | ) |
| | | | |
Net unrealized appreciation (depreciation) | | | $2,730,353 | |
| |
Cost for federal income tax purposes | | | $286,686,045 | |
Fair Valuation Measurements
The following table is a summary of the inputs used, as of October 31, 2011, in valuing Small Cap Stock Fund’s assets carried at fair value.
| | | | | | | | | | | | | | | | |
| Investments in Securities | | Total | | | Level 1 | | | Level 2 | | | Level 3 | |
| | | | |
Common Stock | | | | | | | | | | | | | | | | |
Consumer Discretionary | | | 35,026,261 | | | | 35,026,261 | | | | – | | | | – | |
Consumer Staples | | | 13,675,477 | | | | 13,675,477 | | | | – | | | | – | |
Energy | | | 24,450,454 | | | | 20,301,882 | | | | 4,148,572 | | | | – | |
Financials | | | 29,699,958 | | | | 29,699,958 | | | | – | | | | – | |
Health Care | | | 27,789,665 | | | | 27,789,665 | | | | – | | | | – | |
Industrials | | | 44,118,945 | | | | 44,118,945 | | | | – | | | | – | |
Information Technology | | | 50,899,948 | | | | 50,899,948 | | | | – | | | | – | |
Materials | | | 3,327,415 | | | | 3,327,415 | | | | – | | | | – | |
Telecommunications Services | | | 1,538,718 | | | | 1,538,718 | | | | – | | | | – | |
Utilities | | | 17,930,153 | | | | 17,930,153 | | | | – | | | | – | |
Collateral Held for Securities Loaned | | | 5,560,875 | | | | 5,560,875 | | | | – | | | | – | |
Short-Term Investments | | | 35,398,529 | | | | – | | | | 35,398,529 | | | | – | |
Total | | | $289,416,398 | | | | $249,869,297 | | | | $39,547,101 | | | | $– | |
| | | | |
| Other Financial Instruments | | Total | | | Level 1 | | | Level 2 | | | Level 3 | |
| | | | |
Asset Derivatives Futures Contracts | | | 1,081,444 | | | | 1,081,444 | | | | – | | | | – | |
Total Asset Derivatives | | | $1,081,444 | | | | $1,081,444 | | | | $– | | | | $– | |
| | | | | | | | | | | | | | | | | | |
| Futures Contracts | | Number of
Contracts
Long/(Short) | | Expiration
Date | | | Notional
Principal
Amount | | | Value | | | Unrealized
Gain/(Loss) | |
Russell 2000 Index Mini-Futures | | 314 | | | December 2011 | | | | $22,132,576 | | | | $23,214,020 | | | | $1,081,444 | |
Total Futures Contracts | | | | | | | | | | | | | | | | | $1,081,444 | |
The accompanying Notes to Financial Statements are an integral part of this schedule.
96
Small Cap Stock Fund
Schedule of Investments as of October 31, 2011
The following table summarizes the fair value and Statement of Assets and Liabilities location, as of October 31, 2011, for Small Cap Stock Fund’s investments in financial derivative instruments by primary risk exposure as discussed under item (2) Significant Accounting Policies of the Notes to Financial Statements.
| | | | | | |
| Derivatives by risk category | | Statement of Assets and Liabilities Location | | Fair Value | |
| | |
Asset Derivatives | | | | | | |
| | |
Equity Contracts | | | | | | |
Futures* | | Net Assets - Net unrealized appreciation/(depreciation) on Futures contracts | | | $1,081,444 | |
Total Equity Contracts | | | | | 1,081,444 | |
Total Asset Derivatives | | | | | $1,081,444 | |
| | * | Includes cumulative appreciation/depreciation of futures contracts as reported in the Schedule of Investments. Only current day’s variation margin is reported within the Statement of Assets and Liabilities. |
The following table summarizes the net realized gains/(losses) and Statement of Operations location, for the period ended October 31, 2011, for Small Cap Stock Fund’s investments in financial derivative instruments by primary risk exposure.
| | | | | | |
| Derivatives by risk category | | Statement of Operations location | | Realized Gains/(Losses) recognized in Income | |
| | |
Equity Contracts | | | | | | |
Futures | | Net realized gains/(losses) on Futures contracts | | | 433,805 | |
| | |
Total Equity Contracts | | | | | 433,805 | |
| | |
Foreign Exchange Contracts | | | | | | |
Forward Contracts | | Net realized gains/(losses) on Foreign currency transactions | | | (30,531 | ) |
| | |
Total Foreign Exchange Contracts | | | | | (30,531 | ) |
| | |
Total | | | | | $403,274 | |
The following table summarizes the change in net unrealized appreciation/(depreciation) and Statement of Operations location, for the period ended October 31, 2011, for Small Cap Stock Fund’s investments in financial derivative instruments by primary risk exposure.
| | | | | | |
| Derivatives by risk category | | Statement of Operations Location | | Change in unrealized
appreciation/(depreciation)
recognized in Income | |
Equity Contracts | | | | | | |
Futures | | Change in net unrealized appreciation/(depreciation) on Futures contracts | | | 659,936 | |
Total Equity Contracts | | | | | 659,936 | |
| | |
Total | | | | | $659,936 | |
The following table presents Small Cap Stock Fund’s average volume of derivative activity during the period ended October 31, 2011.
| | | | | | | | | | | | | | | | |
Derivative Risk Category | | Futures
(Notional*) | | | Futures
(Percentage
of Average
Net Assets) | | | Forwards
(Notional*) | | | Forwards
(Percentage
of Average
Net Assets) | |
Equity Contracts | | $ | 21,703,774 | | | | 6.8 | % | | | N/A | | | | N/A | |
Foreign Exchange Contracts | | | N/A | | | | N/A | | | $ | 58,999 | | | | <0.1 | % |
| * | Notional amount represents long or short, or both, derivative positions held by the Fund. |
The accompanying Notes to Financial Statements are an integral part of this schedule.
97
Small Cap Stock Fund
Schedule of Investments as of October 31, 2011
Investment in Affiliates
Affiliated issuers, as defined under the Investment Company Act of 1940, include those in which the Fund’s holdings of an issuer represent 5% or more of the outstanding voting securities of an issuer, or any affiliated mutual fund.
A summary of transactions for the fiscal year to date, in Small Cap Stock Fund, is as follows:
| | | | | | | | | | | | | | | | | | | | | | | | |
| Fund | | Value
October 31, 2010 | | | Gross
Purchases | | | Gross Sales | | | Shares Held at
October 31, 2011 | | | Value
October 31, 2011 | | | Income Earned
November 1, 2010 -
October 31, 2011 | |
Thrivent Financial Securities Lending Trust | | | $21,723,500 | | | | $166,423,738 | | | | $182,586,363 | | | | 5,560,875 | | | | $5,560,875 | | | | $66,649 | |
Total Value and Income Earned | | | 21,723,500 | | | | | | | | | | | | | | | | 5,560,875 | | | | 66,649 | |
The accompanying Notes to Financial Statements are an integral part of this schedule.
98
Mid Cap Growth Fund
Schedule of Investments as of October 31, 2011
| | | | | | |
| Shares | | Common Stock (94.1%) | | Value | |
Consumer Discretionary (14.8%) | | | | |
82,300 | | Abercrombie & Fitch Companya | | | $6,123,120 | |
40,000 | | BorgWarner, Inc.a,b | | | 3,059,600 | |
59,600 | | Darden Restaurants, Inc. | | | 2,853,648 | |
27,900 | | Deckers Outdoor Corporationb | | | 3,215,196 | |
151,250 | | Discovery Communications, Inc.b | | | 6,573,325 | |
111,200 | | Dollar Tree, Inc.b | | | 8,891,552 | |
126,300 | | Limited Brands, Inc. | | | 5,394,273 | |
64,100 | | O’Reilly Automotive, Inc.b | | | 4,874,805 | |
121,700 | | PetSmart, Inc. | | | 5,713,815 | |
68,200 | | Tractor Supply Company | | | 4,838,108 | |
38,500 | | VF Corporation | | | 5,321,470 | |
30,500 | | Williams-Sonoma, Inc. | | | 1,144,970 | |
| | | |
| | Total Consumer Discretionary | | | 58,003,882 | |
| | | |
| |
Consumer Staples (5.0%) | | | | |
54,700 | | Clorox Company | | | 3,661,618 | |
78,400 | | Corn Products International, Inc. | | | 3,802,400 | |
90,800 | | H.J. Heinz Company | | | 4,852,352 | |
101,599 | | Whole Foods Market, Inc. | | | 7,327,320 | |
| | | |
| | Total Consumer Staples | | | 19,643,690 | |
| | | |
| |
Energy (8.4%) | | | | |
143,060 | | Brigham Exploration Companyb | | | 5,209,530 | |
22,800 | | Concho Resources, Inc.b | | | 2,159,616 | |
87,100 | | ENSCO International plc ADR | | | 4,325,386 | |
280,793 | | Helix Energy Solutions Group, Inc.b | | | 5,071,122 | |
71,500 | | Oil States International, Inc.b | | | 4,977,115 | |
106,000 | | Peabody Energy Corporation | | | 4,597,220 | |
29,800 | | Range Resources Corporation | | | 2,051,432 | |
290,900 | | Weatherford International, Ltd.b | | | 4,508,950 | |
| | | |
| | Total Energy | | | 32,900,371 | |
| | | |
| |
Financials (5.6%) | | | | |
58,100 | | Affiliated Managers Group, Inc.b | | | 5,380,641 | |
256,000 | | Discover Financial Services | | | 6,031,360 | |
34,400 | | IntercontinentalExchange, Inc.b | | | 4,467,872 | |
79,392 | | MSCI, Inc.b | | | 2,650,899 | |
205,100 | | TD Ameritrade Holding Corporation | | | 3,441,578 | |
| | | |
| | Total Financials | | | 21,972,350 | |
| | | |
| |
Health Care (8.5%) | | | | |
72,900 | | Alexion Pharmaceuticals, Inc.b | | | 4,921,479 | |
123,300 | | AmerisourceBergen Corporation | | | 5,030,640 | |
41,300 | | C.R. Bard, Inc. | | | 3,549,735 | |
113,300 | | CIGNA Corporation | | | 5,023,722 | |
41,900 | | Onyx Pharmaceuticals, Inc.b | | | 1,714,967 | |
38,500 | | Shire Pharmaceuticals Group plc ADR | | | 3,630,550 | |
53,176 | | SXC Health Solutions Corporationa,b | | | 2,489,700 | |
101,300 | | Watson Pharmaceuticals, Inc.b | | | 6,803,308 | |
| | | |
| | Total Health Care | | | 33,164,101 | |
| | | |
| |
Industrials (15.8%) | | | | |
191,800 | | BE Aerospace, Inc.b | | | 7,236,614 | |
34,300 | | C.H. Robinson Worldwide, Inc. | | | 2,381,449 | |
158,911 | | Chicago Bridge and Iron Company | | | 5,812,964 | |
135,900 | | Delta Air Lines, Inc.b | | | 1,157,868 | |
128,240 | | Expeditors International of Washington, Inc. | | | 5,847,744 | |
20,700 | | Flowserve Corporation | | | 1,918,683 | |
| | | | | | |
| Shares | | Common Stock (94.1%) | | Value | |
Industrials (15.8%) - continued | | | | |
151,800 | | JB Hunt Transport Services, Inc. | | | $6,422,658 | |
117,300 | | Kansas City Southern, Inc.b | | | 7,409,841 | |
107,500 | | Pentair, Inc. | | | 3,864,625 | |
30,600 | | Precision Castparts Corporation | | | 4,992,390 | |
86,000 | | Roper Industries, Inc. | | | 6,974,600 | |
50,500 | | SPX Corporation | | | 2,757,805 | |
58,600 | | Stericycle, Inc.b | | | 4,897,788 | |
| | | |
| | Total Industrials | | | 61,675,029 | |
| | | |
| |
Information Technology (27.7%) | | | | |
112,974 | | Akamai Technologies, Inc.b | | | 3,043,520 | |
37,900 | | Altera Corporation | | | 1,437,168 | |
96,000 | | ANSYS, Inc.b | | | 5,218,560 | |
431,200 | | Atmel Corporationb | | | 4,553,472 | |
139,700 | | Broadcom Corporationb | | | 5,041,773 | |
243,400 | | Electronic Arts, Inc.b | | | 5,683,390 | |
80,000 | | F5 Networks, Inc.b | | | 8,316,000 | |
113,600 | | Fortinet, Inc.b | | | 2,619,616 | |
151,600 | | Lam Research Corporationb | | | 6,517,284 | |
330,500 | | Marvell Technology Group, Ltd.b | | | 4,623,695 | |
51,200 | | Mercadolibre, Inc.a | | | 3,338,240 | |
87,800 | | NetApp, Inc.b | | | 3,596,288 | |
147,796 | | Netlogic Microsystems, Inc.b | | | 7,271,563 | |
60,400 | | Nice Systems, Ltd. ADRb | | | 2,159,904 | |
258,519 | | Nuance Communications, Inc.b | | | 6,845,583 | |
353,500 | | NVIDIA Corporationb | | | 5,231,800 | |
144,584 | | Polycom, Inc.b | | | 2,389,974 | |
133,600 | | Red Hat, Inc.b | | | 6,633,240 | |
149,000 | | SuccessFactors, Inc.a,b | | | 3,978,300 | |
191,600 | | Symantec Corporationb | | | 3,259,116 | |
163,900 | | Teradata Corporationb | | | 9,778,274 | |
108,140 | | VeriFone Systems, Inc.b | | | 4,564,589 | |
59,200 | | Xilinx, Inc. | | | 1,980,832 | |
| | | |
| | Total Information Technology | | | 108,082,181 | |
| | | |
| |
Materials (6.1%) | | | | |
143,400 | | Celanese Corporation | | | 6,245,070 | |
64,200 | | Newmont Mining Corporation | | | 4,290,486 | |
144,100 | | Pan American Silver Corporation | | | 4,029,036 | |
113,500 | | Silver Wheaton Corporation | | | 3,927,100 | |
69,300 | | Walter Energy, Inc. | | | 5,242,545 | |
| | | |
| | Total Materials | | | 23,734,237 | |
| | | |
| |
Telecommunications Services (2.2%) | | | | |
48,302 | | NII Holdings, Inc.b | | | 1,136,546 | |
69,000 | | SBA Communications Corporationb | | | 2,628,210 | |
266,300 | | TW Telecom, Inc.b | | | 4,926,550 | |
| | | |
| | Total Telecommunications Services | | | 8,691,306 | |
| | | |
| | | | | | |
| | | |
| | Total Common Stock (cost $277,943,831) | | | 367,867,147 | |
| | | |
| | |
| Shares | | Collateral Held for Securities Loaned (2.3%) | | Value | |
8,790,050 | | Thrivent Financial Securities Lending Trust | | | 8,790,050 | |
| | | |
| | Total Collateral Held for Securities Loaned (cost $8,790,050) | | | 8,790,050 | |
| | | |
The accompanying Notes to Financial Statements are an integral part of this schedule.
99
Mid Cap Growth Fund
Schedule of Investments as of October 31, 2011
| | | | | | |
Principal Amount | | Short-Term Investments (5.4%)c | | Value | |
| | Federal Home Loan Bank Discount Notes | | | | |
$3,000,000 | | 0.025%, 11/14/2011d | | | $2,999,973 | |
2,000,000 | | 0.025%, 11/18/2011d | | | 1,999,976 | |
| | Federal National Mortgage Association Discount Notes | | | | |
10,000,000 | | 0.020%, 12/21/2011d | | | 9,999,722 | |
| | Straight-A Funding, LLC | | | | |
6,000,000 | | 0.130%, 11/16/2011d,e | | | 5,999,675 | |
| | | |
| | Total Short-Term Investments
(at amortized cost) | | | 20,999,346 | |
| | | |
| | Total Investments
(cost $307,733,227) 101.8% | | $ | 397,656,543 | |
| | | |
| | Other Assets and Liabilities, Net (1.8%) | | | (6,880,499 | ) |
| | | |
| | Total Net Assets 100.0% | | $ | 390,776,044 | |
| | | |
| a | All or a portion of the security is on loan. |
| b | Non-income producing security. |
| c | The interest rate shown reflects the yield, coupon rate or the discount rate at the date of purchase. |
| d | Denotes investments that benefit from credit enhancement or liquidity support provided by a third party bank, institution or government. |
| e | Denotes securities sold under Rule 144A of the Securities Act of 1933, which exempts them from registration. These securities have been deemed liquid and may be resold to other dealers in the program or to other qualified institutional buyers. As of October 31, 2011, the value of these investments was $5,999,675 or 1.5% of total net assets. |
Definitions:
| | |
ADR - | | American Depositary Receipt, which are certificates for an underlying foreign security’s shares held by an issuing U.S. depository bank. |
| | | | |
Unrealized Appreciation (Depreciation) | | | | |
Gross unrealized appreciation and depreciation of investments,based on cost for federal income tax purposes, were as follows: | | | | |
Gross unrealized appreciation | | | $90,996,027 | |
Gross unrealized depreciation | | | (1,600,380 | ) |
| | | | |
Net unrealized appreciation (depreciation) | | | $89,395,647 | |
| |
Cost for federal income tax purposes | | | $308,260,896 | |
The accompanying Notes to Financial Statements are an integral part of this schedule.
100
Mid Cap Growth Fund
Schedule of Investments as of October 31, 2011
Fair Valuation Measurements
The following table is a summary of the inputs used, as of October 31, 2011, in valuing Mid Cap Growth Fund’s assets carried at fair value.
| | | | | | | | | | | | | | | | |
| Investments in Securities | | Total | | | Level 1 | | | Level 2 | | | Level 3 | |
Common Stock | | | | | | | | | | | | | | | | |
Consumer Discretionary | | | 58,003,882 | | | | 58,003,882 | | | | – | | | | – | |
Consumer Staples | | | 19,643,690 | | | | 19,643,690 | | | | – | | | | – | |
Energy | | | 32,900,371 | | | | 32,900,371 | | | | – | | | | – | |
Financials | | | 21,972,350 | | | | 21,972,350 | | | | – | | | | – | |
Health Care | | | 33,164,101 | | | | 33,164,101 | | | | – | | | | – | |
Industrials | | | 61,675,029 | | | | 61,675,029 | | | | – | | | | – | |
Information Technology | | | 108,082,181 | | | | 108,082,181 | | | | – | | | | – | |
Materials | | | 23,734,237 | | | | 23,734,237 | | | | – | | | | – | |
Telecommunications Services | | | 8,691,306 | | | | 8,691,306 | | | | – | | | | – | |
Collateral Held for Securities Loaned | | | 8,790,050 | | | | 8,790,050 | | | | – | | | | – | |
Short-Term Investments | | | 20,999,346 | | | | – | | | | 20,999,346 | | | | – | |
| | | | | | | | | | | | | | | | | |
Total | | | $397,656,543 | | | | $376,657,197 | | | | $20,999,346 | | | | $– | |
Investment in Affiliates
Affiliated issuers, as defined under the Investment Company Act of 1940, include those in which the Fund’s holdings of an issuer represent 5% or more of the outstanding voting securities of an issuer, or any affiliated mutual fund.
A summary of transactions for the fiscal year to date, in Mid Cap Growth Fund, is as follows:
| | | | | | | | | | | | | | | | | | | | | | | | |
| Fund | | Value
October 31, 2010 | | | Gross
Purchases | | | Gross Sales | | | Shares Held at
October 31, 2011 | | | Value
October 31, 2011 | | | Income Earned November 1, 2010 - October 31, 2011 | |
Thrivent Financial Securities Lending Trust | | | $17,310,111 | | | | $183,779,641 | | | | $192,299,702 | | | | 8,790,050 | | | | $8,790,050 | | | | $29,877 | |
Total Value and Income Earned | | | 17,310,111 | | | | | | | | | | | | | | | | 8,790,050 | | | | 29,877 | |
The accompanying Notes to Financial Statements are an integral part of this schedule.
101
Partner Mid Cap Value Fund
Schedule of Investments as of October 31, 2011
| | | | | | |
| Shares | | Common Stock (98.2%) | | Value | |
Consumer Discretionary (12.1%) | | | | |
7,878 | | DISH Network Corporationa | | | $190,411 | |
41,777 | | Lear Corporation | | | 1,959,759 | |
37,953 | | Liberty Global, Inc.a | | | 1,524,952 | |
119,598 | | Liberty Interactive Corporationa | | | 1,964,995 | |
38,315 | | Newell Rubbermaid, Inc. | | | 567,062 | |
1,235 | | NVR, Inc.a | | | 793,796 | |
17,984 | | PetSmart, Inc. | | | 844,349 | |
19,716 | | PVH Corporation | | | 1,467,068 | |
9,585 | | Ross Stores, Inc. | | | 840,892 | |
45,212 | | Scripps Networks Interactive | | | 1,920,606 | |
23,527 | | Starwood Hotels & Resorts Worldwide, Inc. | | | 1,178,938 | |
25,805 | | TRW Automotive Holdings Corporationa | | | 1,086,390 | |
| | | |
| | Total Consumer Discretionary | | | 14,339,218 | |
| | | |
| |
Consumer Staples (5.1%) | | | | |
2,119 | | Bunge, Ltd. | | | 130,891 | |
23,016 | | Coca-Cola Enterprises, Inc. | | | 617,289 | |
38,244 | | ConAgra Foods, Inc. | | | 968,720 | |
11,929 | | Energizer Holdings, Inc.a | | | 880,241 | |
30,648 | | J.M. Smucker Company | | | 2,360,509 | |
6,002 | | Ralcorp Holdings, Inc.a | | | 485,202 | |
31,951 | | Sara Lee Corporation | | | 568,728 | |
| | | |
| | Total Consumer Staples | | | 6,011,580 | |
| | | |
| |
Energy (6.2%) | | | | |
26,286 | | Cameron International Corporationa | | | 1,291,694 | |
12,139 | | Consol Energy, Inc. | | | 519,064 | |
17,790 | | Energen Corporation | | | 872,777 | |
36,253 | | EQT Corporation | | | 2,302,066 | |
16,202 | | Pioneer Natural Resources Company | | | 1,359,348 | |
14,510 | | Range Resources Corporation | | | 998,868 | |
| | | |
| | Total Energy | | | 7,343,817 | |
| | | |
| |
Financials (32.3%) | | | | |
15,542 | | Alexandria Real Estate Equities, Inc. | | | 1,027,171 | |
12,604 | | AvalonBay Communities, Inc. | | | 1,685,029 | |
13,455 | | Camden Property Trust | | | 815,911 | |
28,977 | | CIT Group, Inc.a | | | 1,009,848 | |
46,644 | | Douglas Emmett, Inc.b | | | 909,558 | |
3,262 | | Essex Property Trust, Inc.b | | | 465,683 | |
25,932 | | Everest Re Group, Ltd. | | | 2,331,805 | |
115,934 | | Fifth Third Bancorp | | | 1,392,367 | |
21,164 | | First Republic Banka | | | 586,243 | |
70,417 | | Genworth Financial, Inc.a | | | 449,261 | |
62,657 | | Hartford Financial Services Group, Inc. | | | 1,206,147 | |
115,092 | | Host Hotels & Resorts, Inc. | | | 1,642,363 | |
54,640 | | Invesco, Ltd. | | | 1,096,625 | |
69,527 | | Janus Capital Group, Inc. | | | 456,097 | |
68,072 | | Kimco Realty Corporation | | | 1,189,218 | |
17,033 | | Lazard, Ltd. | | | 465,682 | |
44,415 | | Legg Mason, Inc. | | | 1,221,413 | |
26,636 | | Liberty Property Trust | | | 852,352 | |
49,099 | | Lincoln National Corporation | | | 935,336 | |
12,203 | | M&T Bank Corporation | | | 928,770 | |
26,211 | | Marsh & McLennan Companies, Inc. | | | 802,581 | |
134,744 | | MFA Financial, Inc. | | | 909,522 | |
61,884 | | NASDAQ OMX Group, Inc.a | | | 1,550,194 | |
| | | | | | |
| Shares | | Common Stock (98.2%) | | Value | |
Financials (32.3%) - continued | | | | |
16,019 | | PartnerRe, Ltd. | | | $996,702 | |
80,473 | | Principal Financial Group, Inc. | | | 2,074,594 | |
125,696 | | SLM Corporation | | | 1,718,264 | |
69,385 | | SunTrust Banks, Inc. | | | 1,368,966 | |
34,642 | | Tanger Factory Outlet Centers, Inc. | | | 975,519 | |
16,108 | | Taubman Centers, Inc. | | | 986,293 | |
30,317 | | Unum Group | | | 722,757 | |
26,807 | | Ventas, Inc. | | | 1,490,737 | |
43,108 | | W.R. Berkley Corporation | | | 1,500,590 | |
67,665 | | XL Group plc | | | 1,471,037 | |
50,957 | | Zions Bancorporation | | | 884,614 | |
| | | |
| | Total Financials | | | 38,119,249 | |
| | | |
| |
Health Care (6.2%) | | | | |
33,709 | | Aetna, Inc. | | | 1,340,270 | |
270,032 | | Boston Scientific Corporationa | | | 1,590,489 | |
56,928 | | Hologic, Inc.a | | | 917,679 | |
33,326 | | Life Technologies Corporationa | | | 1,355,368 | |
19,511 | | Patterson Companies, Inc. | | | 614,011 | |
83,480 | | Warner Chilcott plca | | | 1,512,658 | |
| | | |
| | Total Health Care | | | 7,330,475 | |
| | | |
| |
Industrials (9.7%) | | | | |
31,489 | | BE Aerospace, Inc.a | | | 1,188,080 | |
15,048 | | Cooper Industries plc | | | 789,418 | |
14,959 | | Eaton Corporation | | | 670,462 | |
30,726 | | GrafTech International, Ltd.a | | | 482,705 | |
149,373 | | JetBlue Airways Corporationa,b | | | 669,191 | |
14,301 | | Kansas City Southern, Inc.a | | | 903,394 | |
108,729 | | Masco Corporation | | | 1,043,798 | |
14,807 | | Parker Hannifin Corporation | | | 1,207,511 | |
44,748 | | Pentair, Inc. | | | 1,608,691 | |
31,697 | | Republic Services, Inc. | | | 902,097 | |
61,323 | | Spirit Aerosystems Holdings, Inc.a | | | 1,046,784 | |
50,750 | | Textron, Inc. | | | 985,565 | |
| | | |
| | Total Industrials | | | 11,497,696 | |
| | | |
| |
Information Technology (8.5%) | | | | |
32,381 | | Adobe Systems, Inc.a | | | 952,325 | |
18,198 | | Amphenol Corporation | | | 864,223 | |
15,438 | | BMC Software, Inc.a | | | 536,625 | |
12,852 | | Cavium, Inc.a | | | 420,132 | |
29,343 | | Electronic Arts, Inc.a | | | 685,159 | |
39,233 | | Maxim Integrated Products, Inc. | | | 1,026,335 | |
14,958 | | NetApp, Inc.a | | | 612,680 | |
62,608 | | NVIDIA Corporationa | | | 926,598 | |
49,895 | | Parametric Technology Corporationa | | | 1,039,313 | |
45,400 | | Polycom, Inc.a | | | 750,462 | |
22,015 | | QLIK Technologies, Inc.a | | | 628,969 | |
22,716 | | Quest Software, Inc.a | | | 399,574 | |
35,902 | | Xilinx, Inc. | | | 1,201,281 | |
| | | |
| | Total Information Technology | | | 10,043,676 | |
| | | |
| |
Materials (3.5%) | | | | |
20,592 | | Albemarle Corporation | | | 1,097,348 | |
11,909 | | Allegheny Technologies, Inc. | | | 552,578 | |
3,749 | | CF Industries Holdings, Inc. | | | 608,350 | |
76,415 | | Chemtura Corporationa | | | 927,678 | |
22,520 | | Cytec Industries, Inc. | | | 1,005,968 | |
| | | |
| | Total Materials | | | 4,191,922 | |
| | | |
The accompanying Notes to Financial Statements are an integral part of this schedule.
102
Partner Mid Cap Value Fund
Schedule of Investments as of October 31, 2011
| | | | | | |
| Shares | | Common Stock (98.2%) | | Value | |
Telecommunications Services (0.9%) | | | | |
412,398 | | Sprint Nextel Corporationa | | | $1,059,863 | |
| | | |
| | Total Telecommunications Services | | | 1,059,863 | |
| | | |
| |
Utilities (13.7%) | | | | |
44,624 | | AES Corporationa | | | 500,681 | |
54,122 | | CMS Energy Corporation | | | 1,126,820 | |
26,631 | | Edison International, Inc. | | | 1,081,219 | |
100,794 | | GenOn Energy, Inc.a | | | 307,422 | |
19,218 | | Great Plains Energy, Inc. | | | 398,581 | |
27,334 | | Northeast Utilities | | | 944,936 | |
76,592 | | NV Energy, Inc. | | | 1,228,536 | |
23,020 | | Pinnacle West Capital Corporation | | | 1,049,252 | |
93,590 | | PPL Corporation | | | 2,748,738 | |
20,346 | | Questar Corporation | | | 392,067 | |
38,175 | | SCANA Corporation | | | 1,614,039 | |
31,954 | | Sempra Energy | | | 1,716,888 | |
19,566 | | Westar Energy, Inc. | | | 533,369 | |
96,023 | | Xcel Energy, Inc. | | | 2,482,195 | |
| | | |
| | Total Utilities | | | 16,124,743 | |
| | | |
| | | | | | |
| | | |
| | Total Common Stock (cost $108,337,028) | | | 116,062,239 | |
| | | |
| | |
| Shares | | Collateral Held for Securities Loaned (1.3%) | | Value | |
1,504,980 | | Thrivent Financial Securities Lending Trust | | | 1,504,980 | |
| | | |
| | Total Collateral Held for Securities Loaned (cost $1,504,980) | | | 1,504,980 | |
| | | |
| | |
Principal Amount | | Short-Term Investments (0.9%)c | | Value | |
| | Federal National Mortgage Association Discount Notes | | | | |
$1,000,000 | | 0.020%, 12/21/2011d | | | 999,972 | |
| | | |
| | Total Short-Term Investments (at amortized cost) | | | 999,972 | |
| | | |
| | Total Investments (cost $110,841,980) 100.4% | | | $118,567,191 | |
| | | |
| | Other Assets and Liabilities, Net (0.4%) | | | (427,509 | ) |
| | | |
| | Total Net Assets 100.0% | | | $118,139,682 | |
| | | |
| a | Non-income producing security. |
| b | All or a portion of the security is on loan. |
| c | The interest rate shown reflects the yield, coupon rate or the discount rate at the date of purchase. |
| d | Denotes investments that benefit from credit enhancement or liquidity support provided by a third party bank, institution or government. |
| | | | |
Unrealized Appreciation (Depreciation) | |
Gross unrealized appreciation and depreciation of investments, based on cost for federal income tax purposes, were as follows: | | | | |
Gross unrealized appreciation | | | $13,649,308 | |
Gross unrealized depreciation | | | (6,427,020 | ) |
| | | | |
Net unrealized appreciation (depreciation) | | | $7,222,288 | |
| |
Cost for federal income tax purposes | | | $111,344,903 | |
The accompanying Notes to Financial Statements are an integral part of this schedule.
103
Partner Mid Cap Value Fund
Schedule of Investments as of October 31, 2011
Fair Valuation Measurements
The following table is a summary of the inputs used, as of October 31, 2011, in valuing Partner Mid Cap Value Fund’s assets carried at fair value.
| | | | | | | | | | | | | | | | |
| Investments in Securities | | Total | | | Level 1 | | | Level 2 | | | Level 3 | |
Common Stock | | | | | | | | | | | | | | | | |
Consumer Discretionary | | | 14,339,218 | | | | 14,339,218 | | | | – | | | | – | |
Consumer Staples | | | 6,011,580 | | | | 6,011,580 | | | | – | | | | – | |
Energy | | | 7,343,817 | | | | 7,343,817 | | | | – | | | | – | |
Financials | | | 38,119,249 | | | | 38,119,249 | | | | – | | | | – | |
Health Care | | | 7,330,475 | | | | 7,330,475 | | | | – | | | | – | |
Industrials | | | 11,497,696 | | | | 11,497,696 | | | | – | | | | – | |
Information Technology | | | 10,043,676 | | | | 10,043,676 | | | | – | | | | – | |
Materials | | | 4,191,922 | | | | 4,191,922 | | | | – | | | | – | |
Telecommunications Services | | | 1,059,863 | | | | 1,059,863 | | | | – | | | | – | |
Utilities | | | 16,124,743 | | | | 16,124,743 | | | | – | | | | – | |
Collateral Held for Securities Loaned | | | 1,504,980 | | | | 1,504,980 | | | | – | | | | – | |
Short-Term Investments | | | 999,972 | | | | – | | | | 999,972 | | | | – | |
| | | | | | | | | | | | | | | | | |
Total | | $ | 118,567,191 | | | $ | 117,567,219 | | | $ | 999,972 | | | | $– | |
Investment in Affiliates
Affiliated issuers, as defined under the Investment Company Act of 1940, include those in which the Fund’s holdings of an issuer represent 5% or more of the outstanding voting securities of an issuer, or any affiliated mutual fund.
A summary of transactions for the fiscal year to date, in Partner Mid Cap Value Fund, is as follows:
| | | | | | | | | | | | | | | | | | | | | | | | |
| Fund | | Value
October 31, 2010 | | | Gross
Purchases | | | Gross Sales | | | Shares Held at
October 31, 2011 | | | Value
October 31, 2011 | | | Income Earned
November 1, 2010 -
October 31, 2011 | |
Thrivent Financial Securities Lending Trust | | | $4,538,968 | | | | $46,213,577 | | | | $49,247,565 | | | | 1,504,980 | | | | $1,504,980 | | | | $11,967 | |
Total Value and Income Earned | | | 4,538,968 | | | | | | | | | | | | | | | | 1,504,980 | | | | 11,967 | |
The accompanying Notes to Financial Statements are an integral part of this schedule.
104
Mid Cap Stock Fund
Schedule of Investments as of October 31, 2011
| | | | | | |
| Shares | | Common Stock (97.2%) | | Value | |
Consumer Discretionary (10.6%) | | | | |
223,811 | | Autoliv, Inc.a | | | $12,929,562 | |
209,500 | | Charter Communications, Inc.b | | | 9,624,430 | |
170,271 | | Dollar Tree, Inc.b | | | 13,614,869 | |
257,400 | | Omnicom Group, Inc. | | | 11,449,152 | |
105,514 | | Panera Bread Companyb | | | 14,106,167 | |
360,300 | | Williams-Sonoma, Inc. | | | 13,525,662 | |
205,773 | | WMS Industries, Inc.b | | | 4,508,486 | |
| | | |
| | Total Consumer Discretionary | | | 79,758,328 | |
| | | |
| |
Consumer Staples (3.4%) | | | | |
218,200 | | Corn Products International, Inc. | | | 10,582,700 | |
242,773 | | TreeHouse Foods, Inc.b | | | 14,891,696 | |
| | | |
| | Total Consumer Staples | | | 25,474,396 | |
| | | |
| |
Energy (10.7%) | | | | |
520,734 | | Alpha Natural Resources, Inc.b | | | 12,518,445 | |
215,800 | | ENSCO International plc ADR | | | 10,716,628 | |
675,700 | | Helix Energy Solutions Group, Inc.b | | | 12,203,142 | |
210,988 | | National Oilwell Varco, Inc. | | | 15,049,774 | |
190,300 | | Newfield Exploration Companyb | | | 7,661,478 | |
267,700 | | Southwestern Energy Companyb | | | 11,254,108 | |
749,600 | | Weatherford International, Ltd.b | | | 11,618,800 | |
| | | |
| | Total Energy | | | 81,022,375 | |
| | | |
| |
Financials (17.7%) | | | | |
645,333 | | Duke Realty Corporation | | | 7,924,689 | |
238,526 | | Endurance Specialty Holdings, Ltd. | | | 8,873,167 | |
554,756 | | Equity One, Inc.a | | | 9,514,065 | |
572,026 | | HCC Insurance Holdings, Inc. | | | 15,221,612 | |
801,409 | | Host Hotels & Resorts, Inc. | | | 11,436,106 | |
57,871 | | IntercontinentalExchange, Inc.b | | | 7,516,286 | |
295,782 | | Lazard, Ltd. | | | 8,086,680 | |
198,800 | | M&T Bank Corporation | | | 15,130,668 | |
438,900 | | NASDAQ OMX Group, Inc.b | | | 10,994,445 | |
240,490 | | Northern Trust Corporation | | | 9,732,630 | |
545,212 | | W.R. Berkley Corporation | | | 18,978,830 | |
563,902 | | Zions Bancorporation | | | 9,789,339 | |
| | | |
| | Total Financials | | | 133,198,517 | |
| | | |
| |
Health Care (12.8%) | | | | |
103,600 | | Alexion Pharmaceuticals, Inc.b | | | 6,994,036 | |
135,214 | | C.R. Bard, Inc. | | | 11,621,643 | |
163,500 | | Covance, Inc.b | | | 8,294,355 | |
291,299 | | Coventry Health Care, Inc.b | | | 9,266,221 | |
337,295 | | Health Net, Inc.b | | | 9,373,428 | |
362,100 | | Thoratec Corporationb | | | 13,220,271 | |
164,300 | | United Therapeutics Corporationb | | | 7,184,839 | |
130,102 | | Varian Medical Systems, Inc.b | | | 7,639,589 | |
173,333 | | Vertex Pharmaceuticals, Inc.b | | | 6,862,254 | |
109,800 | | Waters Corporationb | | | 8,797,176 | |
145,163 | | Zimmer Holdings, Inc.b | | | 7,639,929 | |
| | | |
| | Total Health Care | | | 96,893,741 | |
| | | |
| |
Industrials (14.0%) | | | | |
258,079 | | Chicago Bridge and Iron Company | | | 9,440,530 | |
353,717 | | CSX Corporation | | | 7,856,054 | |
206,007 | | Expeditors International of Washington, Inc. | | | 9,393,919 | |
260,300 | | FTI Consulting, Inc.a,b | | | 10,258,423 | |
1,129,961 | | Manitowoc Company, Inc. | | | 12,519,968 | |
162,298 | | Manpower, Inc. | | | 7,001,536 | |
| | | | | | |
| Shares | | Common Stock (97.2%) | | Value | |
Industrials (14.0%) - continued | | | | |
507,844 | | Oshkosh Corporationb | | | $10,593,626 | |
130,618 | | Parker Hannifin Corporation | | | 10,651,898 | |
282,700 | | Republic Services, Inc. | | | 8,045,642 | |
158,606 | | SPX Corporation | | | 8,661,474 | |
238,983 | | Tyco International, Ltd. | | | 10,885,675 | |
| | | |
| | Total Industrials | | | 105,308,745 | |
| | | |
| |
Information Technology (19.7%) | | | | |
188,900 | | Alliance Data Systems Corporationa,b | | | 19,350,916 | |
335,053 | | eBay, Inc.b | | | 10,664,737 | |
476,150 | | Juniper Networks, Inc.b | | | 11,651,391 | |
275,950 | | Lam Research Corporationb | | | 11,863,090 | |
725,562 | | NVIDIA Corporationb | | | 10,738,318 | |
292,300 | | SuccessFactors, Inc.a,b | | | 7,804,410 | |
1,294,637 | | Teradyne, Inc.a,b | | | 18,539,202 | |
652,607 | | TIBCO Software, Inc.b | | | 18,853,816 | |
661,575 | | ValueClick, Inc.b | | | 11,643,720 | |
314,100 | | VeriFone Systems, Inc.b | | | 13,258,161 | |
436,496 | | Xilinx, Inc. | | | 14,605,156 | |
| | | |
| | Total Information Technology | | | 148,972,917 | |
| | | |
| |
Materials (4.1%) | | | | |
203,816 | | Albemarle Corporation | | | 10,861,355 | |
274,900 | | Silgan Holdings, Inc. | | | 10,319,746 | |
803,694 | | Steel Dynamics, Inc. | | | 10,038,138 | |
| | | |
| | Total Materials | | | 31,219,239 | |
| | | |
| |
Utilities (4.2%) | | | | |
518,600 | | CMS Energy Corporation | | | 10,797,252 | |
702,138 | | NV Energy, Inc. | | | 11,262,293 | |
334,962 | | UGI Corporation | | | 9,603,361 | |
| | | |
| | Total Utilities | | | 31,662,906 | |
| | | |
| | | | | | |
| | | |
| | Total Common Stock (cost $621,895,425) | | | 733,511,164 | |
| | | |
| | |
| Shares | | Collateral Held for Securities Loaned (4.7%) | | Value | |
35,829,950 | | Thrivent Financial Securities Lending Trust | | | 35,829,950 | |
| | | |
| | Total Collateral Held for Securities Loaned (cost $35,829,950) | | | 35,829,950 | |
| | | |
| | |
Principal Amount | | Short-Term Investments (2.7%)c | | Value | |
| | Federal Home Loan Bank Discount Notes | | | | |
$5,000,000 | | 0.020%, 11/18/2011d | | | 4,999,953 | |
4,000,000 | | 0.020%, 11/23/2011d | | | 3,999,951 | |
| | Federal Home Loan Mortgage
Corporation Discount Notes | | | | |
5,000,000 | | 0.030%, 1/23/2012d | | | 4,999,654 | |
The accompanying Notes to Financial Statements are an integral part of this schedule.
105
Mid Cap Stock Fund
Schedule of Investments as of October 31, 2011
| | | | | | |
Principal
Amount | | Short-Term Investments (2.7%)c | | Value | |
| | Federal National Mortgage Association Discount Notes | | | | |
$2,000,000 | | 0.020%, 12/2/2011d | | | $1,999,966 | |
4,000,000 | | 0.020%, 12/21/2011d | | | 3,999,889 | |
| | | |
| | Total Short-Term Investments (at amortized cost) | | | 19,999,413 | |
| | | |
| | Total Investments (cost $677,724,788) 104.6% | | $ | 789,340,527 | |
| | | |
| | Other Assets and Liabilities, Net (4.6%) | | | (34,952,332 | ) |
| | | |
| | Total Net Assets 100.0% | | $ | 754,388,195 | |
| | | |
| a | All or a portion of the security is on loan. |
| b | Non-income producing security. |
| c | The interest rate shown reflects the yield, coupon rate or the discount rate at the date of purchase. |
| d | Denotes investments that benefit from credit enhancement or liquidity support provided by a third party bank, institution or government. |
Definitions:
| | |
ADR - | | American Depositary Receipt, which are certificates for an underlying foreign security’s shares held by an issuing U.S. depository bank. |
| | | | |
| Unrealized Appreciation (Depreciation) | | | | |
Gross unrealized appreciation and depreciation of investments, based on cost for federal income tax purposes, were as follows: | |
Gross unrealized appreciation | | $ | 139,872,153 | |
Gross unrealized depreciation | | | (31,064,121 | ) |
| | | | |
Net unrealized appreciation (depreciation) | | $ | 108,808,032 | |
| |
Cost for federal income tax purposes | | $ | 680,532,495 | |
Fair Valuation Measurements
The following table is a summary of the inputs used, as of October 31, 2011, in valuing Mid Cap Stock Fund’s assets carried at fair value.
| | | | | | | | | | | | | | | | |
| Investments in Securities | | Total | | | Level 1 | | | Level 2 | | | Level 3 | |
Common Stock | | | | | | | | | | | | | | | | |
Consumer Discretionary | | | 79,758,328 | | | | 79,758,328 | | | | – | | | | – | |
Consumer Staples | | | 25,474,396 | | | | 25,474,396 | | | | – | | | | – | |
Energy | | | 81,022,375 | | | | 81,022,375 | | | | – | | | | – | |
Financials | | | 133,198,517 | | | | 133,198,517 | | | | – | | | | – | |
Health Care | | | 96,893,741 | | | | 96,893,741 | | | | – | | | | – | |
Industrials | | | 105,308,745 | | | | 105,308,745 | | | | – | | | | – | |
Information Technology | | | 148,972,917 | | | | 148,972,917 | | | | – | | | | – | |
Materials | | | 31,219,239 | | | | 31,219,239 | | | | – | | | | – | |
Utilities | | | 31,662,906 | | | | 31,662,906 | | | | – | | | | – | |
Collateral Held for Securities Loaned | | | 35,829,950 | | | | 35,829,950 | | | | – | | | | – | |
Short-Term Investments | | | 19,999,413 | | | | – | | | | 19,999,413 | | | | – | |
| |
Total | | | $789,340,527 | | | | $769,341,114 | | | | $19,999,413 | | | | $– | |
| |
Investment in Affiliates
Affiliated issuers, as defined under the Investment Company Act of 1940, include those in which the Fund’s holdings of an issuer represent 5% or more of the outstanding voting securities of an issuer, or any affiliated mutual fund.
A summary of transactions for the fiscal year to date, in Mid Cap Stock Fund, is as follows:
| | | | | | | | | | | | | | | | | | | | | | | | |
| Fund | | Value
October 31, 2010 | | | Gross Purchases | | | Gross Sales | | | Shares Held at October 31, 2011 | | | Value October 31, 2011 | | | Income Earned November 1, 2010 - October 31, 2011 | |
Thrivent Financial Securities Lending Trust | | | $64,107,848 | | | $ | 549,310,873 | | | $ | 577,588,771 | | | | 35,829,950 | | | | $35,829,950 | | | | $74,744 | |
Total Value and Income Earned | | | 64,107,848 | | | | | | | | | | | | | | | | 35,829,950 | | | | 74,744 | |
The accompanying Notes to Financial Statements are an integral part of this schedule.
106
Partner Worldwide Allocation Fund
Schedule of Investments as of October 31, 2011
| | | | | | |
| Shares | | Common Stock (87.7%) | | Value | |
Australia (4.6%) | | | | |
48,974 | | Ansell, Ltd. | | | $716,272 | |
59,262 | | Australia & New Zealand Banking Group, Ltd. | | | 1,339,044 | |
220,144 | | BHP Billiton, Ltd. | | | 8,617,051 | |
491,411 | | Boart Longyear Group | | | 1,639,642 | |
148,894 | | Bradken, Ltd. | | | 1,200,833 | |
191,056 | | Brambles, Ltd. | | | 1,320,681 | |
33,267 | | Campbell Brothers, Ltd. | | | 1,601,402 | |
273,933 | | Challenger, Ltd. | | | 1,305,808 | |
26,950 | | Flight Centre, Ltd. | | | 559,554 | |
135,709 | | Fortescue Metals Group, Ltd. | | | 681,606 | |
129,628 | | GrainCorp, Ltd. | | | 1,067,747 | |
97,805 | | Iluka Resources, Ltd. | | | 1,625,899 | |
131,699 | | Mineral Resources, Ltd. | | | 1,544,081 | |
363,006 | | Mount Gibson Iron, Ltd. | | | 580,565 | |
276,299 | | NRW Holdings, Ltd. | | | 702,962 | |
37,829 | | Rio Tinto, Ltd. | | | 2,715,774 | |
245,916 | | SAI Global, Ltd. | | | 1,224,941 | |
122,436 | | United Group, Ltd. | | | 1,693,898 | |
| | | |
| | Total Australia | | | 30,137,760 | |
| | | |
| |
Austria (0.1%) | | | | |
11,439 | | Voestalpine AG | | | 393,032 | |
| | | |
| | Total Austria | | | 393,032 | |
| | | |
| |
Belgium (0.6%) | | | | |
49,017 | | Anheuser-Busch InBev NV | | | 2,718,290 | |
4,397 | | Bekaert SA | | | 195,155 | |
22,125 | | Compagnie d’ Entreprises CFE | | | 1,242,171 | |
| | | |
| | Total Belgium | | | 4,155,616 | |
| | | |
| |
Bermuda (0.4%) | | | | |
300,860 | | Archer, Ltd.a | | | 1,265,016 | |
1,480,000 | | Trinity, Ltd. | | | 1,341,407 | |
| | | |
| | Total Bermuda | | | 2,606,423 | |
| | | |
| |
Brazil (3.3%) | | | | |
198,181 | | Banco Bradesco SA ADR | | | 3,606,894 | |
52,000 | | Lojas Renner SA | | | 1,580,989 | |
58,000 | | Multiplan Empreendimentos Imobiliarios SA | | | 1,171,216 | |
99,600 | | Petroleo Brasileiro SA ADR | | | 2,690,196 | |
151,000 | | Petroleo Brasileiro SA PREF ADR | | | 3,818,790 | |
143,500 | | Souza Cruz SA | | | 1,780,273 | |
149,000 | | Ultrapar Participacoes SA | | | 2,649,525 | |
188,000 | | Vale SA SP PREF ADR | | | 4,436,800 | |
| | | |
| | Total Brazil | | | 21,734,683 | |
| | | |
| |
Canada (3.1%) | | | | |
20,821 | | Agrium, Inc. | | | 1,716,563 | |
38,633 | | Alimentation Couche-Tard, Inc. | | | 1,162,711 | |
53,909 | | Barrick Gold Corporation | | | 2,661,377 | |
61,594 | | Brookfield Asset Management, Inc. | | | 1,782,074 | |
12,000 | | Canadian National Railway Company | | | 939,968 | |
31,640 | | Finning International, Inc. | | | 739,579 | |
36,629 | | Goldcorp, Inc. | | | 1,782,210 | |
63,719 | | Neo Material Technologies, Inca | | | 492,851 | |
46,717 | | Potash Corporation of Saskatchewan, Inc. | | | 2,211,183 | |
26,486 | | Shoppers Drug Mart Corporation | | | 1,113,326 | |
90,014 | | Suncor Energy, Inc. | | | 2,867,119 | |
20,267 | | Tim Hortons, Inc. | | | 997,491 | |
42,164 | | Trican Well Service, Ltd. | | | 745,738 | |
| | | | | | |
| Shares | | Common Stock (87.7%) | | Value | |
Canada (3.1%) - continued | | | | |
83,276 | | Yamana Gold, Inc. | | | $1,243,125 | |
| | | |
| | Total Canada | | | 20,455,315 | |
| | | |
| |
Cayman Islands (0.2%) | | | | |
1,664,000 | | Sa Sa International Holdings, Ltd. | | | 989,237 | |
| | | |
| | Total Cayman Islands | | | 989,237 | |
| | | |
| |
Chile (0.3%) | | | | |
26,600 | | Banco Santander Chile SA ADR | | | 2,172,688 | |
| | | |
| | Total Chile | | | 2,172,688 | |
| | | |
| |
China (0.5%) | | | | |
2,390,000 | | PetroChina Company, Ltd. | | | 3,102,650 | |
| | | |
| | Total China | | | 3,102,650 | |
| | | |
| |
Denmark (0.6%) | | | | |
50,503 | | Christian Hansen Holding AS | | | 1,098,920 | |
22,716 | | Novo Nordisk AS | | | 2,411,677 | |
16,620 | | Vestas Wind Systemsa | | | 257,645 | |
| | | |
| | Total Denmark | | | 3,768,242 | |
| | | |
| |
Finland (1.2%) | | | | |
103,321 | | Amer Sports Oyj | | | 1,422,790 | |
31,989 | | Cargotec Oyj | | | 1,070,479 | |
144,550 | | Neste Oil Oyj | | | 1,748,921 | |
35,167 | | Outotec Oyj | | | 1,632,499 | |
42,012 | | Sampo Oyj | | | 1,154,781 | |
55,888 | | YIT Oyj | | | 881,935 | |
| | | |
| | Total Finland | | | 7,911,405 | |
| | | |
| |
France (5.8%) | | | | |
159,201 | | Alcatel-Lucenta | | | 440,132 | |
43,564 | | Alten, Ltd. | | | 1,240,540 | |
17,846 | | AtoS | | | 862,759 | |
261,616 | | AXA SA | | | 4,207,793 | |
88,519 | | Beneteau SA | | | 1,263,126 | |
81,750 | | Cap Gemini SA | | | 3,128,186 | |
9,614 | | Christian Dior SA | | | 1,356,379 | |
102,571 | | Compagnie de Saint-Gobain | | | 4,740,562 | |
17,856 | | Compagnie Generale de Geophysique-Veritasa | | | 390,141 | |
53,516 | | Credit Agricole SA | | | 414,229 | |
38,514 | | Faurecia | | | 1,018,316 | |
38,522 | | Ingenico | | | 1,522,858 | |
7,327 | | Remy Cointreau SA | | | 600,242 | |
23,737 | | Rubis | | | 1,348,943 | |
40,836 | | Safran SA | | | 1,333,541 | |
102,220 | | Total SA | | | 5,333,545 | |
4,403 | | Vallourec SA | | | 266,981 | |
35,028 | | Vinci SA | | | 1,717,715 | |
7,440 | | Virbac SA | | | 1,285,337 | |
212,156 | | Vivendi SA | | | 4,740,910 | |
11,349 | | Wendel SA | | | 840,605 | |
| | | |
| | Total France | | | 38,052,840 | |
| | | |
| |
Germany (4.9%) | | | | |
17,260 | | BASF SE | | | 1,259,908 | |
24,202 | | Bayerische Motoren Werke AG | | | 1,966,028 | |
1,398,150 | | Commerzbank AGa | | | 3,413,830 | |
95,242 | | Daimler AG | | | 4,837,246 | |
60,450 | | Deutsche Boerse AGa | | | 3,331,626 | |
167,826 | | Deutz AGa | | | 1,049,476 | |
27,958 | | Gerresheimer AG | | | 1,239,007 | |
37,786 | | Gerry Weber International AG | | | 1,173,070 | |
11,748 | | Pfeiffer Vacuum Technology AG | | | 1,187,317 | |
The accompanying Notes to Financial Statements are an integral part of this schedule.
107
Partner Worldwide Allocation Fund
Schedule of Investments as of October 31, 2011
| | | | | | |
| Shares | | Common Stock (87.7%) | | Value | |
| Germany (4.9%) - continued | | | | |
21,014 | | Rheinmetall AG | | | $1,114,451 | |
46,658 | | SAP AG ADR | | | 2,821,308 | |
33,913 | | Siemens AG | | | 3,554,788 | |
50,130 | | Suedzucker AG | | | 1,464,300 | |
45,338 | | Symrise AG | | | 1,173,569 | |
45,712 | | TUI AGa | | | 298,168 | |
11,860 | | Volkswagen AG | | | 2,065,416 | |
2,812 | | Wacker Chemie AG | | | 283,026 | |
| | | |
| | Total Germany | | | 32,232,534 | |
| | | |
| |
| Hong Kong (3.5%) | | | | |
607,400 | | AIA Group, Ltd. | | | 1,857,266 | |
398,000 | | China Mobile, Ltd. | | | 3,782,726 | |
86,986 | | CLP Holdings, Ltd. | | | 774,882 | |
1,042,000 | | Dah Chong Hong Holdings, Ltd. | | | 1,265,441 | |
1,744,850 | | Guangzhou Automobile Group Company, Ltd. | | | 1,740,762 | |
393,000 | | Hang Lung Group, Ltd. | | | 2,388,448 | |
364,750 | | Hutchison Whampoa, Ltd. | | | 3,336,162 | |
2,938,672 | | New World Development Company, Ltd. | | | 3,095,728 | |
1,469,336 | | New World Development Company, Ltd. Rights, 5.68 HKD, expires 11/23/2011a,b | | | 473,602 | |
447,000 | | SJM Holdings, Ltd. | | | 766,180 | |
236,711 | | Swire Pacific, Ltd., Class A | | | 2,735,327 | |
270,000 | | Swire Pacific, Ltd., Class B | | | 617,408 | |
| | | |
| | Total Hong Kong | | | 22,833,932 | |
| | | |
| |
| Hungary (0.3%) | | | | |
11,001 | | Richter Gedeon Nyrt | | | 1,767,200 | |
| | | |
| | Total Hungary | | | 1,767,200 | |
| | | |
| |
| India (2.0%) | | | | |
123,500 | | Bharti Airtel, Ltd. | | | 988,772 | |
19,036 | | GlaxoSmithKline Pharmaceuticals, Ltd. | | | 802,597 | |
9,500 | | Grasim Industries, Ltd. | | | 483,020 | |
40,779 | | Hero Motocorp, Ltd. | | | 1,818,336 | |
141,000 | | Hindustan Unilever, Ltd. | | | 1,085,798 | |
186,711 | | Housing Development Finance Corporation | | | 2,626,743 | |
78,000 | | ICICI Bank, Ltd. | | | 1,470,543 | |
46,600 | | Infosys, Ltd. | | | 2,726,118 | |
53,428 | | Ultra Tech Cement, Ltd. | | | 1,261,096 | |
| | | |
| | Total India | | | 13,263,023 | |
| | | |
| |
| Indonesia (0.4%) | | | | |
336,000 | | PT Astra International Tbk | | | 2,590,823 | |
| | | |
| | Total Indonesia | | | 2,590,823 | |
| | | |
| |
| Israel (0.7%) | | | | |
34,832 | | Mellanox Technologies, Ltd.a | | | 1,127,164 | |
92,650 | | Teva Pharmaceutical Industries, Ltd. ADR | | | 3,784,752 | |
| | | |
| | Total Israel | | | 4,911,916 | |
| | | |
| |
| Italy (2.2%) | | | | |
129,247 | | Banca Generali SPA | | | 1,292,184 | |
101,551 | | Davide Campari - Milano SPA | | | 784,530 | |
34,468 | | DiaSorin SPA | | | 1,115,748 | |
199,950 | | Eni SPA | | | 4,419,650 | |
36,341 | | MARR SPA | | | 389,734 | |
546,274 | | Sorin SPAa | | | 1,141,756 | |
3,607,425 | | Telecom Italia SPA | | | 3,785,625 | |
| | | | | | |
| Shares | | Common Stock (87.7%) | | Value | |
| Italy (2.2%) - continued | | | | |
365,721 | | Unicredit SPA | | | $424,372 | |
76,758 | | Yoox SPAa | | | 1,099,125 | |
| | | |
| | Total Italy | | | 14,452,724 | |
| | | |
| |
| Japan (15.7%) | | | | |
24,500 | | Aisin Seiki Company, Ltd. | | | 774,861 | |
90,400 | | Asics Corporation | | | 1,198,447 | |
194,000 | | Bank of Yokohama, Ltd. | | | 888,213 | |
209,000 | | Bridgestone Corporation | | | 4,900,443 | |
56,700 | | Canon, Inc. | | | 2,574,057 | |
18,800 | | Capcom Company, Ltd. | | | 491,813 | |
136,000 | | Chiyoda Corporation | | | 1,566,137 | |
48,000 | | Daihatsu Motor Company, Ltd. | | | 844,678 | |
212,250 | | Daiichi Sankyo Company, Ltd. | | | 4,122,874 | |
47,571 | | Daito Trust Construction Company, Ltd. | | | 4,214,817 | |
1,020,144 | | Daiwa Securities Group, Inc. | | | 3,569,455 | |
9,500 | | Dena Company, Ltd. | | | 410,035 | |
78,550 | | East Japan Railway Company | | | 4,762,357 | |
42,000 | | Elpida Memory, Inc.a | | | 261,073 | |
31,542 | | Exedy Corporation | | | 913,790 | |
17,800 | | Gree, Inc. | | | 574,391 | |
200,000 | | Hitachi, Ltd. | | | 1,071,657 | |
17,700 | | Honda Motor Company, Ltd. | | | 529,296 | |
14,900 | | Idemitsu Kosan Company, Ltd. | | | 1,393,725 | |
477,000 | | IHI Corporation | | | 1,086,611 | |
125,900 | | ITOCHU Corporation | | | 1,245,207 | |
90,700 | | Kao Corporation | | | 2,379,456 | |
335,000 | | Kawasaki Heavy Industries, Ltd. | | | 854,156 | |
130 | | KDDI Corporation | | | 952,296 | |
41,900 | | Komatsu, Ltd. | | | 1,035,970 | |
274,000 | | Kureha Corporation | | | 1,223,717 | |
26,400 | | Lawson, Inc. | | | 1,485,520 | |
147,000 | | Marubeni Corporation | | | 855,624 | |
23,200 | | Maruwa Company, Ltd. | | | 1,003,742 | |
154,000 | | Mitsubishi Electric Corporation | | | 1,424,993 | |
42,200 | | Mitsui & Company, Ltd. | | | 615,889 | |
193,900 | | Mori Seiki Company, Ltd. | | | 1,760,525 | |
171,907 | | MS and AD Insurance Group Holdings, Inc. | | | 3,367,032 | |
56,000 | | Nabtesco Corporation | | | 1,226,490 | |
96,600 | | Namco Bandai Holdings, Inc. | | | 1,400,661 | |
196,500 | | Nikon Corporation | | | 4,399,849 | |
93,000 | | Nippon Shokubai Company, Ltd. | | | 948,529 | |
17,600 | | Nippon Telegraph & Telephone Corporation | | | 902,807 | |
182,000 | | Nippon Yusen KK | | | 459,013 | |
574,400 | | Nissan Motor Company, Ltd. | | | 5,281,463 | |
209,000 | | Penta-Ocean Construction Company, Ltd. | | | 664,120 | |
40,751 | | Pigeon Corporation | | | 1,505,600 | |
28,000 | | Pola Orbis Holdings, Inc. | | | 748,641 | |
22,400 | | Ryohin Keikaku Company, Ltd. | | | 1,063,041 | |
27,900 | | Sanrio Company, Ltd. | | | 1,378,629 | |
16,819 | | Sanyo Chemical Industries, Ltd. | | | 108,764 | |
238 | | So-net M3, Inc. | | | 1,076,338 | |
42,600 | | Sony Corporation | | | 888,782 | |
24,300 | | Start Today Company, Ltd. | | | 514,048 | |
84,956 | | Sumitomo Bakelite Company, Ltd | | | 497,433 | |
350,000 | | Sumitomo Corporation | | | 4,333,403 | |
122,700 | | Sumitomo Electric Industries, Ltd. | | | 1,360,432 | |
1,433,100 | | Sumitomo Mitsui Trust Holdings, Inc. | | | 4,904,244 | |
483,000 | | Sumitomo Osaka Cement Company, Ltd. | | | 1,463,196 | |
63,000 | | Sumitomo Rubber Industries, Ltd. | | | 787,050 | |
The accompanying Notes to Financial Statements are an integral part of this schedule.
108
Partner Worldwide Allocation Fund
Schedule of Investments as of October 31, 2011
| | | | | | |
| Shares | | Common Stock (87.7%) | | Value | |
Japan (15.7%) - continued | | | | |
39,200 | | Sysmex Corporation | | | $1,288,507 | |
178,958 | | Tadano, Ltd. | | | 1,194,233 | |
7,800 | | TDK Corporation | | | 318,070 | |
166,000 | | Tokyu Corporation | | | 801,213 | |
26,000 | | Toyo Suisan Kaisha, Ltd. | | | 663,509 | |
29,498 | | Toyo Tanso Company, Ltd. | | | 1,368,707 | |
29,400 | | Trend Micro, Inc. | | | 1,051,371 | |
28,800 | | Unipres Corporation | | | 785,571 | |
194,300 | | UNY Company, Ltd. | | | 1,752,728 | |
67,700 | | Ushio, Inc. | | | 1,000,934 | |
36,900 | | West Japan Railway Company | | | 1,563,585 | |
12,310 | | Yamada Denki Company, Ltd. | | | 885,271 | |
| | | |
| | Total Japan | | | 102,939,089 | |
| | | |
| |
Luxembourg (0.3%) | | | | |
68,000 | | Tenaris SA ADR | | | 2,163,080 | |
| | | |
| | Total Luxembourg | | | 2,163,080 | |
| | | |
| |
Malaysia (0.2%) | | | | |
240,000 | | CIMB Group Holdings Berhad | | | 589,103 | |
135,500 | | Public Bank Berhad | | | 559,777 | |
| | | |
| | Total Malaysia | | | 1,148,880 | |
| | | |
| |
Mexico (1.1%) | | | | |
168,000 | | Consorcio ARA SAB de CV | | | 46,138 | |
43,000 | | Fomento Economico Mexicano SAB de CV ADR | | | 2,883,150 | |
18,100 | | Grupo Aeroportuario del Sureste SAB de CV ADR | | | 1,042,560 | |
718,500 | | Grupo Financiero Banorte SAB de CV ADR | | | 2,450,351 | |
323,000 | | Organizacion Soriana SAB de CVa | | | 702,859 | |
| | | |
| | Total Mexico | | | 7,125,058 | |
| | | |
| |
Netherlands (1.8%) | | | | |
891,950 | | Aegon NVa | | | 4,253,640 | |
94,937 | | Koninklijke DSM NV | | | 4,858,102 | |
12,480 | | TKH Group NV | | | 307,704 | |
77,969 | | Unilever NV | | | 2,691,770 | |
| | | |
| | Total Netherlands | | | 12,111,216 | |
| | | |
| |
Norway (2.2%) | | | | |
36,275 | | DnB NOR ASA | | | 419,592 | |
215,343 | | Renewable Energy Corporation ASAa | | | 207,637 | |
53,400 | | Schibsted ASA | | | 1,388,933 | |
34,373 | | Seadrill, Ltd. | | | 1,128,777 | |
223,422 | | Statoil ASA | | | 5,669,123 | |
268,600 | | Storebrand ASA | | | 1,641,002 | |
1,365,000 | | STX OSV Holdings, Ltd. | | | 1,207,810 | |
199,554 | | Tomra Systems ASA | | | 1,463,232 | |
31,298 | | Yara International ASA | | | 1,480,064 | |
| | | |
| | Total Norway | | | 14,606,170 | |
| | | |
| |
Philippines (0.3%) | | | | |
3,130,000 | | Ayala Land, Inc. | | | 1,173,286 | |
809,966 | | Bank of the Philippine Islands | | | 1,093,808 | |
| | | |
| | Total Philippines | | | 2,267,094 | |
| | | |
| |
Poland (0.3%) | | | | |
37,500 | | Bank Pekao SA | | | 1,736,237 | |
| | | |
| | Total Poland | | | 1,736,237 | |
| | | |
| |
Portugal (0.5%) | | | | |
3,071,746 | | Banco Comercial Portugues SAa | | | 649,882 | |
| | | | | | |
| Shares | | Common Stock (87.7%) | | Value | |
Portugal (0.5%) - continued | | | | |
570,650 | | Banco Espirito Santo SA | | | $1,224,446 | |
70,662 | | Jeronimo Martins SGPS SA | | | 1,211,696 | |
| | | |
| | Total Portugal | | | 3,086,024 | |
| | | |
| |
Russia (0.4%) | | | | |
48,500 | | LUKOIL OAO | | | 2,809,173 | |
| | | |
| | Total Russia | | | 2,809,173 | |
| | | |
| |
Singapore (1.4%) | | | | |
1,131,000 | | Biosenors International Group, Ltd.a | | | 1,260,793 | |
545,510 | | Keppel Corporation, Ltd. | | | 4,083,718 | |
132,000 | | Oversea-Chinese Banking Corporation, Ltd. | | | 883,731 | |
672,000 | | Raffles Medical Group, Ltd. | | | 1,195,172 | |
271,000 | | SembCorp Industries, Ltd. | | | 893,449 | |
997,000 | | Super Group, Ltd. | | | 1,186,023 | |
| | | |
| | Total Singapore | | | 9,502,886 | |
| | | |
| |
South Africa (0.6%) | | | | |
78,890 | | Massmart Holdings, Ltd. | | | 1,570,723 | |
260,000 | | Truworths International, Ltd. | | | 2,616,415 | |
| | | |
| | Total South Africa | | | 4,187,138 | |
| | | |
| |
South Korea (2.6%) | | | | |
13,399 | | BS Financial Group, Inc.a | | | 147,470 | |
3,003 | | E-Mart Company, Ltd.a | | | 784,487 | |
22,408 | | Fila Korea, Ltd. | | | 1,533,042 | |
51,450 | | Halla Climate Control Corporation | | | 1,088,297 | |
9,900 | | POSCO | | | 3,430,235 | |
7,650 | | Samsung Electronics Company, Ltd. | | | 4,364,701 | |
1,356 | | Shinsegae Company, Ltd. | | | 341,034 | |
2,690 | | SK Telecom Company, Ltd. | | | 358,189 | |
235,649 | | SK Telecom Company, Ltd. ADR | | | 3,485,248 | |
12,814 | | Soulbrain Company, Ltd. | | | 430,592 | |
35,775 | | Youngone Corporation | | | 813,574 | |
| | | |
| | Total South Korea | | | 16,776,869 | |
| | | |
| |
Spain (1.8%) | | | | |
455,318 | | Banco Bilbao Vizcaya Argentaria SA | | | 4,097,800 | |
385,714 | | Banco Popular Espanol SA | | | 1,765,467 | |
148,550 | | Indra Sistemas SA | | | 2,489,132 | |
21,562 | | Industria de Diseno Textil SA (Inditex) | | | 1,957,386 | |
59,756 | | Repsol YPF SA | | | 1,798,633 | |
| | | |
| | Total Spain | | | 12,108,418 | |
| | | |
| |
Sweden (2.2%) | | | | |
70,056 | | Atlas Copco AB | | | 1,522,968 | |
24,100 | | Electrolux AB | | | 448,748 | |
30,885 | | Elekta AB | | | 1,233,357 | |
58,469 | | Hexpol AB | | | 1,504,439 | |
40,584 | | Hoganas AB | | | 1,293,554 | |
65,185 | | Husqvarna AB | | | 331,066 | |
80,580 | | JM AB | | | 1,462,066 | |
28,145 | | Kinnevik Investment AB | | | 588,138 | |
6,207 | | Modern Times Group AB | | | 328,188 | |
84,154 | | Nordea Bank AB | | | 764,185 | |
116,099 | | Swedbank AB | | | 1,625,429 | |
117,353 | | Telefonaktiebolaget LM Ericsson | | | 1,223,222 | |
The accompanying Notes to Financial Statements are an integral part of this schedule.
109
Partner Worldwide Allocation Fund
Schedule of Investments as of October 31, 2011
| | | | | | |
| Shares | | Common Stock (87.7%) | | Value | |
| Sweden (2.2%) - continued | | | | |
161,396 | | Volvo AB | | | $2,008,831 | |
| | | |
| | Total Sweden | | | 14,334,191 | |
| | | |
| |
| Switzerland (6.3%) | | | | |
54,982 | | ABB, Ltd.a | | | 1,035,056 | |
66,350 | | Adecco SAa | | | 3,186,606 | |
17,307 | | Aryzta AG | | | 834,512 | |
6,215 | | Bucher Industries AG | | | 1,072,924 | |
3,869 | | Burckhardt Compression Holding AG | | | 855,183 | |
125,100 | | Credit Suisse Groupa | | | 3,608,005 | |
2,435 | | Galenica AG | | | 1,410,547 | |
3,333 | | Givaudan SAa | | | 3,031,426 | |
60,245 | | Holcim, Ltd.a | | | 3,815,077 | |
3,057 | | Kaba Holding AG | | | 1,182,178 | |
92,734 | | Nestle SA | | | 5,363,518 | |
79,150 | | Novartis AG | | | 4,458,937 | |
57,263 | | Roche Holding AG | | | 9,395,104 | |
79,201 | | UBS AGa | | | 1,000,957 | |
16,528 | | Zehnder Group AG | | | 981,799 | |
| | | |
| | Total Switzerland | | | 41,231,829 | |
| | | |
| |
| Taiwan (0.7%) | | | | |
447,100 | | Taiwan Mobile Company, Ltd. | | | 1,281,166 | |
1,440,362 | | Taiwan Semiconductor Manufacturing Company, Ltd. | | | 3,509,981 | |
| | | |
| | Total Taiwan | | | 4,791,147 | |
| | | |
| |
| Thailand (1.7%) | | | | |
308,450 | | Bangkok Bank pcl | | | 1,563,120 | |
392,000 | | PTT Exploration & Production pcl | | | 2,035,805 | |
430,550 | | PTT pcl | | | 4,244,843 | |
173,400 | | Siam Cement pcl | | | 2,076,965 | |
378,400 | | Siam Commercial Bank pcl | | | 1,430,102 | |
| | | |
| | Total Thailand | | | 11,350,835 | |
| | | |
| |
| Turkey (0.7%) | | | | |
651,258 | | Akbank TAS | | | 2,371,840 | |
50,000 | | BIM Birlesik Magazalar AS | | | 1,519,908 | |
267,000 | | Turkiye Garanti Bankasi AS | | | 936,780 | |
| | | |
| | Total Turkey | | | 4,828,528 | |
| | | |
| |
| United Kingdom (12.2%) | | | | |
14,943 | | Anglo American plc | | | 547,843 | |
11,919 | | AstraZeneca plc | | | 572,248 | |
50,673 | | Aveva Group plc | | | 1,283,064 | |
109,251 | | Babcock International Group plc | | | 1,234,752 | |
1,221,110 | | BAE Systems plc | | | 5,415,374 | |
173,759 | | BG Group plc | | | 3,767,964 | |
71,555 | | BHP Billiton plc | | | 2,253,332 | |
87,355 | | British American Tobacco plc | | | 4,005,435 | |
349,504 | | BT Group plc | | | 1,054,582 | |
68,035 | | Burberry Group plc | | | 1,460,614 | |
226,596 | | Carillion plc | | | 1,258,612 | |
52,386 | | Croda International plc | | | 1,472,806 | |
233,168 | | Halma plc | | | 1,253,011 | |
402,825 | | HSBC Holdings plc | | | 3,514,922 | |
89,200 | | HSBC Holdings plc ADR | | | 3,894,471 | |
47,480 | | IMI plc | | | 625,783 | |
73,605 | | Imperial Tobacco Group plc | | | 2,681,322 | |
136,737 | | Inchcape plc | | | 713,983 | |
229,633 | | Intermediate Capital Group plc | | | 899,184 | |
249,677 | | Kingfisher plc | | | 1,034,479 | |
399,242 | | Legal & General Group plc | | | 703,280 | |
1,914,318 | | Lloyds TSB Group plca | | | 989,942 | |
| | | | | | |
| Shares | | Common Stock (87.7%) | | Value | |
| United Kingdom (12.2%) - continued | | | | |
318,150 | | Morgan Crucible Company plc | | | $1,443,876 | |
121,100 | | Pearson plc | | | 2,224,801 | |
118,277 | | Prudential plc | | | 1,221,739 | |
51,063 | | Rio Tinto plc | | | 2,762,575 | |
20,276 | | Royal Dutch Shell plc | | | 727,497 | |
27,996 | | SABMiller plc | | | 1,034,080 | |
60,579 | | SABMiller plc | | | 2,206,395 | |
44,786 | | Shire plc | | | 1,405,700 | |
43,561 | | Spirax-Sarco Engineering plc | | | 1,338,217 | |
588,992 | | Spirent plc | | | 1,181,015 | |
75,659 | | SSE plc | | | 1,634,777 | |
116,854 | | Standard Chartered plc | | | 2,726,819 | |
72,237 | | Tate & Lyle plc | | | 755,800 | |
730,950 | | Tesco plc | | | 4,712,916 | |
45,527 | | Ultra Electronics Holdings plc | | | 1,161,630 | |
43,657 | | Unilever plc | | | 1,463,454 | |
1,796,137 | | Vodafone Group plc | | | 4,987,536 | |
403,527 | | William Morrison Supermarkets plc | | | 1,956,902 | |
432,400 | | WPP plc | | | 4,475,990 | |
| | | |
| | Total United Kingdom | | | 80,058,722 | |
| | | |
| | | | | | |
| | | |
| | Total Common Stock (cost $589,438,247) | | | 576,694,627 | |
| | | |
| | |
Principal Amount | | Long-Term Fixed Income (9.4%) | | Value | |
| Argentina (0.2%) | | | | |
| | Argentina Government International Bond | | | | |
$260,000 | | 7.000%, 10/3/2015 | | | 232,050 | |
246,504 | | 7.820%, 12/31/2033c | | | 204,653 | |
791,408 | | 7.820%, 12/31/2033c | | | 657,042 | |
368,838 | | 8.280%, 12/31/2033 | | | 289,537 | |
150,000 | | Zero Coupon, 12/15/2035 | | | 23,213 | |
1,420,000 | | Zero Coupon, 12/15/2035c | | | 267,220 | |
50,000 | | 2.260%, 12/31/2038c,d | | | 20,756 | |
| | | |
| | Total Argentina | | | 1,694,471 | |
| | | |
| |
| Belarus (0.1%) | | | | |
| | Belarus Government International Bond | | | | |
606,000 | | 8.750%, 8/3/2015 | | | 512,070 | |
| | | |
| | Total Belarus | | | 512,070 | |
| | | |
| |
| Belize (<0.1%) | | | | |
| | Belize Government International Bond | | | | |
70,000 | | 6.000%, 2/20/2029d | | | 42,000 | |
| | | |
| | Total Belize | | | 42,000 | |
| | | |
| |
| Brazil (0.6%) | | | | |
| | BFF International, Ltd. | | | | |
300,000 | | 7.250%, 1/28/2020 | | | 325,500 | |
| | Brazil Government International Bond | | | | |
1,080,000 | | 4.875%, 1/22/2021 | | | 1,192,859 | |
20,000 | | 8.250%, 1/20/2034 | | | 29,100 | |
320,000 | | 7.125%, 1/20/2037 | | | 428,000 | |
340,000 | | 11.000%, 8/17/2040 | | | 449,990 | |
150,000 | | 5.625%, 1/7/2041 | | | 169,350 | |
| | Centrais Eletricas Brasileiras SA | | | | |
410,000 | | 5.750%, 10/27/2021e | | | 424,350 | |
The accompanying Notes to Financial Statements are an integral part of this schedule.
110
Partner Worldwide Allocation Fund
Schedule of Investments as of October 31, 2011
| | | | | | |
Principal Amount | | Long-Term Fixed Income (9.4%) | | Value | |
| Brazil (0.6%) - continued | | | | |
| | Independencia International, Ltd. | | | | |
$95,246 | | 12.000%, 12/30/2016b,e,f | | | $10 | |
| | | |
| | Total Brazil | | | 3,019,159 | |
| | | |
| |
| Bulgaria (<0.1%) | | | | |
| | Sinochem Overseas Capital Company, Ltd. | | | | |
100,000 | | 6.300%, 11/12/2040 | | | 100,303 | |
| | | |
| | Total Bulgaria | | | 100,303 | |
| | | |
| |
| Canada (0.1%) | | | | |
| | PTTEP Canada International Finance, Ltd. | | | | |
200,000 | | 5.692%, 4/5/2021e | | | 204,520 | |
200,000 | | 5.692%, 4/5/2021 | | | 204,520 | |
| | Sino-Forest Corporation | | | | |
88,000 | | 6.250%, 10/21/2017 | | | 29,040 | |
| | | |
| | Total Canada | | | 438,080 | |
| | | |
| |
| Cayman Islands (0.2%) | | | | |
| | Country Garden Holdings Company | | | | |
300,000 | | 2.500%, 2/22/2013g | | | 51,399 | |
| | ENN Energy Holdings, Ltd. | | | | |
300,000 | | 6.000%, 5/13/2021 | | | 318,291 | |
| | Evergrande Real Estate Group, Ltd. | | | | |
1,000,000 | | 7.500%, 1/19/2014g | | | 133,784 | |
| | TGI International, Ltd. | | | | |
130,000 | | 9.500%, 10/3/2017 | | | 141,050 | |
| | Vale Overseas, Ltd. | | | | |
220,000 | | 5.625%, 9/15/2019 | | | 237,365 | |
420,000 | | 4.625%, 9/15/2020 | | | 424,549 | |
| | | |
| | Total Cayman Islands | | | 1,306,438 | |
| | | |
| |
| Chile (0.3%) | | | | |
| | AES Gener SA | | | | |
80,000 | | 5.250%, 8/15/2021 | | | 81,200 | |
70,000 | | 5.250%, 8/15/2021e | | | 71,050 | |
| | Banco del Estado de Chile | | | | |
100,000 | | 4.125%, 10/7/2020e | | | 102,630 | |
330,000 | | 4.125%, 10/7/2020 | | | 338,677 | |
| | Chile Government International Bond | | | | |
100,000 | | 3.875%, 8/5/2020 | | | 104,500 | |
380,000 | | 3.250%, 9/14/2021 | | | 375,250 | |
| | Corporacion Nacional del Cobre de Chile - Codelco | | | | |
100,000 | | 7.500%, 1/15/2019 | | | 126,019 | |
100,000 | | 3.750%, 11/4/2020e | | | 100,418 | |
520,000 | | 3.750%, 11/4/2020 | | | 522,172 | |
110,000 | | 6.150%, 10/24/2036 | | | 130,915 | |
| | E-CL SA | | | | |
120,000 | | 5.625%, 1/15/2021e | | | 126,145 | |
| | | |
| | Total Chile | | | 2,078,976 | |
| | | |
| |
| China (<0.1%) | | | | |
| | Sinochem Overseas Capital Company, Ltd. | | | | |
70,000 | | 6.300%, 11/12/2040e | | | 69,712 | |
| | | |
| | Total China | | | 69,712 | |
| | | |
| | | | | | |
Principal Amount | | Long-Term Fixed Income (9.4%) | | Value | |
| Colombia (0.7%) | | | | |
| | Colombia Government International Bond | | | | |
$20,000 | | 8.250%, 12/22/2014 | | | $23,660 | |
600,000 | | 7.375%, 1/27/2017 | | | 729,000 | |
540,000 | | 7.375%, 3/18/2019 | | | 680,400 | |
1,560,000 | | 4.375%, 7/12/2021 | | | 1,630,200 | |
50,000 | | 8.125%, 5/21/2024 | | | 68,150 | |
500,000 | | 7.375%, 9/18/2037 | | | 680,000 | |
1,030,000 | | 6.125%, 1/18/2041 | | | 1,228,275 | |
| | | |
| | Total Colombia | | | 5,039,685 | |
| | | |
| |
| Costa Rica (<0.1%) | | | | |
| | Costa Rica Government International Bond | | | | |
13,000 | | 9.995%, 8/1/2020 | | | 17,680 | |
| | | |
| | Total Costa Rica | | | 17,680 | |
| | | |
| |
| Croatia (0.1%) | | | | |
| | Croatia Government International Bond | | | | |
120,000 | | 6.625%, 7/14/2020 | | | 118,350 | |
410,000 | | 6.375%, 3/24/2021 | | | 396,675 | |
200,000 | | 6.375%, 3/24/2021e | | | 195,505 | |
| | | |
| | Total Croatia | | | 710,530 | |
| | | |
| |
| Dominican Republic (0.2%) | | | | |
| | Dominican Republic Government International Bond | | | | |
87,438 | | 9.040%, 1/23/2018 | | | 97,494 | |
590,000 | | 7.500%, 5/6/2021 | | | 612,420 | |
390,000 | | 8.625%, 4/20/2027 | | | 417,300 | |
| | | |
| | Total Dominican Republic | | | 1,127,214 | |
| | | |
| |
| El Salvador (0.1%) | | | | |
| | El Salvador Government International Bond | | | | |
380,000 | | 7.650%, 6/15/2035 | | | 383,800 | |
| | | |
| | Total El Salvador | | | 383,800 | |
| | | |
| |
| Gabon (<0.1%) | | | | |
| | Gabon Government International Bond | | | | |
235,000 | | 8.200%, 12/12/2017 | | | 270,250 | |
| | | |
| | Total Gabon | | | 270,250 | |
| | | |
| |
| Hong Kong (<0.1%) | | | | |
| | Zijin International Finance Company, Ltd. | | | | |
100,000 | | 4.250%, 6/30/2016 | | | 98,429 | |
| | | |
| | Total Hong Kong | | | 98,429 | |
| | | |
| |
| Hungary (0.1%) | | | | |
| | Hungary Government International Bond | | | | |
490,000 | | 6.375%, 3/29/2021 | | | 471,625 | |
212,000 | | 7.625%, 3/29/2041 | | | 205,640 | |
| | | |
| | Total Hungary | | | 677,265 | |
| | | |
| |
| Iceland (0.1%) | | | | |
| | Iceland Government International Bond | | | | |
300,000 | | 4.875%, 6/16/2016e | | | 296,218 | |
The accompanying Notes to Financial Statements are an integral part of this schedule.
111
Partner Worldwide Allocation Fund
Schedule of Investments as of October 31, 2011
| | | | | | |
Principal
Amount | | Long-Term Fixed Income (9.4%) | | Value | |
Iceland (0.1%) - continued | | | | |
$360,000 | | 4.875%, 6/16/2016 | | | $355,462 | |
| | | |
| | Total Iceland | | | 651,680 | |
| | | |
| |
| India (<0.1%) | | | | |
| | ICICI Bank, Ltd./Dubai | | | | |
200,000 | | 4.750%, 11/25/2016 | | | 198,134 | |
| | | |
| | Total India | | | 198,134 | |
| | | |
| |
| Indonesia (1.1%) | | | | |
| | Indonesia Government International Bond | | | | |
100,000 | | 6.750%, 3/10/2014 | | | 108,750 | |
300,000 | | 6.875%, 1/17/2018 | | | 354,000 | |
2,100,000 | | 11.625%, 3/4/2019 | | | 3,129,000 | |
240,000 | | 5.875%, 3/13/2020 | | | 273,600 | |
1,430,000 | | 4.875%, 5/5/2021 | | | 1,533,675 | |
200,000 | | 4.875%, 5/5/2021e | | | 214,500 | |
190,000 | | 8.500%, 10/12/2035 | | | 273,600 | |
600,000 | | 7.750%, 1/17/2038 | | | 813,000 | |
| | | |
| | Total Indonesia | | | 6,700,125 | |
| | | |
| |
| Iraq (0.1%) | | | | |
| | Iraq Government International Bond | | | | |
750,000 | | 5.800%, 1/15/2028 | | | 635,625 | |
| | | |
| | Total Iraq | | | 635,625 | |
| | | |
| |
| Ireland (<0.1%) | | | | |
| | MTS International Funding, Ltd. | | | | |
100,000 | | 8.625%, 6/22/2020 | | | 109,250 | |
| | Vimpel Communications Via VIP Finance Ireland, Ltd. OJSC | | | | |
170,000 | | 9.125%, 4/30/2018 | | | 179,775 | |
| | | |
| | Total Ireland | | | 289,025 | |
| | | |
| |
| Ivory Coast (0.1%) | | | | |
| | Ivory Coast Government International Bond | | | | |
907,000 | | 2.500%, 12/31/2032f | | | 492,048 | |
| | | |
| | Total Ivory Coast | | | 492,048 | |
| | | |
| |
| Kazakhstan (0.2%) | | | | |
| | Kazatomprom Natsionalnaya
Atomnaya Kompaniya AO | | | | |
100,000 | | 6.250%, 5/20/2015 | | | 103,250 | |
| | KazMunaiGaz Finance Sub BV | | | | |
290,000 | | 7.000%, 5/5/2020 | | | 317,550 | |
| | KazMunayGas National Company | | | | |
340,000 | | 11.750%, 1/23/2015 | | | 413,100 | |
260,000 | | 6.375%, 4/9/2021 | | | 276,900 | |
200,000 | | 6.375%, 4/9/2021e | | | 213,000 | |
| | | |
| | Total Kazakhstan | | | 1,323,800 | |
| | | |
| |
| Lithuania (<0.1%) | | | | |
| | Lithuania Government International Bond | | | | |
120,000 | | 6.125%, 3/9/2021 | | | 123,600 | |
| | | |
| | Total Lithuania | | | 123,600 | |
| | | |
| |
| Luxembourg (0.3%) | | | | |
| | Alrosa Finance SA | | | | |
400,000 | | 7.750%, 11/3/2020 | | | 414,500 | |
| | Gazprom Via Gaz Capital SA | | | | |
590,000 | | 9.250%, 4/23/2019 | | | 730,892 | |
| | | | | | |
Principal
Amount | | Long-Term Fixed Income (9.4%) | | Value | |
| Luxembourg (0.3%) - continued | | | | |
| | Gazprom Via Gazprom International, Ltd. | | | | |
$72,711 | | 7.201%, 2/1/2020 | | | $79,982 | |
| | TNK-BP Finance SA | | | | |
490,000 | | 7.875%, 3/13/2018 | | | 556,150 | |
100,000 | | 7.250%, 2/2/2020 | | | 110,250 | |
| | | |
| | Total Luxembourg | | | 1,891,774 | |
| | | |
| |
| Malaysia (0.1%) | | | | |
| | Petronas Capital, Ltd. | | | | |
350,000 | | 5.250%, 8/12/2019 | | | 395,809 | |
| | Wakala Global Sukuk Bhd | | | | |
290,000 | | 4.646%, 7/6/2021e | | | 310,328 | |
| | | |
| | Total Malaysia | | | 706,137 | |
| | | |
| |
| Mexico (0.7%) | | | | |
| | Mexican Bonos | | | | |
4,000,000 | | 6.500%, 6/10/2021h | | | 306,776 | |
1,747,200 | | 10.000%, 11/20/2036h | | | 168,057 | |
| | Mexico Government International Bond | | | | |
30,000 | | 7.500%, 1/14/2012 | | | 30,345 | |
20,000 | | 5.875%, 1/15/2014 | | | 21,740 | |
10,000 | | 6.625%, 3/3/2015 | | | 11,400 | |
40,000 | | 5.625%, 1/15/2017 | | | 45,600 | |
130,000 | | 5.950%, 3/19/2019 | | | 152,295 | |
1,040,000 | | 5.125%, 1/15/2020 | | | 1,158,560 | |
30,000 | | 8.300%, 8/15/2031 | | | 43,500 | |
250,000 | | 6.750%, 9/27/2034 | | | 311,875 | |
60,000 | | 6.050%, 1/11/2040 | | | 70,350 | |
540,000 | | 5.750%, 10/12/2110 | | | 548,640 | |
| | Pemex Project Funding Master Trust | | | | |
540,000 | | 5.750%, 3/1/2018 | | | 594,000 | |
350,000 | | 6.625%, 6/15/2035 | | | 381,500 | |
| | Petroleos Mexicanos | | | | |
30,000 | | 8.000%, 5/3/2019 | | | 37,425 | |
150,000 | | 5.500%, 1/21/2021 | | | 160,125 | |
300,000 | | 6.500%, 6/2/2041e | | | 321,750 | |
| | | |
| | Total Mexico | | | 4,363,938 | |
| | | |
| |
| Namibia (<0.1%) | | | | |
| | Namibia Government International Bond | | | | |
210,000 | | 5.500%, 11/3/2021e | | | 210,000 | |
| | | |
| | Total Namibia | | | 210,000 | |
| | | |
| |
| Netherlands (<0.1%) | | | | |
| | Myriad International Holding BV | | | | |
100,000 | | 6.375%, 7/28/2017 | | | 107,250 | |
| | VimpelCom Holdings BV | | | | |
200,000 | | 7.504%, 3/1/2022e | | | 187,500 | |
| | | |
| | Total Netherlands | | | 294,750 | |
| | | |
| |
| Nigeria (0.1%) | | | | |
| | Nigeria Government International Bond | | | | |
600,000 | | 6.750%, 1/28/2021 | | | 639,000 | |
| | | |
| | Total Nigeria | | | 639,000 | |
| | | |
| |
| Pakistan (<0.1%) | | | | |
| | Pakistan Government International Bond | | | | |
200,000 | | 6.875%, 6/1/2017 | | | 154,000 | |
The accompanying Notes to Financial Statements are an integral part of this schedule.
112
Partner Worldwide Allocation Fund
Schedule of Investments as of October 31, 2011
| | | | | | |
Principal Amount | | Long-Term Fixed Income (9.4%) | | Value | |
| Pakistan (<0.1%) - continued | | | | |
$120,000 | | 7.875%, 3/31/2036 | | | $80,400 | |
| | | |
| | Total Pakistan | | | 234,400 | |
| | | |
| |
| Panama (0.1%) | | | | |
| | Panama Government International Bond | | | | |
347,000 | | 8.875%, 9/30/2027 | | | 511,825 | |
190,000 | | 9.375%, 4/1/2029 | | | 293,550 | |
| | | |
| | Total Panama | | | 805,375 | |
| | | |
| |
| Peru (0.1%) | | | | |
| | Peru Government International Bond | | | | |
80,000 | | 7.125%, 3/30/2019 | | | 99,200 | |
490,000 | | 7.350%, 7/21/2025 | | | 639,450 | |
125,000 | | 8.750%, 11/21/2033 | | | 187,813 | |
160,000 | | 6.550%, 3/14/2037 | | | 199,200 | |
| | | |
| | Total Peru | | | 1,125,663 | |
| | | |
| |
| Philippines (0.5%) | | | | |
| | Energy Development Corporation | | | | |
100,000 | | 6.500%, 1/20/2021 | | | 100,898 | |
| | Philippines Government International Bond | | | | |
860,000 | | 7.500%, 9/25/2024 | | | 1,083,600 | |
50,000 | | 9.500%, 10/21/2024 | | | 71,938 | |
730,000 | | 5.500%, 3/30/2026 | | | 797,525 | |
284,000 | | 9.500%, 2/2/2030 | | | 433,455 | |
752,000 | | 6.375%, 10/23/2034 | | | 891,120 | |
| | | |
| | Total Philippines | | | 3,378,536 | |
| | | |
| |
| Poland (0.2%) | | | | |
| | Poland Government International Bond | | | | |
1,260,000 | | 5.000%, 3/23/2022 | | | 1,244,250 | |
| | | |
| | Total Poland | | | 1,244,250 | |
| | | |
| |
| Qatar (<0.1%) | | | | |
| | Ras Laffan Liquefied Natural Gas Company, Ltd. II | | | | |
264,360 | | 5.298%, 9/30/2020 | | | 285,509 | |
| | | |
| | Total Qatar | | | 285,509 | |
| | | |
| |
| Russia (0.7%) | | | | |
| | Russia Government International Bond | | | | |
200,000 | | 3.625%, 4/29/2015 | | | 203,500 | |
3,193,875 | | 7.500%, 3/31/2030 | | | 3,784,741 | |
| | | |
| | Total Russia | | | 3,988,241 | |
| | | |
| |
| Serbia (<0.1%) | | | | |
| | Serbia Government International Bond | | | | |
135,000 | | 6.750%, 11/1/2024 | | | 133,313 | |
| | | |
| | Total Serbia | | | 133,313 | |
| | | |
| |
| South Africa (0.4%) | | | | |
| | Peermont Global Proprietary, Ltd. | | | | |
170,000 | | 7.750%, 4/30/2014c | | | 194,064 | |
| | South Africa Government International Bond | | | | |
4,475,000 | | 13.500%, 9/15/2015i | | | 695,089 | |
1,800,000 | | 8.000%, 12/21/2018i | | | 231,547 | |
2,575,000 | | 7.250%, 1/15/2020i | | | 310,944 | |
| | | | | | |
Principal Amount | | Long-Term Fixed Income (9.4%) | | Value | |
| South Africa (0.4%) - continued | | | | |
$5,375,000 | | 6.750%, 3/31/2021i | | | $629,207 | |
1,055,000 | | 10.500%, 12/21/2026i | | | 158,233 | |
| | Transnet, Ltd. | | | | |
200,000 | | 4.500%, 2/10/2016 | | | 209,395 | |
| | | |
| | Total South Africa | | | 2,428,479 | |
| | | |
| |
| Sri Lanka (<0.1%) | | | | |
| | Sri Lanka Government International Bond | | | | |
220,000 | | 6.250%, 7/27/2021e | | | 224,113 | |
| | | |
| | Total Sri Lanka | | | 224,113 | |
| | | |
| |
| Supranational (0.1%) | | | | |
| | Corporacion Andina de Fomento | | | | |
599,000 | | 3.750%, 1/15/2016 | | | 601,057 | |
| | | |
| | Total Supranational | | | 601,057 | |
| | | |
| |
| Turkey (0.4%) | | | | |
| | Export Credit Bank of Turkey | | | | |
270,000 | | 5.375%, 11/4/2016e | | | 270,000 | |
| | Turkey Government International Bond | | | | |
802,000 | | 5.625%, 3/30/2021 | | | 846,110 | |
640,000 | | 5.125%, 3/25/2022 | | | 640,800 | |
50,000 | | 7.250%, 3/5/2038 | | | 57,750 | |
550,000 | | 6.750%, 5/30/2040 | | | 599,500 | |
| | Turkiye Garanti Bankasi AS | | | | |
200,000 | | 6.250%, 4/20/2021e | | | 192,500 | |
| | | |
| | Total Turkey | | | 2,606,660 | |
| | | |
| |
| Ukraine (0.4%) | | | | |
| | Ukraine Government International Bond | | | | |
560,000 | | 4.950%, 10/13/2015c | | | 674,139 | |
430,000 | | 6.250%, 6/17/2016e | | | 407,425 | |
200,000 | | 6.250%, 6/17/2016 | | | 189,500 | |
100,000 | | 6.580%, 11/21/2016 | | | 95,000 | |
130,000 | | 7.750%, 9/23/2020 | | | 124,475 | |
400,000 | | 7.950%, 2/23/2021e | | | 387,000 | |
650,000 | | 7.950%, 2/23/2021 | | | 628,875 | |
| | | |
| | Total Ukraine | | | 2,506,414 | |
| | | |
| |
| United Arab Emirates (<0.1%) | | | | |
| | Dolphin Energy, Ltd. | | | | |
88,360 | | 5.888%, 6/15/2019 | | | 96,427 | |
| | | |
| | Total United Arab Emirates | | | 96,427 | |
| | | |
| |
| United States (0.2%) | | | | |
| | Corporacion Andina de Fomento | | | | |
130,000 | | 5.750%, 1/12/2017 | | | 142,411 | |
| | HSBC Bank USA | | | | |
290,000 | | 5.910%, 8/15/2040b,j | | | 372,567 | |
| | U.S. Treasury Notes | | | | |
600,000 | | 0.375%, 7/31/2013 | | | 601,336 | |
| | | |
| | Total United States | | | 1,116,314 | |
| | | |
| |
| Uruguay (0.2%) | | | | |
| | Uruguay Government International Bond | | | | |
480,000 | | 8.000%, 11/18/2022 | | | 636,000 | |
30,000 | | 7.875%, 1/15/2033 | | | 40,200 | |
572,000 | | 7.625%, 3/21/2036 | | | 755,040 | |
| | | |
| | Total Uruguay | | | 1,431,240 | |
| | | |
The accompanying Notes to Financial Statements are an integral part of this schedule.
113
Partner Worldwide Allocation Fund
Schedule of Investments as of October 31, 2011
| | | | | | |
Principal
Amount | | Long-Term Fixed Income (9.4%) | | Value | |
Venezuela (0.6%) | | | | |
| | Petroleos de Venezuela SA | | | | |
$40,000 | | 4.900%, 10/28/2014 | | | $30,400 | |
558,400 | | 5.250%, 4/12/2017 | | | 344,114 | |
280,000 | | 8.500%, 11/2/2017e | | | 203,000 | |
300,000 | | 5.375%, 4/12/2027 | | | 148,875 | |
10,000 | | 5.500%, 4/12/2037 | | | 4,788 | |
| | Venezuela Government International Bond | | | | |
80,000 | | 13.625%, 8/15/2018 | | | 78,800 | |
30,000 | | 13.625%, 8/15/2018 | | | 29,550 | |
1,120,000 | | 7.750%, 10/13/2019 | | | 781,200 | |
292,000 | | 6.000%, 12/9/2020 | | | 174,470 | |
490,000 | | 9.000%, 5/7/2023 | | | 335,650 | |
460,000 | | 8.250%, 10/13/2024 | | | 295,550 | |
320,000 | | 7.650%, 4/21/2025 | | | 199,200 | |
40,000 | | 9.250%, 5/7/2028 | | | 26,600 | |
1,420,000 | | 11.950%, 8/5/2031 | | | 1,125,350 | |
30,000 | | 7.000%, 3/31/2038 | | | 17,175 | |
| | | |
| | Total Venezuela | | | 3,794,722 | |
| | | |
| | | | | | |
| | | |
| | Total Long-Term Fixed Income (cost $60,332,139) | | | 62,106,411 | |
| | | |
| | |
| Shares | | Preferred Stock (0.2%) | | Value | |
Germany (0.2%) | | | | |
9,625 | | Draegerwerk AG & Company KGaA | | | 1,008,342 | |
| | | |
| | Total Germany | | | 1,008,342 | |
| | | |
| | | | | | |
| | | |
| | Total Preferred Stock (cost $944,303) | | | 1,008,342 | |
| | | |
| | |
Principal
Amount | | Short-Term Investments (0.8%)k | | Value | |
| | Federal Home Loan Bank Discount Notes | | | | |
3,400,000 | | 0.015%, 12/9/2011l | | | 3,399,946 | |
| | Federal Home Loan Mortgage Corporation Discount Notes | | | | |
2,000,000 | | 0.020%, 11/28/2011l | | | 1,999,970 | |
| | Federal National Mortgage Association Discount Notes | | | | |
100,000 | | 0.099%, 2/22/2012l,m | | | 99,969 | |
| | | |
| | Total Short-Term Investments (at amortized cost) | | | 5,499,885 | |
| | | |
| | Total Investments (cost $656,214,574) 98.1% | | $ | 645,309,265 | |
| | | |
| | Other Assets and Liabilities, Net 1.9% | | | 12,513,883 | |
| | | |
| | Total Net Assets 100.0% | | $ | 657,823,148 | |
| | | |
| a | Non-income producing security. |
| b | Security is fair valued. |
| c | Principal amount is displayed in Euros. |
| d | Denotes step coupon securities. Step coupon securities pay an initial coupon rate for the first period and then different coupon rates for following periods. The rate shown is as of October 31, 2011. |
| e | Denotes securities sold under Rule 144A of the Securities Act of 1933, which exempts them from registration. These securities have been deemed liquid and may be resold to other dealers in the program or to other qualified institutional buyers. As of October 31, 2011, the value of these investments was $4,731,674 or 0.7% of total net assets. |
| f | Defaulted security. Interest is not being accrued. |
| g | Principal amount is displayed in Chinese Yuan. |
| h | Principal amount is displayed in Mexican Pesos. |
| i | Principal amount is displayed in South African Rand. |
| j | Principal amount is displayed in Brazilian Real. Security is linked to Brazilian Government Bonds due August 15, 2040. |
| k | The interest rate shown reflects the yield, coupon rate or the discount rate at the date of purchase. |
| l | Denotes investments that benefit from credit enhancement or liquidity support provided by a third party bank, institution or government. |
| m | At October 31, 2011, $99,969 of investments were held on deposit with the counterparty and pledged as the initial margin deposit for open futures contracts. |
Definitions:
| | |
ADR - | | American Depositary Receipt, which are certificates for an underlying foreign security’s shares held by an issuing U.S. depository bank. |
| | | | |
Unrealized Appreciation (Depreciation) | | | | |
Gross unrealized appreciation and depreciation of investments,based on cost for federal income tax purposes, were as follows: | | | | |
Gross unrealized appreciation | | | $43,367,924 | |
Gross unrealized depreciation | | | (57,032,956 | ) |
| | | | |
Net unrealized appreciation (depreciation) | | | ($13,665,032 | ) |
| |
Cost for federal income tax purposes | | | $658,974,297 | |
The accompanying Notes to Financial Statements are an integral part of this schedule.
114
Partner Worldwide Allocation Fund
Schedule of Investments as of October 31, 2011
Fair Valuation Measurements
The following table is a summary of the inputs used, as of October 31, 2011, in valuing Partner Worldwide Allocation Fund’s assets carried at fair value.
| | | | | | | | | | | | | | | | |
| Investments in Securities | | Total | | | Level 1 | | | Level 2 | | | Level 3 | |
Common Stock | | | | | | | | | | | | | | | | |
Consumer Discretionary | | | 93,194,157 | | | | – | | | | 93,194,157 | | | | – | |
Consumer Staples | | | 56,433,980 | | | | 2,883,150 | | | | 53,550,830 | | | | – | |
Energy | | | 50,514,146 | | | | 11,481,239 | | | | 39,032,907 | | | | – | |
Financials | | | 98,882,462 | | | | 9,674,053 | | | | 89,208,409 | | | | – | |
Health Care | | | 42,250,354 | | | | 3,784,752 | | | | 38,465,602 | | | | – | |
Industrials | | | 91,857,291 | | | | 1,042,560 | | | | 90,341,129 | | | | 473,602 | |
Information Technology | | | 37,863,742 | | | | 1,127,164 | | | | 36,736,578 | | | | – | |
Materials | | | 78,088,673 | | | | 4,436,800 | | | | 73,651,873 | | | | – | |
Telecommunications Services | | | 21,578,947 | | | | 3,485,248 | | | | 18,093,699 | | | | – | |
Utilities | | | 6,030,875 | | | | – | | | | 6,030,875 | | | | – | |
Long-Term Fixed Income | | | | | | | | | | | | | | | | |
Basic Materials | | | 2,253,422 | | | | – | | | | 2,253,422 | | | | – | |
Communications Services | | | 476,525 | | | | – | | | | 476,525 | | | | – | |
Consumer Cyclical | | | 245,463 | | | | – | | | | 245,463 | | | | – | |
Consumer Non-Cyclical | | | 325,510 | | | | – | | | | 325,500 | | | | 10 | |
Energy | | | 5,714,875 | | | | – | | | | 5,714,875 | | | | – | |
Financials | | | 1,274,235 | | | | – | | | | 901,668 | | | | 372,567 | |
Foreign Government | | | 49,243,705 | | | | – | | | | 49,243,705 | | | | – | |
Transportation | | | 350,445 | | | | – | | | | 350,445 | | | | – | |
U.S. Government and Agencies | | | 601,336 | | | | – | | | | 601,336 | | | | – | |
Utilities | | | 1,620,895 | | | | – | | | | 1,620,895 | | | | – | |
Preferred Stock | | | | | | | | | | | | | | | | |
Health Care | | | 1,008,342 | | | | – | | | | 1,008,342 | | | | – | |
Short-Term Investments | | | 5,499,885 | | | | – | | | | 5,499,885 | | | | – | |
| | | | | | | | | | | | | | | | | |
Total | | | $645,309,265 | | | | $37,914,966 | | | | $606,548,120 | | | | $846,179 | |
| | | | |
| Other Financial Instruments | | Total | | | Level 1 | | | Level 2 | | | Level 3 | |
Asset Derivatives | | | | | | | | | | | | | | | | |
Futures Contracts | | | 18,954 | | | | 18,954 | | | | – | | | | – | |
Foreign Currency Forward Contracts | | | 276,349 | | | | – | | | | 276,349 | | | | – | |
| | | | | | | | | | | | | | | | | |
Total Asset Derivatives | | | $295,303 | | | | $18,954 | | | | $276,349 | | | | $– | |
Liability Derivatives | | | | | | | | | | | | | | | | |
Futures Contracts | | | 23,775 | | | | 23,775 | | | | – | | | | – | |
Foreign Currency Forward Contracts | | | 210,157 | | | | – | | | | 210,157 | | | | – | |
| | | | | | | | | | | | | | | | | |
Total Liability Derivatives | | | $233,932 | | | | $23,775 | | | | $210,157 | | | | $– | |
The following table is a reconciliation of assets in which significant unobservable inputs (Level 3) were used in determining fair value for Partner Worldwide Allocation Fund.
| | | | | | | | | | | | | | | | | | | | | | | | | | | | | | | | |
| Investments in Securities | | Value October 31, 2010 | | | Realized Gain/ (Loss) | | | Change in Unrealized Appreciation/ (Depreciation)* | | | Purchases | | | Sales | | | Transfers Into
Level 3 | | | Transfers
Out of
Level 3 | | | Value
October 31,
2011 | |
Common Stock | | | | | | | | | | | | | | | | | | | | | | | | | | | | | | | | |
Industrials | | | - | | | | - | | | | 473,602 | | | | - | | | | - | | | | - | | | | - | | | | 473,602 | |
Long-Term Fixed Income | | | | | | | | | | | | | | | | | | | | | | | | | | | | | | | | |
Basic Materials | | | 99,620 | | | | - | | | | 798 | | | | - | | | | - | | | | - | | | | (100,418 | ) | | | - | |
Consumer Non-Cyclical | | | - | | | | - | | | | (2,847 | ) | | | - | | | | - | | | | 2,857 | | | | - | | | | 10 | |
Energy | | | 196,778 | | | | - | | | | 6,222 | | | | - | | | | - | | | | - | | | | (203,000 | ) | | | - | |
Financials | | | 338,644 | | | | - | | | | 33,923 | | | | - | | | | - | | | | - | | | | - | | | | 372,567 | |
| | | | | | | | | | | | | | | | | | | | | | | | | | | | | | | | | |
Total | | | $635,042 | | | | $- | | | | $511,698 | | | | $- | | | | $- | | | | $2,857 | | | | ($303,418 | ) | | | $846,179 | |
| * | Includes the change in net unrealized appreciation/(depreciation) on level 3 securities held on October 31, 2011 of $405,979. |
The accompanying Notes to Financial Statements are an integral part of this schedule.
115
Partner Worldwide Allocation Fund
Schedule of Investments as of October 31, 2011
| | | | | | | | | | | | | | | | | | |
| Futures Contracts | | Number of Contracts Long/(Short) | | | Expiration
Date | | Notional
Principal
Amount | | | Value | | | Unrealized Gain/(Loss) | |
2-Yr. U.S. Treasury Bond Futures | | | 3 | | | December 2011 | | | $661,559 | | | | $660,843 | | | | ($716 | ) |
5-Yr. U.S. Treasury Bond Futures | | | 42 | | | December 2011 | | | 5,130,640 | | | | 5,149,594 | | | | 18,954 | |
10-Yr. U.S. Treasury Bond Futures | | | (3) | | | December 2011 | | | (387,089 | ) | | | (387,188 | ) | | | (99 | ) |
20-Yr. U.S. Treasury Bond Futures | | | 5 | | | December 2011 | | | 715,587 | | | | 695,158 | | | | (20,429 | ) |
Mini MSCI EAFE Index Futures | | | 11 | | | December 2011 | | | 816,618 | | | | 814,495 | | | | (2,123 | ) |
Ultra Long Term U.S. Treasury Bond Futures | | | (1) | | | December 2011 | | | (151,967 | ) | | | (152,375 | ) | | | (408 | ) |
Total Futures Contracts | | | | | | | | | | | | | | | | | ($4,821 | ) |
The accompanying Notes to Financial Statements are an integral part of this schedule.
116
Partner Worldwide Allocation Fund
Schedule of Investments as of October 31, 2011
| | | | | | | | | | | | | | | | | | | | |
Foreign Currency Forward Contracts | | Counterparty | | Contracts to Deliver/Receive | | | Settlement Date | | Value on Settlement Date | | | Value | | | Unrealized
Gain/(Loss) | |
Purchases | | | | | | | | | | | | | | | | | | | | |
Australian Dollar | | SSB | | | 50,474 | | | 11/2/2011 | | | $54,101 | | | | $53,192 | | | | ($909 | ) |
Brazilian Real | | DB | | | 69,845 | | | 11/7/2011 | | | 39,360 | | | | 40,622 | | | | 1,262 | |
Brazilian Real | | UBS | | | 140,657 | | | 11/7/2011 | | | 81,000 | | | | 81,806 | | | | 806 | |
Chinese Yuan | | CITI | | | 3,270,264 | | | 5/9/2012 | | | 514,031 | | | | 515,984 | | | | 1,953 | |
Chinese Yuan | | HSBC | | | 8,258,232 | | | 1/18/2012 - 5/9/2012 | | | 1,298,398 | | | | 1,301,915 | | | | 3,517 | |
Chinese Yuan | | DB | | | 2,268,841 | | | 1/18/2012 | | | 355,000 | | | | 357,348 | | | | 2,348 | |
Chinese Yuan | | JPM | | | 1,004,328 | | | 3/1/2012 | | | 158,812 | | | | 158,310 | | | | (502 | ) |
Chinese Yuan | | BB | | | 2,908,658 | | | 3/1/2012 | | | 458,000 | | | | 458,486 | | | | 486 | |
Chinese Yuan | | MSC | | | 3,250,000 | | | 5/9/2012 | | | 510,645 | | | | 512,786 | | | | 2,141 | |
Euro | | SSB | | | 403,089 | | | 11/4/2011 - 12/21/2011 | | | 551,900 | | | | 557,495 | | | | 5,595 | |
Euro | | BOA | | | 17,473 | | | 11/3/2011 | | | 24,190 | | | | 24,177 | | | | (13 | ) |
Euro | | CITI | | | 234,000 | | | 12/21/2011 | | | 321,096 | | | | 323,596 | | | | 2,500 | |
Euro | | MSC | | | 65,649 | | | 12/21/2011 | | | 90,120 | | | | 90,786 | | | | 666 | |
Euro | | SSB | | | 15,464 | | | 11/1/2011 - 11/2/2011 | | | 21,910 | | | | 21,397 | | | | (513 | ) |
Euro | | BB | | | 172,084 | | | 12/21/2011 | | | 231,582 | | | | 237,973 | | | | 6,391 | |
Hungarian Forint | | JPM | | | 18,752,651 | | | 12/21/2011 | | | 94,969 | | | | 84,660 | | | | (10,309 | ) |
Hungarian Forint | | SSB | | | 18,544,713 | | | 12/16/2011 | | | 85,107 | | | | 83,761 | | | | (1,346 | ) |
Indian Rupee | | CITI | | | 19,859,800 | | | 11/14/2011 - 1/18/2012 | | | 397,707 | | | | 403,460 | | | | 5,753 | |
Indian Rupee | | DB | | | 4,498,200 | | | 1/18/2012 | | | 90,000 | | | | 91,256 | | | | 1,256 | |
Indian Rupee | | HSBC | | | 2,818,650 | | | 11/14/2011 | | | 57,000 | | | | 57,741 | | | | 741 | |
Indonesian Rupiah | | HSBC | | | 2,055,948,999 | | | 12/15/2011 | | | 229,331 | | | | 231,217 | | | | 1,886 | |
Indonesian Rupiah | | CSFB | | | 717,659,999 | | | 11/21/2011 | | | 81,000 | | | | 80,912 | | | | (88 | ) |
Indonesian Rupiah | | CITI | | | 1,284,864,999 | | | 11/7/2011 - 12/15/2011 | | | 141,000 | | | | 144,822 | | | | 3,822 | |
Israeli Shekel | | DB | | | 210,433 | | | 12/21/2011 | | | 57,000 | | | | 58,035 | | | | 1,035 | |
Japanese Yen | | BOA | | | 16,379,487 | | | 11/4/2011 | | | 209,566 | | | | 209,510 | | | | (56 | ) |
Malaysian Ringgit | | RBS | | | 1,468,199 | | | 1/18/2012 | | | 468,430 | | | | 477,391 | | | | 8,961 | |
Malaysian Ringgit | | BB | | | 179,379 | | | 1/18/2012 | | | 57,000 | | | | 58,326 | | | | 1,326 | |
Malaysian Ringgit | | CITI | | | 611,391 | | | 1/18/2012 | | | 194,000 | | | | 198,797 | | | | 4,797 | |
Mexican Peso | | CSFB | | | 977,507 | | | 12/21/2011 | | | 79,000 | | | | 73,007 | | | | (5,993 | ) |
Mexican Peso | | DB | | | 977,546 | | | 12/21/2011 | | | 79,000 | | | | 73,010 | | | | (5,990 | ) |
Mexican Peso | | SSB | | | 11,417,230 | | | 12/21/2011 | | | 844,858 | | | | 852,717 | | | | 7,859 | |
Mexican Peso | | HSBC | | | 1,796,774 | | | 12/21/2011 | | | 143,000 | | | | 134,196 | | | | (8,804 | ) |
Mexican Peso | | BB | | | 5,677,138 | | | 11/29/2011 - 12/21/2011 | | | 428,917 | | | | 424,233 | | | | (4,684 | ) |
Mexican Peso | | RBC | | | 2,399,066 | | | 11/29/2011 | | | 178,773 | | | | 179,532 | | | | 759 | |
Philippines Peso | | JPM | | | 2,465,763 | | | 11/14/2011 | | | 57,000 | | | | 57,801 | | | | 801 | |
Philippines Peso | | CITI | | | 6,696,620 | | | 11/14/2011 | | | 155,000 | | | | 156,979 | | | | 1,979 | |
Philippines Peso | | DB | | | 2,462,270 | | | 11/14/2011 | | | 56,500 | | | | 57,719 | | | | 1,219 | |
Philippines Peso | | BB | | | 2,465,193 | | | 11/14/2011 | | | 57,000 | | | | 57,788 | | | | 788 | |
Polish Zloty | | JPM | | | 242,279 | | | 12/21/2011 | | | 80,886 | | | | 75,821 | | | | (5,065 | ) |
Polish Zloty | | BB | | | 124,367 | | | 12/21/2011 | | | 41,521 | | | | 38,920 | | | | (2,601 | ) |
Russian Ruble | | CITI | | | 3,691,890 | | | 1/18/2012 | | | 114,000 | | | | 120,185 | | | | 6,185 | |
Singapore Dollar | | CITI | | | 146,591 | | | 12/21/2011 | | | 114,000 | | | | 116,848 | | | | 2,848 | |
Singapore Dollar | | BOA | | | 73,779 | | | 12/21/2011 | | | 57,000 | | | | 58,809 | | | | 1,809 | |
South African Rand | | UBS | | | 450,853 | | | 12/21/2011 | | | 57,000 | | | | 56,436 | | | | (564 | ) |
South African Rand | | SSB | | | 491,905 | | | 12/21/2011 | | | 62,932 | | | | 61,575 | | | | (1,357 | ) |
South African Rand | | JPM | | | 559,581 | | | 12/21/2011 | | | 79,000 | | | | 70,046 | | | | (8,954 | ) |
South Korea Won | | BB | | | 66,496,200 | | | 11/14/2011 | | | 57,000 | | | | 60,021 | | | | 3,021 | |
South Korea Won | | HSBC | | | 133,270,750 | | | 11/14/2011 | | | 113,500 | | | | 120,294 | | | | 6,794 | |
South Korea Won | | CSFB | | | 667,046,525 | | | 1/18/2012 | | | 568,304 | | | | 601,371 | | | | 33,067 | |
South Korea Won | | CITI | | | 420,118,500 | | | 11/7/2011 - 1/18/2012 | | | 361,000 | | | | 378,850 | | | | 17,850 | |
Taiwan Dollar | | MSC | | | 1,723,224 | | | 11/14/2011 | | | 57,000 | | | | 57,626 | | | | 626 | |
Taiwan Dollar | | CITI | | | 1,727,670 | | | 11/14/2011 | | | 57,000 | | | | 57,775 | | | | 775 | |
Taiwan Dollar | | RBS | | | 3,441,980 | | | 11/14/2011 | | | 113,000 | | | | 115,103 | | | | 2,103 | |
Taiwan Dollar | | HSBC | | | 1,723,509 | | | 11/14/2011 | | | 57,000 | | | | 57,636 | | | | 636 | |
Turkish Lira | | JPM | | | 144,994 | | | 12/21/2011 | | | 78,000 | | | | 81,107 | | | | 3,107 | |
Total Purchases | | | | | | | | | | | $11,019,446 | | | | $11,111,166 | | | | $91,720 | |
| | | | | | |
Sales | | | | | | | | | | | | | | | | | | | | |
Brazilian Real | | BB | | | 103,488 | | | 11/7/2011 | | | $56,000 | | | | $60,188 | | | | ($4,188 | ) |
Brazilian Real | | RBC | | | 615,070 | | | 1/18/2012 | | | 332,974 | | | | 352,124 | | | | (19,150 | ) |
Brazilian Real | | MSC | | | 139,885 | | | 11/7/2011 | | | 80,649 | | | | 81,357 | | | | (708 | ) |
Chinese Yuan | | DB | | | 1,018,880 | | | 3/1/2012 | | | 160,000 | | | | 160,604 | | | | (604 | ) |
The accompanying Notes to Financial Statements are an integral part of this schedule.
117
Partner Worldwide Allocation Fund
Schedule of Investments as of October 31, 2011
| | | | | | | | | | | | | | | | | | | | |
Foreign Currency Forward Contracts | | Counterparty | | Contracts to Deliver/Receive | | | Settlement Date | | Value on
Settlement Date | | | Value | | | Unrealized Gain/(Loss) | |
Chinese Yuan | | CITI | | | 2,017,778 | | | 1/18/2012 - 3/1/2012 | | | $316,241 | | | | $317,931 | | | | ($1,690 | ) |
Chinese Yuan | | RBS | | | 3,763,611 | | | 5/9/2012 | | | 589,353 | | | | 593,824 | | | | (4,471 | ) |
Chinese Yuan | | BB | | | 6,909,990 | | | 3/1/2012 - 5/9/2012 | | | 1,081,000 | | | | 1,090,107 | | | | (9,107 | ) |
Danish Krone | | SSB | | | 1,231,523 | | | 11/1/2011 | | | 234,598 | | | | 229,010 | | | | 5,588 | |
Danish Krone | | BOA | | | 704,956 | | | 11/2/2011 | | | 134,032 | | | | 131,091 | | | | 2,941 | |
Euro | | DB | | | 316,619 | | | 11/21/2011 | | | 436,783 | | | | 437,979 | | | | (1,196 | ) |
Euro | | JPM | | | 1,186,022 | | | 11/21/2011 - | | | 1,619,747 | | | | 1,640,523 | | | | (20,776 | ) |
| | | | | | | | 12/21/2011 | | | | | | | | | | | | |
Euro | | RBC | | | 83,359 | | | 12/21/2011 | | | 113,948 | | | | 115,275 | | | | (1,327 | ) |
Euro | | CITI | | | 377,684 | | | 12/21/2011 | | | 523,247 | | | | 522,294 | | | | 953 | |
Euro | | RBS | | | 543,000 | | | 12/21/2011 | | | 742,129 | | | | 750,908 | | | | (8,779 | ) |
Euro | | SSB | | | 276,224 | | | 12/16/2011 - | | | 380,006 | | | | 381,991 | | | | (1,985 | ) |
| | | | | | | | 12/21/2011 | | | | | | | | | | | | |
Euro | | CSFB | | | 305,000 | | | 12/21/2011 | | | 405,296 | | | | 421,780 | | | | (16,484 | ) |
Euro | | BB | | | 954,491 | | | 11/4/2011 - 12/21/2011 | | | 1,337,499 | | | | 1,320,021 | | | | 17,478 | |
Euro | | MSC | | | 57,000 | | | 12/21/2011 | | | 79,278 | | | | 78,825 | | | | 453 | |
Hungarian Forint | | SSB | | | 18,544,713 | | | 12/16/2011 | | | 87,122 | | | | 83,761 | | | | 3,361 | |
Hungarian Forint | | BB | | | 934,651 | | | 12/21/2011 | | | 4,267 | | | | 4,220 | | | | 47 | |
Hungarian Forint | | CITI | | | 17,818,000 | | | 12/21/2011 | | | 80,659 | | | | 80,440 | | | | 219 | |
Indian Rupee | | CITI | | | 4,034,400 | | | 11/14/2011 | | | 80,000 | | | | 82,646 | | | | (2,646 | ) |
Indonesian Rupiah | | DB | | | 515,330,000 | | | 11/21/2011 | | | 58,000 | | | | 58,100 | | | | (100 | ) |
Indonesian Rupiah | | HSBC | | | 513,285,000 | | | 11/7/2011 | | | 57,000 | | | | 57,960 | | | | (960 | ) |
Indonesian Rupiah | | CITI | | | 192,755,000 | | | 11/7/2011 | | | 21,646 | | | | 21,766 | | | | (120 | ) |
Israeli Shekel | | DB | | | 210,433 | | | 12/21/2011 | | | 57,442 | | | | 58,035 | | | | (593 | ) |
Japanese Yen | | BOA | | | 33,630,340 | | | 11/2/2011 | | | 443,536 | | | | 430,166 | | | | 13,370 | |
Japanese Yen | | SSB | | | 3,728,407 | | | 11/1/2011 | | | 49,050 | | | | 47,690 | | | | 1,360 | |
Mexican Peso | | DB | | | 5,676,627 | | | 12/21/2011 | | | 413,287 | | | | 423,970 | | | | (10,683 | ) |
Mexican Peso | | CITI | | | 6,294,600 | | | 12/21/2011 | | | 494,238 | | | | 470,125 | | | | 24,113 | |
Mexican Peso | | JPM | | | 2,421,428 | | | 12/21/2011 | | | 174,500 | | | | 180,849 | | | | (6,349 | ) |
Polish Zloty | | SSB | | | 366,645 | | | 12/21/2011 | | | 115,203 | | | | 114,741 | | | | 462 | |
Russian Ruble | | BB | | | 3,691,890 | | | 1/18/2012 | | | 115,120 | | | | 120,185 | | | | (5,065 | ) |
Singapore Dollar | | HSBC | | | 96,800 | | | 12/21/2011 | | | 76,042 | | | | 77,159 | | | | (1,117 | ) |
Singapore Dollar | | CITI | | | 123,570 | | | 12/21/2011 | | | 97,000 | | | | 98,498 | | | | (1,498 | ) |
South African Rand | | HSBC | | | 13,303,540 | | | 12/15/2011 | | | 1,660,971 | | | | 1,666,600 | | | | (5,629 | ) |
South African Rand | | MSC | | | 2,329,049 | | | 12/21/2011 | | | 321,625 | | | | 291,543 | | | | 30,082 | |
South African Rand | | BB | | | 951,052 | | | 12/21/2011 | | | 123,606 | | | | 119,049 | | | | 4,557 | |
South African Rand | | SSB | | | 1,079,718 | | | 12/21/2011 | | | 134,161 | | | | 135,155 | | | | (994 | ) |
South Korea Won | | DB | | | 135,556,300 | | | 11/30/2011 | | | 121,000 | | | | 122,398 | | | | (1,398 | ) |
South Korea Won | | CITI | | | 20,344,573 | | | 11/7/2011 | | | 18,010 | | | | 18,370 | | | | (360 | ) |
Swiss Franc | | SSB | | | 14,091 | | | 11/1/2011 | | | 16,375 | | | | 16,052 | | | | 323 | |
Turkish Lira | | BB | | | 144,550 | | | 12/21/2011 | | | 78,000 | | | | 80,858 | | | | (2,858 | ) |
Total Sales | | | | | | | | | | | $13,520,640 | | | | $13,546,168 | | | | ($25,528 | ) |
| | | |
Net Unrealized Gain/(Loss) on Foreign Currency Forward Contracts | | | | | | | | | | | $66,192 | |
| | | | |
Counterparty |
| BOA | | - | | Bank of America |
| BB | | - | | Barclays Bank |
| CITI | | - | | Citibank |
| CSFB | | - | | CS First Boston Corporation |
| DB | | - | | Deutsche Bank |
| HSBC | | - | | HSBC Securities, Inc. |
| JPM | | - | | J.P. Morgan |
| MSC | | - | | Morgan Stanley & Company |
| RBC | | - | | The Royal Bank of Canada |
| RBS | | - | | The Royal Bank of Scotland |
| SSB | | - | | State Street Bank |
| UBS | | - | | UBS Securities, Ltd. |
The accompanying Notes to Financial Statements are an integral part of this schedule.
118
Partner Worldwide Allocation Fund
Schedule of Investments as of October 31, 2011
The following table summarizes the fair value and Statement of Assets and Liabilities location, as of October 31, 2011, for Partner Worldwide Allocation Fund’s investments in financial derivative instruments by primary risk exposure as discussed under item (2) Significant Accounting Policies of the Notes to Financial Statements.
| | | | | | |
| Derivatives by risk category | | Statement of Assets and Liabilities Location | | Fair Value | |
Asset Derivatives | | | | | | |
| | |
Interest Rate Contracts | | | | | | |
Futures* | | Net Assets - Net unrealized appreciation/(depreciation) on Futures contracts | | | $18,954 | |
Total Interest Rate Contracts | | | | | 18,954 | |
| | |
Foreign Exchange Contracts | | | | | | |
Forward Contracts | | Receivable/Payable for forward contracts, Net Assets - Net unrealized appreciation/(depreciation) on Foreign currency forward contracts | | | 276,349 | |
Total Foreign Exchange Contracts | | | | | 276,349 | |
Total Asset Derivatives | | | | | $295,303 | |
Liability Derivatives | | | | | | |
| | |
Interest Rate Contracts | | | | | | |
Futures* | | Net Assets - Net unrealized appreciation/(depreciation) on Futures contracts | | | 21,652 | |
Total Interest Rate Contracts | | | | | 21,652 | |
| | |
Equity Contracts | | | | | | |
Futures* | | Net Assets - Net unrealized appreciation/(depreciation) on Futures contracts | | | 2,123 | |
Total Equity Contracts | | | | | 2,123 | |
| | |
Foreign Exchange Contracts | | | | | | |
Forward Contracts | | Receivable/Payable for forward contracts, Net Assets - Net unrealized appreciation/(depreciation) on Foreign currency forward contracts | | | 210,157 | |
Total Foreign Exchange Contracts | | | | | 210,157 | |
Total Liability Derivatives | | | | | $233,932 | |
| * | Includes cumulative appreciation/depreciation of futures contracts as reported in the Schedule of Investments. Only current day’s variation margin is reported within the Statement of Assets and Liabilities. |
The following table summarizes the net realized gains/(losses) and Statement of Operations location, for the period ended October 31, 2011, for Partner Worldwide Allocation Fund’s investments in financial derivative instruments by primary risk exposure.
| | | | | | |
| Derivatives by risk category | | Statement of Operations location | | Realized Gains/(Losses) recognized in Income | |
Interest Rate Contracts | | | | | | |
Futures | | Net realized gains/(losses) on Futures contracts | | | 118,162 | |
| | |
Total Interest Rate Contracts | | | | | 118,162 | |
| | |
Equity Contracts | | | | | | |
Futures | | Net realized gains/(losses) on Futures contracts | | | (548,504 | ) |
| | |
Total Equity Contracts | | | | | (548,504 | ) |
| | |
Foreign Exchange Contracts | | | | | | |
Forward Contracts | | Net realized gains/(losses) on Foreign currency transactions | | | (771,784 | ) |
| | |
Total Foreign Exchange Contracts | | | | | (771,784 | ) |
| | |
Credit Contracts | | | | | | |
Credit Default Swaps | | Net realized gains/(losses) on Swap agreements | | | (1,118 | ) |
| | |
Total Credit Contracts | | | | | (1,118 | ) |
Total | | | | | ($1,203,244 | ) |
The accompanying Notes to Financial Statements are an integral part of this schedule.
119
Partner Worldwide Allocation Fund
Schedule of Investments as of October 31, 2011
The following table summarizes the change in net unrealized appreciation/(depreciation) and Statement of Operations location, for the period ended October 31, 2011, for Partner Worldwide Allocation Fund’s investments in financial derivative instruments by primary risk exposure.
| | | | | | |
| Derivatives by risk category | | Statement of Operations Location | | Change in unrealized appreciation/(depreciation) recognized in Income | |
Interest Rate Contracts | | | | | | |
Futures | | Change in net unrealized appreciation/(depreciation) on Futures contracts | | | (2,698 | ) |
Total Interest Rate Contracts | | | | | (2,698 | ) |
Equity Contracts | | | | | | |
Futures | | Change in net unrealized appreciation/(depreciation) on Futures contracts | | | (142,353 | ) |
Total Equity Contracts | | | | | (142,353 | ) |
Foreign Exchange Contracts | | | | | | |
Forward Contracts | | Change in net unrealized appreciation/(depreciation) on Foreign currency forward contracts | | | 147,765 | |
Total Foreign Exchange Contracts | | | 147,765 | |
Total | | | | | $2,714 | |
The following table presents Partner Worldwide Allocation Fund’s average volume of derivative activity during the period ended October 31, 2011.
| | | | | | | | | | | | | | | | |
Derivative Risk Category | | Futures
(Notional*) | | | Futures
(Percentage
of Average
Net Assets) | | | Forwards
(Notional*) | | | Forwards
(Percentage
of Average
Net Assets) | |
Equity Contracts | | | $5,144,509 | | | | 1.6% | | | | N/A | | | | N/A | |
Interest Rate Contracts | | | 4,970,648 | | | | 1.5 | | | | N/A | | | | N/A | |
Foreign Exchange Contracts | | | N/A | | | | N/A | | | | $24,845,414 | | | | 7.7 | |
| * | Notional amount represents long or short, or both, derivative positions held by the Fund. |
The accompanying Notes to Financial Statements are an integral part of this schedule.
120
Large Cap Growth Fund
Schedule of Investments as of October 31, 2011
| | | | | | |
| Shares | | Common Stock (99.5%) | | Value | |
| Consumer Discretionary (13.8%) | | | | |
55,041 | | Amazon.com, Inc.a | | | $11,751,804 | |
356,700 | | Comcast Corporation | | | 8,364,615 | |
105,478 | | Discovery Communications, Inc.a | | | 4,584,074 | |
218,300 | | Las Vegas Sands Corporationa | | | 10,249,185 | |
171,050 | | Target Corporation | | | 9,364,987 | |
| | | |
| | Total Consumer Discretionary | | | 44,314,665 | |
| | | |
| |
| Consumer Staples (11.4%) | | | | |
285,500 | | Altria Group, Inc. | | | 7,865,525 | |
141,710 | | Anheuser-Busch InBev NV ADR | | | 7,860,654 | |
94,797 | | British American Tobacco plc ADR | | | 8,745,023 | |
217,500 | | Wal-Mart Stores, Inc. | | | 12,336,600 | |
| | | |
| | Total Consumer Staples | | | 36,807,802 | |
| | | |
| |
| Energy (12.4%) | | | | |
93,471 | | Apache Corporation | | | 9,312,516 | |
98,121 | | Baker Hughes, Inc. | | | 5,690,037 | |
164,660 | | ENSCO International plc ADR | | | 8,177,015 | |
162,964 | | Peabody Energy Corporation | | | 7,067,749 | |
631,900 | | Weatherford International, Ltd.a | | | 9,794,450 | |
| | | |
| | Total Energy | | | 40,041,767 | |
| | | |
| |
| Financials (5.0%) | | | | |
100,000 | | Citigroup, Inc. | | | 3,159,000 | |
12,100 | | CME Group, Inc. | | | 3,334,276 | |
143,239 | | J.P. Morgan Chase & Company | | | 4,978,988 | |
182,600 | | Wells Fargo & Company | | | 4,731,166 | |
| | | |
| | Total Financials | | | 16,203,430 | |
| | | |
| |
| Health Care (11.4%) | | | | |
120,624 | | Amgen, Inc. | | | 6,908,137 | |
130,000 | | Baxter International, Inc. | | | 7,147,400 | |
95,119 | | McKesson Corporation | | | 7,756,954 | |
390,269 | | Mylan, Inc.a | | | 7,637,564 | |
149,800 | | UnitedHealth Group, Inc. | | | 7,188,902 | |
| | | |
| | Total Health Care | | | 36,638,957 | |
| | | |
| |
| Industrials (10.8%) | | | | |
73,200 | | Boeing Company | | | 4,815,828 | |
63,050 | | Caterpillar, Inc. | | | 5,955,703 | |
92,400 | | Honeywell International, Inc. | | | 4,841,760 | |
51,200 | | Parker Hannifin Corporation | | | 4,175,360 | |
36,800 | | Precision Castparts Corporation | | | 6,003,920 | |
74,321 | | Union Pacific Corporation | | | 7,400,142 | |
9,400 | | W.W. Grainger, Inc. | | | 1,610,314 | |
| | | |
| | Total Industrials | | | 34,803,027 | |
| | | |
| |
| Information Technology (32.5%) | | | | |
171,236 | | Akamai Technologies, Inc.a | | | 4,613,098 | |
56,352 | | Apple, Inc.a | | | 22,810,163 | |
19,750 | | Baidu.com, Inc. ADRa | | | 2,768,555 | |
107,200 | | Broadcom Corporationa | | | 3,868,848 | |
100,898 | | Cognizant Technology Solutions Corporationa | | | 7,340,330 | |
98,550 | | eBay, Inc.a | | | 3,136,846 | |
275,606 | | EMC Corporationa | | | 6,755,103 | |
33,077 | | F5 Networks, Inc.a | | | 3,438,354 | |
20,153 | | Google, Inc.a | | | 11,943,474 | |
57,750 | | Microsoft Corporation | | | 1,537,882 | |
199,620 | | NVIDIA Corporationa | | | 2,954,376 | |
342,614 | | Oracle Corporation | | | 11,227,461 | |
174,050 | | QUALCOMM, Inc. | | | 8,980,980 | |
51,215 | | Red Hat, Inc.a | | | 2,542,825 | |
36,738 | | Salesforce.com, Inc.a | | | 4,892,399 | |
| | | | | | |
| Shares | | Common Stock (99.5%) | | Value | |
| Information Technology (32.5%) - continued | | | | |
57,871 | | VMware, Inc.a | | | $5,656,890 | |
| | | |
| | Total Information Technology | | | 104,467,584 | |
| | | |
| |
| Materials (2.2%) | | | | |
174,094 | | Freeport-McMoRan Copper & Gold, Inc. | | | 7,009,025 | |
| | | |
| | Total Materials | | | 7,009,025 | |
| | | |
| | | | | | |
| | | |
| | Total Common Stock (cost $307,917,690) | | | 320,286,257 | |
| | | |
| | | | | | |
| | | |
| | Total Investments (cost $307,917,690) 99.5% | | | $320,286,257 | |
| | | |
| | Other Assets and Liabilities, Net 0.5% | | | 1,729,621 | |
| | | |
| | Total Net Assets 100.0% | | | $322,015,878 | |
| | | |
| a | Non-income producing security. |
Definitions:
| | |
ADR - | | American Depositary Receipt, which are certificates for an underlying foreign security’s shares held by an issuing U.S. depository bank. |
| | | | |
| Unrealized Appreciation (Depreciation) | | | | |
Gross unrealized appreciation and depreciation of investments, based on cost for federal income tax purposes, were as follows: | |
Gross unrealized appreciation | | | $19,324,303 | |
Gross unrealized depreciation | | | (7,224,967 | ) |
| | | | |
Net unrealized appreciation (depreciation) | | | $12,099,336 | |
| |
Cost for federal income tax purposes | | | $308,186,921 | |
The accompanying Notes to Financial Statements are an integral part of this schedule.
121
Large Cap Growth Fund
Schedule of Investments as of October 31, 2011
Fair Valuation Measurements
The following table is a summary of the inputs used, as of October 31, 2011, in valuing Large Cap Growth Fund’s assets carried at fair value.
| | | | | | | | | | | | | | | | |
| Investments in Securities | | Total | | | Level 1 | | | Level 2 | | | Level 3 | |
Common Stock | | | | | | | | | | | | | | | | |
Consumer Discretionary | | | 44,314,665 | | | | 44,314,665 | | | | – | | | | – | |
Consumer Staples | | | 36,807,802 | | | | 36,807,802 | | | | – | | | | – | |
Energy | | | 40,041,767 | | | | 40,041,767 | | | | – | | | | – | |
Financials | | | 16,203,430 | | | | 16,203,430 | | | | – | | | | – | |
Health Care | | | 36,638,957 | | | | 36,638,957 | | | | – | | | | – | |
Industrials | | | 34,803,027 | | | | 34,803,027 | | | | – | | | | – | |
Information Technology | | | 104,467,584 | | | | 104,467,584 | | | | – | | | | – | |
Materials | | | 7,009,025 | | | | 7,009,025 | | | | – | | | | – | |
Total | | | $320,286,257 | | | | $320,286,257 | | | | $– | | | | $– | |
The following table summarizes the net realized gains/(losses) and Statement of Operations location, for the period ended October 31, 2011, for Large Cap Growth Fund’s investments in financial derivative instruments by primary risk exposure.
| | | | | | |
| Derivatives by risk category | | Statement of Operations location | | Realized Gains/(Losses)
recognized in Income | |
Equity Contracts | | | | | | |
Options Written | | Net realized gains/(losses) on Written option contracts | | | 129,343 | |
Total Equity Contracts | | | | | 129,343 | |
Total | | | | | $129,343 | |
The following table summarizes the change in net unrealized appreciation/(depreciation) and Statement of Operations location, for the period ended October 31, 2011, for Large Cap Growth Fund’s investments in financial derivative instruments by primary risk exposure.
| | | | | | |
| Derivatives by risk category | | Statement of Operations Location | | Change in unrealized
appreciation/(depreciation)
recognized in Income | |
Equity Contracts | | | | | | |
Options Written | | Change in net unrealized appreciation/(depreciation) on Written option contracts | | | (4,833) | |
Total Equity Contracts | | | | | (4,833) | |
Total | | | | | ($4,833) | |
The following table presents Large Cap Growth Fund’s average volume of derivative activity during the period ended October 31, 2011.
| | | | |
Derivative Risk
Category | | Options
(Contracts) | |
Equity Contracts | | | 30 | |
Investment in Affiliates
Affiliated issuers, as defined under the Investment Company Act of 1940, include those in which the Fund’s holdings of an issuer represent 5% or more of the outstanding voting securities of an issuer, or any affiliated mutual fund.
A summary of transactions for the fiscal year to date, in Large Cap Growth Fund, is as follows:
| | | | | | | | | | | | | | | | | | | | | | | | |
| Fund | | Value
October 31, 2010 | | | Gross
Purchases | | | Gross
Sales | | | Shares Held at
October 31, 2011 | | | Value
October 31, 2011 | | | Income Earned
November 1, 2010 -
October 31, 2011 | |
Thrivent Financial Securities Lending Trust | | | $2,018,813 | | | | $58,901,137 | | | | $60,919,950 | | | | – | | | | $– | | | | $14,159 | |
Total Value and Income Earned | | | 2,018,813 | | | | | | | | | | | | | | | | – | | | | 14,159 | |
The accompanying Notes to Financial Statements are an integral part of this schedule.
122
Large Cap Value Fund
Schedule of Investments as of October 31, 2011
| | | | | | |
| Shares | | Common Stock (98.6%) | | Value | |
Consumer Discretionary (9.0%) | | | | |
75,566 | | Carnival Corporation | | | $2,660,679 | |
103,210 | | CBS Corporation | | | 2,663,850 | |
136,140 | | Harley-Davidson, Inc. | | | 5,295,846 | |
240,791 | | Lowe’s Companies, Inc. | | | 5,061,427 | |
256,598 | | Macy’s, Inc. | | | 7,833,937 | |
238,280 | | News Corporation | | | 4,253,298 | |
66,826 | | Omnicom Group, Inc. | | | 2,972,420 | |
93,000 | | Target Corporation | | | 5,091,750 | |
84,580 | | Time Warner Cable, Inc. | | | 5,386,900 | |
126,980 | | Viacom, Inc. | | | 5,568,073 | |
| | | |
| | Total Consumer Discretionary | | | 46,788,180 | |
| | | |
| |
Consumer Staples (9.0%) | | | | |
231,160 | | Altria Group, Inc. | | | 6,368,458 | |
137,503 | | Diageo plc ADR | | | 11,396,249 | |
373,896 | | Kraft Foods, Inc. | | | 13,153,661 | |
75,267 | | Philip Morris International, Inc. | | | 5,258,905 | |
79,773 | | Unilever NV ADR | | | 2,754,562 | |
137,680 | | Wal-Mart Stores, Inc. | | | 7,809,210 | |
| | | |
| | Total Consumer Staples | | | 46,741,045 | |
| | | |
| |
Energy (13.0%) | | | | |
137,610 | | Anadarko Petroleum Corporation | | | 10,802,385 | |
82,043 | | Baker Hughes, Inc. | | | 4,757,674 | |
128,939 | | Chevron Corporation | | | 13,545,042 | |
216,248 | | ConocoPhillips | | | 15,061,673 | |
222,182 | | ENSCO International plc ADR | | | 11,033,558 | |
37,656 | | Exxon Mobil Corporation | | | 2,940,557 | |
55,767 | | Occidental Petroleum Corporation | | | 5,182,985 | |
289,620 | | Weatherford International, Ltd.a | | | 4,489,110 | |
| | | |
| | Total Energy | | | 67,812,984 | |
| | | |
| |
Financials (23.2%) | | | | |
175,577 | | ACE, Ltd. | | | 12,667,881 | |
78,480 | | Allstate Corporation | | | 2,067,163 | |
163,460 | | Aon Corporation | | | 7,620,505 | |
116,643 | | Citigroup, Inc. | | | 3,684,752 | |
50,254 | | Goldman Sachs Group, Inc. | | | 5,505,326 | |
537,633 | | J.P. Morgan Chase & Company | | | 18,688,123 | |
447,270 | | KKR & Company, LP | | | 6,029,200 | |
127,009 | | MetLife, Inc. | | | 4,465,636 | |
278,370 | | Principal Financial Group, Inc. | | | 7,176,379 | |
155,950 | | State Street Corporation | | | 6,298,820 | |
123,863 | | SVB Financial Groupa,b | | | 5,690,266 | |
76,146 | | Travelers Companies, Inc. | | | 4,443,119 | |
158,000 | | U.S. Bancorp | | | 4,043,220 | |
458,317 | | Unum Group | | | 10,926,277 | |
68,890 | | Vanguard REIT ETFb | | | 4,005,265 | |
682,245 | | Wells Fargo & Company | | | 17,676,968 | |
| | | |
| | Total Financials | | | 120,988,900 | |
| | | |
| |
Health Care (12.0%) | | | | |
201,980 | | Baxter International, Inc. | | | 11,104,860 | |
190,786 | | Covidien plc | | | 8,974,573 | |
140,392 | | Johnson & Johnson | | | 9,039,841 | |
997,030 | | Pfizer, Inc. | | | 19,202,798 | |
184,713 | | UnitedHealth Group, Inc. | | | 8,864,377 | |
99,531 | | Zimmer Holdings, Inc.a | | | 5,238,317 | |
| | | |
| | Total Health Care | | | 62,424,766 | |
| | | |
| |
Industrials (11.8%) | | | | |
1,014,692 | | General Electric Company | | | 16,955,503 | |
122,846 | | Honeywell International, Inc. | | | 6,437,130 | |
| | | | | | |
| Shares | | Common Stock (98.6%) | | Value | |
Industrials (11.8%) - continued | | | | |
63,640 | | Parker Hannifin Corporation | | | $5,189,842 | |
154,150 | | SPX Corporation | | | 8,418,132 | |
354,464 | | Textron, Inc.b | | | 6,883,691 | |
117,722 | | United Technologies Corporation | | | 9,179,962 | |
172,261 | | WESCO International, Inc.a | | | 8,347,768 | |
| | | |
| | Total Industrials | | | 61,412,028 | |
| | | |
| |
Information Technology (9.4%) | | | | |
105,280 | | Avnet, Inc.a | | | 3,191,037 | |
633,940 | | Cisco Systems, Inc. | | | 11,746,908 | |
58,719 | | International Business Machines Corporation | | | 10,841,289 | |
220,091 | | Microsoft Corporation | | | 5,861,023 | |
91,813 | | Oracle Corporation | | | 3,008,712 | |
251,780 | | Texas Instruments, Inc. | | | 7,737,200 | |
191,583 | | Xilinx, Inc. | | | 6,410,367 | |
| | | |
| | Total Information Technology | | | 48,796,536 | |
| | | |
| |
Materials (4.0%) | | | | |
300,978 | | Dow Chemical Company | | | 8,391,267 | |
160,851 | | E.I. du Pont de Nemours and Company | | | 7,732,107 | |
72,811 | | Sigma-Aldrich Corporation | | | 4,767,664 | |
| | | |
| | Total Materials | | | 20,891,038 | |
| | | |
| |
Telecommunications Services (3.0%) | | | | |
180,853 | | AT&T, Inc. | | | 5,300,801 | |
274,219 | | Verizon Communications, Inc. | | | 10,140,619 | |
| | | |
| | Total Telecommunications Services | | | 15,441,420 | |
| | | |
Utilities (4.2%) | | | | |
280,860 | | Exelon Corporation | | | 12,467,375 | |
439,150 | | NiSource, Inc. | | | 9,700,824 | |
| | | |
| | Total Utilities | | | 22,168,199 | |
| | | |
| | | | | | |
| | | |
| | Total Common Stock (cost $487,054,465) | | | 513,465,096 | |
| | | |
| | |
| Shares | | Collateral Held for Securities Loaned (2.2%) | | Value | |
11,556,500 | | Thrivent Financial Securities Lending Trust | | | 11,556,500 | |
| | | |
| | Total Collateral Held for Securities Loaned (cost $11,556,500) | | | 11,556,500 | |
| | | |
| | |
Principal
Amount | | Short-Term Investments (0.8%)c | | Value | |
| | Federal Home Loan Mortgage Corporation Discount Notes | | | | |
$4,000,000 | | 0.020%, 12/5/2011 | | | 3,999,925 | |
| | | |
| | Total Short-Term Investments (at amortized cost) | | | 3,999,925 | |
| | | |
| | Total Investments (cost $502,610,890) 101.6% | | $ | 529,021,521 | |
| | | |
| | Other Assets and Liabilities, Net (1.6%) | | | (8,437,828 | ) |
| | | |
| | Total Net Assets 100.0% | | $ | 520,583,693 | |
| | | |
| a | Non-income producing security. |
| b | All or a portion of the security is on loan. |
The accompanying Notes to Financial Statements are an integral part of this schedule.
123
Large Cap Value Fund
Schedule of Investments as of October 31, 2011
| c | The interest rate shown reflects the yield, coupon rate or the discount rate at the date of purchase. |
| | | | | | |
Definitions: | | | | | | |
ADR | | | - | | | American Depositary Receipt, which are certificates for an underlying foreign security’s shares held by an issuing U.S. depository bank. |
REIT | | | - | | | Real Estate Investment Trust is a company that buys, develops, manages and/or sells real estate assets. |
ETF | | | - | | | Exchange Traded Fund. |
| | | | |
Unrealized Appreciation (Depreciation) | | | | |
Gross unrealized appreciation and depreciation of investments, based on cost for federal income tax purposes, were as follows: | |
Gross unrealized appreciation | | $ | 49,026,046 | |
Gross unrealized depreciation | | | (23,068,146 | ) |
Net unrealized appreciation (depreciation) | | $ | 25,957,900 | |
| | | | |
| |
Cost for federal income tax purposes | | $ | 503,063,621 | |
Fair Valuation Measurements
The following table is a summary of the inputs used, as of October 31, 2011, in valuing Large Cap Value Fund’s assets carried at fair value.
| | | | | | | | | | | | | | | | |
| Investments in Securities | | Total | | | Level 1 | | | Level 2 | | | Level 3 | |
Common Stock | | | | | | | | | | | | | | | | |
Consumer Discretionary | | | 46,788,180 | | | | 46,788,180 | | | | – | | | | – | |
Consumer Staples | | | 46,741,045 | | | | 46,741,045 | | | | – | | | | – | |
Energy | | | 67,812,984 | | | | 67,812,984 | | | | – | | | | – | |
Financials | | | 120,988,900 | | | | 120,988,900 | | | | – | | | | – | |
Health Care | | | 62,424,766 | | | | 62,424,766 | | | | – | | | | – | |
Industrials | | | 61,412,028 | | | | 61,412,028 | | | | – | | | | – | |
Information Technology | | | 48,796,536 | | | | 48,796,536 | | | | – | | | | – | |
Materials | | | 20,891,038 | | | | 20,891,038 | | | | – | | | | – | |
Telecommunications Services | | | 15,441,420 | | | | 15,441,420 | | | | – | | | | – | |
Utilities | | | 22,168,199 | | | | 22,168,199 | | | | – | | | | – | |
Collateral Held for Securities Loaned | | | 11,556,500 | | | | 11,556,500 | | | | – | | | | – | |
Short-Term Investments | | | 3,999,925 | | | | – | | | | 3,999,925 | | | | – | |
Total | | | $529,021,521 | | | | $525,021,596 | | | | $3,999,925 | | | | $– | |
Investment in Affiliates
Affiliated issuers, as defined under the Investment Company Act of 1940, include those in which the Fund’s holdings of an issuer represent 5% or more of the outstanding voting securities of an issuer, or any affiliated mutual fund.
A summary of transactions for the fiscal year to date, in Large Cap Value Fund, is as follows:
| | | | | | | | | | | | | | | | | | | | | | | | |
| Fund | | Value
October 31, 2010 | | | Gross
Purchases | | | Gross Sales | | | Shares Held at
October 31, 2011 | | | Value
October 31, 2011 | | | Income Earned
November 1, 2010 -
October 31, 2011 | |
Thrivent Financial Securities Lending Trust | | | $17,426,288 | | | | $165,679,793 | | | | $171,549,581 | | | | 11,556,500 | | | | $11,556,500 | | | | $14,209 | |
Total Value and Income Earned | | | 17,426,288 | | | | | | | | | | | | | | | | 11,556,500 | | | | 14,209 | |
The accompanying Notes to Financial Statements are an integral part of this schedule.
124
Large Cap Stock Fund
Schedule of Investments as of October 31, 2011
| | | | | | |
| Shares | | Common Stock (98.7%) | | Value | |
Consumer Discretionary (11.0%) | | | | |
126,700 | | Amazon.com, Inc.a | | | $27,051,717 | |
145,680 | | CBS Corporation | | | 3,760,001 | |
821,300 | | Comcast Corporation | | | 19,259,485 | |
255,815 | | Discovery Communications, Inc.a | | | 11,117,720 | |
190,600 | | Harley-Davidson, Inc. | | | 7,414,340 | |
502,530 | | Las Vegas Sands Corporationa | | | 23,593,783 | |
351,610 | | Lowe’s Companies, Inc. | | | 7,390,842 | |
387,650 | | Macy’s, Inc. | | | 11,834,955 | |
59,100 | | McDonald’s Corporation | | | 5,487,435 | |
333,430 | | News Corporation | | | 5,951,725 | |
99,150 | | Omnicom Group, Inc. | | | 4,410,192 | |
523,920 | | Target Corporation | | | 28,684,620 | |
118,340 | | Time Warner Cable, Inc. | | | 7,537,075 | |
179,240 | | Viacom, Inc. | | | 7,859,674 | |
| | | |
| | Total Consumer Discretionary | | | 171,353,564 | |
| | | |
| |
Consumer Staples (12.5%) | | | | |
984,530 | | Altria Group, Inc. | | | 27,123,801 | |
326,358 | | Anheuser-Busch InBev NV ADR | | | 18,103,078 | |
238,687 | | British American Tobacco plc ADR | | | 22,018,876 | |
129,400 | | Campbell Soup Company | | | 4,302,550 | |
76,500 | | Coca-Cola Company | | | 5,226,480 | |
55,800 | | Colgate-Palmolive Company | | | 5,042,646 | |
194,100 | | Diageo plc ADR | | | 16,087,008 | |
60,000 | | Dr. Pepper Snapple Group, Inc. | | | 2,247,000 | |
125,500 | | General Mills, Inc. | | | 4,835,515 | |
93,100 | | H.J. Heinz Company | | | 4,975,264 | |
132,800 | | Hormel Foods Corporation | | | 3,913,616 | |
73,600 | | Kimberly-Clark Corporation | | | 5,130,656 | |
537,307 | | Kraft Foods, Inc. | | | 18,902,460 | |
83,100 | | PepsiCo, Inc. | | | 5,231,145 | |
105,279 | | Philip Morris International, Inc. | | | 7,355,844 | |
83,400 | | Procter & Gamble Company | | | 5,336,766 | |
693,680 | | Wal-Mart Stores, Inc. | | | 39,345,530 | |
| | | |
| | Total Consumer Staples | | | 195,178,235 | |
| | | |
| |
Energy (12.0%) | | | | |
194,250 | | Anadarko Petroleum Corporation | | | 15,248,625 | |
215,381 | | Apache Corporation | | | 21,458,409 | |
340,775 | | Baker Hughes, Inc. | | | 19,761,542 | |
218,110 | | Chevron Corporation | | | 22,912,456 | |
316,230 | | ConocoPhillips | | | 22,025,420 | |
692,881 | | ENSCO International plc ADR | | | 34,408,470 | |
78,370 | | Occidental Petroleum Corporation | | | 7,283,708 | |
375,346 | | Peabody Energy Corporation | | | 16,278,756 | |
1,863,850 | | Weatherford International, Ltd.a | | | 28,889,675 | |
| | | |
| | Total Energy | | | 188,267,061 | |
| | | |
| |
Financials (12.9%) | | | | |
246,660 | | ACE, Ltd. | | | 17,796,519 | |
230,740 | | Aon Corporation | | | 10,757,099 | |
410,496 | | Citigroup, Inc. | | | 12,967,569 | |
27,900 | | CME Group, Inc. | | | 7,688,124 | |
97,900 | | Genworth Financial, Inc.a | | | 624,602 | |
74,650 | | Goldman Sachs Group, Inc. | | | 8,177,907 | |
1,089,904 | | J.P. Morgan Chase & Company | | | 37,885,063 | |
628,640 | | KKR & Company, LPb | | | 8,474,067 | |
187,510 | | MetLife, Inc. | | | 6,592,852 | |
411,473 | | Principal Financial Group, Inc. | | | 10,607,774 | |
222,570 | | State Street Corporation | | | 8,989,602 | |
174,850 | | SVB Financial Groupa,c | | | 8,032,609 | |
221,130 | | U.S. Bancorp | | | 5,658,717 | |
| | | | | | |
| Shares | | Common Stock (98.7%) | | Value | |
Financials (12.9%) - continued | | | | |
673,250 | | Unum Group | | | $16,050,280 | |
97,520 | | Vanguard REIT ETFb | | | 5,669,813 | |
1,375,150 | | Wells Fargo & Company | | | 35,630,136 | |
| | | |
| | Total Financials | | | 201,602,733 | |
| | | |
| |
Health Care (12.4%) | | | | |
101,800 | | Abbott Laboratories | | | 5,483,966 | |
331,290 | | Amgen, Inc. | | | 18,972,978 | |
588,250 | | Baxter International, Inc. | | | 32,341,985 | |
131,400 | | Bristol-Myers Squibb Company | | | 4,150,926 | |
279,590 | | Covidien plc | | | 13,151,914 | |
142,400 | | Eli Lilly and Company | | | 5,291,584 | |
90,600 | | Forest Laboratories, Inc.a | | | 2,835,780 | |
195,820 | | Johnson & Johnson | | | 12,608,850 | |
219,091 | | McKesson Corporation | | | 17,866,871 | |
929,550 | | Mylan, Inc.a | | | 18,191,293 | |
1,395,083 | | Pfizer, Inc. | | | 26,869,299 | |
610,630 | | UnitedHealth Group, Inc. | | | 29,304,134 | |
145,850 | | Zimmer Holdings, Inc.a | | | 7,676,085 | |
| | | |
| | Total Health Care | | | 194,745,665 | |
| | | |
| |
Industrials (10.7%) | | | | |
168,600 | | Boeing Company | | | 11,092,194 | |
145,300 | | Caterpillar, Inc. | | | 13,725,038 | |
1,419,230 | | General Electric Company | | | 23,715,333 | |
393,660 | | Honeywell International, Inc. | | | 20,627,784 | |
208,860 | | Parker Hannifin Corporation | | | 17,032,533 | |
84,800 | | Precision Castparts Corporation | | | 13,835,120 | |
217,890 | | SPX Corporation | | | 11,898,973 | |
500,230 | | Textron, Inc. | | | 9,714,467 | |
171,104 | | Union Pacific Corporation | | | 17,036,825 | |
165,500 | | United Technologies Corporation | | | 12,905,690 | |
21,600 | | W.W. Grainger, Inc. | | | 3,700,296 | |
256,660 | | WESCO International, Inc.a | | | 12,437,744 | |
| | | |
| | Total Industrials | | | 167,721,997 | |
| | | |
| |
Information Technology (20.0%) | | | | |
394,362 | | Akamai Technologies, Inc.a | | | 10,624,112 | |
129,778 | | Apple, Inc.a | | | 52,531,539 | |
45,500 | | Baidu.com, Inc. ADRa | | | 6,378,190 | |
246,800 | | Broadcom Corporationa | | | 8,907,012 | |
878,130 | | Cisco Systems, Inc. | | | 16,271,749 | |
232,338 | | Cognizant Technology Solutions Corporationa | | | 16,902,589 | |
226,800 | | eBay, Inc.a | | | 7,219,044 | |
634,700 | | EMC Corporationa | | | 15,556,497 | |
76,147 | | F5 Networks, Inc.a | | | 7,915,481 | |
46,342 | | Google, Inc.a | | | 27,464,123 | |
82,880 | | International Business Machines Corporation | | | 15,302,134 | |
21,200 | | JDS Uniphase Corporationa | | | 254,400 | |
440,840 | | Microsoft Corporation | | | 11,739,569 | |
459,680 | | NVIDIA Corporationa | | | 6,803,264 | |
923,940 | | Oracle Corporation | | | 30,277,514 | |
400,650 | | QUALCOMM, Inc. | | | 20,673,540 | |
118,052 | | Red Hat, Inc.a | | | 5,861,282 | |
84,644 | | Salesforce.com, Inc.a | | | 11,272,041 | |
580,060 | | Texas Instruments, Inc. | | | 17,825,244 | |
133,151 | | VMware, Inc.a | | | 13,015,510 | |
281,360 | | Xilinx, Inc. | | | 9,414,306 | |
| | | |
| | Total Information Technology | | | 312,209,140 | |
| | | |
| |
Materials (3.0%) | | | | |
33,900 | | AK Steel Holding Corporationb | | | 282,387 | |
The accompanying Notes to Financial Statements are an integral part of this schedule.
125
Large Cap Stock Fund
Schedule of Investments as of October 31, 2011
| | | | | | |
| Shares | | Common Stock (98.7%) | | Value | |
Materials (3.0%) - continued | | | | |
420,130 | | Dow Chemical Company | | | $11,713,224 | |
224,541 | | E.I. du Pont de Nemours and Company | | | 10,793,686 | |
400,885 | | Freeport-McMoRan Copper & Gold, Inc. | | | 16,139,630 | |
104,241 | | Sigma-Aldrich Corporation | | | 6,825,701 | |
20,600 | | United States Steel Corporationb | | | 522,416 | |
| | | |
| | Total Materials | | | 46,277,044 | |
| | | |
|
Telecommunications Services (1.2%) | |
181,200 | | AT&T, Inc. | | | 5,310,972 | |
382,464 | | Verizon Communications, Inc. | | | 14,143,519 | |
| | | |
| | Total Telecommunications Services | | | 19,454,491 | |
| | | |
|
Utilities (3.0%) | |
90,700 | | Consolidated Edison, Inc. | | | 5,248,809 | |
255,300 | | Duke Energy Corporation | | | 5,213,226 | |
393,000 | | Exelon Corporation | | | 17,445,270 | |
618,710 | | NiSource, Inc. | | | 13,667,304 | |
123,400 | | Southern Company | | | 5,330,880 | |
| | | |
| | Total Utilities | | | 46,905,489 | |
| | | |
| | | | | | |
| | | |
| | Total Common Stock (cost $1,436,354,834) | | | 1,543,715,419 | |
| | | |
| | |
| Shares | | Collateral Held for Securities
Loaned (0.4%) | | Value | |
6,767,600 | | Thrivent Financial Securities Lending Trust | | | 6,767,600 | |
| | | |
| | Total Collateral Held for Securities Loaned (cost $6,767,600) | | | 6,767,600 | |
| | | |
| | |
Principal
Amount | | Short-Term Investments (1.7%)d | | Value | |
| | Federal Home Loan Bank Discount Notes | | | | |
$5,000,000 | | 0.025%, 11/9/2011e | | | 4,999,972 | |
3,000,000 | | 0.025%, 12/23/2011e | | | 2,999,892 | |
| | Federal Home Loan Mortgage Corporation Discount Notes | | | | |
1,000,000 | | 0.024%, 11/28/2011e | | | 999,982 | |
3,000,000 | | 0.030%, 1/23/2012e | | | 2,999,793 | |
| | Federal National Mortgage Association Discount Notes | | | | |
2,000,000 | | 0.020%, 12/21/2011e | | | 1,999,944 | |
875,000 | | 0.105%, 2/22/2012e,f | | | 874,716 | |
| | Nieuw Amsterdam Receivables Corporation | | | | |
7,565,000 | | 0.100%, 11/1/2011e | | | 7,565,000 | |
| | Straight-A Funding, LLC | | | | |
4,000,000 | | 0.130%, 11/16/2011e,g | | | 3,999,783 | |
| | | |
| | Total Short-Term Investments (at amortized cost) | | | 26,439,082 | |
| | | |
| | Total Investments (cost $1,469,561,516) 100.8% | | | $1,576,922,101 | |
| | | |
| | Other Assets and Liabilities, Net (0.8%) | | | (13,181,546 | ) |
| | | |
| | Total Net Assets 100.0% | | | $1,563,740,555 | |
| | | |
| a | Non-income producing security. |
| b | All or a portion of the security is on loan. |
| c | All or a portion of the security was earmarked to cover written options. |
| d | The interest rate shown reflects the yield, coupon rate or the discount rate at the date of purchase. |
| e | Denotes investments that benefit from credit enhancement or liquidity support provided by a third party bank, institution or government. |
| f | At October 31, 2011, $399,870 of investments were held on deposit with the counterparty and pledged as the initial margin deposit for open futures contracts. |
| g | Denotes securities sold under Rule 144A of the Securities Act of 1933, which exempts them from registration. These securities have been deemed liquid and may be resold to other dealers in the program or to other qualified institutional buyers. As of October 31, 2011, the value of these investments was $3,999,783 or 0.3% of total net assets. |
| | | | |
Definitions: | | | | |
ADR | | - | | American Depositary Receipt, which are certificates for an underlying foreign security’s shares held by an issuing U.S. depository bank. |
REIT | | - | | Real Estate Investment Trust is a company that buys, develops, manages and/or sells real estate assets. |
ETF | | - | | Exchange Traded Fund. |
| | | | |
Unrealized Appreciation (Depreciation) | | | | |
Gross unrealized appreciation and depreciation of investments, based on cost for federal income tax purposes, were as follows: | |
Gross unrealized appreciation | | | $151,687,702 | |
Gross unrealized depreciation | | | (53,075,155) | |
| | | | |
Net unrealized appreciation (depreciation) | | | $98,612,547 | |
| |
Cost for federal income tax purposes | | | $1,478,309,554 | |
The accompanying Notes to Financial Statements are an integral part of this schedule.
126
Large Cap Stock Fund
Schedule of Investments as of October 31, 2011
Fair Valuation Measurements
The following table is a summary of the inputs used, as of October 31, 2011, in valuing Large Cap Stock Fund’s assets carried at fair value.
| | | | | | | | | | | | | | | | |
| Investments in Securities | | Total | | | Level 1 | | | Level 2 | | | Level 3 | |
Common Stock | | | | | | | | | | | | | | | | |
Consumer Discretionary | | | 171,353,564 | | | | 171,353,564 | | | | – | | | | – | |
Consumer Staples | | | 195,178,235 | | | | 195,178,235 | | | | – | | | | – | |
Energy | | | 188,267,061 | | | | 188,267,061 | | | | – | | | | – | |
Financials | | | 201,602,733 | | | | 201,602,733 | | | | – | | | | – | |
Health Care | | | 194,745,665 | | | | 194,745,665 | | | | – | | | | – | |
Industrials | | | 167,721,997 | | | | 167,721,997 | | | | – | | | | – | |
Information Technology | | | 312,209,140 | | | | 312,209,140 | | | | – | | | | – | |
Materials | | | 46,277,044 | | | | 46,277,044 | | | | – | | | | – | |
Telecommunications Services | | | 19,454,491 | | | | 19,454,491 | | | | – | | | | – | |
Utilities | | | 46,905,489 | | | | 46,905,489 | | | | – | | | | – | |
Collateral Held for Securities Loaned | | | 6,767,600 | | | | 6,767,600 | | | | – | | | | – | |
Short-Term Investments | | | 26,439,082 | | | | – | | | | 26,439,082 | | | | – | |
Total | | | $1,576,922,101 | | | | $1,550,483,019 | | | | $26,439,082 | | | | $– | |
| | | | |
| Other Financial Instruments | | Total | | | Level 1 | | | Level 2 | | | Level 3 | |
Asset Derivatives | | | | | | | | | | | | | | | | |
Futures Contracts | | | 72,409 | | | | 72,409 | | | | – | | | | – | |
Call Options Written | | | 18,000 | | | | 18,000 | | | | – | | | | – | |
Total Asset Derivatives | | | $90,409 | | | | $90,409 | | | | $– | | | | $– | |
| | | | | | | | | | | | | | | | | | | | |
| Futures Contracts | | Number of
Contracts
Long/(Short) | | | Expiration
Date | | | Notional
Principal
Amount | | | Value | | | Unrealized
Gain/(Loss) | |
S&P 500 Index Futures | | | 4 | | | | December 2011 | | | | $1,176,891 | | | | $1,249,300 | | | | $72,409 | |
Total Futures Contracts | | | | | | | | | | | | | | | | | | | $72,409 | |
| | | | | |
| Call Options Written | | Number of
Contracts | | | Exercise
Price | | | Expiration
Date | | | Value | | | Unrealized
Gain/(Loss) | |
S&P 500 Mini-Futures Call Option | | | 40 | | | | $1,305.00 | | | | November 2011 | | | | ($13,000 | ) | | | $6,900 | |
S&P 500 Mini-Futures Call Option | | | 40 | | | | 1,315.00 | | | | November 2011 | | | | (9,300 | ) | | | 11,100 | |
Total Call Options Written | | | | | | | | | | | | | | | ($22,300 | ) | | | $18,000 | |
The following table summarizes the fair value and Statement of Assets and Liabilities location, as of October 31, 2011, for Large Cap Stock Fund’s investments in financial derivative instruments by primary risk exposure as discussed under item (2) Significant Accounting Policies of the Notes to Financial Statements.
| | | | | | |
| Derivatives by risk category | | Statement of Assets and Liabilities Location | | Fair Value | |
Asset Derivatives | | | | | | |
| | |
Equity Contracts | | | | | | |
Options Written | | Net Assets - Net unrealized appreciation/(depreciation) on Written option contracts | | | 18,000 | |
Futures* | | Net Assets - Net unrealized appreciation/(depreciation) on Futures contracts | | | 72,409 | |
Total Equity Contracts | | | | | 90,409 | |
Total Asset Derivatives | | | | | $90,409 | |
| * | Includes cumulative appreciation/depreciation of futures contracts as reported in the Schedule of Investments. Only current day’s variation margin is reported within the Statement of Assets and Liabilities. |
The accompanying Notes to Financial Statements are an integral part of this schedule.
127
Large Cap Stock Fund
Schedule of Investments as of October 31, 2011
The following table summarizes the net realized gains/(losses) and Statement of Operations location, for the period ended October 31, 2011, for Large Cap Stock Fund’s investments in financial derivative instruments by primary risk exposure.
| | | | | | |
| Derivatives by risk category | | Statement of Operations location | | Realized Gains/(Losses)
recognized in Income | |
Equity Contracts | | | | | | |
Options Written | | Net realized gains/(losses) on Written option contracts | | | (391,552 | ) |
Futures | | Net realized gains/(losses) on Futures contracts | | | 3,833,059 | |
Total Equity Contracts | | | | | 3,441,507 | |
Total | | | | | $3,441,507 | |
The following table summarizes the change in net unrealized appreciation/(depreciation) and Statement of Operations location, for the period ended October 31, 2011, for Large Cap Stock Fund’s investments in financial derivative instruments by primary risk exposure.
| | | | | | |
| Derivatives by risk category | | Statement of Operations Location | | Change in unrealized
appreciation/(depreciation)
recognized in Income | |
Equity Contracts | | | | | | |
Options Written | | Change in net unrealized appreciation/(depreciation) on Written option contracts | | | 12,062 | |
Futures | | Change in net unrealized appreciation/(depreciation) on Futures contracts | | | (1,248,982 | ) |
Total Equity Contracts | | | | | (1,236,920 | ) |
Total | | | | | ($1,236,920 | ) |
The following table presents Large Cap Stock Fund’s average volume of derivative activity during the period ended October 31, 2011.
| | | | | | | | | | | | |
Derivative Risk
Category | | Futures
(Notional*) | | | Futures
(Percentage
of Average
Net Assets) | | | Options
(Contracts) | |
Equity Contracts | | | $15,913,128 | | | | 0.9% | | | | 95 | |
* Notional amount represents long or short, or both, derivative positions held by the Fund.
Investment in Affiliates
Affiliated issuers, as defined under the Investment Company Act of 1940, include those in which the Fund’s holdings of an issuer represent 5% or more of the outstanding voting securities of an issuer, or any affiliated mutual fund.
A summary of transactions for the fiscal year to date, in Large Cap Stock Fund, is as follows:
| | | | | | | | | | | | | | | | | | | | | | | | |
| Fund | | Value
October 31, 2010 | | | Gross
Purchases | | | Gross
Sales | | | Shares Held at
October 31, 2011 | | | Value
October 31, 2011 | | | Income Earned
November 1, 2010 -
October 31, 2011 | |
Thrivent Financial Securities Lending Trust | | | $67,901,380 | | | | $503,535,728 | | | | $564,669,508 | | | | 6,767,600 | | | | $6,767,600 | | | | $123,413 | |
Total Value and Income Earned | | | 67,901,380 | | | | | | | | | | | | | | | | 6,767,600 | | | | 123,413 | |
The accompanying Notes to Financial Statements are an integral part of this schedule.
128
Balanced Fund
Schedule of Investments as of October 31, 2011
| | | | | | |
| Shares | | Common Stock (63.6%) | | Value | |
| Consumer Discretionary (7.7%) | | | | |
7,300 | | Amazon.com, Inc.a | | | $1,558,623 | |
151,268 | | Comcast Corporation | | | 3,547,235 | |
42,300 | | Discovery Communications, Inc.a | | | 1,838,358 | |
9,686 | | Dollar Tree, Inc.a | | | 774,492 | |
31,551 | | Foot Locker, Inc. | | | 689,705 | |
55,600 | | Las Vegas Sands Corporationa | | | 2,610,420 | |
4,400 | | Panera Bread Companya | | | 588,236 | |
63,578 | | Pier 1 Imports, Inc.a | | | 795,361 | |
15,517 | | Signet Jewelers, Ltd. | | | 668,938 | |
33,200 | | Target Corporation | | | 1,817,700 | |
| | | |
| | Total Consumer Discretionary | | | 14,889,068 | |
| | | |
| |
| Consumer Staples (7.0%) | | | | |
94,244 | | Altria Group, Inc. | | | 2,596,422 | |
32,029 | | Anheuser-Busch InBev NV ADR | | | 1,776,649 | |
29,836 | | British American Tobacco plc ADR | | | 2,752,371 | |
12,849 | | Corn Products International, Inc. | | | 623,176 | |
9,700 | | Herbalife, Ltd. | | | 604,892 | |
62,600 | | Wal-Mart Stores, Inc. | | | 3,550,672 | |
23,500 | | Whole Foods Market, Inc. | | | 1,694,820 | |
| | | |
| | Total Consumer Staples | | | 13,599,002 | |
| | | |
| |
| Energy (7.8%) | | | | |
28,031 | | Alpha Natural Resources, Inc.a | | | 673,865 | |
24,100 | | Anadarko Petroleum Corporation | | | 1,891,850 | |
19,711 | | Apache Corporation | | | 1,963,807 | |
33,058 | | Baker Hughes, Inc. | | | 1,917,034 | |
45,577 | | BP plc ADR | | | 2,013,592 | |
37,705 | | ENSCO International plc ADR | | | 1,872,430 | |
19,300 | | Marathon Oil Corporation | | | 502,379 | |
12,600 | | Newfield Exploration Companya | | | 507,276 | |
9,966 | | Oil States International, Inc.a | | | 693,733 | |
52,998 | | Patriot Coal Corporationa | | | 665,655 | |
50,129 | | Petroleum Geo-Services ASAa | | | 544,640 | |
124,800 | | Weatherford International, Ltd.a | | | 1,934,400 | |
| | | |
| | Total Energy | | | 15,180,661 | |
| | | |
| |
| Financials (8.4%) | | | | |
51,700 | | Aflac, Inc. | | | 2,331,153 | |
17,600 | | Aon Corporation | | | 820,512 | |
60,200 | | Citigroup, Inc. | | | 1,901,718 | |
162,700 | | Fifth Third Bancorp | | | 1,954,027 | |
51,100 | | Host Hotels & Resorts, Inc. | | | 729,197 | |
53,200 | | J.P. Morgan Chase & Company | | | 1,849,232 | |
22,781 | | Lazard, Ltd. | | | 622,833 | |
41,605 | | Ocwen Financial Corporationa | | | 603,272 | |
362,897 | | Popular, Inc.a | | | 674,988 | |
36,494 | | Prudential Financial, Inc. | | | 1,977,975 | |
23,036 | | Texas Capital Bancshares, Inc.a | | | 645,008 | |
61,800 | | Wells Fargo & Company | | | 1,601,238 | |
33,725 | | Zions Bancorporation | | | 585,466 | |
| | | |
| | Total Financials | | | 16,296,619 | |
| | | |
| |
| Health Care (7.3%) | | | | |
13,731 | | Covance, Inc.a | | | 696,574 | |
44,862 | | Covidien plc | | | 2,110,308 | |
28,300 | | iShares Nasdaq Biotechnology Index Funda,b | | | 2,779,909 | |
27,811 | | McKesson Corporation | | | 2,267,987 | |
116,477 | | Pfizer, Inc. | | | 2,243,347 | |
42,388 | | UnitedHealth Group, Inc. | | | 2,034,200 | |
12,483 | | Varian Medical Systems, Inc.a | | | 733,002 | |
8,300 | | Waters Corporationa | | | 664,996 | |
| | | | | | |
| Shares | | Common Stock (63.6%) | | Value | |
| Health Care (7.3%) - continued | | | | |
8,948 | | Watson Pharmaceuticals, Inc.a | | | $600,948 | |
| | | |
| | Total Health Care | | | 14,131,271 | |
| | | |
| |
| Industrials (8.4%) | | | | |
19,410 | | BE Aerospace, Inc.a | | | 732,339 | |
40,689 | | Boeing Company | | | 2,676,930 | |
24,600 | | Caterpillar, Inc. | | | 2,323,716 | |
24,600 | | Deluxe Corporation | | | 581,052 | |
27,288 | | EMCOR Group, Inc. | | | 684,110 | |
14,405 | | FTI Consulting, Inc.a,b | | | 567,701 | |
16,634 | | Jacobs Engineering Group, Inc.a | | | 645,399 | |
76,503 | | Manitowoc Company, Inc. | | | 847,653 | |
15,688 | | Manpower, Inc. | | | 676,781 | |
26,509 | | Parker Hannifin Corporation | | | 2,161,809 | |
18,867 | | Republic Services, Inc. | | | 536,955 | |
13,287 | | SPX Corporation | | | 725,603 | |
38,586 | | United Technologies Corporation | | | 3,008,936 | |
| | | |
| | Total Industrials | | | 16,168,984 | |
| | | |
| |
| Information Technology (11.9%) | | | | |
34,333 | | Accenture plc | | | 2,068,907 | |
26,470 | | Akamai Technologies, Inc.a | | | 713,102 | |
5,469 | | Apple, Inc.a | | | 2,213,742 | |
59,688 | | Atmel Corporationa | | | 630,305 | |
49,100 | | Broadcom Corporationa | | | 1,772,019 | |
105,300 | | Cisco Systems, Inc. | | | 1,951,209 | |
13,500 | | Informatica Corporationa | | | 614,250 | |
39,100 | | NVIDIA Corporationa | | | 578,680 | |
60,018 | | Oracle Corporation | | | 1,966,790 | |
20,499 | | Plexus Corporationa | | | 526,824 | |
33,570 | | Polycom, Inc.a | | | 554,912 | |
32,300 | | Quest Software, Inc.a | | | 568,157 | |
12,100 | | Red Hat, Inc.a | | | 600,765 | |
49,211 | | Teradyne, Inc.a | | | 704,701 | |
60,033 | | Texas Instruments, Inc. | | | 1,844,814 | |
20,230 | | VMware, Inc.a | | | 1,977,482 | |
54,871 | | Xilinx, Inc. | | | 1,835,984 | |
120,978 | | Yahoo!, Inc.a | | | 1,892,096 | |
| | | |
| | Total Information Technology | | | 23,014,739 | |
| | | |
| |
| Materials (2.3%) | | | | |
37,600 | | Barrick Gold Corporation | | | 1,861,200 | |
27,700 | | Newmont Mining Corporation | | | 1,851,191 | |
8,965 | | Walter Energy, Inc. | | | 678,202 | |
| | | |
| | Total Materials | | | 4,390,593 | |
| | | |
| |
| Utilities (2.8%) | | | | |
72,126 | | Calpine Corporationa | | | 1,094,151 | |
35,591 | | Dominion Resources, Inc. | | | 1,836,140 | |
32,804 | | NextEra Energy, Inc. | | | 1,850,146 | |
18,158 | | Southwest Gas Corporation | | | 716,878 | |
| | | |
| | Total Utilities | | | 5,497,315 | |
| | | |
| | | | | | |
| | | |
| | Total Common Stock (cost $117,267,822) | | | 123,168,252 | |
| | | |
| | |
Principal Amount | | Long-Term Fixed Income (35.1%) | | Value | |
| Asset-Backed Securities (1.7%) | | | | |
| | Carrington Mortgage Loan Trust | | | | |
$150,000 | | 0.395%, 8/25/2036c | | | 48,682 | |
| | Countrywide Asset-Backed Certificates | | | | |
178,032 | | 5.549%, 8/25/2021d | | | 155,658 | |
The accompanying Notes to Financial Statements are an integral part of this schedule.
129
Balanced Fund
Schedule of Investments as of October 31, 2011
| | | | | | |
Principal Amount | | Long-Term Fixed Income (35.1%) | | Value | |
| Asset-Backed Securities (1.7%) - continued | | | | |
| | First Horizon ABS Trust | | | | |
$458,440 | | 0.375%, 10/25/2026c,d | | | $331,501 | |
| | GMAC Mortgage Corporation Loan Trust | | | | |
552,609 | | 0.425%, 8/25/2035c,d | | | 343,194 | |
511,191 | | 0.425%, 12/25/2036c,d | | | 314,263 | |
| | Green Tree Financial Corporation | | | | |
255,658 | | 6.330%, 11/1/2029 | | | 262,086 | |
| | GSAMP Trust | | | | |
190,120 | | 0.325%, 8/25/2036c | | | 171,478 | |
| | Popular ABS Mortgage Pass- Through Trust | | | | |
250,000 | | 5.297%, 11/25/2035 | | | 168,997 | |
| | Renaissance Home Equity Loan Trust | | | | |
1,233,566 | | 5.608%, 5/25/2036 | | | 806,005 | |
500,000 | | 5.285%, 1/25/2037 | | | 206,898 | |
| | Wachovia Asset Securitization, Inc. | | | | |
633,397 | | 0.385%, 7/25/2037c,d,e | | | 451,474 | |
| | | |
| | Total Asset-Backed Securities | | | 3,260,236 | |
| | | |
| |
| Basic Materials (0.7%) | | | | |
| | Alcoa, Inc. | | | | |
250,000 | | 5.400%, 4/15/2021 | | | 247,715 | |
| | ArcelorMittal | | | | |
250,000 | | 6.125%, 6/1/2018 | | | 256,780 | |
200,000 | | 5.250%, 8/5/2020b | | | 194,180 | |
| | Dow Chemical Company | | | | |
200,000 | | 4.250%, 11/15/2020 | | | 205,668 | |
| | Gold Fields Orogen Holding BVI, Ltd. | | | | |
200,000 | | 4.875%, 10/7/2020f | | | 186,250 | |
| | Noble Group, Ltd. | | | | |
300,000 | | 6.750%, 1/29/2020f | | | 294,000 | |
| | | |
| | Total Basic Materials | | | 1,384,593 | |
| | | |
| |
| Capital Goods (0.6%) | | | | |
| | Boeing Capital Corporation | | | | |
200,000 | | 2.125%, 8/15/2016 | | | 203,794 | |
| | Danaher Corporation | | | | |
200,000 | | 2.300%, 6/23/2016 | | | 204,250 | |
| | Hutchinson Whampoa Finance, Ltd. | | | | |
250,000 | | 5.750%, 9/11/2019f | | | 278,784 | |
| | Republic Services, Inc. | | | | |
100,000 | | 5.000%, 3/1/2020 | | | 111,170 | |
200,000 | | 5.250%, 11/15/2021 | | | 228,033 | |
| | Textron, Inc. | | | | |
100,000 | | 7.250%, 10/1/2019 | | | 110,928 | |
| | | |
| | Total Capital Goods | | | 1,136,959 | |
| | | |
| |
| Collateralized Mortgage Obligations (0.9%) | | | | |
| | Banc of America Mortgage Securities, Inc. | | | | |
629,896 | | 2.764%, 9/25/2035c | | | 503,846 | |
| | Bear Stearns Mortgage Funding Trust | | | | |
137,730 | | 0.525%, 8/25/2036c | | | 38,952 | |
| | HomeBanc Mortgage Trust | | | | |
497,829 | | 2.171%, 4/25/2037 | | | 271,914 | |
| | | | | | |
Principal Amount | | Long-Term Fixed Income (35.1%) | | Value | |
| Collateralized Mortgage Obligations (0.9%) - continued | | | | |
| | J.P. Morgan Alternative Loan Trust | | | | |
$498,168 | | 2.669%, 3/25/2036 | | | $267,319 | |
| | J.P. Morgan Mortgage Trust | | | | |
23,579 | | 5.543%, 6/25/2036 | | | 23,166 | |
| | Merrill Lynch Mortgage Investors, Inc. | | | | |
618,264 | | 2.628%, 6/25/2035 | | | 507,931 | |
| | Thornburg Mortgage Securities Trust | | | | |
317,682 | | 0.355%, 11/25/2046c | | | 316,973 | |
| | | |
| | Total Collateralized Mortgage Obligations | | | 1,930,101 | |
| | | |
| |
| Commercial Mortgage-Backed Securities (3.3%) | | | | |
| | Banc of America Commercial Mortgage, Inc. | | | | |
150,000 | | 5.655%, 4/10/2049 | | | 130,132 | |
| | Bear Stearns Commercial Mortgage Securities, Inc. | | | | |
227,845 | | 5.613%, 6/11/2050 | | | 236,463 | |
785,274 | | 0.393%, 3/15/2022c,e | | | 770,518 | |
268,732 | | 4.487%, 2/11/2041 | | | 274,965 | |
| | Citigroup/Deutsche Bank Commercial Mortgage | | | | |
250,000 | | 5.322%, 12/11/2049 | | | 261,774 | |
| | Commercial Mortgage Pass- Through Certificates | | | | |
1,000,000 | | 0.373%, 12/15/2020c,e | | | 912,110 | |
750,000 | | 0.423%, 6/15/2022c,e | | | 687,766 | |
| | Credit Suisse Mortgage Capital Certificates | | | | |
679,197 | | 0.413%, 10/15/2021c,f | | | 628,022 | |
| | Government National Mortgage Association | | | | |
616,177 | | 3.214%, 1/16/2040 | | | 645,090 | |
| | GS Mortgage Securities Corporation II | | | | |
1,000,000 | | 1.317%, 3/6/2020c,f | | | 990,972 | |
| | Morgan Stanley Capital I | | | | |
200,000 | | 3.224%, 7/15/2049 | | | 205,556 | |
| | Morgan Stanley Capital, Inc. | | | | |
197,000 | | 5.406%, 3/15/2044 | | | 178,200 | |
| | Wachovia Bank Commercial Mortgage Trust | | | | |
375,000 | | 5.765%, 7/15/2045 | | | 413,186 | |
| | WaMu Commercial Mortgage Securities Trust | | | | |
16,820 | | 3.830%, 1/25/2035f | | | 16,869 | |
| | | |
| | Total Commercial Mortgage- Backed Securities | | | 6,351,623 | |
| | | |
| |
| Communications Services (0.9%) | | | | |
| | American Tower Corporation | | | | |
200,000 | | 5.050%, 9/1/2020 | | | 211,287 | |
| | CBS Corporation | | | | |
200,000 | | 8.875%, 5/15/2019 | | | 258,419 | |
| | Crown Castle Towers, LLC | | | | |
200,000 | | 4.883%, 8/15/2020f | | | 204,448 | |
| | Frontier Communications Corporation | | | | |
120,000 | | 6.250%, 1/15/2013 | | | 122,700 | |
The accompanying Notes to Financial Statements are an integral part of this schedule.
130
Balanced Fund
Schedule of Investments as of October 31, 2011
| | | | | | |
Principal Amount | | Long-Term Fixed Income (35.1%) | | Value | |
| Communications Services (0.9%) - continued | | | | |
| | News America, Inc. | | | | |
$125,000 | | 6.400%, 12/15/2035 | | | $140,622 | |
| | Qwest Communications International, Inc. | | | | |
150,000 | | 7.125%, 4/1/2018 | | | 153,375 | |
| | Rogers Communications, Inc. | | | | |
40,000 | | 8.750%, 5/1/2032 | | | 57,635 | |
| | SBA Tower Trust | | | | |
200,000 | | 5.101%, 4/15/2017f | | | 217,900 | |
| | Telecom Italia Capital SA | | | | |
200,000 | | 5.250%, 10/1/2015 | | | 194,760 | |
| | Verizon Communications, Inc. | | | | |
100,000 | | 8.950%, 3/1/2039 | | | 158,900 | |
| | Virgin Media Secured Finance plc | | | | |
100,000 | | 5.250%, 1/15/2021 | | | 107,740 | |
| | | |
| | Total Communications Services | | | 1,827,786 | |
| | | |
| |
| Consumer Cyclical (0.5%) | | | | |
| | Ford Motor Credit Company, LLC | | | | |
150,000 | | 7.000%, 4/15/2015 | | | 163,500 | |
100,000 | | 5.000%, 5/15/2018 | | | 101,641 | |
| | Harley-Davidson Financial Services, Inc. | | | | |
250,000 | | 3.875%, 3/15/2016f | | | 256,511 | |
| | Macy’s Retail Holdings, Inc. | | | | |
100,000 | | 7.450%, 7/15/2017 | | | 116,534 | |
| | RCI Banque SA | | | | |
200,000 | | 4.600%, 4/12/2016f | | | 194,263 | |
| | University of Southern California | | | | |
125,000 | | 5.250%, 10/1/2111 | | | 145,266 | |
| | | |
| | Total Consumer Cyclical | | | 977,715 | |
| | | |
| |
| Consumer Non-Cyclical (1.0%) | | | | |
| | Altria Group, Inc. | | | | |
200,000 | | 9.700%, 11/10/2018 | | | 268,804 | |
| | AmerisourceBergen Corporation | | | | |
200,000 | | 4.875%, 11/15/2019 | | | 220,953 | |
| | Colgate-Palmolive Company | | | | |
250,000 | | 2.625%, 5/1/2017 | | | 262,619 | |
| | CVS Caremark Corporation | | | | |
125,000 | | 6.125%, 9/15/2039 | | | 151,815 | |
| | Energizer Holdings, Inc. | | | | |
250,000 | | 4.700%, 5/19/2021f | | | 264,275 | |
| | HCA, Inc. | | | | |
200,000 | | 6.500%, 2/15/2020 | | | 209,500 | |
| | Kraft Foods, Inc. | | | | |
250,000 | | 5.375%, 2/10/2020 | | | 288,142 | |
| | Quest Diagnostics, Inc. | | | | |
250,000 | | 4.700%, 4/1/2021 | | | 267,553 | |
| | | |
| | Total Consumer Non-Cyclical | | | 1,933,661 | |
| | | |
| |
| Energy (0.9%) | | | | |
| | BP Capital Markets plc | | | | |
250,000 | | 4.742%, 3/11/2021 | | | 280,409 | |
| | Cameron International Corporation | | | | |
200,000 | | 4.500%, 6/1/2021 | | | 214,049 | |
| | CenterPoint Energy Resources Corporation | | | | |
300,000 | | 6.125%, 11/1/2017 | | | 342,077 | |
| | Nabors Industries, Inc. | | | | |
100,000 | | 4.625%, 9/15/2021f | | | 99,990 | |
| | | | | | |
Principal Amount | | Long-Term Fixed Income (35.1%) | | Value | |
| Energy (0.9%) - continued | | | | |
| | NiSource Finance Corporation | | | | |
$100,000 | | 6.125%, 3/1/2022 | | | $115,346 | |
| | Petrobras International Finance Company | | | | |
200,000 | | 5.375%, 1/27/2021 | | | 210,386 | |
| | Schlumberger Norge AS | | | | |
100,000 | | 4.200%, 1/15/2021f | | | 109,371 | |
| | Transocean, Inc. | | | | |
200,000 | | 7.375%, 4/15/2018 | | | 224,560 | |
| | Valero Energy Corporation | | | | |
200,000 | | 6.125%, 2/1/2020b | | | 229,659 | |
| | | |
| | Total Energy | | | 1,825,847 | |
| | | |
| |
| Financials (6.4%) | | | | |
| | Ally Financial, Inc. | | | | |
100,000 | | 4.500%, 2/11/2014 | | | 97,750 | |
| | Axis Specialty Finance, LLC | | | | |
250,000 | | 5.875%, 6/1/2020 | | | 249,986 | |
| | Bank of America Corporation | | | | |
100,000 | | 5.875%, 1/5/2021 | | | 97,913 | |
| | Barclays Bank plc | | | | |
200,000 | | 2.375%, 1/13/2014 | | | 197,498 | |
| | Barclays Bank plc, Convertible | | | | |
500,000 | | 1.000%, 6/25/2017g | | | 534,550 | |
| | Bear Stearns Companies, LLC | | | | |
200,000 | | 6.400%, 10/2/2017 | | | 230,850 | |
| | Blackstone Holdings Finance Company, LLC | | | | |
150,000 | | 6.625%, 8/15/2019f | | | 159,820 | |
| | Boston Properties, LP | | | | |
200,000 | | 4.125%, 5/15/2021 | | | 196,134 | |
| | Capital One Capital V | | | | |
150,000 | | 10.250%, 8/15/2039 | | | 155,250 | |
| | Capital One Financial Corporation | | | | |
200,000 | | 2.125%, 7/15/2014 | | | 199,726 | |
| | Citigroup, Inc. | | | | |
200,000 | | 6.500%, 8/19/2013 | | | 211,869 | |
250,000 | | 1.302%, 4/1/2014c | | | 240,720 | |
| | CNA Financial Corporation | | | | |
200,000 | | 6.500%, 8/15/2016 | | | 216,936 | |
| | Cooperatieve Centrale Raiffeisen- Boerenleenbank BA | | | | |
300,000 | | 4.750%, 1/15/2020f | | | 332,721 | |
| | Credit Suisse Securities USA, LLC | | | | |
300,000 | | 1.000%, 4/28/2017g | | | 289,800 | |
| | Danske Bank AS | | | | |
250,000 | | 3.875%, 4/14/2016f | | | 246,133 | |
| | Fairfax Financial Holdings, Ltd. | | | | |
200,000 | | 5.800%, 5/15/2021f | | | 188,468 | |
| | Fifth Third Bancorp | | | | |
50,000 | | 3.625%, 1/25/2016 | | | 51,271 | |
200,000 | | 5.450%, 1/15/2017 | | | 213,191 | |
| | FUEL Trust | | | | |
200,000 | | 3.984%, 6/15/2016f | | | 197,784 | |
| | General Electric Capital Corporation | | | | |
200,000 | | 4.375%, 9/16/2020 | | | 203,525 | |
100,000 | | 5.300%, 2/11/2021 | | | 106,426 | |
| | Goldman Sachs Group, Inc., Convertible | | | | |
21,430 | | 2.600%, 3/16/2012f,h | | | 244,602 | |
422 | | 0.500%, 3/30/2012f,i | | | 284,200 | |
4,750 | | 0.250%, 11/9/2012f,j | | | 124,056 | |
The accompanying Notes to Financial Statements are an integral part of this schedule.
131
Balanced Fund
Schedule of Investments as of October 31, 2011
| | | | | | |
Principal Amount | | Long-Term Fixed Income (35.1%) | | Value | |
| Financials (6.4%) - continued | | | | |
| | Health Care REIT, Inc. | | | | |
$200,000 | | 6.125%, 4/15/2020 | | $ | 205,293 | |
| | HSBC Holdings plc | | | | |
250,000 | | 5.100%, 4/5/2021 | | | 269,267 | |
165,000 | | 6.500%, 5/2/2036 | | | 175,496 | |
| | ING Bank NV | | | | |
200,000 | | 5.000%, 6/9/2021f | | | 205,284 | |
| | International Lease Finance Corporation | | | | |
100,000 | | 8.625%, 9/15/2015 | | | 105,000 | |
| | J.P. Morgan Chase & Company | | | | |
100,000 | | 3.150%, 7/5/2016 | | | 100,170 | |
100,000 | | 4.350%, 8/15/2021b | | | 100,033 | |
| | Jefferies Group, Inc. | | | | |
250,000 | | 5.125%, 4/13/2018 | | | 225,705 | |
| | KeyCorp | | | | |
250,000 | | 5.100%, 3/24/2021 | | | 259,918 | |
| | Liberty Property, LP | | | | |
200,000 | | 5.500%, 12/15/2016 | | | 217,021 | |
| | Marsh & McLennan Companies, Inc. | | | | |
175,000 | | 4.800%, 7/15/2021 | | | 188,711 | |
| | Merrill Lynch & Company, Inc. | | | | |
200,000 | | 6.875%, 4/25/2018 | | | 205,448 | |
| | Metropolitan Life Global Funding I | | | | |
250,000 | | 3.650%, 6/14/2018f | | | 252,043 | |
| | Morgan Stanley | | | | |
200,000 | | 7.300%, 5/13/2019 | | | 214,621 | |
200,000 | | 5.500%, 1/26/2020 | | | 197,060 | |
| | Nationwide Building Society | | | | |
200,000 | | 6.250%, 2/25/2020f | | | 207,785 | |
| | Nordea Eiendomskreditt AS | | | | |
250,000 | | 1.875%, 4/7/2014f | | | 252,978 | |
| | PNC Funding Corporation | | | | |
200,000 | | 5.125%, 2/8/2020 | | | 221,096 | |
| | Principal Financial Group, Inc. | | | | |
200,000 | | 8.875%, 5/15/2019 | | | 253,400 | |
| | Prudential Financial, Inc. | | | | |
250,000 | | 6.100%, 6/15/2017 | | | 272,880 | |
100,000 | | 5.700%, 12/14/2036 | | | 105,211 | |
| | Rabobank Capital Funding Trust II | | | | |
101,000 | | 5.260%, 12/29/2049f,k | | | 97,008 | |
| | Reinsurance Group of America, Inc. | | | | |
300,000 | | 5.625%, 3/15/2017 | | | 322,421 | |
| | Simon Property Group, LP | | | | |
200,000 | | 4.375%, 3/1/2021 | | | 206,964 | |
| | SLM Corporation | | | | |
100,000 | | 6.250%, 1/25/2016 | | | 100,000 | |
100,000 | | 8.000%, 3/25/2020 | | | 104,000 | |
| | Swiss RE Capital I, LP | | | | |
275,000 | | 6.854%, 5/29/2049f,k | | | 247,978 | |
| | Travelers Companies, Inc. | | | | |
105,000 | | 6.250%, 6/15/2037 | | | 130,890 | |
| | UnitedHealth Group, Inc. | | | | |
150,000 | | 6.500%, 6/15/2037 | | | 190,727 | |
| | USB Capital XIII Trust | | | | |
200,000 | | 6.625%, 12/15/2039 | | | 205,552 | |
| | Wachovia Bank NA | | | | |
285,000 | | 4.875%, 2/1/2015 | | | 301,753 | |
| | Wachovia Corporation | | | | |
150,000 | | 5.250%, 8/1/2014 | | | 159,976 | |
| | | | | | |
Principal Amount | | Long-Term Fixed Income (35.1%) | | Value | |
| Financials (6.4%) - continued | | | | |
| | WEA Finance, LLC/WT Finance Australia, Pty Ltd. | | | | |
$225,000 | | 6.750%, 9/2/2019f | | $ | 254,043 | |
| | Westpac Banking Corporation | | | | |
250,000 | | 1.099%, 3/31/2014c,f | | | 250,722 | |
| | Willis North America, Inc. | | | | |
220,000 | | 6.200%, 3/28/2017 | | | 240,949 | |
| | | |
| | Total Financials | | | 12,318,582 | |
| | | |
| |
| Foreign Government (0.9%) | | | | |
| | Bank Nederlandse Gemeenten | | | | |
250,000 | | 4.375%, 2/16/2021f | | | 278,379 | |
| | Chile Government International Bond | | | | |
200,000 | | 3.875%, 8/5/2020 | | | 209,000 | |
| | Corporacion Andina de Fomento | | | | |
250,000 | | 5.750%, 1/12/2017 | | | 273,868 | |
| | Mexico Government International Bond | | | | |
250,000 | | 6.050%, 1/11/2040 | | | 293,125 | |
| | Poland Government International Bond | | | | |
250,000 | | 5.125%, 4/21/2021 | | | 255,000 | |
| | Province of New Brunswick | | | | |
250,000 | | 2.750%, 6/15/2018 | | | 257,641 | |
| | Province of Ontario | | | | |
200,000 | | 1.600%, 9/21/2016 | | | 197,767 | |
| | | |
| | Total Foreign Government | | | 1,764,780 | |
| | | |
| |
| Mortgage-Backed Securities (8.0%) | | | | |
| | Federal National Mortgage Association Conventional 15- Yr. Pass Through | | | | |
500,000 | | 3.000%, 11/1/2026l | | | 512,031 | |
3,750,000 | | 3.000%, 12/1/2026l | | | 3,827,344 | |
| | Federal National Mortgage Association Conventional 30- Yr. Pass Through | | | | |
6,625,000 | | 4.500%, 11/1/2041l | | | 7,004,904 | |
1,750,000 | | 5.000%, 11/1/2041l | | | 1,882,344 | |
2,100,000 | | 6.000%, 11/1/2041l | | | 2,301,140 | |
| | | |
| | Total Mortgage-Backed Securities | | | 15,527,763 | |
| | | |
| |
| Technology (0.5%) | | | | |
| | Affiliated Computer Services, Inc. | | | | |
200,000 | | 5.200%, 6/1/2015 | | | 214,887 | |
| | Hewlett-Packard Company | | | | |
250,000 | | 4.300%, 6/1/2021 | | | 260,461 | |
| | Texas Instruments, Inc. | | | | |
250,000 | | 2.375%, 5/16/2016 | | | 258,555 | |
| | Xerox Corporation | | | | |
200,000 | | 4.500%, 5/15/2021 | | | 208,262 | |
| | | |
| | Total Technology | | | 942,165 | |
| | | |
| |
| Transportation (0.3%) | | | | |
| | American Airlines Pass Through Trust | | | | |
93,862 | | 10.375%, 7/2/2019 | | | 100,667 | |
| | CSX Corporation | | | | |
200,000 | | 3.700%, 10/30/2020 | | | 205,787 | |
| | Delta Air Lines, Inc. | | | | |
98,568 | | 4.950%, 11/23/2019b | | | 98,568 | |
The accompanying Notes to Financial Statements are an integral part of this schedule.
132
Balanced Fund
Schedule of Investments as of October 31, 2011
| | | | | | |
Principal Amount | | Long-Term Fixed Income (35.1%) | | Value | |
| Transportation (0.3%) - continued | | | | |
| | ERAC USA Finance, LLC | | | | |
$200,000 | | 5.250%, 10/1/2020f | | | $215,854 | |
| | | |
| | Total Transportation | | | 620,876 | |
| | | |
| |
| U.S. Government and Agencies (6.9%) | | | | |
| | Federal Home Loan Mortgage Corporation | | | | |
1,250,000 | | 0.375%, 10/30/2013 | | | 1,248,392 | |
| | U.S. Treasury Bonds | | | | |
1,230,000 | | 4.375%, 5/15/2041 | | | 1,509,825 | |
| | U.S. Treasury Notes | | | | |
1,750,000 | | 1.500%, 12/31/2013 | | | 1,795,253 | |
150,000 | | 0.750%, 6/15/2014 | | | 151,512 | |
1,100,000 | | 2.375%, 9/30/2014 | | | 1,162,477 | |
1,750,000 | | 2.000%, 1/31/2016 | | | 1,839,687 | |
100,000 | | 1.500%, 6/30/2016 | | | 102,688 | |
500,000 | | 2.750%, 2/28/2018 | | | 540,938 | |
100,000 | | 3.125%, 5/15/2021 | | | 108,711 | |
| | U.S. Treasury Notes, TIPS | | | | |
1,205,806 | | 2.500%, 7/15/2016 | | | 1,402,975 | |
1,326,150 | | 1.875%, 7/15/2019 | | | 1,539,266 | |
1,786,289 | | 1.125%, 1/15/2021 | | | 1,964,220 | |
| | | |
| | Total U.S. Government and Agencies | | | 13,365,944 | |
| | | |
| |
| U.S. Municipals (0.1%) | | | | |
| | North Texas Tollway Authority Revenue Bonds (Build America Bonds) | | | | |
150,000 | | 6.718%, 1/1/2049 | | | 183,388 | |
| | | |
| | Total U.S. Municipals | | | 183,388 | |
| | | |
| |
| Utilities (1.5%) | | | | |
| | Cleveland Electric Illuminating Company | | | | |
245,000 | | 5.700%, 4/1/2017 | | | 270,590 | |
| | Comision Federal de Electricidad | | | | |
200,000 | | 4.875%, 5/26/2021f | | | 204,000 | |
| | Energy Transfer Partners, LP | | | | |
250,000 | | 4.650%, 6/1/2021 | | | 248,178 | |
| | Enterprise Products Operating, LLC | | | | |
200,000 | | 5.200%, 9/1/2020 | | | 223,766 | |
| | Exelon Generation Company, LLC | | | | |
145,000 | | 5.750%, 10/1/2041 | | | 163,466 | |
| | FirstEnergy Solutions Corporation | | | | |
150,000 | | 4.800%, 2/15/2015 | | | 160,756 | |
| | ITC Holdings Corporation | | | | |
225,000 | | 6.050%, 1/31/2018f | | | 259,289 | |
| | Kinder Morgan Energy Partners, LP | | | | |
100,000 | | 4.150%, 3/1/2022b | | | 102,487 | |
| | MidAmerican Energy Holdings Company | | | | |
225,000 | | 6.500%, 9/15/2037 | | | 290,031 | |
| | ONEOK Partners, LP | | | | |
200,000 | | 8.625%, 3/1/2019 | | | 258,601 | |
| | Pennsylvania Electric Company | | | | |
200,000 | | 5.200%, 4/1/2020 | | | 221,128 | |
| | Power Receivables Finance, LLC | | | | |
31,120 | | 6.290%, 1/1/2012e | | | 31,146 | |
| | | | | | |
Principal Amount | | Long-Term Fixed Income (35.1%) | | Value | |
| Utilities (1.5%) - continued | | | | |
| | Union Electric Company | | | | |
$350,000 | | 6.400%, 6/15/2017 | | | $414,852 | |
| | | |
| | Total Utilities | | | 2,848,290 | |
| | | |
| | | | | | |
| | | |
| | Total Long-Term Fixed Income (cost $68,237,732) | | | 68,200,309 | |
| | | |
| | |
| Shares | | Mutual Funds (0.9%) | | Value | |
| Fixed Income Mutual Funds (0.9%) | | | | |
366,132 | | Thrivent High Yield Fund | | | 1,728,143 | |
| | | |
| | Total Fixed Income Mutual Funds | | | 1,728,143 | |
| | | |
| | | | | | |
| | | |
| | Total Mutual Funds (cost $1,400,000) | | | 1,728,143 | |
| | | |
| | |
| Shares | | Preferred Stock (0.1%) | | Value | |
| Financials (0.1%) | | | | |
1,150 | | Citigroup, Inc., Convertiblem | | | 109,296 | |
12,000 | | Federal National Mortgage Association, 8.250%a,k | | | 23,520 | |
4,000 | | HSBC Holdings plc, 8.000%k | | | 107,000 | |
| | | |
| | Total Financials | | | 239,816 | |
| | | |
| | | | | | |
| | | |
| | Total Preferred Stock (cost $384,738) | | | 239,816 | |
| | | |
| | |
| Shares | | Collateral Held for Securities Loaned (1.9%) | | Value | |
3,606,713 | | Thrivent Financial Securities Lending Trust | | | 3,606,713 | |
| | | |
| | Total Collateral Held for Securities Loaned (cost $3,606,713) | | | 3,606,713 | |
| | | |
| | |
Principal
Amount | | Short-Term Investments (8.0%)n | | Value | |
| | Federal Home Loan Bank Discount Notes | | | | |
$14,500,000 | | 0.025%, 11/18/2011o | | | 14,499,829 | |
| | Federal National Mortgage Association Discount Notes | | | | |
900,000 | | 0.099%, 2/22/2012o,p | | | 899,721 | |
| | | |
| | Total Short-Term Investments (at amortized cost) | | | 15,399,550 | |
| | | |
| | Total Investments (cost $206,296,555) 109.6% | | | $212,342,783 | |
| | | |
| | Other Assets and Liabilities, Net (9.6%) | | | (18,623,152 | ) |
| | | |
| | Total Net Assets 100.0% | | | $193,719,631 | |
| | | |
| a | Non-income producing security. |
| b | All or a portion of the security is on loan. |
| c | Denotes variable rate securities. Variable rate securities are securities whose yields vary with a designated market index or market rate. The rate shown is as of October 31, 2011. |
| d | All or a portion of the security is insured or guaranteed. |
The accompanying Notes to Financial Statements are an integral part of this schedule.
133
Balanced Fund
Schedule of Investments as of October 31, 2011
| e | Denotes restricted securities. Restricted securities are investment securities which have been deemed illiquid and cannot be offered for public sale without first being registered under the Securities Act of 1933. The following table indicates the acquisition date and cost of restricted securities Balanced Fund owned as of October 31, 2011. |
| | | | | | | | |
| Security | | Acquisition Date | | | Amortized Cost | |
Bear Stearns Commercial Mortgage Securities, Inc. | | | 3/30/2007 | | | | $785,274 | |
Commercial Mortgage Pass- Through Certificates | | | 5/2/2007 | | | | $750,000 | |
Commercial Mortgage Pass- Through Certificates | | | 10/18/2006 | | | | $1,000,000 | |
Power Receivables Finance, LLC | | | 9/30/2003 | | | | $31,135 | |
Wachovia Asset Securitization, Inc. | | | 3/16/2007 | | | | $633,397 | |
| f | Denotes securities sold under Rule 144A of the Securities Act of 1933, which exempts them from registration. These securities have been deemed liquid and may be resold to other dealers in the program or to other qualified institutional buyers. As of October 31, 2011, the value of these investments was $8,244,802 or 4.3% of total net assets. |
| g | Denotes equity-linked structured security. This security is linked to the S&P 500 Index. |
| h | Security is displayed in shares. This security is an equity-linked structured security. This security is linked to the common stock of RadioShack Corporation. |
| i | Security is displayed in shares. This security is an equity-linked structured security. This security is linked to the common stock of Kubota Corporation. |
| j | Security is displayed in shares. This security is an equity-linked structured security. This security is linked to the common stock of Microsoft Corporation. |
| k | Denotes perpetual securities. Perpetual securities pay an indefinite stream of interest, but may be called by the issuer at an earlier date. |
| l | Denotes investments purchased on a when-issued or delayed delivery basis. |
| m | Comprised of a 79.7% prepaid stock purchase contract for common stock of Citigroup, Inc. and a 20.3% amortizing note. |
The quarterly payments received consists of return of capital and 6.15% interest on only the portion that is the note.
| n | The interest rate shown reflects the yield, coupon rate or the discount rate at the date of purchase. |
| o | Denotes investments that benefit from credit enhancement or liquidity support provided by a third party bank, institution or government. |
| p | At October 31, 2011, $499,845 of investments were held on deposit with the counterparty and pledged as the initial margin deposit for open futures contracts. |
Definitions:
| | | | |
ADR | | - | | American Depositary Receipt, which are certificates for an underlying foreign security’s shares held by an issuing U.S. depository bank. |
REIT | | - | | Real Estate Investment Trust is a company that buys, develops, manages and/or sells real estate assets. |
TIPS | | - | | Treasury Inflation Protected Security. |
| | | | |
Unrealized Appreciation (Depreciation) | | | | |
Gross unrealized appreciation and depreciation of investments,based on cost for federal income tax purposes, were as follows: | |
Gross unrealized appreciation | | | $14,474,384 | |
Gross unrealized depreciation | | | (8,707,876 | ) |
Net unrealized appreciation (depreciation) | | | $5,766,508 | |
| |
Cost for federal income tax purposes | | | $206,576,274 | |
The accompanying Notes to Financial Statements are an integral part of this schedule.
134
Balanced Fund
Schedule of Investments as of October 31, 2011
Fair Valuation Measurements
The following table is a summary of the inputs used, as of October 31, 2011, in valuing Balanced Fund’s assets carried at fair value.
| | | | | | | | | | | | | | | | |
| Investments in Securities | | Total | | | Level 1 | | | Level 2 | | | Level 3 | |
Common Stock | | | | | | | | | | | | | | | | |
Consumer Discretionary | | | 14,889,068 | | | | 14,889,068 | | | | – | | | | – | |
Consumer Staples | | | 13,599,002 | | | | 13,599,002 | | | | – | | | | – | |
Energy | | | 15,180,661 | | | | 14,636,021 | | | | 544,640 | | | | – | |
Financials | | | 16,296,619 | | | | 16,296,619 | | | | – | | | | – | |
Health Care | | | 14,131,271 | | | | 14,131,271 | | | | – | | | | – | |
Industrials | | | 16,168,984 | | | | 16,168,984 | | | | – | | | | – | |
Information Technology | | | 23,014,739 | | | | 23,014,739 | | | | – | | | | – | |
Materials | | | 4,390,593 | | | | 4,390,593 | | | | – | | | | – | |
Utilities | | | 5,497,315 | | | | 5,497,315 | | | | – | | | | – | |
Long-Term Fixed Income | | | | | | | | | | | | | | | | |
Asset-Backed Securities | | | 3,260,236 | | | | – | | | | 3,260,236 | | | | – | |
Basic Materials | | | 1,384,593 | | | | – | | | | 1,384,593 | | | | – | |
Capital Goods | | | 1,136,959 | | | | – | | | | 1,136,959 | | | | – | |
Collateralized Mortgage Obligations | | | 1,930,101 | | | | – | | | | 1,930,101 | | | | – | |
Commercial Mortgage-Backed Securities | | | 6,351,623 | | | | – | | | | 6,351,623 | | | | – | |
Communications Services | | | 1,827,786 | | | | – | | | | 1,609,886 | | | | 217,900 | |
Consumer Cyclical | | | 977,715 | | | | – | | | | 977,715 | | | | – | |
Consumer Non-Cyclical | | | 1,933,661 | | | | – | | | | 1,933,661 | | | | – | |
Energy | | | 1,825,847 | | | | – | | | | 1,825,847 | | | | – | |
Financials | | | 12,318,582 | | | | – | | | | 10,841,374 | | | | 1,477,208 | |
Foreign Government | | | 1,764,780 | | | | – | | | | 1,764,780 | | | | – | |
Mortgage-Backed Securities | | | 15,527,763 | | | | – | | | | 15,527,763 | | | | – | |
Technology | | | 942,165 | | | | – | | | | 942,165 | | | | – | |
Transportation | | | 620,876 | | | | – | | | | 620,876 | | | | – | |
U.S. Government and Agencies | | | 13,365,944 | | | | – | | | | 13,365,944 | | | | – | |
U.S. Municipals | | | 183,388 | | | | – | | | | 183,388 | | | | – | |
Utilities | | | 2,848,290 | | | | – | | | | 2,848,290 | | | | – | |
Mutual Funds | | | | | | | | | | | | | | | | |
Fixed Income Mutual Funds | | | 1,728,143 | | | | 1,728,143 | | | | – | | | | – | |
Preferred Stock | | | | | | | | | | | | | | | | |
Financials | | | 239,816 | | | | 239,816 | | | | – | | | | – | |
Collateral Held for Securities Loaned | | | 3,606,713 | | | | 3,606,713 | | | | – | | | | – | |
Short-Term Investments | | | 15,399,550 | | | | – | | | | 15,399,550 | | | | – | |
| |
Total | | | $212,342,783 | | | | $128,198,284 | | | | $82,449,391 | | | | $1,695,108 | |
| | | | |
Other Financial Instruments | | | Total | | | | Level 1 | | | | Level 2 | | | | Level 3 | |
| | | | |
Asset Derivatives | | | | | | | | | | | | | | | | |
Futures Contracts | | | 183,845 | | | | 183,845 | | | | – | | | | – | |
Credit Default Swaps | | | 85,687 | | | | – | | | | 85,687 | | | | – | |
| |
Total Asset Derivatives | | | $269,532 | | | | $183,845 | | | | $85,687 | | | | $– | |
The accompanying Notes to Financial Statements are an integral part of this schedule.
135
Balanced Fund
Schedule of Investments as of October 31, 2011
The following table is a reconciliation of assets in which significant unobservable inputs (Level 3) were used in determining fair value for Balanced Fund.
| | | | | | | | | | | | | | | | | | | | | | | | | | | | | | | | |
| Investments in Securities | | Value
October 31,
2010 | | | Realized
Gain/
(Loss) | | | Change in
Unrealized
Appreciation/
(Depreciation)* | | | Purchases | | | Sales | | | Transfers
Into
Level 3 | | | Transfers
Out of
Level 3 | | | Value
October 31,
2011 | |
Long-Term Fixed Income | | | | | | | | | | | | | | | | | | | | | | | | | | | | | | | | |
Asset-Backed Securities | | | 506,090 | | | | - | | | | 64,537 | | | | - | | | | (119,153) | | | | - | | | | (451,474) | | | | - | |
Communications Services | | | - | | | | - | | | | 2,778 | | | | - | | | | - | | | | 215,122 | | | | - | | | | 217,900 | |
Financials | | | 956,792 | | | | 1,211 | | | | (136,359) | | | | 781,653 | | | | (126,089) | | | | - | | | | - | | | | 1,477,208 | |
Transportation | | | 780,429 | | | | 64,271 | | | | (83,372) | | | | - | | | | (660,661) | | | | - | | | | (100,667) | | | | - | |
| |
Total | | | $2,243,311 | | | | $65,482 | | | | ($152,416) | | | | $781,653 | | | | ($905,903) | | | | $215,122 | | | | ($552,141) | | | | $1,695,108 | |
* Includes the change in net unrealized appreciation/(depreciation) on level 3 securities held on October 31, 2011 of ($118,165).
| | | | | | | | | | | | | | | | | | | | |
| Futures Contracts | | Number of
Contracts
Long/(Short) | | | Expiration
Date | | | Notional
Principal
Amount | | | Value | | | Unrealized
Gain/(Loss) | |
2-Yr. U.S. Treasury Bond Futures | | | (15 | ) | | | December 2011 | | | | ($3,306,517 | ) | | | ($3,304,219 | ) | | | $2,298 | |
10-Yr. U.S. Treasury Bond Futures | | | (65 | ) | | | December 2011 | | | | (8,434,568 | ) | | | (8,389,063 | ) | | | 45,505 | |
20-Yr. U.S. Treasury Bond Futures | | | 20 | | | | December 2011 | | | | 2,777,092 | | | | 2,780,625 | | | | 3,533 | |
S&P 500 Index Futures | | | 10 | | | | December 2011 | | | | 2,990,741 | | | | 3,123,250 | | | | 132,509 | |
Total Futures Contracts | | | | | | | | | | | | | | | | | | | $183,845 | |
| | | | | | | | | | | | | | | | | | | | | | |
Credit Default Swaps and Counterparty | | Buy/Sell Protection1 | | Termination
Date | | | Notional
Principal
Amount2 | | | Upfront
Payments
Received (Made) | | | Value3 | | | Unrealized
Gain/(Loss) | |
CDX HY, Series 16, 5 Year, at 5.00%; Bank of America | | Buy | | | 6/20/2016 | | | | $1,500,000 | | | | $26,620 | | | | $46,253 | | | | $72,873 | |
CDX IG, Series 16, 5 Year, at 1.00%; J.P. Morgan Chaseand Co. | | Buy | | | 6/20/2016 | | | | 1,500,000 | | | | 2,579 | | | | 10,235 | | | | 12,814 | |
Total Credit Default Swaps | | | | | | | | | | | | | | | | | $56,488 | | | | $85,687 | |
| 1 | As the buyer of protection, Balanced Fund pays periodic fees in return for payment by the seller which is contingent upon an adverse credit event occurring in the underlying issuer or reference entity. As the seller of protection, Balanced Fund collects periodic fees from the buyer and profits if the credit of the underlying issuer or reference entity remains stable or improves while the swap is outstanding, but the seller in a credit default swap contract would be required to pay the amount of credit loss, determined as specified in the agreement, to the buyer in the event of an adverse credit event in the reference entity. |
| 2 | The maximum potential amount of future payments Balanced Fund could be required to make as the seller or receive as the buyer of protection. |
| 3 | The values for credit indexes (CDX or LCDX) serve as an indicator of the current status of the payment/performance risk and represent the liability or profit for the credit default swap contract had the contract been closed as of the reporting date. When protection has been sold, the value of the swap will increase when the swap spread declines representing an improvement in the reference entity’s credit worthiness. The value of the swap will decrease when the swap spread increases representing a deterioration in the reference entity’s credit worthiness. When protection has been purchased, the value of the swap will increase when the swap spread increases representing a deterioration in the reference entity’s credit worthiness. The value of the swap will decrease when the swap spread declines representing an improvement in the reference entity’s credit worthiness. |
The accompanying Notes to Financial Statements are an integral part of this schedule.
136
Balanced Fund
Schedule of Investments as of October 31, 2011
The following table summarizes the fair value and Statement of Assets and Liabilities location, as of October 31, 2011, for Balanced Fund’s investments in financial derivative instruments by primary risk exposure as discussed under item (2) Significant Accounting Policies of the Notes to Financial Statements.
| | | | | | |
| Derivatives by risk category | | Statement of Assets and Liabilities Location | | Fair Value | |
| | |
Asset Derivatives | | | | | | |
| | |
Interest Rate Contracts | | | | | | |
Futures* | | Net Assets - Net unrealized appreciation/(depreciation) on Futures contracts | | | $51,336 | |
Total Interest Rate Contracts | | | | | 51,336 | |
| | |
Equity Contracts | | | | | | |
Futures* | | Net Assets - Net unrealized appreciation/(depreciation) on Futures contracts | | | 132,509 | |
Total Equity Contracts | | | | | 132,509 | |
| | |
Credit Contracts | | | | | | |
Credit Default Swaps | | Receivable/Payable - Swap agreements, at value; Net Assets - Net unrealized appreciation/(depreciation) on Swap agreements | | | 85,687 | |
Total Credit Contracts | | | | | 85,687 | |
| |
Total Asset Derivatives | | | | | $269,532 | |
| * | Includes cumulative appreciation/depreciation of futures contracts as reported in the Schedule of Investments. Only current day’s variation margin is reported within the Statement of Assets and Liabilities. |
The following table summarizes the net realized gains/(losses) and Statement of Operations location, for the period ended October 31, 2011, for Balanced Fund’s investments in financial derivative instruments by primary risk exposure.
| | | | | | |
| Derivatives by risk category | | Statement of Operations location | | Realized Gains/(Losses)
recognized in Income | |
| | |
Interest Rate Contracts | | | | | | |
Options Purchased | | Net realized gains/(losses) on Investments | | | (96,567 | ) |
Futures | | Net realized gains/(losses) on Futures contracts | | | (285,926 | ) |
| | |
Total Interest Rate Contracts | | | | | (382,493 | ) |
| | |
Equity Contracts | | | | | | |
Futures | | Net realized gains/(losses) on Futures contracts | | | 372,178 | |
| | |
Total Equity Contracts | | | | | 372,178 | |
| | |
Foreign Exchange Contracts | | | | | | |
Forward Contracts | | Net realized gains/(losses) on Foreign currency transactions | | | 11,333 | |
| | |
Total Foreign Exchange Contracts | | | | | 11,333 | |
| | |
Credit Contracts | | | | | | |
Credit Default Swaps | | Net realized gains/(losses) on Swap agreements | | | (111,119 | ) |
| | |
Total Credit Contracts | | | | | (111,119 | ) |
| |
| | |
Total | | | | | ($110,101 | ) |
The accompanying Notes to Financial Statements are an integral part of this schedule.
137
Balanced Fund
Schedule of Investments as of October 31, 2011
The following table summarizes the change in net unrealized appreciation/(depreciation) and Statement of Operations location, for the period ended October 31, 2011, for Balanced Fund’s investments in financial derivative instruments by primary risk exposure.
| | | | | | |
| Derivatives by risk category | | Statement of Operations Location | | Change in unrealized
appreciation/(depreciation)
recognized in Income | |
Interest Rate Contracts | | | | | | |
Options Purchased | | Change in net unrealized appreciation/(depreciation) on Investments | | | 5,745 | |
Futures | | Change in net unrealized appreciation/(depreciation) on Futures contracts | | | 164,115 | |
Total Interest Rate Contracts | | | | | 169,860 | |
Equity Contracts | | | | | | |
Futures | | Change in net unrealized appreciation/(depreciation) on Futures contracts | | | 25,909 | |
Total Equity Contracts | | | | | 25,909 | |
Credit Contracts | | | | | | |
Credit Default Swaps | | Change in net unrealized appreciation/(depreciation) on Swap agreements | | | 115,366 | |
Total Credit Contracts | | | | | 115,366 | |
| |
| | |
Total | | | | | $311,135 | |
The following table presents Balanced Fund’s average volume of derivative activity during the period ended October 31, 2011.
| | | | | | | | | | | | | | | | | | | | | | | | | | | | |
Derivative Risk Category | | Futures
(Notional*) | | | Futures
(Percentage
of Average
Net Assets) | | | Forwards
(Notional*) | | | Forwards
(Percentage
of Average
Net Assets) | | | Swaps
(Notional*) | | | Swaps
(Percentage
of Average
Net Assets) | | | Options
(Contracts) | |
Equity Contracts | | | $1,898,021 | | | | 0.9 | % | | | N/A | | | | N/A | | | | N/A | | | | N/A | | | | N/A | |
Interest Rate Contracts | | | 13,496,560 | | | | 6.5 | | | | N/A | | | | N/A | | | | N/A | | | | N/A | | | | 23 | |
Foreign Exchange Contracts | | | N/A | | | | N/A | | | | $54,740 | | | | <0.1 | % | | | N/A | | | | N/A | | | | N/A | |
Credit Contracts | | | N/A | | | | N/A | | | | N/A | | | | N/A | | | | $3,310,418 | | | | 1.6 | % | | | N/A | |
| * | Notional amount represents long or short, or both, derivative positions held by the Fund. |
Investment in Affiliates
Affiliated issuers, as defined under the Investment Company Act of 1940, include those in which the Fund’s holdings of an issuer represent 5% or more of the outstanding voting securities of an issuer, or any affiliated mutual fund.
A summary of transactions for the fiscal year to date, in Balanced Fund, is as follows:
| | | | | | | | | | | | | | | | | | | | | | | | |
| Fund | | Value
October 31, 2010 | | | Gross
Purchases | | | Gross Sales | | | Shares Held at
October 31, 2011 | | | Value
October 31, 2011 | | | Income Earned
November 1, 2010 -
October 31, 2011 | |
High Yield | | | $1,779,402 | | | | $– | | | | $– | | | | 366,132 | | | | $1,728,143 | | | | $137,814 | |
Thrivent Financial Securities Lending Trust | | | 4,547,275 | | | | 50,152,627 | | | | 51,093,189 | | | | 3,606,713 | | | | 3,606,713 | | | | 9,403 | |
Total Value and Income Earned | | | 6,326,677 | | | | | | | | | | | | | | | | 5,334,856 | | | | 147,217 | |
The accompanying Notes to Financial Statements are an integral part of this schedule.
138
High Yield Fund
Schedule of Investments as of October 31, 2011
| | | | | | |
Principal
Amount | | Bank Loans (1.9%)a | | Value | |
| Financials (0.5%) | | | | |
| | Nuveen Investments, Inc., Term Loan | | | | |
$3,530,000 | | 12.500%, 7/31/2015 | | | $3,640,313 | |
| | | |
| | Total Financials | | | 3,640,313 | |
| | | |
| |
| Technology (0.5%) | | | | |
| | First Data Corporation Extended, Term Loan | | | | |
3,809,215 | | 4.245%, 3/24/2018 | | | 3,278,630 | |
| | | |
| | Total Technology | | | 3,278,630 | |
| | | |
| |
| Utilities (0.9%) | | | | |
| | Texas Competitive Electric Holdings, LLC, Term Loan | | | | |
9,080,379 | | 4.757%, 10/10/2017 | | | 6,154,771 | |
| | | |
| | Total Utilities | | | 6,154,771 | |
| | | |
| | | | | | |
| | | |
| | Total Bank Loans (cost $15,128,883) | | | 13,073,714 | |
| | | |
| | |
Principal
Amount | | Long-Term Fixed Income (92.8%) | | Value | |
| Asset-Backed Securities (0.5%) | | | | |
| | J.P. Morgan Mortgage Acquisition Corporation | | | | |
2,400,000 | | 5.461%, 10/25/2036 | | | 1,823,376 | |
| | Renaissance Home Equity Loan Trust | | | | |
2,279,193 | | 5.746%, 5/25/2036 | | | 1,297,267 | |
1,600,000 | | 6.011%, 5/25/2036 | | | 704,045 | |
| | | |
| | Total Asset-Backed Securities | | | 3,824,688 | |
| | | |
| |
| Basic Materials (8.1%) | | | | |
| | AbitibiBowater, Inc. | | | | |
4,696,000 | | 10.250%, 10/15/2018b | | | 5,142,120 | |
| | APERAM | | | | |
1,430,000 | | 7.750%, 4/1/2018b | | | 1,258,400 | |
| | Arch Coal, Inc. | | | | |
1,900,000 | | 7.000%, 6/15/2019b | | | 1,966,500 | |
1,500,000 | | 7.250%, 10/1/2020 | | | 1,556,250 | |
950,000 | | 7.250%, 6/15/2021b | | | 978,500 | |
| | Cascades, Inc. | | | | |
750,000 | | 7.750%, 12/15/2017 | | | 735,000 | |
| | CONSOL Energy, Inc. | | | | |
1,700,000 | | 8.000%, 4/1/2017 | | | 1,861,500 | |
2,430,000 | | 8.250%, 4/1/2020 | | | 2,660,850 | |
| | FMG Resources Property, Ltd. | | | | |
2,370,000 | | 7.000%, 11/1/2015b | | | 2,370,000 | |
3,300,000 | | 6.875%, 2/1/2018b,c | | | 3,168,000 | |
3,860,000 | | 8.250%, 11/1/2019b | | | 3,898,600 | |
| | Graphic Packaging International, Inc. | | | | |
700,000 | | 9.500%, 6/15/2017 | | | 764,750 | |
1,400,000 | | 7.875%, 10/1/2018 | | | 1,498,000 | |
| | Hexion US Finance Corporation/Hexion Nova Scotia Finance ULC | | | | |
4,450,000 | | 8.875%, 2/1/2018 | | | 4,394,375 | |
2,850,000 | | 9.000%, 11/15/2020 | | | 2,486,625 | |
| | Lyondell Chemical Company | | | | |
1,848,000 | | 8.000%, 11/1/2017 | | | 2,079,000 | |
2,376,667 | | 11.000%, 5/1/2018 | | | 2,647,013 | |
| | Midwest Vanadium Pty., Ltd. | | | | |
2,370,000 | | 11.500%, 2/15/2018b | | | 1,978,950 | |
| | | | | | |
Principal Amount | | Long-Term Fixed Income (92.8%) | | Value | |
| Basic Materials (8.1%) - continued | | | | |
| | NOVA Chemicals Corporation | | | | |
$4,890,000 | | 8.625%, 11/1/2019 | | | $5,501,250 | |
| | Novelis, Inc. | | | | |
3,550,000 | | 8.750%, 12/15/2020 | | | 3,869,500 | |
| | Ryerson Holding Corporation | | | | |
4,230,000 | | Zero Coupon, 2/1/2015 | | | 1,861,200 | |
| | Ryerson, Inc. | | | | |
1,700,000 | | 12.000%, 11/1/2015 | | | 1,734,000 | |
| | Severstal Columbus, LLC | | | | |
1,400,000 | | 10.250%, 2/15/2018 | | | 1,470,000 | |
| | | |
| | Total Basic Materials | | | 55,880,383 | |
| | | |
| |
| Capital Goods (7.8%) | | | | |
| | Associated Materials, LLC | | | | |
4,200,000 | | 9.125%, 11/1/2017c | | | 3,822,000 | |
| | BE Aerospace, Inc. | | | | |
3,280,000 | | 6.875%, 10/1/2020 | | | 3,534,200 | |
| | Case New Holland, Inc. | | | | |
4,700,000 | | 7.875%, 12/1/2017 | | | 5,299,250 | |
| | Cemex SAB de CV | | | | |
2,390,000 | | 5.369%, 9/30/2015b,d | | | 1,768,600 | |
4,620,000 | | 9.000%, 1/11/2018b,c | | | 3,857,700 | |
| | Coleman Cable, Inc. | | | | |
1,580,000 | | 9.000%, 2/15/2018 | | | 1,564,200 | |
| | EnergySolutions, Inc. | | | | |
2,350,000 | | 10.750%, 8/15/2018 | | | 2,373,500 | |
| | Liberty Tire Recycling | | | | |
2,340,000 | | 11.000%, 10/1/2016b | | | 2,363,400 | |
| | Manitowoc Company, Inc. | | | | |
4,270,000 | | 8.500%, 11/1/2020 | | | 4,440,800 | |
| | Nortek, Inc. | | | | |
2,840,000 | | 10.000%, 12/1/2018b | | | 2,783,200 | |
2,860,000 | | 8.500%, 4/15/2021b,c | | | 2,538,250 | |
| | Owens-Illinois, Inc. | | | | |
3,030,000 | | 7.800%, 5/15/2018 | | | 3,264,825 | |
| | Packaging Dynamics Corporation | | | | |
710,000 | | 8.750%, 2/1/2016b | | | 720,650 | |
| | Plastipak Holdings, Inc. | | | | |
2,595,000 | | 8.500%, 12/15/2015b | | | 2,633,925 | |
500,000 | | 10.625%, 8/15/2019b | | | 542,500 | |
| | RBS Global, Inc./Rexnord Corporation | | | | |
3,980,000 | | 8.500%, 5/1/2018 | | | 4,079,500 | |
| | Reynolds Group Issuer, Inc. | | | | |
1,420,000 | | 9.000%, 4/15/2019b | | | 1,370,300 | |
2,370,000 | | 8.250%, 2/15/2021b | | | 2,174,475 | |
| | RSC Equipment Rental, Inc. | | | | |
2,780,000 | | 8.250%, 2/1/2021 | | | 2,821,700 | |
| | Sealed Air Corporation | | | | |
1,450,000 | | 8.375%, 9/15/2021b | | | 1,569,625 | |
| | | |
| | Total Capital Goods | | | 53,522,600 | |
| | | |
| |
| Communications Services (15.1%) | | | | |
| | AMC Networks, Inc. | | | | |
4,690,000 | | 7.750%, 7/15/2021b | | | 5,088,650 | |
| | Cablevision Systems Corporation | | | | |
3,740,000 | | 8.625%, 9/15/2017 | | | 4,057,900 | |
| | CCO Holdings, LLC | | | | |
3,750,000 | | 7.250%, 10/30/2017 | | | 3,918,750 | |
1,890,000 | | 7.000%, 1/15/2019 | | | 1,960,875 | |
| | Clear Channel Worldwide Holdings, Inc. | | | | |
5,720,000 | | 9.250%, 12/15/2017 | | | 6,206,200 | |
The accompanying Notes to Financial Statements are an integral part of this schedule.
139
High Yield Fund
Schedule of Investments as of October 31, 2011
| | | | | | |
Principal Amount | | Long-Term Fixed Income (92.8%) | | Value | |
| Communications Services (15.1%) - continued | | | | |
| | Cricket Communications, Inc. | | | | |
$1,440,000 | | 7.750%, 10/15/2020c | | | $1,231,200 | |
1,900,000 | | 7.750%, 10/15/2020b | | | 1,605,500 | |
| | CSC Holdings, LLC | | | | |
3,750,000 | | 6.750%, 11/15/2021e | | | 3,750,000 | |
3,050,000 | | 8.500%, 6/15/2015 | | | 3,309,250 | |
| | Digicel, Ltd. | | | | |
3,790,000 | | 8.250%, 9/1/2017b | | | 3,865,800 | |
| | EH Holding Corporation | | | | |
4,400,000 | | 6.500%, 6/15/2019b | | | 4,499,000 | |
| | Frontier Communications Corporation | | | | |
2,810,000 | | 8.250%, 4/15/2017 | | | 2,999,675 | |
| | GCI, Inc. | | | | |
3,800,000 | | 6.750%, 6/1/2021 | | | 3,714,500 | |
| | Intelsat Bermuda, Ltd. | | | | |
5,300,000 | | 11.250%, 2/4/2017 | | | 5,260,250 | |
| | Intelsat Jackson Holdings SA | | | | |
6,320,000 | | 7.250%, 10/15/2020b | | | 6,335,800 | |
| | Intelsat Luxembourg SA | | | | |
7,178,461 | | 11.500%, 2/4/2017 | | | 7,178,461 | |
710,000 | | 11.500%, 2/4/2017b | | | 710,000 | |
| | Level 3 Financing, Inc. | | | | |
940,000 | | 8.750%, 2/15/2017 | | | 961,150 | |
1,880,000 | | 8.125%, 7/1/2019b,c | | | 1,861,200 | |
| | Nielsen Finance, LLC/Nielsen Finance Company | | | | |
2,700,000 | | 7.750%, 10/15/2018 | | | 2,976,750 | |
| | NII Capital Corporation | | | | |
4,670,000 | | 8.875%, 12/15/2019 | | | 4,903,500 | |
1,910,000 | | 7.625%, 4/1/2021 | | | 1,967,300 | |
| | Quebecor Media, Inc. | | | | |
3,210,000 | | 7.750%, 3/15/2016 | | | 3,314,325 | |
| | Satmex Escrow SA de CV | | | | |
4,770,000 | | 9.500%, 5/15/2017b | | | 4,865,400 | |
| | Sprint Nextel Corporation | | | | |
1,870,000 | | 8.375%, 8/15/2017 | | | 1,720,400 | |
| | TW Telecom Holdings, Inc. | | | | |
2,100,000 | | 8.000%, 3/1/2018 | | | 2,226,000 | |
| | UPC Holding BV | | | | |
4,000,000 | | 9.875%, 4/15/2018b | | | 4,350,000 | |
| | Videotron Ltee | | | | |
1,710,000 | | 9.125%, 4/15/2018 | | | 1,881,000 | |
| | VimpelCom Holdings BV | | | | |
2,360,000 | | 7.504%, 3/1/2022b | | | 2,212,500 | |
| | Virgin Media Finance plc | | | | |
1,560,000 | | 8.375%, 10/15/2019 | | | 1,735,500 | |
| | XM Satellite Radio, Inc. | | | | |
3,320,000 | | 7.625%, 11/1/2018b | | | 3,577,300 | |
| | | |
| | Total Communications Services | | | 104,244,136 | |
| | | |
| |
| Consumer Cyclical (15.9%) | | | | |
| | American Axle & Manufacturing, Inc. | | | | |
1,850,000 | | 5.250%, 2/11/2014c | | | 1,822,250 | |
1,870,000 | | 7.875%, 3/1/2017c | | | 1,893,375 | |
| | Beazer Homes USA, Inc. | | | | |
2,800,000 | | 6.875%, 7/15/2015 | | | 2,306,500 | |
2,370,000 | | 9.125%, 5/15/2019 | | | 1,682,700 | |
| | Bon-Ton Department Stores, Inc. | | | | |
2,700,000 | | 10.250%, 3/15/2014c | | | 2,396,250 | |
| | | | | | |
Principal
Amount | | Long-Term Fixed Income (92.8%) | | Value | |
| Consumer Cyclical (15.9%) - continued | | | | |
| | Burlington Coat Factory Warehouse Corporation | | | | |
$3,350,000 | | 10.000%, 2/15/2019b | | | $3,316,500 | |
| | Caesars Entertainment Operating Company, Inc. | | | | |
3,500,000 | | 10.000%, 12/15/2018c | | | 2,638,125 | |
| | Chrysler Group, LLC | | | | |
3,205,000 | | 8.000%, 6/15/2019b,c | | | 2,948,600 | |
3,930,000 | | 8.250%, 6/15/2021b | | | 3,595,950 | |
| | Circus & Eldorado Joint Venture/Silver Legacy Capital Corporation | | | | |
2,075,000 | | 10.125%, 3/1/2012 | | | 1,587,375 | |
| | DineEquity, Inc. | | | | |
3,800,000 | | 9.500%, 10/30/2018 | | | 4,028,000 | |
| | Eldorado Resorts, LLC | | | | |
1,900,000 | | 8.625%, 6/15/2019b | | | 1,643,500 | |
| | FireKeepers Development Authority | | | | |
2,470,000 | | 13.875%, 5/1/2015b | | | 2,815,800 | |
| | Ford Motor Credit Company, LLC | | | | |
4,680,000 | | 7.000%, 4/15/2015 | | | 5,101,200 | |
| | Gaylord Entertainment Company | | | | |
4,390,000 | | 6.750%, 11/15/2014 | | | 4,335,125 | |
| | General Motors Financial Company, Inc. | | | | |
1,190,000 | | 6.750%, 6/1/2018b | | | 1,200,892 | |
| | Lear Corporation | | | | |
1,950,000 | | 7.875%, 3/15/2018 | | | 2,101,125 | |
1,950,000 | | 8.125%, 3/15/2020 | | | 2,135,250 | |
| | Levi Strauss & Company | | | | |
2,370,000 | | 7.625%, 5/15/2020c | | | 2,423,325 | |
| | Limited Brands, Inc. | | | | |
1,430,000 | | 6.625%, 4/1/2021 | | | 1,501,500 | |
| | Marina District Finance Company, Inc. | | | | |
4,240,000 | | 9.500%, 10/15/2015c | | | 4,197,600 | |
470,000 | | 9.875%, 8/15/2018c | | | 464,125 | |
| | NCL Corporation, Ltd. | | | | |
1,830,000 | | 11.750%, 11/15/2016 | | | 2,104,500 | |
4,030,000 | | 9.500%, 11/15/2018b | | | 4,191,200 | |
| | Peninsula Gaming, LLC | | | | |
1,830,000 | | 8.375%, 8/15/2015 | | | 1,880,325 | |
3,980,000 | | 10.750%, 8/15/2017c | | | 4,099,400 | |
| | Pittsburgh Glass Works, LLC | | | | |
1,550,000 | | 8.500%, 4/15/2016b | | | 1,550,000 | |
| | Realogy Corporation | | | | |
2,645,000 | | 11.500%, 4/15/2017 | | | 2,142,450 | |
| | Realogy Corporation, Convertible | | | | |
1,430,000 | | 11.000%, 4/15/2018f | | | 829,400 | |
| | Rite Aid Corporation | | | | |
2,530,000 | | 7.500%, 3/1/2017 | | | 2,517,350 | |
1,790,000 | | 9.500%, 6/15/2017 | | | 1,628,900 | |
| | ROC Finance, LLC | | | | |
4,220,000 | | 12.125%, 9/1/2018b | | | 4,452,100 | |
| | Seminole Indian Tribe of Florida | | | | |
4,530,000 | | 7.804%, 10/1/2020b | | | 4,375,708 | |
| | Service Corporation International | | | | |
1,600,000 | | 6.750%, 4/1/2015 | | | 1,704,000 | |
| | Seven Seas Cruises S de RL, LLC | | | | |
3,790,000 | | 9.125%, 5/15/2019b | | | 3,865,800 | |
| | Shingle Springs Tribal Gaming Authority | | | | |
5,075,000 | | 9.375%, 6/15/2015f | | | 2,689,750 | |
The accompanying Notes to Financial Statements are an integral part of this schedule.
140
High Yield Fund
Schedule of Investments as of October 31, 2011
| | | | | | |
Principal
Amount | | Long-Term Fixed Income (92.8%) | | Value | |
| Consumer Cyclical (15.9%) - continued | | | | |
| | Tunica-Biloxi Gaming Authority | | | | |
$4,230,000 | | 9.000%, 11/15/2015f | | | $4,208,850 | |
| | West Corporation | | | | |
4,350,000 | | 8.625%, 10/1/2018 | | | 4,502,250 | |
3,560,000 | | 7.875%, 1/15/2019 | | | 3,613,400 | |
| | WMG Acquisition Corporation | | | | |
470,000 | | 9.500%, 6/15/2016b | | | 498,200 | |
2,350,000 | | 11.500%, 10/1/2018b | | | 2,344,125 | |
| | | |
| | Total Consumer Cyclical | | | 109,332,775 | |
| | | |
| |
| Consumer Non-Cyclical (13.0%) | | | | |
| | Biomet, Inc. | | | | |
1,700,000 | | 10.375%, 10/15/2017 | | | 1,836,000 | |
3,100,000 | | 11.625%, 10/15/2017 | | | 3,379,000 | |
| | Blue Merger Sub, Inc. | | | | |
1,275,000 | | 7.625%, 2/15/2019b | | | 1,211,250 | |
| | Capella Healthcare, Inc. | | | | |
3,540,000 | | 9.250%, 7/1/2017b | | | 3,646,200 | |
| | CDRT Merger Sub, Inc. | | | | |
3,680,000 | | 8.125%, 6/1/2019b | | | 3,680,000 | |
| | Community Health Systems, Inc. | | | | |
2,270,000 | | 8.875%, 7/15/2015c | | | 2,323,913 | |
| | Diversey, Inc. | | | | |
1,420,000 | | 8.250%, 11/15/2019 | | | 1,718,200 | |
| | DJO Finance, LLC/DJO Finance Corporation | | | | |
2,550,000 | | 9.750%, 10/15/2017 | | | 2,097,375 | |
1,570,000 | | 7.750%, 4/15/2018 | | | 1,326,650 | |
| | Endo Pharmaceuticals Holdings, Inc. | | | | |
710,000 | | 7.000%, 7/15/2019b | | | 766,800 | |
2,360,000 | | 7.250%, 1/15/2022b | | | 2,542,900 | |
| | Fresenius Medical Care US Finance, Inc. | | | | |
2,340,000 | | 6.500%, 9/15/2018b | | | 2,457,000 | |
| | Giant Funding Corporation | | | | |
3,620,000 | | 8.250%, 2/1/2018b | | | 3,810,050 | |
| | HCA, Inc. | | | | |
2,290,000 | | 8.500%, 4/15/2019 | | | 2,519,000 | |
3,730,000 | | 7.250%, 9/15/2020 | | | 3,995,762 | |
4,570,000 | | 7.500%, 2/15/2022 | | | 4,661,400 | |
| | Ingles Markets, Inc. | | | | |
1,400,000 | | 8.875%, 5/15/2017 | | | 1,501,500 | |
| | Jarden Corporation | | | | |
930,000 | | 7.500%, 1/15/2020 | | | 995,100 | |
| | JBS Finance II, Ltd. | | | | |
4,450,000 | | 8.250%, 1/29/2018f | | | 4,116,250 | |
| | JBS USA, LLC/JBS USA Finance, Inc. | | | | |
2,850,000 | | 11.625%, 5/1/2014 | | | 3,135,000 | |
| | Kinetic Concepts, Inc./KCI USA, Inc. | | | | |
4,185,000 | | 10.500%, 11/1/2018b,e | | | 4,232,081 | |
| | Libbey Glass, Inc. | | | | |
676,000 | | 10.000%, 2/15/2015 | | | 719,940 | |
| | Michael Foods, Inc. | | | | |
3,760,000 | | 9.750%, 7/15/2018 | | | 3,919,800 | |
| | Mylan, Inc. | | | | |
2,790,000 | | 7.875%, 7/15/2020b | | | 3,124,800 | |
| | Revlon Consumer Products Corporation | | | | |
3,270,000 | | 9.750%, 11/15/2015 | | | 3,507,075 | |
| | Select Medical Corporation | | | | |
1,511,000 | | 7.625%, 2/1/2015 | | | 1,405,230 | |
2,900,000 | | 6.267%, 9/15/2015d | | | 2,479,500 | |
| | | | | | |
Principal
Amount | | Long-Term Fixed Income (92.8%) | | Value | |
| Consumer Non-Cyclical (13.0%) - continued | | | | |
| | Spectrum Brands Holdings, Inc. | | | | |
$3,300,000 | | 9.500%, 6/15/2018 | | | $3,663,000 | |
| | Teleflex, Inc. | | | | |
3,790,000 | | 6.875%, 6/1/2019 | | | 3,922,650 | |
| | Tenet Healthcare Corporation | | | | |
1,950,000 | | 8.875%, 7/1/2019 | | | 2,203,500 | |
940,000 | | 8.000%, 8/1/2020 | | | 970,550 | |
| | Valeant Pharmaceuticals International | | | | |
1,880,000 | | 6.875%, 12/1/2018b | | | 1,872,950 | |
1,415,000 | | 6.750%, 8/15/2021b | | | 1,365,475 | |
| | Visant Corporation | | | | |
4,360,000 | | 10.000%, 10/1/2017 | | | 4,229,200 | |
| | | |
| | Total Consumer Non-Cyclical | | | 89,335,101 | |
| | | |
| |
| Energy (13.3%) | | | | |
| | Chesapeake Energy Corporation | | | | |
2,810,000 | | 6.875%, 8/15/2018 | | | 3,013,725 | |
| | Chesapeake Oilfield Operating, LLC | | | | |
1,760,000 | | 6.625%, 11/15/2019b,c | | | 1,808,400 | |
| | Citgo Petroleum Corporation | | | | |
3,080,000 | | 11.500%, 7/1/2017f | | | 3,526,600 | |
| | Coffeyville Resources, LLC | | | | |
1,791,000 | | 9.000%, 4/1/2015b | | | 1,929,803 | |
3,900,000 | | 10.875%, 4/1/2017b | | | 4,416,750 | |
| | Concho Resources, Inc. | | | | |
4,760,000 | | 6.500%, 1/15/2022 | | | 4,998,000 | |
| | Connacher Oil and Gas, Ltd. | | | | |
4,280,000 | | 8.500%, 8/1/2019b | | | 3,124,400 | |
| | Denbury Resources, Inc. | | | | |
700,000 | | 9.750%, 3/1/2016 | | | 775,250 | |
369,000 | | 8.250%, 2/15/2020 | | | 407,745 | |
1,540,000 | | 6.375%, 8/15/2021 | | | 1,586,200 | |
| | Energy XXI Gulf Coast, Inc. | | | | |
1,890,000 | | 9.250%, 12/15/2017 | | | 2,012,850 | |
1,420,000 | | 7.750%, 6/15/2019 | | | 1,434,200 | |
| | Forest Oil Corporation | | | | |
3,390,000 | | 7.250%, 6/15/2019 | | | 3,474,750 | |
| | Harvest Operations Corporation | | | | |
4,710,000 | | 6.875%, 10/1/2017b | | | 4,863,075 | |
| | Helix Energy Solutions Group, Inc. | | | | |
3,500,000 | | 9.500%, 1/15/2016b | | | 3,675,000 | |
| | Linn Energy, LLC | | | | |
2,250,000 | | 8.625%, 4/15/2020 | | | 2,480,625 | |
1,930,000 | | 7.750%, 2/1/2021 | | | 2,060,275 | |
| | Markwest Energy Partners, LP/Markwest Energy Finance Corporation | | | | |
2,340,000 | | 6.250%, 6/15/2022e | | | 2,398,500 | |
| | McJunkin Red Man Corporation | | | | |
2,770,000 | | 9.500%, 12/15/2016c | | | 2,825,400 | |
| | Newfield Exploration Company | | | | |
3,390,000 | | 6.625%, 4/15/2016 | | | 3,487,462 | |
2,340,000 | | 5.750%, 1/30/2022 | | | 2,480,400 | |
| | Oasis Petroleum, Inc. | | | | |
2,430,000 | | 7.250%, 2/1/2019b | | | 2,563,650 | |
1,410,000 | | 6.500%, 11/1/2021e | | | 1,417,050 | |
| | Petrohawk Energy Corporation | | | | |
2,810,000 | | 7.250%, 8/15/2018 | | | 3,217,450 | |
| | Pioneer Natural Resources Company | | | | |
2,800,000 | | 7.500%, 1/15/2020 | | | 3,170,241 | |
The accompanying Notes to Financial Statements are an integral part of this schedule.
141
High Yield Fund
Schedule of Investments as of October 31, 2011
| | | | | | |
Principal
Amount | | Long-Term Fixed Income (92.8%) | | Value | |
| Energy (13.3%) - continued | | | | |
| | Plains Exploration & Production Company | | | | |
$1,450,000 | | 7.750%, 6/15/2015 | | | $1,504,375 | |
3,730,000 | | 10.000%, 3/1/2016 | | | 4,140,300 | |
| | Precision Drilling Corporation | | | | |
2,200,000 | | 6.625%, 11/15/2020 | | | 2,337,500 | |
940,000 | | 6.500%, 12/15/2021b | | | 991,700 | |
| | QEP Resources, Inc. | | | | |
3,230,000 | | 6.875%, 3/1/2021 | | | 3,488,400 | |
| | SandRidge Energy, Inc. | | | | |
3,320,000 | | 8.000%, 6/1/2018b | | | 3,320,000 | |
| | SESI, LLC | | | | |
1,550,000 | | 6.375%, 5/1/2019b | | | 1,581,000 | |
| | Southwestern Energy Company | | | | |
2,550,000 | | 7.500%, 2/1/2018 | | | 2,958,000 | |
| | United Refining Company | | | | |
4,290,000 | | 10.500%, 2/28/2018 | | | 4,139,850 | |
| | | |
| | Total Energy | | | 91,608,926 | |
| | | |
| |
| Financials (7.6%) | | | | |
| | Ally Financial, Inc. | | | | |
1,920,000 | | 7.500%, 12/31/2013 | | | 1,977,600 | |
2,350,000 | | 8.000%, 3/15/2020 | | | 2,420,500 | |
4,910,000 | | 7.500%, 9/15/2020c | | | 4,959,100 | |
| | Aviv Healthcare Properties, LP | | | | |
2,840,000 | | 7.750%, 2/15/2019 | | | 2,740,600 | |
| | Bank of America Corporation | | | | |
3,340,000 | | 8.125%, 12/29/2049c,g | | | 3,107,770 | |
| | CIT Group, Inc. | | | | |
2,630,000 | | 5.250%, 4/1/2014b | | | 2,616,850 | |
6,600,000 | | 7.000%, 5/1/2017c | | | 6,600,000 | |
| | Community Choice Financial, Inc. | | | | |
2,380,000 | | 10.750%, 5/1/2019b | | | 2,380,000 | |
| | Developers Diversified Realty Corporation | | | | |
2,810,000 | | 7.875%, 9/1/2020 | | | 3,041,550 | |
| | Harbinger Group, Inc. | | | | |
2,610,000 | | 10.625%, 11/15/2015c | | | 2,616,525 | |
| | Icahn Enterprises, LP | | | | |
4,270,000 | | 7.750%, 1/15/2016 | | | 4,376,750 | |
5,220,000 | | 8.000%, 1/15/2018 | | | 5,311,350 | |
| | International Lease Finance Corporation | | | | |
2,250,000 | | 8.625%, 9/15/2015 | | | 2,362,500 | |
2,050,000 | | 8.750%, 3/15/2017c | | | 2,160,700 | |
1,400,000 | | 8.875%, 9/1/2017 | | | 1,456,000 | |
| | Nuveen Investments, Inc. | | | | |
2,370,000 | | 10.500%, 11/15/2015b | | | 2,346,300 | |
| | Speedy Cash, Inc. | | | | |
1,900,000 | | 10.750%, 5/15/2018b | | | 1,942,750 | |
| | | |
| | Total Financials | | | 52,416,845 | |
| | | |
| |
| Technology (4.7%) | | | | |
| | Advanced Micro Devices, Inc. | | | | |
2,800,000 | | 8.125%, 12/15/2017 | | | 2,884,000 | |
820,000 | | 7.750%, 8/1/2020 | | | 832,300 | |
| | Amkor Technology, Inc. | | | | |
9,520,000 | | 6.625%, 6/1/2021b,c | | | 9,044,000 | |
| | Equinix, Inc. | | | | |
3,330,000 | | 8.125%, 3/1/2018 | | | 3,629,700 | |
950,000 | | 7.000%, 7/15/2021 | | | 1,011,750 | |
| | First Data Corporation | | | | |
1,910,000 | | 11.250%, 3/31/2016c | | | 1,699,900 | |
| | | | | | |
Principal
Amount | | Long-Term Fixed Income (92.8%) | | Value | |
| Technology (4.7%) - continued | | | | |
$1,629,000 | | 12.625%, 1/15/2021b | | | $1,539,405 | |
| | Freescale Semiconductor, Inc. | | | | |
1,890,000 | | 8.050%, 2/1/2020c | | | 1,809,675 | |
2,089,000 | | 10.750%, 8/1/2020c | | | 2,193,450 | |
| | NXP BV/NXP Funding, LLC | | | | |
2,340,000 | | 9.750%, 8/1/2018b | | | 2,574,000 | |
| | Seagate HDD Cayman | | | | |
2,860,000 | | 7.750%, 12/15/2018b | | | 2,988,700 | |
| | Sensata Technologies BV | | | | |
1,900,000 | | 6.500%, 5/15/2019b | | | 1,900,000 | |
| | | |
| | Total Technology | | | 32,106,880 | |
| | | |
| |
| Transportation (3.2%) | | | | |
| | American Petroleum Tankers, LLC | | | | |
1,059,000 | | 10.250%, 5/1/2015 | | | 1,088,122 | |
| | CMA CGM SA | | | | |
4,290,000 | | 8.500%, 4/15/2017b | | | 1,909,050 | |
| | Continental Airlines, Inc. | | | | |
2,750,000 | | 6.750%, 9/15/2015b | | | 2,756,875 | |
| | Delta Air Lines, Inc. | | | | |
1,240,000 | | 9.500%, 9/15/2014b | | | 1,314,400 | |
| | Hertz Corporation | | | | |
5,250,000 | | 6.750%, 4/15/2019 | | | 5,355,000 | |
| | Navios Maritime Acquisition Corporation | | | | |
2,140,000 | | 8.625%, 11/1/2017 | | | 1,658,500 | |
| | Navios Maritime Holdings, Inc. | | | | |
1,170,000 | | 8.875%, 11/1/2017c | | | 1,120,275 | |
2,980,000 | | 8.125%, 2/15/2019c | | | 2,346,750 | |
| | Navios South American Logistics, Inc./Navios Logistics Finance US, Inc. | | | | |
1,240,000 | | 9.250%, 4/15/2019b | | | 1,094,300 | |
| | United Air Lines, Inc. | | | | |
1,689,750 | | 9.750%, 1/15/2017 | | | 1,858,725 | |
| | United Maritime Group, LLC/United Maritime Group Finance Corporation | | | | |
1,860,000 | | 11.750%, 6/15/2015 | | | 1,878,600 | |
| | | |
| | Total Transportation | | | 22,380,597 | |
| | | |
| |
| Utilities (3.6%) | | | | |
| | AES Corporation | | | | |
5,350,000 | | 7.375%, 7/1/2021b,c | | | 5,724,500 | |
| | Covanta Holding Corporation | | | | |
2,400,000 | | 7.250%, 12/1/2020 | | | 2,490,331 | |
| | Crosstex Energy/Crosstex Energy Finance Corporation | | | | |
3,270,000 | | 8.875%, 2/15/2018 | | | 3,466,200 | |
| | Holly Energy Partners, LP | | | | |
1,870,000 | | 8.250%, 3/15/2018 | | | 1,982,200 | |
| | Inergy, LP | | | | |
4,440,000 | | 7.000%, 10/1/2018 | | | 4,462,200 | |
| | Regency Energy Partners, LP | | | | |
3,330,000 | | 6.875%, 12/1/2018 | | | 3,513,150 | |
| | Targa Resources Partners, LP | | | | |
3,040,000 | | 7.875%, 10/15/2018 | | | 3,161,600 | |
| | | |
| | Total Utilities | | | 24,800,181 | |
| | | |
| | | | | | |
| | | |
| | Total Long-Term Fixed Income (cost $636,371,441) | | | 639,453,112 | |
| | | |
The accompanying Notes to Financial Statements are an integral part of this schedule.
142
High Yield Fund
Schedule of Investments as of October 31, 2011
| | | | | | |
| Shares | | Preferred Stock (1.3%) | | Value | |
| Financials (1.3%) | | | | |
57,310 | | Ally Financial, Inc.g | | | $1,111,814 | |
3,014 | | Ally Financial, Inc.b,g | | | 2,247,785 | |
95,148 | | Citigroup Capital XII, 8.500% | | | 2,435,789 | |
23,500 | | Citigroup, Inc., Convertibleh | | | 2,233,440 | |
41,750 | | GMAC Capital Trust I, 8.125% | | | 875,080 | |
| | | |
| | Total Financials | | | 8,903,908 | |
| | | |
| | | | | | |
| | | |
| | Total Preferred Stock (cost $9,324,034) | | | 8,903,908 | |
| | | |
| | |
| Shares | | Common Stock (<0.1%) | | Value | |
| Consumer Discretionary (<0.1%) | | | | |
36,330 | | TVMAX Holdings, Inc.i,j | | | 0 | |
| | | |
| | Total Consumer Discretionary | | | 0 | |
| | | |
| | | | | | |
| | | |
| | Total Common Stock (cost $2,245,000) | | | 0 | |
| | | |
| | |
| Shares | | Collateral Held for Securities Loaned (9.4%) | | Value | |
64,933,950 | | Thrivent Financial Securities Lending Trust | | | 64,933,950 | |
| | | |
| | Total Collateral Held for Securities Loaned (cost $64,933,950) | | | 64,933,950 | |
| | | |
| | |
Principal
Amount | | Short-Term Investments (3.4%)k | | Value | |
| | Federal Home Loan Bank Discount Notes | | | | |
$3,000,000 | | 0.025%, 11/14/2011l | | | 2,999,973 | |
1,815,000 | | 0.025%, 11/16/2011l | | | 1,814,981 | |
5,500,000 | | 0.016%, 11/18/2011l | | | 5,499,962 | |
6,500,000 | | 0.020%, 11/23/2011l | | | 6,499,920 | |
3,000,000 | | 0.025%, 12/23/2011l | | | 2,999,892 | |
| | Federal Home Loan Mortgage Corporation Discount Notes | | | | |
2,000,000 | | 0.020%, 11/28/2011l | | | 1,999,970 | |
| | Federal National Mortgage Association Discount Notes | | | | |
1,450,000 | | 0.081%, 2/22/2012l,m,n | | | 1,449,635 | |
| | | |
| | Total Short-Term Investments (at amortized cost) | | | 23,264,333 | |
| | | |
| | Total Investments (cost $751,267,641) 108.8% | | $ | 749,629,017 | |
| | | |
| | Other Assets and Liabilities, Net (8.8%) | | | (60,935,253 | ) |
| | | |
| | Total Net Assets 100.0% | | $ | 688,693,764 | |
| | | |
| a | The stated interest rate represents the weighted average of all contracts within the bank loan facility. |
| b | Denotes securities sold under Rule 144A of the Securities Act of 1933, which exempts them from registration. These securities have been deemed liquid and may be resold to other dealers in the program or to other qualified institutional buyers. As of October 31, 2011, the value of these investments was $218,215,419 or 31.7% of total net assets. |
| c | All or a portion of the security is on loan. |
| d | Denotes variable rate securities. Variable rate securities are securities whose yields vary with a designated market index or market rate. The rate shown is as of October 31, 2011. |
| e | Denotes investments purchased on a when-issued or delayed delivery basis. |
| f | Denotes restricted securities. Restricted securities are investment securities which have been deemed illiquid and cannot be offered for public sale without first being registered under the Securities Act of 1933. The following table indicates the acquisition date and cost of restricted securities High Yield Fund owned as of October 31, 2011. |
| | | | | | | | |
| Security | | Acquisition
Date | | | Amortized
Cost | |
Citgo Petroleum Corporation | | | 6/18/2010 | | | $ | 3,043,718 | |
JBS Finance II, Ltd. | | | 7/22/2010 | | | $ | 4,389,213 | |
Realogy Corporation, Convertible | | | 3/10/2011 | | | $ | 1,627,942 | |
Shingle Springs Tribal Gaming Authority | | | 6/22/2007 | | | $ | 4,875,421 | |
Tunica-Biloxi Gaming Authority | | | 11/8/2005 | | | $ | 4,211,970 | |
| g | Denotes perpetual securities. Perpetual securities pay an indefinite stream of interest, but may be called by the issuer at an earlier date. |
| h | Comprised of a 79.7% prepaid stock purchase contract for common stock of Citigroup, Inc. and a 20.3% amortizing note. |
The quarterly payments received consists of return of capital and 6.15% interest on only the portion that is the note.
| i | Security is fair valued. |
| j | Non-income producing security. |
| k | The interest rate shown reflects the yield, coupon rate or the discount rate at the date of purchase. |
| l | Denotes investments that benefit from credit enhancement or liquidity support provided by a third party bank, institution or government. |
| m | At October 31, 2011, $199,950 of investments were held on deposit with the counterparty and pledged as the initial margin deposit for open futures contracts. |
| n | At October 31, 2011, $664,833 of investments were pledged as collateral with the custodian under the agreement between the counterparty, the custodian and the fund for open swap contracts. |
| | | | |
| Unrealized Appreciation (Depreciation) | | | | |
Gross unrealized appreciation and depreciation of investments, based on cost for federal income tax purposes, were as follows: | |
Gross unrealized appreciation | | | $24,696,602 | |
Gross unrealized depreciation | | | (26,451,147) | |
| | | | |
Net unrealized appreciation (depreciation) | | | ($1,754,545) | |
| |
Cost for federal income tax purposes | | | $751,383,562 | |
The accompanying Notes to Financial Statements are an integral part of this schedule.
143
High Yield Fund
Schedule of Investments as of October 31, 2011
Fair Valuation Measurements
The following table is a summary of the inputs used, as of October 31, 2011, in valuing High Yield Fund’s assets carried at fair value.
| | | | | | | | | | | | | | | | |
| Investments in Securities | | Total | | | Level 1 | | | Level 2 | | | Level 3 | |
Bank Loans | | | | | | | | | | | | | | | | |
Financials | | | 3,640,313 | | | | – | | | | 3,640,313 | | | | – | |
Technology | | | 3,278,630 | | | | – | | | | 3,278,630 | | | | – | |
Utilities | | | 6,154,771 | | | | – | | | | 6,154,771 | | | | – | |
Long-Term Fixed Income | | | | | | | | | | | | | | | | |
Asset-Backed Securities | | | 3,824,688 | | | | – | | | | 3,824,688 | | | | – | |
Basic Materials | | | 55,880,383 | | | | – | | | | 55,880,383 | | | | – | |
Capital Goods | | | 53,522,600 | | | | – | | | | 53,522,600 | | | | – | |
Communications Services | | | 104,244,136 | | | | – | | | | 104,244,136 | | | | – | |
Consumer Cyclical | | | 109,332,775 | | | | – | | | | 108,503,375 | | | | 829,400 | |
Consumer Non-Cyclical | | | 89,335,101 | | | | – | | | | 89,335,101 | | | | – | |
Energy | | | 91,608,926 | | | | – | | | | 91,608,926 | | | | – | |
Financials | | | 52,416,845 | | | | – | | | | 52,416,845 | | | | – | |
Technology | | | 32,106,880 | | | | – | | | | 32,106,880 | | | | – | |
Transportation | | | 22,380,597 | | | | – | | | | 22,380,597 | | | | – | |
Utilities | | | 24,800,181 | | | | – | | | | 24,800,181 | | | | – | |
Preferred Stock | | | | | | | | | | | | | | | | |
Financials | | | 8,903,908 | | | | 6,656,123 | | | | 2,247,785 | | | | – | |
Common Stock | | | | | | | | | | | | | | | | |
Consumer Discretionary* | | | – | | | | – | | | | – | | | | – | |
Collateral Held for Securities Loaned | | | 64,933,950 | | | | 64,933,950 | | | | – | | | | – | |
Short-Term Investments | | | 23,264,333 | | | | – | | | | 23,264,333 | | | | – | |
Total | | | $749,629,017 | | | | $71,590,073 | | | | $677,209,544 | | | | $829,400 | |
| | | | |
| Other Financial Instruments | | Total | | | Level 1 | | | Level 2 | | | Level 3 | |
Asset Derivatives | | | | | | | | | | | | | | | | |
Futures Contracts | | | 25,961 | | | | 25,961 | | | | – | | | | – | |
Total Asset Derivatives | | | $25,961 | | | | $25,961 | | | | $– | | | | $– | |
* Security in this section is fair valued at $0.
The following table is a reconciliation of assets in which significant unobservable inputs (Level 3) were used in determining fair value for High Yield Fund.
| | | | | | | | | | | | | | | | | | | | | | | | | | | | | | | | |
| Investments in Securities | | Value
October 31,
2010 | | | Realized
Gain/(Loss) | | | Change in
Unrealized
Appreciation/ (Depreciation)** | | | Purchases | | | Sales | | | Transfers
Into
Level 3 | | | Transfers
Out of
Level 3 | | | Value
October
31, 2011 | |
Long-Term Fixed Income | | | | | | | | | | | | | | | | | | | | | | | | | | | | | | | | |
Consumer Cyclical | | | – | | | | – | | | | (772,200 | ) | | | 1,601,600 | | | | – | | | | – | | | | – | | | | 829,400 | |
Common Stock | | | | | | | | | | | | | | | | | | | | | | | | | | | | | | | | |
Consumer Discretionary* | | | – | | | | – | | | | – | | | | – | | | | – | | | | – | | | | – | | | | – | |
Total | | | $– | | | | $– | | | | ($772,200) | | | | $1,601,600 | | | | $– | | | | $– | | | | $– | | | | $829,400 | |
* Security in this section is fair valued at $0.
** Includes the change in net unrealized appreciation/(depreciation) on level 3 securities held on October 31, 2011 of ($798,542).
| | | | | | | | | | | | | | | | |
| Futures Contracts | | Number of
Contracts
Long/(Short) | | Expiration
Date | | Notional
Principal
Amount | | | Value | | | Unrealized
Gain/(Loss) | |
EURO Foreign Exchange Currency | | | | | | | | | | | | | | | | |
Future | | (13) | | December 2011 | | ($ | 2,287,961 | ) | | ($ | 2,262,000 | ) | | | $25,961 | |
Total Futures Contracts | | | | | | | | | | | | | | | $25,961 | |
The accompanying Notes to Financial Statements are an integral part of this schedule.
144
High Yield Fund
Schedule of Investments as of October 31, 2011
The following table summarizes the fair value and Statement of Assets and Liabilities location, as of October 31, 2011, for High Yield Fund’s investments in financial derivative instruments by primary risk exposure as discussed under item (2) Significant Accounting Policies of the Notes to Financial Statements.
| | | | | | |
| Derivatives by risk category | | Statement of Assets and Liabilities Location | | Fair Value | |
Asset Derivatives | | | | | | |
| | |
Equity Contracts | | | | | | |
Futures* | | Net Assets -Net unrealized appreciation/(depreciation) on Futures contracts | | | $25,961 | |
Total Equity Contracts | | | | | 25,961 | |
Total Asset Derivatives | | | | | $25,961 | |
| * | Includes cumulative appreciation/depreciation of futures contracts as reported in the Schedule of Investments. Only current day’s variation margin is reported within the Statement of Assets and Liabilities. |
The following table summarizes the net realized gains/(losses) and Statement of Operations location, for the period ended October 31, 2011, for High Yield Fund’s investments in financial derivative instruments by primary risk exposure.
| | | | | | |
| Derivatives by risk category | | Statement of Operations location | | Realized Gains/(Losses)
recognized in Income | |
Equity Contracts | | | | | | |
Futures | | Net realized gains/(losses) on Futures contracts | | | (49,214 | ) |
| | |
Total Equity Contracts | | | | | (49,214 | ) |
| | |
Foreign Exchange Contracts | | | | | | |
Forward Contracts | | Net realized gains/(losses) on Foreign currency transactions | | | (130,831 | ) |
| | |
Total Foreign Exchange Contracts | | | | | (130,831 | ) |
| | |
Credit Contracts | | | | | | |
Credit Default Swaps | | Net realized gains/(losses) on Swap agreements | | | 124,713 | |
| | |
Total Credit Contracts | | | | | 124,713 | |
Total | | | | | ($55,332) | |
The following table summarizes the change in net unrealized appreciation/(depreciation) and Statement of Operations location, for the period ended October 31, 2011, for High Yield Fund’s investments in financial derivative instruments by primary risk exposure.
| | | | | | |
| Derivatives by risk category | | Statement of Operations Location | | Change in unrealized
appreciation/(depreciation)
recognized in Income | |
Equity Contracts | | | | | | |
Futures | | Change in net unrealized appreciation/(depreciation) on Futures contracts | | | 25,961 | |
Total Equity Contracts | | | | | 25,961 | |
Total | | | | | $25,961 | |
The following table presents High Yield Fund’s average volume of derivative activity during the period ended October 31, 2011.
| | | | | | | | | | | | | | | | | | | | | | | | | | |
Derivative Risk
Category | | Futures
(Notional*) | | | Futures
(Percentage
of Average
Net Assets) | | | Forwards
(Notional*) | | | Forwards
(Percentage
of Average
Net Assets) | | | Swaps
(Notional*) | | | Swaps
(Percentage
of Average
Net Assets) | | | |
Interest Rate Contracts | | | $1,168,563 | | | | 0.2 | % | | | N/A | | | | N/A | | | | N/A | | | | N/A | | |
Foreign Exchange Contracts | | | N/A | | | | N/A | | | $ | 98,376 | | | | <0.1 | % | | | N/A | | | | N/A | | |
Credit Contracts | | | N/A | | | | N/A | | | | N/A | | | | N/A | | | | $8,528,609 | | | | 1.2 | % | |
* Notional amount represents long or short, or both, derivative positions held by the Fund.
The accompanying Notes to Financial Statements are an integral part of this schedule.
145
High Yield Fund
Schedule of Investments as of October 31, 2011
Investment in Affiliates
Affiliated issuers, as defined under the Investment Company Act of 1940, include those in which the Fund’s holdings of an issuer represent 5% or more of the outstanding voting securities of an issuer, or any affiliated mutual fund.
A summary of transactions for the fiscal year to date, in High Yield Fund, is as follows:
| | | | | | | | | | | | | | | | | | | | | | | | |
| Fund | | Value
October 31, 2010 | | | Gross
Purchases | | | Gross Sales | | | Shares Held at
October 31, 2011 | | | Value
October 31, 2011 | | | Income Earned
November 1, 2010 -
October 31, 2011 | |
Thrivent Financial Securities Lending Trust | | | $63,913,080 | | | | $276,447,059 | | | | $275,426,189 | | | | 64,933,950 | | | | $64,933,950 | | | | $235,474 | |
Total Value and Income Earned | | | 63,913,080 | | | | | | | | | | | | | | | | 64,933,950 | | | | 235,474 | |
The accompanying Notes to Financial Statements are an integral part of this schedule.
146
Municipal Bond Fund
Schedule of Investments as of October 31, 2011
| | | | | | |
Principal
Amount | | Long-Term Fixed Income (99.8%) | | Value | |
Alabama (0.2%) | | | | |
| | Alabama 21st Century Authority Tobacco Settlement Revenue Bonds | | | | |
$1,000,000 | | 5.750%, 12/1/2020 | | | $1,002,530 | |
| | Alabama Public School and College Authority Capital Improvement Revenue Refunding Bonds | | | | |
1,500,000 | | 5.000%, 5/1/2029, Series Aa | | | 1,819,890 | |
| | | |
| | Total Alabama | | | 2,822,420 | |
| | | |
| |
| Alaska (0.8%) | | | | |
| | Valdez, Alaska Marine Terminal Revenue Bonds (Exxon Pipeline Company) | | | | |
6,185,000 | | 0.120%, 10/1/2025 | | | 6,185,000 | |
| | Valdez, Alaska Marine Terminal Revenue Bonds (ExxonMobil) | | | | |
5,820,000 | | 0.120%, 12/1/2029 | | | 5,820,000 | |
| | | |
| | Total Alaska | | | 12,005,000 | |
| | | |
|
Arizona (0.8%) | |
| | Arizona Health Facilities Authority Revenue Bonds (Arizona Healthcare Pooled Financing Program) (NATL-RE FGIC Insured) | | | | |
1,020,000 | | 5.000%, 6/1/2012, Series Cb | | | 1,032,995 | |
| | Arizona Health Facilities Authority Revenue Bonds (Blood Systems, Inc.) | | | | |
1,000,000 | | 5.000%, 4/1/2017 | | | 1,043,550 | |
1,200,000 | | 5.000%, 4/1/2018 | | | 1,242,924 | |
| | Glendale, Arizona Industrial Development Authority Revenue Bonds (Midwestern University) | | | | |
2,500,000 | | 5.000%, 5/15/2031 | | | 2,514,200 | |
1,000,000 | | 5.000%, 5/15/2035 | | | 987,720 | |
| | Phoenix, Arizona Civic Improvement Corporation Airport Revenue Bonds | | | | |
3,000,000 | | 5.250%, 7/1/2033, Series A | | | 3,159,720 | |
| | Pima County Industrial Development Authority Multifamily Housing Revenue Refunding Bonds (La Hacienda) (GNMA Collateralized) | | | | |
1,285,000 | | 7.000%, 12/20/2031a,b | | | 1,335,667 | |
| | Yavapai County Industrial Development Authority Hospital Revenue Bonds (Yavapai Regional Medical Center) | | | | |
500,000 | | 6.000%, 8/1/2033, Series A | | | 502,175 | |
| | | |
| | Total Arizona | | | 11,818,951 | |
| | | |
| | | | | | |
Principal
Amount | | Long-Term Fixed Income (99.8%) | | Value | |
Arkansas (0.4%) | |
| | Arkansas Community Water System Public Water Authority Water Revenue Refunding and Construction Bonds (NATL-RE Insured) | | | | |
$2,400,000 | | 5.000%, 10/1/2023, Series Bb | | | $2,442,768 | |
| | Rogers, Arkansas Sales and Use Tax Refunding Revenue Bonds | | | | |
2,000,000 | | 4.000%, 11/1/2027, Series 2011c | | | 1,972,080 | |
1,000,000 | | 4.125%, 11/1/2031, Series 2011c | | | 988,580 | |
| | | |
| | Total Arkansas | | | 5,403,428 | |
| | | |
|
California (12.7%) | |
| | Anaheim Public Financing Authority Lease Revenue Bonds (Anaheim Public Improvements) (AGM Insured) | | | | |
3,950,000 | | 6.000%, 9/1/2024, Series Ab | | | 4,670,282 | |
| | Beverly Hills Unified School District, Los Angeles County, California General Obligation Bonds | | | | |
10,000,000 | | Zero Coupon, 8/1/2031 | | | 3,445,500 | |
| | California Educational Facilities Authority Revenue Bonds (Stanford University) | | | | |
5,000,000 | | 5.250%, 4/1/2040 | | | 6,314,050 | |
| | California General Obligation Refunding Bonds | | | | |
2,765,000 | | 5.000%, 9/1/2015 | | | 3,094,063 | |
| | California Infrastructure and Economic Development Bank Bay Area Toll Bridges Seismic Retrofit Revenue Bonds (FGIC Insured) | | | | |
5,000,000 | | 5.000%, 7/1/2025, Series Aa,b | | | 6,177,350 | |
| | California Infrastructure and Economic Development Bank Revenue Bonds (California Independent System Operator Corporation) | | | | |
3,000,000 | | 6.250%, 2/1/2039, Series A | | | 3,222,150 | |
| | California Municipal Finance Authority Refunding Revenue Bonds (Biola University) | | | | |
1,000,000 | | 5.875%, 10/1/2034 | | | 1,031,950 | |
| | California Pollution Control Financing Authority Pollution Control Revenue Refunding Bonds (Exxon) | | | | |
1,900,000 | | 0.090%, 12/1/2012 | | | 1,900,000 | |
| | California Rural Home Mortgage Finance Authority Single Family Mortgage Revenue Bonds (GNMA/FNMA Collateralized) | | | | |
20,000 | | 7.100%, 6/1/2031, Series D, AMTb | | | 20,242 | |
| | California State Department of Water Resources Supply Revenue Bonds | | | | |
6,250,000 | | 5.000%, 5/1/2016, Series M | | | 7,179,687 | |
The accompanying Notes to Financial Statements are an integral part of this schedule.
147
Municipal Bond Fund
Schedule of Investments as of October 31, 2011
| | | | | | |
Principal
Amount | | Long-Term Fixed Income (99.8%) | | Value | |
California (12.7%) - continued | |
| | California State Public Works Board Lease Revenue Bonds (Regents of the University of California - UCLA Replacement Hospital) (AGM Insured) | | | | |
$4,000,000 | | 5.375%, 10/1/2015, Series Ab | | | $4,174,400 | |
| | California Various Purpose General Obligation Bonds | | | | |
2,000,000 | | 5.250%, 11/1/2021 | | | 2,131,740 | |
3,990,000 | | 5.250%, 4/1/2029a | | | 4,436,481 | |
10,000 | | 5.250%, 4/1/2029 | | | 10,406 | |
10,000,000 | | 5.250%, 3/1/2038 | | | 10,182,300 | |
10,000,000 | | 6.000%, 4/1/2038 | | | 11,035,300 | |
5,000,000 | | 6.000%, 11/1/2039 | | | 5,523,650 | |
| | California Various Purpose General Obligation Bonds (NATL-RE Insured) | | | | |
300,000 | | 6.000%, 8/1/2016b | | | 304,044 | |
| | Chula Vista Industrial Development Revenue Refunding Bonds (San Diego Gas & Electric Company) | | | | |
2,000,000 | | 5.875%, 2/15/2034, Series C | | | 2,197,740 | |
| | Contra Costa County, California Home Mortgage Revenue Bonds (GNMA Collateralized) | | | | |
4,030,000 | | 7.500%, 5/1/2014a,b | | | 4,720,742 | |
| | East Bay Municipal Utility District, Alameda and Contra Costa Counties, California Water System Revenue Refunding Bonds (NATL-RE FGIC Insured) | | | | |
10,000,000 | | 5.000%, 6/1/2037, Series Ab | | | 10,536,100 | |
| | Foothill-De Anza California Community College District General Obligation Bonds | | | | |
5,000,000 | | 5.000%, 8/1/2040, Series C | | | 5,296,350 | |
| | Golden West Schools Financing Authority Revenue Bonds (NATL-RE Insured) | | | | |
420,000 | | 5.800%, 2/1/2022, Series Ab | | | 464,751 | |
| | Los Angeles Community College District, Los Angeles County, California General Obligation Bonds (Election 2008) | | | | |
10,000,000 | | 6.000%, 8/1/2033, Series A | | | 11,448,900 | |
| | Los Angeles Department of Airports Revenue Bonds (Los Angeles International Airport) | | | | |
8,000,000 | | 5.000%, 5/15/2040, Series A | | | 8,413,840 | |
| | Los Angeles Unified School District, Los Angeles County, California General Obligation Bonds | | | | |
5,000,000 | | 5.000%, 1/1/2034, Series I | | | 5,216,150 | |
| | Pittsburg, California Redevelopment Agency Tax Allocation Bonds (Los Medanos Community Development) (AMBAC Insured) | | | | |
5,000,000 | | Zero Coupon, 8/1/2024b | | | 2,268,050 | |
| | | | | | |
Principal
Amount | | Long-Term Fixed Income (99.8%) | | Value | |
California (12.7%) - continued | |
| | Pomona, California Single Family Mortgage Revenue Refunding Bonds (GNMA/FNMA Collateralized) | | | | |
$3,410,000 | | 7.600%, 5/1/2023, Series Aa,b | | | $4,323,266 | |
| | San Bernardino, California Single Family Mortgage Revenue Refunding Bonds (FHA/VA MTGS GNMA Collateralized) | | | | |
1,215,000 | | 7.500%, 5/1/2023, Series Aa,b | | | 1,525,445 | |
| | San Diego Community College District, San Diego County, California General Obligation Bonds (AGM Insured) | | | | |
10,000,000 | | 5.000%, 5/1/2030b | | | 10,329,700 | |
| | San Diego County, California Certificates of Participation | | | | |
5,000,000 | | 5.250%, 7/1/2030 | | | 5,215,200 | |
| | San Diego Unified School District General Obligation Bonds Zero Coupon, | | | | |
10,000,000 | | 7/1/2033, Series Ad | | | 6,546,700 | |
| | San Francisco, California City & County Airport Commission Revenue Bonds (San Francisco International Airport) | | | | |
7,030,000 | | 6.000%, 5/1/2039, Series E | | | 7,746,216 | |
| | San Jose, California Airport Revenue Bonds (AMBAC Insured) | | | | |
8,000,000 | | 5.000%, 3/1/2037, Series A, AMTb | | | 7,592,240 | |
| | San Jose, California Redevelopment Agency Tax Allocation Refunding Bonds (Merged Area Redevelopment) (NATL-RE Insured) | | | | |
2,760,000 | | 5.000%, 8/1/2025, Series Ab | | | 2,542,733 | |
| | Santa Monica Community College District, Los Angeles County, California General Obligation Bonds Zero Coupon, | | | | |
5,000,000 | | 8/1/2025, Series C | | | 2,442,800 | |
| | Tuolumne Wind Project Authority Revenue Bonds (Tuolumne Company) | | | | |
2,000,000 | | 5.625%, 1/1/2029, Series A | | | 2,171,980 | |
| | University of California General Revenue Bonds | | | | |
5,000,000 | | 5.250%, 5/15/2039, Series O | | | 5,389,500 | |
| | | |
| | Total California | | | 181,241,998 | |
| | | |
|
Colorado (5.1%) | |
| | Colorado Educational and Cultural Facilities Authority Charter School Refunding Revenue Bonds (Cherry Creek Project) | | | | |
570,000 | | 6.000%, 4/1/2021 | | | 570,154 | |
1,280,000 | | 6.000%, 4/1/2030 | | | 1,257,549 | |
The accompanying Notes to Financial Statements are an integral part of this schedule.
148
Municipal Bond Fund
Schedule of Investments as of October 31, 2011
| | | | | | |
Principal
Amount | | Long-Term Fixed Income (99.8%) | | Value | |
Colorado (5.1%) - continued | | | | |
| | Colorado Educational and Cultural Facilities Authority Charter School Revenue Bonds (Cheyenne Mountain Charter Academy) | | | | |
$475,000 | | 5.125%, 6/15/2032, Series A | | | $435,095 | |
1,000,000 | | 5.375%, 6/15/2038, Series A | | | 927,350 | |
| | Colorado Educational and Cultural Facilities Authority Charter School Revenue Bonds (Classical Academy) | | | | |
2,825,000 | | 7.250%, 12/1/2030a | | | 2,840,622 | |
| | Colorado Educational and Cultural Facilities Authority Charter School Revenue Bonds (Crown Pointe Academy of Westminster) | | | | |
1,000,000 | | 5.000%, 7/15/2039 | | | 923,900 | |
| | Colorado Educational and Cultural Facilities Authority Charter School Revenue Bonds (Pinnacle Charter School, Inc.) | | | | |
3,000,000 | | 5.125%, 12/1/2039 | | | 2,791,350 | |
| | Colorado Health Facilities Authority Health Facilities Revenue Bonds (Evangelical Lutheran Good Samaritan Society) | | | | |
1,920,000 | | 6.800%, 12/1/2020 | | | 1,943,366 | |
1,000,000 | | 6.125%, 6/1/2038, Series A | | | 1,007,620 | |
| | Colorado Health Facilities Authority Hospital Revenue Refunding Bonds (Valley View Hospital Association) | | | | |
3,000,000 | | 5.750%, 5/15/2036 | | | 3,017,760 | |
| | Colorado Higher Education Capital Construction Lease Purchase Financing Program Certificates of Participation | | | | |
405,000 | | 5.500%, 11/1/2027a | | | 504,877 | |
1,095,000 | | 5.500%, 11/1/2027 | | | 1,183,257 | |
| | Colorado Housing and Finance Authority Single Family Program Bonds | | | | |
55,000 | | 7.450%, 10/1/2016, Series A- 2, AMT | | | 57,881 | |
200,000 | | 6.700%, 8/1/2017, Series B-3 | | | 204,712 | |
370,000 | | 6.350%, 11/1/2029, Series D- 2, AMT | | | 385,570 | |
| | Colorado Housing and Finance Authority Single Family Program Bonds (FHA Insured) | | | | |
15,000 | | 7.150%, 10/1/2030, Series C- 3b | | | 15,408 | |
| | Colorado Water Resources and Power Development Authority Clean Water Revenue Bonds (FSA/VA MTGS Insured) | | | | |
10,000 | | 6.250%, 9/1/2013, Series Ab | | | 10,041 | |
| | Colorado Water Resources and Power Development Authority Small Water Resources Revenue Bonds (NATL-RE FGIC Insured) | | | | |
3,525,000 | | 5.250%, 11/1/2021, Series Ab | | | 3,567,864 | |
| | | | | | |
Principal
Amount | | Long-Term Fixed Income (99.8%) | | Value | |
Colorado (5.1%) - continued | | | | |
| | Denver Health and Hospital Authority Healthcare Revenue Bonds | | | | |
$2,000,000 | | 5.250%, 12/1/2031, Series A | | | $1,859,220 | |
| | Denver Health and Hospital | | | | |
| | Authority Healthcare Revenue Bonds (ACA-CBI Insured) | | | | |
2,000,000 | | 6.250%, 12/1/2016, Series Aa,b | | | 2,009,420 | |
| | Denver, Colorado Airport System Revenue Bonds (XLCA Insured) | | | | |
5,000,000 | | 5.000%, 11/15/2022, Series Ab | | | 5,359,500 | |
| �� | Denver, Colorado Board of Water Commissioners General Obligation Water Refunding Bonds | | | | |
6,000,000 | | 5.600%, 10/1/2029 | | | 6,231,900 | |
| | Denver, Colorado Health & Hospital Authority Healthcare Revenue Bonds | | | | |
5,000,000 | | 5.500%, 12/1/2030 | | | 4,912,300 | |
| | Jefferson County School District No. R-1, Jefferson and Broomfield Counties, Colorado General Obligation Refunding Bonds (AGM Insured) | | | | |
10,000,000 | | 5.000%, 12/15/2016, Series Ab | | | 11,340,600 | |
| | Larimer County, Colorado, Poudre School District R-1 General Obligation Improvement Bonds (NATL- RE-IBC Insured) | | | | |
3,000,000 | | 7.000%, 12/15/2016b | | | 3,367,590 | |
| | Northwest Parkway Public Highway Authority Revenue Bonds (AMBAC Insured) | | | | |
4,000,000 | | 5.700%, 6/15/2021, Series Ca,b | | | 4,723,040 | |
| | University of Colorado University Enterprise Revenue Bonds | | | | |
1,250,000 | | 5.375%, 6/1/2032, Series A | | | 1,368,200 | |
9,790,000 | | 5.000%, 6/1/2033c | | | 10,546,180 | |
| | | |
| | Total Colorado | | | 73,362,326 | |
| | | |
| |
District of Columbia (0.8%) | | | | |
| | District of Columbia Income Tax Secured Revenue Refunding Bonds | | | | |
5,225,000 | | 5.000%, 12/1/2028, Series C | | | 5,752,882 | |
| | District of Columbia Tobacco Settlement Financing Corporation Tobacco Settlement Asset-Backed Bonds | | | | |
5,065,000 | | 6.250%, 5/15/2024 | | | 5,073,509 | |
| | | |
| | Total District of Columbia | | | 10,826,391 | |
| | | |
| |
Florida (4.6%) | | | | |
| | Broward County, Florida Water and Sewer Utility Revenue Bonds | | | | |
3,000,000 | | 5.250%, 10/1/2034, Series A | | | 3,222,510 | |
The accompanying Notes to Financial Statements are an integral part of this schedule.
149
Municipal Bond Fund
Schedule of Investments as of October 31, 2011
| | | | | | |
Principal
Amount | | Long-Term Fixed Income (99.8%) | | Value | |
Florida (4.6%) - continued | | | | |
| | Florida Refunding Bonds (Jacksonville Transportation Authority) | | | | |
$1,520,000 | | 5.000%, 7/1/2019 | | | $1,524,150 | |
| | Florida State Board of Education Public Education Capital Outlay Bonds (NATL-RE-IBC Insured) | | | | |
255,000 | | 9.125%, 6/1/2014b | | | 283,371 | |
| | Greater Orlando Aviation Authority Airport Facilities Revenue Bonds | | | | |
1,500,000 | | 5.000%, 10/1/2039, Series C | | | 1,530,375 | |
| | Gulf Breeze, Florida Revenue Refunding Bonds | | | | |
2,000,000 | | 5.000%, 12/1/2033 | | | 2,057,260 | |
| | Hillsborough County, Florida Industrial Development Authority Pollution Control Revenue Refunding Bonds (Tampa Electric Company) | | | | |
2,500,000 | | 5.150%, 9/1/2025, Series B | | | 2,652,175 | |
| | Leon County Educational Facilities Authority Certificates of Participation (Southgate Residence Hall Project) | | | | |
1,145,000 | | 8.500%, 9/1/2017a | | | 1,572,154 | |
| | Miami-Dade County Authority Toll System Revenue Bonds (Florida Expressway) | | | | |
2,000,000 | | 5.000%, 7/1/2040, Series A | | | 2,000,420 | |
| | Miami-Dade County, Florida Aviation Revenue Bonds (Miami International Airport - Hub of the Americas) | | | | |
7,500,000 | | 5.500%, 10/1/2036, Series B | | | 7,737,225 | |
8,000,000 | | 5.500%, 10/1/2041, Series A | | | 8,226,720 | |
| | Miami-Dade County, Florida Public Facilities Revenue Bonds (Jackson Health System) (AGM Insured) | | | | |
2,000,000 | | 5.625%, 6/1/2034b | | | 2,125,880 | |
| | Orange County, Florida Health Facilities Authority Hospital Revenue Bonds (Orlando Health, Inc.) | | | | |
5,000,000 | | 5.125%, 10/1/2026 | | | 5,125,550 | |
| | Orange County, Florida Health Facilities Authority Hospital Revenue Bonds (Orlando Regional Healthcare System) (NATL-RE Insured) | | | | |
2,700,000 | | 6.250%, 10/1/2018, Series Ab | | | 3,067,038 | |
| | Orange County, Orlando Expressway Authority Revenue Bonds | | | | |
4,070,000 | | 5.000%, 7/1/2035, Series C | | | 4,208,502 | |
| | Orange County, Orlando Expressway Authority Revenue Bonds (Florida Expressway) | | | | |
3,600,000 | | 5.000%, 7/1/2030, Series A | | | 3,804,408 | |
| | | | | | |
Principal
Amount | | Long-Term Fixed Income (99.8%) | | Value | |
Florida (4.6%) - continued | | | | |
| | South Miami, Florida Health Facilities Authority Hospital Revenue Bonds (Baptist Health South Florida) | | | | |
$6,000,000 | | 5.000%, 8/15/2032 | | | $6,105,000 | |
| | St. Johns County Industrial Development Authority Revenue Bonds (Presbyterian Retirement Communities) | | | | |
5,500,000 | | 5.875%, 8/1/2040, Series A | | | 5,516,170 | |
| | Tallahassee, Florida Consolidated Utility Systems Revenue Bonds | | | | |
4,000,000 | | 5.000%, 10/1/2032 | | | 4,193,560 | |
| | | |
| | Total Florida | | | 64,952,468 | |
| | | |
| |
Georgia (2.0%) | | | | |
| | Brunswick, Georgia Water and Sewer Revenue Refunding and Improvement Bonds (NATL-RE Insured) | | | | |
1,500,000 | | 6.100%, 10/1/2019a,b | | | 1,836,375 | |
| | Burke County Development Authority Pollution Control Revenue Bonds (Oglethorpe Power Corporation Vogtle) | | | | |
6,000,000 | | 5.700%, 1/1/2043, Series C | | | 6,242,460 | |
| | Chatham County Hospital Authority, Savannah, Georgia Hospital Revenue Improvement Bonds (Memorial Health University Medical Center, Inc.) | | | | |
1,000,000 | | 6.125%, 1/1/2024, Series A | | | 954,170 | |
1,560,000 | | 5.750%, 1/1/2029, Series A | | | 1,313,270 | |
| | Cherokee County, Georgia Water and Sewerage Authority Water and Sewerage Revenue Bonds (Refunding and Improvements) (NATL-RE Insured) | | | | |
4,940,000 | | 5.500%, 8/1/2018b | | | 5,621,918 | |
| | Gainesville Redevelopment Authority Educational Facilities Refunding Revenue Bonds (Riverside Military Academy) | | | | |
5,275,000 | | 5.125%, 3/1/2027 | | | 4,336,472 | |
| | Georgia General Obligation Bonds | | | | |
1,965,000 | | 5.650%, 3/1/2012, Series B | | | 2,000,193 | |
35,000 | | 5.650%, 3/1/2012, Series Ba | | | 35,630 | |
3,500,000 | | 5.000%, 8/1/2012, Series D | | | 3,624,110 | |
| | Milledgeville and Baldwin County Development Authority Revenue Bonds (Georgia College and State University Foundation Property III, LLC Student Housing System) | | | | |
2,500,000 | | 5.500%, 9/1/2024a | | | 2,862,175 | |
| | | |
| | Total Georgia | | | 28,826,773 | |
| | | |
The accompanying Notes to Financial Statements are an integral part of this schedule.
150
Municipal Bond Fund
Schedule of Investments as of October 31, 2011
| | | | | | |
Principal
Amount | | Long-Term Fixed Income (99.8%) | | Value | |
Hawaii (2.0%) | | | | |
| | Hawaii Airports System Revenue Bonds | | | | |
$3,040,000 | | 5.250%, 7/1/2030, Series A | | | $3,217,506 | |
| | Hawaii State Harbor System Revenue Bonds | | | | |
6,000,000 | | 5.250%, 7/1/2030, Series A | | | 6,328,260 | |
| | Honolulu City and County, Hawaii General Obligation Bonds (NATL-RE Insured) | | | | |
1,410,000 | | 5.250%, 3/1/2027, Series Ab | | | 1,469,516 | |
| | Honolulu, Hawaii Board of Water Supply Water System Revenue Bonds (NATL-RE Insured) | | | | |
5,000,000 | | 5.000%, 7/1/2036, Series Ab | | | 5,208,300 | |
| | Honolulu, Hawaii General Obligation Bonds (NATL-RE FGIC-TCRS Insured) | | | | |
2,555,000 | | 6.250%, 4/1/2014, Series Ab | | | 2,886,843 | |
| | Honolulu, Hawaii General Obligation Bonds (NATL-RE Insured) | | | | |
8,590,000 | | 5.250%, 3/1/2027, Series Aa,b | | | 9,143,454 | |
| | | |
| | Total Hawaii | | | 28,253,879 | |
| | | |
| |
Illinois (9.1%) | | | | |
| | Broadview, Cook County, Illinois Tax Increment Revenue Bonds | | | | |
700,000 | | 5.250%, 7/1/2012 | | | 700,098 | |
1,000,000 | | 5.375%, 7/1/2015 | | | 1,000,120 | |
| | Chicago General Obligation Bonds (City Colleges of Chicago Capital Improvement) (NATL-RE FGIC Insured) | | | | |
10,000,000 | | Zero Coupon, 1/1/2024b | | | 5,305,800 | |
| | Chicago Parking Facilities Bonds (Lakefront Millennium) (NATL-RE Insured) | | | | |
3,000,000 | | 5.750%, 1/1/2029a,b | | | 3,086,790 | |
| | Chicago Tax Increment Allocation Bonds (Near South Redevelopment Project) (ACA Insured) | | | | |
7,200,000 | | Zero Coupon, 11/15/2014, Series Ab | | | 6,216,696 | |
| | Chicago, Illinois Midway Airport Revenue Bonds | | | | |
2,000,000 | | 5.000%, 1/1/2034, Series Be | | | 2,158,600 | |
| | Cook County, Illinois Community Consolidated School District No. 15 Limited Tax Capital Appreciation School Bonds (NATL-RE FGIC Insured) | | | | |
1,000,000 | | Zero Coupon, 12/1/2014a,b | | | 923,850 | |
| | Cook County, Illinois General Obligation Refunding Bonds (NATL-RE Insured) | | | | |
2,500,000 | | 6.250%, 11/15/2011, Series Aa,b | | | 2,506,005 | |
| | Cook County, Illinois School District No. 99 (Cicero) General Obligation School Bonds (NATL-RE FGIC Insured) | | | | |
1,250,000 | | 8.500%, 12/1/2011b | | | 1,252,858 | |
1,565,000 | | 8.500%, 12/1/2014b | | | 1,853,727 | |
| | | | | | |
Principal
Amount | | Long-Term Fixed Income (99.8%) | | Value | |
Illinois (9.1%) - continued | | | | |
| | Cook County, Illinois School District No. 99 (Cicero) General Obligation School Bonds (NATL-RE FGIC Insured) - continued | | | | |
$1,815,000 | | 8.500%, 12/1/2016b | | | $2,303,417 | |
| | Illinois Educational Facilities Authority Revenue Bonds (Northwestern University) | | | | |
4,900,000 | | 5.250%, 11/1/2032a | | | 5,730,256 | |
| | Illinois Educational Facilities Authority Student Housing Revenue Bonds (Educational Advancement Fund, Inc. - University Center Project) | | | | |
1,000,000 | | 6.625%, 5/1/2017a | | | 1,041,730 | |
| | Illinois Finance Authority Revenue Bonds (DePaul University) | | | | |
4,000,000 | | 6.000%, 10/1/2032, Series A | | | 4,334,640 | |
| | Illinois Finance Authority Revenue Bonds (Rush University Medical Center) | | | | |
3,000,000 | | 7.250%, 11/1/2038, Series A | | | 3,341,910 | |
| | Illinois Finance Authority Revenue Refunding Bonds (Rush University Medical Center) (NATL-RE Insured) | | | | |
2,000,000 | | 5.250%, 11/1/2035, Series Bb | | | 2,005,800 | |
| | Illinois Finance Authority Sales Tax Revenue Bonds | | | | |
2,000,000 | | 5.000%, 6/15/2028 | | | 2,044,140 | |
| | Illinois Health Facilities Authority Revenue Bonds (Bethesda Home and Retirement Center) | | | | |
1,425,000 | | 6.250%, 9/1/2014, Series A | | | 1,430,087 | |
| | Illinois Health Facilities Authority Revenue Bonds (Centegra Health System) | | | | |
2,000,000 | | 5.250%, 9/1/2018 | | | 2,001,760 | |
| | Illinois Health Facilities Authority Revenue Bonds (Rush-Presbyterian-St. Luke’s Medical Center) (NATL-RE Insured) | | | | |
2,785,000 | | 5.250%, 11/15/2014, Series Ab | | | 2,790,682 | |
| | Illinois Health Facilities Authority Revenue Refunding Bonds (Lutheran General Health System) (AGM-CR Insured) | | | | |
2,000,000 | | 6.000%, 4/1/2018, Series Cb | | | 2,313,620 | |
| | Illinois Health Facilities Authority Revenue Refunding Bonds (Thorek Hospital and Medical Center) | | | | |
3,490,000 | | 5.250%, 8/15/2018 | | | 3,492,548 | |
| | Illinois Sales Tax Revenue Bonds (Build Illinois Bonds) | | | | |
3,065,000 | | 7.450%, 6/15/2012, Series L | | | 3,190,083 | |
The accompanying Notes to Financial Statements are an integral part of this schedule.
151
Municipal Bond Fund
Schedule of Investments as of October 31, 2011
| | | | | | |
Principal
Amount | | Long-Term Fixed Income (99.8%) | | Value | |
Illinois (9.1%) - continued | | | | |
| | Illinois Sales Tax Revenue Bonds (Build Illinois Bonds) (NATL- RE-FGIC Insured) | | | | |
$7,975,000 | | 5.750%, 6/15/2018, 2nd Seriesb | | | $9,460,822 | |
| | Joliet Regional Port District, Illinois Marine Terminal Revenue Refunding Bonds (Exxon) | | | | |
7,100,000 | | 0.120%, 10/1/2024 | | | 7,100,000 | |
| | McHenry and Lake Counties, Illinois, Community High School District No. 157 General Obligation School Bonds (AGM Insured) | | | | |
3,035,000 | | 9.000%, 12/1/2017b | | | 4,023,833 | |
| | McLean County, Illinois, Bloomington-Normal Airport Authority Passenger Facility Charge Revenue Bonds (Central Illinois Regional Airport) | | | | |
4,000,000 | | 6.050%, 12/15/2019, AMT | | | 4,000,360 | |
| | Metropolitan Pier and Exposition Authority, Illinois Refunding Bonds (McCormick Place Expansion) (NATL-RE FGIC Insured) | | | | |
885,000 | | 5.500%, 6/15/2015, Series Ab | | | 975,597 | |
17,505,000 | | Zero Coupon, 6/15/2020, Series Ab | | | 12,101,907 | |
| | Metropolitan Pier and Exposition Authority, Illinois Refunding Bonds (McCormick Place Expansion) (NATL-RE Insured) | | | | |
7,000,000 | | Zero Coupon, 6/15/2020, Series Bb,d | | | 7,303,590 | |
3,100,000 | | Zero Coupon, 6/15/2024, Series Ab | | | 1,652,300 | |
2,000,000 | | Zero Coupon, 12/15/2024, Series Ab | | | 1,039,740 | |
| | Metropolitan Water Reclamation District of Greater Chicago General Obligation Refunding Bonds | | | | |
7,280,000 | | 5.250%, 12/1/2032, Series C | | | 8,556,038 | |
| | Railsplitter Tobacco Settlement Authority Tobacco Settlement Revenue Bonds | | | | |
6,000,000 | | 5.000%, 6/1/2017 | | | 6,496,560 | |
| | Regional Transportation Authority, Cook, DuPage, Kane, Lake, McHenry and Will Counties, Illinois Revenue Bonds (NATL-RE FGIC Insured) | | | | |
3,000,000 | | 6.700%, 11/1/2021, Series Ab | | | 3,642,600 | |
| | University of Illinois Auxiliary Facilities System Revenue Bonds | | | | |
2,500,000 | | 5.750%, 4/1/2038, Series A | | | 2,659,350 | |
| | | |
| | Total Illinois | | | 130,037,914 | |
| | | |
| | | | | | |
Principal
Amount | | Long-Term Fixed Income (99.8%) | | Value | |
Indiana (1.9%) | | | | |
| | Ball State University Student Fee Bonds (FGIC Insured) | | | | |
$700,000 | | 5.750%, 7/1/2020, Series Ka,b | | | $706,251 | |
| | East Chicago Elementary School Building Corporation, Lake County, Indiana First Mortgage Refunding Bonds | | | | |
815,000 | | 6.250%, 1/5/2016 | | | 864,454 | |
| | Indiana Bond Bank Special Program Bonds (Clark Memorial Hospital) | | | | |
7,000,000 | | 5.500%, 8/1/2029, Series D | | | 7,287,630 | |
| | Indiana Finance Authority Hospital Revenue Bonds (Deaconess Hospital) | | | | |
1,500,000 | | 6.750%, 3/1/2039, Series A | | | 1,664,115 | |
| | Indiana Health and Educational Facility Financing Authority Health System Revenue Refunding Bonds (Sisters of St. Francis Health Services, Inc.) (AGM Insured) | | | | |
500,000 | | 5.250%, 5/15/2041, Series Eb | | | 507,135 | |
| | Indiana Municipal Power Agency Power Supply System Revenue Bonds | | | | |
4,155,000 | | 5.000%, 1/1/2042, Series A | | | 4,224,804 | |
| | Indiana Transportation Finance Authority Highway Revenue Bonds | | | | |
220,000 | | 6.800%, 12/1/2016, Series A | | | 246,657 | |
| | Indiana Transportation Finance Authority Highway Revenue Bonds (NATL-RE-IBC Insured) | | | | |
2,900,000 | | 7.250%, 6/1/2015, Series Ab | | | 3,237,792 | |
| | Indianapolis Local Public Improvement Bond Bank Bonds (Waterworks) | | | | |
5,000,000 | | 5.750%, 1/1/2038, Series A | | | 5,445,700 | |
| | Purdue University Student Fee Bonds | | | | |
2,120,000 | | 5.000%, 7/1/2020, Series La | | | 2,136,388 | |
| | | |
| | Total Indiana | | | 26,320,926 | |
| | | |
| |
Iowa (0.5%) | | | | |
| | Cedar Falls Community School District, Black Hawk County School Infrastructure Sales, Services and Use Tax Revenue Bonds | | | | |
3,165,000 | | 5.400%, 6/1/2029 | | | 3,331,542 | |
| | Iowa Finance Authority Single Family Mortgage Bonds (GNMA/FNMA Collateralized) | | | | |
5,000 | | 5.000%, 1/1/2037, Series E, AMTb | | | 5,000 | |
| | Waterloo Iowa Community School District Tax Revenue Refunding Bonds (School Infrastructure Sales, Services, and Use) | | | | |
3,560,000 | | 5.000%, 7/1/2029, Series A | | | 3,632,411 | |
| | | |
| | Total Iowa | | | 6,968,953 | |
| | | |
The accompanying Notes to Financial Statements are an integral part of this schedule.
152
Municipal Bond Fund
Schedule of Investments as of October 31, 2011
| | | | | | |
Principal
Amount | | Long-Term Fixed Income (99.8%) | | Value | |
Kansas (0.7%) | | | | |
| | Kansas Development Finance Authority Health Facilities Revenue Bonds (Stormont-Vail HealthCare, Inc.) (NATL-RE Insured) | | | | |
$90,000 | | 5.375%, 11/15/2024, Series Ka,b | | | $90,157 | |
910,000 | | 5.375%, 11/15/2024, Series Kb | | | 911,583 | |
| | Kansas Development Finance Authority Revenue Bonds | | | | |
3,500,000 | | 5.000%, 5/15/2030, Series S | | | 3,388,980 | |
| | Salina, Kansas Hospital Refunding and Improvement Revenue Bonds (Salina Regional Health Center, Inc.) | | | | |
1,725,000 | | 5.000%, 10/1/2036 | | | 1,738,490 | |
| | Sedgwick and Shawnee Counties, Kansas Single Family Mortgage Revenue Bonds (GNMA Collateralized) | | | | |
120,000 | | 6.700%, 6/1/2029, Series A- 2b | | | 124,670 | |
| | Wyandotte County/Kansas City, Kansas Sales Tax Special Obligation Revenue Refunding Bonds (Redevelopment Project Area B) | | | | |
3,610,000 | | 5.000%, 12/1/2020 | | | 3,689,673 | |
| | | |
| | Total Kansas | | | 9,943,553 | |
| | | |
| |
Kentucky (1.0%) | | | | |
| | Kentucky Economic Development Finance Authority Hospital Revenue Bonds (Owensboro Medical Health System, Inc.) | | | | |
5,880,000 | | 6.375%, 6/1/2040, Series A | | | 6,133,840 | |
| | Kentucky Economic Development Finance Authority Revenue Bonds (Louisville Arena Authority, Inc.) (AGM Insured) | | | | |
1,000,000 | | 6.000%, 12/1/2033, Series A- 1b | | | 1,062,900 | |
| | Paducah, Kentucky Electric Plant Board Revenue Bonds (AGM Insured) | | | | |
2,500,000 | | 5.250%, 10/1/2035, Series Ab | | | 2,642,775 | |
| | Pikeville, Kentucky Hospital Revenue Bonds (Pikeville Medical Center, Inc.) | | | | |
3,500,000 | | 6.500%, 3/1/2041 | | | 3,697,470 | |
| | | |
| | Total Kentucky | | | 13,536,985 | |
| | | |
| |
Louisiana (3.1%) | | | | |
| | Louisiana Public Facilities Authority Revenue Bonds (University of New Orleans Research and Technology Foundation, Inc. - Student Housing) (NATL-RE Insured) | | | | |
4,745,000 | | 5.250%, 3/1/2031b | | | 4,883,080 | |
| | | | | | |
Principal
Amount | | Long-Term Fixed Income (99.8%) | | Value | |
Louisiana (3.1%) - continued | | | | |
| | Louisiana State Gas and Fuels Tax Revenue Bonds | | | | |
$5,000,000 | | 5.000%, 5/1/2033, Series B | | | $5,320,050 | |
7,000,000 | | 5.000%, 5/1/2045, Series B | | | 7,360,850 | |
| | New Orleans, Louisiana General Obligation Refunding Bonds (AMBAC Insured) | | | | |
6,500,000 | | Zero Coupon, 9/1/2012b | | | 6,382,805 | |
| | Regional Transit Authority, Louisiana Sales Tax Revenue Refunding Bonds (NATL-RE FGIC Insured) | | | | |
2,605,000 | | 8.000%, 12/1/2012, Series Ab,f | | | 2,715,686 | |
| | St. John the Baptist Parish, Louisiana Revenue Bonds (Marathon Oil Corporation) | | | | |
13,000,000 | | 5.125%, 6/1/2037, Series A | | | 12,682,800 | |
| | St. Tammany Parish, Louisiana Utilities Revenue Bonds | | | | |
2,000,000 | | 5.500%, 8/1/2035, Series B | | | 2,144,620 | |
| | Tobacco Settlement Financing Corporation Tobacco Settlement Asset-Backed Bonds | | | | |
3,160,000 | | 5.500%, 5/15/2030, Series 2001 B | | | 3,145,401 | |
| | | |
| | Total Louisiana | | | 44,635,292 | |
| | | |
| |
Maryland (0.5%) | | | | |
| | Maryland Economic Development Corporation Student Housing Revenue Bonds (University Village at Sheppard Pratt) (ACA Insured) | | | | |
1,550,000 | | 6.000%, 7/1/2033b | | | 1,286,919 | |
| | Maryland Health and Higher Educational Facilities Authority Revenue Bonds (University of Maryland Medical Systems) | | | | |
1,000,000 | | 6.000%, 7/1/2022a | | | 1,037,820 | |
| | Morgan State University Academic Fees and Auxiliary Facilities Fees Revenue Refunding Bonds (NATL-RE Insured) | | | | |
3,705,000 | | 6.050%, 7/1/2015b | | | 4,063,903 | |
| | | |
| | Total Maryland | | | 6,388,642 | |
| | | |
|
Massachusetts (3.5%) | |
| | Massachusetts Bay Transportation Authority Sales Tax Bonds (NATL-RE Insured) | | | | |
5,000,000 | | 5.500%, 7/1/2025, Series Bb | | | 6,170,450 | |
| | Massachusetts Bay Transportation Authority Sales Tax Revenue Bonds | | | | |
6,000,000 | | 5.250%, 7/1/2031, Series A | | | 7,068,240 | |
| | Massachusetts Development Finance Agency Revenue Bonds (Devens Electric Systems) | | | | |
725,000 | | 5.625%, 12/1/2016 | | | 733,439 | |
The accompanying Notes to Financial Statements are an integral part of this schedule.
153
Municipal Bond Fund
Schedule of Investments as of October 31, 2011
| | | | | | |
Principal
Amount | | Long-Term Fixed Income (99.8%) | | Value | |
| Massachusetts (3.5%) - continued | | | | |
| | Massachusetts General Obligation Bonds (NATL-RE FGIC-TCRS Insured) | | | | |
$4,935,000 | | 5.250%, 1/1/2013, Series Ab | | | $5,212,544 | |
| | Massachusetts Health and Educational Facilities Authority Revenue Bonds (Massachusetts Institute of Technology) | | | | |
15,000,000 | | 5.250%, 7/1/2033, Series L | | | 18,622,500 | |
| | Massachusetts Health and Educational Facilities Authority Revenue Bonds (Partners Healthcare System, Inc.) | | | | |
35,000 | | 6.000%, 7/1/2016, Series C | | | 35,466 | |
| | Massachusetts Health and Educational Facilities Authority Revenue Bonds (Tufts University) | | | | |
5,400,000 | | 5.500%, 2/15/2028, Series M | | | 6,617,916 | |
| | Massachusetts Water Pollution Abatement Trust Pool Program Refunding Bonds | | | | |
5,000,000 | | 5.000%, 8/1/2024 | | | 6,093,950 | |
| | | |
| | Total Massachusetts | | | 50,554,505 | |
| | | |
| |
| Michigan (2.2%) | | | | |
| | East Lansing Building Authority, Ingham and Clinton Counties, Michigan Building Authority Bonds (General Obligation Limited Tax) | | | | |
2,000,000 | | 5.700%, 4/1/2020 | | | 2,355,160 | |
| | Grand Valley State University General Revenue Bonds | | | | |
1,000,000 | | 5.750%, 12/1/2034 | | | 1,060,800 | |
| | Kalamazoo Hospital Finance Authority Hospital Revenue Bonds (AGM Insured) | | | | |
4,000,000 | | 5.250%, 5/15/2036b | | | 4,127,560 | |
| | Kalamazoo Hospital Finance Authority Hospital Revenue Refunding Bonds (Bronson Methodist Hospital) (AGM Insured) | | | | |
3,250,000 | | 5.000%, 5/15/2026, Series Ab | | | 3,383,965 | |
| | Kent County, Michigan General Obligation Bonds | | | | |
2,775,000 | | 5.000%, 1/1/2024, AMT | | | 3,009,321 | |
| | Michigan Public Power Agency Revenue Bonds (Combustion Turbine No. 1) (AMBAC Insured) | | | | |
1,380,000 | | 5.250%, 1/1/2016, Series Aa,b | | | 1,391,219 | |
| | Michigan State Hospital Finance Authority Hospital Revenue and Refunding Bonds (Crittenton Hospital Medical Center) | | | | |
2,750,000 | | 5.500%, 3/1/2022, Series A | | | 2,767,958 | |
| | | | | | |
Principal
Amount | | Long-Term Fixed Income (99.8%) | | Value | |
| Michigan (2.2%) - continued | | | | |
| | Michigan State Hospital Finance Authority Hospital Revenue and Refunding Bonds (Sisters of Mercy Health Corporation) (NATL-RE Insured) | | | | |
$1,940,000 | | 5.375%, 8/15/2014, Series Pa,b | | | $2,034,381 | |
60,000 | | 5.375%, 8/15/2014, Series Pa,b | | | 62,919 | |
| | Michigan State Trunk Line Fund Refunding Bonds (AGM Insured) | | | | |
5,000,000 | | 5.000%, 11/1/2022b | | | 5,385,500 | |
| | Rochester Community School District, Oakland and Macomb Counties, Michigan School Building and Site General Obligation Bonds (NATL-RE Q- SBLF Insured) | | | | |
4,500,000 | | 5.000%, 5/1/2019b | | | 5,032,755 | |
| | | |
| | Total Michigan | | | 30,611,538 | |
| | | |
| |
| Minnesota (2.5%) | | | | |
| | Baytown Township, Minnesota Lease Revenue Bonds (St. Croix Preparatory Academy) | | | | |
1,000,000 | | 7.000%, 8/1/2038, Series A | | | 987,940 | |
| | Minneapolis and St. Paul, Minnesota Housing and Redevelopment Authority Health Care Facility Revenue Bonds (HealthPartners) | | | | |
800,000 | | 6.000%, 12/1/2021 | | | 857,344 | |
| | Minnesota Agricultural and Economic Development Board Health Care System Revenue Bonds (Fairview Hospital and Healthcare Services) (NATL-RE Insured) | | | | |
85,000 | | 5.750%, 11/15/2026, Series Ab | | | 85,060 | |
| | Minnesota Higher Education Facilities Authority Revenue Bond (College of St. Scholastica, Inc.) | | | | |
1,800,000 | | 6.300%, 12/1/2040, Series 7J | | | 1,891,602 | |
| | Minnesota Higher Education Facilities Authority Revenue Bonds | | | | |
1,575,000 | | 5.250%, 12/1/2035, Series H | | | 1,583,158 | |
| | Minnesota Higher Education Facilities Authority Revenue Bonds (University of St. Thomas) | | | | |
530,000 | | 5.250%, 10/1/2019, Series 5- Y | | | 573,147 | |
| | North Oaks, Minnesota Senior Housing Revenue Bonds (Presbyterian Homes of North Oaks, Inc.) | | | | |
2,000,000 | | 6.125%, 10/1/2039 | | | 2,010,180 | |
The accompanying Notes to Financial Statements are an integral part of this schedule.
154
Municipal Bond Fund
Schedule of Investments as of October 31, 2011
| | | | | | |
Principal
Amount | | Long-Term Fixed Income (99.8%) | | Value | |
| Minnesota (2.5%) - continued | | | | |
| | Northern Municipal Power Agency, Minnesota Electric System Revenue Bonds (AMBAC Insured) | | | | |
$2,000,000 | | 5.000%, 1/1/2026, Series Ab | | | $2,138,560 | |
| | Northfield, Minnesota Hospital Revenue Bonds | | | | |
1,000,000 | | 6.000%, 11/1/2021, Series Ca | | | 1,000,000 | |
1,300,000 | | 6.000%, 11/1/2026, Series Ca | | | 1,300,000 | |
2,040,000 | | 6.000%, 11/1/2031, Series Ca | | | 2,040,000 | |
| | Rochester, Minnesota Health Care Facilities Revenue Bonds (Olmsted Medical Center) | | | | |
1,000,000 | | 5.875%, 7/1/2030 | | | 1,000,910 | |
| | St. Cloud, Minnesota Health Care Revenue Bonds (CentraCare Health System) | | | | |
2,000,000 | | 5.125%, 5/1/2030, Series A | | | 2,050,520 | |
| | St. Louis Park, Minnesota Health Care Facilities Revenue Refunding Bonds (Park Nicollet Health Services) | | | | |
2,000,000 | | 5.250%, 7/1/2030, Series Ba | | | 2,229,920 | |
1,000,000 | | 5.750%, 7/1/2030, Series C | | | 1,032,820 | |
5,500,000 | | 5.750%, 7/1/2039 | | | 5,643,275 | |
| | St. Paul, Minnesota Housing and Redevelopment Authority Educational Facility Revenue Refunding Bonds (Saint Paul Academy and Summit School) | | | | |
4,000,000 | | 5.000%, 10/1/2024 | | | 4,275,880 | |
| | St. Paul, Minnesota Housing and Redevelopment Authority Health Care Facility Revenue Bonds (HealthPartners) | | | | |
230,000 | | 5.250%, 5/15/2019 | | | 239,791 | |
1,500,000 | | 5.250%, 5/15/2036 | | | 1,491,780 | |
| | University of Minnesota, Minnesota Revenue Bonds (State Supported Biomedical Science Research Facilities Funding) | | | | |
1,655,000 | | 5.000%, 8/1/2030, Series B | | | 1,797,115 | |
| | White Earth Band of Chippewa Indians Revenue Bonds (ACA Insured) | | | | |
1,150,000 | | 7.000%, 12/1/2011, Series Ab,f | | | 1,150,000 | |
| | | |
| | Total Minnesota | | | 35,379,002 | |
| | | |
| |
| Missouri (1.1%) | | | | |
| | Jackson County, Missouri Special Obligation Bonds (Harry S. Truman Sports Complex) (AMBAC Insured) | | | | |
7,500,000 | | 5.000%, 12/1/2027b | | | 7,730,025 | |
| | Missouri State Environmental Improvement and Energy Resources Authority Water Pollution Revenue Bonds | | | | |
825,000 | | 5.250%, 1/1/2018a | | | 871,497 | |
175,000 | | 5.250%, 1/1/2018 | | | 182,709 | |
| | | | | | |
Principal
Amount | | Long-Term Fixed Income (99.8%) | | Value | |
| Missouri (1.1%) - continued | | | | |
| | Missouri State Health and Educational Facilities Authority Health Facilities Revenue Bonds (Barnes-Jewish, Inc./Christian Health Services) | | | | |
$3,000,000 | | 5.250%, 5/15/2014, Series A | | | $3,176,460 | |
| | Missouri State Health and Educational Facilities Authority Health Facilities Revenue Bonds (BJC Health System) | | | | |
2,500,000 | | 5.000%, 5/15/2020, Series A | | | 2,662,950 | |
| | Missouri State Health and Educational Facilities Authority Health Facilities Revenue Bonds (Lake Regional Health System) | | | | |
1,500,000 | | 5.600%, 2/15/2025 | | | 1,520,685 | |
| | | |
| | Total Missouri | | | 16,144,326 | |
| | | |
| |
| Montana (0.5%) | | | | |
| | Montana Board of Housing Single Family Mortgage Bonds | | | | |
15,000 | | 6.000%, 6/1/2016, Series A-1 | | | 15,010 | |
45,000 | | 6.250%, 6/1/2019, Series A- 2, AMT | | | 45,051 | |
| | Montana Facility Finance Authority Hospital Facilities Revenue Bonds (St. Peter’s Hospital) | | | | |
3,860,000 | | 5.250%, 6/1/2018 | | | 4,011,466 | |
| | Montana Facility Finance Authority Revenue Bonds (Providence Health & Services) | | | | |
2,830,000 | | 5.000%, 10/1/2024 | | | 2,998,951 | |
| | | |
| | Total Montana | | | 7,070,478 | |
| | | |
| |
| Nebraska (1.4%) | | | | |
| | Douglas County, Nebraska Hospital Authority No. 3 Health Facilities Refunding and Revenue Bonds (Nebraska Methodist Health System) | | | | |
2,000,000 | | 5.750%, 11/1/2048 | | | 2,028,700 | |
| | Nebraska Public Power District General Revenue Bonds (AMBAC Insured) | | | | |
2,500,000 | | 5.000%, 1/1/2013, Series Bb | | | 2,626,775 | |
| | Omaha, Nebraska Public Power District Electric System Revenue Bonds | | | | |
920,000 | | 6.150%, 2/1/2012, Series Ba | | | 933,368 | |
5,780,000 | | 5.000%, 2/1/2046, Series A | | | 5,891,323 | |
| | Omaha, Nebraska Special Obligation Bonds (Riverfront Redevelopment) | | | | |
1,675,000 | | 5.500%, 2/1/2015, Series A | | | 1,709,354 | |
| | University of Nebraska Student Fees and Facilities Revenue Bonds | | | | |
5,000,000 | | 5.000%, 7/1/2023, Series B | | | 5,281,550 | |
The accompanying Notes to Financial Statements are an integral part of this schedule.
155
Municipal Bond Fund
Schedule of Investments as of October 31, 2011
| | | | | | |
Principal
Amount | | Long-Term Fixed Income (99.8%) | | Value | |
| Nebraska (1.4%) - continued | | | | |
| | University of Nebraska Student Housing Revenue Bonds | | | | |
$1,680,000 | | 5.000%, 5/15/2040, Series B | | | $1,810,502 | |
| | | |
| | Total Nebraska | | | 20,281,572 | |
| | | |
| |
| New Hampshire (0.2%) | | | | |
| | New Hampshire State Turnpike System Revenue Refunding Bonds | | | | |
2,000,000 | | 5.000%, 10/1/2019c | | | 2,268,420 | |
| | | |
| | Total New Hampshire | | | 2,268,420 | |
| | | |
| |
| New Jersey (1.5%) | | | | |
| | Hudson County, New Jersey Refunding Certificates of Participation (NATL-RE Insured) | | | | |
2,000,000 | | 6.250%, 12/1/2015b | | | 2,220,100 | |
| | New Jersey Educational Facilities Authority Revenue Refunding Bonds (Kean University) | | | | |
1,000,000 | | 5.500%, 9/1/2036, Series A | | | 1,076,230 | |
| | New Jersey General Obligation Bonds (AMBAC Insured) | | | | |
1,000,000 | | 5.250%, 7/15/2018, Series Lb | | | 1,193,130 | |
| | New Jersey Transportation Trust Fund Authority Revenue Bonds | | | | |
1,500,000 | | 5.000%, 6/15/2026, Series A | | | 1,598,955 | |
| | New Jersey Transportation Trust Fund Authority Transportation System Bonds (AGM Insured) | | | | |
5,000,000 | | 5.500%, 12/15/2016, Series Ab | | | 5,762,800 | |
| | New Jersey Turnpike Authority Turnpike Revenue Bonds (AMBAC-TCRS Insured) | | | | |
260,000 | | 6.500%, 1/1/2016, Series Ca,b | | | 289,382 | |
745,000 | | 6.500%, 1/1/2016, Series Cb | | | 824,514 | |
| | New Jersey Turnpike Authority Turnpike Revenue Bonds (AMBAC-TCRS-BNY Insured) | | | | |
3,695,000 | | 6.500%, 1/1/2016, Series Ca,b | | | 4,112,572 | |
| | Ocean County, New Jersey Utilities Authority Wastewater Revenue Bonds (NATL-RE Insured) | | | | |
3,180,000 | | 5.250%, 1/1/2025b | | | 3,949,242 | |
| | | |
| | Total New Jersey | | | 21,026,925 | |
| | | |
| |
| New Mexico (0.9%) | | | | |
| | Jicarilla, New Mexico Apache Nation Revenue Bonds | | | | |
3,500,000 | | 5.500%, 9/1/2023, Series A | | | 3,637,270 | |
| | Sandoval County, New Mexico Incentive Payment Refunding Revenue Bonds | | | | |
9,000,000 | | 5.000%, 6/1/2020 | | | 9,484,110 | |
| | | |
| | Total New Mexico | | | 13,121,380 | |
| | | |
| |
| New York (5.3%) | | | | |
| | Metropolitan Transportation Authority State Service Contract Refunding Bonds | | | | |
5,000,000 | | 5.500%, 7/1/2017, Series A | | | 5,964,600 | |
| | | | | | |
Principal
Amount | | Long-Term Fixed Income (99.8%) | | Value | |
| New York (5.3%) - continued | | | | |
| | Metropolitan Transportation Authority Transit Facilities Service Contract Bonds | | | | |
$1,340,000 | | 5.750%, 7/1/2013, Series Oa | | | $1,396,816 | |
| | New York City General Obligation Bonds | | | | |
12,000,000 | | 5.250%, 8/1/2017, Series B | | | 13,380,480 | |
220,000 | | 5.500%, 8/1/2022, Series Aa | | | 239,483 | |
1,530,000 | | 5.500%, 8/1/2022, Series A | | | 1,639,349 | |
| | New York City Municipal Water Finance Authority Water and Sewer System Revenue Bonds | | | | |
11,000,000 | | 5.750%, 6/15/2040, Series A | | | 12,450,130 | |
2,000,000 | | 5.375%, 6/15/2043, Series EE | | | 2,198,640 | |
| | New York City Municipal Water Finance Authority Water and Sewer System Revenue Bonds (AMBAC Insured) | | | | |
2,000,000 | | 5.875%, 6/15/2012, Series Aa,b | | | 2,069,020 | |
| | New York City Transitional Finance Authority Future Tax Secured Refunding Bonds | | | | |
2,540,000 | | 5.375%, 11/15/2021, Series Aa | | | 2,675,077 | |
8,940,000 | | 5.500%, 11/1/2026, Series Ad | | | 8,940,000 | |
| | New York State Dormitory Authority State Personal Income Tax Revenue Bonds | | | | |
5,125,000 | | 5.000%, 2/15/2029, Series A | | | 5,526,339 | |
| | New York State Dormitory Authority State University Educational Facilities Revenue Bonds | | | | |
2,000,000 | | 7.500%, 5/15/2013, Series A | | | 2,196,660 | |
5,000,000 | | 5.875%, 5/15/2017, Series A | | | 5,823,400 | |
4,000,000 | | 5.250%, 11/15/2023, Series Be | | | 4,100,200 | |
| | New York State Local Government Assistance Corporation Refunding Bonds (NATL-RE-IBC Insured) | | | | |
2,000,000 | | 5.250%, 4/1/2016, Series Eb | | | 2,295,320 | |
| | New York State Urban Development Corporation State Personal Income Tax Revenue Bonds (State Facilities and Equipment) | | | | |
3,870,000 | | 5.000%, 3/15/2036, Series B- 1 | | | 4,086,836 | |
| | | |
| | Total New York | | | 74,982,350 | |
| | | |
| |
| North Carolina (2.4%) | | | | |
| | North Carolina Eastern Municipal Power Agency Power System Revenue Bonds | | | | |
5,000,000 | | 5.500%, 1/1/2014, Series D | | | 5,466,250 | |
4,000,000 | | 5.375%, 1/1/2017, Series C | | | 4,157,360 | |
7,170,000 | | 5.250%, 1/1/2020, Series A | | | 8,049,616 | |
1,535,000 | | 5.500%, 1/1/2021, Series B | | | 1,537,748 | |
2,000,000 | | 5.000%, 1/1/2026, Series B | | | 2,120,800 | |
1,475,000 | | 6.000%, 1/1/2026, Series Aa | | | 1,935,657 | |
The accompanying Notes to Financial Statements are an integral part of this schedule.
156
Municipal Bond Fund
Schedule of Investments as of October 31, 2011
| | | | | | |
Principal
Amount | | Long-Term Fixed Income (99.8%) | | Value | |
| North Carolina (2.4%) - continued | | | | |
| | North Carolina Municipal Power Agency No. 1 Catawba Electric Revenue Bonds | | | | |
$3,200,000 | | 5.000%, 1/1/2025, Series A | | | $3,488,864 | |
1,250,000 | | 5.000%, 1/1/2030, Series A | | | 1,319,137 | |
| | Raleigh-Durham, North Carolina Airport Authority Revenue Bonds | | | | |
4,435,000 | | 5.000%, 5/1/2036, Series A | | | 4,683,050 | |
| | Wake County Industrial Facilities and Pollution Control Financing Authority Pollution Control Revenue Refunding Bonds (Carolina Power & Light Company) | | | | |
2,000,000 | | 5.375%, 2/1/2017 | | | 2,037,140 | |
| | | |
| | Total North Carolina | | | 34,795,622 | |
| | | |
| |
| North Dakota (0.7%) | | | | |
| | North Dakota Public Finance Authority Revenue Bonds (State Revolving Fund) | | | | |
1,495,000 | | 5.000%, 10/1/2031, Series A | | | 1,661,543 | |
| | South Central Regional Water District, North Dakota Utility System Revenue Bonds (Refunding and Northern Burleigh County Expansion) | | | | |
2,945,000 | | 5.650%, 10/1/2029, Series A | | | 3,059,119 | |
| | Ward County, North Dakota Health Care Facilities Refunding Revenue Bonds (Trinity) | | | | |
3,035,000 | | 6.250%, 7/1/2021, Series B | | | 3,037,792 | |
| | Ward County, North Dakota Health Care Facilities Revenue Bonds (Trinity) | | | | |
2,895,000 | | 5.125%, 7/1/2025 | | | 2,873,751 | |
| | | |
| | Total North Dakota | | | 10,632,205 | |
| | | |
| |
| Ohio (2.7%) | | | | |
| | Akron, Ohio Non-Tax Revenue Economic Development Bonds (NATL-RE Insured) | | | | |
600,000 | | 6.000%, 12/1/2012b | | | 603,234 | |
| | Buckeye Tobacco Settlement Financing Authority Tobacco Settlement Asset-Backed Bonds | | | | |
6,455,000 | | 5.125%, 6/1/2024, Series A-2 | | | 4,965,573 | |
| | Lorain County, Ohio Hospital Facilities Revenue Refunding and Improvement Bonds (Catholic Healthcare Partners) | | | | |
2,000,000 | | 5.400%, 10/1/2021, Series A | | | 2,024,740 | |
| | Lucas County, Ohio Health Care Facilities Revenue Refunding and Improvement Bonds | | | | |
2,000,000 | | 6.550%, 8/15/2024, Series A | | | 2,007,760 | |
| | Lucas County, Ohio Health Care System Refunding Revenue Bonds (Sunset Retirement Communities) | | | | |
1,250,000 | | 5.125%, 8/15/2025c | | | 1,226,300 | |
1,250,000 | | 5.500%, 8/15/2030c | | | 1,221,288 | |
| | | | | | |
Principal Amount | | Long-Term Fixed Income (99.8%) | | Value | |
| Ohio (2.7%) - continued | | | | |
| | Ohio Higher Educational Facility Commission Revenue Bonds (Case Western Reserve University) | | | | |
$2,000,000 | | 6.500%, 10/1/2020, Series B | | | $2,439,520 | |
| | Ohio Higher Educational Facility Commission Revenue Bonds (Kenyon College) | | | | |
4,740,000 | | 5.250%, 7/1/2044 | | | 4,885,992 | |
| | Ohio Turnpike Commission Turnpike Revenue Refunding Bonds (NATL-RE FGIC Insured) | | | | |
2,000,000 | | 5.500%, 2/15/2024, Series Ab | | | 2,359,160 | |
10,000,000 | | 5.500%, 2/15/2026, Series Ab | | | 11,738,900 | |
| | Port of Greater Cincinnati Development Authority Economic Development Revenue Bonds (Sisters of Mercy of the Americas, Regional Community of Cincinnati) | | | | |
1,750,000 | | 5.000%, 10/1/2025 | | | 1,766,607 | |
| | University of Cincinnati General Receipts Bonds (AMBAC Insured) | | | | |
2,545,000 | | 5.000%, 6/1/2016, Series Db | | | 2,755,904 | |
| | | |
| | Total Ohio | | | 37,994,978 | |
| | | |
| |
| Oklahoma (0.2%) | | | | |
| | Oklahoma Housing Finance Agency Single Family Mortgage Revenue Bonds (Homeownership Loan Program) (GNMA/FNMA Collateralized) | | | | |
60,000 | | 7.100%, 9/1/2028, Series D- 2, AMTb | | | 60,044 | |
| | Oklahoma Municipal Power Authority Power Supply System Revenue Bonds | | | | |
1,500,000 | | 6.000%, 1/1/2038, Series A | | | 1,641,735 | |
| | Oklahoma Municipal Power Authority Power Supply System Revenue Bonds (NATL- RE Insured) | | | | |
530,000 | | 5.875%, 1/1/2012, Series Bb | | | 534,558 | |
| | Oklahoma State Turnpike Authority Revenue Bonds | | | | |
500,000 | | 5.000%, 1/1/2028, Series A | | | 555,015 | |
| | | |
| | Total Oklahoma | | | 2,791,352 | |
| | | |
| |
| Oregon (0.2%) | | | | |
| | Clackamas County, Oregon Hospital Facility Authority Revenue Bonds (Legacy Health Systems) | | | | |
300,000 | | 5.500%, 7/15/2035, Series A | | | 314,937 | |
The accompanying Notes to Financial Statements are an integral part of this schedule.
157
Municipal Bond Fund
Schedule of Investments as of October 31, 2011
| | | | | | |
Principal
Amount | | Long-Term Fixed Income (99.8%) | | Value | |
| Oregon (0.2%) - continued | | | | |
| | Salem-Keizer School District No. 24J, Marion and Polk Counties, Oregon General Obligation Bonds | | | | |
$5,000,000 | | Zero Coupon, 6/15/2028, Series B | | | $2,433,850 | |
| | | |
| | Total Oregon | | | 2,748,787 | |
| | | |
| |
| Pennsylvania (2.9%) | | | | |
| | Allegheny County Hospital Development Authority Revenue Bonds (University of Pittsburgh Medical Center) | | | | |
3,000,000 | | 5.000%, 6/15/2018, Series B | | | 3,421,290 | |
2,000,000 | | 5.625%, 8/15/2039 | | | 2,109,940 | |
| | Cornwall-Lebanon School District, Lebanon County, Pennsylvania General Obligation Notes (AGM Insured) | | | | |
2,000,000 | | Zero Coupon, 3/15/2016b | | | 1,807,580 | |
1,520,000 | | Zero Coupon, 3/15/2017b | | | 1,328,146 | |
| | Cumberland County, Pennsylvania Municipal Authority Revenue Bonds (Diakon Lutheran Social Ministries) | | | | |
2,750,000 | | 5.000%, 1/1/2027 | | | 2,601,500 | |
2,000,000 | | 6.125%, 1/1/2029 | | | 2,049,220 | |
2,000,000 | | 5.000%, 1/1/2036 | | | 1,750,780 | |
| | Delaware County, Pennsylvania Industrial Development Authority Airport Facilities Revenue Bonds | | | | |
3,100,000 | | 0.200%, 12/1/2015 | | | 3,100,000 | |
| | Lancaster County Hospital Authority Hospital Revenue Bonds (Lancaster General Hospital) | | | | |
2,000,000 | | 5.500%, 3/15/2026a | | | 2,179,660 | |
| | Lycoming County Authority Health System Revenue Bonds (Susquehanna Health System) | | | | |
5,795,000 | | 5.750%, 7/1/2039, Series A | | | 5,798,013 | |
| | Pennsylvania Turnpike Commission Turnpike Revenue Bonds (AGM Insured) | | | | |
8,000,000 | | Zero Coupon, 6/1/2033, Series Cb,d | | | 6,707,920 | |
5,000,000 | | 6.250%, 6/1/2038, Series Cb | | | 5,577,500 | |
| | Philadelphia Authority for Industrial Development Revenue Bonds (Please Touch Museum) | | | | |
2,000,000 | | 5.250%, 9/1/2026 | | | 1,632,120 | |
| | York County, Pennsylvania Solid Waste and Refuse Authority Solid Waste System Refunding Revenue Bonds (NATL-RE FGIC Insured) | | | | |
1,000,000 | | 5.500%, 12/1/2012b | | | 1,048,220 | |
| | | |
| | Total Pennsylvania | | | 41,111,889 | |
| | | |
| | | | | | |
Principal
Amount | | Long-Term Fixed Income (99.8%) | | Value | |
| Puerto Rico (1.2%) | | | | |
| | Puerto Rico Electric Power Authority Power Revenue Bonds | | | | |
$10,000,000 | | 5.250%, 7/1/2040, Series XX | | | $10,082,300 | |
| | Puerto Rico Industrial, Tourist, Educational, Medical, and Environmental Control Facilities Financing Authority Cogeneration Facility Revenue Bonds (AES Puerto Rico) | | | | |
7,655,000 | | 6.625%, 6/1/2026, AMT | | | 7,587,483 | |
| | | |
| | Total Puerto Rico | | | 17,669,783 | |
| | | |
| |
| South Carolina (1.4%) | | | | |
| | Greenwood County, South Carolina Hospital Facilities Revenue Bonds (Self Memorial Hospital) | | | | |
1,000,000 | | 5.500%, 10/1/2026 | | | 1,000,450 | |
| | Greenwood County, South Carolina Hospital Facilities Revenue Bonds (Self Regional Healthcare) | | | | |
2,250,000 | | 5.375%, 10/1/2039 | | | 2,285,370 | |
| | Piedmont, South Carolina Municipal Power Agency Electric Revenue Bonds (NATL- RE FGIC Insured) | | | | |
4,000,000 | | 6.250%, 1/1/2021b | | | 4,936,840 | |
| | South Carolina Jobs-Economic Development Authority Hospital Refunding and Improvement Revenue Bonds (Palmetto Health Alliance) | | | | |
605,000 | | 6.875%, 8/1/2027, Series Ca | | | 670,213 | |
4,895,000 | | 6.875%, 8/1/2027, Series Ca | | | 5,422,632 | |
| | South Carolina Public Service Authority Revenue Obligations (Santee Cooper) | | | | |
3,710,000 | | 5.500%, 1/1/2038, Series A | | | 4,012,550 | |
| | Spartanburg, South Carolina Water System Revenue Bonds (FGIC Insured) | | | | |
2,000,000 | | 5.250%, 6/1/2028a,b | | | 2,233,700 | |
| | | |
| | Total South Carolina | | | 20,561,755 | |
| | | |
| |
| South Dakota (0.9%) | | | | |
| | South Dakota Educational Enhancement Funding Corporation Tobacco Settlement Asset-Backed Bonds | | | | |
5,000,000 | | 6.500%, 6/1/2032, Series B | | | 5,098,550 | |
| | South Dakota Health and Educational Facilities Authority Revenue Bonds (Prairie Lakes Health Care System) | | | | |
1,170,000 | | 5.625%, 4/1/2032a | | | 1,256,276 | |
| | South Dakota Health and Educational Facilities Authority Revenue Bonds (Sanford Health) | | | | |
5,000,000 | | 5.000%, 11/1/2040 | | | 5,045,400 | |
The accompanying Notes to Financial Statements are an integral part of this schedule.
158
Municipal Bond Fund
Schedule of Investments as of October 31, 2011
| | | | | | |
Principal
Amount | | Long-Term Fixed Income (99.8%) | | Value | |
| South Dakota (0.9%) - continued | | | | |
| | South Dakota Health and Educational Facilities Authority Revenue Bonds (Sanford Health) - continued | | | | |
$1,250,000 | | 5.500%, 11/1/2040 | | | $1,308,375 | |
| | | |
| | Total South Dakota | | | 12,708,601 | |
| | | |
| |
| Tennessee (1.2%) | | | | |
| | Jackson, Tennessee Hospital Revenue Refunding and Improvement Bonds (Jackson- Madison County General Hospital) | | | | |
2,000,000 | | 5.625%, 4/1/2038 | | | 2,099,040 | |
3,450,000 | | 5.750%, 4/1/2041 | | | 3,644,442 | |
| | Memphis-Shelby County Airport Authority Special Facilities Revenue Refunding Bonds (Federal Express Corporation) | | | | |
4,500,000 | | 5.050%, 9/1/2012 | | | 4,647,915 | |
2,000,000 | | 5.350%, 9/1/2012 | | | 2,070,660 | |
| | Nashville and Davidson Counties Industrial Development Board Multifamily Housing Revenue Refunding Bonds (Beechwood Terrace Apartments) (GNMA Collateralized) | | | | |
4,155,000 | | 6.625%, 3/20/2036, Series Ab | | | 4,283,431 | |
| | | |
| | Total Tennessee | | | 16,745,488 | |
| | | |
| |
| Texas (10.3%) | | | | |
| | Alliance Airport Authority, Inc. Special Facilities Revenue Refunding Bonds (Federal Express Corporation) | | | | |
10,285,000 | | 4.850%, 4/1/2021, AMT | | | 10,685,601 | |
| | Amarillo Health Facilities Corporation Hospital Revenue Bonds (Baptist St. Anthony’s Hospital Corporation) (AGM Insured) | | | | |
2,000,000 | | 5.500%, 1/1/2017b | | | 2,108,960 | |
| | Austin, Texas Combined Utility Systems Revenue Refunding Bonds (NATL-RE FGIC-TCRS Insured) | | | | |
1,665,000 | | 6.000%, 11/15/2013b | | | 1,702,762 | |
| | Bexar County Housing Finance Corporation Multifamily Housing Revenue Bonds (Dymaxion and Marbach Park Apartments) (NATL-RE Insured) | | | | |
1,930,000 | | 6.000%, 8/1/2023, Series Ab | | | 1,871,347 | |
| | Bluebonnet Trails Community Mental Health and Mental Retardation Center Revenue Bonds | | | | |
1,000,000 | | 6.125%, 12/1/2016 | | | 1,008,210 | |
| | Clifton Higher Education Finance Corporation Education Revenue Bonds (Uplift Education) | | | | |
4,000,000 | | 6.250%, 12/1/2045, Series A | | | 4,105,560 | |
| | | | | | |
Principal
Amount | | Long-Term Fixed Income (99.8%) | | Value | |
| Texas (10.3%) - continued | | | | |
| | Corpus Christi, Texas General Improvement Refunding Bonds (AGM Insured) | | | | |
$135,000 | | 5.000%, 3/1/2012, Series Ab | | | $137,117 | |
| | Dallas and Fort Worth, Texas Joint Revenue Improvement and Refunding Bonds (Dallas/Fort Worth International Airport) (NATL- RE Insured) | | | | |
1,000,000 | | 5.500%, 11/1/2016, Series A, AMTb | | | 1,030,080 | |
500,000 | | 5.500%, 11/1/2017, Series A AMTb | | | 513,250 | |
| | Dallas and Fort Worth, Texas Joint Revenue Improvement and Refunding Bonds (Dallas/Fort Worth International Airport) (XLCA Insured) | | | | |
9,750,000 | | 2, 6.125%, 11/1/2018, Series C- AMTb | | | 9,783,443 | |
| | Dallas Independent School District, Dallas County, Texas Unlimited Tax School Building Bonds (PSF-GTD Insured) | | | | |
10,000,000 | | 6.375%, 2/15/2034b | | | 11,837,400 | |
| | Deer Park Independent School District, Harris County, Texas School Building Refunding Bonds (PSF-GTD Insured) | | | | |
1,375,000 | | 5.000%, 2/15/2013b | | | 1,454,778 | |
| | Denton, Texas Utility System Revenue Bonds (AGM Insured) | | | | |
3,210,000 | | 5.250%, 12/1/2015, Series Aa,b | | | 3,380,130 | |
| | Gulf Coast Waste Disposal Authority, Texas Pollution Control Revenue Refunding Bonds (Exxon) | | | | |
3,000,000 | | 0.080%, 10/1/2024 | | | 3,000,000 | |
| | Harris County Health Facilities Development Corporation Hospital Revenue Refunding Bonds (Memorial Hermann Healthcare System) | | | | |
2,000,000 | | 7.250%, 12/1/2035, Series B | | | 2,261,560 | |
| | Harris County, Texas General Obligation and Revenue Refunding Bonds (NATL-RE Insured) | | | | |
7,000,000 | | Zero Coupon, 8/15/2024b | | | 4,600,890 | |
| | Harris County, Texas Toll Road Revenue and Refunding Bonds | | | | |
6,500,000 | | 5.250%, 8/15/2047, Series B | | | 6,847,815 | |
| | Houston, Texas Airport System Revenue Bonds (AGM Insured) | | | | |
500,000 | | 5.625%, 7/1/2030, Series A, AMTb | | | 500,205 | |
| | Houston, Texas Water and Sewer System Revenue Refunding Bonds (AGM Insured) | | | | |
10,000,000 | | 5.750%, 12/1/2032, Series Aa,b | | | 12,964,600 | |
The accompanying Notes to Financial Statements are an integral part of this schedule.
159
Municipal Bond Fund
Schedule of Investments as of October 31, 2011
| | | | | | |
Principal
Amount | | Long-Term Fixed Income (99.8%) | | Value | |
| Texas (10.3%) - continued | | | | |
| | Lewisville Independent School District, Denton County, Texas Unlimited Tax School Building and Refunding Bonds (PSF- GTD Insured) | | | | |
$5,315,000 | | Zero Coupon, 8/15/2019b | | $ | 4,310,359 | |
| | Lower Colorado River Authority, Texas Unrefunded Balance Revenue Bonds (AGM Insured) | | | | |
215,000 | | 5.875%, 5/15/2015, Series Ab | | | 215,776 | |
| | North East Independent School District, Bexar County, Texas Unlimited Tax Refunding Bonds (PSF-GTD Insured) | | | | |
5,000,000 | | 5.250%, 2/1/2028b | | | 6,049,100 | |
2,000,000 | | 5.250%, 2/1/2029b | | | 2,409,600 | |
| | North Texas Health Facilities Development Corporation Hospital Revenue Bonds (United Regional Healthcare System, Inc.) | | | | |
2,600,000 | | 6.000%, 9/1/2023a | | | 2,852,304 | |
| | North Texas Tollway Authority System Revenue Refunding Bonds | | | | |
1,000,000 | | 5.625%, 1/1/2033, Series A | | | 1,048,370 | |
| | North Texas Tollway Authority System Revenue Refunding Bonds (AGM Insured) | | | | |
5,000,000 | | Zero Coupon, 1/1/2028, Series Db | | | 2,096,850 | |
| | Pharr, Texas Higher Education Finance Authority Education Revenue Bonds (IDEA Public Schools) | | | | |
2,500,000 | | 6.250%, 8/15/2029, Series A | | | 2,491,750 | |
2,000,000 | | 6.500%, 8/15/2039, Series A | | | 2,016,740 | |
| | Ridge Parc Development Corporation Multifamily Housing Revenue Bonds (GNMA Collateralized) | | | | |
1,000,000 | | 6.100%, 6/20/2033b | | | 1,051,230 | |
2,795,000 | | 6.150%, 11/20/2041b | | | 2,937,601 | |
| | San Antonio, Texas General Obligation Bonds | | | | |
425,000 | | 5.250%, 2/1/2014 | | | 426,517 | |
| | San Antonio, Texas Water System Revenue Refunding Bonds (AGM Insured) | | | | |
885,000 | | 5.500%, 5/15/2018b | | | 905,452 | |
115,000 | | 5.500%, 5/15/2018a,b | | | 118,248 | |
115,000 | | 5.500%, 5/15/2019a,b | | | 118,248 | |
885,000 | | 5.500%, 5/15/2019b | | | 904,930 | |
115,000 | | 5.500%, 5/15/2020a,b | | | 118,247 | |
885,000 | | 5.500%, 5/15/2020b | | | 904,541 | |
| | San Juan, Texas Higher Education Finance Authority Education Revenue Bonds (IDEA Public Schools) | | | | |
2,000,000 | | 6.700%, 8/15/2040, Series A | | | 2,061,240 | |
| | San Leanna Education Facilities Corporation Higher Education Revenue Bonds (Saint Edward’s University) | | | | |
1,160,000 | | 5.125%, 6/1/2024 | | | 1,179,349 | |
| | | | | | |
Principal
Amount | | Long-Term Fixed Income (99.8%) | | Value | |
| Texas (10.3%) - continued | | | | |
| | San Leanna Education Facilities Corporation Higher Education Revenue Bonds (Saint Edward’s University) - continued | | | | |
$1,000,000 | | 5.125%, 6/1/2027 | | | $998,360 | |
| | Socorro, Texas Independent School District General Obligation Refunding Bonds (School Building) | | | | |
2,000,000 | | 5.000%, 8/15/2034b | | | 2,162,180 | |
| | Southeast Texas Housing Finance Corporation Single Family Mortgage Revenue Bonds (NATL-RE Insured) | | | | |
11,615,000 | | Zero Coupon, 9/1/2017a,b | | | 10,439,097 | |
| | Southwest Higher Education Authority, Inc. Higher Education Revenue Bonds (Southern Methodist University) | | | | |
1,500,000 | | 5.000%, 10/1/2041 | | | 1,580,400 | |
| | Tarrant County College District, Texas General Obligation Refunding Bonds | | | | |
1,410,000 | | 5.375%, 2/15/2013 | | | 1,499,309 | |
| | Tarrant County Cultural Education Facilities Finance Corporation Hospital Revenue Bonds (Hendrick Medical Center) (AGM Insured) | | | | |
1,250,000 | | 5.250%, 9/1/2026, Series Bb | | | 1,329,000 | |
2,000,000 | | 5.250%, 9/1/2027, Series Bb | | | 2,115,500 | |
1,000,000 | | 5.250%, 9/1/2028, Series Bb | | | 1,055,710 | |
| | Tarrant County Cultural Education Facilities Finance Corporation Refunding Revenue Bonds (Texas Health Resources System) | | | | |
2,000,000 | | 5.000%, 2/15/2023, Series A | | | 2,131,540 | |
| | Westlake, Texas Certificates of Obligation | | | | |
315,000 | | 6.500%, 5/1/2013 | | | 338,578 | |
350,000 | | 6.500%, 5/1/2015 | | | 388,951 | |
335,000 | | 6.500%, 5/1/2017a | | | 383,682 | |
1,650,000 | | 5.750%, 5/1/2024 | | | 1,759,494 | |
2,000,000 | | 5.800%, 5/1/2032a | | | 2,256,040 | |
| | Wylie, Texas Independent School District General Obligation Bonds (PSF-GTD Insured) | | | | |
430,000 | | 6.875%, 8/15/2014b | | | 437,770 | |
3,280,000 | | 7.000%, 8/15/2024b | | | 3,328,216 | |
| | | |
| | Total Texas | | | 146,213,987 | |
| | | |
| |
| Utah (0.7%) | | | | |
| | Riverton, Utah Hospital Revenue Bonds (IHC Health Services, Inc.) | | | | |
3,000,000 | | 5.000%, 8/15/2041 | | | 3,048,120 | |
| | Utah Associated Municipal Power Systems Revenue and Refunding Bonds (Central-St. George Transmission) | | | | |
6,000,000 | | 5.250%, 12/1/2027 | | | 6,318,360 | |
The accompanying Notes to Financial Statements are an integral part of this schedule.
160
Municipal Bond Fund
Schedule of Investments as of October 31, 2011
| | | | | | |
Principal
Amount | | Long-Term Fixed Income (99.8%) | | Value | |
| Utah (0.7%) - continued | | | | |
| | Utah State Charter School Finance Authority Charter School Revenue Bonds (North Davis Preparatory) | | | | |
$1,000,000 | | 6.250%, 7/15/2030 | | | $952,300 | |
| | | |
| | Total Utah | | | 10,318,780 | |
| | | |
| |
| Virginia (1.2%) | | | | |
| | Fairfax County, Virginia Industrial Development Authority Health Care Revenue Bonds (Inova Health System) | | | | |
1,000,000 | | 5.000%, 5/15/2025, Series C | | | 1,103,440 | |
| | Fairfax County, Virginia Industrial Development Authority Hospital Revenue Refunding Bonds (Inova Health System Hospitals) | | | | |
2,500,000 | | 5.250%, 8/15/2019 | | | 2,825,625 | |
| | Tobacco Settlement Financing Corporation Tobacco Settlement Asset-Backed Bonds | | | | |
515,000 | | 5.250%, 6/1/2019a | | | 529,183 | |
| | Virginia Commonwealth Transportation Board Revenue Bonds | | | | |
10,000,000 | | 5.000%, 5/15/2034 | | | 10,835,500 | |
| | Virginia Port Authority Port Facilities Revenue Refunding Bonds | | | | |
2,000,000 | | 5.000%, 7/1/2040 | | | 2,106,460 | |
| | | |
| | Total Virginia | | | 17,400,208 | |
| | | |
| |
| Washington (4.9%) | | | | |
| | Energy Northwest Columbia Generating Station Refunding Electric Revenue Bonds (NATL- RE Insured) | | | | |
1,000,000 | | 5.750%, 7/1/2018, Series Ab | | | 1,032,150 | |
| | Franklin County, Washington, Pasco School District No. 1 Unlimited Tax General Obligation Bonds (NATL-RE Insured) | | | | |
6,000,000 | | 5.250%, 12/1/2022b | | | 6,630,060 | |
| | FYI Properties Lease Revenue Bonds (State of Washington DIS) | | | | |
2,500,000 | | 5.500%, 6/1/2034 | | | 2,658,925 | |
| | King County, Washington Sewer Revenue Refunding Bonds (AGM Insured) | | | | |
10,000,000 | | 5.500%, 1/1/2013, Series Ba,b | | | 10,085,300 | |
| | Tobacco Settlement Authority Tobacco Settlement Asset- Backed Bonds | | | | |
7,005,000 | | 6.500%, 6/1/2026 | | | 7,134,523 | |
| | Washington Economic Development Finance Authority Lease Revenue Bonds (Washington Biomedical Research Properties II) (NATL-RE Insured) | | | | |
5,620,000 | | 5.000%, 6/1/2030b | | | 5,835,808 | |
| | | | | | |
Principal
Amount | | Long-Term Fixed Income (99.8%) | | Value | |
| Washington (4.9%) - continued | | | | |
| | Washington General Obligation Bonds | | | | |
$2,000,000 | | 6.000%, 6/1/2012, Series B & AT-7 | | | $2,066,580 | |
665,000 | | 5.750%, 10/1/2012, Series 93A | | | 698,137 | |
10,000 | | 5.750%, 10/1/2012, Series 93Aa | | | 10,498 | |
4,135,000 | | 6.750%, 2/1/2015, Series A | | | 4,404,561 | |
| | Washington General Obligation Bonds (AGM Insured) | | | | |
5,000,000 | | 5.000%, 7/1/2021, Series 2007Ab | | | 5,626,300 | |
| | Washington Health Care Facilities Authority Revenue Bonds | | | | |
2,500,000 | | 5.250%, 12/1/2030 | | | 2,443,925 | |
5,000,000 | | 5.250%, 10/1/2032, Series A | | | 5,256,400 | |
| | Washington Health Care Facilities Authority Revenue Bonds (Kadlec Medical Center) (AGM Insured) | | | | |
1,000,000 | | 5.000%, 12/1/2030, Series Ab | | | 1,003,070 | |
| | Washington Health Care Facilities Authority Revenue Bonds (Seattle Cancer Care Alliance) | | | | |
5,000,000 | | 7.375%, 3/1/2038 | | | 5,561,800 | |
| | Washington Health Care Facilities Authority Revenue Bonds (Swedish Health Services) (AMBAC Insured) | | | | |
2,000,000 | | 5.125%, 11/15/2018b | | | 2,005,160 | |
| | Washington Higher Education Facilities Authority Refunding Revenue Bonds (Gonzaga University) | | | | |
5,325,000 | | 5.000%, 4/1/2029, Series B | | | 5,453,918 | |
| | Washington Higher Education Facilities Authority Revenue and Refunding Revenue Bonds (Whitworth University) | | | | |
1,290,000 | | 5.875%, 10/1/2034 | | | 1,315,645 | |
1,000,000 | | 5.625%, 10/1/2040 | | | 981,040 | |
| | | |
| | Total Washington | | | 70,203,800 | |
| | | |
| |
| Wisconsin (1.6%) | | | | |
| | Monroe, Wisconsin Redevelopment Authority Development Revenue Bonds (Monroe Clinic, Inc.) | | | | |
3,500,000 | | 5.875%, 2/15/2039 | | | 3,569,160 | |
| | Wisconsin Health and Educational Facilities Authority Revenue and Refunding Bonds (Wheaton Franciscan Services, Inc.) | | | | |
6,000,000 | | 5.750%, 8/15/2025a | | | 6,154,200 | |
| | Wisconsin Health and Educational Facilities Authority Revenue Bonds (Blood Center of Southeastern Wisconsin, Inc.) | | | | |
2,000,000 | | 5.750%, 6/1/2034 | | | 2,059,640 | |
The accompanying Notes to Financial Statements are an integral part of this schedule.
161
Municipal Bond Fund
Schedule of Investments as of October 31, 2011
| | | | | | |
Principal
Amount | | Long-Term Fixed Income (99.8%) | | Value | |
| Wisconsin (1.6%) - continued | | | | |
| | Wisconsin Health and Educational Facilities Authority Revenue Bonds (Eagle River Memorial Hospital, Inc.) (Radian Insured) | | | | |
$920,000 | | 5.750%, 8/15/2020b | | | $930,166 | |
| | Wisconsin Health and Educational Facilities Authority Revenue Bonds (Marshfield Clinic) | | | | |
2,000,000 | | 6.000%, 2/15/2025, Series B | | | 2,005,500 | |
| | Wisconsin Health and Educational Facilities Authority Revenue Bonds (Thedacare, Inc.) | | | | |
5,000,000 | | 5.500%, 12/15/2038, Series A | | | 5,117,900 | |
| | Wisconsin Health and Educational Facilities Authority Revenue Bonds (Watertown Memorial Hospital, Inc.) (Radian Insured) | | | | |
2,000,000 | | 5.500%, 8/15/2029b | | | 1,986,380 | |
| | Wisconsin Health and Educational Facilities Authority Revenue Refunding Bonds (Marquette University) | | | | |
1,000,000 | | 15.000%, 10/1/2033, Series B-1 | | | 1,033,710 | |
| | | |
| | Total Wisconsin | | | 22,856,656 | |
| | | |
| |
| Wyoming (2.0%) | | | | |
| | Lincoln County, Wyoming Pollution Control Revenue Bonds (Exxon) | | | | |
6,500,000 | | 0.080%, 11/1/2014, Series C | | | 6,500,000 | |
6,000,000 | | 0.080%, 11/1/2014, Series A | | | 6,000,000 | |
6,525,000 | | 0.120%, 11/1/2014, Series B | | | 6,525,000 | |
| | Wyoming Municipal Power Agency Power Supply System Revenue Bonds | | | | |
3,270,000 | | 5.375%, 1/1/2042, Series A | | | 3,391,971 | |
| | Wyoming State Farm Loan Board Capital Facilities Refunding Revenue Bonds | | | | |
5,825,000 | | 5.750%, 10/1/2020 | | | 6,681,391 | |
| | | |
| | Total Wyoming | | | 29,098,362 | |
| | | |
| | Total Long-Term Fixed Income (cost $1,343,734,970) | | | 1,422,638,648 | |
| | | |
| |
| | | |
| | Total Investments (cost $1,343,734,970) 99.8% | | | $1,422,638,648 | |
| | | |
| | Other Assets and Liabilities, Net 0.2% | | | 3,467,951 | |
| | | |
| | Total Net Assets 100.0% | | | $1,426,106,599 | |
| | | |
| a | Denotes securities that have been pre-refunded or escrowed to maturity. Under such an arrangement, money is deposited into an irrevocable escrow account and is used to purchase U.S. Treasury securities or government agency securities with maturing principal and interest earnings sufficient to pay all debt service requirements of the pre-refunded bonds. |
| b | To reduce certain risks associated with securities issued by municipalities, which may include but are not limited to economic development in a specific industry or municipality, the principal and/or interest payments are guaranteed by the bond insurance company or government agency identified. |
| c | Denotes investments purchased on a when-issued or delayed delivery basis. |
| d | Denotes step coupon securities. Step coupon securities pay an initial coupon rate for the first period and then different coupon rates for following periods. The rate shown is as of October 31, 2011. |
| e | Denotes variable rate securities. Variable rate securities are securities whose yields vary with a designated market index or market rate. The rate shown is as of October 31, 2011. |
| f | Denotes restricted securities. Restricted securities are investment securities which have been deemed illiquid and cannot be offered for public sale without first being registered under the Securities Act of 1933. The following table indicates the acquisition date and cost of restricted securities Municipal Bond Fund owned as of October 31, 2011. |
| | | | | | | | |
| Security | | Acquisition
Date | | | Amortized
Cost | |
Regional Transit Authority, Louisiana Sales Tax Revenue Refunding Bonds (NATL-RE FGIC Insured) | | | 1/21/2000 | | | | $2,663,820 | |
White Earth Band of Chippewa Indians Revenue Bonds (ACA Insured) | | | 6/9/2000 | | | | $1,150,000 | |
The accompanying Notes to Financial Statements are an integral part of this schedule.
162
Municipal Bond Fund
Schedule of Investments as of October 31, 2011
| | | | |
Definitions: | | | | |
ACA | | - | | American Capital Access Holding, Ltd. |
AGM | | - | | Assured Guaranty Municipal Corporation |
AMBAC | | - | | American Municipal Bond Insurance Corporation |
AMT | | - | | Subject to Alternative Minimum Tax |
CR | | - | | Custodial Receipts |
FGIC | | - | | Financial Guaranty Insurance Company |
FHA | | - | | Federal Housing Administration |
FHLMC | | - | | Federal Home Loan Mortgage Corporation |
FNMA | | - | | Federal National Mortgage Association |
FSA | | - | | Financial Security Assurance, Inc. |
GNMA | | - | | Government National Mortgage Association |
IBC | | - | | Insured Bond Certificate |
NATL-RE | | - | | National Public Finance Guarantee Corporation |
PSF-GTD | | - | | Public School Fund Guaranteed |
Q-SBLF | | - | | Qualified School Bond Loan Fund |
Radian | | - | | Radian Guaranty, Inc. |
TCRS | | - | | Temporary Custodial Receipts |
VA | | - | | Department of Veterans’ Affairs |
XLCA | | - | | XL Capital Assurance |
Unrealized Appreciation (Depreciation)
| | | | |
Gross unrealized appreciation and depreciation of investments,based on cost for federal income tax purposes, were as follows: | |
Gross unrealized appreciation | | | $83,297,413 | |
Gross unrealized depreciation | | | (4,393,735 | ) |
Net unrealized appreciation (depreciation) | | | $78,903,678 | |
| | | | |
| |
Cost for federal income tax purposes | | | $1,343,734,970 | |
Fair Valuation Measurements
The following table is a summary of the inputs used, as of October 31, 2011, in valuing Municipal Bond Fund’s assets carried at fair value.
| | | | | | | | | | | | | | | | |
| Investments in Securities | | Total | | | Level 1 | | | Level 2 | | | Level 3 | |
Long-Term Fixed Income | | | | | | | | | | | | | | | | |
Education | | | 154,570,706 | | | | – | | | | 154,570,706 | | | | – | |
Electric Revenue | | | 72,099,811 | | | | – | | | | 72,099,811 | | | | – | |
Escrowed/Pre-refunded | | | 143,735,950 | | | | – | | | | 143,735,950 | | | | – | |
General Obligation | | | 265,013,039 | | | | – | | | | 265,013,039 | | | | – | |
Health Care | | | 190,693,779 | | | | – | | | | 190,693,779 | | | | – | |
Housing Finance | | | 15,238,750 | | | | – | | | | 15,238,750 | | | | – | |
Industrial Development Revenue | | | 71,092,114 | | | | – | | | | 71,092,114 | | | | – | |
Other Revenue | | | 183,834,812 | | | | – | | | | 183,834,812 | | | | – | |
Tax Revenue | | | 95,111,687 | | | | – | | | | 95,111,687 | | | | – | |
Transportation | | | 157,955,716 | | | | – | | | | 157,955,716 | | | | – | |
Water & Sewer | | | 73,292,284 | | | | – | | | | 73,292,284 | | | | – | |
Total | | | $1,422,638,648 | | | | $– | | | | $1,422,638,648 | | | | $– | |
The accompanying Notes to Financial Statements are an integral part of this schedule.
163
Income Fund
Schedule of Investments as of October 31, 2011
| | | | | | |
Principal Amount | | Bank Loans (1.2%)a | | Value | |
| Capital Goods (<0.1%) | | | | |
| | Transdigm Group, Inc., Term Loan | | | | |
$367,225 | | 4.000%, 2/14/2017 | | | $365,694 | |
| | | |
| | Total Capital Goods | | | 365,694 | |
| | | |
| |
| Communications Services (0.2%) | | | | |
| | Atlantic Broadband Finance, LLC, Term Loan | | | | |
804,249 | | 4.000%, 3/8/2016 | | | 786,724 | |
| | Charter Communications Operating, LLC, Term Loan | | | | |
20,239 | | 7.250%, 3/6/2014 | | | 20,230 | |
| | Lamar Media Corporation, Term Loan | | | | |
473,448 | | 4.000%, 12/30/2016 | | | 474,040 | |
| | | |
| | Total Communications Services | | | 1,280,994 | |
| | | |
| |
| Consumer Cyclical (0.2%) | | | | |
| | Chrysler Group, LLC, Term Loan | | | | |
1,436,400 | | 6.000%, 5/24/2017 | | | 1,346,625 | |
| | | |
| | Total Consumer Cyclical | | | 1,346,625 | |
| | | |
| |
| Consumer Non-Cyclical (0.1%) | | | | |
| | Dole Food Company, Term Loan | | | | |
235,370 | | 5.032%, 7/8/2018 | | | 234,572 | |
126,738 | | 5.045%, 7/8/2018 | | | 126,308 | |
| | Michael Foods, Inc., Term Loan | | | | |
746,250 | | 4.250%, 2/25/2018 | | | 735,527 | |
| | | |
| | Total Consumer Non-Cyclical | | | 1,096,407 | |
| | | |
| |
| Energy (0.1%) | | | | |
| | MEG Energy Corporation, Term Loan | | | | |
900,000 | | 4.000%, 3/18/2018 | | | 895,500 | |
| | | |
| | Total Energy | | | 895,500 | |
| | | |
| |
| Financials (0.1%) | | | | |
| | Springleaf Financial Funding Company, Term Loan | | | | |
925,000 | | 5.500%, 5/10/2017 | | | 844,395 | |
| | | |
| | Total Financials | | | 844,395 | |
| | | |
| |
| Technology (0.3%) | | | | |
| | Freescale Semiconductor, Term Loan | | | | |
939,430 | | 4.489%, 12/1/2016 | | | 901,383 | |
| | Intelsat Jackson Holdings SA, Term Loan | | | | |
1,104,450 | | 5.250%, 4/2/2018 | | | 1,094,786 | |
| | Syniverse Holdings, Inc., Term Loan | | | | |
178,650 | | 5.250%, 12/21/2017 | | | 178,352 | |
| | | |
| | Total Technology | | | 2,174,521 | |
| | | |
| |
| Transportation (0.2%) | | | | |
| | Delta Air Lines, Inc., Term Loan | | | | |
1,446,375 | | 5.500%, 4/20/2017 | | | 1,405,399 | |
| | | |
| | Total Transportation | | | 1,405,399 | |
| | | |
| | | | | | |
| | | |
| | Total Bank Loans (cost $9,611,888) | | | 9,409,535 | |
| | | |
| | | | | | |
Principal
Amount | | Long-Term Fixed Income (96.5%) | | Value | |
| Asset-Backed Securities (1.3%) | | | | |
| | Carrington Mortgage Loan Trust | | | | |
$1,100,000 | | 0.395%, 8/25/2036b | | | $357,003 | |
| | Countrywide Asset-Backed Certificates | | | | |
774,052 | | 5.549%, 8/25/2021c | | | 676,774 | |
| | First Horizon ABS Trust | | | | |
1,218,593 | | 0.405%, 10/25/2034b,c | | | 764,158 | |
| | GMAC Mortgage Corporation Loan Trust | | | | |
3,014,231 | | 0.425%, 8/25/2035b,c | | | 1,871,967 | |
3,322,745 | | 0.425%, 12/25/2036b,c | | | 2,042,710 | |
| | GSAMP Trust | | | | |
3,168,670 | | 0.325%, 8/25/2036b | | | 2,857,969 | |
| | IndyMac Seconds Asset-Backed Trust | | | | |
1,572,567 | | 0.415%, 10/25/2036b,c | | | 291,447 | |
| | Renaissance Home Equity Loan Trust | | | | |
1,994,294 | | 5.746%, 5/25/2036 | | | 1,135,108 | |
1,400,000 | | 6.011%, 5/25/2036 | | | 616,039 | |
| | | |
| | Total Asset-Backed Securities | | | 10,613,175 | |
| | | |
| |
| Basic Materials (5.6%) | | | | |
| | AbitibiBowater, Inc. | | | | |
1,264,000 | | 10.250%, 10/15/2018d | | | 1,384,080 | |
| | Alcoa, Inc. | | | | |
1,430,000 | | 5.720%, 2/23/2019 | | | 1,433,669 | |
675,000 | | 6.150%, 8/15/2020 | | | 696,867 | |
1,000,000 | | 6.750%, 1/15/2028 | | | 1,026,607 | |
| | ArcelorMittal | | | | |
1,500,000 | | 9.000%, 2/15/2015 | | | 1,755,691 | |
2,250,000 | | 5.250%, 8/5/2020 | | | 2,184,525 | |
| | Arch Coal, Inc. | | | | |
1,170,000 | | 7.000%, 6/15/2019d | | | 1,210,950 | |
| | Celulosa Arauco y Constitucion SA | | | | |
1,480,000 | | 5.000%, 1/21/2021 | | | 1,521,162 | |
| | CF Industries, Inc. | | | | |
2,380,000 | | 6.875%, 5/1/2018 | | | 2,713,200 | |
| | Cliffs Natural Resources, Inc. | | | | |
1,800,000 | | 4.875%, 4/1/2021 | | | 1,802,617 | |
| | CONSOL Energy, Inc. | | | | |
290,000 | | 8.000%, 4/1/2017 | | | 317,550 | |
940,000 | | 8.250%, 4/1/2020 | | | 1,029,300 | |
| | Domtar Corporation | | | | |
1,100,000 | | 7.125%, 8/15/2015 | | | 1,210,000 | |
| | Dow Chemical Company | | | | |
1,750,000 | | 5.900%, 2/15/2015 | | | 1,947,479 | |
1,130,000 | | 8.550%, 5/15/2019 | | | 1,467,971 | |
2,150,000 | | 4.250%, 11/15/2020 | | | 2,210,931 | |
| | FMG Resources Property, Ltd. | | | | |
1,110,000 | | 7.000%, 11/1/2015d | | | 1,110,000 | |
710,000 | | 6.875%, 2/1/2018d,e | | | 681,600 | |
370,000 | | 8.250%, 11/1/2019d | | | 373,700 | |
| | Georgia-Pacific, LLC | | | | |
2,020,000 | | 5.400%, 11/1/2020d | | | 2,252,064 | |
| | International Paper Company | | | | |
1,500,000 | | 7.500%, 8/15/2021 | | | 1,822,926 | |
750,000 | | 7.300%, 11/15/2039 | | | 874,541 | |
| | Lyondell Chemical Company | | | | |
1,130,000 | | 11.000%, 5/1/2018 | | | 1,258,537 | |
| | Noble Group, Ltd. | | | | |
750,000 | | 4.875%, 8/5/2015d | | | 736,875 | |
1,850,000 | | 6.750%, 1/29/2020d | | | 1,813,000 | |
The accompanying Notes to Financial Statements are an integral part of this schedule.
164
Income Fund
Schedule of Investments as of October 31, 2011
| | | | | | |
Principal Amount | | Long-Term Fixed Income (96.5%) | | Value | |
| Basic Materials (5.6%) - continued | | | | |
| | NOVA Chemicals Corporation | | | | |
$750,000 | | 8.625%, 11/1/2019 | | | $843,750 | |
| | Novelis, Inc. | | | | |
1,080,000 | | 8.375%, 12/15/2017 | | | 1,166,400 | |
| | Rio Tinto Finance USA, Ltd. | | | | |
1,965,000 | | 6.500%, 7/15/2018 | | | 2,357,735 | |
1,100,000 | | 3.500%, 11/2/2020 | | | 1,125,189 | |
| | Teck Resources, Ltd. | | | | |
827,000 | | 10.250%, 5/15/2016 | | | 968,582 | |
| | Vale Overseas, Ltd. | | | | |
1,875,000 | | 6.875%, 11/10/2039 | | | 2,160,810 | |
| | Weyerhaeuser Company | | | | |
1,430,000 | | 7.375%, 3/15/2032 | | | 1,428,917 | |
| | | |
| | Total Basic Materials | | | 44,887,225 | |
| | | |
| |
| Capital Goods (2.4%) | | | | |
| | BAE Systems plc | | | | |
2,120,000 | | 4.750%, 10/11/2021d | | | 2,140,863 | |
| | Ball Corporation | | | | |
1,060,000 | | 5.750%, 5/15/2021 | | | 1,094,450 | |
| | Boeing Capital Corporation | | | | |
900,000 | | 2.125%, 8/15/2016 | | | 917,071 | |
| | Case New Holland, Inc. | | | | |
750,000 | | 7.750%, 9/1/2013 | | | 798,750 | |
950,000 | | 7.875%, 12/1/2017 | | | 1,071,125 | |
| | Cemex SAB de CV | | | | |
730,000 | | 5.369%, 9/30/2015b,d | | | 540,200 | |
| | CRH America, Inc. | | | | |
1,000,000 | | 4.125%, 1/15/2016 | | | 1,000,523 | |
1,100,000 | | 8.125%, 7/15/2018 | | | 1,268,181 | |
| | Crown Americas, LLC | | | | |
1,460,000 | | 7.625%, 5/15/2017 | | | 1,584,100 | |
| | John Deere Capital Corporation | | | | |
1,700,000 | | 5.350%, 4/3/2018 | | | 1,989,398 | |
| | Lockheed Martin Corporation | | | | |
1,425,000 | | 3.350%, 9/15/2021 | | | 1,436,299 | |
| | Republic Services, Inc. | | | | |
370,000 | | 5.500%, 9/15/2019 | | | 425,287 | |
900,000 | | 5.000%, 3/1/2020 | | | 1,000,530 | |
1,300,000 | | 5.250%, 11/15/2021 | | | 1,482,217 | |
| | Sealed Air Corporation | | | | |
710,000 | | 8.375%, 9/15/2021d | | | 768,575 | |
| | Textron, Inc. | | | | |
1,500,000 | | 6.200%, 3/15/2015 | | | 1,612,189 | |
| | | |
| | Total Capital Goods | | | 19,129,758 | |
| | | |
| |
| Collateralized Mortgage Obligations (1.7%) | | | | |
| | Banc of America Mortgage Securities, Inc. | | | | |
3,359,446 | | 2.764%, 9/25/2035b | | | 2,687,177 | |
| | Bear Stearns Mortgage Funding Trust | | | | |
550,918 | | 0.525%, 8/25/2036b | | | 155,809 | |
| | CitiMortgage Alternative Loan Trust | | | | |
1,860,742 | | 5.750%, 4/25/2037 | | | 1,230,706 | |
| | Countrywide Alternative Loan Trust | | | | |
2,528,644 | | 6.000%, 1/25/2037 | | | 1,700,151 | |
| | HomeBanc Mortgage Trust | | | | |
1,742,400 | | 2.171%, 4/25/2037 | | | 951,697 | |
| | | | | | |
Principal Amount | | Long-Term Fixed Income (96.5%) | | Value | |
| Collateralized Mortgage Obligations (1.7%) - continued | | | | |
| | Merrill Lynch Mortgage Investors, Inc. | | | | |
$2,473,057 | | 2.628%, 6/25/2035 | | | $2,031,723 | |
| | Wachovia Mortgage Loan Trust, LLC | | | | |
2,249,762 | | 2.902%, 5/20/2036 | | | 1,475,007 | |
| | Washington Mutual Alternative Mortgage Pass-Through Certificates | | | | |
3,434,673 | | 0.980%, 2/25/2047b | | | 1,486,183 | |
| | Washington Mutual Mortgage Pass-Through Certificates | | | | |
1,393,622 | | 0.535%, 10/25/2045b | | | 1,048,936 | |
| | | |
| | Total Collateralized Mortgage Obligations | | | 12,767,389 | |
| | | |
| |
| Commercial Mortgage-Backed Securities (3.8%) | | | | |
| | Banc of America Commercial Mortgage, Inc. | | | | |
1,800,000 | | 5.655%, 4/10/2049 | | | 1,561,585 | |
| | Bear Stearns Commercial Mortgage Securities, Inc. | | | | |
1,570,548 | | 0.393%, 3/15/2022b,f | | | 1,541,036 | |
2,500,000 | | 5.331%, 2/11/2044 | | | 2,602,107 | |
| | Citigroup Commercial Mortgage Trust | | | | |
3,000,000 | | 0.383%, 4/15/2022b,d | | | 2,878,689 | |
| | Citigroup/Deutsche Bank Commercial Mortgage | | | | |
1,300,000 | | 5.322%, 12/11/2049 | | | 1,361,225 | |
| | Commercial Mortgage Pass- Through Certificates | | | | |
4,000,000 | | 0.373%, 12/15/2020b,f | | | 3,648,440 | |
3,500,000 | | 0.423%, 6/15/2022b,f | | | 3,209,573 | |
| | Credit Suisse First Boston Mortgage Securities | | | | |
1,800,000 | | 5.542%, 1/15/2049 | | | 1,854,709 | |
| | Credit Suisse Mortgage Capital Certificates | | | | |
1,811,192 | | 0.413%, 10/15/2021b,d | | | 1,674,726 | |
2,500,000 | | 5.467%, 9/15/2039 | | | 2,643,795 | |
| | LB-UBS Commercial Mortgage Trust | | | | |
1,800,000 | | 6.167%, 9/15/2045 | | | 1,534,896 | |
| | Morgan Stanley Capital, Inc. | | | | |
1,800,000 | | 5.406%, 3/15/2044 | | | 1,628,228 | |
| | Wachovia Bank Commercial Mortgage Trust | | | | |
5,000,000 | | 0.363%, 9/15/2021b,f | | | 4,408,075 | |
| | WaMu Commercial Mortgage Securities Trust | | | | |
48,057 | | 3.830%, 1/25/2035d | | | 48,197 | |
| | | |
| | Total Commercial Mortgage- Backed Securities | | | 30,595,281 | |
| | | |
| |
| Communications Services (9.6%) | | | | |
| | Alltel Corporation | | | | |
2,350,000 | | 7.000%, 3/15/2016 | | | 2,826,890 | |
| | America Movil SAB de CV | | | | |
710,000 | | 2.375%, 9/8/2016 | | | 708,859 | |
2,200,000 | | 5.000%, 3/30/2020 | | | 2,449,528 | |
The accompanying Notes to Financial Statements are an integral part of this schedule.
165
Income Fund
Schedule of Investments as of October 31, 2011
| | | | | | |
Principal
Amount | | Long-Term Fixed Income (96.5%) | | Value | |
| Communications Services (9.6%) - continued | | | | |
| | American Tower Corporation | | | | |
$1,200,000 | | 4.625%, 4/1/2015 | | | $1,280,424 | |
750,000 | | 4.500%, 1/15/2018 | | | 771,410 | |
| | AT&T, Inc. | | | | |
2,900,000 | | 4.450%, 5/15/2021 | | | 3,152,291 | |
1,245,000 | | 5.550%, 8/15/2041 | | | 1,404,732 | |
| | Cablevision Systems Corporation | | | | |
700,000 | | 8.625%, 9/15/2017 | | | 759,500 | |
| | CBS Corporation | | | | |
1,500,000 | | 8.875%, 5/15/2019 | | | 1,938,143 | |
700,000 | | 7.875%, 9/1/2023 | | | 872,636 | |
| | CCO Holdings, LLC | | | | |
1,120,000 | | 7.250%, 10/30/2017 | | | 1,170,400 | |
720,000 | | 7.000%, 1/15/2019 | | | 747,000 | |
| | Cellco Partnership/Verizon Wireless Capital, LLC | | | | |
1,400,000 | | 8.500%, 11/15/2018 | | | 1,892,901 | |
| | CenturyLink, Inc. | | | | |
1,480,000 | | 5.150%, 6/15/2017 | | | 1,493,557 | |
| | Clear Channel Worldwide Holdings, Inc. | | | | |
1,120,000 | | 9.250%, 12/15/2017 | | | 1,215,200 | |
| | Comcast Corporation | | | | |
1,100,000 | | 6.300%, 11/15/2017 | | | 1,299,625 | |
1,100,000 | | 5.700%, 5/15/2018 | | | 1,267,609 | |
1,300,000 | | 6.400%, 5/15/2038 | | | 1,548,304 | |
| | Cox Communications, Inc. | | | | |
1,100,000 | | 9.375%, 1/15/2019d | | | 1,518,652 | |
1,500,000 | | 8.375%, 3/1/2039d | | | 2,097,438 | |
| | Crown Castle Towers, LLC | | | | |
2,950,000 | | 4.174%, 8/15/2017d | | | 3,005,652 | |
| | CSC Holdings, Inc. | | | | |
710,000 | | 7.625%, 7/15/2018 | | | 773,900 | |
| | DIRECTV Holdings, LLC/DIRECTV Financing Company, Inc. | | | | |
2,925,000 | | 5.000%, 3/1/2021 | | | 3,201,962 | |
| | Discovery Communications, LLC | | | | |
1,080,000 | | 4.375%, 6/15/2021 | | | 1,131,816 | |
| | Dish DBS Corporation | | | | |
1,765,000 | | 6.750%, 6/1/2021 | | | 1,822,363 | |
| | EH Holding Corporation | | | | |
1,780,000 | | 6.500%, 6/15/2019d | | | 1,820,050 | |
| | Embarq Corporation | | | | |
1,400,000 | | 7.082%, 6/1/2016 | | | 1,517,282 | |
| | Frontier Communications Corporation | | | | |
750,000 | | 7.875%, 4/15/2015 | | | 794,531 | |
1,240,000 | | 8.250%, 4/15/2017 | | | 1,323,700 | |
| | Intelsat Jackson Holdings SA | | | | |
1,100,000 | | 7.500%, 4/1/2021d | | | 1,105,500 | |
| | MetroPCS Wireless, Inc. | | | | |
1,120,000 | | 7.875%, 9/1/2018 | | | 1,139,600 | |
| | NBCUniversal Media, LLC | | | | |
2,250,000 | | 5.150%, 4/30/2020 | | | 2,528,595 | |
| | News America, Inc. | | | | |
1,100,000 | | 7.625%, 11/30/2028 | | | 1,299,604 | |
1,350,000 | | 6.400%, 12/15/2035 | | | 1,518,720 | |
| | NII Capital Corporation | | | | |
1,100,000 | | 8.875%, 12/15/2019 | | | 1,155,000 | |
| | Qwest Communications International, Inc. | | | | |
1,820,000 | | 7.125%, 4/1/2018 | | | 1,860,950 | |
| | | | | | |
Principal
Amount | | Long-Term Fixed Income (96.5%) | | Value | |
| Communications Services (9.6%) - continued | | | | |
| | Qwest Corporation | | | | |
$400,000 | | 8.375%, 5/1/2016 | | | $457,000 | |
1,800,000 | | 6.500%, 6/1/2017 | | | 1,939,500 | |
| | Rogers Communications, Inc. | | | | |
1,420,000 | | 8.750%, 5/1/2032 | | | 2,046,034 | |
| | SBA Tower Trust | | | | |
2,000,000 | | 5.101%, 4/15/2017d | | | 2,179,000 | |
| | Telefonica Emisiones SAU | | | | |
735,000 | | 5.462%, 2/16/2021 | | | 744,925 | |
| | Telefonica SA | | | | |
720,000 | | 5.877%, 7/15/2019 | | | 747,074 | |
| | Telemar Norte Leste SA | | | | |
2,200,000 | | 5.500%, 10/23/2020d | | | 2,216,500 | |
| | Time Warner Cable, Inc. | | | | |
1,500,000 | | 8.250%, 4/1/2019 | | | 1,910,282 | |
1,450,000 | | 6.750%, 6/15/2039 | | | 1,762,469 | |
| | Time Warner Entertainment Company, LP | | | | |
1,150,000 | | 8.375%, 3/15/2023 | | | 1,512,205 | |
| | Verizon Communications, Inc. | | | | |
1,400,000 | | 3.500%, 11/1/2021g | | | 1,412,373 | |
| | VimpelCom Holdings BV | | | | |
1,440,000 | | 6.255%, 3/1/2017d | | | 1,369,728 | |
| | Virgin Media Finance plc | | | | |
1,480,000 | | 9.500%, 8/15/2016 | | | 1,650,200 | |
| | | |
| | Total Communications Services | | | 76,361,614 | |
| | | |
| |
| Consumer Cyclical (5.1%) | | | | |
| | American Honda Finance Corporation | | | | |
2,600,000 | | 3.875%, 9/21/2020d | | | 2,688,886 | |
| | Chrysler Group, LLC | | | | |
710,000 | | 8.000%, 6/15/2019d,e | | | 653,200 | |
| | CVS Caremark Corporation | | | | |
1,500,000 | | 6.302%, 6/1/2037 | | | 1,456,875 | |
| | Daimler Finance North America, LLC | | | | |
1,240,000 | | 3.875%, 9/15/2021d | | | 1,242,985 | |
| | FireKeepers Development Authority | | | | |
760,000 | | 13.875%, 5/1/2015d | | | 866,400 | |
| | Ford Motor Credit Company, LLC | | | | |
1,250,000 | | 8.000%, 6/1/2014e | | | 1,374,570 | |
1,400,000 | | 3.875%, 1/15/2015 | | | 1,400,687 | |
1,070,000 | | 7.000%, 4/15/2015 | | | 1,166,300 | |
370,000 | | 6.625%, 8/15/2017 | | | 405,473 | |
| | Goodyear Tire & Rubber Company | | | | |
1,145,000 | | 8.250%, 8/15/2020e | | | 1,225,150 | |
| | Home Depot, Inc. | | | | |
375,000 | | 3.950%, 9/15/2020e | | | 395,217 | |
2,100,000 | | 5.875%, 12/16/2036 | | | 2,481,879 | |
| | Hyatt Hotels Corporation | | | | |
1,900,000 | | 5.750%, 8/15/2015d | | | 2,038,994 | |
| | Hyundai Motor Manufacturing Czech | | | | |
1,475,000 | | 4.500%, 4/15/2015d | | | 1,523,851 | |
| | J.C. Penney Company, Inc. | | | | |
1,050,000 | | 5.650%, 6/1/2020 | | | 989,625 | |
| | KIA Motors Corporation | | | | |
1,740,000 | | 3.625%, 6/14/2016d | | | 1,694,101 | |
The accompanying Notes to Financial Statements are an integral part of this schedule.
166
Income Fund
Schedule of Investments as of October 31, 2011
| | | | | | |
Principal
Amount | | Long-Term Fixed Income (96.5%) | | Value | |
| Consumer Cyclical (5.1%) - continued | | | | |
| | Macy’s Retail Holdings, Inc. | | | | |
$1,930,000 | | 8.125%, 7/15/2015 | | | $2,236,380 | |
1,080,000 | | 7.450%, 7/15/2017 | | | 1,258,570 | |
| | MGM Resorts International | | | | |
720,000 | | 11.125%, 11/15/2017 | | | 817,200 | |
| | Peninsula Gaming, LLC | | | | |
270,000 | | 10.750%, 8/15/2017 | | | 278,100 | |
| | RCI Banque SA | | | | |
1,275,000 | | 4.600%, 4/12/2016d | | | 1,238,429 | |
| | Sheraton Holding Corporation | | | | |
710,000 | | 7.375%, 11/15/2015 | | | 782,775 | |
| | Starwood Hotels & Resorts Worldwide, Inc. | | | | |
1,150,000 | | 6.750%, 5/15/2018 | | | 1,276,500 | |
| | Time Warner, Inc. | | | | |
700,000 | | 4.000%, 1/15/2022 | | | 718,029 | |
1,400,000 | | 7.700%, 5/1/2032 | | | 1,823,025 | |
| | Toll Brothers Finance Corporation | | | | |
1,000,000 | | 6.750%, 11/1/2019 | | | 1,030,766 | |
| | Toys R Us Property Company II, LLC | | | | |
1,080,000 | | 8.500%, 12/1/2017 | | | 1,140,750 | |
| | Volkswagen International Finance NV | | | | |
1,455,000 | | 2.875%, 4/1/2016d | | | 1,469,130 | |
| | Wal-Mart Stores, Inc. | | | | |
2,000,000 | | 5.250%, 9/1/2035 | | | 2,330,452 | |
| | West Corporation | | | | |
920,000 | | 7.875%, 1/15/2019 | | | 933,800 | |
| | Wyndham Worldwide Corporation | | | | |
1,120,000 | | 6.000%, 12/1/2016 | | | 1,184,528 | |
730,000 | | 5.625%, 3/1/2021 | | | 748,573 | |
| | | |
| | Total Consumer Cyclical | | | 40,871,200 | |
| | | |
| |
| Consumer Non-Cyclical (5.4%) | | | | |
| | Altria Group, Inc. | | | | |
1,000,000 | | 9.700%, 11/10/2018 | | | 1,344,021 | |
905,000 | | 4.750%, 5/5/2021 | | | 974,927 | |
1,500,000 | | 9.950%, 11/10/2038 | | | 2,278,952 | |
| | Anheuser-Busch InBev Worldwide, Inc. | | | | |
1,450,000 | | 5.375%, 1/15/2020 | | | 1,716,559 | |
1,475,000 | | 5.000%, 4/15/2020 | | | 1,712,235 | |
| | Biomet, Inc. | | | | |
1,475,000 | | 10.000%, 10/15/2017d | | | 1,593,000 | |
| | Boston Scientific Corporation | | | | |
2,200,000 | | 4.500%, 1/15/2015 | | | 2,316,393 | |
| | Bunge Limited Finance Corporation | | | | |
1,265,000 | | 5.100%, 7/15/2015 | | | 1,325,200 | |
900,000 | | 4.100%, 3/15/2016 | | | 926,810 | |
| | Celgene Corporation | | | | |
1,500,000 | | 3.950%, 10/15/2020 | | | 1,514,073 | |
| | Coca-Cola Company | | | | |
1,075,000 | | 1.800%, 9/1/2016d | | | 1,072,511 | |
| | Community Health Systems, Inc. | | | | |
1,720,000 | | 8.875%, 7/15/2015e | | | 1,760,850 | |
| | DJO Finance, LLC/DJO Finance Corporation | | | | |
360,000 | | 7.750%, 4/15/2018 | | | 304,200 | |
| | Endo Pharmaceuticals Holdings, Inc. | | | | |
70,000 | | 7.000%, 7/15/2019d | | | 75,600 | |
| | | | | | |
Principal
Amount | | Long-Term Fixed Income (96.5%) | | Value | |
| Consumer Non-Cyclical (5.4%) - continued | | | | |
| | Energizer Holdings, Inc. | | | | |
$1,000,000 | | 4.700%, 5/19/2021d | | | $1,057,101 | |
| | Express Scripts, Inc. | | | | |
1,265,000 | | 3.125%, 5/15/2016 | | | 1,293,764 | |
| | Fortune Brands, Inc. | | | | |
485,000 | | 6.375%, 6/15/2014 | | | 532,080 | |
127,000 | | 5.375%, 1/15/2016 | | | 136,168 | |
| | Hasbro, Inc. | | | | |
1,750,000 | | 6.350%, 3/15/2040 | | | 1,887,888 | |
| | HCA, Inc. | | | | |
1,510,000 | | 8.500%, 4/15/2019 | | | 1,661,000 | |
730,000 | | 7.250%, 9/15/2020 | | | 782,012 | |
180,000 | | 7.500%, 2/15/2022 | | | 183,600 | |
| | JBS Finance II, Ltd. | | | | |
750,000 | | 8.250%, 1/29/2018f | | | 693,750 | |
| | Kinetic Concepts, Inc./KCI USA, Inc. | | | | |
350,000 | | 10.500%, 11/1/2018d,g | | | 353,937 | |
| | Kraft Foods, Inc. | | | | |
1,300,000 | | 6.125%, 2/1/2018 | | | 1,533,347 | |
3,300,000 | | 5.375%, 2/10/2020 | | | 3,803,468 | |
| | Life Technologies Corporation | | | | |
750,000 | | 6.000%, 3/1/2020 | | | 835,906 | |
| | Mylan, Inc. | | | | |
2,145,000 | | 7.875%, 7/15/2020d | | | 2,402,400 | |
| | Roche Holdings, Inc. | | | | |
1,790,000 | | 6.000%, 3/1/2019d | | | 2,170,320 | |
| | Stryker Corporation | | | | |
1,420,000 | | 2.000%, 9/30/2016 | | | 1,435,941 | |
| | Tenet Healthcare Corporation | | | | |
1,120,000 | | 8.875%, 7/1/2019 | | | 1,265,600 | |
| | Tyson Foods, Inc. | | | | |
2,160,000 | | 6.850%, 4/1/2016 | | | 2,332,800 | |
| | | |
| | Total Consumer Non-Cyclical | | | 43,276,413 | |
| | | |
| |
| Energy (9.9%) | | | | |
| | Anadarko Petroleum Corporation | | | | |
1,600,000 | | 6.375%, 9/15/2017 | | | 1,882,790 | |
| | BG Energy Capital plc | | | | |
925,000 | | 4.000%, 10/15/2021d | | | 953,740 | |
| | BP Capital Markets plc | | | | |
1,750,000 | | 2.248%, 11/1/2016 | | | 1,759,733 | |
1,975,000 | | 4.500%, 10/1/2020 | | | 2,168,633 | |
1,100,000 | | 4.742%, 3/11/2021 | | | 1,233,800 | |
| | CenterPoint Energy Resources Corporation | | | | |
3,650,000 | | 6.125%, 11/1/2017 | | | 4,161,934 | |
| | CNPC HK Overseas Capital, Ltd. | | | | |
1,630,000 | | 5.950%, 4/28/2041d | | | 1,845,268 | |
| | Concho Resources, Inc. | | | | |
720,000 | | 6.500%, 1/15/2022 | | | 756,000 | |
| | Devon Energy Corporation | | | | |
2,160,000 | | 5.600%, 7/15/2041 | | | 2,547,396 | |
| | El Paso Pipeline Partners Operating Company, LLC | | | | |
710,000 | | 5.000%, 10/1/2021 | | | 728,087 | |
| | Enbridge Energy Partners, LP | | | | |
550,000 | | 5.200%, 3/15/2020 | | | 603,687 | |
2,200,000 | | 8.050%, 10/1/2037 | | | 2,290,653 | |
| | Energy Transfer Partners, LP | | | | |
2,880,000 | | 6.700%, 7/1/2018 | | | 3,210,284 | |
| | Enterprise Products Operating, LLC | | | | |
1,400,000 | | 7.034%, 1/15/2068 | | | 1,442,000 | |
The accompanying Notes to Financial Statements are an integral part of this schedule.
167
Income Fund
Schedule of Investments as of October 31, 2011
| | | | | | |
Principal
Amount | | Long-Term Fixed Income (96.5%) | | Value | |
| Energy (9.9%) - continued | | | | |
$2,250,000 | | 6.300%, 9/15/2017 | | $ | 2,639,995 | |
| | EQT Corporation | | | | |
800,000 | | 8.125%, 6/1/2019 | | | 951,868 | |
| | Harvest Operations Corporation | | | | |
700,000 | | 6.875%, 10/1/2017d | | | 722,750 | |
| | Inergy, LP | | | | |
370,000 | | 6.875%, 8/1/2021 | | | 361,675 | |
| | Key Energy Services, Inc. | | | | |
1,175,000 | | 6.750%, 3/1/2021 | | | 1,201,437 | |
| | Kinder Morgan Energy Partners, LP | | | | |
730,000 | | 3.500%, 3/1/2016 | | | 763,111 | |
750,000 | | 5.950%, 2/15/2018 | | | 857,110 | |
1,900,000 | | 5.800%, 3/1/2021 | | | 2,155,254 | |
1,450,000 | | 5.625%, 9/1/2041 | | | 1,547,069 | |
| | Linn Energy, LLC | | | | |
1,750,000 | | 7.750%, 2/1/2021 | | | 1,868,125 | |
| | Marathon Oil Corporation | | | | |
1,273,000 | | 5.900%, 3/15/2018 | | | 1,487,466 | |
| | Markwest Energy Partners, LP/Markwest Energy Finance Corporation | | | | |
700,000 | | 6.250%, 6/15/2022g | | | 717,500 | |
| | Nabors Industries, Inc. | | | | |
1,425,000 | | 4.625%, 9/15/2021d | | | 1,424,859 | |
| | Newfield Exploration Company | | | | |
710,000 | | 6.625%, 4/15/2016 | | | 730,412 | |
390,000 | | 5.750%, 1/30/2022 | | | 413,400 | |
| | Nexen, Inc. | | | | |
1,090,000 | | 7.400%, 5/1/2028 | | | 1,269,637 | |
| | Noble Energy, Inc. | | | | |
1,900,000 | | 8.250%, 3/1/2019 | | | 2,499,636 | |
730,000 | | 6.000%, 3/1/2041 | | | 849,013 | |
| | Odebrecht Drilling Norbe VIII/IX, Ltd. | | | | |
750,000 | | 6.350%, 6/30/2021d | | | 783,750 | |
| | ONEOK Partners, LP | | | | |
1,750,000 | | 6.850%, 10/15/2037 | | | 2,149,735 | |
| | Petrobras International Finance Company | | | | |
1,200,000 | | 5.750%, 1/20/2020 | | | 1,288,750 | |
1,825,000 | | 5.375%, 1/27/2021 | | | 1,919,772 | |
| | Pioneer Natural Resources Company | | | | |
1,500,000 | | 6.875%, 5/1/2018 | | | 1,621,975 | |
| | Plains All American Pipeline, LP | | | | |
1,850,000 | | 6.500%, 5/1/2018 | | | 2,143,728 | |
| | Plains Exploration & Production Company | | | | |
1,130,000 | | 8.625%, 10/15/2019 | | | 1,254,300 | |
| | Rowan Companies, Inc. | | | | |
2,550,000 | | 5.000%, 9/1/2017 | | | 2,633,038 | |
| | SandRidge Energy, Inc. | | | | |
550,000 | | 7.500%, 3/15/2021d | | | 530,750 | |
| | Schlumberger Investment SA | | | | |
1,065,000 | | 3.300%, 9/14/2021d | | | 1,089,791 | |
| | SESI, LLC | | | | |
270,000 | | 6.375%, 5/1/2019d | | | 275,400 | |
| | Southwestern Energy Company | | | | |
1,000,000 | | 7.500%, 2/1/2018 | | | 1,160,000 | |
| | Spectra Energy Partners, LP | | | | |
1,800,000 | | 4.600%, 6/15/2021 | | | 1,845,648 | |
| | Suncor Energy, Inc. | | | | |
2,290,000 | | 6.100%, 6/1/2018 | | | 2,710,103 | |
| | | | | | |
Principal
Amount | | Long-Term Fixed Income (96.5%) | | Value | |
| Energy (9.9%) - continued | | | | |
| | Transocean, Inc. | | | | |
$1,080,000 | | 7.375%, 4/15/2018 | | | $1,212,626 | |
| | Valero Energy Corporation | | | | |
1,875,000 | | 6.125%, 2/1/2020 | | | 2,153,051 | |
| | Weatherford International, Inc. | | | | |
1,300,000 | | 6.350%, 6/15/2017 | | | 1,483,108 | |
| | Weatherford International, Ltd. | | | | |
2,500,000 | | 6.000%, 3/15/2018 | | | 2,774,743 | |
| | Woodside Finance, Ltd. | | | | |
1,875,000 | | 4.500%, 11/10/2014d | | | 1,990,875 | |
| | | |
| | Total Energy | | | 79,065,465 | |
| | | |
| |
| Financials (27.4%) | | | | |
| | Abbey National Capital Trust I | | | | |
1,910,000 | | 8.963%, 12/29/2049h | | | 1,814,500 | |
| | Aegon NV | | | | |
1,400,000 | | 2.397%, 7/29/2049b,h | | | 679,770 | |
| | Ally Financial, Inc. | | | | |
1,100,000 | | 4.500%, 2/11/2014 | | | 1,075,250 | |
930,000 | | 7.500%, 9/15/2020 | | | 939,300 | |
| | American Express Credit Corporation | | | | |
2,125,000 | | 2.800%, 9/19/2016 | | | 2,157,986 | |
| | American International Group, Inc. | | | | |
1,775,000 | | 4.250%, 9/15/2014 | | | 1,745,927 | |
1,750,000 | | 6.400%, 12/15/2020 | | | 1,832,857 | |
| | Associated Banc Corporation | | | | |
1,820,000 | | 5.125%, 3/28/2016 | | | 1,877,874 | |
| | Associates Corporation of North America | | | | |
2,200,000 | | 6.950%, 11/1/2018 | | | 2,470,585 | |
| | AXA SA | | | | |
2,600,000 | | 6.463%, 12/14/2018d,h | | | 1,839,500 | |
| | Axis Specialty Finance, LLC | | | | |
1,750,000 | | 5.875%, 6/1/2020 | | | 1,749,902 | |
| | BAC Capital Trust VI | | | | |
1,100,000 | | 5.625%, 3/8/2035 | | | 863,125 | |
| | BAC Capital Trust XV | | | | |
1,810,000 | | 1.126%, 6/1/2056b | | | 984,499 | |
| | Banco BTG Pactual SA | | | | |
1,800,000 | | 4.875%, 7/8/2016d | | | 1,761,750 | |
| | Banco do Brasil SA | | | | |
1,445,000 | | 5.875%, 1/26/2022d | | | 1,452,225 | |
| | Bank of America Corporation | | | | |
1,800,000 | | 6.500%, 8/1/2016 | | | 1,873,318 | |
1,420,000 | | 5.625%, 10/14/2016 | | | 1,415,412 | |
1,700,000 | | 5.750%, 12/1/2017 | | | 1,692,173 | |
1,440,000 | | 5.875%, 1/5/2021 | | | 1,409,944 | |
1,100,000 | | 8.000%, 12/29/2049h | | | 1,023,517 | |
| | Bank of Nova Scotia | | | | |
2,145,000 | | 2.150%, 8/3/2016d | | | 2,168,243 | |
| | BBVA Bancomer SA/Texas | | | | |
1,460,000 | | 6.500%, 3/10/2021d | | | 1,452,700 | |
| | BBVA International Preferred SA Unipersonal | | | | |
1,850,000 | | 5.919%, 12/29/2049e,h | | | 1,337,458 | |
| | Bear Stearns Companies, LLC | | | | |
1,200,000 | | 4.650%, 7/2/2018 | | | 1,257,694 | |
| | Berkshire Hathaway, Inc. | | | | |
1,785,000 | | 3.750%, 8/15/2021 | | | 1,832,811 | |
| | Blackstone Holdings Finance Company, LLC | | | | |
1,860,000 | | 5.875%, 3/15/2021d | | | 1,886,592 | |
The accompanying Notes to Financial Statements are an integral part of this schedule.
168
Income Fund
Schedule of Investments as of October 31, 2011
| | | | | | |
Principal
Amount | | Long-Term Fixed Income (96.5%) | | Value | |
Financials (27.4%) - continued | |
| | BNP Paribas Home Loan Covered Bonds SA | | | | |
$2,600,000 | | 2.200%, 11/2/2015d,e | | $ | 2,501,109 | |
| | Boston Properties, LP | | | | |
2,250,000 | | 5.875%, 10/15/2019 | | | 2,482,452 | |
| | Capital One Capital V | | | | |
1,075,000 | | 10.250%, 8/15/2039 | | | 1,112,625 | |
| | Capital One Financial Corporation | | | | |
930,000 | | 6.150%, 9/1/2016 | | | 987,569 | |
1,790,000 | | 4.750%, 7/15/2021 | | | 1,878,598 | |
| | CIT Group, Inc. | | | | |
550,000 | | 5.250%, 4/1/2014d | | | 547,250 | |
1,902,313 | | 7.000%, 5/1/2017 | | | 1,902,313 | |
| | Citigroup, Inc. | | | | |
1,875,000 | | 6.010%, 1/15/2015 | | | 2,015,693 | |
2,700,000 | | 4.750%, 5/19/2015 | | | 2,810,627 | |
1,300,000 | | 6.125%, 5/15/2018 | | | 1,440,495 | |
1,450,000 | | 8.500%, 5/22/2019 | | | 1,794,256 | |
| | CME Group Index Services, LLC | | | | |
1,400,000 | | 4.400%, 3/15/2018d | | | 1,486,906 | |
| | CNA Financial Corporation | | | | |
2,225,000 | | 7.350%, 11/15/2019 | | | 2,452,161 | |
700,000 | | 5.875%, 8/15/2020 | | | 710,475 | |
| | CommonWealth REIT | | | | |
1,850,000 | | 6.250%, 8/15/2016 | | | 1,958,416 | |
| | Cooperatieve Centrale Raiffeisen- Boerenleenbank BA | | | | |
1,085,000 | | 5.250%, 5/24/2041 | | | 1,272,521 | |
710,000 | | 11.000%, 12/29/2049d,h | | | 859,100 | |
| | Corporacion Andina de Fomento | | | | |
960,000 | | 8.125%, 6/4/2019 | | | 1,168,063 | |
| | Credit Suisse of New York, Convertible | | | | |
720,000 | | 0.500%, 6/22/2018i | | | 711,720 | |
| | Developers Diversified Realty Corporation | | | | |
1,460,000 | | 4.750%, 4/15/2018 | | | 1,373,942 | |
| | Discover Bank | | | | |
1,125,000 | | 8.700%, 11/18/2019 | | | 1,272,420 | |
1,300,000 | | 7.000%, 4/15/2020e | | | 1,357,564 | |
| | DnB NOR Boligkreditt | | | | |
2,600,000 | | 2.900%, 3/29/2016d | | | 2,701,949 | |
| | Fairfax Financial Holdings, Ltd. | | | | |
1,625,000 | | 5.800%, 5/15/2021d | | | 1,531,301 | |
| | Fifth Third Bancorp | | | | |
1,100,000 | | 3.625%, 1/25/2016 | | | 1,127,952 | |
1,790,000 | | 0.771%, 12/20/2016b | | | 1,612,860 | |
1,700,000 | | 5.450%, 1/15/2017 | | | 1,812,123 | |
| | FUEL Trust | | | | |
725,000 | | 4.207%, 4/15/2016d | | | 727,820 | |
1,800,000 | | 3.984%, 6/15/2016d | | | 1,780,054 | |
| | GE Capital Trust I | | | | |
2,500,000 | | 6.375%, 11/15/2067 | | | 2,467,200 | |
| | General Electric Capital Corporation | | | | |
1,100,000 | | 6.000%, 8/7/2019 | | | 1,249,786 | |
1,500,000 | | 4.375%, 9/16/2020 | | | 1,526,439 | |
900,000 | | 5.300%, 2/11/2021 | | | 957,837 | |
925,000 | | 6.750%, 3/15/2032 | | | 1,081,717 | |
| | Goldman Sachs Group, Inc. | | | | |
1,750,000 | | 6.250%, 9/1/2017 | | | 1,892,296 | |
1,650,000 | | 5.950%, 1/18/2018 | | | 1,734,879 | |
1,750,000 | | 5.250%, 7/27/2021 | | | 1,766,457 | |
1,800,000 | | 6.750%, 10/1/2037 | | | 1,729,571 | |
| | | | | | |
Principal
Amount | | Long-Term Fixed Income (96.5%) | | Value | |
Financials (27.4%) - continued | |
| | Health Care Property Investors, Inc. | | | | |
$1,900,000 | | 5.625%, 5/1/2017 | | $ | 1,992,663 | |
| | Health Care REIT, Inc. | | | | |
1,800,000 | | 6.125%, 4/15/2020 | | | 1,847,637 | |
1,850,000 | | 4.950%, 1/15/2021 | | | 1,742,089 | |
| | HSBC USA, Inc. | | | | |
1,100,000 | | 5.000%, 9/27/2020 | | | 1,068,793 | |
| | Huntington Bancshares, Inc. | | | | |
1,650,000 | | 7.000%, 12/15/2020 | | | 1,846,170 | |
| | Hutchinson Whampoa Finance, Ltd. | | | | |
1,450,000 | | 6.000%, 12/29/2049d,h | | | 1,460,875 | |
| | Icahn Enterprises, LP | | | | |
710,000 | | 7.750%, 1/15/2016 | | | 727,750 | |
| | ING Bank NV | | | | |
1,850,000 | | 2.500%, 1/14/2016d | | | 1,858,786 | |
| | ING Capital Funding Trust III | | | | |
1,800,000 | | 3.969%, 12/31/2049b,h | | | 1,525,003 | |
| | International Lease Finance Corporation | | | | |
900,000 | | 5.750%, 5/15/2016 | | | 849,136 | |
1,875,000 | | 6.750%, 9/1/2016d | | | 1,928,906 | |
| | J.P. Morgan Chase & Company | | | | |
900,000 | | 3.150%, 7/5/2016 | | | 901,527 | |
1,850,000 | | 5.500%, 10/15/2040 | | | 1,981,480 | |
1,800,000 | | 7.900%, 4/29/2049h | | | 1,938,078 | |
| | J.P. Morgan Chase Capital XXV | | | | |
900,000 | | 6.800%, 10/1/2037 | | | 898,875 | |
| | Jefferies Group, Inc. | | | | |
2,500,000 | | 5.125%, 4/13/2018 | | | 2,257,052 | |
| | JPMorgan Chase Bank NA | | | | |
1,785,000 | | 5.875%, 6/13/2016 | | | 1,935,518 | |
| | KeyCorp | | | | |
2,425,000 | | 5.100%, 3/24/2021 | | | 2,521,200 | |
| | Kilroy Realty, LP | | | | |
1,435,000 | | 4.800%, 7/15/2018 | | | 1,412,699 | |
| | LBG Capital No. 1 plc | | | | |
1,100,000 | | 7.875%, 11/1/2020d | | | 946,000 | |
| | Liberty Property, LP | | | | |
1,830,000 | | 5.500%, 12/15/2016 | | | 1,985,744 | |
1,125,000 | | 4.750%, 10/1/2020 | | | 1,131,047 | |
| | Marsh & McLennan Companies, Inc. | | | | |
1,075,000 | | 4.800%, 7/15/2021 | | | 1,159,223 | |
| | Merrill Lynch & Company, Inc. | | | | |
1,950,000 | | 6.875%, 4/25/2018 | | | 2,003,120 | |
2,000,000 | | 7.750%, 5/14/2038 | | | 1,995,226 | |
| | MetLife Capital Trust IV | | | | |
300,000 | | 7.875%, 12/15/2037d | | | 317,594 | |
| | MetLife Capital Trust X | | | | |
750,000 | | 9.250%, 4/8/2038d | | | 877,500 | |
| | Morgan Stanley | | | | |
1,875,000 | | 4.200%, 11/20/2014 | | | 1,852,972 | |
1,420,000 | | 5.375%, 10/15/2015 | | | 1,428,225 | |
2,270,000 | | 6.625%, 4/1/2018 | | | 2,365,853 | |
1,100,000 | | 5.625%, 9/23/2019 | | | 1,086,166 | |
2,300,000 | | 5.500%, 1/26/2020 | | | 2,266,188 | |
| | MUFG Capital Finance 1, Ltd. | | | | |
1,920,000 | | 6.346%, 7/29/2049h | | | 1,930,326 | |
| | National Bank of Canada | | | | |
2,110,000 | | 2.200%, 10/19/2016d | | | 2,133,769 | |
| | National City Bank | | | | |
2,950,000 | | 5.800%, 6/7/2017 | | | 3,250,965 | |
The accompanying Notes to Financial Statements are an integral part of this schedule.
169
Income Fund
Schedule of Investments as of October 31, 2011
| | | | | | |
Principal
Amount | | Long-Term Fixed Income (96.5%) | | Value | |
Financials (27.4%) - continued | |
| | Nationwide Building Society | | | | |
$1,600,000 | | 6.250%, 2/25/2020d | | | $1,662,277 | |
| | Nordea Bank AB | | | | |
1,830,000 | | 4.875%, 5/13/2021d | | | 1,642,226 | |
| | ORIX Corporation | | | | |
2,550,000 | | 5.000%, 1/12/2016 | | | 2,623,555 | |
| | PNC Financial Services Group, Inc. | | | | |
1,790,000 | | 0.292%, 12/31/2049e,h | | | 1,789,749 | |
| | Preferred Term Securities XXIII, Ltd. | | | | |
2,894,998 | | 0.547%, 12/22/2036b,f | | | 1,418,549 | |
| | ProLogis, LP | | | | |
1,450,000 | | 6.250%, 3/15/2017 | | | 1,583,409 | |
1,070,000 | | 6.875%, 3/15/2020 | | | 1,184,518 | |
| | Prudential Financial, Inc. | | | | |
750,000 | | 6.200%, 1/15/2015 | | | 824,468 | |
1,875,000 | | 5.375%, 6/21/2020 | | | 2,086,886 | |
725,000 | | 5.700%, 12/14/2036 | | | 762,781 | |
825,000 | | 6.200%, 11/15/2040 | | | 927,621 | |
| | QBE Capital Funding III, Ltd. | | | | |
1,260,000 | | 7.250%, 5/24/2041d | | | 1,183,054 | |
| | Rabobank Capital Funding Trust II | | | | |
1,249,000 | | 5.260%, 12/29/2049d,h | | | 1,199,640 | |
| | Regions Bank | | | | |
1,070,000 | | 7.500%, 5/15/2018 | | | 1,045,925 | |
| | Regions Financial Corporation | | | | |
1,825,000 | | 5.750%, 6/15/2015 | | | 1,756,562 | |
| | Reinsurance Group of America, Inc. | | | | |
2,100,000 | | 5.625%, 3/15/2017 | | | 2,256,946 | |
| | Simon Property Group, LP | | | | |
1,485,000 | | 5.750%, 12/1/2015 | | | 1,664,231 | |
750,000 | | 10.350%, 4/1/2019 | | | 1,019,593 | |
| | SLM Corporation | | | | |
1,800,000 | | 5.000%, 10/1/2013 | | | 1,799,206 | |
1,700,000 | | 5.375%, 5/15/2014 | | | 1,691,500 | |
2,080,000 | | 6.250%, 1/25/2016 | | | 2,080,000 | |
| | SSIF Nevada, LP | | | | |
1,750,000 | | 1.101%, 4/14/2014b,d | | | 1,749,454 | |
| | SunTrust Banks, Inc. | | | | |
1,830,000 | | 3.600%, 4/15/2016 | | | 1,874,632 | |
| | Swiss RE Capital I, LP | | | | |
2,600,000 | | 6.854%, 5/29/2049d,h | | | 2,344,519 | |
| | TD Ameritrade Holding Corporation | | | | |
2,225,000 | | 5.600%, 12/1/2019 | | | 2,408,712 | |
| | U.S. Bank National Association | | | | |
1,800,000 | | 3.778%, 4/29/2020 | | | 1,863,583 | |
| | UnitedHealth Group, Inc. | | | | |
1,500,000 | | 6.500%, 6/15/2037 | | | 1,907,271 | |
| | Unum Group | | | | |
1,500,000 | | 7.125%, 9/30/2016 | | | 1,720,623 | |
| | Ventas Realty, LP | | | | |
1,800,000 | | 4.750%, 6/1/2021 | | | 1,762,650 | |
| | Wachovia Bank NA | | | | |
1,220,000 | | 4.875%, 2/1/2015 | | | 1,291,714 | |
| | Wachovia Corporation | | | | |
1,500,000 | | 5.250%, 8/1/2014 | | | 1,599,765 | |
| | WEA Finance, LLC | | | | |
1,000,000 | | 7.125%, 4/15/2018d | | | 1,133,256 | |
| | WellPoint, Inc. | | | | |
1,785,000 | | 3.700%, 8/15/2021 | | | 1,817,337 | |
| | | | | | |
Principal
Amount | | Long-Term Fixed Income (96.5%) | | Value | |
Financials (27.4%) - continued | |
| | Wells Fargo & Company | | | | |
$2,185,000 | | 4.600%, 4/1/2021 | | | $2,337,329 | |
| | Willis North America, Inc. | | | | |
2,040,000 | | 6.200%, 3/28/2017 | | | 2,234,257 | |
1,100,000 | | 7.000%, 9/29/2019 | | | 1,221,301 | |
| | ZFS Finance USA Trust II | | | | |
1,500,000 | | 6.450%, 12/15/2065d | | | 1,440,000 | |
| | | |
| | Total Financials | | | 218,724,682 | |
| | | |
|
Foreign Government (4.3%) | |
| | Brazil Government International Bond | | | | |
1,070,000 | | 4.875%, 1/22/2021 | | | 1,181,815 | |
| | Chile Government International Bond | | | | |
2,480,000 | | 3.250%, 9/14/2021 | | | 2,449,000 | |
| | Export-Import Bank of Korea | | | | |
1,420,000 | | 4.375%, 9/15/2021 | | | 1,419,935 | |
| | Finland Government International Bond | | | | |
2,900,000 | | 2.250%, 3/17/2016d | | | 3,026,365 | |
| | Hydro Quebec | | | | |
1,800,000 | | 2.000%, 6/30/2016 | | | 1,828,931 | |
| | Korea Development Bank | | | | |
1,500,000 | | 4.375%, 8/10/2015 | | | 1,562,136 | |
| | Mexico Government International Bond | | | | |
1,850,000 | | 5.125%, 1/15/2020 | | | 2,060,900 | |
1,270,000 | | 6.050%, 1/11/2040 | | | 1,489,075 | |
| | Province of British Columbia | | | | |
2,170,000 | | 2.100%, 5/18/2016 | | | 2,242,426 | |
1,750,000 | | 2.650%, 9/22/2021 | | | 1,744,312 | |
| | Province of New Brunswick | | | | |
2,150,000 | | 2.750%, 6/15/2018 | | | 2,215,717 | |
| | Province of Ontario | | | | |
4,500,000 | | 2.300%, 5/10/2016e | | | 4,605,116 | |
1,770,000 | | 1.600%, 9/21/2016 | | | 1,750,236 | |
4,320,000 | | 3.000%, 7/16/2018 | | | 4,471,364 | |
| | Province of Quebec | | | | |
2,493,000 | | 2.750%, 8/25/2021 | | | 2,449,689 | |
| | | |
| | Total Foreign Government | | | 34,497,017 | |
| | | |
|
Mortgage-Backed Securities (4.7%) | |
| | Federal National Mortgage Association Conventional 15- Yr. Pass Through | | | | |
5,075,000 | | 3.000%, 11/1/2026g | | | 5,197,120 | |
3,500,000 | | 3.000%, 12/1/2026g | | | 3,572,188 | |
| | Federal National Mortgage Association Conventional 30- Yr. Pass Through | | | | |
15,050,000 | | 4.500%, 11/1/2041g | | | 15,913,027 | |
8,675,000 | | 5.000%, 11/1/2041g | | | 9,331,047 | |
3,300,000 | | 6.000%, 11/1/2041g | | | 3,616,077 | |
| | | |
| | Total Mortgage-Backed Securities | | | 37,629,459 | |
| | | |
|
Technology (1.4%) | |
| | Amkor Technology, Inc. | | | | |
1,810,000 | | 6.625%, 6/1/2021d | | | 1,719,500 | |
| | CA, Inc. | | | | |
1,925,000 | | 5.375%, 12/1/2019 | | | 2,088,816 | |
| | Equinix, Inc. | | | | |
1,100,000 | | 8.125%, 3/1/2018 | | | 1,199,000 | |
The accompanying Notes to Financial Statements are an integral part of this schedule.
170
Income Fund
Schedule of Investments as of October 31, 2011
| | | | | | |
Principal
Amount | | Long-Term Fixed Income (96.5%) | | Value | |
Technology (1.4%) - continued | |
$360,000 | | 7.000%, 7/15/2021 | | | $383,400 | |
| | Hewlett-Packard Company | | | | |
1,800,000 | | 2.650%, 6/1/2016 | | | 1,827,992 | |
| | Intel Corporation | | | | |
1,060,000 | | 3.300%, 10/1/2021 | | | 1,093,954 | |
| | Seagate HDD Cayman | | | | |
1,090,000 | | 7.750%, 12/15/2018d | | | 1,139,050 | |
| | Xerox Corporation | | | | |
750,000 | | 6.400%, 3/15/2016 | | | 841,523 | |
550,000 | | 5.625%, 12/15/2019 | | | 612,406 | |
| | | |
| | Total Technology | | | 10,905,641 | |
| | | |
|
Transportation (2.2%) | |
| | American Airlines Pass Through Trust | | | | |
1,032,479 | | 10.375%, 7/2/2019 | | | 1,107,334 | |
| | Burlington Northern Santa Fe, LLC | | | | |
1,800,000 | | 5.400%, 6/1/2041 | | | 2,043,797 | |
| | Continental Airlines, Inc. | | | | |
1,300,000 | | 6.750%, 9/15/2015d | | | 1,303,250 | |
642,544 | | 7.250%, 11/10/2019 | | | 674,671 | |
| | CSX Corporation | | | | |
793,000 | | 7.900%, 5/1/2017 | | | 989,394 | |
720,000 | | 4.250%, 6/1/2021 | | | 771,175 | |
1,107,000 | | 6.220%, 4/30/2040 | | | 1,373,560 | |
| | Delta Air Lines, Inc. | | | | |
1,379,949 | | 4.950%, 11/23/2019e | | | 1,379,949 | |
| | ERAC USA Finance, LLC | | | | |
2,050,000 | | 5.250%, 10/1/2020d | | | 2,212,510 | |
1,085,000 | | 4.500%, 8/16/2021d | | | 1,108,652 | |
| | Kansas City Southern de Mexico SA de CV | | | | |
270,000 | | 6.125%, 6/15/2021 | | | 280,800 | |
| | Navios Maritime Holdings, Inc. | | | | |
990,000 | | 8.875%, 11/1/2017e | | | 947,925 | |
| | Navios South American Logistics, Inc./Navios Logistics Finance US, Inc. | | | | |
270,000 | | 9.250%, 4/15/2019d | | | 238,275 | |
| | Railamerica, Inc. | | | | |
1,060,000 | | 9.250%, 7/1/2017 | | | 1,152,750 | |
| | Union Pacific Corporation | | | | |
1,080,000 | | 4.750%, 9/15/2041 | | | 1,136,149 | |
| | US Airways Group, Inc. | | | | |
1,258,040 | | 6.250%, 4/22/2023 | | | 1,132,236 | |
| | | |
| | Total Transportation | | | 17,852,427 | |
| | | |
|
U.S. Government and Agencies (5.1%) | |
| | Federal National Mortgage Association | | | | |
1,770,000 | | 1.375%, 11/15/2016 | | | 1,770,218 | |
| | U.S. Treasury Bonds | | | | |
2,000,000 | | 4.375%, 5/15/2041 | | | 2,455,000 | |
| | U.S. Treasury Bonds, TIPS | | | | |
2,130,727 | | 0.625%, 7/15/2021 | | | 2,243,922 | |
| | U.S. Treasury Notes | | | | |
1,850,000 | | 1.250%, 10/31/2015 | | | 1,889,745 | |
1,600,000 | | 1.500%, 6/30/2016 | | | 1,643,008 | |
3,500,000 | | 1.000%, 8/31/2016 | | | 3,506,580 | |
2,830,000 | | 1.000%, 10/31/2016 | | | 2,832,660 | |
1,810,000 | | 2.875%, 3/31/2018 | | | 1,970,638 | |
1,440,000 | | 3.625%, 2/15/2020 | | | 1,636,088 | |
4,500,000 | | 3.500%, 5/15/2020 | | | 5,068,125 | |
| | | | | | |
Principal
Amount | | Long-Term Fixed Income (96.5%) | | Value | |
U.S. Government and Agencies (5.1%) -continued | |
$3,980,000 | | 2.625%, 11/15/2020 | | | $4,174,956 | |
3,545,000 | | 3.625%, 2/15/2021 | | | 4,014,436 | |
2,445,000 | | 3.125%, 5/15/2021 | | | 2,657,984 | |
2,970,000 | | 2.125%, 8/15/2021 | | | 2,957,021 | |
| | U.S. Treasury Notes, TIPS | | | | |
2,175,650 | | 0.125%, 4/15/2016 | | | 2,279,163 | |
| | | |
| | Total U.S. Government and Agencies | | | 41,099,544 | |
| | | |
|
U.S. Municipals (0.5%) | |
| | California General Obligation Bonds (Build America Bonds) | | | | |
720,000 | | 7.950%, 3/1/2036 | | | 811,166 | |
| | Denver, Colorado City & County Airport Revenue Bonds | | | | |
1,450,000 | | 5.250%, 11/15/2022 | | | 1,587,272 | |
| | Illinois State General Obligation Bonds | | | | |
1,825,000 | | 5.877%, 3/1/2019 | | | 1,935,157 | |
| | | |
| | Total U.S. Municipals | | | 4,333,595 | |
| | | |
|
Utilities (6.1%) | |
| | AES Corporation | | | | |
935,000 | | 7.750%, 10/15/2015 | | | 1,005,125 | |
410,000 | | 7.375%, 7/1/2021d,e | | | 438,700 | |
| | Ameren Illinois Company | | | | |
1,800,000 | | 6.125%, 11/15/2017 | | | 2,096,428 | |
| | Cleveland Electric Illuminating Company | | | | |
1,065,000 | | 5.700%, 4/1/2017 | | | 1,176,239 | |
| | CMS Energy Corporation | | | | |
1,490,000 | | 4.250%, 9/30/2015 | | | 1,508,151 | |
| | Columbus Southern Power Company | | | | |
1,600,000 | | 6.050%, 5/1/2018 | | | 1,842,706 | |
| | Comision Federal de Electricidad | | | | |
625,000 | | 4.875%, 5/26/2021d | | | 637,500 | |
| | Commonwealth Edison Company | | | | |
1,000,000 | | 6.150%, 9/15/2017 | | | 1,188,376 | |
| | Consolidated Natural Gas Company | | | | |
1,100,000 | | 5.000%, 12/1/2014 | | | 1,211,277 | |
| | Dolphin Subsidiary II, Inc. | | | | |
1,770,000 | | 6.500%, 10/15/2016d | | | 1,911,600 | |
| | Dominion Resources, Inc. | | | | |
1,460,000 | | 2.669%, 9/30/2066b | | | 1,236,430 | |
| | DTE Energy Company | | | | |
1,500,000 | | 6.375%, 4/15/2033 | | | 1,773,623 | |
| | Energy Transfer Partners, LP | | | | |
1,500,000 | | 4.650%, 6/1/2021 | | | 1,489,066 | |
| | Exelon Generation Company, LLC | | | | |
600,000 | | 5.200%, 10/1/2019 | | | 645,235 | |
1,500,000 | | 4.000%, 10/1/2020 | | | 1,536,722 | |
| | Florida Power Corporation | | | | |
1,000,000 | | 6.400%, 6/15/2038 | | | 1,344,381 | |
| | ITC Holdings Corporation | | | | |
2,000,000 | | 5.875%, 9/30/2016d | | | 2,254,720 | |
1,400,000 | | 6.050%, 1/31/2018d | | | 1,613,356 | |
The accompanying Notes to Financial Statements are an integral part of this schedule.
171
Income Fund
Schedule of Investments as of October 31, 2011
| | | | | | |
Principal
Amount | | Long-Term Fixed Income (96.5%) | | Value | |
Utilities (6.1%) - continued | |
| | Markwest Energy Partners, LP/Markwest Energy Finance Corporation | | | | |
$1,090,000 | | 6.500%, 8/15/2021 | | | $1,125,425 | |
| | Nevada Power Company | | | | |
1,700,000 | | 6.750%, 7/1/2037 | | | 2,262,421 | |
| | NiSource Finance Corporation | | | | |
1,700,000 | | 6.400%, 3/15/2018 | | | 1,987,021 | |
1,800,000 | | 5.450%, 9/15/2020 | | | 1,940,848 | |
| | NRG Energy, Inc. | | | | |
1,070,000 | | 7.875%, 5/15/2021d | | | 1,080,700 | |
| | Ohio Edison Company | | | | |
950,000 | | 6.875%, 7/15/2036 | | | 1,150,020 | |
| | Ohio Power Company | | | | |
1,300,000 | | 5.375%, 10/1/2021 | | | 1,486,796 | |
| | Pennsylvania Electric Company | | | | |
2,300,000 | | 5.200%, 4/1/2020 | | | 2,542,967 | |
| | Power Receivables Finance, LLC | | | | |
124,479 | | 6.290%, 1/1/2012f | | | 124,584 | |
| | PSEG Power, LLC | | | | |
2,400,000 | | 5.000%, 4/1/2014 | | | 2,567,628 | |
700,000 | | 5.320%, 9/15/2016 | | | 779,374 | |
| | Southern Star Central Corporation | | | | |
2,400,000 | | 6.750%, 3/1/2016 | | | 2,436,000 | |
| | Southwestern Public Service Company | | | | |
1,730,000 | | 6.000%, 10/1/2036 | | | 2,021,071 | |
| | Union Electric Company | | | | |
1,600,000 | | 6.400%, 6/15/2017 | | | 1,896,467 | |
| | | |
| | Total Utilities | | | 48,310,957 | |
| | | |
| | | | | | |
| | | |
| | Total Long-Term Fixed Income (cost $749,869,541) | | | 770,920,842 | |
| | | |
| | |
| Shares | | Preferred Stock (0.6%) | | Value | |
Financials (0.6%) | |
46,082 | | Citigroup Capital XII, 8.500% | | | 1,179,699 | |
13,000 | | Citigroup, Inc., Convertiblej | | | 1,235,520 | |
238,000 | | Federal National Mortgage Association, 8.250%h,k | | | 466,480 | |
31,750 | | GMAC Capital Trust I, 8.125% | | | 665,480 | |
43,750 | | HSBC Holdings plc, 8.000%h | | | 1,170,313 | |
| | | |
| | Total Financials | | | 4,717,492 | |
| | | |
| | | | | | |
| | | |
| | Total Preferred Stock (cost $8,755,132) | | | 4,717,492 | |
| | | |
| | |
| Shares | | Mutual Funds (0.1%) | | Value | |
Fixed Income Mutual Funds (<0.1%) | |
200,237 | | Thrivent High Yield Fund | | | 945,118 | |
| | | |
| | Total Fixed Income Mutual Funds | | | 945,118 | |
| | | |
| | | | | | |
| | | |
| | Total Mutual Funds (cost $716,848) | | | 945,118 | |
| | | |
| | | | | | |
| Shares | | Common Stock (<0.1%) | | Value | |
Financials (<0.1%) | |
9,893 | | CIT Group, Inc.k | | | $344,771 | |
| | | |
| | Total Financials | | | 344,771 | |
| | | |
| | | | | | |
| | | |
| | Total Common Stock (cost $313,151) | | | 344,771 | |
| | | |
| | |
| Shares | | Collateral Held for Securities Loaned (2.0%) | | Value | |
16,053,730 | | Thrivent Financial Securities Lending Trust | | | 16,053,730 | |
| | | |
| | Total Collateral Held for Securities Loaned (cost $16,053,730) | | | 16,053,730 | |
| | | |
| | |
Principal
Amount | | Short-Term Investments (4.7%)l | | Value | |
| | Federal Home Loan Bank Discount Notes | | | | |
$10,000,000 | | 0.030%, 11/14/2011m | | | 9,999,891 | |
1,000,000 | | 0.020%, 11/18/2011m | | | 999,991 | |
5,000,000 | | 0.020%, 11/23/2011m | | | 4,999,939 | |
| | Federal Home Loan Mortgage Corporation Discount Notes | | | | |
3,000,000 | | 0.020%, 11/9/2011m | | | 2,999,987 | |
3,262,000 | | 0.020%, 11/28/2011m | | | 3,261,951 | |
5,000,000 | | 0.030%, 12/6/2011m | | | 4,999,854 | |
| | Federal National Mortgage Association Discount Notes | | | | |
3,000,000 | | 0.020%, 12/21/2011m | | | 2,999,917 | |
3,000,000 | | 0.020%, 12/28/2011m | | | 2,999,905 | |
3,000,000 | | 0.020%, 1/17/2012m | | | 2,999,872 | |
1,100,000 | | 0.105%, 2/22/2012m,n | | | 1,099,643 | |
| | | |
| | Total Short-Term Investments (at amortized cost) | | | 37,360,950 | |
| | | |
| | Total Investments (cost $822,681,240) 105.1% | | | $839,752,438 | |
| | | |
| | Other Assets and Liabilities, Net (5.1%) | | | (40,726,085 | ) |
| | | |
| | Total Net Assets 100.0% | | | $799,026,353 | |
| | | |
| a | The stated interest rate represents the weighted average of all contracts within the bank loan facility. |
| b | Denotes variable rate securities. Variable rate securities are securities whose yields vary with a designated market index or market rate. The rate shown is as of October 31, 2011. |
| c | All or a portion of the security is insured or guaranteed. |
| d | Denotes securities sold under Rule 144A of the Securities Act of 1933, which exempts them from registration. These securities have been deemed liquid and may be resold to other dealers in the program or to other qualified institutional buyers. As of October 31, 2011, the value of these investments was $127,942,600 or 16.0% of total net assets. |
| e | All or a portion of the security is on loan. |
The accompanying Notes to Financial Statements are an integral part of this schedule.
172
Income Fund
Schedule of Investments as of October 31, 2011
| f | Denotes restricted securities. Restricted securities are investment securities which have been deemed illiquid and cannot be offered for public sale without first being registered under the Securities Act of 1933. The following table indicates the acquisition date and cost of restricted securities Income Fund owned as of October 31, 2011. |
| | | | | | | | |
| Security | | Acquisition
Date | | | Amortized
Cost | |
Bear Stearns Commercial Mortgage Securities, Inc. | | | 3/30/2007 | | | | $1,570,548 | |
Commercial Mortgage Pass- Through Certificates | | | 5/2/2007 | | | | $3,500,000 | |
Commercial Mortgage Pass- Through Certificates | | | 10/18/2006 | | | | $4,000,000 | |
JBS Finance II, Ltd. | | | 7/22/2010 | | | | $739,755 | |
Power Receivables Finance, LLC | | | 9/30/2003 | | | | $124,443 | |
Preferred Term Securities XXIII, Ltd. | | | 9/14/2006 | | | | $2,894,998 | |
Wachovia Bank Commercial Mortgage Trust | | | 5/2/2007 | | | | $5,000,277 | |
| g | Denotes investments purchased on a when-issued or delayed delivery basis. |
| h | Denotes perpetual securities. Perpetual securities pay an indefinite stream of interest, but may be called by the issuer at an earlier date. |
| i | Denotes equity-linked structured security. This security is linked to the common stock of Berkshire Hathaway, Inc. |
| j | Comprised of a 79.7% prepaid stock purchase contract for common stock of Citigroup, Inc. and a 20.3% amortizing note. |
The quarterly payments received consists of return of capital and 6.15% interest on only the portion that is the note.
| k | Non-income producing security. |
| l | The interest rate shown reflects the yield, coupon rate or the discount rate at the date of purchase. |
| m | Denotes investments that benefit from credit enhancement or liquidity support provided by a third party bank, institution or government. |
| n | At October 31, 2011, $1,099,643 of investments were held on deposit with the counterparty and pledged as the initial margin deposit for open futures contracts. |
Definitions:
| | | | | | |
REIT | | | - | | | Real Estate Investment Trust is a company that buys, develops, manages and/or sells real estate assets. |
TIPS | | | - | | | Treasury Inflation Protected Security. |
| | | | |
| Unrealized Appreciation (Depreciation) | | | | |
Gross unrealized appreciation and depreciation of investments, based on cost for federal income tax purposes, were as follows: | |
Gross unrealized appreciation | | | $42,069,384 | |
Gross unrealized depreciation | | | (25,069,991 | ) |
| | | | |
Net unrealized appreciation (depreciation) | | | $16,999,393 | |
| |
Cost for federal income tax purposes | | | $822,753,045 | |
The accompanying Notes to Financial Statements are an integral part of this schedule.
173
Income Fund
Schedule of Investments as of October 31, 2011
Fair Valuation Measurements
The following table is a summary of the inputs used, as of October 31, 2011, in valuing Income Fund’s assets carried at fair value.
| | | | | | | | | | | | | | | | |
| Investments in Securities | | Total | | | Level 1 | | | Level 2 | | | Level 3 | |
Bank Loans | | | | | | | | | | | | | | | | |
Capital Goods | | | 365,694 | | | | – | | | | 365,694 | | | | – | |
Communications Services | | | 1,280,994 | | | | – | | | | 1,280,994 | | | | – | |
Consumer Cyclical | | | 1,346,625 | | | | – | | | | 1,346,625 | | | | – | |
Consumer Non-Cyclical | | | 1,096,407 | | | | – | | | | 1,096,407 | | | | – | |
Energy | | | 895,500 | | | | – | | | | 895,500 | | | | – | |
Financials | | | 844,395 | | | | – | | | | 844,395 | | | | – | |
Technology | | | 2,174,521 | | | | – | | | | 2,174,521 | | | | – | |
Transportation | | | 1,405,399 | | | | – | | | | 1,405,399 | | | | – | |
Long-Term Fixed Income | | | | | | | | | | | | | | | | |
Asset-Backed Securities | | | 10,613,175 | | | | – | | | | 10,613,175 | | | | – | |
Basic Materials | | | 44,887,225 | | | | – | | | | 44,887,225 | | | | – | |
Capital Goods | | | 19,129,758 | | | | – | | | | 19,129,758 | | | | – | |
Collateralized Mortgage Obligations | | | 12,767,389 | | | | – | | | | 12,767,389 | | | | – | |
Commercial Mortgage-Backed Securities | | | 30,595,281 | | | | – | | | | 30,595,281 | | | | – | |
Communications Services | | | 76,361,614 | | | | – | | | | 74,182,614 | | | | 2,179,000 | |
Consumer Cyclical | | | 40,871,200 | | | | – | | | | 40,871,200 | | | | – | |
Consumer Non-Cyclical | | | 43,276,413 | | | | – | | | | 43,276,413 | | | | – | |
Energy | | | 79,065,465 | | | | – | | | | 79,065,465 | | | | – | |
Financials | | | 218,724,682 | | | | – | | | | 216,594,413 | | | | 2,130,269 | |
Foreign Government | | | 34,497,017 | | | | – | | | | 34,497,017 | | | | – | |
Mortgage-Backed Securities | | | 37,629,459 | | | | – | | | | 37,629,459 | | | | – | |
Technology | | | 10,905,641 | | | | – | | | | 10,905,641 | | | | – | |
Transportation | | | 17,852,427 | | | | – | | | | 17,852,427 | | | | – | |
U.S. Government and Agencies | | | 41,099,544 | | | | – | | | | 41,099,544 | | | | – | |
U.S. Municipals | | | 4,333,595 | | | | – | | | | 4,333,595 | | | | – | |
Utilities | | | 48,310,957 | | | | – | | | | 48,310,957 | | | | – | |
Preferred Stock | | | | | | | | | | | | | | | | |
Financials | | | 4,717,492 | | | | 4,717,492 | | | | – | | | | – | |
Mutual Funds | | | | | | | | | | | | | | | | |
Fixed Income Mutual Funds | | | 945,118 | | | | 945,118 | | | | – | | | | – | |
Common Stock | | | | | | | | | | | | | | | | |
Financials | | | 344,771 | | | | 344,771 | | | | – | | | | – | |
Collateral Held for Securities Loaned | | | 16,053,730 | | | | 16,053,730 | | | | – | | | | – | |
Short-Term Investments | | | 37,360,950 | | | | – | | | | 37,360,950 | | | | – | |
Total | | | $839,752,438 | | | | $22,061,111 | | | | $813,382,058 | | | | $4,309,269 | |
| | | | |
| Other Financial Instruments | | Total | | | Level 1 | | | Level 2 | | | Level 3 | |
Asset Derivatives | | | | | | | | | | | | | | | | |
Futures Contracts | | | 651,187 | | | | 651,187 | | | | – | | | | – | |
Credit Default Swaps | | | 73,696 | | | | – | | | | 73,696 | | | | – | |
Total Asset Derivatives | | | $724,883 | | | | $651,187 | | | | $73,696 | | | | $– | |
Liability Derivatives | | | | | | | | | | | | | | | | |
Futures Contracts | | | 90,167 | | | | 90,167 | | | | – | | | | – | |
Credit Default Swaps | | | 168,578 | | | | – | | | | 168,578 | | | | – | |
Total Liability Derivatives | | | $258,745 | | | | $90,167 | | | | $168,578 | | | | $– | |
The accompanying Notes to Financial Statements are an integral part of this schedule.
174
Income Fund
Schedule of Investments as of October 31, 2011
The following table is a reconciliation of assets in which significant unobservable inputs (Level 3) were used in determining fair value for Income Fund.
| | | | | | | | | | | | | | | | | | | | | | | | | | | | | | | | |
| Investments in Securities | | Value
October 31,
2010 | | | Realized
Gain/(Loss) | | | Change in
Unrealized
Appreciation/
(Depreciation)* | | | Purchases | | | Sales | | | Transfers
Into
Level 3 | | | Transfers
Out of
Level 3 | | | Value
October 31,
2011 | |
Long-Term Fixed Income | | | | | | | | | | | | | | | | | | | | | | | | | | | | | | | | |
Basic Materials | | | 1,569,015 | | | | (56,889 | ) | | | (21,751 | ) | | | - | | | | (1,490,375) | | | | - | | | | - | | | | - | |
Communications Services | | | - | | | | - | | | | 27,784 | | | | - | | | | - | | | | 2,151,216 | | | | - | | | | 2,179,000 | |
Financials | | | 2,956,277 | | | | - | | | | 160,485 | | | | 720,000 | | | | (245,618) | | | | - | | | | (1,460,875) | | | | 2,130,269 | |
Transportation | | | 7,553,221 | | | | 364,698 | | | | (649,503 | ) | | | - | | | | (5,486,411) | | | | - | | | | (1,782,005) | | | | - | |
Total | | | $12,078,513 | | | | $307,809 | | | | ($482,985 | ) | | | $720,000 | | | | ($7,222,404) | | | | $2,151,216 | | | | ($3,242,880) | | | | $4,309,269 | |
| * | Includes the change in net unrealized appreciation/(depreciation) on level 3 securities held on October 31, 2011 of $163,548. |
| | | | | | | | | | | | | | | | | | |
| Futures Contracts | | Number of
Contracts
Long/(Short) | | | Expiration
Date | | Notional
Principal
Amount | | | Value | | | Unrealized
Gain/(Loss) | |
2-Yr. U.S. Treasury Bond Futures | | | 155 | | | December 2011 | | | $34,180,395 | | | | $34,143,593 | | | | ($36,802 | ) |
5-Yr. U.S. Treasury Bond Futures | | | (335 | ) | | December 2011 | | | (41,020,777 | ) | | | (41,074,142 | ) | | | (53,365 | ) |
10-Yr. U.S. Treasury Bond Futures | | | (840 | ) | | December 2011 | | | (109,000,097 | ) | | | (108,412,500 | ) | | | 587,597 | |
20-Yr. U.S. Treasury Bond Futures | | | 360 | | | December 2011 | | | 49,987,660 | | | | 50,051,250 | | | | 63,590 | |
Total Futures Contracts | | | | | | | | | | | | | | | | | $561,020 | |
| | | | | | | | | | | | | | | | | | | | | | |
| Credit Default Swaps and Counterparty | | Buy/Sell Protection1 | | Termination
Date | | | Notional
Principal
Amount2 | | | Upfront
Payments
Received (Made) | | | Value3 | | | Unrealized
Gain/(Loss) | |
CDX IG, Series 16, 5 Year, at 1.00%; Bank of America | | Buy | | | 6/20/2016 | | | | $10,800,000 | | | | $– | | | | $73,696 | | | | $73,696 | |
iTraxx, Series 15, 5 Year, at 1.00%; Bank of America | | Buy | | | 6/20/2016 | | | | 3,500,000 | | | | (419,803 | ) | | | 251,225 | | | | (168,578 | ) |
Total Credit Default Swaps | | | | | | | | | | | | | | | | | $324,921 | | | | ($94,882 | ) |
| | 1 | As the buyer of protection, Income Fund pays periodic fees in return for payment by the seller which is contingent upon an adverse credit event occurring in the underlying issuer or reference entity. As the seller of protection, Income Fund collects periodic fees from the buyer and profits if the credit of the underlying issuer or reference entity remains stable or improves while the swap is outstanding, but the seller in a credit default swap contract would be required to pay the amount of credit loss, determined as specified in the agreement, to the buyer in the event of an adverse credit event in the reference entity. |
| | 2 | The maximum potential amount of future payments Income Fund could be required to make as the seller or receive as the buyer of protection. |
| | 3 | The values for credit indexes (CDX or LCDX) serve as an indicator of the current status of the payment/performance risk and represent the liability or profit for the credit default swap contract had the contract been closed as of the reporting date. When protection has been sold, the value of the swap will increase when the swap spread declines representing an improvement in the reference entity’s credit worthiness. The value of the swap will decrease when the swap spread increases representing a deterioration in the reference entity’s credit worthiness. When protection has been purchased, the value of the swap will increase when the swap spread increases representing a deterioration in the reference entity’s credit worthiness. The value of the swap will decrease when the swap spread declines representing an improvement in the reference entity’s credit worthiness. |
The accompanying Notes to Financial Statements are an integral part of this schedule.
175
Income Fund
Schedule of Investments as of October 31, 2011
The following table summarizes the fair value and Statement of Assets and Liabilities location, as of October 31, 2011, for Income Fund’s investments in financial derivative instruments by primary risk exposure as discussed under item (2) Significant Accounting Policies of the Notes to Financial Statements.
| | | | | | |
| Derivatives by risk category | | Statement of Assets and Liabilities Location | | Fair Value | |
Asset Derivatives | | | | | | |
Interest Rate Contracts | | | | | | |
Futures* | | Net Assets - Net unrealized appreciation/(depreciation) on Futures contracts | | | $651,187 | |
Total Interest Rate Contracts | | | | | 651,187 | |
Credit Contracts | | | | | | |
Credit Default Swaps | | Receivable/Payable - Swap agreements, at value; Net Assets - Net unrealized appreciation/(depreciation) on Swap agreements | | | 73,696 | |
Total Credit Contracts | | | | | 73,696 | |
Total Asset Derivatives | | | | | $724,883 | |
Liability Derivatives | | | | | | |
Interest Rate Contracts | | | | | | |
Futures* | | Net Assets - Net unrealized appreciation/(depreciation) on Futures contracts | | | 90,167 | |
Total Interest Rate Contracts | | | | | 90,167 | |
Credit Contracts | | | | | | |
Credit Default Swaps | | Receivable/Payable - Swap agreements, at value; Net Assets - Net unrealized appreciation/(depreciation) on Swap agreements | | | 168,578 | |
Total Credit Contracts | | | | | 168,578 | |
Total Liability Derivatives | | | | | $258,745 | |
| * | Includes cumulative appreciation/depreciation of futures contracts as reported in the Schedule of Investments. Only current day’s variation margin is reported within the Statement of Assets and Liabilities. |
The following table summarizes the net realized gains/(losses) and Statement of Operations location, for the period ended October 31, 2011, for Income Fund’s investments in financial derivative instruments by primary risk exposure.
| | | | | | |
| Derivatives by risk category | | Statement of Operations location | | Realized Gains/(Losses)
recognized in Income | |
Interest Rate Contracts | | | | | | |
Options Purchased | | Net realized gains/(losses) on Investments | | | (346,106 | ) |
Futures | | Net realized gains/(losses) on Futures contracts | | | (4,591,190 | ) |
Total Interest Rate Contracts | | | | | (4,937,296 | ) |
Foreign Exchange Contracts | | | | | | |
Forward Contracts | | Net realized gains/(losses) on Foreign currency transactions | | | (1,042 | ) |
Total Foreign Exchange Contracts | | | | | (1,042 | ) |
Credit Contracts | | | | | | |
Credit Default Swaps | | Net realized gains/(losses) on Swap agreements | | | (957,049 | ) |
Total Credit Contracts | | | | | (957,049 | ) |
Total | | | | | ($5,895,387 | ) |
The following table summarizes the change in net unrealized appreciation/(depreciation) and Statement of Operations location, for the period ended October 31, 2011, for Income Fund’s investments in financial derivative instruments by primary risk exposure.
| | | | | | |
| Derivatives by risk category | | Statement of Operations Location | | Change in unrealized
appreciation/(depreciation)
recognized in Income | |
Interest Rate Contracts | | | | | | |
Options Purchased | | Change in net unrealized appreciation/(depreciation) on Investments | | | 61,206 | |
Futures | | Change in net unrealized appreciation/(depreciation) on Futures contracts | | | 2,403,382 | |
Total Interest Rate Contracts | | | | | 2,464,588 | |
Credit Contracts | | | | | | |
Credit Default Swaps | | Change in net unrealized appreciation/(depreciation) on Swap agreements | | | 146,210 | |
Total Credit Contracts | | | | | 146,210 | |
Total | | | | | $2,610,798 | |
The accompanying Notes to Financial Statements are an integral part of this schedule.
176
Income Fund
Schedule of Investments as of October 31, 2011
The following table presents Income Fund’s average volume of derivative activity during the period ended October 31, 2011.
| | | | | | | | | | | | | | | | | | | | |
Derivative Risk
Category | | Futures
(Notional*) | | | Futures
(Percentage
of Average
Net Assets) | | | Swaps
(Notional*) | | | Swaps
(Percentage
of Average
Net Assets) | | | Options
(Contracts) | |
Interest Rate Contracts | | | $228,119,388 | | | | 29.2 | % | | | N/A | | | | N/A | | | | 63 | |
Credit Contracts | | | N/A | | | | N/A | | | | $14,152,246 | | | | 1.8 | % | | | N/A | |
| * | Notional amount represents long or short, or both, derivative positions held by the Fund. |
Investment in Affiliates
Affiliated issuers, as defined under the Investment Company Act of 1940, include those in which the Fund’s holdings of an issuer represent 5% or more of the outstanding voting securities of an issuer, or any affiliated mutual fund.
A summary of transactions for the fiscal year to date, in Income Fund, is as follows:
| | | | | | | | | | | | | | | | | | | | | | | | |
| Fund | | Value
October 31, 2010 | | | Gross
Purchases | | | Gross
Sales | | | Shares Held at
October 31, 2011 | | | Value
October 31, 2011 | | | Income Earned
November 1, 2010 -
October 31, 2011 | |
High Yield | | | $13,360,360 | | | | $- | | | | $12,370,000 | | | | 200,237 | | | | $945,118 | | | | $710,201 | |
Thrivent Financial Securities Lending Trust | | | 5,860,500 | | | | 117,975,751 | | | | 107,782,521 | | | | 16,053,730 | | | | 16,053,730 | | | | 16,601 | |
Total Value and Income Earned | | | 19,220,860 | | | | | | | | | | | | | | | | 16,998,848 | | | | 726,802 | |
The accompanying Notes to Financial Statements are an integral part of this schedule.
177
Core Bond Fund
Schedule of Investments as of October 31, 2011
| | | | | | |
Principal
Amount | | Long-Term Fixed Income (104.1%) | | Value | |
Asset-Backed Securities (4.3%) | | | | |
| | Carrington Mortgage Loan Trust | | | | |
$650,000 | | 0.395%, 8/25/2036a | | | $210,956 | |
| | Countrywide Asset-Backed Certificates | | | | |
541,836 | | 5.549%, 8/25/2021b | | | 473,741 | |
| | Credit Based Asset Servicing and Securitization, LLC | | | | |
779,080 | | 5.501%, 12/25/2036 | | | 518,199 | |
| | First Horizon ABS Trust | | | | |
1,833,762 | | 0.375%, 10/25/2026a,b | | | 1,326,003 | |
1,624,791 | | 0.405%, 10/25/2034a,b | | | 1,018,877 | |
| | GMAC Mortgage Corporation Loan Trust | | | | |
2,511,859 | | 0.425%, 8/25/2035a,b | | | 1,559,973 | |
2,044,766 | | 0.425%, 12/25/2036a,b | | | 1,257,053 | |
| | Green Tree Financial Corporation | | | | |
182,428 | | 7.650%, 10/15/2027 | | | 187,390 | |
| | GSAMP Trust | | | | |
666,678 | | 0.325%, 8/25/2036a | | | 601,308 | |
| | Popular ABS Mortgage Pass- Through Trust | | | | |
900,000 | | 5.297%, 11/25/2035 | | | 608,388 | |
| | Renaissance Home Equity Loan Trust | | | | |
4,111,887 | | 5.608%, 5/25/2036 | | | 2,686,682 | |
1,000,000 | | 5.285%, 1/25/2037 | | | 413,796 | |
| | Wachovia Asset Securitization, Inc. | | | | |
2,533,588 | | 0.385%, 7/25/2037a,b,c | | | 1,805,896 | |
| | | |
| | Total Asset-Backed Securities | | | 12,668,262 | |
| | | |
| |
Basic Materials (2.3%) | | | | |
| | Alcoa, Inc. | | | | |
500,000 | | 5.400%, 4/15/2021 | | | 495,430 | |
| | ArcelorMittal | | | | |
1,000,000 | | 6.125%, 6/1/2018 | | | 1,027,120 | |
800,000 | | 5.250%, 8/5/2020 | | | 776,720 | |
| | Dow Chemical Company | | | | |
800,000 | | 4.250%, 11/15/2020 | | | 822,672 | |
| | Gold Fields Orogen Holding BVI, Ltd. | | | | |
1,300,000 | | 4.875%, 10/7/2020d | | | 1,210,622 | |
| | Noble Group, Ltd. | | | | |
1,200,000 | | 6.750%, 1/29/2020d | | | 1,176,000 | |
| | Teck Resources, Ltd. | | | | |
1,000,000 | | 10.250%, 5/15/2016 | | | 1,171,200 | |
| | | |
| | Total Basic Materials | | | 6,679,764 | |
| | | |
| |
Capital Goods (1.5%) | | | | |
| | Boeing Capital Corporation | | | | |
800,000 | | 2.125%, 8/15/2016 | | | 815,174 | |
| | Danaher Corporation | | | | |
600,000 | | 2.300%, 6/23/2016 | | | 612,750 | |
| | Hutchinson Whampoa Finance, Ltd. | | | | |
1,000,000 | | 5.750%, 9/11/2019d | | | 1,115,134 | |
| | Republic Services, Inc. | | | | |
400,000 | | 5.000%, 3/1/2020 | | | 444,680 | |
800,000 | | 5.250%, 11/15/2021 | | | 912,134 | |
| | Textron, Inc. | | | | |
500,000 | | 7.250%, 10/1/2019 | | | 554,641 | |
| | | |
| | Total Capital Goods | | | 4,454,513 | |
| | | |
| | | | | | |
Principal
Amount | | Long-Term Fixed Income (104.1%) | | Value | |
Collateralized Mortgage Obligations (3.1%) | | | | |
| | Banc of America Mortgage Securities, Inc. | | | | |
$2,099,654 | | 2.764%, 9/25/2035a | | | $1,679,486 | |
| | Bear Stearns Mortgage Funding Trust | | | | |
550,919 | | 0.525%, 8/25/2036a | | | 155,809 | |
| | Chase Mortgage Finance Corporation | | | | |
195,761 | | 5.257%, 1/25/2036a | | | 16,773 | |
| | Countrywide Alternative Loan Trust | | | | |
1,346,081 | | 6.000%, 1/25/2037 | | | 905,047 | |
| | HomeBanc Mortgage Trust | | | | |
1,742,400 | | 2.171%, 4/25/2037 | | | 951,697 | |
| | J.P. Morgan Alternative Loan Trust | | | | |
2,490,841 | | 2.669%, 3/25/2036 | | | 1,336,596 | |
| | J.P. Morgan Mortgage Trust | | | | |
67,368 | | 5.543%, 6/25/2036 | | | 66,189 | |
| | Merrill Lynch Mortgage Investors, Inc. | | | | |
2,060,881 | | 2.628%, 6/25/2035 | | | 1,693,102 | |
| | Thornburg Mortgage Securities Trust | | | | |
1,270,727 | | 0.355%, 11/25/2046a | | | 1,267,893 | |
| | WaMu Mortgage Pass Through Certificates | | | | |
354,337 | | 2.567%, 8/25/2046 | | | 269,671 | |
| | Wells Fargo Mortgage Backed Securities Trust | | | | |
640,144 | | 6.000%, 7/25/2037 | | | 601,606 | |
| | | |
| | Total Collateralized Mortgage Obligations | | | 8,943,869 | |
| | | |
| |
Commercial Mortgage-Backed Securities (7.8%) | | | | |
| | Banc of America Commercial Mortgage, Inc. | | | | |
500,000 | | 5.655%, 4/10/2049 | | | 433,774 | |
| | Bear Stearns Commercial Mortgage Securities, Inc. | | | | |
1,367,071 | | 5.613%, 6/11/2050 | | | 1,418,776 | |
2,617,580 | | 0.393%, 3/15/2022a,c | | | 2,568,393 | |
| | Citigroup/Deutsche Bank Commercial Mortgage | | | | |
1,250,000 | | 5.322%, 12/11/2049 | | | 1,308,870 | |
| | Commercial Mortgage Pass- Through Certificates | | | | |
4,000,000 | | 0.373%, 12/15/2020a,c | | | 3,648,440 | |
| | Credit Suisse Mortgage Capital Certificates | | | | |
1,811,192 | | 0.413%, 10/15/2021a,d | | | 1,674,726 | |
1,200,000 | | 5.467%, 9/15/2039 | | | 1,269,022 | |
| | Government National Mortgage Association | | | | |
2,200,630 | | 3.214%, 1/16/2040 | | | 2,303,892 | |
| | GS Mortgage Securities Corporation II | | | | |
3,000,000 | | 1.317%, 3/6/2020a,d | | | 2,972,916 | |
| | LB-UBS Commercial Mortgage Trust | | | | |
700,000 | | 5.866%, 9/15/2045 | | | 743,226 | |
500,000 | | 6.167%, 9/15/2045 | | | 426,360 | |
The accompanying Notes to Financial Statements are an integral part of this schedule.
178
Core Bond Fund
Schedule of Investments as of October 31, 2011
| | | | | | |
Principal Amount | | Long-Term Fixed Income (104.1%) | | Value | |
| Commercial Mortgage-Backed Securities (7.8%) - continued | | | | |
| | Morgan Stanley Capital I | | | | |
$1,000,000 | | 3.224%, 7/15/2049 | | | $1,027,780 | |
| | Morgan Stanley Capital, Inc. | | | | |
800,000 | | 5.406%, 3/15/2044 | | | 723,657 | |
| | Wachovia Bank Commercial Mortgage Trust | | | | |
2,000,000 | | 5.765%, 7/15/2045 | | | 2,203,656 | |
| | | |
| | Total Commercial Mortgage- Backed Securities | | | 22,723,488 | |
| | | |
| |
| Communications Services (3.3%) | | | | |
| | American Tower Corporation | | | | |
1,000,000 | | 5.050%, 9/1/2020 | | | 1,056,432 | |
| | CBS Corporation | | | | |
800,000 | | 8.875%, 5/15/2019 | | | 1,033,676 | |
| | Cox Communications, Inc. | | | | |
750,000 | | 8.375%, 3/1/2039d | | | 1,048,719 | |
| | Crown Castle Towers, LLC | | | | |
800,000 | | 4.883%, 8/15/2020d | | | 817,793 | |
| | Frontier Communications Corporation | | | | |
681,000 | | 6.250%, 1/15/2013 | | | 696,322 | |
| | News America, Inc. | | | | |
510,000 | | 6.400%, 12/15/2035 | | | 573,739 | |
| | Qwest Communications International, Inc. | | | | |
450,000 | | 7.125%, 4/1/2018 | | | 460,125 | |
| | Rogers Communications, Inc. | | | | |
130,000 | | 8.750%, 5/1/2032 | | | 187,313 | |
| | SBA Tower Trust | | | | |
800,000 | | 5.101%, 4/15/2017d | | | 871,600 | |
| | Telecom Italia Capital SA | | | | |
975,000 | | 5.250%, 10/1/2015 | | | 949,456 | |
| | Telemar Norte Leste SA | | | | |
1,000,000 | | 5.500%, 10/23/2020d | | | 1,007,500 | |
| | Verizon Communications, Inc. | | | | |
350,000 | | 8.950%, 3/1/2039 | | | 556,150 | |
| | Virgin Media Secured Finance plc | | | | |
400,000 | | 5.250%, 1/15/2021 | | | 430,960 | |
| | | |
| | Total Communications Services | | | 9,689,785 | |
| | | |
| |
| Consumer Cyclical (1.6%) | | | | |
| | Ford Motor Credit Company, LLC | | | | |
600,000 | | 7.000%, 4/15/2015 | | | 654,000 | |
400,000 | | 5.000%, 5/15/2018 | | | 406,563 | |
| | Harley-Davidson Financial Services, Inc. | | | | |
750,000 | | 3.875%, 3/15/2016d | | | 769,532 | |
| | Hyundai Motor Manufacturing Czech | | | | |
1,000,000 | | 4.500%, 4/15/2015d | | | 1,033,119 | |
| | Macy’s Retail Holdings, Inc. | | | | |
400,000 | | 7.450%, 7/15/2017 | | | 466,137 | |
| | RCI Banque SA | | | | |
300,000 | | 4.600%, 4/12/2016d | | | 291,395 | |
| | University of Southern California | | | | |
500,000 | | 5.250%, 10/1/2111 | | | 581,065 | |
| | Wyndham Worldwide Corporation | | | | |
500,000 | | 7.375%, 3/1/2020 | | | 562,801 | |
| | | |
| | Total Consumer Cyclical | | | 4,764,612 | |
| | | |
| | | | | | |
Principal Amount | | Long-Term Fixed Income (104.1%) | | Value | |
| Consumer Non-Cyclical (2.1%) | | | | |
| | Altria Group, Inc. | | | | |
$525,000 | | 9.700%, 11/10/2018 | | | $705,611 | |
| | Celgene Corporation | | | | |
1,000,000 | | 3.950%, 10/15/2020 | | | 1,009,382 | |
| | Coca-Cola Enterprises, Inc. | | | | |
500,000 | | 3.250%, 8/19/2021 | | | 501,016 | |
| | Colgate-Palmolive Company | | | | |
500,000 | | 2.625%, 5/1/2017 | | | 525,237 | |
| | CVS Caremark Corporation | | | | |
500,000 | | 6.125%, 9/15/2039 | | | 607,261 | |
| | Energizer Holdings, Inc. | | | | |
500,000 | | 4.700%, 5/19/2021d | | | 528,551 | |
| | HCA, Inc. | | | | |
800,000 | | 6.500%, 2/15/2020 | | | 838,000 | |
| | Kraft Foods, Inc. | | | | |
1,000,000 | | 5.375%, 2/10/2020 | | | 1,152,566 | |
| | Quest Diagnostics, Inc. | | | | |
350,000 | | 4.700%, 4/1/2021 | | | 374,574 | |
| | | |
| | Total Consumer Non-Cyclical | | | 6,242,198 | |
| | | |
| |
| Energy (3.5%) | | | | |
| | BP Capital Markets plc | | | | |
1,000,000 | | 4.500%, 10/1/2020 | | | 1,098,042 | |
| | Cameron International Corporation | | | | |
250,000 | | 4.500%, 6/1/2021 | | | 267,562 | |
| | CenterPoint Energy Resources Corporation | | | | |
1,150,000 | | 6.125%, 11/1/2017 | | | 1,311,294 | |
| | Forest Oil Corporation | | | | |
1,000,000 | | 7.250%, 6/15/2019 | | | 1,025,000 | |
| | International Petroleum Investment Company, Ltd. | | | | |
1,000,000 | | 5.000%, 11/15/2020d | | | 1,001,250 | |
| | Nabors Industries, Inc. | | | | |
400,000 | | 4.625%, 9/15/2021d | | | 399,960 | |
| | NiSource Finance Corporation | | | | |
400,000 | | 6.125%, 3/1/2022 | | | 461,384 | |
| | ONEOK Partners, LP | | | | |
500,000 | | 3.250%, 2/1/2016 | | | 511,753 | |
| | Petrobras International Finance Company | | | | |
800,000 | | 5.375%, 1/27/2021 | | | 841,544 | |
| | Schlumberger Norge AS | | | | |
400,000 | | 4.200%, 1/15/2021d | | | 437,484 | |
| | Transocean, Inc. | | | | |
800,000 | | 7.375%, 4/15/2018 | | | 898,242 | |
| | Valero Energy Corporation | | | | |
800,000 | | 6.125%, 2/1/2020 | | | 918,635 | |
| | Weatherford International, Ltd. | | | | |
500,000 | | 6.000%, 3/15/2018 | | | 554,948 | |
500,000 | | 5.125%, 9/15/2020 | | | 529,174 | |
| | | |
| | Total Energy | | | 10,256,272 | |
| | | |
| |
| Financials (17.5%) | | | | |
| | Ally Financial, Inc. | | | | |
400,000 | | 4.500%, 2/11/2014 | | | 391,000 | |
| | American Express Bank FSB | | | | |
500,000 | | 6.000%, 9/13/2017 | | | 568,817 | |
| | Axis Specialty Finance, LLC | | | | |
1,100,000 | | 5.875%, 6/1/2020 | | | 1,099,938 | |
| | Bank of America Corporation | | | | |
400,000 | | 5.875%, 1/5/2021 | | | 391,651 | |
The accompanying Notes to Financial Statements are an integral part of this schedule.
179
Core Bond Fund
Schedule of Investments as of October 31, 2011
| | | | | | |
Principal
Amount | | Long-Term Fixed Income (104.1%) | | Value | |
| Financials (17.5%) | | | | |
| | Barclays Bank plc | | | | |
$550,000 | | 5.140%, 10/14/2020 | | | $499,412 | |
| | Barclays Bank plc, Convertible | | | | |
2,000,000 | | 1.000%, 6/25/2017e | | | 2,138,200 | |
| | Bear Stearns Companies, LLC | | | | |
800,000 | | 6.400%, 10/2/2017 | | | 923,398 | |
| | Blackstone Holdings Finance Company, LLC | | | | |
850,000 | | 6.625%, 8/15/2019d | | | 905,644 | |
| | Boston Properties, LP | | | | |
800,000 | | 4.125%, 5/15/2021 | | | 784,534 | |
| | Capital One Capital V | | | | |
850,000 | | 10.250%, 8/15/2039 | | | 879,750 | |
| | Capital One Financial Corporation | | | | |
550,000 | | 2.125%, 7/15/2014 | | | 549,247 | |
| | Citigroup, Inc. | | | | |
300,000 | | 6.500%, 8/19/2013 | | | 317,804 | |
1,250,000 | | 1.302%, 4/1/2014a | | | 1,203,600 | |
| | CNA Financial Corporation | | | | |
800,000 | | 6.500%, 8/15/2016 | | | 867,743 | |
500,000 | | 5.750%, 8/15/2021 | | | 504,605 | |
| | Cooperatieve Centrale Raiffeisen- Boerenleenbank BA | | | | |
1,200,000 | | 4.750%, 1/15/2020d | | | 1,330,883 | |
500,000 | | 11.000%, 12/29/2049d,f | | | 605,000 | |
| | Credit Suisse of New York, Convertible | | | | |
350,000 | | 0.500%, 6/22/2018g | | | 345,975 | |
| | Credit Suisse Securities USA, LLC | | | | |
1,200,000 | | 1.000%, 4/28/2017e | | | 1,159,200 | |
| | Danske Bank AS | | | | |
750,000 | | 3.875%, 4/14/2016d | | | 738,399 | |
| | Discover Bank | | | | |
500,000 | | 7.000%, 4/15/2020 | | | 522,140 | |
| | Fairfax Financial Holdings, Ltd. | | | | |
800,000 | | 5.800%, 5/15/2021d | | | 753,871 | |
| | Fifth Third Bancorp | | | | |
200,000 | | 3.625%, 1/25/2016 | | | 205,082 | |
650,000 | | 5.450%, 1/15/2017 | | | 692,871 | |
| | FUEL Trust | | | | |
500,000 | | 3.984%, 6/15/2016d | | | 494,460 | |
| | General Electric Capital Corporation | | | | |
800,000 | | 4.375%, 9/16/2020 | | | 814,101 | |
400,000 | | 5.300%, 2/11/2021 | | | 425,705 | |
300,000 | | 6.750%, 3/15/2032 | | | 350,827 | |
| | Goldman Sachs Group, Inc., Convertible | | | | |
5,520 | | 2.600%, 3/16/2012d,h | | | 63,005 | |
128 | | 0.500%, 3/30/2012d,i | | | 86,203 | |
21,850 | | 0.250%, 11/9/2012d,j | | | 570,657 | |
| | HCP, Inc. | | | | |
800,000 | | 5.375%, 2/1/2021 | | | 821,627 | |
| | Health Care REIT, Inc. | | | | |
800,000 | | 6.125%, 4/15/2020 | | | 821,172 | |
| | HSBC Holdings plc | | | | |
750,000 | | 5.100%, 4/5/2021 | | | 807,801 | |
575,000 | | 6.500%, 5/2/2036 | | | 611,579 | |
| | ING Bank NV | | | | |
500,000 | | 5.000%, 6/9/2021d | | | 513,210 | |
| | International Lease Finance Corporation | | | | |
300,000 | | 8.625%, 9/15/2015 | | | 315,000 | |
| | | | | | |
Principal Amount | | Long-Term Fixed Income (104.1%) | | Value | |
| | J.P. Morgan Chase & Company | | | | |
$400,000 | | 3.150%, 7/5/2016 | | | $400,679 | |
400,000 | | 4.350%, 8/15/2021 | | | 400,132 | |
| | Jefferies Group, Inc. | | | | |
750,000 | | 5.125%, 4/13/2018 | | | 677,116 | |
| | KeyCorp | | | | |
450,000 | | 5.100%, 3/24/2021 | | | 467,852 | |
| | Liberty Property, LP | | | | |
630,000 | | 5.500%, 12/15/2016 | | | 683,617 | |
| | Lloyds TSB Bank plc | | | | |
600,000 | | 6.500%, 9/14/2020d | | | 558,832 | |
| | Marsh & McLennan Companies, Inc. | | | | |
675,000 | | 4.800%, 7/15/2021 | | | 727,884 | |
| | Merrill Lynch & Company, Inc. | | | | |
475,000 | | 6.875%, 4/25/2018 | | | 487,939 | |
| | Metropolitan Life Global Funding I | | | | |
750,000 | | 3.650%, 6/14/2018d | | | 756,129 | |
| | Morgan Stanley | | | | |
800,000 | | 7.300%, 5/13/2019 | | | 858,486 | |
800,000 | | 5.500%, 1/26/2020 | | | 788,239 | |
| | Nationwide Building Society | | | | |
800,000 | | 6.250%, 2/25/2020d | | | 831,138 | |
| | Nordea Eiendomskreditt AS | | | | |
750,000 | | 1.875%, 4/7/2014d | | | 758,933 | |
| | PNC Funding Corporation | | | | |
800,000 | | 5.125%, 2/8/2020 | | | 884,385 | |
| | Principal Financial Group, Inc. | | | | |
800,000 | | 8.875%, 5/15/2019 | | | 1,013,602 | |
| | Prudential Financial, Inc. | | | | |
1,150,000 | | 6.100%, 6/15/2017 | | | 1,255,249 | |
390,000 | | 5.700%, 12/14/2036 | | | 410,324 | |
| | Rabobank Capital Funding Trust II | | | | |
405,000 | | 5.260%, 12/29/2049d,f | | | 388,994 | |
| | Reinsurance Group of America, Inc. | | | | |
950,000 | | 5.625%, 3/15/2017 | | | 1,020,999 | |
1,000,000 | | 6.450%, 11/15/2019 | | | 1,132,026 | |
| | Royal Bank of Canada | | | | |
850,000 | | 1.128%, 10/30/2014a | | | 852,768 | |
| | Simon Property Group, LP | | | | |
800,000 | | 4.375%, 3/1/2021 | | | 827,855 | |
| | SLM Corporation | | | | |
400,000 | | 6.250%, 1/25/2016 | | | 400,000 | |
400,000 | | 8.000%, 3/25/2020 | | | 416,000 | |
| | SSIF Nevada, LP | | | | |
750,000 | | 1.101%, 4/14/2014a,d | | | 749,766 | |
| | State Street Capital Trust III | | | | |
1,200,000 | | 5.337%, 3/15/2042a,f | | | 1,202,040 | |
| | SVB Financial Group | | | | |
1,000,000 | | 5.375%, 9/15/2020 | | | 1,031,952 | |
| | Swiss RE Capital I, LP | | | | |
850,000 | | 6.854%, 5/29/2049d,f | | | 766,477 | |
| | Travelers Companies, Inc. | | | | |
350,000 | | 6.250%, 6/15/2037 | | | 436,301 | |
| | UnitedHealth Group, Inc. | | | | |
550,000 | | 6.500%, 6/15/2037 | | | 699,333 | |
| | USB Capital XIII Trust | | | | |
800,000 | | 6.625%, 12/15/2039 | | | 822,208 | |
| | Wachovia Bank NA | | | | |
770,000 | | 4.875%, 2/1/2015 | | | 815,262 | |
| | Wachovia Corporation | | | | |
850,000 | | 5.250%, 8/1/2014 | | | 906,534 | |
The accompanying Notes to Financial Statements are an integral part of this schedule.
180
Core Bond Fund
Schedule of Investments as of October 31, 2011
| | | | | | |
Principal Amount | | Long-Term Fixed Income (104.1%) | | Value | |
| | Westpac Banking Corporation | | | | |
$750,000 | | 1.099%, 3/31/2014a,d | | | $752,165 | |
| | Willis North America, Inc. | | | | |
760,000 | | 6.200%, 3/28/2017 | | | 832,370 | |
| | | |
| | Total Financials | | | 51,087,697 | |
| | | |
| |
| Foreign Government (2.6%) | | | | |
| | Bank Nederlandse Gemeenten | | | | |
1,250,000 | | 4.375%, 2/16/2021d | | | 1,391,894 | |
| | Chile Government International Bond | | | | |
800,000 | | 3.875%, 8/5/2020 | | | 836,000 | |
| | Corporacion Andina de Fomento | | | | |
750,000 | | 5.750%, 1/12/2017 | | | 821,603 | |
| | Mexico Government International Bond | | | | |
750,000 | | 6.050%, 1/11/2040 | | | 879,375 | |
| | Poland Government International Bond | | | | |
750,000 | | 5.125%, 4/21/2021 | | | 765,000 | |
| | Province of British Columbia | | | | |
1,375,000 | | 2.650%, 9/22/2021 | | | 1,370,531 | |
| | Province of New Brunswick | | | | |
750,000 | | 2.750%, 6/15/2018 | | | 772,925 | |
| | Province of Ontario | | | | |
800,000 | | 1.600%, 9/21/2016 | | | 791,067 | |
| | | |
| | Total Foreign Government | | | 7,628,395 | |
| | | |
| |
| Mortgage-Backed Securities (22.1%) | | | | |
| | Federal National Mortgage Association Conventional 15- Yr. Pass Through | | | | |
16,350,000 | | 3.000%, 12/1/2026k | | | 16,687,219 | |
| | Federal National Mortgage Association Conventional 30- Yr. Pass Through | | | | |
28,700,000 | | 4.500%, 11/1/2041k | | | 30,345,773 | |
5,150,000 | | 5.000%, 11/1/2041k | | | 5,539,468 | |
11,000,000 | | 6.000%, 11/1/2041k | | | 12,053,591 | |
| | | |
| | Total Mortgage-Backed Securities | | | 64,626,051 | |
| | | |
| |
| Technology (1.0%) | | | | |
| | Affiliated Computer Services, Inc. | | | | |
800,000 | | 5.200%, 6/1/2015 | | | 859,548 | |
| | Hewlett-Packard Company | | | | |
750,000 | | 4.300%, 6/1/2021 | | | 781,382 | |
| | Texas Instruments, Inc. | | | | |
750,000 | | 2.375%, 5/16/2016 | | | 775,666 | |
| | Xerox Corporation | | | | |
600,000 | | 4.500%, 5/15/2021 | | | 624,785 | |
| | | |
| | Total Technology | | | 3,041,381 | |
| | | |
| |
| Transportation (1.2%) | | | | |
| | American Airlines Pass Through Trust | | | | |
844,755 | | 10.375%, 7/2/2019 | | | 906,000 | |
| | CSX Corporation | | | | |
800,000 | | 3.700%, 10/30/2020 | | | 823,150 | |
| | Delta Air Lines, Inc. | | | | |
492,839 | | 4.950%, 11/23/2019 | | | 492,839 | |
| | ERAC USA Finance, LLC | | | | |
800,000 | | 5.250%, 10/1/2020d | | | 863,418 | |
| | | | | | |
Principal Amount | | Long-Term Fixed Income (104.1%) | | Value | |
| Transportation (1.2%) - continued | | | | |
| | US Airways Group, Inc. | | | | |
$387,089 | | 6.250%, 4/22/2023 | | | $348,380 | |
| | | |
| | Total Transportation | | | 3,433,787 | |
| | | |
| |
| U.S. Government and Agencies (25.7%) | | | | |
| | Federal Home Loan Banks | | | | |
2,400,000 | | 0.155%, 2/10/2012a | | | 2,400,384 | |
10,000,000 | | 0.174%, 4/19/2013a | | | 9,995,530 | |
| | Federal Home Loan Mortgage Corporation | | | | |
5,000,000 | | 0.193%, 6/17/2013a | | | 5,000,250 | |
1,750,000 | | 0.375%, 10/30/2013 | | | 1,747,749 | |
| | U.S. Treasury Bonds | | | | |
1,500,000 | | 4.500%, 5/15/2038 | | | 1,867,968 | |
5,725,000 | | 4.375%, 5/15/2041 | | | 7,027,437 | |
| | U.S. Treasury Notes | | | | |
1,500,000 | | 2.250%, 5/31/2014 | | | 1,572,657 | |
1,750,000 | | 0.750%, 6/15/2014 | | | 1,767,637 | |
1,650,000 | | 2.375%, 9/30/2014 | | | 1,743,715 | |
9,000,000 | | 2.000%, 1/31/2016 | | | 9,461,250 | |
1,900,000 | | 1.500%, 6/30/2016 | | | 1,951,072 | |
3,775,000 | | 2.750%, 2/28/2018 | | | 4,084,078 | |
6,200,000 | | 3.125%, 5/15/2021 | | | 6,740,082 | |
100,000 | | 3.500%, 2/15/2039 | | | 105,766 | |
| | U.S. Treasury Notes, TIPS | | | | |
5,748,610 | | 2.500%, 7/15/2016 | | | 6,688,600 | |
5,569,830 | | 1.875%, 7/15/2019 | | | 6,464,918 | |
6,109,627 | | 1.125%, 1/15/2021 | | | 6,718,201 | |
| | | |
| | Total U.S. Government and Agencies | | | 75,337,294 | |
| | | |
| |
| U.S. Municipals (0.4%) | | | | |
| | North Texas Tollway Authority Revenue Bonds (Build America Bonds) | | | | |
850,000 | | 6.718%, 1/1/2049 | | | 1,039,202 | |
| | | |
| | Total U.S. Municipals | | | 1,039,202 | |
| | | |
| |
| Utilities (4.1%) | | | | |
| | Cleveland Electric Illuminating Company | | | | |
825,000 | | 5.700%, 4/1/2017 | | | 911,171 | |
| | Comision Federal de Electricidad | | | | |
600,000 | | 4.875%, 5/26/2021d | | | 612,000 | |
| | Energy Transfer Partners, LP | | | | |
1,000,000 | | 4.650%, 6/1/2021 | | | 992,711 | |
| | Enterprise Products Operating, LLC | | | | |
800,000 | | 5.200%, 9/1/2020 | | | 895,063 | |
| | Exelon Generation Company, LLC | | | | |
1,000,000 | | 4.000%, 10/1/2020 | | | 1,024,481 | |
515,000 | | 5.750%, 10/1/2041 | | | 580,587 | |
| | FirstEnergy Solutions Corporation | | | | |
850,000 | | 4.800%, 2/15/2015 | | | 910,950 | |
| | ITC Holdings Corporation | | | | |
775,000 | | 6.050%, 1/31/2018d | | | 893,108 | |
| | Kinder Morgan Energy Partners, LP | | | | |
400,000 | | 4.150%, 3/1/2022 | | | 409,949 | |
| | MidAmerican Energy Holdings Company | | | | |
775,000 | | 6.500%, 9/15/2037 | | | 998,994 | |
The accompanying Notes to Financial Statements are an integral part of this schedule.
181
Core Bond Fund
Schedule of Investments as of October 31, 2011
| | | | | | |
Principal Amount | | Long-Term Fixed Income (104.1%) | | Value | |
| Utilities (4.1%) - continued | | | | |
| | ONEOK Partners, LP | | | | |
$450,000 | | 8.625%, 3/1/2019 | | | $581,853 | |
| | Pennsylvania Electric Company | | | | |
800,000 | | 5.200%, 4/1/2020 | | | 884,510 | |
| | Potomac Electric Power Company | | | | |
600,000 | | 7.900%, 12/15/2038 | | | 901,102 | |
| | Power Receivables Finance, LLC | | | | |
62,240 | | 6.290%, 1/1/2012c | | | 62,292 | |
| | Union Electric Company | | | | |
1,150,000 | | 6.400%, 6/15/2017 | | | 1,363,086 | |
| | | |
| | Total Utilities | | | 12,021,857 | |
| | | |
| | | | | | |
| | | |
| | Total Long-Term Fixed Income (cost $302,556,417) | | | 304,638,427 | |
| | | |
| | |
| Shares | | Mutual Funds (4.3%) | | Value | |
| Fixed Income Mutual Funds (4.3%) | | | | |
2,646,014 | | Thrivent High Yield Fund | | | 12,489,184 | |
| | | |
| | Total Fixed Income Mutual Funds | | | 12,489,184 | |
| | | |
| | | | | | |
| | | |
| | Total Mutual Funds (cost $9,800,000) | | | 12,489,184 | |
| | | |
| | |
| Shares | | Preferred Stock (0.3%) | | Value | |
| Financials (0.3%) | | | | |
4,850 | | Citigroup, Inc., Convertiblel | | | 460,944 | |
56,005 | | Federal National Mortgage
Association, 8.250%f,m | | | 109,770 | |
16,000 | | HSBC Holdings plc, 8.000%f | | | 428,000 | |
| | | |
| | Total Financials | | | 998,714 | |
| | | |
| | | | | | |
| | | |
| | Total Preferred Stock (cost $1,680,650) | | | 998,714 | |
| | | |
| | |
Principal Amount | | Short-Term Investments (11.8%)n | | Value | |
| | Federal Home Loan Bank Discount Notes | | | | |
17,000,000 | | 0.023%, 11/18/2011o | | | 16,999,832 | |
| | Federal Home Loan Mortgage Corporation Discount Notes | | | | |
10,000,000 | | 0.030%, 1/23/2012o | | | 9,999,308 | |
| | Federal National Mortgage Association Discount Notes | | | | |
4,000,000 | | 0.025%, 12/21/2011o | | | 3,999,861 | |
3,000,000 | | 0.020%, 1/17/2012o | | | 2,999,872 | |
500,000 | | 0.105%, 2/22/2012o,p | | | 499,838 | |
| | | |
| | Total Short-Term Investments (at amortized cost) | | | 34,498,711 | |
| | | |
| | Total Investments (cost $348,535,778) 120.5% | | | $352,625,036 | |
| | | |
| | Other Assets and Liabilities, Net (20.5%) | | | (59,887,291 | ) |
| | | |
| | Total Net Assets 100.0% | | | $292,737,745 | |
| | | |
| a | Denotes variable rate securities. Variable rate securities are securities whose yields vary with a designated market index or market rate. The rate shown is as of October 31, 2011. |
| b | All or a portion of the security is insured or guaranteed. |
| c | Denotes restricted securities. Restricted securities are investment securities which have been deemed illiquid and cannot be offered for public sale without first being registered under the Securities Act of 1933. The following table indicates the acquisition date and cost of restricted securities Core Bond Fund owned as of October 31, 2011. |
| | | | | | | | |
| Security | | Acquisition
Date | | | Amortized
Cost | |
Bear Stearns Commercial Mortgage Securities, Inc. | | | 3/30/2007 | | | | $2,617,580 | |
Commercial Mortgage Pass- Through Certificates | | | 10/18/2006 | | | | $4,000,000 | |
Power Receivables Finance, LLC | | | 9/30/2003 | | | | $62,222 | |
Wachovia Asset Securitization, Inc. | | | 3/16/2007 | | | | $2,533,587 | |
| d | Denotes securities sold under Rule 144A of the Securities Act of 1933, which exempts them from registration. These securities have been deemed liquid and may be resold to other dealers in the program or to other qualified institutional buyers. As of October 31, 2011, the value of these investments was $31,740,487 or 10.8% of total net assets. |
| e | Denotes equity-linked structured security. This security is linked to the S&P 500 Index. |
| f | Denotes perpetual securities. Perpetual securities pay an indefinite stream of interest, but may be called by the issuer at an earlier date. |
| g | Denotes equity-linked structured security. This security is linked to the common stock of Berkshire Hathaway, Inc. |
| h | Security is displayed in shares. This security is an equity-linked structured security. This security is linked to the common stock of RadioShack Corporation. |
| i | Security is displayed in shares. This security is an equity-linked structured security. This security is linked to the common stock of Kubota Corporation. |
| j | Security is displayed in shares. This security is an equity-linked structured security. This security is linked to the common stock of Microsoft Corporation. |
| k | Denotes investments purchased on a when-issued or delayed delivery basis. |
| l | Comprised of a 79.7% prepaid stock purchase contract for common stock of Citigroup, Inc. and a 20.3% amortizing note. The quarterly payments received consists of return of capital and 6.15% interest on only the portion that is the note. |
| m | Non-income producing security. |
| n | The interest rate shown reflects the yield, coupon rate or the discount rate at the date of purchase. |
| o | Denotes investments that benefit from credit enhancement or liquidity support provided by a third party bank, institution or government. |
| p | At October 31, 2011, $439,857 of investments were held on deposit with the counterparty and pledged as the initial margin deposit for open futures contracts. |
Definitions:
| | | | |
REIT | | - | | Real Estate Investment Trust is a company that buys, develops, manages and/or sells real estate assets. |
TIPS | | - | | Treasury Inflation Protected Security. |
The accompanying Notes to Financial Statements are an integral part of this schedule.
182
Core Bond Fund
Schedule of Investments as of October 31, 2011
| | | | |
| Unrealized Appreciation (Depreciation) | | | |
Gross unrealized appreciation and depreciation of investments, based on cost for federal income tax purposes, were as follows: | |
Gross unrealized appreciation | | | $15,165,325 | |
Gross unrealized depreciation | | | (11,608,846 | ) |
Net unrealized appreciation (depreciation) | | | $3,556,479 | |
| |
Cost for federal income tax purposes | | | $349,068,557 | |
Fair Valuation Measurements
The following table is a summary of the inputs used, as of October 31, 2011, in valuing Core Bond Fund’s assets carried at fair value.
| | | | | | | | | | | | | | | | |
| Investments in Securities | | Total | | | Level 1 | | | Level 2 | | | Level 3 | |
| | | | |
Long-Term Fixed Income | | | | | | | | | | | | | | | | |
Asset-Backed Securities | | | 12,668,262 | | | | – | | | | 12,668,262 | | | | – | |
Basic Materials | | | 6,679,764 | | | | – | | | | 6,679,764 | | | | – | |
Capital Goods | | | 4,454,513 | | | | – | | | | 4,454,513 | | | | – | |
Collateralized Mortgage Obligations | | | 8,943,869 | | | | – | | | | 8,943,869 | | | | – | |
Commercial Mortgage-Backed Securities | | | 22,723,488 | | | | – | | | | 22,723,488 | | | | – | |
Communications Services | | | 9,689,785 | | | | – | | | | 8,818,185 | | | | 871,600 | |
Consumer Cyclical | | | 4,764,612 | | | | – | | | | 4,764,612 | | | | – | |
Consumer Non-Cyclical | | | 6,242,198 | | | | – | | | | 6,242,198 | | | | – | |
Energy | | | 10,256,272 | | | | – | | | | 10,256,272 | | | | – | |
Financials | | | 51,087,697 | | | | – | | | | 46,724,457 | | | | 4,363,240 | |
Foreign Government | | | 7,628,395 | | | | – | | | | 7,628,395 | | | | – | |
Mortgage-Backed Securities | | | 64,626,051 | | | | – | | | | 64,626,051 | | | | – | |
Technology | | | 3,041,381 | | | | – | | | | 3,041,381 | | | | – | |
Transportation | | | 3,433,787 | | | | – | | | | 3,433,787 | | | | – | |
U.S. Government and Agencies | | | 75,337,294 | | | | – | | | | 75,337,294 | | | | – | |
U.S. Municipals | | | 1,039,202 | | | | – | | | | 1,039,202 | | | | – | |
Utilities | | | 12,021,857 | | | | – | | | | 12,021,857 | | | | – | |
| | | | |
Mutual Funds | | | | | | | | | | | | | | | | |
Fixed Income Mutual Funds | | | 12,489,184 | | | | 12,489,184 | | | | – | | | | – | |
| | | | |
Preferred Stock | | | | | | | | | | | | | | | | |
Financials | | | 998,714 | | | | 998,714 | | | | – | | | | – | |
Short-Term Investments | | | 34,498,711 | | | | – | | | | 34,498,711 | | | | – | |
Total | | | $352,625,036 | | | | $13,487,898 | | | | $333,902,298 | | | | $5,234,840 | |
| | | | |
| Other Financial Instruments | | Total | | | Level 1 | | | Level 2 | | | Level 3 | |
| | | | |
Asset Derivatives | | | | | | | | | | | | | | | | |
Futures Contracts | | | 218,394 | | | | 218,394 | | | | – | | | | – | |
Credit Default Swaps | | | 685,485 | | | | – | | | | 685,485 | | | | – | |
Total Asset Derivatives | | | $903,879 | | | | $218,394 | | | | $685,485 | | | | $– | |
| | | | |
Liability Derivatives | | | | | | | | | | | | | | | | |
Futures Contracts | | | 11,036 | | | | 11,036 | | | | – | | | | – | |
Total Liability Derivatives | | | $11,036 | | | | $11,036 | | | | $– | | | | $– | |
The accompanying Notes to Financial Statements are an integral part of this schedule.
183
Core Bond Fund
Schedule of Investments as of October 31, 2011
The following table is a reconciliation of assets in which significant unobservable inputs (Level 3) were used in determining fair value for Core Bond Fund.
| | | | | | | | | | | | | | | | | | | | | | | | | | | | | | | | |
| Investments in Securities | | Value
October 31,
2010 | | | Realized
Gain/(Loss) | | | Change in
Unrealized
Appreciation/
(Depreciation)* | | | Purchases | | | Sales | | | Transfers
Into Level 3 | | | Transfers Out of Level 3 | | | Value
October 31,
2011 | |
Long-Term Fixed Income | | | | | | | | | | | | | | | | | | | | | | | | | | | | | | | | |
Asset-Backed Securities | | | 2,024,360 | | | | - | | | | 258,150 | | | | - | | | | (476,613) | | | | - | | | | (1,805,897) | | | | - | |
Basic Materials | | | 747,150 | | | | (19,343) | | | | (10,357) | | | | - | | | | (717,450) | | | | - | | | | | | | | - | |
Communications Services | | | - | | | | - | | | | 11,114 | | | | - | | | | - | | | | 860,486 | | | | | | | | 871,600 | |
Financials | | | 3,902,271 | | | | 5,572 | | | | (58,050) | | | | 1,093,455 | | | | (580,008) | | | | - | | | | - | | | | 4,363,240 | |
Transportation | | | 3,710,995 | | | | 257,084 | | | | (395,619) | | | | - | | | | (2,666,460) | | | | - | | | | (906,000) | | | | - | |
Total | | | $10,384,776 | | | | $243,313 | | | | ($194,762) | | | | $1,093,455 | | | | ($4,440,531) | | | | $860,486 | | | | ($2,711,897) | | | | $5,234,840 | |
| * | Includes the change in net unrealized appreciation/(depreciation) on level 3 securities held on October 31, 2011 of $11,419. |
| | | | | | | | | | | | | | | | | | |
| Futures Contracts | | Number of
Contracts
Long/(Short) | | Expiration
Date | | | Notional
Principal
Amount | | | Value | | | Unrealized
Gain/(Loss) | |
2-Yr. U.S. Treasury Bond Futures | | (100) | | | December 2011 | | | | ($22,043,445 | ) | | | ($22,028,125 | ) | | | $15,320 | |
5-Yr. U.S. Treasury Bond Futures | | (45) | | | December 2011 | | | | (5,506,386 | ) | | | (5,517,422 | ) | | | (11,036 | ) |
10-Yr. U.S. Treasury Bond Futures | | (270) | | | December 2011 | | | | (35,035,818 | ) | | | (34,846,875 | ) | | | 188,943 | |
20-Yr. U.S. Treasury Bond Futures | | 80 | | | December 2011 | | | | 11,108,369 | | | | 11,122,500 | | | | 14,131 | |
Total Futures Contracts | | | | | | | | | | | | | | | | | $207,358 | |
| | | | | | | | | | | | | | | | | | | | | | |
| Credit Default Swaps and Counterparty | | Buy/Sell Protection1 | | Termination Date | | | Notional
Principal
Amount2 | | | Upfront
Payments
Received (Made) | | | Value3 | | | Unrealized Gain/(Loss) | |
CDX HY, Series 16, 5 Year, at 5.00%; Bank of America | | Buy | | | 6/20/2016 | | | | $12,000,000 | | | | $212,955 | | | | $370,022 | | | | $582,977 | |
CDX IG, Series 16, 5 Year, at 1.00%; J.P. Morgan Chase and Co. | | Buy | | | 6/20/2016 | | | | 12,000,000 | | | | 20,623 | | | | 81,885 | | | | 102,508 | |
Total Credit Default Swaps | | | | | | | | | | | | | | | | | $451,907 | | | | $685,485 | |
| 1 | As the buyer of protection, Core Bond Fund pays periodic fees in return for payment by the seller which is contingent upon an adverse credit event occurring in the underlying issuer or reference entity. As the seller of protection, Core Bond Fund collects periodic fees from the buyer and profits if the credit of the underlying issuer or reference entity remains stable or improves while the swap is outstanding, but the seller in a credit default swap contract would be required to pay the amount of credit loss, determined as specified in the agreement, to the buyer in the event of an adverse credit event in the reference entity. |
| 2 | The maximum potential amount of future payments Core Bond Fund could be required to make as the seller or receive as the buyer of protection. |
| 3 | The values for credit indexes (CDX or LCDX) serve as an indicator of the current status of the payment/performance risk and represent the liability or profit for the credit default swap contract had the contract been closed as of the reporting date. When protection has been sold, the value of the swap will increase when the swap spread declines representing an improvement in the reference entity’s credit worthiness. The value of the swap will decrease when the swap spread increases representing a deterioration in the reference entity’s credit worthiness. When protection has been purchased, the value of the swap will increase when the swap spread increases representing a deterioration in the reference entity’s credit worthiness. The value of the swap will decrease when the swap spread declines representing an improvement in the reference entity’s credit worthiness. |
The accompanying Notes to Financial Statements are an integral part of this schedule.
184
Core Bond Fund
Schedule of Investments as of October 31, 2011
The following table summarizes the fair value and Statement of Assets and Liabilities location, as of October 31, 2011, for Core Bond Fund’s investments in financial derivative instruments by primary risk exposure as discussed under item (2) Significant Accounting Policies of the Notes to Financial Statements.
| | | | | | |
| Derivatives by risk category | | Statement of Assets and Liabilities Location | | Fair Value | |
| | |
Asset Derivatives | | | | | | |
| | |
Interest Rate Contracts | | | | | | |
Futures* | | Net Assets - Net unrealized appreciation/(depreciation) on Futures contracts | | | $218,394 | |
Total Interest Rate Contracts | | | | | 218,394 | |
| | |
Credit Contracts | | | | | | |
Credit Default Swaps | | Receivable/Payable - Swap agreements, at value; Net Assets - Net unrealized appreciation/(depreciation) on Swap agreements | | | 685,485 | |
Total Credit Contracts | | | | | 685,485 | |
Total Asset Derivatives | | | | | $903,879 | |
| | |
Liability Derivatives | | | | | | |
| | |
Interest Rate Contracts | | | | | | |
Futures* | | Net Assets - Net unrealized appreciation/(depreciation) on Futures contracts | | | 11,036 | |
Total Interest Rate Contracts | | | | | 11,036 | |
Total Liability Derivatives | | | | | $11,036 | |
| | * | Includes cumulative appreciation/depreciation of futures contracts as reported in the Schedule of Investments. Only current day’s variation margin is reported within the Statement of Assets and Liabilities. |
The following table summarizes the net realized gains/(losses) and Statement of Operations location, for the period ended October 31, 2011, for Core Bond Fund’s investments in financial derivative instruments by primary risk exposure.
| | | | | | |
| Derivatives by risk category | | Statement of Operations location | | Realized Gains/(Losses) recognized in Income | |
| | |
Interest Rate Contracts | | | | | | |
Options Purchased | | Net realized gains/(losses) on Investments | | | (483,524 | ) |
Futures | | Net realized gains/(losses) on Futures contracts | | | (2,261,140 | ) |
| | |
Total Interest Rate Contracts | | | | | (2,744,664 | ) |
| | |
Credit Contracts | | | | | | |
Credit Default Swaps | | Net realized gains/(losses) on Swap agreements | | | (869,455 | ) |
| | |
Total Credit Contracts | | | | | (869,455 | ) |
Total | | | | | ($3,614,119 | ) |
The following table summarizes the change in net unrealized appreciation/(depreciation) and Statement of Operations location, for the period ended October 31, 2011, for Core Bond Fund’s investments in financial derivative instruments by primary risk exposure.
| | | | | | |
| Derivatives by risk category | | Statement of Operations Location | | Change in unrealized
appreciation/ (depreciation)
recognized in Income | |
Interest Rate Contracts | | | | | | |
Options Purchased | | Change in net unrealized appreciation/(depreciation) on Investments | | | 31,598 | |
Futures | | Change in net unrealized appreciation/(depreciation) on Futures contracts | | | 937,696 | |
Total Interest Rate Contracts | | | | | 969,294 | |
Credit Contracts | | | | | | |
Credit Default Swaps | | Change in net unrealized appreciation/(depreciation) on Swap agreements | | | 921,668 | |
Total Credit Contracts | | | | | 921,668 | |
Total | | | | | $1,890,962 | |
The accompanying Notes to Financial Statements are an integral part of this schedule.
185
Core Bond Fund
Schedule of Investments as of October 31, 2011
The following table presents Core Bond Fund’s average volume of derivative activity during the period ended October 31, 2011.
| | | | | | | | | | | | | | | | | | | | |
Derivative Risk Category | | Futures
(Notional*) | | | Futures
(Percentage
of Average
Net Assets) | | | Swaps
(Notional*) | | | Swaps
(Percentage
of Average
Net Assets) | | | Options
(Contracts) | |
Interest Rate Contracts | | | $70,850,573 | | | | 24.3% | | | | N/A | | | | N/A | | | | 112 | |
Credit Contracts | | | N/A | | | | N/A | | | | $26,450,839 | | | | 9.1% | | | | N/A | |
| * | Notional amount represents long or short, or both, derivative positions held by the Fund. |
Investment in Affiliates
Affiliated issuers, as defined under the Investment Company Act of 1940, include those in which the Fund’s holdings of an issuer represent 5% or more of the outstanding voting securities of an issuer, or any affiliated mutual fund.
A summary of transactions for the fiscal year to date, in Core Bond Fund, is as follows:
| | | | | | | | | | | | | | | | | | | | | | | | |
| Fund | | Value
October 31, 2010 | | | Gross
Purchases | | | Gross
Sales | | | Shares Held at
October 31, 2011 | | | Value
October 31, 2011 | | | Income Earned
November 1, 2010 -
October 31, 2011 | |
High Yield | | | $12,859,626 | | | | $– | | | | $– | | | | 2,646,014 | | | | $12,489,184 | | | | $995,972 | |
Total Value and | | | | | | | | | | | | | | | | | | | | | | | | |
Income Earned | | | 12,859,626 | | | | | | | | | | | | | | | | 12,489,184 | | | | 995,972 | |
The accompanying Notes to Financial Statements are an integral part of this schedule.
186
Government Bond Fund
Schedule of Investments as of October 31, 2011
| | | | | | |
Principal
Amount | | Long-Term Fixed Income (95.8%) | | Value | |
| Commercial Mortgage-Backed Securities (2.2%) | | | | |
| | Government National Mortgage Association | | | | |
$969,895 | | 2.164%, 3/16/2033 | | | $987,248 | |
880,252 | | 3.214%, 1/16/2040 | | | 921,557 | |
| | Morgan Stanley Capital I | | | | |
350,000 | | 3.224%, 7/15/2049 | | | 359,723 | |
| | | |
| | Total Commercial Mortgage- Backed Securities | | | 2,268,528 | |
| | | |
| |
| Financials (9.7%) | | | | |
| | Achmea Hypotheekbank NV | | | | |
1,000,000 | | 3.200%, 11/3/2014a | | | 1,056,449 | |
| | Bank of Montreal | | | | |
750,000 | | 2.625%, 1/25/2016a | | | 777,963 | |
| | Bank of Nova Scotia | | | | |
500,000 | | 1.450%, 7/26/2013a | | | 504,160 | |
| | Canadian Imperial Bank of Commerce | | | | |
1,000,000 | | 2.600%, 7/2/2015a | | | 1,035,368 | |
| | Cie de Financement Foncier | | | | |
1,000,000 | | 2.250%, 3/7/2014a | | | 995,297 | |
| | Dexia Credit Local SA | | | | |
1,000,000 | | 2.750%, 4/29/2014a | | | 943,800 | |
| | International Bank for Reconstruction & Development | | | | |
1,000,000 | | 2.375%, 5/26/2015 | | | 1,052,117 | |
| | National Bank of Canada | | | | |
500,000 | | 2.200%, 10/19/2016a | | | 505,633 | |
| | NCUA Guaranteed Notes | | | | |
844,854 | | 0.691%, 10/7/2020b | | | 846,174 | |
| | Royal Bank of Canada | | | | |
1,000,000 | | 3.125%, 4/14/2015a | | | 1,049,129 | |
| | Toronto-Dominion Bank | | | | |
1,000,000 | | 2.200%, 7/29/2015a | | | 1,024,439 | |
| | | |
| | Total Financials | | | 9,790,529 | |
| | | |
| |
| Foreign Government (6.3%) | | | | |
| | Bank Nederlandse Gemeenten | | | | |
1,875,000 | | 4.375%, 2/16/2021a | | | 2,087,841 | |
| | Finland Government International Bond | | | | |
500,000 | | 2.250%, 3/17/2016a | | | 521,787 | |
| | Kommunalbanken AS | | | | |
1,000,000 | | 2.750%, 5/5/2015a | | | 1,054,335 | |
| | Kreditanstalt fuer Wiederaufbau | | | | |
825,000 | | 0.253%, 6/17/2013b | | | 824,580 | |
| | Landwirtschaftliche Rentenbank | | | | |
1,000,000 | | 1.875%, 9/17/2018 | | | 981,599 | |
| | Province of British Columbia | | | | |
1,000,000 | | 2.650%, 9/22/2021 | | | 996,750 | |
| | | |
| | Total Foreign Government | | | 6,466,892 | |
| | | |
| |
| Mortgage-Backed Securities (6.2%) | | | | |
| | Federal National Mortgage Association Conventional 15- Yr. Pass Through | | | | |
750,000 | | 3.000%, 11/1/2026c | | | 768,047 | |
1,500,000 | | 3.000%, 12/1/2026c | | | 1,530,938 | |
| | Federal National Mortgage Association Conventional 30- Yr. Pass Through | | | | |
3,000,000 | | 4.500%, 11/1/2041c | | | 3,172,032 | |
| | | | | | |
Principal
Amount | | Long-Term Fixed Income (95.8%) | | Value | |
| Mortgage-Backed Securities (6.2%) - continued | | | | |
$750,000 | | 5.000%, 11/1/2041c | | | $806,719 | |
| | | |
| | Total Mortgage-Backed Securities | | | 6,277,736 | |
| | | |
| |
| U.S. Government and Agencies (71.4%) | | | | |
| | FDIC Structured Sale Guaranteed Notes | | | | |
400,000 | | Zero Coupon, 1/7/2012a | | | 399,696 | |
400,000 | | Zero Coupon, 1/7/2014a | | | 391,744 | |
| | Federal Agricultural Mortgage Corporation | | | | |
1,000,000 | | 2.125%, 9/15/2015 | | | 1,030,775 | |
1,000,000 | | 2.000%, 7/27/2016 | | | 1,019,013 | |
| | Federal Home Loan Banks | | | | |
3,400,000 | | 5.000%, 11/17/2017 | | | 4,060,766 | |
| | Federal Home Loan Mortgage Corporation | | | | |
3,625,000 | | 0.750%, 3/28/2013 | | | 3,646,525 | |
1,800,000 | | 2.500%, 1/7/2014 | | | 1,879,522 | |
2,750,000 | | 4.875%, 6/13/2018 | | | 3,267,676 | |
| | Federal National Mortgage Association | | | | |
2,100,000 | | 1.250%, 2/27/2014 | | | 2,138,365 | |
2,000,000 | | 0.625%, 10/30/2014 | | | 1,996,772 | |
25,000 | | 4.375%, 10/15/2015 | | | 28,254 | |
3,500,000 | | 1.375%, 11/15/2016 | | | 3,500,431 | |
809,788 | | 2.250%, 6/25/2025 | | | 823,487 | |
1,250,000 | | 6.250%, 5/15/2029 | | | 1,703,675 | |
| | Tennessee Valley Authority | | | | |
1,225,000 | | 5.250%, 9/15/2039 | | | 1,501,819 | |
| | U.S. Treasury Bonds | | | | |
850,000 | | 6.500%, 11/15/2026 | | | 1,245,250 | |
2,150,000 | | 4.375%, 5/15/2041 | | | 2,639,125 | |
| | U.S. Treasury Bonds, TIPS | | | | |
340,616 | | 2.125%, 2/15/2040 | | | 447,219 | |
| | U.S. Treasury Notes | | | | |
550,000 | | 2.000%, 1/31/2016 | | | 578,187 | |
2,800,000 | | 2.625%, 2/29/2016 | | | 3,017,000 | |
3,500,000 | | 3.250%, 3/31/2017 | | | 3,887,188 | |
1,500,000 | | 2.250%, 11/30/2017 | | | 1,578,750 | |
2,300,000 | | 2.750%, 2/28/2018 | | | 2,488,312 | |
4,000,000 | | 2.375%, 6/30/2018 | | | 4,217,500 | |
2,750,000 | | 1.500%, 8/31/2018 | | | 2,737,540 | |
7,300,000 | | 3.125%, 5/15/2021 | | | 7,935,903 | |
2,125,000 | | 7.625%, 2/15/2025 | | | 3,338,243 | |
| | U.S. Treasury Notes, TIPS | | | | |
1,211,943 | | 3.375%, 1/15/2012 | | | 1,219,707 | |
1,655,046 | | 2.000%, 1/15/2014 | | | 1,772,321 | |
711,798 | | 1.625%, 1/15/2015 | | | 774,692 | |
1,959,900 | | 0.500%, 4/15/2015 | | | 2,065,245 | |
1,289,932 | | 2.500%, 7/15/2016 | | | 1,500,857 | |
1,530,158 | | 2.625%, 7/15/2017 | | | 1,822,443 | |
1,553,295 | | 1.125%, 1/15/2021 | | | 1,708,017 | |
330,479 | | 2.375%, 1/15/2025 | | | 414,260 | |
| | | |
| | Total U.S. Government and Agencies | | | 72,776,279 | |
| | | |
| |
| | | |
| | Total Long-Term Fixed Income (cost $92,309,345) | | | 97,579,964 | |
| | | |
The accompanying Notes to Financial Statements are an integral part of this schedule.
187
Government Bond Fund
Schedule of Investments as of October 31, 2011
| | | | | | |
Principal
Amount | | Short-Term Investments (9.3%)d | | Value | |
| | Federal Home Loan Bank Discount Notes | | | | |
$3,000,000 | | 0.010%, 11/4/2011e | | | $2,999,997 | |
6,500,000 | | 0.020%, 11/16/2011e | | | 6,499,946 | |
| | | |
| | Total Short-Term Investments (at amortized cost) | | | 9,499,943 | |
| | | |
| | Total Investments (cost $101,809,288) 105.1% | | | $107,079,907 | |
| | | |
| | Other Assets and Liabilities, Net (5.1%) | | | (5,204,689 | ) |
| | | |
| | Total Net Assets 100.0% | | | $101,875,218 | |
| | | |
| a | Denotes securities sold under Rule 144A of the Securities Act of 1933, which exempts them from registration. These securities have been deemed liquid and may be resold to other dealers in the program or to other qualified institutional buyers. As of October 31, 2011, the value of these investments was $12,347,641 or 12.1% of total net assets. |
| b | Denotes variable rate securities. Variable rate securities are securities whose yields vary with a designated market index or market rate. The rate shown is as of October 31, 2011. |
| c | Denotes investments purchased on a when-issued or delayed delivery basis. |
| d | The interest rate shown reflects the yield, coupon rate or the discount rate at the date of purchase. |
| e | Denotes investments that benefit from credit enhancement or liquidity support provided by a third party bank, institution or government. |
Definitions:
| | | | | | | | |
| | TIPS | | | - | | | Treasury Inflation Protected Security. |
Unrealized Appreciation (Depreciation)
| | | | |
Gross unrealized appreciation and depreciation of investments, based on cost for federal income tax purposes, were as follows: | |
Gross unrealized appreciation | | | $5,408,744 | |
Gross unrealized depreciation | | | (138,125 | ) |
| | | | |
Net unrealized appreciation (depreciation) | | | $5,270,619 | |
| |
Cost for federal income tax purposes | | | $101,809,288 | |
Fair Valuation Measurements
The following table is a summary of the inputs used, as of October 31, 2011, in valuing Government Bond Fund’s assets carried at fair value.
| | | | | | | | | | | | | | | | |
| Investments in Securities | | Total | | | Level 1 | | | Level 2 | | | Level 3 | |
Long-Term Fixed Income | | | | | | | | | | | | | | | | |
Commercial Mortgage-Backed Securities | | | 2,268,528 | | | | – | | | | 2,268,528 | | | | – | |
Financials | | | 9,790,529 | | | | – | | | | 9,790,529 | | | | – | |
Foreign Government | | | 6,466,892 | | | | – | | | | 6,466,892 | | | | – | |
Mortgage-Backed Securities | | | 6,277,736 | | | | – | | | | 6,277,736 | | | | – | |
U.S. Government and Agencies | | | 72,776,279 | | | | – | | | | 72,776,279 | | | | – | |
Short-Term Investments | | | 9,499,943 | | | | – | | | | 9,499,943 | | | | – | |
Total | | | $107,079,907 | | | | $– | | | | $107,079,907 | | | | $– | |
The accompanying Notes to Financial Statements are an integral part of this schedule.
188
Government Bond Fund
Schedule of Investments as of October 31, 2011
The following table is a reconciliation of assets in which significant unobservable inputs (Level 3) were used in determining fair value for Government Bond Fund.
| | | | | | | | | | | | | | | | | | | | | | | | | | | | | | | | |
| Investments in Securities | | Value
October 31,
2010 | | | Realized Gain/(Loss) | | | Change in
Unrealized
Appreciation/ (Depreciation) | | | Purchases | | | Sales | | | Transfers
Into
Level 3 | | | Transfers
Out of
Level 3 | | | Value
October 31,
2011 | |
Long-Term Fixed Income Financials | | | 1,000,000 | | | | - | | | | 1,321 | | | | - | | | | (155,146 | ) | | | - | | | | (846,175 | ) | | | - | |
Total | | | $1,000,000 | | | | $- | | | | $1,321 | | | | $- | | | | ($155,146 | ) | | | $- | | | | ($846,175 | ) | | | $- | |
| | | | | | | | |
Other Financial Instruments | | | | | | | | | | | | | | | | | | | | | | | | | | | | | | | | |
Liability Derivatives Call Options Written | | | 3,094 | | | | - | | | | (3,094 | ) | | | - | | | | - | | | | - | | | | - | | | | - | |
Total | | | $3,094 | | | | $- | | | | ($3,094 | ) | | | $- | | | | $- | | | | $- | | | | $- | | | | $- | |
The following table summarizes the net realized gains/(losses) and Statement of Operations location, for the period ended October 31, 2011, for Government Bond Fund’s investments in financial derivative instruments by primary risk exposure.
| | | | | | |
| Derivatives by risk category | | Statement of Operations location | | Realized Gains/(Losses)
recognized in Income | |
Interest Rate Contracts | | | | | | |
Options Written | | Net realized gains/(losses) on Written option contracts | | | 4,062 | |
Options Purchased | | Net realized gains/(losses) on Investments | | | (76,074 | ) |
Total Interest Rate Contracts | | | | | (72,012 | ) |
Total | | | | | ($72,012 | ) |
The following table summarizes the change in net unrealized appreciation/(depreciation) and Statement of Operations location, for the period ended October 31, 2011, for Government Bond Fund’s investments in financial derivative instruments by primary risk exposure.
| | | | | | |
| Derivatives by risk category | | Statement of Operations Location | | Change in unrealized
appreciation/(depreciation)
recognized in Income | |
Interest Rate Contracts | | | | | | |
Options Written | | Change in net unrealized appreciation/(depreciation) on Written option contracts | | | 3,094 | |
Total Interest Rate Contracts | | | | | 3,094 | |
Total | | | | | $3,094 | |
The following table presents Government Bond Fund’s average volume of derivative activity during the period ended October 31, 2011.
| | | | |
Derivative Risk
Category | | Options
(Contracts) | |
Interest Rate Contracts | | | 20 | |
The accompanying Notes to Financial Statements are an integral part of this schedule.
189
Limited Maturity Bond Fund
Schedule of Investments as of October 31, 2011
| | | | | | |
Principal
Amount | | Long-Term Fixed Income (98.2%) | | Value | |
| Asset-Backed Securities (13.8%) | | | | |
| | Avis Budget Rental Car Funding | | | | |
$3,500,000 | | 2.370%, 11/20/2014a | | | $3,524,227 | |
| | Bank of America Auto Trust | | | | |
2,019,674 | | 1.390%, 3/15/2014a | | | 2,026,625 | |
| | Carrington Mortgage Loan Trust | | | | |
1,000,000 | | 0.395%, 8/25/2036b | | | 324,548 | |
| | Chrysler Financial Auto Securitization | | | | |
1,463,054 | | 2.820%, 1/15/2016 | | | 1,475,449 | |
| | CIT Equipment | | | | |
207,614 | | 3.070%, 8/15/2016a | | | 207,945 | |
| | Citibank Omni Master Trust | | | | |
4,000,000 | | 4.900%, 11/15/2018a | | | 4,394,672 | |
| | CNH Equipment Trust | | | | |
1,578,818 | | 7.210%, 12/16/2013 | | | 1,620,007 | |
| | Countrywide Asset-Backed Certificates | | | | |
309,621 | | 5.549%, 8/25/2021c | | | 270,709 | |
| | Countrywide Home Loans, Inc. | | | | |
1,264,621 | | 6.085%, 6/25/2021c | | | 841,949 | |
| | Credit Based Asset Servicing and Securitization, LLC | | | | |
818,034 | | 5.501%, 12/25/2036 | | | 544,109 | |
| | Discover Card Master Trust | | | | |
4,500,000 | | 0.893%, 9/15/2015b | | | 4,533,444 | |
| | Enterprise Fleet Financing, LLC | | | | |
4,500,000 | | 1.430%, 10/20/2016a | | | 4,500,783 | |
| | First Franklin Mortgage Loan Asset-Backed Certificates | | | | |
86,028 | | 5.500%, 3/25/2036d,e | | | 1 | |
| | First Horizon ABS Trust | | | | |
454,329 | | 0.375%, 9/25/2029b,c | | | 329,585 | |
| | First National Master Note Trust | | | | |
5,500,000 | | 1.593%, 7/15/2015b | | | 5,529,194 | |
| | Ford Credit Auto Owner Trust | | | | |
554,001 | | 3.960%, 5/15/2013 | | | 556,526 | |
| | Ford Credit Floor Plan Master Owner Trust | | | | |
5,000,000 | | 1.500%, 9/15/2015 | | | 5,018,260 | |
| | Fosse Master Issuer plc | | | | |
3,500,000 | | 1.805%, 10/18/2054a,b | | | 3,495,562 | |
| | GE Capital Credit Card Master Note Trust | | | | |
3,650,000 | | 3.690%, 7/15/2015 | | | 3,727,059 | |
| | GMAC Mortgage Corporation Loan Trust | | | | |
753,558 | | 0.425%, 8/25/2035b,c | | | 467,992 | |
1,039,053 | | 5.750%, 10/25/2036c | | | 679,699 | |
1,533,574 | | 0.425%, 12/25/2036b,c | | | 942,789 | |
| | GSAMP Trust | | | | |
1,832,344 | | 0.425%, 2/25/2036b | | | 1,436,514 | |
1,774,455 | | 0.325%, 8/25/2036b | | | 1,600,463 | |
| | Harley-Davidson Motorcycle Trust | | | | |
330,035 | | 3.190%, 11/15/2013 | | | 331,319 | |
| | Hyundai Auto Lease Securitization Trust | | | | |
5,000,000 | | 1.020%, 8/15/2014a | | | 4,998,625 | |
| | J.P. Morgan Mortgage Trust | | | | |
794,928 | | 2.806%, 2/25/2036 | | | 661,901 | |
| | John Deere Owner Trust | | | | |
1,500,000 | | 3.960%, 5/16/2016 | | | 1,525,755 | |
| | Mortgage Equity Conversion Asset Trust | | | | |
2,572,844 | | 0.610%, 1/25/2042b,d | | | 2,315,560 | |
| | | | | | |
Principal
Amount | | Long-Term Fixed Income (98.2%) | | Value | |
| Asset-Backed Securities (13.8%) - continued | | | | |
$2,542,198 | | 0.590%, 2/25/2042b,d | | | $2,287,978 | |
| | Nissan Auto Receivables Owner Trust | | | | |
1,277,586 | | 4.280%, 6/16/2014 | | | 1,285,453 | |
3,000,000 | | 4.740%, 8/17/2015 | | | 3,092,445 | |
| | Permanent Master plc | | | | |
5,000,000 | | 1.872%, 7/15/2042a,b | | | 5,001,000 | |
| | Renaissance Home Equity Loan Trust | | | | |
1,644,755 | | 5.608%, 5/25/2036 | | | 1,074,673 | |
750,000 | | 5.285%, 1/25/2037 | | | 310,347 | |
| | Santander Drive Auto Receivables Trust | | | | |
2,173,983 | | 0.950%, 8/15/2013 | | | 2,174,524 | |
| | SLM Student Loan Trust | | | | |
8,000,000 | | 0.488%, 4/27/2020b | | | 7,937,792 | |
7,720,135 | | 0.488%, 4/25/2022b | | | 7,653,109 | |
4,399,192 | | 0.498%, 4/25/2023b | | | 4,383,271 | |
2,652,962 | | 0.645%, 3/25/2025b | | | 2,627,565 | |
6,611,186 | | 0.765%, 3/25/2026b | | | 6,620,025 | |
| | Toyota Auto Receivables Owner Trust | | | | |
5,689,446 | | 1.270%, 12/16/2013 | | | 5,709,553 | |
| | USAA Auto Owner Trust | | | | |
2,500,000 | | 4.770%, 9/15/2014 | | | 2,568,252 | |
| | Volkswagen Auto Loan Enhanced Trust | | | | |
1,014,472 | | 1.310%, 1/20/2014 | | | 1,017,474 | |
| | Wachovia Asset Securitization, Inc. | | | | |
950,095 | | 0.385%, 7/25/2037b,c,d | | | 677,211 | |
| | Wachovia Student Loan Trust | | | | |
5,509,814 | | 0.528%, 7/27/2020b | | | 5,471,984 | |
| | World Financial Network Credit Card | | | | |
7,000,000 | | 4.600%, 9/15/2015 | | | 7,009,541 | |
| | World Omni Auto Receivables Trust | | | | |
1,791,428 | | 1.340%, 12/16/2013 | | | 1,795,711 | |
1,000,000 | | 5.120%, 5/15/2014 | | | 1,032,943 | |
| | | |
| | Total Asset-Backed Securities | | | 127,612,122 | |
| | | |
| |
| Basic Materials (0.8%) | | | | |
| | ArcelorMittal | | | | |
1,500,000 | | 9.000%, 2/15/2015 | | | 1,755,692 | |
1,750,000 | | 3.750%, 8/5/2015 | | | 1,700,899 | |
| | Dow Chemical Company | | | | |
1,500,000 | | 4.850%, 8/15/2012 | | | 1,544,914 | |
1,500,000 | | 2.500%, 2/15/2016 | | | 1,505,436 | |
| | Noble Group, Ltd. | | | | |
1,000,000 | | 4.875%, 8/5/2015a | | | 982,500 | |
| | | |
| | Total Basic Materials | | | 7,489,441 | |
| | | |
| |
| Capital Goods (1.4%) | | | | |
| | Caterpillar Financial Services Corporation | | | | |
3,000,000 | | 2.050%, 8/1/2016 | | | 3,035,292 | |
| | Caterpillar, Inc. | | | | |
2,500,000 | | 1.375%, 5/27/2014 | | | 2,529,612 | |
| | CRH America, Inc. | | | | |
1,500,000 | | 4.125%, 1/15/2016 | | | 1,500,785 | |
| | Danaher Corporation | | | | |
1,000,000 | | 0.603%, 6/21/2013b | | | 1,001,049 | |
The accompanying Notes to Financial Statements are an integral part of this schedule.
190
Limited Maturity Bond Fund
Schedule of Investments as of October 31, 2011
| | | | | | |
Principal
Amount | | Long-Term Fixed Income (98.2%) | | Value | |
| Capital Goods (1.4%) - continued | | | | |
| | Eaton Corporation | | | | |
$2,000,000 | | 0.679%, 6/16/2014b | | | $2,002,668 | |
| | Hutchinson Whampoa Finance, Ltd. | | | | |
1,700,000 | | 4.625%, 9/11/2015a | | | 1,802,362 | |
| | Textron, Inc. | | | | |
1,300,000 | | 6.200%, 3/15/2015 | | | 1,397,231 | |
| | | |
| | Total Capital Goods | | | 13,268,999 | |
| | | |
| |
| Collateralized Mortgage Obligations (2.0%) | | | | |
| | American Home Mortgage Assets Trust | | | | |
1,577,281 | | 1.150%, 11/25/2046b | | | 649,346 | |
| | Banc of America Mortgage Securities, Inc. | | | | |
629,896 | | 2.764%, 9/25/2035b | | | 503,846 | |
| | Bear Stearns Adjustable Rate Mortgage Trust | | | | |
902,281 | | 2.560%, 10/25/2035b | | | 735,330 | |
| | Chase Mortgage Finance Corporation | | | | |
287,884 | | 5.257%, 1/25/2036b | | | 24,667 | |
| | Countrywide Alternative Loan Trust | | | | |
1,068,204 | | 5.500%, 11/25/2035 | | | 1,009,763 | |
610,484 | | 5.500%, 2/25/2036 | | | 426,728 | |
842,881 | | 6.000%, 1/25/2037 | | | 566,717 | |
| | Countrywide Home Loans, Inc. | | | | |
1,182,375 | | 2.682%, 3/20/2036 | | | 520,459 | |
1,198,592 | | 2.776%, 9/20/2036 | | | 617,934 | |
| | Deutsche Alt-A Securities, Inc. | | | | |
1,864,548 | | 1.000%, 4/25/2047b | | | 1,110,204 | |
| | GSR Mortgage Loan Trust | | | | |
2,094,090 | | 0.435%, 8/25/2046b | | | 1,733,241 | |
| | HomeBanc Mortgage Trust | | | | |
995,657 | | 2.171%, 4/25/2037 | | | 543,827 | |
| | Impac CMB Trust | | | | |
326,403 | | 0.885%, 8/25/2035b | | | 224,553 | |
| | J.P. Morgan Alternative Loan Trust | | | | |
1,865,640 | | 2.669%, 3/25/2036 | | | 1,001,110 | |
| | J.P. Morgan Mortgage Trust | | | | |
185,262 | | 5.543%, 6/25/2036 | | | 182,021 | |
735,861 | | 2.774%, 10/25/2036 | | | 551,986 | |
| | Merrill Lynch Mortgage Investors, Inc. | | | | |
1,466,935 | | 2.628%, 6/25/2035 | | | 1,205,150 | |
| | Residential Accredit Loans, Inc. | | | | |
913,590 | | 3.605%, 9/25/2035 | | | 549,978 | |
| | Thornburg Mortgage Securities Trust | | | | |
476,523 | | 0.355%, 11/25/2046b | | | 475,460 | |
| | Wachovia Mortgage Loan Trust, LLC | | | | |
857,052 | | 2.902%, 5/20/2036 | | | 561,907 | |
| | WaMu Mortgage Pass Through Certificates | | | | |
1,608,777 | | 1.110%, 10/25/2046b | | | 842,745 | |
1,969,960 | | 1.050%, 12/25/2046b | | | 1,088,786 | |
1,860,986 | | 0.970%, 1/25/2047b | | | 953,376 | |
| | Washington Mutual Alternative Mortgage Pass-Through Certificates | | | | |
1,540,695 | | 1.150%, 9/25/2046b | | | 563,787 | |
| | | | | | |
Principal
Amount | | Long-Term Fixed Income (98.2%) | | Value | |
| Collateralized Mortgage Obligations (2.0%) - continued | | | | |
$2,266,884 | | 0.980%, 2/25/2047b | | | $980,881 | |
| | Washington Mutual Mortgage Pass-Through Certificates | | | | |
633,465 | | 0.535%, 10/25/2045b | | | 476,789 | |
| | Wells Fargo Mortgage Backed Securities Trust | | | | |
341,163 | | 2.718%, 3/25/2036 | | | 276,111 | |
1,250,197 | | 2.764%, 3/25/2036 | | | 992,537 | |
| | | |
| | Total Collateralized Mortgage Obligations | | | 19,369,239 | |
| | | |
| |
| Commercial Mortgage-Backed Securities (8.9%) | | | | |
| | Banc of America Commercial Mortgage, Inc. | | | | |
2,000,000 | | 5.655%, 4/10/2049 | | | 1,735,094 | |
| | Bank Nederlandse Gemeenten NV | | | | |
3,500,000 | | 1.500%, 3/28/2014a | | | 3,546,931 | |
| | Bear Stearns Commercial Mortgage Securities, Inc. | | | | |
4,101,213 | | 5.613%, 6/11/2050 | | | 4,256,329 | |
1,047,032 | | 0.393%, 3/15/2022b,d | | | 1,027,357 | |
1,191,842 | | 5.663%, 6/11/2040 | | | 1,234,604 | |
439,496 | | 5.205%, 2/11/2044 | | | 441,066 | |
1,000,000 | | 5.331%, 2/11/2044 | | | 1,040,843 | |
| | Citigroup/Deutsche Bank Commercial Mortgage | | | | |
1,595,000 | | 5.322%, 12/11/2049 | | | 1,670,118 | |
| | Commercial Mortgage Pass- Through Certificates | | | | |
1,000,000 | | 0.373%, 12/15/2020b,d | | | 912,110 | |
1,500,000 | | 0.423%, 6/15/2022b,d | | | 1,375,531 | |
1,000,000 | | 5.306%, 12/10/2046 | | | 1,072,647 | |
| | Credit Suisse AG Guernsey | | | | |
1,000,000 | | 2.600%, 5/27/2016a | | | 1,016,844 | |
| | Credit Suisse First Boston Mortgage Securities Corporation | | | | |
4,129,710 | | 4.691%, 4/15/2037 | | | 4,262,349 | |
| | Credit Suisse Mortgage Capital Certificates | | | | |
679,197 | | 0.413%, 10/15/2021a,b | | | 628,022 | |
1,750,000 | | 5.467%, 9/15/2039 | | | 1,850,656 | |
| | Government National Mortgage Association | | | | |
2,937,207 | | 2.870%, 3/16/2051 | | | 3,048,231 | |
4,843,863 | | 1.864%, 8/16/2031 | | | 4,888,717 | |
6,643,778 | | 2.164%, 3/16/2033 | | | 6,762,649 | |
5,721,638 | | 3.214%, 1/16/2040 | | | 5,990,120 | |
| | Greenwich Capital Commercial Funding Corporation | | | | |
2,697,000 | | 5.074%, 1/5/2036 | | | 2,705,191 | |
4,500,000 | | 5.224%, 4/10/2037 | | | 4,807,346 | |
| | J.P. Morgan Chase Commercial Mortgage Securities Corporation | | | | |
3,500,000 | | 5.429%, 12/12/2043 | | | 3,781,585 | |
| | LB-UBS Commercial Mortgage Trust | | | | |
4,141,952 | | 5.303%, 2/15/2040 | | | 4,170,673 | |
1,600,000 | | 6.167%, 9/15/2045 | | | 1,364,352 | |
| | Morgan Stanley Capital I | | | | |
2,000,000 | | 3.224%, 7/15/2049 | | | 2,055,560 | |
The accompanying Notes to Financial Statements are an integral part of this schedule.
191
Limited Maturity Bond Fund
Schedule of Investments as of October 31, 2011
| | | | | | |
Principal
Amount | | Long-Term Fixed Income (98.2%) | | Value | |
| Commercial Mortgage-Backed Securities (8.9%) - continued | | | | |
| | Morgan Stanley Capital, Inc. | | | | |
$1,600,000 | | 5.406%, 3/15/2044 | | | $1,447,314 | |
3,122,034 | | 5.591%, 4/12/2049 | | | 3,206,750 | |
| | NCUA Guaranteed Notes | | | | |
4,577,397 | | 1.600%, 10/29/2020 | | | 4,623,139 | |
| | Network Rail Infrastructure Finance plc | | | | |
6,000,000 | | 1.500%, 1/13/2014a | | | 6,100,056 | |
| | Wachovia Bank Commercial Mortgage Trust | | | | |
1,500,000 | | 5.765%, 7/15/2045 | | | 1,652,742 | |
| | WaMu Commercial Mortgage Securities Trust | | | | |
117,481 | | 3.830%, 1/25/2035a | | | 117,823 | |
| | | |
| | Total Commercial Mortgage-Backed Securities | | | 82,792,749 | |
| | | |
| |
| Communications Services (2.2%) | | | | |
| | Alltel Corporation | | | | |
1,325,000 | | 7.000%, 7/1/2012 | | | 1,379,383 | |
| | CBS Corporation | | | | |
1,500,000 | | 8.875%, 5/15/2019 | | | 1,938,143 | |
| | Crown Castle Towers, LLC | | | | |
1,750,000 | | 4.523%, 1/15/2015a | | | 1,827,948 | |
1,500,000 | | 3.214%, 8/15/2015a | | | 1,516,317 | |
850,000 | | 4.174%, 8/15/2017a | | | 866,035 | |
| | GTP Acquisition Partners I, LLC | | | | |
1,500,000 | | 4.347%, 6/15/2016a | | | 1,506,651 | |
| | Qwest Communications International, Inc. | | | | |
1,000,000 | | 7.125%, 4/1/2018 | | | 1,022,500 | |
| | SBA Tower Trust | | | | |
3,500,000 | | 4.254%, 4/15/2015a | | | 3,692,175 | |
| | Telecom Italia Capital SA | | | | |
3,000,000 | | 4.950%, 9/30/2014 | | | 2,954,715 | |
| | Telemar Norte Leste SA | | | | |
500,000 | | 5.500%, 10/23/2020a | | | 503,750 | |
| | Time Warner Cable, Inc. | | | | |
1,100,000 | | 5.400%, 7/2/2012 | | | 1,132,363 | |
1,650,000 | | 7.500%, 4/1/2014 | | | 1,873,128 | |
| | | |
| | Total Communications Services | | | 20,213,108 | |
| | | |
| |
| Consumer Cyclical (1.5%) | | | | |
| | American Honda Finance Corporation | | | | |
3,000,000 | | 1.850%, 9/19/2014a | | | 3,035,637 | |
| | Daimler Finance North America, LLC | | | | |
3,000,000 | | 0.973%, 3/28/2014a,b | | | 2,954,268 | |
| | Ford Motor Credit Company, LLC | | | | |
1,500,000 | | 7.000%, 4/15/2015 | | | 1,635,000 | |
| | Harley-Davidson Financial Services, Inc. | | | | |
1,000,000 | | 3.875%, 3/15/2016a | | | 1,026,043 | |
| | KIA Motors Corporation | | | | |
1,000,000 | | 3.625%, 6/14/2016a | | | 973,621 | |
| | RCI Banque SA | | | | |
1,000,000 | | 4.600%, 4/12/2016a | | | 971,317 | |
| | | | | | |
Principal
Amount | | Long-Term Fixed Income (98.2%) | | Value | |
| Consumer Cyclical (1.5%) - continued | | | | |
| | Volkswagen International Finance NV | | | | |
$3,000,000 | | 1.875%, 4/1/2014a,f | | | $3,022,473 | |
| | | |
| | Total Consumer Cyclical | | | 13,618,359 | |
| | | |
| |
| Consumer Non-Cyclical (2.2%) | | | | |
| | Altria Group, Inc. | | | | |
2,000,000 | | 4.125%, 9/11/2015 | | | 2,175,536 | |
| | Anheuser-Busch InBev Worldwide, Inc. | | | | |
2,500,000 | | 0.972%, 1/27/2014b | | | 2,502,032 | |
| | Bunge Limited Finance Corporation | | | | |
1,000,000 | | 4.100%, 3/15/2016 | | | 1,029,789 | |
| | Cargill, Inc. | | | | |
1,073,000 | | 4.307%, 5/14/2021a | | | 1,158,454 | |
| | Celgene Corporation | | | | |
1,500,000 | | 2.450%, 10/15/2015 | | | 1,514,671 | |
| | Coca-Cola Enterprises, Inc. | | | | |
2,000,000 | | 2.000%, 8/19/2016 | | | 2,003,620 | |
| | Express Scripts, Inc. | | | | |
1,500,000 | | 3.125%, 5/15/2016 | | | 1,534,107 | |
| | General Mills, Inc. | | | | |
2,000,000 | | 0.640%, 5/16/2014b,f | | | 1,991,942 | |
| | Kraft Foods, Inc. | | | | |
1,500,000 | | 4.125%, 2/9/2016 | | | 1,626,500 | |
| | Lorillard Tobacco Company | | | | |
1,000,000 | | 3.500%, 8/4/2016 | | | 1,003,881 | |
| | Quest Diagnostics, Inc. | | | | |
2,000,000 | | 1.208%, 3/24/2014b | | | 2,010,518 | |
| | Teva Pharmaceutical Finance III BV | | | | |
2,000,000 | | 0.853%, 3/21/2014b | | | 1,999,676 | |
| | | |
| | Total Consumer Non-Cyclical | | | 20,550,726 | |
| | | |
| |
| Energy (3.5%) | | | | |
| | BP Capital Markets plc | | | | |
4,000,000 | | 0.937%, 3/11/2014b | | | 4,004,140 | |
| | Cameron International Corporation | | | | |
2,000,000 | | 1.257%, 6/2/2014b | | | 2,009,364 | |
| | Cenovus Energy, Inc. | | | | |
1,000,000 | | 4.500%, 9/15/2014 | | | 1,083,061 | |
| | CNPC HK Overseas Capital, Ltd. | | | | |
1,750,000 | | 3.125%, 4/28/2016a,f | | | 1,806,667 | |
| | Energy Transfer Partners, LP | | | | |
1,000,000 | | 6.000%, 7/1/2013 | | | 1,063,950 | |
| | Enterprise Products Operating, LLC | | | | |
2,500,000 | | 3.200%, 2/1/2016 | | | 2,590,435 | |
| | International Petroleum Investment Company, Ltd. | | | | |
1,000,000 | | 3.125%, 11/15/2015a | | | 1,006,250 | |
| | Kinder Morgan Energy Partners, LP | | | | |
750,000 | | 3.500%, 3/1/2016 | | | 784,018 | |
| | Occidental Petroleum Corporation | | | | |
2,000,000 | | 1.450%, 12/13/2013 | | | 2,037,216 | |
| | ONEOK Partners, LP | | | | |
2,750,000 | | 3.250%, 2/1/2016 | | | 2,814,641 | |
| | Petrobras International Finance Company | | | | |
2,000,000 | | 3.875%, 1/27/2016 | | | 2,046,602 | |
The accompanying Notes to Financial Statements are an integral part of this schedule.
192
Limited Maturity Bond Fund
Schedule of Investments as of October 31, 2011
| | | | | | |
Principal
Amount | | Long-Term Fixed Income (98.2%) | | Value | |
| Energy (3.5%) - continued | | | | |
| | Rowan Companies, Inc. | | | | |
$1,500,000 | | 5.000%, 9/1/2017 | | | $1,548,846 | |
| | Schlumberger SA | | | | |
2,500,000 | | 2.650%, 1/15/2016a | | | 2,589,665 | |
| | Statoil ASA | | | | |
1,786,000 | | 5.125%, 4/30/2014a | | | 1,970,717 | |
| | Transocean, Inc., Convertible | | | | |
2,500,000 | | 1.500%, 12/15/2037 | | | 2,493,750 | |
| | Valero Energy Corporation | | | | |
1,000,000 | | 4.500%, 2/1/2015 | | | 1,079,439 | |
350,000 | | 6.125%, 2/1/2020 | | | 401,903 | |
| | Weatherford International, Ltd. | | | | |
1,000,000 | | 6.000%, 3/15/2018 | | | 1,109,897 | |
| | | |
| | Total Energy | | | 32,440,561 | |
| | | |
| |
| Financials (28.8%) | | | | |
| | Abbey National Treasury Services plc | | | | |
1,500,000 | | 3.875%, 11/10/2014a | | | 1,468,952 | |
| | ABN Amro Bank NV | | | | |
3,500,000 | | 2.198%, 1/30/2014a,b | | | 3,433,451 | |
| | Achmea Hypotheekbank NV | | | | |
5,500,000 | | 3.200%, 11/3/2014a | | | 5,810,469 | |
| | Ally Financial, Inc. | | | | |
1,250,000 | | 4.500%, 2/11/2014 | | | 1,221,875 | |
| | American International Group, Inc. | | | | |
1,500,000 | | 5.050%, 10/1/2015 | | | 1,494,677 | |
| | Banco BTG Pactual SA | | | | |
3,000,000 | | 4.875%, 7/8/2016a | | | 2,936,250 | |
| | Bank of America Corporation | | | | |
2,000,000 | | 1.848%, 1/30/2014b | | | 1,895,280 | |
1,000,000 | | 5.625%, 10/14/2016 | | | 996,769 | |
| | Bank of Montreal | | | | |
3,250,000 | | 2.625%, 1/25/2016a,f | | | 3,371,173 | |
| | Bank of Nova Scotia | | | | |
2,000,000 | | 1.250%, 11/7/2014a,g | | | 2,006,058 | |
2,000,000 | | 2.150%, 8/3/2016a | | | 2,021,672 | |
| | Barclays Bank plc | | | | |
1,500,000 | | 2.375%, 1/13/2014 | | | 1,481,236 | |
3,000,000 | | 2.500%, 9/21/2015a | | | 2,991,324 | |
| | Barclays Bank plc, Convertible | | | | |
3,000,000 | | 1.000%, 6/25/2017h | | | 3,207,300 | |
| | Bear Stearns Companies, LLC | | | | |
1,500,000 | | 6.400%, 10/2/2017 | | | 1,731,372 | |
1,250,000 | | 4.650%, 7/2/2018 | | | 1,310,098 | |
| | Berkshire Hathaway Finance Corporation | | | | |
1,750,000 | | 0.523%, 1/13/2012b | | | 1,750,852 | |
2,000,000 | | 2.450%, 12/15/2015 | | | 2,070,690 | |
| | BNP Paribas Home Loan Covered Bonds SA | | | | |
4,500,000 | | 2.200%, 11/2/2015a,f | | | 4,328,843 | |
| | Caisse centrale Desjardins du Quebec | | | | |
2,000,000 | | 2.550%, 3/24/2016a | | | 2,079,866 | |
| | CalEnergy Capital Trust III, Convertible, 6.500% | | | | |
20,000 | | 6.500%, 9/1/2027 | | | 987,500 | |
| | Canadian Imperial Bank of Commerce | | | | |
3,500,000 | | 0.900%, 9/19/2014a,f | | | 3,470,674 | |
1,500,000 | | 2.600%, 7/2/2015a | | | 1,553,052 | |
| | | | | | |
Principal
Amount | | Long-Term Fixed Income (98.2%) | | Value | |
| Financials (28.8%) - continued | | | | |
| | Capital One Financial Corporation | | | | |
$3,000,000 | | 1.553%, 7/15/2014b | | $ | 2,943,963 | |
1,250,000 | | 2.125%, 7/15/2014 | | | 1,248,289 | |
| | CDP Financial, Inc. | | | | |
4,000,000 | | 3.000%, 11/25/2014a | | | 4,164,544 | |
| | Cie de Financement Foncier | | | | |
4,000,000 | | 2.250%, 3/7/2014a | | | 3,981,188 | |
| | Citigroup, Inc. | | | | |
3,000,000 | | 6.000%, 12/13/2013 | | | 3,175,590 | |
2,400,000 | | 1.302%, 4/1/2014b | | | 2,310,912 | |
| | CME Group Index Services, LLC | | | | |
1,500,000 | | 4.400%, 3/15/2018a | | | 1,593,114 | |
| | CNA Financial Corporation | | | | |
2,000,000 | | 6.500%, 8/15/2016 | | | 2,169,358 | |
| | Commonwealth Bank of Australia | | | | |
3,300,000 | | 2.500%, 12/10/2012a | | | 3,365,851 | |
| | Cooperatieve Centrale Raiffeisen-Boerenleenbank BA | | | | |
2,000,000 | | 2.125%, 10/13/2015 | | | 2,016,254 | |
| | Credit Agricole Home Loan SFH | | | | |
4,000,000 | | 1.162%, 7/21/2014a,b | | | 3,839,756 | |
| | Credit Suisse of New York, Convertible | | | | |
1,050,000 | | 0.500%, 6/22/2018i | | | 1,037,925 | |
| | Credit Suisse Securities USA, LLC | | | | |
3,000,000 | | 1.000%, 4/28/2017h | | | 2,898,000 | |
| | Danske Bank AS | | | | |
3,000,000 | | 3.875%, 4/14/2016a | | | 2,953,596 | |
| | Dexia Credit Local SA | | | | |
5,000,000 | | 2.750%, 4/29/2014a | | | 4,719,000 | |
| | DnB NOR Boligkreditt | | | | |
3,500,000 | | 2.900%, 3/29/2016a | | | 3,637,239 | |
| | Fifth Third Bancorp | | | | |
400,000 | | 3.625%, 1/25/2016 | | | 410,164 | |
| | Fifth Third Bank | | | | |
2,250,000 | | 0.402%, 5/17/2013b | | | 2,198,747 | |
| | FUEL Trust | | | | |
1,250,000 | | 4.207%, 4/15/2016a | | | 1,254,861 | |
1,300,000 | | 3.984%, 6/15/2016a | | | 1,285,595 | |
| | GATX Corporation | | | | |
1,000,000 | | 4.750%, 10/1/2012 | | | 1,026,424 | |
1,000,000 | | 4.750%, 5/15/2015 | | | 1,056,181 | |
| | General Electric Capital Corporation | | | | |
3,000,000 | | 0.607%, 9/15/2014b | | | 2,924,760 | |
2,500,000 | | 3.350%, 10/17/2016 | | | 2,569,025 | |
| | Goldman Sachs Group, Inc., Convertible | | | | |
64,950 | | 2.600%, 3/16/2012a,j | | | 741,339 | |
1,278 | | 0.500%, 3/30/2012a,k | | | 860,682 | |
66,550 | | 0.250%, 11/9/2012a,l | | | 1,738,086 | |
| | HCP, Inc. | | | | |
2,000,000 | | 2.700%, 2/1/2014 | | | 1,982,004 | |
| | Health Care REIT, Inc. | | | | |
500,000 | | 6.125%, 4/15/2020 | | | 513,232 | |
| | HSBC Bank plc | | | | |
2,500,000 | | 1.625%, 8/12/2013a | | | 2,488,380 | |
4,000,000 | | 1.625%, 7/7/2014a | | | 4,010,220 | |
| | ING Bank NV | | | | |
5,500,000 | | 2.500%, 1/14/2016a | | | 5,526,119 | |
1,750,000 | | 4.000%, 3/15/2016a | | | 1,791,505 | |
| | International Lease Finance Corporation | | | | |
700,000 | | 8.625%, 9/15/2015 | | | 735,000 | |
The accompanying Notes to Financial Statements are an integral part of this schedule.
193
Limited Maturity Bond Fund
Schedule of Investments as of October 31, 2011
| | | | | | |
Principal
Amount | | Long-Term Fixed Income (98.2%) | | Value | |
| Financials (28.8%) - continued | | | | |
| | Irish Life & Permanent plc | | | | |
$4,000,000 | | 3.600%, 1/14/2013a | | | $3,486,244 | |
| | J.P. Morgan Chase & Company | | | | |
500,000 | | 3.150%, 7/5/2016 | | | 500,849 | |
400,000 | | 4.350%, 8/15/2021 | | | 400,132 | |
| | Jefferies Group, Inc. | | | | |
1,250,000 | | 5.125%, 4/13/2018 | | | 1,128,526 | |
| | JPMorgan Chase & Company | | | | |
3,000,000 | | 1.119%, 9/30/2013b | | | 2,982,486 | |
| | JPMorgan Chase Bank NA | | | | |
1,000,000 | | 5.875%, 6/13/2016 | | | 1,084,324 | |
| | KeyCorp | | | | |
2,000,000 | | 3.750%, 8/13/2015 | | | 2,040,206 | |
| | Landwirtschaftliche Rentenbank | | | | |
5,000,000 | | 0.547%, 3/15/2016a,b | | | 4,988,535 | |
| | Lehman Brothers Holdings E-Capital Trust I | | | | |
1,500,000 | | 1.076%, 8/19/2065b,m | | | 150 | |
| | Lloyds TSB Bank plc | | | | |
3,500,000 | | 4.375%, 1/12/2015a | | | 3,509,629 | |
300,000 | | 6.500%, 9/14/2020a | | | 279,416 | |
| | MetLife, Inc. | | | | |
3,500,000 | | 1.519%, 8/6/2013b | | | 3,519,397 | |
| | Metropolitan Life Global Funding I | | | | |
1,320,000 | | 5.125%, 4/10/2013a | | | 1,387,486 | |
2,250,000 | | 3.650%, 6/14/2018a | | | 2,268,387 | |
| | Morgan Stanley | | | | |
1,000,000 | | 4.750%, 4/1/2014 | | | 1,004,774 | |
2,000,000 | | 4.200%, 11/20/2014 | | | 1,976,504 | |
| | National Australia Bank, Ltd. | | | | |
2,500,000 | | 1.372%, 7/25/2014a,b,f | | | 2,526,540 | |
| | National Bank of Canada | | | | |
2,000,000 | | 1.650%, 1/30/2014a | | | 2,027,542 | |
1,750,000 | | 2.200%, 10/19/2016a | | | 1,769,714 | |
| | Nationwide Building Society | | | | |
2,000,000 | | 4.650%, 2/25/2015a | | | 1,984,154 | |
| | NCUA Guaranteed Notes | | | | |
4,224,273 | | 0.691%, 10/7/2020b | | | 4,230,873 | |
4,015,357 | | 0.591%, 12/7/2020b | | | 4,017,665 | |
| | Nederlandse Waterschapsbank NV | | | | |
3,500,000 | | 1.375%, 5/16/2014a | | | 3,536,568 | |
800,000 | | 1.250%, 10/20/2014a | | | 801,927 | |
| | New York Life Global Funding | | | | |
4,000,000 | | 3.000%, 5/4/2015a | | | 4,153,940 | |
| | Nordea Eiendomskreditt AS | | | | |
4,000,000 | | 1.875%, 4/7/2014a | | | 4,047,640 | |
| | Oesterreichische Kontrollbank AG | | | | |
6,000,000 | | 2.000%, 6/3/2016 | | | 6,155,574 | |
| | ORIX Corporation | | | | |
2,500,000 | | 5.000%, 1/12/2016 | | | 2,572,113 | |
| | Private Export Funding Corporation | | | | |
3,000,000 | | 2.125%, 7/15/2016 | | | 3,093,033 | |
| | ProLogis LP, Convertible | | | | |
1,525,000 | | 2.250%, 4/1/2037 | | | 1,525,000 | |
| | Prudential Financial, Inc. | | | | |
2,000,000 | | 5.100%, 9/20/2014 | | | 2,153,024 | |
1,000,000 | | 6.100%, 6/15/2017 | | | 1,091,521 | |
| | Rabobank Capital Funding Trust II | | | | |
1,012,000 | | 5.260%, 12/29/2049a,n | | | 972,006 | |
| | | | | | |
Principal
Amount | | Long-Term Fixed Income (98.2%) | | Value | |
| Financials (28.8%) - continued | | | | |
| | Reinsurance Group of America, Inc. | | | | |
$1,500,000 | | 6.450%, 11/15/2019 | | | $1,698,039 | |
| | Royal Bank of Canada | | | | |
3,000,000 | | 1.128%, 10/30/2014b | | | 3,009,771 | |
4,175,000 | | 3.125%, 4/14/2015a,f | | | 4,380,114 | |
| | Santander US Debt SA Unipersonal | | | | |
750,000 | | 2.991%, 10/7/2013a | | | 725,792 | |
| | SLM Corporation | | | | |
1,000,000 | | 8.000%, 3/25/2020 | | | 1,040,000 | |
| | SSIF Nevada, LP | | | | |
2,900,000 | | 1.101%, 4/14/2014a,b | | | 2,899,095 | |
| | Stadshypotek AB | | | | |
4,000,000 | | 0.919%, 9/30/2013a,b | | | 3,995,328 | |
| | State Street Capital Trust III | | | | |
1,000,000 | | 5.337%, 3/15/2042b,n | | | 1,001,700 | |
| | Sumitomo Mitsui Banking Corporation | | | | |
3,000,000 | | 1.366%, 7/22/2014a,b,f | | | 3,008,436 | |
| | Svenske Exportkredit AB | | | | |
2,500,000 | | 3.250%, 9/16/2014 | | | 2,655,265 | |
| | Swedbank AB | | | | |
2,500,000 | | 2.800%, 2/10/2012a | | | 2,515,810 | |
| | Swedbank Hypotek AB | | | | |
5,000,000 | | 0.813%, 3/28/2014a,b | | | 5,006,025 | |
| | Toronto-Dominion Bank | | | | |
3,000,000 | | 0.600%, 7/26/2013b | | | 2,998,224 | |
2,500,000 | | 2.200%, 7/29/2015a,f | | | 2,561,097 | |
| | U.S. Bank National Association | | | | |
3,000,000 | | 3.778%, 4/29/2020 | | | 3,105,972 | |
| | U.S. Central Federal Credit Union | | | | |
3,500,000 | | 1.900%, 10/19/2012 | | | 3,557,309 | |
| | UnitedHealth Group, Inc. | | | | |
1,000,000 | | 5.500%, 11/15/2012 | | | 1,046,706 | |
| | Vestjysk Bank AS | | | | |
5,500,000 | | 0.900%, 6/17/2013a,b | | | 5,529,188 | |
| | Wachovia Corporation | | | | |
2,000,000 | | 5.250%, 8/1/2014 | | | 2,133,020 | |
| | WEA Finance, LLC/WT Finance Australia, Pty, Ltd. | | | | |
1,650,000 | | 5.750%, 9/2/2015a | | | 1,779,464 | |
| | Westpac Banking Corporation | | | | |
3,000,000 | | 1.099%, 3/31/2014a,b | | | 3,008,661 | |
| | | |
| | Total Financials | | | 267,657,231 | |
| | | |
| |
| Foreign Government (4.3%) | | | | |
| | Corporacion Andina de Fomento | | | | |
2,500,000 | | 5.750%, 1/12/2017 | | | 2,738,677 | |
| | European Investment Bank | | | | |
6,000,000 | | 1.250%, 2/14/2014f | | | 6,073,560 | |
| | Finland Government International Bond | | | | |
3,000,000 | | 2.250%, 3/17/2016a | | | 3,130,722 | |
| | Hydro Quebec | | | | |
2,000,000 | | 2.000%, 6/30/2016 | | | 2,032,146 | |
| | Kommunalbanken AS | | | | |
5,000,000 | | 2.750%, 5/5/2015a | | | 5,271,675 | |
| | Korea Housing Finance Corporation | | | | |
2,000,000 | | 3.500%, 12/15/2016a | | | 2,027,146 | |
| | Kreditanstalt fuer Wiederaufbau | | | | |
5,500,000 | | 0.253%, 6/17/2013b | | | 5,497,201 | |
The accompanying Notes to Financial Statements are an integral part of this schedule.
194
Limited Maturity Bond Fund
Schedule of Investments as of October 31, 2011
| | | | | | |
Principal
Amount | | Long-Term Fixed Income (98.2%) | | Value | |
| Foreign Government (4.3%) - continued | | | | |
| | Landwirtschaftliche Rentenbank | | | | |
$2,500,000 | | 1.875%, 9/17/2018f | | | $2,453,997 | |
| | Mexico Government International Bond | | | | |
750,000 | | 5.125%, 1/15/2020 | | | 835,500 | |
| | Poland Government International Bond | | | | |
1,250,000 | | 5.125%, 4/21/2021 | | | 1,275,000 | |
| | Province of British Columbia | | | | |
3,500,000 | | 2.100%, 5/18/2016 | | | 3,616,816 | |
| | Province of New Brunswick | | | | |
2,000,000 | | 2.750%, 6/15/2018 | | | 2,061,132 | |
| | Province of Ontario | | | | |
3,000,000 | | 1.600%, 9/21/2016 | | | 2,966,502 | |
| | | |
| | Total Foreign Government | | | 39,980,074 | |
| | | |
| |
| Mortgage-Backed Securities (3.2%) | | | | |
| | Federal Home Loan Mortgage Corporation Gold 30-Yr. Pass Through | | | | |
1,753,747 | | 6.500%, 9/1/2037 | | | 1,950,529 | |
| | Federal National Mortgage Association Conventional 15-Yr. Pass Through | | | | |
2,500,000 | | 3.000%, 11/1/2026g | | | 2,560,157 | |
7,500,000 | | 3.000%, 12/1/2026g | | | 7,654,688 | |
| | Federal National Mortgage Association Conventional 20-Yr. Pass Through | | | | |
1,725,964 | | 6.000%, 8/1/2024 | | | 1,916,982 | |
| | Federal National Mortgage Association Conventional 30-Yr. Pass Through | | | | |
2,178,054 | | 5.850%, 9/1/2037b | | | 2,358,813 | |
986,720 | | 5.618%, 10/1/2037b | | | 1,065,107 | |
11,340,000 | | 6.000%, 11/1/2041g | | | 12,426,157 | |
| | | |
| | Total Mortgage-Backed Securities | | | 29,932,433 | |
| | | |
| |
| Technology (1.0%) | | | | |
| | Affiliated Computer Services, Inc. | | | | |
1,000,000 | | 5.200%, 6/1/2015 | | | 1,074,435 | |
| | Hewlett-Packard Company | | | | |
2,000,000 | | 0.719%, 5/30/2014b | | | 1,967,398 | |
| | Symantec Corporation | | | | |
1,000,000 | | 2.750%, 9/15/2015 | | | 1,010,618 | |
| | Texas Instruments, Inc. | | | | |
2,000,000 | | 0.466%, 5/15/2013b,f | | | 2,003,780 | |
1,400,000 | | 2.375%, 5/16/2016 | | | 1,447,909 | |
| | Xerox Corporation | | | | |
2,000,000 | | 1.110%, 5/16/2014b | | | 1,981,972 | |
| | | |
| | Total Technology | | | 9,486,112 | |
| | | |
| |
| Transportation (0.9%) | | | | |
| | Continental Airlines, Inc. | | | | |
1,350,000 | | 6.750%, 9/15/2015a | | | 1,353,375 | |
| | CSX Corporation | | | | |
1,500,000 | | 6.250%, 4/1/2015 | | | 1,729,181 | |
| | Delta Air Lines, Inc. | | | | |
250,000 | | 6.750%, 5/23/2017 | | | 230,000 | |
1,000,000 | | 6.375%, 7/2/2017 | | | 920,000 | |
| | Erac USA Finance Company | | | | |
2,500,000 | | 2.750%, 7/1/2013a | | | 2,527,497 | |
| | | | | | |
Principal
Amount | | Long-Term Fixed Income (98.2%) | | Value | |
| Transportation (0.9%) - continued | | | | |
| | US Airways Group, Inc. | | | | |
$1,161,267 | | 6.250%, 4/22/2023 | | | $1,045,141 | |
| | | |
| | Total Transportation | | | 7,805,194 | |
| | | |
| |
| U.S. Government and Agencies (22.8%) | | | | |
| | FDIC Structured Sale Guaranteed Notes | | | | |
6,000,000 | | Zero Coupon, 1/7/2013a | | | 5,962,380 | |
| | Federal Agricultural Mortgage Corporation | | | | |
4,000,000 | | 1.250%, 12/6/2013 | | | 4,057,124 | |
2,500,000 | | 2.125%, 9/15/2015 | | | 2,576,938 | |
2,500,000 | | 2.000%, 7/27/2016 | | | 2,547,532 | |
| | Federal Farm Credit Bank | | | | |
5,000,000 | | 1.375%, 6/25/2013 | | | 5,086,890 | |
10,000,000 | | 0.301%, 9/23/2013b | | | 10,001,470 | |
| | Federal Home Loan Banks | | | | |
6,000,000 | | 0.155%, 2/10/2012b | | | 6,000,960 | |
5,000,000 | | 0.310%, 9/16/2013b | | | 4,994,475 | |
| | Federal Home Loan Mortgage Corporation | | | | |
7,000,000 | | 0.193%, 6/17/2013b | | | 7,000,350 | |
5,500,000 | | 0.375%, 10/30/2013 | | | 5,492,927 | |
| | Federal National Mortgage Association | | | | |
3,500,000 | | 5.125%, 1/2/2014 | | | 3,808,077 | |
7,500,000 | | 0.625%, 10/30/2014 | | | 7,487,895 | |
5,000,000 | | 1.375%, 11/15/2016 | | | 5,000,615 | |
7,423,055 | | 2.250%, 6/25/2025 | | | 7,548,631 | |
| | U.S. Treasury Bonds | | | | |
4,325,000 | | 4.375%, 5/15/2041 | | | 5,308,938 | |
| | U.S. Treasury Notes | | | | |
4,500,000 | | 0.625%, 12/31/2012 | | | 4,522,851 | |
9,500,000 | | 1.500%, 12/31/2013 | | | 9,745,660 | |
17,200,000 | | 2.250%, 5/31/2014 | | | 18,033,134 | |
30,925,000 | | 0.750%, 6/15/2014 | | | 31,236,662 | |
6,650,000 | | 2.375%, 9/30/2014 | | | 7,027,700 | |
28,100,000 | | 2.000%, 1/31/2016 | | | 29,540,125 | |
3,000,000 | | 1.500%, 6/30/2016 | | | 3,080,640 | |
400,000 | | 2.375%, 6/30/2018 | | | 421,750 | |
| | U.S. Treasury Notes, TIPS | | | | |
5,608,400 | | 2.500%, 7/15/2016 | | | 6,525,463 | |
5,941,152 | | 1.875%, 7/15/2019 | | | 6,895,913 | |
10,873,065 | | 1.125%, 1/15/2021 | | | 11,956,120 | |
| | | |
| | Total U.S. Government and Agencies | | | 211,861,220 | |
| | | |
| |
| Utilities (0.9%) | | | | |
| | CMS Energy Corporation | | | | |
1,000,000 | | 4.250%, 9/30/2015 | | | 1,012,182 | |
| | Commonwealth Edison Company | | | | |
1,700,000 | | 1.625%, 1/15/2014 | | | 1,715,002 | |
| | Enterprise Products Operating, LLC | | | | |
1,500,000 | | 5.200%, 9/1/2020 | | | 1,678,244 | |
| | National Rural Utilities Cooperative Finance Corporation | | | | |
1,350,000 | | 5.500%, 7/1/2013 | | | 1,453,028 | |
| | Oncor Electric Delivery Company, LLC | | | | |
1,300,000 | | 5.750%, 9/30/2020 | | | 1,487,368 | |
The accompanying Notes to Financial Statements are an integral part of this schedule.
195
Limited Maturity Bond Fund
Schedule of Investments as of October 31, 2011
| | | | | | |
Principal
Amount | | Long-Term Fixed Income (98.2%) | | Value | |
Utilities (0.9%) - continued | | | | |
| | ONEOK Partners, LP | | | | |
$350,000 | | 8.625%, 3/1/2019 | | | $452,552 | |
| | Power Receivables Finance, LLC | | | | |
20,747 | | 6.290%, 1/1/2012d | | | 20,764 | |
| | Virginia Electric & Power Company | | | | |
640,000 | | 5.100%, 11/30/2012 | | | 668,956 | |
| | | |
| | Total Utilities | | | 8,488,096 | |
| | | |
| | | | | | |
| | | |
| | Total Long-Term Fixed Income (cost $915,116,469) | | | 912,565,664 | |
| | | |
| | |
| Shares | | Mutual Funds (1.2%) | | Value | |
Fixed Income Mutual Funds (1.2%) | | | | |
2,247,228 | | Thrivent High Yield Fund | | | 10,606,918 | |
| | | |
| | Total Fixed Income Mutual Funds | | | 10,606,918 | |
| | | |
| | | | | | |
| | | |
| | Total Mutual Funds (cost $8,300,000) | | | 10,606,918 | |
| | | |
| | |
| Shares | | Preferred Stock (0.2%) | | Value | |
Financials (0.2%) | | | | |
10,250 | | Citigroup, Inc., Convertibleo | | | 974,160 | |
72,400 | | Federal National Mortgage Association, 8.250%n,p | | | 141,904 | |
39,000 | | HSBC Holdings plc, 8.000%n | | | 1,043,250 | |
| | | |
| | Total Financials | | | 2,159,314 | |
| | | |
| | | | | | |
| | | |
| | Total Preferred Stock (cost $3,499,654) | | | 2,159,314 | |
| | | |
| | |
| Shares | | Collateral Held for Securities Loaned(2.7%) | | Value | |
25,117,922 | | Thrivent Financial Securities Lending Trust | | | 25,117,922 | |
| | | |
| | Total Collateral Held for Securities Loaned (cost $25,117,922) | | | 25,117,922 | |
| | | |
Principal
Amount | | Short-Term Investments (2.8%)q | | Value | |
| | Federal Home Loan Bank Discount Notes | | | | |
5,000,000 | | 0.025%, 11/16/2011r | | | 4,999,948 | |
1,000,000 | | 0.020%, 11/18/2011r | | | 999,991 | |
| | Federal Home Loan Mortgage Corporation Discount Notes | | | | |
4,500,000 | | 0.020%, 11/7/2011r | | | 4,499,984 | |
10,000,000 | | 0.030%, 12/6/2011r | | | 9,999,708 | |
| | Federal National Mortgage Association Discount Notes | | | | |
4,115,000 | | 0.020%, 12/28/2011r | | | 4,114,870 | |
1,650,000 | | 0.105%, 2/22/2012r,s | | | 1,649,465 | |
| | | |
| | Total Short-Term Investments (at amortized cost) | | | 26,263,966 | |
| | | |
| | Total Investments (cost $978,298,011) 105.1% | | $ | 976,713,784 | |
| | | |
| | Other Assets and Liabilities, Net (5.1%) | | | (47,255,688 | ) |
| | | |
| | Total Net Assets 100.0% | | $ | 929,458,096 | |
| | | |
| a | Denotes securities sold under Rule 144A of the Securities Act of 1933, which exempts them from registration. These securities have been deemed liquid and may be resold to other dealers in the program or to other qualified institutional buyers. As of October 31, 2011, the value of these investments was $249,616,357 or 26.9% of total net assets. |
| b | Denotes variable rate securities. Variable rate securities are securities whose yields vary with a designated market index or market rate. The rate shown is as of October 31, 2011. |
| c | All or a portion of the security is insured or guaranteed. |
| d | Denotes restricted securities. Restricted securities are investment securities which have been deemed illiquid and cannot be offered for public sale without first being registered under the Securities Act of 1933. The following table indicates the acquisition date and cost of restricted securities Limited Maturity Bond Fund owned as of October 31, 2011. |
| | | | | | | | |
| Security | | Acquisition
Date | | | Amortized
Cost | |
Bear Stearns Commercial Mortgage Securities, Inc. | | | 3/30/2007 | | | | $1,047,032 | |
Commercial Mortgage Pass- Through Certificates | | | 5/2/2007 | | | | $1,500,000 | |
Commercial Mortgage Pass- Through Certificates | | | 10/18/2006 | | | | $1,000,000 | |
First Franklin Mortgage Loan Asset-Backed Certificates | | | 4/19/2006 | | | | $85,895 | |
Mortgage Equity Conversion Asset Trust | | | 2/14/2007 | | | | $2,572,844 | |
Mortgage Equity Conversion Asset Trust | | | 1/18/2007 | | | | $2,542,198 | |
Power Receivables Finance, LLC | | | 9/30/2003 | | | | $20,741 | |
Wachovia Asset Securitization, Inc. | | | 3/16/2007 | | | | 1$950,095 | |
| e | Defaulted security. Interest is not being accrued. |
| f | All or a portion of the security is on loan. |
| g | Denotes investments purchased on a when-issued or delayed delivery basis. |
| h | Denotes equity-linked structured security. This security is linked to the S&P 500 Index. |
| i | Denotes equity-linked structured security. This security is linked to the common stock of Berkshire Hathaway, Inc. |
| j | Security is displayed in shares. This security is an equity-linked structured security. This security is linked to the common stock of RadioShack Corporation. |
| k | Security is displayed in shares. This security is an equity-linked structured security. This security is linked to the common stock of Kubota Corporation. |
| l | Security is displayed in shares. This security is an equity-linked structured security. This security is linked to the common stock of Microsoft Corporation. |
| m | In bankruptcy. Interest is not being accrued. |
| n | Denotes perpetual securities. Perpetual securities pay an indefinite stream of interest, but may be called by the issuer at an earlier date. |
| o | Comprised of a 79.7% prepaid stock purchase contract for common stock of Citigroup, Inc. and a 20.3% amortizing note. The quarterly payments received consists of return of capital and 6.15% interest on only the portion that is the note. |
| p | Non-income producing security. |
| q | The interest rate shown reflects the yield, coupon rate or the discount rate at the date of purchase. |
| r | Denotes investments that benefit from credit enhancement or liquidity support provided by a third party bank, institution or government. |
The accompanying Notes to Financial Statements are an integral part of this schedule.
196
Limited Maturity Bond Fund
Schedule of Investments as of October 31, 2011
| S | At October 31, 2011, $1,649,465 of investments were held on deposit with the counterparty and pledged as the initial margin deposit for open futures contracts. |
| | | | | | |
| | | Definitions: |
| | REIT | | - Real Estate Investment Trust is a company that buys, develops, manages and/or sells real estate assets. |
| | TIPS | | - Treasury Inflation Protected Security. |
| | | | |
Unrealized Appreciation (Depreciation) | | | | |
Gross unrealized appreciation and depreciation of investments, based on cost for federal income tax purposes, were as follows: | |
Gross unrealized appreciation | | | $20,997,220 | |
Gross unrealized depreciation | | | (22,811,292 | ) |
| | | | |
Net unrealized appreciation (depreciation) | | | ($1,814,072 | ) |
| |
Cost for federal income tax purposes | | | $978,527,855 | |
Fair Valuation Measurements
The following table is a summary of the inputs used, as of October 31, 2011, in valuing Limited Maturity Bond Fund’s assets carried at fair value.
| | | | | | | | | | | | | | | | |
| Investments in Securities | | Total | | | Level 1 | | | Level 2 | | | Level 3 | |
Long-Term Fixed Income | | | | | | | | | | | | | | | | |
Asset-Backed Securities | | | 127,612,122 | | | | – | | | | 118,007,584 | | | | 9,604,538 | |
Basic Materials | | | 7,489,441 | | | | – | | | | 7,489,441 | | | | – | |
Capital Goods | | | 13,268,999 | | | | – | | | | 13,268,999 | | | | – | |
Collateralized Mortgage Obligations | | | 19,369,239 | | | | – | | | | 19,369,239 | | | | – | |
Commercial Mortgage-Backed Securities | | | 82,792,749 | | | | – | | | | 82,792,749 | | | | – | |
Communications Services | | | 20,213,108 | | | | – | | | | 20,213,108 | | | | – | |
Consumer Cyclical | | | 13,618,359 | | | | – | | | | 13,618,359 | | | | – | |
Consumer Non-Cyclical | | | 20,550,726 | | | | – | | | | 20,550,726 | | | | – | |
Energy | | | 32,440,561 | | | | – | | | | 32,440,561 | | | | – | |
Financials | | | 267,657,231 | | | | – | | | | 257,173,899 | | | | 10,483,332 | |
Foreign Government | | | 39,980,074 | | | | – | | | | 39,980,074 | | | | – | |
Mortgage-Backed Securities | | | 29,932,433 | | | | – | | | | 29,932,433 | | | | – | |
Technology | | | 9,486,112 | | | | – | | | | 9,486,112 | | | | – | |
Transportation | | | 7,805,194 | | | | – | | | | 7,805,194 | | | | – | |
U.S. Government and Agencies | | | 211,861,220 | | | | – | | | | 211,861,220 | | | | – | |
Utilities | | | 8,488,096 | | | | – | | | | 8,488,096 | | | | – | |
Mutual Funds | | | | | | | | | | | | | | | | |
Fixed Income Mutual Funds | | | 10,606,918 | | | | 10,606,918 | | | | – | | | | – | |
Preferred Stock | | | | | | | | | | | | | | | | |
Financials | | | 2,159,314 | | | | 2,159,314 | | | | – | | | | – | |
Collateral Held for Securities Loaned | | | 25,117,922 | | | | 25,117,922 | | | | – | | | | – | |
Short-Term Investments | | | 26,263,966 | | | | – | | | | 26,263,966 | | | | – | |
Total | | | $976,713,784 | | | | $37,884,154 | | | | $918,741,760 | | | | $20,087,870 | |
| | | | |
Other Financial Instruments | | | Total | | | | Level 1 | | | | Level 2 | | | | Level 3 | |
Asset Derivatives | | | | | | | | | | | | | | | | |
Futures Contracts | | | 135,882 | | | | 135,882 | | | | – | | | | – | |
Credit Default Swaps | | | 742,608 | | | | – | | | | 742,608 | | | | – | |
Total Asset Derivatives | | | $878,490 | | | | $135,882 | | | | $742,608 | | | | $– | |
Liability Derivatives | | | | | | | | | | | | | | | | |
Futures Contracts | | | 115,082 | | | | 115,082 | | | | – | | | | – | |
Total Liability Derivatives | | | $115,082 | | | | $115,082 | | | | $– | | | | $– | |
The accompanying Notes to Financial Statements are an integral part of this schedule.
197
Limited Maturity Bond Fund
Schedule of Investments as of October 31, 2011
The following table is a reconciliation of assets in which significant unobservable inputs (Level 3) were used in determining fair value for Limited Maturity Bond Fund.
| | | | | | | | | | | | | | | | | | | | | | | | | | | | | | | | |
| Investments in Securities | | Value
October 31,
2010 | | | Realized
Gain/
(Loss) | | | Change in
Unrealized
Appreciation/
(Depreciation)* | | | Purchases | | | Sales | | | Transfers
Into
Level 3 | | | Transfers
Out of
Level 3 | | | Value
October 31,
2011 | |
Long-Term Fixed Income | | | | | | | | | | | | | | | | | | | | | | | | | | | | | | | | |
Asset-Backed Securities | | | 5,826,035 | | | | - | | | | (142,767 | ) | | | 5,000,000 | | | | (401,519 | ) | | | - | | | | (677,211 | ) | | | 9,604,538 | |
Financials | | | 12,911,525 | | | | 16,970 | | | | (422,773 | ) | | | 4,750,780 | | | | (2,542,297 | ) | | | - | | | | (4,230,873 | ) | | | 10,483,332 | |
Mortgage-Backed Securities | | | 4,334,031 | | | | 2,182 | | | | 1 | | | | - | | | | (4,336,214 | ) | | | - | | | | - | | | | - | |
Transportation | | | 6,283,000 | | | | 421,334 | | | | (529,994 | ) | | | - | | | | (6,174,340 | ) | | | - | | | | - | | | | - | |
Total | | | $29,354,591 | | | | $440,486 | | | | ($1,095,533 | ) | | | $9,750,780 | | | | ($13,454,370 | ) | | | $- | | | | ($4,908,084 | ) | | | $20,087,870 | |
* Includes the change in net unrealized appreciation/(depreciation) on level 3 securities held on October 31, 2011 of ($686,584).
| | | | | | | | | | | | | | | | | | | | |
| Futures Contracts | | Number of
Contracts
Long/(Short) | | | Expiration
Date | | | Notional
Principal
Amount | | | Value | | | Unrealized
Gain/(Loss) | |
2-Yr. U.S. Treasury Bond Futures | | | (85 | ) | | | December 2011 | | | | ($18,736,928 | ) | | | ($18,723,906 | ) | | | $13,022 | |
5-Yr. U.S. Treasury Bond Futures | | | (1,100 | ) | | | December 2011 | | | | (134,755,236 | ) | | | (134,870,318 | ) | | | (115,082 | ) |
10-Yr. U.S. Treasury Bond Futures | | | (205 | ) | | | December 2011 | | | | (26,578,906 | ) | | | (26,457,812 | ) | | | 121,094 | |
20-Yr. U.S. Treasury Bond Futures | | | 10 | | | | December 2011 | | | | 1,388,546 | | | | 1,390,312 | | | | 1,766 | |
Total Futures Contracts | | | | | | | | | | | | | | | | | | | $20,800 | |
| | | | | | | | | | | | | | | | | | | | | | |
Credit Default Swaps and Counterparty | | Buy/Sell Protection1 | | Termination
Date | | | Notional
Principal
Amount2 | | | Upfront
Payments
Received (Made) | | | Value3 | | | Unrealized
Gain/(Loss) | |
CDX HY, Series 16, 5 Year, at 5.00%; Bank of America | | Buy | | | 6/20/2016 | | | | $13,000,000 | | | | $230,702 | | | | $400,858 | | | | $631,560 | |
CDX IG, Series 16, 5 Year, at 1.00%; J.P. Morgan Chase and Co. | | Buy | | | 6/20/2016 | | | | 13,000,000 | | | | 22,340 | | | | 88,708 | | | | 111,048 | |
Total Credit Default Swaps | | | | | | | | | | | | | | | | | $489,566 | | | | $742,608 | |
| 1 | As the buyer of protection, Limited Maturity Bond Fund pays periodic fees in return for payment by the seller which is contingent upon an adverse credit event occurring in the underlying issuer or reference entity. As the seller of protection, Limited Maturity Bond Fund collects periodic fees from the buyer and profits if the credit of the underlying issuer or reference entity remains stable or improves while the swap is outstanding, but the seller in a credit default swap contract would be required to pay the amount of credit loss, determined as specified in the agreement, to the buyer in the event of an adverse credit event in the reference entity. |
| 2 | The maximum potential amount of future payments Limited Maturity Bond Fund could be required to make as the seller or receive as the buyer of protection. |
| 3 | The values for credit indexes (CDX or LCDX) serve as an indicator of the current status of the payment/performance risk and represent the liability or profit for the credit default swap contract had the contract been closed as of the reporting date. When protection has been sold, the value of the swap will increase when the swap spread declines representing an improvement in the reference entity’s credit worthiness. The value of the swap will decrease when the swap spread increases representing a deterioration in the reference entity’s credit worthiness. When protection has been purchased, the value of the swap will increase when the swap spread increases representing a deterioration in the reference entity’s credit worthiness. The value of the swap will decrease when the swap spread declines representing an improvement in the reference entity’s credit worthiness. |
The accompanying Notes to Financial Statements are an integral part of this schedule.
198
Limited Maturity Bond Fund
Schedule of Investments as of October 31, 2011
The following table summarizes the fair value and Statement of Assets and Liabilities location, as of October 31, 2011, for Limited Maturity Bond Fund’s investments in financial derivative instruments by primary risk exposure as discussed under item (2) Significant Accounting Policies of the Notes to Financial Statements.
| | | | | | |
| Derivatives by risk category | | Statement of Assets and Liabilities Location | | Fair Value | |
Asset Derivatives | | | | | | |
Interest Rate Contracts | | | | | | |
Futures* | | Net Assets - Net unrealized appreciation/(depreciation) on Futures contracts | | | $135,882 | |
Total Interest Rate Contracts | | | | | 135,882 | |
Credit Contracts | | | | | | |
Credit Default Swaps | | Receivable/Payable - Swap agreements, at value; Net Assets - Net unrealized appreciation/(depreciation) on Swap agreements | | | 742,608 | |
Total Credit Contracts | | | | | 742,608 | |
Total Asset Derivatives | | | | | $878,490 | |
Liability Derivatives | | | | | | |
Interest Rate Contracts | | | | | | |
Futures* | | Net Assets - Net unrealized appreciation/(depreciation) on Futures contracts | | | 115,082 | |
Total Interest Rate Contracts | | | | | 115,082 | |
Total Liability Derivatives | | | | | $115,082 | |
| * | Includes cumulative appreciation/depreciation of futures contracts as reported in the Schedule of Investments. Only current day’s variation margin is reported within the Statement of Assets and Liabilities. |
The following table summarizes the net realized gains/(losses) and Statement of Operations location, for the period ended October 31, 2011, for Limited Maturity Bond Fund’s investments in financial derivative instruments by primary risk exposure.
| | | | | | |
| Derivatives by risk category | | Statement of Operations location | | Realized Gains/(Losses)
recognized in Income | |
Interest Rate Contracts | | | | | | |
Options Purchased | | Net realized gains/(losses) on Investments | | | (630,069 | ) |
Futures | | Net realized gains/(losses) on Futures contracts | | | (9,331,655 | ) |
| | |
Total Interest Rate Contracts | | | | | (9,961,724 | ) |
| | |
Credit Contracts | | | | | | |
Credit Default Swaps | | Net realized gains/(losses) on Swap agreements | | | (988,782 | ) |
Total Credit Contracts | | | | | (988,782 | ) |
Total | | | | | ($10,950,506 | ) |
The following table summarizes the change in net unrealized appreciation/(depreciation) and Statement of Operations location, for the period ended October 31, 2011, for Limited Maturity Bond Fund’s investments in financial derivative instruments by primary risk exposure.
| | | | | | |
| Derivatives by risk category | | Statement of Operations Location | | Change in unrealized
appreciation/(depreciation)
recognized in Income | |
Interest Rate Contracts | | | | | | |
Options Purchased | | Change in net unrealized appreciation/(depreciation) on Investments | | | 34,470 | |
Futures | | Change in net unrealized appreciation/(depreciation) on Futures contracts | | | 2,402,454 | |
Total Interest Rate Contracts | | | | | 2,436,924 | |
Credit Contracts | | | | | | |
Credit Default Swaps | | Change in net unrealized appreciation/(depreciation) on Swap agreements | | | 999,826 | |
Total Credit Contracts | | | | | 999,826 | |
Total | | | | | $3,436,750 | |
The accompanying Notes to Financial Statements are an integral part of this schedule.
199
Limited Maturity Bond Fund
Schedule of Investments as of October 31, 2011
The following table presents Limited Maturity Bond Fund’s average volume of derivative activity during the period ended October 31, 2011.
| | | | | | | | | | | | | | | | | | | | |
Derivative Risk
Category | | Futures
(Notional*) | | | Futures
(Percentage
of Average
Net Assets) | | | Swaps
(Notional*) | | | Swaps
(Percentage
of Average
Net Assets) | | | Options
(Contracts) | |
Interest Rate Contracts | | | $176,836,095 | | | | 20.0 | % | | | N/A | | | | N/A | | | | 169 | |
Credit Contracts | | | N/A | | | | N/A | | | | $28,736,171 | | | | 3.3 | % | | | N/A | |
| * | Notional amount represents long or short, or both, derivative positions held by the Fund. |
Investment in Affiliates
Affiliated issuers, as defined under the Investment Company Act of 1940, include those in which the Fund’s holdings of an issuer represent 5% or more of the outstanding voting securities of an issuer, or any affiliated mutual fund.
A summary of transactions for the fiscal year to date, in Limited Maturity Bond Fund, is as follows:
| | | | | | | | | | | | | | | | | | | | | | | | |
| Fund | | Value
October 31, 2010 | | | Gross
Purchases | | | Gross
Sales | | | Shares Held at
October 31, 2011 | | | Value
October 31, 2011 | | | Income Earned
November 1, 2010 -
October 31, 2011 | |
High Yield | | | $10,921,529 | | | | $– | | | | $– | | | | 2,247,228 | | | | $10,606,918 | | | | $849,734 | |
Thrivent Financial Securities Lending Trust | | | 6,975,715 | | | | 215,540,846 | | | | 197,398,639 | | | | 25,117,922 | | | | 25,117,922 | | | | 19,995 | |
Total Value and Income Earned | | | 17,897,244 | | | | | | | | | | | | | | | | 35,724,840 | | | | 869,729 | |
The accompanying Notes to Financial Statements are an integral part of this schedule.
200
Money Market Fund
Schedule of Investments as of October 31, 2011
| | | | | | |
Principal Amount | | Asset Backed Commercial Paper (21.1%)a | | Value | |
| | Barton Capital Corporation | | | | |
$29,300,000 | | 0.400%, 11/1/2011b,c | | | $29,300,000 | |
| | Dealers Capital Access | | | | |
5,980,000 | | 0.400%, 11/7/2011b | | | 5,979,601 | |
6,020,000 | | 0.440%, 11/22/2011b | | | 6,018,455 | |
6,000,000 | | 0.380%, 11/23/2011b | | | 5,998,607 | |
6,120,000 | | 0.460%, 12/12/2011b | | | 6,116,794 | |
3,100,000 | | 0.490%, 12/29/2011b | | | 3,097,552 | |
| | Golden Funding Corporation | | | | |
5,728,000 | | 0.330%, 12/21/2011b,c | | | 5,725,375 | |
| | Jupiter Securitization Company, LLC | | | | |
6,000,000 | | 0.210%, 12/20/2011b,c | | | 5,998,285 | |
| | Kells Funding, LLC | | | | |
5,970,000 | | 0.330%, 11/16/2011b,c | | | 5,969,179 | |
5,550,000 | | 0.420%, 1/17/2012b,c | | | 5,545,014 | |
6,160,000 | | 0.410%, 1/25/2012b,c | | | 6,154,037 | |
| | Nieuw Amsterdam Receivables Corporation | | | | |
6,170,000 | | 0.450%, 2/14/2012b,c | | | 6,161,902 | |
| | Sydney Capital Corporation | | | | |
6,215,000 | | 0.370%, 11/14/2011b,c | | | 6,214,170 | |
6,100,000 | | 0.350%, 12/12/2011b,c | | | 6,097,569 | |
6,090,000 | | 0.350%, 12/14/2011b,c | | | 6,087,454 | |
| | Thunder Bay Funding, LLC | | | | |
6,200,000 | | 0.260%, 12/9/2011b,c | | | 6,198,299 | |
4,067,000 | | 0.240%, 1/17/2012b,c | | | 4,064,912 | |
6,030,000 | | 0.250%, 2/15/2012b,c | | | 6,025,561 | |
| | | |
| | Total Asset Backed Commercial Paper | | | 126,752,766 | |
| | | |
| | |
Principal
Amount | | Financial Company Commercial Paper (34.1%)a | | Value | |
| | AllianceBernstein, LP | | | | |
15,000,000 | | 0.120%, 11/1/2011c | | | 15,000,000 | |
| | Bank of Nova Scotia | | | | |
3,000,000 | | 0.240%, 12/12/2011 | | | 3,000,000 | |
6,220,000 | | 0.300%, 2/10/2012 | | | 6,220,000 | |
| | Bank of Nova Scotia/Houston | | | | |
3,175,000 | | 0.318%, 6/11/2012d | | | 3,175,000 | |
6,340,000 | | 0.537%, 9/12/2012d | | | 6,347,350 | |
| | Barclays Bank plc | | | | |
6,170,000 | | 1.131%, 3/5/2012b,c,d | | | 6,187,442 | |
5,945,000 | | 0.671%, 4/10/2012b,c,d | | | 5,951,921 | |
| | BNP Paribas Finance, Inc. | | | | |
6,330,000 | | 0.390%, 11/23/2011b | | | 6,328,491 | |
| | General Electric Capital Corporation | | | | |
275,000 | | 0.630%, 2/15/2012b | | | 279,133 | |
6,300,000 | | 0.457%, 6/12/2012b,d | | | 6,300,098 | |
5,500,000 | | 0.666%, 6/15/2012b | | | 5,684,977 | |
6,120,000 | | 0.592%, 7/27/2012b,d | | | 6,127,801 | |
| | J.P. Morgan Chase & Company | | | | |
6,000,000 | | 0.388%, 2/22/2012d | | | 6,001,411 | |
| | J.P. Morgan Chase Bank NA | | | | |
3,290,000 | | 0.435%, 5/18/2012d | | | 3,290,000 | |
| | Prudential Funding, LLC | | | | |
2,900,000 | | 0.410%, 2/21/2012b | | | 2,896,301 | |
| | Rabobank Nederland NV/NY | | | | |
7,400,000 | | 0.321%, 12/6/2011b,d | | | 7,400,000 | |
| | Rabobank USA Financial Corporation | | | | |
6,090,000 | | 0.320%, 12/14/2011b | | | 6,087,672 | |
| | Royal Bank of Canada | | | | |
6,090,000 | | 0.320%, 12/2/2011d | | | 6,090,262 | |
| | | | | | |
Principal
Amount | | Financial Company Commercial Paper (34.1%)a | | Value | |
$6,170,000 | | 0.265%, 4/5/2012d | | | $6,170,000 | |
6,170,000 | | 0.401%, 7/9/2012d | | | 6,170,000 | |
| | Royal Bank of Canada, New York | | | | |
6,000,000 | | 0.300%, 5/16/2012d | | | 6,001,207 | |
3,428,000 | | 0.975%, 6/18/2012d | | | 3,442,189 | |
| | Societe Generale North America, Inc. | | | | |
27,675,000 | | 0.220%, 11/1/2011b | | | 27,675,000 | |
| | Toronto-Dominion Bank NY | | | | |
3,485,000 | | 0.323%, 1/12/2012d | | | 3,485,000 | |
6,220,000 | | 0.300%, 2/10/2012 | | | 6,220,000 | |
3,000,000 | | 0.426%, 10/19/2012d | | | 3,000,000 | |
| | Toronto-Dominion Holdings USA, Inc. | | | | |
6,070,000 | | 0.230%, 12/30/2011b,c | | | 6,067,712 | |
| | US Bank NA | | | | |
6,025,000 | | 0.310%, 3/30/2012 | | | 6,017,218 | |
6,015,000 | | 0.340%, 4/16/2012 | | | 6,005,513 | |
| | Wells Fargo & Company | | | | |
6,990,000 | | 0.506%, 1/24/2012d | | | 6,991,194 | |
| | Westpac Banking Corporation | | | | |
3,175,000 | | 0.407%, 1/10/2012c,d | | | 3,175,154 | |
6,070,000 | | 0.470%, 3/16/2012c | | | 6,059,222 | |
| | Westpac Banking Corporation of New York | | | | |
6,050,000 | | 0.619%, 12/30/2011d | | | 6,052,730 | |
| | | |
| | Total Financial Company Commercial Paper | | | 204,899,998 | |
| | | |
| | |
Principal
Amount | | Government Agency Debt (15.2%)a | | Value | |
| | Federal Farm Credit Bank | | | | |
7,320,000 | | 0.170%, 8/8/2012b,d | | | 7,319,312 | |
| | Federal Home Loan Banks | | | | |
7,900,000 | | 0.220%, 3/20/2012b,d | | | 7,899,683 | |
6,150,000 | | 0.240%, 1/25/2013b,d | | | 6,150,382 | |
| | Federal Home Loan Mortgage Corporation | | | | |
8,300,000 | | 0.195%, 12/21/2011b,d | | | 8,299,403 | |
8,300,000 | | 0.070%, 1/25/2012b,d | | | 8,295,381 | |
4,515,000 | | 0.210%, 10/12/2012b,d | | | 4,517,611 | |
3,090,000 | | 0.320%, 9/3/2013b,d | | | 3,088,799 | |
| | Federal National Mortgage Association | | | | |
14,130,000 | | 0.320%, 9/13/2012b,d | | | 14,139,515 | |
8,000,000 | | 0.273%, 9/17/2012b,d | | | 8,000,000 | |
3,700,000 | | 0.290%, 11/23/2012b,d | | | 3,699,225 | |
| | Overseas Private Investment Corporation | | | | |
1,765,516 | | 0.110%, 11/2/2011b,d | | | 1,765,516 | |
1,982,758 | | 0.110%, 11/2/2011b,d | | | 1,982,758 | |
4,473,686 | | 0.110%, 11/2/2011b,d | | | 4,473,686 | |
2,415,000 | | 0.503%, 12/9/2011b | | | 2,518,965 | |
8,830,000 | | 0.650%, 12/9/2011b | | | 8,830,000 | |
| | | |
| | Total Government Agency Debt | | | 90,980,236 | |
| | | |
| | |
| Shares | | Investment Company (5.0%) | | Value | |
| | AIM Investments Institutional Government and Agency Portfolio | | | | |
100,000 | | 0.020% | | | 100,000 | |
| | BlackRock Cash Funds | | | | |
16,743,000 | | 0.150% | | | 16,743,000 | |
The accompanying Notes to Financial Statements are an integral part of this schedule.
201
Money Market Fund
Schedule of Investments as of October 31, 2011
| | | | | | |
| Shares | | Investment Company (5.0%) | | Value | |
| | Dreyfus Institutional Cash Advantage Fund | | | | |
12,815,000 | | 0.070% | | $ | 12,815,000 | |
| | DWS Money Market Series | | | | |
182,024 | | 0.090% | | | 182,024 | |
| | | |
| | Total Investment Company | | | 29,840,024 | |
| | | |
| | |
Principal
Amount | | Other Commercial Paper (9.9%)a | | Value | |
| | Caisse D’Amortissement de la Dette Sociale | | | | |
$6,220,000 | | 0.420%, 11/28/2011b,c | | | 6,218,041 | |
6,120,000 | | 0.450%, 12/1/2011b,c | | | 6,117,705 | |
6,400,000 | | 0.341%, 6/22/2012b,c,d | | | 6,400,000 | |
| | Erste Abwicklungsanstalt | | | | |
6,200,000 | | 0.430%, 11/29/2011b,c | | | 6,197,927 | |
| | Georgia Transmission Corporation | | | | |
6,020,000 | | 0.250%, 12/16/2011c | | | 6,018,119 | |
3,860,000 | | 0.310%, 1/27/2012c | | | 3,857,108 | |
| | Reckitt Benckiser Treasury Services plc | | | | |
6,170,000 | | 0.460%, 3/8/2012b,c | | | 6,159,909 | |
6,080,000 | | 0.470%, 3/14/2012b,c | | | 6,069,363 | |
| | Toyota Motor Credit Corporation | | | | |
6,120,000 | | 0.290%, 12/28/2011 | | | 6,117,190 | |
6,100,000 | | 0.420%, 2/27/2012 | | | 6,091,602 | |
| | | |
| | Total Other Commercial Paper | | | 59,246,964 | |
| | | |
| | |
Principal
Amount | | Other Municipal Debt (2.6%)a | | Value | |
| | Alaska Housing Finance Corporation | | | | |
6,210,000 | | 0.350%, 11/9/2011 | | | 6,209,517 | |
6,210,000 | | 0.350%, 11/14/2011 | | | 6,209,215 | |
| | County of Hamilton, Tennessee | | | | |
3,000,000 | | 0.500%, 11/1/2011b | | | 3,000,000 | |
| | | |
| | Total Other Municipal Debt | | | 15,418,732 | |
| | | |
| | |
Principal
Amount | | Variable Rate Demand Note (12.1%)a | | Value | |
| | Andrew W. Mellon Foundation | | | | |
9,100,000 | | 0.190%, 11/7/2011d | | | 9,100,000 | |
| | Denver, Colorado Airport System Revenue Bonds | | | | |
21,500,000 | | 0.120%, 11/7/2011b,d | | | 21,500,000 | |
| | Douglas County, Nebraska Hospital Authority No. 2 Health Facilities Revenue Refunding Bonds (Children’s Hospital) | | | | |
6,700,000 | | 0.120%, 11/1/2011b,d | | | 6,700,000 | |
| | Lancaster County, Nebraska Hospital Authority No. 1 Hospital Revenue Refunding Bonds (BryanLGH Medical Center) | | | | |
6,200,000 | | 0.110%, 11/7/2011b,d | | | 6,200,000 | |
| | | | | | |
Principal
Amount | | Variable Rate Demand Note (12.1%)a | | Value | |
| | Louisiana Housing Finance Agency Qualified Gulf Opportunity Zone Bonds (Canterbury House Apartments - Sherwood) | | | | |
$9,000,000 | | 0.150%, 11/7/2011b,d | | | $9,000,000 | |
| | Pitney Road Partners, LLC | | | | |
5,190,000 | | 0.280%, 11/7/2011b,c,d | | | 5,190,000 | |
| | St. Cloud, Minnesota Health Care Refunding Revenue Bonds (CentraCare Health System) | | | | |
8,240,000 | | 0.110%, 11/7/2011b,d | | | 8,240,000 | |
| | Wisconsin State Health & Educational Facilities Authority Revenue Prohealth Care Inc. | | | | |
6,560,000 | | 0.120%, 11/1/2011b,d | | | 6,560,000 | |
| | | |
| | Total Variable Rate Demand Note | | | 72,490,000 | |
| | | |
| | | | | | |
| | | |
| | Total Investments (at amortized cost) 100.0% | | $ | 599,628,720 | |
| | | |
| | Other Assets and Liabilities, Net (<0.1%) | | | (181,451 | ) |
| | | |
| | Total Net Assets 100.0% | | $ | 599,447,269 | |
| | | |
| a | The interest rate shown reflects the yield, coupon rate or the discount rate at the date of purchase. |
| b | Denotes investments that benefit from credit enhancement or liquidity support provided by a third party bank, institution or government. |
| c | Denotes securities sold under Rule 144A of the Securities Act of 1933, which exempts them from registration. These securities have been deemed liquid and may be resold to other dealers in the program or to other qualified institutional buyers. As of October 31, 2011, the value of these investments was $194,211,380 or 32.4% of total net assets. |
| d | Denotes variable rate securities. Variable rate securities are securities whose yields vary with a designated market index or market rate. The rate shown is as of October 31, 2011. |
| | |
| Cost for federal income tax purposes | | $599,628,720 |
The accompanying Notes to Financial Statements are an integral part of this schedule.
202
Money Market Fund
Schedule of Investments as of October 31, 2011
Fair Valuation Measurements
The following table is a summary of the inputs used, as of October 31, 2011, in valuing Money Market Fund’s assets carried at fair value or amortized cost, which approximates fair value.
| | | | | | | | | | | | | | | | | | | | | | |
| Investments in Securities | | Total | | | | | Level 1 | | | | | Level 2 | | | Level 3 | | | |
Asset Backed Commercial Paper | | | 126,752,766 | | | | | | – | | | | | | 126,752,766 | | | | | | – | |
Financial Company Commercial Paper | | | 204,899,998 | | | | | | – | | | | | | 204,899,998 | | | | | | – | |
Government Agency Debt | | | 90,980,236 | | | | | | – | | | | | | 90,980,236 | | | | | | – | |
Investment Company | | | 29,840,024 | | | | | | 29,840,024 | | | | | | – | | | | | | – | |
Other Commercial Paper | | | 59,246,964 | | | | | | – | | | | | | 59,246,964 | | | | | | – | |
Other Municipal Debt | | | 15,418,732 | | | | | | – | | | | | | 15,418,732 | | | | | | – | |
Variable Rate Demand Note | | | 72,490,000 | | | | | | – | | | | | | 72,490,000 | | | | | | – | |
Total | | $ | 599,628,720 | | | | | $ | 29,840,024 | | | | | $ | 569,788,696 | | | | | $ | – | |
The accompanying Notes to Financial Statements are an integral part of this schedule.
203
Thrivent Mutual Funds
Statement of Assets and Liabilities
| | | | | | | | | | | | | | | | |
| As of October 31, 2011 | | Aggressive Allocation Fund | | | Moderately Aggressive Allocation Fund | | | Moderate Allocation Fund | | | Moderately Conservative Allocation Fund | |
Assets | | | | | | | | | | | | | | | | |
Investments at cost | | | $541,726,607 | | | | $1,280,079,459 | | | | $1,279,032,927 | | | | $574,026,900 | |
Investments in securities at value | | | 189,990,158 | | | | 376,279,667 | | | | 343,332,067 | | | | 171,003,895 | |
Investments in affiliates at value | | | 356,439,116 | | | | 894,593,215 | | | | 939,893,064 | | | | 412,874,787 | |
Investments at Value | | | 546,429,274 | | | | 1,270,872,882 | | | | 1,283,225,131 | | | | 583,878,682 | |
Cash | | | 2,388,977 (a) | | | | 3,392,410 | | | | 3,751,172 | | | | 3,807,934 | |
Dividends and interest receivable | | | 305,725 | | | | 920,739 | | | | 1,157,071 | | | | 644,870 | |
Prepaid expenses | | | 17,180 | | | | 23,909 | | | | 24,063 | | | | 20,375 | |
Receivable for investments sold | | | 7,729,918 | | | | 10,606,726 | | | | 6,862,109 | | | | 9,435,940 | |
Receivable for fund shares sold | | | 236,857 | | | | 848,045 | | | | 847,438 | | | | 694,987 | |
Receivable for forward contracts | | | — | | | | — | | | | — | | | | — | |
Receivable for variation margin | | | 2,624,700 | | | | 2,730,900 | | | | 1,512,380 | | | | 276,040 | |
Total Assets | | | 559,732,631 | | | | 1,289,395,611 | | | | 1,297,379,364 | | | | 598,758,828 | |
Liabilities | | | | | | | | | | | | | | | | |
Accrued expenses | | | 93,222 | | | | 154,997 | | | | 130,451 | | | | 65,784 | |
Payable for investments purchased | | | 13,439,053 | | | | 29,139,439 | | | | 24,780,294 | | | | 14,464,697 | |
Payable upon return of collateral for securities loaned | | | — | | | | — | | | | — | | | | — | |
Payable for fund shares redeemed | | | 734,939 | | | | 744,862 | | | | 577,512 | | | | 286,038 | |
Payable for forward contracts | | | — | | | | — | | | | — | | | | — | |
Payable for variation margin | | | 3,016,841 | | | | 4,950,544 | | | | 3,970,017 | | | | 1,545,146 | |
Payable to affiliate | | | 278,163 | | | | 683,556 | | | | 642,793 | | | | 298,755 | |
Mortgage dollar roll deferred revenue | | | 14,764 | | | | 39,331 | | | | 39,605 | | | | 18,976 | |
Total Liabilities | | | 17,576,982 | | | | 35,712,729 | | | | 30,140,672 | | | | 16,679,396 | |
Net Assets | | | | | | | | | | | | | | | | |
Capital stock (beneficial interest) | | | 545,860,826 | | | | 1,276,912,455 | | | | 1,274,870,947 | | | | 573,897,927 | |
Accumulated undistributed net investment income/(loss) | | | 1,024,456 | | | | 10,247,581 | | | | 1,286,371 | | | | 770,688 | |
Accumulated undistributed net realized gain/(loss) | | | (12,308,083) | | | | (28,858,307) | | | | (20,569,876) | | | | (5,121,585) | |
Net unrealized appreciation/(depreciation) on: | | | | | | | | | | | | | | | | |
Investments | | | 6,912,119 | | | | 11,269,771 | | | | 8,506,764 | | | | 3,285,738 | |
Affiliated investments | | | (2,209,452) | | | | (20,476,348) | | | | (4,314,560) | | | | 6,566,044 | |
Futures contracts | | | 2,876,231 | | | | 4,588,517 | | | | 7,459,580 | | | | 2,680,620 | |
Foreign currency forward contracts | | | — | | | | — | | | | — | | | | — | |
Foreign currency transactions | | | (448) | | | | (787) | | | | (534) | | | | — | |
Total Net Assets | | | $542,155,649 | | | | $1,253,682,882 | | | | $1,267,238,692 | | | | $582,079,432 | |
Class A Share Capital | | | $462,144,709 | | | | $1,168,608,825 | | | | $1,207,559,771 | | | | $559,658,317 | |
Shares of beneficial interest outstanding (Class A) | | | 43,195,886 | | | | 107,861,283 | | | | 111,860,838 | | | | 52,053,784 | |
Net asset value per share | | | $10.70 | | | | $10.83 | | | | $10.80 | | | | $10.75 | |
Maximum public offering price | | | $11.32 | | | | $11.46 | | | | $11.43 | | | | $11.38 | |
Institutional Class Share Capital | | | $80,010,940 | | | | $85,074,057 | | | | $59,678,921 | | | | $22,421,115 | |
Shares of beneficial interest outstanding (Institutional Class) | | | 7,421,910 | | | | 7,792,909 | | | | 5,516,637 | | | | 2,080,335 | |
Net asset value per share | | | $10.78 | | | | $10.92 | | | | $10.82 | | | | $10.78 | |
(a) Includes foreign currency holdings of $3 (cost $3).
The accompanying Notes to Financial Statements are an integral part of this schedule.
204
Thrivent Mutual Funds
Statement of Assets and Liabilities - continued
| | | | | | | | | | | | | | | | | | | | | | | | | | |
Partner Small Cap Growth Fund | | | Partner Small
Cap Value Fund | | | Small Cap
Stock Fund | | | Mid Cap
Growth Fund | | | Partner Mid
Cap Value Fund | | | Mid Cap Stock
Fund | | | Partner Worldwide Allocation Fund | |
| | | | | | | | | | | | | | | | | | | | | | | | | | | |
| | $116,472,100 | | | | $186,060,645 | | | | $286,587,951 | | | | $307,733,227 | | | | $110,841,980 | | | | $677,724,788 | | | | $656,214,574 | |
| | 120,908,607 | | | | 211,331,412 | | | | 283,855,523 | | | | 388,866,493 | | | | 117,062,211 | | | | 753,510,577 | | | | 645,309,265 | |
| | 11,198,490 | | | | 12,183,249 | | | | 5,560,875 | | | | 8,790,050 | | | | 1,504,980 | | | | 35,829,950 | | | | — | |
| | 132,107,097 | | | | 223,514,661 | | | | 289,416,398 | | | | 397,656,543 | | | | 118,567,191 | | | | 789,340,527 | | | | 645,309,265 | |
| | 3,145,304 | | | | 1,502,568 | | | | 3,139,322 | | | | 2,635,155 | | | | 764,253 | | | | 1,765,009 | | | | 11,037,061(b) | |
| | 17,225 | | | | 70,792 | | | | 70,430 | | | | 126,385 | | | | 63,278 | | | | 150,023 | | | | 3,032,711 | |
| | 11,790 | | | | 13,554 | | | | 13,951 | | | | 14,513 | | | | 11,903 | | | | 17,503 | | | | 6,732 | |
| | 1,981,895 | | | | 42,081 | | | | 11,256,689 | | | | 4,511,536 | | | | 839,492 | | | | — | | | | 2,815,101 | |
| | 7,748 | | | | 48,715 | | | | 23,083 | | | | 194,917 | | | | 58,166 | | | | 126,855 | | | | 90,280 | |
| | — | | | | — | | | | — | | | | — | | | | — | | | | — | | | | 219,554 | |
| | — | | | | — | | | | — | | | | — | | | | — | | | | — | | | | 38,203 | |
| | 137,271,059 | | | | 225,192,371 | | | | 303,919,873 | | | | 405,139,049 | | | | 120,304,283 | | | | 791,399,917 | | | | 662,548,907 | |
| | | | | | | | | | | | | | | | | | | | | | | | | | |
| | 26,634 | | | | 55,371 | | | | 114,228 | | | | 102,572 | | | | 27,640 | | | | 204,998 | | | | 232,780 | |
| | 1,537,745 | | | | — | | | | 10,492,832 | | | | 5,073,089 | | | | 548,113 | | | | — | | | | 3,427,744 | |
| | 11,198,490 | | | | 12,183,249 | | | | 5,560,875 | | | | 8,790,050 | | | | 1,504,980 | | | | 35,829,950 | | | | — | |
| | 350 | | | | 88,232 | | | | 248,760 | | | | 169,559 | | | | 1,555 | | | | 377,585 | | | | 398,373 | |
| | — | | | | — | | | | — | | | | — | | | | — | | | | — | | | | 153,362 | |
| | — | | | | — | | | | 634,280 | | | | — | | | | — | | | | — | | | | 8,716 | |
| | 102,047 | | | | 157,211 | | | | 254,423 | | | | 227,735 | | | | 82,313 | | | | 599,189 | | | | 504,784 | |
| | — | | | | — | | | | — | | | | — | | | | — | | | | — | | | | — | |
| | 12,865,266 | | | | 12,484,063 | | | | 17,305,398 | | | | 14,363,005 | | | | 2,164,601 | | | | 37,011,722 | | | | 4,725,759 | |
| | | | | | | | | | | | | | | | | | | | | | | | | | |
| | 115,084,079 | | | | 173,322,800 | | | | 320,500,532 | | | | 298,331,067 | | | | 110,819,592 | | | | 811,778,284 | | | | 800,536,428 | |
| | (15,220) | | | | 44,202 | | | | (67,634) | | | | (44,303) | | | | 542,505 | | | | (132,044) | | | | 5,378,677 | |
| | (6,298,063) | | | | 1,887,290 | | | | (37,728,314) | | | | 2,565,964 | | | | (947,626) | | | | (168,873,784) | | | | (137,218,292) | |
| | | | | | | | | | | | | | | | | | | | | | | | | | | |
| | 15,634,997 | | | | 37,454,016 | | | | 2,828,447 | | | | 89,923,316 | | | | 7,725,211 | | | | 111,615,739 | | | | (10,905,309) | |
| | — | | | | — | | | �� | — | | | | — | | | | — | | | | — | | | | — | |
| | — | | | | — | | | | 1,081,444 | | | | — | | | | — | | | | — | | | | (4,821) | |
| | — | | | | — | | | | — | | | | — | | | | — | | | | — | | | | 66,192 | |
| | — | | | | — | | | | — | | | | — | | | | — | | | | — | | | | (29,727) | |
| | $124,405,793 | | | | $212,708,308 | | | | $286,614,475 | | | | $390,776,044 | | | | $118,139,682 | | | | $754,388,195 | | | | $657,823,148 | |
| $19,976,679 | | | | $69,292,565 | | | | $226,331,425 | | | | $238,024,156 | | | | $17,772,100 | | | | $538,746,300 | | | | $179,871,032 | |
| | 1,704,733 | | | | 4,788,986 | | | | 16,949,365 | | | | 13,470,104 | | | | 1,538,572 | | | | 37,680,655 | | | | 21,663,630 | |
| | $11.72 | | | | $14.47 | | | | $13.35 | | | | $17.67 | | | | $11.55 | | | | $14.30 | | | | $8.30 | |
| | $12.40 | | | | $15.31 | | | | $14.13 | | | | $18.70 | | | | $12.22 | | | | $15.13 | | | | $8.78 | |
| $104,429,114 | | | | $143,415,743 | | | | $60,283,050 | | | | $152,751,888 | | | | $100,367,582 | | | | $215,641,895 | | | | $477,952,116 | |
| | 8,710,062 | | | | 9,440,078 | | | | 4,029,775 | | | | 7,711,675 | | | | 8,652,795 | | | | 13,977,970 | | | | 57,300,915 | |
| | $11.99 | | | | $15.19 | | | | $14.96 | | | | $19.81 | | | | $11.60 | | | | $15.43 | | | | $8.34 | |
(b) Includes foreign currency holdings of $160,387 (cost $159,758).
The accompanying Notes to Financial Statements are an integral part of this schedule.
205
Thrivent Mutual Funds
Statement of Assets and Liabilities – continued
| | | | | | | | | | | | | | | | |
| As of October 31, 2011 | | Large Cap Growth Fund | | | Large Cap Value Fund | | | Large Cap Stock Fund | | | Balanced Fund | |
Assets | | | | | | | | | | | | | | | | |
Investments at cost | | | $307,917,690 | | | | $502,610,890 | | | | $1,469,561,516 | | | | $206,296,555 | |
Investments in securities at value | | | 320,286,257 | | | | 517,465,021 | | | | 1,570,154,501 | | | | 207,007,927 | |
Investments in affiliates at value | | | — | | | | 11,556,500 | | | | 6,767,600 | | | | 5,334,856 | |
Investments at Value | | | 320,286,257 | | | | 529,021,521 | | | | 1,576,922,101 | | | | 212,342,783 | |
Cash | | | — | | | | 2,897,267 | | | | 3,214,148 | | | | 1,497,532 | |
Dividends and interest receivable | | | 177,525 | | | | 729,585 | | | | 1,681,862 | | | | 502,679 | |
Prepaid expenses | | | 14,161 | | | | 14,233 | | | | 24,072 | | | | 17,861 | |
Receivable for investments sold | | | 50,359,460 | | | | 4,255,371 | | | | 117,938,453 | | | | 3,507,026 | |
Receivable for fund shares sold | | | 19,807 | | | | 110,693 | | | | 110,772 | | | | 15,914 | |
Swap agreements, at value | | | — | | | | — | | | | — | | | | 56,488 | |
Receivable for variation margin | | | — | | | | — | | | | — | | | | 43,125 | |
Total Assets | | | 370,857,210 | | | | 537,028,670 | | | | 1,699,891,408 | | | | 217,983,408 | |
Liabilities | | | | | | | | | | | | | | | | |
Distributions payable | | | — | | | | — | | | | — | | | | — | |
Accrued expenses | | | 94,958 | | | | 117,287 | | | | 644,765 | | | | 85,066 | |
Other liabilities | | | 934,772 | | | | — | | | | — | | | | — | |
Payable for investments purchased | | | 47,503,534 | | | | 4,288,583 | | | | 120,871,144 | | | | 20,108,475 | |
Payable upon return of collateral for securities loaned | | | — | | | | 11,556,500 | | | | 6,767,600 | | | | 3,606,713 | |
Payable for fund shares redeemed | | | 84,858 | | | | 214,040 | | | | 6,595,549 | | | | 150,906 | |
Open options written, at value | | | — | | | | — | | | | 22,300 | | | | — | |
Payable for variation margin | | | — | | | | — | | | | 42,562 | | | | 144,078 | |
Payable to affiliate | | | 223,210 | | | | 268,567 | | | | 1,206,933 | | | | 142,990 | |
Mortgage dollar roll deferred revenue | | | — | | | | — | | | | — | | | | 25,549 | |
Total Liabilities | | | 48,841,332 | | | | 16,444,977 | | | | 136,150,853 | | | | 24,263,777 | |
Net Assets | | | | | | | | | | | | | | | | |
Capital stock (beneficial interest) | | | 406,421,864 | | | | 574,007,958 | | | | 1,466,494,426 | | | | 183,032,442 | |
Accumulated undistributed net investment income/(loss) | | | (45,123 | ) | | | 6,757,974 | | | | 7,816,114 | | | | (6,748 | ) |
Accumulated undistributed net realized gain/(loss) | | | (96,729,430 | ) | | | (86,592,870 | ) | | | (18,020,979 | ) | | | 4,378,177 | |
Net unrealized appreciation/(depreciation) on: | | | | | | | | | | | | | | | | |
Investments | | | 12,368,567 | | | | 26,410,631 | | | | 107,360,585 | | | | 5,718,085 | |
Affiliated investments | | | — | | | | — | | | | — | | | | 328,143 | |
Written option contracts | | | — | | | | — | | | | 18,000 | | | | — | |
Futures contracts | | | — | | | | — | | | | 72,409 | | | | 183,845 | |
Foreign currency transactions | | | — | | | | — | | | | — | | | | — | |
Swap agreements | | | — | | | | — | | | | — | | | | 85,687 | |
Total Net Assets | | | $322,015,878 | | | | $520,583,693 | | | | $1,563,740,555 | | | | $193,719,631 | |
Class A Share Capital | | | $117,669,519 | | | | $164,537,752 | | | | $1,393,492,775 | | | | $140,986,989 | |
Shares of beneficial interest outstanding (Class A) | | | 23,933,689 | | | | 12,719,395 | | | | 65,430,159 | | | | 11,644,346 | |
Net asset value per share | | | $4.92 | | | | $12.94 | | | | $21.30 | | | | $12.11 | |
Maximum public offering price | | | $5.21 | | | | $13.69 | | | | $22.54 | | | | $12.81 | |
| | | | |
Institutional Class Share Capital | | | $204,346,359 | | | | $356,045,941 | | | | $170,247,780 | | | | $52,732,642 | |
Shares of beneficial interest outstanding (Institutional Class) | | | 38,736,197 | | | | 27,309,178 | | | | 7,926,853 | | | | 4,361,779 | |
Net asset value per share | | | $5.28 | | | | $13.04 | | | | $21.48 | | | | $12.09 | |
The accompanying Notes to Financial Statements are an integral part of this schedule.
206
Thrivent Mutual Funds
Statement of Assets and Liabilities – continued
| | | | | | | | | | | | | | | | | | | | | | | | | | |
High Yield Fund | | | Municipal Bond Fund | | | Income Fund | | | Core Bond Fund | | | Government Bond Fund | | | Limited Maturity Bond Fund | | | Money Market Fund | |
| | | | | | | | | | | | | | | | | | | | | | | | | | |
| | $751,267,641 | | | | $1,343,734,970 | | | | $822,681,240 | | | | $348,535,778 | | | | $101,809,288 | | | | $978,298,011 | | | | $599,628,720 | |
| | 684,695,067 | | | | 1,422,638,648 | | | | 822,753,590 | | | | 340,135,852 | | | | 107,079,907 | | | | 940,988,944 | | | | 599,628,720 | |
| | 64,933,950 | | | | — | | | | 16,998,848 | | | | 12,489,184 | | | | — | | | | 35,724,840 | | | | — | |
| | 749,629,017 | | | | 1,422,638,648 | | | | 839,752,438 | | | | 352,625,036 | | | | 107,079,907 | | | | 976,713,784 | | | | 599,628,720 | |
| | 236,555 | | | | 527,621 | | | | 753,679 | | | | 432,150 | | | | 458,242 | | | | 392,547 | | | | 2,692 | |
| | 14,071,075 | | | | 20,847,983 | | | | 9,309,190 | | | | 2,001,270 | | | | 655,267 | | | | 3,941,143 | | | | 274,919 | |
| | 15,853 | | | | 24,562 | | | | 15,012 | | | | 15,012 | | | | 5,340 | | | | 27,297 | | | | 20,999 | |
| | 8,610,033 | | | | 4,596,937 | | | | 12,690,182 | | | | 2,329,423 | | | | — | | | | 8,435,726 | | | | — | |
| | 356,446 | | | | 887,919 | | | | 158,444 | | | | 184,839 | | | | 41,130 | | | | 1,646,863 | | | | 2,554,180 | |
| | — | | | | — | | | | 324,921 | | | | 451,907 | | | | — | | | | 489,566 | | | | — | |
| | 37,050 | | | | — | | | | 798,046 | | | | 172,500 | | | | — | | | | 21,562 | | | | — | |
| | 772,956,029 | | | | 1,449,523,670 | | | | 863,801,912 | | | | 358,212,137 | | | | 108,239,886 | | | | 991,668,488 | | | | 602,481,510 | |
| | | | | | | | | | | | | | | | | | | | | | | | | | | |
| | 1,132,406 | | | | 764,905 | | | | 228,172 | | | | 67,701 | | | | 1,252 | | | | 17,968 | | | | — | |
| | 133,711 | | | | 252,921 | | | | 132,602 | | | | 103,927 | | | | 14,921 | | | | 109,209 | | | | 105,382 | |
| | — | | | | — | | | | — | | | | — | �� | | | — | | | | — | | | | — | |
| | 17,459,874 | | | | 21,186,464 | | | | 46,852,226 | | | | 64,584,633 | | | | 6,273,594 | | | | 35,181,973 | | | | — | |
| | 64,933,950 | | | | — | | | | 16,053,730 | | | | — | | | | — | | | | 25,117,922 | | | | — | |
| | 240,054 | | | | 368,373 | | | | 108,148 | | | | 130,879 | | | | 19,927 | | | | 621,351 | | | | 2,884,282 | |
| | — | | | | — | | | | — | | | | — | | | | — | | | | — | | | | — | |
| | — | | | | — | | | | 996,955 | | | | 300,234 | | | | — | | | | 812,114 | | | | — | |
| | 362,270 | | | | 844,408 | | | | 360,814 | | | | 180,883 | | | | 43,723 | | | | 309,908 | | | | 44,577 | |
| | — | | | | — | | | | 42,912 | | | | 106,135 | | | | 11,251 | | | | 39,947 | | | | — | |
| | 84,262,265 | | | | 23,417,071 | | | | 64,775,559 | | | | 65,474,392 | | | | 6,364,668 | | | | 62,210,392 | | | | 3,034,241 | |
| | | | | | | | | | | | | | | | | | | | | | | | | | | |
| | 768,224,583 | | | | 1,348,122,568 | | | | 818,082,490 | | | | 304,396,722 | | | | 94,168,431 | | | | 935,972,429 | | | | 599,447,269 | |
| | (216,746) | | | | (62,577) | | | | (11,177) | | | | (30,817) | | | | 35,528 | | | | (292,465) | | | | — | |
| | (77,701,410) | | | | (857,070) | | | | (36,582,232) | | | | (16,610,261) | | | | 2,400,640 | | | | (5,401,049) | | | | — | |
| | | | | | | | | | | | | | | | | | | | | | | | | | | |
| | (1,638,624) | | | | 78,903,678 | | | | 16,842,928 | | | | 1,400,074 | | | | 5,270,619 | | | | (3,891,145) | | | | — | |
| | — | | | | — | | | | 228,270 | | | | 2,689,184 | | | | — | | | | 2,306,918 | | | | — | |
| | — | | | | — | | | | — | | | | — | | | | — | | | | — | | | | — | |
| | 25,961 | | | | — | | | | 561,020 | | | | 207,358 | | | | — | | | | 20,800 | | | | — | |
| | — | | | | — | | | | (64) | | | | — | | | | — | | | | — | | | | — | |
| | — | | | | — | | | | (94,882) | | | | 685,485 | | | | — | | | | 742,608 | | | | — | |
| | $688,693,764 | | | | $1,426,106,599 | | | | $799,026,353 | | | | $292,737,745 | | | | $101,875,218 | | | | $929,458,096 | | | | $599,447,269 | |
| | $445,267,651 | | | | $1,339,612,174 | | | | $397,944,025 | | | | $236,250,627 | | | | $7,300,696 | | | | $344,802,184 | | | | $587,884,921 | |
| | 94,454,795 | | | | 118,560,661 | | | | 45,388,954 | | | | 23,184,144 | | | | 682,948 | | | | 27,794,857 | | | | 587,884,921 | |
| | $4.71 | | | | $11.30 | | | | $8.77 | | | | $10.19 | | | | $10.69 | | | | $12.41 | | | | $1.00 | |
| | $4.93 | | | | $11.83 | | | | $9.18 | | | | $10.67 | | | | $10.91 | | | | $12.41 | | | | $1.00 | |
| | | | | | |
| | $243,426,113 | | | | $86,494,425 | | | | $401,082,328 | | | | $56,487,118 | | | | $94,574,522 | | | | $584,655,912 | | | | $11,562,348 | |
| | 51,614,934 | | | | 7,655,279 | | | | 45,785,689 | | | | 5,541,832 | | | | 8,845,315 | | | | 47,139,794 | | | | 11,562,348 | |
| | $4.72 | | | | $11.30 | | | | $8.76 | | | | $10.19 | | | | $10.69 | | | | $12.40 | | | | $1.00 | |
The accompanying Notes to Financial Statements are an integral part of this schedule.
207
Thrivent Mutual Funds
Statement of Operations
| | | | | | | | | | | | | | | | |
| For the year ended October 31, 2011 | | Aggressive
Allocation
Fund | | | Moderately
Aggressive
Allocation
Fund | | | Moderate
Allocation
Fund | | | Moderately
Conservative
Allocation
Fund | |
Investment Income | | | | | | | | | | | | | | | | |
Dividends | | | $2,042,987 | | | | $3,774,258 | | | | $2,861,350 | | | | $957,476 | |
Taxable interest | | | 812,698 | | | | 4,071,541 | | | | 6,193,077 | | | | 3,641,859 | |
Income from mortgage dollar rolls | | | 44,290 | | | | 218,811 | | | | 200,299 | | | | 169,049 | |
Income from securities loaned | | | — | | | | — | | | | — | | | | — | |
Income from affiliated investments | | | 4,865,151 | | | | 19,002,774 | | | | 24,374,859 | | | | 11,703,784 | |
Foreign tax withholding | | | (37,071) | | | | (59,450) | | | | (42,120) | | | | (8,998) | |
Total Investment Income | | | 7,728,055 | | | | 27,007,934 | | | | 33,587,465 | | | | 16,463,170 | |
Expenses | | | | | | | | | | | | | | | | |
Adviser fees | | | 1,896,869 | | | | 3,632,672 | | | | 3,279,464 | | | | 1,528,733 | |
Sub-Adviser fees | | | — | | | | — | | | | — | | | | — | |
Administrative service fees | | | 180,559 | | | | 322,573 | | | | 321,862 | | | | 182,815 | |
Audit and legal fees | | | 26,359 | | | | 36,223 | | | | 36,289 | | | | 26,613 | |
Custody fees | | | 80,751 | | | | 88,184 | | | | 85,183 | | | | 51,623 | |
Distribution expenses Class A | | | 1,183,719 | | | | 2,941,625 | | | | 3,004,256 | | | | 1,355,430 | |
Insurance expenses | | | 6,610 | | | | 10,918 | | | | 10,776 | | | | 6,533 | |
Printing and postage expenses Class A | | | 301,920 | | | | 554,506 | | | | 425,035 | | | | 168,977 | |
Printing and postage expenses Institutional Class | | | 528 | | | | 494 | | | | 529 | | | | 405 | |
SEC and state registration expenses | | | 29,664 | | | | 53,716 | | | | 63,399 | | | | 42,881 | |
Transfer agent fees Class A | | | 793,666 | | | | 1,465,406 | | | | 1,107,534 | | | | 426,779 | |
Transfer agent fees Institutional Class | | | 392 | | | | 449 | | | | 587 | | | | 564 | |
Trustees’ fees | | | 9,645 | | | | 14,994 | | | | 13,768 | | | | 8,775 | |
Other expenses | | | 21,950 | | | | 23,363 | | | | 23,408 | | | | 16,215 | |
Total Expenses Before Reimbursement | | | 4,532,632 | | | | 9,145,123 | | | | 8,372,090 | | | | 3,816,343 | |
Less: | | | | | | | | | | | | | | | | |
Reimbursement from adviser | | | (648,629) | | | | (640,749) | | | | (438,895) | | | | (264,610) | |
Custody earnings credit | | | (365) | | | | (312) | | | | (281) | | | | (154) | |
Total Net Expenses | | | 3,883,638 | | | | 8,504,062 | | | | 7,932,914 | | | | 3,551,579 | |
| | | | | | | | | | | | | | | | |
Net Investment Income/(Loss) | | | 3,844,417 | | | | 18,503,872 | | | | 25,654,551 | | | | 12,911,591 | |
Realized and Unrealized Gains/(Losses) | | | | | | | | | | | | | | | | |
Net realized gains/(losses) on: | | | | | | | | | | | | | | | | |
Investments | | | 7,852,291 | | | | 13,855,800 | | | | 10,591,673 | | | | 5,432,425 | |
Affiliated investments | | | (1,339,026) | | | | (2,584,084) | | | | (1,164,146) | | | | (2,258,252) | |
Distributions of realized capital gains from affiliated investments | | | 88,707 | | | | 196,531 | | | | 152,834 | | | | 87,658 | |
Futures contracts | | | 1,928,188 | | | | (2,915,111) | | | | (1,521,213) | | | | (1,413,316) | |
Foreign currency transactions | | | (26,511) | | | | (45,594) | | | | (31,845) | | | | (440) | |
Swap agreements | | | 130,243 | | | | 816,285 | | | | 816,285 | | | | 378,611 | |
Change in net unrealized appreciation/(depreciation) on: | | | | | | | | | | | | | | | | |
Investments | | | (4,018,558) | | | | (8,724,489) | | | | (7,478,671) | | | | (4,265,671) | |
Affiliated investments | | | 8,362,457 | | | | 10,399,040 | | | | 3,133,413 | | | | 181,589 | |
Futures contracts | | | 2,876,231 | | | | 5,161,549 | | | | 5,940,289 | | | | 1,839,020 | |
Foreign currency forward contracts | | | — | | | | — | | | | — | | | | — | |
Foreign currency transactions | | | (448) | | | | (787) | | | | (534) | | | | — | |
Net Realized and Unrealized Gains/(Losses) | | | 15,853,574 | | | | 16,159,140 | | | | 10,438,085 | | | | (18,376 | ) |
| | | | | | | | | | | | | | | | |
Net Increase/(Decrease) in Net Assets Resulting From Operations | | $ | 19,697,991 | | | $ | 34,663,012 | | | $ | 36,092,636 | | | | $12,893,215 | |
The accompanying Notes to Financial Statements are an integral part of this schedule.
208
Thrivent Mutual Funds
Statement of Operations - continued
| | | | | | | | | | | | | | | | | | | | | | | | | | |
Partner Small Cap Growth Fund | | | Partner Small Cap Value Fund | | | Small Cap Stock Fund | | | Mid Cap Growth Fund | | | Partner Mid Cap Value Fund | | | Mid Cap Stock
Fund | | | Partner Worldwide
Allocation Fund | |
| | | | | | | | | | | | | | | | | | | | | | | | | | |
| | $407,339 | | | | $3,853,529 | | | | $2,134,265 | | | | $2,954,684 | | | | $2,095,047 | | | | $8,543,874 | | | | $9,269,660 | |
| | 3,379 | | | | 4,111 | | | | 25,926 | | | | 23,456 | | | | 2,835 | | | | 37,483 | | | | 1,723,605 | |
| | — | | | | — | | | | — | | | | — | | | | — | | | | — | | | | — | |
| | 79,373 | | | | 23,086 | | | | 66,649 | | | | 29,877 | | | | 11,967 | | | | 74,744 | | | | — | |
| | — | | | | — | | | | — | | | | — | | | | — | | | | — | | | | — | |
| | — | | | | (2,904) | | | | — | | | | (2,847) | | | | — | | | | (3,648) | | | | (767,045) | |
| | 490,091 | | | | 3,877,822 | | | | 2,226,840 | | | | 3,005,170 | | | | 2,109,849 | | | | 8,652,453 | | | | 10,226,220 | |
| | | | | | | | | | | | | | | | | | | | | | | | | | |
| | 352,910 | | | | 230,434 | | | | 2,165,681 | | | | 1,623,006 | | | | 336,447 | | | | 5,495,111 | | | | 1,316,898 | |
| | 819,651 | | | | 1,382,602 | | | | — | | | | — | | | | 592,047 | | | | — | | | | 1,561,205 | |
| | 96,057 | | | | 116,087 | | | | 133,559 | | | | 152,743 | | | | 94,760 | | | | 236,004 | | | | 134,779 | |
| | 20,395 | | | | 22,195 | | | | 23,310 | | | | 24,563 | | | | 20,509 | | | | 30,513 | | | | 30,622 | |
| | 39,065 | | | | 15,802 | | | | 21,933 | | | | 19,550 | | | | 25,585 | | | | 26,163 | | | | 256,364 | |
| | 51,559 | | | | 187,752 | | | | 631,268 | | | | 635,409 | | | | 46,022 | | | | 1,496,337 | | | | 141,207 | |
| | 4,020 | | | | 4,658 | | | | 5,228 | | | | 5,786 | | | | 3,951 | | | | 8,574 | | | | 4,854 | |
| | 9,641 | | | | 64,512 | | | | 230,673 | | | | 236,780 | | | | 9,093 | | | | 327,333 | | | | 50,982 | |
| | 561 | | | | 15,520 | | | | 851 | | | | 16,624 | | | | 957 | | | | 3,574 | | | | 2,601 | |
| | 17,080 | | | | 17,736 | | | | 19,277 | | | | 22,012 | | | | 17,116 | | | | 25,308 | | | | 28,959 | |
| | 33,243 | | | | 207,858 | | | | 684,159 | | | | 705,069 | | | | 43,067 | | | | 1,103,052 | | | | 133,433 | |
| | 276 | | | | 74,764 | | | | 1,877 | | | | 85,103 | | | | 2,624 | | | | 11,563 | | | | 2,779 | |
| | 8,178 | | | | 11,340 | | | | 13,824 | | | | 16,970 | | | | 7,982 | | | | 29,739 | | | | 9,492 | |
| | 11,150 | | | | 11,130 | | | | 11,266 | | | | 11,567 | | | | 10,002 | | | | 13,580 | | | | 64,453 | |
| | 1,463,786 | | | | 2,362,390 | | | | 3,942,906 | | | | 3,555,182 | | | | 1,210,162 | | | | 8,806,851 | | | | 3,738,628 | |
| | | | | | | | | | | | | | | | | | | | | | | | | | |
| | (7,102) | | | | — | | | | — | | | | — | | | | (32,825) | | | | — | | | | (327,206) | |
| | (1,175) | | | | (217) | | | | (132) | | | | (149) | | | | (619) | | | | (70) | | | | (3,015) | |
| | 1,455,509 | | | | 2,362,173 | | | | 3,942,774 | | | | 3,555,033 | | | | 1,176,718 | | | | 8,806,781 | | | | 3,408,407 | |
| | | | | | | | | | | | | | | | | | | | | | | | | | |
| | (965,418) | | | | 1,515,649 | | | | (1,715,934) | | | | (549,863) | | | | 933,131 | | | | (154,328) | | | | 6,817,813 | |
| | | | | | | | | | | | | | | | | | | | | | | | | | |
| | | | | | | | | | | | | | | | | | | | | | | | | | |
| | 20,963,346 | | | | 2,706,803 | | | | 46,397,557 | | | | 7,282,668 | | | | 14,017,044 | | | | 63,409,154 | | | | 12,122,122 | |
| | — | | | | — | | | | — | | | | — | | | | — | | | | — | | | | — | |
| | — | | | | — | | | | — | | | | — | | | | — | | | | — | | | | — | |
| | — | | | | — | | | | 433,805 | | | | — | | | | — | | | | — | | | | (430,342) | |
| | — | | | | (63) | | | | (9,489) | | | | — | | | | — | | | | — | | | | (939,876) | |
| | — | | | | — | | | | — | | | | — | | | | — | | | | — | | | | (1,118) | |
| | | | | | | | | | | | | | | | | | | | | | | | | | |
| | (10,113,995) | | | | 11,809,912 | | | | (23,533,273) | | | | 20,162,608 | | | | (10,124,703) | | | | (10,647,308) | | | | (24,552,468) | |
| | — | | | | — | | | | — | | | | — | | | | — | | | | — | | | | — | |
| | — | | | | — | | | | 659,936 | | | | — | | | | — | | | | — | | | | (145,051) | |
| | — | | | | — | | | | — | | | | — | | | | — | | | | — | | | | 147,765 | |
| | — | | | | — | | | | — | | | | — | | | | — | | | | — | | | | (59,530) | |
| | 10,849,351 | | | | 14,516,652 | | | | 23,948,536 | | | | 27,445,276 | | | | 3,892,341 | | | | 52,761,846 | | | | (13,858,498) | |
| | | | | | | | | | | | | | | | | | | | | | | | | | |
| | $9,883,933 | | | | $16,032,301 | | | | $22,232,602 | | | | $26,895,413 | | | | $4,825,472 | | | | $52,607,518 | | | | $(7,040,685) | |
The accompanying Notes to Financial Statements are an integral part of this schedule.
209
Thrivent Mutual Funds
Statement of Operations – continued
| | | | | | | | | | | | | | | | |
| For the year ended October 31, 2011 | | Large Cap
Growth Fund | | | Large Cap
Value Fund | | | Large Cap Stock
Fund | | | Balanced Fund | |
Investment Income | | | | | | | | | | | | | | | | |
Dividends | | | $3,269,486 | | | | $12,392,711 | | | | $29,032,774 | | | | $2,056,835 | |
Taxable interest | | | 7,214 | | | | 11,977 | | | | 66,564 | | | | 2,215,598 | |
Tax-Exempt interest | | | — | | | | — | | | | — | | | | — | |
Income from mortgage dollar rolls | | | — | | | | — | | | | — | | | | 485,716 | |
Income from securities loaned | | | 14,159 | | | | 14,209 | | | | 123,413 | | | | 9,403 | |
Income from affiliated investments | | | — | | | | — | | | | — | | | | 137,814 | |
Foreign tax withholding | | | (60,983) | | | | (79,810) | | | | (417,752) | | | | (9,409) | |
Total Investment Income | | | 3,229,876 | | | | 12,339,087 | | | | 28,804,999 | | | | 4,895,957 | |
Expenses | | | | | | | | | | | | | | | | |
Adviser fees | | | 2,497,784 | | | | 2,435,687 | | | | 9,759,683 | | | | 1,135,213 | |
Administrative service fees | | | 136,607 | | | | 178,253 | | | | 415,387 | | | | 111,281 | |
Amortization of offering costs | | | — | | | | — | | | | — | | | | — | |
Audit and legal fees | | | 23,515 | | | | 26,306 | | | | 44,511 | | | | 21,766 | |
Custody fees | | | 39,163 | | | | 21,688 | | | | 66,269 | | | | 23,242 | |
Distribution expenses Class A | | | 310,935 | | | | 449,542 | | | | 3,855,674 | | | | 374,990 | |
Insurance expenses | | | 5,231 | | | | 6,554 | | | | 13,989 | | | | 4,443 | |
Printing and postage expenses Class A | | | 120,160 | | | | 107,378 | | | | 956,394 | | | | 77,792 | |
Printing and postage expenses Institutional Class | | | 1,166 | | | | 11,230 | | | | 1,132 | | | | 455 | |
SEC and state registration expenses | | | 19,076 | | | | 22,567 | | | | 38,026 | | | | 12,400 | |
Transfer agent fees Class A | | | 485,429 | | | | 439,144 | | | | 2,943,004 | | | | 265,980 | |
Transfer agent fees Institutional Class | | | 2,239 | | | | 51,823 | | | | 1,959 | | | | 504 | |
Trustees’ fees | | | 14,321 | | | | 20,849 | | | | 57,091 | | | | 10,297 | |
Other expenses | | | 11,466 | | | | 12,075 | | | | 19,791 | | | | 19,101 | |
Total Expenses Before Reimbursement | | | 3,667,092 | | | | 3,783,096 | | | | 18,172,910 | | | | 2,057,464 | |
Less: | | | | | | | | | | | | | | | | |
Reimbursement from adviser | | | (449,834) | | | | — | | | | — | | | | (6,817) | |
Custody earnings credit | | | (191) | | | | (166) | | | | (301) | | | | (540) | |
Total Net Expenses | | | 3,217,067 | | | | 3,782,930 | | | | 18,172,609 | | | | 2,050,107 | |
| | | | | | | | | | | | | | | | |
Net Investment Income/(Loss) | | | 12,809 | | | | 8,556,157 | | | | 10,632,390 | | | | 2,845,850 | |
Realized and Unrealized Gains/(Losses) | | | | | | | | | | | | | | | | |
Net realized gains/(losses) on: | | | | | | | | | | | | | | | | |
Investments | | | 30,592,401 | | | | 42,679,438 | | | | 128,916,298 | | | | 16,786,175 | |
Affiliated investments | | | — | | | | — | | | | — | | | | — | |
Written option contracts | | | 129,343 | | | | — | | | | (391,552) | | | | — | |
Futures contracts | | | — | | | | — | | | | 3,833,059 | | | | 86,252 | |
Foreign currency transactions | | | — | | | | — | | | | — | | | | (18,418) | |
Swap agreements | | | — | | | | — | | | | — | | | | (111,119) | |
Change in net unrealized appreciation/(depreciation) on: | | | | | | | | | | | | | | | | |
Investments | | | (21,300,823) | | | | (31,565,657) | | | | (91,572,919) | | | | (9,075,164) | |
Affiliated investments | | | — | | | | — | | | | — | | | | (51,259) | |
Written option contracts | | | (4,833) | | | | — | | | | 12,062 | | | | — | |
Futures contracts | | | — | | | | — | | | | (1,248,982) | | | | 190,024 | |
Foreign currency transactions | | | — | | | | — | | | | — | | | | — | |
Swap agreements | | | — | | | | — | | | | — | | | | 115,366 | |
Net Realized and Unrealized Gains/(Losses) | | | 9,416,088 | | | | 11,113,781 | | | | 39,547,966 | | | | 7,921,857 | |
| | | | | | | | | | | | | | | | |
Net Increase/(Decrease) in Net Assets Resulting From Operations | | $ | 9,428,897 | | | $ | 19,669,938 | | | $ | 50,180,356 | | | $ | 10,767,707 | |
The accompanying Notes to Financial Statements are an integral part of this schedule.
210
Thrivent Mutual Funds
Statement of Operations - continued
| | | | | | | | | | | | | | | | | | | | | | | | | | |
High Yield Fund | | | Municipal Bond Fund | | | Income Fund | | | Core Bond Fund | | | Government Bond Fund | | | Limited Maturity Bond Fund | | | Money Market
Fund | |
| | | | | | | | | | | | | | | | | | | | | | | | | | |
| | $669,355 | | | | $— | | | | $287,846 | | | | $38,370 | | | | $— | | | | $166,308 | | | | $58,161 | |
| | 56,869,864 | | | | 327,718 | | | | 38,258,593 | | | | 10,142,358 | | | | 2,629,920 | | | | 23,227,439 | | | | 1,850,450 | |
| | — | | | | 68,945,499 | | | | — | | | | — | | | | — | | | | — | | | | — | |
| | — | | | | — | | | | 1,094,439 | | | | 1,907,951 | | | | 191,913 | | | | 537,486 | | | | — | |
| | 235,474 | | | | — | | | | 16,601 | | | | — | | | | — | | | | 19,995 | | | | — | |
| | — | | | | — | | | | 710,201 | | | | 995,972 | | | | — | | | | 849,734 | | | | — | |
| | — | | | | — | | | | — | | | | — | | | | — | | | | — | | | | — | |
| | 57,774,693 | | | | 69,273,217 | | | | 40,367,680 | | | | 13,084,651 | | | | 2,821,833 | | | | 24,800,962 | | | | 1,908,611 | |
| | | | | | | | | | | | | | | | | | | | | | | | | | |
| | 2,695,261 | | | | 5,649,101 | | | | 2,663,573 | | | | 1,311,906 | | | | 409,188 | | | | 2,553,990 | | | | 3,103,754 | |
| | 209,729 | | | | 349,948 | | | | 226,220 | | | | 128,307 | | | | 90,459 | | | | 246,654 | | | | 200,188 | |
| | — | | | | — | | | | — | | | | — | | | | 12,287 | | | | — | | | | — | |
| | 29,195 | | | | 40,852 | | | | 30,272 | | | | 23,090 | | | | 21,112 | | | | 30,796 | | | | 29,003 | |
| | 24,348 | | | | 32,697 | | | | 34,445 | | | | 19,186 | | | | 8,313 | | | | 34,501 | | | | 27,290 | |
| | 1,120,477 | | | | 3,275,381 | | | | 993,744 | | | | 593,586 | | | | 6,531 | | | | 397,059 | | | | 797,558 | |
| | 7,350 | | | | 11,177 | | | | 7,731 | | | | 4,898 | | | | 3,745 | | | | 8,327 | | | | 7,069 | |
| | 177,330 | | | | 249,279 | | | | 145,638 | | | | 85,809 | | | | 3,308 | | | | 117,798 | | | | 471,033 | |
| | 12,348 | | | | 7,730 | | | | 1,848 | | | | 896 | | | | 680 | | | | 17,815 | | | | 774 | |
| | 35,145 | | | | 51,432 | | | | 32,425 | | | | 22,439 | | | | 24,967 | | | | 68,016 | | | | 92,631 | |
| | 517,034 | | | | 570,059 | | | | 443,155 | | | | 321,658 | | | | 12,513 | | | | 356,714 | | | | 1,209,222 | |
| | 60,819 | | | | 34,660 | | | | 2,310 | | | | 1,718 | | | | 551 | | | | 80,994 | | | | 1,857 | |
| | 25,817 | | | | 48,152 | | | | 28,403 | | | | 12,638 | | | | 5,416 | | | | 31,635 | | | | 35,720 | |
| | 23,324 | | | | 69,366 | | | | 36,410 | | | | 20,221 | | | | 11,238 | | | | 26,752 | | | | 14,681 | |
| | 4,938,177 | | | | 10,389,834 | | | | 4,646,174 | | | | 2,546,352 | | | | 610,308 | | | | 3,971,051 | | | | 5,990,780 | |
| | | | | | | | | | | | | | | | | | | | | | | | | | |
| | — | | | | — | | | | (35,615) | | | | (248,187) | | | | (4,410) | | | | (41,838) | | | | (4,062,717) | |
| | (170) | | | | (26) | | | | (149) | | | | (291) | | | | (724) | | | | (179) | | | | (39) | |
| | 4,938,007 | | | | 10,389,808 | | | | 4,610,410 | | | | 2,297,874 | | | | 605,174 | | | | 3,929,034 | | | | 1,928,024 | |
| | | | | | | | | | | | | | | | | | | | | | | | | | |
| | 52,836,686 | | | | 58,883,409 | | | | 35,757,270 | | | | 10,786,777 | | | | 2,216,659 | | | | 20,871,928 | | | | (19,413) | |
| | | | | | | | | | | | | | | | | | | | | | | | | | |
| | | | | | | | | | | | | | | | | | | | | | | | | | |
| | 25,871,040 | | | | (460,915) | | | | 21,058,350 | | | | 6,548,527 | | | | 2,403,260 | | | | 8,485,684 | | | | 19,413 | |
| | — | | | | — | | | | 3,386,848 | | | | — | | | | — | | | | — | | | | — | |
| | — | | | | — | | | | — | | | | — | | | | 4,062 | | | | — | | | | — | |
| | (49,214) | | | | — | | | | (4,591,190) | | | | (2,261,140) | | | | — | | | | (9,331,655) | | | | — | |
| | (151,200) | | | | — | | | | (2,721) | | | | — | | | | — | | | | — | | | | — | |
| | 124,713 | | | | — | | | | (957,049) | | | | (869,455) | | | | — | | | | (988,782) | | | | — | |
| | | | | | | | | | | | | | | | | | | | | | | | | | |
| | (46,805,703) | | | | (14,792,119) | | | | (20,936,165) | | | | (2,616,576) | | | | (469,509) | | | | (13,506,343) | | | | — | |
| | — | | | | — | | | | (3,432,090) | | | | (370,442) | | | | — | | | | (314,612) | | | | — | |
| | — | | | | — | | | | — | | | | — | | | | 3,094 | | | | — | | | | — | |
| | 25,961 | | | | — | | | | 2,403,382 | | | | 937,696 | | | | — | | | | 2,402,454 | | | | — | |
| | — | | | | — | | | | (64) | | | | — | | | | — | | | | — | | | | — | |
| | — | | | | — | | | | 146,210 | | | | 921,668 | | | | — | | | | 999,826 | | | | — | |
| | (20,984,403) | | | | (15,253,034) | | | | (2,924,489) | | | | 2,290,278 | | | | 1,940,907 | | | | (12,253,428) | | | | 19,413 | |
| | | | | | | | | | | | | | | | | | | | | | | | | | |
| | $31,852,283 | | | | $43,630,375 | | | | $32,832,781 | | | | $13,077,055 | | | | $4,157,566 | | | | $8,618,500 | | | | $— | |
The accompanying Notes to Financial Statements are an integral part of this schedule.
211
Thrivent Mutual Funds
Statement of Changes in Net Assets
| | | | | | | | | | | | | | | | |
| | | Aggressive Allocation Fund | | | Moderately Aggressive Allocation
Fund | |
| For the periods ended | | 10/31/2011 | | | 10/31/2010 | | | 10/31/2011 | | | 10/31/2010 | |
Operations | | | | | | | | | | | | | | | | |
Net investment income/(loss) | | | $3,844,417 | | | | $2,939,392 | | | | $18,503,872 | | | | $17,493,930 | |
Net realized gains/(losses) | | | 8,633,892 | | | | 3,039,244 | | | | 9,323,827 | | | | 7,183,776 | |
Change in net unrealized appreciation/(depreciation) | | | 7,219,682 | | | | 71,608,074 | | | | 6,835,313 | | | | 141,020,981 | |
Net Change in Net Assets Resulting From Operations | | | 19,697,991 | | | | 77,586,710 | | | | 34,663,012 | | | | 165,698,687 | |
Distributions to Shareholders | | | | | | | | | | | | | | | | |
From net investment income Class A | | | (2,192,280) | | | | (2,664,479) | | | | (15,308,506) | | | | (14,861,791) | |
From net investment income Institutional Class | | | (604,063) | | | | (658,060) | | | | (1,376,000) | | | | (1,318,354) | |
Total From Net Investment Income | | | (2,796,343) | | | | (3,322,539) | | | | (16,684,506) | | | | (16,180,145) | |
Total Distributions to Shareholders | | | (2,796,343) | | | | (3,322,539) | | | | (16,684,506) | | | | (16,180,145) | |
Capital Stock Transactions | | | | | | | | | | | | | | | | |
Class A | | | | | | | | | | | | | | | | |
Sold | | | 72,979,932 | | | | 68,966,735 | | | | 191,221,945 | | | | 165,343,830 | |
Distributions reinvested | | | 2,185,958 | | | | 2,656,356 | | | | 15,263,771 | | | | 14,802,004 | |
Redeemed | | | (62,704,921) | | | | (53,896,599) | | | | (139,703,885) | | | | (137,940,860) | |
Total Class A Capital Stock Transactions | | | 12,460,969 | | | | 17,726,492 | | | | 66,781,831 | | | | 42,204,974 | |
Institutional Class | | | | | | | | | | | | | | | | |
Sold | | | 21,133,637 | | | | 14,716,084 | | | | 17,258,665 | | | | 13,566,962 | |
Distributions reinvested | | | 604,063 | | | | 657,354 | | | | 1,373,640 | | | | 1,316,075 | |
Redeemed | | | (18,139,215) | | | | (15,622,819) | | | | (14,480,535) | | | | (14,882,728) | |
Total Institutional Class Capital Stock Transactions | | | 3,598,485 | | | | (249,381) | | | | 4,151,770 | | | | 309 | |
Capital Stock Transactions | | | 16,059,454 | | | | 17,477,111 | | | | 70,933,601 | | | | 42,205,283 | |
| | | | | | | | | | | | | | | | |
Net Increase/(Decrease) in Net Assets | | | 32,961,102 | | | | 91,741,282 | | | | 88,912,107 | | | | 191,723,825 | |
Net Assets, Beginning of Period | | | 509,194,547 | | | | 417,453,265 | | | | 1,164,770,775 | | | | 973,046,950 | |
Net Assets, End of Period | | | $542,155,649 | | | | $509,194,547 | | | | $1,253,682,882 | | | | $1,164,770,775 | |
Accumulated Undistributed Net Investment Income/(Loss) | | | $1,024,456 | | | | $67,966 | | | | $10,247,581 | | | | $8,928,662 | |
| | | | |
Capital Stock Share Transactions | | | | | | | | | | | | | | | | |
| | | | |
Class A shares | | | | | | | | | | | | | | | | |
Sold | | | 6,576,113 | | | | 7,178,016 | | | | 17,106,063 | | | | 16,664,078 | |
Distributions reinvested | | | 197,830 | | | | 280,206 | | | | 1,377,675 | | | | 1,521,276 | |
Redeemed | | | (5,649,501) | | | | (5,618,283) | | | | (12,574,154) | | | | (13,921,180) | |
Total Class A shares | | | 1,124,442 | | | | 1,839,939 | | | | 5,909,584 | | | | 4,264,174 | |
| | | | |
Institutional Class shares | | | | | | | | | | | | | | | | |
Sold | | | 1,914,739 | | | | 1,521,617 | | | | 1,554,504 | | | | 1,367,382 | |
Distributions reinvested | | | 54,420 | | | | 69,050 | | | | 123,529 | | | | 134,706 | |
Redeemed | | | (1,614,642) | | | | (1,616,293) | | | | (1,301,965) | | | | (1,491,806) | |
Total Institutional Class shares | | | 354,517 | | | | (25,626) | | | | 376,068 | | | | 10,282 | |
The accompanying Notes to Financial Statements are an integral part of this schedule.
212
Thrivent Mutual Funds
Statement of Changes in Net Assets - continued
| | | | | | | | | | | | | | | | | | | | | | | | | | | | | | |
| Moderate Allocation Fund | | | Moderately Conservative Allocation Fund | | | Partner Small Cap Growth Fund | | | Partner Small Cap Value Fund | |
| 10/31/2011 | | | 10/31/2010 | | | 10/31/2011 | | | 10/31/2010 | | | 10/31/2011 | | | 10/31/2010 | | | 10/31/2011 | | | 10/31/2010 | |
| | | | | | | | | | | | | | | | | | | | | | | | | | | | | | |
| | $25,654,551 | | | | $24,486,316 | | | | $12,911,591 | | | | $12,163,239 | | | | $(965,418) | | | | $(751,652) | | | | $1,515,649 | | | | $1,111,240 | |
| | 8,843,588 | | | | 10,148,826 | | | | 2,226,686 | | | | 4,024,183 | | | | 20,963,346 | | | | 9,387,923 | | | | 2,706,740 | | | | 5,713,394 | |
| | 1,594,497 | | | | 116,495,752 | | | | (2,245,062) | | | | 38,705,916 | | | | (10,113,995) | | | | 17,796,518 | | | | 11,809,912 | | | | 34,309,656 | |
| | 36,092,636 | | | | 151,130,894 | | | | 12,893,215 | | | | 54,893,338 | | | | 9,883,933 | | | | 26,432,789 | | | | 16,032,301 | | | | 41,134,290 | |
| | | | | | | | | | | | | | | | | | | | | | | | | | | | | | |
| | (23,758,811) | | | | (22,341,325) | | | | (12,198,274) | | | | (11,249,131) | | | | – | | | | – | | | | (460,512) | | | | (156,873) | |
| | (1,328,738) | | | | (1,114,227) | | | | (564,122) | | | | (496,610) | | | | – | | | | – | | | | (1,636,460) | | | | (1,044,089) | |
| | (25,087,549) | | | | (23,455,552) | | | | (12,762,396) | | | | (11,745,741) | | | | – | | | | – | | | | (2,096,972) | | | | (1,200,962) | |
| | (25,087,549) | | | | (23,455,552) | | | | (12,762,396) | | | | (11,745,741) | | | | – | | | | – | | | | (2,096,972) | | | | (1,200,962) | |
| | | | | | | | | | | | | | | | | | | | | | | | | | | | | | |
| | | | | | | | | | | | | | | | | | | | | | | | | | | | | | |
| | 216,818,090 | | | | 195,649,684 | | | | 131,811,352 | | | | 130,576,281 | | | | 4,189,096 | | | | 1,567,361 | | | | 8,129,748 | | | | 11,027,094 | |
| | 23,524,722 | | | | 22,112,999 | | | | 12,059,387 | | | | 11,125,731 | | | | – | | | | – | | | | 455,500 | | | | 155,336 | |
| | (162,036,497) | | | | (144,709,833) | | | | (88,008,474) | | | | (72,393,697) | | | | (2,873,078) | | | | (1,005,627) | | | | (15,114,533) | | | | (11,164,110) | |
| | 78,306,315 | | | | 73,052,850 | | | | 55,862,265 | | | | 69,308,315 | | | | 1,316,018 | | | | 561,734 | | | | (6,529,285) | | | | 18,320 | |
| | | | | | | | | | | | | | | | | | | | | | | | | | | | | | |
| | 19,051,720 | | | | 13,779,414 | | | | 8,556,023 | | | | 11,937,321 | | | | 157,714 | | | | 2,170,767 | | | | 23,113,533 | | | | 35,643,617 | |
| | 1,315,981 | | | | 1,105,761 | | | | 560,593 | | | | 478,689 | | | | – | | | | – | | | | 1,636,460 | | | | 1,044,089 | |
| | (11,598,838) | | | | (8,171,642) | | | | (8,385,190) | | | | (6,247,625) | | | | (105,696) | | | | (1,553,161) | | | | (51,890,518) | | | | (22,438,898) | |
| | 8,768,863 | | | | 6,713,533 | | | | 731,426 | | | | 6,168,385 | | | | 52,018 | | | | 617,606 | | | | (27,140,525) | | | | 14,248,808 | |
| | 87,075,178 | | | | 79,766,383 | | | | 56,593,691 | | | | 75,476,700 | | | | 1,368,036 | | | | 1,179,340 | | | | (33,669,810) | | | | 14,267,128 | |
| | | | | | | | | | | | | | | | | | | | | | | | | | | | | | |
| | 98,080,265 | | | | 207,441,725 | | | | 56,724,510 | | | | 118,624,297 | | | | 11,251,969 | | | | 27,612,129 | | | | (19,734,481) | | | | 54,200,456 | |
| | 1,169,158,427 | | | | 961,716,702 | | | | 525,354,922 | | | | 406,730,625 | | | | 113,153,824 | | | | 85,541,695 | | | | 232,442,789 | | | | 178,242,333 | |
| | $1,267,238,692 | | | | $1,169,158,427 | | | | $582,079,432 | | | | $525,354,922 | | | | $124,405,793 | | | | $113,153,824 | | | | $212,708,308 | | | | $232,442,789 | |
| | $1,286,371 | | | | $1,220,033 | | | | $770,688 | | | | $788,101 | | | | $(15,220) | | | | $(11,240) | | | | $44,202 | | | | $642,456 | |
| | | | | | | |
| | | | | | | | | | | | | | | | | | | | | | | | | | | | | | | |
| | | | | | | |
| | | | | | | | | | | | | | | | | | | | | | | | | | | | | | | |
| | 19,555,874 | | | | 19,400,212 | | | | 12,034,613 | | | | 12,749,658 | | | | 336,293 | | | | 156,451 | | | | 541,306 | | | | 840,392 | |
| | 2,162,972 | | | | 2,210,464 | | | | 1,113,915 | | | | 1,092,199 | | | | – | | | | – | | | | 29,752 | | | | 12,358 | |
| | (14,682,271) | | | | (14,385,892) | | | | (8,049,776) | | | | (7,075,922) | | | | (230,042) | | | | (101,618) | | | | (1,006,570) | | | | (870,513) | |
| | 7,036,575 | | | | 7,224,784 | | | | 5,098,752 | | | | 6,765,935 | | | | 106,251 | | | | 54,833 | | | | (435,512) | | | | (17,763) | |
| | | | | | | |
| | | | | | | | | | | | | | | | | | | | | | | | | | | | | | |
| | 1,723,560 | | | | 1,364,566 | | | | 781,661 | | | | 1,163,646 | | | | 12,216 | | | | 231,340 | | | | 1,473,068 | | | | 2,651,175 | |
| | 120,804 | | | | 110,301 | | | | 51,693 | | | | 46,876 | | | | – | | | | – | | | | 102,279 | | | | 79,580 | |
| | (1,052,198) | | | | (809,707) | | | | (769,403) | | | | (606,648) | | | | (9,118) | | | | (157,526) | | | | (3,304,858) | | | | (1,658,262) | |
| | 792,166 | | | | 665,160 | | | | 63,951 | | | | 603,874 | | | | 3,098 | | | | 73,814 | | | | (1,729,511) | | | | 1,072,493 | |
The accompanying Notes to Financial Statements are an integral part of this schedule.
213
Thrivent Mutual Funds
Statement of Changes in Net Assets - continued
| | | | | | | | | | | | | | | | |
| | | Small Cap Stock Fund | | | Mid Cap Growth Fund | |
| For the periods ended | | 10/31/2011 | | | 10/31/2010 | | | 10/31/2011 | | | 10/31/2010 | |
Operations | | | | | | | | | | | | | | | | |
Net investment income/(loss) | | | $(1,715,934) | | | | $(1,431,307) | | | | $(549,863) | | | | $(941,923) | |
Net realized gains/(losses) | | | 46,821,873 | | | | 58,406,065 | | | | 7,282,668 | | | | 23,770,581 | |
Change in net unrealized appreciation/(depreciation) | | | (22,873,337) | | | | 3,389,604 | | | | 20,162,608 | | | | 63,423,523 | |
Net Change in Net Assets Resulting From Operations | | | 22,232,602 | | | | 60,364,362 | | | | 26,895,413 | | | | 86,252,181 | |
Distributions to Shareholders | | | | | | | | | | | | | | | | |
From net investment income Class A | | | – | | | | – | | | | – | | | | – | |
From net investment income Institutional Class | | | – | | | | – | | | | – | | | | – | |
Total From Net Investment Income | | | – | | | | – | | | | – | | | | – | |
Total Distributions to Shareholders | | | – | | | | – | | | | – | | | | – | |
Capital Stock Transactions | | | | | | | | | | | | | | | | |
Class A | | | | | | | | | | | | | | | | |
Sold | | | 10,133,524 | | | | 9,156,418 | | | | 16,969,696 | | | | 15,244,965 | |
Issued in connection with merger | | | – | | | | – | | | | – | | | | – | |
Distributions reinvested | | | – | | | | – | | | | 6 | | | | – | |
Redeemed | | | (39,659,221) | | | | (38,192,640) | | | | (36,287,847) | | | | (30,167,334) | |
Total Class A Capital Stock Transactions | | | (29,525,697) | | | | (29,036,222) | | | | (19,318,145) | | | | (14,922,369) | |
Institutional Class | | | | | | | | | | | | | | | | |
Sold | | | 549,852 | | | | 5,881,036 | | | | 32,340,395 | | | | 40,515,809 | |
Issued in connection with merger | | | – | | | | – | | | | – | | | | – | |
Distributions reinvested | | | – | | | | – | | | | – | | | | – | |
Redeemed | | | (14,383,661) | | | | (9,431,539) | | | | (38,374,110) | | | | (14,387,712) | |
Total Institutional Class Capital Stock Transactions | | | (13,833,809) | | | | (3,550,503) | | | | (6,033,715) | | | | 26,128,097 | |
Capital Stock Transactions | | | (43,359,506) | | | | (32,586,725) | | | | (25,351,860) | | | | 11,205,728 | |
| | | | | | | | | | | | | | | | |
Net Increase/(Decrease) in Net Assets | | | (21,126,904) | | | | 27,777,637 | | | | 1,543,553 | | | | 97,457,909 | |
Net Assets, Beginning of Period | | | 307,741,379 | | | | 279,963,742 | | | | 389,232,491 | | | | 291,774,582 | |
Net Assets, End of Period | | | $286,614,475 | | | | $307,741,379 | | | | $390,776,044 | | | | $389,232,491 | |
Accumulated Undistributed Net Investment Income/(Loss) | | | $(67,634) | | | | $(67,688) | | | | $(44,303) | | | | $(41,895) | |
| | | | |
Capital Stock Share Transactions | | | | | | | | | | | | | | | | |
| | | | |
Class A shares | | | | | | | | | | | | | | | | |
Sold | | | 717,941 | | | | 790,845 | | | | 932,901 | | | | 1,031,581 | |
Issued in connection with merger | | | – | | | | – | | | | – | | | | – | |
Distributions reinvested | | | – | | | | – | | | | – | | | | – | |
Redeemed | | | (2,801,742) | | | | (3,317,946) | | | | (2,003,953) | | | | (2,044,697) | |
Total Class A shares | | | (2,083,801) | | | | (2,527,101) | | | | (1,071,052) | | | | (1,013,116) | |
| | | | |
Institutional Class shares | | | | | | | | | | | | | | | | |
Sold | | | 42,060 | | | | 468,154 | | | | 1,612,274 | | | | 2,484,591 | |
Issued in connection with merger | | | – | | | | – | | | | – | | | | – | |
Distributions reinvested | | | – | | | | – | | | | – | | | | – | |
Redeemed | | | (916,311) | | | | (743,301) | | | | (1,864,757) | | | | (867,026) | |
Total Institutional Class shares | | | (874,251) | | | | (275,147) | | | | (252,483) | | | | 1,617,565 | |
The accompanying Notes to Financial Statements are an integral part of this schedule.
214
Thrivent Mutual Funds
Statement of Changes in Net Assets - continued
| | | | | | | | | | | | | | | | | | | | | | | | | | | | | | |
| Partner Mid Cap Value Fund | | | Mid Cap Stock Fund | | | Partner Worldwide Allocation
Fund | | | Large Cap Growth Fund | |
| 10/31/2011 | | | 10/31/2010 | | | 10/31/2011 | | | 10/31/2010 | | | 10/31/2011 | | | 10/31/2010 | | | 10/31/2011 | | | 10/31/2010 | |
| | | | | | | | | | | | | | | | | | | | | | | | | | | | | | |
| | $933,131 | | | | $960,033 | | | | $(154,328) | | | | $1,233,618 | | | | $6,817,813 | | | | $3,558,015 | | | | $12,809 | | | | $(17,614) | |
| | 14,017,044 | | | | 10,280,114 | | | | 63,409,154 | | | | 45,868,961 | | | | 10,750,786 | | | | 3,375,992 | | | | 30,721,744 | | | | 6,433,282 | |
| | (10,124,703) | | | | 13,485,838 | | | | (10,647,308) | | | | 117,529,372 | | | | (24,609,284) | | | | 23,532,822 | | | | (21,305,656) | | | | 31,951,425 | |
| | 4,825,472 | | | | 24,725,985 | | | | 52,607,518 | | | | 164,631,951 | | | | (7,040,685) | | | | 30,466,829 | | | | 9,428,897 | | | | 38,367,093 | |
| | | | | | | | | | | | | | | | | | | | | | | | | | | | | | |
| | (61,484) | | | | (102,980) | | | | – | | | | – | | | | (427,163) | | | | (393,632) | | | | – | | | | (304,669) | |
| | (649,610) | | | | (837,433) | | | | (701,194) | | | | (766,405) | | | | (3,182,677) | | | | (2,098,535) | | | | – | | | | (895,056) | |
| | (711,094) | | | | (940,413) | | | | (701,194) | | | | (766,405) | | | | (3,609,840) | | | | (2,492,167) | | | | – | | | | (1,199,725) | |
| | (711,094) | | | | (940,413) | | | | (701,194) | | | | (766,405) | | | | (3,609,840) | | | | (2,492,167) | | | | – | | | | (1,199,725) | |
| | | | | | | | | | | | | | | | | | | | | | | | | | | | | | | |
| | | | | | | | | | | | | | | | | | | | | | | | | | | | | | | |
| | 2,949,752 | | | | 2,100,222 | | | | 20,133,595 | | | | 18,961,193 | | | | 10,960,979 | | | | 8,289,252 | | | | 14,799,227 | | | | 9,355,578 | |
| | – | | | | – | | | | – | | | | – | | | | 139,748,822 | | | | – | | | | – | | | | – | |
| | 60,710 | | | | 102,004 | | | | – | | | | – | | | | 423,858 | | | | 392,530 | | | | 8 | | | | 300,544 | |
| | (2,342,670) | | | | (2,198,681) | | | | (90,080,115) | | | | (82,352,010) | | | | (6,244,494) | | | | (2,989,721) | | | | (21,654,591) | | | | (21,522,276) | |
| | 667,792 | | | | 3,545 | | | | (69,946,520) | | | | (63,390,817) | | | | 144,889,165 | | | | 5,692,061 | | | | (6,855,356) | | | | (11,866,154) | |
| | | | | | | | | | | | | | | | | | | | | | | | | | | | | | |
| | 1,494,093 | | | | 3,338,732 | | | | 10,124,335 | | | | 19,899,352 | | | | 27,438,370 | | | | 77,410,248 | | | | 3,338,841 | | | | 11,510,965 | |
| | – | | | | – | | | | – | | | | – | | | | 244,906,000 | | | | – | | | | – | | | | – | |
| | 649,610 | | | | 837,432 | | | | 697,344 | | | | 763,555 | | | | 3,178,915 | | | | 2,098,535 | | | | – | | | | 885,312 | |
| | (9,563,591) | | | | (1,489,047) | | | | (26,104,038) | | | | (56,952,622) | | | | (6,484,240) | | | | (3,081,557) | | | | (5,186,236) | | | | (8,747,119) | |
| | (7,419,888) | | | | 2,687,117 | | | | (15,282,359) | | | | (36,289,715) | | | | 269,039,045 | | | | 76,427,226 | | | | (1,847,395) | | | | 3,649,158 | |
| | (6,752,096) | | | | 2,690,662 | | | | (85,228,879) | | | | (99,680,532) | | | | 413,928,210 | | | | 82,119,287 | | | | (8,702,751) | | | | (8,216,996) | |
| | | | | | | | | | | | | | | | | | | | | | | | | | | | | | |
| | (2,637,718) | | | | 26,476,234 | | | | (33,322,555) | | | | 64,185,014 | | | | 403,277,685 | | | | 110,093,949 | | | | 726,146 | | | | 28,950,372 | |
| | 120,777,400 | | | | 94,301,166 | | | | 787,710,750 | | | | 723,525,736 | | | | 254,545,463 | | | | 144,451,514 | | | | 321,289,732 | | | | 292,339,360 | |
| | $118,139,682 | | | | $120,777,400 | | | | $754,388,195 | | | | $787,710,750 | | | | $657,823,148 | | | | $254,545,463 | | | | $322,015,878 | | | | $321,289,732 | |
| | $542,505 | | | | $394,071 | | | | $(132,044) | | | | $568,402 | | | | $5,378,677 | | | | $3,016,613 | | | | $(45,123) | | | | $(57,932) | |
| | | | | | | |
| | | | | | | | | | | | | | | | | | | | | | | | | | | | | | |
| | | | | | | |
| | | | | | | | | | | | | | | | | | | | | | | | | | | | | | |
| | 242,135 | | | | 203,958 | | | | 1,334,701 | | | | 1,537,346 | | | | 1,242,781 | | | | 1,032,950 | | | | 2,915,107 | | | | 2,037,183 | |
| | – | | | | – | | | | – | | | | – | | | | 17,097,278 | | | | – | | | | – | | | | – | |
| | 4,993 | | | | 10,262 | | | | – | | | | – | | | | 47,518 | | | | 49,005 | | | | 2 | | | | 64,216 | |
| | (191,822) | | | | (216,162) | | | | (5,998,350) | | | | (6,706,663) | | | | (736,865) | | | | (381,116) | | | | (4,273,848) | | | | (4,705,429) | |
| | 55,306 | | | | (1,942) | | | | (4,663,649) | | | | (5,169,317) | | | | 17,650,712 | | | | 700,839 | | | | (1,358,739) | | | | (2,604,030) | |
| | | | | | | |
| | | | | | | | | | | | | | | | | | | | | | | | | | | | | | |
| | 122,097 | | | | 338,044 | | | | 638,012 | | | | 1,515,029 | | | | 3,016,555 | | | | 9,548,496 | | | | 676,635 | | | | 2,403,604 | |
| | – | | | | – | | | | – | | | | – | | | | 29,836,547 | | | | – | | | | – | | | | – | |
| | 53,378 | | | | 84,164 | | | | 43,126 | | | | 58,780 | | | | 355,549 | | | | 261,663 | | | | – | | | | 177,417 | |
| | (803,760) | | | | (146,577) | | | | (1,612,954) | | | | (4,249,364) | | | | (735,786) | | | | (387,416) | | | | (941,925) | | | | (1,775,733) | |
| | (628,285) | | | | 275,631 | | | | (931,816) | | | | (2,675,555) | | | | 32,472,865 | | | | 9,422,743 | | | | (265,290) | | | | 805,288 | |
The accompanying Notes to Financial Statements are an integral part of this schedule.
215
Thrivent Mutual Funds
Statement of Changes in Net Assets - continued
| | | | | | | | | | | | | | | | |
| | | Large Cap Value Fund | | | Large Cap Stock Fund | |
| For the periods ended | | 10/31/2011 | | | 10/31/2010 | | | 10/31/2011 | | | 10/31/2010 | |
Operations | | | | | | | | | | | | | | | | |
Net investment income/(loss) | | | $8,556,157 | | | | $6,152,727 | | | | $10,632,390 | | | | $5,991,962 | |
Net realized gains/(losses) | | | 42,679,438 | | | | 8,640,628 | | | | 132,357,805 | | | | 172,352,474 | |
Change in net unrealized appreciation/(depreciation) | | | (31,565,657) | | | | 34,965,078 | | | | (92,809,839) | | | | 9,514,454 | |
Net Change in Net Assets Resulting From Operations | | | 19,669,938 | | | | 49,758,433 | | | | 50,180,356 | | | | 187,858,890 | |
Distributions to Shareholders | | | | | | | | | | | | | | | | |
From net investment income Class A | | | (1,579,142) | | | | (2,200,300) | | | | (5,246,492) | | | | (8,586,854) | |
From net investment income Institutional Class | | | (4,934,596) | | | | (5,142,330) | | | | (1,549,194) | | | | (1,920,348) | |
Total From Net Investment Income | | | (6,513,738) | | | | (7,342,630) | | | | (6,795,686) | | | | (10,507,202) | |
From net realized gains Class A | | | – | | | | – | | | | – | | | | – | |
From net realized gains Institutinal Class | | | – | | | | – | | | | – | | | | – | |
Total From Net Realized Gains | | | – | | | | – | | | | – | | | | – | |
Total Distributions to Shareholders | | | (6,513,738) | | | | (7,342,630) | | | | (6,795,686) | | | | (10,507,202) | |
Capital Stock Transactions | | | | | | | | | | | | | | | | |
Class A | | | | | | | | | | | | | | | | |
Sold | | | 12,881,324 | | | | 8,383,073 | | | | 40,472,102 | | | | 39,718,700 | |
Distributions reinvested | | | 1,534,657 | | | | 2,141,468 | | | | 5,160,525 | | | | 8,449,428 | |
Redeemed | | | (31,046,601) | | | | (29,955,576) | | | | (241,048,632) | | | | (237,448,708) | |
Total Class A Capital Stock Transactions | | | (16,630,620) | | | | (19,431,035) | | | | (195,416,005) | | | | (189,280,580) | |
Institutional Class | | | | | | | | | | | | | | | | |
Sold | | | 40,269,765 | | | | 49,320,502 | | | | 3,428,263 | | | | 8,056,429 | |
Distributions reinvested | | | 4,917,644 | | | | 5,122,221 | | | | 1,540,355 | | | | 1,902,767 | |
Redeemed | | | (28,246,884) | | | | (23,426,472) | | | | (14,984,926) | | | | (25,787,956) | |
Total Institutional Class Capital Stock Transactions | | | 16,940,525 | | | | 31,016,251 | | | | (10,016,308) | | | | (15,828,760) | |
Capital Stock Transactions | | | 309,905 | | | | 11,585,216 | | | | (205,432,313) | | | | (205,109,340) | |
| | | | | | | | | | | | | | | | |
Net Increase/(Decrease) in Net Assets | | | 13,466,105 | | | | 54,001,019 | | | | (162,047,643) | | | | (27,757,652) | |
Net Assets, Beginning of Period | | | 507,117,588 | | | | 453,116,569 | | | | 1,725,788,198 | | | | 1,753,545,850 | |
Net Assets, End of Period | | | $520,583,693 | | | | $507,117,588 | | | | $1,563,740,555 | | | | $1,725,788,198 | |
Accumulated Undistributed Net Investment Income/(Loss) | | | $6,757,974 | | | | $4,734,847 | | | | $7,816,114 | | | | $4,018,330 | |
| | | | |
Capital Stock Share Transactions | | | | | | | | | | | | | | | | |
| | | | |
Class A shares | | | | | | | | | | | | | | | | |
Sold | | | 950,048 | | | | 680,489 | | | | 1,825,037 | | | | 1,969,018 | |
Distributions reinvested | | | 113,342 | | | | 174,245 | | | | 232,142 | | | | 413,575 | |
Redeemed | | | (2,299,498) | | | | (2,452,840) | | | | (10,868,388) | | | | (11,841,571) | |
Total Class A shares | | | (1,236,108) | | | | (1,598,106) | | | | (8,811,209) | | | | (9,458,978) | |
| | | | |
Institutional Class shares | | | | | | | | | | | | | | | | |
Sold | | | 3,005,622 | | | | 4,053,795 | | | | 156,349 | | | | 397,809 | |
Distributions reinvested | | | 362,124 | | | | 415,428 | | | | 69,012 | | | | 92,773 | |
Redeemed | | | (2,116,224) | | | | (1,911,313) | | | | (680,359) | | | | (1,267,635) | |
Total Institutional Class shares | | | 1,251,522 | | | | 2,557,910 | | | | (454,998) | | | | (777,053) | |
The accompanying Notes to Financial Statements are an integral part of this schedule.
216
Thrivent Mutual Funds
Statement of Changes in Net Assets - continued
| | | | | | | | | | | | | | | | | | | | | | | | | | | | | | |
| Balanced Fund | | | High Yield Fund | | | Municipal Bond Fund | | | Income Fund | |
| 10/31/2011 | | | 10/31/2010 | | | 10/31/2011 | | | 10/31/2010 | | | 10/31/2011 | | | 10/31/2010 | | | 10/31/2011 | | | 10/31/2010 | |
| | | | | | | | | | | | | | | | | | | | | | | | | | | | | | | |
| | $2,845,850 | | | | $2,937,865 | | | | $52,836,686 | | | | $55,100,521 | | | | $58,883,409 | | | | $59,159,650 | | | | $35,757,270 | | | | $37,575,328 | |
| | 16,742,890 | | | | 18,503,265 | | | | 25,795,339 | | | | 14,431,747 | | | | (460,915) | | | | 2,872,931 | | | | 18,894,238 | | | | 23,166,588 | |
| | (8,821,033) | | | | 8,982,829 | | | | (46,779,742) | | | | 43,106,825 | | | | (14,792,119) | | | | 31,407,282 | | | | (21,818,727) | | | | 36,943,241 | |
| | 10,767,707 | | | | 30,423,959 | | | | 31,852,283 | | | | 112,639,093 | | | | 43,630,375 | | | | 93,439,863 | | | | 32,832,781 | | | | 97,685,157 | |
| | | | | | | | | | | | | | | | | | | | | | | | | | | | | | | |
| | (1,841,354) | | | | (1,958,480) | | | | (33,268,039) | | | | (33,273,825) | | | | (55,185,971) | | | | (55,045,777) | | | | (17,401,619) | | | | (18,193,417) | |
| | (962,616) | | | | (1,024,330) | | | | (19,523,402) | | | | (21,666,076) | | | | (4,017,796) | | | | (3,948,211) | | | | (18,309,267) | | | | (19,240,510) | |
| | (2,803,970) | | | | (2,982,810) | | | | (52,791,441) | | | | (54,939,901) | | | | (59,203,767) | | | | (58,993,988) | | | | (35,710,886) | | | | (37,433,927) | |
| | – | | | | – | | | | – | | | | – | | | | (2,455,320) | | | | – | | | | – | | | | – | |
| | – | | | | – | | | | – | | | | – | | | | (169,100) | | | | – | | | | – | | | | – | |
| | – | | | | – | | | | – | | | | – | | | | (2,624,420) | | | | – | | | | – | | | | – | |
| | (2,803,970) | | | | (2,982,810) | | | | (52,791,441) | | | | (54,939,901) | | | | (61,828,187) | | | | (58,993,988) | | | | (35,710,886) | | | | (37,433,927) | |
| | | | | | | | | | | | | | | | | | | | | | | | | | | | | | | |
| | | | | | | | | | | | | | | | | | | | | | | | | | | | | | | |
| | 6,990,434 | | | | 6,696,437 | | | | 45,990,851 | | | | 40,783,677 | | | | 107,696,648 | | | | 181,804,086 | | | | 35,013,016 | | | | 38,171,486 | |
| | 1,794,656 | | | | 1,911,371 | | | | 23,674,359 | | | | 23,784,653 | | | | 48,031,722 | | | | 45,483,356 | | | | 14,639,654 | | | | 15,218,289 | |
| | (22,410,197) | | | | (23,716,521) | | | | (58,752,341) | | | | (56,061,970) | | | | (183,703,992) | | | | (121,553,891) | | | | (55,211,906) | | | | (44,769,056) | |
| | (13,625,107) | | | | (15,108,713) | | | | 10,912,869 | | | | 8,506,360 | | | | (27,975,622) | | | | 105,733,551 | | | | (5,559,236) | | | | 8,620,719 | |
| | | | | | | | | | | | | | | | | | | | | | | | | | | | | | | |
| | 751,956 | | | | 248,009 | | | | 46,710,070 | | | | 50,531,882 | | | | 31,844,349 | | | | 35,288,186 | | | | 33,301,247 | | | | 36,082,588 | |
| | 960,765 | | | | 1,022,560 | | | | 13,717,817 | | | | 14,942,393 | | | | 3,815,536 | | | | 3,469,716 | | | | 18,023,904 | | | | 18,911,875 | |
| | (7,766,371) | | | | (6,426,134) | | | | (64,343,015) | | | | (63,671,516) | | | | (43,170,718) | | | | (32,082,870) | | | | (19,683,227) | | | | (97,013,694) | |
| | (6,053,650) | | | | (5,155,565) | | | | (3,915,128) | | | | 1,802,759 | | | | (7,510,833) | | | | 6,675,032 | | | | 31,641,924 | | | | (42,019,231) | |
| | (19,678,757) | | | | (20,264,278) | | | | 6,997,741 | | | | 10,309,119 | | | | (35,486,455) | | | | 112,408,583 | | | | 26,082,688 | | | | (33,398,512) | |
| | | | | | | | | | | | | | | | | | | | | | | | | | | | | | | |
| | (11,715,020) | | | | 7,176,871 | | | | (13,941,417) | | | | 68,008,311 | | | | (53,684,267) | | | | 146,854,458 | | | | 23,204,583 | | | | 26,852,718 | |
| | 205,434,651 | | | | 198,257,780 | | | | 702,635,181 | | | | 634,626,870 | | | | 1,479,790,866 | | | | 1,332,936,408 | | | | 775,821,770 | | | | 748,969,052 | |
| | $193,719,631 | | | | $205,434,651 | | | | $688,693,764 | | | | $702,635,181 | | | | $1,426,106,599 | | | | $1,479,790,866 | | | | $799,026,353 | | | | $775,821,770 | |
| | $(6,748) | | | | $59,336 | | | | $(216,746) | | | | $80,827 | | | | $(62,577) | | | | $258,821 | | | | $(11,177) | | | | $270,554 | |
| | | | | | | |
| | | | | | | | | | | | | | | | | | | | | | | | | | | | | | | |
| | | | | | | |
| | | | | | | | | | | | | | | | | | | | | | | | | | | | | | | |
| | 561,207 | | | | 607,091 | | | | 9,538,503 | | | | 8,822,895 | | | | 9,743,582 | | | | 16,119,728 | | | | 4,010,830 | | | | 4,524,071 | |
| | 146,440 | | | | 173,560 | | | | 4,916,656 | | | | 5,142,971 | | | | 4,360,334 | | | | 4,029,396 | | | | 1,675,223 | | | | 1,805,875 | |
| | (1,811,312) | | | | (2,154,582) | | | | (12,170,187) | | | | (12,141,884) | | | | (16,755,034) | | | | (10,775,955) | | | | (6,333,359) | | | | (5,332,228) | |
| | (1,103,665) | | | | (1,373,931) | | | | 2,284,972 | | | | 1,823,982 | | | | (2,651,118) | | | | 9,373,169 | | | | (647,306) | | | | 997,718 | |
| | | | | | | |
| | | | | | | | | | | | | | | | | | | | | | | | | | | | | | | |
| | 59,780 | | | | 22,431 | | | | 9,649,659 | | | | 10,940,006 | | | | 2,902,159 | | | | 3,128,098 | | | | 3,814,841 | | | | 4,316,224 | |
| | 78,556 | | | | 93,064 | | | | 2,850,368 | | | | 3,229,004 | | | | 346,539 | | | | 307,330 | | | | 2,064,056 | | | | 2,249,624 | |
| | (628,129) | | | | (584,946) | | | | (13,219,326) | | | | (13,482,687) | | | | (3,935,093) | | | | (2,848,410) | | | | (2,258,819) | | | | (11,598,312) | |
| | (489,793) | | | | (469,451) | | | | (719,299) | | | | 686,323 | | | | (686,395) | | | | 587,018 | | | | 3,620,078 | | | | (5,032,464) | |
The accompanying Notes to Financial Statements are an integral part of this schedule.
217
Thrivent Mutual Funds
Statement of Changes in Net Assets - continued
| | | | | | | | | | | | | | | | |
| | | Core Bond Fund | | | Government Bond Fund | |
| For the periods ended | | 10/31/2011 | | | 10/31/2010 | | | 10/31/2011 | | | 10/31/2010(a) | |
Operations | | | | | | | | | | | | | | | | |
Net investment income/(loss) | | | $10,786,777 | | | | $12,055,488 | | | | $2,216,659 | | | | $1,223,965 | |
Net realized gains/(losses) | | | 3,417,932 | | | | 7,561,980 | | | | 2,407,322 | | | | 839,759 | |
Change in net unrealized appreciation/(depreciation) | | | (1,127,654) | | | | 14,665,935 | | | | (466,415) | | | | 5,737,034 | |
Net Change in Net Assets Resulting From Operations | | | 13,077,055 | | | | 34,283,403 | | | | 4,157,566 | | | | 7,800,758 | |
Distributions to Shareholders | | | | | | | | | | | | | | | | |
From net investment income Class A | | | (8,686,567) | | | | (9,453,575) | | | | (95,619) | | | | (34,589) | |
From net investment income Institutional Class | | | (2,154,708) | | | | (2,446,337) | | | | (2,131,632) | | | | (1,178,783) | |
Total From Net Investment Income | | | (10,841,275) | | | | (11,899,912) | | | | (2,227,251) | | | | (1,213,372) | |
From net realized gains Class A | | | – | | | | – | | | | (40,966) | | | | – | |
From net realized gains Institutional Class | | | – | | | | – | | | | (805,421) | | | | – | |
Total From Net Realized Gains | | | – | | | | – | | | | (846,387) | | | | – | |
Total Distributions to Shareholders | | | (10,841,275) | | | | (11,899,912) | | | | (3,073,638) | | | | (1,213,372) | |
Capital Stock Transactions | | | | | | | | | | | | | | | | |
Class A | | | | | | | | | | | | | | | | |
Sold | | | 20,476,289 | | | | 23,834,160 | | | | 4,812,940 | | | | 6,710,747 | |
Distributions reinvested | | | 7,807,323 | | | | 8,464,144 | | | | 132,849 | | | | 33,830 | |
Redeemed | | | (38,752,826) | | | | (36,875,720) | | | | (3,596,543) | | | | (1,022,447) | |
Total Class A Capital Stock Transactions | | | (10,469,214) | | | | (4,577,416) | | | | 1,349,246 | | | | 5,722,130 | |
Institutional Class | | | | | | | | | | | | | | | | |
Sold | | | 23,090,523 | | | | 15,954,728 | | | | 11,761,893 | | | | 110,608,824 | |
Distributions reinvested | | | 2,054,740 | | | | 2,351,427 | | | | 2,924,411 | | | | 1,178,460 | |
Redeemed | | | (19,265,677) | | | | (36,409,525) | | | | (26,757,219) | | | | (12,583,841) | |
Total Institutional Class Capital Stock Transactions | | | 5,879,586 | | | | (18,103,370) | | | | (12,070,915) | | | | 99,203,443 | |
Capital Stock Transactions | | | (4,589,628) | | | | (22,680,786) | | | | (10,721,669) | | | | 104,925,573 | |
| | | | | | | | | | | | | | | | |
Net Increase/(Decrease) in Net Assets | | | (2,353,848) | | | | (297,295) | | | | (9,637,741) | | | | 111,512,959 | |
Net Assets, Beginning of Period | | | 295,091,593 | | | | 295,388,888 | | | | 111,512,959 | | | | – | |
Net Assets, End of Period | | | $292,737,745 | | | | $295,091,593 | | | | $101,875,218 | | | | $111,512,959 | |
Accumulated Undistributed Net Investment Income/(Loss) | | | $(30,817) | | | | $337,985 | | | | $35,528 | | | | $34,242 | |
| | | | |
Capital Stock Share Transactions | | | | | | | | | | | | | | | | |
| | | | |
Class A shares | | | | | | | | | | | | | | | | |
Sold | | | 2,030,938 | | | | 2,446,828 | | | | 459,087 | | | | 656,194 | |
Distributions reinvested | | | 774,028 | | | | 871,285 | | | | 12,946 | | | | 3,245 | |
Redeemed | | | (3,849,331) | | | | (3,809,297) | | | | (349,438) | | | | (99,086) | |
Total Class A shares | | | (1,044,365) | | | | (491,184) | | | | 122,595 | | | | 560,353 | |
| | | | |
Institutional Class shares | | | | | | | | | | | | | | | | |
Sold | | | 2,297,871 | | | | 1,683,569 | | | | 1,142,619 | | | | 11,101,926 | |
Distributions reinvested | | | 203,610 | | | | 242,698 | | | | 284,986 | | | | 114,015 | |
Redeemed | | | (1,915,101) | | | | (3,809,041) | | | | (2,576,237) | | | | (1,221,994) | |
Total Institutional Class shares | | | 586,380 | | | | (1,882,774) | | | | (1,148,632) | | | | 9,993,947 | |
| (a) | For the period from February 26, 2010 (inception) through October 31, 2010 |
The accompanying Notes to Financial Statements are an integral part of this schedule.
218
Thrivent Mutual Funds
Statement of Changes in Net Assets - continued
| | | | | | | | | | | | |
| Limited Maturity Bond Fund | | | Money Market Fund | |
| 10/31/2011 | | 10/31/2010 | | | 10/31/2011 | | | 10/31/2010 | |
| | | | | | | | | | | | |
| $20,871,928 | | | $22,733,915 | | | | $(19,413) | | | | $(6,416) | |
| (1,834,753) | | | 4,841,469 | | | | 19,413 | | | | 6,416 | |
| (10,418,675) | | | 14,087,698 | | | | – | | | | – | |
| 8,618,500 | | | 41,663,082 | | | | – | | | | – | |
| | | | | | | | | | | | |
| (7,000,789) | | | (6,054,107) | | | | – | | | | – | |
| (13,990,772) | | | (16,244,195) | | | | – | | | | – | |
| (20,991,561) | | | (22,298,302) | | | | – | | | | – | |
| – | | | – | | | | – | | | | – | |
| – | | | – | | | | – | | | | – | |
| – | | | – | | | | – | | | | – | |
| (20,991,561) | | | (22,298,302) | | | | – | | | | – | |
| | | | | | | | | | | | |
| | | | | | | | | | | | |
| 218,047,690 | | | 211,529,595 | | | | 564,068,703 | | | | 565,586,695 | |
| 6,742,670 | | | 5,834,085 | | | | – | | | | (193) | |
| (148,163,749) | | | (78,497,987) | | | | (693,165,743) | | | | (865,939,874) | |
| 76,626,611 | | | 138,865,693 | | | | (129,097,040) | | | | (300,353,372) | |
| | | | | | | | | | | | |
| 120,601,099 | | | 143,296,227 | | | | 1,788,060 | | | | 83,353,750 | |
| 13,918,831 | | | 16,084,393 | | | | – | | | | – | |
| (72,722,440) | | | (97,813,085) | | | | (4,732,296) | | | | (137,214,579) | |
| 61,797,490 | | | 61,567,535 | | | | (2,944,236) | | | | (53,860,829) | |
| 138,424,101 | | | 200,433,228 | | | | (132,041,276) | | | | (354,214,201) | |
| | | | | | | | | | | | |
| 126,051,040 | | | 219,798,008 | | | | (132,041,276) | | | | (354,214,201) | |
| 803,407,056 | | | 583,609,048 | | | | 731,488,545 | | | | 1,085,702,746 | |
| $929,458,096 | | | $803,407,056 | | | | $599,447,269 | | | | $731,488,545 | |
| $(292,465) | | | $493,211 | | | | $– | | | | $(132,857) | |
| | | |
| | | | | | | | | | | | |
| | | |
| | | | | | | | | | | | |
| 17,446,301 | | | 17,063,375 | | | | 564,068,701 | | | | 565,586,691 | |
| 539,808 | | | 469,821 | | | | – | | | | (193) | |
| (11,865,052) | | | (6,323,770) | | | | (693,165,741) | | | | (865,939,871) | |
| 6,121,057 | | | 11,209,426 | | | | (129,097,040) | | | | (300,353,373) | |
| | | |
| | | | | | | | | | | | |
| 9,652,673 | | | 11,570,619 | | | | 1,788,061 | | | | 83,353,749 | |
| 1,114,575 | | | 1,297,181 | | | | – | | | | – | |
| (5,827,458) | | | (7,903,395) | | | | (4,732,296) | | | | (137,214,579) | |
| 4,939,790 | | | 4,964,405 | | | | (2,944,235) | | | | (53,860,830) | |
The accompanying Notes to Financial Statements are an integral part of this schedule.
219
Thrivent Mutual Funds
Notes to Financial Statements
As of October 31, 2011
(1) ORGANIZATION
Thrivent Mutual Funds (the “Trust”) was organized as a Massachusetts Business Trust on March 10, 1987 and is registered as an open-end management investment company under the Investment Company Act of 1940 (the “1940 Act”). The Trust is divided into twenty-five separate series (each, a “Fund” and, collectively, the “Funds”), each with its own investment objective and policies. The Trust currently consists of four allocation funds, twelve equity funds, two hybrid funds, six fixed-income funds and one money market fund. Thrivent Natural Resources Fund, Thrivent Equity Income Plus Fund and Thrivent Diversified Income Plus Fund have a fiscal year end on a calendar-year basis and are presented under a separate annual report.
(A) Fund Mergers – At a meeting held on September 9, 2011, shareholders of Thrivent Partner International Stock Fund (the “Target Fund”) approved the merger of the Target Fund into Thrivent Partner Worldwide Allocation Fund (the “Acquiring Fund”). The merger occurred at the close of business on September 16, 2011. Acquisition of the assets and liabilities of the Target Fund by the Acquiring Fund was followed by the distribution of the Acquiring Fund shares to the Target Fund shareholders. The shares issued of the Acquiring Fund are disclosed in the Statement of Changes in Net Assets.
The merger was accomplished by a tax free exchange as detailed below:
| | | | |
| Fund | | Description | | Net Assets as of
September 16, 2011 |
Partner Worldwide Allocation | | Acquiring Fund | | $264,018,467 |
Partner International Stock | | Target Fund | | $384,586,546 |
Partner Worldwide Allocation | | After Acquisition | | $648,605,013 |
As of September 16, 2011, the net assets of the Target Fund were comprised of the following:
| | | | | | | | | | | | |
Unrealized
Depreciation | | Undistributed
Net Investment
Income | | | Accumulated
Net Realized
Losses | | | Capital Stock | |
$(19,746,473) | | | $(447,637) | | | $ | (129,811,787 | ) | | $ | 534,592,443 | |
The Target Fund’s capital loss carryovers are carried over to the Acquiring Fund. The amounts and applicable limitations are disclosed in Note (4) Tax Information.
(B) Share Classes – As of October 31, 2011, the Trust includes two classes of shares: Class A and Institutional Class. The classes of shares differ principally in their respective distribution expenses and other class-specific expenses and arrangements. Class A shares have a 0.25% annual 12b-1 fee and a maximum front-end sales load of 5.50% for equity funds and 4.50% for fixed-income funds, although some of the fixed-income funds have reduced 12b-1 fees and either a reduced or no front-end
sales load. Institutional Class shares are offered at net asset value and have no annual 12b-1 fees. The share classes have identical rights to earnings, assets and voting privileges, except for class-specific expenses and exclusive rights to vote on matters affecting only individual classes. All 25 Funds of the Trust offer Class A and Institutional Class shares.
(C) Other – Under the Trust’s organizational documents, its officers and trustees are indemnified against certain liabilities arising out of the performance of their duties to the Trust. In addition, in the normal course of business, the Trust enters into contracts with vendors and others that provide general damage clauses. The Trust’s maximum exposure under these contracts is unknown, as this would involve future claims that may be made against the Trust. However, based on experience, the Trust expects the risk of loss to be remote.
(2) SIGNIFICANT ACCOUNTING POLICIES
(A) Valuation of Investments – Securities traded on U.S. or foreign securities exchanges or included in a national market system are valued at the official closing price at the close of each business day unless otherwise stated below. Over-the-counter securities and listed securities for which no price is readily available are valued at the current bid price considered best to represent the value at that time. Swap agreements are valued at the fair value of the contract as furnished by an independent pricing service. Security prices are based on quotes that are obtained from an independent pricing service approved by the Board of Trustees. The pricing service, in determining values of fixed-income securities, takes into consideration such factors as current quotations by broker/dealers, coupon, maturity, quality, type of issue, trading characteristics, and other yield and risk factors it deems relevant in determining valuations. Securities which cannot be valued by the approved pricing service are valued using valuations obtained from dealers that make markets in the securities. Exchange-listed options and futures contracts are valued at the last quoted sales price. Investments in open-ended mutual funds are valued at the net asset value at the close of each business day. Short-term securities are valued at amortized cost (which approximates market value) to the extent it is not materially different than market value.
Securities held by Money Market Fund are valued on the basis of amortized cost (which approximates market value), whereby a portfolio security is valued at its cost initially and thereafter valued to reflect a constant amortization to maturity of any discount or premium. Money Market Fund and the Trust’s investment adviser, Thrivent Asset Management, LLC (“Thrivent Asset Mgt.” or the “Adviser”), follow procedures designed to help maintain a constant net asset value of $1.00 per share.
Financial Accounting Standards Board (FASB) guidelines require increased fair value disclosure intended to improve the consistency and comparability of fair value measurements used in financial reporting. The guidelines define fair value, establish a framework for measuring fair value in U.S. Generally Accepted
220
Thrivent Mutual Funds
Notes to Financial Statements
As of October 31, 2011
Accounting Principles (“GAAP”) and expand disclosures about fair value requirements. The various inputs used to determine the fair value of the Funds’ investments are summarized in three broad levels: Level 1 includes quoted prices in active markets for identical securities, typically included in this level are U.S. equity securities, futures and options; Level 2 includes other significant observable inputs such as quoted prices for similar securities, interest rates, prepayment speeds and credit risk, typically included in this level are fixed income securities, international securities, swaps and forward contracts; and Level 3 includes significant unobservable inputs such as the Adviser’s own assumptions and broker evaluations in determining the fair value of investments. Of the Level 3 securities, those for which market values were not readily available or were deemed unreliable were fair valued as determined in good faith under procedures established by the Board of Trustees. As of October 31, 2011, the following funds held these types of Level 3 securities:
| | | | |
| Fund | | Number of
Securities | | Percent of Fund’s
Net Assets |
Partner Worldwide Allocation | | 3 | | 0.13% |
High Yield | | 1 | | 0.00% |
Valuation of International Securities – Because many foreign markets close before the U.S. markets, events may occur between the close of the foreign markets and the close of the U.S. markets that could have a material impact on the valuation of foreign securities. The Funds, under the supervision of the Board of Trustees, evaluate the impacts of these events and may adjust the valuation of foreign securities to reflect fair value as of the close of the U.S. markets. The Board of Trustees has authorized the investment adviser to make fair valuation determinations pursuant to policies approved by the Board of Trustees.
(B) Foreign Currency Translation – The accounting records of each Fund are maintained in U.S. dollars. Securities and other assets and liabilities that are denominated in foreign currencies are translated into U.S. dollars at the daily closing rates of exchange.
Foreign currency amounts related to the purchase or sale of securities and income and expenses are translated at the exchange rate on the transaction date. Net realized and unrealized currency gains and losses are recorded from sales of foreign currency, exchange gains or losses between the trade date and settlement date on securities transactions, and other translation gains or losses on dividends, interest income and foreign withholding taxes. The Funds do not separately report the effect of changes in foreign exchange rates from changes in market prices on securities held. Such changes are included in net realized and unrealized gain or loss from investments in the Statement of Operations.
For federal income tax purposes, the Funds treat the effect of changes in foreign exchange rates arising from actual foreign
currency transactions and the changes in foreign exchange rates between the trade date and settlement date as ordinary income.
(C) Foreign Currency Forward Contracts – In connection with purchases and sales of securities denominated in foreign currencies all Funds, except Money Market Fund, may enter into foreign currency forward contracts. Additionally, the Funds may enter into such contracts to hedge certain other foreign-currency-denominated investments. These contracts are recorded at value and the related realized and unrealized foreign exchange gains and losses are included in the Statement of Operations. In the event that counterparties fail to settle these forward contracts, the Funds could be exposed to foreign currency fluctuations. Foreign currency contracts are valued daily and unrealized appreciation or depreciation is recorded daily as the difference between the contract exchange rate and the closing forward rate applied to the face amount of the contract. A realized gain or loss is recorded at the time a forward contract is closed. These contracts are over-the-counter and the Fund is exposed to counterparty risk equal to the discounted net amount of payments to the Fund. This risk is partially mitigated by the Fund’s collateral posting requirements. During the year ended October 31, 2011, Aggressive Allocation Fund, Moderately Aggressive Allocation Fund, Moderate Allocation Fund, Moderately Conservative Allocation Fund, Partner Small Cap Value Fund, Small Cap Stock Fund, Partner Worldwide Allocation Fund, Balanced Fund, High Yield Fund and Income Fund engaged in this type of investment.
(D) Foreign Denominated Investments – Foreign denominated assets and currency contracts may involve more risks than domestic transactions including currency risk, political and economic risk, regulatory risk, and market risk. Certain Funds may also invest in securities of companies located in emerging markets. Future economic or political developments could adversely affect the liquidity or value, or both, of such securities.
(E) Federal Income Taxes – No provision has been made for income taxes because each Fund’s policy is to qualify as a regulated investment company under the Internal Revenue Code and distribute substantially all investment company taxable income and net capital gain on a timely basis. It is also the intention of each Fund to distribute an amount sufficient to avoid imposition of any federal excise tax. The Funds, accordingly, anticipate paying no federal taxes and no federal tax provision was recorded. Each Fund is treated as a separate taxable entity for federal income tax purposes. Certain Funds may utilize earnings and profits distributed to shareholders on the redemption of shares as part of the dividends paid deduction.
Foreign Income Taxes – Certain Funds are subject to foreign income taxes imposed by certain countries in which they invest. Withholding taxes on foreign dividends have been provided for in accordance with the applicable country’s tax rules and rates. These amounts are shown as foreign dividend tax withholding on the Statement of Operations. The funds pay tax on foreign capital gains, where applicable.
Thrivent Mutual Funds
Notes to Financial Statements
As of October 31, 2011
GAAP requires management of the Funds to make additional tax disclosures with respect to the tax effects of certain income tax positions, whether those positions were taken on previously filed tax returns or are expected to be taken on future returns. These positions must meet a “more likely than not” standard that, based on the technical merits of the position, would have a greater than 50 percent likelihood of being sustained upon examination. In evaluating whether a tax position has met the more-likely-than-not recognition threshold, management of the Funds must presume that the position will be examined by the appropriate taxing authority that has full knowledge of all relevant information.
Management of the Funds analyzed all open tax years, as defined by the statute of limitations, for all major jurisdictions. Open tax years are those that are open for examination by taxing authorities. Major jurisdictions for the Funds include U.S. Federal, Minnesota, Wisconsin, and Massachusetts as well as certain foreign countries. As of October 31, 2011, open U.S. Federal, Minnesota, Wisconsin and Massachusetts tax years include the tax years ended October 31, 2008 through 2011. Additionally, as of October 31, 2011, the tax year ended October 31, 2007 is open for Wisconsin. The Funds have no examinations in progress and none are expected at this time.
As of October 31, 2011, management of the Funds has reviewed all open tax years and major jurisdictions and concluded that there is no effect to the Funds’ tax liability, financial position or results of operations. There is no tax liability resulting from unrecognized tax benefits related to uncertain income tax positions taken or expected to be taken in future tax returns. The Funds are also not aware of any tax positions for which it is reasonably possible that the total amounts of unrecognized tax benefits will significantly change in the next 12 months.
(F) Expenses and Income – Estimated expenses are accrued daily. The Funds are charged for those expenses that are directly attributable to them. Expenses that are not directly attributable to a Fund are allocated among all appropriate Funds in proportion to their respective net assets, number of shareholder accounts or other reasonable basis. Net investment income, expenses which are not class-specific, and realized and unrealized gains and losses are allocated directly to each class based upon the relative net asset value of outstanding shares.
Interest income is accrued daily and is determined on the basis of interest or discount earned on all debt securities, including accretion of market discount and original issue discount and amortization of premium. Paydown gains and losses on mortgage- and asset-backed securities are recorded as components of interest income. Dividend income is recorded on the ex-dividend date.
For certain securities, including real estate investment trusts, the Trust records distributions received in excess of income as a reduction of cost of investments and/or realized gain. Such amounts are based on estimates if actual amounts are not available. Actual amounts of income, realized gain and return of
capital may differ from the estimated amounts. The Trust adjusts the estimated amounts of the components of distributions as adjustments to investment income, unrealized appreciation/depreciation and realized gain/loss on investments as necessary, once the issuers provide information about the actual composition of the distributions.
(G) Custody Earnings Credit – The Funds have a deposit arrangement with the custodian whereby interest earned on uninvested cash balances is used to pay a portion of custodian fees. This deposit arrangement is an alternative to overnight investments. Earnings credits are shown as a reduction of total expenses on the Statement of Operations.
(H) Distributions to Shareholders – Dividend and capital gain distributions are recorded on the ex-dividend date. With the exception of Money Market Fund, net realized gains from securities transactions, if any, are paid at least annually after the close of the fiscal year.
| | | | |
| Fund | | Dividends Declared | | Dividends Paid |
Aggressive Allocation | | Annually | | Annually |
Moderately Aggressive Allocation | | Annually | | Annually |
Moderate Allocation | | Quarterly | | Quarterly |
Moderately Conservative Allocation | | Quarterly | | Quarterly |
Partner Small Cap Growth | | Annually | | Annually |
Partner Small Cap Value | | Annually | | Annually |
Small Cap Stock | | Annually | | Annually |
Mid Cap Growth | | Annually | | Annually |
Partner Mid Cap Value | | Annually | | Annually |
Mid Cap Stock | | Annually | | Annually |
Partner Worldwide Allocation | | Annually | | Annually |
Large Cap Growth | | Annually | | Annually |
Large Cap Value | | Annually | | Annually |
Large Cap Stock | | Annually | | Annually |
Balanced | | Quarterly | | Quarterly |
High Yield | | Daily | | Monthly |
Municipal Bond | | Daily | | Monthly |
Income | | Daily | | Monthly |
Core Bond | | Daily | | Monthly |
Government Bond | | Daily | | Monthly |
Limited Maturity Bond | | Daily | | Monthly |
Money Market* | | Daily | | Monthly |
* Dividends are net of any short-term realized gains or losses on the sale of securities.
(I) Options – All Funds, with the exception of Money Market Fund, may buy put and call options and write put and covered call options. The Funds intend to use such derivative instruments as hedges to facilitate buying or selling securities or to provide protection against adverse movements in security prices or interest rates. The Funds may also enter into options contracts to protect against adverse foreign exchange rate
Thrivent Mutual Funds
Notes to Financial Statements
As of October 31, 2011
fluctuations. Option contracts are valued daily and unrealized appreciation or depreciation is recorded. A Fund will realize a gain or loss upon expiration or closing of the option transaction. When an option is exercised, the proceeds upon sale for a written call option or the cost of a security for purchased put and call options is adjusted by the amount of premium received or paid.
Buying put options tends to decrease a Fund’s exposure to the underlying security while buying call options tends to increase a Fund’s exposure to the underlying security. The risk associated with purchasing put and call options is limited to the premium paid. There is no significant counterparty risk on exchange-traded options as the exchange guarantees the contract against default. Writing put options tends to increase a Fund’s exposure to the underlying security while writing call options tends to decrease a Fund’s exposure to the underlying security. The writer of an option has no control over whether the underlying security may be bought or sold, and therefore bears the market risk of an unfavorable change in the price of the underlying security. The counterparty risk for purchased options arises when the Fund has purchased an option, exercises that option, and the counterparty doesn’t buy from the Fund or sell to the Fund the underlying asset as required. In the case where the Fund has written an option, the Fund doesn’t have counterparty risk. Counterparty risk on purchased over-the-counter options is partially mitigated by the Fund’s collateral posting requirements. As the option increases in value to the Fund, the Fund receives collateral from the counterparty. Risks of loss may exceed amounts recognized on the Statement of Assets and Liabilities. During the year ended October 31, 2011, Large Cap Growth Fund, Large Cap Stock Fund, Balanced Fund, Income Fund, Core Bond Fund, Government Bond Fund and Limited Maturity Bond Fund engaged in these types of investments.
(J) Futures Contracts – Certain Funds may use futures contracts to manage the exposure to interest rate and market or currency fluctuations. Gains or losses on futures contracts can offset changes in the yield of securities. When a futures contract is opened, cash or other investments equal to the required “initial margin deposit” are held on deposit with and pledged to the broker. Additional securities held by the Funds may be earmarked to cover open futures contracts. The futures contract’s daily change in value (“variation margin”) is either paid to or received from the broker, and is recorded as an unrealized gain or loss. When the contract is closed, realized gain or loss is recorded equal to the difference between the value of the contract when opened and the value of the contract when closed. Futures contracts involve, to varying degrees, risk of loss in excess of the variation margin disclosed in the Statement of Assets and Liabilities. Exchange-traded futures have no significant counterparty risk as the exchange guarantees the contracts against default. During year ended October 31, 2011, Aggressive Allocation Fund, Moderately Aggressive Allocation Fund, Moderate Allocation Fund, Moderately Conservative Allocation Fund, Small Cap Stock Fund, Partner Worldwide Allocation Fund, Large Cap Stock Fund, Balanced Fund, High Yield Fund, Income Fund, Core
Bond Fund and Limited Maturity Bond Fund engaged in this type of investment.
(K) Swap Agreements – Certain Funds enter into swap transactions, which involve swapping one or more investment characteristics of a security or a basket of securities with another party. Such transactions include market risk, risk of default by the other party to the transaction, risk of imperfect correlation and manager risk and may involve commissions or other costs. Swap transactions generally do not involve delivery of securities, other underlying assets or principal. Accordingly, the risk of loss with respect to swap transactions is generally limited to the net amount of payments that the Fund is contractually obligated to make, or in the case of the counterparty defaulting, the net amount of payments that the Fund is contractually entitled to receive. Risks of loss may exceed amounts recognized on the Statement of Assets and Liabilities. If there is a default by the counterparty, the Fund may have contractual remedies pursuant to the agreements related to the transaction. The contracts are valued daily and unrealized appreciation or depreciation is recorded. Swap agreements are valued at fair value of the contract as provided by an independent pricing service. The pricing service takes into account such factors as swap curves, default probabilities, recent trades, recovery rates and other factors it deems relevant in determining valuations. The Fund accrues for the periodic payment and amortizes upfront payments, if any, on swap agreements on a daily basis with the net amount, recorded as realized gains or losses on the Statement of Operations. Receipts and payments received or made as a result of a credit event or termination of the contract are also recognized as realized gains or losses on the Statement of Operations. Collateral, in the form of cash or securities, may be required to be held with the Fund’s custodian, or a third party, in connection with these agreements. These swap agreements are over-the-counter and the Fund is exposed to counterparty risk, which is the discounted net amount of payments owed to the Fund. This risk is partially mitigated by the Fund’s collateral posting requirements. As the swap increases in value to the Fund, the Fund receives collateral from the counterparty.
Credit Default Swaps – A credit default swap is a swap agreement between two parties to exchange the credit risk of a particular issuer, basket of securities or reference entity. In a credit default swap transaction, a buyer pays periodic fees in return for payment by the seller which is contingent upon an adverse credit event occurring in the underlying issuer or reference entity. The seller collects periodic fees from the buyer and profits if the credit of the underlying issuer or reference entity remains stable or improves while the swap is outstanding, but the seller in a credit default swap contract would be required to pay the amount of credit loss, determined as specified in the agreement, to the buyer in the event of an adverse credit event in the reference entity. A buyer of a credit default swap is said to buy protection whereas a seller of a credit default swap is said to sell protection. The Funds may be either the protection seller or the protection buyer.
Thrivent Mutual Funds
Notes to Financial Statements
As of October 31, 2011
Certain Funds enter into credit default derivative contracts directly through credit default swaps (CDS) or through credit default swap indices (CDX Indices). CDX indices are static pools of equally weighted credit default swaps referencing corporate bonds and/or loans designed to provide diversified credit exposure to these asset classes. Funds sell default protection and assume long-risk positions in individual credits or indices. Index positions are entered into to gain exposure to the corporate bond and/or loan markets in a cost-efficient and diversified structure. In the event that a position defaults, by going into bankruptcy and failing to pay interest or principal on borrowed money, within any given CDX Index held, the maximum potential amount of future payments required would be equal to the pro-rata share of that position within the index based on the notional amount of the index. In the event of a default under a CDS contract the maximum potential amount of future payments would be the notional amount. For CDS, the default events could be bankruptcy and failing to pay interest or principal on borrowed money or a restructuring. A restructuring is a change in the underlying obligations which would include reduction in interest or principal, maturity extension and subordination to other obligations. Refer to the credit default swap tables located within the Funds’ Schedules of Investments for additional information as of October 31, 2011. During the year ended October 31, 2011, Aggressive Allocation Fund, Moderately Aggressive Allocation Fund, Moderate Allocation Fund, Moderately Conservative Allocation Fund, Partner Worldwide Allocation Fund, Balanced Fund, High Yield Fund, Income Fund, Core Bond Fund and Limited Maturity Bond Fund engaged in this type of investment.
(L) Mortgage Dollar Roll Transactions – Certain Funds enter into dollar roll transactions on securities issued or to be issued by the Government National Mortgage Association, Federal National Mortgage Association and Federal Home Loan Mortgage Corporation, in which the Funds sell mortgage securities and simultaneously agree to repurchase similar (same type and coupon) securities at a later date at an agreed upon price. The Funds must maintain liquid securities having a value not less than the repurchase price (including accrued interest) for such dollar rolls. The value of the securities that the Funds are required to purchase may decline below the agreed upon repurchase price of those securities.
During the period between the sale and repurchase, the Funds forgo principal and interest paid on the mortgage securities sold. The Funds are compensated from negotiated fees paid by brokers offered as an inducement to the Funds to “roll over” their purchase commitments, thus enhancing the yield. Mortgage dollar rolls may be renewed with a new purchase and repurchase price and a cash settlement made on settlement date without physical delivery of the securities subject to the contract. The fees received are recognized over the roll period and are included in Income from mortgage dollar rolls in the Statement of Operations. During the year ended October 31, 2011, Aggressive Allocation Fund, Moderately Aggressive Allocation Fund, Moderate Allocation Fund, Moderately Conservative Allocation Fund, Balanced Fund, Income Fund,
Core Bond Fund, Government Bond Fund and Limited Maturity Bond Fund engaged in this type of investment.
(M) Securities Lending – The Trust has entered into a Securities Lending Agreement (the “Agreement”) with Deutsche Bank AG (“Deutsche”). The Agreement authorizes Deutsche to lend securities to authorized borrowers on behalf of the Funds. Pursuant to the Agreement, all loaned securities are initially collateralized by cash equal to at least 102% of the value of the loaned securities. All cash collateral received is invested in Thrivent Financial Securities Lending Trust. The Funds receive dividends and interest that would have been earned on the securities loaned while simultaneously seeking to earn income on the investment of cash collateral. Amounts earned on investments in Thrivent Financial Securities Lending Trust, net of rebates, fees paid to Deutsche for services provided and any other securities lending expenses, are included in Income from securities loaned on the Statement of Operations. By investing any cash collateral it receives in these transactions, a Fund could realize additional gains or losses. If the borrower fails to return the securities or the invested collateral has declined in value, the Fund could lose money.
During the year ended October 31, 2011, all Funds except Aggressive Allocation Fund, Moderately Aggressive Allocation Fund, Moderate Allocation Fund, Moderately Conservative Allocation Fund, Partner Worldwide Allocation Fund, Large Cap Growth Fund, Municipal Bond Fund, Core Bond Fund, Government Bond Fund and Money Market Fund had securities on loan. As of October 31, 2011, the value of securities on loan is as follows:
| | | | |
| Fund | | Securities on
Loan | |
Partner Small Cap Growth | | $ | 10,114,285 | |
Partner Small Cap Value | | | 11,314,756 | |
Small Cap Stock | | | 5,161,407 | |
Mid Cap Growth | | | 8,474,282 | |
Partner Mid Cap Value | | | 1,439,968 | |
Mid Cap Stock | | | 34,146,477 | |
Large Cap Value | | | 10,953,449 | |
Large Cap Stock | | | 6,481,356 | |
Balanced | | | 3,473,787 | |
High Yield | | | 61,715,474 | |
Income | | | 15,522,120 | |
Limited Maturity Bond | | | 24,522,371 | |
(N) When-Issued and Delayed Delivery Transactions – Certain Funds may purchase or sell securities on a when-issued or delayed delivery basis. These transactions involve a commitment by a Fund to purchase or sell securities for a predetermined price or yield, with payment and delivery taking place beyond the customary settlement period. When delayed delivery purchases are outstanding, a Fund will designate liquid assets in an amount sufficient to meet the purchase price. When purchasing a security on a delayed delivery basis, a Fund assumes the rights and risks of ownership of the security, including the risk of price and yield fluctuations, and takes such fluctuations into account when determining its net asset value. A Fund may dispose of a delayed delivery transaction after it is
Thrivent Mutual Funds
Notes to Financial Statements
As of October 31, 2011
entered into, and may sell when-issued securities before they are delivered, which may result in a capital gain or loss. When a Fund has sold a security on a delayed delivery basis, a Fund does not participate in future gains and losses with respect to the security.
(O) Treasury Inflation Protected Securities – Certain Funds may invest in treasury inflation protected securities (TIPS). These securities are fixed income securities whose principal value is periodically adjusted to the rate of inflation. The interest rate is generally fixed at issuance. Interest is paid based on the principal value, which is adjusted for inflation. Any increase in the principal amount will be included as taxable interest in the Statement of Operations and received upon maturity or sale of the security. During the year ended October 31, 2011, Balanced Fund, Income Fund, Core Bond Fund, Government Bond Fund and Limited Maturity Bond Fund engaged in this type of investment.
(P) Repurchase Agreements – Each Fund may engage in repurchase agreement transactions in pursuit of its investment objective. A repurchase agreement consists of a purchase and a simultaneous agreement to resell an investment for later delivery at an agreed upon price and rate of interest. The Fund uses a third-party custodian to maintain the collateral. If the original seller of a security subject to a repurchase agreement fails to repurchase the security at the agreed upon time, the Fund could incur a loss due to a drop in the value of the security during the time it takes the Fund to either sell the security or take action to enforce the original seller’s agreement to repurchase the security. Also, if a defaulting original seller filed for bankruptcy or became insolvent, disposition of such security might be delayed by pending legal action. The Fund may only enter into repurchase agreements with banks and other recognized financial institutions such as broker/dealers that are found by the Adviser or subadviser to be creditworthy. During the year ended October 31, 2011, Moderately Aggressive Allocation Fund, Moderate Allocation Fund, Moderately Conservative Allocation Fund, Partner Mid Cap Value Fund, Mid Cap Stock Fund, Large Cap Stock Fund, High Yield Fund, Income Fund, Core Bond Fund, Limited Maturity Bond Fund and Money Market Fund engaged in these types of investments.
(Q) Equity-Linked Structured Securities – Certain funds may invest in equity-linked structured notes. Equity-linked structured notes are debt securities which combine the characteristics of common stock and the sale of an option. The return component is based upon the performance of a single equity security, a basket of equity securities, or an equity index and the sale of an option. There is no guaranteed return of principal with these securities. The appreciation potential of these securities may be limited by a maximum payment or call right and can be influenced by many unpredictable factors. In addition to the performance of the equity, the nature and credit of the issuer may also impact return. During the year ended October 31, 2011, Balanced Fund, Income Fund, Core Bond Fund, and Limited Maturity Bond Fund engaged in this type of investment.
(R) Credit Risk – The Funds may be susceptible to credit risk to the extent an issuer or counterparty defaults on its payment obligation. The Funds’ policy is to monitor the creditworthiness of issuers and counterparties. Interest receivable on defaulted securities is monitored for ability to collect payments in default and is adjusted accordingly.
(S) Accounting Estimates – The preparation of financial statements in conformity with GAAP requires management to make estimates and assumptions that affect the reported amounts of assets and liabilities and disclosure of contingent assets and liabilities at the date of the financial statements and the reported amounts of income and expenses during the reporting period. Actual results could differ from those estimates.
(T) Loan Commitments – Certain Funds may enter into loan commitments, which generally have interest rates which are reset daily, monthly, quarterly or semi-annually by reference to a base lending rate, plus a premium. These base rates are primarily the London-Interbank Offered Rate (“LIBOR”), and secondarily the prime rate offered by one or more major United States banks (the “Prime Rate”) and the certificate of deposit (“CD”) rate or other base lending rates used by commercial lenders. Loan commitments often require prepayments from excess cash flows or allow the borrower to repay at its election. The rate at which the borrower repays cannot be predicted with accuracy. Therefore, the remaining maturity may be considerably less than the stated maturity shown in the Schedule of Investments.
All or a portion of these loan commitments may be unfunded. The Fund is obligated to fund these commitments at the borrower’s discretion. Therefore, the Fund must have funds sufficient to cover its contractual obligation. These unfunded loan commitments, which are marked to market daily, are presented in the Schedule of Investments.
(U) Loss Contingencies – Thrivent High Yield Fund and Thrivent Income Fund are defendants in an adversary action filed on July 31, 2009 by the Official Committee of Unsecured Creditors of Motors Liquidation Company, formerly known as General Motors Corporation (GM), against prior and current holders of term loan debt of GM. The suit seeks to determine whether GM’s term loan facility was secured at the time it entered bankruptcy. High Yield Fund at one time held term loans in an original principal amount of at least $4,723,994 and, if the plaintiffs are successful, it is reasonably possible that the Fund will be required to make payments in some amount. This loss contingency has not been accrued as a liability because the amount of potential damages and the likelihood of loss cannot be reasonably estimated.
(V) Litigation – Awards from class action litigation are recorded as a reduction of cost if the Fund still owns the applicable securities on the payment date. If the Fund no longer owns the applicable securities, the proceeds are recorded as realized gains.
Thrivent Mutual Funds
Notes to Financial Statements
As of October 31, 2011
(W) Amortization of Offering Costs – The offering costs referenced in the Statement of Operations for Government Bond Fund are costs incurred by the Fund in order to establish it for sale. These costs generally include costs related to registering the shares for sale with the various states as well as any legal costs associated with registering the Fund. These costs are amortized over a period of 12 months from inception.
(X) Other – For financial statement purposes, investment security transactions are accounted for on the trade date. Realized gains and losses from investment transactions are determined on a specific cost identification basis, which is the same basis used for federal income tax purposes.
(3) FEES AND COMPENSATION PAID TO AFFILIATES
(A) Investment Advisory Fees – The Trust has entered into an Investment Advisory Agreement with Thrivent Asset Mgt. Under the Investment Advisory Agreement, each of the Funds pays a fee for investment advisory services. The fees are accrued daily and paid monthly.
The four Asset Allocation Funds – Aggressive Allocation Fund, Moderately Aggressive Allocation Fund, Moderate Allocation Fund and Moderately Conservative Allocation Fund – pay investment advisory fees for asset allocation services. In addition, for investments (other than underlying Thrivent Funds) held directly by the Asset Allocation Funds, each Asset Allocation Fund will pay an additional advisory fee. The annual rates of fees as a percentage of average daily net assets under the Investment Advisory Agreement are as follows:
| | | | | | |
| Fund (M – Millions) | | $0 to
$500M | | $500 to
$2,000M | | Over
$2,000M |
| | | |
Aggressive Allocation | | 0.150% | | 0.125% | | 0.100% |
Aggressive Allocation – Direct Holdings | | 0.600% | | 0.600% | | 0.600% |
| | | |
Moderately Aggressive Allocation | | 0.150% | | 0.125% | | 0.100% |
Moderately Aggressive Allocation – Direct Holdings | | 0.550% | | 0.550% | | 0.550% |
| | | |
Moderate Allocation | | 0.150% | | 0.125% | | 0.100% |
Moderate Allocation – Direct Holdings | | 0.500% | | 0.500% | | 0.500% |
| | | |
Moderately Conservative Allocation | | 0.150% | | 0.125% | | 0.100% |
Moderately Conservative Allocation – Direct Holdings | | 0.450% | | 0.450% | | 0.450% |
For all other Funds, the annual rates of fees as a percent of average daily net assets under the Investment Advisory Agreement were as follows:
| | | | | | | | | | | | | | | | | | | | | | | | | | | | | | | | | | | | | | | | | | | | |
| Fund (M - Millions) | | $0 to
$50M | | | $50 to
$100M | | | $100 to
$200M | | | $200 to
$250M | | | $250 to
$500M | | | $500 to
$750M | | | $750 to
$1,000M | | | $1,000 to
$2,000M | | | $2,000 to
$2,500M | | | $2,500 to
$5,000M | | | Over
$5,000M | |
Partner Small Cap Growth | | | 0 .900 | % | | | 0.900 | % | | | 0 .900 | % | | | 0.900 | % | | | 0.900 | % | | | 0.800 | % | | | 0.800 | % | | | 0.800 | % | | | 0 .800 | % | | | 0 .800 | % | | | 0.800 | % |
Partner Small Cap Value | | | 0 .700 | % | | | 0.700 | % | | | 0 .700 | % | | | 0.700 | % | | | 0.700 | % | | | 0.700 | % | | | 0.700 | % | | | 0.700 | % | | | 0 .700 | % | | | 0 .700 | % | | | 0.700 | % |
Small Cap Stock | | | 0 .700 | % | | | 0.700 | % | | | 0 .700 | % | | | 0.650 | % | | | 0.650 | % | | | 0.650 | % | | | 0.650 | % | | | 0.600 | % | | | 0 .600 | % | | | 0 .550 | % | | | 0.525 | % |
Mid Cap Growth | | | 0 .450 | % | | | 0.450 | % | | | 0 .400 | % | | | 0.400 | % | | | 0.350 | % | | | 0.300 | % | | | 0.300 | % | | | 0.250 | % | | | 0 .250 | % | | | 0 .250 | % | | | 0.250 | % |
Partner Mid Cap Value | | | 0 .750 | % | | | 0.750 | % | | | 0 .750 | % | | | 0.700 | % | | | 0.700 | % | | | 0.700 | % | | | 0.700 | % | | | 0.700 | % | | | 0 .700 | % | | | 0 .700 | % | | | 0.700 | % |
Mid Cap Stock | | | 0 .700 | % | | | 0.700 | % | | | 0 .700 | % | | | 0.650 | % | | | 0.650 | % | | | 0.650 | % | | | 0.650 | % | | | 0.600 | % | | | 0 .600 | % | | | 0 .550 | % | | | 0.525 | % |
Partner Worldwide Allocation | | | 0 .900 | % | | | 0.900 | % | | | 0 .900 | % | | | 0.900 | % | | | 0.850 | % | | | 0.850 | % | | | 0.850 | % | | | 0.800 | % | | | 0 .800 | % | | | 0 .800 | % | | | 0.800 | % |
Large Cap Growth | | | 0 .750 | % | | | 0.750 | % | | | 0 .750 | % | | | 0.750 | % | | | 0.750 | % | | | 0.700 | % | | | 0.700 | % | | | 0.650 | % | | | 0 .650 | % | | | 0 .600 | % | | | 0.575 | % |
Large Cap Value | | | 0 .450 | % | | | 0.450 | % | | | 0 .450 | % | | | 0.450 | % | | | 0.450 | % | | | 0.450 | % | | | 0.450 | % | | | 0.450 | % | | | 0 .450 | % | | | 0 .450 | % | | | 0.450 | % |
Large Cap Stock | | | 0 .650 | % | | | 0.650 | % | | | 0 .650 | % | | | 0.650 | % | | | 0.650 | % | | | 0.575 | % | | | 0.575 | % | | | 0.500 | % | | | 0 .475 | % | | | 0 .450 | % | | | 0.425 | % |
Balanced | | | 0 .550 | % | | | 0.550 | % | | | 0 .550 | % | | | 0.550 | % | | | 0.550 | % | | | 0.500 | % | | | 0.500 | % | | | 0.475 | % | | | 0 .475 | % | | | 0 .450 | % | | | 0.425 | % |
High Yield | | | 0 .400 | % | | | 0.400 | % | | | 0 .400 | % | | | 0.400 | % | | | 0.400 | % | | | 0.350 | % | | | 0.350 | % | | | 0.300 | % | | | 0 .300 | % | | | 0 .300 | % | | | 0.300 | % |
Municipal Bond | | | 0 .450 | % | | | 0.450 | % | | | 0 .450 | % | | | 0.450 | % | | | 0.450 | % | | | 0.400 | % | | | 0.400 | % | | | 0.350 | % | | | 0 .350 | % | | | 0 .325 | % | | | 0.300 | % |
Income | | | 0 .350 | % | | | 0.350 | % | | | 0 .350 | % | | | 0.350 | % | | | 0.350 | % | | | 0.325 | % | | | 0.325 | % | | | 0.300 | % | | | 0 .300 | % | | | 0 .300 | % | | | 0.300 | % |
Core Bond | | | 0 .450 | % | | | 0.450 | % | | | 0 .450 | % | | | 0.450 | % | | | 0.450 | % | | | 0.400 | % | | | 0.400 | % | | | 0.375 | % | | | 0 .375 | % | | | 0 .350 | % | | | 0.325 | % |
Government Bond | | | 0 .400 | % | | | 0.400 | % | | | 0 .400 | % | | | 0.400 | % | | | 0.400 | % | | | 0.350 | % | | | 0.350 | % | | | 0.350 | % | | | 0 .350 | % | | | 0 .350 | % | | | 0.350 | % |
Limited Maturity Bond | | | 0 .300 | % | | | 0.300 | % | | | 0 .300 | % | | | 0.300 | % | | | 0.300 | % | | | 0.275 | % | | | 0.275 | % | | | 0.250 | % | | | 0 .250 | % | | | 0 .250 | % | | | 0.250 | % |
Money Market | | | 0 .500 | % | | | 0.500 | % | | | 0 .500 | % | | | 0.500 | % | | | 0.500 | % | | | 0.400 | % | | | 0.350 | % | | | 0.325 | % | | | 0 .325 | % | | | 0 .300 | % | | | 0.275 | % |
226
Thrivent Mutual Funds
Notes to Financial Statements
As of October 31, 2011
(B) Sub-Adviser Fees – The following subadviser fees are charged as part of the total investment advisory fees stated in the table above. The subadvisory fees are borne directly by the Adviser and do not increase the overall fees paid by the Fund.
Partner Small Cap Growth Fund
The Adviser has entered into a subadvisory agreement with Turner Investment Partners, Inc. (“Turner”) for performance of subadvisory services. For assets that are defined as microcap assets, the fee payable is equal to 0.80% of the average daily net assets in that microcap portion. For all other assets, the fee payable is equal to 0.65% of the average daily net assets when the entire portfolio assets (including the microcap portion) are no greater than $100 million, 0.60% of the average daily net assets when the entire portfolio assets are greater than $100 million but no greater than $350 million, and 0.575% of the average daily net assets when the entire portfolio assets are greater than $350 million. Thrivent Partner Small Cap Growth Portfolio (including the microcap portion of that Portfolio) is included in determining breakpoints for the assets managed by Turner.
Partner Small Cap Value Fund
The Adviser has entered into a subadvisory agreement with T. Rowe Price Associates, Inc. for performance of subadvisory services. The fee payable is equal to 0.60% of average daily net assets.
Partner Mid Cap Value Fund
The Adviser has entered into a subadvisory agreement with Goldman Sachs Asset Management, LP (“GSAM”) for the performance of subadvisory services. The fee payable is equal to 0.50% of the first $200 million of average daily net assets and 0.45% for assets over $200 million. Thrivent Partner Mid Cap Value Portfolio is included in determining breakpoints for the assets managed by GSAM.
Partner Worldwide Allocation Fund
The Adviser has entered into subadvisory agreements with Mercator Asset Management, LP (“Mercator”), Principal Global Investors, LLC (“Principal”), Aberdeen Asset Management Investment Services Limited (“Aberdeen”), Victory Capital Management, Inc. (“Victory”) and GSAM for the performance of subadvisory services.
The fee payable for Mercator is equal to 0.75% of the first $25 million of average daily net assets, 0.60% of the next $25 million, 0.55% of the next $25 million, 0.50% of the next $225 million, 0.40% of the next $200 million and 0.20% of average daily net assets over $500 million. Thrivent Partner Worldwide Allocation Portfolio and Thrivent Partner International Stock Portfolio will be included in determining breakpoints for the assets managed by Mercator.
The fee payable for Principal is equal to 0.35% of the first $500 million of average daily net assets, 0.30% of the next $500 million and 0.25% of average daily net assets over $1 billion. Thrivent Partner Worldwide Allocation Portfolio and Thrivent Partner International Stock Portfolio will be included in
determining breakpoints for the assets managed by Principal.
The fee payable for Aberdeen is equal to 0.85% of the first $50 million of average daily net assets, 0.72% of the next $50 million and 0.68% of average daily net assets over $100 million. Thrivent Partner Worldwide Allocation Portfolio and Thrivent Partner Emerging Markets Portfolio will be included in determining breakpoints for the assets managed by Aberdeen.
The fee payable for Victory is equal to 0.95% of the first $25 million of average daily net assets, 0.85% of the next $75 million, 0.80% of the next $50 million, 0.75% of the next $100 million and 0.70% of average daily net assets over $250 million. Thrivent Partner Worldwide Allocation Portfolio will be included in determining breakpoints for the assets managed by Victory.
The fee payable for GSAM is equal to 0.55% of the first $50 million of average daily net assets, 0.50% of the next $200 million and 0.45% of average daily net assets over $250 million. Thrivent Partner Worldwide Allocation Portfolio will be included in determining breakpoints for the assets managed by GSAM.
(C) Expense Reimbursements – As of October 31, 2011, the following contractual expense reimbursements, as a percentage of net assets, were in effect:
| | | | | | | | | | | | |
| Fund | | Class A | | | Institutional
Class | | | Expiration Date | |
Money Market* | | | 0.20% | | | | 0.10% | | | | 2/28/2012 | |
| * | Thrivent Asset Mgt. has voluntarily agreed to reimburse certain class-specific and fund level expenses of Thrivent Money Market Fund to the extent necessary in order to maintain a minimum annualized net yield of 0.00% for all classes of the Fund. |
As of October 31, 2011, contractual expense reimbursements to limit expenses to the following percentages were in effect:
| | | | | | | | | | | | |
| Fund | | Class A | | | Institutional
Class | | | Expiration Date | |
Aggressive Allocation | | | 1.30% | 1 | | | N/A | | | | 2/28/2012 | |
Partner Small Cap Growth | | | 1.45% | 2 | | | N/A | | | | 2/28/2012 | |
Partner Small Cap Value | | | 1.40% | | | | N/A | | | | 2/28/2012 | |
Small Cap Stock | | | 1.40% | 3 | | | N/A | | | | 2/28/2012 | |
Partner Mid Cap Value | | | 1.25% | | | | N/A | | | | 2/28/2012 | |
Partner Worldwide Allocation | | | 1.30% | | | | 1.00% | | | | 2/28/2013 | |
Large Cap Growth | | | 1.20% | | | | N/A | | | | 2/28/2012 | |
Core Bond | | | 0.85% | | | | N/A | | | | 2/28/2012 | |
Government Bond | | | 0.90% | 4 | | | 0.65% | | | | 2/28/2012 | |
| 1 | Prior contractual expense reimbursement of 1.25% expired on May 15, 2011. |
| 2 | New contractual expense reimbursement of 1.45% became effective on March 1, 2011. |
| 3 | New contractual expense reimbursement of 1.40% became effective on March 1, 2011. |
| 4 | Prior contractual expense reimbursement of 0.95% expired on February 28, 2011. |
227
Thrivent Mutual Funds
Notes to Financial Statements
As of October 31, 2011
The expense caps for Aggressive Allocation include all indirect expenses.
Thrivent does not recoup amounts previously reimbursed or waived in prior fiscal years.
Each equity, hybrid and fixed income fund may invest cash in High Yield Fund and Money Market Fund, subject to certain limitations. During the year ended October 31, 2011, Balanced Fund, Income Fund, Core Bond Fund and Limited Maturity Bond Fund invested in High Yield Fund. During the year ended October 31, 2011, no funds invested in Money Market Fund. These related-party transactions are subject to the same terms as non-related party transactions except that, to avoid duplicate investment advisory fees, Thrivent Asset Mgt. reimburses an amount equal to the advisory fee which is charged to the equity, hybrid or fixed income fund for its investment in High Yield Fund or Money Market Fund.
(D) Distribution Plan – Thrivent Investment Management, Inc. (“Thrivent Investment Mgt.”) is the Trust’s distributor. The Trust has adopted a Distribution Plan pursuant to Rule 12b-1 under the 1940 Act. Class A shares have a Rule 12b-1 fee of up to 0.25% (up to 0.125% for Government Bond Fund, Limited Maturity Bond Fund and Money Market Fund) of average net assets.
(E) Sales Charges and Other Fees – For the year ended October 31, 2011, Thrivent Investment Mgt. received $11,064,551 of aggregate underwriting concessions from the sales of the Trust’s Class A shares. Sales charges are not an expense of the Trust and are not reflected in the financial statements of any of the Funds.
The Trust has entered into an accounting and administrative services agreement with Thrivent Asset Mgt. pursuant to which Thrivent Asset Mgt. provides certain accounting and administrative personnel and services to the Funds. For the year ended October 31, 2011, Thrivent Asset Mgt. received aggregate fees for accounting and administrative personnel and services of $4,404,826 from the Trust.
The Trust has entered into an agreement with Thrivent Financial Investor Services Inc. (“Thrivent Investor Services”) to provide the Funds with transfer agent services. For the year ended October 31, 2011, Thrivent Investor Services received $15,128,841 for transfer agent services from the Trust. A portion of this amount is remitted to third-party administrators that provide shareholder services on behalf of Thrivent Mutual Funds.
Each Trustee is eligible to participate in a deferred compensation plan with respect to fees received from the Funds. Participants in the plan may designate their deferred Trustee’s fees as if invested in a series of the Thrivent Mutual Funds. The value of each Trustee’s deferred compensation account will increase or decrease as if invested in shares of that series. Their fees as well as the change in value are included in Trustee’s fees in the Statement of Operations. The deferred fees
remain in the appropriate Fund until distribution in accordance with the plan. The deferred fee liability, included in accured expenses in the Statement of Assets and Liabilities, is unsecured.
Those Trustees not participating in the above plan received $425,746 in fees from the Trust for the year ended October 31, 2011. In addition, the Trust reimbursed unaffiliated Trustees for reasonable expenses incurred in relation to attendance at the meetings and industry conferences.
Certain officers and non-independent trustees of the Funds are officers and directors of Thrivent Asset Mgt., Thrivent Investment Mgt. and Thrivent Investor Services; however, they receive no compensation from the Trust.
(F) Indirect Expenses – Some Funds invest in other mutual funds. Fees and expenses of those underlying funds are not included in those Funds’ expense ratios. The Funds indirectly bear their proportionate share of the annualized weighted average expense ratio of the underlying funds in which they invest.
(4) TAX INFORMATION
Distributions are based on amounts calculated in accordance with the applicable federal income tax regulations, which may differ from GAAP. To the extent that these differences are permanent in nature, such amounts are reclassified within the capital accounts based on their federal tax-basis treatment; temporary differences do not require reclassifications.
On the Statement of Assets and Liabilities, as a result of permanent book-to-tax differences, reclassification adjustments were made as follows [Increase/(Decrease)]:
| | | | | | | | | | | | |
| Fund | | Accumulated Net Investment Income/(Loss) | | | Accumulated Net Realized Gain/(Loss) | | | Capital Stock | |
Aggressive Allocation | | | ($91,584 | ) | | | $91,584 | | | | $– | |
Moderately Aggressive Allocation | | | (500,447 | ) | | | 500,447 | | | | – | |
Moderate Allocation | | | (500,664 | ) | | | 500,664 | | | | – | |
Moderately Conservative Allocation | | | (166,608 | ) | | | (133,392 | ) | | | 300,000 | |
Partner Small Cap Growth | | | 961,438 | | | | (777,239 | ) | | | (184,199 | ) |
Partner Small Cap Value | | | (16,931 | ) | | | 16,931 | | | | – | |
Small Cap Stock | | | 1,715,988 | | | | 400,596 | | | | (2,116,584 | ) |
Mid Cap Growth | | | 547,455 | | | | (388,631 | ) | | | (158,824 | ) |
Partner Mid Cap Value | | | (73,603 | ) | | | 73,603 | | | | – | |
Mid Cap Stock | | | 155,076 | | | | 485,790 | | | | (640,866 | ) |
Partner Worldwide Allocation | | | (398,272 | ) | | | 590,230 | | | | (191,958 | ) |
Large Cap Growth | | | – | | | | 22,413 | | | | (22,413 | ) |
Large Cap Value | | | (19,292 | ) | | | 19,292 | | | | – | |
Large Cap Stock | | | (38,920 | ) | | | 38,920 | | | | – | |
Balanced | | | (107,964 | ) | | | 107,964 | | | | – | |
High Yield | | | (342,818 | ) | | | 65,177,995 | | | | (64,835,177 | ) |
228
Thrivent Mutual Funds
Notes to Financial Statements
As of October 31, 2011
| | | | | | | | | | | | |
| Fund | | Accumulated Net Investment Income/(Loss) | | | Accumulated Net Realized Gain/(Loss) | | | Capital Stock | |
Municipal Bond | | | (1,040 | ) | | | 1,040 | | | | – | |
Income | | | (328,115 | ) | | | 328,115 | | | | – | |
Core Bond | | | (314,304 | ) | | | 314,304 | | | | – | |
Government Bond | | | 11,878 | | | | (54 | ) | | | (11,824 | ) |
Limited Maturity Bond | | | (666,043 | ) | | | 708,471 | | | | (42,428 | ) |
Money Market | | | 152,270 | | | | (19,413 | ) | | | (132,857 | ) |
At October 31, 2011, the components of distributable earnings on a tax basis were as follows:
| | | | | | |
| Fund | | Undistributed Ordinary Income | | Undistributed Long-Term Capital Gain | |
Aggressive Allocation | | $1,040,036 | | | $– | |
Moderately Aggressive Allocation | | 10,267,796 | | | – | |
Moderate Allocation | | 1,305,750 | | | 1,508,481 | |
Moderately Conservative Allocation | | 1,652,617 | | | 2,320,527 | |
Partner Small Cap Value | | 839,967 | | | 2,250,323 | |
Mid Cap Growth | | – | | | 3,093,633 | |
Partner Mid Cap Value | | 556,624 | | | – | |
Partner Worldwide Allocation | | 5,794,154 | | | – | |
Large Cap Growth | | 13,341 | | | – | |
Large Cap Value | | 6,833,819 | | | – | |
Large Cap Stock | | 8,241,118 | | | – | |
Balanced | | 79,841 | | | 4,829,293 | |
High Yield | | (142,680) | | | – | |
Municipal Bonda | | 105,437 | | | – | |
Income | | 72,690 | | | – | |
Core Bond | | 165,088 | | | – | |
Government Bond | | 1,133,922 | | | 1,327,106 | |
Limited Maturity Bond | | (17,968) | | | – | |
| | a | Municipal Bond Fund undistributed ordinary income is primarily exempt from federal income taxes. |
At October 31, 2011, the following Funds had accumulated net realized capital loss carryovers expiring as follows:
| | | | | | | | |
| Fund | | Capital Loss
Carryover | | | Expiration Year | |
Aggressive Allocation | | $ | 3,281,022 | | | | 2017 | |
| | | | | | | | |
| | $ | 3,281,022 | | | | | |
| | | | | | | | |
| | |
Moderately Aggressive | | | | | | | | |
Allocation | | | 8,371,201 | | | | 2017 | |
| | | | | | | | |
| | $ | 8,371,201 | | | | | |
| | | | | | | | |
| | |
Partner Small Cap Growth | | | 5,460,068 | | | | 2017 | |
| | | | | | | | |
| | $ | 5,460,068 | | | | | |
| | | | | | | | |
| | |
Small Cap Stock | | | 36,548,776 | | | | 2017 | |
| | | | | | | | |
| | $ | 36,548,776 | | | | | |
| | | | | | | | |
| | |
Partner Mid Cap Value | | | 444,703 | | | | 2017 | |
| | | | | | | | |
| | $ | 444,703 | | | | | |
| | | | | | | | |
| | | | | | | | |
| Fund | | Capital Loss Carryover | | | Expiration Year | |
Mid Cap Stock | | | 85,286,594 | | | | 2016 | |
| | | 80,779,485 | | | | 2017 | |
| | | | | | | | |
| | $ | 166,066,079 | | | | | |
| | | | | | | | |
| | |
Partner Worldwide | | | | | | | | |
Allocation | | | 11,277,565 | | | | 2015 | |
| | | 109,990,616 | | | | 2016 | |
| | | 13,383,870 | | | | 2017 | |
| | | | | | | | |
| | $ | 134,652,051 | | | | | |
| | | | | | | | |
| | |
Large Cap Growth | | | 4,167,188 | | | | 2015 | |
| | | 32,047,527 | | | | 2016 | |
| | | 60,235,691 | | | | 2017 | |
| | | | | | | | |
| | $ | 96,450,406 | | | | | |
| | | | | | | | |
| | |
Large Cap Value | | | 86,140,139 | | | | 2017 | |
| | | | | | | | |
| | $ | 86,140,139 | | | | | |
| | | | | | | | |
| | |
Large Cap Stock | | | 9,182,531 | | | | 2017 | |
| | | | | | | | |
| | $ | 9,182,531 | | | | | |
| | | | | | | | |
| | |
High Yield | | | 11,792,481 | | | | 2012 | |
| | | 1,037,644 | | | | 2013 | |
| | | 1,574,393 | | | | 2014 | |
| | | 32,937,341 | | | | 2016 | |
| | | 30,243,630 | | | | 2017 | |
| | | | | | | | |
| | $ | 77,585,489 | | | | | |
| | | | | | | | |
| | |
Municipal Bond | | | 582,671 | | | | 2019 | |
| | | | | | | | |
| | $ | 582,671 | | | | | |
| | | | | | | | |
| | |
Income | | | 4,261,739 | | | | 2016 | |
| | | 28,531,756 | | | | 2017 | |
| | | | | | | | |
| | $ | 32,793,495 | | | | | |
| | | | | | | | |
| | |
Core Bond | | | 762,995 | | | | 2014 | |
| | | 1,199,140 | | | | 2015 | |
| | | 5,142,913 | | | | 2016 | |
| | | 8,698,163 | | | | 2017 | |
| | | | | | | | |
| | $ | 15,803,211 | | | | | |
| | | | | | | | |
| | |
Limited Maturity Bond | | | 1,788,838 | | | | 2017 | |
| | | 828,463 | | | | 2019 | |
| | | | | | | | |
| | $ | 2,617,301 | | | | | |
| | | | | | | | |
To the extent that these Funds realize future net capital gains, taxable distributions will be reduced by any unused capital loss carryovers as permitted by the Internal Revenue Code.
Of the capital loss carryovers attributable to Partner Worldwide Allocation Fund, the following amounts were obtained as a result of the reorganization, as described in Note (1)(A), with Partner International Stock Fund in September 2011:
| | | | | | | | |
| Fund | | Capital Loss Carryover | | | Expiration Year | |
Partner Worldwide | | | 11,277,565 | | | | 2015 | |
Allocation Fund | | | | | | | | |
| | | 105,432,640 | | | | 2016 | |
| | | | | | | | |
| | $ | 116,710,205 | | | | | |
| | | | | | | | |
229
Thrivent Mutual Funds
Notes to Financial Statements
As of October 31, 2011
The Internal Revenue Code may limit the ability to utilize capital losses after a fund merger.
The Regulated Investment Company Modernization Act of 2010 (the Act), enacted December 22, 2010, made several changes to the tax rules that impact the Funds. In general, the provisions of the Act will be effective for the Funds’ fiscal year ending October 31, 2012. Under the Act, capital losses will be carried forward with no expiration and with the short-term or long-term character of the losses retained. Additionally, these future carryover losses must be fully utilized before a Fund can utilize carryovers generated in pre-enactment years. The Funds’ pre-enactment carryovers are listed with noted expiration dates in the table above. As a result of the Act, the losses listed in the table above may be more likely to expire unused.
During the fiscal year 2011, capital loss carryovers utilized by the Funds were as follows:
| | | | |
| Fund | | Capital Loss Carryover | |
Aggressive Allocation | | | $12,426,769 | |
Moderately Aggressive Allocation | | | 18,506,622 | |
Moderate Allocation | | | 17,180,296 | |
Moderately Conservative Allocation | | | 2,447,070 | |
Partner Small Cap Growth | | | 20,566,762 | |
Partner Small Cap Value | | | 220,503 | |
Small Cap Stock | | | 47,261,477 | |
Mid Cap Growth | | | 3,262,227 | |
Partner Mid Cap Value | | | 13,966,403 | |
Mid Cap Stock | | | 62,790,609 | |
Partner Worldwide Allocation | | | 12,109,191 | |
Large Cap Growth | | | 27,214,053 | |
Large Cap Value | | | 42,591,303 | |
Large Cap Stock | | | 124,499,005 | |
Balanced | | | 11,585,399 | |
High Yield | | | 26,138,157 | |
Income | | | 21,656,543 | |
Core Bond | | | 3,879,811 | |
In addition, the following capital loss carryovers expired during the fiscal year 2011: High Yield Fund; $64,835,177.
230
Thrivent Mutual Funds
Notes to Financial Statements
As of October 31, 2011
The tax character of distributions paid during the years ended October 31, 2011 and 2010 was as follows:
| | | | | | | | | | | | | | | | | | | | | | | | |
| | | Tax-Exempt Income | | | Ordinary Income | | | Long-Term Capital Gain | |
| | | | | | |
| Fund | | 10/31/2011 | | | 10/31/2010 | | | 10/31/2011 | | | 10/31/2010 | | | 10/31/2011 | | | 10/31/2010 | |
Aggressive Allocation | | $ | – | | | $ | – | | | $ | 2,796,343 | | | $ | 3,322,539 | | | $ | – | | | $ | – | |
Moderately Aggressive Allocation | | | – | | | | – | | | | 16,684,506 | | | | 16,180,145 | | | | – | | | | – | |
Moderate Allocation | | | – | | | | – | | | | 25,087,549 | | | | 23,455,552 | | | | – | | | | – | |
Moderately Conservative Allocation | | | – | | | | – | | | | 12,762,396 | | | | 11,745,741 | | | | – | | | | – | |
Partner Small Cap Value | | | – | | | | – | | | | 2,096,972 | | | | 1,200,962 | | | | – | | | | – | |
Partner Mid Cap Value | | | – | | | | – | | | | 711,094 | | | | 940,413 | | | | – | | | | – | |
Mid Cap Stock | | | – | | | | – | | | | 701,194 | | | | 766,405 | | | | – | | | | – | |
Partner Worldwide Allocation | | | – | | | | – | | | | 3,609,840 | | | | 2,492,167 | | | | – | | | | – | |
Large Cap Growth | | | – | | | | – | | | | – | | | | 1,199,725 | | | | – | | | | – | |
Large Cap Value | | | – | | | | – | | | | 6,513,738 | | | | 7,342,630 | | | | – | | | | – | |
Large Cap Stock | | | – | | | | – | | | | 6,795,686 | | | | 10,507,202 | | | | – | | | | – | |
Balanced | | | – | | | | – | | | | 2,803,970 | | | | 2,982,810 | | | | – | | | | – | |
High Yield | | | – | | | | – | | | | 52,791,441 | | | | 54,939,901 | | | | – | | | | – | |
Municipal Bond | | | 58,916,628 | | | | 58,497,274 | | | | 288,179 | | | | 496,714 | | | | 2,623,380 | | | | – | |
Income | | | – | | | | – | | | | 35,710,886 | | | | 37,433,927 | | | | – | | | | – | |
Core Bond | | | – | | | | – | | | | 10,841,275 | | | | 11,899,912 | | | | – | | | | – | |
Government Bond | | | – | | | | – | | | | 3,073,638 | | | | 1,213,372 | | | | – | | | | – | |
Limited Maturity Bond | | | – | | | | – | | | | 20,991,561 | | | | 22,298,302 | | | | – | | | | – | |
(5) SECURITY TRANSACTIONS
(A) Purchases and Sales of Investment Securities – For the year ended October 31, 2011, the cost of purchases and the proceeds from sales of investment securities, other than U.S. Government and short-term securities were as follows:
| | | | | | | | |
| | | In thousands | |
| Fund | | Purchases | | | Sales | |
Aggressive Allocation | | | $354,497 | | | | $352,114 | |
Moderately Aggressive Allocation | | | 645,840 | | | | 613,841 | |
Moderate Allocation | | | 524,549 | | | | 457,393 | |
Moderately Conservative Allocation | | | 218,096 | | | | 175,734 | |
Partner Small Cap Growth | | | 134,227 | | | | 135,248 | |
Partner Small Cap Value | | | 19,936 | | | | 54,004 | |
Small Cap Stock | | | 284,800 | | | | 338,989 | |
Mid Cap Growth | | | 262,568 | | | | 283,542 | |
Partner Mid Cap Value | | | 95,381 | | | | 100,573 | |
Mid Cap Stock | | | 274,497 | | | | 337,737 | |
Partner Worldwide Allocation | | | 383,995 | | | | 322,994 | |
Large Cap Growth | | | 819,605 | | | | 821,711 | |
Large Cap Value | | | 401,159 | | | | 393,915 | |
Large Cap Stock | | | 2,442,085 | | | | 2,589,795 | |
Balanced | | | 191,846 | | | | 215,610 | |
High Yield | | | 426,172 | | | | 424,867 | |
Municipal Bond | | | 108,034 | | | | 156,674 | |
Income | | | 525,315 | | | | 530,443 | |
Core Bond | | | 115,844 | | | | 133,720 | |
Government Bond | | | 7,789 | | | | 8,475 | |
Limited Maturity Bond | | | 482,096 | | | | 406,373 | |
Purchases and sales of U.S. Government securities were:
| | | | | | | | |
| | | In thousands | |
| Fund | | Purchases | | | Sales | |
Aggressive Allocation | | | $30,902 | | | | $26,782 | |
Moderately Aggressive Allocation | | | 115,613 | | | | 101,545 | |
Moderate Allocation | | | 109,077 | | | | 93,721 | |
| | | | | | | | |
| | | In thousands | |
| Fund | | Purchases | | | Sales | |
Moderately Conservative Allocation | | | 77,113 | | | | 67,862 | |
Small Cap Stock | | | – | | | | 600 | |
Partner Worldwide Allocation | | | 600 | | | | – | |
Balanced | | | 248,957 | | | | 246,813 | |
Income | | | 563,362 | | | | 544,201 | |
Core Bond | | | 922,820 | | | | 903,344 | |
Government Bond | | | 175,526 | | | | 188,554 | |
Limited Maturity Bond | | | 606,095 | | | | 532,840 | |
(B) Investments in Restricted Securities – Certain Funds may own restricted securities that have been deemed illiquid and were purchased in private placement transactions without registration under the Securities Act of 1933. Unless such securities subsequently become registered, they generally may be resold only in privately negotiated transactions with a limited number of purchasers. As of October 31, 2011, the following funds held restricted securities:
| | | | |
| Fund | | Number of Securities | | Percent of Fund’s Net Assets |
Balanced | | 5 | | 1.47% |
High Yield | | 5 | | 2.23% |
Municipal Bond | | 2 | | 0.27% |
Income | | 7 | | 1.88% |
Core Bond | | 4 | | 2.76% |
Limited Maturity Bond | | 8 | | 0.93% |
The Funds have no right to require registration of unregistered securities.
(C) Investments in High-Yielding Securities – High Yield Fund invests primarily in high-yielding fixed-income securities. Each of the other Funds, except Money Market Fund, may also invest in high-yielding securities. These securities will typically
231
Thrivent Mutual Funds
Notes to Financial Statements
As of October 31, 2011
be in the lower rating categories or will be non-rated and generally will involve more risk than securities in the higher rating categories. Lower rated or unrated securities are more likely to react to developments affecting market risk and credit risk than are more highly rated securities, which react primarily to movements in the general level of interest rates.
(D) Investments in Options and Futures Contracts – The movement in the price of the security underlying an option or futures contract may not correlate perfectly with the movement in the prices of the portfolio securities being hedged. A lack of correlation could render the Fund’s hedging strategy unsuccessful and could result in a loss to the Fund. In the event that a liquid secondary market would not exist, the Fund could be prevented from entering into a closing transaction, which could result in additional losses to the Fund.
(E) Written Option Contracts – The number of contracts and premium amounts associated with call option contracts written during the year ended October 31, 2011 were as follows:
| | | | | | | | |
| | | Number of
Contracts | | | Premium
Amount | |
Large Cap Growth | | | | | | | | |
Balance at October 31, 2010 | | | 298 | | | $ | 20,393 | |
Opened | | | 1,782 | | | | 266,591 | |
Closed | | | (1,083 | ) | | | (155,148 | ) |
Expired | | | (860 | ) | | | (110,045 | ) |
Exercised | | | (137 | ) | | | (21,791 | ) |
| | | | | | | | |
Balance at October 31, 2011 | | | – | | | $ | – | |
| | | | | | | | |
Large Cap Stock | | | | | | | | |
Balance at October 31, 2010 | | | 350 | | | $ | 190,938 | |
Opened | | | 5,010 | | | | 2,118,594 | |
Closed | | | (5,180 | ) | | | (2,244,400 | ) |
Expired | | | (100 | ) | | | (24,832 | ) |
Exercised | | | – | | | | – | |
| | | | | | | | |
Balance at October 31, 2011 | | | 80 | | | $ | 40,300 | |
| | | | | | | | |
Government Bond | | | | | | | | |
Balance at October 31, 2010 | | | 2 | | | $ | 7,906 | |
Opened | | | 12 | | | | 46,562 | |
Closed | | | – | | | | – | |
Expired | | | (2 | ) | | | (4,062 | ) |
Exercised | | | (12 | ) | | | (50,406 | ) |
| | | | | | | | |
Balance at October 31, 2011 | | | – | | | $ | – | |
| | | | | | | | |
(6) SECURITY TRANSACTIONS WITH AFFILIATED FUNDS
The Funds are permitted to purchase or sell securities from or to certain other Funds under specified conditions outlined in procedures adopted by the Board of Trustees of the Trust. The procedures have been designed to ensure that any purchase or sale of securities by the Fund from or to another fund or portfolio that is or could be considered an affiliate by virtue of having a common investment adviser (or affiliated investment advisers), common Trustees and/or common officers complies with Rule 17a-7 of the 1940 Act. Further, as defined under the procedures, each transaction is executed at the current market
price. Pursuant to these procedures, during the year ended October 31, 2011, the Funds engaged in purchases and sales of securities of $3,175,380 and $3,347,834, respectively.
(7) RELATED PARTY TRANSACTIONS
As of October 31, 2011, related parties (other than the Thrivent Asset Allocation Funds) held the following shares in excess of 5% of Thrivent Mutual Funds:
| | | | | | | | |
| Fund | | Shares | | | Percent of Fund’s Outstanding Shares | |
Partner Small Cap Growth | | | 942,592 | | | | 9.1 | % |
Partner Worldwide Allocation | | | 4,676,841 | | | | 5.9 | % |
Large Cap Growth | | | 3,194,268 | | | | 5.1 | % |
Core Bond | | | 4,557,352 | | | | 15.9 | % |
Government Bond | | | 2,093,179 | | | | 22.0 | % |
As of October 31, 2011, retirement plans sponsored by Thrivent Financial for Lutherans held the following shares in excess of 5% of Thrivent Mutual Funds:
| | | | | | | | |
| Fund | | Shares | | | Percent of Fund’s Outstanding Shares | |
Aggressive Allocation | | | 7,430,678 | | | | 14.7 | % |
Moderately Aggressive Allocation | | | 7,683,508 | | | | 6.6 | % |
Partner Small Cap Value | | | 1,193,212 | | | | 8.4 | % |
Mid Cap Stock | | | 3,271,441 | | | | 6.3 | % |
Balanced | | | 4,093,566 | | | | 25.6 | % |
(8) SUBSEQUENT EVENTS
Management of the Funds has evaluated the impact of subsequent events, and, except as already included in the Notes to Financial Statements, has determined that no additional items require disclosure.
232
[THIS PAGE INTENTIONALLY LEFT BLANK]
233
Thrivent Mutual Funds
Financial Highlights
| | | | | | |
| | | FOR A SHARE OUTSTANDING THROUGHOUT EACH PERIOD* |
| | | | | | | | | | | | |
| | | | | Income from Investment Operations | | Less Distributions from |
| | | | | | |
| | Net Asset Value, Beginning of Period | | Net Investment Income/(Loss) | | Net Realized and Unrealized Gain/(Loss) on Investments(a) | | Total from Investment Operations | | Net Investment Income | | Net Realized Gain on Investments |
AGGRESSIVE ALLOCATION FUND | | | | |
| | | | | | |
Class A Shares | | | | | | | | | | | | |
Year Ended 10/31/2011 | | $10.35 | | $0.07 | | $0.33 | | $0.40 | | $(0.05) | | $– |
Year Ended 10/31/2010 | | 8.81 | | 0.06 | | 1.55 | | 1.61 | | (0.07) | | – |
Year Ended 10/31/2009 | | 8.26 | | 0.10 | | 0.99 | | 1.09 | | (0.09) | | (0.45) |
Year Ended 10/31/2008 | | 13.79 | | 0.16 | | (5.13) | | (4.97) | | (0.35) | | (0.21) |
Year Ended 10/31/2007 | | 11.88 | | 0.14 | | 1.99 | | 2.13 | | (0.19) | | (0.03) |
| | | | | | |
Institutional Class Shares | | | | | | | | | | | | |
Year Ended 10/31/2011 | | 10.43 | | 0.11 | | 0.33 | | 0.44 | | (0.09) | | – |
Year Ended 10/31/2010 | | 8.87 | | 0.09 | | 1.56 | | 1.65 | | (0.09) | | – |
Year Ended 10/31/2009 | | 8.31 | | 0.13 | | 1.00 | | 1.13 | | (0.12) | | (0.45) |
Year Ended 10/31/2008 | | 13.86 | | 0.21 | | (5.18) | | (4.97) | | (0.37) | | (0.21) |
Year Ended 10/31/2007 | | 11.94 | | 0.16 | | 2.02 | | 2.18 | | (0.23) | | (0.03) |
MODERATELY AGGRESSIVE ALLOCATION FUND | | | | |
| | | | | | |
Class A Shares | | | | | | | | | | | | |
Year Ended 10/31/2011 | | 10.65 | | 0.16 | | 0.17 | | 0.33 | | (0.15) | | – |
Year Ended 10/31/2010 | | 9.25 | | 0.16 | | 1.39 | | 1.55 | | (0.15) | | – |
Year Ended 10/31/2009 | | 8.36 | | 0.20 | | 1.11 | | 1.31 | | (0.20) | | (0.22) |
Year Ended 10/31/2008 | | 13.23 | | 0.24 | | (4.58) | | (4.34) | | (0.36) | | (0.17) |
Year Ended 10/31/2007 | | 11.72 | | 0.21 | | 1.56 | | 1.77 | | (0.24) | | (0.02) |
| | | | | | |
Institutional Class Shares | | | | | | | | | | | | |
Year Ended 10/31/2011 | | 10.72 | | 0.20 | | 0.18 | | 0.38 | | (0.18) | | – |
Year Ended 10/31/2010 | | 9.31 | | 0.20 | | 1.39 | | 1.59 | | (0.18) | | – |
Year Ended 10/31/2009 | | 8.41 | | 0.23 | | 1.12 | | 1.35 | | (0.23) | | (0.22) |
Year Ended 10/31/2008 | | 13.30 | | 0.27 | | (4.60) | | (4.33) | | (0.39) | | (0.17) |
Year Ended 10/31/2007 | | 11.77 | | 0.23 | | 1.60 | | 1.83 | | (0.28) | | (0.02) |
MODERATE ALLOCATION FUND | | | | | | |
| | | | | | |
Class A Shares | | | | | | | | | | | | |
Year Ended 10/31/2011 | | 10.67 | | 0.22 | | 0.13 | | 0.35 | | (0.22) | | – |
Year Ended 10/31/2010 | | 9.46 | | 0.23 | | 1.20 | | 1.43 | | (0.22) | | – |
Year Ended 10/31/2009 | | 8.42 | | 0.27 | | 1.09 | | 1.36 | | (0.26) | | (0.06) |
Year Ended 10/31/2008 | | 12.32 | | 0.30 | | (3.62) | | (3.32) | | (0.41) | | (0.17) |
Year Ended 10/31/2007 | | 11.30 | | 0.30 | | 1.10 | | 1.40 | | (0.34) | | (0.04) |
| | | | | | |
Institutional Class Shares | | | | | | | | | | | | |
Year Ended 10/31/2011 | | 10.69 | | 0.26 | | 0.13 | | 0.39 | | (0.26) | | – |
Year Ended 10/31/2010 | | 9.48 | | 0.26 | | 1.20 | | 1.46 | | (0.25) | | – |
Year Ended 10/31/2009 | | 8.43 | | 0.29 | | 1.11 | | 1.40 | | (0.29) | | (0.06) |
Year Ended 10/31/2008 | | 12.34 | | 0.35 | | (3.65) | | (3.30) | | (0.44) | | (0.17) |
Year Ended 10/31/2007 | | 11.32 | | 0.33 | | 1.09 | | 1.42 | | (0.36) | | (0.04) |
(a) The amount shown may not correlate with the change in aggregate gains and losses of portfolio securities due to the timing of sales and redemptions of fund shares.
* All per share amounts have been rounded to the nearest cent
The accompanying Notes to Financial Statements are an integral part of this schedule.
234
Thrivent Mutual Funds
Financial Highlights - continued
| | | | | | | | | | | | | | | | | | | | | | | | | | | | | | |
| | | | | | | | | RATIOS / SUPPLEMENTAL DATA | | |
| | | | | | | | | | | | | | | | | | |
| | | | | | | | | | Ratio to Average Net
Assets** | | Ratios to Average Net Assets Before Expenses Waived, Credited or Paid Indirectly** | | |
| | | | | | | | |
Total
Distributions | | Net Asset Value, End of Period | | | Total Return(b) | | Net Assets,
End of Period (in millions) | | Expenses | | Net Investment Income/ (Loss) | | Expenses | | Net Investment Income/ (Loss) | | Portfolio Turnover Rate |
| | | | | | | | | | | | | | | | | | | |
| | | | | | | | |
| | | | | | | | | | | | | | | | | | | |
| $(0.05) | | | $10.70 | | | 3.87% | | $462.1 | | 0.75% | | 0.64% | | 0.89% | | 0.51% | | 72% |
| (0.07) | | | 10.35 | | | 18.29% | | 435.5 | | 0.70% | | 0.57% | | 0.90% | | 0.37% | | 52% |
| (0.54) | | | 8.81 | | | 14.66% | | 354.6 | | 0.57% | | 1.27% | | 0.88% | | 0.96% | | 19% |
| (0.56) | | | 8.26 | | | (37.44)% | | 264.2 | | 0.53% | | 0.94% | | 0.72% | | 0.75% | | 15% |
| (0.22) | | | 13.79 | | | 18.27% | | 332.7 | | 0.38% | | 0.79% | | 0.72% | | 0.45% | | 15% |
| | | | | | | | |
| | | | | | | | | | | | | | | | | | | |
| (0.09) | | | 10.78 | | | 4.16% | | 80.0 | | 0.40% | | 1.01% | | 0.41% | | 1.00% | | 72% |
| (0.09) | | | 10.43 | | | 18.73% | | 73.7 | | 0.35% | | 0.94% | | 0.39% | | 0.90% | | 52% |
| (0.57) | | | 8.87 | | | 15.16% | | 62.9 | | 0.23% | | 1.62% | | 0.25% | | 1.60% | | 19% |
| (0.58) | | | 8.31 | | | (37.27)% | | 50.4 | | 0.20% | | 1.26% | | 0.20% | | 1.26% | | 15% |
| (0.26) | | | 13.86 | | | 18.64% | | 57.8 | | 0.10% | | 1.11% | | 0.21% | | 1.00% | | 15% |
| | | | | | | | | | | | | | | | | | | |
| | | | | | | | |
| | | | | | | | | | | | | | | | | | | |
| (0.15) | | | 10.83 | | | 3.06% | | 1,168.6 | | 0.70% | | 1.44% | | 0.75% | | 1.39% | | 58% |
| (0.15) | | | 10.65 | | | 16.92% | | 1,085.3 | | 0.62% | | 1.60% | | 0.75% | | 1.47% | | 39% |
| (0.42) | | | 9.25 | | | 16.78% | | 904.1 | | 0.54% | | 2.50% | | 0.72% | | 2.31% | | 17% |
| (0.53) | | | 8.36 | | | (33.99)% | | 698.3 | | 0.51% | | 1.87% | | 0.61% | | 1.78% | | 20% |
| (0.26) | | | 13.23 | | | 15.45% | | 859.2 | | 0.37% | | 1.52% | | 0.61% | | 1.28% | | 18% |
| | | | | | | | |
| | | | | | | | | | | | | | | | | | | |
| (0.18) | | | 10.92 | | | 3.55% | | 85.1 | | 0.32% | | 1.82% | | 0.33% | | 1.81% | | 58% |
| (0.18) | | | 10.72 | | | 17.24% | | 79.5 | | 0.28% | | 1.94% | | 0.31% | | 1.92% | | 39% |
| (0.45) | | | 9.31 | | | 17.27% | | 69.0 | | 0.20% | | 2.85% | | 0.21% | | 2.84% | | 17% |
| (0.56) | | | 8.41 | | | (33.83)% | | 56.2 | | 0.18% | | 2.21% | | 0.18% | | 2.21% | | 20% |
| (0.30) | | | 13.30 | | | 15.85% | | 68.9 | | 0.09% | | 1.86% | | 0.19% | | 1.76% | | 18% |
| | | | | | | | | | | | | | | | | | | |
| | | | | | | | |
| | | | | | | | | | | | | | | | | | | |
| (0.22) | | | 10.80 | | | 3.27% | | 1,207.6 | | 0.65% | | 2.02% | | 0.68% | | 1.99% | | 46% |
| (0.22) | | | 10.67 | | | 15.30% | | 1,118.6 | | 0.60% | | 2.28% | | 0.68% | | 2.21% | | 30% |
| (0.32) | | | 9.46 | | | 16.91% | | 923.2 | | 0.53% | | 3.24% | | 0.64% | | 3.12% | | 19% |
| (0.58) | | | 8.42 | | | (28.06)% | | 739.6 | | 0.50% | | 2.61% | | 0.55% | | 2.56% | | 17% |
| (0.38) | | | 12.32 | | | 12.60% | | 843.2 | | 0.37% | | 2.36% | | 0.56% | | 2.17% | | 23% |
| | | | | | | | |
| | | | | | | | | | | | | | | | | | | |
| (0.26) | | | 10.82 | | | 3.62% | | 59.7 | | 0.30% | | 2.36% | | 0.31% | | 2.35% | | 46% |
| (0.25) | | | 10.69 | | | 15.64% | | 50.5 | | 0.27% | | 2.60% | | 0.29% | | 2.58% | | 30% |
| (0.35) | | | 9.48 | | | 17.38% | | 38.5 | | 0.20% | | 3.55% | | 0.21% | | 3.54% | | 19% |
| (0.61) | | | 8.43 | | | (27.87)% | | 28.4 | | 0.18% | | 2.92% | | 0.18% | | 2.92% | | 17% |
| (0.40) | | | 12.34 | | | 12.84% | | 27.9 | | 0.11% | | 2.66% | | 0.20% | | 2.57% | | 23% |
(b) Total investment return assumes dividend reinvestment and does not reflect any deduction for sales charges. Not annualized for periods less than one year.
** Computed on an annualized basis for periods less than one year.
The accompanying Notes to Financial Statements are an integral part of this schedule.
235
Thrivent Mutual Funds
Financial Highlights - continued
| | | | | | |
| | | FOR A SHARE OUTSTANDING THROUGHOUT EACH PERIOD* | | | | |
| | | | | | | | | | | | |
| | | | | Income from Investment Operations | | Less Distributions from |
| | | | | | |
| | | Net Asset Value, Beginning of Period | | Net Investment Income/(Loss) | | Net Realized
and Unrealized
Gain/(Loss) on
Investments(a) | | Total from
Investment
Operations | | Net
Investment
Income | | Net Realized
Gain on
Investments |
MODERATELY CONSERVATIVE ALLOCATION FUND |
| | | | | | |
Class A Shares | | | | | | | | | | | | |
Year Ended 10/31/2011 | | $10.73 | | $0.25 | | $0.02 | | $0.27 | | $(0.25) | | $– |
Year Ended 10/31/2010 | | 9.78 | | 0.27 | | 0.94 | | 1.21 | | (0.26) | | – |
Year Ended 10/31/2009 | | 8.75 | | 0.30 | | 1.03 | | 1.33 | | (0.30) | | – |
Year Ended 10/31/2008 | | 11.54 | | 0.34 | | (2.63) | | (2.29) | | (0.40) | | (0.10) |
Year Ended 10/31/2007 | | 10.91 | | 0.36 | | 0.68 | | 1.04 | | (0.38) | | (0.03) |
| | | | | | |
Institutional Class Shares | | | | | | | | | | | | |
Year Ended 10/31/2011 | | 10.75 | | 0.28 | | 0.03 | | 0.31 | | (0.28) | | – |
Year Ended 10/31/2010 | | 9.80 | | 0.29 | | 0.94 | | 1.23 | | (0.28) | | – |
Year Ended 10/31/2009 | | 8.77 | | 0.32 | | 1.03 | | 1.35 | | (0.32) | | – |
Year Ended 10/31/2008 | | 11.56 | | 0.37 | | (2.63) | | (2.26) | | (0.43) | | (0.10) |
Year Ended 10/31/2007 | | 10.93 | | 0.37 | | 0.69 | | 1.06 | | (0.40) | | (0.03) |
PARTNER SMALL CAP GROWTH FUND |
| | | | | | |
Class A Shares | | | | | | | | | | | | |
Year Ended 10/31/2011 | | 10.81 | | (0.12) | | 1.03 | | 0.91 | | – | | – |
Year Ended 10/31/2010 | | 8.31 | | (0.11) | | 2.61 | | 2.50 | | – | | – |
Year Ended 10/31/2009 | | 7.72 | | (0.04) | | 0.63 | | 0.59 | | – | | – |
Year Ended 10/31/2008 | | 13.93 | | (0.04) | | (5.59) | | (5.63) | | – | | (0.58) |
Year Ended 10/31/2007 | | 11.69 | | (0.06) | | 2.30 | | 2.24 | | – | | – |
| | | | | | |
Institutional Class Shares | | | | | | | | | | | | |
Year Ended 10/31/2011 | | 11.01 | | (0.08) | | 1.06 | | 0.98 | | – | | – |
Year Ended 10/31/2010 | | 8.42 | | (0.07) | | 2.66 | | 2.59 | | – | | – |
Year Ended 10/31/2009 | | 7.79 | | (0.03) | | 0.66 | | 0.63 | | – | | – |
Year Ended 10/31/2008 | | 14.00 | | (0.01) | | (5.62) | | (5.63) | | – | | (0.58) |
Year Ended 10/31/2007 | | 11.73 | | (0.02) | | 2.31 | | 2.29 | | (0.02) | | – |
PARTNER SMALL CAP VALUE FUND |
| | | | | | |
Class A Shares | | | | | | | | | | | | |
Year Ended 10/31/2011 | | 13.72 | | 0.04 | | 0.80 | | 0.84 | | (0.09) | | – |
Year Ended 10/31/2010 | | 11.26 | | 0.02 | | 2.47 | | 2.49 | | (0.03) | | – |
Year Ended 10/31/2009 | | 11.02 | | 0.05 | | 0.86 | | 0.91 | | (0.05) | | (0.62) |
Year Ended 10/31/2008 | | 16.41 | | 0.09 | | (4.26) | | (4.17) | | – | | (1.22) |
Year Ended 10/31/2007 | | 15.65 | | 0.04 | | 1.45 | | 1.49 | | (0.02) | | (0.71) |
| | | | | | |
Institutional Class Shares | | | | | | | | | | | | |
Year Ended 10/31/2011 | | 14.39 | | 0.14 | | 0.82 | | 0.96 | | (0.16) | | – |
Year Ended 10/31/2010 | | 11.81 | | 0.09 | | 2.59 | | 2.68 | | (0.10) | | – |
Year Ended 10/31/2009 | | 11.53 | | 0.10 | | 0.94 | | 1.04 | | (0.14) | | (0.62) |
Year Ended 10/31/2008 | | 17.10 | | 0.12 | | (4.37) | | (4.25) | | (0.10) | | (1.22) |
Year Ended 10/31/2007 | | 16.26 | | 0.13 | | 1.52 | | 1.65 | | (0.10) | | (0.71) |
(a) The amount shown may not correlate with the change in aggregate gains and losses of portfolio securities due to the timing of sales and redemptions of fund shares.
* All per share amounts have been rounded to the nearest cent.
The accompanying Notes to Financial Statements are an integral part of this schedule.
236
Thrivent Mutual Funds
Financial Highlights - continued
| | | | | | | | | | |
| | | | | | | RATIOS / SUPPLEMENTAL DATA | | | | |
| | | | | | | | | | | | | | | | | | |
| | | | | | | | | | Ratio to Average Net
Assets** | | Ratios to Average Net Assets Before Expenses Waived, Credited or Paid Indirectly** | | |
| | | | | | | | |
Total Distributions | | Net Asset
Value, End of
Period | | | Total
Return(b) | | Net Assets, End
of Period (in millions) | | Expenses | | Net
Investment
Income/(Loss) | | Expenses | | Net
Investment
Income/(Loss) | | Portfolio
Turnover Rate |
| | | | | | | | | | | | | | | | | | | |
| | | | | | | | |
| | | | | | | | | | | | | | | | | | | |
| $(0.25) | | | $10.75 | | | 2.49% | | $559.7 | | 0.64% | | 2.28% | | 0.69% | | 2.23% | | 46% |
| (0.26) | | | 10.73 | | | 12.53% | | 503.7 | | 0.58% | | 2.61% | | 0.69% | | 2.50% | | 29% |
| (0.30) | | | 9.78 | | | 15.66% | | 392.9 | | 0.51% | | 3.45% | | 0.64% | | 3.31% | | 21% |
| (0.50) | | | 8.75 | | | (20.53)% | | 314.7 | | 0.47% | | 3.15% | | 0.56% | | 3.06% | | 19% |
| (0.41) | | | 11.54 | | | 9.72% | | 305.5 | | 0.33% | | 3.16% | | 0.57% | | 2.92% | | 19% |
| | | | | | | | |
| | | | | | | | | | | | | | | | | | | |
| (0.28) | | | 10.78 | | | 2.88% | | 22.4 | | 0.33% | | 2.59% | | 0.33% | | 2.59% | | 46% |
| (0.28) | | | 10.75 | | | 12.78% | | 21.7 | | 0.32% | | 2.87% | | 0.33% | | 2.86% | | 29% |
| (0.32) | | | 9.80 | | | 15.91% | | 13.8 | | 0.25% | | 3.72% | | 0.25% | | 3.71% | | 21% |
| (0.53) | | | 8.77 | | | (20.30)% | | 11.1 | | 0.22% | | 3.45% | | 0.22% | | 3.45% | | 19% |
| (0.43) | | | 11.56 | | | 9.91% | | 9.8 | | 0.12% | | 3.41% | | 0.23% | | 3.31% | | 19% |
| | | | | | | | | | | | | | | | | | | |
| | | | | | | | |
| | | | | | | | | | | | | | | | | | | |
| – | | | 11.72 | | | 8.42% | | 20.0 | | 1.47% | | (1.10)% | | 1.51% | | (1.13)% | | 106% |
| – | | | 10.81 | | | 30.08% | | 17.3 | | 1.56% | | (1.14)% | | 1.56% | | (1.14)% | | 102% |
| – | | | 8.31 | | | 7.64% | | 12.8 | | 1.58% | | (0.90)% | | 1.61% | | (0.93)% | | 116% |
| (0.58) | | | 7.72 | | | (41.96)% | | 9.6 | | 1.42% | | (0.44)% | | 1.43% | | (0.45)% | | 186% |
| – | | | 13.93 | | | 19.16% | | 15.5 | | 1.20% | | (0.52)% | | 1.46% | | (0.77)% | | 98% |
| | | | | | | | |
| | | | | | | | | | | | | | | | | | | |
| – | | | 11.99 | | | 8.90% | | 104.4 | | 1.05% | | (0.67)% | | 1.05% | | (0.67)% | | 106% |
| – | | | 11.01 | | | 30.76% | | 95.9 | | 1.09% | | (0.67)% | | 1.09% | | (0.67)% | | 102% |
| – | | | 8.42 | | | 8.09% | | 72.7 | | 1.09% | | (0.40)% | | 1.12% | | (0.43)% | | 116% |
| (0.58) | | | 7.79 | | | (41.74)% | | 64.7 | | 1.06% | | (0.07)% | | 1.07% | | (0.08)% | | 186% |
| (0.02) | | | 14.00 | | | 19.55% | | 64.5 | | 0.92% | | (0.25)% | | 1.13% | | (0.45)% | | 98% |
| | | | | | | | | | | | | | | | | | | |
| | | | | | | | |
| | | | | | | | | | | | | | | | | | | |
| (0.09) | | | 14.47 | | | 6.08% | | 69.3 | | 1.40% | | 0.28% | | 1.40% | | 0.28% | | 9% |
| (0.03) | | | 13.72 | | | 22.14% | | 71.7 | | 1.40% | | 0.14% | | 1.47% | | 0.07% | | 17% |
| (0.67) | | | 11.26 | | | 9.51% | | 59.0 | | 1.56% | | 0.55% | | 1.67% | | 0.44% | | 14% |
| (1.22) | | | 11.02 | | | (26.94)% | | 54.3 | | 1.35% | | 0.61% | | 1.46% | | 0.49% | | 35% |
| (0.73) | | | 16.41 | | | 9.77% | | 82.5 | | 1.25% | | 0.21% | | 1.43% | | 0.03% | | 34% |
| | | | | | | | |
| | | | | | | | | | | | | | | | | | | |
| (0.16) | | | 15.19 | | | 6.64% | | 143.4 | | 0.84% | | 0.84% | | 0.84% | | 0.84% | | 9% |
| (0.10) | | | 14.39 | | | 22.78% | | 160.7 | | 0.85% | | 0.70% | | 0.85% | | 0.70% | | 17% |
| (0.76) | | | 11.81 | | | 10.37% | | 119.2 | | 0.83% | | 1.25% | | 0.87% | | 1.21% | | 14% |
| (1.32) | | | 11.53 | | | (26.46)% | | 75.4 | | 0.69% | | 1.27% | | 0.80% | | 1.15% | | 35% |
| (0.81) | | | 17.10 | | | 10.45% | | 57.7 | | 0.63% | | 0.79% | | 0.80% | | 0.62% | | 34% |
(b) Total investment return assumes dividend reinvestment and does not reflect any deduction for sales charges. Not annualized for periods less than one year.
** Computed on an annualized basis for periods less than one year.
The accompanying Notes to Financial Statements are an integral part of this schedule.
237
Thrivent Mutual Funds
Financial Highlights - continued
| | | | | | | | |
| | | FOR A SHARE OUTSTANDING THROUGHOUT EACH PERIOD* | | | | | |
| | | | | | | | | | | | |
| | | | | Income from Investment Operations | | Less Distributions from |
| | | | | | |
| | | Net Asset
Value,
Beginning of
Period | | Net
Investment
Income/(Loss) | | Net Realized
and Unrealized
Gain/(Loss) on
Investments(a) | | Total from
Investment
Operations | | Net
Investments
Income | | Net Realized
Gain on
Investment |
SMALL CAP STOCK FUND |
| | | | | | |
Class A Shares | | | | | | | | | | | | |
Year Ended 10/31/2011 | | $12.56 | | $(0.11) | | $0.90 | | $0.79 | | $– | | $– |
Year Ended 10/31/2010 | | 10.26 | | (0.09) | | 2.39 | | 2.30 | | – | | – |
Year Ended 10/31/2009 | | 10.33 | | – | | (0.06) | | (0.06) | | (0.01) | | – |
Year Ended 10/31/2008 | | 18.98 | | 0.01 | | (6.34) | | (6.33) | | – | | (2.32) |
Year Ended 10/31/2007 | | 18.48 | | 0.01 | | 2.40 | | 2.41 | | – | | (1.91) |
| | | | | | |
Institutional Class Shares | | | | | | | | | | | | |
Year Ended 10/31/2011 | | 13.99 | | 0.07 | | 0.90 | | 0.97 | | – | | – |
Year Ended 10/31/2010 | | 11.35 | | 0.02 | | 2.62 | | 2.64 | | – | | – |
Year Ended 10/31/2009 | | 11.43 | | 0.22 | | (0.20) | | 0.02 | | (0.10) | | – |
Year Ended 10/31/2008 | | 20.62 | | 0.01 | | (6.88) | | (6.87) | | – | | (2.32) |
Year Ended 10/31/2007 | | 19.82 | | 0.08 | | 2.63 | | 2.71 | | – | | (1.91) |
MID CAP GROWTH FUND |
| | | | | | |
Class A Shares | | | | | | | | | | | | |
Year Ended 10/31/2011 | | 16.62 | | (0.08) | | 1.13 | | 1.05 | | – | | – |
Year Ended 10/31/2010 | | 12.92 | | (0.08) | | 3.78 | | 3.70 | | – | | – |
Year Ended 10/31/2009 | | 10.24 | | (0.06) | | 2.74 | | 2.68 | | – | | – |
Year Ended 10/31/2008 | | 19.45 | | (0.03) | | (6.95) | | (6.98) | | – | | (2.23) |
Year Ended 10/31/2007 | | 16.17 | | (0.06) | | 4.50 | | 4.44 | | – | | (1.16) |
| | | | | | |
Institutional Class Shares | | | | | | | | | | | | |
Year Ended 10/31/2011 | | 18.53 | | 0.05 | | 1.23 | | 1.28 | | – | | – |
Year Ended 10/31/2010 | | 14.31 | | (0.02) | | 4.24 | | 4.22 | | – | | – |
Year Ended 10/31/2009 | | 11.24 | | (0.05) | | 3.12 | | 3.07 | | – | | – |
Year Ended 10/31/2008 | | 20.98 | | (0.08) | | (7.43) | | (7.51) | | – | | (2.23) |
Year Ended 10/31/2007 | | 17.24 | | 0.06 | | 4.84 | | 4.90 | | – | | (1.16) |
PARTNER MID CAP VALUE FUND |
| | | | | | |
Class A Shares | | | | | | | | | | | | |
Year Ended 10/31/2011 | | 11.19 | | 0.05 | | 0.35 | | 0.40 | | (0.04) | | – |
Year Ended 10/31/2010 | | 8.97 | | 0.06 | | 2.23 | | 2.29 | | (0.07) | | – |
Year Ended 10/31/2009 | | 7.89 | | 0.04 | | 1.11 | | 1.15 | | (0.07) | | – |
Year Ended 10/31/2008 | | 12.93 | | 0.12 | | (4.43) | | (4.31) | | (0.09) | | (0.64) |
Year Ended 10/31/2007 | | 11.83 | | 0.11 | | 1.23 | | 1.34 | | (0.17) | | (0.07) |
| | | | | | |
Institutional Class Shares | | | | | | | | | | | | |
Year Ended 10/31/2011 | | 11.23 | | 0.10 | | 0.35 | | 0.45 | | (0.08) | | – |
Year Ended 10/31/2010 | | 8.99 | | 0.09 | | 2.24 | | 2.33 | | (0.09) | | – |
Year Ended 10/31/2009 | | 7.92 | | 0.09 | | 1.08 | | 1.17 | | (0.10) | | – |
Year Ended 10/31/2008 | | 12.97 | | 0.10 | | (4.40) | | (4.30) | | (0.11) | | (0.64) |
Year Ended 10/31/2007 | | 11.87 | | 0.16 | | 1.21 | | 1.37 | | (0.20) | | (0.07) |
(a) The amount shown may not correlate with the change in aggregate gains and losses of portfolio securities due to the timing of sales and redemptions of fund shares.
* All per share amounts have been rounded to the nearest cent.
The accompanying Notes to Financial Statements are an integral part of this schedule.
238
Thrivent Mutual Funds
Financial Highlights - continued
| | | | | | | | | | | | | | | | | | |
| | | | | | | | | | Ratio to Average Net
Assets** | | Ratios to Average Net Assets
Before Expenses Waived,
Credited or Paid Indirectly** | | |
| | | | | | | | |
Total Distributions | | Net Asset
Value, End of
Period | | | Total
Return(b) | | Net Assets, End
of Period (in
millions) | | Expenses | | Net
Investment
Income/(Loss) | | Expenses | | Net
Investment
Income/(Loss) | | Portfolio
Turnover Rate |
| | | | | | | | |
| $– | | $ | 13.35 | | | 6.29% | | $226.3 | | 1.37% | | (0.67)% | | 1.37% | | (0.67)% | | 99% |
| – | | | 12.56 | | | 22.42% | | 239.1 | | 1.46% | | (0.62)% | | 1.46% | | (0.62)% | | 203% |
| (0.01) | | | 10.26 | | | (0.54)% | | 221.2 | | 1.58% | | 0.03% | | 1.58% | | 0.03% | | 283% |
| (2.32) | | | 10.33 | | | (37.25)% | | 241.9 | | 1.32% | | 0.09% | | 1.33% | | 0.07% | | 245% |
| (1.91) | | | 18.98 | | | 14.32% | | 448.9 | | 1.27% | | 0.03% | | 1.29% | | 0.01% | | 112% |
| | | | | | | | |
| – | | | 14.96 | | | 6.93% | | 60.3 | | 0.76% | | (0.05)% | | 0.76% | | (0.05)% | | 99% |
| – | | | 13.99 | | | 23.26% | | 68.6 | | 0.78% | | 0.05% | | 0.78% | | 0.05% | | 203% |
| (0.10) | | | 11.35 | | | 0.27% | | 58.8 | | 0.77% | | 0.82% | | 0.78% | | 0.82% | | 283% |
| (2.32) | | | 11.43 | | | (36.86)% | | 106.7 | | 0.73% | | 0.66% | | 0.74% | | 0.64% | | 245% |
| (1.91) | | | 20.62 | | | 14.92% | | 106.6 | | 0.71% | | 0.56% | | 0.73% | | 0.54% | | 112% |
| | | | | | | | |
| – | | | 17.67 | | | 6.32% | | 238.0 | | 1.07% | | (0.35)% | | 1.07% | | (0.35)% | | 68% |
| – | | | 16.62 | | | 28.64% | | 241.7 | | 1.18% | | (0.51)% | | 1.18% | | (0.51)% | | 55% |
| – | | | 12.92 | | | 26.17% | | 201.0 | | 1.40% | | (0.55)% | | 1.41% | | (0.56)% | | 65% |
| (2.23) | | | 10.24 | | | (39.95)% | | 165.0 | | 1.16% | | (0.19)% | | 1.19% | | (0.22)% | | 85% |
| (1.16) | | | 19.45 | | | 29.25% | | 302.7 | | 1.16% | | (0.32)% | | 1.18% | | (0.34)% | | 84% |
| | | | | | | | |
| – | | | 19.81 | | | 6.91% | | 152.8 | | 0.52% | | 0.21% | | 0.52% | | 0.21% | | 68% |
| – | | | 18.53 | | | 29.49% | | 147.6 | | 0.53% | | 0.15% | | 0.53% | | 0.15% | | 55% |
| – | | | 14.31 | | | 27.31% | | 90.8 | | 0.54% | | 0.29% | | 0.55% | | 0.28% | | 65% |
| (2.23) | | | 11.24 | | | (39.52)% | | 45.2 | | 0.45% | | 0.51% | | 0.48% | | 0.49% | | 85% |
| (1.16) | | | 20.98 | | | 30.15% | | 42.1 | | 0.46% | | 0.37% | | 0.48% | | 0.36% | | 84% |
| | | | | | | | |
| (0.04) | | | 11.55 | | | 3.57% | | 17.8 | | 1.25% | | 0.45% | | 1.43% | | 0.27% | | 78% |
| (0.07) | | | 11.19 | | | 25.63% | | 16.6 | | 1.25% | | 0.60% | | 1.46% | | 0.38% | | 91% |
| (0.07) | | | 8.97 | | | 14.70% | | 13.3 | | 1.25% | | 0.80% | | 1.57% | | 0.48% | | 111% |
| (0.73) | | | 7.89 | | | (35.12)% | | 7.4 | | 1.25% | | 1.12% | | 1.41% | | 0.96% | | 100% |
| (0.24) | | | 12.93 | | | 11.45% | | 12.0 | | 0.95% | | 0.99% | | 1.48% | | 0.46% | | 96% |
| | | | | | | | |
| (0.08) | | | 11.60 | | | 3.94% | | 100.4 | | 0.90% | | 0.81% | | 0.90% | | 0.81% | | 78% |
| (0.09) | | | 11.23 | | | 26.07% | | 104.2 | | 0.93% | | 0.92% | | 0.93% | | 0.92% | | 91% |
| (0.10) | | | 8.99 | | | 15.02% | | 81.0 | | 0.95% | | 1.19% | | 0.97% | | 1.18% | | 111% |
| (0.75) | | | 7.92 | | | (34.95)% | | 69.4 | | 0.93% | | 1.41% | | 0.95% | | 1.38% | | 100% |
| (0.27) | | | 12.97 | | | 11.73% | | 33.9 | | 0.72% | | 1.23% | | 1.06% | | 0.89% | | 96% |
(b) Total investment return assumes dividend reinvestment and does not reflect any deduction for sales charges. Not annualized for periods less than one year.
** Computed on an annualized basis for periods less than one year.
The accompanying Notes to Financial Statements are an integral part of this schedule.
239
Thrivent Mutual Funds
Financial Highlights - continued
| | | | | | |
| | | FOR A SHARE OUTSTANDING THROUGHOUT EACH PERIOD* | | | | |
| | | | | | | | | | | | | | |
| | | | | Income from Investment Operations | | | | Less Distributions from |
| | | | | | | |
| | | Net Asset
Value,
Beginning of
Period | | Net
Investment
Income/(Loss) | | Net Realized
and Unrealized
Gain/(Loss) on
Investments(a) | | Total from
Investment
Operations | | | | Net
Investment
Income | | Net Realized
Gain on
Investments |
MID CAP STOCK FUND | | |
| | | | | | | |
Class A Shares | | | | | | | | | | | | | | |
Year Ended 10/31/2011 | | $13.49 | | $(0.02) | | $0.83 | | $0.81 | | | | $– | | $– |
Year Ended 10/31/2010 | | 10.89 | | – | | 2.60 | | 2.60 | | | | – | | – |
Year Ended 10/31/2009 | | 9.05 | | 0.01 | | 1.87 | | 1.88 | | | | (0.04) | | – |
Year Ended 10/31/2008 | | 17.98 | | 0.05 | | (6.60) | | (6.55) | | | | (0.01) | | (2.37) |
Year Ended 10/31/2007 | | 18.61 | | 0.13 | | 2.40 | | 2.53 | | | | (0.02) | | (3.14) |
| | | | | | | |
Institutional Class Shares | | | | | | | | | | | | | | |
Year Ended 10/31/2011 | | 14.53 | | 0.06 | | 0.89 | | 0.95 | | | | (0.05) | | – |
Year Ended 10/31/2010 | | 11.71 | | 0.07 | | 2.79 | | 2.86 | | | | (0.04) | | – |
Year Ended 10/31/2009 | | 9.74 | | 0.07 | | 2.01 | | 2.08 | | | | (0.11) | | – |
Year Ended 10/31/2008 | | 19.14 | | 0.07 | | (7.02) | | (6.95) | | | | (0.08) | | (2.37) |
Year Ended 10/31/2007 | | 19.60 | | 0.16 | | 2.60 | | 2.76 | | | | (0.08) | | (3.14) |
PARTNER WORLDWIDE ALLOCATION FUND | | |
| | | | | | | |
Class A Shares | | | | | | | | | | | | | | |
Year Ended 10/31/2011 | | 8.80 | | 0.10 | | (0.50) | | (0.40) | | | | (0.10) | | – |
Year Ended 10/31/2010 | | 7.70 | | 0.11 | | 1.10 | | 1.21 | | | | (0.11) | | – |
Year Ended 10/31/2009 | | 6.09 | | 0.11 | | 1.61 | | 1.72 | | | | (0.11) | | – |
Year Ended 10/31/2008 (c) | | 10.00 | | 0.15 | | (4.06) | | (3.91) | | | | – | | – |
| | | | | | | |
Institutional Class Shares | | | | | | | | | | | | | | |
Year Ended 10/31/2011 | | 8.83 | | 0.08 | | (0.45) | | (0.37) | | | | (0.12) | | – |
Year Ended 10/31/2010 | | 7.72 | | 0.13 | | 1.11 | | 1.24 | | | | (0.13) | | – |
Year Ended 10/31/2009 | | 6.10 | | 0.08 | | 1.66 | | 1.74 | | | | (0.12) | | – |
Year Ended 10/31/2008 (c) | | 10.00 | | 0.17 | | (4.07) | | (3.90) | | | | – | | – |
LARGE CAP GROWTH FUND | | | | | | | | | | | | | | |
| | | | | | | |
Class A Shares | | | | | | | | | | | | | | |
Year Ended 10/31/2011 | | 4.80 | | (0.01) | | 0.13 | | 0.12 | | | | – | | – |
Year Ended 10/31/2010 | | 4.26 | | (0.01) | | 0.56 | | 0.55 | | | | (0.01) | | – |
Year Ended 10/31/2009 | | 3.69 | | – | | 0.57 | | 0.57 | | | | – | | – |
Year Ended 10/31/2008 | | 6.52 | | – | | (2.40) | | (2.40) | | | | – | | (0.43) |
Year Ended 10/31/2007 | | 5.31 | | 0.01 | | 1.20 | | 1.21 | | | | – | | – |
| | | | | | | |
Institutional Class Shares | | | | | | | | | | | | | | |
Year Ended 10/31/2011 | | 5.13 | | 0.01 | | 0.14 | | 0.15 | | | | – | | – |
Year Ended 10/31/2010 | | 4.54 | | 0.01 | | 0.60 | | 0.61 | | | | (0.02) | | – |
Year Ended 10/31/2009 | | 3.94 | | 0.03 | | 0.58 | | 0.61 | | | | (0.01) | | – |
Year Ended 10/31/2008 | | 6.93 | | 0.02 | | (2.55) | | (2.53) | | | | (0.03) | | (0.43) |
Year Ended 10/31/2007 | | 5.65 | | 0.03 | | 1.29 | | 1.32 | | | | (0.04) | | – |
(a) The amount shown may not correlate with the change in aggregate gains and losses of portfolio securities due to the timing of sales and redemptions of fund shares.
(c) Since fund inception, February 29, 2008.
* All per share amounts have been rounded to the nearest cent.
The accompanying Notes to Financial Statements are an integral part of this schedule.
240
Thrivent Mutual Funds
Financial Highlights - continued
| | | | | | | | | | |
| | | | | | | RATIOS / SUPPLEMENTAL DATA | | | | |
| | | | | | | | | | | | | | | | |
| | | | | | | | | Ratio to Average Net
Assets** | | Ratios to Average Net Assets Before Expenses Waived, Credited or Paid Indirectly** | | |
| | | | | | | | |
Total
Distributions | | Net Asset
Value, End of
Period | | Total
Return(b) | | Net Assets, End
of Period (in
millions) | | Expenses | | Net Investment Income/
(Loss) | | Expenses | | Net
Investment
Income/(Loss) | | Portfolio
Turnover Rate |
| | | | | | | | | | | | | | | | | |
| | | | | | | | |
| | | | | | | | | | | | | | | | | |
| $– | | $14.30 | | 6.00% | | $538.7 | | 1.20% | | (0.15)% | | 1.20% | | (0.15)% | | 35% |
| – | | 13.49 | | 23.88% | | 571.1 | | 1.25% | | 0.01% | | 1.25% | | 0.01% | | 69% |
| (0.04) | | 10.89 | | 20.85% | | 517.6 | | 1.35% | | 0.08% | | 1.35% | | 0.08% | | 56% |
| (2.38) | | 9.05 | | (41.38)% | | 488.9 | | 1.20% | | 0.34% | | 1.21% | | 0.33% | | 242% |
| (3.16) | | 17.98 | | 15.56% | | 988.9 | | 1.16% | | 0.72% | | 1.17% | | 0.71% | | 188% |
| | | | | | | | |
| | | | | | | | | | | | | | | | | |
| (0.05) | | 15.43 | | 6.51% | | 215.6 | | 0.71% | | 0.33% | | 0.71% | | 0.33% | | 35% |
| (0.04) | | 14.53 | | 24.50% | | 216.6 | | 0.73% | | 0.55% | | 0.73% | | 0.55% | | 69% |
| (0.11) | | 11.71 | | 21.63% | | 205.9 | | 0.73% | | 0.65% | | 0.73% | | 0.65% | | 56% |
| (2.45) | | 9.74 | | (41.07)% | | 217.4 | | 0.71% | | 0.79% | | 0.71% | | 0.78% | | 242% |
| (3.22) | | 19.14 | | 16.09% | | 172.1 | | 0.70% | | 1.08% | | 0.71% | | 1.07% | | 188% |
| | | | | | | | | | | | | | | | | |
| | | | | | | | |
| | | | | | | | | | | | | | | | | |
| (0.10) | | 8.30 | | (4.60)% | | 179.9 | | 1.30% | | 1.86% | | 1.61% | | 1.55% | | 101% |
| (0.11) | | 8.80 | | 15.88% | | 35.3 | | 1.30% | | 1.61% | | 1.64% | | 1.27% | | 88% |
| (0.11) | | 7.70 | | 28.63% | | 25.5 | | 1.30% | | 2.03% | | 1.78% | | 1.55% | | 90% |
| – | | 6.09 | | (39.10)% | | 15.9 | | 1.30% | | 2.46% | | 1.66% | | 2.10% | | 47% |
| | | | | | | | |
| | | | | | | | | | | | | | | | | |
| (0.12) | | 8.34 | | (4.24)% | | 478.0 | | 1.00% | | 2.16% | | 1.06% | | 2.10% | | 101% |
| (0.13) | | 8.83 | | 16.26% | | 219.2 | | 0.99% | | 1.95% | | 1.19% | | 1.75% | | 88% |
| (0.12) | | 7.72 | | 29.13% | | 119.0 | | 0.95% | | 2.37% | | 1.34% | | 1.99% | | 90% |
| – | | 6.10 | | (39.00)% | | 47.0 | | 0.96% | | 2.80% | | 1.28% | | 2.48% | | 47% |
| | | | | | | | | | | | | | | | | |
| | | | | | | | |
| | | | | | | | | | | | | | | | | |
| – | | 4.92 | | 2.50% | | 117.7 | | 1.20% | | (0.23)% | | 1.56% | | (0.59)% | | 249% |
| (0.01) | | 4.80 | | 12.94% | | 121.3 | | 1.19% | | (0.22)% | | 1.64% | | (0.66)% | | 232% |
| – | | 4.26 | | 15.45% | | 118.7 | | 1.17% | | 0.17% | | 1.79% | | (0.44)% | | 221% |
| (0.43) | | 3.69 | | (39.08)% | | 89.0 | | 1.17% | | (0.01)% | | 1.48% | | (0.32)% | | 188% |
| – | | 6.52 | | 22.86% | | 157.3 | | 1.01% | | 0.09% | | 1.48% | | (0.39)% | | 168% |
| | | | | | | | |
| | | | | | | | | | | | | | | | | |
| – | | 5.28 | | 2.92% | | 204.3 | | 0.83% | | 0.14% | | 0.83% | | 0.14% | | 249% |
| (0.02) | | 5.13 | | 13.52% | | 200.0 | | 0.84% | | 0.13% | | 0.84% | | 0.13% | | 232% |
| (0.01) | | 4.54 | | 15.72% | | 173.6 | | 0.84% | | 0.56% | | 0.84% | | 0.56% | | 221% |
| (0.46) | | 3.94 | | (38.86)% | | 216.4 | | 0.80% | | 0.36% | | 0.81% | | 0.35% | | 188% |
| (0.04) | | 6.93 | | 23.45% | | 418.3 | | 0.60% | | 0.48% | | 0.81% | | 0.26% | | 168% |
| (b) | Total investment return assumes dividend reinvestment and does not reflect any deduction for sales charges. Not annualized for periods less than one year. |
| ** | Computed on an annualized basis for periods less than one year. |
The accompanying Notes to Financial Statements are an integral part of this schedule.
241
Thrivent Mutual Funds
Financial Highlights - continued
| | | | | | | | | | | | | | |
| | | FOR A SHARE OUTSTANDING THROUGHOUT EACH PERIOD* |
| | | | | | | | | | | | | | |
| | | |
| | | | | Income from Investment Operations | | Less Distributions from |
| | | Net Asset Value, Beginning of Period | | Net Investment Income/(Loss) | | Net Realized and Unrealized Gain/(Loss) on Investments(a) | | Total from Investment Operations | | Net
Investment
Income | | Net Realized Gain on Investments |
LARGE CAP VALUE FUND | | | | | | | | | | | | |
Class A Shares | | | | | | | | | | | | |
Year Ended 10/31/2011 | | $12.61 | | $0.19 | | $0.26 | | $0.45 | | $(0.12) | | $– |
Year Ended 10/31/2010 | | 11.55 | | 0.13 | | 1.07 | | 1.20 | | (0.14) | | – |
Year Ended 10/31/2009 | | 11.10 | | 0.17 | | 0.52 | | 0.69 | | (0.24) | | – |
Year Ended 10/31/2008 | | 17.92 | | 0.27 | | (6.09) | | (5.82) | | (0.19) | | (0.81) |
Year Ended 10/31/2007 | | 16.85 | | 0.22 | | 1.97 | | 2.19 | | (0.17) | | (0.95) |
Institutional Class Shares | | | | | | | | | | | | |
Year Ended 10/31/2011 | | 12.71 | | 0.24 | | 0.28 | | 0.52 | | (0.19) | | – |
Year Ended 10/31/2010 | | 11.64 | | 0.18 | | 1.10 | | 1.28 | | (0.21) | | – |
Year Ended 10/31/2009 | | 11.19 | | 0.23 | | 0.54 | | 0.77 | | (0.32) | | – |
Year Ended 10/31/2008 | | 18.07 | | 0.30 | | (6.10) | | (5.80) | | (0.27) | | (0.81) |
Year Ended 10/31/2007 | | 16.98 | | 0.28 | | 2.01 | | 2.29 | | (0.25) | | (0.95) |
LARGE CAP STOCK FUND | | | | | | | | | | | | |
Class A Shares | | | | | | | | | | | | |
Year Ended 10/31/2011 | | 20.87 | | 0.13 | | 0.37 | | 0.50 | | (0.07) | | – |
Year Ended 10/31/2010 | | 18.87 | | 0.06 | | 2.04 | | 2.10 | | (0.10) | | – |
Year Ended 10/31/2009 | | 17.67 | | 0.15 | | 1.31 | | 1.46 | | (0.26) | | – |
Year Ended 10/31/2008 | | 31.33 | | 0.24 | | (10.28) | | (10.04) | | (0.23) | | (3.39) |
Year Ended 10/31/2007 | | 28.61 | | 0.33 | | 3.87 | | 4.20 | | (0.27) | | (1.21) |
Institutional Class Shares | | | | | | | | | | | | |
Year Ended 10/31/2011 | | 21.05 | | 0.24 | | 0.38 | | 0.62 | | (0.19) | | – |
Year Ended 10/31/2010 | | 19.02 | | 0.15 | | 2.09 | | 2.24 | | (0.21) | | – |
Year Ended 10/31/2009 | | 17.84 | | 0.25 | | 1.31 | | 1.56 | | (0.38) | | – |
Year Ended 10/31/2008 | | 31.59 | | 0.35 | | (10.35) | | (10.00) | | (0.36) | | (3.39) |
Year Ended 10/31/2007 | | 28.84 | | 0.42 | | 3.93 | | 4.35 | | (0.39) | | (1.21) |
BALANCED FUND | | | | | | | | | | | | |
Class A Shares | | | | | | | | | | | | |
Year Ended 10/31/2011 | | 11.68 | | 0.16 | | 0.42 | | 0.58 | | (0.15) | | – |
Year Ended 10/31/2010 | | 10.20 | | 0.15 | | 1.48 | | 1.63 | | (0.15) | | – |
Year Ended 10/31/2009 | | 8.91 | | 0.14 | | 1.30 | | 1.44 | | (0.15) | | – |
Year Ended 10/31/2008 | | 13.64 | | 0.23 | | (3.89) | | (3.66) | | (0.23) | | (0.84) |
Year Ended 10/31/2007 | | 12.95 | | 0.24 | | 1.29 | | 1.53 | | (0.22) | | (0.62) |
Institutional Class Shares | | | | | | | | | | | | |
Year Ended 10/31/2011 | | 11.66 | | 0.21 | | 0.43 | | 0.64 | | (0.21) | | – |
Year Ended 10/31/2010 | | 10.19 | | 0.20 | | 1.47 | | 1.67 | | (0.20) | | – |
Year Ended 10/31/2009 | | 8.90 | | 0.19 | | 1.30 | | 1.49 | | (0.20) | | – |
Year Ended 10/31/2008 | | 13.63 | | 0.28 | | (3.88) | | (3.60) | | (0.29) | | (0.84) |
Year Ended 10/31/2007 | | 12.93 | | 0.30 | | 1.30 | | 1.60 | | (0.28) | | (0.62) |
(a) The amount shown may not correlate with the change in aggregate gains and losses of portfolio securities due to the timing of sales and redemptions of fund shares.
* All per share amounts have been rounded to the nearest cent.
The accompanying Notes to Financial Statements are an integral part of this schedule.
242
Thrivent Mutual Funds
Financial Highlights - continued
| | | | | | | | | | | | | | | | | | |
| | | | | | | RATIOS / SUPPLEMENTAL DATA |
| | | | | | | | | | | | | | | | |
| | | | | | | | | Ratio to Average Net Assets** | | Ratios to Average Net Assets Before Expenses Waived, Credited or Paid Indirectly** | | |
Total Distributions | | Net Asset
Value, End of
Period | | Total
Return(b) | | Net Assets, End
of Period (in
millions) | | Expenses | | Net Investment Income/(Loss) | | Expenses | | Net
Investment Income/(Loss) | | Portfolio
Turnover Rate |
| | | | | | | | | | | | | | | | |
| | | | | | | | | | | | | | | | |
$(0.12) | | $12.94 | | 3.49% | | $164.5 | | 1.06% | | 1.22% | | 1.06% | | 1.22% | | 74% |
(0.14) | | 12.61 | | 10.45% | | 176.0 | | 1.10% | | 0.91% | | 1.10% | | 0.91% | | 115% |
(0.24) | | 11.55 | | 6.54% | | 179.6 | | 1.17% | | 1.48% | | 1.18% | | 1.48% | | 105% |
(1.00) | | 11.10 | | (34.17)% | | 187.4 | | 1.01% | | 1.71% | | 1.02% | | 1.71% | | 49% |
(1.12) | | 17.92 | | 13.63% | | 336.9 | | 0.98% | | 1.28% | | 0.99% | | 1.27% | | 37% |
| | | | | | | | | | | | | | | | |
(0.19) | | 13.04 | | 4.03% | | 356.0 | | 0.52% | | 1.76% | | 0.52% | | 1.76% | | 74% |
(0.21) | | 12.71 | | 11.09% | | 331.2 | | 0.53% | | 1.46% | | 0.53% | | 1.46% | | 115% |
(0.32) | | 11.64 | | 7.32% | | 273.5 | | 0.52% | | 2.10% | | 0.52% | | 2.10% | | 105% |
(1.08) | | 11.19 | | (33.88)% | | 268.9 | | 0.50% | | 2.21% | | 0.50% | | 2.21% | | 49% |
(1.20) | | 18.07 | | 14.19% | | 312.9 | | 0.50% | | 1.73% | | 0.51% | | 1.72% | | 37% |
| | | | | | | | | | | | | | | | |
| | | | | | | | | | | | | | | | |
(0.07) | | 21.30 | | 2.39% | | 1,393.5 | | 1.11% | | 0.56% | | 1.11% | | 0.56% | | 146% |
(0.10) | | 20.87 | | 11.16% | | 1,549.4 | | 1.13% | | 0.29% | | 1.13% | | 0.29% | | 185% |
(0.26) | | 18.87 | | 8.55% | | 1,579.3 | | 1.20% | | 0.82% | | 1.20% | | 0.82% | | 149% |
(3.62) | | 17.67 | | (35.72)% | | 1,658.8 | | 1.03% | | 1.03% | | 1.04% | | 1.03% | | 93% |
(1.48) | | 31.33 | | 15.29% | | 3,029.0 | | 1.00% | | 1.09% | | 1.00% | | 1.09% | | 103% |
| | | | | | | | | | | | | | | | |
(0.19) | | 21.48 | | 2.89% | | 170.2 | | 0.60% | | 1.06% | | 0.60% | | 1.06% | | 146% |
(0.21) | | 21.05 | | 11.80% | | 176.4 | | 0.61% | | 0.81% | | 0.61% | | 0.81% | | 185% |
(0.38) | | 19.02 | | 9.15% | | 174.2 | | 0.62% | | 1.39% | | 0.62% | | 1.39% | | 149% |
(3.75) | | 17.84 | | (35.42)% | | 164.2 | | 0.57% | | 1.49% | | 0.57% | | 1.48% | | 93% |
(1.60) | | 31.59 | | 15.78% | | 369.3 | | 0.56% | | 1.46% | | 0.56% | | 1.46% | | 103% |
| | | | | | | | | | | | | | | | |
| | | | | | | | | | | | | | | | |
(0.15) | | 12.11 | | 4.98% | | 141.0 | | 1.12% | | 1.25% | | 1.13% | | 1.24% | | 211% |
(0.15) | | 11.68 | | 16.04% | | 148.9 | | 1.17% | | 1.30% | | 1.17% | | 1.30% | | 219% |
(0.15) | | 10.20 | | 16.42% | | 144.0 | | 1.23% | | 1.55% | | 1.24% | | 1.54% | | 264% |
(1.07) | | 8.91 | | (28.76)% | | 143.0 | | 1.09% | | 1.96% | | 1.11% | | 1.94% | | 176% |
(0.84) | | 13.64 | | 12.39% | | 237.0 | | 1.07% | | 1.83% | | 1.09% | | 1.81% | | 176% |
| | | | | | | | | | | | | | | | |
(0.21) | | 12.09 | | 5.50% | | 52.7 | | 0.65% | | 1.73% | | 0.65% | | 1.72% | | 211% |
(0.20) | | 11.66 | | 16.55% | | 56.6 | | 0.67% | | 1.80% | | 0.67% | | 1.80% | | 219% |
(0.20) | | 10.19 | | 17.12% | | 54.2 | | 0.66% | | 2.11% | | 0.67% | | 2.10% | | 264% |
(1.13) | | 8.90 | | (28.43)% | | 50.7 | | 0.61% | | 2.44% | | 0.63% | | 2.41% | | 176% |
(0.90) | | 13.63 | | 13.00% | | 83.8 | | 0.61% | | 2.29% | | 0.63% | | 2.27% | | 176% |
(b) Total investment return assumes dividend reinvestment and does not reflect any deduction for sales charges. Not annualized for periods less than one year.
** Computed on an annualized basis for periods less than one year.
The accompanying Notes to Financial Statements are an integral part of this schedule.
243
Thrivent Mutual Funds
Financial Highlights - continued
| | | | | | | | | | | | | | |
| | | FOR A SHARE OUTSTANDING THROUGHOUT EACH PERIOD* |
| | | | | | | | | | | | |
| | | |
| | | | | Income from Investment Operations | | Less Distributions from |
| | | | | | |
| | | Net Asset
Value,
Beginning of
Period | | Net
Investment
Income/ (Loss) | | Net Realized
and Unrealized
Gain/(Loss) on
Investments(a) | | Total from
Investment
Operations | | Net
Investment
Income | | Net Realized
Gain on
Investments |
HIGH YIELD FUND | | | | | | | | | | | | |
Class A Shares | | | | | | | | | | | | |
Year Ended 10/31/2011 | | $4.86 | | $0.36 | | $(0.15) | | $0.21 | | $(0.36) | | $– |
Year Ended 10/31/2010 | | 4.47 | | 0.37 | | 0.39 | | 0.76 | | (0.37) | | – |
Year Ended 10/31/2009 | | 3.59 | | 0.36 | | 0.87 | | 1.23 | | (0.35) | | – |
Year Ended 10/31/2008 | | 5.03 | | 0.36 | | (1.43) | | (1.07) | | (0.37) | | – |
Year Ended 10/31/2007 | | 5.08 | | 0.38 | | (0.05) | | 0.33 | | (0.38) | | – |
Institutional Class Shares | | | | | | | | | | | | |
Year Ended 10/31/2011 | | 4.86 | | 0.38 | | (0.14) | | 0.24 | | (0.38) | | – |
Year Ended 10/31/2010 | | 4.47 | | 0.39 | | 0.38 | | 0.77 | | (0.38) | | – |
Year Ended 10/31/2009 | | 3.59 | | 0.38 | | 0.87 | | 1.25 | | (0.37) | | – |
Year Ended 10/31/2008 | | 5.04 | | 0.38 | | (1.44) | | (1.06) | | (0.39) | | – |
Year Ended 10/31/2007 | | 5.09 | | 0.40 | | (0.04) | | 0.36 | | (0.41) | | – |
MUNICIPAL BOND FUND | | | | | | | | | | | | |
Class A Shares | | | | | | | | | | | | |
Year Ended 10/31/2011 | | 11.42 | | 0.46 | | (0.10) | | 0.36 | | (0.46) | | (0.02) |
Year Ended 10/31/2010 | | 11.15 | | 0.47 | | 0.27 | | 0.74 | | (0.47) | | – |
Year Ended 10/31/2009 | | 10.37 | | 0.48 | | 0.79 | | 1.27 | | (0.48) | | (0.01) |
Year Ended 10/31/2008 | | 11.16 | | 0.48 | | (0.79) | | (0.31) | | (0.48) | | – |
Year Ended 10/31/2007 | | 11.39 | | 0.49 | | (0.23) | | 0.26 | | (0.49) | | – |
Institutional Class Shares | | | | | | | | | | | | |
Year Ended 10/31/2011 | | 11.42 | | 0.49 | | (0.10) | | 0.39 | | (0.49) | | (0.02) |
Year Ended 10/31/2010 | | 11.15 | | 0.50 | | 0.27 | | 0.77 | | (0.50) | | – |
Year Ended 10/31/2009 | | 10.36 | | 0.51 | | 0.80 | | 1.31 | | (0.51) | | (0.01) |
Year Ended 10/31/2008 | | 11.16 | | 0.51 | | (0.80) | | (0.29) | | (0.51) | | – |
Year Ended 10/31/2007 | | 11.39 | | 0.53 | | (0.23) | | 0.30 | | (0.53) | | – |
INCOME FUND | | | | | | | | | | | | |
Class A Shares | | | | | | | | | | | | |
Year Ended 10/31/2011 | | 8.80 | | 0.38 | | (0.03) | | 0.35 | | (0.38) | | – |
Year Ended 10/31/2010 | | 8.12 | | 0.40 | | 0.68 | | 1.08 | | (0.40) | | – |
Year Ended 10/31/2009 | | 6.92 | | 0.40 | | 1.21 | | 1.61 | | (0.41) | | – |
Year Ended 10/31/2008 | | 8.50 | | 0.42 | | (1.57) | | (1.15) | | (0.43) | | – |
Year Ended 10/31/2007 | | 8.59 | | 0.43 | | (0.10) | | 0.33 | | (0.42) | | – |
Institutional Class Shares | | | | | | | | | | | | |
Year Ended 10/31/2011 | | 8.79 | | 0.42 | | (0.03) | | 0.39 | | (0.42) | | – |
Year Ended 10/31/2010 | | 8.12 | | 0.44 | | 0.67 | | 1.11 | | (0.44) | | – |
Year Ended 10/31/2009 | | 6.91 | | 0.43 | | 1.22 | | 1.65 | | (0.44) | | – |
Year Ended 10/31/2008 | | 8.49 | | 0.45 | | (1.57) | | (1.12) | | (0.46) | | – |
Year Ended 10/31/2007 | | 8.58 | | 0.47 | | (0.11) | | 0.36 | | (0.45) | | – |
(a) The amount shown may not correlate with the change in aggregate gains and losses of portfolio securities due to the timing of sales and redemptions of fund shares.
* All per share amounts have been rounded to the nearest cent.
The accompanying Notes to Financial Statements are an integral part of this schedule.
244
Thrivent Mutual Funds
Financial Highlights - continued
| | | | | | | | | | | | | | | | | | | | |
| | | | | | | | | | | | | RATIOS / SUPPLEMENTAL DATA | | |
| | | | | | | |
| | | | | | | | | | | | Ratio to Average Net
Assets** | | Ratios to Average Net Assets
Before Expenses Waived,
Credited or Paid Indirectly** | | |
| | | | | | | | | |
Total
Distributions | | Net Asset
Value, End of
Period | | | | | Total
Return(b) | | Net Assets, End
of Period (in
millions) | | Expenses | | Net
Investment
Income/(Loss) | | Expenses | | Net
Investment
Income/(Loss) | | Portfolio
Turnover Rate |
| | | | | | | | | | | | | | | | | | | | |
| | | | | | | | | | | | | | | | | | | | |
| $(0.36) | | | $4.71 | | | | | 4.37% | | $445.3 | | 0.84% | | 7.43% | | 0.84% | | 7.43% | | 63% |
| (0.37) | | | 4.86 | | | | | 17.65% | | 448.1 | | 0.86% | | 7.96% | | 0.86% | | 7.96% | | 83% |
| (0.35) | | | 4.47 | | | | | 36.32% | | 403.7 | | 0.93% | | 9.24% | | 0.93% | | 9.24% | | 54% |
| (0.37) | | | 3.59 | | | | | (22.70)% | | 318.8 | | 0.87% | | 7.81% | | 0.88% | | 7.79% | | 51% |
| (0.38) | | | 5.03 | | | | | 6.72% | | 486.2 | | 0.86% | | 7.50% | | 0.87% | | 7.49% | | 72% |
| | | | | | | | | | | | | | | | | | | | |
| (0.38) | | | 4.72 | | | | | 4.98% | | 243.4 | | 0.47% | | 7.80% | | 0.47% | | 7.80% | | 63% |
| (0.38) | | | 4.86 | | | | | 18.12% | | 254.6 | | 0.46% | | 8.36% | | 0.46% | | 8.36% | | 83% |
| (0.37) | | | 4.47 | | | | | 36.96% | | 230.9 | | 0.46% | | 9.57% | | 0.46% | | 9.57% | | 54% |
| (0.39) | | | 3.59 | | | | | (22.52)% | | 129.4 | | 0.44% | | 8.31% | | 0.45% | | 8.30% | | 51% |
| (0.41) | | | 5.04 | | | | | 7.16% | | 62.1 | | 0.44% | | 7.92% | | 0.46% | | 7.90% | | 72% |
| | | | | | | | | | | | | | | | | | | | |
| | | | | | | | | | | | | | | | | | | | |
| (0.48) | | | 11.30 | | | | | 3.39% | | 1,339.6 | | 0.76% | | 4.19% | | 0.76% | | 4.19% | | 8% |
| (0.47) | | | 11.42 | | | | | 6.79% | | 1,384.5 | | 0.76% | | 4.20% | | 0.76% | | 4.20% | | 9% |
| (0.49) | | | 11.15 | | | | | 12.48% | | 1,246.5 | | 0.78% | | 4.43% | | 0.78% | | 4.43% | | 8% |
| (0.48) | | | 10.37 | | | | | (2.92)% | | 1,104.8 | | 0.78% | | 4.36% | | 0.78% | | 4.36% | | 9% |
| (0.49) | | | 11.16 | | | | | 2.39% | | 1,145.8 | | 0.78% | | 4.40% | | 0.78% | | 4.40% | | 7% |
| | | | | | | | | | | | | | | | | | | | |
| (0.51) | | | 11.30 | | | | | 3.67% | | 86.5 | | 0.49% | | 4.46% | | 0.49% | | 4.46% | | 8% |
| (0.50) | | | 11.42 | | | | | 7.08% | | 95.3 | | 0.50% | | 4.46% | | 0.50% | | 4.46% | | 9% |
| (0.52) | | | 11.15 | | | | | 12.90% | | 86.4 | | 0.50% | | 4.69% | | 0.50% | | 4.69% | | 8% |
| (0.51) | | | 10.36 | | | | | (2.71)% | | 35.1 | | 0.47% | | 4.69% | | 0.47% | | 4.69% | | 9% |
| (0.53) | | | 11.16 | | | | | 2.68% | | 17.4 | | 0.49% | | 4.70% | | 0.49% | | 4.70% | | 7% |
| | | | | | | | | | | | | | | | | | | | |
| | | | | | | | | | | | | | | | | | | | |
| (0.38) | | | 8.77 | | | | | 4.11% | | 397.9 | | 0.79% | | 4.38% | | 0.79% | | 4.38% | | 138% |
| (0.40) | | | 8.80 | | | | | 13.66% | | 405.1 | | 0.80% | | 4.81% | | 0.81% | | 4.80% | | 146% |
| (0.41) | | | 8.12 | | | | | 24.03% | | 365.9 | | 0.84% | | 5.53% | | 0.85% | | 5.53% | | 173% |
| (0.43) | | | 6.92 | | | | | (14.19)% | | 326.2 | | 0.80% | | 5.16% | | 0.81% | | 5.15% | | 160% |
| (0.42) | | | 8.50 | | | | | 3.90% | | 433.0 | | 0.80% | | 5.06% | | 0.81% | | 5.05% | | 236% |
| | | | | | | | | | | | | | | | | | | | |
| (0.42) | | | 8.76 | | | | | 4.52% | | 401.1 | | 0.39% | | 4.78% | | 0.39% | | 4.77% | | 138% |
| (0.44) | | | 8.79 | | | | | 13.99% | | 370.7 | | 0.39% | | 5.23% | | 0.40% | | 5.22% | | 146% |
| (0.44) | | | 8.12 | | | | | 24.76% | | 383.1 | | 0.39% | | 5.98% | | 0.40% | | 5.97% | | 173% |
| (0.46) | | | 6.91 | | | | | (13.85)% | | 318.5 | | 0.39% | | 5.58% | | 0.40% | | 5.57% | | 160% |
| (0.45) | | | 8.49 | | | | | 4.32% | | 368.9 | | 0.39% | | 5.51% | | 0.40% | | 5.50% | | 236% |
(b) Total investment return assumes dividend reinvestment and does not reflect any deduction for sales charges. Not annualized for periods less than one year.
** Computed on an annualized basis for periods less than one year.
The accompanying Notes to Financial Statements are an integral part of this schedule.
245
Thrivent Mutual Funds
Financial Highlights - continued
| | |
| | FOR A SHARE OUTSTANDING THROUGHOUT EACH PERIOD* |
| | | | | | | | | | | | |
| | | | | Income from Investment Operations | | Less Distributions from |
| | | | | | |
| | | Net Asset
Value,
Beginning of
Period | | Net
Investment
Income/(Loss) | | Net Realized
and Unrealized
Gain/(Loss) on
Investments(a) | | Total from
Investment
Operations | | Net
Investment
Income | | Net Realized
Gain on
Investments |
CORE BOND FUND | | | | | | | | | | | | |
| | | | | | |
Class A Shares | | | | | | | | | | | | |
Year Ended 10/31/2011 | | $10.11 | | $0.37 | | $0.08 | | $0.45 | | $(0.37) | | $– |
Year Ended 10/31/2010 | | 9.36 | | 0.39 | | 0.75 | | 1.14 | | (0.39) | | – |
Year Ended 10/31/2009 | | 8.36 | | 0.37 | | 1.02 | | 1.39 | | (0.39) | | – |
Year Ended 10/31/2008 | | 9.77 | | 0.45 | | (1.40) | | (0.95) | | (0.46) | | – |
Year Ended 10/31/2007 | | 9.90 | | 0.46 | | (0.15) | | 0.31 | | (0.44) | | – |
| | | | | | |
Institutional Class Shares | | | | | | | | | | | | |
Year Ended 10/31/2011 | | 10.11 | | 0.40 | | 0.08 | | 0.48 | | (0.40) | | – |
Year Ended 10/31/2010 | | 9.36 | | 0.43 | | 0.74 | | 1.17 | | (0.42) | | – |
Year Ended 10/31/2009 | | 8.36 | | 0.40 | | 1.02 | | 1.42 | | (0.42) | | – |
Year Ended 10/31/2008 | | 9.78 | | 0.48 | | (1.41) | | (0.93) | | (0.49) | | – |
Year Ended 10/31/2007 | | 9.91 | | 0.49 | | (0.13) | | 0.36 | | (0.49) | | – |
GOVERNMENT BOND FUND | | | | | | | | | | | | |
| | | | | | |
Class A Shares | | | | | | | | | | | | |
Year Ended 10/31/2011 | | 10.56 | | 0.19 | | 0.21 | | 0.40 | | (0.19) | | (0.08) |
Year Ended 10/31/2010 (c) | | 10.00 | | 0.11 | | 0.56 | | 0.67 | | (0.11) | | – |
| | | | | | |
Institutional Class Shares | | | | | | | | | | | | |
Year Ended 10/31/2011 | | 10.57 | | 0.23 | | 0.20 | | 0.43 | | (0.23) | | (0.08) |
Year Ended 10/31/2010 (c) | | 10.00 | | 0.13 | | 0.57 | | 0.70 | | (0.13) | | – |
LIMITED MATURITY BOND FUND | | | | | | | | | | | | |
| | | | | | |
Class A Shares | | | | | | | | | | | | |
Year Ended 10/31/2011 | | 12.58 | | 0.28 | | (0.17) | | 0.11 | | (0.28) | | – |
Year Ended 10/31/2010 | | 12.24 | | 0.38 | | 0.34 | | 0.72 | | (0.38) | | – |
Year Ended 10/31/2009 | | 11.40 | | 0.46 | | 0.83 | | 1.29 | | (0.45) | | – |
Year Ended 10/31/2008 | | 12.53 | | 0.52 | | (1.13) | | (0.61) | | (0.52) | | – |
Year Ended 10/31/2007 | | 12.58 | | 0.57 | | (0.06) | | 0.51 | | (0.56) | | – |
| | | | | | |
Institutional Class Shares | | | | | | | | | | | | |
Year Ended 10/31/2011 | | 12.58 | | 0.31 | | (0.18) | | 0.13 | | (0.31) | | – |
Year Ended 10/31/2010 | | 12.23 | | 0.42 | | 0.34 | | 0.76 | | (0.41) | | – |
Year Ended 10/31/2009 | | 11.40 | | 0.50 | | 0.82 | | 1.32 | | (0.49) | | – |
Year Ended 10/31/2008 | | 12.53 | | 0.56 | | (1.13) | | (0.57) | | (0.56) | | – |
Year Ended 10/31/2007 | | 12.58 | | 0.61 | | (0.06) | | 0.55 | | (0.60) | | – |
(a) The amount shown may not correlate with the change in aggregate gains and losses of portfolio securities due to the timing of sales and redemptions of fund shares.
(c) Since fund inception, February 26, 2010.
| * | All per share amounts have been rounded to the nearest cent. |
The accompanying Notes to Financial Statements are an integral part of this schedule.
246
Thrivent Mutual Funds
Financial Highlights - continued
| | | | |
| | | | | RATIOS / SUPPLEMENTAL DATA |
| | | | | | | | | | | | | | | | | | |
| | | | | | |
| | | | | | | | | | Ratio to Average Net
Assets** | | Ratios to Average Net Assets
Before Expenses Waived,
Credited or Paid Indirectly** | | |
| | | | | | | | |
Total
Distributions | | Net Asset
Value, End of
Period | | | Total
Return(b) | | Net Assets, End
of Period (in
millions) | | Expenses | | Net
Investment
Income/(Loss) | | Expenses | | Net Investment
Income/(Loss) | | Portfolio
Turnover Rate |
| | | | | | | | | | | | | | | | | | |
| | | | | | | | |
| | | | | | | | | | | | | | | | | | | |
| $(0.37) | | | $10.19 | | | 4.53% | | $236.3 | | 0.85% | | 3.64% | | 0.95% | | 3.54% | | 333% |
| (0.39) | | | 10.11 | | | 12.42% | | 245.0 | | 0.86% | | 4.08% | | 0.97% | | 3.96% | | 307% |
| (0.39) | | | 9.36 | | | 17.12% | | 231.4 | | 0.89% | | 4.35% | | 1.01% | | 4.24% | | 409% |
| (0.46) | | | 8.36 | | | (10.13)% | | 223.5 | | 0.83% | | 4.77% | | 0.95% | | 4.65% | | 344% |
| (0.44) | | | 9.77 | | | 3.24% | | 295.1 | | 0.93% | | 4.62% | | 0.95% | | 4.60% | | 381% |
| | | | | | | | |
| | | | | | | | | | | | | | | | | | | |
| (0.40) | | | 10.19 | | | 4.88% | | 56.5 | | 0.52% | | 3.97% | | 0.53% | | 3.95% | | 333% |
| (0.42) | | | 10.11 | | | 12.79% | | 50.1 | | 0.53% | | 4.42% | | 0.55% | | 4.40% | | 307% |
| (0.42) | | | 9.36 | | | 17.54% | | 64.0 | | 0.53% | | 4.71% | | 0.54% | | 4.69% | | 409% |
| (0.49) | | | 8.36 | | | (9.92)% | | 65.0 | | 0.50% | | 5.12% | | 0.52% | | 5.10% | | 344% |
| (0.49) | | | 9.78 | | | 3.68% | | 83.8 | | 0.51% | | 5.00% | | 0.53% | | 4.98% | | 381% |
| | | | | | | | |
| | | | | | | | | | | | | | | | | | |
| | | | | | | | |
| | | | | | | | | | | | | | | | | | | |
| (0.27) | | | 10.69 | | | 3.99% | | 7.3 | | 0.92% | | 1.82% | | 1.00% | | 1.74% | | 183% |
| (0.11) | | | 10.56 | | | 6.73% | | 5.9 | | 0.87% | | 1.61% | | 0.87% | | 1.61% | | 146% |
| | | | | | | | | | | | | | | | | | |
| (0.31) | | | 10.69 | | | 4.25% | | 94.6 | | 0.57% | | 2.18% | | 0.57% | | 2.18% | | 183% |
| (0.13) | | | 10.57 | | | 7.04% | | 105.6 | | 0.60% | | 1.94% | | 0.60% | | 1.94% | | 146% |
| | | | | | | | | | | | | | | | | | |
| | | | | | | | |
| | | | | | | | | | | | | | | | | | | |
| (0.28) | | | 12.41 | | | 0.87% | | 344.8 | | 0.61% | | 2.20% | | 0.61% | | 2.19% | | 109% |
| (0.38) | | | 12.58 | | | 5.97% | | 272.7 | | 0.64% | | 3.09% | | 0.64% | | 3.09% | | 131% |
| (0.45) | | | 12.24 | | | 11.62% | | 128.1 | | 0.73% | | 3.98% | | 0.73% | | 3.98% | | 164% |
| (0.52) | | | 11.40 | | | (5.03)% | | 90.5 | | 0.68% | | 4.22% | | 0.70% | | 4.20% | | 113% |
| (0.56) | | | 12.53 | | | 4.10% | | 112.0 | | 0.73% | | 4.52% | | 0.74% | | 4.50% | | 130% |
| | | | | | | | |
| | | | | | | | | | | | | | | | | | |
| (0.31) | | | 12.40 | | | 1.05% | | 584.7 | | 0.35% | | 2.45% | | 0.36% | | 2.45% | | 109% |
| (0.41) | | | 12.58 | | | 6.35% | | 530.8 | | 0.36% | | 3.38% | | 0.37% | | 3.38% | | 131% |
| (0.49) | | | 12.23 | | | 11.93% | | 455.6 | | 0.37% | | 4.35% | | 0.38% | | 4.35% | | 164% |
| (0.56) | | | 11.40 | | | (4.71)% | | 376.9 | | 0.35% | | 4.56% | | 0.36% | | 4.54% | | 113% |
| (0.60) | | | 12.53 | | | 4.47% | | 303.7 | | 0.36% | | 4.91% | | 0.38% | | 4.89% | | 130% |
(b) Total investment return assumes dividend reinvestment and does not reflect any deduction for sales charges. Not annualized for periods less than one year.
** Computed on an annualized basis for periods less than one year.
The accompanying Notes to Financial Statements are an integral part of this schedule.
247
Thrivent Mutual Funds
Financial Highlights - continued
| | | | | | |
| | | FOR A SHARE OUTSTANDING THROUGHOUT EACH PERIOD* | | | | |
| | | | | | | | | | | | | | |
| | | | | Income from Investment Operations | | | | Less Distributions from |
| | | | | | | |
| | | Net Asset
Value,
Beginning of Period | | Net
Investment
Income/(Loss) | | Net Realized
and Unrealized
Gain/(Loss) on
Investments(a) | | Total from
Investment
Operations | | | | Net
Investment
Income | | Net Realized
Gain on
Investments |
MONEY MARKET FUND |
| | | | | | | |
Class A Shares | | | | | | | | | | | | | | |
Year Ended 10/31/2011 | | $1.00 | | $– | | $– | | $– | | | | $– | | $– |
Year Ended 10/31/2010 | | 1.00 | | – | | – | | – | | | | – | | – |
Year Ended 10/31/2009 | | 1.00 | | 0.01 | | – | | 0.01 | | | | (0.01) | | – |
Year Ended 10/31/2008 | | 1.00 | | 0.03 | | – | | 0.03 | | | | (0.03) | | – |
Year Ended 10/31/2007 | | 1.00 | | 0.05 | | – | | 0.05 | | | | (0.05) | | – |
| | | | | | | |
Institutional Class Shares | | | | | | | | | | | | | | |
Year Ended 10/31/2011 | | 1.00 | | – | | – | | – | | | | – | | – |
Year Ended 10/31/2010 | | 1.00 | | – | | – | | – | | | | – | | – |
Year Ended 10/31/2009 | | 1.00 | | 0.01 | | – | | 0.01 | | | | (0.01) | | – |
Year Ended 10/31/2008 | | 1.00 | | 0.03 | | – | | 0.03 | | | | (0.03) | | – |
Year Ended 10/31/2007 | | 1.00 | | 0.05 | | – | | 0.05 | | | | (0.05) | | – |
(a) The amount shown may not correlate with the change in aggregate gains and losses of portfolio securities due to the timing of sales and redemptions of fund shares.
* All per share amounts have been rounded to the nearest cent.
The accompanying Notes to Financial Statements are an integral part of this schedule.
248
Thrivent Mutual Funds
Financial Highlights - continued
| | | | | | | | | | | | |
| | | | | | | | | RATIOS / SUPPLEMENTAL DATA | | | | |
| | | | | | | | | | | | | | | | | | | | |
| | | | | | | | | Ratio to Average Net
Assets** | | | | Ratios to Average Net Assets Before Expenses Waived, Credited or Paid Indirectly** | | |
| | | | | | | | | |
Total Distributions | | Net Asset
Value, End of
Period | | Total
Return(b) | | Net Assets, End
of Period (in
millions) | | Expenses | | Net
Investment
Income/(Loss) | | | | Expenses | | Net
Investment
Income/(Loss) | | Net Portfolio
Turnover Rate |
| | | | | | | | | | | | | | | | | | |
| | | | | | | | | |
| | | | | | | | | | | | | | | | | | |
| $– | | $1.00 | | 0.00% | | $587.9 | | 0.30% | | 0.00% | | | | 0.93% | | (0.63)% | | N/A |
| – | | 1.00 | | 0.00% | | 717.0 | | 0.30% | | 0.00% | | | | 0.88% | | (0.57)% | | N/A |
| (0.01) | | 1.00 | | 0.61% | | 1,017.3 | | 0.60% | | 0.63% | | | | 0.83% | | 0.40% | | N/A |
| (0.03) | | 1.00 | | 3.21% | | 1,306.0 | | 0.54% | | 3.14% | | | | 0.74% | | 2.94% | | N/A |
| (0.05) | | 1.00 | | 4.92% | | 1,183.9 | | 0.58% | | 4.83% | | | | 0.78% | | 4.63% | | N/A |
| | | | | | | | | |
| | | | | | | | | | | | | | | | | | |
| – | | 1.00 | | 0.00% | | 11.6 | | 0.30% | | 0.00% | | | | 0.56% | | (0.27)% | | N/A |
| – | | 1.00 | | 0.00% | | 14.5 | | 0.30% | | 0.00% | | | | 0.52% | | (0.22)% | | N/A |
| (0.01) | | 1.00 | | 0.80% | | 68.4 | | 0.40% | | 0.93% | | | | 0.50% | | 0.83% | | N/A |
| (0.03) | | 1.00 | | 3.41% | | 223.3 | | 0.35% | | 3.45% | | | | 0.45% | | 3.36% | | N/A |
| (0.05) | | 1.00 | | 5.16% | | 425.0 | | 0.36% | | 5.05% | | | | 0.46% | | 4.95% | | N/A |
(b) Total investment return assumes dividend reinvestment and does not reflect any deduction for sales charges. Not annualized for periods less than one year.
** Computed on an annualized basis for periods less than one year.
The accompanying Notes to Financial Statements are an integral part of this schedule.
249
Additional Information
(unaudited)
Shareholder Notification of Federal Tax Information
The following information is provided solely to satisfy the requirements set forth by the Internal Revenue Code. Shareholders will be provided information regarding their distributions in January 2012.
The Funds designate the following percentages of dividends declared from net investment income as dividends qualifying for the 70% dividends received deduction for corporations or as qualified dividend income for individuals under the Jobs and Growth Tax Relief Reconciliation Act of 2003 for the tax period ending October 31, 2011:
| | | | | | | | |
| Fund | | Dividends Received Deduction for Corporations | | | Qualified Dividend Income for Individuals | |
Aggressive Allocation | | | 60 | % | | | 100 | % |
Moderately Aggressive Allocation | | | 29 | % | | | 52 | % |
Moderate Allocation | | | 16 | % | | | 33 | % |
Moderately Conservative Allocation | | | 11 | % | | | 19 | % |
Partner Small Cap Value | | | 100 | % | | | 100 | % |
Partner Mid Cap Value | | | 100 | % | | | 100 | % |
Mid Cap Stock | | | 41 | % | | | 41 | % |
Partner Worldwide Allocation | | | 0 | % | | | 100 | % |
Large Cap Value | | | 100 | % | | | 100 | % |
Large Cap Stock | | | 100 | % | | | 100 | % |
Balanced | | | 55 | % | | | 66 | % |
High Yield | | | 1 | % | | | 1 | % |
The Municipal Bond Fund designates 99.51% of the dividends declared from net investment income as exempt from federal income tax for the tax period ended October 31, 2011.
Pursuant to IRC 852(b)(3) of the Internal Revenue Code, the Funds hereby designate the following amounts as long-term capital gains distributed during the year ended October 31, 2011, or if subsequently determined to be different, the net capital gain of such year:
| | | | |
| Fund | | Distributions of Long-
Term Capital Gains | |
Moderately Conservative Allocation | | | $300,000 | |
Mid Cap Growth | | | $400,000 | |
Municipal Bond | | | $2,623,380 | |
Money Market | | | $10,531 | |
These amounts may include earnings and profits distributed to shareholders on the redemption of shares as part of the dividend paid deduction.
Proxy Voting
The policies and procedures that the Trust uses to determine how to vote proxies relating to portfolio securities are attached to the Trust’s Statement of Additional Information. You may request a free copy of the Statement of Additional Information or the report of how the Trust voted
proxies relating to portfolio securities during the most recent 12-month period ended June 30 by calling 1-800-847-4836. You also may review the Statement of Additional Information or the report of how the Trust voted proxies relating to portfolio securities during the most recent 12-month period ended June 30 at www.thrivent.com or www.sec.gov.
Quarterly Schedule of Portfolio Holdings
The Trust files its Schedule of Portfolio Holdings on Form N-Q with the SEC for the first and third quarters of each fiscal year. You may request a free copy of the Trust’s Forms N-Q by calling 1-800-847-4836. The Trust’s most recent Form N-Q Schedule of Investments also is at www.thrivent.com or www.sec.gov. You also may review and copy the Forms N-Q for the Trust at the SEC’s Public Reference Room in Washington, DC. You may get information about the operation of the Public Reference Room by calling 1-800-SEC-0330.
Results of Special Shareholder Meeting
A special meeting of the shareholders of Thrivent Partner International Stock Fund convened on September 9, 2011 to approve the merger of this Fund into the Thrivent Partner Worldwide Allocation Fund.
Shareholder votes rendered the following results:
| | | | | | | | | | | | |
| Name | | For | | | Against | | | Abstain | |
| Partner International Stock Fund merger | | | 29,196,975.769 | | | | 706,551.555 | | | | 716,733.668 | |
250
Board of Trustees and Officers
The following table provides information about the Trustees and Officers of the Trust. Each Trustee oversees each of the 25 series of the Trust and also serves as:
| | • | | Director of Thrivent Series Fund, Inc., a registered investment company consisting of 41 portfolios that serve as underlying funds for variable contracts issued by Thrivent Financial for Lutherans (“Thrivent Financial”) and Thrivent Life Insurance Company and investment options in the retirement plan offered by Thrivent Financial; and |
| | • | | Trustee of Thrivent Financial Securities Lending Trust, a registered investment company consisting of one portfolio that serves as a cash collateral fund for a securities lending program sponsored by Thrivent Financial. |
The 25 series of the Trust, the 41 portfolios of Thrivent Series Fund, Inc. and Thrivent Financial Securities Lending Trust are referred to herein as the “Fund Complex.” The Statement of Additional Information includes additional information about the Trustees and is available, without charge, by calling 1-800-847-4836.
Interested Trustee (1)
| | | | | | | | |
Name, Address and Age | | Position with Trust and Length of Service (2) | | Number of Portfolios in Fund Complex Overseen by Trustee | | Principal Occupation
During the Past 5 Years | | Other Directorships Held
Currently and Within Past 5 Years |
Russell W. Swansen 625 Fourth Avenue South Minneapolis, MN Age 54 | | President since 2008; Trustee since 2009; Vice President from 2004 until 2008 | | 67 | | Senior Vice President, Chief Investment Officer, Thrivent Financial since 2003 | | None |
Independent Trustees (3)
| | | | | | | | |
Name, Address and Age | | Position with Trust and Length of Service (2) | | Number of Portfolios in Fund Complex Overseen by Trustee | | Principal Occupation
During the Past 5 Years | | Other Directorships Held
Currently and Within Past 5 Years |
F. Gregory Campbell 625 Fourth Avenue South Minneapolis, MN Age 71 | | Trustee from 1992 until December 2011 | | 67 | | President, Carthage College | | Currently, Director of Optique Funds, Inc., an investment company consisting of one portfolio; Kenosha Hospital and Medical Center, Prairie School Board and United Health Systems Board. Previously, Director of the National Association of Independent Colleges and Universities |
251
Board of Trustees and Officers
| | | | | | | | |
Name, Address and Age | | Position with Trust and Length of Service (2) | | Number of Portfolios in Fund Complex Overseen by Trustee | | Principal Occupation
During the Past 5 Years | | Other Directorships Held
Currently and Within Past 5 Years |
Janice B. Case 625 Fourth Avenue South Minneapolis, MN Age 59 | | Trustee since 2011 | | 67 | | Independent Trustee of North American Electric Reliability Corporation (self-regulatory organization) since 2008; Independent Director of Western Electricity Coordinating Council (nonprofit corporation coordinating and promoting bulk electric system reliability) from 2002 through 2008; Independent Director/Trustee of three affiliated family of funds (AEGON/Transamerica Series Trust (consisted of 40 funds), Transamerica IDEX Funds (consisted of 53 funds) and Transamerica Income Shares, Inc. (consisted of one fund)) from 2001 through 2007; Independent Director of Central Vermont Public Service Corporation (electric utility) from 2001 through 2007; Advisory Board Director of AmSouth Bank, N.A. from 1997 through 2007 | | Please see principal occupation during the past 5 years |
| | | | |
Richard L. Gady 625 Fourth Avenue South Minneapolis, MN Age 68 | | Trustee since 1987 | | 67 | | Retired | | None |
| | | | |
Richard A. Hauser 625 Fourth Avenue South Minneapolis, MN Age 68 | | Trustee since 2004 | | 67 | | Vice President and Assistant General Counsel, Boeing Company since 2007; President, National Legal Center for the Public Interest from 2004 to 2007 | | Previously, Director of Washington Hospital Center |
| | | | |
Marc S. Joseph 625 Fourth Avenue South Minneapolis, MN Age 51 | | Trustee since 2011 | | 67 | | Managing Director of GraniteRidgeLLP (consulting and advisory firm) since 2009; Managing Director of MJosephLLC (private investing and consulting firm) since 2004 | | None |
252
Board of Trustees and Officers
| | | | | | | | |
Name, Address and Age | | Position with Trust and Length of Service (2) | | Number of Portfolios in Fund Complex Overseen by Trustee | | Principal Occupation During the Past 5 Years | | Other Directorships Held Currently and Within Past 5 Years |
Paul R. Laubscher 625 Fourth Avenue South Minneapolis, MN Age 55 | | Trustee since 2009 | | 67 | | Portfolio Manager for U.S. and international equity portfolios and private real estate portfolios of IBM Retirement Funds | | None |
| | | | |
Connie M. Levi 625 Fourth Avenue South Minneapolis, MN Age 72 | | Chair from 2009 until December 2011; Trustee from 2004 until December 2011 | | 67 | | Retired | | None |
| | | | |
James A. Nussle 625 Fourth Avenue South Minneapolis, MN Age 51 | | Trustee since 2011 | | 67 | | President and Chief Operating Officer of Growth Energy (trade association) since 2010; Advisory Board member of AVISTA Capital Partners (private equity firm) since 2010; Contributor on CNBC (media) since 2010; CEO of The Nussle Group LLC (consulting firm) since 2009; Director of the Office of Management and Budget from 2007 through 2009; CEO of The Nussle Group, Navigating Strategies LLC (consulting firm) from January 2007 through September 2007; and Member of Congress in U.S. House of Representatives from 1991 through 2007 | | Currently, Advisory Board member of AVISTA Capital Partners |
| | | | |
Douglas D. Sims 625 Fourth Avenue South Minneapolis, MN Age 65 | | Trustee since 2006 | | 67 | | Retired | | Currently, Director of Keystone Neighbourhood Company, Keystone Center and Keystone Science School. Previously, Director of the Center for Corporate Excellence |
253
Board of Trustees and Officers
| | | | | | | | |
Name, Address and Age | | Position with Trust and Length of Service (2) | | Number of Portfolios in Fund Complex Overseen by Trustee | | Principal Occupation
During the Past 5 Years | | Other Directorships Held
Currently and Within Past 5 Years |
Constance L. Souders 625 Fourth Avenue South Minneapolis, MN Age 61 | | Trustee since 2007 | | 67 | | Retired; previously Director from 1983 to 2007, Executive Vice President from 2001 to 2007 and AML Compliance Officer from 2003 to 2007 of Harbor Capital Advisors, Inc.; Director from 1992 to 2007, President from 2000 to 2007 and AML Compliance Officer from 2003 to 2007 of Harbor Services Group, Inc.; Director from 1992 to 2007, Executive Vice President from 2001 to 2007, Chief Compliance Officer from 2004 to 2007, AML Compliance Officer from 2003 to 2007, Supervisory Registered Principal from 2000 to 2007, of Harbor Funds Distributors, Inc.; Vice President from 2000 to 2007 of Harbor Funds | | None |
254
Board of Trustees and Officers
Executive Officers
| | | | |
Name, Address and Age | | Position with Trust and Length of Service (2) | | Principal Occupation During the Past 5 Years |
Russell W. Swansen 625 Fourth Avenue South Minneapolis, MN Age 54 | | President since 2008; Trustee since 2009; Vice President from 2004 until 2008 | | Senior Vice President, Chief Investment Officer, Thrivent Financial since 2003 |
| | |
David S. Royal 625 Fourth Avenue South Minneapolis, MN Age 40 | | Secretary and Chief Legal Officer since 2006 | | Vice President and Managing Counsel, since 2006 and Interim Investment Company and Investment Adviser Chief Compliance Officer from May 2010 until December 2010, Thrivent Financial |
| | |
Gerard V. Vaillancourt 625 Fourth Avenue South Minneapolis, MN Age 44 | | Treasurer and Principal Accounting Officer since 2005 | | Vice President, Mutual Fund Accounting, Thrivent Financial since 2006 |
| | |
Ted S. Dryden 625 Fourth Avenue South Minneapolis, MN Age 46 | | Chief Compliance Officer since 2010 | | Investment Company and Investment Adviser Chief Compliance Officer, Thrivent Financial since December 2010; Chief Compliance Officer, OptumHealth Financial Services from 2009 to 2010; Vice President, Asset Management Compliance, Ameriprise Financial from 2006 to 2009 |
| | |
Janice M. Guimond 625 Fourth Avenue South Minneapolis, MN Age 47 | | Vice President since 2005 | | Vice President, Investment Operations, Thrivent Financial since 2004 |
| | |
Karl D. Anderson 625 Fourth Avenue South Minneapolis, MN Age 50 | | Vice President since 2006 | | Vice President, Products, Thrivent Financial since 2005 |
| | |
Kathleen M. Koelling 4321 North Ballard Road Appleton, WI Age 34 | | Anti-Money Laundering Officer since 2011 | | Privacy and Anti-Money Laundering Officer, Thrivent Financial since 2010; Senior Counsel, Thrivent Financial since 2002 |
| | |
Mark D. Anema 625 Fourth Avenue South Minneapolis, MN Age 50 | | Assistant Vice President since 2007 | | Vice President, Accumulation and Retirement Income Solutions, Thrivent Financial since 2007; Vice President, Strategic Planning, Thrivent Financial from 2004 to 2007 |
| | |
James M. Odland 625 Fourth Avenue South Minneapolis, MN Age 56 | | Assistant Secretary since 2006 | | Vice President and Managing Counsel, Thrivent Financial since 2005 |
| | |
Rebecca A. Paulzine 625 Fourth Avenue South Minneapolis, MN Age 32 | | Assistant Secretary since 2010 | | Counsel, Thrivent Financial since January 2010; Associate, Faegre & Benson LLP from 2005 to December 2009 |
| | |
John L. Sullivan 625 Fourth Avenue South Minneapolis, MN Age 40 | | Assistant Secretary since 2007 | | Senior Counsel, Thrivent Financial since 2007; Senior Counsel, Division of Investment Management of the SEC from 2000 to 2007 |
255
Board of Trustees and Officers
| | | | |
Name, Address and Age | | Position with Trust and Length of Service (2) | | Principal Occupation During the Past 5 Years |
Todd J. Kelly 4321 North Ballard Road Appleton, WI Age 42 | | Assistant Treasurer since 1999 | | Director, Fund Accounting Operations, Thrivent Financial since 2002 |
| | |
Sarah L. Bergstrom 625 Fourth Avenue South Minneapolis, MN Age 34 | | Assistant Treasurer since 2007 | | Director, Fund Accounting Administration, Thrivent Financial since 2007; Manager, Fund Accounting Administration, Thrivent Financial from 2005 to 2007 |
| (1) | “Interested person” of the Trust as defined in the Investment Company Act of 1940 by virtue of positions with Thrivent Financial. Mr. Swansen is considered an interested person because of his principal occupation with Thrivent Financial. |
| (2) | Each Trustee generally serves an indefinite term until her or his successor is duly elected and qualified. Officers serve at the discretion of the board until their successors are duly appointed and qualified. |
| (3) | The Trustees other than Mr. Swansen are not “interested persons” of the Trust and are referred to as “Independent Trustees.” |
256
As of the end of the period covered by this report, registrant has adopted a code of ethics (as defined in Item 2 of Form N-CSR) applicable to registrant’s Principal Executive Officer, Principal Financial Officer and Principal Accounting Officer. No waivers were granted to such code of ethics during the period covered by this report. A copy of this code of ethics is filed as an exhibit to this Form N-CSR.
| Item 3. | Audit Committee Financial Expert |
Registrant’s Board of Trustees has determined that Constance L. Souders, an independent trustee, is the Audit Committee Financial Expert.
| Item 4. | Principal Accountant Fees and Services |
The aggregate fees billed by registrant’s independent public accountants, PricewaterhouseCoopers LLP (“PwC”), for the fiscal year ended October 31, 2011 and the fiscal year ended October 31, 2010, for professional services rendered in connection with the audit of registrant’s annual financial statements or services that are normally provided by the accountant in connection with statutory and regulatory filings or engagements were $335,601.08 and $428,965.67, respectively. In addition, the parent company of the Registrant’s investment adviser paid PwC $8,000 for services in connection with PwC’s review of the Registrant’s Registration Statement on Form N-14 (relating to the merger of two series of the Registrant) and semiannual report to shareholders, to which the Registration Statement on Form N-14 incorporated by reference.
The aggregate fees PwC billed to registrant for the fiscal year ended October 31, 2011 and the fiscal year ended October 31, 2010, for assurance and other services that are reasonably related to the performance of registrant’s audit and are not reported under Item 4(a), were $0 for each respective period. The aggregate fees PwC billed to registrant’s investment adviser and any entity controlling, controlled by, or under common control with registrant’s investment adviser for the fiscal year ended October 31, 2011 and the fiscal year ended October 31, 2010, for assurance and other services directly related to the operations and financial reporting of registrant, were $0 for each respective period.
The aggregate tax fees PwC billed to registrant for the fiscal year ended October 31, 2011 and the fiscal year ended October 31, 2010, for tax compliance, tax advice and tax planning services, were $121,530.00 and $105,388.06, respectively. The aggregate tax fees PwC billed to registrant’s investment adviser and any entity controlling, controlled by, or under common control with registrant’s investment adviser for the fiscal year ended October 31, 2011 and the fiscal year ended October 31, 2010, for services directly related to the operations and financial reporting of registrant, were $0 for each respective period.
The aggregate fees PwC billed to registrant for the fiscal year ended October 31, 2011 and the fiscal year ended October 31, 2010 for products and services provided, other than the services reported in paragraphs (a) through (c) of this item, were $0 for each respective period. The aggregate fees PwC billed to registrant’s investment adviser and any entity controlling, controlled by, or under common control with registrant’s investment adviser for the fiscal year ended October 31, 2011 and the fiscal year ended October 31, 2010, for products and services provided, other than the services reported in paragraphs (a) through (c) of this item, were $1,800 and $1,500, respectively. These fees were for access to a PwC-sponsored online library that provides interpretive guidance regarding U.S. and foreign accounting standards. These figures are also reported in response to item 4(g) below.
| | (e) | Registrant’s audit committee charter provides that the audit committee (comprised of the independent Trustees of registrant) is responsible for pre-approval of all auditing services performed for the registrant. The audit committee also is responsible for pre-approval (subject to the de minimis exceptions for non-audit services described in Section 10A(i)(1)(B) of the Securities Exchange Act of 1934) of all non-auditing services performed for the registrant or an affiliate of registrant. In addition, registrant’s audit committee charter permits a designated member of the audit committee to pre-approve, between meetings, one or more audit or non-audit service projects, subject to an expense limit and notification to the audit committee at the next committee meeting. Registrant’s audit committee pre-approved all fees described above that PwC billed to registrant. |
| | (f) | Less than 50% of the hours billed by PwC for auditing services to registrant for the fiscal year ended October 31, 2011 was for work performed by persons other than full-time permanent employees of PwC. |
| | (g) | The aggregate non-audit fees billed by PwC to registrant and to registrant’s investment adviser and any entity controlling, controlled by, or under common control with registrant’s investment adviser for the fiscal year ended October 31, 2011 and the fiscal year ended October 31, 2010 were $1,800 and $1,500 for each respective period. These figures are also reported in response to item 4(d) above. |
| | (h) | Registrant’s audit committee has considered the non-audit services provided to the registrant and registrant’s investment adviser and any entity controlling, controlled by, or under common control with registrant’s investment adviser as described above and determined that these services do not compromise PwC’s independence. |
| Item 5. | Audit Committee of Listed Registrants |
Not applicable.
| Item 6. | Schedule of Investments |
| | (a) | Registrant’s Schedule of Investments is included in the report to shareholders filed under Item 1. |
| | (b) | Not applicable to this filing. |
| Item 7. | Disclosure of Proxy Voting Policies and Procedures for Closed-End Management Investment Companies |
Not applicable.
| Item 8. | Portfolio Managers of Closed-End Management Investment Companies |
Not applicable.
| Item 9. | Purchases of Equity Securities by Closed-End Management Investment Company and Affiliated Purchasers. |
Not applicable.
| Item 10. | Submission of Matters to a Vote of Security Holders |
There have been no material changes to the procedures by which shareholders may recommend nominees to registrant’s board of trustees.
| Item 11. | Controls and Procedures |
(a)(i) Registrant’s President and Treasurer have concluded that registrant’s disclosure controls and procedures (as defined in Rule 30a-3(c) under the Investment Company Act of 1940) are effective, based on their evaluation of these controls and procedures as of a date within 90 days of the filing date of this report.
(a)(ii) Registrant’s President and Treasurer are aware of no change in registrant’s internal control over financial reporting (as defined in Rule 30a-3(d) under the Investment Company Act of 1940) that occurred during registrant’s most recent fiscal quarter that has materially affected, or is reasonably likely to materially affect, registrant’s internal control over financial reporting.
| | (a) | The code of ethics pursuant to Item 2 is attached hereto. |
| | (b) | Certifications pursuant to Rules 30a-2(a) and 30a-2(b) under the Investment Company Act of 1940 are attached hereto. |
SIGNATURES
Pursuant to the requirements of the Securities Exchange Act of 1934 and the Investment Company Act of 1940, the registrant has duly caused this report to be signed on its behalf by the undersigned, thereunto duly authorized.
| | | | | | |
Date: December 29, 2011 | | THRIVENT MUTUAL FUNDS |
| | | |
| | By: | | | | |
| | | | /s/ Russell W. Swansen |
| | | | Russell W. Swansen |
| | | | President |
Pursuant to the requirements of the Securities Exchange Act of 1934 and the Investment Company Act of 1940, this report has been signed below by the following persons on behalf of the registrant and in the capacities and on the dates indicated.
| | | | | | |
Date: December 29, 2011 | | By: | | | | |
| | | |
| | | | | | /s/ Russell W. Swansen |
| | | | | | Russell W. Swansen |
| | | | | | President |
| | | |
Date: December 29, 2011 | | By: | | | | |
| | | |
| | | | | | /s/ Gerard V. Vaillancourt |
| | | | | | Gerard V. Vaillancourt |
| | | | | | Treasurer |