UNITED STATES
SECURITIES AND EXCHANGE COMMISSION
Washington, D.C. 20549
FORM N-CSR
CERTIFIED SHAREHOLDER REPORT OF REGISTERED MANAGEMENT INVESTMENT COMPANIES
| | |
Investment Company Act file number: | | 811-05075 |
Thrivent Mutual Funds
(Exact name of registrant as specified in charter)
| | |
625 Fourth Avenue South Minneapolis, Minnesota | | 55415 |
| (Address of principal executive offices) | | (Zip code) |
John L. Sullivan
625 Fourth Avenue South
Minneapolis, Minnesota 55415
(Name and address of agent for service)
Registrant’s telephone number, including area code: (612) 844-5704
Date of fiscal year end: December 31
Date of reporting period: December 31, 2009
| Item 1. | Report to Stockholders |

Table of Contents
| | |
 | | Dear Shareholder: |
It has truly been a tale of two markets over the 12 months ended December 31, 2009. The same types of investments that were shunned in the panic environment of early 2009 were aggressively snapped up from March through December as the markets rebounded strongly from early March lows. While it is no great surprise that the stock market was due for a recovery, the speed and extent of the rally should give us pause.
In weighing future investment choices, risks and opportunities, it is worth considering and debating two prevailing (though somewhat extreme) views on where the U.S. economy and markets go from here.
What goes down, will go up
Historically, bull markets rise from the ashes of bear markets, and this past fiscal year’s terrible sell-off will likely be no different. Sharp recoveries typically follow sharp declines. Optimists point to unprecedented global stimulus, healing credit markets, rising leading economic indicators and stronger corporate profits as evidence there will be a traditional “V-shaped” recovery.
We have unprecedented global stimulus in terms of a very low federal funds rate—0.25%—and members of the Federal Reserve noted in September that economic conditions were likely to warrant exceptionally low interest rate levels for an extended time. This makes the cost of borrowing and financing very low and nurtures conditions for improved economic growth. Perhaps more important to the investment markets were the Fed’s extraordinary measures to expand its balance sheet and inject massive liquidity into the financial system, including buying large amounts of agency mortgage-backed and Treasury securities. Considering that the bulk of federal stimulus and government spending has yet to take effect, much fuel for the U.S. economic growth engine appears available.
Inflation increased modestly during the period as the recession continued to restrain wages and spending. The Consumer Price Index (CPI) increased 2.7% during the 12 months through December 2009, while the core CPI (minus the prices of energy and food) increased 1.8%.1 As inflation remains tame, no Fed action to raise short-term interest rates appears imminent. Stronger growth proponents would point to the declining U.S. dollar and rising gold prices as evidence that the market believes future inflation to be more of a worry than a “slow or no-growth” deflationary state.
Could it be different this time?
Diverging from the more optimistic assessments of where the U.S. economy and markets may be headed is what I term the “subdued or slow-growth” view. This perspective is based primarily on concerns with the U.S. consumer and aggressive government actions. Burdened by a still fundamentally weak national housing market, higher debt levels and pervasive anxiety over joblessness, the U.S. consumer—responsible for approximately 70% of the nation’s gross domestic product (GDP)2—may no longer be able to contribute as much to the overall economic equation. If that is the case, who or what will take up the slack?
Right now the government is filling the gap, but many would call this short-term “medication” for our recovering economy. Arguably, the government cannot continue to spend and issue Treasury debt at its current pace and soon will likely have to wrestle, along with the Federal Reserve, with how to pull some of the “fuel” out of the system. Businesses may not be able to come to the rescue as continued tight lending standards, especially for small businesses, limit access to capital and therefore crimp business investment and hiring. Larger companies have seen credit conditions improve, but access to capital remains more challenging for small businesses. These smaller businesses account for a good part of our nation’s total employment. Proponents of this view may point to the fact that, despite the resumption of economic growth, the nation’s job market continues to struggle, prompting uncertainty about the pace of the recovery. Employers cut just over 4 million jobs in 2009, and the U.S. unemployment rate jumped to 10% in December.3 We expect unemployment to improve only slowly.
What’s next? Our view
The unprecedented amount of government stimulus in the economy should fuel growth in 2010, but we believe activity will remain below trend and unemployment will stay high for the foreseeable future. Under such a scenario, the Federal Reserve will likely keep short-term interest rates at record low levels at least into early 2010. The more pessimistic view I shared earlier is largely predicated on the current economic snapshot and may not materialize given the massive fiscal and monetary stimuli at work. Betting against this liquidity and a corresponding economic recovery has historically been unwise.
Even so, these pessimistic conclusions are worthy of thought. We remain concerned about the threats to growth posed by continued problems in the housing and credit markets, rising unemployment and weak consumer and business spending. The Federal Reserve will have to walk a tightrope in knowing when and how to remove some of the monetary stimulus in the system or run the
2
risk of runaway inflation or another economic downturn. Government policy, legislative risk, increased regulation and taxes will also weigh on the extent and trajectory of the economic recovery.
As always, we will monitor the economy and markets closely and work hard to provide ongoing value to you. Thank you for continuing to turn to us for your financial options.
|
| Sincerely, |
|
 |
Russell W. Swansen |
President Thrivent Mutual Funds |
| 1 | U.S. Department of Commerce, Bureau of Economic Analysis |
| 2 | Bureau of Economic Statistics |
| 3 | U.S. Department of Labor, Bureau of Labor Statistics |
3
| | |
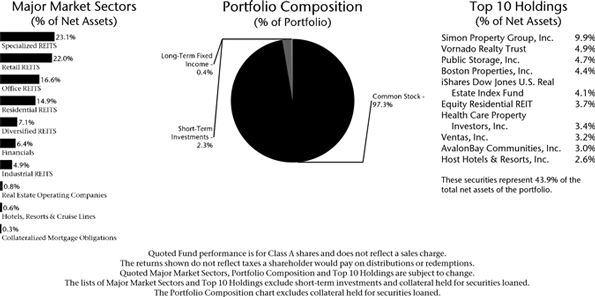
 | | Thrivent Real Estate Securities Fund Reginald L. Pfeifer, CFA, Portfolio Manager Thrivent Real Estate Securities Fund seeks to provide long-term capital appreciation and high current income. The Fund is subject to risks arising from the fact that it invests, under normal circumstances, at least 80% of its total assets in securities of companies that are primarily engaged in the real estate industry. Portfolio security prices are influenced by the underlying value of properties owned by the issuer, which may be influenced by the supply and demand for space and other factors. The real estate industry is cyclical, and securities issued by companies doing business in the real estate industry may fluctuate in value. These and other risks are described in the Fund’s prospectus. |
How did the Fund perform during the 12-month period ended December 31, 2009?
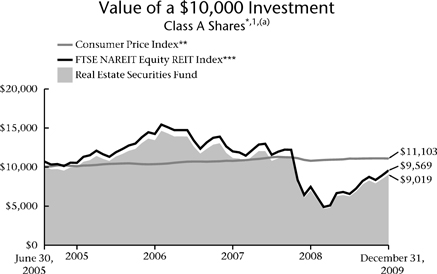
Thrivent Real Estate Securities Fund earned a return of 28.55% as compared to the median return of its peer group, the Lipper Real Estate category, of 29.22%. The Fund’s market benchmark, the FTSE NAREIT Equity REIT Index, earned a return of 27.99%.
What factors affected the Fund’s performance?
Real estate investment trust (REIT) stocks staged a significant rebound in 2009, after reaching their lowest levels in 15 years in early March. This recovery occurred primarily because REITs were able to raise more than $20 billion in new equity to reduce leverage and repay current or near-term debt maturities. REITs also raised approximately $14 billion in the public real estate debt market to refinance or extend debt maturities. In general, REITs were able to maintain reasonable occupancy levels due to their high-quality portfolios and experienced management teams. Nonetheless, 2009 was a difficult year that could have been significantly worse without U.S. government support for both the economy and capital markets.
The best performing sectors in the Fund were lodging, apartments and office REITs. The worst performing were shopping center, self storage and industrial properties.
The Fund’s largest positive contributors to performance were Simon Property Group, which owns and manages regional malls, outlet centers and community shopping centers in the U.S. and internationally; Digital Realty Trust, which specializes in data centers and technology-related real estate in the U.S. and Europe; and AvalonBay Communities, which develops and manages upscale apartment communities in high barrier-to-entry U.S. housing markets.
What is your outlook?
We expect the U.S. economy to experience gradual improvement in 2010. As a result, the commercial real estate sector is likely to improve in 2010 as well. Construction activity has been extremely low, and new supply is expected to be limited over the next few years. However, job growth is necessary in order for vacancy rates to begin declining. This process may take more time than historical U.S. cyclical recoveries. However, we believe that economic improvement will likely begin to benefit commercial real estate vacancy rates in 2010, and then rental rates. We expect that most property sectors should see improvement during the year. The sectors that are likely to recover most quickly are those property types that have short-term leases, specifically lodging, multifamily apartment and self-storage properties.
4
Property sectors that have longer-term leases, such as office buildings, shopping centers and industrial properties, are unlikely to see an immediate rebound in rental rates, but should benefit from a gradual improvement in occupancy rates. The Fund has exposure to companies within each property sector, with the largest concentration being in large-cap REITs with strong management teams. These companies have demonstrated the ability to access debt and equity capital in the public and private markets, which we believe remains critical in the current environment. In addition, we also maintain exposure in mid- and small-cap REITs that we believe offer attractive relative value and long-term growth potential. During 2010, we will seek to make adjustments as changes occur in either the economy or the various property sectors in which the Fund invests.
Portfolio Facts
As of December 31, 2009
| | | | |
| | | Class A | | Institutional Class |
Ticker | | TREFX | | TREIX |
Transfer Agent ID | | 069 | | 469 |
Net Assets | | $10,840,055 | | $80,242,033 |
NAV | | $7.79 | | $7.80 |
NAV - High† | | 12/28/2009 -$8.11 | | 12/28/2009 -$8.11 |
NAV - Low† | | 3/6/2009 -$3.74 | | 3/6/2009 -$3.74 |
Number of Holdings: 97 | | | | |
| | † | For the year ended December 31, 2009 |
Average Annual Total Returns1
As of December 31, 2009
| | | | |
Class A2 | | 1-Year | | From Inception
6/30/2005 |
without sales charge | | 28.55% | | -1.03% |
with sales charge | | 21.46% | | -2.26% |
| | |
Institutional Class3 | | 1-Year | | From Inception
6/30/2005 |
Net Asset Value | | 28.97% | | -0.66% |
| 1 | Past performance is not an indication of future results. Average annual total returns represent past performance and reflect changes in share prices, the reinvestment of all dividends and capital gains, and the effects of compounding. The prospectus contains more complete information on the investment objectives, risks, charges and expenses of the investment company, which investors should read and consider carefully before investing. To obtain a prospectus, contact a registered representative or visit www.thrivent.com. At various times, the Fund’s adviser may have waived its management fee and/or reimbursed Fund expenses. If this were the case, the Fund’s total returns would have been lower. The returns shown do not reflect taxes a shareholder would pay on distributions or redemptions. Total investment return and principal value of your investment will fluctuate, and your shares, when redeemed, may be worth more or less than their original cost. Current performance may be higher or lower than the performance data quoted. Call 800-THRIVENT or visit www.thrivent.com for performance results current to the most recent month-end. |
| 2 | Class A performance with sales charge reflects the maximum sales charge of 5.5%. |
| 3 | Institutional Class shares have no sales load and are for institutional shareholders only. |
| (a) | Performance of other classes will be greater or less than the line shown based on the differences in loads and fees paid by shareholders investing in the different classes. |
| * | As you compare performance, please note that the Fund’s performance reflects the maximum 5.5% sales charge, while the Consumer Price Index and the FTSE NAREIT Equity REIT Index do not reflect any such charges. If you were to purchase any of the above individual stocks or funds represented in the Index, any charges you would pay would reduce your total return as well. |
| ** | The Consumer Price Index is an inflationary indicator that measures the change in the cost of a fixed basket of products and services, including housing, electricity, food and transportation. It is not possible to invest directly in the Index. |
| *** | The FTSE NAREIT Equity REIT Index is an unmanaged capitalization-weighted index of all equity real estate investment trusts. It is not possible to invest directly in this Index. The performance of this Index does not reflect deductions for fees, expenses or taxes. |
5
| | | | |
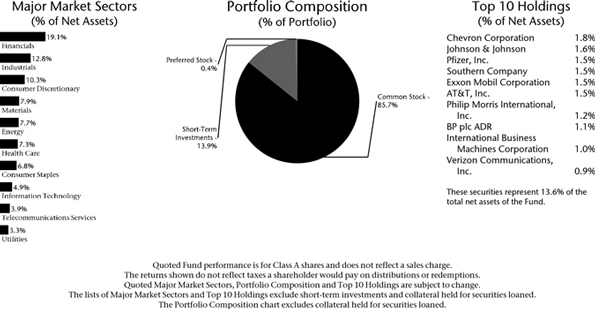
 | | Thrivent Equity Income Plus Fund David R. Spangler, CFA and Kevin R. Brimmer, FSA, Portfolio Co-Managers The Fund seeks income plus long-term capital growth. The Fund may invest in, among others, REITs, preferred stocks and foreign (including emerging market) stocks. These investments are subject to unique risks. The Fund may also sell covered options on any securities in which the Fund invests. Successful use of this strategy can augment portfolio return but can also magnify losses if executed incorrectly. These and other risks are described in the Fund’s prospectus. | |  |
How did the Fund perform during the 12-month period ended December 31, 2009?
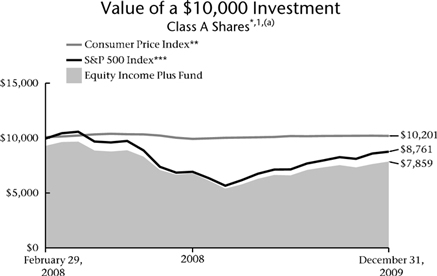
Thrivent Equity Income Plus Fund earned a return of 15.74% as compared to the median return of its peer group, the Lipper Equity Income category, of 22.55%. The Fund’s market benchmark, the S&P 500 Index, earned a return of 26.47%.
What factors affected the Fund’s performance?
Following the dramatic declines in stocks in the second half of 2008, the U.S. stock market posted one of the sharpest rebounds in history. The return to riskier assets included small caps outperforming large caps, growth over value, lower-quality over higher-quality, higher beta over lower beta and nondividend payers over dividend payers. Overall, the Fund maintained a higher-quality, lower-risk positioning in dividend-paying stocks, which contributed to the Fund lagging behind the market in 2009.
Security selection was the major contributor to underperformance, with weak performance in all but one sector due to the Fund’s positioning in higher-quality securities when the market rewarded lower-quality. Sector allocation was modestly positive for the year, with positive contribution coming from the materials, technology, health care and consumer discretionary sectors, but negative contribution coming from the energy and financial sectors. The Fund’s options buy-write strategy added value by generating premiums and moderating volatility.
What is your outlook?
It is expected that the economy will transition from early expansion to later expansion during 2010. At year-end 2009, Fund sectors were positioned with overweighting to economically sensitive securities in the financial, materials, industrials and consumer discretionary sectors, and underweighting to more counter-cyclical sectors such as consumer staples, utilities and health care. However, as the economy moves to later expansion (as we expect), it is expected that the Fund will be positioned to sectors such as health care, consumer staples, energy, materials and industrials, with underweighting to consumer discretionary, financials and technology. The Fund intends to maintain its options buy-write strategy.
6
Portfolio Facts
As of December 31, 2009
| | | | |
| | | Class A | | Institutional Class |
Ticker | | TEIAX | | TEIIX |
Transfer Agent ID | | 033 | | 050 |
Net Assets | | $4,092,064 | | $24,686,268 |
NAV | | $7.98 | | $7.98 |
NAV - High† | | 12/28/2009 - $8.10 | | 12/28/2009 - $8.12 |
NAV - Low† | | 3/9/2009 - $5.15 | | 3/9/2009 - $5.16 |
Number of Holdings: 138 | | | | |
| | † | For the year ended December 31, 2009 |
Average Annual Total Returns1
As of December 31, 2009
| | | | |
Class A2 | | 1-Year | | From Inception
2/29/2008 |
without sales charge | | 15.74% | | -9.54% |
with sales charge | | 9.36% | | -12.27% |
| | |
Institutional Class3 | | 1-Year | | From Inception
2/29/2008 |
Net Asset Value | | 15.97% | | -9.28% |
| 1 | Past performance is not an indication of future results. Average annual total returns represent past performance and reflect changes in share prices, the reinvestment of all dividends and capital gains, and the effects of compounding. The prospectus contains more complete information on the investment objectives, risks, charges and expenses of the investment company, which investors should read and consider carefully before investing. To obtain a prospectus, contact a registered representative or visit www.thrivent.com. At various times, the Fund’s adviser may have waived its management fee and/or reimbursed Fund expenses. If this were the case, the Fund’s total returns would have been lower. The returns shown do not reflect taxes a shareholder would pay on distributions or redemptions. Total investment return and principal value of your investment will fluctuate, and your shares, when redeemed, may be worth more or less than their original cost. Current performance may be higher or lower than the performance data quoted. Call 800-THRIVENT or visit www.thrivent.com for performance results current to the most recent month-end. |
| 2 | Class A performance with sales charge reflects the maximum sales charge of 5.5%. |
| 3 | Institutional Class shares have no sales load and are for institutional shareholders only. |
| (a) | Performance of other classes will be greater or less than the line shown based on the differences in loads and fees paid by shareholders investing in the different classes. |
| * | As you compare performance, please note that the Fund’s performance reflects the maximum 5.5% sales charge, while the Consumer Price Index and the S&P 500 Index do not reflect any such charges. If you were to purchase any of the above individual stocks or funds represented in the Index, any charges you would pay would reduce your total return as well. |
| ** | The Consumer Price Index is an inflationary indicator that measures the change in the cost of a fixed basket of products and services, including housing, electricity, food and transportation. It is not possible to invest directly in the Index. |
| *** | The S&P 500 Index is an index that represents the average performance of a group of 500 widely held, publicly traded stocks. “S&P 500” is a trademark of The McGraw-Hill Companies, Inc. and has been licensed for use by Thrivent Financial for Lutherans. The product is not sponsored, endorsed or promoted by Standard & Poor’s and Standard & Poor’s makes no representation regarding the advisability of investing in the product. It is not possible to invest directly in the Index. The performance of the Index does not reflect deductions for fees, expenses or taxes. |
7
| | | | | | | | |
 | |  | | Thrivent Diversified Income Plus Fund Mark L. Simenstad, CFA, Paul J. Ocenasek, CFA, Kevin R. Brimmer, FSA and David R. Spangler, CFA, Portfolio Co-Managers | | | | |
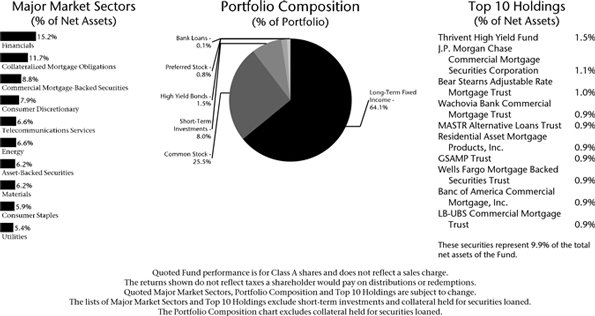
Thrivent Diversified Income Plus Fund seeks to maximize income while maintaining prospects for capital appreciation.
The Fund may invest in debt or equity securities. Debt securities include high-yield, high-risk securities commonly known as “junk bonds.” High-yield securities are subject to greater price fluctuations and increased risk of loss of principal than investment grade bonds. Equity securities include securities of REITs, which are subject to the risk that changes in real estate values or economic downturns can have a negative effect on issuers in the real estate industry. These and other risks are described in the Fund’s prospectus.
How did the Fund perform during the 12-month period ended December 31, 2009?
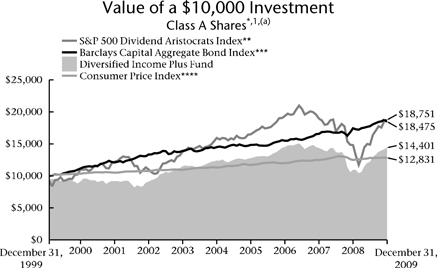
Thrivent Diversified Income Plus Fund earned a total return of 31.50%. This compares with the Fund’s market benchmarks, the S&P 500 Dividend Aristocrats Index and the Barclays Capital Aggregate Bond Index, which returned 26.56% and 5.93%, respectively.
What factors affected the Fund’s performance?
Riskier sectors of the credit market reversed course early in the period and rallied strongly as investors increasingly believed that government bailouts and liquidity programs would revive the economy and markets. The yield premium, or “spread,” that riskier bonds offered over Treasury securities narrowed dramatically.
High-yield, investment-grade corporate and mortgage-related bonds were among the best-performing sectors, while the prices of U.S. government securities fell. In the U.S. equities markets, real estate investment trusts (REITs) were strong performers after a previous pullback.
The Fund’s favorable performance relative to its benchmark indexes was due to several factors, including an overweighted position in high-yield bonds; a large position in non-agency mortgage bonds; a meaningful allocation to preferred stocks; and—to a lesser degree—a focus on REIT bonds rather than REIT stocks.
What is your outlook?
We believe that the recession is over and that economic growth will continue into 2010, still fueled largely by an array of government stimulus programs. We expect the pace of growth to pick up early in the year, though it will likely remain more subdued than investors would like. Unemployment will likely remain high, necessitating the Federal Reserve to keep short-term interest rates at current low levels at least through the first half of the year.
While we expect the bond and stock markets to continue returning toward normalcy, we don’t expect a repeat any time soon of 2009’s outsized returns from either type of asset. Rather, combined returns should be more muted—in the single to low double digits. On the bond side, we would hope to earn coupon payments that offset potentially falling securities prices if the Federal Reserve begins to raise interest rates.
8
Going forward, we expect to keep the Fund at roughly one-third high-yield bonds, one-third investment-grade bonds, and one-third dividend-paying stocks. As always, we will continue to monitor the economy and markets closely and watch for opportunities to add value to the Fund.
Portfolio Facts
As of December 31, 2009
| | | | |
| | | Class A | | Institutional Class |
Ticker | | AAHYX | | THYFX |
Transfer Agent ID | | 025 | | 095 |
Net Assets | | $135,181,696 | | $6,672,795 |
NAV | | $5.83 | | $5.81 |
NAV - High† | | 12/29/2009 - $5.86 | | 12/29/2009 - $5.85 |
NAV - Low† | | 3/9/2009 - $4.20 | | 3/9/2009 - $4.19 |
Number of Holdings: 385 | | | | |
| | † | For the year ended December 31, 2009 |
Average Annual Total Returns1,2
As of December 31, 2009
| | | | | | |
Class A3 | | 1-Year | | 5 Years | | 10 Years |
without sales charge | | 31.50% | | 3.04% | | 4.19% |
with sales charge | | 25.60% | | 2.09% | | 3.72% |
| | | |
Institutional Class4 | | 1-Year | | 5 Years | | 10 Years |
Net Asset Value | | 31.97% | | 3.47% | | 4.61% |
| 1 | Past performance is not an indication of future results. Average annual total returns represent past performance and reflect changes in share prices, the reinvestment of all dividends and capital gains, and the effects of compounding. The prospectus contains more complete information on the investment objectives, risks, charges and expenses of the investment company, which investors should read and consider carefully before investing. To obtain a prospectus, contact a registered representative or visit www.thrivent.com. At various times, the Fund’s adviser may have waived its management fee and/or reimbursed Fund expenses. If this were the case, the Fund’s total returns would have been lower. The returns shown do not reflect taxes a shareholder would pay on distributions or redemptions. Total investment return and principal value of your investment will fluctuate, and your shares, when redeemed, may be worth more or less than their original cost. Current performance may be higher or lower than the performance data quoted. Call 800-THRIVENT or visit www.thrivent.com for performance results current to the most recent month-end. |
| 2 | Prior to July 3, 2006, the Fund invested primarily in junk bonds. |
| 3 | Class A performance with sales charge reflects the maximum sales charge of 4.5%. |
| 4 | Institutional Class shares have no sales load and are for institutional shareholders only. |
| (a) | Performance of other classes will be greater or less than the line shown based on the differences in loads and fees paid by shareholders investing in the different classes. |
| * | As you compare performance, please note that the Fund’s performance reflects the maximum 4.5% sales charge, while the S&P 500 Dividend Aristocrats Index, the Barclays Capital Aggregate Bond Index and the Consumer Price Index do not reflect any such charges. If you were to purchase any of the above individual stocks or funds represented in the S&P and Barclays Capital Indexes, any charges you would pay would reduce your total return as well. |
| ** | The S&P 500 Dividend Aristocrats Index is an index which measures the performance of large-capitalization companies within the S&P 500 Index that have followed a managed dividends policy of consistently increasing dividends every year for at least 25 years. The Index has both capital growth and dividend income characteristics, is equal-weighted and is broadly diversified across sectors. “S&P 500” is a trademark of The McGraw-Hill Companies, Inc. and has been licensed for use by Thrivent Financial for Lutherans. The product is not sponsored, endorsed or promoted by Standard & Poor’s, and Standard & Poor’s makes no representation regarding the advisability of investing in the product. It is not possible to invest directly in each Index. The performance of each Index does not reflect deductions for fees, expenses or taxes. |
| *** | The Barclays Capital Aggregate Bond Index is an index that measures the performance of U.S. investment grade bonds. It is not possible to invest directly in the Index. The performance of the Index does not reflect deductions for fees, expenses or taxes. |
| **** | The Consumer Price Index is an inflationary indicator that measures the change in the cost of a fixed basket of products and services, including housing, electricity, food and transportation. It is not possible to invest directly in the Index. |
9
Shareholder Expense Example
(Unaudited)
As a shareholder of the Fund, you incur two types of costs: (1) transaction costs, including sales charges (loads) on purchase payments; and (2) ongoing costs, including management fees, distribution (12b-1) fees and other Fund expenses. This Example is intended to help you understand your ongoing costs (in dollars) of investing in the Fund and to compare these costs with the ongoing costs of investing in other mutual funds. The Example is based on an investment of $1,000 invested at the beginning of the period and held for the entire period from July 1, 2009 through December 31, 2009.
Actual Expenses
In the table below, the first section, labeled “Actual,” provides information about actual account values and actual expenses. You may use the information in this section, together with the amount you invested, to estimate the expenses that you paid over the period. Simply divide your account value by $1,000 (for example, an $8,600 account value divided by $1,000 = 8.6), then multiply the result by the number from the appropriate Class line under the heading entitled “Expenses Paid During Period” to estimate the expenses you paid. A small account fee of $12 may be charged to Class A shareholder accounts if the value falls below the stated account minimum of $1,000. This fee is not included in the table below. If it were, the expenses you paid during the period would have been higher and the ending account value would have been lower.
Hypothetical Example for Comparison Purposes
In the table below, the second section, labeled “Hypothetical,” provides information about hypothetical account values and hypothetical expenses based on the Fund’s actual expense ratio and an assumed rate of return of 5% per year before expenses, which is not the Fund’s actual return. The hypothetical account values and expenses may not be used to estimate the actual ending account balance or expenses you paid for the period. You may use this information to compare the ongoing costs of investing in the Fund and other funds. To do so, compare this 5% hypothetical example with the 5% hypothetical examples that appear in the shareholder reports of the other funds. A small account fee of $12 may be charged to Class A shareholder accounts if the value falls below the stated account minimum of $1,000. This fee is not included in the table below. If it were, the expenses you paid during the period would have been higher and the ending account value would have been lower.
Please note that the expenses shown in the table are meant to highlight your ongoing costs only and do not reflect any transactional costs, such as sales charges (loads). Therefore, the second section of the table is useful in comparing ongoing costs only, and will not help you determine the relative total costs of owning different funds. In addition, if these transactional costs were included, your costs would have been higher.
| | | | | | | | | | | | |
| | | Beginning
Account
Value
7/1/2009 | | Ending
Account
Value
12/31/2009 | | Expenses
Paid
During
Period
7/1/2009-
12/31/2009* | | Annualized
Expense
Ratio | |
Thrivent Real Estate Securities Fund | | | | | | | | | | | | |
Actual | | | | | | | | | | | | |
Class A | | $ | 1,000 | | $ | 1,443 | | $ | 7.70 | | 1.25 | % |
Institutional Class | | $ | 1,000 | | $ | 1,447 | | $ | 6.01 | | 0.97 | % |
Hypothetical** | | | | | | | | | | | | |
Class A | | $ | 1,000 | | $ | 1,019 | | $ | 6.36 | | 1.25 | % |
Institutional Class | | $ | 1,000 | | $ | 1,020 | | $ | 4.96 | | 0.97 | % |
Thrivent Equity Income Plus Fund | | | | | | | | | | | | |
Actual | | | | | | | | | | | | |
Class A | | $ | 1,000 | | $ | 1,190 | | $ | 6.35 | | 1.15 | % |
Institutional Class | | $ | 1,000 | | $ | 1,192 | | $ | 4.42 | | 0.80 | % |
Hypothetical** | | | | | | | | | | | | |
Class A | | $ | 1,000 | | $ | 1,019 | | $ | 5.85 | | 1.15 | % |
Institutional Class | | $ | 1,000 | | $ | 1,021 | | $ | 4.08 | | 0.80 | % |
Thrivent Diversified Income Plus Fund | | | | | | | | | | | | |
Actual | | | | | | | | | | | | |
Class A | | $ | 1,000 | | $ | 1,181 | | $ | 6.23 | | 1.13 | % |
Institutional Class | | $ | 1,000 | | $ | 1,184 | | $ | 4.12 | | 0.75 | % |
Hypothetical** | | | | | | | | | | | | |
Class A | | $ | 1,000 | | $ | 1,019 | | $ | 5.77 | | 1.13 | % |
Institutional Class | | $ | 1,000 | | $ | 1,021 | | $ | 3.81 | | 0.75 | % |
| * | Expenses are equal to the Fund’s annualized expense ratio, multiplied by the average account value over the period, multiplied by 184/365 to reflect the one-half year period. |
| ** | Assuming 5% total return before expenses. |
10

| | | | |
| | | | PricewaterhouseCoopers LLP 225 South Sixth Street Suite 1400 Minneapolis, MN 55402 Telephone (612) 596 6000 |
Report of Independent Registered Public Accounting Firm
To the Shareholders and Trustees of
the Thrivent Mutual Funds:
In our opinion, the accompanying statements of assets and liabilities, including the schedules of investments, and the related statements of operations and of changes in net assets and the financial highlights present fairly, in all material respects, the financial position of Thrivent Real Estate Securities Fund, Thrivent Diversified Income Plus Fund and Thrivent Equity Income Plus Fund (hereafter referred to as the “Funds”) at December 31, 2009, and the results of each of their operations in the year then ended, changes in each of their net assets and the financial highlights for each of the periods presented, in conformity with accounting principles generally accepted in the United States of America. These financial statements and financial highlights (hereafter referred to as “financial statements”) are the responsibility of the Funds’ management. Our responsibility is to express an opinion on these financial statements based on our audits. We conducted our audits of these statements in accordance with the standards of the Public Company Accounting Oversight Board (United States). Those standards require that we plan and perform the audit to obtain reasonable assurance about whether the financial statements are free of material misstatement. An audit includes examining, on a test basis, evidence supporting the amounts and disclosures in the financial statements, assessing the accounting principles used and significant estimates made by management, and evaluating the overall financial statement presentation. We believe that our audits, which included confirmation of securities at December 31, 2009 by correspondence with the custodian, brokers, and transfer agent, provide a reasonable basis for our opinion.

February 18, 2010
11
Real Estate Securities Fund
Schedule of Investments as of December 31, 2009
| | | | | | | |
Shares | | Common Stock (96.7%) | | Value |
Diversified REITS (7.1%) | | | |
| 11,919 | | Colonial Properties Trust | | $ | 139,810 |
| 3,042 | | Cousins Properties, Inc. | | | 23,211 |
| 40,138 | | Liberty Property Trust | | | 1,284,817 |
| 5,400 | | PS Business Parks, Inc. | | | 270,270 |
| 63,247 | | Vornado Realty Trust | | | 4,423,495 |
| 11,380 | | Washington Real Estate | | | |
| | Investment Trust | | | 313,519 |
| | | | | | | |
| | Total Diversified REITS | | | 6,455,122 |
| | | | | | | |
| | |
Financials (6.4%) | | | | | |
| 80,363 | | iShares Dow Jones U.S. Real Estate Index Fund | | | 3,690,269 |
| 2,000 | | Pebblebrook Hotel Trusta | | | 44,020 |
| 47,022 | | Vanguard REIT ETF | | | 2,103,764 |
| | | | | | | |
| | Total Financials | | | 5,838,053 |
| | | | | | | |
| | |
Hotels, Resorts & Cruise Lines (0.6%) | | | | | |
| 1,000 | | Hyatt Hotels Corporationa | | | 29,810 |
| 14,479 | | Starwood Hotels & Resorts Worldwide, Inc. | | | 529,497 |
| | | | | | | |
| | Total Hotels, Resorts & Cruise Lines | | | 559,307 |
| | | | | | | |
| | |
Industrial REITS (4.9%) | | | | | |
| 55,543 | | AMB Property Corporation | | | 1,419,124 |
| 78,382 | | DCT Industrial Trust, Inc. | | | 393,477 |
| 9,225 | | DuPont Fabros Technology, Inc. | | | 165,958 |
| 9,500 | | EastGroup Properties, Inc. | | | 363,660 |
| 6,100 | | First Potomac Realty Trust | | | 76,677 |
| 148,423 | | ProLogis | | | 2,031,911 |
| | | | | | | |
| | Total Industrial REITS | | | 4,450,807 |
| | | | | | | |
| | |
Mortgage REITS (0.3%) | | | | | |
| 8,987 | | Annaly Capital Management, Inc. | | | 155,924 |
| 4,500 | | Anworth Mortgage Asset Corporation | | | 31,500 |
| 8,000 | | MFA Mortgage Investments, Inc. | | | 58,800 |
| 2,400 | | Resource Capital Corporation | | | 11,808 |
| | | | | | | |
| | Total Mortgage REITS | | | 258,032 |
| | | | | | | |
| | |
Office REITS (16.6%) | | | | | |
| 19,250 | | Alexandria Real Estate Equities, Inc. | | | 1,237,583 |
| 31,353 | | BioMed Realty Trust, Inc. | | | 494,750 |
| 59,800 | | Boston Properties, Inc. | | | 4,010,786 |
| 56,246 | | Brandywine Realty Trust | | | 641,204 |
| 26,095 | | Corporate Office Properties Trust | | | 955,860 |
| 44,525 | | Digital Realty Trust, Inc. | | | 2,238,717 |
| 46,793 | | Douglas Emmett, Inc. | | | 666,800 |
| 64,600 | | Duke Realty Corporation | | | 786,182 |
| 23,431 | | Highwoods Properties, Inc. | | | 781,424 |
| 19,540 | | HRPT Properties Trust | | | 126,424 |
| 20,070 | | Kilroy Realty Corporation | | | 615,547 |
| 30,325 | | Mack-Cali Realty Corporation | | | 1,048,335 |
| 30,642 | | SL Green Realty Corporation | | | 1,539,454 |
| | | | | | | |
| | Total Office REITS | | | 15,143,066 |
| | | | | | | |
| | |
Real Estate Operating Companies (0.8%) | | | | | |
| 40,000 | | Brookfield Properties Corporation | | | 484,800 |
| 21,439 | | Forest City Enterprises, Inc.a | | | 252,551 |
| | | | | | | |
| | Total Real Estate Operating Companies | | | 737,351 |
| | | | | | | |
| |
Residential REITS (14.9%) | | |
| 24,550 | | American Campus Communities, Inc. | | | | | 689,855 |
| 44,849 | | Apartment Investment & Management Company | | 713,996 |
| 33,653 | | AvalonBay Communities, Inc. | | 2,763,248 |
| 18,300 | | BRE Properties, Inc. | | 605,364 |
| 27,540 | | Camden Property Trust | | 1,166,870 |
| 7,550 | | Education Realty Trust, Inc. | | 36,542 |
| 15,640 | | Equity Lifestyle Properties, Inc. | | 789,351 |
| 100,794 | | Equity Residential REIT | | 3,404,821 |
| 15,600 | | Essex Property Trust, Inc. | | 1,304,940 |
| 12,200 | | Home Properties, Inc. | | 582,062 |
| 11,188 | | Mid-America Apartment Communities, Inc. | | 540,156 |
| 15,588 | | Post Properties, Inc. | | 305,525 |
| 42,313 | | UDR, Inc. | | 695,626 |
| | | | | | | |
| | Total Residential REITS | | 13,598,356 |
| | | | | | | |
| |
Retail REITS (22.0%) | | |
| 17,076 | | Acadia Realty Trust | | 288,072 |
| 38,418 | | CBL & Associates Properties, Inc. | | 371,502 |
| 30,071 | | Developers Diversified Realty Corporation | | 278,457 |
| 9,519 | | Equity One, Inc. | | 153,922 |
| 31,680 | | Federal Realty Investment Trust | | 2,145,370 |
| 15,000 | | Inland Real Estate Corporation | | 122,250 |
| 117,967 | | Kimco Realty Corporation | | 1,596,094 |
| 12,500 | | Kite Realty Group Trust | | 50,875 |
| 43,686 | | Macerich Company | | 1,570,512 |
| 28,000 | | National Retail Properties, Inc. | | 594,160 |
| 4,884 | | Ramco-Gershenson Properties Trust | | 46,593 |
| 13,075 | | Realty Income Corporation | | 338,773 |
| 40,400 | | Regency Centers Corporation | | 1,416,424 |
| 2,900 | | Saul Centers, Inc. | | 95,004 |
| 113,226 | | Simon Property Group, Inc. | | 9,035,435 |
| 16,749 | | Tanger Factory Outlet Centers, Inc. | | 653,044 |
| 21,700 | | Taubman Centers, Inc. | | 779,247 |
| 23,700 | | Weingarten Realty Investors | | 469,023 |
| | | | | | | |
| | Total Retail REITS | | 20,004,757 |
| | | | | | | |
| |
Specialized REITS (23.1%) | | |
| 28,202 | | DiamondRock Hospitality Company | | 238,871 |
| 12,440 | | Entertainment Properties Trust | | 438,759 |
| 34,955 | | Extra Space Storage, Inc. | | 403,730 |
| 100,771 | | Health Care Property Investors, Inc. | | 3,077,546 |
| 38,326 | | Health Care REIT, Inc. | | 1,698,608 |
| 17,500 | | Healthcare Realty Trust, Inc. | | 375,550 |
| 23,548 | | Hospitality Properties Trust | | 558,323 |
| 199,296 | | Host Hotels & Resorts, Inc.a | | 2,325,784 |
| 18,300 | | LaSalle Hotel Properties | | 388,509 |
| 4,229 | | LTC Properties, Inc. | | 113,126 |
| 7,587 | | Medical Properties Trust, Inc. | | 75,870 |
| 44,675 | | Nationwide Health Properties, Inc. | | 1,571,667 |
| 23,730 | | Omega Healthcare Investors, Inc. | | 461,549 |
| 15,902 | | Plum Creek Timber Company, Inc. | | 600,460 |
| 52,210 | | Public Storage, Inc. | | 4,252,505 |
| 5,000 | | Rayonier, Inc. REIT | | 210,800 |
The accompanying Notes to Financial Statements are an integral part of this schedule.
12
Real Estate Securities Fund
Schedule of Investments as of December 31, 2009
| | | | | |
Shares | | Common Stock (96.7%) | | Value |
Specialized REITS (23.1%) - continued | | | |
| 41,644 | | Senior Housing Property Trust | | $ | 910,754 |
| 3,300 | | Sovran Self Storage, Inc. | | | 117,909 |
| 24,415 | | Sunstone Hotel Investors, Inc.a | | | 216,805 |
| 15,825 | | U-Store-It Trust | | | 115,839 |
| 66,941 | | Ventas, Inc. | | | 2,927,999 |
| | | | | |
| | Total Specialized REITS | | | 21,080,963 |
| | | | | |
| | Total Common Stock (cost $101,029,747) | | | 88,125,814 |
| | | | | |
| | |
Principal
Amount | | Long-Term Fixed Income (0.4%) | | |
Asset-Backed Securities (0.1%) | | | |
| | Residential Funding Mortgage Securities | | | |
| 58,666 | | 4.470%, 7/25/2018b | | | 56,075 |
| | | | | |
| | Total Asset-Backed Securities | | | 56,075 |
| | | | | |
| |
| Collateralized Mortgage Obligations (0.3%) | | | |
| | Countrywide Home Loans, Inc. | | | |
| 83,755 | | 5.447%, 3/20/2036 | | | 78,805 |
| | Deutsche Alt-A Securities, Inc. | | | |
| 75,881 | | 5.888%, 6/25/2036 | | | 71,636 |
| | Impac Secured Assets Corporation | | | |
| 91,425 | | 0.311%, 1/25/2010c | | | 50,584 |
| 61,537 | | 0.341%, 1/25/2010c | | | 23,769 |
| | J.P. Morgan Alternative Loan Trust | | | |
| 70,394 | | 0.311%, 1/25/2010c | | | 67,768 |
| | | | | |
| | Total Collateralized Mortgage Obligations | | | 292,562 |
| | | | | |
| | Total Long-Term Fixed Income (cost $404,207) | | | 348,637 |
| | | | | |
| | |
| | | Short-Term Investments (2.3%)d | | |
| | Federal Home Loan Bank Discount Notes | | | |
| 1,000,000 | | 0.040%, 1/15/2010 | | | 999,985 |
| 1,000,000 | | 0.050%, 2/3/2010 | | | 999,954 |
| | Federal National Mortgage Association Discount Notes | | | |
| 100,000 | | 0.010%, 2/1/2010 | | | 99,999 |
| | | | | |
| | Total Short-Term Investments (at amortized cost) | | | 2,099,938 |
| | | | | |
| | Total Investments (cost $103,533,892) 99.4% | | $ | 90,574,389 |
| | | | | |
| | Other Assets and Liabilities, Net 0.6% | | | 507,699 |
| | | | | |
| | Total Net Assets 100.0% | | $ | 91,082,088 |
| | | | | |
| a | Non-income producing security. |
| b | All or a portion of the security is insured or guaranteed. |
| c | Denotes variable rate obligations for which the current coupon rate and next scheduled reset date are shown. |
| d | The interest rate shown reflects the yield, coupon rate or, for securities purchased at a discount, the discount rate at the date of purchase. |
Definitions:
| | | | |
REIT | | - | | Real Estate Investment Trust, is a company that buys, develops, manages and/or sells real estate assets. |
ETF | | - | | Exchange Traded Fund. |
Unrealized Appreciation (Depreciation)
Gross unrealized appreciation and depreciation of investments, based on cost for federal income tax purposes, were as follows:
| | | | |
Gross unrealized appreciation | | $ | 5,562,415 | |
Gross unrealized depreciation | | | (22,844,966 | ) |
| | | | |
Net unrealized appreciation (depreciation) | | $ | (17,282,551 | ) |
| |
Cost for federal income tax purposes | | $ | 107,856,940 | |
The accompanying Notes to Financial Statements are an integral part of this schedule.
13
Real Estate Securities Fund
Schedule of Investments as of December 31, 2009
Fair Valuation Measurements
The following table is a summary of the inputs used, as of December 31, 2009, in valuing Real Estate Securities Fund's assets carried at fair value as discussed in the Notes to Financial Statements.
| | | | | | | | | | | | |
Investments in Securities | | Total | | Level 1 | | Level 2 | | Level 3 |
Common Stock | | | | | | | | | | | | |
Diversified REITS | | | 6,455,122 | | | 6,455,122 | | | — | | | — |
Financials | | | 5,838,053 | | | 5,838,053 | | | — | | | — |
Hotels, Resorts & Cruise Lines | | | 559,307 | | | 559,307 | | | — | | | — |
Industrial REITS | | | 4,450,807 | | | 4,450,807 | | | — | | | — |
Mortgage REITS | | | 258,032 | | | 258,032 | | | — | | | — |
Office REITS | | | 15,143,066 | | | 15,143,066 | | | — | | | — |
Real Estate Operating Companies | | | 737,351 | | | 737,351 | | | — | | | — |
Residential REITS | | | 13,598,356 | | | 13,598,356 | | | — | | | — |
Retail REITS | | | 20,004,757 | | | 20,004,757 | | | — | | | — |
Specialized REITS | | | 21,080,963 | | | 21,080,963 | | | — | | | — |
Long-Term Fixed Income | | | | | | | | | | | | |
Asset-Backed Securities | | | 56,075 | | | — | | | 56,075 | | | — |
Collateralized Mortgage Obligations | | | 292,562 | | | — | | | 292,562 | | | — |
Short-Term Investments | | | 2,099,938 | | | — | | | 2,099,938 | | | — |
| | | | | | | | | | | | |
Total | | $ | 90,574,389 | | $ | 88,125,814 | | $ | 2,448,575 | | $ | — |
| | | | | | | | | | | | |
Investment in Affiliates
Affiliated issuers, as defined under the Investment Company Act of 1940, include those in which the Fund's holdings of an issuer represent 5% or more of the outstanding voting securities of an issuer, or any affiliated mutual fund.
A summary of transactions for the fiscal year to date, in Real Estate Securities Fund, is as follows:
| | | | | | | | | | | | | | | | | |
Fund | | Value
December 31, 2008 | | Gross
Purchases | | Gross
Sales | | Shares Held at
December 31, 2009 | | Value
December 31, 2009 | | Income Earned
January 1, 2009 -
December 31, 2009 |
Money Market | | $ | 1,785,067 | | $ | 11,558,988 | | $ | 13,344,055 | | — | | $ | — | | $ | 5,960 |
Thrivent Financial Securities Lending Trust | | | 6,258,786 | | | 81,522,218 | | | 87,781,004 | | — | | | — | | | 48,167 |
Total Value and Income Earned | | | 8,043,853 | | | | | | | | | | | | | | 54,127 |
The accompanying Notes to Financial Statements are an integral part of this schedule.
14
Equity Income Plus Fund
Schedule of Investments as of December 31, 2009
| | | | | | | |
Shares | | Common Stock (83.6%) | | Value |
Consumer Discretionary (10.3%) | | | |
| 6,700 | | Aaron’s, Inc. | | $ | 185,791 |
| 4,300 | | Advance Auto Parts, Inc. | | | 174,064 |
| 11,500 | | Comcast Corporationa | | | 193,890 |
| 7,800 | | Gap, Inc. | | | 163,410 |
| 5,600 | | Garmin, Ltd. | | | 171,920 |
| 4,500 | | Guess ?, Inc.a | | | 190,350 |
| 6,600 | | Interactive Data Corporation | | | 166,980 |
| 9,900 | | Jones Apparel Group, Inc. | | | 158,994 |
| 8,600 | | Leggett & Platt, Inc. | | | 175,440 |
| 5,600 | | McGraw-Hill Companies, Inc. | | | 187,656 |
| 8,200 | | Men’s Wearhouse, Inc. | | | 172,692 |
| 11,600 | | Newell Rubbermaid, Inc. | | | 174,116 |
| 2,200 | | Polo Ralph Lauren Corporation | | | 178,156 |
| 3,800 | | Ross Stores, Inc. | | | 162,298 |
| 4,400 | | TJX Companies, Inc. | | | 160,820 |
| 2,300 | | VF Corporation | | | 168,452 |
| 6,600 | | Wolverine World Wide, Inc. | | | 179,652 |
| | | | | | | |
| | Total Consumer Discretionary | | | 2,964,681 |
| | | | | | | |
| | |
Consumer Staples (6.8%) | | | | | |
| 5,500 | | Casey’s General Stores, Inc. | | | 175,560 |
| 16,000 | | Del Monte Foods Companya | | | 181,440 |
| 4,700 | | Hershey Company | | | 168,213 |
| 4,700 | | J & J Snack Foods Corporation | | | 187,812 |
| 3,500 | | Lancaster Colony Corporation | | | 173,950 |
| 3,700 | | Molson Coors Brewing Company | | | 167,092 |
| 6,300 | | Nu Skin Enterprises, Inc. | | | 169,281 |
| 7,100 | | Philip Morris International, Inc. | | | 342,149 |
| 6,200 | | SYSCO Corporation | | | 173,228 |
| 3,800 | | Wal-Mart Stores, Inc. | | | 203,110 |
| | | | | | | |
| | Total Consumer Staples | | | 1,941,835 |
| | | | | | | |
| | |
Energy (7.7%) | | | | | |
| 5,300 | | BP plc ADR | | | 307,241 |
| 6,800 | | Chevron Corporation | | | 523,532 |
| 2,500 | | ConocoPhillips | | | 127,675 |
| 3,800 | | ENSCO International plc ADR | | | 151,772 |
| 6,300 | | Exxon Mobil Corporationa | | | 429,597 |
| 4,100 | | Noble Corporation | | | 166,870 |
| 3,800 | | Peabody Energy Corporation | | | 171,798 |
| 13,100 | | Tesoro Corporation | | | 177,505 |
| 6,300 | | World Fuel Services Corporation | | | 168,777 |
| | | | | | | |
| | Total Energy | | | 2,224,767 |
| | | | | | | |
| | |
Financials (18.9%) | | | | | |
| 10,300 | | Acadia Realty Trust | | | 173,761 |
| 3,400 | | ACE, Ltd.b | | | 171,360 |
| 6,900 | | American Financial Group, Inc. | | | 172,155 |
| 9,100 | | Annaly Capital Management, Inc. | | | 157,885 |
| 6,500 | | Aspen Insurance Holdings, Ltd. | | | 165,425 |
| 5,500 | | Assurant, Inc. | | | 162,140 |
| 3,700 | | Bank of Hawaii Corporationa | | | 174,122 |
| 9,400 | | Brown & Brown, Inc. | | | 168,918 |
| 3,300 | | Chubb Corporation | | | 162,294 |
| 3,900 | | Commerce Bancshares, Inc. | | | 151,008 |
| 21,700 | | CVB Financial Corporationa | | | 187,488 |
| 7,700 | | Delphi Financial Group, Inc. | | | 172,249 |
| 10,900 | | Discover Financial Services | | | 160,339 |
| 2,000 | | Everest Re Group, Ltd. | | | 171,360 |
| 6,500 | | Federated Investors, Inc. | | | 178,750 |
| 12,600 | | First Financial Bancorpa | | | 183,456 |
| 1,000 | | Goldman Sachs Group, Inc. | | | 168,840 |
| 6,400 | | HCC Insurance Holdings, Inc.a | | 179,008 |
| 27,300 | | HRPT Properties Trust | | 176,631 |
| 7,500 | | Itau Unibanco Holding SA ADR | | 171,300 |
| 4,000 | | J.P. Morgan Chase & Company | | 166,680 |
| 5,900 | | Legg Mason, Inc. | | 177,944 |
| 5,500 | | Mack-Cali Realty Corporation | | 190,135 |
| 7,400 | | Marsh & McLennan Companies, Inc. | | 163,392 |
| 2,200 | | PartnerRe, Ltd. | | 164,252 |
| 10,200 | | Protective Life Corporation | | 168,810 |
| 2,100 | | Public Storage, Inc. | | 171,045 |
| 9,600 | | SEI Investments Company | | 168,192 |
| 3,100 | | Transatlantic Holdings, Inc. | | 161,541 |
| 3,200 | | Travelers Companies, Inc. | | 159,552 |
| 8,800 | | Unum Group | | 171,776 |
| 6,000 | | Wells Fargo & Company | | 161,940 |
| | | | | | | |
| | Total Financials | | 5,433,748 |
| | | | | | | |
| |
| Health Care (7.3%) | | |
| 2,100 | | Abbott Laboratoriesa | | 113,379 |
| 3,700 | | AstraZeneca plc ADR | | 173,678 |
| 7,100 | | Johnson & Johnson | | 457,311 |
| 5,500 | | Merck & Company, Inc. | | 200,970 |
| 50 | | Novartis AG ADR | | 2,722 |
| 4,200 | | Perrigo Company | | 167,328 |
| 24,459 | | Pfizer, Inc. | | 444,909 |
| 5,200 | | STERIS Corporation | | 145,444 |
| 800 | | Teva Pharmaceutical Industries, Ltd. ADR | | 44,944 |
| 5,900 | | UnitedHealth Group, Inc. | | 179,832 |
| 6,000 | | Universal Health Services, Inc. | | 183,000 |
| | | | | | | |
| | Total Health Care | | 2,113,517 |
| | | | | | | |
| |
| Industrials (12.8%) | | |
| 2,200 | | 3M Company | | 181,874 |
| 4,000 | | A.O. Smith Corporation | | 173,560 |
| 9,150 | | ABB, Ltd. ADRb | | 174,765 |
| 3,200 | | Bucyrus International, Inc.a | | 180,384 |
| 5,200 | | Carlisle Companies, Inc. | | 178,152 |
| 6,000 | | Crane Companya | | 183,720 |
| 2,400 | | Danaher Corporationa | | 180,480 |
| 13,000 | | Deluxe Corporationa | | 192,270 |
| 1,700 | | Flowserve Corporation | | 160,701 |
| 3,700 | | Hubbell, Inc. | | 175,010 |
| 3,200 | | ITT Corporation | | 159,168 |
| 3,100 | | Joy Global, Inc. | | 159,929 |
| 2,100 | | L-3 Communications Holdings, Inc. | | 182,595 |
| 3,100 | | Parker Hannifin Corporation | | 167,028 |
| 7,300 | | Pitney Bowes, Inc. | | 166,148 |
| 3,500 | | Regal-Beloit Corporation | | 181,790 |
| 4,200 | | Toro Company | | 175,602 |
| 4,700 | | Universal Forest Products, Inc. | | 173,007 |
| 2,200 | | Valmont Industries, Inc. | | 172,590 |
| 1,700 | | W.W. Grainger, Inc. | | 164,611 |
| 7,200 | | Woodward Governor Company | | 185,544 |
| | | | | | | |
| | Total Industrials | | 3,668,928 |
| | | | | | | |
| |
| Information Technology (4.9%) | | |
| 8,000 | | Altera Corporationa | | 181,040 |
| 2,800 | | Hewlett-Packard Company | | 144,228 |
| 2,200 | | International Business Machines Corporation | | 287,980 |
The accompanying Notes to Financial Statements are an integral part of this schedule.
15
Equity Income Plus Fund
Schedule of Investments as of December 31, 2009
| | | | | |
Shares | | Common Stock (83.6%) | | Value |
Information Technology (4.9%) - continued | | | |
| 4,000 | | Lender Processing Services, Inc. | | $ | 162,640 |
| 5,300 | | Microsoft Corporation | | | 161,597 |
| 3,100 | | QUALCOMM, Inc. | | | 143,406 |
| 4,400 | | Syntel, Inc. | | | 167,332 |
| 9,100 | | Western Union Company | | | 171,535 |
| | | | | |
| | Total Information Technology | | | 1,419,758 |
| | | | | |
| |
| Materials (7.9%) | | | |
| 5,600 | | Celanese Corporationa | | | 179,760 |
| 4,100 | | International Flavors & Fragrances, Inc. | | | 168,674 |
| 6,600 | | International Paper Company | | | 176,748 |
| 2,300 | | Lubrizol Corporation | | | 167,785 |
| 1,600 | | NewMarket Corporation | | | 183,632 |
| 4,100 | | Reliance Steel & Aluminum Company | | | 177,202 |
| 3,700 | | Rock-Tenn Company | | | 186,517 |
| 8,600 | | RPM International, Inc. | | | 174,838 |
| 3,100 | | Silgan Holdings, Inc. | | | 179,428 |
| 2,700 | | Stepan Company | | | 174,987 |
| 6,400 | | Valspar Corporation | | | 173,696 |
| 2,400 | | Walter Energy, Inc. | | | 180,744 |
| 6,400 | | Westlake Chemical Corporation | | | 159,552 |
| | | | | |
| | Total Materials | | | 2,283,563 |
| | | | | |
| |
Telecommunications Services (3.9%) | | | |
| 14,800 | | AT&T, Inc.a | | | 414,844 |
| 13,000 | | Chunghwa Telecom Company, Ltd. ADRa | | | 241,410 |
| 46,000 | | Qwest Communications International, Inc. | | | 193,660 |
| 8,000 | | Verizon Communications, Inc. | | | 265,040 |
| | | | | |
| | Total Telecommunications Services | | | 1,114,954 |
| | | | | |
| |
Utilities (3.1%) | | | |
| 3,300 | | Consolidated Edison, Inc. | | | 149,919 |
| 200 | | Dominion Resources, Inc. | | | 7,784 |
| 6,500 | | Duke Energy Corporation | | | 111,865 |
| 2,200 | | PG&E Corporation | | | 98,230 |
| 800 | | Progress Energy, Inc. | | | 32,808 |
| 13,000 | | Southern Company | | | 433,160 |
| 2,600 | | Xcel Energy, Inc. | | | 55,198 |
| | | | | |
| | Total Utilities | | | 888,964 |
| | | | | |
| | |
| | Total Common Stock (cost $23,447,434) | | | 24,054,715 |
| | | | | |
| | |
| | | Preferred Stock (0.4%) | | |
| Financials (0.2%) | | | |
| 2,000 | | U.S. Bancorp | | | 55,600 |
| | | | | |
| | Total Financials | | | 55,600 |
| | | | | |
| Utilities (0.2%) | | | |
| 1,720 | | Xcel Energy, Inc. | | | 45,752 |
| | | | | |
| | Total Utilities | | | 45,752 |
| | | | | |
| | |
| | Total Preferred Stock (cost $93,886) | | | 101,352 |
| | | | | |
| | | | | |
Principal Amount | | Short-Term Investments (13.5%)c | | |
| | Federal Home Loan Bank Discount Notes | | | |
| 2,000,000 | | 0.040%, 1/15/2010d | | | 1,999,969 |
| 600,000 | | 0.020%, 2/2/2010 | | | 599,989 |
| 300,000 | | 0.200%, 3/17/2010d | | | 299,877 |
| | Federal National Mortgage Association Discount Notes | | | |
| 1,000,000 | | 0.030%, 2/4/2010 | | | 999,972 |
| | | | | |
| | Total Short-Term Investments (at amortized cost) | | | 3,899,807 |
| | | | | |
| | Total Investments (cost $27,441,127) 97.5% | | $ | 28,055,874 |
| | | | | |
| | Other Assets and Liabilities, Net 2.5% | | | 722,458 |
| | | | | |
| | Total Net Assets 100.0% | | $ | 28,778,332 |
| | | | | |
| a | All or a portion of the security was earmarked to cover written options. |
| b | Non-income producing security. |
| c | The interest rate shown reflects the yield, coupon rate or, for securities purchased at a discount, the discount rate at the date of purchase. |
| d | At December 31, 2009, $399,876 of investments were held on deposit with the counterparty and pledged as the initial margin deposit for open futures contracts. |
Definitions:
| | | | |
| ADR | | - | | American Depositary Receipt, which are certificates for an underlying foreign security's shares held by an issuing U.S. depository bank. |
Unrealized Appreciation (Depreciation)
Gross unrealized appreciation and depreciation of investments, based on cost for federal income tax purposes, were as follows:
| | | | |
Gross unrealized appreciation | | $ | 678,966 | |
Gross unrealized depreciation | | | (318,948 | ) |
| | | | |
Net unrealized appreciation (depreciation) | | $ | 360,018 | |
| |
Cost for federal income tax purposes | | $ | 27,695,856 | |
The accompanying Notes to Financial Statements are an integral part of this schedule.
16
Equity Income Plus Fund
Schedule of Investments as of December 31, 2009
Fair Valuation Measurements
The following table is a summary of the inputs used, as of December 31, 2009, in valuing Equity Income Plus Fund’s assets carried at fair value as discussed in the Notes to Financial Statements.
| | | | | | | | | | | | |
Investments in Securities | | Total | | Level 1 | | Level 2 | | Level 3 |
Common Stock | | | | | | | | | | | | |
Consumer Discretionary | | | 2,964,681 | | | 2,964,681 | | | — | | | — |
Consumer Staples | | | 1,941,835 | | | 1,941,835 | | | — | | | — |
Energy | | | 2,224,767 | | | 2,224,767 | | | — | | | — |
Financials | | | 5,433,748 | | | 5,433,748 | | | — | | | — |
Health Care | | | 2,113,517 | | | 2,113,517 | | | — | | | — |
Industrials | | | 3,668,928 | | | 3,668,928 | | | — | | | — |
Information Technology | | | 1,419,758 | | | 1,419,758 | | | — | | | — |
Materials | | | 2,283,563 | | | 2,283,563 | | | — | | | — |
Telecommunications Services | | | 1,114,954 | | | 1,114,954 | | | — | | | — |
Utilities | | | 888,964 | | | 888,964 | | | — | | | — |
Preferred Stock | | | | | | | | | | | | |
Financials | | | 55,600 | | | 55,600 | | | — | | | — |
Utilities | | | 45,752 | | | 45,752 | | | — | | | — |
Short-Term Investments | | | 3,899,807 | | | — | | | 3,899,807 | | | — |
| | | | | | | | | | | | |
Total | | $ | 28,055,874 | | $ | 24,156,067 | | $ | 3,899,807 | | $ | — |
| | | | | | | | | | | | |
Other Financial Instruments* | | $ | 41,159 | | $ | 41,159 | | $ | — | | $ | — |
| | | | | | | | | | | | |
| * | Other Financial Instruments include Futures, Forwards, Written Options and Swap agreements. |
| | | | | | | | | | | | | | | |
Futures Contracts | | Number of
Contracts
Long/(Short) | | Expiration
Date | | Notional
Principal
Amount | | Value | | | Unrealized
Gain/(Loss) |
S&P 500 Index Mini-Futures | | 62 | | | March 2010 | | $ | 3,406,056 | | $ | 3,443,171 | | | $ | 37,115 |
Total Futures Contracts | | | | | | | | | | | | | | $ | 37,115 |
| | | | | |
Call Options Written | | Number of
Contracts | | Exercise
Price | | Expiration
Date | | Value | | | Unrealized
Gain/(Loss) |
S&P 500 Index Mini-Futures | | 15 | | $ | 1,130.00 | | | January 2010 | | | ($5,400 | ) | | $ | 202 |
S&P 500 Index Mini-Futures | | 10 | | | 1,140.00 | | | January 2010 | | | (2,200 | ) | | | 1,273 |
S&P 500 Index Mini-Futures | | 15 | | | 1,125.00 | | | January 2010 | | | (6,750 | ) | | | 510 |
S&P 500 Index Mini-Futures | | 15 | | | 1,135.00 | | | January 2010 | | | (4,275 | ) | | | 2,059 |
Total Call Options Written | | | | | | | | | | | ($18,625 | ) | | $ | 4,044 |
The following table summarizes the fair value and Statement of Assets and Liabilities location, as of December 31, 2009, for Equity Income Plus Fund's investments in financial derivative instruments by primary risk exposure as discussed under item (2) Significant Accounting Policies of the Notes to Financial Statements.
| | | | | |
Derivatives by risk category | | Statement of Assets and Liabilities Location | | Fair Value |
Asset Derivatives | | | | | |
Equity Contracts | | | | | |
Options Written | | Net Assets - Net unrealized appreciation/(depreciation) on Written option contracts | | | 4,044 |
Futures* | | Net Assets - Net unrealized appreciation/(depreciation) on Futures contracts | | | 37,115 |
Total Equity Contracts | | | | | 41,159 |
| | | | | |
Total Asset Derivatives | | | | $ | 41,159 |
| | | | | |
| * | Includes cumulative appreciation/depreciation of futures contracts as reported in the Schedule of Investments. Only current day’s variation margin is reported within the Statement of Assets and Liabilities. |
The accompanying Notes to Financial Statements are an integral part of this schedule.
17
Equity Income Plus Fund
Schedule of Investments as of December 31, 2009
The following table summarizes the net realized gains/(losses) and Statement of Operations location, for the period ended December 31, 2009, for Equity Income Plus Fund’s investments in financial derivative instruments by primary risk exposure.
| | | | | | |
Derivatives by risk category | | Statement of Operations Location | | Realized Gains/(Losses)
recognized in Income | |
Equity Contracts | | | | | | |
Options Written | | Net realized gains/(losses) on Written option contracts | | | (25,434 | ) |
Futures | | Net realized gains/(losses) on Futures contracts | | | 598,930 | |
Total Equity Contracts | | | | | 573,496 | |
| | | | | | |
Total | | | | $ | 573,496 | |
| | | | | | |
The following table summarizes the change in net unrealized appreciation/(depreciation) and Statement of Operations location, for the period ended December 31, 2009, for Equity Income Plus Fund’s investments in financial derivative instruments by primary risk exposure.
| | | | | | |
Derivatives by risk category | | Statement of Operations Location | | Change in unrealized
appreciation/(depreciation)
recognized in Income | |
Equity Contracts | | | | | | |
Options Written | | Change in net unrealized appreciation/(depreciation) on Written option contracts | | | 3,152 | |
Futures | | Change in net unrealized appreciation/(depreciation) on Futures contracts | | | (35,308 | ) |
Total Equity Contracts | | | | | (32,156 | ) |
| | | | | | |
Total | | | | ($ | 32,156 | ) |
| | | | | | |
The following table presents Equity Income Plus Fund’s average daily volume of derivative activity during the period ended December 31, 2009.
| | | | | | | | |
Derivative Risk Category | | Futures
(Notional*) | | Futures
(Percentage of
Average Net Assets) | | | Options
(Contracts) |
Equity Contracts | | $ | 2,559,888 | | 10.8 | % | | 36 |
| * | Notional amount represents long or short, or both, derivative positions held by the fund. |
Investment in Affiliates
Affiliated issuers, as defined under the Investment Company Act of 1940, include those in which the Fund’s holdings of an issuer represent 5% or more of the outstanding voting securities of an issuer, or any affiliated mutual fund.
A summary of transactions for the fiscal year to date, in Equity Income Plus Fund, is as follows:
| | | | | | | | | | | | | | | | | |
Fund | | Value
December 31, 2008 | | Gross
Purchases | | Gross
Sales | | Shares Held at
December 31, 2009 | | Value
December 31, 2009 | | Income Earned
January 1, 2009-
December 31, 2009 |
Money Market | | $ | 1,634,430 | | $ | 13,743,995 | | $ | 15,378,425 | | — | | $ | — | | $ | 11,667 |
Total Value and Income Earned | | | 1,634,430 | | | | | | | | | | | | | | 11,667 |
The accompanying Notes to Financial Statements are an integral part of this schedule.
18
Diversified Income Plus Fund
Schedule of Investments as of December 31, 2009
| | | | | |
Principal
Amount | | Bank Loans (0.1%)a | | Value |
Financials (0.1%) | | | |
| | Nuveen Investments, Inc., Term Loan | | | |
| $140,000 | | 12.500%, 7/31/2015 | | $ | 143,920 |
| | | | | |
| | Total Financials | | | 143,920 |
| | | | | |
| | |
| | Total Bank Loans (cost $126,744) | | | 143,920 |
| | | | | |
| | |
| | | Long-Term Fixed Income (63.5%) | | |
| Asset-Backed Securities (6.2%) | | | |
| | Americredit Automobile Receivables Trust | | | |
| 595,681 | | 5.490%, 7/6/2012b | | | 603,661 |
| | GAMUT Reinsurance, Ltd. | | | |
| 850,000 | | 7.281%, 2/1/2010c,d | | | 851,955 |
| 250,000 | | 15.281%, 2/1/2010c,d | | | 190,000 |
| | GMAC Mortgage Corporation Loan Trust | | | |
| 987,141 | | 6.180%, 5/25/2036b | | | 888,984 |
| | GSAMP Trust | | | |
| 1,722,363 | | 0.411%, 1/25/2010d | | | 1,258,498 |
| | Merna Reinsurance, Ltd. | | | |
| 600,000 | | 2.001%, 3/31/2010c,d | | | 591,060 |
| 600,000 | | 3.001%, 3/31/2010c,d | | | 593,520 |
| | Renaissance Home Equity Loan Trust | | | |
| 874,932 | | 5.746%, 5/25/2036 | | | 662,576 |
| 1,000,000 | | 6.011%, 5/25/2036 | | | 560,617 |
| 1,450,000 | | 5.797%, 8/25/2036 | | | 931,613 |
| | Residential Asset Mortgage Products, Inc. | | | |
| 1,450,207 | | 4.547%, 12/25/2034 | | | 1,286,725 |
| | Residential Funding Mortgage Securities | | | |
| 351,999 | | 4.470%, 7/25/2018b | | | 336,447 |
| | | | | |
| | Total Asset-Backed Securities | | | 8,755,656 |
| | | | | |
| |
| Basic Materials (2.7%) | | | |
| | ArcelorMittal | | | |
| 600,000 | | 6.125%, 6/1/2018 | | | 619,102 |
| | Arch Western Finance, LLC | | | |
| 220,000 | | 6.750%, 7/1/2013 | | | 218,350 |
| | Domtar Corporation | | | |
| 285,000 | | 7.125%, 8/15/2015 | | | 286,425 |
| | Dow Chemical Company | | | |
| 600,000 | | 8.550%, 5/15/2019 | | | 715,887 |
| | Drummond Company, Inc. | | | |
| 320,000 | | 7.375%, 2/15/2016c | | | 312,800 |
| | FMG Finance, Pty., Ltd. | | | |
| 320,000 | | 10.625%, 9/1/2016c | | | 354,000 |
| | Graphic Packaging International, Inc. | | | |
| 300,000 | | 9.500%, 8/15/2013 | | | 309,750 |
| | Griffin Coal Mining Company, Pty., Ltd. | | | |
| 230,000 | | 9.500%, 12/1/2016c,e | | | 135,987 |
| | Jefferson Smurfit Corporation | | | |
| 100,000 | | 8.250%, 10/1/2012f,g | | | 88,000 |
| | Smurfit-Stone Container Enterprises, Inc. | | | |
| 240,000 | | 8.000%, 3/15/2017f,g | | | 211,500 |
| | Steel Dynamics, Inc. | | | |
| 250,000 | | 8.250%, 4/15/2016 | | | 260,313 |
| | Teck Resources, Ltd. | | | |
| 150,000 | | 10.250%, 5/15/2016 | | | 174,750 |
| 150,000 | | 10.750%, 5/15/2019 | | | 179,250 |
| | | | | |
| | Total Basic Materials | | | 3,866,114 |
| | | | | |
| |
| Capital Goods (2.4%) | | | |
| | Associated Materials, LLC | | | |
| 40,000 | | 9.875%, 11/15/2016c | | | 42,200 |
| | Berry Plastics Escrow Corporation | | | |
| 130,000 | | 8.875%, 9/15/2014c | | | 126,425 |
| | Case New Holland, Inc. | | | |
| 290,000 | | 7.125%, 3/1/2014 | | | 294,350 |
| | General Cable Corporation, Convertible | | | |
| 129,000 | | 4.500%, 11/15/2019h | | | 132,709 |
| | Graham Packaging Company, LP/GPC Capital Corporation I | | | |
| 160,000 | | 8.250%, 1/1/2017c | | | 158,000 |
| | L-3 Communications Corporation | | | |
| 390,000 | | 5.875%, 1/15/2015 | | | 389,512 |
| | Leucadia National Corporation | | | |
| 370,000 | | 7.125%, 3/15/2017 | | | 349,650 |
| | Norcraft Companies, LP/Norcraft Finance Corporation | | | |
| 90,000 | | 10.500%, 12/15/2015c | | | 92,250 |
| | Owens-Illinois, Inc. | | | |
| 320,000 | | 7.800%, 5/15/2018 | | | 322,400 |
| | RBS Global, Inc./Rexnord Corporation | | | |
| 290,000 | | 9.500%, 8/1/2014 | | | 290,725 |
| 60,000 | | 11.750%, 8/1/2016 | | | 59,400 |
| | SPX Corporation | | | |
| 295,000 | | 7.625%, 12/15/2014 | | | 303,850 |
| | Textron, Inc. | | | |
| 450,000 | | 7.250%, 10/1/2019 | | | 465,782 |
| | TransDigm, Inc. | | | |
| 150,000 | | 7.750%, 7/15/2014 | | | 151,875 |
| | United Rentals North America, Inc. | | | |
| 150,000 | | 10.875%, 6/15/2016 | | | 163,125 |
| | | | | |
| | Total Capital Goods | | | 3,342,253 |
| | | | | |
| |
| Collateralized Mortgage Obligations (11.7%) | | | |
| | Bear Stearns Adjustable Rate Mortgage Trust | | | |
| 1,744,575 | | 4.625%, 8/25/2010d | | | 1,484,251 |
| | Citigroup Mortgage Loan Trust, Inc. | | | |
| 1,120,807 | | 5.500%, 11/25/2035 | | | 801,688 |
| | Citimortgage Alternative Loan Trust | | | |
| 1,521,361 | | 5.750%, 4/25/2037 | | | 1,122,258 |
| | Countrywide Alternative Loan Trust | | | |
| 1,059,575 | | 6.000%, 4/25/2036 | | | 959,067 |
| 675,447 | | 6.000%, 1/25/2037 | | | 467,529 |
| | Deutsche Alt-A Securities, Inc. | | | |
| 2,258,073 | | 1.001%, 1/1/2010d | | | 1,221,931 |
The accompanying Notes to Financial Statements are an integral part of this schedule.
19
Diversified Income Plus Fund
Schedule of Investments as of December 31, 2009
| | | | | | |
Principal
Amount | | Long-Term Fixed Income (63.5%) | | Value |
| | Collateralized Mortgage Obligations (11.7%) - continued | | | |
| $ | 772,157 | | 5.500%, 10/25/2021 | | $ | 584,909 |
| | | First Horizon Mortgage Pass-Through Trust | | | |
| | 1,114,695 | | 5.845%, 8/25/2037 | | | 792,286 |
| | | GSR Mortgage Loan Trust | | | |
| | 1,343,035 | | 0.421%, 1/25/2010d | | | 963,238 |
| | | J.P. Morgan Alternative Loan Trust | | | |
| | 430,618 | | 0.301%, 1/25/2010d | | | 395,224 |
| | | J.P. Morgan Mortgage Trust | | | |
| | 483,924 | | 6.500%, 1/25/2035 | | | 445,664 |
| | 922,195 | | 5.994%, 10/25/2036 | | | 767,274 |
| | | MASTR Alternative Loans Trust | | | |
| | 1,422,491 | | 6.500%, 5/25/2034 | | | 1,310,027 |
| | 647,241 | | 6.500%, 7/25/2034 | | | 615,486 |
| | | Structured Adjustable Rate Mortgage Loan Trust | | | |
| | 902,284 | | 5.917%, 9/25/2036 | | | 233,007 |
| | | WaMu Mortgage Pass Through Certificates | | | |
| | 1,169,658 | | 5.606%, 11/25/2036 | | | 965,850 |
| | 921,030 | | 5.838%, 8/25/2046 | | | 778,939 |
| | | Washington Mutual Mortgage Pass-Through Certificates | | | |
| | 2,040,946 | | 1.294%, 1/1/2010d | | | 872,682 |
| | | Wells Fargo Mortgage Backed Securities Trust | | | |
| | 2,209,988 | | 6.026%, 9/25/2036 | | | 548,201 |
| | 1,522,818 | | 6.000%, 7/25/2037 | | | 1,232,056 |
| | | | | | |
| | | Total Collateralized Mortgage Obligations | | | 16,561,567 |
| | | | | | |
| |
| | Commercial Mortgage-Backed Securities (8.8%) | | | |
| | | Banc of America Commercial Mortgage, Inc. | | | |
| | 1,250,000 | | 5.928%, 5/10/2045 | | | 1,228,409 |
| | 1,250,000 | | 5.356%, 10/10/2045i | | | 1,120,595 |
| | | Bear Stearns Commercial Mortgage Securities, Inc. | | | |
| | 1,200,000 | | 5.694%, 6/11/2050 | | | 1,050,692 |
| | | Commercial Mortgage Pass-Through Certificates | | | |
| | 1,000,000 | | 0.413%, 1/15/2010d,j | | | 826,971 |
| | | Credit Suisse Mortgage Capital Certificates | | | |
| | 1,250,000 | | 5.467%, 9/15/2039 | | | 1,070,654 |
| | | Greenwich Capital Commercial Funding Corporation | | | |
| | 1,250,000 | | 5.867%, 12/10/2049i | | | 959,355 |
| | | J.P. Morgan Chase Commercial Mortgage Securities Corporation | | | |
| | 1,750,000 | | 5.336%, 5/15/2047 | | | 1,517,717 |
| | | LB-UBS Commercial Mortgage Trust | | | |
| | 1,250,000 | | 4.568%, 1/15/2031 | | | 1,222,706 |
| | 1,200,000 | | 5.866%, 9/15/2045 | | | 1,053,252 |
| | | Wachovia Bank Commercial Mortgage Trust | | | |
| | 2,000,000 | | 0.353%, 1/15/2010d,j | | | 1,357,666 |
| | 1,250,000 | | 5.765%, 7/15/2045 | | | 1,132,179 |
| | | | | | |
| | | Total Commercial Mortgage-Backed Securities | | | 12,540,196 |
| | | | | | |
| |
| | Communications Services (5.5%) | | | |
| | | CBS Corporation | | | |
| | 450,000 | | 8.875%, 5/15/2019 | | | 538,346 |
| | | Cequel Communications Holdings I, LLC | | | |
| | 420,000 | | 8.625%, 11/15/2017c,i | | | 424,200 |
| | | Charter Communications Operating, LLC | | | |
| | 300,000 | | 8.375%, 4/30/2014c,g | | | 308,250 |
| | | Cricket Communications, Inc. | | | |
| | 295,000 | | 9.375%, 11/1/2014 | | | 296,475 |
| | | CSC Holdings, Inc. | | | |
| | 150,000 | | 8.500%, 4/15/2014c | | | 159,750 |
| | | Dex Media West, LLC/Dex Media West Finance Company | | | |
| | 99,000 | | 9.875%, 8/15/2013g | | | 31,185 |
| | | DISH DBS Corporation | | | |
| | 285,000 | | 6.625%, 10/1/2014 | | | 287,494 |
| | | Frontier Communications Corporation | | | |
| | 150,000 | | 8.125%, 10/1/2018 | | | 151,875 |
| | | GCI, Inc. | | | |
| | 240,000 | | 8.625%, 11/15/2019c | | | 242,100 |
| | | Intelsat Subsidiary Holding Company, Ltd. | | | |
| | 240,000 | | 8.500%, 1/15/2013 | | | 244,800 |
| | 295,000 | | 8.875%, 1/15/2015 | | | 305,325 |
| | | Level 3 Communications, Inc., Convertible | | | |
| | 50,000 | | 5.250%, 12/15/2011 | | | 47,438 |
| | 60,000 | | 3.500%, 6/15/2012 | | | 52,500 |
| | | Level 3 Financing, Inc. | | | |
| | 470,000 | | 9.250%, 11/1/2014 | | | 444,150 |
| | | Nielsen Finance, LLC/Nielsen Finance Company | | | |
| | 150,000 | | 10.000%, 8/1/2014 | | | 156,375 |
| | | PAETEC Holding Corporation | | | |
| | 50,000 | | 9.500%, 7/15/2015 | | | 48,125 |
| | 180,000 | | 8.875%, 6/30/2017 | | | 182,250 |
| | | Quebecor Media, Inc. | | | |
| | 420,000 | | 7.750%, 3/15/2016 | | | 418,950 |
| | | Qwest Communications International, Inc. | | | |
| | 280,000 | | 7.250%, 2/15/2011 | | | 281,400 |
| | | R.H. Donnelley Corporation | | | |
| | 300,000 | | 6.875%, 1/15/2013g | | | 28,125 |
| | | R.H. Donnelley, Inc. | | | |
| | 9,000 | | 11.750%, 5/15/2015c,g | | | 7,425 |
| | | Sprint Capital Corporation | | | |
| | 290,000 | | 8.375%, 3/15/2012 | | | 300,150 |
| | | Sprint Nextel Corporation | | | |
| | 230,000 | | 8.375%, 8/15/2017 | | | 234,600 |
| | | Time Warner Cable, Inc. | | | |
| | 450,000 | | 8.250%, 4/1/2019 | | | 535,992 |
| | | Videotron Ltee | | | |
| | 390,000 | | 6.875%, 1/15/2014 | | | 391,950 |
| | | Virgin Media Finance plc | | | |
| | 240,000 | | 9.125%, 8/15/2016 | | | 252,900 |
The accompanying Notes to Financial Statements are an integral part of this schedule.
20
Diversified Income Plus Fund
Schedule of Investments as of December 31, 2009
| | | | | | |
Principal
Amount | | Long-Term Fixed Income (63.5%) | | Value |
| | Communications Services (5.5%) - continued | | | |
| $ | 90,000 | | 8.375%, 10/15/2019 | | $ | 92,587 |
| | | Wind Acquisition Finance SA | | | |
| | 180,000 | | 11.750%, 7/15/2017c | | | 196,650 |
| | | Wind Acquisition Holdings Finance SPA | | | |
| | 110,000 | | 12.250%, 7/15/2017c | | | 108,350 |
| | | Windstream Corporation | | | |
| | 1,000,000 | | 7.875%, 11/1/2017c,f | | | 987,500 |
| | | | | | |
| | | Total Communications Services | | | 7,757,217 |
| | | | | | |
| |
| | Consumer Cyclical (6.0%) | | | |
| | | AMC Entertainment, Inc. | | | |
| | 300,000 | | 8.750%, 6/1/2019i | | | 306,000 |
| | | American Axle & Manufacturing, Inc. | | | |
| | 100,000 | | 5.250%, 2/11/2014 | | | 86,750 |
| | | Beazer Homes USA, Inc. | | | |
| | 100,000 | | 6.875%, 7/15/2015 | | | 75,500 |
| | | Blockbuster, Inc. | | | |
| | 90,000 | | 11.750%, 10/1/2014c,f | | | 85,500 |
| | | Bon-Ton Stores, Inc. | | | |
| | 210,000 | | 10.250%, 3/15/2014 | | | 193,725 |
| | | Burlington Coat Factory Warehouse Corporation | | | |
| | 220,000 | | 11.125%, 4/15/2014i | | | 227,150 |
| | | Circus & Eldorado Joint Venture/Silver Legacy Capital Corporation | | | |
| | 350,000 | | 10.125%, 3/1/2012 | | | 309,750 |
| | | CVS Caremark Corporation | | | |
| | 1,200,000 | | 6.302%, 6/1/2037 | | | 1,035,000 |
| | | Dollarama Group, LP | | | |
| | 139,000 | | 7.206%, 6/15/2010d | | | 159,850 |
| | | Ford Motor Company, Convertible | | | |
| | 130,000 | | 4.250%, 11/15/2016 | | | 162,988 |
| | | Ford Motor Credit Company, LLC | | | |
| | 640,000 | | 8.000%, 6/1/2014 | | | 657,144 |
| | | Gaylord Entertainment Company | | | |
| | 220,000 | | 6.750%, 11/15/2014 | | | 204,600 |
| | | Goodyear Tire & Rubber Company | | | |
| | 150,000 | | 8.625%, 12/1/2011 | | | 155,625 |
| | | Harrah’s Operating Company, Inc. | | | |
| | 220,000 | | 11.250%, 6/1/2017c,f | | | 230,175 |
| | | KB Home | | | |
| | 280,000 | | 6.250%, 6/15/2015 | | | 261,100 |
| | | Limited Brands, Inc. | | | |
| | 350,000 | | 6.900%, 7/15/2017 | | | 349,562 |
| | | MGM MIRAGE | | | |
| | 150,000 | | 7.500%, 6/1/2016 | | | 117,000 |
| | 110,000 | | 11.125%, 11/15/2017c | | | 121,825 |
| | 60,000 | | 11.375%, 3/1/2018c | | | 53,700 |
| | | Mohegan Tribal Gaming Authority | | | |
| | 310,000 | | 11.500%, 11/1/2017c | | | 316,200 |
| | | NCL Corporation, Ltd. | | | |
| | 210,000 | | 11.750%, 11/15/2016c | | | 207,375 |
| | | Neiman Marcus Group, Inc. | | | |
| | 50,000 | | 10.375%, 10/15/2015f | | | 49,000 |
| | | Peninsula Gaming, LLC | | | |
| | 140,000 | | 8.375%, 8/15/2015c | | | 139,650 |
| | 150,000 | | 10.750%, 8/15/2017c | | | 150,750 |
| | | Pinnacle Entertainment, Inc. | | | |
| | 160,000 | | 7.500%, 6/15/2015 | | | 147,200 |
| | | Pokagon Gaming Authority | | | |
| | 270,000 | | 10.375%, 6/15/2014c | | | 280,800 |
| | | Rite Aid Corporation | | | |
| | 240,000 | | 7.500%, 3/1/2017 | | | 225,600 |
| | 100,000 | | 9.500%, 6/15/2017 | | | 87,000 |
| | | Service Corporation International | | | |
| | 170,000 | | 6.750%, 4/1/2015 | | | 166,600 |
| | | Shingle Springs Tribal Gaming Authority | | | |
| | 320,000 | | 9.375%, 6/15/2015c | | | 243,200 |
| | | Speedway Motorsports, Inc. | | | |
| | 90,000 | | 8.750%, 6/1/2016 | | | 94,950 |
| | | Toys R Us Property Company I, LLC | | | |
| | 180,000 | | 10.750%, 7/15/2017c | | | 197,100 |
| | | TRW Automotive, Inc. | | | |
| | 240,000 | | 7.000%, 3/15/2014c | | | 235,200 |
| | 130,000 | | 8.875%, 12/1/2017c | | | 135,200 |
| | | Tunica-Biloxi Gaming Authority | | | |
| | 360,000 | | 9.000%, 11/15/2015j | | | 324,450 |
| | | Turning Stone Resort Casino Enterprise | | | |
| | 280,000 | | 9.125%, 9/15/2014c | | | 273,700 |
| | | Universal City Development Partners, Ltd. | | | |
| | 150,000 | | 10.875%, 11/15/2016c | | | 150,375 |
| | | West Corporation | | | |
| | 100,000 | | 9.500%, 10/15/2014 | | | 101,500 |
| | | Wyndham Worldwide Corporation | | | |
| | 200,000 | | 6.000%, 12/1/2016 | | | 186,319 |
| | | | | | |
| | | Total Consumer Cyclical | | | 8,505,113 |
| | | | | | |
| |
| | Consumer Non-Cyclical (3.4%) | | | |
| | | Altria Group, Inc. | | | |
| | 450,000 | | 9.950%, 11/10/2038 | | | 586,580 |
| | | Biomet, Inc. | | | |
| | 130,000 | | 10.375%, 10/15/2017 | | | 141,050 |
| | | Community Health Systems, Inc. | | | |
| | 480,000 | | 8.875%, 7/15/2015 | | | 496,800 |
| | | DJO Finance, LLC/DJO Finance Corporation | | | |
| | 200,000 | | 10.875%, 11/15/2014i | | | 211,000 |
| | | HCA, Inc. | | | |
| | 300,000 | | 6.750%, 7/15/2013 | | | 295,500 |
| | 550,000 | | 9.250%, 11/15/2016 | | | 590,562 |
| | | Jarden Corporation | | | |
| | 250,000 | | 7.500%, 5/1/2017 | | | 249,375 |
| | | JohnsonDiversey, Inc. | | | |
| | 100,000 | | 8.250%, 11/15/2019c | | | 101,250 |
| | 150,000 | | 10.500%, 5/15/2020c | | | 150,750 |
| | | M-Foods Holdings, Inc. | | | |
| | 200,000 | | 9.750%, 10/1/2013c | | | 207,750 |
| | | Michael Foods, Inc. | | | |
| | 230,000 | | 8.000%, 11/15/2013 | | | 235,462 |
| | | Omnicare, Inc. | | | |
| | 180,000 | | 6.875%, 12/15/2015 | | | 175,050 |
The accompanying Notes to Financial Statements are an integral part of this schedule.
21
Diversified Income Plus Fund
Schedule of Investments as of December 31, 2009
| | | | | | |
Principal
Amount | | Long-Term Fixed Income (63.5%) | | Value |
| Consumer Non-Cyclical (3.4%) - continued | | | |
| | | Revlon Consumer Products Corporation | | | |
| $ | 160,000 | | 9.750%, 11/15/2015c | | $ | 165,200 |
| | | Stater Brothers Holdings, Inc. | | | |
| | 290,000 | | 8.125%, 6/15/2012 | | | 292,900 |
| | | Tenet Healthcare Corporation | | | |
| | 300,000 | | 7.375%, 2/1/2013 | | | 300,750 |
| | 150,000 | | 10.000%, 5/1/2018c | | | 168,000 |
| | | U.S. Oncology, Inc. | | | |
| | 130,000 | | 10.750%, 8/15/2014 | | | 136,500 |
| | 200,000 | | 9.125%, 8/15/2017 | | | 210,000 |
| | | Visant Corporation | | | |
| | 150,000 | | 7.625%, 10/1/2012 | | | 150,750 |
| | | | | | |
| | | Total Consumer Non-Cyclical | | | 4,865,229 |
| | | | | | |
| |
| Energy (3.6%) | | | |
| | | Chesapeake Energy Corporation | | | |
| | 470,000 | | 6.375%, 6/15/2015i | | | 460,600 |
| | 200,000 | | 6.250%, 1/15/2018 | | | 192,000 |
| | | Compagnie Generale de Geophysique-Veritas | | | |
| | 380,000 | | 7.500%, 5/15/2015i | | | 377,150 |
| | | Connacher Oil and Gas, Ltd. | | | |
| | 280,000 | | 10.250%, 12/15/2015c | | | 256,200 |
| | | Denbury Resources, Inc. | | | |
| | 220,000 | | 7.500%, 12/15/2015 | | | 219,450 |
| | | Enbridge Energy Partners, LP | | | |
| | 600,000 | | 8.050%, 10/1/2037 | | | 557,798 |
| | | Forest Oil Corporation | | | |
| | 270,000 | | 7.250%, 6/15/2019 | | | 266,625 |
| | | Helix Energy Solutions Group, Inc. | | | |
| | 310,000 | | 9.500%, 1/15/2016c | | | 317,750 |
| | | Marathon Oil Corporation | | | |
| | 450,000 | | 7.500%, 2/15/2019 | | | 519,353 |
| | | Mariner Energy, Inc. | | | |
| | 160,000 | | 11.750%, 6/30/2016 | | | 178,400 |
| | | McJunkin Red Man Corporation | | | |
| | 240,000 | | 9.500%, 12/15/2016c | | | 234,600 |
| | | Newfield Exploration Company | | | |
| | 225,000 | | 6.625%, 4/15/2016 | | | 225,562 |
| | | PetroHawk Energy Corporation | | | |
| | 270,000 | | 9.125%, 7/15/2013 | | | 282,150 |
| | | Pioneer Natural Resources Company | | | |
| | 150,000 | | 7.500%, 1/15/2020 | | | 150,068 |
| | | Plains Exploration & Production Company | | | |
| | 230,000 | | 7.750%, 6/15/2015 | | | 234,025 |
| | 280,000 | | 10.000%, 3/1/2016 | | | 306,600 |
| | | SandRidge Energy, Inc. | | | |
| | 170,000 | | 9.875%, 5/15/2016c | | | 178,925 |
| | 120,000 | | 8.750%, 1/15/2020c | | | 120,000 |
| | | | | | |
| | | Total Energy | | | 5,077,256 |
| | | | | | |
| |
| Financials (6.8%) | | | |
| | | Bank of America Corporation | | | |
| | 360,000 | | 8.000%, 1/30/2018 | | | 346,587 |
| | | Deluxe Corporation | | | |
| | 150,000 | | 5.125%, 10/1/2014 | | | 135,375 |
| | | ERP Operating, LP | | | |
| | 450,000 | | 5.750%, 6/15/2017 | | | 450,051 |
| | | General Motors Acceptance Corporation, LLC | | | |
| | 170,000 | | 5.375%, 6/6/2011c | | | 163,625 |
| | 150,000 | | 6.875%, 9/15/2011c | | | 147,750 |
| | 120,000 | | 7.500%, 12/31/2013c | | | 115,800 |
| | | GGP, LP, Convertible | | | |
| | 180,000 | | 3.980%, 4/15/2027c,e | | | 170,550 |
| | | HCP, Inc. | | | |
| | 450,000 | | 6.700%, 1/30/2018 | | | 436,560 |
| | | J.P. Morgan Chase Capital XX | | | |
| | 560,000 | | 6.550%, 9/29/2036 | | | 513,239 |
| | | Lehman Brothers Holdings, Inc. | | | |
| | 600,000 | | 7.000%, 9/27/2027g | | | 117,000 |
| | | Liberty Mutual Group, Inc. | | | |
| | 300,000 | | 10.750%, 6/15/2058c | | | 318,000 |
| | | Lincoln National Corporation | | | |
| | 870,000 | | 7.000%, 5/17/2066 | | | 722,100 |
| | | MetLife, Inc. | | | |
| | 675,000 | | 7.875%, 12/15/2037c | | | 671,625 |
| | | Nuveen Investments, Inc. | | | |
| | 90,000 | | 10.500%, 11/15/2015 | | | 81,675 |
| | | ProLogis | | | |
| | 600,000 | | 5.625%, 11/15/2016 | | | 552,927 |
| | | Prudential Financial, Inc. | | | |
| | 550,000 | | 8.875%, 6/15/2038 | | | 583,000 |
| | | Rabobank Nederland | | | |
| | 435,000 | | 11.000%, 6/30/2019c | | | 530,376 |
| | | Regency Centers, LP | | | |
| | 450,000 | | 5.875%, 6/15/2017 | | | 416,429 |
| | | Reinsurance Group of America, Inc. | | | |
| | 900,000 | | 6.750%, 12/15/2065 | | | 760,767 |
| | | SLM Corporation | | | |
| | 450,000 | | 5.125%, 8/27/2012 | | | 421,863 |
| | | Swiss RE Capital I, LP | | | |
| | 580,000 | | 6.854%, 5/25/2016c | | | 468,814 |
| | | Wachovia Capital Trust III | | | |
| | 430,000 | | 5.800%, 3/15/2011 | | | 328,950 |
| | | Wells Fargo Capital XIII | | | |
| | 370,000 | | 7.700%, 3/26/2013 | | | 358,900 |
| | | XL Capital, Ltd. | | | |
| | 1,200,000 | | 6.500%, 4/15/2017 | | | 906,000 |
| | | | | | |
| | | Total Financials | | | 9,717,963 |
| | | | | | |
| |
| Technology (1.3%) | | | |
| | | Advanced Micro Devices, Inc., Convertible | | | |
| | 160,000 | | 6.000%, 5/1/2015i | | | 144,000 |
| | | Amkor Technology, Inc. | | | |
| | 150,000 | | 7.750%, 5/15/2013 | | | 152,437 |
| | | First Data Corporation | | | |
| | 550,000 | | 9.875%, 9/24/2015 | | | 512,875 |
| | | Freescale Semiconductor, Inc. | | | |
| | 200,000 | | 8.875%, 12/15/2014 | | | 183,500 |
| | | NXP BV/NXP Funding, LLC | | | |
| | 29,000 | | 10.000%, 7/15/2013c | | | 29,798 |
| | 90,000 | | 7.875%, 10/15/2014 | | | 81,675 |
| | | Seagate Technology HDD Holdings | | | |
| | 230,000 | | 6.800%, 10/1/2016 | | | 222,525 |
The accompanying Notes to Financial Statements are an integral part of this schedule.
22
Diversified Income Plus Fund
Schedule of Investments as of December 31, 2009
| | | | | | |
Principal
Amount | | Long-Term Fixed Income (63.5%) | | Value |
| Technology (1.3%) - continued | | | |
| | | Sungard Data Systems, Inc. | | | |
| $ | 570,000 | | 4.875%, 1/15/2014 | | $ | 531,525 |
| | | | | | |
| | | Total Technology | | | 1,858,335 |
| | | | | | |
| |
| Transportation (0.9%) | | | |
| | | Delta Air Lines, Inc. | | | |
| | 180,000 | | 7.920%, 11/18/2010 | | | 180,900 |
| | | Hertz Corporation | | | |
| | 370,000 | | 8.875%, 1/1/2014 | | | 378,325 |
| | | Kansas City Southern de Mexico SA de CV | | | |
| | 210,000 | | 7.625%, 12/1/2013 | | | 206,850 |
| | 300,000 | | 12.500%, 4/1/2016 | | | 345,000 |
| | | United Maritime Group, LLC/United Maritime Group Finance Corporation | | | |
| | 120,000 | | 11.750%, 6/15/2015c | | | 120,300 |
| | | | | | |
| | | Total Transportation | | | 1,231,375 |
| | | | | | |
| |
| Utilities (4.2%) | | | |
| | | AES Corporation | | | |
| | 570,000 | | 7.750%, 10/15/2015 | | | 578,550 |
| | | Copano Energy, LLC | | | |
| | 290,000 | | 8.125%, 3/1/2016i | | | 292,900 |
| | | Dominion Resources, Inc. | | | |
| | 600,000 | | 6.300%, 9/30/2066 | | | 528,000 |
| | | Dynegy Holdings, Inc. | | | |
| | 170,000 | | 8.375%, 5/1/2016f | | | 161,500 |
| | | Edison Mission Energy | | | |
| | 180,000 | | 7.750%, 6/15/2016 | | | 153,000 |
| | 270,000 | | 7.000%, 5/15/2017 | | | 213,300 |
| | | El Paso Corporation | | | |
| | 320,000 | | 6.875%, 6/15/2014 | | | 319,763 |
| | | Energy Transfer Partners, LP | | | |
| | 450,000 | | 6.625%, 10/15/2036 | | | 449,100 |
| | | Enterprise Products Operating, LLC | | | |
| | 1,000,000 | | 7.034%, 1/15/2068 | | | 917,500 |
| | | NRG Energy, Inc. | | | |
| | 475,000 | | 7.375%, 2/1/2016 | | | 475,594 |
| | | Regency Energy Partners, LP | | | |
| | 150,000 | | 8.375%, 12/15/2013 | | | 155,250 |
| | 210,000 | | 9.375%, 6/1/2016c | | | 223,650 |
| | | Southern Star Central Corporation | | | |
| | 150,000 | | 6.750%, 3/1/2016 | | | 144,750 |
| | | Southern Union Company | | | |
| | 300,000 | | 7.200%, 11/1/2066 | | | 256,500 |
| | | Texas Competitive Electric Holdings Company, LLC | | | |
| | 390,000 | | 10.250%, 11/1/2015f | | | 315,900 |
| | | TransCanada PipeLines, Ltd. | | | |
| | 600,000 | | 6.350%, 5/15/2067 | | | 562,960 |
| | | Williams Partners, LP/Williams Partners Finance Corporation | | | |
| | 220,000 | | 7.250%, 2/1/2017 | | | 222,242 |
| | | | | | |
| | | Total Utilities | | | 5,970,459 |
| | | | | | |
| | |
| | | Total Long-Term Fixed Income (cost $91,085,533) | | | 90,048,733 |
| | | | | | |
| | |
| Shares | | Common Stock (25.2%) | | |
| Consumer Discretionary (1.9%) | | | |
| | 4,500 | | Genuine Parts Company | | | 170,820 |
| | 21,700 | | Home Depot, Inc. | | | 627,781 |
| | 2,059 | | Lear Corporationk | | | 139,271 |
| | 763 | | Lear Corporation Warrants, $0.01, expires 11/9/2014k | | | 48,222 |
| | 4,200 | | McDonald’s Corporation | | | 262,248 |
| | 13,300 | | Omnicom Group, Inc. | | | 520,695 |
| | 1,500 | | Starwood Hotels & Resorts Worldwide, Inc. | | | 54,855 |
| | 8,000 | | Target Corporation | | | 386,960 |
| | 10,466 | | Time Warner, Inc. | | | 304,979 |
| | 3,300 | | VF Corporation | | | 241,692 |
| | | | | | |
| | | Total Consumer Discretionary | | | 2,757,523 |
| | | | | | |
| |
| Consumer Staples (2.5%) | | | |
| | 11,700 | | Altria Group, Inc. | | | 229,671 |
| | 14,100 | | Coca-Cola Enterprises, Inc. | | | 298,920 |
| | 2,900 | | General Mills, Inc. | | | 205,349 |
| | 3,700 | | Kimberly-Clark Corporation | | | 235,727 |
| | 9,800 | | Kraft Foods, Inc. | | | 266,364 |
| | 3,400 | | Lorillard, Inc. | | | 272,782 |
| | 3,470 | | Mead Johnson Nutrition Company | | | 151,639 |
| | 16,900 | | Nu Skin Enterprises, Inc. | | | 454,103 |
| | 8,100 | | Philip Morris International, Inc. | | | 390,339 |
| | 5,040 | | Procter & Gamble Company | | | 305,575 |
| | 16,300 | | SYSCO Corporation | | | 455,422 |
| | 6,400 | | Wal-Mart Stores, Inc. | | | 342,080 |
| | | | | | |
| | | Total Consumer Staples | | | 3,607,971 |
| | | | | | |
| |
| Energy (3.0%) | | | |
| | 4,200 | | BP plc ADR | | | 243,474 |
| | 10,600 | | Chevron Corporation | | | 816,094 |
| | 13,000 | | ConocoPhillips | | | 663,910 |
| | 8,700 | | Exxon Mobil Corporation | | | 593,253 |
| | 11,700 | | Marathon Oil Corporation | | | 365,274 |
| | 12,800 | | Noble Corporation | | | 520,960 |
| | 2,900 | | Occidental Petroleum Corporation | | | 235,915 |
| | 4,700 | | Royal Dutch Shell plc ADR | | | 282,517 |
| | 6,600 | | Teekay Corporation | | | 153,186 |
| | 14,200 | | World Fuel Services Corporation | | | 380,418 |
| | | | | | |
| | | Total Energy | | | 4,255,001 |
| | | | | | |
| |
| Financials (7.6%) | | | |
| | 2,500 | | Acadia Realty Trust | | | 42,175 |
| | 6,500 | | AFLAC, Inc.i | | | 300,625 |
| | 5,500 | | Alexandria Real Estate Equities, Inc.f | | | 353,595 |
| | 7,300 | | Allstate Corporation | | | 219,292 |
| | 3,600 | | AMB Property Corporationi | | | 91,980 |
| | 2,400 | | American Campus Communities, Inc. | | | 67,440 |
| | 7,200 | | Ameriprise Financial, Inc.i | | | 279,504 |
| | 1,900 | | Apartment Investment & Management Company | | | 30,248 |
| | 2,353 | | AvalonBay Communities, Inc. | | | 193,204 |
| | 22,800 | | Banco Bradesco SA ADR | | | 498,636 |
| | 16,400 | | Banco Santander SA ADR | | | 269,616 |
| | 24,900 | | Bank of America Corporation | | | 374,994 |
| | 6,500 | | Bank of New York Mellon Corporation | | | 181,805 |
The accompanying Notes to Financial Statements are an integral part of this schedule.
23
Diversified Income Plus Fund
Schedule of Investments as of December 31, 2009
| | | | | |
| Shares | | Common Stock (25.2%) | | Value |
Financials (7.6%) - continued | | | |
| 2,500 | | BioMed Realty Trust, Inc. | | $ | 39,450 |
| 3,800 | | Boston Properties, Inc. | | | 254,866 |
| 3,600 | | Brandywine Realty Trust | | | 41,040 |
| 1,500 | | BRE Properties, Inc. | | | 49,620 |
| 4,400 | | Brookfield Properties Corporation | | | 53,328 |
| 25,100 | | Brown & Brown, Inc.i | | | 451,047 |
| 2,200 | | Camden Property Trust | | | 93,214 |
| 3,200 | | CBL & Associates Properties, Inc. | | | 30,944 |
| 4,700 | | Chubb Corporation | | | 231,146 |
| 2,400 | | Corporate Office Properties Trust | | | 87,912 |
| 8,500 | | DCT Industrial Trust, Inc. | | | 42,670 |
| 3,200 | | Digital Realty Trust, Inc. | | | 160,896 |
| 4,400 | | Douglas Emmett, Inc. | | | 62,700 |
| 3,800 | | Duke Realty Corporation | | | 46,246 |
| 1,600 | | Equity Lifestyle Properties, Inc. | | | 80,752 |
| 7,100 | | Equity Residential REIT | | | 239,838 |
| 1,200 | | Essex Property Trust, Inc. | | | 100,380 |
| 3,100 | | Extra Space Storage, Inc. | | | 35,805 |
| 2,400 | | Federal Realty Investment Trust | | | 162,528 |
| 2,000 | | Forest City Enterprises, Inc.k | | | 23,560 |
| 1,900 | | Goldman Sachs Group, Inc. | | | 320,796 |
| 7,000 | | Health Care Property Investors, Inc. | | | 213,780 |
| 2,800 | | Health Care REIT, Inc. | | | 124,096 |
| 2,400 | | Highwoods Properties, Inc. | | | 80,040 |
| 1,100 | | Home Properties, Inc.f | | | 52,481 |
| 13,867 | | Host Hotels & Resorts, Inc.k | | | 161,828 |
| 11,400 | | J.P. Morgan Chase & Company | | | 475,038 |
| 1,900 | | Kilroy Realty Corporation | | | 58,273 |
| 7,145 | | Kimco Realty Corporation | | | 96,672 |
| 3,500 | | Liberty Property Trust | | | 112,035 |
| 3,062 | | Macerich Companyf | | | 110,079 |
| 2,800 | | Mack-Cali Realty Corporation | | | 96,796 |
| 5,300 | | Mission West Properties, Inc. | | | 38,107 |
| 4,800 | | Monmouth Real Estate Investment Corporation | | | 35,712 |
| 3,800 | | Nationwide Health Properties, Inc. | | | 133,684 |
| 14,400 | | Plum Creek Timber Company, Inc.f | | | 543,744 |
| 9,600 | | ProLogis | | | 131,424 |
| 3,302 | | Public Storage, Inc. | | | 268,948 |
| 3,000 | | Regency Centers Corporation | | | 105,180 |
| 4,300 | | Senior Housing Property Trust | | | 94,041 |
| 7,095 | | Simon Property Group, Inc. | | | 566,181 |
| 2,100 | | SL Green Realty Corporation | | | 105,504 |
| 6,300 | | State Street Corporation | | | 274,302 |
| 1,600 | | Tanger Factory Outlet Centers, Inc. | | | 62,384 |
| 1,800 | | Taubman Centers, Inc. | | | 64,638 |
| 4,800 | | Travelers Companies, Inc. | | | 239,328 |
| 9,700 | | U.S. Bancorp | | | 218,347 |
| 3,000 | | Urstadt Biddle Properties | | | 45,000 |
| 5,100 | | Ventas, Inc. | | | 223,074 |
| 4,180 | | Vornado Realty Trust | | | 292,349 |
| 10,300 | | Weingarten Realty Investorsf | | | 203,837 |
| | | | | |
| | Total Financials | | | 10,738,754 |
| | | | | |
| |
Health Care (2.1%) | | | |
| 5,100 | | Abbott Laboratoriesi | | | 275,349 |
| 41,800 | | Boston Scientific Corporationk | | | 376,200 |
| 4,703 | | Bristol-Myers Squibb Company | | | 118,751 |
| 7,000 | | Johnson & Johnson | | | 450,870 |
| 19,963 | | Merck & Company, Inc. | | | 729,448 |
| 8,900 | | Novartis AG ADR | | | 484,427 |
| 23,128 | | Pfizer, Inc. | | | 420,698 |
| 2,000 | | UnitedHealth Group, Inc. | | | 60,960 |
| | | | | |
| | Total Health Care | | | 2,916,703 |
| | | | | |
| |
Industrials (2.4%) | | | |
| 3,900 | | 3M Company | | | 322,413 |
| 3,600 | | Eaton Corporation | | | 229,032 |
| 4,300 | | Emerson Electric Company | | | 183,180 |
| 3,800 | | FedEx Corporation | | | 317,110 |
| 25,400 | | Herman Miller, Inc. | | | 405,892 |
| 5,800 | | Honeywell International, Inc. | | | 227,360 |
| 6,500 | | Illinois Tool Works, Inc. | | | 311,935 |
| 6,100 | | ITT Corporation | | | 303,414 |
| 20,700 | | Masco Corporation | | | 285,867 |
| 18,200 | | R.R. Donnelley & Sons Company | | | 405,314 |
| 6,600 | | United Technologies Corporation | | | 458,106 |
| | | | | |
| | Total Industrials | | | 3,449,623 |
| | | | | |
| |
Information Technology (2.3%) | | | |
| 942 | | AOL, Inc.k | | | 21,930 |
| 6,900 | | Cisco Systems, Inc.k | | | 165,186 |
| 17,300 | | Intel Corporation | | | 352,920 |
| 4,300 | | International Business Machines Corporation | | | 562,870 |
| 11,800 | | Linear Technology Corporation | | | 360,372 |
| 19,200 | | Microsoft Corporation | | | 585,408 |
| 20,900 | | National Semiconductor Corporation | | | 321,024 |
| 19,900 | | Oracle Corporation | | | 488,346 |
| 7,200 | | Paychex, Inc. | | | 220,608 |
| 8,800 | | Tyco Electronics, Ltd. | | | 216,040 |
| | | | | |
| | Total Information Technology | | | 3,294,704 |
| | | | | |
| |
Materials (1.1%) | | | |
| 12,500 | | Bemis Company, Inc.i | | | 370,625 |
| 3,700 | | BHP Billiton, Ltd. ADRf | | | 283,346 |
| 19,800 | | E.I. du Pont de Nemours and Company | | | 666,666 |
| 4,900 | | Southern Copper Corporationf | | | 161,259 |
| | | | | |
| | Total Materials | | | 1,481,896 |
| | | | | |
| |
Telecommunications Services (1.1%) | | | |
| 22,800 | | AT&T, Inc. | | | 639,084 |
| 73,800 | | Qwest Communications International, Inc. | | | 310,698 |
| 13,400 | | Verizon Communications, Inc. | | | 443,942 |
| 9,200 | | Vodafone Group plc ADR | | | 212,428 |
| | | | | |
| | Total Telecommunications Services | | | 1,606,152 |
| | | | | |
| |
Utilities (1.2%) | | | |
| 13,200 | | Duke Energy Corporation | | | 227,172 |
| 5,500 | | Energen Corporation | | | 257,400 |
| 8,900 | | Exelon Corporation | | | 434,943 |
| 5,300 | | Integrys Energy Group, Inc. | | | 222,547 |
| 13,300 | | NiSource, Inc. | | | 204,554 |
| 543 | | Semgroup Corporationk,l | | | 13,846 |
| 571 | | Semgroup Corporation Warrants, $25, expires 11/30/2014k,l | | | 286 |
The accompanying Notes to Financial Statements are an integral part of this schedule.
24
Diversified Income Plus Fund
Schedule of Investments as of December 31, 2009
| | | | | | |
| Shares | | Common Stock (25.2%) | | Value | |
Utilities (1.2%) - continued | | | | |
| 11,100 | | UGI Corporation | | $ | 268,509 | |
| | | | | | |
| | Total Utilities | | | 1,629,257 | |
| | | | | | |
| | |
| | Total Common Stock (cost $35,602,669) | | | 35,737,584 | |
| | | | | | |
| | |
| Shares | | Mutual Funds (1.5%) | | | |
Fixed Income Mutual Funds (1.5%) | | | | |
| 464,191 | | Thrivent High Yield Fund | | | 2,125,995 | |
| | | | | | |
| | Total Fixed Income Mutual Funds | | | 2,125,995 | |
| | | | | | |
| | |
| | Total Mutual Funds (cost $1,750,000) | | | 2,125,995 | |
| | | | | | |
| | |
| Shares | | Preferred Stock (0.7%) | | | |
Financials (0.7%) | | | | |
| 14,200 | | Bank of America Corporation, 8.625% | | | 348,468 | |
| 6,200 | | Citigroup, Inc., Convertible, 7.500%k | | | 646,908 | |
| 4,000 | | Federal National Mortgage Association, 8.250%k | | | 4,400 | |
| 101 | | GMAC, Inc., 7.000%c,k | | | 66,572 | |
| | | | | | |
| | Total Financials | | | 1,066,348 | |
| | | | | | |
| | |
| | Total Preferred Stock (cost $1,091,462) | | | 1,066,348 | |
| | | | | | |
| | |
| Shares | | Collateral Held for Securities Loaned (2.3%) | | | |
| 3,207,922 | | Thrivent Financial Securities Lending Trust | | | 3,207,922 | |
| | | | | | |
| | |
| | Total Collateral Held for Securities Loaned (cost $3,207,922) | | | 3,207,922 | |
| | | | | | |
| | |
Principal
Amount | | Short-Term Investments (7.9%)m | | | |
| | Federal Home Loan Bank Discount Notes | | | | |
| 4,000,000 | | 0.040%, 1/15/2010 | | | 3,999,938 | |
| 4,000,000 | | 0.025%, 1/22/2010 | | | 3,999,941 | |
| 250,000 | | 0.020%, 2/1/2010 | | | 249,996 | |
| 1,500,000 | | 0.200%, 3/17/2010n | | | 1,499,386 | |
| | Federal Home Loan Mortgage Corporation Discount Notes | | | | |
| 200,000 | | 0.140%, 3/17/2010n | | | 199,942 | |
| | Federal National Mortgage Association Discount Notes | | | | |
| 1,250,000 | | 0.030%, 2/4/2010 | | | 1,249,964 | |
| | | | | | |
| | Total Short-Term Investments (at amortized cost) | | | 11,199,167 | |
| | | | | | |
| | Total Investments (cost $144,063,497) 101.2% | | $ | 143,529,669 | |
| | | | | | |
| | Other Assets and Liabilities, Net (1.2%) | | | (1,675,178 | ) |
| | | | | | |
| | Total Net Assets 100.0% | | $ | 141,854,491 | |
| | | | | | |
| a | The stated interest rate represents the weighted average of all contracts within the bank loan facility. |
| b | All or a portion of the security is insured or guaranteed. |
| c | Denotes securities sold under Rule 144A of the Securities Act of 1933, which exempts them from registration. These securities have been deemed liquid and may be resold to other dealers in the program or to other qualified institutional buyers. As of December 31, 2009, the value of these investments was $13,630,457 or 9.6% of total net assets. |
| d | Denotes variable rate obligations for which the current coupon rate and next scheduled reset date are shown. |
| e | Defaulted security. Interest is not being accrued. |
| f | All or a portion of the security is on loan as discussed in item 2(M) of the Notes to Financial Statements. |
| g | In bankruptcy. Interest is not being accrued. |
| h | Denotes step coupon bonds for which the current interest rate and next scheduled reset date are shown. |
| i | All or a portion of the security was earmarked to cover written options. |
| j | Denotes restricted securities. Restricted securities are investment securities which have been deemed illiquid and cannot be offered for public sale without first being registered under the Securities Act of 1933. The following table indicates the acquisition date and cost of restricted securities Diversified Income Plus Fund owned as of December 31, 2009. |
| | | | | |
Security | | Acquisition
Date | | Amortized
Cost |
Commercial Mortgage Pass- Through Certificates | | 5/2/2007 | | $ | 1,000,000 |
Tunica-Biloxi Gaming Authority | | 11/8/2005 | | | 360,000 |
Wachovia Bank Commercial Mortgage Trust | | 4/25/2007 | | | 2,000,000 |
| k | Non-income producing security. |
| l | Security is fair valued as discussed in item 2(A) of the Notes to Financial Statements. |
| m | The interest rate shown reflects the yield, coupon rate or, for securities purchased at a discount, the discount rate at the date of purchase. |
| n | At December 31, 2009, $1,699,328 of investments were held on deposit with the counterparty and pledged as the initial margin deposit for open futures contracts. |
Definitions:
| | | | |
| ADR | | - | | American Depositary Receipt, which are certificates for an underlying foreign security’s shares held by an issuing U.S. depository bank. |
| REIT | | - | | Real Estate Investment Trust, is a company that buys, develops, manages and/or sells real estate assets. |
Unrealized Appreciation (Depreciation)
Gross unrealized appreciation and depreciation of investments, based on cost for federal income tax purposes, were as follows:
| | | | |
Gross unrealized appreciation | | $ | 7,980,121 | |
Gross unrealized depreciation | | | (9,255,814 | ) |
| | | | |
Net unrealized appreciation (depreciation) | | $ | (1,275,693 | ) |
| |
Cost for federal income tax purposes | | $ | 144,805,362 | |
The accompanying Notes to Financial Statements are an integral part of this schedule.
25
Diversified Income Plus Fund
Schedule of Investments as of December 31, 2009
Fair Valuation Measurements
The following table is a summary of the inputs used, as of December 31, 2009, in valuing Diversified Income Plus Fund’s assets carried at fair value as discussed in the Notes to Financial Statements.
| | | | | | | | | | | | | | | |
Investments in Securities | | Total | | | Level 1 | | | Level 2 | | | Level 3 |
Bank Loans | | | | | | | | | | | | | | | |
Financials | | | 143,920 | | | | — | | | | 143,920 | | | | — |
Long-Term Fixed Income | | | | | | | | | | | | | | | |
Asset-Backed Securities | | | 8,755,656 | | | | — | | | | 6,529,121 | | | | 2,226,535 |
Basic Materials | | | 3,866,114 | | | | — | | | | 3,866,114 | | | | — |
Capital Goods | | | 3,342,253 | | | | — | | | | 3,342,253 | | | | — |
Collateralized Mortgage Obligations | | | 16,561,567 | | | | — | | | | 16,561,567 | | | | — |
Commercial Mortgage-Backed Securities | | | 12,540,196 | | | | — | | | | 12,540,196 | | | | — |
Communications Services | | | 7,757,217 | | | | — | | | | 7,757,217 | | | | — |
Consumer Cyclical | | | 8,505,113 | | | | — | | | | 8,505,113 | | | | — |
Consumer Non-Cyclical | | | 4,865,229 | | | | — | | | | 4,865,229 | | | | — |
Energy | | | 5,077,256 | | | | — | | | | 5,077,256 | | | | — |
Financials | | | 9,717,963 | | | | — | | | | 9,717,963 | | | | — |
Technology | | | 1,858,335 | | | | — | | | | 1,858,335 | | | | — |
Transportation | | | 1,231,375 | | | | — | | | | 1,050,475 | | | | 180,900 |
Utilities | | | 5,970,459 | | | | — | | | | 5,970,459 | | | | — |
Common Stock | | | | | | | | | | | | | | | |
Consumer Discretionary | | | 2,757,523 | | | | 2,757,523 | | | | — | | | | — |
Consumer Staples | | | 3,607,971 | | | | 3,607,971 | | | | — | | | | — |
Energy | | | 4,255,001 | | | | 4,255,001 | | | | — | | | | — |
Financials | | | 10,738,754 | | | | 10,738,754 | | | | — | | | | — |
Health Care | | | 2,916,703 | | | | 2,916,703 | | | | — | | | | — |
Industrials | | | 3,449,623 | | | | 3,449,623 | | | | — | | | | — |
Information Technology | | | 3,294,704 | | | | 3,294,704 | | | | — | | | | — |
Materials | | | 1,481,896 | | | | 1,481,896 | | | | — | | | | — |
Telecommunications Services | | | 1,606,152 | | | | 1,606,152 | | | | — | | | | — |
Utilities | | | 1,629,257 | | | | 1,615,125 | | | | — | | | | 14,132 |
Mutual Funds | | | | | | | | | | | | | | | |
Fixed Income Mutual Funds | | | 2,125,995 | | | | 2,125,995 | | | | — | | | | — |
Preferred Stock | | | | | | | | | | | | | | | |
Financials | | | 1,066,348 | | | | 999,776 | | | | 66,572 | | | | — |
Collateral Held for Securities Loaned | | | 3,207,922 | | | | 3,207,922 | | | | — | | | | — |
Short-Term Investments | | | 11,199,167 | | | | — | | | | 11,199,167 | | | | — |
| | | | | | | | | | | | | | | |
Total | | $ | 143,529,669 | | | $ | 42,057,145 | | | $ | 99,050,957 | | | $ | 2,421,567 |
| | | | | | | | | | | | | | | |
Other Financial Instruments* | | | ($403,567 | ) | | | ($42,505 | ) | | | ($361,062 | ) | | $ | — |
| | | | | | | | | | | | | | | |
| * | Other Financial Instruments include Futures, Forwards, Written Options and Swap agreements. |
The following table is a reconciliation of assets in which significant unobservable inputs (Level 3) were used in determining fair value for Diversified Income Plus Fund as discussed in item 2(A) of the Notes to Financial Statements.
| | | | | | | | | | | | | | | | | | | | | | |
Investments in Securities | | Value
December 31, 2008 | | Accrued
Discounts
and/or
Premiums | | Realized
Gain/(Loss) | | | Change in
Unrealized
Gain/(Loss) | | Net
Purchases/(Sales) | | | Transfers in
and/or (Out of)
Level 3 | | | Value
December 31, 2009 |
Long-Term Fixed Income | | | | | | | | | | | | | | | | | | | | | | |
Asset-Backed Securities | | | 1,854,895 | | | — | | — | | | | 181,640 | | — | | | | 190,000 | | | | 2,226,535 |
Transportation | | | 598,228 | | | 1,644 | | (167,976 | ) | | | 313,597 | | (564,593 | ) | | | — | | | | 180,900 |
Utilities | | | — | | | — | | — | | | | 557 | | 13,575 | | | | — | | | | 14,132 |
Preferred Stock | | | | | | | | | | | | | | | | | | | | | | |
Financials | | | 423,368 | | | — | | (120,758 | ) | | | 156,837 | | (392,875 | ) | | | (66,572 | ) | | | — |
| | | | | | | | | | | | | | | | | | | | | | |
Total | | $ | 2,876,491 | | $ | 1,644 | | ($288,734 | ) | | $ | 652,631 | | ($943,893 | ) | | $ | 123,428 | | | $ | 2,421,567 |
| | | | | | | | | | | | | | | | | | | | | | |
The accompanying Notes to Financial Statements are an integral part of this schedule.
26
Diversified Income Plus Fund
Schedule of Investments as of December 31, 2009
| | | | | | | | | | | | | | | | |
Futures Contracts | | Number of
Contracts
Long/(Short) | | | Expiration Date | | Notional
Principal
Amount | | | Value | | | Unrealized
Gain/
(Loss) | |
5-Yr. U.S. Treasury Bond Futures | | 39 | | | March 2010 | | $ | 4,532,631 | | | $ | 4,460,930 | | | ($71,701 | ) |
10-Yr. U.S. Treasury Bond Futures | | (20 | ) | | March 2010 | | | (2,370,564 | ) | | | (2,309,063 | ) | | 61,501 | |
S&P 500 Index Futures | | (24 | ) | | March 2010 | | | (6,545,303 | ) | | | (6,664,200 | ) | | (118,897 | ) |
S&P 500 Index Mini-Futures | | 127 | | | March 2010 | | | 6,974,152 | | | | 7,052,945 | | | 78,793 | |
Total Futures Contracts | | | | | | | | | | | | | | | ($50,304 | ) |
| | | | | | | | | | | | | |
Call Options Written | | Number of
Contracts | | Exercise Price | | Expiration Date | | Value | | | Unrealized
Gain/(Loss) |
S&P 500 Index Mini-Futures | | 25 | | $ | 1,130.00 | | January 2010 | | ($9,000 | ) | | $ | 337 |
S&P 500 Index Mini-Futures | | 25 | | | 1,140.00 | | January 2010 | | (5,500 | ) | | | 3,181 |
S&P 500 Index Mini-Futures | | 25 | | | 1,125.00 | | January 2010 | | (11,250 | ) | | | 850 |
S&P 500 Index Mini-Futures | | 25 | | | 1,135.00 | | January 2010 | | (7,125 | ) | | | 3,431 |
Total Call Options Written | | | | | | | | | ($32,875 | ) | | $ | 7,799 |
| | | | | | | | | | | | | | | | |
Credit Default Swaps and Counterparty | | Buy/Sell Protection1 | | Termination
Date | | Notional
Principal
Amount2 | | Upfront
Payments
Received (Made) | | | Value3 | | Unrealized
Gain/(Loss) | |
CDX HY, Series 13, 5 Year, at 5.00%; Bank of America | | Buy | | 12/20/2014 | | $ | 6,138,000 | | ($399,682 | ) | | $ | 38,620 | | ($361,062 | ) |
Total Credit Default Swaps | | | | | | | | | | | | $ | 38,620 | | ($361,062 | ) |
| 1 | As the buyer of protection, Diversified Income Plus Fund pays periodic fees in return for payment by the seller which is contingent upon an adverse credit event occurring in the underlying issuer or reference entity. As the seller of protection, Diversified Income Plus Fund collects periodic fees from the buyer and profits if the credit of the underlying issuer or reference entity remains stable or improves while the swap is outstanding, but the seller in a credit default swap contract would be required to pay the amount of credit loss, determined as specified in the agreement, to the buyer in the event of an adverse credit event in the reference entity. |
| 2 | The maximum potential amount of future payments Diversified Income Plus Fund could be required to make as the seller or receive as the buyer of protection. |
| 3 | The market values for credit indexes (CDX or LCDX) serve as an indicator of the current status of the payment/performance risk and represent the liability or profit for the credit default swap contract had the contract been closed as of the reporting date. When protection has been sold, the market value of the swap will increase when the swap spread declines representing an improvement in the reference entity's credit worthiness. The market value of the swap will decrease when the swap spread increases representing a deterioration in the reference entity's credit worthiness. |
The accompanying Notes to Financial Statements are an integral part of this schedule.
27
Diversified Income Plus Fund
Schedule of Investments as of December 31, 2009
The following table summarizes the fair value and Statement of Assets and Liabilities location, as of December 31, 2009, for Diversified Income Plus Fund's investments in financial derivative instruments by primary risk exposure as discussed under item (2) Significant Accounting Policies of the Notes to Financial Statements.
| | | | | |
Derivatives by risk category | | Statement of Assets and Liabilities Location | | Fair Value |
Asset Derivatives | | | | | |
Equity Contracts | | | | | |
Options Written | | Net Assets - Net unrealized appreciation/(depreciation) on Written option contracts | | | 7,799 |
Futures* | | Net Assets - Net unrealized appreciation/(depreciation) on Futures contracts | | | 78,793 |
Total Equity Contracts | | | | | 86,592 |
Interest Rate Contracts | | | | | |
Futures* | | Net Assets - Net unrealized appreciation/(depreciation) on Futures contracts | | | 61,501 |
Total Interest Rate Contracts | | | | | 61,501 |
| | | | | |
Total Asset Derivatives | | | | $ | 148,093 |
| | | | | |
Liability Derivatives | | | | | |
Equity Contracts | | | | | |
Futures* | | Net Assets - Net unrealized appreciation/(depreciation) on Futures contracts | | | 118,897 |
Total Equity Contracts | | | | | 118,897 |
Interest Rate Contracts | | | | | |
Futures* | | Net Assets - Net unrealized appreciation/(depreciation) on Futures contracts | | | 71,701 |
Total Interest Rate Contracts | | | | | 71,701 |
Credit Contracts | | | | | |
Credit Default Swaps | | Receivable/Payable - Swap agreements, at value; Net Assets - Net unrealized appreciation/(depreciation) on Swap agreements | | | 361,062 |
Total Credit Contracts | | | | | 361,062 |
| | | | | |
Total Liability Derivatives | | | | $ | 551,660 |
| | | | | |
| * | Includes cumulative appreciation/depreciation of futures contracts as reported in the Schedule of Investments. Only current day's variation margin is reported within the Statement of Assets and Liabilities. |
The following table summarizes the net realized gains/(losses) and Statement of Operations location, for the period ended December 31, 2009, for Diversified Income Plus Fund's investments in financial derivative instruments by primary risk exposure.
| | | | | | |
Derivatives by risk category | | Statement of Operations Location | | Realized Gains/(Losses)
recognized in Income | |
Equity Contracts | | | | | | |
Options Written | | Net realized gains/(losses) on Written option contracts | | | (47,247 | ) |
Futures | | Net realized gains/(losses) on Futures contracts | | | 919,412 | |
Total Equity Contracts | | | | | 872,165 | |
Interest Rate Contracts | | | | | | |
Futures | | Net realized gains/(losses) on Futures contracts | | | 201,108 | |
Total Interest Rate Contracts | | | | | 201,108 | |
Credit Contracts | | | | | | |
Credit Default Swaps | | Net realized gains/(losses) on Swap agreements | | | (36,005 | ) |
Total Credit Contracts | | | | | (36,005 | ) |
| | | | | | |
Total | | | | $ | 1,037,268 | |
| | | | | | |
The accompanying Notes to Financial Statements are an integral part of this schedule.
28
Diversified Income Plus Fund
Schedule of Investments as of December 31, 2009
The following table summarizes the change in net unrealized appreciation/(depreciation) and Statement of Operations location, for the period ended December 31, 2009, for Diversified Income Plus Fund’s investments in financial derivative instruments by primary risk exposure.
| | | | | |
Derivatives by risk category | | Statement of Operations Location | | Change in unrealized
appreciation/(depreciation)
recognized in Income | |
| Equity Contracts | | | | | |
Futures | | Change in net unrealized appreciation/(depreciation) on Futures contracts | | (112,962 | ) |
Options Written | | Change in net unrealized appreciation/(depreciation) on Written option contracts | | 7,799 | |
Total Equity Contracts | | | | (105,163 | ) |
Interest Rate Contracts | | | | | |
Futures | | Change in net unrealized appreciation/(depreciation) on Futures contracts | | (88,510 | ) |
Total Interest Rate Contracts | | | | (88,510 | ) |
Credit Contracts | | | | | |
Credit Default Swaps | | Change in net unrealized appreciation/(depreciation) on Swap agreements | | (361,062 | ) |
Total Credit Contracts | | | | (361,062 | ) |
| | | | | |
Total | | | | ($554,735 | ) |
| | | | | |
The following table presents Diversified Income Plus Fund’s average daily volume of derivative activity during the period ended December 31, 2009.
| | | | | | | | | | | | | | |
Derivative Risk Category | | Futures
(Notional*) | | Futures
(Percentage of
Average Net Assets) | | | Swaps
(Notional*) | | Swaps
(Percentage of
Average Net Assets) | | | Options
(Contracts) |
Equity Contracts | | $ | 7,415,733 | | 6.1 | % | | | N/A | | N/A | | | 33 |
Interest Rate Contracts | | | 8,036,728 | | 6.6 | % | | | N/A | | N/A | | | N/A |
Credit Contracts | | | N/A | | N/A | | | $ | 790,175 | | 0.7 | % | | N/A |
| * | Notional amount represents long or short, or both, derivative positions held by the fund. |
Investment in Affiliates
Affiliated issuers, as defined under the Investment Company Act of 1940, include those in which the Fund’s holdings of an issuer represent 5% or more of the outstanding voting securities of an issuer, or any affiliated mutual fund.
A summary of transactions for the fiscal year to date, in Diversified Income Plus Fund, is as follows:
| | | | | | | | | | | | | | | | | |
Fund | | Value
December 31, 2008 | | Gross
Purchases | | Gross
Sales | | Shares Held at
December 31, 2009 | | Value
December 31, 2009 | | Income Earned
January 1, 2009 -
December 31, 2009 |
High Yield | | $ | — | | $ | 1,750,000 | | $ | — | | 464,191 | | $ | 2,125,995 | | $ | 120,183 |
Money Market | | | 3,960,876 | | | 61,260,191 | | | 65,221,067 | | — | | | — | | | 23,894 |
Thrivent Financial Securities Lending Trust | | | 2,951,110 | | | 23,888,401 | | | 23,631,589 | | 3,207,922 | | | 3,207,922 | | | 18,279 |
Total Value and Income Earned | | | 6,911,986 | | | | | | | | | | | 5,333,917 | | | 162,356 |
The accompanying Notes to Financial Statements are an integral part of this schedule.
29
Thrivent Mutual Funds
Statement of Assets and Liabilities
| | | | | | | | | | | | |
As of December 31, 2009 | | Real Estate
Securities Fund | | | Equity Income
Plus Fund | | | Diversified
Income Plus
Fund | |
Assets | | | | | | | | | | | | |
Investments at cost | | $ | 103,533,892 | | | $ | 27,441,127 | | | $ | 144,063,497 | |
Investments in securities at market value | | | 90,574,389 | | | | 28,055,874 | | | | 138,195,752 | |
Investments in affiliates at market value | | | — | | | | — | | | | 5,333,917 | |
Investments at Market Value | | | 90,574,389 | | | | 28,055,874 | | | | 143,529,669 | |
Cash | | | 220,384 | | | | 747,942 | | | | 522,833 | |
Dividends and interest receivable | | | 316,408 | | | | 49,413 | | | | 1,207,659 | |
Prepaid expenses | | | 1,015 | | | | 956 | | | | 1,171 | |
Receivable for investments sold | | | 140,798 | | | | — | | | | 80,355 | |
Receivable for fund shares sold | | | 49,299 | | | | 9,667 | | | | 144,010 | |
Swap agreements, at value | | | — | | | | — | | | | 38,620 | |
Receivable for variation margin | | | — | | | | — | | | | 76,212 | |
Total Assets | | | 91,302,293 | | | | 28,863,852 | | | | 145,600,529 | |
Liabilities | | | | | | | | | | | | |
Distributions payable | | | — | | | | — | | | | 13 | |
Accrued expenses | | | 16,217 | | | | 11,669 | | | | 52,543 | |
Payable for investments purchased | | | 130,149 | | | | — | | | | 127,791 | |
Payable upon return of collateral for securities loaned | | | — | | | | — | | | | 3,207,922 | |
Payable for fund shares redeemed | | | 3,779 | | | | 13,572 | | | | 123,445 | |
Open options written, at value | | | — | | | | 18,625 | | | | 32,875 | |
Payable for variation margin | | | — | | | | 35,340 | | | | 83,664 | |
Payable to affiliate | | | 70,060 | | | | 6,314 | | | | 117,785 | |
Total Liabilities | | | 220,205 | | | | 85,520 | | | | 3,746,038 | |
Net Assets | | | | | | | | | | | | |
Capital stock (beneficial interest) | | | 121,060,197 | | | | 34,295,577 | | | | 170,889,534 | |
Accumulated undistributed net investment income/(loss) | | | (6,922 | ) | | | 3,498 | | | | 12,192 | |
Accumulated undistributed net realized gain/(loss) | | | (17,011,565 | ) | | | (6,176,649 | ) | | | (28,109,840 | ) |
Net unrealized appreciation/(depreciation) on: | | | | | | | | | | | | |
Investments | | | (12,959,503 | ) | | | 614,747 | | | | (909,823 | ) |
Affiliated investments | | | — | | | | — | | | | 375,995 | |
Written option contracts | | | — | | | | 4,044 | | | | 7,799 | |
Futures contracts | | | — | | | | 37,115 | | | | (50,304 | ) |
Swap agreements | | | — | | | | — | | | | (361,062 | ) |
Foreign currency transactions | | | (119 | ) | | | — | | | | — | |
Total Net Assets | | $ | 91,082,088 | | | $ | 28,778,332 | | | $ | 141,854,491 | |
Class A Share Capital | | $ | 10,840,055 | | | $ | 4,092,064 | | | $ | 135,181,696 | |
Shares of beneficial interest outstanding (Class A) | | | 1,390,774 | | | | 512,941 | | | | 23,172,615 | |
Net asset value per share | | $ | 7.79 | | | $ | 7.98 | | | $ | 5.83 | |
Maximum public offering price | | $ | 8.24 | | | $ | 8.44 | | | $ | 6.10 | |
Institutional Class Share Capital | | $ | 80,242,033 | | | $ | 24,686,268 | | | $ | 6,672,795 | |
Shares of beneficial interest outstanding (Institutional Class) | | | 10,291,116 | | | | 3,092,083 | | | | 1,147,775 | |
Net asset value per share | | $ | 7.80 | | | $ | 7.98 | | | $ | 5.81 | |
The accompanying Notes to Financial Statements are an integral part of this schedule.
30
Thrivent Mutual Funds
Statement of Operations
| | | | | | | | | | | | |
For the year ended December 31, 2009 | | Real Estate
Securities Fund | | | Equity Income
Plus Fund | | | Diversified
Income Plus
Fund | |
Investment Income | | | | | | | | | | | | |
Dividends | | $ | 2,687,863 | | | $ | 715,392 | | | $ | 1,133,503 | |
Taxable interest | | | 100,356 | | | | 9,495 | | | | 7,896,488 | |
Income from securities loaned | | | 48,167 | | | | — | | | | 18,279 | |
Income from affiliated investments | | | 5,960 | | | | 11,667 | | | | 144,077 | |
Foreign dividend tax withholding | | | (4,334 | ) | | | (4,245 | ) | | | (6,845 | ) |
Total Investment Income | | | 2,838,012 | | | | 732,309 | | | | 9,185,502 | |
Expenses | | | | | | | | | | | | |
Adviser fees | | | 530,654 | | | | 154,597 | | | | 673,698 | |
Administrative service fees | | | 83,266 | | | | 74,757 | | | | 94,498 | |
Amortization of offering costs | | | — | | | | 5,370 | | | | — | |
Audit and legal fees | | | 20,016 | | | | 18,370 | | | | 20,498 | |
Custody fees | | | 11,193 | | | | 23,884 | | | | 26,579 | |
Distribution expenses Class A | | | 20,370 | | | | 7,888 | | | | 292,365 | |
Distribution expenses Class B | | | — | | | | — | | | | 584 | |
Insurance expenses | | | 3,999 | | | | 3,708 | | | | 4,559 | |
Printing and postage expenses Class A | | | 23,121 | | | | 2,315 | | | | 76,549 | |
Printing and postage expenses Class B | | | — | | | | — | | | | 183 | |
Printing and postage expenses Institutional Class | | | 981 | | | | 1,494 | | | | 672 | |
SEC and state registration expenses | | | 25,869 | | | | 24,882 | | | | 27,708 | |
Transfer agent fees Class A | | | 53,836 | | | | 8,656 | | | | 195,303 | |
Transfer agent fees Class B | | | — | | | | — | | | | 439 | |
Transfer agent fees Institutional Class | | | 400 | | | | 123 | | | | 3,059 | |
Trustees' fees | | | 4,929 | | | | 4,336 | | | | 12,641 | |
Other expenses | | | 7,874 | | | | 8,738 | | | | 22,678 | |
Total Expenses Before Reimbursement | | | 786,508 | | | | 339,118 | | | | 1,452,013 | |
Less: | | | | | | | | | | | | |
Reimbursement from adviser | | | (85,933 | ) | | | (137,789 | ) | | | (32,075 | ) |
Custody earnings credit | | | (1 | ) | | | (12 | ) | | | (11 | ) |
Total Net Expenses | | | 700,574 | | | | 201,317 | | | | 1,419,927 | |
Net Investment Income/(Loss) | | | 2,137,438 | | | | 530,992 | | | | 7,765,575 | |
Realized and Unrealized Gains/(Losses) | | | | | | | | | | | | |
Net realized gains/(losses) on: | | | | | | | | | | | | |
Investments | | | (8,809,432 | ) | | | (1,942,474 | ) | | | (7,469,577 | ) |
Written option contracts | | | — | | | | (25,434 | ) | | | (47,247 | ) |
Futures contracts | | | — | | | | 598,930 | | | | 1,120,520 | |
Swap agreements | | | — | | | | — | | | | (36,005 | ) |
Change in net unrealized appreciation/(depreciation) on: | | | | | | | | | | | | |
Investments | | | 27,194,091 | | | | 4,658,521 | | | | 32,648,728 | |
Affiliated investments | | | — | | | | — | | | | 375,995 | |
Written option contracts | | | — | | | | 3,152 | | | | 7,799 | |
Futures contracts | | | — | | | | (35,308 | ) | | | (201,472 | ) |
Foreign currency transactions | | | 80 | | | | — | | | | — | |
Swap agreements | | | — | | | | — | | | | (361,062 | ) |
Net Realized and Unrealized Gains/(Losses) | | | 18,384,739 | | | | 3,257,387 | | | | 26,037,679 | |
Net Increase/(Decrease) in Net Assets Resulting From
Operations | | $ | 20,522,177 | | | $ | 3,788,379 | | | $ | 33,803,254 | |
The accompanying Notes to Financial Statements are an integral part of this schedule.
31
Thrivent Mutual Funds
Statement of Changes in Net Assets
| | | | | | | | | | | | | | | | |
| | | Real Estate Securities Fund | | | Equity Income Plus Fund | |
For the periods ended | | 12/31/2009 | | | 12/31/2008 | | | 12/31/2009 | | | 12/31/2008(a) | |
Operations | | | | | | | | | | | | | | | | |
Net investment income/(loss) | | $ | 2,137,438 | | | $ | 2,593,690 | | | $ | 530,992 | | | $ | 574,052 | |
Net realized gains/(losses) | | | (8,809,432 | ) | | | (6,309,531 | ) | | | (1,368,978 | ) | | | (4,808,405 | ) |
Change in net unrealized appreciation/(depreciation) | | | 27,194,171 | | | | (35,091,014 | ) | | | 4,626,365 | | | | (3,970,459 | ) |
Net Change in Net Assets Resulting From Operations | | | 20,522,177 | | | | (38,806,855 | ) | | | 3,788,379 | | | | (8,204,812 | ) |
Distributions to Shareholders | | | | | | | | | | | | | | | | |
From net investment income | | | (2,063,121 | ) | | | (2,553,815 | ) | | | (530,920 | ) | | | (601,659 | ) |
From return of capital | | | (903,104 | ) | | | (1,655,454 | ) | | | — | | | | (29,022 | ) |
Total Distributions to Shareholders | | | (2,966,225 | ) | | | (4,209,269 | ) | | | (530,920 | ) | | | (630,681 | ) |
Capital Stock Transactions | | | | | | | | | | | | | | | | |
Class A | | | | | | | | | | | | | | | | |
Sold | | | 1,950,543 | | | | 4,297,862 | | | | 1,419,398 | | | | 8,441,173 | |
Distributions reinvested | | | 346,979 | | | | 501,778 | | | | 56,810 | | | | 73,763 | |
Redeemed | | | (1,885,351 | ) | | | (4,912,324 | ) | | | (778,482 | ) | | | (4,274,399 | ) |
| | | | | | | | | | | | | | | | |
Total Class A Capital Stock Transactions | | | 412,171 | | | | (112,684 | ) | | | 697,726 | | | | 4,240,537 | |
| | | | | | | | | | | | | | | | |
Institutional Class | | | | | | | | | | | | | | | | |
Sold | | | 11,603,470 | | | | 30,421,761 | | | | 1,570,415 | | | | 27,843,145 | |
Distributions reinvested | | | 2,604,905 | | | | 3,690,230 | | | | 470,000 | | | | 553,495 | |
Redeemed | | | (5,990,065 | ) | | | (15,863,248 | ) | | | (475,561 | ) | | | (543,391 | ) |
| | | | | | | | | | | | | | | | |
Total Institutional Class Capital Stock Transactions | | | 8,218,310 | | | | 18,248,743 | | | | 1,564,854 | | | | 27,853,249 | |
| | | | | | | | | | | | | | | | |
Capital Stock Transactions | | | 8,630,481 | | | | 18,136,059 | | | | 2,262,580 | | | | 32,093,786 | |
Net Increase/(Decrease) in Net Assets | | | 26,186,433 | | | | (24,880,065 | ) | | | 5,520,039 | | | | 23,258,293 | |
Net Assets, Beginning of Period | | | 64,895,655 | | | | 89,775,720 | | | | 23,258,293 | | | | — | |
Net Assets, End of Period | | $ | 91,082,088 | | | $ | 64,895,655 | | | $ | 28,778,332 | | | $ | 23,258,293 | |
Accumulated undistributed net investment income/(loss) | | $ | (6,922 | ) | | $ | (3,940 | ) | | $ | 3,498 | | | $ | (1,109 | ) |
Capital Stock Share Transactions | | | | | | | | | | | | | | | | |
Class A shares | | | | | | | | | | | | | | | | |
Sold | | | 325,798 | | | | 431,194 | | | | 203,710 | | | | 873,747 | |
Distributions reinvested | | | 60,442 | | | | 59,459 | | | | 8,130 | | | | 8,956 | |
Redeemed | | | (317,928 | ) | | | (551,069 | ) | | | (117,958 | ) | | | (463,644 | ) |
| | | | | | | | | | | | | | | | |
Total Class A shares | | | 68,312 | | | | (60,416 | ) | | | 93,882 | | | | 419,059 | |
| | | | | | | | | | | | | | | | |
Institutional Class shares | | | | | | | | | | | | | | | | |
Sold | | | 1,856,427 | | | | 2,924,853 | | | | 212,976 | | | | 2,875,596 | |
Distributions reinvested | | | 445,721 | | | | 434,304 | | | | 67,457 | | | | 67,773 | |
Redeemed | | | (919,555 | ) | | | (1,571,049 | ) | | | (73,763 | ) | | | (57,956 | ) |
| | | | | | | | | | | | | | | | |
Total Institutional Class shares | | | 1,382,593 | | | | 1,788,108 | | | | 206,670 | | | | 2,885,413 | |
| | | | | | | | | | | | | | | | |
| (a) | For the period from February 29, 2008 (inception) through December 31, 2008 |
The accompanying Notes to Financial Statements are an integral part of this schedule.
32
Thrivent Mutual Funds
Statement of Changes in Net Assets – continued
| | | | | | | | |
| | | Diversified Income Plus Fund | |
For the periods ended | | 12/31/2009 | | | 12/31/2008 | |
Operations | | | | | | | | |
Net investment income/(loss) | | $ | 7,765,575 | | | $ | 7,791,687 | |
Net realized gains/(losses) | | | (6,432,309 | ) | | | (21,696,366 | ) |
Change in net unrealized appreciation/(depreciation) | | | 32,469,988 | | | | (24,637,397 | ) |
Net Change in Net Assets Resulting From Operations | | | 33,803,254 | | | | (38,542,076 | ) |
Distributions to Shareholders | | | | | | | | |
From net investment income | | | (6,586,560 | ) | | | (8,262,778 | ) |
From return of capital | | | – | | | | (40,687 | ) |
Total Distributions to Shareholders | | | (6,586,560 | ) | | | (8,303,465 | ) |
Capital Stock Transactions | | | | | | | | |
Class A | | | | | | | | |
Sold | | | 16,992,144 | | | | 15,208,811 | |
Distributions reinvested | | | 4,944,708 | | | | 6,220,982 | |
Redeemed | | | (22,185,046 | ) | | | (42,787,885 | ) |
| | | | | | | | |
Total Class A Capital Stock Transactions | | | (248,194 | ) | | | (21,358,092 | ) |
| | | | | | | | |
Class B | | | | | | | | |
Sold | | | 228 | | | | 12,275 | |
Distributions reinvested | | | 1,954 | | | | 49,396 | |
Redeemed | | | (564,785 | ) | | | (1,411,618 | ) |
| | | | | | | | |
Total Class B Capital Stock Transactions | | | (562,603 | ) | | | (1,349,947 | ) |
| | | | | | | | |
Institutional Class | | | | | | | | |
Sold | | | 3,431,470 | | | | 851,164 | |
Distributions reinvested | | | 312,396 | | | | 355,690 | |
Redeemed | | | (2,376,470 | ) | | | (4,865,229 | ) |
| | | | | | | | |
Total Institutional Class Capital Stock Transactions | | | 1,367,396 | | | | (3,658,375 | ) |
| | | | | | | | |
Capital Stock Transactions | | | 556,599 | | | | (26,366,414 | ) |
Net Increase/(Decrease) in Net Assets | | | 27,773,293 | | | | (73,211,955 | ) |
Net Assets, Beginning of Period | | | 114,081,198 | | | | 187,293,153 | |
Net Assets, End of Period | | $ | 141,854,491 | | | $ | 114,081,198 | |
Accumulated undistributed net investment income/(loss) | | $ | 12,192 | | | $ | (70,432 | ) |
Capital Stock Share Transactions | | | | | | | | |
Class A shares | | | | | | | | |
Sold | | | 3,236,011 | | | | 2,533,459 | |
Distributions reinvested | | | 971,418 | | | | 1,083,423 | |
Redeemed | | | (4,425,502 | ) | | | (7,316,603 | ) |
| | | | | | | | |
Total Class A shares | | | (218,073 | ) | | | (3,699,721 | ) |
| | | | | | | | |
Class B shares | | | | | | | | |
Sold | | | 49 | | | | 2,030 | |
Distributions reinvested | | | 420 | | | | 8,350 | |
Redeemed | | | (120,445 | ) | | | (241,977 | ) |
| | | | | | | | |
Total Class B shares | | | (119,976 | ) | | | (231,597 | ) |
| | | | | | | | |
Institutional Class shares | | | | | | | | |
Sold | | | 677,877 | | | | 148,662 | |
Distributions reinvested | | | 61,445 | | | | 61,513 | |
Redeemed | | | (468,245 | ) | | | (817,788 | ) |
| | | | | | | | |
Total Institutional Class shares | | | 271,077 | | | | (607,613 | ) |
| | | | | | | | |
The accompanying Notes to Financial Statements are an integral part of this schedule.
33
THRIVENT MUTUAL FUNDS
Notes to Financial Statements
As of December 31, 2009
(1) ORGANIZATION
Thrivent Mutual Funds (the “Trust”) was organized as a Massachusetts Business Trust on March 10, 1987 and is registered as an open-end management investment company under the Investment Company Act of 1940 (the “1940 Act”). As of December 31, 2009, the Trust is divided into twenty-five separate series (each, a “Fund” and, collectively, the "Funds"), each with its own investment objective and policies. The Trust currently consists of four allocation funds, thirteen equity funds, two hybrid funds, five fixed-income funds, and one money market fund.
This annual report includes Thrivent Real Estate Securities Fund, Thrivent Equity Income Plus Fund and Thrivent Diversified Income Plus Fund, three of the Trust’s twenty-five Funds. The other Funds of the Trust are presented under a separate annual report.
As of December 31, 2009, the Trust includes two classes of shares: Class A and Institutional Class. Class B shares had previously been offered, but effective October 16, 2004, the Trust no longer offered Class B shares for sale. On February 11, 2009, the Trust converted all outstanding Class B shares to Class A Shares. The existing classes of shares differ principally in their respective distribution expenses, other class-specific expenses and arrangements. Class A shares generally have a 0.25% annual 12b-1 fee and a maximum front-end sales load of 5.50% for equity funds and 4.50% for fixed-income funds. Institutional Class shares are offered at net asset value and have no annual 12b-1 fees. The share classes have identical rights to earnings, assets and voting privileges, except for class-specific expenses and exclusive rights to vote on matters affecting only individual classes. Although no longer in existence, Class B shares were offered at net asset value and generally had a 1.00% annual 12b-1 fee. In addition, Class B shares had a maximum deferred sales charge of 5.00%. The deferred sales charge declined by 1.00% per year through the fifth year.
Diversified Income Plus Fund had all three classes of shares but now has only Class A and Institutional Class shares. Real Estate Securities Fund and Equity Income Plus Fund have only offered Class A and Institutional Class shares.
All outstanding Class B shares were converted to Class A shares on February 11, 2009. At that time, Diversified Income Plus Fund converted the following Class B shares and amounts into Class A shares:
| | | | | | | |
Fund | | Amount | | Shares
converted
from Class B | | Shares
Converted
to Class A |
Diversified Income Plus | | $ | 470,996 | | 100,640 | | 100,426 |
Under the Trust’s organizational documents, its officers and trustees are indemnified against certain liabilities arising out of the performance of their duties to the Trust. In addition, in the normal course of business, the Trust enters into contracts with vendors and others that provide general damage clauses. The Trust’s maximum exposure under these contracts is unknown, as this would involve future claims that may be made against the Trust. However, based on experience, the Trust expects the risk of loss to be remote.
(2) SIGNIFICANT ACCOUNTING POLICIES
(A) Valuation of Investments – Securities traded on U.S. or foreign securities exchanges or included in a national market system are valued at the official closing price at the close of each business day unless otherwise stated below. Over-the-counter securities and listed securities for which no price is readily available are valued at the current bid price considered best to represent the value at that time. Swap agreements are valued at the fair value of the contract as furnished by an independent pricing service. Security prices are based on quotes that are obtained from an independent pricing service approved by the Board of Trustees. The pricing service, in determining values of fixed-income securities, takes into consideration such factors as current quotations by broker/dealers, coupon, maturity, quality, type of issue, trading characteristics, and other yield and risk factors it deems relevant in determining valuations. Securities which cannot be valued by the approved pricing service are valued using valuations obtained from dealers that make markets in the securities. Exchange listed options and futures contracts are valued at the last quoted sales price. Investments in open-ended mutual funds are valued at the net asset value at the close of each business day. Short-term securities are valued at amortized cost to the extent it is not materially different than market value.
The various inputs used to determine the fair value of the Funds’ investments are summarized in three broad levels: Level 1 includes quoted prices in active markets for identical securities; Level 2 includes other significant observable inputs such as quoted prices for similar securities, interest rates, prepayment speeds and credit risk; and Level 3 includes significant unobservable inputs such as the Fund’s own assumptions and broker evaluations in determining the fair value of investments. Of the Level 3 securities, those for which market values were not readily available or were deemed unreliable were valued as determined in good faith under the direction of the Board of Trustees. As of December 31, 2009, the following fund held these types of securities:
| | | | | |
Fund | | Number of
Securities | | Percent of Fund's
Net Assets | |
Diversified Income Plus | | 2 | | 0.01 | % |
The valuation levels are not necessarily an indication of the risk associated with investing in these securities or other investments.
Valuation of International Securities – Because many foreign markets close before the U.S. markets, events may occur between the close of the foreign market and the close of the U.S.
34
THRIVENT MUTUAL FUNDS
Notes to Financial Statements
As of December 31, 2009
markets that could have a material impact on the valuation of foreign securities. The Funds, under the supervision of the Board of Trustees, evaluate the impacts of these events and may adjust the valuation of foreign securities to reflect fair value as of the close of the U.S. markets. The Board of Trustees has authorized the investment adviser to make fair valuation determinations pursuant to policies approved by the Board of Trustees.
(B) Foreign Currency Translation – The accounting records of each Fund are maintained in U.S. dollars. Securities and other assets and liabilities that are denominated in foreign currencies are translated into U.S. dollars at the daily closing rates of exchange.
Foreign currency amounts related to the purchase or sale of securities and income and expenses are translated at the exchange rate on the transaction date. Net realized and unrealized currency gains and losses are recorded from sales of foreign currency, exchange gains or losses between the trade date and settlement dates on securities transactions, and other translation gains or losses on dividends, interest income and foreign withholding taxes. The Funds do not separately report the effect of changes in foreign exchange rates from changes in market prices on securities held. Such changes are included in net realized and unrealized gain or loss from investments.
For federal income tax purposes, the Funds treat the effect of changes in foreign exchange rates arising from actual foreign currency transactions and the changes in foreign exchange rates between the trade date and settlement date as ordinary income.
(C) Foreign Currency Forward Contracts – In connection with purchases and sales of securities denominated in foreign currencies, the Funds may enter into foreign currency forward contracts. Additionally, the Funds may enter into such contracts to hedge certain other foreign-currency-denominated investments. These contracts are recorded at market value and the related realized and unrealized foreign exchange gains and losses are included in the Statement of Operations. In the event that counterparties fail to settle these forward contracts, the Funds could be exposed to foreign currency fluctuations. Foreign currency contracts are valued daily and unrealized appreciation or depreciation is recorded daily as the difference between the contract exchange rate and the closing forward rate applied to the face amount of the contract. A realized gain or loss is recorded at the time a forward contract is closed. These contracts are over-the-counter and the Funds are exposed to counterparty risk equal to the discounted net amount of payments to the Fund. During the year ended December 31, 2009, none of the Funds engaged in this type of investment.
(D) Foreign Denominated Investments – Foreign denominated assets and currency contracts may involve more risks than domestic transactions including currency risk, political and economic risk, regulatory risk, and market risk. Certain Funds may also invest in securities of companies located in emerging markets. Future economic or political developments could adversely affect the liquidity or value, or both, of such securities.
(E) Income Taxes – No provision has been made for income taxes because each Fund’s policy is to qualify as a regulated investment company under the Internal Revenue Code and distribute substantially all investment company taxable income and net capital gain on a timely basis. It is also the intention of each Fund to distribute an amount sufficient to avoid imposition of any federal excise tax. The Funds, accordingly, anticipate paying no federal taxes and no federal tax provision was recorded. Each Fund is treated as a separate taxable entity for federal income tax purposes. Certain Funds may utilize earnings and profits distributed to shareholders on the redemption of shares as part of the dividends paid deduction.
Certain Funds are subject to foreign income taxes imposed by certain countries in which they invest. Withholding taxes on foreign dividends and gains, if applicable, have been provided for in accordance with the applicable country’s tax rules and rates. These amounts are shown as foreign dividend tax withholding on the Statement of Operations.
Generally Accepted Accounting Principles in the United States (GAAP) require management of the Funds to make additional tax disclosures with respect to the tax effects of any uncertain income tax positions, whether those positions were taken on previously filed tax returns or are expected to be taken on future returns. In order to be recognized in the financial statements, the benefits of a tax position must meet a “more likely than not” standard, based on the technical merits of the position. In evaluating whether a tax position has met the more-likely-than-not recognition threshold, management of the Funds must presume that the position will be examined by the appropriate taxing authority that has full knowledge of all relevant information.
Management of the Funds analyzed all open tax years, as defined by the statute of limitations, for all major jurisdictions. Open tax years are those that are open for examination by taxing authorities. Major jurisdictions for the Funds include U.S. Federal, Minnesota, Wisconsin, and Massachusetts, as well as certain foreign countries. As of December 31, 2009, open U.S. Federal, Minnesota, Wisconsin, and Massachusetts tax years include the tax years ended December 31, 2006, through 2009. Additionally, as of December 31, 2009, the tax year ended December 31, 2005, is open for Minnesota and Wisconsin. The Funds have no examinations in progress and none are expected at this time.
As of December 31, 2009, management of the Funds has reviewed all open tax years and major jurisdictions and concluded that there is no effect to the Funds’ tax liability, financial position or results of operations. There is no tax liability resulting from unrecognized tax benefits related to uncertain income tax positions taken or expected to be taken in
35
THRIVENT MUTUAL FUNDS
Notes to Financial Statements
As of December 31, 2009
future tax returns. The Funds are also not aware of any tax positions for which it is reasonably possible that the total amounts of unrecognized tax benefits will significantly change in the next 12 months.
(F) Expenses and Income – Estimated expenses are accrued daily. The Funds are charged for those expenses that are directly attributable to them. Expenses that are not directly attributable to a Fund are allocated among all appropriate Funds in proportion to their respective net assets, number of shareholder accounts or other reasonable basis. Net investment income, expenses which are not class-specific, and realized and unrealized gains and losses are allocated directly to each class based upon the relative net asset value of outstanding shares.
Interest income is accrued daily and is determined on the basis of interest or discount earned on all debt securities, including accretion of market discount and original issue discount and amortization of premium. Paydown gains and losses on mortgage- and asset-backed securities are recorded as components of interest income. Dividend income is recorded on the ex-dividend date.
(G) Custody Earnings Credit – The Funds have a deposit arrangement with the custodian whereby interest earned on uninvested cash balances is used to pay a portion of custodian fees. This deposit arrangement is an alternative to overnight investments. Earnings credits are shown as a reduction of total expenses on the Statement of Operations.
(H) Distributions to Shareholders – Net investment income is distributed to each shareholder as a dividend. Dividends from Real Estate Securities Fund and Equity Income Plus Fund are declared and paid quarterly. Dividends from Diversified Income Plus Fund are declared and paid monthly. Additionally, it is possible that such dividends may be reclassified as return of capital or capital gains after year end. Such determination can not be made until tax information is received from the real estate investments of the Fund. Net realized gains from securities transactions, if any, are distributed at least annually.
(I) Options – All Funds may buy put and call options and write put and covered call options. The Funds intend to use such derivative instruments as hedges to facilitate buying or selling securities or to provide protection against adverse movements in security prices or interest rates. The Funds may also enter into options contracts to protect against adverse foreign exchange rate fluctuations. Option contracts are valued daily and unrealized appreciation or depreciation is recorded. A Fund will realize a gain or loss upon expiration or closing of the option transaction. When an option is exercised, the proceeds upon sale for a written call option or the cost of a security for purchased put and call options is adjusted by the amount of premium received or paid.
Buying put options tends to decrease a Fund’s exposure to the underlying security while buying call options tends to increase a Fund’s exposure to the underlying security. The risk associated with purchasing put and call options is limited to the premium paid. There is no significant counterparty risk on exchange-traded options as the exchange guarantees the contract against default. Writing put options tends to increase a Fund’s exposure to the underlying security while writing call options tends to decrease a Fund’s exposure to the underlying security. The writer of an option has no control over whether the underlying security may be bought or sold, and therefore bears the market risk of an unfavorable change in the price of the underlying security. The counterparty risk for written options arises when the Fund has purchased an option, exercised that option, and the counterparty doesn’t buy from the Fund or sell to the Fund the underlying asset as required. In the case where the Fund has written an option, the Fund doesn’t have counterparty risk. Counterparty risk on purchased over-the-counter options is partially mitigated by the Fund’s collateral posting requirements. As the option increases in value to the Fund, the Fund receives collateral from the counterparty. Risks of loss may exceed amounts recognized on the Statement of Assets and Liabilities. During the year ended December 31, 2009, Equity Income Plus Fund and Diversified Income Plus Fund engaged in these types of investments.
(J) Futures Contracts – Certain Funds may use futures contracts to manage the exposure to interest rate and market or currency fluctuations. Gains or losses on futures contracts can offset changes in the yield of securities. When a futures contract is opened, cash or other investments equal to the required “initial margin deposit” are held on deposit with and pledged to the broker. Additional securities held by the Funds may be earmarked to cover open futures contracts. The futures contract’s daily change in value (“variation margin”) is either paid to or received from the broker, and is recorded as an unrealized gain or loss. When the contract is closed, realized gain or loss is recorded equal to the difference between the value of the contract when opened and the value of the contract when closed. Futures contracts involve, to varying degrees, risk of loss in excess of the variation margin disclosed in the Statement of Assets and Liabilities. Exchange-traded futures have no significant counterparty risk as the exchange guarantees the contracts against default. During the year ended December 31, 2009, Equity Income Plus Fund and Diversified Income Plus Fund engaged in this type of investment.
(K) Swap Agreements – Certain Funds may enter into swap transactions, which involve swapping one or more investment characteristics of a security or a basket of securities with another party. Such transactions include market risk, risk of default by the other party to the transaction, risk of imperfect correlation and manager risk and may involve commissions or other costs. Swap transactions generally do not involve delivery of securities, other underlying assets or principal. Accordingly, the risk of loss with respect to swap transactions is generally limited to the net amount of payments that the Fund is contractually
36
THRIVENT MUTUAL FUNDS
Notes to Financial Statements
As of December 31, 2009
obligated to make, or in the case of the counterparty defaulting, the net amount of payments that the Fund is contractually entitled to receive. Risks of loss may exceed amounts recognized on the Statement of Assets and Liabilities. If there is a default by the counterparty, the Fund may have contractual remedies pursuant to the agreements related to the transaction. The contracts are valued daily and unrealized appreciation or depreciation is recorded. Swap agreements are valued at fair value of the contract as provided by an independent pricing service. The pricing service takes into account such factors as swap curves, default probabilities, recent trades, recovery rates and other factors it deems relevant in determining valuations. Periodic payments and receipts and payments received or made as a result of a credit event or termination of the contract are recognized as realized gains or losses on the Statement of Operations. Collateral, in the form of cash or securities, may be required to be held with the Fund’s custodian, or a third party, in connection with these agreements. These swap agreements are over-the-counter and the Fund is exposed to counterparty risk, which is the discounted net amount of payments owed to the Fund. This risk is partially mitigated by the Fund’s collateral posting requirements. As the swap increases in value to the Fund, the Fund receives collateral from the counterparty.
Credit Default Swaps – A credit default swap is a swap agreement between two parties to exchange the credit risk of a particular issuer, basket of securities or reference entity. In a credit default swap transaction, a buyer pays periodic fees in return for payment by the seller which is contingent upon an adverse credit event occurring in the underlying issuer or reference entity. The seller collects periodic fees from the buyer and profits if the credit of the underlying issuer or reference entity remains stable or improves while the swap is outstanding, but the seller in a credit default swap contract would be required to pay the amount of credit loss, determined as specified in the agreement, to the buyer in the event of an adverse credit event in the reference entity. A buyer of a credit default swap is said to buy protection whereas a seller of a credit default swap is said to sell protection. The Funds may be either the protection seller or the protection buyer.
Certain Funds enter into credit default derivative contracts directly through credit default swaps (CDS) or through credit default swap indices (CDX Indices). CDX Indices are static pools of equally weighted credit default swaps referencing corporate bonds and/or loans designed to provide diversified credit exposure to these asset classes. Funds sell default protection and assume long-risk positions in individual credits or indices. Index positions are entered into to gain exposure to the corporate bond and/or loan markets in a cost-efficient and diversified structure. In the event that a position defaults, by going into bankruptcy and failing to pay interest or principal on borrowed money, within any given CDX Index held, the maximum potential amount of future payments required would be equal to the pro-rata share of that position within the index based on the notional amount of the index. In the event of a default under a CDS contract, the maximum potential amount of future payments would be the notional amount. For CDS, the default events could be bankruptcy and failing to pay interest or principal on borrowed money or a restructuring. A restructuring is a change in the underlying obligations which would include reduction in interest or principal, maturity extension and subordination to other obligations. During the year ended December 31, 2009, Diversified Income Plus Fund engaged in these types of investments. Refer to the credit default swap tables located within the Fund’s Schedule of Investments for additional information as of December 31, 2009.
(L) Mortgage Dollar Roll Transactions – Certain Funds enter into mortgage dollar roll transactions on securities to be issued by the Government National Mortgage Association, Federal National Mortgage Association and Federal Home Loan Mortgage Corporation, in which the Funds sell mortgage securities and simultaneously agree to repurchase similar (same type and coupon) securities at a later date at an agreed upon price. The Funds maintain liquid securities having a value not less than the repurchase price (including accrued interest) for such dollar rolls. The market value of the securities that the Funds are required to purchase may decline below the agreed upon repurchase price of those securities.
The Funds are compensated from negotiated fees paid by brokers offered as an inducement to the Funds to "roll over" their purchase commitments, thus enhancing the yield. Mortgage dollar rolls may be renewed with a new purchase and repurchase price and a cash settlement made on settlement date without physical delivery of the securities subject to the contract. The fees received are recognized over the roll period and are included in Income from mortgage dollar rolls in the Statement of Operations. During the year ended December 31, 2009, none of the Funds engaged in this type of transaction.
(M) Securities Lending – The Trust has entered into a Securities Lending Agreement (the “Agreement”) with Deutsche Bank AG (“Deutsche”). The Agreement authorizes Deutsche to lend securities to authorized borrowers on behalf of the Funds. Pursuant to the Agreement, all loaned securities are initially collateralized by cash equal to at least 102% of the value of the loaned securities. All cash collateral received is invested in Thrivent Financial Securities Lending Trust. The Funds receive payments equivalent to the dividends and interest that would have been earned on the securities loaned while simultaneously seeking to earn income on the investment of cash collateral. Amounts earned on investments in Thrivent Financial Securities Lending Trust, net of rebates, fees paid to Deutsche for services provided and any other securities lending expenses, are included in Income from securities loaned on the Statement of Operations. By investing any cash collateral it receives in these transactions, a Fund could realize additional gains or losses. If the borrower fails to return the securities or the invested collateral has declined in value, the Fund could lose money.
37
THRIVENT MUTUAL FUNDS
Notes to Financial Statements
As of December 31, 2009
During the year ended December 31, 2009, Real Estate Securities Fund and Diversified Income Plus Fund had securities on loan. As of December 31, 2009, the value of securities on loan is as follows:
| | | |
Fund | | Securities on
Loan |
Diversified Income Plus | | $ | 3,087,720 |
(N) When-Issued and Delayed Delivery Transactions – Certain Funds may purchase or sell securities on a when-issued or delayed delivery basis. These transactions involve a commitment by a Fund to purchase or sell securities for a predetermined price or yield, with payment and delivery taking place beyond the customary settlement period. When delayed delivery purchases are outstanding, a Fund will designate liquid assets in an amount sufficient to meet the purchase price. When purchasing a security on a delayed delivery basis, a Fund assumes the rights and risks of ownership of the security, including the risk of price and yield fluctuations, and takes such fluctuations into account when determining its net asset value. A Fund may dispose of a delayed delivery transaction after it is entered into, and may sell when-issued securities before they are delivered, which may result in a capital gain or loss. When a Fund has sold a security on a delayed delivery basis, a Fund does not participate in future gains and losses with respect to the security.
(O) Treasury Inflation Protected Securities – Certain Funds may invest in treasury inflation protected securities (TIPS). These securities are fixed income securities whose principal value is periodically adjusted to the rate of inflation. The interest rate is generally fixed at issuance. Interest is paid based on the principal value, which is adjusted for inflation. Any increase in the principal amount will be included as taxable interest in the Statement of Operations and received upon maturity or sale of the security. During the year ended December 31, 2009, none of the Funds engaged in this type of transaction.
(P) Repurchase Agreements — Each Fund may engage in repurchase agreement transactions in pursuit of its investment objective. A repurchase agreement consists of a purchase and a simultaneous agreement to resell an investment for later delivery at an agreed upon price and rate of interest. The Fund must take possession of collateral either directly or through a third-party custodian. If the original seller of a security subject to a repurchase agreement fails to repurchase the security at the agreed upon time, the Fund could incur a loss due to a drop in the market value of the security during the time it takes the Fund to either sell the security or take action to enforce the original seller’s agreement to repurchase the security. Also, if a defaulting original seller filed for bankruptcy or became insolvent, disposition of such security might be delayed by pending legal action. The Fund may only enter into repurchase agreements with banks and other recognized financial institutions such as broker/dealers that are found by the Funds’ investment adviser Thrivent Asset Management, LLC (“Thrivent Asset Mgt.” or the “Adviser”) or subadviser to be creditworthy. During the year ended December 31, 2009, none of the Funds engaged in this type of investment.
(Q) Equity-Linked Structured Securities – Certain funds may invest in equity-linked structured notes. Equity-linked structured notes are debt securities which combine the characteristics of common stock and the sale of an option. The return component is based upon the performance of a single equity security, a basket of equity securities, or an equity index and the sale of an option. There is no guaranteed return of principal with these securities. The appreciation potential of these securities may be limited by a maximum payment or call right and can be influenced by many unpredictable factors. In addition to the performance of the equity, the nature and credit of the issuer may also impact return. During the year ended December 31, 2009, Diversified Income Plus Fund engaged in this type of investment.
(R) Credit Risk – The Funds may be susceptible to credit risk to the extent an issuer or counterparty defaults on its payment obligation. The Funds’ policy is to monitor the creditworthiness of issuers and counterparties. Interest receivable on defaulted securities is monitored for ability to collect payments in default and is adjusted accordingly.
(S) Accounting Estimates – The preparation of financial statements in conformity with GAAP requires management to make estimates and assumptions that affect the reported amounts of assets and liabilities and disclosure of contingent assets and liabilities at the date of the financial statements and the reported amounts of income and expenses during the reporting period. Actual results could differ from those estimates.
(T) Loss Contingencies –Diversified Income Plus Fund is a defendant in an adversary action filed on July 7, 2004 by the Official Committee of Asbestos Claimants of G-I Holdings, Inc.
(G-I) against prior and current holders of secured debt of Building Materials Corporation of America (BMCA), a wholly owned subsidiary of G-I. The suit seeks to recover the value of assets G-I transferred to BMCA that later served as collateral for BMCA’s Debt. The Fund at one time held secured notes in the amount of $1,650,000 and, if the plaintiffs are successful, it is possible that the Fund will be required to pay damages in some amount. This loss contingency has not been accrued as a liability because the amount of potential damages and the likelihood of loss can not be reasonably estimated.
(U) Loan Commitments – Certain Funds may enter into loan commitments, which generally have interest rates which are reset daily, monthly, quarterly or semi-annually by reference to a base lending rate, plus a premium. These base rates are primarily the London-Interbank Offered Rate (“LIBOR”), and secondarily the prime rate offered by one or more major United States banks (the “Prime Rate”) and the certificate of deposit
38
THRIVENT MUTUAL FUNDS
Notes to Financial Statements
As of December 31, 2009
(“CD”) rate or other base lending rates used by commercial lenders. Loan commitments often require prepayments from excess cash flows or allow the borrower to repay at its election. The rate at which the borrower repays cannot be predicted with accuracy. Therefore, the remaining maturity may be considerably less than the stated maturity shown in the Schedule of Investments.
All or a portion of these loan commitments may be unfunded. The Fund is obligated to fund these commitments at the borrower’s discretion. Therefore, the Fund must have funds sufficient to cover its contractual obligation. These unfunded loan commitments, which are marked to market daily, are presented in the Schedule of Investments and may represent all or a portion of the loan’s market value.
(V) Amortization of Offering Costs – The offering costs referenced in the Statement of Operations for Equity Income Plus Fund are costs incurred by the Fund in order to establish it for sale. These costs generally include costs related to registering the shares for sale with the various states as well as any legal costs associated with registering the Fund. These costs are amortized over a period of 12 months from inception and therefore, as of December 31, 2009, have been fully amortized.
(W) Recent Accounting Pronouncements
FASB ASC 815-10-50: Derivatives and Hedging
This pronouncement was announced in March 2008 and is intended to improve financial reporting for derivative instruments by requiring enhanced disclosure that enables investors to understand how and why an entity uses derivatives, how derivatives are accounted for and how derivative instruments affect an entity’s results of operations and financial position.
FASB ASC 850-10-50: Related Party Transactions
This pronouncement was announced in May 2009 and is intended to establish general standards of accounting for and disclosure of events or transactions that occur after the balance sheet date but before financial statements are issued or available to be issued. It requires the disclosure of the date through which an entity has evaluated subsequent events and the basis for that date.
FASB ASC 820-10-65: Fair Value Measurements and Disclosures
This pronouncement was announced in April 2009 and provides additional guidance for estimating fair value. The pronouncement focuses on markets that experience significant decline in volume and level of activity for assets or liabilities as compared to markets that have a history of being inactive. When this exposure to pricing conditions is present further evaluation and disclosure is provided.
(X) Other – For financial statement purposes, investment security transactions are accounted for on the trade date. Realized gains and losses from investment transactions are determined on a specific cost identification basis, which is the same basis used for federal income tax purposes.
(3) FEES AND COMPENSATION PAID TO AFFILIATES
(A) Investment Advisory Fees – The Trust has entered into an Investment Advisory Agreement with Thrivent Asset Mgt. Under the Investment Advisory Agreement, each of the Funds pays a fee for investment advisory services. The fees are accrued daily and paid monthly. The annual rates of fees as a percent of average daily net assets under the Investment Advisory Agreement were as follows:
| | | | | | | | | | | | | | | | | | | | | | | | | | | | | | | | | |
Fund (M - Millions) | | $0 to
$50M | | | $50 to
$100M | | | $100 to
$200M | | | $200 to
$250M | | | $250 to
$500M | | | $500 to
$750M | | | $750 to
$1,000M | | | $1,000 to
$2,000M | | | $2,000 to
$2,500M | | | $2,500 to
$5,000M | | | Over
$5,000M | |
Real Estate Securities | | 0.800 | % | | 0.800 | % | | 0.800 | % | | 0.800 | % | | 0.800 | % | | 0.750 | % | | 0.750 | % | | 0.750 | % | | 0.750 | % | | 0.750 | % | | 0.750 | % |
Equity Income Plus | | 0.650 | % | | 0.650 | % | | 0.650 | % | | 0.650 | % | | 0.600 | % | | 0.600 | % | | 0.600 | % | | 0.600 | % | | 0.600 | % | | 0.600 | % | | 0.600 | % |
Diversified Income Plus | | 0.550 | % | | 0.550 | % | | 0.550 | % | | 0.550 | % | | 0.550 | % | | 0.550 | % | | 0.550 | % | | 0.550 | % | | 0.550 | % | | 0.550 | % | | 0.550 | % |
(B) Expense Reimbursements – As of December 31, 2009, contractual expense reimbursements to limit expenses to the following percentages were in effect:
| | | | | | | | |
Fund | | Class A | | | Institutional
Class | | | Expiration
Date |
Real Estate Securities | | 1.25 | % | | N/A | | | 2/28/2010 |
Equity Income Plus | | 1.15 | % | | 0.80 | % | | 2/28/2010 |
The Funds may invest cash in High Yield Fund and Money Market Fund, subject to certain limitations. During the year ended December 31, 2009, Diversified Income Plus Fund invested in High Yield Fund. During the year ended December 31, 2009, Real Estate Securities Fund, Equity Income Plus Fund and Diversified Income Plus Fund invested in Money Market Fund. These related-party transactions are subject to the same terms as non-related party transactions except that, to avoid duplicate investment advisory fees, Thrivent Asset Mgt.
39
THRIVENT MUTUAL FUNDS
Notes to Financial Statements
As of December 31, 2009
reimburses an amount equal to the advisory fee which is charged to the Fund for its investment in High Yield Fund or Money Market Fund.
(C) Distribution Plan – Thrivent Investment Management, Inc. (“Thrivent Investment Mgt.”) is the Trust's distributor. The Trust has adopted a Distribution Plan pursuant to Rule 12b-1 under the 1940 Act. Class A shares generally have a Rule 12b-1 fee of up to 0.25% of average net assets.
(D) Sales Charges and Other Fees – For the year ended December 31, 2009, Thrivent Investment Mgt. received $210,282 of aggregate underwriting concessions from the sales of the Trust’s Class A and Class B shares and aggregate deferred sales charges of $10 from redemptions of Class A and Class B shares. Sales charges are not an expense of the Trust and are not reflected in the financial statements of any of the Funds.
The Trust has entered into an accounting and administrative services agreement with Thrivent Asset Mgt. pursuant to which Thrivent Asset Mgt. provides certain accounting and administrative personnel and services to the Funds. For the year ended December 31, 2009, Thrivent Asset Mgt. received aggregate fees for accounting and administrative personnel and services of $252,521 from the Trust.
The Trust has entered into an agreement with Thrivent Financial Investor Services Inc. (“Thrivent Investor Services”) to provide the Funds with transfer agent services. For the year ended December 31, 2009, Thrivent Investor Services received $265,232 for transfer agent services from the Trust. A portion of this amount is remitted to third-party administrators that provide shareholder services on behalf of Thrivent Mutual Funds.
Each Trustee is eligible to participate in a deferred compensation plan with respect to fees received from the Funds. Participants in the plan may designate their deferred Trustee’s fees as if invested in a series of Thrivent Mutual Funds. The value of each Trustee’s deferred compensation account will increase or decrease as if invested in shares of that series. The deferred fees remain in the appropriate Fund until distribution in accordance with the plan. The deferred fee liability is an unsecured liability.
Those Trustees not participating in the above plan received $7,707 in fees from the Trust for the year ended December 31, 2009. No remuneration has been paid by the Trust to any of the officers or non-independent Trustees of the Trust. In addition, the Trust reimbursed independent Trustees for reasonable expenses incurred in relation to attendance at the meetings and industry conferences.
Certain officers and non-independent Trustees of the Funds are officers and directors of Thrivent Asset Mgt., Thrivent Investment Mgt. and Thrivent Investor Services; however, they receive no compensation from the Funds.
(E) Indirect Expenses – Some Funds invest in other mutual funds. Fees and expenses of those underlying funds are not included in those Funds’ expense ratios. The Funds indirectly bear their proportionate share of the annualized weighted average expense ratio of the underlying funds in which they invest.
(4) TAX INFORMATION
Distributions are based on amounts calculated in accordance with applicable federal income tax regulations, which may differ from GAAP. To the extent that these differences are permanent in nature, such amounts are reclassified within the capital accounts based on their federal tax-basis treatment; temporary differences do not require reclassifications.
On the Statement of Assets and Liabilities, as a result of permanent book-to-tax differences, reclassification adjustments were made as follows [Increase/(Decrease)]:
| | | | | | | | | | | |
Fund | | Accumulated
Net
Investment
Income/(Loss) | | | Accumulated
Net Realized
Gain/(Loss) | | Trust Capital | |
Real Estate Securities | | ($ | 77,299 | ) | | $ | 71,617 | | $ | 5,682 | |
Equity Income Plus | | | 4,535 | | | | 689 | | | (5,224 | ) |
Diversified Income Plus | | | (1,096,391 | ) | | | 13,763,597 | | | (12,667,206 | ) |
At December 31, 2009, the components of distributable earnings on a tax basis were as follows:
| | | | | | |
Fund | | Undistributed
Ordinary Income | | Undistributed
Long-Term
Capital Gain |
Equity Income Plus | | $ | 7,125 | | $ | — |
Diversified Income Plus | | | 82,394 | | | — |
At December 31, 2009, the following funds had accumulated net realized capital loss carryovers expiring as follows:
| | | | | |
Fund | | Capital Loss
Carryover | | Expiration
Year |
Real Estate Securities | | $ | 4,701,392 | | 2016 |
| | | 7,987,125 | | 2017 |
| | | | | |
| | $ | 12,688,517 | | |
| | | | | |
Equity Income Plus | | | 4,389,370 | | 2016 |
| | | 1,491,391 | | 2017 |
| | | | | |
| | $ | 5,880,761 | | |
| | | | | |
Diversified Income Plus | | | 324,797 | | 2011 |
| | | 20,726,055 | | 2016 |
| | | 6,421,129 | | 2017 |
| | | | | |
| | $ | 27,471,981 | | |
| | | | | |
To the extent that these Funds realize future net capital gains, taxable distributions will be reduced by any unused capital loss carryovers as permitted by the Internal Revenue Code.
40
THRIVENT MUTUAL FUNDS
Notes to Financial Statements
As of December 31, 2009
The following capital loss carryover expired during 2009:
Diversified Income Plus Fund, $12,668,032.
The tax character of distributions paid during the year ended December 31, 2009 and 2008 was as follows:
| | | | | | | | | | | | |
| | | Ordinary Income | | Return of Capital |
Fund | | 12/31/2009 | | 12/31/2008 | | 12/31/2009 | | 12/31/2008 |
Real Estate Securities | | $ | 2,063,121 | | $ | 2,553,815 | | $ | 903,104 | | $ | 1,655,454 |
Equity Income Plus | | | 530,920 | | | 601,659 | | | — | | | 29,022 |
Diversified Income Plus | | | 6,586,560 | | | 8,262,778 | | | — | | | 40,687 |
(5) DISTRIBUTIONS BY CLASS
Net investment income and return of capital distributions by class for the Funds were as follows:
| | | | | | | | | | | | | | | | | | |
| | | Net Investment Income |
| | | For the period ended December 31, 2009 | | For the period ended December 31, 2008 |
Fund | | Class A | | Class B | | Institutional
Class | | Class A | | Class B | | Institutional
Class |
Real Estate Securities | | $ | 239,156 | | | N/A | | $ | 1,823,965 | | $ | 293,918 | | | N/A | | $ | 2,259,897 |
Equity Income Plus | | | 60,920 | | | N/A | | | 470,000 | | | 73,366 | | | N/A | | | 528,293 |
Diversified Income Plus | | | 6,264,304 | | $ | 2,163 | | | 320,093 | | | 7,843,159 | | $ | 56,565 | | | 363,054 |
| |
| | | Return of Capital |
| | | For the period ended December 31, 2009 | | For the period ended December 31, 2008 |
Fund | | Class A | | Class B | | Institutional
Class | | Class A | | Class B | | Institutional
Class |
Real Estate Securities | | $ | 111,510 | | | N/A | | $ | 791,594 | | $ | 214,965 | | | N/A | | $ | 1,440,489 |
Equity Income Plus | | | — | | | N/A | | | — | | | 3,821 | | | N/A | | | 25,201 |
Diversified Income Plus | | | — | | $ | — | | | — | | | 38,698 | | $ | 359 | | | 1,630 |
41
THRIVENT MUTUAL FUNDS
Notes to Financial Statements
As of December 31, 2009
(6) SECURITY TRANSACTIONS
(A) Purchases and Sales of Investment Securities – For the year ended December 31, 2009, the cost of purchases and the proceeds from sales of investment securities, other than U.S. Government and short-term securities were as follows:
| | | | | | |
| | | In thousands |
Fund | | Purchases | | Sales |
Real Estate Securities | | $ | 20,709 | | $ | 12,716 |
Equity Income Plus | | | 85,852 | | | 83,544 |
Diversified Income Plus | | | 105,131 | | | 111,351 |
(B) Investments in Restricted Securities – Certain Funds may own restricted securities that have been deemed illiquid and were purchased in private placement transactions without registration under the Securities Act of 1933. Unless such securities subsequently become registered, they generally may be resold only in privately negotiated transactions with a limited number of purchasers. As of December 31, 2009, the following Fund held restricted securities:
| | | | | |
Fund | | Number of
Securities | | Percent of
Fund’s
Net Assets | |
Diversified Income Plus | | 3 | | 1.77 | % |
The Funds have no right to require registration of unregistered securities.
(C) Investments in High-Yielding Securities – The Funds may invest in high-yielding securities. These securities will typically be in the lower rating categories or will be non-rated and generally will involve more risk than securities in the higher rating categories. Lower rated or unrated securities are more likely to react to developments affecting market risk and credit risk than are more highly rated securities, which react primarily to movements in the general level of interest rates.
(D) Investments in Options and Futures Contracts – The movement in the price of the security underlying an option or futures contract may not correlate perfectly with the movement in the prices of the portfolio securities being hedged. A lack of correlation could render the Fund’s hedging strategy unsuccessful and could result in a loss to the Fund. In the event that a liquid secondary market would not exist, the Fund could be prevented from entering into a closing transaction, which could result in additional losses to the Fund.
(E) Written Option Contracts – The number of contracts and premium amounts associated with covered call option contracts written during the year ended December 31, 2009, were as follows:
| | | | | | | |
| | | Number of
Contracts | | | Premium
Amount | |
Equity Income Plus | | | | | | | |
Balance at December 31, 2008 | | 30 | | | $ | 16,043 | |
Opened | | 1,145 | | | | 559,740 | |
Closed | | (1,120 | ) | | | (553,114 | ) |
Expired | | — | | | | — | |
Exercised | | — | | | | — | |
| | | | | | | |
Balance at December 31, 2009 | | 55 | | | $ | 22,669 | |
| | | | | | | |
Diversified Income Plus | | | | | | | |
Balance at December 31, 2008 | | — | | | $ | — | |
Opened | | 1,545 | | | | 645,545 | |
Closed | | (1,445 | ) | | | (604,871 | ) |
Expired | | — | | | | — | |
Exercised | | — | | | | — | |
| | | | | | | |
Balance at December 31, 2009 | | 100 | | | $ | 40,674 | |
| | | | | | | |
(7) SECURITY TRANSACTIONS WITH AFFILIATED FUNDS
The Funds are permitted to purchase or sell securities from or to certain other Funds under specified conditions outlined in procedures adopted by the Board of Trustees of the Trust. The procedures have been designed to ensure that any purchase or sale of securities by the Fund from or to another fund or portfolio that is or could be considered an affiliate by virtue of having a common investment adviser (or affiliated investment advisers), common Trustees and/or common officers complies with Rule 17a-7 of the 1940 Act. Further, as defined under the procedures, each transaction is effected at the current market price. Pursuant to these procedures, during the year ended December 31, 2009, the Funds engaged in purchases and sales of $317,600 and $0, respectively.
(8) RELATED PARTY TRANSACTIONS
As of December 31, 2009, related parties held the following shares in excess of 5% of Thrivent Mutual Funds:
| | | | | |
Fund | | Shares | | Percent of
Fund’s
Outstanding
Shares | |
Real Estate Securities | | 760,238 | | 6.5 | % |
(9) SUBSEQUENT EVENTS
Management of the Funds has evaluated the impact of subsequent events through February 18, 2010, the date the financial statements were issued, and, except as already included in the Notes to Financial Statements, has determined that no additional items require disclosure.
42
[THIS PAGE INTENTIONALLY LEFT BLANK]
43
THRIVENT MUTUAL FUNDS
Financial Highlights
| | | | | | | | | | | | | | | | | | | | | | | | | | |
| | | FOR A SHARE OUSTANDING THROUGHOUT EACH PERIOD* | |
| | | | | Income from Investment Operations | | | Less Distributions from | |
| | | Net Asset
Value,
Beginning
of Period | | Net
Investment
Income/(Loss) | | Net Realized
and Unrealized
Gain/(Loss) on
Investments(a) | | | Total from
Investment
Operations | | | Net
Investment
Income | | | Net Realized
Gain on
Investments | | | Return of
Capital | |
| REAL ESTATE SECURITIES FUND | | | | | | | | | | | | | | | | | | | | | | | |
Class A Shares | | | | | | | | | | | | | | | | | | | | | | | | | | |
Year Ended 12/31/2009 | | $ | 6.36 | | $ | 0.19 | | $ | 1.50 | | | $ | 1.69 | | | $ | (0.18 | ) | | $ | — | | | $ | (0.08 | ) |
Year Ended 12/31/2008 | | | 10.56 | | | 0.23 | | | (4.05 | ) | | | (3.82 | ) | | | (0.22 | ) | | | — | | | | (0.16 | ) |
Year Ended 12/31/2007 | | | 13.34 | | | 0.12 | | | (2.34 | ) | | | (2.22 | ) | | | (0.20 | ) | | | (0.35 | ) | | | (0.01 | ) |
Year Ended 12/31/2006 | | | 10.42 | | | 0.23 | | | 3.30 | | | | 3.53 | | | | (0.26 | ) | | | (0.31 | ) | | | (0.04 | ) |
Year Ended 12/31/2005 (c) | | | 10.00 | | | 0.11 | | | 0.48 | | | | 0.59 | | | | (0.11 | ) | | | (0.04 | ) | | | (0.02 | ) |
Institutional Class Shares | | | | | | | | | | | | | | | | | | | | | | | | | | |
Year Ended 12/31/2009 | | | 6.34 | | | 0.20 | | | 1.53 | | | | 1.73 | | | | (0.19 | ) | | | — | | | | (0.08 | ) |
Year Ended 12/31/2008 | | | 10.56 | | | 0.25 | | | (4.06 | ) | | | (3.81 | ) | | | (0.25 | ) | | | — | | | | (0.16 | ) |
Year Ended 12/31/2007 | | | 13.35 | | | 0.25 | | | (2.43 | ) | | | (2.18 | ) | | | (0.25 | ) | | | (0.35 | ) | | | (0.01 | ) |
Year Ended 12/31/2006 | | | 10.42 | | | 0.31 | | | 3.29 | | | | 3.60 | | | | (0.32 | ) | | | (0.31 | ) | | | (0.04 | ) |
Year Ended 12/31/2005 (c) | | | 10.00 | | | 0.12 | | | 0.49 | | | | 0.61 | | | | (0.13 | ) | | | (0.04 | ) | | | (0.02 | ) |
| | | | | | | | | | | | | | | | | | | | | | | | | | |
EQUITY INCOME PLUS FUND | | | | | | | | | | | | | | | | | | | | | | | | | | |
Class A Shares | | | | | | | | | | | | | | | | | | | | | | | | | | |
Year Ended 12/31/2009 | | | 7.03 | | | 0.13 | | | 0.95 | | | | 1.08 | | | | (0.13 | ) | | | — | | | | — | |
Year Ended 12/31/2008 (d) | | | 10.00 | | | 0.18 | | | (2.97 | ) | | | (2.79 | ) | | | (0.17 | ) | | | — | | | | (0.01 | ) |
| Institutional Class Shares | | | | | | | | | | | | | | | | | | | | | | | | | | |
Year Ended 12/31/2009 | | | 7.04 | | | 0.16 | | | 0.94 | | | | 1.10 | | | | (0.16 | ) | | | — | | | | — | |
Year Ended 12/31/2008 (d) | | | 10.00 | | | 0.18 | | | (2.94 | ) | | | (2.76 | ) | | | (0.19 | ) | | | — | | | | (0.01 | ) |
| | | | | | | | | | | | | | | | | | | | | | | | | | |
DIVERSIFIED INCOME PLUS FUND | | | | | | | | | | | | | | | | | | | | | | | |
Class A Shares | | | | | | | | | | | | | | | | | | | | | | | | | | |
Year Ended 12/31/2009 | | | 4.68 | | | 0.32 | | | 1.11 | | | | 1.43 | | | | (0.28 | ) | | | — | | | | — | |
Year Ended 12/31/2008 | | | 6.48 | | | 0.30 | | | (1.78 | ) | | | (1.48 | ) | | | (0.32 | ) | | | — | | | | — | |
Year Ended 12/31/2007 | | | 6.88 | | | 0.32 | | | (0.39 | ) | | | (0.07 | ) | | | (0.33 | ) | | | — | | | | — | |
Year Ended 12/31/2006 (e) | | | 6.70 | | | 0.05 | | | 0.18 | | | | 0.23 | | | | (0.05 | ) | | | — | | | | — | |
Year Ended 10/31/2006 | | | 6.41 | | | 0.43 | | | 0.29 | | | | 0.72 | | | | (0.43 | ) | | | — | | | | — | |
Year Ended 10/31/2005 | | | 6.71 | | | 0.46 | | | (0.27 | ) | | | 0.19 | | | | (0.49 | ) | | | — | | | | — | |
Institutional Class Shares | | | | | | | | | | | | | | | | | | | | | | | | | | |
Year Ended 12/31/2009 | | | 4.67 | | | 0.35 | | | 1.09 | | | | 1.44 | | | | (0.30 | ) | | | — | | | | — | |
Year Ended 12/31/2008 | | | 6.47 | | | 0.31 | | | (1.76 | ) | | | (1.45 | ) | | | (0.35 | ) | | | — | | | | — | |
Year Ended 12/31/2007 | | | 6.88 | | | 0.35 | | | (0.40 | ) | | | (0.05 | ) | | | (0.36 | ) | | | — | | | | — | |
Year Ended 12/31/2006 (e) | | | 6.70 | | | 0.05 | | | 0.19 | | | | 0.24 | | | | (0.06 | ) | | | — | | | | — | |
Year Ended 10/31/2006 | | | 6.41 | | | 0.45 | | | 0.30 | | | | 0.75 | | | | (0.46 | ) | | | — | | | | — | |
Year Ended 10/31/2005 | | | 6.71 | | | 0.49 | | | (0.27 | ) | | | 0.22 | | | | (0.52 | ) | | | — | | | | — | |
| (a) | The amount shown may not correlate with the change in aggregate gains and losses of portfolio securities due to the timing of sales and redemptions of fund shares. |
| (c) | Since fund inception, June 30, 2005. |
| (d) | Since fund inception, February 29, 2008. |
| (e) | For the period from November 1, 2006 to December 31, 2006. |
| * | All per share amounts have been rounded to the nearest cent. |
The accompanying Notes to Financial Statements are an integral part of this schedule.
44
THRIVENT MUTUAL FUNDS
Financial Highlights – continued
| | | | | | | | | | | | | | | | | | | | | | | | | | |
| RATIOS / SUPPLEMENTAL DATA | |
| | | | | | | | | | | Ratio to Average Net
Assets** | | | Ratios to Average Net Assets
Before Expenses Waived,
Credited or Paid Indirectly** | | | | |
Total Distributions | | | Net Asset
Value, End
of Period | | Total Return(b) | | | Net Assets,
End of Period
(in millions) | | Expenses | | | Net Investment
Income/(Loss) | | | Expenses | | | Net Investment
Income/(Loss) | | | Portfolio
Turnover
Rate | |
| | | | | | | | | | | | | | | | | | | | | | | | | | |
| $ | (0.26 | ) | | $ | 7.79 | | 28.55 | % | | $ | 10.8 | | 1.25 | % | | 3.09 | % | | 2.23 | % | | 2.11 | % | | 20 | % |
| | (0.38 | ) | | | 6.36 | | (37.16 | )% | | | 8.4 | | 1.25 | % | | 2.50 | % | | 1.73 | % | | 2.02 | % | | 49 | % |
| | (0.56 | ) | | | 10.56 | | (16.84 | )% | | | 14.6 | | 1.10 | % | | 1.24 | % | | 1.53 | % | | 0.81 | % | | 77 | % |
| | (0.61 | ) | | | 13.34 | | 34.27 | % | | | 24.3 | | 0.48 | % | | 2.01 | % | | 1.60 | % | | 0.89 | % | | 70 | % |
| | (0.17 | ) | | | 10.42 | | 5.90 | % | | | 10.0 | | 1.06 | % | | 2.30 | % | | 2.30 | % | | 1.07 | % | | 16 | % |
| | (0.27 | ) | | | 7.80 | | 28.97 | % | | | 80.2 | | 1.03 | % | | 3.24 | % | | 1.04 | % | | 3.23 | % | | 20 | % |
| | (0.41 | ) | | | 6.34 | | (37.00 | )% | | | 56.5 | | 0.91 | % | | 2.73 | % | | 0.93 | % | | 2.72 | % | | 49 | % |
| | (0.61 | ) | | | 10.56 | | (16.59 | )% | | | 75.2 | | 0.82 | % | | 1.92 | % | | 0.95 | % | | 1.78 | % | | 77 | % |
| | (0.67 | ) | | | 13.35 | | 34.96 | % | | | 47.3 | | 0.00 | % | | 2.51 | % | | 1.06 | % | | 1.45 | % | | 70 | % |
| | (0.19 | ) | | | 10.42 | | 6.11 | % | | | 14.9 | | 0.31 | % | | 3.34 | % | | 1.61 | % | | 2.04 | % | | 16 | % |
| | | | | | | | | | | | | | | | | | | | | | | | | | | |
| | | | | | | | | | | | | | | | | | | | | | | | | | |
| | (0.13 | ) | | | 7.98 | | 15.74 | % | | | 4.1 | | 1.15 | % | | 1.92 | % | | 1.93 | % | | 1.14 | % | | 414 | % |
| | (0.18 | ) | | | 7.03 | | (28.15 | )% | | | 2.9 | | 1.15 | % | | 2.35 | % | | 1.68 | % | | 1.82 | % | | 114 | % |
| | (0.16 | ) | | | 7.98 | | 15.97 | % | | | 24.7 | | 0.80 | % | | 2.28 | % | | 1.35 | % | | 1.73 | % | | 414 | % |
| | (0.20 | ) | | | 7.04 | | (27.90 | )% | | | 20.3 | | 0.80 | % | | 2.56 | % | | 1.08 | % | | 2.28 | % | | 114 | % |
| | | | | | | | | | | | | | | | | | | | | | | | | | | |
| | | | | | | | | | | | | | | | | | | | | | | | | | |
| | (0.28 | ) | | | 5.83 | | 31.50 | % | | | 135.2 | | 1.18 | % | | 6.32 | % | | 1.20 | % | | 6.30 | % | | 94 | % |
| | (0.32 | ) | | | 4.68 | | (23.69 | )% | | | 109.4 | | 1.06 | % | | 5.02 | % | | 1.11 | % | | 4.97 | % | | 114 | % |
| | (0.33 | ) | | | 6.48 | | (1.12 | )% | | | 175.4 | | 0.90 | % | | 4.82 | % | | 1.08 | % | | 4.64 | % | | 171 | % |
| | (0.05 | ) | | | 6.88 | | 3.50 | % | | | 138.8 | | 1.08 | % | | 4.80 | % | | 1.25 | % | | 4.63 | % | | 16 | % |
| | (0.43 | ) | | | 6.70 | | 11.77 | % | | | 123.4 | | 0.98 | % | | 6.66 | % | | 1.15 | % | | 6.49 | % | | 170 | % |
| | (0.49 | ) | | | 6.41 | | 2.91 | % | | | 124.3 | | 0.95 | % | | 6.99 | % | | 1.13 | % | | 6.82 | % | | 57 | % |
| | (0.30 | ) | | | 5.81 | | 31.97 | % | | | 6.7 | | 0.76 | % | | 6.71 | % | | 0.79 | % | | 6.69 | % | | 94 | % |
| | (0.35 | ) | | | 4.67 | | (23.32 | )% | | | 4.1 | | 0.63 | % | | 5.42 | % | | 0.68 | % | | 5.37 | % | | 114 | % |
| | (0.36 | ) | | | 6.47 | | (0.78 | )% | | | 9.6 | | 0.51 | % | | 5.22 | % | | 0.69 | % | | 5.04 | % | | 171 | % |
| | (0.06 | ) | | | 6.88 | | 3.59 | % | | | 7.0 | | 0.66 | % | | 5.15 | % | | 0.83 | % | | 4.98 | % | | 16 | % |
| | (0.46 | ) | | | 6.70 | | 12.29 | % | | | 5.8 | | 0.54 | % | | 6.84 | % | | 0.72 | % | | 6.66 | % | | 170 | % |
| | (0.52 | ) | | | 6.41 | | 3.36 | % | | | 4.3 | | 0.50 | % | | 7.42 | % | | 0.67 | % | | 7.25 | % | | 57 | % |
| (b) | Total investment return assumes dividend reinvestment and does not reflect any deduction for sales charges. Not annualized for periods less than one year. |
| ** | Computed on an annualized basis of less than one year. |
The accompanying Notes to Financial Statements are an integral part of this schedule.
45
Additional Information
(unaudited)
Shareholder Notification of Federal Tax Information
The following information is provided solely to satisfy the requirements set forth by the Internal Revenue Code. Shareholders will be provided information regarding their distribution in February 2010.
The Funds designate the percentage of dividends declared from net investment income as dividends qualifying for the 70% dividends received deduction for corporations and the percentage as qualified dividend income for individuals under the Jobs and Growth Tax Relief Reconciliation Act of 2003 as follows:
| | | | | | |
Fund | | Dividends
Received
Deduction
for
Corporations | | | Qualified
Dividend
Income for
Individuals | |
Real Estate Securities | | 2 | % | | 2 | % |
Equity Income Plus | | 96 | % | | 98 | % |
Diversified Income Plus | | 10 | % | | 11 | % |
Proxy Voting
The policies and procedures that the Trust uses to determine how to vote proxies relating to portfolio securities are attached to the Trust’s Statement of Additional Information. You may request a free copy of the Statement of Additional Information or the report of how the Trust voted proxies relating to portfolio securities during the most recent 12-month period ended June 30 by calling 1-800-847-4836. You also may review the Statement of Additional Information or the report of how the Trust voted proxies relating to portfolio securities during the most recent 12-month period ended June 30 at www.thrivent.com or www.sec.gov.
Quarterly Schedule of Portfolio Holdings
The Trust files its Schedule of Portfolio Holdings on Form N-Q with the SEC for the first and third quarters of each fiscal year. You may request a free copy of the Trust’s Forms N-Q by calling 1-800-847-4836. The Trust’s most recent Form N-Q Schedule of Investments also is at www.thrivent.com or www.sec.gov. You also may review and copy the Forms N-Q for the Trust at the SEC’s Public Reference Room in Washington, DC. You may get information about the operation of the Public Reference Room by calling 1-800-SEC-0330.
Board Approval of Investment Advisory Agreements and Subadvisory Agreements
Both the Investment Company Act of 1940 and the terms of the Investment Advisory and Subadvisory Agreements of the Thrivent Mutual Funds (the “Trust”) require that these agreements be approved annually by a majority of the Board of Trustees, including a majority of the Independent Trustees.
At its meeting on November 10, 2009, the Board of Trustees of the Trust voted unanimously to renew the existing Advisory Agreement between the Trust and Thrivent Asset Management, LLC (the “Adviser”) for each series (each, a “Fund”) of the Trust. The Board also unanimously approved the Subadvisory Agreements for each of the Funds for which there is an investment subadviser (each a “Subadviser”). The Adviser and Subadvisers are referred to, collectively, as the “Advisory Organizations.” In connection with its evaluation of the agreements with the Advisory Organizations, the Board reviewed a broad range of information requested for this purpose and considered a variety of factors, including the following:
| | 1. | The nature, extent and quality of the services provided by the Advisory Organizations; |
| | 2. | The performance of the Funds; |
| | 3. | The costs of services provided and profits realized by the Adviser; |
| | 4. | The extent to which economies of scale may be realized as the Funds grow; and |
| | 5. | Whether the breakpoint levels reflect these economies of scale for the benefit of shareholders. |
In connection with the renewal process, the Contracts Committee of the Board (consisting of each of the Independent Trustees of the Trust) met on July 8, August 25 and November 10, 2009 to consider information relevant to the renewal process. The Independent Trustees also retained the services of Management Practice, Inc. (“MPI”) as an independent consultant to assist
46
Additional Information
(unaudited)
them in the compilation, organization and evaluation of relevant information. This information included statistical comparisons of the advisory fees, total operating expenses, and performance of each of the Funds in comparison to a peer group of comparable investment companies; detailed information prepared by management with respect to the cost of services provided to the Funds and fees charged, including effective advisory fees that take into account breakpoints and fee waivers by the Adviser; profit realized by the Adviser and its affiliates that provide services to the Funds; and information regarding the types of services furnished to the Funds, the personnel providing the services, changes in staff, systems improvements and plans for further hiring. The Board also received reports from the Adviser’s investment management staff with respect to the performance of the Funds. In addition to its review of the information presented to the Board during the contract renewal process and throughout the year, the Board also considered knowledge gained from discussions with management.
The Independent Trustees were represented by independent counsel throughout the review process and during executive sessions without management present to consider reapproval of the agreements. The Trustees also received a memorandum from independent counsel summarizing their responsibilities under the Investment Company Act of 1940 in reviewing and approving the Advisory Agreement and the Subadvisory Agreements. The Independent Trustees relied on their own business judgment in determining the weight to be given to each factor considered in evaluating the materials that were presented to them. The Contract Committee’s and Board’s review and conclusions were based on a comprehensive consideration of all information presented to the Board and not the result of any single controlling factor. The key factors considered and the conclusions reached are described below.
Nature, Extent and Quality of Services
At each of the Board’s regular quarterly meetings during 2009, management presented information describing the services furnished to the Funds by the Adviser and, as appropriate, the Subadvisers. During these meetings, management reported on the investment management, portfolio trading, and compliance functions provided to the Funds under the Advisory and Subadvisory Agreements. During the renewal process, the Board considered the specific services provided under the Advisory Agreement as compared to the services provided by other mutual fund investment advisers under similar investment advisory agreements. The Board also considered information relating to the investment experience and qualifications of the Adviser’s portfolio managers and those of the Subadvisers.
The Board received reports at each of its quarterly meetings from the Adviser’s Directors of Equity and Fixed Income Investments, as supplemented by the Adviser’s Chief Investment Officer, who was also present at the meetings. In addition, the Board had, over the past year, met with a majority of the portfolio managers of both the Adviser and each of the Subadvisers, which gave the Board an opportunity to evaluate the managers’ abilities, experience, and the quality of services they provide to the Funds. Information was also presented to the Board describing the portfolio compliance functions performed by the Adviser and the Adviser’s oversight of Subadvisers to the Trust. The Independent Trustees also received quarterly reports from the Trust’s Chief Compliance Officer.
The Board considered other benefits to the Adviser and its affiliates derived from its relationship with the Funds. These benefits include, among other things, fees for transfer agency services provided to the Funds, research received by the Adviser generated from commission dollars spent on the Funds’ portfolio trading, and, in certain cases, distribution or service fees related to Funds’ sales. The Board reviewed with the Adviser these arrangements and the reasonableness of the costs relative to the services performed.
The Adviser also reviewed with the Board the Adviser’s ongoing program to enhance portfolio management capabilities, including recruitment and, in light of the economic downturn, retention of research analysts and other personnel, and investment in technology systems and applications to improve investment research, trading, portfolio compliance, and investment reporting functions. The Board viewed these actions as a positive factor in approving the current Advisory Agreement as they demonstrated the Adviser’s commitment to provide the Funds with quality service and competitive investment performance. The Board concluded that, within the context of its full deliberations, the nature, extent and quality of the investment advisory services provided to the Funds by the Adviser and Subadvisers supported renewal of the Advisory Agreement and Subadvisory Agreements.
Performance of the Funds
The Board received regular monthly performance reports, which included both the absolute and relative investment performance of each Fund. In addition, in connection with each of its regular quarterly meetings, the Board received more extensive information on the performance of each Fund, including absolute performance, relative performance rankings within each Fund’s Lipper peer group and performance as compared to benchmark index returns. The Board considered investment performance for each Fund, to the extent applicable, over the one-, three- and five-year periods. When evaluating investment performance, the Board considered longer-term performance and the trend of performance, and focused particularly upon the three-year performance record.
47
Additional Information
(unaudited)
For the three-year period ended June 30, 2009, 47% of the internally managed Funds and 50% of the subadvised Funds performed at or above the median of their respective Lipper peer groups. The Board concluded that the performance of the Thrivent funds was either satisfactory compared to their peer groups of funds or that the Adviser had taken appropriate actions to improve performance.
Cost of Services and Profitability
The Board considered both the contractual and effective advisory fees for each of the Funds. The Board noted that 80% of the Funds, representing 67% of total Trust assets, had contractual advisory fees at or below the medians of their peer groups. The Board also considered advisory fees after the voluntary and contractual fee waivers and expense reimbursements provided by the Adviser for several of the Funds, noting that 80% of the Funds, representing 74.8% of total Trust assets, had effective advisory fees at or below the medians of their peer groups. In addition, the Board reviewed information prepared by MPI comparing each Fund’s overall expense ratio with the expense ratio of its peer group of funds. The Board also considered the profitability of the Adviser both overall and on a Fund-by-Fund basis.
The Board considered the allocations of the Adviser’s costs to the Funds. The internal audit department of the Adviser conducted a review of such allocations and reported to the Board regarding the reasonableness and consistency of these allocations.
From its review of the MPI data and expense and profit information provided by the Adviser, the Board concluded that the profits earned by the Adviser from the Advisory Agreements were reasonable, taking into consideration the expense reimbursements and waivers in effect.
On the basis of its review, the Board concluded that the advisory fees charged to the Funds for investment management services were reasonable. With respect to fees paid to Subadvisers under the Subadvisory Agreements, the Trustees considered that those contracts had been negotiated at arm’s length between the Adviser and each Subadviser, and that the Subadviser’s separate profitability from its relationship with the Funds was not a material factor in determining whether to renew the agreement.
Economies of Scale and Breakpoints
The Trustees considered information regarding the extent to which economies of scale may be realized as a Fund’s assets increase and whether the fee levels reflect these economies of scale for the benefit of shareholders. The Trustees also considered management’s view that it is difficult to generalize as to whether or to what extent economies in the advisory function may be realized as a Fund’s assets increase. The Board noted that expected economies of scale, where they exist, may be shared through the use of fee breakpoints, fee waivers by the Adviser, and/or a lower overall fee rate.
The Trustees considered information provided by the Adviser related to fee rates, fee breakpoints in the Advisory Agreement and fee waivers provided by the Adviser. The Adviser explained that its general goal with respect to fee waivers, expense reimbursements and breakpoints was that the overall expense ratio for each Fund should be at or below the median expense ratio of its peer group. The Adviser noted that 52% of the Funds, representing 48.8% of total Trust assets, had net operating expenses at or below the median of their peer groups. It was noted, however, that peer group expense comparisons were particularly difficult during this fiscal year because market volatility had led to significant declines in assets under management of nearly all the Funds and that the peer groups’ expense data was available only with a time lag over a review period that may have differed from the time period used for the Funds.
Based on the factors discussed above, the Contracts Committee unanimously recommended approval of the Advisory Agreement and the Subadvisory Agreements, and the Board, including all of the Independent Trustees voting separately, approved each of the agreements.
48
Board of Trustees and Officers
The following table provides information about the Trustees and Officers of the Trust. In addition to serving as a Trustee of the Trust, each Trustee also serves as:
| | • | | Director of Thrivent Series Fund, Inc., a registered investment company consisting of 41 portfolios that serve as underlying funds for variable contracts issued by Thrivent Financial for Lutherans (“Thrivent Financial”) and Thrivent Life Insurance Company and investment options in the retirement plan offered by Thrivent Financial; and |
| | • | | Trustee of Thrivent Financial Securities Lending Trust, a registered investment company consisting of one portfolio that serves as a cash collateral fund for a securities lending program sponsored by Thrivent Financial. |
The 25 series of the Trust, the 41 portfolios of Thrivent Series Fund, Inc. and Thrivent Financial Securities Lending Trust are referred to herein as the “Fund Complex.” The Statement of Additional Information includes additional information about the Trustees and is available, without charge, by calling 1-800-847-4836.
Interested Trustee (1)
| | | | | | | | |
Name, Address and Age | | Position with Trust and Length of Service (2) | | Number of
Portfolios in
Fund
Complex
Overseen by
Trustee | | Principal Occupation During the Past 5 Years | | Other Directorships Held by Trustee |
Russell W. Swansen 625 Fourth Avenue South Minneapolis, MN Age 52 | | President since 2008; Trustee since 2009 | | 67 | | Senior Vice President, Chief Investment Officer, Thrivent Financial since 2003 | | None |
Independent Trustees (3)
| | | | | | | | |
Name, Address and Age | | Position with Trust and Length of Service (2) | | Number of
Portfolios in
Fund
Complex
Overseen by
Trustee | | Principal Occupation During the Past 5 Years | | Other Directorships Held by Trustee |
F. Gregory Campbell 625 Fourth Avenue South Minneapolis, MN Age 70 | | Trustee since 1992 | | 67 | | President, Carthage College | | Director, Optique Funds, Inc., an investment company consisting of four portfolios; Director, Kenosha Hospital and Medical Center Board; Director, Prairie School Board; Director, United Health Systems Board |
49
Board of Trustees and Officers
| | | | | | | | |
Name, Address and Age | | Position with Trust and Length of Service (2) | | Number of
Portfolios in
Fund
Complex
Overseen by
Trustee | | Principal Occupation During the Past 5 Years | | Other Directorships Held by Trustee |
Herbert F. Eggerding, Jr. 625 Fourth Avenue South Minneapolis, MN Age 72 | | Trustee from 2003 through December 2009 | | 67 | | Management consultant to several privately owned companies | | None |
| | | | |
Noel K. Estenson 625 Fourth Avenue South Minneapolis, MN Age 71 | | Trustee since 2004 | | 67 | | Retired | | None |
| | | | |
Richard L. Gady 625 Fourth Avenue South Minneapolis, MN Age 66 | | Trustee since 1987 | | 67 | | Retired; previously Vice President, Public Affairs and Chief Economist, ConAgra, Inc. (agribusiness) | | None |
| | | | |
Richard A. Hauser 625 Fourth Avenue South Minneapolis, MN Age 66 | | Trustee since 2004 | | 67 | | Vice President and Assistant General Counsel, Boeing Company since June 2007; President, National Legal Center for the Public Interest since 2004; General Counsel U.S. Department of Housing and Urban Development from 2001 to 2004; Partner, Baker & Hostetler, from 1986 to 2001 | | None |
| | | | |
Paul R. Laubscher 625 Fourth Avenue South Minneapolis, MN Age 53 | | Trustee since 2009 | | 67 | | Portfolio Manager for U.S. and international equity portfolios and private real estate portfolios of IBM Retirement Funds | | None |
| | | | |
Connie M. Levi 625 Fourth Avenue South Minneapolis, MN Age 70 | | Chair since 2009; Trustee since 2004 | | 67 | | Retired | | None |
| | | | |
Douglas D. Sims 625 Fourth Avenue South Minneapolis, MN Age 63 | | Trustee since 2006 | | 67 | | Retired; previously Chief Executive Officer of CoBank from 1994 to 2006 | | Director, Keystone Neighborhood Company, Keystone Center and Keystone Science School |
50
Board of Trustees and Officers
| | | | | | | | |
Name, Address and Age | | Position with Trust and Length of Service (2) | | Number of
Portfolios in
Fund
Complex
Overseen by
Trustee | | Principal Occupation During the Past 5 Years | | Other Directorships Held by Trustee |
Constance L. Souders 625 Fourth Avenue South Minneapolis, MN Age 59 | | Trustee since 2007 | | 67 | | Retired; previously Director from 1983 to September 30, 2007, Executive Vice President from 2001 to 2007, AML Compliance Officer from 2003 to 2007, Chief Financial Officer from 2000 to 2005, Chief Administrative Officer from 2000 to 2005 and Treasurer from 1992 to 2005 of Harbor Capital Advisors, Inc.; Director from 1992 to 2007, President from 2000 to 2007 and AML Compliance Officer from 2003 to 2007 of Harbor Services Group, Inc.; Director from 1992 to 2007, Executive Vice President from 2001 to 2007, Chief Compliance Officer from 2004 to 2007, AML Compliance Officer from 2003 to 2007, Supervisory Registered Principal from 2000 to 2007, Interim President from 2002 to 2003, Treasurer from 2000 to 2005 and Secretary from 2000 to 2005 of Harbor Funds Distributors, Inc.; Vice President from 2000 to 2007, Chief Financial Officer from 2000 to 2005 and Treasurer from 1992 to 2005 of Harbor Funds | | None |
51
Board of Trustees and Officers
Executive Officers
| | | | |
Name, Address and Age | | Position with Trust and Length of Service (2) | | Principal Occupation During the Past 5 Years |
Russell W. Swansen 625 Fourth Avenue South Minneapolis, MN Age 52 | | President since 2008; previously, Vice President since 2004 | | Senior Vice President, Chief Investment Officer, Thrivent Financial since 2003 |
| | |
David S. Royal 625 Fourth Avenue South Minneapolis, MN Age 38 | | Secretary and Chief Legal Officer since 2006 | | Vice President and Managing Counsel, Thrivent Financial since 2006; Partner, Kirkland & Ellis LLP from April 2004 to June 2006 |
| | |
Katie S. Kloster 625 Fourth Avenue South Minneapolis, MN Age 44 | | Vice President, Investment Company and Investment Adviser Chief Compliance Officer since 2004 | | Vice President and Investment Company and Investment Adviser Chief Compliance Officer since 2004 |
| | |
Gerard V. Vaillancourt 625 Fourth Avenue South Minneapolis, MN Age 42 | | Treasurer and Principal Accounting Officer since 2005 | | Vice President, Mutual Fund Accounting since 2006; Head of Mutual Fund Accounting, Thrivent Financial from 2005 to 2006; Director, Fund Accounting Administration, Thrivent Financial from 2002 to 2005 |
| | |
Janice M. Guimond 625 Fourth Avenue South Minneapolis, MN Age 45 | | Vice President since 2005 | | Vice President, Investment Operations, Thrivent Financial since 2004 |
| | |
Karl D. Anderson 625 Fourth Avenue South Minneapolis, MN Age 48 | | Vice President since 2006 | | Vice President, Products, Thrivent Financial |
| | |
Brian W. Picard 4321 North Ballard Road Appleton, WI Age 39 | | Vice President Anti-Money Laundering Officer since 2006 | | Director, Business Control Services, Thrivent Financial since 2006; Manager, Field and Securities Compliance, Thrivent Financial from 2002 to 2006 |
| | |
Mark D. Anema 625 Fourth Avenue South Minneapolis, MN Age 48 | | Assistant Vice President since 2007 | | Vice President, Accumulation and Retirement Income Solutions, Thrivent Financial since 2007; Vice President, Strategic Planning, Thrivent Financial from 2004 to 2007 |
| | |
James M. Odland 625 Fourth Avenue South Minneapolis, MN Age 54 | | Assistant Secretary since 2006 | | Vice President and Managing Counsel, Thrivent Financial since 2005; Senior Securities Counsel, Allianz Life Insurance Company from January 2005 to August 2005; Vice President and Chief Legal Officer, Woodbury Financial Services, Inc. from 2003 to 2005 |
| | |
John L. Sullivan 625 Fourth Avenue South Minneapolis, MN Age 39 | | Assistant Secretary since 2007 | | Senior Counsel, Thrivent Financial since 2007; previously, Senior Counsel, Division of Investment Management of the Securities and Exchange Commission since 2001 |
52
Board of Trustees and Officers
| | | | |
Name, Address and Age | | Position with Trust and Length of Service (2) | | Principal Occupation During the Past 5 Years |
Todd J. Kelly 4321 North Ballard Road Appleton, WI Age 40 | | Assistant Treasurer since 2004 | | Director, Fund Accounting Operations, Thrivent Financial |
| | |
Sarah L. Bergstrom 625 Fourth Avenue South Minneapolis, MN Age 32 | | Assistant Treasurer since 2007 | | Director, Fund Accounting Administration, Thrivent Financial since 2007; Manager, Fund Accounting Administration, Thrivent Financial from 2005 to 2007; Manager, Mutual Fund Tax Reporting, Thrivent Financial from 2004 to 2005 |
| (1) | “Interested person” of the Trust as defined in the 1940 Act by virtue of positions with Thrivent Financial. Mr. Swansen is considered an interested person because of his principal occupation with Thrivent Financial. |
| (2) | Each Trustee generally serves an indefinite term until her or his successor is duly elected and qualified. Officers serve at the discretion of the board until their successors are duly appointed and qualified. |
| (3) | The Trustees other than Mr. Swansen are not “interested persons” of the Trust and are referred to as “Independent Trustees.” |
53
[THIS PAGE INTENTIONALLY LEFT BLANK]
54
[THIS PAGE INTENTIONALLY LEFT BLANK]
55
[THIS PAGE INTENTIONALLY LEFT BLANK]
56

As of the end of the period covered by this report, registrant has adopted a code of ethics (as defined in Item 2 of Form N-CSR) applicable to registrant’s Principal Executive Officer, Principal Financial Officer, and Principal Accounting Officer. No waivers were granted to such code of ethics during the period covered by this report. A copy of this code of ethics is filed as an exhibit to this Form N-CSR.
| Item 3. | Audit Committee Financial Expert |
Registrant’s Board of Trustees has determined that Constance L. Souders, an independent trustee, is the Audit Committee Financial Expert.
| Item 4. | Principal Accountant Fees and Services |
(a) through (d)
Thrivent Real Estate Securities Fund, Thrivent Equity Income Plus Fund and Thrivent Diversified Income Plus Fund (each a “Fund” and collectively, the “Funds”) are each a series of Thrivent Mutual Funds, a Massachusetts business trust (the “Trust”). The Trust, as of the date of filing this Form N-CSR, contains a total of 25 series (the “Series”), including the Funds. This Form N-CSR relates to the annual report of each Fund.
The following table presents the aggregate fees billed to the Funds for the respective fiscal years ended December 31, 2009 and December 31, 2008 by the Funds’ independent public accountants, PricewaterhouseCoopers LLP (“PwC”), for professional services rendered for the audit of the Fund’s annual financial statements and fees billed for other services rendered by PwC during those periods.
| | | | | | |
Fiscal Years Ended | | 12/31/09 | | 12/31/08 |
| | |
Audit Fees | | $ | 24,714 | | $ | 24,619 |
| | |
Audit-Related Fees(1) | | $ | 0 | | $ | 0 |
| | |
Tax Fees(2) | | $ | 20,024 | | $ | 10,741 |
| | |
All Other Fees(3) | | $ | 0 | | $ | 0 |
| | | | | | |
| | |
Total | | $ | 44,738 | | $ | 35,360 |
| | | | | | |
| (1) | Audit-related fees consist of the aggregate fees billed for assurance and related services that are reasonably related to the performance of the audit of financial statements and are not reported under the category of audit fees. |
| (2) | Tax fees consist of the aggregate fees billed for professional services rendered by the principal accountant relating to tax compliance, tax advice, and tax planning and specifically include fees for tax return preparation. |
| (3) | All other fees consist of the aggregate fees billed for products and services provided by the principal accountant other than audit, audit-related, and tax services. |
The following table presents the aggregate fees billed to all Series of the Trust (other than the Funds) with fiscal years ending on October 31 for the fiscal years ended October 31, 2009 and October 31, 2008 by PwC for professional services rendered for the audit of the annual financial statements of the applicable Series and fees billed for other services rendered by PwC during those periods.
| | | | | | |
Fiscal Years Ended | | 10/31/09 | | 10/31/08 |
| | |
Audit Fees | | $ | 318,302 | | $ | 294,455 |
| | |
Audit-Related Fees(1) | | $ | 0 | | $ | 0 |
| | |
Tax Fees(2) | | $ | 147,675 | | $ | 156,366 |
| | |
All Other Fees(3) | | $ | 0 | | $ | 0 |
| | | | | | |
| | |
Total | | $ | 465,977 | | $ | 450,821 |
| | | | | | |
| (1) | Audit-related fees consist of the aggregate fees billed for assurance and related services that are reasonably related to the performance of the audit of financial statements and are not reported under the category of audit fees. |
| (2) | Tax fees consist of the aggregate fees billed for professional services rendered by the principal accountant relating to tax compliance, tax advice, and tax planning and specifically include fees for tax return preparation. |
| (3) | All other fees consist of the aggregate fees billed for products and services provided by the principal accountant other than audit, audit-related, and tax services. |
| | (e) | Registrant’s audit committee charter, adopted in August 2004, provides that the audit committee (comprised of the independent Trustees of registrant) is responsible for pre-approval of all auditing services performed for the registrant. The audit committee also is responsible for pre-approval (subject to the de minimis exceptions for non-audit services described in Section 10A(i)(1)(B) of the Securities Exchange Act of 1934) of all non-auditing services performed for the registrant or an affiliate of registrant. In addition, registrant’s audit committee charter permits a designated member of the audit committee to pre-approve, between meetings, one or more audit or non-audit service projects, subject to an expense limit and notification to the audit committee at the next committee meeting. Registrant’s audit committee pre-approved all fees described above which PwC billed to registrant. |
| | (f) | Less than 50% of the hours billed by PwC for auditing services to each Fund and to the registrant for the fiscal year ended December 31, 2009 were for work performed by persons other than full-time, permanent employees of PwC. |
| | (g) | The aggregate non-audit fees billed by PwC to registrant and to registrant’s investment adviser and any entity controlling, controlled by, or under common control with registrant’s investment adviser for the fiscal years set forth below are disclosed in the table below. The disclosed payments were for access to a PwC-sponsored online library that provides interpretive guidance regarding U.S. and foreign accounting standards. |
| | | | | | | | | | | | |
Fiscal Year Ended | | 10/31/09 | | 12/31/09 | | 10/31/08 | | 12/31/08 |
Registrant(1) | | $ | 0 | | $ | 0 | | $ | 0 | | $ | 0 |
Adviser | | $ | 1,500 | | $ | 1,500 | | $ | 1,500 | | $ | 1,500 |
| | (1) | Includes all Series of the Trust |
| | (h) | Registrant’s audit committee has considered the non-audit services provided to the registrant and registrant’s investment adviser and any entity controlling, controlled by, or under common control with registrant’s investment adviser as described above and determined that these services do not compromise PwC’s independence. |
| Item 5. | Audit Committee of Listed Registrants |
Not applicable.
| Item 6. | Schedule of Investments |
(a) Registrant’s Schedule of Investments is included in the report to shareholders filed under Item 1.
(b) Not applicable to this filing.
| Item 7. | Disclosure of Proxy Voting Policies and Procedures for Closed-End Management Investment Companies |
Not applicable.
| Item 8. | Portfolio Managers of Closed-End Management Investment Companies |
Not applicable.
| Item 9. | Purchases of Equity Securities by Closed-End Management Investment Company and Affiliated Purchasers. |
Not applicable.
| Item 10. | Submission of Matters to a Vote of Security Holders |
There have been no material changes to the procedures by which shareholders may recommend nominees to registrant’s board of trustees.
| Item 11. | Controls and Procedures |
(a)(i) Registrant’s President and Treasurer have concluded that registrant’s disclosure controls and procedures (as defined in Rule 30a-3(c) under the Investment Company Act) are effective, based on their evaluation of these controls and procedures as of a date within 90 days of the filing date of this report.
(a)(ii) Registrant’s President and Treasurer are aware of no change in registrant’s internal control over financial reporting (as defined in Rule 30a-3(d) under the Investment Company Act) that occurred during registrant’s most recent fiscal quarter that has materially affected, or is reasonably likely to materially affect, registrant’s internal control over financial reporting.
| | (a) | The code of ethics pursuant to Item 2 is attached hereto. |
| | (b) | Certifications pursuant to Rules 30a-2(a) and 30a-2(b) under the Investment Company Act of 1940 are attached hereto. |
SIGNATURES
Pursuant to the requirements of the Securities Exchange Act of 1934 and the Investment Company Act of 1940, the registrant has duly caused this report to be signed on its behalf by the undersigned, thereunto duly authorized.
| | |
| Date: February 26, 2010 | | THRIVENT MUTUAL FUNDS |
| |
| | /s/ Russell W. Swansen |
| | Russell W. Swansen |
| | President |
Pursuant to the requirements of the Securities Exchange Act of 1934 and the Investment Company Act of 1940, this report has been signed below by the following persons on behalf of the registrant and in the capacities and on the dates indicated.
| | | | |
| Date: February 26, 2010 | | By: | | /s/ Russell W. Swansen |
| | | | Russell W. Swansen |
| | | | President |
| | | | |
| Date: February 26, 2010 | | By: | | /s/ Gerard V. Vaillancourt |
| | | | Gerard V. Vaillancourt |
| | | | Treasurer |