UNITED STATES
SECURITIES AND EXCHANGE COMMISSION
Washington, D.C. 20549
FORM N-CSR
CERTIFIED SHAREHOLDER REPORT OF REGISTERED
MANAGEMENT INVESTMENT COMPANIES
| | |
Investment Company Act file number: | | 811-05075 |
Thrivent Mutual Funds
|
| (Exact name of registrant as specified in charter) |
| | |
625 Fourth Avenue South Minneapolis, Minnesota | | 55415 |
| (Address of principal executive offices) | | (Zip code) |
John L. Sullivan
625 Fourth Avenue South
Minneapolis, Minnesota 55415
|
| (Name and address of agent for service) |
Registrant’s telephone number, including area code: (612) 844-5704
Date of fiscal year end: October 31
Date of reporting period: October 31, 2008
Item 1. Report to Stockholders

Table of Contents

Dear Shareholder:
Economic and Market Review
Stocks and most types of bonds generally posted negative returns during the 12 months ended October 31, 2008. Credit market troubles that started in sub-prime mortgages spread far and wide during the period, culminating in a global liquidity crisis that affected many of the world’s investment markets. This led to major policy adjustments by central bankers around the globe as they attempted to facilitate the availability of credit and liquidity to the markets. Over the period, the U.S. Federal Reserve lowered targeted short-term rates by 3.50% as heightened risks in both the real economy and the financial markets became apparent.
U.S. Economy
The nation’s gross domestic product shrank during part of the reporting period and grew only modestly the remainder of the time, as tight credit, declining housing and investment values, rising unemployment and somber economic news weighed on consumers. GDP growth increased from a -0.2% annual rate in the fourth quarter of 2007 to 0.9% in the first quarter, rose to 2.8% in the second quarter, and then declined to -0.3% in the third quarter (the latter figure according to advanced estimate).1
The U.S. housing market malaise continued to curb economic activity. Weak sales, rising inventories, falling prices and much tighter lending standards caused the imbalances in the housing market to worsen over the period. Sales of existing homes nationwide rose just 1.4% to 5.18 million units annually from September 2007 to September 2008. For the same period, the average sale price of an existing home fell 9% to $191,600. Two years earlier, national sales totaled 7.076 million units annually with an average price of $219,600.2
As the economy cooled, job losses began to mount during the period. Employers cut 240,000 jobs in October 2008, following declines of 284,000 in September and 127,000 in August. For the first 10 months of 2008, employment fell by 1.2 million jobs, bringing the unemployment rate to 6.5% in October. That was the highest unemployment rate since March 1994. During the 12-month reporting period, the number of unemployed persons increased by 2.8 million and the unemployment rate rose by 1.7%.3
Inflation & Monetary Policy
Inflation indicators generally eased during the period. The Consumer Price Index (CPI) rose at a 3.7% annual rate for the 12 months ended October 31, 2008, compared with a 4.1% rate for all of 2007. The index for energy, which rose 17.4% in all of 2007, advanced at an 11.5% annual rate during the 12-month period. Excluding the volatile prices of food and energy, the core CPI advanced at a 2.2% annual rate during the period, compared to a 2.4% increase for all of 2007.
Notably, inflation appeared to abate sharply late in the period as credit market troubles intensified and economic activity slowed. The CPI decreased 1.0% in October 2008–the largest decline on record–following very little change in September and August. The energy index fell 8.6% in October after declining 1.9% in September and 3.1% in August.
After returning to a rate-easing mode in September of 2007, the Federal Reserve Open Market Committee (FOMC) cut interest rates repeatedly during the period, with the federal funds target rate dropping from 4.50% on October 31, 2007, to 1.00% on October 29, 2008. At their October 29 meeting, policymakers said they expected inflation to moderate in coming quarters but that downside risks to growth remained.
Equity Performance
Many stock indexes set record highs in early October 2007, just prior to this reporting period. For much of the following year, however, prices pulled back sharply–for some indexes to five-year lows in October 2008–due to worries in the credit, housing, job and consumer markets and the growing potential for a severe recession.
Small-company stocks outperformed large-company issues during the period. The Russell 2000® Index of small-company stocks posted a -34.16% total return, while the S&P 500 Index of large-company stocks recorded a -36.08% return. Value stocks modestly outperformed growth stocks during the period. The Russell 1000® Value Index returned - -36.80%, while the Russell 1000® Growth Index posted a return of -37.30%.
Major market foreign stocks underperformed most domestic issues in dollar terms. The Morgan Stanley Capital International Europe, Australasia, Far East (EAFE) Index posted a -46.34% total return in dollar terms.
Fixed Income Performance
The worsening credit crisis hurt all areas of the bond market except U.S. Treasury securities during the period. An investor flight to safety pushed U.S. Treasury bond prices up, driving Treasury yields down. Mortgage- and asset-backed bonds, municipals, high-yield bonds, bank loans and corporate bonds all suffered price declines as liquidity drained out of the market. Late in the period, the situation intensified with the failure and subsequent federal takeover or forced sale of a number of large financial institutions. Fannie Mae, Freddie Mac, Lehman Brothers, Washington Mutual, Wachovia, Merrill Lynch and AIG all were casualties of the crisis that overtook the financial industry.
The yield curve steepened during the period as Treasury yields fell especially sharply in shorter maturity lengths. The six-month Treasury yield fell from 4.09% to 0.94%, the five-year yield declined from 4.16% to 2.80%, the 10-year yield fell from 4.48% to 4.01%, and the 30-year Treasury yield declined from 4.74% to 4.35%.
1
The Barclays Capital (formerly Lehman Brothers) Aggregate Bond Index of the broad U.S. bond market posted a 0.30% total return for the 12-month period, while the Barclays Capital Government/Corporate 1-3 Year Bond Index registered a 4.20% total return. The Barclays Capital Municipal Bond Index posted a -3.30% total return. Below-investment-grade corporate bonds were among the weakest performers, with the Barclays Capital U.S. Corporate High Yield Bond Index registering a -25.81% total return.
Outlook
Economic activity will likely remain sluggish at least until mid-2009. Eventually, the unprecedented amount of government stimulus in the system–in the form of bailouts and other liquidity programs–should begin to spur faster growth. Until then, the Federal Reserve will likely keep short-term interest rates low.
The mortgage crisis that started in 2007 has spread from the consumer through the banking system and is now poised to impact the broader economy. Rising unemployment, very weak consumer spending, and business spending cutbacks are now the primary risks to the economy. The support from exports that U.S. corporations have enjoyed is also now in jeopardy as global growth slows and the U.S. dollar strengthens. Helping to offset these risks somewhat, the U.S. government and governments around the world have initiated financial system rescue plans that may begin to show signs of returning some liquidity to the credit markets.
On a Personal Note
My colleague, Pam Moret, has recently taken on a new role at Thrivent Financial and will no longer serve as the President of Thrivent Mutual Funds. I, along with all of us at Thrivent Mutual Funds, want to thank Pam for her years of dedicated service to our shareholders. Her tenure saw tremendous improvement in investment performance, innovative product design and lower expenses for our shareholders. Her leadership and integrity set a standard for the position. It’s a standard I will work to build upon as I assume the position of President of Thrivent Mutual Funds, in addition to maintaining my current role as Chief Investment Officer of Thrivent Asset Management.
I look forward to using this forum in future publications to share thoughts and insight on the markets and investment strategies, along with updates on your Thrivent Mutual Funds. Until then, thank you for continuing to turn to us for your financial options.
|
| Sincerely, |
|
 |
| Russell W. Swansen |
President and Chief Investment Officer Thrivent Mutual Funds |
1 | U.S. Department of Commerce, Bureau of Economic Analysis |
2 | National Association of Realtors |
3 | U.S. Department of Labor, Bureau of Labor Statistics |
Investing in a mutual fund involves risks, including the possible loss of principal. The prospectus contains more complete information on the investment objectives, risks, charges and expenses of the investment company, which investors should read and consider carefully before investing. To obtain a prospectus, contact a registered representative or visit www.thrivent .com.
2
[THIS PAGE INTENTIONALLY LEFT BLANK]
3
| | | | |
 | | Thrivent Aggressive Allocation Fund | |  |
| | Russell W. Swansen (left), David C. Francis, CFA (right) and Mark L. Simenstad, CFA (far right), Portfolio Co-Managers The Fund seeks long-term capital growth by implementing an asset allocation strategy. | |
The Fund’s performance depends upon how its assets are allocated across broad asset categories and applicable sub-classes within such categories. Some broad asset categories and sub-classes may perform below expectations or below the securities markets generally over short or extended periods. In particular, underperformance in the equity markets would have material adverse effect on the Fund’s total return, given its allocation to equity securities. Therefore, a principal risk of investing in the Fund is heavily dependent upon the performance of the underlying funds in which the Fund invests. As a result, the Fund is subject to the same risks as those faced by the underlying funds. These and other risks are described in the Fund’s prospectus.
How did the Fund perform during the 12-month period ended October 31, 2008?
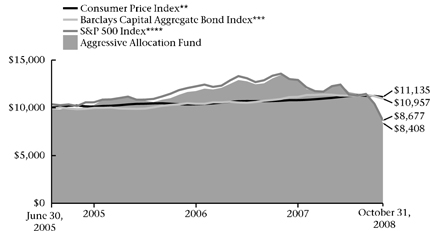
Thrivent Aggressive Allocation Fund earned a return of - -37.44%, as compared to the median return of its peer group, the Lipper Multi Cap Core category, of -38.7%. The Fund’s market benchmarks, the S&P 500 Index and the Barclays Capital Aggregate Bond Index, earned a total return of -36.08% and 0.30%, respectively.
What factors affected the Fund’s performance?
Stocks fell sharply over the last fiscal year, reflecting profound disruptions in the credit markets that have meaningfully impaired expectations for economic growth not only in the United States but around the world. Credit has become both quite expensive and, in many areas, severely restricted for all but the highest quality borrowers. Governments around the world have stepped in with various programs to take the place of the traditional providers of credit as investors directed capital to only the safest alternatives.
Government and sovereign debt securities provided the best returns, with longer dated bonds appreciating and short-term government rates falling to levels not seen since the last recession. Late in the period, developing economy stock markets fell in concert with significant price breaks in oil and industrial metals. Domestically, small-cap stocks outperformed large-caps, but mid-cap stocks corrected more sharply than both large- and small-cap stocks.
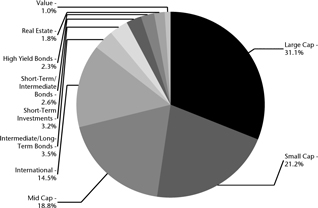
The Fund has meaningful exposure to international stocks, although we were underweighted relative to our long-term target. In addition, we had significant exposure to both small- and mid-capitalization stocks, the benefit of the former being outweighed by the relative returns in the latter. The two most significant factors limiting our returns versus the S&P 500 benchmark were our exposure to international and mid-cap markets. We modestly bested the median Fund in our peer group category.
What is your outlook?
There is still a tremendous amount of uncertainty in both the economic and financial outlook. The programs that have been put in place appear to be making progress in facilitating a more normal lending environment. This would establish the basis for an improving economic environment. Holders of risk capital around the globe continue to be cautious. Additionally, consumers remain hesitant and have reduced purchases as the employment outlook remains tentative. Mitigating some of these concerns is a relatively well balanced corporate sector with moderate inventories and generally good balance sheets. That is not the case universally, with severe constraints in both automobiles and retail, areas that likely will experience significant restructuring pressure.
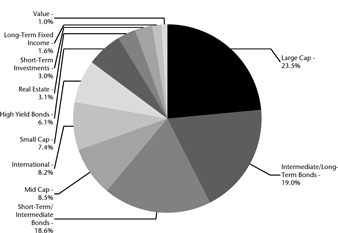
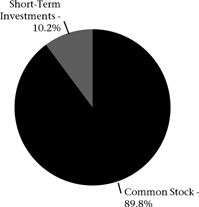
Portfolio Composition
(% of Portfolio)
Top 10 Holdings
(% of Net Assets)
| | | |
Thrivent Large Cap Growth Fund | | 14.4 | % |
Thrivent Partner International Stock Fund | | 14.2 | % |
Thrivent Small Cap Stock Fund | | 9.5 | % |
Thrivent Mid Cap Stock Fund | | 9.2 | % |
Thrivent Large Cap Value Fund | | 9.0 | % |
Thrivent Partner Small Cap Growth Fund | | 8.7 | % |
Thrivent Large Cap Stock Fund | | 7.7 | % |
Thrivent Mid Cap Growth Fund | | 5.8 | % |
Thrivent Partner Mid Cap Value Fund | | 3.8 | % |
Thrivent Income Fund | | 3.5 | % |
The shares of these Funds represent 85.8% of the total net assets of the Fund.
Quoted Fund performance is for Class A shares and does not reflect a sales charge. The returns shown do not reflect taxes a shareholder would pay on distributions or redemptions. Quoted Portfolio Composition and Top 10 Holdings are subject to change.
4
Most risk asset classes are priced at extraordinary discounts to normal valuations, some at levels not seen in generations. At some point over the next 12 months, the holders of fresh capital will become dissatisfied with the unusually low returns currently being earned by the safest investment alternatives. Stock markets bottom well in advance of economic recovery. Recent studies have suggested that economic and market dislocations associated with crises in banking systems tend be longer in duration and deeper in magnitude. The data also suggests that broad and deep policy interventions have historically been associated with market inflection points. While not unequivocally in evidence at this point, the weight of the evidence suggests that the worst is likely behind us and sufficient catalysts are in place that would imply improvement for both the markets and the economy in 2009. We are positioning the Fund with that outlook in mind.
Portfolio Facts
As of October 31, 2008
| | | | | | |
| | | Class A | | Institutional Class |
Ticker | | | TAAAX | | | TAAIX |
Transfer Agent ID | | | 038 | | | 468 |
Net Assets | | $ | 264,196,147 | | $ | 50,408,491 |
NAV | | $ | 8.26 | | $ | 8.31 |
NAV - High† | | | 11/6/2007 - $13.59 | | | 11/6/2007 - $13.65 |
NAV - Low† | | | 10/27/2008 - $7.18 | | | 10/27/2008 - $7.23 |
| Number of Holdings: 22 | | | | | | |
| † | For the year ended October 31, 2008 |
Average Annual Total Returns1
As of October 31, 2008
| | | | | | |
Class A2 | | 1-Year | | | From
Inception
6/30/2005 | |
without sales charge | | (37.44 | %) | | (3.44 | %) |
with sales charge | | (40.87 | %) | | (5.05 | %) |
| | |
Institutional Class3 | | 1-Year | | | From
Inception
6/30/2005 | |
Net Asset Value | | (37.27 | %) | | (3.09 | %) |
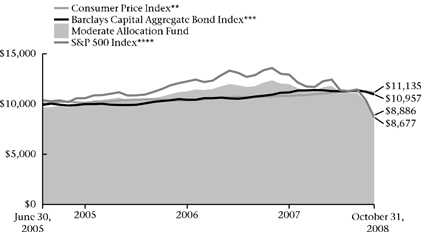
Value of a $10,000 Investment
Class A Shares*,1,(a)
1 | Past performance is not an indication of future results. Annualized total returns represent past performance and reflect changes in share prices, the reinvestment of all dividends and capital gains, and the effects of compounding. Investing in a mutual fund involves risks, including the possible loss of principal. The prospectus contains more complete information on the investment objectives, risks, charges and expenses of the investment company, which investors should read and consider carefully before investing. To obtain a prospectus, contact a registered representative or visit www.thrivent.com. At various times, the Fund’s adviser waived its management fee and/or reimbursed Fund expenses. Had the adviser not done so, the Fund’s total returns would have been lower. The returns shown do not reflect taxes a shareholder would pay on distributions or redemptions. |
2 | Class A performance reflects the maximum sales charge of 5.5%. |
3 | Institutional Class shares have no sales load and are for institutional shareholders only. |
(a) | Performance of other classes will be greater or less than the line shown based on the differences in loads and fees paid by shareholders investing in the different classes. |
| * | As you compare performance, please note that the Fund’s performance reflects the maximum 5.5% sales charge, while the Consumer Price Index, the S&P 500 Index and the Barclays Capital Aggregate Bond Index do not reflect any such charges. If you were to purchase any of the above individual stocks or funds represented in those Indexes, any charges you would pay would reduce your total return as well. |
| ** | The Consumer Price Index is an inflationary indicator that measures the change in the cost of a fixed basket of products and services, including housing, electricity, food and transportation. It is not possible to invest directly in the Index. |
| *** | The Barclays Capital Aggregate Bond Index is an index that measures the performance of U.S. investment grade bonds. It is not possible to invest directly in the Index. The performance of the Index does not reflect deductions for fees, expenses or taxes. The Barclays Capital Aggregate Bond Index is the new name for the index formerly known as the Lehman Brothers Aggregate Bond Index. The Barclays Capital Aggregate Bond Index assumes the prior history and is compiled going forward using the same methodology of the Lehman Brothers Aggregate Bond Index. |
| **** | The S&P 500 Index is an index that represents the average performance of a group of 500 widely held, publicly traded stocks. It is not possible to invest directly in the Index. The performance of the Index does not reflect deductions for fees, expenses or taxes. |
5
| | | | |
 | | Thrivent Moderately Aggressive Allocation Fund | |  |
| | Russell W. Swansen (left), David C. Francis, CFA (right) and Mark L. Simenstad, CFA (far right), Portfolio Co-Managers The Fund seeks long-term capital growth by implementing an asset allocation strategy. | |
The Fund’s performance depends upon how its assets are allocated across broad asset categories and applicable sub-classes within such categories. Some broad asset categories and sub-classes may perform below expectations or below the securities markets generally over short or extended periods. In particular, underperformance in the equity markets would have material adverse effect on the Fund’s total return, given its allocation to equity securities. Therefore, a principal risk of investing in the Fund is heavily dependent upon the performance of the underlying funds in which the Fund invests. As a result, the Fund is subject to the same risks as those faced by the underlying funds. These and other risks are described in the Fund’s prospectus.
How did the Fund perform during the 12-month period ended October 31, 2008?
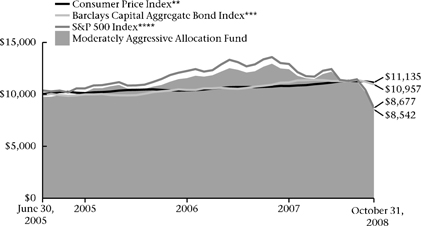
Thrivent Moderately Aggressive Allocation Fund earned a return of -33.99%, as compared to the median return of its peer group, the Lipper Mixed Asset Target Allocation Growth category, of -30.84%. The Fund’s market benchmarks, the S&P 500 Index and the Barclays Capital Aggregate Bond Index, earned a total return of -36.08% and 0.30%, respectively.
What factors affected the Fund’s performance?
Stocks fell sharply over the last fiscal year, reflecting profound disruptions in the credit markets that have meaningfully impaired expectations for economic growth not only in the United States but around the world. Credit has become both quite expensive and, in many areas, severely restricted for all but the highest quality borrowers. Governments around the world have stepped in with various programs to take the place of the traditional providers of credit as investors directed capital to only the safest alternatives.
Government and sovereign debt securities provided the best returns with longer dated bonds appreciating and short-term government rates falling to levels not seen since the last recession. Bonds exposed to credit risk have suffered significant price erosion. Late in the period, developing economy stock markets fell in concert with significant price breaks in oil and industrial metals. Domestically, small-cap stocks outperformed large-caps, but mid-cap stocks corrected more sharply than both large- and small-cap stocks.
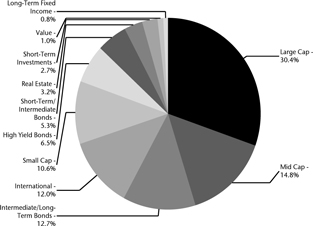
The Fund has meaningful exposure to international stocks, although we were underweighted in this area versus our long-term target. In addition, we had significant exposure to both small- and mid-capitalization stocks, the benefit of the former being outweighed by the relative returns in the latter. The three most significant factors limiting our returns versus those of our peer group were a larger allocation to equity securities, our exposure to international and mid-cap equity markets and our holdings in credit based fixed-income products that did not provide the buffer of a larger allocation to government or sovereign debt. In aggregate, we outperformed the benchmark equity index.
What is your outlook?
There is still a tremendous amount of uncertainty in both the economic and financial outlook. The programs that have been put in place appear to be making progress in facilitating a more normal lending environment. Additionally, consumers remain hesitant and have reduced purchases as the employment outlook remains tentative. Mitigating some of these concerns is a relatively well balanced corporate sector with moderate inventories and generally good balance sheets. That is not the case universally, with severe constraints in both automobiles and retail, areas that likely will experience significant restructuring pressure.
Portfolio Composition
(% of Portfolio)
Top 10 Holdings
(% of Net Assets)
| | | |
Thrivent Income Fund | | 12.6 | % |
Thrivent Large Cap Value Fund | | 12.1 | % |
Thrivent Large Cap Growth Fund | | 10.5 | % |
Thrivent Partner International Stock Fund | | 10.0 | % |
Thrivent Mid Cap Stock Fund | | 8.4 | % |
Thrivent Large Cap Stock Fund | | 7.8 | % |
Thrivent High Yield Fund | | 6.5 | % |
Thrivent Limited Maturity Bond Fund | | 5.3 | % |
Thrivent Small Cap Stock Fund | | 4.7 | % |
Thrivent Partner Mid Cap Value Fund | | 3.9 | % |
The shares of these Funds represent 81.8% of the total net assets of the Fund.
Quoted Fund performance is for Class A shares and does not reflect a sales charge. The returns shown do not reflect taxes a shareholder would pay on distributions or redemptions. Quoted Portfolio Composition and Top 10 Holdings are subject to change.
6
Most risk asset classes are priced at extraordinary discounts to normal valuations, some at levels not seen in generations. At some point over the next 12 months, the holders of fresh capital will become dissatisfied with the unusually low returns currently being earned by the safest investment alternatives. Stock markets bottom well in advance of economic recovery. Recent studies have suggested that economic and market dislocations associated with crises in banking systems tend be longer in duration and deeper in magnitude. The data also suggests that broad and deep policy interventions have historically been associated with market inflection points. While not unequivocally in evidence at this point, the weight of the evidence suggests that the worst is likely behind us and sufficient catalysts are in place that would imply improvement for both the markets and the economy in 2009. We are positioning the Fund with that outlook in mind.
Portfolio Facts
As of October 31, 2008
| | | | | | |
| | | Class A | | Institutional Class |
Ticker | | | TMAAX | | | TMAFX |
Transfer Agent ID | | | 037 | | | 467 |
Net Assets | | $ | 698,349,835 | | $ | 56,199,716 |
NAV | | $ | 8.36 | | $ | 8.41 |
NAV - High† | | | 11/6/2007 - $13.04 | | | 11/6/2007 - $13.11 |
NAV - Low† | | | 10/27/2008 - $7.43 | | | 10/27/2008 - $7.48 |
Number of Holdings: 33 | | | | | | |
| † | For the year ended October 31, 2008 |
Average Annual Total Returns1
As of October 31, 2008
| | | | | | |
Class A2 | | 1-Year | | | From
Inception
6/30/2005 | |
without sales charge | | (33.99 | %) | | (2.98 | %) |
with sales charge | | (37.62 | %) | | (4.60 | %) |
| | |
Institutional Class3 | | 1-Year | | | From
Inception
6/30/2005 | |
Net Asset Value | | (33.83 | %) | | (2.65 | %) |
Value of a $10,000 Investment
Class A Shares*,1,(a)
1 | Past performance is not an indication of future results. Annualized total returns represent past performance and reflect changes in share prices, the reinvestment of all dividends and capital gains, and the effects of compounding. Investing in a mutual fund involves risks, including the possible loss of principal. The prospectus contains more complete information on the investment objectives, risks, charges and expenses of the investment company, which investors should read and consider carefully before investing. To obtain a prospectus, contact a registered representative or visit www.thrivent.com. At various times, the Fund’s adviser waived its management fee and/or reimbursed Fund expenses. Had the adviser not done so, the Fund’s total returns would have been lower. The returns shown do not reflect taxes a shareholder would pay on distributions or redemptions. |
2 | Class A performance reflects the maximum sales charge of 5.5%. |
3 | Institutional Class shares have no sales load and are for institutional shareholders only. |
(a) | Performance of other classes will be greater or less than the line shown based on the differences in loads and fees paid by shareholders investing in the different classes. |
| * | As you compare performance, please note that the Fund’s performance reflects the maximum 5.5% sales chare, while the Consumer Price Index, the S&P 500 Index and the Barclays Capital Aggregate Bond Index do not reflect any such charges. If you were to purchase any of the above individual stocks or funds represented in these Indexes, any charges you would pay would reduce your total return as well. |
| ** | The Consumer Price Index is an inflationary indicator that measures the change in the cost of a fixed basket of products and services, including housing, electricity, food and transportation. It is not possible to invest directly in the Index. |
| *** | The Barclays Capital Aggregate Bond Index is an index that measures the performance of U.S. investment grade bonds. It is not possible to invest directly in the Index. The performance of the Index does not reflect deductions for fees, expenses or taxes. The Barclays Capital Aggregate Bond Index is the new name for the index formerly known as the Lehman Brothers Aggregate Bond Index. The Barclays Capital Aggregate Bond Index assumes the prior history and is compiled going forward using the same methodology of the Lehman Brothers Aggregate Bond Index. |
| **** | The S&P 500 Index is an index that represents the average performance of a group of 500 widely held, publicly traded stocks. It is not possible to invest directly in the Index. The performance of the Index does not reflect deductions for fees, expenses or taxes. |
7
| | | | |
 | | Thrivent Moderate
Allocation Fund | |  |
| | Russell W. Swansen (left), David C. Francis, CFA (right) and Mark L. Simenstad, CFA (far right), Portfolio Co-Managers The Fund seeks long-term capital growth while providing reasonable stability of principal by implementing an asset allocation strategy. | |
The Fund’s performance depends upon how its assets are allocated across broad asset categories and applicable sub-classes within such categories. Some broad asset categories and sub-classes may perform below expectations or below the securities markets generally over short or extended periods. In particular, underperformance in the equity markets would have material adverse effect on the Fund’s total return, given its allocation to equity securities. Therefore, a principal risk of investing in the Fund is heavily dependent upon the performance of the underlying funds in which the Fund invests. As a result, the Fund is subject to the same risks as those faced by the underlying funds. These and other risks are described in the Fund’s prospectus.
How did the Fund perform during the 12-month period ended October 31, 2008?
Thrivent Moderate Allocation Fund earned a return of - -28.06%, as compared to the median return of its peer group, the Lipper Mixed Asset Target Allocation Moderate category, of -26.48%. The Fund’s market benchmarks, the S&P 500 Index and the Barclays Capital Aggregate Bond Index, earned a total return of -36.08% and 0.30%, respectively.
What factors affected the Fund’s performance?
Stocks fell sharply over the last fiscal year, reflecting profound disruptions in the credit markets that have meaningfully impaired expectations for economic growth not only in the United States but around the world. Credit has become both quite expensive and, in many areas, severely restricted for all but the highest quality borrowers. Governments around the world have stepped in with various programs to take the place of the traditional providers of credit as investors directed capital to only the safest alternatives.
Government and sovereign debt securities provided the best returns, with longer dated bonds appreciating and short-term government rates falling to levels not seen since the last recession. Bonds exposed to credit risk have suffered significant price erosion. Late in the period, developing economy stock markets fell in concert with significant price breaks in oil and industrial metals. Domestically, small-cap stocks outperformed large-caps, but mid-cap stocks corrected more sharply than both large- and small-cap stocks.
The Fund had meaningful exposure to international stocks, although we were underweighted in the area versus our long-term target. In addition, we had significant exposure to both small- and mid-capitalization stocks, the benefit of the former being outweighed by the relative returns in the latter. The three most significant factors limiting our returns were a meaningful allocation to equity securities, our exposure to international and mid-cap equity markets and our holdings in credit based fixed-income products that did not provide the buffer of a larger allocation to government or sovereign debt. In aggregate, we outperformed the benchmark equity index.
What is your outlook?
There is still a tremendous amount of uncertainty in both the economic and financial outlook. The programs that have been put in place appear to be making progress in facilitating a more normal lending environment. This would establish the basis for an improving economic environment. Holders of risk capital around the globe continue to be cautious. Additionally, consumers remain hesitant and have reduced purchases as the employment outlook remains tentative. Mitigating some of these concerns is a relatively well balanced corporate sector with moderate inventories and generally good balance sheets. That is not the case universally, with severe constraints in both automobiles and retail.
Portfolio Composition
(% of Portfolio)
Top 10 Holdings
(% of Net Assets)
| | | |
Thrivent Income Fund | | 18.9 | % |
Thrivent Limited Maturity Bond Fund | | 18.6 | % |
Thrivent Large Cap Value Fund | | 10.9 | % |
Thrivent Large Cap Growth Fund | | 7.9 | % |
Thrivent Partner International Stock Fund | | 6.8 | % |
Thrivent High Yield Fund | | 6.1 | % |
Thrivent Mid Cap Stock Fund | | 5.3 | % |
Thrivent Large Cap Stock Fund | | 4.7 | % |
Thrivent Real Estate Securities Fund | | 3.1 | % |
Thrivent Partner Small Cap Value Fund | | 2.9 | % |
The shares of these Funds represent 85.2% of the total net assets of the Fund.
Quoted Fund performance is for Class A shares and does not reflect a sales charge. The returns shown do not reflect taxes a shareholder would pay on distributions or redemptions. Quoted Portfolio Composition and Top 10 Holdings are subject to change.
8
Most risk asset classes are priced at extraordinary discounts to normal valuations, some at levels not seen in generations. Stock markets bottom well in advance of economic recovery. Recent studies have suggested that economic and market dislocations associated with crises in banking systems tend be longer in duration and deeper in magnitude. The data also suggests that broad and deep policy interventions have historically been associated with market inflection points. While not unequivocally in evidence at this point, the weight of the evidence suggests that the worst is likely behind us and sufficient catalysts are in place that would imply improvement for both the markets and the economy in 2009. We are positioning the Fund with that outlook in mind.
Portfolio Facts
As of October 31, 2008
| | | | | | |
| | | Class A | | Institutional Class |
Ticker | | | THMAX | | | TMAIX |
Transfer Agent ID | | | 036 | | | 466 |
Net Assets | | $ | 739,643,364 | | $ | 28,365,136 |
NAV | | $ | 8.42 | | $ | 8.43 |
NAV - High† | | | 11/6/2007 - $12.19 | | | 11/6/2007 - $12.21 |
NAV - Low† | | | 10/27/2008 - $7.69 | | | 10/27/2008 - $7.71 |
Number of Holdings: 33 | | | | | | |
| † | For the year ended October 31, 2008 |
Average Annual Total Returns1
As of October 31, 2008
| | | | | | |
Class A2 | | 1-Year | | | From
Inception
6/30/2005 | |
without sales charge | | (28.06 | %) | | (1.83 | %) |
with sales charge | | (32.03 | %) | | (3.47 | %) |
| | |
Institutional Class3 | | 1-Year | | | From
Inception
6/30/2005 | |
Net Asset Value | | (27.87 | %) | | (1.54 | %) |
Value of a $10,000 Investment
Class A Shares*,1,(a)
1 | Past performance is not an indication of future results. Annualized total returns represent past performance and reflect changes in share prices, the reinvestment of all dividends and capital gains, and the effects of compounding. Investing in a mutual fund involves risks, including the possible loss of principal. The prospectus contains more complete information on the investment objectives, risks, charges and expenses of the investment company, which investors should read and consider carefully before investing. To obtain a prospectus, contact a registered representative or visit www.thrivent.com. At various times, the Fund’s adviser waived its management fee and/or reimbursed Fund expenses. Had the adviser not done so, the Fund’s total returns would have been lower. The returns shown do not reflect taxes a shareholder would pay on distributions or redemptions. |
2 | Class A performance reflects the maximum sales charge of 5.5%. |
3 | Institutional Class shares have no sales load and are for institutional shareholders only. |
(a) | Performance of other classes will be greater or less than the line shown based on the differences in loads and fees paid by shareholders investing in the different classes. |
| * | As you compare performance, please note that the Fund’s performance reflects the maximum 5.5% sales charge, while the Consumer Price Index, the S&P 500 Index and the Barclays Capital Aggregate Bond Index do not reflect any such charges. If you were to purchase any of the above individual stocks or funds represented in the Indexes, any charges you would pay would reduce your total return as well. |
| ** | The Consumer Price Index is an inflationary indicator that measures the change in the cost of a fixed basket of products and services, including housing, electricity, food and transportation. It is not possible to invest directly in the Index. |
| *** | The Barclays Capital Aggregate Bond Index is an index that measures the performance of U.S. investment grade bonds. It is not possible to invest directly in the Index. The performance of the Index does not reflect deductions for fees, expenses or taxes. The Barclays Capital Aggregate Bond Index is the new name for the index formerly known as the Lehman Brothers Aggregate Bond Index. The Barclays Capital Aggregate Bond Index assumes the prior history and is compiled going forward using the same methodology of the Lehman Brothers Aggregate Bond Index. |
| **** | The S&P 500 Index is an index that represents the average performance of a group of 500 widely held, publicly traded stocks. It is not possible to invest directly in the Index. The performance of the Index does not reflect deductions for fees, expenses or taxes. |
9
| | | | |
 | | Thrivent Moderately
Conservative Allocation Fund | |  |
| | Russell W. Swansen (left), David C. Francis, CFA (right) and Mark L. Simenstad, CFA (far right), Portfolio Co-Managers The Fund seeks long-term capital growth while providing reasonable stability of principal by implementing an asset allocation strategy. | |
The Fund’s performance depends upon how its assets are allocated across broad asset categories and applicable sub-classes within such categories. Some broad asset categories and sub-classes may perform below expectations or below the securities markets generally over short or extended periods. In particular, underperformance in the equity markets would have material adverse effect on the Fund’s total return, given its allocation to equity securities. Therefore, a principal risk of investing in the Fund is heavily dependent upon the performance of the underlying funds in which the Fund invests. As a result, the Fund is subject to the same risks as those faced by the underlying funds. These and other risks are described in the Fund’s prospectus.
How did the Fund perform during the 12-month period ended October 31, 2008?
Thrivent Moderately Conservative Allocation Fund earned a return of -20.53%, as compared to the median return for its peer group, the Lipper Mixed Asset Target Allocation Conservative category, of -19.12%. The Fund’s market benchmarks, the S&P 500 Index and the Barclays Capital Aggregate Bond Index, earned a total return of -36.08% and 0.30%, respectively.
What factors affected the Fund’s performance?
Stocks fell sharply over the last fiscal year, reflecting profound disruptions in the credit markets that have meaningfully impaired expectations for economic growth not only in the United States but around the world. Credit has become both quite expensive and, in many areas, severely restricted for all but the highest quality borrowers. Governments around the world have stepped in with various programs to take the place of the traditional providers of credit.
Government and sovereign debt securities provided the best returns, with longer dated bonds appreciating and short-term government rates falling to levels not seen since the last recession. Bonds exposed to credit risk have suffered significant price erosion. Late in the period, developing economy stock markets fell in concert with significant price breaks in oil and industrial metals. Domestically, small-cap stocks outperformed large-caps, but mid-cap stocks corrected more sharply than both large- and small-cap stocks.
The Fund had exposure to international stocks, although we were underweighted in this area versus our long-term target. In addition, we had exposure to both small- and mid-capitalization stocks, the benefit of the former being outweighed by the relative returns in the latter. The three most significant factors limiting our returns were a meaningful allocation to equity securities, our exposure to international and mid-cap equity markets and our holdings in credit based fixed-income products that did not provide the buffer of a larger allocation to government or sovereign debt. In aggregate, we outperformed the benchmark equity index.
What is your outlook?
There is still a tremendous amount of uncertainty in both the economic and financial outlook. The programs that have been put in place appear to be making progress in facilitating a more normal lending environment. This would establish the basis for an improving economic environment. Holders of risk capital around the globe continue to be cautious. Additionally, consumers remain hesitant and have reduced purchases as the employment outlook remains tentative. Mitigating some of these concerns is a relatively well balanced corporate sector with moderate inventories and generally good balance sheets. That is not the case universally, with severe constraints in both automobiles and retail.
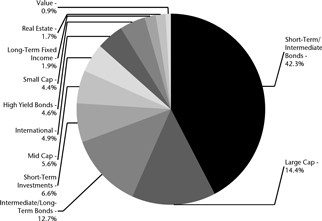
Portfolio Composition
(% of Portfolio)
Top 10 Holdings
(% of Net Assets)
| | | |
Thrivent Limited Maturity Bond Fund | | 42.3 | % |
Thrivent Income Fund | | 12.7 | % |
Thrivent Large Cap Value Fund | | 8.3 | % |
Thrivent Money Market Fund | | 4.9 | % |
Thrivent High Yield Fund | | 4.6 | % |
Thrivent Large Cap Growth Fund | | 4.2 | % |
Thrivent Partner International Stock Fund | | 3.8 | % |
Thrivent Mid Cap Stock Fund | | 3.2 | % |
Thrivent Small Cap Stock Fund | | 2.6 | % |
Thrivent Partner Mid Cap Value Fund | | 2.4 | % |
The shares of these Funds represent 89.0% of the total net assets of the Fund.
Quoted Fund performance is for Class A shares and does not reflect a sales charge. The returns shown do not reflect taxes a shareholder would pay on distributions or redemptions. Quoted Portfolio Composition and Top 10 Holdings are subject to change.
10
Most risk asset classes are priced at extraordinary discounts to normal valuations, some at levels not seen in generations. Recent studies have suggested that economic and market dislocations associated with crises in banking systems tend be longer in duration and deeper in magnitude. The data also suggests that broad and deep policy interventions have historically been associated with market inflection points. While not unequivocally in evidence at this point, the weight of the evidence suggests that the worst is likely behind us and sufficient catalysts are in place that would imply improvement for both the markets and the economy in 2009. We are positioning the Fund with that outlook in mind.
Portfolio Facts
As of October 31, 2008
| | | | | | |
| | | Class A | | Institutional Class |
Ticker | | | TCAAX | | | TCAIX |
Transfer Agent ID | | | 035 | | | 465 |
Net Assets | | $ | 314,698,748 | | $ | 11,064,603 |
NAV | | $ | 8.75 | | $ | 8.77 |
NAV - High† | | | 11/6/2007 - $11.46 | | | 11/6/2007 - $11.48 |
NAV - Low† | | | 10/27/2008 - $8.24 | | | 10/27/2008 - $8.25 |
Number of Holdings: 31 | | | | | | |
| † | For the year ended October 31, 2008 |
Average Annual Total Returns1
As of October 31, 2008
| | | | | | |
Class A2 | | 1-Year | | | From
Inception
6/30/2005 | |
without sales charge | | (20.53 | %) | | (0.54 | %) |
with sales charge | | (24.89 | %) | | (2.20 | %) |
| | |
Institutional Class3 | | 1-Year | | | From
Inception
6/30/2005 | |
Net Asset Value | | (20.30 | %) | | (0.25 | %) |
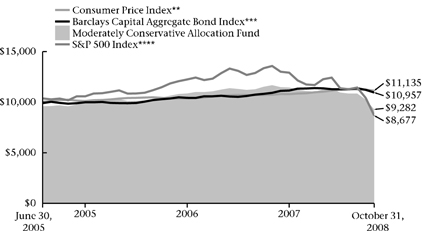
Value of a $10,000 Investment
Class A Shares*,1,(a)
1 | Past performance is not an indication of future results. Annualized total returns represent past performance and reflect changes in share prices, the reinvestment of all dividends and capital gains, and the effects of compounding. Investing in a mutual fund involves risks, including the possible loss of principal. The prospectus contains more complete information on the investment objectives, risks, charges and expenses of the investment company, which investors should read and consider carefully before investing. To obtain a prospectus, contact a registered representative or visit www.thrivent.com. At various times, the Fund’s adviser waived its management fee and/or reimbursed Fund expenses. Had the adviser not done so, the Fund’s total returns would have been lower. The returns shown do not reflect taxes a shareholder would pay on distributions or redemptions. |
2 | Class A performance reflects the maximum sales charge of 5.5%. |
3 | Institutional Class shares have no sales load and are for institutional shareholders only. |
(a) | Performance of other classes will be greater or less than the line shown based on the differences in loads and fees paid by shareholders investing in the different classes. |
| * | As you compare performance, please note that the Fund’s performance reflects the maximum 5.5% sales charge, while the Consumer Price Index, the S&P 500 Index and the Barclays Capital Aggregate Bond Index do not reflect any such charges. If you were to purchase any of the above individual stocks or funds represented in these Indexes, any charges you would pay would reduce your total return as well. |
| ** | The Consumer Price Index is an inflationary indicator that measures the change in the cost of a fixed basket of products and services, including housing, electricity, food and transportation. It is not possible to invest directly in the Index. |
| *** | The Barclays Capital Aggregate Bond Index is an index that measures the performance of U.S. investment grade bonds. It is not possible to invest directly in the Index. The performance of the Index does not reflect deductions for fees, expenses or taxes. The Barclays Capital Aggregate Bond Index is the new name for the index formerly known as the Lehman Brothers Aggregate Bond Index. The Barclays Capital Aggregate Bond Index assumes the prior history and is compiled going forward using the same methodology of the Lehman Brothers Aggregate Bond Index. |
| **** | The S&P 500 Index is an index that represents the average performance of a group of 500 widely held, publicly traded stocks. It is not possible to invest directly in the Index. The performance of the Index does not reflect deductions for fees, expenses or taxes. |
11
| | |
 | | Thrivent Technology Fund Darren M. Bagwell, CFA, Portfolio Manager The Fund seeks long-term capital appreciation by investing primarily in a diversified portfolio of common stocks and securities convertible into common stocks. The Fund primarily invests in technology-related industries; as a consequence, the Fund may be subject to greater price volatility than a fund investing in a broad range of industries. This and other risks are described in the Fund’s prospectus. |
How did the Fund perform during the 12-month period ended October 31, 2008?
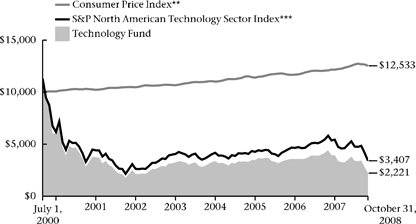
Thrivent Technology Fund earned a return of -49.79%, as compared to the median return of its peer group, the Lipper Science and Technology category, of -43.74%. The Fund’s market benchmark, the S&P North American Technology Sector Index, earned a total return of -41.46%.
What factors affected the Fund’s performance?
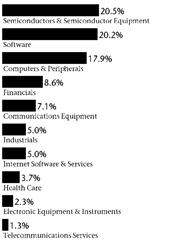
The Fund’s disappointing relative performance was almost entirely attributable to its exposure to the alternative energy sector–notably wind and solar. While we believed that the long-term secular growth potential for alternative energy to address global environmental, economic and security concerns posed by oil and fossil fuels was significant, and still do, we underestimated the short-term influence that declining oil prices and delayed government subsidy legislation would have on the group’s performance.
The health care sector was the other, much smaller, contributor to relative underperformance. Poor security selection was the culprit in a group that broadly outperformed the market, despite our emphasis on higher-quality, low-beta companies like biopharmaceutical maker BioMarin and eye-care supplier Alcon. We were absent from the strong-performing large-cap biopharmaceutical companies like Amgen, Gilead and Genzyme, as well.
Alternative energy and health care offset the general outperformance of almost all the other sectors represented in the Fund. Of particular note were the solid performances of our technology hardware holdings like Netezza (storage), FormFactor (semiconductor equipment) and Apple (computers). Software also contributed positively to relative performance, especially application software holdings in Compuware, Adobe and Quest Software.
What is your outlook?
At a macroeconomic level, we expect 2009 to be characterized by continued weak domestic economic growth burdened by further housing market weakness, difficult credit markets and deteriorating consumer spending trends; low and stable interest rates; a stable or stronger dollar; and continued weakening in international demand, including emerging economies. As difficult as current economic conditions remain, especially in technology, we are mindful that the equity markets are at historically low valuation levels even against significantly lowered expectations, and that their recovery can precede economic improvements by 12-18 months.
With respect to technology specifically, we expect global spending to be flat in 2009, compared to 5%-10% growth in the previous two years. We believe there will be moderate declines in developed economies, offsetting positive, but below-trend, growth in emerging economies. This should result in technology spending trends that are healthier than overall corporate profit and capital expenditure trends (which should be decidedly negative), due to the relative importance of technology to the competitive positioning and productivity pursuits that are key in weaker economic environments, as well as the relatively restrained technology spending patterns of corporations since 2001. As a result, we
Major Market Sectors
(% of Net Assets)
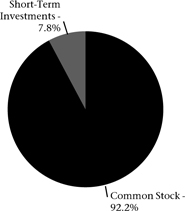
Portfolio Composition
(% of Portfolio)
Top 10 Holdings
(% of Net Assets)
| | | |
EMC Corporation | | 10.4 | % |
Teradyne, Inc. | | 4.5 | % |
FormFactor, Inc. | | 4.5 | % |
SPDR KBW Bank ETF | | 4.3 | % |
Financial Select Sector SPDR Fund | | 4.3 | % |
Apple, Inc. | | 4.1 | % |
Google, Inc. | | 4.0 | % |
Oracle Corporation | | 3.8 | % |
International Business Machines Corporation | | 3.4 | % |
Cisco Systems, Inc. | | 3.1 | % |
These securities represent 46.4% of the total net assets of the Fund.
Quoted Fund performance is for Class A shares and does not reflect a sales charge.
The returns shown do not reflect taxes a shareholder would pay on distributions or redemptions.
Quoted Major Market Sectors, Portfolio Composition and Top 10 Holdings are subject to change.
The lists of Major Market Sectors and Top 10 Holdings exclude short-term investments and collateral held for securities loaned.
The Portfolio Composition chart excludes collateral held for securities loaned.
12
are de-emphasizing consumer-dependent technology companies in favor of productivity-focused application software companies. Despite difficult credit conditions and the deteriorating expenditure environment, we believe there are value opportunities in areas like semiconductor equipment, where spending has already declined to maintenance levels and many debt-free companies sell near book values comprised of 35%-70% cash. We also retain our strong belief that the risk/reward remains favorable in alternative energy companies, with the heightened support and commitment of the new U.S. administration and probable recovery in oil prices representing the most likely catalysts for the group over the next 12 months.
Portfolio Facts
As of October 31, 2008
| | | | | | | | | |
| | | Class A | | Class B | | Institutional Class |
Ticker | | | AATSX | | | BBTSX | | | THTIX |
Transfer Agent ID | | | 028 | | | 078 | | | 098 |
Net Assets | | $ | 19,151,529 | | $ | 366,589 | | $ | 1,280,321 |
NAV | | $ | 2.35 | | $ | 2.21 | | $ | 2.50 |
NAV - High† | | | 11/2/2007 - $4.60 | | | 11/2/2007 - $4.36 | | | 11/2/2007 - $4.87 |
NAV - Low† | | | 10/27/2008 - $2.07 | | | 10/27/2008 - $1.94 | | | 10/27/2008 - $2.20 |
Number of Holdings: 41 | | | | | | | | | |
| † | For the year ended October 31, 2008 |
Average Annual Total Returns1
As of October 31, 2008
| | | | | | | | | |
Class A2 | | 1-Year | | | 5 Years | | | From
Inception
7/1/2000 | |
without sales charge | | (49.79 | %) | | (6.56 | %) | | (15.95 | %) |
with sales charge | | (52.53 | %) | | (7.60 | %) | | (16.52 | %) |
| | | |
Class B3 | | 1-Year | | | 5 Years | | | From
Inception
7/1/2000 | |
without sales charge | | (50.23 | %) | | (7.14 | %) | | (16.36 | %) |
with sales charge | | (52.22 | %) | | (7.14 | %) | | (16.36 | %) |
| | | |
Institutional Class4 | | 1-Year | | | 5 Years | | | From
Inception
7/1/2000 | |
Net Asset Value | | (49.49 | %) | | (6.02 | %) | | (15.32 | %) |
Value of a $10,000 Investment
Class A Shares*,1,(a)
1 | Past performance is not an indication of future results. Annualized total returns represent past performance and reflect changes in share prices, the reinvestment of all dividends and capital gains, and the effects of compounding. Investing in a mutual fund involves risks, including the possible loss of principal. The prospectus contains more complete information on the investment objectives, risks, charges and expenses of the investment company which investors should read and consider carefully before investing. To obtain a prospectus, contact a registered representative or visit www.thrivent.com. The Fund primarily invests in technology-related industries; as a consequence, the Fund may be subject to greater price volatility than a fund investing in a broad range of industries. At various times, the Fund’s adviser waived its management fee and/or reimbursed Fund expenses. Had the adviser not done so, the Fund’s total returns would have been lower. The returns shown do not reflect taxes a shareholder would pay on distributions or redemptions. |
2 | Class A performance reflects the maximum sales charge of 5.5%. |
3 | Class B performance reflects the maximum defferred sales charge of 5%, declining 1% each year during the first five years and then converting to Class A shares after the fifth year. |
4 | Institutional Class shares have no sales load and are for institutional shareholders only. |
(a) | Performance of other classes will be greater or less than the line shown based on the differences in loads and fees paid by shareholders investing in the different classes. |
| * | As you compare performance, please note that the Fund’s performance reflects the maximum 5.5% sales charge, while the Consumer Price Index and S&P North American Technology Sector Index do not reflect any such charges. If you were to purchase any of the above individual stocks or funds represented in the Index, any charges you would pay would reduce your total return as well. |
| ** | The Consumer Price Index is an inflationary indicator that measures the change in the cost of a fixed basket of products and services, including housing, electricity, food and transportation. It is not possible to invest directly in the Index. |
| *** | The S&P North American Technology Sector Index is a modified capitalization-weighted index of selected technology stocks. It is not possible to invest directly in the Index. The performance of the Index does not reflect deductions for fees, expenses or taxes. The S&P North American Technology Sector Index is the new name for the index formerly known as the CBOE GSTI Composite Index. The S&P North American Technology Sector Index assumes the prior history and is compiled going forward using the same methodology of the CBOE GSTI Composite Index. |
13
Thrivent Partner Small Cap Growth Fund
| | |
 | | Subadvised by Turner Investment Partners, Inc. The Fund seeks long-term capital growth by investing primarily in a diversified portfolio of common stocks of U.S. small-capitalization companies. |
The Fund is exposed to the risks of investing in equity securities of smaller companies, which may include, but are not limited to, lower trading volume and less liquidity than larger, more established companies. Small company stock prices are generally more volatile than large company stock prices. These and other risks are described in the Fund’s prospectus.
How did the Fund perform during the 12-month period ended October 31, 2008?
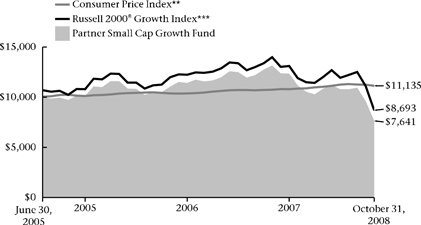
Thrivent Partner Small Cap Growth Fund earned a return of -41.96%, as compared to the median return of its peer group, the Lipper Small Cap Growth category, of -42.47%. The Fund’s market benchmark, the Russell 2000® Growth Index, earned a total return of -37.87%.
What factors affected the Fund’s performance?
As the financial crisis expanded over the last fiscal year, it began to more seriously impair the outlook for the domestic and global economy. As growth stocks tend to have higher levels of expectations embedded in prices, they can be more sensitive as economic and financial variables enter a state of flux. This was a meaningful factor in both the absolute returns of the group versus other sectors of the market and relative returns of the Fund. As our strategy emphasizes strong revenue and earnings growth, prices sometimes can adjust more quickly and harshly in times of heightened uncertainty.
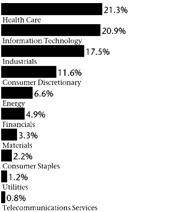
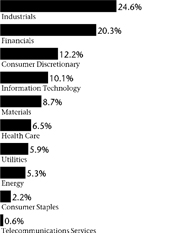
Stock selection in both the information technology and consumer discretionary sectors was the main variable limiting the Fund’s returns versus the benchmark. Both of these groups, particularly in the small-cap growth segment, tend to be more dependent on good economic growth and will adjust more meaningfully as expectations are adjusted. In particular, in the information technology group, holdings in the software and services segments limited our results. In the consumer discretionary segment, the diminished economic outlook had the largest effect on our holdings in the travel and leisure industries, as well as holdings in consumer products companies with products and services most driven by discretionary spending. The industrial sector also experienced a more severe adjustment as expectations for global growth deteriorated late in the period. Many of these companies are suppliers to larger industrial manufacturers, and diminished credit availability caused concern related to future capital spending plans and infrastructure projects.
Mitigating some of the weakness above was a modest cash position, as well as better-than-benchmark results from holdings in the energy group. In particular, Petrohawk Energy and Concho Resources are examples of a few companies that achieved strong results despite the deteriorating fundamental environment. Holdings in tele-communications, utilities and health care provided better-than-benchmark results, but were not sufficient to offset the aforementioned factors limiting Fund performance.
Major Market Sectors
(% of Net Assets)
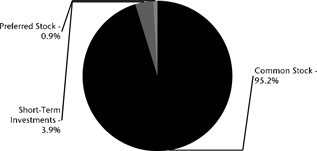
Portfolio Composition
(% of Portfolio)
Top 10 Holdings
(% of Net Assets)
| | | |
Amedisys, Inc. | | 2.2 | % |
United Therapeutics Corporation | | 1.8 | % |
Haemonetics Corporation | | 1.6 | % |
NuVasive, Inc. | | 1.6 | % |
WMS Industries, Inc. | | 1.5 | % |
Huron Consulting Group, Inc. | | 1.5 | % |
Polycom, Inc. | | 1.5 | % |
Thoratec Corporation | | 1.4 | % |
Novellus Systems, Inc. | | 1.4 | % |
Wabtec Corporation | | 1.3 | % |
These securities represent 15.8% of the total net assets of the Fund.
Quoted Fund performance is for Class A shares and does not reflect a sales charge.
The returns shown do not reflect taxes a shareholder would pay on distributions or redemptions.
Quoted Major Market Sectors, Portfolio Composition and Top 10 Holdings are subject to change.
The lists of Major Market Sectors and Top 10 Holdings exclude short-term investments and collateral held for securities loaned.
The Portfolio Composition chart excludes collateral held for securities loaned.
14
What is your outlook?
The factors that have limited Fund results in the period are likely to mitigate and become advantages as we expect the deterioration in economic fundamentals will run its course over the next year. Markets will discount any improvement in the outlook long before it becomes apparent, and we believe the Fund is well positioned to benefit from that shift.
Our focus remains on owning stocks we believe have superior earnings prospects. With that in mind, the expected earnings growth of the Fund remains at a premium to that of the Russell 2000® Growth Index. Additionally, valuations for the portfolio are at a discount. This combination should position the Fund for improved results in a more constructive investment environment.
Portfolio Facts
As of October 31, 2008
| | | | | | |
| | | Class A | | Institutional Class |
Ticker | | | TPSAX | | | TPGIX |
Transfer Agent ID | | | 063 | | | 463 |
Net Assets | | $ | 9,625,248 | | $ | 64,668,414 |
NAV | | $ | 7.72 | | $ | 7.79 |
NAV - High† | | | 11/6/2007 - $13.74 | | | 11/6/2007 - $13.82 |
NAV - Low† | | | 10/27/2008 - $6.60 | | | 10/27/2008 - $6.66 |
Number of Holdings: 118 | | | | | | |
| † | For the year ended October 31, 2008 |
Average Annual Total Returns1
As of October 31, 2008
| | | | | | |
Class A2 | | 1-Year | | | From
Inception
6/30/2005 | |
without sales charge | | (41.96 | %) | | (6.17 | %) |
with sales charge | | (45.15 | %) | | (7.74 | %) |
| | |
Institutional Class3 | | 1-Year | | | From
Inception
6/30/2005 | |
Net Asset Value | | (41.74 | %) | | (5.87 | %) |
Value of a $10,000 Investment
Class A Shares*,1,(a)
1 | Past performance is not an indication of future results. Annualized total returns represent past performance and reflect changes in share prices, the reinvestment of all dividends and capital gains, and the effects of compounding. Investing in a mutual fund involves risks, including the possible loss of principal. The prospectus contains more complete information on the investment objectives, risks, charges and expenses of the investment company, which investors should read and consider carefully before investing. To obtain a prospectus, contact a registered representative or visit www.thrivent.com. At various times, the Fund’s adviser waived its management fee and/or reimbursed Fund expenses. Had the adviser not done so, the Fund’s total returns would have been lower. The returns shown do not reflect taxes a shareholder would pay on distributions or redemptions. |
2 | Class A performance reflects the maximum sales charge of 5.5%. |
3 | Institutional Class shares have no sales load and are for institutional shareholders only. |
(a) | Performance of other classes will be greater or less than the line shown based on the differences in loads and fees paid by shareholders investing in the different classes. |
* | As you compare performance, please note that the Fund’s performance reflects the maximum 5.5% sales charge, while the Consumer Price Index, and the Russell 2000® Growth Index do not reflect any such charges. If you were to purchase any of the above individual stocks or funds represented in the Index, any charges you would pay would reduce your total return as well. |
| ** | The Consumer Price Index is an inflationary indicator that measures the change in the cost of a fixed basket of products and services, including housing, electricity, food and transportation. It is not possible to invest directly in the Index. |
*** | The Russell 2000® Growth Index is an index comprised of companies with a greater than average growth orientation. It is not possible to invest directly in the Index. The performance of the Index does not reflect deductions for fees, expenses or taxes. |
15
Thrivent Partner Small Cap Value Fund
| | |
 | | Subadvised by T. Rowe Price Associates, Inc. The Fund seeks long-term capital appreciation by investing primarily in a diversified portfolio of small company common stock and securities convertible into small company common stocks. |
The Fund is exposed to the risks of investing in equity securities of smaller companies, which may include, but are not limited to, lower trading volume and less liquidity than larger, more established companies. Small company stock prices are generally more volatile than large company stock prices. These and other risks are described in the Fund’s prospectus.
How did the Fund perform during the 12-month period ended October 31, 2008?
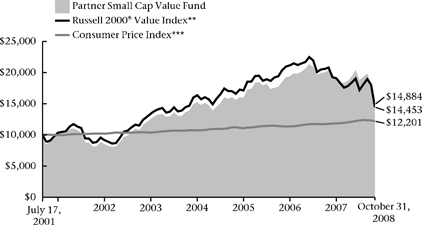
Thrivent Partner Small Cap Value Fund earned a return of -26.94%, as compared to the median return of its peer group, the Lipper Small Cap Value category, of -33.08%. The Fund’s market benchmark, the Russell 2000® Value Index, earned a total return of -30.54%.
What factors affected the Fund’s performance?
Stock selection and avoiding securities in particularly weak industries were the most significant factors in the good relative returns achieved in the Fund. While absolute results were disappointing, the Fund did conserve some capital relative to the indexes and peers.
We achieved relatively favorable stock selection results across a number of sectors. The consumer discretionary sector was the most significant contributor, as our holdings declined appreciably less than the group. A lack of exposure in the media industry was a positive. Additionally, select exposures in the specialty retail industry declined modestly as compared to the group and the market. In particular, our positions in Aaron Rents and Haverty Furniture actually advanced over the holding period. Diversified consumer services and household durables were two other industries in which our average holdings provided results superior to their group peers. Fund results in information technology (IT) also bested the averages. In particular, holdings in the semiconductor, software and equipment industries performed better than the peer groups. Our holdings in IT services did not keep up with the broader industry and offset some of the advantage gained in other segments of the sector. The industrial sector was also responsible for some of the Fund’s advantage. Select holdings in the distribution, trading and air freight segments actually advanced over the period and materially lifted our relative returns. Electrical equipment holding Genlyte Group also advanced for the period. Health care sector results were quite supportive with strong relative returns across the Fund’s holdings in the biotechnology, heath care providers and equipment industries. A moderate cash position over the period also was additive to returns.
A factor limiting relative returns included a lack of exposure to certain segments in the financial sector. Despite all the macro challenges impairing financial firms, many small and regional banks had not exposed their operations to many of the more egregious practices of larger industry players and were able to expand market share as others retrenched. Moderate underweighting in the consumer staples sector was also a factor, as the segment declined much less than the broad market averages. Finally, an overweighted position in the energy sector offset some of the advantage gained in other Fund segments. While the energy sector was strong early in the period, it declined significantly in the final quarter of the fiscal year, as commodity and energy prices fell precipitously in the face of the weakening global economic outlook. We had reduced our position over the year but had not fully underweighted the group in advance of the fourth fiscal quarter weakness.
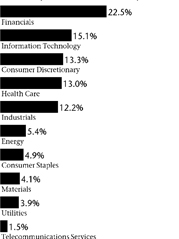
Major Market Sectors
(% of Net Assets)
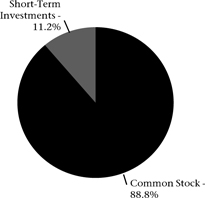
Portfolio Composition
(% of Portfolio)
Top 10 Holdings
(% of Net Assets)
| | | |
ProAssurance Corporation | | 2.2 | % |
Aaron Rents, Inc. | | 2.1 | % |
Owens & Minor, Inc. | | 1.9 | % |
Whiting Petroleum Corporation | | 1.7 | % |
Mariner Energy, Inc. | | 1.5 | % |
Cleco Corporation | | 1.4 | % |
Woodward Governor Company | | 1.4 | % |
AptarGroup, Inc. | | 1.4 | % |
SVB Financial Group | | 1.2 | % |
Genesee & Wyoming, Inc. | | 1.2 | % |
These securities represent 16.0% of the total net assets of the Fund.
Quoted Fund performance is for Class A shares and does not reflect a sales charge.
The returns shown do not reflect taxes a shareholder would pay on distributions or redemptions.
Quoted Major Market Sectors, Portfolio Composition and Top 10 Holdings are subject to change.
The lists of Major Market Sectors and Top 10 Holdings exclude short-term investments and collateral held for securities loaned.
The Portfolio Composition chart excludes collateral held for securities loaned.
16
What is your outlook?
We believe that the long-term trend for energy is increasing global demand and expect to remain overweighted in the sector. The financial sector is paying the price of excess. We have an underweighted stance in the sector, as we believe the benchmark index’s 30%+ allocation is too much. Rising food and energy costs and tighter lending conditions are taking a bite out of discretionary income. We continue to seek financially strong consumer discretionary companies that can navigate these tough times. We are taking care to ensure that the Fund’s largest holdings have strong balance sheets and business models. Bargains have been increasing across all industries, providing plentiful opportunities for value investing.
Portfolio Facts
As of October 31, 2008
| | | | | | | | | |
| | | Class A | | Class B | | Institutional Class |
Ticker | | | AALVX | | | BBSVX | | | TPSIX |
Transfer Agent ID | | | 032 | | | 082 | | | 099 |
Net Assets | | $ | 54,295,492 | | $ | 1,249,979 | | $ | 75,397,695 |
NAV | | $ | 11.02 | | $ | 10.20 | | $ | 11.53 |
NAV - High† | | | 11/2/2007 - $15.84 | | | 11/2/2007 - $14.91 | | | 11/2/2007 - $16.51 |
NAV - Low† | | | 10/27/2008 - $9.27 | | | 10/27/2008 - $8.58 | | | 10/27/2008 - $9.69 |
Number of Holdings: 156 | | | | | | | | | |
| † | For the year ended October 31, 2008 |
Average Annual Total Returns1
As of October 31, 2008
| | | | | | | | | |
Class A2 | | 1-Year | | | 5 Years | | | From
Inception
7/17/2001 | |
without sales charge | | (26.94 | %) | | 5.14 | % | | 6.42 | % |
with sales charge | | (30.98 | %) | | 3.95 | % | | 5.61 | % |
| | | |
Class B3 | | 1-Year | | | 5 Years | | | From
Inception
7/17/2001 | |
without sales charge | | (27.75 | %) | | 4.10 | % | | 5.78 | % |
with sales charge | | (30.39 | %) | | 4.10 | % | | 5.78 | % |
| | | |
Institutional Class4 | | 1-Year | | | 5 Years | | | From
Inception
7/17/2001 | |
Net Asset Value | | (26.46 | %) | | 5.85 | % | | 7.20 | % |
Value of a $10,000 Investment
Class A Shares*,1,(a)
1 | Past performance is not an indication of future results. Annualized total returns represent past performance and reflect changes in share prices, the reinvestment of all dividends and capital gains, and the effects of compounding. Investing in a mutual fund involves risks, including the possible loss of principal. The prospectus contains more complete information on the investment objectives, risks, charges and expenses of the investment company, which investors should read and consider carefully before investing. To obtain a prospectus, contact a registered representative or visit www.thrivent.com. At various times, the Fund’s adviser waived its management fee and/or reimbursed Fund expenses. Had the adviser not done so, the Fund’s total returns would have been lower. The returns shown do not reflect taxes a shareholder would pay on distributions or redemptions. |
2 | Class A performance reflects the maximum sales charge of 5.5%. |
3 | Class B performance reflects the maximum defferred sales charge of 5%, declining 1% each year during the first five years and then converting to Class A shares after the fifth year. |
4 | Institutional Class shares have no sales load and are for institutional shareholders only. |
(a) | Performance of other classes will be greater or less than the line shown based on the differences in loads and fees paid by shareholders investing in the different classes. |
* | As you compare performance, please note that the Fund’s performance reflects the maximum 5.5% sales charge, while the Russell 2000® Value Index and the Consumer Price Index do not reflect any such charges. If you were to purchase any of the above individual stocks or funds represented in the Index, any charges you would pay would reduce your total return as well. |
** | The Russell 2000® Value Index measures the performance of small cap value stocks. It is not possible to invest directly in the Index. The performance of the Index does not reflect deductions for fees, expenses or taxes. |
| *** | The Consumer Price Index is an inflationary indicator that measures the change in the cost of a fixed basket of products and services, including housing, electricity, food and transportation. It is not possible to invest directly in the Index. |
17
| | |
 | | Thrivent Small Cap Stock Fund David A. Maule, CFA, Portfolio Manager The Fund seeks long-term capital growth by investing primarily in small company common stocks and securities convertible into small company common stocks. The Fund is exposed to the risks of investing in equity securities of smaller companies, which may include, but are not limited to, lower trading volume and less liquidity than larger, more established companies. Small company stock prices are generally more volatile than large company stock prices. These and other risks are described in the Fund’s prospectus. |
How did the Fund perform during the 12-month period ending October 31, 2008?
Thrivent Small Cap Stock Fund earned a return of -37.25%, as compared to the median return of its peer group, the Lipper Inc. Small Cap Core category, of -36.60%. The Fund’s market benchmark, the Russell 2000® Index, earned a total return of -34.16%.
What factors affected the Fund’s performance?
During the period, the financial markets saw unprecedented volatility due, in large part, to the weaknesses of both the housing and credit markets. The impact of this crisis reverberated throughout all financial markets, resulting in significant losses on an absolute basis for most asset classes, including small-cap stocks. There was literally no place to hide, as all sectors had negative returns for the period, although defensive sectors such as utilities, consumer staples, financials and health care performed better than the economically sensitive sectors of energy, materials, industrials and information technology.
Given our concerns regarding the deteriorating credit environment and an overleveraged consumer, the Fund was underweighted in the financials sector, which resulted in negative relative performance as the massive government intervention stabilized and supported the sector. Additionally, our economically sensitive holdings detracted from Fund performance during the period, as the market recognized the potential for a global economic slowdown. Within the energy, materials and industrials sectors, many of our highly cyclical holdings exhibited volatile negative price reactions over a very short period of time as the energy and commodity bull market began to unwind.
On the positive side, the Fund benefited from superior security selection within the consumer discretionary space, particularly within the media, restaurants and specialty retail industries. Other positive sector contributions included telecommunication services and consumer staples. Within the health care sector, our biotechnology holdings performed extremely well, while within the financial sector our real estate investment trusts provided solid outperformance.
What is your outlook?
We remain concerned regarding the worldwide economic outlook, as the credit crisis continues to roil the financial markets while many of the world’s largest economies appear to have entered a recession. Deflationary forces continue to push down valuations on almost all assets, including real estate, stocks, bonds, commodities and oil. Credit contraction has been severe, which should hinder economic growth for some time. Consumers are constrained and many will likely have to increase savings and reduce spending. We expect increased job losses and a higher unemployment rate going forward, along with declining wage growth. Therefore, the outlook for consumer spending remains poor, which should translate into weak economic growth.
Given our outlook, the Fund is positioned with an overweighted stance in the more defensive sectors of health care, consumer staples and utilities. Additionally, the Fund has an overweighted position in the financials sector, primarily regional banks, as they should benefit from aggressive government monetary policies.
Major Market Sectors
(% of Net Assets)
Portfolio Composition
(% of Portfolio)
Top 10 Holdings
(% of Net Assets)
| | | |
Waste Connections, Inc. | | 0.9 | % |
Ralcorp Holdings, Inc. | | 0.9 | % |
TreeHouse Foods, Inc. | | 0.8 | % |
Petrohawk Energy Corporation | | 0.8 | % |
Carter’s, Inc. | | 0.8 | % |
Chattem, Inc. | | 0.8 | % |
New Jersey Resources Corporation | | 0.8 | % |
Comtech Telecommunications Corporation | | 0.8 | % |
Sybase, Inc. | | 0.7 | % |
SVB Financial Group | | 0.7 | % |
These securities represent 8.0% of the total net assets of the Fund.
Quoted Fund performance is for Class A shares and does not reflect a sales charge.
The returns shown do not reflect taxes a shareholder would pay on distributions or redemptions.
Quoted Major Market Sectors, Portfolio Composition and Top 10 Holdings are subject to change.
The lists of Major Market Sectors and Top 10 Holdings exclude short-term investments and collateral held for securities loaned.
The Portfolio Composition chart excludes collateral held for securities loaned.
18
While the recent aggressive actions of the Fed, the U.S. Treasury and Congress may positively impact the economy in the short-term, the longer-term benefits are still uncertain. We remain fairly cautious because all the government programs will probably contribute to a larger Federal deficit at a time when the economy is likely in recession. The recession may be longer and deeper than many expect, as frugality should become the next big consumer trend, while corporations and state governments likely cut back on hiring and capital spending. We believe the Fund is positioned well for the current environment and, as economic conditions improve, we will adjust to a more aggressive stance.
Portfolio Facts
As of October 31, 2008
| | | | | | | | | |
| | | Class A | | Class B | | Institutional Class |
Ticker | | | AASMX | | | BBSMX | | | TSCSX |
Transfer Agent ID | | | 024 | | | 074 | | | 094 |
Net Assets | | $ | 241,884,273 | | $ | 2,848,610 | | $ | 106,670,063 |
NAV | | $ | 10.33 | | $ | 8.65 | | $ | 11.43 |
NAV - High† | | | 11/6/2007 - $18.51 | | | 11/6/2007 - $16.04 | | | 11/6/2007 - $20.11 |
NAV - Low† | | | 10/27/2008 - $8.89 | | | 10/27/2008 - $7.44 | | | 10/27/2008 - $9.84 |
Number of Holdings: 257 | | | | | | | | | |
| † | For the year ended October 31, 2008 |
Average Annual Total Returns1
As of October 31, 2008
| | | | | | | | | |
Class A2 | | 1-Year | | | 5 Years | | | 10 Years | |
without sales charge | | (37.25 | %) | | 1.96 | % | | 6.57 | % |
with sales charge | | (40.69 | %) | | 0.81 | % | | 5.96 | % |
| | | |
Class B3 | | 1-Year | | | 5 Years | | | 10 Years | |
without sales charge | | (37.94 | %) | | 0.89 | % | | 6.02 | % |
with sales charge | | (40.04 | %) | | 0.89 | % | | 6.02 | % |
| | | |
Institutional Class4 | | 1-Year | | | 5 Years | | | 10 Years | |
Net Asset Value | | (36.86 | %) | | 2.56 | % | | 7.27 | % |
Value of a $10,000 Investment
Class A Shares*,1,(a)
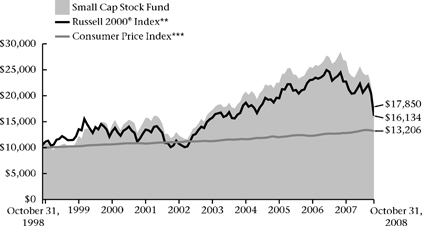
1 | Past performance is not an indication of future results. Annualized total returns represent past performance and reflect changes in share prices, the reinvestment of all dividends and capital gains, and the effects of compounding. Investing in a mutual fund involves risks, including the possible loss of principal. The prospectus contains more complete information on the investment objectives, risks, charges and expenses of the investment company, which investors should read and consider carefully before investing. To obtain a prospectus, contact a registered representative or visit www.thrivent.com. At various times, the Fund’s adviser waived its management fee and/or reimbursed Fund expenses. Had the adviser not done so, the Fund’s total returns would have been lower. The returns shown do not reflect taxes a shareholder would pay on distributions or redemptions. |
2 | Class A performance reflects the maximum sales charge of 5.5%. |
3 | Class B performance reflects the maximum defferred sales charge of 5%, declining 1% each year during the first five years and then converting to Class A shares after the fifth year. |
4 | Institutional Class shares have no sales load and are for institutional shareholders only. |
(a) | Performance of other classes will be greater or less than the line shown based on the differences in loads and fees paid by shareholders investing in the different classes. |
* | As you compare performance, please note that the Fund’s performance reflects the maximum 5.5% sales charge, while the Russell 2000® Index and the Consumer Price Index do not reflect any such charges. If you were to purchase any of the above individual stocks or funds represented in the Index, any charges you would pay would reduce your total return as well. |
** | The Russell 2000® Index measures the performance of small cap stocks. It is not possible to invest directly in the Index. The performance of the Index does not reflect deductions for fees, expenses or taxes. |
| *** | The Consumer Price Index is an inflationary indicator that measures the change in the cost of a fixed basket of products and services, including housing, electricity, food and transportation. It is not possible to invest directly in the Index. |
19
| | |
 | | Thrivent Small Cap Index Fund Kevin R. Brimmer, FSA, Portfolio Manager The Fund seeks capital growth that tracks the performance of the S&P SmallCap 600 Index by investing primarily in common stocks of the Index. The Fund is exposed to the risks of investing in equity securities of smaller companies, which may include, but are not limited to, lower trading volume and less liquidity than larger, more established companies. Small company stock prices are generally more volatile than large company stock prices. While the Fund attempts to closely track the S&P SmallCap 600 Index, it does not duplicate the composition of the Index. Individuals may not invest directly in any index. Index funds are subject to the same market risks associated with the stocks in their respective indexes. These and other risks are described in the Fund’s prospectus. |
How did the Fund perform during the 12-month period ended October 31, 2008?
Thrivent Small Cap Index Fund earned a return of -32.77%, as compared to the median return of its peer group, the Lipper Small Cap Core Funds category, of -36.60%. The Fund’s market benchmark, the S&P SmallCap 600 Index, earned a total return of -32.44%.
What factors affected the Fund’s performance?
The Fund is managed to virtually replicate the performance of the S&P SmallCap 600 Index, a prime measure of small stock performance. We seek to maintain a fully invested position with limited transactions to minimize costs. As typically occurs with an index fund, the difference in performance between the benchmark index and the Fund itself can be largely attributed to expenses and minor differences in portfolio composition.
All sectors delivered negative 12-month returns. Small-cap stocks slightly outperformed large-cap and mid-cap stocks. Two sectors with the best relative performance were consumer staples and utilities. Investors showed a flight to quality, looking for lower volatility stocks. Stocks of consumer discretionary firms and materials, by contrast, were the weakest performers, posting the most negative returns. The former group has a significant exposure to the retail and automotive sectors, areas that were under extreme pressure as a result of the ongoing credit crunch. The latter is most exposed to changes of commodity prices. With the economic weakness spreading around the globe and supplies of many items becoming more available, prices weakened dramatically late in the period, pulling down earnings expectations and share prices in the group.
What is your outlook?
The Fund will remain fully invested in stocks designed to track the performance of the S&P SmallCap 600 Index. This strategy offers individuals an attractive way to take advantage of the growth potential of the broad, diversified marketplace of small-cap stocks.
With uncertainty growing over the strength of the U.S. economy and an ongoing inflation threat, investors backed away from risk. Generally in a down market, large-cap stocks tend to out perform small-cap issues as the companies are better able to weather economic and financial downturns. Small-cap stocks corrected more severely in 2007 and were discounting some of the economic distress that has become
Major Market Sectors
(% of Net Assets)
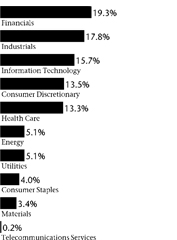
Portfolio Composition
(% of Portfolio)
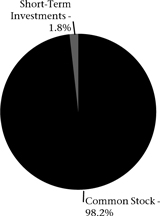
Top 10 Holdings
(% of Net Assets)
| | | |
Waste Connections, Inc. | | 0.8 | % |
Piedmont Natural Gas Company, Inc. | | 0.7 | % |
Southern Union Company | | 0.6 | % |
Senior Housing Property Trust | | 0.6 | % |
Atmos Energy Corporation | | 0.6 | % |
Landstar System, Inc. | | 0.6 | % |
Flowers Foods, Inc. | | 0.6 | % |
CLARCOR, Inc. | | 0.5 | % |
Woodward Governor Company | | 0.5 | % |
Teledyne Technologies, Inc. | | 0.5 | % |
These securities represent 6.0% of the total net assets of the Fund.
Quoted Fund performance is for Class A shares and does not reflect a sales charge.
The returns shown do not reflect taxes a shareholder would pay on distributions or redemptions.
Quoted Major Market Sectors, Portfolio Composition and Top 10 Holdings are subject to change.
The lists of Major Market Sectors and Top 10 Holdings exclude short-term investments and collateral held for securities loaned.
The Portfolio Composition chart excludes collateral held for securities loaned.
20
more apparent over the recent fiscal year. Many risk assets are priced at extraordinary discounts to normal valuations. Typically, as equity markets bottom in anticipation of an economic recovery, small-cap stocks tend to perform well versus their larger-cap counterparts. Our belief is that adequate programs and policies are in place to allow an economic recovery to take hold in 2009. Stocks generally anticipate and react well in advance of apparent improvements of economic statistics.
Portfolio Facts
As of October 31, 2008
| | | |
| | | Class A |
Ticker | | | AALSX |
Transfer Agent ID | | | 029 |
Net Assets | | $ | 26,280,253 |
NAV | | $ | 9.71 |
NAV - High† | | | 11/6/2007 - $15.93 |
NAV - Low† | | | 10/27/2008 - $8.13 |
| Number of Holdings: 603 | | | |
| † | For the year ended October 31, 2008 |
Average Annual Total Returns1
As of October 31, 2008
| | | | | | | | | |
Class A2 | | 1-Year | | | 5 Years | | | From
Inception
7/1/2000 | |
without sales charge | | (32.77 | %) | | 2.41 | % | | 3.33 | % |
with sales charge | | (36.46 | %) | | 1.26 | % | | 2.63 | % |
Value of a $10,000 Investment
Class A Shares*,1
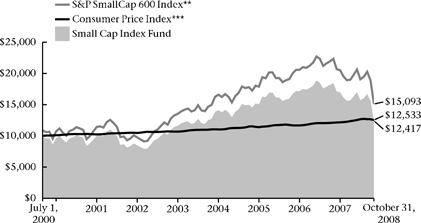
1 | Past performance is not an indication of future results. Annualized total returns represent past performance and reflect changes in share prices, the reinvestment of all dividends and capital gains, and the effects of compounding. Investing in a mutual fund involves risks, including the possible loss of principal. The prospectus contains more complete information on the investment objectives, risks, charges and expenses of the investment company, which investors should read and consider carefully before investing. To obtain a prospectus, contact a registered representative or visit www.thrivent.com. At various times, the Fund’s adviser waived its management fee and/or reimbursed Fund expenses. Had the adviser not done so, the Fund’s total returns would have been lower. The returns shown do not reflect taxes a shareholder would pay on distributions or redemptions. |
2 | Class A performance reflects the maximum sales charge of 5.5%. |
| * | As you compare performance, please note that the Fund’s performance reflects the maximum 5.5% sales charge, while the S&P SmallCap 600 Index and the Consumer Price Index do not reflect any such charges. If you were to purchase any of the above individual stocks or funds represented in the Index, any charges you would pay would reduce your total return as well. |
| ** | The S&P SmallCap 600 Index is an index that represents the average performance of a group of 600 small capitalization stocks. “S&P SmallCap 600 Index” is a trademark of The McGraw-Hill Companies, Inc. and has been licensed for use by Thrivent Financial for Lutherans. The product is not sponsored, endorsed or promoted by Standard & Poor’s and Standard & Poor’s makes no representation regarding the advisability of investing in the product. It is not possible to invest directly in the Index. The performance of the Index does not reflect deductions for fees, expenses or taxes. |
| *** | The Consumer Price Index is an inflationary indicator that measures the change in the cost of a fixed basket of products and services, including housing, electricity, food and transportation. It is not possible to invest directly in the Index. |
21
| | |
 | | Thrivent Mid Cap Growth Fund Andrea J. Thomas, CFA, Portfolio Manager The Fund seeks long-term growth of capital by investing primarily in common stocks of medium-sized companies. Mid-cap stocks offer the potential for long-term gains but can be subject to short-term price movements. Mid-sized company stock prices are generally more volatile than large company stock prices. These and other risks are described in the Fund’s prospectus. |
How did the Fund perform during the 12-month period ended October 31, 2008?
Thrivent Mid Cap Growth Fund earned a return of -39.95%, as compared to the median return of its peer group, the Lipper Mid Cap Growth category, of -43.16%. The Fund’s market benchmark, the Russell Midcap® Growth Index, earned a total return of -43.77%.
What factors affected the Fund’s performance?
Over the fiscal year, the global financial markets have been buffeted by the severe credit crisis that now is impairing growth not only in the United States, but in global economies as well. Emerging economies like China, India, Russia and Brazil are slowing dramatically, even though—as recently as this summer—strong domestic demand was expected to insulate those economies. While domestic demand will moderate the slowdown for those economies, it will not insulate them.
Although the Fund outperformed its benchmark and peers, it too has suffered a significant decline. Our modest but not insignificant position in cash over the period benefitted portfolio results. The financial sector was another contributor to performance; although this sector was negatively impacted by the credit crisis, we had underweighted this group and stock selection was better than average.
Stock selection in the telecom services area was a drag on performance as many of these companies rely on debt markets to finance their growth. Companies that are heavily dependent on access to credit and low financing costs generally did not fare well over the period, as capital became both scarce and expensive.
What is your outlook?
Globally, credit conditions are severe for all but the most creditworthy borrowers and government or sovereign debt issuers. Credit is the lifeblood of any healthy economy. Policymakers around the world are attempting to identify and implement fiscal or monetary programs to free up the lack of liquidity in traditional credit markets. We believe the process of repairing the markets will take quite a long while.
As we look at investing in this market, we still come back to the fact that despite all the problems with our system right now, the United States still has more transparency in its financial system than any other nation on the globe. We believe policymakers are taking the right steps to shore up the banking system, and we have seen encouraging signs that the short-term money markets and commercial paper markets have become less volatile. This is a giant first step. The next step, in our opinion, is to get bank lending back to healthy levels to sustain growth in the economy.
Major Market Sectors
(% of Net Assets)
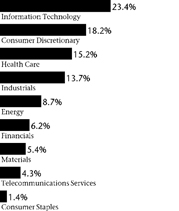
Portfolio Composition
(% of Portfolio)

Top 10 Holdings
(% of Net Assets)
| | | |
Activision Blizzard, Inc. | | 2.4 | % |
C.R. Bard, Inc. | | 1.9 | % |
DeVry, Inc. | | 1.9 | % |
Burger King Holdings, Inc. | | 1.9 | % |
F5 Networks, Inc. | | 1.8 | % |
T. Rowe Price Group, Inc. | | 1.7 | % |
Ultra Petroleum Corporation | | 1.7 | % |
WMS Industries, Inc. | | 1.6 | % |
Illumina, Inc. | | 1.6 | % |
Pactiv Corporation | | 1.6 | % |
These securities represent 18.1% of the total net assets of the Fund.
Quoted Fund performance is for Class A shares and does not reflect a sales charge.
The returns shown do not reflect taxes a shareholder would pay on distributions or redemptions.
Quoted Major Market Sectors, Portfolio Composition and Top 10 Holdings are subject to change.
The lists of Major Market Sectors and Top 10 Holdings exclude short-term investments and collateral held for securities loaned.
The Portfolio Composition chart excludes collateral held for securities loaned.
22
While we do not believe we are fully through the credit unwinding and recession in the U.S. economy, we do believe it is time to begin positioning the portfolio toward early cycle stocks that will benefit from a turn in the U.S. economy over the course of the next 18 months. With that as our base assumption, we are positioning the portfolio toward stocks that have compelling valuations, trough margins, potential product cycles and, above all, healthy balance sheets.
While we believe the emerging markets will, over the course of time, continue to grow and be an ever-bigger factor in global supply and demand equations, it will likely be the United States that comes out of the quagmire first. However, in the next 12 to 24 months, these emerging areas may be good places once again to look for growth ideas.
Portfolio Facts
As of October 31, 2008
| | | | | | | | | |
| | | Class A | | Class B | | Institutional Class |
Ticker | | | LBMGX | | | LUGBX | | | LBMIX |
Transfer Agent ID | | | 058 | | | 358 | | | 458 |
Net Assets | | $ | 165,013,929 | | $ | 5,094,190 | | $ | 45,186,767 |
NAV | | $ | 10.24 | | $ | 9.06 | | $ | 11.24 |
NAV - High† | | | 11/6/2007 - $19.21 | | | 11/6/2007 - $17.45 | | | 11/6/2007 - $20.72 |
NAV - Low† | | | 10/27/2008 - $8.65 | | | 10/27/2008 - $7.66 | | | 10/27/2008 - $9.49 |
| Number of Holdings: 122 | | | | | | | | | |
| † | For the year ended October 31, 2008 |
Average Annual Total Returns1
As of October 31, 2008
| | | | | | | | | |
Class A2 | | 1-Year | | | 5 Years | | | 10 Years | |
without sales charge | | (39.95 | %) | | 0.32 | % | | 4.36 | % |
with sales charge | | (43.25 | %) | | (0.81 | %) | | 3.78 | % |
| | | |
Class B3 | | 1-Year | | | 5 Years | | | 10 Years | |
without sales charge | | (40.70 | %) | | (0.77 | %) | | 3.97 | % |
with sales charge | | (42.75 | %) | | (0.77 | %) | | 3.97 | % |
| | | |
Institutional Class4 | | 1-Year | | | 5 Years | | | 10 Years | |
Net Asset Value | | (39.52 | %) | | 1.07 | % | | 5.15 | % |
Value of a $10,000 Investment
Class A Shares*,1,(a)
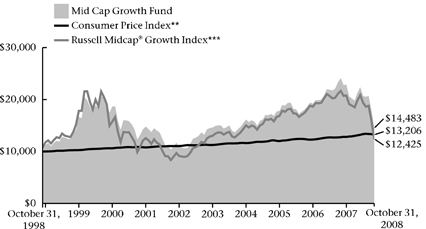
1 | Past performance is not an indication of future results. Annualized total returns represent past performance and reflect changes in share prices, the reinvestment of all dividends and capital gains, and the effects of compounding. Investing in a mutual fund involves risks, including the possible loss of principal. The prospectus contains more complete information on the investment objectives, risks, charges and expenses of the investment company, which investors should read and consider carefully before investing. To obtain a prospectus, contact a registered representative or visit www.thrivent.com. At various times, the Fund’s adviser waived its management fee and/or reimbursed Fund expenses. Had the adviser not done so, the Fund’s total returns would have been lower. The returns shown do not reflect taxes a shareholder would pay on distributions or redemptions. |
2 | Class A performance reflects the maximum sales charge of 5.5%. |
3 | Class B performance reflects the maximum defferred sales charge of 5%, declining 1% each year during the first five years and then converting to Class A shares after the fifth year. |
4 | Institutional Class shares have no sales load and are for institutional shareholders only. |
(a) | Performance of other classes will be greater or less than the line shown based on the differences in loads and fees paid by shareholders investing in the different classes. |
* | As you compare performance, please note that the Fund’s performance reflects the maximum 5.5% sales charge, while the Russell Midcap® Growth Index and the Consumer Price Index do not reflect any such charges. If you were to purchase any of the above individual stocks or funds represented in the Index, any charges you would pay would reduce your total return as well. |
| ** | The Consumer Price Index is an inflationary indicator that measures the change in the cost of a fixed basket of products and services, including housing, electricity, food and transportation. It is not possible to invest directly in the Index. |
*** | The Russell Midcap® Growth Index measures the performance of mid cap growth stocks. It is not possible to invest directly in the Index. The performance of the Index does not reflect deductions for fees, expenses, or taxes. |
23
| | |
 | | Thrivent Partner Mid Cap Value Fund Subadvised by Goldman Sachs Asset Management, L.P. The Fund seeks to achieve long-term growth of capital. Mid-cap stocks offer the potential for long-term gains but can be subject to short-term price movements. Mid-sized company stock prices are generally more volatile than large company stock prices. These and other risks are described in the Fund’s prospectus. |
How did the Fund perform during the 12-month period ended October 31, 2008?
Thrivent Partner Mid Cap Value Fund earned a return of –35.12%, as compared to the median return of its peer group, the Lipper Mid Cap Value category, of -38.67%. The Fund’s market benchmark, the Russell Midcap® Value Index, earned a total return of -38.83%.
What factors affected the Fund’s performance?
The financial markets were under severe pressure across the majority of asset classes over the latest fiscal year owing to the unusual disruptions in the credit markets. Those factors ultimately manifest themselves in the real economy and have significantly impaired growth not only in the United States but around the world. Only those segments associated with safety of principal have been spared the declines that have impacted both the financial and real asset markets. Government or sovereign debt is currently viewed by many investors as the most attractive opportunity for risk capital.
Over the last fiscal year, the Fund has maintained a modest level of cash reserves but, given the severity of the decline, even a modest position in cash was a meaningful factor for portfolio results. Stock selection and sector emphasis in the Fund were additional components of the management process that aided relative returns in the period. In particular, holdings in the consumer discretionary sector and our underweighting of the group contributed to returns versus the benchmark, as results in the group were unusually weak. A lack of exposure to both the specialty retail industries and the media group were additive, since both of these segments were particularly weak. The Fund’s holding in H&R Block in the diversified consumer segment lifted results as the stock achieved positive returns for the holding period. In addition, a lack of exposure to the automobile segment also proved additive. Energy has been an area of focus for the Fund, with particular sensitivity to those companies in the natural gas area. This tilt was beneficial in an environment in which oil prices declined precipitously from unsustainable levels. Natural gas prices had experienced their correction in the prior year and held up relatively well when oil prices finally corrected. Our below average exposure to the financial sector was also rewarded over the reporting period.
Offsetting some of the factors above was poor performance from the Fund’s holdings in the materials and information technology sectors. In materials, holdings in the chemical and packaging sectors did not perform well as expectations for economic growth adjusted downwards. Both of these groups are more sensitive to the changed outlook for the global economy. Spending in information technology also tends to be closely related to economic activity, with a particular sensitivity to the health of the financial sector, as that group tends to be a significant customer for investment technology (IT). With the ongoing turmoil in the financial group, concerns related to IT budgets have increased.
Major Market Sectors
(% of Net Assets)
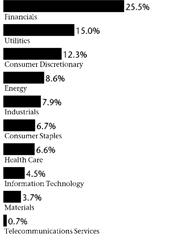
Portfolio Composition
(% of Portfolio)
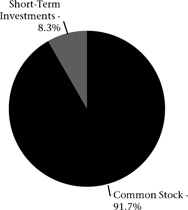
Top 10 Holdings
(% of Net Assets)
| | | |
Entergy Corporation | | 2.8 | % |
PPL Corporation | | 2.5 | % |
Amphenol Corporation | | 2.0 | % |
W.R. Berkley Corporation | | 2.0 | % |
H&R Block, Inc. | | 1.9 | % |
Laboratory Corporation of America Holdings | | 1.8 | % |
Clorox Company | | 1.8 | % |
EOG Resources, Inc. | | 1.8 | % |
Edison International, Inc. | | 1.6 | % |
Newfield Exploration Company | | 1.6 | % |
These securities represent 19.8% of the total net assets of the Fund.
Quoted Fund performance is for Class A shares and does not reflect a sales charge.
The returns shown do not reflect taxes a shareholder would pay on distributions or redemptions.
Quoted Major Market Sectors, Portfolio Composition and Top 10 Holdings are subject to change.
The lists of Major Market Sectors and Top 10 Holdings exclude short-term investments and collateral held for securities loaned.
The Portfolio Composition chart excludes collateral held for securities loaned.
24
What is your outlook?
We believe the impact of the credit crunch is likely to ripple across the economy, impacting funding costs and end markets in a variety of industries. We are wary of companies led by unseasoned or untested management teams and are concerned that looming earnings disappointments will support market volatility at elevated levels. Looking forward, we see prospects in select companies that are poised to benefit from an environment of lower competition, higher pricing and improved market share. As a team, we strive to build a “quality statement” throughout the portfolio.
Portfolio Facts
As of October 31, 2008
| | | | | | |
| | | Class A | | Institutional Class |
Ticker | | | TPMAX | | | TPMIX |
Transfer Agent ID | | | 086 | | | 486 |
Net Assets | | $ | 7,364,290 | | $ | 69,439,216 |
NAV | | $ | 7.89 | | $ | 7.92 |
NAV - High† | | | 11/6/2007 - $12.72 | | | 11/6/2007 - $12.75 |
NAV - Low† | | | 10/27/2008 - $6.96 | | | 10/27/2008 - $6.99 |
Number of Holdings: 109 | | | | | | |
| † | For the year ended October 31, 2008 |
Average Annual Total Returns1
As of October 31, 2008
| | | | | | |
Class A2 | | 1-Year | | | From
Inception
6/30/2005 | |
without sales charge | | (35.12 | %) | | (4.47 | %) |
with sales charge | | (38.68 | %) | | (6.07 | %) |
| | |
Institutional Class3 | | 1-Year | | | From
Inception
6/30/2005 | |
Net Asset Value | | (34.95 | %) | | (4.18 | %) |
Value of a $10,000 Investment
Class A Shares*,1,(a)
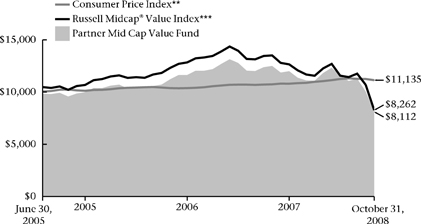
1 | Past performance is not an indication of future results. Annualized total returns represent past performance and reflect changes in share prices, the reinvestment of all dividends and capital gains, and the effects of compounding. Periods of less than one year are not annualized. Investing in a mutual fund involves risks, including the possible loss of principal. The prospectus contains more complete information on the investment objectives, risks, charges and expenses of the investment company which investors should read and consider carefully before investing. To obtain a prospectus, contact a registered representative or visit www.thrivent.com. At various times, the Fund’s adviser waived its management fee and/or reimbursed Fund expenses. Had the adviser not done so, the Fund’s total returns would have been lower. The returns shown do not reflect taxes a shareholder would pay on distributions or redemptions. |
2 | Class A performance reflects the maximum sales charge of 5.5%. |
3 | Institutional Class shares have no sales load and are for institutional shareholders only. |
(a) | Performance of other classes will be greater or less than the line shown based on the differences in loads and fees paid by shareholders investing in the different classes. |
* | As you compare performance, please note that the Fund’s performance reflects the maximum 5.5% sales charge, while the Consumer Price Index and the Russell Midcap® Value Index do not reflect any such charges. If you were to purchase any of the above individual stocks or funds represented in the Index, any charges you would pay would reduce your total return as well. |
| ** | The Consumer Price Index is an inflationary indicator that measures the change in the cost of a fixed basket of products and services, including housing, electricity, food and transportation. It is not possible to invest directly in the Index. |
*** | The Russell Midcap® Value Index is an index comprised of mid-cap companies with lower than average price-to-book ratios and lower forecasted growth values. It is not possible to invest directly in the Index. The performance of the Index does not reflect deductions for fees, expenses or taxes. |
25
| | |
 | | Thrivent Mid Cap Stock Fund Brian J. Flanagan, CFA Portfolio Manager The Fund seeks long-term capital growth by investing primarily in common stocks and securities convertible into common stocks of mid-sized companies. Mid-cap stocks offer the potential for long-term gains but can be subject to short-term price movements. Mid-sized company stock prices are generally more volatile than large company stock prices. These and other risks are described in the Fund’s prospectus. |
How did the Fund perform during the 12-month period ended October 31, 2008?
Thrivent Mid Cap Stock Fund earned a return of -41.38%, as compared to the median return of its peer group, the Lipper Mid Cap Core category, of -38.43%. The Fund’s market benchmark, the Russell Midcap® Index, earned a total return of -40.67%.
What factors affected the Fund’s performance?
Thrivent Mid Cap Stock Fund slightly underperformed its benchmark. While no sector was positive on an absolute basis, the financials, materials, consumer staples and information technology sectors all provided relative outperformance. This positive relative performance was offset by the energy, industrial and utility sectors. Security selection within the insurance and commercial bank sectors led the financial sector performance. Decent container volumes, significant price increases and cost management benefitted Silgan Holdings, Inc., which provided the majority of the material sector outperformance. Overweighting the consumer staples sector proved beneficial heading into a recession. Companies such as Treehouse Foods, H.J. Heinz Co., and Flowers Foods, Inc. all benefited as consumers ate more meals at home. Finally, special situations within the information technology (IT) sector offset a difficult IT spending environment. These contributions were offset by poor timing within the energy, industrial and utility sectors. Being underweighted in the energy and utility sectors for much of the first half of the year weighed on performance, as commodity prices hit all-time highs. Neutralizing these sectors at the middle of year failed to recapture that underperformance when commodity prices plummeted. Finally, poor security selection within the industrial sector detracted from relative performance. Overweighting the airline stocks as oil prices soared was particularly ill-timed.
What is your outlook?
The U.S. economic slowdown has been fast and furious, and the implications are spreading to Europe and Asia quickly. In this uncertain environment, valuation based on metrics, including cash levels, book values, and normalized earnings, is arguably the ballast providing safety and opportunity. Information technology, materials and financials appear to be attractive sectors. Even though IT spending levels continue to fall, the technology sector offers, in our opinion, many compelling characteristics–attractive valuations, strong balance sheets and cash flows, and restrained corporate information technology spending during the past few years. The valuation support should offer downside protection, and the restrained spending should create pent-up demand when the cycle eventually turns. Within the materials sector, the container and packaging companies continue to exhibit pricing discipline as they reduce capacity and turn away low-return business. While the slowing economy has resulted in less volume growth lately, declining raw material costs should offer significant margin leverage in 2009. Finally, many insurance companies offer attractive valuations combined with an improving pricing environment. The combination of a heavy catastrophe season, significant investment losses, and a lack of new
Major Market Sectors
(% of Net Assets)
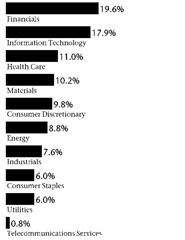
Portfolio Composition
(% of Portfolio)
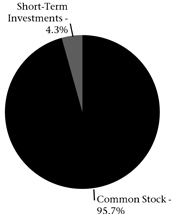
Top 10 Holdings
(% of Net Assets)
| | | |
Silgan Holdings, Inc. | | 3.0 | % |
HCC Insurance Holdings, Inc. | | 2.8 | % |
W.R. Berkley Corporation | | 2.5 | % |
Southwestern Energy Company | | 1.7 | % |
C.R. Bard, Inc. | | 1.7 | % |
Albemarle Corporation | | 1.7 | % |
Compuware Corporation | | 1.6 | % |
FormFactor, Inc. | | 1.6 | % |
New York Community Bancorp, Inc. | | 1.6 | % |
TreeHouse Foods, Inc. | | 1.5 | % |
These securities represent 19.7% of the total net assets of the Fund.
Quoted Fund performance is for Class A shares and does not reflect a sales charge.
The returns shown do not reflect taxes a shareholder would pay on distributions or redemptions.
Quoted Major Market Sectors, Portfolio Composition and Top 10 Holdings are subject to change.
The lists of Major Market Sectors and Top 10 Holdings exclude short-term investments and collateral held for securities loaned.
The Portfolio Composition chart excludes collateral held for securities loaned.
26
capital has resulted in an improving pricing environment–the first in many years. At the same time pricing is turning, many of these companies are trading at trough valuations. Conversely, areas that have added significant capacity over the last few years and need access to the capital markets should be particularly vulnerable. The industrial and consumer discretionary sectors appear to be two such areas. Many industrial companies added significant capacity during the commodity boom and are now feeling the impacts of declining sales, lower pricing and weaker balance sheets. The consumer discretionary sector is also facing many headwinds. A slowing economy, a weak job market and a significant tightening of credit will all limit discretionary purchases, and consumer spending may decline for many quarters.
Portfolio Facts
As of October 31, 2008
| | | | | | | | | |
| | | Class A | | Class B | | Institutional Class |
Ticker | | | AASCX | | | BBSCX | | | TMSIX |
Transfer Agent ID | | | 021 | | | 083 | | | 051 |
Net Assets | | $ | 488,882,295 | | $ | 3,042,057 | | $ | 217,403,055 |
NAV | | $ | 9.05 | | $ | 7.37 | | $ | 9.74 |
NAV - High† | | | 12/10/2007 - $17.65 | | | 12/10/2007 - $14.95 | | | 12/10/2007 - $18.80 |
NAV - Low† | | | 10/27/2008 - $7.77 | | | 10/27/2008 - $6.33 | | | 10/27/2008 - $8.36 |
Number of Holdings: 129 | | | | | | | | | |
| † | For the year ended October 31, 2008 |
Average Annual Total Returns1
As of October 31, 2008
| | | | | | | | | |
Class A2 | | 1-Year | | | 5 Years | | | 10 Years | |
without sales charge | | (41.38 | %) | | 1.22 | % | | 4.31 | % |
with sales charge | | (44.61 | %) | | 0.09 | % | | 3.72 | % |
| | | |
Class B3 | | 1-Year | | | 5 Years | | | 10 Years | |
without sales charge | | (42.10 | %) | | 0.10 | % | | 3.69 | % |
with sales charge | | (44.03 | %) | | 0.10 | % | | 3.69 | % |
| | | |
Institutional Class4 | | 1-Year | | | 5 Years | | | 10 Years | |
Net Asset Value | | (41.07 | %) | | 1.74 | % | | 4.86 | % |
Value of a $10,000 Investment
Class A Shares*,1,(a)
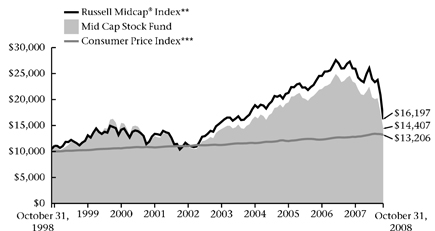
1 | Past performance is not an indication of future results. Annualized total returns represent past performance and reflect changes in share prices, the reinvestment of all dividends and capital gains, and the effects of compounding. Investing in a mutual fund involves risks, including the possible loss of principal. The prospectus contains more complete information on the investment objectives, risks, charges and expenses of the investment company, which investors should read and consider carefully before investing. To obtain a prospectus, contact a registered representative or visit www.thrivent.com. At various times, the Fund’s adviser waived its management fee and/or reimbursed Fund expenses. Had the adviser not done so, the Fund’s total returns would have been lower. The returns shown do not reflect taxes a shareholder would pay on distributions or redemptions. |
2 | Class A performance reflects the maximum sales charge of 5.5%. |
3 | Class B performance reflects the maximum defferred sales charge of 5%, declining 1% each year during the first five years and then converting to Class A shares after the fifth year. |
4 | Institutional Class shares have no sales load and are for institutional shareholders only. |
(a) | Performance of other classes will be greater or less than the line shown based on the differences in loads and fees paid by shareholders investing in the different classes. |
* | As you compare performance, please note that the Fund’s performance reflects the maximum 5.5% sales charge, while the Russell Midcap® Index and the Consumer Price Index do not reflect any such charges. If you were to purchase any of the above individual stocks or funds represented in the Index, any charges you would pay would reduce your total return as well. |
** | The Russell Midcap® Index is an index that measures the performance of the smallest 800 securities in the Russell 1000® Index, as ranked by total market capitalization. It is not possible to invest directly in these Indexes. The performance of these Indexes does not reflect deductions for fees, expenses or taxes. |
| *** | The Consumer Price Index is an inflationary indicator that measures the change in the cost of a fixed basket of products and services, including housing, electricity, food and transportation. It is not possible to invest directly in the Index. |
27
| | |
 | | Thrivent Mid Cap Index Fund Kevin R. Brimmer, FSA, Portfolio Manager The Fund seeks total returns that track the performance of the S&P MidCap 400 Index by investing primarily in common stocks comprising the Index. Mid-cap stocks offer the potential for long-term gains but can be subject to short-term price movements. Mid-sized company stock prices are generally more volatile than large company stock prices. These and other risks are described in the Fund’s prospectus. While the Fund attempts to closely track the S&P MidCap 400 Index, it does not duplicate the composition of the Index. Individuals may not invest directly in any index. Index funds are subject to the same market risks associated with the stocks in their respective indexes. These and other risks are described in the Fund’s prospectus. |
How did the Fund perform during the 12-month period ended October 31, 2008?
Thrivent Mid Cap Index Fund earned a return of -36.58%, as compared to the median return of its peer group, the Lipper Mid Cap Core category, of -38.43%. The Fund’s market benchmark, the S&P MidCap 400 Index, earned a total return of -36.46%.
What factors affected the Fund’s performance?
Because the Fund’s portfolio is designed to invest in a way that reflects its benchmark index, the only changes made to the portfolio are done to reconcile it with any alterations in the composition of the benchmark index. As typically occurs with an index fund, the difference in performance between the benchmark index and the Fund itself can be largely attributed to expenses and minor differences in portfolio composition.
Mid-caps underperformed both small-cap and large-cap stocks. All sectors had negative returns for the year. Utilities and consumer staples were the best performing sectors on a relative basis. By contrast, energy and telecommunication services stocks underperformed the most, due in part to lower demand for oil. Mid-cap indexes have a relatively large exposure to the more volatile components of the energy sector, and this exposure was a contributing factor in returns versus large- and small-cap stocks.
What is your outlook?
The Fund will remain fully invested in a way that tracks the performance of the S&P MidCap 400 Index. This strategy is an attractive way for individuals to take advantage of the investment potential of the broad, diversified marketplace for mid-cap stocks.
Major Market Sectors
(% of Net Assets)
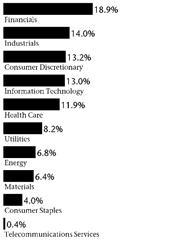
Portfolio Composition
(% of Portfolio)
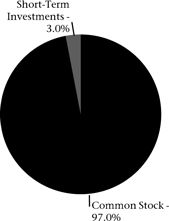
Top 10 Holdings
(% of Net Assets)
| | | |
McAfee, Inc. | | 0.7 | % |
New York Community Bancorp, Inc. | | 0.7 | % |
Stericycle, Inc. | | 0.7 | % |
Everest Re Group, Ltd. | | 0.6 | % |
Cephalon, Inc. | | 0.6 | % |
Equitable Resources, Inc. | | 0.6 | % |
Health Care REIT, Inc. | | 0.6 | % |
Ross Stores, Inc. | | 0.6 | % |
FMC Technologies, Inc. | | 0.6 | % |
Dentsply International, Inc. | | 0.6 | % |
These securities represent 6.3% of the total net assets of the Fund.
Quoted Fund performance is for Class A shares and does not reflect a sales charge.
The returns shown do not reflect taxes a shareholder would pay on distributions or redemptions.
Quoted Major Market Sectors, Portfolio Composition and Top 10 Holdings are subject to change.
The lists of Major Market Sectors and Top 10 Holdings exclude short-term investments and collateral held for securities loaned.
The Portfolio Composition chart excludes collateral held for securities loaned.
28
Typically, as the economic cycle progresses, investors begin to favor larger-cap issues. There is a potential for mid-cap stocks to outperform larger-cap stocks as large-cap stocks have more exposure to the global market. We still believe that attractive opportunities are available in the mid-cap marketplace in the months ahead. If investors’ appetite for risk were to increase as financial pressures ease, the mid-cap sector provides access to many companies that are more sensitive to economic growth and thus should perform accordingly.
Portfolio Facts
As of October 31, 2008
| | | |
| | | Class A |
Ticker | | | AAMIX |
Transfer Agent ID | | | 030 |
Net Assets | | $ | 33,050,043 |
NAV | | $ | 8.89 |
NAV - High† | | | 12/10/2007 - $15.66 |
NAV - Low† | | | 10/27/2008 - $7.51 |
| Number of Holdings: 402 | | | |
| † | For the year ended October 31, 2008 |
Average Annual Total Returns1
As of October 31, 2008
| | | | | | | | | |
Class A2 | | 1-Year | | | 5 Years | | | From
Inception
7/1/2000 | |
without sales charge | | (36.58 | %) | | 1.19 | % | | 1.85 | % |
with sales charge | | (40.09 | %) | | 0.05 | % | | 1.16 | % |
Value of a $10,000 Investment
Class A Shares*,1
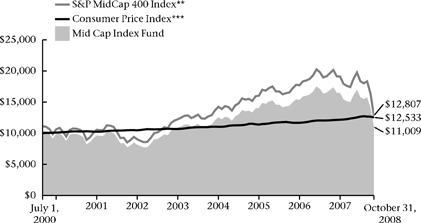
1 | Past performance is not an indication of future results. Annualized total returns represent past performance and reflect changes in share prices, the reinvestment of all dividends and capital gains, and the effects of compounding. Investing in a mutual fund involves risks, including the possible loss of principal. The prospectus contains more complete information on the investment objectives, risks, charges and expenses of the investment company, which investors should read and consider carefully before investing. To obtain a prospectus, contact a registered representative or visit www.thrivent.com. At various times, the Fund’s adviser waived its management fee and/or reimbursed Fund expenses. Had the adviser not done so, the Fund’s total returns would have been lower. The returns shown do not reflect taxes a shareholder would pay on distributions or redemptions. |
2 | Class A performance reflects the maximum sales charge of 5.5%. |
| * | As you compare performance, please note that the Fund’s performance reflects Fund expenses, net of any reimbursements, while the S&P MidCap 400 Index and the Consumer Price Index do not reflect such charges. If you were to purchase any of the above individual stocks or funds represented in the Index, any charges you would pay would reduce your total return as well. |
| ** | The S&P MidCap 400 Index is an index that represents the average performance of a group of 400 medium capitalization stocks. “S&P MidCap 400 Index” is a trademark of The McGraw-Hill Companies, Inc. and has been licensed for use by Thrivent Financial for Lutherans. The product is not sponsored, endorsed or promoted by Standard & Poor’s and Standard & Poor’s makes no representation regarding the advisability of investing in the product. It is not possible to invest directly in the Index. The performance of the Index does not reflect deductions for fees, expenses or taxes. |
| *** | The Consumer Price Index is an inflationary indicator that measures the change in the cost of a fixed basket of products and services, including housing, electricity, food and transportation. It is not possible to invest directly in the Index. |
29
| | |
 | | Thrivent Partner Worldwide Allocation Fund Subadvised by Mercator Asset Management, LP Principal Global Investors, LLC, Aberdeen Asset Management Investment Services Limited, Victory Capital Management Inc. and Goldman Sachs Asset Management, L.P. The Fund seeks long-term capital growth by investing primarily in equity and debt securities of issuers in developed and emerging markets. Foreign investments, as compared to domestic ones, involve additional risks, including currency fluctuations, different accounting standards, and greater political, economic and market instability. These risks are magnified when the portfolio invests in emerging markets, which may be of relatively small size and less liquid than domestic markets. These and other risks are described in the Fund’s prospectus. |
How did the Fund perform during the 8-month period ended October 31, 2008?
Thrivent Partner Worldwide Allocation Fund earned a return of -39.10% for the eight month period ending October 31, 2008. The inception date for the Fund was February 29, 2008. The Fund’s market benchmark, the MSCI All Country World Index, earned a total return of -41.41%.
What factors affected the Fund’s performance?
Thrivent Partner Worldwide Allocation Fund allocates assets across four major segments of investments: large-capitalization companies across Europe, Australasia and the Far East; small- and mid-capitalization companies across the same geographies; emerging or developing markets; and developing market debt. Major foreign stock markets succumbed to the same economic malaise that so severely depressed U.S. equity and fixed income markets, falling in the face of significant credit contraction and diminished outlook for economic growth. Small- and mid-capitalization companies fell more than their broader markets, reflecting a higher level of business sensitivity to both credit markets and slowing domestic and global demand. Debt fared better than equity, but emerging markets debt was impacted by the sharp falloff in commodity prices towards the end of the reporting period.
As asset prices fell, leveraged investors chose to or were forced to reduce holdings, many of which had a currency component to them. The yen and the dollar both rose significantly against most major and minor currencies late in the period, further impairing returns to U.S.-based holders of non-U.S. assets.
An underweighted stance in the financial sector, as well as a modest allocation to cash and emerging market debt, mitigated the decline over the period. The financial sector, particularly in the large markets of Western Europe and the UK, was under particular pressure because of exposure to many of the globally troubled asset classes. Emerging market debt took quite a sell-off late in the period as commodity and energy prices fell sharply in the face of expectations for meaningfully diminished demand just as additional capacity is expected to come on stream. While the longer-term picture for economically sensitive raw materials is reasonable, prices that have been far above trend or economic viability have constricted demand at the same time a slowdown in the global economy is setting back growth expectations. While shares of companies in emerging markets and small-capitalization issues fared poorly over the period relative to large-caps, the Fund’s holdings in those groups were modestly beneficial to results as managers in those portfolio segments added value when compared to their respective benchmarks.
Major Market Sectors
(% of Net Assets)
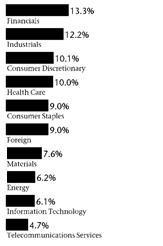
Portfolio Composition
(% of Portfolio)
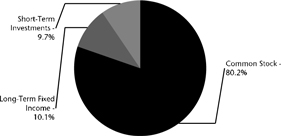
Top 10 Countries
(% of Net Assets)
| | | |
Japan | | 16.2 | % |
United Kingdom | | 13.7 | % |
Switzerland | | 7.1 | % |
France | | 5.1 | % |
Germany | | 4.0 | % |
Brazil | | 3.5 | % |
Spain | | 2.8 | % |
Netherlands | | 2.8 | % |
Italy | | 2.6 | % |
Mexico | | 2.3 | % |
Investments in securities in these countries represent 60.1% of the total net assets of the Fund.
Quoted Fund performance is for Class A shares and does not reflect a sales charge.
The returns shown do not reflect taxes a shareholder would pay on distributions or redemptions.
Quoted Major Market Sectors, Portfolio Composition and Top 10 Countries are subject to change.
The lists of Major Market Sectors and Top 10 Countries exclude short-term investments and collateral held for securities loaned.
The Portfolio Composition chart excludes collateral held for securities loaned.
30
What is your outlook?
Global risk assets have been vigorously re-priced as investors grapple with the unwinding of the excessive debt and leverage that had built up over the last recovery. The credit crunch has resulted in serious implications for real growth in all economies. While there originally was some thought that domestic demand in emerging economies would mitigate the deterioration in large markets, that expectation has been dashed, as cross-economic dependencies are still quite high. Further exacerbating the challenges presented by the credit issues has been unacceptably high inflation readings, particularly in developing economies, which resulted in necessarily strong policy responses.
Valuations are attractive across most risk asset classes. The government policies that have been or are being implemented appear to be taking hold. That is a necessary prerequisite for any expectation of economic re-acceleration and market stabilization. The Fund is fully allocated across all asset categories, as we believe that markets are likely in the early phases of establishing the basis for improved returns.
Portfolio Facts
As of October 31, 2008
| | | | | | |
| | | Class A | | Institutional Class |
Ticker | | | TWAAX | | | TWAIX |
Transfer Agent ID | | | 034 | | | 087 |
Net Assets | | $ | 15,862,261 | | $ | 46,957,552 |
NAV | | $ | 6.09 | | $ | 6.10 |
NAV - High† | | | 5/16/2008 - $10.62 | | | 5/16/2008 - $10.63 |
NAV - Low† | | | 10/27/2008 - $5.25 | | | 10/27/2008 - $5.27 |
| Number of Holdings: 358 | | | | | | |
| † | For the period ended October 31, 2008 |
Average Annual Total Returns1
As of October 31, 2008
| | | |
Class A2 | | From
Inception
2/29/2008 | |
without sales charge | | (39.10 | %) |
with sales charge | | (42.44 | %) |
| |
Institutional Class3 | | From
Inception
2/29/2008 | |
Net Asset Value | | (39.00 | %) |
Value of a $10,000 Investment
Class A Shares*,1,(a)
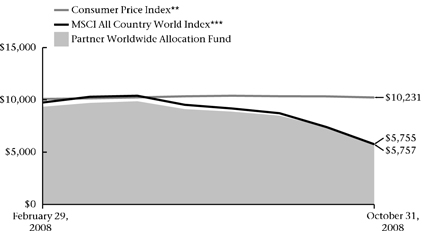
1 | Past performance is not an indication of future results. Annualized total returns represent past performance and reflect changes in share prices, the reinvestment of all dividends and capital gains, and the effects of compounding. Investing in a mutual fund involves risks, including the possible loss of principal. The prospectus contains more complete information on the investment objectives, risks, charges and expenses of the investment company, which investors should read and consider carefully before investing. To obtain a prospectus, contact a registered representative or visit www.thrivent.com. At various times, the Fund’s adviser waived its management fee and/or reimbursed Fund expenses. Had the adviser not done so, the Fund’s total returns would have been lower. The returns shown do not reflect taxes a shareholder would pay on distributions or redemptions. |
2 | Class A performance reflects the maximum sales charge of 5.5%. |
3 | Institutional Class shares have no sales load and are for institutional shareholders only. |
(a) | Performance of other classes will be greater or less than the line shown based on the differences in loads and fees paid by shareholders investing in the different classes. |
| * | As you compare performance, please note that the Fund’s performance reflects the maximum 5.5% sales charge, while the MSCI All Country World Index and the Consumer Price Index do not reflect any such charges. If you were to purchase any of the above individual stocks or funds represented in the Index, any charges you would pay would reduce your total return as well. |
| ** | The Consumer Price Index is an inflationary indicator that measures the change in the cost of a fixed basket of products and services, including housing, electricity, food and transportation. It is not possible to invest directly in the Index. |
| *** | The MSCI All Country World Index is an unmanaged market capitalization-weighted index that is designed to represent the performance of developed and emerging stock markets throughout the world. It is not possible to invest directly in the Index. The performance of the Index does not reflect deductions for fees, expenses or taxes. |
31
| | |
 | | Thrivent Partner International Stock Fund Subadvised by Mercator Asset Management, LP and Principal Global Investors, LLC The Fund seeks long-term capital growth by investing primarily in a diversified portfolio of foreign stocks. Foreign investments involve additional risks including currency fluctuations and greater political, economic and market instability and different accounting standards, as compared with domestic investments. These risks are magnified when the portfolio invests in emerging markets, which may be of relatively small size and less liquid than domestic markets. These and other risks are described in the Fund’s prospectus. |
How did the Fund perform during the 12-month period ended October 31, 2008?
Thrivent Partner International Stock Fund earned a return of -47.01%, as compared to the median return of its peer group, the Lipper International Large Cap Core category, of -47.39%. The Fund’s market benchmark, the Morgan Stanley Europe, Australasia and Far East (EAFE) Index, earned a total return of -46.34%.
What factors affected the Fund’s performance?
Major foreign stock markets succumbed to the same economic malaise that so severely depressed U.S. equity and fixed-income markets, falling in the face of significant credit contraction and diminished outlook for economic growth. As asset prices fell, leveraged investors chose to or were forced to reduce exposures, many of which had a cross currency component to them. The yen and the dollar both rose significantly late in the period, further impairing returns to U.S.-based holders of non-U.S. assets.
The yen was often a currency of funding choice given the low interest rates. The dollar advanced as both a safe haven and in response to a severe break in commodity prices. Additionally, financial institutions’ efforts to shepherd capital and reduce outstanding loan balances reduced the amount of dollars available in the market. The UK and Continental Europe appeared to be most impacted, as their real estate and financial markets were geared in ways similar to that of the U.S. Europe is quite exposed to the deterioration in trade and increased financial risk that has surfaced in the commodity-based markets around the globe, given the strong export nature of some of its markets, particularly in Germany.
The Fund had been limiting its exposure to the financial sector, which mitigated some of the decline over the period. An offsetting factor was an emphasis on the industrial group, a segment that came under pressure late in the fiscal year under expectations of slowing economic growth and slower demand for industrial goods, particularly from emerging market countries. Health care shares also provided defensive positioning for the Fund, as did the traditionally conservative consumer staples sector. Our better-than-average stock selection within the energy sector had only a limited positive impact, since we had an underweighted sector stance. Country weightings were generally not a meaningful factor impacting returns positively or negatively over the period, as the Fund’s average exposures matched the major investment regions. Currency impacts were not a factor directly impacting portfolio performance relative to the benchmark.
Major Market Sectors
(% of Net Assets)

Portfolio Composition
(% of Portfolio)
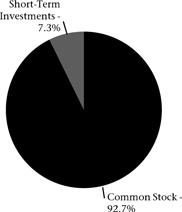
Top 10 Countries
(% of Net Assets)
| | | |
Japan | | 22.2 | % |
United Kingdom | | 20.3 | % |
Switzerland | | 11.8 | % |
France | | 6.7 | % |
Germany | | 5.3 | % |
Spain | | 4.7 | % |
Italy | | 3.4 | % |
Canada | | 3.1 | % |
Netherlands | | 2.9 | % |
Australia | | 2.6 | % |
Investments in securities in these countries represent 83.0% of the total net assets of the Fund.
Quoted Fund performance is for Class A shares and does not reflect a sales charge.
The returns shown do not reflect taxes a shareholder would pay on distributions or redemptions.
Quoted Major Market Sectors, Portfolio Composition and Top 10 Countries are subject to change.
The lists of Major Market Sectors and Top 10 Countries exclude short-term investments and collateral held for securities loaned.
The Portfolio Composition chart excludes collateral held for securities loaned.
32
What is your outlook?
When investor confidence is undermined, valuation may not matter as much, and stocks can become far cheaper than fundamentals would indicate. Therefore, some of the best buying junctures occur during points of maximum pessimism. The intense and indiscriminate selling pressure we have witnessed in recent weeks has given rise to some very attractive investment opportunities. While uncertainty remains high and volatility will likely remain elevated, we believe that current price levels offer attractive points to establish positions for investors with a reasonable time horizon. The portfolio has been biased towards larger-capitalization companies. We are seeing unusual opportunities in mid-capitalization segments and have begun to direct some effort to ferreting out attractive companies in that sector of the markets, as well.
Portfolio Facts
As of October 31, 2008
| | | | | | | | | |
| | | Class A | | Class B | | Institutional Class |
Ticker | | | AAITX | | | BBITX | | | TISFX |
Transfer Agent ID | | | 023 | | | 084 | | | 093 |
Net Assets | | $ | 173,506,385 | | $ | 2,572,150 | | $ | 214,234,882 |
NAV | | $ | 7.50 | | $ | 7.17 | | $ | 7.67 |
NAV - High† | | | 11/6/2007 - $15.64 | | | 11/6/2007 - $15.01 | | | 11/6/2007 - $15.95 |
NAV - Low† | | | 10/27/2008 - $6.46 | | | 10/27/2008 - $6.18 | | | 10/27/2008 - $6.61 |
Number of Holdings: 215 | | | | | | | | | |
| † | For the year ended October 31, 2008 |
Average Annual Total Returns1
As of October 31, 2008
| | | | | | | | | |
Class A2 | | 1-Year | | | 5 Years | | | 10 Years | |
without sales charge | | (47.01 | %) | | 1.07 | % | | (0.56 | %) |
with sales charge | | (49.94 | %) | | (0.07 | %) | | (1.12 | %) |
| | | |
Class B3 | | 1-Year | | | 5 Years | | | 10 Years | |
without sales charge | | (47.76 | %) | | (0.08 | %) | | (0.95 | %) |
with sales charge | | (49.64 | %) | | (0.08 | %) | | (0.95 | %) |
| | | |
Institutional Class4 | | 1-Year | | | 5 Years | | | 10 Years | |
Net Asset Value | | (46.66 | %) | | 1.75 | % | | 0.16 | % |
Value of a $10,000 Investment
Class A Shares*,1,(a)
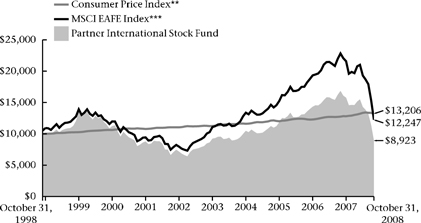
1 | Past performance is not an indication of future results. Annualized total returns represent past performance and reflect changes in share prices, the reinvestment of all dividends and capital gains, and the effects of compounding. Investing in a mutual fund involves risks, including the possible loss of principal. The prospectus contains more complete information on the investment objectives, risks, charges and expenses of the investment company, which investors should read and consider carefully before investing. To obtain a prospectus, contact a registered representative or visit www.thrivent.com. At various times, the Fund’s adviser waived its management fee and/or reimbursed Fund expenses. Had the adviser not done so, the Fund’s total returns would have been lower. The returns shown do not reflect taxes a shareholder would pay on distributions or redemptions. |
2 | Class A performance reflects the maximum sales charge of 5.5%. |
3 | Class B performance reflects the maximum defferred sales charge of 5%, declining 1% each year during the first five years and then converting to Class A shares after the fifth year. |
4 | Institutional Class shares have no sales load and are for institutional shareholders only. |
(a) | Performance of other classes will be greater or less than the line shown based on the differences in loads and fees paid by shareholders investing in the different classes. |
| * | As you compare performance, please note that the Fund’s performance reflects the maximum 5.5% sales charge, while the MSCI EAFE Index and the Consumer Price Index do not reflect any such charges. If you were to purchase any of the above individual stocks or funds represented in the Index, any charges you would pay would reduce your total return as well. |
| ** | The Consumer Price Index is an inflationary indicator that measures the change in the cost of a fixed basket of products and services, including housing, electricity, food and transportation. It is not possible to invest directly in the Index. |
| *** | The MSCI EAFE Index measures the performance of stocks in developed countries outside of North America. It is not possible to invest directly in the Index. The performance of the Index does not reflect deductions for fees, expenses or taxes. |
33
| | |
 | | Thrivent Large Cap Growth Fund Scott A. Vergin, CFA, Portfolio Manager The Fund seeks long-term capital appreciation by investing primarily in a diversified portfolio of common stocks and securities convertible into common stocks. Large-cap stocks are subject to the basic market risk that a particular security, or securities in general, may decrease in value over short or even extended time periods. These and other risks are described in the Fund’s prospectus. |
How did the Fund perform during the 12-month period ended October 31, 2008?
The Thrivent Large Cap Growth Fund earned a return of -39.08%, as compared to the median return of its peer group, the Lipper Large Cap Growth category, of -38.07%. The Fund’s market benchmark, the Russell 1000® Growth Index, earned a total return of -37.30%.
What factors affected the Fund’s performance?
The overall bear market in equities was a major factor in our performance. In addition, the fact that the Fund held less cash than the median of the peer group during the sharp market decline hurt performance.
A sector-based analysis shows that three sectors—financial, industrials and health care—provided the greatest contribution to the Fund’s performance. The financial sector posted the best relative returns, as our overweighted stances in JP Morgan Chase and NASDAQ OMX Group were significant outperformers in an overall poorly performing sector. The decline in oil prices during the latter part of the time period helped lift our holdings in the industrial sector by benefiting transportation companies like Northwest Airlines and Union Pacific. The health care sector was once again a positive contributor to performance, led by our ownership of Gilead Sciences, Abbott Laboratories and Baxter International.
Three sectors were the primary detractors from performance. Our underweighted position in consumer staples, which is a defensive sector, hurt during this equity market sell-off. Poor stock selection within the technology sector also detracted from performance, as our holdings in MasterCard and LDK Solar experienced severe corrections. The retreat in the price of commodities negatively impacted the materials sector; both our overweighted position and the substantial declines in our holdings of Freeport-McMoRan and U.S. Steel were major detractors from performance.
Major Market Sectors
(% of Net Assets)
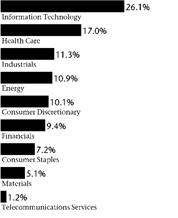
Portfolio Composition
(% of Portfolio)
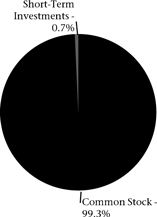
Top 10 Holdings
(% of Net Assets)
| | | |
Gilead Sciences, Inc. | | 3.6 | % |
Google, Inc. | | 3.5 | % |
Microsoft Corporation | | 2.9 | % |
Monsanto Company | | 2.4 | % |
QUALCOMM, Inc. | | 2.4 | % |
Apple, Inc. | | 2.4 | % |
McDonald’s Corporation | | 2.2 | % |
Wal-Mart Stores, Inc. | | 2.1 | % |
Cisco Systems, Inc. | | 2.0 | % |
J.P. Morgan Chase & Company | | 2.0 | % |
These securities represent 25.5% of the total net assets of the Fund.
Quoted Fund performance is for Class A shares and does not reflect a sales charge.
The returns shown do not reflect taxes a shareholder would pay on distributions or redemptions.
Quoted Major Market Sectors, Portfolio Composition and Top 10 Holdings are subject to change.
The lists of Major Market Sectors and Top 10 Holdings exclude short-term investments and collateral held for securities loaned.
The Portfolio Composition chart excludes collateral held for securities loaned.
34
What is your outlook?
The historical sell-off in the equity markets implies the market has already discounted a significant amount of bad news. The market will likely exhibit continued volatile, choppy trading until the depth and duration of the economic recession and financial crisis becomes clearer. New sector leadership usually emerges from such market sell-offs and we look to financials and other early-cycle sectors as potential leaders in a market recovery.
Portfolio Facts
As of October 31, 2008
| | | | | | | | | |
| | | Class A | | Class B | | Institutional Class |
Ticker | | | AAAGX | | | BBAGX | | | THLCX |
Transfer Agent ID | | | 027 | | | 077 | | | 060 |
Net Assets | | $ | 88,979,259 | | $ | 2,689,776 | | $ | 216,430,313 |
NAV | | $ | 3.69 | | $ | 3.38 | | $ | 3.94 |
NAV - High† | | | 11/6/2007 - $6.46 | | | 11/6/2007 - $6.00 | | | 11/6/2007 - $6.87 |
NAV - Low† | | | 10/27/2008 - $3.15 | | | 10/27/2008 - $2.88 | | | 10/27/2008 - $3.36 |
| Number of Holdings: 121 | | | | | | | | | |
| † | For the year ended October 31, 2008 |
Average Annual Total Returns1
As of October 31, 2008
| | | | | | | | | |
Class A2 | | 1-Year | | | 5 Years | | | From
Inception
10/29/1999 | |
without sales charge | | (39.08 | %) | | (1.46 | %) | | (5.42 | %) |
with sales charge | | (42.43 | %) | | (2.57 | %) | | (6.01 | %) |
| | | |
Class B3 | | 1-Year | | | 5 Years | | | From
Inception
10/29/1999 | |
without sales charge | | (39.63 | %) | | (2.41 | %) | | (5.85 | %) |
with sales charge | | (41.86 | %) | | (2.41 | %) | | (5.85 | %) |
| | | |
Institutional Class4 | | 1-Year | | | 5 Years | | | From
Inception
10/29/1999 | |
Net Asset Value | | (38.86 | %) | | (0.86 | %) | | (4.62 | %) |
Value of a $10,000 Investment
Class A Shares*,1,(a)
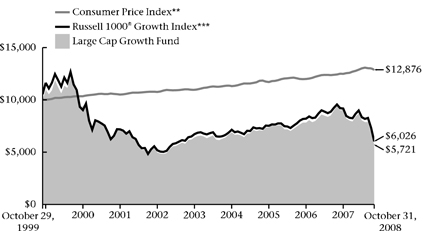
1 | Past performance is not an indication of future results. Annualized total returns represent past performance and reflect changes in share prices, the reinvestment of all dividends and capital gains, and the effects of compounding. Investing in a mutual fund involves risks, including the possible loss of principal. The prospectus contains more complete information on the investment objectives, risks, charges and expenses of the investment company, which investors should read and consider carefully before investing. To obtain a prospectus, contact a registered representative or visit www.thrivent.com. At various times, the Fund’s adviser waived its management fee and/or reimbursed Fund expenses. Had the adviser not done so, the Fund’s total returns would have been lower. The returns shown do not reflect taxes a shareholder would pay on distributions or redemptions. |
2 | Class A performance reflects the maximum sales charge of 5.5%. |
3 | Class B performance reflects the maximum defferred sales charge of 5%, declining 1% each year during the first five years and then converting to Class A shares after the fifth year. |
4 | Institutional Class shares have no sales load and are for institutional shareholders only. |
(a) | Performance of other classes will be greater or less than the line shown based on the differences in loads and fees paid by shareholders investing in the different classes. |
* | As you compare performance, please note that the Fund’s performance reflects the maximum 5.5% sales charge, while the Consumer Price Index and the Russell 1000® Growth Index do not reflect any such charges. If you were to purchase any of the above individual stocks or funds represented in the Index, any charges you would pay would reduce your total return as well. |
| ** | The Consumer Price Index is an inflationary indicator that measures the change in the cost of a fixed basket of products and services, including housing, electricity, food and transportation. It is not possible to invest directly in the Index. |
*** | The Russell 1000® Growth Index measures the performance of large cap growth stocks. It is not possible to invest directly in the Index. The performance of the Index does not reflect deductions for fees, expenses or taxes. |
35
| | |
 | | Thrivent Large Cap Value Fund Matthew D. Finn, CFA, Portfolio Manager The Fund seeks to achieve long-term growth of capital. Large-cap stocks are subject to the basic market risk that a particular security, or securities in general, may decrease in value over short or even extended time periods. These and other risks are described in the Fund’s prospectus. |
How did the Fund perform during the 12-month period ended October 31, 2008?
Thrivent Large Cap Value Fund earned a return of -34.17%, as compared to the median return of its peer group, the Lipper Large Cap Value category, of -36.82%. The Fund’s market benchmark, the Russell 1000® Value Index, earned a total return of -36.80%.
What factors affected the Fund’s performance?
Investors have seen the economy slowing over the last year. By the end of October, any optimism that a recession could be avoided had disappeared. Indeed, investors appear to now be anticipating a severe global recession.
Stock selection accounted for the Fund’s outperformance of the benchmark. Stock selection was strongest in the financial services, technology and consumer staples sectors. In the financial services sector, the decision to sell AIG benefited the portfolio significantly relative to the benchmark and peers. Our research suggested that AIG had unquantifiable credit exposure primarily through its mortgage insurance and credit default swap books of business. If we can’t understand it, or value it, we generally avoid it. Minimal exposure to mortgage-related stocks also aided performance. The largest position in the thrift and mortgage industry, Hudson City Bancorp, helped performance significantly.
In the technology sector, positions in Accenture, International Business Machines (IBM) and Sybase were the primary contributors to strong relative performance. In the consumer staples sector, our significant position in General Mills helped relative returns, as the shares appreciated considerably.
Areas that hurt performance included the energy and materials sectors. In energy, the bulk of the pain was due to the position in Nabors Industries (drilling rigs). This position has been increased as the worst appears to be already reflected, valuation is attractive and eventually drilling activity will recover. In materials, positions in companies that participate in the chemicals industry hurt performance and have been reduced.
What is your outlook?
Economic forecasting is not an area where we have consistently added value. Therefore our focus is on stock selection. Our stock selection is of course guided by valuation. Currently we are finding the most attractive valuations in the banking and consumer cyclical areas of the market, and the portfolio is overweighted in those areas. While valuations are attractive, a major risk to these areas of
Major Market Sectors
(% of Net Assets)
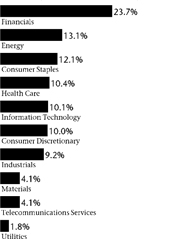
Portfolio Composition
(% of Portfolio)
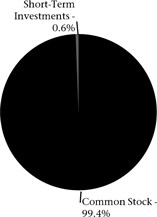
Top 10 Holdings
(% of Net Assets)
| | | |
J.P. Morgan Chase & Company | | 4.0 | % |
Exxon Mobil Corporation | | 3.2 | % |
International Business Machines Corporation | | 2.8 | % |
AT&T, Inc. | | 2.4 | % |
Wal-Mart Stores, Inc. | | 2.3 | % |
Chevron Corporation | | 2.3 | % |
Abbott Laboratories | | 2.0 | % |
General Mills, Inc. | | 2.0 | % |
General Electric Company | | 1.9 | % |
Johnson & Johnson | | 1.9 | % |
These securities represent 24.8% of the total net assets of the Fund.
Quoted Fund performance is for Class A shares and does not reflect a sales charge.
The returns shown do not reflect taxes a shareholder would pay on distributions or redemptions.
Quoted Major Market Sectors, Portfolio Composition and Top 10 Holdings are subject to change.
The lists of Major Market Sectors and Top 10 Holdings exclude short-term investments and collateral held for securities loaned.
The Portfolio Composition chart excludes collateral held for securities loaned.
36
the market is that any recession is long and these companies suffer accordingly. Our approach is to manage this risk with our position sizes and also to purchase the shares when the valuations are exceedingly low compared to how we expect them to perform at the lowest part of the economic cycle. Our emphasis on quality companies that are well positioned to survive and prosper in the ultimate recovery also helps to mitigate the risk of this strategy.
Portfolio Facts
As of October 31, 2008
| | | | | | | | | |
| | | Class A | | Class B | | Institutional Class |
Ticker | | | AAUTX | | | BBEIX | | | TLVIX |
Transfer Agent ID | | | 022 | | | 072 | | | 092 |
Net Assets | | $ | 187,378,228 | | $ | 2,810,533 | | $ | 268,859,818 |
NAV | | $ | 11.10 | | $ | 10.87 | | $ | 11.19 |
NAV - High† | | | 12/10/2007 - $17.63 | | | 12/10/2007 - $17.28 | | | 12/10/2007 - $17.78 |
NAV - Low† | | | 10/27/2008 - $9.71 | | | 10/27/2008 - $9.52 | | | 10/27/2008 - $9.80 |
Number of Holdings: 109 | | | | | | | | | |
| † | For the year ended October 31, 2008 |
Average Annual Total Returns1
As of October 31, 2008
| | | | | | | | | |
Class A2 | | 1-Year | | | 5 Years | | | From
Inception
10/29/1999 | |
without sales charge | | (34.17 | %) | | 2.24 | % | | (0.31 | %) |
with sales charge | | (37.78 | %) | | 1.08 | % | | (0.93 | %) |
| | | |
Class B3 | | 1-Year | | | 5 Years | | | From
Inception
10/29/1999 | |
without sales charge | | (35.01 | %) | | 1.10 | % | | (0.74 | %) |
with sales charge | | (37.48 | %) | | 1.10 | % | | (0.74 | %) |
| | | |
Institutional Class4 | | 1-Year | | | 5 Years | | | From
Inception
10/29/1999 | |
Net Asset Value | | (33.88 | %) | | 2.76 | % | | 0.35 | % |
Value of a $10,000 Investment
Class A Shares*,1,(a)
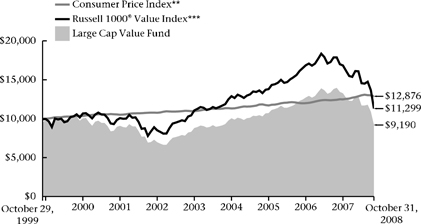
1 | Past performance is not an indication of future results. Annualized total returns represent past performance and reflect changes in share prices, the reinvestment of all dividends and capital gains, and the effects of compounding. Investing in a mutual fund involves risks, including the possible loss of principal. The prospectus contains more complete information on the investment objectives, risks, charges and expenses of the investment company, which investors should read and consider carefully before investing. To obtain a prospectus, contact a registered representative or visit www.thrivent.com. At various times, the Fund’s adviser waived its management fee and/or reimbursed Fund expenses. Had the adviser not done so, the Fund’s total returns would have been lower. The returns shown do not reflect taxes a shareholder would pay on distributions or redemptions. |
2 | Class A performance reflects the maximum sales charge of 5.5%. |
3 | Class B performance reflects the maximum defferred sales charge of 5%, declining 1% each year during the first five years and then converting to Class A shares after the fifth year. |
4 | Institutional Class shares have no sales load and are for institutional shareholders only. |
(a) | Performance of other classes will be greater or less than the line shown based on the differences in loads and fees paid by shareholders investing in the different classes. |
* | As you compare performance, please note that the Fund’s performance reflects the maximum 5.5% sales charge, while the Russell 1000® Value Index and the Consumer Price Index do not reflect any such charges. If you were to purchase any of the above individual stocks or funds represented in the Index, any charges you would pay would reduce your total return as well. |
| ** | The Consumer Price Index is an inflationary indicator that measures the change in the cost of a fixed basket of products and services, including housing, electricity, food and transportation. It is not possible to invest directly in the Index. |
*** | The Russell 1000® Value Index measures the performance of large cap value stocks. It is not possible to invest directly in the Index. The performance of the Index does not reflect deductions for fees, expenses or taxes. |
37
| | | | |
 | | Thrivent Large Cap Stock Fund | |  |
| | Matthew D. Finn, CFA (left) and Scott A. Vergin, CFA (right), Portfolio Co-Managers The Fund seeks long-term capital growth by investing primarily in a diversified portfolio of common stocks and securities convertible into common stocks. Large-cap stocks are subject to the basic market risk that a particular security, or securities in general, may decrease in value over short or even extended time periods. These and other risks are described in the Fund’s prospectus. | |
How did the Fund perform during the 12-month period ended October 31, 2008?
Thrivent Large Cap Stock Fund earned a return of -35.72%, as compared to the median return of its peer group, the Lipper Large Cap Core category, of -36.37%. The Fund’s market benchmark, the S&P 500 Index, earned a total return of -36.08%.
What factors affected the Fund’s performance?
Stocks fell sharply over the last fiscal year, reflecting the serious disruptions in the credit markets. Credit has become both quite expensive and, in many areas, severely restricted for all but the highest quality borrowers. Governments around the world have stepped in with various programs to take the place of the traditional credit providers as investors direct capital to only the safest alternatives. The financial sector continues to be largely impaired, reflecting severe investment and operating losses from both traditional and non-traditional banking activities.
The most important factor impacting the Fund’s modestly better results versus the benchmark was our defensive positioning in the financial sector. In general, the Fund had a bias against firms that had a business model highly dependent on capital markets’ activities or the securitization markets. Our emphasis on firms that operate within the framework of traditional lending practices and credit and balance sheet integrity was a benefit to results. Stock selection in both health care and information technology was also better than that of the benchmark.
Holdings in the materials sectors had a negative impact on results. For most of the period, commodity-related and energy sectors performed relatively well despite the turmoil in the broader market. In the final quarter of the fiscal year, however, commodity and energy prices fell sharply as the global economic outlook appeared to accelerate downwards and cascade over to emerging economies, impairing the outlook for near-term commodity demand. Also offsetting some of the better results in the financial group was an underweighted stance in the relatively defensive consumer staples sector, a group that appears to be overvalued as investors have rushed into the most conservative sectors of the markets.
What is your outlook?
There is still a tremendous amount of uncertainty in both the economic and financial outlook. The programs that have been put in place appear to be making progress in facilitating a more normal lending environment, which would establish the basis for an improving economic environment. Holders of risk capital around the globe continue to be cautious. Additionally, consumers remain hesitant and have reduced purchases as the employment outlook remains tentative. Mitigating some of these concerns is a relatively well-balanced corporate sector with moderate inventories and generally good balance sheets. That is not the case universally, with severe constraints in both automobiles and retail, areas that likely will experience significant restructuring pressure.
Major Market Sectors
(% of Net Assets)
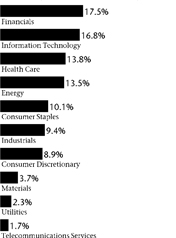
Portfolio Composition
(% of Portfolio)

Top 10 Holdings
(% of Net Assets)
| | | |
Exxon Mobil Corporation | | 4.0 | % |
J.P. Morgan Chase & Company | | 3.4 | % |
International Business Machines Corporation | | 2.9 | % |
Johnson & Johnson | | 2.6 | % |
Gilead Sciences, Inc. | | 2.5 | % |
Abbott Laboratories | | 2.4 | % |
Wal-Mart Stores, Inc. | | 2.3 | % |
McDonald’s Corporation | | 2.0 | % |
General Electric Company | | 2.0 | % |
Southern Company | | 2.0 | % |
These securities represent 26.1% of the total net assets of the Fund.
Quoted Fund performance is for Class A shares and does not reflect a sales charge.
The returns shown do not reflect taxes a shareholder would pay on distributions or redemptions.
Quoted Major Market Sectors, Portfolio Composition and Top 10 Holdings are subject to change.
The lists of Major Market Sectors and Top 10 Holdings exclude short-term investments and collateral held for securities loaned.
The Portfolio Composition chart excludes collateral held for securities loaned.
38
Most risk asset classes are priced at extraordinary discounts to normal valuations, some at levels not seen in generations. At some point over the next 12 months, the holders of fresh capital will become dissatisfied with the unusually low returns currently being earned by the safest investment alternatives. We are beginning to reposition assets to those segments that should benefit from an improving economic outlook and more stable financial environment. Immediate risks remain high, so activity is thoughtful and deliberate, but we believe valuations are unusually attractive for an investor with only a moderate time horizon. The large-cap core segment will benefit directly in any improvement in investor sentiment and outlook as it provides broad market exposure in highly liquid securities, both domestically and abroad.
Portfolio Facts
As of October 31, 2008
| | | | | | | | | |
| | | Class A | | Class B | | Institutional Class |
Ticker | | | AALGX | | | BBLGX | | | IILGX |
Transfer Agent ID | | | 017 | | | 067 | | | 090 |
Net Assets | | $ | 1,658,797,719 | | $ | 12,975,566 | | $ | 164,189,326 |
NAV | | $ | 17.67 | | $ | 16.06 | | $ | 17.84 |
NAV - High† | | | 12/10/2007 - $30.94 | | | 12/10/2007 - $28.42 | | | 12/10/2007 - $31.21 |
NAV - Low† | | | 10/27/2008 - $15.37 | | | 10/27/2008 - $13.98 | | | 10/27/2008 - $15.52 |
Number of Holdings: 155 | | | | | | | | | |
| † | For the year ended October 31, 2008 |
Average Annual Total Returns1
As of October 31, 2008
| | | | | | | | | |
Class A2 | | 1-Year | | | 5 Years | | | 10 Years | |
without sales charge | | (35.72 | %) | | (1.01 | %) | | 0.08 | % |
with sales charge | | (39.25 | %) | | (2.12 | %) | | (0.48 | %) |
| | | |
Class B3 | | 1-Year | | | 5 Years | | | 10 Years | |
without sales charge | | (36.29 | %) | | (1.93 | %) | | (0.45 | %) |
with sales charge | | (38.52 | %) | | (1.93 | %) | | (0.45 | %) |
| | | |
Institutional Class4 | | 1-Year | | | 5 Years | | | 10 Years | |
Net Asset Value | | (35.42 | %) | | (0.56 | %) | | 0.51 | % |
Value of a $10,000 Investment
Class A Shares*,1,(a)
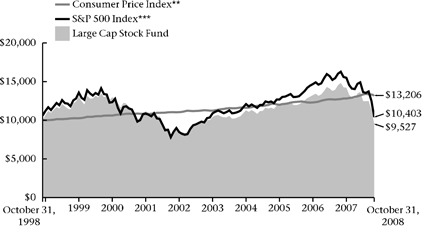
1 | Past performance is not an indication of future results. Annualized total returns represent past performance and reflect changes in share prices, the reinvestment of all dividends and capital gains, and the effects of compounding. Investing in a mutual fund involves risks, including the possible loss of principal. The prospectus contains more complete information on the investment objectives, risks, charges and expenses of the investment company, which investors should read and consider carefully before investing. To obtain a prospectus, contact a registered representative or visit www.thrivent.com. At various times, the Fund’s adviser waived its management fee and/or reimbursed Fund expenses. Had the adviser not done so, the Fund’s total returns would have been lower. The returns shown do not reflect taxes a shareholder would pay on distributions or redemptions. |
2 | Class A performance reflects the maximum sales charge of 5.5%. |
3 | Class B performance reflects the maximum defferred sales charge of 5%, declining 1% each year during the first five years and then converting to Class A shares after the fifth year. |
4 | Institutional Class shares have no sales load and are for institutional shareholders only. |
(a) | Performance of other classes will be greater or less than the line shown based on the differences in loads and fees paid by shareholders investing in the different classes. |
| * | As you compare performance, please note that the Fund’s performance reflects the maximum 5.5% sales charge, while the S&P 500 Index and the Consumer Price Index do not reflect any such charges. If you were to purchase any of the above individual stocks or funds represented in the Index, any charges you would pay would reduce your total return as well. |
| ** | The Consumer Price Index is an inflationary indicator that measures the change in the cost of a fixed basket of products and services, including housing, electricity, food and transportation. It is not possible to invest directly in the Index. |
*** | The S&P 500 Index is an index that represents the average performance of a group of 500 widely held, publicly traded stocks. “S&P 500®” is a trademark of The McGraw-Hill Companies, Inc. and has been licensed for use by Thrivent Financial for Lutherans. The product is not sponsored, endorsed or promoted by Standard & Poor’s and Standard & Poor’s makes no representation regarding the advisability of investing in the product. It is not possible to invest directly in the Index. The performance of the Index does not reflect deductions for fees, expenses or taxes. |
39
| | |
 | | Thrivent Large Cap Index Fund Kevin R. Brimmer, FSA, Portfolio Manager The Fund seeks total returns that track the performance of the S&P 500 Index by investing primarily in common stocks comprising the Index. Large-cap stocks are subject to the basic market risk that a particular security, or securities in general, may decrease in value over short or even extended time periods. While the Fund attempts to closely track the S&P 500 Index, it does not exactly duplicate the composition of the Index. Individuals may not invest directly in any Index. Index funds are subject to the same market risks associated with stocks in their respective indexes. These and other risks are described in the Fund’s prospectus. |
How did the Fund perform during the 12-month period ended October 31, 2008?
Thrivent Large Cap Index Fund earned a return of -36.36%, as compared to the median return of its peer group, the Lipper S&P 500 Index Objective Funds category, of - -36.38%. The Fund’s market benchmark, the S&P 500 Index, earned a total return of -36.08%.
What factors affected the Fund’s performance?
The Fund’s holdings are aligned with those of the S&P 500 Index. As typically occurs in an index fund, the difference in performance between the benchmark index and the Fund itself can largely be attributed to expenses and minor differences in portfolio composition.
All sectors delivered negative returns over the past year. Consumer staples and health care had the best relative performance in the market over the past year. These sectors tend to grow more than or, at worst, decline less than more cyclical companies in periods of economic weakness. They also tend to have higher-quality balance sheets.
Large-cap stocks outperformed mid-cap stocks but underperformed small-cap stocks over the past fiscal year. Information technology and the financial sectors delivered the most negative returns for the 12-month period. IT spending is cyclical and expectations are for spending to decline in the face of slowing or negative economic growth. The financial sector is essentially being restructured in the aftermath of the debt and excesses of the last cycle.
What is your outlook?
There is still a tremendous amount of uncertainty in both the financial and economic outlook. The programs that have been put in place appear to be making progress in facilitating a more normal lending environment. At some point, investors may become dissatisfied with unusually low returns being earned by the safest investment alternatives, and may shift money toward more recognizable blue chip companies that have the potential to achieve higher returns for their portfolios.
Major Market Sectors
(% of Net Assets)
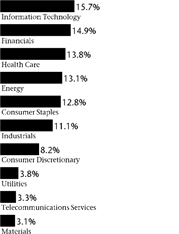
Portfolio Composition
(% of Portfolio)
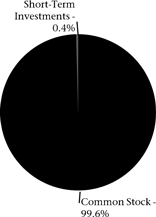
Top 10 Holdings
(% of Net Assets)
| | | |
Exxon Mobil Corporation | | 4.5 | % |
General Electric Company | | 2.5 | % |
Procter & Gamble Company | | 2.3 | % |
Microsoft Corporation | | 2.1 | % |
Johnson & Johnson | | 2.0 | % |
AT&T, Inc. | | 1.9 | % |
J.P. Morgan Chase & Company | | 1.8 | % |
Chevron Corporation | | 1.8 | % |
International Business Machines Corporation | | 1.5 | % |
Wal-Mart Stores, Inc. | | 1.5 | % |
These securities represent 21.9% of the total net assets of the Fund.
Quoted Fund performance is for Class A shares and does not reflect a sales charge.
The returns shown do not reflect taxes a shareholder would pay on distributions or redemptions.
Quoted Major Market Sectors, Portfolio Composition and Top 10 Holdings are subject to change.
The lists of Major Market Sectors and Top 10 Holdings exclude short-term investments and collateral held for securities loaned.
The Portfolio Composition chart excludes collateral held for securities loaned.
40
The financial calamity that began in the credit markets and has cascaded over to both the real economy and the equity markets appears to be running its course. The equity market should anticipate the ultimate recovery in the economy, and certainly the policy levers are all being exercised to foster greater availability of credit and higher growth. Inflation risks appear to have diminished significantly in the short term, and commodity and energy prices have experienced sharp corrections to levels that are more realistic in relation to costs and demand and supply variables. We believe the catalysts are in place for a meaningful recovery in equity prices over the next 12 months.
Portfolio Facts
As of October 31, 2008
| | | |
| | | Class A |
Ticker | | | AALCX |
Transfer Agent ID | | | 031 |
Net Assets | | $ | 51,265,474 |
NAV | | $ | 6.71 |
NAV - High† | | | 12/10/2007 - $10.50 |
NAV - Low† | | | 10/27/2008 - $5.88 |
Number of Holdings: 503 | | | |
| † | For the year ended October 31, 2008 |
Average Annual Total Returns1
As of October 31, 2008
| | | | | | | | | |
Class A2 | | 1-Year | | | 5 Years | | | From
Inception
7/1/2000 | |
without sales charge | | (36.36 | %) | | (0.27 | %) | | (3.88 | %) |
with sales charge | | (39.85 | %) | | (1.39 | %) | | (4.53 | %) |
Value of a $10,000 Investment
Class A Shares*,1
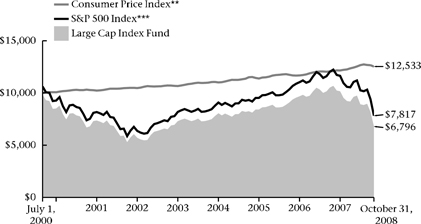
1 | Past performance is not an indication of future results. Annualized total returns represent past performance and reflect changes in share prices, the reinvestment of all dividends and capital gains, and the effects of compounding. Investing in a mutual fund involves risks, including the possible loss of principal. The prospectus contains more complete information on the investment objectives, risks, charges and expenses of the investment company, which investors should read and consider carefully before investing. To obtain a prospectus, contact a registered representative or visit www.thrivent.com. At various times, the Fund’s adviser waived its management fee and/or reimbursed Fund expenses. Had the adviser not done so, the Fund’s total returns would have been lower. The returns shown do not reflect taxes a shareholder would pay on distributions or redemptions. |
2 | Class A performance reflects the maximum sales charge of 5.5%. |
| * | As you compare performance, please note that the Fund’s performance reflects the maximum 5.5% sales charge, while the Consumer Price Index and the S&P 500 Index do not reflect any such charges. If you were to purchase any of the above individual stocks or funds represented in the Index, any charges you would pay would reduce your total return as well. |
| ** | The Consumer Price Index is an inflationary indicator that measures the change in the cost of a fixed basket of products and services, including housing, electricity, food and transportation. It is not possible to invest directly in the Index. |
*** | The S&P 500 Index is an index that represents the average performance of a group of 500 widely held, publicly traded stocks. “S&P 500®” is a trademark of The McGraw-Hill Companies, Inc. and has been licensed for use by Thrivent Financial for Lutherans. The product is not sponsored, endorsed or promoted by Standard & Poor’s and Standard & Poor’s makes no representation regarding the advisability of investing in the product. It is not possible to invest directly in the Index. The performance of the Index does not reflect deductions for fees, expenses or taxes. |
41
| | | | |
 | | Thrivent Balanced Fund | |  |
| | Darren Bagwell, CFA (left) and Michael G. Landreville, CFA (right), Portfolio Co-Managers The Fund seeks long-term total return through a balance between income and the potential for long-term capital growth by investing primarily in a diversified portfolio of common stocks, bonds and money market instruments. The Fund is subject to interest rate risk, credit risk and volatility risk, which may result in overall price fluctuations over short or even extended time periods. Common stocks are subject to the basic market risk that a particular security, or securities in general, may decrease in value over short or even extended time periods. These and other risks are described in the Fund’s prospectus. | |
How did the Fund perform during the 12-month period ended October 31, 2008?
Thrivent Balanced Fund earned a return of -28.76%, as compared to the median return of its peer group, the Lipper Mixed-Asset Target Allocation Growth category, of - -30.84%. The Fund’s market benchmarks, the S&P Supercomposite 1500 Index and the Barclays Capital Aggregate Bond Index, earned total returns of -35.95% and 0.30%, respectively.
What factors affected the Fund’s performance?
The Fund’s equity component returned -35.89%. Sectors contributing the most to relative outperformance on the equity side included financials, consumer discretionary, consumer staples and materials. Health care was the primary source of partially offsetting relative underperformance.
Our equity outperformance in financials was due to our emphasis on higher-quality regional banks as well as our timely entries into stronger-performing national banks. Our continuing preference for JP Morgan at the expense of struggling Citigroup amongst the money-center banks was also a major contributor to performance. Within consumer discretionary, stock positions in value-oriented retailers Wal-Mart, TJX and Ross Stores generated solid relative returns. In consumer staples, our overweighted positions in large packaged food companies helped relative performance. Finally, our favoring of more stable and conservative materials names at the expense of the metals and commodity producers paid significant dividends. Underperformance in the health care sector was primarily due to our underweighting of pharmaceuticals.
A main reason for our fixed-income component’s relative underperformance was our underweighting of Treasury securities, which outperformed other fixed-income categories as investors flocked to safety throughout the period. Although we maintained a diversified portfolio of high-quality, mortgage-backed, asset-backed agency and corporate bonds, these securities generally experienced a drop in prices and a hike in yields–in many cases to record margins over Treasury yields–as the liquidity crunch worsened throughout the year.
The other major detractor from the fixed-income component’s relative performance was the floating-rate debt we used to back our forward purchase of Fannie Mae and Freddie Mac mortgage securities. The debt we used, all AAA-rated with maturities of from one to three years and a coupon rate that readjusts between one and three months, was impacted by sub-prime mortgage-related troubles and lost value.
What is your outlook?
We expect 2009 to be characterized by continued weak economic growth, burdened by further housing market weakness, difficult credit markets and deteriorating consumer spending trends; low and stable interest rates; a stable or stronger dollar; and continued weakening in international demand.
Major Market Sectors
(% of Net Assets)
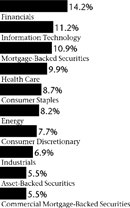
Portfolio Composition
(% of Portfolio)

Top 10 Holdings
(% of Net Assets)
| | | |
Federal National Mortgage Association Conventional 30-Yr. Pass Through | | 8.3 | % |
U.S. Treasury Notes, TIPS | | 1.9 | % |
Federal National Mortgage Association Conventional 30-Yr. Pass Through | | 1.5 | % |
J.P. Morgan Chase & Company | | 1.3 | % |
Exxon Mobil Corporation | | 1.2 | % |
Apple, Inc. | | 1.2 | % |
Federal National Mortgage Association Conventional 30-Yr. Pass Through | | 1.1 | % |
Procter & Gamble Company | | 1.1 | % |
Devon Energy Corporation | | 0.9 | % |
McDonald’s Corporation | | 0.9 | % |
These securities represent 19.4% of the total net assets of the Fund.
Quoted Fund performance is for Class A shares and does not reflect a sales charge.
The returns shown do not reflect taxes a shareholder would pay on distributions or redemptions.
Quoted Major Market Sectors, Portfolio Composition and Top 10 Holdings are subject to change.
The lists of Major Market Sectors and Top 10 Holdings exclude short-term investments and collateral held for securities loaned.
The Portfolio Composition chart excludes collateral held for securities loaned.
42
Within the equity component, we see value in energy, technology, retailing, and the financial sector. As difficult as economic conditions remain, equity markets are at historically low valuation levels and their recovery can precede economic improvements by 12-18 months.
In the fixed-income markets, we expect the yield curve to remain steep and credit spreads to remain wide in the near future. We will maintain our current bond portfolio posture, not adding risk but not selling adversely affected securities that we believe are money good while market prices are down due to investor fears.
Portfolio Facts
As of October 31, 2008
| | | | | | | | | |
| | | Class A | | Class B | | Institutional Class |
Ticker | | | AABFX | | | BBBFX | | | IBBFX |
Transfer Agent ID | | | 026 | | | 085 | | | 056 |
Net Assets | | $ | 143,027,811 | | $ | 2,633,324 | | $ | 50,741,268 |
NAV | | $ | 8.91 | | $ | 8.88 | | $ | 8.90 |
NAV - High† | | | 12/10/2007 - $13.50 | | | 12/10/2007 - $13.43 | | | 12/10/2007 - $13.49 |
NAV - Low† | | | 10/27/2008 - $8.15 | | | 10/27/2008 - $8.13 | | | 10/27/2008 - $8.14 |
Number of Holdings: 436 | | | | | | | | | |
| † | For the year ended October 31, 2008 |
Average Annual Total Returns1
As of October 31, 2008
| | | | | | | | | |
Class A2 | | 1-Year | | | 5 Years | | | 10 Years | |
without sales charge | | (28.76 | %) | | (0.13 | %) | | 1.59 | % |
with sales charge | | (32.66 | %) | | (1.26 | %) | | 1.02 | % |
| | | |
Class B3 | | 1-Year | | | 5 Years | | | 10 Years | |
without sales charge | | (29.47 | %) | | (1.11 | %) | | 1.12 | % |
with sales charge | | (32.08 | %) | | (1.11 | %) | | 1.12 | % |
| | | |
Institutional Class4 | | 1-Year | | | 5 Years | | | 10 Years | |
Net Asset Value | | (28.43 | %) | | 0.34 | % | | 2.05 | % |
Value of a $10,000 Investment
Class A Shares*,1,(a)
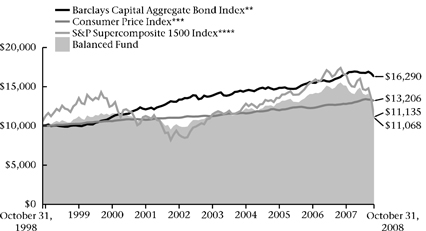
1 | Past performance is not an indication of future results. Annualized total returns represent past performance and reflect changes in share prices, the reinvestment of all dividends and capital gains, and the effects of compounding. Investing in a mutual fund involves risks, including the possible loss of principal. The prospectus contains more complete information on the investment objectives, risks, charges and expenses of the investment company, which investors should read and consider carefully before investing. To obtain a prospectus, contact a registered representative or visit www.thrivent.com. At various times, the Fund’s adviser waived its management fee and/or reimbursed Fund expenses. Had the adviser not done so, the Fund’s total returns would have been lower. The returns shown do not reflect taxes a shareholder would pay on distributions or redemptions. |
2 | Class A performance reflects the maximum sales charge of 5.5%. |
3 | Class B performance reflects the maximum defferred sales charge of 5%, declining 1% each year during the first five years and then converting to Class A shares after the fifth year. |
4 | Institutional Class shares have no sales load and are for institutional shareholders only. |
(a) | Performance of other classes will be greater or less than the line shown based on the differences in loads and fees paid by shareholders investing in the different classes. |
| * | As you compare performance, please note that the Fund’s performance reflects the maximum 5.5% sales charge, while the Barclays Capital Aggregate Bond Index, the S&P Supercomposite 1500 Index and the Consumer Price Index do not reflect any such charges. If you were to purchase any of the above individual stocks or funds represented in these Indexes, any charges you would pay would reduce your total return as well. |
| ** | The Barclays Capital Aggregate Bond Index is an index that measures the performance of U.S. investment grade bonds. It is not possible to invest directly in the Index. The performance of the Index does not reflect deductions for fees, expenses or taxes. The Barclays Capital Aggregate Bond Index is the new name for the index formerly known as the Lehman Brothers Aggregate Bond Index. The Barclays Capital Aggregate Bond Index assumes the prior history and is compiled going forward using the same methodology of the Lehman Brothers Aggregate Bond Index. |
| *** | The Consumer Price Index is an inflationary indicator that measures the change in the cost of a fixed basket of products and services, including housing, electricity, food and transportation. It is not possible to invest directly in the Index. |
| **** | The S&P Supercomposite 1500 Index measures the performance of a group of 1500 publicly traded stocks. It is not possible to invest directly in the Index. The performance of the Index does not reflect deductions for fees, expenses or taxes. |
43
| | |
 | | Thrivent High Yield Fund Paul J. Ocenasek, CFA, Portfolio Manager The Fund seeks high current income and, secondarily, growth of capital by investing primarily in a diversified portfolio of high-yield corporate bonds. The Fund typically invests a majority of its assets in high-yield bonds (commonly referred to as junk bonds). Although high-yield bonds typically have a higher current yield than investment-grade bonds, high-yield are also subject to greater price fluctuations and increased risk of loss of principal than investment-grade bonds. These and other risks are described in the Fund’s prospectus. |
How did the Fund perform during the 12-month period ended October 31, 2008?
Thrivent High Yield Fund earned a return of -22.70%, as compared to the median return of its peer group, the Lipper U.S. High Current Yield Funds, of -24.21%. The Fund’s market benchmark, the Barclays Capital U.S. Corporate High Yield Bond Index, earned a total return of -25.81%.
What factors affected the Fund’s performance?
With investors focused on growing troubles in the credit markets and a massive de-leveraging of the U.S. financial system, the high-yield bond market sold off significantly during the period. The yield premium or “spread” high-yield bonds offered over that of Treasury securities increased from 4.21% at the beginning of the period to 14.79% on October 31, 2008, with a simultaneous drop in their prices. This was the most significant spread widening that the high-yield market has ever witnessed. The sell-off was especially dramatic in the period’s final month of October. Also, spreads became much wider during the period than those seen in either of the last two recessions (1990-1991 and 2000-2001).
The Fund outperformed its peer group during this challenging period mainly due to our emphasis on higher-quality bonds. Our position in bonds of the lowest credit quality (CCC-rated) was significantly underweighted relative to our benchmark index (by about 7.50 percentage points at the end of the period). Other factors that enhanced our performance relative to our peer group included our overweighted positions in recession-resistant industries such as health care (down 10.50%, a modest decline compared to the overall market), wireless (down 12%), and our underweighted positions in recession-prone industries such as autos (down 36%), retail (down 28%), building materials (down 32%) and finance (down 63%).
Detracting from the Fund’s performance was our overweighted position in the gaming sector (down 43% during the period), though our credit selection in this sector was good. The Fund’s gaming sector holdings were down 32% during the period.
What is your outlook?
Our outlook for high-yield bonds is cautious and will remain so until it becomes clearer how the economy will perform in 2009. We think the rate cutting and other credit-easing moves undertaken by the Federal Reserve and central banks around the world during the period will help stabilize our financial system.
Even so, we are concerned about the threats to growth posed by continued problems in the housing and credit markets, softening consumer demand and rising unemployment. In a recession, high-yield bonds typically perform poorly. With slow or no economic growth, we expect default rates in high-yield bonds to increase significantly over the next year or two. For these reasons, we will keep a defensive stance.
Major Market Sectors
(% of Net Assets)
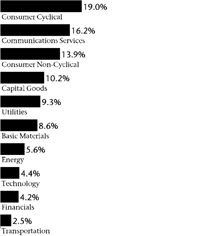
Moody’s Bond Quality
Ratings Distributions
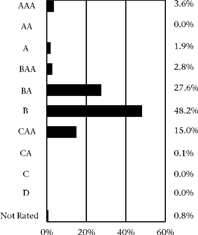
Top 10 Holdings
(% of Net Assets)
| | | |
Texas Competitive Electric Holdings Company, LLC | | 1.1 | % |
Ford Motor Company, Term Loan | | 1.1 | % |
Intelsat Subsidiary Holding Company, Ltd. | | 1.1 | % |
MGM MIRAGE | | 1.1 | % |
Leucadia National Corporation | | 1.0 | % |
HCA, Inc., Term Loan | | 1.0 | % |
General Motors Acceptance Corporation | | 1.0 | % |
Tunica Biloxi Gaming Authority | | 0.9 | % |
TransDigm, Inc. | | 0.9 | % |
Centennial Communications Corporation | | 0.9 | % |
These securities represent 10.1% of the total net assets of the Fund.
Quoted Fund performance is for Class A shares and does not reflect a sales charge.
The returns shown do not reflect taxes a shareholder would pay on distributions or redemptions.
Quoted Major Market Sectors, Moody’s Bond Quality Ratings Distributions and Top 10 Holdings are subject to change.
The lists of Major Market Sectors and Top 10 Holdings exclude short-term investments and collateral held for securities loaned.
44
With high-yield bond yield spreads so wide, however, the market appears to have priced in the expected increase in defaults and, we think, may be overcompensating investors at current yields. As much of the damage to the market appears to have been done already, we are finding some very attractive opportunities to add value to the Fund by making selective investments. For suitable investors, we believe that now may be a good time to be averaging into a high-yield bond portfolio.
Portfolio Facts
As of October 31, 2008
| | | | | | | | | |
| | | Class A | | Class B | | Institutional Class |
Ticker | | | LBHYX | | | LUHBX | | | LBHIX |
Transfer Agent ID | | | 073 | | | 373 | | | 473 |
Net Assets | | $ | 318,801,212 | | $ | 3,357,971 | | $ | 129,418,421 |
NAV | | $ | 3.59 | | $ | 3.59 | | $ | 3.59 |
NAV - High† | | | 11/1/2007 - $5.02 | | | 11/1/2007 - $5.02 | | | 11/1/2007 - $5.03 |
NAV - Low† | | | 10/28/2008 - $3.57 | | | 10/28/2008 - $3.57 | | | 10/28/2008 - $3.57 |
Number of Holdings: 236 | | | | | | | | | |
| † | For the year ended October 31, 2008 |
Average Annual Total Returns1
As of October 31, 2008
| | | | | | | | | |
Class A2 | | 1-Year | | | 5 Years | | | 10 Years | |
without sales charge | | (22.70 | %) | | 0.75 | % | | 0.94 | % |
with sales charge | | (26.22 | %) | | (0.18 | %) | | 0.48 | % |
| | | |
Class B3 | | 1-Year | | | 5 Years | | | 10 Years | |
without sales charge | | (23.37 | %) | | (0.10 | %) | | 0.58 | % |
with sales charge | | (26.22 | %) | | (0.10 | %) | | 0.58 | % |
| | | |
Institutional Class4 | | 1-Year | | | 5 Years | | | 10 Years | |
Net Asset Value | | (22.52 | %) | | 1.17 | % | | 1.32 | % |
Value of a $10,000 Investment
Class A Shares*,1,(a)
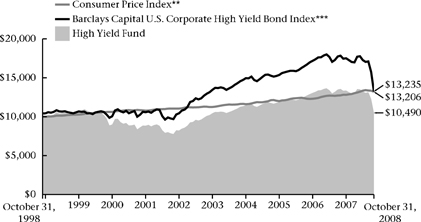
1 | Past performance is not an indication of future results. Annualized total returns represent past performance and reflect changes in share prices, the reinvestment of all dividends and capital gains, and the effects of compounding. Investing in a mutual fund involves risks, including the possible loss of principal. The prospectus contains more complete information on the investment objectives, risks, charges and expenses of the investment company, which investors should read and consider carefully before investing. To obtain a prospectus, contact a registered representative or visit www.thrivent.com. At various times, the Fund’s adviser waived its management fee and/or reimbursed Fund expenses. Had the adviser not done so, the Fund’s total returns would have been lower. The returns shown do not reflect taxes a shareholder would pay on distributions or redemptions. |
2 | Class A performance reflects the maximum sales charge of 4.5%. |
3 | Class B performance reflects the maximum defferred sales charge of 5%, declining 1% each year during the first five years and then converting to Class A shares after the fifth year. |
4 | Institutional Class shares have no sales load and are for institutional shareholders only. |
(a) | Performance of other classes will be greater or less than the line shown based on the differences in loads and fees paid by shareholders investing in the different classes. |
| * | As you compare performance, please note that the Fund’s performance reflects the maximum 4.5% sales charge, while the Barclays Capital U.S. Corporate High Yield Bond Index and the Consumer Price Index do not reflect any such charges. If you were to purchase any of the above individual stocks or funds represented in the Index, any charges you would pay would reduce your total return as well. |
| ** | The Consumer Price Index is an inflationary indicator that measures the change in the cost of a fixed basket of products and services, including housing, electricity, food and transportation. It is not possible to invest directly in the Index. |
| *** | The Barclays Capital U.S. Corporate High Yield Bond Index is an index which measures the performance of fixed-rate non-investment grade bonds. It is not possible to invest directly in the Index. The performance of the Index does not reflect deductions for fees, expenses or taxes. The Barclays Capital U.S Corporate High Yield Bond Index is the new name for the index formerly known as the Lehman Brothers U.S Corporate High Yield Bond Index. The Barclays Capital U.S Corporate High Yield Bond Index assumes the prior history and is compiled going forward using the same methodology of the Lehman Brothers U.S Corporate High Yield Bond Index. |
45
| | |
 | | Thrivent Municipal Bond Fund Janet I. Grangaard, CFA, Portfolio Manager The Fund seeks a high level of current income exempt from federal income taxes, consistent with capital preservation, by investing primarily in a diversified portfolio of municipal bonds.* The Fund is subject to interest rate risk, credit risk related to an issuer’s underlying financial position and volatility risk, which may result in overall price fluctuations over short or even extended time periods. These and other risks are described in the Fund’s prospectus. |
How did the Fund perform during the 12-month period ended October 31, 2008?
Thrivent Municipal Bond Fund earned a return of -2.92%, as compared to the median return of its peer group, the Lipper General Municipal Debt Funds Category, of -6.87%. The Fund’s market benchmark, the Barclays Capital Municipal Bond Index, earned a total return of -3.30%.
What factors affected the Fund’s performance?
The credit crunch that started in sub-prime mortgages worsened throughout the period and affected all types of fixed-income securities, including municipal bonds. Yields fell on shorter-term municipal bonds and rose on longer-term securities as the Federal Reserve cut interest rates repeatedly and investors sought the relative safety of shorter maturities and higher-rated issuers. Fortunately, our portfolio was positioned for a steepening yield curve and a market emphasis on quality.
Our heavier weighting of three- to 10-year bonds enhanced our performance relative to our peer group as prices at the shorter end of the yield curve rose slightly or stayed relatively stable. A focus on high-quality securities also benefited our relative performance, as investor appetite for risk diminished and the liquidity crisis continued to impact other bond sectors. The ongoing flight to quality boosted yields of lower-rated bonds and pushed down their prices. Consequently, our lower weighting in high-yield municipal bonds enhanced our performance relative to our peer group. The Fund had limited exposure to high yield, whereas some other funds had a considerable percentage of their portfolios in this segment.
Our decision to avoid two types of securities that performed poorly also enhanced the Fund’s performance relative to its peer group. These included gas prepay bonds, which lost value due to concerns about unrelated losses incurred by the major banks that underwrite them; and floating-rate-note securities, many of which were down sharply during the period. Our underweighted position in tobacco-sector bonds, which also performed poorly, benefited the Fund’s relative performance as well.
Despite the troubles facing bond insurers during the period, the Portfolio fared well because our insured holdings are, on average, of high quality and their prices did not fall dramatically as a result. Rather than rely on bond insurance, we insist on carefully researching the credit quality of each security we consider.
What is your outlook?
Economic activity will likely remain sluggish at least through the first half of 2009. Eventually, however, the massive government bailout and stimulus programs should begin to spur faster growth. At that point, inflation may once again become a concern.
Major Market Sectors
(% of Net Assets)
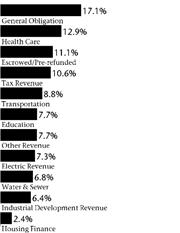
Moody’s Bond Quality
Ratings Distributions
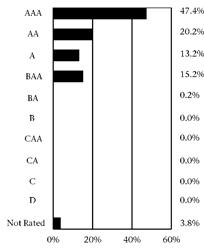
Top 10 States
(% of Net Assets)
| | | |
Texas | | 10.9 | % |
Illinois | | 9.3 | % |
New York | | 8.3 | % |
California | | 7.9 | % |
Colorado | | 5.9 | % |
Washington | | 4.6 | % |
Minnesota | | 3.8 | % |
Georgia | | 3.2 | % |
Ohio | | 3.1 | % |
Massachusetts | | 3.0 | % |
Investments in securities in these States represent 60.0% of the total net assets of the Fund.
*Investors may be subject to state taxes and federal alternative minimum tax.
Quoted Fund performance is for Class A shares and does not reflect a sales charge.
The returns shown do not reflect taxes a shareholder would pay on distributions or redemptions.
Quoted Major Market Sectors, Moody’s Bond Quality Ratings Distributions and Top 10 States are subject to change.
The lists of Major Market Sectors and Top 10 States exclude short-term investments.
46
In the meantime, we expect further volatility in the municipal bond market, a continued steep yield curve and wide credit spreads. State and local governments will likely face tighter budgets, requiring difficult decisions about priorities. Insurance should also be less prevalent than in past years, when roughly 50% of new issuances came with insurance. The market for municipal bonds itself is also shifting from institutional to retail buyers. With the dynamic nature of today’s municipal bond market, investors must do their homework and monitor their holdings carefully. We will continue to do that for you. We believe that the Fund is in a strong position to take advantage of upcoming market values. Going forward, we will look for opportunities to add select longer-maturity and slightly lower-rated bonds to our Portfolio to continue our efforts to enhance shareholders’ total return.
Portfolio Facts
As of October 31, 2008
| | | | | | | | | |
| | | Class A | | Class B | | Institutional Class |
Ticker | | | AAMBX | | | TMBBX | | | TMBIX |
Transfer Agent ID | | | 015 | | | 065 | | | 088 |
Net Assets | | $ | 1,104,836,754 | | $ | 3,807,038 | | $ | 35,064,623 |
NAV | | $ | 10.37 | | $ | 10.36 | | $ | 10.36 |
NAV - High† | | | 1/23/2008 - $11.41 | | | 1/23/2008 - $11.41 | | | 1/23/2008 - $11.41 |
NAV - Low† | | | 10/17/2008 - $10.01 | | | 10/17/2008 - $10.00 | | | 10/17/2008 - $10.01 |
| Number of Holdings: 433 | | | | | | | | | |
| † | For the year ended October 31, 2008 |
Average Annual Total Returns1
As of October 31, 2008
| | | | | | | | | |
Class A2 | | 1-Year | | | 5 Years | | | 10 Years | |
without sales charge | | (2.92 | %) | | 2.43 | % | | 3.71 | % |
with sales charge | | (7.32 | %) | | 1.49 | % | | 3.24 | % |
| | | |
Class B3 | | 1-Year | | | 5 Years | | | 10 Years | |
without sales charge | | (3.69 | %) | | 1.72 | % | | 3.32 | % |
with sales charge | | (7.40 | %) | | 1.72 | % | | 3.32 | % |
| | | |
Institutional Class4 | | 1-Year | | | 5 Years | | | 10 Years | |
Net Asset Value | | (2.71 | %) | | 2.72 | % | | 3.96 | % |
Value of a $10,000 Investment
Class A Shares*,1,(a)
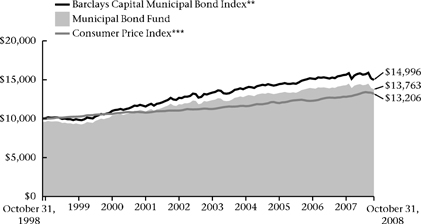
1 | Past performance is not an indication of future results. Annualized total returns represent past performance and reflect changes in share prices, the reinvestment of all dividends and capital gains, and the effects of compounding. Investing in a mutual fund involves risks, including the possible loss of principal. The prospectus contains more complete information on the investment objectives, risks, charges and expenses of the investment company, which investors should read and consider carefully before investing. To obtain a prospectus, contact a registered representative or visit www.thrivent.com. At various times, the Fund’s adviser waived its management fee and/or reimbursed Fund expenses. Had the adviser not done so, the Fund’s total returns would have been lower. The returns shown do not reflect taxes a shareholder would pay on distributions or redemptions. |
2 | Class A performance reflects the maximum sales charge of 4.5%. |
3 | Class B performance reflects the maximum defferred sales charge of 5%, declining 1% each year during the first five years and then converting to Class A shares after the fifth year. |
4 | Institutional Class shares have no sales load and are for institutional shareholders only. |
(a) | Performance of other classes will be greater or less than the line shown based on the differences in loads and fees paid by shareholders investing in the different classes. |
| * | As you compare performance, please note that the Fund’s performance reflects the maximum 4.5% sales charge, while the Barclays Capital Municipal Bond Index and the Consumer Price Index do not reflect any such charges. If you were to purchase any of the above individual stocks or funds represented in the Index, any charges you would pay would reduce your total return as well. |
| ** | The Barclays Capital Municipal Bond Index is a market value-weighted index of investment-grade municipal bonds with maturities of one year or more. It is not possible to invest directly in the Index. The performance of the Index does not reflect deductions for fees, expenses or taxes. The Barclays Capital Municipal Bond Index is the new name for the index formerly known as the Lehman Brothers Municipal Bond Index. The Barclays Capital Municipal Bond Index assumes the prior history and is compiled going forward using the same methodology of the Lehman Brothers Municipal Bond Index. |
| *** | The Consumer Price Index is an inflationary indicator that measures the change in the cost of a fixed basket of products and services, including housing, electricity, food and transportation. It is not possible to invest directly in the Index. |
47
| | | | |
 | | Thrivent Income Fund Kent L. White, CFA (left) and Paul J. Ocenasek, CFA (right), Portfolio Co-Managers The Fund seeks high current income while preserving principal and, secondarily, long-term growth of capital. The Fund is subject to interest rate risk, credit risk related to a company’s underlying financial position and volatility risk, which may result in overall price fluctuations over short or even extended time periods. These and other risks are described in the Fund’s prospectus. | |  |
How did the Fund perform during the 12-month period ended October 31, 2008?
Thrivent Income Fund earned a return of -14.19%, as compared to the median return of its peer group, the Lipper Corporate Debt Funds BBB-Rated Funds, of -14.91%. The Fund’s market benchmark, the Barclays Capital Aggregate Bond Index, earned a total return of 0.30%.
What factors affected the Fund’s performance?
Most of the outperformance relative to our peer group was attributable to the defensive, up-in-quality bias of the Fund’s holdings in corporate bonds. Given our expectations for a prolonged period of economic weakness and limited availability of capital, we were overweighted in investment-grade corporate bonds versus lower quality high-yield corporate bonds, and underweighted in consumer and cyclically exposed sectors of the economy. Being overweighted in cash and underweighted in a number of the large financial failures such as AIG, Washington Mutual and Fannie Mae also helped performance relative to our peer group during the worst part of this past year’s credit crisis.
The Fund has continued to be negatively impacted by the illiquid floating-rate securities that were used to support the forward purchase of mortgage securities. These securities have been the largest source of negative return contribution over the past year and remain highly illiquid. We also had an underweighted position in U.S. Treasury securities, U.S. agency securities and agency-backed mortgage securities, all of which are higher-quality asset classes that outperformed as riskier credit underperformed in one of the worst years ever for the credit markets.
What is your outlook?
We continue to expect a prolonged period of significant economic weakness as it appears the world’s economies are entering one of the first synchronized global recessions in a long time. The mortgage crisis that started in 2007 has spread from the consumer through the banking system and is now poised to impact the broader economy. Rising unemployment, very weak consumer spending, and business spending cutbacks are now the primary risks to the economy. The support from exports that U.S. corporations have enjoyed is also now in jeopardy as global growth slows and the U.S. dollar strengthens. Helping to offset these risks somewhat, the U.S. government and governments around the world have initiated financial-system rescue plans that may begin to show signs of returning some liquidity to the credit markets.
Major Market Sectors
(% of Net Assets)
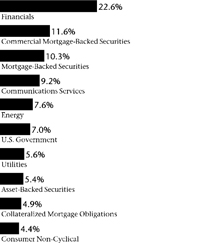
Moody’s Bond Quality
Ratings Distributions
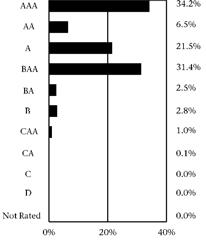
Top 10 Holdings
(% of Net Assets)
| | | |
Federal National Mortgage Association Conventional 30-Yr. Pass Through | | 8.0 | % |
Wachovia Bank Commercial Mortgage Trust | | 1.3 | % |
Federal Home Loan Bank | | 1.3 | % |
Federal National Mortgage Association Conventional 30-Yr. Pass Through | | 1.2 | % |
Federal Home Loan Mortgage Corporation | | 1.1 | % |
Federal National Mortgage Association Conventional 30-Yr. Pass Through | | 1.1 | % |
Federal National Mortgage Association | | 1.1 | % |
Citigroup Commercial Mortgage Trust | | 1.0 | % |
Merna Re, Ltd. | | 1.0 | % |
U.S. Treasury Notes | | 1.0 | % |
These securities represent 18.1% of the total net assets of the Fund.
Quoted Fund performance is for Class A shares and does not reflect a sales charge.
The returns shown do not reflect taxes a shareholder would pay on distributions or redemptions.
Quoted Major Market Sectors, Moody’s Bond Quality Ratings Distributions and Top 10 Holdings are subject to change.
The lists of Major Market Sectors and Top 10 Holdings exclude short-term investments and collateral held for securities loaned.
48
We are much less concerned about inflation at this point in the economic cycle, but need to stay vigilant due to the very large amount of stimulus that is in the pipeline from governments around the world. Given this outlook, with downside risks to growth and minimal inflation concerns, we have a neutral to slightly long bias to duration and the Treasury curve.
Portfolio Facts
As of October 31, 2008
| | | | | | | | | |
| | | Class A | | Class B | | Institutional Class |
Ticker | | | LUBIX | | | LUIBX | | | LBIIX |
Transfer Agent ID | | | 055 | | | 355 | | | 455 |
Net Assets | | $ | 326,207,647 | | $ | 2,404,589 | | $ | 318,513,413 |
NAV | | $ | 6.92 | | $ | 6.90 | | $ | 6.91 |
NAV - High† | | | 1/23/2008 - $8.57 | | | 1/23/2008 - $8.55 | | | 1/23/2008 - $8.56 |
NAV - Low† | | | 10/31/2008 - $6.92 | | | 10/31/2008 - $6.90 | | | 10/31/2008 - $6.91 |
| Number of Holdings: 316 | | | | | | | | | |
| † | For the year ended October 31, 2008 |
Average Annual Total Returns1
As of October 31, 2008
| | | | | | | | | |
Class A2 | | 1-Year | | | 5 Years | | | 10 Years | |
without sales charge | | (14.19 | %) | | (0.01 | %) | | 2.68 | % |
with sales charge | | (18.05 | %) | | (0.92 | %) | | 2.21 | % |
| | | |
Class B3 | | 1-Year | | | 5 Years | | | 10 Years | |
without sales charge | | (14.95 | %) | | (0.84 | %) | | 2.29 | % |
with sales charge | | (18.20 | %) | | (0.84 | %) | | 2.29 | % |
| | | |
Institutional Class4 | | 1-Year | | | 5 Years | | | 10 Years | |
Net Asset Value | | (13.85 | %) | | 0.37 | % | | 3.03 | % |
Value of a $10,000 Investment
Class A Shares*,1,(a)
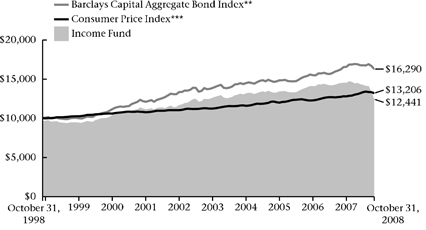
1 | Past performance is not an indication of future results. Annualized total returns represent past performance and reflect changes in share prices, the reinvestment of all dividends and capital gains, and the effects of compounding. Investing in a mutual fund involves risks, including the possible loss of principal. The prospectus contains more complete information on the investment objectives, risks, charges and expenses of the investment company, which investors should read and consider carefully before investing. To obtain a prospectus, contact a registered representative or visit www.thrivent.com. At various times, the Fund’s adviser waived its management fee and/or reimbursed Fund expenses. Had the adviser not done so, the Fund’s total returns would have been lower. The returns shown do not reflect taxes a shareholder would pay on distributions or redemptions. |
2 | Class A performance reflects the maximum sales charge of 4.5%. |
3 | Class B performance reflects the maximum defferred sales charge of 5%, declining 1% each year during the first five years and then converting to Class A shares after the fifth year. |
4 | Institutional Class shares have no sales load and are for institutional shareholders only. |
(a) | Performance of other classes will be greater or less than the line shown based on the differences in loads and fees paid by shareholders investing in the different classes. |
| * | As you compare performance, please note that the Fund’s performance reflects the maximum 4.5% sales charge, while the Barclays Capital Aggregate Bond Index and the Consumer Price Index do not reflect any such charges. If you were to purchase any of the above individual stocks or funds represented in the Index, any charges you would pay would reduce your total return as well. |
| ** | The Barclays Capital Aggregate Bond Index is an index that measures the performance of U.S. investment grade bonds. It is not possible to invest directly in the Index. The performance of the Index does not reflect deductions for fees, expenses or taxes. The Barclays Capital Aggregate Bond Index is the new name for the index formerly known as the Lehman Brothers Aggregate Bond Index. The Barclays Capital Aggregate Bond Index assumes the prior history and is compiled going forward using the same methodology of the Lehman Brothers Aggregate Bond Index. |
| *** | The Consumer Price Index is an inflationary indicator that measures the change in the cost of a fixed basket of products and services, including housing, electricity, food and transportation. It is not possible to invest directly in the Index. |
49
| | | | |
 | | Thrivent Core Bond Fund Michael G. Landreville, CFA (left) and Gregory R. Anderson, CFA (right), Portfolio
Co-Managers The Fund seeks a high level of current income consistent with capital preservation by investing primarily in a diversified portfolio of investment-grade bonds. The Fund is subject to interest rate risk, credit risk related to a company’s underlying financial position and volatility risk, which may result in overall price fluctuations over short or even extended time periods. These and other risks are described in the Fund’s prospectus. | |  |
How did the Fund perform during the 12-month period ended October 31, 2008?
Thrivent Core Bond Fund earned a return of -10.13%, as compared to the median return of its peer group, the Lipper Intermediate Investment Grade Debt Funds, of -6.38%. The Fund’s market benchmark, the Barclays Capital Aggregate Bond Index, earned a total return of 0.30%.
What factors affected the Fund’s performance?
A main reason for our underperformance relative to the peer group was our underweighting of Treasury securities, which outperformed other fixed-income categories as investors flocked to safety throughout the period. Although we maintained a diversified portfolio of high-quality mortgage-backed, asset-backed, agency and corporate bonds, these securities generally experienced a drop in prices and a hike in yields–in many cases to record margins over Treasury yields–as the liquidity crunch worsened throughout the year.
Within our corporate bond holdings we’ve typically held an overweighted position in the financial sector, which generally has been a high-rated area of the market. But during the 12-month reporting period, the worsening liquidity crisis hurt the financial sector overall, since finance corporations issue and hold the affected securities. Our bank and brokerage securities were particularly affected during the period. In addition, some of the corporate financial sector bonds we held were “hybrid securities.” These securities are designed to put the bondholder lower in the corporate repayment order in case of bankruptcy–but still ahead of stockholders–in exchange for higher returns. However, they were also hard hit by the credit crunch.
The other major detractor from the Fund’s relative performance was the floating-rate debt we used to back our forward purchase of Fannie Mae and Freddie Mac mortgage securities. The debt we used, all AAA-rated with maturities of from one to three years and a coupon rate that readjusts between one and three months, was impacted by sub-prime mortgage-related troubles and lost value.
What is your outlook?
Economic activity will likely remain sluggish at least until mid-2009. Eventually, the unprecedented amount of government stimulus in the system–in the form of bailouts and other liquidity programs–should begin to spur faster growth. Until then, the Federal Reserve will likely keep short-term interest rates low. Lower interest rates, however, may be less effective in prompting a recovery than the massive government liquidity programs planned or in progress.
Major Market Sectors
(% of Net Assets)
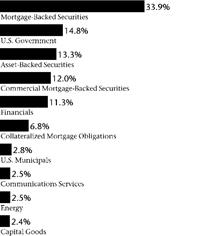
Moody’s Bond Quality
Ratings Distributions
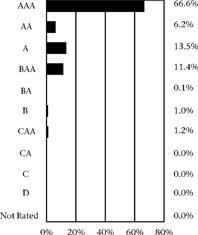
Top 10 Holdings
(% of Net Assets)
| | | |
Federal National Mortgage Association Conventional 30-Yr. Pass Through | | 24.8 | % |
U.S. Treasury Notes, TIPS | | 6.1 | % |
Federal National Mortgage Association Conventional 30-Yr. Pass Through | | 5.2 | % |
Federal National Mortgage Association Conventional 30-Yr. Pass Through | | 3.9 | % |
Federal Home Loan Bank | | 1.7 | % |
U.S. Treasury Notes | | 1.6 | % |
Renaissance Home Equity Loan Trust | | 1.6 | % |
Bear Stearns Commercial Mortgage Securities, Inc. | | 1.6 | % |
U.S. Treasury Notes | | 1.3 | % |
Federal National Mortgage Association | | 1.3 | % |
These securities represent 49.1% of the total net assets of the Fund.
Quoted Fund performance is for Class A shares and does not reflect a sales charge.
The returns shown do not reflect taxes a shareholder would pay on distributions or redemptions.
Quoted Major Market Sectors, Moody’s Bond Quality Ratings Distributions and Top 10 Holdings are subject to change.
The lists of Major Market Sectors and Top 10 Holdings exclude short-term investments and collateral held for securities loaned.
50
We expect the yield curve to remain steep and credit spreads to remain wide in the near future. We will maintain our current portfolio posture, not adding risk but not selling adversely affected securities, which we believe are money good while market prices are down due to investor fears. As noted, we think the worst is over for our affected corporate and floating-rate securities and that their value should rebound as the market calms down.
Portfolio Facts
As of October 31, 2008
| | | | | | | | | |
| | | Class A | | Class B | | Institutional Class |
Ticker | | | AAINX | | | BBFBX | | | IIINX |
Transfer Agent ID | | | 016 | | | 066 | | | 089 |
Net Assets | | $ | 223,492,006 | | $ | 1,481,556 | | $ | 64,979,765 |
NAV | | $ | 8.36 | | $ | 8.36 | | $ | 8.36 |
NAV - High† | | | 1/23/2008 - $9.88 | | | 1/23/2008 - $9.88 | | | 1/23/2008 - $9.88 |
NAV - Low† | | | 10/31/2008 - $8.36 | | | 10/31/2008 - $8.36 | | | 10/31/2008 - $8.36 |
| Number of Holdings: 186 | | | | | | | | | |
| † | For the year ended October 31, 2008 |
Average Annual Total Returns1
As of October 31, 2008
| | | | | | | | | |
Class A2 | | 1-Year | | | 5 Years | | | 10 Years | |
without sales charge | | (10.13 | %) | | 0.47 | % | | 3.03 | % |
with sales charge | | (14.17 | %) | | (0.45 | %) | | 2.56 | % |
| | | |
Class B3 | | 1-Year | | | 5 Years | | | 10 Years | |
without sales charge | | (11.23 | %) | | (0.57 | %) | | 2.54 | % |
with sales charge | | (14.65 | %) | | (0.57 | %) | | 2.54 | % |
| | | |
Institutional Class4 | | 1-Year | | | 5 Years | | | 10 Years | |
Net Asset Value | | (9.92 | %) | | 0.86 | % | | 3.44 | % |
Value of a $10,000 Investment
Class A Shares*,1,(a)
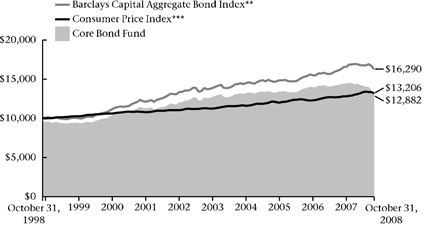
1 | Past performance is not an indication of future results. Annualized total returns represent past performance and reflect changes in share prices, the reinvestment of all dividends and capital gains, and the effects of compounding. Investing in a mutual fund involves risks, including the possible loss of principal. The prospectus contains more complete information on the investment objectives, risks, charges and expenses of the investment company, which investors should read and consider carefully before investing. To obtain a prospectus, contact a registered representative or visit www.thrivent.com. At various times, the Fund’s adviser waived its management fee and/or reimbursed Fund expenses. Had the adviser not done so, the Fund’s total returns would have been lower. The returns shown do not reflect taxes a shareholder would pay on distributions or redemptions. |
2 | Class A performance reflects the maximum sales charge of 4.5%. |
3 | Class B performance reflects the maximum defferred sales charge of 5%, declining 1% each year during the first five years and then converting to Class A shares after the fifth year. |
4 | Institutional Class shares have no sales load and are for institutional shareholders only. |
(a) | Performance of other classes will be greater or less than the line shown based on the differences in loads and fees paid by shareholders investing in the different classes. |
| * | As you compare performance, please note that the Fund’s performance reflects the maximum 4.5% sales charge, while the Barclays Capital Aggregate Bond Index and the Consumer Price Index do not reflect any such charges. If you were to purchase any of the above individual stocks or funds represented in the Index, any charges you would pay would reduce your total return as well. |
| ** | The Barclays Capital Aggregate Bond Index is an index that measures the performance of U.S. investment grade bonds. It is not possible to invest directly in the Index. The performance of the Index does not reflect deductions for fees, expenses or taxes. The Barclays Capital Aggregate Bond Index is the new name for the index formerly known as the Lehman Brothers Aggregate Bond Index. The Barclays Capital Aggregate Bond Index assumes the prior history and is compiled going forward using the same methodology of the Lehman Brothers Aggregate Bond Index. |
| *** | The Consumer Price Index is an inflationary indicator that measures the change in the cost of a fixed basket of products and services, including housing, electricity, food and transportation. It is not possible to invest directly in the Index. |
51
| | | | |
 | | Thrivent Limited Maturity Bond Fund | |  |
| | Michael G. Landreville, CFA (left) and Gregory R. Anderson, CFA (right), Portfolio Co-Managers The Fund seeks a high level of current income with stability of principal. The Fund is subject to interest rate risk, credit risk related to a company’s underlying financial position and volatility risk, which may result in overall price fluctuations over short or even extended time periods. These and other risks are described in the Fund’s prospectus. | |
How did the Fund perform during the 12-month period ended October 31, 2008?
Thrivent Limited Maturity Bond Fund earned a return of -5.03%, as compared to the median return of its peer group, the Lipper Short Investment Grade Debt Funds, of - -3.15%. The Fund’s market benchmark, the Barclays Capital Government/Credit 1-3 Year Bond Index, earned a total return of 4.20%.
What factors affected the Fund’s performance?
The main reason for our underperformance relative to the peer group was our underweighting of Treasury securities, which outperformed other fixed-income categories as investors flocked to safety throughout the period. Although we maintained a diversified portfolio of high-quality mortgage-backed, asset-backed, agency and corporate bonds, these securities generally experienced a drop in prices and a hike in yields as the liquidity crunch worsened throughout the year.
Most of the Fund’s negative performance occurred over the last three months of the 12-month period. The failures or forced sale of several large financial institutions–including Fannie Mae, Freddie Mac, Lehman Brothers, Washington Mutual, Wachovia, Merrill Lynch and AIG–escalated investors’ fears and their rush to safety. During these months the yield spread, or the yield margin over government-guaranteed Treasury securities that other types of bonds pay, grew to the widest levels ever seen.
With rising concerns about how much the housing slump and worsening credit crisis would disrupt the economy, the Federal Reserve Open Market Committee cut short-term interest rates repeatedly during the period, with the federal funds target rate dropping from 4.50% on October 31, 2007, to 1.00% on October 29, 2008. The government also undertook other extraordinary measures to inject liquidity into the financial system. The yield on the two-year Treasury note fell from 3.95% to 1.55% during the period.
Our relative performance benefited during the period from moves to position the Portfolio for a steeper yield curve and purchasing options on Treasury futures, which enabled us to extend the Portfolio’s duration when interest rates declined significantly. The options’ value grew as rates fell. The Fund’s relative performance also benefited from our overweighted position in agency securities, which did significantly better than corporate bonds or securitized assets.
Major Market Sectors
(% of Net Assets)
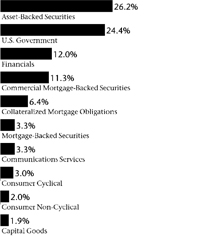
Moody’s Bond Quality
Ratings Distributions
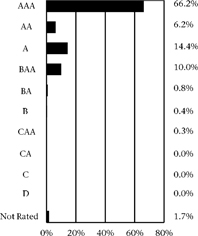
Top 10 Holdings
(% of Net Assets)
| | | |
U.S. Treasury Notes, TIPS | | 3.4 | % |
U.S. Treasury Notes | | 2.7 | % |
Federal National Mortgage Association Conventional 30-Yr. Pass Through | | 2.2 | % |
Federal Home Loan Bank | | 2.1 | % |
Federal Home Loan Mortgage Corporation | | 1.8 | % |
Federal National Mortgage Association | | 1.6 | % |
Federal Home Loan Bank | | 1.3 | % |
Federal Home Loan Bank | | 1.1 | % |
Federal Home Loan Bank | | 1.1 | % |
Federal Home Loan Bank | | 1.1 | % |
These securities represent 18.4% of the total net assets of the Fund.
Quoted Fund performance is for Class A shares.
The returns shown do not reflect taxes a shareholder would pay on distributions or redemptions.
Quoted Major Market Sectors, Moody’s Bond Quality Ratings Distributions and Top 10 Holdings are subject to change.
The lists of Major Market Sectors and Top 10 Holdings exclude short-term investments and collateral held for securities loaned.
52
What is your outlook?
Economic activity will likely remain sluggish at least until mid-2009. Eventually, the unprecedented amount of government stimulus in the system–in the form of bailouts and other liquidity programs–should begin to spur faster growth. Until then, the Federal Reserve will likely keep short-term interest rates low. Lower interest rates, however, may be less effective in prompting a recovery than the massive government liquidity programs planned or in progress.
Portfolio Facts
As of October 31, 2008
| | | | | | | | | |
| | | Class A | | Class B | | Institutional Class |
Ticker | | | LBLAX | | | TLMBX | | | THLIX |
Transfer Agent ID | | | 076 | | | 376 | | | 476 |
Net Assets | | $ | 90,451,603 | | $ | 1,536,587 | | $ | 376,898,264 |
NAV | | $ | 11.40 | | $ | 11.41 | | $ | 11.40 |
NAV - High† | | | 1/23/2008 - $12.61 | | | 1/23/2008 - $12.62 | | | 1/23/2008 - $12.61 |
NAV - Low† | | | 10/31/2008 -$11.40 | | | 10/31/2008 - $11.41 | | | 10/31/2008 - $11.40 |
Number of Holdings: 286 | | | | | | | | | |
| † | For the year ended October 31, 2008 |
Average Annual Total Returns1
As of October 31, 2008
| | | | | | | | | |
Class A2 | | 1-Year | | | 5 Years | | | From
Inception
10/29/1999 | |
Net Asset Value | | (5.03 | %) | | 1.25 | % | | 3.40 | % |
| | | |
Class B3 | | 1-Year | | | 5 Years | | | From
Inception
10/29/1999 | |
Net Asset Value | | (5.20 | %) | | 1.15 | % | | 3.37 | % |
| | | |
Institutional Class4 | | 1-Year | | | 5 Years | | | From
Inception
10/29/1999 | |
Net Asset Value | | (4.71 | %) | | 1.65 | % | | 3.75 | % |
Value of a $10,000 Investment
Class A Shares1,(a)
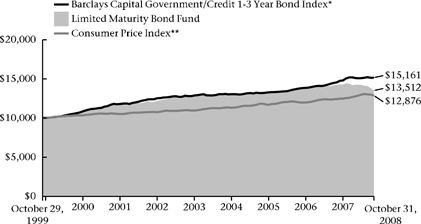
1 | Past performance is not an indication of future results. Annualized total returns represent past performance and reflect changes in share prices, the reinvestment of all dividends and capital gains, and the effects of compounding. Investing in a mutual fund involves risks, including the possible loss of principal. The prospectus contains more complete information on the investment objectives, risks, charges and expenses of the investment company, which investors should read and consider carefully before investing. To obtain a prospectus, contact a registered representative or visit www.thrivent.com. At various times, the Fund’s adviser waived its management fee and/or reimbursed Fund expenses. Had the adviser not done so, the Fund’s total returns would have been lower. The returns shown do not reflect taxes a shareholder would pay on distributions or redemptions. |
2 | Class A shares have no sales load. |
3 | Class B shares have no sales load. |
4 | Institutional Class shares have no sales load and are for institutional shareholders only. |
(a) | Performance of other classes will be greater or less than the line shown based on the differences in loads and fees paid by shareholders investing in the different classes. |
| * | The Barclays Capital Government/Credit 1-3 Year Bond Index is an index that measures the performance of government and fixed-rate debt securities with maturities of 1-3 years. It is not possible to invest directly in the Index. The performance of the Index does not reflect deductions for fees, expenses or taxes. The Barclays Capital Government/Credit 1-3 Year Bond Index is the new name for the index formerly known as the Lehman Brothers Government/Credit 1-3 Year Bond Index. The Barclays Capital Government/Credit 1-3 Year Bond Index assumes the prior history and is compiled going forward using the same methodology of the Lehman Brothers Government/Credit 1-3 Year Bond Index. |
| ** | The Consumer Price Index is an inflationary indicator that measures the change in the cost of a fixed basket of products and services, including housing, electricity, food and transportation. It is not possible to invest directly in the Index. |
53
| | |
 | | Thrivent Money Market Fund William D. Stouten, Portfolio Manager The Fund seeks a high level of current income, while maintaining liquidity and a constant net asset value of $1.00 per share, by investing in a diversified portfolio of high-quality, short-term money market instruments. The principal risk of investing in the Fund is current income risk—that is, the income the Fund receives may fall as a result of a decline in interest rates. This and other risks are described in the Fund’s prospectus. |
How did the Fund perform during the 12-month period ended October 31, 2008?
Thrivent Money Market Fund earned a return of 3.21%, as compared to the median return of its peer group, the Lipper Money Market Funds category, of 2.64%.
What factors affected the Fund’s performance?
The worsening global “liquidity crunch” was the factor that most influenced money market securities during the reporting period. Yields rose on most structured securities, while yields declined on industrial names, U.S agency debt and Treasuries as investors sought quality.
Fortunately, our investment philosophy was rewarded during this market upheaval. We had little exposure through most of the period to the types of securities that concerned the market. Throughout the 12 months, we took advantage of the higher yields offered on many types of securities that we felt still offered our shareholders the liquidity and safety they expect. Early in the period, we purchased some longer-dated (three to six months) securities at attractive prices, enabling us to extend the Fund’s weighted average maturity in high-quality investments. This move benefited us as the Fed cut interest rates repeatedly during the period, with the federal funds target rate dropping from 4.50% on October 31, 2007, to 1.00% on October 29, 2008. When government intervention steps boosted credit quality and liquidity, we began to take advantage of the pricing discrepancies that remained in the market.
The Fund also benefited from its holdings of LIBOR (London Interbank Offered Rate)-based floaters, which reset at high rates during the period because of the disruption in the European banking system and the subsequent increase in LIBOR rates. Further, we benefited by significantly expanding our holdings of municipal credits (taxable short-term securities issued by local and state governmental units).
Yet another positive influence on the Fund’s performance was our effective management of overnight liquidity. Our willingness to shift in and out of a variety of overnight investments depending on the yield provided us with a competitive advantage against industry participants that have been less flexible.
Money market securities in general were also affected by several federal programs initiated during the period to bolster market liquidity and investor confidence. One is the U.S. Treasury Temporary Guarantee Program for Money Market Funds, which protects the value of shares in participating funds (held by investors as of September 19, 2008) from dropping below $1.00. Thrivent Money Market Fund was a participant in the initial Program (September 19, 2008 through December 18, 2008) and applied to participate
Portfolio Composition
(% of Portfolio)
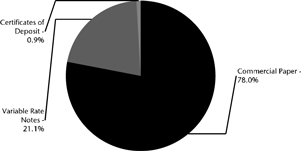
An investment in Thrivent Money Market Fund is not insured or guaranteed by the FDIC or, generally, any other government agency. Although the Fund seeks to preserve the value of your investment at $1.00 per share, it is possible to lose money by investing in the Fund.
Quoted Fund performance is for Class A shares.
The returns shown do not reflect taxes a shareholder would pay on distributions or redemptions.
Quoted Portfolio Composition is subject to change.
54
in the extended Program (December 19, 2008 through April 30, 2009). Two other programs, the Commercial Paper Funding Facility and the Asset-Backed Commercial Paper Money Market Mutual Fund Liquidity Facility, provide federal funding and backing to enhance liquidity of money market securities.
What is your outlook?
With all of the federal backstops in place, we expect money market liquidity to improve and yields to come down. The Federal Reserve may cut short-term interest rates further to help spur economic growth. So we expect a period of relatively low money market yields ahead.
We continue to manage the Fund conservatively as we prepare for the possibility that interest rates and fund flows may change unexpectedly. As in any economic environment, we will continue to focus on our primary goals of safety and liquidity, while pursuing the optimum risk-adjusted yield.
Portfolio Facts
As of October 31, 2008
| | | | | | | | | |
| | | Class A | | Class B | | Institutional Class |
Ticker | | | AMMXX | | | TMBXX | | | AALXX |
Transfer Agent ID | | | 018 | | | 068 | | | 091 |
Net Assets | | $ | 1,305,957,005 | | $ | 1,047,567 | | $ | 223,260,818 |
NAV | | $ | 1.00 | | $ | 1.00 | | $ | 1.00 |
Number of Holdings: 118 | | | | | | | | | |
| † | For the year ended October 31, 2008 |
Average Annual Total Returns1
As of October 31, 2008
| | | | | | | | | |
Class A2 | | 1-Year | | | 5 Years | | | 10 Years | |
Net Asset Value | | 3.21 | % | | 2.97 | % | | 3.10 | % |
| | | |
Class B3 | | 1-Year | | | 5 Years | | | 10 Years | |
without sales charge | | 2.73 | % | | 2.65 | % | | 2.68 | % |
with sales charge | | (1.27 | %) | | 2.65 | % | | 2.68 | % |
| | | |
Institutional Class4 | | 1-Year | | | 5 Years | | | 10 Years | |
Net Asset Value | | 3.41 | % | | 3.28 | % | | 3.41 | % |
Money Market Portfolio Yields*
As of October 31, 2008
| | | | | | | | | |
| | | Class A | | | Class B | | | Institutional Class | |
7-Day Yield | | 2.52 | % | | 2.11 | % | | 2.76 | % |
7-Day Effective Yield | | 2.55 | % | | 2.14 | % | | 2.80 | % |
1 | Past performance is not an indication of future results. Annualized total returns represent past performance and reflect changes in share prices, the reinvestment of all dividends and capital gains, and the effects of compounding. Investing in a mutual fund involves risks, including the possible loss of principal. The prospectus contains more complete information on the investment objectives, risks, charges and expenses of the investment company, which investors should read and consider carefully before investing. To obtain a prospectus, contact a registered representative or visit www.thrivent.com. At various times, the Fund’s adviser waived its management fee and/or reimbursed Fund expenses. Had the adviser not done so, the Fund’s total returns would have been lower. The returns shown do not reflect taxes a shareholder would pay on distributions or redemptions. |
2 | Class A shares have no sales load. |
3 | Class B performance reflects the maximum defferred sales charge of 5%, declining 1% each year during the first five years and then converting to Class A shares after the fifth year. |
4 | Institutional Class shares have no sales load and are for institutional shareholders only. |
| * | Seven-day yields of Thrivent Money Market Fund refer to the income generated by an investment in the Fund over a specified seven-day period. Effective yields reflect the reinvestment of income. Yields are subject to daily fluctuation and should not be considered an indication of future results. |
55
Shareholder Expense Example
(Unaudited)
As a shareholder of the Fund, you incur two types of costs: (1) transaction costs, including sales charges (loads) on purchase payments; and (2) ongoing costs, including management fees; distribution (12b-1) fees and other Fund expenses. This Example is intended to help you understand your ongoing costs (in dollars) of investing in the Fund and to compare these costs with the ongoing costs of investing in other mutual funds. The Example is based on an investment of $1,000 invested at the beginning of the period and held for the entire period from May 1, 2008 through October 31, 2008.
Actual Expenses
In the table below, the first section, labeled “Actual,” provides information about actual account values and actual expenses. You may use the information in this section, together with the amount you invested, to estimate the expenses that you paid over the period. Simply divide your account value by $1,000 (for example, an $8,600 account value divided by $1,000 = 8.6), then multiply the result by the number from the appropriate Class line under the heading entitled “Expenses Paid During Period” to estimate the expenses you paid. A small account fee of $12 is charged to Class A shareholder accounts if the value falls below stated account minimums ($2,500 for Thrivent Limited Maturity Bond Fund, $1,500 for Thrivent Money Market Fund and $1,000 for all other Funds). This fee is not included in the table below. If it were, the expenses you paid during the period would have been higher and the ending account value would have been lower.
Hypothetical Example for Comparison Purposes
In the table below, the second section, labeled “Hypothetical,” provides information about hypothetical account values and hypothetical expenses based on the Fund’s actual expense ratio and an assumed rate of return of 5% per year before expenses, which is not the Fund’s actual return. The hypothetical account values and expenses may not be used to estimate the actual ending account balance or expenses you paid for the period. You may use this information to compare the ongoing costs of investing in the Fund and other funds. To do so, compare this 5% hypothetical example with the 5% hypothetical examples that appear in the shareholder reports of the other funds. A small account fee of $12 is charged to Class A shareholder accounts if the value falls below stated account minimums ($2,500 for Thrivent Limited Maturity Bond Fund, $1,500 for Thrivent Money Market Fund and $1,000 for all other Funds). This fee is not included in the table below. If it were, the expenses you paid during the period would have been higher and the ending account value would have been lower.
Please note that the expenses shown in the table are meant to highlight your ongoing costs only and do not reflect any transactional costs, such as sales charges (loads). Therefore, the second section of the table is useful in comparing ongoing costs only, and will not help you determine the relative total costs of owning different funds. In addition, if these transactional costs were included, your costs would have been higher.
| | | | | | | | | | | | |
| | | Beginning Account
Value 5/1/2008 | | Ending Account
Value 10/31/2008 | | Expenses Paid During
Period 5/1/2008-
10/31/2008* | | Annualized
Expense
Ratio | |
Thrivent Aggressive Allocation Fund | | | | | | | | | |
Actual | | | | | | | | | | | | |
Class A | | $ | 1,000 | | $ | 690 | | $ | 2.34 | | 0.55 | % |
Institutional Class | | $ | 1,000 | | $ | 691 | | $ | 0.88 | | 0.21 | % |
Hypothetical** | | | | | | | | | | | | |
Class A | | $ | 1,000 | | $ | 1,022 | | $ | 2.80 | | 0.55 | % |
Institutional Class | | $ | 1,000 | | $ | 1,024 | | $ | 1.05 | | 0.21 | % |
Thrivent Moderately Aggressive Allocation Fund | | | | | | | | | |
Actual | | | | | | | | | | | | |
Class A | | $ | 1,000 | | $ | 715 | | $ | 2.24 | | 0.52 | % |
Institutional Class | | $ | 1,000 | | $ | 715 | | $ | 0.79 | | 0.18 | % |
Hypothetical** | | | | | | | | | | | | |
Class A | | $ | 1,000 | | $ | 1,023 | | $ | 2.65 | | 0.52 | % |
Institutional Class | | $ | 1,000 | | $ | 1,024 | | $ | 0.93 | | 0.18 | % |
56
| | | | | | | | | | | | |
| | | Beginning Account
Value 5/1/2008 | | Ending Account
Value 10/31/2008 | | Expenses Paid During
Period 5/1/2008-
10/31/2008* | | Annualized
Expense
Ratio | |
Thrivent Moderate Allocation Fund | | | | | | | | | |
Actual | | | | | | | | | | | | |
Class A | | $ | 1,000 | | $ | 761 | | $ | 2.27 | | 0.51 | % |
Institutional Class | | $ | 1,000 | | $ | 762 | | $ | 0.82 | | 0.19 | % |
Hypothetical** | | | | | | | | | | | | |
Class A | | $ | 1,000 | | $ | 1,023 | | $ | 2.60 | | 0.51 | % |
Institutional Class | | $ | 1,000 | | $ | 1,024 | | $ | 0.95 | | 0.19 | % |
Thrivent Moderately Conservative Allocation Fund | | | | | | | | | |
Actual | | | | | | | | | | | | |
Class A | | $ | 1,000 | | $ | 824 | | $ | 2.20 | | 0.48 | % |
Institutional Class | | $ | 1,000 | | $ | 824 | | $ | 0.99 | | 0.22 | % |
Hypothetical** | | | | | | | | | | | | |
Class A | | $ | 1,000 | | $ | 1,023 | | $ | 2.44 | | 0.48 | % |
Institutional Class | | $ | 1,000 | | $ | 1,024 | | $ | 1.10 | | 0.22 | % |
Thrivent Technology Fund | | | | | | | | | | | | |
Actual | | | | | | | | | | | | |
Class A | | $ | 1,000 | | $ | 635 | | $ | 6.04 | | 1.47 | % |
Class B | | $ | 1,000 | | $ | 631 | | $ | 11.43 | | 2.79 | % |
Institutional Class | | $ | 1,000 | | $ | 636 | | $ | 4.37 | | 1.06 | % |
Hypothetical** | | | | | | | | | | | | |
Class A | | $ | 1,000 | | $ | 1,018 | | $ | 7.46 | | 1.47 | % |
Class B | | $ | 1,000 | | $ | 1,011 | | $ | 14.09 | | 2.79 | % |
Institutional Class | | $ | 1,000 | | $ | 1,020 | | $ | 5.39 | | 1.06 | % |
Thrivent Partner Small Cap Growth Fund | | | | | | | | | | | | |
Actual | | | | | | | | | | | | |
Class A | | $ | 1,000 | | $ | 704 | | $ | 6.05 | | 1.41 | % |
Institutional Class | | $ | 1,000 | | $ | 705 | | $ | 4.47 | | 1.04 | % |
Hypothetical** | | | | | | | | | | | | |
Class A | | $ | 1,000 | | $ | 1,018 | | $ | 7.16 | | 1.41 | % |
Institutional Class | | $ | 1,000 | | $ | 1,020 | | $ | 5.30 | | 1.04 | % |
Thrivent Partner Small Cap Value Fund | | | | | | | | | | | | |
Actual | | | | | | | | | | | | |
Class A | | $ | 1,000 | | $ | 767 | | $ | 5.99 | | 1.35 | % |
Class B | | $ | 1,000 | | $ | 762 | | $ | 11.16 | | 2.52 | % |
Institutional Class | | $ | 1,000 | | $ | 770 | | $ | 3.06 | | 0.69 | % |
Hypothetical** | | | | | | | | | | | | |
Class A | | $ | 1,000 | | $ | 1,018 | | $ | 6.84 | | 1.35 | % |
Class B | | $ | 1,000 | | $ | 1,012 | | $ | 12.74 | | 2.52 | % |
Institutional Class | | $ | 1,000 | | $ | 1,022 | | $ | 3.49 | | 0.69 | % |
Thrivent Small Cap Stock Fund | | | | | | | | | | | | |
Actual | | | | | | | | | | | | |
Class A | | $ | 1,000 | | $ | 728 | | $ | 5.84 | | 1.35 | % |
Class B | | $ | 1,000 | | $ | 724 | | $ | 10.54 | | 2.43 | % |
Institutional Class | | $ | 1,000 | | $ | 731 | | $ | 3.18 | | 0.73 | % |
Hypothetical** | | | | | | | | | | | | |
Class A | | $ | 1,000 | | $ | 1,018 | | $ | 6.83 | | 1.35 | % |
Class B | | $ | 1,000 | | $ | 1,013 | | $ | 12.30 | | 2.43 | % |
Institutional Class | | $ | 1,000 | | $ | 1,021 | | $ | 3.71 | | 0.73 | % |
Thrivent Small Cap Index Fund | | | | | | | | | | | | |
Actual | | | | | | | | | | | | |
Class A | | $ | 1,000 | | $ | 762 | | $ | 4.22 | | 0.95 | % |
Hypothetical** | | | | | | | | | | | | |
Class A | | $ | 1,000 | | $ | 1,020 | | $ | 4.84 | | 0.95 | % |
57
| | | | | | | | | | | | |
| | | Beginning
Account
Value 5/1/2008 | | Ending
Account
Value 10/31/2008 | | Expenses Paid
During Period
5/1/2008-10/31/2008* | | Annualized
Expense
Ratio | |
Thrivent Mid Cap Growth Fund | | | | | | | | | | | | |
Actual | | | | | | | | | | | | |
Class A | | $ | 1,000 | | $ | 680 | | $ | 5.03 | | 1.19 | % |
Class B | | $ | 1,000 | | $ | 676 | | $ | 9.73 | | 2.31 | % |
Institutional Class | | $ | 1,000 | | $ | 682 | | $ | 1.94 | | 0.46 | % |
Hypothetical** | | | | | | | | | | | | |
Class A | | $ | 1,000 | | $ | 1,019 | | $ | 6.05 | | 1.19 | % |
Class B | | $ | 1,000 | | $ | 1,014 | | $ | 11.69 | | 2.31 | % |
Institutional Class | | $ | 1,000 | | $ | 1,023 | | $ | 2.33 | | 0.46 | % |
Thrivent Partner Mid Cap Value Fund | | | | | | | | | |
Actual | | | | | | | | | | | | |
Class A | | $ | 1,000 | | $ | 686 | | $ | 5.30 | | 1.25 | % |
Institutional Class | | $ | 1,000 | | $ | 688 | | $ | 3.88 | | 0.91 | % |
Hypothetical** | | | | | | | | | | | | |
Class A | | $ | 1,000 | | $ | 1,019 | | $ | 6.34 | | 1.25 | % |
Institutional Class | | $ | 1,000 | | $ | 1,021 | | $ | 4.64 | | 0.91 | % |
Thrivent Mid Cap Stock Fund | | | | | | | | | | | | |
Actual | | | | | | | | | | | | |
Class A | | $ | 1,000 | | $ | 669 | | $ | 5.15 | | 1.23 | % |
Class B | | $ | 1,000 | | $ | 665 | | $ | 10.00 | | 2.39 | % |
Institutional Class | | $ | 1,000 | | $ | 671 | | $ | 2.99 | | 0.71 | % |
Hypothetical** | | | | | | | | | | | | |
Class A | | $ | 1,000 | | $ | 1,019 | | $ | 6.24 | | 1.23 | % |
Class B | | $ | 1,000 | | $ | 1,013 | | $ | 12.10 | | 2.39 | % |
Institutional Class | | $ | 1,000 | | $ | 1,022 | | $ | 3.61 | | 0.71 | % |
Thrivent Mid Cap Index Fund | | | | | | | | | | | | |
Actual | | | | | | | | | | | | |
Class A | | $ | 1,000 | | $ | 683 | | $ | 2.54 | | 0.60 | % |
Hypothetical** | | | | | | | | | | | | |
Class A | | $ | 1,000 | | $ | 1,022 | | $ | 3.06 | | 0.60 | % |
Thrivent Partner Worldwide Allocation Fund | | | | | | | | | |
Actual | | | | | | | | | | | | |
Class A | | $ | 1,000 | | $ | 593 | | $ | 5.20 | | 1.30 | % |
Institutional Class | | $ | 1,000 | | $ | 593 | | $ | 3.75 | | 0.94 | % |
Hypothetical** | | | | | | | | | | | | |
Class A | | $ | 1,000 | | $ | 1,019 | | $ | 6.59 | | 1.30 | % |
Institutional Class | | $ | 1,000 | | $ | 1,020 | | $ | 4.75 | | 0.94 | % |
Thrivent Partner International Stock Fund | | | | | | | | | |
Actual | | | | | | | | | | | | |
Class A | | $ | 1,000 | | $ | 589 | | $ | 5.20 | | 1.30 | % |
Class B | | $ | 1,000 | | $ | 584 | | $ | 11.04 | | 2.77 | % |
Institutional Class | | $ | 1,000 | | $ | 590 | | $ | 2.73 | | 0.68 | % |
Hypothetical** | | | | | | | | | | | | |
Class A | | $ | 1,000 | | $ | 1,019 | | $ | 6.61 | | 1.30 | % |
Class B | | $ | 1,000 | | $ | 1,011 | | $ | 14.01 | | 2.77 | % |
Institutional Class | | $ | 1,000 | | $ | 1,022 | | $ | 3.47 | | 0.68 | % |
Thrivent Large Cap Growth Fund | | | | | | | | | | | | |
Actual | | | | | | | | | | | | |
Class A | | $ | 1,000 | | $ | 681 | | $ | 4.94 | | 1.17 | % |
Class B | | $ | 1,000 | | $ | 677 | | $ | 9.27 | | 2.20 | % |
Institutional Class | | $ | 1,000 | | $ | 680 | | $ | 3.41 | | 0.81 | % |
Hypothetical** | | | | | | | | | | | | |
Class A | | $ | 1,000 | | $ | 1,019 | | $ | 5.94 | | 1.17 | % |
Class B | | $ | 1,000 | | $ | 1,014 | | $ | 11.13 | | 2.20 | % |
Institutional Class | | $ | 1,000 | | $ | 1,021 | | $ | 4.10 | | 0.81 | % |
58
| | | | | | | | | | | | |
| | | Beginning
Account
Value 5/1/2008 | | Ending
Account
Value 10/31/2008 | | Expenses Paid
During Period
5/1/2008-10/31/2008* | | Annualized
Expense
Ratio | |
Thrivent Large Cap Value Fund | | | | | | | | | | | | |
Actual | | | | | | | | | | | | |
Class A | | $ | 1,000 | | $ | 717 | | $ | 4.44 | | 1.03 | % |
Class B | | $ | 1,000 | | $ | 712 | | $ | 9.56 | | 2.22 | % |
Institutional Class | | $ | 1,000 | | $ | 719 | | $ | 2.16 | | 0.50 | % |
Hypothetical** | | | | | | | | | | | | |
Class A | | $ | 1,000 | | $ | 1,020 | | $ | 5.23 | | 1.03 | % |
Class B | | $ | 1,000 | | $ | 1,014 | | $ | 11.24 | | 2.22 | % |
Institutional Class | | $ | 1,000 | | $ | 1,023 | | $ | 2.54 | | 0.50 | % |
Thrivent Large Cap Stock Fund | | | | | | | | | | | | |
Actual | | | | | | | | | | | | |
Class A | | $ | 1,000 | | $ | 708 | | $ | 4.55 | | 1.06 | % |
Class B | | $ | 1,000 | | $ | 705 | | $ | 8.10 | | 1.89 | % |
Institutional Class | | $ | 1,000 | | $ | 710 | | $ | 2.49 | | 0.58 | % |
Hypothetical** | | | | | | | | | | | | |
Class A | | $ | 1,000 | | $ | 1,020 | | $ | 5.37 | | 1.06 | % |
Class B | | $ | 1,000 | | $ | 1,016 | | $ | 9.58 | | 1.89 | % |
Institutional Class | | $ | 1,000 | | $ | 1,022 | | $ | 2.94 | | 0.58 | % |
Thrivent Large Cap Index Fund | | | | | | | | | | | | |
Actual | | | | | | | | | | | | |
Class A | | $ | 1,000 | | $ | 706 | | $ | 2.58 | | 0.60 | % |
Hypothetical** | | | | | | | | | | | | |
Class A | | $ | 1,000 | | $ | 1,022 | | $ | 3.05 | | 0.60 | % |
Thrivent Balanced Fund | | | | | | | | | | | | |
Actual | | | | | | | | | | | | |
Class A | | $ | 1,000 | | $ | 758 | | $ | 4.81 | | 1.09 | % |
Class B | | $ | 1,000 | | $ | 754 | | $ | 9.09 | | 2.06 | % |
Institutional Class | | $ | 1,000 | | $ | 760 | | $ | 2.66 | | 0.60 | % |
Hypothetical** | | | | | | | | | | | | |
Class A | | $ | 1,000 | | $ | 1,020 | | $ | 5.52 | | 1.09 | % |
Class B | | $ | 1,000 | | $ | 1,015 | | $ | 10.44 | | 2.06 | % |
Institutional Class | | $ | 1,000 | | $ | 1,022 | | $ | 3.05 | | 0.60 | % |
Thrivent High Yield Fund | | | | | | | | | | | | |
Actual | | | | | | | | | | | | |
Class A | | $ | 1,000 | | $ | 775 | | $ | 3.93 | | 0.88 | % |
Class B | | $ | 1,000 | | $ | 771 | | $ | 7.73 | | 1.74 | % |
Institutional Class | | $ | 1,000 | | $ | 776 | | $ | 1.97 | | 0.44 | % |
Hypothetical** | | | | | | | | | | | | |
Class A | | $ | 1,000 | | $ | 1,021 | | $ | 4.47 | | 0.88 | % |
Class B | | $ | 1,000 | | $ | 1,016 | | $ | 8.80 | | 1.74 | % |
Institutional Class | | $ | 1,000 | | $ | 1,023 | | $ | 2.25 | | 0.44 | % |
Thrivent Municipal Bond Fund | | | | | | | | | | | | |
Actual | | | | | | | | | | | | |
Class A | | $ | 1,000 | | $ | 959 | | $ | 3.83 | | 0.78 | % |
Class B | | $ | 1,000 | | $ | 954 | | $ | 7.22 | | 1.47 | % |
Institutional Class | | $ | 1,000 | | $ | 959 | | $ | 2.31 | | 0.47 | % |
Hypothetical** | | | | | | | | | | | | |
Class A | | $ | 1,000 | | $ | 1,021 | | $ | 3.96 | | 0.78 | % |
Class B | | $ | 1,000 | | $ | 1,018 | | $ | 7.46 | | 1.47 | % |
Institutional Class | | $ | 1,000 | | $ | 1,023 | | $ | 2.38 | | 0.47 | % |
59
| | | | | | | | | | | | |
| | | Beginning
Account
Value 5/1/2008 | | Ending
Account
Value 10/31/2008 | | Expenses Paid
During Period
5/1/2008-10/31/2008* | | Annualized
Expense
Ratio | |
Thrivent Income Fund | | | | | | | | | | | | |
Actual | | | | | | | | | | | | |
Class A | | $ | 1,000 | | $ | 857 | | $ | 3.79 | | 0.81 | % |
Class B | | $ | 1,000 | | $ | 853 | | $ | 7.61 | | 1.63 | % |
Institutional Class | | $ | 1,000 | | $ | 859 | | $ | 1.83 | | 0.39 | % |
Hypothetical** | | | | | | | | | | | | |
Class A | | $ | 1,000 | | $ | 1,021 | | $ | 4.12 | | 0.81 | % |
Class B | | $ | 1,000 | | $ | 1,017 | | $ | 8.28 | | 1.63 | % |
Institutional Class | | $ | 1,000 | | $ | 1,023 | | $ | 1.99 | | 0.39 | % |
Thrivent Core Bond Fund | | | | | | | | | | | | |
Actual | | | | | | | | | | | | |
Class A | | $ | 1,000 | | $ | 894 | | $ | 4.00 | | 0.84 | % |
Class B | | $ | 1,000 | | $ | 888 | | $ | 9.27 | | 1.95 | % |
Institutional Class | | $ | 1,000 | | $ | 895 | | $ | 2.40 | | 0.50 | % |
Hypothetical** | | | | | | | | | | | | |
Class A | | $ | 1,000 | | $ | 1,021 | | $ | 4.27 | | 0.84 | % |
Class B | | $ | 1,000 | | $ | 1,015 | | $ | 9.90 | | 1.95 | % |
Institutional Class | | $ | 1,000 | | $ | 1,023 | | $ | 2.56 | | 0.50 | % |
Thrivent Limited Maturity Bond Fund | | | | | | | | | |
Actual | | | | | | | | | | | | |
Class A | | $ | 1,000 | | $ | 949 | | $ | 3.39 | | 0.69 | % |
Class B | | $ | 1,000 | | $ | 948 | | $ | 4.24 | | 0.87 | % |
Institutional Class | | $ | 1,000 | | $ | 950 | | $ | 1.73 | | 0.35 | % |
Hypothetical** | | | | | | | | | | | | |
Class A | | $ | 1,000 | | $ | 1,022 | | $ | 3.52 | | 0.69 | % |
Class B | | $ | 1,000 | | $ | 1,021 | | $ | 4.40 | | 0.87 | % |
Institutional Class | | $ | 1,000 | | $ | 1,023 | | $ | 1.79 | | 0.35 | % |
Thrivent Money Market Fund | | | | | | | | | | | | |
Actual | | | | | | | | | | | | |
Class A | | $ | 1,000 | | $ | 1,012 | | $ | 2.75 | | 0.54 | % |
Class B | | $ | 1,000 | | $ | 1,010 | | $ | 5.10 | | 1.01 | % |
Institutional Class | | $ | 1,000 | | $ | 1,013 | | $ | 1.76 | | 0.35 | % |
Hypothetical** | | | | | | | | | | | | |
Class A | | $ | 1,000 | | $ | 1,022 | | $ | 2.77 | | 0.54 | % |
Class B | | $ | 1,000 | | $ | 1,020 | | $ | 5.13 | | 1.01 | % |
Institutional Class | | $ | 1,000 | | $ | 1,023 | | $ | 1.77 | | 0.35 | % |
| * | Expenses are equal to the Fund’s annualized expense ratio, multiplied by the average account value over the period, multiplied by 184/366 to reflect the one-half year period. |
| ** | Assuming 5% total return before expenses. |
60

| | |
| | PricewaterhouseCoopers LLP 225 South Sixth Street Suite 1400 Minneapolis, MN 55402 Telephone (612) 596 6000 |
Report of Independent Registered Public Accounting Firm
To the Shareholders and Trustees of the Thrivent Mutual Funds:
In our opinion, the accompanying statements of assets and liabilities, including the schedules of investments, and the related statements of operations and of changes in net assets and the financial highlights present fairly, in all material respects, the financial position of the Thrivent Aggressive Allocation Fund, Thrivent Moderately Aggressive Allocation Fund, Thrivent Moderate Allocation Fund, Thrivent Moderately Conservative Allocation Fund, Thrivent Technology Fund, Thrivent Partner Small Cap Growth Fund, Thrivent Partner Small Cap Value Fund, Thrivent Small Cap Stock Fund, Thrivent Small Cap Index Fund, Thrivent Mid Cap Growth Fund, Thrivent Partner Mid Cap Value Fund, Thrivent Mid Cap Stock Fund, Thrivent Mid Cap Index Fund, Thrivent Partner Worldwide Allocation Fund, Thrivent Partner International Stock Fund, Thrivent Large Cap Growth Fund, Thrivent Large Cap Value Fund, Thrivent Large Cap Stock Fund, Thrivent Large Cap Index Fund, Thrivent Balanced Fund, Thrivent High Yield Fund, Thrivent Municipal Bond Fund, Thrivent Income Fund, Thrivent Core Bond Fund, Thrivent Limited Maturity Bond Fund, and Thrivent Money Market Fund (twenty-six of the Thrivent Mutual Funds, hereafter referred to as the “Funds”) at October 31, 2008, the results of each of their operations, changes in each of their net assets and their financial highlights for each of the periods presented, in conformity with accounting principles generally accepted in the United States of America. These financial statements and financial highlights (hereafter referred to as “financial statements”) are the responsibility of the Funds’ management; our responsibility is to express an opinion on these financial statements based on our audits. We conducted our audits of these financial statements in accordance with the standards of the Public Company Accounting Oversight Board (United States). Those standards require that we plan and perform the audit to obtain reasonable assurance about whether the financial statements are free of material misstatement. An audit includes examining, on a test basis, evidence supporting the amounts and disclosures in the financial statements, assessing the accounting principles used and significant estimates made by management, and evaluating the overall financial statement presentation. We believe that our audits, which included confirmation of securities at October 31, 2008 by correspondence with the custodian and brokers, provide a reasonable basis for our opinion.

December 16, 2008
61
Aggressive Allocation Fund
Schedule of Investments as of October 31, 2008
| | | | | |
| Shares | | Mutual Funds (96.8%) | | Value |
| Equity Mutual Funds (88.4%) | | | |
| 777,887 | | Thrivent Real Estate Securities Fund | | $ | 5,624,127 |
| 3,499,382 | | Thrivent Partner Small Cap Growth Funda | | | 27,260,188 |
| 813,965 | | Thrivent Partner Small Cap Value Fund | | | 9,385,012 |
| 2,620,284 | | Thrivent Small Cap Stock Funda | | | 29,949,849 |
| 1,610,743 | | Thrivent Mid Cap Growth Funda,b | | | 18,104,754 |
| 1,528,778 | | Thrivent Partner Mid Cap Value Fund | | | 12,107,922 |
| 2,962,730 | | Thrivent Mid Cap Stock Fund | | | 28,856,990 |
| 165,514 | | Thrivent Partner Worldwide Allocation Funda,b | | | 1,009,633 |
| 5,829,416 | | Thrivent Partner International Stock Fund | | | 44,711,623 |
| 11,510,159 | | Thrivent Large Cap Growth Fundb | | | 45,350,028 |
| 2,534,047 | | Thrivent Large Cap Value Fund | | | 28,355,981 |
| 1,358,355 | | Thrivent Large Cap Stock Fund | | | 24,233,056 |
| 430,087 | | Thrivent Equity Income Plus Fund | | | 3,182,645 |
| | | | | |
| | Total Equity Mutual Funds | | | 278,131,808 |
| | | | | |
| Fixed Income Mutual Funds (8.4%) | | | |
| 1,985,256 | | Thrivent High Yield Fundb | | | 7,127,068 |
| 1,594,454 | | Thrivent Income Fund | | | 11,017,674 |
| 717,254 | | Thrivent Limited Maturity Bond Fund | | | 8,176,698 |
| | | | | |
| | Total Fixed Income Mutual Funds | | | 26,321,440 |
| | | | | |
| | Total Mutual Funds (cost $449,907,911) | | | 304,453,248 |
| | | | | |
| | |
Shares or
Principal
Amount | | Short-Term Investments (3.2%)c | | |
| | Federal Home Loan Bank Discount Notes | | | |
| 350,000 | | 1.114%, 12/8/2008d | | | 349,599 |
| 600,000 | | 1.290%, 12/10/2008d | | | 599,162 |
| | Federal Home Loan Mortgage Corporation Discount Notes | | | |
| 100,000 | | 1.350%, 12/8/2008d | | | 99,861 |
| | Federal National Mortgage Association Discount Notes | | | |
| 200,000 | | 2.100%, 12/10/2008d | | | 199,550 |
| 100,000 | | 0.500%, 12/15/2008d | | | 99,939 |
| 8,732,303 | | Thrivent Money Market Fund | | | 8,732,303 |
| | | | | |
| | Total Short-Term Investments (at amortized cost) | | | 10,080,414 |
| | | | | |
| | Total Investments (cost $459,988,325) 100.0% | | $ | 314,533,662 |
| | | | | |
| | Other Assets and Liabilities, Net 0.0% | | | 70,976 |
| | | | | |
| | Total Net Assets 100.0% | | $ | 314,604,638 |
| | | | | |
| a | Non-income producing security. |
| b | At October 31, 2008, $20,705,756 of investments were earmarked to cover open financial futures contracts. |
| c | The interest rate shown reflects the yield, coupon rate or, for securities purchased at a discount, the discount rate at the date of purchase. |
| d | At October 31, 2008, $1,348,111 of investments were held on deposit with the counterparty and pledged as the initial margin deposit for open financial futures contracts. |
Gross unrealized appreciation and depreciation of investments, based on cost for federal income tax purposes, were as follows:
| | | | |
Gross unrealized appreciation | | $ | — | |
Gross unrealized depreciation | | | (147,166,218 | ) |
| | | | |
Net unrealized appreciation (depreciation) | | | ($147,166,218 | ) |
Cost for federal income tax purposes | | $ | 461,699,880 | |
The accompanying Notes to Financial Statements are an integral part of this schedule.
62
Aggressive Allocation Fund
Schedule of Investments as of October 31, 2008
| | | | | | | | | | | | | | |
Futures | | Number of
Contracts
Long/(Short) | | Expiration Date | | Notional
Principal
Amount | | Value | | Unrealized
Gain/(Loss) | |
E-Mini MSCI EAFE Index Futures | | 29 | | December 2008 | | $ | 1,716,012 | | $ | 1,848,460 | | $ | 132,448 | |
Russell 2000 Index Futures | | 12 | | December 2008 | | | 3,336,306 | | | 3,219,000 | | | (117,306 | ) |
Russell 2000 Index Mini-Futures | | 17 | | December 2008 | | | 809,577 | | | 912,050 | | | 102,473 | |
S&P 400 Index Mini-Futures | | 48 | | December 2008 | | | 2,530,558 | | | 2,728,320 | | | 197,762 | |
S&P 500 Index Futures | | 12 | | December 2008 | | | 3,079,914 | | | 2,901,899 | | | (178,015 | ) |
Total Futures | | | | | | | | | | | | $ | 137,362 | |
Investment in Affiliates
Affiliated issuers, as defined under the Investment Company Act of 1940, include those in which the Fund’s holdings of an issuer represent 5% or more of the outstanding voting securities of an issuer, or any affiliated mutual fund.
A summary of transactions for the fiscal year to date, in Aggressive Allocation Fund, is as follows:
| | | | | | | | | | | | | | | | | |
Fund | | Value
October 31,
2007 | | Gross
Purchases and
Additions | | Gross Sales
and
Reductions | | Balance of
Shares Held at
October 31, 2008 | | Value
October 31, 2008 | | Income Earned
November 1, 2007-
October 31, 2008 |
Real Estate Securities | | $ | — | | $ | 9,513,647 | | $ | 1,548,050 | | 777,887 | | $ | 5,624,127 | | $ | 154,683 |
Partner Small Cap Growth | | | 23,656,064 | | | 19,388,412 | | | 81,271 | | 3,499,382 | | | 27,260,188 | | | — |
Partner Small Cap Value | | | 16,387,607 | | | 6,127,228 | | | 7,697,306 | | 813,965 | | | 9,385,012 | | | 120,257 |
Small Cap Stock | | | 28,805,358 | | | 19,793,883 | | | 351,588 | | 2,620,284 | | | 29,949,849 | | | — |
Mid Cap Growth | | | 14,357,962 | | | 15,486,377 | | | 928,964 | | 1,610,743 | | | 18,104,754 | | | — |
Partner Mid Cap Value | | | 12,785,858 | | | 6,769,078 | | | 473,673 | | 1,528,778 | | | 12,107,922 | | | 136,808 |
Mid Cap Stock | | | 28,154,410 | | | 23,007,885 | | | 733,049 | | 2,962,730 | | | 28,856,990 | | | 151,483 |
Partner Worldwide Allocation | | | — | | | 1,606,701 | | | — | | 165,514 | | | 1,009,633 | | | — |
Partner International Stock | | | 83,475,862 | | | 15,614,383 | | | 6,899,312 | | 5,829,416 | | | 44,711,623 | | | 1,768,520 |
Large Cap Growth | | | 83,941,207 | | | 14,888,615 | | | 16,386,877 | | 11,510,159 | | | 45,350,028 | | | 337,633 |
Large Cap Value | | | 26,603,331 | | | 17,248,453 | | | 813,911 | | 2,534,047 | | | 28,355,981 | | | 487,995 |
Large Cap Stock | | | 37,033,043 | | | 9,233,712 | | | 3,781,463 | | 1,358,355 | | | 24,233,056 | | | 503,305 |
Equity Income Plus | | | — | | | 4,158,001 | | | — | | 430,087 | | | 3,182,645 | | | 54,195 |
High Yield | | | 6,146,398 | | | 3,763,746 | | | 92,842 | | 1,985,256 | | | 7,127,068 | | | 675,754 |
Income | | | 20,745,356 | | | 5,090,920 | | | 12,100,538 | | 1,594,454 | | | 11,017,674 | | | 897,166 |
Limited Maturity Bond | | | 3,638,056 | | | 9,942,448 | | | 4,647,499 | | 717,254 | | | 8,176,698 | | | 342,453 |
Money Market | | | 5,177,999 | | | 23,931,658 | | | 20,377,354 | | 8,732,303 | | | 8,732,303 | | | 56,093 |
Total Value and Dividend Income | | | 390,908,511 | | | | | | | | | | | 313,185,551 | | | 5,686,345 |
The accompanying Notes to Financial Statements are an integral part of this schedule.
63
Moderately Aggressive Allocation Fund
Schedule of Investments as of October 31, 2008
| | | | | | |
| Shares | | Mutual Funds (96.4%) | | Value |
| | Equity Mutual Funds (72.0%) | | | |
| | 3,308,233 | | Thrivent Real Estate Securities Fund | | $ | 23,918,527 |
| | 3,006,540 | | Thrivent Partner Small Cap Growth Funda,b | | | 23,420,948 |
| | 1,865,583 | | Thrivent Partner Small Cap Value Fund | | | 21,510,166 |
| | 3,101,291 | | Thrivent Small Cap Stock Funda,b | | | 35,447,751 |
| | 1,672,589 | | Thrivent Mid Cap Growth Funda,b | | | 18,799,904 |
| | 3,731,505 | | Thrivent Partner Mid Cap Value Fund | | | 29,553,521 |
| | 6,533,119 | | Thrivent Mid Cap Stock Fund | | | 63,632,580 |
| | 2,417,646 | | Thrivent Partner Worldwide Allocation Funda | | | 14,747,642 |
| | 9,855,447 | | Thrivent Partner International Stock Fund | | | 75,591,277 |
| | 20,044,372 | | Thrivent Large Cap Growth Fundb | | | 78,974,825 |
| | 8,127,774 | | Thrivent Large Cap Value Fund | | | 90,949,786 |
| | 3,310,681 | | Thrivent Large Cap Stock Fund | | | 59,062,554 |
| | 1,026,857 | | Thrivent Equity Income Plus Fundb | | | 7,598,740 |
| | | | | | |
| | | Total Equity Mutual Funds | | | 543,208,221 |
| | | | | | |
| | Fixed Income Mutual Funds (24.4%) | | | |
| | 13,675,289 | | Thrivent High Yield Fund | | | 49,094,286 |
| | 13,800,358 | | Thrivent Income Fund | | | 95,360,477 |
| | 3,500,488 | | Thrivent Limited Maturity Bond Fund | | | 39,905,562 |
| | | | | | |
| | | Total Fixed Income Mutual Funds | | | 184,360,325 |
| | | | | | |
| | | Total Mutual Funds (cost $1,038,469,642) | | | 727,568,546 |
| | | | | | |
| | |
Principal
Amount | | Long-Term Fixed Income (0.8%) | | |
| | Collateralized Mortgage Obligations (0.7%) | | | |
| | | Citigroup Mortgage Loan Trust, Inc. | | | |
| | 582,355 | | 5.500%, 11/25/2035 | | | 517,307 |
| | | Citimortgage Alternative Loan Trust | | | |
| | 1,685,588 | | 5.750%, 4/25/2037 | | | 1,208,663 |
| | | Countrywide Alternative Loan Trust | | | |
| | 464,896 | | 6.000%, 1/25/2037 | | | 410,507 |
| | | Countrywide Home Loans | | | |
| | 1,733,810 | | 5.750%, 4/25/2037 | | | 1,667,018 |
| | | Deutsche Alt-A Securities, Inc. | | | |
| | 464,885 | | 5.500%, 10/25/2021 | | | 384,401 |
| | 746,775 | | 6.000%, 10/25/2021 | | | 567,359 |
| | | J.P. Morgan Mortgage Trust | | | |
| | 444,682 | | 6.043%, 10/25/2036 | | | 378,000 |
| | | Master Alternative Loans Trust | | | |
| | 414,342 | | 6.500%, 7/25/2034 | | | 345,328 |
| | | Merrill Lynch Alternative Note Asset | | | |
| | 443,861 | | 6.000%, 3/25/2037 | | | 310,258 |
| | | | | | |
| | | Total Collateralized Mortgage Obligations | | | 5,788,841 |
| | | | | | |
| | Commercial Mortgage-Backed Securities (0.1%) | | | |
| | | Greenwich Capital Commercial Funding Corporation | | | |
| $ | 720,000 | | 5.867%, 8/10/2017 | | | 436,384 |
| | | | | | |
| | | Total Commercial Mortgage-Backed Securities | | | 436,384 |
| | | | | | |
| | | Total Long-Term Fixed Income (cost $6,086,408) | | | 6,225,225 |
| | | | | | |
| | |
Shares or
Principal
Amount | | Short-Term Investments (2.7%)c | | |
| | | Federal Home Loan Bank Discount Notes | | | |
| | 1,400,000 | | 1.107%, 12/8/2008d | | | 1,398,407 |
| | 2,200,000 | | 1.301%, 12/10/2008d | | | 2,196,900 |
| | | Federal Home Loan Mortgage Corporation Discount Notes | | | |
| | 100,000 | | 1.350%, 12/8/2008d | | | 99,861 |
| | | Federal National Mortgage Association Discount Notes | | | |
| | 400,000 | | 1.373%, 12/8/2008d | | | 399,436 |
| | 1,200,000 | | 1.783%, 12/10/2008d | | | 1,197,695 |
| | 450,000 | | 0.500%, 12/15/2008d | | | 449,725 |
| | 14,530,324 | | Thrivent Money Market Fund | | | 14,530,324 |
| | | | | | |
| | | Total Short-Term Investments (at amortized cost) | | | 20,272,348 |
| | | | | | |
| | | Total Investments (cost $1,064,828,398) 99.9% | | $ | 754,066,119 |
| | | | | | |
| | | Other Assets and Liabilities, Net 0.1% | | | 483,432 |
| | | | | | |
| | | Total Net Assets 100.0% | | $ | 754,549,551 |
| | | | | | |
| a | Non-income producing security. |
| b | At October 31, 2008, $67,808,740 of investments were earmarked to cover open financial futures contracts. |
| c | The interest rate shown reflects the yield, coupon rate or, for securities purchased at a discount, the discount rate at the date of purchase. |
| d | At October 31, 2008, $5,742,024 of investments were held on deposit with the counterparty and pledged as the initial margin deposit for open financial futures contracts. |
Gross unrealized appreciation and depreciation of investments, based on cost for federal income tax purposes, were as follows:
| | | | |
Gross unrealized appreciation | | $ | 331,584 | |
Gross unrealized depreciation | | | (318,874,643 | ) |
| | | | |
Net unrealized appreciation (depreciation) | | | ($318,543,059 | ) |
Cost for federal income tax purposes | | $ | 1,072,609,178 | |
The accompanying Notes to Financial Statements are an integral part of this schedule.
64
Moderately Aggressive Allocation Fund
Schedule of Investments as of October 31, 2008
| | | | | | | | | | | | | | |
Futures | | Number of
Contracts
Long/(Short) | | Expiration
Date | | Notional
Principal
Amount | | Value | | Unrealized
Gain/(Loss) | |
E-Mini MSCI EAFE Index Futures | | 100 | | December 2008 | | $ | 5,953,248 | | $ | 6,374,001 | | $ | 420,753 | |
Russell 2000 Index Futures | | 39 | | December 2008 | | | 10,997,357 | | | 10,461,750 | | | (535,607 | ) |
Russell 2000 Index Mini-Futures | | 56 | | December 2008 | | | 2,669,872 | | | 3,004,400 | | | 334,528 | |
S&P 400 Index Mini-Futures | | 166 | | December 2008 | | | 8,773,905 | | | 9,435,440 | | | 661,535 | |
S&P 500 Index Futures | | 95 | | December 2008 | | | 24,228,327 | | | 22,973,375 | | | (1,254,952 | ) |
Total Futures | | | | | | | | | | | | | ($373,743 | ) |
Investment in Affiliates
Affiliated issuers, as defined under the Investment Company Act of 1940, include those in which the Fund’s holdings of an issuer represent 5% or more of the outstanding voting securities of an issuer, or any affiliated mutual fund.
A summary of transactions for the fiscal year to date, in Moderately Aggressive Allocation Fund, is as follows:
| | | | | | | | | | | | | | | | | |
Fund | | Value
October 31,
2007 | | Gross
Purchases and
Additions | | Gross Sales
and
Reductions | | Balance of
Shares Held at
October 31, 2008 | | Value
October 31, 2008 | | Income Earned
November 1, 2007-
October 31, 2008 |
Real Estate Securities | | $ | 26,888,622 | | $ | 16,872,538 | | $ | 3,837,036 | | 3,308,233 | | $ | 23,918,527 | | $ | 1,329,015 |
Partner Small Cap Growth | | | 28,021,999 | | | 11,226,206 | | | 11,700 | | 3,006,540 | | | 23,420,948 | | | — |
Partner Small Cap Value | | | 17,345,976 | | | 14,422,214 | | | 1,527,226 | | 1,865,583 | | | 21,510,166 | | | 136,546 |
Small Cap Stock | | | 36,342,259 | | | 29,664,402 | | | 8,515,600 | | 3,101,291 | | | 35,447,751 | | | — |
Mid Cap Growth | | | 14,516,628 | | | 19,437,612 | | | 2,006,825 | | 1,672,589 | | | 18,799,904 | | | — |
Partner Mid Cap Value | | | 12,943,571 | | | 30,635,854 | | | 449,677 | | 3,731,505 | | | 29,553,521 | | | 130,844 |
Mid Cap Stock | | | 35,768,035 | | | 71,873,482 | | | 4,172,511 | | 6,533,119 | | | 63,632,580 | | | 193,330 |
Partner Worldwide Allocation | | | — | | | 23,899,001 | | | — | | 2,417,646 | | | 14,747,642 | | | — |
Partner International Stock | | | 131,867,007 | | | 33,250,111 | | | 11,681,935 | | 9,855,447 | | | 75,591,277 | | | 2,748,887 |
Large Cap Growth | | | 156,316,356 | | | 29,282,206 | | | 37,767,467 | | 20,044,372 | | | 78,974,825 | | | 634,733 |
Large Cap Value | | | 126,079,605 | | | 34,478,778 | | | 14,361,541 | | 8,127,774 | | | 90,949,786 | | | 2,258,236 |
Large Cap Stock | | | 134,579,716 | | | 33,595,964 | | | 51,817,233 | | 3,310,681 | | | 59,062,554 | | | 1,838,298 |
Equity Income Plus | | | — | | | 9,930,945 | | | — | | 1,026,857 | | | 7,598,740 | | | 129,872 |
High Yield | | | 17,443,177 | | | 49,274,227 | | | 212,985 | | 13,675,289 | | | 49,094,286 | | | 4,184,900 |
Income | | | 120,427,429 | | | 28,959,346 | | | 32,085,988 | | 13,800,358 | | | 95,360,477 | | | 6,409,214 |
Limited Maturity Bond | | | 35,165,853 | | | 23,928,346 | | | 15,291,853 | | 3,500,488 | | | 39,905,562 | | | 1,895,565 |
Money Market | | | 34,776,744 | | | 39,787,675 | | | 60,034,095 | | 14,530,324 | | | 14,530,324 | | | 153,029 |
Total Value and Dividend Income | | | 928,482,977 | | | | | | | | | | | 742,098,870 | | | 22,042,469 |
The accompanying Notes to Financial Statements are an integral part of this schedule.
65
Moderate Allocation Fund
Schedule of Investments as of October 31, 2008
| | | | | | |
| Shares | | Mutual Funds (95.3%) | | Value |
| | Equity Mutual Funds (51.7%) | | | |
| | 3,250,479 | | Thrivent Real Estate Securities Fund | | $ | 23,500,966 |
| | 1,762,110 | | Thrivent Partner Small Cap Growth Funda | | | 13,726,837 |
| | 1,906,230 | | Thrivent Partner Small Cap Value Fund | | | 21,978,826 |
| | 1,847,694 | | Thrivent Small Cap Stock Funda | | | 21,119,143 |
| | 468,134 | | Thrivent Mid Cap Growth Funda,b | | | 5,261,825 |
| | 2,499,667 | | Thrivent Partner Mid Cap Value Fundb | | | 19,797,365 |
| | 4,163,191 | | Thrivent Mid Cap Stock Fund | | | 40,549,481 |
| | 1,790,857 | | Thrivent Partner Worldwide Allocation Funda | | | 10,924,226 |
| | 6,778,117 | | Thrivent Partner International Stock Fund | | | 51,988,160 |
| | 15,394,688 | | Thrivent Large Cap Growth Fundb | | | 60,655,070 |
| | 7,498,935 | | Thrivent Large Cap Value Fund | | | 83,913,077 |
| | 2,027,860 | | Thrivent Large Cap Stock Fund | | | 36,177,029 |
| | 1,004,848 | | Thrivent Equity Income Plus Fundb | | | 7,435,878 |
| | | | | | |
| | | Total Equity Mutual Funds | | | 397,027,883 |
| | | | | | |
| | Fixed Income Mutual Funds (43.6%) | | | |
| | 13,107,875 | | Thrivent High Yield Fund | | | 47,057,270 |
| | 21,032,703 | | Thrivent Income Fund | | | 145,335,978 |
| | 12,532,717 | | Thrivent Limited Maturity Bond Fundb | | | 142,872,969 |
| | | | | | |
| | | Total Fixed Income Mutual Funds | | | 335,266,217 |
| | | | | | |
| | | Total Mutual Funds (cost $983,981,977) | | | 732,294,100 |
| | | | | | |
| | |
Principal
Amount | | Long-Term Fixed Income (1.6%) | | |
| | Collateralized Mortgage Obligations (1.5%) | | | |
| | | Citigroup Mortgage Loan Trust, Inc. | | | |
| | 1,091,916 | | 5.500%, 11/25/2035 | | | 969,950 |
| | | Citimortgage Alternative Loan Trust | | | |
| | 3,277,533 | | 5.750%, 4/25/2037 | | | 2,350,178 |
| | �� | Countrywide Alternative Loan Trust | | | |
| | 871,679 | | 6.000%, 1/25/2037 | | | 769,701 |
| | | Countrywide Home Loans | | | |
| | 3,467,620 | | 5.750%, 4/25/2037 | | | 3,334,036 |
| | | Deutsche Alt-A Securities, Inc. | | | |
| | 871,659 | | 5.500%, 10/25/2021 | | | 720,753 |
| | 1,493,550 | | 6.000%, 10/25/2021 | | | 1,134,718 |
| | | J.P. Morgan Mortgage Trust | | | |
| | 833,779 | | 6.043%, 10/25/2036 | | | 708,749 |
| | | Master Alternative Loans Trust | | | |
| | 779,938 | | 6.500%, 7/25/2034 | | | 650,030 |
| | | Merrill Lynch Alternative Note Asset | | | |
| | 832,240 | | 6.000%, 3/25/2037 | | | 581,733 |
| | | | | | |
| | | Total Collateralized Mortgage Obligations | | | 11,219,848 |
| | | | | | |
| | |
| | | Long-Term Fixed Income (1.6%) | | |
| | Commercial Mortgage-Backed Securities (0.1%) | | | |
| | | Greenwich Capital Commercial Funding Corporation | | | |
| $ | 1,350,000 | | 5.867%, 8/10/2017 | | | 818,220 |
| | | | | | |
| | | Total Commercial Mortgage- Backed Securities | | | 818,220 |
| | | | | | |
| | | Total Long-Term Fixed Income (cost $11,754,073) | | | 12,038,068 |
| | | | | | |
| | |
Shares or
Principal
Amount | | Short-Term Investments (3.0%)c | | |
| | | Federal Home Loan Bank Discount Notes | | | |
| | 1,900,000 | | 1.118%, 12/8/2008d | | | 1,897,816 |
| | 2,100,000 | | 1.240%, 12/10/2008d | | | 2,097,180 |
| | | Federal Home Loan Mortgage Corporation Discount Notes | | | |
| | 200,000 | | 1.350%, 12/8/2008d | | | 199,723 |
| | | Federal National Mortgage Association Discount Notes | | | |
| | 1,500,000 | | 1.233%, 12/8/2008d | | | 1,498,098 |
| | 1,400,000 | | 1.671%, 12/10/2008d | | | 1,397,479 |
| | 700,000 | | 0.500%, 12/15/2008d | | | 699,572 |
| | 15,094,595 | | Thrivent Money Market Fund | | | 15,094,595 |
| | | | | | |
| | | Total Short-Term Investments (at amortized cost) | | | 22,884,463 |
| | | | | | |
| | | Total Investments (cost $1,018,620,513) 99.9% | | $ | 767,216,631 |
| | | | | | |
| | | Other Assets and Liabilities, Net 0.1% | | | 791,869 |
| | | | | | |
| | | Total Net Assets 100.0% | | $ | 768,008,500 |
| | | | | | |
| a | Non-income producing security. |
| b | At October 31, 2008, $97,795,068 of investments were earmarked to cover open financial futures contracts. |
| c | The interest rate shown reflects the yield, coupon rate or, for securities purchased at a discount, the discount rate at the date of purchase. |
| d | At October 31, 2008, $7,789,868 of investments were held on deposit with the counterparty and pledged as the initial margin deposit for open financial futures contracts. |
Gross unrealized appreciation and depreciation of investments, based on cost for federal income tax purposes, were as follows:
| | | | |
Gross unrealized appreciation | | $ | 647,417 | |
Gross unrealized depreciation | | | (258,654,611 | ) |
| | | | |
Net unrealized appreciation (depreciation) | | | ($258,007,194 | ) |
Cost for federal income tax purposes | | $ | 1,025,223,825 | |
The accompanying Notes to Financial Statements are an integral part of this schedule.
66
Moderate Allocation Fund
Schedule of Investments as of October 31, 2008
| | | | | | | | | | | | | | |
Futures | | Number of
Contracts
Long/(Short) | | Expiration Date | | Notional
Principal
Amount | | Value | | Unrealized
Gain/(Loss) | |
E-Mini MSCI EAFE Index Futures | | 129 | | December 2008 | | $ | 7,805,293 | | $ | 8,222,460 | | $ | 417,167 | |
Russell 2000 Index Futures | | 52 | | December 2008 | | | 14,490,240 | | | 13,949,000 | | | (541,240 | ) |
Russell 2000 Index Mini-Futures | | 51 | | December 2008 | | | 2,435,973 | | | 2,736,150 | | | 300,177 | |
S&P 400 Index Mini-Futures | | 244 | | December 2008 | | | 12,996,243 | | | 13,868,960 | | | 872,717 | |
S&P 500 Index Futures | | 134 | | December 2008 | | | 33,745,813 | | | 32,404,550 | | | (1,341,263 | ) |
Total Futures | | | | | | | | | | | | | ($292,442 | ) |
Investment in Affiliates
Affiliated issuers, as defined under the Investment Company Act of 1940, include those in which the Fund’s holdings of an issuer represent 5% or more of the outstanding voting securities of an issuer, or any affiliated mutual fund.
A summary of transactions for the fiscal year to date, in Moderate Allocation Fund, is as follows:
| | | | | | | | | | | | | | | | | |
Fund | | Value
October 31,
2007 | | Gross
Purchases and
Additions | | Gross Sales
and
Reductions | | Balance of
Shares Held at
October 31, 2008 | | Value
October 31, 2008 | | Income Earned
November 1, 2007-
October 31, 2008 |
Real Estate Securities | | $ | 27,497,973 | | $ | 15,428,222 | | $ | 3,559,070 | | 3,250,479 | | $ | 23,500,966 | | $ | 1,357,360 |
Partner Small Cap Growth | | | 12,738,369 | | | 9,508,263 | | | 8,939 | | 1,762,110 | | | 13,726,837 | | | — |
Partner Small Cap Value | | | 7,873,970 | | | 21,168,923 | | | 7,449 | | 1,906,230 | | | 21,978,826 | | | 72,510 |
Small Cap Stock | | | 13,688,783 | | | 18,609,897 | | | 539,711 | | 1,847,694 | | | 21,119,143 | | | — |
Mid Cap Growth | | | 9,142,524 | | | 3,476,170 | | | 2,062,266 | | 468,134 | | | 5,261,825 | | | — |
Partner Mid Cap Value | | | 8,162,828 | | | 23,771,561 | | | 2,402,381 | | 2,499,667 | | | 19,797,365 | | | 104,578 |
Mid Cap Stock | | | 25,365,467 | | | 46,358,583 | | | 4,345,586 | | 4,163,191 | | | 40,549,481 | | | 138,473 |
Partner Worldwide Allocation | | | — | | | 17,548,943 | | | — | | 1,790,857 | | | 10,924,226 | | | — |
Partner International Stock | | | 89,039,652 | | | 26,489,170 | | | 10,563,188 | | 6,778,117 | | | 51,988,160 | | | 1,816,065 |
Large Cap Growth | | | 125,248,551 | | | 28,838,685 | | | 38,047,491 | | 15,394,688 | | | 60,655,070 | | | 514,304 |
Large Cap Value | | | 85,137,182 | | | 44,628,270 | | | 1,150,984 | | 7,498,935 | | | 83,913,077 | | | 1,561,742 |
Large Cap Stock | | | 102,328,711 | | | 31,063,951 | | | 55,656,092 | | 2,027,860 | | | 36,177,029 | | | 1,422,711 |
Equity Income Plus | | | — | | | 9,709,534 | | | — | | 1,004,848 | | | 7,435,878 | | | 126,664 |
High Yield | | | 16,919,546 | | | 47,251,539 | | | 392,693 | | 13,107,875 | | | 47,057,270 | | | 4,032,372 |
Income | | | 165,062,023 | | | 42,788,526 | | | 28,957,532 | | 21,032,703 | | | 145,335,978 | | | 9,581,051 |
Limited Maturity Bond | | | 115,714,654 | | | 44,172,507 | | | 3,160,643 | | 12,532,717 | | | 142,872,969 | | | 6,534,318 |
Money Market | | | 67,606,196 | | | 50,620,566 | | | 103,132,167 | | 15,094,595 | | | 15,094,595 | | | 816,261 |
Total Value and Dividend Income | | | 871,526,429 | | | | | | | | | | | 747,388,695 | | | 28,078,409 |
The accompanying Notes to Financial Statements are an integral part of this schedule.
67
Moderately Conservative Allocation Fund
Schedule of Investments as of October 31, 2008
| | | | | | |
| Shares | | Mutual Funds (91.4%) | | Value |
| | Equity Mutual Funds (31.8%) | | | |
| | 756,287 | | Thrivent Real Estate Securities Fund | | $ | 5,467,954 |
| | 518,714 | | Thrivent Partner Small Cap Value Fund | | | 5,980,770 |
| | 738,867 | | Thrivent Small Cap Stock Funda,b | | | 8,445,246 |
| | 991,419 | | Thrivent Partner Mid Cap Value Fund | | | 7,852,042 |
| | 1,056,492 | | Thrivent Mid Cap Stock Fundb | | | 10,290,228 |
| | 544,124 | | Thrivent Partner Worldwide Allocation Funda | | | 3,319,158 |
| | 1,627,658 | | Thrivent Partner International Stock Fund | | | 12,484,133 |
| | 3,512,229 | | Thrivent Large Cap Growth Fundb | | | 13,838,184 |
| | 2,417,191 | | Thrivent Large Cap Value Fund | | | 27,048,365 |
| | 337,984 | | Thrivent Large Cap Stock Fund | | | 6,029,642 |
| | 399,750 | | Thrivent Equity Income Plus Fundb | | | 2,958,153 |
| | | | | | |
| | | Total Equity Mutual Funds | | | 103,713,875 |
| | | | | | |
| | Fixed Income Mutual Funds (59.6%) | | | |
| | 4,203,615 | | Thrivent High Yield Fund | | | 15,090,979 |
| | 5,978,239 | | Thrivent Income Fundb | | | 41,309,632 |
| | 12,077,850 | | Thrivent Limited Maturity Bond Fund | | | 137,687,487 |
| | | | | | |
| | | Total Fixed Income Mutual Funds | | | 194,088,098 |
| | | | | | |
| | | Total Mutual Funds (cost $372,310,095) | | | 297,801,973 |
| | | | | | |
| | |
Principal
Amount | | Long-Term Fixed Income (1.9%) | | |
| | Collateralized Mortgage Obligations (1.8%) | | | |
| | | Citigroup Mortgage Loan Trust, Inc. | | | |
| | 582,355 | | 5.500%, 11/25/2035 | | | 517,307 |
| | | Citimortgage Alternative Loan Trust | | | |
| | 1,685,588 | | 5.750%, 4/25/2037 | | | 1,208,663 |
| | | Countrywide Alternative Loan Trust | | | |
| | 464,896 | | 6.000%, 1/25/2037 | | | 410,507 |
| | | Countrywide Home Loans | | | |
| | 1,733,810 | | 5.750%, 4/25/2037 | | | 1,667,018 |
| | | Deutsche Alt-A Securities, Inc. | | | |
| | 464,885 | | 5.500%, 10/25/2021 | | | 384,402 |
| | 814,664 | | 6.000%, 10/25/2021 | | | 618,937 |
| | | J.P. Morgan Mortgage Trust | | | |
| | 444,682 | | 6.043%, 10/25/2036 | | | 378,000 |
| | | Master Alternative Loans Trust | | | |
| | 414,342 | | 6.500%, 7/25/2034 | | | 345,328 |
| | | Merrill Lynch Alternative Note Asset | | | |
| | 443,861 | | 6.000%, 3/25/2037 | | | 310,258 |
| | | | | | |
| | | Total Collateralized Mortgage Obligations | | | 5,840,420 |
| | | | | | |
| | Commercial Mortgage-Backed Securities (0.1%) | | | |
| | | Greenwich Capital Commercial Funding Corporation | | | |
| $ | 720,000 | | 5.867%, 8/10/2017 | | | 436,384 |
| | | | | | |
| | | Total Commercial Mortgage-Backed Securities | | | 436,384 |
| | | | | | |
| | | Total Long-Term Fixed Income (cost $6,139,393) | | | 6,276,804 |
| | | | | | |
| | |
Shares or
Principal
Amount | | Short-Term Investments (6.6%)c | | |
| | | Federal Home Loan Bank Discount Notes | | | |
| | 1,970,000 | | 1.000%, 11/10/2008 | | | 1,969,508 |
| | 1,150,000 | | 1.120%, 12/8/2008d | | | 1,148,677 |
| | 1,300,000 | | 1.273%, 12/10/2008d | | | 1,298,206 |
| | | Federal Home Loan Mortgage Corporation Discount Notes | | | |
| | 500,000 | | 1.350%, 12/8/2008d | | | 499,306 |
| | | Federal National Mortgage Association Discount Notes | | | |
| | 300,000 | | 2.167%, 12/10/2008d | | | 299,301 |
| | 200,000 | | 0.500%, 12/15/2008d | | | 199,878 |
| | 15,848,508 | | Thrivent Money Market Fund | | | 15,848,508 |
| | | | | | |
| | | Total Short-Term Investments (cost $21,263,385) | | | 21,263,384 |
| | | | | | |
| | | Total Investments (cost $399,712,873) 99.9% | | $ | 325,342,161 |
| | | | | | |
| | | Other Assets and Liabilities, Net 0.1% | | | 421,190 |
| | | | | | |
| | | Total Net Assets 100.0% | | $ | 325,763,351 |
| | | | | | |
| a | Non-income producing security. |
| b | At October 31, 2008, $45,363,627 of investments were earmarked to cover open financial futures contracts. |
| c | The interest rate shown reflects the yield, coupon rate or, for securities purchased at a discount, the discount rate at the date of purchase. |
| d | At October 31, 2008, $3,445,368 of investments were held on deposit with the counterparty and pledged as the initial margin deposit for open financial futures contracts. |
Gross unrealized appreciation and depreciation of investments, based on cost for federal income tax purposes, were as follows:
| | | | |
Gross unrealized appreciation | | $ | 331,618 | |
Gross unrealized depreciation | | | (75,603,919 | ) |
| | | | |
Net unrealized appreciation (depreciation) | | | ($75,272,301 | ) |
Cost for federal income tax purposes | | $ | 400,614,462 | |
The accompanying Notes to Financial Statements are an integral part of this schedule.
68
Moderately Conservative Allocation Fund
Schedule of Investments as of October 31, 2008
| | | | | | | | | | | | | | |
Futures | | Number of
Contracts
Long/(Short) | | Expiration Date | | Notional
Principal
Amount | | Value | | Unrealized
Gain/(Loss) | |
E-Mini MSCI EAFE Index Futures | | 58 | | December 2008 | | $ | 3,489,188 | | $ | 3,696,920 | | $ | 207,732 | |
Russell 2000 Index Futures | | 25 | | December 2008 | | | 7,516,389 | | | 6,706,250 | | | (810,139 | ) |
Russell 2000 Index Mini-Futures | | 27 | | December 2008 | | | 1,287,834 | | | 1,448,550 | | | 160,716 | |
S&P 400 Index Mini-Futures | | 105 | | December 2008 | | | 5,577,364 | | | 5,968,200 | | | 390,836 | |
S&P 500 Index Futures | | 56 | | December 2008 | | | 14,363,581 | | | 13,542,199 | | | (821,382 | ) |
Total Futures | | | | | | | | | | | | | ($872,237 | ) |
Investment in Affiliates
Affiliated issuers, as defined under the Investment Company Act of 1940, include those in which the Fund’s holdings of an issuer represent 5% or more of the outstanding voting securities of an issuer, or any affiliated mutual fund.
A summary of transactions for the fiscal year to date, in Moderately Conservative Allocation Fund, is as follows:
| | | | | | | | | | | | | | | | | |
Fund | | Value
October 31, 2007 | | Gross
Purchases and
Additions | | Gross Sales
and
Reductions | | Balance of
Shares Held at
October 31, 2008 | | Value
October 31, 2008 | | Income Earned
November 1, 2007-
October 31, 2008 |
Real Estate Securities | | $ | 9,938,388 | | $ | 6,896,306 | | $ | 6,685,833 | | 756,287 | | $ | 5,467,954 | | $ | 527,550 |
Partner Small Cap Value | | | — | | | 7,321,290 | | | — | | 518,714 | | | 5,980,770 | | | — |
Small Cap Stock | | | 9,460,435 | | | 5,160,437 | | | 342,870 | | 738,867 | | | 8,445,246 | | | — |
Partner Mid Cap Value | | | — | | | 10,322,013 | | | — | | 991,419 | | | 7,852,042 | | | — |
Mid Cap Stock | | | 6,162,564 | | | 12,196,706 | | | 1,059,331 | | 1,056,492 | | | 10,290,228 | | | 38,714 |
Partner Worldwide Allocation | | | — | | | 5,377,257 | | | — | | 544,124 | | | 3,319,158 | | | — |
Partner International Stock | | | 19,441,529 | | | 9,221,521 | | | 4,024,305 | | 1,627,658 | | | 12,484,133 | | | 374,929 |
Large Cap Growth | | | 31,007,166 | | | 9,715,282 | | | 13,014,800 | | 3,512,229 | | | 13,838,184 | | | 129,943 |
Large Cap Value | | | 20,141,951 | | | 20,677,076 | | | 683,761 | | 2,417,191 | | | 27,048,365 | | | 387,726 |
Large Cap Stock | | | 24,428,983 | | | 9,813,985 | | | 19,084,963 | | 337,984 | | | 6,029,642 | | | 349,430 |
Equity Income Plus | | | — | | | 3,865,901 | | | — | | 399,750 | | | 2,958,153 | | | 50,505 |
High Yield | | | 6,431,168 | | | 14,386,318 | | | 361,800 | | 4,203,615 | | | 15,090,979 | | | 1,278,419 |
Income | | | 46,785,979 | | | 16,243,588 | | | 11,934,271 | | 5,978,239 | | | 41,309,632 | | | 2,834,644 |
Limited Maturity Bond | | | 109,406,366 | | | 48,230,515 | | | 6,741,164 | | 12,077,850 | | | 137,687,487 | | | 6,174,816 |
Money Market | | | 32,162,304 | | | 44,793,699 | | | 61,107,495 | | 15,848,508 | | | 15,848,508 | | | 602,284 |
Total Value and Dividend | | | | | | | | | | | | | | | | | |
Income | | | 315,366,833 | | | | | | | | | | | 313,650,481 | | | 12,748,960 |
The accompanying Notes to Financial Statements are an integral part of this schedule.
69
Technology Fund
Schedule of Investments as of October 31, 2008
| | | | | | |
| Shares | | Common Stock (91.6%) | | Value | |
| Communications Equipment (7.1%) | | | | |
| 36,800 | | Cisco Systems, Inc.a | | $ | 653,936 | |
| 10,900 | | Polycom, Inc.a | | | 229,009 | |
| 15,700 | | QUALCOMM, Inc. | | | 600,682 | |
| | | | | | |
| | Total Communications Equipment | | | 1,483,627 | |
| | | | | | |
| Computers & Peripherals (17.9%) | | | | |
| 7,900 | | Apple, Inc.a | | | 849,961 | |
| 184,200 | | EMC Corporationa | | | 2,169,876 | |
| 7,600 | | International Business Machines Corporation | | | 706,572 | |
| | | | | | |
| | Total Computers & Peripherals | | | 3,726,409 | |
| | | | | | |
| Electronic Equipment & Instruments (2.3%) | | | | |
| 254,000 | | China High Speed Transmission Equipment Group Company, Ltd. | | | 201,778 | |
| 59,000 | | Comverge, Inc.a,b | | | 267,860 | |
| | | | | | |
| | Total Electronic Equipment & Instruments | | | 469,638 | |
| | | | | | |
| Financials (8.6%) | | | | |
| 57,400 | | Financial Select Sector SPDR Fund | | | 889,700 | |
| 31,500 | | SPDR KBW Bank ETF | | | 909,720 | |
| | | | | | |
| | Total Financials | | | 1,799,420 | |
| | | | | | |
| Health Care (3.7%) | | | | |
| 1,700 | | Alcon, Inc. | | | 149,804 | |
| 10,400 | | BioMarin Pharmaceutical, Inc.a,b | | | 190,528 | |
| 6,300 | | Novartis AG ADR | | | 321,237 | |
| 1,400 | | Roche Holding AG ADR | | | 106,120 | |
| | | | | | |
| | Total Health Care | | | 767,689 | |
| | | | | | |
| Industrials (5.0%) | | | | |
| 11,000 | | American Superconductor Corporationa,b | | | 137,610 | |
| 2,400 | | First Solar, Inc.a | | | 344,880 | |
| 165,500 | | Hansen Transmissions International NVa | | | 277,600 | |
| 32 | | Japan Wind Development Company, Ltd. | | | 59,565 | |
| 25,900 | | Polypore International, Inc.a | | | 220,927 | |
| | | | | | |
| | Total Industrials | | | 1,040,582 | |
| | | | | | |
| Internet Software & Services (5.0%) | | | | |
| 2,300 | | Google, Inc.a | | | 826,528 | |
| 16,300 | | Yahoo!, Inc.a | | | 208,966 | |
| | | | | | |
| | Total Internet Software & Services | | | 1,035,494 | |
| | | | | | |
| Semiconductors & Semiconductor Equipment (20.5%) | | | | |
| 28,100 | | ASML Holding NV ADR | | | 493,155 | |
| 135,100 | | Atmel Corporationa | | | 560,665 | |
| 54,900 | | EMCORE Corporationa,b | | | 195,444 | |
| 53,900 | | FormFactor, Inc.a | | | 938,938 | |
| 13,700 | | International Rectifier Corporationa | | | 211,528 | |
| 18,200 | | Lam Research Corporationa | | | 406,952 | |
| 17,700 | | MEMC Electronic Materials, Inc.a | | | 325,326 | |
| 41,800 | | PMC-Sierra, Inc.a | | | 195,624 | |
| 183,600 | | Teradyne, Inc.a | | | 936,360 | |
| | | | | | |
| | Total Semiconductors & Semiconductor Equipment | | | 4,263,992 | |
| | | | | | |
| Software (20.2%) | | | | |
| 19,200 | | BMC Software, Inc.a | | | 495,744 | |
| 25,800 | | Check Point Software Technologies, Ltd.a | | | 521,676 | |
| 15,100 | | Citrix Systems, Inc.a | | | 389,127 | |
| 16,800 | | McAfee, Inc.a | | | 546,840 | |
| 43,400 | | Oracle Corporationa | | | 793,786 | |
| 40,700 | | Quest Software, Inc.a | | | 539,275 | |
| 32,200 | | Synopsys, Inc.a | | | 588,616 | |
| 10,600 | | VMware, Inc.a,b | | | 328,600 | |
| | | | | | |
| | Total Software | | | 4,203,664 | |
| | | | | | |
| Telecommunications Services (1.3%) | | | | |
| 17,000 | | NTT DoCoMo, Inc. ADRb | | | 263,500 | |
| | | | | | |
| | Total Telecommunications Services | | | 263,500 | |
| | | | | | |
| | Total Common Stock (cost $24,345,979) | | | 19,054,015 | |
| | | | | | |
| | |
| | | Collateral Held for Securities Loaned (8.2%)c | | | |
| 1,705,385 | | Thrivent Financial Securities Lending Trust | | | 1,705,385 | |
| | | | | | |
| | Total Collateral Held for Securities Loaned (cost $1,705,385) | | | 1,705,385 | |
| | |
| | | Short-Term Investments (7.8%)c | | | |
| 1,613,891 | | Thrivent Money Market Fund | | | 1,613,891 | |
| | | | | | |
| | Total Short-Term Investments (at amortized cost) | | | 1,613,891 | |
| | | | | | |
| | Total Investments (cost $27,665,255) 107.6% | | $ | 22,373,291 | |
| | | | | | |
| | Other Assets and Liabilities, Net (7.6%) | | | (1,574,852 | ) |
| | | | | | |
| | Total Net Assets 100.0% | | $ | 20,798,439 | |
| | | | | | |
| a | Non-income producing security. |
| b | All or a portion of the security is on loan as discussed in item 2(M) of the Notes to Financial Statements. |
| c | The interest rate shown reflects the yield, coupon rate or, for securities purchased at a discount, the discount rate at the date of purchase. |
Definitions:
| | | | |
| ADR | | - | | American Depositary Receipt, which are certificates for an underlying foreign security’s shares held by an issuing U.S. depository bank. |
| ETF | | - | | Exchange Traded Fund. |
The accompanying Notes to Financial Statements are an integral part of this schedule.
70
Technology Fund
Schedule of Investments as of October 31, 2008
Gross unrealized appreciation and depreciation of investments, based on cost for federal income tax purposes, were as follows:
| | | | |
Gross unrealized appreciation | | $ | 559,979 | |
Gross unrealized depreciation | | | (6,657,460 | ) |
| | | | |
Net unrealized appreciation (depreciation) | | | ($6,097,481 | ) |
Cost for federal income tax purposes | | $ | 28,470,772 | |
| | | | | | | | | | | | | |
Foreign Currency Forward Contracts | | Contracts to
Deliver/Receive | | Settlement Date | | Value on
Settlement Date | | Value | | Unrealized
Gain/(Loss) | |
Purchases | | | | | | | | | | | | | |
British Pound | | 81,903 | | 11/03/2008 - 11/05/2008 | | $ | 135,149 | | $ | 131,805 | | ($3,344 | ) |
Total Foreign Currency | | | | | | | | | | | | | |
Forward Contracts Purchases | | | | | | $ | 135,149 | | $ | 131,805 | | ($3,344 | ) |
Net Unrealized Gain/(Loss) on Foreign Currency Forward Contracts | | | | | | | | | | | | ($3,344 | ) |
Investment in Affiliates
Affiliated issuers, as defined under the Investment Company Act of 1940, include those in which the Fund’s holdings of an issuer represent 5% or more of the outstanding voting securities of an issuer, or any affiliated mutual fund.
A summary of transactions for the fiscal year to date, in Technology Fund, is as follows:
| | | | | | | | | | | | | | | | | |
Fund | | Value
October 31,
2007 | | Gross
Purchases and
Additions | | Gross Sales
and
Reductions | | Balance of
Shares Held at
October 31, 2008 | | Value
October 31, 2008 | | Income Earned
November 1, 2007-
October 31, 2008 |
Money Market | | $ | 1,246,466 | | $ | 30,252,657 | | $ | 29,885,232 | | 1,613,891 | | $ | 1,613,891 | | $ | 54,888 |
Thrivent Financial Securities Lending Trust | | | 3,005,900 | | | 44,996,991 | | | 46,297,506 | | 1,705,385 | | | 1,705,385 | | | 102,252 |
Total Value and Dividend Income | | | 4,252,366 | | | | | | | | | | | 3,319,276 | | | 157,140 |
The accompanying Notes to Financial Statements are an integral part of this schedule.
71
Partner Small Cap Growth Fund
Schedule of Investments as of October 31, 2008
| | | | | |
| Shares | | Common Stock (90.3%) | | Value |
| Consumer Discretionary (11.6%) | | | |
| 14,850 | | Aeropostale, Inc.a | | $ | 359,518 |
| 9,345 | | Buckle, Inc.b | | | 246,147 |
| 15,080 | | Capella Education Companya | | | 714,792 |
| 39,180 | | Centex Corporation | | | 479,955 |
| 100,110 | | Chico’s FAS, Inc.a,c | | | 340,374 |
| 22,990 | | Collective Brands, Inc.a | | | 294,042 |
| 9,110 | | Deckers Outdoor Corporationa | | | 773,075 |
| 28,200 | | Gymboree Corporationa | | | 729,252 |
| 32,680 | | Hibbett Sports, Inc.a,c | | | 582,031 |
| 32,020 | | Interactive Data Corporation | | | 755,032 |
| 45,480 | | LKQ Corporationa | | | 520,291 |
| 35,740 | | Lululemon Athletica, Inc.a,c | | | 506,436 |
| 27,260 | | True Religion Apparel, Inc.a | | | 456,605 |
| 23,730 | | Warnaco Group, Inc.a | | | 707,391 |
| 45,920 | | WMS Industries, Inc.a | | | 1,148,000 |
| | | | | |
| | Total Consumer Discretionary | | | 8,612,941 |
| | | | | |
| Consumer Staples (2.2%) | | | |
| 21,755 | | Flowers Foods, Inc. | | | 645,036 |
| 19,270 | | Green Mountain Coffee Roasters, Inc.a,c | | | 558,637 |
| 14,910 | | TreeHouse Foods, Inc.a | | | 451,177 |
| | | | | |
| | Total Consumer Staples | | | 1,654,850 |
| | | | | |
| Energy (6.6%) | | | |
| 23,110 | | Arena Resources, Inc.a | | | 704,393 |
| 14,860 | | Atwood Oceanics, Inc.a,c | | | 408,353 |
| 8,180 | | Carbo Ceramics, Inc.c | | | 353,948 |
| 23,640 | | Complete Production Services, Inc.a | | | 292,900 |
| 23,440 | | Concho Resources, Inc.a | | | 498,100 |
| 10,560 | | Core Laboratories NVc | | | 778,272 |
| 16,290 | | Goodrich Petroleum Corporationa,c | | | 452,210 |
| 7,310 | | Lufkin Industries, Inc. | | | 382,459 |
| 16,890 | | Penn Virginia Corporation | | | 627,801 |
| 25,730 | | Willbros Group, Inc.a,c | | | 398,558 |
| | | | | |
| | Total Energy | | | 4,896,994 |
| | | | | |
| Financials (4.9%) | | | |
| 18,350 | | Digital Realty Trust, Inc.b | | | 614,358 |
| 21,010 | | Dime Community Bancshares | | | 350,867 |
| 4,490 | | Greenhill & Company, Inc.c | | | 296,205 |
| 9,750 | | Home Properties, Inc.c | | | 394,777 |
| 18,800 | | PrivateBancorp, Inc.c | | | 676,988 |
| 8,890 | | Prosperity Bancshares, Inc. | | | 295,237 |
| 35,020 | | Riskmetrics Group, Inc.a,c | | | 539,658 |
| 13,650 | | Tanger Factory Outlet Centers, Inc.c | | | 493,721 |
| | | | | |
| | Total Financials | | | 3,661,811 |
| | | | | |
| Health Care (21.3%) | | | |
| 21,890 | | Acorda Therapeutics, Inc.a,c | | | 446,556 |
| 22,870 | | Alexion Pharmaceuticals, Inc.a,b | | | 931,953 |
| 29,240 | | Amedisys, Inc.a,c | | | 1,649,428 |
| 17,900 | | Auxilium Pharmaceuticals, Inc.a | | | 351,735 |
| 11,450 | | Cougar Biotechnology, Inc.a | | | 290,830 |
| 26,830 | | Eclipsys Corporationa | | | 398,426 |
| 25,840 | | Endo Pharmaceutical Holdings, Inc.a | | | 478,040 |
| 20,000 | | Haemonetics Corporationa | | | 1,181,200 |
| 20,820 | | ICON plc ADRa | | | 528,203 |
| 12,840 | | Myriad Genetics, Inc.a | | | 810,076 |
| 25,310 | | NuVasive, Inc.a,c | | | 1,191,848 |
| 18,830 | | Onyx Pharmaceuticals, Inc.a | | | 508,033 |
| 17,680 | | OSI Pharmaceuticals, Inc.a,c | | | 670,956 |
| 50,220 | | PAREXEL International Corporationa | | | 522,288 |
| 12,250 | | Perrigo Company | | | 416,500 |
| 21,480 | | Psychiatric Solutions, Inc.a,c | | | 715,069 |
| 43,250 | | Thoratec Corporationa | | | 1,064,815 |
| 15,300 | | United Therapeutics Corporationa,c | | | 1,334,619 |
| 21,160 | | West Pharmaceutical Services, Inc.c | | | 844,707 |
| 37,800 | | Wright Medical Group, Inc.a,c | | | 876,204 |
| 15,290 | | Xenoport, Inc.a | | | 636,217 |
| | | | | |
| | Total Health Care | | | 15,847,703 |
| | | | | |
| Industrials (17.5%) | | | |
| 2,600 | | Actuant Corporation | | | 46,618 |
| 38,610 | | Aecom Technology Corporationa,b | | | 680,694 |
| 11,730 | | Clean Harbors, Inc.a | | | 769,136 |
| 8,690 | | Energy Conversion Devices, Inc.a,b,c | | | 296,676 |
| 12,450 | | ESCO Technologies, Inc.a | | | 429,525 |
| 18,900 | | Genesee & Wyoming, Inc.a,b | | | 630,315 |
| 20,180 | | Huron Consulting Group, Inc.a | | | 1,097,187 |
| 71,780 | | Kforce, Inc.a | | | 564,909 |
| 19,140 | | Landstar System, Inc. | | | 738,613 |
| 8,730 | | Lindsay Manufacturing Companyc | | | 415,373 |
| 47,530 | | Mobile Mini, Inc.a,c | | | 798,504 |
| 37,550 | | Navigant Consulting, Inc.a | | | 607,183 |
| 37,010 | | Orbital Sciences Corporationa,c | | | 758,335 |
| 20,480 | | RBC Bearings, Inc.a | | | 485,990 |
| 13,640 | | Teledyne Technologies, Inc.a | | | 621,575 |
| 28,640 | | Tetra Tech, Inc.a | | | 629,794 |
| 20,810 | | UAL Corporation | | | 302,993 |
| 7,960 | | Valmont Industries, Inc. | | | 436,049 |
| 24,760 | | Wabtec Corporation | | | 984,458 |
| 20,340 | | Waste Connections, Inc.a | | | 688,509 |
| 5,920 | | Watsco, Inc. | | | 243,253 |
| 23,480 | | Woodward Governor Company | | | 753,708 |
| | | | | |
| | Total Industrials | | | 12,979,397 |
| | | | | |
| Information Technology (20.9%) | | | |
| 41,320 | | Ariba, Inc.a | | | 442,124 |
| 30,990 | | AsiaInfo Holdings, Inc.a | | | 340,580 |
| 46,520 | | Atheros Communications, Inc.a,b,c | | | 835,964 |
| 38,180 | | Cavium Networks, Inc.a,c | | | 486,413 |
| 19,430 | | Comscore, Inc.a | | | 237,046 |
| 28,030 | | Concur Technologies, Inc.a | | | 707,197 |
| 29,690 | | F5 Networks, Inc.a | | | 736,906 |
| 13,010 | | Gartner, Inc.a | | | 239,384 |
| 31,730 | | Interwoven, Inc.a | | | 400,115 |
| 36,820 | | Microsemi Corporationa | | | 800,467 |
| 41,350 | | Monolithic Power Systems, Inc.a | | | 702,537 |
| 27,240 | | Net 1 UEPS Technology, Inc.a | | | 381,360 |
| 64,710 | | Novellus Systems, Inc.a | | | 1,022,418 |
| 58,040 | | Omniture, Inc.a,c | | | 667,460 |
| 44,000 | | Plexus Corporationa | | | 821,040 |
| 135,550 | | PMC-Sierra, Inc.a | | | 634,374 |
| 51,810 | | Polycom, Inc.a | | | 1,088,528 |
The accompanying Notes to Financial Statements are an integral part of this schedule.
72
Partner Small Cap Growth Fund
Schedule of Investments as of October 31, 2008
| | | | | | |
| Shares | | Common Stock (90.3%) | | Value | |
| Information Technology (20.9%) - continued | | | | |
| 55,180 | | Riverbed Technology, Inc.a | | $ | 691,406 | |
| 29,580 | | Sybase, Inc.a | | | 787,715 | |
| 15,700 | | Synaptics, Inc.a,c | | | 484,973 | |
| 39,290 | | Taleo Corporationa | | | 542,202 | |
| 47,110 | | TiVo, Inc.a,c | | | 323,646 | |
| 11,900 | | Varian Semiconductor Equipment Associates, Inc.a | | | 233,478 | |
| 21,690 | | Verigy, Ltd.a | | | 314,505 | |
| 31,190 | | VistaPrint, Ltd.a,c | | | 532,413 | |
| 27,130 | | Vocus, Inc.a | | | 456,598 | |
| 31,580 | | Websense, Inc.a | | | 616,442 | |
| | | | | | |
| | Total Information Technology | | | 15,527,291 | |
| | | | | | |
| Materials (3.3%) | | | | |
| 17,550 | | Cabot Corporation | | | 464,198 | |
| 9,840 | | Compass Minerals International, Inc. | | | 540,511 | |
| 22,480 | | Koppers Holdings, Inc. | | | 534,799 | |
| 30,850 | | Olin Corporation | | | 560,236 | |
| 39,960 | | Solutia, Inc.a,c | | | 385,214 | |
| | | | | | |
| | Total Materials | | | 2,484,958 | |
| | | | | | |
| Telecommunications Services (0.8%) | | | | |
| 10,690 | | NTELOS Holdings Corporation | | | 277,940 | |
| 34,120 | | Premiere Global Services, Inc.a | | | 339,494 | |
| | | | | | |
| | Total Telecommunications Services | | | 617,434 | |
| | | | | | |
| Utilities (1.2%) | | | | |
| 21,010 | | ITC Holdings Corporation | | | 852,586 | |
| | | | | | |
| | Total Utilities | | | 852,586 | |
| | | | | | |
| | Total Common Stock (cost $83,484,162) | | | 67,135,965 | |
| | | | | | |
| | |
| | | Collateral Held for Securities Loaned (18.9%)d | | | |
| 14,040,435 | | Thrivent Financial Securities Lending Trust | | | 14,040,435 | |
| | | | | | |
| | Total Collateral Held for Securities Loaned (cost $14,040,435) | | | 14,040,435 | |
| | | | | | |
| | |
Shares or
Principal
Amount | | Short-Term Investments (10.3%)d | | | |
| 100,000 | | Federal Home Loan Bank Discount Notes 2.250%, 12/10/2008e | | | 99,756 | |
| 500,000 | | Federal National Mortgage Association Discount Notes 2.152%, 12/10/2008e | | | 498,837 | |
| 7,042,556 | | Thrivent Money Market Fund | | | 7,042,556 | |
| | | | | | |
| | Total Short-Term Investments (at amortized cost) | | | 7,641,149 | |
| | | | | | |
| | Total Investments (cost $105,165,746) 119.5% | | $ | 88,817,549 | |
| | | | | | |
| | Other Assets and Liabilities, Net (19.5%) | | | (14,523,887 | ) |
| | | | | | |
| | Total Net Assets 100.0% | | $ | 74,293,662 | |
| | | | | | |
| a | Non-income producing security. |
| b | At October 31, 2008, $3,674,763 of investments were earmarked to cover open financial futures contracts. |
| c | All or a portion of the security is on loan as discussed in item 2(M) of the Notes to Financial Statements. |
| d | The interest rate shown reflects the yield, coupon rate or, for securities purchased at a discount, the discount rate at the date of purchase. |
| e | At October 31, 2008, $498,826 of investments were held on deposit with the counterparty and pledged as the initial margin deposit for open financial futures contracts. |
Definitions:
| | | | |
| ADR | | - | | American Depositary Receipt, which are certificates for an underlying foreign security’s shares held by an issuing U.S. depository bank. |
Gross unrealized appreciation and depreciation of investments, based on cost for federal income tax purposes, were as follows:
| | | | |
Gross unrealized appreciation | | $ | 1,356,486 | |
Gross unrealized depreciation | | | (18,175,552 | ) |
| | | | |
Net unrealized appreciation (depreciation) | | | ($16,819,066 | ) |
Cost for federal income tax purposes | | $ | 105,636,615 | |
The accompanying Notes to Financial Statements are an integral part of this schedule.
73
Partner Small Cap Growth Fund
Schedule of Investments as of October 31, 2008
| | | | | | | | | | | | | | |
Futures | | Numberof
Contracts
Long/(Short) | | Expiration
Date | | Notional
Principal
Amount | | Value | | Unrealized
Gain/(Loss) | |
Russell 2000 Index Mini-Futures | | 74 | | December 2008 | | $ | 4,746,110 | | $ | 3,970,100 | | ($ | 776,010 | ) |
Total Futures | | | | | | | | | | | | ($ | 776,010 | ) |
Investment in Affiliates
Affiliated issuers, as defined under the Investment Company Act of 1940, include those in which the Fund’s holdings of an issuer represent 5% or more of the outstanding voting securities of an issuer, or any affiliated mutual fund.
A summary of transactions for the fiscal year to date, in Partner Small Cap Growth Fund, is as follows:
| | | | | | | | | | | | | | | | | |
Fund | | Value
October 31,
2007 | | Gross
Purchases and
Additions | | Gross Sales
and
Reductions | | Balance of
Shares Held at
October 31,
2008 | | Value
October 31,
2008 | | Income Earned
November 1, 2007-
October 31, 2008 |
Money Market | | $ | 1,200,706 | | $ | 56,469,032 | | $ | 50,627,182 | | 7,042,556 | | $ | 7,042,556 | | $ | 102,423 |
Thrivent Financial Securities Lending Trust | | | 25,651,383 | | | 86,523,886 | | | 98,134,834 | | 14,040,435 | | | 14,040,435 | | | 314,820 |
Total Value and Dividend Income | | | 26,852,089 | | | | | | | | | | | 21,082,991 | | | 417,243 |
74
Partner Small Cap Value Fund
Schedule of Investments as of October 31, 2008
| | | | | |
| Shares | | Common Stock (95.5%) | | Value |
| Consumer Discretionary (12.2%) | | | |
| 110,000 | | Aaron Rents, Inc. | | $ | 2,726,900 |
| 35,300 | | Cavco Industries, Inc.a | | | 1,201,259 |
| 52,000 | | Corinthian Colleges, Inc.a,b | | | 742,560 |
| 32,300 | | CSS Industries, Inc. | | | 717,060 |
| 54,400 | | Dixie Group, Inc.a | | | 223,040 |
| 44,000 | | Dorman Products, Inc.a | | | 495,000 |
| 66,800 | | Drew Industries, Inc.a,b | | | 808,280 |
| 48,000 | | Fred’s, Inc. | | | 588,000 |
| 58,000 | | Haverty Furniture Companies, Inc. | | | 570,720 |
| 11,300 | | Lee Enterprises, Inc.b | | | 28,250 |
| 35,500 | | M/I Homes, Inc.b | | | 483,155 |
| 44,500 | | MarineMax, Inc.a,b | | | 103,240 |
| 28,800 | | Matthews International Corporation | | | 1,285,344 |
| 57,300 | | Men’s Wearhouse, Inc.b | | | 876,117 |
| 57,000 | | Meritage Homes Corporationa,b | | | 782,610 |
| 54,200 | | Orient Express Hotels, Ltd.b | | | 666,660 |
| 48,500 | | Pool Corporationb | | | 844,385 |
| 51,900 | | Saga Communications, Inc.a | | | 277,665 |
| 100,000 | | Shiloh Industries, Inc. | | | 501,000 |
| 37,200 | | Stanley Furniture Company, Inc.b | | | 366,048 |
| 48,000 | | Steak n Shake Companya | | | 247,200 |
| 105,000 | | Stein Mart, Inc.b | | | 225,750 |
| 34,700 | | Steven Madden, Ltd.a | | | 755,766 |
| 78,000 | | Winnebago Industries, Inc.b | | | 463,320 |
| | | | | |
| | Total Consumer Discretionary | | | 15,979,329 |
| | | | | |
| Consumer Staples (2.2%) | | | |
| 189,000 | | Alliance One International, Inc.a | | | 631,260 |
| 32,100 | | Casey’s General Stores, Inc.b | | | 969,420 |
| 31,300 | | Nash Finch Company | | | 1,234,159 |
| | | | | |
| | Total Consumer Staples | | | 2,834,839 |
| | | | | |
| Energy (5.3%) | | | |
| 10,000 | | Atwood Oceanics, Inc.a,b | | | 274,800 |
| 32,500 | | Carbo Ceramics, Inc.b | | | 1,406,275 |
| 46,500 | | Hercules Offshore, Inc.a,b | | | 338,985 |
| 140,000 | | Mariner Energy, Inc.a | | | 2,014,600 |
| 122,200 | | NGAS Resources, Inc.a,b | | | 384,930 |
| 41,000 | | TETRA Technologies, Inc.a | | | 285,360 |
| 43,500 | | Whiting Petroleum Corporationa | | | 2,261,565 |
| | | | | |
| | Total Energy | | | 6,966,515 |
| | | | | |
| Financials (19.8%) | | | |
| 132,500 | | Ares Capital Corporation | | | 1,041,450 |
| 48,000 | | Cascade Bancorpb | | | 457,920 |
| 92,000 | | Cedar Shopping Centers, Inc. | | | 879,520 |
| 86,000 | | East West Bancorp, Inc.b | | | 1,492,100 |
| 27,000 | | Employers Holdings, Inc. | | | 344,520 |
| 85,000 | | First Opportunity Fund, Inc. | | | 481,950 |
| 61,000 | | Glacier Bancorp, Inc.b | | | 1,230,370 |
| 51,000 | | Gladstone Capital Corporationb | | | 607,410 |
| 51,000 | | Hatteras Financial Corporationb | | | 1,111,800 |
| 85,000 | | Hercules Technology Growth Capital, Inc.b | | | 737,800 |
| 43,800 | | Home Bancshares, Inc.b | | | 1,140,552 |
| 13,000 | | iShares Russell 2000 Value Fundb | | | 685,360 |
| 40,800 | | JMP Group, Inc.b | | | 208,080 |
| 70,500 | | Kite Realty Group Trust | | | 428,640 |
| 43,500 | | LaSalle Hotel Propertiesb | | | 612,480 |
| 2,850 | | Markel Corporationa | | | 999,894 |
| 67,700 | | Max Re Capital, Ltd. | | | 1,079,815 |
| 67,000 | | Meadowbrook Insurance Group, Inc. | | | 353,090 |
| 41,700 | | National Interstate Corporationb | | | 729,750 |
| 25,200 | | Parkway Properties, Inc.b | | | 434,700 |
| 115,000 | | PennantPark Investment Corporation | | | 525,550 |
| 25,500 | | Piper Jaffray Companiesa | | | 1,005,975 |
| 44,500 | | Potlatch Corporationb | | | 1,477,845 |
| 53,500 | | ProAssurance Corporationa,b | | | 2,939,824 |
| 34,000 | | Provident Bankshares Corporationb | | | 362,780 |
| 24,500 | | Redwood Trust, Inc.b | | | 373,380 |
| 38,000 | | Sandy Spring Bancorp, Inc.b | | | 815,860 |
| 39,900 | | Seabright Insurance Holdingsa | | | 417,354 |
| 86,000 | | Strategic Hotel Capital, Inc.b | | | 425,700 |
| 30,500 | | SVB Financial Groupa | | | 1,569,225 |
| 37,000 | | Wintrust Financial Corporationb | | | 947,200 |
| | | | | |
| | Total Financials | | | 25,917,894 |
| | | | | |
| Health Care (6.1%) | | | |
| 12,000 | | Analogic Corporation | | | 529,920 |
| 30,000 | | Angiodynamics, Inc.a | | | 378,000 |
| 5,100 | | Atrion Corporation | | | 504,696 |
| 290,000 | | Lexicon Pharmaceuticals, Inc.a,b | | | 455,300 |
| 72,500 | | Momenta Pharmaceuticals, Inc.a,b | | | 660,475 |
| 24,300 | | National Healthcare Corporationb | | | 996,543 |
| 58,000 | | Owens & Minor, Inc. | | | 2,509,660 |
| 48,900 | | Triple-S Management Corporationa,b | | | 499,269 |
| 36,400 | | West Pharmaceutical Services, Inc.b | | | 1,453,088 |
| | | | | |
| | Total Health Care | | | 7,986,951 |
| | | | | |
| Industrials (24.6%) | | | |
| 87,200 | | Accuride Corporationa,b | | | 27,904 |
| 60,000 | | Alaska Air Group, Inc.a | | | 1,482,000 |
| 20,800 | | Ameron International Corporation | | | 977,600 |
| 34,700 | | Applied Industrial Technologies, Inc. | | | 700,593 |
| 24,000 | | Astec Industries, Inc.a | | | 610,080 |
| 110,000 | | Beacon Roofing Supply, Inc.a,b | | | 1,504,800 |
| 40,000 | | Belden, Inc.b | | | 833,600 |
| 53,500 | | C&D Technologies, Inc.a,b | | | 187,250 |
| 23,000 | | Cascade Corporationb | | | 759,230 |
| 33,500 | | Circor International, Inc. | | | 1,026,775 |
| 68,000 | | Comfort Systems USA, Inc. | | | 634,440 |
| 28,000 | | Courier Corporation | | | 487,480 |
| 51,600 | | Dollar Thrifty Automotive Group, Inc.a,b | | | 83,592 |
| 11,600 | | Franklin Electric Company, Inc.b | | | 489,056 |
| 16,200 | | FTI Consulting, Inc.a | | | 943,650 |
| 42,500 | | G & K Services, Inc. | | | 960,075 |
| 46,800 | | Genesee & Wyoming, Inc.a | | | 1,560,780 |
| 60,200 | | Gibraltar Industries, Inc. | | | 797,650 |
| 35,000 | | Greenbrier Companies, Inc.b | | | 288,750 |
| 45,500 | | Hub Group, Inc.a | | | 1,430,975 |
| 43,200 | | IDEX Corporation | | | 1,001,376 |
| 61,000 | | Insituform Technologies, Inc.a,b | | | 819,230 |
| 29,500 | | Kaman Corporation | | | 753,135 |
| 135,500 | | Kforce, Inc.a | | | 1,066,385 |
The accompanying Notes to Financial Statements are an integral part of this schedule.
75
Partner Small Cap Value Fund
Schedule of Investments as of October 31, 2008
| | | | | | |
| Shares | | Common Stock (95.5%) | | Value | |
| Industrials (24.6%) - continued | | | | |
| 47,500 | | Kirby Corporationa | | $ | 1,630,200 | |
| 285,000 | | Kratos Defense & Security Solutions, Inc.a | | | 421,800 | |
| 62,500 | | McGrath Rentcorp | | | 1,421,250 | |
| 147,500 | | MPS Group, Inc.a | | | 1,149,025 | |
| 41,600 | | Navigant Consulting, Inc.a | | | 672,672 | |
| 37,400 | | Nordson Corporation | | | 1,381,182 | |
| 18,800 | | School Specialty, Inc.a,b | | | 394,800 | |
| 56,000 | | Sterling Construction Company, Inc.a | | | 739,760 | |
| 35,200 | | Universal Forest Products, Inc. | | | 832,480 | |
| 105,000 | | Vitran Corporation, Inc.a | | | 933,450 | |
| 37,800 | | Waste Connections, Inc.a | | | 1,279,530 | |
| 58,000 | | Woodward Governor Company | | | 1,861,800 | |
| | | | | | |
| | Total Industrials | | | 32,144,355 | |
| | | | | | |
| Information Technology (10.1%) | | | | |
| 145,000 | | Acme Packet, Inc.a,b | | | 687,300 | |
| 93,000 | | Advanced Energy Industries, Inc.a | | | 992,310 | |
| 87,000 | | Ariba, Inc.a,b | | | 930,900 | |
| 27,000 | | ATMI, Inc.a | | | 328,320 | |
| 72,000 | | Brooks Automation, Inc.a | | | 493,200 | |
| 19,600 | | Cabot Microelectronics Corporationa | | | 563,108 | |
| 54,800 | | Catapult Communications Corporationa | | | 233,996 | |
| 38,000 | | Cymer, Inc.a | | | 929,860 | |
| 71,700 | | Electro Rent Corporation | | | 859,683 | |
| 114,000 | | GSI Group, Inc.a | | | 220,020 | |
| 32,000 | | Littelfuse, Inc.a | | | 597,120 | |
| 56,000 | | Methode Electronics, Inc. | | | 425,040 | |
| 93,000 | | Palm, Inc.a,b | | | 371,070 | |
| 65,500 | | Progress Software Corporationa | | | 1,502,570 | |
| 540,000 | | Safeguard Scientifics, Inc.a | | | 421,200 | |
| 48,500 | | SPSS, Inc.a | | | 1,132,960 | |
| 30,000 | | Standard Microsystems Corporationa | | | 540,300 | |
| 54,900 | | StarTek, Inc.a | | | 181,719 | |
| 66,000 | | Symyx Technologies, Inc.a | | | 291,060 | |
| 49,700 | | Synnex Corporationa | | | 766,871 | |
| 60,000 | | Vignette Corporationa | | | 487,200 | |
| 37,000 | | Xyratex, Ltd. ADRa | | | 207,200 | |
| 311,100 | | Zarlink Semiconductor, Inc.a,b | | | 82,442 | |
| | | | | | |
| | Total Information Technology | | | 13,245,449 | |
| | | | | | |
| Materials (8.7%) | | | | |
| 32,400 | | Airgas, Inc. | | | 1,242,864 | |
| 47,000 | | AMCOL International Corporationb | | | 1,152,910 | |
| 71,500 | | American Vanguard Corporationb | | | 1,046,045 | |
| 60,600 | | AptarGroup, Inc. | | | 1,837,392 | |
| 44,500 | | Arch Chemicals, Inc. | | | 1,262,465 | |
| 43,700 | | Carpenter Technology Corporation | | | 790,970 | |
| 9,900 | | Deltic Timber Corporation | | | 450,945 | |
| 42,000 | | Innospec, Inc. | | | 367,500 | |
| 18,400 | | Minerals Technologies, Inc. | | | 1,044,384 | |
| 102,000 | | Myers Industries, Inc.b | | | 1,078,140 | |
| 121,000 | | Wausau Paper Corporation | | | 1,120,460 | |
| | | | | | |
| | Total Materials | | | 11,394,075 | |
| | | | | | |
| Telecommunications Services (0.6%) | | | | |
| 85,000 | | Premiere Global Services, Inc.a | | | 845,750 | |
| | | | | | |
| | Total Telecommunications Services | | | 845,750 | |
| | | | | | |
| Utilities (5.9%) | | | | |
| 54,500 | | Black Hills Corporation | | | 1,376,125 | |
| 77,500 | | Cleco Corporationb | | | 1,783,275 | |
| 47,700 | | El Paso Electric Companya | | | 883,404 | |
| 30,000 | | Empire District Electric Companyb | | | 576,300 | |
| 48,500 | | Southwest Gas Corporation | | | 1,266,820 | |
| 34,500 | | UniSource Energy Corporation | | | 951,510 | |
| 35,000 | | Vectren Corporation | | | 882,000 | |
| | | | | | |
| | Total Utilities | | | 7,719,434 | |
| | | | | | |
| | Total Common Stock (cost $154,965,051) | | | 125,034,591 | |
| | | | | | |
| | |
| | | Preferred Stock (0.9%) | | | |
| Financials (0.5%) | | | | |
| 632 | | East West Bancorp, Inc. | | | 714,160 | |
| | | | | | |
| | Total Financials | | | 714,160 | |
| | | | | | |
| Health Care (0.4%) | | | | |
| 40,000 | | National Healthcare Corporation, Convertible | | | 454,000 | |
| | | | | | |
| | Total Health Care | | | 454,000 | |
| | | | | | |
| | Total Preferred Stock (cost $1,165,578) | | | 1,168,160 | |
| | | | | | |
| | |
| | | Collateral Held for Securities Loaned (23.8%)c | | | |
| 31,225,748 | | Thrivent Financial Securities Lending Trust | | | 31,225,748 | |
| | | | | | |
| | Total Collateral Held for Securities Loaned (cost $31,225,748) | | | 31,225,748 | |
| | | | | | |
| | |
| | | Short-Term Investments (3.9%)c | | | |
| 5,100,015 | | Thrivent Money Market Fund | | | 5,100,015 | |
| | | | | | |
| | Total Short-Term Investments (at amortized cost) | | | 5,100,015 | |
| | | | | | |
| | Total Investments (cost $192,456,392) 124.1% | | $ | 162,528,514 | |
| | | | | | |
| | Other Assets and Liabilities, Net (24.1%) | | | (31,585,348 | ) |
| | | | | | |
| | Total Net Assets 100.0% | | $ | 130,943,166 | |
| | | | | | |
| a | Non-income producing security. |
| b | All or a portion of the security is on loan as discussed in item 2(M) of the Notes to Financial Statements. |
| c | The interest rate shown reflects the yield, coupon rate or, for securities purchased at a discount, the discount rate at the date of purchase. |
Definitions:
| | | | |
ADR | | - | | American Depositary Receipt, which are certificates for an underlying foreign security’s shares held by an issuing U.S. depository bank. |
76
Partner Small Cap Value Fund
Schedule of Investments as of October 31, 2008
Gross unrealized appreciation and depreciation of investments, based on cost for federal income tax purposes, were as follows:
| | | | |
Gross unrealized appreciation | | $ | 11,146,863 | |
Gross unrealized depreciation | | | (41,347,372 | ) |
| | | | |
Net unrealized appreciation (depreciation) | | | ($30,200,509 | ) |
Cost for federal income tax purposes | | $ | 192,729,023 | |
Investment in Affiliates
Affiliated issuers, as defined under the Investment Company Act of 1940, include those in which the Fund’s holdings of an issuer represent 5% or more of the outstanding voting securities of an issuer, or any affiliated mutual fund.
A summary of transactions for the fiscal year to date, in Partner Small Cap Value Fund, is as follows:
| | | | | | | | | | | | | | | | | |
Fund | | Value
October 31,
2007 | | Gross
Purchases and
Additions | | Gross Sales
and
Reductions | | Balance of
Shares Held at
October 31,
2008 | | Value
October 31,
2008 | | Income Earned
November 1, 2007-
October 31, 2008 |
Money Market | | $ | 4,123,694 | | $ | 36,904,254 | | $ | 35,927,933 | | 5,100,015 | | $ | 5,100,015 | | $ | 176,713 |
Thrivent Financial Securities Lending Trust | | | 38,943,138 | | | 139,514,768 | | | 147,232,158 | | 31,225,748 | | | 31,225,748 | | | 415,690 |
Total Value and Dividend Income | | | 43,066,832 | | | | | | | | | | | 36,325,763 | | | 592,403 |
The accompanying Notes to Financial Statements are an integral part of this schedule.
77
Small Cap Stock Fund
Schedule of Investments as of October 31, 2008
| | | | | |
| Shares | | Common Stock (95.9%) | | Value |
| Consumer Discretionary (13.3%) | | | |
| 40,900 | | American Public Education, Inc.a | | $ | 1,810,643 |
| 30,400 | | Apollo Group, Inc.a | | | 2,113,104 |
| 154,700 | | ArvinMeritor, Inc.b | | | 915,824 |
| 32,500 | | Burger King Holdings, Inc. | | | 646,100 |
| 128,500 | | Carter’s, Inc.a | | | 2,729,340 |
| 37,800 | | CEC Entertainment, Inc.a | | | 970,704 |
| 49,400 | | Children’s Place Retail Stores, Inc.a,b | | | 1,651,442 |
| 10,200 | | Deckers Outdoor Corporationa | | | 865,572 |
| 62,000 | | Dollar Tree, Inc.a | | | 2,357,240 |
| 155,000 | | Fred’s, Inc. | | | 1,898,750 |
| 155,700 | | Fuqi International, Inc.a | | | 1,231,587 |
| 95,400 | | Gentex Corporation | | | 914,886 |
| 32,300 | | Guess ?, Inc. | | | 703,171 |
| 18,000 | | Hasbro, Inc. | | | 523,260 |
| 260,400 | | Hot Topic, Inc.a | | | 1,687,392 |
| 59,700 | | Interactive Data Corporation | | | 1,407,726 |
| 65,200 | | Jack in the Box, Inc.a | | | 1,310,520 |
| 191,000 | | Leapfrog Enterprises, Inc.a,b | | | 1,289,250 |
| 67,400 | | Marvel Entertainment, Inc.a,b | | | 2,169,606 |
| 36,200 | | Matthews International Corporation | | | 1,615,606 |
| 87,500 | | Meritage Homes Corporationa,b | | | 1,201,375 |
| 32,100 | | Panera Bread Companya | | | 1,448,352 |
| 23,400 | | Polaris Industries, Inc.b | | | 787,878 |
| 133,400 | | Pulte Homes, Inc. | | | 1,486,076 |
| 39,600 | | Regal Entertainment Group | | | 508,464 |
| 44,400 | | Ross Stores, Inc. | | | 1,451,436 |
| 336,900 | | Shuffle Master, Inc.a,b | | | 1,300,434 |
| 25,400 | | Steiner Leisure, Ltd.a | | | 657,860 |
| 4,800 | | Strayer Education, Inc. | | | 1,086,096 |
| 85,800 | | Toll Brothers, Inc.a | | | 1,983,696 |
| 54,900 | | Tractor Supply Companya | | | 2,281,644 |
| 48,500 | | Warnaco Group, Inc.a | | | 1,445,785 |
| 85,700 | | WMS Industries, Inc.a | | | 2,142,500 |
| | | | | |
| | Total Consumer Discretionary | | | 46,593,319 |
| | | | | |
| Consumer Staples (4.9%) | | | |
| 52,958 | | Calavo Growers, Inc.b | | | 537,524 |
| 78,400 | | Casey’s General Stores, Inc. | | | 2,367,680 |
| 39,000 | | Chattem, Inc.a,b | | | 2,951,130 |
| 64,600 | | Elizabeth Arden, Inc.a | | | 1,116,934 |
| 46,550 | | Flowers Foods, Inc. | | | 1,380,207 |
| 42,200 | | Nash Finch Company | | | 1,663,946 |
| 51,400 | | Nu Skin Enterprises, Inc. | | | 662,546 |
| 85,500 | | Omega Protein Corporationa | | | 630,990 |
| 47,500 | | Ralcorp Holdings, Inc.a | | | 3,214,800 |
| 88,600 | | TreeHouse Foods, Inc.a | | | 2,681,036 |
| | | | | |
| | Total Consumer Staples | | | 17,206,793 |
| | | | | |
| Energy (5.4%) | | | |
| 32,800 | | Alpha Natural Resources, Inc.a | | | 1,173,256 |
| 11,800 | | Dril-Quip, Inc.a | | | 291,460 |
| 329,900 | | Edge Petroleum Corporationa,b | | | 194,641 |
| 36,600 | | Forest Oil Corporationa | | | 1,069,086 |
| 40,900 | | Helmerich & Payne, Inc. | | | 1,403,279 |
| 39,200 | | Mariner Energy, Inc.a | | | 564,088 |
| 21,500 | | McMoran Exploration Companya,b | | | 305,085 |
| 75,900 | | Oil States International, Inc.a | | | 1,755,567 |
| 43,000 | | Penn Virginia Corporation | | | 1,598,310 |
| 142,162 | | Petrohawk Energy Corporationa | | | 2,693,970 |
| 45,700 | | Range Resources Corporation | | | 1,929,454 |
| 52,700 | | Superior Energy Services, Inc.a | | | 1,123,564 |
| 15,900 | | Teekay Shipping Corporation | | | 339,465 |
| 75,100 | | Tesco Corporationa,b | | | 854,638 |
| 104,700 | | TETRA Technologies, Inc.a | | | 728,712 |
| 29,000 | | Unit Corporationa | | | 1,088,660 |
| 20,200 | | Whiting Petroleum Corporationa | | | 1,050,198 |
| 50,000 | | Willbros Group, Inc.a,b | | | 774,500 |
| | | | | |
| | Total Energy | | | 18,937,933 |
| | | | | |
| Financials (22.5%) | | | |
| 66,100 | | American Campus Communities, Inc.b | | | 1,717,278 |
| 61,000 | | American Financial Group, Inc. | | | 1,386,530 |
| 102,100 | | Amerisafe, Inc.a | | | 1,760,204 |
| 84,600 | | Aspen Insurance Holdings, Ltd. | | | 1,942,416 |
| 25,400 | | Bank of Hawaii Corporation | | | 1,288,034 |
| 61,800 | | Bank of the Ozarks, Inc.b | | | 1,878,720 |
| 53,800 | | BioMed Realty Trust, Inc. | | | 755,890 |
| 32,200 | | Cash America International, Inc. | | | 1,138,914 |
| 36,200 | | City Holding Company | | | 1,514,608 |
| 146,400 | | Colonial BancGroup, Inc.b | | | 598,776 |
| 63,700 | | Community Bank System, Inc. | | | 1,589,315 |
| 42,800 | | Corporate Office Properties Trust | | | 1,330,652 |
| 34,207 | | Cullen/Frost Bankers, Inc. | | | 1,914,566 |
| 38,700 | | Digital Realty Trust, Inc.b | | | 1,295,676 |
| 93,700 | | Dime Community Bancshares | | | 1,564,790 |
| 107,500 | | East West Bancorp, Inc.b | | | 1,865,125 |
| 91,500 | | First Cash Financial Services, Inc.a | | | 1,406,355 |
| 79,200 | | First Commonwealth Financial Corporation | | | 875,952 |
| 72,900 | | First Midwest Bancorp, Inc. | | | 1,619,109 |
| 148,700 | | First Niagara Financial Group, Inc. | | | 2,344,999 |
| 55,900 | | Glacier Bancorp, Inc.b | | | 1,127,503 |
| 53,800 | | Hanover Insurance Group, Inc. | | | 2,111,650 |
| 69,600 | | HCC Insurance Holdings, Inc. | | | 1,535,376 |
| 28,400 | | Home Properties, Inc.b | | | 1,149,916 |
| 30,400 | | Infinity Property & Casualty Corporation | | | 1,210,528 |
| 84,500 | | Inland Real Estate Corporationb | | | 968,370 |
| 79,800 | | Investors Real Estate Trustb | | | 788,424 |
| 42,900 | | IPC Holdings, Ltd. | | | 1,184,469 |
| 41,600 | | iShares Russell Microcap Index Fundb | | | 1,453,504 |
| 420,500 | | MGIC Investment Corporationb | | | 1,631,540 |
| 32,200 | | Nationwide Health Properties, Inc.b | | | 960,848 |
| 74,300 | | Nelnet, Inc. | | | 1,087,009 |
| 139,000 | | NewAlliance Bancshares, Inc. | | | 1,918,200 |
| 96,600 | | Old National Bancorp | | | 1,829,604 |
| 53,000 | | Platinum Underwriters Holdings, Ltd. | | | 1,682,220 |
| 51,700 | | Portfolio Recovery Associates, Inc.a,b | | | 1,854,996 |
| 21,200 | | Potlatch Corporationb | | | 704,052 |
| 37,600 | | ProAssurance Corporationa | | | 2,066,120 |
| 54,100 | | Prosperity Bancshares, Inc. | | | 1,796,661 |
| 56,100 | | Raymond James Financial, Inc.b | | | 1,306,569 |
| 32,100 | | Realty Income Corporationb | | | 742,152 |
| 37,400 | | RLI Corporationb | | | 2,146,386 |
| 62,300 | | Senior Housing Property Trust | | | 1,194,291 |
| 46,800 | | Signature Banka | | | 1,524,744 |
| 169,900 | | South Financial Group, Inc.b | | | 987,119 |
The accompanying Notes to Financial Statements are an integral part of this schedule.
78
Small Cap Stock Fund
Schedule of Investments as of October 31, 2008
| | | | | |
| Shares | | Common Stock (95.9%) | | Value |
| Financials (22.5%) - continued | | | |
| 152,900 | | Sterling Bancshares, Inc. | | $ | 1,217,084 |
| 113,000 | | Sterling Financial Corporationb | | | 959,370 |
| 51,950 | | Stifel Financial Corporationa | | | 2,267,617 |
| 47,700 | | SVB Financial Groupa | | | 2,454,165 |
| 257,500 | | UCBH Holdings, Inc.b | | | 1,359,600 |
| 30,200 | | UMB Financial Corporation | | | 1,368,966 |
| 41,400 | | United Bankshares, Inc.b | | | 1,320,660 |
| 29,600 | | United Fire & Casualty Company | | | 685,832 |
| 42,300 | | Washington Real Estate Investment Trustb | | | 1,268,154 |
| 25,600 | | Westamerica Bancorporationb | | | 1,465,600 |
| | | | | |
| | Total Financials | | | 79,117,208 |
| | | | | |
| Health Care (13.0%) | | | |
| 43,800 | | Alexion Pharmaceuticals, Inc.a | | | 1,784,850 |
| 82,200 | | Alpharma, Inc.a,b | | | 2,573,682 |
| 44,900 | | Amedisys, Inc.a,b | | | 2,532,809 |
| 69,000 | | AmSurg Corporationa | | | 1,720,860 |
| 47,100 | | ArthroCare Corporationa,b | | | 978,738 |
| 22,100 | | Beckman Coulter, Inc. | | | 1,103,232 |
| 55,800 | | BioMarin Pharmaceutical, Inc.a,b | | | 1,022,256 |
| 15,000 | | Bio-Rad Laboratories, Inc.a | | | 1,280,700 |
| 24,600 | | Cephalon, Inc.a,b | | | 1,764,312 |
| 19,200 | | Haemonetics Corporationa | | | 1,133,952 |
| 112,100 | | Healthspring, Inc.a | | | 1,851,892 |
| 47,200 | | ICON plc ADRa | | | 1,197,464 |
| 61,925 | | IPC The Hospitalist Company, Inc.a | | | 1,260,793 |
| 73,200 | | Kindred Healthcare, Inc.a | | | 1,060,668 |
| 36,000 | | Lincare Holdings, Inc.a | | | 948,600 |
| 37,600 | | Martek Biosciences Corporationa,b | | | 1,121,608 |
| 44,050 | | Masimo Corporationa | | | 1,409,160 |
| 17,600 | | Myriad Genetics, Inc.a | | | 1,110,384 |
| 66,000 | | Natus Medical, Inc.a | | | 1,009,800 |
| 35,200 | | NuVasive, Inc.a,b | | | 1,657,568 |
| 46,200 | | Owens & Minor, Inc. | | | 1,999,074 |
| 80,500 | | PAREXEL International Corporationa | | | 837,200 |
| 16,700 | | Pediatrix Medical Group, Inc.a | | | 645,455 |
| 26,100 | | PerkinElmer, Inc. | | | 468,234 |
| 32,400 | | Perrigo Company | | | 1,101,600 |
| 75,400 | | Phase Forward, Inc.a | | | 1,075,958 |
| 78,700 | | PSS World Medical, Inc.a,b | | | 1,427,618 |
| 42,800 | | Psychiatric Solutions, Inc.a | | | 1,424,812 |
| 24,100 | | Shire Pharmaceuticals Group plc ADR | | | 950,745 |
| 58,300 | | STERIS Corporation | | | 1,984,532 |
| 14,000 | | United Therapeutics Corporationa,b | | | 1,221,220 |
| 27,700 | | Universal Health Services, Inc. | | | 1,164,508 |
| 35,200 | | West Pharmaceutical Services, Inc.b | | | 1,405,184 |
| 61,100 | | Wright Medical Group, Inc.a,b | | | 1,416,298 |
| | | | | |
| | Total Health Care | | | 45,645,766 |
| | | | | |
| Industrials (12.2%) | | | |
| 51,900 | | Allegiant Travel Companya | | | 2,067,177 |
| 52,700 | | Applied Industrial Technologies, Inc. | | | 1,064,013 |
| 106,300 | | Beacon Roofing Supply, Inc.a | | | 1,454,184 |
| 52,700 | | Brady Corporationb | | | 1,633,700 |
| 40,700 | | Carlisle Companies, Inc. | | | 946,275 |
| 115,400 | | Continental Airlines, Inc.a,b | | | 2,183,368 |
| 29,200 | | Curtiss-Wright Corporation | | | 1,077,480 |
| 48,100 | | EMCOR Group, Inc.a | | | 854,737 |
| 15,600 | | Esterline Technologies Corporationa | | | 562,380 |
| 8,700 | | Genesee & Wyoming, Inc.a | | | 290,145 |
| 28,100 | | Heartland Express, Inc. | | | 431,054 |
| 26,100 | | Hub Group, Inc.a | | | 820,845 |
| 68,000 | | IDEX Corporation | | | 1,576,240 |
| 43,900 | | JB Hunt Transport Services, Inc.b | | | 1,248,077 |
| 14,500 | | Kirby Corporationa | | | 497,640 |
| 71,100 | | Knight Transportation, Inc. | | | 1,130,490 |
| 141,900 | | Knoll, Inc. | | | 2,051,874 |
| 24,700 | | Landstar System, Inc. | | | 953,173 |
| 36,400 | | Lennox International, Inc. | | | 1,085,448 |
| 42,000 | | Moog, Inc.a | | | 1,475,040 |
| 26,400 | | MSC Industrial Direct Company, Inc. | | | 946,704 |
| 62,000 | | Oshkosh Corporation | | | 474,920 |
| 50,900 | | Pacer International, Inc. | | | 574,661 |
| 27,200 | | Pentair, Inc. | | | 751,808 |
| 41,900 | | Polypore International, Inc.a | | | 357,407 |
| 39,500 | | Regal-Beloit Corporationb | | | 1,286,120 |
| 21,200 | | Roper Industries, Inc. | | | 961,420 |
| 13,500 | | SPX Corporation | | | 522,990 |
| 78,400 | | Sykes Enterprises, Inc.a,b | | | 1,251,264 |
| 39,300 | | Teledyne Technologies, Inc.a | | | 1,790,901 |
| 136,200 | | UAL Corporation | | | 1,983,072 |
| 22,800 | | Wabtec Corporation | | | 906,528 |
| 92,625 | | Waste Connections, Inc.a | | | 3,135,356 |
| 36,000 | | Watsco, Inc. | | | 1,479,240 |
| 33,000 | | Watson Wyatt Worldwide, Inc. | | | 1,401,510 |
| 52,600 | | Woodward Governor Company | | | 1,688,460 |
| | | | | |
| | Total Industrials | | | 42,915,701 |
| | | | | |
| Information Technology (15.1%) | | | |
| 30,500 | | Anixter International, Inc.a,b | | | 1,025,105 |
| 36,600 | | ANSYS, Inc.a | | | 1,047,858 |
| 377,500 | | Atmel Corporationa | | | 1,566,625 |
| 41,500 | | Cabot Microelectronics Corporationa | | | 1,192,295 |
| 15,300 | | CACI International, Inc.a | | | 630,054 |
| 207,900 | | Compuware Corporationa | | | 1,326,402 |
| 58,300 | | Comtech Telecommunications Corporationa | | | 2,822,886 |
| 226,100 | | Cypress Semiconductor Corporationa | | | 1,132,761 |
| 62,800 | | DTS, Inc.a,b | | | 1,296,820 |
| 256,300 | | EarthLink, Inc.a | | | 1,768,470 |
| 78,700 | | F5 Networks, Inc.a | | | 1,953,334 |
| 50,788 | | FLIR Systems, Inc.a | | | 1,630,295 |
| 132,500 | | FormFactor, Inc.a,b | | | 2,308,150 |
| 160,900 | | Informatica Corporationa | | | 2,260,645 |
| 12,700 | | Itron, Inc.a,b | | | 615,696 |
| 77,800 | | Lawson Software, Inc.a | | | 413,896 |
| 41,900 | | ManTech International Corporationa | | | 2,260,086 |
| 98,100 | | MKS Instruments, Inc.a | | | 1,819,755 |
| 86,700 | | Monolithic Power Systems, Inc.a | | | 1,473,033 |
| 248,200 | | ON Semiconductor Corporationa | | | 1,268,302 |
| 70,000 | | Parametric Technology Corporationa | | | 909,300 |
| 157,000 | | Perot Systems Corporationa | | | 2,259,230 |
| 59,300 | | Plexus Corporationa | | | 1,106,538 |
| 169,900 | | PMC-Sierra, Inc.a | | | 795,132 |
| 102,400 | | Polycom, Inc.a,b | | | 2,151,424 |
The accompanying Notes to Financial Statements are an integral part of this schedule.
79
Small Cap Stock Fund
Schedule of Investments as of October 31, 2008
| | | | | | |
| Shares | | Common Stock (95.9%) | | Value | |
| Information Technology (15.1%) - continued | | | | |
| 104,800 | | QLogic Corporationa | | $ | 1,259,696 | |
| 25,600 | | Quest Software, Inc.a | | | 339,200 | |
| 28,400 | | Rogers Corporationa | | | 854,840 | |
| 287,800 | | S1 Corporationa | | | 1,804,506 | |
| 94,500 | | SAIC, Inc.a | | | 1,745,415 | |
| 54,700 | | Shanda Interactive Entertainment, Ltd.a,b | | | 1,512,455 | |
| 104,800 | | Skyworks Solutions, Inc.a | | | 747,224 | |
| 75,900 | | Solera Holdings, Inc.a | | | 1,889,151 | |
| 87,900 | | Sybase, Inc.a | | | 2,340,777 | |
| 41,500 | | Synaptics, Inc.a | | | 1,281,935 | |
| 147,000 | | TIBCO Software, Inc.a | | | 757,050 | |
| 31,600 | | Trimble Navigation, Ltd.a | | | 650,012 | |
| 37,400 | | Varian Semiconductor Equipment Associates, Inc.a | | | 733,788 | |
| | | | | | |
| | Total Information Technology | | | 52,950,141 | |
| | | | | | |
| Materials (4.1%) | | | | |
| 20,900 | | Airgas, Inc. | | | 801,724 | |
| 17,400 | | AptarGroup, Inc. | | | 527,568 | |
| 70,900 | | Bemis Company, Inc. | | | 1,761,156 | |
| 8,300 | | FMC Corporation | | | 361,382 | |
| 37,000 | | Greif, Inc. | | | 1,501,460 | |
| 45,600 | | Koppers Holdings, Inc. | | | 1,084,824 | |
| 107,800 | | Pactiv Corporationa,b | | | 2,539,768 | |
| 55,600 | | Rock-Tenn Company | | | 1,690,796 | |
| 33,600 | | Rockwood Holdings, Inc.a | | | 414,960 | |
| 37,100 | | Royal Gold, Inc.b | | | 1,069,593 | |
| 42,500 | | RPM International, Inc. | | | 603,500 | |
| 14,500 | | SPDR Gold Trusta | | | 1,034,430 | |
| 102,400 | | Steel Dynamics, Inc. | | | 1,220,608 | |
| | | | | | |
| | Total Materials | | | 14,611,769 | |
| | | | | | |
| Telecommunications Services (1.5%) | | | | |
| 37,100 | | CenturyTel, Inc.b | | | 931,581 | |
| 66,100 | | NTELOS Holdings Corporation | | | 1,718,600 | |
| 87,800 | | Premiere Global Services, Inc.a | | | 873,610 | |
| 97,000 | | Syniverse Holdings, Inc.a | | | 1,823,600 | |
| | | | | | |
| | Total Telecommunications Services | | | 5,347,391 | |
| | | | | | |
| Utilities (3.9%) | | | | |
| 93,600 | | Avista Corporation | | | 1,858,896 | |
| 71,100 | | Cleco Corporation | | | 1,636,011 | |
| 95,100 | | El Paso Electric Companya | | | 1,761,252 | |
| 70,700 | | New Jersey Resources Corporationb | | | 2,632,868 | |
| 68,200 | | Piedmont Natural Gas Company, Inc.b | | | 2,245,144 | |
| 36,100 | | Portland General Electric Company | | | 740,772 | |
| 88,900 | | UGI Corporation | | | 2,122,043 | |
| 32,800 | | Vectren Corporation | | | 826,560 | |
| | | | | | |
| | Total Utilities | | | 13,823,546 | |
| | | | | | |
| | Total Common Stock (cost $371,965,845) | | | 337,149,567 | |
| | | | | | |
| | |
| | | Collateral Held for Securities Loaned (15.6%)c | | | |
| 54,683,469 | | Thrivent Financial Securities Lending Trust | | | 54,683,469 | |
| | | | | | |
| | Total Collateral Held for Securities Loaned (cost $54,683,469) | | | 54,683,469 | |
| | | | | | |
| | |
Shares or
Principal
Amount | | Short-Term Investments (12.1%)c | | | |
| 7,410,000 | | Alcon Capital Corporation 0.080%, 11/3/2008 | | | 7,409,967 | |
| 12,500,000 | | Deutsche Financial Bank, LLC 0.130%, 11/3/2008 | | | 12,499,910 | |
| 5,120,000 | | Federal Home Loan Bank Discount Notes 0.010%, 11/3/2008 | | | 5,119,997 | |
| 300,000 | | 1.100%, 12/8/2008 | | | 299,661 | |
| 100,000 | | 1.200%, 12/10/2008 | | | 99,870 | |
| 900,000 | | Federal National Mortgage Association Discount Notes 2.100%, 12/10/2008 | | | 897,976 | |
| 16,013,258 | | Thrivent Money Market Fund | | | 16,013,258 | |
| | | | | | |
| | Total Short-Term Investments (at amortized cost) | | | 42,340,639 | |
| | | | | | |
| | Total Investments (cost $468,989,953) 123.6% | | $ | 434,173,675 | |
| | | | | | |
| | Other Assets and Liabilities, Net (23.6%) | | | (82,770,729 | ) |
| | | | | | |
| | Total Net Assets 100.0% | | $ | 351,402,946 | |
| | | | | | |
| a | Non-income producing security. |
| b | All or a portion of the security is on loan as discussed in item 2(M) of the Notes to Financial Statements. |
| c | The interest rate shown reflects the yield, coupon rate or, for securities purchased at a discount, the discount rate at the date of purchase. |
Definitions:
| | | | |
| ADR | | - | | American Depositary Receipt, which are certificates for an underlying foreign security’s shares held by an issuing U.S. depository bank. |
Gross unrealized appreciation and depreciation of investments, based on cost for federal income tax purposes, were as follows:
| | | | |
Gross unrealized appreciation | | $ | 16,581,612 | |
Gross unrealized depreciation | | | (64,566,931 | ) |
| | | | |
Net unrealized appreciation (depreciation) | | | ($47,985,319 | ) |
Cost for federal income tax purposes | | $ | 482,158,994 | |
The accompanying Notes to the Financial Statements are an integral part of this schedule.
80
Small Cap Stock Fund
Schedule of Investments as of October 31, 2008
Investment in Affiliates
Affiliated issuers, as defined under the Investment Company Act of 1940, include those in which the Fund’s holdings of an issuer represent 5% or more of the outstanding voting securities of an issuer, or any affiliated mutual fund.
A summary of transactions for the fiscal year to date, in Small Cap Stock Fund, is as follows:
| | | | | | | | | | | | | | | | | |
Fund | | Value
October 31,
2007 | | Gross
Purchases and
Additions | | Gross Sales and
Reductions | | Balance of
Shares Held at
October 31,
2008 | | Value
October 31,
2008 | | Income Earned
November 1, 2007-
October 31, 2008 |
Money Market | | $ | 34,676,065 | | $ | 185,685,541 | | $ | 204,348,348 | | 16,013,258 | | $ | 16,013,258 | | $ | 629,825 |
Thrivent Financial Securities Lending Trust | | | 158,510,727 | | | 405,421,368 | | | 509,248,626 | | 54,683,469 | | | 54,683,469 | | | 1,334,723 |
Total Value and Dividend Income | | | 193,186,792 | | | | | | | | | | | 70,696,727 | | | 1,964,548 |
The accompanying Notes to Financial Statements are an integral part of this schedule.
81
Small Cap Index Fund
Schedule of Investments as of October 31, 2008
| | | | | |
| Shares | | Common Stock (97.4%) | | Value |
| Consumer Discretionary (13.5%) | | | |
| 900 | | 4Kids Entertainment, Inc.a | | $ | 4,761 |
| 3,875 | | Aaron Rents, Inc. | | | 96,061 |
| 1,300 | | AH Belo Corporation | | | 4,303 |
| 1,900 | | Arbitron, Inc.b | | | 61,902 |
| 900 | | Arctic Cat, Inc. | | | 6,822 |
| 1,500 | | ATC Technology Corporationa | | | 32,895 |
| 1,400 | | Audiovox Corporationa | | | 8,246 |
| 800 | | Bassett Furniture Industries, Inc. | | | 3,528 |
| 1,600 | | Big 5 Sporting Goods Corporation | | | 10,048 |
| 1,100 | | Blue Nile, Inc.a,c | | | 33,638 |
| 3,050 | | Brown Shoe Company, Inc. | | | 32,147 |
| 6,400 | | Brunswick Corporationc | | | 22,208 |
| 1,650 | | Buckle, Inc. | | | 43,461 |
| 1,300 | | Buffalo Wild Wings, Inc.a,c | | | 36,764 |
| 2,900 | | Cabela’s, Inc.a,c | | | 23,055 |
| 1,800 | | California Pizza Kitchen, Inc.a | | | 17,586 |
| 3,700 | | Carter’s, Inc.a | | | 78,588 |
| 2,150 | | Cato Corporation | | | 33,368 |
| 1,600 | | CBRL Group, Inc. | | | 31,872 |
| 1,650 | | CEC Entertainment, Inc.a | | | 42,372 |
| 5,700 | | Champion Enterprises, Inc.a | | | 10,659 |
| 1,500 | | Charlotte Russe Holding, Inc.a | | | 12,675 |
| 1,800 | | Children’s Place Retail Stores, Inc.a | | | 60,174 |
| 2,600 | | Christopher & Banks Corporation | | | 13,572 |
| 3,800 | | CKE Restaurants, Inc. | | | 32,262 |
| 2,100 | | Coinstar, Inc.a | | | 50,379 |
| 300 | | CPI Corporation | | | 2,190 |
| 6,000 | | Crocs, Inc.a,c | | | 15,060 |
| 1,000 | | Deckers Outdoor Corporationa | | | 84,860 |
| 1,100 | | DineEquity, Inc.c | | | 19,833 |
| 3,300 | | Dress Barn, Inc.a,c | | | 31,548 |
| 1,400 | | Drew Industries, Inc.a,c | | | 16,940 |
| 2,133 | | E.W. Scripps Company | | | 9,918 |
| 2,100 | | Ethan Allen Interiors, Inc.c | | | 37,569 |
| 4,043 | | Finish Line, Inc. | | | 38,692 |
| 3,300 | | Fossil, Inc.a | | | 59,895 |
| 2,900 | | Fred’s, Inc. | | | 35,525 |
| 1,400 | | Genesco, Inc.a,c | | | 34,734 |
| 1,700 | | Group 1 Automotive, Inc. | | | 17,085 |
| 2,100 | | Gymboree Corporationa | | | 54,306 |
| 1,400 | | Haverty Furniture Companies, Inc. | | | 13,776 |
| 2,050 | | Hibbett Sports, Inc.a,c | | | 36,510 |
| 4,600 | | Hillenbrand, Inc. | | | 87,400 |
| 3,175 | | Hot Topic, Inc.a | | | 20,574 |
| 2,800 | | HSN, Inc.a | | | 17,220 |
| 4,200 | | Iconix Brand Group, Inc.a,c | | | 45,738 |
| 2,800 | | Interval Leisure Group, Inc.a | | | 20,328 |
| 4,100 | | Jack in the Box, Inc.a | | | 82,410 |
| 2,000 | | JAKKS Pacific, Inc.a | | | 44,740 |
| 1,810 | | Jo-Ann Stores, Inc.a | | | 34,680 |
| 1,350 | | Joseph A. Bank Clothiers, Inc.a | | | 34,384 |
| 2,000 | | K-Swiss, Inc. | | | 30,260 |
| 900 | | Landry’s Restaurants, Inc. | | | 11,295 |
| 3,800 | | La-Z-Boy, Inc.c | | | 21,964 |
| 1,100 | | Libbey, Inc.c | | | 4,026 |
| 1,200 | | Lithia Motors, Inc.c | | | 4,920 |
| 5,500 | | Live Nation, Inc.a | | | 61,875 |
| 9,900 | | LKQ Corporationa | | �� | 113,256 |
| 1,000 | | M/I Homes, Inc.c | | | 13,610 |
| 1,400 | | Maidenform Brands, Inc.a | | | 15,372 |
| 1,500 | | Marcus Corporation | | | 21,045 |
| 1,300 | | MarineMax, Inc.a | | | 3,016 |
| 3,800 | | Men’s Wearhouse, Inc.c | | | 58,102 |
| 2,200 | | Meritage Homes Corporationa,c | | | 30,206 |
| 1,000 | | Midas, Inc.a | | | 13,030 |
| 2,200 | | Monaco Coach Corporation | | | 4,840 |
| 800 | | Monarch Casino & Resort, Inc.a | | | 7,128 |
| 1,300 | | Movado Group, Inc. | | | 19,773 |
| 1,700 | | Multimedia Games, Inc.a | | | 5,134 |
| 300 | | National Presto Industries, Inc. | | | 19,875 |
| 1,700 | | Nautilus Group, Inc.a | | | 4,148 |
| 2,200 | | NutriSystem, Inc. | | | 31,130 |
| 1,600 | | O’Charley’s, Inc. | | | 12,000 |
| 5,500 | | OfficeMax, Inc. | | | 44,275 |
| 1,000 | | Oxford Industries, Inc.c | | | 13,470 |
| 1,700 | | P.F. Chang’s China Bistro, Inc.a | | | 34,782 |
| 2,200 | | Panera Bread Companya,c | | | 99,264 |
| 1,600 | | Papa John’s International, Inc.a | | | 36,096 |
| 900 | | Peet’s Coffee & Tea, Inc.a | | | 20,214 |
| 3,200 | | Pep Boys - Manny, Moe & Jackc | | | 15,424 |
| 900 | | Perry Ellis International, Inc.a | | | 8,811 |
| 1,700 | | PetMed Express, Inc.a | | | 30,022 |
| 4,400 | | Pinnacle Entertainment, Inc.a,c | | | 24,640 |
| 2,400 | | Polaris Industries, Inc.c | | | 80,808 |
| 3,475 | | Pool Corporationc | | | 60,500 |
| 600 | | Pre-Paid Legal Services, Inc.a | | | 23,688 |
| 9,300 | | Quiksilver, Inc.a | | | 24,087 |
| 1,300 | | RC2 Corporationa | | | 16,510 |
| 1,200 | | Red Robin Gourmet Burgers, Inc.a | | | 18,228 |
| 3,895 | | Ruby Tuesday, Inc.a | | | 9,387 |
| 1,200 | | Russ Berrie and Company, Inc.a | | | 3,240 |
| 1,500 | | Ruth’s Chris Steak House, Inc.a | | | 3,435 |
| 3,250 | | Select Comfort Corporationa | | | 1,560 |
| 4,075 | | Shuffle Master, Inc.a | | | 15,729 |
| 2,400 | | Skechers USA, Inc.a | | | 32,592 |
| 500 | | Skyline Corporation | | | 10,810 |
| 2,000 | | Sonic Automotive, Inc. | | | 10,260 |
| 4,375 | | Sonic Corporationa | | | 46,813 |
| 2,400 | | Spartan Motors, Inc. | | | 11,016 |
| 2,800 | | Stage Stores, Inc. | | | 21,588 |
| 1,100 | | Stamps.com, Inc.a | | | 10,736 |
| 900 | | Standard Motor Products, Inc. | | | 3,789 |
| 8,400 | | Standard Pacific Corporationa,c | | | 23,940 |
| 2,100 | | Steak n Shake Companya | | | 10,815 |
| 1,900 | | Stein Mart, Inc. | | | 4,085 |
| 1,500 | | Sturm, Ruger & Company, Inc.a | | | 10,725 |
| 1,700 | | Superior Industries International, Inc.c | | | 24,310 |
| 3,800 | | Texas Roadhouse, Inc.a | | | 26,676 |
| 2,800 | | Ticketmastera | | | 27,104 |
| 2,300 | | Tractor Supply Companya | | | 95,588 |
| 1,300 | | True Religion Apparel, Inc.a,c | | | 21,775 |
| 2,200 | | Tuesday Morning Corporationa | | | 4,928 |
| 1,800 | | Tween Brands, Inc.a | | | 15,336 |
| 1,000 | | UniFirst Corporation | | | 32,630 |
| 1,000 | | Universal Electronic Inc.a | | | 21,130 |
| 1,600 | | Universal Technical Institute, Inc.a | | | 26,400 |
| 1,200 | | Volcom, Inc.a,c | | | 15,516 |
| 2,100 | | Winnebago Industries, Inc.c | | | 12,474 |
| 3,700 | | WMS Industries, Inc.a | | | 92,500 |
| 3,550 | | Wolverine World Wide, Inc. | | | 83,425 |
| 2,600 | | Zale Corporationa,c | | | 44,356 |
The accompanying Notes to Financial Statements are an integral part of this schedule.
82
Small Cap Index Fund
Schedule of Investments as of October 31, 2008
| | | | | |
| Shares | | Common Stock (97.4%) | | Value |
| Consumer Discretionary (13.5%) - continued | | | |
| 1,500 | | Zumiez, Inc.a,c | | $ | 14,640 |
| | | | | |
| | Total Consumer Discretionary | | | 3,545,393 |
| | | | | |
| Consumer Staples (4.0%) | | | |
| 6,500 | | Alliance One International, Inc.a | | | 21,710 |
| 1,300 | | Andersons, Inc.c | | | 34,619 |
| 700 | | Boston Beer Company, Inc.a | | | 26,453 |
| 800 | | Cal-Maine Foods Inc | | | 23,512 |
| 3,700 | | Casey’s General Stores, Inc. | | | 111,740 |
| 5,200 | | Central Garden & Pet Companya | | | 16,536 |
| 1,400 | | Chattem, Inc.a,c | | | 105,938 |
| 6,000 | | Darling International, Inc.a | | | 45,240 |
| 5,812 | | Flowers Foods, Inc. | | | 172,326 |
| 2,200 | | Great Atlantic & Pacific Tea Company, Inc.a | | | 18,194 |
| 1,300 | | Green Mountain Coffee Roasters, Inc.a,c | | | 37,687 |
| 2,900 | | Hain Celestial Group, Inc.a | | | 67,396 |
| 1,000 | | J & J Snack Foods Corporation | | | 31,360 |
| 2,300 | | Lance, Inc. | | | 47,587 |
| 1,100 | | Mannatech, Inc. | | | 4,411 |
| 900 | | Nash Finch Company | | | 35,487 |
| 1,300 | | Sanderson Farms, Inc.c | | | 40,586 |
| 1,600 | | Spartan Stores, Inc. | | | 43,184 |
| 2,900 | | Spectrum Brands, Inc.a | | | 1,769 |
| 2,300 | | TreeHouse Foods, Inc.a | | | 69,598 |
| 3,100 | | United Natural Foods, Inc.a,c | | | 69,254 |
| 1,200 | | WD-40 Company | | | 34,920 |
| | | | | |
| | Total Consumer Staples | | | 1,059,507 |
| | | | | |
| Energy (5.1%) | | | |
| 4,100 | | Atwood Oceanics, Inc.a,c | | | 112,668 |
| 1,700 | | Basic Energy Services, Inc.a | | | 23,256 |
| 2,100 | | Bristow Group, Inc.a,c | | | 52,017 |
| 1,500 | | Carbo Ceramics, Inc.c | | | 64,905 |
| 2,200 | | Dril-Quip, Inc.a | | | 54,340 |
| 1,000 | | Gulf Island Fabrication, Inc. | | | 19,710 |
| 1,700 | | Hornbeck Offshore Services, Inc.a,c | | | 40,460 |
| 6,300 | | Input/Output, Inc.a | | | 41,328 |
| 1,100 | | Lufkin Industries, Inc. | | | 57,552 |
| 1,900 | | Matrix Service Companya | | | 23,275 |
| 1,450 | | NATCO Group, Inc.a | | | 30,653 |
| 3,100 | | Penn Virginia Corporation | | | 115,227 |
| 1,100 | | Petroleum Development Corporationa | | | 22,781 |
| 3,200 | | PetroQuest Energy, Inc.a | | | 31,840 |
| 3,600 | | Pioneer Drilling Companya | | | 27,864 |
| 1,550 | | SEACOR Holdings, Inc.a | | | 104,114 |
| 9,056 | | Southern Union Companyb | | | 155,944 |
| 4,500 | | St. Mary Land & Exploration Company | | | 112,005 |
| 2,500 | | Stone Energy Corporationa | | | 75,850 |
| 1,200 | | Superior Well Services, Inc.a | | | 20,100 |
| 2,300 | | Swift Energy Companya | | | 73,784 |
| 5,500 | | TETRA Technologies, Inc.a | | | 38,280 |
| 2,100 | | World Fuel Services Corporation | | | 45,003 |
| | | | | |
| | Total Energy | | | 1,342,956 |
| | | | | |
| Financials (19.3%) | | | |
| 2,400 | | Acadia Realty Trustb | | | 43,368 |
| 1,300 | | Anchor BanCorp Wisconsin, Inc.c | | | 7,410 |
| 3,500 | | Bank Mutual Corporation | | | 40,355 |
| 600 | | BankAtlantic Bancorp, Inc. | | | 3,702 |
| 6,000 | | BioMed Realty Trust, Inc. | | | 84,300 |
| 4,200 | | Boston Private Financial Holdings, Inc.c | | | 37,128 |
| 4,300 | | Brookline Bancorp, Inc. | | | 50,310 |
| 2,000 | | Cascade Bancorpc | | | 19,080 |
| 2,100 | | Cash America International, Inc. | | | 74,277 |
| 3,200 | | Cedar Shopping Centers, Inc. | | | 30,592 |
| 2,100 | | Central Pacific Financial Corporation | | | 32,760 |
| 3,500 | | Colonial Properties Trust | | | 36,890 |
| 1,300 | | Columbia Banking System, Inc. | | | 20,696 |
| 2,300 | | Community Bank System, Inc. | | | 57,385 |
| 2,300 | | Corus Bankshares, Inc.c | | | 5,060 |
| 3,000 | | Delphi Financial Group, Inc. | | | 47,250 |
| 6,700 | | DiamondRock Hospitality Company | | | 34,706 |
| 1,950 | | Dime Community Bancshares | | | 32,565 |
| 4,600 | | East West Bancorp, Inc.c | | | 79,810 |
| 1,800 | | EastGroup Properties, Inc. | | | 60,264 |
| 2,400 | | Entertainment Properties Trust | | | 89,880 |
| 6,000 | | Extra Space Storage, Inc. | | | 69,060 |
| 1,900 | | Financial Federal Corporation | | | 43,985 |
| 5,500 | | First BanCorpc | | | 56,210 |
| 1,900 | | First Cash Financial Services, Inc.a | | | 29,203 |
| 5,500 | | First Commonwealth Financial Corporationc | | | 60,830 |
| 2,300 | | First Financial Bancorp | | | 30,935 |
| 1,500 | | First Financial Bankshares, Inc.c | | | 81,285 |
| 3,500 | | First Midwest Bancorp, Inc. | | | 77,735 |
| 900 | | FirstFed Financial Corporationa,c | | | 8,055 |
| 3,700 | | Flagstar Bancorp, Inc.c | | | 7,030 |
| 2,600 | | Forestar Real Estate Group, Inc.a | | | 22,750 |
| 3,400 | | Frontier Financial Corporationc | | | 22,644 |
| 3,900 | | Glacier Bancorp, Inc. | | | 78,663 |
| 1,300 | | Greenhill & Company, Inc.c | | | 85,761 |
| 3,300 | | Guaranty Financial Group, Inc.a,c | | | 6,699 |
| 1,700 | | Hancock Holding Company | | | 75,072 |
| 2,700 | | Hanmi Financial Corporation | | | 10,800 |
| 1,000 | | Home Bancshares, Inc. | | | 26,040 |
| 2,300 | | Home Properties, Inc.c | | | 93,127 |
| 1,385 | | Independent Bank Corporation | | | 5,083 |
| 1,100 | | Infinity Property & Casualty Corporation | | | 43,802 |
| 4,200 | | Inland Real Estate Corporationc | | | 48,132 |
| 3,200 | | Investment Technology Group, Inc.a | | | 65,312 |
| 1,400 | | Irwin Financial Corporation | | | 3,080 |
| 2,400 | | Kilroy Realty Corporation | | | 77,160 |
| 2,600 | | Kite Realty Group Trust | | | 15,808 |
| 3,900 | | LaBranche & Company, Inc.a | | | 24,297 |
| 1,100 | | LandAmerica Financial Group, Inc. | | | 10,835 |
| 3,000 | | LaSalle Hotel Propertiesc | | | 42,240 |
| 4,700 | | Lexington Corporate Properties Trust | | | 37,741 |
| 1,700 | | LTC Properties, Inc. | | | 41,089 |
| 4,800 | | Medical Properties Trust, Inc.c | | | 35,424 |
| 2,000 | | Mid-America Apartment Communities, Inc.c | | | 70,480 |
| 1,600 | | Nara Bancorp, Inc. | | | 17,600 |
| 2,900 | | National Financial Partners | | | 19,314 |
| 5,800 | | National Penn Bancshares, Inc. | | | 98,252 |
| 5,400 | | National Retail Properties, Inc. | | | 96,282 |
The accompanying Notes to Financial Statements are an integral part of this schedule.
83
Small Cap Index Fund
Schedule of Investments as of October 31, 2008
| | | | | |
| Shares | | Common Stock (97.4%) | | Value |
| Financials (19.3%) - continued | | | |
| 1,000 | | Navigators Group, Inc.a | | $ | 50,510 |
| 4,800 | | Old National Bancorp | | | 90,912 |
| 3,100 | | optionsXpress Holdings, Inc.c | | | 55,056 |
| 1,100 | | Parkway Properties, Inc. | | | 18,975 |
| 2,900 | | Pennsylvania Real Estate Investment Trust | | | 36,685 |
| 1,200 | | Piper Jaffray Companiesa | | | 47,340 |
| 1,100 | | Portfolio Recovery Associates, Inc.a,c | | | 39,468 |
| 3,500 | | Post Properties, Inc. | | | 78,120 |
| 1,600 | | Presidential Life Corporation | | | 15,008 |
| 2,000 | | PrivateBancorp, Inc.c | | | 72,020 |
| 2,400 | | ProAssurance Corporationa | | | 131,880 |
| 3,000 | | Prosperity Bancshares, Inc. | | | 99,630 |
| 2,455 | | Provident Bankshares Corporation | | | 26,195 |
| 1,100 | | PS Business Parks, Inc. | | | 49,797 |
| 2,000 | | Rewards Network, Inc.a | | | 7,600 |
| 1,300 | | RLI Corporation | | | 74,607 |
| 1,200 | | Safety Insurance Group, Inc. | | | 45,588 |
| 3,800 | | Selective Insurance Group, Inc. | | | 90,250 |
| 8,400 | | Senior Housing Property Trust | | | 161,028 |
| 2,500 | | Signature Banka,c | | | 81,450 |
| 5,300 | | South Financial Group, Inc. | | | 30,793 |
| 1,600 | | Sovran Self Storage, Inc. | | | 51,920 |
| 1,300 | | Sterling Bancorp | | | 20,384 |
| 5,375 | | Sterling Bancshares, Inc. | | | 42,785 |
| 3,820 | | Sterling Financial Corporation | | | 32,432 |
| 1,300 | | Stewart Information Services Corporation | | | 21,580 |
| 1,900 | | Stifel Financial Corporationa | | | 82,935 |
| 6,300 | | Susquehanna Bancshares, Inc.c | | | 97,587 |
| 1,989 | | SWS Group, Inc. | | | 36,916 |
| 2,300 | | Tanger Factory Outlet Centers, Inc. | | | 83,191 |
| 1,500 | | Tower Group, Inc. | | | 31,545 |
| 2,300 | | Tradestation Group, Inc.a | | | 18,009 |
| 5,533 | | TrustCo Bank Corporation NYc | | | 67,336 |
| 8,100 | | UCBH Holdings, Inc.c | | | 42,768 |
| 2,200 | | UMB Financial Corporation | | | 99,726 |
| 4,400 | | Umpqua Holdings Corporation | | | 74,888 |
| 2,700 | | United Bankshares, Inc.c | | | 86,130 |
| 2,922 | | United Community Banks, Inc.c | | | 38,337 |
| 1,600 | | United Fire & Casualty Company | | | 37,072 |
| 1,600 | | Urstadt Biddle Properties | | | 26,208 |
| 4,675 | | Whitney Holding Corporation | | | 88,825 |
| 1,400 | | Wilshire Bancorp, Inc. | | | 15,442 |
| 1,700 | | Wintrust Financial Corporationc | | | 43,520 |
| 1,194 | | World Acceptance Corporationa | | | 22,065 |
| 2,700 | | Zenith National Insurance Corporation | | | 88,722 |
| | | | | |
| | Total Financials | | | 5,078,838 |
| | | | | |
| Health Care (13.3%) | | | |
| 1,600 | | Abaxis, Inc.a | | | 24,592 |
| 800 | | Air Methods Corporationa | | | 13,424 |
| 3,000 | | Alpharma, Inc.a,c | | | 93,930 |
| 1,933 | | Amedisys, Inc.a,c | | | 109,041 |
| 5,300 | | American Medical Systems Holdings, Inc.a,c | | | 57,346 |
| 3,900 | | AMERIGROUP Corporationa,b | | | 97,500 |
| 2,500 | | AMN Healthcare Services, Inc.a | | | 22,475 |
| 2,300 | | AmSurg Corporationa | | | 57,362 |
| 950 | | Analogic Corporation | | | 41,952 |
| 2,100 | | ArQule, Inc.a | | | 5,796 |
| 1,900 | | ArthroCare Corporationa,c | | | 39,482 |
| 1,800 | | BioLase Technology, Inc.a | | | 3,132 |
| 2,100 | | Cambrex Corporationa | | | 9,450 |
| 2,800 | | Catalyst Health Solutions, Inc.a | | | 47,236 |
| 3,200 | | Centene Corporationa | | | 60,288 |
| 1,700 | | Chemed Corporation | | | 74,443 |
| 2,100 | | CONMED Corporationa | | | 55,020 |
| 3,300 | | Cooper Companies, Inc. | | | 54,384 |
| 500 | | Corvel Corporationa | | | 13,410 |
| 2,200 | | Cross Country Healthcare, Inc.a | | | 24,904 |
| 2,050 | | CryoLife, Inc.a | | | 27,470 |
| 4,100 | | Cubist Pharmaceuticals, Inc.a | | | 104,099 |
| 1,700 | | Cyberonics, Inc.a | | | 21,658 |
| 1,000 | | Datascope Corporation | | | 50,170 |
| 1,300 | | Dionex Corporationa | | | 69,979 |
| 4,000 | | Eclipsys Corporationa | | | 59,400 |
| 2,322 | | Enzo Biochem, Inc.a | | | 13,398 |
| 2,100 | | Gentiva Health Services, Inc.a | | | 57,015 |
| 1,700 | | Greatbatch, Inc.a | | | 36,975 |
| 1,900 | | Haemonetics Corporationa | | | 112,214 |
| 3,600 | | Healthspring, Inc.a | | | 59,472 |
| 2,500 | | Healthways, Inc.a | | | 25,250 |
| 1,800 | | HMS Holding Corporationa | | | 44,586 |
| 900 | | ICU Medical, Inc.a | | | 28,827 |
| 5,112 | | Immucor, Inc.a | | | 135,724 |
| 1,400 | | Integra LifeSciences Holdings Corporationa | | | 52,556 |
| 2,300 | | Invacare Corporation | | | 41,837 |
| 2,400 | | inVentiv Health, Inc.a | | | 22,728 |
| 1,000 | | Kendle International, Inc.a | | | 18,070 |
| 800 | | Kensey Nash Corporationa | | | 20,312 |
| 700 | | Landauer, Inc. | | | 37,842 |
| 1,400 | | LCA-Vision, Inc. | | | 4,788 |
| 1,100 | | LHC Group, Inc.a | | | 38,808 |
| 3,000 | | Magellan Health Services, Inc.a | | | 110,820 |
| 2,400 | | Martek Biosciences Corporationa,c | | | 71,592 |
| 1,400 | | MedCath Corporationa | | | 21,588 |
| 2,500 | | Mentor Corporationc | | | 42,250 |
| 2,950 | | Meridian Bioscience, Inc. | | | 72,511 |
| 2,000 | | Merit Medical Systems, Inc.a | | | 36,600 |
| 1,000 | | Molina Healthcare, Inc.a | | | 22,270 |
| 900 | | MWI Veterinary Supply, Inc.a | | | 31,167 |
| 2,000 | | Natus Medical, Inc.a | | | 30,600 |
| 1,800 | | Noven Pharmaceuticals, Inc.a | | | 20,250 |
| 2,350 | | Odyssey Healthcare, Inc.a | | | 22,536 |
| 2,300 | | Omnicell, Inc.a | | | 25,254 |
| 1,300 | | Osteotech, Inc.a | | | 4,147 |
| 3,000 | | Owens & Minor, Inc. | | | 129,810 |
| 1,300 | | Palomar Medical Technologies, Inc.a | | | 14,872 |
| 2,500 | | Par Pharmaceutical Companies, Inc.a | | | 25,000 |
| 4,000 | | PAREXEL International Corporationa | | | 41,600 |
| 3,300 | | Pediatrix Medical Group, Inc.a | | | 127,545 |
| 2,200 | | PharMerica Corporationa | | | 45,166 |
| 1,400 | | Pharmnet Development Groupa | | | 2,240 |
| 3,100 | | Phase Forward, Inc.a | | | 44,237 |
| 4,500 | | PSS World Medical, Inc.a,c | | | 81,630 |
| 4,600 | | Regeneron Pharmaceuticals, Inc.a | | | 88,780 |
| 1,300 | | RehabCare Group, Inc.a | | | 22,269 |
| 1,900 | | Res-Care, Inc.a | | | 29,279 |
| 3,500 | | Salix Pharmaceuticals, Ltd.a | | | 32,200 |
The accompanying Notes to the Financial Statements are an integral part of this schedule.
84
Small Cap Index Fund
Schedule of Investments as of October 31, 2008
| | | | | |
| Shares | | Common Stock (97.4%) | | Value |
| Health Care (13.3%) - continued | | | |
| 3,400 | | Savient Pharmaceuticals, Inc.a | | $ | 16,184 |
| 3,300 | | Sunrise Senior Living, Inc.a | | | 9,966 |
| 1,100 | | SurModics, Inc.a,c | | | 29,150 |
| 2,600 | | Symmetry Medical, Inc.a | | | 33,592 |
| 2,400 | | Theragenics Corporationa | | | 4,680 |
| 6,000 | | ViroPharma, Inc.a | | | 75,240 |
| 2,400 | | West Pharmaceutical Services, Inc. | | | 95,808 |
| 1,500 | | Zoll Medical Corporationa | | | 36,120 |
| | | | | |
| | Total Health Care | | | 3,485,298 |
| | | | | |
| Industrials (17.8%) | | | |
| 1,600 | | A.O. Smith Corporationc | | | 50,480 |
| 2,800 | | AAR Corporationa | | | 44,772 |
| 3,200 | | ABM Industries, Inc. | | | 52,256 |
| 3,000 | | Acuity Brands, Inc.b | | | 104,880 |
| 1,700 | | Administaff, Inc.b | | | 33,983 |
| 1,900 | | Albany International Corporation | | | 27,664 |
| 2,100 | | Apogee Enterprises, Inc. | | | 20,706 |
| 2,675 | | Applied Industrial Technologies, Inc. | | | 54,008 |
| 900 | | Applied Signal Technology, Inc. | | | 16,128 |
| 1,800 | | Arkansas Best Corporation | | | 52,542 |
| 1,400 | | Astec Industries, Inc.a | | | 35,588 |
| 3,400 | | Baldor Electric Company | | | 59,704 |
| 3,200 | | Barnes Group, Inc. | | | 46,432 |
| 3,125 | | Belden, Inc.b | | | 65,125 |
| 2,000 | | Bowne & Company, Inc. | | | 15,580 |
| 3,900 | | Brady Corporation | | | 120,900 |
| 3,600 | | Briggs & Stratton Corporationc | | | 56,736 |
| 1,900 | | C&D Technologies, Inc.a,c | | | 6,650 |
| 625 | | Cascade Corporation | | | 20,631 |
| 1,000 | | CDI Corporation | | | 13,000 |
| 1,950 | | Ceradyne, Inc.a | | | 45,825 |
| 3,700 | | CLARCOR, Inc. | | | 130,943 |
| 800 | | Consolidated Graphics, Inc.a | | | 10,408 |
| 1,100 | | Cubic Corporation | | | 24,475 |
| 3,300 | | Curtiss-Wright Corporation | | | 121,770 |
| 4,800 | | EMCOR Group, Inc.a | | | 85,296 |
| 1,500 | | EnPro Industries, Inc.a | | | 33,315 |
| 2,200 | | Esterline Technologies Corporationa | | | 79,310 |
| 2,100 | | Forward Air Corporationc | | | 54,957 |
| 1,400 | | G & K Services, Inc. | | | 31,626 |
| 3,900 | | Gardner Denver, Inc.a | | | 99,918 |
| 3,500 | | GenCorp, Inc.a | | | 17,150 |
| 2,000 | | Gibraltar Industries, Inc. | | | 26,500 |
| 3,020 | | Griffon Corporationa | | | 25,489 |
| 3,125 | | Healthcare Services Group, Inc. | | | 51,750 |
| 4,101 | | Heartland Express, Inc. | | | 62,909 |
| 1,200 | | Heidrick & Struggles International, Inc. | | | 28,956 |
| 2,700 | | Hub Group, Inc.a | | | 84,915 |
| 1,800 | | II-VI, Inc.a | | | 50,562 |
| 2,000 | | Insituform Technologies, Inc.a,c | | | 26,860 |
| 4,100 | | Interface, Inc. | | | 28,905 |
| 2,000 | | John Bean Technologies Corporation | | | 16,760 |
| 1,900 | | Kaman Corporation | | | 48,507 |
| 2,000 | | Kaydon Corporation | | | 66,820 |
| 3,900 | | Kirby Corporationa | | | 133,848 |
| 4,225 | | Knight Transportation, Inc. | | | 67,177 |
| 3,900 | | Landstar System, Inc. | | | 150,501 |
| 300 | | Lawson Products, Inc. | | | 8,940 |
| 3,400 | | Lennox International, Inc. | | | 101,388 |
| 900 | | Lindsay Manufacturing Companyc | | | 42,822 |
| 1,200 | | Lydall, Inc.a | | | 7,980 |
| 2,200 | | MagneTek, Inc.a | | | 4,730 |
| 2,500 | | Mobile Mini, Inc.a,c | | | 42,000 |
| 3,125 | | Moog, Inc.a | | | 109,750 |
| 2,700 | | Mueller Industries, Inc. | | | 61,749 |
| 1,400 | | NCI Building Systems, Inc.a | | | 26,054 |
| 2,000 | | Old Dominion Freight Line, Inc.a | | | 60,680 |
| 2,600 | | On Assignment, Inc.a | | | 16,900 |
| 4,300 | | Orbital Sciences Corporationa,c | | | 88,107 |
| 2,775 | | Quanex Building Products Corporation | | | 25,419 |
| 2,400 | | Regal-Beloit Corporation | | | 78,144 |
| 2,500 | | Robbins & Myers, Inc. | | | 51,000 |
| 1,200 | | School Specialty, Inc.a,c | | | 25,200 |
| 2,700 | | Simpson Manufacturing Company, Inc.c | | | 62,208 |
| 4,200 | | SkyWest, Inc. | | | 64,722 |
| 3,900 | | Spherion Corporationa | | | 12,402 |
| 900 | | Standard Register Company | | | 7,317 |
| 900 | | Standex International Corporation | | | 23,229 |
| 2,400 | | Sykes Enterprises, Inc.a | | | 38,304 |
| 2,600 | | Teledyne Technologies, Inc.a | | | 118,482 |
| 4,300 | | Tetra Tech, Inc.a | | | 94,557 |
| 2,600 | | Toro Company | | | 87,464 |
| 1,400 | | Tredegar Corporation | | | 20,608 |
| 1,200 | | Triumph Group, Inc. | | | 52,632 |
| 3,200 | | TrueBlue, Inc.a | | | 26,656 |
| 1,700 | | United Stationers, Inc.a | | | 63,563 |
| 1,200 | | Universal Forest Products, Inc. | | | 28,380 |
| 1,300 | | Valmont Industries, Inc. | | | 71,214 |
| 1,500 | | Viad Corporation | | | 32,775 |
| 1,400 | | Vicor Corporation | | | 9,786 |
| 950 | | Volt Information Sciences, Inc.a | | | 7,268 |
| 2,200 | | Wabash National Corporation | | | 13,376 |
| 5,875 | | Waste Connections, Inc.a | | | 198,869 |
| 2,100 | | Watsco, Inc.c | | | 86,289 |
| 3,200 | | Watson Wyatt Worldwide, Inc. | | | 135,904 |
| 2,100 | | Watts Water Technologies, Inc. | | | 55,503 |
| 4,000 | | Woodward Governor Company | | | 128,400 |
| | | | | |
| | Total Industrials | | | 4,693,988 |
| | | | | |
| Information Technology (15.7%) | | | |
| 1,900 | | Actel Corporationa | | | 22,971 |
| 8,800 | | Adaptec, Inc.a | | | 28,248 |
| 2,400 | | Advanced Energy Industries, Inc.a | | | 25,608 |
| 1,700 | | Agilysys, Inc. | | | 6,834 |
| 2,200 | | Anixter International, Inc.a,b | | | 73,942 |
| 8,995 | | Arris Group, Inc.a | | | 62,155 |
| 2,300 | | ATMI, Inc.a,b | | | 27,968 |
| 2,247 | | Avid Technology, Inc.a,c | | | 33,323 |
| 7,500 | | Axcelis Technologies, Inc.a | | | 3,300 |
| 1,000 | | Bankrate, Inc.a | | | 32,910 |
| 900 | | Bel Fuse, Inc. | | | 19,530 |
| 4,850 | | Benchmark Electronics, Inc.a,b | | | 58,152 |
| 1,300 | | Black Box Corporation | | | 39,533 |
| 3,200 | | Blackbaud, Inc. | | | 48,640 |
| 2,800 | | Blue Coat Systems, Inc.a | | | 37,800 |
| 3,720 | | Brightpoint, Inc.a | | | 21,427 |
| 4,653 | | Brooks Automation, Inc.a | | | 31,873 |
The accompanying Notes to Financial Statements are an integral part of this schedule.
85
Small Cap Index Fund
Schedule of Investments as of October 31, 2008
| | | | | |
| Shares | | Common Stock (97.4%) | | Value |
| Information Technology (15.7%) - continued | | | |
| 1,700 | | Cabot Microelectronics Corporationa | | $ | 48,841 |
| 2,200 | | CACI International, Inc.a | | | 90,596 |
| 600 | | Catapult Communications Corporationa | | | 2,562 |
| 2,800 | | Checkpoint Systems, Inc.a | | | 35,308 |
| 3,900 | | CIBER, Inc.a | | | 21,060 |
| 3,100 | | Cognex Corporation | | | 49,662 |
| 1,700 | | Cohu, Inc. | | | 24,038 |
| 1,800 | | Comtech Telecommunications Corporationa | | | 87,156 |
| 3,100 | | Concur Technologies, Inc.a | | | 78,213 |
| 2,500 | | CSG Systems International, Inc.a | | | 41,575 |
| 2,500 | | CTS Corporation | | | 17,475 |
| 5,054 | | CyberSource Corporationa | | | 61,406 |
| 2,200 | | Cymer, Inc.a | | | 53,834 |
| 11,700 | | Cypress Semiconductor Corporationa | | | 58,617 |
| 2,500 | | Daktronics, Inc.c | | | 24,900 |
| 3,000 | | DealerTrack Holdings, Inc.a | | | 32,190 |
| 1,900 | | Digi International, Inc.a | | | 19,456 |
| 2,350 | | Diodes, Inc.a | | | 23,218 |
| 2,000 | | DSP Group, Inc.a | | | 12,600 |
| 2,000 | | Electro Scientific Industries, Inc.a | | | 16,740 |
| 1,200 | | EMS Technologies, Inc.a | | | 25,080 |
| 4,300 | | Epicor Software Corporationa | | | 30,315 |
| 2,600 | | EPIQ Systems, Inc.a,c | | | 35,334 |
| 3,100 | | Exar Corporationa | | | 20,708 |
| 1,200 | | Faro Technologies, Inc.a | | | 18,204 |
| 2,700 | | FEI Companya | | | 56,727 |
| 1,700 | | Gerber Scientific, Inc.a | | | 8,126 |
| 1,700 | | Gevity HR, Inc. | | | 5,797 |
| 6,900 | | Harmonic, Inc.a | | | 49,059 |
| 1,800 | | Heartland Payment Systems, Inc.c | | | 31,338 |
| 1,700 | | Hutchinson Technology, Inc.a | | | 11,628 |
| 6,500 | | Informatica Corporationa | | | 91,325 |
| 2,500 | | InfoSpace, Inc. | | | 21,425 |
| 3,350 | | Insight Enterprises, Inc.a | | | 32,596 |
| 1,200 | | Integral Systems, Inc.a | | | 29,484 |
| 1,600 | | Intevac, Inc.a | | | 12,448 |
| 2,500 | | Itron, Inc.a,c | | | 121,200 |
| 3,200 | | J2 Global Communication, Inc.a | | | 51,584 |
| 2,000 | | JDA Software Group, Inc.a | | | 28,560 |
| 1,000 | | Keithley Instruments, Inc. | | | 4,250 |
| 2,100 | | Knot, Inc.a,c | | | 14,490 |
| 4,900 | | Kopin Corporationa | | | 11,368 |
| 3,900 | | Kulicke and Soffa Industries, Inc.a | | | 11,466 |
| 1,600 | | Littelfuse, Inc.a | | | 29,856 |
| 1,300 | | LoJack Corporationa | | | 5,681 |
| 1,800 | | Manhattan Associates, Inc.a | | | 30,258 |
| 1,500 | | ManTech International Corporationa | | | 80,910 |
| 1,400 | | MAXIMUS, Inc. | | | 44,716 |
| 1,700 | | Mercury Computer Systems, Inc.a | | | 12,206 |
| 2,800 | | Methode Electronics, Inc. | | | 21,252 |
| 3,600 | | Micrel, Inc. | | | 26,460 |
| 5,900 | | MICROS Systems, Inc.a | | | 100,477 |
| 5,800 | | Microsemi Corporationa | | | 126,092 |
| 3,600 | | MKS Instruments, Inc.a | | | 66,780 |
| 1,200 | | MTS Systems Corporation | | | 38,976 |
| 2,600 | | NETGEAR, Inc.a | | | 28,730 |
| 2,100 | | Network Equipment Technologies, Inc.a | | | 5,733 |
| 2,600 | | Newport Corporationa | | | 18,694 |
| 2,300 | | Novatel Wireless, Inc.a | | | 11,983 |
| 1,500 | | Park Electrochemical Corporation | | | 32,430 |
| 1,400 | | PC TEL, Inc. | | | 8,218 |
| 2,300 | | Perficient, Inc.a | | | 12,627 |
| 1,800 | | Pericom Semiconductor Corporationa | | | 14,040 |
| 2,000 | | Phoenix Technologies, Ltd.a | | | 8,840 |
| 3,100 | | Photronics, Inc.a | | | 2,139 |
| 2,900 | | Plexus Corporationa | | | 54,114 |
| 3,000 | | Progress Software Corporationa | | | 68,820 |
| 1,300 | | Quality Systems, Inc.c | | | 50,037 |
| 2,000 | | Radiant Systems, Inc.a | | | 10,540 |
| 1,600 | | RadiSys Corporationa | | | 10,192 |
| 1,300 | | Rogers Corporationa | | | 39,130 |
| 2,200 | | Rudolph Technologies, Inc.a | | | 7,370 |
| 1,900 | | ScanSource, Inc.a | | | 37,696 |
| 5,000 | | Secure Computing Corporationa | | | 28,300 |
| 1,000 | | SI International, Inc.a | | | 28,800 |
| 12,000 | | Skyworks Solutions, Inc.a | | | 85,560 |
| 2,000 | | Smith Micro Software, Inc.a | | | 12,500 |
| 1,900 | | Sonic Solutions, Inc.a,c | | | 3,876 |
| 1,300 | | SPSS, Inc.a | | | 30,368 |
| 1,600 | | Standard Microsystems Corporationa | | | 28,816 |
| 800 | | StarTek, Inc.a | | | 2,648 |
| 1,500 | | Stratasys, Inc.a,c | | | 18,120 |
| 900 | | Supertex, Inc.a | | | 21,708 |
| 3,250 | | Symmetricom, Inc.a | | | 14,463 |
| 2,450 | | Synaptics, Inc.a,c | | | 75,680 |
| 1,400 | | Synnex Corporationa | | | 21,602 |
| 5,650 | | Take-Two Interactive Software, Inc.a | | | 67,009 |
| 2,300 | | Taleo Corporationa | | | 31,740 |
| 3,000 | | Technitrol, Inc. | | | 17,310 |
| 4,800 | | Tekelec, Inc.a | | | 60,912 |
| 4,900 | | THQ, Inc.a | | | 36,505 |
| 1,000 | | Tollgrade Communications, Inc.a | | | 4,400 |
| 10,600 | | TriQuint Semiconductor, Inc.a | | | 47,488 |
| 3,100 | | TTM Technologies, Inc.a | | | 22,196 |
| 2,300 | | Tyler Technologies, Inc.a | | | 31,257 |
| 1,700 | | Ultratech, Inc.a | | | 25,636 |
| 5,900 | | United Online, Inc. | | | 43,660 |
| 5,275 | | Varian Semiconductor Equipment Associates, Inc.a | | | 103,495 |
| 2,300 | | Veeco Instruments, Inc.a | | | 17,802 |
| 2,000 | | ViaSat, Inc.a | | | 36,440 |
| 3,300 | | Websense, Inc.a | | | 64,416 |
| 2,800 | | Wright Express Corporationa | | | 38,332 |
| | | | | |
| | Total Information Technology | | | 4,122,209 |
| | | | | |
| Materials (3.4%) | | | |
| 1,900 | | A. Schulman, Inc. | | | 34,029 |
| 1,200 | | A.M. Castle & Company | | | 14,604 |
| 1,600 | | AMCOL International Corporation | | | 39,248 |
| 1,800 | | Arch Chemicals, Inc. | | | 51,066 |
| 1,300 | | Balchem Corporation | | | 33,228 |
| 1,500 | | Brush Engineered Materials, Inc.a | | | 18,405 |
| 2,900 | | Buckeye Technologies, Inc.a | | | 17,081 |
| 3,600 | | Calgon Carbon Corporationa | | | 47,952 |
| 2,700 | | Century Aluminum Companya | | | 33,939 |
The accompanying Notes to the Financial Statements are an integral part of this schedule.
86
Small Cap Index Fund
Schedule of Investments as of October 31, 2008
| | | | | | |
| Shares | | Common Stock (97.4%) | | Value | |
| Materials (3.4%) - continued | | | | |
| 800 | | Deltic Timber Corporation | | $ | 36,440 | |
| 2,200 | | Georgia Gulf Corporation | | | 5,060 | |
| 3,500 | | H.B. Fuller Company | | | 61,845 | |
| 3,100 | | Headwaters, Inc.a | | | 32,860 | |
| 900 | | Material Sciences Corporationa | | | 4,437 | |
| 2,098 | | Myers Industries, Inc. | | | 22,176 | |
| 1,100 | | Neenah Paper, Inc. | | | 9,933 | |
| 900 | | NewMarket Corporation | | | 33,921 | |
| 700 | | Olympic Steel, Inc. | | | 16,002 | |
| 2,200 | | OM Group, Inc.a | | | 46,948 | |
| 800 | | Penford Corporation | | | 10,296 | |
| 6,800 | | PolyOne Corporationa | | | 32,300 | |
| 800 | | Quaker Chemical Corporation | | | 15,304 | |
| 2,800 | | Rock-Tenn Company | | | 85,148 | |
| 1,700 | | RTI International Metals, Inc.a,c | | | 26,843 | |
| 1,100 | | Schweitzer-Mauduit International, Inc. | | | 18,392 | |
| 500 | | Stepan Company | | | 17,915 | |
| 2,000 | | Texas Industries, Inc.c | | | 63,260 | |
| 3,600 | | Wausau Paper Corporation | | | 33,336 | |
| 1,500 | | Zep, Inc. | | | 31,575 | |
| | | | | | |
| | Total Materials | | | 893,543 | |
| | | | | | |
| Telecommunications Services (0.2%) | | | | |
| 6,500 | | FairPoint Communications, Inc. | | | 25,870 | |
| 3,200 | | General Communication, Inc.a | | | 24,576 | |
| | | | | | |
| | Total Telecommunications Services | | | 50,446 | |
| | | | | | |
| Utilities (5.1%) | | | | |
| 1,900 | | ALLETE, Inc.b | | | 66,500 | |
| 1,300 | | American States Water Company | | | 44,473 | |
| 6,600 | | Atmos Energy Corporation | | | 160,182 | |
| 3,900 | | Avista Corporation | | | 77,454 | |
| 800 | | Central Vermont Public Service Corporationc | | | 15,928 | |
| 1,200 | | CH Energy Group, Inc. | | | 49,476 | |
| 4,400 | | Cleco Corporation | | | 101,244 | |
| 3,300 | | El Paso Electric Companya | | | 61,116 | |
| 1,600 | | Laclede Group, Inc. | | | 83,712 | |
| 3,100 | | New Jersey Resources Corporation | | | 115,444 | |
| 1,900 | | Northwest Natural Gas Companyc | | | 96,672 | |
| 5,300 | | Piedmont Natural Gas Company, Inc.c | | | 174,476 | |
| 2,200 | | South Jersey Industries, Inc. | | | 74,954 | |
| 3,200 | | Southwest Gas Corporation | | | 83,584 | |
| 1,799 | | UIL Holdings Corporation | | | 59,367 | |
| 2,600 | | UniSource Energy Corporation | | | 71,708 | |
| | | | | | |
| | Total Utilities | | | 1,336,290 | |
| | | | | | |
| | Total Common Stock (cost $28,211,854) | | | 25,608,468 | |
| | | | | | |
| | |
| | | Collateral Held for Securities Loaned (13.0%)d | | | |
| 3,416,960 | | Thrivent Financial Securities Lending Trust | | | 3,416,960 | |
| | | | | | |
| | Total Collateral Held for Securities Loaned (cost $3,416,960) | | | 3,416,960 | |
| | | | | | |
| | |
Shares or
Principal
Amount | | Short-Term Investments
(1.8%)d | | | |
| | Federal National Mortgage Association Discount Notes | | | | |
| 100,000 | | 2.100%, 12/10/2008e | | $ | 99,775 | |
| 372,839 | | Thrivent Money Market Fund | | | 372,839 | |
| | | | | | |
| | Total Short-Term Investments (at amortized cost) | | | 472,614 | |
| | | | | | |
| | Total Investments (cost $32,101,428) 112.2% | | $ | 29,498,042 | |
| | | | | | |
| | Other Assets and Liabilities, Net (12.2%) | | | (3,217,789 | ) |
| | | | | | |
| | Total Net Assets 100.0% | | $ | 26,280,253 | |
| | | | | | |
| a | Non-income producing security. |
| b | At October 31, 2008, $766,042 of investments were earmarked to cover open financial futures contracts. |
| c | All or a portion of the security is on loan as discussed in item 2(M) of the Notes to Financial Statements. |
| d | The interest rate shown reflects the yield, coupon rate or, for securities purchased at a discount, the discount rate at the date of purchase. |
| e | At October 31, 2008, $99,775 of investments were held on deposit with the counterparty and pledged as the initial margin deposit for open financial futures contracts. |
Gross unrealized appreciation and depreciation of investments, based on cost for federal income tax purposes, were as follows:
| | | | |
Gross unrealized appreciation | | $ | 4,891,771 | |
Gross unrealized depreciation | | | (8,121,402 | ) |
| | | | |
Net unrealized appreciation (depreciation) | | | ($3,229,631 | ) |
Cost for federal income tax purposes | | $ | 32,727,673 | |
The accompanying Notes to Financial Statements are an integral part of this schedule.
87
Small Cap Index Fund
Schedule of Investments as of October 31, 2008
| | | | | | | | | | | | | |
Futures | | Number of
Contracts
Long/(Short) | | Expiration Date | | Notional
Principal
Amount | | Value | | Unrealized
Gain/
(Loss) |
Russell 2000 Index Mini-Futures | | 13 | | December 2008 | | $ | 686,666 | | $ | 697,450 | | $ | 10,784 |
Total Futures | | | | | | | | | | | | $ | 10,784 |
Investment in Affiliates
Affiliated issuers, as defined under the Investment Company Act of 1940, include those in which the Fund’s holdings of an issuer represent 5% or more of the outstanding voting securities of an issuer, or any affiliated mutual fund.
A summary of transactions for the fiscal year to date, in Small Cap Index Fund, is as follows:
| | | | | | | | | | | | | | | | | |
Fund | | Value
October 31,
2007 | | Gross
Purchases and
Additions | | Gross Sales
and
Reductions | | Balance of
Shares Held at
October 31,
2008 | | Value
October 31,
2008 | | Income Earned
November 1, 2007-
October 31, 2008 |
Money Market | | $ | 254,837 | | $ | 8,765,523 | | $ | 8,647,521 | | 372,839 | | $ | 372,839 | | $ | 29,433 |
Thrivent Financial Securities | | | | | | | | | | | | | | | | | |
Lending Trust | | | 7,664,789 | | | 18,873,140 | | | 23,120,969 | | 3,416,960 | | | 3,416,960 | | | 107,774 |
Total Value and Dividend Income | | | 7,919,626 | | | | | | | | | | | 3,789,799 | | | 137,207 |
The accompanying Notes to the Financial Statements are an integral part of this schedule.
88
Mid Cap Growth Fund
Schedule of Investments as of October 31, 2008
| | | | | |
| Shares | | Common Stock (96.5%) | | Value |
| Consumer Discretionary (18.2%) | | | |
| 6,345 | | Ascent Media Corporationa | | $ | 160,465 |
| 41,000 | | Bed Bath & Beyond, Inc.a | | | 1,056,570 |
| 202,800 | | Burger King Holdings, Inc. | | | 4,031,664 |
| 22,800 | | Central European Media Enterprises, Ltd.a,b | | | 608,988 |
| 390,900 | | Chico’s FAS, Inc.a,b | | | 1,329,060 |
| 540,050 | | Coldwater Creek, Inc.a,b | | | 1,938,779 |
| 140,200 | | Corinthian Colleges, Inc.a,b | | | 2,002,056 |
| 72,500 | | DeVry, Inc. | | | 4,110,025 |
| 63,450 | | Discovery Communications, Inc.a | | | 865,458 |
| 63,450 | | Discovery Communications, Inc.a | | | 845,154 |
| 125,000 | | Gentex Corporation | | | 1,198,750 |
| 195,900 | | Goodyear Tire & Rubber Companya | | | 1,747,428 |
| 26,400 | | Guess ?, Inc. | | | 574,728 |
| 63,300 | | Harley-Davidson, Inc.b | | | 1,549,584 |
| 33,300 | | Hasbro, Inc. | | | 968,031 |
| 75,600 | | International Game Technology | | | 1,058,400 |
| 32,100 | | ITT Educational Services, Inc.a | | | 2,813,565 |
| 71,700 | | Jack in the Box, Inc.a | | | 1,441,170 |
| 162,800 | | Leapfrog Enterprises, Inc.a,b | | | 1,098,900 |
| 61,100 | | Marvel Entertainment, Inc.a,b | | | 1,966,809 |
| 192,100 | | Quiksilver, Inc.a | | | 497,539 |
| 182,500 | | Texas Roadhouse, Inc.a,b | | | 1,281,150 |
| 21,300 | | VF Corporation | | | 1,173,630 |
| 139,500 | | WMS Industries, Inc.a | | | 3,487,500 |
| 139,700 | | Zumiez, Inc.a,b | | | 1,363,472 |
| | | | | |
| | Total Consumer Discretionary | | | 39,168,875 |
| | | | | |
| Consumer Staples (1.4%) | | | |
| 68,200 | | Coca-Cola Enterprises, Inc. | | | 685,410 |
| 39,100 | | Green Mountain Coffee Roasters, Inc.a,b | | | 1,133,509 |
| 49,700 | | Pepsi Bottling Group, Inc. | | | 1,149,064 |
| | | | | |
| | Total Consumer Staples | | | 2,967,983 |
| | | | | |
| Energy (8.7%) | | | |
| 38,800 | | Cameron International | | | |
| | Corporationa | | | 941,288 |
| 29,700 | | Diamond Offshore Drilling, Inc. | | | 2,637,360 |
| 92,900 | | Dril-Quip, Inc.a | | | 2,294,630 |
| 72,700 | | Forest Oil Corporationa | | | 2,123,567 |
| 53,600 | | Oil States International, Inc.a | | | 1,239,768 |
| 98,400 | | Petrohawk Energy Corporationa | | | 1,864,680 |
| 67,500 | | Sunoco, Inc.b | | | 2,058,750 |
| 79,100 | | Ultra Petroleum Corporationa | | | 3,682,105 |
| 116,536 | | Willbros Group, Inc.a,b | | | 1,805,143 |
| | | | | |
| | Total Energy | | | 18,647,291 |
| | | | | |
| Financials (6.2%) | | | |
| 147,800 | | Hudson City Bancorp, Inc. | | | 2,780,118 |
| 9,700 | | IntercontinentalExchange, Inc.a | | | 829,932 |
| 70,300 | | Lazard, Ltd. | | | 2,120,951 |
| 118,300 | | New York Community Bancorp, Inc.b | | | 1,852,578 |
| 92,100 | | T. Rowe Price Group, Inc. | | | 3,641,634 |
| 167,600 | | TD Ameritrade Holding Corporationa | | | 2,227,404 |
| | | | | |
| | Total Financials | | | 13,452,617 |
| | | | | |
| Health Care (15.2%) | | | |
| 62,100 | | Alkermes, Inc.a,b | | | 613,548 |
| 69,200 | | Amylin Pharmaceuticals, Inc.a,b | | | 706,532 |
| 26,000 | | Beckman Coulter, Inc. | | | 1,297,920 |
| 92,100 | | BioMarin Pharmaceutical, Inc.a,b | | | 1,687,272 |
| 45,800 | | C.R. Bard, Inc. | | | 4,041,851 |
| 34,800 | | Cephalon, Inc.a,b | | | 2,495,856 |
| 23,200 | | Express Scripts, Inc.a | | | 1,406,152 |
| 40,300 | | Genzyme Corporationa | | | 2,937,064 |
| 81,000 | | Hologic, Inc.a | | | 991,440 |
| 114,300 | | Illumina, Inc.a,b | | | 3,523,869 |
| 43,000 | | Millipore Corporationa | | | 2,231,270 |
| 49,300 | | Myriad Genetics, Inc.a,b | | | 3,110,337 |
| 67,900 | | NuVasive, Inc.a,b | | | 3,197,411 |
| 39,500 | | Shire Pharmaceuticals Group plc | | | |
| | ADR | | | 1,558,275 |
| 22,300 | | United Therapeutics Corporationa | | | 1,945,229 |
| 22,718 | | Waters Corporationa | | | 995,048 |
| | | | | |
| | Total Health Care | | | 32,739,074 |
| | | | | |
| Industrials (13.7%) | | | |
| 232,800 | | AMR Corporationa,b | | | 2,376,888 |
| 118,500 | | BE Aerospace, Inc.a | | | 1,525,095 |
| 50,500 | | C.H. Robinson Worldwide, Inc. | | | 2,614,890 |
| 62,800 | | Evergreen Solar, Inc.a,b | | | 238,012 |
| 35,040 | | Expeditors International of Washington, Inc. | | | 1,144,056 |
| 26,600 | | Flowserve Corporation | | | 1,514,072 |
| 68,300 | | Foster Wheeler, Ltd.a | | | 1,871,420 |
| 18,800 | | FTI Consulting, Inc.a | | | 1,095,100 |
| 15,000 | | Huron Consulting Group, Inc.a | | | 815,550 |
| 71,200 | | JB Hunt Transport Services, Inc.b | | | 2,024,216 |
| 19,900 | | Joy Global, Inc. | | | 576,702 |
| 97,600 | | Monster Worldwide, Inc.a | | | 1,389,824 |
| 57,000 | | Pentair, Inc.b | | | 1,575,480 |
| 33,600 | | Precision Castparts Corporation | | | 2,177,616 |
| 106,200 | | Quanta Services, Inc.a | | | 2,098,512 |
| 15,400 | | Rockwell Collins, Inc. | | | 573,342 |
| 26,300 | | Roper Industries, Inc. | | | 1,192,705 |
| 85,100 | | Ryanair Holdings plca,b | | | 1,895,177 |
| 39,700 | | Stericycle, Inc.a | | | 2,319,671 |
| 14,700 | | SunPower Corporationa,b | | | 574,182 |
| | | | | |
| | Total Industrials | | | 29,592,510 |
| | | | | |
| Information Technology (23.4%) | | | |
| 408,000 | | Activision Blizzard, Inc.a | | | 5,083,680 |
| 80,774 | | Akamai Technologies, Inc.a | | | 1,161,530 |
| 95,600 | | ASML Holding NV ADR | | | 1,677,780 |
| 176,800 | | Broadcom Corporationa | | | 3,019,744 |
| 58,900 | | Electronic Arts, Inc.a | | | 1,341,742 |
| 158,800 | | F5 Networks, Inc.a | | | 3,941,416 |
| 114,700 | | FormFactor, Inc.a,b | | | 1,998,074 |
| 66,900 | | Hewitt Associates, Inc.a | | | 1,865,841 |
| 61,600 | | Hittite Microwave Corporationa | | | 2,018,632 |
| 94,700 | | Intersil Corporation | | | 1,296,443 |
| 372,500 | | Marvell Technology Group, Ltd.a | | | 2,592,600 |
| 81,700 | | Maxim Integrated Products, Inc. | | | 1,111,120 |
| 111,901 | | Mercadolibre, Inc.a,b | | | 1,529,687 |
| 74,200 | | Molex, Inc. | | | 1,069,222 |
| 125,100 | | NETAPP, Inc.a | | | 1,692,603 |
| 56,700 | | Nuance Communications, Inc.a,b | | | 518,805 |
| 328,300 | | NVIDIA Corporationa | | | 2,875,908 |
| 144,500 | | Omniture, Inc.a,b | | | 1,661,750 |
| 223,600 | | PMC-Sierra, Inc.a | | | 1,046,448 |
The accompanying Notes to Financial Statements are an integral part of this schedule.
89
Mid Cap Growth Fund
Schedule of Investments as of October 31, 2008
| | | | | | |
| Shares | | Common Stock (96.5%) | | Value | |
| Information Technology (23.4%) - continued | | | | |
| 66,200 | | Polycom, Inc.a | | $ | 1,390,862 | |
| 534,100 | | RF Micro Devices, Inc.a,b | | | 1,062,859 | |
| 183,000 | | Seagate Technology | | | 1,238,910 | |
| 73,200 | | Synaptics, Inc.a,b | | | 2,261,148 | |
| 135,200 | | Synopsys, Inc.a | | | 2,471,456 | |
| 257,300 | | Tellabs, Inc.a | | | 1,090,952 | |
| 65,900 | | Tyco Electronics, Ltd. | | | 1,281,096 | |
| 57,900 | | VeriSign, Inc.a | | | 1,227,480 | |
| 29,700 | | VMware, Inc.a,b | | | 920,700 | |
| | | | | | |
| | Total Information Technology | | | 50,448,488 | |
| | | | | | |
| Materials (5.4%) | | | | |
| 32,000 | | Albemarle Corporation | | | 779,200 | |
| 56,400 | | Bemis Company, Inc. | | | 1,400,976 | |
| 73,800 | | Celanese Corporation | | | 1,022,868 | |
| 117,400 | | Owens-Illinois, Inc.a | | | 2,686,112 | |
| 149,900 | | Pactiv Corporationa | | | 3,531,644 | |
| 68,500 | | Rockwood Holdings, Inc.a | | | 845,975 | |
| 40,400 | | Steel Dynamics, Inc. | | | 481,568 | |
| 22,300 | | United States Steel Corporation | | | 822,424 | |
| | | | | | |
| | Total Materials | | | 11,570,767 | |
| | | | | | |
| Telecommunications Services (4.3%) | | | | |
| 70,410 | | American Tower Corporationa | | | 2,274,947 | |
| 76,300 | | Clearwire Corporationa,b | | | 661,521 | |
| 94,300 | | NII Holdings, Inc.a | | | 2,429,168 | |
| 109,900 | | SBA Communications Corporationa,b | | | 2,306,801 | |
| 212,200 | | TW Telecom, Inc.a,b | | | 1,502,376 | |
| | | | | | |
| | Total Telecommunications Services | | | 9,174,813 | |
| | | | | | |
| | Total Common Stock (cost $282,844,532) | | | 207,762,418 | |
| | | | | | |
| | Collateral Held for Securities Loaned (20.4%)c | | | | |
| 43,949,649 | | Thrivent Financial Securities Lending Trust | | | 43,949,649 | |
| | | | | | |
| | Total Collateral Held for Securities Loaned (cost $43,949,649) | | | 43,949,649 | |
| | | | | | |
| | Short-Term Investments (3.6%)c | | | | |
| 7,673,664 | | Thrivent Money Market Fund | | | 7,673,664 | |
| | | | | | |
| | Total Short-Term Investments (at amortized cost) | | | 7,673,664 | |
| | | | | | |
| | Total Investments (cost $334,467,845) 120.5% | | $ | 259,385,731 | |
| | | | | | |
| | Other Assets and Liabilities, Net (20.5%) | | | (44,090,845 | ) |
| | | | | | |
| | Total Net Assets 100.0% | | $ | 215,294,886 | |
| | | | | | |
| a | Non-income producing security. |
| b | All or a portion of the security is on loan as discussed in item 2(M) of the Notes to Financial Statements. |
| c | The interest rate shown reflects the yield, coupon rate or, for securities purchased at a discount, the discount rate at the date of purchase. |
| | | | |
Definitions: |
| | |
| ADR | | - | | American Depositary Receipt, which are certificates for an underlying foreign security’s shares held by an issuing U.S. depository bank. |
Gross unrealized appreciation and depreciation of investments, based on cost for federal income tax purposes, were as follows:
| | | | |
Gross unrealized appreciation | | $ | 14,726,129 | |
Gross unrealized depreciation | | | (90,676,183 | ) |
| | | | |
Net unrealized appreciation (depreciation) | | | ($75,950,054 | ) |
Cost for federal income tax purposes | | $ | 335,335,785 | |
The accompanying Notes to the Financial Statements are an integral part of this schedule.
90
Mid Cap Growth Fund
Schedule of Investments as of October 31, 2008
Investment in Affiliates
Affiliated issuers, as defined under the Investment Company Act of 1940, include those in which the Fund’s holdings of an issuer represent 5% or more of the outstanding voting securities of an issuer, or any affiliated mutual fund.
A summary of transactions for the fiscal year to date, in Mid Cap Growth Fund, is as follows:
| | | | | | | | | | | | | | | | | |
Fund | | Value
October 31,
2007 | | Gross
Purchases and
Additions | | Gross Sales and
Reductions | | Balance of
Shares Held at
October 31,
2008 | | Value
October 31, 2008 | | Income Earned
November 1, 2007-
October 31, 2008 |
Money Market | | $ | 19,343,238 | | $ | 89,368,399 | | $ | 101,037,973 | | 7,673,664 | | $ | 7,673,664 | | $ | 618,081 |
Thrivent Financial Securities Lending Trust | | | 89,916,284 | | | 283,291,960 | | | 329,258,595 | | 43,949,649 | | | 43,949,649 | | | 510,477 |
Total Value and Dividend Income | | | 109,259,522 | | | | | | | | | | | 51,623,313 | | | 1,128,558 |
The accompanying Notes to Financial Statements are an integral part of this schedule.
91
Partner Mid Cap Value Fund
Schedule of Investments as of October 31, 2008
| | | | | |
Shares | | Common Stock (91.5%) | | Value |
Consumer Discretionary (12.3%) | | | |
| 5,432 | | AutoZone, Inc.a | | $ | 691,439 |
| 8,779 | | BorgWarner, Inc. | | | 197,264 |
| 29,760 | | DISH Network Corporationa | | | 468,422 |
| 21,377 | | Fortune Brands, Inc. | | | 815,319 |
| 72,263 | | H&R Block, Inc. | | | 1,425,026 |
| 7,249 | | J.C. Penney Company, Inc. | | | 173,396 |
| 25,397 | | Johnson Controls, Inc. | | | 450,289 |
| 22,399 | | Kohl’s Corporationa | | | 786,877 |
| 7,754 | | M.D.C. Holdings, Inc. | | | 260,767 |
| 29,270 | | Mattel, Inc. | | | 439,635 |
| 62,980 | | Newell Rubbermaid, Inc. | | | 865,975 |
| 1,147 | | NVR, Inc.a,b | | | 562,271 |
| 16,642 | | Ross Stores, Inc. | | | 544,027 |
| 30,043 | | TJX Companies, Inc. | | | 803,951 |
| 49,130 | | Viacom, Inc.a | | | 993,409 |
| | | | | |
| | Total Consumer Discretionary | | | 9,478,067 |
| | | | | |
Consumer Staples (6.7%) | | | |
| 15,326 | | Campbell Soup Company | | | 581,622 |
| 23,096 | | Clorox Company | | | 1,404,468 |
| 18,106 | | Coca-Cola Enterprises, Inc. | | | 181,965 |
| 50,455 | | ConAgra Foods, Inc. | | | 878,926 |
| 3,444 | | Energizer Holdings, Inc.a | | | 168,274 |
| 1,837 | | General Mills, Inc. | | | 124,438 |
| 5,540 | | Herbalife, Ltd. | | | 135,342 |
| 5,357 | | Lorillard, Inc. | | | 352,812 |
| 6,405 | | Reynolds American, Inc. | | | 313,589 |
| 22,175 | | Safeway, Inc. | | | 471,662 |
| 36,025 | | SUPERVALU, Inc. | | | 512,996 |
| | | | | |
| | Total Consumer Staples | | | 5,126,094 |
| | | | | |
Energy (8.6%) | | | |
| 20,363 | | Dril-Quip, Inc.a | | | 502,966 |
| 17,209 | | EOG Resources, Inc. | | | 1,392,552 |
| 9,470 | | Frontier Oil Corporation | | | 125,099 |
| 53,427 | | Newfield Exploration Companya | | | 1,227,752 |
| 28,145 | | Range Resources Corporation | | | 1,188,282 |
| 28,652 | | Smith International, Inc. | | | 987,917 |
| 54,880 | | Williams Companies, Inc. | | | 1,150,834 |
| | | | | |
| | Total Energy | | | 6,575,402 |
| | | | | |
Financials (25.5%) | | | |
| 12,664 | | Alexandria Real Estate Equities, Inc. | | | 880,401 |
| 16,880 | | Aon Corporation | | | 714,024 |
| 8,260 | | Arch Capital Group, Ltd.a | | | 576,135 |
| 12,529 | | Assurant, Inc. | | | 319,239 |
| 27,951 | | CIT Group, Inc.b | | | 115,717 |
| 19,260 | | Commerce Bancshares, Inc. | | | 910,613 |
| 18,614 | | Digital Realty Trust, Inc.b | | | 623,197 |
| 9,520 | | Essex Property Trust, Inc. | | | 926,296 |
| 15,659 | | Everest Re Group, Ltd. | | | 1,169,727 |
| 32,531 | | Genworth Financial, Inc. | | | 157,450 |
| 33,790 | | Health Care Property Investors, Inc. | | | 1,011,335 |
| 33,295 | | Hudson City Bancorp, Inc. | | | 626,279 |
| 28,136 | | Huntington Bancshares, Inc.b | | | 265,885 |
| 47,792 | | Invesco, Ltd. | | | 712,579 |
| 7,817 | | Lazard, Ltd. | | | 235,839 |
| 18,228 | | Lincoln National Corporation | | | 314,251 |
| 8,098 | | M&T Bank Corporationb | | | 656,748 |
| 32,415 | | Marsh & McLennan Companies, Inc. | | | 950,408 |
| 14,530 | | Nasdaq OMX Group, Inc.a | | | 471,644 |
| 14,458 | | Northern Trust Corporation | | | 814,130 |
| 12,429 | | PartnerRe, Ltd. | | | 841,319 |
| 47,925 | | People’s United Financial, Inc. | | | 838,687 |
| 10,184 | | Principal Financial Group, Inc. | | | 193,394 |
| 63,963 | | Progressive Corporation | | | 912,752 |
| 9,180 | | RenaissanceRe Holdings, Ltd. | | | 421,362 |
| 40,764 | | SLM Corporationa | | | 434,952 |
| 24,560 | | Synovus Financial Corporationb | | | 253,705 |
| 9,199 | | Torchmark Corporation | | | 384,242 |
| 25,438 | | UnumProvident Corporation | | | 400,648 |
| 58,197 | | W.R. Berkley Corporation | | | 1,528,835 |
| 33,521 | | Willis Group Holdings, Ltd. | | | 879,591 |
| | | | | |
| | Total Financials | | | 19,541,384 |
| | | | | |
Health Care (6.6%) | | | |
| 5,154 | | Coventry Health Care, Inc.a | | | 67,981 |
| 12,462 | | Edwards Lifesciences Corporationa | | | 658,492 |
| 5,713 | | Health Net, Inc.a | | | 73,583 |
| 39,442 | | IMS Health, Inc. | | | 565,598 |
| 24,199 | | Kinetic Concepts, Inc.a,b | | | 585,858 |
| 21,985 | | Laboratory Corporation of America Holdingsa | | | 1,351,858 |
| 4,770 | | Patterson Companies, Inc.a | | | 120,824 |
| 17,686 | | PerkinElmer, Inc. | | | 317,287 |
| 21,710 | | WellPoint, Inc.a | | | 843,868 |
| 10,798 | | Zimmer Holdings, Inc.a | | | 501,351 |
| | | | | |
| | Total Health Care | | | 5,086,700 |
| | | | | |
Industrials (7.9%) | | | |
| 5,233 | | Alliant Techsystems, Inc.a | | | 431,199 |
| 99,824 | | Allied Waste Industries, Inc.a | | | 1,040,166 |
| 12,415 | | Cooper Industries, Ltd. | | | 384,244 |
| 6,987 | | Eaton Corporation | | | 311,620 |
| 5,724 | | Ingersoll-Rand Company | | | 105,608 |
| 40,823 | | Iron Mountain, Inc.a | | | 991,183 |
| 20,003 | | Landstar System, Inc. | | | 771,916 |
| 4,842 | | Lennox International, Inc. | | | 144,389 |
| 10,886 | | Parker-Hannifin Corporation | | | 422,050 |
| 20,890 | | Republic Services, Inc. | | | 495,093 |
| 14,597 | | Ryder System, Inc.b | | | 578,333 |
| 30,330 | | Southwest Airlines Company | | | 357,287 |
| | | | | |
| | Total Industrials | | | 6,033,088 |
| | | | | |
Information Technology (4.5%) | | | |
| 49,216 | | Activision Blizzard, Inc.a | | | 613,231 |
| 54,045 | | Amphenol Corporation | | | 1,548,389 |
| 28,066 | | Autodesk, Inc.a | | | 598,087 |
| 48,998 | | CommScope, Inc.a | | | 720,761 |
| | | | | |
| | Total Information Technology | | | 3,480,468 |
| | | | | |
Materials (3.7%) | | | |
| 19,030 | | Air Products and Chemicals, Inc. | | | 1,106,214 |
| 32,437 | | Albemarle Corporation | | | 789,841 |
| 6,856 | | Carpenter Technology Corporation | | | 124,094 |
| 25,090 | | International Paper Company | | | 432,050 |
The accompanying Notes to Financial Statements are an integral part of this schedule.
92
Partner Mid Cap Value Fund
Schedule of Investments as of October 31, 2008
| | | | | | |
Shares | | Common Stock (91.5%) | | Value | |
Materials (3.7%) - continued | | | | |
| 10,292 | | Weyerhaeuser Company | | $ | 393,360 | |
| | | | | | |
| | Total Materials | | | 2,845,559 | |
| | | | | | |
Telecommunications Services (0.7%) | | | | |
| 17,854 | | Embarq Corporation | | | 535,620 | |
| | | | | | |
| | Total Telecommunications Services | | | 535,620 | |
| | | | | | |
Utilities (15.0%) | | | | |
| 32,550 | | American Electric Power Company, Inc. | | | 1,062,106 | |
| 42,653 | | CMS Energy Corporation | | | 437,193 | |
| 55,439 | | DPL, Inc. | | | 1,264,564 | |
| 35,835 | | Edison International, Inc. | | | 1,275,368 | |
| 27,325 | | Entergy Corporation | | | 2,132,715 | |
| 18,120 | | Equitable Resources, Inc. | | | 628,945 | |
| 22,129 | | FirstEnergy Corporation | | | 1,154,249 | |
| 31,277 | | PG&E Corporation | | | 1,146,928 | |
| 58,265 | | PPL Corporation | | | 1,912,257 | |
| 10,259 | | Sempra Energy | | | 436,931 | |
| 2,050 | | Wisconsin Energy Corporation | | | 89,175 | |
| | | | | | |
| | Total Utilities | | | 11,540,431 | |
| | | | | | |
| | Total Common Stock (cost $90,381,827) | | | 70,242,813 | |
| | | | | | |
| | |
| | | Collateral Held for Securities Loaned (3.6%)c | | | |
| 2,746,527 | | Thrivent Financial Securities Lending Trust | | | 2,746,527 | |
| | | | | | |
| | Total Collateral Held for Securities Loaned (cost $2,746,527) | | | 2,746,527 | |
| | | | | | |
| | Short-Term Investments (8.2%)c | | | | |
| 6,327,498 | | Thrivent Money Market Fund | | | 6,327,498 | |
| | Total Short-Term Investments (at amortized cost) | | | 6,327,498 | |
| | | | | | |
| | Total Investments (cost $99,455,852) 103.3% | | $ | 79,316,838 | |
| | | | | | |
| | Other Assets and Liabilities, Net (3.3%) | | | (2,513,332 | ) |
| | | | | | |
| | Total Net Assets 100.0% | | $ | 76,803,506 | |
| | | | | | |
| a | Non-income producing security. |
| b | All or a portion of the security is on loan as discussed in item 2(M) of the Notes to Financial Statements. |
| c | The interest rate shown reflects the yield, coupon rate or, for securities purchased at a discount, the discount rate at the date of purchase. |
Gross unrealized appreciation and depreciation of investments, based on cost for federal income tax purposes, were as follows:
| | | | |
Gross unrealized appreciation | | $ | 1,223,716 | |
Gross unrealized depreciation | | | (23,284,671 | ) |
| | | | |
Net unrealized appreciation (depreciation) | | | ($22,060,955 | ) |
Cost for federal income tax purposes | | $ | 101,377,793 | |
The accompanying Notes to Financial Statements are an integral part of this schedule.
93
Partner Mid Cap Value Fund
Schedule of Investments as of October 31, 2008
Investment in Affiliates
Affiliated issuers, as defined under the Investment Company Act of 1940, include those in which the Fund’s holdings of an issuer represent 5% or more of the outstanding voting securities of an issuer, or any affiliated mutual fund.
A summary of transactions for the fiscal year to date, in Partner Mid Cap Value Fund, is as follows:
| | | | | | | | | | | | | | | | | |
Fund | | Value
October 31,
2007 | | Gross
Purchases and
Additions | | Gross Sales
and
Reductions | | Balance of
Shares Held at
October 31,
2008 | | Value
October 31,
2008 | | Income Earned
November 1, 2007-
October 31, 2008 |
Money Market | | $ | 2,336,105 | | $ | 40,839,635 | | $ | 36,848,242 | | 6,327,498 | | $ | 6,327,498 | | $ | 106,970 |
Thrivent Financial Securities Lending Trust | | | 4,022,546 | | | 58,057,017 | | | 59,333,036 | | 2,746,527 | | | 2,746,527 | | | 33,775 |
Total Value and Dividend Income | | | 6,358,651 | | | | | | | | | | | 9,074,025 | | | 140,745 |
The accompanying Notes to the Financial Statements are an integral part of this schedule.
94
Mid Cap Stock Fund
Schedule of Investments as of October 31, 2008
| | | | | |
| Shares | | Common Stock (97.7%) | | Value |
| Consumer Discretionary (9.8%) | | | |
| 150,100 | | Advance Auto Parts, Inc. | | $ | 4,683,120 |
| 138,800 | | Autoliv, Inc. | | | 2,964,768 |
| 154,800 | | BorgWarner, Inc. | | | 3,478,356 |
| 193,300 | | Burger King Holdings, Inc. | | | 3,842,804 |
| 240,300 | | Dollar Tree, Inc.a | | | 9,136,206 |
| 184,700 | | Fossil, Inc.a,b | | | 3,352,305 |
| 136,900 | | Guess ?, Inc. | | | 2,980,313 |
| 145,600 | | Kohl’s Corporationa | | | 5,114,928 |
| 147,300 | | McGraw-Hill Companies, Inc. | | | 3,953,532 |
| 214,300 | | PetSmart, Inc. | | | 4,219,567 |
| 272,900 | | Ross Stores, Inc. | | | 8,921,101 |
| 207,800 | | Scientific Games Corporationa,b | | | 3,740,400 |
| 176,700 | | TJX Companies, Inc. | | | 4,728,492 |
| 327,900 | | WMS Industries, Inc.a,b | | | 8,197,500 |
| | | | | |
| | Total Consumer Discretionary | | | 69,313,392 |
| | | | | |
| Consumer Staples (6.0%) | | | |
| 67,800 | | Church & Dwight Company, Inc. | | | 4,006,302 |
| 326,900 | | Flowers Foods, Inc. | | | 9,692,585 |
| 189,400 | | Kellogg Company | | | 9,549,548 |
| 179,700 | | Kroger Company | | | 4,934,562 |
| 61,100 | | Ralcorp Holdings, Inc.a | | | 4,135,248 |
| 352,000 | | TreeHouse Foods, Inc.a,b | | | 10,651,520 |
| | | | | |
| | Total Consumer Staples | | | 42,969,765 |
| | | | | |
| Energy (8.8%) | | | |
| 102,900 | | Dril-Quip, Inc.a | | | 2,541,630 |
| 290,900 | | Forest Oil Corporationa | | | 8,497,189 |
| 186,400 | | Holly Corporation | | | 3,659,032 |
| 132,600 | | National Oilwell Varco, Inc.a | | | 3,963,414 |
| 311,400 | | Petrohawk Energy Corporationa | | | 5,901,030 |
| 158,600 | | Range Resources Corporation | | | 6,696,092 |
| 336,700 | | Southwestern Energy Companya | | | 11,993,254 |
| 456,300 | | TETRA Technologies, Inc.a | | | 3,175,848 |
| 193,700 | | Weatherford International, Ltd.a | | | 3,269,656 |
| 307,100 | | Willbros Group, Inc.a,b | | | 4,756,979 |
| 230,700 | | XTO Energy, Inc. | | | 8,293,665 |
| | | | | |
| | Total Energy | | | 62,747,789 |
| | | | | |
| Financials (19.6%) | | | |
| 672,400 | | Colonial BancGroup, Inc.b | | | 2,750,116 |
| 209,395 | | Commerce Bancshares, Inc. | | | 9,900,196 |
| 148,100 | | Cousins Properties, Inc.b | | | 2,144,488 |
| 127,600 | | Cullen/Frost Bankers, Inc.b | | | 7,141,772 |
| 212,500 | | Duke Realty Corporationb | | | 2,998,375 |
| 71,800 | | Eaton Vance Corporation | | | 1,579,600 |
| 160,100 | | Endurance Specialty Holdings, Ltd.b | | | 4,841,424 |
| 271,400 | | Equity One, Inc.b | | | 4,741,358 |
| 119,800 | | Hanover Insurance Group, Inc. | | | 4,702,150 |
| 893,150 | | HCC Insurance Holdings, Inc. | | | 19,702,889 |
| 137,500 | | Lazard, Ltd. | | | 4,148,375 |
| 397,400 | | Marshall & Ilsley Corporationb | | | 7,165,122 |
| 776,900 | | MGIC Investment Corporationb | | | 3,014,372 |
| 718,479 | | New York Community Bancorp, Inc.b | | | 11,251,381 |
| 111,500 | | PartnerRe, Ltd. | | | 7,547,435 |
| 168,200 | | Raymond James Financial, Inc.b | | | 3,917,378 |
| 181,400 | | Rayonier, Inc. REIT | | | 6,000,712 |
| 838,300 | | U-Store-It Trust | | | 5,750,738 |
| 666,050 | | W.R. Berkley Corporation | | | 17,497,133 |
| 91,500 | | Westamerica Bancorporationb | | | 5,238,375 |
| 177,400 | | Zions Bancorporationb | | | 6,760,714 |
| | | | | |
| | Total Financials | | | 138,794,103 |
| | | | | |
| Health Care (11.0%) | | | |
| 138,900 | | AmerisourceBergen Corporation | | | 4,343,403 |
| 113,600 | | Beckman Coulter, Inc. | | | 5,670,912 |
| 162,600 | | BioMarin Pharmaceutical, Inc.a,b | | | 2,978,832 |
| 132,500 | | C.R. Bard, Inc. | | | 11,693,125 |
| 280,600 | | Celera Corporationa,b | | | 3,173,586 |
| 357,300 | | Community Health Systems, Inc.a | | | 7,324,650 |
| 130,200 | | Coventry Health Care, Inc.a | | | 1,717,338 |
| 95,000 | | DaVita, Inc.a | | | 5,391,250 |
| 61,900 | | Henry Schein, Inc.a | | | 2,897,539 |
| 48,500 | | NuVasive, Inc.a,b | | | 2,283,865 |
| 98,700 | | Shire Pharmaceuticals Group plc ADR | | | 3,893,715 |
| 166,000 | | STERIS Corporation | | | 5,650,640 |
| 48,900 | | United Therapeutics Corporationa,b | | | 4,265,547 |
| 175,400 | | Varian Medical Systems, Inc.a | | | 7,982,454 |
| 97,300 | | Varian, Inc.a | | | 3,585,505 |
| 190,700 | | Vertex Pharmaceuticals, Inc.a | | | 4,998,247 |
| | | | | |
| | Total Health Care | | | 77,850,608 |
| | | | | |
| Industrials (7.6%) | | | |
| 52,200 | | Alliant Techsystems, Inc.a,b | | | 4,301,280 |
| 130,300 | | Continental Airlines, Inc.a | | | 2,465,276 |
| 86,600 | | Eaton Corporation | | | 3,862,360 |
| 153,800 | | IDEX Corporation | | | 3,565,084 |
| 158,900 | | Masco Corporation | | | 1,612,835 |
| 459,200 | | Oshkosh Corporation | | | 3,517,472 |
| 142,000 | | Pall Corporation | | | 3,750,220 |
| 398,600 | | Polypore International, Inc.a | | | 3,400,058 |
| 126,800 | | Rockwell Automation, Inc. | | | 3,508,556 |
| 158,100 | | Rockwell Collins, Inc. | | | 5,886,063 |
| 123,500 | | Roper Industries, Inc. | | | 5,600,725 |
| 246,800 | | Shaw Group, Inc.a | | | 4,415,252 |
| 58,500 | | SPX Corporation | | | 2,266,290 |
| 138,000 | | Tyco International, Ltd. | | | 3,488,640 |
| 117,000 | | WESCO International, Inc.a | | | 2,325,960 |
| | | | | |
| | Total Industrials | | | 53,966,071 |
| | | | | |
| Information Technology (17.9%) | | | |
| 322,100 | | Activision Blizzard, Inc.a | | | 4,013,366 |
| 367,700 | | ASML Holding NV ADRb | | | 6,453,135 |
| 2,546,400 | | Atmel Corporationa | | | 10,567,560 |
| 204,600 | | Broadcom Corporationa | | | 3,494,568 |
| 234,400 | | Check Point Software Technologies, Ltd.a | | | 4,739,568 |
| 484,800 | | CIENA Corporationa,b | | | 4,658,928 |
| 1,831,300 | | Compuware Corporationa | | | 11,683,694 |
| 182,700 | | Electronic Arts, Inc.a | | | 4,161,906 |
| 340,000 | | F5 Networks, Inc.a | | | 8,438,800 |
| 673,800 | | FormFactor, Inc.a,b | | | 11,737,596 |
| 166,300 | | Intersil Corporation | | | 2,276,647 |
| 198,600 | | Juniper Networks, Inc.a | | | 3,721,764 |
| 151,700 | | Lam Research Corporationa,b | | | 3,392,012 |
| 109,500 | | Logitech International SAa,b | | | 1,619,505 |
| 121,600 | | McAfee, Inc.a | | | 3,958,080 |
| 185,100 | | Paychex, Inc. | | | 5,282,754 |
| 1,026,300 | | PMC-Sierra, Inc.a | | | 4,803,084 |
The accompanying Notes to Financial Statements are an integral part of this schedule.
95
Mid Cap Stock Fund
Schedule of Investments as of October 31, 2008
| | | | | |
| Shares | | Common Stock (97.7%) | | Value |
| Information Technology (17.9%) - continued | | | |
| 453,100 | | Polycom, Inc.a,b | | $ | 9,519,631 |
| 430,500 | | Quest Software, Inc.a | | | 5,704,125 |
| 1,114,000 | | Teradyne, Inc.a | | | 5,681,400 |
| 462,200 | | TIBCO Software, Inc.a | | | 2,380,330 |
| 231,100 | | Xilinx, Inc. | | | 4,256,862 |
| 239,100 | | Zebra Technologies Corporationa | | | 4,839,384 |
| | | | | |
| | Total Information Technology | | | 127,384,699 |
| | | | | |
| Materials (10.2%) | | | |
| 510,700 | | Albemarle Corporation | | | 12,435,545 |
| 227,848 | | Ball Corporation | | | 7,792,401 |
| 32,900 | | CF Industries Holdings, Inc. | | | 2,111,851 |
| 335,100 | | Commercial Metals Company | | | 3,719,610 |
| 218,600 | | Crown Holdings, Inc.a | | | 4,411,348 |
| 268,600 | | Owens-Illinois, Inc.a | | | 6,145,568 |
| 402,800 | | Packaging Corporation of America | | | 6,779,124 |
| 197,803 | | Pactiv Corporationa | | | 4,660,239 |
| 454,285 | | Silgan Holdings, Inc. | | | 21,142,424 |
| 241,100 | | Steel Dynamics, Inc. | | | 2,873,912 |
| | | | | |
| | Total Materials | | | 72,072,022 |
| | | | | |
| Telecommunications Services (0.8%) | | | |
| 1,305,500 | | Cincinnati Bell, Inc.a,b | | | 3,120,145 |
| 94,500 | | Telephone and Data Systems, Inc. | | | 2,537,325 |
| | | | | |
| | Total Telecommunications Services | | | 5,657,470 |
| | | | | |
| Utilities (6.0%) | | | |
| 124,300 | | Equitable Resources, Inc. | | | 4,314,453 |
| 439,700 | | MDU Resources Group, Inc. | | | 8,006,937 |
| 107,400 | | National Fuel Gas Company | | | 3,886,806 |
| 218,100 | | Pepco Holdings, Inc. | | | 4,503,765 |
| 210,500 | | Portland General Electric Company | | | 4,319,460 |
| 315,000 | | UGI Corporation | | | 7,519,050 |
| 224,500 | | Wisconsin Energy Corporation | | | 9,765,750 |
| | | | | |
| | Total Utilities | | | 42,316,221 |
| | | | | |
| | Total Common Stock (cost $883,241,320) | | | 693,072,140 |
| | | | | |
| | |
| | | Collateral Held for Securities Loaned (11.0%)c | | |
| 77,710,896 | | Thrivent Financial Securities Lending Trust | | | 77,710,896 |
| | | | | |
| | Total Collateral Held for Securities Loaned (cost $77,710,896) | | | 77,710,896 |
| | | | | |
| | |
Shares or
Principal
Amount | | Short-Term Investments (4.4%)c | | |
| | Barclays Bank plc Repurchase Agreement | | | |
| 17,715,000 | | 0.200%, 11/3/2008d | | | 17,715,000 |
| | Deutsche Financial Bank, LLC | | | |
| 12,295,000 | | 0.130%, 11/3/2008 | | | 12,294,911 |
| | |
| | | Short-Term Investments (4.4%)c | | |
| 1,614,580 | | Thrivent Money Market Fund | | | $1,614,580 |
| | Total Short-Term Investments (at amortized cost) | | | 31,624,491 |
| | | | | |
| | Total Investments (cost $992,576,707) 113.1% | | | $802,407,527 |
| | | | | |
| | Other Assets and Liabilities, Net (13.1%) | | | (93,080,120) |
| | | | | |
| | Total Net Assets 100.0% | | | $709,327,407 |
| | | | | |
| a | Non-income producing security. |
| b | All or a portion of the security is on loan as discussed in item 2(M) of the Notes to Financial Statements. |
| c | The interest rate shown reflects the yield, coupon rate or, for securities purchased at a discount, the discount rate at the date of purchase. |
| d | Repurchase agreement dated October 31, 2008, $17,715,295 maturing November 3, 2008, collateralized by $18,070,718 Federal Home Loan Bank, 2.375% due April 21, 2009. |
Definitions:
| | | | |
| ADR | | - | | American Depositary Receipt, which are certificates for an underlying foreign security’s shares held by an issuing U.S. depository bank. |
| REIT | | - | | Real Estate Investment Trust, is a company that buys, develops, manages and/or sells real estate assets. |
Gross unrealized appreciation and depreciation of investments, based on cost for federal income tax purposes, were as follows:
| | | | |
Gross unrealized appreciation | | $ | 13,588,958 | |
Gross unrealized depreciation | | | (220,976,540 | ) |
| | | | |
Net unrealized appreciation (depreciation) | | | ($207,387,582 | ) |
Cost for federal income tax purposes | | $ | 1,009,795,109 | |
The accompanying Notes to the Financial Statements are an integral part of this schedule.
96
Mid Cap Stock Fund
Schedule of Investments as of October 31, 2008
Investment in Affiliates
Affiliated issuers, as defined under the Investment Company Act of 1940, include those in which the Fund’s holdings of an issuer represent 5% or more of the outstanding voting securities of an issuer, or any affiliated mutual fund.
A summary of transactions for the fiscal year to date, in Mid Cap Stock Fund, is as follows:
| | | | | | | | | | | | | | | | | |
Fund | | Value
October 31,
2007 | | Gross
Purchases and
Additions | | Gross Sales and
Reductions | | Balance of
Shares Held at
October 31,
2008 | | Value
October 31,
2008 | | Income Earned
November 1, 2007-
October 31, 2008 |
Money Market | | $ | 18,634,670 | | $ | 112,913,667 | | $ | 129,933,757 | | 1,614,580 | | $ | 1,614,580 | | $ | 594,853 |
Thrivent Financial Securities Lending Trust | | | 263,325,754 | | | 899,897,419 | | | 1,085,512,277 | | 77,710,896 | | | 77,710,896 | | | 1,540,753 |
Total Value and Dividend Income | | | 281,960,424 | | | | | | | | | | | 79,325,476 | | | 2,135,606 |
The accompanying Notes to Financial Statements are an integral part of this schedule.
97
Mid Cap Index Fund
Schedule of Investments as of October 31, 2008
| | | | | |
| Shares | | Common Stock (96.8%) | | Value |
| Consumer Discretionary (13.2%) | | | |
| 2,100 | | 99 Cents Only Storesa | | $ | 25,620 |
| 4,200 | | Advance Auto Parts, Inc.b | | | 131,040 |
| 3,000 | | Aeropostale, Inc.a | | | 72,630 |
| 9,150 | | American Eagle Outfitters, Inc.b | | | 101,748 |
| 2,200 | | American Greetings Corporation | | | 25,696 |
| 2,500 | | AnnTaylor Stores Corporationa | | | 31,425 |
| 3,317 | | ArvinMeritor, Inc.c | | | 19,637 |
| 1,660 | | Barnes & Noble, Inc. | | | 31,341 |
| 3,910 | | Belo Corporation | | | 8,328 |
| 1,110 | | Blyth, Inc. | | | 9,546 |
| 1,410 | | Bob Evans Farms, Inc. | | | 29,441 |
| 2,660 | | Borders Group, Inc. | | | 9,017 |
| 5,180 | | BorgWarner, Inc. | | | 116,395 |
| 2,500 | | Boyd Gaming Corporation | | | 17,000 |
| 4,462 | | Brinker International, Inc. | | | 41,497 |
| 2,850 | | Callaway Golf Company | | | 29,811 |
| 3,300 | | Career Education Corporationa,c | | | 52,173 |
| 9,800 | | CarMax, Inc.a,b | | | 104,076 |
| 2,900 | | Cheesecake Factory, Inc.a,c | | | 25,520 |
| 7,800 | | Chico’s FAS, Inc.a | | | 26,520 |
| 1,500 | | Chipotle Mexican Grill, Inc.a,c | | | 76,125 |
| 2,100 | | Coldwater Creek, Inc.a | | | 7,539 |
| 2,870 | | Collective Brands, Inc.a | | | 36,707 |
| 3,800 | | Corinthian Colleges, Inc.a | | | 54,264 |
| 2,690 | | DeVry, Inc. | | | 152,496 |
| 3,800 | | Dick’s Sporting Goods, Inc.a | | | 58,216 |
| 3,970 | | Dollar Tree, Inc.a | | | 150,939 |
| 3,600 | | DreamWorks Animation SKG, Inc.a | | | 101,160 |
| 6,900 | | Foot Locker, Inc. | | | 100,878 |
| 1,820 | | Furniture Brands International, Inc. | | | 10,356 |
| 6,300 | | Gentex Corporation | | | 60,417 |
| 2,700 | | Guess ?, Inc. | | | 58,779 |
| 4,200 | | Hanesbrands, Inc.a | | | 73,374 |
| 1,720 | | Harte-Hanks, Inc. | | | 12,074 |
| 2,200 | | Hovnanian Enterprises, Inc.a,c | | | 9,438 |
| 1,250 | | International Speedway Corporation | | | 39,238 |
| 1,400 | | ITT Educational Services, Inc.a | | | 122,710 |
| 2,300 | | J. Crew Group, Inc.a,c | | | 46,575 |
| 1,900 | | John Wiley and Sons, Inc. | | | 66,082 |
| 3,400 | | Lamar Advertising Companya,c | | | 51,578 |
| 3,400 | | Lear Corporationa | | | 6,834 |
| 1,500 | | Life Time Fitness, Inc.a,c | | | 28,560 |
| 1,600 | | M.D.C. Holdings, Inc. | | | 53,808 |
| 2,200 | | Marvel Entertainment, Inc.a,c | | | 70,818 |
| 1,400 | | Matthews International Corporation | | | 62,482 |
| 1,010 | | Media General, Inc.c | | | 7,706 |
| 1,450 | | Modine Manufacturing Company | | | 10,730 |
| 2,460 | | Mohawk Industries, Inc.a,c | | | 119,015 |
| 1,900 | | Netflix, Inc.a | | | 47,044 |
| 200 | | NVR, Inc.a | | | 98,042 |
| 5,900 | | O’Reilly Automotive, Inc.a | | | 159,949 |
| 2,900 | | Pacific Sunwear of California, Inc.a | | | 9,918 |
| 5,600 | | PetSmart, Inc. | | | 110,264 |
| 2,300 | | Phillips-Van Heusen Corporation | | | 56,373 |
| 1,700 | | Priceline.com, Inc.a,c | | | 89,471 |
| 1,900 | | Regis Corporation | | | 23,503 |
| 3,000 | | Rent-A-Center, Inc.a | | | 43,800 |
| 5,800 | | Ross Stores, Inc. | | | 189,602 |
| 1,900 | | Ryland Group, Inc. | | | 35,701 |
| 6,310 | | Saks, Inc.a,c | | | 37,860 |
| 1,180 | | Scholastic Corporation | | | 21,913 |
| 2,900 | | Scientific Games Corporationa | | | 52,200 |
| 11,400 | | Service Corporation International | | | 78,660 |
| 3,000 | | Sotheby’s Holdings, Inc.c | | | 27,930 |
| 600 | | Strayer Education, Inc. | | | 135,762 |
| 1,600 | | Thor Industries, Inc.c | | | 28,640 |
| 2,100 | | Timberland Companya | | | 25,410 |
| 5,800 | | Toll Brothers, Inc.a | | | 134,096 |
| 2,800 | | Tupperware Corporation | | | 70,840 |
| 1,600 | | Under Armour, Inc.a,c | | | 41,600 |
| 5,000 | | Urban Outfitters, Inc.a | | | 108,700 |
| 2,160 | | Valassis Communications, Inc.a | | | 9,590 |
| 2,000 | | Warnaco Group, Inc.a | | | 59,620 |
| 24,200 | | Wendy’s/Arby’s Group, Inc. | | | 87,604 |
| 3,860 | | Williams-Sonoma, Inc. | | | 31,961 |
| | | | | |
| | Total Consumer Discretionary | | | 4,373,412 |
| | | | | |
| Consumer Staples (4.0%) | | | |
| 3,800 | | Alberto-Culver Company | | | 97,774 |
| 2,620 | | BJ’s Wholesale Club, Inc.a | | | 92,224 |
| 2,980 | | Church & Dwight Company, Inc. | | | 176,088 |
| 3,300 | | Corn Products International, Inc. | | | 80,256 |
| 2,550 | | Energizer Holdings, Inc.a | | | 124,593 |
| 3,300 | | Hansen Natural Corporationa,c | | | 83,556 |
| 3,100 | | Hormel Foods Corporation | | | 87,606 |
| 2,388 | | J.M. Smucker Companyc | | | 106,409 |
| 930 | | Lancaster Colony Corporation | | | 29,332 |
| 2,400 | | NBTY, Inc.a | | | 56,088 |
| 2,560 | | PepsiAmericas, Inc. | | | 48,461 |
| 2,500 | | Ralcorp Holdings, Inc.a | | | 169,200 |
| 1,690 | | Ruddick Corporation | | | 48,401 |
| 5,200 | | Smithfield Foods, Inc.a,c | | | 54,704 |
| 1,195 | | Tootsie Roll Industries, Inc.c | | | 29,720 |
| 1,140 | | Universal Corporationc | | | 45,133 |
| | | | | |
| | Total Consumer Staples | | | 1,329,545 |
| | | | | |
| Energy (6.8%) | | | |
| 6,400 | | Arch Coal, Inc. | | | 137,024 |
| 1,600 | | Bill Barrett Corporationa,c | | | 32,640 |
| 3,700 | | Cimarex Energy Company | | | 149,702 |
| 1,800 | | Comstock Resources, Inc.a | | | 88,956 |
| 10,900 | | Denbury Resources, Inc.a | | | 138,539 |
| 2,400 | | Encore Acquisition Companya | | | 74,760 |
| 2,916 | | Exterran Holdings, Inc.a | | | 65,348 |
| 5,600 | | FMC Technologies, Inc.a | | | 195,944 |
| 4,000 | | Forest Oil Corporationa | | | 116,840 |
| 4,600 | | Frontier Oil Corporation | | | 60,766 |
| 4,100 | | Helix Energy Solutions Group, Inc.a | | | 43,296 |
| 4,640 | | Helmerich & Payne, Inc. | | | 159,198 |
| 5,900 | | Newfield Exploration Companya | | | 135,582 |
| 2,800 | | Oceaneering International, Inc.a | | | 78,876 |
| 1,190 | | Overseas Shipholding Group, Inc. | | | 44,720 |
| 2,800 | | Patriot Coal Corporationa | | | 44,324 |
| 6,900 | | Patterson-UTI Energy, Inc. | | | 91,563 |
| 4,742 | | Plains Exploration & Production Companya | | | 133,725 |
| 7,700 | | Pride International, Inc.a | | | 144,683 |
| 5,000 | | Quicksilver Resources, Inc.a | | | 52,350 |
The accompanying Notes to Financial Statements are an integral part of this schedule.
98
Mid Cap Index Fund
Schedule of Investments as of October 31, 2008
| | | | | |
| Shares | | Common Stock (96.8%) | | Value |
| Energy (6.8%) - continued | | | |
| 3,600 | | Superior Energy Services, Inc.a | | $ | 76,752 |
| 2,310 | | Tidewater, Inc. | | | 100,739 |
| 1,900 | | Unit Corporationa | | | 71,326 |
| | | | | |
| | Total Energy | | | 2,237,653 |
| | | | | |
| Financials (18.9%) | | | |
| 1,800 | | Affiliated Managers Group, Inc.a | | | 83,484 |
| 1,400 | | Alexandria Real Estate Equities, Inc. | | | 97,328 |
| 4,300 | | AMB Property Corporationb | | | 103,329 |
| 3,350 | | American Financial Group, Inc. | | | 76,146 |
| 5,200 | | AmeriCredit Corporationa,c | | | 30,472 |
| 6,300 | | Apollo Investment Corporation | | | 83,034 |
| 4,100 | | Arthur J. Gallagher & Company | | | 99,876 |
| 5,678 | | Associated Banc-Corpc | | | 125,257 |
| 3,520 | | Astoria Financial Corporation | | | 66,950 |
| 3,200 | | BancorpSouth, Inc. | | | 77,664 |
| 2,070 | | Bank of Hawaii Corporation | | | 104,970 |
| 2,300 | | BRE Properties, Inc. | | | 80,063 |
| 5,100 | | Brown & Brown, Inc. | | | 104,652 |
| 2,400 | | Camden Property Trust | | | 80,904 |
| 2,200 | | Cathay General Bancorpc | | | 53,856 |
| 1,800 | | City National Corporation | | | 96,354 |
| 9,000 | | Colonial BancGroup, Inc.c | | | 36,810 |
| 2,800 | | Commerce Bancshares, Inc. | | | 132,384 |
| 1,900 | | Cousins Properties, Inc. | | | 27,512 |
| 2,600 | | Cullen/Frost Bankers, Inc. | | | 145,522 |
| 6,500 | | Duke Realty Corporation | | | 91,715 |
| 5,100 | | Eaton Vance Corporation | | | 112,200 |
| 1,400 | | Equity One, Inc.c | | | 24,458 |
| 1,100 | | Essex Property Trust, Inc. | | | 107,030 |
| 2,690 | | Everest Re Group, Ltd. | | | 200,943 |
| 2,600 | | Federal Realty Investment Trust | | | 159,302 |
| 9,372 | | Fidelity National Financial, Inc. | | | 84,442 |
| 4,100 | | First American Corporation | | | 83,681 |
| 5,500 | | First Niagara Financial Group, Inc. | | | 86,735 |
| 3,550 | | FirstMerit Corporationc | | | 82,786 |
| 2,260 | | Hanover Insurance Group, Inc. | | | 88,705 |
| 5,100 | | HCC Insurance Holdings, Inc. | | | 112,506 |
| 4,500 | | Health Care REIT, Inc. | | | 200,295 |
| 2,800 | | Highwoods Properties, Inc. | | | 69,496 |
| 1,750 | | Horace Mann Educators Corporation | | | 13,930 |
| 4,200 | | Hospitality Properties Trust | | | 42,630 |
| 5,300 | | Jefferies Group, Inc. | | | 83,899 |
| 1,800 | | Jones Lang LaSalle, Inc. | | | 59,256 |
| 4,400 | | Liberty Property Trust | | | 104,940 |
| 3,300 | | Macerich Company | | | 97,086 |
| 2,900 | | Mack-Cali Realty Corporation | | | 65,888 |
| 1,600 | | Mercury General Corporation | | | 82,192 |
| 4,300 | | Nationwide Health Properties, Inc.c | | | 128,312 |
| 15,210 | | New York Community Bancorp, Inc.c | | | 238,189 |
| 10,206 | | Old Republic International Corporation | | | 93,997 |
| 1,100 | | PacWest Bancorp | | | 27,489 |
| 2,600 | | Philadelphia Consolidated Holding Corporationa | | | 152,074 |
| 3,040 | | PMI Group, Inc. | | | 7,570 |
| 1,755 | | Potlatch Corporationc | | | 58,284 |
| 3,050 | | Protective Life Corporation | | | 25,467 |
| 4,225 | | Raymond James Financial, Inc. | | | 98,400 |
| 3,528 | | Rayonier, Inc. REIT | | | 116,706 |
| 4,500 | | Realty Income Corporationc | | | 104,040 |
| 3,100 | | Regency Centers Corporation | | | 122,326 |
| 3,100 | | Reinsurance Group of America, Inc. | | | 115,754 |
| 5,900 | | SEI Investments Company | | | 104,312 |
| 2,200 | | StanCorp Financial Group, Inc. | | | 74,976 |
| 1,400 | | SVB Financial Groupa | | | 72,030 |
| 12,400 | | Synovus Financial Corporationc | | | 128,092 |
| 5,080 | | TCF Financial Corporationc | | | 90,119 |
| 6,500 | | UDR, Inc. | | | 128,440 |
| 2,190 | | Unitrin, Inc. | | | 45,990 |
| 6,250 | | W.R. Berkley Corporation | | | 164,187 |
| 3,800 | | Waddell & Reed Financial, Inc. | | | 55,176 |
| 3,896 | | Washington Federal, Inc. | | | 68,648 |
| 2,350 | | Webster Financial Corporation | | | 43,569 |
| 3,300 | | Weingarten Realty Investorsc | | | 67,485 |
| 1,310 | | Westamerica Bancorporation | | | 74,997 |
| 2,940 | | Wilmington Trust Corporation | | | 84,848 |
| | | | | |
| | Total Financials | | | 6,252,159 |
| | | | | |
| Health Care (11.9%) | | | |
| 2,356 | | Advanced Medical Optics, Inc.a | | | 14,536 |
| 3,100 | | Affymetrix, Inc.a | | | 11,439 |
| 2,800 | | Beckman Coulter, Inc.b | | | 139,776 |
| 3,000 | | Cephalon, Inc.a,c | | | 215,160 |
| 3,000 | | Cerner Corporationa | | | 111,690 |
| 3,000 | | Charles River Laboratories International, Inc.a,c | | | 107,490 |
| 4,300 | | Community Health Systems, Inc.a | | | 88,150 |
| 2,790 | | Covance, Inc.a | | | 139,500 |
| 6,620 | | Dentsply International, Inc. | | | 201,115 |
| 2,490 | | Edwards Lifesciences Corporationa | | | 131,572 |
| 5,300 | | Endo Pharmaceutical Holdings, Inc.a | | | 98,050 |
| 2,400 | | Gen-Probe, Inc.a | | | 112,944 |
| 10,800 | | Health Management Associates, Inc.a | | | 22,680 |
| 4,740 | | Health Net, Inc.a | | | 61,051 |
| 4,000 | | Henry Schein, Inc.a | | | 187,240 |
| 2,730 | | Hill-Rom Holdings, Inc.c | | | 62,135 |
| 11,400 | | Hologic, Inc.a | | | 139,536 |
| 2,600 | | IDEXX Laboratories, Inc.a | | | 91,494 |
| 4,100 | | Invitrogen Corporationa | | | 118,039 |
| 1,300 | | Kindred Healthcare, Inc.a | | | 18,837 |
| 2,500 | | Kinetic Concepts, Inc.a | | | 60,525 |
| 2,400 | | LifePoint Hospitals, Inc.a | | | 57,528 |
| 3,300 | | Lincare Holdings, Inc.a | | | 86,955 |
| 2,500 | | Medicis Pharmaceutical Corporation | | | 35,675 |
| 4,580 | | Omnicare, Inc.c | | | 126,271 |
| 5,300 | | PDL BioPharma, Inc. | | | 51,675 |
| 3,420 | | Perrigo Company | | | 116,280 |
| 5,300 | | Pharmaceutical Product Development, Inc. | | | 164,194 |
| 2,500 | | Psychiatric Solutions, Inc.a | | | 83,225 |
| 3,400 | | ResMed, Inc.a | | | 116,484 |
| 4,820 | | Sepracor, Inc.a | | | 64,202 |
| 2,570 | | STERIS Corporation | | | 87,483 |
| 1,700 | | Techne Corporation | | | 117,334 |
| 1,720 | | Teleflex, Inc. | | | 91,143 |
| 1,000 | | United Therapeutics Corporationa | | | 87,230 |
| 2,300 | | Universal Health Services, Inc. | | | 96,692 |
The accompanying Notes to Financial Statements are an integral part of this schedule.
99
Mid Cap Index Fund
Schedule of Investments as of October 31, 2008
| | | | | |
| Shares | | Common Stock (96.8%) | | Value |
| Health Care (11.9%) - continued | | | |
| 3,870 | | Valeant Pharmaceuticals Internationala | | $ | 72,640 |
| 1,300 | | Varian, Inc.a | | | 47,905 |
| 3,700 | | VCA Antech, Inc.a | | | 66,970 |
| 6,600 | | Vertex Pharmaceuticals, Inc.a | | | 172,986 |
| 1,800 | | Wellcare Health Plans, Inc.a | | | 43,506 |
| | | | | |
| | Total Health Care | | | 3,919,337 |
| | | | | |
| Industrials (14.0%) | | | |
| 4,110 | | AGCO Corporationa,b | | | 129,547 |
| 5,200 | | AirTran Holdings, Inc.a | | | 21,268 |
| 1,620 | | Alaska Air Group, Inc.a | | | 40,014 |
| 1,850 | | Alexander & Baldwin, Inc.c | | | 59,015 |
| 1,500 | | Alliant Techsystems, Inc.a | | | 123,600 |
| 4,760 | | AMETEK, Inc. | | | 158,270 |
| 4,500 | | Avis Budget Group, Inc.a | | | 7,380 |
| 4,400 | | BE Aerospace, Inc.a | | | 56,628 |
| 1,840 | | Brink’s Company | | | 89,222 |
| 2,720 | | Carlisle Companies, Inc. | | | 63,240 |
| 800 | | Clean Harbors, Inc.a | | | 52,456 |
| 2,010 | | Con-way, Inc. | | | 68,420 |
| 2,900 | | Copart, Inc.a | | | 101,210 |
| 1,500 | | Corporate Executive Board Company | | | 44,745 |
| 5,600 | | Corrections Corporation of Americaa | | | 107,016 |
| 2,100 | | Crane Company | | | 34,377 |
| 2,300 | | Deluxe Corporation | | | 27,968 |
| 3,480 | | Donaldson Company, Inc. | | | 122,322 |
| 2,400 | | Dun & Bradstreet Corporation | | | 176,856 |
| 1,700 | | Dycom Industries, Inc.a | | | 15,096 |
| 2,080 | | Federal Signal Corporation | | | 17,701 |
| 2,200 | | GATX Corporation | | | 62,810 |
| 2,650 | | Graco, Inc.c | | | 65,534 |
| 1,445 | | Granite Construction, Inc. | | | 51,543 |
| 3,780 | | Harsco Corporation | | | 89,473 |
| 2,470 | | Herman Miller, Inc. | | | 54,340 |
| 2,010 | | HNI Corporationc | | | 36,823 |
| 2,530 | | Hubbell, Inc. | | | 90,751 |
| 3,700 | | IDEX Corporation | | | 85,766 |
| 3,600 | | JB Hunt Transport Services, Inc. | | | 102,348 |
| 8,100 | | JetBlue Airways Corporationa,c | | | 44,955 |
| 4,750 | | Joy Global, Inc. | | | 137,655 |
| 4,000 | | Kansas City Southern, Inc.a | | | 123,480 |
| 7,500 | | KBR, Inc. | | | 111,300 |
| 1,200 | | Kelly Services, Inc. | | | 17,088 |
| 3,420 | | Kennametal, Inc. | | | 72,572 |
| 2,100 | | Korn/Ferry Internationala | | | 29,169 |
| 1,900 | | Lincoln Electric Holdings, Inc. | | | 81,985 |
| 3,540 | | Manpower, Inc. | | | 110,200 |
| 1,300 | | Mine Safety Appliances Company | | | 35,100 |
| 4,120 | | MPS Group, Inc.a | | | 32,095 |
| 2,000 | | MSC Industrial Direct Company, Inc. | | | 71,720 |
| 2,100 | | Navigant Consulting, Inc.a,c | | | 33,957 |
| 1,480 | | Nordson Corporation | | | 54,656 |
| 3,300 | | Oshkosh Corporation | | | 25,278 |
| 4,420 | | Pentair, Inc. | | | 122,169 |
| 7,790 | | Quanta Services, Inc.a | | | 153,930 |
| 6,900 | | Republic Services, Inc. | | | 163,530 |
| 1,843 | | Rollins, Inc. | | | 32,382 |
| 4,000 | | Roper Industries, Inc. | | | 181,400 |
| 3,700 | | Shaw Group, Inc.a | | | 66,193 |
| 2,440 | | SPX Corporation | | | 94,526 |
| 3,800 | | Stericycle, Inc.a | | | 222,034 |
| 2,600 | | Thomas & Betts Corporationa | | | 61,750 |
| 3,800 | | Timken Company | | | 60,344 |
| 3,595 | | Trinity Industries, Inc. | | | 60,684 |
| 2,619 | | United Rentals, Inc.a,c | | | 26,845 |
| 3,700 | | URS Corporationa | | | 108,743 |
| 2,100 | | Wabtec Corporation | | | 83,496 |
| 1,900 | | Werner Enterprises, Inc. | | | 37,278 |
| 2,500 | | YRC Worldwide, Inc.a | | | 11,450 |
| | | | | |
| | Total Industrials | | | 4,623,703 |
| | | | | |
| Information Technology (13.0%) | | | |
| 18,000 | | 3Com Corporationa | | | 49,140 |
| 1,480 | | ACI Worldwide, Inc.a | | | 20,276 |
| 3,030 | | Acxiom Corporation | | | 23,816 |
| 5,200 | | ADC Telecommunications, Inc.a | | | 32,968 |
| 2,460 | | ADTRAN, Inc. | | | 37,392 |
| 700 | | Advent Software, Inc.a | | | 13,118 |
| 3,000 | | Alliance Data Systems Corporationa,b | | | 150,480 |
| 3,900 | | ANSYS, Inc.a | | | 111,657 |
| 5,320 | | Arrow Electronics, Inc.a | | | 92,834 |
| 19,760 | | Atmel Corporationa,b | | | 82,004 |
| 6,640 | | Avnet, Inc.a,c | | | 111,154 |
| 2,010 | | Avocent Corporationa | | | 30,190 |
| 6,200 | | Broadridge Financial Solutions, Inc. | | | 75,020 |
| 11,580 | | Cadence Design Systems, Inc.a | | | 47,131 |
| 3,066 | | CommScope, Inc.a | | | 45,101 |
| 3,900 | | Cree, Inc.a,c | | | 76,557 |
| 2,900 | | Diebold, Inc. | | | 86,188 |
| 1,600 | | Digital River, Inc.a | | | 39,648 |
| 1,910 | | DST Systems, Inc.a,c | | | 77,508 |
| 3,600 | | F5 Networks, Inc.a | | | 89,352 |
| 1,900 | | FactSet Research Systems, Inc. | | | 73,701 |
| 2,150 | | Fair Isaac Corporation | | | 33,518 |
| 5,500 | | Fairchild Semiconductor International, Inc.a | | | 31,240 |
| 6,200 | | FLIR Systems, Inc.a | | | 199,020 |
| 6,500 | | Foundry Networks, Inc.a | | | 96,525 |
| 2,600 | | Gartner, Inc.a | | | 47,840 |
| 3,500 | | Global Payments, Inc. | | | 141,785 |
| 1,300 | | Imation Corporation | | | 16,016 |
| 7,400 | | Ingram Micro, Inc.a | | | 98,642 |
| 7,490 | | Integrated Device Technology, Inc.a | | | 47,636 |
| 3,200 | | International Rectifier Corporationa | | | 49,408 |
| 5,500 | | Intersil Corporation | | | 75,295 |
| 3,800 | | Jack Henry & Associates, Inc. | | | 72,238 |
| 5,600 | | Lam Research Corporationa | | | 125,216 |
| 3,700 | | Lender Processing Services, Inc. | | | 85,359 |
| 3,700 | | Macrovision Solutions Corporationa | | | 40,996 |
| 6,680 | | McAfee, Inc.a | | | 217,434 |
| 4,140 | | Mentor Graphics Corporationa | | | 30,388 |
| 4,000 | | Metavante Technologies, Inc.a | | | 67,080 |
| 2,550 | | National Instruments Corporation | | | 64,770 |
| 7,300 | | NCR Corporationa | | | 133,444 |
| 3,500 | | NeuStar, Inc.a | | | 68,950 |
| 4,800 | | Palm, Inc.a,c | | | 19,152 |
| 5,100 | | Parametric Technology Corporationa | | | 66,249 |
The accompanying Notes to the Financial Statements are an integral part of this schedule.
100
Mid Cap Index Fund
Schedule of Investments as of October 31, 2008
| | | | | |
| Shares | | Common Stock (96.8%) | | Value |
| Information Technology (13.0%) - continued | | | |
| 2,200 | | Plantronics, Inc. | | $ | 31,768 |
| 3,800 | | Polycom, Inc.a | | | 79,838 |
| 11,600 | | RF Micro Devices, Inc.a | | | 23,084 |
| 8,500 | | SAIC, Inc.a | | | 156,995 |
| 2,760 | | Semtech Corporationa | | | 33,451 |
| 2,100 | | Silicon Laboratories, Inc.a | | | 54,516 |
| 1,900 | | SRA International, Inc.a | | | 35,112 |
| 3,560 | | Sybase, Inc.a | | | 94,803 |
| 6,380 | | Synopsys, Inc.a | | | 116,626 |
| 2,240 | | Tech Data Corporationa | | | 48,048 |
| 5,400 | | Trimble Navigation, Ltd.a | | | 111,078 |
| 3,800 | | ValueClick, Inc.a | | | 28,120 |
| 8,270 | | Vishay Intertechnology, Inc.a | | | 35,644 |
| 9,800 | | Western Digital Corporationa | | | 161,700 |
| 3,100 | | Wind River Systems, Inc.a | | | 27,094 |
| 2,900 | | Zebra Technologies Corporationa | | | 58,696 |
| | | | | |
| | Total Information Technology | | | 4,290,009 |
| | | | | |
| Materials (6.4%) | | | |
| 3,690 | | Airgas, Inc.b | | | 141,548 |
| 4,080 | | Albemarle Corporationb | | | 99,348 |
| 3,000 | | AptarGroup, Inc. | | | 90,960 |
| 2,870 | | Cabot Corporation | | | 75,912 |
| 2,000 | | Carpenter Technology Corporation | | | 36,200 |
| 10,770 | | Chemtura Corporation | | | 18,632 |
| 4,700 | | Cliffs Natural Resources, Inc. | | | 126,853 |
| 5,100 | | Commercial Metals Company | | | 56,610 |
| 2,150 | | Cytec Industries, Inc. | | | 60,888 |
| 1,890 | | Ferro Corporation | | | 29,257 |
| 3,300 | | FMC Corporation | | | 143,682 |
| 1,500 | | Greif, Inc. | | | 60,870 |
| 4,000 | | Louisiana-Pacific Corporation | | | 19,200 |
| 2,960 | | Lubrizol Corporation | | | 111,237 |
| 1,800 | | Martin Marietta Materials, Inc.c | | | 141,084 |
| 870 | | Minerals Technologies, Inc. | | | 49,381 |
| 3,380 | | Olin Corporation | | | 61,381 |
| 4,600 | | Packaging Corporation of America | | | 77,418 |
| 2,800 | | Reliance Steel & Aluminum Company | | | 70,112 |
| 5,790 | | RPM International, Inc. | | | 82,218 |
| 1,900 | | Scotts Miracle-Gro Company | | | 49,628 |
| 2,120 | | Sensient Technologies Corporation | | | 53,488 |
| 4,440 | | Sonoco Products Company | | | 111,799 |
| 7,900 | | Steel Dynamics, Inc. | | | 94,168 |
| 4,700 | | Temple-Inland, Inc. | | | 27,871 |
| 4,100 | | Terra Industries, Inc. | | | 90,159 |
| 4,420 | | Valspar Corporation | | | 90,389 |
| 2,700 | | Worthington Industries, Inc.c | | | 32,589 |
| | | | | |
| | Total Materials | | | 2,102,882 |
| | | | | |
| Telecommunications Services (0.4%) | | | |
| 10,410 | | Cincinnati Bell, Inc.a | | | 24,880 |
| 4,710 | | Telephone and Data Systems, Inc. | | | 126,463 |
| | | | | |
| | Total Telecommunications Services | | | 151,343 |
| | | | | |
| Utilities (8.2%) | | | |
| 3,360 | | AGL Resources, Inc.b | | | 102,144 |
| 4,870 | | Alliant Energy Corporationb | | | 143,081 |
| 5,966 | | Aqua America, Inc.c | | | 107,388 |
| 1,680 | | Black Hills Corporation | | | 42,420 |
| 5,020 | | DPL, Inc. | | | 114,506 |
| 3,200 | | Energen Corporation | | | 107,424 |
| 5,800 | | Equitable Resources, Inc. | | | 201,318 |
| 5,292 | | Great Plains Energy, Inc. | | | 102,876 |
| 3,740 | | Hawaiian Electric Industries, Inc. | | | 99,559 |
| 2,020 | | IDACORP, Inc. | | | 53,853 |
| 8,125 | | MDU Resources Group, Inc. | | | 147,956 |
| 3,660 | | National Fuel Gas Company | | | 132,455 |
| 6,860 | | Northeast Utilities | | | 154,762 |
| 4,740 | | NSTAR | | | 156,657 |
| 4,060 | | OGE Energy Corporation | | | 110,838 |
| 4,600 | | ONEOK, Inc. | | | 146,740 |
| 3,860 | | PNM Resources, Inc. | | | 37,635 |
| 5,720 | | Puget Energy, Inc. | | | 134,020 |
| 5,190 | | SCANA Corporation | | | 170,803 |
| 10,370 | | Sierra Pacific Resources | | | 85,967 |
| 5,000 | | UGI Corporation | | | 119,350 |
| 3,620 | | Vectren Corporation | | | 91,224 |
| 4,800 | | Westar Energy, Inc. | | | 93,552 |
| 2,190 | | WGL Holdings, Inc. | | | 70,496 |
| | | | | |
| | Total Utilities | | | 2,727,024 |
| | | | | |
| | Total Common Stock (cost $37,589,621) | | | 32,007,067 |
| | | | | |
| | |
| | | Collateral Held for Securities Loaned (7.6%)d | | |
| 2,503,733 | | Thrivent Financial Securities Lending Trust | | | 2,503,733 |
| | | | | |
| | Total Collateral Held for Securities Loaned (cost $2,503,733) | | | 2,503,733 |
| | | | | |
| | |
Shares or
Principal
Amount | | Short-Term Investments (3.0%)d | | |
| 100,000 | | Federal National Mortgage Association Discount Notes 2.100%, 12/10/2008e | | | 99,775 |
| 880,872 | | Thrivent Money Market Fund | | | 880,872 |
| | | | | |
| | Total Short-Term Investments (at amortized cost) | | | 980,647 |
| | | | | |
| | Total Investments (cost $41,074,001) 107.4% | | | $35,491,447 |
| | | | | |
| | Other Assets and Liabilities, Net (7.4%) | | | (2,441,404) |
| | | | | |
| | Total Net Assets 100.0% | | | $33,050,043 |
| | | | | |
| a | Non-income producing security. |
| b | At October 31, 2008, $1,327,403 of investments were earmarked to cover open financial futures contracts. |
| c | All or a portion of the security is on loan as discussed in item 2(M) of the Notes to Financial Statements. |
| d | The interest rate shown reflects the yield, coupon rate or, for securities purchased at a discount, the discount rate at the date of purchase. |
| e | At October 31, 2008, $99,775 of investments were held on deposit with the counterparty and pledged as the initial margin deposit for open financial futures contracts. |
The accompanying Notes to Financial Statements are an integral part of this schedule.
101
Mid Cap Index Fund
Schedule of Investments as of October 31, 2008
Definitions:
| | | | |
| REIT | | - | | Real Estate Investment Trust, is a company that buys, develops, manages and/or sells real estate assets. |
Gross unrealized appreciation and depreciation of investments, based on cost for federal income tax purposes, were as follows:
| | | | |
Gross unrealized appreciation | | $ | 4,806,330 | |
Gross unrealized depreciation | | | (11,145,852 | ) |
| | | | |
Net unrealized appreciation (depreciation) | | | ($6,339,522 | ) |
Cost for federal income tax purposes | | $ | 41,830,969 | |
| | | | | | | | | | | | | |
Futures | | Number of
Contracts
Long/(Short) | | Expiration Date | | Notional
Principal
Amount | | Value | | Unrealized
Gain/(Loss) | |
S&P 400 Index Mini-Futures | | 17 | | December 2008 | | $ | 991,783 | | $ | 966,280 | | ($25,503 | ) |
Total Futures | | | | | | | | | | | | ($25,503 | ) |
Investment in Affiliates
Affiliated issuers, as defined under the Investment Company Act of 1940, include those in which the Fund’s holdings of an issuer represent 5% or more of the outstanding voting securities of an issuer, or any affiliated mutual fund.
A summary of transactions for the fiscal year to date, in Mid Cap Index Fund, is as follows:
| | | | | | | | | | | | | | | | | |
Fund | | Value
October 31, 2007 | | Gross
Purchases and
Additions | | Gross Sales
and
Reductions | | Balance of
Shares Held at
October 31, 2008 | | Value
October 31, 2008 | | Income Earned
November 1, 2007-
October 31, 2008 |
Money Market | | $ | 792,453 | | $ | 11,255,269 | | $ | 11,166,850 | | 880,872 | | $ | 880,872 | | $ | 30,942 |
Thrivent Financial Securities Lending Trust | | | 5,297,773 | | | 20,375,618 | | | 23,169,658 | | 2,503,733 | | | 2,503,733 | | | 80,291 |
Total Value and Dividend Income | | | 6,090,226 | | | | | | | | | | | 3,384,605 | | | 111,233 |
The accompanying Notes to the Financial Statements are an integral part of this schedule.
102
Partner Worldwide Allocation Fund
Schedule of Investments as of October 31, 2008
| | | | | |
| Shares | | Common Stock (80.5%) | | Valuea |
| Australia (2.3%) | | | |
| 52,517 | | AJ Lucas Group, Ltd. | | $ | 143,256 |
| 16,505 | | BHP Billiton, Ltd. | | | 317,075 |
| 9,339 | | Campbell Brothers, Ltd. | | | 149,527 |
| 16,382 | | Centennial Coal Company, Ltd. | | | 38,522 |
| 5,470 | | CSL, Ltd. | | | 133,027 |
| 3,111 | | Leighton Holdings, Ltd. | | | 51,728 |
| 123,886 | | Macmahon Holdings, Ltd. | | | 60,124 |
| 20,338 | | Mount Gibson Iron, Ltd.b | | | 6,758 |
| 15,343 | | OneSteel, Ltd. | | | 35,249 |
| 10,932 | | Origin Energy, Ltd. | | | 114,645 |
| 2,725 | | Rio Tinto, Ltd. | | | 140,970 |
| 7,060 | | Sonic Healthcare, Ltd. | | | 64,518 |
| 28,745 | | Transpacific Industries Group, Ltd. | | | 68,439 |
| 18,605 | | United Group, Ltd. | | | 118,057 |
| | | | | |
| | Total Australia | | | 1,441,895 |
| | | | | |
| Austria (0.3%) | | | |
| 2,215 | | Erste Group Bank AG | | | 59,765 |
| 1,436 | | OMV AG | | | 45,966 |
| 1,641 | | Verbund - Oesterreichische Elektrizitaetswirtschafts-AG | | | 77,628 |
| | | | | |
| | Total Austria | | | 183,359 |
| | | | | |
| Belgium (0.6%) | | | |
| 302 | | Colruyt SA | | | 67,875 |
| 2,133 | | Compagnie d’ Entreprises CFE | | | 103,537 |
| 1,918 | | EVS Broadcast Equipment SA | | | 123,851 |
| 584 | | Group Bruxelles Lambert SA | | | 42,902 |
| 756 | | Mobistar SA | | | 50,168 |
| | | | | |
| | Total Belgium | | | 388,333 |
| | | | | |
| Bermuda (<0.1%) | | | |
| 43,000 | | Noble Group, Ltd. | | | 31,300 |
| | | | | |
| | Total Bermuda | | | 31,300 |
| | | | | |
| Brazil (2.3%) | | | |
| 21,000 | | Banco Bradesco SA ADRc | | | 245,700 |
| 21,000 | | Companhia Vale do Rio Doce SP ADRc | | | 245,910 |
| 14,200 | | Empresa Brasileira de Aeronautica SA ADR | | | 297,064 |
| 16,000 | | Lojas Renner SA | | | 118,163 |
| 11,000 | | Petroleo Brasileiro SA ADR | | | 242,769 |
| 7,300 | | Souza Cruz SA | | | 126,592 |
| 8,000 | | Ultrapar Participacoes SA | | | 147,704 |
| | | | | |
| | Total Brazil | | | 1,423,902 |
| | | | | |
| Canada (1.7%) | | | |
| 1,400 | | Agrium, Inc. | | | 53,628 |
| 4,200 | | Alimentation Couche-Tard, Inc. | | | 56,625 |
| 5,100 | | Brookfield Asset Management, Inc. | | | 89,281 |
| 2,100 | | Canadian Oil Sands Trust | | | 56,346 |
| 6,900 | | CGI Group, Inc.b | | | 55,072 |
| 4,700 | | EnCana Corporation | | | 238,762 |
| 1,811 | | Gildan Activewear, Inc.b | | | 42,221 |
| 1,500 | | Potash Corporation of Saskatchewan, Inc. | | | 127,687 |
| 2,400 | | Precision Drilling Trust | | | 25,886 |
| 2,800 | | Shoppers Drug Mart Corporation | | | 107,791 |
| 6,400 | | Sino-Forest Corporationb | | | 59,895 |
| 900 | | Suncor Energy, Inc. | | | 21,617 |
| 3,800 | | Teck Cominco, Ltd. | | | 37,833 |
| 1,100 | | Toronto-Dominion Bank | | | 51,947 |
| 4,500 | | Viterra, Inc.b | | | 28,561 |
| | | | | |
| | Total Canada | | | 1,053,152 |
| | | | | |
| Chile (0.3%) | | | |
| 5,600 | | Banco Santander Chile SA ADRc | | | 200,480 |
| | | | | |
| | Total Chile | | | 200,480 |
| | | | | |
| China (0.4%) | | | |
| 310,000 | | PetroChina Company, Ltd. | | | 233,081 |
| | | | | |
| | Total China | | | 233,081 |
| | | | | |
| Denmark (0.6%) | | | |
| 1,190 | | ALK-Abello AS | | | 94,414 |
| 3,600 | | Novo Nordisk AS | | | 192,971 |
| 1,850 | | Vestas Wind Systemsb | | | 75,775 |
| | | | | |
| | Total Denmark | | | 363,160 |
| | | | | |
| Finland (0.5%) | | | |
| 3,546 | | Fortum Oyj | | | 87,145 |
| 4,183 | | Konecranes Oyj | | | 71,083 |
| 10,911 | | Nokia Oyj | | | 167,135 |
| | | | | |
| | Total Finland | | | 325,363 |
| | | | | |
| France (5.1%) | | | |
| 2,235 | | Alstom | | | 110,773 |
| 1,851 | | April Group | | | 67,130 |
| 19,400 | | Axa SA | | | 370,613 |
| 6,100 | | Cap Gemini SA | | | 196,537 |
| 3,300 | | Compagnie de Saint-Gobain | | | 127,335 |
| 2,483 | | Eurofins Scientific | | | 139,092 |
| 2,203 | | Eutelsat Communications | | | 47,283 |
| 7,182 | | GDF Suez | | | 319,693 |
| 797 | | Hermes International | | | 102,866 |
| 1,625 | | Ingenico | | | 25,379 |
| 3,880 | | Orpeab | | | 126,233 |
| 1,460 | | Rubis | | | 80,863 |
| 5,200 | | Schneider Electric SA | | | 311,671 |
| 2,535 | | Sechilienne SA | | | 97,333 |
| 1,767 | | Stallergenes | | | 87,357 |
| 2,093 | | Teleperformance | | | 45,163 |
| 1,094 | | UBISOFT Entertainment SAb | | | 57,827 |
| 577 | | Unibail-Rodamco | | | 86,540 |
| 364 | | Vallourec SA | | | 40,716 |
| 1,369 | | Vilmorin & Cie | | | 133,766 |
| 23,602 | | Vivendi Universal SA | | | 616,925 |
| | | | | |
| | Total France | | | 3,191,095 |
| | | | | |
| Germany (4.0%) | | | |
| 5,700 | | Adidas AG | | | 197,994 |
| 1,926 | | Bayer AG | | | 105,430 |
| 7,300 | | Bayerische Motoren Werke AG | | | 185,115 |
| 21,400 | | Deutsche Post AG-REG | | | 234,639 |
| 9,831 | | E.ON AG | | | 368,411 |
| 6,237 | | GEA Group AG | | | 89,563 |
| 4,080 | | Gerresheimer AGb | | | 140,620 |
| 3,126 | | Krones AG | | | 137,429 |
| 2,013 | | Morphosys AGb | | | 125,114 |
| 980 | | RWE AG | | | 80,340 |
| 5,294 | | SAP AG | | | 185,347 |
The accompanying Notes to Financial Statements are an integral part of this schedule.
103
Partner Worldwide Allocation Fund
Schedule of Investments as of October 31, 2008
| | | | | |
| Shares | | Common Stock (80.5%) | | Valuea |
| Germany (4.0%) - continued | | | |
| 1,840 | | SGL Carbon AGb | | $ | 35,515 |
| 7,641 | | Siemens AG | | | 449,328 |
| 1,757 | | Vossloh AG | | | 133,038 |
| 435 | | Wacker Chemie AG | | | 47,009 |
| | | | | |
| | Total Germany | | | 2,514,892 |
| | | | | |
| Greece (0.3%) | | | |
| 6,257 | | Alpha Bank AE | | | 91,350 |
| 3,247 | | Greek Organization of Football Prognostics SA | | | 70,896 |
| | | | | |
| | Total Greece | | | 162,246 |
| | | | | |
| Hong Kong (1.7%) | | | |
| 30,000 | | BOC Hong Kong (Holdings), Ltd. | | | 34,347 |
| 6,000 | | Cheung Kong Holdings, Ltd. | | | 57,609 |
| 34,000 | | China Mobile, Ltd. | | | 299,311 |
| 73,000 | | Hang Lung Group, Ltd. | | | 234,910 |
| 4,600 | | Hang Seng Bank, Ltd. | | | 57,396 |
| 18,000 | | Hutchison Whampoa, Ltd. | | | 97,269 |
| 185,000 | | Swire Pacific, Ltd. | | | 245,173 |
| 12,000 | | Wharf Holdings, Ltd. | | | 23,942 |
| | | | | |
| | Total Hong Kong | | | 1,049,957 |
| | | | | |
| Hungary (0.4%) | | | |
| 1,900 | | Richter Gedeon Nyrt | | | 262,510 |
| | | | | |
| | Total Hungary | | | 262,510 |
| | | | | |
| Indonesia (0.2%) | | | |
| 155,000 | | PT Astra International Tbk | | | 129,022 |
| | | | | |
| | Total Indonesia | | | 129,022 |
| | | | | |
| Israel (0.6%) | | | |
| 8,500 | | Check Point Software Technologies, Ltd.b | | | 171,870 |
| 5,500 | | Teva Pharmaceutical Industries, Ltd. ADR | | | 235,840 |
| | | | | |
| | Total Israel | | | 407,710 |
| | | | | |
| Italy (2.6%) | | | |
| 11,880 | | Ansaldo STS SPA | | | 152,188 |
| 12,754 | | Enel SPA | | | 85,326 |
| 21,300 | | Eni SPA | | | 508,385 |
| 26,400 | | Finmeccanica SPA | | | 327,413 |
| 26,400 | | Finmeccanica SPA - Rights | | | 10,767 |
| 2,450 | | Lottomatica SPA | | | 57,202 |
| 34,894 | | Maire Tecnimont SPA | | | 63,646 |
| 18,207 | | Terna-Rete Elettrica Nationale SPA | | | 58,719 |
| 9,758 | | Trevi Finanziaria SPA | | | 113,381 |
| 97,600 | | Unicredit SPA | | | 238,912 |
| | | | | |
| | Total Italy | | | 1,615,939 |
| | | | | |
| Japan (16.2%) | | | |
| 4,600 | | Aeon Delight Company, Ltd. | | | 113,319 |
| 5,700 | | Asahi Breweries, Ltd. | | | 94,085 |
| 1,700 | | Astellas Pharmaceutical, Inc. | | | 68,474 |
| 5,000 | | Bank of Kyoto, Ltd. | | | 52,594 |
| 20,700 | | Bridgestone Corporation | | | 361,898 |
| 2,400 | | Canon, Inc. | | | 83,980 |
| 6,600 | | Capcom Company, Ltd. | | | 147,139 |
| 50 | | CyberAgent, Inc. | | | 44,638 |
| 5,000 | | Daihatsu Motor Company, Ltd. | | | 37,020 |
| 13,200 | | Daiichi Sankyo Company, Ltd. | | | 270,665 |
| 8,200 | | Daiseki Company, Ltd. | | | 186,761 |
| 14,400 | | Daito Trust Construction Company, Ltd. | | | 607,463 |
| 27 | | East Japan Railway Company | | | 192,132 |
| 1,600 | | FamilyMart Company, Ltd. | | | 63,391 |
| 1,230 | | Fast Retailing Company, Ltd. | | | 131,128 |
| 15,600 | | Fuji Oil Company, Ltd. | | | 179,083 |
| 36,400 | | GMO Internet, Inc.b | | | 96,776 |
| 1,900 | | Hisamitsu Pharmaceutical Company, Inc. | | | 79,191 |
| 5,000 | | Hitachi Metals, Ltd. | | | 37,596 |
| 31,000 | | Hitachi, Ltd. | | | 145,547 |
| 3,500 | | Honda Motor Company, Ltd. | | | 87,029 |
| 4,200 | | Hosiden Corporation | | | 44,108 |
| 14,000 | | ITOCHU Corporation | | | 73,987 |
| 44 | | Japan Tobacco, Inc. | | | 156,098 |
| 18 | | KDDI Corporation | | | 107,848 |
| 2,200 | | KONAMI Corporation | | | 39,800 |
| 39,000 | | Kureha Corporation | | | 173,029 |
| 2,100 | | Kurita Water Industries, Ltd. | | | 47,914 |
| 1,500 | | Lawson, Inc. | | | 73,315 |
| 22,000 | | Marubeni Corporation | | | 85,471 |
| 9,200 | | Mitsubishi Corporation | | | 154,209 |
| 19,000 | | Mitsubishi Electric Corporation | | | 117,787 |
| 100,800 | | Mitsubishi UFJ Financial Group, Inc. | | | 633,444 |
| 8,000 | | Mitsui & Company, Ltd. | | | 77,516 |
| 9,000 | | Mitsui Fudosan Company, Ltd. | | | 156,989 |
| 13,000 | | Mitsui O.S.K. Lines, Ltd. | | | 67,885 |
| 16,952 | | Mitsui Sumitomo Insurance Group Holdings, Inc.b | | | 471,069 |
| 7,600 | | Nichi-iko Pharmaceutical Company, Ltd. | | | 160,623 |
| 5,000 | | Nikon Corporation | | | 70,466 |
| 600 | | Nintendo Company, Ltd. | | | 192,785 |
| 4,000 | | Nippon Meat Packers, Inc. | | | 54,864 |
| 13,000 | | Nippon Yusen Kabushiki Kaisha | | | 62,864 |
| 3,700 | | NPC, Inc. | | | 119,060 |
| 12,000 | | Panasonic Corporation | | | 193,245 |
| 151 | | Rakuten, Inc. | | | 74,856 |
| 23 | | Seven Bank, Ltd. | | | 66,246 |
| 1,700 | | Shimano, Inc. | | | 48,629 |
| 8,900 | | Shin-Etsu Chemical Company, Ltd. | | | 473,083 |
| 52 | | So-net M3, Inc. | | | 175,864 |
| 1,200 | | Sony Corporation | | | 28,440 |
| 1,700 | | Square ENIX Holdings Company, Ltd. | | | 42,829 |
| 6,400 | | Sugi Pharmacy Company, Ltd. | | | 153,911 |
| 56,100 | | Sumitomo Corporation | | | 493,570 |
| 94,400 | | Sumitomo Trust and Banking Company, Ltd. | | | 437,174 |
| 6,000 | | Suruga Bank, Ltd. | | | 56,481 |
| 4,300 | | Sysmex Corporation | | | 133,581 |
| 1,300 | | T&D Holdings, Inc. | | | 49,662 |
| 8,000 | | Takeda Pharmaceutical Company, Ltd. | | | 397,481 |
| 4,800 | | Tokio Marine Holdings, Inc. | | | 148,060 |
| 8,600 | | Torishima Pump Manufacturing Company, Ltd. | | | 117,420 |
| 13,800 | | Toyota Motor Corporation | | | 538,902 |
| 4,800 | | Tsumura & Company | | | 122,843 |
| 5,700 | | Unicharm Petcare Corporation | | | 201,131 |
The accompanying Notes to the Financial Statements are an integral part of this schedule.
104
Partner Worldwide Allocation Fund
Schedule of Investments as of October 31, 2008
| | | | | |
| Shares | | Common Stock (80.5%) | | Valuea |
| Japan (16.2%) - continued | | | |
| 9,000 | | Yokohama Rubber Company, Ltd. | | $ | 44,161 |
| | | | | |
| | Total Japan | | | 10,218,609 |
| | | | | |
| Luxembourg (0.2%) | | | |
| 1,150 | | Oriflame Cosmetics SA | | | 35,928 |
| 5,500 | | Tenaris SA ADRd | | | 113,245 |
| | | | | |
| | Total Luxembourg | | | 149,173 |
| | | | | |
| Malaysia (0.4%) | | | |
| 67,000 | | Bumiputra-Commerce Holdings Berhad | | | 116,736 |
| 55,000 | | Public Bank Berhad | | | 130,243 |
| | | | | |
| | Total Malaysia | | | 246,979 |
| | | | | |
| Mexico (1.4%) | | | |
| 168,000 | | Consorcio ARA SAB de CV | | | 67,761 |
| 10,500 | | Fomento Economico Mexicano SAB de CV ADRc | | | 265,545 |
| 3,600 | | Grupo Aeroportuario del Sureste SAB de CV ADR | | | 116,064 |
| 95,000 | | Grupo Financiero Banorte SA de CV ADR | | | 174,016 |
| 117,000 | | Organizacion Soriana SAB de CVb | | | 235,319 |
| | | | | |
| | Total Mexico | | | 858,705 |
| | | | | |
| Netherlands (2.1%) | | | |
| 2,832 | | Arcelor Mittal | | | 73,522 |
| 1,395 | | Furgo NV | | | 49,849 |
| 1,795 | | Gemalto NVb | | | 50,290 |
| 7,738 | | Imtech NV | | | 118,213 |
| 19,800 | | ING Groep NV | | | 185,728 |
| 11,437 | | Koninklijke (Royal) Ahold NV | | | 122,778 |
| 12,877 | | Koninklijke (Royal) KPN NV | | | 181,346 |
| 1,286 | | Koninklijke Boskalis Westminster NV | | | 42,454 |
| 1,239 | | Koninklijke DSM NV | | | 34,504 |
| 1,058 | | Koninklijke Vopak NV | | | 34,304 |
| 5,147 | | Qiagen NVb | | | 74,269 |
| 8,839 | | Reed Elsevier NV | | | 118,140 |
| 4,632 | | Ten Cate NV | | | 98,207 |
| 5,131 | | Unilever NV | | | 123,653 |
| | | | | |
| | Total Netherlands | | | 1,307,257 |
| | | | | |
| Norway (1.8%) | | | |
| 47,200 | | Norsk Hydro ASA | | | 197,215 |
| 15,439 | | ODIM ASAb | | | 94,100 |
| 29,650 | | StatoilHydro ASA | | | 596,369 |
| 3,700 | | Tandberg ASA | | | 45,778 |
| 27,508 | | Tomra Systems ASA | | | 127,927 |
| 2,050 | | Yara International ASA | | | 42,829 |
| | | | | |
| | Total Norway | | | 1,104,218 |
| | | | | |
| Philippines (0.4%) | | | |
| 750,000 | | Ayala Land, Inc. | | | 90,990 |
| 157,200 | | Bank of the Philippine Islands | | | 130,154 |
| | | | | |
| | Total Philippines | | | 221,144 |
| | | | | |
| Portugal (0.1%) | | | |
| 10,061 | | Jeronimo Martins SGPS SA | | | 51,342 |
| | | | | |
| | Total Portugal | | | 51,342 |
| | | | | |
| Russia (0.3%) | | | |
| 5,500 | | LUKOIL ADR | | | 211,151 |
| | | | | |
| | Total Russia | | | 211,151 |
| | | | | |
| Singapore (1.4%) | | | |
| 110,000 | | Parkway Holdings, Ltd. | | | 117,937 |
| 94,084 | | Raffles Education Corporation, Ltd. | | | 36,333 |
| 35,400 | | Singapore Airlines, Ltd. | | | 271,216 |
| 204,600 | | Singapore Telecommunications, Ltd. | | | 344,316 |
| 107,000 | | SMRT Corporation, Ltd. | | | 112,700 |
| | | | | |
| | Total Singapore | | | 882,502 |
| | | | | |
| South Africa (1.1%) | | | |
| 49,000 | | Massmart Holdings, Ltd. | | | 439,540 |
| 80,000 | | Truworths International, Ltd. | | | 271,771 |
| | | | | |
| | Total South Africa | | | 711,311 |
| | | | | |
| South Korea (1.9%) | | | |
| 11,000 | | Pusan Bank | | | 56,191 |
| 1,440 | | Samsung Electronics Company, Ltd. | | | 378,166 |
| 2,200 | | Samsung Electronics Company, Ltd. GDRe | | | 455,866 |
| 350 | | Shinsegae Company, Ltd. | | | 122,845 |
| 2,210 | | SODIFF Advanced Materials Company, Ltd. | | | 73,448 |
| 1,581 | | Taewoong Company, Ltd. | | | 76,992 |
| | | | | |
| | Total South Korea | | | 1,163,508 |
| | | | | |
| Spain (2.8%) | | | |
| 21,800 | | Banco Bilbao Vizcaya Argentaria SA | | | 253,014 |
| 38 | | Construcciones y Auxiliar de Ferrocarriles SA | | | 10,623 |
| 2,503 | | Grifols SA | | | 49,811 |
| 37,982 | | Iberdrola SA | | | 274,882 |
| 14,390 | | Mapfre SA | | | 45,795 |
| 974 | | Prosegur Cia de Seguridad SA | | | 27,671 |
| 57,950 | | Telefonica SA | | | 1,072,925 |
| | | | | |
| | Total Spain | | | 1,734,721 |
| | | | | |
| Sweden (0.9%) | | | |
| 8,800 | | Atlas Copco AB | | | 73,807 |
| 13,624 | | Intrum Justitia AB | | | 134,605 |
| 1,450 | | Modern Times Group AB | | | 31,114 |
| 3,800 | | Nordea Bank AB | | | 30,457 |
| 17,100 | | Sandvik AB | | | 110,982 |
| 24,560 | | Telefonaktiebolaget LM Ericsson | | | 167,190 |
| | | | | |
| | Total Sweden | | | 548,155 |
| | | | | |
| Switzerland (7.1%) | | | |
| 4,485 | | ABB, Ltd.b | | | 58,848 |
| 2,042 | | Actelion, Ltd.b | | | 107,874 |
| 7,400 | | Adecco SA | | | 257,423 |
| 2,232 | | Bobst Group AG | | | 80,779 |
| 730 | | Burckhardt Compression Holding AG | | | 94,903 |
| 1,082 | | Komax Holding AG | | | 70,171 |
| 858 | | Lonza Group AG | | | 71,208 |
| 625 | | Meyer Burger Technology AGb | | | 87,163 |
| 34,169 | | Nestle SA | | | 1,328,728 |
| 24,550 | | Novartis AG | | | 1,246,108 |
The accompanying Notes to Financial Statements are an integral part of this schedule.
105
Partner Worldwide Allocation Fund
Schedule of Investments as of October 31, 2008
| | | | | |
| Shares | | Common Stock (80.5%) | | Valuea |
| Switzerland (7.1%) - continued | | | |
| 2,107 | | Roche Holding AG | | $ | 322,217 |
| 2,226 | | Schulthess Group AG | | | 75,012 |
| 1,325 | | Sonova Holding AG | | | 55,054 |
| 9,200 | | Swiss Reinsurance Company | | | 383,673 |
| 2,056 | | Temenos Group AGb | | | 25,750 |
| 99 | | Vetropack Holding AG | | | 132,740 |
| 411 | | Zurich Financial Services AG | | | 83,383 |
| | | | | |
| | Total Switzerland | | | 4,481,034 |
| | | | | |
| Taiwan (1.5%) | | | |
| 70,000 | | Taiwan Mobile Company, Ltd. | | | 96,782 |
| 195,983 | | Taiwan Semiconductor Manufacturing Company, Ltd. | | | 285,166 |
| 67,337 | | Taiwan Semiconductor Manufacturing Company, Ltd. ADR | | | 556,203 |
| | | | | |
| | Total Taiwan | | | 938,151 |
| | | | | |
| Thailand (0.6%) | | | |
| 66,000 | | PTT Exploration & Production Public Company, Ltd. | | | 160,999 |
| 70,000 | | Siam Cement Public Company, Ltd. | | | 211,725 |
| | | | | |
| | Total Thailand | | | 372,724 |
| | | | | |
| Turkey (0.6%) | | | |
| 71,000 | | Akbank TAS | | | 243,854 |
| 7,500 | | BIM Birlesik Magazalar AS | | | 151,458 |
| | | | | |
| | Total Turkey | | | 395,312 |
| | | | | |
| United Kingdom (13.7%) | | | |
| 8,338 | | Aggreko plc | | | 58,343 |
| 7,141 | | Anglo American plc | | | 179,167 |
| 10,300 | | AstraZeneca plc | | | 436,475 |
| 5,135 | | Autonomy Corporation plcb | | | 81,414 |
| 2,701 | | Aveva Group plc | | | 34,431 |
| 30,336 | | Babcock International Group | | | 189,803 |
| 24,669 | | BAE Systems plc | | | 138,653 |
| 18,194 | | BG Group plc | | | 267,508 |
| 8,512 | | BHP Billiton plc | | | 144,530 |
| 9,778 | | British American Tobacco plc | | | 268,190 |
| 66,700 | | British Sky Broadcasting Group plcd | | | 405,868 |
| 38,222 | | Cable & Wireless plc | | | 75,749 |
| 31,668 | | Carillion plc | | | 106,211 |
| 1,641 | | Chemring Group plc | | | 42,097 |
| 25,934 | | Cobham plc | | | 78,812 |
| 19,772 | | Compass Group plc | | | 91,936 |
| 15,203 | | Dignity plc | | | 145,840 |
| 17,335 | | Enterprise Inns plc | | | 27,297 |
| 66,682 | | Fenner plc | | | 109,960 |
| 9,347 | | FirstGroup plc | | | 61,678 |
| 17,619 | | GAME GROUP plc | | | 36,956 |
| 44,439 | | GlaxoSmithKline plc | | | 854,246 |
| 26,587 | | Group 4 Securicor plc | | | 80,518 |
| 20,020 | | HMV Group plc | | | 32,066 |
| 9,387 | | IG Group Holdings plc | | | 43,853 |
| 7,438 | | Imperial Tobacco Group plc | | | 199,339 |
| 9,436 | | Inmarsat plc | | | 64,330 |
| 22,682 | | International Power plc | | | 81,139 |
| 3,704 | | Intertek Group plc | | | 43,864 |
| 9,760 | | John Wood Group plc | | | 37,722 |
| 196,200 | | Kingfisher plc | | | 362,089 |
| 44,600 | | Pearson plc | | | 444,206 |
| 6,062 | | Petrofac, Ltd. | | | 41,964 |
| 19,853 | | Prudential plc | | | 99,722 |
| 58,218 | | PV Crystalox Solar plc | | | 127,135 |
| 5,122 | | Reckitt Benckiser Group plc | | | 216,649 |
| 3,041 | | Rio Tinto plc | | | 142,045 |
| 14,789 | | Rotork plc | | | 177,204 |
| 20,872 | | Stagecoach Group plc | | | 62,666 |
| 17,009 | | Standard Chartered plcd | | | 281,092 |
| 17,540 | | Tesco plc | | | 96,097 |
| 10,725 | | Tullett Prebon plc | | | 41,098 |
| 7,870 | | Ultra Electronics Holdings | | | 139,605 |
| 32,476 | | Unilever plc | | | 729,561 |
| 286,300 | | Vodafone Group plc | | | 550,715 |
| 17,901 | | VT Group plc | | | 144,190 |
| 9,596 | | Wellstream Holdings plc | | | 66,991 |
| 25,037 | | William Morrison Supermarkets plc | | | 106,599 |
| 51,700 | | WPP Group plc | | | 309,235 |
| 6,744 | | Xstrata plc | | | 115,345 |
| | | | | |
| | Total United Kingdom | | | 8,672,203 |
| | | | | |
| United States (2.1%) | | | |
| 7,222 | | iShares MSCI EAFE Index Fund | | | 322,246 |
| 791 | | Synthes, Inc. | | | 102,073 |
| 75,700 | | WisdomTree India Earnings Fundb,d | | | 864,493 |
| | | | | |
| | Total United States | | | 1,288,812 |
| | | | | |
| | Total Common Stock (cost $81,009,184) | | | 50,534,407 |
| | | | | |
| | |
Principal
Amount | | Long-Term Fixed Income (10.1%) | | |
| Argentina (0.4%) | | | |
| | Argentina Bonos | | | |
| 520,000 | | 3.127%, 2/3/2009f | | | 94,900 |
| 430,000 | | 7.000%, 10/3/2015 | | | 85,140 |
| | Republic of Argentina International Bond | | | |
| 320,000 | | 1.330%, 3/31/2009g | | | 56,000 |
| | | | | |
| | Total Argentina | | | 236,040 |
| | | | | |
| Brazil (1.2%) | | | |
| | Federative Republic of Brazil International Bond | | | |
| 840,000 | | 6.000%, 1/17/2017 | | | 758,100 |
| | Independencia International, Ltd. | | | |
| 70,000 | | 9.875%, 5/15/2015e | | | 32,200 |
| | | | | |
| | Total Brazil | | | 790,300 |
| | | | | |
| Colombia (0.4%) | | | |
| | Colombia Government International Bond | | | |
| 280,000 | | 7.375%, 9/18/2037 | | | 229,600 |
| | | | | |
| | Total Colombia | | | 229,600 |
| | | | | |
| Dominican Republic (0.1%) | | | |
| | Dominican Republic International Bond | | | |
| 163,947 | | 9.040%, 1/23/2018 | | | 85,252 |
| | | | | |
| | Total Dominican Republic | | | 85,252 |
| | | | | |
The accompanying Notes to the Financial Statements are an integral part of this schedule.
106
Partner Worldwide Allocation Fund
Schedule of Investments as of October 31, 2008
| | | | | |
Principal
Amount | | Long-Term Fixed Income (10.1%) | | Valuea |
| Ecuador (0.1%) | | | |
| | Republic of Ecuador International Bond | | | |
| $150,000 | | 10.000%, 8/15/2030 | | $ | 43,500 |
| | | | | |
| | Total Ecuador | | | 43,500 |
| | | | | |
| Indonesia (0.2%) | | | |
| | Republic of Indonesia Government International Bond | | | |
| 200,000 | | 7.750%, 1/17/2038 | | | 119,743 |
| | | | | |
| | Total Indonesia | | | 119,743 |
| | | | | |
| Ireland (0.1%) | | | |
| | VIP Finance Ireland, Ltd. | | | |
| 100,000 | | 9.125%, 4/30/2018e,h | | | 51,673 |
| | | | | |
| | Total Ireland | | | 51,673 |
| | | | | |
| Israel (<0.1%) | | | |
| | Israel Government International Bond | | | |
| 20,000 | | 5.125%, 3/1/2014 | | | 19,314 |
| | | | | |
| | Total Israel | | | 19,314 |
| | | | | |
| Kazakhstan (0.1%) | | | |
| | KazMunaiGaz Finance Sub BV | | | |
| 100,000 | | 8.375%, 7/2/2013e | | | 67,000 |
| | | | | |
| | Total Kazakhstan | | | 67,000 |
| | | | | |
| Lebanon (0.2%) | | | |
| | Lebanon Government International Bond | | | |
| 218,500 | | 4.000%, 12/31/2017 | | | 152,950 |
| | | | | |
| | Total Lebanon | | | 152,950 |
| | | | | |
| Luxembourg (0.3%) | | | |
| | VTB Capital SA | | | |
| 370,000 | | 6.875%, 5/29/2018 | | | 207,200 |
| | | | | |
| | Total Luxembourg | | | 207,200 |
| | | | | |
| Malaysia (0.3%) | | | |
| | Malaysia Government International Bond | | | |
| 180,000 | | 7.500%, 7/15/2011 | | | 182,135 |
| | | | | |
| | Total Malaysia | | | 182,135 |
| | | | | |
| Mexico (0.9%) | | | |
| | Mexico Government International Bond | | | |
| 270,000 | | 7.500%, 4/8/2033 | | | 259,200 |
| 180,000 | | 6.750%, 9/27/2034 | | | 149,400 |
| | United Mexican States | | | |
| 110,000 | | 5.625%, 1/15/2017 | | | 97,900 |
| 50,000 | | 6.050%, 1/11/2040 | | | 37,960 |
| | | | | |
| | Total Mexico | | | 544,460 |
| | | | | |
| Netherlands (0.7%) | | | |
| | Majapahit Holding BV | | | |
| 700,000 | | 7.750%, 10/17/2016 | | | 420,609 |
| | TuranAlem Finance BV | | | |
| 150,000 | | 8.000%, 3/24/2014 | | | 45,000 |
| | | | | |
| | Total Netherlands | | | 465,609 |
| | | | | |
| Panama (0.2%) | | | |
| | Panama Government International Bond | | | |
| 170,000 | | 6.700%, 1/26/2036 | | | 132,600 |
| | | | | |
| | Total Panama | | | 132,600 |
| | | | | |
| Peru (0.3%) | | | |
| | Peruvian Government International Bond | | | |
| 240,000 | | 6.550%, 3/14/2037 | | | 165,600 |
| | | | | |
| | Total Peru | | | 165,600 |
| | | | | |
| Philippines (0.9%) | | | |
| | Philippine Government International Bond | | | |
| 410,000 | | 10.625%, 3/16/2025 | | | 438,700 |
| 100,000 | | 9.500%, 2/2/2030 | | | 102,000 |
| | | | | |
| | Total Philippines | | | 540,700 |
| | | | | |
| Russia (1.2%) | | | |
| | Russian Federation International Bond | | | |
| 833,000 | | 7.500%, 3/31/2030 | | | 728,475 |
| | | | | |
| | Total Russia | | | 728,475 |
| | | | | |
| South Africa (0.2%) | | | |
| | Republic of South Africa International Bond | | | |
| 230,000 | | 5.875%, 5/30/2022 | | | 147,200 |
| | | | | |
| | Total South Africa | | | 147,200 |
| | | | | |
| South Korea (0.1%) | | | |
| | Republic of Korea International Bond | | | |
| 100,000 | | 5.625%, 11/3/2025 | | | 70,182 |
| | | | | |
| | Total South Korea | | | 70,182 |
| | | | | |
| Trinidad & Tobago (0.2%) | | | |
| | National Gas Company of Trinidad & Tobago, Ltd. | | | |
| 170,000 | | 6.050%, 1/15/2036e | | | 116,351 |
| | | | | |
| | Total Trinidad & Tobago | | | 116,351 |
| | | | | |
| Turkey (0.7%) | | | |
| | Republic of Turkey International Bond | | | |
| 460,000 | | 6.750%, 4/3/2018 | | | 354,200 |
| 60,000 | | 7.000%, 3/11/2019 | | | 46,725 |
| 50,000 | | 6.875%, 3/17/2036 | | | 34,000 |
| 60,000 | | 7.250%, 3/5/2038 | | | 41,400 |
| | | | | |
| | Total Turkey | | | 476,325 |
| | | | | |
| Ukraine (0.3%) | | | |
| | Ukraine Government International Bond | | | |
| 200,000 | | 7.650%, 6/11/2013 | | | 100,000 |
| 200,000 | | 6.580%, 11/21/2016 | | | 80,000 |
| | | | | |
| | Total Ukraine | | | 180,000 |
| | | | | |
The accompanying Notes to Financial Statements are an integral part of this schedule.
107
Partner Worldwide Allocation Fund
Schedule of Investments as of October 31, 2008
| | | | | |
Principal
Amount | | Long-Term Fixed Income (10.1%) | | Valuea |
| Uruguay (0.3%) | | | |
| | Oriental Republic of Uruguay International Bond | | | |
| $300,000 | | 7.625%, 3/21/2036 | | $ | 180,000 |
| | | | | |
| | Total Uruguay | | | 180,000 |
| | | | | |
| Venezuela (0.7%) | | | |
| | Petroleos de Venezuela SA | | | |
| 30,000 | | 5.250%, 4/12/2017 | | | 11,400 |
| 240,000 | | 5.375%, 4/12/2027 | | | 85,200 |
| | Venezuela Government International Bond | | | |
| 170,000 | | 10.750%, 9/19/2013 | | | 115,600 |
| 250,000 | | 6.000%, 12/9/2020 | | | 103,750 |
| 50,000 | | 9.000%, 5/7/2023 | | | 23,875 |
| 110,000 | | 9.250%, 5/7/2028 | | | 50,600 |
| 70,000 | | 9.375%, 1/13/2034 | | | 35,700 |
| | | | | |
| | Total Venezuela | | | 426,125 |
| | | | | |
| | Total Long-Term Fixed Income (cost $8,793,768) | | | 6,358,334 |
| | | | | |
| | |
Shares or
Principal
Amount | | Short-Term Investments (9.7%)i | | Value |
| | Federal National Mortgage Association Discount Notes | | | |
| 200,000 | | 2.100%, 12/10/2008j | | | 199,550 |
| 5,901,139 | | Thrivent Money Market Fundc | | | 5,901,139 |
| | | | | |
| | Total Short-Term Investments (at amortized cost) | | | 6,100,689 |
| | | | | |
| | Total Investments (cost $95,903,641) 100.3% | | | $62,993,430 |
| | | | | |
| | Other Assets and Liabilities, Net (0.3%) | | | (173,617) |
| | | | | |
| | Total Net Assets 100.0% | | | $62,819,813 |
| | | | | |
| a | Security is fair valued as discussed in item 2(A) of the Notes to Financial Statements. |
| b | Non-income producing security. |
| c | Designated as cover for long settling trades as discussed in the Notes to Financial Statements. |
| d | At October 31, 2008, $1,644,108 of investments were earmarked to cover open financial futures contracts. |
| e | Denotes securities sold under Rule 144A of the Securities Act of 1933, which exempts them from registration. These securities have been determined to be liquid under the guidelines established by the Fund’s Board of Trustees and may be resold to other dealers in the program or to other qualified institutional buyers. As of October 31, 2008, the value of these investments was $723,090 or 1.2% of total net assets. |
| f | Denotes variable rate obligations for which the current yield and next scheduled reset date are shown. |
| g | Denotes step coupon bonds for which the current interest rate and next scheduled reset date are shown. |
| h | Denotes restricted securities. Restricted securities are investment securities which have been deemed illiquid and cannot be offered for public sale without first being registered under the Securities Act of 1933. The following table indicates the acquisition date and cost of restricted securities Partner Worldwide Allocation Fund owned as of October 31, 2008. |
| | | | | |
Security | | Acquisition
Date | | Cost |
VIP Finance Ireland, Ltd. | | 5/2/2008 | | $ | 101,058 |
| i | The interest rate shown reflects the yield, coupon rate or, for securities purchased at a discount, the discount rate at the date of purchase. |
| j | At October 31, 2008, $199,550 of investments were held on deposit with the counterparty and pledged as the initial margin deposit for open financial futures contracts. |
Definitions:
| | | | |
ADR | | - | | American Depositary Receipt, which are certificates for an underlying foreign security’s shares held by an issuing U.S. depository bank. |
GDR | | - | | Global Depository Receipts, which are certificates for shares of an underlying foreign security’s shares held by an issuing depository bank from more than one country. |
Gross unrealized appreciation and depreciation of investments, based on cost for federal income tax purposes, were as follows:
| | | | |
Gross unrealized appreciation | | $ | 305,087 | |
Gross unrealized depreciation | | | (33,303,410 | ) |
| | | | |
Net unrealized appreciation (depreciation) | | | ($32,998,323 | ) |
Cost for federal income tax purposes | | $ | 95,991,753 | |
The accompanying Notes to the Financial Statements are an integral part of this schedule.
108
Partner Worldwide Allocation Fund
Schedule of Investments as of October 31, 2008
| | | | | | | | | | | | | | |
Futures | | Number of
Contracts
Long/(Short) | | Expiration Date | | Notional
Principal
Amount | | Value | | Unrealized
Gain/(Loss) | |
E-Mini MSCI EAFE Index Futures | | 24 | | December 2008 | | $ | 1,620,949 | | $ | 1,529,760 | | | ($91,189 | ) |
Total Futures | | | | | | | | | | | | | ($91,189 | ) |
| | | | | |
Foreign Currency Forward Contracts | | Contracts to
Deliver/Receive | | Settlement Date | | Value on
Settlement
Date | | Value | | Unrealized
Gain/(Loss) | |
Purchases | | | | | | | | | | | | | | |
Australian Dollar | | 96,725 | | 11/03/2008 - 11/05/2008 | | $ | 64,142 | | $ | 64,278 | | $ | 136 | |
Brazilian Real | | 555,284 | | 11/04/2008 | | | 292,435 | | | 255,933 | | | (36,502 | ) |
British Pound | | 65,456 | | 11/03/2008 - 11/05/2008 | | | 107,006 | | | 105,336 | | | (1,670 | ) |
Canadian Dollar | | 97,650 | | 11/03/2008 - 11/05/2008 | | | 80,617 | | | 81,017 | | | 400 | |
Chinese Renminbi Yuan | | 1,369,597 | | 11/04/2008 | | | 201,537 | | | 200,169 | | | (1,368 | ) |
Chinese Renminbi Yuan | | 532,000 | | 2/03/2009 | | | 76,757 | | | 77,016 | | | 259 | |
EURO | | 125,032 | | 11/03/2008 - 11/05/2008 | | | 162,245 | | | 159,358 | | | (2,887 | ) |
Japanese Yen | | 4,124,107 | | 11/03/2008 - 11/05/2008 | | | 42,336 | | | 41,865 | | | (471 | ) |
Singapore Dollar | | 53,701 | | 11/03/2008 - 11/05/2008 | | | 36,238 | | | 36,211 | | | (27 | ) |
Total Foreign Currency Forward Contracts Purchases | | | | | | $ | 1,063,313 | | $ | 1,021,183 | | | ($42,130 | ) |
Sales | | | | | | | | | | | | | | |
Australian Dollar | | 2,903 | | 11/03/2008 - 11/05/2008 | | $ | 1,931 | | $ | 1,929 | | $ | 2 | |
Brazilian Real | | 569,539 | | 11/04/2008 | | | 265,800 | | | 262,504 | | | 3,296 | |
British Pound | | 37,276 | | 11/03/2008 - 11/05/2008 | | | 60,767 | | | 59,987 | | | 780 | |
Canadian Dollar | | 29,960 | | 11/03/2008 - 11/05/2008 | | | 24,434 | | | 24,857 | | | (423 | ) |
Chinese Renminbi Yuan | | 1,369,597 | | 11/04/2008 | | | 200,135 | | | 200,169 | | | (34 | ) |
EURO | | 110,800 | | 11/03/2008 - 11/05/2008 | | | 142,867 | | | 141,219 | | | 1,648 | |
Japanese Yen | | 3,103,251 | | 11/03/2008 - 11/05/2008 | | | 31,857 | | | 31,502 | | | 355 | |
Singapore Dollar | | 36,884 | | 11/03/2008 - 11/05/2008 | | | 24,718 | | | 24,871 | | | (153 | ) |
Swiss Franc | | 127,249 | | 11/03/2008 - 11/05/2008 | | | 112,260 | | | 109,726 | | | 2,534 | |
Total Foreign Currency Forward Contracts Sales | | | | | | $ | 864,769 | | $ | 856,764 | | $ | 8,005 | |
Net Unrealized Gain/(Loss) on Foreign Currency Forward Contracts | | | | | | | | | | | | | ($34,125 | ) |
Investment in Affiliates
Affiliated issuers, as defined under the Investment Company Act of 1940, include those in which the Fund’s holdings of an issuer represent 5% or more of the outstanding voting securities of an issuer, or any affiliated mutual fund.
A summary of transactions for the fiscal year to date, in Partner Worldwide Allocation Fund, is as follows:
| | | | | | | | | | | | | | | | | |
Fund | | Value
February 29,
2008 | | Gross
Purchases and
Additions | | Gross Sales
and
Reductions | | Balance of
Shares
Held at
October 31,
2008 | | Value
October 31,
2008 | | Income
Earned
February 29,
2008-
October 31,
2008 |
Money Market | | $ | — | | $ | 28,426,825 | | $ | 22,525,686 | | 5,901,139 | | $ | 5,901,139 | | $ | 76,514 |
Total Value and Dividend Income | | | — | | | | | | | | | | | 5,901,139 | | | 76,514 |
The accompanying Notes to Financial Statements are an integral part of this schedule.
109
Partner International Stock Fund
Schedule of Investments as of October 31, 2008
| | | | | |
| Shares | | Common Stock (96.0%) | | Valuea |
| Australia (2.6%) | | | |
| 187,656 | | BHP Billiton, Ltd. | | $ | 3,605,046 |
| 173,664 | | Centennial Coal Company, Ltd. | | | 408,367 |
| 62,185 | | CSL, Ltd. | | | 1,512,300 |
| 35,085 | | Leighton Holdings, Ltd. | | | 583,374 |
| 216,434 | | Mount Gibson Iron, Ltd.b | | | 71,915 |
| 163,589 | | OneSteel, Ltd. | | | 375,826 |
| 124,752 | | Origin Energy, Ltd. | | | 1,308,287 |
| 30,958 | | Rio Tinto, Ltd. | | | 1,601,521 |
| 80,545 | | Sonic Healthcare, Ltd. | | | 736,060 |
| | | | | |
| | Total Australia | | | 10,202,696 |
| | | | | |
| Austria (0.4%) | | | |
| 16,210 | | OMV AG | | | 518,873 |
| 18,716 | | Verbund - Oesterreichische Elektrizitaetswirtschafts-AG | | | 885,377 |
| | | | | |
| | Total Austria | | | 1,404,250 |
| | | | | |
| Belgium (0.5%) | | | |
| 3,447 | | Colruyt SA | | | 774,723 |
| 6,648 | | Group Bruxelles Lambert SA | | | 488,374 |
| 8,620 | | Mobistar SA | | | 572,016 |
| | | | | |
| | Total Belgium | | | 1,835,113 |
| | | | | |
| Bermuda (0.1%) | | | |
| 474,000 | | Noble Group, Ltd. | | | 345,032 |
| | | | | |
| | Total Bermuda | | | 345,032 |
| | | | | |
| Brazil (0.8%) | | | |
| 149,300 | | Empresa Brasileira de Aeronautica | | | |
| | SA ADR | | | 3,123,356 |
| | | | | |
| | Total Brazil | | | 3,123,356 |
| | | | | |
| Canada (3.1%) | | | |
| 15,700 | | Agrium, Inc. | | | 601,401 |
| 47,900 | | Alimentation Couche-Tard, Inc. | | | 645,794 |
| 58,300 | | Brookfield Asset Management, Inc. | | | 1,020,601 |
| 24,200 | | Canadian Oil Sands Trust | | | 649,322 |
| 81,678 | | CGI Group, Inc.b | | | 651,906 |
| 54,800 | | EnCana Corporation | | | 2,783,875 |
| 20,408 | | Gildan Activewear, Inc.b | | | 475,786 |
| 16,700 | | Potash Corporation of Saskatchewan, Inc. | | | 1,421,571 |
| 27,000 | | Precision Drilling Trust | | | 291,214 |
| 32,100 | | Shoppers Drug Mart Corporation | | | 1,235,742 |
| 72,800 | | Sino-Forest Corporationb | | | 681,311 |
| 10,300 | | Suncor Energy, Inc. | | | 247,395 |
| 42,600 | | Teck Cominco, Ltd. | | | 424,127 |
| 12,700 | | Toronto-Dominion Bank | | | 599,754 |
| 49,700 | | Viterra, Inc.b | | | 315,444 |
| | | | | |
| | Total Canada | | | 12,045,243 |
| | | | | |
| Denmark (0.8%) | | | |
| 41,544 | | Novo Nordisk AS | | | 2,226,871 |
| 21,239 | | Vestas Wind Systemsb | | | 869,943 |
| | | | | |
| | Total Denmark | | | 3,096,814 |
| | | | | |
| Finland (0.7%) | | | |
| 40,346 | | Fortum Oyj | | | 991,531 |
| 124,073 | | Nokia Oyj | | | 1,900,550 |
| | | | | |
| | Total Finland | | | 2,892,081 |
| | | | | |
| France (6.7%) | | | |
| 25,427 | | Alstom | | | $1,260,237 |
| 191,900 | | Axa SA | | | 3,666,009 |
| 64,200 | | Cap Gemini SA | | | 2,068,474 |
| 32,700 | | Compagnie de Saint-Gobain | | | 1,261,772 |
| 25,259 | | Eutelsat Communications | | | 542,132 |
| 81,192 | | GDF Suez | | | 3,614,100 |
| 9,069 | | Hermes International | | | 1,170,507 |
| 17,258 | | Ingenico | | | 269,529 |
| 53,100 | | Schneider Electric SA | | | 3,182,643 |
| 23,633 | | Teleperformance | | | 509,959 |
| 12,464 | | UBISOFT Entertainment SAb | | | 658,829 |
| 6,580 | | Unibail-Rodamco | | | 986,887 |
| 3,939 | | Vallourec SA | | | 440,607 |
| 245,594 | | Vivendi Universal SA | | | 6,419,499 |
| | | | | |
| | Total France | | | 26,051,184 |
| | | | | |
| Germany (5.3%) | | | |
| 55,900 | | Adidas AG | | | 1,941,731 |
| 21,974 | | Bayer AG | | | 1,202,865 |
| 73,400 | | Bayerische Motoren Werke AG | | | 1,861,297 |
| 214,800 | | Deutsche Post AG-REG | | | 2,355,162 |
| 111,622 | | E.ON AG | | | 4,182,965 |
| 39,936 | | GEA Group AG | | | 573,478 |
| 11,155 | | RWE AG | | | 914,485 |
| 60,250 | | SAP AG | | | 2,109,395 |
| 20,763 | | SGL Carbon AGb | | | 400,758 |
| 81,532 | | Siemens AG | | | 4,794,479 |
| 4,965 | | Wacker Chemie AG | | | 536,547 |
| | | | | |
| | Total Germany | | | 20,873,162 |
| | | | | |
| Greece (0.5%) | | | |
| 71,023 | | Alpha Bank AE | | | 1,036,912 |
| 36,991 | | Greek Organization of Football Prognostics SA | | | 807,673 |
| | | | | |
| | Total Greece | | | 1,844,585 |
| | | | | |
| Hong Kong (0.8%) | | | |
| 329,000 | | BOC Hong Kong (Holdings), Ltd. | | | 376,677 |
| 72,000 | | Cheung Kong Holdings, Ltd. | | | 691,305 |
| 52,400 | | Hang Seng Bank, Ltd. | | | 653,816 |
| 202,000 | | Hutchison Whampoa, Ltd. | | | 1,091,573 |
| 128,000 | | Wharf Holdings, Ltd. | | | 255,386 |
| | | | | |
| | Total Hong Kong | | | 3,068,757 |
| | | | | |
| Italy (3.4%) | | | |
| 144,725 | | Enel SPA | | | 968,234 |
| 218,000 | | Eni SPA | | | 5,203,187 |
| 260,700 | | Finmeccanica SPA | | | 3,233,198 |
| 290,800 | | Finmeccanica SPA - Rights | | | 118,603 |
| 27,905 | | Lottomatica SPA | | | 651,514 |
| 207,032 | | Terna-Rete Elettrica Nationale SPA | | | 667,695 |
| 981,200 | | Unicredit SPA | | | 2,401,852 |
| | | | | |
| | Total Italy | | | 13,244,283 |
| | | | | |
| Japan (22.2%) | | | |
| 65,900 | | Asahi Breweries, Ltd. | | | 1,087,760 |
| 19,300 | | Astellas Pharmaceutical, Inc. | | | 777,380 |
| 63,000 | | Bank of Kyoto, Ltd. | | | 662,681 |
| 202,600 | | Bridgestone Corporation | | | 3,542,054 |
| 27,100 | | Canon, Inc. | | | 948,273 |
| 592 | | CyberAgent, Inc. | | | 528,520 |
| 63,000 | | Daihatsu Motor Company, Ltd. | | | 466,447 |
The accompanying Notes to Financial Statements are an integral part of this schedule.
110
Partner International Stock Fund
Schedule of Investments as of October 31, 2008
| | | | | |
| Shares | | Common Stock (96.0%) | | Valuea |
| Japan (22.2%) - continued | | | |
| 133,000 | | Daiichi Sankyo Company, Ltd.c | | $ | 2,727,154 |
| 142,900 | | Daito Trust Construction Company, Ltd. | | | 6,028,235 |
| 301 | | East Japan Railway Company | | | 2,141,917 |
| 18,600 | | FamilyMart Company, Ltd. | | | 736,916 |
| 13,967 | | Fast Retailing Company, Ltd. | | | 1,488,995 |
| 21,300 | | Hisamitsu Pharmaceutical Company, Inc. | | | 887,773 |
| 52,000 | | Hitachi Metals, Ltd. | | | 390,994 |
| 351,000 | | Hitachi, Ltd. | | | 1,647,964 |
| 40,300 | | Honda Motor Company, Ltd. | | | 1,002,075 |
| 47,500 | | Hosiden Corporation | | | 498,838 |
| 154,000 | | ITOCHU Corporation | | | 813,852 |
| 505 | | Japan Tobacco, Inc. | | | 1,791,575 |
| 202 | | KDDI Corporation | | | 1,210,290 |
| 25,200 | | KONAMI Corporation | | | 455,890 |
| 24,600 | | Kurita Water Industries, Ltd. | | | 561,275 |
| 17,000 | | Lawson, Inc. | | | 830,898 |
| 258,000 | | Marubeni Corporation | | | 1,002,342 |
| 104,900 | | Mitsubishi Corporation | | | 1,758,318 |
| 220,000 | | Mitsubishi Electric Corporation | | | 1,363,851 |
| 1,040,900 | | Mitsubishi UFJ Financial Group, Inc. | | | 6,541,195 |
| 88,000 | | Mitsui & Company, Ltd. | | | 852,677 |
| 98,000 | | Mitsui Fudosan Company, Ltd. | | | 1,709,440 |
| 147,000 | | Mitsui O.S.K. Lines, Ltd. | | | 767,621 |
| 176,155 | | Mitsui Sumitomo Insurance Group Holdings, Inc.b | | | 4,895,065 |
| 58,000 | | Nikon Corporation | | | 817,402 |
| 7,200 | | Nintendo Company, Ltd. | | | 2,313,420 |
| 42,000 | | Nippon Meat Packers, Inc. | | | 576,074 |
| 144,000 | | Nippon Yusen Kabushiki Kaisha | | | 696,338 |
| 134,000 | | Panasonic Corporation | | | 2,157,901 |
| 1,715 | | Rakuten, Inc. | | | 850,191 |
| 265 | | Seven Bank, Ltd. | | | 763,263 |
| 18,900 | | Shimano, Inc. | | | 540,644 |
| 94,500 | | Shin-Etsu Chemical Company, Ltd. | | | 5,023,189 |
| 13,700 | | Sony Corporation | | | 324,695 |
| 18,900 | | Square ENIX Holdings Company, Ltd. | | | 476,159 |
| 555,700 | | Sumitomo Corporation | | | 4,889,071 |
| 942,700 | | Sumitomo Trust and Banking Company, Ltd. | | | 4,365,717 |
| 63,000 | | Suruga Bank, Ltd. | | | 593,050 |
| 14,600 | | T&D Holdings, Inc. | | | 557,739 |
| 80,100 | | Takeda Pharmaceutical Company, Ltd. | | | 3,979,786 |
| 55,100 | | Tokio Marine Holdings, Inc. | | | 1,699,609 |
| 139,600 | | Toyota Motor Corporation | | | 5,451,508 |
| 104,000 | | Yokohama Rubber Company, Ltd. | | | 510,302 |
| | | | | |
| | Total Japan | | | 86,704,323 |
| | | | | |
| Luxembourg (0.1%) | | | |
| 13,284 | | Oriflame Cosmetics SA | | | 415,012 |
| | | | | |
| | Total Luxembourg | | | 415,012 |
| | | | | |
| Netherlands (2.9%) | | | |
| 32,202 | | Arcelor Mittal | | | 836,000 |
| 15,734 | | Furgo NV | | | 562,235 |
| 20,412 | | Gemalto NVb | | | 571,879 |
| 203,300 | | ING Groep NV | | | 1,906,993 |
| 130,532 | | Koninklijke (Royal) Ahold NV | | | 1,401,281 |
| 145,109 | | Koninklijke (Royal) KPN NV | | | 2,043,566 |
| 14,642 | | Koninklijke Boskalis Westminster NV | | | 483,372 |
| 14,088 | | Koninklijke DSM NV | | | 392,322 |
| 12,067 | | Koninklijke Vopak NV | | | 391,249 |
| 100,547 | | Reed Elsevier NV | | | 1,343,890 |
| 58,260 | | Unilever NV | | | 1,404,018 |
| | | | | |
| | Total Netherlands | | | 11,336,805 |
| | | | | |
| Norway (2.4%) | | | |
| 473,500 | | Norsk Hydro ASA | | | 1,978,418 |
| 308,999 | | StatoilHydro ASA | | | 6,215,086 |
| 42,600 | | Tandberg ASA | | | 527,065 |
| 23,430 | | Yara International ASA | | | 489,504 |
| | | | | |
| | Total Norway | | | 9,210,073 |
| | | | | |
| Portugal (0.1%) | | | |
| 114,389 | | Jeronimo Martins SGPS SA | | | 583,740 |
| | | | | |
| | Total Portugal | | | 583,740 |
| | | | | |
| Singapore (1.5%) | | | |
| 358,600 | | Singapore Airlines, Ltd. | | | 2,747,413 |
| 1,957,690 | | Singapore Telecommunications, Ltd. | | | 3,294,543 |
| | | | | |
| | Total Singapore | | | 6,041,956 |
| | | | | |
| South Korea (1.2%) | | | |
| 11,331 | | Samsung Electronics Company, Ltd. | | | 4,777,191 |
| | | | | |
| | Total South Korea | | | 4,777,191 |
| | | | | |
| Spain (4.7%) | | | |
| 215,200 | | Banco Bilbao Vizcaya Argentaria SA | | | 2,497,648 |
| 28,462 | | Grifols SA | | | 566,407 |
| 416,874 | | Iberdrola SA | | | 3,016,997 |
| 163,681 | | Mapfre SA | | | 520,896 |
| 625,360 | | Telefonica SA | | | 11,578,325 |
| | | | | |
| | Total Spain | | | 18,180,273 |
| | | | | |
| Sweden (1.1%) | | | |
| 101,000 | | Atlas Copco AB | | | 847,108 |
| 16,550 | | Modern Times Group AB | | | 355,129 |
| 41,600 | | Nordea Bank AB | | | 333,429 |
| 172,400 | | Sandvik AB | | | 1,118,896 |
| 256,540 | | Telefonaktiebolaget LM Ericsson | | | 1,746,370 |
| | | | | |
| | Total Sweden | | | 4,400,932 |
| | | | | |
| Switzerland (11.8%) | | | |
| 51,174 | | ABB, Ltd.b | | | 671,457 |
| 23,236 | | Actelion, Ltd.b | | | 1,227,507 |
| 74,600 | | Adecco SA | | | 2,595,098 |
| 5,950 | | Givaudan SA | | | 4,054,417 |
| 9,685 | | Lonza Group AG | | | 803,785 |
| 365,357 | | Nestle SA | | | 14,207,621 |
| 259,801 | | Novartis AG | | | 13,186,968 |
| 23,941 | | Roche Holding AG | | | 3,661,221 |
| 15,062 | | Sonova Holding AG | | | 625,833 |
| 94,000 | | Swiss Reinsurance Company | | | 3,920,141 |
| 21,891 | | Temenos Group AGb | | | 274,169 |
| 4,651 | | Zurich Financial Services AG | | | 943,584 |
| | | | | |
| | Total Switzerland | | | 46,171,801 |
| | | | | |
The accompanying Notes to Financial Statements are an integral part of this schedule.
111
Partner International Stock Fund
Schedule of Investments as of October 31, 2008
| | | | | | |
| Shares | | Common Stock (96.0%) | | Valuea | |
| Taiwan (1.4%) | | | | |
| 665,100 | | Taiwan Semiconductor Manufacturing Company, Ltd. ADR | | $ | 5,493,726 | |
| | | | | | |
| | Total Taiwan | | | 5,493,726 | |
| | | | | | |
| United Kingdom (20.3%) | | | | |
| 94,620 | | Aggreko plc | | | 662,081 | |
| 81,201 | | Anglo American plc | | | 2,037,330 | |
| 103,800 | | AstraZeneca plc | | | 4,398,654 | |
| 57,872 | | Autonomy Corporation plcb | | | 917,552 | |
| 28,204 | | Aveva Group plc | | | 359,526 | |
| 93,967 | | Babcock International Group | | | 587,921 | |
| 281,306 | | BAE Systems plc | | | 1,581,091 | |
| 206,465 | | BG Group plc | | | 3,035,674 | |
| 96,690 | | BHP Billiton plc | | | 1,641,754 | |
| 110,955 | | British American Tobacco plc | | | 3,043,263 | |
| 662,900 | | British Sky Broadcasting Group plc | | | 4,033,727 | |
| 434,943 | | Cable & Wireless plc | | | 861,977 | |
| 18,641 | | Chemring Group plc | | | 478,204 | |
| 294,279 | | Cobham plc | | | 894,297 | |
| 222,754 | | Compass Group plc | | | 1,035,767 | |
| 183,408 | | Enterprise Inns plc | | | 288,807 | |
| 106,655 | | FirstGroup plc | | | 703,779 | |
| 191,140 | | GAME GROUP plc | | | 400,920 | |
| 478,246 | | GlaxoSmithKline plc | | | 9,193,267 | |
| 301,692 | | Group 4 Securicor plc | | | 913,670 | |
| 213,070 | | HMV Group plc | | | 341,275 | |
| 101,243 | | IG Group Holdings plc | | | 472,978 | |
| 84,878 | | Imperial Tobacco Group plc | | | 2,274,741 | |
| 108,595 | | Inmarsat plc | | | 740,347 | |
| 257,376 | | International Power plc | | | 920,697 | |
| 41,746 | | Intertek Group plc | | | 494,375 | |
| 110,758 | | John Wood Group plc | | | 428,078 | |
| 1,925,900 | | Kingfisher plc | | | 3,554,268 | |
| 441,900 | | Pearson plc | | | 4,401,221 | |
| 64,276 | | Petrofac, Ltd. | | | 444,946 | |
| 223,653 | | Prudential plc | | | 1,123,412 | |
| 58,151 | | Reckitt Benckiser Group plc | | | 2,459,654 | |
| 34,553 | | Rio Tinto plc | | | 1,613,965 | |
| 31,662 | | Rotork plc | | | 379,378 | |
| 236,839 | | Stagecoach Group plc | | | 711,089 | |
| 113,835 | | Standard Chartered plc | | | 1,881,245 | |
| 199,226 | | Tesco plc | | | 1,091,511 | |
| 122,384 | | Tullett Prebon plc | | | 468,975 | |
| 334,446 | | Unilever plc | | | 7,513,194 | |
| 2,660,787 | | Vodafone Group plc | | | 5,118,183 | |
| 285,750 | | William Morrison Supermarkets plc | | | 1,216,622 | |
| 509,300 | | WPP Group plc | | | 3,046,293 | |
| 76,950 | | Xstrata plc | | | 1,316,100 | |
| | | | | | |
| | Total United Kingdom | | | 79,081,808 | |
| | | | | | |
| United States (0.6%) | | | | |
| 29,907 | | iShares MSCI EAFE Index Fund | | | 1,334,450 | |
| 9,017 | | Synthes, Inc. | | | 1,163,576 | |
| | | | | | |
| | Total United States | | | 2,498,026 | |
| | | | | | |
| | Total Common Stock (cost $526,122,886) | | | 374,922,222 | |
| | | | | | |
| | |
| | | Collateral Held for Securities Loaned (0.2%)d | | | |
| 630,480 | | Thrivent Financial Securities Lending Trust | | | 630,480 | |
| | | | | | |
| | Total Collateral Held for Securities Loaned (cost $630,480) | | | 630,480 | |
| | | | | | |
| | |
Shares or
Principal
Amount | | Short-Term Investments (7.5%)d | | | |
| | Bank of America Corporation | | | | |
| 15,240,000 | | 0.125%, 11/3/2008 | | | 15,239,894 | |
| 14,145,405 | | Thrivent Money Market Fund | | | 14,145,405 | |
| | | | | | |
| | Total Short-Term Investments (at amortized cost) | | | 29,385,299 | |
| | | | | | |
| | Total Investments (cost $556,138,665) 103.7% | | $ | 404,938,001 | |
| | | | | | |
| | Other Assets and Liabilities, Net (3.7%) | | | (14,624,584 | ) |
| | | | | | |
| | Total Net Assets 100.0% | | $ | 390,313,417 | |
| | | | | | |
| a | Security is fair valued as discussed in item 2(A) of the Notes to Financial Statements. |
| b | Non-income producing security. |
| c | All or a portion of the security is on loan as discussed in item 2(M) of the Notes to Financial Statements. |
| d | The interest rate shown reflects the yield, coupon rate or, for securities purchased at a discount, the discount rate at the date of purchase. |
Definitions:
| | | | |
| ADR | | - | | American Depositary Receipt, which are certificates for an underlying foreign security’s shares held by an issuing U.S. depository bank. |
Gross unrealized appreciation and depreciation of investments, based on cost for federal income tax purposes, were as follows:
| | | | |
Gross unrealized appreciation | | $ | 7,054,036 | |
Gross unrealized depreciation | | | (163,457,887 | ) |
| | | | |
Net unrealized appreciation (depreciation) | | | ($156,403,851 | ) |
Cost for federal income tax purposes | | $ | 561,341,852 | |
The accompanying Notes to the Financial Statements are an integral part of this schedule.
112
Partner International Stock Fund
Schedule of Investments as of October 31, 2008
| | | | | | | | | | | | | | |
Foreign Currency
Forward Contrats | | Contracts to
Deliver/Receive | | Settlement
Date | | Value on
Settlement
Date | | Value | | Unrealized
Gain/(Loss) | |
| Purchases | | | | | | | | | | | | | | |
Australian Dollar | | 2,113,284 | | 11/03/2008 -11/05/2008 | | $ | 1,414,960 | | $ | 1,404,362 | | | ($10,598 | ) |
British Pound | | 3,026,551 | | 11/03/2008 -11/05/2008 | | | 4,936,491 | | | 4,870,537 | | | (65,954 | ) |
Canadian Dollar | | 2,058,136 | | 11/03/2008 -11/05/2008 | | | 1,697,320 | | | 1,707,572 | | | 10,252 | |
Danish Krone | | 1,309,279 | | 1/03/2008 -11/05/2008 | | | 226,794 | | | 224,103 | | | (2,691 | ) |
EURO | | 3,723,817 | | 11/03/2008 -11/05/2008 | | | 4,818,228 | | | 4,746,134 | | | (72,094 | ) |
Hong Kong Dollar | | 1,354,113 | | 11/03/2008 -11/05/2008 | | | 174,679 | | | 174,722 | | | 43 | |
Japanese Yen | | 352,522,652 | | 11/03/2008 -11/05/2008 | | | 3,576,606 | | | 3,578,547 | | | 1,941 | |
Norwegian Krone | | 1,372,392 | | 11/03/2008 -11/05/2008 | | | 206,623 | | | 203,761 | | | (2,862 | ) |
Swedish Krona | | 1,037,959 | | 11/03/2008 -11/05/2008 | | | 136,340 | | | 133,758 | | | (2,582 | ) |
Swiss Franc | | 2,215,413 | | 11/03/2008 -11/05/2008 | | | 1,948,815 | | | 1,910,333 | | | (38,482 | ) |
Total Foreign Currency Forward Contracts Purchases | | | | | | $ | 19,136,856 | | $ | 18,953,829 | | ($ | 183,027 | ) |
| Sales | | | | | | | | | | | | | | |
British Pound | | 380,688 | | 11/03/2008 -11/05/2008 | | $ | 620,978 | | $ | 612,629 | | $ | 8,349 | |
Canadian Dollar | | 301,455 | | 11/03/2008 -11/05/2008 | | | 245,855 | | | 250,108 | | | (4,253 | ) |
EURO | | 862,844 | | 11/03/2008 -11/05/2008 | | | 1,117,372 | | | 1,099,725 | | | 17,647 | |
Japanese Yen | | 33,049,620 | | 11/03/2008 -11/05/2008 | | | 339,273 | | | 335,495 | | | 3,778 | |
Singapore Dollar | | 399,575 | | 11/03/2008 -11/05/2008 | | | 267,777 | | | 269,437 | | | (1,660 | ) |
Swiss Franc | | 1,350,974 | | 11/03/2008 -11/05/2008 | | | 1,191,839 | | | 1,164,934 | | | 26,905 | |
Total Foreign Currency Forward Contracts Sales | | | | | | $ | 3,783,094 | | $ | 3,732,328 | | $ | 50,766 | |
Net Unrealized Gain/(Loss) on Foreign Currency Forward Contracts | | | | | | | | | | | | | ($132,261 | ) |
Investment in Affiliates
Affiliated issuers, as defined under the Investment Company Act of 1940, include those in which the Fund’s holdings of an issuer represent 5% or more of the outstanding voting securities of an issuer, or any affiliated mutual fund.
A summary of transactions for the fiscal year to date, in Partner International Stock Fund, is as follows:
| | | | | | | | | | | | | | | | | |
Fund | | Value
October 31,
2007 | | Gross
Purchases and
Additions | | Gross Sales and
Reductions | | Balance of
Shares Held at
October 31,
2008 | | Value
October 31,
2008 | | Income Earned
November 1, 2007-
October 31, 2008 |
Money Market | | $ | 3,750,651 | | $ | 144,999,703 | | $ | 134,604,949 | | 14,145,405 | | $ | 14,145,405 | | $ | 273,643 |
Thrivent Financial Securities Lending Trust | | | 27,736,142 | | | 283,378,468 | | | 310,484,130 | | 630,480 | | | 630,480 | | | 427,548 |
Total Value and Dividend Income | | | 31,486,793 | | | | | | | | | | | 14,775,885 | | | 701,191 |
The accompanying Notes to Financial Statements are an integral part of this schedule.
113
Large Cap Growth Fund
Schedule of Investments as of October 31, 2008
| | | | | |
| Shares | | Common Stock (98.3%) | | Value |
| Consumer Discretionary (10.1%) | | | |
| 25,850 | | Aeropostale, Inc.a,b | | $ | 625,828 |
| 70,300 | | Amazon.com, Inc.b | | | 4,023,972 |
| 18,750 | | Best Buy Company, Inc. | | | 502,687 |
| 27,750 | | Carnival Corporation | | | 704,850 |
| 173,000 | | Comcast Corporation | | | 2,726,480 |
| 49,600 | | Guess ?, Inc. | | | 1,079,792 |
| 157,950 | | Interpublic Group of Companies, Inc.a,b | | | 819,761 |
| 60,050 | | J.C. Penney Company, Inc. | | | 1,436,396 |
| 133,850 | | Lowe’s Companies, Inc.a | | | 2,904,545 |
| 119,700 | | Macy’s, Inc | | | 1,471,113 |
| 117,200 | | McDonald’s Corporation | | | 6,789,396 |
| 44,900 | | MGM MIRAGEa,b | | | 739,054 |
| 36,400 | | NIKE, Inc. | | | 2,097,732 |
| 61,400 | | Regal Entertainment Group | | | 788,376 |
| 87,700 | | SPDR S&P Homebuilders ETF | | | 1,236,570 |
| 60,300 | | WMS Industries, Inc.b | | | 1,507,500 |
| 61,450 | | Yum! Brands, Inc. | | | 1,782,665 |
| | | | | |
| | Total Consumer Discretionary | | | 31,236,717 |
| | | | | |
| Consumer Staples (7.2%) | | | |
| 21,800 | | Avon Products, Inc. | | | 541,294 |
| 67,500 | | Coca-Cola Company | | | 2,974,050 |
| 122,950 | | CVS/Caremark Corporation | | | 3,768,418 |
| 42,700 | | Dean Foods Companyb | | | 933,422 |
| 51,550 | | Kellogg Company | | | 2,599,151 |
| 21,800 | | Lorillard, Inc. | | | 1,435,748 |
| 78,150 | | Philip Morris International, Inc. | | | 3,397,180 |
| 115,400 | | Wal-Mart Stores, Inc. | | | 6,440,474 |
| | | | | |
| | Total Consumer Staples | | | 22,089,737 |
| | | | | |
| Energy (10.9%) | | | |
| 39,250 | | Devon Energy Corporation | | | 3,173,755 |
| 42,700 | | EOG Resources, Inc. | | | 3,455,284 |
| 104,000 | | Halliburton Company | | | 2,058,160 |
| 116,800 | | Holly Corporation | | | 2,292,784 |
| 60,950 | | National Oilwell Varco, Inc.b | | | 1,821,796 |
| 85,100 | | Occidental Petroleum Corporation | | | 4,726,454 |
| 124,600 | | Petroleo Brasileiro SA ADR | | | 3,350,494 |
| 64,078 | | Transocean, Inc.a,b | | | 5,275,542 |
| 238,600 | | Weatherford International, Ltd.b | | | 4,027,568 |
| 99,450 | | XTO Energy, Inc. | | | 3,575,227 |
| | | | | |
| | Total Energy | | | 33,757,064 |
| | | | | |
| Financials (9.4%) | | | |
| 10,600 | | ACE, Ltd. | | | 608,016 |
| 116,150 | | Bank of America Corporation | | | 2,807,345 |
| 57,500 | | Bank of New York Mellon Corporation | | | 1,874,500 |
| 4,800 | | BlackRock, Inc. | | | 630,432 |
| 50,200 | | Capital One Financial Corporation | | | 1,963,824 |
| 214,650 | | Charles Schwab Corporation | | | 4,104,108 |
| 31,250 | | IntercontinentalExchange, Inc.b | | | 2,673,750 |
| 152,100 | | J.P. Morgan Chase & Company | | | 6,274,125 |
| 43,288 | | Lazard, Ltd. | | | 1,305,999 |
| 71,599 | | Marsh & McLennan Companies, Inc. | | | 2,099,283 |
| 41,800 | | Nasdaq OMX Group, Inc.a,b | | | 1,356,828 |
| 30,650 | | Raymond James Financial, Inc.a | | | 713,839 |
| 32,800 | | Travelers Companies, Inc. | | | 1,395,640 |
| 35,200 | | Wells Fargo & Company | | | 1,198,560 |
| | | | | |
| | Total Financials | | | 29,006,249 |
| | | | | |
| Health Care (17.0%) | | | |
| 77,750 | | Abbott Laboratories | | | 4,287,912 |
| 36,746 | | Aetna, Inc. | | | 913,873 |
| 18,250 | | Allergan, Inc. | | | 723,977 |
| 42,550 | | Amgen, Inc.b | | | 2,548,320 |
| 101,650 | | Baxter International, Inc. | | | 6,148,809 |
| 48,900 | | Celgene Corporationb | | | 3,142,314 |
| 55,800 | | Genentech, Inc.b | | | 4,628,052 |
| 14,000 | | Genzyme Corporationb | | | 1,020,320 |
| 241,800 | | Gilead Sciences, Inc.b | | | 11,086,530 |
| 8,200 | | Intuitive Surgical, Inc.b | | | 1,416,878 |
| 88,100 | | Medco Health Solutions, Inc.b | | | 3,343,395 |
| 71,150 | | St. Jude Medical, Inc.b | | | 2,705,835 |
| 39,350 | | Teva Pharmaceutical Industries, Ltd. ADRa | | | 1,687,328 |
| 141,344 | | Thermo Fisher Scientific, Inc.b | | | 5,738,566 |
| 15,950 | | Waters Corporationb | | | 698,610 |
| 69,750 | | Wyeth | | | 2,244,555 |
| | | | | |
| | Total Health Care | | | 52,335,274 |
| | | | | |
| Industrials (11.3%) | | | |
| 85,800 | | ABB, Ltd. ADR | | | 1,128,270 |
| 112,700 | | BE Aerospace, Inc.b | | | 1,450,449 |
| 14,650 | | Burlington Northern Santa Fe Corporation | | | 1,304,729 |
| 22,000 | | C.H. Robinson Worldwide, Inc. | | | 1,139,160 |
| 59,400 | | Continental Airlines, Inc.b | | | 1,123,848 |
| 47,450 | | Danaher Corporation | | | 2,810,938 |
| 48,150 | | Deere & Company | | | 1,856,664 |
| 300,437 | | Delta Air Lines, Inc.b | | | 3,298,798 |
| 6,050 | | First Solar, Inc.b | | | 869,385 |
| 21,800 | | Fluor Corporationa | | | 870,474 |
| 52,250 | | Foster Wheeler, Ltd.b | | | 1,431,650 |
| 42,900 | | General Dynamics Corporation | | | 2,587,728 |
| 103,650 | | General Electric Company | | | 2,022,212 |
| 88,500 | | McDermott International, Inc.b | | | 1,516,005 |
| 16,850 | | Precision Castparts Corporation | | | 1,092,048 |
| 41,800 | | Raytheon Company | | | 2,136,398 |
| 67,950 | | Union Pacific Corporation | | | 4,537,022 |
| 64,100 | | United Technologies Corporation | | | 3,522,936 |
| | | | | |
| | Total Industrials | | | 34,698,714 |
| | | | | |
| Information Technology (26.1%) | | | |
| 37,400 | | Accenture, Ltd. | | | 1,236,070 |
| 275,000 | | ADC Telecommunications, Inc.b | | | 1,743,500 |
| 56,050 | | Adobe Systems, Inc.b | | | 1,493,172 |
| 57,550 | | Altera Corporation | | | 998,492 |
| 67,900 | | Apple, Inc.b | | | 7,305,361 |
| 114,050 | | Broadcom Corporationb | | | 1,947,974 |
| 171,450 | | CIENA Corporationa,b | | | 1,647,635 |
| 340,300 | | Cisco Systems, Inc.b | | | 6,047,131 |
| 36,200 | | Electronic Arts, Inc.b | | | 824,636 |
| 230,480 | | EMC Corporationb | | | 2,715,054 |
| 30,000 | | Google, Inc.b | | | 10,780,800 |
| 32,900 | | Hewlett-Packard Company | | | 1,259,412 |
| 231,000 | | Intel Corporation | | | 3,696,000 |
| 33,700 | | International Business Machines Corporation | | | 3,133,089 |
The accompanying Notes to Financial Statements are an integral part of this schedule.
114
Large Cap Growth Fund
Schedule of Investments as of October 31, 2008
| | | | | |
| Shares | | Common Stock (98.3%) | | Value |
| Information Technology (26.1%) - continued | | | |
| 42,750 | | LDK Solar Company, Ltd.a,b | | $ | 776,340 |
| 325,150 | | Marvell Technology Group, Ltd.b | | | 2,263,044 |
| 31,550 | | MasterCard, Inc.a | | | 4,663,721 |
| 71,865 | | MEMC Electronic Materials, Inc.b | | | 1,320,879 |
| 400,350 | | Microsoft Corporation | | | 8,939,815 |
| 17,668 | | Nice Systems, Ltd. ADRa,b | | | 395,056 |
| 46,600 | | Nokia Oyj ADR | | | 707,388 |
| 96,751 | | NVIDIA Corporationb | | | 847,539 |
| 86,250 | | Omniture, Inc.a,b | | | 991,875 |
| 178,895 | | Oracle Corporationb | | | 3,271,990 |
| 193,550 | | QUALCOMM, Inc. | | | 7,405,223 |
| 58,200 | | Research in Motion, Ltd.b | | | 2,935,026 |
| 79,150 | | Symantec Corporationb | | | 995,707 |
| | | | | |
| | Total Information Technology | | | 80,341,929 |
| | | | | |
| Materials (5.1%) | | | |
| 61,500 | | Freeport-McMoRan Copper & Gold, Inc. | | | 1,789,650 |
| 83,400 | | Monsanto Company | | | 7,420,932 |
| 45,900 | | Owens-Illinois, Inc.b | | | 1,050,192 |
| 33,400 | | Pactiv Corporationb | | | 786,904 |
| 21,200 | | Potash Corporation of Saskatchewan, Inc. | | | 1,807,512 |
| 31,100 | | Praxair, Inc. | | | 2,026,165 |
| 62,800 | | Steel Dynamics, Inc. | | | 748,576 |
| | | | | |
| | Total Materials | | | 15,629,931 |
| | | | | |
| Telecommunications Services (1.2%) | | | |
| 89,550 | | Crown Castle International Corporationb | | | 1,895,773 |
| 68,000 | | NII Holdings, Inc.b | | | 1,751,680 |
| | Total Telecommunications Services | | | 3,647,453 |
| | | | | |
| | Total Common Stock (cost $391,265,274) | | | 302,743,068 |
| | | | | |
| | |
| | | Collateral Held for Securities Loaned (5.5%)c | | |
| 17,017,857 | | Thrivent Financial Securities Lending Trust | | | 17,017,857 |
| | | | | |
| | Total Collateral Held for Securities Loaned (cost $17,017,857) | | | 17,017,857 |
| | | | | |
| | |
| | | Short-Term Investments (0.8%)c | | |
| 2,435,558 | | Thrivent Money Market Fund | | | 2,435,558 |
| | | | | |
| | Total Short-Term Investments (at amortized cost) | | | 2,435,558 |
| | | | | |
| | Total Investments (cost $410,718,689) 104.6% | | | $322,196,483 |
| | | | | |
| | Other Assets and Liabilities, Net (4.6%) | | | (14,097,135) |
| | | | | |
| | Total Net Assets 100.0% | | | $308,099,348 |
| | | | | |
| a | All or a portion of the security is on loan as discussed in item 2(M) of the Notes to Financial Statements. |
| b | Non-income producing security. |
| c | The interest rate shown reflects the yield, coupon rate or, for securities purchased at a discount, the discount rate at the date of purchase. |
Definitions:
| | | | |
| ADR | | - | | American Depositary Receipt, which are certificates for an underlying foreign security’s shares held by an issuing U.S. depository bank. |
| ETF | | - | | Exchange Traded Fund. |
Gross unrealized appreciation and depreciation of investments, based on cost for federal income tax purposes, were as follows:
| | | | |
Gross unrealized appreciation | | $ | 4,110,588 | |
Gross unrealized depreciation | | | (94,820,622 | ) |
| | | | |
Net unrealized appreciation (depreciation) | | | ($90,710,034 | ) |
Cost for federal income tax purposes | | $ | 412,906,517 | |
The accompanying Notes to Financial Statements are an integral part of this schedule.
115
Large Cap Growth Fund
Schedule of Investments as of October 31, 2008
Investment in Affiliates
Affiliated issuers, as defined under the Investment Company Act of 1940, include those in which the Fund’s holdings of an issuer represent 5% or more of the outstanding voting securities of an issuer, or any affiliated mutual fund.
A summary of transactions for the fiscal year to date, in Large Cap Growth Fund, is as follows:
| | | | | | | | | | | | | | | | | |
Fund | | Value
October 31,
2007 | | Gross
Purchases and
Additions | | Gross Sales and
Reductions | | Balance of
Shares Held at
October 31,
2008 | | Value
October 31,
2008 | | Income Earned
November 1, 2007-
October 31, 2008 |
Money Market | | $ | 23,750,652 | | $ | 150,917,926 | | $ | 172,233,020 | | 2,435,558 | | $ | 2,435,558 | | $ | 408,960 |
Thrivent Financial Securities Lending Trust | | | 43,016,898 | | | 444,278,113 | | | 470,277,154 | | 17,017,857 | | | 17,017,857 | | | 248,313 |
Total Value and Dividend Income | | | 66,767,550 | | | | | | | | | | | 19,453,415 | | | 657,273 |
The accompanying Notes to Financial Statements are an integral part of this schedule.
116
Large Cap Value Fund
Schedule of Investments as of October 31, 2008
| | | | | |
| Shares | | Common Stock (98.6%) | | Value |
| Consumer Discretionary (10.0%) | | | |
| 184,600 | | BorgWarner, Inc. | | $ | 4,147,962 |
| 320,150 | | Comcast Corporation | | | 5,045,564 |
| 110,200 | | General Motors Corporationa | | | 636,956 |
| 215,800 | | Home Depot, Inc. | | | 5,090,722 |
| 76,200 | | McDonald’s Corporation | | | 4,414,266 |
| 108,100 | | Omnicom Group, Inc. | | | 3,193,274 |
| 48,100 | | Sherwin-Williams Company | | | 2,737,371 |
| 78,400 | | SPDR S&P Homebuilders ETF | | | 1,105,440 |
| 118,000 | | Staples, Inc. | | | 2,292,740 |
| 226,000 | | Time Warner, Inc. | | | 2,280,340 |
| 120,500 | | Toll Brothers, Inc.b | | | 2,785,960 |
| 152,600 | | Viacom, Inc.b | | | 3,085,572 |
| 129,000 | | Walt Disney Company | | | 3,341,100 |
| 119,300 | | Whirlpool Corporationa | | | 5,565,345 |
| | | | | |
| | Total Consumer Discretionary | | | 45,722,612 |
| | | | | |
| Consumer Staples (12.1%) | | | |
| 179,100 | | Altria Group, Inc. | | | 3,436,929 |
| 64,400 | | Costco Wholesale Corporation | | | 3,671,444 |
| 148,100 | | CVS/Caremark Corporation | | | 4,539,265 |
| 135,200 | | General Mills, Inc. | | | 9,158,448 |
| 75,300 | | Kimberly-Clark Corporation | | | 4,615,137 |
| 210,100 | | Kraft Foods, Inc. | | | 6,122,314 |
| 179,100 | | Philip Morris International, Inc. | | | 7,785,477 |
| 83,000 | | Procter & Gamble Company | | | 5,356,820 |
| 191,900 | | Wal-Mart Stores, Inc. | | | 10,709,939 |
| | | | | |
| | Total Consumer Staples | | | 55,395,773 |
| | | | | |
| Energy (13.1%) | | | |
| 53,750 | | Apache Corporation | | | 4,425,238 |
| 139,714 | | Chevron Corporation | | | 10,422,664 |
| 112,212 | | ConocoPhillips | | | 5,837,268 |
| 49,600 | | Devon Energy Corporation | | | 4,010,656 |
| 198,300 | | Exxon Mobil Corporation | | | 14,697,996 |
| 121,200 | | Halliburton Company | | | 2,398,548 |
| 479,000 | | Nabors Industries, Ltd.b | | | 6,888,020 |
| 73,200 | | Occidental Petroleum Corporation | | | 4,065,528 |
| 42,600 | | Royal Dutch Shell plc ADR | | | 2,377,506 |
| 77,600 | | Total SA ADR | | | 4,302,144 |
| 37,500 | | Valero Energy Corporation | | | 771,750 |
| | | | | |
| | Total Energy | | | 60,197,318 |
| | | | | |
| Financials (23.7%) | | | |
| 96,500 | | ACE, Ltd. | | | 5,535,240 |
| 49,200 | | AFLAC, Inc. | | | 2,178,576 |
| 64,100 | | Ameriprise Financial, Inc. | | | 1,384,560 |
| 296,080 | | Bank of America Corporation | | | 7,156,254 |
| 260,003 | | Bank of New York Mellon Corporation | | | 8,476,098 |
| 144,100 | | Capital One Financial Corporation | | | 5,637,192 |
| 86,700 | | Chubb Corporation | | | 4,492,794 |
| 168,932 | | Citigroup, Inc. | | | 2,305,922 |
| 17,300 | | Everest Re Group, Ltd. | | | 1,292,310 |
| 55,100 | | Goldman Sachs Group, Inc. | | | 5,096,750 |
| 21,680 | | Hartford Financial Services Group, Inc. | | | 223,737 |
| 252,700 | | Hudson City Bancorp, Inc. | | | 4,753,287 |
| 449,400 | | J.P. Morgan Chase & Company | | | 18,537,750 |
| 165,600 | | Marshall & Ilsley Corporationa | | | 2,985,768 |
| 57,100 | | Merrill Lynch & Company, Inc. | | | 1,061,489 |
| 96,900 | | Morgan Stanley | | | 1,692,843 |
| 38,300 | | Piper Jaffray Companiesb | | | 1,510,935 |
| 61,900 | | Principal Financial Group, Inc. | | | 1,175,481 |
| 77,700 | | Raymond James Financial, Inc.a | | | 1,809,633 |
| 25,000 | | S&P 500 Large Index Depository Receipts | | | 2,423,500 |
| 355,000 | | Synovus Financial Corporationa | | | 3,667,150 |
| 140,700 | | Travelers Companies, Inc. | | | 5,986,785 |
| 116,700 | | U.S. Bancorp | | | 3,478,827 |
| 511,514 | | Wachovia Corporation | | | 3,278,805 |
| 299,800 | | Washington Federal, Inc. | | | 5,282,476 |
| 215,800 | | Wells Fargo & Company | | | 7,347,990 |
| | | | | |
| | Total Financials | | | 108,772,152 |
| | | | | |
| Health Care (10.4%) | | | |
| 165,400 | | Abbott Laboratories | | | 9,121,810 |
| 40,800 | | Aetna, Inc. | | | 1,014,696 |
| 86,700 | | Baxter International, Inc. | | | 5,244,483 |
| 39,500 | | iShares Nasdaq Biotechnology Index Funda | | | 2,820,695 |
| 144,560 | | Johnson & Johnson | | | 8,867,310 |
| 105,700 | | McKesson Corporation | | | 3,888,703 |
| 76,000 | | Merck & Company, Inc. | | | 2,352,200 |
| 334,700 | | Pfizer, Inc. | | | 5,927,537 |
| 141,300 | | Sanofi-Aventis ADR | | | 4,467,906 |
| 42,300 | | WellPoint, Inc.b | | | 1,644,201 |
| 77,300 | | Wyeth | | | 2,487,514 |
| | | | | |
| | Total Health Care | | | 47,837,055 |
| | | | | |
| Industrials (9.2%) | | | |
| 109,000 | | AMR Corporationb | | | 1,112,890 |
| 39,300 | | Caterpillar, Inc. | | | 1,500,081 |
| 68,300 | | Eaton Corporation | | | 3,046,180 |
| 101,200 | | Emerson Electric Company | | | 3,312,276 |
| 33,600 | | FedEx Corporation | | | 2,196,432 |
| 440,500 | | General Electric Company | | | 8,594,155 |
| 115,500 | | Honeywell International, Inc. | | | 3,516,975 |
| 63,600 | | Lockheed Martin Corporation | | | 5,409,180 |
| 210,550 | | Republic Services, Inc. | | | 4,990,035 |
| 127,550 | | Tyco International, Ltd. | | | 3,224,464 |
| 95,200 | | United Technologies Corporation | | | 5,232,192 |
| | | | | |
| | Total Industrials | | | 42,134,860 |
| | | | | |
| Information Technology (10.1%) | | | |
| 132,100 | | Accenture, Ltd. | | | 4,365,905 |
| 95,400 | | Amdocs, Ltd.b | | | 2,152,224 |
| 163,400 | | Automatic Data Processing, Inc. | | | 5,710,830 |
| 117,800 | | Corning, Inc. | | | 1,275,774 |
| 35,600 | | F5 Networks, Inc.b | | | 883,592 |
| 65,400 | | Hewlett-Packard Company | | | 2,503,512 |
| 138,400 | | Intel Corporation | | | 2,214,400 |
| 140,350 | | International Business Machines Corporation | | | 13,048,339 |
| 86,550 | | Nokia Oyj ADRa | | | 1,313,829 |
| 273,400 | | Oracle Corporationb | | | 5,000,486 |
| 115,149 | | Sybase, Inc.b | | | 3,066,418 |
| 343,700 | | Teradyne, Inc.b | | | 1,752,870 |
| 163,800 | | Texas Instruments, Inc. | | | 3,203,928 |
| | | | | |
| | Total Information Technology | | | 46,492,107 |
| | | | | |
The accompanying Notes to Financial Statements are an integral part of this schedule.
117
Large Cap Value Fund
Schedule of Investments as of October 31, 2008
| | | | | |
| Shares | | Common Stock (98.6%) | | Value |
| Materials (4.1%) | | | |
| 113,850 | | Alcoa, Inc. | | $ | 1,310,414 |
| 42,600 | | BHP Billiton, Ltd.a | | | 1,656,288 |
| 138,700 | | E.I. du Pont de Nemours and Company | | | 4,438,400 |
| 231,700 | | MeadWestvaco Corporation | | | 3,250,751 |
| 56,200 | | Praxair, Inc. | | | 3,661,430 |
| 147,200 | | Rockwood Holdings, Inc.b | | | 1,817,920 |
| 69,100 | | Weyerhaeuser Company | | | 2,641,002 |
| | | | | |
| | Total Materials | | | 18,776,205 |
| | | | | |
| Telecommunications Services (4.1%) | | | |
| 409,898 | | AT&T, Inc. | | | 10,972,969 |
| 179,600 | | TW Telecom, Inc.b | | | 1,271,568 |
| 225,464 | | Verizon Communications, Inc. | | | 6,689,517 |
| | | | | |
| | Total Telecommunications Services | | | 18,934,054 |
| | | | | |
| Utilities (1.8%) | | | |
| 49,400 | | Entergy Corporation | | | 3,855,670 |
| 88,200 | | FirstEnergy Corporation | | | 4,600,512 |
| | | | | |
| | Total Utilities | | | 8,456,182 |
| | | | | |
| | Total Common Stock (cost $533,722,529) | | | 452,718,318 |
| | | | | |
| | |
| | | Collateral Held for Securities Loaned (2.9%)c | | |
| 13,448,200 | | Thrivent Financial Securities Lending Trust | | | 13,448,200 |
| | | | | |
| | Total Collateral Held for Securities Loaned (cost $13,448,200) | | | 13,448,200 |
| | | | | |
| | |
| | | Short-Term Investments (0.7%)c | | |
| 2,912,238 | | Thrivent Money Market Fund | | | 2,912,238 |
| | | | | |
| | Total Short-Term Investments (at amortized cost) | | | 2,912,238 |
| | | | | |
| | Total Investments (cost $550,082,967) 102.2% | | $ | 469,078,756 |
| | | | | |
| | Other Assets and Liabilities, Net (2.2%) | | | (10,030,177) |
| | | | | |
| | Total Net Assets 100.0% | | $ | 459,048,579 |
| | | | | |
| a | All or a portion of the security is on loan as discussed in item 2(M) of the Notes to Financial Statements. |
| b | Non-income producing security. |
| c | The interest rate shown reflects the yield, coupon rate or, for securities purchased at a discount, the discount rate at the date of purchase. |
Definitions:
| | | | |
| ADR | | - | | American Depositary Receipt, which are certificates for an underlying foreign security’s shares held by an issuing U.S. depository bank. |
| ETF | | - | | Exchange Traded Fund. |
Gross unrealized appreciation and depreciation of investments, based on cost for federal income tax purposes, were as follows:
| | | | |
Gross unrealized appreciation | | $ | 35,537,913 | |
Gross unrealized depreciation | | | (118,104,110 | ) |
| | | | |
Net unrealized appreciation (depreciation) | | | ($82,566,197 | ) |
Cost for federal income tax purposes | | $ | 551,644,953 | |
The accompanying Notes to the Financial Statements are an integral part of this schedule.
118
Large Cap Value Fund
Schedule of Investments as of October 31, 2008
Investment in Affiliates
Affiliated issuers, as defined under the Investment Company Act of 1940, include those in which the Fund’s holdings of an issuer represent 5% or more of the outstanding voting securities of an issuer, or any affiliated mutual fund.
A summary of transactions for the fiscal year to date, in Large Cap Value Fund, is as follows:
| | | | | | | | | | | | | | | | | |
Fund | | Value
October 31,
2007 | | Gross
Purchases and
Additions | | Gross Sales and
Reductions | | Balance of
Shares Held
at
October 31,
2008 | | Value
October 31,
2008 | | Income
Earned
November 1,
2007-
October 31,
2008 |
Money Market | | $ | 27,288,103 | | $ | 124,517,085 | | $ | 148,892,950 | | 2,912,238 | | $ | 2,912,238 | | $ | 384,203 |
Thrivent Financial Securities Lending Trust | | | 75,833,378 | | | 647,962,517 | | | 710,347,695 | | 13,448,200 | | | 13,448,200 | | | 468,863 |
Total Value and Dividend Income | | | 103,121,481 | | | | | | | | | | | 16,360,438 | | | 853,066 |
The accompanying Notes to Financial Statements are an integral part of this schedule.
119
Large Cap Stock Fund
Schedule of Investments as of October 31, 2008
| | | | | |
| Shares | | Common Stock (97.7%) | | Value |
| Consumer Discretionary (8.9%) | | | |
| 201,550 | | Amazon.com, Inc.a,b | | $ | 11,536,722 |
| 343,000 | | BorgWarner, Inc. | | | 7,707,210 |
| 1,216,251 | | Comcast Corporation | | | 19,168,116 |
| 315,000 | | General Motors Corporationa | | | 1,820,700 |
| 200,000 | | Goodyear Tire & Rubber Companyb | | | 1,784,000 |
| 798,000 | | Home Depot, Inc. | | | 18,824,820 |
| 391,100 | | Lowe’s Companies, Inc. | | | 8,486,870 |
| 561,500 | | Macy’s, Inca | | | 6,900,835 |
| 643,100 | | McDonald’s Corporation | | | 37,254,783 |
| 98,667 | | Nordstrom, Inc.a | | | 1,784,886 |
| 205,900 | | Omnicom Group, Inc. | | | 6,082,286 |
| 141,600 | | Pulte Homes, Inc.a | | | 1,577,424 |
| 90,600 | | Sherwin-Williams Company | | | 5,156,046 |
| 145,700 | | SPDR S&P Homebuilders ETF | | | 2,054,370 |
| 222,100 | | Staples, Inc. | | | 4,315,403 |
| 310,389 | | Time Warner, Inc. | | | 3,131,825 |
| 227,100 | | Toll Brothers, Inc.b | | | 5,250,552 |
| 287,300 | | Viacom, Inc.b | | | 5,809,206 |
| 220,400 | | Whirlpool Corporationa | | | 10,281,660 |
| 170,700 | | WMS Industries, Inc.b | | | 4,267,500 |
| | | | | |
| | Total Consumer Discretionary | | | 163,195,214 |
| | | | | |
| Consumer Staples (10.1%) | | | |
| 796,039 | | Altria Group, Inc. | | | 15,275,988 |
| 119,300 | | Costco Wholesale Corporation | | | 6,801,293 |
| 282,300 | | CVS/Caremark Corporation | | | 8,652,495 |
| 253,102 | | General Mills, Inc. | | | 17,145,129 |
| 237,700 | | Kellogg Company | | | 11,984,834 |
| 141,800 | | Kimberly-Clark Corporation | | | 8,690,922 |
| 499,404 | | Kraft Foods, Inc. | | | 14,552,633 |
| 91,100 | | Lorillard, Inc. | | | 5,999,846 |
| 667,527 | | Philip Morris International, Inc. | | | 29,017,399 |
| 338,300 | | Procter & Gamble Company | | | 21,833,882 |
| 136,300 | | Sara Lee Corporation | | | 1,523,834 |
| 772,350 | | Wal-Mart Stores, Inc. | | | 43,104,854 |
| | | | | |
| | Total Consumer Staples | | | 184,583,109 |
| | | | | |
| Energy (13.5%) | | | |
| 154,816 | | Apache Corporation | | | 12,746,001 |
| 560,571 | | ConocoPhillips | | | 29,160,903 |
| 235,950 | | Devon Energy Corporation | | | 19,078,917 |
| 995,244 | | Exxon Mobil Corporation | | | 73,767,485 |
| 231,100 | | Halliburton Company | | | 4,573,469 |
| 435,346 | | Holly Corporation | | | 8,545,842 |
| 887,900 | | Nabors Industries, Ltd.a,b | | | 12,768,002 |
| 367,700 | | Occidental Petroleum Corporation | | | 20,422,058 |
| 474,450 | | Petroleo Brasileiro SA ADR | | | 12,757,961 |
| 79,900 | | Royal Dutch Shell plc ADR | | | 4,459,219 |
| 147,592 | | Total SA ADRa | | | 8,182,500 |
| 180,993 | | Transocean, Inc.a,b | | | 14,901,154 |
| 69,600 | | Valero Energy Corporation | | | 1,432,368 |
| 867,700 | | Weatherford International, Ltd.b | | | 14,646,776 |
| 288,900 | | XTO Energy, Inc. | | | 10,385,955 |
| | | | | |
| | Total Energy | | | 247,828,610 |
| | | | | |
| Financials (17.5%) | | | |
| 183,700 | | ACE, Ltd. | | | 10,537,032 |
| 93,700 | | AFLAC, Inc. | | | 4,149,036 |
| 25,000 | | Allstate Corporation | | | 659,750 |
| 85,854 | | American Express Company | | | 2,360,985 |
| 261,470 | | Ameriprise Financial, Inc. | | | 5,647,752 |
| 1,433,651 | | Bank of America Corporation | | | 34,651,345 |
| 761,434 | | Bank of New York Mellon Corporation | | | 24,822,748 |
| 445,800 | | Capital One Financial Corporationa | | | 17,439,696 |
| 263,910 | | Chubb Corporation | | | 13,675,816 |
| 402,177 | | Citigroup, Inc. | | | 5,489,716 |
| 103,900 | | Goldman Sachs Group, Inc. | | | 9,610,750 |
| 483,200 | | Hudson City Bancorp, Inc. | | | 9,088,992 |
| 96,700 | | IntercontinentalExchange, Inc.b | | | 8,273,652 |
| 1,518,004 | | J.P. Morgan Chase & Company | | | 62,617,665 |
| 309,000 | | KeyCorp | | | 3,779,070 |
| 161,283 | | Loews Corporation | | | 5,356,208 |
| 264,400 | | Marsh & McLennan Companies, Inc. | | | 7,752,208 |
| 537,500 | | Marshall & Ilsley Corporationa | | | 9,691,125 |
| 109,408 | | Merrill Lynch & Company, Inc. | | | 2,033,895 |
| 229,200 | | Morgan Stanley | | | 4,004,124 |
| 147,500 | | Nasdaq OMX Group, Inc.b | | | 4,787,850 |
| 74,900 | | Piper Jaffray Companiesb | | | 2,954,805 |
| 117,873 | | Principal Financial Group, Inc. | | | 2,238,408 |
| 133,481 | | Prudential Financial, Inc. | | | 4,004,430 |
| 146,300 | | Raymond James Financial, Inc.a | | | 3,407,327 |
| 33,663 | | Reinsurance Group of America, Inc.b | | | 1,246,878 |
| 840,800 | | Synovus Financial Corporationa | | | 8,685,464 |
| 412,961 | | Travelers Companies, Inc. | | | 17,571,491 |
| 960,101 | | Wachovia Corporation | | | 6,154,247 |
| 557,900 | | Washington Federal, Inc. | | | 9,830,198 |
| 568,355 | | Wells Fargo & Company | | | 19,352,488 |
| | | | | |
| | Total Financials | | | 321,875,151 |
| | | | | |
| Health Care (13.8%) | | | |
| 805,168 | | Abbott Laboratories | | | 44,405,015 |
| 108,539 | | Aetna, Inc. | | | 2,699,365 |
| 377,843 | | Baxter International, Inc. | | | 22,855,723 |
| 984,986 | | Gilead Sciences, Inc.b | | | 45,161,608 |
| 73,800 | | iShares Nasdaq Biotechnology Index Funda | | | 5,270,058 |
| 775,514 | | Johnson & Johnson | | | 47,570,029 |
| 406,717 | | McKesson Corporation | | | 14,963,118 |
| 305,950 | | Medco Health Solutions, Inc.b | | | 11,610,802 |
| 588,736 | | Pfizer, Inc. | | | 10,426,515 |
| 269,067 | | Sanofi-Aventis ADR | | | 8,507,899 |
| 281,700 | | St. Jude Medical, Inc.b | | | 10,713,051 |
| 648,524 | | Thermo Fisher Scientific, Inc.b | | | 26,330,074 |
| 86,833 | | WellPoint, Inc.b | | | 3,375,199 |
| | | | | |
| | Total Health Care | | | 253,888,456 |
| | | | | |
| Industrials (9.4%) | | | |
| 201,600 | | AMR Corporationb | | | 2,058,336 |
| 121,752 | | Caterpillar, Inc. | | | 4,647,274 |
| 137,806 | | Danaher Corporationa | | | 8,163,627 |
| 220,350 | | Deere & Company | | | 8,496,696 |
| 1,022,312 | | Delta Air Lines, Inc.b | | | 11,224,986 |
| 130,100 | | Eaton Corporationc | | | 5,802,460 |
| 64,500 | | FedEx Corporation | | | 4,216,365 |
| 24,500 | | First Solar, Inc.b | | | 3,520,650 |
| 255,100 | | Foster Wheeler, Ltd.b | | | 6,989,740 |
| 1,845,328 | | General Electric Company | | | 36,002,349 |
| 385,014 | | Honeywell International, Inc. | | | 11,723,676 |
The accompanying Notes to Financial Statements are an integral part of this schedule.
120
Large Cap Stock Fund
Schedule of Investments as of October 31, 2008
| | | | | |
| Shares | | Common Stock (97.7%) | | Value |
| Industrials (9.4%) - continued | | | |
| 120,329 | | Lockheed Martin Corporation | | $ | 10,233,982 |
| 404,000 | | Republic Services, Inc. | | | 9,574,800 |
| 237,600 | | Tyco International, Ltd. | | | 6,006,528 |
| 259,896 | | Union Pacific Corporation | | | 17,353,256 |
| 489,226 | | United Technologies Corporation | | | 26,887,861 |
| | | | | |
| | Total Industrials | | | 172,902,586 |
| | | | | |
| Information Technology (16.8%) | | | |
| 506,550 | | Accenture, Ltd. | | | 16,741,478 |
| 133,150 | | Adobe Systems, Inc.b | | | 3,547,116 |
| 183,500 | | Amdocs, Ltd.b | | | 4,139,760 |
| 172,328 | | Apple, Inc.b | | | 18,540,770 |
| 304,100 | | Automatic Data Processing, Inc. | | | 10,628,295 |
| 313,100 | | Broadcom Corporationb | | | 5,347,748 |
| 488,000 | | CIENA Corporationa,b | | | 4,689,680 |
| 811,055 | | Cisco Systems, Inc.b | | | 14,412,447 |
| 336,000 | | Corning, Inc. | | | 3,638,880 |
| 64,800 | | Electronic Arts, Inc.b | | | 1,476,144 |
| 704,850 | | EMC Corporationb | | | 8,303,133 |
| 66,900 | | F5 Networks, Inc.b | | | 1,660,458 |
| 76,892 | | Google, Inc.b | | | 27,631,909 |
| 121,083 | | Hewlett-Packard Company | | | 4,635,057 |
| 1,078,307 | | Intel Corporation | | | 17,252,912 |
| 570,130 | | International Business Machines Corporation | | | 53,004,986 |
| 885,850 | | Marvell Technology Group, Ltd.b | | | 6,165,516 |
| 82,700 | | MasterCard, Inc.a | | | 12,224,714 |
| 1,111,800 | | Microsoft Corporation | | | 24,826,494 |
| 110,850 | | Nokia Oyj ADR | | | 1,682,703 |
| 232,036 | | NVIDIA Corporationb | | | 2,032,635 |
| 1,024,554 | | Oracle Corporationb | | | 18,739,093 |
| 510,363 | | QUALCOMM, Inc. | | | 19,526,488 |
| 156,800 | | Research in Motion, Ltd.b | | | 7,907,424 |
| 229,246 | | Sybase, Inc.b | | | 6,104,821 |
| 340,833 | | Symantec Corporationb | | | 4,287,679 |
| 648,600 | | Teradyne, Inc.b | | | 3,307,860 |
| 312,300 | | Texas Instruments, Inc. | | | 6,108,588 |
| | | | | |
| | Total Information Technology | | | 308,564,788 |
| | | | | |
| Materials (3.7%) | | | |
| 357,622 | | Alcoa, Inc. | | | 4,116,229 |
| 81,600 | | BHP Billiton, Ltd.a | | | 3,172,608 |
| 256,751 | | E.I. du Pont de Nemours and Company | | | 8,216,032 |
| 175,189 | | Freeport-McMoRan Copper & Gold, Inc.a | | | 5,098,000 |
| 421,074 | | MeadWestvaco Corporation | | | 5,907,668 |
| 221,800 | | Monsanto Company | | | 19,735,764 |
| 71,550 | | Potash Corporation of Saskatchewan, Inc. | | | 6,100,353 |
| 107,642 | | Praxair, Inc. | | | 7,012,877 |
| 280,000 | | Rockwood Holdings, Inc.b | | | 3,458,000 |
| 127,900 | | Weyerhaeuser Company | | | 4,888,338 |
| | | | | |
| | Total Materials | | | 67,705,869 |
| | | | | |
| Telecommunications Services (1.7%) | | | |
| 446,900 | | AT&T, Inc.c | | | 11,963,513 |
| 333,100 | | Crown Castle International Corporationb | | | 7,051,727 |
| 269,312 | | NII Holdings, Inc.b | | | 6,937,477 |
| 701,746 | | TW Telecom, Inc.b | | | 4,968,362 |
| | | | | |
| | Total Telecommunications Services | | | 30,921,079 |
| | | | | |
| Utilities (2.3%) | | | |
| 144,800 | | DTE Energy Company | | | 5,111,440 |
| 1,099,355 | | Southern Company | | | 37,751,851 |
| | Total Utilities | | | 42,863,291 |
| | Total Common Stock (cost $1,961,253,344) | | | 1,794,328,153 |
| | |
| Shares | | Collateral Held for Securities Loaned (4.0%)d | | |
| 73,426,536 | | Thrivent Financial Securities Lending Trust | | | 73,426,536 |
| | | | | |
| | Total Collateral Held for Securities Loaned (cost $73,426,536) | | | 73,426,536 |
| | | | | |
| | |
Shares or
Principal
Amount | | Short-Term Investments (1.8%)d | | |
| | Deutsche Financial Bank, LLC | | | |
| 18,555,000 | | 0.130%, 11/3/2008 | | | 18,554,866 |
| | Federal National Mortgage Association Discount Notes | | | |
| 2,100,000 | | 2.100%, 12/10/2008e | | | 2,095,279 |
| 11,944,723 | | Thrivent Money Market Fund | | | 11,944,723 |
| | | | | |
| | Total Short-Term Investments (at amortized cost) | | | 32,594,868 |
| | | | | |
| | Total Investments (cost $2,067,274,748) 103.5% | | $ | 1,900,349,557 |
| | | | | |
| | Other Assets and Liabilities, Net (3.5%) | | | (64,386,946) |
| | | | | |
| | Total Net Assets 100.0% | | $ | 1,835,962,611 |
| | | | | |
| a | All or a portion of the security is on loan as discussed in item 2(M) of the Notes to Financial Statements. |
| b | Non-income producing security. |
| c | At October 31, 2008, $17,765,973 of investments were earmarked to cover open financial futures contracts. |
| d | The interest rate shown reflects the yield, coupon rate or, for securities purchased at a discount, the discount rate at the date of purchase. |
| e | At October 31, 2008, $2,095,279 of investments were held on deposit with the counterparty and pledged as the initial margin deposit for open financial futures contracts. |
Definitions:
| | | | |
| ADR | | - | | American Depositary Receipt, which are certificates for an underlying foreign security’s shares held by an issuing U.S. depository bank. |
| ETF | | - | | Exchange Traded Fund. |
The accompanying Notes to Financial Statements are an integral part of this schedule.
121
Large Cap Stock Fund
Schedule of Investments as of October 31, 2008
Gross unrealized appreciation and depreciation of investments, based on cost for federal income tax purposes, were as follows:
| | | | |
Gross unrealized appreciation | | $ | 209,706,134 | |
Gross unrealized depreciation | | | (401,375,837 | ) |
| | | | |
Net unrealized appreciation (depreciation) | | | ($191,669,703) | |
Cost for federal income tax purposes | | $ | 2,092,019,260 | |
| | | | | | | | | | | | | |
Futures | | Number of
Contracts
Long/(Short) | | Expiration Date | | Notional
Principal
Amount | | Value | | Unrealized
Gain/(Loss) |
S&P 500 Index Futures | | 19 | | December 2008 | | $ | 4,573,470 | | $ | 4,594,675 | | $ | 21,205 |
Total Futures | | | | | | | | | | | | $ | 21,205 |
Investment in Affiliates
Affiliated issuers, as defined under the Investment Company Act of 1940, include those in which the Fund’s holdings of an issuer represent 5% or more of the outstanding voting securities of an issuer, or any affiliated mutual fund.
A summary of transactions for the fiscal year to date, in Large Cap Stock Fund, is as follows:
| | | | | | | | | | | | | | | | | |
Fund | | Value
October 31,
2007 | | Gross
Purchases and
Additions | | Gross
Sales and
Reductions | | Balance of
Shares Held at
October 31,
2008 | | Value
October 31,
2008 | | Income Earned
November 1, 2007-
October 31, 2008 |
Money Market | | $ | 4,615,730 | | $ | 335,856,914 | | $ | 328,527,921 | | 11,944,723 | | $ | 11,944,723 | | $ | 529,362 |
Thrivent Financial Securities Lending Trust | | | 417,436,171 | | | 2,923,342,075 | | | 3,267,351,710 | | 73,426,536 | | | 73,426,536 | | | 2,279,039 |
Total Value and Dividend Income | | | 422,051,901 | | | | | | | | | | | 85,371,259 | | | 2,808,401 |
The accompanying Notes to the Financial Statements are an integral part of this schedule.
122
Large Cap Index Fund
Schedule of Investments as of October 31, 2008
| | | | | |
| Shares | | Common Stock (99.8%) | | Value |
| Consumer Discretionary (8.2%) | | | |
| 500 | | Abercrombie & Fitch Company | | $ | 14,480 |
| 1,900 | | Amazon.com, Inc.a | | | 108,756 |
| 600 | | Apollo Group, Inc.a | | | 41,706 |
| 600 | | AutoNation, Inc.a | | | 4,122 |
| 300 | | AutoZone, Inc.a,b | | | 38,187 |
| 1,600 | | Bed Bath & Beyond, Inc.a | | | 41,232 |
| 2,075 | | Best Buy Company, Inc. | | | 55,631 |
| 500 | | Big Lots, Inc.a | | | 12,215 |
| 400 | | Black & Decker Corporation | | | 20,248 |
| 2,600 | | Carnival Corporation | | | 66,040 |
| 4,050 | | CBS Corporation | | | 39,326 |
| 700 | | Centex Corporation | | | 8,575 |
| 2,000 | | Coach, Inc.a | | | 41,200 |
| 17,530 | | Comcast Corporation | | | 276,273 |
| 1,700 | | D.R. Horton, Inc. | | | 12,546 |
| 800 | | Darden Restaurants, Inc. | | | 17,736 |
| 3,500 | | DIRECTV Group, Inc.a,b | | | 76,615 |
| 1,700 | | Eastman Kodak Company | | | 15,606 |
| 1,300 | | Expedia, Inc.a | | | 12,363 |
| 800 | | Family Dollar Stores, Inc. | | | 21,528 |
| 13,656 | | Ford Motor Companya,b | | | 29,907 |
| 900 | | Fortune Brands, Inc. | | | 34,326 |
| 1,000 | | GameStop Corporationa | | | 27,390 |
| 1,400 | | Gannett Company, Inc. | | | 15,400 |
| 2,800 | | Gap, Inc. | | | 36,232 |
| 3,400 | | General Motors Corporationb | | | 19,652 |
| 1,000 | | Genuine Parts Company | | | 39,350 |
| 1,500 | | Goodyear Tire & Rubber Companya | | | 13,380 |
| 2,000 | | H&R Block, Inc. | | | 39,440 |
| 1,400 | | Harley-Davidson, Inc. | | | 34,272 |
| 400 | | Harman International Industries, Inc. | | | 7,348 |
| 800 | | Hasbro, Inc. | | | 23,256 |
| 10,200 | | Home Depot, Inc. | | | 240,618 |
| 1,900 | | International Game Technology | | | 26,600 |
| 2,831 | | Interpublic Group of Companies, Inc.a,b | | | 14,693 |
| 1,300 | | J.C. Penney Company, Inc. | | | 31,096 |
| 3,600 | | Johnson Controls, Inc. | | | 63,828 |
| 500 | | Jones Apparel Group, Inc. | | | 5,555 |
| 500 | | KB Homeb | | | 8,345 |
| 1,800 | | Kohl’s Corporationa,b | | | 63,234 |
| 1,000 | | Leggett & Platt, Inc. | | | 17,360 |
| 900 | | Lennar Corporation | | | 6,966 |
| 1,700 | | Limited Brands, Inc. | | | 20,366 |
| 600 | | Liz Claiborne, Inc. | | | 4,890 |
| 8,800 | | Lowe’s Companies, Inc.b | | | 190,960 |
| 2,556 | | Macy’s, Inc | | | 31,413 |
| 1,800 | | Marriott International, Inc. | | | 37,566 |
| 2,200 | | Mattel, Inc. | | | 33,044 |
| 6,800 | | McDonald’s Corporation | | | 393,924 |
| 1,900 | | McGraw-Hill Companies, Inc. | | | 50,996 |
| 200 | | Meredith Corporation | | | 3,874 |
| 700 | | New York Times Companyb | | | 7,000 |
| 1,700 | | Newell Rubbermaid, Inc. | | | 23,375 |
| 13,800 | | News Corporation | | | 146,832 |
| 2,400 | | NIKE, Inc. | | | 138,312 |
| 1,000 | | Nordstrom, Inc.b | | | 18,090 |
| 1,700 | | Office Depot, Inc.a | | | 6,120 |
| 1,900 | | Omnicom Group, Inc. | | | 56,126 |
| 300 | | Polo Ralph Lauren Corporation | | | 14,151 |
| 1,300 | | Pulte Homes, Inc. | | | 14,482 |
| 800 | | RadioShack Corporation | | | 10,128 |
| 500 | | Scripps Networks Interactive | | | 14,200 |
| 372 | | Sears Holdings Corporationa | | | 21,479 |
| 600 | | Sherwin-Williams Company | | | 34,146 |
| 300 | | Snap-On, Inc. | | | 11,085 |
| 500 | | Stanley Works | | | 16,370 |
| 4,250 | | Staples, Inc. | | | 82,577 |
| 4,400 | | Starbucks Corporationa | | | 57,772 |
| 1,100 | | Starwood Hotels & Resorts Worldwide, Inc. | | | 24,794 |
| 4,500 | | Target Corporation | | | 180,540 |
| 750 | | Tiffany & Company | | | 20,588 |
| 21,550 | | Time Warner, Inc. | | | 217,439 |
| 2,500 | | TJX Companies, Inc. | | | 66,900 |
| 500 | | VF Corporation | | | 27,550 |
| 3,750 | | Viacom, Inc.a | | | 75,825 |
| 11,300 | | Walt Disney Company | | | 292,670 |
| 50 | | Washington Post Company | | | 21,340 |
| 483 | | Whirlpool Corporation | | | 22,532 |
| 1,100 | | Wyndham Worldwide Corporation | | | 9,009 |
| 2,800 | | Yum! Brands, Inc. | | | 81,228 |
| | | | | |
| | Total Consumer Discretionary | | | 4,202,326 |
| | | | | |
| Consumer Staples (12.8%) | | | |
| 12,400 | | Altria Group, Inc.c | | | 237,956 |
| 4,300 | | Anheuser-Busch Companies, Inc. | | | 266,729 |
| 3,896 | | Archer-Daniels-Midland Company | | | 80,764 |
| 2,600 | | Avon Products, Inc. | | | 64,558 |
| 625 | | Brown-Forman Corporation | | | 28,375 |
| 1,300 | | Campbell Soup Company | | | 49,335 |
| 800 | | Clorox Company | | | 48,648 |
| 12,000 | | Coca-Cola Company | | | 528,720 |
| 1,900 | | Coca-Cola Enterprises, Inc. | | | 19,095 |
| 3,000 | | Colgate-Palmolive Company | | | 188,280 |
| 2,700 | | ConAgra Foods, Inc. | | | 47,034 |
| 1,200 | | Constellation Brands, Inc.a | | | 15,048 |
| 2,600 | | Costco Wholesale Corporation | | | 148,226 |
| 8,610 | | CVS/Caremark Corporation | | | 263,897 |
| 900 | | Dean Foods Companya | | | 19,674 |
| 1,600 | | Dr. Pepper Snapple Group, Inc.a | | | 36,640 |
| 700 | | Estee Lauder Companies, Inc. | | | 25,228 |
| 2,000 | | General Mills, Inc. | | | 135,480 |
| 1,900 | | H.J. Heinz Company | | | 83,258 |
| 1,000 | | Hershey Company | | | 37,240 |
| 1,500 | | Kellogg Company | | | 75,630 |
| 2,500 | | Kimberly-Clark Corporation | | | 153,225 |
| 9,180 | | Kraft Foods, Inc. | | | 267,505 |
| 3,900 | | Kroger Company | | | 107,094 |
| 1,000 | | Lorillard, Inc. | | | 65,860 |
| 800 | | McCormick & Company, Inc. | | | 26,928 |
| 900 | | Molson Coors Brewing Company | | | 33,624 |
| 800 | | Pepsi Bottling Group, Inc. | | | 18,496 |
| 9,390 | | PepsiCo, Inc. | | | 535,324 |
| 12,400 | | Philip Morris International, Inc. | | | 539,028 |
| 18,310 | | Procter & Gamble Company | | | 1,181,727 |
| 1,000 | | Reynolds American, Inc. | | | 48,960 |
| 2,600 | | Safeway, Inc. | | | 55,302 |
| 4,300 | | Sara Lee Corporation | | | 48,074 |
| 1,309 | | SUPERVALU, Inc. | | | 18,640 |
The accompanying Notes to Financial Statements are an integral part of this schedule.
123
Large Cap Index Fund
Schedule of Investments as of October 31, 2008
| | | | | |
| Shares | | Common Stock (99.8%) | | Value |
| Consumer Staples (12.8%) - continued | | | |
| 3,600 | | SYSCO Corporation | | $ | 94,320 |
| 1,800 | | Tyson Foods, Inc. | | | 15,732 |
| 900 | | UST, Inc. | | | 60,831 |
| 6,000 | | Walgreen Company | | | 152,760 |
| 13,500 | | Wal-Mart Stores, Inc. | | | 753,435 |
| 800 | | Whole Foods Market, Inc.b | | | 8,576 |
| | | | | |
| | Total Consumer Staples | | | 6,585,256 |
| | | | | |
| Energy (13.1%) | | | |
| 2,790 | | Anadarko Petroleum Corporation | | | 98,487 |
| 2,022 | | Apache Corporation | | | 166,471 |
| 1,900 | | Baker Hughes, Inc. | | | 66,405 |
| 1,800 | | BJ Services Company | | | 23,130 |
| 600 | | Cabot Oil & Gas Corporation | | | 16,842 |
| 1,300 | | Cameron International Corporationa | | | 31,538 |
| 3,100 | | Chesapeake Energy Corporation | | | 68,107 |
| 12,403 | | Chevron Corporation | | | 925,264 |
| 9,188 | | ConocoPhillips | | | 477,960 |
| 1,100 | | CONSOL Energy, Inc. | | | 34,529 |
| 2,700 | | Devon Energy Corporation | | | 218,322 |
| 4,192 | | El Paso Corporation | | | 40,662 |
| 900 | | ENSCO International, Inc. | | | 34,209 |
| 1,500 | | EOG Resources, Inc. | | | 121,380 |
| 31,300 | | Exxon Mobil Corporation | | | 2,319,956 |
| 5,300 | | Halliburton Company | | | 104,887 |
| 1,700 | | Hess Corporation | | | 102,357 |
| 4,230 | | Marathon Oil Corporation | | | 123,093 |
| 500 | | Massey Energy Company | | | 11,545 |
| 1,100 | | Murphy Oil Corporation | | | 55,704 |
| 1,700 | | Nabors Industries, Ltd.a | | | 24,446 |
| 2,500 | | National Oilwell Varco, Inc.a | | | 74,725 |
| 1,600 | | Noble Corporation | | | 51,536 |
| 1,000 | | Noble Energy, Inc. | | | 51,820 |
| 4,900 | | Occidental Petroleum Corporation | | | 272,146 |
| 1,600 | | Peabody Energy Corporation | | | 55,216 |
| 700 | | Pioneer Natural Resources Company | | | 19,481 |
| 900 | | Range Resources Corporation | | | 37,998 |
| 700 | | Rowan Companies, Inc. | | | 12,698 |
| 7,200 | | Schlumberger, Ltd. | | | 371,880 |
| 1,300 | | Smith International, Inc. | | | 44,824 |
| 2,100 | | Southwestern Energy Companya | | | 74,802 |
| 3,670 | | Spectra Energy Corporation | | | 70,941 |
| 700 | | Sunoco, Inc.b | | | 21,350 |
| 800 | | Tesoro Petroleum Corporation | | | 7,736 |
| 1,968 | | Transocean, Inc.a | | | 162,025 |
| 3,100 | | Valero Energy Corporation | | | 63,798 |
| 4,100 | | Weatherford International, Ltd.a | | | 69,208 |
| 3,500 | | Williams Companies, Inc. | | | 73,395 |
| 3,350 | | XTO Energy, Inc. | | | 120,433 |
| | | | | |
| | Total Energy | | | 6,721,306 |
| | | | | |
| Financials (14.9%) | | | |
| 2,900 | | AFLAC, Inc.c | | | 128,412 |
| 3,300 | | Allstate Corporationc | | | 87,087 |
| 1,200 | | American Capital, Ltd.b | | | 16,860 |
| 7,000 | | American Express Companyc | | | 192,500 |
| 16,144 | | American International Group, Inc. | | | 30,835 |
| 1,300 | | Ameriprise Financial, Inc. | | | 28,080 |
| 1,700 | | Aon Corporation | | | 71,910 |
| 479 | | Apartment Investment & Management Company | | | 7,008 |
| 700 | | Assurant, Inc. | | | 17,836 |
| 500 | | Avalonbay Communities, Inc. | | | 35,510 |
| 30,176 | | Bank of America Corporation | | | 729,354 |
| 6,905 | | Bank of New York Mellon Corporation | | | 225,103 |
| 3,300 | | BB&T Corporation | | | 118,305 |
| 700 | | Boston Properties, Inc. | | | 49,616 |
| 2,218 | | Capital One Financial Corporation | | | 86,768 |
| 1,000 | | CB Richard Ellis Group, Inc.a | | | 7,010 |
| 5,600 | | Charles Schwab Corporation | | | 107,072 |
| 2,200 | | Chubb Corporation | | | 114,004 |
| 1,007 | | Cincinnati Financial Corporation | | | 26,172 |
| 1,700 | | CIT Group, Inc. | | | 7,038 |
| 32,806 | | Citigroup, Inc. | | | 447,802 |
| 390 | | CME Group, Inc. | | | 110,038 |
| 900 | | Comerica, Inc. | | | 24,831 |
| 700 | | Developers Diversified Realty Corporation | | | 9,219 |
| 2,900 | | Discover Financial Services | | | 35,525 |
| 3,200 | | E*TRADE Financial Corporationa,b | | | 5,824 |
| 1,600 | | Equity Residential REIT | | | 55,888 |
| 500 | | Federated Investors, Inc. | | | 12,100 |
| 3,522 | | Fifth Third Bancorp | | | 38,214 |
| 1,236 | | First Horizon National Corporation | | | 14,721 |
| 900 | | Franklin Resources, Inc. | | | 61,200 |
| 1,400 | | General Growth Properties, Inc. | | | 5,796 |
| 2,600 | | Genworth Financial, Inc. | | | 12,584 |
| 2,700 | | Goldman Sachs Group, Inc. | | | 249,750 |
| 1,800 | | Hartford Financial Services Group, Inc. | | | 18,576 |
| 1,500 | | Health Care Property Investors, Inc. | | | 44,895 |
| 3,100 | | Host Marriott Corporation | | | 32,054 |
| 3,100 | | Hudson City Bancorp, Inc. | | | 58,311 |
| 2,210 | | Huntington Bancshares, Inc. | | | 20,884 |
| 500 | | IntercontinentalExchange, Inc.a | | | 42,780 |
| 2,300 | | Invesco, Ltd. | | | 34,293 |
| 22,332 | | J.P. Morgan Chase & Company | | | 921,195 |
| 1,000 | | Janus Capital Group, Inc. | | | 11,740 |
| 3,000 | | KeyCorp | | | 36,690 |
| 1,400 | | Kimco Realty Corporation | | | 31,612 |
| 900 | | Legg Mason, Inc. | | | 19,971 |
| 1,100 | | Leucadia National Corporation | | | 29,524 |
| 1,543 | | Lincoln National Corporation | | | 26,601 |
| 2,200 | | Loews Corporation | | | 73,062 |
| 500 | | M&T Bank Corporation | | | 40,550 |
| 3,100 | | Marsh & McLennan Companies, Inc. | | | 90,892 |
| 1,600 | | Marshall & Ilsley Corporation | | | 28,848 |
| 1,200 | | MBIA, Inc. | | | 11,796 |
| 9,200 | | Merrill Lynch & Company, Inc. | | | 171,028 |
| 4,664 | | MetLife, Inc. | | | 154,938 |
| 1,200 | | Moody’s Corporationb | | | 30,720 |
| 6,700 | | Morgan Stanley | | | 117,049 |
| 700 | | Nasdaq OMX Group, Inc.a | | | 22,722 |
| 13,000 | | National City Corporation | | | 35,100 |
| 1,300 | | Northern Trust Corporation | | | 73,203 |
| 1,600 | | NYSE Euronext | | | 48,288 |
| 1,000 | | Plum Creek Timber Company, Inc. | | | 37,280 |
The accompanying Notes to the Financial Statements are an integral part of this schedule.
124
Large Cap Index Fund
Schedule of Investments as of October 31, 2008
| | | | | |
| Shares | | Common Stock (99.8%) | | Value |
| Financials (14.9%) - continued | | | |
| 2,100 | | PNC Financial Services Group, Inc. | | $ | 140,007 |
| 1,600 | | Principal Financial Group, Inc. | | | 30,384 |
| 4,100 | | Progressive Corporation | | | 58,507 |
| 1,600 | | ProLogis Trust | | | 22,400 |
| 2,600 | | Prudential Financial, Inc. | | | 78,000 |
| 800 | | Public Storage, Inc. | | | 65,200 |
| 4,214 | | Regions Financial Corporation | | | 46,733 |
| 1,400 | | Simon Property Group, Inc. | | | 93,842 |
| 2,800 | | SLM Corporationa | | | 29,876 |
| 3,235 | | Sovereign Bancorp, Inc.a | | | 9,382 |
| 2,600 | | State Street Corporation | | | 112,710 |
| 2,100 | | SunTrust Banks, Inc. | | | 84,294 |
| 1,600 | | T. Rowe Price Group, Inc. | | | 63,264 |
| 500 | | Torchmark Corporation | | | 20,885 |
| 3,564 | | Travelers Companies, Inc. | | | 151,648 |
| 10,518 | | U.S. Bancorp | | | 313,542 |
| 2,100 | | UnumProvident Corporation | | | 33,075 |
| 800 | | Vornado Realty Trust | | | 56,440 |
| 13,032 | | Wachovia Corporation | | | 83,535 |
| 19,900 | | Wells Fargo & Company | | | 677,595 |
| 1,900 | | XL Capital, Ltd.b | | | 18,430 |
| 700 | | Zions Bancorporation | | | 26,677 |
| | | | | |
| | Total Financials | | | 7,651,000 |
| | | | | |
| Health Care (13.8%) | | | |
| 9,300 | | Abbott Laboratoriesc | | | 512,895 |
| 2,800 | | Aetna, Inc. | | | 69,636 |
| 1,900 | | Allergan, Inc. | | | 75,373 |
| 1,000 | | AmerisourceBergen Corporation | | | 31,270 |
| 6,336 | | Amgen, Inc.a | | | 379,463 |
| 1,000 | | Applied Biosystems, Inc. | | | 30,830 |
| 700 | | Barr Pharmaceuticals, Inc.a | | | 44,982 |
| 3,800 | | Baxter International, Inc. | | | 229,862 |
| 1,500 | | Becton, Dickinson and Company | | | 104,100 |
| 1,790 | | Biogen Idec, Inc.a | | | 76,165 |
| 9,035 | | Boston Scientific Corporationa | | | 81,586 |
| 11,900 | | Bristol-Myers Squibb Company | | | 244,545 |
| 600 | | C.R. Bard, Inc. | | | 52,950 |
| 2,200 | | Cardinal Health, Inc. | | | 84,040 |
| 2,700 | | Celgene Corporationa | | | 173,502 |
| 1,700 | | CIGNA Corporation | | | 27,710 |
| 850 | | Coventry Health Care, Inc.a | | | 11,212 |
| 3,059 | | Covidien, Ltd. | | | 135,483 |
| 600 | | DaVita, Inc.a | | | 34,050 |
| 6,000 | | Eli Lilly and Company | | | 202,920 |
| 1,500 | | Express Scripts, Inc.a | | | 90,915 |
| 1,800 | | Forest Laboratories, Inc.a | | | 41,814 |
| 1,600 | | Genzyme Corporationa | | | 116,608 |
| 5,500 | | Gilead Sciences, Inc.a | | | 252,175 |
| 950 | | Hospira, Inc.a | | | 26,429 |
| 1,000 | | Humana, Inc.a | | | 29,590 |
| 1,100 | | IMS Health, Inc. | | | 15,774 |
| 200 | | Intuitive Surgical, Inc.a | | | 34,558 |
| 16,790 | | Johnson & Johnson | | | 1,029,899 |
| 1,433 | | King Pharmaceuticals, Inc.a | | | 12,596 |
| 700 | | Laboratory Corporation of America Holdingsa | | | 43,043 |
| 1,700 | | McKesson Corporation | | | 62,543 |
| 3,050 | | Medco Health Solutions, Inc.a | | | 115,747 |
| 6,800 | | Medtronic, Inc. | | | 274,244 |
| 12,900 | | Merck & Company, Inc. | | | 399,255 |
| 300 | | Millipore Corporationa | | | 15,567 |
| 1,800 | | Mylan Laboratories, Inc.a,b | | | 15,426 |
| 500 | | Patterson Companies, Inc.a | | | 12,665 |
| 700 | | PerkinElmer, Inc. | | | 12,558 |
| 40,540 | | Pfizer, Inc. | | | 717,963 |
| 1,000 | | Quest Diagnostics, Inc. | | | 46,800 |
| 9,800 | | Schering-Plough Corporation | | | 142,002 |
| 2,100 | | St. Jude Medical, Inc.a | | | 79,863 |
| 1,500 | | Stryker Corporation | | | 80,190 |
| 2,500 | | Tenet Healthcare Corporationa | | | 10,950 |
| 2,500 | | Thermo Fisher Scientific, Inc.a | | | 101,500 |
| 7,300 | | UnitedHealth Group, Inc. | | | 173,229 |
| 800 | | Varian Medical Systems, Inc.a | | | 36,408 |
| 600 | | Waters Corporationa | | | 26,280 |
| 600 | | Watson Pharmaceuticals, Inc.a | | | 15,702 |
| 3,100 | | WellPoint, Inc.a | | | 120,497 |
| 8,000 | | Wyeth | | | 257,440 |
| 1,340 | | Zimmer Holdings, Inc.a | | | 62,216 |
| | | | | |
| | Total Health Care | | | 7,075,020 |
| | | | | |
| Industrials (11.1%) | | | |
| 4,200 | | 3M Company | | | 270,060 |
| 2,000 | | Allied Waste Industries, Inc.a | | | 20,840 |
| 600 | | Avery Dennison Corporation | | | 21,012 |
| 4,500 | | Boeing Company | | | 235,215 |
| 1,700 | | Burlington Northern Santa Fe Corporation | | | 151,402 |
| 1,000 | | C.H. Robinson Worldwide, Inc. | | | 51,780 |
| 3,700 | | Caterpillar, Inc. | | | 141,229 |
| 800 | | Cintas Corporation | | | 18,960 |
| 1,000 | | Cooper Industries, Ltd. | | | 30,950 |
| 2,500 | | CSX Corporation | | | 114,300 |
| 1,200 | | Cummins, Inc. | | | 31,020 |
| 1,500 | | Danaher Corporationb | | | 88,860 |
| 2,600 | | Deere & Company | | | 100,256 |
| 1,100 | | Dover Corporation | | | 34,947 |
| 950 | | Eaton Corporation | | | 42,370 |
| 4,700 | | Emerson Electric Company | | | 153,831 |
| 800 | | Equifax, Inc. | | | 20,864 |
| 1,300 | | Expeditors International of Washington, Inc. | | | 42,445 |
| 800 | | Fastenal Company | | | 32,208 |
| 1,900 | | FedEx Corporation | | | 124,203 |
| 400 | | Flowserve Corporation | | | 22,768 |
| 1,100 | | Fluor Corporation | | | 43,923 |
| 2,400 | | General Dynamics Corporation | | | 144,768 |
| 66,100 | | General Electric Company | | | 1,289,611 |
| 800 | | Goodrich Corporation | | | 29,248 |
| 4,500 | | Honeywell International, Inc. | | | 137,025 |
| 2,400 | | Illinois Tool Works, Inc. | | | 80,136 |
| 1,953 | | Ingersoll-Rand Company | | | 36,033 |
| 1,100 | | ITT Corporation | | | 48,950 |
| 700 | | Jacobs Engineering Group, Inc.a | | | 25,501 |
| 700 | | L-3 Communications Holdings, Inc. | | | 56,819 |
| 2,000 | | Lockheed Martin Corporation | | | 170,100 |
| 800 | | Manitowoc Company, Inc. | | | 7,872 |
| 2,200 | | Masco Corporation | | | 22,330 |
| 700 | | Monster Worldwide, Inc.a | | | 9,968 |
| 2,300 | | Norfolk Southern Corporation | | | 137,862 |
| 2,034 | | Northrop Grumman Corporation | | | 95,374 |
| 2,155 | | PACCAR, Inc. | | | 63,012 |
| 700 | | Pall Corporation | | | 18,487 |
| 1,050 | | Parker-Hannifin Corporation | | | 40,708 |
| 1,200 | | Pitney Bowes, Inc. | | | 29,736 |
| 800 | | Precision Castparts Corporation | | | 51,848 |
The accompanying Notes to Financial Statements are an integral part of this schedule.
125
Large Cap Index Fund
Schedule of Investments as of October 31, 2008
| | | | | |
| Shares | | Common Stock (99.8%) | | Value |
| Industrials (11.1%) - continued | | | |
| 1,300 | | R.R. Donnelley & Sons Company | | $ | 21,541 |
| 2,500 | | Raytheon Company | | | 127,775 |
| 900 | | Robert Half International, Inc. | | | 16,983 |
| 900 | | Rockwell Automation, Inc. | | | 24,903 |
| 1,000 | | Rockwell Collins, Inc. | | | 37,230 |
| 300 | | Ryder System, Inc. | | | 11,886 |
| 4,400 | | Southwest Airlines Company | | | 51,832 |
| 600 | | Terex Corporationa | | | 10,014 |
| 1,500 | | Textron, Inc. | | | 26,550 |
| 2,859 | | Tyco International, Ltd. | | | 72,276 |
| 3,100 | | Union Pacific Corporation | | | 206,987 |
| 6,100 | | United Parcel Service, Inc. | | | 321,958 |
| 5,800 | | United Technologies Corporation | | | 318,768 |
| 400 | | W.W. Grainger, Inc. | | | 31,428 |
| 3,000 | | Waste Management, Inc. | | | 93,690 |
| | | | | |
| | Total Industrials | | | 5,662,652 |
| | | | | |
| Information Technology (15.7%) | | | |
| 3,200 | | Adobe Systems, Inc.a | | | 85,248 |
| 3,700 | | Advanced Micro Devices, Inc.a,b | | | 12,950 |
| 600 | | Affiliated Computer Services, Inc.a | | | 24,600 |
| 2,200 | | Agilent Technologies, Inc.a | | | 48,818 |
| 1,000 | | Akamai Technologies, Inc.a | | | 14,380 |
| 1,800 | | Altera Corporation | | | 31,230 |
| 1,200 | | Amphenol Corporation | | | 34,380 |
| 1,700 | | Analog Devices, Inc. | | | 36,312 |
| 5,300 | | Apple, Inc.a,c | | | 570,227 |
| 8,100 | | Applied Materials, Inc. | | | 104,571 |
| 1,400 | | Autodesk, Inc.a | | | 29,834 |
| 3,100 | | Automatic Data Processing, Inc. | | | 108,345 |
| 1,100 | | BMC Software, Inc.a | | | 28,402 |
| 2,700 | | Broadcom Corporationa | | | 46,116 |
| 2,400 | | CA, Inc. | | | 42,720 |
| 585 | | CIENA Corporationa | | | 5,622 |
| 35,500 | | Cisco Systems, Inc.a | | | 630,835 |
| 1,100 | | Citrix Systems, Inc.a | | | 28,347 |
| 1,800 | | Cognizant Technology Solutions Corporationa | | | 34,560 |
| 900 | | Computer Sciences Corporationa | | | 27,144 |
| 1,500 | | Compuware Corporationa | | | 9,570 |
| 700 | | Convergys Corporationa | | | 5,383 |
| 9,500 | | Corning, Inc. | | | 102,885 |
| 10,500 | | Dell, Inc.a | | | 127,575 |
| 6,600 | | eBay, Inc.a | | | 100,782 |
| 1,900 | | Electronic Arts, Inc.a | | | 43,282 |
| 12,500 | | EMC Corporationa | | | 147,250 |
| 1,100 | | Fidelity National Information Services, Inc. | | | 16,599 |
| 950 | | Fiserv, Inc.a | | | 31,692 |
| 1,400 | | Google, Inc.a | | | 503,104 |
| 800 | | Harris Corporation | | | 28,760 |
| 14,741 | | Hewlett-Packard Company | | | 564,285 |
| 33,800 | | Intel Corporation | | | 540,800 |
| 8,200 | | International Business Machines Corporation | | | 762,354 |
| 1,900 | | Intuit, Inc.a | | | 47,614 |
| 1,300 | | Jabil Circuit, Inc. | | | 10,933 |
| 1,275 | | JDS Uniphase Corporationa | | | 6,962 |
| 3,300 | | Juniper Networks, Inc.a | | | 61,842 |
| 1,000 | | KLA-Tencor Corporation | | | 23,250 |
| 500 | | Lexmark International, Inc.a | | | 12,915 |
| 1,300 | | Linear Technology Corporation | | | 29,484 |
| 3,900 | | LSI Corporationa,b | | | 15,015 |
| 400 | | MasterCard, Inc. | | | 59,128 |
| 1,400 | | MEMC Electronic Materials, Inc.a | | | 25,732 |
| 1,100 | | Microchip Technology, Inc.b | | | 27,093 |
| 4,600 | | Micron Technology, Inc.a | | | 21,666 |
| 47,300 | | Microsoft Corporation | | | 1,056,209 |
| 900 | | Molex, Inc. | | | 12,969 |
| 13,600 | | Motorola, Inc. | | | 73,032 |
| 1,200 | | National Semiconductor Corporation | | | 15,804 |
| 2,000 | | NETAPP, Inc.a | | | 27,060 |
| 2,100 | | Novell, Inc.a | | | 9,786 |
| 600 | | Novellus Systems, Inc.a | | | 9,480 |
| 3,350 | | NVIDIA Corporationa | | | 29,346 |
| 23,591 | | Oracle Corporationa | | | 431,479 |
| 1,900 | | Paychex, Inc. | | | 54,226 |
| 800 | | QLogic Corporationa | | | 9,616 |
| 9,900 | | QUALCOMM, Inc. | | | 378,774 |
| 600 | | Salesforce.com, Inc.a | | | 18,576 |
| 1,400 | | SanDisk Corporationa | | | 12,446 |
| 4,500 | | Sun Microsystems, Inc.a | | | 20,700 |
| 5,047 | | Symantec Corporationa | | | 63,491 |
| 2,400 | | Tellabs, Inc.a | | | 10,176 |
| 1,100 | | Teradata Corporationa | | | 16,929 |
| 1,000 | | Teradyne, Inc.a | | | 5,100 |
| 7,900 | | Texas Instruments, Inc. | | | 154,524 |
| 1,200 | | Total System Services, Inc. | | | 16,488 |
| 2,859 | | Tyco Electronics, Ltd. | | | 55,579 |
| 2,200 | | Unisys Corporationa | | | 3,344 |
| 1,200 | | VeriSign, Inc.a | | | 25,440 |
| 4,403 | | Western Union Company | | | 67,190 |
| 5,200 | | Xerox Corporation | | | 41,704 |
| 1,700 | | Xilinx, Inc. | | | 31,314 |
| 8,300 | | Yahoo!, Inc.a | | | 106,406 |
| | | | | |
| | Total Information Technology | | | 8,027,784 |
| | | | | |
| Materials (3.1%) | | | |
| 1,300 | | Air Products and Chemicals, Inc. | | | 75,569 |
| 700 | | AK Steel Holding Corporation | | | 9,744 |
| 4,900 | | Alcoa, Inc. | | | 56,399 |
| 600 | | Allegheny Technologies, Inc. | | | 15,924 |
| 300 | | Ashland, Inc. | | | 6,777 |
| 600 | | Ball Corporation | | | 20,520 |
| 600 | | Bemis Company, Inc. | | | 14,904 |
| 300 | | CF Industries Holdings, Inc. | | | 19,257 |
| 5,583 | | Dow Chemical Company | | | 148,898 |
| 5,400 | | E.I. du Pont de Nemours and Company | | | 172,800 |
| 500 | | Eastman Chemical Company | | | 20,195 |
| 1,100 | | Ecolab, Inc. | | | 40,986 |
| 2,338 | | Freeport-McMoRan Copper & Gold, Inc. | | | 68,036 |
| 700 | | Hercules, Inc. | | | 11,767 |
| 500 | | International Flavors & Fragrances, Inc. | | | 15,940 |
| 2,600 | | International Paper Company | | | 44,772 |
| 991 | | MeadWestvaco Corporation | | | 13,904 |
| 3,268 | | Monsanto Company | | | 290,787 |
| 2,700 | | Newmont Mining Corporation | | | 71,118 |
| 1,900 | | Nucor Corporation | | | 76,969 |
| 800 | | Pactiv Corporationa | | | 18,848 |
| 1,000 | | PPG Industries, Inc. | | | 49,580 |
| 1,900 | | Praxair, Inc. | | | 123,785 |
| 700 | | Rohm and Haas Company | | | 49,245 |
The accompanying Notes to the Financial Statements are an integral part of this schedule.
126
Large Cap Index Fund
Schedule of Investments as of October 31, 2008
| | | | | |
| Shares | | Common Stock (99.8%) | | Value |
| Materials (3.1%) - continued | | | |
| 1,000 | | Sealed Air Corporation | | $ | 16,920 |
| 800 | | Sigma-Aldrich Corporation | | | 35,088 |
| 500 | | Titanium Metals Corporationb | | | 4,655 |
| 700 | | United States Steel Corporation | | | 25,816 |
| 700 | | Vulcan Materials Companyb | | | 37,996 |
| 1,300 | | Weyerhaeuser Company | | | 49,686 |
| | | | | |
| | Total Materials | | | 1,606,885 |
| | | | | |
| Telecommunications Services (3.3%) | | | |
| 2,400 | | American Tower Corporationa | | | 77,544 |
| 35,468 | | AT&T, Inc. | | | 949,478 |
| 600 | | CenturyTel, Inc. | | | 15,066 |
| 843 | | Embarq Corporation | | | 25,290 |
| 1,900 | | Frontier Communications Corporation | | | 14,459 |
| 8,900 | | Qwest Communications International, Inc.b | | | 25,454 |
| 17,168 | | Sprint Nextel Corporationb | | | 53,736 |
| 17,100 | | Verizon Communications, Inc. | | | 507,357 |
| 2,601 | | Windstream Corporation | | | 19,534 |
| | | | | |
| | Total Telecommunications Services | | | 1,687,918 |
| | | | | |
| Utilities (3.8%) | | | |
| 4,000 | | AES Corporationa | | | 31,880 |
| 1,000 | | Allegheny Energy, Inc. | | | 30,150 |
| 1,300 | | Ameren Corporation | | | 42,185 |
| 2,400 | | American Electric Power Company, Inc. | | | 78,312 |
| 2,100 | | CenterPoint Energy, Inc. | | | 24,192 |
| 1,400 | | CMS Energy Corporation | | | 14,350 |
| 1,600 | | Consolidated Edison, Inc. | | | 69,312 |
| 1,100 | | Constellation Energy Group, Inc. | | | 26,631 |
| 3,500 | | Dominion Resources, Inc. | | | 126,980 |
| 1,000 | | DTE Energy Company | | | 35,300 |
| 7,640 | | Duke Energy Corporation | | | 125,143 |
| 3,083 | | Dynegy, Inc.a | | | 11,222 |
| 2,000 | | Edison International, Inc. | | | 71,180 |
| 1,200 | | Entergy Corporation | | | 93,660 |
| 3,950 | | Exelon Corporation | | | 214,248 |
| 1,800 | | FirstEnergy Corporation | | | 93,888 |
| 2,500 | | FPL Group, Inc. | | | 118,100 |
| 430 | | Integrys Energy Group, Inc. | | | 20,468 |
| 300 | | Nicor, Inc. | | | 13,863 |
| 1,637 | | NiSource, Inc. | | | 21,216 |
| 1,200 | | Pepco Holdings, Inc. | | | 24,780 |
| 2,200 | | PG&E Corporation | | | 80,674 |
| 600 | | Pinnacle West Capital Corporation | | | 18,990 |
| 2,300 | | PPL Corporation | | | 75,486 |
| 1,527 | | Progress Energy, Inc. | | | 60,118 |
| 3,100 | | Public Service Enterprise Group, Inc. | | | 87,265 |
| 1,000 | | Questar Corporation | | | 34,460 |
| 1,500 | | Sempra Energy | | | 63,885 |
| 4,600 | | Southern Company | | | 157,964 |
| 1,300 | | TECO Energy, Inc. | | | 15,002 |
| 700 | | Wisconsin Energy Corporation | | | 30,450 |
| 2,655 | | Xcel Energy, Inc. | | | 46,250 |
| | | | | |
| | Total Utilities | | | 1,957,604 |
| | | | | |
| | Total Common Stock (cost $54,114,478) | | | 51,177,751 |
| | | | | |
| | |
| | | Collateral Held for Securities Loaned (1.4%)d | | |
| 705,338 | | Thrivent Financial Securities Lending Trust | | | 705,338 |
| | | | | |
| | Total Collateral Held for Securities Loaned (cost $705,338) | | | 705,338 |
| | | | | |
| | |
Shares or
Principal
Amount | | Short-Term Investments (0.4%)d | | |
| | Federal National Mortgage Association Discount Notes | | | |
| 200,000 | | 2.400%, 12/10/2008e | | | 199,483 |
| 1,036 | | Thrivent Money Market Fund | | | 1,036 |
| | | | | |
| | Total Short-Term Investments (at amortized cost) | | | 200,519 |
| | | | | |
| | Total Investments (cost $55,020,335) 101.6% | | | $52,083,608 |
| | | | | |
| | Other Assets and Liabilities, Net (1.6%) | | | (818,134) |
| | | | | |
| | Total Net Assets 100.0% | | | $51,265,474 |
| | | | | |
| a | Non-income producing security. |
| b | All or a portion of the security is on loan as discussed in item 2(M) of the Notes to Financial Statements. |
| c | At October 31, 2008, $1,714,721 of investments were earmarked to cover open financial futures contracts. |
| d | The interest rate shown reflects the yield, coupon rate or, for securities purchased at a discount, the discount rate at the date of purchase. |
| e | At October 31, 2008, $199,483 of investments were held on deposit with the counterparty and pledged as the initial margin deposit for open financial futures contracts. |
Definitions:
| | | | |
| REIT | | - | | Real Estate Investment Trust, is a company that buys, develops, manages and/or sells real estate assets. |
Gross unrealized appreciation and depreciation of investments, based on cost for federal income tax purposes, were as follows:
| | | | |
Gross unrealized appreciation | | $ | 9,685,889 | |
Gross unrealized depreciation | | | (13,541,198 | ) |
| | | | |
Net unrealized appreciation (depreciation) | | | ($3,855,309 | ) |
Cost for federal income tax purposes | | $ | 55,938,917 | |
The accompanying Notes to Financial Statements are an integral part of this schedule.
127
Large Cap Index Fund
Schedule of Investments as of October 31, 2008
| | | | | | | | | | | | | |
Futures | | Number of
Contracts
Long/(Short) | | Expiration Date | | Notional
Principal
Amount | | Value | | Unrealized
Gain/(Loss) |
S&P 500 Index Mini-Futures | | 2 | | December 2008 | | $ | 93,023 | | $ | 96,730 | | $ | 3,707 |
Total Futures | | | | | | | | | | | | $ | 3,707 |
Investment in Affiliates
Affiliated issuers, as defined under the Investment Company Act of 1940, include those in which the Fund’s holdings of an issuer represent 5% or more of the outstanding voting securities of an issuer, or any affiliated mutual fund.
A summary of transactions for the fiscal year to date, in Large Cap Index Fund, is as follows:
| | | | | | | | | | | | | | | | | |
Fund | | Value
October 31,
2007 | | Gross
Purchases and
Additions | | Gross Sales
and
Reductions | | Balance of
Shares Held at
October 31,
2008 | | Value
October 31,
2008 | | Income Earned
November 1, 2007-
October 31, 2008 |
Money Market | | $ | 2,178,690 | | $ | 9,838,802 | | $ | 12,016,456 | | 1,036 | | $ | 1,036 | | $ | 28,625 |
Thrivent Financial Securities Lending Trust | | | 4,630,568 | | | 20,311,387 | | | 24,236,617 | | 705,338 | | | 705,338 | | | 19,596 |
Total Value and Dividend Income | | | 6,809,258 | | | | | | | | | | | 706,374 | | | 48,221 |
The accompanying Notes to Financial Statements are an integral part of this schedule.
128
Balanced Fund
Schedule of Investments as of October 31, 2008
| | | | | |
| Shares | | Common Stock (66.8%) | | Value |
| Consumer Discretionary (7.0%) | | | |
| 5,100 | | Advance Auto Parts, Inc.a | | $ | 159,120 |
| 9,000 | | Autoliv, Inc.a | | | 192,240 |
| 15,900 | | Bed Bath & Beyond, Inc.b,c | | | 409,743 |
| 2,600 | | Black & Decker Corporationc | | | 131,612 |
| 16,200 | | BorgWarner, Inc.d | | | 364,014 |
| 16,500 | | Carter’s, Inc.a,b | | | 350,460 |
| 3,800 | | Centex Corporation | | | 46,550 |
| 41,300 | | Chico’s FAS, Inc.b,e | | | 140,420 |
| 11,300 | | Children’s Place Retail Stores, Inc.a,b | | | 377,759 |
| 46,700 | | Coldwater Creek, Inc.a,b | | | 167,653 |
| 92,100 | | Comcast Corporationa,c | | | 1,451,496 |
| 8,200 | | D.R. Horton, Inc. | | | 60,516 |
| 13,000 | | Dollar Tree, Inc.b | | | 494,260 |
| 10,400 | | DreamWorks Animation SKG, Inc.b | | | 292,240 |
| 2,651 | | Finish Line, Inc. | | | 25,370 |
| 17,600 | | Fossil, Inc.a,b | | | 319,440 |
| 7,700 | | Genesco, Inc.b,e | | | 191,037 |
| 24,200 | | Goodyear Tire & Rubber Companyb | | | 215,864 |
| 13,500 | | Guess ?, Inc. | | | 293,895 |
| 23,300 | | Harley-Davidson, Inc. | | | 570,384 |
| 2,400 | | Harman International Industries, Inc. | | | 44,088 |
| 2,100 | | Hasbro, Inc. | | | 61,047 |
| 6,800 | | Home Depot, Inc. | | | 160,412 |
| 40,500 | | Hot Topic, Inc.b | | | 262,440 |
| 24,500 | | Kohl’s Corporationb,e | | | 860,685 |
| 73,000 | | Leapfrog Enterprises, Inc.b,e | | | 492,750 |
| 4,100 | | Lennar Corporation | | | 31,734 |
| 29,000 | | McDonald’s Corporation | | | 1,679,970 |
| 2,000 | | Mohawk Industries, Inc.b,e | | | 96,760 |
| 5,300 | | Newell Rubbermaid, Inc. | | | 72,875 |
| 69,700 | | Pier 1 Imports, Inc.b,e | | | 96,186 |
| 6,100 | | Pulte Homes, Inc. | | | 67,954 |
| 70,400 | | Regal Entertainment Groupe | | | 903,936 |
| 18,400 | | Ross Stores, Inc.a | | | 601,496 |
| 8,000 | | Skechers USA, Inc.b | | | 108,640 |
| 4,500 | | Target Corporation | | | 180,540 |
| 12,200 | | TJX Companies, Inc. | | | 326,472 |
| 17,400 | | Viacom, Inc.b | | | 351,828 |
| 7,500 | | Warnaco Group, Inc.b | | | 223,575 |
| 32,300 | | Yum! Brands, Inc. | | | 937,023 |
| | | | | |
| | Total Consumer Discretionary | | | 13,814,484 |
| | | | | |
| Consumer Staples (7.9%) | | | |
| 10,000 | | Alberto-Culver Companya | | | 257,300 |
| 21,100 | | Altria Group, Inc.a | | | 404,909 |
| 14,400 | | Avon Products, Inc.a | | | 357,552 |
| 5,724 | | Cadbury plca | | | 211,674 |
| 27,100 | | Coca-Cola Companya | | | 1,194,026 |
| 21,400 | | Constellation Brands, Inc.a,b | | | 268,356 |
| 37,195 | | CVS/Caremark Corporationc | | | 1,140,027 |
| 7,000 | | Diageo plc ADR | | | 435,330 |
| 4,368 | | Dr. Pepper Snapple Group, Inc.b | | | 100,027 |
| 18,300 | | Elizabeth Arden, Inc.a,b | | | 316,407 |
| 14,250 | | Flowers Foods, Inc. | | | 422,513 |
| 14,500 | | General Mills, Inc. | | | 982,230 |
| 9,400 | | Hormel Foods Corporation | | | 265,644 |
| 21,766 | | Kraft Foods, Inc. | | | 634,261 |
| 27,100 | | Kroger Company | | | 744,166 |
| 8,100 | | Lorillard, Inc. | | | $533,466 |
| 18,300 | | Pepsi Bottling Group, Inc. | | | 423,096 |
| 24,800 | | PepsiCo, Inc.a | | | 1,413,848 |
| 21,100 | | Philip Morris International, Inc. | | | 917,217 |
| 32,912 | | Procter & Gamble Companya | | | 2,124,140 |
| 14,997 | | Reckitt Benckiser Group plc | | | 634,339 |
| 11,300 | | Smithfield Foods, Inc.b,e | | | 118,876 |
| 27,500 | | Wal-Mart Stores, Inc. | | | 1,534,775 |
| | | | | |
| | Total Consumer Staples | | | 15,434,179 |
| | | | | |
| Energy (7.7%) | | | |
| 21,500 | | Devon Energy Corporation | | | 1,738,490 |
| 32,300 | | Dril-Quip, Inc.b | | | 797,810 |
| 32,586 | | Exxon Mobil Corporationc | | | 2,415,274 |
| 55,400 | | Halliburton Company | | | 1,096,366 |
| 38,600 | | Noble Corporation | | | 1,243,306 |
| 25,400 | | Occidental Petroleum Corporationa | | | 1,410,716 |
| 1,560 | | Patriot Coal Corporationb | | | 24,695 |
| 7,500 | | Peabody Energy Corporation | | | 258,825 |
| 79,600 | | Petrohawk Energy Corporationa,b | | | 1,508,420 |
| 39,100 | | Petroleo Brasileiro SA ADR | | | 1,051,399 |
| 19,500 | | Petroleum Development Corporationb,c | | | 403,845 |
| 45,151 | | Sunoco, Inc.e | | | 1,377,106 |
| 22,300 | | Total SA ADR | | | 1,236,312 |
| 37,800 | | Willbros Group, Inc.b,e | | | 585,522 |
| | | | | |
| | Total Energy | | | 15,148,086 |
| | | | | |
| Financials (10.1%) | | | |
| 6,600 | | Affiliated Managers Group, Inc.b,d | | | 306,108 |
| 18,300 | | AFLAC, Inc.c | | | 810,324 |
| 12,800 | | Allstate Corporationc | | | 337,792 |
| 2,200 | | AMB Property Corporationa | | | 52,866 |
| 22,800 | | American Express Companyc | | | 627,000 |
| 34,362 | | American International Group, Inc.c | | | 65,631 |
| 7,900 | | Ameriprise Financial, Inc.c | | | 170,640 |
| 2,601 | | Apartment Investment & Management Companye | | | 38,052 |
| 13,000 | | Axis Capital Holdings, Ltd. | | | 370,240 |
| 30,500 | | Bank of America Corporationa,c | | | 737,185 |
| 16,300 | | Bank of New York Mellon Corporationc | | | 531,380 |
| 2,363 | | CapitalSource, Inc. | | | 17,486 |
| 13,700 | | Chubb Corporationa | | | 709,934 |
| 18,800 | | Citigroup, Inc.a,c | | | 256,620 |
| 2,371 | | CME Group, Inc.a,c | | | 668,978 |
| 8,575 | | Commerce Bancshares, Inc. | | | 405,426 |
| 7,700 | | Cullen/Frost Bankers, Inc.d | | | 430,969 |
| 1,800 | | Developers Diversified Realty Corporation | | | 23,706 |
| 17,200 | | East West Bancorp, Inc.d,e | | | 298,420 |
| 11,800 | | Endurance Specialty Holdings, Ltd. | | | 356,832 |
| 300 | | Entertainment Properties Trust | | | 11,235 |
| 3,700 | | Equity Residential REIT | | | 129,241 |
| 1,300 | | Essex Property Trust, Inc. | | | 126,490 |
| 20,500 | | First Commonwealth Financial Corporation | | | 226,730 |
| 7,300 | | Franklin Resources, Inc. | | | 496,400 |
| 7,200 | | Goldman Sachs Group, Inc. | | | 666,000 |
| 677 | | Gramercy Capital Corporation | | | 1,801 |
The accompanying Notes to Financial Statements are an integral part of this schedule.
129
Balanced Fund
Schedule of Investments as of October 31, 2008
| | | | | |
| Shares | | Common Stock (66.8%) | | Value |
| Financials (10.1%) - continued | | | |
| 4,100 | | Hartford Financial Services Group, Inc. | | $ | 42,312 |
| 13,200 | | HCC Insurance Holdings, Inc. | | | 291,192 |
| 3,300 | | Hospitality Properties Trust | | | 33,495 |
| 19,000 | | Hudson City Bancorp, Inc. | | | 357,390 |
| 63,700 | | J.P. Morgan Chase & Company | | | 2,627,625 |
| 400 | | Kilroy Realty Corporation | | | 12,860 |
| 2,300 | | Mack-Cali Realty Corporation | | | 52,256 |
| 14,400 | | Marshall & Ilsley Corporatione | | | 259,632 |
| 15,000 | | Merrill Lynch & Company, Inc. | | | 278,850 |
| 35,000 | | MGIC Investment Corporatione | | | 135,800 |
| 18,100 | | Morgan Stanley | | | 316,207 |
| 33,300 | | NewAlliance Bancshares, Inc. | | | 459,540 |
| 9,300 | | Northern Trust Corporation | | | 523,683 |
| 100 | | Parkway Properties, Inc. | | | 1,725 |
| 27,900 | | People’s United Financial, Inc. | | | 488,250 |
| 2,400 | | Plum Creek Timber Company, Inc. | | | 89,472 |
| 63,600 | | PMI Group, Inc.e | | | 158,364 |
| 6,400 | | Portfolio Recovery Associates, Inc.b,e | | | 229,632 |
| 2,700 | | ProLogis Trust | | | 37,800 |
| 7,500 | | Prudential Financial, Inc. | | | 225,000 |
| 2,940 | | Public Storage, Inc. | | | 239,610 |
| 2,400 | | Rayonier, Inc. REIT | | | 79,392 |
| 16,000 | | Signature Bankb | | | 521,280 |
| 3,000 | | Simon Property Group, Inc.e | | | 201,090 |
| 39,100 | | South Financial Group, Inc.e | | | 227,171 |
| 100 | | Sovran Self Storage, Inc. | | | 3,245 |
| 4,900 | | SVB Financial Groupb | | | 252,105 |
| 9,100 | | Syncora Holdings, Ltd.b,e | | | 9,852 |
| 20,400 | | U.S. Bancorpa | | | 608,124 |
| 3,800 | | UDR, Inc. | | | 75,088 |
| 4,800 | | UMB Financial Corporation | | | 217,584 |
| 2,300 | | Weingarten Realty Investors | | | 47,035 |
| 34,300 | | Wells Fargo & Company | | | 1,167,915 |
| 20,000 | | Zions Bancorporatione | | | 762,200 |
| | | | | |
| | Total Financials | | | 19,906,262 |
| | | | | |
| Health Care (9.9%) | | | |
| 9,600 | | Aetna, Inc.c | | | 238,752 |
| 21,100 | | Alpharma, Inc.b,e | | | 660,641 |
| 533 | | Amedisys, Inc.b | | | 30,067 |
| 3,400 | | AmerisourceBergen Corporation | | | 106,318 |
| 17,300 | | ArthroCare Corporationb,e | | | 359,494 |
| 18,700 | | Beckman Coulter, Inc.c | | | 933,504 |
| 37,300 | | BioMarin Pharmaceutical, Inc.b,c | | | 683,336 |
| 14,500 | | C.R. Bard, Inc.c | | | 1,279,625 |
| 5,900 | | Cardinal Health, Inc.a | | | 225,380 |
| 13,400 | | Cephalon, Inc.b,c,e | | | 961,048 |
| 7,100 | | CIGNA Corporation | | | 115,730 |
| 1,400 | | Covance, Inc.a,b | | | 70,000 |
| 5,600 | | Coventry Health Care, Inc.a,b | | | 73,864 |
| 21,300 | | Dentsply International, Inc.d | | | 647,094 |
| 98,400 | | Dexcom, Inc.a,b | | | 444,768 |
| 7,600 | | Express Scripts, Inc.b | | | 460,636 |
| 20,500 | | Gilead Sciences, Inc.a,b | | | 939,925 |
| 2,000 | | Health Net, Inc.b | | | 25,760 |
| 1,700 | | Henry Schein, Inc.b | | | 79,577 |
| 31,100 | | Hospira, Inc.b | | | 865,202 |
| 3,100 | | Humana, Inc.b | | | 91,729 |
| 19,200 | | ImClone Systems, Inc.b | | | 1,320,192 |
| 7,600 | | IMS Health, Inc. | | | 108,984 |
| 2,300 | | Laboratory Corporation of America Holdingsb | | | $141,427 |
| 38,200 | | Masimo Corporationb | | | 1,222,018 |
| 5,000 | | McKesson Corporationc | | | 183,950 |
| 9,956 | | Medco Health Solutions, Inc.b | | | 377,830 |
| 3,600 | | Millipore Corporationb | | | 186,804 |
| 21,800 | | NuVasive, Inc.b,e | | | 1,026,562 |
| 2,100 | | Omnicare, Inc. | | | 57,897 |
| 2,300 | | Patterson Companies, Inc.b,c | | | 58,259 |
| 283 | | PharMerica Corporationb | | | 5,810 |
| 100 | | Psychiatric Solutions, Inc.b | | | 3,329 |
| 2,700 | | Quest Diagnostics, Inc. | | | 126,360 |
| 31,528 | | SenoRx, Inc.b | | | 83,234 |
| 21,500 | | Shire Pharmaceuticals Group plc ADR | | | 848,175 |
| 19,200 | | STERIS Corporation | | | 653,568 |
| 8,200 | | Thermo Fisher Scientific, Inc.b | | | 332,920 |
| 9,300 | | United Therapeutics Corporationb | | | 811,239 |
| 15,640 | | UnitedHealth Group, Inc. | | | 371,137 |
| 46,400 | | Vertex Pharmaceuticals, Inc.b | | | 1,216,144 |
| 10,500 | | WellPoint, Inc.b | | | 408,135 |
| 13,300 | | Zimmer Holdings, Inc.b | | | 617,519 |
| | | | | |
| | Total Health Care | | | 19,453,943 |
| | | | | |
| Industrials (6.9%) | | | |
| 250 | | Allegiant Travel Companyb | | | 9,957 |
| 22,400 | | American Commercial Lines, Inc.b,e | | | 166,432 |
| 19,400 | | American Reprographics Companya,b | | | 206,416 |
| 9,800 | | C.H. Robinson Worldwide, Inc.a | | | 507,444 |
| 6,100 | | Canadian National Railway Companyc | | | 263,886 |
| 10,400 | | Carlisle Companies, Inc.c | | | 241,800 |
| 15,500 | | Danaher Corporationc,e | | | 918,220 |
| 9,100 | | Eaton Corporationa | | | 405,860 |
| 15,700 | | Emerson Electric Companya | | | 513,861 |
| 14,800 | | FTI Consulting, Inc.b | | | 862,100 |
| 46,000 | | General Electric Company | | | 897,460 |
| 15,400 | | Hub Group, Inc.b | | | 484,330 |
| 24,700 | | JB Hunt Transport Services, Inc.e | | | 702,221 |
| 13,900 | | Kirby Corporationb | | | 477,048 |
| 5,700 | | Manpower, Inc. | | | 177,441 |
| 47,000 | | Oshkosh Corporation | | | 360,020 |
| 28,600 | | Pall Corporation | | | 755,326 |
| 12,000 | | Pentair, Inc. | | | 331,680 |
| 94,500 | | Polypore International, Inc.b | | | 806,085 |
| 6,400 | | Precision Castparts Corporation | | | 414,784 |
| 14,500 | | Rockwell Automation, Inc. | | | 401,215 |
| 10,500 | | Rockwell Collins, Inc. | | | 390,915 |
| 12,700 | | Roper Industries, Inc. | | | 575,945 |
| 19,100 | | Shaw Group, Inc.b | | | 341,699 |
| 13,300 | | SPX Corporation | | | 515,242 |
| 29,800 | | Tyco International, Ltd. | | | 753,344 |
| 26,200 | | Waste Management, Inc. | | | 818,226 |
| 12,900 | | WESCO International, Inc.b | | | 256,452 |
| | | | | |
| | Total Industrials | | | 13,555,409 |
| | | | | |
| Information Technology (11.0%) | | | |
| 62,700 | | ADC Telecommunications, Inc.a,b,c | | | 397,518 |
| 22,300 | | Apple, Inc.b,c | | | 2,399,257 |
| 14,900 | | Applied Materials, Inc.a | | | 192,359 |
| 11,100 | | ASML Holding NV ADR | | | 194,805 |
The accompanying Notes to the Financial Statements are an integral part of this schedule.
130
Balanced Fund
Schedule of Investments as of October 31, 2008
| | | | | |
| Shares | | Common Stock (66.8%) | | Value |
| Information Technology (11.0%) - continued | | | |
| 22,800 | | BMC Software, Inc.b | | $ | 588,696 |
| 72,200 | | Cisco Systems, Inc.b,c | | | 1,282,994 |
| 62,400 | | Citrix Systems, Inc.b,d | | | 1,608,048 |
| 101,600 | | Compuware Corporationa,b | | | 648,208 |
| 12,800 | | DTS, Inc.b,e | | | 264,320 |
| 19,800 | | Electronic Arts, Inc.b | | | 451,044 |
| 49,800 | | EMC Corporationb,d | | | 586,644 |
| 17,900 | | F5 Networks, Inc.b,c | | | 444,278 |
| 15,200 | | FormFactor, Inc.b | | | 264,784 |
| 1,370 | | Google, Inc.b | | | 492,323 |
| 7,700 | | Harris Corporation | | | 276,815 |
| 21,000 | | Informatica Corporationb | | | 295,050 |
| 72,300 | | Integrated Device Technology, Inc.b | | | 459,828 |
| 97,600 | | Intel Corporationc | | | 1,561,600 |
| 34,500 | | Intersil Corporation | | | 472,305 |
| 57,000 | | Ixiab | | | 379,620 |
| 12,900 | | Juniper Networks, Inc.b | | | 241,746 |
| 61,400 | | Microsoft Corporation | | | 1,371,062 |
| 16,300 | | NETAPP, Inc.b | | | 220,539 |
| 13,600 | | Nokia Oyj ADRc | | | 206,448 |
| 32,050 | | NVIDIA Corporationb | | | 280,758 |
| 58,100 | | Omniture, Inc.b,e | | | 668,150 |
| 19,600 | | ON Semiconductor Corporationb | | | 100,156 |
| 36,200 | | Oracle Corporationb | | | 662,098 |
| 19,300 | | QUALCOMM, Inc. | | | 738,418 |
| 100,400 | | Quest Software, Inc.b | | | 1,330,300 |
| 5,400 | | Research in Motion, Ltd.b | | | 272,322 |
| 8,900 | | Solera Holdings, Inc.b | | | 221,521 |
| 73,100 | | Sonus Networks, Inc.b,e | | | 161,551 |
| 26,200 | | Symantec Corporationb | | | 329,596 |
| 105,200 | | Tellabs, Inc.b | | | 446,048 |
| 34,900 | | Texas Instruments, Inc. | | | 682,644 |
| 59,900 | | TIBCO Software, Inc.b | | | 308,485 |
| 2,477 | | Verigy, Ltd.b | | | 35,917 |
| 7,900 | | Zebra Technologies Corporationb | | | 159,896 |
| | | | | |
| | Total Information Technology | | | 21,698,151 |
| | | | | |
| Materials (2.5%) | | | |
| 9,700 | | Air Products and Chemicals, Inc.c | | | 563,861 |
| 375 | | Arkema ADR | | | 8,550 |
| 15,700 | | Dow Chemical Companyc | | | 418,719 |
| 14,900 | | E.I. du Pont de Nemours and Company | | | 476,800 |
| 8,500 | | FMC Corporationc | | | 370,090 |
| 15,000 | | Freeport-McMoRan Copper & Gold, Inc.a | | | 436,500 |
| 8,700 | | Lubrizol Corporation | | | 326,946 |
| 21,400 | | Pactiv Corporationb | | | 504,184 |
| 15,200 | | Praxair, Inc. | | | 990,280 |
| 15,600 | | Silgan Holdings, Inc. | | | 726,024 |
| | | | | |
| | Total Materials | | | 4,821,954 |
| | | | | |
| Telecommunications Services (1.1%) | | | |
| 58,300 | | AT&T, Inc.a,c | | | 1,560,691 |
| 12,900 | | Embarq Corporationc | | | 387,000 |
| 8,500 | | NII Holdings, Inc.b | | | 218,960 |
| | | | | |
| | Total Telecommunications Services | | | 2,166,651 |
| | | | | |
| Utilities (2.7%) | | | |
| 12,400 | | AES Corporationb | | | 98,828 |
| 4,400 | | Ameren Corporation | | | 142,780 |
| 8,300 | | American Electric Power Company, Inc.c | | | 270,829 |
| 5,300 | | Consolidated Edison, Inc. | | | 229,596 |
| 4,000 | | Constellation Energy Group, Inc.a | | | 96,840 |
| 14,700 | | Dominion Resources, Inc.c | | | 533,316 |
| 3,900 | | DTE Energy Company | | | 137,670 |
| 19,816 | | Duke Energy Corporationa | | | 324,586 |
| 6,900 | | Edison International, Inc.a | | | 245,571 |
| 4,600 | | Entergy Corporationa | | | 359,030 |
| 13,700 | | Exelon Corporationa | | | 743,088 |
| 7,000 | | FirstEnergy Corporationa | | | 365,120 |
| 7,100 | | PG&E Corporation | | | 260,357 |
| 7,600 | | PPL Corporation | | | 249,432 |
| 5,600 | | Progress Energy, Inc. | | | 220,472 |
| 11,000 | | Public Service Enterprise Group, Inc. | | | 309,650 |
| 4,200 | | Questar Corporation | | | 144,732 |
| 5,600 | | Sempra Energy | | | 238,504 |
| 2,500 | | Wisconsin Energy Corporation | | | 108,750 |
| 8,500 | | Xcel Energy, Inc.c | | | 148,070 |
| | | | | |
| | Total Utilities | | | 5,227,221 |
| | | | | |
| | Total Common Stock (cost $165,122,886) | | | 131,226,340 |
| | | | | |
| | |
Principal
Amount | | Long-Term Fixed Income (38.0%) | | |
| Asset-Backed Securities (5.5%) | | | |
| | Americredit Automobile Receivables Trust | | | |
| 803,425 | | 2.258%, 11/6/2008c,f,g | | | 739,066 |
| | Bear Stearns Mortgage Funding Trust | | | |
| 505,912 | | 3.399%, 11/25/2008g | | | 99,774 |
| | Chase Funding Issuance Trust | | | |
| 1,000,000 | | 4.960%, 9/17/2012a | | | 949,853 |
| | Citibank Credit Card Issuance Trust | | | |
| 750,000 | | 5.650%, 9/20/2019a | | | 554,069 |
| | Countrywide Asset-Backed Certificates | | | |
| 760,554 | | 5.549%, 4/25/2036c,f | | | 689,782 |
| | Discover Card Master Trust | | | |
| 1,000,000 | | 5.650%, 3/16/2020c | | | 710,521 |
| | First Franklin Mortgage Loan
Asset-Backed Certificates | | | |
| 826,811 | | 3.369%, 11/25/2008a,g | | | 801,162 |
| | First Horizon ABS Trust | | | |
| 718,641 | | 3.389%, 11/25/2008f,g | | | 493,200 |
| | Ford Credit Floor Plan Master Owner Trust | | | |
| 1,000,000 | | 4.740%, 11/17/2008c,g | | | 965,265 |
| | GMAC Mortgage Corporation Loan Trust | | | |
| 898,234 | | 3.329%, 11/25/2008f,g | | | 525,831 |
| 964,410 | | 3.439%, 11/25/2008f,g | | | 526,053 |
| | Green Tree Financial Corporation | | | |
| 444,134 | | 6.330%, 11/1/2029c | | | 441,963 |
| | Merna Re, Ltd. | | | |
| 700,000 | | 5.512%, 12/31/2008g,h | | | 662,200 |
| | Popular ABS Mortgage Pass- Through Trust | | | |
| 140,535 | | 4.000%, 12/25/2034 | | | 138,610 |
The accompanying Notes to Financial Statements are an integral part of this schedule.
131
Balanced Fund
Schedule of Investments as of October 31, 2008
| | | | | | |
Principal
Amount | | Long-Term Fixed Income (38.0%) | | Value |
| | Asset-Backed Securities (5.5%) - continued | | | |
| | | Renaissance Home Equity Loan Trust | | | |
| $ | 1,500,000 | | 5.608%, 5/25/2036a | | $ | 1,436,224 |
| | | Residential Asset Securities Corporation | | | |
| | 204,661 | | 4.160%, 7/25/2030 | | | 202,478 |
| | | Residential Funding Mortgage Securities II | | | |
| | 291,150 | | 3.389%, 11/25/2008f,g | | | 276,238 |
| | | SLM Student Loan Trust | | | |
| | 117,356 | | 3.545%, 1/26/2009g | | | 116,896 |
| | | Wachovia Asset Securitization, Inc. | | | |
| | 852,690 | | 3.399%, 11/25/2008f,g,h | | | 530,662 |
| | | | | | |
| | | Total Asset-Backed Securities | | | 10,859,847 |
| | | | | | |
| | Basic Materials (0.3%) | | | |
| | | ArcelorMittal | | | |
| | 250,000 | | 6.125%, 6/1/2018c,h | | | 172,263 |
| | | Precision Castparts Corporation | | | |
| | 500,000 | | 5.600%, 12/15/2013c | | | 507,506 |
| | | | | | |
| | | Total Basic Materials | | | 679,769 |
| | | | | | |
| | Capital Goods (0.9%) | | | |
| | | Caterpillar Financial Services Corporation | | | |
| | 135,000 | | 5.850%, 9/1/2017c | | | 117,840 |
| | | Honeywell International, Inc. | | | |
| | 225,000 | | 5.300%, 3/1/2018 | | | 197,981 |
| | | John Deere Capital Corporation | | | |
| | 500,000 | | 5.350%, 1/17/2012d | | | 481,598 |
| | | Oakmont Asset Trust | | | |
| | 750,000 | | 4.514%, 12/22/2008h | | | 750,068 |
| | | United Technologies Corporation | | | |
| | 350,000 | | 4.875%, 5/1/2015 | | | 318,931 |
| | | | | | |
| | | Total Capital Goods | | | 1,866,418 |
| | | | | | |
| | Collateralized Mortgage Obligations (2.1%) | | | |
| | | Banc of America Mortgage Securities, Inc. | | | |
| | 1,087,963 | | 4.804%, 9/25/2035a | | | 888,913 |
| | | HomeBanc Mortgage Trust | | | |
| | 670,241 | | 5.989%, 4/25/2037 | | | 454,257 |
| | | J.P. Morgan Alternative Loan Trust | | | |
| | 661,874 | | 5.803%, 3/25/2036 | | | 414,854 |
| | | Merrill Lynch Mortgage Investors, Inc. | | | |
| | 968,064 | | 4.870%, 6/25/2035 | | | 786,447 |
| | | Thornburg Mortgage Securities Trust | | | |
| | 632,144 | | 3.349%, 11/25/2008g | | | 627,954 |
| | 625,790 | | 3.369%, 11/25/2008g | | | 567,362 |
| | | Zuni Mortgage Loan Trust | | | |
| | 372,899 | | 3.389%, 11/25/2008g | | | 357,071 |
| | | | | | |
| | | Total Collateralized Mortgage Obligations | | | 4,096,858 |
| | | | | | |
| | Commercial Mortgage-Backed Securities (5.5%) | | | |
| | | Bear Stearns Commercial Mortgage Securities, Inc. | | | |
| | 1,500,000 | | 4.710%, 11/15/2008a,g,h | | | 1,356,819 |
| | 1,000,000 | | 4.487%, 2/11/2041c | | | 929,060 |
| | 500,000 | | 5.835%, 9/11/2042c | | | 301,032 |
| | | Citigroup Commercial Mortgage Trust | | | |
| | 7,127 | | 4.630%, 11/15/2008g,h | | | 6,511 |
| | | Commercial Mortgage Pass- Through Certificates | | | |
| | 30,022 | | 4.660%, 11/15/2008g,h | | | 27,786 |
| | 1,000,000 | | 4.690%, 11/15/2008a,g,h | | | 838,444 |
| | 1,500,000 | | 4.740%, 11/15/2008a,g,h | | | 1,289,496 |
| | | Credit Suisse Mortgage Capital Certificates | | | |
| | 1,500,000 | | 4.730%, 11/15/2008g,h | | | 1,300,049 |
| | | Crown Castle International Corporation | | | |
| | 500,000 | | 5.245%, 11/15/2036c,h | | | 480,115 |
| | | Greenwich Capital Commercial Funding Corporation | | | |
| | 1,250,000 | | 5.867%, 8/10/2017c | | | 757,611 |
| | | GS Mortgage Securities Corporation II | | | |
| | 1,000,000 | | 4.175%, 11/6/2008a,g,h | | | 849,109 |
| | | LB-UBS Commercial Mortgage Trust | | | |
| | 35,781 | | 3.086%, 5/15/2027 | | | 35,650 |
| | | Merrill Lynch Mortgage Trust | | | |
| | 1,000,000 | | 5.266%, 1/12/2044 | | | 683,530 |
| | | TIAA Real Estate CDO, Ltd. | | | |
| | 1,000,000 | | 5.815%, 8/15/2039 | | | 890,623 |
| | | Wachovia Bank Commercial Mortgage Trust | | | |
| | 875,000 | | 5.765%, 7/15/2045 | | | 658,725 |
| | | Washington Mutual Asset Securities Corporation | | | |
| | 338,197 | | 3.830%, 1/25/2035h | | | 318,915 |
| | | | | | |
| | | Total Commercial Mortgage- Backed Securities | | | 10,723,475 |
| | | | | | |
| | Communications Services (0.7%) | | | |
| | | AT&T, Inc. | | | |
| | 125,000 | | 6.500%, 9/1/2037 | | | 101,542 |
| | | British Telecom plc | | | |
| | 150,000 | | 9.125%, 12/15/2030c | | | 135,829 |
| | | Citizens Communications Company | | | |
| | 150,000 | | 6.250%, 1/15/2013a | | | 124,125 |
| | | Comcast Corporation | | | |
| | 330,000 | | 6.500%, 1/15/2015c | | | 297,445 |
| | | New Cingular Wireless Services, Inc. | | | |
| | 140,000 | | 8.750%, 3/1/2031a | | | 130,222 |
| | | News America, Inc. | | | |
| | 125,000 | | 6.400%, 12/15/2035 | | | 94,617 |
| | | Rogers Cable, Inc. | | | |
| | 280,000 | | 6.750%, 3/15/2015 | | | 250,155 |
| | 40,000 | | 8.750%, 5/1/2032 | | | 37,707 |
The accompanying Notes to the Financial Statements are an integral part of this schedule.
132
Balanced Fund
Schedule of Investments as of October 31, 2008
| | | | | | |
Principal
Amount | | Long-Term Fixed Income (38.0%) | | Value |
| | Communications Services (0.7%) - continued | | | |
| | | Verizon Communications, Inc. | | | |
| $ | 200,000 | | 5.550%, 2/15/2016 | | $ | 174,502 |
| | | | | | |
| | | Total Communications Services | | | 1,346,144 |
| | | | | | |
| | Consumer Cyclical (0.7%) | | | |
| | | Ford Motor Credit Company | | | |
| | 350,000 | | 7.375%, 10/28/2009 | | | 290,536 |
| | | McDonald’s Corporation | | | |
| | 150,000 | | 6.300%, 3/1/2038 | | | 130,972 |
| | | MGM MIRAGE | | | |
| | 260,000 | | 13.000%, 11/15/2013h,i | | | 231,400 |
| | | Nissan Motor Acceptance Corporation | | | |
| | 250,000 | | 4.625%, 3/8/2010h | | | 251,396 |
| | 315,000 | | 5.625%, 3/14/2011h | | | 322,192 |
| | | Wal-Mart Stores, Inc. | | | |
| | 230,000 | | 5.875%, 4/5/2027 | | | 196,572 |
| | | | | | |
| | | Total Consumer Cyclical | | | 1,423,068 |
| | | | | | |
| | Consumer Non-Cyclical (0.8%) | | | |
| | | Baxter International, Inc. | | | |
| | 230,000 | | 5.900%, 9/1/2016c | | | 214,743 |
| | | HCA, Inc. | | | |
| | 150,000 | | 9.250%, 11/15/2016 | | | 127,500 |
| | | Johnson & Johnson Company | | | |
| | 250,000 | | 5.950%, 8/15/2037 | | | 230,956 |
| | | Kroger Company | | | |
| | 200,000 | | 6.400%, 8/15/2017 | | | 174,016 |
| | | PepsiCo, Inc. | | | |
| | 375,000 | | 4.650%, 2/15/2013 | | | 360,345 |
| | | Schering-Plough Corporation | | | |
| | 300,000 | | 6.000%, 9/15/2017a | | | 263,554 |
| | | United Health Group | | | |
| | 150,000 | | 6.500%, 6/15/2037 | | | 101,404 |
| | | Wyeth | | | |
| | 100,000 | | 5.950%, 4/1/2037 | | | 81,184 |
| | | | | | |
| | | Total Consumer Non-Cyclical | | | 1,553,702 |
| | | | | | |
| | Energy (0.5%) | | | |
| | | Nexen, Inc. | | | |
| | 265,000 | | 5.650%, 5/15/2017 | | | 210,447 |
| | | Ras Laffan Liquefied Natural Gas Company, Ltd. II | | | |
| | 300,000 | | 5.298%, 9/30/2020h | | | 261,666 |
| | | Ras Laffan Liquefied Natural Gas Company, Ltd. III | | | |
| | 125,000 | | 5.832%, 9/30/2016h | | | 114,259 |
| | | Transocean, Inc. | | | |
| | 220,000 | | 6.000%, 3/15/2018 | | | 188,214 |
| | | XTO Energy, Inc. | | | |
| | 200,000 | | 5.500%, 6/15/2018 | | | 157,428 |
| | | | | | |
| | | Total Energy | | | 932,014 |
| | | | | | |
| | Financials (3.8%) | | | |
| | | Ace INA Holdings, Inc. | | | |
| | 225,000 | | 5.800%, 3/15/2018a | | | 180,647 |
| | | American Express Company | | | |
| | 200,000 | | 7.000%, 3/19/2018a | | | 154,063 |
| | | Bank of America Corporation | | | |
| | 600,000 | | 8.125%, 5/15/2018a | | | 464,958 |
| | | Bear Stearns Companies, Inc. | | | |
| | 225,000 | | 6.950%, 8/10/2012c | | | 222,021 |
| | 200,000 | | 6.400%, 10/2/2017 | | | 177,767 |
| | | Capmark Financial Group, Inc. | | | |
| | 350,000 | | 5.875%, 5/10/2012a | | | 87,486 |
| | 100,000 | | 6.300%, 5/10/2017 | | | 22,179 |
| | | CIT Group, Inc. | | | |
| | 325,000 | | 7.625%, 11/30/2012 | | | 190,047 |
| | | Citigroup, Inc. | | | |
| | 225,000 | | 5.000%, 9/15/2014c | | | 177,854 |
| | | Corestates Capital Trust I | | | |
| | 375,000 | | 8.000%, 12/15/2026c,h | | | 279,075 |
| | | General Electric Capital Corporation | | | |
| | 120,000 | | 5.625%, 9/15/2017 | | | 98,105 |
| | | General Motors Acceptance Corporation, LLC | | | |
| | 250,000 | | 6.000%, 12/15/2011 | | | 141,103 |
| | | Goldman Sachs Group, Inc. | | | |
| | 450,000 | | 5.125%, 1/15/2015c | | | 373,436 |
| | 150,000 | | 6.750%, 10/1/2037 | | | 97,695 |
| | | Goldman Sachs Group, Inc., Convertible | | | |
| | 500,000 | | 1.000%, 1/31/2015 l | | | 390,560 |
| | 400,000 | | 1.000%, 5/7/2015 l | | | 307,572 |
| | | HSBC Holdings plc | | | |
| | 165,000 | | 6.500%, 5/2/2036 | | | 130,545 |
| | | International Lease Finance Corporation | | | |
| | 390,000 | | 5.750%, 6/15/2011 | | | 267,232 |
| | | Lehman Brothers Holdings, Inc. | | | |
| | 500,000 | | 5.250%, 2/6/2012j | | | 65,000 |
| | | Liberty Property, LP | | | |
| | 200,000 | | 5.500%, 12/15/2016 | | | 138,034 |
| | | Merrill Lynch & Company, Inc. | | | |
| | 325,000 | | 5.450%, 2/5/2013 | | | 292,941 |
| | | Mitsubishi UFG Capital Finance, Ltd. | | | |
| | 215,000 | | 6.346%, 7/25/2016 | | | 150,500 |
| | | Nationwide Health Properties, Inc. | | | |
| | 375,000 | | 6.250%, 2/1/2013 | | | 303,665 |
| | | ProLogis | | | |
| | 525,000 | | 5.500%, 4/1/2012c | | | 340,969 |
| | | Prudential Financial, Inc. | | | |
| | 225,000 | | 6.100%, 6/15/2017 | | | 180,531 |
| | 100,000 | | 5.700%, 12/14/2036 | | | 61,693 |
| | | Reinsurance Group of America, Inc. | | | |
| | 300,000 | | 5.625%, 3/15/2017 | | | 242,800 |
| | | Royal Bank of Scotland Group plc | | | |
| | 350,000 | | 6.990%, 10/5/2017h | | | 187,593 |
| | | Swiss RE Capital I, LP | | | |
| | 275,000 | | 6.854%, 5/25/2016h | | | 150,630 |
| | | Travelers Companies, Inc. | | | |
| | 105,000 | | 6.250%, 6/15/2037 | | | 79,673 |
| | | Wachovia Bank NA | | | |
| | 285,000 | | 4.875%, 2/1/2015 | | | 243,704 |
| | | Wachovia Capital Trust III | | | |
| | 495,000 | | 5.800%, 3/15/2011 | | | 264,825 |
| | | WEA Finance, LLC | | | |
| | 225,000 | | 7.125%, 4/15/2018h | | | 176,623 |
The accompanying Notes to Financial Statements are an integral part of this schedule.
133
Balanced Fund
Schedule of Investments as of October 31, 2008
| | | | | | |
Principal
Amount | | Long-Term Fixed Income (38.0%) | | Value |
| | Financials (3.8%) - continued | | | |
| | | Wells Fargo & Company | | | |
| $ | 225,000 | | 4.375%, 1/31/2013 | | $ | 207,732 |
| | 200,000 | | 5.625%, 12/11/2017 | | | 176,438 |
| | | Wells Fargo Capital XV | | | |
| | 225,000 | | 9.750%, 9/26/2013 | | | 218,250 |
| | | Willis North America, Inc. | | | |
| | 220,000 | | 6.200%, 3/28/2017 | | | 160,318 |
| | | | | | |
| | | Total Financials | | | 7,404,264 |
| | | | | | |
| | Foreign (0.2%) | | | |
| | | Corporacion Andina de Fomento | | | |
| | 500,000 | | 5.750%, 1/12/2017d | | | 377,639 |
| | | | | | |
| | | Total Foreign | | | 377,639 |
| | | | | | |
| | Mortgage-Backed Securities (10.9%) | | | |
| | | Federal National Mortgage Association Conventional 30-Yr. Pass Through | | | |
| | 16,725,000 | | 5.500%, 11/1/2038i | | | 16,338,234 |
| | 3,000,000 | | 6.000%, 11/1/2038i | | | 2,998,125 |
| | 2,000,000 | | 6.500%, 11/1/2038i | | | 2,026,876 |
| | | | | | |
| | | Total Mortgage-Backed Securities | | | 21,363,235 |
| | | | | | |
| | Technology (0.2%) | | | |
| | | International Business Machines Corporation | | | |
| | 200,000 | | 7.625%, 10/15/2018 | | | 206,954 |
| | | Oracle Corporation | | | |
| | 250,000 | | 5.750%, 4/15/2018 | | | 218,757 |
| | | | | | |
| | | Total Technology | | | 425,711 |
| | | | | | |
| | Transportation (1.0%) | | | |
| | | Burlington Northern Santa Fe Corporation | | | |
| | 175,000 | | 7.000%, 12/15/2025c | | | 153,952 |
| | | Continental Airlines, Inc. | | | |
| | 350,000 | | 5.983%, 4/19/2022c | | | 243,250 |
| | | Delta Air Lines, Inc. | | | |
| | 450,000 | | 7.111%, 9/18/2011a | | | 360,000 |
| | | FedEx Corporation | | | |
| | 342,181 | | 6.720%, 1/15/2022 | | | 342,186 |
| | | Southwest Airlines Company | | | |
| | 604,214 | | 6.150%, 8/1/2022 | | | 472,935 |
| | | Union Pacific Corporation | | | |
| | 450,000 | | 6.125%, 1/15/2012a | | | 430,207 |
| | | | | | |
| | | Total Transportation | | | 2,002,530 |
| | | | | | |
| | U.S. Government (3.8%) | | | |
| | | Federal Home Loan Bank | | | |
| | 500,000 | | 4.625%, 10/10/2012 | | | 507,996 |
| | | Federal Home Loan Mortgage Corporation | | | |
| | 750,000 | | 5.000%, 12/14/2018 | | | 681,330 |
| | | Federal National Mortgage Association | | | |
| | 1,000,000 | | 4.625%, 5/1/2013 | | | 967,810 |
| | | U.S. Treasury Bonds | | | |
| | 210,000 | | 4.750%, 2/15/2037 | | | 222,649 |
| | 175,000 | | 5.000%, 5/15/2037e | | | 192,746 |
| | 55,000 | | 4.375%, 2/15/2038e | | | 55,163 |
| | | U.S. Treasury Notes | | | |
| | 150,000 | | 2.750%, 2/28/2013e | | | 152,074 |
| | 450,000 | | 4.250%, 8/15/2013e | | | 481,746 |
| | 230,000 | | 3.875%, 5/15/2018e | | | 229,623 |
| | 245,000 | | 4.000%, 8/15/2018e | | | 245,326 |
| | | U.S. Treasury Notes, TIPS | | | |
| | 4,068,505 | | 2.000%, 7/15/2014 | | | 3,720,139 |
| | | | | | |
| | | Total U.S. Government | | | 7,456,602 |
| | | | | | |
| | Utilities (1.1%) | | | |
| | | CenterPoint Energy Resources Corporation | | | |
| | 300,000 | | 6.125%, 11/1/2017c | | | 230,135 |
| | | Cleveland Electric Illuminating Company | | | |
| | 245,000 | | 5.700%, 4/1/2017c | | | 195,127 |
| | | Commonwealth Edison Company | | | |
| | 220,000 | | 5.400%, 12/15/2011c | | | 205,823 |
| | | Exelon Corporation | | | |
| | 300,000 | | 6.750%, 5/1/2011 | | | 286,078 |
| | | ITC Holdings Corporation | | | |
| | 225,000 | | 6.050%, 1/31/2018h | | | 196,925 |
| | | MidAmerican Energy Holdings Company | | | |
| | 225,000 | | 6.500%, 9/15/2037 | | | 173,765 |
| | | Power Receivables Finance, LLC | | | |
| | 370,194 | | 6.290%, 1/1/2012k | | | 385,309 |
| | | Union Electric Company | | | |
| | 350,000 | | 6.400%, 6/15/2017 | | | 292,844 |
| | | Virginia Electric & Power Company | | | |
| | 145,000 | | 6.000%, 1/15/2036 | | | 109,734 |
| | | | | | |
| | | Total Utilities | | | 2,075,740 |
| | | | | | |
| | | Total Long-Term Fixed Income (cost $85,953,059) | | | 74,587,016 |
| | | | | | |
| | |
| Shares | | Preferred Stock (0.3%) | | |
| | Financials (0.3%) | | | |
| | 5,025 | | Allegro Investment Corporation SA TGT, Reverse Convertible, 20.000%b,h,l | | | 189,902 |
| | 15,771 | | Credit Suisse New York, NY, Zero Couponc,l | | | 240,981 |
| | 12,000 | | Federal National Mortgage Association, 8.250% | | | 25,200 |
| | | | | | |
| | | Total Financials | | | 456,083 |
| | | | | | |
| | | Total Preferred Stock (cost $818,822) | | | 456,083 |
| | | | | | |
| | |
| Contracts | | Options Purchased (<0.1%) | | |
| | 150 | | Call on U.S. Treasury Note Futures $117.50, expires 11/21/2008 | | | 23,437 |
| | | | | | |
| | | Total Options Purchased (cost $300,450) | | | 23,437 |
| | | | | | |
The accompanying Notes to the Financial Statements are an integral part of this schedule.
134
Balanced Fund
Schedule of Investments as of October 31, 2008
| | | | | |
| Shares | | Collateral Held for Securities Loaned (5.8%)m | | Value |
| 11,379,048 | | Thrivent Financial Securities Lending Trust | | $ | 11,379,048 |
| | | | | |
| | Total Collateral Held for Securities Loaned (cost $11,379,048) | | | 11,379,048 |
| | | | | |
| | |
Shares or
Principal
Amount | | Short-Term Investments (6.4%)m | | |
| | Federal Home Loan Bank Discount Notes | | | |
| 350,000 | | 1.340%, 12/10/2008n | | | 349,492 |
| | Federal National Mortgage Association Discount Notes | | | |
| 100,000 | | 1.300%, 12/8/2008o | | | 99,866 |
| 200,000 | | 2.100%, 12/10/2008o | | | 199,551 |
| 11,999,191 | | Thrivent Money Market Fund | | | 11,999,191 |
| | | | | |
| | Total Short-Term Investments (at amortized cost) | | | 12,648,100 |
| | | | | |
| | Total Investments (cost $276,222,365) 117.3% | | | $230,320,024 |
| | | | | |
| | Other Assets and Liabilities, Net (17.3%) | | | (33,917,621) |
| | | | | |
| | Total Net Assets 100.0% | | | $196,402,403 |
| | | | | |
| a | At October 31, 2008, $33,736,746 of investments were earmarked to cover open financial futures contracts. |
| b | Non-income producing security. |
| c | Designated as cover for long settling trades as discussed in the Notes to Financial Statements. |
| d | At October 31, 2008, $4,870,517 of investments were earmarked to cover open swap contracts. |
| e | All or a portion of the security is on loan as discussed in item 2(M) of the Notes to Financial Statements. |
| f | All or a portion of the security is insured or guaranteed. |
| g | Denotes variable rate obligations for which the current yield and next scheduled reset date are shown. |
| h | Denotes securities sold under Rule 144A of the Securities Act of 1933, which exempts them from registration. These securities have been determined to be liquid under the guidelines established by the Fund’s Board of Trustees and may be resold to other dealers in the program or to other qualified institutional buyers. As of October 31, 2008, the value of these investments was $10,944,098 or 5.6% of total net assets. |
| i | Denotes investments purchased on a when-issued or delayed delivery basis. |
| k | Denotes restricted securities. Restricted securities are investment securities which have been deemed illiquid and cannot be offered for public sale without first being registered under the Securities Act of 1933. The following table indicates the acquisition date and cost of restricted securities Balanced Fund owned as of October 31, 2008. |
| | | | | |
Security | | Acquisition
Date | | Cost |
Power Receivables Finance, LLC | | 9/30/2003 | | $ | 372,829 |
| l | These securities are Equity-Linked Structured Securities as discussed in item 2(Q) of the Notes to Financial Statements. |
| m | The interest rate shown reflects the yield, coupon rate or, for securities purchased at a discount, the discount rate at the date of purchase. |
| n | At October 31, 2008, $349,492 of investments were pledged as collateral with the custodian under the agreement between the counterparty, the custodian and the fund for open swap contracts. |
| o | At October 31, 2008, $299,417 of investments were held on deposit with the counterparty and pledged as the initial margin deposit for open financial futures contracts. |
Definitions:
| | | | |
| ADR | | - | | American Depositary Receipt, which are certificates for an underlying foreign security’s shares held by an issuing U.S. depository bank. |
| REIT | | - | | Real Estate Investment Trust, is a company that buys, develops, manages and/or sells real estate assets. |
| TIPS | | - | | Treasury Inflation Protected Security. |
Gross unrealized appreciation and depreciation of investments, based on cost for federal income tax purposes, were as follows:
| | | | |
Gross unrealized appreciation | | $ | 10,571,739 | |
Gross unrealized depreciation | | | (57,341,867 | ) |
| | | | |
Net unrealized appreciation (depreciation) | | | ($46,770,128 | ) |
Cost for federal income tax purposes | | $ | 277,090,152 | |
The accompanying Notes to Financial Statements are an integral part of this schedule.
135
Balanced Fund
Schedule of Investments as of October 31, 2008
| | | | | | | | | | | | | |
Futures | | Number of
Contracts
Long/(Short) | | Expiration
Date | | Notional
Principal
Amount | | | Value | | | Unrealized
Gain/(Loss) | |
2-Yr. U.S. Treasury Bond Futures | | (35) | | December 2008 | | ($7,424,268 | ) | | ($7,518,984 | ) | | ($94,716 | ) |
5-Yr. U.S. Treasury Bond Futures | | (40) | | December 2008 | | (4,475,190 | ) | | (4,530,312 | ) | | (55,122 | ) |
10-Yr. U.S. Treasury Bond Futures | | (120) | | December 2008 | | (13,877,447 | ) | | (13,569,376 | ) | | 308,071 | |
20-Yr. U.S. Treasury Bond Futures | | 40 | | December 2008 | | 4,717,602 | | | 4,525,000 | | | (192,602 | ) |
Total Futures | | | | | | | | | | | | ($34,369 | ) |
| | | | | | | | | | | | | | | | |
Credit Default Swaps and Counterparty | | Buy/Sell
Protection | | Termination
Date | | Notional
Principal
Amount | | Upfront
Payments
Received (Made) | | Value | | | Unrealized
Gain/(Loss) | |
CDX HY, Series 10, 5 Year, at 5.00%; Bank of America | | Sell | | 6/20/2013 | | $ | 250,000 | | $ | 22,049 | | ($38,921 | ) | | ($17,209 | ) |
CDX HY, Series 10, 5 Year, at 5.00%; J.P. Morgan Chaseand Co. | | Sell | | 6/20/2013 | | | 500,000 | | | 26,736 | | (77,845 | ) | | (45,541 | ) |
CDX HY, Series 11, 5 Year, at 5.00%; Bank of America | | Sell | | 12/20/2013 | | | 500,000 | | | 88,333 | | (93,149 | ) | | (3,673 | ) |
CDX IG, Series 10, 5 Year, at 1.55%; Bank of America | | Sell | | 6/20/2013 | | | 366,000 | | | 3,989 | | (9,393 | ) | | (5,451 | ) |
CDX IG, Series 10, 5 Year, at 1.55%; J.P. Morgan Chaseand Co. | | Sell | | 6/20/2013 | | | 366,000 | | | 3,687 | | (9,393 | ) | | (5,740 | ) |
CDX, Series 10, 5 Year, at 5.00%; Bank of America | | Sell | | 6/20/2013 | | | 1,000,000 | | | 62,222 | | (155,689 | ) | | (94,825 | ) |
Total Credit Default Swaps | | | | | | | | | | | | ($384,390 | ) | | ($172,439 | ) |
Investment in Affiliates
Affiliated issuers, as defined under the Investment Company Act of 1940, include those in which the Fund’s holdings of an issuer represent 5% or more of the outstanding voting securities of an issuer, or any affiliated mutual fund.
A summary of transactions for the fiscal year to date, in Balanced Fund, is as follows:
| | | | | | | | | | | | | | | | | |
Fund | | Value
October 31,
2007 | | Gross
Purchases and
Additions | | Gross Sales
and
Reductions | | Balance of
Shares Held at
October 31,
2008 | | Value
October 31,
2008 | | Income Earned
November 1, 2007-
October 31, 2008 |
Money Market | | $ | 14,248,100 | | $ | 49,757,320 | | $ | 52,006,229 | | 11,999,191 | | $ | 11,999,191 | | $ | 533,154 |
Thrivent Financial Securities Lending Trust | | | 39,692,963 | | | 121,075,866 | | | 149,389,781 | | 11,379,048 | | | 11,379,048 | | | 303,305 |
Total Value and Dividend Income | | | 53,941,063 | | | | | | | | | | | 23,378,239 | | | 836,459 |
The accompanying Notes to the Financial Statements are an integral part of this schedule.
136
High Yield Fund
Schedule of Investments as of October 31, 2008
| | | | | | |
Principal
Amount | | Bank Loans (5.1%)a | | Value |
| | Basic Materials (0.5%) | | | |
| | | Lyondell Chemical Company, Term Loan | | | |
| $ | 2,079,109 | | 7.794%, 12/20/2013 | | $ | 1,292,519 |
| | 1,293,500 | | 8.044%, 12/20/2014 | | | 764,381 |
| | | | | | |
| | | Total Basic Materials | | | 2,056,900 |
| | | | | | |
| | Communications Services (0.7%) | | | |
| | | Alltel Communications, Inc., Term Loan | | | |
| | 3,491,184 | | 5.316%, 5/15/2015 | | | 3,314,460 |
| | | | | | |
| | | Total Communications Services | | | 3,314,460 |
| | | | | | |
| | Consumer Cyclical (1.2%) | | | |
| | | Blockbuster, Inc., Term Loan | | | |
| | 850,000 | | 3.750%, 8/20/2011 | | | 648,660 |
| | | Ford Motor Company, Term Loan | | | |
| | 8,898,100 | | 7.590%, 12/16/2013 | | | 4,858,363 |
| | | | | | |
| | | Total Consumer Cyclical | | | 5,507,023 |
| | | | | | |
| | Consumer Non-Cyclical (1.5%) | | | |
| | | CHS/Community Health Systems, Inc., Term Loan | | | |
| | 124,501 | | 1.000%, 7/25/2014b,c | | | 100,535 |
| | 2,434,358 | | 5.222%, 7/25/2014 | | | 1,965,744 |
| | | HCA, Inc., Term Loan | | | |
| | 5,450,000 | | 5.273%, 11/18/2013 | | | 4,495,269 |
| | | | | | |
| | | Total Consumer Non-Cyclical | | | 6,561,548 |
| | | | | | |
| | Technology (0.4%) | | | |
| | | Flextronics Semiconductor, Ltd., Term Loan | | | |
| | 1,828,297 | | 6.155%, 10/1/2014 | | | 1,383,417 |
| | 525,372 | | 7.069%, 10/1/2014 | | | 446,567 |
| | | | | | |
| | | Total Technology | | | 1,829,984 |
| | | | | | |
| | Utilities (0.8%) | | | |
| | | Energy Future Holdings, Term Loan | | | |
| | 4,900,500 | | 6.659%, 10/10/2014 | | | 3,836,847 |
| | | | | | |
| | | Total Utilities | | | 3,836,847 |
| | | | | | |
| | | Total Bank Loans (cost $27,522,894) | | | 23,106,762 |
| | | | | | |
| | |
| | | Long-Term Fixed Income (88.2%) | | |
| | Asset-Backed Securities (0.3%) | | | |
| | | Countrywide Home Loans Asset-Backed Securities | | | |
| | 1,966,456 | | 3.369%, 11/25/2008d,e | | | 1,589,404 |
| | | | | | |
| | | Total Asset-Backed Securities | | | 1,589,404 |
| | | | | | |
| | Basic Materials (8.1%) | | | |
| | | Aleris International, Inc. | | | |
| | 1,610,000 | | 9.000%, 12/15/2014 | | | 555,450 |
| | | Arch Western Finance, LLC | | | |
| | 2,585,000 | | 6.750%, 7/1/2013 | | | 2,171,400 |
| | | Domtar, Inc. | | | |
| | 2,360,000 | | 7.125%, 8/15/2015 | | | 1,758,200 |
| | | Drummond Company, Inc. | | | |
| | 2,155,000 | | 7.375%, 2/15/2016f | | | 1,476,175 |
| | | FMG Finance, Pty., Ltd. | | | |
| | 4,215,000 | | 10.625%, 9/1/2016f | | | 2,887,275 |
| | | Freeport-McMoRan Copper & Gold, Inc. | | | |
| | 2,120,000 | | 8.250%, 4/1/2015g | | | 1,696,000 |
| | 3,025,000 | | 8.375%, 4/1/2017 | | | 2,374,625 |
| | | Georgia-Pacific Corporation | | | |
| | 1,400,000 | | 8.125%, 5/15/2011g | | | 1,183,000 |
| | 1,805,000 | | 7.125%, 1/15/2017f | | | 1,254,475 |
| | | Graphic Packaging International Corporation | | | |
| | 3,540,000 | | 9.500%, 8/15/2013 | | | 2,424,900 |
| | | Griffin Coal Mining Company, Pty., Ltd. | | | |
| | 2,965,000 | | 9.500%, 12/1/2016f | | | 1,215,650 |
| | | Jefferson Smurfit Corporation | | | |
| | 1,300,000 | | 8.250%, 10/1/2012 | | | 663,000 |
| | | Momentive Performance Materials, Inc. | | | |
| | 2,120,000 | | 9.750%, 12/1/2014 | | | 1,187,200 |
| | | Mosaic Global Holdings, Inc., Convertible | | | |
| | 2,540,000 | | 7.375%, 12/1/2014f | | | 2,220,420 |
| | | NewPage Corporation | | | |
| | 1,820,000 | | 10.000%, 5/1/2012 | | | 1,237,600 |
| | | Peabody Energy Corporation | | | |
| | 3,540,000 | | 6.875%, 3/15/2013 | | | 3,106,350 |
| | | Rock-Tenn Company | | | |
| | 650,000 | | 9.250%, 3/15/2016h | | | 572,000 |
| | | Ryerson, Inc. | | | |
| | 1,700,000 | | 12.000%, 11/1/2015f | | | 1,156,000 |
| | | Smurfit-Stone Container Enterprises, Inc. | | | |
| | 1,840,000 | | 8.000%, 3/15/2017g | | | 901,600 |
| | | Southern Copper Corporation | | | |
| | 1,460,000 | | 7.500%, 7/27/2035 | | | 957,560 |
| | | Steel Dynamics, Inc. | | | |
| | 4,080,000 | | 7.750%, 4/15/2016f | | | 2,703,000 |
| | | Terra Capital, Inc. | | | |
| | 3,200,000 | | 7.000%, 2/1/2017 | | | 2,720,000 |
| | | | | | |
| | | Total Basic Materials | | | 36,421,880 |
| | | | | | |
| | Capital Goods (10.2%) | | | |
| | | Allied Waste North America, Inc. | | | |
| | 3,610,000 | | 7.875%, 4/15/2013 | | | 3,357,300 |
| | | Ashtead Capital, Inc. | | | |
| | 1,300,000 | | 9.000%, 8/15/2016f | | | 819,000 |
| | | Ball Corporation | | | |
| | 2,155,000 | | 6.625%, 3/15/2018 | | | 1,767,100 |
| | | BE Aerospace, Inc. | | | |
| | 4,250,000 | | 8.500%, 7/1/2018i | | | 3,655,000 |
| | | Berry Plastics Holding Corporation | | | |
| | 1,200,000 | | 8.875%, 9/15/2014 | | | 624,000 |
| | | Case New Holland, Inc. | | | |
| | 2,230,000 | | 7.125%, 3/1/2014 | | | 1,661,350 |
| | | Crown Americas, Inc. | | | |
| | 1,830,000 | | 7.625%, 11/15/2013 | | | 1,610,400 |
| | 1,830,000 | | 7.750%, 11/15/2015 | | | 1,596,675 |
The accompanying Notes to Financial Statements are an integral part of this schedule.
137
High Yield Fund
Schedule of Investments as of October 31, 2008
| | | | | | |
Principal
Amount | | Long-Term Fixed Income (88.2%) | | Value |
| | Capital Goods (10.2%) - continued | | | |
| | | DRS Technologies, Inc. | | | |
| $ | 2,600,000 | | 6.625%, 2/1/2016 | | $ | 2,574,000 |
| | | Graham Packaging Company, Inc. | | | |
| | 2,530,000 | | 9.875%, 10/15/2014 | | | 1,593,900 |
| | | L-3 Communications Corporation | | | |
| | 3,030,000 | | 6.375%, 10/15/2015 | | | 2,514,900 |
| | | Legrand SA | | | |
| | 850,000 | | 8.500%, 2/15/2025 | | | 792,860 |
| | | Leucadia National Corporation | | | |
| | 5,070,000 | | 7.125%, 3/15/2017 | | | 4,334,850 |
| | | Mueller Water Products, Inc. | | | |
| | 1,390,000 | | 7.375%, 6/1/2017 | | | 910,450 |
| | | Norcraft Companies, LP/Norcraft Finance Corporation | | | |
| | 1,760,000 | | 9.000%, 11/1/2011 | | | 1,531,200 |
| | | Owens-Brockway Glass Container, Inc. | | | |
| | 1,230,000 | | 8.250%, 5/15/2013 | | | 1,150,050 |
| | | Owens-Illinois, Inc. | | | |
| | 4,250,000 | | 7.800%, 5/15/2018 | | | 3,315,000 |
| | | Plastipak Holdings, Inc. | | | |
| | 2,595,000 | | 8.500%, 12/15/2015f | | | 1,855,425 |
| | | RBS Global, Inc./Rexnord Corporation | | | |
| | 2,385,000 | | 9.500%, 8/1/2014 | | | 1,645,650 |
| | | Rental Services Corporation | | | |
| | 1,780,000 | | 9.500%, 12/1/2014g | | | 1,068,000 |
| | | SPX Corporation | | | |
| | 2,980,000 | | 7.625%, 12/15/2014f | | | 2,503,200 |
| | | TransDigm, Inc. | | | |
| | 4,865,000 | | 7.750%, 7/15/2014 | | | 3,892,000 |
| | | United Rentals North America, Inc. | | | |
| | 1,740,000 | | 6.500%, 2/15/2012 | | | 1,218,000 |
| | | | | | |
| | | Total Capital Goods | | | 45,990,310 |
| | | | | | |
| | Commercial Mortgage-Backed Securities (0.4%) | | | |
| | | Greenwich Capital Commercial Funding Corporation | | | |
| | 3,000,000 | | 5.867%, 8/10/2017 | | | 1,818,267 |
| | | | | | |
| | | Total Commercial Mortgage-Backed Securities | | | 1,818,267 |
| | | | | | |
| | Communications Services (15.5%) | | | |
| | | American Tower Corporation | | | |
| | 4,250,000 | | 7.000%, 10/15/2017f | | | 3,697,500 |
| | | Centennial Communications Corporation | | | |
| | 5,050,000 | | 9.633%, 1/1/2009e | | | 3,838,000 |
| | 2,760,000 | | 8.125%, 2/1/2014 | | | 2,359,800 |
| | | Charter Communications Holdings II, LLC | | | |
| | 2,130,000 | | 10.250%, 9/15/2010g | | | 1,480,350 |
| | | Charter Communications Holdings, LLC | | | |
| | 2,270,000 | | 8.750%, 11/15/2013g | | | 1,498,200 |
| | | Charter Communications Operating, LLC | | | |
| | 2,130,000 | | 8.375%, 4/30/2014f | | | 1,544,250 |
| | | Citizens Communications Company | | | |
| | 2,915,000 | | 9.250%, 5/15/2011 | | | 2,477,750 |
| | | CSC Holdings, Inc. | | | |
| | 2,550,000 | | 8.500%, 6/15/2015f,i | | | 2,154,750 |
| | | Dex Media West, LLC/Dex Media West Finance Company | | | |
| | 1,120,000 | | 9.875%, 8/15/2013 | | | 420,000 |
| | | DIRECTV Holdings, LLC | | | |
| | 4,220,000 | | 7.625%, 5/15/2016f | | | 3,544,800 |
| | | EchoStar DBS Corporation | | | |
| | 3,220,000 | | 7.125%, 2/1/2016g | | | 2,584,050 |
| | | Idearc, Inc. | | | |
| | 2,665,000 | | 8.000%, 11/15/2016 | | | 369,769 |
| | | Intelsat Subsidiary Holding Company, Ltd. | | | |
| | 5,760,000 | | 8.875%, 1/15/2015f | | | 4,896,000 |
| | | Intelsat, Ltd. | | | |
| | 4,608,000 | | Zero Coupon, 2/1/2010f,j | | | 3,156,480 |
| | | Lamar Media Corporation | | | |
| | 1,505,000 | | 6.625%, 8/15/2015 | | | 1,106,175 |
| | 2,080,000 | | 6.625%, 8/15/2015 | | | 1,528,800 |
| | | Level 3 Financing, Inc. | | | |
| | 2,550,000 | | 12.250%, 3/15/2013 | | | 1,612,875 |
| | 1,440,000 | | 9.250%, 11/1/2014g | | | 820,800 |
| | | Mediacom, LLC/Mediacom Capital Corporation | | | |
| | 4,230,000 | | 9.500%, 1/15/2013 | | | 3,331,125 |
| | | MetroPCS Wireless, Inc. | | | |
| | 3,450,000 | | 9.250%, 11/1/2014g | | | 2,872,125 |
| | | Nextel Communications, Inc. | | | |
| | 1,270,000 | | 6.875%, 10/31/2013 | | | 723,900 |
| | | NTL Cable plc | | | |
| | 4,010,000 | | 9.125%, 8/15/2016 | | | 2,646,600 |
| | | Quebecor Media, Inc. | | | |
| | 2,500,000 | | 7.750%, 3/15/2016 | | | 1,731,250 |
| | | Qwest Communications International, Inc. | | | |
| | 1,080,000 | | 7.500%, 2/15/2014 | | | 742,500 |
| | | Qwest Corporation | | | |
| | 3,860,000 | | 7.875%, 9/1/2011 | | | 3,348,550 |
| | 1,230,000 | | 7.625%, 6/15/2015 | | | 940,950 |
| | | R.H. Donnelley Corporation | | | |
| | 3,395,000 | | 6.875%, 1/15/2013g | | | 780,850 |
| | | Sprint Capital Corporation | | | |
| | 1,250,000 | | 8.375%, 3/15/2012 | | | 1,006,250 |
| | | Time Warner Telecom Holdings, Inc. | | | |
| | 4,380,000 | | 9.250%, 2/15/2014 | | | 3,547,800 |
| | | TL Acquisitions, Inc. | | | |
| | 3,610,000 | | 10.500%, 1/15/2015f | | | 2,147,950 |
| | | Videotron Ltee | | | |
| | 4,000,000 | | 6.875%, 1/15/2014 | | | 3,320,000 |
| | | Videotron, Ltd. | | | |
| | 640,000 | | 9.125%, 4/15/2018f | | | 568,000 |
| | | Virgin Media Finance plc | | | |
| | 2,160,000 | | 8.750%, 4/15/2014 | | | 1,512,000 |
| | | Windstream Corporation | | | |
| | 1,080,000 | | 8.625%, 8/1/2016 | | | 815,400 |
The accompanying Notes to the Financial Statements are an integral part of this schedule.
138
High Yield Fund
Schedule of Investments as of October 31, 2008
| | | | | | |
Principal
Amount | | Long-Term Fixed Income (88.2%) | | Value |
| | Communications Services (15.5%) - continued | | | |
| $ | 1,600,000 | | 7.000%, 3/15/2019 | | $ | 976,000 |
| | | | | | |
| | | Total Communications Services | | | 70,101,599 |
| | | | | | |
| | Consumer Cyclical (17.7%) | | | |
| | | AutoNation, Inc. | | | |
| | 2,110,000 | | 7.000%, 4/15/2014 | | | 1,371,500 |
| | | Beazer Homes USA, Inc. | | | |
| | 1,105,000 | | 8.625%, 5/15/2011 | | | 718,250 |
| | | Blockbuster, Inc. | | | |
| | 2,550,000 | | 9.000%, 9/1/2012g | | | 1,453,500 |
| | | Bon-Ton Stores, Inc. | | | |
| | 3,400,000 | | 10.250%, 3/15/2014 | | | 544,000 |
| | | Boyd Gaming Corporation | | | |
| | 3,820,000 | | 6.750%, 4/15/2014g | | | 2,406,600 |
| | | Circus & Eldorado Joint Venture/Silver Legacy Capital Corporation | | | |
| | 3,160,000 | | 10.125%, 3/1/2012 | | | 1,864,400 |
| | | Dollarama Group, LP | | | |
| | 1,489,000 | | 8.883%, 12/15/2008e | | | 1,042,300 |
| | 4,300,000 | | 8.875%, 8/15/2012 | | | 3,225,000 |
| | | Firekeepers Development Authority | | | |
| | 4,450,000 | | 13.875%, 5/15/2015f | | | 3,159,500 |
| | | Fontainebleau Las Vegas Holdings, LLC | | | |
| | 5,180,000 | | 10.250%, 6/15/2015f | | | 699,300 |
| | | Ford Motor Credit Company | | | |
| | 2,120,000 | | 9.750%, 9/15/2010 | | | 1,441,704 |
| | 3,820,000 | | 7.375%, 2/1/2011 | | | 2,376,984 |
| | 2,020,000 | | 7.000%, 10/1/2013g | | | 1,118,989 |
| | | Gaylord Entertainment Company | | | |
| | 1,760,000 | | 6.750%, 11/15/2014 | | | 1,128,600 |
| | | General Motors Corporation | | | |
| | 1,700,000 | | 8.375%, 7/15/2033g | | | 552,500 |
| | | Group 1 Automotive, Inc. | | | |
| | 3,810,000 | | 8.250%, 8/15/2013 | | | 2,514,600 |
| | | Hanesbrands, Inc. | | | |
| | 2,090,000 | | 6.508%, 12/15/2008e | | | 1,418,587 |
| | | Host Hotels & Resorts LP | | | |
| | 3,400,000 | | 6.875%, 11/1/2014 | | | 2,533,000 |
| | | KB Home | | | |
| | 3,040,000 | | 6.250%, 6/15/2015g | | | 2,021,600 |
| | | Lear Corporation | | | |
| | 3,820,000 | | 8.500%, 12/1/2013g | | | 1,451,600 |
| | | MGM MIRAGE | | | |
| | 2,550,000 | | 6.000%, 10/1/2009 | | | 2,269,500 |
| | 5,520,000 | | 13.000%, 11/15/2013c,f | | | 4,912,800 |
| | | Mohegan Tribal Gaming Authority | | | |
| | 2,150,000 | | 8.000%, 4/1/2012g | | | 1,580,250 |
| | | Norcraft Holdings, LP/Norcraft Capital Corporation | | | |
| | 1,250,000 | | 9.750%, 9/1/2012g | | | 1,025,000 |
| | | Perry Ellis International, Inc. | | | |
| | 2,200,000 | | 8.875%, 9/15/2013 | | | 1,694,000 |
| | | Pinnacle Entertainment, Inc. | | | |
| | 2,550,000 | | 8.250%, 3/15/2012g | | | 1,765,875 |
| | 1,280,000 | | 7.500%, 6/15/2015 | | | 800,000 |
| | | Pokagon Gaming Authority | | | |
| | 3,531,000 | | 10.375%, 6/15/2014f | | | 3,213,210 |
| | | Pulte Homes, Inc. | | | |
| | 850,000 | | 7.875%, 8/1/2011 | | | 720,375 |
| | 2,150,000 | | 5.200%, 2/15/2015 | | | 1,333,000 |
| | | Rite Aid Corporation | | | |
| | 3,475,000 | | 8.625%, 3/1/2015 | | | 1,233,625 |
| | | Sally Holdings, LLC | | | |
| | 2,990,000 | | 9.250%, 11/15/2014g | | | 2,392,000 |
| | | Seminole Hard Rock Entertainment | | | |
| | 2,415,000 | | 5.319%, 12/15/2008e,f | | | 1,593,900 |
| | | Service Corporation International | | | |
| | 1,600,000 | | 6.750%, 4/1/2015 | | | 1,260,000 |
| | | Shingle Springs Tribal Gaming Authority | | | |
| | 4,650,000 | | 9.375%, 6/15/2015f | | | 2,278,500 |
| | | Speedway Motorsports, Inc. | | | |
| | 3,300,000 | | 6.750%, 6/1/2013 | | | 2,508,000 |
| | | Tunica Biloxi Gaming Authority | | | |
| | 4,870,000 | | 9.000%, 11/15/2015h | | | 4,249,075 |
| | | Turning Stone Resort Casino Enterprise | | | |
| | 1,500,000 | | 9.125%, 12/15/2010h | | | 1,305,000 |
| | 3,130,000 | | 9.125%, 9/15/2014h | | | 2,472,700 |
| | | Universal City Development Services | | | |
| | 1,270,000 | | 11.750%, 4/1/2010 | | | 1,016,000 |
| | | Universal City Florida Holding Company I/II | | | |
| | 3,655,000 | | 7.942%, 2/1/2009e | | | 2,704,700 |
| | | Vail Resorts, Inc. | | | |
| | 1,740,000 | | 6.750%, 2/15/2014 | | | 1,331,100 |
| | | Warnaco, Inc. | | | |
| | 3,495,000 | | 8.875%, 6/15/2013 | | | 3,285,300 |
| | | | | | |
| | | Total Consumer Cyclical | | | 79,986,424 |
| | | | | | |
| | Consumer Non-Cyclical (12.4%) | | | |
| | | Biomet, Inc. | | | |
| | 4,100,000 | | 10.000%, 10/15/2017f | | | 3,772,000 |
| | 3,190,000 | | 11.625%, 10/15/2017 | | | 2,775,300 |
| | | Boston Scientific Corporation | | | |
| | 4,200,000 | | 5.450%, 6/15/2014 | | | 3,444,000 |
| | | Community Health Systems, Inc. | | | |
| | 3,460,000 | | 8.875%, 7/15/2015 | | | 2,897,750 |
| | | Constellation Brands, Inc. | | | |
| | 3,830,000 | | 7.250%, 9/1/2016g | | | 3,178,900 |
| | | DaVita, Inc. | | | |
| | 3,845,000 | | 7.250%, 3/15/2015 | | | 3,287,475 |
| | | HCA, Inc. | | | |
| | 4,520,000 | | 6.750%, 7/15/2013 | | | 2,892,800 |
| | 2,520,000 | | 9.625%, 11/15/2016 | | | 2,028,600 |
| | | Jarden Corporation | | | |
| | 2,830,000 | | 7.500%, 5/1/2017g | | | 2,108,350 |
| | | Jostens Holding Corporation | | | |
| | 3,565,000 | | Zero Coupon, 12/1/2008j | | | 2,459,850 |
| | | Michael Foods, Inc. | | | |
| | 2,760,000 | | 8.000%, 11/15/2013 | | | 2,387,400 |
| | | Omnicare, Inc. | | | |
| | 4,250,000 | | 6.875%, 12/15/2015 | | | 3,272,500 |
| | | Pinnacle Foods Finance, LLC | | | |
| | 2,780,000 | | 9.250%, 4/1/2015 | | | 2,029,400 |
| | | Select Medical Corporation | | | |
| | 1,300,000 | | 8.834%, 3/15/2009e,g | | | 799,500 |
| | 2,990,000 | | 7.625%, 2/1/2015 | | | 1,868,750 |
The accompanying Notes to Financial Statements are an integral part of this schedule.
139
High Yield Fund
Schedule of Investments as of October 31, 2008
| | | | | |
Principal
Amount | | Long-Term Fixed Income (88.2%) | | Value |
| Consumer Non-Cyclical (12.4%) | | | |
| | Stater Brothers Holdings, Inc. | | | |
| $1,830,000 | | 8.125%, 6/15/2012 | | $ | 1,628,700 |
| | Sun Healthcare Group, Inc. | | | |
| 2,590,000 | | 9.125%, 4/15/2015 | | | 2,188,550 |
| | SUPERVALU, Inc. | | | |
| 2,020,000 | | 7.500%, 11/15/2014 | | | 1,656,400 |
| | Surgical Care Affiliates, Inc. | | | |
| 3,220,000 | | 8.875%, 7/15/2015h | | | 2,415,000 |
| | Tenet Healthcare Corporation | | | |
| 1,750,000 | | 6.375%, 12/1/2011 | | | 1,505,000 |
| 440,000 | | 6.500%, 6/1/2012 | | | 367,400 |
| 1,780,000 | | 9.875%, 7/1/2014 | | | 1,455,150 |
| | Vanguard Health Holding Company II, LLC | | | |
| 3,560,000 | | 9.000%, 10/1/2014 | | | 2,954,800 |
| | Ventas Realty, LP/Ventas Capital Corporation | | | |
| 3,190,000 | | 6.500%, 6/1/2016 | | | 2,615,800 |
| | | | | |
| | Total Consumer Non-Cyclical | | | 55,989,375 |
| | | | | |
| Energy (5.6%) | | | |
| | Chesapeake Energy Corporation | | | |
| 1,710,000 | | 7.500%, 9/15/2013 | | | 1,436,400 |
| 3,070,000 | | 6.250%, 1/15/2018 | | | 2,179,700 |
| | Connacher Oil and Gas, Ltd. | | | |
| 2,560,000 | | 10.250%, 12/15/2015f | | | 1,792,000 |
| | Denbury Resources, Inc. | | | |
| 2,590,000 | | 7.500%, 12/15/2015 | | | 1,800,050 |
| | Forest Oil Corporation | | | |
| 3,390,000 | | 7.250%, 6/15/2019 | | | 2,305,200 |
| | Helix Energy Solutions Group, Inc. | | | |
| 2,550,000 | | 9.500%, 1/15/2016f | | | 1,632,000 |
| | Hornbeck Offshore Services, Inc. | | | |
| 1,815,000 | | 6.125%, 12/1/2014 | | | 1,334,025 |
| | Key Energy Services, Inc. | | | |
| 3,100,000 | | 8.375%, 12/1/2014 | | | 2,294,000 |
| | Mariner Energy, Inc. | | | |
| 1,910,000 | | 8.000%, 5/15/2017 | | | 1,126,900 |
| | Newfield Exploration Company | | | |
| 2,890,000 | | 6.625%, 4/15/2016 | | | 2,138,600 |
| | OPTI Canada, Inc. | | | |
| 1,710,000 | | 8.250%, 12/15/2014 | | | 1,017,450 |
| | PetroHawk Energy Corporation | | | |
| 2,840,000 | | 9.125%, 7/15/2013 | | | 2,186,800 |
| | Plains Exploration & Production Company | | | |
| 2,870,000 | | 7.750%, 6/15/2015 | | | 2,095,100 |
| | Southwestern Energy Company | | | |
| 2,550,000 | | 7.500%, 2/1/2018f | | | 2,091,000 |
| | | | | |
| | Total Energy | | | 25,429,225 |
| | | | | |
| Financials (3.2%) | | | |
| | Bank of America Corporation | | | |
| 2,340,000 | | 8.125%, 5/15/2018 | | | 1,813,336 |
| | Countrywide Financial Corporation | | | |
| 2,120,000 | | 6.250%, 5/15/2016g | | | 1,873,699 |
| | Deluxe Corporation | | | |
| 1,075,000 | | 7.375%, 6/1/2015 | | | 806,250 |
| | FTI Consulting, Inc. | | | |
| 1,750,000 | | 7.625%, 6/15/2013 | | | 1,666,875 |
| | General Motors Acceptance Corporation | | | |
| 7,555,000 | | 6.875%, 9/15/2011 | | | 4,424,578 |
| | Lender Processing Services, Inc. | | | |
| 530,000 | | 8.125%, 7/1/2016 | | | 453,150 |
| | Morgan Stanley | | | |
| 2,100,000 | | 4.904%, 11/14/2008e | | | 1,932,405 |
| | Nuveen Investments, Inc. | | | |
| 2,130,000 | | 10.500%, 11/15/2015f | | | 575,100 |
| | Rouse Company | | | |
| 2,100,000 | | 3.625%, 3/15/2009 | | | 966,000 |
| | | | | |
| | Total Financials | | | 14,511,393 |
| | | | | |
| Technology (4.0%) | | | |
| | Amkor Technology, Inc. | | | |
| 2,120,000 | | 7.750%, 5/15/2013 | | | 1,314,400 |
| | Avago Technologies Finance Pte | | | |
| 488,000 | | 8.311%, 12/1/2008e | | | 415,410 |
| 3,250,000 | | 10.125%, 12/1/2013 | | | 2,730,000 |
| | First Data Corporation | | | |
| 2,130,000 | | 9.875%, 9/24/2015 | | | 1,363,200 |
| | Freescale Semiconductor, Inc. | | | |
| 2,100,000 | | 8.875%, 12/15/2014 | | | 934,500 |
| 2,970,000 | | 9.125%, 12/15/2014 | | | 1,084,050 |
| | Nortel Networks, Ltd. | | | |
| 4,260,000 | | 9.003%, 1/15/2009e | | | 2,311,050 |
| | NXP BV/NXP Funding, LLC | | | |
| 1,210,000 | | 7.503%, 1/15/2009e | | | 532,400 |
| 3,680,000 | | 9.500%, 10/15/2015g | | | 1,242,000 |
| | Seagate Technology HDD Holdings | | | |
| 3,585,000 | | 6.800%, 10/1/2016 | | | 2,509,500 |
| | SunGard Data Systems, Inc. | | | |
| 1,270,000 | | 9.125%, 8/15/2013 | | | 1,054,100 |
| 3,350,000 | | 10.250%, 8/15/2015 | | | 2,345,000 |
| | | | | |
| | Total Technology | | | 17,835,610 |
| | | | | |
| Transportation (2.5%) | | | |
| | Continental Airlines, Inc. | | | |
| 2,265,731 | | 7.875%, 7/2/2018 | | | 1,314,124 |
| | Delta Air Lines, Inc. | | | |
| 2,010,000 | | 7.920%, 11/18/2010 | | | 1,507,500 |
| | Hertz Corporation | | | |
| 1,555,000 | | 8.875%, 1/1/2014 | | | 1,135,150 |
| | Kansas City Southern de Mexico SA de CV | | | |
| 2,420,000 | | 7.625%, 12/1/2013 | | | 1,893,650 |
| 870,000 | | 7.375%, 6/1/2014 | | | 680,775 |
| | Navios Maritime Holdings, Inc. | | | |
| 2,700,000 | | 9.500%, 12/15/2014 | | | 2,214,000 |
| | Windsor Petroleum Transport Corporation | | | |
| 2,750,000 | | 7.840%, 1/15/2021h | | | 2,564,133 |
| | | | | |
| | Total Transportation | | | 11,309,332 |
| | | | | |
| Utilities (8.3%) | | | |
| | AES Corporation | | | |
| 1,376,000 | | 8.750%, 5/15/2013f,i | | | 1,252,160 |
| 2,700,000 | | 7.750%, 10/15/2015 | | | 2,116,125 |
| 2,700,000 | | 8.000%, 10/15/2017 | | | 2,079,000 |
| | Copano Energy, LLC | | | |
| 3,010,000 | | 8.125%, 3/1/2016 | | | 2,212,350 |
The accompanying Notes to the Financial Statements are an integral part of this schedule.
140
High Yield Fund
Schedule of Investments as of October 31, 2008
| | | | | |
Principal
Amount | | Long-Term Fixed Income (88.2%) | | Value |
| Utilities (8.3%) - continued | | | |
| | Dynegy Holdings, Inc. | | | |
| $1,720,000 | | 6.875%, 4/1/2011 | | $ | 1,436,200 |
| 3,675,000 | | 8.375%, 5/1/2016g | | | 2,719,500 |
| | Edison Mission Energy | | | |
| 1,670,000 | | 7.500%, 6/15/2013 | | | 1,406,975 |
| 2,820,000 | | 7.000%, 5/15/2017 | | | 2,231,325 |
| 2,820,000 | | 7.200%, 5/15/2019 | | | 2,115,000 |
| | El Paso Corporation | | | |
| 1,900,000 | | 6.875%, 6/15/2014g | | | 1,512,288 |
| 1,900,000 | | 7.000%, 6/15/2017 | | | 1,450,087 |
| | Ferrellgas Partners, LP | | | |
| 2,120,000 | | 6.750%, 5/1/2014f | | | 1,505,200 |
| | NRG Energy, Inc. | | | |
| 4,160,000 | | 7.375%, 2/1/2016 | | | 3,588,000 |
| | Regency Energy Partners, LP | | | |
| 2,650,000 | | 8.375%, 12/15/2013 | | | 2,014,000 |
| | SemGroup, LP | | | |
| 3,680,000 | | 8.750%, 11/15/2015f,k | | | 220,800 |
| | Southern Star Central Corporation | | | |
| 1,910,000 | | 6.750%, 3/1/2016 | | | 1,652,150 |
| | Texas Competitive Electric Holdings Company, LLC | | | |
| 6,380,000 | | 10.250%, 11/1/2015f | | | 4,864,750 |
| | Williams Companies, Inc. | | | |
| 2,250,000 | | 7.625%, 7/15/2019 | | | 1,856,250 |
| | Williams Partners, LP | | | |
| 1,810,000 | | 7.250%, 2/1/2017 | | | 1,438,950 |
| | | | | |
| | Total Utilities | | | 37,671,110 |
| | | | | |
| | Total Long-Term Fixed Income (cost $542,160,287) | | | 398,653,929 |
| | | | | |
| | |
| Shares | | Preferred Stock (1.3%) | | |
| Consumer Discretionary (0.1%) | | | |
| 63,831 | | General Motors Corporation, Convertible, 5.250% | | | 411,710 |
| | | | | |
| | Total Consumer Discretionary | | | 411,710 |
| | | | | |
| Financials (1.0%) | | | |
| 2,600 | | Bank of America Corporation, Convertible, 7.250% | | | 1,820,000 |
| 8,660 | | Citigroup, Inc., Convertible, 6.500% | | | 278,939 |
| 63,648 | | Credit Suisse New York, NY, Zero Coupono | | | 972,541 |
| 978 | | Lehman Brothers Holdings, Inc., Convertible, 7.250%k | | | 1,125 |
| 69,000 | | Merrill Lynch & Company, Inc., 8.625% | | | 1,417,260 |
| | | | | |
| | Total Financials | | | 4,489,865 |
| | | | | |
| Utilities (0.2%) | | | |
| 3,720 | | NRG Energy, Inc., Convertible, 5.750% | | | 781,014 |
| | | | | |
| | Total Utilities | | | 781,014 |
| | | | | |
| | Total Preferred Stock (cost $8,371,344) | | | 5,682,589 |
| | | | | |
| | |
| | | Common Stock (<0.1%) | | |
| Communications Services (<0.1%) | | | |
| 4,540 | | XO Communications, Inc., Stock Warrantsl | | | $45 |
| 6,054 | | XO Communications, Inc., Stock Warrantsl | | | 85 |
| 4,540 | | XO Communications, Inc., Stock Warrantsl | | | 50 |
| 3,026 | | XO Holdings, Inc., Stock Warrantsl | | | 511 |
| | | | | |
| | Total Communications Services | | | 691 |
| | | | | |
| Consumer Discretionary (<0.1%) | | | |
| 36,330 | | TVMAX Holdings, Inc.l,m | | | 0 |
| | | | | |
| | Total Consumer Discretionary | | | 0 |
| | | | | |
| Materials (<0.1%) | | | |
| 15 | | Pliant Corporationl,m | | | 0 |
| | Total Materials | | | 0 |
| | | | | |
| | Total Common Stock (cost $2,344,578) | | | 691 |
| | | | | |
| | |
| | | Collateral Held for Securities Loaned (6.9%)n | | |
| 30,966,137 | | Thrivent Financial Securities Lending Trust | | | 30,966,137 |
| | | | | |
| | Total Collateral Held for Securities Loaned (cost $30,966,137) | | | 30,966,137 |
| | | | | |
| | |
Shares or
Principal
Amount | | Short-Term Investments (5.2%)n | | |
| | Deutsche Financial Bank, LLC | | | |
| 7,720,000 | | 0.130%, 11/3/2008 | | | 7,719,944 |
| | Federal National Mortgage Association Discount Notes | | | |
| 2,050,000 | | 2.162%, 12/10/2008 | | | 2,045,228 |
| 13,845,003 | | Thrivent Money Market Fund | | | 13,845,003 |
| | | | | |
| | Total Short-Term Investments (at amortized cost) | | | 23,610,175 |
| | | | | |
| | Total Investments (cost $634,975,415) 106.7% | | | $482,020,283 |
| | | | | |
| | Other Assets and Liabilities, Net (6.7%) | | | (30,442,679) |
| | | | | |
| | Total Net Assets 100.0% | | | $451,577,604 |
| | | | | |
The accompanying Notes to Financial Statements are an integral part of this schedule.
141
High Yield Fund
Schedule of Investments as of October 31, 2008
| a | The stated interest rate represents the weighted average of all contracts within the bank loan facility. Bank loans generally have rates of interest which are reset either daily, monthly, quarterly or semi-annually by reference to a base lending rate, plus a premium. These base lending rates are primarily the London-Interbank Offered Rate (“LIBOR”), and secondarily the prime rate offered by one or more major United States banks (the “Prime Rate”) and the certificate of deposit (“CD”) rate or other base lending rates used by commercial lenders. Bank loans often require prepayments from excess cash flows or allow the borrower to repay at its election. The rate at which the borrower repays cannot be predicted with accuracy. Therefore, the actual maturity may occur considerably earlier than the stated maturities shown. |
| b | All or a portion of the loan is unfunded as discussed in item 2(U) of the Notes to Financial Statements. |
| c | Denotes investments purchased on a when-issued or delayed delivery basis. |
| d | All or a portion of the security is insured or guaranteed. |
| e | Denotes variable rate obligations for which the current yield and next scheduled reset date are shown. |
| f | Denotes securities sold under Rule 144A of the Securities Act of 1933, which exempts them from registration. These securities have been determined to be liquid under the guidelines established by the Fund’s Board of Trustees and may be resold to other dealers in the program or to other qualified institutional buyers. As of October 31, 2008, the value of these investments was $73,362,570 or 16.2% of total net assets. |
| g | All or a portion of the security is on loan as discussed in item 2(M) of the Notes to Financial Statements. |
| h | Denotes restricted securities. Restricted securities are investment securities which have been deemed illiquid and cannot be offered for public sale without first being registered under the Securities Act of 1933. The following table indicates the acquisition date and cost of restricted securities High Yield Fund owned as of October 31, 2008. |
| | | | | |
Security | | Acquisition
Date | | Cost |
Rock-Tenn Company | | 2/28/2008 | | $ | 645,450 |
Surgical Care Affiliates, Inc. | | 6/21/2007 | | | 3,220,000 |
Tunica Biloxi Gaming Authority | | 11/8/2005 | | | 4,880,088 |
Turning Stone Resort Casino Enterprise | | 9/8/2006 | | | 3,177,214 |
Turning Stone Resort Casino Enterprise | | 5/1/2007 | | | 1,516,148 |
Windsor Petroleum Transport Corporation | | 4/21/1998 | | | 2,459,096 |
| i | Designated as cover for long settling trades as discussed in the Notes to Financial Statements. |
| j | Denotes step coupon bonds for which the current interest rate and next scheduled reset date are shown. |
| l | Non-income producing security. |
| m | Security is fair valued as discussed in item 2(A) of the Notes to Financial Statements. |
| n | The interest rate shown reflects the yield, coupon rate or, for securities purchased at a discount, the discount rate at the date of purchase. |
| o | These securities are Equity-Linked Structured Securities as discussed in item 2(Q) of the Notes to Financial Statements. |
Gross unrealized appreciation and depreciation of investments, based on cost for federal income tax purposes, were as follows:
| | | | |
Gross unrealized appreciation | | $ | 583,554 | |
Gross unrealized depreciation | | | (154,055,565 | ) |
| | | | |
Net unrealized appreciation (depreciation) | | | ($153,472,011 | ) |
Cost for federal income tax purposes | | $ | 635,492,294 | |
The accompanying Notes to the Financial Statements are an integral part of this schedule.
142
High Yield Fund
Schedule of Investments as of October 31, 2008
Investment in Affiliates
Affiliated issuers, as defined under the Investment Company Act of 1940, include those in which the Fund’s holdings of an issuer represent 5% or more of the outstanding voting securities of an issuer, or any affiliated mutual fund.
A summary of transactions for the fiscal year to date, in High Yield Fund, is as follows:
| | | | | | | | | | | | | | | | | |
Fund | | Value
October 31,
2007 | | Gross
Purchases and
Additions | | Gross Sales and
Reductions | | Balance of
Shares Held at
October 31,
2008 | | Value
October 31,
2008 | | Income Earned
November 1, 2007-
October 31, 2008 |
Money Market | | $ | 10,283,074 | | $ | 128,399,032 | | $ | 124,837,103 | | 13,845,003 | | $ | 13,845,003 | | $ | 588,538 |
Thrivent Financial Securities Lending Trust | | | 69,283,020 | | | 215,593,853 | | | 253,910,736 | | 30,966,137 | | | 30,966,137 | | | 335,376 |
Total Value and Dividend Income | | | 79,566,094 | | | | | | | | | | | 44,811,140 | | | 923,914 |
The accompanying Notes to Financial Statements are an integral part of this schedule.
143
Municipal Bond Fund
Schedule of Investments as of October 31, 2008
| | | | | |
Principal
Amount | | Long-Term Fixed Income (98.7%) | | Value |
| Alabama (0.1%) | | | |
| | Alabama 21st Century Authority Tobacco Settlement Revenue Bonds | | | |
| $ 1,000,000 | | 5.750%, 12/1/2020 | | $ | 928,710 |
| | | | | |
| | Total Alabama | | | 928,710 |
| | | | | |
| Alaska (0.8%) | | | |
| | Alaska Energy Authority Power Revenue Refunding Bonds (Bradley Lake) (Series 5) (FSA Insured) | | | |
| 3,155,000 | | 5.000%, 7/1/2021a | | | 3,128,529 |
| | Northern Tobacco Securitization Corporation, Alaska Tobacco Settlement Asset Backed Revenue Bonds (Series A) | | | |
| 2,045,000 | | 6.200%, 6/1/2022b | | | 2,085,348 |
| 2,000,000 | | 5.000%, 6/1/2032 | | | 1,362,660 |
| | Valdez, Alaska Marine Terminal Revenue Bonds | | | |
| 1,625,000 | | 0.540%, 11/3/2008c | | | 1,625,000 |
| 780,000 | | 0.540%, 11/3/2008c | | | 780,000 |
| | | | | |
| | Total Alaska | | | 8,981,537 |
| | | | | |
| Arizona (0.9%) | | | |
| | Arizona Health Facilities Authority Revenue Bonds (Arizona Healthcare Pooled Financing) (FGIC Insured) | | | |
| 975,000 | | 5.000%, 6/1/2011a | | | 997,142 |
| 1,020,000 | | 5.000%, 6/1/2012a | | | 1,043,042 |
| | Arizona Health Facilities Authority Revenue Bonds (Blood Systems, Inc.) | | | |
| 1,000,000 | | 5.000%, 4/1/2017 | | | 964,840 |
| 1,200,000 | | 5.000%, 4/1/2018 | | | 1,138,572 |
| | Glendale, Arizona Industrial Development Authority Revenue Bonds | | | |
| 2,500,000 | | 5.000%, 5/15/2031 | | | 2,120,875 |
| | Glendale, Arizona Industrial Development Authority Revenue Bonds (Midwestern University) (Series A) | | | |
| 500,000 | | 5.750%, 5/15/2021b | | | 542,970 |
| | Phoenix, Arizona Industrial Development Authority Government Office Lease Revenue Bonds (Capital Mall Project) (AMBAC Insured) | | | |
| 2,000,000 | | 5.375%, 9/15/2020a,b | | | 2,102,740 |
| | Phoenix, Arizona Industrial Development Authority Single Family Mortgage Revenue Bonds (Series 1A) (GNMA/FNMA/FHLMC Insured) | | | |
| 5,000 | | 5.875%, 6/1/2016a | | | 4,979 |
| | Pima County, Arizona Industrial Development Authority Multifamily Bonds (La Hacienda Project) (GNMA/FHA Insured) | | | |
| 1,285,000 | | 7.000%, 12/20/2031a,b | | | 1,435,872 |
| | Yavapai County, Arizona Hospital Revenue Bonds (Yavapai Regional Medical Center) (Series A) | | | |
| 500,000 | | 6.000%, 8/1/2033 | | | 396,910 |
| | | | | |
| | Total Arizona | | | 10,747,942 |
| | | | | |
| Arkansas (0.5%) | | | |
| | Arkansas Housing Development Agency Single Family Mortgage Revenue Bonds (FHA Insured) | | | |
| 240,000 | | 8.375%, 7/1/2010a,b | | | 254,697 |
| | Arkansas State Community Water System Public Water Authority Revenue Bonds (Series B) (MBIA Insured) | | | |
| 2,400,000 | | 5.000%, 10/1/2023a | | | 2,355,408 |
| | Jonesboro, Arkansas Residential Housing and Health Care Facilities Revenue Bonds (St. Bernards Regional Medical Center) (AMBAC Insured) | | | |
| 2,310,000 | | 5.800%, 7/1/2011a | | | 2,313,858 |
| | Pope County, Arkansas Pollution Control Revenue Bonds (Arkansas Power and Light Company Project) (FSA Insured) | | | |
| 875,000 | | 6.300%, 12/1/2016a | | | 876,225 |
| | | | | |
| | Total Arkansas | | | 5,800,188 |
| | | | | |
| California (7.9%) | | | |
| | Anaheim, California Public Financing Authority Lease Revenue Bonds (Public Improvements Project) (Series A) (FSA Insured) | | | |
| 3,950,000 | | 6.000%, 9/1/2024a | | | 4,245,934 |
| | California Educational Finance Authority Revenue Bonds | | | |
| 1,000,000 | | 5.875%, 10/1/2034 | | | 733,330 |
| | California Infrastructure & Economic Bank Revenue Bonds (Bay Area Toll Bridges) (1st Lien-A) | | | |
| 5,000,000 | | 5.000%, 7/1/2025b | | | 4,994,050 |
| | California Pollution Control Financing Authority Revenue Bonds | | | |
| 900,000 | | 0.390%, 11/3/2008c | | | 900,000 |
The accompanying Notes to Financial Statements are an integral part of this schedule.
144
Municipal Bond Fund
Schedule of Investments as of October 31, 2008
| | | | | | |
Principal
Amount | | Long-Term Fixed Income (98.7%) | | Value |
| | California (7.9%) - continued | | | |
| | | California Rural Home Mortgage Finance Authority Single Family Mortgage Revenue Bonds (Series D) (GNMA/FNMA Insured) (Subject to ‘AMT’) | | | |
| $ | 50,000 | | 7.100%, 6/1/2031a | | $ | 49,984 |
| | | California State General Obligation Bonds (AMBAC Insured) | | | |
| | 2,000,000 | | 6.300%, 9/1/2010a | | | 2,123,780 |
| | | California State General Obligation Revenue Bonds | | | |
| | 10,000,000 | | 5.250%, 3/1/2038 | | | 9,110,600 |
| | | California State Public Works Board Lease Revenue Bonds (Department of Corrections State Prison) | | | |
| | 3,000,000 | | 7.400%, 9/1/2010 | | | 3,213,930 |
| | | California State Public Works Board Lease Revenue Bonds (UCLA Replacement Hospital) (Series A) (FSA Insured) | | | |
| | 4,000,000 | | 5.375%, 10/1/2015a | | | 4,135,480 |
| | | California State Revenue General Obligation Bonds | | | |
| | 2,000,000 | | 5.250%, 11/1/2021 | | | 1,999,980 |
| | 3,990,000 | | 5.250%, 4/1/2029b | | | 4,376,352 |
| | 10,000 | | 5.250%, 4/1/2029 | | | 9,542 |
| | | California State Unrefunded General Obligation Bonds (MBIA Insured) | | | |
| | 300,000 | | 6.000%, 8/1/2016a | | | 301,041 |
| | | California State Veterans General Obligation Revenue Bonds (FGIC Insured) (Series AT) | | | |
| | 2,000,000 | | 9.500%, 2/1/2010a | | | 2,152,180 |
| | | Contra Costa County, California Home Mortgage Revenue Bonds (GNMA Insured) (Escrowed to Maturity) | | | |
| | 4,030,000 | | 7.500%, 5/1/2014a,b | | | 4,844,262 |
| | | East Bay, California Municipal Utility District Water System Revenue Bonds | | | |
| | 10,000,000 | | 5.000%, 6/1/2037 | | | 9,069,900 |
| | | Foothill/Eastern Transportation Corridor Agency, California Toll Road Revenue Bonds (Series A) | | | |
| | 6,000,000 | | 7.150%, 1/1/2013b | | | 6,473,340 |
| | | Golden West Schools Financing Authority, California Revenue Bonds (Series A) (MBIA Insured) | | | |
| | 420,000 | | 5.800%, 2/1/2022a | | | 450,530 |
| | | Los Angeles, California Unified School District Revenue Bonds | | | |
| | 3,000,000 | | 5.000%, 7/1/2023 | | | 2,911,830 |
| | | Pittsburg, California Redevelopment Agency Tax Allocation Bonds (Los Medanos Community Development Project) (AMBAC Insured) | | | |
| | 5,000,000 | | Zero Coupon, 8/1/2024a | | | 1,866,450 |
| | | Pomona, California Single Family Mortgage Revenue Bonds (Series A) (GNMA/FNMA Insured) | | | |
| | 3,880,000 | | 7.600%, 5/1/2023a,b | | | 4,645,524 |
| | | San Bernardino County, California Single Family Mortgage Revenue Bonds (Series A) (GNMA Insured) | | | |
| | 1,385,000 | | 7.500%, 5/1/2023a,b | | | 1,673,329 |
| | | San Diego Community College District, California Revenue Bonds (FSA guaranteed) | | | |
| | 10,000,000 | | 5.000%, 5/1/2030a | | | 9,556,100 |
| | | San Francisco, California Bay Area Rapid Transit District Sales Tax Revenue Bonds (AMBAC Insured) | | | |
| | 1,500,000 | | 6.750%, 7/1/2010a | | | 1,602,690 |
| | | San Jose, California Airport Revenue Bonds (Series A) | | | |
| | 8,000,000 | | 5.000%, 3/1/2037 | | | 6,071,040 |
| | | San Jose, California Redevelopment Agency Tax Allocation Bonds (Series A) (MBIA Insured) | | | |
| | 2,760,000 | | 5.000%, 8/1/2025a | | | 2,439,950 |
| | | | | | |
| | | Total California | | | 89,951,128 |
| | | | | | |
| | Colorado (5.9%) | | | |
| | | Colorado Educational & Cultural Facilities Authority Revenue Bonds | | | |
| | 475,000 | | 5.125%, 6/15/2032 | | | 364,278 |
| | 1,000,000 | | 5.375%, 6/15/2038 | | | 775,660 |
| | | Colorado Educational and Cultural Facilities Authority Revenue Bonds (Bromley East Project) (Series A) | | | |
| | 2,000,000 | | 7.250%, 9/15/2030b | | | 2,231,280 |
| | | Colorado Educational and Cultural Facilities Authority Revenue Bonds (Cherry Creek Academy Facility, Inc.) | | | |
| | 570,000 | | 6.000%, 4/1/2021 | | | 508,873 |
| | 1,280,000 | | 6.000%, 4/1/2030 | | | 1,040,794 |
| | | Colorado Educational and Cultural Facilities Authority Revenue Bonds (Classical Academy) | | | |
| | 2,825,000 | | 7.250%, 12/1/2030b | | | 3,192,532 |
| | | Colorado Educational and Cultural Facilities Authority Revenue Bonds (University Lab School Project) | | | |
| | 1,000,000 | | 5.750%, 6/1/2016b | | | 1,072,700 |
The accompanying Notes to Financial Statements are an integral part of this schedule.
145
Municipal Bond Fund
Schedule of Investments as of October 31, 2008
| | | | | | |
Principal
Amount | | Long-Term Fixed Income (98.7%) | | Value |
| | Colorado (5.9%) - continued | | | |
| | | Colorado Educational and Cultural Facilities Authority Revenue Bonds (University Lab School Project) - continued | | | |
| $ | 750,000 | | 6.125%, 6/1/2021b | | $ | 811,455 |
| | 6,250,000 | | 6.250%, 6/1/2031b | | | 6,781,375 |
| | | Colorado Health Facilities Authority Revenue Bonds | | | |
| | 615,000 | | 6.250%, 12/1/2010b | | | 628,542 |
| | 160,000 | | 6.250%, 12/1/2010 | | | 161,659 |
| | 3,080,000 | | 6.800%, 12/1/2020b | | | 3,389,047 |
| | 1,920,000 | | 6.800%, 12/1/2020 | | | 1,959,399 |
| | 3,000,000 | | 5.750%, 5/15/2036 | | | 2,337,900 |
| | | Colorado Health Facilities Authority Revenue Bonds (Parkview Medical Center Project) | | | |
| | 1,000,000 | | 6.500%, 9/1/2020b | | | 1,093,980 |
| | 500,000 | | 6.600%, 9/1/2025b | | | 548,335 |
| | | Colorado Housing and Finance Authority Revenue Bonds (Single Family Program) (Series A-2) (Subject to ‘AMT’) | | | |
| | 110,000 | | 7.450%, 10/1/2016 | | | 102,899 |
| | | Colorado Housing and Finance Authority Revenue Bonds (Single Family Program) (Series A-3) | | | |
| | 30,000 | | 7.250%, 4/1/2010 | | | 30,118 |
| | | Colorado Housing and Finance Authority Revenue Bonds (Single Family Program) (Series B-3) | | | |
| | 385,000 | | 6.700%, 8/1/2017 | | | 366,100 |
| | | Colorado Housing and Finance Authority Revenue Bonds (Single Family Program) (Series C-3) (FHA/VA Insured) | | | |
| | 45,000 | | 7.150%, 10/1/2030a | | | 44,999 |
| | | Colorado Housing and Finance Authority Single Family Revenue Bonds (Series A-3) | | | |
| | 20,000 | | 7.000%, 11/1/2016 | | | 20,000 |
| | | Colorado Housing and Finance Authority Single Family Revenue Bonds (Series D-2) (Subject to ‘AMT’) | | | |
| | 515,000 | | 6.350%, 11/1/2029 | | | 499,025 |
| | | Colorado State Higher Education Capital Construction Lease Purchase Program Certificates of Participation | | | |
| | 1,500,000 | | 5.500%, 11/1/2027d | | | 1,456,995 |
| | | Colorado Water Resources and Power Development Authority Clean Water Revenue Unrefunded Bonds (Series A) (FSA Insured) | | | |
| | 50,000 | | 6.250%, 9/1/2013a | | | 50,067 |
| | | Colorado Water Resources and Power Development Authority Small Water Resources Revenue Bonds (Series A) (FGIC Insured) | | | |
| | 3,525,000 | | 5.250%, 11/1/2021a | | | 3,556,478 |
| | | Denver, Colorado City and County Airport Revenue Bonds (Series A) | | | |
| | 5,000,000 | | 5.000%, 11/15/2022 | | | 4,634,700 |
| | | Denver, Colorado City and County Bonds | | | |
| | 6,000,000 | | 5.600%, 10/1/2029 | | | 6,102,420 |
| | | Denver, Colorado Health and Hospital Authority Healthcare Revenue Bonds (Series A) | | | |
| | 2,000,000 | | 5.250%, 12/1/2031 | | | 1,485,160 |
| | | Denver, Colorado Health and Hospital Authority Healthcare Revenue Bonds (Series A) (ACA/CBI Insured) | | | |
| | 2,000,000 | | 6.250%, 12/1/2016a,b | | | 2,189,360 |
| | | Goldsmith, Colorado Metropolitan District Capital Appreciation General Obligation Bonds (MBIA Insured) | | | |
| | 1,885,000 | | Zero Coupon, 12/1/2008a | | | 1,876,327 |
| | | Jefferson County, Colorado School District General Obligation Bonds (FSA Guaranteed) | | | |
| | 10,000,000 | | 5.000%, 12/15/2016a | | | 10,505,800 |
| | | Larimer County, Colorado School District #R1 Poudre Valley General Obligation Bonds (MBIA/IBC Insured) | | | |
| | 3,000,000 | | 7.000%, 12/15/2016a | | | 3,572,190 |
| | | Northwest Parkway Public Highway Authority, Colorado Capital Appreciation Revenue Bonds (Series C) (AMBAC Insured) | | | |
| | 4,000,000 | | Zero Coupon, 6/15/2011a,b,e | | | 3,689,160 |
| | | | | | |
| | | Total Colorado | | | 67,079,607 |
| | | | | | |
| | Connecticut (0.4%) | | | |
| | | Connecticut State Special Tax Obligation Revenue Bonds (Transportation Infrastructure) (Series B) | | | |
| | 4,000,000 | | 6.500%, 10/1/2010 | | | 4,277,280 |
| | | | | | |
| | | Total Connecticut | | | 4,277,280 |
| | | | | | |
| | District of Columbia (0.5%) | | | |
| | | District of Columbia Tobacco Settlement Financing Corporation Revenue Bonds | | | |
| | 6,205,000 | | 6.250%, 5/15/2024 | | | 5,459,531 |
| | | | | | |
| | | Total District of Columbia | | | 5,459,531 |
| | | | | | |
The accompanying Notes to the Financial Statements are an integral part of this schedule.
146
Municipal Bond Fund
Schedule of Investments as of October 31, 2008
| | | | | | |
Principal
Amount | | Long-Term Fixed Income (98.7%) | | Value |
| | Florida (1.7%) | | | |
| | | Brevard County, Florida Housing Finance Authority Homeowner Mortgage Revenue Bonds (Series B) (GNMA Insured) | | | |
| $ | 343,000 | | 6.500%, 9/1/2022a | | $ | 334,998 |
| | | Clay County, Florida Housing Finance Authority Single Family Mortgage Revenue Bonds (GNMA/FNMA Insured) (Subject to ‘AMT’) | | | |
| | 815,000 | | 6.000%, 4/1/2029a | | | 777,909 |
| | | Florida State Board of Education Capital Outlay Unrefunded General Obligation Bonds (MBIA Insured) | | | |
| | 620,000 | | 9.125%, 6/1/2014a | | | 717,166 |
| | | Florida State Revenue Bonds (Jacksonville Transportation) | | | |
| | 1,520,000 | | 5.000%, 7/1/2019 | | | 1,490,391 |
| | | Hillsborough County, Florida Industrial Development Authority Pollution Control Revenue Bonds | | | |
| | 2,000,000 | | 5.150%, 9/1/2025 | | | 1,897,140 |
| | | Jacksonville, Florida Health Facilities Authority Revenue Bonds (Series C) | | | |
| | 1,500,000 | | 5.750%, 8/15/2015b | | | 1,556,955 |
| | | Leon County, Florida Educational Facilities Authority Certificates of Participation | | | |
| | 1,145,000 | | 8.500%, 9/1/2017b | | | 1,507,725 |
| | | Orange County, Florida Health Facilities Authority Revenue Bonds (Orlando Regional Healthcare System) (Series A) (MBIA Insured) | | | |
| | 2,000,000 | | 6.250%, 10/1/2018a | | | 2,136,240 |
| | | Orange County, Florida Housing Finance Authority Homeowner Revenue Bonds (Series B-1) (GNMA/FNMA Insured) (Subject to ‘AMT’) | | | |
| | 135,000 | | 5.900%, 9/1/2028a | | | 132,193 |
| | | Palm Beach County, Florida Housing Finance Authority Single Family Homeowner Revenue Bonds (Series A-1) (GNMA/FNMA Insured) (Subject to ‘AMT’) | | | |
| | 60,000 | | 5.900%, 10/1/2027a | | | 57,685 |
| | | South Miami, Florida Health Facilities Authority Hospital Revenue Bonds | | | |
| | 6,000,000 | | 5.000%, 8/15/2032 | | | 4,744,260 |
| | | Tallahassee, Florida Consolidated Utility Revenue Bonds | | | |
| | 4,000,000 | | 5.000%, 10/1/2032 | | | 3,730,200 |
| | | | | | |
| | | Total Florida | | | 19,082,862 |
| | | | | | |
| | Georgia (3.2%) | | | |
| | | Bibb County, Georgia Authority Environmental Improvement Revenue Bonds | | | |
| | 6,900,000 | | 4.850%, 12/1/2009 | | | 6,737,919 |
| | | Brunswick, Georgia Water and Sewer Revenue Refunding Bonds (MBIA Insured) | | | |
| | 1,275,000 | | 6.000%, 10/1/2011a | | | 1,328,269 |
| | 1,500,000 | | 6.100%, 10/1/2019a | | | 1,691,175 |
| | | Burke County Georgia Development Authority Pollution Control Revenue Bonds | | | |
| | 6,000,000 | | 5.700%, 1/1/2043 | | | 5,124,240 |
| | | Chatham County, Georgia Hospital Authority Revenue Bonds (C/O Memorial Medical Center) | | | |
| | 1,560,000 | | 5.750%, 1/1/2029 | | | 1,127,038 |
| | | Chatham County, Georgia Hospital Authority Revenue Bonds (Memorial Health University Medical Center) | | | |
| | 1,000,000 | | 6.125%, 1/1/2024 | | | 801,750 |
| | | Cherokee County, Georgia Water and Sewer Authority Revenue Refunding Bonds (MBIA Insured) | | | |
| | 5,000,000 | | 5.500%, 8/1/2018a | | | 5,328,550 |
| | | Gainesville, Georgia Redevelopment Authority Educational Facilities Revenue Bonds | | | |
| | 5,275,000 | | 5.125%, 3/1/2027 | | | 3,676,939 |
| | | Georgia State General Obligation Bonds (Series D) | | | |
| | 3,500,000 | | 5.000%, 8/1/2012 | | | 3,716,370 |
| | | Georgia State Prerefunded Balance General Obligation Bonds (Series B) | | | |
| | 35,000 | | 5.650%, 3/1/2012b | | | 37,887 |
| | | Georgia State Unrefunded Balance General Obligation Bonds (Series B) | | | |
| | 1,965,000 | | 5.650%, 3/1/2012 | | | 2,118,702 |
| | | Milledgeville-Balswin County, Georgia Development Authority Revenue Bonds | | | |
| | 2,500,000 | | 5.500%, 9/1/2024b | | | 2,770,450 |
| | | Savannah, Georgia Economic Development Authority Student Housing Revenue Bonds (State University Project) (Series A) (ACA Insured) | | | |
| | 1,500,000 | | 6.750%, 11/15/2020a,b | | | 1,643,400 |
| | | | | | |
| | | Total Georgia | | | 36,102,689 |
| | | | | | |
| | Hawaii (2.2%) | | | |
| | | Hawaii State Highway Revenue Bonds | | | |
| | 7,330,000 | | 5.500%, 7/1/2018 | | | 7,880,629 |
The accompanying Notes to Financial Statements are an integral part of this schedule.
147
Municipal Bond Fund
Schedule of Investments as of October 31, 2008
| | | | | | |
Principal
Amount | | Long-Term Fixed Income (98.7%) | | Value |
| | Hawaii (2.2%) - continued | | | |
| | | Honolulu, Hawaii City & County Board of Water Supply Water System Revenue Bonds (Series A) | | | |
| $ | 5,000,000 | | 5.000%, 7/1/2036 | | $ | 4,560,250 |
| | | Honolulu, Hawaii City & County Revenue Bonds (Series A) (FSA Insured) | | | |
| | 10,000,000 | | 5.250%, 3/1/2027a | | | 10,022,200 |
| | | Honolulu, Hawaii City & County Revenue Bonds (Unrefunded Balance) (Series A) (FGIC Insured) | | | |
| | 2,555,000 | | 6.250%, 4/1/2014a | | | 2,855,545 |
| | | | | | |
| | | Total Hawaii | | | 25,318,624 |
| | | | | | |
| | Idaho (0.4%) | | | |
| | | Idaho Falls, Idaho General Obligation Bonds (FGIC Insured) | | | |
| | 3,115,000 | | Zero Coupon, 4/1/2010a | | | 2,974,109 |
| | 2,000,000 | | Zero Coupon, 4/1/2011a | | | 1,818,260 |
| | | | | | |
| | | Total Idaho | | | 4,792,369 |
| | | | | | |
| | Illinois (9.3%) | | | |
| | | Broadview, Illinois Tax Increment Tax Allocation Revenue Bonds | | | |
| | 2,000,000 | | 5.250%, 7/1/2012 | | | 1,911,500 |
| | 1,000,000 | | 5.375%, 7/1/2015 | | | 912,370 |
| | 10,000,000 | | Chicago, Illinois Capital Appreciation City Colleges General Obligation Bonds (FGIC Insured) Zero Coupon, 1/1/2024a | | | 4,124,400 |
| | | Chicago, Illinois Lakefront Millennium Project General Obligation Bonds (MBIA Insured) | | | |
| | 3,000,000 | | 5.750%, 1/1/2029a,b | | | 3,294,420 |
| | | Chicago, Illinois Single Family Mortgage Revenue Bonds (Series C) (GNMA/FNMA/FHLMC Insured) (Subject to ‘AMT’) | | | |
| | 125,000 | | 7.050%, 10/1/2030a | | | 125,399 |
| | 130,000 | | 7.000%, 3/1/2032a | | | 124,016 |
| | | Chicago, Illinois Tax Increment Capital Appreciation Tax Allocation Bonds (Series A) (ACA Insured) | | | |
| | 7,200,000 | | Zero Coupon, 11/15/2014a | | | 4,736,376 |
| | | Cook County, Illinois Community Consolidated School District #15 Palatine Capital Appreciation General Obligation Bonds (FGIC Insured) | | | |
| | 1,000,000 | | Zero Coupon, 12/1/2014a,b | | | 759,140 |
| | | Cook County, Illinois General Obligation Bonds (Series A) (MBIA Insured) | | | |
| | 2,500,000 | | 6.250%, 11/15/2011a | | | 2,720,600 |
| | | Cook County, Illinois School District #99 Cicero General Obligation Bonds (FGIC Insured) | | | |
| | 1,250,000 | | 8.500%, 12/1/2011a | | | 1,435,225 |
| | 1,565,000 | | 8.500%, 12/1/2014a | | | 1,927,031 |
| | 1,815,000 | | 8.500%, 12/1/2016a | | | 2,301,765 |
| | | Du Page County, Illinois General Obligation Bonds (Stormwater Project) | | | |
| | 1,000,000 | | 5.600%, 1/1/2021 | | | 1,082,770 |
| | | Illinois Development Finance Authority Revenue Bonds (Midwestern University) (Series B) | | | |
| | 1,000,000 | | 6.000%, 5/15/2026b | | | 1,092,020 |
| | | Illinois Educational Facilities Authority Revenue Bonds (Northwestern University) | | | |
| | 4,900,000 | | 5.250%, 11/1/2032b | | | 5,310,571 |
| | | Illinois Educational Facilities Authority Student Housing Revenue Bonds (University Center Project) | | | |
| | 1,000,000 | | 6.625%, 5/1/2017b | | | 1,122,220 |
| | | Illinois Health Facilities Authority Revenue Bonds (Bethesda Home and Retirement) (Series A) | | | |
| | 1,600,000 | | 6.250%, 9/1/2014 | | | 1,537,328 |
| | | Illinois Health Facilities Authority Revenue Bonds (Centegra Health Systems) | | | |
| | 2,000,000 | | 5.250%, 9/1/2018 | | | 1,831,220 |
| | | Illinois Health Facilities Authority Revenue Bonds (Lutheran General Health Care Facilities) (FSA Insured) | | | |
| | 2,000,000 | | 6.000%, 4/1/2018a | | | 2,176,280 |
| | | Illinois Health Facilities Authority Revenue Bonds (Passavant Memorial Area Hospital Association) | | | |
| | 2,500,000 | | 6.000%, 10/1/2024b | | | 2,686,575 |
| | | Illinois Health Facilities Authority Revenue Bonds (Rush-Presbyterian-St. Lukes) (Series A) (MBIA Insured) | | | |
| | 4,180,000 | | 5.250%, 11/15/2014a | | | 4,233,295 |
| | | Illinois Health Facilities Authority Revenue Bonds (Swedish American Hospital) | | | |
| | 3,970,000 | | 6.875%, 11/15/2030b | | | 4,217,410 |
| | | Illinois Health Facilities Authority Revenue Bonds (Thorek Hospital and Medical Center) | | | |
| | 4,655,000 | | 5.250%, 8/15/2018 | | | 4,132,476 |
| | | Illinois Health Facilities Authority Unrefunded Revenue Bonds (Series B) (MBIA/IBC Insured) | | | |
| | 2,120,000 | | 5.250%, 8/15/2018a | | | 2,138,762 |
The accompanying Notes to the Financial Statements are an integral part of this schedule.
148
Municipal Bond Fund
Schedule of Investments as of October 31, 2008
| | | | | | |
Principal
Amount | | Long-Term Fixed Income (98.7%) | | Value |
| | Illinois (9.3%) - continued | | | |
| | | Illinois State Sales Tax Revenue Bonds (Second Series) | | | |
| $ | 7,900,000 | | 5.750%, 6/15/2018 | | $ | 8,611,711 |
| | | Illinois State Sales Tax Revenue Bonds (Series L) | | | |
| | 3,065,000 | | 7.450%, 6/15/2012 | | | 3,484,445 |
| | | Illinois, Rush University Medical Center Finance Authority Refunding Bonds (Series B) (MBIA Insured) | | | |
| | 1,000,000 | | 5.250%, 11/1/2035a | | | 778,990 |
| | | Joliet, Illinois Regional Port District Marine Term Revenue Bonds | | | |
| | 955,000 | | 0.540%, 11/3/2008c | | | 955,000 |
| | | McHenry County, Illinois Community High School District #157 General Obligation Bonds (FSA Insured) | | | |
| | 3,035,000 | | 9.000%, 12/1/2017a | | | 3,968,718 |
| | | McLean County, Illinois Bloomington - Normal Airport Central Illinois Regional Authority Revenue Bonds (Subject to ‘AMT’) | | | |
| | 4,000,000 | | 6.050%, 12/15/2019 | | | 3,589,760 |
| | | Metropolitan Pier and Exposition Authority, Illinois State Tax Revenue Bonds (McCormick Place Exposition Project) (FGIC Insured) | | | |
| | 1,410,000 | | 5.250%, 12/15/2028a | | | 1,379,093 |
| | | Metropolitan Pier and Exposition Authority, Illinois State Tax Revenue Bonds (McCormick Place Exposition Project) (Series A) (FGIC Insured) | | | |
| | 885,000 | | 5.500%, 6/15/2015a | | | 952,358 |
| | 17,505,000 | | Zero Coupon, 6/15/2020a | | | 9,207,980 |
| | | Metropolitan Pier and Exposition Authority, Illinois State Tax Revenue Bonds (McCormick Place Exposition Project) (Series A) (MBIA Insured) | | | |
| | 3,100,000 | | Zero Coupon, 6/15/2024a | | | 1,263,994 |
| | 2,000,000 | | Zero Coupon, 12/15/2024a | | | 792,400 |
| | | Metropolitan Pier and Exposition Authority, Illinois State Tax Revenue Bonds (McCormick Place Exposition Project) (Series B) (MBIA Insured) | | | |
| | 7,000,000 | | Zero Coupon, 6/15/2012a,e | | | 5,873,070 |
| | | Metropolitan Water Reclamation District of Greater Chicago General Obligation Refunding Bonds | | | |
| | 6,550,000 | | 5.250%, 12/1/2032 | | | 6,487,906 |
| | | Regional Transportation Authority, Illinois Revenue Bonds (Series A) (FGIC Insured) | | | |
| | 3,000,000 | | 6.700%, 11/1/2021a | | | 3,402,480 |
| | | | | | |
| | | Total Illinois | | | 106,681,074 |
| | | | | | |
| | Indiana (0.9%) | | | |
| | | Ball State University, Indiana University Student Fee Revenue Bonds (Series K) (FGIC Insured) | | | |
| | $700,000 | | 5.750%, 7/1/2020a,b | | | 757,078 |
| | | East Chicago, Indiana Elementary School Building Corporation Revenue Bonds | | | |
| | 1,250,000 | | 6.250%, 1/5/2016 | | | 1,332,887 |
| | | Indiana Health and Educational Facilities Finance Authority Hospital Revenue Bonds | | | |
| | 500,000 | | 5.250%, 5/15/2041 | | | 441,085 |
| | | Indiana Transportation Finance Authority Highway Revenue Bonds (Series A) | | | |
| | 250,000 | | 6.800%, 12/1/2016 | | | 279,640 |
| | | Indiana Transportation Finance Authority Highway Revenue Bonds (Series A) (MBIA/IBC Insured) | | | |
| | 985,000 | | 7.250%, 6/1/2015a,b | | | 1,047,380 |
| | | Indiana Transportation Finance Authority Highway Unrefunded Revenue Bonds (Series A) (MBIA/IBC Insured) | | | |
| | 3,565,000 | | 7.250%, 6/1/2015a | | | 4,026,846 |
| | | Purdue University, Indiana Revenue Bonds (Student Fees) (Series L) | | | |
| | 2,120,000 | | 5.000%, 7/1/2020 | | | 2,127,844 |
| | | | | | |
| | | Total Indiana | | | 10,012,760 |
| | | | | | |
| | Iowa (0.9%) | | | |
| | | Coralville, Iowa Urban Renewal Annual Appropriation Revenue Bonds (Tax Increment-H2) | | | |
| | 2,085,000 | | 5.000%, 6/1/2011 | | | 2,135,937 |
| | 3,125,000 | | 5.000%, 6/1/2021 | | | 2,831,125 |
| | | Iowa Finance Authority Health Care Facilities Revenue Bonds (Genesis Medical Center) | | | |
| | 4,500,000 | | 6.250%, 7/1/2025 | | | 4,535,325 |
| | | Iowa Finance Authority Single Family Revenue Bonds (Series E) | | | |
| | 1,740,000 | | 5.000%, 1/1/2037 | | | 1,274,724 |
| | | | | | |
| | | Total Iowa | | | 10,777,111 |
| | | | | | |
| | Kansas (0.7%) | | | |
| | | Kansas State Development Finance Authority Health Facility Revenue Bonds | | | |
| | 90,000 | | 5.375%, 11/15/2024b | | | 96,683 |
| | 910,000 | | 5.375%, 11/15/2024 | | | 902,747 |
| | | Olathe, Kansas Health Facilities Revenue Bonds (Olathe Medical Center Project) (Series A) (AMBAC Insured) | | | |
| | 2,000,000 | | 5.500%, 9/1/2025a | | | 1,961,140 |
| | | Salina, Kansas Hospital Revenue Bonds | | | |
| | 1,725,000 | | 5.000%, 10/1/2036 | | | 1,337,030 |
The accompanying Notes to Financial Statements are an integral part of this schedule.
149
Municipal Bond Fund
Schedule of Investments as of October 31, 2008
| | | | | | |
Principal
Amount | | Long-Term Fixed Income (98.7%) | | Value |
| | Kansas (0.7%) - continued | | | |
| | | Sedgwick and Shawnee Counties, Kansas Single Family Mortgage Revenue Bonds (Series A-2) (GNMA Insured) | | | |
| $ | 225,000 | | 6.700%, 6/1/2029a | | $ | 218,637 |
| | | Wyandotte County/Kansas City, Kansas Unified Government Special Obligation Revenue Bonds (2nd Lien-B) | | | |
| | 4,350,000 | | 5.000%, 12/1/2020 | | | 3,712,377 |
| | | | | | |
| | | Total Kansas | | | 8,228,614 |
| | | | | | |
| | Kentucky (0.5%) | | | |
| | | Kentucky Economic Development Authority Louisville Arena Project Revenue Bonds | | | |
| | 1,000,000 | | 6.000%, 12/1/2033 | | | 956,320 |
| | | Kentucky State Turnpike Authority Economic Development Revenue Bonds (Revitalization Project) (FGIC Insured) | | | |
| | 5,345,000 | | Zero Coupon, 1/1/2010a | | | 5,180,695 |
| | | | | | |
| | | Total Kentucky | | | 6,137,015 |
| | | | | | |
| | Louisiana (2.4%) | | | |
| | | Jefferson Parish, Louisiana Home Mortgage Authority Single Family Mortgage Revenue Bonds (Series A-2) (GNMA/FNMA Insured) (Subject to ‘AMT’) | | | |
| | 500,000 | | 7.500%, 12/1/2030a | | | 500,045 |
| | | Jefferson Parish, Louisiana Home Mortgage Authority Single Family Mortgage Revenue Bonds (Series D-1) (GNMA/FNMA Insured) (Subject to ‘AMT’) | | | |
| | 150,000 | | 7.500%, 6/1/2026a | | | 150,018 |
| | | Louisiana Housing Finance Agency Single Family Mortgage Revenue Bonds (Series D-2) (GNMA/FNMA Insured) (Subject to ‘AMT’) | | | |
| | 125,000 | | 7.050%, 6/1/2031a | | | 124,555 |
| | | Louisiana Public Facilities Authority Hospital Revenue Bonds (Lake Charles Memorial) (AMBAC/TCRS Insured) | | | |
| | 3,000,000 | | 8.625%, 12/1/2030a,b | | | 3,413,850 |
| | | Louisiana Public Facilities Authority Revenue Bonds | | | |
| | 500,000 | | 5.000%, 7/1/2031 | | | 362,750 |
| | | Louisiana Public Facilities Authority Revenue Bonds (MBIA Insured) | | | |
| | 4,745,000 | | 5.250%, 3/1/2031a | | | 4,259,729 |
| | | New Orleans, Louisiana General Obligation Bonds (AMBAC Insured) | | | |
| | 6,500,000 | | Zero Coupon, 9/1/2012a | | | 5,547,295 |
| | | Parish of St. John Baptist, Louisiana Revenue Bonds (Marathon Oil Corporation Project) (Series 2007A) (Non- AMT) | | | |
| | 10,000,000 | | 5.125%, 6/1/2037 | | | 6,232,300 |
| | | Regional Transportation Authority, Louisiana Sales Tax Revenue Bonds (Series A) (FGIC Insured) | | | |
| | 2,605,000 | | 8.000%, 12/1/2012a | | | 2,992,884 |
| | | Tobacco Settlement Financing Corporation, Louisiana Revenue Bonds (Series 2001-B) | | | |
| | 4,200,000 | | 5.500%, 5/15/2030 | | | 3,536,106 |
| | | | | | |
| | | Total Louisiana | | | 27,119,532 |
| | | | | | |
| | Maryland (0.8%) | | | |
| | | Maryland State Economic Development Corporation Revenue Bonds (Lutheran World Relief) | | | |
| | 1,815,000 | | 7.200%, 4/1/2025b | | | 1,960,998 |
| | | Maryland State Economic Development Corporation Student Housing Revenue Bonds (Sheppard Pratt) (ACA Insured) | | | |
| | 1,550,000 | | 6.000%, 7/1/2033a | | | 1,180,728 |
| | | Maryland State Health and Higher Educational Facilities Authority Revenue Bonds (University of Maryland Medical System) | | | |
| | 1,000,000 | | 6.000%, 7/1/2022b | | | 1,091,490 |
| | | Morgan State University, Maryland Academic and Auxiliary Facilities Fees Revenue Bonds (MBIA Insured) | | | |
| | 4,500,000 | | 6.050%, 7/1/2015a | | | 4,895,280 |
| | | Prince George’s County, Maryland Housing Authority Single Family Mortgage Revenue Bonds (Series A) (GNMA/FNMA/FHLMC Insured) (Subject to ‘AMT’) | | | |
| | 5,000 | | 7.400%, 8/1/2032a | | | 4,958 |
| | | | | | |
| | | Total Maryland | | | 9,133,454 |
| | | | | | |
| | Massachusetts (3.0%) | | | |
| | | Massachusetts Bay Transportation Authority Sales Tax Revenue Bonds (Series B) (MBIA Insured) | | | |
| | 5,000,000 | | 5.500%, 7/1/2025a | | | 5,092,700 |
| | | Massachusetts State Construction Lien General Obligation Bonds (Series A) (FGIC-TCRS Insured) | | | |
| | 4,935,000 | | 5.250%, 1/1/2013a | | | 5,252,321 |
The accompanying Notes to the Financial Statements are an integral part of this schedule.
150
Municipal Bond Fund
Schedule of Investments as of October 31, 2008
| | | | | | |
Principal
Amount | | Long-Term Fixed Income (98.7%) | | Value |
| | Massachusetts (3.0%) - continued | | | |
| | | Massachusetts State Development Finance Agency Revenue Bonds (Devens Electric Systems) | | | |
| $ | 725,000 | | 5.625%, 12/1/2016 | | $ | 729,908 |
| | | Massachusetts State Health and Educational Facilities Authority Revenue Bonds | | | |
| | 15,000,000 | | 5.250%, 7/1/2033 | | | 14,555,100 |
| | | Massachusetts State Health and Educational Facilities Authority Revenue Bonds (Partners Healthcare System) (Series C) | | | |
| | 1,000,000 | | 6.000%, 7/1/2016 | | | 1,035,040 |
| | | Massachusetts State School Building Authority Dedicated Sales Tax Revenue Bonds (Series A) (MBIA Insured) | | | |
| | 3,000,000 | | 5.000%, 8/15/2027a | | | 2,921,370 |
| | | Massachusetts State Water Pollution Abatement Trust Revenue Bonds | | | |
| | 5,000,000 | | 5.000%, 8/1/2024 | | | 4,940,600 |
| | | | | | |
| | | Total Massachusetts | | | 34,527,039 |
| | | | | | |
| | Michigan (2.6%) | | | |
| | | East Lansing, Michigan Building Authority General Obligation Bonds | | | |
| | 2,000,000 | | 5.700%, 4/1/2020 | | | 2,162,060 |
| | | Kalamazoo, Michigan Hospital Finance Authority Revenue Bonds | | | |
| | 3,250,000 | | 5.000%, 5/15/2026 | | | 2,959,548 |
| | | Livonia, Michigan Public Schools School District General Obligation Bonds (FGIC Insured) | | | |
| | 1,500,000 | | Zero Coupon, 5/1/2009a,b | | | 1,483,965 |
| | | Michigan Public Power Agency Revenue Bonds (Combustion Turbine #1 Project) (Series A) (AMBAC Insured) | | | |
| | 1,380,000 | | 5.250%, 1/1/2016a | | | 1,420,268 |
| | | Michigan State Hospital Finance Authority Revenue Bonds (Detroit Medical Center) | | | |
| | 45,000 | | 8.125%, 8/15/2012 | | | 45,106 |
| | | Michigan State Hospital Finance Authority Revenue Bonds (MBIA Insured) | | | |
| | 2,825,000 | | 5.375%, 8/15/2014a,b | | | 3,004,359 |
| | | Michigan State Hospital Finance Authority Revenue Bonds (Series P) (MBIA Insured) | | | |
| | 175,000 | | 5.375%, 8/15/2014a,b | | | 183,404 |
| | | Michigan State Hospital Finance Authority Revenue Refunding Bonds (Crittenton Hospital) (Series A) | | | |
| | 2,750,000 | | 5.500%, 3/1/2022 | | | 2,622,400 |
| | | Michigan State Trunk Line Fund Revenue Bonds (FSA Insured) | | | |
| | 5,000,000 | | 5.000%, 11/1/2022a | | | 5,029,250 |
| | | Rochester, Michigan Community School District General Obligation Bonds (MBIA Insured) | | | |
| | 4,500,000 | | 5.000%, 5/1/2019a | | | 4,618,260 |
| | | Sault Ste. Marie, Michigan Chippewa Indians Housing Authority Revenue Bonds (Tribal Health and Human Services Center) | | | |
| | 2,340,000 | | 7.750%, 9/1/2012 | | | 2,341,240 |
| | | St. Clair County, Michigan Economic Development Corporation Revenue Bonds (Detroit Edison) (Series AA) (AMBAC Insured) | | | |
| | 2,000,000 | | 6.400%, 8/1/2024a | | | 2,036,540 |
| | | Summit Academy North, Michigan Public School Academy Certificates of Participation | | | |
| | 990,000 | | 6.550%, 7/1/2014b | | | 1,054,083 |
| | 690,000 | | 8.375%, 7/1/2030b | | | 754,356 |
| | | | | | |
| | | Total Michigan | | | 29,714,839 |
| | | | | | |
| | Minnesota (3.8%) | | | |
| | | Baytown Township Minnesota Revenue Bonds | | | |
| | 1,000,000 | | 7.000%, 8/1/2038 | | | 828,070 |
| | | Minneapolis and St. Paul, Minnesota Housing & Redevelopment Authority Healthcare System (Healthpartners Obligation Group Project) | | | |
| | 800,000 | | 6.000%, 12/1/2021 | | | 681,480 |
| | | Minneapolis and St. Paul, Minnesota Metropolitan Airports Commission Airport Revenue Bonds | | | |
| | 2,030,000 | | 5.000%, 1/1/2022 | | | 1,751,748 |
| | | Minneapolis and St. Paul, Minnesota Metropolitan Airports Commission Airport Revenue Bonds (Series A) (AMBAC Insured) | | | |
| | 5,000,000 | | 5.000%, 1/1/2035a | | | 4,241,800 |
| | | Minneapolis and St. Paul, Minnesota Metropolitan Airports Commission Airport Revenue Bonds (Series C) (FGIC Insured) | | | |
| | 5,000,000 | | 5.000%, 1/1/2031a | | | 4,292,500 |
| | | Minneapolis, Minnesota Community Development Agency Tax Increment Revenue Bonds (MBIA Insured) | | | |
| | 7,685,000 | | Zero Coupon, 3/1/2009a | | | 7,622,367 |
The accompanying Notes to Financial Statements are an integral part of this schedule.
151
Municipal Bond Fund
Schedule of Investments as of October 31, 2008
| | | | | | |
Principal
Amount | | Long-Term Fixed Income (98.7%) | | Value |
| | Minnesota (3.8%) - continued | | | |
| | | Minnesota Agricultural and Economic Development Board Health Care System Unrefunded Balance Revenue Bonds (Fairview Hospital) (Series A) (MBIA Insured) | | | |
| $ | 85,000 | | 5.750%, 11/15/2026a | | $ | 87,554 |
| | | Minnesota Higher Education Facilities Authority Revenue Bonds (College of Art and Design) (Series 5-D) | | | |
| | 1,000,000 | | 6.625%, 5/1/2020b | | | 1,059,460 |
| | | Minnesota Higher Education Facilities Authority Revenue Bonds (University of St. Thomas) (Series 5-Y) | | | |
| | 530,000 | | 5.250%, 10/1/2019 | | | 535,062 |
| | | North Oaks, Minnesota Senior Housing Revenue Bonds (Presbyterian Homes, North Oaks) | | | |
| | 2,000,000 | | 6.125%, 10/1/2039 | | | 1,509,400 |
| | | Northern Municipal Power Agency Minnesota Electric System Revenue Bonds (Series A) | | | |
| | 2,000,000 | | 5.000%, 1/1/2026 | | | 1,869,940 |
| | | Northfield, Minnesota Hospital Revenue Bonds (Series C) | | | |
| | 1,000,000 | | 6.000%, 11/1/2021b | | | 1,079,200 |
| | 1,300,000 | | 6.000%, 11/1/2026b | | | 1,402,960 |
| | 2,040,000 | | 6.000%, 11/1/2031b | | | 2,201,568 |
| | | St. Louis Park, Minnesota Health Care Facilities Revenue Bonds | | | |
| | 2,000,000 | | 5.250%, 7/1/2030b | | | 2,169,540 |
| | 1,000,000 | | 5.750%, 7/1/2030 | | | 837,540 |
| | | St. Paul, Minnesota Housing and Redevelopment Authority Educational Facility Revenue Bonds | | | |
| | 4,000,000 | | 5.000%, 10/1/2024 | | | 3,707,280 |
| | | St. Paul, Minnesota Housing and Redevelopment Authority Health Care Facilities Revenue Bonds (Healthpartners Obligation Group PJ) | | | |
| | 230,000 | | 5.250%, 5/15/2019 | | | 189,847 |
| | 1,500,000 | | 5.250%, 5/15/2036 | | | 1,024,200 |
| | | St. Paul, Minnesota Housing and Redevelopment Authority Lease Parking Facilities Revenue Bonds (Rivercentre Parking Ramp) | | | |
| | 1,690,000 | | 6.000%, 5/1/2013 | | | 1,707,255 |
| | | White Earth Band of Chippewa Indians, Minnesota Revenue Bonds (Series A) (ACA Insured) | | | |
| | 4,135,000 | | 7.000%, 12/1/2011a | | | 4,200,829 |
| | | | | | |
| | | Total Minnesota | | | 42,999,600 |
| | | | | | |
| | Missouri (1.9%) | | | |
| | | Jackson County, Missouri Special Obligation Harry S. Truman Sports Complex Revenue Bonds (AMBAC Insured) | | | |
| | 7,500,000 | | 5.000%, 12/1/2027a | | | 7,188,300 |
| | | Missouri State Environmental Improvement and Energy Resources Authority Pollution Control Revenue Bonds (Associated Electric Coop Project) | | | |
| | 2,000,000 | | 4.375%, 12/1/2034 | | | 2,010,200 |
| | | Missouri State Environmental Improvement and Energy Resources Authority Water Pollution Revenue Bonds (Series A) | | | |
| | 1,000,000 | | 5.250%, 1/1/2018 | | | 1,033,820 |
| | | Missouri State Health and Educational Facilities Authority Health Facilities Revenue Bonds | | | |
| | 2,500,000 | | 5.000%, 5/15/2020 | | | 2,367,875 |
| | | Missouri State Health and Educational Facilities Authority Health Facilities Revenue Bonds (Barnes Jewish, Inc. Christian) (Series A) | | | |
| | 3,000,000 | | 5.250%, 5/15/2014 | | | 3,082,320 |
| | | Missouri State Health and Educational Facilities Authority Health Facilities Revenue Bonds (Lake Regional Health Securities Project) | | | |
| | 1,500,000 | | 5.600%, 2/15/2025 | | | 1,224,705 |
| | | Missouri State Health and Educational Facilities Authority Health Facilities Revenue Bonds (Saint Anthony’s Medical Center) | | | |
| | 1,000,000 | | 6.250%, 12/1/2030b | | | 1,085,170 |
| | | Missouri State Health and Educational Facilities Authority Revenue Bonds (Lake of the Ozarks) | | | |
| | 655,000 | | 6.500%, 2/15/2021 | | | 604,912 |
| | | Missouri State Housing Development Commission Single Family Mortgage Revenue Bonds (Series B-1) (GNMA/FNMA Insured) (Subject to ‘AMT’) | | | |
| | 120,000 | | 7.450%, 9/1/2031a | | | 118,420 |
| | | Missouri State Housing Development Commission Single Family Mortgage Revenue Bonds (Series C-1) (GNMA/FNMA Insured) | | | |
| | 125,000 | | 6.550%, 9/1/2028a | | | 122,807 |
The accompanying Notes to the Financial Statements are an integral part of this schedule.
152
Municipal Bond Fund
Schedule of Investments as of October 31, 2008
| | | | | | |
Principal
Amount | | Long-Term Fixed Income (98.7%) | | Value |
| | Missouri (1.9%) - continued | | | |
| | | Missouri State Housing Development Commission Single Family Mortgage Revenue Bonds
(Series C-1) (GNMA/FNMA Insured) (Subject to ‘AMT’) | | | |
| $ | 225,000 | | 7.150%, 3/1/2032a | | $ | 224,764 |
| | | St. Charles County, Missouri Francis Howell School District General Obligation Bonds (Series A) | | | |
| | 2,000,000 | | 5.250%, 3/1/2018 | | | 2,105,260 |
| | | | | | |
| | | Total Missouri | | | 21,168,553 |
| | | | | | |
| | Montana (1.3%) | | | |
| | | Montana Facility Finance Authority Revenue Providence Health and Services Revenue Bonds | | | |
| | 2,830,000 | | 5.000%, 10/1/2024 | | | 2,515,474 |
| | | Montana State Board of Housing Single Family Mortgage Revenue Bonds (Series A-1) | | | |
| | 40,000 | | 6.000%, 6/1/2016 | | | 36,812 |
| | | Montana State Board of Housing Single Family Mortgage Revenue Bonds (Series A-2) (Subject to ‘AMT’) | | | |
| | 140,000 | | 6.250%, 6/1/2019 | | | 125,670 |
| | | Montana State Board of Investment Refunded Balance 1996 Payroll Tax Revenue Bonds (MBIA Insured) | | | |
| | 2,385,000 | | 6.875%, 6/1/2020a,b | | | 2,471,504 |
| | | Montana State Board of Investment Refunded Revenue Bonds (1996 Payroll Tax) (MBIA Insured) | | | |
| | 775,000 | | 6.875%, 6/1/2020a,b | | | 803,109 |
| | | Montana State Board of Investment Refunded Revenue Bonds (Payroll Tax) (MBIA Insured) | | | |
| | 1,240,000 | | 6.875%, 6/1/2020a,b | | | 1,284,975 |
| | | Montana State Board of Regents Revenue Bonds (Higher Education-University of Montana) (Series F) (MBIA insured) | | | |
| | 1,165,000 | | 5.750%, 5/15/2016a | | | 1,215,421 |
| | | Montana State Health Facilities Authority Revenue Bonds (Hillcrest Senior Living Project) | | | |
| | 3,000,000 | | 7.375%, 6/1/2030b | | | 3,266,070 |
| | | Montana State Hospital Finance Authority Revenue Refunding Bonds | | | |
| | 3,860,000 | | 5.250%, 6/1/2018 | | | 3,577,216 |
| | | | | | |
| | | Total Montana | | | 15,296,251 |
| | | | | | |
| | Nebraska (1.8%) | | | |
| | | Douglas County, Nebraska Hospital Authority Revenue Bonds | | | |
| | 2,000,000 | | 5.750%, 11/1/2048 | | | 1,546,960 |
| | | Nebraska Public Power District Revenue Bonds (Series B) (AMBAC Insured) | | | |
| | 2,500,000 | | 5.000%, 1/1/2013a | | | 2,590,825 |
| | | Omaha, Nebraska Public Power District Electric Revenue Bonds (Series A) | | | |
| | 5,780,000 | | 5.000%, 2/1/2046 | | | 5,112,699 |
| | | Omaha, Nebraska Public Power District Revenue Bonds (Series B) | | | |
| | 3,455,000 | | 6.150%, 2/1/2012b | | | 3,639,946 |
| | | Omaha, Nebraska Special Assessment Bonds (Riverfront Redevelopment Project) (Series A) | | | |
| | 1,675,000 | | 5.500%, 2/1/2015 | | | 1,765,232 |
| | | University of Nebraska Revenue Bonds (Lincoln Student Fees & Facilities) (Series B) | | | |
| | 6,000,000 | | 5.000%, 7/1/2023 | | | 5,956,500 |
| | | | | | |
| | | Total Nebraska | | | 20,612,162 |
| | | | | | |
| | New Hampshire (0.1%) | | | |
| | | New Hampshire State Health and Education Facilities Authority Revenue Bonds | | | |
| | 1,800,000 | | 5.000%, 1/1/2036 | | | 1,216,692 |
| | | | | | |
| | | Total New Hampshire | | | 1,216,692 |
| | | | | | |
| | New Jersey (1.8%) | | | |
| | | Hudson County, New Jersey Department of Finance and Administration Certificate Of Participation (MBIA Insured) | | | |
| | 2,000,000 | | 6.250%, 12/1/2015a | | | 2,217,580 |
| | | New Jersey State Educational Facilities Authority Revenue Bonds | | | |
| | 965,000 | | 0.360%, 11/3/2008c | | | 965,000 |
| | | New Jersey State Highway Authority Revenue Bonds (Series L) | | | |
| | 1,000,000 | | 5.250%, 7/15/2018 | | | 1,057,530 |
| | | New Jersey State Turnpike Authority Revenue Bonds (Series C) (AMBAC-TCRS Insured) | | | |
| | 3,695,000 | | 6.500%, 1/1/2016a,b | | | 4,156,099 |
| | 260,000 | | 6.500%, 1/1/2016a,b | | | 292,446 |
| | 745,000 | | 6.500%, 1/1/2016a | | | 829,453 |
| | | New Jersey Transportation Trust Fund Authority Revenue Bonds (Transportation System) (Series A) (FSA Insured) | | | |
| | 5,000,000 | | 5.500%, 12/15/2016a | | | 5,195,150 |
The accompanying Notes to Financial Statements are an integral part of this schedule.
153
Municipal Bond Fund
Schedule of Investments as of October 31, 2008
| | | | | | |
Principal
Amount | | Long-Term Fixed Income (98.7%) | | Value |
| | New Jersey (1.8%) - continued | | | |
| | | Ocean County, New Jersey Utilities Authority Wastewater Revenue Bonds | | | |
| $ | 3,180,000 | | 5.250%, 1/1/2025 | | $ | 3,190,081 |
| | | West New York, New Jersey Municipal Utilities Authority Revenue Bonds (FGIC Insured) | | | |
| | 2,595,000 | | Zero Coupon, 12/15/2009a,b | | | 2,538,247 |
| | | | | | |
| | | Total New Jersey | | | 20,441,586 |
| | | | | | |
| | New Mexico (1.0%) | | | |
| | | Jicarilla, New Mexico Apache Nation Revenue Bonds (Series A) | | | |
| | 3,500,000 | | 5.500%, 9/1/2023 | | | 3,468,220 |
| | | New Mexico Mortgage Finance Authority Single Family Mortgage Capital Appreciation Revenue Bonds (Series D-2) (Subject to ‘AMT’) | | | |
| | 145,000 | | Zero Coupon, 9/1/2009e | | | 127,759 |
| | | New Mexico Mortgage Finance Authority Single Family Mortgage Revenue Bonds (Series C-2) (GNMA/FNMA Insured) (Subject to ‘AMT’) | | | |
| | 475,000 | | 6.950%, 9/1/2031a | | | 482,814 |
| | | Sandoval County, New Mexico Incentive Payment Revenue Bonds | | | |
| | 7,500,000 | | 5.000%, 6/1/2020 | | | 7,408,950 |
| | | | | | |
| | | Total New Mexico | | | 11,487,743 |
| | | | | | |
| | New York (8.3%) | | | |
| | | Metropolitan Transportation Authority, New York Transportation Facilities Revenue Bonds (Series A) | | | |
| | 5,000,000 | | 5.500%, 7/1/2017 | | | 5,252,400 |
| | | Metropolitan Transportation Authority, New York Transportation Facilities Revenue Bonds (Series O) | | | |
| | 4,225,000 | | 5.750%, 7/1/2013b | | | 4,484,964 |
| | | New York State Dormitory Authority Revenue Bonds (Series B) | | | |
| | 4,000,000 | | 5.250%, 5/15/2012c | | | 4,115,200 |
| | | New York State Dormitory Authority Revenue Bonds (State University Educational Facilities) (Series A) | | | |
| | 2,000,000 | | 7.500%, 5/15/2013 | | | 2,285,480 |
| | 5,000,000 | | 5.875%, 5/15/2017 | | | 5,266,300 |
| | | New York State Local Government Assistance Corporation Revenue Bonds (Series E) (MBIA/IBC Insured) | | | |
| | 2,000,000 | | 5.250%, 4/1/2016a | | | 2,110,120 |
| | | New York State Mortgage Agency Revenue Bonds (Series 26) | | | |
| | 495,000 | | 5.350%, 10/1/2016 | | | 487,793 |
| | | New York State Thruway Authority Revenue Bonds (Series B) (FSA Insured) | | | |
| | 2,500,000 | | 5.000%, 4/1/2015a | | | 2,641,400 |
| | | New York State Urban Development Corporation Revenue Bonds (Correctional and Youth Facilities) (Series A) | | | |
| | 20,000,000 | | 5.000%, 1/1/2017 | | | 20,478,800 |
| | | New York, New York City Municipal Water and Sewer System Revenue Bonds (Series A) (AMBAC Insured) | | | |
| | 2,000,000 | | 5.875%, 6/15/2012a,b | | | 2,197,480 |
| | | New York, New York City Transitional Finance Authority Revenue Bonds | | | |
| | 735,000 | | 5.375%, 11/15/2021b | | | 746,804 |
| | | New York, New York City Transitional Finance Authority Revenue Bonds (Future Tax Secured) (Series A) | | | |
| | 8,940,000 | | 5.500%, 11/1/2011c,e | | | 9,350,078 |
| | 1,805,000 | | 5.375%, 11/15/2021b | | | 1,961,493 |
| | | New York, New York City Transitional Finance Authority Revenue Bonds (Future Tax Secured) (Series B) | | | |
| | 13,000,000 | | 5.250%, 2/1/2011c,e | | | 13,411,450 |
| | | New York, New York General Obligation Bonds (Series A) | | | |
| | 1,750,000 | | 5.500%, 8/1/2022 | | | 1,765,803 |
| | | New York, New York General Obligation Bonds (Series B) | | | |
| | 12,000,000 | | 5.250%, 8/1/2017 | | | 12,273,240 |
| | | New York, New York General Obligation Bonds (Series H) (FSA/CR Insured) | | | |
| | 655,000 | | 5.250%, 3/15/2016a,b | | | 670,556 |
| | | New York, New York General Obligation Bonds (Series I-1) | | | |
| | 5,000,000 | | 5.000%, 4/1/2023 | | | 4,763,650 |
| | | New York, New York Municipal Water Finance Authority and Sewer System Revenue Bonds | | | |
| | 1,000,000 | | 5.750%, 6/15/2040 | | | 995,600 |
| | | | | | |
| | | Total New York | | | 95,258,611 |
| | | | | | |
| | North Carolina (2.4%) | | | |
| | | North Carolina Eastern Municipal Power Agency Power System Prerefunded Revenue Bonds (Series A) | | | |
| | 1,475,000 | | 6.000%, 1/1/2026b | | | 1,641,483 |
| | | North Carolina Eastern Municipal Power Agency Power System Revenue Bonds | | | |
| | 4,000,000 | | 5.375%, 1/1/2017 | | | 4,001,920 |
| | 7,170,000 | | 5.250%, 1/1/2020 | | | 6,695,561 |
The accompanying Notes to the Financial Statements are an integral part of this schedule.
154
Municipal Bond Fund
Schedule of Investments as of October 31, 2008
| | | | | | |
Principal
Amount | | Long-Term Fixed Income (98.7%) | | Value |
| | North Carolina (2.4%) - continued | | | |
| | | North Carolina Eastern Municipal Power Agency Power System Revenue Bonds (Series B) | | | |
| $ | 2,375,000 | | 5.500%, 1/1/2021 | | $ | 2,271,379 |
| | | North Carolina Eastern Municipal Power Agency Power System Revenue Bonds (Series D) | | | |
| | 5,000,000 | | 5.500%, 1/1/2014 | | | 5,155,550 |
| | 2,000,000 | | 6.750%, 1/1/2026 | | | 2,011,260 |
| | | North Carolina Municipal Power Agency #1 Catawba Electric Revenue Bonds (Series B) | | | |
| | 250,000 | | 6.500%, 1/1/2009 | | | 251,640 |
| | 610,000 | | 6.375%, 1/1/2013 | | | 627,653 |
| | | North Carolina Municipal Power Agency #1 Catawba Electric Revenue Bonds (Series B) (MBIA Insured) | | | |
| | 4,000,000 | | 6.000%, 1/1/2011a | | | 4,233,000 |
| | | Wake County, North Carolina Industrial, Facilities, and Pollution Control Revenue Bonds (Carolina Power and Light Company Project) | | | |
| | 1,000,000 | | 5.375%, 2/1/2017 | | | 990,410 |
| | | | | | |
| | | Total North Carolina | | | 27,879,856 |
| | | | | | |
| | North Dakota (0.8%) | | | |
| | | Grand Forks, North Dakota Health Care System Revenue Bonds (Altru Health Systems Group) | | | |
| | 3,500,000 | | 7.125%, 8/15/2024b | | | 3,791,935 |
| | | South Central Regional Water District, North Dakota Utility System Revenue Bonds (Northern Burleigh County) (Series A) | | | |
| | 2,945,000 | | 5.650%, 10/1/2029 | | | 2,860,479 |
| | | Ward County, North Dakota Health Care Facilities Revenue Bonds (Trinity Medical Center) (Series B) | | | |
| | 3,250,000 | | 6.250%, 7/1/2021 | | | 2,882,425 |
| | | | | | |
| | | Total North Dakota | | | 9,534,839 |
| | | | | | |
| | Ohio (3.1%) | | | |
| | | Akron, Ohio Economic Development Revenue Bonds (MBIA Insured) | | | |
| | 875,000 | | 6.000%, 12/1/2012a | | | 940,782 |
| | | Buckeye Tobacco Settlement Financing Authority Bonds (Series A-2) | | | |
| | 4,850,000 | | 5.125%, 6/1/2024 | | | 3,758,217 |
| | | Cincinnati, Ohio General Obligation Bonds | | | |
| | 1,700,000 | | 5.375%, 12/1/2019b | | | 1,798,770 |
| | | Lorain County, Ohio Hospital Revenue Bonds (Catholic Healthcare Partners) | | | |
| | 2,000,000 | | 5.400%, 10/1/2021 | | | 1,943,800 |
| | | Lucas County, Ohio Health Care Facilities Revenue Bonds (Sunset Retirement) (Series A) | | | |
| | 2,000,000 | | 6.550%, 8/15/2024 | | | 1,842,980 |
| | | Montgomery County, Ohio Hospital Revenue Bonds (Kettering Medical Center) | | | |
| | 2,000,000 | | 6.750%, 4/1/2018b | | | 2,142,300 |
| | 2,500,000 | | 6.750%, 4/1/2022b | | | 2,677,875 |
| | | Ohio State Higher Education Faculty Revenue Bonds (Case Western Reserve University) | | | |
| | 2,000,000 | | 6.500%, 10/1/2020 | | | 2,235,640 |
| | | Ohio State Turnpike Commission Turnpike Revenue Bonds | | | |
| | 10,000,000 | | 5.500%, 2/15/2026 | | | 10,269,300 |
| | | Ohio State Turnpike Commission Turnpike Revenue Bonds (Series A) (FGIC Insured) | | | |
| | 2,000,000 | | 5.500%, 2/15/2024a | | | 2,063,500 |
| | | Port of Greater Cincinnati Development Authority Revenue Bonds | | | |
| | 1,750,000 | | 5.000%, 10/1/2025 | | | 1,415,522 |
| | | Reynoldsburg, Ohio City School District General Obligation Bonds (FSA Insured) | | | |
| | 1,610,000 | | 5.000%, 12/1/2028a | | | 1,581,922 |
| | | University of Cincinnati, Ohio General Receipts Revenue Bonds (Series D) (AMBAC Insured) | | | |
| | 2,545,000 | | 5.000%, 6/1/2016a | | | 2,622,190 |
| | | | | | |
| | | Total Ohio | | | 35,292,798 |
| | | | | | |
| | Oklahoma (0.7%) | | | |
| | | Bass, Oklahoma Memorial Baptist Hospital Authority Hospital Revenue Bonds (Bass Memorial Hospital Project) | | | |
| | 730,000 | | 8.350%, 5/1/2009b | | | 730,409 |
| | | Oklahoma Development Finance Authority Hospital Revenue Bonds (Unity Health Center Project) | | | |
| | 1,040,000 | | 5.000%, 10/1/2011 | | | 1,038,565 |
| | | Oklahoma Housing Finance Agency Single Family Mortgage Revenue Bonds (Series C-2) (Subject to ‘AMT’) | | | |
| | 125,000 | | 7.550%, 9/1/2028 | | | 121,645 |
| | | Oklahoma Housing Finance Agency Single Family Mortgage Revenue Bonds (Series D-2) (GNMA/FNMA Insured) (Subject to ‘AMT’) | | | |
| | 155,000 | | 7.100%, 9/1/2028a | | | 153,067 |
The accompanying Notes to Financial Statements are an integral part of this schedule.
155
Municipal Bond Fund
Schedule of Investments as of October 31, 2008
| | | | | | |
Principal
Amount | | Long-Term Fixed Income (98.7%) | | Value |
| | Oklahoma (0.7%) - continued | | | |
| | | Oklahoma State Municipal Power Authority Revenue Bonds | | | |
| $ | 1,500,000 | | 6.000%, 1/1/2038 | | $ | 1,475,520 |
| | | Oklahoma State Municipal Power Authority Revenue Bonds (Series B) (MBIA Insured) | | | |
| | 1,500,000 | | 5.875%, 1/1/2012a | | | 1,573,470 |
| | | Payne County, Oklahoma Economic Development Authority Student Housing Revenue Bonds (Collegiate Housing Foundation) (Series A) | | | |
| | 2,900,000 | | 6.375%, 6/1/2030b | | | 3,140,468 |
| | | | | | |
| | | Total Oklahoma | | | 8,233,144 |
| | | | | | |
| | Pennsylvania (2.5%) | | | |
| | | Allegheny County, Pennsylvania Redevelopment Authority Tax Increment Tax Allocation Bonds (Waterfront Project) (Series B) | | | |
| | 715,000 | | 6.000%, 12/15/2010 | | | 751,043 |
| | | Allegheny County, Pennsylvania Redevelopment Authority Tax Increment Tax Allocation Bonds (Waterfront Project) (Series C) | | | |
| | 1,940,000 | | 6.550%, 12/15/2017b | | | 2,022,838 |
| | | Allegheny County, University of Pittsburgh Medical Center Hospital Development Authority Revenue Bonds (Series B) | | | |
| | 3,000,000 | | 5.000%, 6/15/2018 | | | 2,868,570 |
| | | Carbon County, Pennsylvania Industrial Development Authority Revenue Bonds (Panther Creek Partners Project) (Subject to ‘AMT’) | | | |
| | 1,670,000 | | 6.650%, 5/1/2010 | | | 1,684,579 |
| | | Cornwall Lebanon, Pennsylvania School District Capital Appreciation General Obligation Bonds (FSA Insured) | | | |
| | 2,000,000 | | Zero Coupon, 3/15/2016a | | | 1,420,740 |
| | 1,520,000 | | Zero Coupon, 3/15/2017a | | | 1,014,053 |
| | | Cumberland County, Pennsylvania Municipal Authority Revenue Bonds (Diakon Lutheran Ministries) | | | |
| | 2,750,000 | | 5.000%, 1/1/2027 | | | 1,950,272 |
| | 2,000,000 | | 5.000%, 1/1/2036 | | | 1,310,420 |
| | | Delaware County, Pennsylvania Industrial Development Authority Revenue Bonds | | | |
| | 2,300,000 | | 1.090%, 11/3/2008c | | | 2,300,000 |
| | | Lancaster County, Pennsylvania Hospital Authority Revenue Bonds | | | |
| | 2,000,000 | | 5.500%, 3/15/2026b | | | 2,178,220 |
| | | Millcreek Township, Pennsylvania School District General Obligation Bonds (FGIC Insured) | | | |
| | 3,170,000 | | Zero Coupon, 8/15/2009a,b | | | 3,124,923 |
| | | Pennsylvania State Turnpike Commission, Turnpike Revenue Bonds | | | |
| | 5,000,000 | | 6.250%, 6/1/2038 | | | 5,193,000 |
| | | Philadelphia, Pennsylvania Authority for Industrial Development Revenue Bonds (Please Touch Museum Project) | | | |
| | 2,000,000 | | 5.250%, 9/1/2026 | | | 1,582,860 |
| | | York County, Pennsylvania Solid Waste & Refuse Authority Solid Waste System Revenue Bonds (FGIC Insured) | | | |
| | 1,000,000 | | 5.500%, 12/1/2012a | | | 1,076,450 |
| | | | | | |
| | | Total Pennsylvania | | | 28,477,968 |
| | | | | | |
| | Puerto Rico (0.5%) | | | |
| | | Puerto Rico Industrial Tourist Educational Medical and Environmental Central Facilities Revenue Bonds (AES Cogen Facilities Project) (Subject to ‘AMT’) | | | |
| | 6,655,000 | | 6.625%, 6/1/2026 | | | 6,158,071 |
| | | | | | |
| | | Total Puerto Rico | | | 6,158,071 |
| | | | | | |
| | South Carolina (1.8%) | | | |
| | | Greenwood County, South Carolina Hospital Revenue Bonds (Self Memorial Hospital) | | | |
| | 1,000,000 | | 5.500%, 10/1/2026 | | | 889,870 |
| | | Piedmont, South Carolina Municipal Power Agency Electric Revenue Bonds (FGIC Insured) | | | |
| | 4,000,000 | | 6.250%, 1/1/2021a | | | 4,030,080 |
| | 5,000,000 | | 5.000%, 1/1/2022a | | | 4,553,400 |
| | | South Carolina Jobs Economic Development Authority Hospital Facilities Prerefunded Revenue Bonds (Palmetto Health Alliance) (Series C) | | | |
| | 605,000 | | 6.875%, 8/1/2027b | | | 683,819 |
| | 4,895,000 | | 6.875%, 8/1/2027b | | | 5,532,721 |
| | | South Carolina State Public Service Authority Revenue Bonds | | | |
| | 2,500,000 | | 5.500%, 1/1/2038 | | | 2,405,075 |
| | | Spartanburg, South Carolina Waterworks Revenue Bonds (FGIC Insured) | | | |
| | 2,000,000 | | 5.250%, 6/1/2028a,b | | | 2,183,140 |
| | | | | | |
| | | Total South Carolina | | | 20,278,105 |
| | | | | | |
The accompanying Notes to the Financial Statements are an integral part of this schedule.
156
Municipal Bond Fund
Schedule of Investments as of October 31, 2008
| | | | | | |
Principal
Amount | | Long-Term Fixed Income (98.7%) | | Value |
| | South Dakota (0.9%) | | | |
| | | South Dakota Educational Enhancement Funding Corporation Tobacco Settlement Revenue Bonds (Series B) | | | |
| $ | 5,000,000 | | 6.500%, 6/1/2032 | | $ | 4,068,000 |
| | | South Dakota State Health and Educational Facilities Authority Revenue Bonds | | | |
| | 5,000,000 | | 5.000%, 11/1/2040 | | | 3,871,950 |
| | | South Dakota State Health and Educational Facilities Authority Revenue Bonds (Prairie Lakes Health Care System, Inc.) | | | |
| | 1,170,000 | | 5.625%, 4/1/2032 | | | 936,527 |
| | | South Dakota State Health and Educational Facilities Authority Revenue Bonds (Prairie Lakes Health Care System, Inc.) (ACA/CBI Insured) | | | |
| | 1,770,000 | | 5.650%, 4/1/2022a | | | 1,488,039 |
| | | | | | |
| | | Total South Dakota | | | 10,364,516 |
| | | | | | |
| | Tennessee (1.6%) | | | |
| | | Jackson Tennessee Hospital Revenue Bonds | | | |
| | 3,000,000 | | 5.750%, 4/1/2041 | | | 2,482,320 |
| | | Memphis-Shelby County, Tennessee Airport Authority Special Facilities and Project Revenue Bonds (Federal Express Corporation) | | | |
| | 2,000,000 | | 5.350%, 9/1/2012 | | | 1,944,720 |
| | | Memphis-Shelby County, Tennessee Airport Authority Special Facilities Revenue Bonds (Federal Express Corporation) | | | |
| | 4,500,000 | | 5.050%, 9/1/2012 | | | 4,330,305 |
| | | Metropolitan Government, Nashville and Davidson County, Tennessee Industrial Development Board Revenue Bonds (Series A) (GNMA Insured) | | | |
| | 4,155,000 | | 6.625%, 3/20/2036a | | | 4,092,675 |
| | | Shelby County, Tennessee Health Educational and Housing Facilities Board Revenue Bonds (St. Jude Children’s Research Project) | | | |
| | 5,000,000 | | 5.375%, 7/1/2024b | | | 5,211,300 |
| | | | | | |
| | | Total Tennessee | | | 18,061,320 |
| | | | | | |
| | Texas (10.9%) | | | |
| | | Alliance Airport Authority, Texas Facilities Income Revenue Bonds | | | |
| | 10,000,000 | | 4.850%, 4/1/2021 | | | 7,456,900 |
| | | Amarillo, Texas Health Facilities Corporation Revenue Bonds (Baptist St. Anthony’s Hospital Corporation) (FSA Insured) | | | |
| | 2,000,000 | | 5.500%, 1/1/2017a,f | | | 2,126,720 |
| | | Arlington, Texas Independent School District Capital Appreciation Refunding General Obligation Bonds (PSF/GTD Insured) | | | |
| | 2,165,000 | | Zero Coupon, 2/15/2009a | | | 2,152,746 |
| | | Austin, Texas Utility System Revenue Bonds (FGIC Insured) | | | |
| | 2,250,000 | | 6.000%, 11/15/2013a | | | 2,417,400 |
| | | Austin, Texas Utility System Revenue Capital Appreciation Refunding Bonds (Financial Services Department) (Series A) (MBIA Insured) | | | |
| | 7,000,000 | | Zero Coupon, 11/15/2008a | | | 6,984,700 |
| | 8,100,000 | | Zero Coupon, 11/15/2009a | | | 7,870,203 |
| | | Bexar County, Texas Housing Finance Corporation Multi-Family Housing Revenue Bonds (Dymaxion and Marrach Park Apartments) (Series A) (MBIA Insured) | | | |
| | 1,930,000 | | 6.000%, 8/1/2023a | | | 1,710,810 |
| | | Bexar County, Texas Housing Finance Corporation Multi-Family Housing Revenue Bonds (Pan American Apartments) (Series A-1) (GNMA Insured) | | | |
| | 1,720,000 | | 7.000%, 3/20/2031a | | | 1,730,114 |
| | | Bluebonnet Trails Community Mental Health and Mental Retardation Revenue Bonds | | | |
| | 1,000,000 | | 6.125%, 12/1/2016 | | | 936,140 |
| | | Corpus Christi, Texas General Obligation Bonds (Series A) (FSA Insured) | | | |
| | 500,000 | | 5.000%, 3/1/2012a | | | 526,035 |
| | | Dallas-Fort Worth, Texas International Airport Revenue Bonds (Series A) (MBIA Insured) (Subject to ‘AMT’) | | | |
| | 1,000,000 | | 5.500%, 11/1/2016a | | | 953,830 |
| | | Dallas-Fort Worth, Texas International Airport Revenue Bonds (Series A) (Subject to ‘AMT’) | | | |
| | 500,000 | | 5.500%, 11/1/2017 | | | 470,190 |
| | | Dallas-Fort Worth, Texas Regional Airport Revenue Bonds | | | |
| | 9,750,000 | | 6.125%, 11/1/2018 | | | 9,366,630 |
| | | Deer Park, Texas Independent School District General Obligation Bonds (PSF/GTD Insured) | | | |
| | 1,375,000 | | 5.000%, 2/15/2013a | | | 1,455,094 |
The accompanying Notes to Financial Statements are an integral part of this schedule.
157
Municipal Bond Fund
Schedule of Investments as of October 31, 2008
| | | | | | |
Principal
Amount | | Long-Term Fixed Income (98.7%) | | Value |
| | Texas (10.9%) - continued | | | |
| | | Denton, Texas Independent School District General Obligation Bonds (PSF/GTD Insured) | | | |
| $ | 475,000 | | 6.250%, 2/15/2009a | | $ | 480,942 |
| | | Denton, Texas Utility System Revenue Bonds (Series A) (FSA Insured) | | | |
| | 3,210,000 | | 5.250%, 12/1/2015a | | | 3,361,769 |
| | | Gulf Coast Waste Disposal Authority, Texas Pollution Control Revenue Bonds | | | |
| | 1,350,000 | | 0.540%, 11/3/2008c | | | 1,350,000 |
| | | Gulf Coast Waste Disposal Authority, Texas Pollution Control Revenue Bonds (Exxon Project) (GTY/AGMT Insured) | | | |
| | 1,100,000 | | 0.540%, 11/3/2008a,c | | | 1,100,000 |
| | | Harris County Texas Industrial Development Corporation Pollution Control Revenue Bonds | | | |
| | 1,400,000 | | 0.540%, 11/3/2008c | | | 1,400,000 |
| | 900,000 | | 0.540%, 11/3/2008c | | | 900,000 |
| | | Harris County, Houston, Texas General Obligation Bonds (MBIA Insured) | | | |
| | 7,000,000 | | Zero Coupon, 8/15/2024a | | | 2,801,120 |
| | 6,500,000 | | 5.250%, 8/15/2047a | | | 5,685,355 |
| | | Harris County, Texas Health Facilities Development Authority Hospital Revenue Bonds (Memorial Hermann Healthcare Project) (Series A) | | | |
| | 2,000,000 | | 6.375%, 6/1/2029b | | | 2,192,200 |
| | | Houston, Texas Airport System Revenue Bonds (Series A) (FSA Insured) (Subject to ‘AMT’) | | | |
| | 2,000,000 | | 5.625%, 7/1/2030a | | | 1,686,420 |
| | | Houston, Texas Water and Sewer System Revenue Bonds (Series A) (FSA Insured) | | | |
| | 5,000,000 | | 5.750%, 12/1/2032a,b | | | 5,248,550 |
| | | Lewisville, Texas Independent School District General Obligation Bonds (PSF/GTD Insured) | | | |
| | 5,315,000 | | Zero Coupon, 8/15/2019a | | | 3,043,635 |
| | | Lower Colorado River Authority, Texas Unrefunded Balance Revenue Bonds (Series A) | | | |
| | 1,000,000 | | 5.875%, 5/15/2015 | | | 1,017,840 |
| | | North East Independent School District Texas Unlimited Tax Refunding Bonds | | | |
| | 5,000,000 | | 5.250%, 2/1/2028 | | | 4,993,550 |
| | | North Texas Health Facilities Development Corporation Hospital Revenue Bonds (United Regional Healthcare System, Inc.) | | | |
| | 2,600,000 | | 6.000%, 9/1/2023b | | | 2,862,938 |
| | | North Texas Tollway Authority Revenue Bonds (Series A) | | | |
| | 1,000,000 | | 5.625%, 1/1/2033 | | | 910,310 |
| | | North Texas Tollway Authority Revenue Bonds (Series D) | | | |
| | 5,000,000 | | Zero Coupon, 1/1/2028 | | | 1,515,400 |
| | 26,125,000 | | Zero Coupon, 1/1/2034 | | | 5,138,265 |
| | | Nueces County, Texas Housing Finance Corporation Multi-Family Housing Revenue Bonds (Dolphins Landing Apartments Project) (Series A) | | | |
| | 250,000 | | 6.250%, 7/1/2010b | | | 258,047 |
| | | Ridge Parc Development Corporation, Texas Multifamily Revenue Bonds (GNMA Insured) | | | |
| | 1,000,000 | | 6.100%, 6/20/2033a | | | 938,310 |
| | 2,795,000 | | 6.150%, 11/20/2041a | | | 2,506,053 |
| | | San Antonio, Texas General Obligation Bonds (General Improvements) | | | |
| | 425,000 | | 5.250%, 2/1/2014 | | | 439,097 |
| | | San Antonio, Texas Water Revenue Bonds (FSA Insured) | | | |
| | 1,000,000 | | 5.500%, 5/15/2018a | | | 1,036,560 |
| | 1,000,000 | | 5.500%, 5/15/2019a | | | 1,031,280 |
| | 1,000,000 | | 5.500%, 5/15/2020a | | | 1,026,040 |
| | | San Leanna Education Facilities Corporation Higher Education Revenue Bonds (Saint Edward’s University Project) (Series 2007) | | | |
| | 1,160,000 | | 5.125%, 6/1/2024 | | | 894,244 |
| | | Southeast Texas Housing Finance Corporation Revenue Bonds (MBIA Insured) | | | |
| | 11,615,000 | | Zero Coupon, 9/1/2017a,b | | | 7,729,434 |
| | | Tarrant County, Texas College District General Obligation Bonds | | | |
| | 1,410,000 | | 5.375%, 2/15/2013 | | | 1,516,427 |
| | | Tarrant County, Texas Cultural Educational Facilities Finance Corporation Revenue Bonds (Texas Health Resources) (Series A) | | | |
| | 2,000,000 | | 5.000%, 2/15/2023 | | | 1,776,420 |
| | | Texas State Veterans Land Board General Obligation Bonds | | | |
| | 4,315,000 | | 0.050%, 7/1/2010b | | | 4,118,970 |
| | | Westlake, Texas General Obligation Bonds | | | |
| | 315,000 | | 6.500%, 5/1/2013 | | | 342,881 |
| | 350,000 | | 6.500%, 5/1/2015 | | | 378,938 |
| | 335,000 | | 6.500%, 5/1/2017b | | | 385,153 |
| | 1,650,000 | | 5.750%, 5/1/2024 | | | 1,676,317 |
| | 2,000,000 | | 5.800%, 5/1/2032b | | | 2,230,020 |
| | | Wylie, Texas Independent School District General Obligation Bonds (PSF/GTD Insured) | | | |
| | 430,000 | | 6.875%, 8/15/2014a | | | 470,097 |
| | 745,000 | | 6.875%, 8/15/2014a,b | | | 824,499 |
The accompanying Notes to the Financial Statements are an integral part of this schedule.
158
Municipal Bond Fund
Schedule of Investments as of October 31, 2008
| | | | | | |
Principal
Amount | | Long-Term Fixed Income (98.7%) | | Value |
| | Texas (10.9%) - continued | | | |
| | | Wylie, Texas Independent School District Unrefunded General Obligation Bonds (PSF/GTD Insured) | | | |
| $ | 3,280,000 | | 7.000%, 8/15/2024a | | $ | 3,446,952 |
| | | | | | |
| | | Total Texas | | | 124,871,545 |
| | | | | | |
| | Virginia (0.8%) | | | |
| | | Fairfax County, Virginia Industrial Development Authority Revenue Bonds (Inova Health Systems Project) | | | |
| | 2,500,000 | | 5.250%, 8/15/2019 | | | 2,618,925 |
| | | Fairfax County, Virginia Water Authority Water Revenue Bonds | | | |
| | 3,625,000 | | 5.000%, 4/1/2021 | | | 3,681,260 |
| | | Tobacco Settlement Authority, Virginia Tobacco Settlement Revenue Bonds | | | |
| | 3,240,000 | | 5.250%, 6/1/2019b | | | 3,338,852 |
| | | | | | |
| | | Total Virginia | | | 9,639,037 |
| | | | | | |
| | Washington (4.6%) | | | |
| | | Energy Northwest, Washington Electric Revenue Bonds (Columbia Generating) (Series A) (MBIA Insured) | | | |
| | 1,000,000 | | 5.750%, 7/1/2018a | | | 1,044,030 |
| | | Franklin County, Washington School District Bonds (MBIA Insured) | | | |
| | 6,000,000 | | 5.250%, 12/1/2022a | | | 5,935,080 |
| | | King County, Washington Sewer Revenue Bonds (Series B) (FSA Insured) | | | |
| | 10,000,000 | | 5.500%, 1/1/2013a | | | 10,619,800 |
| | | Tobacco Settlement Authority, Washington Tobacco Settlement Revenue Bonds | | | |
| | 7,935,000 | | 6.500%, 6/1/2026 | | | 7,131,661 |
| | | Washington State Economic Development Finance Authority Lease Revenue Bonds (MBIA Insured) | | | |
| | 5,620,000 | | 5.000%, 6/1/2030a | | | 5,065,025 |
| | | Washington State General Obligation Bonds (Series 93A) | | | |
| | 40,000 | | 5.750%, 10/1/2012b | | | 42,073 |
| | 2,430,000 | | 5.750%, 10/1/2012 | | | 2,554,537 |
| | | Washington State General Obligation Bonds (Series A and AT-6) | | | |
| | 955,000 | | 6.250%, 2/1/2011 | | | 995,005 |
| | | Washington State General Obligation Bonds (Series A) | | | |
| | 5,000,000 | | 6.750%, 2/1/2015 | | | 5,571,850 |
| | | Washington State General Obligation Bonds (Series A) (FSA Insured) | | | |
| | 5,000,000 | | 5.000%, 7/1/2021a | | | 5,028,100 |
| | | Washington State General Obligation Bonds (Series B and AT-7) | | | |
| | 2,500,000 | | 6.250%, 6/1/2010 | | | 2,642,400 |
| | 2,000,000 | | 6.000%, 6/1/2012 | | | 2,176,280 |
| | | Washington State Health Care Facilities Authority Revenue Bonds (Series A) | | | |
| | 1,000,000 | | 5.000%, 12/1/2030 | | | 894,080 |
| | | Washington State Health Care Facilities Authority Revenue Bonds (Swedish Health Services) (AMBAC Insured) | | | |
| | 2,000,000 | | 5.125%, 11/15/2018a | | | 2,007,020 |
| | | Washington State Housing Finance Commission Nonprofit Housing Revenue Bonds (Crista Ministries Projects) (Series A) | | | |
| | 1,000,000 | | 5.350%, 7/1/2014 | | | 999,930 |
| | | | | | |
| | | Total Washington | | | 52,706,871 |
| | | | | | |
| | West Virginia (0.3%) | | | |
| | | West Virginia State Water Development Authority Revenue Bonds (Series B-II) (FGIC Insured) | | | |
| | 3,465,000 | | 5.000%, 11/1/2033a | | | 2,955,368 |
| | | | | | |
| | | Total West Virginia | | | 2,955,368 |
| | | | | | |
| | Wisconsin (1.1%) | | | |
| | | Wisconsin State Health and Educational Facilities Authority Revenue Bonds (Aurora Health Care) (Series B) | | | |
| | 1,500,000 | | 5.500%, 2/15/2015 | | | 1,384,935 |
| | | Wisconsin State Health and Educational Facilities Authority Revenue Bonds (Eagle River Memorial Hospital, Inc. Project) | | | |
| | 1,000,000 | | 5.750%, 8/15/2020 | | | 1,012,150 |
| | | Wisconsin State Health and Educational Facilities Authority Revenue Bonds (Marshfield Clinic) (Series B) | | | |
| | 2,000,000 | | 6.000%, 2/15/2025 | | | 1,690,520 |
| | | Wisconsin State Health and Educational Facilities Authority Revenue Bonds (Watertown Memorial Hospital, Inc.) | | | |
| | 2,000,000 | | 5.500%, 8/15/2029 | | | 1,719,580 |
| | | Wisconsin State Health and Educational Facilities Authority Revenue Bonds (Wheaton Franciscan Services) | | | |
| | 6,000,000 | | 5.750%, 8/15/2025b | | | 6,551,760 |
| | | | | | |
| | | Total Wisconsin | | | 12,358,945 |
| | | | | | |
The accompanying Notes to Financial Statements are an integral part of this schedule.
159
Municipal Bond Fund
Schedule of Investments as of October 31, 2008
| | | | | | |
Principal
Amount | | Long-Term Fixed Income (98.7%) | | Value |
| | Wyoming (1.1%) | | | |
| | | Kemmerer, Wyoming Pollution Control Term Revenue Bonds | | | |
| $ | 1,215,000 | | 0.540%, 11/3/2008c | | $ | 1,215,000 |
| | | Lincoln County, Wyoming Pollution Control Revenue Bonds | | | |
| | 300,000 | | 0.540%, 11/3/2008c | | | 300,000 |
| | 1,200,000 | | 0.540%, 11/3/2008c | | | 1,200,000 |
| | 640,000 | | 0.540%, 11/3/2008c | | | 640,000 |
| | | Lincoln County, Wyoming Pollution Control Revenue Bonds (Exxon Project) (Series A) | | | |
| | 765,000 | | 0.540%, 11/3/2008c | | | 765,000 |
| | | Wyoming Municipal Power Agency Power Supply System Revenue Bonds | | | |
| | 3,270,000 | | 5.375%, 1/1/2042 | | | 2,824,920 |
| | | Wyoming State Farm Loan Board Capital Facilities Revenue Bonds | | | |
| | 5,825,000 | | 5.750%, 10/1/2020 | | | 6,199,839 |
| | | | | | |
| | | Total Wyoming | | | 13,144,759 |
| | | | | | |
| | | Total Long-Term Fixed Income (cost $1,155,836,307) | | | 1,129,292,245 |
| | | | | | |
| | | Total Investments (cost $1,155,836,307) 98.7% | | $ | 1,129,292,245 |
| | | | | | |
| | | Other Assets and Liabilities, Net 1.3% | | | 14,416,170 |
| | | | | | |
| | | Total Net Assets 100.0% | | $ | 1,143,708,415 |
| | | | | | |
| a | To reduce certain risks associated with securities issued by municipalities, which may include but are not limited to economic development in a specific industry or municipality, the principal and/or interest payments are guaranteed by the bond insurance company or Government agency identified. |
| b | Denotes securities that have been pre-refunded or escrowed to maturity. Under such an arrangement, money is deposited into an irrevocable escrow account and is used to purchase U.S. Treasury securities or government agency securities with maturing principal and interest earnings sufficient to pay all debt service requirements of the pre-refunded bonds. |
| c | Denotes variable rate obligations for which the current yield and next scheduled reset date are shown. |
| d | Denotes investments purchased on a when-issued or delayed delivery basis. |
| e | Denotes step coupon bonds for which the current interest rate and next scheduled reset date are shown. |
| f | Designated as cover for long settling trades as discussed in the Notes to Financial Statements. |
Gross unrealized appreciation and depreciation of investments, based on cost for federal income tax purposes, were as follows:
| | | | |
Gross unrealized appreciation | | $ | 33,734,379 | |
Gross unrealized depreciation | | | (60,308,324 | ) |
| | | | |
Net unrealized appreciation (depreciation) | | | ($26,573,945 | ) |
Cost for federal income tax purposes | | $ | 1,155,866,190 | |
The accompanying Notes to the Financial Statements are an integral part of this schedule.
160
Income Fund
Schedule of Investments as of October 31, 2008
| | | | | | |
Principal
Amount | | Bank Loans (0.2%)a | | Value |
| | Consumer Non-Cyclical (0.2%) | | | |
| | | HCA, Inc., Term Loan | | | |
| $ | 1,886,675 | | 5.273%, 11/18/2013 | | $ | 1,556,167 |
| | | | | | |
| | | Total Consumer Non-Cyclical | | | 1,556,167 |
| | | | | | |
| | | Total Bank Loans (cost $1,472,572) | | | 1,556,167 |
| | | | | | |
| | |
| | | Long-Term Fixed Income (102.2%) | | |
| | Asset-Backed Securities (5.4%) | | | |
| | | Bear Stearns Mortgage Funding Trust | | | |
| | 2,023,648 | | 3.399%, 11/25/2008b | | | 399,098 |
| | | Capitalsource Commercial Loan Trust | | | |
| | 2,320,460 | | 4.408%, 11/20/2008b,c | | | 1,915,254 |
| | | Countrywide Asset-Backed Certificates | | | |
| | 3,306,755 | | 5.549%, 4/25/2036d,e | | | 2,999,052 |
| | | Credit Based Asset Servicing and Securitization, LLC | | | |
| | 1,488,268 | | 3.369%, 11/25/2008b,e | | | 1,447,497 |
| | | Discover Card Master Trust | | | |
| | 5,000,000 | | 5.650%, 3/16/2020f | | | 3,552,605 |
| | | First Franklin Mortgage Loan Asset-Backed Certificates | | | |
| | 2,773,998 | | 3.349%, 11/25/2008b,e | | | 2,662,300 |
| | | First Horizon ABS Trust | | | |
| | 1,798,225 | | 3.419%, 11/25/2008b,d | | | 876,678 |
| | | Ford Credit Floor Plan Master Owner Trust | | | |
| | 5,000,000 | | 4.740%, 11/17/2008b,e | | | 4,826,325 |
| | | GMAC Mortgage Corporation Loan Trust | | | |
| | 5,838,521 | | 3.329%, 11/25/2008b,d | | | 3,417,899 |
| | 627,142 | | 3.359%, 11/25/2008b,d,e | | | 605,331 |
| | 5,260,418 | | 3.439%, 11/25/2008b,d | | | 2,869,379 |
| | | IndyMac Seconds Asset-Backed Trust | | | |
| | 3,500,743 | | 3.429%, 11/25/2008b,d | | | 1,585,256 |
| | | Merna Re, Ltd. | | | |
| | 7,250,000 | | 5.512%, 12/31/2008b,e,g | | | 6,858,500 |
| | | Residential Funding Mortgage Securities II | | | |
| | 1,455,752 | | 3.389%, 11/25/2008b,d,e | | | 1,381,191 |
| | | | | | |
| | | Total Asset-Backed Securities | | | 35,396,365 |
| | | | | | |
| | Basic Materials (1.5%) | | | |
| | | ArcelorMittal | | | |
| | 3,500,000 | | 6.125%, 6/1/2018g,h | | | 2,411,682 |
| | | E.I. Du Pont de Nemours & Company | | | |
| | 2,800,000 | | 6.000%, 7/15/2018 | | | 2,562,655 |
| | | Freeport-McMoRan Copper & Gold, Inc. | | | |
| | 1,000,000 | | 7.084%, 4/1/2009b,e | | | 779,680 |
| | | Precision Castparts Corporation | | | |
| | 2,000,000 | | 5.600%, 12/15/2013e | | | 2,030,024 |
| | | Rio Tinto Finance, Ltd. | | | |
| | 2,700,000 | | 6.500%, 7/15/2018e | | | 2,094,388 |
| | | | | | |
| | | Total Basic Materials | | | 9,878,429 |
| | | | | | |
| | Capital Goods (3.9%) | | | |
| | | Caterpillar Financial Services Corporation | | | |
| | 1,200,000 | | 5.450%, 4/15/2018 | | | 987,468 |
| | 2,975,000 | | 7.050%, 10/1/2018f | | | 2,807,811 |
| | | CRH America, Inc. | | | |
| | 1,600,000 | | 6.000%, 9/30/2016e | | | 1,154,397 |
| | 3,000,000 | | 8.125%, 7/15/2018h | | | 2,465,100 |
| | | Honeywell International, Inc. | | | |
| | 3,800,000 | | 5.300%, 3/1/2018e | | | 3,343,677 |
| | | John Deere Capital Corporation | | | |
| | 2,800,000 | | 5.350%, 4/3/2018e | | | 2,335,267 |
| | 2,100,000 | | 5.750%, 9/10/2018e | | | 1,750,421 |
| | | Lockheed Martin Corporation | | | |
| | 1,170,000 | | 6.150%, 9/1/2036 | | | 1,003,249 |
| | | Oakmont Asset Trust | | | |
| | 3,250,000 | | 4.514%, 12/22/2008e,g | | | 3,250,296 |
| | | Owens Corning, Inc. | | | |
| | 1,200,000 | | 7.000%, 12/1/2036e | | | 760,005 |
| | | Systems 2001 Asset Trust, LLC | | | |
| | 2,203,317 | | 6.664%, 9/15/2013g | | | 2,172,257 |
| | | United Technologies Corporation | | | |
| | 3,000,000 | | 4.875%, 5/1/2015 | | | 2,733,693 |
| | | | | | |
| | | Total Capital Goods | | | 24,763,641 |
| | | | | | |
| | Collateralized Mortgage Obligations (4.9%) | | | |
| | | Banc of America Mortgage Securities, Inc. | | | |
| | 5,802,469 | | 4.804%, 9/25/2035e | | | 4,740,866 |
| | | Citigroup Mortgage Loan Trust, Inc. | | | |
| | 651,159 | | 5.536%, 3/25/2036h | | | 643,286 |
| | | Countrywide Alternative Loan Trust | | | |
| | 4,358,397 | | 6.000%, 1/25/2037 | | | 3,848,504 |
| | | HomeBanc Mortgage Trust | | | |
| | 2,345,845 | | 5.989%, 4/25/2037e | | | 1,589,899 |
| | | J.P. Morgan Mortgage Trust | | | |
| | 4,743,327 | | 5.003%, 7/25/2035e | | | 4,388,109 |
| | | Merrill Lynch Mortgage Investors, Inc. | | | |
| | 3,872,257 | | 4.870%, 6/25/2035e | | | 3,145,787 |
| | | Thornburg Mortgage Securities Trust | | | |
| | 3,160,721 | | 3.349%, 11/25/2008b | | | 3,139,768 |
| | | Wachovia Mortgage Loan Trust, LLC | | | |
| | 3,413,517 | | 5.562%, 5/20/2036 | | | 2,762,330 |
| | | Washington Mutual Alternative Loan Trust | | | |
| | 4,396,917 | | 3.415%, 11/1/2008b | | | 1,984,414 |
| | | Washington Mutual Mortgage Pass-Through Certificates | | | |
| | 1,891,688 | | 3.549%, 11/25/2008b | | | 1,072,230 |
| | 2,650,600 | | 4.833%, 9/25/2035 | | | 2,357,976 |
The accompanying Notes to Financial Statements are an integral part of this schedule.
161
Income Fund
Schedule of Investments as of October 31, 2008
| | | | | | |
Principal
Amount | | Long-Term Fixed Income (102.2%) | | Value |
| | Collateralized Mortgage Obligations (4.9%) - continued | | | |
| | | Zuni Mortgage Loan Trust | | | |
| $ | 2,237,395 | | 3.389%, 11/25/2008b,h | | $ | 2,142,427 |
| | | | | | |
| | | Total Collateralized Mortgage Obligations | | | 31,815,596 |
| | | | | | |
| | Commercial Mortgage-Backed Securities (11.6%) | | | |
| | | Banc of America Commercial Mortgage, Inc. | | | |
| | 2,000,000 | | 5.118%, 7/11/2043e,f | | | 1,833,530 |
| | | Banc of America Large Loan Trust | | | |
| | 1,484,163 | | 4.670%, 11/15/2008b,e,g | | | 1,294,758 |
| | 4,000,000 | | 4.770%, 11/15/2008b,e,g | | | 3,541,072 |
| | | Bear Stearns Commercial Mortgage Securities, Inc. | | | |
| | 3,000,000 | | 4.710%, 11/15/2008b,e,g | | | 2,713,638 |
| | 3,000,000 | | 5.835%, 9/11/2042f | | | 1,806,189 |
| | | Citigroup Commercial Mortgage Trust | | | |
| | 7,500,000 | | 4.700%, 11/17/2008b,g,h | | | 6,386,235 |
| | | Commercial Mortgage Pass-Through Certificates | | | |
| | 180,131 | | 4.660%, 11/15/2008b,e,g | | | 166,716 |
| | 4,000,000 | | 4.690%, 11/15/2008b,e,g | | | 3,353,776 |
| | 7,000,000 | | 4.740%, 11/15/2008b,e,g | | | 6,017,648 |
| | | Credit Suisse Mortgage Capital Certificates | | | |
| | 4,000,000 | | 4.730%, 11/15/2008b,e,g | | | 3,466,796 |
| | | Crown Castle International Corporation | | | |
| | 6,500,000 | | 5.245%, 11/15/2036g,h | | | 6,241,495 |
| | | Greenwich Capital Commercial Funding Corporation | | | |
| | 6,200,000 | | 5.867%, 8/10/2017e | | | 3,757,752 |
| | | J.P. Morgan Chase Commercial Mortgage Securities Corporation | | | |
| | 2,750,000 | | 4.302%, 1/15/2038e | | | 2,518,178 |
| | 5,890,614 | | 5.284%, 5/15/2047e | | | 5,267,876 |
| | 5,000,000 | | 6.007%, 6/15/2049e | | | 3,769,060 |
| | | Merrill Lynch Mortgage Trust | | | |
| | 6,500,000 | | 4.747%, 5/12/2043e | | | 5,155,040 |
| | 5,500,000 | | 5.266%, 1/12/2044 | | | 3,759,415 |
| | | Wachovia Bank Commercial Mortgage Trust | | | |
| | 10,000,000 | | 4.680%, 11/15/2008b,e,g | | | 8,485,820 |
| | 6,000,000 | | 5.765%, 7/15/2045e | | | 4,516,968 |
| | | Washington Mutual Asset Securities Corporation | | | |
| | 966,278 | | 3.830%, 1/25/2035g | | | 911,187 |
| | | | | | |
| | | Total Commercial Mortgage-Backed Securities | | | 74,963,149 |
| | | | | | |
| | Communications Services (9.2%) | | | |
| | | AT&T, Inc. | | | |
| | 2,475,000 | | 5.500%, 2/1/2018 | | | 2,102,884 |
| | 1,225,000 | | 6.500%, 9/1/2037e | | | 995,110 |
| | 1,000,000 | | 6.400%, 5/15/2038 | | | 800,269 |
| | | British Telecom plc | | | |
| | 1,925,000 | | 9.125%, 12/15/2030e | | | 1,743,145 |
| | | Citizens Communications Company | | | |
| | 3,690,000 | | 6.250%, 1/15/2013f | | | 3,053,475 |
| | | Comcast Corporation | | | |
| | 3,520,000 | | 6.500%, 1/15/2015h | | | 3,172,749 |
| | 2,700,000 | | 5.900%, 3/15/2016e | | | 2,323,547 |
| | 3,000,000 | | 5.700%, 5/15/2018 | | | 2,478,825 |
| | 1,300,000 | | 6.400%, 5/15/2038h | | | 994,293 |
| | | Cox Communications, Inc. | | | |
| | 4,000,000 | | 4.625%, 6/1/2013e | | | 3,386,096 |
| | 770,000 | | 5.450%, 12/15/2014e | | | 653,575 |
| | | Deutsche Telekom International Finance BV | | | |
| | 3,500,000 | | 6.750%, 8/20/2018h | | | 2,917,366 |
| | | Intelsat Subsidiary Holding Company, Ltd. | | | |
| | 3,150,000 | | 8.875%, 1/15/2015g,h | | | 2,677,500 |
| | | New Cingular Wireless Services, Inc. | | | |
| | 765,000 | | 8.750%, 3/1/2031h | | | 711,570 |
| | | News America, Inc. | | | |
| | 1,350,000 | | 6.400%, 12/15/2035h | | | 1,021,861 |
| | 1,225,000 | | 6.650%, 11/15/2037 | | | 970,272 |
| | | Rogers Cable, Inc. | | | |
| | 700,000 | | 6.750%, 3/15/2015h | | | 625,387 |
| | 1,420,000 | | 8.750%, 5/1/2032 | | | 1,338,604 |
| | | Rogers Communications, Inc. | | | |
| | 2,250,000 | | 6.800%, 8/15/2018h | | | 1,968,824 |
| | | Rogers Wireless Communications, Inc. | | | |
| | 1,300,000 | | 8.000%, 12/15/2012 | | | 1,212,250 |
| | 2,000,000 | | 6.375%, 3/1/2014e | | | 1,785,890 |
| | 1,800,000 | | 7.500%, 3/15/2015e | | | 1,688,963 |
| | | Telecom Italia Capital SA | | | |
| | 3,550,000 | | 5.250%, 11/15/2013 | | | 2,694,578 |
| | 1,750,000 | | 5.250%, 10/1/2015 | | | 1,200,336 |
| | | Telefonica Emisones SAU | | | |
| | 2,600,000 | | 6.221%, 7/3/2017 | | | 2,194,452 |
| | | Thomson Reuters Corporation | | | |
| | 2,500,000 | | 6.500%, 7/15/2018f | | | 2,101,925 |
| | | Time Warner Cable, Inc. | | | |
| | 2,000,000 | | 5.850%, 5/1/2017e | | | 1,638,436 |
| | 1,950,000 | | 6.750%, 7/1/2018h | | | 1,672,460 |
| | | Time Warner Entertainment Company, LP | | | |
| | 1,150,000 | | 8.375%, 3/15/2023 | | | 1,026,249 |
| | | Verizon Communications, Inc. | | | |
| | 1,900,000 | | 5.550%, 2/15/2016f | | | 1,657,769 |
| | 1,500,000 | | 5.500%, 2/15/2018 | | | 1,258,935 |
| | 1,500,000 | | 8.750%, 11/1/2018 | | | 1,531,650 |
| | 1,000,000 | | 6.900%, 4/15/2038 | | | 836,540 |
| | 3,100,000 | | 8.950%, 3/1/2039 | | | 3,145,973 |
| | | | | | |
| | | Total Communications Services | | | 59,581,758 |
| | | | | | |
| | Consumer Cyclical (3.4%) | | | |
| | | D.R. Horton, Inc. | | | |
| | 3,500,000 | | 5.375%, 6/15/2012e | | | 2,485,000 |
| | | Ford Motor Credit Company | | | |
| | 4,250,000 | | 7.375%, 10/28/2009 | | | 3,527,942 |
| | | JC Penney & Company, Inc. | | | |
| | 700,000 | | 7.950%, 4/1/2017 | | | 580,355 |
The accompanying Notes to the Financial Statements are an integral part of this schedule.
162
Income Fund
Schedule of Investments as of October 31, 2008
| | | | | | |
Principal
Amount | | Long-Term Fixed Income (102.2%) | | Value |
| | Consumer Cyclical (3.4%) - continued | | | |
| | | Macy’s Retail Holdings, Inc. | | | |
| $ | 2,600,000 | | 7.875%, 7/15/2015h | | $ | 1,956,859 |
| | | McDonald’s Corporation | | | |
| | 2,300,000 | | 5.800%, 10/15/2017e | | | 2,104,387 |
| | 1,400,000 | | 6.300%, 3/1/2038e | | | 1,222,405 |
| | | MGM MIRAGE | | | |
| | 3,160,000 | | 13.000%, 11/15/2013g,i | | | 2,812,400 |
| | | Nissan Motor Acceptance Corporation | | | |
| | 2,650,000 | | 5.625%, 3/14/2011g | | | 2,710,502 |
| | | SLM Private Credit Student Loan Trust | | | |
| | 1,340,304 | | 2.829%, 12/15/2008b | | | 1,253,184 |
| | | Wal-Mart Stores, Inc. | | | |
| | 1,800,000 | | 4.250%, 4/15/2013 | | | 1,749,281 |
| | 1,930,000 | | 5.875%, 4/5/2027 | | | 1,649,500 |
| | | | | | |
| | | Total Consumer Cyclical | | | 22,051,815 |
| | | | | | |
| | Consumer Non-Cyclical (4.2%) | | | |
| | | AmerisourceBergen Corporation | | | |
| | 2,000,000 | | 5.875%, 9/15/2015e | | | 1,641,448 |
| | | AstraZeneca plc | | | |
| | 2,700,000 | | 5.400%, 9/15/2012e | | | 2,656,692 |
| | | Baxter International, Inc. | | | |
| | 2,215,000 | | 5.900%, 9/1/2016h | | | 2,068,070 |
| | | Bunge Limited Finance Corporation | | | |
| | 3,800,000 | | 5.350%, 4/15/2014e | | | 2,731,056 |
| | | Cargill, Inc. | | | |
| | 3,500,000 | | 5.600%, 9/15/2012g,h | | | 3,249,183 |
| | | Community Health Systems, Inc. | | | |
| | 2,400,000 | | 8.875%, 7/15/2015e | | | 2,010,000 |
| | | General Mills, Inc. | | | |
| | 1,000,000 | | 5.650%, 9/10/2012e | | | 923,344 |
| | 2,400,000 | | 5.200%, 3/17/2015e | | | 2,077,896 |
| | | Johnson & Johnson Company | | | |
| | 370,000 | | 5.950%, 8/15/2037e | | | 341,815 |
| | | Kellogg Company | | | |
| | 3,400,000 | | 4.250%, 3/6/2013e | | | 3,142,491 |
| | | Kroger Company | | | |
| | 1,500,000 | | 6.400%, 8/15/2017e | | | 1,305,117 |
| | 875,000 | | 6.150%, 1/15/2020e | | | 718,342 |
| | | PepsiCo, Inc. | | | |
| | 700,000 | | 7.900%, 11/1/2018 | | | 738,509 |
| | | Safeway, Inc. | | | |
| | 900,000 | | 6.350%, 8/15/2017h | | | 778,039 |
| | | Schering-Plough Corporation | | | |
| | 2,000,000 | | 6.000%, 9/15/2017f | | | 1,757,024 |
| | | Wyeth | | | |
| | 910,000 | | 5.950%, 4/1/2037h | | | 738,777 |
| | | | | | |
| | | Total Consumer Non-Cyclical | | | 26,877,803 |
| | | | | | |
| | Energy (7.6%) | | | |
| | | Apache Corporation | | | |
| | 2,200,000 | | 5.250%, 4/15/2013e | | | 2,081,440 |
| | | CenterPoint Energy Resources Corporation | | | |
| | 3,650,000 | | 6.125%, 11/1/2017h | | | 2,799,970 |
| | | Consolidated Natural Gas Company | | | |
| | 1,100,000 | | 5.000%, 12/1/2014e | | | 916,392 |
| | | Energy Transfer Partners, LP | | | |
| | 3,350,000 | | 6.700%, 7/1/2018e | | | 2,728,488 |
| | | Enterprise Products Operating, LP | | | |
| | 3,100,000 | | 5.600%, 10/15/2014e | | | 2,597,884 |
| | 2,250,000 | | 6.300%, 9/15/2017e | | | 1,838,788 |
| | | EOG Resources, Inc. | | | |
| | 1,500,000 | | 5.875%, 9/15/2017e | | | 1,326,063 |
| | | Magellan Midstream Partners, LP | | | |
| | 1,800,000 | | 6.450%, 6/1/2014 | | | 1,656,923 |
| | | Marathon Oil Corporation | | | |
| | 1,600,000 | | 6.000%, 10/1/2017f | | | 1,274,502 |
| | | Nexen, Inc. | | | |
| | 735,000 | | 5.650%, 5/15/2017e | | | 583,693 |
| | 1,925,000 | | 6.400%, 5/15/2037e | | | 1,313,004 |
| | | Oneok Partners, LP | | | |
| | 1,750,000 | | 6.850%, 10/15/2037 | | | 1,189,153 |
| | | Plains All American Pipeline, LP/PAA Finance Corporation | | | |
| | 1,850,000 | | 6.500%, 5/1/2018g | | | 1,368,885 |
| | | Premcor Refining Group, Inc. | | | |
| | 1,500,000 | | 6.125%, 5/1/2011 | | | 1,505,293 |
| | 1,850,000 | | 6.750%, 5/1/2014 | | | 1,659,676 |
| | | Quicksilver Resources, Inc. | | | |
| | 2,200,000 | | 7.750%, 8/1/2015 | | | 1,529,000 |
| | | Ras Laffan Liquefied Natural Gas Company, Ltd. II | | | |
| | 2,550,000 | | 5.298%, 9/30/2020g | | | 2,224,161 |
| | | Ras Laffan Liquefied Natural Gas Company, Ltd. III | | | |
| | 900,000 | | 5.832%, 9/30/2016g | | | 822,663 |
| | | Southern Natural Gas Company | | | |
| | 2,000,000 | | 5.900%, 4/1/2017g | | | 1,542,472 |
| | | Southern Star Central Corporation | | | |
| | 2,400,000 | | 6.750%, 3/1/2016 | | | 2,076,000 |
| | | Transcontinental Gas Pipe Corporation | | | |
| | 2,000,000 | | 8.875%, 7/15/2012e | | | 1,941,018 |
| | 600,000 | | 6.400%, 4/15/2016h | | | 517,128 |
| | | Transocean, Inc. | | | |
| | 3,100,000 | | 6.000%, 3/15/2018e | | | 2,652,100 |
| | | Weatherford International, Ltd. | | | |
| | 2,500,000 | | 5.150%, 3/15/2013 | | | 2,169,335 |
| | 1,350,000 | | 6.000%, 3/15/2018 | | | 1,031,177 |
| | | Western Oil Sands, Inc. | | | |
| | 4,600,000 | | 8.375%, 5/1/2012e | | | 4,614,380 |
| | | XTO Energy, Inc. | | | |
| | 1,900,000 | | 5.300%, 6/30/2015 | | | 1,554,960 |
| | 1,500,000 | | 6.750%, 8/1/2037 | | | 1,111,623 |
| | 600,000 | | 6.375%, 6/15/2038 | | | 421,326 |
| | | | | | |
| | | Total Energy | | | 49,047,497 |
| | | | | | |
| | Financials (22.5%) | | | |
| | | Ace INA Holdings, Inc. | | | |
| | 775,000 | | 5.800%, 3/15/2018f | | | 622,227 |
| | | American Express Bank FSB/Salt Lake City, UT | | | |
| | 1,250,000 | | 6.000%, 9/13/2017 | | | 934,462 |
| | | American Express Centurion Bank | | | |
| | 1,450,000 | | 5.550%, 10/17/2012f | | | 1,213,286 |
| | | American Express Credit Corporation | | | |
| | 1,750,000 | | 7.300%, 8/20/2013f | | | 1,544,662 |
The accompanying Notes to Financial Statements are an integral part of this schedule.
163
Income Fund
Schedule of Investments as of October 31, 2008
| | | | | | |
Principal
Amount | | Long-Term Fixed Income (102.2%) | | Value |
| | Financials (22.5%) - continued | | | |
| | | American International Group, Inc. | | | |
| $ | 3,000,000 | | 8.250%, 8/15/2018g | | $ | 1,235,667 |
| | | Australia & New Zealand Banking Group, Ltd. | | | |
| | 1,400,000 | | 6.200%, 7/19/2013f,g | | | 1,263,552 |
| | | AXA SA | | | |
| | 2,600,000 | | 6.463%, 12/14/2018g,h | | | 1,427,062 |
| | | Bank of America Corporation | | | |
| | 500,000 | | 6.000%, 9/1/2017e | | | 437,690 |
| | 4,375,000 | | 8.125%, 5/15/2018f,h | | | 3,390,319 |
| | | Bear Stearns Companies, Inc. | | | |
| | 1,200,000 | | 6.950%, 8/10/2012 | | | 1,184,112 |
| | 2,200,000 | | 6.400%, 10/2/2017e,h | | | 1,955,439 |
| | | BNP Paribas SA | | | |
| | 2,100,000 | | 5.186%, 6/29/2015e,g | | | 1,367,287 |
| | | Capital One Capital IV | | | |
| | 1,600,000 | | 6.745%, 2/17/2037 | | | 753,749 |
| | | Capmark Financial Group, Inc. | | | |
| | 3,500,000 | | 6.300%, 5/10/2017f | | | 776,282 |
| | | Chubb Corporation | | | |
| | 1,750,000 | | 5.750%, 5/15/2018f | | | 1,452,370 |
| | | CIGNA Corporation | | | |
| | 2,250,000 | | 6.350%, 3/15/2018e | | | 1,837,582 |
| | | CIT Group, Inc. | | | |
| | 3,600,000 | | 7.625%, 11/30/2012e | | | 2,105,136 |
| | | Citigroup Capital XXI | | | |
| | 1,100,000 | | 8.300%, 12/21/2057h | | | 755,106 |
| | | Citigroup, Inc. | | | |
| | 4,500,000 | | 6.500%, 8/19/2013f | | | 4,265,815 |
| | 1,900,000 | | 5.000%, 9/15/2014f | | | 1,501,880 |
| | 2,200,000 | | 6.000%, 8/15/2017f | | | 1,891,089 |
| | 1,850,000 | | 8.400%, 4/30/2018 | | | 1,285,935 |
| | | CME Group, Inc. | | | |
| | 3,700,000 | | 5.400%, 8/1/2013h | | | 3,492,793 |
| | | Corestates Capital Trust I | | | |
| | 1,000,000 | | 8.000%, 12/15/2026e,g | | | 744,199 |
| | | Countrywide Home Loans, Inc. | | | |
| | 2,250,000 | | 4.125%, 9/15/2009 | | | 2,157,739 |
| | | Coventry Health Care, Inc. | | | |
| | 1,200,000 | | 5.875%, 1/15/2012e | | | 971,544 |
| | 1,000,000 | | 6.125%, 1/15/2015e | | | 685,292 |
| | 600,000 | | 5.950%, 3/15/2017e | | | 387,112 |
| | | Credit Agricole SA | | | |
| | 2,400,000 | | 6.637%, 5/31/2017g | | | 1,859,993 |
| | | Credit Suisse/New York, NY | | | |
| | 2,500,000 | | 6.000%, 2/15/2018e | | | 1,918,990 |
| | | Endurance Specialty Holdings, Ltd. | | | |
| | 2,800,000 | | 6.150%, 10/15/2015e | | | 2,179,092 |
| | | ERP Operating, LP | | | |
| | 1,500,000 | | 5.125%, 3/15/2016e | | | 1,021,413 |
| | | Fifth Third Bank | | | |
| | 2,000,000 | | 4.200%, 2/23/2010 | | | 1,865,414 |
| | | General Electric Capital Corporation | | | |
| | 1,630,000 | | 5.625%, 9/15/2017f | | | 1,332,593 |
| | 700,000 | | 6.150%, 8/7/2037e | | | 514,721 |
| | 350,000 | | 5.875%, 1/14/2038 | | | 249,669 |
| | 2,500,000 | | 6.375%, 11/15/2067e,f | | | 1,616,563 |
| | | General Motors Acceptance Corporation, LLC | | | |
| | 4,550,000 | | 6.000%, 12/15/2011 | | | 2,568,079 |
| | | Goldman Sachs Group, Inc. | | | |
| | 3,500,000 | | 5.125%, 1/15/2015h | | | 2,904,500 |
| | 1,400,000 | | 6.150%, 4/1/2018h | | | 1,159,750 |
| | 700,000 | | 6.750%, 10/1/2037e | | | 455,909 |
| | | HSBC Capital Funding, LP/Jersey Channel Islands | | | |
| | 2,500,000 | | 9.547%, 6/30/2010g,h | | | 2,074,593 |
| | | HSBC Holdings plc | | | |
| | 815,000 | | 6.500%, 5/2/2036e | | | 644,811 |
| | 1,300,000 | | 6.800%, 6/1/2038e | | | 1,072,786 |
| | | International Lease Finance Corporation | | | |
| | 2,095,000 | | 5.750%, 6/15/2011e | | | 1,435,513 |
| | | J.P. Morgan Chase & Company | | | |
| | 1,700,000 | | 5.750%, 1/2/2013e | | | 1,617,728 |
| | 4,500,000 | | 7.900%, 4/30/2018f | | | 3,646,980 |
| | | Keybank National Association | | | |
| | 1,750,000 | | 5.500%, 9/17/2012e | | | 1,484,847 |
| | | KeyCorp | | | |
| | 800,000 | | 6.500%, 5/14/2013 | | | 704,335 |
| | | Lehman Brothers Holdings, Inc. | | | |
| | 3,500,000 | | 5.625%, 1/24/2013j | | | 455,000 |
| | | Liberty Property, LP | | | |
| | 1,830,000 | | 5.500%, 12/15/2016e | | | 1,263,011 |
| | | Lincoln National Corporation | | | |
| | 2,220,000 | | 7.000%, 5/17/2016e | | | 1,043,400 |
| | | Merrill Lynch & Company, Inc. | | | |
| | 2,750,000 | | 5.450%, 2/5/2013 | | | 2,478,732 |
| | 3,000,000 | | 6.875%, 4/25/2018k | | | 2,664,567 |
| | 850,000 | | 6.110%, 1/29/2037e | | | 562,441 |
| | 2,000,000 | | 7.750%, 5/14/2038 | | | 1,641,100 |
| | | MetLife Capital Trust X | | | |
| | 2,200,000 | | 9.250%, 4/8/2038g | | | 1,369,368 |
| | | MetLife, Inc. | | | |
| | 2,600,000 | | 6.817%, 8/15/2018e | | | 2,238,561 |
| | | Mitsubishi UFG Capital Finance, Ltd. | | | |
| | 4,420,000 | | 6.346%, 7/25/2016h | | | 3,094,000 |
| | | Morgan Stanley | | | |
| | 5,350,000 | | 6.625%, 4/1/2018 | | | 4,451,072 |
| | | Nationwide Health Properties, Inc. | | | |
| | 3,850,000 | | 6.250%, 2/1/2013e | | | 3,117,626 |
| | | Preferred Term Securities XXIII, Ltd. | | | |
| | 3,261,120 | | 3.019%, 12/22/2008b,c | | | 1,540,879 |
| | | ProLogis | | | |
| | 2,050,000 | | 5.500%, 4/1/2012e | | | 1,331,401 |
| | 1,400,000 | | 5.625%, 11/15/2015e | | | 746,869 |
| | 1,000,000 | | 6.625%, 5/15/2018k | | | 575,592 |
| | | Prudential Financial, Inc. | | | |
| | 1,600,000 | | 6.000%, 12/1/2017 | | | 1,215,634 |
| | 725,000 | | 5.900%, 3/17/2036h | | | 428,239 |
| | 725,000 | | 5.700%, 12/14/2036h | | | 447,274 |
| | | QBE Capital Funding II, LP | | | |
| | 1,600,000 | | 6.797%, 6/1/2017e,g | | | 680,000 |
| | | RBS Capital Trust I | | | |
| | 2,250,000 | | 5.512%, 9/30/2014h | | | 1,033,583 |
| | | Regency Centers, LP | | | |
| | 1,500,000 | | 5.875%, 6/15/2017 | | | 1,142,736 |
| | | Regions Financial Corporation | | | |
| | 1,700,000 | | 6.375%, 5/15/2012 | | | 1,464,140 |
The accompanying Notes to the Financial Statements are an integral part of this schedule.
164
Income Fund
Schedule of Investments as of October 31, 2008
| | | | | | |
Principal
Amount | | Long-Term Fixed Income (102.2%) | | Value |
| | Financials (22.5%) - continued | | | |
| | | Reinsurance Group of America, Inc. | | | |
| $ | 3,100,000 | | 5.625%, 3/15/2017e | | $ | 2,508,932 |
| | | Resona Bank, Ltd. | | | |
| | 4,000,000 | | 5.850%, 4/15/2016e,g | | | 2,527,644 |
| | | Simon Property Group, LP | | | |
| | 1,485,000 | | 5.750%, 12/1/2015 | | | 1,102,912 |
| | | SLM Corporation | | | |
| | 2,875,000 | | 5.400%, 10/25/2011h | | | 2,036,696 |
| | 1,400,000 | | 8.450%, 6/15/2018 | | | 951,084 |
| | | SMFG Preferred Capital GBP 1, Ltd. | | | |
| | 2,340,000 | | 6.078%, 1/25/2017g | | | 1,608,750 |
| | | Swiss RE Capital I, LP | | | |
| | 2,600,000 | | 6.854%, 5/25/2016g,h | | | 1,424,137 |
| | | Travelers Companies, Inc. | | | |
| | 550,000 | | 6.250%, 6/15/2037h | | | 417,333 |
| | | Travelers Property Casualty Corporation | | | |
| | 2,000,000 | | 5.000%, 3/15/2013e | | | 1,753,398 |
| | | United Health Group | | | |
| | 1,500,000 | | 6.500%, 6/15/2037 | | | 1,014,044 |
| | | UnitedHealth Group, Inc. | | | |
| | 2,200,000 | | 6.000%, 11/15/2017 | | | 1,757,131 |
| | | Wachovia Bank NA | | | |
| | 2,420,000 | | 4.875%, 2/1/2015 | | | 2,069,349 |
| | | Wachovia Capital Trust III | | | |
| | 2,225,000 | | 5.800%, 3/15/2011 | | | 1,190,375 |
| | | Wachovia Corporation | | | |
| | 700,000 | | 7.980%, 3/15/2018 | | | 528,696 |
| | | WEA Finance, LLC | | | |
| | 3,075,000 | | 7.125%, 4/15/2018g | | | 2,413,850 |
| | | WellPoint, Inc. | | | |
| | 4,000,000 | | 5.000%, 12/15/2014e | | | 3,453,020 |
| | | Wells Fargo & Company | | | |
| | 2,700,000 | | 5.625%, 12/11/2017 | | | 2,381,916 |
| | | Wells Fargo Capital XIII | | | |
| | 3,500,000 | | 7.700%, 3/26/2013f | | | 2,861,383 |
| | | Wells Fargo Capital XV | | | |
| | 2,600,000 | | 9.750%, 9/26/2013 | | | 2,522,000 |
| | | Willis North America, Inc. | | | |
| | 2,940,000 | | 6.200%, 3/28/2017e | | | 2,142,437 |
| | | | | | |
| | | Total Financials | | | 145,617,979 |
| | | | | | |
| | Foreign (0.2%) | | | |
| | | United Mexican States | | | |
| | 1,900,000 | | 6.050%, 1/11/2040 | | | 1,442,480 |
| | | | | | |
| | | Total Foreign | | | 1,442,480 |
| | | | | | |
| | Mortgage-Backed Securities (10.3%) | | | |
| | | Federal National Mortgage Association Conventional 30- Yr. Pass Through | | | |
| | 53,000,000 | | 5.500%, 11/1/2038i | | | 51,774,374 |
| | 7,500,000 | | 6.000%, 11/1/2038i | | | 7,495,313 |
| | 7,500,000 | | 6.500%, 11/1/2038i | | | 7,600,785 |
| | | | | | |
| | | Total Mortgage-Backed Securities | | | 66,870,472 |
| | | | | | |
| | Technology (1.2%) | | | |
| | | Hewlett-Packard Company | | | |
| | 2,100,000 | | 4.500%, 3/1/2013h | | | 1,953,472 |
| | 1,500,000 | | 5.500%, 3/1/2018e | | | 1,289,429 |
| | | International Business Machines Corporation | | | |
| | 2,700,000 | | 7.625%, 10/15/2018h | | | 2,793,879 |
| | 1,800,000 | | 8.000%, 10/15/2038 | | | 1,867,014 |
| | | | | | |
| | | Total Technology | | | 7,903,794 |
| | | | | | |
| | Transportation (3.7%) | | | |
| | | Burlington Northern Santa Fe Corporation | | | |
| | 1,800,000 | | 7.000%, 12/15/2025e | | | 1,583,503 |
| | | Continental Airlines, Inc. | | | |
| | 383,541 | | 7.875%, 7/2/2018e | | | 222,454 |
| | 2,250,000 | | 5.983%, 4/19/2022e | | | 1,563,750 |
| | | Delta Air Lines, Inc. | | | |
| | 4,500,000 | | 7.111%, 9/18/2011e | | | 3,600,000 |
| | | FedEx Corporation | | | |
| | 4,251,785 | | 6.720%, 1/15/2022e | | | 4,251,845 |
| | | Kansas City Southern de Mexico SA de CV | | | |
| | 3,650,000 | | 7.375%, 6/1/2014h | | | 2,856,125 |
| | | Northwest Airlines, Inc. | | | |
| | 5,050,000 | | 6.841%, 4/1/2011e | | | 4,014,750 |
| | | Piper Jaffray Equipment Trust Securities | | | |
| | 2,820,057 | | 6.750%, 4/1/2011c | | | 2,086,842 |
| | | Union Pacific Corporation | | | |
| | 2,800,000 | | 5.450%, 1/31/2013e | | | 2,582,910 |
| | 1,400,000 | | 5.700%, 8/15/2018f | | | 1,177,506 |
| | | | | | |
| | | Total Transportation | | | 23,939,685 |
| | | | | | |
| | U.S. Government (7.0%) | | | |
| | | Federal Home Loan Bank | | | |
| | 8,000,000 | | 4.625%, 10/10/2012 | | | 8,127,936 |
| | | Federal Home Loan Mortgage Corporation | | | |
| | 7,500,000 | | 4.125%, 9/27/2013k | | | 7,461,818 |
| | 3,250,000 | | 5.000%, 12/14/2018e | | | 2,952,430 |
| | | Federal National Mortgage Association | | | |
| | 7,000,000 | | 5.250%, 8/1/2012l | | | 6,996,710 |
| | | U.S. Treasury Bonds | | | |
| | 1,020,000 | | 7.625%, 2/15/2025l | | | 1,358,193 |
| | 175,000 | | 4.750%, 2/15/2037 | | | 185,541 |
| | 720,000 | | 5.000%, 5/15/2037k | | | 793,012 |
| | 1,430,000 | | 4.375%, 2/15/2038k | | | 1,434,246 |
| | | U.S. Treasury Notes | | | |
| | 3,800,000 | | 2.750%, 2/28/2013k | | | 3,852,546 |
| | 6,210,000 | | 4.000%, 8/15/2018k | | | 6,218,247 |
| | | U.S. Treasury Notes, TIPS | | | |
| | 6,528,207 | | 2.000%, 7/15/2014 | | | 5,969,229 |
| | | | | | |
| | | Total U.S. Government | | | 45,349,908 |
| | | | | | |
| | Utilities (5.6%) | | | |
| | | AES Corporation | | | |
| | 3,700,000 | | 8.000%, 6/1/2020e,g | | | 2,719,500 |
| | | Cleveland Electric Illuminating Company | | | |
| | 1,065,000 | | 5.700%, 4/1/2017h | | | 848,205 |
| | | Columbus Southern Power Company | | | |
| | 1,600,000 | | 6.050%, 5/1/2018 | | | 1,331,384 |
The accompanying Notes to Financial Statements are an integral part of this schedule.
165
Income Fund
Schedule of Investments as of October 31, 2008
| | | | | | |
Principal
Amount | | Long-Term Fixed Income (102.2%) | | Value |
| | Utilities (5.6%) - continued | | | |
| | | Commonwealth Edison Company | | | |
| $ | 1,885,000 | | 5.400%, 12/15/2011e | | $ | 1,763,531 |
| | 2,170,000 | | 7.500%, 7/1/2013e | | | 2,134,907 |
| | 1,000,000 | | 6.150%, 9/15/2017e | | | 851,018 |
| | | DTE Energy Company | | | |
| | 1,500,000 | | 6.375%, 4/15/2033e | | | 962,811 |
| | | Exelon Corporation | | | |
| | 2,000,000 | | 4.900%, 6/15/2015e | | | 1,496,320 |
| | | Florida Power Corporation | | | |
| | 1,000,000 | | 6.400%, 6/15/2038h | | | 879,730 |
| | | Illinois Power Company | | | |
| | 2,000,000 | | 6.125%, 11/15/2017 | | | 1,624,740 |
| | | ITC Holdings Corporation | | | |
| | 2,000,000 | | 5.875%, 9/30/2016e,g | | | 1,761,538 |
| | 2,500,000 | | 6.050%, 1/31/2018e,g | | | 2,188,060 |
| | | MidAmerican Energy Holdings Company | | | |
| | 1,600,000 | | 6.125%, 4/1/2036e | | | 1,177,744 |
| | 2,200,000 | | 6.500%, 9/15/2037e | | | 1,699,034 |
| | | Nevada Power Company | | | |
| | 1,700,000 | | 6.750%, 7/1/2037e | | | 1,287,213 |
| | | Nisource Finance Corporation | | | |
| | 1,700,000 | | 6.400%, 3/15/2018e | | | 1,231,951 |
| | | NRG Energy, Inc. | | | |
| | 1,500,000 | | 7.250%, 2/1/2014h | | | 1,312,500 |
| | 1,000,000 | | 7.375%, 2/1/2016h | | | 862,500 |
| | | Ohio Edison Company | | | |
| | 950,000 | | 6.875%, 7/15/2036h | | | 729,096 |
| | | Power Contract Financing, LLC | | | |
| | 685,988 | | 6.256%, 2/1/2010c | | | 696,292 |
| | | Power Receivables Finance, LLC | | | |
| | 1,480,776 | | 6.290%, 1/1/2012c | | | 1,541,236 |
| | | Progress Energy, Inc. | | | |
| | 725,000 | | 7.000%, 10/30/2031 | | | 556,409 |
| | | PSEG Power, LLC | | | |
| | 3,200,000 | | 5.000%, 4/1/2014e | | | 2,603,731 |
| | | Southwestern Public Service Company | | | |
| | 1,730,000 | | 6.000%, 10/1/2036 | | | 1,255,720 |
| | | TXU Corporation | | | |
| | 750,000 | | 5.550%, 11/15/2014 | | | 405,960 |
| | | Union Electric Company | | | |
| | 1,600,000 | | 6.400%, 6/15/2017h | | | 1,338,714 |
| | | Virginia Electric and Power Company | | | |
| | 700,000 | | 5.950%, 9/15/2017 | | | 602,749 |
| | 700,000 | | 6.350%, 11/30/2037 | | | 535,205 |
| | | | | | |
| | | Total Utilities | | | 36,397,798 |
| | | | | | |
| | | Total Long-Term Fixed Income (cost $795,445,088) | | | 661,898,169 |
| | | | | | |
| | |
| Shares | | Preferred Stock (0.1%) | | |
| | Financials (0.1%) | | | |
| | 238,000 | | Federal National Mortgage Association, 8.250% | | | 499,800 |
| | | | | | |
| | | Total Financials | | | 499,800 |
| | | | | | |
| | | Total Preferred Stock (cost $4,475,429) | | | 499,800 |
| | | | | | |
| | |
| Shares | | Collateral Held for Securities Loaned (3.3%)m | | |
| | 21,097,170 | | Thrivent Financial Securities Lending Trust | | | 21,097,170 |
| | | | | | |
| | | Total Collateral Held for Securities Loaned (cost $21,097,170) | | | 21,097,170 |
| | | | | | |
| | |
Shares or
Principal
Amount | | Short-Term Investments (8.1%)m | | |
| | | Alcon Capital Corporation | | | |
| | 9,855,000 | | 0.080%, 11/3/2008 | | | 9,854,956 |
| | | Federal Home Loan Bank Discount Notes | | | |
| | 10,215,000 | | 0.900%, 11/12/2008 | | | 10,212,191 |
| | 3,302,000 | | 0.500%, 11/14/2008 | | | 3,301,404 |
| | 1,600,000 | | 1.248%, 12/10/2008n | | | 1,597,837 |
| | | Federal Home Loan Mortgage Corporation Discount Notes | | | |
| | 2,400,000 | | 1.225%, 12/8/2008n | | | 2,396,978 |
| | 5,000,000 | | 2.570%, 12/23/2008 | | | 4,981,439 |
| | | Federal National Mortgage Association Discount Notes | | | |
| | 6,000,000 | | 1.006%, 11/10/2008 | | | 5,998,491 |
| | 650,000 | | 1.348%, 12/8/2008n | | | 649,124 |
| | 2,400,000 | | 2.422%, 12/10/2008f,l,n | | | 2,393,723 |
| | | Novartis Finance Corporation | | | |
| | 4,400,000 | | 0.930%, 11/7/2008 | | | 4,399,318 |
| | 6,179,037 | | Thrivent Money Market Fund | | | 6,179,037 |
| | | | | | |
| | | Total Short-Term Investments (at amortized cost) | | | 51,964,498 |
| | | | | | |
| | | Total Investments (cost $874,454,757) 113.9% | | $ | 737,015,804 |
| | | | | | |
| | | Other Assets and Liabilities, Net (13.9%) | | | (89,890,155) |
| | | | | | |
| | | Total Net Assets 100.0% | | $ | 647,125,649 |
| | | | | | |
| a | The stated interest rate represents the weighted average of all contracts within the bank loan facility. Bank loans generally have rates of interest which are reset either daily, monthly, quarterly or semi-annually by reference to a base lending rate, plus a premium. These base lending rates are primarily the London-Interbank Offered Rate (“LIBOR”), and secondarily the prime rate offered by one or more major United States banks (the “Prime Rate”) and the certificate of deposit (“CD”) rate or other base lending rates used by commercial lenders. Bank loans often require prepayments from excess cash flows or allow the borrower to repay at its election. The rate at which the borrower repays cannot be predicted with accuracy. Therefore, the actual maturity may occur considerably earlier than the stated maturities shown. |
| b | Denotes variable rate obligations for which the current yield and next scheduled reset date are shown. |
The accompanying Notes to the Financial Statements are an integral part of this schedule.
166
Income Fund
Schedule of Investments as of October 31, 2008
| c | Denotes restricted securities. Restricted securities are investment securities which have been deemed illiquid and cannot be offered for public sale without first being registered under the Securities Act of 1933. The following table indicates the acquisition date and cost of restricted securities Income Fund owned as of October 31, 2008. |
| | | | | |
Security | | Acquisition
Date | | Cost |
Capitalsource Commercial Loan Trust | | 4/5/2007 | | $ | 2,320,460 |
Piper Jaffray Equipment Trust Securities | | 9/13/2006 | | | 2,802,069 |
Power Contract Financing, LLC | | 6/11/2003 | | | 685,880 |
Power Receivables Finance, LLC | | 9/30/2003 | | | 1,480,341 |
Preferred Term Securities XXIII, Ltd. | | 9/14/2006 | | | 3,261,120 |
| d | All or a portion of the security is insured or guaranteed. |
| e | At October 31, 2008, $257,341,202 of investments were earmarked to cover open financial futures contracts. |
| f | At October 31, 2008, $46,036,448 of investments were earmarked to cover open swap contracts. |
| g | Denotes securities sold under Rule 144A of the Securities Act of 1933, which exempts them from registration. These securities have been determined to be liquid under the guidelines established by the Fund’s Board of Trustees and may be resold to other dealers in the program or to other qualified institutional buyers. As of October 31, 2008, the value of these investments was $101,344,842 or 15.7% of total net assets. |
| h | Designated as cover for long settling trades as discussed in the Notes to Financial Statements. |
| i | Denotes investments purchased on a when-issued or delayed delivery basis. |
| k | All or a portion of the security is on loan as discussed in item 2(M) of the Notes to Financial Statements. |
| l | At October 31, 2008, $3,264,366 of investments were held on deposit with the counterparty and pledged as the initial margin deposit for open financial futures contracts. |
| m | The interest rate shown reflects the yield, coupon rate or, for securities purchased at a discount, the discount rate at the date of purchase. |
| n | At October 31, 2008, $6,479,127 of investments were pledged as collateral with the custodian under the agreement between the counterparty, the custodian and the fund for open swap contracts. |
Definitions:
| | | | |
| TIPS | | - | | Treasury Inflation Protected Security. |
Gross unrealized appreciation and depreciation of investments, based on cost for federal income tax purposes, were as follows:
| | | | |
Gross unrealized appreciation | | $ | 1,389,496 | |
Gross unrealized depreciation | | | (139,518,336 | ) |
| | | | |
Net unrealized appreciation (depreciation) | | | ($138,128,840 | ) |
Cost for federal income tax purposes | | $ | 875,144,644 | |
The accompanying Notes to Financial Statements are an integral part of this schedule.
167
Income Fund
Schedule of Investments as of October 31, 2008
| | | | | | | | | | | | | | | | | |
Futures | | Number of
Contracts
Long/(Short) | | | Expiration Date | | Notional
Principal
Amount | | | Value | | | Unrealized
Gain/(Loss) | |
2-Yr. U.S. Treasury Bond Futures | | 155 | | | December 2008 | | $ | 33,000,005 | | | $ | 33,298,359 | | | $ | 298,354 | |
5-Yr. U.S. Treasury Bond Futures | | (345 | ) | | December 2008 | | | (38,832,659 | ) | | | (39,073,945 | ) | | | (241,286 | ) |
10-Yr. U.S. Treasury Bond Futures | | (425 | ) | | December 2008 | | | (49,062,961 | ) | | | (48,058,206 | ) | | | 1,004,755 | |
20-Yr. U.S. Treasury Bond Futures | | 340 | | | December 2008 | | | 40,109,395 | | | | 38,462,500 | | | | (1,646,895 | ) |
Total Futures | | | | | | | | | | | | | | | | ($585,072 | ) |
| | | | | | | | | | | | | | | | |
Credit Default Swaps and Counterparty | | Buy/Sell
Protection | | Termination
Date | | Notional
Principal
Amount | | Upfront
Payments
Received (Made) | | Value | | | Unrealized
Gain/(Loss) | |
CDX HY, Series 10, 5 Year, at 5.00%; Bank of America | | Sell | | 6/20/2013 | | $ | 12,830,000 | | $ | 1,052,238 | | ($1,997,484 | ) | | ($818,700 | ) |
CDX HY, Series 11, 5 Year, at 5.00%; Bank of America | | Sell | | 12/20/2013 | | | 9,500,000 | | | 1,651,944 | | (1,769,871 | ) | | (111,417 | ) |
CDX IG Hvol, Series 10, 5 Year, at 3.50%; J.P. Morgan Chase and Co. | | Buy | | 6/20/2013 | | | 3,576,679 | | | 149,678 | | 225,928 | | | 345,519 | |
CDX IG, Series 10, 5 Year, at 1.55%; Bank of America | | Sell | | 6/20/2013 | | | 5,758,400 | | | 62,756 | | (147,789 | ) | | (85,763 | ) |
CDX IG, Series 10, 5 Year, at 1.55%; J.P. Morgan Chase and Co. | | Sell | | 6/20/2013 | | | 5,758,400 | | | 58,003 | | (147,788 | ) | | (90,313 | ) |
LCDX North America, Series 9, 5 Year, at 2.25%; J.P. Morgan Chase and Co. | | Sell | | 12/20/2012 | | | 9,000,000 | | | 224,438 | | (1,195,594 | ) | | (999,586 | ) |
Total Credit Default Swaps | | | | | | | | | | | | ($5,032,598 | ) | | ($1,760,260 | ) |
Investment in Affiliates
Affiliated issuers, as defined under the Investment Company Act of 1940, include those in which the Fund’s holdings of an issuer represent 5% or more of the outstanding voting securities of an issuer, or any affiliated mutual fund.
A summary of transactions for the fiscal year to date, in Income Fund, is as follows:
| | | | | | | | | | | | | | | | | |
Fund | | Value
October 31,
2007 | | Gross
Purchases and
Additions | | Gross Sales and
Reductions | | Balance of
Shares Held at
October 31, 2008 | | Value
October 31, 2008 | | Income Earned
November 1, 2007-
October 31, 2008 |
Money Market | | $ | 17,265,511 | | $ | 136,517,911 | | $ | 147,604,385 | | 6,179,037 | | $ | 6,179,037 | | $ | 639,630 |
Thrivent Financial Securities Lending Trust | | | 58,963,653 | | | 131,925,388 | | | 169,791,871 | | 21,097,170 | | | 21,097,170 | | | 344,123 |
Total Value and Dividend Income | | | 76,229,164 | | | | | | | | | | | 27,276,207 | | | 983,753 |
The accompanying Notes to Financial Statements are an integral part of this schedule.
168
Core Bond Fund
Schedule of Investments as of October 31, 2008
| | | | | | |
Principal
Amount | | Long-Term Fixed Income (111.9%) | | Value |
| | Asset-Backed Securities (13.3%) | | | |
| | | Americredit Automobile Receivables Trust | | | |
| $ | 4,017,124 | | 2.258%, 11/6/2008a,b,c | | $ | 3,695,328 |
| | | Associates Manufactured Housing Contract Pass-Through Certificates | | | |
| | 976,273 | | 7.900%, 3/15/2027c | | | 984,803 |
| | | Bear Stearns Mortgage Funding Trust | | | |
| | 2,023,648 | | 3.399%, 11/25/2008b | | | 399,098 |
| | | Citibank Credit Card Issuance Trust | | | |
| | 3,000,000 | | 5.650%, 9/20/2019d | | | 2,216,274 |
| | | Countrywide Asset-Backed Certificates | | | |
| | 2,314,729 | | 5.549%, 4/25/2036a | | | 2,099,336 |
| | | Credit Based Asset Servicing and Securitization, LLC | | | |
| | 1,984,357 | | 3.369%, 11/25/2008b,c | | | 1,929,996 |
| | 1,970,914 | | 5.501%, 12/25/2036c | | | 1,720,578 |
| | | Discover Card Master Trust | | | |
| | 3,500,000 | | 5.650%, 3/16/2020c | | | 2,486,824 |
| | | First Franklin Mortgage Loan Asset-Backed Certificates | | | |
| | 2,311,665 | | 3.349%, 11/25/2008b,e | | | 2,218,583 |
| | | First Horizon ABS Trust | | | |
| | 2,874,564 | | 3.389%, 11/25/2008a,b,d | | | 1,972,799 |
| | 2,397,633 | | 3.419%, 11/25/2008a,b | | | 1,168,904 |
| | | GMAC Mortgage Corporation Loan Trust | | | |
| | 3,592,936 | | 3.329%, 11/25/2008a,b | | | 2,103,323 |
| | 376,285 | | 3.359%, 11/25/2008a,b,d | | | 363,199 |
| | 4,383,681 | | 3.439%, 11/25/2008a,b | | | 2,391,149 |
| | | Green Tree Financial Corporation | | | |
| | 829,961 | | 7.650%, 10/15/2027d | | | 822,200 |
| | | Merna Re, Ltd. | | | |
| | 2,300,000 | | 5.512%, 12/31/2008b,c,f | | | 2,175,800 |
| | | PG&E Energy Recovery Funding, LLC | | | |
| | 257,404 | | 3.870%, 6/25/2011c | | | 256,991 |
| | | Popular ABS Mortgage Pass-Through Trust | | | |
| | 562,140 | | 4.000%, 12/25/2034d | | | 554,440 |
| | | Renaissance Home Equity Loan Trust | | | |
| | 5,000,000 | | 5.608%, 5/25/2036c,d | | | 4,787,415 |
| | | Residential Asset Securities Corporation | | | |
| | 272,881 | | 4.160%, 7/25/2030d | | | 269,971 |
| | | Residential Funding Mortgage Securities II | | | |
| | 1,164,602 | | 3.389%, 11/25/2008a,b,c | | | 1,104,953 |
| | | SLM Student Loan Trust | | | |
| | 586,781 | | 3.545%, 1/26/2009b,d | | | 584,479 |
| | | Wachovia Asset Securitization, Inc. | | | |
| | 3,410,758 | | 3.399%, 11/25/2008a,b,c,f | | | 2,122,648 |
| | | | | | |
| | | Total Asset-Backed Securities | | | 38,429,091 |
| | | | | | |
| | Basic Materials (0.9%) | | | |
| | | ArcelorMittal | | | |
| | 1,000,000 | | 6.125%, 6/1/2018d,f | | | 689,052 |
| | | Precision Castparts Corporation | | | |
| | 2,000,000 | | 5.600%, 12/15/2013d | | | 2,030,024 |
| | | | | | |
| | | Total Basic Materials | | | 2,719,076 |
| | | | | | |
| | Capital Goods (2.4%) | | | |
| | | Caterpillar Financial Services Corporation | | | |
| | 365,000 | | 5.850%, 9/1/2017d | | | 318,605 |
| | 750,000 | | 7.050%, 10/1/2018d | | | 707,851 |
| | | Honeywell International, Inc. | | | |
| | 775,000 | | 5.300%, 3/1/2018c | | | 681,934 |
| | | John Deere Capital Corporation | | | |
| | 1,500,000 | | 5.350%, 1/17/2012c | | | 1,444,794 |
| | | Oakmont Asset Trust | | | |
| | 2,750,000 | | 4.514%, 12/22/2008d,f | | | 2,750,250 |
| | | United Technologies Corporation | | | |
| | 1,150,000 | | 4.875%, 5/1/2015c | | | 1,047,916 |
| | | | | | |
| | | Total Capital Goods | | | 6,951,350 |
| | | | | | |
| | Collateralized Mortgage Obligations (6.8%) | | | |
| | | Banc of America Mortgage Securities, Inc. | | | |
| | 3,626,543 | | 4.804%, 9/25/2035c,d | | | 2,963,041 |
| | | Countrywide Alternative Loan Trust | | | |
| | 2,320,120 | | 6.000%, 1/25/2037 | | | 2,048,687 |
| | | HomeBanc Mortgage Trust | | | |
| | 2,345,845 | | 5.989%, 4/25/2037d | | | 1,589,899 |
| | | J.P. Morgan Alternative Loan Trust | | | |
| | 3,309,368 | | 5.803%, 3/25/2036d | | | 2,074,272 |
| | | Merrill Lynch Mortgage Investors, Inc. | | | |
| | 3,226,881 | | 4.870%, 6/25/2035c | | | 2,621,489 |
| | | Thornburg Mortgage Securities Trust | | | |
| | 2,528,577 | | 3.349%, 11/25/2008b,c | | | 2,511,815 |
| | 2,503,160 | | 3.369%, 11/25/2008b,d | | | 2,269,450 |
| | | Washington Mutual Mortgage Pass-Through Certificates | | | |
| | 2,650,600 | | 4.833%, 9/25/2035c | | | 2,357,976 |
| | | Zuni Mortgage Loan Trust | | | |
| | 1,491,596 | | 3.389%, 11/25/2008b,c | | | 1,428,284 |
| | | | | | |
| | | Total Collateralized Mortgage Obligations | | | 19,864,913 |
| | | | | | |
| | Commercial Mortgage-Backed Securities (12.0%) | | | |
| | | Bear Stearns Commercial Mortgage Securities, Inc. | | | |
| | 5,000,000 | | 4.710%, 11/15/2008b,c,f | | | 4,522,730 |
| | 1,750,000 | | 5.835%, 9/11/2042c,d | | | 1,053,610 |
| | | Citigroup Commercial Mortgage Trust | | | |
| | 28,506 | | 4.630%, 11/15/2008b,c,f | | | 26,045 |
| | | Commercial Mortgage Pass-Through Certificates | | | |
| | 150,109 | | 4.660%, 11/15/2008b,c,f | | | 138,930 |
| | 4,000,000 | | 4.690%, 11/15/2008b,d,f | | | 3,353,776 |
The accompanying Notes to Financial Statements are an integral part of this schedule.
169
Core Bond Fund
Schedule of Investments as of October 31, 2008
| | | | | | |
Principal
Amount | | Long-Term Fixed Income (111.9%) | | Value |
| | Commercial Mortgage-Backed Securities (12.0%) - continued | | | |
| | | Credit Suisse Mortgage Capital Certificates | | | |
| $ | 4,000,000 | | 4.730%, 11/15/2008b,d,f | | $ | 3,466,796 |
| | | Crown Castle International Corporation | | | |
| | 2,000,000 | | 5.245%, 11/15/2036d,f | | | 1,920,460 |
| | | Greenwich Capital Commercial Funding Corporation | | | |
| | 3,500,000 | | 5.867%, 8/10/2017d | | | 2,121,312 |
| | | GS Mortgage Securities Corporation II | | | |
| | 3,000,000 | | 4.175%, 11/6/2008b,d,f | | | 2,547,327 |
| | | J.P. Morgan Chase Commercial Mortgage Securities Corporation | | | |
| | 3,632,546 | | 5.284%, 5/15/2047d | | | 3,248,524 |
| | 2,500,000 | | 6.007%, 6/15/2049d | | | 1,884,530 |
| | | Merrill Lynch Mortgage Trust | | | |
| | 3,500,000 | | 4.747%, 5/12/2043c | | | 2,775,790 |
| | 3,250,000 | | 5.266%, 1/12/2044c,d | | | 2,221,473 |
| | | TIAA Real Estate CDO, Ltd. | | | |
| | 3,500,000 | | 5.815%, 8/15/2039d | | | 3,117,180 |
| | | Wachovia Bank Commercial Mortgage Trust | | | |
| | 3,125,000 | | 5.765%, 7/15/2045c | | | 2,352,588 |
| | | | | | |
| | | Total Commercial Mortgage-Backed Securities | | | 34,751,071 |
| | | | | | |
| | Communications Services (2.5%) | | | |
| | | AT&T, Inc. | | | |
| | 300,000 | | 6.500%, 9/1/2037c,d | | | 243,700 |
| | | British Telecom plc | | | |
| | 500,000 | | 9.125%, 12/15/2030d | | | 452,765 |
| | | Citizens Communications Company | | | |
| | 850,000 | | 6.250%, 1/15/2013d | | | 703,375 |
| | | Comcast Corporation | | | |
| | 1,300,000 | | 6.500%, 1/15/2015d | | | 1,171,754 |
| | | New Cingular Wireless Services, Inc. | | | |
| | 520,000 | | 8.750%, 3/1/2031c | | | 483,682 |
| | | News America, Inc. | | | |
| | 510,000 | | 6.400%, 12/15/2035d | | | 386,036 |
| | | Rogers Cable, Inc. | | | |
| | 975,000 | | 6.750%, 3/15/2015d | | | 871,075 |
| | 130,000 | | 8.750%, 5/1/2032c | | | 122,548 |
| | | Telecom Italia Capital SA | | | |
| | 1,175,000 | | 5.250%, 10/1/2015c | | | 805,940 |
| | | Time Warner Cable, Inc. | | | |
| | 750,000 | | 6.750%, 7/1/2018c | | | 643,254 |
| | | Verizon Communications, Inc. | | | |
| | 990,000 | | 5.550%, 2/15/2016e | | | 863,785 |
| | 450,000 | | 8.950%, 3/1/2039 | | | 456,673 |
| | | | | | |
| | | Total Communications Services | | | 7,204,587 |
| | | | | | |
| | Consumer Cyclical (1.9%) | | | |
| | | Ford Motor Credit Company | | | |
| | 1,500,000 | | 7.375%, 10/28/2009e | | | 1,245,156 |
| | | McDonald’s Corporation | | | |
| | 525,000 | | 6.300%, 3/1/2038e | | | 458,402 |
| | | MGM MIRAGE | | | |
| | 1,310,000 | | 13.000%, 11/15/2013f,g | | | 1,165,900 |
| | | Nissan Motor Acceptance Corporation | | | |
| | 750,000 | | 4.625%, 3/8/2010c,f | | | 754,187 |
| | 1,110,000 | | 5.625%, 3/14/2011c,f | | | 1,135,342 |
| | | Wal-Mart Stores, Inc. | | | |
| | 800,000 | | 5.875%, 4/5/2027c | | | 683,730 |
| | | | | | |
| | | Total Consumer Cyclical | | | 5,442,717 |
| | | | | | |
| | Consumer Non-Cyclical (1.9%) | | | |
| | | Baxter International, Inc. | | | |
| | 765,000 | | 5.900%, 9/1/2016c,e | | | 714,254 |
| | | HCA, Inc. | | | |
| | 850,000 | | 9.250%, 11/15/2016d | | | 722,500 |
| | | Johnson & Johnson Company | | | |
| | 750,000 | | 5.950%, 8/15/2037c | | | 692,869 |
| | | Kroger Company | | | |
| | 800,000 | | 6.400%, 8/15/2017c | | | 696,062 |
| | | PepsiCo, Inc. | | | |
| | 1,375,000 | | 4.650%, 2/15/2013d | | | 1,321,264 |
| | | Schering-Plough Corporation | | | |
| | 1,200,000 | | 6.000%, 9/15/2017d | | | 1,054,214 |
| | | Wyeth | | | |
| | 340,000 | | 5.950%, 4/1/2037c | | | 276,027 |
| | | | | | |
| | | Total Consumer Non-Cyclical | | | 5,477,190 |
| | | | | | |
| | Energy (2.5%) | | | |
| | | Apache Corporation | | | |
| | 1,400,000 | | 5.250%, 4/15/2013d,e | | | 1,324,553 |
| | | CenterPoint Energy Resources Corporation | | | |
| | 1,150,000 | | 6.125%, 11/1/2017c | | | 882,182 |
| | | EOG Resources, Inc. | | | |
| | 1,000,000 | | 5.875%, 9/15/2017d | | | 884,042 |
| | | Forest Oil Corporation | | | |
| | 1,000,000 | | 7.250%, 6/15/2019d,f | | | 680,000 |
| | | Nexen, Inc. | | | |
| | 900,000 | | 5.650%, 5/15/2017d | | | 714,726 |
| | | Ras Laffan Liquefied Natural Gas Company, Ltd. II | | | |
| | 1,200,000 | | 5.298%, 9/30/2020c,f | | | 1,046,664 |
| | | Ras Laffan Liquefied Natural Gas Company, Ltd. III | | | |
| | 375,000 | | 5.832%, 9/30/2016e,f | | | 342,776 |
| | | Transocean, Inc. | | | |
| | 770,000 | | 6.000%, 3/15/2018c | | | 658,747 |
| | | XTO Energy, Inc. | | | |
| | 800,000 | | 5.500%, 6/15/2018c | | | 629,714 |
| | 200,000 | | 6.375%, 6/15/2038d | | | 140,442 |
| | | | | | |
| | | Total Energy | | | 7,303,846 |
| | | | | | |
| | Financials (10.6%) | | | |
| | | Ace INA Holdings, Inc. | | | |
| | 775,000 | | 5.800%, 3/15/2018d | | | 622,227 |
| | | American Express Bank FSB/Salt Lake City, UT | | | |
| | 500,000 | | 6.000%, 9/13/2017c,d | | | 373,785 |
| | | American Express Company | | | |
| | 400,000 | | 7.000%, 3/19/2018d | | | 308,126 |
| | | American International Group, Inc. | | | |
| | 650,000 | | 8.250%, 8/15/2018d,f | | | 267,728 |
The accompanying Notes to the Financial Statements are an integral part of this schedule.
170
Core Bond Fund
Schedule of Investments as of October 31, 2008
| | | | | | |
Principal
Amount | | Long-Term Fixed Income (111.9%) | | Value |
| | Financials (10.6%) - continued | | | |
| | | Australia & New Zealand Banking Group, Ltd. | | | |
| $ | 1,000,000 | | 6.200%, 7/19/2013d,f | | $ | 902,537 |
| | | Bank of America Corporation | | | |
| | 900,000 | | 6.000%, 9/1/2017c,d | | | 787,841 |
| | 200,000 | | 8.125%, 5/15/2018d | | | 154,986 |
| | | Bear Stearns Companies, Inc. | | | |
| | 775,000 | | 6.950%, 8/10/2012d | | | 764,739 |
| | 800,000 | | 6.400%, 10/2/2017d,e | | | 711,069 |
| | | Capmark Financial Group, Inc. | | | |
| | 1,150,000 | | 5.875%, 5/10/2012d | | | 287,455 |
| | 400,000 | | 6.300%, 5/10/2017d | | | 88,718 |
| | | CIT Group, Inc. | | | |
| | 1,175,000 | | 7.625%, 11/30/2012c | | | 687,093 |
| | | Citigroup, Inc. | | | |
| | 1,500,000 | | 6.500%, 8/19/2013c | | | 1,421,939 |
| | 775,000 | | 5.000%, 9/15/2014c | | | 612,609 |
| | | Corestates Capital Trust I | | | |
| | 1,250,000 | | 8.000%, 12/15/2026c,f | | | 930,249 |
| | | General Electric Capital Corporation | | | |
| | 450,000 | | 5.625%, 9/15/2017c | | | 367,894 |
| | | General Motors Acceptance Corporation, LLC | | | |
| | 1,000,000 | | 6.000%, 12/15/2011d | | | 564,413 |
| | | Goldman Sachs Group, Inc. | | | |
| | 1,500,000 | | 5.125%, 1/15/2015d | | | 1,244,786 |
| | 550,000 | | 6.750%, 10/1/2037d | | | 358,214 |
| | | Goldman Sachs Group, Inc., Convertible | | | |
| | 2,000,000 | | 1.000%, 1/31/2015d,m | | | 1,562,240 |
| | 1,850,000 | | 1.000%, 5/7/2015d,m | | | 1,422,520 |
| | | HSBC Holdings plc | | | |
| | 575,000 | | 6.500%, 5/2/2036c,d | | | 454,928 |
| | | International Lease Finance Corporation | | | |
| | 765,000 | | 5.750%, 6/15/2011d | | | 524,185 |
| | | Lehman Brothers Holdings, Inc. | | | |
| | 1,500,000 | | 5.250%, 2/6/2012h | | | 195,000 |
| | | Liberty Property, LP | | | |
| | 630,000 | | 5.500%, 12/15/2016d | | | 434,807 |
| | | Lincoln National Corporation | | | |
| | 850,000 | | 7.000%, 5/17/2016d | | | 399,500 |
| | | Merrill Lynch & Company, Inc. | | | |
| | 1,125,000 | | 5.450%, 2/5/2013c,d | | | 1,014,027 |
| | 675,000 | | 6.875%, 4/25/2018c | | | 599,528 |
| | | Mitsubishi UFG Capital Finance, Ltd. | | | |
| | 1,595,000 | | 6.346%, 7/25/2016c | | | 1,116,500 |
| | | Nationwide Health Properties, Inc. | | | |
| | 1,375,000 | | 6.250%, 2/1/2013c | | | 1,113,438 |
| | | ProLogis | | | |
| | 2,000,000 | | 5.500%, 4/1/2012d | | | 1,298,928 |
| | | Prudential Financial, Inc. | | | |
| | 775,000 | | 6.100%, 6/15/2017e | | | 621,831 |
| | 390,000 | | 5.700%, 12/14/2036c,d | | | 240,602 |
| | | Reinsurance Group of America, Inc. | | | |
| | 950,000 | | 5.625%, 3/15/2017e | | | 768,866 |
| | | Royal Bank of Scotland Group plc | | | |
| | 1,325,000 | | 6.990%, 10/5/2017d,f | | | 710,174 |
| | | State Street Capitol Trust II | | | |
| | 1,200,000 | | 8.250%, 3/15/2011e | | | 1,033,524 |
| | | Swiss RE Capital I, LP | | | |
| | 850,000 | | 6.854%, 5/25/2016d,f | | | 465,583 |
| | | Travelers Companies, Inc. | | | |
| | 350,000 | | 6.250%, 6/15/2037 | | | 265,575 |
| | | United Health Group | | | |
| | 550,000 | | 6.500%, 6/15/2037d | | | 371,816 |
| | | Wachovia Bank NA | | | |
| | 770,000 | | 4.875%, 2/1/2015c | | | 658,429 |
| | | Wachovia Capital Trust III | | | |
| | 1,895,000 | | 5.800%, 3/15/2011c | | | 1,013,825 |
| | | WEA Finance, LLC | | | |
| | 775,000 | | 7.125%, 4/15/2018c,f | | | 608,369 |
| | | Wells Fargo & Company | | | |
| | 775,000 | | 4.375%, 1/31/2013c | | | 715,522 |
| | 300,000 | | 5.625%, 12/11/2017c | | | 264,657 |
| | | Wells Fargo Capital XV | | | |
| | 900,000 | | 9.750%, 9/26/2013c | | | 873,000 |
| | | Willis North America, Inc. | | | |
| | 760,000 | | 6.200%, 3/28/2017e | | | 553,827 |
| | | | | | |
| | | Total Financials | | | 30,757,609 |
| | | | | | |
| | Foreign (0.5%) | | | |
| | | Corporacion Andina de Fomento | | | |
| | 2,000,000 | | 5.750%, 1/12/2017c | | | 1,510,554 |
| | | | | | |
| | | Total Foreign | | | 1,510,554 |
| | | | | | |
| | Mortgage-Backed Securities (33.9%) | | | |
| | | Federal National Mortgage Association Conventional 30-Yr. Pass Through | | | |
| | 73,750,000 | | 5.500%, 11/1/2038g | | | 72,044,531 |
| | 11,200,000 | | 6.000%, 11/1/2038g | | | 11,193,000 |
| | 15,000,000 | | 6.500%, 11/1/2038g | | | 15,201,570 |
| | | | | | |
| | | Total Mortgage-Backed Securities | | | 98,439,101 |
| | | | | | |
| | Technology (0.6%) | | | |
| | | International Business Machines Corporation | | | |
| | 800,000 | | 7.625%, 10/15/2018d | | | 827,816 |
| | | Oracle Corporation | | | |
| | 1,000,000 | | 5.750%, 4/15/2018d | | | 875,029 |
| | | | | | |
| | | Total Technology | | | 1,702,845 |
| | | | | | |
| | Transportation (2.3%) | | | |
| | | Burlington Northern Santa Fe Corporation | | | |
| | 575,000 | | 7.000%, 12/15/2025c,d | | | 505,841 |
| | | Continental Airlines, Inc. | | | |
| | 1,150,000 | | 5.983%, 4/19/2022d | | | 799,250 |
| | | Delta Air Lines, Inc. | | | |
| | 1,550,000 | | 7.111%, 9/18/2011d | | | 1,240,000 |
| | | FedEx Corporation | | | |
| | 1,128,470 | | 6.720%, 1/15/2022d | | | 1,128,486 |
| | | Southwest Airlines Company | | | |
| | 1,812,641 | | 6.150%, 8/1/2022d | | | 1,418,804 |
| | | Union Pacific Corporation | | | |
| | 1,550,000 | | 6.125%, 1/15/2012c | | | 1,481,825 |
| | | | | | |
| | | Total Transportation | | | 6,574,206 |
| | | | | | |
The accompanying Notes to Financial Statements are an integral part of this schedule.
171
Core Bond Fund
Schedule of Investments as of October 31, 2008
| | | | | | |
Principal
Amount | | Long-Term Fixed Income (111.9%) | | Value |
| | U.S. Government (14.8%) | | | |
| | | Federal Home Loan Bank | | | |
| $ | 5,000,000 | | 5.330%, 3/6/2012d | | $ | 5,043,595 |
| | 2,000,000 | | 4.625%, 10/10/2012c | | | 2,031,984 |
| | | Federal Home Loan Mortgage Corporation | | | |
| | 2,000,000 | | 5.000%, 12/14/2018c | | | 1,816,880 |
| | | Federal National Mortgage Association | | | |
| | 4,000,000 | | 4.625%, 5/1/2013d | | | 3,871,240 |
| | | U.S. Treasury Bonds | | | |
| | 400,000 | | 4.750%, 2/15/2037c | | | 424,094 |
| | 725,000 | | 5.000%, 5/15/2037d,i | | | 798,519 |
| | 575,000 | | 4.375%, 2/15/2038i | | | 576,707 |
| | | U.S. Treasury Notes | | | |
| | 75,000 | | 4.625%, 8/31/2011c | | | 80,953 |
| | 600,000 | | 2.750%, 2/28/2013i | | | 608,297 |
| | 3,550,000 | | 4.000%, 2/15/2015c | | | 3,709,750 |
| | 4,775,000 | | 3.875%, 5/15/2018c | | | 4,767,164 |
| | 1,580,000 | | 4.000%, 8/15/2018c | | | 1,582,098 |
| | | U.S. Treasury Notes, TIPS | | | |
| | 19,180,095 | | 2.000%, 7/15/2014c,d,e | | | 17,537,800 |
| | | | | | |
| | | Total U.S. Government | | | 42,849,081 |
| | | | | | |
| | U.S. Municipals (2.8%) | | | |
| | | California Infrastructure & Economic Bank Revenue Bonds | | | |
| | 3,000,000 | | 5.000%, 7/1/2036c,j | | | 3,029,340 |
| | | Little Rock, Arkansas Sewer Revenue Bonds | | | |
| | 3,000,000 | | 5.000%, 10/1/2037c | | | 2,694,810 |
| | | Missouri Joint Municipal Electric Utility Commission Revenue Bonds (Power Project) | | | |
| | 3,000,000 | | 5.000%, 1/1/2032e | | | 2,530,140 |
| | | | | | |
| | | Total U.S. Municipals | | | 8,254,290 |
| | | | | | |
| | Utilities (2.2%) | | | |
| | | Cleveland Electric Illuminating Company | | | |
| | 825,000 | | 5.700%, 4/1/2017c | | | 657,061 |
| | | Commonwealth Edison Company | | | |
| | 965,000 | | 5.400%, 12/15/2011c | | | 902,816 |
| | | Exelon Corporation | | | |
| | 1,500,000 | | 6.750%, 5/1/2011e | | | 1,430,391 |
| | | ITC Holdings Corporation | | | |
| | 775,000 | | 6.050%, 1/31/2018c,f | | | 678,299 |
| | | MidAmerican Energy Holdings Company | | | |
| | 775,000 | | 6.500%, 9/15/2037d | | | 598,523 |
| | | Power Receivables Finance, LLC | | | |
| | 740,388 | | 6.290%, 1/1/2012k | | | 770,618 |
| | | Union Electric Company | | | |
| | 1,150,000 | | 6.400%, 6/15/2017c | | | 962,200 |
| | | Virginia Electric & Power Company | | | |
| | 515,000 | | 6.000%, 1/15/2036c | | | 389,746 |
| | | | | | |
| | | Total Utilities | | | 6,389,654 |
| | | | | | |
| | | Total Long-Term Fixed Income (cost $371,732,689) | | | 324,621,181 |
| | | | | | |
| | |
| Shares | | Preferred Stock (0.7%) | | |
| | Financials (0.7%) | | | |
| | 20,100 | | Allegro Investment Corporation SA TGT, Reverse Convertible, 20.000%d,f,l,m | | | 759,609 |
| | 68,717 | | Credit Suisse New York, NY, Zero Couponc,m | | | 1,049,996 |
| | 56,005 | | Federal National Mortgage Association, 8.250%d | | | 117,610 |
| | | | | | |
| | | Total Financials | | | 1,927,215 |
| | | | | | |
| | | Total Preferred Stock (cost $3,543,673) | | | 1,927,215 |
| | | | | | |
| | |
| | | Contracts Options Purchased (<0.1%) | | |
| | 510 | | Call on U.S. Treasury Note Futures $117.50, expires 11/21/2008 | | | 79,688 |
| | | | | | |
| | | Total Options Purchased (cost $1,021,530) | | | 79,688 |
| | | | | | |
| | |
| | | Collateral Held for Securities Loaned (0.5%)n | | |
| | 1,605,479 | | Thrivent Financial Securities Lending Trust | | | 1,605,479 |
| | | | | | |
| | | Total Collateral Held for Securities Loaned (cost $1,605,479) | | | 1,605,479 |
| | | | | | |
| | |
Shares or
Principal
Amount | | Short-Term Investments (22.7%)n | | |
| | | Alcon Capital Corporation | | | |
| | 4,265,000 | | 0.080%, 11/3/2008 | | | 4,264,981 |
| | | Federal Home Loan Bank Discount Notes | | | |
| | 13,710,000 | | 1.027%, 11/10/2008c,d | | | 13,706,480 |
| | 15,030,000 | | 1.167%, 11/13/2008c,e | | | 15,024,154 |
| | 2,100,000 | | 1.359%, 12/10/2008o,p | | | 2,096,908 |
| | | Federal Home Loan Mortgage Corporation Discount Notes | | | |
| | 8,000,000 | | 2.570%, 12/23/2008c | | | 7,970,302 |
| | | Federal National Mortgage Association Discount Notes | | | |
| | 2,100,000 | | 1.200%, 11/13/2008c | | | 2,099,160 |
| | 8,000,000 | | 0.450%, 11/17/2008 | | | 7,998,400 |
| | 900,000 | | 1.667%, 12/10/2008p | | | 898,375 |
| | 11,588,686 | | Thrivent Money Market Fund | | | 11,588,686 |
| | | | | | |
| | | Total Short-Term Investments (at amortized cost) | | | 65,647,446 |
| | | | | | |
| | | Total Investments (cost $443,550,817) 135.8% | | $ | 393,881,009 |
| | | | | | |
| | | Other Assets and Liabilities, Net (35.8%) | | | (103,927,682) |
| | | | | | |
| | | Total Net Assets 100.0% | | $ | 289,953,327 |
| | | | | | |
| a | All or a portion of the security is insured or guaranteed. |
| b | Denotes variable rate obligations for which the current yield and next scheduled reset date are shown. |
| c | At October 31, 2008, $125,012,585 of investments were earmarked to cover open financial futures contracts. |
| d | Designated as cover for long settling trades as discussed in the Notes to Financial Statements. |
The accompanying Notes to the Financial Statements are an integral part of this schedule.
172
Core Bond Fund
Schedule of Investments as of October 31, 2008
| e | At October 31, 2008, $18,539,882 of investments were earmarked to cover open swap contracts. |
| f | Denotes securities sold under Rule 144A of the Securities Act of 1933, which exempts them from registration. These securities have been determined to be liquid under the guidelines established by the Fund’s Board of Trustees and may be resold to other dealers in the program or to other qualified institutional buyers. As of October 31, 2008, the value of these investments was $34,161,231 or 11.8% of total net assets. |
| g | Denotes investments purchased on a when-issued or delayed delivery basis. |
| i | All or a portion of the security is on loan as discussed in item 2(M) of the Notes to Financial Statements. |
| j | Denotes securities that have been pre-refunded or escrowed to maturity. Under such an arrangement, money is deposited into an irrevocable escrow account and is used to purchase U.S. Treasury securities or government agency securities with maturing principal and interest earnings sufficient to pay all debt service requirements of the pre-refunded bonds. |
| k | Denotes restricted securities. Restricted securities are investment securities which have been deemed illiquid and cannot be offered for public sale without first being registered under the Securities Act of 1933. The following table indicates the acquisition date and cost of restricted securities Core Bond Fund owned as of October 31, 2008. |
| | | | | |
Security | | Acquisition
Date | | Cost |
Power Receivables Finance, LLC | | 9/30/2003 | | $ | 740,170 |
| l | Non-income producing security. |
| m | These securities are Equity-Linked Structured Securities as discussed in item 2(Q) of the Notes to Financial Statements. |
| n | The interest rate shown reflects the yield, coupon rate or, for securities purchased at a discount, the discount rate at the date of purchase. |
| o | At October 31, 2008, $1,198,233 of investments were held on deposit with the counterparty and pledged as the initial margin deposit for open financial futures contracts. |
| p | At October 31, 2008, $1,797,050 of investments were pledged as collateral with the custodian under the agreement between the counterparty, the custodian and the fund for open swap contracts. |
Definitions:
| | | | |
| TIPS | | - | | Treasury Inflation Protected Security. |
Gross unrealized appreciation and depreciation of investments, based on cost for federal income tax purposes, were as follows:
| | | | |
Gross unrealized appreciation | | $ | 1,200,643 | |
Gross unrealized depreciation | | | (51,291,039 | ) |
| | | | |
Net unrealized appreciation (depreciation) | | | ($50,090,396 | ) |
Cost for federal income tax purposes | | $ | 443,971,405 | |
The accompanying Notes to Financial Statements are an integral part of this schedule.
173
Core Bond Fund
Schedule of Investments as of October 31, 2008
| | | | | | | | | | | | | | |
Futures | | Number of
Contracts
Long/(Short) | | Expiration Date | | Notional
Principal
Amount | | | Value | | | Unrealized
Gain/(Loss) | |
2-Yr. U.S. Treasury Bond Futures | | (140) | | December 2008 | | ($29,738,479 | ) | | ($30,075,936 | ) | | | ($337,457 | ) |
5-Yr. U.S. Treasury Bond Futures | | (195) | | December 2008 | | (21,851,241 | ) | | (22,085,273 | ) | | | (234,032 | ) |
10-Yr. U.S. Treasury Bond Futures | | (500) | | December 2008 | | (57,822,695 | ) | | (56,539,066 | ) | | | 1,283,629 | |
20-Yr. U.S. Treasury Bond Futures | | 100 | | December 2008 | | 11,794,005 | | | 11,312,500 | | | | (481,505 | ) |
Total Futures | | | | | | | | | | | | $ | 230,635 | |
| | | | | | | | | | | | | | | | |
Credit Default Swaps and Counterparty | | Buy/Sell
Protection | | Termination
Date | | Notional
Principal
Amount | | Upfront
Payments
Received (Made) | | Value | | | Unrealized
Gain/(Loss) | |
CDX HY, Series 10, 5 Year, at 5.00%; Bank of America | | Sell | | 6/20/2013 | | $ | 4,000,000 | | $ | 248,889 | | ($622,754 | ) | | ($379,300 | ) |
CDX HY, Series 10, 5 Year, at 5.00%; Bank of America | | Sell | | 6/20/2013 | | | 1,000,000 | | | 88,194 | | (155,686 | ) | | (68,835 | ) |
CDX HY, Series 10, 5 Year, at 5.00%; J.P. Morgan Chase & Co. | | Sell | | 6/20/2013 | | | 2,000,000 | | | 106,945 | | (311,379 | ) | | (182,163 | ) |
CDX HY, Series 11, 5 Year, at 5.00%; Bank of America | | Sell | | 12/20/2013 | | | 3,000,000 | | | 530,000 | | (558,891 | ) | | (22,041 | ) |
CDX IG, Series 10, 5 Year, at 1.55%; Bank of America | | Sell | | 6/20/2013 | | | 1,488,400 | | | 16,221 | | (38,200 | ) | | (22,168 | ) |
CDX IG, Series 10, 5 Year, at 1.55%; J.P. Morgan Chase & Co. | | Sell | | 6/20/2013 | | | 1,488,400 | | | 14,992 | | (38,200 | ) | | (23,344 | ) |
Total Credit Default Swaps | | | | | | | | | | | | ($1,725,110 | ) | | ($697,851 | ) |
Investment in Affiliates
Affiliated issuers, as defined under the Investment Company Act of 1940, include those in which the Fund’s holdings of an issuer represent 5% or more of the outstanding voting securities of an issuer, or any affiliated mutual fund.
A summary of transactions for the fiscal year to date, in Core Bond Fund, is as follows:
| | | | | | | | | | | | | | | | | |
Fund | | Value
October 31,
2007 | | Gross
Purchases and
Additions | | Gross Sales and
Reductions | | Balance of
Shares Held at
October 31, 2008 | | Value
October 31, 2008 | | Income Earned
November 1, 2007-
October 31, 2008 |
Money Market | | $ | 32,927,528 | | $ | 86,440,137 | | $ | 107,778,979 | | 11,588,686 | | $ | 11,588,686 | | $ | 771,838 |
Thrivent Financial Securities Lending Trust | | | 28,870,709 | | | 60,149,114 | | | 87,414,344 | | 1,605,479 | | | 1,605,479 | | | 136,269 |
Total Value and Dividend Income | | | 61,798,237 | | | | | | | | | | | 13,194,165 | | | 908,107 |
The accompanying Notes to Financial Statements are an integral part of this schedule.
174
Limited Maturity Bond Fund
Schedule of Investments as of October 31, 2008
| | | | | | |
Principal
Amount | | Long-Term Fixed Income (100.1%) | | Value |
| | Asset-Backed Securities (26.2%) | | | |
| | | Americredit Automobile Receivables Trust | | | |
| $ | 1,205,137 | | 2.258%, 11/6/2008a,b | | $ | 1,108,598 |
| | 2,010,690 | | 3.430%, 7/6/2011a,c | | | 1,932,721 |
| | 2,500,000 | | 5.490%, 7/6/2012a | | | 2,396,335 |
| | | Bank of America Credit Card Trust | | | |
| | 4,500,000 | | 4.070%, 7/16/2012d | | | 4,331,407 |
| | | BMW Vehicle Lease Trust | | | |
| | 4,000,000 | | 4.590%, 8/15/2013e | | | 3,897,912 |
| | | Cabela’s Master Credit Card Trust | | | |
| | 4,500,000 | | 4.310%, 12/16/2013e,f | | | 4,141,089 |
| | | Capital Auto Receivables Asset Trust | | | |
| | 3,000,000 | | 5.380%, 7/15/2010 | | | 2,970,264 |
| | 4,100,006 | | 4.980%, 5/15/2011 | | | 4,026,579 |
| | | Carmax Auto Owner Trust | | | |
| | 3,750,000 | | 4.960%, 11/17/2008b,d | | | 3,622,459 |
| | | Chase Funding Issuance Trust | | | |
| | 3,750,000 | | 4.960%, 9/17/2012d | | | 3,561,949 |
| | | Citibank Credit Card Issuance Trust | | | |
| | 3,475,000 | | 4.850%, 2/10/2011 | | | 3,454,192 |
| | | CNH Equipment Trust | | | |
| | 3,000,000 | | 5.160%, 11/17/2008b,d | | | 2,904,255 |
| | 2,949,983 | | 4.400%, 5/16/2011d | | | 2,906,854 |
| | | Countrywide Alternative Loan Trust | | | |
| | 1,830,657 | | 5.500%, 2/25/2036 | | | 1,587,967 |
| | | Countrywide Asset-Backed Certificates | | | |
| | 1,322,702 | | 5.549%, 4/25/2036a | | | 1,199,621 |
| | 2,269,000 | | 5.683%, 10/25/2046 | | | 2,090,527 |
| | | Countrywide Home Loans Asset-Backed Securities | | | |
| | 2,000,000 | | 6.085%, 6/25/2021a | | | 725,352 |
| | | CPL Transition Funding, LLC | | | |
| | 1,203,238 | | 5.560%, 1/15/2012 | | | 1,228,712 |
| | | Credit Acceptance Auto Dealer Loan Trust | | | |
| | 1,209,526 | | 5.320%, 10/15/2012a,f | | | 1,187,640 |
| | | Credit Based Asset Servicing and Securitization, LLC | | | |
| | 1,576,731 | | 5.501%, 12/25/2036c | | | 1,376,462 |
| | | DaimlerChrysler Auto Trust | | | |
| | 940,155 | | 5.330%, 8/8/2010 | | | 932,859 |
| | 4,500,000 | | 5.000%, 2/8/2012 | | | 4,242,065 |
| | | Discover Card Master Trust | | | |
| | 4,500,000 | | 5.100%, 10/15/2013d | | | 4,138,681 |
| | | Drive Auto Receivables Trust | | | |
| | 627,528 | | 5.300%, 7/15/2011a,f | | | 625,355 |
| | | Federal Home Loan Mortgage Corporation | | | |
| | 1,975,417 | | 3.299%, 11/25/2008b,c | | | 1,911,215 |
| | | First Franklin Mortgage Loan Asset-Backed Certificates | | | |
| | 86,028 | | 5.500%, 3/25/2036g,h | | | 9 |
| | | First Horizon ABS Trust | | | |
| | 646,092 | | 3.389%, 11/25/2008a,b | | | 383,867 |
| | | Ford Credit Auto Owner Trust | | | |
| | 1,500,000 | | 5.150%, 11/15/2011d | | | 1,432,386 |
| | | GE Commercial Loan Trust | | | |
| | 10,716 | | 4.563%, 1/20/2009b,f | | | 10,502 |
| | | GMAC Mortgage Corporation Loan Trust | | | |
| | 2,694,702 | | 3.329%, 11/25/2008a,b | | | 1,577,492 |
| | 313,571 | | 3.359%, 11/25/2008a,b | | | 302,666 |
| | 1,315,104 | | 3.439%, 11/25/2008a,b | | | 717,345 |
| | 2,500,000 | | 5.750%, 10/25/2036a | | | 2,010,040 |
| | | Harley Davidson Motorcycle Trust | | | |
| | 3,500,000 | | 4.910%, 11/17/2008b,d | | | 3,390,740 |
| | 828,246 | | 5.240%, 1/15/2012c | | | 824,004 |
| | 392,662 | | 3.200%, 5/15/2012 | | | 389,365 |
| | | Honda Auto Receivables Owner Trust | | | |
| | 2,000,000 | | 4.470%, 1/18/2012 | | | 1,913,172 |
| | | Household Home Equity Loan Trust | | | |
| | 3,500,000 | | 5.320%, 3/20/2036 | | | 3,236,404 |
| | 2,000,000 | | 5.660%, 3/20/2036e | | | 1,915,082 |
| | | Merna Re, Ltd. | | | |
| | 3,500,000 | | 5.512%, 12/31/2008b,d,f | | | 3,311,000 |
| | | Merrill Auto Trust Securitization | | | |
| | 4,000,000 | | 5.500%, 3/15/2012d | | | 3,864,464 |
| | | Mortgage Equity Conversion Asset Trust | | | |
| | 2,959,466 | | 2.610%, 11/25/2008b,d,f | | | 2,826,290 |
| | 2,944,380 | | 2.640%, 11/25/2008b,f | | | 2,811,883 |
| | | Nissan Auto Receivables Owner Trust | | | |
| | 128,003 | | 4.740%, 9/15/2009 | | | 127,980 |
| | 3,000,000 | | 5.030%, 5/16/2011 | | | 2,940,951 |
| | 3,500,000 | | 4.280%, 7/15/2013 | | | 3,182,847 |
| | | Nomura Asset Acceptance Corporation | | | |
| | 93,750 | | 3.399%, 11/25/2008b,f | | | 76,061 |
| | | PG&E Energy Recovery Funding, LLC | | | |
| | 286,004 | | 3.870%, 6/25/2011d | | | 285,545 |
| | | Popular ABS Mortgage Pass-Through Trust | | | |
| | 140,535 | | 4.000%, 12/25/2034 | | | 138,610 |
| | | Renaissance Home Equity Loan Trust | | | |
| | 2,000,000 | | 5.608%, 5/25/2036 | | | 1,914,966 |
| | | Residential Asset Mortgage Products, Inc. | | | |
| | 1,148,056 | | 4.547%, 12/25/2034 | | | 1,048,033 |
| | | Residential Asset Securities Corporation | | | |
| | 539,464 | | 5.010%, 4/25/2033 | | | 392,331 |
| | | Residential Funding Mortgage Securities | | | |
| | 2,653,765 | | 4.470%, 7/25/2018a | | | 2,500,574 |
| | | Santander Drive Auto Receivables Trust | | | |
| | 2,716,783 | | 5.050%, 9/15/2011a,d | | | 2,683,625 |
| | | SLM Student Loan Trust | | | |
| | 176,034 | | 3.545%, 1/26/2009b,d | | | 175,344 |
| | | USAA Auto Owner Trust | | | |
| | 49,190 | | 4.830%, 4/15/2010d | | | 49,198 |
| | 4,000,000 | | 4.500%, 10/15/2013d | | | 3,773,712 |
The accompanying Notes to Financial Statements are an integral part of this schedule.
175
Limited Maturity Bond Fund
Schedule of Investments as of October 31, 2008
| | | | | | |
Principal
Amount | | Long-Term Fixed Income (100.1%) | | Value |
| | Asset-Backed Securities (26.2%) - continued | | | |
| | | Wachovia Asset Securitization, Inc. | | | |
| $ | 1,279,034 | | 3.399%, 11/25/2008a,b,d,f | | $ | 795,993 |
| | | Wachovia Auto Loan Owner Trust | | | |
| | 1,880,931 | | 5.230%, 8/22/2011d,f | | | 1,866,762 |
| | | Wachovia Auto Owner Trust | | | |
| | 4,500,000 | | 4.810%, 9/20/2012 | | | 4,233,451 |
| | | Washington Mutual Master Note Trust | | | |
| | 4,000,000 | | 4.590%, 11/17/2008b,f | | | 3,325,796 |
| | | | | | |
| | | Total Asset-Backed Securities | | | 122,929,560 |
| | | | | | |
| | Basic Materials (0.8%) | | | |
| | | ArcelorMittal | | | |
| | 1,000,000 | | 5.375%, 6/1/2013c,f | | | 812,560 |
| | | Lubrizol Corporation | | | |
| | 1,000,000 | | 4.625%, 10/1/2009 | | | 963,337 |
| | | Nucor Corporation | | | |
| | 1,300,000 | | 5.000%, 6/1/2013 | | | 1,234,190 |
| | | Rio Tinto Finance. Ltd. | | | |
| | 1,000,000 | | 5.875%, 7/15/2013 | | | 853,310 |
| | | | | | |
| | | Total Basic Materials | | | 3,863,397 |
| | | | | | |
| | Capital Goods (1.9%) | | | |
| | | Caterpillar Financial Services Corporation | | | |
| | 500,000 | | 4.850%, 12/7/2012e | | | 464,474 |
| | 1,650,000 | | 6.200%, 9/30/2013i | | | 1,591,272 |
| | | John Deere Capital Corporation | | | |
| | 1,000,000 | | 4.400%, 7/15/2009c | | | 992,407 |
| | 800,000 | | 5.350%, 1/17/2012e | | | 770,557 |
| | | Litton Industries, Inc. | | | |
| | 1,650,000 | | 8.000%, 10/15/2009 | | | 1,649,135 |
| | | Lockheed Martin Corporation | | | |
| | 1,250,000 | | 4.121%, 3/14/2013 | | | 1,158,667 |
| | | Oakmont Asset Trust | | | |
| | 1,000,000 | | 4.514%, 12/22/2008f | | | 999,848 |
| | | Textron Financial Corporation | | | |
| | 1,100,000 | | 5.125%, 2/3/2011 | | | 982,363 |
| | | | | | |
| | | Total Capital Goods | | | 8,608,723 |
| | | | | | |
| | Collateralized Mortgage Obligations (6.4%) | | | |
| | | American Home Mortgage Assets | | | |
| | 2,056,854 | | 3.585%, 11/1/2008b | | | 910,558 |
| | | Banc of America Mortgage Securities, Inc. | | | |
| | 1,087,963 | | 4.804%, 9/25/2035 | | | 888,913 |
| | | Bear Stearns Adjustable Rate Mortgage Trust | | | |
| | 1,437,228 | | 4.625%, 8/25/2010b | | | 1,227,697 |
| | | Chase Mortgage Finance Corporation | | | |
| | 1,605,871 | | 4.568%, 11/25/2008 | | | 1,375,152 |
| | | Citigroup Mortgage Loan Trust, Inc. | | | |
| | 434,106 | | 5.536%, 3/25/2036 | | | 428,857 |
| | | Countrywide Alternative Loan Trust | | | |
| | 1,452,799 | | 6.000%, 1/25/2037 | | | 1,282,835 |
| | | Countrywide Home Loans, Inc. | | | |
| | 1,544,883 | | 5.342%, 3/20/2036e | | | 942,536 |
| | 1,657,779 | | 5.807%, 9/20/2036d | | | 986,496 |
| | | Deutsche Alt-A Securities, Inc. | | | |
| | 2,539,177 | | 4.029%, 11/1/2008b | | | 1,249,090 |
| | | HomeBanc Mortgage Trust | | | |
| | 1,340,483 | | 5.989%, 4/25/2037d | | | 908,514 |
| | | Impac CMB Trust | | | |
| | 480,515 | | 3.579%, 11/25/2008b,c | | | 266,980 |
| | | J.P. Morgan Alternative Loan Trust | | | |
| | 2,478,717 | | 5.803%, 3/25/2036 | | | 1,553,630 |
| | | J.P. Morgan Mortgage Trust | | | |
| | 2,371,663 | | 5.003%, 7/25/2035c | | | 2,194,054 |
| | | Merrill Lynch Mortgage Investors, Inc. | | | |
| | 2,296,894 | | 4.870%, 6/25/2035 | | | 1,865,976 |
| | | Residential Accredit Loans, Inc. | | | |
| | 1,246,267 | | 5.600%, 9/25/2035 | | | 803,257 |
| | | Thornburg Mortgage Securities Trust | | | |
| | 938,685 | | 3.369%, 11/25/2008b,d | | | 851,044 |
| | | Wachovia Mortgage Loan Trust, LLC | | | |
| | 1,300,387 | | 5.562%, 5/20/2036d | | | 1,052,316 |
| | | Washington Mutual Alternative Loan Trust | | | |
| | 2,901,965 | | 3.415%, 11/1/2008b,d | | | 1,309,713 |
| | 1,995,921 | | 3.585%, 11/1/2008b | | | 971,027 |
| | | Washington Mutual Mortgage Pass-Through Certificates | | | |
| | 2,082,177 | | 3.550%, 11/1/2008b | | | 1,004,175 |
| | 859,858 | | 3.549%, 11/25/2008b,d | | | 487,377 |
| | 795,180 | | 4.833%, 9/25/2035d | | | 707,393 |
| | | Washington Mutual, Inc. | | | |
| | 2,416,560 | | 3.405%, 11/1/2008b,d | | | 1,155,426 |
| | 2,484,517 | | 3.485%, 11/1/2008b | | | 1,148,400 |
| | | Wells Fargo Mortgage Backed Securities Trust | | | |
| | 3,500,000 | | 3.698%, 11/25/2008d | | | 3,435,499 |
| | 544,823 | | 4.950%, 3/25/2036 | | | 422,873 |
| | 660,845 | | 5.093%, 3/25/2036 | | | 524,257 |
| | | | | | |
| | | Total Collateralized Mortgage Obligations | | | 29,954,045 |
| | | | | | |
| | Commercial Mortgage-Backed Securities (11.3%) | | | |
| | | Banc of America Commercial Mortgage, Inc. | | | |
| | 2,600,000 | | 5.001%, 9/10/2010e | | | 2,444,104 |
| | 341,995 | | 4.037%, 11/10/2039c | | | 338,903 |
| | | Banc of America Large Loan Trust | | | |
| | 2,968,325 | | 4.670%, 11/15/2008b,d,f | | | 2,589,517 |
| | 3,000,000 | | 4.770%, 11/15/2008b,d,f | | | 2,655,804 |
| | | Bear Stearns Commercial Mortgage Securities, Inc. | | | |
| | 2,000,000 | | 4.710%, 11/15/2008b,e,f | | | 1,809,092 |
| | 3,628,225 | | 3.869%, 2/11/2041 | | | 3,595,154 |
| | 3,478,961 | | 5.422%, 9/11/2042 | | | 3,198,174 |
| | | Commercial Mortgage Pass-Through Certificates | | | |
| | 45,033 | | 4.660%, 11/15/2008b,f | | | 41,679 |
| | 1,000,000 | | 4.690%, 11/15/2008b,f | | | 838,444 |
| | 3,000,000 | | 4.740%, 11/15/2008b,e,f | | | 2,578,992 |
The accompanying Notes to the Financial Statements are an integral part of this schedule.
176
Limited Maturity Bond Fund
Schedule of Investments as of October 31, 2008
| | | | | | |
Principal
Amount | | Long-Term Fixed Income (100.1%) | | Value |
| | Commercial Mortgage-Backed Securities (11.3%) - continued | | | |
| | | Credit Suisse First Boston Mortgage Securities Corporation | | | |
| $ | 3,000,000 | | 4.609%, 2/15/2038d | | $ | 2,864,085 |
| | 4,000,000 | | 3.382%, 5/15/2038 | | | 3,796,372 |
| | | Credit Suisse Mortgage Capital Certificates | | | |
| | 1,500,000 | | 4.730%, 11/15/2008b,e,f | | | 1,300,048 |
| | | Crown Castle International Corporation | | | |
| | 2,620,000 | | 5.245%, 11/15/2036d,f | | | 2,515,803 |
| | | General Electric Commercial Mortgage Corporation | | | |
| | 927,444 | | 4.591%, 7/10/2045e | | | 891,579 |
| | | J.P. Morgan Chase Commercial Mortgage Securities Corporation | | | |
| | 1,500,000 | | 4.302%, 1/15/2038 | | | 1,373,552 |
| | 502,932 | | 2.790%, 1/12/2039 | | | 495,350 |
| | 4,000,000 | | 5.198%, 12/15/2044 | | | 3,743,896 |
| | | LB-UBS Commercial Mortgage Trust | | | |
| | 6,490 | | 3.323%, 3/15/2027c | | | 6,450 |
| | 1,123,775 | | 4.207%, 11/15/2027 | | | 1,087,938 |
| | 1,781,766 | | 4.567%, 6/15/2029d | | | 1,760,823 |
| | 4,500,000 | | 4.187%, 8/15/2029 | | | 4,393,714 |
| | 685,275 | | 4.741%, 9/15/2040 | | | 668,704 |
| | | TIAA Real Estate CDO, Ltd. | | | |
| | 4,000,000 | | 5.815%, 8/15/2039d | | | 3,562,492 |
| | | Wachovia Bank Commercial Mortgage Trust | | | |
| | 2,500,903 | | 3.894%, 11/15/2035d | | | 2,493,440 |
| | 266,121 | | 3.958%, 12/15/2035d | | | 265,335 |
| | | Washington Mutual Asset Securities Corporation | | | |
| | 1,565,371 | | 3.830%, 1/25/2035f | | | 1,476,123 |
| | | | | | |
| | | Total Commercial Mortgage-Backed Securities | | | 52,785,567 |
| | | | | | |
| | Communications Services (3.3%) | | | |
| | | Ameritech Capital Funding Corporation | | | |
| | 1,200,000 | | 6.250%, 5/18/2009 | | | 1,213,162 |
| | | AT&T, Inc. | | | |
| | 750,000 | | 4.950%, 1/15/2013d | | | 694,402 |
| | | British Telecom plc | | | |
| | 1,000,000 | | 8.625%, 12/15/2010e | | | 988,030 |
| | | Comcast Cable Communications, Inc. | | | |
| | 1,400,000 | | 6.200%, 11/15/2008d | | | 1,407,550 |
| | 900,000 | | 6.875%, 6/15/2009e | | | 892,645 |
| | | Cox Communications, Inc. | | | |
| | 750,000 | | 7.875%, 8/15/2009e | | | 717,365 |
| | 600,000 | | 4.625%, 1/15/2010 | | | 575,137 |
| | | GTE Corporation | | | |
| | 1,050,000 | | 7.510%, 4/1/2009e | | | 1,057,775 |
| | | Qwest Corporation | | | |
| | 500,000 | | 5.625%, 11/15/2008d | | | 499,890 |
| | | Rogers Cable, Inc. | | | |
| | 1,120,000 | | 7.875%, 5/1/2012 | | | 1,106,873 |
| | | SBC Communications, Inc. | | | |
| | 1,000,000 | | 4.125%, 9/15/2009 | | | 988,510 |
| | | Telecom Italia Capital SA | | | |
| | 1,000,000 | | 4.000%, 11/15/2008d | | | 999,664 |
| | 600,000 | | 6.200%, 7/18/2011d | | | 509,090 |
| | | Telefonos de Mexico SA de CV | | | |
| | 500,000 | | 4.500%, 11/19/2008d | | | 499,900 |
| | | Thomson Reuters Corporation | | | |
| | 1,000,000 | | 5.950%, 7/15/2013 | | | 907,191 |
| | | Time Warner Cable, Inc. | | | |
| | 1,100,000 | | 5.400%, 7/2/2012d | | | 986,018 |
| | 1,000,000 | | 6.200%, 7/1/2013 | | | 912,283 |
| | | Verizon Communications, Inc. | | | |
| | 650,000 | | 4.350%, 2/15/2013d | | | 579,062 |
| | | | | | |
| | | Total Communications Services | | | 15,534,547 |
| | | | | | |
| | Consumer Cyclical (3.0%) | | | |
| | | CVS Caremark Corporation | | | |
| | 1,300,000 | | 3.111%, 12/1/2008b,e | | | 1,174,551 |
| | | CVS Corporation | | | |
| | 1,200,000 | | 4.000%, 9/15/2009e | | | 1,157,144 |
| | | D.R. Horton, Inc. | | | |
| | 900,000 | | 8.000%, 2/1/2009c | | | 868,500 |
| | | Ford Motor Credit Company | | | |
| | 2,000,000 | | 7.375%, 10/28/2009 | | | 1,660,208 |
| | | May Department Stores Company | | | |
| | 900,000 | | 4.800%, 7/15/2009 | | | 851,495 |
| | | McDonald’s Corporation | | | |
| | 1,275,000 | | 4.300%, 3/1/2013 | | | 1,252,092 |
| | | MGM MIRAGE | | | |
| | 1,840,000 | | 13.000%, 11/15/2013f,j | | | 1,637,600 |
| | | Nissan Motor Acceptance Corporation | | | |
| | 1,200,000 | | 4.625%, 3/8/2010f | | | 1,206,699 |
| | | SLM Private Credit Student Loan Trust | | | |
| | 893,536 | | 2.829%, 12/15/2008b,d | | | 835,456 |
| | | Wal-Mart Stores, Inc. | | | |
| | 700,000 | | 4.250%, 4/15/2013 | | | 680,276 |
| | | Walt Disney Company | | | |
| | 2,600,000 | | 4.705%, 1/16/2009b,c | | | 2,515,547 |
| | | | | | |
| | | Total Consumer Cyclical | | | 13,839,568 |
| | | | | | |
| | Consumer Non-Cyclical (2.0%) | | | |
| | | Abbott Laboratories | | | |
| | 700,000 | | 5.150%, 11/30/2012c | | | 691,897 |
| | | AstraZeneca plc | | | |
| | 625,000 | | 5.400%, 9/15/2012d | | | 614,975 |
| | | Bottling Group, LLC | | | |
| | 1,000,000 | | 6.950%, 3/15/2014 | | | 1,021,991 |
| | | Bunge Limited Finance Corporation | | | |
| | 1,600,000 | | 4.375%, 12/15/2008c | | | 1,598,777 |
| | | Cargill, Inc. | | | |
| | 1,000,000 | | 5.200%, 1/22/2013c,f | | | 909,007 |
| | | Fortune Brands, Inc. | | | |
| | 890,000 | | 5.125%, 1/15/2011c,d | | | 823,044 |
| | | Kellogg Company | | | |
| | 1,250,000 | | 5.125%, 12/3/2012d | | | 1,192,657 |
| | | Kroger Company | | | |
| | 1,225,000 | | 7.250%, 6/1/2009 | | | 1,233,819 |
| | | PepsiCo, Inc. | | | |
| | 650,000 | | 4.650%, 2/15/2013 | | | 624,597 |
The accompanying Notes to Financial Statements are an integral part of this schedule.
177
Limited Maturity Bond Fund
Schedule of Investments as of October 31, 2008
| | | | | | |
Principal
Amount | | Long-Term Fixed Income (100.1%) | | Value |
| | Consumer Non-Cyclical (2.0%) - continued | | | |
| | | Safeway, Inc. | | | |
| $ | 400,000 | | 6.500%, 11/15/2008d | | $ | 400,259 |
| | | | | | |
| | | Total Consumer Non-Cyclical | | | 9,111,023 |
| | | | | | |
| | Energy (1.6%) | | | |
| | | Energy Transfer Partners, LP | | | |
| | 1,000,000 | | 6.000%, 7/1/2013e | | | 887,080 |
| | | Enterprise Products Operating, LP | | | |
| | 500,000 | | 4.625%, 10/15/2009 | | | 478,568 |
| | | Occidental Petroleum Corporation | | | |
| | 1,000,000 | | 7.000%, 11/1/2013 | | | 1,029,060 |
| | | Premcor Refining Group, Inc. | | | |
| | 900,000 | | 6.125%, 5/1/2011 | | | 903,176 |
| | | Ras Laffan Liquefied Natural Gas Company, Ltd. III | | | |
| | 625,000 | | 5.832%, 9/30/2016f | | | 571,294 |
| | | Sempra Energy | | | |
| | 1,600,000 | | 7.950%, 3/1/2010d | | | 1,608,578 |
| | | Transocean, Inc. | | | |
| | 650,000 | | 5.250%, 3/15/2013d | | | 591,922 |
| | | Weatherford International, Ltd. | | | |
| | 1,000,000 | | 5.150%, 3/15/2013 | | | 867,734 |
| | | Western Oil Sands, Inc. | | | |
| | 650,000 | | 8.375%, 5/1/2012 | | | 652,032 |
| | | | | | |
| | | Total Energy | | | 7,589,444 |
| | | | | | |
| | Financials (11.6%) | | | |
| | | Allstate Life Global Funding Trust | | | |
| | 1,000,000 | | 5.375%, 4/30/2013e | | | 903,708 |
| | | American Express Centurion Bank | | | |
| | 1,000,000 | | 5.200%, 11/26/2010c | | | 907,744 |
| | | American Express Company | | | |
| | 1,650,000 | | 5.875%, 5/2/2013d | | | 1,379,293 |
| | | Australia & New Zealand Banking Group, Ltd. | | | |
| | 1,650,000 | | 6.200%, 7/19/2013d,f | | | 1,489,186 |
| | | Bank of New York Mellon Corporation | | | |
| | 1,600,000 | | 4.950%, 11/1/2012d,e | | | 1,543,899 |
| | | Bear Stearns Companies, Inc. | | | |
| | 1,000,000 | | 4.550%, 6/23/2010 | | | 977,604 |
| | | Berkshire Hathaway Finance Corporation | | | |
| | 650,000 | | 5.000%, 8/15/2013c,f | | | 618,965 |
| | | Capmark Financial Group, Inc. | | | |
| | 850,000 | | 5.875%, 5/10/2012 | | | 212,467 |
| | | CIT Group, Inc. | | | |
| | 1,100,000 | | 5.200%, 11/3/2010c | | | 678,893 |
| | 500,000 | | 7.625%, 11/30/2012d | | | 292,380 |
| | | Citigroup, Inc. | | | |
| | 1,600,000 | | 5.125%, 2/14/2011c | | | 1,516,274 |
| | 1,000,000 | | 5.500%, 4/11/2013e | | | 914,730 |
| | 1,650,000 | | 6.500%, 8/19/2013d | | | 1,564,132 |
| | | CME Group, Inc. | | | |
| | 1,300,000 | | 5.400%, 8/1/2013d | | | 1,227,197 |
| | | Corestates Capital Trust I | | | |
| | 300,000 | | 8.000%, 12/15/2026f | | | 223,260 |
| | | Credit Suisse First Boston USA, Inc. | | | |
| | 900,000 | | 2.944%, 12/9/2008b,e | | | 900,000 |
| | | Credit Suisse New York, NY | | | |
| | 1,000,000 | | 5.000%, 5/15/2013d | | | 901,851 |
| | | Developers Diversified Realty Corporation | | | |
| | 600,000 | | 4.625%, 8/1/2010 | | | 527,830 |
| | | Fifth Third Bancorp | | | |
| | 675,000 | | 6.250%, 5/1/2013e | | | 585,654 |
| | | General Electric Capital Corporation | | | |
| | 900,000 | | 5.200%, 2/1/2011d | | | 870,472 |
| | 1,000,000 | | 4.800%, 5/1/2013c | | | 898,686 |
| | | General Motors Acceptance Corporation, LLC | | | |
| | 1,200,000 | | 6.875%, 8/28/2012e | | | 656,759 |
| | | Goldman Sachs Group, Inc. | | | |
| | 3,500,000 | | 3.290%, 12/23/2008b | | | 3,306,317 |
| | 900,000 | | 6.875%, 1/15/2011e | | | 877,484 |
| | | Goldman Sachs Group, Inc., Convertible | | | |
| | 2,500,000 | | 1.000%, 1/31/2015e,o | | | 1,952,800 |
| | 1,250,000 | | 1.000%, 5/7/2015o | | | 961,162 |
| | | International Lease Finance Corporation | | | |
| | 950,000 | | 5.750%, 6/15/2011c | | | 650,949 |
| | | iSTAR Financial, Inc. | | | |
| | 750,000 | | 4.875%, 1/15/2009d | | | 622,500 |
| | | J.P. Morgan Chase & Company | | | |
| | 1,650,000 | | 6.750%, 2/1/2011e | | | 1,638,521 |
| | 705,000 | | 5.600%, 6/1/2011 | | | 691,716 |
| | | Lehman Brothers Holdings E-Capital Trust I | | | |
| | 1,500,000 | | 3.589%, 11/19/2008b,k | | | 150 |
| | | Lehman Brothers Holdings, Inc. | | | |
| | 800,000 | | 5.250%, 2/6/2012k | | | 104,000 |
| | | Lincoln National Corporation | | | |
| | 550,000 | | 5.650%, 8/27/2012 | | | 520,134 |
| | | Merrill Lynch & Company, Inc. | | | |
| | 3,500,000 | | 3.079%, 11/5/2008b | | | 3,173,142 |
| | 1,000,000 | | 6.150%, 4/25/2013 | | | 922,701 |
| | | Metropolitan Life Global Funding | | | |
| | 1,320,000 | | 5.125%, 4/10/2013f | | | 1,179,965 |
| | | Monumental Global Funding, Ltd. | | | |
| | 670,000 | | 5.500%, 4/22/2013f | | | 635,249 |
| | | Morgan Stanley | | | |
| | 1,750,000 | | 5.033%, 1/15/2009b | | | 1,614,814 |
| | 650,000 | | 5.050%, 1/21/2011 | | | 592,216 |
| | 650,000 | | 5.250%, 11/2/2012i | | | 545,469 |
| | | Nations Bank Capital Trust IV | | | |
| | 2,700,000 | | 8.250%, 4/15/2027d | | | 2,239,474 |
| | | Northern Trust Company | | | |
| | 1,000,000 | | 5.500%, 8/15/2013 | | | 988,960 |
| | | Protective Life Secured Trust | | | |
| | 1,000,000 | | 4.000%, 10/7/2009 | | | 959,088 |
| | | Simon Property Group, LP | | | |
| | 1,700,000 | | 4.600%, 6/15/2010 | | | 1,575,279 |
| | | SLM Corporation | | | |
| | 1,000,000 | | 4.000%, 1/15/2009d | | | 953,118 |
| | | State Street Capitol Trust II | | | |
| | 1,000,000 | | 8.250%, 3/15/2011d | | | 861,270 |
| | | UFJ Finance Aruba AEC | | | |
| | 1,650,000 | | 8.750%, 11/13/2008 | | | 1,647,195 |
The accompanying Notes to the Financial Statements are an integral part of this schedule.
178
Limited Maturity Bond Fund
Schedule of Investments as of October 31, 2008
| | | | | | |
Principal
Amount | | Long-Term Fixed Income (100.1%) | | Value |
| | Financials (11.6%) - continued | | | |
| | | UnitedHealth Group, Inc. | | | |
| $ | 1,000,000 | | 5.500%, 11/15/2012d | | $ | 883,257 |
| | | Wachovia Capital Trust III | | | |
| | 300,000 | | 5.800%, 3/15/2011d | | | 160,500 |
| | | Wachovia Corporation | | | |
| | 700,000 | | 6.150%, 3/15/2009d | | | 694,174 |
| | 1,000,000 | | 5.500%, 5/1/2013 | | | 938,849 |
| | | Wells Fargo & Company | | | |
| | 1,000,000 | | 2.919%, 12/15/2008b,e | | | 979,546 |
| | 325,000 | | 4.375%, 1/31/2013 | | | 300,058 |
| | | Wells Fargo Capital XIII | | | |
| | 1,000,000 | | 7.700%, 3/26/2013 | | | 817,538 |
| | | Wells Fargo Capital XV | | | |
| | 1,000,000 | | 9.750%, 9/26/2013 | | | 970,000 |
| | | | | | |
| | | Total Financials | | | 54,748,579 |
| | | | | | |
| | Foreign (0.4%) | | | |
| | | Corporacion Andina de Fomento | | | |
| | 2,500,000 | | 5.750%, 1/12/2017e | | | 1,888,193 |
| | | | | | |
| | | Total Foreign | | | 1,888,193 |
| | | | | | |
| | Mortgage-Backed Securities (3.3%) | | | |
| | | Federal National Mortgage Association | | | |
| | 3,479,548 | | 6.000%, 8/1/2024 | | | 3,484,454 |
| | | Federal National Mortgage Association Conventional 30-Yr. Pass Through | | | |
| | 2,000,000 | | 6.000%, 11/1/2038j | | | 1,998,750 |
| | 10,000,000 | | 6.500%, 11/1/2038j | | | 10,134,380 |
| | | | | | |
| | | Total Mortgage-Backed Securities | | | 15,617,584 |
| | | | | | |
| | Technology (0.9%) | | | |
| | | Hewlett-Packard Company | | | |
| | 1,300,000 | | 4.500%, 3/1/2013d | | | 1,209,292 |
| | | International Business Machines | | | |
| | | Corporation | | | |
| | 2,000,000 | | 6.500%, 10/15/2013 | | | 2,057,622 |
| | | Sun Microsystems, Inc. | | | |
| | 300,000 | | 7.650%, 8/15/2009d | | | 299,428 |
| | | Xerox Corporation | | | |
| | 900,000 | | 5.500%, 5/15/2012 | | | 699,476 |
| | | | | | |
| | | Total Technology | | | 4,265,818 |
| | | | | | |
| | Transportation (0.9%) | | | |
| | | Delta Air Lines, Inc. | | | |
| | 625,000 | | 7.111%, 9/18/2011e | | | 500,000 |
| | | FedEx Corporation | | | |
| | 700,000 | | 3.500%, 4/1/2009d | | | 688,667 |
| | | Norfolk Southern Corporation | | | |
| | 1,400,000 | | 6.200%, 4/15/2009 | | | 1,395,170 |
| | | Northwest Airlines, Inc. | | | |
| | 1,085,000 | | 6.841%, 4/1/2011 | | | 862,575 |
| | | Union Pacific Corporation | | | |
| | 500,000 | | 6.125%, 1/15/2012d | | | 478,008 |
| | 400,000 | | 5.450%, 1/31/2013d | | | 368,987 |
| | | | | | |
| | | Total Transportation | | | 4,293,407 |
| | | | | | |
| | U.S. Government (24.4%) | | | |
| | | Federal Farm Credit Bank | | | |
| | 4,000,000 | | 5.375%, 7/18/2011l | | | 4,186,252 |
| | 5,000,000 | | 3.875%, 8/25/2011i | | | 5,052,755 |
| | | Federal Home Loan Bank | | | |
| | 9,650,000 | | 4.250%, 11/20/2009i | | | 9,754,770 |
| | 3,000,000 | | 3.550%, 1/25/2010 | | | 3,010,620 |
| | 5,000,000 | | 2.750%, 6/18/2010 | | | 4,958,875 |
| | 5,000,000 | | 3.500%, 7/16/2010i | | | 5,018,580 |
| | 5,000,000 | | 3.375%, 8/13/2010 | | | 5,008,875 |
| | 6,000,000 | | 3.375%, 10/20/2010 | | | 6,012,834 |
| | 2,500,000 | | 3.625%, 7/1/2011i | | | 2,512,465 |
| | 5,000,000 | | 3.625%, 9/16/2011i | | | 5,023,265 |
| | 4,000,000 | | 4.625%, 10/10/2012 | | | 4,063,968 |
| | | Federal Home Loan Mortgage Corporation | | | |
| | 2,000,000 | | 4.750%, 11/3/2009e | | | 2,033,808 |
| | 8,500,000 | | 4.125%, 11/30/2009i | | | 8,597,274 |
| | | Federal National Mortgage Association | | | |
| | 7,500,000 | | 3.875%, 12/10/2009 | | | 7,566,982 |
| | 5,000,000 | | 2.500%, 4/9/2010 | | | 4,953,880 |
| | 2,500,000 | | 5.125%, 4/15/2011e | | | 2,598,195 |
| | 5,000,000 | | 4.625%, 5/1/2013 | | | 4,839,050 |
| | | U.S. Treasury Notes | | | |
| | 12,500,000 | | 2.125%, 1/31/2010i | | | 12,599,613 |
| | 725,000 | | 2.750%, 2/28/2013i | | | 735,025 |
| | | U.S. Treasury Notes, TIPS | | | |
| | 17,436,450 | | 2.000%, 7/15/2014 | | | 15,943,454 |
| | | | | | |
| | | Total U.S. Government | | | 114,470,540 |
| | | | | | |
| | U.S. Municipals (0.8%) | | | |
| | | Denver, Colorado City & County Airport Revenue Bonds | | | |
| | 2,500,000 | | 5.250%, 11/15/2032d | | | 2,514,525 |
| | | Houston, Texas Utility System Revenue Bonds | | | |
| | 650,000 | | 5.000%, 5/15/2011 | | | 667,674 |
| | | South Carolina State Public Service Authority Revenue Bonds | | | |
| | 650,000 | | 5.750%, 1/1/2014d,m | | | 682,656 |
| | | | | | |
| | | Total U.S. Municipals | | | 3,864,855 |
| | | | | | |
| | Utilities (1.3%) | | | |
| | | Carolina Power & Light, Inc. | | | |
| | 1,300,000 | | 5.950%, 3/1/2009c | | | 1,296,415 |
| | | Cleveland Electric Illuminating Company | | | |
| | 235,000 | | 7.430%, 11/1/2009 | | | 236,494 |
| | | National Rural Utilities | | | |
| | | Cooperative Finance Corporation | | | |
| | 1,350,000 | | 5.500%, 7/1/2013 | | | 1,200,655 |
| | | Oncor Electric Delivery Company | | | |
| | 1,300,000 | | 5.950%, 9/1/2013f | | | 1,191,605 |
| | | Pacific Gas & Electric Company | | | |
| | 500,000 | | 3.600%, 3/1/2009 | | | 495,589 |
| | | Power Receivables Finance, LLC | | | |
| | 246,796 | | 6.290%, 1/1/2012g | | | 256,873 |
| | | Virginia Electric & Power Company | | | |
| | 1,000,000 | | 4.500%, 12/15/2010d | | | 981,184 |
The accompanying Notes to Financial Statements are an integral part of this schedule.
179
Limited Maturity Bond Fund
Schedule of Investments as of October 31, 2008
| | | | | | |
Principal
Amount | | Long-Term Fixed Income (100.1%) | | Value |
| | Utilities (1.3%) - continued | | | |
| $ | 640,000 | | 5.100%, 11/30/2012d | | $ | 583,428 |
| | | | | | |
| | | Total Utilities | | | 6,242,243 |
| | | | | | |
| | | Total Long-Term Fixed Income (cost $510,465,036) | | | 469,607,093 |
| | | | | | |
| | |
| Shares | | Preferred Stock (0.4%) | | |
| | Financials (0.4%) | | | |
| | 25,125 | | Allegro Investment Corporation SA TGT, Reverse Convertible, 20.000%e,f,n,o | | | 949,511 |
| | 46,750 | | Credit Suisse New York, NY, Zero Coupone,o | | | 714,340 |
| | 72,400 | | Federal National Mortgage Association, 8.250% | | | 152,040 |
| | | | | | |
| | | Total Financials | | | 1,815,891 |
| | | | | | |
| | | Total Preferred Stock (cost $3,920,193) | | | 1,815,891 |
| | | | | | |
| | |
| Contracts | | Options Purchased (<0.1%) | | |
| | | Call on U.S. Treasury Bond Futures | | | |
| | 410 | | $117.50, expires 11/21/2008 | | | 64,062 |
| | | | | | |
| | | Total Options Purchased (cost $821,230) | | | 64,062 |
| | | | | | |
| | |
| Shares | | Collateral Held for Securities Loaned (11.3%)p | | |
| | 52,879,250 | | Thrivent Financial Securities Lending Trust | | | 52,879,250 |
| | | | | | |
| | | Total Collateral Held for Securities Loaned (cost $52,879,250) | | | 52,879,250 |
| | | | | | |
| | |
Shares or
Principal
Amount | | Short-Term Investments (3.1%)p | | |
| | | Alcon Capital Corporation | | | |
| | 3,970,000 | | 0.080%, 11/3/2008 | | | 3,969,982 |
| | | Federal Home Loan Bank Discount Notes | | | |
| | 1,100,000 | | 1.164%, 12/10/2008l,q | | | 1,098,613 |
| | | Federal Home Loan Mortgage Corporation Discount Notes | | | |
| | 350,000 | | 1.200%, 12/8/2008q | | | 349,569 |
| | | Federal National Mortgage Association Discount Notes | | | |
| | 200,000 | | 1.300%, 12/8/2008l | | | 199,733 |
| | 1,050,000 | | 2.300%, 12/10/2008l,q | | | 1,047,402 |
| | 7,923,037 | | Thrivent Money Market Fund | | | 7,923,037 |
| | | | | | |
| | | Total Short-Term Investments (at amortized cost) | | | 14,588,336 |
| | | | | | |
| | | Total Investments (cost $582,674,045) 114.9% | | $ | 538,954,632 |
| | | | | | |
| | | Other Assets and Liabilities, Net (14.9%) | | | (70,068,178) |
| | | | | | |
| | | Total Net Assets 100.0% | | $ | 468,886,454 |
| | | | | | |
| a | All or a portion of the security is insured or guaranteed. |
| b | Denotes variable rate obligations for which the current yield and next scheduled reset date are shown. |
| c | Designated as cover for long settling trades as discussed in the Notes to Financial Statements. |
| d | At October 31, 2008, $110,534,293 of investments were earmarked to cover open financial futures contracts. |
| e | At October 31, 2008, $46,579,752 of investments were earmarked to cover open swap contracts. |
| f | Denotes securities sold under Rule 144A of the Securities Act of 1933, which exempts them from registration. These securities have been determined to be liquid under the guidelines established by the Fund’s Board of Trustees and may be resold to other dealers in the program or to other qualified institutional buyers. As of October 31, 2008, the value of these investments was $49,208,622 or 10.5% of total net assets. |
| g | Denotes restricted securities. Restricted securities are investment securities which have been deemed illiquid and cannot be offered for public sale without first being registered under the Securities Act of 1933. The following table indicates the acquisition date and cost of restricted securities Limited Maturity Bond Fund owned as of October 31, 2008. |
| | | | | |
Security | | Acquisition
Date | | Cost |
First Franklin Mortgage Loan Asset-Backed Certificates | | 4/19/2008 | | $ | 85,895 |
Power Receivables Finance, LLC | | 9/30/2003 | | | 246,724 |
| i | All or a portion of the security is on loan as discussed in item 2(M) of the Notes to Financial Statements. |
| j | Denotes investments purchased on a when-issued or delayed delivery basis. |
| l | At October 31, 2008, $1,202,405 of investments were held on deposit with the counterparty and pledged as the initial margin deposit for open financial futures contracts. |
| m | Denotes securities that have been pre-refunded or escrowed to maturity. Under such an arrangement, money is deposited into an irrevocable escrow account and is used to purchase U.S. Treasury securities or government agency securities with maturing principal and interest earnings sufficient to pay all debt service requirements of the pre-refunded bonds. |
| n | Non-income producing security. |
| o | These securities are Equity-Linked Structured Securities as discussed in item 2(Q) of the Notes to Financial Statements. |
| p | The interest rate shown reflects the yield, coupon rate or, for securities purchased at a discount, the discount rate at the date of purchase. |
| q | At October 31, 2008, $1,597,568 of investments were pledged as collateral with the custodian under the agreement between the counterparty, the custodian and the fund for open swap contracts. |
Definitions:
| | | | |
| TIPS | | - | | Treasury Inflation Protected Security. |
| LIBOR | | - | | London Interbank Offered Rate. |
Gross unrealized appreciation and depreciation of investments, based on cost for federal income tax purposes, were as follows:
| | | | |
Gross unrealized appreciation | | $ | 1,621,454 | |
Gross unrealized depreciation | | | (45,447,517 | ) |
| | | | |
Net unrealized appreciation (depreciation) | | | ($43,826,063 | ) |
Cost for federal income tax purposes | | $ | 582,780,695 | |
The accompanying Notes to the Financial Statements are an integral part of this schedule.
180
Limited Maturity Bond Fund
Schedule of Investments as of October 31, 2008
| | | | | | | | | | | | | | |
Futures | | Number of
Contracts
Long/(Short) | | | Expiration
Date | | Notional
Principal
Amount | | | Value | | | Unrealized
Gain/(Loss) | |
2-Yr. U.S. Treasury Bond Futures | | (115 | ) | | December 2008 | | ($24,466,993 | ) | | ($24,705,234 | ) | | ($238,241 | ) |
5-Yr. U.S. Treasury Bond Futures | | (355 | ) | | December 2008 | | (39,717,315 | ) | | (40,206,523 | ) | | (489,208 | ) |
10-Yr. U.S. Treasury Bond Futures | | (275 | ) | | December 2008 | | (31,802,482 | ) | | (31,096,485 | ) | | 705,997 | |
20-Yr. U.S. Treasury Bond Futures | | 35 | | | December 2008 | | 4,127,902 | | | 3,959,375 | | | (168,527 | ) |
Total Futures | | | | | | | | | | | | | ($189,979 | ) |
| | | | | | | | | | | | | | | | |
Credit Default Swaps and Counterparty | | Buy/Sell
Protection | | Termination
Date | | Notional
Principal
Amount | | Upfront
Payments
Received
(Made) | | Value | | | Unrealized
Gain/(Loss) | |
CDX HY, Series 10, 5 Year, at 5.00%; Bank of America | | Sell | | 6/20/2013 | | $ | 1,000,000 | | $ | 88,194 | | ($155,686 | ) | | ($68,835 | ) |
CDX HY, Series 10, 5 Year, at 5.00%; J.P. Morgan Chase and Co. | | Sell | | 6/20/2013 | | | 2,000,000 | | | 106,944 | | (311,380 | ) | | (182,164 | ) |
CDX HY, Series 11, 5 Year, at 5.00%; Bank of America | | Sell | | 12/20/2013 | | | 4,500,000 | | | 795,000 | | (838,337 | ) | | (33,062 | ) |
CDX IG, Series 10, 5 Year, at 1.55%; Bank of America | | Sell | | 6/20/2013 | | | 2,440,000 | | | 26,592 | | (62,622 | ) | | (36,340 | ) |
CDX IG, Series 10, 5 Year, at 1.55%; J.P. Morgan Chaseand Co. | | Sell | | 6/20/2013 | | | 2,440,000 | | | 24,578 | | (62,622 | ) | | (38,268 | ) |
LCDX, N.A., Index Series 8, 5 Year, at 1.20%; Bank of America | | Sell | | 6/20/2012 | | | 1,615,000 | | | 21,375 | | (212,165 | ) | | (220,826 | ) |
LCDX, N.A., Index Series 8, 5 Year, at 1.20%; J.P. Morgan Chase and Co. | | Sell | | 6/20/2012 | | | 1,615,000 | | | 21,375 | | (212,166 | ) | | (219,743 | ) |
Total Credit Default Swaps | | | | | | | | | | | | ($1,854,978 | ) | | ($799,238 | ) |
| | | | | | | | | | | | | | | | | | |
Interest Rate Swaps and Counterparty | | Fund
Receives | | | Fund Pays | | Termination
Date | | Notional
Principal
Amount | | Upfront
Payments
Received (Made) | | Value | | Unrealized
Gain/(Loss) |
Bank of America, N.A., 2 Year | | 5.306 | % | | 3 Month
LIBOR | | 6/29/2009 | | $ | 15,000,000 | | N/A | | $ | 262,160 | | $ | 262,160 |
Bank of America, N.A., 2 Year | | 5.275 | % | | 3 Month
LIBOR | | 5/29/2009 | | | 11,000,000 | | N/A | | | 179,235 | | | 179,235 |
Total Interest Rate Swaps | | | | | | | | | | | | | | $ | 441,395 | | $ | 441,395 |
Investment in Affiliates
Affiliated issuers, as defined under the Investment Company Act of 1940, include those in which the Fund’s holdings of an issuer represent 5% or more of the outstanding voting securities of an issuer, or any affiliated mutual fund.
A summary of transactions for the fiscal year to date, in Limited Maturity Bond Fund, is as follows:
| | | | | | | | | | | | | | | | | |
Fund | | Value
October 31,
2007 | | Gross
Purchases and
Additions | | Gross Sales and
Reductions | | Balance of
Shares Held at
October 31, 2008 | | Value
October 31, 2008 | | Income Earned
November 1, 2007-
October 31, 2008 |
Money Market | | $ | 28,229,455 | | $ | 144,571,171 | | $ | 164,877,589 | | 7,923,037 | | $ | 7,923,037 | | $ | 757,954 |
Thrivent Financial Securities Lending Trust | | | 14,722,625 | | | 210,466,803 | | | 172,310,178 | | 52,879,250 | | | 52,879,250 | | | 349,421 |
Total Value and Dividend Income | | | 42,952,080 | | | | | | | | | | | 60,802,287 | | | 1,107,375 |
The accompanying Notes to Financial Statements are an integral part of this schedule.
181
Money Market Fund
Schedule of Investments as of October 31, 2008
| | | | | | |
Principal
Amount | | Certificates of Deposit (0.9%)a | | Value |
| | | US Bank NA | | | |
| $ | 13,500,000 | | 2.950%, 3/11/2009 | | $ | 13,500,000 |
| | | | | | |
| | | Total Certificates of Deposit | | | 13,500,000 |
| | | | | | |
| | |
| | | Commercial Paper (78.5%)a | | |
| | Asset-Backed Commercial Paper (2.9%) | | | |
| | | GOVCO, Inc. | | | |
| | 10,115,000 | | 2.750%, 11/20/2008b | | | 10,100,319 |
| | 13,510,000 | | 3.050%, 12/10/2008b | | | 13,465,361 |
| | 6,750,000 | | 3.020%, 12/18/2008b | | | 6,723,386 |
| | 13,600,000 | | 2.600%, 1/28/2009b | | | 13,513,565 |
| | | | | | |
| | | Total Asset-Backed Commercial Paper | | | 43,802,631 |
| | | | | | |
| | Banking-Domestic (4.8%) | | | |
| | | Bank of America Corporation | | | |
| | 16,890,000 | | 2.955%, 3/17/2009 | | | 16,701,451 |
| | | BNP Paribas Financial | | | |
| | 16,880,000 | | 2.835%, 12/30/2008 | | | 16,801,571 |
| | | J.P. Morgan Chase & Company | | | |
| | 6,070,000 | | 2.740%, 12/8/2008 | | | 6,052,906 |
| | | River Fuel Company No. 2, Inc. | | | |
| | 17,000,000 | | 3.050%, 12/4/2008b | | | 16,952,471 |
| | | River Fuel Trust No. 1 | | | |
| | 17,000,000 | | 3.050%, 12/5/2008b | | | 16,951,031 |
| | | | | | |
| | | Total Banking-Domestic | | | 73,459,430 |
| | | | | | |
| | Banking-Foreign (6.9%) | | | |
| | | Bank of Scotland plc | | | |
| | 16,875,000 | | 2.790%, 11/28/2008 | | | 16,839,689 |
| | 16,900,000 | | 2.785%, 12/11/2008 | | | 16,847,704 |
| | | BNP Paribas Financial | | | |
| | 22,130,000 | | 0.250%, 11/3/2008 | | | 22,129,692 |
| | | DnB NORBank ASA | | | |
| | 16,860,000 | | 2.710%, 11/12/2008 | | | 16,846,039 |
| | 16,875,000 | | 2.805%, 12/29/2008 | | | 16,798,739 |
| | | Svenska Handelsbanken AB | | | |
| | 16,900,000 | | 3.150%, 5/26/2009c | | | 16,900,000 |
| | | | | | |
| | | Total Banking-Foreign | | | 106,361,863 |
| | | | | | |
| | Basic Industry (2.4%) | | | |
| | | BASF AG | | | |
| | 20,565,000 | | 3.350%, 11/4/2008 | | | 20,559,259 |
| | | Praxair, Inc. | | | |
| | 16,325,000 | | 2.250%, 11/21/2008 | | | 16,304,594 |
| | | | | | |
| | | Total Basic Industry | | | 36,863,853 |
| | | | | | |
| | Consumer Cyclical (1.2%) | | | |
| | | Toyota Credit Puerto Rico | | | |
| | 5,400,000 | | 2.530%, 11/25/2008 | | | 5,390,892 |
| | 13,510,000 | | 2.700%, 3/23/2009 | | | 13,366,118 |
| | | | | | |
| | | Total Consumer Cyclical | | | 18,757,010 |
| | | | | | |
| | Education (3.8%) | | | |
| | | Northwestern University | | | |
| | 7,500,000 | | 2.400%, 11/18/2008 | | | 7,491,500 |
| | 7,000,000 | | 2.600%, 11/19/2008 | | | 6,990,900 |
| | | Yale University | | | |
| | 14,000,000 | | 3.700%, 11/6/2008 | | | 13,992,805 |
| | 23,490,000 | | 3.126%, 11/13/2008 | | | 23,465,526 |
| | 6,745,000 | | 2.800%, 12/9/2008 | | | 6,725,065 |
| | | | | | |
| | | Total Education | | | 58,665,796 |
| | | | | | |
| | Finance (28.2%) | | | |
| | | Barton Capital Corporation | | | |
| | 9,660,000 | | 2.789%, 12/8/2008b | | | 9,632,312 |
| | 16,770,000 | | 4.200%, 12/12/2008b | | | 16,689,783 |
| | 17,140,000 | | 4.100%, 12/17/2008b | | | 17,050,206 |
| | 16,970,000 | | 2.700%, 12/23/2008b | | | 16,903,817 |
| | | Bryant Illinois Park Fund | | | |
| | 16,985,000 | | 3.000%, 12/9/2008b | | | 16,931,214 |
| | 16,765,000 | | 4.250%, 12/12/2008b | | | 16,683,853 |
| | 17,140,000 | | 4.000%, 12/30/2008b | | | 17,027,638 |
| | | Chariot Funding, LLC | | | |
| | 17,000,000 | | 3.000%, 11/26/2008b | | | 16,964,583 |
| | | Enterprise Funding Corporation | | | |
| | 17,595,000 | | 2.649%, 11/19/2008b | | | 17,571,691 |
| | 6,965,000 | | 3.800%, 12/4/2008b | | | 6,940,739 |
| | 5,000,000 | | 3.800%, 12/5/2008b | | | 4,982,056 |
| | | Falcon Asset Securitization Corporation | | | |
| | 17,720,000 | | 3.700%, 11/17/2008b | | | 17,690,860 |
| | 7,970,000 | | 2.700%, 11/25/2008b | | | 7,955,654 |
| | | General Electric Capital Corporation | | | |
| | 13,500,000 | �� | 2.820%, 3/11/2009 | | | 13,362,525 |
| | | HSBC Finance Corporation | | | |
| | 16,885,000 | | 2.950%, 3/11/2009 | | | 16,705,128 |
| | | ING US Funding, LLC | | | |
| | 16,880,000 | | 2.975%, 3/12/2009 | | | 16,697,262 |
| | | Kitty Hawk Funding Corporation | | | |
| | 20,420,000 | | 2.800%, 11/17/2008b | | | 20,394,588 |
| | 2,000,000 | | 2.800%, 11/19/2008b | | | 1,997,200 |
| | 2,279,000 | | 3.750%, 12/8/2008b | | | 2,270,216 |
| | 7,993,000 | | 3.000%, 12/18/2008b | | | 7,961,694 |
| | 2,812,000 | | 4.150%, 12/19/2008b | | | 2,796,440 |
| | | Old Line Funding Corporation | | | |
| | 13,500,000 | | 2.790%, 11/12/2008b | | | 13,488,491 |
| | 16,860,000 | | 2.780%, 11/17/2008b | | | 16,839,169 |
| | 16,915,000 | | 3.700%, 12/15/2008b | | | 16,838,507 |
| | 16,770,000 | | 4.000%, 12/19/2008b | | | 16,680,560 |
| | 10,200,000 | | 2.600%, 2/20/2009b | | | 10,118,230 |
| | | Private Export Funding Corporation | | | |
| | 5,700,000 | | 2.000%, 11/3/2008 | | | 5,699,367 |
| | | Ranger Funding Company | | | |
| | 5,440,000 | | 3.000%, 12/16/2008b | | | 5,419,600 |
| | | Sheffield Receivables Corporation | | | |
| | 13,610,000 | | 2.800%, 12/4/2008b | | | 13,575,068 |
| | 16,765,000 | | 4.250%, 12/11/2008b | | | 16,685,832 |
| | | Thunder Bay Funding, Inc. | | | |
| | 10,601,000 | | 0.500%, 11/3/2008b | | | 10,600,706 |
| | 13,500,000 | | 2.790%, 11/12/2008b | | | 13,488,491 |
| | 10,130,000 | | 2.780%, 12/15/2008b | | | 10,095,580 |
| | | Yorktown Capital, LLC | | | |
| | 16,875,000 | | 2.740%, 11/19/2008b | | | 16,851,881 |
| | | | | | |
| | | Total Finance | | | 431,590,941 |
| | | | | | |
| | Insurance (3.5%) | | | |
| | | Swiss Reinsurance Company | | | |
| | 16,860,000 | | 2.750%, 11/13/2008 | | | 16,844,545 |
| | 20,260,000 | | 2.720%, 11/21/2008 | | | 20,229,385 |
The accompanying Notes to Financial Statements are an integral part of this schedule.
182
Money Market Fund
Schedule of Investments as of October 31, 2008
| | | | | | |
Principal
Amount | | Commercial Paper (78.5%)a | | Value |
| | Insurance (3.5%) - continued | | | |
| $ | 2,500,000 | | 3.000%, 2/12/2009 | | $ | 2,478,542 |
| | 13,510,000 | | 3.020%, 3/16/2009 | | | 13,356,999 |
| | | | | | |
| | | Total Insurance | | | 52,909,471 |
| | | | | | |
| | U.S. Government (20.1%) | | | |
| | | Federal Home Loan Bank Discount Notes | | | |
| | 10,000,000 | | 1.000%, 11/5/2008 | | | 9,998,889 |
| | 10,190,000 | | 3.150%, 12/31/2008 | | | 10,136,502 |
| | 10,230,000 | | 2.550%, 2/17/2009 | | | 10,151,740 |
| | 6,750,000 | | 2.750%, 3/2/2009 | | | 6,687,609 |
| | 11,280,000 | | 2.544%, 4/14/2009 | | | 11,149,256 |
| | | Federal Home Loan Mortgage Corporation | | | |
| | 10,250,000 | | 4.875%, 2/17/2009 | | | 10,315,108 |
| | | Federal Home Loan Mortgage Corporation Discount Notes | | | |
| | 16,970,000 | | 2.550%, 11/25/2008 | | | 16,941,151 |
| | 8,000,000 | | 2.760%, 12/15/2008 | | | 7,973,013 |
| | 10,190,000 | | 2.660%, 12/22/2008 | | | 10,151,601 |
| | 34,984,000 | | 2.765%, 12/26/2008 | | | 34,836,236 |
| | 10,140,000 | | 2.600%, 12/29/2008 | | | 10,097,525 |
| | 30,580,000 | | 2.604%, 2/24/2009 | | | 30,325,582 |
| | 2,000,000 | | 3.000%, 3/2/2009 | | | 1,979,833 |
| | 16,930,000 | | 3.050%, 3/30/2009 | | | 16,716,282 |
| | 6,800,000 | | 2.250%, 3/31/2009 | | | 6,736,250 |
| | | Federal National Mortgage Association Discount Notes | | | |
| | 13,500,000 | | 2.698%, 12/22/2008 | | | 13,448,401 |
| | 20,380,000 | | 2.800%, 12/24/2008 | | | 20,295,989 |
| | 10,165,000 | | 2.600%, 12/31/2008 | | | 10,120,952 |
| | 16,900,000 | | 2.250%, 2/17/2009 | | | 16,785,925 |
| | 6,400,000 | | 2.700%, 2/27/2009 | | | 6,343,360 |
| | 13,600,000 | | 2.700%, 3/16/2009 | | | 13,462,300 |
| | 17,000,000 | | 2.500%, 3/18/2009 | | | 16,838,264 |
| | 10,245,000 | | 3.000%, 3/19/2009 | | | 10,127,183 |
| | 6,450,000 | | 2.870%, 5/1/2009 | | | 6,356,928 |
| | | | | | |
| | | Total U.S. Government | | | 307,975,879 |
| | | | | | |
| | U.S. Municipal (4.7%) | | | |
| | | Alaska Housing Financing | | | |
| | 17,550,000 | | 3.300%, 11/13/2008 | | | 17,530,695 |
| | 10,130,000 | | 2.730%, 12/5/2008 | | | 10,103,881 |
| | | California State Public Works Board Lease Revenue Bonds | | | |
| | 6,740,000 | | 2.800%, 11/10/2008 | | | 6,740,000 |
| | 20,400,000 | | 3.890%, 12/4/2008 | | | 20,400,000 |
| | | State of Michigan Regional Authority General Obligation Bonds | | | |
| | 16,870,000 | | 2.800%, 11/4/2008 | | | 16,870,000 |
| | | | | | |
| | | Total U.S. Municipal | | | 71,644,576 |
| | | | | | |
| | | Total Commercial Paper | | | 1,202,031,450 |
| | | | | | |
| | |
| | | Variable Rate Notes (21.3%)a | | |
| | Banking-Domestic (12.0%) | | | |
| | | Bank of America Corporation | | | |
| | 10,000,000 | | 2.998%, 11/6/2008d | | | 10,000,000 |
| | | Bank of America NA | | | |
| | 10,140,000 | | 4.350%, 1/3/2009d | | | 10,140,000 |
| | | Bank of New York Company, Inc. | | | |
| | 9,250,000 | | 4.304%, 11/10/2008c,d | | | 9,250,000 |
| | | Barclays Bank plc NY | | | |
| | 10,120,000 | | 3.253%, 11/12/2008d | | | 10,120,000 |
| | | Bear Stearns & Company, Inc. | | | |
| | 10,200,000 | | 3.852%, 12/30/2008b,d | | | 10,177,500 |
| | | Branch Banking and Trust Company | | | |
| | 13,515,000 | | 3.213%, 12/4/2008d | | | 13,515,000 |
| | | Deutsche Bank AG/NY | | | |
| | 13,530,000 | | 3.414%, 12/22/2008d | | | 13,530,000 |
| | | J.P. Morgan Chase & Company | | | |
| | 20,360,000 | | 3.254%, 12/22/2008d | | | 20,363,411 |
| | | Rabobank Nederland NV/NY | | | |
| | 13,690,000 | | 2.784%, 11/17/2008c,d | | | 13,690,000 |
| | | Royal Bank of Canada NY | | | |
| | 10,150,000 | | 3.104%, 11/17/2008c,d | | | 10,150,000 |
| | 13,510,000 | | 3.215%, 1/2/2009d | | | 13,510,000 |
| | | Svenska Handlesbanken NY | | | |
| | 20,230,000 | | 3.161%, 11/26/2008d | | | 20,230,000 |
| | | Wachovia Bank | | | |
| | 10,130,000 | | 4.418%, 1/5/2009d | | | 10,130,000 |
| | | Wells Fargo & Company | | | |
| | 19,225,000 | | 4.710%, 11/17/2008c,d | | | 19,225,000 |
| | | | | | |
| | | Total Banking-Domestic | | | 184,030,911 |
| | | | | | |
| | Banking-Foreign (1.5%) | | | |
| | | ING Bank NV | | | |
| | 13,520,000 | | 3.726%, 12/29/2008c,d | | | 13,520,000 |
| | | Societe Generale | | | |
| | 10,120,000 | | 3.285%, 12/4/2008c,d | | | 10,120,000 |
| | | | | | |
| | | Total Banking-Foreign | | | 23,640,000 |
| | | | | | |
| | Basic Industry (1.4%) | | | |
| | | BASF Finance Europe NV | | | |
| | 20,620,000 | | 4.513%, 12/19/2008c,d | | | 20,620,000 |
| | | | | | |
| | | Total Basic Industry | | | 20,620,000 |
| | | | | | |
| | Consumer Cyclical (2.6%) | | | |
| | | American Honda Finance Corporation | | | |
| | 10,150,000 | | 2.924%, 11/5/2008c,d | | | 10,150,000 |
| | 4,760,000 | | 2.874%, 12/9/2008c,d | | | 4,760,860 |
| | 18,230,000 | | 4.419%, 1/8/2009c,d | | | 18,230,000 |
| | 6,760,000 | | 4.949%, 1/14/2009c,d | | | 6,760,000 |
| | | | | | |
| | | Total Consumer Cyclical | | | 39,900,860 |
| | | | | | |
| | Finance (0.9%) | | | |
| | | Procter & Gamble International Funding SCA | | | |
| | 13,530,000 | | 2.879%, 11/19/2008d | | | 13,530,000 |
| | | | | | |
| | | Total Finance | | | 13,530,000 |
| | | | | | |
| | Insurance (1.1%) | | | |
| | | Allstate Life Global Funding Trust | | | |
| | 16,900,000 | | 3.454%, 12/22/2008d | | | 16,900,000 |
| | | | | | |
| | | Total Insurance | | | 16,900,000 |
| | | | | | |
| | U.S. Government (1.8%) | | | |
| | | Federal Home Loan Bank | | | |
| | 6,750,000 | | 0.850%, 11/3/2008d | | | 6,750,000 |
| | 6,900,000 | | 4.038%, 1/5/2009d | | | 6,899,522 |
The accompanying Notes to Financial Statements are an integral part of this schedule.
183
Money Market Fund
Schedule of Investments as of October 31, 2008
| | | | | | |
Principal
Amount | | Variable Rate Notes (21.3%)a | | Value |
| | U.S. Government (1.8%) - continued | | | |
| | | Federal Home Loan Mortgage Corporation | | | |
| $ | 13,500,000 | | 3.306%, 12/26/2008d | | $ | 13,498,570 |
| | | | | | |
| | | Total U.S. Government | | | 27,148,092 |
| | | | | | |
| | | Total Variable Rate Notes | | | 325,769,863 |
| | | | | | |
| | | Total Investments (at amortized cost) 100.7% | | $ | 1,541,301,313 |
| | | | | | |
| | | Other Assets and Liabilities, Net (0.7)% | | | (11,035,923) |
| | | | | | |
| | | Total Net Assets 100.0% | | $ | 1,530,265,390 |
| | | | | | |
| a | The interest rate shown reflects the yield, coupon rate or, for securities purchased at a discount, the discount rate at the date of purchase. |
| b | Denotes investments that benefit from credit enhancement or liquidity support provided by a third party bank or institution. |
| c | Denotes securities sold under Rule 144A of the Securities Act of 1933, which exempts them from registration. These securities have been determined to be liquid under the guidelines established by the Fund’s Board of Trustees and may be resold to other dealers in the program or to other qualified institutional buyers. As of October 31, 2008, the value of these investments was $153,375,860 or 10.0% of total net assets. |
| d | Denotes variable rate obligations for which the current yield and next scheduled reset date are shown. |
| | | |
Cost for federal income tax purposes | | $ | 1,541,301,313 |
The accompanying Notes to the Financial Statements are an integral part of this schedule.
184
[THIS PAGE INTENTIONALLY LEFT BLANK]
185
Thrivent Mutual Funds
Statement of Assets and Liabilities
| | | | | | | | | | | | | | | | |
As of October 31, 2008 | | Aggressive
Allocation
Fund | | | Moderately
Aggressive
Allocation
Fund | | | Moderate
Allocation
Fund | | | Moderately
Conservative
Allocation
Fund | |
Assets | | | | | | | | | | | | | | | | |
Investments at cost | | $ | 459,988,325 | | | $ | 1,064,828,398 | | | $ | 1,018,620,513 | | | $ | 399,712,873 | |
Investments in securities at market value | | | 1,348,111 | | | | 11,967,249 | | | | 19,827,936 | | | | 11,691,680 | |
Investments in affiliates at market value | | | 313,185,551 | | | | 742,098,870 | | | | 747,388,695 | | | | 313,650,481 | |
Investments at Market Value | | | 314,533,662 | | | | 754,066,119 | | | | 767,216,631 | | | | 325,342,161 | |
Cash | | | 62 | | | | 281 | | | | 438 | | | | 125 | |
Dividends and interest receivable | | | — | | | | 37,462 | | | | 72,324 | | | | 37,805 | |
Prepaid expenses | | | 2,283 | | | | 3,629 | | | | 3,580 | | | | 2,206 | |
Receivable for investments sold | | | — | | | | — | | | | 308,169 | | | | — | |
Receivable for fund shares sold | | | 864,657 | | | | 997,706 | | | | 257,185 | | | | 540,590 | |
Receivable for forward contracts | | | — | | | | — | | | | — | | | | — | |
Receivable for variation margin | | | 227,905 | | | | 835,010 | | | | 1,093,865 | | | | 505,950 | |
Total Assets | | | 315,628,569 | | | | 755,940,207 | | | | 768,952,192 | | | | 326,428,837 | |
Liabilities | | | | | | | | | | | | | | | | |
Accrued expenses | | | 70,990 | | | | 113,098 | | | | 90,771 | | | | 42,260 | |
Other liabilities | | | — | | | | — | | | | — | | | | — | |
Payable for investments purchased | | | 771,302 | | | | 929,641 | | | | — | | | | 265,328 | |
Payable upon return of collateral for securities loaned | | | — | | | | — | | | | — | | | | — | |
Payable for fund shares redeemed | | | 81,115 | | | | 79,049 | | | | 560,627 | | | | 241,802 | |
Payable for forward contracts | | | — | | | | — | | | | — | | | | — | |
Payable to affiliate | | | 100,524 | | | | 268,868 | | | | 292,294 | | | | 116,096 | |
Total Liabilities | | | 1,023,931 | | | | 1,390,656 | | | | 943,692 | | | | 665,486 | |
Net Assets | | | | | | | | | | | | | | | | |
Capital stock (beneficial interest) | | | 444,079,810 | | | | 1,045,167,447 | | | | 1,019,197,634 | | | | 402,370,294 | |
Accumulated undistributed net investment income/(loss) | | | 239,864 | | | | 7,679,490 | | | | 1,240,131 | | | | 730,721 | |
Accumulated undistributed net realized gain/(loss) | | | 15,602,265 | | | | 12,838,636 | | | | (732,941 | ) | | | (2,094,715 | ) |
Net unrealized appreciation/(depreciation) on: | | | | | | | | | | | | | | | | |
Investments | | | — | | | | 138,817 | | | | 283,996 | | | | 137,410 | |
Affiliated investments | | | (145,454,663 | ) | | | (310,901,096 | ) | | | (251,687,878 | ) | | | (74,508,122 | ) |
Futures contracts | | | 137,362 | | | | (373,743 | ) | | | (292,442 | ) | | | (872,237 | ) |
Foreign currency forward contracts | | | — | | | | — | | | | — | | | | — | |
Foreign currency transactions | | | — | | | | — | | | | — | | | | — | |
Total Net Assets | | $ | 314,604,638 | | | $ | 754,549,551 | | | $ | 768,008,500 | | | $ | 325,763,351 | |
Class A Share Capital | | $ | 264,196,147 | | | $ | 698,349,835 | | | $ | 739,643,364 | | | $ | 314,698,748 | |
Shares of beneficial interest outstanding (Class A) | | | 31,983,260 | | | | 83,536,171 | | | | 87,881,152 | | | | 35,976,747 | |
Net asset value per share | | $ | 8.26 | | | $ | 8.36 | | | $ | 8.42 | | | $ | 8.75 | |
Maximum public offering price | | $ | 8.74 | | | $ | 8.85 | | | $ | 8.91 | | | $ | 9.26 | |
Class B Share Capital | | $ | — | | | $ | — | | | $ | — | | | $ | — | |
Shares of beneficial interest outstanding (Class B) | | | — | | | | — | | | | — | | | | — | |
Net asset value per share | | $ | — | | | $ | — | | | $ | — | | | $ | — | |
Institutional Class Share Capital | | $ | 50,408,491 | | | $ | 56,199,716 | | | $ | 28,365,136 | | | $ | 11,064,603 | |
Shares of beneficial interest outstanding (Institutional Class) | | | 6,063,270 | | | | 6,679,421 | | | | 3,364,080 | | | | 1,262,287 | |
Net asset value per share | | $ | 8.31 | | | $ | 8.41 | | | $ | 8.43 | | | $ | 8.77 | |
The accompanying Notes to Financial Statements are an integral part of this schedule.
186
Thrivent Mutual Funds
Statement of Assets and Liabilities - continued
| | | | | | | | | | | | | | | | | | | | | | | | | |
| | | | | | |
Technology Fund | | Partner Small
Cap Growth
Fund | | | Partner Small
Cap Value Fund | | | Small Cap
Stock Fund | | | Small Cap
Index Fund | | | Mid Cap
Growth Fund | | | Partner Mid
Cap Value
Fund | |
| | | | | | | | | | | | | | | | | | | | | | | | | |
| $ | 27,665,255 | | $ | 105,165,746 | | | $ | 192,456,392 | | | $ | 468,989,953 | | | $ | 32,101,428 | | | $ | 334,467,845 | | | $ | 99,455,852 | |
| | 19,054,015 | | | 67,734,558 | | | | 126,202,751 | | | | 363,476,948 | | | | 25,708,243 | | | | 207,762,418 | | | | 70,242,813 | |
| | 3,319,276 | | | 21,082,991 | | | | 36,325,763 | | | | 70,696,727 | | | | 3,789,799 | | | | 51,623,313 | | | | 9,074,025 | |
| | 22,373,291 | | | 88,817,549 | | | | 162,528,514 | | | | 434,173,675 | | | | 29,498,042 | | | | 259,385,731 | | | | 79,316,838 | |
| | — | | | — | | | | — | | | | 771 | | | | — | | | | — | | | | — | |
| | 10,945 | | | 39,092 | | | | 116,071 | | | | 244,389 | | | | 30,013 | | | | 144,948 | | | | 113,630 | |
| | 1,412 | | | 1,531 | | | | 1,675 | | | | 2,511 | | | | 1,419 | | | | 2,069 | | | | 1,453 | |
| | 2,320,896 | | | 385,692 | | | | 21,582 | | | | 14,151,714 | | | | 333,300 | | | | — | | | | 655,501 | |
| | 9,223 | | | 7,726 | | | | 307,345 | | | | 74,924 | | | | 15,086 | | | | 21,727 | | | | 17,460 | |
| | 131,805 | | | — | | | | — | | | | — | | | | — | | | | — | | | | — | |
| | — | | | 148,000 | | | | — | | | | 241,861 | | | | 30,086 | | | | — | | | | — | |
| | 24,847,572 | | | 89,399,590 | | | | 162,975,187 | | | | 448,889,845 | | | | 29,907,946 | | | | 259,554,475 | | | | 80,104,882 | |
| | | | | | | | | | | | | | | | | | | | | | | | | |
| | 33,028 | | | 22,708 | | | | 38,415 | | | | 139,225 | | | | 32,714 | | | | 101,342 | | | | 24,730 | |
| | — | | | — | | | | — | | | | — | | | | 21,966 | | | | — | | | | — | |
| | 2,140,572 | | | 982,509 | | | | 629,989 | | | | 42,176,487 | | | | 137,238 | | | | — | | | | 460,841 | |
| | 1,705,385 | | | 14,040,435 | | | | 31,225,748 | | | | 54,683,469 | | | | 3,416,960 | | | | 43,949,649 | | | | 2,746,527 | |
| | 26,092 | | | 800 | | | | 42,828 | | | | 171,307 | | | | 11,063 | | | | 52,278 | | | | 18,731 | |
| | 135,149 | | | — | | | | — | | | | — | | | | — | | | | — | | | | — | |
| | 8,907 | | | 59,476 | | | | 95,041 | | | | 316,411 | | | | 7,752 | | | | 156,320 | | | | 50,547 | |
| | 4,049,133 | | | 15,105,928 | | | | 32,032,021 | | | | 97,486,899 | | | | 3,627,693 | | | | 44,259,589 | | | | 3,301,376 | |
| | | | | | | | | | | | | | | | | | | | | | | | | |
| | 60,799,236 | | | 108,684,697 | | | | 152,408,144 | | | | 458,465,672 | | | | 25,401,635 | | | | 304,497,885 | | | | 108,034,273 | |
| | (10,804) | | | (26,069 | ) | | | 1,029,078 | | | | 682,683 | | | | 161,636 | | | | (25,883 | ) | | | 576,607 | |
| | (34,697,812) | | | (17,240,759 | ) | | | 7,433,822 | | | | (72,929,131 | ) | | | 3,309,584 | | | | (14,095,002 | ) | | | (11,668,360 | ) |
| | | | | | | | | | | | | | | | | | | | | | | | | |
| | (5,291,964) | | | (16,348,197 | ) | | | (29,927,878 | ) | | | (34,816,278 | ) | | | (2,603,386 | ) | | | (75,082,114 | ) | | | (20,139,014 | ) |
| | — | | | — | | | | — | | | | — | | | | — | | | | — | | | | — | |
| | — | | | (776,010 | ) | | | — | | | | — | | | | 10,784 | | | | — | | | | — | |
| | (3,344) | | | — | | | | — | | | | — | | | | — | | | | — | | | | — | |
| | 3,127 | | | — | | | | — | | | | — | | | | — | | | | — | | | | — | |
| $ | 20,798,439 | | $ | 74,293,662 | | | $ | 130,943,166 | | | $ | 351,402,946 | | | $ | 26,280,253 | | | $ | 215,294,886 | | | $ | 76,803,506 | |
| $ | 19,151,529 | | $ | 9,625,248 | | | $ | 54,295,492 | | | $ | 241,884,273 | | | $ | 26,280,253 | | | $ | 165,013,929 | | | $ | 7,364,290 | |
| | 8,141,603 | | | 1,246,522 | | | | 4,925,638 | | | | 23,411,153 | | | | 2,705,487 | | | | 16,119,019 | | | | 933,880 | |
| $ | 2.35 | | $ | 7.72 | | | $ | 11.02 | | | $ | 10.33 | | | $ | 9.71 | | | $ | 10.24 | | | $ | 7.89 | |
| $ | 2.49 | | $ | 8.17 | | | $ | 11.66 | | | $ | 10.93 | | | $ | 10.28 | | | $ | 10.84 | | | $ | 8.35 | |
| $ | 366,589 | | $ | — | | | $ | 1,249,979 | | | $ | 2,848,610 | | | $ | — | | | $ | 5,094,190 | | | $ | — | |
| | 166,139 | | | — | | | | 122,517 | | | | 329,486 | | | | — | | | | 562,008 | | | | — | |
| $ | 2.21 | | $ | — | | | $ | 10.20 | | | $ | 8.65 | | | $ | — | | | $ | 9.06 | | | $ | — | |
| $ | 1,280,321 | | $ | 64,668,414 | | | $ | 75,397,695 | | | $ | 106,670,063 | | | $ | — | | | $ | 45,186,767 | | | $ | 69,439,216 | |
| | 511,852 | | | 8,298,534 | | | | 6,538,712 | | | | 9,332,322 | | | | — | | | | 4,021,045 | | | | 8,772,087 | |
| $ | 2.50 | | $ | 7.79 | | | $ | 11.53 | | | $ | 11.43 | | | $ | — | | | $ | 11.24 | | | $ | 7.92 | |
The accompanying Notes to Financial Statements are an integral part of this schedule.
187
Thrivent Mutual Funds
Statement of Assets and Liabilities - continued
| | | | | | | | | | | | | | | | |
As of October 31, 2008 | | Mid Cap Stock
Fund | | | Mid Cap Index
Fund | | | Partner
Worldwide
Allocation
Fund | | | Partner
International
Stock Fund | |
Assets | | | | | | | | | | | | | | | | |
Investments at cost | | $ | 992,576,707 | | | $ | 41,074,001 | | | $ | 95,903,641 | | | $ | 556,138,665 | |
Investments in securities at market value | | | 723,082,051 | | | | 32,106,842 | | | | 57,092,291 | | | | 390,162,116 | |
Investments in affiliates at market value | | | 79,325,476 | | | | 3,384,605 | | | | 5,901,139 | | | | 14,775,885 | |
Investments at Market Value | | | 802,407,527 | | | | 35,491,447 | | | | 62,993,430 | | | | 404,938,001 | |
Cash | | | 3,978 | | | | — | | | | 30,012 | (a) | | | 12,319 | (b) |
Dividends and interest receivable | | | 409,733 | | | | 30,816 | | | | 344,686 | | | | 1,662,570 | |
Prepaid expenses | | | 3,719 | | | | 1,451 | | | | 13,906 | | | | 2,846 | |
Receivable for investments sold | | | 10,270,855 | | | | 234,166 | | | | 479,011 | | | | 3,701,638 | |
Receivable for fund shares sold | | | 423,040 | | | | 11,916 | | | | 46,802 | | | | 65,421 | |
Receivable for forward contracts | | | — | | | | — | | | | 1,885,952 | | | | 22,736,923 | |
Receivable for variation margin | | | — | | | | 18,932 | | | | 14,262 | | | | — | |
Total Assets | | | 813,518,852 | | | | 35,788,728 | | | | 65,808,061 | | | | 433,119,718 | |
Liabilities | | | | | | | | | | | | | | | | |
Distributions payable | | | — | | | | — | | | | — | | | | — | |
Accrued expenses | | | 216,269 | | | | 31,521 | | | | 50,139 | | | | 137,274 | |
Other liabilities | | | — | | | | — | | | | — | | | | — | |
Payable for investments purchased | | | 24,689,250 | | | | 174,463 | | | | 989,424 | | | | 18,716,872 | |
Payable upon return of collateral for securities loaned | | | 77,710,896 | | | | 2,503,733 | | | | — | | | | 630,480 | |
Payable for fund shares redeemed | | | 962,484 | | | | 24,922 | | | | — | | | | 142,028 | |
Payable for forward contracts | | | — | | | | — | | | | 1,920,077 | | | | 22,869,184 | |
Swap agreements, at value | | | — | | | | — | | | | — | | | | — | |
Payable for variation margin | | | — | | | | — | | | | — | | | | — | |
Payable to affiliate | | | 612,546 | | | | 4,046 | | | | 28,608 | | | | 310,463 | |
Mortgage dollar roll deferred revenue | | | — | | | | — | | | | — | | | | — | |
Total Liabilities | | | 104,191,445 | | | | 2,738,685 | | | | 2,988,248 | | | | 42,806,301 | |
Net Assets | | | | | | | | | | | | | | | | |
Capital stock (beneficial interest) | | | 1,100,490,388 | | | | 36,029,152 | | | | 102,637,260 | | | | 596,798,818 | |
Accumulated undistributed net investment income/(loss) | | | 3,777,146 | | | | 347,760 | | | | 1,564,231 | | | | 10,663,759 | |
Accumulated undistributed net realized gain/(loss) | | | (204,770,947 | ) | | | 2,281,188 | | | | (8,339,093 | ) | | | (66,005,853 | ) |
Net unrealized appreciation/(depreciation) on: | | | | | | | | | | | | | | | | |
Investments | | | (190,169,180 | ) | | | (5,582,554 | ) | | | (32,910,211 | ) | | | (151,200,664 | ) |
Futures contracts | | | — | | | | (25,503 | ) | | | (91,189 | ) | | | — | |
Swap agreements | | | — | | | | — | | | | — | | | | — | |
Foreign currency forward contracts | | | — | | | | — | | | | (34,125 | ) | | | (132,261 | ) |
Foreign currency transactions | | | — | | | | — | | | | (7,060 | ) | | | 189,618 | |
Total Net Assets | | $ | 709,327,407 | | | $ | 33,050,043 | | | $ | 62,819,813 | | | $ | 390,313,417 | |
Class A Share Capital | | $ | 488,882,295 | | | $ | 33,050,043 | | | $ | 15,862,261 | | | $ | 173,506,385 | |
Shares of beneficial interest outstanding (Class A) | | | 54,002,318 | | | | 3,717,369 | | | | 2,606,438 | | | | 23,136,460 | |
Net asset value per share | | $ | 9.05 | | | $ | 8.89 | | | $ | 6.09 | | | $ | 7.50 | |
Maximum public offering price | | $ | 9.58 | | | $ | 9.41 | | | $ | 6.44 | | | $ | 7.94 | |
Class B Share Capital | | $ | 3,042,057 | | | $ | — | | | $ | — | | | $ | 2,572,150 | |
Shares of beneficial interest outstanding (Class B) | | | 412,622 | | | | — | | | | — | | | | 358,539 | |
Net asset value per share | | $ | 7.37 | | | $ | — | | | $ | — | | | $ | 7.17 | |
Institutional Class Share Capital | | $ | 217,403,055 | | | $ | — | | | $ | 46,957,552 | | | $ | 214,234,882 | |
Shares of beneficial interest outstanding (Institutional Class) | | | 22,317,952 | | | | — | | | | 7,697,731 | | | | 27,939,865 | |
Net asset value per share | | $ | 9.74 | | | $ | — | | | $ | 6.10 | | | $ | 7.67 | |
(a) | Includes foreign currency holdings of $30,012 (cost $32,252). |
(b) | Includes foreign currency holdings of $9,275 (cost $8,982). |
The accompanying Notes to the Financial Statements are an integral part of this schedule.
188
Thrivent Mutual Funds
Statement of Assets and Liabilities - continued
| | | | | | | | | | | | | | | | | | | | | | | | | |
| | | | | | |
Large Cap Growth Fund | | Large Cap
Value Fund | | | Large Cap
Stock Fund | | | Large Cap
Index Fund | | | Balanced Fund | | | High Yield
Fund | | | Municipal
Bond Fund | |
| | | | | | | | | | | | | | | | | | | | | | | | | |
| $ | 410,718,689 | | $ | 550,082,967 | | | $ | 2,067,274,748 | | | $ | 55,020,335 | | | $ | 276,222,365 | | | $ | 634,975,415 | | | $ | 1,155,836,307 | |
| | 302,743,068 | | | 452,718,318 | | | | 1,814,978,298 | | | | 51,377,234 | | | | 206,941,785 | | | | 437,209,143 | | | | 1,129,292,245 | |
| | 19,453,415 | | | 16,360,438 | | | | 85,371,259 | | | | 706,374 | | | | 23,378,239 | | | | 44,811,140 | | | | — | |
| | 322,196,483 | | | 469,078,756 | | | | 1,900,349,557 | | | | 52,083,608 | | | | 230,320,024 | | | | 482,020,283 | | | | 1,129,292,245 | |
| | — | | | — | | | | — | | | | — | | | | 9 | (c) | | | — | | | | 20,994 | |
| | 197,868 | | | 887,066 | | | | 2,934,702 | | | | 76,944 | | | | 711,411 | | | | 12,504,158 | | | | 18,100,352 | |
| | 2,624 | | | 2,861 | | | | 8,370 | | | | 1,519 | | | | 2,021 | | | | 2,747 | | | | 4,222 | |
| | 5,693,462 | | | 2,723,327 | | | | 19,109,776 | | | | 2,553 | | | | 3,666,498 | | | | 1,061,082 | | | | — | |
| | 20,987 | | | 345,183 | | | | 187,606 | | | | 16,768 | | | | 13,953 | | | | 77,070 | | | | 1,198,006 | |
| | — | | | — | | | | — | | | | — | | | | — | | | | — | | | | — | |
| | — | | | — | | | | 17,785 | | | | — | | | | 74,375 | | | | — | | | | — | |
| | 328,111,424 | | | 473,037,193 | | | | 1,922,607,796 | | | | 52,181,392 | | | | 234,788,291 | | | | 495,665,340 | | | | 1,148,615,819 | |
| | | | | | | | | | | | | | | | | | | | | | | | | |
| | — | | | — | | | | — | | | | — | | | | — | | | | 857,356 | | | | 828,096 | |
| | 68,933 | | | 97,488 | | | | 647,010 | | | | 33,745 | | | | 81,484 | | | | 100,028 | | | | 176,226 | |
| | — | | | — | | | | 667,701 | | | | 45,673 | | | | — | | | | 31,160 | | | | — | |
| | 2,363,836 | | | — | | | | 9,450,577 | | | | 30,660 | | | | 26,227,115 | | | | 11,685,630 | | | | 1,482,585 | |
| | 17,017,857 | | | 13,448,200 | | | | 73,426,536 | | | | 705,338 | | | | 11,379,048 | | | | 30,966,137 | | | | — | |
| | 351,128 | | | 179,773 | | | | 988,412 | | | | 87,509 | | | | 105,510 | | | | 173,425 | | | | 1,721,726 | |
| | — | | | — | | | | — | | | | — | | | | — | | | | — | | | | — | |
| | — | | | — | | | | — | | | | — | | | | 384,390 | | | | — | | | | — | |
| | — | | | — | | | | — | | | | 801 | | | | 47,500 | | | | — | | | | — | |
| | 210,322 | | | 263,153 | | | | 1,464,949 | | | | 12,192 | | | | 150,383 | | | | 274,000 | | | | 698,771 | |
| | — | | | — | | | | — | | | | — | | | | 10,458 | | | | — | | | | — | |
| | 20,012,076 | | | 13,988,614 | | | | 86,645,185 | | | | 915,918 | | | | 38,385,888 | | | | 44,087,736 | | | | 4,907,404 | |
| | | | | | | | | | | | | | | | | | | | | | | | | |
| | 464,335,080 | | | 576,075,704 | | | | 2,070,663,404 | | | | 58,056,320 | | | | 245,160,401 | | | | 1,092,617,121 | | | | 1,169,592,616 | |
| | 770,141 | | | 9,569,545 | | | | 22,186,218 | | | | 914,261 | | | | 224,255 | | | | (205,702 | ) | | | (61,123 | ) |
| | (68,483,667) | | | (45,592,459 | ) | | | (89,983,025 | ) | | | (4,772,087 | ) | | | (2,873,103 | ) | | | (487,878,683 | ) | | | 720,984 | |
| | | | | | | | | | | | | | | | | | | | | | | | | |
| | (88,522,206) | | | (81,004,211 | ) | | | (166,925,191 | ) | | | (2,936,727 | ) | | | (45,902,341 | ) | | | (152,955,132 | ) | | | (26,544,062 | ) |
| | — | | | — | | | | 21,205 | | | | 3,707 | | | | (34,369 | ) | | | — | | | | — | |
| | — | | | — | | | | — | | | | — | | | | (172,439 | ) | | | — | | | | — | |
| | — | | | — | | | | — | | | | — | | | | — | | | | — | | | | — | |
| | — | | | — | | | | — | | | | — | | | | (1 | ) | | | — | | | | — | |
| $ | 308,099,348 | | $ | 459,048,579 | | | $ | 1,835,962,611 | | | $ | 51,265,474 | | | $ | 196,402,403 | | | $ | 451,577,604 | | | $ | 1,143,708,415 | |
| $ | 88,979,259 | | $ | 187,378,228 | | | $ | 1,658,797,719 | | | $ | 51,265,474 | | | $ | 143,027,811 | | | $ | 318,801,212 | | | $ | 1,104,836,754 | |
| | 24,111,223 | | | 16,887,682 | | | | 93,882,898 | | | | 7,641,440 | | | | 16,049,473 | | | | 88,809,466 | | | | 106,592,219 | |
| $ | 3.69 | | $ | 11.10 | | | $ | 17.67 | | | $ | 6.71 | | | $ | 8.91 | | | $ | 3.59 | | | $ | 10.37 | |
| $ | 3.90 | | $ | 11.75 | | | $ | 18.70 | | | $ | 7.10 | | | $ | 9.43 | | | $ | 3.76 | | | $ | 10.86 | |
| $ | 2,689,776 | | $ | 2,810,533 | | | $ | 12,975,566 | | | $ | — | | | $ | 2,633,324 | | | $ | 3,357,971 | | | $ | 3,807,038 | |
| | 796,331 | | | 258,518 | | | | 807,745 | | | | — | | | | 296,406 | | | | 935,824 | | | | 367,476 | |
| $ | 3.38 | | $ | 10.87 | | | $ | 16.06 | | | $ | — | | | $ | 8.88 | | | $ | 3.59 | | | $ | 10.36 | |
| $ | 216,430,313 | | $ | 268,859,818 | | | $ | 164,189,326 | | | $ | — | | | $ | 50,741,268 | | | $ | 129,418,421 | | | $ | 35,064,623 | |
| | 54,893,973 | | | 24,018,289 | | | | 9,204,844 | | | | — | | | | 5,700,762 | | | | 36,027,891 | | | | 3,383,089 | |
| $ | 3.94 | | $ | 11.19 | | | $ | 17.84 | | | $ | — | | | $ | 8.90 | | | $ | 3.59 | | | $ | 10.36 | |
(c) | Includes foreign currency holdings of $9 (cost $10). |
The accompanying Notes to Financial Statements are an integral part of this schedule.
189
Thrivent Mutual Funds
Statement of Assets and Liabilities - continued
| | | | | | | | | | | | | | | | |
As of October 31, 2008 | | Income Fund | | | Core Bond
Fund | | | Limited
Maturity Bond
Fund | | | Money Market
Fund | |
Assets | | | | | | | | | | | | | | | | |
Investments at cost | | $ | 874,454,757 | | | $ | 443,550,817 | | | $ | 582,674,045 | | | $ | 1,541,301,313 | |
Investments in securities at market value | | | 709,739,597 | | | | 380,686,844 | | | | 478,152,345 | | | | 1,541,301,313 | |
Investments in affiliates at market value | | | 27,276,207 | | | | 13,194,165 | | | | 60,802,287 | | | | — | |
Investments at Market Value | | | 737,015,804 | | | | 393,881,009 | | | | 538,954,632 | | | | 1,541,301,313 | 1 |
Cash | | | 354 | | | | 193 | | | | 755 | | | | 772 | |
Dividends and interest receivable | | | 8,755,600 | | | | 2,409,638 | | | | 4,376,346 | | | | 1,722,101 | |
Prepaid expenses | | | 3,303 | | | | 2,248 | | | | 2,530 | | | | 108,715 | |
Receivable for investments sold | | | 9,468,213 | | | | 1,013,816 | | | | — | | | | — | |
Receivable for fund shares sold | | | 10,165 | | | | 23,565 | | | | 502,398 | | | | 10,359,941 | |
Swap agreements, at value | | | 225,928 | | | | — | | | | 441,395 | | | | — | |
Receivable for variation margin | | | 261,017 | | | | 312,423 | | | | 216,174 | | | | — | |
Total Assets | | | 755,740,384 | | | | 397,642,892 | | | | 544,494,230 | | | | 1,553,492,842 | |
Liabilities | | | | | | | | | | | | | | | | |
Distributions payable | | | 301,983 | | | | 110,270 | | | | 25,314 | | | | 32,890 | |
Accrued expenses | | | 104,037 | | | | 95,763 | | | | 48,750 | | | | 241,116 | |
Payable for investments purchased | | | 80,846,604 | | | | 103,660,204 | | | | 19,450,471 | | | | 13,655,412 | |
Payable upon return of collateral for securities loaned | | | 21,097,170 | | | | 1,605,479 | | | | 52,879,250 | | | | — | |
Payable for fund shares redeemed | | | 227,719 | | | | 159,385 | | | | 1,152,528 | | | | 8,755,977 | |
Swap agreements, at value | | | 5,258,526 | | | | 1,725,110 | | | | 1,854,978 | | | | — | |
Payable for variation margin | | | 442,500 | | | | 118,750 | | | | 41,563 | | | | — | |
Payable to affiliate | | | 306,360 | | | | 174,466 | | | | 147,676 | | | | 542,057 | |
Mortgage dollar roll deferred revenue | | | 29,836 | | | | 40,138 | | | | 7,246 | | | | — | |
Total Liabilities | | | 108,614,735 | | | | 107,689,565 | | | | 75,607,776 | | | | 23,227,452 | |
Net Assets | | | | | | | | | | | | | | | | |
Capital stock (beneficial interest) | | | 834,443,274 | | | | 357,613,431 | | | | 518,411,970 | | | | 1,530,274,379 | |
Accumulated undistributed net investment income/(loss) | | | 310,744 | | | | 237,975 | | | | 129,926 | | | | 77,651 | |
Accumulated undistributed net realized gain/(loss) | | | (47,844,084 | ) | | | (17,761,055 | ) | | | (5,388,207 | ) | | | (86,640 | ) |
Net unrealized appreciation/(depreciation) on: | | | | | | | | | | | | | | | | |
Investments | | | (137,438,953 | ) | | | (49,669,808 | ) | | | (43,719,413 | ) | | | — | |
Futures contracts | | | (585,072 | ) | | | 230,635 | | | | (189,979 | ) | | | — | |
Swap agreements | | | (1,760,260 | ) | | | (697,851 | ) | | | (357,843 | ) | | | — | |
Total Net Assets | | $ | 647,125,649 | | | $ | 289,953,327 | | | $ | 468,886,454 | | | $ | 1,530,265,390 | |
Class A Share Capital | | $ | 326,207,647 | | | $ | 223,492,006 | | | $ | 90,451,603 | | | $ | 1,305,957,005 | |
Shares of beneficial interest outstanding (Class A) | | | 47,165,777 | | | | 26,740,034 | | | | 7,933,589 | | | | 1,305,957,006 | |
Net asset value per share | | $ | 6.92 | | | $ | 8.36 | | | $ | 11.40 | | | $ | 1.00 | |
Maximum public offering price | | $ | 7.25 | | | $ | 8.75 | | | $ | 11.40 | | | $ | 1.00 | |
Class B Share Capital | | $ | 2,404,589 | | | $ | 1,481,556 | | | $ | 1,536,587 | | | $ | 1,047,567 | |
Shares of beneficial interest outstanding (Class B) | | | 348,459 | | | | 177,166 | | | | 134,667 | | | | 1,047,567 | |
Net asset value per share | | $ | 6.90 | | | $ | 8.36 | | | $ | 11.41 | | | $ | 1.00 | |
Institutional Class Share Capital | | $ | 318,513,413 | | | $ | 64,979,765 | | | $ | 376,898,264 | | | $ | 223,260,818 | |
Shares of beneficial interest outstanding (Institutional Class) | | | 46,097,983 | | | | 7,772,052 | | | | 33,065,595 | | | | 223,260,818 | |
Net asset value per share | | $ | 6.91 | | | $ | 8.36 | | | $ | 11.40 | | | $ | 1.00 | |
1 | Securities held by this fund are valued on the basis of amortized cost, which approximates market value. |
The accompanying Notes to the Financial Statements are an integral part of this schedule.
190
[THIS PAGE INTENTIONALLY LEFT BLANK]
191
Thrivent Mutual Funds
Statement of Operations
| | | | | | | | | | | | | | | | |
For the year ended October 31, 2008 | | Aggressive
Allocation
Fund | | | Moderately
Aggressive
Allocation
Fund | | | Moderate
Allocation
Fund | | | Moderately
Conservative
Allocation
Fund | |
Investment Income | | | | | | | | | | | | | | | | |
Dividends | | $ | — | | | $ | — | | | $ | — | | | $ | — | |
Taxable interest | | | 2,196 | | | | 61,773 | | | | 113,011 | | | | 60,914 | |
Income from securities loaned | | | — | | | | — | | | | — | | | | — | |
Income from affiliated investments | | | 5,686,345 | | | | 22,042,469 | | | | 28,078,409 | | | | 12,748,960 | |
Foreign dividend tax withholding | | | — | | | | — | | | | — | | | | — | |
Total Investment Income | | | 5,688,541 | | | | 22,104,242 | | | | 28,191,420 | | | | 12,809,874 | |
Expenses | | | | | | | | | | | | | | | | |
Adviser fees | | | 580,139 | | | | 1,285,287 | | | | 1,256,930 | | | | 529,868 | |
Sub-Adviser fees | | | — | | | | — | | | | — | | | | — | |
Accounting and pricing fees | | | 24,019 | | | | 12,063 | | | | 34,035 | | | | 44,035 | |
Administrative service fees | | | 77,352 | | | | 185,646 | | | | 181,109 | | | | 70,649 | |
Audit and legal fees | | | 20,487 | | | | 27,911 | | | | 27,130 | | | | 19,441 | |
Custody fees | | | 5,528 | | | | 5,996 | | | | 5,956 | | | | 5,829 | |
Distribution expenses Class A | | | 822,883 | | | | 2,151,413 | | | | 2,185,933 | | | | 854,040 | |
Distribution expenses Class B | | | — | | | | — | | | | — | | | | — | |
Insurance expenses | | | 5,519 | | | | 8,392 | | | | 8,229 | | | | 5,223 | |
Printing and postage expenses Class A | | | 259,240 | | | | 447,741 | | | | 316,584 | | | | 106,351 | |
Printing and postage expenses Class B | | | — | | | | — | | | | — | | | | — | |
Printing and postage expenses Institutional Class | | | 807 | | | | 1,086 | | | | 713 | | | | 362 | |
SEC and state registration expenses | | | 58,760 | | | | 104,491 | | | | 103,003 | | | | 65,505 | |
Transfer agent fees Class A | | | 613,404 | | | | 1,090,950 | | | | 762,148 | | | | 241,251 | |
Transfer agent fees Class B | | | — | | | | — | | | | — | | | | — | |
Transfer agent fees Institutional Class | | | 167 | | | | 247 | | | | 327 | | | | 227 | |
Trustees’ fees | | | 2,794 | | | | 2,795 | | | | 2,795 | | | | 2,795 | |
Other expenses | | | 6,804 | | | | 7,317 | | | | 7,326 | | | | 6,817 | |
Total Expenses Before Reimbursement | | | 2,477,903 | | | | 5,331,335 | | | | 4,892,218 | | | | 1,952,393 | |
Less: | | | | | | | | | | | | | | | | |
Reimbursement from adviser | | | (601,354 | ) | | | (845,054 | ) | | | (449,572 | ) | | | (316,910 | ) |
Custody earnings credit | | | — | | | | — | | | | — | | | | — | |
Total Net Expenses | | | 1,876,549 | | | | 4,486,281 | | | | 4,442,646 | | | | 1,635,483 | |
Net Investment Income/(Loss) | | | 3,811,992 | | | | 17,617,961 | | | | 23,748,774 | | | | 11,174,391 | |
Realized and Unrealized Gains/(Losses) | | | | | | | | | | | | | | | | |
Net realized gains/(losses) on: | | | | | | | | | | | | | | | | |
Investments | | | — | | | | — | | | | (88 | ) | | | — | |
Affiliated investments | | | (6,854,194 | ) | | | (31,077,363 | ) | | | (28,884,043 | ) | | | (9,585,324 | ) |
Distributions of realized capital gains from affiliated investments | | | 29,546,829 | | | | 57,282,251 | | | | 39,762,547 | | | | 9,879,658 | |
Written option contracts | | | — | | | | — | | | | — | | | | — | |
Futures contracts | | | 4,989 | | | | — | | | | — | | | | — | |
Foreign currency transactions | | | — | | | | — | | | | — | | | | — | |
Change in net unrealized appreciation/(depreciation) on: | | | | | | | | | | | | | | | | |
Investments | | | — | | | | 138,817 | | | | 283,996 | | | | 137,410 | |
Affiliated investments | | | (199,520,219 | ) | | | (412,051,979 | ) | | | (322,700,809 | ) | | | (91,312,332 | ) |
Written option contracts | | | — | | | | — | | | | — | | | | — | |
Futures contracts | | | 137,362 | | | | (373,743 | ) | | | (292,442 | ) | | | (872,237 | ) |
Foreign currency forward contracts | | | — | | | | — | | | | — | | | | — | |
Foreign currency transactions | | | — | | | | — | | | | — | | | | — | |
Net Realized and Unrealized Gains/(Losses) | | | (176,685,233 | ) | | | (386,082,017 | ) | | | (311,830,839 | ) | | | (91,752,825 | ) |
Net Increase/(Decrease) in Net Assets Resulting From Operations | | $ | (172,873,241 | ) | | $ | (368,464,056 | ) | | $ | (288,082,065 | ) | | $ | (80,578,434 | ) |
The accompanying Notes to Financial Statements are an integral part of this schedule.
192
Thrivent Mutual Funds
Statement of Operations - continued
| | | | | | | | | | | | | | | | | | | | | | | | | |
| | | | | | |
Technology Fund | | Partner Small
Cap Growth
Fund | | | Partner Small
Cap Value
Fund | | | Small Cap Stock
Fund | | | Small Cap
Index Fund | | | Mid Cap Growth
Fund | | | Partner Mid
Cap Value
Fund | |
| | | | | | | | | | | | | | | | | | | | | | | | | |
| $ | 149,749 | | $ | 392,116 | | | $ | 2,234,001 | | | $ | 4,508,022 | | | $ | 476,275 | | | $ | 1,859,895 | | | $ | 1,332,120 | |
| | 47 | | | 35,612 | | | | 6,802 | | | | 264,016 | | | | 4,580 | | | | 10,030 | | | | 5,619 | |
| | 102,252 | | | 314,820 | | | | 415,690 | | | | 1,334,723 | | | | 107,774 | | | | 510,477 | | | | 33,775 | |
| | 54,888 | | | 102,423 | | | | 176,713 | | | | 629,825 | | | | 29,433 | | | | 618,081 | | | | 106,970 | |
| | (418) | | | (10,155 | ) | | | — | | | | (4,495 | ) | | | (155 | ) | | | — | | | | (58 | ) |
| | 306,518 | | | 834,816 | | | | 2,833,206 | | | | 6,732,091 | | | | 617,907 | | | | 2,998,483 | | | | 1,478,426 | |
| | | | | | | | | | | | | | | | | | | | | | | | | |
| | 257,449 | | | 307,285 | | | | 144,962 | | | | 3,224,071 | | | | 91,925 | | | | 1,257,389 | | | | 158,278 | |
| | — | | | 452,830 | | | | 869,775 | | | | — | | | | — | | | | — | | | | 315,464 | |
| | 19,053 | | | 23,676 | | | | 26,780 | | | | 49,985 | | | | 24,450 | | | | 35,750 | | | | 20,423 | |
| | 6,865 | | | 16,891 | | | | 28,993 | | | | 96,125 | | | | 7,354 | | | | 61,934 | | | | 12,633 | |
| | 15,734 | | | 16,437 | | | | 17,088 | | | | 22,989 | | | | 15,730 | | | | 20,157 | | | | 15,719 | |
| | 7,439 | | | 46,846 | | | | 17,928 | | | | 64,260 | | | | 25,920 | | | | 16,248 | | | | 38,426 | |
| | 78,462 | | | 32,904 | | | | 172,413 | | | | 883,840 | | | | 91,925 | | | | 617,535 | | | | 25,520 | |
| | 9,450 | | | — | | | | 24,081 | | | | 63,746 | | | | — | | | | 116,571 | | | | — | |
| | 3,651 | | | 3,846 | | | | 4,303 | | | | 6,557 | | | | 3,679 | | | | 5,327 | | | | 3,705 | |
| | 71,835 | | | 3,685 | | | | 72,105 | | | | 328,068 | | | | 37,911 | | | | 315,791 | | | | 3,906 | |
| | 2,668 | | | — | | | | 3,454 | | | | 9,858 | | | | — | | | | 18,789 | | | | — | |
| | 181 | | | 1,642 | | | | 1,333 | | | | 2,051 | | | | — | | | | 1,099 | | | | 1,154 | |
| | 32,861 | | | 27,409 | | | | 41,072 | | | | 60,848 | | | | 17,315 | | | | 49,483 | | | | 26,647 | |
| | 178,512 | | | 10,882 | | | | 210,079 | | | | 899,278 | | | | 118,031 | | | | 829,947 | | | | 16,494 | |
| | 11,276 | | | — | | | | 14,803 | | | | 53,760 | | | | — | | | | 111,537 | | | | — | |
| | 204 | | | 153 | | | | 229 | | | | 545 | | | | — | | | | 462 | | | | 187 | |
| | 1,217 | | | 2,794 | | | | 3,949 | | | | 6,346 | | | | 1,602 | | | | 8,107 | | | | 2,795 | |
| | 7,684 | | | 7,182 | | | | 8,002 | | | | 10,373 | | | | 7,884 | | | | 9,121 | | | | 7,041 | |
| | 704,541 | | | 954,462 | | | | 1,661,349 | | | | 5,782,700 | | | | 443,726 | | | | 3,475,247 | | | | 648,392 | |
| | | | | | | | | | | | | | | | | | | | | | | | | |
| | (199,296) | | | (14,055 | ) | | | (166,404 | ) | | | (87,065 | ) | | | (94,081 | ) | | | (101,583 | ) | | | (28,076 | ) |
| | (4) | | | (70 | ) | | | (3,667 | ) | | | (1,474 | ) | | | (329 | ) | | | (137 | ) | | | (64 | ) |
| | 505,241 | | | 940,337 | | | | 1,491,278 | | | | 5,694,161 | | | | 349,316 | | | | 3,373,527 | | | | 620,252 | |
| | (198,723) | | | (105,521 | ) | | | 1,341,928 | | | | 1,037,930 | | | | 268,591 | | | | (375,044 | ) | | | 858,174 | |
| | | | | | | | | | | | | | | | | | | | | | | | | |
| | | | | | | | | | | | | | | | | | | | | | | | | |
| | (10,402,721) | | | (16,826,936 | ) | | | 7,545,688 | | | | (70,851,324 | ) | | | 3,914,024 | | | | 6,358,212 | | | | (11,524,992 | ) |
| | — | | | — | | | | — | | | | — | | | | — | | | | — | | | | — | |
| | | | | | |
| | — | | | — | | | | — | | | | — | | | | — | | | | — | | | | — | |
| | — | | | — | | | | — | | | | — | | | | — | | | | 7,984 | | | | — | |
| | — | | | (8,446 | ) | | | — | | | | (437,898 | ) | | | (448,702 | ) | | | — | | | | — | |
| | (8,598) | | | — | | | | — | | | | 5 | | | | — | | | | (15 | ) | | | — | |
| | | | | | | | | | | | | | | | | | | | | | | | | |
| | (11,332,579) | | | (26,491,450 | ) | | | (53,999,043 | ) | | | (139,026,582 | ) | | | (17,606,343 | ) | | | (152,832,655 | ) | | | (23,766,655 | ) |
| | — | | | — | | | | — | | | | — | | | | — | | | | — | | | | — | |
| | — | | | — | | | | — | | | | — | | | | — | | | | (1,226 | ) | | | — | |
| | — | | | (776,010 | ) | | | — | | | | — | | | | 10,461 | | | | — | | | | — | |
| | (3,344) | | | — | | | | — | | | | — | | | | — | | | | — | | | | — | |
| | 3,127 | | | — | | | | — | | | | — | | | | — | | | | — | | | | — | |
| | (21,744,115) | | | (44,102,842 | ) | | | (46,453,355 | ) | | | (210,315,799 | ) | | | (14,130,560 | ) | | | (146,467,700 | ) | | | (35,291,647 | ) |
| | | | | | |
| $ | (21,942,838) | | $ | (44,208,363 | ) | | $ | (45,111,427 | ) | | $ | (209,277,869 | ) | | $ | (13,861,969 | ) | | $ | (146,842,744 | ) | | $ | (34,433,473 | ) |
The accompanying Notes to Financial Statements are an integral part of this schedule.
193
Thrivent Mutual Funds
Statement of Operations - continued
| | | | | | | | | | | | | | | | |
For the year ended October 31, 2008 | | Mid Cap Stock
Fund | | | Mid Cap Index
Fund | | | Partner
Worldwide
Allocation
Fund(a) | | | Partner
International
Stock Fund | |
Investment Income | | | | | | | | | | | | | | | | |
Dividends | | $ | 12,128,395 | | | $ | 734,706 | | | $ | 2,016,497 | | | $ | 19,061,014 | |
Taxable interest | | | 763,835 | | | | 3,902 | | | | 468,218 | | | | 310,272 | |
Tax Exempt interest | | | — | | | | — | | | | — | | | | — | |
Income from mortgage dollar rolls | | | — | | | | — | | | | — | | | | — | |
Income from securities loaned | | | 1,540,753 | | | | 80,291 | | | | — | | | | 427,548 | |
Income from affiliated investments | | | 594,853 | | | | 30,942 | | | | 76,514 | | | | 273,643 | |
Foreign dividend tax withholding | | | (477 | ) | | | — | | | | (182,015 | ) | | | (1,776,883 | ) |
Total Investment Income | | | 15,027,359 | | | | 849,841 | | | | 2,379,214 | | | | 18,295,594 | |
Expenses | | | | | | | | | | | | | | | | |
Adviser fees | | | 6,469,331 | | | | 124,189 | | | | 259,083 | | | | 1,617,842 | |
Sub-Adviser fees | | | — | | | | — | | | | 308,107 | | | | 1,986,907 | |
Accounting and pricing fees | | | 79,364 | | | | 23,379 | | | | 51,904 | | | | 88,196 | |
Administrative service fees | | | 196,336 | | | | 9,935 | | | | 12,604 | | | | 119,325 | |
Amortization of offering costs | | | — | | | | — | | | | 24,648 | | | | — | |
Audit and legal fees | | | 31,461 | | | | 15,935 | | | | 19,262 | | | | 28,787 | |
Custody fees | | | 47,127 | | | | 22,471 | | | | 115,497 | | | | 210,971 | |
Distribution expenses Class A | | | 1,929,679 | | | | 124,189 | | | | 39,302 | | | | 754,824 | |
Distribution expenses Class B | | | 72,714 | | | | — | | | | — | | | | 66,202 | |
Insurance expenses | | | 9,856 | | | | 3,760 | | | | 2,244 | | | | 7,250 | |
Printing and postage expenses Class A | | | 453,433 | | | | 34,745 | | | | 8,439 | | | | 192,287 | |
Printing and postage expenses Class B | | | 9,281 | | | | — | | | | — | | | | 8,515 | |
Printing and postage expenses Institutional Class | | | 3,013 | | | | — | | | | 1,891 | | | | 4,122 | |
SEC and state registration expenses | | | 94,704 | | | | 18,092 | | | | 8,780 | | | | 68,874 | |
Transfer agent fees Class A | | | 1,487,440 | | | | 145,142 | | | | 12,474 | | | | 848,037 | |
Transfer agent fees Class B | | | 57,274 | | | | — | | | | — | | | | 51,016 | |
Transfer agent fees Institutional Class | | | 717 | | | | — | | | | 76 | | | | 747 | |
Trustees’ fees | | | 10,648 | | | | 1,445 | | | | 2,662 | | | | 12,136 | |
Other expenses | | | 12,676 | | | | 7,503 | | | | 4,668 | | | | 9,922 | |
Total Expenses Before Reimbursement | | | 10,965,054 | | | | 530,785 | | | | 871,641 | | | | 6,075,960 | |
Less: | | | | | | | | | | | | | | | | |
Reimbursement from adviser | | | (78,096 | ) | | | (203,842 | ) | | | (211,478 | ) | | | (37,705 | ) |
Custody earnings credit | | | (1,263 | ) | | | (197 | ) | | | (6,440 | ) | | | (109 | ) |
Total Net Expenses | | | 10,885,695 | | | | 326,746 | | | | 653,723 | | | | 6,038,146 | |
Net Investment Income/(Loss) | | | 4,141,664 | | | | 523,095 | | | | 1,725,491 | | | | 12,257,448 | |
Realized and Unrealized Gains/(Losses) | | | | | | | | | | | | | | | | |
Net realized gains/(losses) on: | | | | | | | | | | | | | | | | |
Investments | | | (202,901,892 | ) | | | 3,158,768 | | | | (7,834,636 | ) | | | (56,592,823 | ) |
Written option contracts | | | — | | | | — | | | | — | | | | — | |
Futures contracts | | | — | | | | (451,081 | ) | | | (503,037 | ) | | | — | |
Foreign currency transactions | | | — | | | | — | | | | (187,083 | ) | | | (444,250 | ) |
Swap agreements | | | — | | | | — | | | | — | | | | — | |
Change in net unrealized appreciation/(depreciation) on: | | | | | | | | | | | | | | | | |
Investments | | | (298,731,729 | ) | | | (23,322,744 | ) | | | (32,910,211 | ) | | | (294,529,254 | ) |
Written option contracts | | | — | | | | — | | | | — | | | | — | |
Futures contracts | | | — | | | | (21,168 | ) | | | (91,189 | ) | | | — | |
Foreign currency forward contracts | | | — | | | | — | | | | (34,125 | ) | | | (131,936 | ) |
Foreign currency transactions | | | — | | | | — | | | | (7,060 | ) | | | 177,003 | |
Swap agreements | | | — | | | | — | | | | — | | | | — | |
Net Realized and Unrealized Gains/(Losses) | | | (501,633,621 | ) | | | (20,636,225 | ) | | | (41,567,341 | ) | | | (351,521,260 | ) |
Net Increase/(Decrease) in Net Assets Resulting From Operations | | $ | (497,491,957 | ) | | $ | (20,113,130 | ) | | $ | (39,841,850 | ) | | $ | (339,263,812 | ) |
(a) | For the period from February 29, 2008 (inception) through October 31, 2008 |
The accompanying Notes to the Financial Statements are an integral part of this schedule.
194
Thrivent Mutual Funds
Statement of Operations - continued
| | | | | | | | | | | | | | | | | | | | | | | | | |
| | | | | | |
Large Cap Growth Fund | | Large Cap
Value Fund | | | Large Cap Stock
Fund | | | Large Cap
Index Fund | | | Balanced Fund | | | High Yield
Fund | | | Municipal
Bond Fund | |
| | | | | | | | | | | | | | | | | | | | | | | | | |
| $ | 5,257,315 | | $ | 15,715,163 | | | $ | 53,616,771 | | | $ | 1,645,886 | | | $ | 3,005,673 | | | $ | 614,324 | | | $ | — | |
| | 15,043 | | | 40,362 | | | | 1,216,850 | | | | 7,391 | | | | 4,019,834 | | | | 48,261,080 | | | | 335,961 | |
| | — | | | — | | | | — | | | | — | | | | — | | | | — | | | | 60,591,955 | |
| | — | | | — | | | | — | | | | — | | | | 606,712 | | | | — | | | | — | |
| | 248,313 | | | 468,863 | | | | 2,279,039 | | | | 19,596 | | | | 303,305 | | | | 335,376 | | | | — | |
| | 408,960 | | | 384,203 | | | | 529,362 | | | | 28,625 | | | | 533,154 | | | | 588,538 | | | | — | |
| | (43,937) | | | (151,004 | ) | | | (507,732 | ) | | | — | | | | (19,157 | ) | | | — | | | | — | |
| | 5,885,694 | | | 16,457,587 | | | | 57,134,290 | | | | 1,701,498 | | | | 8,449,521 | | | | 49,799,318 | | | | 60,927,916 | |
| | | | | | | | | | | | | | | | | | | | | | | | | |
| | 3,782,895 | | | 2,726,346 | | | | 14,667,711 | | | | 188,172 | | | | 1,526,279 | | | | 2,253,527 | | | | 4,900,198 | |
| | — | | | — | | | | — | | | | — | | | | — | | | | — | | | | — | |
| | 33,723 | | | 43,468 | | | | 209,936 | | | | 25,418 | | | | 56,377 | | | | 68,367 | | | | 149,979 | |
| | 101,307 | | | 121,171 | | | | 552,806 | | | | 15,054 | | | | 55,501 | | | | 114,555 | | | | 237,154 | |
| | — | | | — | | | | — | | | | — | | | | — | | | | — | | | | — | |
| | 23,181 | | | 24,259 | | | | 63,210 | | | | 16,390 | | | | 19,679 | | | | 22,872 | | | | 31,474 | |
| | 55,471 | | | 21,374 | | | | 105,224 | | | | 22,635 | | | | 25,766 | | | | 23,431 | | | | 29,624 | |
| | 332,689 | | | 676,824 | | | | 6,089,408 | | | | 188,172 | | | | 500,586 | | | | 1,075,055 | | | | 2,879,177 | |
| | 58,380 | | | 60,875 | | | | 284,601 | | | | — | | | | 54,107 | | | | 68,861 | | | | 78,949 | |
| | 6,373 | | | 7,063 | | | | 22,116 | | | | 3,935 | | | | 5,271 | | | | 7,123 | | | | 10,679 | |
| | 115,410 | | | 140,784 | | | | 1,302,055 | | | | 41,059 | | | | 102,696 | | | | 205,775 | | | | 204,973 | |
| | 8,849 | | | 7,044 | | | | 40,057 | | | | — | | | | 5,033 | | | | 6,217 | | | | 3,294 | |
| | 4,228 | | | 4,102 | | | | 4,053 | | | | — | | | | 1,218 | | | | 2,525 | | | | 571 | |
| | 65,232 | | | 72,148 | | | | 160,957 | | | | 20,209 | | | | 49,631 | | | | 63,496 | | | | 114,437 | |
| | 449,506 | | | 574,133 | | | | 3,941,825 | | | | 172,883 | | | | 354,877 | | | | 585,621 | | | | 519,226 | |
| | 51,142 | | | 42,432 | | | | 245,648 | | | | — | | | | 26,033 | | | | 32,994 | | | | 11,123 | |
| | 405 | | | 613 | | | | 1,478 | | | | — | | | | 263 | | | | 1,204 | | | | 308 | |
| | 13,808 | | | 10,686 | | | | 7,176 | | | | 1,255 | | | | 979 | | | | 12,581 | | | | 14,289 | |
| | 9,627 | | | 10,157 | | | | 22,727 | | | | 7,833 | | | | 9,453 | | | | 8,698 | | | | 11,191 | |
| | 5,112,226 | | | 4,543,479 | | | | 27,720,988 | | | | 703,015 | | | | 2,793,749 | | | | 4,552,902 | | | | 9,196,646 | |
| | | | | | | | | | | | | | | | | | | | | | | | | |
| | (495,900) | | | (43,938 | ) | | | (265,935 | ) | | | (251,322 | ) | | | (70,178 | ) | | | (87,264 | ) | | | (13,757 | ) |
| | (126) | | | (65 | ) | | | (3,293 | ) | | | (80 | ) | | | (193 | ) | | | (3,014 | ) | | | (1,162 | ) |
| | 4,616,200 | | | 4,499,476 | | | | 27,451,760 | | | | 451,613 | | | | 2,723,378 | | | | 4,462,624 | | | | 9,181,727 | |
| | 1,269,494 | | | 11,958,111 | | | | 29,682,530 | | | | 1,249,885 | | | | 5,726,143 | | | | 45,336,694 | | | | 51,746,189 | |
| | | | | | | | | | | | | | | | | | | | | | | | | |
| | | | | | | | | | | | | | | | | | | | | | | | | |
| | (60,602,679) | | | (45,172,966 | ) | | | (3,923,179 | ) | | | (1,595,754 | ) | | | (812,371 | ) | | | (30,882,296 | ) | | | 2,799,669 | |
| | 372,251 | | | — | | | | 761,401 | | | | — | | | | 33,125 | | | | — | | | | — | |
| | — | | | — | | | | (7,455,901 | ) | | | (577,145 | ) | | | (978,413 | ) | | | 141,611 | | | | — | |
| | (2) | | | — | | | | (3 | ) | | | — | | | | (626 | ) | | | — | | | | — | |
| | — | | | — | | | | — | | | | — | | | | 59,734 | | | | (2,079,069 | ) | | | — | |
| | | | | | | | | | | | | | | | | | | | | | | | | |
| | (161,365,078) | | | (202,362,296 | ) | | | (1,127,936,677 | ) | | | (30,396,122 | ) | | | (88,740,687 | ) | | | (147,280,135 | ) | | | (91,235,351 | ) |
| | (1,470) | | | — | | | | — | | | | — | | | | (9,375 | ) | | | — | | | | — | |
| | — | | | — | | | | (467,882 | ) | | | (10,803 | ) | | | (21,120 | ) | | | — | | | | — | |
| | — | | | — | | | | — | | | | — | | | | — | | | | — | | | | — | |
| | — | | | — | | | | — | | | | — | | | | (1 | ) | | | — | | | | — | |
| | — | | | — | | | | — | | | | — | | | | (172,439 | ) | | | 212,718 | | | | — | |
| | (221,596,978) | | | (247,535,262 | ) | | | (1,139,022,241 | ) | | | (32,579,824 | ) | | | (90,642,173 | ) | | | (179,887,171 | ) | | | (88,435,682 | ) |
| | | | | | |
| $ | (220,327,484) | | $ | (235,577,151 | ) | | $ | (1,109,339,711 | ) | | $ | (31,329,939 | ) | | $ | (84,916,030 | ) | | $ | (134,550,477 | ) | | $ | (36,689,493 | ) |
The accompanying Notes to Financial Statements are an integral part of this schedule.
195
Thrivent Mutual Funds
Statement of Operations - continued
| | | | | | | | | | | | | | | | |
For the year ended October 31, 2008 | | Income Fund | | | Core Bond
Fund | | | Limited
Maturity Bond
Fund | | | Money Market
Fund | |
Investment Income | | | | | | | | | | | | | | | | |
Dividends | | $ | 229,272 | | | $ | 168,993 | | | $ | 267,932 | | | $ | 1,992,571 | |
Taxable interest | | | 43,527,125 | | | | 16,772,247 | | | | 21,520,285 | | | | 57,278,635 | |
Income from mortgage dollar rolls | | | 1,348,345 | | | | 2,147,756 | | | | 585,047 | | | | — | |
Income from securities loaned | | | 344,123 | | | | 136,269 | | | | 349,421 | | | | — | |
Income from affiliated investments | | | 639,630 | | | | 771,838 | | | | 757,954 | | | | — | |
Total Investment Income | | | 46,088,495 | | | | 19,997,103 | | | | 23,480,639 | | | | 59,271,206 | |
Expenses | | | | | | | | | | | | | | | | |
Adviser fees | | | 2,636,675 | | | | 1,605,129 | | | | 1,436,964 | | | | 6,327,557 | |
Accounting and pricing fees | | | 76,865 | | | | 58,151 | | | | 47,556 | | | | 85,044 | |
Administrative service fees | | | 154,565 | | | | 71,339 | | | | 95,798 | | | | 320,157 | |
Audit and legal fees | | | 26,288 | | | | 20,428 | | | | 20,849 | | | | 36,639 | |
Custody fees | | | 38,008 | | | | 22,180 | | | | 25,280 | | | | 44,733 | |
Distribution expenses Class A | | | 1,005,562 | | | | 673,412 | | | | 131,915 | | | | 1,632,522 | |
Distribution expenses Class B | | | 45,978 | | | | 30,536 | | | | 4,293 | | | | 11,220 | |
Insurance expenses | | | 8,063 | | | | 5,704 | | | | 5,986 | | | | 66,460 | |
Printing and postage expenses Class A | | | 170,877 | | | | 102,055 | | | | 41,709 | | | | 650,616 | |
Printing and postage expenses Class B | | | 5,069 | | | | 2,724 | | | | 810 | | | | 1,068 | |
Printing and postage expenses Institutional Class | | | 4,639 | | | | 1,464 | | | | 4,364 | | | | 6,772 | |
SEC and state registration expenses | | | 73,474 | | | | 54,027 | | | | 66,330 | | | | 195,833 | |
Transfer agent fees Class A | | | 502,594 | | | | 395,641 | | | | 183,657 | | | | 1,594,656 | |
Transfer agent fees Class B | | | 29,456 | | | | 15,038 | | | | 3,753 | | | | 4,544 | |
Transfer agent fees Institutional Class | | | 1,561 | | | | 920 | | | | 525 | | | | 2,294 | |
Trustees’ fees | | | 18,127 | | | | (216 | ) | | | 13,778 | | | | 29,945 | |
Other expenses | | | 9,134 | | | | 7,548 | | | | 7,274 | | | | 11,870 | |
Total Expenses Before Reimbursement | | | 4,806,935 | | | | 3,066,080 | | | | 2,090,841 | | | | 11,021,930 | |
Less: | | | | | | | | | | | | | | | | |
Reimbursement from adviser | | | (88,439 | ) | | | (353,713 | ) | | | (65,228 | ) | | | (2,915,095 | ) |
Custody earnings credit | | | (618 | ) | | | (1,189 | ) | | | (1,221 | ) | | | (1,008 | ) |
Total Net Expenses | | | 4,717,878 | | | | 2,711,178 | | | | 2,024,392 | | | | 8,105,827 | |
Net Investment Income/(Loss) | | | 41,370,617 | | | | 17,285,925 | | | | 21,456,247 | | | | 51,165,379 | |
Realized and Unrealized Gains/(Losses) | | | | | | | | | | | | | | | | |
Net realized gains/(losses) on: | | | | | | | | | | | | | | | | |
Investments | | | (16,338,012 | ) | | | (684,669 | ) | | | (1,027,614 | ) | | | (67,104 | ) |
Written option contracts | | | 152,813 | | | | 119,922 | | | | 15,313 | | | | — | |
Futures contracts | | | (2,983,422 | ) | | | (3,269,537 | ) | | | (3,140,487 | ) | | | — | |
Swap agreements | | | 411,644 | | | | 226,004 | | | | 487,092 | | | | — | |
Change in net unrealized appreciation/(depreciation) on: | | | | | | | | | | | | | | | | |
Investments | | | (128,190,314 | ) | | | (47,070,100 | ) | | | (41,512,214 | ) | | | — | |
Written option contracts | | | (34,688 | ) | | | (37,500 | ) | | | (6,563 | ) | | | — | |
Futures contracts | | | (751,527 | ) | | | 169,981 | | | | (182,070 | ) | | | — | |
Swap agreements | | | (1,760,260 | ) | | | (697,851 | ) | | | (495,706 | ) | | | — | |
Net Realized and Unrealized Gains/(Losses) | | | (149,493,766 | ) | | | (51,243,750 | ) | | | (45,862,249 | ) | | | (67,104 | ) |
Net Increase/(Decrease) in Net Assets Resulting From Operations | | $ | (108,123,149 | ) | | $ | (33,957,825 | ) | | $ | (24,406,002 | ) | | $ | 51,098,275 | |
The accompanying Notes to the Financial Statements are an integral part of this schedule.
196
[THIS PAGE INTENTIONALLY LEFT BLANK]
197
Thrivent Mutual Funds
Statement of Changes in Net Assets
| | | | | | | | | | | | | | | | |
| | | Aggressive Allocation Fund | | | Moderately Aggressive Allocation
Fund | |
For the periods ended | | 10/31/2008 | | | 10/31/2007 | | | 10/31/2008 | | | 10/31/2007 | |
Operations | | | | | | | | | | | | | | | | |
Net investment income/(loss) | | $ | 3,811,992 | | | $ | 2,519,787 | | | $ | 17,617,961 | | | $ | 10,720,957 | |
Net realized gains/(losses) | | | 22,697,624 | | | | 6,936,624 | | | | 26,204,888 | | | | 13,845,211 | |
Change in net unrealized appreciation/(depreciation) | | | (199,382,857 | ) | | | 41,239,805 | | | | (412,286,905 | ) | | | 75,005,268 | |
Net Change in Net Assets Resulting From Operations | | | (172,873,241 | ) | | | 50,696,216 | | | | (368,464,056 | ) | | | 99,571,436 | |
Distributions to Shareholders | | | | | | | | | | | | | | | | |
From net investment income | | | (10,542,747 | ) | | | (3,897,772 | ) | | | (27,361,524 | ) | | | (10,860,937 | ) |
From net realized gains | | | (6,153,794 | ) | | | (632,879 | ) | | | (12,775,832 | ) | | | (1,030,546 | ) |
Total Distributions to Shareholders | | | (16,696,541 | ) | | | (4,530,651 | ) | | | (40,137,356 | ) | | | (11,891,483 | ) |
Capital Stock Transactions | | | | | | | | | | | | | | | | |
Class A | | | | | | | | | | | | | | | | |
Sold | | | 118,087,378 | | | | 141,612,846 | | | | 294,741,004 | | | | 405,451,968 | |
Distributions reinvested | | | 14,095,300 | | | | 3,665,237 | | | | 36,947,136 | | | | 10,702,312 | |
Redeemed | | | (40,104,629 | ) | | | (27,540,811 | ) | | | (113,700,523 | ) | | | (60,789,521 | ) |
| | | | | | | | | | | | | | | | |
Total Class A Capital Stock Transactions | | | 92,078,049 | | | | 117,737,272 | | | | 217,987,617 | | | | 355,364,759 | |
| | | | | | | | | | | | | | | | |
Class B | | | | | | | | | | | | | | | | |
Sold | | | — | | | | — | | | | — | | | | — | |
Redeemed | | | — | | | | — | | | | — | | | | — | |
| | | | | | | | | | | | | | | | |
Total Class B Capital Stock Transactions | | | — | | | | — | | | | — | | | | — | |
| | | | | | | | | | | | | | | | |
Institutional Class | | | | | | | | | | | | | | | | |
Sold | | | 30,105,168 | | | | 25,221,287 | | | | 22,778,698 | | | | 29,828,380 | |
Distributions reinvested | | | 2,560,040 | | | | 855,522 | | | | 3,063,040 | | | | 1,153,325 | |
Redeemed | | | (11,149,284 | ) | | | (11,249,500 | ) | | | (8,744,827 | ) | | | (9,070,981 | ) |
| | | | | | | | | | | | | | | | |
Total Institutional Class Capital Stock Transactions | | | 21,515,924 | | | | 14,827,309 | | | | 17,096,911 | | | | 21,910,724 | |
| | | | | | | | | | | | | | | | |
Capital Stock Transactions | | | 113,593,973 | | | | 132,564,581 | | | | 235,084,528 | | | | 377,275,483 | |
Net Increase/(Decrease) in Net Assets | | | (75,975,809 | ) | | | 178,730,146 | | | | (173,516,884 | ) | | | 464,955,436 | |
Net Assets, Beginning of Period | | | 390,580,447 | | | | 211,850,301 | | | | 928,066,435 | | | | 463,110,999 | |
Net Assets, End of Period | | $ | 314,604,638 | | | $ | 390,580,447 | | | $ | 754,549,551 | | | $ | 928,066,435 | |
Capital Stock Share Transactions | | | | | | | | | | | | | | | | |
Class A shares | | | | | | | | | | | | | | | | |
Sold | | | 10,335,528 | | | | 11,145,392 | | | | 26,042,536 | | | | 32,827,844 | |
Distributions reinvested | | | 1,115,967 | | | | 303,204 | | | | 3,026,738 | | | | 903,871 | |
Redeemed | | | (3,589,602 | ) | | | (2,149,549 | ) | | | (10,476,377 | ) | | | (4,890,773 | ) |
| | | | | | | | | | | | | | | | |
Total Class A shares | | | 7,861,893 | | | | 9,299,047 | | | | 18,592,897 | | | | 28,840,942 | |
| | | | | | | | | | | | | | | | |
Class B shares | | | | | | | | | | | | | | | | |
Sold | | | — | | | | — | | | | — | | | | — | |
Redeemed | | | — | | | | — | | | | — | | | | — | |
| | | | | | | | | | | | | | | | |
Total Class B shares | | | — | | | | — | | | | — | | | | — | |
| | | | | | | | | | | | | | | | |
Institutional Class shares | | | | | | | | | | | | | | | | |
Sold | | | 2,665,828 | | | | 1,979,500 | | | | 2,049,170 | | | | 2,408,374 | |
Distributions reinvested | | | 201,906 | | | | 70,543 | | | | 249,988 | | | | 97,155 | |
Redeemed | | | (977,087 | ) | | | (879,192 | ) | | | (801,520 | ) | | | (727,993 | ) |
| | | | | | | | | | | | | | | | |
Total Institutional Class shares | | | 1,890,647 | | | | 1,170,851 | | | | 1,497,638 | | | | 1,777,536 | |
| | | | | | | | | | | | | | | | |
The accompanying Notes to Financial Statements are an integral part of this schedule.
198
Thrivent Mutual Funds
Statement of Changes in Net Assets - continued
| | | | | | | | | | | | | | | | | | | | | | | | | | | | | | |
| Moderate Allocation Fund | | | Moderately Conservative
Allocation Fund | | | Technology Fund | | | Partner Small Cap Growth Fund | |
| 10/31/2008 | | | 10/31/2007 | | | 10/31/2008 | | | 10/31/2007 | | | 10/31/2008 | | | 10/31/2007 | | | 10/31/2008 | | | 10/31/2007 | |
| | | | | | | | | | | | | | | | | | | | | | | |
| $ | 23,748,774 | | | $ | 15,543,401 | | | $ | 11,174,391 | | | $ | 7,191,868 | | | $ | (198,723 | ) | | $ | (413,442 | ) | | $ | (105,521 | ) | | $ | (178,832 | ) |
| | 10,878,416 | | | | 12,870,990 | | | | 294,334 | | | | 3,235,181 | | | | (10,411,319 | ) | | | 3,589,799 | | | | (16,835,382 | ) | | | 3,385,615 | |
| | (322,709,255 | ) | | | 49,052,561 | | | | (92,047,159 | ) | | | 10,872,839 | | | | (11,332,796 | ) | | | 6,649,095 | | | | (27,267,460 | ) | | | 7,179,543 | |
| | | | | | | | | | | | | | | | | | | | | | | | | | | | | | |
| | (288,082,065 | ) | | | 77,466,952 | | | | (80,578,434 | ) | | | 21,299,888 | | | | (21,942,838 | ) | | | 9,825,452 | | | | (44,208,363 | ) | | | 10,386,326 | |
| | | | | | | | | | | | | | | | | | | | | | | | | | | | | | |
| | (32,890,391 | ) | | | (17,495,259 | ) | | | (13,212,189 | ) | | | (7,495,708 | ) | | | — | | | | — | | | | — | | | | (53,994 | ) |
| | (12,721,584 | ) | | | (1,698,236 | ) | | | (2,938,427 | ) | | | (463,260 | ) | | | — | | | | — | | | | (3,442,116 | ) | | | — | |
| | (45,611,975 | ) | | | (19,193,495 | ) | | | (16,150,616 | ) | | | (7,958,968 | ) | | | — | | | | — | | | | (3,442,116 | ) | | | (53,994 | ) |
| | | | | | | | | | | | | | | | | | | | | | | | | | | | | | |
| | | | | | | | | | | | | | | | | | | | | | | | | | | | | | |
| | 314,251,604 | | | | 393,578,244 | | | | 159,768,489 | | | | 158,211,117 | | | | 4,110,468 | | | | 4,607,775 | | | | 1,615,690 | | | | 1,624,901 | |
| | 43,615,989 | | | | 18,327,726 | | | | 15,359,813 | | | | 7,522,058 | | | | — | | | | — | | | | 654,872 | | | | — | |
| | (139,386,632 | ) | | | (67,815,953 | ) | | | (72,480,669 | ) | | | (30,042,629 | ) | | | (7,297,647 | ) | | | (11,179,185 | ) | | | (761,499 | ) | | | (497,747 | ) |
| | | | | | | | | | | | | | | | | | | | | | | | | | | | | | | |
| | 218,480,961 | | | | 344,090,017 | | | | 102,647,633 | | | | 135,690,546 | | | | (3,187,179 | ) | | | (6,571,410 | ) | | | 1,509,063 | | | | 1,127,154 | |
| | | | | | | | | | | | | | | | | | | | | | | | | | | | | | | |
| | | | | | | | | | | | | | | | | | | | | | | | | | | | | | |
| | — | | | | — | | | | — | | | | — | | | | 225 | | | | 9,130 | | | | — | | | | — | |
| | — | | | | — | | | | — | | | | — | | | | (722,898 | ) | | | (1,092,074 | ) | | | — | | | | — | |
| | | | | | | | | | | | | | | | | | | | | | | | | | | | | | | |
| | — | | | | — | | | | — | | | | — | | | | (722,673 | ) | | | (1,082,944 | ) | | | — | | | | — | |
| | | | | | | | | | | | | | | | | | | | | | | | | | | | | | | |
| | | | | | | | | | | | | | | | | | | | | | | | | | | | | | |
| | 18,236,660 | | | | 14,190,666 | | | | 10,602,695 | | | | 8,905,753 | | | | 997 | | | | 53,217 | | | | 38,293,336 | | | | 32,039,224 | |
| | 1,622,526 | | | | 706,921 | | | | 544,765 | | | | 321,484 | | | | — | | | | — | | | | 2,786,333 | | | | 53,894 | |
| | (7,779,995 | ) | | | (6,064,902 | ) | | | (6,538,713 | ) | | | (6,455,102 | ) | | | (66,350 | ) | | | (114,062 | ) | | | (634,361 | ) | | | (4,855,762 | ) |
| | | | | | | | | | | | | | | | | | | | | | | | | | | | | | | |
| | 12,079,191 | | | | 8,832,685 | | | | 4,608,747 | | | | 2,772,135 | | | | (65,353 | ) | | | (60,845 | ) | | | 40,445,308 | | | | 27,237,356 | |
| | | | | | | | | | | | | | | | | | | | | | | | | | | | | | | |
| | 230,560,152 | | | | 352,922,702 | | | | 107,256,380 | | | | 138,462,681 | | | | (3,975,205 | ) | | | (7,715,199 | ) | | | 41,954,371 | | | | 28,364,510 | |
| | (103,133,888 | ) | | | 411,196,159 | | | | 10,527,330 | | | | 151,803,601 | | | | (25,918,043 | ) | | | 2,110,253 | | | | (5,696,108 | ) | | | 38,696,842 | |
| | 871,142,388 | | | | 459,946,229 | | | | 315,236,021 | | | | 163,432,420 | | | | 46,716,482 | | | | 44,606,229 | | | | 79,989,770 | | | | 41,292,928 | |
| $ | 768,008,500 | | | $ | 871,142,388 | | | $ | 325,763,351 | | | $ | 315,236,021 | | | $ | 20,798,439 | | | $ | 46,716,482 | | | $ | 74,293,662 | | | $ | 79,989,770 | |
| | | | | | | | | | | | | | | | | | | | | | | | | | | | | | |
| | | | | | | | | | | | | | | | | | | | | | | | | | | | | | |
| | 28,893,347 | | | | 33,473,526 | | | | 15,167,039 | | | | 14,097,689 | | | | 1,149,822 | | | | 1,146,815 | | | | 147,293 | | | | 128,058 | |
| | 3,899,903 | | | | 1,577,026 | | | | 1,444,622 | | | | 675,328 | | | | — | | | | — | | | | 53,854 | | | | — | |
| | (13,381,235 | ) | | | (5,753,418 | ) | | | (7,113,668 | ) | | | (2,678,590 | ) | | | (2,077,310 | ) | | | (2,827,104 | ) | | | (68,430 | ) | | | (39,443 | ) |
| | | | | | | | | | | | | | | | | | | | | | | | | | | | | | | |
| | 19,412,015 | | | | 29,297,134 | | | | 9,497,993 | | | | 12,094,427 | | | | (927,488 | ) | | | (1,680,289 | ) | | | 132,717 | | | | 88,615 | |
| | | | | | | | | | | | | | | | | | | | | | | | | | | | | | | |
| | | | | | | | | | | | | | | | | | | | | | | | | | | | | | |
| | — | | | | — | | | | — | | | | — | | | | 59 | | | | 2,428 | | | | — | | | | — | |
| | — | | | | — | | | | — | | | | — | | | | (215,511 | ) | | | (288,947 | ) | | | — | | | | — | |
| | | | | | | | | | | | | | | | | | | | | | | | | | | | | | | |
| | — | | | | — | | | | — | | | | — | | | | (215,452 | ) | | | (286,519 | ) | | | — | | | | — | |
| | | | | | | | | | | | | | | | | | | | | | | | | | | | | | | |
| | | | | | | | | | | | | | | | | | | | | | | | | | | | | | |
| | 1,697,627 | | | | 1,206,409 | | | | 1,003,142 | | | | 797,525 | | | | 231 | | | | 11,922 | | | | 3,533,886 | | | | 2,488,996 | |
| | 145,478 | | | | 60,742 | | | | 51,122 | | | | 28,867 | | | | — | | | | — | | | | 227,827 | | | | 4,414 | |
| | (742,001 | ) | | | (515,341 | ) | | | (636,918 | ) | | | (576,060 | ) | | | (18,743 | ) | | | (26,208 | ) | | | (69,148 | ) | | | (384,916 | ) |
| | | | | | | | | | | | | | | | | | | | | | | | | | | | | | | |
| | 1,101,104 | | | | 751,810 | | | | 417,346 | | | | 250,332 | | | | (18,512 | ) | | | (14,286 | ) | | | 3,692,565 | | | | 2,108,494 | |
| | | | | | | | | | | | | | | | | | | | | | | | | | | | | | | |
The accompanying Notes to Financial Statements are an integral part of this schedule.
199
Thrivent Mutual Funds
Statement of Changes in Net Assets - continued
| | | | | | | | | | | | | | | | |
| | | Partner Small Cap Value Fund | | | Small Cap Stock Fund | |
For the periods ended | | 10/31/2008 | | | 10/31/2007 | | | 10/31/2008 | | | 10/31/2007 | |
Operations | | | | | | | | | | | | | | | | |
Net investment income/(loss) | | $ | 1,341,928 | | | $ | 584,082 | | | $ | 1,037,930 | | | $ | 514,511 | |
Net realized gains/(losses) | | | 7,545,688 | | | | 11,865,792 | | | | (71,289,217 | ) | | | 72,042,582 | |
Change in net unrealized appreciation/(depreciation) | | | (53,999,043 | ) | | | 874,667 | | | | (139,026,582 | ) | | | 3,069,598 | |
Net Change in Net Assets Resulting From Operations | | | (45,111,427 | ) | | | 13,324,541 | | | | (209,277,869 | ) | | | 75,626,691 | |
Distributions to Shareholders | | | | | | | | | | | | | | | | |
From net investment income | | | (445,782 | ) | | | (366,586 | ) | | | — | | | | — | |
From net realized gains | | | (11,134,358 | ) | | | (5,916,750 | ) | | | (68,131,147 | ) | | | (56,856,098 | ) |
Total Distributions to Shareholders | | | (11,580,140 | ) | | | (6,283,336 | ) | | | (68,131,147 | ) | | | (56,856,098 | ) |
Capital Stock Transactions | | | | | | | | | | | | | | | | |
Class A | | | | | | | | | | | | | | | | |
Sold | | | 12,816,358 | | | | 15,747,777 | | | | 19,474,848 | | | | 27,270,640 | |
Distributions reinvested | | | 5,887,688 | | | | 3,652,846 | | | | 53,464,780 | | | | 46,060,560 | |
Capital contribution from adviser | | | — | | | | — | | | | — | | | | — | |
Redeemed | | | (20,209,911 | ) | | | (20,814,723 | ) | | | (72,370,050 | ) | | | (95,829,947 | ) |
| | | | | | | | | | | | | | | | |
Total Class A Capital Stock Transactions | | | (1,505,865 | ) | | | (1,414,100 | ) | | | 569,578 | | | | (22,498,747 | ) |
| | | | | | | | | | | | | | | | |
Class B | | | | | | | | | | | | | | | | |
Sold | | | 48,232 | | | | 102,992 | | | | 14,553 | | | | 86,399 | |
Distributions reinvested | | | 261,424 | | | | 243,530 | | | | 1,334,360 | | | | 1,758,869 | |
Redeemed | | | (1,691,237 | ) | | | (2,497,225 | ) | | | (4,841,997 | ) | | | (7,585,929 | ) |
| | | | | | | | | | | | | | | | |
Total Class B Capital Stock Transactions | | | (1,381,581 | ) | | | (2,150,703 | ) | | | (3,493,084 | ) | | | (5,740,661 | ) |
| | | | | | | | | | | | | | | | |
Institutional Class | | | | | | | | | | | | | | | | |
Sold | | | 55,104,895 | | | | 33,076,549 | | | | 64,932,409 | | | | 64,910,432 | |
Distributions reinvested | | | 5,366,175 | | | | 2,350,278 | | | | 12,668,023 | | | | 8,511,934 | |
Capital contribution from adviser | | | — | | | | — | | | | — | | | | — | |
Redeemed | | | (13,675,898 | ) | | | (25,420,864 | ) | | | (11,745,778 | ) | | | (56,947,213 | ) |
| | | | | | | | | | | | | | | | |
Total Institutional Class Capital Stock Transactions | | | 46,795,173 | | | | 10,005,963 | | | | 65,854,654 | | | | 16,475,153 | |
| | | | | | | | | | | | | | | | |
Capital Stock Transactions | | | 43,907,727 | | | | 6,441,160 | | | | 62,931,148 | | | | (11,764,255 | ) |
Net Increase/(Decrease) in Net Assets | | | (12,783,840 | ) | | | 13,482,365 | | | | (214,477,868 | ) | | | 7,006,338 | |
Net Assets, Beginning of Period | | | 143,727,006 | | | | 130,244,641 | | | | 565,880,814 | | | | 558,874,476 | |
Net Assets, End of Period | | $ | 130,943,166 | | | $ | 143,727,006 | | | $ | 351,402,946 | | | $ | 565,880,814 | |
Capital Stock Share Transactions | | | | | | | | | | | | | | | | |
Class A shares | | | | | | | | | | | | | | | | |
Sold | | | 932,125 | | | | 968,005 | | | | 1,387,798 | | | | 1,528,313 | |
Distributions reinvested | | | 420,820 | | | | 236,169 | | | | 3,524,377 | | | | 2,727,091 | |
Redeemed | | | (1,453,985 | ) | | | (1,278,190 | ) | | | (5,148,565 | ) | | | (5,355,767 | ) |
| | | | | | | | | | | | | | | | |
Total Class A shares | | | (101,040 | ) | | | (74,016 | ) | | | (236,390 | ) | | | (1,100,363 | ) |
| | | | | | | | | | | | | | | | |
Class B shares | | | | | | | | | | | | | | | | |
Sold | | | 3,740 | | | | 6,664 | | | | 1,301 | | | | 5,394 | |
Distributions reinvested | | | 20,002 | | | | 16,612 | | | | 104,084 | | | | 119,003 | |
Redeemed | | | (131,380 | ) | | | (161,479 | ) | | | (404,731 | ) | | | (485,003 | ) |
| | | | | | | | | | | | | | | | |
Total Class B shares | | | (107,638 | ) | | | (138,203 | ) | | | (299,346 | ) | | | (360,606 | ) |
| | | | | | | | | | | | | | | | |
Institutional Class shares | | | | | | | | | | | | | | | | |
Sold | | | 3,766,136 | | | | 1,947,958 | | | | 4,191,744 | | | | 3,359,223 | |
Distributions reinvested | | | 366,191 | | | | 145,712 | | | | 759,019 | | | | 466,152 | |
Redeemed | | | (967,316 | ) | | | (1,484,075 | ) | | | (786,802 | ) | | | (2,953,241 | ) |
| | | | | | | | | | | | | | | | |
Total Institutional Class shares | | | 3,165,011 | | | | 609,595 | | | | 4,163,961 | | | | 872,134 | |
| | | | | | | | | | | | | | | | |
The accompanying Notes to the Financial Statements are an integral part of this schedule.
200
Thrivent Mutual Funds
Statement of Changes in Net Assets - continued
| | | | | | | | | | | | | | | | | | | | | | | | | | | | | | |
| Small Cap Index Fund | | | Mid Cap Growth Fund | | | Partner Mid Cap Value Fund | | | Mid Cap Stock Fund | |
| 10/31/2008 | | | 10/31/2007 | | | 10/31/2008 | | | 10/31/2007 | | | 10/31/2008 | | | 10/31/2007 | | | 10/31/2008 | | | 10/31/2007 | |
| | | | | | | | | | | | | | | | | | | | | | | |
| $ | 268,591 | | | $ | 175,296 | | | $ | (375,044 | ) | | $ | (1,065,438 | ) | | $ | 858,174 | | | $ | 466,112 | | | $ | 4,141,664 | | | $ | 8,810,048 | |
| | 3,465,322 | | | | 5,074,185 | | | | 6,366,181 | | | | 49,849,260 | | | | (11,524,992 | ) | | | 2,404,520 | | | | (202,901,892 | ) | | | 155,586,048 | |
| | (17,595,882 | ) | | | (448,188 | ) | | | (152,833,881 | ) | | | 38,119,170 | | | | (23,766,655 | ) | | | 1,040,494 | | | | (298,731,729 | ) | | | 4,549,641 | |
| | | | | | | | | | | | | | | | | | | | | | | | | | | | | | |
| | (13,861,969 | ) | | | 4,801,293 | | | | (146,842,744 | ) | | | 86,902,992 | | | | (34,433,473 | ) | | | 3,911,126 | | | | (497,491,957 | ) | | | 168,945,737 | |
| | | | | | | | | | | | | | | | | | | | | | | | | | | | | | |
| | (156,496 | ) | | | (70,526 | ) | | | — | | | | — | | | | (453,407 | ) | | | (506,983 | ) | | | (1,780,710 | ) | | | (1,531,416 | ) |
| | (5,072,886 | ) | | | (3,380,175 | ) | | | (41,457,007 | ) | | | (22,856,197 | ) | | | (2,647,499 | ) | | | (198,154 | ) | | | (151,620,333 | ) | | | (185,489,976 | ) |
| | (5,229,382 | ) | | | (3,450,701 | ) | | | (41,457,007 | ) | | | (22,856,197 | ) | | | (3,100,906 | ) | | | (705,137 | ) | | | (153,401,043 | ) | | | (187,021,392 | ) |
| | | | | | | | | | | | | | | | | | | | | | | | | | | | | | |
| | | | | | | | | | | | | | | | | | | | | | | | | | | | | | |
| | 2,822,926 | | | | 4,199,158 | | | | 22,031,114 | | | | 25,689,155 | | | | 1,415,670 | | | | 4,658,869 | | | | 40,777,711 | | | | 67,807,186 | |
| | 5,160,319 | | | | 3,398,452 | | | | 33,948,162 | | | | 18,439,231 | | | | 659,429 | | | | 160,156 | | | | 126,907,304 | | | | 161,645,118 | |
| | — | | | | — | | | | — | | | | — | | | | 957 | | | | — | | | | — | | | | — | |
| | (8,979,542 | ) | | | (10,607,413 | ) | | | (44,694,988 | ) | | | (58,829,380 | ) | | | (2,042,613 | ) | | | (1,137,851 | ) | | | (168,390,878 | ) | | | (198,642,538 | ) |
| | | | | | | | | | | | | | | | | | | | | | | | | | | | | | | |
| | (996,297 | ) | | | (3,009,803 | ) | | | 11,284,288 | | | | (14,700,994 | ) | | | 33,443 | | | | 3,681,174 | | | | (705,863 | ) | | | 30,809,766 | |
| | | | | | | | | | | | | | | | | | | | | | | | | | | | | | | |
| | | | | | | | | | | | | | | | | | | | | | | | | | | | | | |
| | — | | | | — | | | | 91,277 | | | | 81,533 | | | | — | | | | — | | | | 12,563 | | | | 209,008 | |
| | — | | | | — | | | | 2,233,836 | | | | 1,919,476 | | | | — | | | | — | | | | 1,683,773 | | | | 3,349,973 | |
| | — | | | | — | | | | (9,130,826 | ) | | | (12,583,879 | ) | | | — | | | | — | | | | (5,610,222 | ) | | | (9,091,254 | ) |
| | | | | | | | | | | | | | | | | | | | | | | | | | | | | | | |
| | — | | | | — | | | | (6,805,713 | ) | | | (10,582,870 | ) | | | — | | | | — | | | | (3,913,886 | ) | | | (5,532,273 | ) |
| | | | | | | | | | | | | | | | | | | | | | | | | | | | | | | |
| | | | | | | | | | | | | | | | | | | | | | | | | | | | | | |
| | — | | | | — | | | | 37,742,884 | | | | 21,125,779 | | | | 69,218,835 | | | | 19,409,359 | | | | 202,707,964 | | | | 90,057,227 | |
| | — | | | | — | | | | 4,816,752 | | | | 2,260,015 | | | | 2,434,685 | | | | 543,873 | | | | 23,133,529 | | | | 19,941,268 | |
| | — | | | | — | | | | — | | | | — | | | | 9,068 | | | | — | | | | — | | | | — | |
| | — | | | | — | | | | (7,470,791 | ) | | | (21,423,642 | ) | | | (3,327,455 | ) | | | (12,323,791 | ) | | | (33,906,180 | ) | | | (55,534,884 | ) |
| | | | | | | | | | | | | | | | | | | | | | | | | | | | | | | |
| | — | | | | — | | | | 35,088,845 | | | | 1,962,152 | | | | 68,335,133 | | | | 7,629,441 | | | | 191,935,314 | | | | 54,463,611 | |
| | | | | | | | | | | | | | | | | | | | | | | | | | | | | | | |
| | (996,297 | ) | | | (3,009,803 | ) | | | 39,567,420 | | | | (23,321,712 | ) | | | 68,368,576 | | | | 11,310,615 | | | | 187,315,565 | | | | 79,741,104 | |
| | (20,087,648 | ) | | | (1,659,211 | ) | | | (148,732,331 | ) | | | 40,725,083 | | | | 30,834,197 | | | | 14,516,604 | | | | (463,577,435 | ) | | | 61,665,449 | |
| | 46,367,901 | | | | 48,027,112 | | | | 364,027,217 | | | | 323,302,134 | | | | 45,969,309 | | | | 31,452,705 | | | | 1,172,904,842 | | | | 1,111,239,393 | |
| $ | 26,280,253 | | | $ | 46,367,901 | | | $ | 215,294,886 | | | $ | 364,027,217 | | | $ | 76,803,506 | | | $ | 45,969,309 | | | $ | 709,327,407 | | | $ | 1,172,904,842 | |
| | | | | | | | | | | | | | | | | | | | | | | | | | | | | | |
| | | | | | | | | | | | | | | | | | | | | | | | | | | | | | |
| | 224,146 | | | | 260,961 | | | | 1,483,331 | | | | 1,499,540 | | | | 136,135 | | | | 365,176 | | | | 3,075,833 | | | | 3,888,821 | |
| | 393,396 | | | | 221,916 | | | | 2,144,546 | | | | 1,179,730 | | | | 57,031 | | | | 13,192 | | | | 8,769,841 | | | | 10,027,387 | |
| | (716,633 | ) | | | (658,792 | ) | | | (3,069,784 | ) | | | (3,480,249 | ) | | | (189,064 | ) | | | (89,498 | ) | | | (12,830,574 | ) | | | (11,395,657 | ) |
| | | | | | | | | | | | | | | | | | | | | | | | | | | | | | | |
| | (99,091 | ) | | | (175,915 | ) | | | 558,093 | | | | (800,979 | ) | | | 4,102 | | | | 288,870 | | | | (984,900 | ) | | | 2,520,551 | |
| | | | | | | | | | | | | | | | | | | | | | | | | | | | | | | |
| | | | | | | | | | | | | | | | | | | | | | | | | | | | | | |
| | — | | | | — | | | | 6,049 | | | | 5,002 | | | | — | | | | — | | | | 1,166 | | | | 13,710 | |
| | — | | | | — | | | | 157,756 | | | | 133,760 | | | | — | | | | — | | | | 141,494 | | | | 242,752 | |
| | — | | | | — | | | | (691,891 | ) | | | (814,726 | ) | | | — | | | | — | | | | (511,002 | ) | | | (608,710 | ) |
| | | | | | | | | | | | | | | | | | | | | | | | | | | | | | | |
| | — | | | | — | | | | (528,086 | ) | | | (675,964 | ) | | | — | | | | — | | | | (368,342 | ) | | | (352,248 | ) |
| | | | | | | | | | | | | | | | | | | | | | | | | | | | | | | |
| | | | | | | | | | | | | | | | | | | | | | | | | | | | | | |
| | — | | | | — | | | | 2,321,661 | | | | 1,187,378 | | | | 6,336,938 | | | | 1,553,427 | | | | 14,655,097 | | | | 4,919,725 | |
| | — | | | | — | | | | 278,909 | | | | 134,846 | | | | 209,964 | | | | 44,738 | | | | 1,485,519 | | | | 1,162,098 | |
| | — | | | | — | | | | (586,073 | ) | | | (1,187,980 | ) | | | (392,674 | ) | | | (992,229 | ) | | | (2,810,655 | ) | | | (3,034,787 | ) |
| | | | | | | | | | | | | | | | | | | | | | | | | | | | | | | |
| | — | | | | — | | | | 2,014,497 | | | | 134,244 | | | | 6,154,228 | | | | 605,936 | | | | 13,329,961 | | | | 3,047,036 | |
| | | | | | | | | | | | | | | | | | | | | | | | | | | | | | | |
The accompanying Notes to Financial Statements are an integral part of this schedule.
201
Thrivent Mutual Funds
Statement of Changes in Net Assets - continued
| | | | | | | | | | | | |
| | | Mid Cap Index Fund | | | Partner
Worldwide
Allocation Fund | |
For the periods ended | | 10/31/2008 | | | 10/31/2007 | | | 10/31/2008(a) | |
Operations | | | | | | | | | | | | |
Net investment income/(loss) | | $ | 523,095 | | | $ | 481,369 | | | $ | 1,725,491 | |
Net realized gains/(losses) | | | 2,707,687 | | | | 6,340,725 | | | | (8,524,756 | ) |
Change in net unrealized appreciation/(depreciation) | | | (23,343,912 | ) | | | 2,392,810 | | | | (33,042,585 | ) |
Net Change in Net Assets Resulting From Operations | | | (20,113,130 | ) | | | 9,214,904 | | | | (39,841,850 | ) |
Distributions to Shareholders | | | | | | | | | | | | |
From net investment income | | | (371,068 | ) | | | (435,746 | ) | | | — | |
From net realized gains | | | (6,334,990 | ) | | | (2,837,634 | ) | | | — | |
Total Distributions to Shareholders | | | (6,706,058 | ) | | | (3,273,380 | ) | | | — | |
Capital Stock Transactions | | | | | | | | | | | | |
Class A | | | | | | | | | | | | |
Sold | | | 4,397,433 | | | | 5,674,544 | | | | 34,871,777 | |
Distributions reinvested | | | 6,607,249 | | | | 3,235,987 | | | | — | |
Redeemed | | | (12,149,991 | ) | | | (15,399,239 | ) | | | (8,991,867 | ) |
| | | | | | | | | | | | |
Total Class A Capital Stock Transactions | | | (1,145,308 | ) | | | (6,488,708 | ) | | | 25,879,910 | |
| | | | | | | | | | | | |
Class B | | | | | | | | | | | | |
Sold | | | — | | | | — | | | | — | |
Distributions reinvested | | | — | | | | — | | | | — | |
Redeemed | | | — | | | | — | | | | — | |
| | | | | | | | | | | | |
Total Class B Capital Stock Transactions | | | — | | | | — | | | | — | |
| | | | | | | | | | | | |
Institutional Class | | | | | | | | | | | | |
Sold | | | — | | | | — | | | | 125,726,410 | |
Distributions reinvested | | | — | | | | — | | | | — | |
Capital contribution from adviser | | | — | | | | — | | | | — | |
Redeemed | | | — | | | | — | | | | (48,944,657 | ) |
| | | | | | | | | | | | |
Total Institutional Class Capital Stock Transactions | | | — | | | | — | | | | 76,781,753 | |
| | | | | | | | | | | | |
Capital Stock Transactions | | | (1,145,308 | ) | | | (6,488,708 | ) | | | 102,661,663 | |
Net Increase/(Decrease) in Net Assets | | | (27,964,496 | ) | | | (547,184 | ) | | | 62,819,813 | |
Net Assets, Beginning of Period | | | 61,014,539 | | | | 61,561,723 | | | | — | |
Net Assets, End of Period | | $ | 33,050,043 | | | $ | 61,014,539 | | | $ | 62,819,813 | |
Capital Stock Share Transactions | | | | | | | | | | | | |
Class A shares | | | | | | | | | | | | |
Sold | | | 354,970 | | | | 375,877 | | | | 3,525,532 | |
Distributions reinvested | | | 500,576 | | | | 227,674 | | | | — | |
Redeemed | | | (976,118 | ) | | | (1,020,279 | ) | | | (919,094 | ) |
| | | | | | | | | | | | |
Total Class A shares | | | (120,572 | ) | | | (416,728 | ) | | | 2,606,438 | |
| | | | | | | | | | | | |
Class B shares | | | | | | | | | | | | |
Sold | | | — | | | | — | | | | — | |
Distributions reinvested | | | — | | | | — | | | | — | |
Redeemed | | | — | | | | — | | | | — | |
| | | | | | | | | | | | |
Total Class B shares | | | — | | | | — | | | | — | |
| | | | | | | | | | | | |
Institutional Class shares | | | | | | | | | | | | |
Sold | | | — | | | | — | | | | 12,675,097 | |
Distributions reinvested | | | — | | | | — | | | | — | |
Redeemed | | | — | | | | — | | | | (4,977,366 | ) |
| | | | | | | | | | | | |
Total Institutional Class shares | | | — | | | | — | | | | 7,697,731 | |
| | | | | | | | | | | | |
(a) | For the period from February 29, 2008 (inception) through October 31, 2008 |
The accompanying Notes to the Financial Statements are an integral part of this schedule.
202
Thrivent Mutual Funds
Statement of Changes in Net Assets - continued
| | | | | | | | | | | | | | | | | | | | | | | | | | | | | | |
Partner International Stock Fund | | | Large Cap Growth Fund | | | Large Cap Value Fund | | | Large Cap Stock Fund | |
| 10/31/2008 | | | 10/31/2007 | | | 10/31/2008 | | | 10/31/2007 | | | 10/31/2008 | | | 10/31/2007 | | | 10/31/2008 | | | 10/31/2007 | |
| | | | | | | | | | | | | | | | | | | | | | | |
| $ | 12,257,448 | | | $ | 12,131,607 | | | $ | 1,269,494 | | | $ | 1,521,628 | | | $ | 11,958,111 | | | $ | 8,397,283 | | | $ | 29,682,530 | | | $ | 37,834,628 | |
| | (57,037,073 | ) | | | 83,859,406 | | | | (60,230,430 | ) | | | 41,643,608 | | | | (45,172,966 | ) | | | 32,852,973 | | | | (10,617,682 | ) | | | 420,579,371 | |
| | (294,484,187 | ) | | | 44,656,212 | | | | (161,366,548 | ) | | | 58,211,254 | | | | (202,362,296 | ) | | | 33,582,411 | | | | (1,128,404,559 | ) | | | 26,341,572 | |
| | | | | | | | | | | | | | | | | | | | | | | | | | | | | | |
| | (339,263,812 | ) | | | 140,647,225 | | | | (220,327,484 | ) | | | 101,376,490 | | | | (235,577,151 | ) | | | 74,832,667 | | | | (1,109,339,711 | ) | | | 484,755,571 | |
| | | | | | | | | | | | | | | | | | | | | | | | | | | | | | |
| | (13,223,577 | ) | | | (7,072,912 | ) | | | (1,770,087 | ) | | | (1,611,639 | ) | | | (9,146,767 | ) | | | (6,247,252 | ) | | | (30,085,209 | ) | | | (32,993,037 | ) |
| | (59,330,101 | ) | | | — | | | | (38,037,772 | ) | | | — | | | | (31,209,694 | ) | | | (28,918,515 | ) | | | (368,171,333 | ) | | | (142,672,537 | ) |
| | (72,553,678 | ) | | | (7,072,912 | ) | | | (39,807,859 | ) | | | (1,611,639 | ) | | | (40,356,461 | ) | | | (35,165,767 | ) | | | (398,256,542 | ) | | | (175,665,574 | ) |
| | | | | | | | | | | | | | | | | | | | | | | | | | | | | | |
| | | | | | | | | | | | | | | | | | | | | | | | | | | | | | |
| | 21,414,324 | | | | 38,314,231 | | | | 22,618,073 | | | | 26,413,730 | | | | 17,510,029 | | | | 30,050,071 | | | | 84,941,128 | | | | 106,554,516 | |
| | 38,251,800 | | | | 3,528,854 | | | | 10,360,211 | | | | 77,678 | | | | 18,210,335 | | | | 21,452,553 | | | | 340,680,547 | | | | 155,979,217 | |
| | (65,070,420 | ) | | | (71,310,619 | ) | | | (31,107,522 | ) | | | (32,676,336 | ) | | | (62,034,324 | ) | | | (68,090,102 | ) | | | (461,397,393 | ) | | | (614,890,225 | ) |
| | | | | | | | | | | | | | | | | | | | | | | | | | | | | | | |
| | (5,404,296 | ) | | | (29,467,534 | ) | | | 1,870,762 | | | | (6,184,928 | ) | | | (26,313,960 | ) | | | (16,587,478 | ) | | | (35,775,718 | ) | | | (352,356,492 | ) |
| | | | | | | | | | | | | | | | | | | | | | | | | | | | | | | |
| | | | | | | | | | | | | | | | | | | | | | | | | | | | | | |
| | 37,280 | | | | 381,838 | | | | 172,752 | | | | 196,211 | | | | 41,764 | | | | 303,308 | | | | 11,676 | | | | 98,022 | |
| | 914,222 | | | | — | | | | 590,688 | | | | — | | | | 415,573 | | | | 775,782 | | | | 4,917,844 | | | | 2,952,941 | |
| | (4,909,421 | ) | | | (6,607,820 | ) | | | (3,939,900 | ) | | | (5,287,685 | ) | | | (4,761,713 | ) | | | (6,463,643 | ) | | | (21,541,574 | ) | | | (30,987,096 | ) |
| | | | | | | | | | | | | | | | | | | | | | | | | | | | | | | |
| | (3,957,919 | ) | | | (6,225,982 | ) | | | (3,176,460 | ) | | | (5,091,474 | ) | | | (4,304,376 | ) | | | (5,384,553 | ) | | | (16,612,054 | ) | | | (27,936,133 | ) |
| | | | | | | | | | | | | | | | | | | | | | | | | | | | | | | |
| | | | | | | | | | | | | | | | | | | | | | | | | | | | | | |
| | 91,009,145 | | | | 125,824,841 | | | | 65,015,370 | | | | 177,863,280 | | | | 114,143,936 | | | | 135,673,675 | | | | 51,249,551 | | | | 145,637,966 | |
| | 32,737,883 | | | | 3,477,872 | | | | 28,560,519 | | | | 1,528,495 | | | | 21,302,734 | | | | 12,464,266 | | | | 46,275,285 | | | | 13,951,238 | |
| | 1,320 | | | | — | | | | — | | | | — | | | | — | | | | — | | | | — | | | | — | |
| | (35,721,811 | ) | | | (59,890,071 | ) | | | (108,501,334 | ) | | | (34,322,841 | ) | | | (29,443,637 | ) | | | (16,736,038 | ) | | | (145,291,442 | ) | | | (66,592,686 | ) |
| | | | | | | | | | | | | | | | | | | | | | | | | | | | | | | |
| | 88,026,537 | | | | 69,412,642 | | | | (14,925,445 | ) | | | 145,068,934 | | | | 106,003,033 | | | | 131,401,903 | | | | (47,766,606 | ) | | | 92,996,518 | |
| | | | | | | | | | | | | | | | | | | | | | | | | | | | | | | |
| | 78,664,322 | | | | 33,719,126 | | | | (16,231,143 | ) | | | 133,792,532 | | | | 75,384,697 | | | | 109,429,872 | | | | (100,154,378 | ) | | | (287,296,107 | ) |
| | (333,153,168 | ) | | | 167,293,439 | | | | (276,366,486 | ) | | | 233,557,383 | | | | (200,548,915 | ) | | | 149,096,772 | | | | (1,607,750,631 | ) | | | 21,793,890 | |
| | 723,466,585 | | | | 556,173,146 | | | | 584,465,834 | | | | 350,908,451 | | | | 659,597,494 | | | | 510,500,722 | | | | 3,443,713,242 | | | | 3,421,919,352 | |
| $ | 390,313,417 | | | $ | 723,466,585 | | | $ | 308,099,348 | | | $ | 584,465,834 | | | $ | 459,048,579 | | | $ | 659,597,494 | | | $ | 1,835,962,611 | | | $ | 3,443,713,242 | |
| | | | | | | | | | | | | | | | | | | | | | | | | | | | | | |
| | | | | | | | | | | | | | | | | | | | | | | | | | | | | | |
| | 1,729,984 | | | | 2,688,054 | | | | 4,282,033 | | | | 4,578,531 | | | | 1,199,984 | | | | 1,766,298 | | | | 3,508,321 | | | | 3,660,513 | |
| | 2,901,249 | | | | 260,818 | | | | 1,817,231 | | | | 14,253 | | | | 1,131,808 | | | | 1,303,412 | | | | 13,019,044 | | | | 5,520,112 | |
| | (5,526,261 | ) | | | (5,005,095 | ) | | | (6,113,108 | ) | | | (5,709,169 | ) | | | (4,246,490 | ) | | | (3,981,337 | ) | | | (19,312,294 | ) | | | (21,101,121 | ) |
| | | | | | | | | | | | | | | | | | | | | | | | | | | | | | | |
| | (895,028 | ) | | | (2,056,223 | ) | | | (13,844 | ) | | | (1,116,385 | ) | | | (1,914,698 | ) | | | (911,627 | ) | | | (2,784,929 | ) | | | (11,920,496 | ) |
| | | | | | | | | | | | | | | | | | | | | | | | | | | | | | | |
| | | | | | | | | | | | | | | | | | | | | | | | | | | | | | |
| | 3,188 | | | | 27,944 | | | | 33,564 | | | | 35,799 | | | | 3,032 | | | | 18,259 | | | | 562 | | | | 3,681 | |
| | 72,727 | | | | — | | | | 112,298 | | | | — | | | | 26,402 | | | | 48,006 | | | | 207,242 | | | | 113,706 | |
| | (422,975 | ) | | | (483,004 | ) | | | (819,137 | ) | | | (992,259 | ) | | | (326,171 | ) | | | (384,831 | ) | | | (975,336 | ) | | | (1,155,704 | ) |
| | | | | | | | | | | | | | | | | | | | | | | | | | | | | | | |
| | (347,060 | ) | | | (455,060 | ) | | | (673,275 | ) | | | (956,460 | ) | | | (296,737 | ) | | | (318,566 | ) | | | (767,532 | ) | | | (1,038,317 | ) |
| | | | | | | | | | | | | | | | | | | | | | | | | | | | | | | |
| | | | | | | | | | | | | | | | | | | | | | | | | | | | | | |
| | 7,656,212 | | | | 8,691,362 | | | | 11,217,880 | | | | 29,124,791 | | | | 7,430,052 | | | | 7,888,623 | | | | 1,965,943 | | | | 4,942,079 | |
| | 2,429,246 | | | | 253,305 | | | | 4,682,173 | | | | 264,904 | | | | 1,313,185 | | | | 751,450 | | | | 1,750,947 | | | | 490,129 | |
| | (2,534,344 | ) | | | (4,039,225 | ) | | | (21,340,501 | ) | | | (5,285,186 | ) | | | (2,040,338 | ) | | | (979,936 | ) | | | (6,201,737 | ) | | | (2,261,086 | ) |
| | | | | | | | | | | | | | | | | | | | | | | | | | | | | | | |
| | 7,551,114 | | | | 4,905,442 | | | | (5,440,448 | ) | | | 24,104,509 | | | | 6,702,899 | | | | 7,660,137 | | | | (2,484,847 | ) | | | 3,171,122 | |
| | | | | | | | | | | | | | | | | | | | | | | | | | | | | | | |
The accompanying Notes to Financial Statements are an integral part of this schedule.
203
Thrivent Mutual Funds
Statement of Changes in Net Assets - continued
| | | | | | | | | | | | | | | | |
| | | Large Cap Index Fund | | | Balanced Fund | |
For the periods ended | | 10/31/2008 | | | 10/31/2007 | | | 10/31/2008 | | | 10/31/2007 | |
Operations | | | | | | | | | | | | | | | | |
Net investment income/(loss) | | $ | 1,249,885 | | | $ | 1,293,774 | | | $ | 5,726,143 | | | $ | 6,453,652 | |
Net realized gains/(losses) | | | (2,172,899 | ) | | | 1,192,266 | | | | (1,698,551 | ) | | | 19,824,770 | |
Change in net unrealized appreciation/(depreciation) | | | (30,406,925 | ) | | | 9,707,690 | | | | (88,943,622 | ) | | | 13,297,224 | |
Net Change in Net Assets Resulting From Operations | | | (31,329,939 | ) | | | 12,193,730 | | | | (84,916,030 | ) | | | 39,575,646 | |
Distributions to Shareholders | | | | | | | | | | | | | | | | |
From net investment income | | | (1,291,440 | ) | | | (1,253,298 | ) | | | (5,867,307 | ) | | | (5,969,912 | ) |
From net realized gains | | | — | | | | — | | | | (19,859,838 | ) | | | (16,231,550 | ) |
Total Distributions to Shareholders | | | (1,291,440 | ) | | | (1,253,298 | ) | | | (25,727,145 | ) | | | (22,201,462 | ) |
Capital Stock Transactions | | | | | | | | | | | | | | | | |
Class A | | | | | | | | | | | | | | | | |
Sold | | | 5,837,857 | | | | 10,620,328 | | | | 12,501,875 | | | | 14,474,672 | |
Distributions reinvested | | | 1,267,437 | | | | 1,233,896 | | | | 18,019,482 | | | | 15,538,875 | |
Redeemed | | | (16,852,896 | ) | | | (21,488,432 | ) | | | (44,509,567 | ) | | | (57,170,898 | ) |
| | | | | | | | | | | | | | | | |
Total Class A Capital Stock Transactions | | | (9,747,602 | ) | | | (9,634,208 | ) | | | (13,988,210 | ) | | | (27,157,351 | ) |
| | | | | | | | | | | | | | | | |
Class B | | | | | | | | | | | | | | | | |
Sold | | | — | | | | — | | | | 42,940 | | | | 96,953 | |
Distributions reinvested | | | — | | | | — | | | | 487,672 | | | | 504,830 | |
Redeemed | | | — | | | | — | | | | (3,465,255 | ) | | | (3,464,158 | ) |
| | | | | | | | | | | | | | | | |
Total Class B Capital Stock Transactions | | | — | | | | — | | | | (2,934,643 | ) | | | (2,862,375 | ) |
| | | | | | | | | | | | | | | | |
Institutional Class | | | | | | | | | | | | | | | | |
Sold | | | — | | | | — | | | | 1,622,188 | | | | 2,587,000 | |
Distributions reinvested | | | — | | | | — | | | | 6,890,449 | | | | 5,884,861 | |
Redeemed | | | — | | | | — | | | | (12,901,705 | ) | | | (15,432,692 | ) |
| | | | | | | | | | | | | | | | |
Total Institutional Class Capital Stock Transactions | | | — | | | | — | | | | (4,389,068 | ) | | | (6,960,831 | ) |
| | | | | | | | | | | | | | | | |
Capital Stock Transactions | | | (9,747,602 | ) | | | (9,634,208 | ) | | | (21,311,921 | ) | | | (36,980,557 | ) |
Net Increase/(Decrease) in Net Assets | | | (42,368,981 | ) | | | 1,306,224 | | | | (131,955,096 | ) | | | (19,606,373 | ) |
Net Assets, Beginning of Period | | | 93,634,455 | | | | 92,328,231 | | | | 328,357,499 | | | | 347,963,872 | |
Net Assets, End of Period | | $ | 51,265,474 | | | $ | 93,634,455 | | | $ | 196,402,403 | | | $ | 328,357,499 | |
Capital Stock Share Transactions | | | | | | | | | | | | | | | | |
Class A shares | | | | | | | | | | | | | | | | |
Sold | | | 651,651 | | | | 1,058,165 | | | | 1,079,049 | | | | 1,112,754 | |
Distributions reinvested | | | 125,613 | | | | 126,539 | | | | 1,490,093 | | | | 1,224,913 | |
Redeemed | | | (1,884,456 | ) | | | (2,130,985 | ) | | | (3,895,037 | ) | | | (4,397,809 | ) |
| | | | | | | | | | | | | | | | |
Total Class A shares | | | (1,107,192 | ) | | | (946,281 | ) | | | (1,325,895 | ) | | | (2,060,142 | ) |
| | | | | | | | | | | | | | | | |
Class B shares | | | | | | | | | | | | | | | | |
Sold | | | — | | | | — | | | | 3,837 | | | | 7,379 | |
Distributions reinvested | | | — | | | | — | | | | 40,118 | | | | 40,172 | |
Redeemed | | | — | | | | — | | | | (305,609 | ) | | | (268,020 | ) |
| | | | | | | | | | | | | | | | |
Total Class B shares | | | — | | | | — | | | | (261,654 | ) | | | (220,469 | ) |
| | | | | | | | | | | | | | | | |
Institutional Class shares | | | | | | | | | | | | | | | | |
Sold | | | — | | | | — | | | | 137,077 | | | | 197,312 | |
Distributions reinvested | | | — | | | | — | | | | 571,981 | | | | 463,340 | |
Redeemed | | | — | | | | — | | | | (1,157,558 | ) | | | (1,183,861 | ) |
| | | | | | | | | | | | | | | | |
Total Institutional Class shares | | | — | | | | — | | | | (448,500 | ) | | | (523,209 | ) |
| | | | | | | | | | | | | | | | |
The accompanying Notes to the Financial Statements are an integral part of this schedule.
204
Thrivent Mutual Funds
Statement of Changes in Net Assets - continued
| | | | | | | | | | | | | | | | | | | | | | | | | | | | | | |
| High Yield Fund | | | Municipal Bond Fund | | | Income Fund | | | Core Bond Fund | |
| 10/31/2008 | | | 10/31/2007 | | | 10/31/2008 | | | 10/31/2007 | | | 10/31/2008 | | | 10/31/2007 | | | 10/31/2008 | | | 10/31/2007 | |
| | | | | | | | | | | | | | | | | | | | | | | |
| $ | 45,336,694 | | | $ | 45,708,254 | | | $ | 51,746,189 | | | $ | 52,666,565 | | | $ | 41,370,617 | | | $ | 38,036,885 | | | $ | 17,285,925 | | | $ | 17,319,787 | |
| | (32,819,754 | ) | | | 11,753,582 | | | | 2,799,669 | | | | 3,170,363 | | | | (18,756,977 | ) | | | 5,190,812 | | | | (3,608,280 | ) | | | (1,429,134 | ) |
| | (147,067,417 | ) | | | (15,896,256 | ) | | | (91,235,351 | ) | | | (26,962,462 | ) | | | (130,736,789 | ) | | | (13,913,033 | ) | | | (47,635,470 | ) | | | (3,679,177 | ) |
| | | | | | | | | | | | | | | | | | | | | | | | | | | | | | |
| | (134,550,477 | ) | | | 41,565,580 | | | | (36,689,493 | ) | | | 28,874,466 | | | | (108,123,149 | ) | | | 29,314,664 | | | | (33,957,825 | ) | | | 12,211,476 | |
| | | | | | | | | | | | | | | | | | | | | | | | | | | | | | |
| | (45,642,978 | ) | | | (45,718,586 | ) | | | (51,746,189 | ) | | | (52,705,357 | ) | | | (41,809,100 | ) | | | (36,677,821 | ) | | | (17,635,379 | ) | | | (16,966,618 | ) |
| | — | | | | — | | | | — | | | | — | | | | — | | | | — | | | | — | | | | — | |
| | (45,642,978 | ) | | | (45,718,586 | ) | | | (51,746,189 | ) | | | (52,705,357 | ) | | | (41,809,100 | ) | | | (36,677,821 | ) | | | (17,635,379 | ) | | | (16,966,618 | ) |
| | | | | | | | | | | | | | | | | | | | | | | | | | | | | | |
| | | | | | | | | | | | | | | | | | | | | | | | | | | | | | |
| | 31,760,192 | | | | 37,047,669 | | | | 152,966,880 | | | | 80,703,622 | | | | 23,725,038 | | | | 28,354,222 | | | | 19,655,625 | | | | 20,448,256 | |
| | 23,345,797 | | | | 26,801,268 | | | | 40,418,869 | | | | 41,098,057 | | | | 17,347,859 | | | | 18,003,759 | | | | 11,617,170 | | | | 12,571,874 | |
| | (90,574,251 | ) | | | (107,048,650 | ) | | | (148,751,440 | ) | | | (153,979,933 | ) | | | (71,095,311 | ) | | | (79,239,954 | ) | | | (63,606,720 | ) | | | (76,855,231 | ) |
| | | | | | | | | | | | | | | | | | | | | | | | | | | | | | | |
| | (35,468,262 | ) | | | (43,199,713 | ) | | | 44,634,309 | | | | (32,178,254 | ) | | | (30,022,414 | ) | | | (32,881,973 | ) | | | (32,333,925 | ) | | | (43,835,101 | ) |
| | | | | | | | | | | | | | | | | | | | | | | | | | | | | | | |
| | | | | | | | | | | | | | | | | | | | | | | | | | | | | | |
| | 31,852 | | | | 114,126 | | | | 125,207 | | | | 98,125 | | | | 152,308 | | | | 142,484 | | | | 57,005 | | | | 28,540 | |
| | 340,121 | | | | 629,179 | | | | 242,412 | | | | 531,637 | | | | 176,984 | | | | 333,352 | | | | 108,420 | | | | 204,880 | |
| | (5,180,354 | ) | | | (7,286,182 | ) | | | (8,582,686 | ) | | | (9,550,832 | ) | | | (3,757,769 | ) | | | (6,426,020 | ) | | | (2,853,071 | ) | | | (3,688,696 | ) |
| | | | | | | | | | | | | | | | | | | | | | | | | | | | | | | |
| | (4,808,381 | ) | | | (6,542,877 | ) | | | (8,215,067 | ) | | | (8,921,070 | ) | | | (3,428,477 | ) | | | (5,950,184 | ) | | | (2,687,646 | ) | | | (3,455,276 | ) |
| | | | | | | | | | | | | | | | | | | | | | | | | | | | | | | |
| | | | | | | | | | | | | | | | | | | | | | | | | | | | | | |
| | 107,467,245 | | | | 60,386,929 | | | | 27,906,904 | | | | 9,310,700 | | | | 89,788,296 | | | | 249,293,219 | | | | 22,733,795 | | | | 50,755,835 | |
| | 10,978,319 | | | | 5,734,298 | | | | 923,511 | | | | 466,278 | | | | 20,273,123 | | | | 13,937,636 | | | | 4,236,537 | | | | 2,163,228 | |
| | (4,608,869 | ) | | | (86,494,765 | ) | | | (8,685,093 | ) | | | (4,334,053 | ) | | | (87,968,405 | ) | | | (58,652,473 | ) | | | (33,735,341 | ) | | | (17,721,396 | ) |
| | | | | | | | | | | | | | | | | | | | | | | | | | | | | | | |
| | 113,836,695 | | | | (20,373,538 | ) | | | 20,145,322 | | | | 5,442,925 | | | | 22,093,014 | | | | 204,578,382 | | | | (6,765,009 | ) | | | 35,197,667 | |
| | | | | | | | | | | | | | | | | | | | | | | | | | | | | | | |
| | 73,560,052 | | | | (70,116,128 | ) | | | 56,564,564 | | | | (35,656,399 | ) | | | (11,357,877 | ) | | | 165,746,225 | | | | (41,786,580 | ) | | | (12,092,710 | ) |
| | (106,633,403 | ) | | | (74,269,134 | ) | | | (31,871,118 | ) | | | (59,487,290 | ) | | | (161,290,126 | ) | | | 158,383,068 | | | | (93,379,784 | ) | | | (16,847,852 | ) |
| | 558,211,007 | | | | 632,480,141 | | | | 1,175,579,533 | | | | 1,235,066,823 | | | | 808,415,775 | | | | 650,032,707 | | | | 383,333,111 | | | | 400,180,963 | |
| $ | 451,577,604 | | | $ | 558,211,007 | | | $ | 1,143,708,415 | | | $ | 1,175,579,533 | | | $ | 647,125,649 | | | $ | 808,415,775 | | | $ | 289,953,327 | | | $ | 383,333,111 | |
| | | | | | | | | | | | | | | | | | | | | | | | | | | | | | |
| | | | | | | | | | | | | | | | | | | | | | | | | | | | | | |
| | 6,851,676 | | | | 7,232,910 | | | | 13,841,231 | | | | 7,183,715 | | | | 2,896,253 | | | | 3,308,668 | | | | 2,078,121 | | | | 2,079,081 | |
| | 5,105,438 | | | | 5,246,263 | | | | 3,696,492 | | | | 3,658,394 | | | | 2,150,081 | | | | 2,101,548 | | | | 1,238,247 | | | | 1,278,083 | |
| | (19,712,865 | ) | | | (20,950,030 | ) | | | (13,576,328 | ) | | | (13,707,985 | ) | | | (8,816,838 | ) | | | (9,245,559 | ) | | | (6,761,904 | ) | | | (7,809,430 | ) |
| | | | | | | | | | | | | | | | | | | | | | | | | | | | | | | |
| | (7,755,751 | ) | | | (8,470,857 | ) | | | 3,961,395 | | | | (2,865,876 | ) | | | (3,770,504 | ) | | | (3,835,343 | ) | | | (3,445,536 | ) | | | (4,452,266 | ) |
| | | | | | | | | | | | | | | | | | | | | | | | | | | | | | | |
| | | | | | | | | | | | | | | | | | | | | | | | | | | | | | |
| | 7,049 | | | | 21,907 | | | | 11,320 | | | | 8,760 | | | | 18,204 | | | | 16,670 | | | | 5,921 | | | | 2,888 | |
| | 73,441 | | | | 123,011 | | | | 22,043 | | | | 47,292 | | | | 21,748 | | | | 38,942 | | | | 11,437 | | | | 20,800 | |
| | (1,117,194 | ) | | | (1,421,027 | ) | | | (775,705 | ) | | | (849,791 | ) | | | (460,922 | ) | | | (750,889 | ) | | | (301,885 | ) | | | (375,012 | ) |
| | | | | | | | | | | | | | | | | | | | | | | | | | | | | | | |
| | (1,036,704 | ) | | | (1,276,109 | ) | | | (742,342 | ) | | | (793,739 | ) | | | (420,970 | ) | | | (695,277 | ) | | | (284,527 | ) | | | (351,324 | ) |
| | | | | | | | | | | | | | | | | | | | | | | | | | | | | | | |
| | | | | | | | | | | | | | | | | | | | | | | | | | | | | | |
| | 22,316,275 | | | | 11,794,211 | | | | 2,542,866 | | | | 833,046 | | | | 10,967,262 | | | | 29,247,235 | | | | 2,378,066 | | | | 5,195,639 | |
| | 2,427,205 | | | | 1,113,882 | | | | 84,933 | | | | 41,561 | | | | 2,519,613 | | | | 1,632,272 | | | | 451,234 | | | | 220,036 | |
| | (1,039,671 | ) | | | (16,761,322 | ) | | | (801,185 | ) | | | (386,267 | ) | | | (10,826,046 | ) | | | (6,903,824 | ) | | | (3,623,321 | ) | | | (1,799,757 | ) |
| | | | | | | | | | | | | | | | | | | | | | | | | | | | | | | |
| | 23,703,809 | | | | (3,853,229 | ) | | | 1,826,614 | | | | 488,340 | | | | 2,660,829 | | | | 23,975,683 | | | | (794,021 | ) | | | 3,615,918 | |
| | | | | | | | | | | | | | | | | | | | | | | | | | | | | | | |
The accompanying Notes to Financial Statements are an integral part of this schedule.
205
Thrivent Mutual Funds
Statement of Changes in Net Assets - continued
| | | | | | | | | | | | | | | | |
| | | Limited Maturity Bond Fund | | | Money Market Fund | |
For the periods ended | | 10/31/2008 | | | 10/31/2007 | | | 10/31/2008 | | | 10/31/2007 | |
Operations | | | | | | | | | | | | | | | | |
Net investment income/(loss) | | $ | 21,456,247 | | | $ | 16,213,816 | | | $ | 51,165,379 | | | $ | 68,091,797 | |
Net realized gains/(losses) | | | (3,665,696 | ) | | | (339,327 | ) | | | (67,104 | ) | | | (19,536 | ) |
Change in net unrealized appreciation/(depreciation) | | | (42,196,553 | ) | | | (1,424,302 | ) | | | — | | | | — | |
Net Change in Net Assets Resulting From Operations | | | (24,406,002 | ) | | | 14,450,187 | | | | 51,098,275 | | | | 68,072,261 | |
Distributions to Shareholders | | | | | | | | | | | | | | | | |
From net investment income | | | (21,722,771 | ) | | | (15,855,497 | ) | | | (51,098,275 | ) | | | (68,072,261 | ) |
Total Distributions to Shareholders | | | (21,722,771 | ) | | | (15,855,497 | ) | | | (51,098,275 | ) | | | (68,072,261 | ) |
Capital Stock Transactions | | | | | | | | | | | | | | | | |
Class A | | | | | | | | | | | | | | | | |
Sold | | | 25,027,579 | | | | 29,853,399 | | | | 1,426,400,808 | | | | 1,394,460,225 | |
Distributions reinvested | | | 4,245,204 | | | | 4,699,357 | | | | 40,198,084 | | | | 47,936,624 | |
Redeemed | | | (41,260,414 | ) | | | (36,972,850 | ) | | | (1,344,504,046 | ) | | | (1,122,834,757 | ) |
| | | | | | | | | | | | | | | | |
Total Class A Capital Stock Transactions | | | (11,987,631 | ) | | | (2,420,094 | ) | | | 122,094,846 | | | | 319,562,092 | |
| | | | | | | | | | | | | | | | |
Class B | | | | | | | | | | | | | | | | |
Sold | | | 35,880 | | | | 79,420 | | | | 874,632 | | | | 665,684 | |
Distributions reinvested | | | 36,515 | | | | 41,463 | | | | 35,163 | | | | 67,358 | |
Redeemed | | | (192,321 | ) | | | (199,188 | ) | | | (1,391,550 | ) | | | (1,000,594 | ) |
| | | | | | | | | | | | | | | | |
Total Class B Capital Stock Transactions | | | (119,926 | ) | | | (78,305 | ) | | | (481,755 | ) | | | (267,552 | ) |
| | | | | | | | | | | | | | | | |
Institutional Class | | | | | | | | | | | | | | | | |
Sold | | | 146,750,945 | | | | 168,536,157 | | | | 2,204,653,813 | | | | 1,980,415,531 | |
Distributions reinvested | | | 17,062,042 | | | | 10,665,647 | | | | 10,094,723 | | | | 19,135,374 | |
Redeemed | | | (54,145,739 | ) | | | (22,843,350 | ) | | | (2,416,514,046 | ) | | | (1,915,625,053 | ) |
| | | | | | | | | | | | | | | | |
Total Institutional Class Capital Stock Transactions | | | 109,667,248 | | | | 156,358,454 | | | | (201,765,510 | ) | | | 83,925,852 | |
| | | | | | | | | | | | | | | | |
Capital Stock Transactions | | | 97,559,691 | | | | 153,860,055 | | | | (80,152,419 | ) | | | 403,220,392 | |
Net Increase/(Decrease) in Net Assets | | | 51,430,918 | | | | 152,454,745 | | | | (80,152,419 | ) | | | 403,220,392 | |
Net Assets, Beginning of Period | | | 417,455,536 | | | | 265,000,791 | | | | 1,610,417,809 | | | | 1,207,197,417 | |
Net Assets, End of Period | | $ | 468,886,454 | | | $ | 417,455,536 | | | $ | 1,530,265,390 | | | $ | 1,610,417,809 | |
Capital Stock Share Transactions | | | | | | | | | | | | | | | | |
Class A shares | | | | | | | | | | | | | | | | |
Sold | | | 2,041,303 | | | | 2,375,503 | | | | 1,426,400,806 | | | | 1,394,460,205 | |
Distributions reinvested | | | 348,358 | | | | 374,035 | | | | 40,198,083 | | | | 47,936,624 | |
Redeemed | | | (3,387,783 | ) | | | (2,942,069 | ) | | | (1,344,504,044 | ) | | | (1,122,834,737 | ) |
| | | | | | | | | | | | | | | | |
Total Class A shares | | | (998,122 | ) | | | (192,531 | ) | | | 122,094,845 | | | | 319,562,092 | |
| | | | | | | | | | | | | | | | |
Class B shares | | | | | | | | | | | | | | | | |
Sold | | | 2,968 | | | | 6,321 | | | | 874,631 | | | | 665,684 | |
Distributions reinvested | | | 2,994 | | | | 3,297 | | | | 35,163 | | | | 67,358 | |
Redeemed | | | (15,842 | ) | | | (15,827 | ) | | | (1,391,549 | ) | | | (1,000,594 | ) |
| | | | | | | | | | | | | | | | |
Total Class B shares | | | (9,880 | ) | | | (6,209 | ) | | | (481,755 | ) | | | (267,552 | ) |
| | | | | | | | | | | | | | | | |
Institutional Class shares | | | | | | | | | | | | | | | | |
Sold | | | 11,867,184 | | | | 13,414,475 | | | | 2,204,653,813 | | | | 1,980,415,531 | |
Distributions reinvested | | | 1,404,278 | | | | 849,457 | | | | 10,094,723 | | | | 19,135,374 | |
Redeemed | | | (4,440,404 | ) | | | (1,818,204 | ) | | | (2,416,514,046 | ) | | | (1,915,625,053 | ) |
| | | | | | | | | | | | | | | | |
Total Institutional Class shares | | | 8,831,058 | | | | 12,445,728 | | | | (201,765,510 | ) | | | 83,925,852 | |
| | | | | | | | | | | | | | | | |
The accompanying Notes to the Financial Statements are an integral part of this schedule.
206
Thrivent Mutual Funds
Notes to Financial Statements
As of October 31, 2008
(1) ORGANIZATION
Thrivent Mutual Funds (the “Trust”) was organized as a Massachusetts Business Trust on March 10, 1987 and is registered as an open-end management investment company under the Investment Company Act of 1940 (the “1940 Act”). The Trust is divided into twenty-nine separate series (each a “Fund” and, collectively, the “Funds”), each with its own investment objective and policies. The Trust currently consists of four allocation funds, seventeen equity funds, two hybrid funds, five fixed-income funds, and one money market fund. Thrivent Real Estate Securities Fund, Thrivent Equity Income Plus Fund and Thrivent Diversified Income Plus Fund have a fiscal year end on a calendar-year basis and are presented under a separate annual report.
The Trust includes three classes of shares: Class A, Class B and Institutional Class. The three classes of shares differ principally in their respective distribution expenses and arrangements. Class A shares have a 0.25% annual 12b-1 fee (0.125% for Limited Maturity Bond Fund and Money Market Fund) and a maximum front-end sales load of 5.50% for allocation funds, equity funds, and hybrid funds and 4.50% for fixed-income funds, excluding Limited Maturity Bond Fund and Money Market Fund, which have no sales load. Class B shares were offered at net asset value and have a 1.00% annual 12b-1 fee (0.25% for Limited Maturity Bond Fund and 0.875% for Money Market Fund). In addition, Class B shares have a maximum deferred sales charge of 5.00%. The deferred sales charge declines by 1.00% per year through the fifth year. Class B shares convert to Class A shares at the end of the fifth year. Institutional Class shares are offered at net asset value and have no annual 12b-1 fees. All three classes of shares have identical rights to earnings, assets and voting privileges, except for class specific expenses and exclusive rights to vote on matters affecting only individual classes. Effective October 16, 2004, the Trust no longer offers Class B shares for sale.
The following Funds have all three classes of shares: Technology Fund, Partner Small Cap Value Fund, Small Cap Stock Fund, Mid Cap Growth Fund, Mid Cap Stock Fund, Partner International Stock Fund, Large Cap Growth Fund, Large Cap Value Fund, Large Cap Stock Fund, Balanced Fund, High Yield Fund, Municipal Bond Fund, Income Fund, Core Bond Fund, Limited Maturity Bond Fund and Money Market Fund. Aggressive Allocation Fund, Moderately Aggressive Allocation Fund, Moderate Allocation Fund, Moderately Conservative Allocation Fund, Partner Small Cap Growth Fund, Partner Mid Cap Value Fund and Partner Worldwide Allocation Fund offer Class A and Institutional Class shares. Small Cap Index Fund, Mid Cap Index Fund and Large Cap Index Fund offer Class A shares only.
Under the Trust’s organizational documents, its officers and trustees are indemnified against certain liabilities arising out of the performance of their duties to the Trust. In addition, in the normal course of business, the Trust enters into contracts with vendors and others that provide general damage clauses. The Trust’s maximum exposure under these contracts is unknown, as this would involve future claims that may be made against the Trust. However, based on experience, the Trust expects the risk of loss to be remote.
(2) SIGNIFICANT ACCOUNTING POLICIES
(A) Valuation of Investments – Securities traded on U.S. or foreign securities exchanges or included in a national market system are valued at the official closing price at the close of each business day unless otherwise stated below. Over-the-counter securities and listed securities for which no price is readily available are valued at the current bid price considered best to represent the value at that time. Security prices are based on quotes that are obtained from an independent pricing service approved by the Board of Trustees. The pricing service, in determining values of fixed-income securities, takes into consideration such factors as current quotations by broker/dealers, coupon, maturity, quality, type of issue, trading characteristics, and other yield and risk factors it deems relevant in determining valuations. Securities which cannot be valued by the approved pricing service are valued using valuations obtained from dealers that make markets in the securities. Exchange listed options and futures contracts are valued at the last quoted sales price. Investments in open-ended mutual funds are valued at the net asset value at the close of each business day.
For all Funds, other than Money Market Fund, short-term securities with maturities of 60 days or less are valued at amortized cost. Securities held by Money Market Fund are valued on the basis of amortized cost (which approximates market value), whereby a portfolio security is valued at its cost initially and thereafter valued to reflect a constant amortization to maturity of any discount or premium. The market values of the securities held in Money Market Fund are determined once per week using prices supplied by the Trust’s independent pricing service. Money Market Fund and the Trust’s investment adviser follow procedures necessary to maintain a constant net asset value of $1.00 per share.
All securities for which market values are not readily available or deemed unreliable are appraised at fair value as determined in good faith under the direction of the Board of Trustees. As of October 31, 2008, one security in High Yield Fund was valued at fair value, which represented less than 0.01% of that Fund’s net assets.
Fair Valuation of International Securities – Because many foreign markets close before the U.S. markets, events may occur between the close of the foreign market and the close of the U.S. markets that could have a material impact on the valuation of foreign securities. The Funds, under the supervision of the Board of Trustees, evaluate the impacts of these events and may adjust the valuation of foreign securities to reflect the fair value as of the close of the U.S. markets. The Board of Trustees has authorized the investment adviser to make fair valuation determinations pursuant to policies approved by the Board of Trustees.
207
Thrivent Mutual Funds
Notes to Financial Statements
As of October 31, 2008
(2) SIGNIFICANT ACCOUNTING POLICIES - continued
(B) Foreign Currency Translation – The accounting records of each Fund are maintained in U.S. dollars. Securities and other assets and liabilities that are denominated in foreign currencies are translated into U.S. dollars at the daily closing rates of exchange.
Foreign currency amounts related to the purchase or sale of securities and income and expenses are translated at the exchange rate on the transaction date. Net realized and unrealized currency gains and losses are recorded from sales of foreign currency, exchange gains or losses between the trade date and settlement dates on securities transactions, and other translation gains or losses on dividends, interest income and foreign withholding taxes. The Funds do not separately report the effect of changes in foreign exchange rates from changes in market prices on securities held. Such changes are included in net realized and unrealized gain or loss from investments.
For federal income tax purposes, the Funds treat the effect of changes in foreign exchange rates arising from actual foreign currency transactions and the changes in foreign exchange rates between the trade date and settlement date as ordinary income.
(C) Foreign Currency Contracts – In connection with purchases and sales of securities denominated in foreign currencies, all Funds except the Money Market Fund may enter into forward currency contracts. Additionally, the Funds may enter into such contracts to hedge certain other foreign currency denominated investments. These contracts are recorded at market value and the related realized and unrealized foreign exchange gains and losses are included in the Statement of Operations. In the event that counterparties fail to settle these forward contracts, the Funds could be exposed to foreign currency fluctuations. Foreign currency contracts are valued daily and unrealized appreciation or depreciation is recorded daily as the difference between the contract exchange rate and the closing forward rate applied to the face amount of the contract. A realized gain or loss is recorded at the time a forward contract is closed. During the year ended October 31, 2008, Technology Fund, Small Cap Stock Fund, Mid Cap Growth Fund, Partner Worldwide Allocation Fund, Partner International Stock Fund, Large Cap Growth Fund, Large Cap Stock Fund and Balanced Fund engaged in this type of investment.
(D) Foreign Denominated Investments – Foreign denominated assets and currency contracts may involve more risks than domestic transactions including currency risk, political and economic risk, regulatory risk, and market risk. Certain Funds may also invest in securities of companies located in emerging markets. Future economic or political developments could adversely affect the liquidity or value, or both, of such securities.
(E) Federal Income Taxes – No provision has been made for income taxes because each Funds’ policy is to qualify as a regulated investment company under the Internal Revenue Code and distribute substantially all investment company taxable income and net capital gain on a timely basis. It is also the intention of each Fund to distribute an amount sufficient to avoid imposition of any federal excise tax. The Funds, accordingly, anticipate paying no federal taxes and no federal tax provision was recorded. Each Fund is treated as a separate taxable entity for federal income tax purposes. Certain Funds may utilize earnings and profits distributed to shareholders on the redemption of shares as part of the dividends paid deduction.
Certain Funds are subject to foreign income taxes imposed by certain countries in which they invest. Withholding taxes on foreign dividends have been provided for in accordance with the applicable country’s tax rules and rates. These amounts are shown as foreign dividend tax withholding on the Statements of Operations.
In June 2006, the Financial Accounting Standards Board (FASB) issued FASB Interpretation No. 48 – Accounting for Uncertainty in Income Taxes (FIN 48), an interpretation of FASB Statement 109 that requires additional tax disclosures with respect to the tax effects of certain income tax positions, whether those positions were taken on previously filed tax returns or are expected to be taken on future returns. These positions must meet a “more likely than not” standard that, based on the technical merits of the position, would have a greater than 50 percent likelihood of being sustained upon examination. In evaluating whether a tax position has met the more-likely-than-not recognition threshold, management of the Fund must presume that the position will be examined by the appropriate taxing authority that has full knowledge of all relevant information. The Fund adopted the provisions of FIN 48 on April 30, 2008, as required by the U.S. Securities and Exchange Commission for mutual funds.
FIN 48 requires management of the Fund to analyze all open tax years, as defined by the statute of limitations, for all major jurisdictions. Open tax years are those that are open for examination by taxing authorities. Major jurisdictions for the Fund include Federal, Minnesota, Wisconsin, and Massachusetts as well as certain foreign countries. As of October 31, 2008, open Federal, Minnesota, Wisconsin, and Massachusetts tax years include the tax years ended October 31, 2005, through 2008. Additionally, as of October 31, 2008, the tax years ending in 2004 are open for Wisconsin. The Funds have no examinations in progress and none are expected at this time.
As of October 31, 2008, Management of the Fund has reviewed all open tax years and major jurisdictions and concluded that the adoption of FIN 48 resulted in no effect to the Fund’s tax liability, financial position or results of operations. There is no tax liability resulting from unrecognized tax benefits related to uncertain income tax
208
Thrivent Mutual Funds
Notes to Financial Statements
As of October 31, 2008
(2) SIGNIFICANT ACCOUNTING POLICIES - continued
positions taken or expected to be taken in future tax returns. The Funds are also not aware of any tax positions for which it is reasonably possible that the total amounts of unrecognized tax benefits will significantly change in the next 12 months.
(F) Expenses and Income – Estimated expenses are accrued daily. The Funds are charged for those expenses that are directly attributable to them. Expenses that are not directly attributable to a Fund are allocated among all appropriate Funds in proportion to their respective net assets, number of shareholder accounts or other reasonable basis. Net investment income, expenses which are not class-specific, and realized and unrealized gains and losses are allocated directly to each class based upon the relative net asset value of outstanding shares.
Interest income is accrued daily and is determined on the basis of interest or discount earned on all debt securities, including accretion of market discount and original issue discount and amortization of premium. Paydown gains and losses on mortgage- and asset-backed securities are recorded as components of interest income. Dividend income is recorded on the ex-dividend date.
(G) Custody Earnings Credit – The Funds have a deposit arrangement with the custodian whereby interest earned on uninvested cash balances is used to pay a portion of custodian fees. This deposit arrangement is an alternative to overnight investments. Earnings credits are shown as a reduction of total expenses on the Statement of Operations.
(H) Distributions to Shareholders – Dividend and capital gain distributions are recorded on the ex-dividend date. With the exception of Money Market Fund, net realized gains from securities transactions, if any, are paid at least annually after the close of the fiscal year.
Dividends from High Yield Fund, Municipal Bond Fund, Income Fund, Core Bond Fund, Limited Maturity Bond Fund and Money Market Fund are declared daily and paid monthly. Dividends from Money Market Fund also include any short-term net realized gains or losses on the sale of securities. Dividends from Moderate Allocation Fund, Moderately Conservative Allocation Fund and Balanced Fund are declared and paid quarterly. Dividends from the following funds are declared and paid annually: Aggressive Allocation Fund, Moderately Aggressive Allocation Fund, Technology Fund, Partner Small Cap Growth Fund, Partner Small Cap Value Fund, Small Cap Stock Fund, Small Cap Index Fund, Mid Cap Growth Fund, Partner Mid Cap Value Fund, Mid Cap Stock Fund, Mid Cap Index Fund, Partner Worldwide Allocation Fund, Partner International Stock Fund, Large Cap Growth Fund, Large Cap Value Fund, Large Cap Stock Fund and Large Cap Index Fund.
(I) Options – All Funds, with the exception of Money Market Fund, may buy put and call options and write put and covered call options. The Funds intend to use such derivative instruments as hedges to facilitate buying or selling securities or to provide protection against adverse movements in security prices or interest rates. The Funds may also enter into options contracts to protect against adverse foreign exchange rate fluctuations. Option contracts are valued daily and unrealized appreciation or depreciation is recorded. A Fund will realize a gain or loss upon expiration or closing of the option transaction. When an option is exercised, the proceeds upon sale for a written call option or the cost of a security for purchased put and call options is adjusted by the amount of premium received or paid.
Buying put options tends to decrease a Fund’s exposure to the underlying security, while buying call options tends to increase a Fund’s exposure to the underlying security. The risk associated with purchasing put and call options is limited to the premium paid. Writing put options tends to increase a Fund’s exposure to the underlying security, while writing call options tends to decrease a Fund’s exposure to the underlying security. The writer of an option has no control over whether the underlying security may be sold or bought, and therefore bears the market risk of an unfavorable change in the price of the underlying security. Risks of loss may exceed amounts recognized on the Statement of Assets and Liabilities. During the year ended October 31, 2008, Mid Cap Growth Fund, Large Cap Growth Fund, Large Cap Stock Fund, Balanced Fund, Income Fund, Core Bond Fund, and Limited Maturity Bond Fund engaged in these types of investment.
(J) Financial Futures Contracts – Certain Funds use futures contracts to manage the exposure to interest rate and market fluctuations. Gains or losses on futures contracts can offset changes in the yield of securities. When a futures contract is opened, cash or other investments equal to the required “initial margin deposit” are held on deposit with and pledged to the broker. Additional securities held by the Funds may be earmarked for open futures contracts. The futures contract’s daily change in value (“variation margin”) is either paid to or received from the broker, and is recorded as an unrealized gain or loss. When the contract is closed, the realized gain or loss is recorded equal to the difference between the value of the contract when opened and the value of the contract when closed. Futures contracts involve, to varying degrees, risk of loss in excess of the variation margin disclosed in the Statement of Assets and Liabilities. During the year ended October 31, 2008, Aggressive Allocation Fund, Moderately Aggressive Allocation Fund, Moderate Allocation Fund, Moderately Conservative Allocation Fund, Partner Small Cap Growth Fund, Small Cap Stock Fund, Small Cap Index Fund, Mid Cap Index Fund, Partner Worldwide Allocation Fund, Large Cap Stock Fund, Large Cap Index Fund, Balanced Fund, High Yield Fund, Income Fund, Core Bond Fund and Limited Maturity Bond Fund engaged in this type of investment.
209
Thrivent Mutual Funds
Notes to Financial Statements
As of October 31, 2008
(2) SIGNIFICANT ACCOUNTING POLICIES - continued
(K) Swap Agreements – Certain Funds enter into swap transactions, which involve swapping one or more investment characteristics of a security or a basket of securities with another party. Such transactions include market risk, risk of default by the other party to the transaction, risk of imperfect correlation and manager risk and may involve commissions or other costs. Swap transactions generally do not involve delivery of securities, other underlying assets or principal. Accordingly, the risk of loss with respect to swap transactions generally is limited to the net amount of payments that the Fund is contractually obligated to make, or in the case of the counterparty defaulting, the net amount of payments that the Fund is contractually entitled to receive. Risks of loss may exceed amounts recognized on the Statement of Assets and Liabilities. If there is a default by the counterparty, the Fund may have contractual remedies pursuant to the agreements related to the transaction. Periodic payments are recorded as realized gains or losses on the Statement of Operations. The contracts are valued daily and unrealized appreciation or depreciation is recorded. Periodic payments and receipts and payments received or made as a result of a credit event or termination of the contract are recognized as realized gains or losses on the Statement of Operations. Collateral, in the form of cash or securities, may be required to be held with the Trust’s custodian, or third party, in connection with these agreements.
Credit Default Swaps – A credit default swap is an agreement between two parties to exchange the credit risk of a particular issuer or reference entity. In a credit default swap transaction, a buyer pays periodic fees in return for payment by the seller which is contingent upon an adverse credit event occurring in the underlying issuer or referenced entity. The seller collects periodic fees from the buyer and profits if the credit of the underlying issuer or reference entity remains stable or improves while the swap is outstanding, but the seller in a credit default swap contract would be required to pay the amount of credit loss, determined as specified in the agreement, to the buyer in the event of an adverse credit event in the reference entity. A buyer of a credit default swap is said to buy protection whereas a seller of a credit default swap is said to sell protection. The Funds may be either the protection seller or the protection buyer. During the year ended October 31, 2008, Balanced Fund, High Yield Fund, Income Fund, Core Bond Fund and Limited Maturity Bond Fund engaged in this type of investment.
Total Rate of Return Swaps – A total rate of return swap is an agreement in which one party makes payments based on a set rate, either fixed or variable, while the other party makes payments based on the return of an underlying asset plus any capital gains and losses over the payment period. The underlying asset is typically an index, loan or a basket of assets. Total rate of return swaps provide the Funds with the additional flexibility of gaining exposure to a market or securities index by using the most cost-effective vehicle available. During the year ended October 31, 2008, no funds engaged in this type of investment.
Interest Rate Swaps – An interest rate swap is an agreement between two parties to exchange cash flows based on the difference between two interest rates. Typically, one party pays a fixed-rate for a specific period while the other pays a variable-rate based on an underlying index for the same period. Interest rate swaps allow the Funds to manage exposure to interest rate fluctuations. During the year ended October 31, 2008, Limited Maturity Bond Fund engaged in this type of investment.
(L) Mortgage Dollar Roll Transactions – Certain Funds enter into dollar roll transactions on securities issued or to be issued by the Government National Mortgage Association, Federal National Mortgage Association and Federal Home Loan Mortgage Corporation, in which the Funds sell mortgage securities and simultaneously agree to repurchase similar (same type and coupon) securities at a later date at an agreed upon price. The Funds must maintain liquid securities having a value not less than the repurchase price (including accrued interest) for such dollar rolls. The market value of the securities that the Funds are required to purchase may decline below the agreed upon repurchase price of those securities.
During the period between the sale and repurchase, the Funds forgo principal and interest paid on the mortgage securities sold. The Funds are compensated from negotiated fees paid by brokers offered as an inducement to the Funds to “roll over” their purchase commitments, thus enhancing their yield. Mortgage dollar rolls may be renewed with a new purchase and repurchase price and a cash settlement made on settlement date without physical delivery of the securities subject to the contract. The fees received are recognized over the roll period and are included in Income from mortgage dollar rolls in the Statement of Operations. During the year ended October 31, 2008, Balanced Fund, Income Fund, Core Bond Fund and Limited Maturity Bond Fund engaged in this type of investment.
(M) Securities Lending – The Trust has entered into a Securities Lending Agreement (the “Agreement”) with Dresdner Bank AG (“Dresdner”). The Agreement authorizes Dresdner to lend securities to authorized borrowers on behalf of the Funds. Pursuant to the Agreement, all loaned securities are initially collateralized by cash equal to at least 102% of the value of the loaned securities. All cash collateral received is invested in Thrivent Financial Securities Lending Trust. The Funds receive dividends and interest that would have been earned on the securities loaned while simultaneously seeking to earn income on the investment of cash collateral. Amounts earned on investments in Thrivent Financial Securities Lending Trust, net of rebates, fees paid to Dresdner for services provided and any other securities lending expenses, are included in Income from securities loaned on the Statement of Operations. By investing any cash collateral it receives in these transactions, a Fund could realize additional gains or losses. If the borrower fails to return the securities or the invested collateral has declined in value, the Fund could lose money. As of October 31, 2008, all
210
Thrivent Mutual Funds
Notes to Financial Statements
As of October 31, 2008
(2) SIGNIFICANT ACCOUNTING POLICIES - continued
Funds except Aggressive Allocation Fund, Moderately Aggressive Allocation Fund, Moderate Allocation Fund, Moderately Conservative Allocation Fund, Partner Worldwide Allocation Fund, Municipal Bond Fund and Money Market Fund had securities on loan. The value of securities on loan is as follows
| | | |
Fund | | Securities on
Loan |
Technology | | $ | 1,312,160 |
Partner Small Cap Growth | | | 13,964,977 |
Partner Small Cap Value | | | 30,820,515 |
Small Cap Stock | | | 51,501,591 |
Small Cap Index | | | 3,415,142 |
Mid Cap Growth | | | 43,180,957 |
Partner Mid Cap Value | | | 2,715,046 |
Mid Cap Stock | | | 77,551,391 |
Mid Cap Index | | | 2,479,204 |
Partner International Stock | | | 606,946 |
Large Cap Growth | | | 17,042,343 |
Large Cap Value | | | 13,179,298 |
Large Cap Stock | | | 71,539,276 |
Large Cap Index | | | 674,624 |
Balanced | | | 11,023,683 |
High Yield | | | 29,148,760 |
Income | | | 20,414,503 |
Core Bond | | | 1,524,237 |
Limited Maturity Bond | | | 51,262,651 |
(N) When-Issued and Delayed Delivery Transactions – Certain Funds may purchase or sell securities on a when-issued or delayed delivery basis. These transactions involve a commitment by a Fund to purchase or sell securities for a predetermined price or yield, with payment and delivery taking place beyond the customary settlement period. When delayed delivery purchases are outstanding, a Fund will designate liquid assets in an amount sufficient to meet the purchase price. When purchasing a security on a delayed delivery basis, a Fund assumes the rights and risks of ownership of the security, including the risk of price and yield fluctuations, and takes such fluctuations into account when determining its net asset value. A Fund may dispose of a delayed delivery transaction after it is entered into, and may sell when-issued securities before they are delivered, which may result in a capital gain or loss. When a Fund has sold a security on a delayed delivery basis, a Fund does not participate in future gains and losses with respect to the security.
(O) Treasury Inflation Protected Securities – Certain Funds may invest in treasury inflation protected securities (TIPS). These securities are fixed income securities whose principal value is periodically adjusted to the rate of inflation. The interest rate is generally fixed at issuance. Interest is paid based on the principal value, which is adjusted for inflation. Any increase in the principal amount will be included as taxable interest in the Statement of Operations and received upon maturity or sale of the security. During the year ended October 31, 2008, Balanced Fund, Income Fund, Core Bond Fund and Limited Maturity Bond Fund engaged in this type of investment.
(P) Repurchase Agreements – Each Fund may engage in repurchase agreement transactions in pursuit of its investment objective. A repurchase agreement consists of a purchase and a simultaneous agreement to resell an investment for later delivery at an agreed upon price and rate of interest. The Fund must take possession of collateral either directly or through a third-party custodian. If the original seller of a security subject to a repurchase agreement fails to repurchase the security at the agreed upon time, the Fund could incur a loss due to a drop in the market value of the security during the time it takes the Fund to either sell the security or take action to enforce the original seller’s agreement to repurchase the security. Also, if a defaulting original seller filed for bankruptcy or became insolvent, disposition of such security might be delayed by pending legal action. The Fund may only enter into repurchase agreements with banks and other recognized financial institutions such as broker/dealers that are found by the Funds’ investment adviser Thrivent Asset Management, LLC (“Thrivent Asset Mgt.” or the “Adviser”) or subadviser to be creditworthy. During the year ended October 31, 2008, Mid Cap Stock Fund, Partner International Stock Fund, Large Cap Stock Fund, High Yield Fund and Core Bond Fund engaged in these types of investments.
(Q) Equity-Linked Structured Securities – Certain funds may invest in equity-linked structured notes. Equity-linked structured notes are debt securities which combine the characteristics of common stock and the sale of an option. The return component is based upon the performance of a single equity security, a basket of equity securities, or an equity index and the sale of an option which is recognized as income. There is no guaranteed return of principal with these securities. The appreciation potential of these securities may be limited by a maximum payment or call right and can be influenced by many unpredictable factors. During the year ended October 31, 2008, Balanced Fund, Core Bond Fund and Limited Maturity Bond Fund engaged in this type of investment.
(R) Credit Risk – The Funds may be susceptible to credit risk to the extent an issuer or counterparty defaults on its payment obligation. The Funds’ policy is to monitor the creditworthiness of issuers. Interest receivable on defaulted securities is monitored for ability to collect payments in default and is adjusted accordingly.
(S) Accounting Estimates – The preparation of financial statements in conformity with accounting principles generally accepted in the United States of America requires management to make estimates and assumptions that affect the reported amounts of assets and liabilities and disclosure of contingent assets and liabilities at the date of the financial statements and the reported amounts of income and expenses during the reporting period. Actual results could differ from those estimates.
211
Thrivent Mutual Funds
Notes to Financial Statements
As of October 31, 2008
(2) SIGNIFICANT ACCOUNTING POLICIES - continued
(T) Temporary Guarantee Program – The Trust, on behalf of Thrivent Money Market Fund, was a participant in the U.S. Department of the Treasury’s Temporary Guarantee Program for Money Market Funds (the “Program”) during the Program’s initial phase from September 19, 2008 through December 18, 2008. The U.S. Treasury has extended the Program until April 30, 2009. Details of Thrivent Money Market Fund’s participation in the extended Program is discussed below.
The Program guarantees the share price of a fund held by shareholders as of September 19, 2008, at $1.00 per share. Persons who were not shareholders as of September 19, 2008, are not covered by the Program.
The guarantee under the Program would be triggered if a fund’s per share net asset value falls below $0.995 (a “Guarantee Event”) and the fund commences the process of liquidation. Under the terms of the Program, the U.S. Treasury guarantees payment to each eligible shareholder the difference between the amount received in liquidation and the amount that eligible shareholder would have received had the net asset value of the fund been $1.00 per share. If the number of shares held by the eligible shareholder in a participating fund fluctuates over the duration of the Program, the Program would cover the lesser of (i) the number of shares held by the eligible shareholder in the fund as of September 19, 2008, or (ii) the number of shares held by the eligible shareholder as of the date of the Guarantee Event.
To participate in the initial phase of the Program, Thrivent Money Market Fund was required to pay an initial participation fee in the amount of 0.01% of the total net assets of the Fund as of September 19, 2008. The program was initially scheduled to remain in effect until December 18, 2008, but, as was stated earlier, the U.S. Treasury has extended the Program until April 30, 2009. The Fund applied to participate in the extension of the Program and was required to pay an extended participation fee of 0.015% of the total net assets of the Fund as of September 19, 2008.
(U) Unfunded Loan Commitment – Certain Funds may enter into loan commitments, all or a portion of which may be unfunded. The Fund is obligated to fund these commitments at the borrower’s discretion. Therefore, the Fund must have funds sufficient to cover its contractual obligation. These unfunded loan commitments, which are marked to market daily, are presented in the Schedule of Investments.
(V) Recent Accounting Pronouncements – In September 2006, the FASB issued FASB Statement No. 157 – Fair Value Measurements (“FAS 157”). The objective of the statement is to improve the consistency and comparability of fair value measurements used in financial reporting. FAS 157 defines fair value, establishes a framework for measuring fair value in generally accepted accounting principles, and expands disclosures about fair value measurements. FAS 157 is effective for fiscal years beginning after November 15, 2007. As of October 31, 2008, management of the Fund does not believe that the adoption of FAS 157 will impact the financial statement amounts. However, additional disclosures may be required describing the inputs used to develop the fair value measurements.
In March 2008, the FASB issued Statement of Financial Accounting Standards No. 161 – Disclosures about Derivative Instruments and Hedging Activities: An Amendment of FASB Statement No. 133 (“FAS 161”). FAS 161 is intended to improve financial reporting for derivative instruments by requiring enhanced disclosure that enables investors to understand how and why an entity uses derivatives, how derivatives are accounted for and how derivative instruments affect an entity’s results of operations and financial position. The provisions are effective for fiscal years beginning after November 15, 2008. Management of the Fund is currently evaluating the impact that FAS 161 will have on the Fund’s financial statements.
In September 2008, the FASB released FASB Staff Position No. 133-1 – Disclosures about Credit Derivatives and Certain Guarantees (“FSP 133-1”). FSP 133-1 amends FASB Statement No. 133 to require disclosures by sellers of credit derivatives, including hybrid instruments that have credit derivatives embedded in them. The disclosures will include current status of the payment/performance risk of the credit derivative, as well as certain additional information, such as the nature and term of the credit derivative, the reason for entering into it, the maximum potential amount of future payments that could be required under the derivative arrangement and the fair value of the credit derivative. The provisions are effective for fiscal years and interim periods ending after November 15, 2008. Management of the Fund is currently evaluating the impact that FSP 133-1 will have on the Fund’s financial statements.
(W) Other – For financial statement purposes, investment security transactions are accounted for on the trade date. Realized gains and losses from investment transactions are determined on a specific cost identification basis, which is the same basis used for federal income tax purposes.
212
Thrivent Mutual Funds
Notes to Financial Statements
As of October 31, 2008
(3) FEES AND COMPENSATION PAID TO AFFILIATES
(A) Investment Advisory Fees – The Trust has entered into an Investment Advisory Agreement with Thrivent Asset Mgt. Under the Investment Advisory Agreement, each of the Funds pays a fee for investment advisory services. The fees are accrued daily and paid monthly. The annual rates of fees as a percent of average daily net assets under the Investment Advisory Agreement were as follows:
| | | | | | | | | | | | | | | | | | | | | | | | | | | | | | | | | |
Fund (M - Millions) | | $0 to
$50M | | | $50 to
$100M | | | $100 to
$200M | | | $200 to
$250M | | | $250 to
$500M | | | $500 to
$750M | | | $750 to
$1,000M | | | $1,000 to
$2,000M | | | $2,000 to
$2,500M | | | $2,500 to
$5,000M | | | Over
$5,000M | |
Aggressive Allocation | | 0.150 | % | | 0.150 | % | | 0.150 | % | | 0.150 | % | | 0.150 | % | | 0.125 | % | | 0.125 | % | | 0.125 | % | | 0.125 | % | | 0.125 | % | | 0.125 | % |
Moderately Aggressive Allocation | | 0.150 | % | | 0.150 | % | | 0.150 | % | | 0.150 | % | | 0.150 | % | | 0.125 | % | | 0.125 | % | | 0.125 | % | | 0.125 | % | | 0.125 | % | | 0.125 | % |
Moderate Allocation | | 0.150 | % | | 0.150 | % | | 0.150 | % | | 0.150 | % | | 0.150 | % | | 0.125 | % | | 0.125 | % | | 0.125 | % | | 0.125 | % | | 0.125 | % | | 0.125 | % |
Moderately Conservative Allocation | | 0.150 | % | | 0.150 | % | | 0.150 | % | | 0.150 | % | | 0.150 | % | | 0.125 | % | | 0.125 | % | | 0.125 | % | | 0.125 | % | | 0.125 | % | | 0.125 | % |
Technology | | 0.750 | % | | 0.750 | % | | 0.750 | % | | 0.750 | % | | 0.750 | % | | 0.750 | % | | 0.750 | % | | 0.750 | % | | 0.750 | % | | 0.750 | % | | 0.750 | % |
Partner Small Cap Growth | | 0.900 | % | | 0.900 | % | | 0.900 | % | | 0.900 | % | | 0.900 | % | | 0.800 | % | | 0.800 | % | | 0.800 | % | | 0.800 | % | | 0.800 | % | | 0.800 | % |
Partner Small Cap Value | | 0.700 | % | | 0.700 | % | | 0.700 | % | | 0.700 | % | | 0.700 | % | | 0.700 | % | | 0.700 | % | | 0.700 | % | | 0.700 | % | | 0.700 | % | | 0.700 | % |
Small Cap Stock | | 0.700 | % | | 0.700 | % | | 0.700 | % | | 0.650 | % | | 0.650 | % | | 0.650 | % | | 0.650 | % | | 0.600 | % | | 0.600 | % | | 0.550 | % | | 0.525 | % |
Small Cap Index | | 0.250 | % | | 0.250 | % | | 0.250 | % | | 0.250 | % | | 0.250 | % | | 0.250 | % | | 0.250 | % | | 0.250 | % | | 0.250 | % | | 0.250 | % | | 0.250 | % |
Mid Cap Growth | | 0.450 | % | | 0.450 | % | | 0.400 | % | | 0.400 | % | | 0.350 | % | | 0.300 | % | | 0.300 | % | | 0.250 | % | | 0.250 | % | | 0.250 | % | | 0.250 | % |
Partner Mid Cap Value | | 0.750 | % | | 0.750 | % | | 0.750 | % | | 0.750 | % | | 0.700 | % | | 0.700 | % | | 0.700 | % | | 0.700 | % | | 0.700 | % | | 0.700 | % | | 0.700 | % |
Mid Cap Stock | | 0.700 | % | | 0.700 | % | | 0.700 | % | | 0.650 | % | | 0.650 | % | | 0.650 | % | | 0.650 | % | | 0.600 | % | | 0.600 | % | | 0.550 | % | | 0.525 | % |
Mid Cap Index | | 0.250 | % | | 0.250 | % | | 0.250 | % | | 0.250 | % | | 0.250 | % | | 0.250 | % | | 0.250 | % | | 0.250 | % | | 0.250 | % | | 0.250 | % | | 0.250 | % |
Partner Worldwide Allocation | | 0.900 | % | | 0.900 | % | | 0.900 | % | | 0.900 | % | | 0.850 | % | | 0.850 | % | | 0.850 | % | | 0.850 | % | | 0.850 | % | | 0.850 | % | | 0.850 | % |
Partner International Stock | | 0.650 | % | | 0.600 | % | | 0.600 | % | | 0.600 | % | | 0.600 | % | | 0.600 | % | | 0.600 | % | | 0.600 | % | | 0.600 | % | | 0.600 | % | | 0.600 | % |
Large Cap Growth | | 0.750 | % | | 0.750 | % | | 0.750 | % | | 0.750 | % | | 0.750 | % | | 0.700 | % | | 0.700 | % | | 0.650 | % | | 0.650 | % | | 0.600 | % | | 0.575 | % |
Large Cap Value | | 0.450 | % | | 0.450 | % | | 0.450 | % | | 0.450 | % | | 0.450 | % | | 0.450 | % | | 0.450 | % | | 0.450 | % | | 0.450 | % | | 0.450 | % | | 0.450 | % |
Large Cap Stock | | 0.650 | % | | 0.650 | % | | 0.650 | % | | 0.650 | % | | 0.650 | % | | 0.575 | % | | 0.575 | % | | 0.500 | % | | 0.475 | % | | 0.450 | % | | 0.425 | % |
Large Cap Index | | 0.250 | % | | 0.250 | % | | 0.250 | % | | 0.250 | % | | 0.250 | % | | 0.250 | % | | 0.250 | % | | 0.250 | % | | 0.250 | % | | 0.250 | % | | 0.250 | % |
Balanced | | 0.550 | % | | 0.550 | % | | 0.550 | % | | 0.550 | % | | 0.550 | % | | 0.500 | % | | 0.500 | % | | 0.475 | % | | 0.475 | % | | 0.450 | % | | 0.425 | % |
High Yield | | 0.400 | % | | 0.400 | % | | 0.400 | % | | 0.400 | % | | 0.400 | % | | 0.350 | % | | 0.350 | % | | 0.300 | % | | 0.300 | % | | 0.300 | % | | 0.300 | % |
Municipal Bond | | 0.450 | % | | 0.450 | % | | 0.450 | % | | 0.450 | % | | 0.450 | % | | 0.400 | % | | 0.400 | % | | 0.350 | % | | 0.350 | % | | 0.325 | % | | 0.300 | % |
Income | | 0.350 | % | | 0.350 | % | | 0.350 | % | | 0.350 | % | | 0.350 | % | | 0.325 | % | | 0.325 | % | | 0.300 | % | | 0.300 | % | | 0.300 | % | | 0.300 | % |
Core Bond | | 0.450 | % | | 0.450 | % | | 0.450 | % | | 0.450 | % | | 0.450 | % | | 0.400 | % | | 0.400 | % | | 0.375 | % | | 0.375 | % | | 0.350 | % | | 0.325 | % |
Limited Maturity Bond | | 0.300 | % | | 0.300 | % | | 0.300 | % | | 0.300 | % | | 0.300 | % | | 0.275 | % | | 0.275 | % | | 0.250 | % | | 0.250 | % | | 0.250 | % | | 0.250 | % |
Money Market | | 0.500 | % | | 0.500 | % | | 0.500 | % | | 0.500 | % | | 0.500 | % | | 0.400 | % | | 0.350 | % | | 0.325 | % | | 0.325 | % | | 0.300 | % | | 0.275 | % |
(B) Sub-Adviser Fees – The following subadviser fees are charged as part of the total investment advisory fees stated in the table above. The subadvisory fees are borne directly by the Adviser and do not increase the overall fees paid by the Fund.
Partner Small Cap Growth Fund
The Adviser had entered into subadvisory agreements with Turner Investment Partners, Inc. (“Turner”) and Transamerica Investment Management, LLC (“Transamerica”) for the performance of subadvisory services. The fee payable to Turner was equal to 0.65% of average daily net assets. The fee payable to Transamerica was 0.50% of average daily net assets. As of May 1, 2008, Transamerica is no longer a subadviser to this Fund. In addition, as of May 1, 2008, the fee payable to Turner is equal to 0.65% of the first $100 million of average net assets and 0.60% for assets over $100 million. Thrivent Partner Small Cap Growth Portfolio is included in determining breakpoints for the assets managed by Turner.
Partner Small Cap Value Fund
The Adviser has entered into a subadvisory agreement with T. Rowe Price Associates, Inc. for performance of subadvisory services. The subadvisory fee, which is paid by the Adviser from its advisory fee, is 0.60% of average daily net assets.
Partner Mid Cap Value Fund
The Adviser has entered into a subadvisory agreement with Goldman Sachs Asset Management, LP (“GSAM”) for the performance of subadvisory services. The fee payable is equal to 0.50% of average daily net assets for the first $250 million and 0.45% for assets over $250 million. Thrivent Partner Mid Cap Value Portfolio is included in determining breakpoints for the assets managed by GSAM.
Partner Worldwide Allocation Fund
The Adviser has entered into subadvisory agreements with Mercator Asset Management, LP (“Mercator”), Principal Global Investors, LLC (“Principal”), Aberdeen Asset Management Investment Services Limited (“Aberdeen”), Victory Capital Management, Inc. (“Victory”) and GSAM for the performance of subadvisory services.
213
Thrivent Mutual Funds
Notes to Financial Statements
As of October 31, 2008
(3) FEES AND COMPENSATION PAID TO AFFILIATES - continued
The fee payable for Mercator is equal to 0.75% of the first $25 million of average daily net assets, 0.60% of the next $25 million, 0.55% of the next $25 million, 0.50% of the next $225 million, 0.40% of the next $200 million and 0.20% of average daily net assets over $500 million. Thrivent Partner Worldwide Allocation Portfolio, Thrivent Partner International Stock Fund and Thrivent Partner International Stock Portfolio will be included in determining breakpoints for the assets managed by Mercator.
The fee payable for Principal is equal to 0.35% of the first $500 million of average daily net assets, 0.30% of the next $500 million and 0.25% of average daily net assets over $1 billion. Thrivent Partner Worldwide Allocation Portfolio, Thrivent Partner International Stock Fund and Thrivent Partner International Stock Portfolio will be included in determining breakpoints for the assets managed by Principal.
The fee payable for Aberdeen is equal to 0.85% of the first $50 million of average daily net assets, 0.72% of the next $50 million and 0.68% of average daily net assets over $100 million. Thrivent Partner Worldwide Allocation Portfolio and Thrivent Partner Emerging Markets Portfolio will be included in determining breakpoints for the assets managed by Aberdeen.
The fee payable for Victory is equal to 0.95% of the first $25 million of average daily net assets, 0.85% of the next $75 million and 0.80% of average daily net assets over $100 million. Thrivent Partner Worldwide Allocation Portfolio will be included in determining breakpoints for the assets managed by Victory.
The fee payable for GSAM is equal to 0.55% of the first $50 million of average daily net assets, 0.50% of the next $200 million and 0.45% of average daily net assets over $250 million. Thrivent Partner Worldwide Allocation Portfolio will be included in determining breakpoints for the assets managed by GSAM.
Partner International Stock Fund
The Adviser has entered into subadvisory agreements with Mercator and Principal for the performance of subadvisory services.
The fee payable for Mercator is equal to 0.75% of the first $25 million of average daily net assets, 0.60% of the next $25 million, 0.55% of the next $25 million, 0.50% of the next $225 million, 0.40% of the next $200 million and 0.20% of average daily net assets over $500 million. Thrivent Partner International Stock Portfolio, Thrivent Partner Worldwide Allocation Fund and Thrivent Partner Worldwide Allocation Portfolio will be included in determining breakpoints for the assets managed by Mercator.
The fee payable for Principal is equal to 0.35% of the first $500 million of average daily net assets, 0.30% of the next $500 million and 0.25% of average daily net assets over $1 billion. Thrivent Partner International Stock Portfolio, Thrivent Partner Worldwide Allocation Fund and Thrivent Partner Worldwide Allocation Portfolio will be included in determining breakpoints for the assets managed by Principal.
214
Thrivent Mutual Funds
Notes to Financial Statements
As of October 31, 2008
(3) FEES AND COMPENSATION PAID TO AFFILIATES - continued
As of October 31, 2008, the following voluntary expense reimbursements, as a percentage of net assets, were in effect:
| | | | | | | | | | | |
Fund | | Class A | | | Class B | | | Institutional
Class | | | Expiration
Date |
Technology | | — | | | 1.00 | % | | — | | | N/A |
Partner Small Cap Value | | 0.10 | % | | 0.10 | % | | 0.10 | % | | N/A |
Large Cap Growth | | — | | | 0.80 | % | | — | | | N/A |
Core Bond | | 0.10 | % | | — | | | — | | | N/A |
Money Market | | 0.20 | % | | 0.10 | % | | 0.10 | % | | N/A |
These voluntary reimbursements may be discontinued at any time.
As of October 31, 2008, contractual expense reimbursements to limit expenses to the following percentages were in effect:
| | | | | | | | | | |
Fund | | Class A | | | Class B | | Institutional
Class | | | Expiration
Date |
Aggressive Allocation | | 0.55 | % | | N/A | | — | | | 2/28/2009 |
Moderately Aggressive Allocation | | 0.52 | % | | N/A | | — | | | 2/28/2009 |
Moderate Allocation | | 0.51 | % | | N/A | | — | | | 2/28/2009 |
Moderately Conservative Allocation | | 0.48 | % | | N/A | | — | | | 2/28/2009 |
Technology | | 1.47 | % | | — | | — | | | 2/28/2009 |
Small Cap Index | | 0.95 | % | | N/A | | N/A | | | 2/28/2009 |
Partner Mid Cap Value | | 1.25 | % | | N/A | | 0.99 | % | | 2/28/2009 |
Mid Cap Index | | 0.60 | % | | N/A | | N/A | | | 2/28/2009 |
Partner Worldwide Allocation | | 1.30 | % | | N/A | | 0.95 | % | | 2/28/2009 |
Large Cap Growth | | 1.17 | % | | — | | — | | | 2/28/2009 |
Large Cap Index | | 0.60 | % | | N/A | | N/A | | | 2/28/2009 |
As of October 15, 2004, all Class B shares net operating expenses are limited to the following percentage of daily net assets of Class B shares: Technology Fund, 3.34%; Partner Small Cap Value Fund, 2.63%; Small Cap Stock Fund, 2.43%; Mid Cap Growth Fund, 2.31%; Mid Cap Stock Fund, 2.39%; Partner International Stock Fund, 2.79%; Large Cap Growth Fund, 2.55%; Large Cap Value Fund, 2.21%; Large Cap Stock Fund, 1.89%; Balanced Fund, 2.06%; High Yield Fund, 1.73%; Municipal Bond Fund, 1.47%; Income Fund, 1.63%; Core Bond Fund, 1.95%; Limited Maturity Bond Fund, 0.89%; and Money Market Fund, 1.95%. These reimbursements will be in effect as long as assets remain in the Class B shares.
Class B share expenses are voluntarily reimbursed to limit expenses to 2.75% of average daily net assets for Technology Fund and Partner International Stock Fund. Additionally, Class B share expenses were voluntarily reimbursed to limit expenses to 1.01% of average daily net assets for Money Market Fund. These voluntary expense reimbursements may be discontinued at any time.
Each equity, hybrid and fixed income fund may invest cash in Money Market Fund, subject to certain limitations. During the year ended October 31, 2008, all funds, with the exception of Municipal Bond Fund, invested in Money Market Fund. These related-party transactions are subject to the same terms as non-related party transactions except that, to avoid duplicate investment advisory fees, Thrivent Asset Mgt. reimburses an amount equal to the smaller of the amount of the advisory fee for that Fund or the amount of the advisory fee which is charged to the Fund for its investment in Money Market Fund.
(C) Distribution Plan – Thrivent Investment Management, Inc. (“Thrivent Investment Mgt.”) is the Trust’s distributor. The Trust has adopted a Distribution Plan pursuant to Rule 12b-1 under the 1940 Act. Class A shares have a Rule 12b-1 fee of up to 0.25% (up to 0.125% for Limited Maturity Bond Fund and Money Market Fund) of average net assets. Class B shares have a Rule 12b-1 fee of up to 1.00% (up to 0.25% for Limited Maturity Bond Fund and up to 0.875% for Money Market Fund) of average net assets.
(D) Sales Charges and Other Fees – For the year ended October 31, 2008, Thrivent Investment Mgt. received $13,694,337 of aggregate underwriting concessions from the sales of the Trust’s Class A and Class B shares and aggregate deferred sales charges of $84,976 from redemptions of Class A and Class B shares. Sales charges are not an expense of the Trust and are not reflected in the financial statements of any of the Funds.
The Trust has entered into an accounting services agreement with Thrivent Asset Mgt. pursuant to which Thrivent Asset Mgt. provides certain accounting personnel and services. For the year ended October 31, 2008, Thrivent Asset Mgt. received aggregate fees for accounting personnel and services of $1,227,559 from the Trust.
The Trust has entered into an administrative services agreement with Thrivent Asset Mgt. to provide certain administrative personnel and services to the Funds. For the year ended October 31, 2008, Thrivent Asset Mgt. received aggregate fees for administrative personnel and services of $2,930,830 from the Trust.
215
Thrivent Mutual Funds
Notes to Financial Statements
As of October 31, 2008
(3) FEES AND COMPENSATION PAID TO AFFILIATES - continued
The Trust has entered into an agreement with Thrivent Financial Investor Services Inc. (“Thrivent Investor Services”) to provide the Funds with transfer agent services. For the year ended October 31, 2008, Thrivent Investor Services received $16,504,090 for transfer agent services from the Trust.
Each Trustee is eligible to participate in a deferred compensation plan with respect to fees received from the Funds. Participants in the plan may designate their deferred Trustee’s fees as if invested in any one of the Thrivent Mutual Funds. The value of each Trustee’s deferred compensation account will increase or decrease as if invested in shares designated to the selected Thrivent Mutual Funds. The deferred fees remain in the appropriate Fund until distribution in accordance with the plan. The deferred fee liability is an unsecured liability.
Those Trustees not participating in the above plan received $206,464 in fees from the Trust for the year ended October 31, 2008. No remuneration has been paid by the Trust to any of the officers or affiliated Trustees of the Trust. In addition, the Trust reimbursed unaffiliated Trustees for reasonable expenses incurred in relation to attendance at the meetings and industry conferences.
Certain officers and non-independent trustees of the Funds are officers and directors of Thrivent Asset Mgt., Thrivent Investment Mgt., and Thrivent Investor Services; however, they receive no compensation from the Funds.
(E) Indirect Expenses – Some Funds invest in other mutual funds. Fees and expenses of those underlying funds are not included in those Funds’ expense ratios. The Funds indirectly bear their proportionate share of the annualized weighted average expense ratio of the underlying funds in which they invest.
(4) TAX INFORMATION
Distributions are based on amounts calculated in accordance with the applicable federal income tax regulations, which may differ from accounting principles generally accepted in the United States of America. To the extent that these differences are permanent in nature, such amounts are reclassified within the capital accounts based on their federal tax-basis treatment; temporary differences do not require reclassifications.
On the Statement of Assets and Liabilities, as a result of permanent book-to-tax differences, reclassification adjustments were made as follows [Increase/(Decrease)]:
| | | | | | | | | | | |
Fund | | Accumulated
Net
Investment
Income/(Loss) | | | Accumulated
Net Realized
Gain/(Loss) | | | Trust Capital | |
Aggressive Allocation | | $ | 6,658,611 | | | ($6,658,611 | ) | | $ | — | |
Moderately Aggressive | | | | | | | | | | | |
Allocation | | | 12,291,614 | | | (12,291,614 | ) | | | — | |
Moderate Allocation | | | 9,258,259 | | | (9,258,259 | ) | | | — | |
Moderately Conservative Allocation | | | 2,096,713 | | | (2,096,713 | ) | | | — | |
Technology | | | 199,202 | | | 8,598 | | | | (207,800 | ) |
Partner Small Cap Growth | | | 83,423 | | | 23,075 | | | | (106,498 | ) |
Partner Small Cap Value | | | (239,346 | ) | | 136,339 | | | | 103,007 | |
Small Cap Stock | | | (70,066 | ) | | (11,356 | ) | | | 81,422 | |
Small Cap Index | | | (86,457 | ) | | 86,457 | | | | — | |
Mid Cap Growth | | | 374,975 | | | (78,031 | ) | | | (296,944 | ) |
Partner Mid Cap Value | | | (99,055 | ) | | 109,080 | | | | (10,025 | ) |
Mid Cap Stock | | | 302,208 | | | 140,302 | | | | (442,510 | ) |
Mid Cap Index | | | (94,272 | ) | | 94,722 | | | | (450 | ) |
Partner Worldwide Allocation | | | (161,260 | ) | | 185,663 | | | | (24,403 | ) |
Partner International Stock | | | 1,559,704 | | | (1,559,704 | ) | | | — | |
Large Cap Growth | | | 4,877 | | | 1,026 | | | | (5,903 | ) |
Large Cap Value | | | (4,206 | ) | | 4,206 | | | | — | |
Large Cap Stock | | | (98,879 | ) | | 7,568 | | | | 91,311 | |
Large Cap Index | | | (30,461 | ) | | 30,461 | | | | — | |
Balanced | | | (332,888 | ) | | (21,996 | ) | | | 354,884 | |
High Yield | | | 224,453 | | | 14,832,619 | | | | (15,057,072 | ) |
Municipal Bond | | | (47,096 | ) | | 47,096 | | | | — | |
Income | | | 443,163 | | | 88,434 | | | | (531,597 | ) |
Core Bond | | | 323,181 | | | (323,181 | ) | | | — | |
Limited Maturity Bond | | | 298,048 | | | (350,218 | ) | | | 52,170 | |
At October 31, 2008, the components of distributable earnings on a tax basis were as follows:
| | | | | | |
Fund | | Undistributed
Ordinary Income | | Undistributed
Long-Term
Capital Gain |
Aggressive Allocation | | $ | 244,933 | | $ | 17,451,182 |
Moderately Aggressive Allocation | | | 7,684,559 | | | 20,245,673 |
Moderate Allocation | | | 1,245,200 | | | 5,577,929 |
Moderately Conservative Allocation | | | 735,790 | | | — |
Partner Small Cap Value | | | 1,039,736 | | | 7,706,453 |
Small Cap Stock | | | 913,755 | | | — |
Small Cap Index | | | 171,043 | | | 3,946,613 |
Partner Mid Cap Value | | | 581,676 | | | — |
Mid Cap Stock | | | 4,268,520 | | | — |
Mid Cap Index | | | 357,738 | | | 3,012,652 |
Partner Worldwide Allocation | | | 1,538,573 | | | — |
Partner International Stock | | | 10,791,815 | | | — |
Large Cap Growth | | | 798,917 | | | — |
Large Cap Value | | | 9,621,335 | | | — |
216
Thrivent Mutual Funds
Notes to Financial Statements
As of October 31, 2008
(4) TAX INFORMATION - continued
| | | | | | | |
Fund | | Undistributed
Ordinary Income | | | Undistributed
Long-Term
Capital Gain |
Large Cap Stock | | $ | 22,541,371 | | | $ | — |
Large Cap Index | | | 924,957 | | | | — |
Balanced | | | 271,100 | | | | — |
High Yield | | | (164,823 | ) | | | — |
Municipal Bonda | | | 46,272 | | | | 1,146,059 |
Income | | | 355,720 | | | | — |
Core Bond | | | 389,100 | | | | — |
Limited Maturity Bond | | | 249,706 | | | | — |
Money Market | | | 177,569 | | | | — |
| a | Municipal Bond Fund undistributed ordinary income is primarily exempt from federal income taxes. |
At October 31, 2008, the following Funds had accumulated net realized capital loss carryovers expiring as follows:
| | | | | |
Fund | | Capital Loss
Carryover | | Expiration
Year |
Moderately Conservative Allocation | | | 2,065,363 | | 2016 |
| | | | | |
| | $ | 2,065,363 | | |
| | | | | |
Technology | | | 7,552,067 | | 2009 |
| | | 13,695,973 | | 2010 |
| | | 1,279,762 | | 2011 |
| | | 1,471,537 | | 2012 |
| | | 9,892,956 | | 2016 |
| | | | | |
| | $ | 33,892,295 | | |
| | | | | |
Partner Small Cap Growth | | | 17,566,900 | | 2016 |
| | | | | |
| | $ | 17,566,900 | | |
| | | | | |
Small Cap Stock | | | 59,938,090 | | 2016 |
| | | | | |
| | $ | 59,938,090 | | |
| | | | | |
Mid Cap Growth | | | 6,613,531 | | 2009 |
| | | 6,613,531 | | 2010 |
| | | | | |
| | $ | 13,227,062 | | |
| | | | | |
Partner Mid Cap Value | | | 9,746,419 | | 2016 |
| | | | | |
| | $ | 9,746,419 | | |
| | | | | |
Mid Cap Stock | | | 187,942,547 | | 2016 |
| | | | | |
| | $ | 187,942,547 | | |
| | | | | |
Partner Worldwide Allocation | | | 8,349,574 | | 2016 |
| | | | | |
| | $ | 8,349,574 | | |
| | | | | |
Partner International Stock | | | 5,685,578 | | 2010 |
| | | 55,197,097 | | 2016 |
| | | | | |
| | $ | 60,882,675 | | |
| | | | | |
Large Cap Growth | | | 4,358,032 | | 2009 |
| | | 2,179,015 | | 2010 |
| | | 59,752,512 | | 2016 |
| | | | | |
| | $ | 66,289,559 | | |
| | | | | |
Large Cap Value | | | 44,030,473 | | 2016 |
| | | | | |
| | $ | 44,030,473 | | |
| | | | | |
Large Cap Stock | | | 20,145,127 | | 2009 |
| | | 45,072,180 | | 2010 |
| | | | | |
| | $ | 65,217,307 | | |
| | | | | |
Large Cap Index | | | 2,326,801 | | 2014 |
| | | 1,522,997 | | 2016 |
| | | | | |
| | $ | 3,849,798 | | |
| | | | | |
Balanced | | | 2,179,766 | | 2016 |
| | | | | |
| | $ | 2,179,766 | | |
| | | | | |
High Yield | | | 125,418,013 | | 2009 |
| | | 223,628,596 | | 2010 |
| | | 90,973,334 | | 2011 |
| | | 11,792,481 | | 2012 |
| | | 1,037,644 | | 2013 |
| | | 1,574,393 | | 2014 |
| | | 32,937,341 | | 2016 |
| | | | | |
| | $ | 487,361,802 | | |
| | | | | |
Income | | | 17,362,752 | | 2010 |
| | | 9,939,596 | | 2014 |
| | | 21,119,656 | | 2016 |
| | | | | |
| | $ | 48,422,004 | | |
| | | | | |
Core Bond | | | 1,246,299 | | 2012 |
| | | 1,300,054 | | 2013 |
| | | 9,402,862 | | 2014 |
| | | 1,199,140 | | 2015 |
| | | 5,142,913 | | 2016 |
| | | | | |
| | $ | 18,291,268 | | |
| | | | | |
Limited Maturity Bond | | | 413,501 | | 2013 |
| | | 602,582 | | 2014 |
| | | 4,583,007 | | 2016 |
| | | | | |
| | $ | 5,599,090 | | |
| | | | | |
Money Market | | | 19,536 | | 2015 |
| | | 67,104 | | 2016 |
| | | | | |
| | $ | 86,640 | | |
| | | | | |
To the extent that these Funds realize future net capital gains, taxable distributions will be reduced by any unused capital loss carryovers as permitted by the Internal Revenue Code.
During the fiscal year 2008, Capital loss carryovers of $6,613,531, $4,846,940, and $631,235 were utilized by Mid Cap Growth Fund, Large Cap Stock Fund, and Municipal Bond Fund. In addition, the following capital loss carryovers expired during the fiscal year 2008: High Yield Fund; $15,133,980 and Income Fund; $531,597.
217
Thrivent Mutual Funds
Notes to Financial Statements
As of October 31, 2008
(4) TAX INFORMATION - continued
The tax character of distributions paid during the years ended October 31, 2008 and 2007 was as follows:
| | | | | | | | | | | | | | | | | | |
| | | Tax-Exempt Income | | Ordinary Income | | Long-Term Capital Gain |
Fund | | 10/31/2008 | | 10/31/2007 | | 10/31/2008 | | 10/31/2007 | | 10/31/2008 | | 10/31/2007 |
Aggressive Allocation | | $ | — | | $ | — | | $ | 10,842,388 | | $ | 4,045,342 | | $ | 5,854,153 | | $ | 485,309 |
Moderately Aggressive Allocation | | | — | | | — | | | 28,317,573 | | | 11,046,128 | | | 11,819,783 | | | 845,355 |
Moderate Allocation | | | — | | | — | | | 34,324,916 | | | 17,864,622 | | | 11,287,059 | | | 1,328,873 |
Moderately Conservative Allocation | | | — | | | — | | | 13,538,182 | | | 7,591,127 | | | 2,612,434 | | | 367,841 |
Partner Small Cap Growth | | | — | | | — | | | 475,418 | | | 50,532 | | | 2,966,698 | | | 3,462 |
Partner Small Cap Value | | | — | | | — | | | 2,077,837 | | | 1,651,146 | | | 9,502,303 | | | 4,632,190 |
Small Cap Stock | | | — | | | — | | | — | | | 32,327 | | | 68,131,147 | | | 56,823,771 |
Small Cap Index | | | — | | | — | | | 287,385 | | | 147,024 | | | 4,941,997 | | | 3,303,677 |
Mid Cap Growth | | | — | | | — | | | 16,107,290 | | | — | | | 25,349,717 | | | 22,856,197 |
Partner Mid Cap Value | | | — | | | — | | | 1,576,185 | | | 582,204 | | | 1,524,721 | | | 122,933 |
Mid Cap Stock | | | — | | | — | | | 48,403,788 | | | 65,331,719 | | | 104,997,255 | | | 121,689,673 |
Mid Cap Index | | | — | | | — | | | 441,326 | | | 465,453 | | | 6,264,732 | | | 2,807,927 |
Partner International Stock | | | — | | | — | | | 13,223,691 | | | 7,072,912 | | | 59,329,987 | | | — |
Large Cap Growth | | | — | | | — | | | 25,580,687 | | | 1,611,639 | | | 14,227,172 | | | — |
Large Cap Value | | | — | | | — | | | 11,198,703 | | | 11,311,021 | | | 29,157,758 | | | 23,854,746 |
Large Cap Stock | | | — | | | — | | | 101,566,144 | | | 32,993,037 | | | 296,690,398 | | | 142,672,537 |
Large Cap Index | | | — | | | — | | | 1,291,440 | | | 1,253,298 | | | — | | | — |
Balanced | | | — | | | — | | | 13,144,368 | | | 14,616,287 | | | 12,582,777 | | | 7,585,175 |
High Yield | | | — | | | — | | | 45,642,978 | | | 45,718,586 | | | — | | | — |
Municipal Bond | | | 51,458,628 | | | 52,400,219 | | | 287,561 | | | 305,138 | | | — | | | — |
Income | | | — | | | — | | | 41,809,100 | | | 36,677,821 | | | — | | | — |
Core Bond | | | — | | | — | | | 17,635,379 | | | 16,966,618 | | | — | | | — |
Limited Maturity Bond | | | — | | | — | | | 21,722,771 | | | 15,855,497 | | | — | | | — |
Money Market | | | — | | | — | | | 51,098,275 | | | 68,072,261 | | | — | | | — |
(5) SECURITY TRANSACTIONS
(A) Purchases and Sales of Investment Securities – For the year ended October 31, 2008, the cost of purchases and the proceeds from sales of investment securities, other than U.S. Government and short-term securities were as follows:
| | | | | | |
| | | In thousands |
Fund | | Purchases | | Sales |
Aggressive Allocation | | $ | 181,633 | | $ | 56,536 |
Moderately Aggressive Allocation | | | 466,834 | | | 183,764 |
Moderate Allocation | | | 442,599 | | | 150,901 |
Moderately Conservative Allocation | | | 185,585 | | | 63,958 |
Technology | | | 88,010 | | | 91,916 |
Partner Small Cap Growth | | | 183,395 | | | 149,815 |
Partner Small Cap Value | | | 82,082 | | | 48,760 |
Small Cap Stock | | | 1,140,260 | | | 1,129,857 |
Small Cap Index | | | 10,336 | | | 16,999 |
Mid Cap Growth | | | 259,582 | | | 249,760 |
Partner Mid Cap Value | | | 123,237 | | | 61,110 |
Mid Cap Stock | | | 2,383,255 | | | 2,300,222 |
Mid Cap Index | | | 12,103 | | | 20,128 |
Partner Worldwide Allocation | | | 134,133 | | | 36,280 |
Partner International Stock | | | 453,991 | | | 426,343 |
Large Cap Growth | | | 931,087 | | | 975,012 |
Large Cap Value | | | 345,787 | | | 292,901 |
Large Cap Stock | | | 2,523,467 | | | 2,963,353 |
Large Cap Index | | | 6,650 | | | 14,667 |
Balanced | | | 137,523 | | | 165,467 |
High Yield | | | 342,656 | | | 276,836 |
Municipal Bond | | | 135,630 | | | 103,236 |
Income | | | 313,785 | | | 322,671 |
Core Bond | | | 74,632 | | | 139,441 |
Limited Maturity Bond | | | 165,278 | | | 134,200 |
Purchases and sales of U.S. Government securities were:
| | | | | | |
| | | In thousands |
Fund | | Purchases | | Sales |
Balanced | | $ | 375,115 | | $ | 397,460 |
Income | | | 962,966 | | | 1,002,943 |
Core Bond | | | 1,332,479 | | | 1,348,239 |
Limited Maturity Bond | | | 468,591 | | | 402,101 |
(B) Investments in Restricted Securities – Certain Funds may own restricted securities that have been deemed illiquid and were purchased in private placement transactions without registration under the Securities Act of 1933. Unless such securities subsequently become registered, they generally may be resold only in privately negotiated transactions with a limited number of purchasers. As of October 31, 2008, the following funds held restricted securities:
218
Thrivent Mutual Funds
Notes to Financial Statements
As of October 31, 2008
(5) SECURITY TRANSACTIONS - continued
| | | | | |
Fund | | Number of
Securities | | Percent of
Fund’s
Net Assets | |
Balanced | | 1 | | 0.20 | % |
High Yield | | 6 | | 3.01 | % |
Income | | 5 | | 1.20 | % |
Core Bond | | 1 | | 0.27 | % |
Limited Maturity Bond | | 2 | | 0.05 | % |
The Funds have no right to require registration of unregistered securities.
(C) Investments in High-Yielding Securities – High Yield Fund invests primarily in high-yielding fixed-income securities. Each of the other Funds, except Money Market Fund, may also invest in high-yielding securities. These securities will typically be in the lower rating categories or will be non-rated and generally will involve more risk than securities in the higher rating categories. Lower rated or unrated securities are more likely to react to developments affecting market risk and credit risk than are more highly rated securities, which react primarily to movements in the general level of interest rates.
(D) Investments in Options and Futures Contracts – The movement in the price of the security underlying an option or futures contract may not correlate perfectly with the movement in the prices of the portfolio securities being hedged. A lack of correlation could render the Fund’s hedging strategy unsuccessful and could result in a loss to the Fund. In the event that a liquid secondary market would not exist, the Fund could be prevented from entering into a closing transaction, which could result in additional losses to the Fund.
(E) Written Option Contracts – The number of contracts and premium amounts associated with call option contracts written during the year ended October 31, 2008, were as follows:
| | | | | | | |
| | | Number of
Contracts | | | Premium
Amount | |
Mid Cap Growth | | | | | | | |
Balance at October 31, 2007 | | 31 | | | $ | 7,984 | |
Opened | | — | | | | — | |
Closed | | — | | | | — | |
Expired | | (31 | ) | | | (7,984 | ) |
Exercised | | — | | | | — | |
| | | | | | | |
Balance at October 31, 2008 | | — | | | $ | — | |
| | | | | | | |
Large Cap Growth | | | | | | | |
Balance at October 31, 2007 | | 833 | | | $ | 109,292 | |
Opened | | 9,157 | | | | 1,797,118 | |
Closed | | (6,144 | ) | | | (1,175,813 | ) |
Expired | | (2,288 | ) | | | (401,255 | ) |
Exercised | | (1,558 | ) | | | (329,342 | ) |
| | | | | | | |
Balance at October 31, 2008 | | — | | | $ | — | |
| | | | | | | |
Large Cap Stock | | | | | | | |
Balance at October 31, 2007 | | — | | | $ | — | |
Opened | | 13,909 | | | | 3,163,184 | |
Closed | | (7,326 | ) | | | (1,716,829 | ) |
Expired | | (2,884 | ) | | | (614,706 | ) |
Exercised | | (3,699 | ) | | | (831,649 | ) |
| | | | | | | |
Balance at October 31, 2008 | | — | | | $ | — | |
| | | | | | | |
Balanced | | | | | | | |
Balance at October 31, 2007 | | 6 | | | $ | 18,750 | |
Opened | | 12 | | | | 64,180 | |
Closed | | — | | | | — | |
Expired | | (10 | ) | | | (33,125 | ) |
Exercised | | (8 | ) | | | (49,805 | ) |
| | | | | | | |
Balance at October 31, 2008 | | — | | | $ | — | |
| | | | | | | |
Income | | | | | | | |
Balance at October 31, 2007 | | 37 | | | $ | 80,938 | |
Opened | | 40 | | | | 231,250 | |
Closed | | — | | | | — | |
Expired | | (57 | ) | | | (152,813 | ) |
Exercised | | (20 | ) | | | (159,375 | ) |
| | | | | | | |
Balance at October 31, 2008 | | — | | | $ | — | |
| | | | | | | |
Core Bond | | | | | | | |
Balance at October 31, 2007 | | 24 | | | $ | 75,000 | |
Opened | | 43 | | | | 224,219 | |
Closed | | — | | | | — | |
Expired | | (37 | ) | | | (119,922 | ) |
Exercised | | (30 | ) | | | (179,297 | ) |
| | | | | | | |
Balance at October 31, 2008 | | — | | | $ | — | |
| | | | | | | |
Limited Maturity Bond | | | | | | | |
Balance at October 31, 2007 | | 7 | | | $ | 15,313 | |
Opened | | — | | | | — | |
Closed | | — | | | | — | |
Expired | | (7 | ) | | | (15,313 | ) |
Exercised | | — | | | | — | |
| | | | | | | |
Balance at October 31, 2008 | | — | | | $ | — | |
| | | | | | | |
(6) SECURITY TRANSACTIONS WITH AFFILIATED FUNDS
The Funds are permitted to purchase or sell securities from or to certain other Funds under specified conditions outlined in procedures adopted by the Board of Trustees of the Trust. The procedures have been designed to ensure that any purchase or sale of securities by the Fund from or to another fund or portfolio that is or could be considered an affiliate by virtue of having a common investment adviser (or affiliated investment advisers), common Trustees and/or common officers complies with Rule 17a-7 of the 1940 Act. Further, as defined under the procedures, each transaction is effected at the current market price. Pursuant to these procedures, during the year ended October 31, 2008, the Funds engaged in purchases and sales of securities of $57,668,607 and $17,775,135, respectively.
219
Thrivent Mutual Funds
Notes to Financial Statements
As of October 31, 2008
(7) RELATED PARTY TRANSACTIONS
As of October 31, 2008, related parties held the following shares in excess of 5% of Thrivent Mutual Funds:
| | | | | |
Fund | | Shares | | Percent of
Fund’s
Outstanding
Shares | |
Technology | | 484,424 | | 5.5 | % |
Partner Small Cap Growth | | 942,592 | | 9.9 | % |
Partner Mid Cap Value | | 489,583 | | 5.0 | % |
Partner Worldwide Allocation | | 4,399,995 | | 42.7 | % |
Core Bond | | 4,672,312 | | 13.5 | % |
As of October 31, 2008, retirement plans sponsored by Thrivent Financial for Lutherans held the following shares of Thrivent Mutual Funds:
| | | | | |
Fund | | Shares | | Percent of
Fund’s
Outstanding
Shares | |
Aggressive Allocation | | 5,970,912 | | 15.7 | % |
Moderately Aggressive Allocation | | 6,368,209 | | 7.1 | % |
Partner Small Cap Value | | 1,023,069 | | 8.8 | % |
Partner International Stock | | 3,458,017 | | 6.7 | % |
Balanced | | 5,455,552 | | 24.7 | % |
220
[THIS PAGE INTENTIONALLY LEFT BLANK]
221
Thrivent Mutual Funds
Financial Highlights
| | | | | | | | | | | | | | | | | | | | | | | | | | | |
| | | FOR A SHARE OUTSTANDING THROUGHOUT EACH PERIOD* | |
| | | | | Income from Investment Operations | | | Less Distributions from | | | | |
| | | Net Asset
Value,
Beginning of
Period | | Net
Investment
Income/(Loss) | | | Net Realized
and Unrealized
Gain/(Loss) on
Investments(a) | | | Total from
Investment
Operations | | | Net
Investment
Income | | | Net Realized
Gain on
Investments | | | Total
Distributions | |
AGGRESSIVE ALLOCATION FUND | | | | | |
Class A Shares | | | | | | | | | | | | | | | | | | | | | | | | | | | |
Year Ended 10/31/2008 | | $ | 13.79 | | $ | 0.16 | | | $ | (5.13 | ) | | $ | (4.97 | ) | | $ | (0.35 | ) | | $ | (0.21 | ) | | $ | (0.56 | ) |
Year Ended 10/31/2007 | | | 11.88 | | | 0.14 | | | | 1.99 | | | | 2.13 | | | | (0.19 | ) | | | (0.03 | ) | | | (0.22 | ) |
Year Ended 10/31/2006 | | | 10.37 | | | 0.15 | | | | 1.49 | | | | 1.64 | | | | (0.13 | ) | | | — | | | | (0.13 | ) |
Year Ended 10/31/2005 (c) | | | 10.00 | | | (0.01 | ) | | | 0.38 | | | | 0.37 | | | | — | | | | — | | | | — | |
Institutional Class Shares | | | | | | | | | | | | | | | | | | | | | | | | | | | |
Year Ended 10/31/2008 | | | 13.86 | | | 0.21 | | | | (5.18 | ) | | | (4.97 | ) | | | (0.37 | ) | | | (0.21 | ) | | | (0.58 | ) |
Year Ended 10/31/2007 | | | 11.94 | | | 0.16 | | | | 2.02 | | | | 2.18 | | | | (0.23 | ) | | | (0.03 | ) | | | (0.26 | ) |
Year Ended 10/31/2006 | | | 10.39 | | | 0.20 | | | | 1.49 | | | | 1.69 | | | | (0.14 | ) | | | — | | | | (0.14 | ) |
Year Ended 10/31/2005 (c) | | | 10.00 | | | — | | | | 0.39 | | | | 0.39 | | | | — | | | | — | | | | — | |
MODERATELY AGGRESSIVE ALLOCATION FUND | | | | | |
Class A Shares | | | | | | | | | | | | | | | | | | | | | | | | | | | |
Year Ended 10/31/2008 | | | 13.23 | | | 0.24 | | | | (4.58 | ) | | | (4.34 | ) | | | (0.36 | ) | | | (0.17 | ) | | | (0.53 | ) |
Year Ended 10/31/2007 | | | 11.72 | | | 0.21 | | | | 1.56 | | | | 1.77 | | | | (0.24 | ) | | | (0.02 | ) | | | (0.26 | ) |
Year Ended 10/31/2006 | | | 10.31 | | | 0.19 | | | | 1.35 | | | | 1.54 | | | | (0.13 | ) | | | — | | | | (0.13 | ) |
Year Ended 10/31/2005 (c) | | | 10.00 | | | 0.01 | | | | 0.30 | | | | 0.31 | | | | — | | | | — | | | | — | |
Institutional Class Shares | | | | | | | | | | | | | | | | | | | | | | | | | | | |
Year Ended 10/31/2008 | | | 13.30 | | | 0.27 | | | | (4.60 | ) | | | (4.33 | ) | | | (0.39 | ) | | | (0.17 | ) | | | (0.56 | ) |
Year Ended 10/31/2007 | | | 11.77 | | | 0.23 | | | | 1.60 | | | | 1.83 | | | | (0.28 | ) | | | (0.02 | ) | | | (0.30 | ) |
Year Ended 10/31/2006 | | | 10.33 | | | 0.23 | | | | 1.35 | | | | 1.58 | | | | (0.14 | ) | | | — | | | | (0.14 | ) |
Year Ended 10/31/2005 (c) | | | 10.00 | | | 0.01 | | | | 0.32 | | | | 0.33 | | | | — | | | | — | | | | — | |
MODERATE ALLOCATION FUND | | | | | |
Class A Shares | | | | | | | | | | | | | | | | | | | | | | | | | | | |
Year Ended 10/31/2008 | | | 12.32 | | | 0.30 | | | | (3.62 | ) | | | (3.32 | ) | | | (0.41 | ) | | | (0.17 | ) | | | (0.58 | ) |
Year Ended 10/31/2007 | | | 11.30 | | | 0.30 | | | | 1.10 | | | | 1.40 | | | | (0.34 | ) | | | (0.04 | ) | | | (0.38 | ) |
Year Ended 10/31/2006 | | | 10.22 | | | 0.27 | | | | 1.08 | | | | 1.35 | | | | (0.27 | ) | | | — | | | | (0.27 | ) |
Year Ended 10/31/2005 (c) | | | 10.00 | | | 0.02 | | | | 0.22 | | | | 0.24 | | | | (0.02 | ) | | | — | | | | (0.02 | ) |
Institutional Class Shares | | | | | | | | | | | | | | | | | | | | | | | | | | | |
Year Ended 10/31/2008 | | | 12.34 | | | 0.35 | | | | (3.65 | ) | | | (3.30 | ) | | | (0.44 | ) | | | (0.17 | ) | | | (0.61 | ) |
Year Ended 10/31/2007 | | | 11.32 | | | 0.33 | | | | 1.09 | | | | 1.42 | | | | (0.36 | ) | | | (0.04 | ) | | | (0.40 | ) |
Year Ended 10/31/2006 | | | 10.23 | | | 0.31 | | | | 1.09 | | | | 1.40 | | | | (0.31 | ) | | | — | | | | (0.31 | ) |
Year Ended 10/31/2005 (c) | | | 10.00 | | | 0.03 | | | | 0.22 | | | | 0.25 | | | | (0.02 | ) | | | — | | | | (0.02 | ) |
(a) | The amount shown may not correlate with the change in aggregate gains and losses of portfolio securities due to the timing of sales and redemptions of fund shares. |
(c) | Since fund inception, June 30, 2005. |
| * | All per share amounts have been rounded to the nearest cent. |
The accompanying Notes to Financial Statements are an integral part of this schedule.
222
Thrivent Mutual Funds
Financial Highlights - continued
| | | | | | | | | | | | | | | | | | | | | | |
| | | RATIOS / SUPPLEMENTAL DATA | |
| | | | | | | | Ratio to Average Net
Assets** | | | Ratios to Average Net
Assets Before Expenses
Waived, Credited or Paid
Indirectly** | | | | |
Net Asset
Value,
End of
Period | | Total Return(b) | | | Net Assets,
End of Period
(in millions) | | Expenses | | | Net Investment
Income/(Loss) | | | Expenses | | | Net Investment
Income/(Loss) | | | Portfolio
Turnover
Rate | |
| | | | | | | | | | | | | | | | | | | | | | |
| | | | | | | | | | | | | | | | | | | | | | |
| $ | 8.26 | | (37.44 | )% | | $ | 264.2 | | 0.53 | % | | 0.94 | % | | 0.72 | % | | 0.75 | % | | 15 | % |
| | 13.79 | | 18.27 | % | | | 332.7 | | 0.38 | % | | 0.79 | % | | 0.72 | % | | 0.45 | % | | 15 | % |
| | 11.88 | | 15.95 | % | | | 176.0 | | 0.10 | % | | 0.78 | % | | 0.81 | % | | 0.07 | % | | 8 | % |
| | 10.37 | | 3.70 | % | | | 25.2 | | 0.89 | % | | (0.60 | )% | | 1.62 | % | | (1.34 | )% | | 3 | % |
| | | | | | | | | | | | | | | | | | | | | | |
| | 8.31 | | (37.27 | )% | | | 50.4 | | 0.20 | % | | 1.26 | % | | 0.20 | % | | 1.26 | % | | 15 | % |
| | 13.86 | | 18.64 | % | | | 57.8 | | 0.10 | % | | 1.11 | % | | 0.21 | % | | 1.00 | % | | 15 | % |
| | 11.94 | | 16.45 | % | | | 35.8 | | (0.44 | )% | | 1.25 | % | | 0.27 | % | | 0.53 | % | | 8 | % |
| | 10.39 | | 3.90 | % | | | 4.2 | | 0.10 | % | | 0.08 | % | | 0.87 | % | | (0.69 | )% | | 3 | % |
| | | | | | | | | | | | | | | | | | | | | | |
| | | | | | | | | | | | | | | | | | | | | | |
| | 8.36 | | (33.99 | )% | | | 698.3 | | 0.51 | % | | 1.87 | % | | 0.61 | % | | 1.78 | % | | 20 | % |
| | 13.23 | | 15.45 | % | | | 859.2 | | 0.37 | % | | 1.52 | % | | 0.61 | % | | 1.28 | % | | 18 | % |
| | 11.72 | | 15.05 | % | | | 423.0 | | 0.08 | % | | 1.60 | % | | 0.67 | % | | 1.01 | % | | 10 | % |
| | 10.31 | | 3.10 | % | | | 63.2 | | 0.44 | % | | 0.45 | % | | 1.03 | % | | (0.14 | )% | | 4 | % |
| | | | | | | | | | | | | | | | | | | | | | |
| | 8.41 | | (33.83 | )% | | | 56.2 | | 0.18 | % | | 2.21 | % | | 0.18 | % | | 2.21 | % | | 20 | % |
| | 13.30 | | 15.85 | % | | | 68.9 | | 0.09 | % | | 1.86 | % | | 0.19 | % | | 1.76 | % | | 18 | % |
| | 11.77 | | 15.43 | % | | | 40.1 | | (0.36 | )% | | 2.05 | % | | 0.23 | % | | 1.46 | % | | 10 | % |
| | 10.33 | | 3.30 | % | | | 2.7 | | (0.04 | )% | | 0.88 | % | | 0.57 | % | | 0.28 | % | | 4 | % |
| | | | | | | | | | | | | | | | | | | | | | |
| | | | | | | | | | | | | | | | | | | | | | |
| | 8.42 | | (28.06 | )% | | | 739.6 | | 0.50 | % | | 2.61 | % | | 0.55 | % | | 2.56 | % | | 17 | % |
| | 12.32 | | 12.60 | % | | | 843.2 | | 0.37 | % | | 2.36 | % | | 0.56 | % | | 2.17 | % | | 23 | % |
| | 11.30 | | 13.40 | % | | | 442.8 | | 0.04 | % | | 2.44 | % | | 0.61 | % | | 1.88 | % | | 10 | % |
| | 10.22 | | 2.36 | % | | | 76.2 | | 0.27 | % | | 1.30 | % | | 0.90 | % | | 0.67 | % | | 3 | % |
| | | | | | | | | | | | | | | | | | | | | | |
| | 8.43 | | (27.87 | )% | | | 28.4 | | 0.18 | % | | 2.92 | % | | 0.18 | % | | 2.92 | % | | 17 | % |
| | 12.34 | | 12.84 | % | | | 27.9 | | 0.11 | % | | 2.66 | % | | 0.20 | % | | 2.57 | % | | 23 | % |
| | 11.32 | | 13.83 | % | | | 17.1 | | (0.33 | )% | | 2.82 | % | | 0.24 | % | | 2.25 | % | | 10 | % |
| | 10.23 | | 2.49 | % | | | 2.9 | | (0.13 | )% | | 1.67 | % | | 0.51 | % | | 1.03 | % | | 3 | % |
(b) | Total investment return assumes dividend reinvestment and does not reflect any deduction for sales charges. Not annualized for periods less than one year. |
| ** | Computed on an annualized basis for periods less than one year. |
The accompanying Notes to Financial Statements are an integral part of this schedule.
223
Thrivent Mutual Funds
Financial Highlights - continued
| | | | | | | | | | | | | | | | | | | | | | | | | | | |
| | | FOR A SHARE OUTSTANDING THROUGHOUT EACH PERIOD* | |
| | | | | Income from Investment Operations | | | Less Distributions from | | | | |
| | | Net Asset
Value,
Beginning of
Period | | Net
Investment
Income/(Loss) | | | Net Realized
and Unrealized
Gain/(Loss) on
Investments(a) | | | Total from
Investment
Operations | | | Net
Investment
Income | | | Net Realized
Gain on
Investments | | | Total
Distributions | |
MODERATELY CONSERVATIVE ALLOCATION FUND | | | | | |
Class A Shares | | | | | | | | | | | | | | | | | | | | | | | | | | | |
Year Ended 10/31/2008 | | $ | 11.54 | | $ | 0.34 | | | $ | (2.63 | ) | | $ | (2.29 | ) | | $ | (0.40 | ) | | $ | (0.10 | ) | | $ | (0.50 | ) |
Year Ended 10/31/2007 | | | 10.91 | | | 0.36 | | | | 0.68 | | | | 1.04 | | | | (0.38 | ) | | | (0.03 | ) | | | (0.41 | ) |
Year Ended 10/31/2006 | | | 10.13 | | | 0.32 | | | | 0.77 | | | | 1.09 | | | | (0.31 | ) | | | — | | | | (0.31 | ) |
Year Ended 10/31/2005 (c) | | | 10.00 | | | 0.04 | | | | 0.11 | | | | 0.15 | | | | (0.02 | ) | | | — | | | | (0.02 | ) |
Institutional Class Shares | | | | | | | | | | | | | | | | | | | | | | | | | | | |
Year Ended 10/31/2008 | | | 11.56 | | | 0.37 | | | | (2.63 | ) | | | (2.26 | ) | | | (0.43 | ) | | | (0.10 | ) | | | (0.53 | ) |
Year Ended 10/31/2007 | | | 10.93 | | | 0.37 | | | | 0.69 | | | | 1.06 | | | | (0.40 | ) | | | (0.03 | ) | | | (0.43 | ) |
Year Ended 10/31/2006 | | | 10.14 | | | 0.34 | | | | 0.79 | | | | 1.13 | | | | (0.34 | ) | | | — | | | | (0.34 | ) |
Year Ended 10/31/2005 (c) | | | 10.00 | | | 0.05 | | | | 0.12 | | | | 0.17 | | | | (0.03 | ) | | | — | | | | (0.03 | ) |
TECHNOLOGY FUND | | | | | |
Class A Shares | | | | | | | | | | | | | | | | | | | | | | | | | | | |
Year Ended 10/31/2008 | | | 4.68 | | | (0.02 | ) | | | (2.31 | ) | | | (2.33 | ) | | | — | | | | — | | | | — | |
Year Ended 10/31/2007 | | | 3.73 | | | (0.04 | ) | | | 0.99 | | | | 0.95 | | | | — | | | | — | | | | — | |
Year Ended 10/31/2006 | | | 3.48 | | | (0.03 | ) | | | 0.28 | | | | 0.25 | | | | — | | | | — | | | | — | |
Year Ended 10/31/2005 | | | 3.28 | | | (0.01 | ) | | | 0.21 | | | | 0.20 | | | | — | | | | — | | | | — | |
Period Ended 10/31/2004 (d) | | | 3.20 | | | (0.02 | ) | | | 0.10 | | | | 0.08 | | | | — | | | | — | | | | — | |
Year Ended 4/30/2004 | | | 2.50 | | | (0.03 | ) | | | 0.73 | | | | 0.70 | | | | — | | | | — | | | | — | |
Class B Shares | | | | | | | | | | | | | | | | | | | | | | | | | | | |
Year Ended 10/31/2008 | | | 4.44 | | | (0.26 | ) | | | (1.97 | ) | | | (2.23 | ) | | | — | | | | — | | | | — | |
Year Ended 10/31/2007 | | | 3.56 | | | (0.12 | ) | | | 1.00 | | | | 0.88 | | | | — | | | | — | | | | — | |
Year Ended 10/31/2006 | | | 3.34 | | | (0.07 | ) | | | 0.29 | | | | 0.22 | | | | — | | | | — | | | | — | |
Year Ended 10/31/2005 | | | 3.16 | | | (0.03 | ) | | | 0.21 | | | | 0.18 | | | | — | | | | — | | | | — | |
Period Ended 10/31/2004 (d) | | | 3.09 | | | (0.03 | ) | | | 0.10 | | | | 0.07 | | | | — | | | | — | | | | — | |
Year Ended 4/30/2004 | | | 2.43 | | | (0.04 | ) | | | 0.70 | | | | 0.66 | | | | — | | | | — | | | | — | |
Institutional Class Shares | | | | | | | | | | | | | | | | | | | | | | | | | | | |
Year Ended 10/31/2008 | | | 4.95 | | | — | | | | (2.45 | ) | | | (2.45 | ) | | | — | | | | — | | | | — | |
Year Ended 10/31/2007 | | | 3.93 | | | (0.02 | ) | | | 1.04 | | | | 1.02 | | | | — | | | | — | | | | — | |
Year Ended 10/31/2006 | | | 3.65 | | | (0.01 | ) | | | 0.29 | | | | 0.28 | | | | — | | | | — | | | | — | |
Year Ended 10/31/2005 | | | 3.42 | | | 0.01 | | | | 0.22 | | | | 0.23 | | | | — | | | | — | | | | — | |
Period Ended 10/31/2004 (d) | | | 3.32 | | | (0.01 | ) | | | 0.11 | | | | 0.10 | | | | — | | | | — | | | | — | |
Year Ended 4/30/2004 | | | 2.59 | | | (0.02 | ) | | | 0.75 | | | | 0.73 | | | | — | | | | — | | | | — | |
(a) | The amount shown may not correlate with the change in aggregate gains and losses of portfolio securities due to the timing of sales and redemptions of fund shares. |
(c) | Since fund inception, June 30, 2005. |
(d) | For the period from May 1, 2004 to October 31, 2004. |
| * | All per share amounts have been rounded to the nearest cent. |
The accompanying Notes to Financial Statements are an integral part of this schedule.
224
Thrivent Mutual Funds
Financial Highlights - continued
| | | | | | | | | | | | | | | | | | | | | | |
| | | RATIOS / SUPPLEMENTAL DATA | |
| | | | | | | | Ratio to Average Net Assets** | | | Ratios to Average Net
Assets Before Expenses
Waived, Credited or Paid
Indirectly** | | | | |
Net Asset
Value, End of
Period | | Total
Return(b) | | | Net Assets, End
of Period
(in millions) | | Expenses | | | Net
Investment
Income/(Loss) | | | Expenses | | | Net
Investment
Income/(Loss) | | | Portfolio
Turnover Rate | |
| | | | | | | | | | | | | | | | | | | | | | |
| | | | | | | | | | | | | | | | | | | | | | |
| $ | 8.75 | | (20.53 | )% | | $ | 314.7 | | 0.47 | % | | 3.15 | % | | 0.56 | % | | 3.06 | % | | 19 | % |
| | 11.54 | | 9.72 | % | | | 305.5 | | 0.33 | % | | 3.16 | % | | 0.57 | % | | 2.92 | % | | 19 | % |
| | 10.91 | | 10.94 | % | | | 156.9 | | 0.01 | % | | 3.19 | % | | 0.65 | % | | 2.55 | % | | 5 | % |
| | 10.13 | | 1.53 | % | | | 32.9 | | 0.34 | % | | 2.04 | % | | 1.21 | % | | 1.17 | % | | 4 | % |
| | | | | | | | | | | | | | | | | | | | | | |
| | 8.77 | | (20.30 | )% | | | 11.1 | | 0.22 | % | | 3.45 | % | | 0.22 | % | | 3.45 | % | | 19 | % |
| | 11.56 | | 9.91 | % | | | 9.8 | | 0.12 | % | | 3.41 | % | | 0.23 | % | | 3.31 | % | | 19 | % |
| | 10.93 | | 11.35 | % | | | 6.5 | | (0.34 | )% | | 3.50 | % | | 0.30 | % | | 2.86 | % | | 5 | % |
| | 10.14 | | 1.66 | % | | | 0.8 | | 0.18 | % | | 2.14 | % | | 1.03 | % | | 1.29 | % | | 4 | % |
| | | | | | | | | | | | | | | | | | | | | | |
| | | | | | | | | | | | | | | | | | | | | | |
| | 2.35 | | (49.79 | )% | | | 19.2 | | 1.47 | % | | (0.58 | )% | | 2.07 | % | | (1.18 | )% | | 264 | % |
| | 4.68 | | 25.47 | % | | | 42.4 | | 1.49 | % | | (0.96 | )% | | 1.98 | % | | (1.46 | )% | | 112 | % |
| | 3.73 | | 7.18 | % | | | 40.1 | | 1.45 | % | | (0.78 | )% | | 1.97 | % | | (1.30 | )% | | 126 | % |
| | 3.48 | | 6.10 | % | | | 42.7 | | 1.52 | % | | (0.40 | )% | | 2.04 | % | | (0.92 | )% | | 37 | % |
| | 3.28 | | 2.50 | % | | | 42.5 | | 1.70 | % | | (1.32 | )% | | 2.22 | % | | (1.84 | )% | | 23 | % |
| | 3.20 | | 28.00 | % | | | 41.5 | | 1.36 | % | | (1.02 | )% | | 2.19 | % | | (1.85 | )% | | 67 | % |
| | | | | | | | | | | | | | | | | | | | | | |
| | 2.21 | | (50.23 | )% | | | 0.4 | | 2.48 | % | | (1.57 | )% | | 3.50 | % | | (2.58 | )% | | 264 | % |
| | 4.44 | | 24.72 | % | | | 1.7 | | 2.05 | % | | (1.51 | )% | | 3.06 | % | | (2.52 | )% | | 112 | % |
| | 3.56 | | 6.59 | % | | | 2.4 | | 1.94 | % | | (1.27 | )% | | 2.95 | % | | (2.28 | )% | | 126 | % |
| | 3.34 | | 5.70 | % | | | 3.5 | | 2.07 | % | | (0.91 | )% | | 3.08 | % | | (1.93 | )% | | 37 | % |
| | 3.16 | | 2.27 | % | | | 4.0 | | 2.32 | % | | (1.94 | )% | | 3.34 | % | | (2.96 | )% | | 23 | % |
| | 3.09 | | 27.16 | % | | | 3.9 | | 1.85 | % | | (1.51 | )% | | 3.36 | % | | (3.02 | )% | | 67 | % |
| | | | | | | | | | | | | | | | | | | | | | |
| | 2.50 | | (49.49 | )% | | | 1.3 | | 1.02 | % | | (0.13 | )% | | 1.05 | % | | (0.15 | )% | | 264 | % |
| | 4.95 | | 25.95 | % | | | 2.6 | | 0.98 | % | | (0.45 | )% | | 0.99 | % | | (0.46 | )% | | 112 | % |
| | 3.93 | | 7.67 | % | | | 2.1 | | 0.96 | % | | (0.30 | )% | | 0.97 | % | | (0.31 | )% | | 126 | % |
| | 3.65 | | 6.73 | % | | | 2.6 | | 0.94 | % | | 0.24 | % | | 0.95 | % | | 0.22 | % | | 37 | % |
| | 3.42 | | 3.01 | % | | | 3.0 | | 1.00 | % | | (0.62 | )% | | 1.02 | % | | (0.64 | )% | | 23 | % |
| | 3.32 | | 28.19 | % | | | 2.9 | | 1.00 | % | | (0.66 | )% | | 1.02 | % | | (0.68 | )% | | 67 | % |
(b) | Total investment return assumes dividend reinvestment and does not reflect any deduction for sales charges. Not annualized for periods less than one year. |
| ** | Computed on an annualized basis for periods less than one year. |
The accompanying Notes to Financial Statements are an integral part of this schedule.
225
Thrivent Mutual Funds
Financial Highlights - continued
| | | | | | | | | | | | | | | | | | | | | | | | | | | |
| | | FOR A SHARE OUTSTANDING THROUGHOUT EACH PERIOD* | |
| | | | | Income from Investment Operations | | | Less Distributions from | | | | |
| | | Net Asset
Value,
Beginning of
Period | | Net
Investment
Income/(Loss) | | | Net Realized
and Unrealized
Gain/(Loss) on
Investments(a) | | | Total from
Investment
Operations | | | Net
Investment
Income | | | Net Realized
Gain on
Investments | | | Total
Distributions | |
PARTNER SMALL CAP GROWTH FUND | | | | | | | | | | | | | | | | | | | | | |
Class A Shares | | | | | | | | | | | | | | | | | | | | | | | | | | | |
Year Ended 10/31/2008 | | $ | 13.93 | | $ | (0.04 | ) | | $ | (5.59 | ) | | $ | (5.63 | ) | | $ | — | | | $ | (0.58 | ) | | $ | (0.58 | ) |
Year Ended 10/31/2007 | | | 11.69 | | | (0.06 | ) | | | 2.30 | | | | 2.24 | | | | — | | | | — | | | | — | |
Year Ended 10/31/2006 | | | 10.28 | | | (0.03 | ) | | | 1.44 | | | | 1.41 | | | | — | | | | — | | | | — | |
Year Ended 10/31/2005 (c) | | | 10.00 | | | (0.04 | ) | | | 0.32 | | | | 0.28 | | | | — | | | | — | | | | — | |
Institutional Class Shares | | | | | | | | | | | | | | | | | | | | | | | | | | | |
Year Ended 10/31/2008 | | | 14.00 | | | (0.01 | ) | | | (5.62 | ) | | | (5.63 | ) | | | — | | | | (0.58 | ) | | | (0.58 | ) |
Year Ended 10/31/2007 | | | 11.73 | | | (0.02 | ) | | | 2.31 | | | | 2.29 | | | | (0.02 | ) | | | — | | | | (0.02 | ) |
Year Ended 10/31/2006 | | | 10.28 | | | — | | | | 1.45 | | | | 1.45 | | | | — | | | | — | | | | — | |
Year Ended 10/31/2005 (c) | | | 10.00 | | | (0.02 | ) | | | 0.30 | | | | 0.28 | | | | — | | | | — | | | | — | |
PARTNER SMALL CAP VALUE FUND | | | | | | | | | | | | | | | | | | | | | |
Class A Shares | | | | | | | | | | | | | | | | | | | | | | | | | | | |
Year Ended 10/31/2008 | | | 16.41 | | | 0.09 | | | | (4.26 | ) | | | (4.17 | ) | | | — | | | | (1.22 | ) | | | (1.22 | ) |
Year Ended 10/31/2007 | | | 15.65 | | | 0.04 | | | | 1.45 | | | | 1.49 | | | | (0.02 | ) | | | (0.71 | ) | | | (0.73 | ) |
Year Ended 10/31/2006 | | | 14.06 | | | 0.07 | | | | 2.46 | | | | 2.53 | | | | (0.04 | ) | | | (0.90 | ) | | | (0.94 | ) |
Year Ended 10/31/2005 | | | 14.27 | | | 0.04 | | | | 1.61 | | | | 1.65 | | | | (0.01 | ) | | | (1.85 | ) | | | (1.86 | ) |
Period Ended 10/31/2004 (d) | | | 13.58 | | | 0.01 | | | | 1.02 | | | | 1.03 | | | | — | | | | (0.34 | ) | | | (0.34 | ) |
Year Ended 4/30/2004 | | | 9.33 | | | (0.05 | ) | | | 4.30 | | | | 4.25 | | | | — | | | | — | | | | — | |
Class B Shares | | | | | | | | | | | | | | | | | | | | | | | | | | | |
Year Ended 10/31/2008 | | | 15.44 | | | (0.64 | ) | | | (3.38 | ) | | | (4.02 | ) | | | — | | | | (1.22 | ) | | | (1.22 | ) |
Year Ended 10/31/2007 | | | 14.89 | | | (0.33 | ) | | | 1.59 | | | | 1.26 | | | | — | | | | (0.71 | ) | | | (0.71 | ) |
Year Ended 10/31/2006 | | | 13.50 | | | (0.08 | ) | | | 2.37 | | | | 2.29 | | | | — | | | | (0.90 | ) | | | (0.90 | ) |
Year Ended 10/31/2005 | | | 13.88 | | | (0.10 | ) | | | 1.57 | | | | 1.47 | | | | — | | | | (1.85 | ) | | | (1.85 | ) |
Period Ended 10/31/2004 (d) | | | 13.29 | | | (0.06 | ) | | | 0.99 | | | | 0.93 | | | | — | | | | (0.34 | ) | | | (0.34 | ) |
Year Ended 4/30/2004 | | | 9.21 | | | (0.14 | ) | | | 4.22 | | | | 4.08 | | | | — | | | | — | | | | — | |
Institutional Class Shares | | | | | | | | | | | | | | | | | | | | | |
Year Ended 10/31/2008 | | | 17.10 | | | 0.12 | | | | (4.37 | ) | | | (4.25 | ) | | | (0.10 | ) | | | (1.22 | ) | | | (1.32 | ) |
Year Ended 10/31/2007 | | | 16.26 | | | 0.13 | | | | 1.52 | | | | 1.65 | | | | (0.10 | ) | | | (0.71 | ) | | | (0.81 | ) |
Year Ended 10/31/2006 | | | 14.57 | | | 0.12 | | | | 2.60 | | | | 2.72 | | | | (0.13 | ) | | | (0.90 | ) | | | (1.03 | ) |
Year Ended 10/31/2005 | | | 14.67 | | | 0.13 | | | | 1.67 | | | | 1.80 | | | | (0.05 | ) | | | (1.85 | ) | | | (1.90 | ) |
Period Ended 10/31/2004 (d) | | | 13.90 | | | 0.05 | | | | 1.06 | | | | 1.11 | | | | — | | | | (0.34 | ) | | | (0.34 | ) |
Year Ended 4/30/2004 | | | 9.47 | | | 0.03 | | | | 4.40 | | | | 4.43 | | | | — | | | | — | | | | — | |
(a) | The amount shown may not correlate with the change in aggregate gains and losses of portfolio securities due to the timing of sales and redemptions of fund shares. |
(c) | Since fund inception, June 30, 2005. |
(d) | For the period from May 1, 2004 to October 31, 2004. |
| * | All per share amounts have been rounded to the nearest cent. |
The accompanying Notes to Financial Statements are an integral part of this schedule.
226
Thrivent Mutual Funds
Financial Highlights - continued
| | | | | | | | | | | | | | | | | | | | | | |
| | | RATIOS / SUPPLEMENTAL DATA | |
| | | | | | | | Ratio to Average Net Assets** | | | Ratios to Average Net
Assets Before Expenses
Waived, Credited or Paid
Indirectly** | | | | |
Net Asset
Value, End of
Period | | Total
Return(b) | | | Net Assets, End
of Period (in
millions) | | Expenses | | | Net
Investment
Income/(Loss) | | | Expenses | | | Net
Investment
Income/(Loss) | | | Portfolio
Turnover
Rate | |
| | | | | | | | | | | | | | | | | | | | | | |
| | | | | | | | | | | | | | | | | | | | | | |
| $ | 7.72 | | (41.96 | )% | | $ | 9.6 | | 1.42 | % | | (0.44 | )% | | 1.43 | % | | (0.45 | )% | | 186 | % |
| | 13.93 | | 19.16 | % | | | 15.5 | | 1.20 | % | | (0.52 | )% | | 1.46 | % | | (0.77 | )% | | 98 | % |
| | 11.69 | | 13.72 | % | | | 12.0 | | 0.91 | % | | (0.31 | )% | | 1.72 | % | | (1.12 | )% | | 109 | % |
| | 10.28 | | 2.80 | % | | | 9.5 | | 1.61 | % | | (1.16 | )% | | 2.42 | % | | (1.97 | )% | | 37 | % |
| | | | | | | | | | | | | | | | | | | | | | |
| | 7.79 | | (41.74 | )% | | | 64.7 | | 1.06 | % | | (0.07 | )% | | 1.07 | % | | (0.08 | )% | | 186 | % |
| | 14.00 | | 19.55 | % | | | 64.5 | | 0.92 | % | | (0.25 | )% | | 1.13 | % | | (0.45 | )% | | 98 | % |
| | 11.73 | | 14.11 | % | | | 29.3 | | 0.53 | % | | 0.10 | % | | 1.35 | % | | (0.71 | )% | | 109 | % |
| | 10.28 | | 2.80 | % | | | 4.2 | | 1.39 | % | | (0.99 | )% | | 2.21 | % | | (1.81 | )% | | 37 | % |
| | | | | | | | | | | | | | | | | | | | | | |
| | | | | | | | | | | | | | | | | | | | | | |
| | 11.02 | | (26.94 | )% | | | 54.3 | | 1.35 | % | | 0.61 | % | | 1.46 | % | | 0.49 | % | | 35 | % |
| | 16.41 | | 9.77 | % | | | 82.5 | | 1.25 | % | | 0.21 | % | | 1.43 | % | | 0.03 | % | | 34 | % |
| | 15.65 | | 19.08 | % | | | 79.8 | | 0.95 | % | | 0.51 | % | | 1.46 | % | | (0.01 | )% | | 22 | % |
| | 14.06 | | 12.13 | % | | | 74.5 | | 1.04 | % | | 0.26 | % | | 1.55 | % | | (0.25 | )% | | 53 | % |
| | 14.27 | | 7.60 | % | | | 61.4 | | 1.10 | % | | 0.61 | % | | 1.61 | % | | 0.10 | % | | 100 | % |
| | 13.58 | | 45.55 | % | | | 50.6 | | 1.32 | % | | (0.46 | )% | | 1.84 | % | | (0.98 | )% | | 80 | % |
| | | | | | | | | | | | | | | | | | | | | | |
| | 10.20 | | (27.75 | )% | | | 1.2 | | 2.45 | % | | (0.48 | )% | | 2.56 | % | | (0.60 | )% | | 35 | % |
| | 15.44 | | 8.70 | % | | | 3.6 | | 2.20 | % | | (0.71 | )% | | 2.39 | % | | (0.91 | )% | | 34 | % |
| | 14.89 | | 17.99 | % | | | 5.5 | | 1.88 | % | | (0.42 | )% | | 2.40 | % | | (0.93 | )% | | 22 | % |
| | 13.50 | | 11.03 | % | | | 5.5 | | 2.02 | % | | (0.72 | )% | | 2.53 | % | | (1.23 | )% | | 53 | % |
| | 13.88 | | 7.01 | % | | | 5.4 | | 2.10 | % | | (0.41 | )% | | 2.61 | % | | (0.92 | )% | | 100 | % |
| | 13.29 | | 44.30 | % | | | 5.7 | | 2.20 | % | | (1.33 | )% | | 2.73 | % | | (1.86 | )% | | 80 | % |
| | | | | | | | | | | | | | | | | | | | | | |
| | 11.53 | | (26.46 | )% | | | 75.4 | | 0.69 | % | | 1.27 | % | | 0.80 | % | | 1.15 | % | | 35 | % |
| | 17.10 | | 10.45 | % | | | 57.7 | | 0.63 | % | | 0.79 | % | | 0.80 | % | | 0.62 | % | | 34 | % |
| | 16.26 | | 19.85 | % | | | 44.9 | | 0.30 | % | | 1.06 | % | | 0.82 | % | | 0.54 | % | | 22 | % |
| | 14.57 | | 12.92 | % | | | 16.4 | | 0.33 | % | | 0.97 | % | | 0.84 | % | | 0.46 | % | | 53 | % |
| | 14.67 | | 8.01 | % | | | 13.3 | | 0.40 | % | | 1.32 | % | | 0.91 | % | | 0.81 | % | | 100 | % |
| | 13.90 | | 46.78 | % | | | 10.3 | | 0.52 | % | | 0.34 | % | | 1.04 | % | | (0.18 | )% | | 80 | % |
(b) | Total investment return assumes dividend reinvestment and does not reflect any deduction for sales charges. Not annualized for periods less than one year. |
| ** | Computed on an annualized basis for periods less than one year. |
The accompanying Notes to Financial Statements are an integral part of this schedule.
227
Thrivent Mutual Funds
Financial Highlights - continued
| | | | | | | | | | | | | | | | | | | | | | | | | | | |
| | | FOR A SHARE OUTSTANDING THROUGHOUT EACH PERIOD* | |
| | | | | Income from Investment Operations | | | Less Distributions from | |
| | | Net Asset
Value,
Beginning of
Period | | Net
Investment
Income/(Loss) | | | Net Realized
and Unrealized
Gain/(Loss) on
Investments(a) | | | Total from
Investment
Operations | | | Net
Investment
Income | | | Net Realized
Gain on
Investments | | | Total
Distributions | |
SMALL CAP STOCK FUND | | | | | | | | | | | | | | | | | | | | | | | | | | | |
Class A Shares | | | | | | | | | | | | | | | | | | | | | | | | | | | |
Year Ended 10/31/2008 | | $ | 18.98 | | $ | 0.01 | | | $ | (6.34 | ) | | $ | (6.33 | ) | | $ | — | | | $ | (2.32 | ) | | $ | (2.32 | ) |
Year Ended 10/31/2007 | | | 18.48 | | | 0.01 | | | | 2.40 | | | | 2.41 | | | | — | | | | (1.91 | ) | | | (1.91 | ) |
Year Ended 10/31/2006 | | | 17.79 | | | (0.05 | ) | | | 2.68 | | | | 2.63 | | | | — | | | | (1.94 | ) | | | (1.94 | ) |
Year Ended 10/31/2005 | | | 16.39 | | | (0.08 | ) | | | 2.30 | | | | 2.22 | | | | — | | | | (0.82 | ) | | | (0.82 | ) |
Period Ended 10/31/2004 (c) | | | 16.39 | | | (0.04 | ) | | | 0.99 | | | | 0.95 | | | | — | | | | (0.95 | ) | | | (0.95 | ) |
Year Ended 4/30/2004 | | | 11.55 | | | (0.11 | ) | | | 4.95 | | | | 4.84 | | | | — | | | | — | | | | — | |
Class B Shares | | | | | | | | | | | | | | | | | | | | | | | | | | | |
Year Ended 10/31/2008 | | | 16.46 | | | (1.06 | ) | | | (4.43 | ) | | | (5.49 | ) | | | — | | | | (2.32 | ) | | | (2.32 | ) |
Year Ended 10/31/2007 | | | 16.44 | | | (0.48 | ) | | | 2.41 | | | | 1.93 | | | | — | | | | (1.91 | ) | | | (1.91 | ) |
Year Ended 10/31/2006 | | | 16.18 | | | (0.30 | ) | | | 2.50 | | | | 2.20 | | | | — | | | | (1.94 | ) | | | (1.94 | ) |
Year Ended 10/31/2005 | | | 15.11 | | | (0.27 | ) | | | 2.16 | | | | 1.89 | | | | — | | | | (0.82 | ) | | | (0.82 | ) |
Period Ended 10/31/2004 (c) | | | 15.26 | | | (0.11 | ) | | | 0.91 | | | | 0.80 | | | | — | | | | (0.95 | ) | | | (0.95 | ) |
Year Ended 4/30/2004 | | | 10.86 | | | (0.26 | ) | | | 4.66 | | | | 4.40 | | | | — | | | | — | | | | — | |
Institutional Class Shares | | | | | | | | | | | | | | | | | | | | | | | | | | | |
Year Ended 10/31/2008 | | | 20.62 | | | 0.01 | | | | (6.88 | ) | | | (6.87 | ) | | | — | | | | (2.32 | ) | | | (2.32 | ) |
Year Ended 10/31/2007 | | | 19.82 | | | 0.08 | | | | 2.63 | | | | 2.71 | | | | — | | | | (1.91 | ) | | | (1.91 | ) |
Year Ended 10/31/2006 | | | 18.85 | | | (0.04 | ) | | | 2.95 | | | | 2.91 | | | | — | | | | (1.94 | ) | | | (1.94 | ) |
Year Ended 10/31/2005 | | | 17.21 | | | 0.02 | | | | 2.44 | | | | 2.46 | | | | — | | | | (0.82 | ) | | | (0.82 | ) |
Period Ended 10/31/2004 (c) | | | 17.12 | | | (0.02 | ) | | | 1.06 | | | | 1.04 | | | | — | | | | (0.95 | ) | | | (0.95 | ) |
Year Ended 4/30/2004 | | | 11.98 | | | (0.01 | ) | | | 5.15 | | | | 5.14 | | | | — | | | | — | | | | — | |
SMALL CAP INDEX FUND | | | | | | | | | | | | | | | | | | | | | | | | |
Class A Shares | | | | | | | | | | | | | | | | | | | | | | | | | | | |
Year Ended 10/31/2008 | | | 16.53 | | | 0.09 | | | | (5.02 | ) | | | (4.93 | ) | | | (0.05 | ) | | | (1.84 | ) | | | (1.89 | ) |
Year Ended 10/31/2007 | | | 16.11 | | | 0.06 | | | | 1.53 | | | | 1.59 | | | | (0.02 | ) | | | (1.15 | ) | | | (1.17 | ) |
Year Ended 10/31/2006 | | | 14.28 | | | 0.03 | | | | 2.09 | | | | 2.12 | | | | (0.02 | ) | | | (0.27 | ) | | | (0.29 | ) |
Year Ended 10/31/2005 | | | 12.63 | | | 0.03 | | | | 1.74 | | | | 1.77 | | | | (0.02 | ) | | | (0.10 | ) | | | (0.12 | ) |
Period Ended 10/31/2004 (c) | | | 12.26 | | | 0.02 | | | | 0.85 | | | | 0.87 | | | | — | | | | (0.50 | ) | | | (0.50 | ) |
Year Ended 4/30/2004 | | | 8.89 | | | (0.01 | ) | | | 3.42 | | | | 3.41 | | | | — | | | | (0.04 | ) | | | (0.04 | ) |
(a) | The amount shown may not correlate with the change in aggregate gains and losses of portfolio securities due to the timing of sales and redemptions of fund shares. |
(c) | For the period from May 1, 2004 to October 31, 2004. |
| * | All per share amounts have been rounded to the nearest cent. |
The accompanying Notes to Financial Statements are an integral part of this schedule.
228
Thrivent Mutual Funds
Financial Highlights - continued
| | | | | | | | | | | | | | | | | | | | | | |
| | | RATIOS / SUPPLEMENTAL DATA | |
| | | | | | | | Ratio to Average Net Assets** | | | Ratios to Average Net
Assets Before Expenses
Waived, Credited or Paid
Indirectly** | | | | |
Net Asset
Value, End of
Period | | Total
Return(b) | | | Net Assets, End
of Period (in
millions) | | Expenses | | | Net
Investment
Income/(Loss) | | | Expenses | | | Net
Investment
Income/(Loss) | | | Portfolio
Turnover Rate | |
| | | | | | | | | | | | | | | | | | | | | | |
| | | | | | | | | | | | | | | | | | | | | | |
| $ | 10.33 | | (37.25 | )% | | $ | 241.9 | | 1.32 | % | | 0.09 | % | | 1.33 | % | | 0.07 | % | | 245 | % |
| | 18.98 | | 14.32 | % | | | 448.9 | | 1.27 | % | | 0.03 | % | | 1.29 | % | | 0.01 | % | | 112 | % |
| | 18.48 | | 16.04 | % | | | 457.5 | | 1.27 | % | | (0.28 | )% | | 1.29 | % | | (0.30 | )% | | 92 | % |
| | 17.79 | | 13.81 | % | | | 440.6 | | 1.32 | % | | (0.45 | )% | | 1.33 | % | | (0.47 | )% | | 114 | % |
| | 16.39 | | 5.88 | % | | | 397.3 | | 1.36 | % | | (0.49 | )% | | 1.38 | % | | (0.51 | )% | | 52 | % |
| | 16.39 | | 41.90 | % | | | 379.5 | | 1.38 | % | | (0.71 | )% | | 1.40 | % | | (0.73 | )% | | 106 | % |
| | | | | | | | | | | | | | | | | | | | | | |
| | 8.65 | | (37.94 | )% | | | 2.8 | | 2.43 | % | | (0.99 | )% | | 2.73 | % | | (1.29 | )% | | 245 | % |
| | 16.46 | | 13.06 | % | | | 10.3 | | 2.38 | % | | (1.06 | )% | | 2.40 | % | | (1.08 | )% | | 112 | % |
| | 16.44 | | 14.86 | % | | | 16.3 | | 2.30 | % | | (1.29 | )% | | 2.32 | % | | (1.31 | )% | | 92 | % |
| | 16.18 | | 12.75 | % | | | 20.5 | | 2.32 | % | | (1.47 | )% | | 2.34 | % | | (1.49 | )% | | 114 | % |
| | 15.11 | | 5.31 | % | | | 25.1 | | 2.39 | % | | (1.52 | )% | | 2.41 | % | | (1.54 | )% | | 52 | % |
| | 15.26 | | 40.52 | % | | | 25.3 | | 2.42 | % | | (1.75 | )% | | 2.44 | % | | (1.77 | )% | | 106 | % |
| | | | | | | | | | | | | | | | | | | | | | |
| | 11.43 | | (36.86 | )% | | | 106.7 | | 0.73 | % | | 0.66 | % | | 0.74 | % | | 0.64 | % | | 245 | % |
| | 20.62 | | 14.92 | % | | | 106.6 | | 0.71 | % | | 0.56 | % | | 0.73 | % | | 0.54 | % | | 112 | % |
| | 19.82 | | 16.68 | % | | | 85.1 | | 0.72 | % | | 0.27 | % | | 0.74 | % | | 0.26 | % | | 92 | % |
| | 18.85 | | 14.58 | % | | | 21.1 | | 0.72 | % | | 0.15 | % | | 0.74 | % | | 0.13 | % | | 114 | % |
| | 17.21 | | 6.17 | % | | | 11.6 | | 0.73 | % | | (0.24 | )% | | 0.75 | % | | (0.26 | )% | | 52 | % |
| | 17.12 | | 42.90 | % | | | 11.0 | | 0.73 | % | | (0.06 | )% | | 0.75 | % | | (0.08 | )% | | 106 | % |
| | | | | | | | | | | | | | | | | | | | | | |
| | | | | | | | | | | | | | | | | | | | | | |
| | 9.71 | | (32.77 | )% | | | 26.3 | | 0.95 | % | | 0.73 | % | | 1.21 | % | | 0.47 | % | | 29 | % |
| | 16.53 | | 10.44 | % | | | 46.4 | | 0.95 | % | | 0.36 | % | | 1.08 | % | | 0.23 | % | | 17 | % |
| | 16.11 | | 15.08 | % | | | 48.0 | | 0.95 | % | | 0.21 | % | | 1.09 | % | | 0.07 | % | | 16 | % |
| | 14.28 | | 14.05 | % | | | 46.9 | | 0.95 | % | | 0.21 | % | | 1.18 | % | | (0.02 | )% | | 17 | % |
| | 12.63 | | 7.11 | % | | | 35.4 | | 0.95 | % | | 0.43 | % | | 1.37 | % | | 0.01 | % | | 17 | % |
| | 12.26 | | 38.37 | % | | | 34.4 | | 1.04 | % | | (0.13 | )% | | 1.25 | % | | (0.34 | )% | | 18 | % |
(b) | Total investment return assumes dividend reinvestment and does not reflect any deduction for sales charges. Not annualized for periods less than one year. |
| ** | Computed on an annualized basis for periods less than one year. |
The accompanying Notes to Financial Statements are an integral part of this schedule.
229
Thrivent Mutual Funds
Financial Highlights - continued
| | | | | | | | | | | | | | | | | | | | | | | | | | | |
| | | FOR A SHARE OUTSTANDING THROUGHOUT EACH PERIOD* | |
| | | | | Income from Investment Operations | | | Less Distributions from | | | | |
| | | Net Asset
Value,
Beginning of
Period | | Net
Investment
Income/(Loss) | | | Net Realized
and Unrealized
Gain/(Loss) on
Investments(a) | | | Total from
Investment
Operations | | | Net
Investment
Income | | | Net Realized
Gain on
Investments | | | Total
Distributions | |
MID CAP GROWTH FUND | | | | | | | | | | | | | | | | | | | | | | | | | | | |
Class A Shares | | | | | | | | | | | | | | | | | | | | | | | | | | | |
Year Ended 10/31/2008 | | $ | 19.45 | | $ | (0.03 | ) | | $ | (6.95 | ) | | $ | (6.98 | ) | | $ | — | | | $ | (2.23 | ) | | $ | (2.23 | ) |
Year Ended 10/31/2007 | | | 16.17 | | | (0.06 | ) | | | 4.50 | | | | 4.44 | | | | — | | | | (1.16 | ) | | | (1.16 | ) |
Year Ended 10/31/2006 | | | 14.59 | | | (0.06 | ) | | | 1.64 | | | | 1.58 | | | | — | | | | — | | | | — | |
Year Ended 10/31/2005 | | | 12.75 | | | (0.10 | ) | | | 1.94 | | | | 1.84 | | | | — | | | | — | | | | — | |
Year Ended 10/31/2004 | | | 12.35 | | | (0.02 | ) | | | 0.42 | | | | 0.40 | | | | — | | | | — | | | | — | |
Class B Shares | | | | | | | | | | | | | | | | | | | | | | | | | | | |
Year Ended 10/31/2008 | | | 17.68 | | | (1.15 | ) | | | (5.24 | ) | | | (6.39 | ) | | | — | | | | (2.23 | ) | | | (2.23 | ) |
Year Ended 10/31/2007 | | | 14.96 | | | (0.56 | ) | | | 4.44 | | | | 3.88 | | | | — | | | | (1.16 | ) | | | (1.16 | ) |
Year Ended 10/31/2006 | | | 13.64 | | | (0.34 | ) | | | 1.66 | | | | 1.32 | | | | — | | | | — | | | | — | |
Year Ended 10/31/2005 | | | 12.05 | | | (0.27 | ) | | | 1.86 | | | | 1.59 | | | | — | | | | — | | | | — | |
Year Ended 10/31/2004 | | | 11.78 | | | (0.19 | ) | | | 0.46 | | | | 0.27 | | | | — | | | | — | | | | — | |
Institutional Class Shares | | | | | | | | | | | | | | | | | | | | | | | | | | | |
Year Ended 10/31/2008 | | | 20.98 | | | (0.08 | ) | | | (7.43 | ) | | | (7.51 | ) | | | — | | | | (2.23 | ) | | | (2.23 | ) |
Year Ended 10/31/2007 | | | 17.24 | | | 0.06 | | | | 4.84 | | | | 4.90 | | | | — | | | | (1.16 | ) | | | (1.16 | ) |
Year Ended 10/31/2006 | | | 15.44 | | | (0.04 | ) | | | 1.84 | | | | 1.80 | | | | — | | | | — | | | | — | |
Year Ended 10/31/2005 | | | 13.39 | | | 0.01 | | | | 2.04 | | | | 2.05 | | | | — | | | | — | | | | — | |
Year Ended 10/31/2004 | | | 12.87 | | | (0.01 | ) | | | 0.53 | | | | 0.52 | | | | — | | | | — | | | | — | |
PARTNER MID CAP VALUE FUND | | | | | | | | | | | | | | | | | | | | | | | | | | | |
Class A Shares | | | | | | | | | | | | | | | | | | | | | | | | | | | |
Year Ended 10/31/2008 | | | 12.93 | | | 0.12 | | | | (4.43 | ) | | | (4.31 | ) | | | (0.09 | ) | | | (0.64 | ) | | | (0.73 | ) |
Year Ended 10/31/2007 | | | 11.83 | | | 0.11 | | | | 1.23 | | | | 1.34 | | | | (0.17 | ) | | | (0.07 | ) | | | (0.24 | ) |
Year Ended 10/31/2006 | | | 10.13 | | | 0.17 | | | | 1.57 | | | | 1.74 | | | | (0.04 | ) | | | — | | | | (0.04 | ) |
Year Ended 10/31/2005 (c) | | | 10.00 | | | — | | | | 0.13 | | | | 0.13 | | | | — | | | | — | | | | — | |
Institutional Class Shares | | | | | | | | | | | | | | | | | | | | | | | | | | | |
Year Ended 10/31/2008 | | | 12.97 | | | 0.10 | | | | (4.40 | ) | | | (4.30 | ) | | | (0.11 | ) | | | (0.64 | ) | | | (0.75 | ) |
Year Ended 10/31/2007 | | | 11.87 | | | 0.16 | | | | 1.21 | | | | 1.37 | | | | (0.20 | ) | | | (0.07 | ) | | | (0.27 | ) |
Year Ended 10/31/2006 | | | 10.14 | | | 0.17 | | | | 1.61 | | | | 1.78 | | | | (0.05 | ) | | | — | | | | (0.05 | ) |
Year Ended 10/31/2005 (c) | | | 10.00 | | | 0.01 | | | | 0.13 | | | | 0.14 | | | | — | | | | — | | | | — | |
(a) | The amount shown may not correlate with the change in aggregate gains and losses of portfolio securities due to the timing of sales and redemptions of fund shares. |
(c) | Since fund inception, June 30, 2005. |
| * | All per share amounts have been rounded to the nearest cent. |
The accompanying Notes to Financial Statements are an integral part of this schedule.
230
Thrivent Mutual Funds
Financial Highlights – continued
| | | | | | | | | | | | | | | | | | | | | | |
| | | RATIOS / SUPPLEMENTAL DATA | |
| | | | | | | | Ratio to Average Net
Assets** | | | Ratios to Average Net
Assets Before Expenses
Waived, Credited or Paid
Indirectly** | | | | |
Net Asset
Value, End
of Period | | Total
Return(b) | | | Net Assets, End
of Period
(in millions) | | Expenses | | | Net
Investment
Income/(Loss) | | | Expenses | | | Net
Investment
Income/(Loss) | | | Portfolio
Turnover Rate | |
| | | | | | | | | | | | | | | | | | | | | | |
| | | | | | | | | | | | | | | | | | | | | | |
| $ | 10.24 | | (39.95 | )% | | $ | 165.0 | | 1.16 | % | | (0.19 | )% | | 1.19 | % | | (0.22 | )% | | 85 | % |
| | 19.45 | | 29.25 | % | | | 302.7 | | 1.16 | % | | (0.32 | )% | | 1.18 | % | | (0.34 | )% | | 84 | % |
| | 16.17 | | 10.83 | % | | | 264.6 | | 1.19 | % | | (0.37 | )% | | 1.21 | % | | (0.38 | )% | | 156 | % |
| | 14.59 | | 14.43 | % | | | 269.0 | | 1.26 | % | | (0.71 | )% | | 1.28 | % | | (0.72 | )% | | 146 | % |
| | 12.75 | | 3.24 | % | | | 250.7 | | 1.36 | % | | (0.95 | )% | | 1.36 | % | | (0.95 | )% | | 154 | % |
| | | | | | | | | | | | | | | | | | | | | | |
| | 9.06 | | (40.70 | )% | | | 5.1 | | 2.31 | % | | (1.34 | )% | | 2.59 | % | | (1.62 | )% | | 85 | % |
| | 17.68 | | 27.77 | % | | | 19.3 | | 2.31 | % | | (1.45 | )% | | 2.32 | % | | (1.47 | )% | | 84 | % |
| | 14.96 | | 9.68 | % | | | 26.4 | | 2.27 | % | | (1.43 | )% | | 2.28 | % | | (1.45 | )% | | 156 | % |
| | 13.64 | | 13.20 | % | | | 36.1 | | 2.31 | % | | (1.75 | )% | | 2.44 | % | | (1.88 | )% | | 146 | % |
| | 12.05 | | 2.29 | % | | | 45.0 | | 2.32 | % | | (1.91 | )% | | 2.32 | % | | (1.91 | )% | | 154 | % |
| | | | | | | | | | | | | | | | | | | | | | |
| | 11.24 | | (39.52 | )% | | | 45.2 | | 0.45 | % | | 0.51 | % | | 0.48 | % | | 0.49 | % | | 85 | % |
| | 20.98 | | 30.15 | % | | | 42.1 | | 0.46 | % | | 0.37 | % | | 0.48 | % | | 0.36 | % | | 84 | % |
| | 17.24 | | 11.66 | % | | | 32.3 | | 0.47 | % | | 0.34 | % | | 0.49 | % | | 0.32 | % | | 156 | % |
| | 15.44 | | 15.31 | % | | | 11.7 | | 0.49 | % | | 0.07 | % | | 0.50 | % | | 0.06 | % | | 146 | % |
| | 13.39 | | 4.04 | % | | | 10.1 | | 0.62 | % | | (0.21 | )% | | 0.73 | % | | (0.32 | )% | | 154 | % |
| | | | | | | | | | | | | | | | | | | | | | |
| | | | | | | | | | | | | | | | | | | | | | |
| | 7.89 | | (35.12 | )% | | | 7.4 | | 1.25 | % | | 1.12 | % | | 1.41 | % | | 0.96 | % | | 100 | % |
| | 12.93 | | 11.45 | % | | | 12.0 | | 0.95 | % | | 0.99 | % | | 1.48 | % | | 0.46 | % | | 96 | % |
| | 11.83 | | 17.19 | % | | | 7.6 | | 0.31 | % | | 1.67 | % | | 1.86 | % | | 0.12 | % | | 43 | % |
| | 10.13 | | 1.30 | % | | | 5.1 | | 1.61 | % | | 0.08 | % | | 3.10 | % | | (1.41 | )% | | 15 | % |
| | | | | | | | | | | | | | | | | | | | | | |
| | 7.92 | | (34.95 | )% | | | 69.4 | | 0.93 | % | | 1.41 | % | | 0.95 | % | | 1.38 | % | | 100 | % |
| | 12.97 | | 11.73 | % | | | 33.9 | | 0.72 | % | | 1.23 | % | | 1.06 | % | | 0.89 | % | | 96 | % |
| | 11.87 | | 17.65 | % | | | 23.9 | | (0.14 | )% | | 2.08 | % | | 1.37 | % | | 0.57 | % | | 43 | % |
| | 10.14 | | 1.40 | % | | | 3.7 | | 1.17 | % | | 0.43 | % | | 2.81 | % | | (1.21 | )% | | 15 | % |
(b) | Total investment return assumes dividend reinvestment and does not reflect any deduction for sales charges. Not annualized for periods less than one year. |
| ** | Computed on an annualized basis for periods less than one year. |
The accompanying Notes to Financial Statements are an integral part of this schedule.
231
Thrivent Mutual Funds
Financial Highlights - continued
| | | | | | | | | | | | | | | | | | | | | | | | | | | |
| | | FOR A SHARE OUTSTANDING THROUGHOUT EACH PERIOD* | |
| | | | | Income from Investment Operations | | | Less Distributions from | | | | |
| | | Net Asset
Value,
Beginning of
Period | | Net
Investment
Income/(Loss) | | | Net Realized
and Unrealized
Gain/(Loss) on
Investments(a) | | | Total from
Investment
Operations | | | Net
Investment
Income | | | Net Realized
Gain on
Investments | | | Total
Distributions | |
MID CAP STOCK FUND | | | | | | | | | | | | | | | | | | | | | | | | | | | |
Class A Shares | | | | | | | | | | | | | | | | | | | | | | | | | | | |
Year Ended 10/31/2008 | | $ | 17.98 | | $ | 0.05 | | | $ | (6.60 | ) | | $ | (6.55 | ) | | $ | (0.01 | ) | | $ | (2.37 | ) | | $ | (2.38 | ) |
Year Ended 10/31/2007 | | | 18.61 | | | 0.13 | | | | 2.40 | | | | 2.53 | | | | (0.02 | ) | | | (3.14 | ) | | | (3.16 | ) |
Year Ended 10/31/2006 | | | 17.85 | | | 0.02 | | | | 2.55 | | | | 2.57 | | | | — | | | | (1.81 | ) | | | (1.81 | ) |
Year Ended 10/31/2005 | | | 14.74 | | | — | | | | 3.11 | | | | 3.11 | | | | — | | | | — | | | | — | |
Period Ended 10/31/2004 (c) | | | 13.96 | | | (0.02 | ) | | | 0.80 | | | | 0.78 | | | | — | | | | — | | | | — | |
Year Ended 4/30/2004 | | | 10.74 | | | (0.05 | ) | | | 3.27 | | | | 3.22 | | | | — | | | | — | | | | — | |
Class B Shares | | | | | | | | | | | | | | | | | | | | | | | | | | | |
Year Ended 10/31/2008 | | | 15.26 | | | (0.86 | ) | | | (4.66 | ) | | | (5.52 | ) | | | — | | | | (2.37 | ) | | | (2.37 | ) |
Year Ended 10/31/2007 | | | 16.39 | | | (0.27 | ) | | | 2.28 | | | | 2.01 | | | | — | | | | (3.14 | ) | | | (3.14 | ) |
Year Ended 10/31/2006 | | | 16.08 | | | (0.24 | ) | | | 2.36 | | | | 2.12 | | | | — | | | | (1.81 | ) | | | (1.81 | ) |
Year Ended 10/31/2005 | | | 13.42 | | | (0.19 | ) | | | 2.85 | | | | 2.66 | | | | — | | | | — | | | | — | |
Period Ended 10/31/2004 (c) | | | 12.78 | | | (0.09 | ) | | | 0.73 | | | | 0.64 | | | | — | | | | — | | | | — | |
Year Ended 4/30/2004 | | | 9.95 | | | (0.19 | ) | | | 3.02 | | | | 2.83 | | | | — | | | | — | | | | — | |
Institutional Class Shares | | | | | | | | | | | | | | | | | | | | | | | | | | | |
Year Ended 10/31/2008 | | | 19.14 | | | 0.07 | | | | (7.02 | ) | | | (6.95 | ) | | | (0.08 | ) | | | (2.37 | ) | | | (2.45 | ) |
Year Ended 10/31/2007 | | | 19.60 | | | 0.16 | | | | 2.60 | | | | 2.76 | | | | (0.08 | ) | | | (3.14 | ) | | | (3.22 | ) |
Year Ended 10/31/2006 | | | 18.63 | | | 0.04 | | | | 2.74 | | | | 2.78 | | | | — | | | | (1.81 | ) | | | (1.81 | ) |
Year Ended 10/31/2005 | | | 15.30 | | | 0.07 | | | | 3.26 | | | | 3.33 | | | | — | | | | — | | | | — | |
Period Ended 10/31/2004 (c) | | | 14.46 | | | 0.02 | | | | 0.82 | | | | 0.84 | | | | — | | | | — | | | | — | |
Year Ended 4/30/2004 | | | 11.06 | | | 0.03 | | | | 3.37 | | | | 3.40 | | | | — | | | | — | | | | — | |
MID CAP INDEX FUND | | | | | | | | | | | | | | | | | | | | | | | | | | | |
Class A Shares | | | | | | | | | | | | | | | | | | | | | | | | | | | |
Year Ended 10/31/2008 | | | 15.90 | | | 0.13 | | | | (5.38 | ) | | | (5.25 | ) | | | (0.09 | ) | | | (1.67 | ) | | | (1.76 | ) |
Year Ended 10/31/2007 | | | 14.47 | | | 0.12 | | | | 2.09 | | | | 2.21 | | | | (0.10 | ) | | | (0.68 | ) | | | (0.78 | ) |
Year Ended 10/31/2006 | | | 13.77 | | | 0.08 | | | | 1.56 | | | | 1.64 | | | | (0.06 | ) | | | (0.88 | ) | | | (0.94 | ) |
Year Ended 10/31/2005 | | | 11.86 | | | 0.08 | | | | 1.91 | | | | 1.99 | | | | (0.03 | ) | | | (0.05 | ) | | | (0.08 | ) |
Period Ended 10/31/2004 (c) | | | 11.48 | | | 0.01 | | | | 0.37 | | | | 0.38 | | | | — | | | | — | | | | — | |
Year Ended 4/30/2004 | | | 8.65 | | | 0.01 | | | | 2.82 | | | | 2.83 | | | | — | | | | — | | | | — | |
(a) | The amount shown may not correlate with the change in aggregate gains and losses of portfolio securities due to the timing of sales and redemptions of fund shares. |
(c) | For the period from May 1, 2004 to October 31, 2004. |
| * | All per share amounts have been rounded to the nearest cent. |
The accompanying Notes to Financial Statements are an integral part of this schedule.
232
Thrivent Mutual Funds
Financial Highlights - continued
| | | | | | | | | | | | | | | | | | | | | | |
| | | RATIOS / SUPPLEMENTAL DATA | |
| | | | | | | | Ratio to Average Net
Assets** | | | Ratios to Average Net
Assets Before Expenses
Waived, Credited or Paid
Indirectly** | | | | |
Net Asset
Value, End of
Period | | Total
Return(b) | | | Net Assets, End
of Period
(in millions) | | Expenses | | | Net
Investment
Income/(Loss) | | | Expenses | | | Net
Investment
Income/(Loss) | | | Portfolio
Turnover Rate | |
| | | | | | | | | | | | | | | | | | | | | | |
| | | | | | | | | | | | | | | | | | | | | | |
| $ | 9.05 | | (41.38 | )% | | $ | 488.9 | | 1.20 | % | | 0.34 | % | | 1.21 | % | | 0.33 | % | | 242 | % |
| | 17.98 | | 15.56 | % | | | 988.9 | | 1.16 | % | | 0.72 | % | | 1.17 | % | | 0.71 | % | | 188 | % |
| | 18.61 | | 15.37 | % | | | 976.3 | | 1.17 | % | | 0.12 | % | | 1.18 | % | | 0.11 | % | | 193 | % |
| | 17.85 | | 21.10 | % | | | 928.0 | | 1.21 | % | | (0.02 | )% | | 1.22 | % | | (0.03 | )% | | 96 | % |
| | 14.74 | | 5.59 | % | | | 808.8 | | 1.24 | % | | (0.30 | )% | | 1.25 | % | | (0.31 | )% | | 46 | % |
| | 13.96 | | 29.98 | % | | | 789.9 | | 1.26 | % | | (0.36 | )% | | 1.27 | % | | (0.37 | )% | | 123 | % |
| | | | | | | | | | | | | | | | | | | | | | |
| | 7.37 | | (42.10 | )% | | | 3.0 | | 2.39 | % | | (0.79 | )% | | 2.62 | % | | (1.02 | )% | | 242 | % |
| | 15.26 | | 14.31 | % | | | 11.9 | | 2.28 | % | | (0.29 | )% | | 2.29 | % | | (0.30 | )% | | 188 | % |
| | 16.39 | | 14.15 | % | | | 18.6 | | 2.24 | % | | (0.93 | )% | | 2.25 | % | | (0.94 | )% | | 193 | % |
| | 16.08 | | 19.82 | % | | | 24.0 | | 2.28 | % | | (1.10 | )% | | 2.29 | % | | (1.12 | )% | | 96 | % |
| | 13.42 | | 5.01 | % | | | 27.0 | | 2.35 | % | | (1.41 | )% | | 2.36 | % | | (1.42 | )% | | 46 | % |
| | 12.78 | | 28.44 | % | | | 26.8 | | 2.44 | % | | (1.55 | )% | | 2.45 | % | | (1.56 | )% | | 123 | % |
| | | | | | | | | | | | | | | | | | | | | | |
| | 9.74 | | (41.07 | )% | | | 217.4 | | 0.71 | % | | 0.79 | % | | 0.71 | % | | 0.78 | % | | 242 | % |
| | 19.14 | | 16.09 | % | | | 172.1 | | 0.70 | % | | 1.08 | % | | 0.71 | % | | 1.07 | % | | 188 | % |
| | 19.60 | | 15.90 | % | | | 116.4 | | 0.70 | % | | 0.57 | % | | 0.71 | % | | 0.56 | % | | 193 | % |
| | 18.63 | | 21.76 | % | | | 50.7 | | 0.70 | % | | 0.51 | % | | 0.71 | % | | 0.49 | % | | 96 | % |
| | 15.30 | | 5.81 | % | | | 29.8 | | 0.71 | % | | 0.23 | % | | 0.72 | % | | 0.22 | % | | 46 | % |
| | 14.46 | | 30.74 | % | | | 28.4 | | 0.70 | % | | 0.20 | % | | 0.71 | % | | 0.19 | % | | 123 | % |
| | | | | | | | | | | | | | | | | | | | | | |
| | | | | | | | | | | | | | | | | | | | | | |
| | 8.89 | | (36.58 | )% | | | 33.1 | | 0.66 | % | | 1.05 | % | | 1.07 | % | | 0.64 | % | | 25 | % |
| | 15.90 | | 15.97 | % | | | 61.0 | | 0.90 | % | | 0.77 | % | | 0.99 | % | | 0.68 | % | | 16 | % |
| | 14.47 | | 12.37 | % | | | 61.6 | | 0.90 | % | | 0.57 | % | | 1.00 | % | | 0.46 | % | | 12 | % |
| | 13.77 | | 16.80 | % | | | 62.5 | | 0.90 | % | | 0.62 | % | | 1.07 | % | | 0.45 | % | | 23 | % |
| | 11.86 | | 3.33 | % | | | 49.2 | | 0.92 | % | | (0.10 | )% | | 1.23 | % | | (0.41 | )% | | 8 | % |
| | 11.48 | | 32.72 | % | | | 38.5 | | 1.12 | % | | 0.09 | % | | 1.24 | % | | (0.03 | )% | | 30 | % |
(b) | Total investment return assumes dividend reinvestment and does not reflect any deduction for sales charges. Not annualized for periods less than one year. |
| ** | Computed on an annualized basis for periods less than one year. |
The accompanying Notes to Financial Statements are an integral part of this schedule.
233
Thrivent Mutual Funds
Financial Highlights - continued
| | | | | | | | | | | | | | | | | | | | | | | | | | | |
| | | FOR A SHARE OUTSTANDING THROUGHOUT EACH PERIOD* | |
| | | | | Income from Investment Operations | | | Less Distributions from | | | | |
| | | Net Asset
Value,
Beginning of
Period | | Net
Investment
Income/(Loss) | | | Net Realized
and Unrealized
Gain/(Loss) on
Investments(a) | | | Total from
Investment
Operations | | | Net
Investment
Income | | | Net Realized
Gain on
Investments | | | Total
Distributions | |
PARTNER WORLDWIDE ALLOCATION FUND | |
Class A Shares | | | | | | | | | | | | | | | | | | | | | | | | | | | |
Year Ended 10/31/2008 (c) | | $ | 10.00 | | $ | 0.15 | | | $ | (4.06 | ) | | $ | (3.91 | ) | | $ | — | | | $ | — | | | $ | — | |
Institutional Class Shares | | | | | | | | | | | | | | | | | | | | | | | | | | | |
Year Ended 10/31/2008 (c) | | | 10.00 | | | 0.17 | | | | (4.07 | ) | | | (3.90 | ) | | | — | | | | — | | | | — | |
PARTNER INTERNATIONAL STOCK FUND | |
Class A Shares | | | | | | | | | | | | | | | | | | | | | | | | | | | |
Year Ended 10/31/2008 | | | 15.90 | | | 0.20 | | | | (7.00 | ) | | | (6.80 | ) | | | (0.24 | ) | | | (1.36 | ) | | | (1.60 | ) |
Year Ended 10/31/2007 | | | 12.94 | | | 0.24 | | | | 2.86 | | | | 3.10 | | | | (0.14 | ) | | | — | | | | (0.14 | ) |
Year Ended 10/31/2006 | | | 10.57 | | | 0.14 | | | | 2.34 | | | | 2.48 | | | | (0.11 | ) | | | — | | | | (0.11 | ) |
Year Ended 10/31/2005 | | | 9.10 | | | 0.11 | | | | 1.36 | | | | 1.47 | | | | — | | | | — | | | | — | |
Year Ended 10/31/2004 | | | 8.19 | | | 0.02 | | | | 0.93 | | | | 0.95 | | | | (0.04 | ) | | | — | | | | (0.04 | ) |
Class B Shares | | | | | | | | | | | | | | | | | | | | | | | | | | | |
Year Ended 10/31/2008 | | | 15.26 | | | 0.05 | | | | (6.74 | ) | | | (6.69 | ) | | | (0.04 | ) | | | (1.36 | ) | | | (1.40 | ) |
Year Ended 10/31/2007 | | | 12.43 | | | 0.04 | | | | 2.79 | | | | 2.83 | | | | — | | | | — | | | | — | |
Year Ended 10/31/2006 | | | 10.16 | | | (0.01 | ) | | | 2.28 | | | | 2.27 | | | | — | | | | — | | | | — | |
Year Ended 10/31/2005 | | | 8.86 | | | (0.02 | ) | | | 1.32 | | | | 1.30 | | | | — | | | | — | | | | — | |
Year Ended 10/31/2004 | | | 8.00 | | | (0.11 | ) | | | 0.97 | | | | 0.86 | | | | — | | | | — | | | | — | |
Institutional Class Shares | | | | | | | | | | | | | | | | | | | | | | | | | | | |
Year Ended 10/31/2008 | | | 16.21 | | | 0.27 | | | | (7.13 | ) | | | (6.86 | ) | | | (0.32 | ) | | | (1.36 | ) | | | (1.68 | ) |
Year Ended 10/31/2007 | | | 13.19 | | | 0.34 | | | | 2.90 | | | | 3.24 | | | | (0.22 | ) | | | — | | | | (0.22 | ) |
Year Ended 10/31/2006 | | | 10.77 | | | 0.20 | | | | 2.40 | | | | 2.60 | | | | (0.18 | ) | | | — | | | | (0.18 | ) |
Year Ended 10/31/2005 | | | 9.23 | | | 0.07 | | | | 1.48 | | | | 1.55 | | | | (0.01 | ) | | | — | | | | (0.01 | ) |
Year Ended 10/31/2004 | | | 8.31 | | | (0.02 | ) | | | 1.07 | | | | 1.05 | | | | (0.13 | ) | | | — | | | | (0.13 | ) |
(a) | The amount shown may not correlate with the change in aggregate gains and losses of portfolio securities due to the timing of sales and redemptions of fund shares. |
(c) | Since fund inception, February 29, 2008. |
| * | All per share amounts have been rounded to the nearest cent. |
The accompanying Notes to Financial Statements are an integral part of this schedule.
234
Thrivent Mutual Funds
Financial Highlights - continued
| | | | | | | | | | | | | | | | | | | | | | |
| | | RATIOS / SUPPLEMENTAL DATA | |
| | | | | | | | Ratio to Average Net
Assets** | | | Ratios to Average Net
Assets Before Expenses
Waived, Credited or Paid
Indirectly** | | | | |
Net Asset
Value, End of
Period | | Total
Return(b) | | | Net Assets, End
of Period
(in millions) | | Expenses | | | Net
Investment
Income/(Loss) | | | Expenses | | | Net
Investment
Income/(Loss) | | | Portfolio
Turnover Rate | |
| | | | | | | | | | | | | | | | | | | | | | |
| | | | | | | | | | | | | | | | | | | | | | |
| $ | 6.09 | | (39.10 | )% | | $ | 15.9 | | 1.30 | % | | 2.46 | % | | 1.66 | % | | 2.10 | % | | 47 | % |
| | | | | | | | | | | | | | | | | | | | | | |
| | 6.10 | | (39.00 | )% | | | 47.0 | | 0.96 | % | | 2.80 | % | | 1.28 | % | | 2.48 | % | | 47 | % |
| | | | | | | | | | | | | | | | | | | | | | |
| | | | | | | | | | | | | | | | | | | | | | |
| | 7.50 | | (47.01 | )% | | | 173.5 | | 1.28 | % | | 1.74 | % | | 1.29 | % | | 1.74 | % | | 73 | % |
| | 15.90 | | 24.13 | % | | | 382.1 | | 1.27 | % | | 1.61 | % | | 1.28 | % | | 1.60 | % | | 111 | % |
| | 12.94 | | 23.63 | % | | | 337.5 | | 1.33 | % | | 1.08 | % | | 1.34 | % | | 1.07 | % | | 50 | % |
| | 10.57 | | 16.18 | % | | | 304.8 | | 1.44 | % | | 1.10 | % | | 1.45 | % | | 1.09 | % | | 43 | % |
| | 9.10 | | 11.65 | % | | | 243.7 | | 1.70 | % | | 0.33 | % | | 1.70 | % | | 0.33 | % | | 126 | % |
| | | | | | | | | | | | | | | | | | | | | | |
| | 7.17 | | (47.76 | )% | | | 2.6 | | 2.59 | % | | 0.33 | % | | 2.59 | % | | 0.32 | % | | 73 | % |
| | 15.26 | | 22.77 | % | | | 10.8 | | 2.39 | % | | 0.36 | % | | 2.39 | % | | 0.36 | % | | 111 | % |
| | 12.43 | | 22.34 | % | | | 14.4 | | 2.42 | % | | (0.03 | )% | | 2.43 | % | | (0.03 | )% | | 50 | % |
| | 10.16 | | 14.67 | % | | | 16.1 | | 2.62 | % | | (0.13 | )% | | 2.63 | % | | (0.14 | )% | | 43 | % |
| | 8.86 | | 10.72 | % | | | 19.5 | | 2.79 | % | | (0.76 | )% | | 2.79 | % | | (0.76 | )% | | 126 | % |
| | | | | | | | | | | | | | | | | | | | | | |
| | 7.67 | | (46.66 | )% | | | 214.2 | | 0.69 | % | | 2.42 | % | | 0.70 | % | | 2.41 | % | | 73 | % |
| | 16.21 | | 24.84 | % | | | 330.6 | | 0.70 | % | | 2.33 | % | | 0.70 | % | | 2.33 | % | | 111 | % |
| | 13.19 | | 24.40 | % | | | 204.2 | | 0.71 | % | | 1.74 | % | | 0.72 | % | | 1.73 | % | | 50 | % |
| | 10.77 | | 16.82 | % | | | 61.1 | | 0.76 | % | | 1.48 | % | | 0.77 | % | | 1.47 | % | | 43 | % |
| | 9.23 | | 12.69 | % | | | 13.1 | | 1.08 | % | | 0.95 | % | | 1.18 | % | | 0.85 | % | | 126 | % |
(b) | Total investment return assumes dividend reinvestment and does not reflect any deduction for sales charges. Not annualized for periods less than one year. |
| ** | Computed on an annualized basis for periods less than one year. |
The accompanying Notes to Financial Statements are an integral part of this schedule.
235
Thrivent Mutual Funds
Financial Highlights - continued
| | | | | | | | | | | | | | | | | | | | | | | | | | | |
| | | FOR A SHARE OUTSTANDING THROUGHOUT EACH PERIOD* | |
| | | | | Income from Investment Operations | | | Less Distributions from | | | | |
| | | Net Asset
Value,
Beginning of
Period | | Net
Investment
Income/(Loss) | | | Net Realized
and Unrealized
Gain/(Loss) on
Investments(a) | | | Total from
Investment
Operations | | | Net
Investment
Income | | | Net Realized
Gain on
Investments | | | Total
Distributions | |
LARGE CAP GROWTH FUND | |
Class A Shares | | | | | | | | | | | | | | | | | | | | | | | | | | | |
Year Ended 10/31/2008 | | $ | 6.52 | | $ | — | | | $ | (2.40 | ) | | $ | (2.40 | ) | | $ | — | | | $ | (0.43 | ) | | $ | (0.43 | ) |
Year Ended 10/31/2007 | | | 5.31 | | | 0.01 | | | | 1.20 | | | | 1.21 | | | | — | | | | — | | | | — | |
Year Ended 10/31/2006 | | | 4.90 | | | 0.01 | | | | 0.40 | | | | 0.41 | | | | — | | | | — | | | | — | |
Year Ended 10/31/2005 | | | 4.45 | | | 0.02 | | | | 0.43 | | | | 0.45 | | | | — | | | | — | | | | — | |
Year Ended 10/31/2004 | | | 4.30 | | | 0.06 | | | | 0.11 | | | | 0.17 | | | | (0.02 | ) | | | — | | | | (0.02 | ) |
Class B Shares | | | | | | | | | | | | | | | | | | | | | | | | | | | |
Year Ended 10/31/2008 | | | 6.06 | | | (0.24 | ) | | | (2.01 | ) | | | (2.25 | ) | | | — | | | | (0.43 | ) | | | (0.43 | ) |
Year Ended 10/31/2007 | | | 4.97 | | | (0.11 | ) | | | 1.20 | | | | 1.09 | | | | — | | | | — | | | | — | |
Year Ended 10/31/2006 | | | 4.64 | | | (0.06 | ) | | | 0.39 | | | | 0.33 | | | | — | | | | — | | | | — | |
Year Ended 10/31/2005 | | | 4.25 | | | (0.04 | ) | | | 0.43 | | | | 0.39 | | | | — | | | | — | | | | — | |
Year Ended 10/31/2004 | | | 4.13 | | | — | | | | 0.12 | | | | 0.12 | | | | — | | | | — | | | | — | |
Institutional Class Shares | | | | | | | | | | | | | | | | | | | | | | | | | | | |
Year Ended 10/31/2008 | | | 6.93 | | | 0.02 | | | | (2.55 | ) | | | (2.53 | ) | | | (0.03 | ) | | | (0.43 | ) | | | (0.46 | ) |
Year Ended 10/31/2007 | | | 5.65 | | | 0.03 | | | | 1.29 | | | | 1.32 | | | | (0.04 | ) | | | — | | | | (0.04 | ) |
Year Ended 10/31/2006 | | | 5.20 | | | 0.04 | | | | 0.44 | | | | 0.48 | | | | (0.03 | ) | | | — | | | | (0.03 | ) |
Year Ended 10/31/2005 | | | 4.69 | | | 0.02 | | | | 0.50 | | | | 0.52 | | | | (0.01 | ) | | | — | | | | (0.01 | ) |
Year Ended 10/31/2004 | | | 4.51 | | | 0.08 | | | | 0.13 | | | | 0.21 | | | | (0.03 | ) | | | — | | | | (0.03 | ) |
LARGE CAP VALUE FUND | |
Class A Shares | | | | | | | | | | | | | | | | | | | | | | | | | | | |
Year Ended 10/31/2008 | | | 17.92 | | | 0.27 | | | | (6.09 | ) | | | (5.82 | ) | | | (0.19 | ) | | | (0.81 | ) | | | (1.00 | ) |
Year Ended 10/31/2007 | | | 16.85 | | | 0.22 | | | | 1.97 | | | | 2.19 | | | | (0.17 | ) | | | (0.95 | ) | | | (1.12 | ) |
Year Ended 10/31/2006 | | | 14.49 | | | 0.21 | | | | 2.53 | | | | 2.74 | | | | (0.17 | ) | | | (0.21 | ) | | | (0.38 | ) |
Year Ended 10/31/2005 | | | 13.15 | | | 0.17 | | | | 1.23 | | | | 1.40 | | | | (0.06 | ) | | | — | | | | (0.06 | ) |
Year Ended 10/31/2004 | | | 11.79 | | | 0.20 | | | | 1.34 | | | | 1.54 | | | | (0.18 | ) | | | — | | | | (0.18 | ) |
Class B Shares | | | | | | | | | | | | | | | | | | | | | | | | | | | |
Year Ended 10/31/2008 | | | 17.59 | | | 0.27 | | | | (6.18 | ) | | | (5.91 | ) | | | — | | | | (0.81 | ) | | | (0.81 | ) |
Year Ended 10/31/2007 | | | 16.57 | | | 0.07 | | | | 1.90 | | | | 1.97 | | | | — | | | | (0.95 | ) | | | (0.95 | ) |
Year Ended 10/31/2006 | | | 14.25 | | | 0.04 | | | | 2.49 | | | | 2.53 | | | | — | | | | (0.21 | ) | | | (0.21 | ) |
Year Ended 10/31/2005 | | | 13.03 | | | — | | | | 1.22 | | | | 1.22 | | | | — | | | | — | | | | — | |
Year Ended 10/31/2004 | | | 11.66 | | | (0.02 | ) | | | 1.43 | | | | 1.41 | | | | (0.04 | ) | | | — | | | | (0.04 | ) |
Institutional Class Shares | | | | | | | | | | | | | | | | | | | | | | | | | | | |
Year Ended 10/31/2008 | | | 18.07 | | | 0.30 | | | | (6.10 | ) | | | (5.80 | ) | | | (0.27 | ) | | | (0.81 | ) | | | (1.08 | ) |
Year Ended 10/31/2007 | | | 16.98 | | | 0.28 | | | | 2.01 | | | | 2.29 | | | | (0.25 | ) | | | (0.95 | ) | | | (1.20 | ) |
Year Ended 10/31/2006 | | | 14.60 | | | 0.25 | | | | 2.59 | | | | 2.84 | | | | (0.25 | ) | | | (0.21 | ) | | | (0.46 | ) |
Year Ended 10/31/2005 | | | 13.20 | | | 0.17 | | | | 1.32 | | | | 1.49 | | | | (0.09 | ) | | | — | | | | (0.09 | ) |
Year Ended 10/31/2004 | | | 11.92 | | | 0.34 | | | | 1.28 | | | | 1.62 | | | | (0.34 | ) | | | — | | | | (0.34 | ) |
(a) | The amount shown may not correlate with the change in aggregate gains and losses of portfolio securities due to the timing of sales and redemptions of fund shares. |
| * | All per share amounts have been rounded to the nearest cent. |
The accompanying Notes to Financial Statements are an integral part of this schedule.
236
Thrivent Mutual Funds
Financial Highlights - continued
| | | | | | | | | | | | | | | | | | | | | | |
| | | RATIOS / SUPPLEMENTAL DATA | |
| | | | | | | | Ratio to Average Net
Assets** | | | Ratios to Average Net
Assets Before Expenses
Waived, Credited or Paid
Indirectly** | | | | |
Net Asset
Value, End of
Period | | Total
Return(b) | | | Net Assets, End
of Period
(in millions) | | Expenses | | | Net
Investment
Income/(Loss) | | | Expenses | | | Net
Investment
Income/(Loss) | | | Portfolio
Turnover Rate | |
| | | | | | | | | | | | | | | | | | | | | | |
| | | | | | | | | | | | | | | | | | | | | | |
| $ | 3.69 | | (39.08 | )% | | $ | 89.0 | | 1.17 | % | | (0.01 | )% | | 1.48 | % | | (0.32 | )% | | 188 | % |
| | 6.52 | | 22.86 | % | | | 157.3 | | 1.01 | % | | 0.09 | % | | 1.48 | % | | (0.39 | )% | | 168 | % |
| | 5.31 | | 8.46 | % | | | 134.0 | | 0.76 | % | | 0.26 | % | | 1.57 | % | | (0.55 | )% | | 138 | % |
| | 4.90 | | 10.16 | % | | | 130.9 | | 0.87 | % | | 0.37 | % | | 1.68 | % | | (0.44 | )% | | 106 | % |
| | 4.45 | | 3.90 | % | | | 83.6 | | 0.51 | % | | 0.35 | % | | 1.68 | % | | (0.82 | )% | | 100 | % |
| | | | | | | | | | | | | | | | | | | | | | |
| | 3.38 | | (39.63 | )% | | | 2.7 | | 2.02 | % | | (0.84 | )% | | 2.83 | % | | (1.65 | )% | | 188 | % |
| | 6.06 | | 21.93 | % | | | 8.9 | | 1.83 | % | | (0.72 | )% | | 2.64 | % | | (1.53 | )% | | 168 | % |
| | 4.97 | | 7.11 | % | | | 12.1 | | 1.87 | % | | (0.84 | )% | | 2.67 | % | | (1.65 | )% | | 138 | % |
| | 4.64 | | 9.18 | % | | | 15.8 | | 2.05 | % | | (0.69 | )% | | 2.86 | % | | (1.50 | )% | | 106 | % |
| | 4.25 | | 2.84 | % | | | 17.7 | | 1.39 | % | | (0.53 | )% | | 2.60 | % | | (1.74 | )% | | 100 | % |
| | | | | | | | | | | | | | | | | | | | | | |
| | 3.94 | | (38.86 | )% | | | 216.4 | | 0.80 | % | | 0.36 | % | | 0.81 | % | | 0.35 | % | | 188 | % |
| | 6.93 | | 23.45 | % | | | 418.3 | | 0.60 | % | | 0.48 | % | | 0.81 | % | | 0.26 | % | | 168 | % |
| | 5.65 | | 9.21 | % | | | 204.8 | | 0.03 | % | | 0.97 | % | | 0.84 | % | | 0.16 | % | | 138 | % |
| | 5.20 | | 11.01 | % | | | 31.3 | | 0.07 | % | | 1.21 | % | | 0.89 | % | | 0.39 | % | | 106 | % |
| | 4.69 | | 4.65 | % | | | 8.9 | | (0.26 | )% | | 1.12 | % | | 0.90 | % | | (0.04 | )% | | 100 | % |
| | | | | | | | | | | | | | | | | | | | | | |
| | | | | | | | | | | | | | | | | | | | | | |
| | 11.10 | | (34.17 | )% | | | 187.4 | | 1.01 | % | | 1.71 | % | | 1.02 | % | | 1.71 | % | | 49 | % |
| | 17.92 | | 13.63 | % | | | 336.9 | | 0.98 | % | | 1.28 | % | | 0.99 | % | | 1.27 | % | | 37 | % |
| | 16.85 | | 19.32 | % | | | 332.1 | | 1.00 | % | | 1.28 | % | | 1.02 | % | | 1.26 | % | | 45 | % |
| | 14.49 | | 10.64 | % | | | 321.2 | | 1.03 | % | | 1.15 | % | | 1.04 | % | | 1.14 | % | | 53 | % |
| | 13.15 | | 13.12 | % | | | 290.0 | | 0.88 | % | | 1.05 | % | | 1.09 | % | | 0.84 | % | | 51 | % |
| | | | | | | | | | | | | | | | | | | | | | |
| | 10.87 | | (35.01 | )% | | | 2.8 | | 2.21 | % | | 0.53 | % | | 2.31 | % | | 0.43 | % | | 49 | % |
| | 17.59 | | 12.37 | % | | | 9.8 | | 2.11 | % | | 0.17 | % | | 2.12 | % | | 0.16 | % | | 37 | % |
| | 16.57 | | 17.96 | % | | | 14.5 | | 2.12 | % | | 0.17 | % | | 2.14 | % | | 0.15 | % | | 45 | % |
| | 14.25 | | 9.36 | % | | | 16.9 | | 2.21 | % | | 0.00 | % | | 2.23 | % | | (0.02 | )% | | 53 | % |
| | 13.03 | | 12.10 | % | | | 19.3 | | 1.70 | % | | 0.22 | % | | 2.23 | % | | (0.31 | )% | | 51 | % |
| | | | | | | | | | | | | | | | | | | | | | |
| | 11.19 | | (33.88 | )% | | | 268.9 | | 0.50 | % | | 2.21 | % | | 0.50 | % | | 2.21 | % | | 49 | % |
| | 18.07 | | 14.19 | % | | | 312.9 | | 0.50 | % | | 1.73 | % | | 0.51 | % | | 1.72 | % | | 37 | % |
| | 16.98 | | 19.92 | % | | | 163.9 | | 0.50 | % | | 1.72 | % | | 0.52 | % | | 1.70 | % | | 45 | % |
| | 14.60 | | 11.29 | % | | | 48.1 | | 0.51 | % | | 1.60 | % | | 0.53 | % | | 1.59 | % | | 53 | % |
| | 13.20 | | 13.71 | % | | | 19.8 | | 0.33 | % | | 1.59 | % | | 0.61 | % | | 1.31 | % | | 51 | % |
(b) | Total investment return assumes dividend reinvestment and does not reflect any deduction for sales charges. Not annualized for periods less than one year. |
| ** | Computed on an annualized basis for periods less than one year. |
The accompanying Notes to Financial Statements are an integral part of this schedule.
237
Thrivent Mutual Funds
Financial Highlights - continued
| | | | | | | | | | | | | | | | | | | | | | | | | | | |
| | | FOR A SHARE OUTSTANDING THROUGHOUT EACH PERIOD* | |
| | | | | Income from Investment Operations | | | Less Distributions from | | | | |
| | | Net Asset
Value,
Beginning
of Period | | Net
Investment
Income/(Loss) | | | Net Realized
and Unrealized
Gain/(Loss) on
Investments(a) | | | Total from
Investment
Operations | | | Net
Investment
Income | | | Net Realized
Gain on
Investments | | | Total
Distributions | |
LARGE CAP STOCK FUND | | | | | | | | | | | | | | | | | | | | | | | | | | | |
Class A Shares | | | | | | | | | | | | | | | | | | | | | | | | | | | |
Year Ended 10/31/2008 | | $ | 31.33 | | $ | 0.24 | | | $ | (10.28 | ) | | $ | (10.04 | ) | | $ | (0.23 | ) | | $ | (3.39 | ) | | $ | (3.62 | ) |
Year Ended 10/31/2007 | | | 28.61 | | | 0.33 | | | | 3.87 | | | | 4.20 | | | | (0.27 | ) | | | (1.21 | ) | | | (1.48 | ) |
Year Ended 10/31/2006 | | | 25.93 | | | 0.25 | | | | 2.88 | | | | 3.13 | | | | (0.17 | ) | | | (0.28 | ) | | | (0.45 | ) |
Year Ended 10/31/2005 | | | 23.93 | | | 0.24 | | | | 1.91 | | | | 2.15 | | | | (0.15 | ) | | | — | | | | (0.15 | ) |
Period Ended 10/31/2004 (c) | | | 29.15 | | | 0.04 | | | | 0.21 | | | | 0.25 | | | | (0.03 | ) | | | (5.44 | ) | | | (5.47 | ) |
Year Ended 4/30/2004 | | | 25.39 | | | 0.11 | | | | 3.75 | | | | 3.86 | | | | (0.10 | ) | | | — | | | | (0.10 | ) |
Class B Shares | | | | | | | | | | | | | | | | | | | | | | | | | | | |
Year Ended 10/31/2008 | | | 28.81 | | | 0.17 | | | | (9.53 | ) | | | (9.36 | ) | | | — | | | | (3.39 | ) | | | (3.39 | ) |
Year Ended 10/31/2007 | | | 26.40 | | | 0.12 | | | | 3.50 | | | | 3.62 | | | | — | | | | (1.21 | ) | | | (1.21 | ) |
Year Ended 10/31/2006 | | | 24.00 | | | 0.01 | | | | 2.67 | | | | 2.68 | | | | — | | | | (0.28 | ) | | | (0.28 | ) |
Year Ended 10/31/2005 | | | 22.21 | | | 0.03 | | | | 1.76 | | | | 1.79 | | | | — | | | | — | | | | — | |
Period Ended 10/31/2004 (c) | | | 27.55 | | | (0.08 | ) | | | 0.18 | | | | 0.10 | | �� | | — | | | | (5.44 | ) | | | (5.44 | ) |
Year Ended 4/30/2004 | | | 24.19 | | | (0.23 | ) | | | 3.59 | | | | 3.36 | | | | — | | | | — | | | | — | |
Institutional Class Shares | | | | | | | | | | | | | | | | | | | | | | | | | | | |
Year Ended 10/31/2008 | | | 31.59 | | | 0.35 | | | | (10.35 | ) | | | (10.00 | ) | | | (0.36 | ) | | | (3.39 | ) | | | (3.75 | ) |
Year Ended 10/31/2007 | | | 28.84 | | | 0.42 | | | | 3.93 | | | | 4.35 | | | | (0.39 | ) | | | (1.21 | ) | | | (1.60 | ) |
Year Ended 10/31/2006 | | | 26.13 | | | 0.33 | | | | 2.95 | | | | 3.28 | | | | (0.29 | ) | | | (0.28 | ) | | | (0.57 | ) |
Year Ended 10/31/2005 | | | 24.06 | | | 0.33 | | | | 1.95 | | | | 2.28 | | | | (0.21 | ) | | | — | | | | (0.21 | ) |
Period Ended 10/31/2004 (c) | | | 29.24 | | | 0.07 | | | | 0.24 | | | | 0.31 | | | | (0.05 | ) | | | (5.44 | ) | | | (5.49 | ) |
Year Ended 4/30/2004 | | | 25.46 | | | 0.23 | | | | 3.77 | | | | 4.00 | | | | (0.22 | ) | | | — | | | | (0.22 | ) |
LARGE CAP INDEX FUND | | | | | | | | | | | | | | | | | | | | | | | | | | | |
Class A Shares | | | | | | | | | | | | | | | | | | | | | | | | | | | |
Year Ended 10/31/2008 | | | 10.70 | | | 0.16 | | | | (4.00 | ) | | | (3.84 | ) | | | (0.15 | ) | | | — | | | | (0.15 | ) |
Year Ended 10/31/2007 | | | 9.52 | | | 0.15 | | | | 1.16 | | | | 1.31 | | | | (0.13 | ) | | | — | | | | (0.13 | ) |
Year Ended 10/31/2006 | | | 8.35 | | | 0.13 | | | | 1.16 | | | | 1.29 | | | | (0.11 | ) | | | (0.01 | ) | | | (0.12 | ) |
Year Ended 10/31/2005 | | | 7.78 | | | 0.12 | | | | 0.53 | | | | 0.65 | | | | (0.08 | ) | | | — | | | | (0.08 | ) |
Period Ended 10/31/2004 (c) | | | 7.61 | | | 0.04 | | | | 0.16 | | | | 0.20 | | | | (0.03 | ) | | | — | | | | (0.03 | ) |
Year Ended 4/30/2004 | | | 6.30 | | | 0.08 | | | | 1.31 | | | | 1.39 | | | | (0.08 | ) | | | — | | | | (0.08 | ) |
(a) | The amount shown may not correlate with the change in aggregate gains and losses of portfolio securities due to the timing of sales and redemptions of fund shares. |
(c) | For the period from May 1, 2004 to October 31, 2004. |
| * | All per share amounts have been rounded to the nearest cent. |
The accompanying Notes to Financial Statements are an integral part of this schedule.
238
Thrivent Mutual Funds
Financial Highlights - continued
| | | | | | | | | | | | | | | | | | | | | | |
| | | RATIOS / SUPPLEMENTAL DATA | |
| | | | | | | | Ratio to Average Net
Assets** | | | Ratios to Average Net
Assets Before Expenses
Waived, Credited or Paid
Indirectly** | | | | |
Net Asset
Value, End of
Period | | Total
Return(b) | | | Net Assets, End
of Period
(in millions) | | Expenses | | | Net
Investment
Income/(Loss) | | | Expenses | | | Net
Investment
Income/(Loss) | | | Portfolio
Turnover Rate | |
| | | | | | | | | | | | | | | | | | | | | | |
| | | | | | | | | | | | | | | | | | | | | | |
| $ | 17.67 | | (35.72 | )% | | $ | 1,658.8 | | 1.03 | % | | 1.03 | % | | 1.04 | % | | 1.03 | % | | 93 | % |
| | 31.33 | | 15.29 | % | | | 3,029.0 | | 1.00 | % | | 1.09 | % | | 1.00 | % | | 1.09 | % | | 103 | % |
| | 28.61 | | 12.18 | % | | | 3,107.2 | | 1.00 | % | | 0.88 | % | | 1.00 | % | | 0.88 | % | | 67 | % |
| | 25.93 | | 9.00 | % | | | 3,332.0 | | 1.00 | % | | 0.93 | % | | 1.01 | % | | 0.92 | % | | 46 | % |
| | 23.93 | | 1.27 | % | | | 3,435.1 | | 1.02 | % | | 0.41 | % | | 1.02 | % | | 0.41 | % | | 43 | % |
| | 29.15 | | 15.23 | % | | | 2,807.4 | | 1.01 | % | | 0.37 | % | | 1.01 | % | | 0.37 | % | | 22 | % |
| | | | | | | | | | | | | | | | | | | | | | |
| | 16.06 | | (36.29 | )% | | | 13.0 | | 1.89 | % | | 0.19 | % | | 2.57 | % | | (0.49 | )% | | 93 | % |
| | 28.81 | | 14.23 | % | | | 45.4 | | 1.89 | % | | 0.27 | % | | 2.26 | % | | (0.10 | )% | | 103 | % |
| | 26.40 | | 11.23 | % | | | 69.0 | | 1.89 | % | | 0.01 | % | | 2.21 | % | | (0.31 | )% | | 67 | % |
| | 24.00 | | 8.06 | % | | | 91.9 | | 1.89 | % | | 0.11 | % | | 2.22 | % | | (0.22 | )% | | 46 | % |
| | 22.21 | | 0.72 | % | | | 122.9 | | 2.00 | % | | (0.57 | )% | | 2.23 | % | | (0.80 | )% | | 43 | % |
| | 27.55 | | 13.89 | % | | | 75.3 | | 2.17 | % | | (0.79 | )% | | 2.17 | % | | (0.79 | )% | | 22 | % |
| | | | | | | | | | | | | | | | | | | | | | |
| | 17.84 | | (35.42 | )% | | | 164.2 | | 0.57 | % | | 1.49 | % | | 0.57 | % | | 1.48 | % | | 93 | % |
| | 31.59 | | 15.78 | % | | | 369.3 | | 0.56 | % | | 1.46 | % | | 0.56 | % | | 1.46 | % | | 103 | % |
| | 28.84 | | 12.72 | % | | | 245.7 | | 0.56 | % | | 1.31 | % | | 0.56 | % | | 1.31 | % | | 67 | % |
| | 26.13 | | 9.47 | % | | | 146.0 | | 0.55 | % | | 1.33 | % | | 0.56 | % | | 1.33 | % | | 46 | % |
| | 24.06 | | 1.50 | % | | | 112.3 | | 0.57 | % | | 0.65 | % | | 0.57 | % | | 0.65 | % | | 43 | % |
| | 29.24 | | 15.76 | % | | | 84.9 | | 0.57 | % | | 0.82 | % | | 0.57 | % | | 0.82 | % | | 22 | % |
| | | | | | | | | | | | | | | | | | | | | | |
| | | | | | | | | | | | | | | | | | | | | | |
| | 6.71 | | (36.36 | )% | | | 51.3 | | 0.60 | % | | 1.66 | % | | 0.93 | % | | 1.33 | % | | 9 | % |
| | 10.70 | | 13.90 | % | | | 93.6 | | 0.60 | % | | 1.38 | % | | 0.88 | % | | 1.10 | % | | 5 | % |
| | 9.52 | | 15.56 | % | | | 92.3 | | 0.60 | % | | 1.37 | % | | 0.91 | % | | 1.05 | % | | 7 | % |
| | 8.35 | | 8.33 | % | | | 94.3 | | 0.60 | % | | 1.49 | % | | 0.94 | % | | 1.15 | % | | 9 | % |
| | 7.78 | | 2.62 | % | | | 76.3 | | 0.57 | % | | 0.64 | % | | 1.08 | % | | 0.13 | % | | 5 | % |
| | 7.61 | | 22.09 | % | | | 51.2 | | 0.41 | % | | 1.28 | % | | 1.17 | % | | 0.52 | % | | 6 | % |
(b) | Total investment return assumes dividend reinvestment and does not reflect any deduction for sales charges. Not annualized for periods less than one year. |
| ** | Computed on an annualized basis for periods less than one year. |
The accompanying Notes to Financial Statements are an integral part of this schedule.
239
Thrivent Mutual Funds
Financial Highlights - continued
| | | | | | | | | | | | | | | | | | | | | | | | | | |
| | | FOR A SHARE OUTSTANDING THROUGHOUT EACH PERIOD* | |
| | | | | Income from Investment Operations | | | Less Distributions from | | | | |
| | | Net Asset
Value,
Beginning
of Period | | Net
Investment
Income/(Loss) | | Net Realized
and Unrealized
Gain/(Loss) on
Investments(a) | | | Total from
Investment
Operations | | | Net
Investment
Income | | | Net Realized
Gain on
Investments | | | Total
Distributions | |
BALANCED FUND | | | | | | | | | | | | | | | | | | | | | | | | | | |
Class A Shares | | | | | | | | | | | | | | | | | | | | | | | | | | |
Year Ended 10/31/2008 | | $ | 13.64 | | $ | 0.23 | | $ | (3.89 | ) | | $ | (3.66 | ) | | $ | (0.23 | ) | | $ | (0.84 | ) | | $ | (1.07 | ) |
Year Ended 10/31/2007 | | | 12.95 | | | 0.24 | | | 1.29 | | | | 1.53 | | | | (0.22 | ) | | | (0.62 | ) | | | (0.84 | ) |
Year Ended 10/31/2006 | | | 12.18 | | | 0.21 | | | 1.09 | | | | 1.30 | | | | (0.21 | ) | | | (0.32 | ) | | | (0.53 | ) |
Year Ended 10/31/2005 | | | 11.81 | | | 0.20 | | | 0.57 | | | | 0.77 | | | | (0.22 | ) | | | (0.18 | ) | | | (0.40 | ) |
Period Ended 10/31/2004 (c) | | | 11.65 | | | 0.09 | | | 0.17 | | | | 0.26 | | | | (0.10 | ) | | | — | | | | (0.10 | ) |
Year Ended 4/30/2004 | | | 10.75 | | | 0.17 | | | 0.92 | | | | 1.09 | | | | (0.19 | ) | | | — | | | | (0.19 | ) |
Class B Shares | | | | | | | | | | | | | | | | | | | | | | | | | | |
Year Ended 10/31/2008 | | | 13.58 | | | 0.20 | | | (3.96 | ) | | | (3.76 | ) | | | (0.10 | ) | | | (0.84 | ) | | | (0.94 | ) |
Year Ended 10/31/2007 | | | 12.89 | | | 0.14 | | | 1.26 | | | | 1.40 | | | | (0.09 | ) | | | (0.62 | ) | | | (0.71 | ) |
Year Ended 10/31/2006 | | | 12.13 | | | 0.10 | | | 1.07 | | | | 1.17 | | | | (0.09 | ) | | | (0.32 | ) | | | (0.41 | ) |
Year Ended 10/31/2005 | | | 11.76 | | | 0.09 | | | 0.56 | | | | 0.65 | | | | (0.10 | ) | | | (0.18 | ) | | | (0.28 | ) |
Period Ended 10/31/2004 (c) | | | 11.60 | | | 0.03 | | | 0.17 | | | | 0.20 | | | | (0.04 | ) | | | — | | | | (0.04 | ) |
Year Ended 4/30/2004 | | | 10.70 | | | 0.06 | | | 0.92 | | | | 0.98 | | | | (0.08 | ) | | | — | | | | (0.08 | ) |
Institutional Class Shares | | | | | | | | | | | | | | | | | | | | | | | | | | |
Year Ended 10/31/2008 | | | 13.63 | | | 0.28 | | | (3.88 | ) | | | (3.60 | ) | | | (0.29 | ) | | | (0.84 | ) | | | (1.13 | ) |
Year Ended 10/31/2007 | | | 12.93 | | | 0.30 | | | 1.30 | | | | 1.60 | | | | (0.28 | ) | | | (0.62 | ) | | | (0.90 | ) |
Year Ended 10/31/2006 | | | 12.17 | | | 0.27 | | | 1.08 | | | | 1.35 | | | | (0.27 | ) | | | (0.32 | ) | | | (0.59 | ) |
Year Ended 10/31/2005 | | | 11.80 | | | 0.26 | | | 0.56 | | | | 0.82 | | | | (0.27 | ) | | | (0.18 | ) | | | (0.45 | ) |
Period Ended 10/31/2004 (c) | | | 11.64 | | | 0.12 | | | 0.17 | | | | 0.29 | | | | (0.13 | ) | | | — | | | | (0.13 | ) |
Year Ended 4/30/2004 | | | 10.74 | | | 0.22 | | | 0.93 | | | | 1.15 | | | | (0.25 | ) | | | — | | | | (0.25 | ) |
(a) | The amount shown may not correlate with the change in aggregate gains and losses of portfolio securities due to the timing of sales and redemptions of fund shares. |
(c) | For the period from May 1, 2004 to October 31, 2004. |
| * | All per share amounts have been rounded to the nearest cent. |
The accompanying Notes to Financial Statements are an integral part of this schedule.
240
Thrivent Mutual Funds
Financial Highlights - continued
| | | | | | | | | | | | | | | | | | | | | | |
| | | RATIOS / SUPPLEMENTAL DATA | |
| | | | | | | | Ratio to Average Net
Assets** | | | Ratios to Average Net
Assets Before Expenses
Waived, Credited or Paid
Indirectly** | | | | |
Net Asset
Value, End of
Period | | Total
Return(b) | | | Net Assets, End
of Period
(in millions) | | Expenses | | | Net
Investment
Income/(Loss) | | | Expenses | | | Net
Investment
Income/(Loss) | | | Portfolio
Turnover Rate | |
| | | | | | | | | | | | | | | | | | | | | | |
| | | | | | | | | | | | | | | | | | | | | | |
| $ | 8.91 | | (28.76 | )% | | $ | 143.0 | | 1.09 | % | | 1.96 | % | | 1.11 | % | | 1.94 | % | | 176 | % |
| | 13.64 | | 12.39 | % | | | 237.0 | | 1.07 | % | | 1.83 | % | | 1.09 | % | | 1.81 | % | | 176 | % |
| | 12.95 | | 10.97 | % | | | 251.6 | | 1.07 | % | | 1.67 | % | | 1.09 | % | | 1.65 | % | | 215 | % |
| | 12.18 | | 6.56 | % | | | 276.1 | | 1.07 | % | | 1.62 | % | | 1.09 | % | | 1.60 | % | | 231 | % |
| | 11.81 | | 2.21 | % | | | 278.5 | | 1.07 | % | | 1.49 | % | | 1.08 | % | | 1.48 | % | | 114 | % |
| | 11.65 | | 10.22 | % | | | 278.0 | | 1.06 | % | | 1.48 | % | | 1.07 | % | | 1.47 | % | | 194 | % |
| | | | | | | | | | | | | | | | | | | | | | |
| | 8.88 | | (29.47 | )% | | | 2.6 | | 2.06 | % | | 0.99 | % | | 2.20 | % | | 0.84 | % | | 176 | % |
| | 13.58 | | 11.31 | % | | | 7.6 | | 2.06 | % | | 0.86 | % | | 2.10 | % | | 0.82 | % | | 176 | % |
| | 12.89 | | 9.83 | % | | | 10.0 | | 2.04 | % | | 0.71 | % | | 2.05 | % | | 0.70 | % | | 215 | % |
| | 12.13 | | 5.54 | % | | | 13.3 | | 2.02 | % | | 0.72 | % | | 2.04 | % | | 0.70 | % | | 231 | % |
| | 11.76 | | 1.71 | % | | | 17.6 | | 2.03 | % | | 0.53 | % | | 2.04 | % | | 0.52 | % | | 114 | % |
| | 11.60 | | 9.22 | % | | | 18.6 | | 2.02 | % | | 0.52 | % | | 2.03 | % | | 0.51 | % | | 194 | % |
| | | | | | | | | | | | | | | | | | | | | | |
| | 8.90 | | (28.43 | )% | | | 50.7 | | 0.61 | % | | 2.44 | % | | 0.63 | % | | 2.41 | % | | 176 | % |
| | 13.63 | | 13.00 | % | | | 83.8 | | 0.61 | % | | 2.29 | % | | 0.63 | % | | 2.27 | % | | 176 | % |
| | 12.93 | | 11.41 | % | | | 86.3 | | 0.61 | % | | 2.13 | % | | 0.63 | % | | 2.12 | % | | 215 | % |
| | 12.17 | | 7.07 | % | | | 98.4 | | 0.59 | % | | 2.11 | % | | 0.62 | % | | 2.09 | % | | 231 | % |
| | 11.80 | | 2.47 | % | | | 108.5 | | 0.60 | % | | 1.97 | % | | 0.61 | % | | 1.96 | % | | 114 | % |
| | 11.64 | | 10.75 | % | | | 111.2 | | 0.59 | % | | 1.96 | % | | 0.60 | % | | 1.95 | % | | 194 | % |
(b) | Total investment return assumes dividend reinvestment and does not reflect any deduction for sales charges. Not annualized for periods less than one year. |
| ** | Computed on an annualized basis for periods less than one year. |
The accompanying Notes to Financial Statements are an integral part of this schedule.
241
Thrivent Mutual Funds
Financial Highlights - continued
| | | | | | | | | | | | | | | | | | | | | | | | | | |
| | | FOR A SHARE OUTSTANDING THROUGHOUT EACH PERIOD* | |
| | | | | Income from Investment Operations | | | Less Distributions from | | | | |
| | | Net Asset
Value,
Beginning
of Period | | Net
Investment
Income/(Loss) | | Net Realized
and Unrealized
Gain/(Loss) on
Investments(a) | | | Total from
Investment
Operations | | | Net
Investment
Income | | | Net Realized
Gain on
Investments | | | Total
Distributions | |
HIGH YIELD FUND | | | | | | | | | | | | | | | | | | | | | | | | | | |
Class A Shares | | | | | | | | | | | | | | | | | | | | | | | | | | |
Year Ended 10/31/2008 | | $ | 5.03 | | $ | 0.36 | | $ | (1.43 | ) | | $ | (1.07 | ) | | $ | (0.37 | ) | | $ | — | | | $ | (0.37 | ) |
Year Ended 10/31/2007 | | | 5.08 | | | 0.38 | | | (0.05 | ) | | | 0.33 | | | | (0.38 | ) | | | — | | | | (0.38 | ) |
Year Ended 10/31/2006 | | | 5.03 | | | 0.38 | | | 0.05 | | | | 0.43 | | | | (0.38 | ) | | | — | | | | (0.38 | ) |
Year Ended 10/31/2005 | | | 5.24 | | | 0.38 | | | (0.20 | ) | | | 0.18 | | | | (0.39 | ) | | | — | | | | (0.39 | ) |
Year Ended 10/31/2004 | | | 5.07 | | | 0.40 | | | 0.16 | | | | 0.56 | | | | (0.39 | ) | | | — | | | | (0.39 | ) |
Class B Shares | | | | | | | | | | | | | | | | | | | | | | | | | | |
Year Ended 10/31/2008 | | | 5.03 | | | 0.32 | | | (1.43 | ) | | | (1.11 | ) | | | (0.33 | ) | | | — | | | | (0.33 | ) |
Year Ended 10/31/2007 | | | 5.08 | | | 0.34 | | | (0.05 | ) | | | 0.29 | | | | (0.34 | ) | | | — | | | | (0.34 | ) |
Year Ended 10/31/2006 | | | 5.02 | | | 0.34 | | | 0.06 | | | | 0.40 | | | | (0.34 | ) | | | — | | | | (0.34 | ) |
Year Ended 10/31/2005 | | | 5.24 | | | 0.34 | | | (0.21 | ) | | | 0.13 | | | | (0.35 | ) | | | — | | | | (0.35 | ) |
Year Ended 10/31/2004 | | | 5.07 | | | 0.36 | | | 0.16 | | | | 0.52 | | | | (0.35 | ) | | | — | | | | (0.35 | ) |
Institutional Class Shares | | | | | | | | | | | | | | | | | | | | | | | | | | |
Year Ended 10/31/2008 | | | 5.04 | | | 0.38 | | | (1.44 | ) | | | (1.06 | ) | | | (0.39 | ) | | | — | | | | (0.39 | ) |
Year Ended 10/31/2007 | | | 5.09 | | | 0.40 | | | (0.04 | ) | | | 0.36 | | | | (0.41 | ) | | | — | | | | (0.41 | ) |
Year Ended 10/31/2006 | | | 5.03 | | | 0.41 | | | 0.06 | | | | 0.47 | | | | (0.41 | ) | | | — | | | | (0.41 | ) |
Year Ended 10/31/2005 | | | 5.24 | | | 0.41 | | | (0.21 | ) | | | 0.20 | | | | (0.41 | ) | | | — | | | | (0.41 | ) |
Year Ended 10/31/2004 | | | 5.07 | | | 0.42 | | | 0.16 | | | | 0.58 | | | | (0.41 | ) | | | — | | | | (0.41 | ) |
MUNICIPAL BOND FUND | | | | | | | | | | | | | | | | | | | | | | | |
Class A Shares | | | | | | | | | | | | | | | | | | | | | | | | | | |
Year Ended 10/31/2008 | | | 11.16 | | | 0.48 | | | (0.79 | ) | | | (0.31 | ) | | | (0.48 | ) | | | — | | | | (0.48 | ) |
Year Ended 10/31/2007 | | | 11.39 | | | 0.49 | | | (0.23 | ) | | | 0.26 | | | | (0.49 | ) | | | — | | | | (0.49 | ) |
Year Ended 10/31/2006 | | | 11.31 | | | 0.50 | | | 0.08 | | | | 0.58 | | | | (0.50 | ) | | | — | | | | (0.50 | ) |
Year Ended 10/31/2005 | | | 11.56 | | | 0.50 | | | (0.25 | ) | | | 0.25 | | | | (0.50 | ) | | | — | | | | (0.50 | ) |
Year Ended 10/31/2004 | | | 11.53 | | | 0.50 | | | 0.12 | | | | 0.62 | | | | (0.53 | ) | | | (0.06 | ) | | | (0.59 | ) |
Class B Shares | | | | | | | | | | | | | | | | | | | | | | | | | | |
Year Ended 10/31/2008 | | | 11.16 | | | 0.40 | | | (0.80 | ) | | | (0.40 | ) | | | (0.40 | ) | | | — | | | | (0.40 | ) |
Year Ended 10/31/2007 | | | 11.38 | | | 0.42 | | | (0.22 | ) | | | 0.20 | | | | (0.42 | ) | | | — | | | | (0.42 | ) |
Year Ended 10/31/2006 | | | 11.30 | | | 0.43 | | | 0.07 | | | | 0.50 | | | | (0.42 | ) | | | — | | | | (0.42 | ) |
Year Ended 10/31/2005 | | | 11.55 | | | 0.42 | | | (0.25 | ) | | | 0.17 | | | | (0.42 | ) | | | — | | | | (0.42 | ) |
Year Ended 10/31/2004 | | | 11.52 | | | 0.44 | | | 0.09 | | | | 0.53 | | | | (0.44 | ) | | | (0.06 | ) | | | (0.50 | ) |
Institutional Class Shares | | | | | | | | | | | | | | | | | | | | | | | | | | |
Year Ended 10/31/2008 | | | 11.16 | | | 0.51 | | | (0.80 | ) | | | (0.29 | ) | | | (0.51 | ) | | | — | | | | (0.51 | ) |
Year Ended 10/31/2007 | | | 11.39 | | | 0.53 | | | (0.23 | ) | | | 0.30 | | | | (0.53 | ) | | | — | | | | (0.53 | ) |
Year Ended 10/31/2006 | | | 11.31 | | | 0.54 | | | 0.08 | | | | 0.62 | | | | (0.54 | ) | | | — | | | | (0.54 | ) |
Year Ended 10/31/2005 | | | 11.55 | | | 0.53 | | | (0.24 | ) | | | 0.29 | | | | (0.53 | ) | | | — | | | | (0.53 | ) |
Year Ended 10/31/2004 | | | 11.53 | | | 0.53 | | | 0.11 | | | | 0.64 | | | | (0.56 | ) | | | (0.06 | ) | | | (0.62 | ) |
(a) | The amount shown may not correlate with the change in aggregate gains and losses of portfolio securities due to the timing of sales and redemptions of fund shares. |
| * | All per share amounts have been rounded to the nearest cent. |
The accompanying Notes to Financial Statements are an integral part of this schedule.
242
Thrivent Mutual Funds
Financial Highlights - continued
| | | | | | | | | | | | | | | | | | | | | | |
| | | RATIOS / SUPPLEMENTAL DATA | |
| | | | | | | | Ratio to Average Net
Assets** | | | Ratios to Average Net
Assets Before Expenses
Waived, Credited or Paid
Indirectly** | | | | |
Net Asset
Value, End of
Period | | Total
Return(b) | | | Net Assets, End
of Period
(in millions) | | Expenses | | | Net
Investment
Income/(Loss) | | | Expenses | | | Net
Investment
Income/(Loss) | | | Portfolio
Turnover Rate | |
| | | | | | | | | | | | | | | | | | | | | | |
| | | | | | | | | | | | | | | | | | | | | | |
| $ | 3.59 | | (22.70 | )% | | $ | 318.8 | | 0.87 | % | | 7.81 | % | | 0.88 | % | | 7.79 | % | | 51 | % |
| | 5.03 | | 6.72 | % | | | 486.2 | | 0.86 | % | | 7.50 | % | | 0.87 | % | | 7.49 | % | | 72 | % |
| | 5.08 | | 8.96 | % | | | 533.7 | | 0.88 | % | | 7.62 | % | | 0.89 | % | | 7.60 | % | | 63 | % |
| | 5.03 | | 3.54 | % | | | 563.0 | | 0.87 | % | | 7.45 | % | | 0.88 | % | | 7.43 | % | | 54 | % |
| | 5.24 | | 11.53 | % | | | 603.1 | | 0.89 | % | | 7.80 | % | | 0.89 | % | | 7.80 | % | | 73 | % |
| | | | | | | | | | | | | | | | | | | | | | |
| | 3.59 | | (23.37 | )% | | | 3.4 | | 1.73 | % | | 6.87 | % | | 2.02 | % | | 6.58 | % | | 51 | % |
| | 5.03 | | 5.79 | % | | | 9.9 | | 1.73 | % | | 6.62 | % | | 1.92 | % | | 6.42 | % | | 72 | % |
| | 5.08 | | 8.25 | % | | | 16.5 | | 1.73 | % | | 6.75 | % | | 1.92 | % | | 6.57 | % | | 63 | % |
| | 5.02 | | 2.45 | % | | | 23.4 | | 1.73 | % | | 6.57 | % | | 1.91 | % | | 6.39 | % | | 54 | % |
| | 5.24 | | 10.66 | % | | | 33.1 | | 1.70 | % | | 7.00 | % | | 1.74 | % | | 6.96 | % | | 73 | % |
| | | | | | | | | | | | | | | | | | | | | | |
| | 3.59 | | (22.52 | )% | | | 129.4 | | 0.44 | % | | 8.31 | % | | 0.45 | % | | 8.30 | % | | 51 | % |
| | 5.04 | | 7.16 | % | | | 62.1 | | 0.44 | % | | 7.92 | % | | 0.46 | % | | 7.90 | % | | 72 | % |
| | 5.09 | | 9.63 | % | | | 82.3 | | 0.45 | % | | 8.07 | % | | 0.46 | % | | 8.06 | % | | 63 | % |
| | 5.03 | | 3.97 | % | | | 15.2 | | 0.46 | % | | 7.88 | % | | 0.47 | % | | 7.87 | % | | 54 | % |
| | 5.24 | | 11.98 | % | | | 10.1 | | 0.49 | % | | 8.21 | % | | 0.60 | % | | 8.10 | % | | 73 | % |
| | | | | | | | | | | | | | | | | | | | | | |
| | | | | | | | | | | | | | | | | | | | | | |
| | 10.37 | | (2.92 | )% | | | 1,104.8 | | 0.78 | % | | 4.36 | % | | 0.78 | % | | 4.36 | % | | 9 | % |
| | 11.16 | | 2.39 | % | | | 1,145.8 | | 0.78 | % | | 4.40 | % | | 0.78 | % | | 4.40 | % | | 7 | % |
| | 11.39 | | 5.28 | % | | | 1,201.2 | | 0.78 | % | | 4.46 | % | | 0.78 | % | | 4.46 | % | | 14 | % |
| | 11.31 | | 2.17 | % | | | 1,242.4 | | 0.78 | % | | 4.31 | % | | 0.78 | % | | 4.31 | % | | 8 | % |
| | 11.56 | | 5.47 | % | | | 1,264.1 | | 0.73 | % | | 4.53 | % | | 0.73 | % | | 4.53 | % | | 12 | % |
| | | | | | | | | | | | | | | | | | | | | | |
| | 10.36 | | (3.69 | )% | | | 3.8 | | 1.47 | % | | 3.64 | % | | 1.64 | % | | 3.46 | % | | 9 | % |
| | 11.16 | | 1.77 | % | | | 12.4 | | 1.47 | % | | 3.70 | % | | 1.61 | % | | 3.56 | % | | 7 | % |
| | 11.38 | | 4.56 | % | | | 21.7 | | 1.47 | % | | 3.77 | % | | 1.60 | % | | 3.64 | % | | 14 | % |
| | 11.30 | | 1.46 | % | | | 28.9 | | 1.47 | % | | 3.61 | % | | 1.60 | % | | 3.48 | % | | 8 | % |
| | 11.55 | | 4.72 | % | | | 34.0 | | 1.46 | % | | 3.81 | % | | 1.51 | % | | 3.76 | % | | 12 | % |
| | | | | | | | | | | | | | | | | | | | | | |
| | 10.36 | | (2.71 | )% | | | 35.1 | | 0.47 | % | | 4.69 | % | | 0.47 | % | | 4.69 | % | | 9 | % |
| | 11.16 | | 2.68 | % | | | 17.4 | | 0.49 | % | | 4.70 | % | | 0.49 | % | | 4.70 | % | | 7 | % |
| | 11.39 | | 5.59 | % | | | 12.2 | | 0.49 | % | | 4.75 | % | | 0.49 | % | | 4.75 | % | | 14 | % |
| | 11.31 | | 2.56 | % | | | 8.4 | | 0.48 | % | | 4.64 | % | | 0.48 | % | | 4.64 | % | | 8 | % |
| | 11.55 | | 5.70 | % | | | 5.1 | | 0.44 | % | | 4.83 | % | | 0.52 | % | | 4.75 | % | | 12 | % |
(b) | Total investment return assumes dividend reinvestment and does not reflect any deduction for sales charges. Not annualized for periods less than one year. |
| ** | Computed on an annualized basis for periods less than one year. |
The accompanying Notes to Financial Statements are an integral part of this schedule.
243
Thrivent Mutual Funds
Financial Highlights - continued
| | | | | | | | | | | | | | | | | | | | | | | | | |
| | | FOR A SHARE OUTSTANDING THROUGHOUT EACH PERIOD* | |
| | | | | Income from Investment Operations | | | Less Distributions from | | | |
| | | Net Asset
Value,
Beginning
of Period | | Net
Investment
Income/(Loss) | | Net Realized
and Unrealized
Gain/(Loss) on
Investments(a) | | | Total from
Investment
Operations | | | Net
Investment
Income | | | Net Realized
Gain on
Investments | | Total
Distributions | |
INCOME FUND | | | | | | | | | | | | | | | | | | | | | | | | | |
Class A Shares | | | | | | | | | | | | | | | | | | | | | | | | | |
Year Ended 10/31/2008 | | $ | 8.50 | | $ | 0.42 | | $ | (1.57 | ) | | $ | (1.15 | ) | | $ | (0.43 | ) | | $ | — | | $ | (0.43 | ) |
Year Ended 10/31/2007 | | | 8.59 | | | 0.43 | | | (0.10 | ) | | | 0.33 | | | | (0.42 | ) | | | — | | | (0.42 | ) |
Year Ended 10/31/2006 | | | 8.56 | | | 0.41 | | | 0.03 | | | | 0.44 | | | | (0.41 | ) | | | — | | | (0.41 | ) |
Year Ended 10/31/2005 | | | 8.86 | | | 0.37 | | | (0.30 | ) | | | 0.07 | | | | (0.37 | ) | | | — | | | (0.37 | ) |
Year Ended 10/31/2004 | | | 8.73 | | | 0.35 | | | 0.13 | | | | 0.48 | | | | (0.35 | ) | | | — | | | (0.35 | ) |
Class B Shares | | | | | | | | | | | | | | | | | | | | | | | | | |
Year Ended 10/31/2008 | | | 8.48 | | | 0.36 | | | (1.58 | ) | | | (1.22 | ) | | | (0.36 | ) | | | — | | | (0.36 | ) |
Year Ended 10/31/2007 | | | 8.57 | | | 0.37 | | | (0.11 | ) | | | 0.26 | | | | (0.35 | ) | | | — | | | (0.35 | ) |
Year Ended 10/31/2006 | | | 8.54 | | | 0.34 | | | 0.03 | | | | 0.37 | | | | (0.34 | ) | | | — | | | (0.34 | ) |
Year Ended 10/31/2005 | | | 8.84 | | | 0.30 | | | (0.30 | ) | | | — | | | | (0.30 | ) | | | — | | | (0.30 | ) |
Year Ended 10/31/2004 | | | 8.71 | | | 0.29 | | | 0.12 | | | | 0.41 | | | | (0.28 | ) | | | — | | | (0.28 | ) |
Institutional Class Shares | | | | | | | | | | | | | | | | | | | | | | | | | |
Year Ended 10/31/2008 | | | 8.49 | | | 0.45 | | | (1.57 | ) | | | (1.12 | ) | | | (0.46 | ) | | | — | | | (0.46 | ) |
Year Ended 10/31/2007 | | | 8.58 | | | 0.47 | | | (0.11 | ) | | | 0.36 | | | | (0.45 | ) | | | — | | | (0.45 | ) |
Year Ended 10/31/2006 | | | 8.55 | | | 0.44 | | | 0.03 | | | | 0.47 | | | | (0.44 | ) | | | — | | | (0.44 | ) |
Year Ended 10/31/2005 | | | 8.85 | | | 0.40 | | | (0.29 | ) | | | 0.11 | | | | (0.41 | ) | | | — | | | (0.41 | ) |
Year Ended 10/31/2004 | | | 8.75 | | | 0.39 | | | 0.10 | | | | 0.49 | | | | (0.39 | ) | | | — | | | (0.39 | ) |
(a) | The amount shown may not correlate with the change in aggregate gains and losses of portfolio securities due to the timing of sales and redemptions of fund shares. |
| * | All per share amounts have been rounded to the nearest cent. |
The accompanying Notes to Financial Statements are an integral part of this schedule.
244
Thrivent Mutual Funds
Financial Highlights - continued
| | | | | | | | | | | | | | | | | | | | | | |
| | | RATIOS / SUPPLEMENTAL DATA | |
| | | | | | | | Ratio to Average Net
Assets** | | | Ratios to Average Net
Assets Before Expenses
Waived, Credited or Paid
Indirectly** | | | | |
Net Asset
Value, End of
Period | | Total
Return(b) | | | Net Assets, End
of Period
(in millions) | | Expenses | | | Net
Investment
Income/(Loss) | | | Expenses | | | Net
Investment
Income/(Loss) | | | Portfolio
Turnover Rate | |
| | | | | | | | | | | | | | | | | | | | | | |
| | | | | | | | | | | | | | | | | | | | | | |
| $ | 6.92 | | (14.19 | )% | | $ | 326.2 | | 0.80 | % | | 5.16 | % | | 0.81 | % | | 5.15 | % | | 160 | % |
| | 8.50 | | 3.90 | % | | | 433.0 | | 0.80 | % | | 5.06 | % | | 0.81 | % | | 5.05 | % | | 236 | % |
| | 8.59 | | 5.25 | % | | | 470.5 | | 0.81 | % | | 4.78 | % | | 0.82 | % | | 4.76 | % | | 303 | % |
| | 8.56 | | 0.82 | % | | | 532.3 | | 0.80 | % | | 4.22 | % | | 0.81 | % | | 4.20 | % | | 245 | % |
| | 8.86 | | 5.64 | % | | | 575.2 | | 0.82 | % | | 4.04 | % | | 0.82 | % | | 4.04 | % | | 203 | % |
| | | | | | | | | | | | | | | | | | | | | | |
| | 6.90 | | (14.95 | )% | | | 2.4 | | 1.63 | % | | 4.28 | % | | 2.14 | % | | 3.77 | % | | 160 | % |
| | 8.48 | | 3.03 | % | | | 6.5 | | 1.63 | % | | 4.21 | % | | 2.02 | % | | 3.81 | % | | 236 | % |
| | 8.57 | | 4.39 | % | | | 12.6 | | 1.63 | % | | 3.93 | % | | 1.96 | % | | 3.60 | % | | 303 | % |
| | 8.54 | | (0.02 | )% | | | 19.2 | | 1.63 | % | | 3.38 | % | | 1.94 | % | | 3.07 | % | | 245 | % |
| | 8.84 | | 4.83 | % | | | 25.4 | | 1.60 | % | | 3.25 | % | | 1.68 | % | | 3.17 | % | | 203 | % |
| | | | | | | | | | | | | | | | | | | | | | |
| | 6.91 | | (13.85 | )% | | | 318.5 | | 0.39 | % | | 5.58 | % | | 0.40 | % | | 5.57 | % | | 160 | % |
| | 8.49 | | 4.32 | % | | | 368.9 | | 0.39 | % | | 5.51 | % | | 0.40 | % | | 5.50 | % | | 236 | % |
| | 8.58 | | 5.68 | % | | | 167.0 | | 0.40 | % | | 5.30 | % | | 0.41 | % | | 5.29 | % | | 303 | % |
| | 8.55 | | 1.22 | % | | | 46.7 | | 0.40 | % | | 4.64 | % | | 0.41 | % | | 4.62 | % | | 245 | % |
| | 8.85 | | 5.94 | % | | | 29.0 | | 0.43 | % | | 4.43 | % | | 0.54 | % | | 4.32 | % | | 203 | % |
(b) | Total investment return assumes dividend reinvestment and does not reflect any deduction for sales charges. Not annualized for periods less than one year. |
| ** | Computed on an annualized basis for periods less than one year. |
The accompanying Notes to Financial Statements are an integral part of this schedule.
245
Thrivent Mutual Funds
Financial Highlights - continued
| | | | | | | | | | | | | | | | | | | | | | | | | | |
| | | FOR A SHARE OUTSTANDING THROUGHOUT EACH PERIOD* | |
| | | | | Income from Investment Operations | | | Less Distributions from | | | | |
| | | Net Asset
Value,
Beginning of
Period | | Net
Investment
Income/(Loss) | | Net Realized
and Unrealized
Gain/(Loss) on
Investments(a) | | | Total from
Investment
Operations | | | Net
Investment
Income | | | Net Realized
Gain on
Investments | | | Total
Distributions | |
CORE BOND FUND | |
Class A Shares | | | | | | | | | | | | | | | | | | | | | | | | | | |
Year Ended 10/31/2008 | | $ | 9.77 | | $ | 0.45 | | $ | (1.40 | ) | | $ | (0.95 | ) | | $ | (0.46 | ) | | $ | — | | | $ | (0.46 | ) |
Year Ended 10/31/2007 | | | 9.90 | | | 0.46 | | | (0.15 | ) | | | 0.31 | | | | (0.44 | ) | | | — | | | | (0.44 | ) |
Year Ended 10/31/2006 | | | 9.89 | | | 0.44 | | | 0.02 | | | | 0.46 | | | | (0.45 | ) | | | — | | | | (0.45 | ) |
Year Ended 10/31/2005 | | | 10.27 | | | 0.39 | | | (0.36 | ) | | | 0.03 | | | | (0.41 | ) | | | — | | | | (0.41 | ) |
Period Ended 10/31/2004 (c) | | | 10.14 | | | 0.20 | | | 0.16 | | | | 0.36 | | | | (0.22 | ) | | | (0.01 | ) | | | (0.23 | ) |
Year Ended 4/30/2004 | | | 10.31 | | | 0.40 | | | (0.12 | ) | | | 0.28 | | | | (0.45 | ) | | | — | | | | (0.45 | ) |
Class B Shares | | | | | | | | | | | | | | | | | | | | | | | | | | |
Year Ended 10/31/2008 | | | 9.78 | | | 0.36 | | | (1.43 | ) | | | (1.07 | ) | | | (0.35 | ) | | | — | | | | (0.35 | ) |
Year Ended 10/31/2007 | | | 9.91 | | | 0.36 | | | (0.15 | ) | | | 0.21 | | | | (0.34 | ) | | | — | | | | (0.34 | ) |
Year Ended 10/31/2006 | | | 9.90 | | | 0.34 | | | 0.02 | | | | 0.36 | | | | (0.35 | ) | | | — | | | | (0.35 | ) |
Year Ended 10/31/2005 | | | 10.27 | | | 0.29 | | | (0.35 | ) | | | (0.06 | ) | | | (0.31 | ) | | | — | | | | (0.31 | ) |
Period Ended 10/31/2004 (c) | | | 10.15 | | | 0.15 | | | 0.15 | | | | 0.30 | | | | (0.17 | ) | | | (0.01 | ) | | | (0.18 | ) |
Year Ended 4/30/2004 | | | 10.32 | | | 0.30 | | | (0.12 | ) | | | 0.18 | | | | (0.35 | ) | | | — | | | | (0.35 | ) |
Institutional Class Shares | | | | | | | | | | | | | | | | | | | | | | | | | | |
Year Ended 10/31/2008 | | | 9.78 | | | 0.48 | | | (1.41 | ) | | | (0.93 | ) | | | (0.49 | ) | | | — | | | | (0.49 | ) |
Year Ended 10/31/2007 | | | 9.91 | | | 0.49 | | | (0.13 | ) | | | 0.36 | | | | (0.49 | ) | | | — | | | | (0.49 | ) |
Year Ended 10/31/2006 | | | 9.90 | | | 0.48 | | | 0.02 | | | | 0.50 | | | | (0.49 | ) | | | — | | | | (0.49 | ) |
Year Ended 10/31/2005 | | | 10.27 | | | 0.43 | | | (0.34 | ) | | | 0.09 | | | | (0.46 | ) | | | — | | | | (0.46 | ) |
Period Ended 10/31/2004 (c) | | | 10.15 | | | 0.22 | | | 0.15 | | | | 0.37 | | | | (0.24 | ) | | | (0.01 | ) | | | (0.25 | ) |
Year Ended 4/30/2004 | | | 10.31 | | | 0.44 | | | (0.11 | ) | | | 0.33 | | | | (0.49 | ) | | | — | | | | (0.49 | ) |
(a) | The amount shown may not correlate with the change in aggregate gains and losses of portfolio securities due to the timing of sales and redemptions of fund shares. |
(c) | For the period from May 1, 2004 to October 31, 2004. |
| * | All per share amounts have been rounded to the nearest cent. |
The accompanying Notes to Financial Statements are an integral part of this schedule.
246
Thrivent Mutual Funds
Financial Highlights - continued
| | | | | | | | | | | | | | | | | | | | | | |
| | | RATIOS / SUPPLEMENTAL DATA | |
| | | | | | | | Ratio to Average Net
Assets** | | | Ratios to Average Net
Assets Before Expenses
Waived, Credited or Paid
Indirectly** | | | | |
Net Asset
Value, End of
Period | | Total
Return(b) | | | Net Assets, End
of Period
(in millions) | | Expenses | | | Net
Investment
Income/(Loss) | | | Expenses | | | Net
Investment
Income/(Loss) | | | Portfolio
Turnover Rate | |
| | | | | | | | | | | | | | | | | | | | | | |
| | | | | | | | | | | | | | | | | | | | | | |
| $ | 8.36 | | (10.13 | )% | | $ | 223.5 | | 0.83 | % | | 4.77 | % | | 0.95 | % | | 4.65 | % | | 344 | % |
| | 9.77 | | 3.24 | % | | | 295.1 | | 0.93 | % | | 4.62 | % | | 0.95 | % | | 4.60 | % | | 381 | % |
| | 9.90 | | 4.75 | % | | | 343.1 | | 0.93 | % | | 4.44 | % | | 0.95 | % | | 4.42 | % | | 394 | % |
| | 9.89 | | 0.31 | % | | | 421.2 | | 0.91 | % | | 3.84 | % | | 0.94 | % | | 3.82 | % | | 368 | % |
| | 10.27 | | 3.58 | % | | | 457.1 | | 0.92 | % | | 3.84 | % | | 0.93 | % | | 3.83 | % | | 167 | % |
| | 10.14 | | 2.74 | % | | | 460.5 | | 0.88 | % | | 3.86 | % | | 0.89 | % | | 3.85 | % | | 463 | % |
| | | | | | | | | | | | | | | | | | | | | | |
| | 8.36 | | (11.23 | )% | | | 1.5 | | 1.95 | % | | 3.64 | % | | 2.10 | % | | 3.50 | % | | 344 | % |
| | 9.78 | | 2.19 | % | | | 4.5 | | 1.95 | % | | 3.60 | % | | 1.99 | % | | 3.56 | % | | 381 | % |
| | 9.91 | | 3.71 | % | | | 8.1 | | 1.94 | % | | 3.43 | % | | 1.96 | % | | 3.41 | % | | 394 | % |
| | 9.90 | | (0.58 | )% | | | 10.8 | | 1.91 | % | | 2.86 | % | | 1.93 | % | | 2.84 | % | | 368 | % |
| | 10.27 | | 2.97 | % | | | 13.3 | | 1.91 | % | | 2.84 | % | | 1.92 | % | | 2.83 | % | | 167 | % |
| | 10.15 | | 1.75 | % | | | 13.4 | | 1.86 | % | | 2.89 | % | | 1.87 | % | | 2.88 | % | | 463 | % |
| | | | | | | | | | | | | | | | | | | | | | |
| | 8.36 | | (9.92 | )% | | | 65.0 | | 0.50 | % | | 5.12 | % | | 0.52 | % | | 5.10 | % | | 344 | % |
| | 9.78 | | 3.68 | % | | | 83.8 | | 0.51 | % | | 5.00 | % | | 0.53 | % | | 4.98 | % | | 381 | % |
| | 9.91 | | 5.20 | % | | | 49.0 | | 0.51 | % | | 4.86 | % | | 0.53 | % | | 4.85 | % | | 394 | % |
| | 9.90 | | 0.84 | % | | | 52.9 | | 0.49 | % | | 4.17 | % | | 0.51 | % | | 4.15 | % | | 368 | % |
| | 10.27 | | 3.69 | % | | | 36.3 | | 0.50 | % | | 4.25 | % | | 0.51 | % | | 4.24 | % | | 167 | % |
| | 10.15 | | 3.25 | % | | | 34.5 | | 0.49 | % | | 4.26 | % | | 0.50 | % | | 4.25 | % | | 463 | % |
(b) | Total investment return assumes dividend reinvestment and does not reflect any deduction for sales charges. Not annualized for periods less than one year. |
| ** | Computed on an annualized basis for periods less than one year. |
The accompanying Notes to Financial Statements are an integral part of this schedule.
247
Thrivent Mutual Funds
Financial Highlights - continued
| | | | | | | | | | | | | | | | | | | | | | | | | | |
| | | FOR A SHARE OUTSTANDING THROUGHOUT EACH PERIOD* | |
| | | | | Income from Investment Operations | | | Less Distributions from | | | | |
| | | Net Asset
Value,
Beginning of
Period | | Net
Investment
Income/(Loss) | | Net Realized
and Unrealized
Gain/(Loss) on
Investments(a) | | | Total from
Investment
Operations | | | Net
Investment
Income | | | Net Realized
Gain on
Investments | | | Total
Distributions | |
LIMITED MATURITY BOND FUND | |
Class A Shares | | | | | | | | | | | | | | | | | | | | | | | | | | |
Year Ended 10/31/2008 | | $ | 12.53 | | $ | 0.52 | | $ | (1.13 | ) | | $ | (0.61 | ) | | $ | (0.52 | ) | | $ | — | | | $ | (0.52 | ) |
Year Ended 10/31/2007 | | | 12.58 | | | 0.57 | | | (0.06 | ) | | | 0.51 | | | | (0.56 | ) | | | — | | | | (0.56 | ) |
Year Ended 10/31/2006 | | | 12.58 | | | 0.50 | | | — | | | | 0.50 | | | | (0.50 | ) | | | — | | | | (0.50 | ) |
Year Ended 10/31/2005 | | | 12.91 | | | 0.41 | | | (0.30 | ) | | | 0.11 | | | | (0.41 | ) | | | (0.03 | ) | | | (0.44 | ) |
Year Ended 10/31/2004 | | | 13.06 | | | 0.35 | | | (0.03 | ) | | | 0.32 | | | | (0.35 | ) | | | (0.12 | ) | | | (0.47 | ) |
Class B Shares | | | | | | | | | | | | | | | | | | | | | | | | | | |
Year Ended 10/31/2008 | | | 12.54 | | | 0.49 | | | (1.12 | ) | | | (0.63 | ) | | | (0.50 | ) | | | — | | | | (0.50 | ) |
Year Ended 10/31/2007 | | | 12.59 | | | 0.55 | | | (0.06 | ) | | | 0.49 | | | | (0.54 | ) | | | — | | | | (0.54 | ) |
Year Ended 10/31/2006 | | | 12.59 | | | 0.50 | | | — | | | | 0.50 | | | | (0.50 | ) | | | — | | | | (0.50 | ) |
Year Ended 10/31/2005 | | | 12.92 | | | 0.41 | | | (0.30 | ) | | | 0.11 | | | | (0.41 | ) | | | (0.03 | ) | | | (0.44 | ) |
Year Ended 10/31/2004 | | | 13.06 | | | 0.33 | | | (0.02 | ) | | | 0.31 | | | | (0.33 | ) | | | (0.12 | ) | | | (0.45 | ) |
Institutional Class Shares | | | | | | | | | | | | | | | | | | | | | | | | | | |
Year Ended 10/31/2008 | | | 12.53 | | | 0.56 | | | (1.13 | ) | | | (0.57 | ) | | | (0.56 | ) | | | — | | | | (0.56 | ) |
Year Ended 10/31/2007 | | | 12.58 | | | 0.61 | | | (0.06 | ) | | | 0.55 | | | | (0.60 | ) | | | — | | | | (0.60 | ) |
Year Ended 10/31/2006 | | | 12.58 | | | 0.56 | | | — | | | | 0.56 | | | | (0.56 | ) | | | — | | | | (0.56 | ) |
Year Ended 10/31/2005 | | | 12.91 | | | 0.47 | | | (0.30 | ) | | | 0.17 | | | | (0.47 | ) | | | (0.03 | ) | | | (0.50 | ) |
Year Ended 10/31/2004 | | | 13.05 | | | 0.39 | | | (0.02 | ) | | | 0.37 | | | | (0.39 | ) | | | (0.12 | ) | | | (0.51 | ) |
(a) | The amount shown may not correlate with the change in aggregate gains and losses of portfolio securities due to the timing of sales and redemptions of fund shares. |
| * | All per share amounts have been rounded to the nearest cent. |
The accompanying Notes to Financial Statements are an integral part of this schedule.
248
Thrivent Mutual Funds
Financial Highlights - continued
| | | | | | | | | | | | | | | | | | | | | | |
| | | RATIOS / SUPPLEMENTAL DATA | |
| | | | | | | | Ratio to Average Net
Assets** | | | Ratios to Average Net
Assets Before Expenses
Waived, Credited or Paid
Indirectly** | | | | |
Net Asset
Value, End of
Period | | Total
Return(b) | | | Net Assets, End
of Period
(in millions) | | Expenses | | | Net
Investment
Income/(Loss) | | | Expenses | | | Net
Investment
Income/(Loss) | | | Portfolio
Turnover Rate | |
| | | | | | | | | | | | | | | | | | | | | | |
| | | | | | | | | | | | | | | | | | | | | | |
| $ | 11.40 | | (5.03 | )% | | $ | 90.5 | | 0.68 | % | | 4.22 | % | | 0.70 | % | | 4.20 | % | | 113 | % |
| | 12.53 | | 4.10 | % | | | 112.0 | | 0.73 | % | | 4.52 | % | | 0.74 | % | | 4.50 | % | | 130 | % |
| | 12.58 | | 4.07 | % | | | 114.8 | | 0.85 | % | | 3.99 | % | | 0.86 | % | | 3.98 | % | | 145 | % |
| | 12.58 | | 0.89 | % | | | 131.3 | | 0.86 | % | | 3.25 | % | | 0.88 | % | | 3.24 | % | | 295 | % |
| | 12.91 | | 2.52 | % | | | 119.4 | | 0.75 | % | | 2.71 | % | | 0.89 | % | | 2.57 | % | | 230 | % |
| | | | | | | | | | | | | | | | | | | | | | |
| | 11.41 | | (5.20 | )% | | | 1.5 | | 0.86 | % | | 4.04 | % | | 0.87 | % | | 4.03 | % | | 113 | % |
| | 12.54 | | 3.93 | % | | | 1.8 | | 0.89 | % | | 4.35 | % | | 0.91 | % | | 4.33 | % | | 130 | % |
| | 12.59 | | 4.02 | % | | | 1.9 | | 0.89 | % | | 3.96 | % | | 0.94 | % | | 3.91 | % | | 145 | % |
| | 12.59 | | 0.87 | % | | | 2.0 | | 0.89 | % | | 3.21 | % | | 0.93 | % | | 3.17 | % | | 295 | % |
| | 12.92 | | 2.45 | % | | | 2.1 | | 0.88 | % | | 2.59 | % | | 0.88 | % | | 2.59 | % | | 230 | % |
| | | | | | | | | | | | | | | | | | | | | | |
| | 11.40 | | (4.71 | )% | | | 376.9 | | 0.35 | % | | 4.56 | % | | 0.36 | % | | 4.54 | % | | 113 | % |
| | 12.53 | | 4.47 | % | | | 303.7 | | 0.36 | % | | 4.91 | % | | 0.38 | % | | 4.89 | % | | 130 | % |
| | 12.58 | | 4.55 | % | | | 148.3 | | 0.38 | % | | 4.58 | % | | 0.39 | % | | 4.57 | % | | 145 | % |
| | 12.58 | | 1.36 | % | | | 37.4 | | 0.41 | % | | 3.78 | % | | 0.42 | % | | 3.77 | % | | 295 | % |
| | 12.91 | | 2.90 | % | | | 9.8 | | 0.45 | % | | 3.01 | % | | 0.57 | % | | 2.89 | % | | 230 | % |
(b) | Total investment return assumes dividend reinvestment and does not reflect any deduction for sales charges. Not annualized for periods less than one year. |
| ** | Computed on an annualized basis for periods less than one year. |
The accompanying Notes to Financial Statements are an integral part of this schedule.
249
Thrivent Mutual Funds
Financial Highlights - continued
| | | | | | | | | | | | | | | | | | | | | | | | | | |
| | | FOR A SHARE OUTSTANDING THROUGHOUT EACH PERIOD* | |
| | | | | Income from Investment Operations | | | Less Distributions from | | | |
| | | Net Asset
Value,
Beginning
of Period | | Net
Investment
Income/(Loss) | | | Net Realized
and Unrealized
Gain/(Loss) on
Investments(a) | | | Total from
Investment
Operations | | | Net
Investment
Income | | | Net Realized
Gain on
Investments | | Total
Distributions | |
MONEY MARKET FUND | | | | | | | | | | | | | | | | | | | | |
Class A Shares | | | | | | | | | | | | | | | | | | | | | | | | | | |
Year Ended 10/31/2008 | | $ | 1.00 | | $ | 0.03 | | | $ | — | | | $ | 0.03 | | | $ | (0.03 | ) | | $ | — | | $ | (0.03 | ) |
Year Ended 10/31/2007 | | | 1.00 | | | 0.05 | | | | — | | | | 0.05 | | | | (0.05 | ) | | | — | | | (0.05 | ) |
Year Ended 10/31/2006 | | | 1.00 | | | 0.04 | | | | — | | | | 0.04 | | | | (0.04 | ) | | | — | | | (0.04 | ) |
Year Ended 10/31/2005 | | | 1.00 | | | 0.02 | | | | — | | | | 0.02 | | | | (0.02 | ) | | | — | | | (0.02 | ) |
Period Ended 10/31/2004 (c) | | | 1.00 | | | 0.00 | ^ | | | 0.00 | ^ | | | 0.00 | ^ | | | 0.00 | ^ | | | — | | | 0.00 | ^ |
Year Ended 4/30/2004 | | | 1.00 | | | 0.00 | ^ | | | — | | | | 0.00 | ^ | | | 0.00 | ^ | | | — | | | 0.00 | ^ |
Class B Shares | | | | | | | | | | | | | | | | | | | | | | | | | | |
Year Ended 10/31/2008 | | | 1.00 | | | 0.03 | | | | — | | | | 0.03 | | | | (0.03 | ) | | | — | | | (0.03 | ) |
Year Ended 10/31/2007 | | | 1.00 | | | 0.04 | | | | — | | | | 0.04 | | | | (0.04 | ) | | | — | | | (0.04 | ) |
Year Ended 10/31/2006 | | | 1.00 | | | 0.04 | | | | — | | | | 0.04 | | | | (0.04 | ) | | | — | | | (0.04 | ) |
Year Ended 10/31/2005 | | | 1.00 | | | 0.02 | | | | — | | | | 0.02 | | | | (0.02 | ) | | | — | | | (0.02 | ) |
Period Ended 10/31/2004 (c) | | | 1.00 | | | 0.00 | ^ | | | — | | | | 0.00 | ^ | | | 0.00 | ^ | | | — | | | 0.00 | ^ |
Year Ended 4/30/2004 | | | 1.00 | | | 0.00 | ^ | | | — | | | | 0.00 | ^ | | | 0.00 | ^ | | | — | | | 0.00 | ^ |
Institutional Class Shares | | | | | | | | | | | | | | | | | | | | | | | | | | |
Year Ended 10/31/2008 | | | 1.00 | | | 0.03 | | | | — | | | | 0.03 | | | | (0.03 | ) | | | — | | | (0.03 | ) |
Year Ended 10/31/2007 | | | 1.00 | | | 0.05 | | | | — | | | | 0.05 | | | | (0.05 | ) | | | — | | | (0.05 | ) |
Year Ended 10/31/2006 | | | 1.00 | | | 0.04 | | | | — | | | | 0.04 | | | | (0.04 | ) | | | — | | | (0.04 | ) |
Year Ended 10/31/2005 | | | 1.00 | | | 0.03 | | | | — | | | | 0.03 | | | | (0.03 | ) | | | — | | | (0.03 | ) |
Period Ended 10/31/2004 (c) | | | 1.00 | | | 0.01 | | | | — | | | | 0.01 | | | | (0.01 | ) | | | — | | | (0.01 | ) |
Year Ended 4/30/2004 | | | 1.00 | | | 0.01 | | | | — | | | | 0.01 | | | | (0.01 | ) | | | — | | | (0.01 | ) |
(a) | The amount shown may not correlate with the change in aggregate gains and losses of portfolio securities due to the timing of sales and redemptions of fund shares. |
(c) | For the period from May 1, 2004 to October 31, 2004. |
| * | All per share amounts have been rounded to the nearest cent. |
| ^ | Amount represents less than $.01 per share. |
The accompanying Notes to the Financial Statements are an integral part of this schedule.
250
Thrivent Mutual Funds
Financial Highlights - continued
| | | | | | | | | | | | | | | | | | | | | |
| | | RATIOS / SUPPLEMENTAL DATA |
| | | | | | | | Ratio to Average Net
Assets** | | | Ratios to Average Net
Assets Before Expenses
Waived, Credited or Paid
Indirectly** | | | |
Net Asset
Value, End of
Period | | Total
Return(b) | | | Net Assets, End
of Period
(in millions) | | Expenses | | | Net
Investment
Income/(Loss) | | | Expenses | | | Net
Investment
Income/(Loss) | | | Portfolio
Turnover Rate |
| | | | | | | | | | | | | | | | | | | | | |
| | | | | | | | | | | | | | | | | | | | | |
| $ | 1.00 | | 3.21 | % | | $ | 1,306.0 | | 0.54 | % | | 3.14 | % | | 0.74 | % | | 2.94 | % | | N/A |
| | 1.00 | | 4.92 | % | | | 1,183.9 | | 0.58 | % | | 4.83 | % | | 0.78 | % | | 4.63 | % | | N/A |
| | 1.00 | | 4.26 | % | | | 864.3 | | 0.71 | % | | 4.22 | % | | 0.89 | % | | 4.04 | % | | N/A |
| | 1.00 | | 2.12 | % | | | 661.3 | | 0.84 | % | | 2.08 | % | | 0.94 | % | | 1.98 | % | | N/A |
| | 1.00 | | 0.26 | % | | | 686.8 | | 0.90 | % | | 0.61 | % | | 1.00 | % | | 0.51 | % | | N/A |
| | 1.00 | | 0.32 | % | | | 262.2 | | 0.83 | % | | 0.32 | % | | 0.93 | % | | 0.22 | % | | N/A |
| | | | | | | | | | | | | | | | | | | | | |
| | 1.00 | | 2.73 | % | | | 1.0 | | 1.01 | % | | 2.82 | % | | 1.76 | % | | 2.08 | % | | N/A |
| | 1.00 | | 4.48 | % | | | 1.5 | | 1.01 | % | | 4.39 | % | | 1.82 | % | | 3.58 | % | | N/A |
| | 1.00 | | 3.94 | % | | | 1.8 | | 1.01 | % | | 3.88 | % | | 1.97 | % | | 2.92 | % | | N/A |
| | 1.00 | | 1.94 | % | | | 1.7 | | 1.01 | % | | 1.84 | % | | 1.93 | % | | 0.91 | % | | N/A |
| | 1.00 | | 0.18 | % | | | 2.9 | | 1.04 | % | | 0.47 | % | | 1.95 | % | | (0.44 | )% | | N/A |
| | 1.00 | | 0.07 | % | | | 1.8 | | 1.08 | % | | 0.07 | % | | 1.84 | % | | (0.69 | )% | | N/A |
| | | | | | | | | | | | | | | | | | | | | |
| | 1.00 | | 3.41 | % | | | 223.3 | | 0.35 | % | | 3.45 | % | | 0.45 | % | | 3.36 | % | | N/A |
| | 1.00 | | 5.16 | % | | | 425.0 | | 0.36 | % | | 5.05 | % | | 0.46 | % | | 4.95 | % | | N/A |
| | 1.00 | | 4.59 | % | | | 341.1 | | 0.39 | % | | 4.51 | % | | 0.49 | % | | 4.42 | % | | N/A |
| | 1.00 | | 2.56 | % | | | 283.1 | | 0.40 | % | | 2.56 | % | | 0.50 | % | | 2.46 | % | | N/A |
| | 1.00 | | 0.47 | % | | | 245.7 | | 0.47 | % | | 1.05 | % | | 0.54 | % | | 0.98 | % | | N/A |
| | 1.00 | | 0.59 | % | | | 114.6 | | 0.56 | % | | 0.59 | % | | 0.56 | % | | 0.59 | % | | N/A |
(b) | Total investment return assumes dividend reinvestment and does not reflect any deduction for sales charges. Not annualized for periods less than one year. |
| ** | Computed on an annualized basis for periods less than one year. |
The accompanying Notes to Financial Statements are an integral part of this schedule.
251
Additional Information
(Unaudited)
Shareholder Notification of Federal Tax Information (unaudited)
The following information is provided solely to satisfy the requirements set forth by the Internal Revenue Code. Shareholders will be provided information regarding their distributions in January 2009.
The Funds designate the following percentages of dividends declared from net investment income as dividends qualifying for the 70% dividends received deduction for corporations or as qualified dividend income for individuals under the Jobs and Growth Tax Relief Reconciliation Act of 2003 for the tax period ending October 31, 2008:
| | | | | | |
Fund | | Dividends
Received
Deduction
for
Corporations | | | Qualified
Dividend
Income for
Individuals | |
Aggressive Allocation | | 25 | % | | 43 | % |
Moderately Aggressive Allocation | | 24 | % | | 34 | % |
Moderate Allocation | | 17 | % | | 22 | % |
Moderately Conservative Allocation | | 10 | % | | 13 | % |
Partner Small Cap Growth | | 20 | % | | 20 | % |
Partner Small Cap Value | | 50 | % | | 51 | % |
Small Cap Index | | 100 | % | | 100 | % |
Mid Cap Growth | | 6 | % | | 6 | % |
Partner Mid Cap Value | | 36 | % | | 38 | % |
Mid Cap Stock | | 24 | % | | 22 | % |
Mid Cap Index | | 100 | % | | 100 | % |
Partner International Stock | | 0 | % | | 100 | % |
Large Cap Growth | | 15 | % | | 16 | % |
Large Cap Value | | 100 | % | | 100 | % |
Large Cap Stock | | 55 | % | | 57 | % |
Large Cap Index | | 100 | % | | 100 | % |
Balanced | | 30 | % | | 32 | % |
High Yield | | 1 | % | | 1 | % |
Income | | 1 | % | | 1 | % |
Limited Maturity Bond | | 1 | % | | 1 | % |
The Municipal Bond Fund designates 99.44% of the dividends declared from net investment income as exempt from federal income tax for the tax period ended October 31, 2008.
Pursuant to IRC 852(b)(3) of the Internal Revenue Code, the Funds hereby designate the following amounts as long-term capital gains distributed during the year ended October 31, 2008, or if subsequently determined to be different, the net capital gain of such year:
| | | |
Fund | | Distributions of
Long-Term
Capital Gains |
Aggressive Allocation | | $ | 5,854,153 |
Moderately Aggressive Allocation | | | 11,819,783 |
Moderate Allocation | | | 11,287,059 |
Moderately Conservative Allocation | | | 2,612,434 |
Partner Small Cap Growth | | | 2,966,698 |
Partner Small Cap Value | | | 9,502,303 |
Small Cap Stock | | | 68,131,147 |
Small Cap Index | | | 4,941,997 |
Mid Cap Growth | | | 25,349,717 |
Partner Mid Cap Value | | | 1,524,721 |
Mid Cap Stock | | | 104,997,255 |
Mid Cap Index | | | 6,264,732 |
Partner International Stock | | | 59,329,987 |
Large Cap Growth | | | 14,227,172 |
Large Cap Value | | | 29,157,758 |
Large Cap Stock | | | 296,690,398 |
Balanced | | | 12,582,777 |
These amounts may include earnings and profits distributed to shareholders on the redemption of shares as part of the dividend paid deduction.
Proxy Voting
The policies and procedures that the Trust uses to determine how to vote proxies relating to portfolio securities are attached to the Trust’s Statement of Additional Information. You may request a free copy of the Statement of Additional Information or the report of how the Trust voted proxies relating to portfolio securities during the most recent 12-month period ended June 30 by calling 1-800-847-4836. You also may review the Statement of Additional Information or the report of how the Trust voted proxies relating to portfolio securities during the most recent 12-month period ended June 30 at the Thrivent Financial web site (www.thrivent.com) or the SEC web site (www.sec.gov).
Quarterly Schedule of Portfolio Holdings
The Trust files its Schedule of Portfolio Holdings on Form N-Q with the SEC for the first and third quarters of each fiscal year. You may request a free copy of the Trust’s Forms N-Q by calling 1-800-847-4836. The Trust’s Forms N-Q also are available on the Thrivent Financial web site (www.thrivent.com) or the SEC web site (www.sec.gov). You also may review and copy the Forms N-Q for the Trust at the SEC’s Public Reference Room in Washington, DC. You may get information about the operation of the Public Reference Room by calling 1-800-SEC-0330.
252
Board of Trustees and Officers
The following table provides information about the Trustees and Officers of the Trust. Each Trustees oversees each of the 29 series of the Trust and also serves as:
| | • | | Director of Thrivent Series Fund, Inc., a registered investment company consisting of 41 portfolios that serve as underlying funds for variable contracts issued by Thrivent Financial for Lutherans (“Thrivent Financial”) and Thrivent Life Insurance Company and investment options in the retirement plan offered by Thrivent Financial; and |
| | • | | Trustee of Thrivent Financial Securities Lending Trust, a registered investment company consisting of one portfolio that serves as a cash collateral fund for a securities lending program sponsored by Thrivent Financial. |
The 29 series of the Trust, the 41 portfolios of Thrivent Series Fund, Inc. and Thrivent Financial Securities Lending Trust are referred to herein as the “Fund Complex.” The Statement of Additional Information includes additional information about the Trustees and is available, without charge, by calling 1-800-847-4836.
Interested Trustee (1)
| | | | | | | | |
Name, Address and Age | | Position
with Trust and
Length of Service (2) | | Number of
Portfolios in
Fund
Complex
Overseen by
Trustee | | Principal Occupation
During the Past 5 Years | | Other Directorships
Held by Trustee |
Pamela J. Moret 625 Fourth Avenue South Minneapolis, MN Age 52 | | President from 2004 until November 2008; Trustee from 2004 until December 2008 | | 71 | | Executive Vice President, Strategic Development, Thrivent Financial since 2008; Executive Vice President, Marketing and Products, Thrivent Financial from 2002 until 2008 | | Director, American Public Media and affiliates; Director, Luther Seminary |
| | | | |
Independent Trustees (3) | | | | | | | | |
Name, Address and Age | | Position
with Trust and
Length of Service (2) | | Number of
Portfolios in
Fund
Complex
Overseen by
Trustee | | Principal Occupation
During the Past 5 Years | | Other Directorships
Held by Trustee |
F. Gregory Campbell 625 Fourth Avenue South Minneapolis, MN Age 68 | | Trustee since 1992 | | 71 | | President, Carthage College | | Director, Optique Funds, Inc., an investment company consisting of four portfolios; Director, Kenosha Hospital and Medical Center Board; Director, Prairie School Board; Director, United Health Systems Board |
253
Board of Trustees and Officers
| | | | | | | | |
Name, Address and Age | | Position
with Trust and
Length of Service (2) | | Number of
Portfolios in
Fund
Complex
Overseen by
Trustee | | Principal Occupation
During the Past 5 Years | | Other Directorships
Held by Trustee |
Herbert F. Eggerding, Jr. 625 Fourth Avenue South Minneapolis, MN Age 71 | | Trustee since 2003 | | 71 | | Management consultant to several privately owned companies | | None |
| | | | |
Noel K. Estenson 625 Fourth Avenue South Minneapolis, MN Age 69 | | Trustee since 2004 | | 71 | | Retired | | None |
| | | | |
Richard L. Gady 625 Fourth Avenue South Minneapolis, MN Age 65 | | Trustee since 1987 | | 71 | | Retired; previously Vice President, Public Affairs and Chief Economist, ConAgra, Inc. (agribusiness) | | None |
| | | | |
Richard A. Hauser 625 Fourth Avenue South Minneapolis, MN Age 65 | | Trustee since 2004 | | 71 | | Vice President and Assistant General Counsel, Boeing Company since June 2007; President, National Legal Center for the Public Interest since 2004; General Counsel U.S. Department of Housing and Urban Development from 2001 to 2004; Partner, Baker & Hostetler, from 1986 to 2001 | | None |
| | | | |
Connie M. Levi 625 Fourth Avenue South Minneapolis, MN Age 69 | | Chairperson beginning in 2009; Trustee since 2004 | | 71 | | Retired | | None |
| | | | |
Douglas D. Sims 625 Fourth Avenue South Minneapolis, MN Age 62 | | Trustee since 2006 | | 71 | | Retired; previously Chief Executive Officer of CoBank from 1994 to 2006 | | Director, Keystone Neighborhood Company; Director, Center for Corporate Excellence |
| | | | |
Edward W. Smeds 625 Fourth Avenue South Minneapolis, MN Age 72 | | Chairman from 2004 until December 2008; Trustee from 1999 until December 2008 | | 71 | | Retired | | Chairman of Carthage College Board |
254
Board of Trustees and Officers
| | | | | | | | |
Name, Address and Age | | Position
with Trust and
Length of Service (2) | | Number of
Portfolios in
Fund
Complex
Overseen by
Trustee | | Principal Occupation
During the Past 5 Years | | Other Directorships
Held by Trustee |
Constance L. Souders 625 Fourth Avenue South Minneapolis, MN Age 58 | | Trustee since 2007 | | 71 | | Retired; previously Director from 1983 to September 30, 2007, Executive Vice President from 2001 to 2007, AML Compliance Officer from 2003 to 2007, Chief Financial Officer from 2000 to 2005, Chief Administrative Officer from 2000 to 2005 and Treasurer from 1992 to 2005 of Harbor Capital Advisors, Inc.; Director from 1992 to 2007, President from 2000 to 2007 and AML Compliance Officer from 2003 to 2007 of Harbor Services Group, Inc.; Director from 1992 to 2007, Executive Vice President from 2001 to 2007, Chief Compliance Officer from 2004 to 2007, AML Compliance Officer from 2003 to 2007, Supervisory Registered Principal from 2000 to 2007, Interim President from 2002 to 2003, Treasurer from 2000 to 2005 and Secretary from 2000 to 2005 of Harbor Funds Distributors, Inc.; Vice President from 2000 to 2007, Chief Financial Officer from 2000 to 2005 and Treasurer from 1992 to 2005 of Harbor Funds | | None |
255
Board of Trustees and Officers
Executive Officers
| | | | |
Name, Address
and Age | | Position with Trust
and Length of Service (2) | | Principal Occupation During the Past 5 Years |
Pamela J. Moret 625 Fourth Avenue South Minneapolis, MN Age 52 | | President from 2002 until November 2008 | | Executive Vice President, Strategic Development, Thrivent Financial since 2008; Executive Vice President, Marketing and Products, Thrivent Financial from 2002 until 2008 |
| | |
Russell W. Swansen 625 Fourth Avenue South Minneapolis, MN Age 51 | | President since November 2008; previously, Vice President since 2004 | | Senior Vice President and Chief Investment Officer, Thrivent Financial since 2004; Managing Director, Colonnade Advisors LLC from 2001 to 2003 |
| | |
David S. Royal 625 Fourth Avenue South Minneapolis, MN Age 37 | | Secretary and Chief Legal Officer since 2006 | | Vice President — Asset Management, Thrivent Financial since 2006; Partner, Kirkland & Ellis LLP from April 2004 to June 2006; Associate, Skadden, Arps, Slate, Meagher & Flom LLP from 1997 to 2004 |
| | |
Katie S. Kloster 625 Fourth Avenue South Minneapolis, MN Age 43 | | Vice President Investment Company and Investment Adviser Chief Compliance Officer since 2004 | | Vice President and IC and IA Chief Compliance Officer, Thrivent Financial since 2004; previously Vice President and Controller of Thrivent Financial |
| | |
Gerard V. Vaillancourt 625 Fourth Avenue South Minneapolis, MN Age 41 | | Treasurer and Principal Financial Officer since 2005 | | Vice President, Mutual Fund Accounting since 2006; Head of Mutual Fund Accounting, Thrivent Financial from 2005 to 2006; Director, Fund Accounting Administration, Thrivent Financial from 2002 to 2005; Manager — Portfolio Compliance, Lutheran Brotherhood from 2001 to 2002; Manager — Fund Accounting, Minnesota Life from 2000 to 2001 |
| | |
Janice M. Guimond 625 Fourth Avenue South Minneapolis, MN Age 44 | | Vice President since 2005 | | Vice President, Investment Operations, Thrivent Financial since 2003; Manager of Portfolio Reporting, Thrivent Financial from 2003 to 2004; Independent Consultant from 2001 to 2003 |
| | |
Karl D. Anderson 625 Fourth Avenue South Minneapolis, MN Age 47 | | Vice President since 2006 | | Vice President, Products, Thrivent Financial |
| | |
Karl D. Anderson 625 Fourth Avenue South Minneapolis, MN Age 47 | | Vice President since 2006 | | Vice President, Products, Thrivent Financial |
| | |
Brian W. Picard 4321 North Ballard Road Appleton, WI Age 38 | | Vice President Anti-Money Laundering Officer since 2006 | | Director of FSO Compliance Corp. BCM since 2006; Manager of Field and Securities Compliance from 2002 to 2006, Thrivent Financial |
| | |
Kenneth L. Kirchner 4321 North Ballard Road Appleton, WI Age 42 | | Assistant Vice President since 2004 | | Director, Mutual Funds Operations, Thrivent Financial |
| | |
Mark D. Anema 625 Fourth Avenue South Minneapolis, MN Age 47 | | Assistant Vice President since 2007 | | Vice President, Accumulation and Retirement Income Solutions, Thrivent Financial since 2007; Vice President, Strategic Planning, Thrivent Financial from 2004 to 2007; Insurance Practice Engagement Manager, McKinsey and Company from 1999 to 2004 |
256
Board of Trustees and Officers
| | | | |
Name, Address
and Age | | Position with Trust
and Length of Service (2) | | Principal Occupation During the Past 5 Years |
James M. Odland 625 Fourth Avenue South Minneapolis, MN Age 53 | | Assistant Secretary since 2006 | | Vice President, Office of the General Counsel, Thrivent Financial since 2005; Senior Securities Counsel, Allianz Life Insurance Company from January 2005 to August 2005; Vice President and Chief Legal Officer, Woodbury Financial Services, Inc. from September 2003 to January 2005; Vice President and Group Counsel, Corporate Practice Group, American Express Financial Advisors, Inc. from 2001 to 2003 |
| | |
John L. Sullivan 625 Fourth Avenue South Minneapolis, MN Age 37 | | Assistant Secretary since 2007 | | Senior Counsel, Thrivent Financial since 2007; previously Senior Counsel, Division of Investment Management of the Securities and Exchange Commission |
| | |
Todd J. Kelly 4321 North Ballard Road Appleton, WI Age 39 | | Assistant Treasurer since 1999 | | Director, Fund Accounting Operations, Thrivent Financial |
| | |
Sarah L. Bergstrom 625 Fourth Avenue South Minneapolis, MN Age 31 | | Assistant Treasurer since 2007 | | Director, Fund Accounting Administration, Thrivent Financial since 2007; Manager, Fund Accounting Administration, Thrivent Financial from 2005 to 2007; Manager, Mutual Fund Tax Reporting, Thrivent Financial from 2004 to 2005; Supervisor, Mutual Fund Tax Reporting, Thrivent Financial from 2002 to 2004 |
| (1) | “Interested person” of the Trust as defined in 1940 Act by virtue of positions with Thrivent Financial. Ms. Moret is considered an interested person because of her principal occupation with Thrivent Financial. |
| (2) | Each Trustee generally serves an indefinite term until her or his successor is duly elected and qualified. Officers serve at the discretion of the board until their successors are duly appointed and qualified. |
| (3) | The Trustees other than Ms. Moret are not “interested persons” of the Trust and are referred to as “Independent Directors.” |
257

Item 2. Code of Ethics
As of the end of the period covered by this report, registrant has adopted a code of ethics (as defined in Item 2 of Form N-CSR) applicable to registrant’s Principal Executive Officer, Principal Financial Officer and Principal Accounting Officer. No waivers were granted to such code of ethics during the period covered by this report. A copy of this code of ethics is filed as an exhibit to this Form N-CSR.
Item 3. Audit Committee Financial Expert
Registrant’s Board of Trustees has determined that Herbert F. Eggerding, Jr., an independent trustee, is the Audit Committee Financial Expert.
Item 4. Principal Accountant Fees and Services
The aggregate fees billed by registrant’s independent public accountants, PricewaterhouseCoopers LLP (“PwC”), for the fiscal year ended October 31, 2007 and the fiscal year ended October 31, 2008, for professional services rendered in connection with the audit of registrant’s annual financial statements or services that are normally provided by the accountant in connection with statutory and regulatory filings or engagements were $364,656 and $294,454.59, respectively.
The aggregate fees PwC billed to registrant for the fiscal year ended October 31, 2007 and the fiscal year ended October 31, 2008, for assurance and other services that are reasonably related to the performance of registrant’s audit and are not reported under Item 4(a), were $0 for each respective period. The aggregate fees PwC billed to registrant’s investment adviser and any entity controlling, controlled by, or under common control with registrant’s investment adviser for the fiscal year ended October 31, 2007 and the fiscal year ended October 31, 2008, for assurance and other services directly related to the operations and financial reporting of registrant, were $0 for each respective period.
The aggregate tax fees PwC billed to registrant for the fiscal year ended October 31, 2007 and the fiscal year ended October 31, 2008, for tax compliance, tax advice and tax planning services, were $117,935 and $156,365.78, respectively. The aggregate tax fees PwC billed to registrant’s investment adviser and any entity controlling, controlled by, or under common control with registrant’s investment adviser for the fiscal year ended October 31, 2007 and the fiscal year ended October 31, 2008, for services directly related to the operations and financial reporting of registrant, were $0 for each respective period.
The aggregate fees PwC billed to registrant for the fiscal year ended October 31, 2007 and the fiscal year ended October 31, 2008 for products and services provided, other than the services reported in paragraphs (a) through (c) of this item, were $0 for each respective period. The aggregate fees PwC billed to registrant’s investment adviser and any entity controlling, controlled by, or under common control with registrant’s investment adviser for the fiscal year ended October 31, 2007 and the fiscal year ended October 31, 2008, for products and services provided, other than the services reported in paragraphs (a) through (c) of this item, were $0 and $0, respectively.
| | (e) | Registrant’s audit committee charter, adopted in August 2004, provides that the audit committee (comprised of the independent Trustees of registrant) is responsible for pre-approval of all auditing services performed for the registrant. The audit committee also is responsible for pre-approval (subject to the de minimis exceptions for non-audit services described in Section 10A(i)(1)(B) of the Securities Exchange Act of 1934) of all non-auditing services performed for the registrant or an affiliate of registrant. In addition, registrant’s audit committee charter permits a designated member of the audit committee to pre-approve, between meetings, one or more audit or non-audit service projects, subject to an expense limit and notification to the audit committee at the next committee meeting. Registrant’s audit committee pre-approved all fees described above that PwC billed to registrant. |
| | (f) | Less than 50% of the hours billed by PwC for auditing services to registrant for the fiscal year ended October 31, 2008 was for work performed by persons other than full-time permanent employees of PwC. |
| | (g) | The aggregate non-audit fees billed by PwC to registrant and to registrant’s investment adviser and any entity controlling, controlled by, or under common control with registrant’s investment adviser for the fiscal year ended October 31, 2007 and the fiscal year ended October 31, 2008 were $1,582 and $1,500 for each respective period. |
| | (h) | Registrant’s audit committee has considered the non-audit services provided to the registrant and registrant’s investment adviser and any entity controlling, controlled by, or under common control with registrant’s investment adviser as described above and determined that these services do not compromise PwC’s independence. |
Item 5. Audit Committee of Listed Registrants
Not applicable.
Item 6. Schedule of Investments
| | (a) | Registrant’s Schedule of Investments is included in the report to shareholders filed under Item 1. |
| | (b) | Not applicable to this filing. |
Item 7. Disclosure of Proxy Voting Policies and Procedures for Closed-End Management Investment Companies
Not applicable.
Item 8. Portfolio Managers of Closed-End Management Investment Companies
Not applicable.
Item 9. Purchases of Equity Securities by Closed-End Management Investment Company and Affiliated Purchasers.
Not applicable.
Item 10. Submission of Matters to a Vote of Security Holders
There have been no material changes to the procedures by which shareholders may recommend nominees to registrant’s board of trustees.
Item 11. Controls and Procedures
(a)(i) Registrant’s President and Treasurer have concluded that registrant’s disclosure controls and procedures (as defined in Rule 30a-3(c) under the Investment Company Act of 1940) are
effective, based on their evaluation of these controls and procedures as of a date within 90 days of the filing date of this report.
(a)(ii) Registrant’s President and Treasurer are aware of no change in registrant’s internal control over financial reporting (as defined in Rule 30a-3(d) under the Investment Company Act of 1940) that occurred during registrant’s most recent fiscal quarter that has materially affected, or is reasonably likely to materially affect, registrant’s internal control over financial reporting.
Item 12. Exhibits
| | (a) | The code of ethics pursuant to Item 2 is attached hereto. |
| | (b) | Certifications pursuant to Rules 30a-2(a) and 30a-2(b) under the Investment Company Act of 1940 are attached hereto. |
SIGNATURES
Pursuant to the requirements of the Securities Exchange Act of 1934 and the Investment Company Act of 1940, the registrant has duly caused this report to be signed on its behalf by the undersigned, thereunto duly authorized.
| | | | | | |
| Date: December 29, 2008 | | | | THRIVENT MUTUAL FUNDS |
| | | |
| | | | By: | | /s/ Russell W. Swansen |
| | | | | | Russell W. Swansen |
| | | | | | President |
Pursuant to the requirements of the Securities Exchange Act of 1934 and the Investment Company Act of 1940, this report has been signed below by the following persons on behalf of the registrant and in the capacities and on the dates indicated.
| | | | | | |
| Date: December 29, 2008 | | | | |
| | | |
| | | | By: | | /s/ Russell W. Swansen |
| | | | | | Russell W. Swansen |
| | | | | | President |
| | | | | | |
| Date: December 29, 2008 | | | | |
| | | |
| | | | By: | | /s/ Gerard V. Vaillancourt |
| | | | | | Gerard V. Vaillancourt |
| | | | | | Treasurer |