UNITED STATES
SECURITIES AND EXCHANGE COMMISSION
Washington, D.C. 20549
FORM N-CSR
CERTIFIED SHAREHOLDER REPORT OF REGISTERED MANAGEMENT
INVESTMENT COMPANIES
Investment Company Act file number: 811-5075
Thrivent Mutual Funds
(Exact name of registrant as specified in charter)
625 Fourth Avenue South
Minneapolis, Minnesota 55415
(Address of principal executive offices) (Zip code)
David S. Royal, Secretary
625 Fourth Avenue South
Minneapolis, Minnesota 55415
(Name and address of agent for service)
Registrant's telephone number, including area code: (612) 340-4249
Date of fiscal year end: December 31
Date of reporting period: December 31, 2006
Item 1. Report to Stockholders
Table of Contents
| President’s Letter | 1 |
| Economic and Market Overview | 2 |
| Portfolio Perspective | |
| Thrivent Real Estate Securities Fund | 4 |
| Thrivent Diversified Income Plus Fund | 6 |
| Shareholder Expense Example | 8 |
| Report of Independent Registered Public | |
| Accounting Firm | 10 |
| Schedules of Investments | |
| Thrivent Real Estate Securities Fund | 11 |
| Thrivent Diversified Income Plus Fund | 13 |
| Statement of Assets and Liabilities | 23 |
| Statement of Operations | 24 |
| Statement of Changes in Net Assets | 25 |
| Notes to Financial Statements | 26 |
| Financial Highlights | 36 |
| Additional Information | 38 |
| Trustees and Officers of | |
| Thrivent Mutual Funds | 41 |

Dear Shareholder:
We are pleased to provide you with the annual report for the period ended Dec. 31, 2006, for the Thrivent Real Estate Securities and Thrivent Diversified Income Plus Funds. In this report, you will find detailed information about both Funds, including performance highlights, overall market conditions and management strategies during the one-year period. In addition, Thrivent Financial’s chief investment officer, Russ Swansen, reviews the larger economic environment in his Economic and Market Overview.
Market Drama Calls for Calm
The past year’s market dynamics were fascinating to watch unfold. Like a dramatic play with multiple acts, the markets started the “first act” of 2006 very strong spurred on by healthy economic numbers and strong corporate profits. By the second quarter, rising interest rates around the globe and the potential for slower economic growth had market participants running for cover with negative returns for both the broad stock and bond markets as a result. As in most dramas, there is always a temptation to allow emotion to cloud sound long-term investment programs. This proved too much for some investors who left the stock market for temporary “safer havens” despite often having a well thought out, long-term strategy.
As so often is the case, this kind of market timing was detrimental to these investors’ fund performance. The 2006 market “drama” had a final act built off Federal Reserve monetary policy that led to a halt in short-term interest rate hikes, lower oil prices and continued strong corporate earnings. Broad stock market indexes such as the S&P 500 rose dramatically from below-water returns in June to record very strong performance from August through the end of 2006, surprising many investment management professionals and causing many “market timers” to miss this substantial portfolio growth opportunity.
Lessons Learned
The financial markets refuse to follow a script. Professionals admit that market timing, or knowing when to exit and enter the stock market, is a difficult, if not impossible pursuit. 2006 left many of these pros (as well as market timing investors) who called for a second half bear market scratching their heads. Why do so many individual investors, even seasoned experts, succumb to the temptation? The great majority of investors are much better off setting a long-term strategy with a financial representative and sticking to it regardless of near-term market conditions.
The Thrivent Asset Allocation Funds may be an ideal way to take the emotion and complexity out of investing. Well-balanced with a variety of different asset classes, these simple, smart solutions are designed to meet your financial goals without a lot of head scratching and second guessing.
By the way, congratulations if you stuck to your plan — 2006 was a good year for disciplined investors!
Our Commitment to You
We remain committed to providing our shareholders with the guidance and solutions they need to prepare for retirement and achieve their goals. Thank you for continuing to turn to us for your financial solutions. We very much value you and your business.

Pamela J. Moret
Trustee and President
Thrivent Mutual Funds
1

Most major stock indices posted double-digit returns during the one-year period ended Dec. 31, 2006, as a cooling economy and falling commodities prices brightened investors’ outlook for inflation and interest rates. Although bond returns were pressured by further Federal Reserve (Fed) interest rate hikes early in the period, most types of bonds provided positive returns due to an easing of inflation worries and a pause in Fed tightening later in the period.
U.S. Economy
The nation’s gross domestic product moderated from a 5.6% annual growth rate in the first quarter to 2.6% and 2.0% in the second and third quarter and 3.5% in the fourth quarter. One of the most visible signs of the slowdown was a sharp pullback in the housing market, though sales of existing and new homes improved slightly late in the period.
The high cost of oil and other commodities was an intermittent concern for investors, weighing on stock prices particularly during mid-summer. However, an easing in energy prices late in the year shifted inflation sentiment dramatically and provided a strong boost to stock and bond markets.
Although economic growth slowed during the period, the labor market continued to add jobs. The unemployment rate sank to a five-year low of 4.4% in October and ended the year at 4.5% — a rate considered “full employment” by many economists.
Inflation & Monetary Policy
Overall inflation declined during the period, largely due to a pullback in energy prices. The Consumer Price Index (CPI) rose at a rate of 2.5% for the 12 months ended Dec. 31, 2006, compared with an increase of 3.4% for all of 2005. However, “core” inflation — excluding the more volatile prices of food and energy - rose 2.6% for the year ended Dec. 31, compared with a 2.2% core rate for all of 2005. The index for energy, which rose 17.1% in 2005, increased 2.9% during the 12-month period ended Dec. 31, 2006.
Noting that inflation was still a concern, the Federal Reserve’s Federal Reserve Open Market Committee (FOMC) continued raising its target for the federal funds rate through June 29, bringing the rate to 5.25% . But in the face of a slowing economy and an accelerating pullback in housing, policymakers left rates steady for the remainder of the year. The Fed continued to indicate its wariness of inflation, however, a possible sign that it may not begin cutting rates any time soon.
Equity Performance
Stocks gained in the first quarter as investors cheered strong economic and corporate profit growth and declining energy prices. But a broad pullback occurred in the second quarter in response to renewed concerns about inflation, interest rates, expensive energy and a slumping housing market. Investors’ mood reversed yet again in July as worries about inflation and interest rates fell with the prices of commodities and dwindling prospects of further Fed rate hikes. Stocks climbed throughout the second half, with the Dow Jones Industrials setting several all-time highs and other equity indices setting multi-year highs.
Small-company stocks outperformed large-company issues during the period. The Russell 2000 Index of small-company stocks posted an 18.37% total return, while the S&P 500 Index of large-company stocks recorded a 15.78% return. Value stocks outperformed growth stocks. During the period, the Russell 1000 Value Index returned 22.22%, while the Russell 1000 Growth Index posted a return of 9.07% .
Sectors that performed best during the period included telecommunications services, energy, consumer discretionary, and utilities, while health care, information technology, industrials, and consumer staples advanced at a more moderate rate. Real estate investment trusts (REITs) performed well during the period, with the NAREIT Equity REIT Index posting a 35.05% return.
Foreign stocks generally continued to outperform most domestic issues. The Morgan Stanley Capital International Europe, Australasia, Far East (EAFE) Index posted a 26.86% total return in dollar terms.
2
Fixed Income Performance
Bond returns were pressured by continued Federal Reserve interest rate hikes during much of the period. But in August — after 17 consecutive rate increases — policymakers moved to the sidelines. The pause brightened investors’ inflation and interest rate outlook dramatically, boosting the prices of most types of bonds.
During the year, yields on shorter-term securities rose more than yields on longer-term bonds. The result was an inverted yield curve (the differences among the yields of different maturities of similar credit quality) for much of the period, an atypical situation in which shorter-term bonds provided higher yields than longer-term bonds. The two-year Treasury yield increased from 4.40% to 4.81% during the period, the 10-year yield increased from 4.39% to 4.71%, and the 30-year Treasury yield rose from 4.54% to 4.81%.
Despite the headwind of rising rates during the first half of the year, most bond sectors provided positive returns. The Lehman Brothers Aggregate Bond Index of the broad U.S. bond market posted a 4.33% total return for the 12 months ended Dec. 31, 2006. Municipal bonds fared better in this environment, with the Lehman Brothers Municipal Bond Index posting a total return of 4.84% during the period. The Lehman Brothers Government/Corporate 1-3 Year Bond Index registered a 4.25% total return.
Below-investment-grade corporate bonds were stronger U.S. market performers during the period. The Lehman Brothers U.S. Corporate High Yield Bond Index registered an 11.84% total return.
Outlook
We think economic growth will remain slow over the next few months, with inflation continuing to ease from the higher levels of 2006. This will provide the “soft landing” sought by the Federal Reserve after more than two years of consecutive interest rate hikes.
Gross domestic product growth should continue at a 2% to 2.5% annual rate, keeping the economy out of recession that concerns some market watchers. Energy and commodities prices should continue to ease, and the housing pullback should moderate. Both of these factors will support consumer spending. Businesses, with plenty of cash on their balance sheets, are investing in productive assets.
Although we don’t expect more Fed interest rate increases in the near future, we don’t expect policymakers to ease rates any time soon either. The stock and bond markets have priced in expectations of lower rates in the first half of 2007, and, in the absence of an unexpected slowdown in the economy, we don’t agree.
The potential for the markets to be surprised by a lack of lower rates in early 2007 makes us cautious on more volatile segments of the stock and bond markets in the near term. Also, with the potential for further weakness in energy and commodities prices, and uncertainty in the housing market, there is a possibility that the economy could slow more than we expect or even enter a recession.
As always, your best strategy is to work with your Thrivent Investment Management registered representative to create an investment program based on your goals, diversify your portfolio and remain focused on the long term.
3

How did the Fund perform during the one-year period ended Dec. 31, 2006?
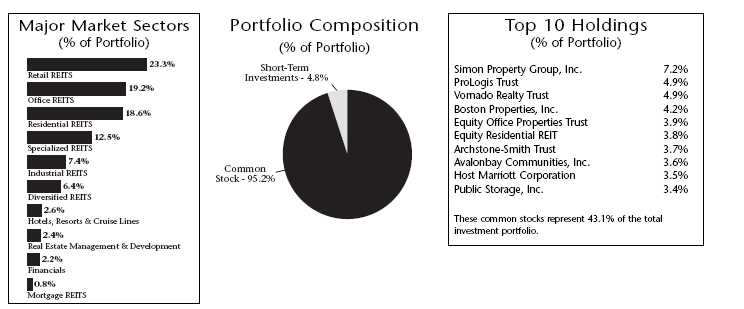
Thrivent Real Estate Securities Fund returned 34.27% during the one-year period ended Dec. 31, 2006. The Fund’s peer group, as represented by the Lipper Inc. Real Estate Category, reported a median return of 34.91% . The Fund’s market benchmark, the NAREIT Equity REIT Index, returned 35.06% . During this performance period, a modest cash position held in the Fund was the primary reason the Fund return was below that of the Index. Sector allocation and security selection decisions both contributed positively to performance results, as summarized below.
What factors impacted performance?
REIT stocks performed exceptionally well over the last 12 months due to strong rental demand for commercial and multifamily residential properties, and limited new supply. In addition, continued investment demand for real estate from both institutional and individual investors helped REIT stocks continue their strong performance record.
Thrivent Real Estate Securities Fund maintained exposure in each of the primary property types (office, industrial, apartments, and retail shopping centers) during the period. The office and apartment sectors were the best performing sectors of the primary property types within the REIT market over the past year. We concentrated our office exposure in REITs that own properties in high barrier to entry markets, specifically New York City, Washington D.C., and California. These markets currently enjoy low vacancy rates and strong rental demand, allowing property owners to increase rental rates for both new leases and renewals. In addition, we anticipated favorable trends in occupancy and rental rates in the apartment market, and steadily increased our allocation to this property type during the year.
Security selection within the office, apartment and retail shopping center sectors contributed positively to performance. Stocks that performed exceptionally within the Fund included Equity Office Properties, Class A office property owner in major U.S. cities, SL Green Realty Corp, a New York City-focused office REIT, AvalonBay Communities Inc, a luxury apartment developer and manager in coastal markets, and Simon Property Group, the largest owner of regional malls in the United States.
What is your outlook?
We anticipate slower economic growth in 2007 as a result of the declining demand for new single family homes, and weakening housing prices in many of the previously
Quoted Fund performance is for Class A shares and does not reflect a sales charge.
The returns shown do not reflect taxes a shareholder would pay on distributions or redemptions.
Quoted Major Market Sectors, Portfolio Composition and Top 10 Holdings are subject to change.
Major Market Sectors and Top 10 Holdings exclude short-term investments and collateral held for securities loaned.
4
booming housing markets. This housing slowdown is likely to have a direct impact on related industries including household goods and building products. Consumer spending in general may also be affected as a result of homeowners feeling less wealthy due to the deterioration in price appreciation trends for single family homes. However, we do not believe that weakness in the housing sector will be enough to trigger a recession in 2007.
Demand for commercial real estate and multifamily residential properties should continue to be steady as long as job growth remains positive in 2007. We continue to overweight REITs that operate in high barrier to entry markets (primarily the coastal areas), although we do maintain a geographically diverse portfolio with exposure across the entire United States. We believe that favorable trends will continue for office REITs with property exposure in New York City, Washington D.C. and California.
We also expect the U.S. apartment market to remain firm as a result of low vacancy rates and housing affordability issues in many parts of the country. While the shopping center sector may be perceived less favorably if consumer spending weakens, we believe that “Class A” malls-those malls in prime locations that generate the highest sales per square foot-will continue to be in strong demand.
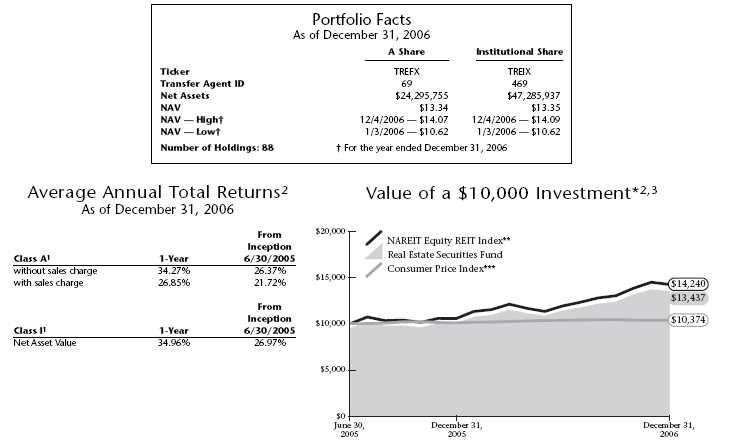
1 Class A performance has been restated to reflect the maximum sales charge of 5.5% . Institutional Class shares have no sales load and are for institutional shareholders only.
2 Past performance is not an indication of future results. Annualized total returns represent past performance and reflect changes in share prices, the reinvestment of all dividends and capital gains, and the effects of compounding. Periods of less than one year are not annualized. Investing in a mutual fund involves risks, including the possible loss of principal. The prospectus contains more complete information on the investment objectives, risks, charges and expenses of the investment company which investors should read and consider carefully before investing. To obtain a prospectus, contact a registered representative or visit www.thrivent.com. The Fund primarily invests in real estate-related industries; as a consequence, the Fund may be subject to greater price volatility than a fund investing in a broad range of industries. At various times, the Fund’s adviser waived its management fee and/or reimbursed Fund expenses. Had the adviser not done so, the Fund’s total returns would have been lower. The returns shown do not reflect taxes a shareholder would pay on distributions or redemptions. Please read your prospectus carefully.
3 Performance of other classes will be greater or less than the line shown based on the differences in fees paid by shareholders in the different classes.
* As you compare performance, please note that the Fund’s performance reflects the maximum 5.5% sales charge, while the Consumer Price Index and NAREIT Equity REIT Index do not reflect any such charges. If you were to purchase any of the above individual stocks or funds represented in these Indexes, any charges you would pay would reduce your total return as well.
** The NAREIT Equity REIT Index is an unmanaged capitalization-weighted index of all equity real estate investment trusts. It is not possible to invest directly in this Index. The performance of this Index does not reflect deductions for fees, expanses or taxes.
*** The Consumer Price Index is an inflationary indicator that measures the change in the cost of a fixed basket of products and services, including housing, electricity, food and transportation. It is not possible to invest directly in the Index.
5

Thrivent Diversified Income Plus Fund (formerly known as High Yield Fund II) recently changed its fiscal year end from October 31 to December 31. Shareholders recently received a report on the year ended Oct. 31, 2006. The following commentary and returns reflect the period from Oct. 31 through Dec. 31, 2006.
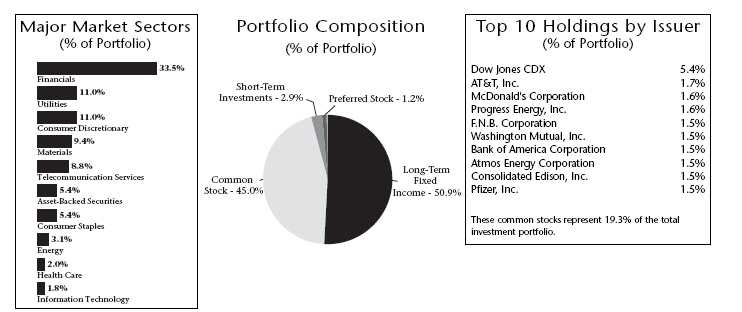
Prior to June 30, 2006, the Fund was named Thrivent High Yield Fund II and invested primarily (i.e., at least 80% of its net assets) in high-risk, high-yield bonds commonly referred to as “junk bonds.*” On June 30, 2006, the Fund adopted its current name and its current strategy, which includes the ability to invest in a more diversified portfolio of income-producing securities, such as dividend-producing equities, REIT stocks and other income-producing securities.
How did the Fund perform during the two-month period ended Dec. 31, 2006?
Thrivent Diversified Income Plus Fund returned 3.50% during the two-month period ended Dec. 31, 2006. This compares with the Fund’s primary benchmarks, including the S&P 500 Dividend Aristocrats Index, which returned 1.83%; the Lehman Brothers Aggregate Bond Index, which returned 0.57%; and the Lehman Brothers U.S. Corporate High Yield Bond Index, which returned 2.80% for the same two-month time frame.
What factors affected the Fund’s performance?
In the equity portion, both a large relative allocation to real estate investment trusts (REITs) and stock selection within that sector contributed to returns. This proved to be the best-performing element in the equity component for the period. REITs continued their surprisingly strong run due to robust demand from investors who value the favorable dividend yield the sector typically provides.
Next, the equity component’s focus on traditionally high-dividend-paying stocks issued by companies in the utilities and financial services sectors significantly supported performance.
The fixed-income component, which comprised primarily high-yield bonds, delivered strong performance due to good security selection and an allocation to hybrid securities, a new sector of the fixed-income market that is similar in structure to preferred stock.
Based on our belief that energy credits generally had peaked in value, we sold many of our energy bonds, enabling us to reap solid gains for the Fund. Investments in the cable industry also helped performance.
Our underweighting in the lowest-rated high-yield credits —CCC-rated and distressed/defaulted credits — detracted from performance.
*High-yield bonds carry greater volatility and risk than investment-grade bonds.
Quoted Fund performance is for Class A shares and does not reflect a sales charge.
The returns shown do not reflect taxes a shareholder would pay on distributions or redemptions.
Quoted Major Market Sectors, Portfolio Composition and Top 10 Holdings by Issuer are subject to change.
Major Market Sectors and Top 10 Holdings by Issuer exclude short-term investments and collateral held for securities loaned.
6
What is your outlook?
Our outlook for the Fund is positive, particularly given its strong start and favorable performance versus its peer group median. In general, we believe that higher-dividend-paying securities will remain in favor among investors, particularly as interest rates stabilize. On the fixed-income side, our outlook for high-yield bonds is somewhat cautious, given our expectations for only a mild slowdown in U.S. economy growth, as opposed to an outright recession, which we believe is unlikely given the strength of current economic fundamentals. Our active management of the Fund, coupled with the generally favorable macro conditions we anticipate, should bode well for the Fund given its highly diversified composition and pursuit of attractive, steady income.
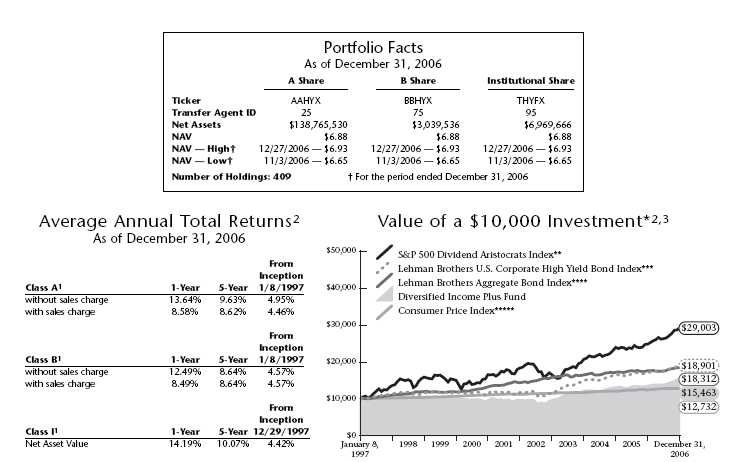
1 Class A performance reflects the maximum sales charge of 4.5% . Class B performance reflects the maximum contingent deferred sales charge (CDSC) of 5%, declining 1% each year during the first five years and then converting to Class A shares after the fifth year. Institutional Class shares have no sales load and are for institutional shareholders only.
2 Past performance is not an indication of future results. Annualized total returns represent past performance and reflect changes in share prices, the reinvestment of all dividends and capital gains, and the effects of compounding. Investing in a mutual fund involves risks, including the possible loss of principal. The prospectus contains more complete information on the investment objectives, risks, charges and expenses of the investment company which investors should read and consider carefully before investing. To obtain a prospectus, contact a registered representative or visit www.thrivent.com. At various times, the Fund’s adviser waived its management fee and/or reimbursed Fund expenses. Had the adviser not done so, the Fund’s total returns would have been lower. The returns shown do not reflect taxes a shareholder wou ld pay on distributions or redemptions. Please read your prospectus carefully.
3 Performance of other classes will be greater or less than the line shown based on the differences in loads and fees paid by shareholders investing in the different classes.
* As you compare performance, please note that the Fund’s performance reflects the maximum 4.5% sales charge, while the S&P 500 Dividend Aristocrats Index, the Lehman Brothers Aggregate Bond Index, the Lehman Brothers U.S. Corporate High Yield Bond Index and the Consumer Price Index do not reflect any such charges. If you were to purchase any of the above individual stocks or funds represented in these Indexes, any charges you would pay would reduce your total return as well.
** The S&P 500 Dividend Aristocrats Index is an index which measures the performance of large-capitalization companies within the S&P 500 that have followed a managed dividends policy of consistently increasing dividends every year for at least 25 years. The index portfolio has both capital growth and dividend income characteristics, is equal-weighted and is broadly diversified across sectors. It is not possible to invest directly in the Index. The performance of the Index does not reflect deductions for fees, expenses or taxes. The composition of the S&P 500 Dividend Aristocrats Index serves as a better reflection of the Fund’s current strategy than does the Lehman Brothers U.S. Corporate High Yield Bond Index.
*** The Lehman Brothers U.S. Corporate High Yield Bond Index is an index which measures the performance of fixed-rate non-investment grade bonds. It is not possible to invest directly in the Index. The performance of the Index does not reflect deductions for fees, expenses or taxes.
**** The Lehman Brothers Aggregate Bond Index is an index that measures the performance of U.S. investment grade bonds. It is not possible to invest directly in the Index. The performance of the Index does not reflect deductions for fees, expenses or taxes. The composition of the Lehman Brothers Aggregate Bond Index serves as a better reflection of the Fund’s current strategy than does the Lehman Brothers High Yield Bond Index.
***** The Consumer Price Index is an inflationary indicator that measures the change in the cost of a fixed basket of products and services, including housing, electricity, food and transportation. It is not possible to invest directly in the Index.
7
Shareholder Expense Example
(Unaudited)
As a shareholder of the Fund, you incur two types of costs: (1) transaction costs, including sales charges (loads) on purchase payments, reinvested dividends, or other distributions; redemption fees; and exchange fees; and (2) ongoing costs, including management fees; distribution (12b-1) fees and other Fund expenses. This Example is intended to help you understand your ongoing costs (in dollars) of investing in the Fund and to compare these costs with the ongoing costs of investing in other mutual funds. The Example is based on an investment of $1,000 invested at the beginning of the period and held for the entire period from July 1, 2006, through December 31, 2006, for Real Estate Securities Fund and from November 1, 2006, through December 31, 2006, for Diversified Income Plus Fund.
Actual Expenses
In the table below, the first section provides information about actual account values and actual expenses. You may use the information in this line, together with the amount you invested, to estimate the expenses that you paid over the period. Simply divide your account value by $1,000 (for example, an $8,600 account value divided by $1,000 = 8.6), then multiply the result by the number in the first line under the heading entitled “Expenses Paid During Period” to estimate the expenses you paid. A small account fee of $12 is charged to Class A and Class B shareholder accounts if the value falls below stated account minimums. This fee is not included in the table below. If it were, the expenses you paid during the period would have been higher and the ending account value would have been lower.
Hypothetical Example for Comparison Purposes
In the table below, the second section provides information about hypothetical account values and hypothetical expenses based on the Fund’s actual expense ratio and an assumed rate of return of 5% per year before expenses, which is not the Fund’s actual return. The hypothetical account values and expenses may not be used to estimate the actual ending account balance or expenses you paid for the period. You may use this information to compare the ongoing costs of investing in the Fund and other funds. To do so, compare this 5% hypothetical example with the 5% hypothetical examples that appear in the shareholder reports of other funds. A small account fee of $12 is charged to Class A and Class B shareholder accounts if the value falls below stated account minimums. This fee is not included in the table below. If it were, the expenses you paid during the period would have been higher and the ending account value would have been lower.
Please note that the expenses shown in the table are meant to highlight your ongoing costs only and do not reflect any transactional costs, such as sales charges (loads), redemption fees, or exchange fees. Therefore, the second line of the table is useful in comparing ongoing costs only, and will not help you determine the relative total costs of owning different funds. In addition, if these transactional costs were included, your costs would have been higher.
| | Beginning | Ending | Expenses | |
| | Account | Account | Paid During | Annualized |
| | Value | Value | Period * | Expense |
| | 7/1/2006 | 12/31/2006 | 7/1/2006 — 12/31/2006 | Ratio |
|
| Thrivent Real Estate Securities Fund | | | |
| Actual | | | | |
| Class A | $1,000 | $1,184 | $1.74 | 0.32% |
| Institutional Class | $1,000 | $1,186 | ($0.46) | (0.08%) |
| Hypothetical ** | | | | |
| Class A | $1,000 | $1,024 | $1.61 | 0.32% |
| Institutional Class | $1,000 | $1,026 | ($0.43) | (0.08%) |
8
| | Beginning | Ending | Expenses | |
| | Account | Account | Paid During | Annualized |
| | Value | Value | Period *** | Expense |
| | 11/1/2006 | 12/31/2006 | 11/1/2006 — 12/31/2006 | Ratio |
|
| Thrivent Diversified Income Plus Fund | | | |
| Actual | | | | |
| Class A | $1,000 | $1,035 | $1.84 | 1.08% |
| Class B | $1,000 | $1,033 | $3.69 | 2.17% |
| Institutional Class | $1,000 | $1,036 | $1.12 | 0.66% |
| Hypothetical ** | | | | |
| Class A | $1,000 | $1,007 | $1.81 | 1.08% |
| Class B | $1,000 | $1,005 | $3.64 | 2.17% |
| Institutional Class | $1,000 | $1,007 | $1.11 | 0.66% |
* Expenses are equal to the Fund’s annualized expense ratio, multiplied by the average account value over the period, multiplied by 184/365 to reflect the one-half year period.
** Assuming 5% total return before expenses
*** Expenses are equal to the Fund’s annualized expense ratio, multiplied by the average account value over the period, multiplied by 61/365 to reflect the 2 month period.
9

Report of Independent Registered Public Accounting Firm
To the Shareholders and Trustees of
the Thrivent Mutual Funds:
In our opinion, the accompanying statements of assets and liabilities, including the schedules of investments, and the related statements of operations and of changes in net assets and the financial highlights present fairly, in all material respects, the financial position of the Thrivent Real Estate Securities Fund and the Thrivent Diversified Income Plus Fund (the “Funds”) at December 31, 2006, the results of each of their operations, changes in each of their net assets and their financial highlights for each of the periods presented, in conformity with accounting principles generally accepted in the United States of America. These financial statements and financial highlights (hereafter referred to as “financial statements”) are the responsibility of the Funds’ management; our responsibility is to express an opinion on these financial statements based on our audits. We conducted our audits of these financial statements in accordance with the standards of the Public Company Accounting Oversight Board (United States). Those standards require that we plan and perform the audit to obtain reasonable assurance about whether the financial statements are free of material misstatement. An audit includes examining, on a test basis, evidence supporting the amounts and disclosures in the financial statements, assessing the accounting principles used and significant estimates made by management, and evaluating the overall financial statement presentation. We believe that our audits, which included confirmation of securities at December 31, 2006 by correspondence with the custodian and brokers, provide a reasonable basis for our opinion.

February 16, 2007
10
| Real Estate Securities Fund |
| Schedule of Investments as of December 31, 2006 |
| | | | | |
| Shares | Common Stock (96.0%) | Value | Shares | Common Stock (96.0%) | Value |
|
| |
| Consumer Discretionary (2.6%) | | 5,000 | Forest City Enterprises * | $292,000 |
| 17,500 | Hilton Hotels Corporation | $610,750 | 36,800 | General Growth Properties, Inc. | 1,922,064 |
| 1 | InterContinental Hotels Group plc | 13 | 10,000 | Health Care Property | |
| 20,000 | Starwood Hotels & Resorts | | | Investors, Inc. | 368,200 |
| | Worldwide, Inc. | 1,250,000 | 6,000 | Health Care REIT, Inc. * | 258,120 |
|
| |
| | Total Consumer | | 4,000 | Healthcare Realty Trust, Inc. | 158,160 |
| | Discretionary | 1,860,763 | 5,667 | Highland Hospitality Corporation | 80,755 |
|
| |
| | | | 11,200 | Highwoods Properties, Inc. | 456,512 |
| Financials (93.4%) | | 6,500 | Home Properties, Inc. | 385,255 |
| 9,200 | Alexandria Real Estate | | 103,983 | Host Marriott Corporation | 2,552,783 |
| | Equities, Inc. * | 923,680 | 15,000 | HRPT Properties Trust * | 185,250 |
| 23,100 | AMB Property Corporation | 1,353,891 | 5,017 | Inland Real Estate Corporation * | 93,918 |
| 5,062 | American Campus | | 3,800 | Innkeepers USA Trust | 58,900 |
| | Communities, Inc. | 144,115 | 10,000 | iShares Dow Jones U.S. Real | |
| 12,600 | Apartment Investment & | | | Estate Index Fund * | 838,300 |
| | Management Company | 705,852 | 6,000 | iStar Financial, Inc. | 286,920 |
| 45,393 | Archstone-Smith Trust | 2,642,327 | 6,000 | Kilroy Realty Corporation | 468,000 |
| 19,900 | Avalonbay Communities, Inc. | 2,587,995 | 48,389 | Kimco Realty Corporation * | 2,175,086 |
| 13,500 | BioMed Realty Trust, Inc. | 386,100 | 6,000 | Kite Realty Group Trust | 111,720 |
| 26,800 | Boston Properties, Inc. | 2,998,384 | 10,200 | LaSalle Hotel Properties | 467,670 |
| 22,081 | Brandywine Realty Trust * | 734,193 | 10,200 | Liberty Property Trust * | 501,228 |
| 8,800 | BRE Properties, Inc. * | 572,176 | 15,600 | Macerich Company | 1,350,492 |
| 35,800 | Brookfield Properties Corporation | 1,408,014 | 10,200 | Mack-Cali Realty Corporation * | 520,200 |
| 14,200 | Camden Property Trust | 1,048,670 | 10,000 | Maguire Properties, Inc. | 400,000 |
| 6,500 | CBL & Associates Properties, Inc. | 281,775 | 7,000 | Medical Properties Trust, Inc. | 107,100 |
| 3,500 | Colonial Properties Trust | 164,080 | 4,317 | Mid-America Apartment | |
| 17,100 | Corporate Office Properties | | | Communities, Inc. | 247,105 |
| | Trust * | 863,037 | 6,000 | National Retail Properties, Inc. | 137,700 |
| 3,600 | Crystal River Capital, Inc. * | 91,908 | 14,200 | Nationwide Health | |
| 24,700 | Developers Diversified Realty | | | Properties, Inc. * | 429,124 |
| | Corporation * | 1,554,865 | 10,000 | New Plan Excel Realty Trust, Inc. | 274,800 |
| 5,000 | DiamondRock Hospitality | | 4,000 | Newcastle Investment | |
| | Company * | 90,050 | | Corporation * | 125,280 |
| 6,700 | Digital Realty Trust, Inc. | 229,341 | 5,000 | NorthStar Realty Finance | |
| 11,700 | Duke Realty Corporation | 478,530 | | Corporation | 82,850 |
| 5,800 | EastGroup Properties, Inc. | 310,648 | 5,000 | Omega Healthcare Investors, Inc. | 88,600 |
| 9,500 | Equity Inns, Inc. | 151,620 | 58,208 | ProLogis Trust | 3,537,300 |
| 6,000 | Equity Lifestyle Properties, Inc. | 326,580 | 2,900 | PS Business Parks, Inc. | 205,059 |
| 58,747 | Equity Office Properties Trust | 2,829,843 | 25,188 | Public Storage, Inc. | 2,455,830 |
| 3,000 | Equity One, Inc. * | 79,980 | 2,000 | Realty Income Corporation | 55,400 |
| 54,700 | Equity Residential REIT | 2,776,025 | 9,500 | Reckson Associates Realty | |
| 7,400 | Essex Property Trust, Inc. * | 956,450 | | Corporation | 433,200 |
| 11,500 | Extra Space Storage, Inc. | 209,990 | 16,600 | Regency Centers Corporation | 1,297,622 |
| 12,900 | Federal Realty Investment Trust | 1,096,500 | 10,000 | Senior Housing Property Trust * | 244,800 |
| 2,500 | First Industrial Realty Trust, Inc. * | 117,225 | 51,400 | Simon Property Group, Inc. | 5,206,306 |
| The accompanying Notes to Financial Statements are an integral part of this schedule. |
|
| 11 |
| Real Estate Securities Fund | | | | | | |
| Schedule of Investments as of December 31, 2006 | | | | | |
| |
| Shares | Common Stock (96.0%) | Value | Shares | Common Stock (96.0%) | Value |
|
| |
| Financials — continued | | | 30,100 | United Dominion Realty | |
| 14,500 | SL Green Realty Corporation | $1,925,310 | | | Trust, Inc. * | | $956,879 |
| 12,000 | SPDR DJ Wilshire International | | | 5,000 | U-Store-It Trust | | 102,750 |
| | Real Estate ETF # | 759,120 | | 21,000 | Ventas, Inc. | | 888,720 |
| 15,500 | Spirit Finance Corporation | 193,285 | | 29,000 | Vornado Realty Trust | 3,523,500 |
| 1,837 | Sun Communities, Inc. | 59,445 | | 8,500 | Weingarten Realty Investors * | 391,935 |
|
|
| 11,700 | Sunstone Hotel Investors, Inc. | 312,741 | | | Total Financials | 66,872,514 |
|
|
| 5,000 | Tanger Factory Outlet | | | | | | |
|
|
| | Centers, Inc. * | 195,400 | | | Total Common Stock | |
| 11,600 | Taubman Centers, Inc. | 589,976 | | | (cost $56,806,594) | 68,733,277 |
|
|
| |
| | | | | Interest | Maturity | |
| Shares | Collateral Held for Securities Loaned (14.5%) | Rate (+) | Date | Value |
|
| 10,395,975 | Thrivent Financial Securities Lending Trust | | 5.280% | N/A | $10,395,975 |
|
|
| | | Total Collateral Held for Securities Loaned | |
| | | (cost $10,395,975) | | | | 10,395,975 |
|
|
| |
| |
| Shares or | | | | | | | |
| Principal | | | | Interest | Maturity | |
| Amount | Short-Term Investments (4.9%) | | Rate (+) | Date | Value |
|
| 2,501,574 | Thrivent Money Market Fund | | | 5.030% | N/A | $2,501,574 |
| $1,000,000 | Windmill Funding Corporation | | | 5.310 | 1/2/2007 | 999,852 |
|
|
| | | Total Short-Term Investments (at amortized cost) | 3,501,426 |
|
|
| | | Total Investments (cost $70,703,995) 115.4% | $82,630,678 |
|
|
| | | Other Assets and Liabilities, Net (15.4%) | | (11,048,986) |
|
|
| | | Total Net Assets 100.0% | | | $71,581,692 |
|
|
# Non-income producing security.
* All or a portion of the security is on loan as discussed in item 2(K) of the Notes to Financial Statements.
+ The interest rate shown reflects the yield, coupon rate or, for securities purchased at a discount, the discount rate at the date of purchase.
Definitions:
REIT – Real Estate Investment Trust, is a company that buys, develops, manages and/or sells real estate assets.
Gross unrealized appreciation and depreciation of investments were as follows:
| Gross unrealized appreciation | $11,761,042 |
| Gross unrealized depreciation | (45,735) |
|
|
| Net unrealized appreciation (depreciation) | $11,715,307 |
| Cost for federal income tax purposes | $70,915,371 |
| The accompanying Notes to Financial Statements are an integral part of this schedule. |
|
| 12 |
| Diversified Income Plus Fund |
| Schedule of Investments as of December 31, 2006 |
| | | | | |
| Shares | Common Stock (45.5%) | Value | Shares | Common Stock (45.5%) | Value |
|
| |
| Consumer Discretionary (3.6%) | | 436 | Capital One Financial Corporation | $33,494 |
| 5,400 | Bandag, Inc. * | $272,322 | 800 | CBL & Associates Properties, Inc. | 34,680 |
| 5,000 | Genuine Parts Company * | 237,150 | 20,200 | Citigroup, Inc. | 1,125,140 |
| 30,000 | La-Z-Boy, Inc. * | 356,100 | 4,600 | Colonial Properties Trust | 215,648 |
| 2,000 | Leggett & Platt, Inc. * | 47,800 | 9,200 | Comerica, Inc. | 539,856 |
| 53,400 | McDonald’s Corporation | 2,367,222 | 14,400 | Commerce Group, Inc. | 428,400 |
| 4,200 | Polaris Industries, Inc. * | 196,686 | 2,600 | Community Banks, Inc. * | 72,176 |
| 46,900 | ServiceMaster Company * | 614,859 | 24,000 | Corus Bankshares, Inc. * | 553,680 |
| 4,700 | Stanley Works * | 236,363 | 14,100 | Crescent Real Estate Equities | |
| 27,200 | Superior Industries | | | Company * | 278,475 |
| | International, Inc. * | 524,144 | 4,300 | Developers Diversified Realty | |
| 9,900 | Talbots, Inc. * | 238,590 | | Corporation * | 270,685 |
| 3,100 | VF Corporation | 254,448 | 3,800 | DiamondRock Hospitality Company * | 68,438 |
|
| |
| | Total Consumer | | 1,500 | Digital Realty Trust, Inc. | 51,345 |
| | Discretionary | 5,345,684 | 7,100 | Duke Realty Corporation * | 290,390 |
|
| |
| | | | 2,000 | Entertainment Properties Trust * | 116,880 |
| Consumer Staples (3.0%) | | 200 | Equity One, Inc. * | 5,332 |
| 18,500 | Altria Group, Inc. ‡ | 1,587,670 | 7,500 | Equity Residential REIT * | 380,625 |
| 11,400 | ConAgra Foods, Inc. * | 307,800 | 4,400 | Extra Space Storage, Inc. * | 80,344 |
| 1,600 | Kimberly-Clark Corporation | 108,720 | 122,200 | F.N.B. Corporation * | 2,232,594 |
| 12,700 | Lancaster Colony Corporation * | 562,737 | 4,600 | Feldman Mall Properties, Inc. * | 57,500 |
| 15,200 | Procter & Gamble Company | 976,904 | 29,000 | Fiduciary/Claymore MLP | |
| 17,600 | Universal Corporation | 862,576 | | Opportunity Fund | 658,300 |
|
| |
| | Total Consumer Staples | 4,406,407 | 23,200 | Fifth Third Bancorp * | 949,576 |
|
| |
| | | | 159,800 | First Commonwealth Financial | |
| Energy (1.2%) | | | Corporation * | 2,146,114 |
| 12,900 | Chevron Corporation ‡ | 948,537 | 8,500 | First Industrial Realty | |
| 23,300 | Kayne Anderson MLP Investment | | | Trust, Inc. * | 398,565 |
| | Company * | 768,434 | 83,500 | FirstMerit Corporation * | 2,015,690 |
|
| |
| | Total Energy | 1,716,971 | 6,900 | Franklin Street Properties | |
|
| |
| | | | | Corporation * | 145,245 |
| Financials (24.6%) | | 5,100 | General Growth Properties, Inc. * | 266,373 |
| 1,700 | Agree Realty Corporation | 58,429 | 20,800 | Glimcher Realty Trust * | 555,568 |
| 18,200 | American Financial Realty Trust * | 208,208 | 200 | Global Signal, Inc. | 10,534 |
| 3,900 | Apartment Investment & | | 7,615 | Harleysville National | |
| | Management Company * | 218,478 | | Corporation * | 147,046 |
| 750 | Arcadia Financial, Ltd., Stock | | 13,700 | Health Care Property | |
| | Warrants #^ | 0 | | Investors, Inc. | 504,434 |
| 4,400 | Archstone-Smith Trust * | 256,124 | 14,000 | Health Care REIT, Inc. * | 602,280 |
| 54,300 | Arthur J. Gallagher & Company * | 1,604,565 | 7,500 | Healthcare Realty Trust, Inc. * | 296,550 |
| 600 | Avalonbay Communities, Inc. | 78,030 | 4,000 | Highwoods Properties, Inc. | 163,040 |
| 41,100 | Bank of America Corporation ‡ | 2,194,329 | 2,900 | Home Properties, Inc. | 171,883 |
| 8,500 | BB&T Corporation | 373,405 | 12,600 | Hospitality Properties Trust | 598,878 |
| 500 | BioMed Realty Trust, Inc. | 14,300 | 13,500 | Host Marriott Corporation * | 331,425 |
| 3,900 | Boston Properties, Inc. | 436,332 | 33,300 | HRPT Properties Trust * | 411,255 |
| 5,700 | Brandywine Realty Trust * | 189,525 | 8,400 | Independent Bank Corporation | 212,436 |
| 300 | Camden Property Trust * | 22,155 | 2,100 | Inland Real Estate Corporation * | 39,312 |
| The accompanying Notes to Financial Statements are an integral part of this schedule. |
|
| 13 |
| Diversified Income Plus Fund | | | | |
| Schedule of Investments as of December 31, 2006 | | | | |
| |
| Shares | Common Stock (45.5%) | Value | Shares | Common Stock (45.5%) | Value |
|
| |
| Financials — continued | | 100 | Tanger Factory Outlet | |
| 7,300 | iStar Financial, Inc. * | $349,086 | | Centers, Inc. * | $3,908 |
| 5,245 | Kimco Realty Corporation * | 235,763 | 16,830 | Tortoise Energy Infrastructure | |
| 100 | LaSalle Hotel Properties * | 4,585 | | Corporation * | 585,516 |
| 14,900 | Lexington Corporate Properties | | 6,600 | Trustreet Properties, Inc. | 111,210 |
| | Trust * | 334,207 | 4,200 | United Dominion Realty | |
| 7,200 | Liberty Property Trust * | 353,808 | | Trust, Inc. * | 133,518 |
| 19,100 | Longview Fibre Company | 419,245 | 2,800 | U-Store-It Trust * | 57,540 |
| 1,000 | Macerich Company | 86,570 | 1,900 | Valley National Bancorp * | 50,369 |
| 4,700 | Mack-Cali Realty Corporation * | 239,700 | 3,600 | Ventas, Inc. | 152,352 |
| 400 | Maguire Properties, Inc. * | 16,000 | 5,000 | Vornado Realty Trust | 607,500 |
| 1,600 | Mercury General Corporation | 84,368 | 48,700 | Washington Mutual, Inc. | 2,215,363 |
| 1,400 | Mid-America Apartment | | 1,100 | Washington Real Estate | |
| | Communities, Inc. | 80,136 | | Investment Trust * | 44,000 |
| 1,000 | Mills Corporation * | 20,000 | 2,000 | Weingarten Realty Investors * | 92,220 |
| 21,700 | National City Corporation * | 793,352 | 3,500 | WesBanco, Inc. * | 117,355 |
|
|
| 4,223 | National penn Bancshares, Inc. * | 85,516 | | Total Financials | 36,580,799 |
|
|
| 9,300 | National Retail Properties, Inc. * | 213,435 | | | |
| 8,900 | Nationwide Health | | Health Care (1.9%) | |
| | Properties, Inc. | 268,958 | 13,600 | Merck & Company, Inc. | 592,960 |
| 2,700 | New Plan Excel Realty | | 6,000 | Meridian Bioscience, Inc. | 147,180 |
| | Trust, Inc. * | 74,196 | 83,100 | Pfizer, Inc. | 2,152,290 |
|
|
| 26,300 | Old National Bancorp * | 497,596 | | Total Health Care | 2,892,430 |
|
|
| 4,900 | Old Republic International | | | | |
| | Corporation | 114,072 | Industrials (1.6%) | |
| 13,300 | Omega Healthcare | | 3,000 | A.O. Smith Corporation | 112,680 |
| | Investors, Inc. * | 235,676 | 4,800 | Avery Dennison Corporation * | 326,064 |
| 900 | Park National Corporation * | 89,100 | 3,300 | Badger Meter, Inc. * | 91,410 |
| 3,400 | Pennsylvania Real Estate | | 23,400 | Briggs & Stratton Corporation * | 630,630 |
| | Investment Trust | 133,892 | 13,200 | General Electric Company | 491,172 |
| 4,700 | ProLogis Trust * | 285,619 | 16,800 | Masco Corporation * | 501,816 |
| 702 | Public Storage, Inc. | 68,445 | 4,700 | McGrath Rentcorp * | 143,961 |
| 11,800 | Realty Income Corporation * | 326,860 | 3,700 | Tennant Company | 107,300 |
|
|
| 1,600 | Reckson Associates Realty | | | Total Industrials | 2,405,033 |
|
|
| | Corporation * | 72,960 | | | |
| 12,758 | Regions Financial Corporation | 477,149 | Information Technology (0.2%) | |
| 1,000 | Sandy Spring Bancorp, Inc. * | 38,180 | 2,400 | Linear Technology Corporation * | 72,768 |
| 9,900 | Senior Housing Property Trust * | 242,352 | 6,600 | Paychex, Inc. | 260,964 |
|
|
| 6,600 | Simon Property Group, Inc. | 668,514 | | Total Information | |
| 6,500 | Sky Financial Group, Inc. * | 185,510 | | Technology | 333,732 |
|
|
| 100 | SL Green Realty Corporation | 13,278 | | | |
| 2,600 | Sovran Self Storage, Inc. | 148,928 | Materials (1.5%) | |
| 37,700 | Spirit Finance Corporation * | 470,119 | 2,200 | Bemis Company, Inc. | 74,756 |
| 23,900 | Sterling Bancorp * | 470,830 | 3,000 | PPG Industries, Inc. * | 192,630 |
| 12,000 | Sun Communities, Inc. | 388,320 | 52,000 | RPM International, Inc. | 1,086,280 |
| 500 | Sunstone Hotel Investors, Inc. | 13,365 | 24,700 | Sonoco Products Company | 940,082 |
|
|
| 25,900 | Susquehanna Bancshares, Inc. * | 696,192 | | Total Materials | 2,293,748 |
|
|
| The accompanying Notes to Financial Statements are an integral part of this schedule. |
|
| 14 |
| Diversified Income Plus Fund | | | | | |
| Schedule of Investments as of December 31, 2006 | | | | |
| |
| Shares | Common Stock (45.5%) | Value | Shares | Preferred Stock (1.2%) | Value |
|
| |
| Telecommunications Services (1.7%) | | Energy (0.3%) | | |
| 68,600 | AT&T, Inc. *‡ | $2,452,450 | 10,000 | Goldman Sachs Group, Inc., | |
| 500 | Unifi Communications, Inc., | | | Convertible #¿ | $299,690 |
| | Stock Warrants #^ƒ | 0 | 2,750 | Lehman Brothers Holdings, Inc., | |
|
| |
| | Total Telecommunications | | | Convertible #¿ | 199,430 |
|
|
| | Services | 2,452,450 | | Total Energy | 499,120 |
|
| |
|
| |
| Utilities (6.2%) | | Financials (0.7%) | | |
| 68,400 | Atmos Energy Corporation *‡ | 2,182,644 | 11,745 | Simon Property Group, Inc., | |
| 45,400 | Consolidated Edison, Inc. * | 2,182,378 | | Convertible # | | 956,043 |
|
|
| 20,100 | Otter Tail Corporation * | 626,316 | | Total Financials | 956,043 |
|
|
| 17,000 | Peoples Energy Corporation * | 757,690 | | | | |
| 47,500 | Progress Energy, Inc. * | 2,331,300 | Utilities (0.2%) | | |
| 28,600 | Vectren Corporation * | 808,808 | 3,505 | CenterPoint Energy, Inc., | |
| 6,100 | WPS Resources Corporation * | 329,583 | | Convertible | | 134,757 |
|
| |
| | Total Utilities | 9,218,719 | 720 | NRG Energy, Inc., Convertible # | 194,130 |
|
| |
|
| | | | | Total Utilities | 328,887 |
|
| |
|
| | Total Common Stock | | | | | |
|
|
| | (cost $63,720,718) | 67,645,973 | | Total Preferred Stock | |
|
| |
| | | | | (cost $1,685,683) | 1,784,050 |
|
|
| |
| Principal | | | Interest | Maturity | |
| Amount | Long-Term Fixed Income (48.4%) | Rate | Date | Value |
|
| |
| Asset-Backed Securities (5.4%) | | | | | |
| $7,850,000 | Dow Jones CDX * | | 8.375% | 12/29/2011 | $8,021,130 |
|
|
| | | Total Asset-Backed Securities | | 8,021,130 |
|
|
| |
| Basic Materials (3.8%) | | | | | |
| 180,000 | Abitibi-Consolidated, Inc. *‡ | | 8.550 | 8/1/2010 | 171,000 |
| 100,000 | Abitibi-Consolidated, Inc. * | | 7.750 | 6/15/2011 | 89,750 |
| 250,000 | Ainsworth Lumber Company, Ltd. *†‡ | 9.110 | 3/30/2007 | 211,250 |
| 120,000 | AK Steel Corporation ‡ | | 7.750 | 6/15/2012 | 120,900 |
| 150,000 | Aleris International, Inc. | | 9.000 | 12/15/2014 | 150,750 |
| 110,000 | Aleris International, Inc. | | 10.000 | 12/15/2016 | 110,275 |
| 130,000 | Appleton Papers, Inc. | | 8.125 | 6/15/2011 | 132,600 |
| 220,000 | Arch Western Finance, LLC * | | 6.750 | 7/1/2013 | 218,350 |
| 143,000 | BCP Caylux Holdings Luxembourg SCA | 9.625 | 6/15/2014 | 158,015 |
| 120,000 | Buckeye Technologies, Inc. | | 8.000 | 10/15/2010 | 120,000 |
| 210,000 | Chaparral Steel Company | | 10.000 | 7/15/2013 | 234,412 |
| 220,000 | Crystal US Holdings 3, LLC/Crystal | | | | |
| | US Sub 3 Corporation *> | | Zero Coupon | 10/1/2009 | 188,100 |
| 190,000 | Domtar, Inc. | | 7.125 | 8/1/2015 | 186,200 |
| 190,000 | Drummond Company, Inc. * | | 7.375 | 2/15/2016 | 186,200 |
| 145,000 | Equistar Chemicals, LP | | 10.625 | 5/1/2011 | 154,425 |
| 320,000 | FMG Finance, Pty. Ltd. * | | 10.625 | 9/1/2016 | 343,200 |
| 120,000 | Georgia-Pacific Corporation | | 8.125 | 5/15/2011 | 126,000 |
| The accompanying Notes to Financial Statements are an integral part of this schedule. |
|
| 15 |
| Diversified Income Plus Fund | | | |
| Schedule of Investments as of December 31, 2006 | | | |
| |
| Principal | | Interest | Maturity | |
| Amount | Long-Term Fixed Income (48.4%) | Rate | Date | Value |
|
| Basic Materials — continued | | | |
| $70,000 | Georgia-Pacific Corporation | 7.000% | 1/15/2015 | $69,825 |
| 190,000 | Georgia-Pacific Corporation | 7.125 | 1/15/2017 | 189,525 |
| 300,000 | Graphic Packaging International Corporation * | 9.500 | 8/15/2013 | 316,500 |
| 210,000 | Griffin Coal Mining Company, Pty. Ltd. * | 9.500 | 12/1/2016 | 216,300 |
| 220,000 | Huntsman International, LLC | 7.875 | 11/13/2014 | 221,650 |
| 100,000 | Jefferson Smurfit Corporation | 8.250 | 10/1/2012 | 97,500 |
| 200,000 | Lyondell Chemical Company | 10.500 | 6/1/2013 | 220,000 |
| 260,000 | Lyondell Chemical Company | 8.250 | 9/15/2016 | 273,000 |
| 180,000 | Momentive Performance Materials, Inc. | 11.500 | 12/1/2016 | 176,400 |
| 90,000 | Mosaic Global Holdings, Inc. | 7.625 | 12/1/2016 | 93,262 |
| 440,000 | Mosaic Global Holdings, Inc., Convertible | 7.375 | 12/1/2014 | 451,550 |
| 130,000 | Peabody Energy Corporation, Convertible * | 4.750 | 12/15/2066 | 123,988 |
| 140,000 | PNA Group, Inc. | 10.750 | 9/1/2016 | 144,725 |
| 220,000 | Ryerson, Inc. * | 8.250 | 12/15/2011 | 218,350 |
|
|
| | Total Basic Materials | | 5,714,002 |
|
|
| |
| Capital Goods (3.9%) | | | |
| 80,000 | Ahern Rentals, Inc. | 9.250 | 8/15/2013 | 83,400 |
| 620,000 | Allied Waste North America, Inc. ‡ | 7.875 | 4/15/2013 | 639,375 |
| 490,000 | Amsted Industries, Inc. | 10.250 | 10/15/2011 | 524,300 |
| 100,000 | Ashtead Capital, Inc. | 9.000 | 8/15/2016 | 107,000 |
| 190,000 | Ball Corporation | 6.625 | 3/15/2018 | 189,050 |
| 210,000 | Berry Plastics Holding Corporation | 8.875 | 9/15/2014 | 213,150 |
| 150,000 | Browning-Ferris Industries, Inc. | 9.250 | 5/1/2021 | 159,000 |
| 150,000 | Browning-Ferris Industries, Inc. | 7.400 | 9/15/2035 | 140,250 |
| 210,000 | Case New Holland, Inc. | 9.250 | 8/1/2011 | 222,338 |
| 220,000 | Consolidated Container Company, LLC > | Zero Coupon | 6/15/2007 | 222,750 |
| 170,000 | Covalence Specialty Materials Corporation | 10.250 | 3/1/2016 | 155,550 |
| 150,000 | Crown Americas, Inc. | 7.625 | 11/15/2013 | 154,500 |
| 150,000 | Crown Americas, Inc. | 7.750 | 11/15/2015 | 155,625 |
| 520,000 | Da-Lite Screen Company, Inc. | 9.500 | 5/15/2011 | 540,800 |
| 610,000 | Fastentech, Inc. | 11.500 | 5/1/2011 | 642,025 |
| 130,000 | Graham Packaging Company, Inc. * | 9.875 | 10/15/2014 | 131,300 |
| 105,000 | Invensys plc * | 9.875 | 3/15/2011 | 112,612 |
| 60,000 | K&F Acquisition, Inc. | 7.750 | 11/15/2014 | 61,800 |
| 49,000 | Mueller Group, Inc. | 10.000 | 5/1/2012 | 53,288 |
| 143,000 | Mueller Holdings, Inc. > | Zero Coupon | 4/15/2009 | 128,700 |
| 100,000 | Owens-Brockway Glass Container, Inc. * | 8.250 | 5/15/2013 | 103,375 |
| 320,000 | Owens-Illinois, Inc. * | 7.500 | 5/15/2010 | 321,200 |
| 260,000 | Plastipak Holdings, Inc. | 8.500 | 12/15/2015 | 270,400 |
| 120,000 | RBS Global, Inc./Rexnord Corporation | 9.500 | 8/1/2014 | 124,800 |
| 40,000 | RBS Global, Inc./Rexnord Corporation | 11.750 | 8/1/2016 | 41,800 |
| 140,000 | Rental Services Corporation | 9.500 | 12/1/2014 | 144,550 |
| 120,000 | United Rentals North America, Inc. | 6.500 | 2/15/2012 | 118,500 |
| 100,000 | United Rentals North America, Inc. * | 7.000 | 2/15/2014 | 98,125 |
|
|
| | Total Capital Goods | | 5,859,563 |
|
|
| The accompanying Notes to Financial Statements are an integral part of this schedule. |
|
| 16 |
| Diversified Income Plus Fund | | | | |
| Schedule of Investments as of December 31, 2006 | | | | |
| |
| Principal | | | Interest | Maturity | |
| Amount | Long-Term Fixed Income (48.4%) | | Rate | Date | Value |
|
| Communications Services (7.2%) | | | | |
| $150,000 | American Cellular Corporation | | 10.000% | 8/1/2011 | $158,625 |
| 660,000 | American Tower Corporation ‡ | | 7.125 | 10/15/2012 | 678,150 |
| 380,000 | American Towers, Inc. * | | 7.250 | 12/1/2011 | 393,300 |
| 70,000 | Cablevision Systems Corporation * | | 8.000 | 4/15/2012 | 68,775 |
| 849,788 | CCH I, LLC * | | 11.000 | 10/1/2015 | 872,094 |
| 180,000 | Centennial Communications Corporation * | | 8.125 | 2/1/2014 | 184,725 |
| 170,000 | Charter Communications Holdings, LLC * | | 8.750 | 11/15/2013 | 176,588 |
| 175,000 | Charter Communications Operating, LLC | | 8.000 | 4/30/2012 | 181,781 |
| 240,000 | Citizens Communications Company * | | 9.250 | 5/15/2011 | 265,500 |
| 160,000 | Cricket Communications, Inc. | | 9.375 | 11/1/2014 | 168,800 |
| 99,000 | Dex Media West, LLC/Dex Media West Finance Company | 9.875 | 8/15/2013 | 107,910 |
| 240,000 | Dobson Cellular Systems | | 9.875 | 11/1/2012 | 261,600 |
| 210,000 | Idearc, Inc. | | 8.000 | 11/15/2016 | 213,150 |
| 90,000 | Intelsat Bermuda, Ltd. | | 9.250 | 6/15/2016 | 96,750 |
| 900,000 | Intelsat Bermuda, Ltd. | | 11.250 | 6/15/2016 | 987,750 |
| 280,000 | Intelsat Intermediate, Inc. *> | Zero Coupon | 2/1/2010 | 212,800 |
| 200,000 | Intelsat Subsidiary Holding Company, Ltd. | | 8.625 | 1/15/2015 | 208,000 |
| 240,000 | Kabel Deutschland GmbH * | | 10.625 | 7/1/2014 | 266,100 |
| 120,000 | Lamar Media Corporation | | 6.625 | 8/15/2015 | 118,950 |
| 370,000 | Level 3 Financing, Inc. | | 9.250 | 11/1/2014 | 377,400 |
| 170,000 | MetroPCS Wireless, Inc. | | 9.250 | 11/1/2014 | 177,650 |
| 220,000 | Morris Publishing Group, LLC | | 7.000 | 8/1/2013 | 208,450 |
| 380,000 | NTL Cable plc | | 9.125 | 8/15/2016 | 401,375 |
| 190,000 | PRIMEDIA, Inc. *† | | 10.749 | 2/15/2007 | 197,600 |
| 230,000 | Quebecor World, Inc. | | 9.750 | 1/15/2015 | 231,438 |
| 110,000 | Qwest Communications International, Inc. † | | 8.874 | 2/15/2007 | 111,375 |
| 280,000 | Qwest Communications International, Inc. | | 7.250 | 2/15/2011 | 286,300 |
| 90,000 | Qwest Communications International, Inc. | | 7.500 | 2/15/2014 | 92,700 |
| 40,000 | Qwest Corporation † | | 8.610 | 3/15/2007 | 43,300 |
| 640,000 | Qwest Corporation | | 7.875 | 9/1/2011 | 681,600 |
| 70,000 | Qwest Corporation | | 7.625 | 6/15/2015 | 74,900 |
| 700,000 | R.H. Donnelley Corporation | | 6.875 | 1/15/2013 | 671,125 |
| 160,000 | R.H. Donnelley Corporation | | 8.875 | 1/15/2016 | 168,000 |
| 205,000 | Rogers Wireless Communications, Inc. * | | 7.500 | 3/15/2015 | 222,425 |
| 120,000 | Rural Cellular Corporation * | | 9.750 | 1/15/2010 | 123,300 |
| 120,000 | Rural Cellular Corporation | | 9.875 | 2/1/2010 | 127,650 |
| 280,000 | Time Warner Telecom Holdings, Inc. | | 9.250 | 2/15/2014 | 299,250 |
| 200,000 | Valor Telecommunications Enterprises, LLC | | 7.750 | 2/15/2015 | 215,250 |
| 290,000 | Videotron Ltee | | 6.875 | 1/15/2014 | 291,812 |
|
|
| | Total Communications Services | | 10,624,248 |
|
|
| |
| Consumer Cyclical (7.3%) | | | | |
| 330,000 | Allied Security Escrow Corporation | | 11.375 | 7/15/2011 | 338,250 |
| 270,000 | American Casino & Entertainment Properties, LLC | | 7.850 | 2/1/2012 | 275,738 |
| 180,000 | Beazer Homes USA, Inc. * | | 8.625 | 5/15/2011 | 185,400 |
| 190,000 | Beazer Homes USA, Inc. * | | 8.125 | 6/15/2016 | 201,400 |
| The accompanying Notes to Financial Statements are an integral part of this schedule. |
|
| 17 |
| Diversified Income Plus Fund | | | |
| Schedule of Investments as of December 31, 2006 | | | |
| |
| Principal | | Interest | Maturity | |
| Amount | Long-Term Fixed Income (48.4%) | Rate | Date | Value |
|
| Consumer Cyclical — continued | | | |
| $350,000 | Bon-Ton Stores, Inc. * | 10.250% | 3/15/2014 | $357,875 |
| 190,000 | Buffets, Inc. | 12.500 | 11/1/2014 | 191,425 |
| 490,000 | Buhrmann U.S., Inc. ‡ | 7.875 | 3/1/2015 | 477,750 |
| 250,000 | Circus & Eldorado Joint Venture/Silver Legacy | | | |
| | Capital Corporation | 10.125 | 3/1/2012 | 262,500 |
| 150,000 | Dollarama Group, LP † | 11.120 | 6/15/2007 | 149,438 |
| 360,000 | Dollarama Group, LP * | 8.875 | 8/15/2012 | 372,600 |
| 230,000 | Ford Motor Credit Company † | 9.824 | 1/16/2007 | 243,740 |
| 80,000 | Ford Motor Credit Company | 9.750 | 9/15/2010 | 85,105 |
| 170,000 | Ford Motor Credit Company * | 7.000 | 10/1/2013 | 162,347 |
| 360,000 | Ford Motor Credit Company * | 8.000 | 12/15/2016 | 355,734 |
| 310,000 | Gaylord Entertainment Company | 6.750 | 11/15/2014 | 307,675 |
| 310,000 | General Motors Corporation * | 8.250 | 7/15/2023 | 288,300 |
| 340,000 | Group 1 Automotive, Inc. | 8.250 | 8/15/2013 | 348,500 |
| 260,000 | Hanesbrands, Inc. † | 8.735 | 6/15/2007 | 264,550 |
| 370,000 | Harrah’s Operating Company, Inc. * | 6.500 | 6/1/2016 | 331,280 |
| 226,000 | Host Marriott, LP, Convertible | 3.250 | 4/15/2024 | 335,045 |
| 820,000 | IAAI Finance Corporation | 11.000 | 4/1/2013 | 926,600 |
| 220,000 | Jean Coutu Group (PJC), Inc. | 7.625 | 8/1/2012 | 231,550 |
| 250,000 | K. Hovnanian Enterprises, Inc. * | 7.500 | 5/15/2016 | 251,250 |
| 160,000 | KB Home | 6.250 | 6/15/2015 | 149,463 |
| 250,000 | Majestic Star Casino, LLC | 9.500 | 10/15/2010 | 262,500 |
| 280,000 | MGM MIRAGE | 5.875 | 2/27/2014 | 259,000 |
| 330,000 | NCL Corporation * | 10.625 | 7/15/2014 | 330,000 |
| 210,000 | NCO Group, Inc. † | 10.244 | 2/15/2007 | 208,425 |
| 260,000 | Poster Financial Group, Inc. | 8.750 | 12/1/2011 | 269,750 |
| 100,000 | Sally Holdings, LLC | 9.250 | 11/15/2014 | 101,875 |
| 170,000 | Sally Holdings, LLC * | 10.500 | 11/15/2016 | 173,400 |
| 210,000 | Six Flags, Inc. * | 9.625 | 6/1/2014 | 194,775 |
| 270,000 | Station Casinos, Inc. | 6.875 | 3/1/2016 | 242,325 |
| 115,000 | TRW Automotive, Inc. | 9.375 | 2/15/2013 | 123,338 |
| 360,000 | Tunica Biloxi Gaming Authority | 9.000 | 11/15/2015 | 372,600 |
| 180,000 | Turning Stone Resort Casino Enterprise | 9.125 | 9/15/2014 | 184,050 |
| 150,000 | United Auto Group, Inc. | 7.750 | 12/15/2016 | 150,750 |
| 242,000 | Universal City Florida Holding Company I/II † | 10.121 | 2/1/2007 | 249,865 |
| 180,000 | VICORP Restaurants, Inc. | 10.500 | 4/15/2011 | 172,800 |
| 210,000 | Warnaco, Inc. | 8.875 | 6/15/2013 | 223,125 |
| 323,000 | WMG Holdings Corporation > | Zero Coupon | 12/15/2009 | 258,400 |
|
|
| | Total Consumer Cyclical | | 10,870,493 |
|
|
| |
| Consumer Non-Cyclical (2.4%) | | | |
| 110,000 | DaVita, Inc. | 7.250 | 3/15/2015 | 112,200 |
| 130,000 | Elan Finance Corporation, Ltd. | 7.750 | 11/15/2011 | 126,912 |
| 120,000 | Elan Finance plc/Elan Finance Corporation † | 9.374 | 2/15/2007 | 119,100 |
| 210,000 | HCA, Inc. | 9.250 | 11/15/2016 | 224,962 |
| 170,000 | HCA, Inc. | 9.625 | 11/15/2016 | 182,750 |
| The accompanying Notes to Financial Statements are an integral part of this schedule. |
|
| 18 |
| Diversified Income Plus Fund | | | | |
| Schedule of Investments as of December 31, 2006 | | | | |
| |
| Principal | | | Interest | Maturity | |
| Amount | Long-Term Fixed Income (48.4%) | | Rate | Date | Value |
|
| Consumer Non-Cyclical — continued | | | | |
| $240,000 | IASIS Healthcare, LLC (IASIS Capital Corporation) * | 8.750% | 6/15/2014 | $243,000 |
| 315,000 | Jostens Holding Corporation > | Zero Coupon | 12/1/2008 | 277,988 |
| 230,000 | Michael Foods, Inc. | | 8.000 | 11/15/2013 | 238,625 |
| 210,000 | Multiplan, Inc. | | 10.375 | 4/15/2016 | 208,950 |
| 150,000 | Smithfield Foods, Inc. * | | 8.000 | 10/15/2009 | 156,750 |
| 160,000 | Stater Brothers Holdings, Inc. | | 8.125 | 6/15/2012 | 162,400 |
| 170,000 | Supervalu, Inc. | | 7.500 | 11/15/2014 | 177,259 |
| 260,000 | Triad Hospitals, Inc. | | 7.000 | 5/15/2012 | 264,550 |
| 180,000 | Triad Hospitals, Inc. | | 7.000 | 11/15/2013 | 181,125 |
| 230,000 | US Oncology Holdings, Inc. † | | 10.675 | 3/15/2007 | 236,325 |
| 120,000 | US Oncology, Inc. | | 9.000 | 8/15/2012 | 126,600 |
| 220,000 | Vanguard Health Holding Company II, LLC | | 9.000 | 10/1/2014 | 222,750 |
| 250,000 | Ventas Realty, LP/Ventas Capital Corporation * | | 6.500 | 6/1/2016 | 256,250 |
| 85,000 | Warner Chilcott Corporation | | 8.750 | 2/1/2015 | 87,125 |
|
|
| | Total Consumer Non-Cyclical | | 3,605,621 |
|
|
| |
| Energy (1.6%) | | | | |
| 110,000 | Chesapeake Energy Corporation * | | 6.375 | 6/15/2015 | 108,900 |
| 200,000 | Chesapeake Energy Corporation | | 6.250 | 1/15/2018 | 192,500 |
| 220,000 | Denbury Resources, Inc. | | 7.500 | 12/15/2015 | 224,400 |
| 170,000 | Hornbeck Offshore Services, Inc. | | 6.125 | 12/1/2014 | 162,138 |
| 650,000 | Ocean Rig Norway AS | | 8.375 | 7/1/2013 | 692,250 |
| 300,000 | OPTI Canada, Inc. | | 8.250 | 12/15/2014 | 308,250 |
| 90,000 | Pioneer Natural Resources Company * | | 5.875 | 7/15/2016 | 82,996 |
| 210,000 | Western Oil Sands, Inc. | | 8.375 | 5/1/2012 | 233,100 |
| 280,000 | Whiting Petroleum Corporation * | | 7.250 | 5/1/2012 | 280,700 |
| 60,000 | Whiting Petroleum Corporation | | 7.250 | 5/1/2013 | 60,150 |
|
|
| | | | Total Energy | | 2,345,384 |
|
|
| |
| Financials (8.1%) | | | | |
| 130,000 | ACE Cash Express, Inc. | | 10.250 | 10/1/2014 | 131,625 |
| 336,000 | Archstone-Smith Operating Trust, Convertible * | | 4.000 | 7/15/2036 | 358,260 |
| 300,000 | AXA SA | | 6.463 | 12/14/2018 | 296,203 |
| 267,000 | Boston Properties, Inc., Convertible | | 3.750 | 5/15/2036 | 309,386 |
| 232,000 | Brandywine Realty Trust, Convertible | | 3.875 | 10/15/2026 | 231,420 |
| 275,000 | BRE Properties, Inc., Convertible | | 4.125 | 8/15/2026 | 294,718 |
| 580,000 | Capital One Capital III * | | 7.686 | 8/15/2036 | 656,884 |
| 325,000 | Developers Diversified Realty Corporation, Convertible | 3.500 | 8/15/2011 | 344,500 |
| 332,000 | Duke Realty, LP, Convertible | | 3.750 | 12/1/2011 | 328,680 |
| 870,000 | EOP Operating, LP, Convertible | | 4.000 | 7/15/2026 | 1,034,212 |
| 400,000 | ERP Operating, LP, Convertible | | 3.850 | 8/15/2026 | 410,560 |
| 110,000 | Essex Portfolio, LP, Convertible | | 3.625 | 11/1/2025 | 142,312 |
| 145,000 | First Industrial, LP, Convertible | | 4.625 | 9/15/2011 | 152,250 |
| 186,000 | Forest City Enterprises, Inc., Convertible | | 3.625 | 10/15/2011 | 197,569 |
| 400,000 | FTI Consulting, Inc. | | 7.625 | 6/15/2013 | 413,000 |
| 710,000 | General Motors Acceptance Corporation, LLC | | 6.875 | 9/15/2011 | 728,246 |
| The accompanying Notes to Financial Statements are an integral part of this schedule. |
|
| 19 |
| Diversified Income Plus Fund | | | | |
| Schedule of Investments as of December 31, 2006 | | | | |
| |
| Principal | | | Interest | Maturity | |
| Amount | Long-Term Fixed Income (48.4%) | | Rate | Date | Value |
|
| Financials — continued | | | | |
| $580,000 | J.P. Morgan Chase Capital XX | | 6.550% | 9/29/2036 | $598,912 |
| 580,000 | Lincoln National Corporation *> | | 7.000 | 5/17/2016 | 614,734 |
| 295,000 | Morgan Stanley, Convertible ¿ | | 16.500 | 1/18/2007 | 295,000 |
| 116,000 | National Retail Properties, Inc., Convertible | | 3.950 | 9/15/2026 | 119,625 |
| 429,000 | New Plan Excel Realty Trust, Convertible | | 3.700 | 9/15/2026 | 427,391 |
| 580,000 | Rabobank Capital Funding Trust | | 5.254 | 10/21/2016 | 559,210 |
| 580,000 | RBS Capital Trust I | | 5.512 | 9/30/2014 | 573,271 |
| 203,000 | Tanger Properties, LP, Convertible * | | 3.750 | 8/15/2026 | 236,749 |
| 133,000 | United Dominion Realty Trust, Inc., Convertible | | 4.000 | 12/15/2035 | 156,109 |
| 667,000 | Vornado Realty Trust, Convertible | | 3.625 | 11/15/2026 | 666,166 |
| 244,000 | Vornado Realty, LP, Convertible * | | 3.875 | 4/15/2025 | 337,940 |
| 580,000 | Wachovia Capital Trust III | | 5.800 | 3/15/2011 | 584,788 |
| 300,000 | Washington Mutual Preferred Funding | | 6.665 | 12/15/2016 | 300,804 |
| 70,000 | Washington Real Estate Investment Trust, Convertible | 3.875 | 9/15/2026 | 70,262 |
| 363,000 | Weingarten Realty Investors, Convertible | | 3.950 | 8/1/2026 | 383,800 |
| 100,000 | Wells Fargo & Company, Convertible † | | 5.121 | 2/1/2007 | 100,323 |
|
|
| | Total Financials | | | | 12,054,909 |
|
|
| |
| Technology (1.6%) | | | | |
| 180,000 | Avago Technologies Finance Pte † | | 10.869 | 3/1/2007 | 188,325 |
| 110,000 | Electronic Data Systems Corporation, Convertible * | 3.875 | 7/15/2023 | 116,738 |
| 230,000 | Freescale Semiconductor, Inc. | | 9.125 | 12/15/2014 | 228,562 |
| 180,000 | Freescale Semiconductor, Inc. * | | 10.125 | 12/15/2016 | 180,225 |
| 117,000 | Intel Corporation, Convertible | | 2.950 | 12/15/2035 | 105,885 |
| 230,000 | MagnaChip Semiconductor SA/MagnaChip | | | | |
| | Semiconductor Finance Company † | | 8.610 | 3/15/2007 | 197,800 |
| 110,000 | NXP BV/NXP Funding, LLC † | | 8.122 | 1/16/2007 | 111,650 |
| 320,000 | Seagate Technology HDD Holdings | | 6.800 | 10/1/2016 | 321,600 |
| 130,000 | SunGard Data Systems, Inc. | | 9.125 | 8/15/2013 | 136,500 |
| 130,000 | SunGard Data Systems, Inc. * | | 10.250 | 8/15/2015 | 138,775 |
| 280,000 | UGS Corporation | | 10.000 | 6/1/2012 | 305,200 |
| 150,000 | Unisys Corporation * | | 6.875 | 3/15/2010 | 147,375 |
| 190,000 | Xerox Corporation * | | 7.625 | 6/15/2013 | 199,500 |
|
|
| | Total Technology | | | | 2,378,135 |
|
|
| |
| Transportation (1.5%) | | | | |
| 220,000 | CHC Helicopter Corporation | | 7.375 | 5/1/2014 | 212,025 |
| 180,000 | Delta Air Lines, Inc. = | | 7.920 | 11/18/2010 | 179,325 |
| 80,000 | Hertz Corporation | | 8.875 | 1/1/2014 | 83,800 |
| 140,000 | Hertz Corporation | | 10.500 | 1/1/2016 | 154,000 |
| 214,000 | H-Lines Finance Holding Corporation > | Zero Coupon | 4/1/2008 | 199,020 |
| 410,000 | Horizon Lines, LLC | | 9.000 | 11/1/2012 | 430,500 |
| 210,000 | Kansas City Southern de Mexico SA de CV | | 7.625 | 12/1/2013 | 210,000 |
| 260,000 | Navios Maritime Holdings, Inc. | | 9.500 | 12/15/2014 | 261,300 |
| 556,931 | Piper Jaffray Equipment Trust Securities | | 6.750 | 4/1/2011 | 552,754 |
|
|
| | Total Transportation | | | | 2,282,724 |
|
|
| The accompanying Notes to Financial Statements are an integral part of this schedule. |
|
| 20 |
| Diversified Income Plus Fund | | | |
| Schedule of Investments as of December 31, 2006 | | | |
| |
| Principal | | Interest | Maturity | |
| Amount | Long-Term Fixed Income (48.4%) | Rate | Date | Value |
|
| U.S. Government (1.1%) | | | |
| $1,606,140 | U.S. Treasury Notes, TIPS * | 2.000% | 7/15/2014 | $1,558,897 |
|
|
| | Total U.S. Government | | | 1,558,897 |
|
|
| |
| Utilities (4.5%) | | | |
| 105,000 | AES Corporation ‡ | 8.875 | 2/15/2011 | 112,612 |
| 240,000 | AES Corporation ‡ | 8.750 | 5/15/2013 | 257,100 |
| 260,000 | AmeriGas Partners, LP | 7.250 | 5/20/2015 | 263,250 |
| 210,000 | Calpine Generating Company, LLC †= | 11.099 | 1/1/2007 | 221,550 |
| 190,000 | Calpine Generating Company, LLC †= | 14.370 | 4/1/2007 | 204,250 |
| 490,000 | Colorado Interstate Gas Company | 6.800 | 11/15/2015 | 509,493 |
| 100,000 | Consumers Energy Company | 6.300 | 2/1/2012 | 100,500 |
| 150,000 | Dynegy Holdings, Inc. | 6.875 | 4/1/2011 | 150,000 |
| 170,000 | Dynegy Holdings, Inc. * | 8.375 | 5/1/2016 | 178,500 |
| 170,000 | Edison Mission Energy | 7.500 | 6/15/2013 | 177,650 |
| 180,000 | Edison Mission Energy | 7.750 | 6/15/2016 | 190,800 |
| 290,000 | Energy Transfer Partners, LP * | 6.625 | 10/15/2036 | 298,604 |
| 590,000 | Enterprise Products Operating, LP > | 8.375 | 8/1/2016 | 639,092 |
| 140,000 | Midwest Generation, LLC | 8.750 | 5/1/2034 | 151,900 |
| 100,000 | Mirant North America, LLC | 7.375 | 12/31/2013 | 101,500 |
| 260,000 | Mission Energy Holding Company | 13.500 | 7/15/2008 | 286,650 |
| 460,000 | NRG Energy, Inc. | 7.375 | 2/1/2016 | 462,300 |
| 170,000 | Pacific Energy Partners, LP/Pacific | | | |
| | Energy Finance Corporation | 7.125 | 6/15/2014 | 174,456 |
| 200,000 | Pacific Energy Partners, LP/Pacific | | | |
| | Energy Finance Corporation | 6.250 | 9/15/2015 | 195,528 |
| 145,000 | Reliant Energy Resources Corporation | 6.750 | 12/15/2014 | 141,738 |
| 210,000 | SemGroup, LP | 8.750 | 11/15/2015 | 211,050 |
| 230,000 | Southern Natural Gas Company | 7.350 | 2/15/2031 | 253,172 |
| 150,000 | Southern Star Central Corporation | 6.750 | 3/1/2016 | 149,625 |
| 570,000 | Williams Companies, Inc. | 8.125 | 3/15/2012 | 617,025 |
| 410,000 | Williams Companies, Inc. | 8.750 | 3/15/2032 | 463,300 |
| 170,000 | Williams Partners, LP | 7.250 | 2/1/2017 | 173,400 |
|
|
| | Total Utilities | | | 6,685,045 |
|
|
| | Total Long-Term Fixed Income (cost $70,892,998) | | | 72,000,151 |
|
|
| The accompanying Notes to Financial Statements are an integral part of this schedule. |
|
| 21 |
| Diversified Income Plus Fund | | | |
| Schedule of Investments as of December 31, 2006 | | | |
| |
| | | Interest | Maturity | |
| Shares | Collateral Held for Securities Loaned (25.6%) | Rate (+) | Date | Value |
|
| 38,151,784 | Thrivent Financial Securities Lending Trust | 5.280% | N/A | $38,151,784 |
|
|
| | Total Collateral Held for Securities Loaned | |
| | (cost $38,151,784) | | | 38,151,784 |
|
|
| |
| Shares or | | | | |
| Principal | | Interest | Maturity | |
| Amount | Short-Term Investments (4.5%) | Rate (+) | Date | Value |
|
| $2,320,000 | Federal Home Loan Mortgage Corporation | 4.891% | 1/2/2007 | $2,319,686 |
| 400,000 | Federal National Mortgage Association ‡ | 5.180 | 2/7/2007 | 397,883 |
| 3,915,178 | Thrivent Money Market Fund | 5.030 | N/A | 3,915,178 |
|
|
| | Total Short-Term Investments (at amortized cost) | 6,632,747 |
|
|
| | Total Investments (cost $181,083,930) 125.2% | $186,214,705 |
|
|
| | Other Assets and Liabilities, Net (25.2%) | | (37,439,973) |
|
|
| | Total Net Assets 100.0% | | | $148,774,732 |
|
|
| | Number of | | Notional | | |
| | Contracts | Expiration | Principal | | Unrealized |
| Futures | Long/(Short) | Date | Amount | Value | Gain/(Loss) |
|
| 10-Yr. U.S. Treasury Bond Futures | (28) | March 2007 | ($3,047,772) | ($3,009,125) | $38,647 |
| S&P 500 Mini-Futures | 36 | March 2007 | $2,573,896 | $2,571,120 | ($2,776) |
# Non-income producing security.
* All or a portion of the security is on loan as discussed in item 2(K) of the Notes to Financial Statements.
+ The interest rate shown reflects the yield, coupon rate or, for securities purchased at a discount, the discount rate at the date of purchase
^ Security is fair valued as discussed in item 2(A) of the Notes to Financial Statements.
> Denotes step coupon bonds for which the current interest rate and next scheduled reset date are shown.
† Denotes variable rate obligations for which the current yield and next scheduled reset date are shown.
‡ At December 31, 2006, $654,983 of investments were held on deposit with the counterparty and pledged as the initial margin deposit for open financial futures contracts and an unfunded loan commitment. In addition, $9,731,717 and $1,026,485 of investments were earmarked as collateral to cover open financial futures contracts and an unfunded loan commitment, respectively. This unfunded loan commitment is discussed in item 2(R) of the Notes to Financial Statements.
ƒ Denotes restricted securities. Restricted securities are investment securities which cannot be offered for public sale without first being registered under the Securities Act of 1933. These securities have been valued from the date of acquisition through December 31, 2006, by obtaining quotations from brokers active with these securities. The following table indicates the acquisition date and cost of restricted securities in the Diversified Income Plus Portfolio owned as of December 31, 2006.
| | Acquisition | |
| Security | Date | Cost |
|
| Unifi Communications, Inc., Stock Warrants | 2/14/1997 | $6,525 |
| = In bankruptcy. | | |
| ¿ These securities are Equity-Linked Structured Securities as discussed in item 2(N) of the Notes to Financial Statements. | |
Definitions:
REIT — Real Estate Investment Trust, is a company that buys, develops, manages and/or sells real estate assets.
TIPS — Treasury Inflation Protected Security
| Gross unrealized appreciation and depreciation of investments were as follows: | |
| Gross unrealized appreciation | | $5,715,572 | |
| Gross unrealized depreciation | | (855,109) | |
| |
| |
| Net unrealized appreciation (depreciation) | | $4,860,463 | |
| Cost for federal income tax purposes | | $181,354,242 | |
| The accompanying Notes to Financial Statements are an integral part of this schedule. |
|
| 22 |
| Thrivent Mutual Funds |
| |
| Statement of Assets and Liabilities |
| |
| | | Diversified |
| | Real Estate | Income |
| As of December 31, 2006 | Securities Fund | Plus Fund |
|
| Assets | | |
| Investments at cost | $70,703,995 | $181,083,930 |
| Investments in securities at market value | 69,733,129 | 144,147,743 |
| Investments in affiliates at market value | 12,897,549 | 42,066,962 |
|
| Investments at Market Value | 82,630,678 | 186,214,705 |
| Cash | 590 | 2,058 |
| Dividends and interest receivable | 398,780 | 1,353,966 |
| Prepaid expenses | 5,140 | 2,153 |
| Receivable for investments sold | 226,025 | 466,503 |
| Receivable for fund shares sold | 114,113 | 144,544 |
| Receivable from affiliate | 5,918 | — |
|
| Total Assets | 83,381,244 | 188,183,929 |
| |
| Liabilities | | |
| Distributions payable | — | 139,419 |
| Accrued expenses | 19,942 | 56,342 |
| Payable for investments purchased | 1,378,784 | 861,523 |
| Payable upon return of collateral for securities loaned | 10,395,975 | 38,151,784 |
| Payable for fund shares redeemed | 4,851 | 97,566 |
| Payable for variation margin | — | 6,047 |
| Payable to affiliate | — | 96,516 |
|
| Total Liabilities | 11,799,552 | 39,409,197 |
| Net Assets | | |
| Capital stock (beneficial interest) | 59,868,277 | 204,308,667 |
| Accumulated undistributed net investment income/(loss) | (1,892) | 491,406 |
| Accumulated undistributed net realized gain/(loss) on investments | | |
| and foreign currency transactions | (211,376) | (61,191,987) |
| Net unrealized appreciation/(depreciation) on: | | |
| Investments | 11,926,683 | 5,130,775 |
| Futures contracts | — | 35,871 |
|
| Total Net Assets | $71,581,692 | $148,774,732 |
| Class A Share Capital | $24,295,755 | $138,765,530 |
| Shares of beneficial interest outstanding (Class A) | 1,821,315 | 20,155,687 |
| Net asset value per share | $13.34 | $6.88 |
| Maximum public offering price | $14.12 | $7.20 |
| Class B Share Capital | $— | $3,039,536 |
| Shares of beneficial interest outstanding (Class B) | — | 441,601 |
| Net asset value per share | $— | $6.88 |
| Class I Share Capital | $47,285,937 | $6,969,666 |
| Shares of beneficial interest outstanding (Class I) | 3,541,847 | 1,012,907 |
| Net asset value per share | $13.35 | $6.88 |
| The accompanying Notes to Financial Statements are an integral part of this schedule. |
|
| 23 |
| Thrivent Mutual Funds |
| |
| Statement of Operations |
| |
| |
| | Real Estate | Diversified Income |
| | Securities Fund | Plus Fund |
| | December 31, | December 31, | October 31, |
| For the Period Ended | 2006 | 2006(a) | 2006 |
|
| Investment Income | | | |
| Dividends | $1,076,912 | $435,158 | $813,662 |
| Taxable interest | 25,616 | 900,247 | 8,423,335 |
| Income from securities loaned | 6,557 | 15,061 | 4,531 |
| Income from affiliated investments | 69,039 | 29,415 | 49,831 |
| Foreign dividend tax withholding | (2,510) | — | 173,701 |
|
| Total Investment Income | 1,175,614 | 1,379,881 | 9,465,060 |
| |
| Expenses | | | |
| Adviser fees | 375,914 | 129,076 | 681,504 |
| Accounting and pricing fees | 17,531 | 7,990 | 45,677 |
| Administrative service fees | 9,398 | 4,694 | 24,782 |
| Amortization of offering costs | 15,288 | — | — |
| Audit and legal fees | 18,740 | 13,231 | 17,659 |
| Custody fees | 12,605 | 2,854 | 17,229 |
| Distribution expenses Class A | 40,967 | 54,756 | 291,366 |
| Distribution expenses Class B | — | 5,091 | 35,775 |
| Insurance expenses | 3,992 | 817 | 5,028 |
| Printing and postage expenses Class A | 15,695 | 14,218 | 55,487 |
| Printing and postage expenses Class B | — | 721 | 3,527 |
| Printing and postage expenses Class I | 2,876 | 127 | 334 |
| SEC and state registration expenses | 32,740 | 21,866 | 46,575 |
| Transfer agent fees Class A | 31,928 | 31,625 | 197,706 |
| Transfer agent fees Class B | — | 2,084 | 14,181 |
| Transfer agent fees Class I | 221 | 350 | 685 |
| Trustees’ fees | 3,117 | 2,307 | 6,262 |
| Other expenses | 7,159 | 1,949 | 5,838 |
|
| Total Expenses Before Reimbursement | 588,171 | 293,756 | 1,449,615 |
| |
| Less: | | | |
| Reimbursement from adviser | (509,321) | (39,863) | (212,977) |
| Custody earnings credit | (262) | (339) | (3,250) |
|
| Total Net Expenses | 78,588 | 253,554 | 1,233,388 |
|
| |
| Net Investment Income/(Loss) | 1,097,026 | 1,126,327 | 8,231,672 |
| |
| Realized and Unrealized Gains/(Losses) on | | | |
| Investments and Foreign Currency Transactions | | | |
| Net realized gains/(losses) on: | | | |
| Investments | 1,557,584 | 1,683,435 | 2,948,783 |
| Futures contracts | — | 11,487 | — |
| Foreign currency transactions | (6,328) | — | 65,497 |
| Change in net unrealized appreciation/(depreciation) on: | | | |
| Investments | 11,225,103 | 2,052,092 | 2,568,745 |
| Futures contracts | — | 51,632 | (15,761) |
|
| |
| Net Realized and Unrealized Gains/(Losses) on | | | |
|
| Investments and Foreign Currency Transactions | 12,776,359 | 3,798,646 | 5,567,264 |
|
| |
| Net Increase/(Decrease) in Net Assets Resulting | | | |
|
| From Operations | $13,873,385 | $4,924,973 | $13,798,936 |
|
| |
| (a) For the period from November 1, 2006 to December 31, 2006 | | | |
| The accompanying Notes to Financial Statements are an integral part of this schedule. |
|
| 24 |
| Thrivent Mutual Funds | | |
| |
| Statement of Changes in Net Assets | |
| |
| |
| | | Real Estate |
| | | Securities Fund |
| | |
|
| For the periods ended | | 12/31/2006 | 12/31/2005(a) |
|
| Operations | | | |
| Net investment income/(loss) | | $1,097,026 | $207,713 |
| Net realized gains/(losses) on: | | | |
| Investments | | 1,557,584 | 34,301 |
| Foreign currency transactions | | (6,328) | — |
| Change in net unrealized appreciation/(depreciation) on: | | | |
| Investments | | 11,225,103 | 701,580 |
|
| |
| Net Change in Net Assets Resulting | | | |
|
| From Operations | | 13,873,385 | 943,594 |
| |
| Distributions to Shareholders | | | |
| From net investment income | | (1,178,158) | (224,399) |
| From net realized gains | | (1,630,889) | (100,694) |
| From return of capital | | (195,501) | (28,084) |
|
| Total Distributions to Shareholders | | (3,004,548) | (353,177) |
|
| Capital Stock Transactions | | 35,814,716 | 24,307,722 |
|
| Net Increase/(Decrease) in Net Assets | | 46,683,553 | 24,898,139 |
|
| Net Assets, Beginning of Period | | 24,898,139 | — |
|
| Net Assets, End of Period | | $71,581,692 | $24,898,139 |
|
| |
| | Diversified Income Plus Fund |
| | |
|
| For the periods ended | 12/31/2006(b) | 10/31/2006 | 10/31/2005 |
|
| Operations | | | |
| Net investment income/(loss) | $1,126,327 | $8,231,672 | $9,920,829 |
| Net realized gains/(losses) on: | | | |
| Investments | 1,683,435 | 2,948,783 | 1,009,632 |
| Futures contracts | 11,487 | 65,497 | — |
| Change in net unrealized appreciation/(depreciation) on: | | | |
| Investments | 2,052,092 | 2,568,745 | (6,912,651) |
| Futures contracts | 51,632 | (15,761) | — |
|
| |
| Net Change in Net Assets Resulting | | | |
|
| From Operations | 4,924,973 | 13,798,936 | 4,017,810 |
| |
| Distributions to Shareholders | | | |
| From net investment income | (1,138,483) | (8,376,527) | (10,545,623) |
|
| Total Distributions to Shareholders | (1,138,483) | (8,376,527) | (10,545,623) |
|
| Capital Stock Transactions | 12,800,379 | (5,873,154) | (9,880,322) |
|
| Net Increase/(Decrease) in Net Assets | 16,586,869 | (450,745) | (16,408,135) |
|
| Net Assets, Beginning of Period | 132,187,863 | 132,638,608 | 149,046,743 |
|
| Net Assets, End of Period | $148,774,732 | $132,187,863 | $132,638,608 |
| |
| (a) For the period from June 30, 2005 (inception) through December 31, 2005 | | |
| (b) For the period from November 1, 2006 through December 31, 2006 | | |
| The accompanying Notes to Financial Statements are an integral part of this schedule. |
|
| 25 |
NOTES TO FINANCIAL STATEMENTS
As of December 31, 2006
(1) ORGANIZATION
Thrivent Mutual Funds (the “Trust”) was organized as a Massachusetts Business Trust on March 10, 1987 and is registered as an open-end management investment company under the Investment Company Act of 1940. The Trust is divided into twenty-nine separate series (the “Fund(s)”), each with its own investment objective and policies. The Trust currently consists of four allocation funds, seventeen equity funds, two hybrid funds, five fixed-income funds, and one money market fund. The Trust commenced operations on July 16, 1987.
Effective June 30, 2006, Thrivent High Yield Fund II changed its name to Thrivent Diversified Income Plus Fund. Thrivent Diversified Income Plus Fund has changed its fiscal year end to a calendar year basis beginning on December 31, 2006. This annual report includes Thrivent Real Estate Securities Fund and Thrivent Diversified Income Plus Fund, two of the Trust's twenty-nine Funds. The other Funds of the Trust are presented under a separate annual report.
The Trust offers three classes of shares: Class A, Class B and Institutional Class. The three classes of shares differ principally in their respective distribution expenses and arrangements. Class A shares have a 0.25% annual 12b-1 fee and a maximum front-end sales load of 5.50% for equity funds and 4.50% for fixed-income funds. Class B shares were offered at net asset value and have a 1.00% annual 12b-1 fee. In addition, Class B shares have a maximum contingent deferred sales charge of 5.00% . The contingent deferred sales charge declines by 1.00% per year through the fifth year. Class B shares convert to Class A shares at the end of the fifth year. Institutional Class shares are offered at net asset value and have no annual 12b-1 fees. All three classes of shares have identical rights to earnings, assets and voting privileges, except for class specific expenses and exclusive rights to vote on matters affecting only individual classes. Effective October 16, 2004, the Tr ust no longer offers Class B shares for sale. Diversified Income Plus Fund has all three classes of shares. Real Estate Securities Fund offers Class A and Institutional Class shares.
Under the Trust’s organizational documents, its officers and trustees are indemnified against certain liabilities arising out of the performance of their duties to the Trust. In addition, in the normal course of business, the Trust enters into contracts with vendors and others that provide general damage clauses. The Trust’s maximum exposure under these contracts is unknown, as this would involve future claims that may be made against the Trust. However, based on experience, the Trust expects the risk of loss to be remote.
(2) SIGNIFICANT ACCOUNTING POLICIES
(A) Valuation of Investments — Securities traded on U.S. or foreign securities exchanges or included in a national market system are valued at the official closing price at the close of each business day unless otherwise stated below. Over-the-counter securities and listed securities for which no price is readily available are valued at the current bid price considered best to represent the value at that time. Security prices are based on quotes that are obtained from an independent pricing service approved by the Board of Trustees. The pricing service, in determining values of fixed-income securities, takes into consideration such factors as current quotations by broker/dealers, coupon, maturity, quality, type of issue, trading characteristics, and other yield and risk factors it deems relevant in determining valuations. Securities which cannot be valued by the approved pricing service are valued using valuations obtained from dealers that make markets in the securities. Exchange listed options and futures contracts are valued at the last quoted sales price. Short-term securities with maturities of 60 days or less are valued at amortized cost. Mutual Funds are valued at the net asset value at the close of each business day.
All securities for which market values are not readily available or deemed unreliable are appraised at fair value as determined in good faith under the direction of the Board of Trustees. As of December 31, 2006, two securities in the Diversified Income Plus Fund were valued at fair value, which represented 0.00%, of the Fund’s net assets.
Fair Valuation of International Securities — Because many foreign markets close before the U.S. markets, events may occur between the close of the foreign market and the close of the U.S. markets that could have a material impact on the valuation of foreign securities. The Funds, under the supervision of the Board of Trustees, evaluates the impacts of these events and may adjust the valuation of foreign securities to reflect the fair value as of the close of the U.S. markets. The Board of Trustees has authorized the investment adviser to make fair valuation determinations pursuant to policies approved by the Board of Trustees.
(B) Foreign Currency Translation — The accounting records of each Fund are maintained in U.S. dollars. Securities and other assets and liabilities that are denominated in foreign currencies are translated into U.S. dollars at the daily closing rates of exchange.
Notes to Financial Statements
December 31, 2006
Foreign currency amounts related to the purchase or sale of securities and income and expenses are translated at the exchange rate on the transaction date. Net realized and unrealized currency gains and losses are recorded from sales of foreign currency, exchange gains or losses between the trade date and settlement dates on securities transactions, and other translation gains or losses on dividends, interest income and foreign withholding taxes. The Funds do not separately report the effect of changes in foreign exchange rates from changes in market prices on securities held. Such changes are included in net realized and unrealized gain or loss from investments.
For federal income tax purposes, the Funds treat the effect of changes in foreign exchange rates arising from actual foreign currency transactions and the changes in foreign exchange rates between the trade date and settlement date as ordinary income.
(C) Foreign Currency Contracts — In connection with purchases and sales of securities denominated in foreign currencies, the Funds may enter into forward currency contracts. Additionally, the Funds may enter into such contracts to hedge certain other foreign currency denominated investments. These contracts are recorded at market value and the related realized and unrealized foreign exchange gains and losses are included in the Statement of Operations. In the event that counterparties fail to settle these forward contracts, the Funds could be exposed to foreign currency fluctuations. Foreign currency contracts are valued daily and unrealized appreciation or depreciation is recorded daily as the difference between the contract exchange rate and the closing forward rate applied to the face amount of the contract. A realized gain or loss is recorded at the time a forward contract is closed. During the year and period ended December 31, 2006, the Real Estate Securities Fund engaged in this type of investment.
(D) Foreign Denominated Investments — Foreign denominated assets and currency contracts may involve more risks than domestic transactions including currency risk, political and economic risk, regulatory risk, and market risk. The Funds may also invest in securities of companies located in emerging markets. Future economic or political developments could adversely affect the liquidity or value, or both, of such securities.
(E) Federal Income Taxes — No provision has been made for income taxes because each Funds’ policy is to qualify as regulated investment companies under the Internal Revenue Code and distribute substantially all taxable income on a timely basis. It is also the intention of the Funds to distribute an amount sufficient to avoid imposition of any federal excise tax. The Funds, accordingly, anticipate paying no federal taxes and no federal tax provision was recorded. Each Fund is treated as a separate taxable entity for federal income tax purposes. Certain Funds may utilize earnings and profits distributed to shareholders on the redemption of shares as part of the dividend paid deduction.
(F) Income and Expenses — Estimated expenses are accrued daily. The Funds are charged for those expenses that are directly attributable to them. Expenses that are not directly attributable to a Fund are allocated among all appropriate Funds in proportion to their respective net assets, number of shareholder accounts or other reasonable basis. Net investment income, expenses which are not class-specific, and realized and unrealized gains and losses are allocated directly to each class based upon the relative net asset value of outstanding shares.
Interest income is accrued daily and is determined on the basis of interest or discount earned on all debt securities, including accretion of market discount and original issue discount and amortization of premium. Dividend income is recorded on the ex-dividend date. For preferred stock payment-in-kind securities, income is recorded on the ex-dividend date in the amount of the value received.
(G) Custody Earnings Credit — The Funds have a deposit arrangement with the custodian whereby interest earned on uninvested cash balances is used to pay a portion of custodian fees. This deposit arrangement is an alternative to overnight investments.
(H) Distributions to Shareholders — Net investment income is distributed to each shareholder as a dividend. Dividends from the Real Estate Securities Fund are declared and paid quarterly. Dividends from the Diversified Income Plus Fund are declared and paid monthly. Additionally, it is possible that such dividends may be reclassified as return of capital or capital gains after year end. Such determination can not be made until tax information is received from the real estate investments of the Fund. Net realized gains from securities transactions, if any, are distributed at least annually.
(I) Options — The Funds may buy put and call options and write put and covered call options. The Funds intend to use such derivative instruments as hedges to facilitate buying or selling securities or to provide protection against adverse movements in security prices or interest rates. Option contracts are valued daily and unrealized appreciation or depreciation is
Notes to Financial Statements
December 31, 2006
(2) SIGNIFICANT ACCOUNTING POLICIES — continued
recorded. The Funds will realize a gain or loss upon expiration or closing of the option transaction. When an option is exercised, the proceeds upon sale for a written call option or the cost of a security for purchased put and call options is adjusted by the amount of premium received or paid. The writer of an option bears the market risk of an unfavorable change in the price of the security underlying the written option. During the year and period ended December 31, 2006, the Real Estate Securities Fund and the Diversified Income Plus Fund did not participate in this type of investment.
(J) Financial Futures Contracts — The Funds may use futures contracts to manage the exposure to interest rate and market fluctuations. Gains or losses on futures contracts can offset changes in the yield of securities. When a futures contract is opened, cash or other investments equal to the required “initial margin deposit” are held on deposit with and pledged to the broker. Additional securities held by the Funds may be earmarked as collateral for open futures contracts. The futures contract’s daily change in value (“variation margin”) is either paid to or received from the broker, and is recorded as an unrealized gain or loss. When the contract is closed, the realized gain or loss is recorded equal to the difference between the value of the contract when opened and the value of the contract when closed. Futures contracts involve, to varying degrees, risk of loss in excess of the variation margin discl osed in the Statement of Assets and Liabilities. During the year and period ended December 31, 2006, the Diversified Income Plus Fund engaged in this type of investment.
(K) Securities Lending — The Trust has entered into a Securities Lending Agreement (the “Agreement”) with State Street Bank and Trust Company (“State Street Bank”). The Agreement authorizes State Street Bank to lend securities to authorized borrowers on behalf of the Funds. Pursuant to the Agreement, all loaned securities are collateralized by cash equal to at least 102% of the value of the loaned securities. All cash collateral received is invested in Thrivent Financial Securities Lending Trust. Amounts earned on investments in Thrivent Financial Securities Lending Trust, net of rebates and other securities lending expenses, are included in Income from securities loaned on the Statement of Operations. As payment for its services, State Street Bank receives a portion of the fee income and earnings on the collateral. By investing any cash collateral it receives in these transactions, a Fund could realize addit ional gains or losses. If the borrower fails to return the securities and the invested collateral has declined in value, the Fund could lose money. The Agreement grants and transfers to State Street Bank a lien upon collateralized assets in the possession of State Street Bank. As of December 31, 2006, Real Estate Securities Fund and Diversified Income Plus Fund had $10,183,504 and $36,807,277 of securities on loan, respectively.
(L) When-Issued and Delayed Delivery Transactions — The Funds may purchase or sell securities on a when-issued or delayed delivery basis. These transactions involve a commitment by a Fund to purchase or sell securities for a predetermined price or yield, with payment and delivery taking place beyond the customary settlement period. When delayed delivery purchases are outstanding, a Fund will designate liquid assets in an amount sufficient to meet the purchase price. When purchasing a security on a delayed delivery basis, a Fund assumes the rights and risks of ownership of the security, including the risk of price and yield fluctuations, and takes such fluctuations into account when determining its net asset value. A Fund may dispose of a delayed delivery transaction after it is entered into, and may sell when-issued securities before they are delivered, which may result in a capital gain or loss. When a Fund has sold a security on a delayed delivery basis, a Fund does not participate in future gains and losses with respect to the security.
(M) Treasury Inflation Protected Securities — Certain Funds may invest in treasury inflation protected securities (TIPS). These securities are fixed income securities whose principal value is periodically adjusted to the rate of inflation. The interest rate is generally fixed at issuance. Interest is paid based on the principal value, which is adjusted for inflation. Any increase in the principal amount will be included as taxable interest in the Statement of Operations and received upon maturity or sale of the security.
(N) Equity-Linked Structured Securities — Certain Funds may invest in equity-linked structured notes. Equity-linked structured notes are debt securities which combine the characteristics of common stock and the sale of an option. The return component is based upon the performance of a single equity security, a basket of equity securities, or an equity index and the sale of an option which is recognized as income. There is no guaranteed return of principal with these securities. The appreciation potential of these securities may be limited by a maximum payment or call right and can be influenced by many unpredictable factors.
(O) Credit Risk — The Funds may be susceptible to credit risk to the extent an issuer or counter party defaults on its payment obligation. The Funds’ policy is to monitor the
Notes to Financial Statements
December 31, 2006
creditworthiness of issuers. Interest receivables on defaulted securities are monitored for ability to collect payments in default and are adjusted accordingly.
(P) Accounting Estimates — The preparation of financial statements in conformity with accounting principles generally accepted in the United States of America require management to make estimates and assumptions that affect the reported amounts of assets and liabilities and disclosure of contingent assets and liabilities at the date of the financial statements and the reported amounts of income and expenses during the reporting period. Actual results could differ from those estimates.
(Q) Loss Contingencies — Thrivent Diversified Income Plus Fund is a defendant in an adversary action brought by the Official Committee of Asbestos Claimants of G-I Holdings Inc. (G-I) against prior and current holders of secured debt of Building Materials Corp. of America (BMCA), a wholly owned subsidiary of G-I. The suit seeks to recover the value of assets G-I transferred to BMCA that later served as collateral for BMCA’s Debt. The Fund at one time held secured notes in the amount of $1,650,000 and, if the plaintiffs are successful, it is possible that the Fund will be required to pay damages in some amount. This loss contingency has not been accrued as a liability because the amount of potential damages and the likelihood of loss can not be reasonably estimated.
(R) Unfunded Loan Commitments — The Diversified Income Plus Fund entered into a loan commitment with Freeport-McMoRan Copper & Gold, Inc. in the amount of $560,000. Initial maturity of the loan commitment is one year from closing. After initial maturity, the loan commitment may be converted into exchange notes. The coupon rate will be determined at time of settlement. The Fund is obligated to fund these loan commitments at the borrower’s discretion upon shareholders’ approval of the merger between Freeport-McMoRan Copper & Gold and Phelps Dodge. A commitment fee is paid to the Funds at the close of the loan commitment. These commitments expire on August 31, 2007.
(S) Recent Accounting Pronouncements — In June 2006, the Financial Accounting Standards Board (FASB) issued FASB Interpretation No. 48 — Accounting for Uncertainty in Income Taxes (FIN 48), that requires additional tax disclosures and the tax effects of certain tax positions to be recognized. These tax positions must meet a “more likely than not” standard that based on their technical merits, have a more than 50 percent likelihood of being sustained upon examination. FIN 48 is effective for fiscal periods beginning after December 15, 2006. At adoption, the financial statements must be adjusted to reflect only those tax positions in any open tax years that are more likely than not of being sustained. Management of the Fund is currently evaluating the impact that FIN 48 will have on the Fund’s financial statements. Effective December 26, 2006, the U.S. Securities and Exchange Comm ission has delayed implementation of FIN 48 until June 29, 2007, for mutual funds.
Additionally, in September 2006, the FASB issued FASB Statement No. 157 — Fair Value Measurements (FAS 157). The objective of the statement is to improve the consistency and comparability of fair value measurements used in financial reporting. FAS 157 defines fair value, establishes a framework for measuring fair value in generally accepted accounting principles, and expands disclosures about fair value measurements. FAS 157 is effective for fiscal years beginning after November 15, 2007. Management of the Fund is currently evaluating the impact that FAS 157 will have on the Fund’s financial statements.
(T) Other — For financial statement purposes, investment security transactions are accounted for on the trade date. Realized gains and losses from investment transactions are determined on a specific cost identification basis, which is the same basis used for federal income tax purposes.
(3) FEES AND COMPENSATION PAID TO AFFILIATES
(A) Investment Advisory Fees — Effective January 1, 2006, the Trust has entered into an Investment Advisory Agreement with Thrivent Asset Management, LLC (Thrivent Asset Mgt.), (“the Adviser”). Thrivent Asset Mgt. is a wholly owned subsidiary of Thrivent Life Insurance Company (Thrivent Life). Prior to January 1, 2006, the Trust’s Adviser was Thrivent Investment Management, Inc. (Thrivent Investment Mgt.). There was no change in the investment management fees and Thrivent Asset Mgt. provides the same investment advisory services using the same investment personnel as previously provided by Thrivent Investment Mgt. Under the Investment Advisory Agreement, each of the Funds pays a fee for investment advisory services. The fees are accrued daily and paid monthly. The annual rates of fees as a percent of average daily net assets under the Investment Advisory Agreement were as follows:
| Real Estate Securities Fund | |
| First $500 million | 0.80% |
| Over $500 million | 0.75% |
| |
| Diversified Income Plus Fund | 0.55% |
Notes to Financial Statements
December 31, 2006
(3) FEES AND COMPENSATION PAID TO AFFILIATES — continued
The Adviser has contractually agreed, through at least February 28, 2007, to reimburse expenses by 0.80% of the average daily net assets of the Real Estate Securities Fund. Additionally, the Adviser has agreed to voluntarily reimburse expenses by 0.25% of the average daily net assets of the Fund. This voluntary expense reimbursement may be discontinued at any time.
The Adviser has agreed to voluntarily reimburse expenses by 0.16% of the average daily net assets of the Diversified Income Plus Fund. This voluntary expense reimbursement may be discontinued at any time.
The Funds may invest cash in Thrivent Money Market Fund, subject to certain limitations. These related-party transactions are subject to the same terms as non-related party transactions except that, to avoid duplicate investment advisory fees, Thrivent Asset Mgt. reimburses an amount equal to the smaller of the amount of the advisory fee for the Fund or the amount of the advisory fee, which is charged to the Fund for its investment in the Thrivent Money Market Fund.
(B) Distribution Plan — Thrivent Investment Mgt. is also the Trust’s distributor. The Trust has adopted a Distribution Plan (“the Plan”) pursuant to Rule 12b-1 under the Investment Company Act of 1940. Class A shares have a Rule 12b-1 fee of 0.25% of average net assets. Class B shares have a Rule 12b-1 fee of 1.00% of average net assets.
(C) Sales Charges and Other Fees — For the year and period ended December 31, 2006, Thrivent Investment Mgt. received $210,427 of aggregate underwriting concessions from the sales of the Trust’s Class A and Class B shares and aggregate contingent deferred sales charges of $281 from redemptions of Class A and Class B shares. For the year ended October 31, 2006, for Thrivent Diversified Income Plus Fund, Thrivent Investment Mgt. received $262,457 of aggregate underwriting concessions from the sales of the Trust’s Class A and Class B shares and the aggregate contingent deferred sales charges of $7,887 from redemptions of Class A and Class B shares. Sales charges are not an expense of the Trust and are not reflected in the financial statement of any of the Funds.
The Trust has entered into an accounting services agreement with Thrivent Asset Mgt. pursuant to which Thrivent Asset Mgt. provides certain accounting personnel and services. For the year and period ended December 31, 2006, Thrivent Asset Mgt. received aggregate fees for accounting personnel and services of $21,830 from the Funds. For the year ended October 31, 2006, Thrivent Asset Mgt. received aggregate fees for accounting personnel and services of $34,670 from Thrivent Diversified Income Plus Fund.
The Trust has entered into an agreement with Thrivent Asset Mgt. to provide certain administrative personnel and services to the Funds. For the year and period ended December 31, 2006, Thrivent Asset Mgt. received aggregate fees for administrative services of $14,092 from the Funds. For the year ended October 31, 2006, Thrivent Asset Mgt. received aggregate fees for administrative services of $24,782 from Thrivent Diversified Income Plus Fund.
The Trust has entered into an agreement with Thrivent Financial Investor Services Inc. (Thrivent Investor Services) to provide the Funds with transfer agent services. For the year and period ended December 31, 2006, Thrivent Investor Services received aggregate fees for transfer agent services of $68,213 from the Funds. For the year ended October 31, 2006, Thrivent Investor Services received aggregate fees for transfer agent services of $213,792 from Thrivent Diversified Income Plus Fund.
Each Trustee is eligible to participate in a deferred compensation plan with respect to fees received from the Funds. Participants in the plan may designate their deferred Trustee’s fees as if invested in any one of the Funds. The value of each Trustee’s deferred compensation account will increase or decrease as if it were invested in shares of the selected Funds. The deferred fees remain in the Funds until distribution in accordance with the plan. The deferred fee liability is an unsecured liability.
Those Trustees not participating in the above plan received $1,466 in fees from the Funds for the year and period ended December 31, 2006. For the year ended October 31, 2006, those Trustees not participating in the above plan received $4,370 in fees from Thrivent Diversified Income Plus Fund. No remuneration has been paid by the Trust to any of the officers or affiliated Trustees of the Trust. In addition, the Trust reimbursed unaffiliated Trustees for reasonable expenses incurred in relation to attendance at the meetings.
Certain officers and non-independent trustees of the Fund are officers and directors of Thrivent Asset Mgt., Thrivent Investment Mgt. and Thrivent Investor Services; however, they receive no compensation from the Funds.
Notes to Financial Statements
December 31, 2006
(4) TAX INFORMATION
Distributions are based on amounts calculated in accordance with the applicable federal income tax regulations, which may differ from accounting principles generally accepted in the United States of America. To the extent that these differences are permanent in nature, such amounts are reclassified within the capital accounts based on their federal tax-basis treatment; temporary differences do not require reclassifications.
On the Statement of Assets and Liabilities, as a result of permanent book-to-tax differences, reclassification adjustments were made as follows [Increase (Decrease)]:
| | | Accumulated | Accumulated | |
| | Net Investment | Net Realized | Capital |
| Fund | Income/(Loss) | Gain/(Loss) | Stock |
|
| |
| Real Estate Securities | | $80,638 | $(65,350) | $(15,288) |
| Diversified Income Plus | (1,563) | 1,563 | — |
| At December 31, 2006, the components of distributable |
| earnings on a tax basis were as follows: | |
| | Undistributed | Undistributed |
| | Ordinary | Long-Term |
| Fund | Income | Capital Gain |
|
| Diversified Income Plus | $559,349 | $— |
| At December 31, 2006, Thrivent Diversified Income Plus |
| Fund had accumulated net realized capital loss carryovers |
| expiring as follows: | | |
| |
| | Capital Loss | Expiration |
| Fund | Carryover | Year |
|
| Diversified Income Plus | $33,965,364 | 2007 |
| | 14,003,544 | 2008 |
| | 12,668,032 | 2009 |
| | 324,797 | 2011 |
| | ————————— | |
| | $60,961,737 | |
| | ================ | |
To the extent that this Fund realizes future net capital gains, taxable distributions will be reduced by any unused capital loss carryovers as permitted by the Internal Revenue Code.
The following capital loss carryover was utilized during the period from November 1, 2006, to December 31, 2006: Thrivent Diversified Income Plus Fund, $1,658,566.
| The tax character of distributions paid during the year ended December 31, 2006, and period ended December 31, 2005, |
| was as follows: | | | | | | |
| | | Ordinary Income | Long-Term Capital Gain | Return of Capital |
| Fund | 12/31/06 | 12/31/05(a) | 12/31/06 | 12/31/05(a) | 12/31/06 | 12/31/05(a) |
|
| Real Estate Securities | $1,881,430 | $236,840 | $927,617 | $88,253 | $195,501 | $28,084 |
| | | Ordinary Income | | | | |
| | 12/31/06(b) | 10/31/06 | 10/31/05 | | | |
|
| Diversified Income Plus | $1,138,483 | $8,376,527 | $10,545,623 | | | |
(a) From Fund’s inception of June 30, 2005.
(b) From November 1, 2006 through December 31, 2006.
Notes to Financial Statements
December 31, 2006
(5) DISTRIBUTIONS BY CLASS
Net investment income and net realized gain distributions by class for the Funds were as follows:
| | Net Investment | Net Realized |
| | Income | Gains |
|
| Real Estate Securities Fund | | |
| Class A Shares | | |
| Year ended December 31, 2006 | $355,518 | $553,751 |
| Period ended December 31, 2005(a) | 94,915 | 40,464 |
| Institutional Class Shares | | |
| Year ended December 31, 2006 | 822,640 | 1,077,138 |
| Period ended December 31, 2005(a) | 129,484 | 60,230 |
| |
| Diversified Income Plus Fund | | |
| Class A Shares | | |
| Period ended December 31, 2006(b) | 1,061,942 | — |
| Year ended October 31, 2006 | 7,897,336 | — |
| Year ended October 31, 2005 | 9,905,335 | — |
| Class B Shares | | |
| Period ended December 31, 2006(b) | 18,633 | — |
| Year ended October 31, 2006 | 207,527 | — |
| Year ended October 31, 2005 | 313,008 | — |
| Institutional Class Shares | | |
| Period ended December 31, 2006(b) | 57,908 | — |
| Year ended October 31, 2006 | 271,664 | — |
| Year ended October 31, 2005 | 327,280 | — |
| |
| (a) For the period from June 30, 2005 (inception), to December 31, |
| 2005. | | |
| (b) For the period from November 1, 2006, to December 31, 2006. |
Distributions from Real Estate Securities Fund to shareholders, by class, for the year ended December 31, 2006, were $66,807 and $128,694 from return of capital for Class A and Institutional Class, respectively, and for the year ended December 31, 2005, were $12,575 and $15,509 from return of capital for Class A and Institutional Class, respectively.
(6) SECURITY TRANSACTIONS
(A) Purchases and Sales of Investment Securities — For the year and period ended December 31, 2006, the cost of purchases and the proceeds from sales of investment securities other than U.S. Government and short-term securities were as follows:
| | In thousands |
|
|
| Fund | Purchases | Sales |
|
| Real Estate Securities Fund | $64,426 | $31,908 |
| Diversified Income Plus Fund | 34,027 | 22,511 |
| Diversified Income Plus Fund(a) | 181,423 | 189,589 |
| Purchases and sales of U.S. Government securities were: |
| | In thousands | |
|
|
| Fund | Purchases | Sales |
|
| Diversified Income Plus Fund | $16 | $— |
| Diversified Income Plus Fund(a) | 19,360 | 17,810 |
(a) For the year ended October 31, 2006.
(B) Investments in Restricted Securities — The Diversified Income Plus Fund owns restricted securities that were purchased in private placement transactions without registration under the Securities Act of 1933. Unless such securities subsequently become registered, they generally may be resold only in privately negotiated transactions with a limited number of purchasers. The aggregate value of restricted securities at December 31, 2006, was $0, which represented 0.00% of the net assets of Fund, respectively. The Fund has no right to require registration of unregistered securities.
(C) Investments in High-Yielding Securities — The Funds may invest in high-yielding securities. These securities will typically be in the lower rating categories or will be non-rated and generally will involve more risk than securities in the higher rating categories. Lower rated or unrated securities are more likely to react to developments affecting market risk and credit risk than are more highly rated securities, which react primarily to movements in the general level of interest rates.
(D) Investments in Options and Futures Contracts — The movement in the price of the security underlying an option or futures contract may not correlate perfectly with the movement in the prices of the portfolio securities being hedged. A lack of correlation could render the Fund’s hedging strategy unsuccessful and could result in a loss to the Fund. In the event that a liquid secondary market would not exist, the Fund could be prevented from entering into a closing transaction, which could result in additional losses to the Fund.
Notes to Financial Statements
December 31, 2006
(7) INVESTMENTS IN AFFILIATES
Affiliated issuers, as defined under the Investment Company Act of 1940, include those in which the Fund’s holdings of an issuer represent 5% or more of the outstanding voting securities of an issuer, or any affiliated mutual fund. A summary of transactions for the year and period ended December 31, 2006, in the Thrivent Money Market Fund, is as follows:
| | Gross | Gross | Balance of | | Dividend Income | Dividend Income |
| | Purchases and | Sales and | Shares Held | Value | Period Ending | Period Ending |
| Fund | Additions | Reductions | December 31, 2006 | December 31, 2006 | December 31, 2006 | October 31, 2006 |
|
| Real Estate Securities Fund | $34,615,720 | $32,121,087 | 2,501,574 | $2,501,574 | $69,039 | N/A |
| Diversified Income Plus Fund (a) | 10,531,341 | 9,234,173 | 3,915,178 | 3,915,178 | 29,415 | $173,701 |
| Total Value and Dividend Income | | | | $6,416,752 | $98,454 | $173,701 |
(a) For the period from November 1, 2006, to December 31, 2006.
A summary of transactions for the year and period ended December 31, 2006, in the Thrivent Financial Securities Lending Trust, is as follows:
| | Gross | Gross | Balance of | |
| | Purchases and | Sales and | Shares Held | Value |
| Fund | Additions | Reductions | December 31, 2006 | December 31, 2006 |
|
| Real Estate Securities Fund | $43,645,434 | $35,085,862 | 10,395,975 | $10,395,975 |
| Diversified Income Plus Fund (a) | 13,873,986 | 9,369,384 | 38,151,784 | 38,151,784 |
| Total Value | | | | $48,547,759 |
(a) For the period from November 1, 2006, to December 31, 2006.
(8) SECURITY TRANSACTIONS WITH AFFILIATED FUNDS
The Funds are permitted to purchase or sell securities from or to certain other Funds under specified conditions outlined in procedures adopted by the Board of Trustees of the Trust. The procedures have been designed to ensure that any purchase or sale of securities by the Fund from or to another fund or portfolio that is or could be considered an affiliate by virtue of having a common investment adviser (or affiliated investment advisers), common Trustees and/or common officers complies with Rule 17a-7 of the 1940 Act. Further, as defined under the procedures, each transaction is effected at the current market price. Pursuant to these procedures, during the period ended December 31, 2006, the Diversified Income Plus Fund engaged in purchases and sales of securities of $733,150 and $0, respectively.
(9) RELATED PARTY TRANSACTIONS
As of December 31, 2006, a related party held 1,176,469, or 22.0%, of the Real Estate Securities Fund’s outstanding shares.
Notes to Financial Statements
December 31, 2006
(10) SHARES OF BENEFICIAL INTEREST
The Declaration of Trust permits the Trust to issue an unlimited number of full and fractional shares of beneficial interest of the Fund. During the year and period ended December 31, 2006, year ended October 31, 2006, period ended December 31, 2005, and the year ended October 31, 2005, transactions in Fund shares were as follows:
| | | | | Real Estate Securities Fund | |
| | | | ----------------———————————————————————————————————————————— |
| | | | Class A | Institutional Class |
| | | | -----——————————————————————— | ---——————————————————————— |
| Year Ended December 31, 2006 | | | Shares | Amount | Shares | Amount |
| ————————————————————————— | | | ——————————— | ——————————— | ——————————— | ——————————— |
| Sold | | | 936,037 | $ 11,367,812 | 3,125,197 | $ 37,459,765 |
| |
| Dividends and distributions reinvested | | | 75,048 | 963,216 | 158,329 | 2,028,641 |
| |
| Capital contribution from adviser | | | — | 31,439 | — | 49,849 |
| |
| Redeemed | | | (145,707) | (1,797,728) | (1,175,056) | (14,288,278) |
| | | | ——————————— | ——————————— | ——————————— | ——————————— |
| Net Change | | | 865,378 | $ 10,564,739 | 2,108,470 | $ 25,249,977 |
| | | | ================== | =================== | =================== | =================== |
| |
| |
| Period Ended December 31, 2005(a) | | | | | | |
| ————————————————————————— | | | | | | |
| Sold | | | 1,061,731 | $ 10,774,484 | 1,439,461 | $ 14,698,842 |
| |
| Dividends and distributions reinvested | | | 14,279 | 147,802 | 19,717 | 204,666 |
| |
| Redeemed | | | (120,073) | (1,242,007) | (25,801) | (276,065) |
| | | | ——————————— | ——————————— | ——————————— | ——————————— |
| Net Change | | | 955,937 | $ 9,680,279 | 1,433,377 | $ 14,627,443 |
| | | | ================== | ================== | =================== | ================== |
| |
| |
| | | | Diversified Income Plus Fund | | |
| | -----————————————————————————————————————————————————————————————————————————————— |
| | Class A | Class B | Institutional Class |
| | ------------————————————————————— | ---——————————————————————————— | ------------------——————————————————— |
| Period Ended December 31, 2006(b) | Shares | Amount | Shares | Amount | Shares | Amount |
| ————————————————————————— | --——————————— | --------—————————— | ---—————————————— | ————————————— | ———————————— | ———————————— |
| Sold | 2,202,970 | $ 15,030,302 | 12,953 | $ 87,907 | 169,013 | $ 1,152,549 |
| |
| Dividends and distributions reinvested | 117,547 | 806,470 | 2,263 | 15,526 | 5,788 | 39,714 |
| |
| Redeemed | (584,365) | (3,987,392) | (26,614) | (181,048) | (24,148) | (163,649) |
| | -------------———————— | ---------------———————— | ---------------------———————— | ---------------———————— | —------------——————— | —------------——————— |
| Net Change | 1,736,152 | $ 11,849,380 | (11,398) | $ (77,615) | 150,653 | $ 1,028,614 |
| | ===================== | ===================== | ======================== | ===================== | =================== | =================== |
| |
| |
| Year Ended October 31, 2006 | | | | | | |
| ————————————————————————— | | | | | | |
| Sold | 4,306,685 | $ 28,014,839 | 17,526 | $ 113,372 | 610,182 | $ 3,981,168 |
| |
| Dividends and distributions reinvested | 857,313 | 5,538,631 | 24,164 | 155,968 | 24,610 | 159,237 |
| |
| Redeemed | (6,139,059) | (39,536,691) | (227,488) | (1,463,782) | (437,305) | (2,835,896) |
| | ———————— | ———————— | ———————— | ———————— | ———————— | ———————— |
| Net Change | (975,061) | $ (5,983,221) | (185,798) | $ (1,194,442) | 197,487 | $ 1,304,509 |
| | ============== | ============= | ============== | ============== | ============== | ============== |
| |
| |
| Year Ended October 31, 2005 | | | | | | |
| ————————————————————————— | | | | | | |
| Sold | 1,645,098 | $ 10,909,037 | 13,662 | $ 89,576 | 59,725 | $ 397,171 |
| |
| Dividends and distributions reinvested | 1,057,002 | 6,959,351 | 35,298 | 232,596 | 35,874 | 235,946 |
| |
| Redeemed | (3,988,894) | (26,331,604) | (284,341) | (1,885,441) | (72,353) | (486,954) |
| | ———————— | ———————— | ———————— | ———————— | ———————— | ———————— |
| Net Change | (1,286,794) | $ (8,463,216) | (235,381) | $ (1,563,269) | 23,246 | $ 146,163 |
| | ============== | ============== | ============== | ============== | ============== | ============== |
(a) For the period from June 30, 2005 (inception), to December 31, 2005.
(b) For the period from November 1, 2006, to December 31, 2006.
This page intentionally left blank.
Thrivent Mutual Funds
Financial Highlights
| ——————————————————————————————————————————————————————————————————————————————————————————————---———--———--———--———--———------------------------------------ |
| | F O R | A S H A R E | O U T S T A N D I N G T H R O U G H O U T E A C H | P E R I O D(a) |
| | ———————————————————————————————————————-———————————————————————————----------————------------------------------------------------------------ |
| |
| | | | | | | Less Distributions | |
| | | Income from Investment Operations | | from | |
| | ————————————————————————————————---- | ---------------————————————––––––––––––––––––––––––-– |
| | Net Asset | | Net Realized | | | Net | |
| | Value, | Net | and Unrealized | Total from | Net | Realized | |
| | Beginning | Investment | Gain/(Loss) on | Investment | Investment | Gain on | Return of |
| | of Period | Income/(Loss) | Investments(b) | Operations | Income | Investments | Capital |
| ——————————————————————————————————————————————————————————————————————————————————————————————————————————------------------------------——---------------------- |
| REAL ESTATE SECURITIES FUND | | | | | | |
| Class A Shares | | | | | | | |
| Year Ended 12/31/2006 | $10.42 | $0.23 | $3.30 | $3.53 | $(0.26) | $(0.31) | $(0.04) |
| Period Ended 12/31/2005(e) | 10.00 | 0.11 | 0.48 | 0.59 | (0.11) | (0.04) | (0.02) |
| Class I Shares | | | | | | | |
| Year Ended 12/31/2006 | 10.42 | 0.31 | 3.29 | 3.60 | (0.32) | (0.31) | (0.04) |
| Period Ended 12/31/2005(e) | 10.00 | 0.12 | 0.49 | 0.61 | (0.13) | (0.04) | (0.02) |
| |
| DIVERSIFIED INCOME PLUS FUND | | | | | | |
| Class A Shares | | | | | | | |
| Period Ended 12/31/2006(f) | 6.70 | 0.05 | 0.18 | 0.23 | (0.05) | — | — |
| Year Ended 10/31/2006 | 6.41 | 0.43 | 0.29 | 0.72 | (0.43) | — | — |
| Year Ended 10/31/2005 | 6.71 | 0.46 | (0.27) | 0.19 | (0.49) | — | — |
| Period Ended 10/31/2004 (g) | 6.54 | 0.22 | 0.18 | 0.40 | (0.23) | — | — |
| Year Ended 4/30/2004 | 6.27 | 0.46 | 0.28 | 0.74 | (0.47) | — | — |
| Year Ended 4/30/2003 | 6.19 | 0.50 | 0.08 | 0.58 | (0.50) | — | — |
| Year Ended 4/30/2002 | 6.76 | 0.54 | (0.56) | (0.02) | (0.55) | — | — |
| Class B Shares | | | | | | | |
| Period Ended 12/31/2006(f) | 6.70 | 0.04 | 0.18 | 0.22 | (0.04) | — | — |
| Year Ended 10/31/2006 | 6.41 | 0.37 | 0.29 | 0.66 | (0.37) | — | — |
| Year Ended 10/31/2005 | 6.72 | 0.40 | (0.28) | 0.12 | (0.43) | — | — |
| Period Ended 10/31/2004 (g) | 6.54 | 0.19 | 0.19 | 0.38 | (0.20) | — | — |
| Year Ended 4/30/2004 | 6.27 | 0.40 | 0.28 | 0.68 | (0.41) | — | — |
| Year Ended 4/30/2003 | 6.19 | 0.45 | 0.08 | 0.53 | (0.45) | — | — |
| Year Ended 4/30/2002 | 6.76 | 0.49 | (0.56) | (0.07) | (0.50) | — | — |
| Class I Shares | | | | | | | |
| Period Ended 12/31/2006(f) | 6.70 | 0.05 | 0.19 | 0.24 | (0.06) | — | — |
| Year Ended 10/31/2006 | 6.41 | 0.45 | 0.30 | 0.75 | (0.46) | — | — |
| Year Ended 10/31/2005 | 6.71 | 0.49 | (0.27) | 0.22 | (0.52) | — | — |
| Period Ended 10/31/2004 (g) | 6.54 | 0.24 | 0.18 | 0.42 | (0.25) | — | — |
| Year Ended 4/30/2004 | 6.27 | 0.48 | 0.29 | 0.77 | (0.50) | — | — |
| Year Ended 4/30/2003 | 6.19 | 0.51 | 0.09 | 0.60 | (0.52) | — | — |
| Year Ended 4/30/2002 | 6.76 | 0.56 | (0.57) | (0.01) | (0.56) | — | — |
(a) All per share amounts have been rounded to the nearest cent.
(b) The amount shown may not correlate with the change in aggregate gains and losses of portfolio securities due to the timing of sales and redemptions of fund shares.
(c) Total investment return assumes dividend reinvestment and does not reflect any deduction for sales charges. Not annualized for periods less than one year.
(d) Computed on an annualized basis for periods less than one year.
| The accompanying Notes to Financial Statements are an integral part of this schedule. |
|
| 36 |
Thrivent Mutual Funds
Financial Highlights — continued
| —————————————————————————————————————————————————————————————————————————————————————---———————————----——————-——-——————-——————-——————-——————-——————-——————-——————-——————-——— ———-——————-——————-——————-——————-——————-————— |
| | | R A T I O S / S U P P L E M E N T A L D A T A | | |
| ————————————————————————————————————— ——————————————————————————————————————————————————————————————————-----———————————-- - -———————---———————————---————————————————————————————————————————————————— |
| | | | Ratios to Average | |
| | | | Net Assets Before Expenses | |
| | | Ratios to Average Net | Waived, Credited or Paid | |
| | | Assets(d) | Directly(d) | |
| | Net Asset | | ————————————–————————— | ————————————–—————— | |
| | Value, | | Net Assets | | Net | | Net | Portfolio |
| Total | End of | Total | End of Period | | Investment | | Investment | Turnover |
| Distributions | Period | Return(c) | (in millions) | Expenses | Income/(Loss) | Expenses | Income/(Loss) | Rate |
| |
|
| $(0.61) | $13.34 | 34.27% | $24.3 | 0.48% | 2.01% | 1.60% | 0.89% | 70% |
| (0.17) | 10.42 | 5.90% | 10.0 | 1.06% | 2.30% | 2.30% | 1.07% | 16% |
| |
| (0.67) | 13.35 | 34.96% | 47.3 | 0.00% | 2.51% | 1.06% | 1.45% | 70% |
| (0.19) | 10.42 | 6.11% | 14.9 | 0.31% | 3.34% | 1.61% | 2.04% | 16% |
| |
| |
| |
| (0.05) | 6.88 | 3.50% | 138.8 | 1.08% | 4.80% | 1.25% | 4.63% | 16% |
| (0.43) | 6.70 | 11.77% | 123.4 | 0.98% | 6.66% | 1.15% | 6.49% | 170% |
| (0.49) | 6.41 | 2.91% | 124.3 | 0.95% | 6.99% | 1.13% | 6.82% | 57% |
| (0.23) | 6.71 | 6.32% | 138.9 | 1.07% | 6.82% | 1.14% | 6.75% | 55% |
| (0.47) | 6.54 | 12.08% | 135.1 | 1.10% | 6.98% | 1.10% | 6.98% | 91% |
| (0.50) | 6.27 | 10.59% | 117.4 | 0.93% | 8.72% | 1.03% | 8.62% | 103% |
| (0.55) | 6.19 | (0.26)% | 118.6 | 1.00% | 8.41% | 1.17% | 8.24% | 72% |
| |
| |
| (0.04) | 6.88 | 3.32% | 3.0 | 2.17% | 3.77% | 2.34% | 3.60% | 16% |
| (0.37) | 6.70 | 10.64% | 3.0 | 2.01% | 5.75% | 2.18% | 5.58% | 170% |
| (0.43) | 6.41 | 1.74% | 4.1 | 1.95% | 6.02% | 2.12% | 5.85% | 57% |
| (0.20) | 6.72 | 5.95% | 5.9 | 2.05% | 5.84% | 2.11% | 5.78% | 55% |
| (0.41) | 6.54 | 11.06% | 6.1 | 2.01% | 6.07% | 2.01% | 6.07% | 91% |
| (0.45) | 6.27 | 9.61% | 6.0 | 1.84% | 7.81% | 2.01% | 7.64% | 103% |
| (0.50) | 6.19 | (1.02)% | 8.2 | 1.74% | 7.67% | 1.93% | 7.48% | 72% |
| |
| |
| (0.06) | 6.88 | 3.59% | 7.0 | 0.66% | 5.15% | 0.83% | 4.98% | 16% |
| (0.46) | 6.70 | 12.29% | 5.8 | 0.54% | 6.84% | 0.72% | 6.66% | 170% |
| (0.52) | 6.41 | 3.36% | 4.3 | 0.50% | 7.42% | 0.67% | 7.25% | 57% |
| (0.25) | 6.71 | 6.56% | 4.3 | 0.61% | 7.28% | 0.68% | 7.21% | 55% |
| (0.50) | 6.54 | 12.56% | 3.8 | 0.67% | 7.41% | 0.67% | 7.41% | 91% |
| (0.52) | 6.27 | 10.88% | 3.3 | 0.67% | 8.98% | 0.67% | 8.98% | 103% |
| (0.56) | 6.19 | 0.05% | 2.7 | 0.68% | 8.73% | 0.68% | 8.73% | 72% |
(e) Since inception, June 30, 2005.
(f) For the period from November 1, 2006 to December 31, 2006.
(g) For the period from May 1, 2004 to October 31, 2004
| The accompanying Notes to Financial Statements are an integral part of this schedule. |
|
| 37 |
Additional Information
(unaudited)
Shareholder Notification of Federal Tax Information (unaudited)
The following information is provided solely to satisfy the requirements set forth by the Internal Revenue Code. Shareholders will be provided information regarding their distributions in February 2007.
The Funds designate the percentage of dividends declared from net investment income as dividends qualifying for the 70% dividends received deduction for corporations and the percentage as qualified dividend income for individuals under the Jobs and Growth Tax Relief Reconciliation Act of 2003 as follows:
| | Dividends | Qualified |
| | Received | Dividend |
| | Deduction for | Income for |
| Fund | Corporations | Individuals |
|
| Real Estate Securities | 2% | 2% |
| Diversified Income Plus(a) | 27% | 27% |
(a) For the two month period ended December 31, 2006. Please consult Thrivent.com for the 2006 calendar year percentage of dividends qualifying for the 70% dividends received deduction for corporations.
Thrivent Real Estate Securities Fund designates $927,617 as distributions of long-term capital gains.
Proxy Voting
The policies and procedures that the Trust uses to determine how to vote proxies relating to portfolio securities are attached to the Trust’s Statement of Additional Information. You may request a free copy of the Statement of Additional Information or the report of how the Trust voted proxies relating to portfolio securities during the most recent 12-month period ended June 30 by calling 1-800-847-4836. You also may review the Statement of Additional Information or the report of how the Trust voted proxies relating to portfolio securities during the most recent 12-month period ended June 30 at the Thrivent Financial web site (www.thrivent.com) or the SEC web site (www.sec.gov).
Quarterly Schedule of Portfolio Holdings
The Trust files its Schedule of Portfolio Holdings on Form N-Q with the SEC for the first and third quarters of each fiscal year. You may request a free copy of the Trust’s Forms N-Q by calling 1-800-847-4836. The Trust’s Forms N-Q also are available on the Thrivent Financial web site (www.thrivent.com) or the SEC web site (www.sec.gov). You also may review and copy the Forms N-Q for the Trust at the SEC’s Public Reference Room in Washington, DC. You may get information about the operation of the Public Reference Room by calling 1-800-SEC-0330.
Board Approval of Investment Advisory Agreements
Both the Investment Company Act of 1940 and the terms of the Advisory Agreement of the Thrivent Mutual Funds (the “Trust”) require that the agreement be approved annually by a majority of the Board of Trustees, including a majority of the Independent Trustees.
At its meeting on November 8, 2006, the Board of Trustees of the Trust voted unanimously to renew the existing Advisory Agreement between the Trust and Thrivent Asset Management, LLC (the “Adviser”) for each series (each a “Fund”) of the Trust. In connection with its reapproval of the Advisory Agreement with the Adviser, the Board considered the following factors:
1. The nature, extent and quality of the services provided by the Adviser;
2. The performance of the Funds;
3. The costs of services provided and profits realized by the Adviser;
4. The extent to which economies of scale may be realized as the Funds grow; and
5. Whether the breakpoint levels reflect these economies of scale for the benefit of shareholders.
In connection with the renewal process, the Contracts Committee of the Board (consisting of each of the Independent Trustees of the Trust) met on July 19, August 28, and November 8, 2006, to consider information relevant to the renewal process. The Independent Trustees also retained the services of Management Practice, Inc. (“MPI”) as an independent consultant to assist them in the compilation, organization and evaluation of relevant information. This information included statistical comparisons of the advisory fees, total operating expenses, and performance of each of the Funds in comparison to a peer group of comparable investment companies; detailed information prepared by management of the Funds with respect to the cost of services provided to the Funds and fees charged, including effective advisory fees that take into account breakpoints and fee waivers by
38
Additional Information
(unaudited)
the Adviser; profit realized by the Adviser and its affiliates that provide services to the Funds; and information regarding the types of services furnished to the Funds, the personnel providing the services, staff additions, systems improvements and plans for further hiring. In addition, the Board received reports from the Adviser’s investment management staff with respect to the performance of the Funds. In addition to review of the information presented to the Board during the contract renewal process and throughout the year, the Board also considered knowledge gained from discussions with Fund management.
The Independent Trustees were represented by independent counsel throughout the review process and during private sessions of the Independent Trustees to consider reapproval of the agreement. The Trustees also received a memorandum from independent counsel summarizing their responsibilities under the Investment Company Act of 1940 in reviewing and approving the Advisory Agreements. The Contract Committee’s and Board’s consideration of the factors listed above and the information provided to it are discussed below.
Nature, Extent and Quality of Services
At each of the Board’s regular quarterly meetings during 2006, management presented information describing the services furnished to the Funds by the Adviser. During these meetings, management reported on the investment management, Fund trading, and compliance functions provided to the Funds under the Advisory Agreement. During the renewal process, the Board considered the specific services provided under the Advisory Agreement as compared to the services provided by other mutual fund investment advisers under similar investment advisory agreements. The Board also considered information relating to the investment experience and educational backgrounds of the Adviser’s Fund managers and research analysts.
The Board received reports at each of its quarterly meetings from the Adviser’s Chief Investment Officer and from the Directors of Equity and Fixed Income Investments. In addition, the Board noted that it had, over the past year, met with a majority of the Fund managers, as well as a number of the research personnel, which gave the Board an opportunity to evaluate the managers’ abilities, experience, and the quality of services they provide to the Funds. Information was also presented to the Board describing the Fund compliance functions performed by the Adviser. The Independent Trustees also received quarterly reports from the Fund’s Chief Compliance Officer.
The Board also considered other benefits to the Adviser and its affiliates derived from its relationship with the Funds. These benefits include, among other things, fees for transfer agency services provided to the Funds, research received by the Adviser generated from commission dollars spent on Funds’ portfolio trading, and in certain cases distribution or service related fees related to Funds’ sales. The Board reviewed with the Adviser each of these arrangements and the reasonableness of the costs relative to the services performed.
The Adviser also reviewed with the Board the Adviser’s ongoing recruitment of personnel and its investment in systems technology to improve trading, Fund compliance, and investment reporting functions. The Board viewed these actions as a significant factor in approving the current Advisory Agreement as they demonstrated the Adviser’s commitment to provide the Funds with quality service and competitive investment performance.
Performance of the Funds
The Board received regular monthly performance reports, which included both the absolute and relative investment performance of each Fund. In addition, in connection with each of its regular quarterly meetings, the Board received more extensive information on the performance of each Fund, including absolute performance, relative performance rankings within each Fund’s Lipper peer group and performance as compared to benchmark index returns. The Board considered investment performance for each Fund over the one-, three- and five-year periods. When evaluating investment performance the Board placed emphasis on longer term performance and on the trend of performance, focusing particularly upon the three-year performance record, since such a period generally coincides with the tenure of the Adviser’s current Chief Investment Officer.
For both the one- and three-year periods ended September 30, 2006, 57% of the internally managed Funds and 80% of the subadvised Funds performed at or above the median of their respective Lipper peer groups. Only one Fund ranked in the bottom quartile of its Lipper peer group for the three-year period and no Fund was in the bottom quartile for the one-year period ended September 30, 2006. The Board concluded that the performance of the individual Funds was either satisfactory compared to their peer groups of funds or that the Adviser had taken appropriate actions to improve performance.
Additional Information
(unaudited)
Cost of Services and Profitability to the Advisory Organization
The Board considered both the contractual and effective advisory fees for each of the Funds. They noted that 86% of the Funds, representing 93% of total Trust assets, had contractual advisory fees at or below the medians of their peer groups. The Board also considered advisory fees after the voluntary and contractual fee waivers and expense reimbursements provided by the Adviser for several of the Funds, noting that 97% of the Funds, representing over 99% of total Trust assets, had effective advisory fees at or below the medians of their peer groups. In addition, the Board reviewed information prepared by MPI comparing each Fund’s overall expense ratio with the expense ratio of its peer group of funds. The Board also considered the profitability of the Adviser both overall and on a Fund-by-Fund basis, noting that overall profitability had declined over the past year, due in part to the fee waivers and expense reimbursements in effect.
The Board considered the allocations of the Adviser’s costs to the Funds. The Board retained an accounting firm to conduct a review of the reasonableness and consistency of these allocations. The Board was satisfied with the results of this review.
From its review of the MPI data and expense and profit information provided by the Adviser, the Board concluded that the profits earned by the Adviser from the Advisory Agreements were reasonable, particularly in light of the expense reimbursements and waivers in effect. On the basis of this information and review, the Board concluded that the advisory fees charged to the Funds for investment management services were reasonable.
Economies of Scale and Breakpoints
The Trustees considered whether economies of scale might be realized as a Fund’s assets increase. Because of differences between Funds as to management style and cost, it is difficult to generalize as to whether or to what extent economies in the advisory function may be realized as a Fund’s assets increase. Typically, expected economies of scale, where they exist, are shared through the use of fee breakpoints and/or fee waivers by the Adviser.
The Trustees considered information provided by the Adviser related to the breakpoints in the Advisory Agreement and fee waivers provided by the Adviser. The Adviser explained that its general goal with respect to fee waivers, expense reimbursements and breakpoints was that the overall expense ratio for each Fund should be at or below the median expense ratio of its peer group. In connection with their review of fee breakpoints and economies of scale, the Trustees noted that all of the Funds had net operating expenses at or below the medians of their peer groups. The Board also noted that while some Funds were increasing in assets and others were decreasing in assets, the Funds overall were not experiencing significant asset growth.
Based on the factors discussed above, the Contracts Committee unanimously recommended approval of the Advisory Agreement and the Board, including all of the Independent Trustees voting separately, approved the agreement.
Board of Trustees and Officers
The following table provides information about the Trustees and Officers of the Funds. Each Trustee oversees each of 29 series of the Trust and also serves as:
• Director of Thrivent Series Fund, Inc., a registered investment company consisting of 31 Portfolios that serve as underlying funds for variable contracts issued by Thrivent Financial for Lutherans (“Thrivent Financial”) and Thrivent Life Insurance Company (“TLIC”) and investment options in the retirement plan offered by Thrivent Financial
• Trustee of Thrivent Financial Securities Lending Trust, a registered investment company consisting of one Portfolio that serves as a cash collateral fund for a securities lending program sponsored by Thrivent Financial.
The 29 series of the Trust, 31 Portfolios of Thrivent Series Fund, Inc., and Thrivent Financial Securities Lending Trust are referred to herein as the “Fund Complex.” The Statement of Additional Information includes additional information about the Trustees and is available, without charge, by calling 1-800-847-4836.
| Interested Trustee1 | | | | |
| | | Number of | | |
| | Position | Portfolios in | Principal | |
| | with Trust | Fund Complex | Occupation | Other |
| Name, Address, | and Length | Overseen | During the | Directorships |
| and Age | of Service2 | by Trustee | Past 5 Years | Held by Trustee |
|
| Pamela J. Moret | President since 2002 | 61 | Executive Vice President, | Director, Banta |
| 625 Fourth Avenue South | and Trustee since 2004 | | Marketing and Products, | Corporation; Director, |
| Minneapolis, MN | | | Thrivent Financial | Minnesota Public Radio |
| Age 51 | | | since 2002 | |
| Independent Trustees3 | | | | |
| | | Number of | | |
| | Position | Portfolios in | Principal | |
| | with Trust | Fund Complex | Occupation | Other |
| Name, Address, | and Length | Overseen | During the | Directorships |
| and Age | of Service2 | by Trustee | Past 5 Years | Held by Trustee |
|
| F. Gregory Campbell | Trustee since 1992 | 61 | President, Carthage | Director, National |
| 625 Fourth Avenue South | | | College | Association of Independent |
| Minneapolis, MN | | | | Colleges and Universities; |
| Age 67 | | | | Director, Johnson Family |
| | | | | Funds, Inc., an investment |
| | | | | company consisting of four |
| | | | | portfolios; Director, |
| | | | | Kenosha Hospital and |
| | | | | Medical Center Board; |
| | | | | Prairie School Board; United |
| | | | | Health Systems Board |
| |
| Herbert F. Eggerding, Jr. | Lead Trustee | 61 | Management consultant | None |
| 625 Fourth Avenue South | since 2003 | | to several privately | |
| Minneapolis, MN | | | owned companies | |
| Age 69 | | | | |
| |
| Noel K. Estenson | Trustee since 2004 | 61 | Retired | None |
| 625 Fourth Avenue South | | | | |
| Minneapolis, MN | | | | |
| Age 68 | | | | |
|
Board of Trustees and Officers
| Independent Trustees3 — continued | | | |
| | | | Number of | | |
| | | Position | Portfolios in | Principal | |
| | | with Trust | Fund Complex | Occupation | Other |
| Name, Address, | and Length | Overseen | During the | Directorships |
| and Age | of Service2 | by Trustee | Past 5 Years | Held by Trustee |
|
| Richard L. Gady | Trustee since 1987 | 61 | Retired; previously Vice | Director, International |
| 625 | Fourth Avenue South | | | President, Public | Agricultural Marketing |
| Minneapolis, MN | | | Affairs and Chief | Association |
| Age | 63 | | | Economist, ConAgra, | |
| | | | | Inc. (agribusiness) | |
| |
| Richard A. Hauser | Trustee since 2004 | 61 | President, National Legal | Director, The Washington |
| 625 | Fourth Avenue South | | | Center for the Public | Hospital Center |
| Minneapolis, MN | | | Interest since 2004; | |
| Age | 63 | | | General Counsel, U.S. | |
| | | | | Department of Housing | |
| | | | | and Urban Development, | |
| | | | | 2001 to 2004 | |
| |
| Connie M. Levi | Trustee since 2004 | 61 | Retired | None |
| 625 | Fourth Avenue South | | | | |
| Minneapolis, MN | | | | |
| Age | 67 | | | | |
| |
| Edward W. Smeds | Chairman and Trustee | 61 | Retired | Chairman of Carthage |
| 625 | Fourth Avenue South | since 1999 | | | College Board |
| Minneapolis, MN | | | | |
| Age | 71 | | | | |
| |
| Douglas D. Sims | Trustee since 2006 | 61 | Retired; previously Chief | Director, Keystone |
| 625 | Fourth Avenue South | | | Executive Officer of | Neighborhood Company; |
| Minneapolis, MN | | | CoBank from 1994 to | Director, Center for |
| Age | 60 | | | June 30, 2006 | Corporate Excellence |
Board of Trustees and Officers
| Executive Officers | | |
| | | Position with Trust | |
| Name, Address, | and Length | |
| and Age | of Service2 | Principal Occupation During the Past 5 Years |
|
| Pamela J. Moret | President since 2002 | Executive Vice President, Marketing and Products, Thrivent |
| 625 | Fourth Avenue South | | Financial since 2002 |
| Minneapolis, MN | | |
| Age | 50 | | |
| |
| David S. Royal | Secretary and Chief | Vice President — Asset Management, Thrivent Financial |
| 625 | Fourth Avenue South | Legal Officer since 2006 | since 2006; Partner, Kirkland & Ellis LLP from April 2004 to |
| Minneapolis, MN | | June 2006; Associate, Skadden, Arps, Slate, Meagher & Flom |
| Age | 35 | | LLP from 1997 to 2004 |
| |
| Katie S. Kloster | Vice President and | Vice President and IC and IA Chief Compliance Officer, |
| 625 | Fourth Avenue South | Investment Company and | since 2004; previously Vice President and Comptroller of |
| Minneapolis, MN | Investment Adviser | Thrivent Financial |
| Age | 41 | Chief Compliance Officer | |
| | | since 2004 | |
| |
| Gerard V. Vaillancourt | Treasurer and Principal | Vice President, Mutual Fund Accounting since 2006; Head of |
| 625 | Fourth Avenue South | Accounting Officer | Mutual Fund Accounting, Thrivent Financial from 2005 to |
| Minneapolis, MN | since 2005 | 2006; Director, Fund Accounting Administration, Thrivent |
| Age | 39 | | Financial from 2002 to 2005; Manager, Portfolio Compliance, |
| | | | Lutheran Brotherhood from 2001 to 2002 |
| |
| Russell W. Swansen | Vice President since 2004 | Senior Vice President and Chief Investment Officer, Thrivent |
| 625 | Fourth Avenue South | | Financial, since 2004; Managing Director, Colonade Advisors, |
| Minneapolis, MN | | LLC, from 2001 to 2003; President and Chief Investment |
| Age | 49 | | Officer of PPM America from 1999 to 2000 |
| |
| Janice M. Guimond | Vice President since 2005 | Vice President, Investment Operations, Thrivent Financial |
| 625 | Fourth Avenue South | | since 2003; Manager of Portfolio Reporting, Thrivent Financial |
| Minneapolis, MN | | 2003 to 2004; Independent Consultant 2001 to 2003; Vice |
| Age | 42 | | President, Director of Technology, Investment Advisers, Inc. |
| | | | 1999 to 2000; Vice President, Investment Systems & Services, |
| | | | Investment Advisers, Inc. from 1997 to 1999 |
| |
| Karl D. Anderson | Vice President since 2006 | Vice President, Products, Thrivent Financial |
| 625 | Fourth Avenue South | | |
| Minneapolis, MN | | |
| Age | 46 | | |
Board of Trustees and Officers
| Executive Officers — continued | |
| | Position with Trust | |
| Name, Address, | and Length | |
| and Age | of Service2�� | Principal Occupation(s) During the Past 5 Years |
|
| Brian W. Picard | Vice President | Director of FSO Compliance Corp. BCM, since 2006; Manager |
| 4321 North Ballard Road | Anti-Money Laundering | of Field and Securities Compliance from 2002 to 2006, |
| Appleton, WI | Officer since 2006 | Thrivent Financial |
| Age 36 | | |
| |
| Kenneth L. Kirchner | Assistant Vice President | Director, Mutual Fund Operations, Thrivent Financial |
| 4321 North Ballard Road | since 2004 | |
| Appleton, WI | | |
| Age 40 | | |
| |
| James M. Odland | Assistant Secretary | Vice President, Office of the General Counsel, Thrivent |
| 625 Fourth Avenue South | since 2006 | Financial for Lutherans, since 2005; Senior Securities Counsel, |
| Minneapolis, MN | | Allianz Life Insurance Company from January 2005 to |
| Age 51 | | August 2005; Vice President and Chief Legal Officer, |
| | | Woodbury Financial Services, Inc., from September 2003 to |
| | | January 2005; Vice President and Group Counsel, Corporate |
| | | Practice Group, American Express Financial Advisors, Inc., |
| | | from 2001 to 2003 |
| |
| John R. Vekich | Assistant Vice President | Vice President Accumulation Product and Solution |
| 625 Fourth Avenue South | since 2006 | Management since 2007, Thrivent Financial; Vice President |
| Minneapolis, MN | | Field Marketing from 2005 to 2006; Director EPMO from |
| Age 38 | | 2003 to 2004; Vice President, Al Frank Asset Management |
| | | from 2000 to 2002 |
| |
| Marlene J. Nogle | Assistant Secretary | Senior Counsel, Thrivent Financial |
| 625 Fourth Avenue South | since 2003 | |
| Minneapolis, MN | | |
| Age 59 | | |
| |
| Todd J. Kelly | Assistant Treasurer | Director, Fund Accounting Operations, Thrivent Financial |
| 4321 North Ballard Road | since 1999 | |
| Appleton, WI | | |
| Age 37 | | |
1 “Interested person” of the Trust as defined in 1940 Act by virtue of positions with Thrivent Financial. Ms. Moret is considered an interested person because of her principal occupation with Thrivent Financial.
2 Each Trustee serves an indefinite term until her or his successor is duly elected and qualified. Officers serve at the discretion of the board until their successors are duly appointed and qualified.
3 The Trustees other than Ms. Moret are not “interested persons” of the Trust and are referred to as “Independent Trustees.”
Item 2. Code of Ethics
As of the end of the period covered by this report, registrant has adopted a code of ethics (as defined in Item 2 of Form N-CSR) applicable to registrant's Principal Executive Officer, Principal Financial Officer, and Principal Accounting Officer. A copy of this code of ethics is filed as an exhibit to this Form N-CSR.
Item 3. Audit Committee Financial Expert
Registrant's Board of Trustees has determined that Herbert F. Eggerding, Jr., an independent trustee, is the Audit Committee Financial Expert.
Item 4. Principal Accountant Fees and Services
(a) through (d)
Thrivent Real Estate Securities Fund and Thrivent Diversified Income Plus Fund (each a “Fund” and collectively, the “Funds”) are each a series (each a “Series” and collectively, the “Series”) of Thrivent Mutual Funds, a Massachusetts business trust (the “Trust”). Including the Funds, the Trust contains a total of 29 series. This Form N-CSR relates to the annual reports of the Funds.
The following table presents the aggregate fees billed to the Thrivent Real Estate Securities Fund for the Fund’s respective fiscal years ended December 31, 2005 and December 31, 2006 by the Fund’s independent public accountants, PricewaterhouseCoopers LLP ("PwC"), for professional services rendered for the audit of the Fund’s annual financial statements and fees billed for other services rendered by PwC during those periods.
| Fiscal Years Ended | | 12/31/05 | | 12/31/06 |
| |
| |
|
| Audit Fees | | $8,500 | | $8,500 |
| |
| Audit-Related Fees(1) | | $0 | | $0 |
| |
| Tax Fees(2) | | $6,250 | | $6,535 |
| |
| All Other Fees(3) | | $0 | | $0 |
| |
| Total | | $14,750 | | $15,035 |
| |
| |
|
(1) Audit-related fees consist of the aggregate fees billed for assurance and related services that are reasonably related to the performance of the audit of financial statements and are not reported under the category of audit fees.
(2) Tax fees consist of the aggregate fees billed for professional services rendered by the principal accountant relating to tax compliance, tax advice, and tax planning and specifically include fees for tax return preparation.
(3) All other fees consist of the aggregate fees billed for products and services provided by the principal accountant other than audit, audit-related, and tax services.
The following table presents the aggregate fees billed to the Thrivent Diversified Income Plus Fund for the Fund’s respective fiscal years ended October 31, 2005, October 31,
2006 and December 31, 2006 by PwC for professional services rendered for the audit of the Fund’s annual financial statements and fees billed for other services rendered by PwC during those periods. The Fund recently changed its fiscal year end from October 31 to December 31; accordingly, an additional column is shown.
| Fiscal Years Ended | | 10/31/05 | | 10/31/06 | | 12/31/06 |
| |
| |
| |
|
| Audit Fees | | $12,367 | | $9,250 | | $11,830 |
| |
| |
| |
|
| Audit-Related Fees(1) | | $0 | | $0 | | $0 |
| |
| |
| |
|
| Tax Fees(2) | | $4,178 | | $4,575 | | $1,800 |
| |
| |
| |
|
| All Other Fees(3) | | $0 | | $0 | | $0 |
| |
| |
| |
|
| Total | | $16,545 | | $12,825 | | $13,630 |
| | |
| |
| |
|
(1) Audit-related fees consist of the aggregate fees billed for assurance and related services that are reasonably related to the performance of the audit of financial statements and are not reported under the category of audit fees.
(2) Tax fees consist of the aggregate fees billed for professional services rendered by the principal accountant relating to tax compliance, tax advice, and tax planning and specifically include fees for tax return preparation.
(3) All other fees consist of the aggregate fees billed for products and services provided by the principal accountant other than audit, audit-related, and tax services.
The following table presents the aggregate fees billed to all Series of the Trust with October 31 fiscal year ends for the fiscal years ended October 31, 2005 and October 31, 2006 by PwC for professional services rendered for the audit of the annual financial statements of the applicable Series and fees billed for other services rendered by PwC during those periods.
| Fiscal Years Ended | | 10/31/05 | | 10/31/06 |
| |
| |
|
| Audit Fees | | $417,660 | | $394,409 |
| |
| |
|
| Audit-Related Fees(1) | | $0 | | $0 |
| |
| |
|
| Tax Fees(2) | | $135,325 | | $124,065 |
| |
| |
|
| All Other Fees(3) | | $0 | | $0 |
| |
| |
|
| Total | | $552,985 | | $518,474 |
| |
| |
|
(1) Audit-related fees consist of the aggregate fees billed for assurance and related services that are reasonably related to the performance of the audit of financial statements and are not reported under the category of audit fees.
(2) Tax fees consist of the aggregate fees billed for professional services rendered by the principal accountant relating to tax compliance, tax advice, and tax planning and specifically include fees for tax return preparation.
(3) All other fees consist of the aggregate fees billed for products and services provided by the principal accountant other than audit, audit-related, and tax services.
(e) Registrant's audit and compliance committee charter, adopted in August 2004, provides that the audit and compliance committee (comprised of the independent directors of registrant) is responsible for pre-approval of all auditing services performed for the registrant. The audit and compliance committee reports to the Board of Trustees ("Board") regarding its approval of the engagement of the auditor and the proposed fees for the engagement, and the majority of the Board (including the members of the Board who are independent directors) must approve the auditor at an in-person meeting. The audit and compliance committee also is responsible for pre-approval (subject to the de minimus exceptions for non-audit services described in Section 10A(i)(1)(B) of the Securities Exchange Act of 1934, as amended) of all non-auditing services performed for the registrant or for any service affiliate of registrant. Registrant's audit and compliance committee charter also permits a designated member of the audit and compliance committee to pre-approve, between meetings, one or more non-audit service projects, subject to ratification by the audit and compliance committee at the next meeting of the audit and compliance committee. Registrant's audit and compliance committee pre-approved all fees described above which PwC billed to registrant.
(f) Less than 50% of the hours billed by PwC for auditing services to each Fund and to the registrant for the fiscal year ended December 31, 2006, were for work performed by persons other than full-time, permanent employees of PwC.
(g) The aggregate non-audit fees billed by PwC to registrant and to registrant's investment adviser and any entity controlling, controlled by, or under common control with registrant's investment adviser for the fiscal years set forth below were as follows:
| Fiscal | Year | 10/31/05 | 12/31/05 | 10/31/06 | 12/31/06 |
| Ended | | | | | |
|
| Registrant(1) | | $0 | $0 | $0 | $0 |
| Adviser | | $44,431 | $10,745 | $14,145 | $6,500 |
(1) Includes all Series of the Trust
(h) Registrant's audit and compliance committee has considered the non-audit services provided to the registrant and registrant's investment adviser and any entity controlling, controlled by, or under common control with registrant's investment adviser as described above and determined that these services do not compromise PwC's independence.
Item 5. Audit Committee of Listed Registrants
Not applicable.
Item 6. Schedule of Investments
Registrant's Schedule of Investments is included in the report to shareholders filed under Item 1.
Item 7. Disclosure of Proxy Voting Policies and Procedures for Closed-End Management Investment Companies
Not applicable.
Item 8. Portfolio Managers of Closed-End Management Investment Companies
Not applicable.
Item 9. Purchases of Equity Securities by Closed-End Management Investment Company and Affiliated Purchasers.
Not applicable.
Item 10. Submission of Matters to a Vote of Security Holders
There have been no material changes to the procedures by which shareholders may recommend nominees to registrant's board of trustees.
Item 11. Controls and Procedures
(a)(i) Registrant's President and Treasurer have concluded that registrant's disclosure controls and procedures (as defined in Rule 30a-3(c) under the Investment Company Act) are effective, based on their evaluation of these controls and procedures as of a date within 90 days of the filing date of this report.
(a)(ii) There has been no change in registrant's internal controls over financial reporting (as defined in Rule 30a-3(d) under the Investment Company Act) that occurred during registrant’s most recent fiscal quarter that has materially affected, or is reasonably likely to materially affect, registrant's internal control over financial reporting.
Item 12. Exhibits
(a) The code of ethics pursuant to Item 2 is attached hereto.
(b) Certifications pursuant to Rules 30a-2(a) and 30a-2(b) under the Investment Company Act of 1940 are attached hereto.
SIGNATURES
Pursuant to the requirements of the Securities Exchange Act of 1934 and the Investment Company Act of 1940, the registrant has duly caused this report to be signed on its behalf by the undersigned, thereunto duly authorized.
| Date: February 27, 2007 | | THRIVENT MUTUAL FUNDS |
| |
| |
| |
| | | By: /s/ Pamela J. Moret |
| |
|
| | | Pamela J. Moret |
| | | President |
Pursuant to the requirements of the Securities Exchange Act of 1934 and the Investment Company Act of 1940, this report has been signed below by the following persons on behalf of the registrant and in the capacities and on the dates indicated.
| Date: February 27, 2007 | | By: /s/ Pamela J. Moret |
| |
|
| | | Pamela J. Moret |
| | | President |
| |
| |
| |
| |
| Date: February 27, 2007 | | By: /s/ Gerard V. Vaillancourt |
| |
|
| | | Gerard V. Vaillancourt |
| | | Treasurer |