UNITED STATES
SECURITIES AND EXCHANGE COMMISSION
Washington, D.C. 20549
FORM N-CSR
CERTIFIED SHAREHOLDER REPORT OF REGISTERED MANAGEMENT
INVESTMENT COMPANIES
Investment Company Act file number: 811-05075
Thrivent Mutual Funds
(Exact name of registrant as specified in charter)
625 Fourth Avenue South
Minneapolis, Minnesota 55415
(Address of principal executive offices) (Zip code)
John L. Sullivan
625 Fourth Avenue South
Minneapolis, Minnesota 55415
(Name and address of agent for service)
Registrant’s telephone number, including area code: (612) 844-5704
Date of fiscal year end: October 31
Date of reporting period: October 31, 2007
Item 1. Report to Stockholders
Table of Contents
| |
| President’s Letter | 1 |
| |
| Economic and Market Review | 2 |
| |
| Portfolio Perspectives | |
| Thrivent Aggressive Allocation Fund | 4 |
| Thrivent Moderately Aggressive Allocation Fund | . 6 |
| Thrivent Moderate Allocation Fund | 8 |
| Thrivent Moderately Conservative Allocation Fund | 10 |
| Thrivent Technology Fund | 12 |
| Thrivent Partner Small Cap Growth Fund | 14 |
| Thrivent Partner Small Cap Value Fund | 16 |
| Thrivent Small Cap Stock Fund | 18 |
| Thrivent Small Cap Index Fund | 20 |
| Thrivent Mid Cap Growth Fund | 22 |
| Thrivent Partner Mid Cap Value Fund | 24 |
| Thrivent Mid Cap Stock Fund | 26 |
| Thrivent Mid Cap Index Fund | 28 |
| Thrivent Mid Cap Index Fund-I | 30 |
| Thrivent Partner International Stock Fund | 32 |
| Thrivent Large Cap Growth Fund | 34 |
| Thrivent Large Cap Value Fund | 36 |
| Thrivent Large Cap Stock Fund | 38 |
| Thrivent Large Cap Index Fund | 40 |
| Thrivent Large Cap Index Fund-I | 42 |
| Thrivent Balanced Fund | 44 |
| Thrivent High Yield Fund | 46 |
| Thrivent Municipal Bond Fund | 48 |
| Thrivent Income Fund | 50 |
| Thrivent Core Bond Fund | 52 |
| Thrivent Limited Maturity Bond Fund | 54 |
| Thrivent Money Market Fund | 56 |
| |
| Shareholder Expense Example | 58 |
| |
| Report of Independent Registered | |
| Public Accounting Firm | 63 |
| |
| Schedules of Investments | |
| Thrivent Aggressive Allocation Fund | 64 |
| Thrivent Moderately Aggressive Allocation Fund | 65 |
| Thrivent Moderate Allocation Fund | 66 |
| Thrivent Moderately Conservative Allocation Fund | 67 |
| Thrivent Technology Fund | 68 |
| Thrivent Partner Small Cap Growth Fund | 70 |
| Thrivent Partner Small Cap Value Fund | 73 |
| Thrivent Small Cap Stock Fund | 76 |
| Thrivent Small Cap Index Fund | 81 |
| Thrivent Mid Cap Growth Fund | 90 |
| Thrivent Partner Mid Cap Value Fund | 94 |
| Thrivent Mid Cap Stock Fund | 97 |
| Thrivent Mid Cap Index Fund | 100 |
| Thrivent Mid Cap Index Fund-I | 106 |
| Thrivent Partner International Stock Fund | 112 |
| |
| Thrivent Large Cap Growth Fund | 117 |
| Thrivent Large Cap Value Fund | 121 |
| Thrivent Large Cap Stock Fund | 124 |
| Thrivent Large Cap Index Fund | 128 |
| Thrivent Large Cap Index Fund-I | 135 |
| Thrivent Balanced Fund | 142 |
| Thrivent High Yield Fund | 152 |
| Thrivent Municipal Bond Fund | 159 |
| Thrivent Income Fund | 184 |
| Thrivent Core Bond Fund | 193 |
| Thrivent Limited Maturity Bond Fund | 200 |
| Thrivent Money Market Fund | 209 |
| |
| Statement of Assets and Liabilities | 214 |
| |
| Statement of Operations | 220 |
| |
| Statement of Changes in Net Assets | 226 |
| |
| Notes to Financial Statements | 231 |
| |
| Financial Highlights | |
| Thrivent Aggressive Allocation Fund | 256 |
| Thrivent Moderately Aggressive Allocation Fund . | 256 |
| Thrivent Moderate Allocation Fund | 256 |
| Thrivent Moderately Conservative Allocation Fund | 256 |
| Thrivent Technology Fund | 258 |
| Thrivent Partner Small Cap Growth Fund | 258 |
| Thrivent Partner Small Cap Value Fund | 260 |
| Thrivent Small Cap Stock Fund | 262 |
| Thrivent Small Cap Index Fund | 262 |
| Thrivent Mid Cap Growth Fund | 264 |
| Thrivent Partner Mid Cap Value Fund | 264 |
| Thrivent Mid Cap Stock Fund | 266 |
| Thrivent Mid Cap Index Fund | 266 |
| Thrivent Mid Cap Index Fund-I | 266 |
| Thrivent Partner International Stock Fund | 268 |
| Thrivent Large Cap Growth Fund | 268 |
| Thrivent Large Cap Value Fund | 270 |
| Thrivent Large Cap Stock Fund | 270 |
| Thrivent Large Cap Index Fund | 272 |
| Thrivent Large Cap Index Fund-I | 272 |
| Thrivent Balanced Fund | 272 |
| Thrivent High Yield Fund | 274 |
| Thrivent Municipal Bond Fund | 274 |
| Thrivent Income Fund | 276 |
| Thrivent Core Bond Fund | 276 |
| Thrivent Limited Maturity Bond Fund | 278 |
| Thrivent Money Market Fund | 278 |
| |
| Additional Information | 280 |
| |
| Board of Trustees and Officers | 281 |

We are pleased to provide you with the annual report for the 12-month period ended October 31, 2007 for Thrivent Mutual Funds. In this report, you will find detailed information about each of the Thrivent Mutual Funds, including performance highlights, overall market conditions and management strategies during the 12-month period. In addition, Thrivent Financial’s Chief Investment Officer, Russ Swansen, reviews the larger economic environment in his Economic and Market Review.
Today’s Financial Markets: Keep Your Seatbelt Fastened!
The later part of the period ushered in a bout of market volatility we haven’t seen since the spring of 2006. Fallout from a much-weakened national housing market and suspect mortgages sent stock and bond investors scrambling as sub-prime loans bundled into complex securities quickly fell to Earth with more questions than answers. Such an unexpected occurrence suggested pause for thought: one can rarely pinpoint exactly which factor will shake up the markets but one should always expect periodic shake-ups. These quick market shifts illustrate the value of diversifying a portfolio and avoiding the temptation to buy what’s hot and sell what’s not. Good advice, a well thought-out long-term plan and a disciplined approach can make all the difference. Be sure to contact your Thrivent Financial representative if you have any questions or concerns with your portfolio.
Supporting Your Most Important Financial Goal: Retirement
Whether saving for retirement or structuring accumulated assets for income generation in retirement, proper advice and guidance for this important goal are critical. At Thrivent Investment Management, we seek to provide you with the financial confidence and security you need to live the life you want in retirement. Our asset management capabilities position us well to structure and monitor an investment course that can help you reach your retirement goals. Whether you seek an aggressive approach for long-term growth or a conservative plan for near-term income, Thrivent Investment Management has the resources to help. Relevant, honest financial advice with the products and services that can deliver the retirement you’ve worked so hard for — that’s our goal.
A Strategy that Fits Your Retirement Needs
We have the investment solutions and a money management philosophy uniquely tailored to support our investors. Critical among these solutions is our strong belief in asset allocation and overall portfolio balance. Studies have shown that strategic asset allocation (the mix of investments in a portfolio) can be the major determinant of how well your portfolio will fare over the long term. Furthermore, success in investing or making retirement assets last longer is often dependent on achieving growth by investing in stocks. A sound asset allocation strategy can reduce the risk of investing in more volatile stocks by diversifying among different types of stocks (large and small, international and domestic, value style and growth style, etc.) as well as bonds and real estate securities.
Consider the following:
• Thrivent Financial registered representatives are equipped with leading-edge tools and advice to build and support ongoing asset allocation strategies.
• Each of our portfolios is strictly managed to its individual investment objective to best support asset allocation.
• Finally, our packaged Thrivent Asset Allocation Funds are customized to specific risk tolerance levels to provide a simple and smart method of investing.
Our Commitment to You
We remain committed to providing our investors with the guidance and solutions they need to prepare for retirement and achieve their goals. Thank you for continuing to turn to us for your financial solutions. We very much value you and your business.
Sincerely,

Pamela J. Moret
President and Trustee
Thrivent Mutual Funds
Investing in a mutual fund involves risks, including the possible loss of principal. The prospectus contains
more complete information on the investment objectives, risks, charges and expenses of the investment
company which investors should read and consider carefully before investing. To obtain a prospectus,
contact a registered representative or visit www.thrivent.com.
1

Economic and Market Review
Stocks and bonds generally posted positive returns for the 12-month period ended October 31, 2007. Moderating economic growth early in the period appeared to mitigate inflation concerns, leading the Federal Reserve to discontinue its policy of increasing short term interest rates, and creating a positive backdrop for the financial markets. In the latter half of the period, there was an increase in economic and investment uncertainty precipitated by the deterioration in the sub-prime mortgage market and followed by other credit markets. This led to a reversal of Fed policy and a reduction in the targeted rates. As the new fiscal year begins, a period of heightened risks in both the real economy and the financial markets is evident.
U.S. Economy
The nation’s gross domestic product fell from a 2.1% annual growth rate in the fourth quarter of 2006 to a 0.6% annual rate in the first quarter of 2007, the weakest rate of expansion in four years. Growth rebounded to 3.8% in the second quarter, however, thanks to strong spending by consumers who were encouraged by employment and income gains, and undeterred by high energy prices and deterioration in housing market. Growth in the third quarter accelerated slightly to a 3.9% annual rate, marking the best back-to-back quarterly performance since the economy emerged from recession in 2001.
Sales of existing homes declined for most of the period. In September, sales fell 8% from the previous month to an annualized rate of 5.04 million units, the lowest pace since the National Association of Realtors began tracking combined single-family homes plus condos in 1999. Likewise, sales of new homes continued to fall, though they increased 4.8% in September to 770,000 annualized units. Sales of new homes were down 23.3% from September 2006 and sales of existing homes were down 19.1% .
Increased business investment offset much of the negative impact of the housing slowdown. Global demand remained strong, particularly from developing economies, and the low valuation of the dollar enhanced the attractiveness of U.S. goods and services in world markets, lifting U.S. exports and causing a moderate improvement in the U.S. trade position.
Inflation & Monetary Policy
Inflation indicators were mixed during the period. The Consumer Price Index (CPI) rose at a 3.6% annual rate for the first nine months of 2007, compared with a 2.5% rate for all of 2006. The index for energy, which rose 2.9% in all of 2006, advanced at an 11.7% annual rate in the first nine months of 2007. Excluding the volatile prices of food and energy, the core CPI advanced at a 2.3% annual rate during the first nine months of 2007, following a 2.6% rise in all of 2006.
For the Federal Reserve Open Market Committee (FOMC), inflation concerns eventually were trumped by worries that the housing slump and related credit crunch might dampen economic growth. On September 18, policymakers cut the Federal Funds rate by a more-than-expected half-percent to 4.75%, and on October 31, they followed with a widely anticipated quarter-percent cut. After the Federal Reserve’s October meeting, policymakers indicated a more neutral position regarding future actions, noting that “the upside risks to inflation roughly balance the downside risks to growth.”
Equity Performance
Stocks gained steadily through late February, spurred by strong corporate profits, a flurry of merger and acquisition activity, and diminishing worries about higher commodity costs, inflation, and interest rates. But on February 27, a 9% slide in Chinese stocks prompted most U.S. stock indexes to fall between 3% and 4% — the worst single-day declines in nearly four years. The Chinese market plunge was a reaction to Chinese authorities’ moves to limit speculative investment activity in Chinese stocks.
Stocks regained their upward momentum and climbed through midsummer, when prices fell again due to worries about the housing and credit markets. A reduction in the Fed Funds rate in September pushed many investment indexes to or near record highs toward the end of the period.
Large-company stocks outperformed small-company issues during the period. The S&P 500 Index of large-company stocks posted a 14.55% total return, while the Russell 2000 Index of small-company stocks recorded a 9.27% return. Growth stocks outperformed value stocks. During the period, the Russell 1000 Growth Index returned 19.23%, while the Russell 1000 Value Index posted a return of 10.83% .
2
Real estate investment trusts (REITs) provided minimal gains, with the FTSE NAREIT Equity REIT Index posting a 0.57% return for the 12 months. Foreign stocks generally continued to outperform most domestic issues. The Morgan Stanley Capital International Europe, Australasia, Far East (EAFE) Index, boosted by a weakening dollar, posted a 25.43% total return in U.S. dollar terms.
Fixed Income Performance
Treasury yields were relatively stable until mid-April, when they spiked as bond investors began to worry about a reac-celeration in economic growth and, consequently, started to suspect that the Federal Reserve would not begin cutting rates anytime soon. An investor flight to safety, spurred by concerns about sub-prime mortgages and liquidity problems at several large financial institutions, pushed down Treasury yields in the third quarter. The Federal Reserve eased both the Federal Funds and discount rates later in the period.
A substantial drop in the yields of shorter-maturity Treasury securities helped eliminate the yield curve inversion — an unusual situation in which shorter-term bonds actually pay higher yields than longer-term bonds — that had persisted for much of the last year. The six-month Treasury yield fell about 1%, to 4.09%, during the period. The five-year yield declined from 4.52% to 4.16%, the 10-year yield fell from 4.57% to 4.48%, and the 30-year Treasury yield rose slightly from 4.68% to 4.74% .
The decline in yields, with corresponding increases in prices, generally boosted bonds’ total returns for the period. The Lehman Brothers Aggregate Bond Index of the broad U.S. bond market posted a 5.38% total return, while the Lehman Brothers Government/Corporate 1-3 Year Bond Index registered a 5.67% total return. The Lehman Brothers Municipal Bond Index registered a total return of 2.91% . Below-investment-grade corporate bonds were strong U.S. market performers during the period, with the Lehman Brothers U.S. Corporate High Yield Bond Index registering a 6.73% total return.
Outlook
We expect economic growth to remain below average over the next few months, with inflation moderating. Gross domestic product growth should continue at around a 2% annual rate. We expect energy and commodities prices to moderate, and the housing market to begin to stabilize in the second half of 2008. These factors suggest that consumer spending, while not robust, will be sufficient to maintain growth. We expect business spending on new plant and equipment to continue, after a number of years of below-average investing in productive resources.
Dislocations unfolding in the credit markets that began with the unwinding of the housing boom of the last five years have the potential to spill over into the rest of the economy. The risks to the economy are not directly a function of the softness in housing but rather how consumer spending or financial lending behaviors may change in reaction to what is happening in the housing market. With policymakers concerned about both an economic slowdown and the potential for higher inflation, it is uncertain whether the Federal Reserve intends to ease interest rates any time soon, but it is our view that the days of policy-driven tightening are past for the near term.
As always, your best strategy is to work with your Thrivent Financial registered representative to create a plan based on your goals, diversify your portfolio and remain focused on the long term.
3

The Fund’s performance depends upon how its assets are allocated across broad asset categories and applicable sub-classes within such categories. Some broad asset categories and sub-classes may perform below expectations or below the securities markets generally over short or extended periods. In particular, underperformance in the equity markets would have material adverse effect on the Fund’s total return, given its allocation to equity securities. Therefore, a principal risk of investing in the Fund is heavily dependent upon the performance of the underlying funds in which the Fund invests. As a result, the Fund is subject to the same risks as those faced by the underlying funds. Those risks include, but are not limited to, allocation risk, non-diversified risk, underlying fund risk, market risk, equity investment and issuer risk, volatility risk, foreign securities risk, real estate industry risk, credit, interest rate and high yield risk, and investment ad viser risk. These and other risks are described in the Fund’s prospectus.
How did the Fund perform during the 12-month period ended October 31, 2007?
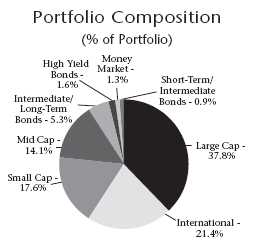
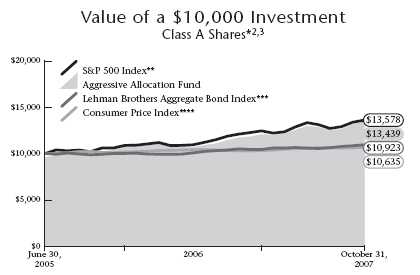
Thrivent Aggressive Allocation Fund earned a total return of 18.27% as compared to the median return for its peer group, the Lipper Multi-Cap Core category, of 15.56% . The Fund’s benchmarks, the Lehman Brothers Aggregate Bond Index and the S&P 500 Index, earned total returns of 5.38% and 14.55%, respectively.
What factors affected the Fund’s performance?
The Fund uses sophisticated asset allocation techniques to direct investments to underlying funds that invest in securities across a broad range of equity and fixed income categories. In addition, our investment strategy group implements modest tilts to strategic allocations in the portfolio to take advantage of tactical opportunities within the markets. Over the past year, we have maintained a bias in the portfolio to both large-capitalization stocks, as well as an emphasis on the growth style of investing. We also have maintained a healthy exposure to international markets. Both of these items were factors in the good performance of the Fund relative to its benchmark and peer group of mutual fund companies. Additionally, the underlying funds within most of the sub-asset categories performed well relative to peers and sub-category benchmarks, which provided an incremental level of return to the Fund. The Fund has some exposure to fixed-income securities in order to moderate equity market volatility and provide an additional level of diversification.
U.S. growth stocks outperformed most of the broad-based U.S. benchmarks as well as their value counterparts. Over the summer, it became evident that many financial firms had been less-than-diligent in extending credit, particularly to the overextended housing sector and mortgagees. This weighed heavily on both mid- and small-capitalization value stocks as the financial sector is a significant component in these categories. On the other hand, the information technology (IT) sectors generally performed well as these companies are direct beneficiaries of continued strong export sales and foreign and domestic business spending. IT stocks generally make up a larger component of growth strategies. Health care stocks also did well, and this group is also a sig-nificant component of growth-oriented investment styles. Large-capitalization companies tend to have more exposure to global growth than some mid- and small-cap groups.
The weak dollar environment over the last year stimulated strong export sales and enhanced earnings of many large-cap multinational companies. It had the additional benefit of enhancing returns to non-dollar based equity portfolios by a significant amount — a factor captured in the international fund holdings of the Fund. Most of the
| | |
| Top 10 Holdings | |
| (% of Portfolio) | |
| | |
| Thrivent Large Cap Growth Fund | 21.5% | |
| Thrivent Partner International Stock Fund | 21.4% | |
| Thrivent Large Cap Stock Fund | 9.5% | |
| Thrivent Small Cap Stock Fund | 7.4% | |
| Thrivent Mid Cap Stock Fund | 7.2% | |
| Thrivent Large Cap Value Fund | 6.8% | |
| Thrivent Partner Small Cap Growth Fund | 6.0% | |
| Thrivent Income Fund | 5.3% | |
| Thrivent Partner Small Cap Value Fund | 4.2% | |
| Thrivent Mid Cap Growth Fund | 3.7% | |
| | |
| | |
| | |
| These funds represent 93.0% of the total | | |
| investment portfolio. | | |
Quoted Fund performance is for Class A shares and does not reflect a sales charge. The returns shown do not reflect taxes a shareholder would pay on
distributions or redemptions. Quoted Portfolio Composition and Top 10 Holdings are subject to change.
4
premium return earned by large-cap international indexes relative to domestic was a function of currency returns driven by the strong Euro and British pound versus the dollar.
What is your outlook?
We remain cautiously optimistic that the current slowdown in economic activity will achieve the objective of moderating inflation pressures in the United States without engendering a recession. Prudent action on the part of both policymakers and corporations to navigate the challenges currently arising in the credit markets will be critical to that outlook. Operating and financial risks are higher now than at any point since the economic recovery and stock bull market began in 2002. We are maintaining our bias to growth and large-capitalization sectors as they offer the best relative valuations and also the best opportunity to sustain organic growth in a period of economic uncertainty. The fundamental outlook for foreign stocks remains good, but we have some concern that foreign currencies are extended relative to long-term valuations and may seek opportunities to modestly reposition some of those assets. At this point, we do not see the pr econditions for recession or a bear market but are vigilant in this time of financial instability.
| | | | | |
| Portfolio Facts | |
| As of October 31, 2007 | |
| | A Share | | Institutional Share | |
| | ————————— | | ————————— | |
| Ticker | TAAAX | | TAAIX | |
| Transfer Agent ID | 038 | | 468 | |
| Net Assets | $332,742,643 | | $57,837,804 | |
| NAV | $13.79 | | $13.86 | |
| NAV — High† | 10/12/2007 — $13.80 | | 10/12/2007 — $13.86 | |
| NAV — Low† | 11/1/2006 — $11.78 | | 11/1/2006 — $11.84 | |
| Number of Holdings: 14 | † For the year ended October 31, 2007 | |
| | | |
| Average Annual Total Returns2 | |
| As of October 31, 2007 | |
| | |
| | | From | |
| | | Inception | |
| Class A1 | 1-Year | 6/30/2005 | |
| |
| without sales charge | 18.27% | 16.26% | |
| with sales charge | 11.78% | 13.49% | |
| | |
| | | From | |
| | | Inception | |
| Institutional Class1 | 1-Year | 6/30/2005 | |
| |
| Net Asset Value | 18.64% | 16.73% | |
1 Class A performance reflects the maximum sales charge of 5.5% . Institutional Class shares have no sales load and are for institutional shareholders only.
2 Past performance is not an indication of future results. Annualized total returns represent past performance and reflect changes in share prices, the reinvestment of all dividends and capital gains, and the effects of compounding. Periods of less than one year are not annualized. Investing in a mutual fund involves risks, including the possible loss of principal. The prospectus contains more complete information on the investment objectives, risks, charges and expenses of the investment company which investors should read and consider carefully before investing. To obtain a prospectus, contact a registered representative or visit www.thrivent.com. At various times, the Fund’s adviser waived its management fee and/or reimbursed Fund expenses. Had the adviser not done so, the Fund’s total returns would have been lower. The re turns shown do not reflect taxes a shareholder would pay on distributions or redemptions.
3 Performance of other classes will be greater or less than the line shown based on the differences in loads and fees paid by shareholders investing in the different classes.
* As you compare performance, please note that the Fund’s performance reflects the maximum 5.5% sales charge, while the Consumer Price Index, the S&P 500 Index and the Lehman Brothers Aggregate Bond Index do not reflect any such charges. If you were to purchase any of the above individual stocks or funds represented in these Indexes, any charges you would pay would reduce your total return as well.
** The S&P 500 Index is an index that represents the average performance of a group of 500 large-capitalization stocks. It is not possible to invest directly in the Index. The performance of the Index does not reflect deductions for fees, expenses or taxes.
*** The Lehman Brothers Aggregate Bond Index is an index that measures the performance of U.S. investment grade bonds. It is not possible to invest directly in the Index. The performance of the Index does not reflect deductions for fees, expenses or taxes.
**** The Consumer Price Index is an inflationary indicator that measures the change in the cost of a fixed basket of products and services, including housing, electricity, food and transportation. It is not possible to invest directly in the Index.
5

The Fund’s performance depends upon how its assets are allocated across broad asset categories and applicable sub-classes within such categories. Some broad asset categories and sub-classes may perform below expectations or below the securities markets generally over short or extended periods. In particular, underperformance in the equity markets would have material adverse effect on the Fund’s total return, given its allocation to equity securities. Therefore, a principal risk of investing in the Fund is heavily dependent upon the performance of the underlying funds in which the Fund invests. As a result, the Fund is subject to the same risks as those faced by the underlying funds. Those risks include, but are not limited to, allocation risk, non-diversified risk, underlying fund risk, market risk, equity investment and issuer risk, volatility risk, foreign securities risk, real estate industry risk, credit, interest rate and high yield risk, and investment ad viser risk. These and other risks are described in the Fund’s prospectus.
How did the Fund perform during the 12-month period ended October 31, 2007?
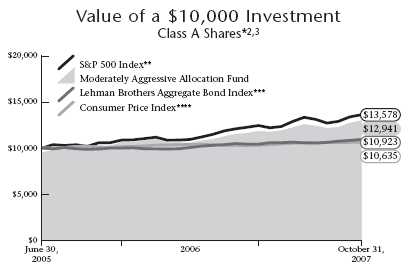
Thrivent Moderately Aggressive Allocation Fund earned a total return of 15.45% as compared to the median return for its peer group, the Lipper Mixed-Asset Target Allocation Growth category, of 13.24% . The Fund’s market benchmarks, the Lehman Brothers Aggregate Bond Index and the S&P 500 Index, earned total returns of 5.38% and 14.55%, respectively.
What factors affected the Fund’s performance?
The Fund uses sophisticated asset allocation techniques to direct investments to underlying funds that invest in securities across a broad range of equity and fixed-income categories. In addition, our investment strategy group implements modest tilts to strategic allocations in the portfolio to take advantage of tactical opportunities within the markets.
We have maintained an allocation of approximately 78% equity and 22% fixed-income for the last fiscal year. We have maintained a bias in the portfolio to both large-capitalization stocks and the growth style of investing. We also have maintained a healthy exposure to international markets. Both of these contributed to the good performance of the Fund relative to its benchmark and its peer group of mutual fund companies. Additionally, the underlying funds within most of the sub-asset categories performed well relative to peers and sub-category benchmarks, which provided an incremental level of return to the Fund. The Fund has exposure to fixed-income securities in order to moderate equity market volatility and provide an additional level of diversification. We were able to achieve returns in excess of the equity benchmark despite fixed-income returns being meaningfully below the equity indexes and an average exposure to equity portfolios and volatility of less than 80%.
U.S. growth stocks outperformed most of the broad-based U.S. benchmarks as well as their value counterparts. Information technology (IT) sectors generally performed well as these companies are direct beneficiaries of continued strong export sales and foreign and domestic business spending. IT stocks generally make up a larger component of growth strategies. Health care stocks also did well, and this group is also a significant component of growth-oriented investment styles. Large-capitalization companies also tend to have more exposure to global growth than some mid- and small-cap groups.
The weak dollar environment over the last year stimulated strong export sales and enhanced earnings of many large-cap multinational companies. It had the additional benefit of enhancing returns to non-dollar based equity portfolios by a significant amount, a factor captured in the international holdings of the
| | |
| Top 10 Holdings | |
| (% of Portfolio) | |
| | |
| Thrivent Large Cap Growth Fund | 16.8% | |
| Thrivent Large Cap Stock Fund | 14.5% | |
| Thrivent Partner International Stock Fund | 14.2% | |
| Thrivent Large Cap Value Fund | 13.6% | |
| Thrivent Income Fund | 12.9% | |
| Thrivent Small Cap Stock Fund | 3.9% | |
| Thrivent Mid Cap Stock Fund | 3.9% | |
| Thrivent Limited Maturity Bond Fund | 3.8% | |
| Thrivent Money Market Fund | 3.7% | |
| Thrivent Partner Small Cap Growth Fund | 3.0% | |
| | |
| | |
| | |
| These funds represent 90.3% of the total | | |
| investment portfolio. | | |
Quoted Fund performance is for Class A shares and does not reflect a sales charge. The returns shown do not reflect taxes a shareholder would pay on
distributions or redemptions. Quoted Portfolio Composition and Top 10 Holdings are subject to change.
6
Fund. Fixed-income returns were modestly below benchmarks for the period owing to below-benchmark exposure to Treasury notes and bonds. Treasury securities rallied strongly late in the period in response to increased concerns about credit quality and economic growth. In addition, policymakers took overt actions to lower short-term interest rates in response to the unfolding illiquidity in select segments of the fixed-income market.
What is your outlook?
We remain cautiously optimistic that the current slowdown in economic activity will achieve the objective of moderating inflation pressures in the United States without engendering a recession. Prudent action on the part of both policymakers and corporations to navigate the challenges currently arising in the credit markets will be critical to that outlook. Operating and financial risks are higher now than at any point since the economic recovery and stock bull market began in 2002. We are maintaining our bias to growth and large-capitalization sectors as they offer the best relative valuations and also the best opportunity to sustain organic growth in a period of economic uncertainly. The fundamental outlook for foreign stocks remains good, but we have some concern that foreign currencies are extended relative to long-term valuations and may seek opportunities to modestly reposition some of those assets. At this point, we do not see the pr econditions for recession or a bear market but are vigilant in this time of financial instability.
| | | | | |
| Portfolio Facts | |
| As of October 31, 2007 | |
| | A Share | | Institutional Share | |
| | ————————— | | ————————— | |
| Ticker | TMAAX | | TMAFX | |
| Transfer Agent ID | 037 | | 467 | |
| Net Assets | $859,173,115 | | $68,893,320 | |
| NAV | $13.23 | | $13.30 | |
| NAV — High† | 10/12/2007 — $13.24 | | 10/12/2007 — $13.31 | |
| NAV — Low† | 11/3/2006 — $11.63 | | 11/3/2006 — $11.69 | |
| Number of Holdings: 15 | † For the year ended October 31, 2007 |
| | | |
| Average Annual Total Returns2 | |
| As of October 31, 2007 | |
| | |
| | | From | |
| | | Inception | |
| Class A1 | 1-Year | 6/30/2005 | |
| |
| without sales charge | 15.45% | 14.40% | |
| with sales charge | 9.12% | 11.67% | |
| | |
| | | From | |
| | | Inception | |
| Institutional Class1 | 1-Year | 6/30/2005 | |
| |
| Net Asset Value | 15.85% | 14.83% | |
1 Class A performance reflects the maximum sales charge of 5.5% . Institutional Class shares have no sales load and are for institutional shareholders only.
2 Past performance is not an indication of future results. Annualized total returns represent past performance and reflect changes in share prices, the reinvestment of all dividends and capital gains, and the effects of compounding. Periods of less than one year are not annualized. Investing in a mutual fund involves risks, including the possible loss of principal. The prospectus contains more complete information on the investment objectives, risks, charges and expenses of the investment company which investors should read and consider carefully before investing. To obtain a prospectus, contact a registered representative or visit www.thrivent.com. At various times, the Fund’s adviser waived its management fee and/or reimbursed Fund expenses. Had the adviser not done so, the Fund’s total returns would have been lower. The re turns shown do not reflect taxes a shareholder would pay on distributions or redemptions.
3 Performance of other classes will be greater or less than the line shown based on the differences in loads and fees paid by shareholders investing in the different classes.
* As you compare performance, please note that the Fund’s performance reflects the maximum 5.5% sales charge, while the Consumer Price Index, the S&P 500 Index and the Lehman Brothers Aggregate Bond Index do not reflect any such charges. If you were to purchase any of the above individual stocks or funds represented in these Indexes, any charges you would pay would reduce your total return as well.
** The S&P 500 Index is an index that represents the average performance of a group of 500 large-capitalization stocks. It is not possible to invest directly in the Index. The performance of the Index does not reflect deductions for fees, expenses or taxes.
*** The Lehman Brothers Aggregate Bond Index is an index that measures the performance of U.S. investment grade bonds. It is not possible to invest directly in the Index. The performance of the Index does not reflect deductions for fees, expenses or taxes.
**** The Consumer Price Index is an inflationary indicator that measures the change in the cost of a fixed basket of products and services, including housing, electricity, food and transportation. It is not possible to invest directly in the Index.
7

The Fund’s performance depends upon how its assets are allocated across broad asset categories and applicable sub-classes within such categories. Some broad asset categories and sub-classes may perform below expectations or below the securities markets generally over short or extended periods. In particular, underperformance in the equity markets would have material adverse effect on the Fund’s total return, given its allocation to equity securities. Therefore, a principal risk of investing in the Fund is heavily dependent upon the performance of the underlying funds in which the Fund invests. As a result, the Fund is subject to the same risks as those faced by the underlying funds. Those risks include, but are not limited to, allocation risk, non-diversified risk, underlying fund risk, market risk, equity investment and issuer risk, volatility risk, foreign securities risk, real estate industry risk, credit, interest rate and high yield risk, and investment ad viser risk. These and other risks are described in the Fund’s prospectus.
How did the Fund perform during the 12-month period ended October 31, 2007?
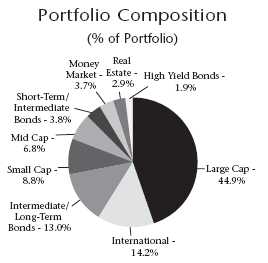
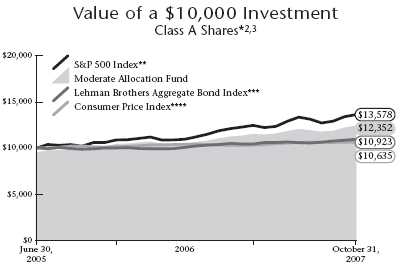
Thrivent Moderate Allocation Fund earned a total return of 12.60% as compared to the median return of its peer group, the Lipper Mixed-Asset Target Allocation Moderate category, of 10.66% . The Fund’s market benchmarks, the Lehman Brothers Aggregate Bond Index and the S&P 500 Index, earned total returns of 5.38% and 14.55%, respectively.
What factors affected the Fund’s performance?
The Fund uses sophisticated asset allocation techniques to direct investments to underlying funds that invest in securities across a broad range of equity and fixed-income categories. In addition, our investment strategy group implements modest tilts to strategic allocations in the portfolio to take advantage of tactical opportunities within the markets. We have maintained an allocation of approximately 58% equity and 42% fixed-income for the last fiscal year. We have maintained a bias in the portfolio to both large-capitalization stocks and an emphasis on the growth style of investing. We also have maintained a healthy exposure to international markets. Both of these items were factors in the good performance of the Fund relative to its benchmark and its peer group of mutual fund companies. Additionally, the underlying funds within most of the sub-asset categories performed well relative to peers and sub-category benchmarks, which provided an incremental level of return to the Fund. The Fund has exposure to fixed-income securities in order to moderate equity market volatility and provide an additional level of diversification. We were able to achieve returns approximating 86% of our equity benchmark despite fixed-income returns being meaningfully below the equity indexes and an average exposure to equity portfolios and volatility of less than 60%.
U.S. growth stocks outperformed most of the broad-based U.S. benchmarks as well as their value counterparts. Information technology (IT) sectors generally performed well as these companies are direct beneficiaries of continued strong export sales and foreign and domestic business spending. IT stocks generally make up a larger component of growth strategies. Health care stocks also did well and this group is also a significant component of growth-oriented investment styles. Large-capitalization companies also tend to have more exposure to global growth than some mid- and small-cap groups.
The weak dollar environment over the last year stimulated strong export sales and enhanced earnings of many large-cap multinational companies. It had the additional benefit of enhancing returns to non-dollar based equity portfolios by a significant amount, a factor captured in the international holdings of the
| | |
| Top 10 Holdings | |
| (% of Portfolio) | |
| | |
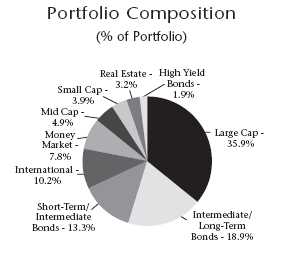
| Thrivent Income Fund | 18.9% | |
| Thrivent Large Cap Growth Fund | 14.4% | |
| Thrivent Limited Maturity Bond Fund | 13.3% | |
| Thrivent Large Cap Stock Fund | 11.7% | |
| Thrivent Partner International Stock Fund | 10.2% | |
| Thrivent Large Cap Value Fund | 9.8% | |
| Thrivent Money Market Fund | 7.8% | |
| Thrivent Real Estate Securities Fund | 3.2% | |
| Thrivent Mid Cap Stock Fund | 2.9% | |
| Thrivent High Yield Fund | 1.9% | |
| | |
| | |
| | |
| These funds represent 94.1% of the total | | |
| investment portfolio. | | |
Quoted Fund performance is for Class A shares and does not reflect a sales charge. The returns shown do not reflect taxes a shareholder would pay on
distributions or redemptions. Quoted Portfolio Composition and Top 10 Holdings are subject to change.
8
Fund. Fixed-income returns were modestly below benchmarks for the period owing to below-benchmark exposure to Treasury notes and bonds. Treasury securities rallied strongly late in the period in response to increased concerns about credit quality and economic growth. In addition, policymakers took overt actions to lower short-term interest rates in response to the unfolding illiquidity in select segments of the fixed-income market.
What is your outlook?
We remain cautiously optimistic that the current slowdown in economic activity will achieve the objective of moderating infla-tion pressures in the U.S. without engendering a recession. Prudent action on the part of both policymakers and corporations to navigate the challenges currently arising in the credit markets will be critical to that outlook. Operating and financial risks are higher now than at any point since the economic recovery and stock bull markets began in 2002. We are maintaining our bias to growth and large-capitalization sectors as they offer the best relative valuations and also the best opportunity to sustain organic growth in a period of economic uncertainly. The fundamental outlook for foreign stocks remains good, but we have some concern that foreign currencies are extended relative to long-term valuations and may seek opportunities to modestly reposition some of those assets. At this point, we do not see the precondit ions for recession or a bear market but are vigilant in this time of financial instability.
| | | | | |
| Portfolio Facts | |
| As of October 31, 2007 | |
| | A Share | | Institutional Share | |
| | ————————— | | ————————— | |
| Ticker | THMAX | | TMAIX | |
| Transfer Agent ID | 036 | | 466 | |
| Net Assets | $843,224,600 | | $27,917,788 | |
| NAV | $12.32 | | $12.34 | |
| NAV — High† | 10/31/2007 — $12.32 | | 10/31/2007 — $12.34 | |
| NAV — Low† | 11/3/2006 — $11.23 | | 11/3/2006 — $11.25 | |
| Number of Holdings: 15 | † For the year ended October 31, 2007 |
| | | |
| Average Annual Total Returns2 | |
| As of October 31, 2007 | |
| | |
| | | From | |
| | | Inception | |
| Class A1 | 1-Year | 6/30/2005 | |
| |
| without sales charge | 12.60% | 12.14% | |
| with sales charge | 6.38% | 9.47% | |
| | |
| | | From | |
| | | Inception | |
| Institutional Class1 | 1-Year | 6/30/2005 | |
| |
| Net Asset Value | 12.84% | 12.49% | |
1 Class A performance reflects the maximum sales charge of 5.5% . Institutional Class shares have no sales load and are for institutional shareholders only.
2 Past performance is not an indication of future results. Annualized total returns represent past performance and reflect changes in share prices, the reinvestment of all dividends and capital gains, and the effects of compounding. Periods of less than one year are not annualized. Investing in a mutual fund involves risks, including the possible loss of principal. The prospectus contains more complete information on the investment objectives, risks, charges and expenses of the investment company which investors should read and consider carefully before investing. To obtain a prospectus, contact a registered representative or visit www.thrivent.com. At various times, the Fund’s adviser waived its management fee and/or reimbursed Fund expenses. Had the adviser not done so, the Fund’s total returns would have been lower. The re turns shown do not reflect taxes a shareholder would pay on distributions or redemptions.
3 Performance of other classes will be greater or less than the line shown based on the differences in loads and fees paid by shareholders investing in the different classes.
* As you compare performance, please note that the Fund’s performance reflects the maximum 5.5% sales charge, while the Consumer Price Index, the S&P 500 Index and the Lehman Brothers Aggregate Bond Index do not reflect any such charges. If you were to purchase any of the above individual stocks or funds represented in these Indexes, any charges you would pay would reduce your total return as well.
** The S&P 500 Index is an index that represents the average performance of a group of 500 large-capitalization stocks. It is not possible to invest directly in the Index. The performance of the Index does not reflect deductions for fees, expenses or taxes.
*** The Lehman Brothers Aggregate Bond Index is an index that measures the performance of U.S. investment grade bonds. It is not possible to invest directly in the Index. The performance of the Index does not reflect deductions for fees, expenses or taxes.
**** The Consumer Price Index is an inflationary indicator that measures the change in the cost of a fixed basket of products and services, including housing, electricity, food and transportation. It is not possible to invest directly in the Index.
9

The Fund’s performance depends upon how its assets are allocated across broad asset categories and applicable sub-classes within such categories. Some broad asset categories and sub-classes may perform below expectations or below the securities markets generally over short or extended periods. In particular, underperformance in the equity markets would have material adverse effect on the Fund’s total return, given its allocation to equity securities. Therefore, a principal risk of investing in the Fund is heavily dependent upon the performance of the underlying funds in which the Fund invests. As a result, the Fund is subject to the same risks as those faced by the underlying funds. Those risks include, but are not limited to, allocation risk, non-diversified risk, underlying fund risk, market risk, equity investment and issuer risk, volatility risk, foreign securities risk, real estate industry risk, credit, interest rate and high yield risk, and investment ad viser risk. These and other risks are described in the Fund’s prospectus.
How did the Fund perform during the 12-month period ended October 31, 2007?
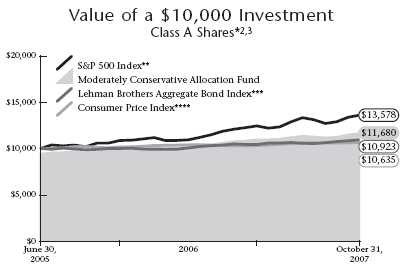
Thrivent Moderately Conservative Allocation Fund earned a return of 9.72% as compared to the median return for its peer group, the Lipper Mixed-Asset Target Allocation Conservative category, of 7.47% . The Fund’s market benchmarks, the Lehman Brothers Aggregate Bond Index and the S&P 500 Index, earned total returns of 5.38% and 14.55%, respectively.
What factors affected the Fund’s performance?
The Fund uses sophisticated asset allocation techniques to direct investments to underlying funds that invest in securities across a broad range of equity and fixed-income categories. In addition, our investment strategy group implements modest tilts to strategic allocations in the portfolio to take advantage of tactical opportunities within the markets. We have maintained an allocation of approximately 38% equity and 62% fixed-income for the last fiscal year. We have maintained a bias in the portfolio to both large-capitalization stocks and the growth style of investing. We also have maintained a healthy exposure to international markets. Both of these items were factors in the good performance of the Fund relative to its benchmark and its peer group of mutual fund companies. Additionally, the underlying funds within most of the sub-asset categories performed well relative to peers and sub-category benchmarks, which provided an incremental level of return to the Fund. The Fund has exposure to fixed income securities in order to moderate equity market volatility and provide an additional level of diversification. We were able to achieve returns approximating 66% of our equity benchmark despite fixed-income returns being meaningfully below the equity indexes and an average exposure to equity portfolios and volatility of less than 40%.
U.S. growth stocks outperformed most of the broad-based U.S. benchmarks as well as their value counterparts. Information technology (IT) sectors generally performed well as these companies are direct beneficiaries of continued strong export sales and foreign and domestic business spending. IT stocks generally make up a larger component of growth strategies. Health care stocks also did well and this group is a significant component of growth-oriented investment styles. Large-capitalization companies also tend to have more exposure to global growth than some mid- and small-cap groups. The weak dollar environment over the last year stimulated strong export sales and enhanced earnings of many large-cap multinational companies. It had the additional benefit of enhancing returns to non-dollar based equity portfolios by a significant amount, a factor captured in the international holdings of the Fund. Fixed-income returns were modestly below benchmarks for the period owing to

| | |
| Top 10 Holdings | |
| (% of Portfolio) | |
| | |
| Thrivent Limited Maturity Bond Fund | 34.7% | |
| Thrivent Income Fund | 14.8% | |
| Thrivent Money Market Fund | 10.2% | |
| Thrivent Large Cap Growth Fund | 9.8% | |
| Thrivent Large Cap Stock Fund | 7.7% | |
| Thrivent Large Cap Value Fund | 6.4% | |
| Thrivent Partner International Stock Fund | 6.2% | |
| Thrivent Real Estate Securities Fund | 3.2% | |
| Thrivent Small Cap Stock Fund | 3.0% | |
| Thrivent High Yield Fund | 2.0% | |
| | |
| | |
| | |
| These funds represent 98.0% of the total | | |
| investment portfolio. | | |
Quoted Fund performance is for Class A shares and does not reflect a sales charge. The returns shown do not reflect taxes a shareholder would pay on
distributions or redemptions. Quoted Portfolio Composition and Top 10 Holdings are subject to change.
10
below-benchmark exposure to Treasury notes and bonds. Treasury securities rallied strongly late in the period in response to increased concerns about credit quality and economic growth. In addition, policymakers took overt actions to lower short-term interest rates in response to the unfolding illiquidity in select segments of the fixed-income market.
What is your outlook?
We remain cautiously optimistic that the current slowdown in economic activity will achieve the objective of moderating inflation pressures in the U.S. without engendering a recession. Prudent action on the part of both policymakers and corporations to navigate the challenges currently arising in the credit markets will be critical to that outlook. Operating and financial risks are higher now than at any point since the economic recovery and stock bull market began in 2002. We are maintaining our bias to growth and large-capitalization sectors as they offer the best relative valuations and also the best opportunity to sustain organic growth in a period of economic uncertainly. The fundamental outlook for foreign stocks remains good, but we have some concern that foreign currencies are extended relative to long-term valuations and may seek opportunities to modestly reposition some of those assets. At this point, we do not see the preconditio ns for recession or a bear market but are vigilant in this time of financial instability.
| | | | | |
| Portfolio Facts | |
| As of October 31, 2007 | |
| | A Share | | Institutional Share | |
| | ————————— | | ————————— | |
| Ticker | TCAAX | | TCAIX | |
| Transfer Agent ID | 035 | | 465 | |
| Net Assets | $305,469,984 | | $9,766,037 | |
| NAV | $11.54 | | $11.56 | |
| NAV — High† | 10/31/2007 — $11.54 | | 10/31/2007 — $11.56 | |
| NAV — Low† | 11/3/2006 — $10.86 | | 11/3/2006 — $10.87 | |
| Number of Holdings: 11 | † For the year ended October 31, 2007 |
| | | |
| Average Annual Total Returns2 | |
| As of October 31, 2007 | |
| | |
| | | From | |
| | | Inception | |
| Class A1 | 1-Year | 6/30/2005 | |
| |
| without sales charge | 9.72% | 9.49% | |
| with sales charge | 3.73% | 6.88% | |
| | |
| | | From | |
| | | Inception | |
| Institutional Class1 | 1-Year | 6/30/2005 | |
| |
| Net Asset Value | 9.91% | 9.80% | |
1 Class A performance reflects the maximum sales charge of 5.5% . Institutional Class shares have no sales load and are for institutional shareholders only.
2 Past performance is not an indication of future results. Annualized total returns represent past performance and reflect changes in share prices, the reinvestment of all dividends and capital gains, and the effects of compounding. Periods of less than one year are not annualized. Investing in a mutual fund involves risks, including the possible loss of principal. The prospectus contains more complete information on the investment objectives, risks, charges and expenses of the investment company which investors should read and consider carefully before investing. To obtain a prospectus, contact a registered representative or visit www.thrivent.com. At various times, the Fund’s adviser waived its management fee and/or reimbursed Fund expenses. Had the adviser not done so, the Fund’s total returns would have been lower. The re turns shown do not reflect taxes a shareholder would pay on distributions or redemptions.
3 Performance of other classes will be greater or less than the line shown based on the differences in loads and fees paid by shareholders investing in the different classes.
* As you compare performance, please note that the Fund’s performance reflects the maximum 5.5% sales charge, while the Consumer Price Index, the S&P 500 Index and the Lehman Brothers Aggregate Bond Index do not reflect any such charges. If you were to purchase any of the above individual stocks or funds represented in these Indexes, any charges you would pay would reduce your total return as well.
** The S&P 500 Index is an index that represents the average performance of a group of 500 large-capitalization stocks. It is not possible to invest directly in the Index. The performance of the Index does not reflect deductions for fees, expenses or taxes.
*** The Lehman Brothers Aggregate Bond Index is an index that measures the performance of U.S. investment grade bonds. It is not possible to invest directly in the Index. The performance of the Index does not reflect deductions for fees, expenses or taxes.
**** The Consumer Price Index is an inflationary indicator that measures the change in the cost of a fixed basket of products and services, including housing, electricity, food and transportation. It is not possible to invest directly in the Index.
11

How did the Fund perform during the 12-month period ended October 31, 2007?
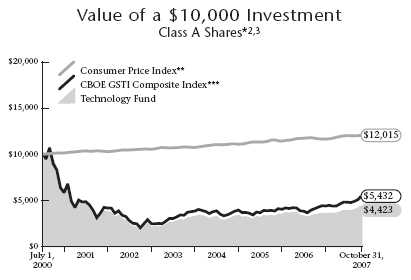
Thrivent Technology Fund earned a total return of 25.47% as compared to the median return of its peer group, the Lipper Science and Technology Index category, of 28.11% . The Fund’s market benchmark, the CBOE Goldman Sachs Technology Industry Composite Index, earned a total return of 27.52% .
What factors affected the Fund’s performance?
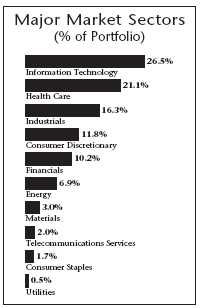
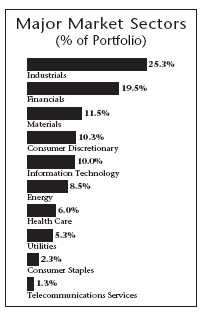
Underperformance relative to the market benchmark was largely attributable to the Fund’s broader capitalization and sector positioning. Roughly 80% of the Fund was invested in information technology companies, with another 10% and 5% in the health care and telecom services sectors, respectively. While we expect the Fund’s multi-cap focus and broadened sector positionings (which could also include sectors like alternative energy and entertainment) to increase the prospects of sustainable outperformance over longer periods of time, it was a headwind in a year where large-cap information technology stocks that comprise the bulk of the benchmark were top performers.
Solid absolute performance was the result of the strong asset selection within information technology, specifically with our heavy sector emphasis on networking, storage, and Internet. In networking, the basket of Cisco Systems, Juniper Networks, Ciena and Foundry Networks generated significant excess returns as domestic carriers and international enterprises increased their budgets. EMC Corporation was a large contributor to the Fund’s performance, not only due to the strength in its core storage and security businesses, but also the market recognition afforded to its VMWare virtualization unit as a result of a partial spin-off. Within the Internet sector, our foc us on search advertising in the forms of Google and aQuantive provided significant gains; the latter as a result of its purchase by Microsoft.
Negative influences on the Fund included its de-emphasis of personal communication equipment makers; lack of exposure to electronic retailers; and overexposure to health care. The Fund missed the strength in handset manufacturers, especially the new product-driven cycle strength in Research in Motion, which was the single best performer in the benchmark. It also lacked any meaningful exposure to Internet retail, most specifically the strong performer Amazon.com, where an inflection in operating leverage was missed. Returns from the Fund’s health care holdings were strong in absolute terms, but trailed the explosive returns of the information technology sectors and represented a relative detriment to Fund performance. The Fund’s emphasis on biotechnology within health care was an additional negative relative performance factor .

| | |
| Top 10 Holdings | |
| (% of Portfolio) | |
| | |
| Cisco Systems, Inc. | 7.4% | |
| Google, Inc. | 6.6% | |
| EMC Corporation | 6.4% | |
| Apple Computer, Inc. | 5.9% | |
| Microsoft Corporation | 4.9% | |
| Intel Corporation | 4.6% | |
| Juniper Networks, Inc. | 4.3% | |
| QUALCOMM, Inc. | 3.9% | |
| Adobe Systems, Inc. | 3.7% | |
| Yahoo!, Inc. | 2.8% | |
| | |
| | |
| | |
| | |
| These common stocks represent 50.5% of the total | | |
| investment portfolio. | | |
Quoted Fund performance is for Class A shares and does not reflect a sales charge.
The returns shown do not reflect taxes a shareholder would pay on distributions or redemptions.
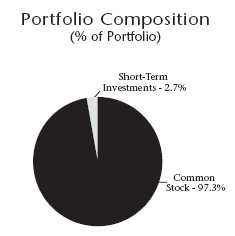
Quoted Major Market Sectors, Portfolio Composition and Top 10 Holdings are subject to change.
The lists of Major Market Sectors and Top 10 Holdings exclude short-term investments and collateral held for securities loaned.
The Portfolio Composition chart excludes collateral held for securities loaned.
12
What is your outlook?
We believe that 2008 will be characterized by moderating domestic economic growth, lower interest rates, a weaker dollar and solid technology spending in excess of overall economic growth as a result of “share” gains in relationship to other forms of capital expenditures. These conditions, combined with the technology sector’s greater exposure to faster-growing international markets, should allow for continued market leadership. We remain especially enthusiastic about worldwide networking and communication equipment spending to support the communications infrastructure needs of emerging economies, as well as the more robust architectures required by the exploding volumes of video and data transmission in developed markets. We also believe virtualization, mobile internet and Internet advertising will be areas of notable investment opportunities in the year ahead.
| | | | | |
| Portfolio Facts | |
| As of October 31, 2007 | |
| | A Share | | B Share | Institutional Share | |
| | ————————— | | ————————— | ————————— | |
| Ticker | AATSX | | BBTSX | THTIX | |
| Transfer Agent ID | 028 | | 078 | 098 | |
| Net Assets | $42,399,104 | | $1,692,666 | $2,624,775 | |
| NAV | $4.68 | | $4.44 | $4.95 | |
| NAV — High† | 10/31/2007 — $4.68 | | 10/31/2007 — $4.44 | 10/31/2007 — $4.95 | |
| NAV — Low† | 11/3/2006 — $3.66 | | 11/3/2006 — $3.49 | 11/3/2006 — $3.86 | |
| Number of Holdings: 44 | † For the year ended October 31, 2007 | |
| | | | |
| Average Annual Total Returns2 | |
| As of October 31, 2007 | |
| | |
| | | | From | |
| | | | Inception | |
| Class A1 | 1-Year | 5 Years | 7/1/2000 | |
| |
| without sales charge | 25.47% | 15.77% | (9.84%) | |
| with sales charge | 18.48% | 14.48% | (10.53%) | |
| | |
| | | | From | |
| | | | Inception | |
| Class B1 | 1-Year | 5 Years | 7/1/2000 | |
| |
| without sales charge | 24.72% | 15.08% | (10.34%) | |
| with sales charge | 20.72% | 15.08% | (10.34%) | |
| | |
| | | | From | |
| | | | Inception | |
| Institutional Class1 | 1-Year | 5 Years | 7/1/2000 | |
| |
| Net Asset Value | 25.95% | 16.37% | (9.15%) | |
1 Class A performance reflects the maximum sales charge of 5.5% . Class B performance reflects the maximum deferred sales charge of 5%, declining 1% each year during the first five years and then converting to Class A shares after the fifth year. Institutional Class shares have no sales load and are for institutional shareholders only.
2 Past performance is not an indication of future results. Annualized total returns represent past performance and reflect changes in share prices, the reinvestment of all dividends and capital gains, and the effects of compounding. Investing in a mutual fund involves risks, including the possible loss of principal. The prospectus contains more complete information on the investment objectives, risks, charges and expenses of the investment company which investors should read and consider carefully before investing. To obtain a prospectus, contact a registered representative or visit www.thrivent.com. The Fund primarily invests in technology-related industries; as a consequence, the Fund may be subject to greater price volatility than a fund investing in a broad range of industries. At various times, the Fund’s adviser waived its m anagement fee and/or reimbursed Fund expenses. Had the adviser not done so, the Fund’s total returns would have been lower. The returns shown do not reflect taxes a shareholder would pay on distributions or redemptions.
3 Performance of other classes will be greater or less than the line shown based on the differences in loads and fees paid by shareholders investing in the different classes.
* As you compare performance, please note that the Fund’s performance reflects the maximum 5.5% sales charge, while the Consumer Price Index and Goldman Sachs Technology Industry Composite Index do not reflect any such charges. If you were to purchase any of the above individual stocks or funds represented in the Index, any charges you would pay would reduce your total return as well.
** The Consumer Price Index is an inflationary indicator that measures the change in the cost of a fixed basket of products and services, including housing, electricity, food and transportation. It is not possible to invest directly in the Index.
*** The Chicago Board Options Exchange Goldman Sachs Technology Index (CBOE GSTI) Composite Index is a modified capitalization-weighted index of selected technology stocks. It is not possible to invest directly in the Index. The performance of the Index does not reflect deductions for fees, expenses or taxes.
13

How did the Fund perform during the 12-month period ended October 31, 2007?
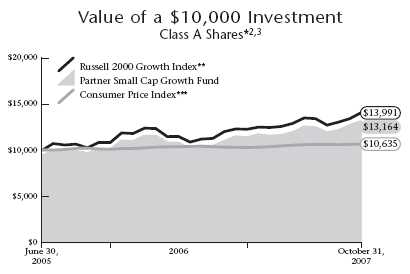
Thrivent Partner Small Cap Growth Fund earned a total return of 19.16% as compared to the return of its peer group, the Lipper Small Cap Growth Funds category, of 20.13% . The Fund’s market benchmark, the Russell 2000 Growth Index, earned a total return of 16.73% .
What factors affected the Fund’s performance?
Strong stock selection was the key variable in portfolio returns versus the benchmark in the last fiscal year. Sector positioning was also a factor in lifting the Fund’s results as the Fund was meaningfully underweighted to the poorly performing companies in the consumer cyclical industries. Stock selection in the health care, energy and financial sectors lifted returns as the Fund’s holdings in those groups generally outperformed those within the benchmark. Financial stocks in the Index provided a negative return over the year while those in the Fund achieved positive results. The Fund’s holding in Digital Realty Trust provided excellent returns versus both the Index and real estate investment trusts (REITs) in general, as did Diamondrock Hospitality Company, an operator of upscale hotels and resorts in North America. T he Fund’s exposure in the energy sector was targeted at firms that provide services for the exploration and production of energy resources like Core Laboratories, Dril-Quip Inc. and Wolbros Group. These firms provide the specialized services necessary in the more sophisticated and challenging exploration environment of today, and all performed well. An overweighted position in the health care equipment industry and stock selection within the group also lifted Fund results for the period. Inverness Medical Innovations Inc., NuVasive Inc., Meridian Bioscience and Integra Lifescience are examples of the types of companies owned in the Fund that benefit from the advancement and application of new tech nologies to the health care industry. NTELOS Holdings Corp. in the telecommunications sector also contributed positively to the Fund’s return.
The Fund was underweighted in the materials sector, a group not traditionally associated with growth investing and not a large segment within the Fund, but one that achieved strong returns as commodity prices advanced quite strongly over the period. We believe that much of that advance is price rather than volume driven from current and expected production levels; thus, it is unlikely to be sustained over the intermediate term.
| | |
| Top 10 Holdings | |
| (% of Portfolio) | |
| | |
| ValueClick, Inc. | 2.8% | |
| Dril-Quip, Inc. | 2.3% | |
| CoStar Group, Inc. | 2.2% | |
| Inverness Medical Innovations, Inc. | 2.2% | |
| Mentor Corporation | 1.7% | |
| Greenhill & Company, Inc. | 1.6% | |
| Euronet Worldwide, Inc. | 1.6% | |
| Informatica Corporation | 1.6% | |
| Cohen & Steers, Inc. | 1.5% | |
| Intermec, Inc. | 1.5% | |
| | |
| | |
| | |
| | |
| These common stocks represent 19.0% of the total | | |
| investment portfolio. | | |
Quoted Fund performance is for Class A shares and does not reflect a sales charge.
The returns shown do not reflect taxes a shareholder would pay on distributions or redemptions.
Quoted Major Market Sectors, Portfolio Composition and Top 10 Holdings are subject to change.
The lists of Major Market Sectors and Top 10 Holdings exclude short-term investments and collateral held for securities loaned.
The Portfolio Composition chart excludes collateral held for securities loaned.
14
What is your outlook?
We continue to anticipate that 2007 will prove a year in which price-to-earnings ratios expand — a circumstance that typically bodes well for growth stocks. We think any multiple expansion (which would be the first since 2003) could help to offset the decelerating rate of corporate earnings’ growth. So, although we think the stock market should be higher at the end of the year than it is now, a number of risks could confound that outlook: consumer spending, which accounts for about 70% of the gross domestic product, is softening; petroleum prices threaten to spike sharply higher; and a large loss in the suddenly unsteady Chinese stock market could have an adverse impact on the U.S. market. But we don’t assign a high probability to any of those risks.
| | | | | |
| Portfolio Facts | |
| As of October 31, 2007 | |
| | A Share | | Institutional Share | |
| | ————————— | | ————————— | |
| Ticker | TPSAX | | TPGIX | |
| Transfer Agent ID | 063 | | 463 | |
| Net Assets | $15,509,766 | | $64,480,004 | |
| NAV | $13.93 | | $14.00 | |
| NAV — High† | 10/10/2007 — $14.18 | | 10/10/2007 — $14.26 | |
| NAV — Low† | 11/1/2006 — $11.52 | | 11/1/2006 — $11.56 | |
| Number of Holdings: 164 | † For the year ended October 31, 2007 |
| | | |
| Average Annual Total Returns2 | |
| As of October 31, 2007 | |
| | |
| | | From | |
| | | Inception | |
| Class A1 | 1-Year | 6/30/2005 | |
| |
| without sales charge | 19.16% | 15.24% | |
| with sales charge | 12.61% | 12.49% | |
| | |
| | | From | |
| | | Inception | |
| Institutional Class1 | 1-Year | 6/30/2005 | |
| |
| Net Asset Value | 19.55% | 15.57% | |
1 Class A performance reflects the maximum sales charge of 5.5% . Institutional Class shares have no sales load and are for institutional shareholders only.
2 Past performance is not an indication of future results. Annualized total returns represent past performance and reflect changes in share prices, the reinvestment of all dividends and capital gains, and the effects of compounding. Periods of less than one year are not annualized. Investing in a mutual fund involves risks, including the possible loss of principal. The prospectus contains more complete information on the investment objectives, risks, charges and expenses of the investment company which investors should read and consider carefully before investing. To obtain a prospectus, contact a registered representative or visit www.thrivent.com. At various times, the Fund’s adviser waived its management fee and/or reimbursed Fund expenses. Had the adviser not done so, the Fund’s total returns would have been lower. The re turns shown do not reflect taxes a shareholder would pay on distributions or redemptions.
3 Performance of other classes will be greater or less than the line shown based on the differences in loads and fees paid by shareholders investing in the different classes.
* As you compare performance, please note that the Fund’s performance reflects the maximum 5.5% sales charge, while the Consumer Price Index, and the Russell 2000 Growth Index do not reflect any such charges. If you were to purchase any of the above individual stocks or funds represented in the Index, any charges you would pay would reduce your total return as well.
** The Russell 2000 Growth Index is an index comprised of companies with a greater than average growth orientation within the Russell 2000 Index. The Russell 2000 Index is comprised of the 2,000 smaller companies in the Russell 3000 Index, which represents the 3,000 largest companies based on market capitalization and is designed to represent the performance of about 98% of the U.S. equity market. It is not possible to invest directly in the Index. The performance of the Index does not reflect deductions for fees, expenses or taxes.
*** The Consumer Price Index is an inflationary indicator that measures the change in the cost of a fixed basket of products and services, including housing, electricity, food and transportation. It is not possible to invest directly in the Index.
15

How did the Fund perform during the 12-month period ended October 31, 2007?
Thrivent Partner Small Cap Value Fund earned a total return of 9.77% as compared to the return of its peer group, the Lipper Small Cap Value Funds category, of 6.22% . The Fund’s market benchmark, the Russell 2000 Value Index, earned a total return of 2.05% .
What factors affected the Fund’s performance?
Strong stock selection was the most significant factor lifting Fund returns above the benchmark. Good sector allocation decisions also helped the Fund’s returns over the fiscal year. A major underweighting of the financial sector and stock selection within that group significantly lifted results versus the benchmark. Financial stocks were under severe pressure for much of the period as the deterioration in the housing market created severe credit dislocations and uncertainty, particularly in the banking and thrift industry, but also shaking investor confidence in the real estate investment trust (REIT) industry. The Fund had significantly underweighted positions in each of these segments. The Fund did have some exposure to highly specialized companies with strong management teams that have successfully managed their firms around many of the problems these companies face. There was also limited exposure to the more specialized segments of the REIT industry that have good operating fundamentals or differentiated market positions. The Fund was also overweighted to the materials and industrials segments, two sectors that continue to benefit from a strong global demand that is offsetting some of the softness in their domestic businesses. Belden Inc. in the electrical products industry and Woodward Governor Co. in the industrial machinery industry both achieved excellent returns based on strong operating performance. In the materials sector, Metal Management and Carpenter Technology, both in the steel industry, provided superior returns. AptarGroup Inc. in the specialty packaging industry also provided str ong results for the Fund, as did Florida Rock Industries in a specialized segment of the construction materials industry. Holdings in the energy segment also contributed positively to the Fund’s results for the period.

| | |
| Top 10 Holdings | |
| (% of Portfolio) | |
| | |
| ProAssurance Corporation | 1.8% | |
| Metal Management, Inc. | 1.7% | |
| Carpenter Technology Corporation | 1.7% | |
| AptarGroup, Inc. | 1.6% | |
| Woodward Governor Company | 1.6% | |
| Kirby Corporation | 1.6% | |
| Owens & Minor, Inc. | 1.5% | |
| Forest Oil Corporation | 1.5% | |
| Belden CDT, Inc. | 1.5% | |
| Whiting Petroleum Corporation | 1.4% | |
| | |
| | |
| | |
| | |
| These common stocks represent 15.9% of the total | | |
| investment portfolio. | | |
Quoted Fund performance is for Class A shares and does not reflect a sales charge.
The returns shown do not reflect taxes a shareholder would pay on distributions or redemptions.
Quoted Major Market Sectors, Portfolio Composition and Top 10 Holdings are subject to change.
The lists of Major Market Sectors and Top 10 Holdings exclude short-term investments and collateral held for securities loaned.
The Portfolio Composition chart excludes collateral held for securities loaned.
16
Holdings in the information technology sector were modestly disappointing in that they did not keep pace with the Index, and the Fund is only modestly underweighted in the segment. This group appears to have finally weathered some of the challenges created in the last up cycle and may offer more opportunity as this business cycle continues to unfold.
What is your outlook?
Stocks are likely to be swimming against the currents of a gradually slowing economy and moderating profit margins for the remainder of 2007. Should profits increase at a slower pace, stock price gains will be the result of expanding multiples or increasing price-to-earnings ratios. Overall, stocks appear attractive relative to bonds, barring any unexpected increase in interest rates. Small-cap energy, materials, and industrials and business services stocks are expected to continue to benefit from the growing global economy. Valuations within the financials sector should decrease given the sector’s weakness in the United States, providing opportunities to invest in companies that appear well positioned to weather the storm.
| | | | | |
| Portfolio Facts | |
| As of October 31, 2007 | |
| | A Share | | B Share | Institutional Share | |
| | ————————— | | ————————— | ————————— | |
| Ticker | AALVX | | BBSVX | TPSIX | |
| Transfer Agent ID | 032 | | 082 | 099 | |
| Net Assets | $82,489,576 | | $3,554,482 | $57,682,948 | |
| NAV | $16.41 | | $15.44 | $17.10 | |
| NAV — High† | 6/4/2007 — $17.37 | | 6/4/2007 — $16.41 | 6/4/2007 — $18.05 | |
| NAV — Low† | 11/2/2006 — $15.33 | | 8/15/2007 — $14.52 | 1/8/2007 — $15.90 | |
| Number of Holdings: 147 | † For the year ended October 31, 2007 |
| | | | |
| Average Annual Total Returns2 | |
| As of October 31, 2007 | |
| | |
| | | | From | |
| | | | Inception | |
| Class A1 | 1-Year | 5 Years | 7/17/2001 | |
| |
| without sales charge | 9.77% | 19.94% | 12.98% | |
| with sales charge | 3.73% | 18.59% | 11.98% | |
| | |
| | | | From | |
| | | | Inception | |
| Class B1 | 1-Year | 5 Years | 7/17/2001 | |
| |
| without sales charge | 8.70% | 18.79% | 12.20% | |
| with sales charge | 4.70% | 18.79% | 12.20% | |
| | |
| | | | From | |
| | | | Inception | |
| Institutional Class1 | 1-Year | 5 Years | 7/17/2001 | |
| |
| Net Asset Value | 10.45% | 20.81% | 13.82% | |
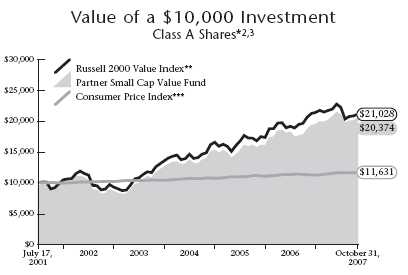
1 Class A performance reflects the maximum sales charge of 5.5% . Class B performance reflects the maximum deferred sales charge of 5%, declining 1% each year during the first five years and then converting to Class A shares after the fifth year. Institutional Class shares have no sales load and are for institutional shareholders only.
2 Past performance is not an indication of future results. Annualized total returns represent past performance and reflect changes in share prices, the reinvestment of all dividends and capital gains, and the effects of compounding. Investing in a mutual fund involves risks, including the possible loss of principal. The prospectus contains more complete information on the investment objectives, risks, charges and expenses of the investment company which investors should read and consider carefully before investing. To obtain a prospectus, contact a registered representative or visit www.thrivent.com. At various times, the Fund’s adviser waived its management fee and/or reimbursed Fund expenses. Had the adviser not done so, the Fund’s total returns would have been lower. The returns shown do not reflect taxes a shareholder wou ld pay on distributions or redemptions.
3 Performance of other classes will be greater or less than the line shown based on the differences in loads and fees paid by shareholders investing in the different classes.
* As you compare performance, please note that the Fund’s performance reflects the maximum 5.5% sales charge, while the Russell 2000 Value Index and the Consumer Price Index do not reflect any such charges. If you were to purchase any of the above individual stocks or funds represented in the Index, any charges you would pay would reduce your total return as well.
** The Russell 2000 Value Index is an index comprised of companies with a greater than average value orientation within the Russell 2000 Index. It is not possible to invest directly in these Indexes. The performance of these Indexes does not reflect deductions for fees, expenses or taxes.
*** The Consumer Price Index is an inflationary indicator that measures the change in the cost of a fixed basket of products and services, including housing, electricity, food and transportation. It is not possible to invest directly in the Index.
17

How did the Fund perform during the 12-month period ended October 31, 2007?
Thrivent Small Cap Stock Fund returned 14.32% during the 12-month period ended October 31, 2007. The Fund’s peer group, as represented by the Lipper Small Cap Core Funds Category, reported a median return of 9.64% . The Fund’s market benchmark, the Russell 2000 Index, returned 9.27% .
What factors affected the Fund’s performance?
The greatest impact on Fund performance during the period on both an absolute and relative basis was the underweighted position in both the financial and consumer discretionary sectors. Given our concerns regarding the mortgage and housing markets, along with credit quality and interest rate concerns, the Fund has been very discriminating in holding both financial and consumer stocks. During the period, elevated defaults within the sub-prime mortgage market caused many stocks within these sectors to perform poorly, driving positive Fund performance.
Additionally, individual stock selection across the Fund had a significantly positive impact on performance. In particular, we had solid performance in both the energy and industrial sectors. Given our positive economic outlook during the period, we continued to maintain an overweighted position within the industrials sector, which paid handsome dividends. The Fund’s holdings in the construction and engineering industry were major contributors to positive performance as demand for these services continues to grow. Within the energy sector, our exploration and production holdings performed extremely well relative to the energy sector in total.
During the period, strong corporate earnings and ample market liquidity provided an ideal environment for merger and acquisition activity. The Fund participated in many deals announced during the past year, with over a dozen of our holdings targeted. Areas which were fertile ground for takeovers within the Fund included the health care and technology sectors.
What is your outlook?
Superior stock selection will continue to be the major driver of Fund performance going forward. During the past year, we have seen strong performance in the market shift from value stocks to those with more growth characteristics. We believe in the current market environment, a continued focus on attractively valued quality companies with a distinct competitive advantage or defensible niche will provide the best opportunity for success.
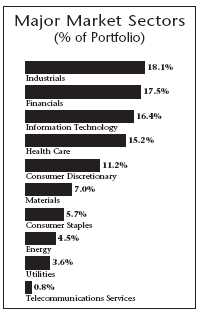
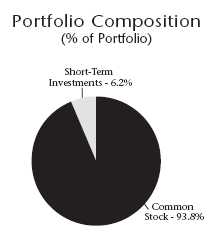
| | |
| Top 10 Holdings | |
| (% of Portfolio) | |
| | |
| BE Aerospace, Inc. | 1.2% | |
| WMS Industries, Inc. | 1.1% | |
| FLIR Systems, Inc. | 1.0% | |
| Central European Distribution Corporation | 1.0% | |
| Casey’s General Stores, Inc. | 1.0% | |
| VCA Antech, Inc. | 0.9% | |
| Insight Enterprises, Inc. | 0.9% | |
| AptarGroup, Inc. | 0.9% | |
| Silgan Holdings, Inc. | 0.9% | |
| Waste Connections, Inc. | 0.8% | |
| | |
| | |
| | |
| | |
| These common stocks represent 9.7% of the total | | |
| investment portfolio. | | |
Quoted Fund performance is for Class A shares and does not reflect a sales charge.
The returns shown do not reflect taxes a shareholder would pay on distributions or redemptions.
Quoted Major Market Sectors, Portfolio Composition and Top 10 Holdings are subject to change.
The lists of Major Market Sectors and Top 10 Holdings exclude short-term investments and collateral held for securities loaned.
The Portfolio Composition chart excludes collateral held for securities loaned.
18
Industrials stocks remain attractive as corporations continue to invest in plant and equipment, while strong global economic growth drives demand for infrastructure projects worldwide. The Fund remains overweighted in health care stocks due to improving fundamentals, attractive valuations and the strong competitive advantages which many of these companies possess. Information technology also continues to be an attractive area for investment as companies increasingly use technology to gain efficiencies, while the strong growth in Internet usage is fueling demand for infrastructure and capital equipment spending.
We remain diligent in monitoring the impact a deteriorating mortgage market and tighter credit standards will have on consumer spending. We are still concerned about how these factors will impact both the financials and consumer discretionary sectors and believe there may be more downside ahead. Thus, the Fund will continue to hold minimal positions in these sectors.
| | | | | |
| Portfolio Facts | |
| As of October 31, 2007 | |
| | A Share | | B Share | Institutional Share | |
| | ————————— | | ————————— | ————————— | |
| Ticker | AASMX | | BBSMX | TSCSX | |
| Transfer Agent ID | 024 | | 074 | 094 | |
| Net Assets | $448,936,836 | | $10,348,783 | $106,595,195 | |
| NAV | $18.98 | | $16.46 | $20.62 | |
| NAV — High† | 12/5/2006 — $19.22 | | 12/5/2006 — $17.08 | 10/10/2007 — $20.67 | |
| NAV — Low† | 3/5/2007 — $16.59 | | 3/5/2007 — $14.49 | 3/5/2007 — $17.95 | |
| Number of Holdings: 244 | † For the year ended October 31, 2007 | |
| | | | |
| Average Annual Total Returns2 | |
| As of October 31, 2007 | |
| | |
| Class A1 | 1-Year | 5 Years | 10 Years | |
| |
| without sales charge | 14.32% | 18.59% | 9.56% | |
| with sales charge | 8.01% | 17.26% | 8.94% | |
| | |
| Class B1 | 1-Year | 5 Years | 10 Years | |
| |
| without sales charge | 13.06% | 17.40% | 8.99% | |
| with sales charge | 9.06% | 17.40% | 8.99% | |
| | |
| | | | From | |
| | | | Inception | |
| Institutional Class1 | 1-Year | 5 Years | 12/29/1997 | |
| |
| Net Asset Value | 14.92% | 19.33% | 11.08% | |
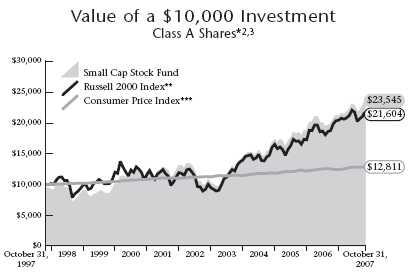
1 Class A performance reflects the maximum sales charge of 5.5% . Class B performance reflects the maximum deferred sales charge of 5%, declining 1% each year during the first five years and then converting to Class A shares after the fifth year. Institutional Class shares have no sales load and are for institutional shareholders only.
2 Past performance is not an indication of future results. Annualized total returns represent past performance and reflect changes in share prices, the reinvestment of all dividends and capital gains, and the effects of compounding. Investing in a mutual fund involves risks, including the possible loss of principal. The prospectus contains more complete information on the investment objectives, risks, charges and expenses of the investment company which investors should read and consider carefully before investing. To obtain a prospectus, contact a registered representative or visit www.thrivent.com. At various times, the Fund’s adviser waived its management fee and/or reimbursed Fund expenses. Had the adviser not done so, the Fund’s total returns would have been lower. The returns shown do not reflect taxes a shareholder wou ld pay on distributions or redemptions.
3 Performance of other classes will be greater or less than the line shown based on the differences in loads and fees paid by shareholders investing in the different classes.
* As you compare performance, please note that the Fund’s performance reflects the maximum 5.5% sales charge, while the Russell 2000 Index and the Consumer Price Index do not reflect any such charges. If you were to purchase any of the above individual stocks or funds represented in the Index, any charges you would pay would reduce your total return as well.
** The Russell 2000 Index is an index comprised of the 2,000 smaller companies in the Russell 3000 index. It is not possible to invest directly in these Indexes. The performance of these Indexes does not reflect deductions for fees, expenses or taxes.
*** The Consumer Price Index is an inflationary indicator that measures the change in the cost of a fixed basket of products and services, including housing, electricity, food and transportation. It is not possible to invest directly in the Index.
19

How did the Fund perform during the 12-month period ended October 31, 2007?
Thrivent Small Cap Index Fund earned a total return of 10.44% as compared to the median return of its peer group, the Lipper Small Cap Core Funds category, of 9.64% . The Fund’s market benchmark, the S&P SmallCap 600 Index, earned a total return of 11.55% .
What factors affected the Fund’s performance?
The Fund is managed to virtually replicate the performance of the S&P SmallCap 600 Index, a prime measure of small stock performance. We seek to maintain a fully invested position with limited transactions to minimize costs. As typically occurs with an index fund, the difference in performance between the benchmark index and the Fund itself can be largely attributed to expenses and minor differences in portfolio composition.
Small-cap stocks slightly underperformed large-cap and mid-cap stocks for the last 12 months. Three sectors drove the Fund’s performance, led by energy, which benefited from a continued spike in energy prices. Materials and information technology also enjoyed solid growth. Since consumer pocketbooks were getting squeezed by gas prices, companies that produce consumer staples also performed well. Stocks of consumer discretionary firms and financials, by contrast, were the weakest performers, posting negative returns. Certain lending segments dried up due to uncertainties in the mortgage loan area.
What is your outlook?
The Fund will remain fully invested in stocks designed to track the performance of the S&P SmallCap 600 Index. This offers investors an attractive way to take advantage of the growth potential of the broad, diversified marketplace of small-cap stocks.
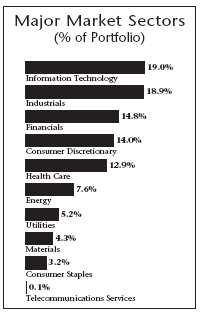
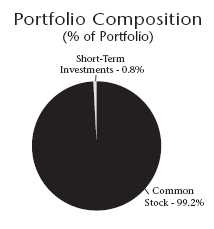
| | |
| Top 10 Holdings | |
| (% of Portfolio) | |
| | |
| Manitowoc Company, Inc. | 1.1% | |
| Crocs, Inc. | 1.0% | |
| Shaw Group, Inc. | 1.0% | |
| Trimble Navigation, Ltd. | 0.9% | |
| FLIR Systems, Inc. | 0.8% | |
| Energen Corporation | 0.8% | |
| Helix Energy Solutions Group, Inc. | 0.7% | |
| Oceaneering International, Inc. | 0.7% | |
| IDEXX Laboratories, Inc. | 0.7% | |
| Cabot Oil & Gas Corporation | 0.7% | |
| | |
| | |
| | |
| | |
| These common stocks represent 8.4% of the total | | |
| investment portfolio. | | |
Quoted Fund performance is for Class A shares and does not reflect a sales charge.
The returns shown do not reflect taxes a shareholder would pay on distributions or redemptions.
Quoted Major Market Sectors, Portfolio Composition and Top 10 Holdings are subject to change.
The lists of Major Market Sectors and Top 10 Holdings exclude short-term investments and collateral held for securities loaned.
The Portfolio Composition chart excludes collateral held for securities loaned.
20
While small stocks have enjoyed an advantage over larger-cap issues in recent years, the situation changed in the past year. With uncertainty growing over the strength of the U.S. economy and an ongoing inflation threat, investors backed away from riskier aspects of the equity markets. Large-cap stocks rallied relative to small-cap issues this past year. Whether this marks a period of rotation in the markets and a shift to more blue chip names remains to be seen. Typically, the longer an economic cycle continues, the more investors tend to favor large-cap stocks in the equity marketplace. We still believe there is solid opportunity in the small-cap arena, but the premium return for small stocks is likely to be limited in the future as the cycle continues to mature.
| | | | |
| | | |
| | Portfolio Facts | | |
| | As of October 31, 2007 | | |
| | A Share | | |
| | ————————— | | |
| Ticker | AALSX | | |
| Transfer Agent ID | 029 | | |
| Net Assets | $46,367,901 | | |
| NAV | $16.53 | | |
| NAV — High† | 7/19/2007 — $17.07 | | |
| NAV — Low† | 3/5/2007 — $14.96 | | |
| Number of Holdings: 604 | | † For the year ended October 31, 2007 |
| | | | |
| Average Annual Total Returns2 | |
| As of October 31, 2007 | |
| | |
| | | | From | |
| | | | Inception | |
| Class A1 | 1-Year | 5 Years | 7/1/2000 | |
| |
| without sales charge | 10.44% | 17.16% | 9.57% | |
| with sales charge | 4.36% | 15.86% | 8.73% | |
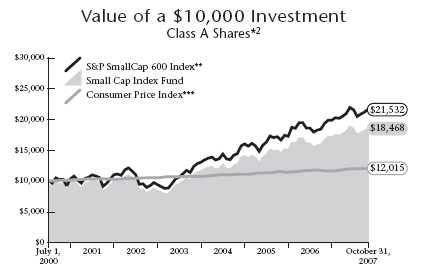
1 Class A performance reflects the maximum sales charge of 5.5% .
2 Past performance is not an indication of future results. Annualized total returns represent past performance and reflect changes in share prices, the reinvestment of all dividends and capital gains, and the effects of compounding. Investing in a mutual fund involves risks, including the possible loss of principal. The prospectus contains more complete information on the investment objectives, risks, charges and expenses of the investment company which investors should read and consider carefully before investing. To obtain a prospectus, contact a registered representative or visit www.thrivent.com. At various times, the Fund’s adviser waived its management fee and/or reimbursed Fund expenses. Had the adviser not done so, the Fund’s total returns would have been lower. The returns shown do not reflect taxes a shareholder wou ld pay on distributions or redemptions.
* As you compare performance, please note that the Fund’s performance reflects the maximum 5.5% sales charge, while the S&P SmallCap 600 Index and the Consumer Price Index do not reflect any such charges. If you were to purchase any of the above individual stocks or funds represented in the Index, any charges you would pay would reduce your total return as well.
** The S&P SmallCap 600 Index is an index that represents the average performance of a group of 600 small capitalization stocks. “S&P SmallCap 600 Index” is a trademark of The McGraw-Hill Companies, Inc. and has been licensed for use by Thrivent Financial for Lutherans. The product is not sponsored, endorsed or promoted by Standard & Poor’s and Standard & Poor’s makes no representation regarding the advisability of investing in the product. Index funds are subject to the same market risks associated with the stocks in their respective indexes. It is not possible to invest directly in the Index. The performance of the Index does not reflect deductions for fees, expenses or taxes.
*** The Consumer Price Index is an inflationary indicator that measures the change in the cost of a fixed basket of products and services, including housing, electricity, food and transportation. It is not possible to invest directly in the Index.
21

How did the Fund perform during the 12-month period ended October 31, 2007?
Thrivent Mid Cap Growth Fund earned a total return of 29.25% as compared to the median return of its peer group, the Lipper Mid Cap Growth category, of 25.52% . The Fund’s market benchmark, the Russell Midcap Growth Index, earned a total return of 19.72% .
What factors affected the Fund’s performance?
Stock selection across all sectors of the portfolio helped propel performance over the past year. Selection within the industrial sector was particularly strong as these companies benefited from high demand of emerging economies. Foster Wheeler LTD, an engineering and construction company, and Precision Castparts Corporation, an aerospace and defense company, did particularly well during the period. The information technology sector was also a positive contributor to performance as enterprise spending in the United States and abroad continued to be quite healthy. The Fund’s position in Aquantive Inc., which was acquired by Microsoft Corporation for a substantial premium, also contributed positiv ely to performance. Health care equipment and supply companies in the portfolio did quite well as many of these companies benefited from product cycles and therefore steadier earnings’ growth.
The Fund had a significantly underweighted position in the consumer sector during the period, which helped performance as these stocks were weak due to the continued deterioration in the U.S. housing market. However, the Fund’s position in Coldwater Creek Incorporated, a women’s apparel retailer, hurt performance as sales did not meet expectations. The Fund’s underweighted position in energy limited performance, as this was a strong sector for most of the period.
What is your outlook?
As we look in 2008, we see several headwinds building for the U.S. economy. We believe the housing market deterioration and subsequent credit problems in the mortgage industry, along with onerous fuel prices, may lead to more problems for the U.S. consumer. We also see potential risk to stocks stemming from a change of administration at the White House in the fall of 2008 and potentially higher taxes that could drag down economic growth further. We believe the Federal Reserve rate cuts may not be able to alleviate the credit woes for the consumer and may put further pressure on the U.S. dollar and ultimately spur inflation. On the bright side, these problems have not yet impacted the job picture in the U.S., and economic growth appears to be stable. Looking out into 2008, however, we are beginning to see the risk of an economic slowdown increasing.

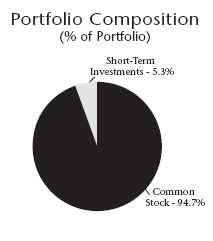
| | |
| Top 10 Holdings | |
| (% of Portfolio) | |
| | |
| Precision Castparts Corporation | 2.2% | |
| T. Rowe Price Group, Inc. | 1.8% | |
| Praxair, Inc. | 1.6% | |
| Foster Wheeler, Ltd. | 1.5% | |
| Cameron International Corporation | 1.4% | |
| Devon Energy Corporation | 1.3% | |
| Diamond Offshore Drilling, Inc. | 1.3% | |
| Adobe Systems, Inc. | 1.3% | |
| Rogers Communications, Inc. | 1.2% | |
| Seagate Technology | 1.2% | |
| | |
| | |
| | |
| | |
| These common stocks represent 14.8% of the total | | |
| investment portfolio. | | |
Quoted Fund performance is for Class A shares and does not reflect a sales charge.
The returns shown do not reflect taxes a shareholder would pay on distributions or redemptions.
Quoted Major Market Sectors, Portfolio Composition and Top 10 Holdings are subject to change.
The lists of Major Market Sectors and Top 10 Holdings exclude short-term investments and collateral held for securities loaned.
The Portfolio Composition chart excludes collateral held for securities loaned.
22
With that, we are positioning the portfolio slightly more conservatively. We continue to look for growth opportunities that can withstand a U.S. economic slowdown. We are finding opportunities in companies with more exposure to international economies and less dependence on the U.S. dollar and consumer. We continue to favor companies that are in front of new product cycles that will foster growth regardless of the underlying economic cycle. Health care remains a target area for us as these stocks have attractive valuation characteristics relative to growth expectations and will likely sustain operating and profit momentum through a period of slowing economic growth.
| | | | | | |
| Portfolio Facts | |
| As of October 31, 2007 | |
| | A Share | | B Share | Institutional Share | |
| | ————————— | | ————————— | ————————— | |
| Ticker | LBMGX | | LUGBX | LBMIX | |
| Transfer Agent ID | 58 | | 358 | 458 | |
| Net Assets | $302,662,551 | | $19,268,143 | $42,096,523 | |
| NAV | $19.45 | | $17.68 | $20.98 | |
| NAV — High† | 10/31/2007 — $19.45 | | 10/31/2007 — $17.68 | 10/31/2007 — $20.98 | |
| NAV — Low† | 1/5/2007 — $15.40 | | 1/5/2007 — $14.13 | 1/5/2007 — $16.51 | |
| Number of Holdings: 170 | † For the year ended October 31, 2007 | |
| | | | |
| Average Annual Total Returns2 | |
| As of October 31, 2007 | |
| | |
| Class A1 | 1-Year | 5 Years | 10 Years | |
| |
| without sales charge | 29.25% | 17.06% | 9.23% | |
| with sales charge | 22.15% | 15.75% | 8.61% | |
| | |
| Class B1 | 1-Year | 5 Years | 10 Years | |
| |
| without sales charge | 27.77% | 15.93% | 8.81% | |
| with sales charge | 23.77% | 15.93% | 8.81% | |
| | |
| Institutional Class1 | 1-Year | 5 Years | 10 Years | |
| |
| Net Asset Value | 30.15% | 18.04% | 10.00% | |
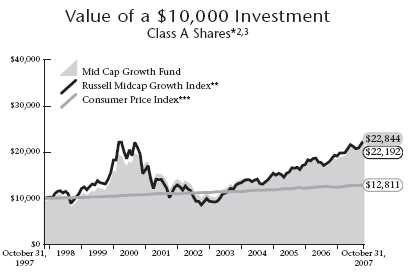
1 Class A performance reflects the maximum sales charge of 5.5% . Class B performance reflects the maximum deferred sales charge of 5%, declining 1% each year during the first five years and then converting to Class A shares after the fifth year. Institutional Class shares have no sales load and are for institutional shareholders only.
2 Past performance is not an indication of future results. Annualized total returns represent past performance and reflect changes in share prices, the reinvestment of all dividends and capital gains, and the effects of compounding. Investing in a mutual fund involves risks, including the possible loss of principal. The prospectus contains more complete information on the investment objectives, risks, charges and expenses of the investment company which investors should read and consider carefully before investing. To obtain a prospectus, contact a registered representative or visit www.thrivent.com. At various times, the Fund’s adviser waived its management fee and/or reimbursed Fund expenses. Had the adviser not done so, the Fund’s total returns would have been lower. The returns shown do not reflect taxes a shareholder wou ld pay on distributions or redemptions.
3 Performance of other classes will be greater or less than the line shown based on the differences in loads and fees paid by shareholders investing in the different classes.
* As you compare performance, please note that the Fund’s performance reflects the maximum 5.5% sales charge, while the Russell Midcap Growth Index and the Consumer Price Index do not reflect any such charges. If you were to purchase any of the above individual stocks or funds represented in the Index, any charges you would pay would reduce your total return as well.
** The Russell Midcap Growth Index is an index comprised of companies with higher than average price-to-book ratios and higher forecasted growth values, within the Russell Midcap Index. It is not possible to invest directly in these Indexes. The performance of these Indexes does not reflect deductions for fees, expenses, or taxes.
*** The Consumer Price Index is an inflationary indicator that measures the change in the cost of a fixed basket of products and services, including housing, electricity, food and transportation. It is not possible to invest directly in the Index.
23

How did the Fund perform during the 12-month period ended October 31, 2007?
Thrivent Partner Mid Cap Value Fund earned a total return of 11.45% as compared to the return of its peer group, the Lipper Mid Cap Value Funds category, of 11.39% . The Fund’s market benchmark, the Russell Midcap Value Index, earned a total return of 9.73% .
What factors affected the Fund’s performance?
A significantly overweighted position in the energy sector, the group with the strongest performance in the mid-cap value segment, as well as stock selection within the group were the most significant factors affecting the Fund’s performance in the period. Below-market exposures within the financial and consumer discretionary sectors, which performed poorly, also lifted the Fund’s return. Within the energy sector, we have maintained a bias to companies that are well-positioned in the natural gas segment, such as Range Resources, Williams Companies and EOG Resources. All three provided returns well in excess of the Index and the energy sector in general. Exposure to the equipment and services segments of the energy sector also contributed favorably to portfolio returns. Exercising caution in the real estate investment trust (REIT) sector was the most significant component affecting returns to holdings in the financial sector. Our underweighted position to the poor performance achieved broadly in REITs enhanced the Fund’s return. A similarly conservative position in the more cyclical segments of the consumer sector was also a positive factor for the Fund’s return, as this group’s returns were significantly below those achieved by the Index.
Two factors that limited Fund returns were an underweighting to the materials sectors, which performed strongly driven by continued global demand for industrial metals. Select companies in the steel industry provided attractive returns and, while we had some portfolio exposure, we did not have it to the levels of the broad Index. Additionally, our holdings in and exposure to the telecommunications sector provided returns modestly below the benchmark.
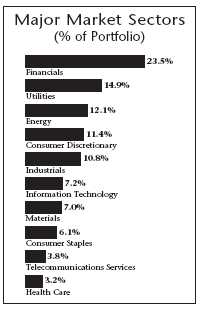
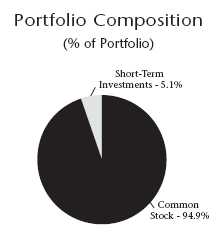
| | |
| Top 10 Holdings | |
| (% of Portfolio) | |
| | |
| Williams Companies, Inc. | 3.5% | |
| Range Resources Corporation | 3.1% | |
| Entergy Corporation | 3.1% | |
| Hess Corporation | 2.7% | |
| PPL Corporation | 2.4% | |
| Embarq Corporation | 1.9% | |
| Amphenol Corporation | 1.9% | |
| Johnson Controls, Inc. | 1.9% | |
| M&T Bank Corporation | 1.8% | |
| SUPERVALU, Inc. | 1.8% | |
| | |
| | |
| | |
| | |
| These common stocks represent 24.1% of the total | | |
| investment portfolio. | | |
Quoted Fund performance is for Class A shares and does not reflect a sales charge.
The returns shown do not reflect taxes a shareholder would pay on distributions or redemptions.
Quoted Major Market Sectors, Portfolio Composition and Top 10 Holdings are subject to change.
The lists of Major Market Sectors and Top 10 Holdings exclude short-term investments and collateral held for securities loaned.
The Portfolio Composition chart excludes collateral held for securities loaned.
24
What is your outlook?
The recent declines in the broad market have impacted a mix of companies in a similar fashion. We have taken the opportunity to actively reassess our investments by upgrading the quality of the portfolios where we can while reducing our exposure to businesses where the risk/reward profile is no longer compelling. In the past, our attention to quality companies trading at compelling valuations has led to strong long-term absolute and relative performance.
| | | | |
| Portfolio Facts | |
| As of October 31, 2007 | |
| | A Share | | Institutional Share | |
| | ————————— | | ————————— | |
| Ticker | TPMAX | | TPMIX | |
| Transfer Agent ID | 086 | | 486 | |
| Net Assets | $12,026,118 | | $33,943,191 | |
| NAV | $12.93 | | $12.97 | |
| NAV — High† | 6/4/2007 — $13.69 | | 6/4/2007 — $13.71 | |
| NAV — Low† | 11/3/2006 — $11.72 | | 11/3/2006 — $11.76 | |
| Number of Holdings: 116 | † For the year ended October 31, 2007 | |
| | | |
| Average Annual Total Returns2 | |
| As of October 31, 2007 | |
| | |
| | | From | |
| | | Inception | |
| Class A1 | 1-Year | 6/30/2005 | |
| |
| without sales charge | 11.45% | 12.72% | |
| with sales charge | 5.30% | 10.04% | |
| | |
| | | From | |
| | | Inception | |
| Institutional Class1 | 1-Year | 6/30/2005 | |
| |
| Net Asset Value | 11.73% | 13.08% | |
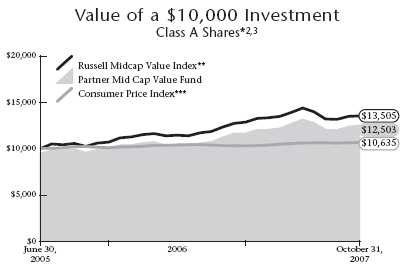
1 Class A performance reflects the maximum sales charge of 5.5% . Institutional Class shares have no sales load and are for institutional shareholders only.
2 Past performance is not an indication of future results. Annualized total returns represent past performance and reflect changes in share prices, the reinvestment of all dividends and capital gains, and the effects of compounding. Periods of less than one year are not annualized. Investing in a mutual fund involves risks, including the possible loss of principal. The prospectus contains more complete information on the investment objectives, risks, charges and expenses of the investment company which investors should read and consider carefully before investing. To obtain a prospectus, contact a registered representative or visit www.thrivent.com. At various times, the Fund’s adviser waived its management fee and/or reimbursed Fund expenses. Had the adviser not done so, the Fund’s total returns would have been lower. The re turns shown do not reflect taxes a shareholder would pay on distributions or redemptions.
3 Performance of other classes will be greater or less than the line shown based on the differences in loads and fees paid by shareholders investing in the different classes.
* As you compare performance, please note that the Fund’s performance reflects the maximum 5.5% sales charge, while the Consumer Price Index and the Russell Midcap Value Index do not reflect any such charges. If you were to purchase any of the above individual stocks or funds represented in the Index, any charges you would pay would reduce your total return as well.
** The Russell Midcap Value Index is an index comprised of companies with lower than average price-to-book ratios and lower forecasted growth values within the Russell Midcap Index. It is not possible to invest directly in these Indexes. The performance of these Indexes does not reflect deductions for fees, expenses or taxes.
*** The Consumer Price Index is an inflationary indicator that measures the change in the cost of a fixed basket of products and services, including housing, electricity, food and transportation. It is not possible to invest directly in the Index.
25

How did the Fund perform during the 12-month period ended October 31, 2007?
Thrivent Mid Cap Stock Fund earned a total return of 15.56% as compared to the median return of its peer group, the Lipper Mid Cap Core category, of 15.78% . The Fund’s market benchmark, the Russell Midcap Index, earned a total return of 15.24% .
What factors affected the Fund’s performance?
Stock selection within the consumer discretionary and information technology sectors, combined with a significant allocation to the materials sector, contributed the majority of the Fund’s outperformance versus the benchmark. Within consumer discretionary, Service Corporation International benefited from a large acquisition and significant cost cutting. Improving sales buffeted Tupperware Brands Corporation. Juniper Networks, Inc. highlighted the information technology performance. The company’s sales improved as regional bell operating companies rolled out Internet Protocol television services with Juniper’s expanded product portfolio to compete against incumbent cable providers. Varian Semiconductor Equipment Associates, Inc. also provided a solid contribution to overall performance as the company continued to increase their market share within the semiconductor capital equipment market, expanded operating margins and bought back stock. Finally, overweighting the materials sector proved timely as it was the second-best performing sector of the year. Specifically, Owens-Illinois, Inc., the Fund’s largest position, performed strongly as it raised prices, sold underperforming businesses, paid down debt and increased operating margins.
These positive contributors were somewhat offset by security selection within the industrial and financial sectors and underweighting the energy sector. Stock selection within the commercial services and airlines industries led the majority of the decline within the industrial sector. Three investments — PMI Group Inc, E*Trade Financial Corporation, and U-Store-It Trust — resulted in the financial sector underperformance. PMI and E*Trade were both casualties of the calamity in mortgage-backed securities. U-Store-It fell victim to a softening self-storage market and increased capital expe nditures required to institute a turnaround. Finally, underweighting energy, the year’s best performer, detracted from overall performance.
What is your outlook?
The economy is clearly slowing as the housing market unwinds, lending standards are tightening in residential and non-residential markets, and profit growth decelerates. While this scenario is clearly worrisome, we believe a recession should be avoided as the Federal Reserve has lowered interest rates 75 basis points since September and money growth has accelerated year-over-year. Given this backdrop, the Fund has a growth bias and continues to avoid cyclical stocks in the energy and industrial sectors. As the economy and profits slow, fewer companies will maintain the ability to increase profits. Those companies that achieve profit growth through the slowdown will enjoy premium valuation multiples as this group narrows to a small, select few. The technology sector should be the beneficiary of this environment as its products increase productivity, lower costs and offer new services. Specifically, many communication equipment companies are providing the infrastructure ne eded to offer new television and marketing services. As the competition continues to increase between the telephone and cable companies, and Google and Microsoft
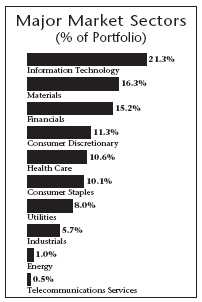
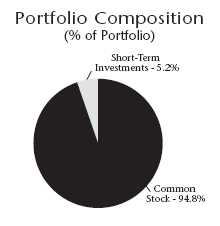
| | |
| Top 10 Holdings | |
| (% of Portfolio) | |
| | |
| Owens-Illinois, Inc. | 4.3% | |
| Silgan Holdings, Inc. | 3.9% | |
| Pactiv Corporation | 3.9% | |
| Crown Holdings, Inc. | 3.5% | |
| Service Corporation International | 3.2% | |
| H.J. Heinz Company | 2.6% | |
| Wisconsin Energy Corporation | 2.5% | |
| Clorox Company | 2.1% | |
| New York Community Bancorp, Inc. | 2.1% | |
| DeVry, Inc. | 2.0% | |
| | |
| | |
| | |
| | |
| These common stocks represent 30.1% of the total | | |
| investment portfolio. | | |
Quoted Fund performance is for Class A shares and does not reflect a sales charge.
The returns shown do not reflect taxes a shareholder would pay on distributions or redemptions.
Quoted Major Market Sectors, Portfolio Composition and Top 10 Holdings are subject to change.
The lists of Major Market Sectors and Top 10 Holdings exclude short-term investments and collateral held for securities loaned.
The Portfolio Composition chart excludes collateral held for securities loaned.
26
build new data centers to offer Internet advertising, capital expenditures on infrastructure products will continue to flourish. Storage hardware and software will also benefit as the proliferation of data will need to be stored, protected and analyzed. Finally, many new software products delivered over the Internet, commonly referred to as software-as-a-service, are lowering costs and improving productivity for many companies. These characteristics are obviously in high demand in all situations, but especially in a slowing economy.
While the technology sector looks reasonably valued for these opportunities, the outlook for the energy sector is less sanguine. Although oil prices continue to hit new highs, many factors point to weakening fundamentals. To begin, demand in the United States has recently reversed and is negative on year-over-year basis driven by the slowing economy. The same is true for most developed economies. Many point to the emerging economies as being the source of accelerating demand; however, oil demand has actually slowed in these regions as well. For example, China’s demand has decelerated from approximately 17% in 2004 to approximately 5% in 2007. Next, oil inventories are at sufficient levels and well above their 10-year averages. Finally, OPEC continues to increase production and still maintains excess capacity approaching four million barrels per day-significantly above the level of just a few years ago. Therefore, the increase in oil pr ices belies the underlying fundamentals and is not necessarily being driven by supply and demand.
| | | | | | |
| Portfolio Facts | |
| As of October 31, 2007 | |
| | A Share | | B Share | Institutional Share | |
| | ————————— | | ————————— | ————————— | |
| Ticker | AASCX | | BBSCX | TMSIX | |
| Transfer Agent ID | 021 | | 083 | 051 | |
| Net Assets | $988,917,187 | | $11,914,074 | $172,073,581 | |
| NAV | $17.98 | | $15.26 | $19.14 | |
| NAV — High† | 12/5/2006 — $19.42 | | 12/5/2006 — $17.08 | 12/5/2006 — $20.46 | |
| NAV — Low† | 12/22/2006 — $16.05 | | 12/22/2006 — $13.73 | 1/5/2007 — $17.07 | |
| Number of Holdings: 128 | † For the year ended October 31, 2007 | |
| | | | |
| Average Annual Total Returns2 | |
| As of October 31, 2007 | |
| | |
| | |
| | |
| Class A1 | 1-Year | 5 Years | 10 Years | |
| |
| without sales charge | 15.56% | 17.87% | 8.71% | |
| with sales charge | 9.22% | 16.54% | 8.10% | |
| | |
| Class B1 | 1-Year | 5 Years | 10 Years | |
| |
| without sales charge | 14.31% | 16.54% | 8.08% | |
| with sales charge | 10.59% | 16.54% | 8.08% | |
| | |
| | | | From | |
| | | | Inception | |
| Institutional Class1 | 1-Year | 5 Years | 12/29/1997 | |
| |
| Net Asset Value | 16.09% | 18.47% | 9.73% | |
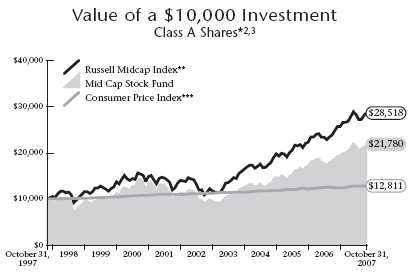
1 Class A performance reflects the maximum sales charge of 5.5% . Class B performance reflects the maximum deferred sales charge of 5%, declining 1% each year during the first five years and then converting to Class A shares after the fifth year. Institutional Class shares have no sales load and are for institutional shareholders only.
2 Past performance is not an indication of future results. Annualized total returns represent past performance and reflect changes in share prices, the reinvestment of all dividends and capital gains, and the effects of compounding. Investing in a mutual fund involves risks, including the possible loss of principal. The prospectus contains more complete information on the investment objectives, risks, charges and expenses of the investment company which investors should read and consider carefully before investing. To obtain a prospectus, contact a registered representative or visit www.thrivent.com. At various times, the Fund’s adviser waived its management fee and/or reimbursed Fund expenses. Had the adviser not done so, the Fund’s total returns would have been lower. The returns shown do not reflect taxes a shareholder wou ld pay on distributions or redemptions.
3 Performance of other classes will be greater or less than the line shown based on the differences in loads and fees paid by shareholders investing in the different classes.
* As you compare performance, please note that the Fund’s performance reflects the maximum 5.5% sales charge, while the Russell Midcap Index and the Consumer Price Index do not reflect any such charges. If you were to purchase any of the above individual stocks or funds represented in the Index, any charges you would pay would reduce your total return as well.
** The Russell Midcap Index is an unmanaged index that measures the performance of the smallest 800 securities in the Russell 1000 Index, as ranked by total market capitalization. It is not possible to invest directly in these Indexes. The performance of these Indexes does not reflect deductions for fees, expenses or taxes.
*** The Consumer Price Index is an inflationary indicator that measures the change in the cost of a fixed basket of products and services, including housing, electricity, food and transportation. It is not possible to invest directly in the Index.
27

How did the Fund perform during the 12-month period ended October 31, 2007?
Thrivent Mid Cap Index Fund earned a total return of 15.97% as compared to the median return of its peer group, the Lipper Mid Cap Core Funds category, of 15.78% . The Fund’s market benchmark, the S&P MidCap 400 Index, earned a total return of 17.01% .
What factors affected the Fund’s performance?
Because it is designed to invest in a way that reflects its benchmark index, the S&P MidCap 400 Index, the only changes made to the Fund are done to reconcile with any alterations in the composition of the Index itself. As typically occurs with an index fund, the difference in performance between the benchmark index and the Fund can be largely attributed to expenses and minor differences in portfolio composition.
Mid-caps outperformed both small-cap and large-cap stocks. Energy, materials, and telecommunication services were a major contributor to the positive return, bolstered by a general increase in commodities. By contrast, financials and consumer discretionary stocks underperformed because of fears that households would be forced to trim unnecessary expenditures due to the impact of higher prices at the gas pump. These sectors were also impacted by lower financial liquidity brought on by uncertainties in the mortgage loan arena.
What is your outlook?
The Fund will remain fully invested in a way that tracks the performance of the S&P MidCap 400 Index. This is an attractive way for investors to take advantage of the investment potential of the broad, diversified marketplace for mid-cap stocks.
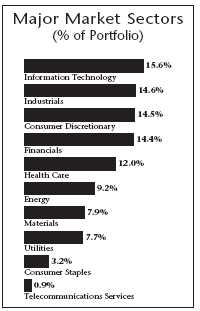
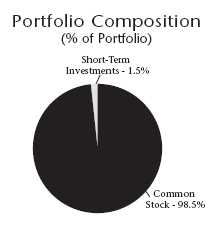
| | |
| Top 10 Holdings | |
| (% of Portfolio) | |
| | |
| Lyondell Chemical Company | 1.0% | |
| Intuitive Surgical, Inc. | 1.0% | |
| Cameron International Corporation | 0.9% | |
| GameStop Corporation | 0.8% | |
| Southwestern Energy Company | 0.7% | |
| Harris Corporation | 0.7% | |
| Hologic, Inc. | 0.7% | |
| Amphenol Corporation | 0.6% | |
| FMC Technologies, Inc. | 0.6% | |
| Telephone and Data Systems, Inc. | 0.6% | |
| | |
| | |
| | |
| | |
| These common stocks represent 7.6% of the total | | |
| investment portfolio. | | |
Quoted Fund performance is for Class A shares and does not reflect a sales charge.
The returns shown do not reflect taxes a shareholder would pay on distributions or redemptions.
Quoted Major Market Sectors, Portfolio Composition and Top 10 Holdings are subject to change.
The lists of Major Market Sectors and Top 10 Holdings exclude short-term investments and collateral held for securities loaned.
The Portfolio Composition chart excludes collateral held for securities loaned.
28
Typically, as the economic cycle progresses, investors begin to favor larger-cap issues. We still believe that attractive opportunities are available in the mid-cap marketplace in the months ahead. At the same time, we are realistic in our expectations that the premium return to the mid-cap sector is likely to be reduced in the future as the economic cycle continues.
| | | |
| | |
| | Portfolio Facts | |
| | As of October 31, 2007 | |
| | A Share | |
| | ————————— | |
| Ticker | AAMIX | |
| Transfer Agent ID | 030 | |
| Net Assets | $61,014,539 | |
| NAV | $15.90 | |
| NAV — High† | 7/13/2007 — $16.21 | |
| NAV — Low† | 1/5/2007 — $13.99 | |
| Number of Holdings: 404 | | † For the year ended October 31, 2007 |
| | | | |
| Average Annual Total Returns2 | |
| As of October 31, 2007 | |
| | |
| | | | From | |
| | | | Inception | |
| Class A1 | 1-Year | 5 Years | 7/1/2000 | |
| |
| without sales charge | 15.97% | 16.62% | 8.65% | |
| with sales charge | 9.60% | 15.32% | 7.82% | |
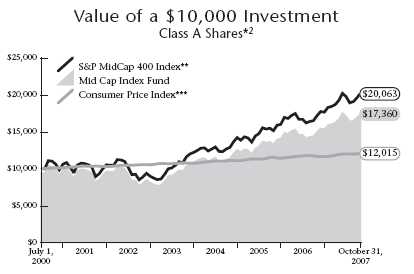
1 Class A performance reflects the maximum sales charge of 5.5% .
2 Past performance is not an indication of future results. Annualized total returns represent past performance and reflect changes in share prices, the reinvestment of all dividends and capital gains, and the effects of compounding. Investing in a mutual fund involves risks, including the possible loss of principal. The prospectus contains more complete information on the investment objectives, risks, charges and expenses of the investment company which investors should read and consider carefully before investing. To obtain a prospectus, contact a registered representative or visit www.thrivent.com. At various times, the Fund’s adviser waived its management fee and/or reimbursed Fund expenses. Had the adviser not done so, the Fund’s total returns would have been lower. The returns shown do not reflect taxes a shareholder wou ld pay on distributions or redemptions.
* As you compare performance, please note that the Fund’s performance reflects the maximum 5.5% sales charge, while the S&P MidCap 400 Index and the Consumer Price Index do not reflect any such charges. If you were to purchase any of the above individual stocks or funds represented in the Index, any charges you would pay would reduce your total return as well.
** The S&P MidCap 400 Index is an index that represents the average performance of a group of 400 medium capitalization stocks. “S&P MidCap 400 Index” is a trademark of The McGraw-Hill Companies, Inc. and has been licensed for use by Thrivent Financial for Lutherans. The product is not sponsored, endorsed or promoted by Standard & Poor’s and Standard & Poor’s makes no representation regarding the advisability of investing in the product. Index funds are subject to the same market risks associated with the stocks in their respective indexes. It is not possible to invest directly in the Index. The performance of the Index does not reflect deductions for fees, expenses or taxes.
*** The Consumer Price Index is an inflationary indicator that measures the change in the cost of a fixed basket of products and services, including housing, electricity, food and transportation. It is not possible to invest directly in the Index.
29

How did the Fund perform during the 12-month period ended October 31, 2007?
Thrivent Mid Cap Index Fund-I earned a total return of 16.35% as compared to the median return of its peer group, the Lipper Mid Cap Core Funds category, of 15.78% . The Fund’s market benchmark, the S&P MidCap 400 Index, earned a total return of 17.01% .
What factors affected the Fund’s performance?
Because it is designed to invest in a way that reflects its benchmark index, the S&P MidCap 400 Index, the only changes made to the Fund are done to reconcile with any alterations in the composition of the Index itself. As typically occurs with an index fund, the difference in performance between the benchmark index and the Fund can be largely attributed to expenses and minor differences in portfolio composition.
Mid-caps outperformed both small-cap and large-cap stocks. Energy, materials, and telecommunication services were a major contributor to the positive return, bolstered by a general increase in commodities. By contrast, financials and consumer discretionary stocks underperformed because of fears that households would be forced to trim unnecessary expenditures due to the impact of higher prices at the gas pump. These sectors were also impacted by lower financial liquidity brought on by uncertainties in the mortgage loan arena.
What is your outlook?
The Fund will remain fully invested in a way that tracks the performance of the S&P MidCap 400 Index. This is an attractive way for investors to take advantage of the investment potential of the broad, diversified marketplace for mid-cap stocks.
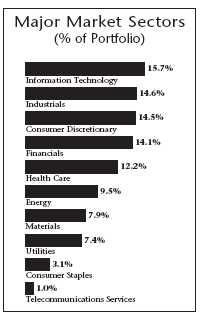
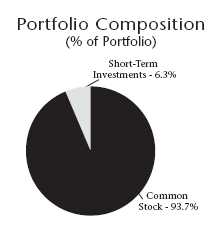
| | |
| Top 10 Holdings | |
| (% of Portfolio) | |
| | |
| Intuitive Surgical, Inc. | 1.0% | |
| Lyondell Chemical Company | 1.0% | |
| Cameron International Corporation | 0.9% | |
| GameStop Corporation | 0.8% | |
| Southwestern Energy Company | 0.7% | |
| Harris Corporation | 0.7% | |
| Hologic, Inc. | 0.7% | |
| FMC Technologies, Inc. | 0.7% | |
| Telephone and Data Systems, Inc. | 0.6% | |
| Amphenol Corporation | 0.6% | |
| | |
| | |
| | |
| | |
| These common stocks represent 7.7% of the total | | |
| investment portfolio. | | |
The returns shown do not reflect taxes a shareholder would pay on distributions or redemptions.
Quoted Major Market Sectors, Portfolio Composition and Top 10 Holdings are subject to change.
The lists of Major Market Sectors and Top 10 Holdings exclude short-term investments and collateral held for securities loaned.
The Portfolio Composition chart excludes collateral held for securities loaned.
30
Typically, as the economic cycle progresses, investors begin to favor larger-cap issues. We still believe that attractive opportunities are available in the mid-cap marketplace in the months ahead. At the same time, we are realistic in our expectations that the premium return to the mid-cap sector is likely to be reduced in the future as the economic cycle continues.
| | | |
| | |
| | Portfolio Facts | |
| | As of October 31, 2007 | |
| | Institutional Share | |
| | ————————— | |
| Ticker | AALMX | |
| Transfer Agent ID | 097 | |
| Net Assets | $14,145,687 | |
| NAV | $15.30 | |
| NAV — High† | 7/13/2007 — $15.58 | |
| NAV — Low† | 1/5/2007 — $13.43 | |
| Number of Holdings: 405 | | † For the year ended October 31, 2007 |
| | | | |
| Average Annual Total Returns2 | |
| As of October 31, 2007 | |
| | |
| | | | From | |
| | | | Inception | |
| Institutional Class1 | 1-Year | 5 Years | 12/31/1999 | |
| |
| Net Asset Value | 16.35% | 17.01% | 10.20% | |
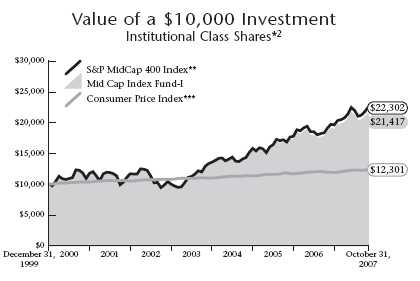
1 Institutional Class shares have no sales load and are for institutional shareholders only.
2 Past performance is not an indication of future results. Annualized total returns represent past performance and reflect changes in share prices, the reinvestment of all dividends and capital gains, and the effects of compounding. Investing in a mutual fund involves risks, including the possible loss of principal. The prospectus contains more complete information on the investment objectives, risks, charges and expenses of the investment company which investors should read and consider carefully before investing. To obtain a prospectus, contact a registered representative or visit www.thrivent.com. At various times, the Fund’s adviser waived its management fee and/or reimbursed Fund expenses. Had the adviser not done so, the Fund’s total returns would have been lower. The returns shown do not reflect taxes a shareholder wou ld pay on distributions or redemptions.
* As you compare performance, please note that the Fund’s performance reflects Fund expenses, net of any reimbursements, while the S&P MidCap 400 Index and the Consumer Price Index do not reflect such charges. If you were to purchase any of the above individual stocks or funds represented in the Index, any charges you would pay would reduce your total return as well.
** The S&P MidCap 400 Index is an index that represents the average performance of a group of 400 medium capitalization stocks. "S&P MidCap 400 Index" is a trademark of The McGraw-Hill Companies, Inc. and has been licensed for use by Thrivent Financial for Lutherans. The product is not sponsored, endorsed or promoted by Standard & Poor’s and Standard & Poor’s makes no representation regarding the advisability of investing in the product. Index funds are subject to the same market risks associated with the stocks in their respective indexes. It is not possible to invest directly in the Index. The performance of the Index does not reflect deductions for fees, expenses or taxes.
*** The Consumer Price Index is an inflationary indicator that measures the change in the cost of a fixed basket of products and services, including housing, electricity, food and transportation. It is not possible to invest directly in the Index.
31

How did the Fund perform during the 12-month period ended October 31, 2007?
Thrivent Partner International Stock Fund earned a total return of 24.13% as compared to the median return of its peer group, the Lipper International Large Cap Core Funds category, of 25.27% . The Fund’s market benchmark, the Morgan Stanley Capital International, Europe, Australasia, Far East Index (the “MSCI EAFE Index”), earned a total return of 25.43% .
What factors affected the Fund’s performance?
The return to the Fund was moderately below that of the Index and the median achieved in the mutual fund universe. The primary factor creating that difference was the modest return earned on our cash reserves that are held as liquidity for transaction purposes as compared to that of the balance of the portfolio’s holdings. The holdings in the Fund achieved returns in line with the Index although the sources of those returns varied from the benchmark. Stock selection in the invested portion of the Fund was mixed, with above-average returns in certain segments offset by less-than-market results in others. Holdings in the telecommunications services and energy sectors did extremely well on both an absolute basis and relative to the benchmark. Energy prices rose strongly over the period and the portfolio’s exposures to exploration and production companies, such as Repsol, as well as oil services companies, aided returns. Additionally, the portfolio had little exposure to the natural gas sector, which did not perform as well. In the diversified telecommunications industry, our holdings in companies such as like Telefonica S.A. and Singapore Telecommunications Ltd. generally performed quite well. In the consumer segment, shares in Metro AG and InBev provided good returns.
The Fund’s holdings in the information technology sector did not keep pace with those in the Index. LM Ericsson in the communications equipment industry provided sub-par returns, as did the diversified technology company Samsung Electronics. Our position in Canon also limited overall portfolio results. The materials sector achieved very high returns; however, the portfolio was not sufficiently exposed in the group to keep up with the benchmark. The Fund’s holdings in the financial sector did not perform well, as bank and diversified financial services companies came under pressure due to the deterioration of credit markets around the world.
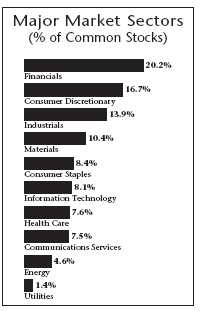
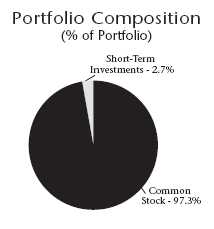
| | |
| Top 10 Countries | |
| (% of Portfolio) | |
| | |
| United Kingdom | 19.9% | |
| Japan | 17.3% | |
| Germany | 9.4% | |
| Switzerland | 8.0% | |
| France | 6.0% | |
| Spain | 5.8% | |
| Australia | 5.2% | |
| Canada | 4.4% | |
| Italy | 3.5% | |
| Singapore | 3.1% | |
| | |
| | |
| | |
| | |
| Investments in these countries represent 82.6% of the | |
| total investment portfolio. | | |
Quoted Fund performance is for Class A shares and does not reflect a sales charge.
The returns shown do not reflect taxes a shareholder would pay on distributions or redemptions.
Quoted Major Market Sectors, Portfolio Composition and Top 10 Countries are subject to change.
The lists of Major Market Sectors and Top 10 Countries exclude short-term investments and collateral held for securities loaned.
The Portfolio Composition chart excludes collateral held for securities loaned.
**Principal Global Investors, LLC replaced T. Rowe Price International, Inc. as one of the Fund’s subadvisers as of February 28, 2007.
32
What is your outlook?
As in the United States, large-capitalization stocks listed on non-U.S. stock exchanges appear to offer better relative values to investors than small- and mid-cap foreign stocks, as well as stocks in the emerging markets. While developing economies continue to enjoy relatively robust growth and strong financial positions, the major developed markets offer better valuations and greater diversification. In light of continued credit dislocations and moderating growth of consuming nations, developing economies face the risk of less demand for their exports, which has been a key growth driver in those markets.
| | | | | | |
| Portfolio Facts | |
| As of October 31, 2007 | |
| | A Share | | B Share | Institutional Share | |
| | ————————— | | ————————— | ————————— | |
| Ticker | AAITX | | BBITX | TISFX | |
| Transfer Agent ID | 023 | | 084 | 093 | |
| Net Assets | $382,101,413 | | $10,769,992 | $330,595,180 | |
| NAV | $15.90 | | $15.26 | $16.21 | |
| NAV — High† | 10/31/2007 — $15.90 | | 10/31/2007 — $15.26 | 10/31/2007 — $16.21 | |
| NAV — Low† | 11/1/2006 — $12.91 | | 11/1/2006 — $12.41 | 11/1/2006 — $13.16 | |
| Number of Holdings: 230 | † For the year ended October 31, 2007 | |
| | | | |
| Average Annual Total Returns2 | |
| As of October 31, 2007 | |
| | |
| | |
| | |
| Class A1 | 1-Year | 5 Years | 10 Years | |
| |
| without sales charge | 24.13% | 18.96% | 6.66% | |
| with sales charge | 17.33% | 17.62% | 6.06% | |
| | |
| Class B1 | 1-Year | 5 Years | 10 Years | |
| |
| without sales charge | 22.77% | 17.77% | 6.26% | |
| with sales charge | 18.77% | 17.77% | 6.26% | |
| | |
| Institutional Class1 | 1-Year | 5 Years | 10 Years | |
| |
| Net Asset Value | 24.84% | 19.90% | 7.40% | |
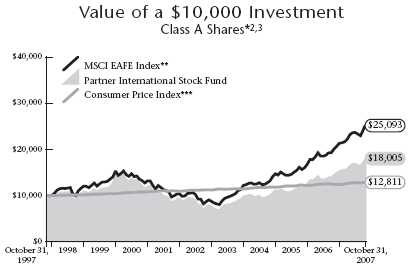
1 Class A performance reflects the maximum sales charge of 5.5% . Class B performance reflects the maximum deferred sales charge of 5%, declining 1% each year during the first five years and then converting to Class A shares after the fifth year. Institutional Class shares have no sales load and are for institutional shareholders only.
2 Past performance is not an indication of future results. Annualized total returns represent past performance and reflect changes in share prices, the reinvestment of all dividends and capital gains, and the effects of compounding. Investing in a mutual fund involves risks, including the possible loss of principal. The prospectus contains more complete information on the investment objectives, risks, charges and expenses of the investment company which investors should read and consider carefully before investing. To obtain a prospectus, contact a registered representative or visit www.thrivent.com. At various times, the Fund’s adviser waived its management fee and/or reimbursed Fund expenses. Had the adviser not done so, the Fund’s total returns would have been lower. The returns shown do not reflect taxes a shareholder wou ld pay on distributions or redemptions.
3 Performance of other classes will be greater or less than the line shown based on the differences in loads and fees paid by shareholders investing in the different classes.
* As you compare performance, please note that the Fund’s performance reflects the maximum 5.5% sales charge, while the MSCI EAFE Index and the Consumer Price Index do not reflect any such charges. If you were to purchase any of the above individual stocks or funds represented in the Index, any charges you would pay would reduce your total return as well.
** The MSCI EAFE Index is a stock index designed to measure the equity performance of developed countries outside of North America. It is not possible to invest directly in the Index. The performance of the Index does not reflect deductions for fees, expenses or taxes.
*** The Consumer Price Index is an inflationary indicator that measures the change in the cost of a fixed basket of products and services, including housing, electricity, food and transportation. It is not possible to invest directly in the Index.
33

How did the Fund perform during the 12-month period ended October 31, 2007?
Thrivent Large Cap Growth Fund earned a total return of 22.86% as compared to the median return of its peer group, the Lipper Large Cap Growth Funds category, of 21.46% . The Fund’s market benchmark, the Russell 1000 Growth Index, earned a total return of 19.23% .
What factors affected the Fund’s performance?
A solid overall equity environment propelled market returns for the year. Our portfolio produced superior returns to both our benchmark and peer group driven entirely by very broad-based superior stock selection. The one exception to this broad-based strength was the consumer-related segments, which experienced a slowdown tied to a weakening housing market and slower consumer spending.
Sector-based analyses indicate that numerous sectors provided relative outperformance versus the benchmark, including the energy, financials, healthcare, industrials, materials, technology and telecommunications sectors. The technology sector posted the strongest returns highlighted by overweighted positions in Apple, Research in Motion and Google. The energy sector again enjoyed a strong year with oil prices sending most stocks higher. Our overweighted position in stocks such as Schlumberger and Diamond Offshore drove excellent stock selection. Other notable individual stock contributors were Foster Wheeler and Percision Castparts in the industrials sector, Gilead Sciences and Express Scripts in the health care sector, and America Movil in telecommunication services.
The two sectors detracting the most from performance for the 12-month period were consumer discretionary and utilities. Despite our underweighted exposure to the underper-forming consumer discretionary group, negative stock selection was the greatest detractor to performance, highlighted by poor performance in Starbucks, Comcast, OfficeMax, Kohls and McGraw-Hill. We held no ownership in utilities stocks, which is our traditional stance as we look towards more growth-heavy industries; however, this sector saw well above average returns for the period and therefore impacted our relative performance.
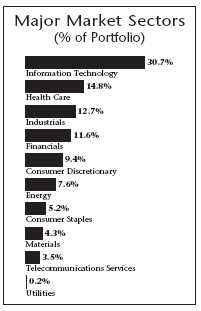
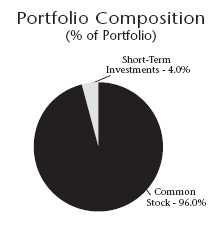
| | |
| Top 10 Holdings | |
| (% of Portfolio) | |
| | |
| Google, Inc. | 4.0% | |
| Cisco Systems, Inc. | 3.3% | |
| Apple Computer, Inc. | 3.2% | |
| Microsoft Corporation | 2.3% | |
| Monsanto Company | 1.8% | |
| Gilead Sciences, Inc. | 1.7% | |
| Schlumberger, Ltd. | 1.5% | |
| Goldman Sachs Group, Inc. | 1.5% | |
| Adobe Systems, Inc. | 1.4% | |
| CME Group, Inc. | 1.4% | |
| | |
| | |
| | |
| | |
| These common stocks represent 22.1% of the total | | |
| investment portfolio. | | |
Quoted Fund performance is for Class A shares and does not reflect a sales charge.
The returns shown do not reflect taxes a shareholder would pay on distributions or redemptions.
Quoted Major Market Sectors, Portfolio Composition and Top 10 Holdings are subject to change.
The lists of Major Market Sectors and Top 10 Holdings exclude short-term investments and collateral held for securities loaned.
The Portfolio Composition chart excludes collateral held for securities loaned.
34
What is your outlook?
A slowing economy and relatively attractive valuations for many large-cap growth companies should provide the opportunity for good performance for this asset class in the coming year. We are very concerned about the continued housing market weakness and the effects being felt in the financial markets and, therefore, have tilted our exposure away from the consumer sector and towards more attractive opportunities in sectors such as industrials, technology and telecommunications services.
| | | | | |
| Portfolio Facts | |
| As of October 31, 2007 | |
| | A Share | | B Share | Institutional Share | |
| | ————————— | | ————————— | ————————— | |
| Ticker | AAAGX | | BBAGX | THLCX | |
| Transfer Agent ID | 027 | | 077 | 060 | |
| Net Assets | $157,277,223 | | $8,899,632 | $418,288,979 | |
| NAV | $6.52 | | $6.06 | $6.93 | |
| NAV — High† | 10/31/2007 — $6.52 | | 10/31/2007 — $6.06 | 10/31/2007 — $6.93 | |
| NAV — Low† | 11/2/2006 — $5.25 | | 11/2/2006 — $4.91 | 11/2/2006 — $5.59 | |
| Number of Holdings: 174 | † For the year ended October 31, 2007 | |
| | | | |
| Average Annual Total Returns2 | |
| As of October 31, 2007 | |
| | |
| | | | From | |
| | | | Inception | |
| Class A1 | 1-Year | 5 Years | 10/29/1999 | |
| |
| without sales charge | 22.86% | 12.90% | (0.08%) | |
| with sales charge | 16.08% | 11.63% | (0.78%) | |
| | |
| | | | From | |
| | | | Inception | |
| Class B1 | 1-Year | 5 Years | 10/29/1999 | |
| |
| without sales charge | 21.93% | 11.84% | (0.59%) | |
| with sales charge | 17.93% | 11.84% | (0.59%) | |
| | |
| | | | From | |
| | | | Inception | |
| Institutional Class1 | 1-Year | 5 Years | 10/29/1999 | |
| |
| Net Asset Value | 23.45% | 13.83% | 0.82% | |
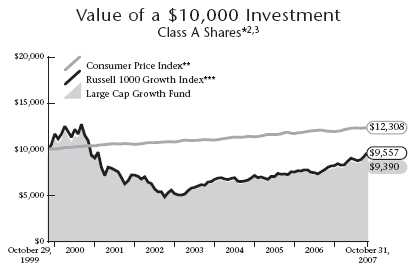
1 Class A performance reflects the maximum sales charge of 5.5% . Class B performance reflects the maximum deferred sales charge of 5%, declining 1% each year during the first five years and then converting to Class A shares after the fifth year. Institutional Class shares have no sales load and are for institutional shareholders only.
2 Past performance is not an indication of future results. Annualized total returns represent past performance and reflect changes in share prices, the reinvestment of all dividends and capital gains, and the effects of compounding. Investing in a mutual fund involves risks, including the possible loss of principal. The prospectus contains more complete information on the investment objectives, risks, charges and expenses of the investment company which investors should read and consider carefully before investing. To obtain a prospectus, contact a registered representative or visit www.thrivent.com. At various times, the Fund’s adviser waived its management fee and/or reimbursed Fund expenses. Had the adviser not done so, the Fund’s total returns would have been lower. The returns shown do not reflect taxes a shareholder wou ld pay on distributions or redemptions.
3 Performance of other classes will be greater or less than the line shown based on the differences in loads and fees paid by shareholders investing in the different classes.
* As you compare performance, please note that the Fund’s performance reflects the maximum 5.5% sales charge, while the Consumer Price Index and the Russell 1000 Growth Index do not reflect any such charges. If you were to purchase any of the above individual stocks or funds represented in the Index, any charges you would pay would reduce your total return as well.
** The Consumer Price Index is an inflationary indicator that measures the change in the cost of a fixed basket of products and services, including housing, electricity, food and transportation. It is not possible to invest directly in the Index.
*** The Russell 1000 Growth Index is an index comprised of those Russell 1000 Index companies with higher than average price-to-book ratios and higher forecasted growth values. It is not possible to invest directly in these Indexes. The performance of these Indexes does not reflect deductions for fees, expenses or taxes.
35

How did the Fund perform during the 12-month period ended October 31, 2007?
Thrivent Large Cap Value Fund provided a total return of 13.63% as compared to the median return for its peer group, the Lipper Large Cap Value category, of 12.18% . The Fund’s market benchmark, the Russell 1000 Value Index, had a total return of 10.83% .
What factors affected the Fund’s performance?
Sectors that helped performance during the period included financials, technology, industrials, consumer discretionary and telecommunications. An underweighted position in financials versus the Russell 1000 Value Index added to the relative performance. In the industrials sector, an overweighting versus the Index helped relative performance. In total, stock selection was the primary source of strong portfolio performance versus the Index.
Highlights in the financial sector included strong performance from positions in State Street Corporation, Bank of New York and Hudson City Bancorp. State Street Corporation and Bank of New York earn income from the custody and management of finan-cial assets globally. Business has exceeded expectations as global capital markets have been strong. Hudson City Bancorp was added later in the period as the stock price of this savings and loan was tarred with the same brush as more exotic mortgage lenders and, in our belief, created an attractive investment opportunity at an attractive price.
In the technology sector, overweighting the group and strong stock selection enhanced relative performance. Positions in International Business Machines, Hewlett Packard, Microsoft, and Intel all were meaningful contributors. All of these positions remain in the portfolio.
In the industrials sector, the position in Flowserve Corporation — pumps, valves and seals — was the largest contributor, appreciating considerably during the period. This position has recently been sold as its valuation appears to be somewhat ahead of business fundamentals.
Areas that limited relative performance included energy, materials and consumer staples. In energy, stock selection was strong but not good enough to overcome underweighting in the sector versus the benchmark. This was the strongest area of the market during the period. In materials, underweighting in the metals and mining industries capped performance. The portfolio remains underweighted in these highly cyclical areas as current operating performance does not appear to be sustainable and the stocks appear fully
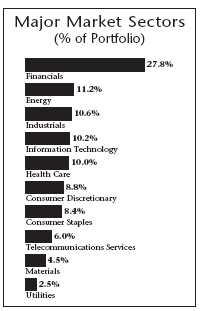
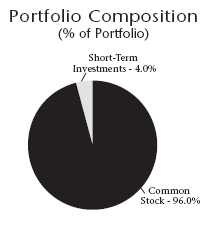
| | |
| Top 10 Holdings | |
| (% of Portfolio) | |
| | |
| Exxon Mobil Corporation | 3.4% | |
| J.P. Morgan Chase & Company | 2.9% | |
| Citigroup, Inc. | 2.8% | |
| AT&T, Inc. | 2.8% | |
| Verizon Communications, Inc. | 2.1% | |
| Pfizer, Inc. | 2.1% | |
| Bank of America Corporation | 2.0% | |
| Altria Group, Inc. | 1.9% | |
| American International Group, Inc. | 1.8% | |
| General Electric Company | 1.8% | |
| | |
| | |
| | |
| | |
| These common stocks represent 23.6% of the total | | |
| investment portfolio. | | |
Quoted Fund performance is for Class A shares and does not reflect a sales charge.
The returns shown do not reflect taxes a shareholder would pay on distributions or redemptions.
Quoted Major Market Sectors, Portfolio Composition and Top 10 Holdings are subject to change.
The lists of Major Market Sectors and Top 10 Holdings exclude short-term investments and collateral held for securities loaned.
The Portfolio Composition chart excludes collateral held for securities loaned.
36
valued. In the consumer staples sector, the position in WalMart hurt performance and has been sold as the company is not planning to cut back its store growth as much as we had expected. In addition, not owning Coca-Cola Co., which performed well in the year, restrained our relative performance. While Coca-Cola Co. is a fine company, it does not meet our parameters for valuation.
What is your outlook?
Our focus is on investing in good companies that are undervalued versus their long-term normal earnings power and growth potential. We are finding value in selected technology companies. Current weakness in the financial service sector and the consumer discretionary sector may soon provide some attractive investment opportunities.
| | | | | |
| Portfolio Facts | |
| As of October 31, 2007 | |
| | A Share | | B Share | Institutional Share | |
| | ————————— | | ————————— | ————————— | |
| Ticker | AAUTX | | BBEIX | TLVIX | |
| Transfer Agent ID | 022 | | 072 | 092 | |
| Net Assets | $336,944,824 | | $9,766,862 | $312,885,808 | |
| NAV | $17.92 | | $17.59 | $18.07 | |
| NAV — High† | 10/9/2007 — $18.15 | | 10/9/2007 — $17.83 | 10/9/2007 — $18.30 | |
| NAV — Low† | 3/5/2007 — $15.95 | | 3/5/2007 — $15.77 | 3/5/2007 — $16.03 | |
| Number of Holdings: 123 | † For the year ended October 31, 2007 | |
| | | | |
| Average Annual Total Returns2 | |
| As of October 31, 2007 | |
| | |
| | | | From | |
| | | | Inception | |
| Class A1 | 1-Year | 5 Years | 10/29/1999 | |
| |
| without sales charge | 13.63% | 14.84% | 4.99% | |
| with sales charge | 7.39% | 13.55% | 4.26% | |
| | |
| | | | From | |
| | | | Inception | |
| Class B1 | 1-Year | 5 Years | 10/29/1999 | |
| |
| without sales charge | 12.37% | 13.67% | 4.48% | |
| with sales charge | 8.37% | 13.67% | 4.48% | |
| | |
| | | | From | |
| | | | Inception | |
| Institutional Class1 | 1-Year | 5 Years | 10/29/1999 | |
| |
| Net Asset Value | 14.19% | 15.57% | 5.71% | |

1 Class A performance reflects the maximum sales charge of 5.5% . Class B performance reflects the maximum deferred sales charge of 5%, declining 1% each year during the first five years and then converting to Class A shares after the fifth year. Institutional Class shares have no sales load and are for institutional shareholders only.
2 Past performance is not an indication of future results. Annualized total returns represent past performance and reflect changes in share prices, the reinvestment of all dividends and capital gains, and the effects of compounding. Investing in a mutual fund involves risks, including the possible loss of principal. The prospectus contains more complete information on the investment objectives, risks, charges and expenses of the investment company which investors should read and consider carefully before investing. To obtain a prospectus, contact a registered representative or visit www.thrivent.com. At various times, the Fund’s adviser waived its management fee and/or reimbursed Fund expenses. Had the adviser not done so, the Fund’s total returns would have been lower. The returns shown do not reflect taxes a shareholder wou ld pay on distributions or redemptions.
3 Performance of other classes will be greater or less than the line shown based on the differences in loads and fees paid by shareholders investing in the different classes.
* As you compare performance, please note that the Fund’s performance reflects the maximum 5.5% sales charge, while the Russell 1000 Value Index and the Consumer Price Index do not reflect any such charges. If you were to purchase any of the above individual stocks or funds represented in the Index, any charges you would pay would reduce your total return as well.
** The Russell 1000 Value Index is an index comprised of companies with lower price-to-book ratios and lower forecasted growth rates within the Russell 1000 Index. It is not possible to invest directly in these Indexes. The performance of these Indexes does not reflect deductions for fees, expenses or taxes.
*** The Consumer Price Index is an inflationary indicator that measures the change in the cost of a fixed basket of products and services, including housing, electricity, food and transportation. It is not possible to invest directly in the Index.
37

How did the Fund perform during the 12-month period ended October 31, 2007?
Thrivent Large Cap Stock Fund earned a total return of 15.29% as compared to the median return of its peer group, the Lipper Large Cap Core category, of 14.13% . The Fund’s benchmark, the S&P 500 Index, earned a total return of 14.55% .
What factors affected the Fund’s performance?
Both stock selection and sector allocations were factors in the portfolio achieving returns superior to both the benchmark and the competitive universe. Stock selection and an underweighted position in the poorly performing financial sector were important factors aiding results. Financial stocks came under substantial pressure late in the period as credit concerns related to the deteriorating housing market became more pronounced. The Fund’s holding in Hudson City Bancorp Inc. and CME Group Inc. performed much better than other stocks in the category. Holdings in the insurance industry also performed well within the financial sector. Stock selection within both the industrial and materials segments added value during the period. Continued strong demand from emerging economies kept commodity prices an d foreign sales of industrial companies with multi-national sales exposure (such as Flowserve) strong. Deere and Co. benefited from a solid farm economy in the United States.
In the aerospace industry, the Fund was lifted by its position in Precision Castparts Inc., a beneficiary of continued strong spending on new airliners. Energy holdings also added to returns as high prices for oil provided support for increased spending on exploration and production. Schlumberger Inc. was a significant beneficiary of those activities.
Modest exposure to home builders impaired returns as those stocks performed poorly in the period. The Fund also had a position in Comcast that did not keep up with the broad advance in stocks this fiscal year. Stocks exposed to discretionary consumer spending generally were under pressure during the period as high energy prices, a slowing economy
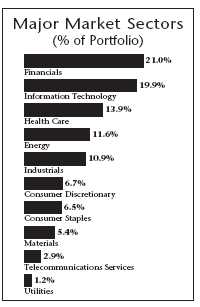
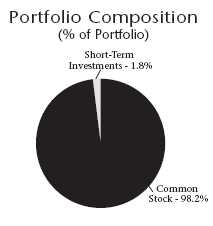
| | |
| Top 10 Holdings | |
| (% of Portfolio) | |
| | |
| Exxon Mobil Corporation | 3.6% | |
| Microsoft Corporation | 2.6% | |
| Google, Inc. | 2.0% | |
| J.P. Morgan Chase & Company | 1.9% | |
| General Electric Company | 1.8% | |
| International Business Machines | | |
| Corporation | 1.8% | |
| Cisco Systems, Inc. | 1.7% | |
| Hewlett-Packard Company | 1.7% | |
| Abbott Laboratories | 1.7% | |
| Bank of America Corporation | 1.7% | |
| | |
| | |
| | |
| These common stocks represent 20.5% of the total | | |
| investment portfolio. | | |
Quoted Fund performance is for Class A shares and does not reflect a sales charge.
The returns shown do not reflect taxes a shareholder would pay on distributions or redemptions.
Quoted Major Market Sectors, Portfolio Composition and Top 10 Holdings are subject to change.
The lists of Major Market Sectors and Top 10 Holdings exclude short-term investments and collateral held for securities loaned.
The Portfolio Composition chart excludes collateral held for securities loaned.
38
and tighter credit caused investors to become more concerned about the consumer’s ability to sustain spending. Modest cash positions over the year also had a small limiting impact on returns when compared to the S&P 500 Index.
What is your outlook?
While there are increasing economic and credit risks becoming apparent, it appears, at this point, that the economy is suf-ficiently resilient to sustain growth, albeit at a more moderate rate in the next few quarters. Growth in emerging economies like China and India remains strong and provides some cushion for the slowdown in U.S. growth and an opportunity for U.S. companies to increase export sales. That said, with many of those economies dependent on exports to sustain growth, it’s uncertain to what extent slower growth in the developed world could affect growth in the developing world. Large-cap stocks tend to have sufficient sales diversification and financial stability to navigate a slowdown in domestic growth, while mid- and small-cap stocks tend to have a higher dependence on U.S. growth. The recent period was the first in many years in which large-cap companies provided a higher return than small caps. We think this environme nt may be sustained for a period of time.
| | | | | |
| Portfolio Facts | |
| As of October 31, 2007 | |
| | A Share | | B Share | Institutional Share | |
| | ————————— | | ————————— | ————————— | |
| Ticker | AALGX | | BBLGX | IILGX | |
| Transfer Agent ID | 017 | | 067 | 090 | |
| Net Assets | $3,028,996,060 | | $45,390,368 | $369,326,814 | |
| NAV | $31.33 | | $28.81 | $31.59 | |
| NAV — High† | 10/9/2007 — $31.47 | | 10/9/2007 — $28.95 | 10/9/2007 — $31.72 | |
| NAV — Low† | 3/5/2007 — $27.19 | | 3/5/2007 — $25.15 | 3/5/2007 — $27.34 | |
| Number of Holdings: 157 | † For the year ended October 31, 2007 | |
| | | | |
| Average Annual Total Returns2 | |
| As of October 31, 2007 | |
| | |
| Class A1 | 1-Year | 5 Years | 10 Years | |
| |
| without sales charge | 15.29% | 11.20% | 6.74% | |
| with sales charge | 8.93% | 9.95% | 6.14% | |
| | |
| Class B1 | 1-Year | 5 Years | 10 Years | |
| |
| without sales charge | 14.23% | 10.10% | 6.20% | |
| with sales charge | 10.23% | 10.10% | 6.20% | |
| | |
| | | | From | |
| | | | Inception | |
| Institutional Class1 | 1-Year | 5 Years | 12/29/1997 | |
| |
| Net Asset Value | 15.78% | 11.70% | 6.69% | |
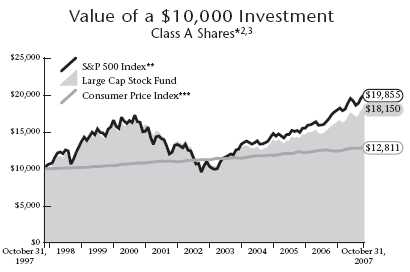
1 Class A performance reflects the maximum sales charge of 5.5% . Class B performance reflects the maximum deferred sales charge of 5%, declining 1% each year during the first five years and then converting to Class A shares after the fifth year. Institutional Class shares have no sales load and are for institutional shareholders only.
2 Past performance is not an indication of future results. Annualized total returns represent past performance and reflect changes in share prices, the reinvestment of all dividends and capital gains, and the effects of compounding. Investing in a mutual fund involves risks, including the possible loss of principal. The prospectus contains more complete information on the investment objectives, risks, charges and expenses of the investment company which investors should read and consider carefully before investing. To obtain a prospectus, contact a registered representative or visit www.thrivent.com. At various times, the Fund’s adviser waived its management fee and/or reimbursed Fund expenses. Had the adviser not done so, the Fund’s total returns would have been lower. The returns shown do not reflect taxes a shareholder wou ld pay on distributions or redemptions.
3 Performance of other classes will be greater or less than the line shown based on the differences in loads and fees paid by shareholders investing in the different classes.
* As you compare performance, please note that the Fund’s performance reflects the maximum 5.5% sales charge, while the S&P 500 Index and the Consumer Price Index do not reflect any such charges. If you were to purchase any of the above individual stocks or funds represented in the Index, any charges you would pay would reduce your total return as well.
** The S&P 500 Index is an index that represents the average performance of a group of 500 widely held, publicly traded stocks. It is not possible to invest directly in the Index. The performance of the Index does not reflect deductions for fees, expenses or taxes.
*** The Consumer Price Index is an inflationary indicator that measures the change in the cost of a fixed basket of products and services, including housing, electricity, food and transportation. It is not possible to invest directly in the Index.
39

How did the Fund perform during the 12-month period ended October 31, 2007?
Thrivent Large Cap Index Fund earned a total return of 13.90% as compared to the median return of its peer group, the S&P 500 Index Objective Funds category, of 14.05% . The Fund’s market benchmark, the S&P 500 Index, earned a total return of 14.55% .
What factors affected the Fund’s performance?
The Fund’s holdings are aligned with those of the S&P 500 Index. As typically occurs in an index fund, the difference in performance between the benchmark index and the Fund itself can largely be attributed to expenses and minor differences in portfolio composition.
Energy, materials, and information technology were the best performing groups in the market over the past year. Energy and materials clearly benefited from the run-up in commodities prices this past year. Large-cap stocks outperformed small-cap stocks and underperformed mid-cap stocks over the past year. On the other side of the coin, consumer discretionary and financials delivered negative returns for the 12-month period. Both of these sectors were negatively impacted by the lack of liquidity due to the uncertainties in sub-prime mortgages.
What is your outlook?
Large-cap stocks have now outperformed small-cap stocks for the first time in quite a few years. As mentioned in the last report six months ago, there were signs that a transition could be underway. Profits remain strong for most companies and typically, as an economic cycle matures, large-cap stocks tend to gain strength relative to the rest of the market. Investors seemed to become more risk-averse, and appeared to shift money toward more recognizable blue chip companies that presumably would provide more of a safe haven for their portfolios.
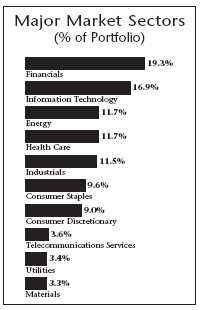
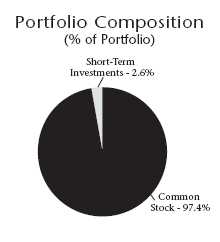
| | |
| Top 10 Holdings | |
| (% of Portfolio) | |
| | |
| Exxon Mobil Corporation | 3.7% | |
| General Electric Company | 3.1% | |
| Microsoft Corporation | 2.2% | |
| AT&T, Inc. | 1.9% | |
| Procter & Gamble Company | 1.6% | |
| Bank of America Corporation | 1.6% | |
| Citigroup, Inc. | 1.5% | |
| Cisco Systems, Inc. | 1.5% | |
| Chevron Corporation | 1.4% | |
| Johnson & Johnson | 1.4% | |
| | |
| | |
| | |
| | |
| These common stocks represent 19.9% of the total | | |
| investment portfolio. | | |
Quoted Fund performance is for Class A shares and does not reflect a sales charge.
The returns shown do not reflect taxes a shareholder would pay on distributions or redemptions.
Quoted Major Market Sectors, Portfolio Composition and Top 10 Holdings are subject to change.
The lists of Major Market Sectors and Top 10 Holdings exclude short-term investments and collateral held for securities loaned.
The Portfolio Composition chart excludes collateral held for securities loaned.
40
It appears that the largest 100 companies may be best positioned from a valuation perspective. In an environment where investors are faced with greater uncertainty about the direction of interest rates and the strength of the domestic economy, large stocks may offer a relatively safe haven in the equity markets. While we can anticipate continued volatility in the equity markets, the stocks represented in this index continue to offer a generally positive outlook, particularly in relation to small- and mid-cap stocks.
| | | |
| | |
| | Portfolio Facts | |
| | As of October 31, 2007 | |
| | A Share | |
| | ————————— | |
| Ticker | AALCX | |
| Transfer Agent ID | 031 | |
| Net Assets | $93,634,455 | |
| NAV | $10.70 | |
| NAV — High† | 10/9/2007 — $10.81 | |
| NAV — Low† | 3/5/2007 — $9.42 | |
| Number of Holdings: 503 | | † For the year ended October 31, 2007 |
| | | | |
| Average Annual Total Returns2 | |
| As of October 31, 2007 | |
| | |
| | | | From | |
| | | | Inception | |
| Class A1 | 1-Year | 5 Years | 7/1/2000 | |
| |
| without sales charge | 13.90% | 13.24% | 1.68% | |
| with sales charge | 7.68% | 11.97% | 0.90% | |
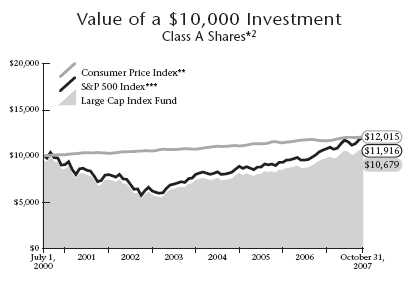
1 Class A performance reflects the maximum sales charge of 5.5% .
2 Past performance is not an indication of future results. Annualized total returns represent past performance and reflect changes in share prices, the reinvestment of all dividends and capital gains, and the effects of compounding. Investing in a mutual fund involves risks, including the possible loss of principal. The prospectus contains more complete information on the investment objectives, risks, charges and expenses of the investment company which investors should read and consider carefully before investing. To obtain a prospectus, contact a registered representative or visit www.thrivent.com. At various times, the Fund’s adviser waived its management fee and/or reimbursed Fund expenses. Had the adviser not done so, the Fund’s total returns would have been lower. The returns shown do not reflect taxes a shareholder wou ld pay on distributions or redemptions.
* As you compare performance, please note that the Fund’s performance reflects the maximum 5.5% sales charge, while the Consumer Price Index and the S&P 500 Index do not reflect any such charges. If you were to purchase any of the above individual stocks or funds represented in the Index, any charges you would pay would reduce your total return as well.
** The Consumer Price Index is an inflationary indicator that measures the change in the cost of a fixed basket of products and services, including housing, electricity, food and transportation. It is not possible to invest directly in the Index.
*** The S&P 500 Index is an index that represents the average performance of a group of 500 widely held, publicly traded stocks. “S&P 500®” is a trademark of The McGraw-Hill Companies, Inc. and has been licensed for use by Thrivent Financial for Lutherans. The product is not sponsored, endorsed or promoted by Standard & Poor’s and Standard & Poor’s makes no representation regarding the advisability of investing in the product. Index funds are subject to the same market risks associated with the stocks in their respective indexes. It is not possible to invest directly in the Index. The performance of the Index does not reflect deductions for fees, expenses or taxes.
41

How did the Fund perform during the 12-month period ended October 31, 2007?
Thrivent Large Cap Index Fund-I earned a total return of 14.27% as compared to the median return of its peer group, the S&P 500 Index Objective Funds category, of 14.05% . The Fund’s market benchmark, the S&P 500 Index, earned a total return of 14.55% .
What factors affected the Fund’s performance?
The Fund’s holdings are aligned with those of the S&P 500 Index. As typically occurs in an index fund, the difference in performance between the benchmark index and the Fund itself can largely be attributed to expenses and minor differences in portfolio composition.
Energy, materials, and information technology were the best performing groups in the market over the past year. Energy and materials clearly benefited from the run-up in commodities prices this past year. Large-cap stocks outperformed small-cap stocks and underperformed mid-cap stocks over the past year. On the other side of the coin, consumer discretionary and financials delivered negative returns for the 12-month period. Both of these sectors were negatively impacted by the lack of liquidity due to the uncertainties in sub-prime mortgages.
What is your outlook?
Large-cap stocks have now outperformed small-cap stocks for the first time in quite a few years. As mentioned in the last report six months ago, there were signs that a transition could be underway. Profits remain strong for most companies and typically, as an economic cycle matures, large-cap stocks tend to gain strength relative to the rest of the market. Investors seemed to become more risk-averse, and appeared to shift money toward more recognizable blue chip companies that presumably would provide more of a safe haven for their portfolios.
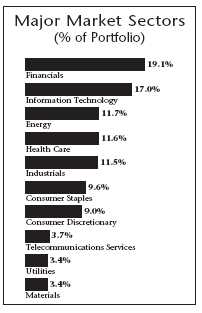
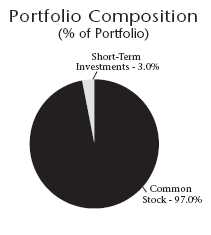
| | |
| Top 10 Holdings | |
| (% of Portfolio) | |
| | |
| Exxon Mobil Corporation | 3.7% | |
| General Electric Company | 3.1% | |
| Microsoft Corporation | 2.2% | |
| AT&T, Inc. | 1.9% | |
| Procter & Gamble Company | 1.6% | |
| Bank of America Corporation | 1.6% | |
| Citigroup, Inc. | 1.5% | |
| Cisco Systems, Inc. | 1.5% | |
| Chevron Corporation | 1.4% | |
| Johnson & Johnson | 1.4% | |
| | |
| | |
| | |
| | |
| These common stocks represent 19.9% of the total | | |
| investment portfolio. | | |
The returns shown do not reflect taxes a shareholder would pay on distributions or redemptions.
Quoted Major Market Sectors, Portfolio Composition and Top 10 Holdings are subject to change.
The lists of Major Market Sectors and Top 10 Holdings exclude short-term investments and collateral held for securities loaned.
The Portfolio Composition chart excludes collateral held for securities loaned.
42
It appears that the largest 100 companies may be best positioned from a valuation perspective. In an environment where investors are faced with greater uncertainty about the direction of interest rates and the strength of the domestic economy, large stocks may offer a relatively safe haven in the equity markets. While we can anticipate continued volatility in the equity markets, the stocks represented in this index continue to offer a generally positive outlook, particularly in relation to small- and mid-cap stocks.
| | | |
| | |
| | Portfolio Facts | |
| | As of October 31, 2007 | |
| | Institutional Share | |
| | ————————— | |
| Ticker | IILCX | |
| Transfer Agent ID | 096 | |
| Net Assets | $35,001,552 | |
| NAV | $10.66 | |
| NAV — High† | 10/9/2007 — $10.76 | |
| NAV — Low† | 3/5/2007 — $9.36 | |
| Number of Holdings: 503 | | † For the year ended October 31, 2007 |
| | | | |
| Average Annual Total Returns2 | |
| As of October 31, 2007 | |
| | |
| | | | From | |
| | | | Inception | |
| Institutional Class1 | 1-Year | 5 Years | 12/31/1999 | |
| |
| Net Asset Value | 14.27% | 13.35% | 1.99% | |
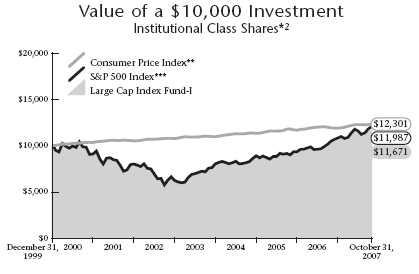
1 Institutional Class shares have no sales load and are for institutional shareholders only.
2 Past performance is not an indication of future results. Annualized total returns represent past performance and reflect changes in share prices, the reinvestment of all dividends and capital gains, and the effects of compounding. Investing in a mutual fund involves risks, including the possible loss of principal. The prospectus contains more complete information on the investment objectives, risks, charges and expenses of the investment company which investors should read and consider carefully before investing. To obtain a prospectus, contact a registered representative or visit www.thrivent.com. At various times, the Fund’s adviser waived its management fee and/or reimbursed Fund expenses. Had the adviser not done so, the Fund’s total returns would have been lower. The returns shown do not reflect taxes a shareholder wou ld pay on distributions or redemptions.
* As you compare performance, please note that the Fund’s performance reflects Fund expenses, net of any reimbursements, while the Consumer Price Index and the S&P 500 Index do not reflect such charges. If you were to purchase any of the above individual stocks or funds represented in the Index, any charges you would pay would reduce your total return as well.
** The Consumer Price Index is an inflationary indicator that measures the change in the cost of a fixed basket of products and services, including housing, electricity, food and transportation. It is not possible to invest directly in the Index.
*** The S&P 500 Index is an index that represents the average performance of a group of 500 large-capitalization stocks. “S&P 500®” is a trademark of The McGraw-Hill Companies, Inc. and has been licensed for use by Thrivent Financial for Lutherans. The product is not sponsored, endorsed or promoted by Standard & Poor’s and Standard & Poor’s makes no representation regarding the advisability of investing in the product. Index funds are subject to the same market risks associated with the stocks in their respective indexes. It is not possible to invest directly in the Index. The performance of the Index does not reflect deductions for fees, expenses or taxes.
43

How did the Fund perform during the 12-month period ended October 31, 2007?
Thrivent Balanced Fund earned a total return of 12.39% as compared to the median return of its peer group, the Lipper Mixed-Asset Target Allocation Growth Funds category, of 13.24% . The Fund’s market benchmarks, the S&P Super-composite 1500 Index and the Lehman Brothers Aggregate Bond Index, returned 14.72% and 5.38%, respectively.
What factors affected the Fund’s performance?
The equity component of the Balanced Fund generated an 18.9% return during the period. Sectors contributing to relative performance included information technology, health care, industrials, consumer staples, materials, utilities, and telecom services. Sectors where asset selection detracted from relative performance were energy, consumer discretionary and financials.
The outperformance in information technology was primarily due to the Fund’s continued aggressive positioning in hardware manufacturers Apple and EMC; and service providers aQuantive and VeriFone. Within health care, we saw significant outperformance generated by medical device positions including NuVasive, Hologic, Conor Medsystems and Kyphon.
Moderate underperformance in the energy sector was attributable to our bearish positioning on the oil services. Our absence from outperforming names Schlumberger and National Oilwell Varco negatively impacted relative performance. Finally, within consumer discretionary, media and retailing were also areas of underperformance.
The fixed-income component of the Fund underperformed the Lehman Brothers Aggregate Bond Index due to two main factors: About 60% of it was due to our holdings in corporate bonds and 40% was due to the floating-rate debt that backs our mortgage securities.
We held an overweighted position in corporate bonds, which were negatively affected by the liquidity crunch that occurred in August. Within our corporate bond holdings, our overweighted position in the finance sector detracted from relative performance. Two of the finance securities we own, Residential Capital (ResCap) and Countrywide Financial, were hit particularly hard.
We used floating-rate debt to back our purchase of Fannie Mae and Freddie Mac mortgage securities through what is called the “dollar-roll” program. While this typically low-risk practice has generated additional yield for the
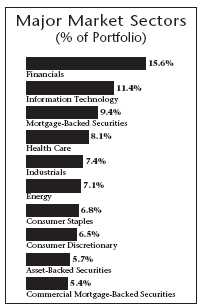
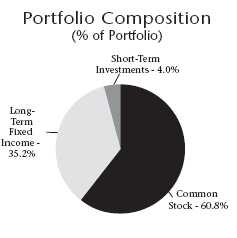
| | |
| Top 10 Holdings | |
| (% of Portfolio) | |
| | |
| Federal National Mortgage Association | | |
| Conventional 30-Yr. Pass Through | 4.3% | |
| Federal National Mortgage Association | | |
| Conventional 30-Yr. Pass Through | 3.6% | |
| U.S. Treasury Notes | 2.1% | |
| Exxon Mobil Corporation | 2.1% | |
| Federal National Mortgage Association | | |
| Conventional 30-Yr. Pass Through | 1.5% | |
| Apple Computer, Inc. | 1.4% | |
| U.S. Treasury Notes, TIPS | 1.3% | |
| J.P. Morgan Chase & Company | 1.2% | |
| Cisco Systems, Inc. | 1.0% | |
| Total SA ADR | 1.0% | |
| These common stocks and long-term fixed | | |
| income securities represent 19.5% of the total | | |
| investment portfolio. | | |
Quoted Fund performance is for Class A shares and does not reflect a sales charge.
The returns shown do not reflect taxes a shareholder would pay on distributions or redemptions.
Quoted Major Market Sectors, Portfolio Composition and Top 10 Holdings are subject to change.
Major Market Sectors represent long-term non-government holdings.
The list of Top 10 Holdings excludes short-term investments and collateral held for securities loaned.
The Portfolio Composition chart excludes collateral held for securities loaned.
44
Fund for many years, our floating-rate securities — backed by higher-quality credit card, auto and other loans — were affected by sub-prime mortgage-related troubles and lost value.
What is your outlook?
We believe that 2008 will be characterized by moderating economic growth catalyzed by further housing market weakness and related softening consumer spending trends; declining interest rates; a weaker dollar; and continued growth in global liquidity.
Within the equity component, we expect to de-emphasize companies with primarily domestic consumer exposure in favor of companies leveraged to global infrastructure development, or with franchises capable of exploiting the emerging consumer markets in Europe, the Middle East and Africa (EMEA) and Asia. The ongoing dislocations in the finance markets should create value opportunities, especially among the financials, that we’ll seek to identify as market conditions stabilize later in 2008.
Within the fixed-income component, we will maintain our current posture — not adding risk but not selling adversely affected securities while market prices are down due to investor fears. We believe that our corporate and floating-rate securities are solid long-term investments and that their value will rebound once the market calms down.
| | | | | | |
| Portfolio Facts | |
| As of October 31, 2007 | |
| | A Share | | B Share | Institutional Share | |
| | ————————— | | ————————— | ————————— | |
| Ticker | AABFX | | BBBFX | IBBFX | |
| Transfer Agent ID | 026 | | 085 | 056 | |
| Net Assets | $236,988,711 | | $7,579,519 | $83,789,269 | |
| NAV | $13.64 | | $13.58 | $13.63 | |
| NAV — High† | 10/12/2007 — $13.68 | | 10/12/2007 — $13.63 | 10/12/2007 — $13.66 | |
| NAV — Low† | 3/5/2007 — $12.37 | | 3/5/2007 — $12.30 | 3/5/2007 — $12.36 | |
| Number of Holdings: 463 | † For the year ended October 31, 2007 | |
| | | | |
| Average Annual Total Returns2 | |
| As of October 31, 2007 | |
| | |
| | | | From | |
| | | | Inception | |
| Class A1 | 1-Year | 5 Years | 12/29/1997 | |
| |
| without sales charge | 12.39% | 9.23% | 6.23% | |
| with sales charge | 6.23% | 8.00% | 5.62% | |
| | |
| | | | From | |
| | | | Inception | |
| Class B1 | 1-Year | 5 Years | 12/29/1997 | |
| |
| without sales charge | 11.31% | 8.21% | 5.75% | |
| with sales charge | 7.31% | 8.21% | 5.75% | |
| | |
| | | | From | |
| | | | Inception | |
| Institutional Class1 | 1-Year | 5 Years | 12/29/1997 | |
| |
| Net Asset Value | 13.00% | 9.76% | 6.65% | |

1 Class A performance reflects the maximum sales charge of 5.5% . Class B performance reflects the maximum deferred sales charge of 5%, declining 1% each year during the first five years and then converting to Class A shares after the fifth year. Institutional Class shares have no sales load and are for institutional shareholders only.
2 Past performance is not an indication of future results. Annualized total returns represent past performance and reflect changes in share prices, the reinvestment of all dividends and capital gains, and the effects of compounding. Investing in a mutual fund involves risks, including the possible loss of principal. The prospectus contains more complete information on the investment objectives, risks, charges and expenses of the investment company which investors should read and consider carefully before investing. To obtain a prospectus, contact a registered representative or visit www.thrivent.com. At various times, the Fund’s adviser waived its management fee and/or reimbursed Fund expenses. Had the adviser not done so, the Fund’s total returns would have been lower. The returns shown do not reflect taxes a shareholder wou ld pay on distributions or redemptions.
3 Performance of other classes will be greater or less than the line shown based on the differences in loads and fees paid by shareholders investing in the different classes.
* As you compare performance, please note that the Fund’s performance reflects the maximum 5.5% sales charge, while the Lehman Brothers Aggregate Bond Index, the S&P Supercomposite 1500 Index and the Consumer Price Index do not reflect any such charges. If you were to purchase any of the above individual stocks or funds represented in these Indexes, any charges you would pay would reduce your total return as well.
** The S&P Supercomposite 1500 Index is an index that represents the performance of a group of 1500 publicly traded stocks. It is not possible to invest directly in the Index. The performance of the Index does not reflect deductions for fees, expenses or taxes.
*** The Lehman Brothers Aggregate Bond Index is an index that measures the performance of U.S. investment grade bonds. It is not possible to invest directly in the Index. The performance of the Index does not reflect deductions for fees, expenses or taxes.
**** The Consumer Price Index is an inflationary indicator that measures the change in the cost of a fixed basket of products and services, including housing, electricity, food and transportation. It is not possible to invest directly in the Index.
45

How did the Fund perform during the 12-month period ended October 31, 2007?
Thrivent High Yield Fund returned 6.72% during the period, outpacing the median return of 6.42% for its Lipper U.S. High Current Yield Funds peer group. During the same period, the Fund’s market benchmark, the Lehman Brothers U.S. Corporate High Yield Bond Index, posted a return of 6.73% .
What factors affected the Fund’s performance?
The reporting period was characterized by two different types of markets. From November 2006 through May 2007, the high-yield bond market was strong. Continued economic growth, a sustained appetite for risk among investors, and low default rates helped fuel investors’ quest for yield, thereby propelling the lowest-quality high-yield bonds to outperform. During these months, our underweighted position in the lowest-rated high-yield credits — CCC-rated and distressed/defaulted credits — held back the Fund’s returns relative to the Index.
After May, the high-yield bond market sold off, largely due to investor fears about growing troubles in the sub-prime and other credit markets. The yield premium or “spread” high-yield bonds offered over that of Treasury securities jumped from 2.90% to 4.60%, with a simultaneous drop in their prices. Our Fund, with its emphasis on higher quality bonds and essentially no exposure to issuers in the troubled financial sector, outperformed its peer group during these months and for the entire reporting period.
Other factors that enhanced our performance relative to our peer group included our overweighted positions in the metals and mining and packaging sectors. In addition, good credit selection within these industries helped the Fund’s holdings outperform each sector’s average return during the period. Some of the securities that boosted our performance included FMG Mining, Freeport-McMoRan and Crown Cork & Seal. Our added exposure to the health care and gaming sectors also boosted our performance. Other positive factors were the sale of most of our holdings in home builders and building materials suppliers and an underweighted position in this sector as the issues with this sector accelerated.
Detracting from the Fund’s performance was our exposure to retail industry bonds. Our underweighted position in autos also hurt the Fund’s results, as this sector did well
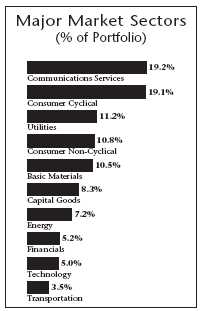
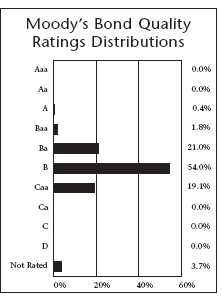
| | |
| Top 10 Holdings by Issuer | |
| (% of Portfolio) | |
| | |
| R.H. Donnelley Corporation | 1.9% | |
| AES Corporation | 1.8% | |
| HCA, Inc. | 1.6% | |
| NRG Energy, Inc. | 1.4% | |
| Edison Mission Energy | 1.3% | |
| First Data Corporation | 1.3% | |
| Ford Motor Credit Company | 1.3% | |
| General Motors Acceptance Corporation | 1.2% | |
| Dynegy Holdings, Inc. | 1.1% | |
| Lyondell Chemical Company | 1.0% | |
| | |
| | |
| | |
| | |
| These long-term fixed income securities represent 13.9% of | |
| the total investment portfolio. | | |
Quoted Fund performance is for Class A shares and does not reflect a sales charge.
The returns shown do not reflect taxes a shareholder would pay on distributions or redemptions.
Quoted Major Market Sectors, Moody’s Bond Quality Ratings Distributions and Top 10 Holdings by Issuer are subject to change.
The lists of Major Market Sectors and Top 10 Holdings by Issuer exclude short-term investments and collateral held for securities loaned.
46
throughout the reporting period. Further, our performance was diminished by holding a number of recently issued highly levered LBO bonds, such as Reader’s Digest and Univision, which sold off during this risk-averse period.
What is your outlook?
Our outlook for high-yield bonds is cautious and will remain so until it becomes clearer how the economy will perform going into 2008. We are concerned about the ongoing troubles in the housing and credit markets, and for that reason, we’ll keep a defensive stance.
However, with high-yield bond yield spreads at 4.60% over Treasury securities, and considering the sector’s continued low default rate, the market appears fairly to attractively valued. In addition, the current market fear and volatility has provided opportunities to buy bonds at attractive prices. Although we are in a defensive mode, we will take advantage of any opportunities to add value to the Fund and enhance shareholder return.
| | | | | |
| Portfolio Facts | |
| As of October 31, 2007 | |
| | A Share | | B Share | Institutional Share | |
| | ————————— | | ————————— | ————————— | |
| Ticker | LBHYX | | LUHBX | LBHIX | |
| Transfer Agent ID | 73 | | 373 | 473 | |
| Net Assets | $486,165,052 | | $9,927,898 | $62,118,057 | |
| NAV | $5.03 | | $5.03 | $5.04 | |
| NAV — High† | 5/22/2007 — $5.23 | | 5/22/2007 — $5.23 | 5/22/2007 — $5.23 | |
| NAV — Low† | 7/27/2007 — $4.86 | | 7/27/2007 — $4.86 | 7/27/2007 — $4.87 | |
| Number of Holdings: 234 | † For the year ended October 31, 2007 | |
| | | | |
| Average Annual Total Returns2 | |
| As of October 31, 2007 | |
| | |
| | |
| | |
| Class A1 | 1-Year | 5 Years | 10 Years | |
| |
| without sales charge | 6.72% | 11.79% | 2.99% | |
| with sales charge | 1.90% | 10.76% | 2.51% | |
| | |
| Class B1 | 1-Year | 5 Years | 10 Years | |
| |
| without sales charge | 5.79% | 10.87% | 2.60% | |
| with sales charge | 1.83% | 10.87% | 2.60% | |
| | |
| Institutional Class1 | 1-Year | 5 Years | 10 Years | |
| |
| Net Asset Value | 7.16% | 12.30% | 3.37% | |
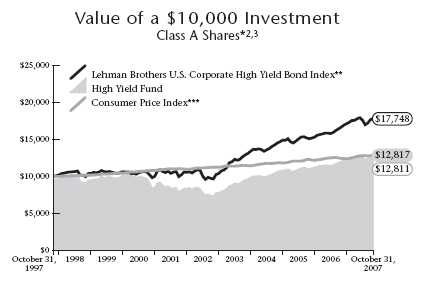
1 Class A performance reflects the maximum sales charge of 4.5% . Class B performance reflects the maximum deferred sales charge of 5%, declining 1% each year during the first five years and then converting to Class A shares after the fifth year. Institutional Class shares have no sales load and are for institutional shareholders only.
2 Past performance is not an indication of future results. Annualized total returns represent past performance and reflect changes in share prices, the reinvestment of all dividends and capital gains, and the effects of compounding. Investing in a mutual fund involves risks, including the possible loss of principal. The prospectus contains more complete information on the investment objectives, risks, charges and expenses of the investment company which investors should read and consider carefully before investing. To obtain a prospectus, contact a registered representative or visit www.thrivent.com. At various times, the Fund’s adviser waived its management fee and/or reimbursed Fund expenses. Had the adviser not done so, the Fund’s total returns would have been lower. The returns shown do not reflect taxes a shareholder wou ld pay on distributions or redemptions.
3 Performance of other classes will be greater or less than the line shown based on the differences in loads and fees paid by shareholders investing in the different classes.
* As you compare performance, please note that the Fund’s performance reflects the maximum 4.5% sales charge, while the Lehman Brothers U.S. Corporate High Yield Bond Index and the Consumer Price Index do not reflect any such charges. If you were to purchase any of the above individual stocks or funds represented in the Index, any charges you would pay would reduce your total return as well.
** The Lehman Brothers U.S. Corporate High Yield Bond Index is an index which measures the performance of fixed-rate non-investment grade bonds. It is not possible to invest directly in the Index. The performance of the Index does not reflect deductions for fees, expenses or taxes.
*** The Consumer Price Index is an inflationary indicator that measures the change in the cost of a fixed basket of products and services, including housing, electricity, food and transportation. It is not possible to invest directly in the Index.
47

How did the Fund perform during the 12-month period ended October 31, 2007?
Thrivent Municipal Bond Fund produced a 2.39% return. The Fund’s peer group, as represented by the Lipper General Municipal Debt Funds Category, reported a median return of 1.65% . The Fund’s market benchmark, the Lehman Brothers Municipal Bond Index, returned 2.91% .
What factors affected the Fund’s performance?
Yields fell on shorter-term municipal bonds and rose on longer-term securities during the period, as many investors sought the relative safety of shorter maturities and higher-rated issuers. Fortunately, our portfolio was positioned for a steepening yield curve and a market emphasis on quality.
Our heavier weighting of five- to 10-year bonds enhanced our performance relative to our peer group as prices of securities at the middle of the yield curve rose slightly or stayed relatively stable. A focus on high-quality securities also ben-efited our relative performance as investor appetite for risk diminished when sub-prime mortgage troubles spread to other bond sectors in the summer. The ensuing flight to quality boosted the yields of lower-rated bonds and pushed down their prices. For the same reason, our lower weighting in high-yield municipal bonds enhanced our performance relative to our peer group. The Fund had limited exposure to high yield bonds, whereas some funds in the peer group had a considerable percentage of their portfolios in this segment.
Our decision not to hold two types of securities that performed poorly during the period also enhanced the Fund’s performance relative to its peer group. These included gas prepay bonds, which lost value due to concerns about unrelated losses incurred by the major banks that underwrite them, and floating-rate-note securities, many of which were down from 8% to 15% during the period.
Our results were hindered slightly by the Fund’s positions in bonds backed by a tobacco settlement.
What is your outlook?
We expect economic growth to continue at a slower pace into 2008, but we don’t expect a recession. Although economic growth is slowing and the housing market is a concern, it’s uncertain how much the Federal Reserve will ease interest rates in 2008. Inflation measures remain above the Fed’s comfort zone and inflation risks are to the upside, particularly as conditions in the U.S. labor markets are still good and commodity prices are high.
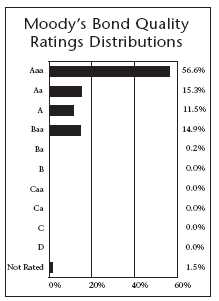
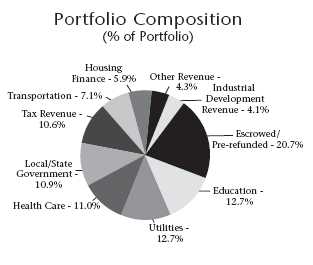
| | |
| Top 10 | |
| States | |
| (% of Portfolio) | |
| | |
| California | 10.5% | |
| Illinois | 9.2% | |
| New York | 9.0% | |
| Texas | 8.5% | |
| Colorado | 5.6% | |
| Washington | 4.9% | |
| Minnesota | 4.1% | |
| Massachusetts | 3.3% | |
| Georgia | 3.1% | |
| Louisiana | 3.0% | |
| | |
| Investments in long-term | |
| fixed income securities in | |
| these States represent | |
| 61.2% of the total | | |
| investment portfolio. | |
*Investors may be subject to state taxes and federal alternative minimum tax.
Quoted Fund performance is for Class A shares and does not reflect a sales charge.
The returns shown do not reflect taxes a shareholder would pay on distributions or redemptions.
Quoted Moody’s Bond Quality Ratings Distributions, Portfolio Composition and Top 10 States are subject to change.
The list of Top 10 States excludes short-term investments.
48
The general outlook for municipal bonds appears favorable. Municipal bonds did not participate fully in Treasury securities’ strong rally late in the period, and we think that has left them generally undervalued. In addition, discussion of tax reform should become more prominent soon, with a major election next year, scheduled expiration of federal tax cuts two years later, and the first wave of retirements now occurring among the baby boomer generation. Higher tax rates would improve the relative value of municipal bonds compared to taxable alternatives.
The Fund is in a strong position to take advantage of upcoming market values. Going forward, we will look for opportunities to add select longer-maturity and slightly lower-rated bonds to our portfolio to continue enhancing shareholders’ total return.
| | | | | |
| Portfolio Facts | |
| As of October 31, 2007 | |
| | A Share | | B Share | Institutional Share | |
| | ————————— | | ————————— | ————————— | |
| Ticker | AAMBX | | TMBBX | TMBIX | |
| Transfer Agent ID | 015 | | 065 | 088 | |
| Net Assets | $1,145,816,509 | | $12,386,127 | $17,376,897 | |
| NAV | $11.16 | | $11.16 | $11.16 | |
| NAV — High† | 12/5/2006 — $11.45 | | 12/6/2006 — $11.44 | 12/5/2006 — $11.45 | |
| NAV — Low† | 8/24/2007 — $10.97 | | 8/24/2007 — $10.97 | 8/24/2007 — $10.97 | |
| Number of Holdings: 420 | † For the year ended October 31, 2007 | |
| | | | |
| Average Annual Total Returns2 | |
| As of October 31, 2007 | |
| | |
| | |
| | |
| Class A1 | 1-Year | 5 Years | 10 Years | |
| |
| without sales charge | 2.39% | 3.93% | 4.84% | |
| with sales charge | (2.25%) | 2.98% | 4.35% | |
| | |
| Class B1 | 1-Year | 5 Years | 10 Years | |
| |
| without sales charge | 1.77% | 3.19% | 4.44% | |
| with sales charge | (2.15%) | 3.19% | 4.44% | |
| | |
| Institutional Class1 | 1-Year | 5 Years | 10 Years | |
| |
| Net Asset Value | 2.68% | 4.23% | 5.09% | |
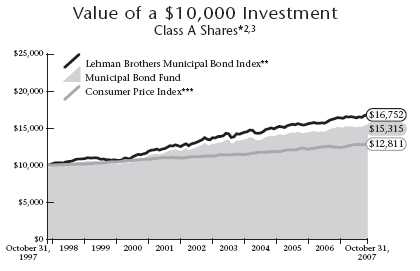
1 Class A performance reflects the maximum sales charge of 4.5% . Class B performance reflects the maximum deferred sales charge of 5%, declining 1% each year during the first five years and then converting to Class A shares after the fifth year. Institutional Class shares have no sales load and are for institutional shareholders only.
2 Past performance is not an indication of future results. Annualized total returns represent past performance and reflect changes in share prices, the reinvestment of all dividends and capital gains, and the effects of compounding. Investing in a mutual fund involves risks, including the possible loss of principal. The prospectus contains more complete information on the investment objectives, risks, charges and expenses of the investment company which investors should read and consider carefully before investing. To obtain a prospectus, contact a registered representative or visit www.thrivent.com. At various times, the Fund’s adviser waived its management fee and/or reimbursed Fund expenses. Had the adviser not done so, the Fund’s total returns would have been lower. The returns shown do not reflect taxes a shareholder wou ld pay on distributions or redemptions.
3 Performance of other classes will be greater or less than the line shown based on the differences in loads and fees paid by shareholders investing in the different classes.
* As you compare performance, please note that the Fund’s performance reflects the maximum 4.5% sales charge, while the Lehman Brothers Municipal Bond Index and the Consumer Price Index do not reflect any such charges. If you were to purchase any of the above individual stocks or funds represented in the Index, any charges you would pay would reduce your total return as well.
** The Lehman Brothers Municipal Bond Index is a market value-weighted index of investment-grade municipal bonds with maturities of one year or more. It is not possible to invest directly in the Index. The performance of the Index does not reflect deductions for fees, expenses or taxes.
*** The Consumer Price Index is an inflationary indicator that measures the change in the cost of a fixed basket of products and services, including housing, electricity, food and transportation. It is not possible to invest directly in the Index.
49

How did the Fund perform during the 12-month period ended October 31, 2007?
Thrivent Income Fund returned 3.90% during the period, compared with a median return of 4.42% for its Lipper Corporate Debt Funds BBB-Rated Funds peer group. During the same period, the Fund’s market benchmark, the Lehman Brothers Aggregate Bond Index, posted a return of 5.38% .
What factors affected the Fund’s performance?
Our underperformance relative to our peer group is attributable to two main factors: about 60% of it was due to our holdings in corporate bonds and 40% was due to the floating-rate debt that backs our mortgage securities.
During the period, we held an overweighted position in corporate bonds, which were negatively affected by the liquidity crunch that occurred in August. Within our corporate bond holdings, we’ve typically held an overweighted position in the finance sector, which generally has been a high-rated area of the market. But during the second half of this reporting period, the worsening situation with sub-prime mortgage securities hurt the finance sector overall, since finance corporations issue and hold the securities. Two of the finance securities we own, Residential Capital and Countrywide Financial, were hit particularly hard during the period.
In addition, some of the corporate financial sector bonds we held were “hybrid securities.” These securities are designed to put the bondholder lower in the corporate repayment order in case of bankruptcy — but still ahead of stockholders — in exchange for higher returns. However, they were particularly hard hit by the credit crunch.
Also during the period, we used floating-rate debt to back our purchase of Fannie Mae and Freddie Mac mortgage securities through what is called the “mortgage dollar-roll” program. In the program, we accept “forward delivery” of securities that haven’t been created yet, agreeing to take physical delivery at a later date. The floating-rate debt we use to back our agreement is all AAA-rated with maturities of one to three years and a coupon rate that readjusts between one and three months. While this typically low-risk practice has generated additional yield for the Fund for many years, the floating-rate securities-backed by higher-quality credit card, auto and other loans were affected by sub-prime mortgage-related troubles and lost value.
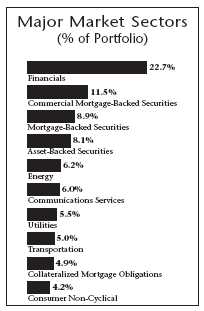
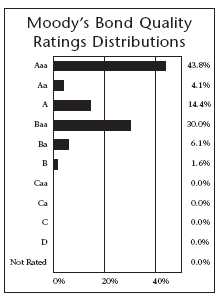
| | |
| Top 10 Holdings | |
| (% of Portfolio) | |
| | |
| Federal National Mortgage Association | | |
| Conventional 30-Yr. Pass Through | 6.7% | |
| U.S. Treasury Notes, TIPS | 3.5% | |
| Federal National Mortgage Association | | |
| Conventional 30-Yr. Pass Through | 1.9% | |
| Wachovia Bank Commercial Mortgage | | |
| Trust | 1.2% | |
| Northwest Airlines, Inc. | 1.1% | |
| U.S. Treasury Principal Strips | 1.0% | |
| U.S. Treasury Principal Strips | 1.0% | |
| Countrywide Financial Corporation, | | |
| Convertible | 0.9% | |
| U.S. Treasury Notes | 0.9% | |
| Federal National Mortgage Association | 0.9% | |
| | |
| These long-term fixed income securities represent 19.1% | |
| of the total investment portfolio. | |
Quoted Fund performance is for Class A shares and does not reflect a sales charge.
The returns shown do not reflect taxes a shareholder would pay on distributions or redemptions.
Quoted Major Market Sectors, Moody’s Bond Quality Ratings Distributions and Top 10 Holdings are subject to change.
Major Market Sectors represent long-term non-government holdings.
The list of Top 10 Holdings excludes short-term investments and collateral held for securities loaned.
50
What is your outlook?
We think economic growth will slow as we move into 2008, but we don’t expect a recession. It will take several months for the economy to work off the effects of the credit crunch. While it’s possible, it’s not certain that the Federal Reserve will ease interest rates again any time soon. If the housing market worsens and growth slows further, a quarter-percent cut is likely in December. The Fed must continue to balance its concerns about an economic slowdown against the potential for higher inflation.
We expect that the yield curve will continue to be steep, with longer-maturity bonds paying more than shorter-maturity issues, but it shouldn’t get much steeper. We will maintain our current portfolio posture, not adding risk but not selling adversely affected securities while market prices are down due to investor fears. We believe that our affected corporate and floating-rate securities are solid long-term investments and that their value will rebound once the market calms down. As always, we will continue to look for opportunities to add value to the Fund and enhance shareholder return.
| | | | | |
| Portfolio Facts | |
| As of October 31, 2007 | |
| | A Share | | B Share | Institutional Share | |
| | ————————— | | ————————— | ————————— | |
| Ticker | LUBIX | | LUIBX | LBIIX | |
| Transfer Agent ID | 55 | | 355 | 455 | |
| Net Assets | $432,983,200 | | $6,525,418 | $368,907,157 | |
| NAV | $8.50 | | $8.48 | $8.49 | |
| NAV — High† | 3/13/2007 — $8.71 | | 3/13/2007 — $8.69 | 3/13/2007 — $8.70 | |
| NAV — Low† | 8/17/2007 — $8.39 | | 8/17/2007 — $8.37 | 8/17/2007 — $8.38 | |
| Number of Holdings: 299 | † For the year ended October 31, 2007 | |
| | | | |
| Average Annual Total Returns2 | |
| As of October 31, 2007 | |
| | |
| | |
| | |
| Class A1 | 1-Year | 5 Years | 10 Years | |
| |
| without sales charge | 3.90% | 4.90% | 5.11% | |
| with sales charge | (0.72%) | 3.94% | 4.62% | |
| | |
| Class B1 | 1-Year | 5 Years | 10 Years | |
| |
| without sales charge | 3.03% | 4.06% | 4.70% | |
| with sales charge | (0.92%) | 4.06% | 4.70% | |
| | |
| Institutional Class1 | 1-Year | 5 Years | 10 Years | |
| |
| Net Asset Value | 4.32% | 5.30% | 5.45% | |
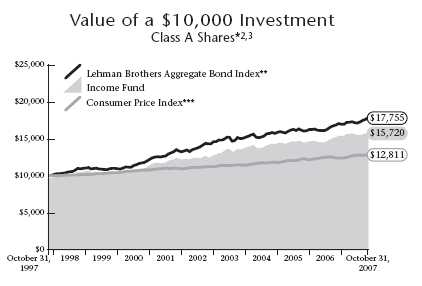
1 Class A performance reflects the maximum sales charge of 4.5% . Class B performance reflects the maximum deferred sales charge of 5%, declining 1% each year during the first five years and then converting to Class A shares after the fifth year. Institutional Class shares have no sales load and are for institutional shareholders only.
2 Past performance is not an indication of future results. Annualized total returns represent past performance and reflect changes in share prices, the reinvestment of all dividends and capital gains, and the effects of compounding. Investing in a mutual fund involves risks, including the possible loss of principal. The prospectus contains more complete information on the investment objectives, risks, charges and expenses of the investment company which investors should read and consider carefully before investing. To obtain a prospectus, contact a registered representative or visit www.thrivent.com. At various times, the Fund’s adviser waived its management fee and/or reimbursed Fund expenses. Had the adviser not done so, the Fund’s total returns would have been lower. The returns shown do not reflect taxes a shareholder wou ld pay on distributions or redemptions.
3 Performance of other classes will be greater or less than the line shown based on the differences in loads and fees paid by shareholders investing in the different classes.
* As you compare performance, please note that the Fund’s performance reflects the maximum 4.5% sales charge, while the Lehman Brothers Aggregate Bond Index and the Consumer Price Index do not reflect any such charges. If you were to purchase any of the above individual stocks or funds represented in the Index, any charges you would pay would reduce your total return as well.
** The Lehman Brothers Aggregate Bond Index is an index that measures the performance of U.S. investment grade bonds. It is not possible to invest directly in the Index. The performance of the Index does not reflect deductions for fees, expenses or taxes.
*** The Consumer Price Index is an inflationary indicator that measures the change in the cost of a fixed basket of products and services, including housing, electricity, food and transportation. It is not possible to invest directly in the Index.
51

How did the Fund perform during the 12-month period ended October 31, 2007?
Thrivent Core Bond Fund returned 3.24% during the period, compared with a median return of 4.47% for its Lipper Intermediate Investment Grade Debt Funds peer group. During the same period, the Fund’s market benchmark, the Lehman Brothers Aggregate Bond Index, posted a return of 5.38% .
What factors affected the Fund’s performance?
Our underperformance relative to our peer group is attributable to two main factors: about 60% of it was due to our holdings in corporate bonds and 40% was due to the floating-rate debt that backs our mortgage securities.
During the period, we held an overweighted position in corporate bonds, which were negatively affected by the liquidity crunch that occurred in August. Within our corporate bond holdings, we’ve typically held an overweighted position in the finance sector, which generally has been a high-rated area of the market. But during the second half of this reporting period, the worsening situation with sub-prime mortgage securities hurt the finance sector overall, since finance corporations issue and hold the securities. Two of the finance securities we own, Residential Capital and Countrywide Financial, were hit particularly hard during the period.
In addition, some of the corporate financial sector bonds we held were “hybrid securities.” These securities are designed to put the bondholder lower in the corporate repayment order in case of bankruptcy — but still ahead of stockholders — in exchange for higher returns. However, they were particularly hard hit by the credit crunch.
Also during the period, we used floating-rate debt to back our purchase of Fannie Mae and Freddie Mac mortgage securities through what is called the “mortgage dollar-roll” program. In the program, we accept “forward delivery” of securities that haven’t been created yet, agreeing to take physical delivery at a later date. The floating-rate debt we use to back our agreement is all AAA-rated with maturities of one to three years and a coupon rate that readjusts between one and three months. While this typically low-risk practice has generated additional yield for the Fund for many years, the floating-rate securities-backed by higher-quality credit card, auto and other loans were affected by sub-prime mortgage-related troubles and lost value.
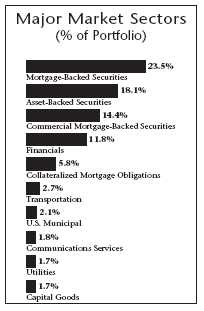
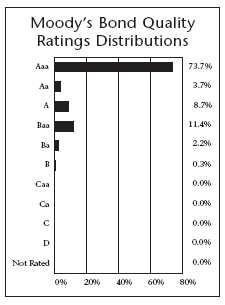
| | |
| Top 10 Holdings | |
| (% of Portfolio) | |
| | |
| Federal National Mortgage Association | | |
| Conventional 30-Yr. Pass Through | 11.5% | |
| Federal National Mortgage Association | | |
| Conventional 30-Yr. Pass Through | 9.4% | |
| U.S. Treasury Notes, TIPS | 3.8% | |
| Federal National Mortgage Association | | |
| Conventional 30-Yr. Pass Through | 2.7% | |
| U.S. Treasury Notes | 2.0% | |
| U.S. Treasury Notes | 1.4% | |
| LB-UBS Commercial Mortgage Trust | 1.2% | |
| Banc of America Commercial | | |
| Mortgage, Inc. | 1.1% | |
| Federal Home Loan Mortgage Corporation | 1.1% | |
| Federal Home Loan Bank | 1.1% | |
| | |
| These long-term fixed income securities represent 35.3% | |
| of the total investment portfolio. | | |
Quoted Fund performance is for Class A shares and does not reflect a sales charge.
The returns shown do not reflect taxes a shareholder would pay on distributions or redemptions.
Quoted Major Market Sectors, Moody’s Bond Quality Ratings Distributions and Top 10 Holdings are subject to change.
Major Market Sectors represent long-term non-government holdings.
The list of Top 10 Holdings excludes short-term investments and collateral held for securities loaned.
52
What is your outlook?
We think economic growth will slow as we move into 2008, but we don’t expect a recession. It will take several months for the economy to work off the effects of the credit crunch. While it’s possible, it’s not certain that the Federal Reserve will ease interest rates again any time soon. If the housing market worsens and growth slows further, a quarter-percent cut is likely in December. The Fed must continue to balance its concerns about an economic slowdown against the potential for higher inflation.
We expect that the yield curve will continue to be steep, with longer-maturity bonds paying more than shorter-maturity issues, but it shouldn’t get much steeper. We will maintain our current portfolio posture, not adding risk but not selling adversely affected securities while market prices are down due to investor fears. We believe that our affected corporate and floating-rate securities are solid long-term investments and that their value will rebound once the market calms down. As always, we will continue to look for opportunities to add value to the Fund and enhance shareholder return.
| | | | | |
| Portfolio Facts | |
| As of October 31, 2007 | |
| | A Share | | B Share | Institutional Share | |
| | ————————— | | ————————— | ————————— | |
| Ticker | AAINX | | BBFBX | IIINX | |
| Transfer Agent ID | 016 | | 066 | 089 | |
| Net Assets | $295,055,621 | | $4,515,363 | $83,762,127 | |
| NAV | $9.77 | | $9.78 | $9.78 | |
| NAV — High† | 12/5/2006 — $9.99 | | 12/5/2006 — $10.00 | 12/5/2006 — $10.00 | |
| NAV — Low† | 6/12/2007 — $9.64 | | 6/12/2007 — $9.64 | 6/12/2007 — $9.64 | |
| Number of Holdings: 194 | † For the year ended October 31, 2007 | |
| | | | |
| Average Annual Total Returns2 | |
| As of October 31, 2007 | |
| | |
| | |
| | |
| Class A1 | 1-Year | 5 Years | 10 Years | |
| |
| without sales charge | 3.24% | 3.92% | 4.92% | |
| with sales charge | (1.44%) | 2.97% | 4.44% | |
| | |
| Class B1 | 1-Year | 5 Years | 10 Years | |
| |
| without sales charge | 2.19% | 2.89% | 4.42% | |
| with sales charge | (1.76%) | 2.89% | 4.42% | |
| | |
| | | | From | |
| | | | Inception | |
| Institutional Class1 | 1-Year | 5 Years | 12/29/1997 | |
| |
| Net Asset Value | 3.68% | 4.36% | 5.30% | |
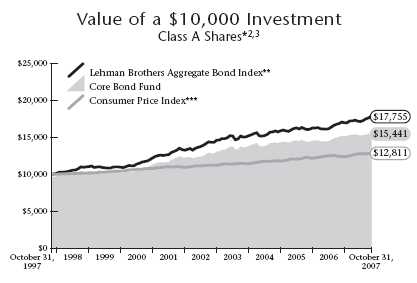
1 Class A performance reflects the maximum sales charge of 4.5% . Class B performance reflects the maximum deferred sales charge of 5%, declining 1% each year during the first five years and then converting to Class A shares after the fifth year. Institutional Class shares have no sales load and are for institutional shareholders only.
2 Past performance is not an indication of future results. Annualized total returns represent past performance and reflect changes in share prices, the reinvestment of all dividends and capital gains, and the effects of compounding. Investing in a mutual fund involves risks, including the possible loss of principal. The prospectus contains more complete information on the investment objectives, risks, charges and expenses of the investment company which investors should read and consider carefully before investing. To obtain a prospectus, contact a registered representative or visit www.thrivent.com. At various times, the Fund’s adviser waived its management fee and/or reimbursed Fund expenses. Had the adviser not done so, the Fund’s total returns would have been lower. The returns shown do not reflect taxes a shareholder wou ld pay on distributions or redemptions.
3 Performance of other classes will be greater or less than the line shown based on the differences in loads and fees paid by shareholders investing in the different classes.
* As you compare performance, please note that the Fund’s performance reflects the maximum 4.5% sales charge, while the Lehman Brothers Aggregate Bond Index and the Consumer Price Index do not reflect any such charges. If you were to purchase any of the above individual stocks or funds represented in the Index, any charges you would pay would reduce your total return as well.
** The Lehman Brothers Aggregate Bond Index is an index that measures the performance of U.S. investment grade bonds. It is not possible to invest directly in the Index. The performance of the Index does not reflect deductions for fees, expenses or taxes.
*** The Consumer Price Index is an inflationary indicator that measures the change in the cost of a fixed basket of products and services, including housing, electricity, food and transportation. It is not possible to invest directly in the Index.
53

How did the Fund perform during the 12-month period ended October 31, 2007?
Thrivent Limited Maturity Bond Fund returned 4.10% during the period, compared to a median return of 4.34% for its Lipper Short Investment Grade Debt Funds peer group. During the same period, the Fund’s market benchmark, the Lehman Brothers Government/Credit 1-3 Year Bond Index, generated a return of 5.67% .
What factors affected the Fund’s performance?
Bond yields stayed in a fairly narrow range for the first nine months of the period, and the yield curve was relatively flat, with little difference in yields among various maturity lengths. In August, however, fears that sub-prime mortgage troubles were spreading to other sectors of the bond market caused investors to sell riskier securities in favor of safe Treasury issues. The result: Yields on shorter maturities and Treasury securities dropped while yields on longer maturities and bonds with credit structures rose.
With growing concerns about how much the housing slump and credit crunch would slow the economy, the Federal Reserve cut the Federal Funds rate twice for a total of 0.75% and the discount rate three times for a total of 1.25% from August through October. The yield on the two-year Treasury note fell from 4.80% at the start of the third quarter to 3.95% on October 31.
As investors flocked to the safety of government-backed U.S. Treasury securities, the yield spread between Treasury issues and spread sectors — including investment-grade corporate, mortgage-backed, and asset-backed bonds — widened dramatically. With bond yields and prices moving in the opposite direction, Treasury prices rose and anything with a credit orientation or mortgage-backed structure did poorly. Most of the Fund’s underperformance relative to its benchmark and peer group was due to its overweighted position in high-quality spread sectors and underweighted position in the government sector.
Our performance benefited during the period from moves to position the portfolio for a steeper yield curve. We did this by purchasing options on Treasury futures, which enabled us to extend the portfolio’s duration when interest rates declined significantly. The options’ value grew as rates fell.
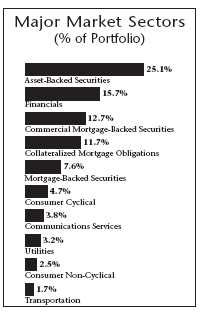
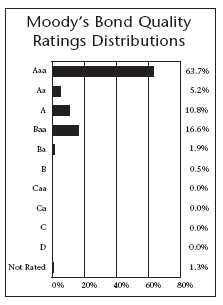
| | |
| Top 10 Holdings | |
| (% of Portfolio) | |
| | |
| Federal National Mortgage Association | | |
| Conventional 30-Yr. Pass Through | 4.9% | |
| U.S. Treasury Notes, TIPS | 3.2% | |
| Federal National Mortgage Association | | |
| Conventional 30-Yr. Pass Through | 1.7% | |
| Federal National Mortgage Association | 1.0% | |
| Bear Stearns Commercial Mortgage | | |
| Securities, Inc. | 1.0% | |
| TIAA Real Estate CDO, Ltd. | 1.0% | |
| BMW Vehicle Lease Trust | 1.0% | |
| J.P. Morgan Chase Commercial Mortgage | | |
| Securities Corporation | 1.0% | |
| Washington Mutual Master Note Trust | 1.0% | |
| AmeriCredit Automobile Receivables Trust | 0.9% | |
| | |
| These long-term fixed income securities represent 16.7% | |
| of the total investment portfolio. | | |
Quoted Fund performance is for Class A shares.
The returns shown do not reflect taxes a shareholder would pay on distributions or redemptions.
Quoted Major Market Sectors, Moody’s Bond Quality Ratings Distributions and Top 10 Holdings are subject to change.
Major Market Sectors represent long-term non-government holdings.
The list of Top 10 Holdings excludes short-term investments and collateral held for securities loaned.
54
What is your outlook?
We think economic growth will slow as we move into 2008, but we don’t expect a recession. It will take several months for the economy to work off the effects of the credit crunch. It’s uncertain whether the Federal Reserve will ease interest rates again any time soon. If the housing market worsens and growth slows further, a quarter-percent cut is possible, perhaps in December. The Fed must continue to balance its concerns about a slowdown against the potential for higher inflation.
We expect that the yield curve will continue to be steep, with longer-maturity bonds paying more than shorter-maturity issues, but it shouldn’t get much steeper. We will maintain our overweighted position in spread-sector investments and have a modest underweighting in cash. Within our cash holdings, we will maintain our slight overweighted position in floating-rate securities. We believe that our spread-sector securities are solid investments and that their value will rebound once the market calms down. As always, we will continue to look for opportunities to add value to the Fund and enhance shareholder return.
| | | | | |
| Portfolio Facts | |
| As of October 31, 2007 | |
| | A Share | | B Share | Institutional Share | |
| | ————————— | | ————————— | ————————— | |
| Ticker | LBLAX | | TLMBX | THLIX | |
| Transfer Agent ID | 76 | | 376 | 476 | |
| Net Assets | $111,953,804 | | $1,813,276 | $303,688,456 | |
| NAV | $12.53 | | $12.54 | $12.53 | |
| NAV — High† | 3/21/2007 — $12.62 | | 3/21/2007 — $12.63 | 3/21/2007 — $12.62 | |
| NAV — Low† | 9/4/2007 — $12.49 | | 9/4/2007 — $12.50 | 9/4/2007 — $12.49 | |
| Number of Holdings: 274 | † For the year ended October 31, 2007 | |
| | | | |
| Average Annual Total Returns2 | |
| As of October 31, 2007 | |
| | |
| | | | From | |
| | | | Inception | |
| Class A1 | 1-Year | 5 Years | 10/29/1999 | |
| |
| Net Asset Value | 4.10% | 3.36% | 4.50% | |
| | |
| | | | From | |
| | | | Inception | |
| Class B1 | 1-Year | 5 Years | 10/29/1999 | |
| |
| Net Asset Value | 3.93% | 3.27% | 4.47% | |
| | |
| | | | From | |
| | | | Inception | |
| Institutional Class1 | 1-Year | 5 Years | 10/29/1999 | |
| |
| Net Asset Value | 4.47% | 3.77% | 4.85% | |
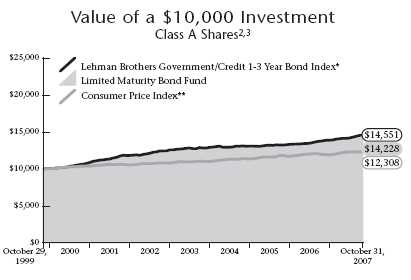
1 Class A, Class B, and Institutional Class shares have no sales loads.
2 Past performance is not an indication of future results. Annualized total returns represent past performance and reflect changes in share prices, the reinvestment of all dividends and capital gains, and the effects of compounding. Investing in a mutual fund involves risks, including the possible loss of principal. The prospectus contains more complete information on the investment objectives, risks, charges and expenses of the investment company which investors should read and consider carefully before investing. To obtain a prospectus, contact a registered representative or visit www.thrivent.com. At various times, the Fund’s adviser waived its management fee and/or reimbursed Fund expenses. Had the adviser not done so, the Fund’s total returns would have been lower. The returns shown do not reflect taxes a shareholder wou ld pay on distributions or redemptions.
3 Performance of other classes will be greater or less than the line shown based on the differences in fees paid by shareholders in the different classes.
* The Lehman Brothers Government/Credit 1-3 Year Bond Index is an unmanaged index that measures the performance of government and fixed-rate debt securities with maturities of 1-3 years. It is not possible to invest directly in the Index. The performance of the Index does not reflect deductions for fees, expenses or taxes.
** The Consumer Price Index is an inflationary indicator that measures the change in the cost of a fixed basket of products and services, including housing, electricity, food and transportation. It is not possible to invest directly in the Index.
55

How did the Fund perform during the 12-month period ended October 31, 2007?
Thrivent Money Market Fund produced a 4.92% return during the period, while its Lipper Money Market Funds Category reported a median net return of 4.68% over the same time frame.
What factors affected the Fund’s performance?
The factor that most influenced money market securities during the period was the “liquidity crunch” that occurred in August. It was caused by a combination of factors, including fears that troubles in the sub-prime mortgage sector would spread to other types of fixed-income securities, including asset-backed commercial paper. Brokerage firms, banks and money fund managers began trying to reduce their exposure to mortgage related products at the same time, and the market for short-term securities froze. As investor demand for asset-backed commercial paper plummeted, yields on the securities jumped and their yield “spread” over Treasury securities widened dramatically (an investor flight to safe Treasury securities depressed Treasury yields at the same time).
Fortunately, our conservative investment philosophy was rewarded during this market turmoil. Our portfolio held little exposure to the types of securities that concerned the market and we entered the period with plenty of liquidity. We maintained a defensive portfolio stance during the summer, focusing less on yield and more on conservative investments and improving liquidity. An added benefit of our conservative strategy was that, when we believed Federal Reserve interest rate easing was more imminent, we were able to extend the Fund’s weighted average maturity in high-quality investments during the third quarter. This move benefited us as the Fed cut the Federal Funds rate twice for a total of 0.75% and the discount rate three times for a total 1.25% through the end of October. As short-term Treasury yields fell dramatically in August and September, our longer weighted average maturity boosted our portfolio value more in response. By the end of the period, we main tained a slightly longer weighted average maturity than our peer group.
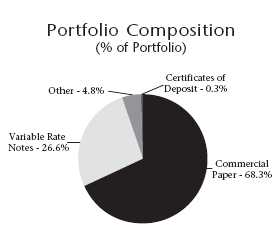
*To the extent practicable, the Fund intends to maintain a stable net asset value of $1.00 per share. An investment in Thrivent Money Market Fund is not
insured or guaranteed by the FDIC or any other government agency. Although the Fund seeks to preserve the value of your investment at $1.00 per share,
it is possible to lose money by investing in the Fund.
Quoted Fund performance is for Class A shares.
The returns shown do not reflect taxes a shareholder would pay on distributions or redemptions.
Quoted Portfolio Composition is subject to change.
56
What is your outlook?
Economic growth is slowing and the housing market remains weak, so we believe it’s likely that Federal Reserve policymakers will ease interest rates further. If this occurs, our portfolio’s longer weighted average maturity should continue to benefit us.
We intend to maintain a slightly longer weighted average maturity in the Fund going forward, but will limit the amount of exposure to securities beyond six months in duration. Doing so will keep the Fund flexible in case signs of economic growth or inflation grow and the market begins to anticipate higher interest rates. As in any interest rate environment, we will continue to focus on our primary objectives of safety and liquidity, while pursuing the optimum risk-adjusted yield.
| | | | |
| Portfolio Facts | |
| As of October 31, 2007 | |
| | A Share | B Share | Institutional Share | |
| | ————————— | ————————— | ————————— | |
| Ticker | AMMXX | TMBXX | AALXX | |
| Transfer Agent ID | 018 | 068 | 091 | |
| Net Assets | $1,183,862,159 | $1,529,322 | $425,026,328 | |
| NAV | $1.00 | $1.00 | $1.00 | |
| Number of Holdings: 133 | | | |
| | | | |
| Average Annual Total Returns2 | |
| As of October 31, 2007 | |
| | |
| Class A1 | 1-Year | 5 Years | 10 Years | |
| |
| Net Asset Value | 4.92% | 2.43% | 3.27% | |
| | |
| | |
| | |
| Class B1 | 1-Year | 5 Years | 10 Years | |
| |
| without sales charge | 4.48% | 2.15% | 2.79% | |
| with sales charge | 0.48% | 2.15% | 2.79% | |
| | |
| | | | From | |
| | | | Inception | |
| Institutional Class1 | 1-Year | 5 Years | 12/29/1997 | |
| |
| Net Asset Value | 5.16% | 2.75% | 3.55% | |
| | | | |
| Money Market Portfolio Yields* | |
| As of October 31, 2007 | |
| | |
| | | | Institutional | |
| | Class A | Class B | Class | |
| |
| 7-Day Yield | 4.83% | 4.35% | 5.02% | |
| 7-Day Effective Yield | 4.95% | 4.44% | 5.15% | |
1 Class A shares have no sales load. Class B performance reflects the maximum deferred sales charge of 5%, declining 1% each year during the first five years and then converting to Class A shares after the fifth year. Institutional Class shares have no sales load and are for institutional shareholders only.
2 Past performance is not an indication of future results. Annualized total returns represent past performance and reflect changes in share prices, the reinvestment of all dividends and capital gains, and the effects of compounding. Investing in a mutual fund involves risks, including the possible loss of principal. The prospectus contains more complete information on the investment objectives, risks, charges and expenses of the investment company which investors should read and consider carefully before investing. To obtain a prospectus, contact a registered representative or visit www.thrivent.com. At various times, the Fund’s adviser waived its management fee and/or reimbursed Fund expenses. Had the adviser not done so, the Fund’s total returns would have been lower. The returns shown do not reflect taxes a shareholder wou ld pay on distributions or redemptions.
* Seven-day yields of Thrivent Money Market Fund refer to the income generated by an investment in the Fund over a specified seven-day period. Effective yields reflect the reinvestment of income. Yields are subject to daily fluctuation and should not be considered an indication of future results.
57
Shareholder Expense Example
(Unaudited)
As a shareholder of the Fund, you incur two types of costs: (1) transaction costs, including sales charges (loads) on purchase payments; and (2) ongoing costs, including management fees; distribution (12b-1) fees and other Fund expenses. This Example is intended to help you understand your ongoing costs (in dollars) of investing in the Fund and to compare these costs with the ongoing costs of investing in other mutual funds. The Example is based on an investment of $1,000 invested at the beginning of the period and held for the entire period from May 1, 2007 through October 31, 2007.
Actual Expenses
In the table below, the first section, labelled “Actual,” provides information about actual account values and actual expenses. You may use the information in this section, together with the amount you invested, to estimate the expenses that you paid over the period. Simply divide your account value by $1,000 (for example, an $8,600 account value divided by $1,000 = 8.6), then multiply the result by the number from the appropriate Class line under the heading entitled “Expenses Paid During Period” to estimate the expenses you paid. A small account fee of $12 is charged to Class A and Class B shareholder accounts if the value falls below stated account minimums ($2,500 for Thrivent Limited Maturity Bond Fund, $1,500 for Thrivent Money Market Fund and $1,000 for all other Funds). This fee is not included in the table below. If it were, the expenses you paid during the period would have been higher and the ending account value would have been lower.
Hypothetical Example for Comparison Purposes
In the table below, the second section, labelled “Hypothetical,” provides information about hypothetical account values and hypothetical expenses based on the Fund’s actual expense ratio and an assumed rate of return of 5% per year before expenses, which is not the Fund’s actual return. The hypothetical account values and expenses may not be used to estimate the actual ending account balance or expenses you paid for the period. You may use this information to compare the ongoing costs of investing in the Fund and other funds. To do so, compare this 5% hypothetical example with the 5% hypothetical examples that appear in the shareholder reports of the other funds. A small account fee of $12 is charged to Class A and Class B shareholder accounts if the value falls below stated account minimums ($2,500 for Thrivent Limited Maturity Bond Fund, $1,500 for Thrivent Money Market Fund and $1,000 for all other Funds). This fee is not included in the table belo w. If it were, the expenses you paid during the period would have been higher and the ending account value would have been lower.
Please note that the expenses shown in the table are meant to highlight your ongoing costs only and do not reflect any transactional costs, such as sales charges (loads). Therefore, the second section of the table is useful in comparing ongoing costs only, and will not help you determine the relative total costs of owning different funds. In addition, if these transactional costs were included, your costs would have been higher.
| | | | |
| | Beginning | Ending | Expenses | |
| | Account | Account | Paid During | Annualized |
| | Value | Value | Period * | Expense |
| | 5/1/2007 | 10/31/2007 | 5/1/2007 — 10/31/2007 | Ratio |
|
| Thrivent Aggressive Allocation Fund | | | |
| Actual | | | | |
| Class A | $1,000 | $1,076 | $2.62 | 0.50% |
| Institutional Class | $1,000 | $1,078 | $1.10 | 0.21% |
| Hypothetical ** | | | | |
| Class A | $1,000 | $1,023 | $2.55 | 0.50% |
| Institutional Class | $1,000 | $1,024 | $1.07 | 0.21% |
| |
| Thrivent Moderately Aggressive Allocation Fund | | | |
| Actual | | | | |
| Class A | $1,000 | $1,063 | $2.50 | 0.48% |
| Institutional Class | $1,000 | $1,065 | $0.99 | 0.19% |
| Hypothetical ** | | | | |
| Class A | $1,000 | $1,023 | $2.45 | 0.48% |
| Institutional Class | $1,000 | $1,024 | $0.97 | 0.19% |
58
| | | | |
| | Beginning | Ending | Expenses | |
| | Account | Account | Paid During | Annualized |
| | Value | Value | Period * | Expense |
| | 5/1/2007 | 10/31/2007 | 5/1/2007 — 10/31/2007 | Ratio |
|
| Thrivent Moderate Allocation Fund | | | |
| Actual | | | | |
| Class A | $1,000 | $1,051 | $2.48 | 0.48% |
| Institutional Class | $1,000 | $1,052 | $0.98 | 0.19% |
| Hypothetical ** | | | | |
| Class A | $1,000 | $1,023 | $2.45 | 0.48% |
| Institutional Class | $1,000 | $1,024 | $0.97 | 0.19% |
| |
| Thrivent Moderately Conservative Allocation Fund | | | |
| Actual | | | | |
| Class A | $1,000 | $1,039 | $2.31 | 0.45% |
| Institutional Class | $1,000 | $1,040 | $1.18 | 0.23% |
| Hypothetical ** | | | | |
| Class A | $1,000 | $1,023 | $2.29 | 0.45% |
| Institutional Class | $1,000 | $1,024 | $1.17 | 0.23% |
| |
| Thrivent Technology Fund | | | |
| Actual | | | | |
| Class A | $1,000 | $1,182 | $8.08 | 1.47% |
| Class B | $1,000 | $1,178 | $11.14 | 2.03% |
| Institutional Class | $1,000 | $1,184 | $5.29 | 0.96% |
| Hypothetical ** | | | | |
| Class A | $1,000 | $1,018 | $7.48 | 1.47% |
| Class B | $1,000 | $1,015 | $10.31 | 2.03% |
| Institutional Class | $1,000 | $1,020 | $4.89 | 0.96% |
| |
| Thrivent Partner Small Cap Growth Fund | | | |
| Actual | | | | |
| Class A | $1,000 | $1,099 | $7.14 | 1.35% |
| Institutional Class | $1,000 | $1,100 | $5.40 | 1.02% |
| Hypothetical ** | | | | |
| Class A | $1,000 | $1,018 | $6.87 | 1.35% |
| Institutional Class | $1,000 | $1,020 | $5.19 | 1.02% |
| |
| Thrivent Partner Small Cap Value Fund | | | |
| Actual | | | | |
| Class A | $1,000 | $986 | $6.56 | 1.31% |
| Class B | $1,000 | $981 | $11.38 | 2.28% |
| Institutional Class | $1,000 | $989 | $3.46 | 0.69% |
| Hypothetical ** | | | | |
| Class A | $1,000 | $1,019 | $6.67 | 1.31% |
| Class B | $1,000 | $1,014 | $11.57 | 2.28% |
| Institutional Class | $1,000 | $1,022 | $3.52 | 0.69% |
| |
| Thrivent Small Cap Stock Fund | | | |
| Actual | | | | |
| Class A | $1,000 | $1,064 | $6.55 | 1.26% |
| Class B | $1,000 | $1,059 | $12.50 | 2.41% |
| Institutional Class | $1,000 | $1,067 | $3.70 | 0.71% |
| Hypothetical ** | | | | |
| Class A | $1,000 | $1,019 | $6.41 | 1.26% |
| Class B | $1,000 | $1,013 | $12.23 | 2.41% |
| Institutional Class | $1,000 | $1,022 | $3.62 | 0.71% |
| |
| Thrivent Small Cap Index Fund | | | |
| Actual | | | | |
| Class A | $1,000 | $1,024 | $4.85 | 0.95% |
| Hypothetical ** | | | | |
| Class A | $1,000 | $1,020 | $4.84 | 0.95% |
59
| | | | |
| | Beginning | Ending | Expenses | |
| | Account | Account | Paid During | Annualized |
| | Value | Value | Period * | Expense |
| | 5/1/2007 | 10/31/2007 | 5/1/2007 — 10/31/2007 | Ratio |
|
| Thrivent Mid Cap Growth Fund | | | |
| Actual | | | | |
| Class A | $1,000 | $1,159 | $6.26 | 1.15% |
| Class B | $1,000 | $1,153 | $12.48 | 2.30% |
| Institutional Class | $1,000 | $1,163 | $2.51 | 0.46% |
| Hypothetical ** | | | | |
| Class A | $1,000 | $1,019 | $5.85 | 1.15% |
| Class B | $1,000 | $1,014 | $11.67 | 2.30% |
| Institutional Class | $1,000 | $1,023 | $2.35 | 0.46% |
| |
| Thrivent Partner Mid Cap Value Fund | | | |
| Actual | | | | |
| Class A | $1,000 | $986 | $6.26 | 1.25% |
| Institutional Class | $1,000 | $987 | $5.06 | 1.01% |
| Hypothetical ** | | | | |
| Class A | $1,000 | $1,019 | $6.36 | 1.25% |
| Institutional Class | $1,000 | $1,020 | $5.14 | 1.01% |
| |
| Thrivent Mid Cap Stock Fund | | | |
| Actual | | | | |
| Class A | $1,000 | $1,023 | $5.86 | 1.15% |
| Class B | $1,000 | $1,018 | $11.75 | 2.31% |
| Institutional Class | $1,000 | $1,026 | $3.52 | 0.69% |
| Hypothetical ** | | | | |
| Class A | $1,000 | $1,019 | $5.85 | 1.15% |
| Class B | $1,000 | $1,014 | $11.72 | 2.31% |
| Institutional Class | $1,000 | $1,022 | $3.52 | 0.69% |
| |
| Thrivent Mid Cap Index Fund | | | |
| Actual | | | | |
| Class A | $1,000 | $1,040 | $4.63 | 0.90% |
| Hypothetical ** | | | | |
| Class A | $1,000 | $1,021 | $4.58 | 0.90% |
| |
| Thrivent Mid Cap Index Fund - I | | | |
| Actual | | | | |
| Institutional Class | $1,000 | $1,042 | $3.19 | 0.62% |
| Hypothetical ** | | | | |
| Institutional Class | $1,000 | $1,022 | $3.16 | 0.62% |
| |
| Thrivent Partner International Stock Fund | | | |
| Actual | | | | |
| Class A | $1,000 | $1,095 | $6.76 | 1.28% |
| Class B | $1,000 | $1,088 | $12.69 | 2.41% |
| Institutional Class | $1,000 | $1,098 | $3.70 | 0.70% |
| Hypothetical ** | | | | |
| Class A | $1,000 | $1,019 | $6.51 | 1.28% |
| Class B | $1,000 | $1,013 | $12.23 | 2.41% |
| Institutional Class | $1,000 | $1,022 | $3.57 | 0.70% |
| |
| Thrivent Large Cap Growth Fund | | | |
| Actual | | | | |
| Class A | $1,000 | $1,134 | $6.29 | 1.17% |
| Class B | $1,000 | $1,131 | $9.77 | 1.82% |
| Institutional Class | $1,000 | $1,136 | $4.31 | 0.80% |
| Hypothetical ** | | | | |
| Class A | $1,000 | $1,019 | $5.96 | 1.17% |
| Class B | $1,000 | $1,016 | $9.25 | 1.82% |
| Institutional Class | $1,000 | $1,021 | $4.08 | 0.80% |
60
| | | | |
| | Beginning | Ending | Expenses | |
| | Account | Account | Paid During | Annualized |
| | Value | Value | Period * | Expense |
| | 5/1/2007 | 10/31/2007 | 5/1/2007 — 10/31/2007 | Ratio |
|
| Thrivent Large Cap Value Fund | | | |
| Actual | | | | |
| Class A | $1,000 | $1,040 | $4.99 | 0.97% |
| Class B | $1,000 | $1,034 | $10.82 | 2.11% |
| Institutional Class | $1,000 | $1,043 | $2.52 | 0.49% |
| Hypothetical ** | | | | |
| Class A | $1,000 | $1,020 | $4.94 | 0.97% |
| Class B | $1,000 | $1,015 | $10.71 | 2.11% |
| Institutional Class | $1,000 | $1,023 | $2.50 | 0.49% |
| |
| Thrivent Large Cap Stock Fund | | | |
| Actual | | | | |
| Class A | $1,000 | $1,077 | $5.23 | 1.00% |
| Class B | $1,000 | $1,072 | $9.87 | 1.89% |
| Institutional Class | $1,000 | $1,079 | $2.93 | 0.56% |
| Hypothetical ** | | | | |
| Class A | $1,000 | $1,020 | $5.09 | 1.00% |
| Class B | $1,000 | $1,016 | $9.60 | 1.89% |
| Institutional Class | $1,000 | $1,022 | $2.85 | 0.56% |
| |
| Thrivent Large Cap Index Fund | | | |
| Actual | | | | |
| Class A | $1,000 | $1,052 | $3.10 | 0.60% |
| Hypothetical ** | | | | |
| Class A | $1,000 | $1,022 | $3.06 | 0.60% |
| |
| Thrivent Large Cap Index Fund - I | | | |
| Actual | | | | |
| Institutional Class | $1,000 | $1,054 | $2.28 | 0.44% |
| Hypothetical ** | | | | |
| Institutional Class | $1,000 | $1,023 | $2.24 | 0.44% |
| |
| Thrivent Balanced Fund | | | |
| Actual | | | | |
| Class A | $1,000 | $1,056 | $5.49 | 1.06% |
| Class B | $1,000 | $1,050 | $10.65 | 2.06% |
| Institutional Class | $1,000 | $1,059 | $3.11 | 0.60% |
| Hypothetical ** | | | | |
| Class A | $1,000 | $1,020 | $5.40 | 1.06% |
| Class B | $1,000 | $1,015 | $10.46 | 2.06% |
| Institutional Class | $1,000 | $1,022 | $3.06 | 0.60% |
| |
| Thrivent High Yield Fund | | | |
| Actual | | | | |
| Class A | $1,000 | $1,000 | $4.29 | 0.85% |
| Class B | $1,000 | $996 | $8.70 | 1.73% |
| Institutional Class | $1,000 | $1,003 | $2.22 | 0.44% |
| Hypothetical ** | | | | |
| Class A | $1,000 | $1,021 | $4.33 | 0.85% |
| Class B | $1,000 | $1,016 | $8.79 | 1.73% |
| Institutional Class | $1,000 | $1,023 | $2.24 | 0.44% |
| |
| Thrivent Municipal Bond Fund | | | |
| Actual | | | | |
| Class A | $1,000 | $1,012 | $3.95 | 0.78% |
| Class B | $1,000 | $1,008 | $7.44 | 1.47% |
| Institutional Class | $1,000 | $1,013 | $2.44 | 0.48% |
| Hypothetical ** | | | | |
| Class A | $1,000 | $1,021 | $3.97 | 0.78% |
| Class B | $1,000 | $1,018 | $7.48 | 1.47% |
| Institutional Class | $1,000 | $1,023 | $2.45 | 0.48% |
61
| | | | |
| | Beginning | Ending | Expenses | |
| | Account | Account | Paid During | Annualized |
| | Value | Value | Period * | Expense |
| | 5/1/2007 | 10/31/2007 | 5/1/2007 — 10/31/2007 | Ratio |
|
| Thrivent Income Fund | | | |
| Actual | | | | |
| Class A | $1,000 | $1,006 | $4.04 | 0.80% |
| Class B | $1,000 | $1,001 | $8.22 | 1.63% |
| Institutional Class | $1,000 | $1,008 | $1.92 | 0.38% |
| Hypothetical ** | | | | |
| Class A | $1,000 | $1,021 | $4.08 | 0.80% |
| Class B | $1,000 | $1,017 | $8.29 | 1.63% |
| Institutional Class | $1,000 | $1,023 | $1.94 | 0.38% |
| |
| Thrivent Core Bond Fund | | | |
| Actual | | | | |
| Class A | $1,000 | $1,008 | $4.71 | 0.93% |
| Class B | $1,000 | $1,003 | $9.85 | 1.95% |
| Institutional Class | $1,000 | $1,011 | $2.53 | 0.50% |
| Hypothetical ** | | | | |
| Class A | $1,000 | $1,021 | $4.74 | 0.93% |
| Class B | $1,000 | $1,015 | $9.91 | 1.95% |
| Institutional Class | $1,000 | $1,023 | $2.55 | 0.50% |
| |
| Thrivent Limited Maturity Bond Fund | | | |
| Actual | | | | |
| Class A | $1,000 | $1,017 | $3.56 | 0.70% |
| Class B | $1,000 | $1,016 | $4.52 | 0.89% |
| Institutional Class | $1,000 | $1,019 | $1.83 | 0.36% |
| Hypothetical ** | | | | |
| Class A | $1,000 | $1,022 | $3.57 | 0.70% |
| Class B | $1,000 | $1,021 | $4.53 | 0.89% |
| Institutional Class | $1,000 | $1,023 | $1.84 | 0.36% |
| |
| Thrivent Money Market Fund | | | |
| Actual | | | | |
| Class A | $1,000 | $1,025 | $2.86 | 0.56% |
| Class B | $1,000 | $1,022 | $5.15 | 1.01% |
| Institutional Class | $1,000 | $1,026 | $1.79 | 0.35% |
| Hypothetical ** | | | | |
| Class A | $1,000 | $1,022 | $2.85 | 0.56% |
| Class B | $1,000 | $1,020 | $5.14 | 1.01% |
| Institutional Class | $1,000 | $1,023 | $1.79 | 0.35% |
* Expenses are equal to the Fund’s annualized expense ratio, multiplied by the average account value over the period, multiplied by 184/365 to reflect the one-half year period.
** Assuming 5% total return before expenses
62

Report of Independent Registered Public Accounting Firm
To the Shareholders and Trustees of
the Thrivent Mutual Funds:
In our opinion, the accompanying statements of assets and liabilities, including the schedules of investments, and the related statements of operations and of changes in net assets and the financial highlights present fairly, in all material respects, the financial position of the Thrivent Aggressive Allocation Fund, Thrivent Moderately Aggressive Allocation Fund, Thrivent Moderate Allocation Fund, Thrivent Moderately Conservative Allocation Fund, Thrivent Technology Fund, Thrivent Partner Small Cap Growth Fund, Thrivent Partner Small Cap Value Fund, Thrivent Small Cap Stock Fund, Thrivent Small Cap Index Fund, Thrivent Mid Cap Growth Fund, Thrivent Partner Mid Cap Value Fund, Thrivent Mid Cap Stock Fund, Thrivent Mid Cap Index Fund, Thrivent Mid Cap Index Fund-I, Thrivent Partner International Stock Fund, Thrivent Large Cap Growth Fund, Thrivent Large Cap Value Fund, Thrivent Large Cap Stock Fund, Thrivent Large Cap Index Fund, Thrivent Large Cap Index Fund-I, Thrivent Balanced Fund, Thrivent High Yield Fund, Thrivent Municipal Bond Fund, Thrivent Income Fund, Thrivent Core Bond Fund, Thrivent Limited Maturity Bond Fund, and Thrivent Money Market Fund (twenty-seven of the Thrivent Mutual Funds, hereafter referred to as the “Funds”) at October 31, 2007, the results of each of their operations, changes in each of their net assets and their financial highlights for each of the periods presented, in conformity with accounting principles generally accepted in the United States of America. These financial statements and financial highlights (hereafter referred to as “financial statements”) are the responsibility of the Funds’ management; our responsibility is to express an opinion on these financial statements based on our audits. We conducted our audits of these financial statements in accordance with the standards of the Public Company Accounting Oversight Board (United States). Those standards require that we plan and perform the audit to obtain reaso nable assurance about whether the financial statements are free of material misstatement. An audit includes examining, on a test basis, evidence supporting the amounts and disclosures in the financial statements, assessing the accounting principles used and significant estimates made by management, and evaluating the overall financial statement presentation. We believe that our audits, which included confirmation of securities at October 31, 2007 by correspondence with the custodian and brokers, provide a reasonable basis for our opinion.

December 17, 2007
63
| | | |
| Aggressive Allocation Fund |
| Schedule of Investments as of October 31, 2007 |
| |
| Shares | | Value | Percentage |
|
| Equity Funds (91.0%) | | |
| 1,689,719 | Thrivent Partner Small Cap Growth Fund | $23,656,063 | 6.0% |
| 958,340 | Thrivent Partner Small Cap Value Fund | 16,387,607 | 4.2 |
| 1,396,962 | Thrivent Small Cap Stock Fund # | 28,805,358 | 7.4 |
| 684,364 | Thrivent Mid Cap Growth Fund # | 14,357,962 | 3.7 |
| 985,802 | Thrivent Partner Mid Cap Value Fund | 12,785,858 | 3.3 |
| 1,470,972 | Thrivent Mid Cap Stock Fund | 28,154,410 | 7.2 |
| 5,149,652 | Thrivent Partner International Stock Fund | 83,475,862 | 21.4 |
| 12,112,728 | Thrivent Large Cap Growth Fund | 83,941,207 | 21.5 |
| 1,472,237 | Thrivent Large Cap Value Fund | 26,603,332 | 6.8 |
| 1,172,303 | Thrivent Large Cap Stock Fund | 37,033,043 | 9.5 |
|
|
| | Total Equity Funds | | |
| | (cost $301,151,650) | 355,200,702 | |
|
|
| |
| Debt Funds (7.8%) | | |
| 1,219,523 | Thrivent High Yield Fund | 6,146,398 | 1.6 |
| 2,443,505 | Thrivent Income Fund | 20,745,356 | 5.3 |
| 290,348 | Thrivent Limited Maturity Bond Fund | 3,638,056 | 0.9 |
|
|
| | Total Debt Funds | | |
| | (cost $30,513,306) | 30,529,810 | |
|
|
| |
| Short-Term Investments (1.3%) | | |
| 5,177,999 | Thrivent Money Market Fund | 5,177,999 | 1.3 |
|
|
| | Total Short-Term Investments | | |
| | (cost $5,177,999) | 5,177,999 | |
|
|
| | Total Investments | | |
| | (cost $336,842,955) 100.1% | $390,908,511 | |
|
|
| Other Assets and Liabilities, | | |
| | Net (0.1%) | (328,064) | |
|
|
| | Total Net Assets 100.0% | $390,580,447 | |
|
|
# Non-income producing security.
Gross unrealized appreciation and depreciation of investments, based on cost for federal income tax purposes, were as follows:
| | |
| Gross unrealized appreciation | $53,640,547 | |
| Gross unrealized depreciation | (11,277) | |
|
| |
| Net unrealized appreciation (depreciation) | $53,629,270 | |
| Cost for federal income tax purposes | $337,279,241 | |
|
| The accompanying Notes to Financial Statements are an integral part of this schedule. |
|
| 64 |
| | | |
| Moderately Aggressive Allocation Fund |
| Schedule of Investments as of October 31, 2007 |
| |
| Shares | | Value | Percentage |
|
| Equity Funds (77.7%) | | |
| 2,001,571 | Thrivent Partner Small Cap Growth Fund | $28,021,999 | 3.0% |
| 1,014,385 | Thrivent Partner Small Cap Value Fund | 17,345,977 | 1.9 |
| 1,762,476 | Thrivent Small Cap Stock Fund # | 36,342,259 | 3.9 |
| 691,927 | Thrivent Mid Cap Growth Fund # | 14,516,628 | 1.6 |
| 997,962 | Thrivent Partner Mid Cap Value Fund | 12,943,571 | 1.4 |
| 1,868,758 | Thrivent Mid Cap Stock Fund | 35,768,035 | 3.9 |
| 8,134,917 | Thrivent Partner International Stock Fund | 131,867,007 | 14.2 |
| 22,556,473 | Thrivent Large Cap Growth Fund | 156,316,355 | 16.8 |
| 6,977,289 | Thrivent Large Cap Value Fund | 126,079,605 | 13.6 |
| 4,260,200 | Thrivent Large Cap Stock Fund | 134,579,715 | 14.5 |
| 2,108,912 | Thrivent Real Estate Securities Fund | 26,888,622 | 2.9 |
|
|
| | Total Equity Funds | | |
| | (cost $619,380,221) | 720,669,773 | |
|
|
| |
| Debt Funds (18.6%) | | |
| 3,460,948 | Thrivent High Yield Fund | 17,443,177 | 1.9 |
| 14,184,621 | Thrivent Income Fund | 120,427,429 | 12.9 |
| 2,806,533 | Thrivent Limited Maturity Bond Fund | 35,165,854 | 3.8 |
|
|
| | Total Debt Funds | | |
| | (cost $173,175,129) | 173,036,460 | |
|
|
| |
| Short-Term Investments (3.7%) | | |
| 34,776,744 | Thrivent Money Market Fund | 34,776,744 | 3.7 |
|
|
| Total Short-Term Investments | | |
| | (cost $34,776,744) | 34,776,744 | |
|
|
| | Total Investments | | |
| | (cost $827,332,094) 100.0% | $928,482,977 | |
|
|
| Other Assets and Liabilities, | | |
| | Net (0.0%) | (416,542) | |
|
|
| | Total Net Assets 100.0% | $928,066,435 | |
|
|
# Non-income producing security.
Gross unrealized appreciation and depreciation of investments, based on cost for federal income tax purposes, were as follows:
| | |
| Gross unrealized appreciation | $100,266,104 | |
| Gross unrealized depreciation | (184,399) | |
|
| |
| Net unrealized appreciation (depreciation) | $100,081,705 | |
| Cost for federal income tax purposes | $828,401,272 | |
|
| The accompanying Notes to Financial Statements are an integral part of this schedule. |
|
| 65 |
| | | |
| Moderate Allocation Fund |
| Schedule of Investments as of October 31, 2007 |
| |
| Shares | | Value | Percentage |
|
| Equity Funds (58.1%) | | |
| 909,883 | Thrivent Partner Small Cap Growth Fund | $12,738,369 | 1.5% |
| 460,466 | Thrivent Partner Small Cap Value Fund | 7,873,970 | 0.9 |
| 663,859 | Thrivent Small Cap Stock Fund # | 13,688,783 | 1.6 |
| 435,773 | Thrivent Mid Cap Growth Fund # | 9,142,524 | 1.0 |
| 629,362 | Thrivent Partner Mid Cap Value Fund | 8,162,829 | 0.9 |
| 1,325,260 | Thrivent Mid Cap Stock Fund | 25,365,467 | 2.9 |
| 5,492,884 | Thrivent Partner International Stock Fund | 89,039,652 | 10.2 |
| 18,073,384 | Thrivent Large Cap Growth Fund | 125,248,551 | 14.4 |
| 4,711,521 | Thrivent Large Cap Value Fund | 85,137,182 | 9.8 |
| 3,239,275 | Thrivent Large Cap Stock Fund | 102,328,711 | 11.7 |
| 2,156,704 | Thrivent Real Estate Securities Fund | 27,497,973 | 3.2 |
|
|
| | Total Equity Funds | | |
| | (cost $434,685,345) | 506,224,011 | |
|
|
| |
| Debt Funds (34.1%) | | |
| 3,357,053 | Thrivent High Yield Fund | 16,919,546 | 1.9 |
| 19,441,934 | Thrivent Income Fund | 165,062,022 | 18.9 |
| 9,235,008 | Thrivent Limited Maturity Bond Fund | 115,714,654 | 13.3 |
|
|
| | Total Debt Funds | | |
| | (cost $298,221,957) | 297,696,222 | |
|
|
| |
| Short-Term Investments (7.8%) | | |
| 67,606,196 | Thrivent Money Market Fund | 67,606,196 | 7.8 |
|
|
| Total Short-Term Investments | | |
| | (cost $67,606,196) | 67,606,196 | |
|
|
| | Total Investments | | |
| | (cost $800,513,498) 100.0% | $871,526,429 | |
|
|
| Other Assets and Liabilities, | | |
| | Net (0.0%) | (384,041) | |
|
|
| | Total Net Assets 100.0% | $871,142,388 | |
|
|
# Non-income producing security.
Gross unrealized appreciation and depreciation of investments, based on cost for federal income tax purposes, were as follows:
| | |
| Gross unrealized appreciation | $69,362,007 | |
| Gross unrealized depreciation | (693,466) | |
|
| |
| Net unrealized appreciation (depreciation) | $68,668,541 | |
| Cost for federal income tax purposes | $802,857,888 | |
|
| The accompanying Notes to Financial Statements are an integral part of this schedule. |
|
| 66 |
| | | |
| Moderately Conservative Allocation Fund |
| Schedule of Investments as of October 31, 2007 |
| |
| Shares | | Value | Percentage |
|
| Equity Funds (38.3%) | | |
| 458,799 | Thrivent Small Cap Stock Fund # | $9,460,435 | 3.0% |
| 321,973 | Thrivent Mid Cap Stock Fund | 6,162,563 | 2.0 |
| 1,199,354 | Thrivent Partner International Stock Fund | 19,441,529 | 6.2 |
| 4,474,339 | Thrivent Large Cap Growth Fund | 31,007,166 | 9.8 |
| 1,114,662 | Thrivent Large Cap Value Fund | 20,141,951 | 6.4 |
| 773,314 | Thrivent Large Cap Stock Fund | 24,428,984 | 7.7 |
| 779,481 | Thrivent Real Estate Securities Fund | 9,938,388 | 3.2 |
|
|
| | Total Equity Funds | | |
| | (cost $103,531,010) | 120,581,016 | |
|
|
| |
| Debt Funds (51.5%) | | |
| 1,276,026 | Thrivent High Yield Fund | 6,431,169 | 2.0 |
| 5,510,716 | Thrivent Income Fund | 46,785,979 | 14.8 |
| 8,731,554 | Thrivent Limited Maturity Bond Fund | 109,406,365 | 34.7 |
|
|
| | Total Debt Funds | | |
| | (cost $162,869,309) | 162,623,513 | |
|
|
| |
| Short-Term Investments (10.2%) | | |
| 32,162,304 | Thrivent Money Market Fund | 32,162,304 | 10.2 |
|
|
| Total Short-Term Investments | | |
| | (cost $32,162,304) | 32,162,304 | |
|
|
| | Total Investments | | |
| | (cost $298,562,623) 100.0% | $315,366,833 | |
|
|
| Other Assets and Liabilities, | | |
| | Net (0.0%) | (130,812) | |
|
|
| | Total Net Assets 100.0% | $315,236,021 | |
|
|
# Non-income producing security.
Gross unrealized appreciation and depreciation of investments, based on cost for federal income tax purposes, were as follows:
| | |
| Gross unrealized appreciation | $16,790,671 | |
| Gross unrealized depreciation | (269,641) | |
|
| |
| Net unrealized appreciation (depreciation) | $16,521,030 | |
| Cost for federal income tax purposes | $298,845,803 | |
|
| The accompanying Notes to Financial Statements are an integral part of this schedule. |
|
| 67 |
| | | | | | |
| Technology Fund |
| Schedule of Investments as of October 31, 2007 |
| |
| Shares | Common Stock (95.8%) | Value | | Shares | Common Stock (95.8%) | Value |
|
| Communications Equipment (24.2%) | | | IT Consulting & Services (3.3%) | |
| |
| |
| 100,500 | Cisco Systems, Inc. # | $3,322,530 | | 15,600 | Accenture, Ltd. | $609,180 |
| 46,400 | Corning, Inc. | 1,126,128 | | 23,000 | Cognizant Technology Solutions | |
| 26,000 | F5 Networks, Inc. # | 936,780 | | | Corporation # | 953,580 |
|
|
| 32,300 | Foundry Networks, Inc. # | 682,822 | | | Total IT Consulting | |
| 33,700 | JDS Uniphase Corporation # | 514,262 | | | & Services | 1,562,760 |
|
|
| 53,600 | Juniper Networks, Inc. # | 1,929,600 | | | | |
| 31,600 | Motorola, Inc. * | 593,764 | | Semiconductors & Semiconductor | |
| 40,850 | OpNext, Inc. # | 486,115 | | Equipment (13.4%) | |
| 40,500 | QUALCOMM, Inc. | 1,730,565 | | 28,700 | Broadcom Corporation # | 934,185 |
|
| | |
| | Total Communications | | | 42,300 | Integrated Device | |
| | Equipment | 11,322,566 | | | Technology, Inc. # | 568,089 |
|
| | |
| | | | | 75,900 | Intel Corporation | 2,041,710 |
| Computers & Peripherals (13.9%) | | | 24,000 | Intersil Corporation | 728,160 |
| 13,900 | Apple Computer, Inc. # | 2,640,305 | | 24,800 | Maxim Integrated Products, Inc. | 672,080 |
| 46,700 | Brocade Communications # | 444,117 | | 87,800 | PMC-Sierra, Inc. #* | 791,078 |
| 113,500 | EMC Corporation # | 2,881,765 | | 41,600 | Teradyne, Inc. # | 513,344 |
|
|
| 24,800 | Emulex Corporation # | 537,168 | | | Total Semiconductors & | |
|
| | |
| | Total Computers | | | | Semiconductor Equipment | 6,248,646 |
|
|
| | & Peripherals | 6,503,355 | | | | |
|
| | |
| | | | | Software (18.6%) | |
| Consumer Discretionary (1.3%) | | | 34,100 | Adobe Systems, Inc. # | 1,633,390 |
| 16,800 | Scientific Games Corporation #* | 607,320 | | 9,400 | Cognos, Inc. # | 473,102 |
|
| | |
| | Total Consumer | | | 24,200 | Commvault Systems, Inc. # | 492,228 |
| | Discretionary | 607,320 | | 112,300 | Compuware Corporation # | 1,123,000 |
|
| | |
| | | | | 14,800 | Fair Isaac Corporation | 561,216 |
| Financials (0.8%) | | | 63,400 | Lawson Software, Inc. # | 715,786 |
| 8,100 | Digital Realty Trust, Inc. | 356,319 | | 59,300 | Microsoft Corporation | 2,182,833 |
|
| | |
| | Total Financials | 356,319 | | 41,000 | Nuance Communications, Inc. #* | 906,510 |
|
| | |
| | | | | 64,600 | TIBCO Software, Inc. # | 593,028 |
|
|
| Health Care (4.6%) | | | | Total Software | 8,681,093 |
|
|
| 5,200 | Beckman Coulter, Inc. | 368,264 | | | | |
| 11,900 | NuVasive, Inc. # | 509,201 | | Telecommunications Services (2.7%) | |
| 7,500 | Shire Pharmaceuticals | | | 10,500 | America Movil SA de CV ADR | 686,595 |
| | Group plc ADR | 563,625 | | 9,500 | NII Holdings, Inc. # | 551,000 |
|
|
| 21,500 | Vertex Pharmaceuticals, Inc. # | 695,310 | | | Total Telecommunications | |
|
| | |
| | Total Health Care | 2,136,400 | | | Services | 1,237,595 |
|
| | |
|
| |
| Internet Software & Services (13.0%) | | | | Total Common Stock | |
| 24,200 | eBay, Inc. # | 873,620 | | | (cost $38,701,296) | 44,741,911 |
|
|
| 4,200 | Google, Inc. # | 2,969,400 | | | | |
| 29,300 | VeriSign, Inc. # | 998,837 | | | | |
| 40,000 | Yahoo!, Inc. # | 1,244,000 | | | | |
|
| | |
| | Total Internet | | | | | |
| | Software & Services | 6,085,857 | | | | |
|
| | |
|
| The accompanying Notes to Financial Statements are an integral part of this schedule. |
|
| 68 |
| | | | |
| Technology Fund | | | |
| Schedule of Investments as of October 31, 2007 | | | |
| |
| | | Interest | Maturity | |
| Shares | Collateral Held for Securities Loaned (6.4%) | Rate (+) | Date | Value |
|
| 3,005,900 | Thrivent Financial Securities Lending Trust | 5.050% | N/A | $3,005,900 |
|
|
| | Total Collateral Held for Securities Loaned | |
| | (cost $3,005,900) | | | 3,005,900 |
|
|
| |
| |
| | | Interest | Maturity | |
| Shares | Short-Term Investments (2.7%) | Rate (+) | Date | Value |
|
| 1,246,466 | Thrivent Money Market Fund | 5.020% | N/A | $1,246,466 |
|
|
| | Total Short-Term Investments (at amortized cost) | 1,246,466 |
|
|
| | Total Investments (cost $42,953,662) 104.9% | $48,994,277 |
|
|
| | Other Assets and Liabilities, Net (4.9%) | | (2,277,795) |
|
|
| | Total Net Assets 100.0% | | | $46,716,482 |
|
|
# Non-income producing security.
* All or a portion of the security is on loan as discussed in item 2(M) of the Notes to Financial Statements.
+ The interest rate shown reflects the yield, coupon rate or, for securities purchased at a discount, the discount rate at the date of purchase.
Definitions:
ADR — American Depository Receipts, which are certificates for shares of an underlying foreign security’s shares held by an issuing U.S. depository bank.
Gross unrealized appreciation and depreciation of investments, based on cost for federal income tax purposes, were as follows:
| | |
| Gross unrealized appreciation | $7,013,818 | |
| Gross unrealized depreciation | (1,268,955) | |
|
| |
| Net unrealized appreciation (depreciation) | $5,744,863 | |
| Cost for federal income tax purposes | $43,249,414 | |
|
| The accompanying Notes to Financial Statements are an integral part of this schedule. |
|
| 69 |
| | | | | | |
| Partner Small Cap Growth Fund |
| Schedule of Investments as of October 31, 2007 |
| |
| Shares | Common Stock (96.1%) | Value | | Shares | Common Stock (96.1%) | Value |
|
| Consumer Discretionary (11.4%) | | | 13,190 | Petrohawk Energy Corporation # | $244,015 |
| 22,705 | BJ’s Restaurants, Inc. #* | $449,332 | | 8,600 | Willbros Group, Inc. #* | 329,122 |
|
|
| 12,260 | Cooper Tire & Rubber Company | 273,153 | | | Total Energy | 5,304,797 |
|
|
| 9,560 | Fossil, Inc. # | 359,074 | | | | |
| 8,000 | Gmarket, Inc. ADR # | 216,400 | | Financials (9.8%) | |
| 13,400 | GSI Commerce, Inc. # | 381,766 | | 31,804 | Cohen & Steers, Inc. * | 1,195,830 |
| 8,780 | Iconix Brand Group, Inc. #* | 200,623 | | 18,720 | DiamondRock Hospitality | |
| 16,090 | Interactive Data Corporation | 517,133 | | | Company * | 358,675 |
| 7,580 | J. Crew Group, Inc. # | 283,492 | | 11,280 | Digital Realty Trust, Inc. | 496,207 |
| 8,060 | Life Time Fitness, Inc. #* | 488,758 | | 11,410 | Frontier Financial Corporation * | 253,188 |
| 7,010 | LKQ Corporation # | 270,306 | | 11,915 | GFI Group, Inc. #* | 1,028,503 |
| 4,630 | McCormick & Schmick’s Seafood | | | 17,349 | Greenhill & Company, Inc. * | 1,283,479 |
| | Restaurants, Inc. # | 78,617 | | 8,750 | Investment Technology | |
| 3,380 | New Oriental Education & | | | | Group, Inc. # | 366,625 |
| | Technology Group, Inc. ADR # | 302,578 | | 19,331 | KBW, Inc. #* | 585,536 |
| 5,110 | Priceline.com, Inc. #* | 475,741 | | 21,323 | Signature Bank # | 728,180 |
| 6,760 | Red Robin Gourmet Burgers, Inc. # | 270,535 | | 26,915 | Texas Capital Bancshares, Inc. # | 595,629 |
| 79,903 | Shuffle Master, Inc. #* | 1,093,073 | | 28,600 | Thomas Weisel Partners | |
| 7,180 | Sotheby’s Holdings, Inc. * | 388,941 | | | Group, Inc. #* | 455,026 |
| 990 | Strayer Education, Inc. | 184,595 | | 14,900 | Waddell & Reed Financial, Inc. | 494,978 |
|
|
| 7,180 | Tempur-Pedic International * | 258,480 | | | Total Financials | 7,841,856 |
|
|
| 27,887 | Tractor Supply Company #* | 1,155,637 | | | | |
| 5,380 | Under Armour, Inc. #* | 334,905 | | Health Care (20.3%) | |
| 4,340 | Volcom, Inc. #* | 126,945 | | 9,920 | Alexion Pharmaceuticals, Inc. #* | 758,880 |
| 16,410 | WMS Industries, Inc. # | 568,935 | | 75,594 | American Medical Systems | |
| 9,590 | Zumiez, Inc. #* | 401,437 | | | Holdings, Inc. #* | 966,847 |
|
| | |
| | Total Consumer | | | 6,760 | AMERIGROUP Corporation # | 236,600 |
| | Discretionary | 9,080,456 | | 14,070 | Array Biopharma, Inc. # | 157,584 |
|
| | |
| | | | | 12,233 | ArthroCare Corporation # | 793,188 |
| Consumer Staples (1.6%) | | | 16,190 | BioMarin Pharmaceutical, Inc. # | 448,949 |
| 7,585 | Bare Escentuals, Inc. #* | 187,350 | | 6,920 | Cepheid, Inc. # | 179,090 |
| 4,840 | Central European Distribution | | | 4,220 | Chemed Corporation | 241,890 |
| | Corporation # | 257,391 | | 12,664 | HealthExtras, Inc. # | 369,029 |
| 6,740 | Chattem, Inc. #* | 500,782 | | 3,800 | Healthways, Inc. #* | 230,660 |
| 16,535 | Flowers Foods, Inc. | 362,778 | | 7,360 | Hologic, Inc. #* | 499,965 |
|
| | |
| | Total Consumer Staples | 1,308,301 | | 5,430 | ICON plc ADR # | 314,940 |
|
| | |
| | | | | 16,025 | Illumina, Inc. #* | 899,804 |
| Energy (6.6%) | | | 14,200 | Immucor, Inc. # | 457,950 |
| 8,560 | Alon USA Energy, Inc. | 314,751 | | 14,459 | Integra LifeSciences Holdings | |
| 8,420 | Arena Resources, Inc. #* | 307,414 | | | Corporation #* | 700,828 |
| 37,795 | Cal Dive International, Inc. #* | 500,028 | | 6,850 | InterMune, Inc. # | 136,452 |
| 13,330 | Concho Resources, Inc. # | 259,802 | | 8,090 | inVentiv Health, Inc. # | 341,641 |
| 3,110 | Core Laboratories NV # | 453,873 | | 28,540 | Inverness Medical | |
| 2,650 | Dawson Geophysical Company # | 211,496 | | | Innovations, Inc. #* | 1,714,969 |
| 34,216 | Dril-Quip, Inc. # | 1,824,739 | | 13,410 | K-V Pharmaceutical Company # | 420,269 |
| 7,472 | Lufkin Industries, Inc. | 444,285 | | 3,300 | Kyphon, Inc. # | 233,904 |
| 9,615 | Oil States International, Inc. # | 415,272 | | 30,541 | Mentor Corporation * | 1,300,130 |
|
| The accompanying Notes to Financial Statements are an integral part of this schedule. |
|
| 70 |
| | | | | | |
| Partner Small Cap Growth Fund | | | | | |
| Schedule of Investments as of October 31, 2007 | | | | | |
| |
| |
| Shares | Common Stock (96.1%) | Value | | Shares | Common Stock (96.1%) | Value |
|
| Health Care — continued | | | Information Technology (25.4%) | |
| 11,732 | Meridian Bioscience, Inc. | $388,195 | | 5,040 | Advent Software, Inc. #* | $278,863 |
| 8,670 | MGI Pharma, Inc. # | 282,469 | | 9,580 | Anadigics, Inc. #* | 141,305 |
| 23,697 | NuVasive, Inc. # | 1,013,995 | | 6,910 | ANSYS, Inc. #* | 268,177 |
| 6,900 | Onyx Pharmaceuticals, Inc. # | 322,299 | | 7,170 | Atheros Communications, Inc. # | 251,667 |
| 10,440 | PAREXEL International | | | 24,863 | Avocent Corporation # | 672,047 |
| | Corporation # | 480,240 | | 9,940 | Blackboard, Inc. # | 496,006 |
| 13,290 | Perrigo Company | 315,106 | | 16,830 | Brightpoint, Inc. #* | 272,646 |
| 8,230 | Progenics Pharmaceuticals, Inc. #* | 190,607 | | 13,340 | Cavium Networks, Inc. #* | 387,927 |
| 7,500 | Sunrise Senior Living, Inc. #* | 277,500 | | 23,299 | Coherent, Inc. # | 764,207 |
| 8,980 | TomoTherapy, Inc. # | 196,393 | | 6,590 | Comscore, Inc. # | 241,589 |
| 50,354 | Trizetto Group, Inc. # | 822,784 | | 16,730 | Comtech Group, Inc. # | 359,862 |
| 4,940 | United Therapeutics | | | 17,840 | Concur Technologies, Inc. # | 642,954 |
| | Corporation #* | 338,094 | | 7,470 | Constant Contact, Inc. #* | 186,003 |
| 4,600 | Xenoport, Inc. # | 225,768 | | 9,310 | Data Domain, Inc. #* | 321,381 |
|
| | |
| | Total Health Care | 16,257,019 | | 9,585 | Double-Take Software, Inc. # | 228,411 |
|
| | |
| | | | | 39,376 | Euronet Worldwide, Inc. #* | 1,261,213 |
| Industrials (15.6%) | | | 6,610 | Faro Technologies, Inc. # | 190,104 |
| 34,259 | AAR Corporation # | 1,098,001 | | 7,020 | FLIR Systems, Inc. #* | 487,118 |
| 8,600 | Actuant Corporation * | 593,228 | | 6,050 | FormFactor, Inc. # | 236,616 |
| 7,480 | Aecom Technology Corporation # | 252,600 | | 27,600 | Foundry Networks, Inc. # | 583,464 |
| 2,430 | Bucyrus International, Inc. | 200,475 | | 17,514 | Harris Stratex Networks, Inc. # | 334,868 |
| 30,553 | CoStar Group, Inc. # | 1,756,798 | | 7,300 | Heartland Payment Systems, Inc. * | 219,000 |
| 17,743 | CRA International, Inc. # | 918,733 | | 71,793 | Informatica Corporation # | 1,226,224 |
| 21,243 | Forward Air Corporation | 693,159 | | 46,402 | Intermec, Inc. #* | 1,179,539 |
| | | | | 3,450 | Itron, Inc. # | 370,840 |
| 7,370 | FTI Consulting, Inc. # | 400,191 | | | | |
| | | | | 9,450 | Jack Henry & Associates, Inc. | 276,129 |
| 17,687 | Gardner Denver, Inc. # | 639,031 | | | | |
| | | | | 21,640 | MasTec, Inc. # | 341,696 |
| 2,700 | Grupo Aeroportuario del Sureste | | | | | |
| | | | | 18,910 | Mentor Graphics Corporation # | 302,938 |
| | SAB de CV ADR | 161,028 | | | | |
| | | | | 6,740 | MICROS Systems, Inc. # | 484,067 |
| 7,910 | Horizon Lines, Inc. | 248,849 | | | | |
| | | | | 13,090 | Net 1 UEPS Technology, Inc. #* | 419,142 |
| 5,830 | Huron Consulting Group, Inc. # | 407,400 | | | | |
| | | | | 4,780 | Nuance Communications, Inc. # | 105,686 |
| 9,710 | IDEX Corporation | 343,928 | | | | |
| | | | | 32,250 | Omniture, Inc. #* | 1,101,660 |
| 7,400 | JA Solar Holdings Company, | | | | | |
| | | | | 8,110 | ON Semiconductor Corporation # | 82,722 |
| | Ltd. ADR #* | 426,240 | | | | |
| | | | | 29,619 | Perficient, Inc. # | 558,318 |
| 20,432 | Ladish Company, Inc. # | 937,624 | | | | |
| | | | | 6,220 | Quality Systems, Inc. * | 225,351 |
| 10,640 | Orbital Sciences Corporation # | 271,639 | | | | |
| | | | | 24,430 | Semtech Corporation # | 417,997 |
| 5,690 | Perini Corporation # | 326,322 | | | | |
| | | | | 8,050 | Silicon Laboratories, Inc. # | 351,785 |
| 25,003 | Polypore International, Inc. # | 429,051 | | | | |
| | | | | 5,510 | Synchronoss Technologies, Inc. #* | 220,400 |
| 4,900 | RBC Bearings, Inc. # | 196,931 | | | | |
| | | | | 13,840 | Take-Two Interactive | |
| 2,780 | Robbins & Myers, Inc. | 200,994 | | | | |
| | | | | | Software, Inc. #* | 259,915 |
| 8,670 | The Geo Group, Inc. # | 274,232 | | 5,700 | Ultimate Software Group, Inc. # | 196,707 |
| 4,700 | TransDigm Group, Inc. # | 213,944 | | 80,184 | ValueClick, Inc. # | 2,180,201 |
| 4,810 | Triumph Group, Inc. | 382,972 | | 27,791 | Veraz Networks, Inc. #* | 222,884 |
| 9,070 | Wabtec Corporation | 340,397 | | 17,051 | ViaSat, Inc. # | 520,056 |
| 11,370 | Waste Connections, Inc. # | 384,420 | | 9,870 | VistaPrint, Ltd. #* | 469,516 |
|
|
| 5,970 | Woodward Governor Company * | 399,990 | | | Total Information | |
|
| | |
| | Total Industrials | 12,498,177 | | | Technology | 20,339,201 |
|
| | |
|
|
| The accompanying Notes to Financial Statements are an integral part of this schedule. |
|
| 71 |
| | | | | | |
| Partner Small Cap Growth Fund | | | | | |
| Schedule of Investments as of October 31, 2007 | | | | | |
| |
| |
| Shares | Common Stock (96.1%) | Value | | Shares | Common Stock (96.1%) | Value |
|
| Materials (2.9%) | | | Telecommunications Services (2.0%) | |
| 7,590 | Century Aluminum Company # | $441,662 | | 33,581 | NeuStar, Inc. # | $1,148,470 |
| 4,990 | Greif, Inc. | 317,364 | | 18,450 | Time Warner Telecom, Inc. # | 428,778 |
|
|
| 13,070 | H.B. Fuller Company | 384,650 | | | Total Telecommunications | |
| 7,200 | Silgan Holdings, Inc. | 392,904 | | | Services | 1,577,248 |
|
|
| 11,970 | Terra Industries, Inc. # | 441,573 | | | | |
| 7,630 | Zoltek Companies, Inc. #* | 337,628 | | Utilities (0.5%) | |
|
| | |
| | Total Materials | 2,315,781 | | 6,500 | ITC Holdings Corporation | 372,060 |
|
| | |
|
| | | | | | Total Utilities | 372,060 |
|
|
| |
| | | | | | Total Common Stock | |
| | | | | | (cost $66,751,643) | 76,894,896 |
|
|
| | | | |
| | | Interest | Maturity | |
| Shares | Collateral Held for Securities Loaned (32.1%) | Rate (+) | Date | Value |
|
| 25,651,383 | Thrivent Financial Securities Lending Trust | 5.050% | N/A | $25,651,383 |
|
|
| | Total Collateral Held for Securities Loaned | |
| | (cost $25,651,383) | | | 25,651,383 |
|
|
| |
| |
| Shares or | | | | |
| Principal | | Interest | Maturity | |
| Amount | Short-Term Investments (3.7%) | Rate (+) | Date | Value |
|
| $1,785,000 | Federal Home Loan Bank | 4.401% | 11/1/2007 | $1,785,000 |
| 1,200,706 | Thrivent Money Market Fund | 5.020 | N/A | 1,200,706 |
|
|
| | Total Short-Term Investments (at amortized cost) | 2,985,706 |
|
|
| | Total Investments (cost $95,388,732) 131.9% | $105,531,985 |
|
|
| | Other Assets and Liabilities, Net (31.9%) | | (25,542,215) |
|
|
| | Total Net Assets 100.0% | | | $79,989,770 |
|
|
# Non-income producing security.
* All or a portion of the security is on loan as discussed in item 2(M) of the Notes to Financial Statements.
+ The interest rate shown reflects the yield, coupon rate or, for securities purchased at a discount, the discount rate at the date of purchase.
Definitions:
ADR — American Depository Receipts, which are certificates for shares of an underlying foreign security’s shares held by an issuing U.S. depository bank.
Gross unrealized appreciation and depreciation of investments, based on cost for federal income tax purposes, were as follows:
| | |
| Gross unrealized appreciation | $12,319,942 | |
| Gross unrealized depreciation | (2,536,515) | |
|
| |
| Net unrealized appreciation (depreciation) | $9,783,427 | |
| Cost for federal income tax purposes | $95,748,558 | |
|
| The accompanying Notes to Financial Statements are an integral part of this schedule. |
|
| 72 |
| | | | | | |
| Partner Small Cap Value Fund |
| Schedule of Investments as of October 31, 2007 |
| |
| Shares | Common Stock (97.0%) | Value | | Shares | Common Stock (97.0%) | Value |
|
| Consumer Discretionary (9.9%) | | | 32,700 | W-H Energy Services, Inc. # | $1,882,212 |
| 74,600 | Aaron Rents, Inc. | $1,580,028 | | 36,900 | Whiting Petroleum | |
| 48,500 | Building Materials Holding | | | | Corporation # | 1,994,814 |
|
|
| | Corporation * | 381,210 | | | Total Energy | 11,888,120 |
|
|
| 29,300 | Cavco Industries, Inc. # | 1,151,783 | | | | |
| 17,300 | Courier Corporation | 653,767 | | Financials (18.9%) | |
| 28,200 | CSS Industries, Inc. | 1,116,720 | | 65,900 | Ares Capital Corporation * | 1,096,576 |
| 51,100 | Dixie Group, Inc. # | 500,780 | | 29,100 | Boston Private Financial | |
| 31,000 | Dorman Products, Inc. # | 436,480 | | | Holdings, Inc. * | 836,916 |
| 10,400 | Drew Industries, Inc. # | 411,632 | | 93,700 | Cedar Shopping Centers, Inc. | 1,204,045 |
| 39,100 | Fred’s, Inc. | 414,460 | | 36,800 | Compass Diversified Trust | 592,848 |
| 17,000 | Fuel Systems Solutions, Inc. # | 319,770 | | 32,400 | East West Bancorp, Inc. | 1,093,176 |
| 68,100 | Haverty Furniture | | | 7,600 | Employers Holdings, Inc. | 145,616 |
| | Companies, Inc. * | 578,850 | | 58,700 | First Financial Fund, Inc. | 723,184 |
| 51,100 | Journal Register Company * | 114,975 | | 39,600 | Glacier Bancorp, Inc. * | 805,464 |
| 28,700 | M/I Homes, Inc. * | 476,420 | | 51,600 | Hercules Technology Growth | |
| 24,100 | Matthews International | | | | Capital, Inc. * | 662,028 |
| | Corporation | 1,098,237 | | 26,500 | Home Bancshares, Inc. * | 564,980 |
| 19,500 | Meritage Homes Corporation #* | 313,755 | | 54,500 | Kohlberg Capital Corporation | 701,960 |
| 5,600 | Orient Express Hotels, Ltd. | 362,880 | | 34,000 | LaSalle Hotel Properties * | 1,404,880 |
| 81,000 | Regent Communications, Inc. # | 186,300 | | 2,200 | Markel Corporation # | 1,195,084 |
| 25,800 | Ruby Tuesday, Inc. * | 412,026 | | 49,600 | Max Re Capital, Ltd. * | 1,403,184 |
| 49,900 | Saga Communications, Inc. # | 364,270 | | 1 | Merrill Lynch & Company, Inc. | 23 |
| 58,000 | Shiloh Industries, Inc. | 609,580 | | 23,500 | Midland Company | 1,495,070 |
| 35,500 | Stanley Furniture Company, Inc. * | 484,930 | | 38,000 | National Health Realty, Inc. | 817,000 |
| 40,900 | Steak n Shake Company #* | 619,635 | | 20,000 | National Interstate Corporation | 640,000 |
| 83,900 | Stein Mart, Inc. * | 551,223 | | 25,700 | Parkway Properties, Inc. | 1,105,100 |
| 44,800 | Winnebago Industries, Inc. * | 1,154,944 | | 11,300 | Piper Jaffray Companies # | 580,820 |
|
| | |
| | Total Consumer | | | 33,400 | Potlatch Corporation * | 1,591,844 |
| | Discretionary | 14,294,655 | | 45,000 | ProAssurance Corporation # | 2,481,300 |
|
| | | |
| | | | | 51,800 | ProCentury Corporation | 770,266 |
| Consumer Staples (2.2%) | | | 30,800 | Sandy Spring Bancorp, Inc. * | 915,376 |
| 103,200 | Alliance One International, Inc. # | 673,896 | | 32,700 | Seabright Insurance Holdings # | 545,436 |
| 26,000 | Casey’s General Stores, Inc. | 741,000 | | 28,400 | Strategic Hotel Capital, Inc. * | 620,256 |
| 32,100 | Nash Finch Company * | 1,202,145 | | 27,300 | SVB Financial Group # | 1,413,867 |
| 23,600 | Winn-Dixie Stores, Inc. #* | 557,904 | | 24,300 | Washington Real Estate | |
|
| | |
| | Total Consumer Staples | 3,174,945 | | | Investment Trust * | 855,846 |
|
| | |
| | | | | 25,200 | Wintrust Financial Corporation * | 925,848 |
|
|
| Energy (8.3%) | | | | Total Financials | 27,187,993 |
|
|
| 15,800 | Atwood Oceanics, Inc. # | 1,330,992 | | | | |
| 16,500 | Carbo Ceramics, Inc. * | 741,180 | | Health Care (5.8%) | |
| 41,800 | Forest Oil Corporation #* | 2,031,062 | | 10,100 | Analogic Corporation | 577,215 |
| 54,100 | Geomet, Inc. #* | 284,025 | | 48,300 | Capital Senior Living | |
| 33,000 | Hercules Offshore, Inc. #* | 892,320 | | | Corporation # | 431,802 |
| 75,000 | Mariner Energy, Inc. # | 1,875,000 | | 77,000 | Momenta Pharmaceuticals, Inc. #* | 1,001,770 |
| 43,500 | TETRA Technologies, Inc. # | 856,515 | | 15,300 | Myriad Genetics, Inc. #* | 847,008 |
|
| The accompanying Notes to Financial Statements are an integral part of this schedule. |
|
| 73 |
| | | | | | |
| Partner Small Cap Value Fund | | | | | |
| Schedule of Investments as of October 31, 2007 | | | | | |
| |
| |
| Shares | Common Stock (97.0%) | Value | | Shares | Common Stock (97.0%) | Value |
|
| Health Care — continued | | | Information Technology (9.7%) | |
| 21,300 | National Healthcare | | | 48,100 | Advanced Energy | |
| | Corporation * | $1,060,740 | | | Industries, Inc. # | $769,600 |
| 50,200 | Owens & Minor, Inc. | 2,035,108 | | 18,000 | ATMI, Inc. # | 578,520 |
| 145,000 | Panacos Pharmaceuticals, Inc. #* | 362,500 | | 62,879 | Brooks Automation, Inc. # | 816,169 |
| 22,500 | Pharmion Corporation # | 1,082,700 | | 52,100 | Catapult Communications | |
| 23,400 | West Pharmaceutical | | | | Corporation #* | 387,103 |
| | Services, Inc. * | 967,356 | | 88,100 | GSI Group, Inc. # | 828,140 |
|
| | |
| | Total Health Care | 8,366,199 | | 148,600 | LookSmart, Ltd. # | 374,472 |
|
| | |
| | | | | 21,700 | Methode Electronics, Inc. | 272,118 |
| Industrials (24.6%) | | | 111,000 | MPS Group, Inc. # | 1,355,310 |
| 45,400 | Accuride Corporation # | 463,080 | | 54,500 | Nextest Systems Corporation # | 735,205 |
| 17,600 | Ameron International | | | 62,000 | Palm, Inc. * | 559,240 |
| | Corporation | 1,898,512 | | 45,400 | Progress Software Corporation # | 1,485,034 |
| 65,500 | Beacon Roofing Supply, Inc. #* | 588,845 | | 216,000 | Safeguard Scientifics, Inc. #* | 507,600 |
| 34,700 | Belden, Inc. * | 2,021,969 | | 31,800 | SPSS, Inc. # | 1,208,400 |
| 63,000 | Builders Firstsource, Inc. #* | 456,750 | | 46,800 | StarTek, Inc. | 503,100 |
| 41,600 | C&D Technologies, Inc. #* | 200,512 | | 68,700 | TNS, Inc. | 1,109,505 |
| 11,400 | Cascade Corporation | 717,972 | | 73,400 | Wind River Systems, Inc. # | 918,234 |
| 29,900 | Circor International, Inc. | 1,501,877 | | 37,900 | Xyratex, Ltd. # | 647,332 |
| 43,000 | Dollar Thrifty Automotive | | | 300,400 | Zarlink Semiconductor, Inc. #* | 387,516 |
| | Group, Inc. # | 1,483,500 | | 46,300 | Zygo Corporation # | 544,488 |
|
|
| 10,500 | EDO Corporation * | 609,000 | | | Total Information | |
| 59,500 | Electro Rent Corporation | 860,370 | | | Technology | 13,987,086 |
|
|
| 21,300 | Franklin Electric Company, Inc. * | 928,041 | | | | |
| 33,200 | FTI Consulting, Inc. #* | 1,802,760 | | Materials (11.2%) | |
| 30,800 | G & K Services, Inc. | 1,248,632 | | 30,300 | Airgas, Inc. | 1,529,241 |
| 51,100 | Genesee & Wyoming, Inc. # | 1,498,252 | | 45,300 | American Vanguard | |
| 20,000 | Genlyte Group, Inc. # | 1,302,000 | | | Corporation * | 804,981 |
| 49,700 | Gibraltar Industries, Inc. | 895,594 | | 50,900 | AptarGroup, Inc. | 2,275,230 |
| 54,500 | Hub Group, Inc. # | 1,382,665 | | 27,700 | Arch Chemicals, Inc. | 1,263,674 |
| 37,650 | IDEX Corporation | 1,333,563 | | 16,100 | Carpenter Technology | |
| 45,400 | Insituform Technologies, Inc. #* | 638,324 | | | Corporation | 2,333,051 |
| 48,300 | Kirby Corporation # | 2,206,344 | | 21,400 | Chesapeake Corporation | 158,574 |
| 16,100 | LSI Industries, Inc. | 304,290 | | 8,700 | Deltic Timber Corporation | 486,504 |
| 51,500 | McGrath Rentcorp | 1,765,420 | | 22,600 | Florida Rock Industries, Inc. | 1,422,218 |
| 33,700 | Nordson Corporation | 1,802,950 | | 31,000 | Innospec, Inc. | 659,990 |
| 21,500 | School Specialty, Inc. # | 725,625 | | 44,800 | Metal Management, Inc. | 2,355,136 |
| 44,400 | Sterling Construction | | | 14,700 | Minerals Technologies, Inc. | 1,032,234 |
| | Company, Inc. # | 1,103,784 | | 54,100 | Myers Industries, Inc. | 1,146,379 |
| 23,200 | Universal Forest Products, Inc. | 830,792 | | 55,300 | Wausau-Mosinee Paper | |
| 87,300 | Vitran Corporation, Inc. # | 1,220,454 | | | Corporation | 553,553 |
|
|
| 36,600 | Waste Connections, Inc. # | 1,237,446 | | | Total Materials | 16,020,765 |
|
|
| 33,600 | Woodward Governor Company * | 2,251,200 | | | | |
|
| | |
| | Total Industrials | 35,280,523 | | | | |
|
| | |
|
| The accompanying Notes to Financial Statements are an integral part of this schedule. |
|
| 74 |
| | | | | | |
| Partner Small Cap Value Fund | | | | | |
| Schedule of Investments as of October 31, 2007 | | | | | |
| |
| |
| Shares | Common Stock (97.0%) | Value | | Shares | Common Stock (97.0%) | Value |
|
| Telecommunications Services (1.3%) | | | 39,700 | El Paso Electric Company #* | $966,695 |
| 111,000 | Kratos Defense & Security | | | 16,500 | Empire District Electric | |
| | Solutions, Inc. # | $300,810 | | | Company * | 396,825 |
| 93,700 | Premiere Global Services, Inc. # | 1,544,176 | | 40,100 | Southwest Gas Corporation | 1,193,376 |
| |
| | |
| | Total Telecommunications | | | 31,200 | UniSource Energy Corporation | 989,664 |
| | Services | 1,844,986 | | 30,100 | Vectren Corporation | 844,004 |
|
| | |
|
| | | | | | Total Utilities | 7,368,013 |
|
|
| Utilities (5.1%) | | | | | |
|
|
| 34,700 | Black Hills Corporation * | 1,541,374 | | | Total Common Stock | |
| 54,500 | Cleco Corporation * | 1,436,075 | | | (cost $115,342,120) | 139,413,285 |
|
|
| | | | |
| | | Interest | Maturity | |
| Shares | Collateral Held for Securities Loaned (27.1%) | Rate (+) | Date | Value |
|
| 38,943,138 | Thrivent Financial Securities Lending Trust | 5.050% | N/A | $38,943,138 |
|
|
| | Total Collateral Held for Securities Loaned | |
| | (cost $38,943,138) | | | 38,943,138 |
|
|
| |
| |
| | | Interest | Maturity | |
| Shares | Short-Term Investments (2.9%) | Rate (+) | Date | Value |
|
| 4,123,694 | Thrivent Money Market Fund | 5.020% | N/A | $4,123,694 |
|
|
| | Total Short-Term Investments (at amortized cost) | 4,123,694 |
|
|
| | Total Investments (cost $158,408,952) 127.0% | $182,480,117 |
|
|
| | Other Assets and Liabilities, Net (27.0%) | | (38,753,111) |
|
|
| | Total Net Assets 100.0% | | | $143,727,006 |
|
|
# Non-income producing security.
* All or a portion of the security is on loan as discussed in item 2(M) of the Notes to Financial Statements.
+ The interest rate shown reflects the yield, coupon rate or, for securities purchased at a discount, the discount rate at the date of purchase.
Gross unrealized appreciation and depreciation of investments, based on cost for federal income tax purposes, were as follows:
| | |
| Gross unrealized appreciation | $36,297,252 | |
| Gross unrealized depreciation | (12,538,100) | |
|
| |
| Net unrealized appreciation (depreciation) | $23,579,152 | |
| Cost for federal income tax purposes | $158,720,965 | |
|
| The accompanying Notes to Financial Statements are an integral part of this schedule. |
|
| 75 |
| | | | | | |
| Small Cap Stock Fund |
| Schedule of Investments as of October 31, 2007 |
| |
| Shares | Common Stock (94.9%) | Value | | Shares | Common Stock (94.9%) | Value |
|
| Consumer Discretionary (10.7%) | | | 13,000 | Ralcorp Holdings, Inc. # | $731,900 |
| 79,700 | Aeropostale, Inc. #± | $1,825,130 | | 40,600 | United Natural Foods, Inc. # | 1,174,964 |
|
|
| 28,700 | Aftermarket Technology | | | | Total Consumer Staples | 30,828,749 |
|
|
| | Corporation # | 990,724 | | | | |
| 62,800 | Burger King Holdings, Inc. | 1,660,432 | | Energy (4.3%) | |
| 18,200 | Capella Education Company # | 1,128,400 | | 64,200 | Arena Resources, Inc. #* | 2,343,942 |
| 26,600 | Chipotle Mexican Grill, Inc. # | 3,280,312 | | 214,200 | Brigham Exploration Company #* | 1,578,654 |
| 47,800 | Crocs, Inc. #* | 3,573,050 | | 30,500 | Denbury Resources, Inc. #* | 1,726,300 |
| 8,200 | Desarrolladora Homex ADR # | 463,382 | | 78,200 | Input/Output, Inc. #* | 1,184,730 |
| 37,200 | DeVry, Inc. | 2,034,468 | | 31,700 | Oil States International, Inc. # | 1,369,123 |
| 85,800 | DreamWorks Animation | | | 41,200 | Penn Virginia Corporation | 1,994,080 |
| | SKG, Inc. # | 2,793,648 | | 167,062 | Petrohawk Energy Corporation # | 3,090,647 |
| 44,900 | Fossil, Inc. # | 1,686,444 | | 57,500 | Petroleum Development | |
| 126,300 | Fuqi International, Inc. # | 1,040,712 | | | Corporation # | 2,611,650 |
| 63,000 | GameStop Corporation # | 3,730,860 | | 39,828 | Range Resources Corporation | 1,789,472 |
| 64,700 | Hasbro, Inc. * | 1,931,295 | | 39,800 | Southwestern Energy Company # | 2,058,854 |
| 16,800 | ITT Educational Services, Inc. # | 2,136,792 | | 58,800 | Tesco Corporation # | 1,734,012 |
| 52,700 | Jack in the Box, Inc. # | 1,653,199 | | 68,500 | Willbros Group, Inc. #* | 2,621,495 |
|
|
| 34,600 | Life Time Fitness, Inc. #* | 2,098,144 | | | Total Energy | 24,102,959 |
|
|
| 53,900 | Men’s Wearhouse, Inc. | 2,277,814 | | | | |
| 55,000 | Meredith Corporation | 3,423,750 | | Financials (16.6%) | |
| 40,700 | Red Robin Gourmet | | | 24,150 | Affiliated Managers | |
| | Burgers, Inc. #* | 1,628,814 | | | Group, Inc. #* | 3,176,932 |
| 74,000 | Regal Entertainment Group | 1,670,180 | | 77,100 | Assured Guaranty, Ltd. | 1,778,697 |
| 92,800 | Scientific Games Corporation #* | 3,354,720 | | 31,400 | Bank of Hawaii Corporation * | 1,669,224 |
| 158,600 | Texas Roadhouse, Inc. # | 2,009,462 | | 57,300 | BioMed Realty Trust, Inc. | 1,368,897 |
| 31,400 | Vail Resorts, Inc. #* | 1,905,666 | | 28,011 | BOK Financial Corporation | 1,527,720 |
| 76,800 | Warnaco Group, Inc. # | 3,124,992 | | 15,500 | Cash America International, Inc. | 604,500 |
| 173,300 | WMS Industries, Inc. #* | 6,008,311 | | 70,900 | CastlePoint Holdings, Ltd. * | 825,985 |
| 114,400 | Wolverine World Wide, Inc. | 2,933,216 | | 25,700 | Cullen/Frost Bankers, Inc. | 1,366,726 |
|
| | |
| | Total Consumer | | | 78,700 | Delphi Financial Group, Inc. | 3,049,625 |
| | Discretionary | 60,363,917 | | 26,000 | Digital Realty Trust, Inc. * | 1,143,740 |
|
| | |
| | | | | 32,200 | East West Bancorp, Inc. | 1,086,428 |
| Consumer Staples (5.4%) | | | 77,300 | Endurance Specialty | |
| 137,800 | Calavo Growers, Inc. | 3,170,778 | | | Holdings, Ltd. | 3,030,933 |
| 180,000 | Casey’s General Stores, Inc. | 5,130,000 | | 82,600 | Equity One, Inc. | 2,162,468 |
| 96,600 | Central European Distribution | | | 57,100 | FCStone Group, Inc. #* | 2,012,775 |
| | Corporation #* | 5,137,188 | | 88,200 | First Cash Financial | |
| 41,900 | Chattem, Inc. #* | 3,113,170 | | | Services, Inc. # | 1,734,012 |
| 16,600 | Church & Dwight Company, Inc. | 785,346 | | 24,800 | First Community Bancorp, Inc. | 1,207,760 |
| 50,700 | Corn Products International, Inc. | 2,156,778 | | 48,200 | First Midwest Bancorp, Inc. * | 1,623,376 |
| 112,300 | Elizabeth Arden, Inc. # | 2,796,270 | | 86,350 | HCC Insurance Holdings, Inc. | 2,581,002 |
| 115,150 | Flowers Foods, Inc. * | 2,526,391 | | 24,700 | Hilb, Rogal and Hobbs Company * | 1,088,529 |
| 67,400 | Longs Drug Stores Corporation | 3,539,174 | | 170,300 | Investors Real Estate Trust * | 1,847,755 |
| 21,000 | Performance Food | | | 55,700 | iShares Russell Microcap | |
| | Group Company # | 566,790 | | | Index Fund * | 3,243,411 |
|
| The accompanying Notes to Financial Statements are an integral part of this schedule. |
|
| 76 |
| | | | | | |
| Small Cap Stock Fund | | | | | |
| Schedule of Investments as of October 31, 2007 | | | | | |
| |
| |
| Shares | Common Stock (94.9%) | Value | | Shares | Common Stock (94.9%) | Value |
|
| Financials — continued | | | 58,500 | Hansen Medical, Inc. #* | $2,273,895 |
| 57,200 | Jefferies Group, Inc. | $1,528,956 | | 71,300 | HealthExtras, Inc. # | 2,077,682 |
| 111,300 | Lexington Corporate | | | 33,400 | Healthways, Inc. #* | 2,027,380 |
| | Properties Trust * | 2,202,627 | | 19,688 | Hologic, Inc. #* | 1,337,406 |
| 33,900 | National Financial Partners | | | 74,400 | inVentiv Health, Inc. # | 3,141,912 |
| | Corporation | 1,853,313 | | 18,600 | Inverness Medical | |
| 99,300 | National Retail Properties, Inc. | 2,517,255 | | | Innovations, Inc. # | 1,117,674 |
| 86,900 | Nationwide Health | | | 28,400 | Invitrogen Corporation #* | 2,580,708 |
| | Properties, Inc. * | 2,713,018 | | 26,100 | Kendle International, Inc. #* | 1,052,613 |
| 73,100 | Philadelphia Consolidated | | | 74,900 | K-V Pharmaceutical Company #* | 2,347,366 |
| | Holding Corporation # | 2,982,480 | | 61,800 | Kyphon, Inc. # | 4,380,384 |
| 93,500 | Platinum Underwriters | | | 51,750 | Masimo Corporation #* | 1,770,885 |
| | Holdings, Ltd. | 3,366,000 | | 68,800 | NuVasive, Inc. # | 2,943,952 |
| 31,500 | Portfolio Recovery | | | 70,100 | Omnicell, Inc. # | 1,850,640 |
| | Associates, Inc. * | 1,420,965 | | 37,200 | Orthofix International NV # | 2,005,080 |
| 58,000 | Potlatch Corporation * | 2,764,280 | | 53,500 | Owens & Minor, Inc. * | 2,168,890 |
| 183,900 | PowerShares Zacks Micro | | | 39,000 | Pediatrix Medical Group, Inc. # | 2,554,500 |
| | Cap Portfolio * | 3,163,080 | | 47,400 | Pharmaceutical Product | |
| 50,000 | ProAssurance Corporation # | 2,757,000 | | | Development, Inc. * | 2,002,176 |
| 59,900 | Prosperity Bancshares, Inc. | 1,935,968 | | 70,200 | PSS World Medical, Inc. #* | 1,418,040 |
| 79,600 | Raymond James Financial, Inc. * | 2,965,100 | | 43,700 | Psychiatric Solutions, Inc. # | 1,730,520 |
| 73,500 | Realty Income Corporation * | 2,171,190 | | 53,500 | STERIS Corporation | 1,553,640 |
| 161,100 | Sterling Bancshares, Inc. | 1,965,420 | | 150,200 | Sun Healthcare Group, Inc. # | 2,425,730 |
| 97,600 | Sterling Financial Corporation * | 2,196,000 | | 100,800 | Tercica, Inc. #* | 619,920 |
| 51,300 | Stifel Financial Corporation #* | 2,911,275 | | 59,300 | The Spectranetics Corporation #* | 948,800 |
| 76,800 | Strategic Hotel Capital, Inc. * | 1,677,312 | | 68,800 | Thoratec Corporation #* | 1,373,936 |
| 120,100 | UCBH Holdings, Inc. * | 2,050,107 | | 64,800 | TomoTherapy, Inc. #* | 1,417,176 |
| 47,200 | United Bankshares, Inc. * | 1,430,160 | | 21,250 | Trans1, Inc. #* | 531,250 |
| 93,000 | Universal American Financial | | | 75,000 | Trizetto Group, Inc. # | 1,225,500 |
| | Corporation #* | 2,256,180 | | 53,400 | Varian, Inc. # | 3,945,726 |
| 105,600 | Waddell & Reed Financial, Inc. | 3,508,032 | | 108,300 | VCA Antech, Inc. #* | 4,987,215 |
| 70,477 | Washington Federal, Inc. | 1,702,724 | | 31,200 | Ventana Medical Systems, Inc. # | 2,745,600 |
|
|
| 36,500 | Westamerica Bancorporation * | 1,754,920 | | | Total Health Care | 81,374,464 |
|
| | |
|
| | Total Financials | 93,923,857 | | | | |
|
| | |
| | | | | Industrials (17.2%) | |
| Health Care (14.4%) | | | 80,100 | Baldor Electric Company | 3,229,632 |
| 78,000 | Accuray, Inc. #* | 1,567,800 | | 128,300 | BE Aerospace, Inc. # | 6,377,793 |
| 14,800 | Amedisys, Inc. #* | 628,260 | | 115,550 | CAI International, Inc. # | 1,537,970 |
| 92,500 | AMERIGROUP Corporation # | 3,237,500 | | 59,900 | Chicago Bridge and | |
| 88,700 | Applera Corporation (Celera | | | | Iron Company | 2,995,000 |
| | Group) # | 1,446,697 | | 62,100 | CLARCOR, Inc. | 2,264,166 |
| 41,200 | Beckman Coulter, Inc. | 2,917,784 | | 61,500 | Consolidated Graphics, Inc. # | 3,934,770 |
| 71,000 | BioMarin Pharmaceutical, Inc. #* | 1,968,830 | | 46,800 | Deluxe Corporation | 1,887,912 |
| 14,100 | Bio-Rad Laboratories, Inc. # | 1,361,778 | | 45,800 | Diana Shipping, Inc. * | 1,960,240 |
| 32,300 | Dade Behring Holdings, Inc. | 2,484,839 | | 49,900 | DRS Technologies, Inc. | 2,866,256 |
| 227,900 | Dexcom, Inc. #* | 2,119,470 | | 13,800 | Dryships, Inc. * | 1,626,468 |
| 15,500 | Gen-Probe, Inc. # | 1,085,310 | | 32,600 | Duff & Phelps Corporation #* | 691,120 |
|
| The accompanying Notes to Financial Statements are an integral part of this schedule. |
|
| 77 |
| | | | | | |
| Small Cap Stock Fund | | | | | |
| Schedule of Investments as of October 31, 2007 | | | | | |
| |
| |
| Shares | Common Stock (94.9%) | Value | | Shares | Common Stock (94.9%) | Value |
|
| Industrials — continued | | | 77,044 | FLIR Systems, Inc. #* | $5,346,083 |
| 40,300 | Eagle Bulk Shipping, Inc. * | $1,373,827 | | 32,600 | FormFactor, Inc. # | 1,274,986 |
| 169,100 | Euroseas, Ltd. | 3,265,321 | | 129,300 | Foundry Networks, Inc. # | 2,733,402 |
| 53,300 | Flowserve Corporation * | 4,208,568 | | 112,700 | Ingram Micro, Inc. # | 2,393,748 |
| 82,500 | FTI Consulting, Inc. #* | 4,479,750 | | 175,600 | Insight Enterprises, Inc. #* | 4,853,584 |
| 26,500 | Gardner Denver, Inc. # | 957,445 | | 111,900 | Integrated Device | |
| 18,500 | General Cable Corporation #* | 1,331,815 | | | Technology, Inc. # | 1,502,817 |
| 41,000 | Genlyte Group, Inc. # | 2,669,100 | | 37,600 | Intersil Corporation | 1,140,784 |
| 54,000 | Huron Consulting Group, Inc. #* | 3,773,520 | | 223,200 | Ixia # | 2,334,672 |
| 82,025 | IDEX Corporation | 2,905,326 | | 66,300 | J2 Global Communication, Inc. # | 2,233,647 |
| 55,400 | Innerworkings, Inc. #* | 891,386 | | 191,300 | Lawson Software, Inc. #* | 2,159,777 |
| 95,300 | Interline Brands, Inc. # | 2,276,717 | | 4,400 | Longtop Financial Technologies, | |
| 16,100 | JA Solar Holdings Company, | | | | Ltd. ADR # | 124,960 |
| | Ltd. ADR #* | 927,360 | | 133,500 | Mentor Graphics Corporation # | 2,138,670 |
| 12,500 | Jacobs Engineering Group, Inc. # | 1,089,375 | | 32,700 | MICROS Systems, Inc. # | 2,348,514 |
| 66,000 | Kaydon Corporation * | 3,550,140 | | 172,800 | Nanometrics, Inc. #* | 1,900,800 |
| 65,000 | Kirby Corporation # | 2,969,200 | | 189,900 | ON Semiconductor Corporation # | 1,936,980 |
| 46,500 | Ladish Company, Inc. # | 2,133,885 | | 51,600 | Progress Software Corporation # | 1,687,836 |
| 64,400 | Manitowoc Company, Inc. | 3,172,344 | | 275,500 | RF Micro Devices, Inc. #* | 1,713,610 |
| 100,500 | Pall Corporation | 4,027,035 | | 237,800 | Sapient Corporation # | 1,664,600 |
| 60,400 | Roper Industries, Inc. * | 4,276,924 | | 57,600 | ScanSource, Inc. # | 2,127,744 |
| 20,200 | Shaw Group, Inc. # | 1,506,920 | | 123,100 | SkillSoft Public Limited | |
| 41,337 | Standard Parking Corporation # | 1,773,357 | | | Company ADR # | 1,101,745 |
| 27,700 | UAL Corporation #* | 1,326,830 | | 204,500 | Skyworks Solutions, Inc. # | 1,885,490 |
| 147,400 | Ultrapetrol Bahamas, Ltd. # | 2,760,802 | | 68,800 | SPSS, Inc. # | 2,614,400 |
| 60,500 | URS Corporation # | 3,739,505 | | 59,600 | Sybase, Inc. # | 1,704,560 |
| 20,500 | Washington Group | | | 285,800 | TIBCO Software, Inc. # | 2,623,644 |
| | International, Inc. # | 1,995,675 | | 93,900 | Trimble Navigation, Ltd. # | 3,915,630 |
| 134,425 | Waste Connections, Inc. # | 4,544,909 | | 69,475 | Varian Semiconductor | |
|
| | |
| | Total Industrials | 97,298,363 | | | Equipment Associates, Inc. # | 3,197,240 |
|
| | |
| | | | | 36,600 | Verifone Holdings, Inc. #* | 1,809,138 |
| Information Technology (15.6%) | | | 43,000 | ViaSat, Inc. # | 1,311,500 |
| 5,000 | Alibaba.com, Ltd. #^§ | 8,709 | | 224,200 | Wind River Systems, Inc. # | 2,804,742 |
|
|
| 53,758 | Avnet, Inc. # | 2,242,784 | | | Total Information | |
| 77,800 | Avocent Corporation # | 2,102,934 | | | Technology | 88,107,684 |
|
|
| 47,600 | Benchmark Electronics, Inc. #* | 976,276 | | | | |
| 65,100 | Bluephoenix Solutions, Ltd. #* | 1,385,979 | | Materials (6.6%) | |
| 374,800 | Brocade Communications # | 3,564,348 | | 76,200 | Airgas, Inc. | 3,845,814 |
| 45,600 | Business Objects SA ADR # | 2,731,896 | | 49,000 | Albemarle Corporation | 2,340,240 |
| 115,300 | China GrenTech Corporation, | | | 74,900 | Apex Silver Mines, Ltd. #* | 1,535,450 |
| | Ltd. ADR #* | 1,161,071 | | 106,500 | AptarGroup, Inc. | 4,760,550 |
| 175,000 | Compuware Corporation # | 1,750,000 | | 29,257 | Century Aluminum Company # | 1,702,465 |
| 63,600 | Constant Contact, Inc. #* | 1,583,640 | | 61,100 | Commercial Metals Company | 1,917,318 |
| 78,200 | Cypress Semiconductor | | | 60,500 | FMC Corporation | 3,478,750 |
| | Corporation # | 2,858,210 | | 59,200 | H.B. Fuller Company | 1,742,256 |
| 62,375 | Diodes, Inc. #* | 2,062,118 | | 221,400 | IAMGOLD Corporation | 1,941,678 |
| 93,700 | Epicor Software Corporation # | 1,094,416 | | 33,900 | Lubrizol Corporation | 2,301,132 |
|
| The accompanying Notes to Financial Statements are an integral part of this schedule. |
|
| 78 |
| | | | | | |
| Small Cap Stock Fund | | | | | |
| Schedule of Investments as of October 31, 2007 | | | | | |
| |
| |
| Shares | Common Stock (94.9%) | Value | | Shares | Common Stock (94.9%) | Value |
|
| Materials — continued | | | Utilities (3.4%) | |
| 131,200 | RPM International, Inc. | $2,811,616 | | 59,600 | AGL Resources, Inc. | $2,355,988 |
| 10,500 | RTI International Metals, Inc. # | 820,890 | | 60,100 | Alliant Energy Corporation * | 2,404,000 |
| 34,100 | Sigma-Aldrich Corporation | 1,761,947 | | 28,100 | Chesapeake Utilities Corporation | 995,302 |
| 86,600 | Silgan Holdings, Inc. | 4,725,762 | | 70,200 | Cleco Corporation * | 1,849,770 |
| 25,800 | Texas Industries, Inc. * | 1,884,948 | | 44,400 | National Fuel Gas Company * | 2,152,956 |
|
| | |
| | Total Materials | 37,570,816 | | 38,200 | Northwest Natural Gas Company | 1,840,094 |
|
| | |
| | | | | 36,500 | Otter Tail Corporation * | 1,264,360 |
| Telecommunications Services (0.7%) | | | 91,500 | UGI Corporation | 2,435,730 |
| 138,250 | Iowa Telecommunications | | | 91,500 | Vectren Corporation | 2,565,660 |
| | Services, Inc. * | 2,726,290 | | 48,100 | Westar Energy, Inc. * | 1,280,422 |
|
|
| 59,000 | Time Warner Telecom, Inc. # | 1,371,160 | | | Total Utilities | 19,144,282 |
|
| | |
|
| | Total Telecommunications | | | | | |
|
|
| | Services | 4,097,450 | | | Total Common Stock | |
|
| | |
| | | | | | (cost $432,602,237) | 536,812,541 |
|
|
| | | | |
| | | Interest | Maturity | |
| Shares | Collateral Held for Securities Loaned (28.0%) | Rate (+) | Date | Value |
|
| 158,510,727 | Thrivent Financial Securities Lending Trust | 5.050% | N/A | $158,510,727 |
|
|
| | Total Collateral Held for Securities Loaned | |
| | (cost $158,510,727) | | | 158,510,727 |
|
|
|
| The accompanying Notes to Financial Statements are an integral part of this schedule. |
|
| 79 |
| | | | |
| Small Cap Stock Fund | | | |
| Schedule of Investments as of October 31, 2007 | | | |
| |
| Shares or | | | | |
| Principal | | Interest | Maturity | |
| Amount | Short-Term Investments (6.4%) | Rate (+) | Date | Value |
|
| $500,000 | Federal National Mortgage Association | 4.775% | 12/5/2007 | $497,768 |
| 1,100,000 | Federal National Mortgage Association | 5.080 | 12/14/2007 | 1,093,325 |
| 34,676,065 | Thrivent Money Market Fund | 5.020 | N/A | 34,676,065 |
|
|
| | Total Short-Term Investments (at amortized cost) | 36,267,158 |
|
|
| | Total Investments (cost $627,380,122) 129.3% | $731,590,426 |
|
|
| | Other Assets and Liabilities, Net (29.3%) | (165,709,612) |
|
|
| | Total Net Assets 100.0% | | | $565,880,814 |
|
|
# Non-income producing security.
* All or a portion of the security is on loan as discussed in item 2(M) of the Notes to Financial Statements.
+ The interest rate shown reflects the yield, coupon rate or, for securities purchased at a discount, the discount rate at the date of purchase.
^ Security is fair valued as discussed in item 2(A) of the Notes to Financial Statements.
§ Denotes investments purchased on a when-issued or delayed delivery basis.
± Designated as cover for long settling trades as discussed in the Notes to Financial Statements.
Definitions:
ADR — American Depository Receipts, which are certificates for shares of an underlying foreign security’s shares held by an issuing U.S. depository bank.
Gross unrealized appreciation and depreciation of investments, based on cost for federal income tax purposes, were as follows:
| | |
| Gross unrealized appreciation | $109,380,835 | |
| Gross unrealized depreciation | (6,947,224) | |
|
| |
| Net unrealized appreciation (depreciation) | $102,433,611 | |
| Cost for federal income tax purposes | $629,156,815 | |
|
| The accompanying Notes to Financial Statements are an integral part of this schedule. |
|
| 80 |
| | | | | | |
| Small Cap Index Fund |
| Schedule of Investments as of October 31, 2007 |
| |
| Shares | Common Stock (99.2%) | Value | | Shares | Common Stock (99.2%) | Value |
|
| Consumer Discretionary (13.9%) | | | 2,200 | JAKKS Pacific, Inc. # | $58,300 |
| 1,200 | 4Kids Entertainment, Inc. # | $20,460 | | 2,010 | Jo-Ann Stores, Inc. # | 38,733 |
| 4,175 | Aaron Rents, Inc. | 88,426 | | 1,350 | Joseph A. Bank Clothiers, Inc. #* | 39,434 |
| 2,300 | Arbitron, Inc. * | 116,426 | | 2,000 | Kellwood Company | 33,140 |
| 1,000 | Arctic Cat, Inc. | 14,420 | | 2,200 | K-Swiss, Inc. | 51,480 |
| 1,300 | Ashworth, Inc. # | 7,228 | | 1,300 | Landry’s Restaurants, Inc. * | 37,336 |
| 1,600 | Audiovox Corporation # | 19,200 | | 4,100 | La-Z-Boy, Inc. * | 32,349 |
| 1,100 | Bassett Furniture Industries, Inc. | 11,671 | | 1,200 | Libbey, Inc. | 21,588 |
| 1,800 | Big 5 Sporting Goods Corporation | 32,130 | | 1,200 | Lithia Motors, Inc. | 20,376 |
| 1,200 | Blue Nile, Inc. #* | 94,848 | | 5,200 | Live Nation, Inc. # | 106,288 |
| 2,000 | Bright Horizons Family | | | 4,100 | LKQ Corporation # | 158,096 |
| | Solutions, Inc. # | 77,600 | | 1,000 | M/I Homes, Inc. | 16,600 |
| 3,450 | Brown Shoe Company, Inc. | 70,380 | | 1,600 | Maidenform Brands, Inc. # | 23,760 |
| 1,200 | Buffalo Wild Wings, Inc. # | 36,792 | | 1,700 | Marcus Corporation | 32,708 |
| 2,300 | Building Materials Holding | | | 1,500 | MarineMax, Inc. # | 21,360 |
| | Corporation * | 18,078 | | 4,200 | Men’s Wearhouse, Inc. | 177,492 |
| 3,200 | Cabela’s, Inc. #* | 62,464 | | 2,000 | Meritage Homes Corporation #* | 32,180 |
| 2,300 | California Pizza Kitchen, Inc. # | 37,214 | | 1,200 | Midas, Inc. # | 19,164 |
| 2,550 | Cato Corporation | 51,204 | | 2,300 | Monaco Coach Corporation | 26,680 |
| 2,450 | CEC Entertainment, Inc. #* | 73,010 | | 1,100 | Monarch Casino & Resort, Inc. # | 33,649 |
| 6,000 | Champion Enterprises, Inc. #* | 71,160 | | 1,600 | Movado Group, Inc. | 48,144 |
| 2,000 | Charlotte Russe Holding, Inc. # | 28,980 | | 1,900 | Multimedia Games, Inc. # | 16,758 |
| 1,800 | Children’s Place Retail | | | 500 | National Presto Industries, Inc. | 27,470 |
| | Stores, Inc. # | 46,080 | | 2,500 | Nautilus Group, Inc. * | 16,075 |
| 2,800 | Christopher & Banks Corporation | 38,416 | | 1,800 | O’Charley’s, Inc. | 28,854 |
| 4,600 | CKE Restaurants, Inc. | 74,428 | | 1,200 | Oxford Industries, Inc. | 31,092 |
| 1,400 | Coachmen Industries, Inc. | 8,680 | | 2,000 | P.F. Chang’s China Bistro, Inc. # | 58,220 |
| 2,200 | Coinstar, Inc. # | 75,790 | | 2,500 | Panera Bread Company # | 102,475 |
| 500 | CPI Corporation | 16,605 | | 1,700 | Papa John’s International, Inc. # | 39,610 |
| 6,400 | Crocs, Inc. #* | 478,400 | | 1,000 | Peet’s Coffee & Tea, Inc. #* | 27,270 |
| 1,000 | Deckers Outdoor Corporation # | 139,790 | | 3,200 | Pep Boys — Manny, Moe & Jack * | 47,072 |
| 3,600 | Dress Barn, Inc. # | 59,004 | | 1,900 | PetMed Express, Inc. # | 27,702 |
| 1,400 | Drew Industries, Inc. # | 55,412 | | 4,700 | Pinnacle Entertainment, Inc. # | 137,240 |
| 2,300 | Ethan Allen Interiors, Inc. * | 70,978 | | 2,800 | Polaris Industries, Inc. * | 137,704 |
| 3,400 | Finish Line, Inc. | 12,750 | | 3,875 | Pool Corporation * | 91,372 |
| 5,000 | Fleetwood Enterprises, Inc. # | 45,000 | | 700 | Pre-Paid Legal Services, Inc. # | 41,720 |
| 3,500 | Fossil, Inc. # | 131,460 | | 9,600 | Quiksilver, Inc. # | 129,600 |
| 3,100 | Fred’s, Inc. | 32,860 | | 6,300 | Radio One, Inc. # | 21,987 |
| 1,700 | Genesco, Inc. # | 78,540 | | 1,600 | RC2 Corporation # | 47,712 |
| 1,800 | Group 1 Automotive, Inc. | 55,890 | | 1,300 | Red Robin Gourmet Burgers, Inc. # | 52,026 |
| 2,400 | Gymboree Corporation # | 81,672 | | 1,400 | Russ Berrie and Company, Inc. # | 24,500 |
| 1,800 | Haverty Furniture Companies, Inc. | 15,300 | | 1,600 | Ruth’s Chris Steak House, Inc. # | 20,224 |
| 2,350 | Hibbett Sports, Inc. #* | 55,436 | | 3,650 | Select Comfort Corporation #* | 41,720 |
| 3,575 | Hot Topic, Inc. # | 27,384 | | 2,775 | Shuffle Master, Inc. #* | 37,962 |
| 4,400 | Iconix Brand Group, Inc. #* | 100,540 | | 2,500 | Skechers USA, Inc. # | 61,475 |
| 1,100 | IHOP Corporation | 69,663 | | 600 | Skyline Corporation | 21,264 |
| 4,800 | Jack in the Box, Inc. # | 150,576 | | 2,400 | Sonic Automotive, Inc. | 60,624 |
|
| The accompanying Notes to Financial Statements are an integral part of this schedule. |
|
| 81 |
| | | | | | |
| Small Cap Index Fund | | | | | |
| Schedule of Investments as of October 31, 2007 | | | | | |
| |
| |
| Shares | Common Stock (99.2%) | Value | | Shares | Common Stock (99.2%) | Value |
|
| Consumer Discretionary — continued | | | 1,200 | Sanderson Farms, Inc. * | $41,760 |
| 4,875 | Sonic Corporation # | $120,802 | | 1,700 | Spartan Stores, Inc. | 37,791 |
| 3,200 | Stage Stores, Inc. | 60,032 | | 3,200 | Spectrum Brands, Inc. #* | 13,792 |
| 1,500 | Stamps.com, Inc. #* | 20,820 | | 2,500 | TreeHouse Foods, Inc. # | 69,750 |
| 1,100 | Standard Motor Products, Inc. | 9,196 | | 3,400 | United Natural Foods, Inc. #* | 98,396 |
| 5,200 | Standard Pacific Corporation * | 24,960 | | 700 | USANA Health Sciences, Inc. #* | 28,567 |
| 2,300 | Steak n Shake Company # | 34,845 | | 1,400 | WD-40 Company | 55,440 |
|
|
| 2,100 | Stein Mart, Inc. | 13,797 | | | Total Consumer Staples | 1,451,556 |
|
|
| 1,700 | Sturm, Ruger & Company, Inc. # | 15,895 | | | | |
| 1,800 | Superior Industries | | | Energy (7.5%) | |
| | International, Inc. * | 36,378 | | 2,100 | Atwood Oceanics, Inc. # | 176,904 |
| 4,200 | Texas Roadhouse, Inc. # | 53,214 | | 1,800 | Basic Energy Services, Inc. # | 35,622 |
| 2,700 | Tractor Supply Company # | 111,888 | | 1,800 | Bristow Group, Inc. # | 89,802 |
| 4,900 | Triarc Companies, Inc. | 54,880 | | 7,600 | Cabot Oil & Gas Corporation ‡ | 301,644 |
| 2,400 | Tuesday Morning Corporation | 18,288 | | 1,500 | Carbo Ceramics, Inc. * | 67,380 |
| 2,500 | Tween Brands, Inc. # | 76,750 | | 2,100 | Dril-Quip, Inc. # | 111,993 |
| 1,100 | UniFirst Corporation | 41,393 | | 900 | Gulf Island Fabrication, Inc. | 31,428 |
| 1,200 | Universal Electronic Inc. # | 43,320 | | 7,215 | Helix Energy Solutions | |
| 1,800 | Universal Technical | | | | Group, Inc. #* | 333,694 |
| | Institute, Inc. # | 33,894 | | 1,800 | Hornbeck Offshore Services, Inc. #* | 70,380 |
| 1,100 | Volcom, Inc. # | 32,175 | | 5,600 | Input/Output, Inc. # | 84,840 |
| 2,400 | Winnebago Industries, Inc. * | 61,872 | | 1,200 | Lufkin Industries, Inc. | 71,352 |
| 3,200 | WMS Industries, Inc. # | 110,944 | | 6,400 | Massey Energy Company | 202,752 |
| 4,150 | Wolverine World Wide, Inc. | 106,406 | | 2,100 | Matrix Service Company # | 61,929 |
| 3,900 | Zale Corporation #* | 82,212 | | 1,400 | NATO Group, Inc. # | 74,634 |
| 1,300 | Zumiez, Inc. #* | 54,418 | | 4,200 | Oceaneering International, Inc. #‡ | 324,534 |
|
| | |
| | Total Consumer | | | 2,000 | Patriot Coal Corporation # | 71,100 |
| | Discretionary | 6,449,309 | | 3,000 | Penn Virginia Corporation | 145,200 |
|
| | |
| | | | | 1,100 | Petroleum Development | |
| Consumer Staples (3.1%) | | | | Corporation # | 49,962 |
| 6,900 | Alliance One International, Inc. # | 45,057 | | 4,000 | Pioneer Drilling Company # | 48,720 |
| 700 | Boston Beer Company, Inc. # | 36,575 | | 1,900 | SEACOR Holdings, Inc. # | 174,135 |
| 3,900 | Casey’s General Stores, Inc. | 111,150 | | 4,900 | St. Mary Land & Exploration | |
| 5,600 | Central Garden & Pet Company # | 46,592 | | | Company | 207,564 |
| 1,500 | Chattem, Inc. #* | 111,450 | | 2,200 | Stone Energy Corporation # | 98,076 |
| 6,112 | Flowers Foods, Inc. | 134,097 | | 1,200 | Superior Well Services, Inc. # | 24,480 |
| 1,500 | Great Atlantic & Pacific Tea | | | 2,300 | Swift Energy Company # | 109,089 |
| | Company, Inc. #* | 48,555 | | 5,700 | TETRA Technologies, Inc. # | 112,233 |
| 3,200 | Hain Celestial Group, Inc. # | 112,192 | | 3,600 | Unit Corporation # | 171,972 |
| 1,200 | J & J Snack Foods Corporation | 42,744 | | 2,400 | W-H Energy Services, Inc. # | 138,144 |
| 2,400 | Lance, Inc. | 50,832 | | 2,200 | World Fuel Services Corporation | 97,438 |
|
|
| 2,400 | Longs Drug Stores Corporation | 126,024 | | | Total Energy | 3,487,001 |
|
|
| 1,200 | Mannatech, Inc. * | 9,540 | | | | |
| 1,000 | Nash Finch Company | 37,450 | | Financials (14.7%) | |
| 2,800 | Performance Food | | | 2,700 | Acadia Realty Trust ‡ | 71,550 |
| | Group Company # | 75,572 | | 1,300 | Alabama National BanCorporation | 102,466 |
| 2,100 | Ralcorp Holdings, Inc. # | 118,230 | | 1,400 | Anchor BanCorp Wisconsin, Inc. * | 34,440 |
|
| The accompanying Notes to Financial Statements are an integral part of this schedule. |
|
| 82 |
| | | | | | |
| Small Cap Index Fund | | | | | |
| Schedule of Investments as of October 31, 2007 | | | | | |
| |
| |
| Shares | Common Stock (99.2%) | Value | | Shares | Common Stock (99.2%) | Value |
|
| Financials — continued | | | 2,600 | Kilroy Realty Corporation | $169,104 |
| 4,500 | Bank Mutual Corporation | $49,995 | | 2,400 | Kite Realty Group Trust | 43,488 |
| 3,300 | BankAtlantic Bancorp, Inc. | 13,563 | | 4,200 | LaBranche & Company, Inc. # | 23,016 |
| 2,400 | BankUnited Financial Corporation * | 20,712 | | 1,400 | LandAmerica Financial Group, Inc. | 38,906 |
| 3,000 | Boston Private Financial | | | 5,000 | Lexington Corporate | |
| | Holdings, Inc. | 86,280 | | | Properties Trust * | 98,950 |
| 4,700 | Brookline Bancorp, Inc. | 50,572 | | 1,800 | LTC Properties, Inc. | 45,612 |
| 2,300 | Cascade Bancorp * | 44,252 | | 3,900 | Medical Properties Trust, Inc. * | 51,207 |
| 2,300 | Cash America International, Inc. | 89,700 | | 2,100 | Mid-America Apartment | |
| 2,300 | Central Pacific Financial | | | | Communities, Inc. | 109,200 |
| | Corporation | 51,589 | | 1,800 | Nara Bancorp, Inc. | 27,864 |
| 3,875 | Chittenden Corporation | 138,028 | | 1 | National City Corporation | 14 |
| 3,600 | Colonial Properties Trust | 112,788 | | 5,800 | National Retail Properties, Inc. | 147,030 |
| 2,500 | Community Bank System, Inc. | 52,275 | | 3,300 | optionsXpress Holdings, Inc. | 98,208 |
| 2,500 | Corus Bankshares, Inc. * | 27,550 | | 1,300 | Parkway Properties, Inc. | 55,900 |
| 3,500 | Delphi Financial Group, Inc. | 135,625 | | 4,500 | Philadelphia Consolidated | |
| 2,250 | Dime Community Bancshares | 32,378 | | | Holding Corporation # | 183,600 |
| 1,500 | Downey Financial Corporation * | 61,095 | | 1,400 | Piper Jaffray Companies # | 71,960 |
| 4,900 | East West Bancorp, Inc. | 165,326 | | 1,200 | Portfolio Recovery | |
| 2,000 | EastGroup Properties, Inc. | 95,360 | | | Associates, Inc. * | 54,132 |
| 2,300 | Entertainment Properties Trust | 126,201 | | 1,700 | Presidential Life Corporation | 29,937 |
| 2,000 | Essex Property Trust, Inc. | 246,860 | | 1,500 | PrivateBancorp, Inc. * | 42,240 |
| 2,000 | Financial Federal Corporation * | 54,040 | | 2,600 | ProAssurance Corporation # | 143,364 |
| 5,900 | First BanCorp * | 51,861 | | 2,900 | Prosperity Bancshares, Inc. | 93,728 |
| 2,200 | First Cash Financial | | | 2,555 | Provident Bankshares Corporation | 63,032 |
| | Services, Inc. # | 43,252 | | 1,400 | PS Business Parks, Inc. | 81,620 |
| 5,000 | First Commonwealth Financial | | | 2,300 | Rewards Network, Inc. # | 11,270 |
| | Corporation * | 57,450 | | 1,700 | RLI Corporation | 98,889 |
| 2,700 | First Financial Bancorp | 31,725 | | 1,200 | Safety Insurance Group, Inc. | 43,152 |
| 1,000 | First Indiana Corporation | 31,800 | | 700 | SCPIE Holdings, Inc. # | 19,005 |
| 3,900 | First Midwest Bancorp, Inc. * | 131,352 | | 4,200 | Selective Insurance Group, Inc. | 102,102 |
| 1,200 | FirstFed Financial Corporation #* | 51,336 | | 6,500 | Senior Housing Property Trust | 145,730 |
| 2,900 | Flagstar Bancorp, Inc. | 23,461 | | 2,400 | Signature Bank # | 81,960 |
| 2,000 | Franklin Bank Corporation # | 15,460 | | 5,800 | South Financial Group, Inc. * | 119,828 |
| 5,400 | Fremont General Corporation * | 14,958 | | 1,800 | Sovran Self Storage, Inc. | 85,158 |
| 3,000 | Frontier Financial Corporation * | 66,570 | | 1,600 | Sterling Bancorp | 23,504 |
| 4,300 | Glacier Bancorp, Inc. * | 87,462 | | 5,675 | Sterling Bancshares, Inc. | 69,235 |
| 2,000 | Hancock Holding Company | 76,060 | | 4,120 | Sterling Financial Corporation | 92,700 |
| 3,200 | Hanmi Financial Corporation | 35,264 | | 1,500 | Stewart Information | |
| 2,900 | Hilb, Rogal and Hobbs Company | 127,803 | | | Services Corporation | 43,500 |
| 1,585 | Independent Bank Corporation | 16,738 | | 4,200 | Susquehanna Bancshares, Inc. * | 84,714 |
| 1,500 | Infinity Property & Casualty | | | 1,689 | SWS Group, Inc. | 32,074 |
| | Corporation | 60,330 | | 2,500 | Tanger Factory Outlet Centers, Inc. | 105,300 |
| 4,500 | Inland Real Estate Corporation * | 67,050 | | 1,600 | Tower Group, Inc. | 48,304 |
| 3,500 | Investment Technology | | | 2,200 | Tradestation Group, Inc. # | 26,840 |
| | Group, Inc. # | 146,650 | | 1,000 | Triad Guaranty, Inc. #* | 8,060 |
| 1,600 | Irwin Financial Corporation | 15,424 | | 5,833 | TrustCo Bank Corporation NY * | 61,480 |
|
| The accompanying Notes to Financial Statements are an integral part of this schedule. |
|
| 83 |
| | | | | | |
| Small Cap Index Fund | | | | | |
| Schedule of Investments as of October 31, 2007 | | | | | |
| |
| |
| Shares | Common Stock (99.2%) | Value | | Shares | Common Stock (99.2%) | Value |
|
| Financials — continued | | | 1,100 | ICU Medical, Inc. #* | $44,110 |
| 8,100 | UCBH Holdings, Inc. * | $138,267 | | 2,500 | IDEXX Laboratories, Inc. # | 304,450 |
| 4,800 | Umpqua Holdings Corporation | 81,264 | | 5,412 | Immucor, Inc. # | 174,537 |
| 3,000 | United Bankshares, Inc. | 90,900 | | 1,500 | Integra LifeSciences Holdings | |
| 3,300 | United Community Banks, Inc. * | 73,062 | | | Corporation #* | 72,705 |
| 1,700 | United Fire & Casual Company | 54,468 | | 2,600 | Invacare Corporation | 70,356 |
| 5,275 | Whitney Holding Corporation | 135,356 | | 2,600 | inVentiv Health, Inc. # | 109,798 |
| 1,400 | Wilshire Bancorp, Inc. | 14,420 | | 1,000 | Kendle International, Inc. # | 40,330 |
| 2,000 | Wintrust Financial Corporation | 73,480 | | 900 | Kensey Nash Corporation # | 24,624 |
| 1,394 | World Acceptance Corporation # | 44,970 | | 1,600 | LCA-Vision, Inc. | 27,312 |
| 3,000 | Zenith National Insurance | | | 1,100 | LHC Group, Inc. # | 25,278 |
| | Corporation | 120,540 | | 2,400 | LifeCell Corporation #* | 105,744 |
|
| | |
| | Total Financials | 6,816,295 | | 2,500 | Martek Biosciences Corporation #* | 76,375 |
|
| | |
| | | | | 1,700 | Matria Healthcare, Inc. # | 43,656 |
| Health Care (12.8%) | | | 1,100 | MedCath Corporation # | 30,503 |
| 4,400 | Allscripts Healthcare | | | 2,700 | Mentor Corporation * | 114,939 |
| | Solutions, Inc. #* | 121,880 | | 3,050 | Meridian Bioscience, Inc. | 100,924 |
| 3,400 | Alpharma, Inc. #‡ | 70,108 | | 2,100 | Merit Medical Systems, Inc. # | 27,405 |
| 2,033 | Amedisys, Inc. #* | 86,315 | | 6,300 | MGI Pharma, Inc. # | 205,254 |
| 5,700 | American Medical Systems | | | 1,100 | Molina Healthcare, Inc. # | 41,921 |
| | Holdings, Inc. #* | 72,903 | | 2,000 | Noven Pharmaceuticals, Inc. #* | 30,920 |
| 4,100 | AMERIGROUP Corporation #‡ | 143,500 | | 2,650 | Odyssey Healthcare, Inc. # | 27,162 |
| 2,400 | AMN Healthcare Services, Inc. # | 45,624 | | 2,600 | Omnicell, Inc. # | 68,640 |
| 2,400 | AmSurg Corporation # | 63,480 | | 1,500 | Osteotech, Inc. # | 10,440 |
| 1,050 | Analogic Corporation | 60,008 | | 3,100 | Owens & Minor, Inc. | 125,674 |
| 2,700 | ArQule, Inc. # | 21,195 | | 1,500 | Palomar Medical | |
| 2,100 | ArthroCare Corporation # | 136,164 | | | Technologies, Inc. # | 37,935 |
| 1,900 | BioLase Technology, Inc. # | 9,709 | | 2,100 | PAREXEL International | |
| 1,000 | Bradley Pharmaceuticals, Inc. # | 19,670 | | | Corporation # | 96,600 |
| 2,300 | Cambrex Corporation | 26,197 | | 3,900 | Pediatrix Medical Group, Inc. # | 255,450 |
| 3,400 | Centene Corporation # | 79,322 | | 2,300 | PharMerica Corporation #* | 36,685 |
| 1,900 | Chemed Corporation | 108,908 | | 1,400 | Pharmnet Development Group # | 45,360 |
| 2,200 | CONMED Corporation # | 62,568 | | 3,300 | Phase Forward, Inc. # | 78,507 |
| 3,600 | Cooper Companies, Inc. | 151,200 | | 1,800 | PolyMedica Corporation | 95,328 |
| 2,500 | Cross Country Healthcare, Inc. # | 39,275 | | 1,500 | Possis Medical, Inc. # | 21,465 |
| 1,850 | CryoLife, Inc. # | 12,488 | | 5,300 | PSS World Medical, Inc. #* | 107,060 |
| 1,700 | Cyberonics, Inc. #* | 24,650 | | 5,200 | Regeneron Pharmaceuticals, Inc. # | 114,400 |
| 1,100 | Datascope Corporation | 39,743 | | 1,300 | RehabCare Group, Inc. # | 26,962 |
| 1,500 | Dionex Corporation # | 132,000 | | 1,900 | Res-Care, Inc. # | 46,664 |
| 1,800 | DJO, Inc. # | 89,910 | | 5,800 | Respironics, Inc. # | 290,348 |
| 2,522 | Enzo Biochem, Inc. # | 30,541 | | 3,400 | Savient Pharmaceuticals, Inc. # | 47,872 |
| 2,100 | Gentiva Health Services, Inc. # | 39,858 | | 2,700 | Sciele Pharma, Inc. #* | 68,688 |
| 1,800 | Greatbatch Technologies, Inc. # | 44,748 | | 4,400 | Sierra Health Services, Inc. # | 186,120 |
| 2,000 | Haemonetics Corporation # | 102,780 | | 3,600 | Sunrise Senior Living, Inc. #* | 133,200 |
| 2,800 | HealthExtras, Inc. # | 81,592 | | 1,200 | SurModics, Inc. #* | 68,088 |
| 2,800 | Healthways, Inc. #* | 169,960 | | 2,700 | Symmetry Medical, Inc. # | 46,305 |
| 5,500 | Hooper Holmes, Inc. # | 12,210 | | 2,800 | Theragenics Corporation # | 13,244 |
|
| The accompanying Notes to Financial Statements are an integral part of this schedule. |
|
| 84 |
| | | | | | |
| Small Cap Index Fund | | | | | |
| Schedule of Investments as of October 31, 2007 | | | | | |
| |
| |
| Shares | Common Stock (99.2%) | Value | | Shares | Common Stock (99.2%) | Value |
|
| Health Care — continued | | | 4,601 | Heartland Express, Inc. * | $64,138 |
| 5,500 | ViroPharma, Inc. #* | $47,355 | | 1,400 | Heidrick & Struggles | |
| 800 | Vital Signs, Inc. | 42,320 | | | International, Inc. | 60,508 |
|
| | |
| | Total Health Care | 5,907,519 | | 3,100 | Hub Group, Inc. # | 78,647 |
|
| | |
| | | | | 2,100 | Insituform Technologies, Inc. #* | 29,526 |
| Industrials (18.8%) | | | 4,300 | Interface, Inc. | 82,259 |
| 1,700 | A.O. Smith Corporation | 63,563 | | 1,900 | Kaman Corporation | 71,649 |
| 1,600 | A.S.V., Inc. #* | 18,624 | | 6,100 | Kansas City Southern, Inc. #* | 236,009 |
| 2,900 | AAR Corporation # | 92,945 | | 2,200 | Kaydon Corporation | 118,338 |
| 3,500 | ABM Industries, Inc. | 82,320 | | 4,200 | Kirby Corporation # | 191,856 |
| 3,400 | Acuity Brands, Inc. ‡ | 162,520 | | 4,525 | Knight Transportation, Inc. * | 72,264 |
| 1,900 | Administaff, Inc. ‡ | 75,772 | | 3,600 | Labor Ready, Inc. # | 63,288 |
| 2,000 | Albany International Corporation | 75,000 | | 4,400 | Landstar System, Inc. | 185,196 |
| 800 | Angelica Corporation | 13,824 | | 500 | Lawson Products, Inc. | 17,695 |
| 2,300 | Apogee Enterprises, Inc. | 54,119 | | 5,300 | Lennox International, Inc. | 189,210 |
| 2,975 | Applied Industrial | | | 1,000 | Lindsay Manufacturing Company * | 49,200 |
| | Technologies, Inc. | 105,464 | | 1,300 | Lydall, Inc. # | 13,988 |
| 1,100 | Applied Signal Technology, Inc. | 15,807 | | 2,500 | MagneTek, Inc. # | 12,825 |
| 2,000 | Arkansas Best Corporation | 54,900 | | 9,800 | Manitowoc Company, Inc. | 482,746 |
| 1,500 | Astec Industries, Inc. # | 67,980 | | 2,400 | Mesa Air Group, Inc. # | 11,160 |
| 3,600 | Baldor Electric Company | 145,152 | | 2,800 | Mobile Mini, Inc. # | 50,204 |
| 3,500 | Barnes Group, Inc. * | 128,555 | | 3,325 | Moog, Inc. # | 153,449 |
| 3,525 | Belden, Inc. | 205,402 | | 3,000 | Mueller Industries, Inc. | 107,880 |
| 2,200 | Bowne & Company, Inc. | 38,236 | | 1,500 | NCI Building Systems, Inc. #* | 58,770 |
| 4,200 | Brady Corporation * | 154,980 | | 2,200 | Old Dominion Freight Line # | 49,698 |
| 4,000 | Briggs & Stratton Corporation * | 90,040 | | 2,700 | On Assignment, Inc. # | 22,518 |
| 2,200 | C&D Technologies, Inc. # | 10,604 | | 2,500 | Regal-Beloit Corporation | 122,600 |
| 700 | Cascade Corporation | 44,086 | | 1,300 | Robbins & Myers, Inc. | 93,990 |
| 1,100 | CDI Corporation | 30,316 | | 1,500 | School Specialty, Inc. # | 50,625 |
| 2,150 | Ceradyne, Inc. # | 147,082 | | 6,400 | Shaw Group, Inc. # | 477,440 |
| 4,000 | CLARCOR, Inc. | 145,840 | | 3,000 | Simpson Manufacturing | |
| 1,000 | Consolidated Graphics, Inc. # | 63,980 | | | Company, Inc. * | 89,970 |
| 1,200 | Cubic Corporation | 54,000 | | 4,800 | SkyWest, Inc. | 130,992 |
| 3,500 | Curtiss-Wright Corporation | 197,015 | | 4,400 | Spherion Corporation # | 38,368 |
| 1,300 | EDO Corporation * | 75,400 | | 1,100 | Standard Register Company | 14,113 |
| 5,000 | EMCOR Group, Inc. # | 172,150 | | 1,100 | Standex International Corporation | 23,584 |
| 1,700 | EnPro Industries, Inc. # | 69,717 | | 2,800 | Teledyne Technologies, Inc. # | 146,468 |
| 2,200 | Esterline Technologies | | | 4,600 | Tetra Tech, Inc. # | 107,410 |
| | Corporation # | 120,516 | | 3,100 | Toro Company | 172,546 |
| 2,300 | Forward Air Corporation | 75,049 | | 1,900 | Tredegar Corporation | 33,098 |
| 2,900 | Frontier Airlines Holdings, Inc. #* | 20,445 | | 1,300 | Triumph Group, Inc. | 103,506 |
| 1,700 | G & K Services, Inc. | 68,918 | | 2,200 | United Stationers, Inc. # | 127,402 |
| 4,200 | Gardner Denver, Inc. # | 151,746 | | 1,400 | Universal Forest Products, Inc. | 50,134 |
| 4,400 | GenCorp, Inc. # | 51,832 | | 4,200 | URS Corporation # | 259,602 |
| 2,300 | Gibraltar Industries, Inc. | 41,446 | | 1,300 | Valmont Industries, Inc. | 124,436 |
| 2,120 | Griffon Corporation # | 32,712 | | 1,600 | Viad Corporation | 56,704 |
| 3,225 | Healthcare Services Group, Inc. | 70,821 | | 1,700 | Vicor Corporation | 23,868 |
|
| The accompanying Notes to Financial Statements are an integral part of this schedule. |
|
| 85 |
| | | | | | |
| Small Cap Index Fund | | | | | |
| Schedule of Investments as of October 31, 2007 | | | | | |
| |
| |
| Shares | Common Stock (99.2%) | Value | | Shares | Common Stock (99.2%) | Value |
|
| Industrials — continued | | | 3,300 | Concur Technologies, Inc. # | $118,932 |
| 1,050 | Volt Information Sciences, Inc. # | $16,328 | | 2,800 | CTS Corporation | 34,580 |
| 2,300 | Wabash National Corporation | 23,345 | | 2,500 | CyberSource Corporation # | 40,875 |
| 5,275 | Waste Connections, Inc. # | 178,348 | | 2,500 | Cymer, Inc. # | 106,250 |
| 2,000 | Watsco, Inc. | 83,280 | | 2,600 | Daktronics, Inc. * | 77,532 |
| 3,400 | Watson Wyatt Worldwide, Inc. | 162,078 | | 2,100 | DealerTrack Holdings, Inc. # | 103,089 |
| 2,400 | Watts Water Technologies, Inc. * | 68,232 | | 1,900 | Digi International, Inc. # | 30,476 |
| 2,300 | Woodward Governor Company | 154,100 | | 2,350 | Diodes, Inc. #* | 77,691 |
|
| | |
| | Total Industrials | 8,694,466 | | 2,000 | Ditech Networks, Inc. # | 9,940 |
|
| | |
| | | | | 2,300 | DSP Group, Inc. # | 36,317 |
| Information Technology (18.8%) | | | 2,200 | Electro Scientific | |
| 2,100 | Actel Corporation # | 23,919 | | | Industries, Inc. # | 48,004 |
| 9,400 | Adaptec, Inc. # | 33,182 | | 4,500 | Epicor Software Corporation # | 52,560 |
| 2,800 | Advanced Energy Industries, Inc. # | 44,800 | | 2,000 | EPIQ Systems, Inc. # | 38,780 |
| 2,100 | Agilysys, Inc. | 36,330 | | 4,000 | Exar Corporation # | 48,640 |
| 5,100 | AMIS Holdings, Inc. # | 39,117 | | 3,300 | FactSet Research Systems, Inc. | 232,716 |
| 2,400 | Anixter International, Inc. # | 172,440 | | 1,300 | Faro Technologies, Inc. # | 37,388 |
| 1,200 | Ansoft Corporation # | 36,096 | | 2,800 | FEI Company # | 81,228 |
| 6,100 | ANSYS, Inc. #* | 236,741 | | 5,200 | FLIR Systems, Inc. #* | 360,828 |
| 8,700 | Arris Group, Inc. # | 100,050 | | 1,900 | Gerber Scientific, Inc. # | 20,995 |
| 2,700 | ATMI, Inc. #‡ | 86,778 | | 1,900 | Gevity HR, Inc. | 18,962 |
| 2,200 | Authorize.Net Holdings, Inc. # | 51,414 | | 6,200 | Harmonic, Inc. #* | 76,384 |
| 2,647 | Avid Technology, Inc. #* | 77,795 | | 2,100 | Hutchinson Technology, Inc. # | 49,833 |
| 8,000 | Axcelis Technologies, Inc. # | 37,520 | | 6,900 | Informatica Corporation #* | 117,852 |
| 1,000 | Bankrate, Inc. #* | 45,950 | | 2,600 | InfoSpace, Inc. | 50,258 |
| 1,000 | Bel Fuse, Inc. | 31,820 | | 3,850 | Insight Enterprises, Inc. # | 106,414 |
| 2,400 | Bell Microproducts, Inc. # | 14,376 | | 1,700 | Intevac, Inc. # | 29,869 |
| 5,750 | Benchmark Electronics, Inc. #‡ | 117,932 | | 2,400 | Itron, Inc. # | 257,976 |
| 1,400 | Black Box Corporation | 55,972 | | 3,900 | J2 Global Communication, Inc. # | 131,391 |
| 3,500 | Blackbaud, Inc. | 94,325 | | 2,000 | JDA Software Group, Inc. # | 49,920 |
| 2,400 | Blue Coat Systems, Inc. # | 97,416 | | 1,300 | Keithley Instruments, Inc. | 13,052 |
| 4,020 | Brightpoint, Inc. #* | 65,124 | | 2,200 | Knot, Inc. #* | 42,658 |
| 5,553 | Brooks Automation, Inc. # | 72,078 | | 5,500 | Kopin Corporation # | 21,890 |
| 1,800 | Cabot Microelectronics | | | 4,300 | Kulicke and Soffa | |
| | Corporation #* | 71,424 | | | Industries, Inc. #* | 32,551 |
| 2,400 | CACI International, Inc. #* | 129,240 | | 1,800 | Littelfuse, Inc. # | 57,294 |
| 2,300 | Captaris, Inc. # | 10,649 | | 1,400 | LoJack Corporation # | 24,598 |
| 900 | Catapult Communications | | | 2,000 | Manhattan Associates, Inc. # | 60,320 |
| | Corporation # | 6,687 | | 1,500 | ManTech International | |
| 3,900 | C-COR, Inc. # | 47,814 | | | Corporation # | 59,640 |
| 3,100 | Checkpoint Systems, Inc. # | 93,775 | | 1,700 | MAXIMUS, Inc. | 81,464 |
| 4,300 | CIBER, Inc. # | 33,497 | | 1,800 | Mercury Computer Systems, Inc. # | 28,152 |
| 3,400 | Cognex Corporation | 61,132 | | 3,000 | Methode Electronics, Inc. | 37,620 |
| 2,500 | Coherent, Inc. # | 82,000 | | 3,200 | MICROS Systems, Inc. # | 229,824 |
| 2,000 | Cohu, Inc. | 32,800 | | 6,000 | Microsemi Corporation # | 159,660 |
| 1,800 | Comtech Telecommunications | | | 2,500 | MIVA, Inc. # | 7,950 |
| | Corporation # | 97,650 | | 3,900 | MKS Instruments, Inc. # | 78,312 |
|
| The accompanying Notes to Financial Statements are an integral part of this schedule. |
|
| 86 |
| | | | | | |
| Small Cap Index Fund | | | | | |
| Schedule of Investments as of October 31, 2007 | | | | | |
| |
| |
| Shares | Common Stock (99.2%) | Value | | Shares | Common Stock (99.2%) | Value |
|
| Information Technology — continued | | | 3,300 | TTM Technologies, Inc. # | $42,339 |
| 1,400 | MTS Systems Corporation | $62,286 | | 2,800 | Tyler Technologies, Inc. # | 45,136 |
| 3,800 | Napster, Inc. # | 12,350 | | 1,800 | Ultratech, Inc. # | 20,862 |
| 2,700 | NETGEAR, Inc. # | 95,418 | | 5,300 | United Online, Inc. | 93,280 |
| 2,100 | Network Equipment | | | 5,975 | Varian Semiconductor Equipment | |
| | Technologies, Inc. # | 31,290 | | | Associates, Inc. # | 274,970 |
| 3,100 | Newport Corporation # | 42,377 | | 2,400 | Veeco Instruments, Inc. # | 43,368 |
| 2,600 | Novatel Wireless, Inc. # | 67,600 | | 2,000 | ViaSat, Inc. # | 61,000 |
| 1,600 | Park Electrochemical Corporation | 50,112 | | 3,500 | Websense, Inc. # | 64,400 |
| 1,900 | PC TEL, Inc. # | 16,549 | | 2,200 | X-Rite, Inc. # | 30,602 |
|
|
| 2,300 | Perficient, Inc. # | 43,355 | | | Total Information | |
| 2,200 | Pericom Semiconductor | | | | Technology | 8,727,850 |
|
|
| | Corporation # | 32,868 | | | | |
| 2,100 | Phoenix Technologies, Ltd. # | 24,045 | | Materials (4.3%) | |
| 1,300 | Photon Dynamics, Inc. # | 13,364 | | 2,100 | A. Schulman, Inc. | 49,581 |
| 3,300 | Photronics, Inc. # | 36,102 | | 1,200 | A.M. Castle & Company | 36,120 |
| 1,500 | Planar Systems, Inc. # | 10,230 | | 1,700 | AMCOL International Corporation | 68,578 |
| 3,700 | Plexus Corporation # | 95,460 | | 5,500 | AptarGroup, Inc. | 245,850 |
| 3,200 | Progress Software Corporation # | 104,672 | | 2,000 | Arch Chemicals, Inc. | 91,240 |
| 1,400 | Quality Systems, Inc. * | 50,722 | | 1,600 | Brush Engineered Materials, Inc. # | 77,280 |
| 2,000 | Radiant Systems, Inc. # | 32,640 | | 3,100 | Buckeye Technologies, Inc. # | 55,552 |
| 1,800 | RadiSys Corporation # | 24,210 | | 2,200 | Caraustar Industries, Inc. # | 8,888 |
| 1,300 | Rogers Corporation # | 63,739 | | 2,200 | Century Aluminum Company # | 128,018 |
| 2,200 | Rudolph Technologies, Inc. # | 28,666 | | 1,700 | Chesapeake Corporation | 12,597 |
| 2,100 | ScanSource, Inc. # | 77,574 | | 900 | Deltic Timber Corporation | 50,328 |
| 4,500 | Secure Computing Corporation # | 44,550 | | 2,800 | Georgia Gulf Corporation * | 33,880 |
| 1,000 | SI International, Inc. # | 28,210 | | 4,800 | H.B. Fuller Company | 141,264 |
| 12,600 | Skyworks Solutions, Inc. # | 116,172 | | 3,400 | Headwaters, Inc. #* | 48,790 |
| 2,300 | Smith Micro Software, Inc. #* | 35,443 | | 1,000 | Material Sciences Corporation # | 8,760 |
| 2,100 | Sonic Solutions, Inc. #* | 25,200 | | 2,198 | Myers Industries, Inc. | 46,576 |
| 1,500 | SPSS, Inc. # | 57,000 | | 1,200 | Neenah Paper, Inc. | 40,800 |
| 1,800 | Standard Microsystems | | | 2,400 | OM Group, Inc. # | 127,152 |
| | Corporation # | 70,200 | | 3,500 | OMNOVA Solutions, Inc. # | 19,845 |
| 1,000 | StarTek, Inc. | 10,750 | | 700 | Penford Corporation | 24,689 |
| 1,600 | Stratasys, Inc. #* | 41,648 | | 7,300 | PolyOne Corporation # | 58,327 |
| 1,100 | Supertex, Inc. #* | 40,194 | | 900 | Quaker Chemical Corporation | 19,422 |
| 2,500 | Sykes Enterprises, Inc. # | 44,125 | | 2,975 | Quanex Corporation | 122,540 |
| 3,750 | Symmetricom, Inc. # | 17,775 | | 2,700 | Rock-Tenn Company | 78,732 |
| 2,000 | Synaptics, Inc. # | 108,700 | | 1,800 | RTI International Metals, Inc. # | 140,724 |
| 1,400 | Synnex Corporation # | 31,318 | | 1,300 | Schweitzer-Mauduit | |
| 5,850 | Take-Two Interactive | | | | International, Inc. | 36,426 |
| | Software, Inc. #* | 109,863 | | 2,200 | Texas Industries, Inc. * | 160,732 |
| 3,200 | Technitrol, Inc. | 94,112 | | 3,300 | Tronox, Inc. | 27,159 |
| 5,200 | THQ, Inc. #* | 140,868 | | 3,900 | Wausau-Mosinee Paper | |
| 1,200 | Tollgrade Communications, Inc. # | 9,648 | | | Corporation | 39,039 |
|
|
| 9,400 | Trimble Navigation, Ltd. # | 391,980 | | | Total Materials | 1,998,889 |
|
|
|
| The accompanying Notes to Financial Statements are an integral part of this schedule. |
|
| 87 |
| | | | | | |
| Small Cap Index Fund | | | | | |
| Schedule of Investments as of October 31, 2007 | | | | | |
| |
| |
| Shares | Common Stock (99.2%) | Value | | Shares | Common Stock (99.2%) | Value |
|
| Telecommunications Services (0.1%) | | | 1,800 | Laclede Group, Inc. | $62,622 |
| 3,500 | General Communication, Inc. # | $41,055 | | 2,400 | New Jersey Resources Corporation | 118,200 |
|
| | |
| | Total Telecommunications | | | 2,100 | Northwest Natural Gas Company | 101,157 |
| | Services | 41,055 | | 5,900 | Piedmont Natural Gas | |
|
| | |
| | | | | | Company, Inc. * | 150,627 |
| Utilities (5.2%) | | | 2,500 | South Jersey Industries, Inc. | 93,900 |
| 2,100 | ALLETE, Inc. ‡ | 91,749 | | 9,356 | Southern Union Company ‡ | 294,714 |
| 1,500 | American States Water Company | 68,175 | | 3,300 | Southwest Gas Corporation | 98,208 |
| 7,100 | Atmos Energy Corporation | 199,155 | | 8,400 | UGI Corporation | 223,608 |
| 4,100 | Avista Corporation | 90,405 | | 1,999 | UIL Holdings Corporation | 70,325 |
| 800 | Central Vermont Public Service | | | 2,700 | UniSource Energy Corporation | 85,644 |
|
|
| | Corporation | 25,424 | | | Total Utilities | 2,397,667 |
|
|
| 1,100 | CH Energy Group, Inc. | 51,414 | | | | |
|
|
| 4,700 | Cleco Corporation | 123,845 | | | Total Common Stock | |
| 3,700 | El Paso Electric Company # | 90,095 | | | (cost $30,968,650) | 45,971,607 |
|
|
| 5,600 | Energen Corporation | 358,400 | | | | |
| | | | |
| | | Interest | Maturity | |
| Shares | Collateral Held for Securities Loaned (16.5%) | Rate (+) | Date | Value |
|
| 7,664,789 | Thrivent Financial Securities Lending Trust | 5.050% | N/A | $7,664,789 |
|
|
| | Total Collateral Held for Securities Loaned | |
| | (cost $7,664,789) | | | 7,664,789 |
|
|
|
| The accompanying Notes to Financial Statements are an integral part of this schedule. |
|
| 88 |
| | | | |
| Small Cap Index Fund | | | |
| Schedule of Investments as of October 31, 2007 | | | |
| |
| Shares or | | | | |
| Principal | | Interest | Maturity | |
| Amount | Short-Term Investments (0.8%) | Rate (+) | Date | Value |
|
| $125,000 | Federal National Mortgage Association ‡ | 5.080% | 12/14/2007 | $124,242 |
| 254,837 | Thrivent Money Market Fund | 5.020 | N/A | 254,837 |
|
|
| | Total Short-Term Investments (at amortized cost) | 379,079 |
|
|
| | Total Investments (cost $39,012,518) 116.5% | $54,015,475 |
|
|
| | Other Assets and Liabilities, Net (16.5%) | (7,647,574) |
|
|
| | Total Net Assets 100.0% | | | $46,367,901 |
|
|
| | | | | |
| | Number of | | Notional | | |
| | Contracts | Expiration | Principal | | Unrealized |
| Futures | Long/(Short) | Date | Amount | Value | Gain/(Loss) |
|
| Russell 2000 Mini-Futures | 6 | December 2007 | $499,057 | $499,380 | $323 |
| Total Futures | | | | | $323 |
# Non-income producing security.
* All or a portion of the security is on loan as discussed in item 2(M) of the Notes to Financial Statements.
+ The interest rate shown reflects the yield, coupon rate or, for securities purchased at a discount, the discount rate at the date of purchase.
‡ At October 31, 2007, $124,242 of investments were held on deposit with the counterparty and pledged as the initial margin deposit for open financial futures contracts. In addition, $1,240,511 of investments were earmarked as collateral to cover open financial futures contracts.
Gross unrealized appreciation and depreciation of investments, based on cost for federal income tax purposes, were as follows:
| | |
| Gross unrealized appreciation | $17,897,241 | |
| Gross unrealized depreciation | (3,136,115) | |
|
| |
| Net unrealized appreciation (depreciation) | $14,761,126 | |
| Cost for federal income tax purposes | $39,254,349 | |
|
| The accompanying Notes to Financial Statements are an integral part of this schedule. |
|
| 89 |
| | | | | | |
| Mid Cap Growth Fund |
| Schedule of Investments as of October 31, 2007 |
| |
| Shares | Common Stock (94.7%) | Value | | Shares | Common Stock (94.7%) | Value |
|
| Consumer Discretionary (13.7%) | | | 38,500 | Diamond Offshore Drilling, Inc. | $4,359,355 |
| 13,500 | Abercrombie & Fitch Company | $1,069,200 | | 14,300 | Dril-Quip, Inc. # | 762,619 |
| 84,400 | Burger King Holdings, Inc. | 2,231,536 | | 28,800 | GlobalSantaFe Corporation | 2,333,664 |
| 24,100 | Chipotle Mexican Grill, Inc. #*~ | 3,349,900 | | 32,900 | Nabors Industries, Ltd. #* | 923,832 |
| 186,550 | Coldwater Creek, Inc. #* | 1,669,622 | | 26,200 | National Oilwell Varco, Inc. # | 1,918,888 |
| 126,800 | Corinthian Colleges, Inc. #* | 2,078,252 | | 27,500 | Peabody Energy Corporation | 1,533,125 |
| 10,600 | Crocs, Inc. #* | 792,350 | | 20,400 | Petrohawk Energy Corporation # | 377,400 |
| 67,800 | DeVry, Inc. | 3,707,982 | | 43,900 | Southwestern Energy Company # | 2,270,947 |
| 59,800 | DreamWorks Animation | | | 44,900 | Ultra Petroleum Corporation #* | 3,181,614 |
| | SKG, Inc. # | 1,947,088 | | 20,142 | XTO Energy, Inc. | 1,337,026 |
|
|
| 26,400 | Focus Media Holding, | | | | Total Energy | 28,391,222 |
|
|
| | Ltd. ADR #* | 1,636,800 | | | | |
| 41,000 | GameStop Corporation # | 2,428,020 | | Financials (5.8%) | |
| 15,300 | Harley-Davidson, Inc. | 787,950 | | 71,100 | Annaly Capital Management, Inc. | 1,215,099 |
| 61,900 | Hasbro, Inc. * | 1,847,715 | | 2,300 | CME Group, Inc. | 1,532,375 |
| 84,700 | International Game Technology | 3,693,767 | | 31,600 | Highland Distressed | |
| 26,100 | ITT Educational Services, Inc. # | 3,319,659 | | | Opportunities, Inc. | 351,708 |
| 18,900 | Kohl’s Corporation # | 1,038,933 | | 9,400 | IntercontinentalExchange, Inc. # | 1,675,080 |
| 94,600 | Leapfrog Enterprises, Inc. #* | 708,554 | | 39,500 | Lazard, Ltd. * | 1,982,900 |
| 171,200 | Quiksilver, Inc. #* | 2,311,200 | | 11,350 | Legg Mason, Inc. | 941,369 |
| 62,800 | Scientific Games Corporation #* | 2,270,220 | | 34,300 | Northern Trust Corporation | 2,579,703 |
| 54,200 | Shuffle Master, Inc. #* | 741,456 | | 13,700 | Nymex Holdings, Inc. * | 1,760,724 |
| 98,200 | Staples, Inc. | 2,291,988 | | 32,100 | PartnerRe, Ltd. * | 2,672,325 |
| 27,300 | Starwood Hotels & Resorts | | | 3,900 | Principal Financial Group, Inc. | 263,913 |
| | Worldwide, Inc. | 1,552,278 | | 96,900 | T. Rowe Price Group, Inc. * | 6,224,856 |
|
|
| 56,700 | Texas Roadhouse, Inc. # | 718,389 | | | Total Financials | 21,200,052 |
|
|
| 93,400 | TJX Companies, Inc. | 2,702,062 | | | | |
| 11,700 | Under Armour, Inc. #* | 728,325 | | Health Care (16.7%) | |
| 60,800 | Volcom, Inc. #* | 1,778,400 | | 79,100 | Advanced Medical Optics, Inc. #* | 2,171,295 |
| 66,700 | WMS Industries, Inc. # | 2,312,489 | | 55,200 | Affymetrix, Inc. #* | 1,405,392 |
|
| | |
| | Total Consumer | | | 62,100 | Alkermes, Inc. #* | 1,006,020 |
| | Discretionary | 49,714,135 | | 53,600 | Allscripts Healthcare | |
|
| | |
| | | | | | Solutions, Inc. #* | 1,484,720 |
| Consumer Staples (4.3%) | | | 59,800 | Amylin Pharmaceuticals, Inc. #* | 2,692,196 |
| 21,400 | Andersons, Inc. * | 1,062,510 | | 46,500 | BioMarin Pharmaceutical, Inc. #* | 1,289,445 |
| 38,300 | Clorox Company | 2,396,431 | | 44,800 | C.R. Bard, Inc. | 3,745,728 |
| 91,000 | Coca-Cola Enterprises, Inc. | 2,348,710 | | 11,100 | Cephalon, Inc. #* | 818,514 |
| 79,400 | H.J. Heinz Company | 3,714,332 | | 39,975 | Coventry Health Care, Inc. # | 2,410,892 |
| 20,000 | Longs Drug Stores Corporation | 1,050,200 | | 54,000 | Elan Corporation plc ADR # | 1,285,200 |
| 51,200 | Pepsi Bottling Group, Inc. | 2,205,696 | | 22,900 | Endo Pharmaceutical | |
| 61,500 | Whole Foods Market, Inc. * | 3,046,710 | | | Holdings, Inc. # | 670,970 |
|
| | |
| | Total Consumer Staples | 15,824,589 | | 11,886 | ev3, Inc. #* | 174,491 |
|
| | |
| | | | | 52,400 | Gen-Probe, Inc. # | 3,669,048 |
| Energy (7.8%) | | | 33,600 | Genzyme Corporation # | 2,552,592 |
| 48,700 | Cameron International | | | 61,600 | Gilead Sciences, Inc. # | 2,845,304 |
| | Corporation # | 4,741,432 | | 12,300 | Henry Schein, Inc. # | 736,770 |
| 49,800 | Devon Energy Corporation | 4,651,320 | | 48,600 | Hologic, Inc. #* | 3,301,398 |
|
| The accompanying Notes to Financial Statements are an integral part of this schedule. |
|
| 90 |
| | | | | | |
| Mid Cap Growth Fund | | | | | |
| Schedule of Investments as of October 31, 2007 | | | | | |
| |
| |
| Shares | Common Stock (94.7%) | Value | | Shares | Common Stock (94.7%) | Value |
|
| Health Care — continued | | | Information Technology (22.9%) | |
| 11,500 | Illumina, Inc. # | $645,725 | | 149,100 | Activision, Inc. # | $3,526,215 |
| 11,900 | Intuitive Surgical, Inc. # | 3,889,753 | | 90,234 | Adobe Systems, Inc. #± | 4,322,209 |
| 32,500 | Millipore Corporation #* | 2,523,625 | | 46,000 | Akamai Technologies, Inc. #* | 1,802,740 |
| 67,900 | NuVasive, Inc. # | 2,905,441 | | 2,650 | Alibaba.com, Ltd. #^§ | 4,616 |
| 62,300 | Patterson Companies, Inc. #* | 2,436,553 | | 16,200 | Amphenol Corporation | 717,174 |
| 57,600 | Pharmaceutical Product | | | 82,000 | Broadcom Corporation # | 2,669,100 |
| | Development, Inc. | 2,433,024 | | 184,900 | Cadence Design Systems, Inc. #* | 3,624,040 |
| 56,000 | Sepracor, Inc. # | 1,542,240 | | 51,700 | CIENA Corporation #* | 2,474,362 |
| 33,500 | Shire Pharmaceuticals | | | 154,500 | CNET Networks, Inc. #* | 1,248,360 |
| | Group plc ADR | 2,517,525 | | 53,752 | Cognizant Technology | |
| 80,100 | St. Jude Medical, Inc. # | 3,262,473 | | | Solutions Corporation # | 2,228,558 |
| 33,000 | Thermo Electron Corporation # | 1,940,730 | | 16,500 | Cognos, Inc. # | 830,445 |
| 65,900 | Thoratec Corporation #* | 1,316,023 | | 23,150 | Constant Contact, Inc. #* | 576,435 |
| 2,450 | Trans1, Inc. # | 61,250 | | 46,500 | Corning, Inc. | 1,128,555 |
| 51,000 | VCA Antech, Inc. # | 2,348,550 | | 21,600 | Cree, Inc. #* | 604,800 |
| 26,100 | Vertex Pharmaceuticals, Inc. # | 844,074 | | 29,900 | Dolby Laboratories, Inc. # | 1,239,654 |
|
| | |
| | Total Health Care | 60,926,961 | | 58,900 | Electronic Arts, Inc. #* | 3,599,968 |
|
| | |
| | | | | 52,300 | Emulex Corporation # | 1,132,818 |
| Industrials (13.8%) | | | 75,700 | F5 Networks, Inc. # | 2,727,471 |
| 43,450 | Aecom Technology Corporation # | 1,467,306 | | 10,600 | Fair Isaac Corporation | 401,952 |
| 54,300 | BE Aerospace, Inc. # | 2,699,253 | | 40,000 | FormFactor, Inc. # | 1,564,400 |
| 22,900 | C.H. Robinson Worldwide, Inc. | 1,143,168 | | 93,600 | Foundry Networks, Inc. # | 1,978,704 |
| 24,140 | Expeditors International of | | | 169,100 | Integrated Device | |
| | Washington, Inc. * | 1,222,691 | | | Technology, Inc. # | 2,271,013 |
| 33,000 | Flowserve Corporation | 2,605,680 | | 90,100 | Intersil Corporation | 2,733,634 |
| 35,200 | Foster Wheeler, Ltd. # | 5,218,400 | | 130,862 | JDS Uniphase Corporation #* | 1,996,954 |
| 23,500 | FTI Consulting, Inc. #* | 1,276,050 | | 179,300 | Lawson Software, Inc. # | 2,024,297 |
| 22,100 | Huron Consulting Group, Inc. # | 1,544,348 | | 69,100 | Linear Technology Corporation * | 2,281,682 |
| 25,900 | ITT Corporation | 1,733,228 | | 87,700 | Marvell Technology | |
| 23,900 | Jacobs Engineering Group, Inc. #* | 2,082,885 | | | Group, Ltd. # | 1,581,231 |
| 43,400 | Joy Global, Inc. | 2,519,804 | | 32,700 | Maxim Integrated Products, Inc. | 886,170 |
| 38,000 | KBR, Inc. # | 1,629,440 | | 43,000 | McAfee, Inc. # | 1,778,050 |
| 34,000 | McDermott International, Inc. # | 2,076,040 | | 46,600 | NAVTEQ Corporation # | 3,597,520 |
| 50,600 | Monster Worldwide, Inc. # | 2,053,348 | | 73,100 | Network Appliance, Inc. # | 2,301,919 |
| 49,600 | Precision Castparts Corporation | 7,430,576 | | 78,800 | Nuance Communications, Inc. #* | 1,742,268 |
| 36,900 | Quanta Services, Inc. # | 1,217,700 | | 84,600 | NVIDIA Corporation # | 2,993,148 |
| 30,800 | Rockwell Collins, Inc. | 2,304,148 | | 172,500 | ON Semiconductor | |
| 26,300 | Roper Industries, Inc. * | 1,862,303 | | | Corporation # | 1,759,500 |
| 24,300 | Spirit Aerosystems | | | 63,000 | OpNext, Inc. # | 749,700 |
| | Holdings, Inc. # | 843,696 | | 380,200 | RF Micro Devices, Inc. #* | 2,364,844 |
| 50,700 | Stericycle, Inc. # | 2,957,331 | | 146,000 | Seagate Technology | 4,064,640 |
| 3,300 | Terex Corporation # | 244,926 | | 90,000 | Synopsys, Inc. # | 2,543,400 |
| 30,200 | Textron, Inc. | 2,090,142 | | 146,000 | Tellabs, Inc. # | 1,286,260 |
| 66,200 | US Airways Group, Inc. # | 1,831,092 | | 44,500 | THQ, Inc. # | 1,205,505 |
|
| | |
| | Total Industrials | 50,053,555 | | 49,600 | VeriSign, Inc. #* | 1,690,864 |
|
| | |
|
| The accompanying Notes to Financial Statements are an integral part of this schedule. |
|
| 91 |
| | | | | | |
| Mid Cap Growth Fund | | | | | |
| Schedule of Investments as of October 31, 2007 | | | | | |
| |
| |
| Shares | Common Stock (94.7%) | Value | | Shares | Common Stock (94.7%) | Value |
|
| Information Technology — continued | | | Telecommunications Services (4.9%) | |
| 53,200 | Western Union Company | $1,172,528 | | 43,710 | American Tower Corporation # | $1,931,108 |
| 72,000 | Xilinx, Inc. | 1,756,800 | | 76,300 | Clearwire Corporation #* | 1,566,439 |
|
| | |
| | Total Information | | | 380,823 | Level 3 Communications, Inc. #* | 1,153,894 |
| | Technology | 83,184,503 | | 41,100 | NeuStar, Inc. #* | 1,405,620 |
|
| | |
| | | | | 50,600 | NII Holdings, Inc. # | 2,934,800 |
| Materials (4.8%) | | | 81,700 | Rogers Communications, Inc. * | 4,163,432 |
| 35,300 | Air Products and Chemicals, Inc. | 3,454,105 | | 63,700 | SBA Communications | |
| 9,400 | Allegheny Technologies, Inc. | 960,398 | | | Corporation # | 2,267,720 |
| 99,100 | Bemis Company, Inc. | 2,790,656 | | 105,200 | Time Warner Telecom, Inc. # | 2,444,848 |
|
|
| 33,600 | Celanese Corporation | 1,409,856 | | | Total Telecommunications | |
| 43,400 | Newmont Mining Corporation | 2,207,324 | | | Services | 17,867,861 |
|
|
| 64,200 | Praxair, Inc. | 5,487,816 | | | | |
|
|
| 32,200 | Titanium Metals Corporation #* | 1,133,440 | | | Total Common Stock | |
|
| | |
| | Total Materials | 17,443,595 | | | (cost $266,855,932) | 344,606,473 |
|
| | |
|
| | | | |
| | | Interest | Maturity | |
| Shares | Collateral Held for Securities Loaned (24.7%) | Rate (+) | Date | Value |
|
| 89,916,284 | Thrivent Financial Securities Lending Trust | 5.050% | N/A | $89,916,284 |
|
|
| | Total Collateral Held for Securities Loaned | |
| | (cost $89,916,284) | | | 89,916,284 |
|
|
|
| The accompanying Notes to Financial Statements are an integral part of this schedule. |
|
| 92 |
| | | | |
| Mid Cap Growth Fund | | | |
| Schedule of Investments as of October 31, 2007 | | | |
| |
| | | Interest | Maturity | |
| Shares | Short-Term Investments (5.3%) | Rate(+) | Date | Value |
|
| 19,343,238 | Thrivent Money Market Fund | 5.020% | N/A | $19,343,238 |
|
|
| | Total Short-Term Investments (at amortized cost) | 19,343,238 |
|
|
| | Total Investments (cost $376,115,454) 124.7% | $453,865,995 |
|
|
| | Other Assets and Liabilities, Net (24.7%) | | (89,838,778) |
|
|
| | Total Net Assets 100.0% | | | $364,027,217 |
|
|
| | | | | |
| | Number of | Exercise | Expiration | | Unrealized |
| Call Options Written | Contracts | Price | Date | Value | Gain/(Loss) |
|
| Chipotle Mexican Grill, Inc. | 31 | $145 | November 2007 | ($6,758) | $1,226 |
| Total Call Options Written | | | | | $1,226 |
# Non-income producing security.
* All or a portion of the security is on loan as discussed in item 2(M) of the Notes to Financial Statements.
+ The interest rate shown reflects the yield, coupon rate or, for securities purchased at a discount, the discount rate at the date of purchase.
^ Security is fair valued as discussed in item 2(A) of the Notes to Financial Statements.
§ Denotes investments purchased on a when-issued or delayed delivery basis.
± Designated as cover for long settling trades as discussed in the Notes to Financial Statements.
~ All or a portion of the security was earmarked as collateral to cover options.
Definitions:
ADR — American Depository Receipts, which are certificates for shares of an underlying foreign security’s shares held by an issuing U.S. depository bank.
Gross unrealized appreciation and depreciation of investments, based on cost for federal income tax purposes, were as follows:
| | |
| Gross unrealized appreciation | $88,719,843 | |
| Gross unrealized depreciation | (11,485,936) | |
|
| |
| Net unrealized appreciation (depreciation) | $77,233,907 | |
| Cost for federal income tax purposes | $376,632,088 | |
|
| The accompanying Notes to Financial Statements are an integral part of this schedule. |
|
| 93 |
| | | | | | |
| Partner Mid Cap Value Fund |
| Schedule of Investments as of October 31, 2007 |
| |
| Shares | Common Stock (94.4%) | Value | | Shares | Common Stock (94.4%) | Value |
|
| Consumer Discretionary (10.8%) | | | 5,864 | Assurant, Inc. | $342,692 |
| 2,241 | BorgWarner, Inc. | $236,896 | | 8,106 | Astoria Financial Corporation | 210,675 |
| 3,536 | Boyd Gaming Corporation | 147,876 | | 9,911 | Brandywine Realty Trust | 256,398 |
| 96,300 | Charter Communications, Inc. #* | 199,341 | | 3,225 | Camden Property Trust | 201,079 |
| 15,937 | Ford Motor Company #* | 141,361 | | 9,715 | CIT Group, Inc. | 342,357 |
| 4,358 | Fortune Brands, Inc. * | 365,070 | | 7,112 | Commerce Bancshares, Inc. | 335,473 |
| 21,789 | H&R Block, Inc. * | 475,000 | | 20,393 | DCT Industrial Trust, Inc. | 218,817 |
| 13,950 | IAC InterActiveCorp # | 410,967 | | 1,309 | Developers Diversified Realty | |
| 7,844 | J.C. Penney Company, Inc. | | | | Corporation | 65,974 |
| | (Holding Company) | 441,147 | | 5,378 | Everest Re Group, Ltd. | 572,972 |
| 18,696 | Johnson Controls, Inc. | 817,389 | | 12,326 | Highwoods Properties, Inc. | 443,243 |
| 3,275 | KB Home | 90,521 | | 19,035 | Hudson City Bancorp, Inc. * | 298,088 |
| 5,325 | Lamar Advertising Company | 284,674 | | 20,945 | KeyCorp | 595,885 |
| 13,400 | Mattel, Inc. | 279,926 | | 3,026 | Lazard, Ltd. | 151,905 |
| 23,517 | Newell Rubbermaid, Inc. | 685,756 | | 1,950 | Legg Mason, Inc. | 161,733 |
| 5,939 | Ross Stores, Inc. | 160,472 | | 9,191 | Liberty Property Trust * | 345,765 |
| 6,751 | Tenneco, Inc. # | 206,648 | | 8,018 | M&T Bank Corporation | 797,631 |
|
| | |
| | Total Consumer | | | 5,246 | Mack-Cali Realty Corporation | 207,689 |
| | Discretionary | 4,943,044 | | 8,305 | Northern Trust Corporation | 624,619 |
|
| | |
| | | | | 4,669 | PartnerRe, Ltd. | 388,694 |
| Consumer Staples (5.8%) | | | 11,255 | Pennsylvania Real Estate | |
| 10,621 | Clorox Company | 664,556 | | | Investment Trust * | 429,378 |
| 6,972 | Coca-Cola Enterprises, Inc. | 179,947 | | 5,161 | Philadelphia Consolidated | |
| 13,150 | ConAgra Foods, Inc. | 312,050 | | | Holding Corporation # | 210,569 |
| 2,117 | Loews Corporation — | | | 4,059 | PMI Group, Inc. | 65,066 |
| | Carolina Group | 181,596 | | 3,461 | RenaissanceRe Holdings, Ltd. | 201,915 |
| 2,912 | Reynolds American, Inc. | 187,620 | | 1,775 | Torchmark Corporation | 115,659 |
| 8,404 | Safeway, Inc. | 285,736 | | 13,854 | UnumProvident Corporation | 323,352 |
| 2,814 | Smithfield Foods, Inc. # | 80,677 | | 4,233 | Vornado Realty Trust | 472,911 |
| 19,934 | SUPERVALU, Inc. | 772,442 | | 11,592 | Webster Financial Corporation | 420,094 |
|
| | |
| | Total Consumer Staples | 2,664,624 | | 2,490 | XL Capital, Ltd. | 179,156 |
|
| | |
|
| | | | | | Total Financials | 10,191,204 |
|
|
| Energy (11.4%) | | | | | |
| 4,252 | EOG Resources, Inc. | 376,727 | | Health Care (3.0%) | |
| 5,675 | Grant Prideco, Inc. # | 278,983 | | 1,992 | Coventry Health Care, Inc. # | 120,138 |
| 16,218 | Hess Corporation | 1,161,371 | | 7,782 | Edwards Lifesciences Corporation # | 390,812 |
| 5,650 | Oil States International, Inc. # | 244,024 | | 2,064 | Health Net, Inc. # | 110,651 |
| 30,304 | Range Resources Corporation | 1,361,559 | | 14,792 | IMS Health, Inc. | 372,906 |
| 5,274 | W-H Energy Services, Inc. # | 303,571 | | 13,497 | PerkinElmer, Inc. | 371,437 |
|
|
| 41,810 | Williams Companies, Inc. | 1,525,649 | | | Total Health Care | 1,365,944 |
|
| | |
|
| | Total Energy | 5,251,884 | | | | |
|
| | |
| | | | | Industrials (10.2%) | |
| Financials (22.2%) | | | 2,191 | Alliant Techsystems, Inc. # | 241,864 |
| 10,494 | Ambac Financial Group, Inc. * | 386,494 | | 55,746 | Allied Waste Industries, Inc. # | 704,629 |
| 12,936 | Annaly Capital Management, Inc. | 221,076 | | 100 | Chicago Bridge and Iron Company | 5,000 |
| 12,922 | Apartment Investment & | | | 4,658 | Cooper Industries, Ltd. | 244,033 |
| | Management Company | 603,845 | | 4,358 | Eaton Corporation | 403,464 |
|
| The accompanying Notes to Financial Statements are an integral part of this schedule. |
|
| 94 |
| | | | | | |
| Partner Mid Cap Value Fund | | | | | |
| Schedule of Investments as of October 31, 2007 | | | | | |
| |
| |
| Shares | Common Stock (94.4%) | Value | | Shares | Common Stock (94.4%) | Value |
|
| Industrials — continued | | | 7,346 | Nucor Corporation | $455,599 |
| 8,651 | JB Hunt Transport Services, Inc. * | $239,806 | | 2,875 | Rockwood Holdings, Inc. # | 112,384 |
| 8,822 | Landstar System, Inc. | 371,318 | | 2,100 | Rohm and Haas Company | 108,948 |
| 8,446 | Lennox International, Inc. | 301,522 | | 1,675 | Steel Dynamics, Inc. | 89,144 |
|
|
| 12,506 | Monster Worldwide, Inc. # | 507,493 | | | Total Materials | 3,047,254 |
|
|
| 4,748 | Norfolk Southern Corporation | 245,234 | | | | |
| 6,238 | Parker-Hannifin Corporation | 501,308 | | Telecommunications Services (3.6%) | |
| 6,741 | Rockwell Collins, Inc. | 504,294 | | 39,967 | Cincinnati Bell, Inc. # | 216,621 |
| 9,127 | Ryder System, Inc. | 436,727 | | 15,580 | Embarq Corporation | 824,494 |
|
| | |
| | Total Industrials | 4,706,692 | | 5,008 | Metropcs Communications, Inc. # | 112,680 |
|
| | |
| | | | | 70,695 | Qwest Communications | |
| Information Technology (6.7%) | | | | International, Inc. #* | 507,590 |
|
|
| 17,930 | Activision, Inc. # | 424,044 | | | Total Telecommunications | |
| 18,480 | Amphenol Corporation | 818,110 | | | Services | 1,661,385 |
|
|
| 23,951 | BearingPoint, Inc. # | 114,725 | | | | |
| 10,762 | Lexmark International, Inc. # | 451,896 | | Utilities (14.1%) | |
| 6,460 | National Semiconductor | | | 7,852 | American Electric Power | |
| | Corporation | 162,404 | | | Company, Inc. | 378,545 |
| 14,858 | Seagate Technology | 413,647 | | 7,620 | CMS Energy Corporation | 129,311 |
| 9,699 | Tessera Technologies, Inc. # | 370,405 | | 1,992 | Constellation Energy Group, Inc. | 188,642 |
| 20,028 | Xerox Corporation # | 349,288 | | 25,873 | DPL, Inc. * | 751,352 |
|
| | |
| | Total Information | | | 12,619 | Edison International, Inc. | 733,038 |
| | Technology | 3,104,519 | | 11,240 | Entergy Corporation | 1,347,339 |
|
| | |
| | | | | 5,100 | Equitable Resources, Inc. | 287,232 |
| Materials (6.6%) | | | 7,894 | FirstEnergy Corporation | 550,212 |
| 5,752 | Airgas, Inc. | 290,303 | | 13,335 | PG&E Corporation | 652,482 |
| 4,129 | Albemarle Corporation | 197,201 | | 20,326 | PPL Corporation | 1,050,854 |
| 10,575 | Celanese Corporation | 443,727 | | 1,370 | SCANA Corporation | 55,608 |
| 12,151 | Chemtura Corporation | 113,247 | | 7,234 | Wisconsin Energy Corporation | 346,364 |
|
|
| 12,306 | Commercial Metals Company | 386,162 | | | Total Utilities | 6,470,979 |
|
|
| 3,470 | Cytec Industries, Inc. | 231,484 | | | | |
|
|
| 31,999 | Domtar Corporation # | 274,551 | | | Total Common Stock | |
| 9,321 | International Paper Company | 344,504 | | | (cost $39,779,888) | 43,407,529 |
|
|
|
| The accompanying Notes to Financial Statements are an integral part of this schedule. |
|
| 95 |
| | | | |
| Partner Mid Cap Value Fund | | | |
| Schedule of Investments as of October 31, 2007 | | | |
| |
| | | Interest | Maturity | |
| Shares | Collateral Held for Securities Loaned (8.8%) | Rate (+) | Date | Value |
|
| 4,022,546 | Thrivent Financial Securities Lending Trust | 5.050% | N/A | $4,022,546 |
|
|
| | Total Collateral Held for Securities Loaned | |
| | (cost $4,022,546) | | | 4,022,546 |
|
|
| |
| |
| | | Interest | Maturity | |
| Shares | Short-Term Investments (5.1%) | Rate (+) | Date | Value |
|
| 2,336,105 | Thrivent Money Market Fund | 5.020% | N/A | $2,336,105 |
|
|
| | Total Short-Term Investments (at amortized cost) | 2,336,105 |
|
|
| | Total Investments (cost $46,138,539) 108.3% | $49,766,180 |
|
|
| | Other Assets and Liabilities, Net (8.3%) | | (3,796,871) |
|
|
| | Total Net Assets 100.0% | | | $45,969,309 |
|
|
# Non-income producing security.
* All or a portion of the security is on loan as discussed in item 2(M) of the Notes to Financial Statements.
+ The interest rate shown reflects the yield, coupon rate or, for securities purchased at a discount, the discount rate at the date of purchase.
Gross unrealized appreciation and depreciation of investments, based on cost for federal income tax purposes, were as follows:
| | |
| Gross unrealized appreciation | $5,426,209 | |
| Gross unrealized depreciation | (2,025,286) | |
|
| |
| Net unrealized appreciation (depreciation) | $3,400,923 | |
| Cost for federal income tax purposes | $46,365,257 | |
|
| The accompanying Notes to Financial Statements are an integral part of this schedule. |
|
| 96 |
| | | | | | |
| Mid Cap Stock Fund |
| Schedule of Investments as of October 31, 2007 |
| |
| Shares | Common Stock (94.8%) | Value | | Shares | Common Stock (94.8%) | Value |
|
| Consumer Discretionary (10.7%) | | | 602,850 | HCC Insurance Holdings, Inc. * | $18,019,186 |
| 49,300 | Apollo Group, Inc. # | $3,907,518 | | 224,700 | Jefferies Group, Inc. * | 6,006,231 |
| 265,200 | Burger King Holdings, Inc. | 7,011,888 | | 1,226,700 | New York Community | |
| 172,600 | Darden Restaurants, Inc. | 7,421,800 | | | Bancorp, Inc. * | 22,828,887 |
| 399,300 | DeVry, Inc. * | 21,837,717 | | 95,200 | PartnerRe, Ltd. * | 7,925,400 |
| 408,200 | International Game Technology | 17,801,602 | | 143,100 | Philadelphia Consolidated | |
| 82,900 | ITT Educational Services, Inc. # | 10,544,051 | | | Holding Corporation # | 5,838,480 |
| 272,400 | Scientific Games Corporation # | 9,847,260 | | 316,600 | PMI Group, Inc. * | 5,075,098 |
| 2,484,800 | Service Corporation | | | 79,200 | Protective Life Corporation | 3,395,304 |
| | International | 35,955,056 | | 154,900 | Rayonier, Inc. REIT | 7,480,121 |
| 149,700 | Urban Outfitters, Inc. #* | 3,782,919 | | 113,900 | SEI Investments Company | 3,601,518 |
| 215,000 | WMS Industries, Inc. #* | 7,454,050 | | 222,700 | Strategic Hotel Capital, Inc. * | 4,863,768 |
|
| | |
| | Total Consumer | | | 715,100 | U-Store-It Trust * | 9,224,790 |
| | Discretionary | 125,563,861 | | 208,550 | W.R. Berkley Corporation | 6,275,270 |
|
| | |
| | | | | 123,900 | Westamerica Bancorporation * | 5,957,112 |
|
|
| Consumer Staples (9.6%) | | | | Total Financials | 169,422,438 |
|
|
| 482,900 | Campbell Soup Company * | 17,857,642 | | | | |
| 374,900 | Clorox Company | 23,457,493 | | Health Care (10.1%) | |
| 430,300 | Coca-Cola Enterprises, Inc. | 11,106,043 | | 114,700 | Advanced Medical Optics, Inc. #* | 3,148,515 |
| 623,000 | H.J. Heinz Company | 29,143,940 | | 239,500 | Applera Corporation | |
| 121,600 | Kroger Company | 3,573,824 | | | (Celera Group) # | 3,906,245 |
| 98,100 | McCormick & Company, Inc. | 3,436,443 | | 95,000 | Beckman Coulter, Inc. * | 6,727,900 |
| 143,300 | NBTY, Inc. # | 5,101,480 | | 83,900 | Cephalon, Inc. #* | 6,186,786 |
| 104,800 | Safeway, Inc. | 3,563,200 | | 111,200 | Coventry Health Care, Inc. # | 6,706,472 |
| 118,600 | Smithfield Foods, Inc. # | 3,400,262 | | 121,894 | Dade Behring Holdings, Inc. | 9,377,305 |
| 435,500 | TreeHouse Foods, Inc. # | 12,150,450 | | 65,200 | DaVita, Inc. # | 4,250,388 |
|
| | |
| | Total Consumer Staples | 112,790,777 | | 129,400 | Endo Pharmaceutical | |
|
| | |
| | | | | | Holdings, Inc. # | 3,791,420 |
| Energy (0.9%) | | | 88,100 | Hologic, Inc. #* | 5,984,633 |
| 285,000 | Willbros Group, Inc. #* | 10,906,950 | | 381,000 | Human Genome Sciences, Inc. #* | 3,604,260 |
|
| | |
| | Total Energy | 10,906,950 | | 123,900 | ImClone Systems, Inc. #* | 5,346,285 |
|
| | |
| | | | | 37,500 | Intuitive Surgical, Inc. #* | 12,257,625 |
| Financials (14.4%) | | | 61,300 | Invitrogen Corporation #* | 5,570,331 |
| 50,550 | Affiliated Managers Group, Inc. #* | 6,649,852 | | 125,300 | LifePoint Hospitals, Inc. # | 3,824,156 |
| 115,700 | Assurant, Inc. | 6,761,508 | | 105,100 | Patterson Companies, Inc. # | 4,110,461 |
| 61,800 | Bear Stearns Companies, Inc. | 7,020,480 | | 68,000 | Shire Pharmaceuticals | |
| 188,900 | Brown & Brown, Inc. | 4,758,391 | | | Group plc ADR | 5,110,200 |
| 44,000 | City National Corporation | 2,974,400 | | 218,500 | St. Jude Medical, Inc. # | 8,899,505 |
| 87,900 | Commerce Bancshares, Inc. | 4,146,243 | | 155,500 | TomoTherapy, Inc. #* | 3,400,785 |
| 126,400 | Cousins Properties, Inc. * | 3,639,056 | | 70,800 | Universal Health Services, Inc. * | 3,451,500 |
| 128,700 | Eaton Vance Corporation | 6,438,861 | | 82,300 | Varian Medical Systems, Inc. # | 4,013,771 |
| 167,000 | Endurance Specialty | | | 37,000 | Ventana Medical Systems, Inc. # | 3,256,000 |
| | Holdings, Ltd. | 6,548,070 | | 162,800 | Vertex Pharmaceuticals, Inc. # | 5,264,952 |
|
|
| 231,600 | Equity One, Inc. * | 6,063,288 | | | Total Health Care | 118,189,495 |
|
|
| 145,900 | General Growth Properties, Inc. * | 7,931,124 | | | | |
|
| The accompanying Notes to Financial Statements are an integral part of this schedule. |
|
| 97 |
| | | | | | |
| Mid Cap Stock Fund | | | | | |
| Schedule of Investments as of October 31, 2007 | | | | | |
| |
| |
| Shares | Common Stock (94.8%) | Value | | Shares | Common Stock (94.8%) | Value |
|
| Industrials (5.4%) | | | 863,600 | RF Micro Devices, Inc. #* | $5,371,592 |
| 440,600 | Continental Airlines, Inc. #* | $15,134,610 | | 329,500 | Synopsys, Inc. # | 9,311,670 |
| 378,900 | Pitney Bowes, Inc. | 15,171,156 | | 614,000 | Tellabs, Inc. # | 5,409,340 |
| 200,400 | Stericycle, Inc. # | 11,689,332 | | 379,900 | Teradyne, Inc. # | 4,687,966 |
| 565,600 | US Airways Group, Inc. #* | 15,644,496 | | 731,700 | TIBCO Software, Inc. #* | 6,717,006 |
| 214,100 | UTI Worldwide, Inc. | 5,461,691 | | 101,400 | Varian Semiconductor | |
|
| | |
| | Total Industrials | 63,101,285 | | | Equipment Associates, Inc. # | 4,666,428 |
|
| | |
| | | | | 377,700 | VeriSign, Inc. #* | 12,875,793 |
| Information Technology (20.2%) | | | 312,700 | Vishay Intertechnology, Inc. # | 3,936,893 |
| 305,100 | ADC Telecommunications, Inc. #* | 5,705,370 | | 440,000 | Wind River Systems, Inc. # | 5,504,400 |
|
|
| 1,883,600 | Atmel Corporation # | 9,210,804 | | | Total Information | |
| 1,222,000 | Brocade Communications # | 11,621,220 | | | Technology | 236,377,856 |
|
|
| 261,600 | Cadence Design Systems, Inc. #* | 5,127,360 | | | | |
| 89,500 | CIENA Corporation #* | 4,283,470 | | Materials (15.4%) | |
| 86,600 | Cognizant Technology | | | 1,560,500 | Crown Holdings, Inc. # | 38,700,400 |
| | Solutions Corporation # | 3,590,436 | | 1,073,100 | Owens-Illinois, Inc. #* | 47,667,104 |
| 60,000 | Cognos, Inc. # | 3,019,800 | | 1,590,503 | Pactiv Corporation # | 43,691,117 |
| 907,500 | Compuware Corporation # | 9,075,000 | | 130,200 | Sigma-Aldrich Corporation | 6,727,434 |
| 87,900 | DealerTrack Holdings, Inc. # | 4,315,011 | | 801,985 | Silgan Holdings, Inc. | 43,764,321 |
|
|
| 41,800 | DST Systems, Inc. # | 3,540,878 | | | Total Materials | 180,550,376 |
|
|
| 131,300 | Electronic Arts, Inc. #* | 8,025,056 | | | | |
| 357,600 | Emulex Corporation # | 7,745,616 | | Telecommunications Services (0.5%) | |
| 94,500 | F5 Networks, Inc. # | 3,404,835 | | 1,113,900 | Cincinnati Bell, Inc. #* | 6,037,338 |
|
|
| 313,900 | Fair Isaac Corporation * | 11,903,088 | | | Total Telecommunications | |
| 115,000 | FormFactor, Inc. #* | 4,497,650 | | | Services | 6,037,338 |
|
|
| 320,900 | Foundry Networks, Inc. # | 6,783,826 | | | | |
| 90,700 | Harris Corporation | 5,492,792 | | Utilities (7.6%) | |
| 385,200 | Integrated Device | | | 240,200 | AGL Resources, Inc. | 9,495,106 |
| | Technology, Inc. # | 5,173,236 | | 982,700 | CMS Energy Corporation * | 16,676,419 |
| 187,200 | Intersil Corporation * | 5,679,648 | | 338,600 | Nicor, Inc. * | 14,651,222 |
| 430,900 | Juniper Networks, Inc. # | 15,512,400 | | 328,900 | SCANA Corporation * | 13,350,051 |
| 87,400 | Lexmark International, Inc. # | 3,669,926 | | 125,000 | Vectren Corporation | 3,505,000 |
| 276,400 | McAfee, Inc. # | 11,429,140 | | 102,800 | WGL Holdings, Inc. * | 3,486,976 |
| 245,400 | Network Appliance, Inc. # | 7,727,646 | | 584,000 | Wisconsin Energy Corporation | 27,961,920 |
|
|
| 82,100 | NVIDIA Corporation # | 2,904,698 | | | Total Utilities | 89,126,694 |
|
|
| 473,300 | ON Semiconductor Corporation # | 4,827,660 | | | | |
|
|
| 411,200 | Palm, Inc. * | 3,709,024 | | | Total Common Stock | |
| 157,800 | Paychex, Inc. * | 6,592,884 | | | (cost $1,003,504,521) | 1,112,067,070 |
|
|
| 369,400 | PMC-Sierra, Inc. #* | 3,328,294 | | | | |
|
| The accompanying Notes to Financial Statements are an integral part of this schedule. |
|
| 98 |
| | | | |
| Mid Cap Stock Fund | | | |
| Schedule of Investments as of October 31, 2007 | | | |
| |
| | | Interest | Maturity | |
| Shares | Collateral Held for Securities Loaned (22.5%) | Rate (+) | Date | Value |
|
| 263,325,754 | Thrivent Financial Securities Lending Trust | 5.050% | N/A | $263,325,754 |
|
|
| | Total Collateral Held for Securities Loaned | |
| | (cost $263,325,754) | | | 263,325,754 |
|
|
| |
| |
| Shares or | | | | |
| Principal | | Interest | Maturity | |
| Amount | Short-Term Investments (5.2%) | Rate (+) | Date | Value |
|
| $27,480,000 | Barclays Bank plc Repurchase Agreement ■ | 4.800% | 11/1/2007 | $27,480,000 |
| 5,000,000 | Barton Capital, LLC | 4.950 | 11/1/2007 | 5,000,000 |
| 5,000,000 | Falcon Asset Securitization Corporation | 4.820 | 11/5/2007 | 4,997,322 |
| 18,634,670 | Thrivent Money Market Fund | 5.020 | N/A | 18,634,670 |
| 5,000,000 | Yorktown Capital, LLC | 4.830 | 11/1/2007 | 5,000,000 |
|
|
| | Total Short-Term Investments (at amortized cost) | 61,111,992 |
|
|
| | Total Investments (cost $1,327,942,267) 122.5% | $1,436,504,816 |
|
|
| | Other Assets and Liabilities, Net (22.5%) | | (263,599,974) |
|
|
| | Total Net Assets 100.0% | | | $1,172,904,842 |
|
|
# Non-income producing security.
* All or a portion of the security is on loan as discussed in item 2(M) of the Notes to Financial Statements.
+ The interest rate shown reflects the yield, coupon rate or, for securities purchased at a discount, the discount rate at the date of purchase.
■ Repurchase agreement dated October 31, 2007 $27,480,861 maturing November 1, 2007, collateralized by $28,030,478 Federal National Mortgage Association, 5.250% due March 24, 2015.
Definitions:
ADR — American Depository Receipts, which are certificates for shares of an underlying foreign security’s shares held by an issuing U.S. depository bank.
REIT — Real Estate Investment Trust, is a company that buys, develops, manages and/or sells real estate assets.
Gross unrealized appreciation and depreciation of investments, based on cost for federal income tax purposes, were as follows:
| | |
| Gross unrealized appreciation | $138,036,266 | |
| Gross unrealized depreciation | (31,987,163) | |
|
| |
| Net unrealized appreciation (depreciation) | $106,049,103 | |
| Cost for federal income tax purposes | $1,330,455,713 | |
|
| The accompanying Notes to Financial Statements are an integral part of this schedule. |
|
| 99 |
| | | | | | |
| Mid Cap Index Fund |
| Schedule of Investments as of October 31, 2007 |
| |
| Shares | Common Stock (98.7%) | Value | | Shares | Common Stock (98.7%) | Value |
|
| Consumer Discretionary (14.3%) | | | 4,100 | Lamar Advertising Company | $219,186 |
| 2,500 | 99 Cents Only Stores # | $26,875 | | 3,800 | Lear Corporation # | 135,014 |
| 5,300 | Advance Auto Parts, Inc. ‡ | 180,836 | | 2,070 | Lee Enterprises, Inc. | 33,224 |
| 3,900 | Aeropostale, Inc. # | 89,310 | | 1,500 | Life Time Fitness, Inc. #* | 90,960 |
| 10,650 | American Eagle Outfitters, Inc. ‡ | 253,257 | | 1,800 | M.D.C. Holdings, Inc. | 72,918 |
| 2,800 | American Greetings Corporation | 73,752 | | 1,600 | Matthews International | |
| 3,100 | AnnTaylor Stores Corporation # | 96,069 | | | Corporation | 72,912 |
| 3,850 | Applebee’s International, Inc. | 97,559 | | 1,310 | Media General, Inc. | 36,654 |
| 3,517 | ArvinMeritor, Inc. | 52,157 | | 1,650 | Modine Manufacturing Company | 38,379 |
| 2,460 | Barnes & Noble, Inc. | 95,054 | | 2,660 | Mohawk Industries, Inc. # | 227,004 |
| 4,510 | Belo Corporation | 83,435 | | 2,400 | Netflix, Inc. #* | 63,528 |
| 1,310 | Blyth, Inc. | 25,008 | | 300 | NVR, Inc. # | 142,725 |
| 1,910 | Bob Evans Farms, Inc. | 53,824 | | 5,700 | O’Reilly Automotive, Inc. # | 188,214 |
| 2,960 | Borders Group, Inc. * | 45,643 | | 3,500 | Pacific Sunwear of | |
| 2,940 | BorgWarner, Inc. | 310,787 | | | California, Inc. # | 58,520 |
| 2,800 | Boyd Gaming Corporation | 117,096 | | 6,800 | PETsMART, Inc. | 203,660 |
| 5,162 | Brinker International, Inc. | 131,063 | | 2,800 | Phillips-Van Heusen Corporation | 133,840 |
| 3,450 | Callaway Golf Company | 59,754 | | 2,200 | Regis Corporation | 73,920 |
| 4,500 | Career Education Corporation # | 160,830 | | 3,500 | Rent-A-Center, Inc. # | 56,000 |
| 10,800 | CarMax, Inc. #‡ | 225,396 | | 6,800 | Ross Stores, Inc. | 183,736 |
| 1,300 | CBRL Group, Inc. | 51,870 | | 2,600 | Ruby Tuesday, Inc. * | 41,522 |
| 6,100 | Charming Shoppes, Inc. # | 45,262 | | 2,100 | Ryland Group, Inc. | 59,703 |
| 3,800 | Cheesecake Factory, Inc. # | 85,234 | | 7,110 | Saks, Inc. | 150,448 |
| 8,800 | Chico’s FAS, Inc. # | 115,632 | | 1,380 | Scholastic Corporation # | 54,620 |
| 1,600 | Chipotle Mexican Grill, Inc. # | 222,400 | | 3,300 | Scientific Games Corporation #* | 119,295 |
| 3,000 | Coldwater Creek, Inc. # | 26,850 | | 3,300 | Sotheby’s Holdings, Inc. | 178,761 |
| 3,270 | Collective Brands, Inc. # | 60,462 | | 800 | Strayer Education, Inc. | 149,168 |
| 4,300 | Corinthian Colleges, Inc. #* | 70,477 | | 1,800 | Thor Industries, Inc. | 86,400 |
| 2,890 | DeVry, Inc. | 158,054 | | 2,600 | Timberland Company # | 50,726 |
| 4,000 | Dick’s Sporting Goods, Inc. # | 133,480 | | 6,300 | Toll Brothers, Inc. # | 144,333 |
| 4,670 | Dollar Tree Stores, Inc. # | 178,861 | | 3,000 | Tupperware Corporation | 108,300 |
| 1,400 | Entercom Communications | | | 5,600 | Urban Outfitters, Inc. # | 141,512 |
| | Corporation | 25,970 | | 2,460 | Valassis Communications, Inc. #* | 24,231 |
| 7,700 | Foot Locker, Inc. | 114,653 | | 2,200 | Warnaco Group, Inc. # | 89,518 |
| 2,420 | Furniture Brands | | | 300 | Washington Post Company | 254,700 |
| | International, Inc. * | 29,161 | | 4,460 | Williams-Sonoma, Inc. | 140,222 |
|
|
| 7,900 | GameStop Corporation # | 467,838 | | | Total Consumer | |
| 7,100 | Gentex Corporation * | 147,538 | | | Discretionary | 8,707,948 |
|
|
| 2,300 | Getty Images, Inc. # | 64,975 | | | | |
| 2,800 | Guess ?, Inc. | 143,892 | | Consumer Staples (3.1%) | |
| 4,800 | Hanesbrands, Inc. # | 148,992 | | 4,300 | Alberto-Culver Company | 111,757 |
| 2,620 | Harte-Hanks, Inc. | 46,191 | | 3,220 | BJ’s Wholesale Club, Inc. # | 115,534 |
| 1,800 | Hovnanian Enterprises, Inc. #* | 20,466 | | 3,280 | Church & Dwight Company, Inc. | 155,177 |
| 1,650 | International Speedway | | | 3,700 | Corn Products International, Inc. | 157,398 |
| | Corporation | 73,310 | | 2,850 | Energizer Holdings, Inc. # | 297,255 |
| 1,400 | ITT Educational Services, Inc. # | 178,066 | | 2,900 | Hansen Natural Corporation #* | 197,200 |
| 2,200 | John Wiley and Sons, Inc. | 96,756 | | 3,800 | Hormel Foods Corporation | 138,624 |
|
| The accompanying Notes to Financial Statements are an integral part of this schedule. |
|
| 100 |
| | | | | | |
| Mid Cap Index Fund | | | | | |
| Schedule of Investments as of October 31, 2007 | | | | | |
| |
| |
| Shares | Common Stock (98.7%) | Value | | Shares | Common Stock (98.7%) | Value |
|
| Consumer Staples — continued | | | 2,470 | Bank of Hawaii Corporation | $131,305 |
| 2,788 | J.M. Smucker Company | $148,963 | | 5,700 | Brown & Brown, Inc. | 143,583 |
| 1,130 | Lancaster Colony Corporation | 45,392 | | 2,500 | Cathay General Bancorp | 77,425 |
| 2,900 | NBTY, Inc. # | 103,240 | | 2,100 | City National Corporation | 141,960 |
| 2,860 | PepsiAmericas, Inc. | 102,159 | | 7,600 | Colonial BancGroup, Inc. | 145,768 |
| 1,990 | Ruddick Corporation | 67,660 | | 2,300 | Commerce Group, Inc. | 83,927 |
| 5,900 | Smithfield Foods, Inc. # | 169,153 | | 1,900 | Cousins Properties, Inc. * | 54,701 |
| 1,352 | Tootsie Roll Industries, Inc. | 34,841 | | 3,000 | Cullen/Frost Bankers, Inc. | 159,540 |
| 1,340 | Universal Corporation | 65,312 | | 7,100 | Duke Realty Corporation | 228,265 |
|
| | |
| | Total Consumer Staples | 1,909,665 | | 6,100 | Eaton Vance Corporation | 305,183 |
|
| | |
| | | | | 2,000 | Equity One, Inc. | 52,360 |
| Energy (9.1%) | | | 3,090 | Everest Re Group, Ltd. | 329,209 |
| 7,100 | Arch Coal, Inc. | 291,100 | | 11,072 | Fidelity National Financial, Inc. | 170,398 |
| 1,800 | Bill Barrett Corporation #* | 84,240 | | 4,800 | First American Corporation | 144,480 |
| 5,500 | Cameron International | | | 1,500 | First Community Bancorp, Inc. | 73,050 |
| | Corporation # | 535,480 | | 5,300 | First Niagara Financial Group, Inc. | 69,960 |
| 4,200 | Cimarex Energy Company | 170,142 | | 4,150 | FirstMerit Corporation * | 87,980 |
| 6,000 | Denbury Resources, Inc. #* | 339,600 | | 2,660 | Hanover Insurance Group, Inc. | 122,546 |
| 2,700 | Encore Acquisition Company # | 99,090 | | 5,600 | HCC Insurance Holdings, Inc. | 167,384 |
| 3,316 | Exterran Holdings, Inc. # | 279,207 | | 2,800 | Highwoods Properties, Inc. | 100,688 |
| 6,400 | FMC Technologies, Inc. # | 388,032 | | 2,350 | Horace Mann Educators | |
| 4,300 | Forest Oil Corporation #* | 208,937 | | | Corporation | 48,622 |
| 5,300 | Frontier Oil Corporation | 242,687 | | 4,800 | Hospitality Properties Trust | 190,080 |
| 6,320 | Grant Prideco, Inc. # | 310,691 | | 3,600 | IndyMac Bancorp, Inc. * | 48,312 |
| 5,140 | Helmerich & Payne, Inc. | 162,527 | | 5,500 | Jefferies Group, Inc. | 147,015 |
| 6,500 | Newfield Exploration Company # | 349,960 | | 1,900 | Jones Lang LaSalle, Inc. | 181,127 |
| 1,390 | Overseas Shipholding Group, Inc. | 103,416 | | 4,600 | Liberty Property Trust | 173,052 |
| 7,800 | Patterson-UTI Energy, Inc. | 155,532 | | 3,500 | Macerich Company | 299,985 |
| 6,150 | Pioneer Natural Resources | | | 3,400 | Mack-Cali Realty Corporation | 134,606 |
| | Company | 313,773 | | 1,900 | Mercury General Corporation | 97,489 |
| 3,600 | Plains Exploration & Production | | | 4,500 | Nationwide Health | |
| | Company #* | 183,420 | | | Properties, Inc. * | 140,490 |
| 2,900 | Pogo Producing Company | 172,724 | | 15,610 | New York Community | |
| 8,300 | Pride International, Inc. # | 306,270 | | | Bancorp, Inc. * | 290,502 |
| 2,500 | Quicksilver Resources, Inc. #* | 142,500 | | 3,900 | Nuveen Investments | 252,720 |
| 8,400 | Southwestern Energy Company # | 434,532 | | 11,606 | Old Republic International | |
| 4,000 | Superior Energy Services, Inc. # | 148,320 | | | Corporation | 177,920 |
| 2,810 | Tidewater, Inc. * | 153,623 | | 4,240 | PMI Group, Inc. | 67,967 |
|
| | |
| | Total Energy | 5,575,803 | | 1,955 | Potlatch Corporation | 93,175 |
|
| | |
| | | | | 3,550 | Protective Life Corporation | 152,188 |
| Financials (14.2%) | | | 4,000 | Radian Group, Inc. * | 50,360 |
| 5,000 | AMB Property Corporation ‡ | 326,750 | | 4,625 | Raymond James Financial, Inc. | 172,281 |
| 3,750 | American Financial Group, Inc. | 112,125 | | 4,028 | Rayonier, Inc. REIT | 194,512 |
| 5,700 | AmeriCredit Corporation # | 80,427 | | 3,400 | Regency Centers Corporation | 243,032 |
| 4,800 | Arthur J. Gallagher & Company | 127,728 | | 6,300 | SEI Investments Company | 199,206 |
| 6,278 | Associated Banc-Corp | 181,183 | | 2,600 | StanCorp Financial Group, Inc. | 143,338 |
| 4,120 | Astoria Financial Corporation | 107,079 | | 1,800 | SVB Financial Group # | 93,222 |
|
| The accompanying Notes to Financial Statements are an integral part of this schedule. |
|
| 101 |
| | | | | | |
| Mid Cap Index Fund | | | | | |
| Schedule of Investments as of October 31, 2007 | | | | | |
| |
| |
| Shares | Common Stock (98.7%) | Value | | Shares | Common Stock (98.7%) | Value |
|
| Financials — continued | | | 1,700 | Par Pharmaceutical | |
| 5,480 | TCF Financial Corporation | $124,780 | | | Companies, Inc. # | $31,348 |
| 6,800 | UDR, Inc. | 161,432 | | 5,800 | PDL BioPharma, Inc. #* | 122,960 |
| 2,690 | Unitrin, Inc. | 124,574 | | 3,920 | Perrigo Company | 92,943 |
| 8,150 | W.R. Berkley Corporation | 245,234 | | 5,200 | Pharmaceutical Product | |
| 1 | Wachovia Corporation | 16 | | | Development, Inc. | 219,648 |
| 4,100 | Waddell & Reed Financial, Inc. | 136,202 | | 2,800 | Psychiatric Solutions, Inc. # | 110,880 |
| 4,496 | Washington Federal, Inc. | 108,623 | | 3,900 | ResMed, Inc. # | 161,577 |
| 2,750 | Webster Financial Corporation | 99,660 | | 5,320 | Sepracor, Inc. # | 146,513 |
| 3,900 | Weingarten Realty Investors | 149,214 | | 3,170 | STERIS Corporation | 92,057 |
| 1,510 | Westamerica Bancorporation * | 72,601 | | 2,100 | Techne Corporation # | 137,004 |
| 3,440 | Wilmington Trust Corporation | 125,113 | | 2,600 | Universal Health Services, Inc. | 126,750 |
|
| | |
| | Total Financials | 8,663,654 | | 4,670 | Valeant Pharmaceuticals | |
|
| | |
| | | | | | International # | 67,948 |
| Health Care (11.9%) | | | 1,600 | Varian, Inc. # | 118,224 |
| 3,056 | Advanced Medical Optics, Inc. #* | 83,887 | | 4,200 | VCA Antech, Inc. # | 193,410 |
| 3,500 | Affymetrix, Inc. # | 89,110 | | 1,400 | Ventana Medical Systems, Inc. # | 123,200 |
| 2,140 | Apria Healthcare Group, Inc. # | 51,724 | | 6,500 | Vertex Pharmaceuticals, Inc. # | 210,210 |
| 3,100 | Beckman Coulter, Inc. ‡ | 219,542 | | 2,000 | Wellcare Health Plans, Inc. #* | 48,380 |
|
|
| 3,300 | Cephalon, Inc. #* | 243,342 | | | Total Health Care | 7,232,794 |
|
|
| 3,200 | Cerner Corporation # | 190,592 | | | | |
| 3,300 | Charles River Laboratories | | | Industrials (14.4%) | |
| | International, Inc. # | 191,400 | | 4,510 | AGCO Corporation #‡ | 269,157 |
| 4,700 | Community Health Systems, Inc. # | 154,771 | | 4,500 | AirTran Holdings, Inc. #* | 46,845 |
| 3,090 | Covance, Inc. # | 254,925 | | 2,120 | Alaska Air Group, Inc. # | 53,848 |
| 7,620 | Dentsply International, Inc. | 316,078 | | 2,150 | Alexander & Baldwin, Inc. | 112,617 |
| 2,890 | Edwards Lifesciences Corporation # | 145,136 | | 1,600 | Alliant Techsystems, Inc. #* | 176,624 |
| 6,700 | Endo Pharmaceutical | | | 5,360 | AMETEK, Inc. | 251,920 |
| | Holdings, Inc. # | 196,310 | | 5,100 | Avis Budget Group, Inc. # | 106,437 |
| 2,700 | Gen-Probe, Inc. # | 189,054 | | 2,340 | Brink’s Company | 146,601 |
| 12,100 | Health Management | | | 3,020 | Carlisle Companies, Inc. | 119,139 |
| | Associates, Inc. | 79,981 | | 3,733 | ChoicePoint, Inc. # | 146,782 |
| 5,640 | Health Net, Inc. # | 302,360 | | 2,210 | Con-way, Inc. | 94,168 |
| 4,400 | Henry Schein, Inc. # | 263,560 | | 3,600 | Copart, Inc. # | 138,168 |
| 3,130 | Hillenbrand Industries, Inc. | 172,839 | | 1,900 | Corporate Executive | |
| 5,900 | Hologic, Inc. #* | 400,787 | | | Board Company | 135,375 |
| 1,800 | Intuitive Surgical, Inc. # | 588,366 | | 2,600 | Crane Company | 123,344 |
| 2,400 | Invitrogen Corporation # | 218,088 | | 2,600 | Deluxe Corporation | 104,884 |
| 1,700 | Kindred Healthcare, Inc. # | 36,108 | | 3,480 | Donaldson Company, Inc. | 149,153 |
| 2,200 | Kyphon, Inc. # | 155,936 | | 2,100 | DRS Technologies, Inc. | 120,624 |
| 2,800 | LifePoint Hospitals, Inc. # | 85,456 | | 2,900 | Dun & Bradstreet Corporation | 280,865 |
| 4,300 | Lincare Holdings, Inc. # | 149,511 | | 6,280 | Fastenal Company * | 279,334 |
| 2,800 | Medicis Pharmaceutical | | | 2,580 | Federal Signal Corporation | 34,546 |
| | Corporation | 83,132 | | 2,820 | Flowserve Corporation | 222,667 |
| 15,938 | Millennium Pharmaceuticals, Inc. # | 188,387 | | 2,600 | GATX Corporation | 106,522 |
| 6,080 | Omnicare, Inc. | 179,360 | | 3,350 | Graco, Inc. | 131,856 |
| | | | | 1,745 | Granite Construction, Inc. | 74,721 |
|
| The accompanying Notes to Financial Statements are an integral part of this schedule. |
|
| 102 |
| | | | | | |
| Mid Cap Index Fund | | | | | |
| Schedule of Investments as of October 31, 2007 | | | | | |
| |
| |
| Shares | Common Stock (98.7%) | Value | | Shares | Common Stock (98.7%) | Value |
|
| Industrials — continued | | | 3,900 | Alliance Data Systems | |
| 4,180 | Harsco Corporation | $253,392 | | | Corporation #‡ | $313,560 |
| 3,070 | Herman Miller, Inc. | 83,565 | | 8,800 | Amphenol Corporation ‡ | 389,576 |
| 2,410 | HNI Corporation * | 104,498 | | 7,800 | Andrew Corporation # | 114,348 |
| 3,030 | Hubbell, Inc. | 166,650 | | 6,120 | Arrow Electronics, Inc. #* | 244,678 |
| 4,000 | IDEX Corporation | 141,680 | | 24,360 | Atmel Corporation #‡ | 119,120 |
| 4,600 | JB Hunt Transport Services, Inc. | 127,512 | | 7,440 | Avnet, Inc. # | 310,397 |
| 8,900 | JetBlue Airways Corporation #* | 81,257 | | 2,460 | Avocent Corporation # | 66,494 |
| 5,450 | Joy Global, Inc. | 316,427 | | 7,000 | Broadridge Financial | |
| 8,400 | KBR, Inc. # | 360,192 | | | Solutions, LLC | 140,000 |
| 1,200 | Kelly Services, Inc. | 25,236 | | 13,780 | Cadence Design Systems, Inc. #* | 270,088 |
| 1,860 | Kennametal, Inc. | 169,651 | | 7,200 | Ceridian Corporation # | 258,768 |
| 2,600 | Korn/Ferry International # | 49,816 | | 4,390 | CheckFree Corporation # | 208,657 |
| 2,200 | Lincoln Electric Holdings, Inc. | 158,950 | | 3,030 | CommScope, Inc. # | 142,925 |
| 4,140 | Manpower, Inc. | 309,424 | | 4,200 | Cree, Inc. #* | 117,600 |
| 1,500 | Mine Safety Appliances Company * | 68,685 | | 2,240 | CSG Systems International, Inc. # | 45,987 |
| 2,300 | MSC Industrial Direct | | | 7,610 | Cypress Semiconductor | |
| | Company, Inc. | 112,033 | | | Corporation # | 278,146 |
| 2,300 | Navigant Consulting, Inc. #* | 30,314 | | 3,300 | Diebold, Inc. | 138,072 |
| 1,780 | Nordson Corporation | 95,230 | | 2,100 | Digital River, Inc. # | 111,426 |
| 3,600 | Oshkosh Truck Corporation | 195,120 | | 2,660 | DST Systems, Inc. # | 225,329 |
| 4,920 | Pentair, Inc. | 174,119 | | 2,000 | Dycom Industries, Inc. # | 56,500 |
| 8,390 | Quanta Services, Inc. # | 276,870 | | 4,200 | F5 Networks, Inc. # | 151,326 |
| 8,100 | Republic Services, Inc. | 276,939 | | 2,850 | Fair Isaac Corporation | 108,072 |
| 1,462 | Rollins, Inc. | 44,401 | | 6,200 | Fairchild Semiconductor | |
| 4,400 | Roper Industries, Inc. | 311,564 | | | International, Inc. # | 113,150 |
| 390 | Sequa Corporation # | 67,790 | | 3,400 | Gartner Group, Inc. # | 74,460 |
| 2,640 | SPX Corporation | 267,432 | | 4,000 | Global Payments, Inc. | 190,240 |
| 4,300 | Stericycle, Inc. # | 250,819 | | 6,780 | Harris Corporation | 410,597 |
| 1,920 | Teleflex, Inc. | 140,563 | | 1,800 | Imation Corporation | 40,104 |
| 2,500 | Thomas & Betts Corporation # | 140,025 | | 7,200 | Ingram Micro, Inc. # | 152,928 |
| 4,700 | Timken Company | 156,322 | | 9,890 | Integrated Device | |
| 3,995 | Trinity Industries, Inc. | 144,379 | | | Technology, Inc. # | 132,823 |
| 3,600 | United Rentals, Inc. # | 123,084 | | 3,700 | International Rectifier | |
| 2,300 | Werner Enterprises, Inc. | 43,746 | | | Corporation # | 123,506 |
| 2,800 | YRC Worldwide, Inc. #* | 68,824 | | 6,600 | Intersil Corporation | 200,244 |
|
| | |
| | Total Industrials | 8,762,706 | | 3,900 | Jack Henry & Associates, Inc. | 113,958 |
|
| | |
| | | | | 4,200 | KEMET Corporation # | 29,694 |
| Information Technology (15.4%) | | | 6,700 | Lam Research Corporation # | 336,340 |
| 20,000 | 3Com Corporation # | 97,600 | | 5,900 | Lattice Semiconductor | |
| 1,880 | ACI Worldwide, Inc. # | 42,996 | | | Corporation # | 24,662 |
| 14,200 | Activision, Inc. # | 335,830 | | 2,700 | Macrovision Corporation # | 64,800 |
| 3,530 | Acxiom Corporation | 46,384 | | 7,980 | McAfee, Inc. # | 329,973 |
| 5,900 | ADC Telecommunications, Inc. # | 110,330 | | 4,440 | Mentor Graphics Corporation # | 71,129 |
| 3,060 | ADTRAN, Inc. | 73,654 | | 2,810 | Micrel, Inc. | 25,430 |
| 900 | Advent Software, Inc. #* | 49,797 | | 4,100 | MoneyGram International, Inc. | 65,395 |
| | | | | 5,120 | MPS Group, Inc. # | 62,515 |
|
| The accompanying Notes to Financial Statements are an integral part of this schedule. |
|
| 103 |
| | | | | | |
| Mid Cap Index Fund | | | | | |
| Schedule of Investments as of October 31, 2007 | | | | | |
| |
| |
| Shares | Common Stock (98.7%) | Value | | Shares | Common Stock (98.7%) | Value |
|
| Information Technology — continued | | | 3,300 | Reliance Steel & Aluminum | |
| 2,850 | National Instruments Corporation | $92,454 | | | Company | $192,555 |
| 9,200 | NCR Corporation # | 253,828 | | 5,990 | RPM International, Inc. | 128,366 |
| 5,200 | Palm, Inc. * | 46,904 | | 2,200 | Scotts Company | 100,958 |
| 5,700 | Parametric Technology | | | 2,520 | Sensient Technologies Corporation | 75,323 |
| | Corporation # | 108,870 | | 4,940 | Sonoco Products Company | 152,745 |
| 2,500 | Plantronics, Inc. | 68,375 | | 5,200 | Steel Dynamics, Inc. | 276,744 |
| 4,600 | Polycom, Inc. # | 128,708 | | 4,700 | Terra Industries, Inc. # | 173,383 |
| 6,520 | Powerwave Technologies, Inc. # | 36,251 | | 5,020 | Valspar Corporation | 125,651 |
| 9,700 | RF Micro Devices, Inc. #* | 60,334 | | 3,500 | Worthington Industries, Inc. * | 87,500 |
|
|
| 3,260 | Semtech Corporation # | 55,779 | | | Total Materials | 4,752,485 |
|
|
| 2,700 | Silicon Laboratories, Inc. # | 117,990 | | | | |
| 2,200 | SRA International, Inc. # | 60,412 | | Telecommunications Services (0.9%) | |
| 4,560 | Sybase, Inc. # | 130,416 | | 12,410 | Cincinnati Bell, Inc. # | 67,262 |
| 7,180 | Synopsys, Inc. # | 202,907 | | 3,800 | NeuStar, Inc. # | 129,960 |
| 2,840 | Tech Data Corporation # | 111,697 | | 5,310 | Telephone and Data Systems, Inc. | 370,638 |
|
|
| 6,979 | TriQuint Semiconductor, Inc. # | 43,758 | | | Total Telecommunications | |
| 5,300 | UTStarcom, Inc. #* | 16,960 | | | Services | 567,860 |
|
|
| 5,000 | ValueClick, Inc. # | 135,950 | | | | |
| 9,270 | Vishay Intertechnology, Inc. # | 116,709 | | Utilities (7.6%) | |
| 10,900 | Western Digital Corporation # | 282,528 | | 4,060 | AGL Resources, Inc. ‡ | 160,492 |
| 3,800 | Wind River Systems, Inc. # | 47,538 | | 5,570 | Alliant Energy Corporation ‡ | 222,800 |
| 3,400 | Zebra Technologies Corporation #* | 132,906 | | 6,666 | Aqua America, Inc. * | 155,051 |
|
| | |
| | Total Information | | | 18,790 | Aquila, Inc. # | 78,542 |
| | Technology | 9,380,882 | | 2,080 | Black Hills Corporation | 92,394 |
|
| | | |
| | | | | 5,820 | DPL, Inc. * | 169,013 |
| Materials (7.8%) | | | 7,950 | Energy East Corporation | 221,646 |
| 3,890 | Airgas, Inc. ‡ | 196,328 | | 6,100 | Equitable Resources, Inc. | 343,552 |
| 3,980 | Albemarle Corporation ‡ | 190,085 | | 4,430 | Great Plains Energy, Inc. | 132,191 |
| 3,370 | Cabot Corporation | 117,984 | | 4,240 | Hawaiian Electric | |
| 1,300 | Carpenter Technology Corporation | 188,383 | | | Industries, Inc. * | 98,368 |
| 2,400 | CF Industries Holdings, Inc. | 210,960 | | 2,220 | IDACORP, Inc. * | 77,456 |
| 12,070 | Chemtura Corporation | 112,492 | | 9,125 | MDU Resources Group, Inc. | 256,960 |
| 2,000 | Cleveland-Cliffs, Inc. | 191,300 | | 4,360 | National Fuel Gas Company * | 211,416 |
| 5,900 | Commercial Metals Company | 185,142 | | 7,760 | Northeast Utilities | |
| 2,150 | Cytec Industries, Inc. | 143,426 | | | Service Company | 239,241 |
| 2,290 | Ferro Corporation | 47,449 | | 5,340 | NSTAR | 187,754 |
| 2,500 | Florida Rock Industries, Inc. | 157,325 | | 4,560 | OGE Energy Corporation | 174,648 |
| 3,700 | FMC Corporation | 212,750 | | 5,100 | ONEOK, Inc. | 254,694 |
| 5,200 | Louisiana-Pacific Corporation | 85,592 | | 9,655 | Pepco Holdings, Inc. | 275,071 |
| 3,460 | Lubrizol Corporation | 234,865 | | 3,860 | PNM Resources, Inc. | 96,539 |
| 12,600 | Lyondell Chemical Company | 597,866 | | 6,020 | Puget Energy, Inc. | 170,065 |
| 2,000 | Martin Marietta Materials, Inc. * | 258,700 | | 5,990 | SCANA Corporation | 243,134 |
| 1,070 | Minerals Technologies, Inc. | 75,135 | | 11,070 | Sierra Pacific Resources | 186,751 |
| 3,680 | Olin Corporation | 83,830 | | 4,020 | Vectren Corporation | 112,721 |
| 4,700 | Packaging Corporation of America | 149,648 | | 4,600 | Westar Energy, Inc. | 122,452 |
|
| The accompanying Notes to Financial Statements are an integral part of this schedule. |
|
| 104 |
| | | | | | |
| Mid Cap Index Fund | | | | | |
| Schedule of Investments as of October 31, 2007 | | | | | |
| | | | | |
| | | | | |
| Shares | Common Stock (98.7%) | Value | | | | |
| | | | |
| Utilities — continued | | | | | |
| 2,590 | WGL Holdings, Inc. | $87,853 | | | | |
| 5,820 | Wisconsin Energy Corporation | 278,662 | | | | |
|
| | | | |
| | Total Utilities | 4,649,466 | | | | |
|
| | | | |
| | | | | |
| | Total Common Stock | | | | | |
| | (cost $42,463,073) | 60,203,263 | | | | |
|
| | | | |
| | | | |
| | | Interest | Maturity | |
| Shares | Collateral Held for Securities Loaned (8.7%) | Rate (+) | Date | Value |
|
| 5,297,773 | Thrivent Financial Securities Lending Trust | 5.050% | N/A | $5,297,773 |
|
|
| | Total Collateral Held for Securities Loaned | |
| | (cost $5,297,773) | | | 5,297,773 |
|
|
| |
| |
| Shares or | | | | |
| Principal | | Interest | Maturity | |
| Amount | Short-Term Investments (1.5%) | Rate (+) | Date | Value |
|
| $125,000 | Federal National Mortgage Association ‡ | 5.080% | 12/14/2007 | $124,242 |
| 792,453 | Thrivent Money Market Fund | 5.020 | N/A | 792,452 |
|
|
| | Total Short-Term Investments (at amortized cost) | 916,694 |
|
|
| | Total Investments (cost $48,677,540) 108.9% | $66,417,730 |
|
|
| | Other Assets and Liabilities, Net (8.9%) | | (5,403,191) |
|
|
| | Total Net Assets 100.0% | | | $61,014,539 |
|
|
| | | | | |
| | Number of | | Notional | | |
| | Contracts | Expiration | Principal | | Unrealized |
| Futures | Long/(Short) | Date | Amount | Value | Gain/(Loss) |
|
| S&P 400 Index Mini-Futures | 9 | December 2007 | $825,225 | $820,890 | ($4,335) |
| Total Futures | | | | | ($4,335) |
# Non-income producing security.
* All or a portion of the security is on loan as discussed in item 2(M) of the Notes to Financial Statements.
+ The interest rate shown reflects the yield, coupon rate or, for securities purchased at a discount, the discount rate at the date of purchase.
‡ At October 31, 2007, $124,242 of investments were held on deposit with the counterparty and pledged as the initial margin deposit for open financial futures contracts. In addition, $2,814,275 of investments were earmarked as collateral to cover open financial futures contracts.
Definitions:
REIT — Real Estate Investment Trust, is a company that buys, develops, manages and/or sells real estate assets.
Gross unrealized appreciation and depreciation of investments, based on cost for federal income tax purposes, were as follows:
| | |
| Gross unrealized appreciation | $20,078,487 | |
| Gross unrealized depreciation | (2,863,801) | |
|
| |
| Net unrealized appreciation (depreciation) | $17,214,686 | |
| Cost for federal income tax purposes | $49,203,044 | |
|
| The accompanying Notes to Financial Statements are an integral part of this schedule. |
|
| 105 |
| | | | | | |
| Mid Cap Index Fund-I |
| Schedule of Investments as of October 31, 2007 |
| |
| Shares | Common Stock (93.4%) | Value | | Shares | Common Stock (93.4%) | Value |
|
| Consumer Discretionary (13.6%) | | | 1,000 | Lamar Advertising Company | $53,460 |
| 466 | 99 Cents Only Stores # | $5,010 | | 900 | Lear Corporation # | 31,977 |
| 1,250 | Advance Auto Parts, Inc. ‡ | 42,650 | | 360 | Lee Enterprises, Inc. | 5,778 |
| 850 | Aeropostale, Inc. # | 19,465 | | 400 | Life Time Fitness, Inc. #* | 24,256 |
| 2,421 | American Eagle Outfitters, Inc. ‡ | 57,571 | | 300 | M.D.C. Holdings, Inc. | 12,153 |
| 700 | American Greetings Corporation | 18,438 | | 400 | Matthews International | |
| 700 | AnnTaylor Stores Corporation # | 21,693 | | | Corporation | 18,228 |
| 900 | Applebee’s International, Inc. | 22,806 | | 335 | Media General, Inc. | 9,373 |
| 886 | ArvinMeritor, Inc. * | 13,139 | | 440 | Modine Manufacturing Company | 10,234 |
| 495 | Barnes & Noble, Inc. | 19,127 | | 620 | Mohawk Industries, Inc. # | 52,911 |
| 915 | Belo Corporation | 16,928 | | 500 | Netflix, Inc. #* | 13,235 |
| 315 | Blyth, Inc. | 6,013 | | 100 | NVR, Inc. # | 47,575 |
| 420 | Bob Evans Farms, Inc. | 11,836 | | 1,300 | O’Reilly Automotive, Inc. # | 42,926 |
| 565 | Borders Group, Inc. * | 8,712 | | 800 | Pacific Sunwear of | |
| 640 | BorgWarner, Inc. ‡ | 67,654 | | | California, Inc. # | 13,376 |
| 600 | Boyd Gaming Corporation | 25,092 | | 1,400 | PETsMART, Inc. | 41,930 |
| 1,135 | Brinker International, Inc. ‡ | 28,818 | | 600 | Phillips-Van Heusen Corporation | 28,680 |
| 750 | Callaway Golf Company | 12,990 | | 400 | Regis Corporation | 13,440 |
| 900 | Career Education Corporation # | 32,166 | | 800 | Rent-A-Center, Inc. # | 12,800 |
| 2,300 | CarMax, Inc. # | 48,001 | | 1,420 | Ross Stores, Inc. | 38,368 |
| 180 | CBRL Group, Inc. | 7,182 | | 500 | Ruby Tuesday, Inc. | 7,985 |
| 1,300 | Charming Shoppes, Inc. # | 9,646 | | 400 | Ryland Group, Inc. | 11,372 |
| 850 | Cheesecake Factory, Inc. # | 19,066 | | 1,635 | Saks, Inc. | 34,597 |
| 2,000 | Chico’s FAS, Inc. #‡ | 26,280 | | 310 | Scholastic Corporation # | 12,270 |
| 400 | Chipotle Mexican Grill, Inc. # | 55,600 | | 700 | Scientific Games Corporation # | 25,305 |
| 700 | Coldwater Creek, Inc. # | 6,265 | | 705 | Sotheby’s Holdings, Inc. | 38,190 |
| 725 | Collective Brands, Inc. # | 13,405 | | 100 | Strayer Education, Inc. | 18,646 |
| 900 | Corinthian Colleges, Inc. # | 14,751 | | 400 | Thor Industries, Inc. | 19,200 |
| 695 | DeVry, Inc. | 38,010 | | 600 | Timberland Company # | 11,706 |
| 800 | Dick’s Sporting Goods, Inc. # | 26,696 | | 1,300 | Toll Brothers, Inc. # | 29,783 |
| 1,002 | Dollar Tree Stores, Inc. # | 38,377 | | 700 | Tupperware Corporation | 25,270 |
| 200 | Entercom Communications | | | 1,300 | Urban Outfitters, Inc. # | 32,851 |
| | Corporation | 3,710 | | 575 | Valassis Communications, Inc. # | 5,664 |
| 1,600 | Foot Locker, Inc. ‡ | 23,824 | | 500 | Warnaco Group, Inc. # | 20,345 |
| 500 | Furniture Brands | | | 70 | Washington Post Company | 59,430 |
| | International, Inc. | 6,025 | | 970 | Williams-Sonoma, Inc. | 30,497 |
|
|
| 1,800 | GameStop Corporation #‡ | 106,596 | | | Total Consumer | |
| 1,600 | Gentex Corporation ‡ | 33,248 | | | Discretionary | 1,921,900 |
|
|
| 500 | Getty Images, Inc. # | 14,125 | | | | |
| 600 | Guess ?, Inc. | 30,834 | | Consumer Staples (2.9%) | |
| 1,100 | Hanesbrands, Inc. # | 34,144 | | 1,000 | Alberto-Culver Company | 25,990 |
| 535 | Harte-Hanks, Inc. | 9,432 | | 730 | BJ’s Wholesale Club, Inc. # | 26,192 |
| 500 | Hovnanian Enterprises, Inc. #* | 5,685 | | 665 | Church & Dwight Company, Inc. ‡ | 31,461 |
| 255 | International Speedway | | | 900 | Corn Products International, Inc. | 38,286 |
| | Corporation | 11,330 | | 600 | Energizer Holdings, Inc. #‡ | 62,580 |
| 300 | ITT Educational Services, Inc. # | 38,157 | | 700 | Hansen Natural Corporation #* | 47,600 |
| 400 | John Wiley and Sons, Inc. | 17,592 | | 725 | Hormel Foods Corporation | 26,448 |
|
| The accompanying Notes to Financial Statements are an integral part of this schedule. |
|
| 106 |
| | | | | | |
| Mid Cap Index Fund-I | | | | | |
| Schedule of Investments as of October 31, 2007 | | | | | |
| |
| |
| Shares | Common Stock (93.4%) | Value | | Shares | Common Stock (93.4%) | Value |
|
| Consumer Staples — continued | | | 485 | Bank of Hawaii Corporation | $25,783 |
| 595 | J.M. Smucker Company | $31,791 | | 1,300 | Brown & Brown, Inc. ‡ | 32,747 |
| 145 | Lancaster Colony Corporation | 5,825 | | 500 | Cathay General Bancorp | 15,485 |
| 600 | NBTY, Inc. # | 21,360 | | 510 | City National Corporation ‡ | 34,476 |
| 610 | PepsiAmericas, Inc. | 21,789 | | 1,700 | Colonial BancGroup, Inc. ‡ | 32,606 |
| 480 | Ruddick Corporation | 16,320 | | 400 | Commerce Group, Inc. | 14,596 |
| 1,200 | Smithfield Foods, Inc. # | 34,404 | | 500 | Cousins Properties, Inc. | 14,395 |
| 195 | Tootsie Roll Industries, Inc. | 5,025 | | 600 | Cullen/Frost Bankers, Inc. | 31,908 |
| 350 | Universal Corporation | 17,059 | | 1,500 | Duke Realty Corporation | 48,225 |
|
| | |
| | Total Consumer Staples | 412,130 | | 1,400 | Eaton Vance Corporation | 70,042 |
|
| | |
| | | | | 500 | Equity One, Inc. | 13,090 |
| Energy (8.9%) | | | 705 | Everest Re Group, Ltd. | 75,111 |
| 1,600 | Arch Coal, Inc. ‡ | 65,600 | | 2,385 | Fidelity National Financial, Inc. ‡ | 36,705 |
| 300 | Bill Barrett Corporation # | 14,040 | | 1,100 | First American Corporation ‡ | 33,110 |
| 1,200 | Cameron International | | | 200 | First Community Bancorp, Inc. ‡ | 9,740 |
| | Corporation #‡ | 116,832 | | 1,100 | First Niagara Financial Group, | |
| 1,000 | Cimarex Energy Company ‡ | 40,510 | | | Inc. ‡ | 14,520 |
| 1,400 | Denbury Resources, Inc. # | 79,240 | | 970 | FirstMerit Corporation ‡ | 20,564 |
| 500 | Encore Acquisition Company # | 18,350 | | 665 | Hanover Insurance Group, Inc. | 30,637 |
| 698 | Exterran Holdings, Inc. # | 58,772 | | 1,150 | HCC Insurance Holdings, Inc. | 34,374 |
| 1,500 | FMC Technologies, Inc. #‡ | 90,945 | | 700 | Highwoods Properties, Inc. | 25,172 |
| 1,000 | Forest Oil Corporation #‡ | 48,590 | | 430 | Horace Mann Educators | |
| 1,200 | Frontier Oil Corporation ‡ | 54,948 | | | Corporation | 8,897 |
| 1,430 | Grant Prideco, Inc. #‡ | 70,299 | | 1,000 | Hospitality Properties Trust | 39,600 |
| 1,050 | Helmerich & Payne, Inc. | 33,201 | | 800 | IndyMac Bancorp, Inc. * | 10,736 |
| 1,500 | Newfield Exploration Company # | 80,760 | | 1,300 | Jefferies Group, Inc. | 34,749 |
| 370 | Overseas Shipholding Group, Inc. | 27,528 | | 400 | Jones Lang LaSalle, Inc. | 38,132 |
| 1,700 | Patterson-UTI Energy, Inc. | 33,898 | | 900 | Liberty Property Trust | 33,858 |
| 1,360 | Pioneer Natural Resources | | | 800 | Macerich Company | 68,568 |
| | Company | 69,387 | | 700 | Mack-Cali Realty Corporation | 27,713 |
| 800 | Plains Exploration & | | | 200 | Mercury General Corporation | 10,262 |
| | Production Company # | 40,760 | | 900 | Nationwide Health | |
| 700 | Pogo Producing Company | 41,692 | | | Properties, Inc. * | 28,098 |
| 1,900 | Pride International, Inc. # | 70,110 | | 3,400 | New York Community | |
| 600 | Quicksilver Resources, Inc. # | 34,200 | | | Bancorp, Inc. | 63,274 |
| 1,900 | Southwestern Energy Company # | 98,287 | | 900 | Nuveen Investments | 58,320 |
| 800 | Superior Energy Services, Inc. # | 29,664 | | 2,621 | Old Republic International | |
| 680 | Tidewater, Inc. * | 37,176 | | | Corporation | 40,180 |
|
| | |
| | Total Energy | 1,254,789 | | 970 | PMI Group, Inc. | 15,549 |
|
| | |
| | | | | 518 | Potlatch Corporation | 24,688 |
| Financials (13.1%) | | | 855 | Protective Life Corporation | 36,654 |
| 1,100 | AMB Property Corporation ‡ | 71,885 | | 900 | Radian Group, Inc. * | 11,331 |
| 900 | American Financial Group, Inc. | 26,910 | | 950 | Raymond James Financial, Inc. | 35,388 |
| 1,300 | AmeriCredit Corporation # | 18,343 | | 783 | Rayonier, Inc. REIT | 37,811 |
| 1,000 | Arthur J. Gallagher & Company ‡ | 26,610 | | 600 | Regency Centers Corporation | 42,888 |
| 1,344 | Associated Banc-Corp ‡ | 38,788 | | 1,400 | SEI Investments Company | 44,268 |
| 845 | Astoria Financial Corporation | 21,962 | | 500 | StanCorp Financial Group, Inc. | 27,565 |
|
| The accompanying Notes to Financial Statements are an integral part of this schedule. |
|
| 107 |
| | | | | | |
| Mid Cap Index Fund-I | | | | | |
| Schedule of Investments as of October 31, 2007 | | | | | |
| |
| |
| Shares | Common Stock (93.4%) | Value | | Shares | Common Stock (93.4%) | Value |
|
| Financials — continued | | | 1,385 | Omnicare, Inc. | $40,858 |
| 400 | SVB Financial Group # | $20,716 | | 400 | Par Pharmaceutical | |
| 1,220 | TCF Financial Corporation | 27,779 | | | Companies, Inc. # | 7,376 |
| 1,500 | UDR, Inc. | 35,610 | | 1,300 | PDL BioPharma, Inc. #* | 27,560 |
| 515 | Unitrin, Inc. | 23,850 | | 930 | Perrigo Company | 22,050 |
| 1,750 | W.R. Berkley Corporation ‡ | 52,658 | | 1,200 | Pharmaceutical Product | |
| 1 | Wachovia Corporation | 16 | | | Development, Inc. | 50,688 |
| 1,000 | Waddell & Reed Financial, Inc. | 33,220 | | 600 | Psychiatric Solutions, Inc. # | 23,760 |
| 873 | Washington Federal, Inc. | 21,092 | | 900 | ResMed, Inc. # | 37,287 |
| 670 | Webster Financial Corporation | 24,281 | | 1,170 | Sepracor, Inc. # | 32,222 |
| 900 | Weingarten Realty Investors | 34,434 | | 780 | STERIS Corporation | 22,651 |
| 125 | Westamerica Bancorporation | 6,010 | | 500 | Techne Corporation # | 32,620 |
| 670 | Wilmington Trust Corporation | 24,368 | | 500 | Universal Health Services, Inc. | 24,375 |
|
| | |
| | Total Financials | 1,860,347 | | 1,070 | Valeant Pharmaceuticals | |
|
| | |
| | | | | | International # | 15,568 |
| Health Care (11.4%) | | | 400 | Varian, Inc. # | 29,556 |
| 624 | Advanced Medical Optics, Inc. # | 17,129 | | 900 | VCA Antech, Inc. # | 41,445 |
| 800 | Affymetrix, Inc. # | 20,368 | | 300 | Ventana Medical Systems, Inc. # | 26,400 |
| 545 | Apria Healthcare Group, Inc. # | 13,173 | | 1,500 | Vertex Pharmaceuticals, Inc. # | 48,510 |
| 710 | Beckman Coulter, Inc. ‡ | 50,282 | | 400 | Wellcare Health Plans, Inc. # | 9,676 |
|
|
| 700 | Cephalon, Inc. # | 51,618 | | | Total Health Care | 1,611,641 |
|
|
| 700 | Cerner Corporation # | 41,692 | | | | |
| 800 | Charles River Laboratories | | | Industrials (13.6%) | |
| | International, Inc. # | 46,400 | | 1,010 | AGCO Corporation #‡ | 60,277 |
| 1,100 | Community Health Systems, Inc. # | 36,223 | | 900 | AirTran Holdings, Inc. #* | 9,369 |
| 670 | Covance, Inc. # | 55,275 | | 535 | Alaska Air Group, Inc. # | 13,589 |
| 1,564 | Dentsply International, Inc. ‡ | 64,875 | | 550 | Alexander & Baldwin, Inc. | 28,809 |
| 700 | Edwards Lifesciences Corporation # | 35,154 | | 400 | Alliant Techsystems, Inc. #‡ | 44,156 |
| 1,500 | Endo Pharmaceutical | | | 1,130 | AMETEK, Inc. ‡ | 53,110 |
| | Holdings, Inc. # | 43,950 | | 1,210 | Avis Budget Group, Inc. # | 25,253 |
| 600 | Gen-Probe, Inc. #‡ | 42,012 | | 505 | Brink’s Company | 31,638 |
| 2,600 | Health Management | | | 630 | Carlisle Companies, Inc. | 24,854 |
| | Associates, Inc. | 17,186 | | 900 | ChoicePoint, Inc. #‡ | 35,388 |
| 1,250 | Health Net, Inc. # | 67,012 | | 415 | Con-way, Inc. | 17,683 |
| 1,000 | Henry Schein, Inc. # | 59,900 | | 700 | Copart, Inc. # | 26,866 |
| 630 | Hillenbrand Industries, Inc. | 34,789 | | 400 | Corporate Executive | |
| 1,400 | Hologic, Inc. # | 95,102 | | | Board Company | 28,500 |
| 400 | Intuitive Surgical, Inc. # | 130,742 | | 600 | Crane Company | 28,464 |
| 500 | Invitrogen Corporation # | 45,435 | | 600 | Deluxe Corporation | 24,204 |
| 300 | Kindred Healthcare, Inc. # | 6,372 | | 690 | Donaldson Company, Inc. | 29,573 |
| 500 | Kyphon, Inc. # | 35,440 | | 500 | DRS Technologies, Inc. | 28,720 |
| 600 | LifePoint Hospitals, Inc. # | 18,312 | | 700 | Dun & Bradstreet Corporation | 67,795 |
| 930 | Lincare Holdings, Inc. # | 32,336 | | 1,440 | Fastenal Company ‡ | 64,051 |
| 600 | Medicis Pharmaceutical | | | 495 | Federal Signal Corporation ‡ | 6,628 |
| | Corporation | 17,814 | | 600 | Flowserve Corporation ‡ | 47,376 |
| 3,422 | Millennium | | | 625 | GATX Corporation ‡ | 25,606 |
| | Pharmaceuticals, Inc. # | 40,448 | | 800 | Graco, Inc. ‡ | 31,488 |
|
| The accompanying Notes to Financial Statements are an integral part of this schedule. |
|
| 108 |
| | | | | | |
| Mid Cap Index Fund-I | | | | | |
| Schedule of Investments as of October 31, 2007 | | | | | |
| |
| |
| Shares | Common Stock (93.4%) | Value | | Shares | Common Stock (93.4%) | Value |
|
| Industrials — continued | | | 900 | Alliance Data Systems | |
| 330 | Granite Construction, Inc. ‡ | $14,131 | | | Corporation #‡ | $72,360 |
| 960 | Harsco Corporation | 58,195 | | 1,900 | Amphenol Corporation ‡ | 84,113 |
| 580 | Herman Miller, Inc. | 15,788 | | 1,800 | Andrew Corporation # | 26,388 |
| 615 | HNI Corporation * | 26,666 | | 1,425 | Arrow Electronics, Inc. #‡ | 56,972 |
| 555 | Hubbell, Inc. | 30,525 | | 5,290 | Atmel Corporation # | 25,868 |
| 800 | IDEX Corporation | 28,336 | | 1,660 | Avnet, Inc. #‡ | 69,255 |
| 1,060 | JB Hunt Transport Services, Inc. | 29,383 | | 600 | Avocent Corporation # | 16,218 |
| 1,900 | JetBlue Airways Corporation # | 17,347 | | 1,600 | Broadridge Financial Solutions, LLC | 32,000 |
| 1,250 | Joy Global, Inc. | 72,575 | | 2,980 | Cadence Design Systems, Inc. #‡ | 58,408 |
| 1,900 | KBR, Inc. # | 81,472 | | 1,600 | Ceridian Corporation #‡ | 57,504 |
| 190 | Kelly Services, Inc. | 3,996 | | 970 | CheckFree Corporation # | 46,104 |
| 465 | Kennametal, Inc. | 42,413 | | 700 | CommScope, Inc. # | 33,019 |
| 600 | Korn/Ferry International # | 11,496 | | 900 | Cree, Inc. #* | 25,200 |
| 300 | Lincoln Electric Holdings, Inc. | 21,675 | | 545 | CSG Systems International, Inc. # | 11,189 |
| 950 | Manpower, Inc. | 71,003 | | 1,740 | Cypress Semiconductor | |
| 300 | Mine Safety Appliances Company | 13,737 | | | Corporation # | 63,597 |
| 600 | MSC Industrial Direct | | | 790 | Diebold, Inc. | 33,054 |
| | Company, Inc. | 29,226 | | 400 | Digital River, Inc. # | 21,224 |
| 400 | Navigant Consulting, Inc. # | 5,272 | | 590 | DST Systems, Inc. # | 49,979 |
| 360 | Nordson Corporation | 19,260 | | 500 | Dycom Industries, Inc. # | 14,125 |
| 800 | Oshkosh Truck Corporation | 43,360 | | 900 | F5 Networks, Inc. #‡ | 32,427 |
| 1,030 | Pentair, Inc. | 36,452 | | 700 | Fair Isaac Corporation ‡ | 26,544 |
| 1,800 | Quanta Services, Inc. # | 59,400 | | 1,300 | Fairchild Semiconductor | |
| 1,750 | Republic Services, Inc. | 59,832 | | | International, Inc. #‡ | 23,725 |
| 340 | Rollins, Inc. | 10,326 | | 800 | Gartner Group, Inc. #‡ | 17,520 |
| 1,000 | Roper Industries, Inc. | 70,810 | | 900 | Global Payments, Inc. ‡ | 42,804 |
| 75 | Sequa Corporation # | 13,036 | | 1,590 | Harris Corporation | 96,290 |
| 640 | SPX Corporation | 64,832 | | 400 | Imation Corporation | 8,912 |
| 1,000 | Stericycle, Inc. # | 58,330 | | 1,500 | Ingram Micro, Inc. # | 31,860 |
| 235 | Teleflex, Inc. | 17,204 | | 2,055 | Integrated Device | |
| 500 | Thomas & Betts Corporation # | 28,005 | | | Technology, Inc. # | 27,599 |
| 1,100 | Timken Company | 36,586 | | 800 | International Rectifier | |
| 880 | Trinity Industries, Inc. | 31,803 | | | Corporation # | 26,704 |
| 800 | United Rentals, Inc. # | 27,352 | | 1,500 | Intersil Corporation | 45,510 |
| 475 | Werner Enterprises, Inc. | 9,034 | | 800 | Jack Henry & Associates, Inc. | 23,376 |
| 700 | YRC Worldwide, Inc. # | 17,206 | | 900 | KEMET Corporation # | 6,363 |
|
| | |
| | Total Industrials | 1,929,461 | | 1,500 | Lam Research Corporation # | 75,300 |
|
| | |
| | | | | 1,200 | Lattice Semiconductor Corporation # | 5,016 |
| Information Technology (14.7%) | | | 500 | Macrovision Corporation # | 12,000 |
| 4,300 | 3Com Corporation # | 20,984 | | 1,795 | McAfee, Inc. # | 74,223 |
| 485 | ACI Worldwide, Inc. # | 11,092 | | 950 | Mentor Graphics Corporation # | 15,219 |
| 3,077 | Activision, Inc. #‡ | 72,771 | | 600 | Micrel, Inc. | 5,430 |
| 845 | Acxiom Corporation | 11,103 | | 900 | MoneyGram International, Inc. | 14,355 |
| 1,300 | ADC Telecommunications, Inc. # | 24,310 | | 1,025 | MPS Group, Inc. # | 12,515 |
| 590 | ADTRAN, Inc. | 14,201 | | 550 | National Instruments Corporation | 17,842 |
| 200 | Advent Software, Inc. # | 11,066 | | 2,200 | NCR Corporation # | 60,698 |
|
| The accompanying Notes to Financial Statements are an integral part of this schedule. |
|
| 109 |
| | | | | | |
| Mid Cap Index Fund-I | | | | | |
| Schedule of Investments as of October 31, 2007 | | | | | |
| |
| |
| Shares | Common Stock (93.4%) | Value | | Shares | Common Stock (93.4%) | Value |
|
| Information Technology — continued | | | 400 | Scotts Company | $18,356 |
| 1,200 | Palm, Inc. * | $10,824 | | 610 | Sensient Technologies Corporation | 18,233 |
| 1,300 | Parametric Technology | | | 1,075 | Sonoco Products Company | 33,239 |
| | Corporation # | 24,830 | | 1,200 | Steel Dynamics, Inc. | 63,864 |
| 600 | Plantronics, Inc. | 16,410 | | 1,100 | Terra Industries, Inc. # | 40,579 |
| 990 | Polycom, Inc. # | 27,700 | | 1,000 | Valspar Corporation | 25,030 |
| 1,400 | Powerwave Technologies, Inc. # | 7,784 | | 700 | Worthington Industries, Inc. | 17,500 |
|
|
| 2,200 | RF Micro Devices, Inc. #* | 13,684 | | | Total Materials | 1,040,220 |
|
|
| 600 | Semtech Corporation # | 10,266 | | | | |
| 700 | Silicon Laboratories, Inc. # | 30,590 | | Telecommunications Services (0.9%) | |
| 400 | SRA International, Inc. # | 10,984 | | 2,660 | Cincinnati Bell, Inc. # | 14,417 |
| 900 | Sybase, Inc. # | 25,740 | | 800 | NeuStar, Inc. # | 27,360 |
| 1,600 | Synopsys, Inc. # | 45,216 | | 1,235 | Telephone and Data Systems, Inc. | 86,203 |
|
|
| 545 | Tech Data Corporation # | 21,435 | | | Total Telecommunications | |
| 1,515 | TriQuint Semiconductor, Inc. # | 9,499 | | | Services | 127,980 |
|
|
| 1,100 | UTStarcom, Inc. #* | 3,520 | | | | |
| 1,100 | ValueClick, Inc. # | 29,909 | | Utilities (6.9%) | |
| 2,095 | Vishay Intertechnology, Inc. # | 26,376 | | 785 | AGL Resources, Inc. ‡ | 31,031 |
| 2,300 | Western Digital Corporation # | 59,616 | | 1,175 | Alliant Energy Corporation ‡ | 47,000 |
| 900 | Wind River Systems, Inc. # | 11,259 | | 1,400 | Aqua America, Inc. * | 32,564 |
| 700 | Zebra Technologies Corporation # | 27,363 | | 3,995 | Aquila, Inc. #‡ | 16,699 |
|
| | |
| | Total Information | | | 370 | Black Hills Corporation | 16,435 |
| | Technology | 2,077,341 | | 1,145 | DPL, Inc. * | 33,251 |
|
| | |
| | | | | 1,665 | Energy East Corporation | 46,420 |
| Materials (7.4%) | | | 1,300 | Equitable Resources, Inc. ‡ | 73,216 |
| 895 | Airgas, Inc. ‡ | 45,171 | | 1,030 | Great Plains Energy, Inc. ‡ | 30,735 |
| 860 | Albemarle Corporation | 41,074 | | 970 | Hawaiian Electric Industries, Inc. | 22,504 |
| 775 | Cabot Corporation | 27,133 | | 525 | IDACORP, Inc. * | 18,317 |
| 300 | Carpenter Technology Corporation | 43,473 | | 2,050 | MDU Resources Group, Inc. | 57,728 |
| 600 | CF Industries Holdings, Inc. | 52,740 | | 870 | National Fuel Gas Company | 42,186 |
| 2,620 | Chemtura Corporation | 24,418 | | 1,625 | Northeast Utilities Service Company | 50,099 |
| 400 | Cleveland-Cliffs, Inc. | 38,260 | | 1,130 | NSTAR | 39,731 |
| 1,300 | Commercial Metals Company | 40,794 | | 965 | OGE Energy Corporation | 36,960 |
| 465 | Cytec Industries, Inc. | 31,020 | | 1,200 | ONEOK, Inc. | 59,928 |
| 390 | Ferro Corporation ‡ | 8,081 | | 2,032 | Pepco Holdings, Inc. | 57,892 |
| 600 | Florida Rock Industries, Inc. | 37,758 | | 795 | PNM Resources, Inc. | 19,883 |
| 800 | FMC Corporation ‡ | 46,000 | | 1,225 | Puget Energy, Inc. | 34,606 |
| 1,100 | Louisiana-Pacific Corporation | 18,106 | | 1,190 | SCANA Corporation | 48,302 |
| 770 | Lubrizol Corporation | 52,268 | | 2,370 | Sierra Pacific Resources | 39,982 |
| 2,710 | Lyondell Chemical Company | 128,590 | | 640 | Vectren Corporation | 17,946 |
| 405 | Martin Marietta Materials, Inc. | 52,387 | | 900 | Westar Energy, Inc. | 23,958 |
| 170 | Minerals Technologies, Inc. | 11,937 | | 580 | WGL Holdings, Inc. | 19,674 |
| 885 | Olin Corporation | 20,160 | | 1,210 | Wisconsin Energy Corporation | 57,935 |
|
|
| 1,100 | Packaging Corporation of America | 35,024 | | | Total Utilities | 974,982 |
|
|
| 700 | Reliance Steel & | | | | | |
|
|
| | Aluminum Company | 40,845 | | | Total Common Stock | |
| 1,315 | RPM International, Inc. | 28,180 | | | (cost $8,064,495) | 13,210,791 |
|
|
|
| The accompanying Notes to Financial Statements are an integral part of this schedule. |
|
| 110 |
| | | | |
| Mid Cap Index Fund-I | | | |
| Schedule of Investments as of October 31, 2007 | | | |
| |
| | | Interest | Maturity | |
| Shares | Collateral Held for Securities Loaned (2.3%) | Rate (+) | Date | Value |
|
| 323,882 | Thrivent Financial Securities Lending Trust | 5.050% | N/A | $323,882 |
|
|
| | Total Collateral Held for Securities Loaned | |
| | (cost $323,882) | | | 323,882 |
|
|
| |
| |
| Shares or | | | | |
| Principal | | Interest | Maturity | |
| Amount | Short-Term Investments (7.8%) | Rate (+) | Date | Value |
|
| $200,000 | Federal National Mortgage Association ‡ | 4.824% | 12/5/2007 | $199,099 |
| 100,000 | Federal National Mortgage Association ‡ | 5.080 | 12/14/2007 | 99,393 |
| 803,792 | Thrivent Money Market Fund | 5.020 | N/A | 803,792 |
|
|
| | Total Short-Term Investments (at amortized cost) | 1,102,284 |
|
|
| | Total Investments (cost $9,490,661) 103.5% | $14,636,957 |
|
|
| | Other Assets and Liabilities, Net (3.5%) | | (491,270) |
|
|
| | Total Net Assets 100.0% | | | $14,145,687 |
|
|
| | | | | |
| | Number of | | Notional | | |
| | Contracts | Expiration | Principal | | Unrealized |
| Futures | Long/(Short) | Date | Amount | Value | Gain/(Loss) |
|
| S&P 400 Index Mini-Futures | 12 | December 2007 | $1,087,709 | $1,094,520 | $6,811 |
| Total Futures | | | | | $6,811 |
# Non-income producing security.
* All or a portion of the security is on loan as discussed in item 2(M) of the Notes to Financial Statements.
+ The interest rate shown reflects the yield, coupon rate or, for securities purchased at a discount, the discount rate at the date of purchase.
‡ At October 31, 2007, $298,492 of investments were held on deposit with the counterparty and pledged as the initial margin deposit for open financial futures contracts. In addition, $2,758,021 of investments were earmarked as collateral to cover open financial futures contracts.
Definitions:
REIT — Real Estate Investment Trust, is a company that buys, develops, manages and/or sells real estate assets.
Gross unrealized appreciation and depreciation of investments, based on cost for federal income tax purposes, were as follows:
| | |
| Gross unrealized appreciation | $5,280,405 | |
| Gross unrealized depreciation | (416,398) | |
|
| |
| Net unrealized appreciation (depreciation) | $4,864,007 | |
| Cost for federal income tax purposes | $9,772,950 | |
|
| The accompanying Notes to Financial Statements are an integral part of this schedule. |
|
| 111 |
| | | | | | |
| Partner International Stock Fund |
| Schedule of Investments as of October 31, 2007 |
| |
| Shares | Common Stock (96.6%) | Value^ | | Shares | Common Stock (96.6%) | Value^ |
|
| Australia (5.1%) | | | 23,300 | Petro-Canada # | $1,344,183 |
| 56,083 | Babcock & Brown, Ltd. * | $1,623,837 | | 28,100 | Potash Corporation of | |
| 154,263 | BHP Billiton, Ltd. | 6,717,042 | | | Saskatchewan # | 3,497,999 |
| 45,002 | Caltex Australia, Ltd. | 905,300 | | 31,000 | Power Corporation | 1,329,650 |
| 28,397 | Cochlear, Ltd. * | 1,825,903 | | 34,200 | Research In Motion, Ltd. # | 4,262,782 |
| 39,365 | Computershare, Ltd. | 317,387 | | 33,200 | Suncor Energy, Inc. # | 3,635,588 |
| 54,728 | CSL, Ltd. | 1,880,065 | | 20,300 | Toronto-Dominion Bank # | 1,533,190 |
|
|
| 38,571 | Leighton Holdings, Ltd. * | 2,257,957 | | | Total Canada | 30,661,049 |
|
|
| 30,043 | Macquarie Bank, Ltd. * | 2,399,302 | | | | |
| 26,709 | Rio Tinto, Ltd. * | 2,772,251 | | Denmark (0.8%) | |
| 194,183 | Seek, Ltd. * | 1,699,359 | | 11,300 | Carlsberg International AS | 1,528,468 |
| 1 | Suncorp-Metway, Ltd. | 19 | | 22,272 | Novo Nordisk AS | 2,775,698 |
| 301,400 | Westpac Banking Corporation | 8,459,299 | | 4,320 | Rockwool International AS | 1,383,409 |
|
|
| 92,587 | Woolworths, Ltd. | 2,901,697 | | | Total Denmark | 5,687,575 |
|
|
| 61,135 | WorleyParsons, Ltd. | 2,763,368 | | | | |
|
| | |
| | Total Australia | 36,522,786 | | Finland (1.1%) | |
|
| | | | |
| | | | | 198,545 | Nokia Oyj | 7,884,687 |
|
|
| Austria (0.4%) | | | | Total Finland | 7,884,687 |
|
|
| 26,883 | Telekom Austria AG | 770,978 | | | | |
| 25,092 | Voestalpine AG | 2,267,024 | | France (5.8%) | |
|
| | |
| | Total Austria | 3,038,002 | | 182,300 | Axa SA | 8,187,631 |
|
| | |
| | | | | 24,636 | Bouygues SA | 2,377,453 |
| Belgium (0.6%) | | | 10,204 | CNP Assurances | 1,303,670 |
| 25,235 | InBev NV | 2,388,235 | | 5,246 | Compagnie Generale des | |
| 11,797 | KBC Groep NV | 1,657,959 | | | Geophysique-Veritas # | 1,716,637 |
|
| | |
| | Total Belgium | 4,046,194 | | 15,784 | Kaufman & Broad SA | 900,570 |
|
| | |
| | | | | 10,637 | Compagnie Generale des | |
| Bermuda (0.2%) | | | | Etablissement Michelin | 1,432,459 |
| 54,695 | Jardine Matheson Holdings, Ltd. | 1,675,581 | | 10,337 | Nexans SA | 1,765,064 |
|
| | |
| | Total Bermuda | 1,675,581 | | 56,400 | Schneider Electric SA | 7,801,221 |
|
| | |
| | | | | 5,348 | UBISOFT Entertainment SA # | 439,134 |
| Brazil (0.7%) | | | 9,769 | Unibail-Rodamco | 2,428,383 |
| 105,500 | Empresa Brasileira de Aeronautica | | | 35,104 | Vinci SA | 2,896,492 |
| | SA ADR | 5,145,235 | | 191,795 | Vivendi Universal SA | 8,666,445 |
|
| | |
| | Total Brazil | 5,145,235 | | 9,541 | Wendel | 1,643,705 |
|
| | |
|
| | | | | | Total France | 41,558,864 |
|
|
| Canada (4.2%) | | | | | |
| 6,492 | Addax Petroleum Corporation # | 284,296 | | Germany (9.1%) | |
| 35,700 | AGF Management, Ltd. | 1,386,885 | | 148,032 | Adidas AG | 9,873,138 |
| 34,500 | Agrium, Inc. # | 2,191,172 | | 4,897 | Allianz AG | 1,102,617 |
| 129,778 | CGI Group, Inc. # | 1,478,153 | | 28,575 | BASF AG | 3,955,506 |
| 56,100 | EnCana Corporation # | 3,925,278 | | 13,459 | Bayer AG | 1,123,503 |
| 5,808 | Finning International, Inc. # | 199,809 | | 95,300 | Celesio AG | 5,414,790 |
| 16,700 | First Quantum Minerals, Ltd. | 1,797,632 | | 17,569 | Continental AG | 2,656,963 |
| 7,660 | Husky Energy, Inc. | 357,013 | | 11,997 | DaimlerChrysler AG | 1,312,400 |
| 37,400 | Imperial Oil, Ltd. # | 2,036,869 | | 18,519 | Deutsche Boerse AG | 2,917,080 |
| 13,100 | Inmet Mining Corporation | 1,400,550 | | 204,100 | Deutsche Post AG-REG | 6,184,254 |
|
| The accompanying Notes to Financial Statements are an integral part of this schedule. |
|
| 112 |
| | | | | | |
| Partner International Stock Fund | | | | | |
| Schedule of Investments as of October 31, 2007 | | | | | |
| |
| |
| Shares | Common Stock (96.6%) | Value^ | | Shares | Common Stock (96.6%) | Value^ |
|
| Germany — continued | | | 316,300 | Bridgestone Corporation | $7,001,545 |
| 7,645 | E.ON AG | $1,494,486 | | 21,100 | Canon, Inc. | 1,067,647 |
| 24,665 | Fresenius Medical Care | | | 220 | Central Japan Railway Company | 2,275,956 |
| | AG & Company | 1,305,569 | | 105,000 | Chiba Bank, Ltd. | 842,757 |
| 14,289 | MAN AG | 2,554,900 | | 135,900 | Daito Trust Construction | |
| 39,400 | Metro AG | 3,575,590 | | | Company, Ltd. | 6,301,027 |
| 911 | Porsche AG | 2,427,745 | | 18,996 | Disco Corporation | 1,136,907 |
| 26,983 | RWE AG | 3,685,849 | | 431 | Geo Corporation | 1,029,835 |
| 9,662 | Salzgitter AG | 1,901,652 | | 40,900 | Hitachi Construction Machinery | |
| 14,223 | SAP AG | 769,027 | | | Company, Ltd. | 1,677,540 |
| 25,670 | SGL Carbon AG # | 1,498,836 | | 22,800 | IBIDEN Company, Ltd. | 1,932,643 |
| 86,844 | Siemens AG | 11,774,834 | | 114,000 | ITOCHU Corporation | 1,423,950 |
|
| | |
| | Total Germany | 65,528,739 | | 286 | Japan Tobacco, Inc. | 1,666,993 |
|
| | |
| | | | | 26,000 | Joint Corporation | 738,793 |
| Greece (0.5%) | | | 101,000 | Kawasaki Kisen Kaisha, Ltd. | 1,401,905 |
| 30,469 | Coca-Cola Hellenic Bottling | | | 276 | KDDI Corporation | 2,084,539 |
| | Company SA | 1,891,276 | | 79,600 | Komatsu, Ltd. | 2,668,722 |
| 27,988 | National Bank of Greece SA | 1,955,560 | | 42,600 | Kyocera Corporation | 3,620,921 |
|
| | |
| | Total Greece | 3,846,836 | | 42,100 | Makita Corporation | 2,028,241 |
|
| | |
| | | | | 43,880 | Matsuda Sangyo Company, Ltd. * | 1,561,427 |
| Hong Kong (1.5%) | | | 660,000 | Mitsubishi UFJ Financial | |
| 143,000 | Esprit Holdings, Ltd. | 2,388,271 | | | Group, Inc. | 6,604,054 |
| 384,000 | Hengan International Group | | | 141,000 | Mitsui Osk Lines, Ltd. | 2,330,382 |
| | Company, Ltd. | 1,497,616 | | 353,850 | Mitsui Sumitomo Insurance | |
| 354,800 | Swire Pacific, Ltd. | 5,067,172 | | | Company | 4,058,258 |
| 218,111 | Vtech Holdings, Ltd. | 1,862,455 | | 203,300 | Nikon Corporation | 6,524,254 |
|
| | |
| | Total Hong Kong | 10,815,514 | | 6,600 | Nintendo Company, Ltd. | 4,191,519 |
|
| | |
| | | | | 249,477 | Nippon Sheet Glass Company | 1,523,048 |
| Ireland (0.5%) | | | 438,000 | Nippon Steel Corporation | 2,911,176 |
| 40,846 | Allied Irish Banks plc | 1,029,723 | | 30,573 | Nisshinbo Industries, Inc. | 414,212 |
| 34,475 | CRH plc | 1,329,974 | | 44,900 | Nomura Research Institute, Ltd. | 1,587,099 |
| 49,923 | Kingspan Group plc | 1,178,520 | | 204 | NTT Data Corporation | 930,271 |
|
| | |
| | Total Ireland | 3,538,217 | | 39,000 | Olympus Corporation | 1,624,142 |
|
| | |
| | | | | 89,000 | Pacific Metals Company, Ltd. | 1,127,378 |
| Italy (3.4%) | | | 128,000 | Shizuoka Bank, Ltd. | 1,343,869 |
| 172,546 | Enel SPA | 2,068,728 | | 122,000 | Sompo Japan Insurance, Inc. | 1,434,859 |
| 183,300 | Eni SPA | 6,692,335 | | 16,600 | Sony Corporation | 819,815 |
| 247,900 | Finmeccanica SPA | 7,373,553 | | 436,200 | Sumitomo Corporation | 7,600,309 |
| 52,319 | Prysmian SPA # | 1,511,075 | | 77,000 | Sumitomo Metal Mining | |
| 779,000 | UniCredito Italiano SPA | 6,700,709 | | | Company, Ltd. | 1,718,245 |
|
| | |
| | Total Italy | 24,346,400 | | 90 | Sumitomo Mitsui Financial | |
|
| | |
| | | | | | Group, Inc. | 737,219 |
| Japan (16.8%) | | | 38,000 | Sumitomo Realty & Development | |
| 30,300 | Aisin Seiki Company, Ltd. | 1,245,031 | | | Company, Ltd. * | 1,341,216 |
| 2,571 | Ardepro Company, Ltd. * | 864,289 | | 710,300 | Sumitomo Trust and Banking | |
| 146,000 | Asahi Glass Company, Ltd. * | 2,010,674 | | | Company, Ltd. | 5,295,998 |
|
| The accompanying Notes to Financial Statements are an integral part of this schedule. |
|
| 113 |
| | | | | | |
| Partner International Stock Fund | | | | | |
| Schedule of Investments as of October 31, 2007 | | | | | |
| |
| |
| Shares | Common Stock (96.6%) | Value^ | | Shares | Common Stock (96.6%) | Value^ |
|
| Japan — continued�� | | | South Korea (1.8%) | |
| 50,439 | Suruga Bank, Ltd. | $662,160 | | 4,612 | Korea Zinc Company, Ltd. | $931,471 |
| 108,400 | Takeda Pharmaceutical | | | 57,350 | LG Electronics, Inc. | 6,030,346 |
| | Company, Ltd. | 6,771,150 | | 9,400 | Samsung Electronics | |
| 84,000 | Tanabe Seiyaku Company, Ltd. | 967,865 | | | Company, Ltd. | 5,796,022 |
|
|
| 47,300 | Tokai Rika Company, Ltd. | 1,398,894 | | | Total South Korea | 12,757,839 |
|
|
| 277,000 | Toshiba Corporation | 2,345,713 | | | | |
| 101,600 | Toyota Motor Corporation | 5,816,011 | | Spain (5.7%) | |
| 28,102 | Trend Micro, Inc. | 1,254,783 | | 36,161 | Actividades de Construccion y | |
| 97,200 | Urban Corporation | 1,702,657 | | | Servicios SA | 2,244,852 |
| 164,000 | Zeon Corporation | 1,548,658 | | 240,521 | Banco Bilbao Vizcaya | |
|
| | |
| | Total Japan | 121,166,556 | | | Argentaria SA | 6,086,394 |
|
| | |
| | | | | 24,039 | Bolsas y Mercados Espanoles | 1,680,811 |
| Luxembourg (0.2%) | | | 58,484 | Grifols SA | 1,551,469 |
| 28,700 | Oriflame Cosmetics SA | 1,738,617 | | 322,000 | Iberdrola SA | 5,194,022 |
|
| | |
| | Total Luxembourg | 1,738,617 | | 30,548 | Industria de Diseno Textil SA | |
|
| | |
| | | | | | (Inditex) | 2,283,852 |
| Netherlands (2.7%) | | | 608,827 | Telefonica SA | 20,157,432 |
| 55,208 | Arcelor Mittal | 4,421,670 | | 24,280 | Union Fenosa SA | 1,617,036 |
|
|
| 50,686 | ASML Holding NV # | 1,764,716 | | | Total Spain | 40,815,868 |
|
|
| 29,789 | Furgo NV | 2,618,308 | | | | |
| 33,540 | Heineken NV | 2,354,227 | | Sweden (2.6%) | |
| 163,800 | ING Groep NV | 7,403,006 | | 28,325 | Alfa Laval AB | 2,256,727 |
| 3,281 | Sligro Food Group NV | 126,300 | | 45,900 | Hennes & Mauritz AB | 3,066,987 |
| 29,442 | Unilever NV | 958,200 | | 89,050 | Meda AB * | 1,348,778 |
|
| | |
| | Total Netherlands | 19,646,427 | | 117,546 | Peab AB | 1,070,224 |
|
| | |
| | | | | 57,173 | Peab Industri AB # | 486,035 |
| Norway (1.6%) | | | 115,400 | Sandvik AB | 2,192,803 |
| 87,400 | DnB NOR ASA | 1,448,409 | | 45,200 | Skandinaviska Enskilda Banken | 1,391,745 |
| 357,700 | Norsk Hydro ASA | 5,258,679 | | 47,000 | Ssab Svenskt Stal AB | 1,532,192 |
| 150,049 | Statoil ASA | 5,111,647 | | 1,919,100 | Telefonaktiebolaget LM Ericsson | 5,741,892 |
|
| | |
|
| | Total Norway | 11,818,735 | | | Total Sweden | 19,087,383 |
|
| | |
|
| |
| Singapore | (3.0%) | | | Switzerland (7.7%) | |
| 316,000 | Capitaland, Ltd. | 1,779,215 | | 145,165 | ABB, Ltd. | 4,388,384 |
| 158,000 | City Developments, Ltd. | 1,744,531 | | 25,660 | Actelion, Ltd. # | 1,276,412 |
| 251,000 | Keppel Land, Ltd. | 1,451,924 | | 6,600 | Givaudan SA | 6,492,250 |
| 3,328,590 | Singapore | | | 29,780 | Julius Baer Holding AG | 2,586,410 |
| | Telecommunications, Ltd. | 9,465,361 | | 39,528 | Nestle SA | 18,257,268 |
| 486,800 | United Overseas Bank, Ltd. | 7,302,606 | | 69,874 | Novartis AG | 3,716,900 |
|
| | |
| | Total Singapore | 21,743,637 | | 21,674 | Roche Holding AG | 3,701,986 |
|
| | |
| | | | | 18,860 | Swatch Group AG | 6,037,842 |
| | | | | 80,400 | Swiss Reinsurance Company | 7,559,058 |
| | | | | 6,567 | Zurich Financial Services AG | 1,982,787 |
|
|
| | | | | | Total Switzerland | 55,999,297 |
|
|
|
| The accompanying Notes to Financial Statements are an integral part of this schedule. |
|
| 114 |
| | | | | | |
| Partner International Stock Fund | | | | | |
| Schedule of Investments as of October 31, 2007 | | | | | |
| |
| |
| Shares | Common Stock (96.6%) | Value^ | | Shares | Common Stock (96.6%) | Value^ |
|
| Taiwan (0.9%) | | | 580,300 | Lloyds TSB Group plc | $6,592,300 |
| 629,436 | Taiwan Semiconductor | | | 16,988 | Next plc | 779,986 |
| | Manufacturing Company, | | | 420,000 | Pearson plc | 7,004,629 |
| | Ltd. ADR * | $6,703,493 | | 147,604 | Petrofac, Ltd. | 1,587,272 |
|
| | |
| | Total Taiwan | 6,703,493 | | 60,460 | Punch Taverns plc | 1,267,774 |
|
| | |
| | | | | 44,253 | Reckitt Benckiser Group plc | 2,570,833 |
| United Kingdom (19.2%) | | | 20,749 | Rio Tinto plc | 1,945,858 |
| 85,136 | Aggreko plc | 1,114,009 | | 476,500 | Royal Bank of Scotland Group plc | 5,146,477 |
| 75,136 | Anglo American plc | 5,226,631 | | 88,524 | SABMiller plc | 2,666,618 |
| 149,027 | AstraZeneca plc | 7,339,293 | | 106,224 | Shire plc | 2,660,879 |
| 85,105 | Autonomy Corporation plc # | 1,745,564 | | 18,550 | SIG plc | 408,879 |
| 46,231 | Berkeley Group Holdings plc # | 1,642,878 | | 114,995 | Southern Cross Healthcare, Ltd. | 1,446,010 |
| 51,353 | BG Group plc | 952,182 | | 96,361 | Standard Chartered plc | 3,748,140 |
| 119,779 | BHP Billiton plc | 4,600,395 | | 46,412 | Taylor Nelson Sofres plc | 207,981 |
| 629,500 | British Sky Broadcasting | | | 151,096 | Tesco plc | 1,537,132 |
| | Group plc | 8,915,626 | | 242,425 | Unilever plc | 8,220,975 |
| 578,543 | BT Group plc | 3,932,625 | | 83,413 | United Business Media plc | 1,268,800 |
| 331,428 | Centricia plc | 2,547,495 | | 2,526,487 | Vodafone Group plc | 9,956,219 |
| 79,308 | Charter plc # | 1,794,630 | | 345,960 | William Morrison | |
| 35,780 | Chemring Group plc | 1,650,039 | | | Supermarkets plc | 2,135,686 |
| 291,318 | GAME GROUP plc | 1,214,158 | | 484,300 | WPP Group plc | 6,626,118 |
|
|
| 449,233 | GlaxoSmithKline plc | 11,539,655 | | | Total United Kingdom | 139,027,718 |
|
|
| 23,271 | Go-Ahead Group plc | 1,309,443 | | | | |
| 424,277 | Henderson Group plc | 1,659,525 | | United States (0.5%) | |
| 55,554 | Imperial Tobacco Group plc | 2,820,062 | | 42,202 | iShares MSCI EAFE Index Fund * | 3,640,345 |
|
|
| 219,857 | International Power plc | 2,241,728 | | | Total United States | 3,640,345 |
|
|
| 72,003 | Keller Group plc | 1,705,239 | | | | |
|
|
| 1,420,100 | Kingfisher plc | 5,844,882 | | | Total Common Stock | |
| 169,105 | Ladbrokes plc | 1,453,093 | | | (cost $555,113,004) | 698,441,594 |
|
|
| | | | |
| | | Interest | Maturity | |
| Shares | Collateral Held for Securities Loaned (3.8%) | Rate (+) | Date | Value |
|
| 27,736,142 | Thrivent Financial Securities Lending Trust | 5.050% | N/A | $27,736,142 |
|
|
| | Total Collateral Held for Securities Loaned | |
| | (cost $27,736,142) | | | 27,736,142 |
|
|
|
| The accompanying Notes to Financial Statements are an integral part of this schedule. |
|
| 115 |
| | | | |
| Partner International Stock Fund | | | |
| Schedule of Investments as of October 31, 2007 | | | |
| |
| Shares or | | | | |
| Principal | | Interest | Maturity | |
| Amount | Short-Term Investments (2.7%) | Rate (+) | Date | Value |
|
| $15,940,000 | Jupiter Securitization Company, LLC | 4.930% | 11/1/2007 | $15,940,000 |
| 3,750,651 | Thrivent Money Market Fund | 5.020 | N/A | 3,750,651 |
|
|
| | Total Short-Term Investments (at amortized cost) | 19,690,651 |
|
|
| | Total Investments (cost $602,539,797) 103.1% | $745,868,387 |
|
|
| | Other Assets and Liabilities, Net (3.1%) | | (22,401,802) |
|
|
| | Total Net Assets 100.0% | | | $723,466,585 |
|
|
# Non-income producing security.
* All or a portion of the security is on loan as discussed in item 2(M) of the Notes to Financial Statements.
+ The interest rate shown reflects the yield, coupon rate or, for securities purchased at a discount, the discount rate at the date of purchase
^ Security is fair valued as discussed in item 2(A) of the Notes to Financial Statements.
Definitions:
ADR — American Depository Receipts, which are certificates for shares of an underlying foreign security’s shares held by an issuing U.S. depository bank.
Gross unrealized appreciation and depreciation of investments, based on cost for federal income tax purposes, were as follows:
| | |
| Gross unrealized appreciation | $150,626,959 | |
| Gross unrealized depreciation | (11,871,958) | |
|
| |
| Net unrealized appreciation (depreciation) | $138,755,001 | |
| Cost for federal income tax purposes | $607,113,386 | |
|
| The accompanying Notes to Financial Statements are an integral part of this schedule. |
|
| 116 |
| | | | | | |
| Large Cap Growth Fund |
| Schedule of Investments as of October 31, 2007 |
| |
| Shares | Common Stock (97.3%) | Value | | Shares | Common Stock (97.3%) | Value |
|
| Consumer Discretionary (9.1%) | | | 54,250 | Exxon Mobil Corporation | $4,990,458 |
| 27,300 | Abercrombie & Fitch Company | $2,162,160 | | 18,850 | FMC Technologies, Inc. #* | 1,142,876 |
| 60,550 | Aeropostale, Inc. # | 1,386,595 | | 55,350 | GlobalSantaFe Corporation | 4,485,010 |
| 38,850 | Amazon.com, Inc. #~ | 3,463,478 | | 44,200 | Halliburton Company | 1,742,364 |
| 209,350 | Comcast Corporation # | 4,369,134 | | 33,650 | National Oilwell Varco, Inc. # | 2,464,526 |
| 34,100 | EchoStar Communications | | | 25,300 | Noble Corporation | 1,339,635 |
| | Corporation # | 1,669,536 | | 21,850 | Oceaneering International, Inc. # | 1,688,350 |
| 75,800 | Home Depot, Inc. | 2,388,458 | | 45,100 | Range Resources Corporation | 2,026,343 |
| 36,850 | International Game Technology | 1,607,028 | | 89,160 | Schlumberger, Ltd. | 8,610,181 |
| 54,850 | Kohl’s Corporation # | 3,015,104 | | 18,050 | Suncor Energy, Inc. * | 1,971,602 |
| 31,850 | Las Vegas Sands Corporation #*~ | 4,226,814 | | 50,400 | XTO Energy, Inc. * | 3,345,552 |
|
|
| 48,850 | Marriott International, Inc. | 2,008,224 | | | Total Energy | 43,024,667 |
|
|
| 73,250 | McDonald’s Corporation | 4,373,025 | | | | |
| 49,900 | McGraw-Hill Companies, Inc. | 2,496,996 | | Financials (11.3%) | |
| 20,350 | MGM MIRAGE #* | 1,864,264 | | 63,600 | American Express Company | 3,876,420 |
| 126,800 | News Corporation | 2,907,524 | | 46,450 | American International | |
| 30,350 | NIKE, Inc. | 2,010,991 | | | Group, Inc. | 2,931,924 |
| 25,800 | Nordstrom, Inc. | 1,017,552 | | 43,450 | Bank of New York | |
| 73,300 | Orbitz Worldwide, Inc. # | 773,315 | | | Mellon Corporation | 2,122,532 |
| 63,550 | Starbucks Corporation # | 1,695,514 | | 5,000 | Bear Stearns Companies, Inc. | 568,000 |
| 42,550 | Target Corporation | 2,610,868 | | 39,350 | CB Richard Ellis Group, Inc. # | 959,353 |
| 66,700 | TJX Companies, Inc. | 1,929,631 | | 127,650 | Charles Schwab Corporation | 2,966,586 |
| 2,950 | Ulta Salon Cosmetics & | | | 12,000 | CME Group, Inc. | 7,995,000 |
| | Fragrance, Inc. # | 100,890 | | 71,350 | Discover Financial Services | 1,377,055 |
| 109,150 | Walt Disney Company | 3,779,864 | | 36,700 | Federal National Mortgage | |
| 36,300 | Yum! Brands, Inc. | 1,461,801 | | | Association | 2,093,368 |
|
| | |
| | Total Consumer | | | 23,200 | Franklin Resources, Inc. | 3,008,576 |
| | Discretionary | 53,318,766 | | 34,100 | Goldman Sachs Group, Inc. | 8,454,072 |
|
| | |
| | | | | 14,000 | IntercontinentalExchange, Inc. # | 2,494,800 |
| Consumer Staples (5.1%) | | | 101,950 | J.P. Morgan Chase & Company | 4,791,650 |
| 58,900 | Altria Group, Inc. | 4,295,577 | | 34,760 | Lehman Brothers Holdings, Inc. | 2,201,698 |
| 11,250 | Bunge, Ltd. | 1,295,888 | | 19,550 | Merrill Lynch & Company, Inc. | 1,290,691 |
| 49,450 | Coca-Cola Company | 3,054,032 | | 67,300 | Morgan Stanley | 4,526,598 |
| 66,800 | Colgate-Palmolive Company | 5,094,836 | | 26,400 | Nymex Holdings, Inc. * | 3,392,928 |
| 46,450 | Costco Wholesale Corporation | 3,124,227 | | 32,150 | Prudential Financial, Inc. | 3,109,548 |
| 174,500 | CVS/Caremark Corporation | 7,288,865 | | 56,250 | State Street Corporation * | 4,487,062 |
| 102,500 | Kroger Company | 3,012,475 | | 48,450 | T. Rowe Price Group, Inc. | 3,112,428 |
|
|
| 38,050 | Safeway, Inc. | 1,293,700 | | | Total Financials | 65,760,289 |
|
|
| 48,450 | Smithfield Foods, Inc. # | 1,389,062 | | | | |
|
| | |
| | Total Consumer Staples | 29,848,662 | | Health Care (14.4%) | |
|
| | |
| | | | | 96,450 | Abbott Laboratories ± | 5,268,099 |
| Energy (7.4%) | | | 52,650 | Aetna, Inc. | 2,957,350 |
| 20,200 | Cameron International | | | 68,500 | Allergan, Inc. * | 4,629,230 |
| | Corporation # | 1,966,672 | | 36,000 | Amgen, Inc. # | 2,091,960 |
| 17,200 | ConocoPhillips | 1,461,312 | | 78,750 | Baxter International, Inc. | 4,725,788 |
| 44,350 | Devon Energy Corporation | 4,142,290 | | 8,500 | Biogen Idec, Inc. # | 632,740 |
| 14,550 | Diamond Offshore Drilling, Inc. | 1,647,496 | | 67,750 | Bristol-Myers Squibb Company | 2,031,822 |
|
| The accompanying Notes to Financial Statements are an integral part of this schedule. |
|
| 117 |
| | | | | | |
| Large Cap Growth Fund | | | | | |
| Schedule of Investments as of October 31, 2007 | | | | | |
| |
| |
| Shares | Common Stock (97.3%) | Value | | Shares | Common Stock (97.3%) | Value |
|
| Health Care — continued | | | 11,700 | Union Pacific Corporation | $1,498,068 |
| 44,550 | Celgene Corporation #* | $2,940,300 | | 63,530 | United Technologies Corporation | 4,865,763 |
|
|
| 63,800 | Express Scripts, Inc. # | 4,025,780 | | | Total Industrials | 72,038,876 |
|
|
| 74,750 | Genentech, Inc. # | 5,541,218 | | | | |
| 36,655 | Genzyme Corporation # | 2,784,680 | | Information Technology (29.9%) | |
| 209,900 | Gilead Sciences, Inc. # | 9,695,281 | | 85,043 | Accenture, Ltd. | 3,320,929 |
| 26,550 | Hologic, Inc. #* | 1,803,542 | | 169,400 | Adobe Systems, Inc. # | 8,114,260 |
| 37,808 | Johnson & Johnson | 2,463,947 | | 2,200 | Alibaba.com, Ltd. #^§ | 3,832 |
| 99,900 | Merck & Company, Inc. | 5,820,174 | | 95,750 | Apple Computer, Inc. # | 18,187,712 |
| 134,150 | Schering-Plough Corporation | 4,094,258 | | 80,525 | Broadcom Corporation # | 2,621,089 |
| 14,350 | Shire Pharmaceuticals Group | | | 559,400 | Cisco Systems, Inc. # | 18,493,764 |
| | plc ADR * | 1,078,402 | | 78,500 | Cognizant Technology | |
| 67,150 | St. Jude Medical, Inc. # | 2,735,020 | | | Solutions Corporation # | 3,254,610 |
| 86,550 | Teva Pharmaceutical Industries, | | | 201,600 | Compuware Corporation # | 2,016,000 |
| | Ltd. ADR | 3,809,066 | | 110,600 | Corning, Inc. | 2,684,262 |
| 96,244 | Thermo Electron Corporation # | 5,660,110 | | 68,700 | Dell, Inc. # | 2,102,220 |
| 79,400 | UnitedHealth Group, Inc. | 3,902,510 | | 134,900 | eBay, Inc. # | 4,869,890 |
| 14,150 | WellPoint, Inc. # | 1,121,104 | | 50,070 | Electronic Arts, Inc. #* | 3,060,278 |
| 53,861 | Wyeth | 2,619,260 | | 169,380 | EMC Corporation # | 4,300,558 |
| 27,550 | Zimmer Holdings, Inc. # | 1,914,450 | | 33,500 | F5 Networks, Inc. # | 1,207,005 |
|
| | |
| | Total Health Care | 84,346,091 | | 27,300 | FormFactor, Inc. # | 1,067,703 |
|
| | |
| | | | | 60,200 | Foundry Networks, Inc. # | 1,272,628 |
| Industrials (12.3%) | | | 31,900 | Google, Inc. # | 22,553,298 |
| 42,650 | ABB, Ltd. | 1,288,883 | | 149,100 | Hewlett-Packard Company | 7,705,488 |
| 55,850 | Boeing Company * | 5,506,252 | | 276,300 | Intel Corporation | 7,432,470 |
| 52,650 | Chicago Bridge and | | | 48,450 | Marvell Technology | |
| | Iron Company | 2,632,500 | | | Group, Ltd. # | 873,554 |
| 22,300 | Cooper Industries, Ltd. | 1,168,297 | | 102,700 | Maxim Integrated | |
| 45,200 | Danaher Corporation | 3,872,284 | | | Products, Inc. | 2,783,170 |
| 29,750 | Deere & Company | 4,608,275 | | 24,050 | MEMC Electronic | |
| 98,050 | Emerson Electric Company | 5,125,074 | | | Materials, Inc. # | 1,760,941 |
| 67,450 | Expeditors International of | | | 353,750 | Microsoft Corporation | 13,021,538 |
| | Washington, Inc. * | 3,416,342 | | 80,450 | Motorola, Inc. * | 1,511,656 |
| 13,800 | FedEx Corporation | 1,426,092 | | 39,100 | Nice Systems, Ltd. ADR # | 1,541,713 |
| 17,600 | Fluor Corporation | 2,780,800 | | 53,450 | Nokia Oyj ADR | 2,123,034 |
| 17,700 | Foster Wheeler, Ltd. # | 2,624,025 | | 54,425 | NVIDIA Corporation # | 1,925,556 |
| 17,450 | General Dynamics Corporation | 1,587,252 | | 71,900 | ON Semiconductor | |
| 186,020 | General Electric Company | 7,656,583 | | | Corporation #* | 733,380 |
| 22,700 | ITT Corporation | 1,519,084 | | 223,645 | Oracle Corporation # | 4,958,210 |
| 34,600 | Lockheed Martin Corporation | 3,807,384 | | 152,250 | QUALCOMM, Inc. | 6,505,642 |
| 20,450 | Manpower, Inc. | 1,528,433 | | 58,350 | Research in Motion, Ltd. # | 7,265,158 |
| 33,750 | Norfolk Southern Corporation | 1,743,188 | | 316,950 | RF Micro Devices, Inc. #* | 1,971,429 |
| 41,050 | Northwest Airlines Corporation # | 761,478 | | 1,572 | Riverbed Technology, Inc. # | 53,118 |
| 25,300 | Oshkosh Truck Corporation ~ | 1,371,260 | | 23,300 | SanDisk Corporation # | 1,034,520 |
| 34,450 | Precision Castparts Corporation | 5,160,954 | | 58,750 | Seagate Technology | 1,635,600 |
| 43,500 | Textron, Inc. | 3,010,635 | | 67,550 | Smith Micro Software, Inc. #*~ | 1,040,946 |
| 64,300 | UAL Corporation #* | 3,079,970 | | 394,600 | Sun Microsystems, Inc. # | 2,253,166 |
|
| The accompanying Notes to Financial Statements are an integral part of this schedule. |
|
| 118 |
| | | | | | |
| Large Cap Growth Fund | | | | | |
| Schedule of Investments as of October 31, 2007 | | | | | |
| |
| |
| Shares | Common Stock (97.3%) | Value | | Shares | Common Stock (97.3%) | Value |
|
| Information Technology — continued | | | Telecommunications Services (3.4%) | |
| 91,250 | Texas Instruments, Inc. * | $2,974,750 | | 103,200 | America Movil SA de CV ADR | $6,748,248 |
| 30,150 | Trina Solar, Ltd. #* | 1,777,946 | | 108,450 | American Tower Corporation # | 4,791,321 |
| 39,850 | Western Union Company | 878,294 | | 69,550 | NII Holdings, Inc. # | 4,033,900 |
| 64,100 | Yahoo!, Inc. # | 1,993,510 | | 97,700 | Time Warner Telecom, Inc. # | 2,270,548 |
|
| | |
| | Total Information | | | 39,000 | Verizon Communications, Inc. | 1,796,730 |
|
|
| | Technology | 174,884,827 | | | Total Telecommunications | |
|
| | |
| | | | | | Services | 19,640,747 |
|
|
| Materials (4.2%) | | | | | |
| 17,050 | Agrium, Inc. | 1,083,868 | | Utilities (0.2%) | |
| 42,150 | Air Products and Chemicals, Inc. | 4,124,378 | | 14,600 | Constellation Energy Group, Inc. | 1,382,620 |
|
|
| 31,650 | Freeport-McMoRan | | | | Total Utilities | 1,382,620 |
|
|
| | Copper & Gold, Inc. | 3,724,572 | | | | |
|
|
| 106,300 | Monsanto Company | 10,378,069 | | | Total Common Stock | |
| 33,850 | Mosaic Company # | 2,362,730 | | | (cost $496,135,120) | 568,977,992 |
|
|
| 30,300 | Nucor Corporation | 1,879,206 | | | | |
| 13,800 | Praxair, Inc. | 1,179,624 | | | | |
|
| | |
| | Total Materials | 24,732,447 | | | | |
|
| | |
| | | | |
| | | Interest | Maturity | |
| Shares | Collateral Held for Securities Loaned (7.4%) | Rate (+) | Date | Value |
|
| 43,016,898 | Thrivent Financial Securities Lending Trust | 5.050% | N/A | $43,016,898 |
|
|
| | Total Collateral Held for Securities Loaned | |
| | (cost $43,016,898) | | | 43,016,898 |
|
|
|
| The accompanying Notes to Financial Statements are an integral part of this schedule. |
|
| 119 |
| | | | |
| Large Cap Growth Fund | | | |
| Schedule of Investments as of October 31, 2007 | | | |
| |
| | | Interest | Maturity | |
| Shares | Short-Term Investments (4.1%) | Rate (+) | Date | Value |
|
| 23,750,651 | Thrivent Money Market Fund | 5.020% | N/A | $23,750,651 |
|
|
| | Total Short-Term Investments (at amortized cost) | 23,750,651 |
|
|
| | Total Investments (cost $562,902,669) 108.8% | $635,745,541 |
|
|
| | Other Assets and Liabilities, Net (8.8%) | | (51,279,707) |
|
|
| | Total Net Assets 100.0% | | | $584,465,834 |
|
|
| | | | | |
| | Number of | Exercise | Expiration | | Unrealized |
| Call Options Written | Contracts | Price | Date | Value | Gain/(Loss) |
|
| Amazon.com, Inc. | 87 | $115 | November 2007 | ($522) | $18,319 |
| Las Vegas Sands Corporation | 36 | 140 | November 2007 | (12,600) | (288) |
| Oshkosh Truck Corporation | 40 | 55 | November 2007 | (7,600) | (1,780) |
| Smith Micro Software, Inc. | 670 | 55 | November 2007 | (87,100) | (14,781) |
| Total Call Options Written | | | | | $1,470 |
# Non-income producing security.
* All or a portion of the security is on loan as discussed in item 2(M) of the Notes to Financial Statements.
+ The interest rate shown reflects the yield, coupon rate or, for securities purchased at a discount, the discount rate at the date of purchase.
^ Security is fair valued as discussed in item 2(A) of the Notes to Financial Statements.
§ Denotes investments purchased on a when-issued or delayed delivery basis.
± Designated as cover for long settling trades as discussed in the Notes to Financial Statements.
~ All or a portion of the security was earmarked as collateral to cover options.
Definitions:
ADR — American Depository Receipts, which are certificates for shares of an underlying foreign security’s shares held by an issuing U.S. depository bank.
Gross unrealized appreciation and depreciation of investments, based on cost for federal income tax purposes, were as follows:
| | |
| Gross unrealized appreciation | $86,175,270 | |
| Gross unrealized depreciation | (14,994,067) | |
|
| |
| Net unrealized appreciation (depreciation) | $71,181,203 | |
| Cost for federal income tax purposes | $564,564,338 | |
|
| The accompanying Notes to Financial Statements are an integral part of this schedule. |
|
| 120 |
| | | | | | |
| Large Cap Value Fund |
| Schedule of Investments as of October 31, 2007 |
| |
| Shares | Common Stock (98.2%) | Value | | Shares | Common Stock (98.2%) | Value |
|
| Consumer Discretionary (8.6%) | | | Financials (27.3%) | |
| 26,400 | BorgWarner, Inc. | $2,790,744 | | 34,100 | ACE, Ltd. | $2,066,801 |
| 68,400 | Carnival Corporation | 3,281,832 | | 189,700 | American International | |
| 49,550 | CBS Corporation * | 1,422,085 | | | Group, Inc. | 11,973,864 |
| 246,850 | Comcast Corporation #* | 5,196,192 | | 271,580 | Bank of America Corporation | 13,111,882 |
| 39,800 | Darden Restaurants, Inc. | 1,711,400 | | 239,204 | Bank of New York | |
| 25,800 | Gannett Company, Inc. | 1,094,178 | | | Mellon Corporation | 11,685,091 |
| 90,400 | Gap, Inc. | 1,708,560 | | 79,600 | Chubb Corporation * | 4,246,660 |
| 42,100 | General Motors Corporation | 1,649,899 | | 429,132 | Citigroup, Inc. | 17,980,631 |
| 71,185 | Liberty Media Corporation — | | | 43,000 | City National Corporation | 2,906,800 |
| | Capital # | 8,896,701 | | 44,450 | Discover Financial Services | 857,885 |
| 69,900 | McDonald’s Corporation | 4,173,030 | | 15,900 | Everest Re Group, Ltd. | 1,693,986 |
| 268,700 | News Corporation | 5,822,729 | | 80,840 | Federal Home Loan Mortgage | |
| 31,200 | NIKE, Inc. | 2,067,312 | | | Corporation | 4,222,273 |
| 56,300 | Office Depot, Inc. # | 1,056,188 | | 52,400 | Federal National Mortgage | |
| 78,000 | Target Corporation | 4,786,080 | | | Association | 2,988,896 |
| 207,300 | Time Warner, Inc. * | 3,785,298 | | 19,400 | Goldman Sachs Group, Inc. | 4,809,648 |
| 111,400 | TJX Companies, Inc. | 3,222,802 | | 19,880 | Hartford Financial Services | |
| 118,300 | Walt Disney Company | 4,096,729 | | | Group, Inc. | 1,928,956 |
|
| | |
| | Total Consumer | | | 402,500 | Hudson City Bancorp, Inc. * | 6,303,150 |
| | Discretionary | 56,761,759 | | 394,000 | J.P. Morgan Chase & Company | 18,518,000 |
|
| | |
| | | | | 29,700 | Lehman Brothers Holdings, Inc. | 1,881,198 |
| Consumer Staples (8.3%) | | | 106,500 | Merrill Lynch & Company, Inc. | 7,031,130 |
| 164,300 | Altria Group, Inc. | 11,982,399 | | 88,900 | Morgan Stanley * | 5,979,414 |
| 73,700 | Anheuser-Busch | | | 66,100 | PNC Financial Services | |
| | Companies, Inc. * | 3,779,336 | | | Group, Inc. | 4,769,776 |
| 190,000 | ConAgra Foods, Inc. | 4,508,700 | | 121,200 | Principal Financial Group, Inc. | 8,201,604 |
| 198,100 | General Mills, Inc. | 11,436,313 | | 36,000 | Prudential Financial, Inc. | 3,481,920 |
| 65,010 | Kimberly-Clark Corporation | 4,608,559 | | 15,900 | Simon Property Group, Inc. | 1,655,349 |
| 192,800 | Kraft Foods, Inc. | 6,441,448 | | 142,900 | State Street Corporation * | 11,399,133 |
| 234,300 | Kroger Company | 6,886,077 | | 129,100 | Travelers Companies, Inc. | 6,740,311 |
| 45,700 | Safeway, Inc. | 1,553,800 | | 107,100 | U.S. Bancorp * | 3,551,436 |
| 107,200 | Unilever NV ADR | 3,479,712 | | 130,114 | Wachovia Corporation | 5,950,113 |
|
| | |
| | Total Consumer Staples | 54,676,344 | | 218,100 | Washington Federal, Inc. | 5,269,296 |
|
| | |
| | | | | 81,762 | Washington Mutual, Inc. * | 2,279,525 |
| Energy (11.0%) | | | 198,000 | Wells Fargo & Company * | 6,733,980 |
|
|
| 72,150 | Apache Corporation | 7,489,892 | | | Total Financials | 180,218,708 |
|
|
| 109,014 | Chevron Corporation * | 9,975,871 | | | | |
| 103,212 | ConocoPhillips | 8,768,892 | | Health Care (9.8%) | |
| 242,300 | Exxon Mobil Corporation | 22,289,180 | | 151,800 | Abbott Laboratories | 8,291,316 |
| 82,200 | Halliburton Company | 3,240,324 | | 37,500 | Aetna, Inc. | 2,106,375 |
| 112,400 | Occidental Petroleum | | | 26,100 | Amgen, Inc. # | 1,516,671 |
| | Corporation | 7,761,220 | | 79,600 | Baxter International, Inc. | 4,776,796 |
| 33,400 | Schlumberger, Ltd. | 3,225,438 | | 60,800 | Eli Lilly and Company | 3,292,320 |
| 123,600 | Total SA ADR | 9,963,396 | | 63,460 | Johnson & Johnson | 4,135,688 |
|
| | |
| | Total Energy | 72,714,213 | | 97,000 | McKesson Corporation | 6,411,700 |
|
| | |
| | | | | 69,700 | Merck & Company, Inc. | 4,060,722 |
|
| The accompanying Notes to Financial Statements are an integral part of this schedule. |
|
| 121 |
| | | | | | |
| Large Cap Value Fund | | | | | |
| Schedule of Investments as of October 31, 2007 | | | | | |
| |
| |
| Shares | Common Stock (98.2%) | Value | | Shares | Common Stock (98.2%) | Value |
|
| Health Care — continued | | | 92,250 | International Business | |
| 38,100 | Novartis AG ADR | $2,025,777 | | | Machines Corporation | $10,712,070 |
| 551,900 | Pfizer, Inc. | 13,582,259 | | 157,200 | Microsoft Corporation | 5,786,532 |
| 176,700 | Sanofi-Aventis ADR | 7,776,567 | | 79,900 | Motorola, Inc. * | 1,501,321 |
| 38,700 | WellPoint, Inc. # | 3,066,201 | | 79,450 | Nokia Oyj ADR | 3,155,754 |
| 70,900 | Wyeth | 3,447,867 | | 106,300 | Oracle Corporation # | 2,356,671 |
|
| | |
| | Total Health Care | 64,490,259 | | 138,900 | Sybase, Inc. # | 3,972,540 |
|
| | |
| | | | | 70,800 | Symantec Corporation # | 1,329,624 |
| Industrials (10.4%) | | | 24,750 | Tyco Electronics, Ltd. | 882,832 |
|
|
| 187,000 | AMR Corporation #* | 4,488,000 | | | Total Information | |
| 33,400 | Armstrong World | | | | Technology | 65,914,828 |
|
|
| | Industries, Inc. # | 1,369,734 | | | | |
| 83,200 | CSX Corporation | 3,724,864 | | Materials (4.4%) | |
| 33,500 | Deere & Company | 5,189,150 | | 104,450 | Alcoa, Inc. | 4,135,176 |
| 92,800 | Emerson Electric Company | 4,850,656 | | 58,000 | Dow Chemical Company | 2,612,320 |
| 15,900 | Flowserve Corporation | 1,255,464 | | 131,400 | E.I. du Pont de Nemours | |
| 19,400 | General Dynamics Corporation | 1,764,624 | | | and Company | 6,505,614 |
| 286,700 | General Electric Company | 11,800,572 | | 65,740 | International Paper Company | 2,429,750 |
| 105,900 | Honeywell International, Inc. * | 6,397,419 | | 212,500 | MeadWestvaco Corporation | 7,148,500 |
| 81,900 | Lockheed Martin Corporation | 9,012,276 | | 51,500 | Praxair, Inc. | 4,402,220 |
| 22,600 | Northrop Grumman Corporation | 1,889,812 | | 30,100 | Rohm and Haas Company * | 1,561,588 |
|
|
| 126,150 | Republic Services, Inc. | 4,313,068 | | | Total Materials | 28,795,168 |
|
|
| 24,750 | Tyco International, Ltd. | 1,018,958 | | | | |
| 87,300 | United Technologies | | | Telecommunications Services (5.9%) | |
| | Corporation | 6,686,307 | | 426,698 | AT&T, Inc. | 17,831,709 |
| 135,000 | Waste Management, Inc. | 4,912,650 | | 206,292 | Sprint Nextel Corporation | 3,527,593 |
|
| | |
| | Total Industrials | 68,673,554 | | 164,700 | Time Warner Telecom, Inc. # | 3,827,628 |
|
| | |
| | | | | 301,064 | Verizon Communications, Inc. | 13,870,018 |
|
|
| Information Technology (10.0%) | | | | Total Telecommunications | |
| 121,200 | Accenture, Ltd. | 4,732,860 | | | Services | 39,056,948 |
|
|
| 87,500 | Amdocs, Ltd. # | 3,010,000 | | | | |
| 12,200 | AMIS Holdings, Inc. #* | 93,574 | | Utilities (2.5%) | |
| 274,000 | Amkor Technology, Inc. # | 3,104,420 | | 45,300 | Entergy Corporation | 5,430,111 |
| 68,420 | Applied Materials, Inc. * | 1,328,716 | | 61,400 | Exelon Corporation | 5,082,692�� |
| 75,200 | Cisco Systems, Inc. # | 2,486,112 | | 80,900 | FirstEnergy Corporation * | 5,638,730 |
|
|
| 58,000 | Dell, Inc. # | 1,774,800 | | | Total Utilities | 16,151,533 |
|
|
| 160,400 | Hewlett-Packard Company | 8,289,472 | | | | |
|
|
| 423,700 | Intel Corporation | 11,397,530 | | | Total Common Stock | |
| | | | | | (cost $526,095,229) | 647,453,314 |
|
|
|
| The accompanying Notes to Financial Statements are an integral part of this schedule. |
|
| 122 |
| | | | |
| Large Cap Value Fund | | | |
| Schedule of Investments as of October 31, 2007 | | | |
| |
| | | Interest | Maturity | |
| Shares | Collateral Held for Securities Loaned (11.5%) | Rate (+) | Date | Value |
|
| 75,833,378 | Thrivent Financial Securities Lending Trust | 5.050% | N/A | $75,833,378 |
|
|
| | Total Collateral Held for Securities Loaned | |
| | (cost $75,833,378) | | | 75,833,378 |
|
|
| |
| |
| | | Interest | Maturity | |
| Shares | Short-Term Investments (4.1%) | Rate (+) | Date | Value |
|
| 27,288,103 | Thrivent Money Market Fund | 5.020% | N/A | $27,288,103 |
|
|
| | Total Short-Term Investments (at amortized cost) | 27,288,103 |
|
|
| | Total Investments (cost $629,216,710) 113.8% | $750,574,795 |
|
|
| | Other Assets and Liabilities, Net (13.8%) | | (90,977,301) |
|
|
| | Total Net Assets 100.0% | | | $659,597,494 |
|
|
# Non-income producing security.
* All or a portion of the security is on loan as discussed in item 2(M) of the Notes to Financial Statements.
+ The interest rate shown reflects the yield, coupon rate or, for securities purchased at a discount, the discount rate at the date of purchase.
Definitions:
ADR — American Depository Receipts, which are certificates for shares of an underlying foreign security’s shares held by an issuing U.S. depository bank.
Gross unrealized appreciation and depreciation of investments, based on cost for federal income tax purposes, were as follows:
| | |
| Gross unrealized appreciation | $133,753,258 | |
| Gross unrealized depreciation | (12,818,781) | |
|
| |
| Net unrealized appreciation (depreciation) | $120,934,477 | |
| Cost for federal income tax purposes | $629,640,318 | |
|
| The accompanying Notes to Financial Statements are an integral part of this schedule. |
|
| 123 |
| | | | | | |
| Large Cap Stock Fund |
| Schedule of Investments as of October 31, 2007 |
| |
| Shares | Common Stock (97.8%) | Value | | Shares | Common Stock (97.8%) | Value |
|
| Consumer Discretionary (6.6%) | | | 1,333,544 | Exxon Mobil Corporation ‡ | $122,672,710 |
| 144,400 | Carnival Corporation | $6,928,312 | | 246,236 | GlobalSantaFe Corporation * | 19,952,503 |
| 1,588,920 | Comcast Corporation #* | 33,289,506 | | 173,700 | Halliburton Company | $6,847,254 |
| 188,169 | Darden Restaurants, Inc. | 8,091,267 | | 139,932 | National Oilwell Varco, Inc. # | 10,248,620 |
| 180,000 | General Motors Corporation * | 7,054,200 | | 256,279 | Occidental Petroleum | |
| 270,650 | Home Depot, Inc. | 8,528,182 | | | Corporation | 17,696,065 |
| 215,793 | Kohl’s Corporation # | 11,862,141 | | 392,180 | Schlumberger, Ltd. | 37,872,823 |
| 99,700 | Las Vegas Sands Corporation # | 13,231,187 | | 88,790 | Suncor Energy, Inc. * | 9,698,532 |
| 135,083 | Liberty Media Corporation — | | | 554,692 | Total SA ADR * | 44,713,722 |
| | Capital # | 16,882,673 | | 285,425 | XTO Energy, Inc. * | 18,946,512 |
|
|
| 480,992 | Marriott International, Inc. | 19,773,581 | | | Total Energy | 391,708,474 |
|
|
| 215,300 | McGraw-Hill Companies, Inc. | 10,773,612 | | | | |
| 1,664,550 | News Corporation | 37,019,641 | | Financials (20.6%) | |
| 143,767 | Nordstrom, Inc. | 5,670,170 | | 309,254 | American Express Company | 18,849,031 |
| 262,823 | Office Depot, Inc. # | 4,930,559 | | 813,083 | American International | |
| 365,750 | Target Corporation | 22,442,420 | | | Group, Inc. | 51,321,799 |
| 324,289 | Time Warner, Inc. * | 5,921,517 | | 157,370 | Ameriprise Financial, Inc. | 9,911,163 |
| 502,742 | TJX Companies, Inc. * | 14,544,326 | | 1,167,401 | Bank of America Corporation | 56,362,120 |
| 4,700 | Ulta Salon Cosmetics & | | | 752,234 | Bank of New York | |
| | Fragrance, Inc. #* | 160,740 | | | Mellon Corporation | 36,746,631 |
|
| | |
| | Total Consumer | | | 275,710 | Chubb Corporation * | 14,709,128 |
| | Discretionary | 227,104,034 | | 960,913 | Citigroup, Inc. | 40,262,255 |
|
| | |
| | | | | 256,279 | City National Corporation | 17,324,460 |
| Consumer Staples (6.3%) | | | 44,308 | CME Group, Inc. * | 29,520,205 |
| 588,377 | Altria Group, Inc. | 42,910,335 | | 183,226 | Discover Financial Services | 3,536,262 |
| 210,620 | Anheuser-Busch | | | 230,404 | Federal National Mortgage | |
| | Companies, Inc. * | 10,800,594 | | | Association | 13,142,244 |
| 205,600 | Colgate-Palmolive Company | 15,681,112 | | 88,800 | Franklin Resources, Inc. | 11,515,584 |
| 882,253 | ConAgra Foods, Inc. | 20,935,864 | | 112,071 | Goldman Sachs Group, Inc. * | 27,784,642 |
| 148,050 | Costco Wholesale Corporation | 9,957,843 | | 887,300 | Hudson City Bancorp, Inc. * | 13,895,118 |
| 439,294 | CVS/Caremark Corporation | 18,349,310 | | 1,326,004 | J.P. Morgan Chase & Company | 62,322,188 |
| 622,702 | General Mills, Inc. | 35,948,586 | | 290,150 | Lehman Brothers Holdings, Inc. | 18,378,101 |
| 517,404 | Kraft Foods, Inc. | 17,286,468 | | 161,283 | Loews Corporation | 7,917,382 |
| 902,350 | Kroger Company | 26,520,066 | | 460,608 | Merrill Lynch & Company, Inc. | 30,409,340 |
| 55,900 | Procter & Gamble Company | 3,886,168 | | 312,420 | MetLife, Inc. | 21,510,117 |
| 352,200 | Unilever NV ADR | 11,432,412 | | 565,453 | Morgan Stanley | 38,032,369 |
| 87,900 | Wal-Mart Stores, Inc. | 3,973,959 | | 912,900 | National City Corporation | 22,137,825 |
|
| | |
| | Total Consumer Staples | 217,682,717 | | 101,250 | Nymex Holdings, Inc. * | 13,012,650 |
|
| | |
| | | | | 314,573 | Principal Financial Group, Inc. | 21,287,155 |
| Energy (11.4%) | | | 214,578 | Prudential Financial, Inc. * | 20,753,984 |
| 217,316 | Apache Corporation | 22,559,574 | | 415,201 | State Street Corporation * | 33,120,584 |
| 119,162 | Chevron Corporation * | 10,904,515 | | 431,361 | Travelers Companies, Inc. | 22,521,358 |
| 544,771 | ConocoPhillips | 46,283,744 | | 464,901 | Wachovia Corporation | 21,259,923 |
| 194,250 | Devon Energy Corporation | 18,142,950 | | 480,800 | Washington Federal, Inc. | 11,616,128 |
| 45,650 | Diamond Offshore | | | 593,655 | Wells Fargo & Company * | 20,190,207 |
|
|
| | Drilling, Inc. * | 5,168,950 | | | Total Financials | 709,349,953 |
|
|
|
| The accompanying Notes to Financial Statements are an integral part of this schedule. |
|
| 124 |
| | | | | | |
| Large Cap Stock Fund | | | | | |
| Schedule of Investments as of October 31, 2007 | | | | | |
| |
| |
| Shares | Common Stock (97.8%) | Value | | Shares | Common Stock (97.8%) | Value |
|
| Health Care (13.5%) | | | Information Technology (19.4%) | |
| 1,033,068 | Abbott Laboratories ± | $56,426,174 | | 1,025,606 | Accenture, Ltd. | $40,049,914 |
| 261,800 | Aetna, Inc. | 14,705,306 | | 481,322 | Adobe Systems, Inc. # | 23,055,324 |
| 267,312 | Allergan, Inc. * | 18,064,945 | | 3,500 | Alibaba.com, Ltd. #^§ | 6,097 |
| 64,600 | Amgen, Inc. # | 3,753,906 | | 191,600 | Amdocs, Ltd. # | 6,591,040 |
| 360,243 | Baxter International, Inc. | 21,618,182 | | 27,600 | AMIS Holdings, Inc. #* | 211,692 |
| 131,700 | Eli Lilly and Company | 7,131,555 | | 600,900 | Amkor Technology, Inc. #* | 6,808,197 |
| 397,766 | Express Scripts, Inc. # | 25,099,035 | | 262,378 | Apple Computer, Inc. # | 49,838,701 |
| 1,050,886 | Gilead Sciences, Inc. # | 48,540,424 | | 389,551 | Broadcom Corporation #* | 12,679,885 |
| 767,614 | Johnson & Johnson | 50,025,404 | | 1,775,155 | Cisco Systems, Inc. # | 58,686,624 |
| 424,917 | McKesson Corporation | 28,087,014 | | 288,250 | Cognizant Technology | |
| 270,529 | Medtronic, Inc. | 12,833,896 | | | Solutions Corporation # | 11,950,845 |
| 368,450 | Merck & Company, Inc. | 21,465,897 | | 471,870 | Corning, Inc. | 11,452,285 |
| 1,472,636 | Pfizer, Inc. * | 36,241,572 | | 177,700 | Dell, Inc. # | 5,437,620 |
| 476,767 | Sanofi-Aventis ADR * | 20,982,516 | | 348,563 | eBay, Inc. # | 12,583,124 |
| 327,550 | St. Jude Medical, Inc. # | 13,341,112 | | 580,450 | EMC Corporation # | 14,737,626 |
| 659,074 | Thermo Electron Corporation # | 38,760,142 | | 187,910 | F5 Networks, Inc. #* | 6,770,397 |
| 341,097 | UnitedHealth Group, Inc. | 16,764,918 | | 93,892 | Google, Inc. # | 66,381,644 |
| 216,833 | WellPoint, Inc. # | 17,179,679 | | 1,096,693 | Hewlett-Packard Company | 56,677,094 |
| 315,945 | Wyeth | 15,364,405 | | 1,906,207 | Intel Corporation | 51,276,968 |
|
| | |
| | Total Health Care | 466,386,082 | | 515,730 | International Business | |
|
| | |
| | | | | | Machines Corporation | 59,886,568 |
| Industrials (10.7%) | | | 356,950 | Maxim Integrated Products, Inc. | 9,673,345 |
| 562,300 | AMR Corporation #* | 13,495,200 | | 2,355,333 | Microsoft Corporation | 86,699,808 |
| 155,550 | Armstrong World | | | 244,900 | Nokia Oyj ADR | 9,727,428 |
| | Industries, Inc. # | 6,379,106 | | 651,104 | Oracle Corporation # | 14,434,976 |
| 147,266 | Boeing Company * | 14,518,955 | | 546,357 | QUALCOMM, Inc. | 23,345,835 |
| 46,152 | Caterpillar, Inc. | 3,443,401 | | 2,074,550 | Sun Microsystems, Inc. # | 11,845,680 |
| 366,523 | CSX Corporation * | 16,409,235 | | 314,800 | Sybase, Inc. # | 9,003,280 |
| 160,156 | Danaher Corporation * | 13,720,565 | | 275,318 | Texas Instruments, Inc. * | 8,975,367 |
|
|
| 101,341 | Deere & Company | 15,697,721 | | | Total Information | |
| 358,050 | Emerson Electric Company * | 18,715,274 | | | Technology | 668,787,364 |
|
|
| 246,400 | Expeditors International of | | | | | |
| | Washington, Inc. * | 12,480,160 | | Materials (5.3%) | |
| 55,689 | Flowserve Corporation * | 4,397,203 | | 191,743 | Air Products and Chemicals, Inc. | 18,762,053 |
| 104,900 | Fluor Corporation * | 16,574,200 | | 1,174,222 | Alcoa, Inc. ‡ | 46,487,449 |
| 1,467,885 | General Electric Company | 60,418,147 | | 363,251 | E.I. du Pont de Nemours and | |
| 402,214 | Honeywell International, Inc. * | 24,297,748 | | | Company * | 17,984,557 |
| 330,479 | Lockheed Martin Corporation | 36,365,909 | | 101,239 | Freeport-McMoRan Copper & | |
| 189,382 | Precision Castparts Corporation | 28,371,317 | | | Gold, Inc. | 11,913,806 |
| 285,216 | UAL Corporation #* | 13,661,846 | | 729,874 | MeadWestvaco Corporation * | 24,552,961 |
| 64,873 | Union Pacific Corporation | 8,306,339 | | 384,750 | Monsanto Company | 37,563,142 |
| 467,518 | United Technologies | | | 295,142 | Praxair, Inc. | 25,228,738 |
|
|
| | Corporation * | 35,807,204 | | | Total Materials | 182,492,706 |
|
|
| 648,777 | Waste Management, Inc. | 23,608,995 | | | | |
|
| | |
| | Total Industrials | 366,668,525 | | | | |
|
| | |
|
| The accompanying Notes to Financial Statements are an integral part of this schedule. |
|
| 125 |
| | | | | | |
| Large Cap Stock Fund | | | | | |
| Schedule of Investments as of October 31, 2007 | | | | | |
| |
| |
| Shares | Common Stock (97.8%) | Value | | Shares | Common Stock (97.8%) | Value |
|
| Telecommunications Services (2.8%) | | | Utilities (1.2%) | | |
| 391,398 | America Movil SA de CV ADR | $25,593,515 | | 1,099,355 | Southern Company | $40,302,354 |
| | |
|
| 370,750 | American Tower Corporation # | 16,379,735 | | | Total Utilities | 40,302,354 |
| | |
|
| 498,066 | AT&T, Inc. ‡ | 20,814,178 | | | | |
| | |
|
| 294,712 | NII Holdings, Inc. #* | 17,093,296 | | | Total Common Stock | |
| 733,046 | Time Warner Telecom, Inc. #* | 17,035,989 | | | (cost $2,406,387,436) | 3,367,398,922 |
|
| | |
|
| | Total Telecommunications | | | | | |
| | Services | 96,916,713 | | | | |
|
| | | |
| | | | |
| | | Interest | Maturity | |
| Shares | Collateral Held for Securities Loaned (12.1%) | Rate (+) | Date | Value |
|
| 417,436,171 | Thrivent Financial Securities Lending Trust | 5.050% | N/A | $417,436,171 |
|
|
| | Total Collateral Held for Securities Loaned | |
| | (cost $417,436,171) | | | 417,436,171 |
|
|
|
| The accompanying Notes to Financial Statements are an integral part of this schedule. |
|
| 126 |
| | | | |
| Large Cap Stock Fund | | | |
| Schedule of Investments as of October 31, 2007 | | | |
| |
| Shares or | | | | |
| Principal | | Interest | Maturity | |
| Amount | Short-Term Investments (1.8%) | Rate (+) | Date | Value |
|
| $21,605,000 | Barclays Bank plc Repurchase Agreement ▪ | 4.800% | 11/1/2007 | $21,605,000 |
| 8,300,000 | Federal National Mortgage Association ‡ | 5.080 | 12/14/2007 | 8,249,637 |
| 26,715,000 | Nieuw Amsterdam Receivables Corporation | 4.900 | 11/1/2007 | 26,715,000 |
| 4,615,730 | Thrivent Money Market Fund | 5.020 | N/A | 4,615,730 |
|
|
| | Total Short-Term Investments (at amortized cost) | 61,185,367 |
|
|
| | Total Investments (cost $2,885,008,974) 111.7% | $3,846,020,460 |
|
|
| | Other Assets and Liabilities, Net (11.7%) | (402,307,218) |
|
|
| | Total Net Assets 100.0% | | | $3,443,713,242 |
|
|
| | | | | |
| | Number of | | Notional | | |
| | Contracts | Expiration | Principal | | Unrealized |
| Futures | Long/(Short) | Date | Amount | Value | Gain/(Loss) |
|
| S&P 500 Index Futures | 89 | December 2007 | $34,107,438 | $34,596,525 | $489,087 |
| Total Futures | | | | | $489,087 |
# Non-income producing security.
* All or a portion of the security is on loan as discussed in item 2(M) of the Notes to Financial Statements.
+ The interest rate shown reflects the yield, coupon rate or, for securities purchased at a discount, the discount rate at the date of purchase.
^ Security is fair valued as discussed in item 2(A) of the Notes to Financial Statements.
§ Denotes investments purchased on a when-issued or delayed delivery basis.
± Designated as cover for long settling trades as discussed in the Notes to Financial Statements.
‡ At October 31, 2007, $8,249,637 of investments were held on deposit with the counterparty and pledged as the initial margin deposit for open financial futures contracts. In addition, $46,470,178 of investments were earmarked as collateral to cover open financial futures contracts.
▪ Repurchase agreement dated October 31, 2007, $21,609,634 maturing November 1, 2007, collateralized by $22,041,827 Federal Home Loan Bank, 5.00% due July 16, 2008.
Definitions:
ADR — American Depository Receipts, which are certificates for shares of an underlying foreign security’s shares held by an issuing U.S. depository bank.
Gross unrealized appreciation and depreciation of investments, based on cost for federal income tax purposes, were as follows:
| | |
| Gross unrealized appreciation | $1,001,771,541 | |
| Gross unrealized depreciation | (49,543,502) | |
|
| |
| Net unrealized appreciation (depreciation) | $952,228,039 | |
| Cost for federal income tax purposes | $2,893,792,421 | |
|
| The accompanying Notes to Financial Statements are an integral part of this schedule. |
|
| 127 |
| | | | | | |
| Large Cap Index Fund |
| Schedule of Investments as of October 31, 2007 |
| |
| Shares | Common Stock (97.4%) | Value | | Shares | Common Stock (97.4%) | Value |
|
| Consumer Discretionary (8.8%) | | | 3,231 | Interpublic Group of | |
| 600 | Abercrombie & Fitch Company | $47,520 | | | Companies, Inc. #* | $33,441 |
| 2,100 | Amazon.com, Inc. # | 187,215 | | 1,400 | J.C. Penney Company, Inc. | |
| 1,000 | Apollo Group, Inc. # | 79,260 | | | (Holding Company) | 78,736 |
| 900 | AutoNation, Inc. # | 15,921 | | 3,900 | Johnson Controls, Inc. | 170,508 |
| 400 | AutoZone, Inc. # | 49,764 | | 600 | Jones Apparel Group, Inc. | 12,564 |
| 1,900 | Bed Bath & Beyond, Inc. # | 64,486 | | 600 | KB Home * | 16,584 |
| 2,375 | Best Buy Company, Inc. | 115,235 | | 2,200 | Kohl’s Corporation # | 120,934 |
| 600 | Big Lots, Inc. # | 14,388 | | 1,300 | Leggett & Platt, Inc. | 25,259 |
| 500 | Black & Decker Corporation | 44,955 | | 1,000 | Lennar Corporation | 22,850 |
| 600 | Brunswick Corporation | 13,386 | | 2,100 | Limited Brands, Inc. | 46,221 |
| 2,900 | Carnival Corporation | 139,142 | | 600 | Liz Claiborne, Inc. | 17,082 |
| 4,650 | CBS Corporation | 133,455 | | 9,800 | Lowe’s Companies, Inc. | 263,522 |
| 900 | Centex Corporation | 22,554 | | 2,956 | Macy’s Group, Inc | 94,681 |
| 1,100 | Circuit City Stores, Inc. | 8,723 | | 2,100 | Marriott International, Inc. | 86,331 |
| 3,400 | Clear Channel | | | 2,700 | Mattel, Inc. | 56,403 |
| | Communications, Inc. | 128,418 | | 7,900 | McDonald’s Corporation | 471,630 |
| 2,400 | Coach, Inc. # | 87,744 | | 2,200 | McGraw-Hill Companies, Inc. | 110,088 |
| 20,630 | Comcast Corporation #* | 434,262 | | 300 | Meredith Corporation | 18,675 |
| 1,800 | D.R. Horton, Inc. | 22,842 | | 1,100 | New York Times Company | 21,516 |
| 1,000 | Darden Restaurants, Inc. | 43,000 | | 1,800 | Newell Rubbermaid, Inc. | 52,488 |
| 400 | Dillard’s, Inc. | 9,212 | | 15,400 | News Corporation | 333,718 |
| 5,000 | DIRECTV Group, Inc. # | 132,400 | | 2,600 | NIKE, Inc. | 172,276 |
| 400 | Dow Jones & Company, Inc. | 23,924 | | 1,300 | Nordstrom, Inc. | 51,272 |
| 600 | E.W. Scripps Company | 27,006 | | 1,900 | Office Depot, Inc. # | 35,644 |
| 2,000 | Eastman Kodak Company * | 57,320 | | 500 | OfficeMax, Inc. | 15,825 |
| 1,400 | Expedia, Inc. # | 45,724 | | 2,200 | Omnicom Group, Inc. | 112,156 |
| 900 | Family Dollar Stores, Inc. | 22,815 | | 400 | Polo Ralph Lauren Corporation | 27,520 |
| 14,000 | Ford Motor Company #* | 124,180 | | 1,400 | Pulte Homes, Inc. | 20,776 |
| 1,100 | Fortune Brands, Inc. | 92,147 | | 1,000 | RadioShack Corporation | 20,620 |
| 1,500 | Gannett Company, Inc. | 63,615 | | 472 | Sears Holdings Corporation #* | 63,621 |
| 3,300 | Gap, Inc. | 62,370 | | 700 | Sherwin-Williams Company | 44,744 |
| 3,800 | General Motors Corporation * | 148,922 | | 400 | Snap-On, Inc. | 19,964 |
| 1,200 | Genuine Parts Company | 58,884 | | 600 | Stanley Works | 34,530 |
| 1,400 | Goodyear Tire & | | | 4,850 | Staples, Inc. | 113,199 |
| | Rubber Company #* | 42,210 | | 4,900 | Starbucks Corporation # | 130,732 |
| 2,200 | H&R Block, Inc. | 47,960 | | 1,500 | Starwood Hotels & Resorts | |
| 1,600 | Harley-Davidson, Inc. * | 82,400 | | | Worldwide, Inc. | 85,290 |
| 500 | Harman International | | | 5,600 | Target Corporation | 343,616 |
| | Industries, Inc. | 42,100 | | 1,000 | Tiffany & Company | 54,180 |
| 1,300 | Harrah’s Entertainment, Inc. | 114,725 | | 24,850 | Time Warner, Inc. | 453,761 |
| 1,100 | Hasbro, Inc. | 32,835 | | 2,900 | TJX Companies, Inc. | 83,897 |
| 11,200 | Home Depot, Inc. | 352,912 | | 654 | Tribune Company | 19,790 |
| 1,200 | IAC InterActiveCorp # | 35,352 | | 600 | VF Corporation | 52,278 |
| 2,300 | International Game Technology | 100,303 | | 4,650 | Viacom, Inc. # | 191,998 |
|
| The accompanying Notes to Financial Statements are an integral part of this schedule. |
|
| 128 |
| | | | | | |
| Large Cap Index Fund | | | | | |
| Schedule of Investments as of October 31, 2007 | | | | | |
| |
| |
| Shares | Common Stock (97.4%) | Value | | Shares | Common Stock (97.4%) | Value |
|
| Consumer Discretionary — continued | | | 1,000 | Whole Foods Market, Inc. * | $49,540 |
| 12,900 | Walt Disney Company | $446,727 | | 1,475 | William Wrigley Jr. Company | 90,963 |
|
|
| 600 | Wendy’s International, Inc. | 20,856 | | | Total Consumer Staples | 8,705,700 |
|
|
| 484 | Whirlpool Corporation * | 38,301 | | | | |
| 1,100 | Wyndham Worldwide Corporation | 36,113 | | Energy (11.4%) | |
| 3,400 | Yum! Brands, Inc. | 136,918 | | 3,090 | Anadarko Petroleum Corporation | 182,372 |
|
| | |
| | Total Consumer | | | 2,122 | Apache Corporation | 220,285 |
| | Discretionary | 8,251,421 | | 2,100 | Baker Hughes, Inc. | 182,112 |
|
| | |
| | | | | 1,900 | BJ Services Company | 47,861 |
| Consumer Staples (9.3%) | | | 2,800 | Chesapeake Energy Corporation * | 110,544 |
| 14,000 | Altria Group, Inc. | 1,021,020 | | 14,203 | Chevron Corporation ‡ | 1,299,717 |
| 5,100 | Anheuser-Busch Companies, Inc. * | 261,528 | | 10,788 | ConocoPhillips | 916,548 |
| 4,296 | Archer-Daniels-Midland Company | 153,711 | | 1,200 | CONSOL Energy, Inc. | 67,800 |
| 2,900 | Avon Products, Inc. | 118,842 | | 2,900 | Devon Energy Corporation | 270,860 |
| 500 | Brown-Forman Corporation | 36,990 | | 4,592 | El Paso Corporation | 81,095 |
| 1,500 | Campbell Soup Company | 55,470 | | 900 | ENSCO International, Inc. | 49,941 |
| 1,000 | Clorox Company | 62,570 | | 1,700 | EOG Resources, Inc. | 150,620 |
| 13,200 | Coca-Cola Company | 815,232 | | 37,000 | Exxon Mobil Corporation | 3,403,627 |
| 2,000 | Coca-Cola Enterprises, Inc. | 51,620 | | 5,900 | Halliburton Company | 232,578 |
| 3,400 | Colgate-Palmolive Company | 259,318 | | 1,900 | Hess Corporation | 136,059 |
| 3,200 | ConAgra Foods, Inc. | 75,936 | | 4,930 | Marathon Oil Corporation | 291,511 |
| 1,300 | Constellation Brands, Inc. # | 32,656 | | 1,200 | Murphy Oil Corporation | 88,356 |
| 3,000 | Costco Wholesale Corporation | 201,780 | | 1,800 | Nabors Industries, Ltd. #* | 50,544 |
| 9,810 | CVS/Caremark Corporation | 409,764 | | 2,300 | National Oilwell Varco, Inc. # | 168,452 |
| 900 | Dean Foods Company | 24,993 | | 1,800 | Noble Corporation | 95,310 |
| 800 | Estee Lauder Companies, Inc. | 35,120 | | 1,200 | Noble Energy, Inc. | 91,848 |
| 2,300 | General Mills, Inc. | 132,779 | | 5,600 | Occidental Petroleum Corporation | 386,680 |
| 2,200 | H.J. Heinz Company | 102,916 | | 1,700 | Peabody Energy Corporation | 94,775 |
| 1,200 | Hershey Company | 51,732 | | 800 | Rowan Companies, Inc. | 31,184 |
| 1,800 | Kellogg Company | 95,022 | | 7,900 | Schlumberger, Ltd. | 762,903 |
| 2,800 | Kimberly-Clark Corporation | 198,492 | | 1,400 | Smith International, Inc. | 92,470 |
| 10,480 | Kraft Foods, Inc. | 350,137 | | 4,170 | Spectra Energy Corporation | 108,337 |
| 4,700 | Kroger Company | 138,133 | | 900 | Sunoco, Inc. | 66,240 |
| 800 | McCormick & Company, Inc. | 28,024 | | 1,000 | Tesoro Petroleum Corporation | 60,530 |
| 900 | Molson Coors Brewing Company | 51,507 | | 1,900 | Transocean, Inc. # | 226,803 |
| 900 | Pepsi Bottling Group, Inc. | 38,772 | | 3,700 | Valero Energy Corporation | 260,591 |
| 10,790 | PepsiCo, Inc. * | 795,439 | | 2,200 | Weatherford International, Ltd. # | 142,802 |
| 20,810 | Procter & Gamble Company | 1,446,711 | | 4,100 | Williams Companies, Inc. | 149,609 |
| 1,200 | Reynolds American, Inc. | 77,316 | | 2,600 | XTO Energy, Inc. | 172,588 |
|
|
| 2,900 | Safeway, Inc. | 98,600 | | | Total Energy | 10,693,552 |
|
|
| 4,900 | Sara Lee Corporation | 81,046 | | | | |
| 1,410 | SUPERVALU, Inc. | 54,622 | | Financials (18.8%) | |
| 4,100 | SYSCO Corporation * | 140,589 | | 2,200 | ACE, Ltd. | 133,342 |
| 1,800 | Tyson Foods, Inc. | 28,440 | | 3,200 | AFLAC, Inc. | 200,896 |
| 1,000 | UST, Inc. | 53,320 | | 4,000 | Allstate Corporation | 209,600 |
| 6,600 | Walgreen Company | 261,690 | | 650 | Ambac Financial Group, Inc. | 23,940 |
| 16,000 | Wal-Mart Stores, Inc. | 723,360 | | 1,200 | American Capital Strategies, Ltd. * | 52,092 |
|
| The accompanying Notes to Financial Statements are an integral part of this schedule. |
|
| 129 |
| | | | | | |
| Large Cap Index Fund | | | | | |
| Schedule of Investments as of October 31, 2007 | | | | | |
| |
| |
| Shares | Common Stock (97.4%) | Value | | Shares | Common Stock (97.4%) | Value |
|
| Financials — continued | | | 3,500 | Host Marriott Corporation | $77,560 |
| 7,900 | American Express Company | $481,505 | | 3,600 | Hudson City Bancorp, Inc. | 56,376 |
| 17,044 | American International | | | 2,510 | Huntington Bancshares, Inc. | 44,954 |
| | Group, Inc. | 1,075,817 | | 500 | IntercontinentalExchange, Inc. # | 89,100 |
| 1,600 | Ameriprise Financial, Inc. | 100,768 | | 22,558 | J.P. Morgan Chase & Company | 1,060,226 |
| 1,900 | Aon Corporation | 86,108 | | 1,000 | Janus Capital Group, Inc. | 34,510 |
| 700 | Apartment Investment & | | | 2,700 | KeyCorp | 76,815 |
| | Management Company | 32,711 | | 1,700 | Kimco Realty Corporation | 70,584 |
| 700 | Assurant, Inc. | 40,908 | | 900 | Legg Mason, Inc. | 74,646 |
| 600 | Avalonbay Communities, Inc. | 73,590 | | 3,500 | Lehman Brothers Holdings, Inc. | 221,690 |
| 29,603 | Bank of America Corporation | 1,429,233 | | 1,100 | Leucadia National Corporation * | 55,726 |
| 7,505 | Bank of New York | | | 1,843 | Lincoln National Corporation | 114,948 |
| | Mellon Corporation | 366,619 | | 3,000 | Loews Corporation | 147,270 |
| 3,700 | BB&T Corporation | 136,789 | | 600 | M&T Bank Corporation | 59,688 |
| 700 | Bear Stearns Companies, Inc. | 79,520 | | 3,600 | Marsh & McLennan | |
| 700 | Boston Properties, Inc. | 75,838 | | | Companies, Inc. | 93,204 |
| 2,718 | Capital One Financial Corporation | 178,274 | | 1,800 | Marshall & Ilsley Corporation # | 76,860 |
| 1,300 | CB Richard Ellis Group, Inc. # | 31,694 | | 900 | MBIA, Inc. | 38,736 |
| 6,400 | Charles Schwab Corporation * | 148,736 | | 5,700 | Merrill Lynch & Company, Inc. | 376,314 |
| 2,600 | Chubb Corporation | 138,710 | | 4,900 | MetLife, Inc. | 337,365 |
| 1,107 | Cincinnati Financial Corporation | 44,036 | | 500 | MGIC Investment Corporation | 9,680 |
| 1,300 | CIT Group, Inc. | 45,812 | | 1,500 | Moody’s Corporation | 65,580 |
| 33,206 | Citigroup, Inc. | 1,391,331 | | 7,000 | Morgan Stanley | 470,820 |
| 390 | CME Group, Inc. | 259,838 | | 4,200 | National City Corporation | 101,850 |
| 1,100 | Comerica, Inc. | 51,348 | | 1,300 | Northern Trust Corporation | 97,773 |
| 1,200 | Commerce Bancorp, Inc. * | 48,900 | | 1,800 | NYSE Euronext | 168,966 |
| 3,800 | Countrywide Financial | | | 1,100 | Plum Creek Timber Company, Inc. | 49,137 |
| | Corporation * | 58,976 | | 2,300 | PNC Financial Services Group, Inc. | 165,968 |
| 900 | Developers Diversified Realty | | | 1,700 | Principal Financial Group, Inc. | 115,039 |
| | Corporation | 45,360 | | 4,900 | Progressive Corporation | 90,650 |
| 3,200 | Discover Financial Services | 61,760 | | 1,800 | ProLogis Trust | 129,132 |
| 2,900 | E*TRADE Financial Corporation # | 32,306 | | 3,000 | Prudential Financial, Inc. | 290,160 |
| 1,900 | Equity Residential REIT | 79,382 | | 900 | Public Storage, Inc. | 72,873 |
| 4,400 | Federal Home Loan Mortgage | | | 4,614 | Regions Financial Corporation | 125,132 |
| | Corporation | 229,812 | | 700 | SAFECO Corporation | 40,530 |
| 6,600 | Federal National Mortgage | | | 1,400 | Simon Property Group, Inc. | 145,754 |
| | Association | 376,464 | | 2,800 | SLM Corporation | 132,048 |
| 600 | Federated Investors, Inc. | 25,800 | | 2,435 | Sovereign Bancorp, Inc. | 35,137 |
| 3,522 | Fifth Third Bancorp | 110,168 | | 2,600 | State Street Corporation | 207,402 |
| 900 | First Horizon National | | | 2,300 | SunTrust Banks, Inc. | 166,980 |
| | Corporation * | 23,472 | | 2,100 | Synovus Financial Corporation | 55,356 |
| 1,000 | Franklin Resources, Inc. | 129,680 | | 1,700 | T. Rowe Price Group, Inc. | 109,208 |
| 1,600 | General Growth Properties, Inc. | 86,976 | | 700 | Torchmark Corporation | 45,612 |
| 2,900 | Genworth Financial, Inc. | 79,170 | | 4,464 | Travelers Companies, Inc. | 233,065 |
| 2,700 | Goldman Sachs Group, Inc. | 669,384 | | 11,518 | U.S. Bancorp * | 381,937 |
| 2,100 | Hartford Financial Services | | | 2,500 | UnumProvident Corporation | 58,350 |
| | Group, Inc. | 203,763 | | 900 | Vornado Realty Trust | 100,548 |
|
| The accompanying Notes to Financial Statements are an integral part of this schedule. |
|
| 130 |
| | | | | | |
| Large Cap Index Fund | | | | | |
| Schedule of Investments as of October 31, 2007 | | | | | |
| |
| |
| Shares | Common Stock (97.4%) | Value | | Shares | Common Stock (97.4%) | Value |
|
| Financials — continued | | | 1,000 | Patterson Companies, Inc. # | $39,110 |
| 12,632 | Wachovia Corporation | $577,661 | | 900 | PerkinElmer, Inc. | 24,768 |
| 5,801 | Washington Mutual, Inc. | 161,732 | | 46,240 | Pfizer, Inc. | 1,137,966 |
| 22,300 | Wells Fargo & Company | 758,423 | | 1,000 | Quest Diagnostics, Inc. * | 53,180 |
| 1,300 | XL Capital, Ltd. | 93,535 | | 10,800 | Schering-Plough Corporation | 329,616 |
| 900 | Zions Bancorporation | 53,199 | | 2,300 | St. Jude Medical, Inc. # | 93,679 |
|
| | |
| | Total Financials | 17,566,237 | | 1,600 | Stryker Corporation | 113,600 |
|
| | |
| | | | | 3,100 | Tenet Healthcare Corporation #* | 10,881 |
| Health Care (11.4%) | | | 2,900 | Thermo Electron Corporation # | 170,549 |
| 10,300 | Abbott Laboratories | 562,586 | | 8,800 | UnitedHealth Group, Inc. | 432,520 |
| 3,400 | Aetna, Inc. | 190,978 | | 900 | Varian Medical Systems, Inc. # | 43,893 |
| 2,100 | Allergan, Inc. | 141,918 | | 600 | Waters Corporation # | 46,188 |
| 1,300 | AmerisourceBergen Corporation | 61,243 | | 700 | Watson Pharmaceuticals, Inc. # | 21,392 |
| 7,236 | Amgen, Inc. # | 420,484 | | 4,000 | WellPoint, Inc. # | 316,920 |
| 1,200 | Applera Corporation (Applied | | | 8,900 | Wyeth | 432,807 |
| | Biosystems Group) | 44,568 | | 1,640 | Zimmer Holdings, Inc. # | 113,964 |
|
|
| 800 | Barr Pharmaceuticals, Inc. # | 45,856 | | | Total Health Care | 10,647,999 |
|
|
| 4,400 | Baxter International, Inc. | 264,044 | | | | |
| 1,600 | Becton, Dickinson and Company | 133,536 | | Industrials (11.2%) | |
| 1,990 | Biogen Idec, Inc. # | 148,136 | | 4,700 | 3M Company | 405,892 |
| 8,835 | Boston Scientific Corporation # | 122,541 | | 1,900 | Allied Waste Industries, Inc. # | 24,016 |
| 13,200 | Bristol-Myers Squibb Company | 395,868 | | 1,200 | American Standard Companies, Inc. | 44,724 |
| 700 | C.R. Bard, Inc. | 58,527 | | 700 | Avery Dennison Corporation | 40,530 |
| 2,400 | Cardinal Health, Inc. | 163,272 | | 5,300 | Boeing Company | 522,527 |
| 2,600 | Celgene Corporation # | 171,600 | | 2,000 | Burlington Northern Santa Fe | |
| 1,800 | CIGNA Corporation | 94,482 | | | Corporation | 174,300 |
| 1,050 | Coventry Health Care, Inc. # | 63,326 | | 1,100 | C.H. Robinson Worldwide, Inc. | 54,912 |
| 3,259 | Covidien, Ltd. | 135,574 | | 4,300 | Caterpillar, Inc. | 320,823 |
| 6,500 | Eli Lilly and Company | 351,975 | | 900 | Cintas Corporation | 32,940 |
| 1,800 | Express Scripts, Inc. # | 113,580 | | 1,200 | Cooper Industries, Ltd. | 62,868 |
| 2,200 | Forest Laboratories, Inc. # | 85,954 | | 3,000 | CSX Corporation | 134,310 |
| 1,800 | Genzyme Corporation # | 136,746 | | 600 | Cummins, Inc. | 71,976 |
| 6,100 | Gilead Sciences, Inc. # | 281,759 | | 1,700 | Danaher Corporation * | 145,639 |
| 950 | Hospira, Inc. # | 39,264 | | 1,500 | Deere & Company | 232,350 |
| 1,200 | Humana, Inc. # | 89,940 | | 1,400 | Dover Corporation | 64,400 |
| 1,300 | IMS Health, Inc. | 32,773 | | 1,000 | Eaton Corporation | 92,580 |
| 19,290 | Johnson & Johnson | 1,257,129 | | 5,200 | Emerson Electric Company | 271,804 |
| 1,533 | King Pharmaceuticals, Inc. # | 16,250 | | 1,000 | Equifax, Inc. | 38,500 |
| 700 | Laboratory Corporation of | | | 1,400 | Expeditors International of | |
| | America Holdings # | 48,125 | | | Washington, Inc. | 70,910 |
| 500 | Manor Care, Inc. | 33,290 | | 2,000 | FedEx Corporation | 206,680 |
| 2,000 | McKesson Corporation | 132,200 | | 600 | Fluor Corporation | 94,800 |
| 1,825 | Medco Health Solutions, Inc. # | 172,244 | | 2,700 | General Dynamics Corporation | 245,592 |
| 7,500 | Medtronic, Inc. | 355,800 | | 68,400 | General Electric Company | 2,815,344 |
| 14,500 | Merck & Company, Inc. | 844,770 | | 900 | Goodrich Corporation | 62,694 |
| 400 | Millipore Corporation #* | 31,060 | | 4,900 | Honeywell International, Inc. * | 296,009 |
| 1,700 | Mylan Laboratories, Inc. | 25,568 | | 2,900 | Illinois Tool Works, Inc. | 166,054 |
|
| The accompanying Notes to Financial Statements are an integral part of this schedule. |
|
| 131 |
| | | | | | |
| Large Cap Index Fund | | | | | |
| Schedule of Investments as of October 31, 2007 | | | | | |
| |
| |
| Shares | Common Stock (97.4%) | Value | | Shares | Common Stock (97.4%) | Value |
|
| Industrials — continued | | | 3,200 | Broadcom Corporation # | $104,160 |
| 2,000 | Ingersoll-Rand Company | $100,700 | | 2,600 | CA, Inc. | 68,770 |
| 1,200 | ITT Corporation | 80,304 | | 585 | CIENA Corporation # | 27,998 |
| 800 | Jacobs Engineering Group, Inc. # | 69,720 | | 40,600 | Cisco Systems, Inc. # | 1,342,236 |
| 900 | L-3 Communications | | | 1,200 | Citrix Systems, Inc. # | 51,588 |
| | Holdings, Inc. | 98,676 | | 2,000 | Cognizant Technology | |
| 2,300 | Lockheed Martin Corporation | 253,092 | | | Solutions Corporation # | 82,920 |
| 2,400 | Masco Corporation | 57,792 | | 1,100 | Computer Sciences Corporation # | 64,229 |
| 900 | Monster Worldwide, Inc. # | 36,522 | | 2,100 | Compuware Corporation # | 21,000 |
| 2,600 | Norfolk Southern Corporation | 134,290 | | 900 | Convergys Corporation # | 16,497 |
| 2,334 | Northrop Grumman Corporation | 195,169 | | 10,500 | Corning, Inc. | 254,835 |
| 2,456 | PACCAR, Inc. * | 136,428 | | 15,100 | Dell, Inc. # | 462,060 |
| 800 | Pall Corporation | 32,056 | | 7,600 | eBay, Inc. # | 274,360 |
| 1,150 | Parker-Hannifin Corporation | 92,426 | | 2,100 | Electronic Arts, Inc. # | 128,352 |
| 1,400 | Pitney Bowes, Inc. | 56,056 | | 3,400 | Electronic Data Systems | |
| 900 | Precision Castparts Corporation | 134,829 | | | Corporation | 73,406 |
| 1,400 | R.R. Donnelley & Sons Company | 56,406 | | 14,000 | EMC Corporation # | 355,460 |
| 3,000 | Raytheon Company | 190,830 | | 1,200 | Fidelity National Information | |
| 1,000 | Robert Half International, Inc. | 30,090 | | | Services, Inc. | 55,344 |
| 1,100 | Rockwell Automation, Inc. | 75,768 | | 1,050 | Fiserv, Inc. # | 58,170 |
| 1,200 | Rockwell Collins, Inc. | 89,772 | | 1,500 | Google, Inc. # | 1,060,500 |
| 400 | Ryder System, Inc. | 19,140 | | 17,141 | Hewlett-Packard Company | 885,847 |
| 4,900 | Southwest Airlines Company | 69,629 | | 39,000 | Intel Corporation | 1,049,100 |
| 700 | Terex Corporation # | 51,954 | | 9,000 | International Business | |
| 1,600 | Textron, Inc. | 110,736 | | | Machines Corporation | 1,045,080 |
| 3,259 | Tyco International, Ltd. | 134,173 | | 2,300 | Intuit, Inc. # | 73,991 |
| 1,800 | Union Pacific Corporation | 230,472 | | 1,400 | Jabil Circuit, Inc. | 30,422 |
| 7,000 | United Parcel Service, Inc. | 525,700 | | 1,475 | JDS Uniphase Corporation # | 22,508 |
| 6,700 | United Technologies Corporation | 513,153 | | 3,500 | Juniper Networks, Inc. # | 126,000 |
| 500 | W.W. Grainger, Inc. | 44,960 | | 1,200 | KLA-Tencor Corporation | 63,180 |
| 3,500 | Waste Management, Inc. | 127,365 | | 600 | Lexmark International, Inc. # | 25,194 |
|
| | |
| | Total Industrials | 10,441,382 | | 1,500 | Linear Technology Corporation * | 49,530 |
|
| | |
| | | | | 4,700 | LSI Corporation #* | 31,020 |
| Information Technology (16.5%) | | | 1,600 | MEMC Electronic Materials, Inc. # | 117,152 |
| 3,900 | Adobe Systems, Inc. #‡ | 186,810 | | 1,400 | Microchip Technology, Inc. | 46,438 |
| 3,600 | Advanced Micro Devices, Inc. #* | 47,088 | | 5,100 | Micron Technology, Inc. #* | 53,601 |
| 600 | Affiliated Computer | | | 53,800 | Microsoft Corporation | 1,980,378 |
| | Services, Inc. # | 30,396 | | 900 | Molex, Inc. | 25,704 |
| 2,500 | Agilent Technologies, Inc. # | 92,125 | | 15,400 | Motorola, Inc. * | 289,366 |
| 1,200 | Akamai Technologies, Inc. # | 47,028 | | 1,700 | National Semiconductor | |
| 2,400 | Altera Corporation * | 47,088 | | | Corporation | 42,738 |
| 2,000 | Analog Devices, Inc. | 66,920 | | 2,400 | Network Appliance, Inc. # | 75,576 |
| 5,800 | Apple Computer, Inc. # | 1,101,710 | | 2,400 | Novell, Inc. # | 18,144 |
| 9,200 | Applied Materials, Inc. | 178,664 | | 900 | Novellus Systems, Inc. # | 25,569 |
| 1,600 | Autodesk, Inc. # | 78,240 | | 3,750 | NVIDIA Corporation # | 132,675 |
| 3,600 | Automatic Data Processing, Inc. | 178,416 | | 26,291 | Oracle Corporation # | 582,871 |
| 1,300 | BMC Software, Inc. # | 43,992 | | 2,300 | Paychex, Inc. * | 96,094 |
|
| The accompanying Notes to Financial Statements are an integral part of this schedule. |
|
| 132 |
| | | | | | |
| Large Cap Index Fund | | | | | |
| Schedule of Investments as of October 31, 2007 | | | | | |
| |
| |
| Shares | Common Stock (97.4%) | Value | | Shares | Common Stock (97.4%) | Value |
|
| Information Technology — continued | | | 1,100 | Sealed Air Corporation | $27,423 |
| 900 | QLogic Corporation # | $13,977 | | 800 | Sigma-Aldrich Corporation | 41,336 |
| 11,100 | QUALCOMM, Inc. | 474,303 | | 700 | Temple-Inland, Inc. | 37,569 |
| 1,500 | SanDisk Corporation # | 66,600 | | 600 | Titanium Metals Corporation # | 21,120 |
| 23,600 | Sun Microsystems, Inc. # | 134,756 | | 700 | United States Steel Corporation | 75,530 |
| 5,947 | Symantec Corporation # | 111,685 | | 600 | Vulcan Materials Company | 51,306 |
| 600 | Tektronix, Inc. | 22,710 | | 1,500 | Weyerhaeuser Company | 113,865 |
|
|
| 3,000 | Tellabs, Inc. # | 26,430 | | | Total Materials | 3,022,267 |
|
|
| 1,200 | Teradata Corporation # | 34,236 | | | | |
| 1,200 | Teradyne, Inc. # | 14,808 | | Telecommunications Services (3.5%) | |
| 9,500 | Texas Instruments, Inc. | 309,700 | | 2,400 | ALLTEL Corporation | 170,760 |
| 3,259 | Tyco Electronics, Ltd. | 116,249 | | 40,668 | AT&T, Inc. ‡ | 1,699,516 |
| 2,300 | Unisys Corporation # | 13,984 | | 700 | CenturyTel, Inc. | 30,835 |
| 1,700 | VeriSign, Inc. #* | 57,953 | | 2,300 | Citizens Communications | |
| 5,203 | Western Union Company | 114,674 | | | Company | 30,268 |
| 6,200 | Xerox Corporation # | 108,128 | | 1,043 | Embarq Corporation | 55,196 |
| 2,000 | Xilinx, Inc. | 48,800 | | 10,600 | Qwest Communications | |
| 8,900 | Yahoo!, Inc. # | 276,790 | | | International, Inc. # | 76,108 |
|
| | |
| | Total Information | | | 18,968 | Sprint Nextel Corporation | 324,353 |
| | Technology | 15,434,323 | | 19,300 | Verizon Communications, Inc. | 889,151 |
|
| | |
| | | | | 3,201 | Windstream Corporation | 43,053 |
|
|
| Materials (3.2%) | | | | Total Telecommunications | |
| 1,400 | Air Products and Chemicals, Inc. | 136,990 | | | Services | 3,319,240 |
|
|
| 6,000 | Alcoa, Inc. ‡ | 237,540 | | | | |
| 700 | Allegheny Technologies, Inc. | 71,519 | | Utilities (3.3%) | |
| 400 | Ashland, Inc. | 23,488 | | 4,400 | AES Corporation # | 94,204 |
| 700 | Ball Corporation | 34,706 | | 1,200 | Allegheny Energy, Inc. # | 72,792 |
| 700 | Bemis Company, Inc. | 19,712 | | 1,400 | Ameren Corporation | 75,684 |
| 6,283 | Dow Chemical Company | 282,986 | | 2,700 | American Electric Power | |
| 6,100 | E.I. du Pont de Nemours and | | | | Company, Inc. | 130,167 |
| | Company | 302,011 | | 2,200 | CenterPoint Energy, Inc. * | 36,872 |
| 600 | Eastman Chemical Company | 39,954 | | 1,500 | CMS Energy Corporation | 25,455 |
| 1,200 | Ecolab, Inc. * | 56,604 | | 1,800 | Consolidated Edison, Inc. * | 84,762 |
| 2,538 | Freeport-McMoRan | | | 1,300 | Constellation Energy Group, Inc. | 123,110 |
| | Copper & Gold, Inc. | 298,672 | | 1,900 | Dominion Resources, Inc. | 174,097 |
| 700 | Hercules, Inc. | 13,167 | | 1,300 | DTE Energy Company | 64,480 |
| 700 | International Flavors & | | | 8,340 | Duke Energy Corporation | 159,878 |
| | Fragrances, Inc. | 36,547 | | 3,383 | Dynegy, Inc. # | 31,157 |
| 2,900 | International Paper Company | 107,184 | | 2,100 | Edison International, Inc. | 121,989 |
| 1,191 | MeadWestvaco Corporation | 40,065 | | 1,300 | Entergy Corporation | 155,831 |
| 3,568 | Monsanto Company | 348,344 | | 4,550 | Exelon Corporation | 376,649 |
| 3,000 | Newmont Mining Corporation | 152,580 | | 2,000 | FirstEnergy Corporation | 139,400 |
| 1,900 | Nucor Corporation * | 117,838 | | 2,700 | FPL Group, Inc. | 184,734 |
| 900 | Pactiv Corporation # | 24,723 | | 630 | Integrys Energy Group, Inc. | 33,900 |
| 1,000 | PPG Industries, Inc. | 74,740 | | 400 | Nicor, Inc. | 17,308 |
| 2,200 | Praxair, Inc. | 188,056 | | 1,837 | NiSource, Inc. | 37,567 |
| 900 | Rohm and Haas Company | 46,692 | | 2,400 | PG&E Corporation | 117,432 |
|
| The accompanying Notes to Financial Statements are an integral part of this schedule. |
|
| 133 |
| | | | | | |
| Large Cap Index Fund | | | | | |
| Schedule of Investments as of October 31, 2007 | | | | | |
| |
| |
| Shares | Common Stock (97.4%) | Value | | Shares | Common Stock (97.4%) | Value |
|
| Utilities — continued | | | 5,000 | Southern Company | $183,300 |
| 700 | Pinnacle West Capital Corporation | $28,280 | | 1,500 | TECO Energy, Inc. | 25,245 |
| 2,600 | PPL Corporation | 134,420 | | 2,855 | Xcel Energy, Inc. * | 64,380 |
|
|
| 1,827 | Progress Energy, Inc. | 87,696 | | | Total Utilities | 3,116,372 |
|
|
| 1,700 | Public Service Enterprise | | | | | |
|
|
| | Group, Inc. | 162,520 | | | Total Common Stock | |
| 1,200 | Questar Corporation | 68,496 | | | (cost $63,739,098) | 91,198,493 |
|
|
| 1,700 | Sempra Energy | 104,567 | | | | |
| | | | |
| | | Interest | Maturity | |
| Shares | Collateral Held for Securities Loaned (4.9%) | Rate (+) | Date | Value |
|
| 4,630,568 | Thrivent Financial Securities Lending Trust | 5.050% | N/A | $4,630,568 |
|
|
| | Total Collateral Held for Securities Loaned | |
| | (cost $4,630,568) | | | 4,630,568 |
|
|
| |
| |
| Shares or | | | | |
| Principal | | Interest | Maturity | |
| Amount | Short-Term Investments (2.6%) | Rate (+) | Date | Value |
|
| $250,000 | Federal National Mortgage Association ‡ | 5.080% | 12/14/2007 | $248,483 |
| 2,178,690 | Thrivent Money Market Fund | 5.020 | N/A | 2,178,690 |
|
|
| | Total Short-Term Investments (at amortized cost) | 2,427,173 |
|
|
| | Total Investments (cost $70,796,839) 104.9% | $98,256,234 |
|
|
| | Other Assets and Liabilities, Net (4.9%) | | (4,621,779) |
|
|
| | Total Net Assets 100.0% | | | $93,634,455 |
|
|
| | | | | |
| | Number of | | Notional | | |
| | Contracts | Expiration | Principal | | Unrealized |
| Futures | Long/(Short) | Date | Amount | Value | Gain/(Loss) |
|
| S&P 500 Index Mini-Futures | 31 | December 2007 | $2,395,585 | $2,410,095 | $14,510 |
| Total Futures | | | | | $14,510 |
# Non-income producing security.
* All or a portion of the security is on loan as discussed in item 2(M) of the Notes to Financial Statements.
+ The interest rate shown reflects the yield, coupon rate or, for securities purchased at a discount, the discount rate at the date of purchase.
‡ At October 31, 2007, $248,483 of investments were held on deposit with the counterparty and pledged as the initial margin deposit for open financial futures contracts. In addition, $3,419,349 of investments were earmarked as collateral to cover open financial futures contracts.
Definitions:
REIT — Real Estate Investment Trust, is a company that buys, develops, manages and/or sells real estate assets.
Gross unrealized appreciation and depreciation of investments, based on cost for federal income tax purposes, were as follows:
| | |
| Gross unrealized appreciation | $29,592,299 | |
| Gross unrealized depreciation | (2,419,651) | |
|
| |
| Net unrealized appreciation (depreciation) | $27,172,648 | |
| Cost for federal income tax purposes | $71,083,586 | |
|
| The accompanying Notes to Financial Statements are an integral part of this schedule. |
|
| 134 |
| | | | | | |
| Large Cap Index Fund-I |
| Schedule of Investments as of October 31, 2007 |
| |
| Shares | Common Stock (97.5%) | Value | | Shares | Common Stock (97.5%) | Value |
|
| Consumer Discretionary (8.8%) | | | 1,217 | Interpublic Group of | |
| 200 | Abercrombie & Fitch Company | $15,840 | | | Companies, Inc. # | $12,596 |
| 800 | Amazon.com, Inc. # | 71,320 | | 556 | J.C. Penney Company, Inc. | |
| 355 | Apollo Group, Inc. # | 28,137 | | | (Holding Company) | 31,269 |
| 358 | AutoNation, Inc. # | 6,333 | | 1,512 | Johnson Controls, Inc. | 66,105 |
| 152 | AutoZone, Inc. # | 18,910 | | 254 | Jones Apparel Group, Inc. | 5,319 |
| 657 | Bed Bath & Beyond, Inc. # | 22,299 | | 200 | KB Home | 5,528 |
| 941 | Best Buy Company, Inc. | 45,657 | | 858 | Kohl’s Corporation # | 47,164 |
| 302 | Big Lots, Inc. # | 7,242 | | 504 | Leggett & Platt, Inc. | 9,793 |
| 201 | Black & Decker Corporation | 18,072 | | 300 | Lennar Corporation | 6,855 |
| 302 | Brunswick Corporation | 6,738 | | 864 | Limited Brands, Inc. | 19,017 |
| 1,165 | Carnival Corporation | 55,897 | | 303 | Liz Claiborne, Inc. | 8,626 |
| 1,611 | CBS Corporation | 46,236 | | 3,748 | Lowe’s Companies, Inc. | 100,784 |
| 302 | Centex Corporation | 7,568 | | 1,038 | Macy’s Group, Inc | 33,247 |
| 354 | Circuit City Stores, Inc. | 2,807 | | 810 | Marriott International, Inc. | 33,299 |
| 1,315 | Clear Channel | | | 962 | Mattel, Inc. | 20,096 |
| | Communications, Inc. | 49,668 | | 2,985 | McDonald’s Corporation | 178,204 |
| 900 | Coach, Inc. # | 32,904 | | 908 | McGraw-Hill Companies, Inc. | 45,436 |
| 7,624 | Comcast Corporation # | 160,485 | | 100 | Meredith Corporation | 6,225 |
| 700 | D.R. Horton, Inc. | 8,883 | | 354 | New York Times Company | 6,924 |
| 280 | Darden Restaurants, Inc. | 12,040 | | 656 | Newell Rubbermaid, Inc. | 19,129 |
| 201 | Dillard’s, Inc. | 4,629 | | 5,700 | News Corporation | 123,519 |
| 1,800 | DIRECTV Group, Inc. # | 47,664 | | 914 | NIKE, Inc. | 60,562 |
| 200 | Dow Jones & Company, Inc. | 11,962 | | 404 | Nordstrom, Inc. | 15,934 |
| 300 | E.W. Scripps Company | 13,503 | | 707 | Office Depot, Inc. # | 13,263 |
| 758 | Eastman Kodak Company | 21,724 | | 101 | OfficeMax, Inc. | 3,197 |
| 500 | Expedia, Inc. # | 16,330 | | 806 | Omnicom Group, Inc. | 41,090 |
| 405 | Family Dollar Stores, Inc. | 10,267 | | 100 | Polo Ralph Lauren Corporation | 6,880 |
| 5,154 | Ford Motor Company #* | 45,716 | | 604 | Pulte Homes, Inc. | 8,963 |
| 354 | Fortune Brands, Inc. * | 29,655 | | 403 | RadioShack Corporation | 8,310 |
| 604 | Gannett Company, Inc. | 25,616 | | 175 | Sears Holdings Corporation # | 23,588 |
| 1,174 | Gap, Inc. | 22,189 | | 253 | Sherwin-Williams Company | 16,172 |
| 1,465 | General Motors Corporation | 57,413 | | 200 | Snap-On, Inc. | 9,982 |
| 454 | Genuine Parts Company | 22,278 | | 201 | Stanley Works | 11,568 |
| 503 | Goodyear Tire & | | | 1,718 | Staples, Inc. | 40,098 |
| | Rubber Company # | 15,165 | | 1,920 | Starbucks Corporation # | 51,226 |
| 910 | H&R Block, Inc. | 19,838 | | 506 | Starwood Hotels & Resorts | |
| 608 | Harley-Davidson, Inc. | 31,312 | | | Worldwide, Inc. | 28,771 |
| 100 | Harman International | | | 2,028 | Target Corporation | 124,438 |
| | Industries, Inc. | 8,420 | | 404 | Tiffany & Company | 21,889 |
| 402 | Harrah’s Entertainment, Inc. | 35,476 | | 9,286 | Time Warner, Inc. | 169,562 |
| 304 | Hasbro, Inc. | 9,074 | | 1,016 | TJX Companies, Inc. | 29,393 |
| 4,167 | Home Depot, Inc. | 131,302 | | 237 | Tribune Company | 7,172 |
| 400 | IAC InterActiveCorp # | 11,784 | | 302 | VF Corporation | 26,313 |
| 808 | International Game Technology | 35,237 | | 1,811 | Viacom, Inc. # | 74,776 |
|
| The accompanying Notes to Financial Statements are an integral part of this schedule. |
|
| 135 |
| | | | | | |
| Large Cap Index Fund-I | | | | | |
| Schedule of Investments as of October 31, 2007 | | | | | |
| |
| |
| Shares | Common Stock (97.5%) | Value | | Shares | Common Stock (97.5%) | Value |
|
| Consumer Discretionary — continued | | | 300 | Whole Foods Market, Inc. | $14,862 |
| 4,911 | Walt Disney Company | $170,068 | | 531 | William Wrigley Jr. Company | 32,747 |
|
|
| 202 | Wendy’s International, Inc. | 7,022 | | | Total Consumer Staples | 3,268,827 |
|
|
| 281 | Whirlpool Corporation * | 22,242 | | | | |
| 525 | Wyndham Worldwide Corporation | 17,236 | | Energy (11.4%) | |
| 1,318 | Yum! Brands, Inc. | 53,076 | | 1,140 | Anadarko Petroleum Corporation | 67,283 |
|
| | |
| | Total Consumer | | | 846 | Apache Corporation | 87,823 |
| | Discretionary | 3,085,516 | | 808 | Baker Hughes, Inc. | 70,070 |
|
| | |
| | | | | 710 | BJ Services Company | 17,885 |
| Consumer Staples (9.3%) | | | 1,000 | Chesapeake Energy Corporation * | 39,480 |
| 5,309 | Altria Group, Inc. | 387,185 | | 5,314 | Chevron Corporation | 486,284 |
| 1,825 | Anheuser-Busch Companies, Inc. ‡ | 93,586 | | 4,080 | ConocoPhillips | 346,637 |
| 1,638 | Archer-Daniels-Midland Company | 58,608 | | 400 | CONSOL Energy, Inc. | 22,600 |
| 1,012 | Avon Products, Inc. | 41,472 | | 1,112 | Devon Energy Corporation | 103,861 |
| 200 | Brown-Forman Corporation | 14,796 | | 1,775 | El Paso Corporation | 31,346 |
| 560 | Campbell Soup Company | 20,709 | | 300 | ENSCO International, Inc. | 16,647 |
| 405 | Clorox Company | 25,341 | | 606 | EOG Resources, Inc. | 53,692 |
| 4,923 | Coca-Cola Company | 304,044 | | 13,805 | Exxon Mobil Corporation | 1,269,908 |
| 711 | Coca-Cola Enterprises, Inc. | 18,351 | | 2,124 | Halliburton Company | 83,728 |
| 1,365 | Colgate-Palmolive Company | 104,109 | | 653 | Hess Corporation | 46,761 |
| 1,312 | ConAgra Foods, Inc. | 31,134 | | 1,932 | Marathon Oil Corporation | 114,239 |
| 500 | Constellation Brands, Inc. # | 12,560 | | 400 | Murphy Oil Corporation | 29,452 |
| 1,161 | Costco Wholesale Corporation | 78,089 | | 606 | Nabors Industries, Ltd. # | 17,016 |
| 3,757 | CVS/Caremark Corporation | 156,930 | | 800 | National Oilwell Varco, Inc. # | 58,592 |
| 400 | Dean Foods Company | 11,108 | | 608 | Noble Corporation | 32,194 |
| 300 | Estee Lauder Companies, Inc. | 13,170 | | 400 | Noble Energy, Inc. | 30,616 |
| 860 | General Mills, Inc. | 49,648 | | 2,022 | Occidental Petroleum Corporation | 139,619 |
| 859 | H.J. Heinz Company | 40,184 | | 700 | Peabody Energy Corporation | 39,025 |
| 504 | Hershey Company | 21,727 | | 301 | Rowan Companies, Inc. | 11,733 |
| 660 | Kellogg Company | 34,841 | | 3,030 | Schlumberger, Ltd. | 292,607 |
| 964 | Kimberly-Clark Corporation | 68,338 | | 600 | Smith International, Inc. | 39,630 |
| 3,912 | Kraft Foods, Inc. | 130,700 | | 1,632 | Spectra Energy Corporation | 42,399 |
| 1,672 | Kroger Company | 49,140 | | 302 | Sunoco, Inc. | 22,227 |
| 304 | McCormick & Company, Inc. | 10,649 | | 400 | Tesoro Petroleum Corporation | 24,212 |
| 300 | Molson Coors Brewing Company | 17,169 | | 757 | Transocean, Inc. # | 90,363 |
| 308 | Pepsi Bottling Group, Inc. | 13,269 | | 1,400 | Valero Energy Corporation | 98,602 |
| 4,097 | PepsiCo, Inc. * | 302,031 | | 800 | Weatherford International, Ltd. # | 51,928 |
| 7,792 | Procter & Gamble Company | 541,700 | | 1,563 | Williams Companies, Inc. | 57,034 |
| 404 | Reynolds American, Inc. | 26,030 | | 933 | XTO Energy, Inc. | 61,933 |
|
|
| 1,161 | Safeway, Inc. | 39,474 | | | Total Energy | 3,997,426 |
|
|
| 1,722 | Sara Lee Corporation | 28,482 | | | | |
| 608 | SUPERVALU, Inc. | 23,573 | | Financials (18.6%) | |
| 1,568 | SYSCO Corporation * | 53,767 | | 757 | ACE, Ltd. | 45,882 |
| 700 | Tyson Foods, Inc. | 11,060 | | 1,163 | AFLAC, Inc. | 73,013 |
| 403 | UST, Inc. | 21,488 | | 1,470 | Allstate Corporation | 77,028 |
| 2,429 | Walgreen Company | 96,310 | | 103 | Ambac Financial Group, Inc. | 3,793 |
| 5,982 | Wal-Mart Stores, Inc. | 270,446 | | 300 | American Capital Strategies, Ltd. | 13,023 |
|
| The accompanying Notes to Financial Statements are an integral part of this schedule. |
|
| 136 |
| | | | | | |
| Large Cap Index Fund-I | | | | | |
| Schedule of Investments as of October 31, 2007 | | | | | |
| |
| |
| Shares | Common Stock (97.5%) | Value | | Shares | Common Stock (97.5%) | Value |
|
| Financials — continued | | | 1,300 | Hudson City Bancorp, Inc. | $20,358 |
| 2,888 | American Express Company | $176,024 | | 926 | Huntington Bancshares, Inc. | 16,585 |
| 6,327 | American International | | | 200 | IntercontinentalExchange, Inc. # | 35,640 |
| | Group, Inc. | 399,360 | | 8,378 | J.P. Morgan Chase & Company | 393,766 |
| 677 | Ameriprise Financial, Inc. | 42,637 | | 306 | Janus Capital Group, Inc. | 10,560 |
| 807 | Aon Corporation | 36,573 | | 910 | KeyCorp | 25,890 |
| 253 | Apartment Investment & | | | 600 | Kimco Realty Corporation | 24,912 |
| | Management Company | 11,823 | | 300 | Legg Mason, Inc. | 24,882 |
| 300 | Assurant, Inc. | 17,532 | | 1,310 | Lehman Brothers Holdings, Inc. | 82,975 |
| 100 | Avalonbay Communities, Inc. | 12,265 | | 400 | Leucadia National Corporation * | 20,264 |
| 11,044 | Bank of America Corporation ‡ | 533,204 | | 639 | Lincoln National Corporation | 39,859 |
| 2,921 | Bank of New York | | | 1,162 | Loews Corporation | 57,043 |
| | Mellon Corporation | 142,691 | | 100 | M&T Bank Corporation | 9,948 |
| 1,412 | BB&T Corporation ‡ | 52,202 | | 1,266 | Marsh & McLennan | |
| 252 | Bear Stearns Companies, Inc. | 28,627 | | | Companies, Inc. | 32,777 |
| 300 | Boston Properties, Inc. | 32,502 | | 706 | Marshall & Ilsley Corporation # | 30,146 |
| 1,069 | Capital One Financial Corporation | 70,116 | | 329 | MBIA, Inc. | 14,160 |
| 500 | CB Richard Ellis Group, Inc. # | 12,190 | | 2,078 | Merrill Lynch & Company, Inc. | 137,190 |
| 2,287 | Charles Schwab Corporation * | 53,150 | | 1,770 | MetLife, Inc. | 121,864 |
| 906 | Chubb Corporation | 48,335 | | 251 | MGIC Investment Corporation * | 4,859 |
| 350 | Cincinnati Financial Corporation | 13,923 | | 606 | Moody’s Corporation | 26,494 |
| 500 | CIT Group, Inc. | 17,620 | | 2,531 | Morgan Stanley | 170,235 |
| 12,360 | Citigroup, Inc. | 517,884 | | 1,616 | National City Corporation | 39,188 |
| 140 | CME Group, Inc. | 93,275 | | 504 | Northern Trust Corporation | 37,906 |
| 353 | Comerica, Inc. | 16,478 | | 700 | NYSE Euronext | 65,709 |
| 400 | Commerce Bancorp, Inc. | 16,300 | | 456 | Plum Creek Timber Company, Inc. | 20,370 |
| 1,506 | Countrywide Financial | | | 755 | PNC Financial Services Group, Inc. | 54,481 |
| | Corporation * | 23,373 | | 660 | Principal Financial Group, Inc. | 44,662 |
| 300 | Developers Diversified | | | 1,824 | Progressive Corporation | 33,744 |
| | Realty Corporation | 15,120 | | 600 | ProLogis Trust | 43,044 |
| 1,165 | Discover Financial Services | 22,484 | | 1,067 | Prudential Financial, Inc. | 103,200 |
| 1,100 | E*TRADE Financial Corporation # | 12,254 | | 300 | Public Storage, Inc. | 24,291 |
| 758 | Equity Residential REIT | 31,669 | | 1,687 | Regions Financial Corporation | 45,751 |
| 1,619 | Federal Home Loan Mortgage | | | 302 | SAFECO Corporation | 17,486 |
| | Corporation | 84,560 | | 555 | Simon Property Group, Inc. | 57,781 |
| 2,528 | Federal National Mortgage | | | 1,062 | SLM Corporation | 50,084 |
| | Association | 144,197 | | 850 | Sovereign Bancorp, Inc. | 12,266 |
| 303 | Federated Investors, Inc. | 13,029 | | 1,008 | State Street Corporation | 80,408 |
| 1,407 | Fifth Third Bancorp | 44,011 | | 956 | SunTrust Banks, Inc. | 69,406 |
| 254 | First Horizon National Corporation | 6,624 | | 908 | Synovus Financial Corporation | 23,935 |
| 355 | Franklin Resources, Inc. | 46,036 | | 702 | T. Rowe Price Group, Inc. | 45,096 |
| 600 | General Growth Properties, Inc. | 32,616 | | 252 | Torchmark Corporation | 16,420 |
| 1,100 | Genworth Financial, Inc. | 30,030 | | 1,553 | Travelers Companies, Inc. | 81,082 |
| 1,113 | Goldman Sachs Group, Inc. | 275,935 | | 4,369 | U.S. Bancorp * | 144,876 |
| 756 | Hartford Financial Services | | | 857 | UnumProvident Corporation | 20,002 |
| | Group, Inc. | 73,355 | | 300 | Vornado Realty Trust | 33,516 |
| 1,400 | Host Marriott Corporation | 31,024 | | 4,727 | Wachovia Corporation | 216,166 |
|
| The accompanying Notes to Financial Statements are an integral part of this schedule. |
|
| 137 |
| | | | | | |
| Large Cap Index Fund-I | | | | | |
| Schedule of Investments as of October 31, 2007 | | | | | |
| |
| |
| Shares | Common Stock (97.5%) | Value | | Shares | Common Stock (97.5%) | Value |
|
| Financials — continued | | | 352 | PerkinElmer, Inc. | $9,687 |
| 2,200 | Washington Mutual, Inc. | $61,336 | | 17,281 | Pfizer, Inc. | 425,285 |
| 8,296 | Wells Fargo & Company | 282,147 | | 406 | Quest Diagnostics, Inc. | 21,591 |
| 404 | XL Capital, Ltd. | 29,068 | | 4,143 | Schering-Plough Corporation | 126,444 |
| 352 | Zions Bancorporation | 20,807 | | 912 | St. Jude Medical, Inc. # | 37,146 |
|
| | |
| | Total Financials | 6,518,402 | | 508 | Stryker Corporation | 36,068 |
|
| | |
| | | | | 1,190 | Tenet Healthcare Corporation #* | 4,177 |
| Health Care (11.4%) | | | 1,054 | Thermo Electron Corporation # | 61,986 |
| 3,796 | Abbott Laboratories ‡ | 207,338 | | 3,332 | UnitedHealth Group, Inc. | 163,768 |
| 1,312 | Aetna, Inc. | 73,695 | | 300 | Varian Medical Systems, Inc. # | 14,631 |
| 706 | Allergan, Inc. | 47,711 | | 254 | Waters Corporation # | 19,553 |
| 304 | AmerisourceBergen Corporation | 14,321 | | 301 | Watson Pharmaceuticals, Inc. # | 9,199 |
| 2,707 | Amgen, Inc. # | 157,304 | | 1,420 | WellPoint, Inc. # | 112,507 |
| 354 | Applera Corporation (Applied | | | 3,439 | Wyeth | 167,239 |
| | Biosystems Group) | 13,148 | | 639 | Zimmer Holdings, Inc. # | 44,404 |
|
|
| 200 | Barr Pharmaceuticals, Inc. # | 11,464 | | | Total Health Care | 3,971,525 |
|
|
| 1,669 | Baxter International, Inc. | 100,157 | | | | |
| 606 | Becton, Dickinson and Company | 50,577 | | Industrials (11.2%) | |
| 805 | Biogen Idec, Inc. # | 59,924 | | 1,724 | 3M Company | 148,885 |
| 3,343 | Boston Scientific Corporation # | 46,367 | | 654 | Allied Waste Industries, Inc. # | 8,267 |
| 4,856 | Bristol-Myers Squibb Company | 145,631 | | 456 | American Standard Companies, Inc. | 16,995 |
| 302 | C.R. Bard, Inc. | 25,250 | | 202 | Avery Dennison Corporation | 11,696 |
| 837 | Cardinal Health, Inc. | 56,941 | | 1,874 | Boeing Company | 184,758 |
| 1,000 | Celgene Corporation # | 66,000 | | 658 | Burlington Northern | |
| 712 | CIGNA Corporation | 37,373 | | | Santa Fe Corporation | 57,345 |
| 350 | Coventry Health Care, Inc. # | 21,108 | | 500 | C.H. Robinson Worldwide, Inc. | 24,960 |
| 1,240 | Covidien, Ltd. | 51,584 | | 1,618 | Caterpillar, Inc. | 120,719 |
| 2,383 | Eli Lilly and Company | 129,039 | | 405 | Cintas Corporation | 14,823 |
| 600 | Express Scripts, Inc. # | 37,860 | | 504 | Cooper Industries, Ltd. | 26,405 |
| 812 | Forest Laboratories, Inc. # | 31,725 | | 1,108 | CSX Corporation | 49,605 |
| 606 | Genzyme Corporation # | 46,038 | | 300 | Cummins, Inc. | 35,988 |
| 2,400 | Gilead Sciences, Inc. # | 110,856 | | 604 | Danaher Corporation * | 51,745 |
| 409 | Hospira, Inc. # | 16,904 | | 555 | Deere & Company | 85,970 |
| 354 | Humana, Inc. # | 26,532 | | 554 | Dover Corporation | 25,484 |
| 454 | IMS Health, Inc. | 11,445 | | 404 | Eaton Corporation | 37,402 |
| 7,135 | Johnson & Johnson | 464,988 | | 1,922 | Emerson Electric Company | 100,463 |
| 673 | King Pharmaceuticals, Inc. # | 7,134 | | 303 | Equifax, Inc. | 11,666 |
| 300 | Laboratory Corporation of | | | 500 | Expeditors International of | |
| | America Holdings # | 20,625 | | | Washington, Inc. | 25,325 |
| 251 | Manor Care, Inc. | 16,712 | | 807 | FedEx Corporation | 83,395 |
| 756 | McKesson Corporation | 49,972 | | 202 | Fluor Corporation | 31,916 |
| 741 | Medco Health Solutions, Inc. # | 69,936 | | 1,008 | General Dynamics Corporation | 91,688 |
| 2,834 | Medtronic, Inc. | 134,445 | | 25,550 | General Electric Company | 1,051,638 |
| 5,517 | Merck & Company, Inc. | 321,420 | | 301 | Goodrich Corporation | 20,968 |
| 150 | Millipore Corporation # | 11,648 | | 1,924 | Honeywell International, Inc. * | 116,229 |
| 600 | Mylan Laboratories, Inc. | 9,024 | | 1,014 | Illinois Tool Works, Inc. | 58,062 |
| 400 | Patterson Companies, Inc. # | 15,644 | | 808 | Ingersoll-Rand Company | 40,683 |
|
| The accompanying Notes to Financial Statements are an integral part of this schedule. |
|
| 138 |
| | | | | | |
| Large Cap Index Fund-I | | | | | |
| Schedule of Investments as of October 31, 2007 | | | | | |
| |
| |
| Shares | Common Stock (97.5%) | Value | | Shares | Common Stock (97.5%) | Value |
|
| Industrials — continued | | | 1,065 | CA, Inc. | $28,169 |
| 504 | ITT Corporation | $33,728 | | 194 | CIENA Corporation # | 9,285 |
| 300 | Jacobs Engineering Group, Inc. # | 26,145 | | 15,114 | Cisco Systems, Inc. # | 499,669 |
| 300 | L-3 Communications | | | 403 | Citrix Systems, Inc. # | 17,325 |
| | Holdings, Inc. | 32,892 | | 800 | Cognizant Technology Solutions | |
| 862 | Lockheed Martin Corporation | 94,854 | | | Corporation # | 33,168 |
| 861 | Masco Corporation | 20,733 | | 404 | Computer Sciences Corporation # | 23,590 |
| 301 | Monster Worldwide, Inc. # | 12,215 | | 659 | Compuware Corporation # | 6,590 |
| 1,010 | Norfolk Southern Corporation | 52,166 | | 404 | Convergys Corporation # | 7,405 |
| 846 | Northrop Grumman Corporation | 70,743 | | 3,833 | Corning, Inc. | 93,027 |
| 996 | PACCAR, Inc. * | 55,338 | | 5,576 | Dell, Inc. # | 170,626 |
| 351 | Pall Corporation | 14,065 | | 2,832 | eBay, Inc. # | 102,235 |
| 528 | Parker-Hannifin Corporation | 42,435 | | 808 | Electronic Arts, Inc. # | 49,385 |
| 455 | Pitney Bowes, Inc. | 18,218 | | 1,312 | Electronic Data Systems | |
| 300 | Precision Castparts Corporation | 44,943 | | | Corporation | 28,326 |
| 501 | R.R. Donnelley & Sons Company | 20,185 | | 5,215 | EMC Corporation # | 132,409 |
| 1,159 | Raytheon Company | 73,724 | | 500 | Fidelity National Information | |
| 405 | Robert Half International, Inc. | 12,186 | | | Services, Inc. | 23,060 |
| 454 | Rockwell Automation, Inc. | 31,272 | | 480 | Fiserv, Inc. # | 26,592 |
| 454 | Rockwell Collins, Inc. | 33,964 | | 600 | Google, Inc. # | 424,200 |
| 200 | Ryder System, Inc. | 9,570 | | 6,407 | Hewlett-Packard Company | 331,114 |
| 1,795 | Southwest Airlines Company | 25,507 | | 14,549 | Intel Corporation | 391,368 |
| 300 | Terex Corporation # | 22,266 | | 3,348 | International Business | |
| 604 | Textron, Inc. | 41,803 | | | Machines Corporation | 388,770 |
| 1,240 | Tyco International, Ltd. | 51,051 | | 910 | Intuit, Inc. # | 29,275 |
| 656 | Union Pacific Corporation | 83,994 | | 505 | Jabil Circuit, Inc. | 10,974 |
| 2,584 | United Parcel Service, Inc. | 194,058 | | 530 | JDS Uniphase Corporation # | 8,088 |
| 2,422 | United Technologies Corporation | 185,501 | | 1,200 | Juniper Networks, Inc. # | 43,200 |
| 252 | W.W. Grainger, Inc. | 22,660 | | 504 | KLA-Tencor Corporation | 26,536 |
| 1,364 | Waste Management, Inc. | 49,636 | | 251 | Lexmark International, Inc. # | 10,539 |
|
| | |
| | Total Industrials | 3,908,932 | | 457 | Linear Technology Corporation * | 15,090 |
|
| | |
| | | | | 1,708 | LSI Corporation #* | 11,273 |
| Information Technology (16.5%) | | | 600 | MEMC Electronic Materials, Inc. # | 43,932 |
| 1,410 | Adobe Systems, Inc. # | 67,539 | | 600 | Microchip Technology, Inc. | 19,902 |
| 1,407 | Advanced Micro Devices, Inc. # | 18,404 | | 1,966 | Micron Technology, Inc. # | 20,663 |
| 200 | Affiliated Computer | | | 20,125 | Microsoft Corporation | 740,801 |
| | Services, Inc. # | 10,132 | | 367 | Molex, Inc. | 10,482 |
| 951 | Agilent Technologies, Inc. # | 35,044 | | 5,851 | Motorola, Inc. | 109,940 |
| 400 | Akamai Technologies, Inc. # | 15,676 | | 508 | National Semiconductor | |
| 959 | Altera Corporation | 18,816 | | | Corporation | 12,771 |
| 810 | Analog Devices, Inc. | 27,103 | | 908 | Network Appliance, Inc. # | 28,593 |
| 2,120 | Apple Computer, Inc. # | 402,694 | | 909 | Novell, Inc. # | 6,872 |
| 3,402 | Applied Materials, Inc. | 66,067 | | 253 | Novellus Systems, Inc. # | 7,188 |
| 504 | Autodesk, Inc. # | 24,646 | | 1,365 | NVIDIA Corporation # | 48,294 |
| 1,365 | Automatic Data Processing, Inc. | 67,649 | | 9,810 | Oracle Corporation # | 217,488 |
| 507 | BMC Software, Inc. # | 17,157 | | 885 | Paychex, Inc. | 36,975 |
| 1,232 | Broadcom Corporation # | 40,102 | | 402 | QLogic Corporation # | 6,243 |
|
| The accompanying Notes to Financial Statements are an integral part of this schedule. |
|
| 139 |
| | | | | | |
| Large Cap Index Fund-I | | | | | |
| Schedule of Investments as of October 31, 2007 | | | | | |
| |
| |
| Shares | Common Stock (97.5%) | Value | | Shares | Common Stock (97.5%) | Value |
|
| Information Technology — continued | | | 402 | Sigma-Aldrich Corporation | $20,771 |
| 4,242 | QUALCOMM, Inc. | $181,261 | | 302 | Temple-Inland, Inc. | 16,208 |
| 600 | SanDisk Corporation # | 26,640 | | 200 | Titanium Metals Corporation # | 7,040 |
| 8,796 | Sun Microsystems, Inc. # | 50,225 | | 251 | United States Steel Corporation | 27,083 |
| 2,236 | Symantec Corporation # | 41,992 | | 251 | Vulcan Materials Company | 21,463 |
| 101 | Tektronix, Inc. | 3,823 | | 605 | Weyerhaeuser Company | 45,926 |
|
|
| 1,160 | Tellabs, Inc. # | 10,220 | | | Total Materials | 1,162,318 |
|
|
| 502 | Teradata Corporation # | 14,322 | | | | |
| 454 | Teradyne, Inc. # | 5,602 | | Telecommunications Services (3.6%) | |
| 3,498 | Texas Instruments, Inc. | 114,035 | | 957 | ALLTEL Corporation | 68,091 |
| 1,240 | Tyco Electronics, Ltd. | 44,231 | | 15,158 | AT&T, Inc. ‡ | 633,453 |
| 857 | Unisys Corporation # | 5,211 | | 304 | CenturyTel, Inc. | 13,391 |
| 600 | VeriSign, Inc. #* | 20,454 | | 907 | Citizens Communications | |
| 1,965 | Western Union Company | 43,309 | | | Company | 11,936 |
| 2,271 | Xerox Corporation # | 39,606 | | 387 | Embarq Corporation | 20,480 |
| 806 | Xilinx, Inc. | 19,666 | | 4,036 | Qwest Communications | |
| 3,428 | Yahoo!, Inc. # | 106,611 | | | International, Inc. # | 28,978 |
|
| | |
| | Total Information | | | 7,041 | Sprint Nextel Corporation | 120,401 |
| | Technology | 5,789,669 | | 7,174 | Verizon Communications, Inc. | 330,506 |
|
| | |
| | | | | 1,289 | Windstream Corporation | 17,337 |
|
|
| Materials (3.3%) | | | | Total Telecommunications | |
| 556 | Air Products and Chemicals, Inc. | 54,405 | | | Services | 1,244,573 |
|
|
| 2,086 | Alcoa, Inc. | 82,585 | | | | |
| 251 | Allegheny Technologies, Inc. | 25,645 | | Utilities (3.4%) | |
| 151 | Ashland, Inc. | 8,867 | | 1,664 | AES Corporation # | 35,626 |
| 302 | Ball Corporation | 14,973 | | 452 | Allegheny Energy, Inc. # | 27,418 |
| 302 | Bemis Company, Inc. | 8,504 | | 503 | Ameren Corporation | 27,192 |
| 2,318 | Dow Chemical Company | 104,403 | | 929 | American Electric Power | |
| 2,329 | E.I. du Pont de Nemours | | | | Company, Inc. | 44,787 |
| | and Company | 115,309 | | 706 | CenterPoint Energy, Inc. | 11,833 |
| 201 | Eastman Chemical Company | 13,385 | | 502 | CMS Energy Corporation | 8,519 |
| 404 | Ecolab, Inc. * | 19,057 | | 657 | Consolidated Edison, Inc. | 30,938 |
| 1,039 | Freeport-McMoRan | | | 503 | Constellation Energy Group, Inc. | 47,634 |
| | Copper & Gold, Inc. | 122,270 | | 729 | Dominion Resources, Inc. | 66,798 |
| 352 | Hercules, Inc. | 6,621 | | 403 | DTE Energy Company | 19,989 |
| 201 | International Flavors & | | | 3,064 | Duke Energy Corporation | 58,737 |
| | Fragrances, Inc. | 10,494 | | 1,237 | Dynegy, Inc. # | 11,393 |
| 1,119 | International Paper Company | 41,358 | | 858 | Edison International, Inc. | 49,841 |
| 396 | MeadWestvaco Corporation | 13,321 | | 506 | Entergy Corporation | 60,654 |
| 1,346 | Monsanto Company | 131,410 | | 1,764 | Exelon Corporation | 146,024 |
| 1,160 | Newmont Mining Corporation | 58,998 | | 858 | FirstEnergy Corporation | 59,803 |
| 804 | Nucor Corporation * | 49,864 | | 1,106 | FPL Group, Inc. | 75,673 |
| 354 | Pactiv Corporation # | 9,724 | | 123 | Integrys Energy Group, Inc. | 6,619 |
| 504 | PPG Industries, Inc. | 37,669 | | 50 | Nicor, Inc. | 2,164 |
| 808 | Praxair, Inc. | 69,068 | | 675 | NiSource, Inc. | 13,804 |
| 306 | Rohm and Haas Company | 15,875 | | 860 | PG&E Corporation | 42,080 |
| 402 | Sealed Air Corporation | 10,022 | | 301 | Pinnacle West Capital Corporation | 12,160 |
|
| The accompanying Notes to Financial Statements are an integral part of this schedule. |
|
| 140 |
| | | | | | |
| Large Cap Index Fund-I | | | | | |
| Schedule of Investments as of October 31, 2007 | | | | | |
| |
| |
| Shares | Common Stock (97.5%) | Value | | Shares | Common Stock (97.5%) | Value |
|
| Utilities — continued | | | 1,970 | Southern Company | $72,220 |
| 1,006 | PPL Corporation | $52,010 | | 604 | TECO Energy, Inc. | 10,165 |
| 682 | Progress Energy, Inc. | 32,736 | | 1,114 | Xcel Energy, Inc. | 25,121 |
|
|
| 606 | Public Service Enterprise | | | | Total Utilities | 1,173,239 |
|
|
| | Group, Inc. | 57,934 | | | | |
|
|
| 400 | Questar Corporation | 22,832 | | | Total Common Stock | |
| 659 | Sempra Energy | 40,535 | | | (cost $27,340,353) | 34,120,427 |
|
|
| | | | |
| | | Interest | Maturity | |
| Shares | Collateral Held for Securities Loaned (2.6%) | Rate (+) | Date | Value |
|
| 911,167 | Thrivent Financial Securities Lending Trust | 5.050% | N/A | $911,167 |
|
|
| | Total Collateral Held for Securities Loaned | |
| | (cost $911,167) | | | 911,167 |
|
|
| |
| |
| Shares or | | | | |
| Principal | | Interest | Maturity | |
| Amount | Short-Term Investments (3.0%) | Rate (+) | Date | Value |
|
| $225,000 | Federal National Mortgage Association ‡ | 5.080% | 12/14/2007 | $223,635 |
| 840,619 | Thrivent Money Market Fund | 5.020 | N/A | 840,619 |
|
|
| | Total Short-Term Investments (at amortized cost) | 1,064,254 |
|
|
| | Total Investments (cost $29,315,774) 103.1% | $36,095,848 |
|
|
| | Other Assets and Liabilities, Net (3.1%) | | (1,094,296) |
|
|
| | Total Net Assets 100.0% | | | $35,001,552 |
|
|
| | | | | |
| | Number of | | Notional | | |
| | Contracts | Expiration | Principal | | Unrealized |
| Futures | Long/(Short) | Date | Amount | Value | Gain/(Loss) |
|
| S&P 500 Index Mini-Futures | 13 | December 2007 | $997,373 | $1,010,685 | $13,312 |
| Total Futures | | | | | $13,312 |
# Non-income producing security.
* All or a portion of the security is on loan as discussed in item 2(M) of the Notes to Financial Statements.
+ The interest rate shown reflects the yield, coupon rate or, for securities purchased at a discount, the discount rate at the date of purchase.
‡ At October 31, 2007, $223,635 of investments were held on deposit with the counterparty and pledged as the initial margin deposit for open financial futures contracts. In addition, $1,288,516 of investments were earmarked as collateral to cover open financial futures contracts.
Definitions:
REIT — Real Estate Investment Trust, is a company that buys, develops, manages and/or sells real estate assets.
Gross unrealized appreciation and depreciation of investments, based on cost for federal income tax purposes, were as follows:
| | |
| Gross unrealized appreciation | $9,134,755 | |
| Gross unrealized depreciation | (2,561,043) | |
|
| |
| Net unrealized appreciation (depreciation) | $6,573,712 | |
| Cost for federal income tax purposes | $29,522,136 | |
|
| The accompanying Notes to Financial Statements are an integral part of this schedule. |
|
| 141 |
| | | | | | |
| Balanced Fund |
| Schedule of Investments as of October 31, 2007 |
| |
| Shares | Common Stock (66.8%) | Value | | Shares | Common Stock (66.8%) | Value |
|
| Consumer Discretionary (6.3%) | | | 22,700 | Constellation Brands, Inc. #~ | $570,224 |
| 6,400 | Advance Auto Parts, Inc. ± | $218,368 | | 36,195 | CVS/Caremark Corporation ~ | 1,511,865 |
| 11,300 | Best Buy Company, Inc. ‡ | 548,276 | | 7,300 | Diageo plc ADR | 669,775 |
| 2,600 | Black & Decker Corporation | 233,766 | | 19,400 | Elizabeth Arden, Inc. # | 483,060 |
| 16,700 | Carnival Corporation | 801,266 | | 15,150 | Flowers Foods, Inc. | 332,391 |
| 3,800 | Centex Corporation | 95,228 | | 15,400 | General Mills, Inc. | 889,042 |
| 36,100 | Coldwater Creek, Inc. #* | 323,095 | | 9,900 | Hormel Foods Corporation | 361,152 |
| 9,100 | Crocs, Inc. # | 680,225 | | 23,066 | Kraft Foods, Inc. | 770,635 |
| 8,600 | D.R. Horton, Inc. | 109,134 | | 22,100 | Kroger Company | 649,519 |
| 12,900 | Darden Restaurants, Inc. | 554,700 | | 8,500 | Loews Corporation — | |
| 25,500 | DIRECTV Group, Inc. # | 675,240 | | | Carolina Group | 729,130 |
| 17,800 | DreamWorks Animation | | | 15,100 | Longs Drug Stores Corporation | 792,901 |
| | SKG, Inc. # | 579,568 | | 19,500 | Pepsi Bottling Group, Inc. | 840,060 |
| 11,700 | GameStop Corporation # | 692,874 | | 26,300 | PepsiCo, Inc. * | 1,938,836 |
| 8,000 | Genesco, Inc. # | 369,600 | | 34,912 | Procter & Gamble Company | 2,427,082 |
| 15,700 | Harley-Davidson, Inc. * | 808,550 | | 14,681 | Reckitt Benckiser Group plc | 852,878 |
| 2,400 | Harman International | | | 11,800 | Safeway, Inc. | 401,200 |
| | Industries, Inc. | 202,080 | | 12,000 | Smithfield Foods, Inc. # | 344,040 |
| 26,100 | Hasbro, Inc. * | 779,085 | | 15,900 | United Natural Foods, Inc. # | 460,146 |
| 8,200 | Home Depot, Inc. | 258,382 | | 8,400 | Walgreen Company | 333,060 |
| 21,800 | Johnson Controls, Inc. | 953,096 | | 21,300 | Wal-Mart Stores, Inc. | 962,973 |
| 15,400 | Kohl’s Corporation # | 846,538 | | 10,300 | William Wrigley Jr. Company * | 635,201 |
|
|
| 4,100 | Lennar Corporation | 93,685 | | | Total Consumer Staples | 21,773,033 |
|
|
| 21,300 | Marriott International, Inc. | 875,643 | | | | |
| 22,700 | McDonald’s Corporation | 1,355,190 | | Energy (7.4%) | |
| 2,000 | Mohawk Industries, Inc. # | 170,680 | | 18,900 | Apache Corporation ± | 1,962,009 |
| 5,400 | Newell Rubbermaid, Inc. | 157,464 | | 22,600 | Chevron Corporation ‡ | 2,068,126 |
| 124,800 | News Corporation | 2,704,416 | | 21,700 | ConocoPhillips ~ | 1,843,632 |
| 10,100 | Nordstrom, Inc. | 398,344 | | 7,100 | Diamond Offshore Drilling, Inc. | 803,933 |
| 6,300 | Pulte Homes, Inc. | 93,492 | | 19,100 | Dril-Quip, Inc. # | 1,018,603 |
| 21,700 | Ross Stores, Inc. | 586,334 | | 78,386 | Exxon Mobil Corporation ±~ | 7,210,730 |
| 10,700 | Staples, Inc. | 249,738 | | 227,400 | Kodiak Oil & Gas Corporation #* | 523,020 |
| 22,500 | Starbucks Corporation # | 600,300 | | 36,200 | Occidental Petroleum | |
| 17,000 | Target Corporation | 1,043,120 | | | Corporation | 2,499,610 |
| 30,500 | TJX Companies, Inc. | 882,365 | | 7,800 | Peabody Energy Corporation | 434,850 |
| 11,400 | Tween Brands, Inc. #* | 349,980 | | 34,400 | Petrohawk Energy Corporation # | 636,400 |
| 36,900 | ValueVision Media, Inc. #* | 190,773 | | 40,700 | Total SA ADR | 3,280,827 |
| 38,000 | Walt Disney Company | 1,315,940 | | 47,200 | Willbros Group, Inc. #* | 1,806,344 |
|
| | |
|
| | Total Consumer | | | | Total Energy | 24,088,084 |
|
|
| | Discretionary | 20,796,535 | | | | |
|
| | |
| | | | | Financials (11.8%) | |
| Consumer Staples (6.6%) | | | 6,800 | Affiliated Managers Group, Inc. #* | 894,540 |
| 10,700 | Alberto-Culver Company | 278,093 | | 19,400 | AFLAC, Inc. ± | 1,217,932 |
| 22,400 | Altria Group, Inc. ‡ | 1,633,632 | | 13,500 | Allstate Corporation ± | 707,400 |
| 15,300 | Avon Products, Inc. | 626,994 | | 2,200 | AMB Property Corporation ‡ | 143,770 |
| 9,400 | Cadbury Schweppes plc ADR | 500,456 | | 24,100 | American Express Company ± | 1,468,895 |
| 28,800 | Coca-Cola Company | 1,778,688 | | 5,600 | American Financial Realty Trust | 37,744 |
|
| The accompanying Notes to Financial Statements are an integral part of this schedule. |
|
| 142 |
| | | | | | |
| Balanced Fund | | | | | |
| Schedule of Investments as of October 31, 2007 | | | | | |
| |
| |
| Shares | Common Stock (66.8%) | Value | | Shares | Common Stock (66.8%) | Value |
|
| Financials — continued | | | 2,400 | Plum Creek Timber | |
| 36,462 | American International | | | | Company, Inc. | $107,208 |
| | Group, Inc. ± | $2,301,481 | | 54,300 | PMI Group, Inc. | 870,429 |
| 2,300 | Apartment Investment & | | | 9,100 | PNC Financial Services | |
| | Management Company | 107,479 | | | Group, Inc. | 656,656 |
| 13,700 | Axis Capital Holdings, Ltd. | 544,438 | | 6,600 | Portfolio Recovery | |
| 56,800 | Bank of America Corporation ± | 2,742,304 | | | Associates, Inc. * | 297,726 |
| 17,400 | Bank of New York | | | 2,700 | ProLogis Trust | 193,698 |
| | Mellon Corporation ~ | 849,990 | | 7,800 | Prudential Financial, Inc. | 754,416 |
| 2,363 | CapitalSource, Inc. * | 43,054 | | 2,940 | Public Storage, Inc. | 238,052 |
| 20,600 | Center Financial Corporation | 263,474 | | 2,400 | Rayonier, Inc. REIT | 115,896 |
| 14,500 | Chubb Corporation ‡ | 773,575 | | 9,600 | Security Capital Assurance, Ltd. * | 125,952 |
| 8,100 | City National Corporation ‡ | 547,560 | | 3,000 | Simon Property Group, Inc. | 312,330 |
| 900 | CME Group, Inc. | 599,625 | | 100 | Sovran Self Storage, Inc. | 4,731 |
| 19,700 | CoBiz, Inc. ± | 351,645 | | 23,700 | U.S. Bancorp | 785,892 |
| 9,500 | Commerce Bancshares, Inc. | 448,115 | | 3,800 | UDR, Inc. | 90,212 |
| 10,800 | Cullen/Frost Bankers, Inc. | 574,344 | | 8,186 | Wachovia Corporation | 374,346 |
| 1,800 | Developers Diversified Realty | | | 2,300 | Weingarten Realty Investors | 87,998 |
| | Corporation | 90,720 | | 61,700 | Wells Fargo & Company ‡ | 2,098,417 |
| 23,000 | E*TRADE Financial Corporation #* | 256,220 | | 11,800 | Westamerica Bancorporation * | 567,344 |
|
|
| 19,200 | Encore Bancshares, Inc. # | 410,880 | | | Total Financials | 38,700,784 |
|
|
| 12,500 | Endurance Specialty Holdings, Ltd. | 490,125 | | | | |
| 300 | Entertainment Properties Trust | 16,461 | | Health Care (8.6%) | |
| 3,700 | Equity Residential REIT | 154,586 | | 40,100 | Abbott Laboratories ±‡ | 2,190,262 |
| 1,300 | Essex Property Trust, Inc. | 160,459 | | 10,100 | Aetna, Inc. ± | 567,317 |
| 14,000 | Federal Home Loan Mortgage | | | 533 | Amedisys, Inc. # | 22,640 |
| | Corporation | 731,220 | | 3,400 | AmerisourceBergen Corporation | 160,174 |
| 9,800 | Federal National Mortgage | | | 8,500 | Amylin Pharmaceuticals, Inc. #* | 382,670 |
| | Association | 558,992 | | 34,200 | Aspect Medical Systems, Inc. #* | 468,198 |
| 14,900 | First Midwest Bancorp, Inc. * | 501,832 | | 46,000 | BioMarin Pharmaceutical, Inc. #* | 1,275,580 |
| 7,600 | Franklin Resources, Inc. | 985,568 | | 6,100 | Cardinal Health, Inc. | 414,983 |
| 7,500 | Goldman Sachs Group, Inc. | 1,859,400 | | 7,400 | CIGNA Corporation ~ | 388,426 |
| 7,800 | Hartford Financial Services | | | 1,400 | Covance, Inc. # | 115,500 |
| | Group, Inc. | 756,834 | | 5,700 | Coventry Health Care, Inc. # | 343,767 |
| 14,000 | HCC Insurance Holdings, Inc. | 418,460 | | 30,200 | Cubist Pharmaceuticals, Inc. #* | 706,680 |
| 3,300 | Hospitality Properties Trust | 130,680 | | 43,400 | Dexcom, Inc. #* | 403,620 |
| 85,200 | J.P. Morgan Chase & Company | 4,004,400 | | 7,900 | Express Scripts, Inc. # | 498,490 |
| 400 | Kilroy Realty Corporation | 26,016 | | 28,700 | Gilead Sciences, Inc. # | 1,325,653 |
| 1 | Lincoln National Corporation | 61 | | 2,000 | Health Net, Inc. # | 107,220 |
| 2,300 | Mack-Cali Realty Corporation | 91,057 | | 1,700 | Henry Schein, Inc. # | 101,830 |
| 15,900 | Merrill Lynch & Company, Inc. | 1,049,718 | | 30,936 | Hologic, Inc. #* | 2,101,482 |
| 19,200 | Morgan Stanley | 1,291,392 | | 25,800 | Hospira, Inc. # | 1,066,314 |
| 41,700 | New York Community | | | 3,100 | Humana, Inc. # | 232,345 |
| | Bancorp, Inc. | 776,037 | | 24,100 | ImClone Systems, Inc. # | 1,039,915 |
| 9,800 | Northern Trust Corporation | 737,058 | | 7,900 | IMS Health, Inc. | 199,159 |
| 7,000 | Nymex Holdings, Inc. * | 899,640 | | 87,600 | Keryx BioPharmaceuticals, Inc. #* | 902,280 |
| 100 | Parkway Properties, Inc. | 4,300 | | 11,100 | Kyphon, Inc. # | 786,768 |
|
| The accompanying Notes to Financial Statements are an integral part of this schedule. |
|
| 143 |
| | | | | | |
| Balanced Fund | | | | | |
| Schedule of Investments as of October 31, 2007 | | | | | |
| |
| |
| Shares | Common Stock (66.8%) | Value | | Shares | Common Stock (66.8%) | Value |
|
| Health Care — continued | | | 14,000 | Kaydon Corporation | $753,060 |
| 2,300 | Laboratory Corporation of | | | 14,700 | Kirby Corporation # | 671,496 |
| | America Holdings # | $158,125 | | 13,400 | Ladish Company, Inc. # | 614,926 |
| 2,400 | Manor Care, Inc. | 159,792 | | 6,700 | Manitowoc Company, Inc. | 330,042 |
| 5,000 | McKesson Corporation | 330,500 | | 5,800 | Manpower, Inc. | 433,492 |
| 5,078 | Medco Health Solutions, Inc. # | 479,262 | | 19,400 | McDermott International, Inc. # | 1,184,564 |
| 3,600�� | Millipore Corporation #* | 279,540 | | 9,400 | Oshkosh Truck Corporation | 509,480 |
| 21,700 | Novartis AG ADR | 1,153,789 | | 36,500 | Pall Corporation | 1,462,555 |
| 59,400 | NuVasive, Inc. # | 2,541,726 | | 11,200 | Rockwell Collins, Inc. | 837,872 |
| 2,100 | Omnicare, Inc. | 61,950 | | 11,300 | Roper Industries, Inc. * | 800,153 |
| 2,300 | Patterson Companies, Inc. #± | 89,953 | | 9,500 | Thomas & Betts Corporation # | 532,095 |
| 283 | PharMerica Corporation # | 4,514 | | 16,600 | URS Corporation # | 1,026,046 |
| 100 | Psychiatric Solutions, Inc. # | 3,960 | | 27,900 | Waste Management, Inc. | 1,015,281 |
|
|
| 2,700 | Quest Diagnostics, Inc. * | 143,586 | | | Total Industrials | 25,692,309 |
|
|
| 25,000 | Sanofi-Aventis ADR | 1,100,250 | | | | |
| 13,600 | Shire Pharmaceuticals | | | Information Technology (11.9%) | |
| | Group plc ADR | 1,022,040 | | 15,100 | Accenture, Ltd. | 589,655 |
| 27,800 | St. Jude Medical, Inc. # | 1,132,294 | | 24,500 | ADC Telecommunications, Inc. # | 458,150 |
| 8,600 | Thermo Electron Corporation # | 505,766 | | 17,300 | Adobe Systems, Inc. # | 828,670 |
| 16,640 | UnitedHealth Group, Inc. | 817,856 | | 24,700 | Apple Computer, Inc. #±~ | 4,691,765 |
| 11,200 | Varian Medical Systems, Inc. # | 546,224 | | 30,800 | Applied Materials, Inc. ‡ | 598,136 |
| 29,600 | Vertex Pharmaceuticals, Inc. # | 957,264 | | 8,900 | Arrow Electronics, Inc. # | 355,822 |
| 11,200 | WellPoint, Inc. # | 887,376 | | 63,200 | AudioCodes, Ltd. #* | 411,432 |
|
| | |
| | Total Health Care | 28,177,040 | | 20,200 | Automatic Data Processing, Inc. | 1,001,112 |
|
| | |
| | | | | 34,200 | China GrenTech | |
| Industrials (7.8%) | | | | Corporation, Ltd. ADR #* | 344,394 |
| 19,300 | 3M Company | 1,666,748 | | 105,900 | Cisco Systems, Inc. #± | 3,501,054 |
| 250 | Allegiant Travel Company # | 9,005 | | 17,700 | Commvault Systems, Inc. #~ | 360,018 |
| 23,700 | American Commercial | | | 32,300 | Corning, Inc. | 783,921 |
| | Lines, Inc. #* | 353,367 | | 25,500 | eBay, Inc. # | 920,550 |
| 20,600 | American Reprographics | | | 53,000 | EMC Corporation # | 1,345,670 |
| | Company #* | 417,768 | | 10,700 | F5 Networks, Inc. # | 385,521 |
| 32,400 | BE Aerospace, Inc. # | 1,610,604 | | 10,100 | FormFactor, Inc. # | 395,011 |
| 10,400 | C.H. Robinson Worldwide, Inc. | 519,168 | | 2,670 | Google, Inc. # | 1,887,690 |
| 6,300 | Canadian National | | | 23,900 | Ingram Micro, Inc. # | 507,636 |
| | Railway Company ~ | 352,737 | | 14,200 | Insight Enterprises, Inc. # | 392,488 |
| 20,400 | Chicago Bridge and | | | 76,800 | Integrated Device | |
| | Iron Company | 1,020,000 | | | Technology, Inc. # | 1,031,424 |
| 18,500 | Cooper Industries, Ltd. | 969,215 | | 92,000 | Intel Corporation ± | 2,474,800 |
| 17,400 | Danaher Corporation | 1,490,658 | | 29,400 | Intersil Corporation | 891,996 |
| 16,700 | Emerson Electric Company | 872,909 | | 48,200 | Ixia # | 504,172 |
| 8,100 | Flowserve Corporation | 639,576 | | 13,700 | Juniper Networks, Inc. # | 493,200 |
| 15,700 | FTI Consulting, Inc. #* | 852,510 | | 53,400 | Microsoft Corporation | 1,965,654 |
| 73,500 | General Electric Company | 3,025,260 | | 7,800 | NAVTEQ Corporation # | 602,160 |
| 8,900 | Genlyte Group, Inc. # | 579,390 | | 17,400 | Network Appliance, Inc. # | 547,926 |
| 16,400 | Hub Group, Inc. # | 416,068 | | 24,000 | Nokia Oyj ADR ± | 953,280 |
| 26,200 | JB Hunt Transport Services, Inc. * | 726,264 | | 43,700 | Novell, Inc. # | 330,372 |
|
| The accompanying Notes to Financial Statements are an integral part of this schedule. |
|
| 144 |
| | | | | | |
| Balanced Fund | | | | | |
| Schedule of Investments as of October 31, 2007 | | | | | |
| |
| |
| Shares | Common Stock (66.8%) | Value | | Shares | Common Stock (66.8%) | Value |
|
| Information Technology — continued | | | Telecommunications Services (1.3%) | |
| 24,450 | NVIDIA Corporation # | $865,041 | | 57,800 | AT&T, Inc. ±‡ | $2,415,462 |
| 20,800 | ON Semiconductor Corporation # | 212,160 | | 8,100 | NII Holdings, Inc. # | 469,800 |
| 22,950 | OpNext, Inc. # | 273,105 | | 19,000 | Time Warner Telecom, Inc. # | 441,560 |
| 58,600 | Oracle Corporation # | 1,299,162 | | 21,000 | Verizon Communications, Inc. | 967,470 |
|
|
| 16,600 | Paychex, Inc. | 693,548 | | | Total Telecommunications | |
| 62,900 | Powerwave Technologies, Inc. #* | 349,724 | | | Services | 4,294,292 |
|
|
| 27,700 | Qimonda AG ADR #* | 267,582 | | | | |
| 19,100 | QUALCOMM, Inc. | 816,143 | | Utilities (2.5%) | |
| 800 | SAIC, Inc. # | 15,768 | | 13,100 | AES Corporation # | 280,471 |
| 34,300 | Tellabs, Inc. # | 302,183 | | 4,400 | Ameren Corporation | 237,864 |
| 56,500 | Texas Instruments, Inc. * | 1,841,900 | | 8,700 | American Electric Power | |
| 111,500 | TIBCO Software, Inc. # | 1,023,570 | | | Company, Inc. ± | 419,427 |
| 20,200 | Verifone Holdings, Inc. #* | 998,486 | | 5,400 | Consolidated Edison, Inc. ~ | 254,286 |
| 2,477 | Verigy, Ltd. # | 56,946 | | 4,000 | Constellation Energy Group, Inc. | 378,800 |
| 16,400 | VeriSign, Inc. # | 559,076 | | 7,800 | Dominion Resources, Inc. | 714,714 |
|
| | |
| | Total Information | | | 3,900 | DTE Energy Company * | 193,440 |
| | Technology | 39,128,073 | | 21,016 | Duke Energy Corporation | 402,877 |
|
| | |
| | | | | 7,200 | Edison International, Inc. | 418,248 |
| Materials (2.6%) | | | 4,600 | Entergy Corporation | 551,402 |
| 10,300 | Air Products and | | | 14,500 | Exelon Corporation | 1,200,310 |
| | Chemicals, Inc. ± | 1,007,855 | | 7,300 | FirstEnergy Corporation | 508,810 |
| 375 | Arkema ADR # | 25,477 | | 7,400 | PG&E Corporation | 362,082 |
| 23,000 | Bemis Company, Inc. | 647,680 | | 7,900 | PPL Corporation | 408,430 |
| 16,700 | Dow Chemical Company ± | 752,168 | | 5,700 | Progress Energy, Inc. | 273,600 |
| 15,800 | E.I. du Pont de Nemours | | | 5,600 | Public Service Enterprise | |
| | and Company | 782,258 | | | Group, Inc. | 535,360 |
| 8,900 | FMC Corporation ± | 511,750 | | 4,200 | Questar Corporation | 239,736 |
| 15,900 | Freeport-McMoRan Copper & | | | 5,700 | Sempra Energy | 350,607 |
| | Gold, Inc. | 1,871,112 | | 2,500 | Wisconsin Energy Corporation | 119,700 |
| 9,200 | Lubrizol Corporation | 624,496 | | 9,000 | Xcel Energy, Inc. ± | 202,950 |
|
|
| 16,200 | Praxair, Inc. | 1,384,776 | | | Total Utilities | 8,053,114 |
|
|
| 16,600 | Silgan Holdings, Inc. | 905,862 | | | | |
|
| | |
|
| | Total Materials | 8,513,434 | | | Total Common Stock | |
|
| | |
| | | | | | (cost $176,003,747) | 219,216,698 |
|
|
|
| The accompanying Notes to Financial Statements are an integral part of this schedule. |
|
| 145 |
| | | | |
| Balanced Fund | | | |
| Schedule of Investments as of October 31, 2007 | | | |
| |
| Principal | | Interest | Maturity | |
| Amount | Long-Term Fixed Income (38.7%) | Rate | Date | Value |
|
| Asset-Backed Securities (6.0%) | | | |
| $1,000,000 | AmeriCredit Automobile Receivables Trust †~« | 5.202% | 11/6/2007 | $996,938 |
| 633,185 | Bear Stearns Asset-Backed Securities, Inc. ±† | 5.112 | 11/25/2007 | 631,782 |
| 604,964 | Bear Stearns Mortgage Funding Trust †~ | 5.012 | 11/25/2007 | 440,486 |
| 1,000,000 | Chase Funding Issuance Trust | 4.960 | 9/17/2012 | 1,001,667 |
| 750,000 | Citibank Credit Card Issuance Trust | 5.650 | 9/20/2019 | 755,404 |
| 1,150,000 | Countrywide Asset-Backed Certificates ±« | 5.549 | 4/25/2036 | 1,138,175 |
| 1,000,000 | DaimlerChrysler Master Owner Trust †~ | 5.141 | 11/15/2007 | 999,146 |
| 1,000,000 | Discover Card Master Trust | 5.650 | 3/16/2020 | 1,001,034 |
| 1,000,000 | First Franklin Mortgage Loan Asset-Backed Certificates †~ | 4.982 | 11/25/2007 | 974,993 |
| 804,981 | First Horizon ABS Trust †« | 5.002 | 11/25/2007 | 755,624 |
| 1,000,000 | Ford Credit Floor Plan Master Owner Trust ±† | 5.271 | 11/15/2007 | 994,288 |
| 1,000,000 | GE Dealer Floorplan Master Note Trust †‡ | 5.037 | 11/20/2007 | 999,229 |
| 1,000,000 | GMAC Mortgage Corporation Loan Trust †« | 4.943 | 11/25/2007 | 994,358 |
| 1,100,000 | GMAC Mortgage Corporation Loan Trust †‡« | 4.962 | 11/25/2007 | 1,095,854 |
| 532,807 | Green Tree Financial Corporation | 6.330 | 11/1/2029 | 528,032 |
| 127,191 | Master Asset-Backed Securities Trust † | 4.952 | 11/25/2007 | 127,003 |
| 700,000 | Merna Re, Ltd. †≤ | 6.980 | 12/31/2007 | 699,020 |
| 388,020 | National Collegiate Student Loan Trust † | 4.932 | 11/25/2007 | 388,314 |
| 121,020 | Popular ABS Mortgage Pass-Through Trust † | 5.002 | 11/25/2007 | 120,852 |
| 157,073 | Popular ABS Mortgage Pass-Through Trust | 4.000 | 12/25/2034 | 154,874 |
| 1,500,000 | Renaissance Home Equity Loan Trust ‡ | 5.608 | 5/25/2036 | 1,483,460 |
| 439,075 | Residential Asset Securities Corporation | 4.160 | 7/25/2030 | 433,981 |
| 791,513 | Residential Funding Mortgage Securities II †« | 5.002 | 11/25/2007 | 781,439 |
| 241,306 | SLM Student Loan Trust † | 5.094 | 1/25/2008 | 240,828 |
| 1,000,000 | Textron Financial Floorplan Master Note Trust †≤ | 5.211 | 11/13/2007 | 999,505 |
| 921,613 | Wachovia Asset Securitization, Inc. †≤« | 5.013 | 11/25/2007 | 902,620 |
|
|
| | Total Asset-Backed Securities | | 19,638,906 |
|
|
| |
| Basic Materials (0.2%) | | | |
| 300,000 | Alcan, Inc. | 5.000 | 6/1/2015 | 288,552 |
| 500,000 | Precision Castparts Corporation ± | 5.600 | 12/15/2013 | 512,363 |
|
|
| | Total Basic Materials | | | 800,915 |
|
|
| |
| Capital Goods (0.7%) | | | |
| 310,000 | Caterpillar Financial Services Corporation ± | 5.850 | 9/1/2017 | 315,949 |
| 275,000 | Goodrich Corporation | 6.290 | 7/1/2016 | 285,558 |
| 500,000 | John Deere Capital Corporation ~ | 5.350 | 1/17/2012 | 502,921 |
| 120,000 | Lockheed Martin Corporation | 6.150 | 9/1/2036 | 123,445 |
| 750,000 | Oakmont Asset Trust ≤ | 4.514 | 12/22/2008 | 745,496 |
| 350,000 | United Technologies Corporation | 4.875 | 5/1/2015 | 338,608 |
|
|
| | Total Capital Goods | | | 2,311,977 |
|
|
| |
| Collateralized Mortgage Obligations (1.9%) | | | |
| 1,197,478 | Banc of America Mortgage Securities, Inc. | 4.802 | 9/25/2035 | 1,180,907 |
| 758,808 | HomeBanc Mortgage Trust | 5.987 | 4/25/2037 | 769,868 |
| 767,565 | J.P. Morgan Alternative Loan Trust | 5.796 | 3/25/2036 | 773,620 |
| 1,061,408 | Merrill Lynch Mortgage Investors, Inc. | 4.874 | 6/25/2035 | 1,057,406 |
|
| The accompanying Notes to Financial Statements are an integral part of this schedule. |
|
| 146 |
| | | | |
| Balanced Fund | | | |
| Schedule of Investments as of October 31, 2007 | | | |
| |
| Principal | | Interest | Maturity | |
| Amount | Long-Term Fixed Income (38.7%) | Rate | Date | Value |
|
| Collateralized Mortgage Obligations — continued | | | |
| $295,998 | National Collegiate Student Loan Trust ±† | 4.942% | 11/25/2007 | $295,983 |
| 770,925 | Thornburg Mortgage Securities Trust † | 4.963 | 11/25/2007 | 766,087 |
| 798,336 | Thornburg Mortgage Securities Trust † | 4.983 | 11/25/2007 | 788,633 |
| 478,450 | Zuni Mortgage Loan Trust † | 5.003 | 11/25/2007 | 475,273 |
|
|
| | Total Collateralized Mortgage Obligations | 6,107,777 |
|
|
| |
| Commercial Mortgage-Backed Securities (5.7%) | | | |
| 597,461 | Banc of America Commercial Mortgage, Inc. ± | 4.037 | 11/10/2039 | 589,421 |
| 1,500,000 | Bear Stearns Commercial Mortgage Securities, Inc. †‡ | 5.241 | 11/15/2007 | 1,489,366 |
| 1,000,000 | Bear Stearns Commercial Mortgage Securities, Inc. ± | 4.487 | 2/11/2041 | 977,412 |
| 500,000 | Bear Stearns Commercial Mortgage Securities, Inc. | 5.835 | 9/11/2042 | 501,166 |
| 177,862 | Citigroup Commercial Mortgage Trust †≤ | 5.161 | 11/15/2007 | 177,508 |
| 1,500,000 | Commercial Mortgage Pass-Through Certificates †‡≤ | 5.053 | 11/15/2007 | 1,484,426 |
| 33,510 | Commercial Mortgage Pass-Through Certificates †≤ | 5.191 | 11/15/2007 | 33,460 |
| 1,000,000 | Commercial Mortgage Pass-Through Certificates †‡≤ | 5.221 | 11/15/2007 | 988,247 |
| 1,500,000 | Credit Suisse Mortgage Capital Certificates †~≤ | 5.261 | 11/15/2007 | 1,492,509 |
| 1,500,000 | Crown Castle International Corporation ±≤ | 5.245 | 11/15/2036 | 1,494,870 |
| 921,470 | First Union National Bank Commercial Mortgage Trust ~ | 7.390 | 12/15/2031 | 956,041 |
| 1,500,000 | Goldman Sachs Mortgage Securities Corporation ‡ | 5.560 | 11/10/2039 | 1,492,434 |
| 1,000,000 | GS Mortgage Securities Corporation II † | 5.252 | 11/6/2007 | 991,756 |
| 1,000,000 | LB-UBS Commercial Mortgage Trust | 3.086 | 5/15/2027 | 989,422 |
| 1,250,000 | Merrill Lynch Mortgage Trust | 4.099 | 11/15/2010 | 1,249,144 |
| 1,000,000 | Merrill Lynch Mortgage Trust | 5.442 | 1/12/2044 | 979,194 |
| 1,184,570 | Morgan Stanley Capital I, Inc. ± | 6.210 | 11/15/2031 | 1,189,869 |
| 1,000,000 | TIAA Real Estate CDO, Ltd. | 5.823 | 8/15/2039 | 1,012,898 |
| 709,098 | Washington Mutual Asset Securities Corporation ≤ | 3.830 | 1/25/2035 | 693,700 |
|
|
| | Total Commercial Mortgage-Backed Securities | 18,782,843 |
|
|
| |
| Communications Services (0.7%) | | | |
| 125,000 | AT&T, Inc. | 6.500 | 9/1/2037 | 131,852 |
| 150,000 | British Telecom plc ± | 9.125 | 12/15/2030 | 202,846 |
| 330,000 | Comcast Corporation ± | 5.875 | 2/15/2018 | 329,361 |
| 140,000 | New Cingular Wireless Services, Inc. ‡ | 8.750 | 3/1/2031 | 181,030 |
| 125,000 | News America, Inc. | 6.400 | 12/15/2035 | 124,183 |
| 220,000 | Rogers Cable, Inc. | 5.500 | 3/15/2014 | 215,041 |
| 280,000 | Rogers Cable, Inc. | 6.750 | 3/15/2015 | 292,169 |
| 40,000 | Rogers Cable, Inc. | 8.750 | 5/1/2032 | 48,918 |
| 225,000 | Sprint Capital Corporation | 6.900 | 5/1/2019 | 225,015 |
| 350,000 | Telecom Italia Capital SA | 5.250 | 11/15/2013 | 343,642 |
| 245,000 | Verizon Communications, Inc. | 5.550 | 2/15/2016 | 246,446 |
|
|
| | Total Communications Services | | 2,340,503 |
|
|
| |
| Consumer Cyclical (0.5%) | | | |
| 320,000 | D.R. Horton, Inc. | 6.500 | 4/15/2016 | 290,552 |
| 375,000 | Ford Motor Credit Company | 6.625 | 6/16/2008 | 373,324 |
| 275,000 | JC Penney Corporation, Inc. | 5.750 | 2/15/2018 | 266,275 |
| 250,000 | Nissan Motor Acceptance Corporation | 4.625 | 3/8/2010 | 247,818 |
|
| The accompanying Notes to Financial Statements are an integral part of this schedule. |
|
| 147 |
| | | | |
| Balanced Fund | | | |
| Schedule of Investments as of October 31, 2007 | | | |
| |
| Principal | | Interest | Maturity | |
| Amount | Long-Term Fixed Income (38.7%) | Rate | Date | Value |
|
| Consumer Cyclical — continued | | | |
| $315,000 | Nissan Motor Acceptance Corporation ≤ | 5.625% | 3/14/2011 | $320,009 |
| 230,000 | Walmart Stores, Inc. | 5.875 | 4/5/2027 | 225,424 |
|
|
| | Total Consumer Cyclical | | 1,723,402 |
|
|
| |
| Consumer Non-Cyclical (0.6%) | | | |
| 230,000 | Baxter International, Inc. ± | 5.900 | 9/1/2016 | 235,213 |
| 250,000 | Johnson & Johnson Company | 5.950 | 8/15/2037 | 261,465 |
| 200,000 | Kroger Company | 6.400 | 8/15/2017 | 208,081 |
| 170,000 | Procter & Gamble Company | 5.550 | 3/5/2037 | 166,847 |
| 300,000 | Schering-Plough Corporation | 6.000 | 9/15/2017 | 305,131 |
| 200,000 | Tesco plc §≤ | 5.500 | 11/15/2017 | 197,738 |
| 150,000 | United Health Group ≤ | 6.500 | 6/15/2037 | 153,787 |
| 250,000 | Wyeth ± | 6.950 | 3/15/2011 | 264,703 |
| 100,000 | Wyeth | 5.950 | 4/1/2037 | 98,898 |
|
|
| | Total Consumer Non-Cyclical | | 1,891,863 |
|
|
| |
| Energy (0.2%) | | | |
| 265,000 | Nexen, Inc. | 5.650 | 5/15/2017 | 259,859 |
| 375,000 | Ras Laffan Liquefied Natural Gas Company, Ltd. II ≤ | 5.298 | 9/30/2020 | 362,130 |
|
|
| | Total Energy | | | 621,989 |
|
|
| |
| Financials (4.6%) | | | |
| 250,000 | American Express Company | 6.150 | 8/28/2017 | 254,962 |
| 230,000 | American International Group, Inc. | 6.250 | 3/15/2037 | 214,040 |
| 25,000 | BAC Capital Trust XI | 6.625 | 5/23/2036 | 25,376 |
| 300,000 | BAC Capital Trust XIV ± | 5.630 | 3/15/2012 | 283,012 |
| 200,000 | Bear Stearns Companies, Inc. | 6.400 | 10/2/2017 | 199,351 |
| 110,000 | Capital One Capital III | 7.686 | 8/15/2036 | 106,618 |
| 350,000 | Capmark Financial Group, Inc. ~≤ | 5.875 | 5/10/2012 | 314,218 |
| 100,000 | Capmark Financial Group, Inc. ≤ | 6.300 | 5/10/2017 | 81,780 |
| 500,000 | Citigroup, Inc. | 5.300 | 10/17/2012 | 501,474 |
| 375,000 | Corestates Capital Trust I ±≤ | 8.000 | 12/15/2026 | 388,425 |
| 330,000 | Countrywide Financial Corporation ± | 5.800 | 6/7/2012 | 284,136 |
| 675,000 | Countrywide Financial Corporation, Convertible ±†≤ | 1.743 | 1/15/2008 | 597,510 |
| 200,000 | General Electric Capital Corporation | 5.720 | 8/22/2011 | 200,883 |
| 555,000 | General Electric Capital Corporation | 4.375 | 3/3/2012 | 539,065 |
| 120,000 | General Electric Capital Corporation | 5.625 | 9/15/2017 | 121,170 |
| 130,000 | General Motors Acceptance Corporation | 6.875 | 9/15/2011 | 119,810 |
| 500,000 | General Motors Acceptance Corporation, LLC | 6.000 | 12/15/2011 | 443,628 |
| 450,000 | Goldman Sachs Group, Inc. | 5.125 | 1/15/2015 | 435,045 |
| 150,000 | Goldman Sachs Group, Inc. | 6.750 | 10/1/2037 | 150,566 |
| 165,000 | HSBC Holdings plc | 6.500 | 5/2/2036 | 162,892 |
| 390,000 | International Lease Finance Corporation | 5.750 | 6/15/2011 | 393,890 |
| 375,000 | iStar Financial, Inc. | 5.850 | 3/15/2017 | 334,567 |
| 300,000 | J.P. Morgan Chase Bank NA | 5.875 | 6/13/2016 | 303,511 |
| 425,000 | Keybank National Association | 5.500 | 9/17/2012 | 422,858 |
|
| The accompanying Notes to Financial Statements are an integral part of this schedule. |
|
| 148 |
| | | | |
| Balanced Fund | | | |
| Schedule of Investments as of October 31, 2007 | | | |
| |
| Principal | | Interest | Maturity | |
| Amount | Long-Term Fixed Income (38.7%) | Rate | Date | Value |
|
| Financials — continued | | | |
| $500,000 | KeyCorp ± | 4.700% | 5/21/2009 | $496,940 |
| 500,000 | Lehman Brothers Holdings, Inc. | 5.250 | 2/6/2012 | 493,268 |
| 135,000 | Lehman Brothers Holdings, Inc. | 7.000 | 9/27/2027 | 137,869 |
| 200,000 | Liberty Property, LP | 5.500 | 12/15/2016 | 188,261 |
| 250,000 | Lincoln National Corporation | 7.000 | 5/17/2016 | 256,781 |
| 185,000 | Merrill Lynch & Company, Inc. | 6.050 | 5/16/2016 | 183,419 |
| 215,000 | Mitsubishi UFG Capital Finance, Ltd. | 6.346 | 7/25/2016 | 204,990 |
| 210,000 | Morgan Stanley | 6.250 | 8/9/2026 | 206,977 |
| 375,000 | Nationwide Health Properties, Inc. | 6.250 | 2/1/2013 | 377,514 |
| 525,000 | ProLogis ± | 5.500 | 4/1/2012 | 518,381 |
| 225,000 | Prudential Financial, Inc. | 6.100 | 6/15/2017 | 227,306 |
| 100,000 | Prudential Financial, Inc. | 5.700 | 12/14/2036 | 92,786 |
| 300,000 | Reinsurance Group of America, Inc. | 5.625 | 3/15/2017 | 292,245 |
| 660,000 | Residential Capital Corporation ±† | 7.314 | 11/2/2007 | 514,800 |
| 435,000 | Residential Capital Corporation ± | 7.500 | 4/17/2013 | 317,550 |
| 380,000 | Residential Capital, LLC | 7.500 | 6/1/2012 | 277,400 |
| 350,000 | Royal Bank of Scotland Group plc ≤ | 6.990 | 10/5/2017 | 353,744 |
| 200,000 | Santander Perpetual SA Unipersonal ≤ | 6.671 | 10/24/2017 | 199,157 |
| 500,000 | Simon Property Group, LP ± | 4.600 | 6/15/2010 | 490,918 |
| 275,000 | Simon Property Group, LP | 5.375 | 6/1/2011 | 274,519 |
| 335,000 | Student Loan Marketing Corporation | 4.500 | 7/26/2010 | 313,657 |
| 275,000 | Swiss RE Capital I, LP ≤ | 6.854 | 5/25/2016 | 277,367 |
| 105,000 | Travelers Companies, Inc. | 6.250 | 6/15/2037 | 103,595 |
| 285,000 | Wachovia Bank NA | 4.875 | 2/1/2015 | 271,820 |
| 495,000 | Wachovia Capital Trust III | 5.800 | 3/15/2011 | 491,066 |
| 55,000 | Washington Mutual Preferred Funding ≤ | 6.665 | 12/15/2016 | 41,800 |
| 600,000 | Washington Mutual Preferred Funding II ≤ | 6.895 | 6/15/2012 | 456,000 |
| 220,000 | Willis North America, Inc. | 6.200 | 3/28/2017 | 222,009 |
|
|
| | Total Financials | | | 15,160,926 |
|
|
| |
| Mortgage-Backed Securities (9.9%) | | | |
| 15,225,000 | Federal National Mortgage Association | | | |
| | Conventional 30-Yr. Pass Through §~ | 5.500 | 11/1/2037 | 15,001,375 |
| 12,375,000 | Federal National Mortgage Association | | | |
| | Conventional 30-Yr. Pass Through § | 6.000 | 11/1/2037 | 12,463,952 |
| 5,000,000 | Federal National Mortgage Association | | | |
| | Conventional 30-Yr. Pass Through § | 6.500 | 11/1/2037 | 5,117,190 |
|
|
| | Total Mortgage-Backed Securities | | 32,582,517 |
|
|
| |
| Technology (0.2%) | | | |
| 500,000 | International Business Machines Corporation | 5.700 | 9/14/2017 | 507,493 |
|
|
| | Total Technology | | | 507,493 |
|
|
|
| The accompanying Notes to Financial Statements are an integral part of this schedule. |
|
| 149 |
| | | | |
| Balanced Fund | | | |
| Schedule of Investments as of October 31, 2007 | | | |
| |
| Principal | | Interest | Maturity | |
| Amount | Long-Term Fixed Income (38.7%) | Rate | Date | Value |
|
| Transportation (1.1%) | | | |
| $175,000 | Burlington Northern Santa Fe Corporation ± | 7.000% | 12/15/2025 | $189,095 |
| 350,000 | Continental Airlines, Inc. ± | 5.983 | 4/19/2022 | 344,074 |
| 450,000 | Delta Air Lines, Inc. ~ | 7.111 | 9/18/2011 | 459,562 |
| 357,245 | FedEx Corporation ~ | 6.720 | 1/15/2022 | 374,393 |
| 200,000 | Norfolk Southern Corporation | 5.640 | 5/17/2029 | 185,763 |
| 1,000,000 | Northwest Airlines, Inc. | 6.841 | 4/1/2011 | 1,008,750 |
| 625,000 | Southwest Airlines Company ^ | 6.150 | 8/1/2022 | 632,836 |
| 450,000 | Union Pacific Corporation | 6.125 | 1/15/2012 | 460,807 |
|
|
| | Total Transportation | | | 3,655,280 |
|
|
| |
| U.S. Government (5.6%) | | | |
| 750,000 | Federal Home Loan Mortgage Corporation * | 5.000 | 12/14/2018 | 735,175 |
| 210,000 | U.S. Treasury Bonds * | 4.750 | 2/15/2037 | 209,885 |
| 2,000,000 | U.S. Treasury Notes * | 4.875 | 7/31/2011 | 2,057,968 |
| 7,200,000 | U.S. Treasury Notes * | 4.875 | 2/15/2012 | 7,426,123 |
| 450,000 | U.S. Treasury Notes * | 4.250 | 8/15/2013 | 451,265 |
| 2,965,000 | U.S. Treasury Notes ‡ | 4.125 | 5/15/2015 | 2,923,072 |
| 4,412,360 | U.S. Treasury Notes, TIPS * | 2.000 | 7/15/2014 | 4,410,983 |
|
|
| | Total U.S. Government | | | 18,214,471 |
|
|
| |
| Utilities (0.8%) | | | |
| 300,000 | CenterPoint Energy Resources Corporation | 6.125 | 11/1/2017 | 300,796 |
| 245,000 | Cleveland Electric Illuminating Company ± | 5.700 | 4/1/2017 | 239,433 |
| 220,000 | Commonwealth Edison Company ± | 5.400 | 12/15/2011 | 220,693 |
| 300,000 | Exelon Corporation ~ | 6.750 | 5/1/2011 | 312,604 |
| 225,000 | MidAmerican Energy Holdings Company | 6.500 | 9/15/2037 | 230,754 |
| 175,000 | Plains All American Pipeline, LP/PAA Finance Corporation | 6.650 | 1/15/2037 | 178,392 |
| 470,118 | Power Receivables Finance, LLC £ | 6.290 | 1/1/2012 | 484,363 |
| 230,000 | PSI Energy, Inc. ± | 5.000 | 9/15/2013 | 224,075 |
| 350,000 | Union Electric Company | 6.400 | 6/15/2017 | 368,732 |
| 195,000 | Virginia Electric & Power Company | 6.000 | 1/15/2036 | 191,649 |
|
|
| | Total Utilities | | | 2,751,491 |
|
|
| | Total Long-Term Fixed Income (cost $127,390,950) | 127,092,353 |
|
|
| |
| | | Strike | Expiration | |
| Contracts | Options Purchased (<0.1%) | Price | Date | Value |
|
| 150 | Call on U.S. Treasury Bond Futures | $110 | 11/21/2007 | $89,062 |
| 20 | Put on Crude Oil Futures | 85 | 12/7/2007 | 29,200 |
|
|
| | Total Options Purchased (cost $194,270) | 118,262 |
|
|
| |
| | | Interest | Maturity | |
| Shares | Collateral Held for Securities Loaned (12.1%) | Rate (+) | Date | Value |
|
| 39,692,963 | Thrivent Financial Securities Lending Trust | 5.050% | N/A | $39,692,963 |
|
|
| | Total Collateral Held for Securities Loaned | |
| | (cost $39,692,963) | | | 39,692,963 |
|
|
|
| The accompanying Notes to Financial Statements are an integral part of this schedule. |
|
| 150 |
| | | | |
| Balanced Fund | | | |
| Schedule of Investments as of October 31, 2007 | | | |
| |
| | | Interest | Maturity | |
| Shares | Short-Term Investments (4.3%) | Rate (+) | Date | Value |
|
| 14,248,100 | Thrivent Money Market Fund | 5.020% | N/A | $14,248,100 |
|
|
| | Total Short-Term Investments (at amortized cost) | 14,248,100 |
|
|
| | Total Investments (cost $357,530,030) 121.9% | $400,368,376 |
|
|
| | Other Assets and Liabilities, Net (21.9%) | | (72,010,877) |
|
|
| | Total Net Assets 100.0% | | | $328,357,499 |
|
|
| | | | | |
| | Number of | | Notional | | |
| | Contracts | Expiration | Principal | | Unrealized |
| Futures | Long/(Short) | Date | Amount | Value | Gain/(Loss) |
|
| 10-Yr. U.S. Treasury Bond Futures | (115) | December 2007 | ($12,626,290) | ($12,651,797) | ($25,507) |
| 20-Yr. U.S. Treasury Bond Futures | 15 | December 2007 | 1,676,647 | 1,688,905 | 12,258 |
| Total Futures | | | | | ($13,249) |
| |
| | Number of | Exercise | Expiration | | Unrealized |
| Call Options Written | Contracts | Price | Date | Value | Gain/(Loss) |
|
| Federal National Mortgage Association | | | | | |
| Conventional 30-Yr. Pass Through | 6 | $99.19 | November 2007 | ($9,375) | $9,375 |
| Total Call Options Written | | | | | $9,375 |
# Non-income producing security.
* All or a portion of the security is on loan as discussed in item 2(M) of the Notes to Financial Statements.
+ The interest rate shown reflects the yield, coupon rate or, for securities purchased at a discount, the discount rate at the date of purchase.
† Denotes variable rate obligations for which the current yield and next scheduled reset date are shown.
^ Security is fair valued as discussed in item 2(A) of the Notes to Financial Statements.
§ Denotes investments purchased on a when-issued or delayed delivery basis.
± Designated as cover for long settling trades as discussed in the Notes to Financial Statements.
‡ At October 31, 2007, $1,380,203 of investments were held on deposit with the counterparty and pledged as the initial margin deposit for open financial futures contracts. In addition, $21,393,081 of investments were earmarked as collateral to cover open financial futures contracts.
~ All or a portion of the security was earmarked as collateral to cover options.
≤ Denotes securities sold under Rule 144A of the Securities Act of 1933, which exempts them from registration. These securities have been determined to be liquid under the guidelines established by the Fund’s Board of Trustees and may be resold to other dealers in the program or to other qualified institutional buyers. As of October 31, 2007, the value of these investments was $13,939,388 or 4.25% of total net assets.
« All or a portion of the security is insured or guaranteed.
Definitions:
ADR — American Depository Receipts, which are certificates for shares of an underlying foreign security’s shares held by an issuing U.S. depository bank.
REIT — Real Estate Investment Trust, is a company that buys, develops, manages and/or sells real estate assets.
TIPS — Treasury Inflation Protected Security.
Gross unrealized appreciation and depreciation of investments, based on cost for federal income tax purposes, were as follows:
| | |
| Gross unrealized appreciation | $50,505,568 | |
| Gross unrealized depreciation | (8,506,097) | |
|
| |
| Net unrealized appreciation (depreciation) | $41,999,471 | |
| Cost for federal income tax purposes | $358,368,905 | |
|
| The accompanying Notes to Financial Statements are an integral part of this schedule. |
|
| 151 |
| | | | |
| High Yield Fund |
| Schedule of Investments as of October 31, 2007 |
| Principal | | Interest | Maturity | |
| Amount | Bank Loans (2.3%) | Rate | Date | Value |
|
| Technology (1.4%) | | | |
| $3,215,000 | First Data Corporation, Term Loan | 7.960% | 9/24/2014 | $3,093,216 |
| 5,000,000 | Flextronics Semiconductor, Ltd., Term Loan §≠ | 7.481 | 10/1/2012 | 4,957,500 |
|
|
| | Total Technology | | | 8,050,716 |
|
|
| |
| Utilities (0.9%) | | | |
| 2,250,000 | Energy Future Holdings, Term Loan | 9.224 | 10/10/2014 | 2,249,752 |
| 2,700,000 | Energy Future Holdings, Term Loan §≠ | 9.224 | 10/10/2014 | 2,699,703 |
|
|
| | Total Utilities | | | 4,949,455 |
|
|
| | Total Bank Loans (cost $12,994,176) | | 13,000,171 |
|
|
| |
| |
| Principal | | Interest | Maturity | |
| Amount | Long-Term Fixed Income (93.4%) | Rate | Date | Value |
|
| Basic Materials (10.1%) | | | |
| $1,610,000 | Aleris International, Inc. | 9.000% | 12/15/2014 | $1,453,025 |
| 2,070,000 | Aleris International, Inc. | 10.000 | 12/15/2016 | 1,821,600 |
| 2,585,000 | Arch Western Finance, LLC | 6.750 | 7/1/2013 | 2,520,375 |
| 1,517,000 | Buckeye Technologies, Inc. | 8.000 | 10/15/2010 | 1,509,415 |
| 2,360,000 | Domtar, Inc. * | 7.125 | 8/1/2015 | 2,336,400 |
| 2,155,000 | Drummond Company, Inc. ≤ | 7.375 | 2/15/2016 | 2,025,700 |
| 1,029,000 | Equistar Chemicals, LP | 10.625 | 5/1/2011 | 1,075,305 |
| 2,965,000 | FMG Finance, Pty. Ltd. ≤ | 10.625 | 9/1/2016 | 3,513,525 |
| 3,025,000 | Freeport-McMoRan Copper & Gold, Inc. | 8.375 | 4/1/2017 | 3,312,375 |
| 1,400,000 | Georgia-Pacific Corporation | 8.125 | 5/15/2011 | 1,428,000 |
| 1,805,000 | Georgia-Pacific Corporation ≤ | 7.125 | 1/15/2017 | 1,759,875 |
| 3,540,000 | Graphic Packaging International Corporation * | 9.500 | 8/15/2013 | 3,717,000 |
| 2,965,000 | Griffin Coal Mining Company, Pty. Ltd. ≤ | 9.500 | 12/1/2016 | 2,935,350 |
| 2,620,000 | Huntsman International, LLC | 7.875 | 11/13/2014 | 2,816,500 |
| 2,760,000 | Ineos Group Holdings plc *≤ | 8.500 | 2/15/2016 | 2,622,000 |
| 1,300,000 | Jefferson Smurfit Corporation | 8.250 | 10/1/2012 | 1,300,000 |
| 2,590,000 | Lyondell Chemical Company | 10.500 | 6/1/2013 | 2,790,725 |
| 1,210,000 | Lyondell Chemical Company | 8.250 | 9/15/2016 | 1,382,425 |
| 1,210,000 | Lyondell Chemical Company | 6.875 | 6/15/2017 | 1,331,000 |
| 1,720,000 | Mosaic Global Holdings, Inc., Convertible >≤ | 7.375 | 12/1/2007 | 1,818,900 |
| 4,140,000 | Nell AF SARL ≤ | 8.375 | 8/15/2015 | 3,705,300 |
| 1,380,000 | PNA Group, Inc. | 10.750 | 9/1/2016 | 1,411,050 |
| 860,000 | PNA Intermediate Holdings Corporation †≤ | 12.558 | 11/15/2007 | 844,950 |
| 1,840,000 | Smurfit-Stone Container Enterprises, Inc. * | 8.000 | 3/15/2017 | 1,828,500 |
| 1,460,000 | Southern Copper Corporation | 7.500 | 7/27/2035 | 1,591,400 |
| 3,200,000 | Terra Capital, Inc. | 7.000 | 2/1/2017 | 3,200,000 |
|
|
| | Total Basic Materials | | | 56,050,695 |
|
|
| |
| Capital Goods (8.0%) | | | |
| 3,610,000 | Allied Waste North America, Inc. ± | 7.875 | 4/15/2013 | 3,718,300 |
| 1,300,000 | Ashtead Capital, Inc. ಠ| 9.000 | 8/15/2016 | 1,261,000 |
| 2,155,000 | Ball Corporation ‡ | 6.625 | 3/15/2018 | 2,133,450 |
|
| The accompanying Notes to Financial Statements are an integral part of this schedule. |
|
| 152 |
| | | | |
| High Yield Fund | | | |
| Schedule of Investments as of October 31, 2007 | | | |
| |
| Principal | | Interest | Maturity | |
| Amount | Long-Term Fixed Income (93.4%) | Rate | Date | Value |
|
| Capital Goods — continued | | | |
| $2,135,000 | Berry Plastics Holding Corporation ‡ | 8.875% | 9/15/2014 | $2,188,375 |
| 1,560,000 | Case New Holland, Inc. ± | 7.125 | 3/1/2014 | 1,614,600 |
| 1,830,000 | Crown Americas, Inc. | 7.625 | 11/15/2013 | 1,862,025 |
| 1,830,000 | Crown Americas, Inc. | 7.750 | 11/15/2015 | 1,884,900 |
| 2,600,000 | Da-Lite Screen Company, Inc. ± | 9.500 | 5/15/2011 | 2,720,250 |
| 860,000 | General Cable Corporation | 7.125 | 4/1/2017 | 860,000 |
| 1,630,000 | Graham Packaging Company, Inc. * | 9.875 | 10/15/2014 | 1,613,700 |
| 850,000 | Legrand SA | 8.500 | 2/15/2025 | 994,500 |
| 2,010,000 | Mueller Water Products, Inc. | 7.375 | 6/1/2017 | 1,869,300 |
| 1,760,000 | Norcraft Companies, LP/Norcraft Finance Corporation * | 9.000 | 11/1/2011 | 1,804,000 |
| 1,230,000 | Owens-Brockway Glass Container, Inc. * | 8.250 | 5/15/2013 | 1,279,200 |
| 4,320,000 | Owens-Illinois, Inc. * | 7.500 | 5/15/2010 | 4,374,000 |
| 3,055,000 | Plastipak Holdings, Inc. ≤ | 8.500 | 12/15/2015 | 3,146,650 |
| 3,385,000 | RBS Global, Inc./Rexnord Corporation | 9.500 | 8/1/2014 | 3,495,012 |
| 3,535,000 | Rental Services Corporation * | 9.500 | 12/1/2014 | 3,398,019 |
| 1,400,000 | TransDigm, Inc. | 7.750 | 7/15/2014 | 1,424,500 |
| 2,760,000 | United Rentals North America, Inc. | 7.000 | 2/15/2014 | 2,925,600 |
|
|
| | Total Capital Goods | | | 44,567,381 |
|
|
| |
| Communications Services (18.3%) | | | |
| 4,250,000 | American Tower Corporation *≤ | 7.000 | 10/15/2017 | 4,345,625 |
| 2,160,000 | Block Communications, Inc. ಠ| 8.250 | 12/15/2015 | 2,170,800 |
| 2,200,000 | CCH II, LLC/CCH II Capital Corporation | 10.250 | 10/1/2013 | 2,266,000 |
| 2,160,000 | Centennial Communications Corporation * | 8.125 | 2/1/2014 | 2,203,200 |
| 4,790,000 | Charter Communications Holdings, LLC * | 8.750 | 11/15/2013 | 4,790,000 |
| 2,915,000 | Citizens Communications Company ‡ | 9.250 | 5/15/2011 | 3,184,638 |
| 1,120,000 | Dex Media West, LLC/Dex Media West | | | |
| | Finance Company | 9.875 | 8/15/2013 | 1,194,200 |
| 2,915,000 | Dobson Cellular Systems | 9.875 | 11/1/2012 | 3,155,488 |
| 2,965,000 | Idearc, Inc. | 8.000 | 11/15/2016 | 2,972,412 |
| 2,820,000 | Intelsat Bermuda, Ltd. † | 8.886 | 1/15/2008 | 2,862,300 |
| 1,210,000 | Intelsat Bermuda, Ltd. | 9.250 | 6/15/2016 | 1,255,375 |
| 3,000,000 | Intelsat Intermediate, Inc. > | Zero Coupon | 2/1/2010 | 2,467,500 |
| 2,140,000 | Intelsat Subsidiary Holding Company, Ltd. | 8.625 | 1/15/2015 | 2,172,100 |
| 1,505,000 | Lamar Media Corporation | 6.625 | 8/15/2015 | 1,444,800 |
| 1,360,000 | Lamar Media Corporation ≤ | 6.625 | 8/15/2015 | 1,302,200 |
| 1,800,000 | Level 3 Financing, Inc. | 12.250 | 3/15/2013 | 1,926,000 |
| 3,380,000 | Level 3 Financing, Inc. | 9.250 | 11/1/2014 | 3,185,650 |
| 5,270,000 | MetroPCS Wireless, Inc. ≤ | 9.250 | 11/1/2014 | 5,230,475 |
| 1,405,000 | Morris Publishing Group, LLC | 7.000 | 8/1/2013 | 1,078,338 |
| 4,010,000 | NTL Cable plc | 9.125 | 8/15/2016 | 4,230,550 |
| 2,500,000 | Quebecor Media, Inc. ≤ | 7.750 | 3/15/2016 | 2,412,500 |
| 2,400,000 | Quebecor World, Inc. ≤ | 9.750 | 1/15/2015 | 2,340,000 |
| 1,080,000 | Qwest Communications International, Inc. * | 7.500 | 2/15/2014 | 1,093,500 |
| 3,860,000 | Qwest Corporation | 7.875 | 9/1/2011 | 4,072,300 |
| 1,230,000 | Qwest Corporation | 7.625 | 6/15/2015 | 1,294,575 |
| 5,865,000 | R.H. Donnelley Corporation * | 6.875 | 1/15/2013 | 5,513,100 |
|
| The accompanying Notes to Financial Statements are an integral part of this schedule. |
|
| 153 |
| | | | |
| High Yield Fund | | | |
| Schedule of Investments as of October 31, 2007 | | | |
| |
| Principal | | Interest | Maturity | |
| Amount | Long-Term Fixed Income (93.4%) | Rate | Date | Value |
|
| Communications Services — continued | | | |
| $2,175,000 | R.H. Donnelley Corporation * | 8.875% | 1/15/2016 | $2,175,000 |
| 2,740,000 | R.H. Donnelley Corporation *≤ | 8.875 | 10/15/2017 | 2,740,000 |
| 3,910,000 | Readers Digest Association, Inc. ≤ | 9.000 | 2/15/2017 | 3,484,788 |
| 1,610,000 | Rural Cellular Corporation †≤ | 8.621 | 12/1/2007 | 1,644,212 |
| 1,515,000 | Rural Cellular Corporation | 9.875 | 2/1/2010 | 1,579,388 |
| 4,380,000 | Time Warner Telecom Holdings, Inc. | 9.250 | 2/15/2014 | 4,549,725 |
| 5,510,000 | TL Acquisitions, Inc. *≤ | 10.500 | 1/15/2015 | 5,482,450 |
| 3,910,000 | Umbrella Acquisition *≤ | 9.750 | 3/15/2015 | 3,831,800 |
| 4,000,000 | Videotron Ltee | 6.875 | 1/15/2014 | 3,990,000 |
| 1,080,000 | Windstream Corporation | 8.625 | 8/1/2016 | 1,155,600 |
| 1,600,000 | Windstream Corporation | 7.000 | 3/15/2019 | 1,576,000 |
|
|
| | Total Communications Services | | 102,372,589 |
|
|
| |
| Consumer Cyclical (18.2%) | | | |
| 1,470,000 | Allied Security Escrow Corporation ‡ | 11.375 | 7/15/2011 | 1,403,850 |
| 1,105,000 | Beazer Homes USA, Inc. * | 8.625 | 5/15/2011 | 906,100 |
| 2,510,000 | Buhrmann U.S., Inc. | 7.875 | 3/1/2015 | 2,415,875 |
| 1,930,000 | Burlington Coat Factory Warehouse Corporation * | 11.125 | 4/15/2014 | 1,756,300 |
| 2,680,000 | Circus & Eldorado Joint Venture/Silver Legacy | | | |
| | Capital Corporation | 10.125 | 3/1/2012 | 2,787,200 |
| 3,680,000 | Claire’s Stores, Inc. *≤ | 10.500 | 6/1/2017 | 2,796,800 |
| 1,489,000 | Dollarama Group, LP †≤ | 11.159 | 12/17/2007 | 1,489,000 |
| 3,250,000 | Dollarama Group, LP ± | 8.875 | 8/15/2012 | 3,306,875 |
| 3,890,000 | Fontainebleau Las Vegas Holdings, LLC ≤ | 10.250 | 6/15/2015 | 3,637,150 |
| 2,960,000 | Ford Motor Credit Company † | 9.693 | 1/15/2008 | 2,988,111 |
| 1,000,000 | Ford Motor Credit Company | 9.750 | 9/15/2010 | 995,809 |
| 2,020,000 | Ford Motor Credit Company | 7.000 | 10/1/2013 | 1,813,198 |
| 1,200,000 | Ford Motor Credit Company * | 8.000 | 12/15/2016 | 1,110,953 |
| 3,310,000 | Gaylord Entertainment Company | 6.750 | 11/15/2014 | 3,210,700 |
| 3,420,000 | Group 1 Automotive, Inc. | 8.250 | 8/15/2013 | 3,420,000 |
| 1,300,000 | Group 1 Automotive, Inc., Convertible > | 2.250 | 6/15/2016 | 947,375 |
| 2,090,000 | Hanesbrands, Inc. † | 8.784 | 12/17/2007 | 2,100,450 |
| 2,100,000 | Harrah’s Operating Company, Inc. | 5.625 | 6/1/2015 | 1,627,500 |
| 2,670,000 | K. Hovnanian Enterprises, Inc. * | 7.500 | 5/15/2016 | 2,109,300 |
| 3,220,000 | Lear Corporation | 8.500 | 12/1/2013 | 3,135,475 |
| 3,580,000 | Majestic Star Casino, LLC | 9.500 | 10/15/2010 | 3,526,300 |
| 3,570,000 | MGM MIRAGE | 5.875 | 2/27/2014 | 3,311,175 |
| 690,000 | Mohegan Tribal Gaming Authority | 6.375 | 7/15/2009 | 683,100 |
| 2,990,000 | Mohegan Tribal Gaming Authority | 6.125 | 2/15/2013 | 2,847,975 |
| 2,320,000 | NCL Corporation | 10.625 | 7/15/2014 | 2,349,000 |
| 1,250,000 | Norcraft Holdings, LP/Norcraft | | | |
| | Capital Corporation > | Zero Coupon | 9/1/2008 | 1,112,500 |
| 2,200,000 | Perry Ellis International, Inc. | 8.875 | 9/15/2013 | 2,200,000 |
| 2,700,000 | Pokagon Gaming Authority ≤ | 10.375 | 6/15/2014 | 2,983,500 |
| 2,160,000 | Realogy Corporation *≤ | 10.500 | 4/15/2014 | 1,795,500 |
| 1,150,000 | Realogy Corporation *≤ | 12.375 | 4/15/2015 | 839,500 |
|
| The accompanying Notes to Financial Statements are an integral part of this schedule. |
|
| 154 |
| | | | |
| High Yield Fund | | | |
| Schedule of Investments as of October 31, 2007 | | | |
| |
| Principal | | Interest | Maturity | |
| Amount | Long-Term Fixed Income (93.4%) | Rate | Date | Value |
|
| Consumer Cyclical — continued | | | |
| $3,085,000 | Rite Aid Corporation | 8.625% | 3/1/2015 | $2,737,938 |
| 2,990,000 | Sally Holdings, LLC * | 9.250 | 11/15/2014 | 3,004,950 |
| 2,415,000 | Seminole Hard Rock Entertainment †≤ | 8.194 | 12/15/2007 | 2,360,662 |
| 1,600,000 | Service Corporation International | 6.750 | 4/1/2015 | 1,596,000 |
| 3,660,000 | Shingle Springs Tribal Gaming Authority ≤ | 9.375 | 6/15/2015 | 3,678,300 |
| 3,785,000 | Station Casinos, Inc. | 6.875 | 3/1/2016 | 3,132,088 |
| 1,140,000 | TRW Automotive, Inc. *≤ | 7.000 | 3/15/2014 | 1,111,500 |
| 4,870,000 | Tunica Biloxi Gaming Authority ≤ | 9.000 | 11/15/2015 | 5,064,800 |
| 1,500,000 | Turning Stone Resort Casino Enterprise ≤ | 9.125 | 12/15/2010 | 1,530,000 |
| 3,130,000 | Turning Stone Resort Casino Enterprise ≤ | 9.125 | 9/15/2014 | 3,239,550 |
| 2,995,000 | Universal City Florida Holding Company I/II † | 10.106 | 11/1/2007 | 3,062,388 |
| 3,495,000 | Warnaco, Inc. | 8.875 | 6/15/2013 | 3,687,225 |
| 2,650,000 | WMG Holdings Corporation > | Zero Coupon | 12/15/2009 | 1,947,750 |
|
|
| | Total Consumer Cyclical | | 101,759,722 |
|
|
| |
| Consumer Non-Cyclical (10.3%) | | | |
| 1,350,000 | Bausch & Lomb, Inc. ≤ | 9.875 | 11/1/2015 | 1,390,500 |
| 3,000,000 | Boston Scientific Corporation ± | 5.450 | 6/15/2014 | 2,730,000 |
| 4,210,000 | Community Health Systems, Inc. *≤ | 8.875 | 7/15/2015 | 4,262,625 |
| 3,830,000 | Constellation Brands, Inc. | 7.250 | 9/1/2016 | 3,858,725 |
| 2,400,000 | HCA, Inc. | 6.750 | 7/15/2013 | 2,154,000 |
| 6,045,000 | HCA, Inc. | 9.250 | 11/15/2016 | 6,362,362 |
| 2,830,000 | Jarden Corporation | 7.500 | 5/1/2017 | 2,688,500 |
| 3,565,000 | Jostens Holding Corporation > | Zero Coupon | 12/1/2008 | 3,333,275 |
| 4,100,000 | LVB Acquisition, Inc. ≤ | 10.000 | 10/15/2017 | 4,212,750 |
| 920,000 | LVB Acquisition, Inc. ≤ | 11.625 | 10/15/2017 | 937,250 |
| 2,760,000 | Michael Foods, Inc. | 8.000 | 11/15/2013 | 2,760,000 |
| 2,820,000 | Omnicare, Inc. | 6.750 | 12/15/2013 | 2,721,300 |
| 1,815,000 | Smithfield Foods, Inc. | 8.000 | 10/15/2009 | 1,869,450 |
| 1,830,000 | Stater Brothers Holdings, Inc. | 8.125 | 6/15/2012 | 1,848,300 |
| 2,590,000 | Sun Healthcare Group, Inc. | 9.125 | 4/15/2015 | 2,661,225 |
| 2,020,000 | SUPERVALU, Inc. | 7.500 | 11/15/2014 | 2,075,550 |
| 3,220,000 | Surgical Care Affiliates, Inc. ≤ | 8.875 | 7/15/2015 | 3,075,100 |
| 4,410,000 | Vanguard Health Holding Company II, LLC | 9.000 | 10/1/2014 | 4,299,750 |
| 3,190,000 | Ventas Realty, LP/Ventas Capital Corporation | 6.500 | 6/1/2016 | 3,150,125 |
| 1,111,000 | Warner Chilcott Corporation | 8.750 | 2/1/2015 | 1,149,885 |
|
|
| | Total Consumer Non-Cyclical | | 57,540,672 |
|
|
| |
| Energy (6.9%) | | | |
| 2,390,000 | CHC Helicopter Corporation | 7.375 | 5/1/2014 | 2,312,325 |
| 1,355,000 | Chesapeake Energy Corporation ± | 6.375 | 6/15/2015 | 1,314,350 |
| 2,310,000 | Chesapeake Energy Corporation | 6.250 | 1/15/2018 | 2,229,150 |
| 2,590,000 | Denbury Resources, Inc. | 7.500 | 12/15/2015 | 2,628,850 |
| 2,300,000 | Energy Partners, Ltd. * | 9.750 | 4/15/2014 | 2,277,000 |
| 2,540,000 | Forest Oil Corporation ≤ | 7.250 | 6/15/2019 | 2,540,000 |
| 1,815,000 | Hornbeck Offshore Services, Inc. | 6.125 | 12/1/2014 | 1,728,788 |
|
| The accompanying Notes to Financial Statements are an integral part of this schedule. |
|
| 155 |
| | | | |
| High Yield Fund | | | |
| Schedule of Investments as of October 31, 2007 | | | |
| |
| Principal | | Interest | Maturity | |
| Amount | Long-Term Fixed Income (93.4%) | Rate | Date | Value |
|
| Energy — continued | | | |
| $2,300,000 | Mariner Energy, Inc. | 8.000% | 5/15/2017 | $2,271,250 |
| 3,120,000 | Newfield Exploration Company | 6.625 | 4/15/2016 | 3,057,600 |
| 3,365,000 | Ocean Rig Norway AS ≤ | 8.375 | 7/1/2013 | 3,440,712 |
| 2,960,000 | OPTI Canada, Inc. ≤ | 8.250 | 12/15/2014 | 2,967,400 |
| 2,390,000 | PetroHawk Energy Corporation | 9.125 | 7/15/2013 | 2,536,388 |
| 3,530,000 | Petroplus Finance, Ltd. ≤ | 7.000 | 5/1/2017 | 3,318,200 |
| 2,870,000 | Plains Exploration & Production Company | 7.750 | 6/15/2015 | 2,855,650 |
| 2,700,000 | Western Oil Sands, Inc. | 8.375 | 5/1/2012 | 3,000,375 |
|
|
| | Total Energy | | | 38,478,038 |
|
|
| |
| Financials (5.0%) | | | |
| 1,620,000 | ACE Cash Express, Inc. ≤ | 10.250 | 10/1/2014 | 1,624,050 |
| 3,160,000 | Countrywide Financial Corporation, Convertible †≤ | 1.743 | 1/15/2008 | 2,797,232 |
| 1,075,000 | Deluxe Corporation | 7.375 | 6/1/2015 | 1,064,250 |
| 1,750,000 | FTI Consulting, Inc. | 7.625 | 6/15/2013 | 1,802,500 |
| 7,055,000 | General Motors Acceptance Corporation | 6.875 | 9/15/2011 | 6,501,971 |
| 5,070,000 | Leucadia National Corporation | 7.125 | 3/15/2017 | 4,765,800 |
| 2,250,000 | Merrill Lynch, Convertible | Zero Coupon | 3/13/2032 | 2,502,225 |
| 2,700,000 | Nuveen Investment, Inc. §≤ | 10.500 | 11/15/2015 | 2,730,375 |
| 1,800,000 | Regency Energy Partners, LP | 8.375 | 12/15/2013 | 1,894,500 |
| 2,700,000 | Residential Capital Corporation | 7.375 | 6/30/2010 | 1,991,250 |
|
|
| | Total Financials | | | 27,674,153 |
|
|
| |
| Technology (3.4%) | | | |
| 2,440,000 | Avago Technologies Finance Pte † | 11.121 | 12/3/2007 | 2,488,800 |
| 1,590,000 | Avago Technologies Finance Pte ± | 10.125 | 12/1/2013 | 1,717,200 |
| 4,050,000 | First Data Corporation ≤ | 9.875 | 9/24/2015 | 3,877,875 |
| 1,710,000 | Nortel Networks, Ltd. †≤ | 9.493 | 1/15/2008 | 1,688,625 |
| 1,210,000 | NXP BV/NXP Funding, LLC † | 7.993 | 1/15/2008 | 1,146,475 |
| 1,910,000 | NXP BV/NXP Funding, LLC * | 9.500 | 10/15/2015 | 1,804,950 |
| 4,435,000 | Seagate Technology HDD Holdings | 6.800 | 10/1/2016 | 4,357,388 |
| 1,600,000 | SunGard Data Systems, Inc. | 10.250 | 8/15/2015 | 1,668,000 |
|
|
| | Total Technology | | | 18,749,313 |
|
|
| |
| Transportation (3.4%) | | | |
| 2,552,185 | Continental Airlines, Inc. | 7.875 | 7/2/2018 | 2,482,000 |
| 2,010,000 | Delta Air Lines, Inc. | 7.920 | 11/18/2010 | 2,007,488 |
| 1,555,000 | Hertz Corporation | 8.875 | 1/1/2014 | 1,601,650 |
| 2,515,000 | Hertz Corporation * | 10.500 | 1/1/2016 | 2,703,625 |
| 2,420,000 | Kansas City Southern de Mexico SA de CV | 7.625 | 12/1/2013 | 2,468,400 |
| 1,850,000 | Navios Maritime Holdings, Inc. | 9.500 | 12/15/2014 | 1,956,375 |
| 1,430,615 | Northwest Airlines, Inc. | 7.691 | 4/1/2017 | 1,402,003 |
| 1,610,000 | Saint Acquisition Corporation ≤ | 12.500 | 5/15/2017 | 1,026,375 |
| 2,750,000 | Windsor Petroleum Transport Corporation ≤ | 7.840 | 1/15/2021 | 3,016,150 |
|
|
| | Total Transportation | | 18,664,066 |
|
|
|
| The accompanying Notes to Financial Statements are an integral part of this schedule. |
|
| 156 |
| | | | |
| High Yield Fund | | | |
| Schedule of Investments as of October 31, 2007 | | | |
| |
| Principal | | Interest | Maturity | |
| Amount | Long-Term Fixed Income (93.4%) | Rate | Date | Value |
|
| Utilities (9.8%) | | | |
| $1,300,000 | AES Corporation ‡ | 8.875% | 2/15/2011 | $1,356,875 |
| 2,700,000 | AES Corporation ≤ | 8.750 | 5/15/2013 | 2,855,250 |
| 2,700,000 | AES Corporation ≤ | 7.750 | 10/15/2015 | 2,703,375 |
| 2,700,000 | AES Corporation ≤ | 8.000 | 10/15/2017 | 2,723,625 |
| 2,210,000 | Colorado Interstate Gas Company | 6.800 | 11/15/2015 | 2,294,365 |
| 1,235,000 | Consumers Energy Company ‡ | 6.300 | 2/1/2012 | 1,232,540 |
| 2,130,000 | Copano Energy, LLC | 8.125 | 3/1/2016 | 2,188,575 |
| 1,720,000 | Dynegy Holdings, Inc. | 6.875 | 4/1/2011 | 1,677,000 |
| 1,410,000 | Dynegy Holdings, Inc. ≤ | 7.500 | 6/1/2015 | 1,346,550 |
| 1,705,000 | Dynegy Holdings, Inc. * | 8.375 | 5/1/2016 | 1,709,262 |
| 1,040,000 | Dynegy Holdings, Inc. ≤ | 7.750 | 6/1/2019 | 976,300 |
| 1,670,000 | Edison Mission Energy | 7.500 | 6/15/2013 | 1,692,962 |
| 2,820,000 | Edison Mission Energy ≤ | 7.000 | 5/15/2017 | 2,756,550 |
| 2,820,000 | Edison Mission Energy ≤ | 7.200 | 5/15/2019 | 2,756,550 |
| 1,900,000 | El Paso Corporation | 6.875 | 6/15/2014 | 1,903,399 |
| 1,900,000 | El Paso Corporation * | 7.000 | 6/15/2017 | 1,903,880 |
| 1,300,000 | Mirant North America, LLC | 7.375 | 12/31/2013 | 1,317,875 |
| 5,860,000 | NRG Energy, Inc. * | 7.375 | 2/1/2016 | 5,845,350 |
| 1,470,000 | Pacific Energy Partners, LP/Pacific Energy | | | |
| | Finance Corporation | 7.125 | 6/15/2014 | 1,518,832 |
| 1,840,000 | Reliant Energy Resources Corporation | 6.750 | 12/15/2014 | 1,872,200 |
| 3,680,000 | SemGroup, LP *≤ | 8.750 | 11/15/2015 | 3,532,800 |
| 1,500,000 | Southern Natural Gas Company | 7.350 | 2/15/2031 | 1,594,056 |
| 1,910,000 | Southern Star Central Corporation | 6.750 | 3/1/2016 | 1,804,950 |
| 3,220,000 | Williams Companies, Inc. | 8.125 | 3/15/2012 | 3,469,550 |
| 1,810,000 | Williams Partners, LP | 7.250 | 2/1/2017 | 1,866,562 |
|
|
| | Total Utilities | | | 54,899,233 |
|
|
| | Total Long-Term Fixed Income (cost $524,745,039) | 520,755,862 |
|
|
| |
| |
| Shares | Preferred Stock (0.8%) | | | Value |
|
| 59,375 | Chevy Chase Preferred Capital Corporation, Convertible # | | | $3,063,750 |
| 3,720 | NRG Energy, Inc., Convertible # | | | 1,474,050 |
|
|
| | Total Preferred Stock (cost $3,902,500) | | 4,537,800 |
|
|
| |
| |
| Shares | Common Stock (<0.1%) | | | Value |
|
| 15 | Pliant Corporation #^ | | | $0 |
| 36,330 | TVMAX Holdings, Inc. # | | | 3,633 |
| 4,540 | XO Communications, Inc., Stock Warrants # | | | 499 |
| 4,540 | XO Communications, Inc., Stock Warrants # | | | 1,226 |
| 6,054 | XO Communications, Inc., Stock Warrants # | | | 2,422 |
| 3,026 | XO Holdings, Inc., Stock Warrants # | | | 9,683 |
|
|
| | Total Common Stock (cost $2,344,578) | | 17,463 |
|
|
|
| The accompanying Notes to Financial Statements are an integral part of this schedule. |
|
| 157 |
| | | | |
| High Yield Fund | | | |
| Schedule of Investments as of October 31, 2007 | | | |
| |
| | | Interest | Maturity | |
| Shares | Collateral Held for Securities Loaned (12.4%) | Rate (+) | Date | Value |
|
| 69,283,020 | Thrivent Financial Securities Lending Trust | 5.050% | N/A | $69,283,020 |
|
|
| | Total Collateral Held for Securities Loaned | |
| | (cost $69,283,020) | | | 69,283,020 |
|
|
| |
| |
| Shares or | | | | |
| Principal | | Interest | Maturity | |
| Amount | Short-Term Investments (4.6%) | Rate (+) | Date | Value |
|
| $400,000 | Federal National Mortgage Association | 5.080% | 12/14/2007 | $397,572 |
| 11,180,000 | GOVCO, Inc. | 4.900 | 11/1/2007 | 11,180,000 |
| 4,000,000 | Ranger Funding Company | 4.880 | 11/1/2007 | 4,000,000 |
| 10,283,074 | Thrivent Money Market Fund | 5.020 | N/A | 10,283,074 |
|
|
| | Total Short-Term Investments (at amortized cost) | 25,860,646 |
|
|
| | Total Investments (cost $639,129,959) 113.5% | $633,454,962 |
|
|
| | Other Assets and Liabilities, Net (13.5%) | (75,243,955) |
|
|
| | Total Net Assets 100.0% | | | $558,211,007 |
|
|
| | | | |
| | | | Notional | |
| | Buy/Sell | Termination | Principal | Unrealized |
| Swaps and Counterparty | Protection | Date | Amount | Gain/(Loss) |
|
| Credit Default Swaps | | | | |
| CDX North America, High Yield, 5 Year, | Buy | June 2012 | $9,000,000 | ($347,980) |
| Series 8, at 2.75%; | | | | |
| Bank of America, N.A. | | | | |
| Ford Motor Company, 5 Year, at 6.90%; | Sell | September 2012 | 4,210,000 | 135,262 |
| Bank of America, N.A. | | | | |
| Total Swaps | | | | ($212,718) |
# Non-income producing security.
* All or a portion of the security is on loan as discussed in item 2(M) of the Notes to Financial Statements.
+ The interest rate shown reflects the yield, coupon rate or, for securities purchased at a discount, the discount rate at the date of purchase.
^ Security is fair valued as discussed in item 2(A) of the Notes to Financial Statements.
> Denotes step coupon bonds for which the current interest rate and next scheduled reset date are shown.
† Denotes variable rate obligations for which the current yield and next scheduled reset date are shown.
§ Denotes investments purchased on a when-issued or delayed delivery basis.
≠ All or a portion of the loan is unfunded as discussed in item 2(U) of the Notes to Financial Statements.
± Designated as cover for long settling trades as discussed in the Notes to Financial Statements.
‡ At October 31, 2007, $14,931,527 of investments were earmarked as collateral to cover open swap contracts.
≤ Denotes securities sold under Rule 144A of the Securities Act of 1933, which exempts them from registration. These securities have been determined to be liquid under the guidelines established by the Fund’s Board of Trustees and may be resold to other dealers in the program or to other qualified institutional buyers. As of October 31, 2007, the value of these investments was $151,700,583 or 27.2% of total net assets.
Gross unrealized appreciation and depreciation of investments, based on cost for federal income tax purposes, were as follows:
| | |
| Gross unrealized appreciation | $8,826,998 | |
| Gross unrealized depreciation | (14,835,100) | |
|
| |
| Net unrealized appreciation (depreciation) | ($6,008,102) | |
| Cost for federal income tax purposes | $639,463,064 | |
|
| The accompanying Notes to Financial Statements are an integral part of this schedule. |
|
| 158 |
| | | | |
| Municipal Bond Fund |
| Schedule of Investments as of October 31, 2007 |
| Principal | | Interest | Maturity | |
| Amount | Long-Term Fixed Income (99.3%) | Rate | Date | Value |
|
| Alabama (0.1%) | | | |
| $1,000,000 | Alabama 21st Century Authority Tobacco Settlement | | | |
| | Revenue Bonds | 5.750% | 12/1/2020 | $1,029,850 |
|
|
| | Total Alabama | | | 1,029,850 |
|
|
| |
| Alaska (0.7%) | | | |
| 3,155,000 | Alaska Energy Authority Power Revenue Refunding | | | |
| | Bonds (Bradley Lake) (Series 5) (FSA Insured) ±! | 5.000 | 7/1/2021 | 3,221,192 |
| 2,625,000 | Northern Tobacco Securitization Corporation, | | | |
| | Alaska Tobacco Settlement Asset Backed Revenue | | | |
| | Bonds (Series A) ÷ | 6.200 | 6/1/2022 | 2,734,436 |
| 2,000,000 | Northern Tobacco Securitization Corporation, | | | |
| | Alaska Tobacco Settlement Asset Backed Revenue | | | |
| | Bonds (Series A) | 5.000 | 6/1/2032 | 1,787,920 |
| 455,000 | Valdez, Alaska Marine Terminal Revenue Bonds † | 3.520 | 11/1/2007 | 455,000 |
|
|
| | Total Alaska | | | 8,198,548 |
|
|
| |
| Arizona (1.0%) | | | |
| 975,000 | Arizona Health Facilities Authority Revenue Bonds | | | |
| | (Arizona Healthcare Pooled Financing) (FGIC Insured) ! | 5.000 | 6/1/2011 | 1,020,016 |
| 1,020,000 | Arizona Health Facilities Authority Revenue Bonds | | | |
| | (Arizona Healthcare Pooled Financing) (FGIC Insured) ! | 5.000 | 6/1/2012 | 1,072,214 |
| 1,000,000 | Arizona Health Facilities Authority Revenue Bonds | | | |
| | (Blood Systems, Inc.) | 5.000 | 4/1/2017 | 1,045,770 |
| 1,200,000 | Arizona Health Facilities Authority Revenue Bonds | | | |
| | (Blood Systems, Inc.) | 5.000 | 4/1/2018 | 1,234,368 |
| 2,500,000 | Glendale, Arizona Industrial Development Authority | | | |
| | Revenue Bonds | 5.000 | 5/15/2031 | 2,533,525 |
| 500,000 | Glendale, Arizona Industrial Development Authority | | | |
| | Revenue Bonds (Midwestern University) (Series A) ÷ | 5.750 | 5/15/2021 | 541,620 |
| 2,000,000 | Phoenix, Arizona Industrial Development Authority | | | |
| | Government Office Lease Revenue Bonds | | | |
| | (Capital Mall Project) (AMBAC Insured) ÷! | 5.375 | 9/15/2020 | 2,105,060 |
| 5,000 | Phoenix, Arizona Industrial Development Authority | | | |
| | Single Family Mortgage Revenue Bonds (Series 1A) | | | |
| | (GNMA/FNMA/FHLMC Insured) ! | 5.875 | 6/1/2016 | 5,001 |
| 1,285,000 | Pima County, Arizona Industrial Development | | | |
| | Authority Multifamily Revenue Bonds (La Hacienda | | | |
| | Project) (GNMA/FHA Insured) ÷! | 7.000 | 12/20/2031 | 1,468,948 |
| 500,000 | Yavapai County, Arizona Hospital Revenue Bonds | | | |
| | (Yavapai Regional Medical Center) (Series A) | 6.000 | 8/1/2033 | 514,090 |
|
|
| | Total Arizona | | | 11,540,612 |
|
|
|
| The accompanying Notes to Financial Statements are an integral part of this schedule. |
|
| 159 |
| | | | |
| Municipal Bond Fund | | | |
| Schedule of Investments as of October 31, 2007 | | | |
| |
| Principal | | Interest | Maturity | |
| Amount | Long-Term Fixed Income (99.3%) | Rate | Date | Value |
|
| Arkansas (1.0%) | | | |
| $355,000 | Arkansas Housing Development Agency Single | | | |
| | Family Mortgage Revenue Bonds (FHA Insured) ÷! | 8.375% | 7/1/2010 | $379,332 |
| 2,400,000 | Arkansas State Community Water System Public | | | |
| | Water Authority Revenue Bonds (Series B) | | | |
| | (MBIA Insured) ! | 5.000 | 10/1/2023 | 2,482,080 |
| 5,000,000 | Arkansas State Development Finance Authority | | | |
| | Revenue Bonds (Series B) (FSA Insured) ! | 5.000 | 11/1/2025 | 5,258,650 |
| 3,000,000 | Jonesboro, Arkansas Residential Housing and Health | | | |
| | Care Facilities Revenue Bonds (St. Bernards Regional | | | |
| | Medical Center) (AMBAC Insured) ! | 5.800 | 7/1/2011 | 3,033,930 |
| 875,000 | Pope County, Arkansas Pollution Control Revenue | | | |
| | Bonds (Arkansas Power and Light Company Project) | | | |
| | (FSA Insured) ! | 6.300 | 12/1/2016 | 876,741 |
|
|
| | Total Arkansas | | | 12,030,733 |
|
|
| |
| California (10.5%) | | | |
| 3,950,000 | Anaheim, California Public Financing Authority | | | |
| | Lease Revenue Bonds (Public Improvements Project) | | | |
| | (Series A) (FSA Insured) ! | 6.000 | 9/1/2024 | 4,675,418 |
| 5,000,000 | California Infrastructure & Economic Bank Revenue | | | |
| | Bonds (Bay Area Toll Bridges) (1st Lien-A) ÷ | 5.000 | 7/1/2025 | 5,468,650 |
| 70,000 | California Rural Home Mortgage Finance Authority | | | |
| | Single Family Mortgage Revenue Bonds (Series D) | | | |
| | (GNMA/FNMA Insured) (Subject to ‘AMT’) ! | 7.100 | 6/1/2031 | 72,474 |
| 2,000,000 | California State General Obligation Bonds | | | |
| | (AMBAC Insured) ! | 6.300 | 9/1/2010 | 2,152,480 |
| 7,500,000 | California State General Obligation Revenue Bonds § | 5.000 | 11/1/2037 | 7,600,050 |
| 3,000,000 | California State Public Works Board Lease Revenue | | | |
| | Bonds (Department of Corrections State Prison) | 7.400 | 9/1/2010 | 3,303,960 |
| 4,000,000 | California State Public Works Board Lease Revenue | | | |
| | Bonds (UCLA Replacement Hospital) (Series A) | | | |
| | (FSA Insured) ! | 5.375 | 10/1/2015 | 4,316,520 |
| 2,000,000 | California State Revenue General Obligation Bonds | 5.250 | 11/1/2021 | 2,112,340 |
| 3,990,000 | California State Revenue General Obligation Bonds ÷ | 5.250 | 4/1/2029 | 4,368,252 |
| 10,000 | California State Revenue General Obligation Bonds | 5.250 | 4/1/2029 | 10,424 |
| 300,000 | California State Unrefunded General Obligation Bonds | | | |
| | (MBIA Insured) ! | 6.000 | 8/1/2016 | 301,839 |
| 2,000,000 | California State Veterans General Obligation Revenue | | | |
| | Bonds (FGIC Insured) (Series AT) ! | 9.500 | 2/1/2010 | 2,247,300 |
| 4,030,000 | Contra Costa County, California Home Mortgage | | | |
| | Revenue Bonds (GNMA Insured) | | | |
| | (Escrowed to Maturity) ÷! | 7.500 | 5/1/2014 | 4,872,633 |
| 10,000,000 | East Bay, California Municipal Utility District Water | | | |
| | System Revenue Bonds | 5.000 | 6/1/2037 | 10,385,100 |
|
| The accompanying Notes to Financial Statements are an integral part of this schedule. |
|
| 160 |
| | | | |
| Municipal Bond Fund | | | |
| Schedule of Investments as of October 31, 2007 | | | |
| |
| Principal | | Interest | Maturity | |
| Amount | Long-Term Fixed Income (99.3%) | Rate | Date | Value |
|
| California — continued | | | |
| $5,000,000 | Foothill/Eastern Transportation Corridor Agency, | | | |
| | California Toll Road Revenue Bonds (Series A) ÷ | 7.050% | 1/1/2009 | $5,211,750 |
| 5,000,000 | Foothill/Eastern Transportation Corridor Agency, | | | |
| | California Toll Road Revenue Bonds (Series A) ÷ | 7.100 | 1/1/2011 | 5,484,000 |
| 6,000,000 | Foothill/Eastern Transportation Corridor Agency, | | | |
| | California Toll Road Revenue Bonds (Series A) ÷ | 7.150 | 1/1/2013 | 6,586,980 |
| 7,145,000 | Foothill/Eastern Transportation Corridor Agency, | | | |
| | California Toll Road Revenue Bonds (Series A) ÷ | 7.150 | 1/1/2014 | 7,843,995 |
| 420,000 | Golden West Schools Financing Authority, California | | | |
| | Revenue Bonds (Series A) (MBIA Insured) ! | 5.800 | 2/1/2022 | 490,946 |
| 3,000,000 | Los Angeles, California Unified School District | | | |
| | Revenue Bonds | 5.000 | 7/1/2023 | 3,165,810 |
| 5,000,000 | Pittsburg, California Redevelopment Agency Tax | | | |
| | Allocation Revenue Bonds (Los Medanos | | | |
| | Community Development Project) | | | |
| | (AMBAC Insured) ! | Zero Coupon | 8/1/2024 | 2,327,750 |
| 4,015,000 | Pomona, California Single Family Mortgage | | | |
| | Revenue Bonds (Series A) (GNMA/FNMA Insured) ÷! | 7.600 | 5/1/2023 | 5,033,164 |
| 1,435,000 | San Bernardino County, California Single Family | | | |
| | Mortgage Revenue Bonds (Series A) | | | |
| | (GNMA Insured) ÷! | 7.500 | 5/1/2023 | 1,787,580 |
| 10,000,000 | San Diego Community College District, California | | | |
| | Revenue Bonds (FSA Guaranteed) ! | 5.000 | 5/1/2030 | 10,366,300 |
| 1,500,000 | San Francisco, California Bay Area Rapid Transit | | | |
| | District Sales Tax Revenue Bonds (AMBAC Insured) ! | 6.750 | 7/1/2010 | 1,629,660 |
| 10,000,000 | San Joaquin Hills Transportation Corridor Agency, | | | |
| | California Toll Road Revenue Bonds ÷ | 7.650 | 1/1/2013 | 10,265,600 |
| 8,000,000 | San Jose, California Airport Revenue Bonds (Series A) | 5.000 | 3/1/2037 | 8,058,720 |
| 2,760,000 | San Jose, California Redevelopment Agency Tax | | | |
| | Allocation Revenue Bonds (Series A) (MBIA Insured) ! | 5.000 | 8/1/2025 | 2,869,268 |
|
|
| | Total California | | | 123,008,963 |
|
|
| |
| Colorado (5.6%) | | | |
| 2,000,000 | Colorado Educational and Cultural Facilities Authority | | | |
| | Revenue Bonds (Bromley East Project) (Series A) ÷ | 7.250 | 9/15/2030 | 2,260,060 |
| 570,000 | Colorado Educational and Cultural Facilities Authority | | | |
| | Revenue Bonds (Cherry Creek Academy Facility, Inc.) | 6.000 | 4/1/2021 | 585,282 |
| 1,280,000 | Colorado Educational and Cultural Facilities Authority | | | |
| | Revenue Bonds (Cherry Creek Academy Facility, Inc.) | 6.000 | 4/1/2030 | 1,301,133 |
| 2,825,000 | Colorado Educational and Cultural Facilities | | | |
| | Authority Revenue Bonds (Classical Academy) ÷ | 7.250 | 12/1/2030 | 3,224,879 |
| 1,000,000 | Colorado Educational and Cultural Facilities Authority | | | |
| | Revenue Bonds (University Lab School Project) ÷ | 5.750 | 6/1/2016 | 1,074,560 |
| 750,000 | Colorado Educational and Cultural Facilities Authority | | | |
| | Revenue Bonds (University Lab School Project) ÷ | 6.125 | 6/1/2021 | 815,288 |
|
| The accompanying Notes to Financial Statements are an integral part of this schedule. |
|
| 161 |
| | | | |
| Municipal Bond Fund | | | |
| Schedule of Investments as of October 31, 2007 | | | |
| |
| Principal | | Interest | Maturity | |
| Amount | Long-Term Fixed Income (99.3%) | Rate | Date | Value |
|
| Colorado — continued | | | |
| $6,250,000 | Colorado Educational and Cultural Facilities Authority | | | |
| | Revenue Bonds (University Lab School Project) ÷ | 6.250% | 6/1/2031 | $6,820,062 |
| 385,000 | Colorado Health Facilities Authority Revenue Bonds | 6.250 | 12/1/2010 | 399,176 |
| 615,000 | Colorado Health Facilities Authority Revenue Bonds ÷ | 6.250 | 12/1/2010 | 639,139 |
| 1,920,000 | Colorado Health Facilities Authority Revenue Bonds | 6.800 | 12/1/2020 | 2,077,651 |
| 3,080,000 | Colorado Health Facilities Authority Revenue Bonds ÷ | 6.800 | 12/1/2020 | 3,435,617 |
| 1,000,000 | Colorado Health Facilities Authority Revenue Bonds | | | |
| | (Parkview Medical Center Project) ÷ | 6.500 | 9/1/2020 | 1,112,510 |
| 500,000 | Colorado Health Facilities Authority Revenue Bonds | | | |
| | (Parkview Medical Center Project) ÷ | 6.600 | 9/1/2025 | 558,135 |
| 130,000 | Colorado Housing and Finance Authority Revenue | | | |
| | Bonds (Single Family Program) (Series A-2) | | | |
| | (Subject to ‘AMT’) | 7.450 | 10/1/2016 | 132,627 |
| 60,000 | Colorado Housing and Finance Authority Revenue | | | |
| | Bonds (Single Family Program) (Series A-3) | 7.250 | 4/1/2010 | 61,739 |
| 465,000 | Colorado Housing and Finance Authority Revenue | | | |
| | Bonds (Single Family Program) (Series B-3) | 6.700 | 8/1/2017 | 467,939 |
| 50,000 | Colorado Housing and Finance Authority Revenue | | | |
| | Bonds (Single Family Program) (Series C-3) | | | |
| | (FHA/VA Insured) ! | 7.150 | 10/1/2030 | 50,716 |
| 35,000 | Colorado Housing and Finance Authority Single | | | |
| | Family Revenue Bonds (Series A-3) | 7.000 | 11/1/2016 | 35,984 |
| 620,000 | Colorado Housing and Finance Authority Single | | | |
| | Family Revenue Bonds (Series D-2) (Subject to ‘AMT’) | 6.350 | 11/1/2029 | 640,999 |
| 70,000 | Colorado Water Resources and Power Development | | | |
| | Authority Clean Water Unrefunded Revenue Bonds | | | |
| | (Series A) (FSA Insured) ! | 6.250 | 9/1/2013 | 70,083 |
| 3,525,000 | Colorado Water Resources and Power Development | | | |
| | Authority Small Water Resources Revenue Bonds | | | |
| | (Series A) (FGIC Insured) ! | 5.250 | 11/1/2021 | 3,735,548 |
| 5,000,000 | Denver, Colorado City and County Airport Revenue | | | |
| | Bonds (Series A) | 5.000 | 11/15/2022 | 5,228,500 |
| 6,000,000 | Denver, Colorado City and County Revenue Bonds | 5.600 | 10/1/2029 | 6,490,440 |
| 2,000,000 | Denver, Colorado Health and Hospital Authority | | | |
| | Healthcare Revenue Bonds (Series A) | | | |
| | (ACA/CBI Insured) ÷! | 6.250 | 12/1/2016 | 2,198,240 |
| 1,890,000 | Goldsmith, Colorado Metropolitan District Capital | | | |
| | Appreciation General Obligation Bonds | | | |
| | (MBIA Insured) ! | Zero Coupon | 6/1/2008 | 1,852,956 |
| 1,885,000 | Goldsmith, Colorado Metropolitan District Capital | | | |
| | Appreciation General Obligation Bonds | | | |
| | (MBIA Insured) ! | Zero Coupon | 12/1/2008 | 1,816,348 |
| 10,000,000 | Jefferson County, Colorado School District | | | |
| | General Obligation Bonds (FSA Guaranteed) ! | 5.000 | 12/15/2016 | 10,808,700 |
|
| The accompanying Notes to Financial Statements are an integral part of this schedule. |
|
| 162 |
| | | | |
| Municipal Bond Fund | | | |
| Schedule of Investments as of October 31, 2007 | | | |
| |
| Principal | | Interest | Maturity | |
| Amount | Long-Term Fixed Income (99.3%) | Rate | Date | Value |
|
| Colorado — continued | | | |
| $3,000,000 | Larimer County, Colorado School District #R1 Poudre | | | |
| | Valley General Obligation Bonds (MBIA/IBC Insured) ! | 7.000% | 12/15/2016 | $3,699,450 |
| 4,000,000 | Northwest Parkway Public Highway Authority, | | | |
| | Colorado Capital Appreciation Revenue Bonds | | | |
| | (Series C) (AMBAC Insured) >! | Zero Coupon | 6/15/2011 | 3,681,920 |
|
|
| | Total Colorado | | | 65,275,681 |
|
|
| |
| Connecticut (0.5%) | | | |
| 2,000,000 | Connecticut State Health and Educational Facilities | | | |
| | Authority Revenue Bonds (Yale University) (Series W) | 5.125 | 7/1/2027 | 2,036,560 |
| 4,000,000 | Connecticut State Special Tax Obligation Revenue | | | |
| | Bonds (Transportation Infrastructure) (Series B) | 6.500 | 10/1/2010 | 4,327,480 |
|
|
| | Total Connecticut | | | 6,364,040 |
|
|
| |
| District of Columbia (0.6%) | | | |
| 6,760,000 | District of Columbia Tobacco Settlement Financing | | | |
| | Corporation Revenue Bonds | 6.250 | 5/15/2024 | 6,984,973 |
|
|
| | Total District of Columbia | | 6,984,973 |
|
|
| |
| Florida (1.3%) | | | |
| 368,000 | Brevard County, Florida Housing Finance Authority | | | |
| | Homeowner Mortgage Revenue Bonds (Series B) | | | |
| | (GNMA Insured) ! | 6.500 | 9/1/2022 | 375,014 |
| 885,000 | Clay County, Florida Housing Finance Authority | | | |
| | Single Family Mortgage Revenue Bonds | | | |
| | (GNMA/FNMA Insured) (Subject to ‘AMT’) ! | 6.000 | 4/1/2029 | 900,567 |
| 620,000 | Florida State Board of Education Capital Outlay | | | |
| | Unrefunded General Obligation Bonds (MBIA Insured) ! | 9.125 | 6/1/2014 | 737,974 |
| 1,520,000 | Florida State Revenue Bonds (Jacksonville | | | |
| | Transportation) | 5.000 | 7/1/2019 | 1,535,078 |
| 1,500,000 | Jacksonville, Florida Health Facilities Authority | | | |
| | Revenue Bonds (Series C) ÷ | 5.750 | 8/15/2015 | 1,566,930 |
| 1,145,000 | Leon County, Florida Educational Facilities Authority | | | |
| | Certificates of Participation ÷ | 8.500 | 9/1/2017 | 1,563,383 |
| 2,000,000 | Orange County, Florida Health Facilities Authority | | | |
| | Revenue Bonds (Orlando Regional Healthcare System) | | | |
| | (Series A) (MBIA Insured) ! | 6.250 | 10/1/2018 | 2,346,080 |
| 195,000 | Orange County, Florida Housing Finance Authority | | | |
| | Homeowner Revenue Bonds (Series B-1) | | | |
| | (GNMA/FNMA Insured) (Subject to ‘AMT’) ! | 5.900 | 9/1/2028 | 197,896 |
| 70,000 | Palm Beach County, Florida Housing Finance Authority | | | |
| | Single Family Homeowner Revenue Bonds (Series A-1) | | | |
| | (GNMA/FNMA Insured) (Subject to ‘AMT’) ! | 5.900 | 10/1/2027 | 70,998 |
| 6,000,000 | South Miami, Florida Health Facilities Authority | | | |
| | Hospital Revenue Bonds | 5.000 | 8/15/2032 | 6,031,800 |
|
|
| | Total Florida | | | 15,325,720 |
|
|
|
| The accompanying Notes to Financial Statements are an integral part of this schedule. |
|
| 163 |
| | | | |
| Municipal Bond Fund | | | |
| Schedule of Investments as of October 31, 2007 | | | |
| |
| Principal | | Interest | Maturity | |
| Amount | Long-Term Fixed Income (99.3%) | Rate | Date | Value |
|
| Georgia (3.1%) | | | |
| $6,900,000 | Bibb County, Georgia Authority Environmental | | | |
| | Improvement Revenue Bonds | 4.850% | 12/1/2009 | $6,907,452 |
| 2,000,000 | Brunswick, Georgia Water and Sewer Refunding | | | |
| | Revenue Bonds (MBIA Insured) ! | 6.000 | 10/1/2011 | 2,105,400 |
| 1,500,000 | Brunswick, Georgia Water and Sewer Refunding | | | |
| | Revenue Bonds (MBIA Insured) ! | 6.100 | 10/1/2019 | 1,742,775 |
| 1,560,000 | Chatham County, Georgia Hospital Authority | | | |
| | Revenue Bonds (C/O Memorial Medical Center) | 5.750 | 1/1/2029 | 1,567,082 |
| 1,000,000 | Chatham County, Georgia Hospital Authority | | | |
| | Revenue Bonds (Memorial Health University | | | |
| | Medical Center) | 6.125 | 1/1/2024 | 1,024,860 |
| 5,000,000 | Cherokee County, Georgia Water and Sewer Authority | | | |
| | Refunding Revenue Bonds (MBIA Insured) ! | 5.500 | 8/1/2018 | 5,557,800 |
| 3,500,000 | Georgia State General Obligation Bonds (Series D) | 5.000 | 8/1/2012 | 3,725,680 |
| 35,000 | Georgia State Prerefunded Balance General Obligation | | | |
| | Bonds (Series B) ÷ | 5.650 | 3/1/2012 | 37,963 |
| 1,000,000 | Georgia State Unrefunded Balance General Obligation | | | |
| | Bonds (Series B) | 6.300 | 3/1/2009 | 1,037,790 |
| 1,000,000 | Georgia State Unrefunded Balance General Obligation | | | |
| | Bonds (Series B) | 6.300 | 3/1/2010 | 1,063,940 |
| 1,965,000 | Georgia State Unrefunded Balance General Obligation | | | |
| | Bonds (Series B) | 5.650 | 3/1/2012 | 2,132,988 |
| 2,500,000 | Milledgeville-Balswin County, Georgia Development | | | |
| | Authority Revenue Bonds ÷ | 5.500 | 9/1/2024 | 2,798,100 |
| 5,000,000 | Rockdale County, Georgia Water and Sewer Authority | | | |
| | Revenue Bonds (Series A) (MBIA Insured) ÷! | 5.500 | 7/1/2025 | 5,263,800 |
| 1,500,000 | Savannah, Georgia Economic Development Authority | | | |
| | Student Housing Revenue Bonds (State University | | | |
| | Project) (Series A) (ACA Insured) ! | 6.750 | 11/15/2020 | 1,607,040 |
|
|
| | Total Georgia | | | 36,572,670 |
|
|
| |
| Hawaii (2.3%) | | | |
| 7,330,000 | Hawaii State Highway Revenue Bonds | 5.500 | 7/1/2018 | 8,282,680 |
| 5,000,000 | Honolulu, Hawaii City & County Board of Water | | | |
| | Supply Water System Revenue Bonds (Series A) | 5.000 | 7/1/2036 | 5,148,400 |
| 10,000,000 | Honolulu, Hawaii City & County Revenue Bonds | | | |
| | (Series A) (FSA Insured) ! | 5.250 | 3/1/2027 | 10,471,200 |
| 2,555,000 | Honolulu, Hawaii City & County Revenue Bonds | | | |
| | (Unrefunded Balance) (Series A) (FGIC Insured) ! | 6.250 | 4/1/2014 | 2,923,457 |
|
|
| | Total Hawaii | | | 26,825,737 |
|
|
|
| The accompanying Notes to Financial Statements are an integral part of this schedule. |
|
| 164 |
| | | | |
| Municipal Bond Fund | | | |
| Schedule of Investments as of October 31, 2007 | | | |
| |
| Principal | | Interest | Maturity | |
| Amount | Long-Term Fixed Income (99.3%) | Rate | Date | Value |
|
| Idaho (0.4%) | | | |
| $3,115,000 | Idaho Falls, Idaho General Obligation Bonds | | | |
| | (FGIC Insured) ! | Zero Coupon | 4/1/2010 | $2,844,649 |
| 2,000,000 | Idaho Falls, Idaho General Obligation Bonds | | | |
| | (FGIC Insured) ! | Zero Coupon | 4/1/2011 | 1,754,660 |
|
|
| | Total Idaho | | | 4,599,309 |
|
|
| |
| Illinois (9.1%) | | | |
| 2,000,000 | Broadview, Illinois Tax Increment Tax Allocation | | | |
| | Revenue Bonds | 5.250% | 7/1/2012 | 2,018,460 |
| 1,000,000 | Broadview, Illinois Tax Increment Tax Allocation | | | |
| | Revenue Bonds | 5.375 | 7/1/2015 | 1,009,610 |
| 10,000,000 | Chicago, Illinois Capital Appreciation City Colleges | | | |
| | General Obligation Bonds (FGIC Insured) ! | Zero Coupon | 1/1/2024 | 4,781,200 |
| 3,000,000 | Chicago, Illinois Lakefront Millennium Project | | | |
| | General Obligation Bonds (MBIA Insured) ÷! | 5.750 | 1/1/2029 | 3,305,820 |
| 2,500,000 | Chicago, Illinois O’Hare International Airport | | | |
| | Revenue Bonds (Series A) (FGIC Insured) ! | 5.000 | 1/1/2033 | 2,556,975 |
| 5,000 | Chicago, Illinois Single Family Mortgage Revenue | | | |
| | Bonds (Series A) (GNMA/FNMA/FHLMC Insured) | | | |
| | (Subject to ‘AMT’) ! | 7.250 | 9/1/2028 | 5,050 |
| 195,000 | Chicago, Illinois Single Family Mortgage Revenue | | | |
| | Bonds (Series C) (GNMA/FNMA/FHLMC Insured) | | | |
| | (Subject to ‘AMT’) ! | 7.050 | 10/1/2030 | 197,824 |
| 150,000 | Chicago, Illinois Single Family Mortgage Revenue | | | |
| | Bonds (Series C) (GNMA/FNMA/FHLMC Insured) | | | |
| | (Subject to ‘AMT’) ! | 7.000 | 3/1/2032 | 153,928 |
| 7,200,000 | Chicago, Illinois Tax Increment Capital Appreciation | | | |
| | Tax Allocation Revenue Bonds (Series A) | | | |
| | (ACA Insured) ! | Zero Coupon | 11/15/2014 | 5,180,256 |
| 1,000,000 | Cook County, Illinois Community Consolidated | | | |
| | School District #15 Palatine Capital Appreciation | | | |
| | General Obligation Bonds (FGIC Insured) ÷! | Zero Coupon | 12/1/2014 | 758,340 |
| 2,500,000 | Cook County, Illinois General Obligation Bonds | | | |
| | (Series A) (MBIA Insured) ! | 6.250 | 11/15/2011 | 2,752,225 |
| 1,250,000 | Cook County, Illinois School District #99 Cicero | | | |
| | General Obligation Bonds (FGIC Insured) ! | 8.500 | 12/1/2011 | 1,477,950 |
| 1,565,000 | Cook County, Illinois School District #99 Cicero | | | |
| | General Obligation Bonds (FGIC Insured) ! | 8.500 | 12/1/2014 | 2,012,856 |
| 1,815,000 | Cook County, Illinois School District #99 Cicero | | | |
| | General Obligation Bonds (FGIC Insured) ! | 8.500 | 12/1/2016 | 2,431,229 |
| 1,000,000 | Du Page County, Illinois General Obligation Bonds | | | |
| | (Stormwater Project) | 5.600 | 1/1/2021 | 1,108,090 |
| 1,000,000 | Illinois Development Finance Authority Revenue | | | |
| | Bonds (Midwestern University) (Series B) ÷ | 6.000 | 5/15/2026 | 1,091,470 |
|
| The accompanying Notes to Financial Statements are an integral part of this schedule. |
|
| 165 |
| | | | |
| Municipal Bond Fund | | | |
| Schedule of Investments as of October 31, 2007 | | | |
| |
| Principal | | Interest | Maturity | |
| Amount | Long-Term Fixed Income (99.3%) | Rate | Date | Value |
|
| Illinois — continued | | | |
| $4,900,000 | Illinois Educational Facilities Authority Revenue | | | |
| | Bonds (Northwestern University) ÷ | 5.250% | 11/1/2032 | $5,410,433 |
| 1,000,000 | Illinois Educational Facilities Authority Student | | | |
| | Housing Revenue Bonds (University Center Project) ÷ | 6.625 | 5/1/2017 | 1,134,650 |
| 1,600,000 | Illinois Health Facilities Authority Revenue Bonds | | | |
| | (Bethesda Home and Retirement) (Series A) | 6.250 | 9/1/2014 | 1,641,584 |
| 2,000,000 | Illinois Health Facilities Authority Revenue Bonds | | | |
| | (Centegra Health Systems) | 5.250 | 9/1/2018 | 2,032,420 |
| 2,000,000 | Illinois Health Facilities Authority Revenue Bonds | | | |
| | (Lutheran General Health Care Facilities) (FSA Insured) ! | 6.000 | 4/1/2018 | 2,246,700 |
| 2,500,000 | Illinois Health Facilities Authority Revenue Bonds | | | |
| | (Passavant Memorial Area Hospital Association) ÷ | 6.000 | 10/1/2024 | 2,698,800 |
| 4,180,000 | Illinois Health Facilities Authority Revenue Bonds | | | |
| | (Rush-Presbyterian-St. Lukes) (Series A) (MBIA Insured) ! | 5.250 | 11/15/2014 | 4,286,256 |
| 3,975,000 | Illinois Health Facilities Authority Revenue Bonds | | | |
| | (Swedish American Hospital) ÷ | 6.875 | 11/15/2030 | 4,283,102 |
| 4,655,000 | Illinois Health Facilities Authority Revenue Bonds | | | |
| | (Thorek Hospital and Medical Center) | 5.250 | 8/15/2018 | 4,698,897 |
| 2,120,000 | Illinois Health Facilities Authority Unrefunded | | | |
| | Revenue Bonds (Series B) (MBIA/IBC Insured) ! | 5.250 | 8/15/2018 | 2,164,287 |
| 7,900,000 | Illinois State Sales Tax Revenue Bonds (Second Series) | 5.750 | 6/15/2018 | 9,048,739 |
| 3,065,000 | Illinois State Sales Tax Revenue Bonds (Series L) | 7.450 | 6/15/2012 | 3,553,622 |
| 265,000 | Joliet, Illinois Regional Port District Marine Term | | | |
| | Revenue Bonds † | 3.520 | 11/1/2007 | 265,000 |
| 3,035,000 | McHenry County, Illinois Community High School | | | |
| | District #157 General Obligation Bonds (FSA Insured) ! | 9.000 | 12/1/2017 | 4,276,588 |
| 4,000,000 | McLean County, Illinois Bloomington — Normal | | | |
| | Airport Central Illinois Regional Authority Revenue | | | |
| | Bonds (Subject to ‘AMT’) | 6.050 | 12/15/2019 | 4,112,240 |
| 1,410,000 | Metropolitan Pier and Exposition Authority, Illinois | | | |
| | State Tax Revenue Bonds (McCormick Place | | | |
| | Exposition Project) (FGIC Insured) ! | 5.250 | 12/15/2028 | 1,448,140 |
| 885,000 | Metropolitan Pier and Exposition Authority, Illinois | | | |
| | State Tax Revenue Bonds (McCormick Place | | | |
| | Exposition Project) (Series A) (FGIC Insured) ! | 5.500 | 6/15/2015 | 982,978 |
| 17,505,000 | Metropolitan Pier and Exposition Authority, Illinois | | | |
| | State Tax Revenue Bonds (McCormick Place | | | |
| | Exposition Project) (Series A) (FGIC Insured) ! | Zero Coupon | 6/15/2020 | 10,098,459 |
| 3,100,000 | Metropolitan Pier and Exposition Authority, Illinois | | | |
| | State Tax Revenue Bonds (McCormick Place | | | |
| | Exposition Project) (Series A) (MBIA Insured) ! | Zero Coupon | 6/15/2024 | 1,451,637 |
| 2,000,000 | Metropolitan Pier and Exposition Authority, Illinois | | | |
| | State Tax Revenue Bonds (McCormick Place | | | |
| | Exposition Project) (Series A) (MBIA Insured) ! | Zero Coupon | 12/15/2024 | 915,400 |
|
| The accompanying Notes to Financial Statements are an integral part of this schedule. |
|
| 166 |
| | | | |
| Municipal Bond Fund | | | |
| Schedule of Investments as of October 31, 2007 | | | |
| |
| Principal | | Interest | Maturity | |
| Amount | Long-Term Fixed Income (99.3%) | Rate | Date | Value |
|
| Illinois — continued | | | |
| $7,000,000 | Metropolitan Pier and Exposition Authority, Illinois | | | |
| | State Tax Revenue Bonds (McCormick Place | | | |
| | Exposition Project) (Series B) (MBIA Insured) >! | Zero Coupon | 6/15/2012 | $6,031,830 |
| 3,000,000 | Regional Transportation Authority, Illinois Revenue | | | |
| | Bonds (Series A) (FGIC Insured) ! | 6.700% | 11/1/2021 | 3,590,880 |
|
|
| | Total Illinois | | | 107,213,925 |
|
|
| |
| Indiana (0.8%) | | | |
| 700,000 | Ball State University, Indiana University Student Fee | | | |
| | Revenue Bonds (Series K) (FGIC Insured) ! | 5.750 | 7/1/2020 | 754,208 |
| 1,250,000 | East Chicago, Indiana Elementary School Building | | | |
| | Corporation Revenue Bonds | 6.250 | 1/5/2016 | 1,365,362 |
| 150,000 | Indiana State Housing Authority Single Family | | | |
| | Mortgage Revenue Bonds (Series C-2) | | | |
| | (GNMA Insured) ! | 5.250 | 7/1/2017 | 151,662 |
| 250,000 | Indiana Transportation Finance Authority Highway | | | |
| | Revenue Bonds (Series A) | 6.800 | 12/1/2016 | 286,235 |
| 985,000 | Indiana Transportation Finance Authority Highway | | | |
| | Revenue Bonds (Series A) (MBIA/IBC Insured) ÷! | 7.250 | 6/1/2015 | 1,067,238 |
| 3,565,000 | Indiana Transportation Finance Authority Highway | | | |
| | Unrefunded Revenue Bonds (Series A) | | | |
| | (MBIA/IBC Insured) ! | 7.250 | 6/1/2015 | 4,115,828 |
| 2,120,000 | Purdue University, Indiana Revenue Bonds | | | |
| | (Student Fees) (Series L) | 5.000 | 7/1/2020 | 2,192,928 |
|
|
| | Total Indiana | | | 9,933,461 |
|
|
| |
| Iowa (1.0%) | | | |
| 2,085,000 | Coralville, Iowa Urban Renewal Annual Appropriation | | |
| | Revenue Bonds (Tax Increment-H2) | 5.000 | 6/1/2011 | 2,135,561 |
| 3,125,000 | Coralville, Iowa Urban Renewal Annual Appropriation | | |
| | Revenue Bonds (Tax Increment-H2) | 5.000 | 6/1/2021 | 3,132,969 |
| 4,500,000 | Iowa Finance Authority Health Care Facilities Revenue | | |
| | Bonds (Genesis Medical Center) | 6.250 | 7/1/2025 | 4,716,540 |
| 1,950,000 | Iowa Finance Authority Single Family Revenue Bonds | | |
| | (Series E) | 5.000 | 1/1/2037 | 1,923,344 |
|
|
| | Total Iowa | | | 11,908,414 |
|
|
| |
| Kansas (0.9%) | | | |
| 520,000 | Kansas State Department of Transportation Highway | | | |
| | Revenue Bonds (Series B-2) † | 3.580 | 11/1/2007 | 520,000 |
| 910,000 | Kansas State Development Finance Authority Health | | | |
| | Facility Revenue Bonds | 5.375 | 11/15/2024 | 951,978 |
| 90,000 | Kansas State Development Finance Authority Health | | | |
| | Facility Revenue Bonds ÷ | 5.375 | 11/15/2024 | 96,322 |
|
| The accompanying Notes to Financial Statements are an integral part of this schedule. |
|
| 167 |
| | | | |
| Municipal Bond Fund | | | |
| Schedule of Investments as of October 31, 2007 | | | |
| |
| Principal | | Interest | Maturity | |
| Amount | Long-Term Fixed Income (99.3%) | Rate | Date | Value |
|
| Kansas — continued | | | |
| $2,000,000 | Olathe, Kansas Health Facilities Revenue Bonds | | | |
| | (Olathe Medical Center Project) (Series A) | | | |
| | (AMBAC Insured) ! | 5.500% | 9/1/2025 | $2,091,160 |
| 2,475,000 | Salina, Kansas Hospital Revenue Bonds | 5.000 | 10/1/2036 | 2,478,242 |
| 280,000 | Sedgwick and Shawnee Counties, Kansas Single | | | |
| | Family Mortgage Revenue Bonds (Series A-2) | | | |
| | (GNMA Insured) ! | 6.700 | 6/1/2029 | 280,322 |
| 4,350,000 | Wyandotte County/Kansas City, Kansas Unified | | | |
| | Government Special Obligation Revenue Bonds | | | |
| | (2nd Lien-B) | 5.000 | 12/1/2020 | 4,392,674 |
|
|
| | Total Kansas | | | 10,810,698 |
|
|
| |
| Kentucky (0.4%) | | | |
| 5,345,000 | Kentucky State Turnpike Authority Economic | | | |
| | Development Revenue Bonds (Revitalization Project) | | | |
| | (FGIC Insured) ! | Zero Coupon | 1/1/2010 | 4,943,056 |
|
|
| | Total Kentucky | | | 4,943,056 |
|
|
| |
| Louisiana (3.0%) | | | |
| 595,000 | Jefferson Parish, Louisiana Home Mortgage Authority | | |
| | Single Family Mortgage Revenue Bonds (Series A-2) | | | |
| | (GNMA/FNMA Insured) (Subject to ‘AMT’) ! | 7.500 | 12/1/2030 | 615,218 |
| 185,000 | Jefferson Parish, Louisiana Home Mortgage Authority | | |
| | Single Family Mortgage Revenue Bonds (Series D-1) | | | |
| | (GNMA/FNMA Insured) (Subject to ‘AMT’) ! | 7.500 | 6/1/2026 | 189,127 |
| 165,000 | Louisiana Housing Finance Agency Single Family | | | |
| | Mortgage Revenue Bonds (Series D-2) | | | |
| | (GNMA/FNMA Insured) (Subject to ‘AMT’) ! | 7.050 | 6/1/2031 | 166,779 |
| 3,000,000 | Louisiana Public Facilities Authority Hospital | | | |
| | Revenue Bonds (Lake Charles Memorial) | | | |
| | (AMBAC/TCRS Insured) ÷! | 8.625 | 12/1/2030 | 3,476,910 |
| 500,000 | Louisiana Public Facilities Authority Revenue Bonds | 5.000 | 7/1/2031 | 493,140 |
| 4,745,000 | Louisiana Public Facilities Authority Revenue Bonds | | | |
| | (MBIA Insured) ! | 5.250 | 3/1/2031 | 4,987,375 |
| 6,500,000 | New Orleans, Louisiana General Obligation Bonds | | | |
| | (AMBAC Insured) ! | Zero Coupon | 9/1/2012 | 5,362,305 |
| 3,000,000 | Orleans Parish, Louisiana School Board | | | |
| | Administration Offices Revenue Bonds | | | |
| | (MBIA Insured) ÷! | 8.950 | 2/1/2008 | 3,038,670 |
| 2,605,000 | Regional Transportation Authority, Louisiana Sales | | | |
| | Tax Revenue Bonds (Series A) (FGIC Insured) ! | 8.000 | 12/1/2012 | 3,113,288 |
| 10,000,000 | St. John Baptist Parish, Louisiana Environmental | | | |
| | Revenue Bonds (Series A) | 5.125 | 6/1/2037 | 9,887,000 |
| 4,200,000 | Tobacco Settlement Financing Corporation, | | | |
| | Louisiana Revenue Bonds (Series 2001-B) | 5.500 | 5/15/2030 | 4,173,204 |
|
|
| | Total Louisiana | | | 35,503,016 |
|
|
|
| The accompanying Notes to Financial Statements are an integral part of this schedule. |
|
| 168 |
| | | | |
| Municipal Bond Fund | | | |
| Schedule of Investments as of October 31, 2007 | | | |
| |
| Principal | | Interest | Maturity | |
| Amount | Long-Term Fixed Income (99.3%) | Rate | Date | Value |
|
| Maryland (0.9%) | | | |
| $1,250,000 | Frederick County, Maryland Educational Facilities | | | |
| | Revenue Bonds (Mount Saint Mary’s College) | | | |
| | (Series A) ÷ | 5.750% | 9/1/2025 | $1,324,250 |
| 1,840,000 | Maryland State Economic Development Corporation | | | |
| | Revenue Bonds (Lutheran World Relief) ÷ | 7.200 | 4/1/2025 | 2,005,214 |
| 1,550,000 | Maryland State Economic Development Corporation | | | |
| | Student Housing Revenue Bonds (Sheppard Pratt) | | | |
| | (ACA Insured) ! | 6.000 | 7/1/2033 | 1,595,694 |
| 1,000,000 | Maryland State Health and Higher Educational | | | |
| | Facilities Authority Revenue Bonds (University of | | | |
| | Maryland Medical System) ÷ | 6.000 | 7/1/2022 | 1,103,780 |
| 4,500,000 | Morgan State University, Maryland Academic and | | | |
| | Auxiliary Facilities Fees Revenue Bonds | | | |
| | (MBIA Insured) ! | 6.050 | 7/1/2015 | 4,965,345 |
| 10,000 | Prince George’s County, Maryland Housing Authority | | |
| | Single Family Mortgage Revenue Bonds (Series A) | | | |
| | (GNMA/FNMA/FHLMC Insured) (Subject to ‘AMT’) ! | 7.400 | 8/1/2032 | 10,061 |
|
|
| | Total Maryland | | | 11,004,344 |
|
|
| |
| Massachusetts (3.3%) | | | |
| 5,000,000 | Massachusetts Bay Transportation Authority Sales | | | |
| | Tax Revenue Bonds (Series B) (MBIA Insured) ! | 5.500 | 7/1/2025 | 5,716,550 |
| 4,935,000 | Massachusetts State Construction Lien General | | | |
| | Obligation Bonds (Series A) (FGIC-TCRS Insured) ! | 5.250 | 1/1/2013 | 5,314,798 |
| 725,000 | Massachusetts State Development Finance Agency | | | |
| | Revenue Bonds (Devens Electric Systems) | 5.625 | 12/1/2016 | 763,766 |
| 15,000,000 | Massachusetts State Health and Educational Facilities | | |
| | Authority Revenue Bonds | 5.250 | 7/1/2033 | 16,898,248 |
| 1,000,000 | Massachusetts State Health and Educational Facilities | | |
| | Authority Revenue Bonds (Partners Healthcare System) | | |
| | (Series C) | 6.000 | 7/1/2016 | 1,075,630 |
| 3,000,000 | Massachusetts State School Building Authority | | | |
| | Dedicated Sales Tax Revenue Bonds (Series A) | | | |
| | (MBIA Insured) ! | 5.000 | 8/15/2027 | 3,127,320 |
| 5,000,000 | Massachusetts State Water Pollution Abatement Trust | | |
| | Revenue Bonds | 5.000 | 8/1/2024 | 5,433,050 |
|
|
| | Total Massachusetts | | 38,329,362 |
|
|
| |
| Michigan (2.7%) | | | |
| 2,000,000 | East Lansing, Michigan Building Authority General | | | |
| | Obligation Bonds | 5.700 | 4/1/2020 | 2,300,240 |
| 1,500,000 | Livonia, Michigan Public Schools School District | | | |
| | General Obligation Bonds (FGIC Insured) ÷! | Zero Coupon | 5/1/2009 | 1,424,055 |
| 1,380,000 | Michigan Public Power Agency Revenue Bonds | | | |
| | (Combustion Turbine #1 Project) (Series A) | | | |
| | (AMBAC Insured) ! | 5.250 | 1/1/2016 | 1,460,537 |
|
| The accompanying Notes to Financial Statements are an integral part of this schedule. |
|
| 169 |
| | | | |
| Municipal Bond Fund | | | |
| Schedule of Investments as of October 31, 2007 | | | |
| |
| Principal | | Interest | Maturity | |
| Amount | Long-Term Fixed Income (99.3%) | Rate | Date | Value |
|
| Michigan — continued | | | |
| $45,000 | Michigan State Hospital Finance Authority Revenue | | | |
| | Bonds (Detroit Medical Center) | 8.125% | 8/15/2012 | $45,097 |
| 2,825,000 | Michigan State Hospital Finance Authority Revenue | | | |
| | Bonds (MBIA Insured) ÷! | 5.375 | 8/15/2014 | 2,954,922 |
| 175,000 | Michigan State Hospital Finance Authority Revenue | | | |
| | Bonds (Series P) (MBIA Insured) ÷! | 5.375 | 8/15/2014 | 183,596 |
| 2,750,000 | Michigan State Hospital Finance Authority Revenue | | | |
| | Refunding Bonds (Crittenton Hospital) (Series A) | 5.500 | 3/1/2022 | 2,887,170 |
| 5,000,000 | Michigan State Trunk Line Fund Revenue Bonds | | | |
| | (FSA Insured) ! | 5.000 | 11/1/2022 | 5,276,000 |
| 4,500,000 | Rochester, Michigan Community School District | | | |
| | General Obligation Bonds (MBIA Insured) ! | 5.000 | 5/1/2019 | 4,876,695 |
| 2,855,000 | Sault Ste. Marie, Michigan Chippewa Indians Housing | | |
| | Authority Revenue Bonds (Tribal Health and Human | | | |
| | Services Center) | 7.750 | 9/1/2012 | 2,870,417 |
| 2,000,000 | St. Clair County, Michigan Economic Development | | | |
| | Corporation Revenue Bonds (Detroit Edison) | | | |
| | (Series AA) (AMBAC Insured) ! | 6.400 | 8/1/2024 | 2,082,140 |
| 990,000 | Summit Academy North, Michigan Public School | | | |
| | Academy Certificates of Participation ÷ | 6.550 | 7/1/2014 | 1,066,398 |
| 690,000 | Summit Academy North, Michigan Public School | | | |
| | Academy Certificates of Participation ÷ | 8.375 | 7/1/2030 | 773,980 |
| 3,560,000 | Wayne State University, Michigan University Revenue | | |
| | Bonds (FGIC Insured) ! | 5.125 | 11/15/2029 | 3,669,363 |
|
|
| | Total Michigan | | | 31,870,610 |
|
|
| |
| Minnesota (4.1%) | | | |
| 800,000 | Minneapolis and St. Paul, Minnesota Housing & | | | |
| | Redevelopment Authority Healthcare System Revenue | | |
| | Bonds (Healthpartners Obligation Group Project) | 6.000 | 12/1/2021 | 840,560 |
| 2,030,000 | Minneapolis and St. Paul, Minnesota Metropolitan | | | |
| | Airports Commission Airport Revenue Bonds | 5.000 | 1/1/2022 | 2,088,890 |
| 5,000,000 | Minneapolis and St. Paul, Minnesota Metropolitan | | | |
| | Airports Commission Airport Revenue Bonds | | | |
| | (Series A) (AMBAC Insured) ! | 5.000 | 1/1/2035 | 5,132,750 |
| 5,000,000 | Minneapolis and St. Paul, Minnesota Metropolitan | | | |
| | Airports Commission Airport Revenue Bonds | | | |
| | (Series C) (FGIC Insured) ! | 5.000 | 1/1/2031 | 5,145,050 |
| 7,685,000 | Minneapolis, Minnesota Community Development | | | |
| | Agency Tax Increment Revenue Bonds | | | |
| | (MBIA Insured) ! | Zero Coupon | 3/1/2009 | 7,341,327 |
| 85,000 | Minnesota Agricultural and Economic Development | | | |
| | Board Health Care System Unrefunded Balance | | | |
| | Revenue Bonds (Fairview Hospital) (Series A) | | | |
| | (MBIA Insured) ! | 5.750 | 11/15/2026 | 86,848 |
|
| The accompanying Notes to Financial Statements are an integral part of this schedule. |
|
| 170 |
| | | | |
| Municipal Bond Fund | | | |
| Schedule of Investments as of October 31, 2007 | | | |
| |
| Principal | | Interest | Maturity | |
| Amount | Long-Term Fixed Income (99.3%) | Rate | Date | Value |
|
| Minnesota — continued | | | |
| $1,000,000 | Minnesota Higher Education Facilities Authority | | | |
| | Revenue Bonds (College of Art and Design) | | | |
| | (Series 5-D) ÷ | 6.625% | 5/1/2020 | $1,074,360 |
| 530,000 | Minnesota Higher Education Facilities Authority | | | |
| | Revenue Bonds (University of St. Thomas) (Series 5-Y) | 5.250 | 10/1/2019 | 563,692 |
| 3,620,000 | Minnesota State General Obligation Bonds | 5.250 | 8/1/2017 | 3,707,314 |
| 2,000,000 | North Oaks, Minnesota Senior Housing Revenue | | | |
| | Bonds (Presbyterian Homes, North Oaks) | 6.125 | 10/1/2039 | 2,034,760 |
| 1,000,000 | Northfield, Minnesota Hospital Revenue Bonds | | | |
| | (Series C) ÷ | 6.000 | 11/1/2021 | 1,089,990 |
| 1,300,000 | Northfield, Minnesota Hospital Revenue Bonds | | | |
| | (Series C) ÷ | 6.000 | 11/1/2026 | 1,416,987 |
| 2,040,000 | Northfield, Minnesota Hospital Revenue Bonds | | | |
| | (Series C) ÷ | 6.000 | 11/1/2031 | 2,223,580 |
| 2,000,000 | St. Louis Park, Minnesota Health Care Facilities | | | |
| | Revenue Bonds ÷ | 5.250 | 7/1/2030 | 2,183,760 |
| 4,000,000 | St. Paul, Minnesota Housing and Redevelopment | | | |
| | Authority Educational Facility Revenue Bonds | 5.000 | 10/1/2024 | 4,081,280 |
| 230,000 | St. Paul, Minnesota Housing and Redevelopment | | | |
| | Authority Health Care Facilities Revenue Bonds | | | |
| | (Healthpartners Obligation Group PJ) | 5.250 | 5/15/2019 | 235,644 |
| 1,500,000 | St. Paul, Minnesota Housing and Redevelopment | | | |
| | Authority Health Care Facilities Revenue Bonds | | | |
| | (Healthpartners Obligation Group PJ) | 5.250 | 5/15/2036 | 1,471,050 |
| 1,690,000 | St. Paul, Minnesota Housing and Redevelopment | | | |
| | Authority Lease Parking Facilities Revenue Bonds | | | |
| | (Rivercentre Parking Ramp) | 6.000 | 5/1/2013 | 1,746,294 |
| 5,000,000 | White Earth Band of Chippewa Indians, Minnesota | | | |
| | Revenue Bonds (Series A) (ACA Insured) ! | 7.000 | 12/1/2011 | 5,247,400 |
|
|
| | Total Minnesota | | | 47,711,536 |
|
|
| |
| Missouri (1.9%) | | | |
| 7,500,000 | Jackson County, Missouri Special Obligation | | | |
| | Harry S. Truman Sports Complex Revenue Bonds | | | |
| | (AMBAC Insured) ! | 5.000 | 12/1/2027 | 7,839,075 |
| 785,000 | Missouri State Development Finance Board | | | |
| | Infrastructure Facilities Revenue Bonds (Eastland | | | |
| | Center Project Phase II) (Series B) | 5.875 | 4/1/2017 | 811,415 |
| 500,000 | Missouri State Development Finance Board | | | |
| | Infrastructure Facilities Revenue Bonds (Eastland | | | |
| | Center Project Phase II) (Series B) ÷ | 6.000 | 4/1/2021 | 517,675 |
| 1,000,000 | Missouri State Environmental Improvement and | | | |
| | Energy Resources Authority Water Pollution Revenue | | | |
| | Bonds (Series A) | 5.250 | 1/1/2018 | 1,064,370 |
| 2,500,000 | Missouri State Health and Educational Facilities | | | |
| | Authority Health Facilities Revenue Bonds | 5.000 | 5/15/2020 | 2,596,825 |
|
| The accompanying Notes to Financial Statements are an integral part of this schedule. |
|
| 171 |
| | | | |
| Municipal Bond Fund | | | |
| Schedule of Investments as of October 31, 2007 | | | |
| |
| Principal | | Interest | Maturity | |
| Amount | Long-Term Fixed Income (99.3%) | Rate | Date | Value |
|
| Missouri — continued | | | |
| $3,000,000 | Missouri State Health and Educational Facilities | | | |
| | Authority Health Facilities Revenue Bonds | | | |
| | (Barnes Jewish, Inc. Christian) (Series A) | 5.250% | 5/15/2014 | $3,205,200 |
| 1,500,000 | Missouri State Health and Educational Facilities | | | |
| | Authority Health Facilities Revenue Bonds | | | |
| | (Lake Regional Health Securities Project) | 5.600 | 2/15/2025 | 1,527,630 |
| 1,000,000 | Missouri State Health and Educational Facilities | | | |
| | Authority Health Facilities Revenue Bonds | | | |
| | (Saint Anthony’s Medical Center) ÷ | 6.250 | 12/1/2030 | 1,090,540 |
| 655,000 | Missouri State Health and Educational Facilities | | | |
| | Authority Revenue Bonds (Lake of the Ozarks) | 6.500 | 2/15/2021 | 657,378 |
| 145,000 | Missouri State Housing Development Commission | | | |
| | Single Family Mortgage Revenue Bonds (Series B-1) | | | |
| | (GNMA/FNMA Insured) (Subject to ‘AMT’) ! | 7.450 | 9/1/2031 | 149,160 |
| 175,000 | Missouri State Housing Development Commission | | | |
| | Single Family Mortgage Revenue Bonds (Series C-1) | | | |
| | (GNMA/FNMA Insured) ! | 6.550 | 9/1/2028 | 178,780 |
| 270,000 | Missouri State Housing Development Commission | | | |
| | Single Family Mortgage Revenue Bonds (Series C-1) | | | |
| | (GNMA/FNMA Insured) (Subject to ‘AMT’) ! | 7.150 | 3/1/2032 | 285,576 |
| 2,000,000 | St. Charles County, Missouri Francis Howell School | | | |
| | District General Obligation Bonds (Series A) | 5.250 | 3/1/2018 | 2,207,820 |
|
|
| | Total Missouri | | | 22,131,444 |
|
|
| |
| Montana (1.4%) | | | |
| 2,830,000 | Montana Facility Finance Authority Revenue | | | |
| | Providence Health and Services Revenue Bonds | 5.000 | 10/1/2024 | 2,907,655 |
| 45,000 | Montana State Board of Housing Single Family | | | |
| | Mortgage Revenue Bonds (Series A-1) | 6.000 | 6/1/2016 | 45,068 |
| 155,000 | Montana State Board of Housing Single Family | | | |
| | Mortgage Revenue Bonds (Series A-2) (Subject to ‘AMT’) | 6.250 | 6/1/2019 | 155,885 |
| 2,385,000 | Montana State Board of Investment Refunded Balance | | | |
| | 1996 Payroll Tax Revenue Bonds (MBIA Insured) ÷! | 6.875 | 6/1/2020 | 2,467,855 |
| 775,000 | Montana State Board of Investment Refunded Revenue | | | |
| | Bonds (1996 Payroll Tax) (MBIA Insured) ÷! | 6.875 | 6/1/2020 | 801,924 |
| 1,240,000 | Montana State Board of Investment Refunded Revenue | | | |
| | Bonds (Payroll Tax) (MBIA Insured) ÷! | 6.875 | 6/1/2020 | 1,283,078 |
| 1,165,000 | Montana State Board of Regents Revenue Bonds | | | |
| | (Higher Education-University of Montana) (Series F) | | | |
| | (MBIA Insured)! | 5.750 | 5/15/2016 | 1,248,332 |
| 3,000,000 | Montana State Health Facilities Authority Revenue | | | |
| | Bonds (Hillcrest Senior Living Project) ÷ | 7.375 | 6/1/2030 | 3,312,480 |
| 3,860,000 | Montana State Hospital Finance Authority Refunding | | | |
| | Revenue Bonds | 5.250 | 6/1/2018 | 4,054,351 |
|
|
| | Total Montana | | | 16,276,628 |
|
|
|
| The accompanying Notes to Financial Statements are an integral part of this schedule. |
|
| 172 |
| | | | |
| Municipal Bond Fund | | | |
| Schedule of Investments as of October 31, 2007 | | | |
| |
| Principal | | Interest | Maturity | |
| Amount | Long-Term Fixed Income (99.3%) | Rate | Date | Value |
|
| Nebraska (1.7%) | | | |
| $2,500,000 | Nebraska Public Power District Revenue Bonds | | | |
| | (Series B) (AMBAC Insured) ! | 5.000% | 1/1/2013 | $2,658,400 |
| 5,780,000 | Omaha, Nebraska Public Power District Electric | | | |
| | Revenue Bonds (Series A) | 5.000 | 2/1/2046 | 5,900,629 |
| 3,455,000 | Omaha, Nebraska Public Power District Revenue | | | |
| | Bonds (Series B) ÷ | 6.150 | 2/1/2012 | 3,666,826 |
| 1,675,000 | Omaha, Nebraska Special Assessment Revenue Bonds | | |
| | (Riverfront Redevelopment Project) (Series A) | 5.500 | 2/1/2015 | 1,807,208 |
| 6,000,000 | University of Nebraska Revenue Bonds (Lincoln | | | |
| | Student Fees & Facilities) (Series B) | 5.000 | 7/1/2023 | 6,257,400 |
|
|
| | Total Nebraska | | | 20,290,463 |
|
|
| |
| New Jersey (1.4%) | | | |
| 2,000,000 | Hudson County, New Jersey Department of Finance | | | |
| | and Administration Certificates of Participation | | | |
| | (MBIA Insured) ! | 6.250 | 12/1/2015 | 2,325,740 |
| 1,000,000 | New Jersey State Highway Authority Revenue Bonds | | | |
| | (Series L) | 5.250 | 7/15/2018 | 1,106,920 |
| 260,000 | New Jersey State Turnpike Authority Revenue Bonds | | | |
| | (Series C) (AMBAC-TCRS Insured) ÷! | 6.500 | 1/1/2016 | 298,236 |
| 745,000 | New Jersey State Turnpike Authority Revenue Bonds | | | |
| | (Series C) (AMBAC-TCRS Insured) ! | 6.500 | 1/1/2016 | 851,371 |
| 3,695,000 | New Jersey State Turnpike Authority Revenue Bonds | | | |
| | (Series C) (AMBAC-TCRS Insured) ÷! | 6.500 | 1/1/2016 | 4,238,387 |
| 5,000,000 | New Jersey Transportation Trust Fund Authority | | | |
| | Revenue Bonds (Transportation System) (Series A) | | | |
| | (FSA Insured) ! | 5.500 | 12/15/2016 | 5,612,400 |
| 2,595,000 | West New York, New Jersey Municipal Utilities | | | |
| | Authority Revenue Bonds (FGIC Insured) ÷! | Zero Coupon | 12/15/2009 | 2,412,701 |
|
|
| | Total New Jersey | | | 16,845,755 |
|
|
| |
| New Mexico (1.4%) | | | |
| 3,315,000 | Alamogordo, New Mexico Hospital Revenue Bonds | | | |
| | (Gerald Champion Memorial Hospital Project) | 5.300 | 1/1/2013 | 3,322,326 |
| 440,000 | Farmington, New Mexico Utility System Revenue | | | |
| | Bonds (AMBAC Insured) ÷! | 9.875 | 1/1/2008 | 444,286 |
| 3,500,000 | Jicarilla, New Mexico Apache Nation Revenue Bonds | | | |
| | (Series A) | 5.500 | 9/1/2023 | 3,697,085 |
| 475,000 | New Mexico Mortgage Finance Authority Revenue | | | |
| | Bonds (Series F) (GNMA/FNMA Insured) ! | 7.000 | 1/1/2026 | 483,507 |
| 175,000 | New Mexico Mortgage Finance Authority Single | | | |
| | Family Mortgage Capital Appreciation Revenue | | | |
| | Bonds (Series D- 2) (Subject to ‘AMT’) > | Zero Coupon | 9/1/2009 | 159,456 |
|
| The accompanying Notes to Financial Statements are an integral part of this schedule. |
|
| 173 |
| | | | |
| Municipal Bond Fund | | | |
| Schedule of Investments as of October 31, 2007 | | | |
| |
| Principal | | Interest | Maturity | |
| Amount | Long-Term Fixed Income (99.3%) | Rate | Date | Value |
|
| New Mexico — continued | | | |
| $540,000 | New Mexico Mortgage Finance Authority Single | | | |
| | Family Mortgage Revenue Bonds (Series C-2) | | | |
| | (GNMA/FNMA Insured) (Subject to ‘AMT’) ! | 6.950% | 9/1/2031 | $556,070 |
| 7,500,000 | Sandoval County, New Mexico Incentive Payment | | | |
| | Revenue Bonds | 5.000 | 6/1/2020 | 7,831,050 |
|
|
| | Total New Mexico | | | 16,493,780 |
|
|
| |
| New York (8.9%) | | | |
| 5,000,000 | Metropolitan Transportation Authority, New York | | | |
| | Transportation Facilities Revenue Bonds (Series A) | 5.500 | 7/1/2017 | 5,578,600 |
| 4,225,000 | Metropolitan Transportation Authority, New York | | | |
| | Transportation Facilities Revenue Bonds (Series O) ÷ | 5.750 | 7/1/2013 | 4,488,218 |
| 4,000,000 | New York State Dormitory Authority Revenue Bonds | | | |
| | (Series B) | 5.250 | 5/15/2012 | 4,254,520 |
| 2,000,000 | New York State Dormitory Authority Revenue Bonds | | | |
| | (State University Educational Facilities) (Series A) | 7.500 | 5/15/2013 | 2,357,060 |
| 5,000,000 | New York State Dormitory Authority Revenue Bonds | | | |
| | (State University Educational Facilities) (Series A) | 5.875 | 5/15/2017 | 5,719,550 |
| 2,000,000 | New York State Local Government Assistance | | | |
| | Corporation Revenue Bonds (Series E) | | | |
| | (MBIA/IBC Insured) ! | 5.250 | 4/1/2016 | 2,192,300 |
| 865,000 | New York State Mortgage Agency Revenue Bonds | | | |
| | (Series 26) | 5.350 | 10/1/2016 | 873,659 |
| 2,605,000 | New York State Thruway Authority General | | | |
| | Unrefunded Balance Revenue Bonds (Series E) ÷ | 5.000 | 1/1/2016 | 2,637,589 |
| 2,500,000 | New York State Thruway Authority Revenue Bonds | | | |
| | (Series B) (FSA Insured) ! | 5.000 | 4/1/2015 | 2,702,025 |
| 20,000,000 | New York State Urban Development Corporation | | | |
| | Revenue Bonds (Correctional and Youth Facilities) | | | |
| | (Series A) | 5.000 | 1/1/2017 | 20,803,000 |
| 1,620,000 | New York State Urban Development Corporation | | | |
| | Revenue Bonds (Syracuse University Center) | 6.000 | 1/1/2009 | 1,665,765 |
| 1,720,000 | New York State Urban Development Corporation | | | |
| | Revenue Bonds (Syracuse University Center) | 6.000 | 1/1/2010 | 1,807,342 |
| 8,940,000 | New York, New York City Municipal Transitional | | | |
| | Finance Authority Revenue Bonds (Series A) > | 5.500 | 11/1/2011 | 9,552,211 |
| 2,000,000 | New York, New York City Municipal Water and | | | |
| | Sewer System Revenue Bonds (Series A) | | | |
| | (AMBAC Insured) ÷! | 5.875 | 6/15/2012 | 2,203,260 |
| 735,000 | New York, New York City Transitional Finance | | | |
| | Authority Revenue Bonds ÷ | 5.375 | 11/15/2021 | 780,952 |
| 1,805,000 | New York, New York City Transitional Finance | | | |
| | Authority Revenue Bonds ÷ | 5.375 | 11/15/2021 | 1,962,378 |
| 13,000,000 | New York, New York City Transitional Finance | | | |
| | Authority Revenue Bonds (Future Tax Secured) (Series B) | 5.250 | 2/1/2011 | 13,633,230 |
|
| The accompanying Notes to Financial Statements are an integral part of this schedule. |
|
| 174 |
| | | | |
| Municipal Bond Fund | | | |
| Schedule of Investments as of October 31, 2007 | | | |
| |
| Principal | | Interest | Maturity | |
| Amount | Long-Term Fixed Income (99.3%) | Rate | Date | Value |
|
| New York — continued | | | |
| $1,750,000 | New York, New York General Obligation Bonds | | | |
| | (Series A) | 5.500% | 8/1/2022 | $1,900,115 |
| 12,000,000 | New York, New York General Obligation Bonds | | | |
| | (Series B) | 5.250 | 8/1/2017 | 12,914,400 |
| 655,000 | New York, New York General Obligation Bonds | | | |
| | (Series H) (FSA/CR Insured) ÷! | 5.250 | 3/15/2016 | 678,010 |
| 5,000,000 | New York, New York General Obligation Bonds | | | |
| | (Series I-1) | 5.000 | 4/1/2023 | 5,226,550 |
| 630,000 | Triborough, New York Bridge and Tunnel Authority | | | |
| | Revenue Bonds (Series Q) ÷ | 6.750 | 1/1/2009 | 642,209 |
|
|
| | Total New York | | | 104,572,943 |
|
|
| |
| North Carolina (1.9%) | | | |
| 1,475,000 | North Carolina Eastern Municipal Power Agency | | | |
| | Power System Prerefunded Revenue Bonds (Series A) ÷ | 6.000 | 1/1/2026 | 1,771,858 |
| 4,000,000 | North Carolina Eastern Municipal Power Agency | | | |
| | Power System Revenue Bonds | 5.375 | 1/1/2017 | 4,191,040 |
| 2,375,000 | North Carolina Eastern Municipal Power Agency | | | |
| | Power System Revenue Bonds (Series B) | 5.500 | 1/1/2021 | 2,393,359 |
| 5,000,000 | North Carolina Eastern Municipal Power Agency | | | |
| | Power System Revenue Bonds (Series D) | 5.500 | 1/1/2014 | 5,388,400 |
| 2,000,000 | North Carolina Eastern Municipal Power Agency | | | |
| | Power System Revenue Bonds (Series D) | 6.750 | 1/1/2026 | 2,106,940 |
| 250,000 | North Carolina Municipal Power Agency #1 Catawba | | | |
| | Electric Revenue Bonds (Series B) | 6.500 | 1/1/2009 | 258,032 |
| 610,000 | North Carolina Municipal Power Agency #1 Catawba | | | |
| | Electric Revenue Bonds (Series B) | 6.375 | 1/1/2013 | 645,069 |
| 4,000,000 | North Carolina Municipal Power Agency #1 Catawba | | | |
| | Electric Revenue Bonds (Series B) (MBIA Insured) ! | 6.000 | 1/1/2011 | 4,287,440 |
| 1,000,000 | Wake County, North Carolina Industrial, Facilities, | | | |
| | and Pollution Control Revenue Bonds (Carolina Power | | | |
| | and Light Company Project) | 5.375 | 2/1/2017 | 1,046,760 |
|
|
| | Total North Carolina | | | 22,088,898 |
|
|
| |
| North Dakota (0.9%) | | | |
| 3,500,000 | Grand Forks, North Dakota Health Care System | | | |
| | Revenue Bonds (Altru Health Systems Group) ÷ | 7.125 | 8/15/2024 | 3,866,555 |
| 2,945,000 | South Central Regional Water District, North Dakota | | | |
| | Utility System Revenue Bonds (Northern Burleigh | | | |
| | County) (Series A) | 5.650 | 10/1/2029 | 3,053,729 |
| 3,250,000 | Ward County, North Dakota Health Care Facilities | | | |
| | Revenue Bonds (Trinity Medical Center) (Series B) | 6.250 | 7/1/2021 | 3,312,985 |
|
|
| | Total North Dakota | | | 10,233,269 |
|
|
|
| The accompanying Notes to Financial Statements are an integral part of this schedule. |
|
| 175 |
| | | | |
| Municipal Bond Fund | | | |
| Schedule of Investments as of October 31, 2007 | | | |
| |
| Principal | | Interest | Maturity | |
| Amount | Long-Term Fixed Income (99.3%) | Rate | Date | Value |
|
| Ohio (2.5%) | | | |
| $875,000 | Akron, Ohio Economic Development Revenue Bonds | | | |
| | (MBIA Insured) ! | 6.000% | 12/1/2012 | $945,455 |
| 5,000,000 | Buckeye, Ohio Tobacco Settlement Financing Authority | | | |
| | Revenue Bonds (Series A-2) | 5.125 | 6/1/2024 | 4,822,950 |
| 1,700,000 | Cincinnati, Ohio General Obligation Bonds ÷ | 5.375 | 12/1/2019 | 1,796,611 |
| 2,000,000 | Lorain County, Ohio Hospital Revenue Bonds | | | |
| | (Catholic Healthcare Partners) | 5.400 | 10/1/2021 | 2,087,840 |
| 2,000,000 | Lucas County, Ohio Health Care Facilities Revenue | | | |
| | Bonds (Sunset Retirement) (Series A) | 6.550 | 8/15/2024 | 2,100,420 |
| 2,000,000 | Montgomery County, Ohio Hospital Revenue Bonds | | | |
| | (Kettering Medical Center) ÷ | 6.750 | 4/1/2018 | 2,170,420 |
| 2,500,000 | Montgomery County, Ohio Hospital Revenue Bonds | | | |
| | (Kettering Medical Center) ÷ | 6.750 | 4/1/2022 | 2,713,025 |
| 2,000,000 | Ohio State Higher Education Faculty Revenue Bonds | | | |
| | (Case Western Reserve University) | 6.500 | 10/1/2020 | 2,393,340 |
| 2,000,000 | Ohio State Turnpike Commission Turnpike Revenue | | | |
| | Bonds (Series A) (FGIC Insured) ! | 5.500 | 2/15/2024 | 2,290,780 |
| 1,750,000 | Port of Greater Cincinnati Development Authority | | | |
| | Revenue Bonds | 5.000 | 10/1/2025 | 1,741,722 |
| 1,610,000 | Reynoldsburg, Ohio City School District General | | | |
| | Obligation Bonds (FSA Insured) ! | 5.000 | 12/1/2028 | 1,676,058 |
| 2,115,000 | University of Akron, Ohio General Receipts Revenue | | | |
| | Bonds (FGIC Insured) ÷! | 5.500 | 1/1/2020 | 2,225,678 |
| 2,545,000 | University of Cincinnati, Ohio General Receipts | | | |
| | Revenue Bonds (Series D) (AMBAC Insured) ! | 5.000 | 6/1/2016 | 2,713,454 |
|
|
| | Total Ohio | | | 29,677,753 |
|
|
| |
| Oklahoma (0.6%) | | | |
| 1,400,000 | Bass, Oklahoma Memorial Baptist Hospital Authority | | | |
| | Hospital Revenue Bonds (Bass Memorial | | | |
| | Hospital Project) ÷ | 8.350 | 5/1/2009 | 1,461,712 |
| 1,040,000 | Oklahoma Development Finance Authority Hospital | | | |
| | Revenue Bonds (Unity Health Center Project) | 5.000 | 10/1/2011 | 1,072,666 |
| 150,000 | Oklahoma Housing Finance Agency Single Family | | | |
| | Mortgage Revenue Bonds (Series C-2) | | | |
| | (Subject to ‘AMT’) | 7.550 | 9/1/2028 | 151,791 |
| 195,000 | Oklahoma Housing Finance Agency Single Family | | | |
| | Mortgage Revenue Bonds (Series D-2) | | | |
| | (GNMA/FNMA Insured) (Subject to ‘AMT’) ! | 7.100 | 9/1/2028 | 197,599 |
| 1,500,000 | Oklahoma State Municipal Power Authority Revenue | | | |
| | Bonds (Series B) (MBIA Insured) ! | 5.875 | 1/1/2012 | 1,586,160 |
| 2,900,000 | Payne County, Oklahoma Economic Development | | | |
| | Authority Student Housing Revenue Bonds | | | |
| | (Collegiate Housing Foundation) (Series A) ÷ | 6.375 | 6/1/2030 | 3,161,319 |
|
|
| | Total Oklahoma | | | 7,631,247 |
|
|
|
| The accompanying Notes to Financial Statements are an integral part of this schedule. |
|
| 176 |
| | | | |
| Municipal Bond Fund | | | |
| Schedule of Investments as of October 31, 2007 | | | |
| |
| Principal | | Interest | Maturity | |
| Amount | Long-Term Fixed Income (99.3%) | Rate | Date | Value |
|
| Pennsylvania (2.3%) | | | |
| $945,000 | Allegheny County, Pennsylvania Redevelopment | | | |
| | Authority Tax Increment Tax Allocation Revenue Bonds | | |
| | (Waterfront Project) (Series B) | 6.000% | 12/15/2010 | $980,674 |
| 2,045,000 | Allegheny County, Pennsylvania Redevelopment | | | |
| | Authority Tax Increment Tax Allocation Revenue | | | |
| | Bonds (Waterfront Project) (Series C) ±÷ | 6.550 | 12/15/2017 | 2,194,837 |
| 2,575,000 | Allegheny County, Pennsylvania Sanitation Authority | | |
| | Sewer Interest Compensatory Revenue Bonds | | | |
| | (Series A) (FGIC Insured) ±! | Zero Coupon | 6/1/2008 | 2,524,659 |
| 2,315,000 | Carbon County, Pennsylvania Industrial | | | |
| | Development Authority Revenue Bonds (Panther | | | |
| | Creek Partners Project) (Subject to ‘AMT’) | 6.650 | 5/1/2010 | 2,358,383 |
| 2,000,000 | Cornwall Lebanon, Pennsylvania School District | | | |
| | Capital Appreciation General Obligation Bonds | | | |
| | (FSA Insured) ! | Zero Coupon | 3/15/2016 | 1,417,500 |
| 1,520,000 | Cornwall Lebanon, Pennsylvania School District | | | |
| | Capital Appreciation General Obligation Bonds | | | |
| | (FSA Insured) ! | Zero Coupon | 3/15/2017 | 1,024,404 |
| 2,750,000 | Cumberland County, Pennsylvania Municipal | | | |
| | Authority Revenue Bonds (Diakon | | | |
| | Lutheran Ministries) | 5.000 | 1/1/2027 | 2,632,162 |
| 2,000,000 | Cumberland County, Pennsylvania Municipal | | | |
| | Authority Revenue Bonds (Diakon | | | |
| | Lutheran Ministries) | 5.000 | 1/1/2036 | 1,852,120 |
| 900,000 | Delaware County, Pennsylvania Industrial | | | |
| | Development Authority Revenue Bonds † | 3.550 | 11/1/2007 | 900,000 |
| 2,000,000 | Lancaster County, Pennsylvania Hospital Authority | | | |
| | Revenue Bonds ÷ | 5.500 | 3/15/2026 | 2,191,340 |
| 3,170,000 | Millcreek Township, Pennsylvania School District | | | |
| | General Obligation Bonds (FGIC Insured) ÷! | Zero Coupon | 8/15/2009 | 2,981,417 |
| 435,000 | Montgomery County, Pennsylvania Higher | | | |
| | Education and Health Authority Revenue Bonds | | | |
| | (Foulkeways at Gwynedd Project) ÷ | 6.750 | 11/15/2024 | 466,933 |
| 1,880,000 | Montgomery County, Pennsylvania Higher | | | |
| | Education and Health Authority Revenue Bonds | | | |
| | (Foulkeways at Gwynedd Project) ÷ | 6.750 | 11/15/2030 | 2,018,011 |
| 2,000,000 | Philadelphia, Pennsylvania Authority for Industrial | | | |
| | Development Revenue Bonds (Please Touch | | | |
| | Museum Project) | 5.250 | 9/1/2026 | 2,019,540 |
| 1,000,000 | York County, Pennsylvania Solid Waste & Refuse | | | |
| | Authority Solid Waste System Revenue Bonds | | | |
| | (FGIC Insured) ! | 5.500 | 12/1/2012 | 1,087,340 |
|
|
| | Total Pennsylvania | | 26,649,320 |
|
|
|
| The accompanying Notes to Financial Statements are an integral part of this schedule. |
|
| 177 |
| | | | |
| Municipal Bond Fund | | | |
| Schedule of Investments as of October 31, 2007 | | | |
| |
| Principal | | Interest | Maturity | |
| Amount | Long-Term Fixed Income (99.3%) | Rate | Date | Value |
|
| Puerto Rico (0.6%) | | | |
| $6,655,000 | Puerto Rico Industrial Tourist Educational Medical | | | |
| | and Environmental Central Facilities Revenue Bonds | | | |
| | (AES Cogen Facilities Project) (Subject to ‘AMT’) | 6.625% | 6/1/2026 | $7,067,277 |
|
|
| | Total Puerto Rico | | | 7,067,277 |
|
|
| |
| South Carolina (1.6%) | | | |
| 1,000,000 | Greenwood County, South Carolina Hospital | | | |
| | Revenue Bonds (Self Memorial Hospital) | 5.500 | 10/1/2026 | 1,030,710 |
| 4,000,000 | Piedmont, South Carolina Municipal Power Agency | | | |
| | Electric Revenue Bonds (FGIC Insured) ! | 6.250 | 1/1/2021 | 4,781,680 |
| 5,000,000 | Piedmont, South Carolina Municipal Power Agency | | | |
| | Electric Revenue Bonds (FGIC Insured) ! | 5.000 | 1/1/2022 | 5,005,450 |
| 4,895,000 | South Carolina Jobs Economic Development | | | |
| | Authority Hospital Facilities Prerefunded Revenue | | | |
| | Bonds (Palmetto Health Alliance) (Series C) ÷ | 6.875 | 8/1/2027 | 5,686,130 |
| 605,000 | South Carolina Jobs Economic Development | | | |
| | Authority Hospital Facilities Prerefunded Revenue | | | |
| | Bonds (Palmetto Health Alliance) (Series C) ÷ | 6.875 | 8/1/2027 | 702,780 |
| 2,000,000 | Spartanburg, South Carolina Waterworks Revenue | | | |
| | Bonds (FGIC Insured) ÷! | 5.250 | 6/1/2028 | 2,184,220 |
|
|
| | Total South Carolina | | | 19,390,970 |
|
|
| |
| South Dakota (1.1%) | | | |
| 5,000,000 | South Dakota Educational Enhancement Funding | | | |
| | Corporation Tobacco Settlement Revenue Bonds | | | |
| | (Series B) | 6.500 | 6/1/2032 | 5,143,750 |
| 5,000,000 | South Dakota State Health and Educational Facilities | | | |
| | Authority Revenue Bonds | 5.000 | 11/1/2040 | 4,983,950 |
| 1,170,000 | South Dakota State Health and Educational Facilities | | | |
| | Authority Revenue Bonds (Prairie Lakes Health | | | |
| | Care System, Inc.) | 5.625 | 4/1/2032 | 1,195,869 |
| 2,000,000 | South Dakota State Health and Educational Facilities | | | |
| | Authority Revenue Bonds (Prairie Lakes Health | | | |
| | Care System, Inc.) (ACA/CBI Insured) ! | 5.650 | 4/1/2022 | 2,024,960 |
|
|
| | Total South Dakota | | | 13,348,529 |
|
|
| |
| Tennessee (1.4%) | | | |
| 2,000,000 | Memphis-Shelby County, Tennessee Airport | | | |
| | Authority Special Facilities and Project Revenue Bonds | | | |
| | (Federal Express Corporation) | 5.350 | 9/1/2012 | 2,090,460 |
| 4,500,000 | Memphis-Shelby County, Tennessee Airport | | | |
| | Authority Special Facilities Revenue Bonds | | | |
| | (Federal Express Corporation) | 5.050 | 9/1/2012 | 4,645,305 |
|
| The accompanying Notes to Financial Statements are an integral part of this schedule. |
|
| 178 |
| | | | |
| Municipal Bond Fund | | | |
| Schedule of Investments as of October 31, 2007 | | | |
| |
| Principal | | Interest | Maturity | |
| Amount | Long-Term Fixed Income (99.3%) | Rate | Date | Value |
|
| Tennessee — continued | | | |
| $4,155,000 | Metropolitan Government, Nashville and Davidson | | | |
| | County, Tennessee Industrial Development Board | | | |
| | Revenue Bonds (Series A) (GNMA Insured) ! | 6.625% | 3/20/2036 | $4,492,552 |
| 5,000,000 | Shelby County, Tennessee Health Educational and | | | |
| | Housing Facilities Board Revenue Bonds (St. Jude | | | |
| | Children’s Research Project) ÷ | 5.375 | 7/1/2024 | 5,247,850 |
|
|
| | Total Tennessee | | | 16,476,167 |
|
|
| |
| Texas (8.5%) | | | |
| 7,000,000 | Alliance Airport Authority, Texas Facilities Income | | | |
| | Revenue Bonds | 4.850 | 4/1/2021 | 6,891,290 |
| 2,000,000 | Amarillo, Texas Health Facilities Corporation | | | |
| | Revenue Bonds (Baptist St. Anthony’s Hospital | | | |
| | Corporation) (FSA Insured) ! | 5.500 | 1/1/2017 | 2,216,660 |
| 2,165,000 | Arlington, Texas Independent School District | | | |
| | Capital Appreciation Refunding General Obligation | | | |
| | Bonds (PSF/GTD Insured) ! | Zero Coupon | 2/15/2009 | 2,070,325 |
| 2,500,000 | Austin, Texas Higher Education Authority University | | | |
| | Revenue Bonds (St. Edward’s University Project) ÷ | 5.750 | 8/1/2031 | 2,646,875 |
| 2,250,000 | Austin, Texas Utility System Revenue Bonds | | | |
| | (FGIC Insured) ! | 6.000 | 11/15/2013 | 2,443,770 |
| 7,000,000 | Austin, Texas Utility System Capital Appreciation | | | |
| | Refunding Revenue Bonds (Financial Services | | | |
| | Department) (Series A) (MBIA Insured) ! | Zero Coupon | 11/15/2008 | 6,755,420 |
| 8,100,000 | Austin, Texas Utility System Capital Appreciation | | | |
| | Refunding Revenue Bonds (Financial Services | | | |
| | Department) (Series A) (MBIA Insured) ! | Zero Coupon | 11/15/2009 | 7,545,150 |
| 1,930,000 | Bexar County, Texas Housing Finance Corporation | | | |
| | Multi-Family Housing Revenue Bonds (Dymaxion | | | |
| | and Marrach Park Apartments) (Series A) | | | |
| | (MBIA Insured) ! | 6.000 | 8/1/2023 | 2,013,994 |
| 1,720,000 | Bexar County, Texas Housing Finance Corporation | | | |
| | Multi-Family Housing Revenue Bonds (Pan American | | |
| | Apartments) (Series A-1) (GNMA Insured) ! | 7.000 | 3/20/2031 | 1,892,292 |
| 1,000,000 | Bluebonnet Trails Community Mental Health and | | | |
| | Mental Retardation Revenue Bonds | 6.125 | 12/1/2016 | 1,032,400 |
| 500,000 | Corpus Christi, Texas General Obligation Bonds | | | |
| | (Series A) (FSA Insured) ! | 5.000 | 3/1/2012 | 527,765 |
| 1,000,000 | Dallas-Fort Worth, Texas International Airport | | | |
| | Revenue Bonds (Series A) (MBIA Insured) | | | |
| | (Subject to ‘AMT’) ! | 5.500 | 11/1/2016 | 1,060,270 |
| 500,000 | Dallas-Fort Worth, Texas International Airport | | | |
| | Revenue Bonds (Series A) (Subject to ‘AMT’) | 5.500 | 11/1/2017 | 528,750 |
| 1,375,000 | Deer Park, Texas Independent School District | | | |
| | General Obligation Bonds (PSF/GTD Insured) ! | 5.000 | 2/15/2013 | 1,461,941 |
|
| The accompanying Notes to Financial Statements are an integral part of this schedule. |
|
| 179 |
| | | | |
| Municipal Bond Fund | | | |
| Schedule of Investments as of October 31, 2007 | | | |
| |
| Principal | | Interest | Maturity | |
| Amount | Long-Term Fixed Income (99.3%) | Rate | Date | Value |
|
| Texas — continued | | | |
| $1,405,000 | Denton, Texas Independent School District General | | | |
| | Obligation Bonds (PSF/GTD Insured) ! | 6.250% | 2/15/2009 | $1,454,386 |
| 3,210,000 | Denton, Texas Utility System Revenue Bonds | | | |
| | (Series A) (FSA Insured) ! | 5.250 | 12/1/2015 | 3,430,431 |
| 205,000 | Gulf Coast Waste Disposal Authority, Texas Pollution | | | |
| | Control Revenue Bonds † | 3.520 | 11/1/2007 | 205,000 |
| 7,000,000 | Harris County, Houston, Texas General Obligation | | | |
| | Bonds (MBIA Insured) ! | Zero Coupon | 8/15/2024 | 3,242,400 |
| 2,000,000 | Harris County, Texas Health Facilities Development | | | |
| | Authority Hospital Revenue Bonds (Memorial | | | |
| | Hermann Healthcare Project) (Series A) ÷ | 6.375 | 6/1/2029 | 2,204,860 |
| 2,000,000 | Houston, Texas Airport System Revenue Bonds | | | |
| | (Series A) (FSA Insured) (Subject to ‘AMT’) ! | 5.625 | 7/1/2030 | 2,046,040 |
| 5,000,000 | Houston, Texas Water and Sewer System Revenue | | | |
| | Bonds (Series A) (FSA Insured) ÷! | 5.750 | 12/1/2032 | 5,961,200 |
| 5,315,000 | Lewisville, Texas Independent School District | | | |
| | General Obligation Bonds (PSF/GTD Insured) ! | Zero Coupon | 8/15/2019 | 3,183,313 |
| 1,000,000 | Lower Colorado River Authority, Texas Revenue | | | |
| | Unrefunded Balance Revenue Bonds (Series A) | 5.875 | 5/15/2015 | 1,043,590 |
| 370,000 | Mesquite, Texas Independent School District General | | | |
| | Obligation Bonds (Series A) (PSF/GTD Insured) ! | 6.000 | 2/15/2020 | 372,590 |
| 2,600,000 | North Texas Health Facilities Development | | | |
| | Corporation Hospital Revenue Bonds (United | | | |
| | Regional Healthcare System, Inc.) ÷ | 6.000 | 9/1/2023 | 2,914,834 |
| 365,000 | Nueces County, Texas Housing Finance Corporation | | | |
| | Multi-Family Housing Revenue Bonds (Dolphins | | | |
| | Landing Apartments Project) (Series A) ÷ | 6.250 | 7/1/2010 | 376,968 |
| 1,000,000 | Ridge Parc Development Corporation, Texas | | | |
| | Multifamily Revenue Bonds (GNMA Insured) ! | 6.100 | 6/20/2033 | 1,086,080 |
| 2,795,000 | Ridge Parc Development Corporation, Texas | | | |
| | Multifamily Revenue Bonds (GNMA Insured) ! | 6.150 | 11/20/2041 | 2,991,852 |
| 425,000 | San Antonio, Texas General Obligation Bonds | | | |
| | (General Improvements) | 5.250 | 2/1/2014 | 445,438 |
| 1,000,000 | San Antonio, Texas Water Revenue Bonds (FSA Insured) ! | 5.500 | 5/15/2018 | 1,070,950 |
| 1,000,000 | San Antonio, Texas Water Revenue Bonds (FSA Insured) ! | 5.500 | 5/15/2019 | 1,070,520 |
| 1,000,000 | San Antonio, Texas Water Revenue Bonds (FSA Insured) ! | 5.500 | 5/15/2020 | 1,070,090 |
| 1,160,000 | San Leanna Education Facilities Corporation | | | |
| | Higher Education Revenue Bonds (Saint Edward’s | | | |
| | University Project) (Series 2007) | 5.125 | 6/1/2024 | 1,168,248 |
| 11,615,000 | Southeast Texas Housing Finance Corporation | | | |
| | Revenue Bonds (MBIA Insured) ÷! | Zero Coupon | 9/1/2017 | 7,669,849 |
| 1,410,000 | Tarrant County, Texas College District General | | | |
| | Obligation Bonds | 5.375 | 2/15/2013 | 1,523,618 |
| 2,000,000 | Tarrant County, Texas Cultural Educational Facilities | | | |
| | Finance Corporation Revenue Bonds (Texas Health | | | |
| | Resources) (Series A) | 5.000 | 2/15/2023 | 2,041,540 |
|
| The accompanying Notes to Financial Statements are an integral part of this schedule. |
|
| 180 |
| | | | |
| Municipal Bond Fund | | | |
| Schedule of Investments as of October 31, 2007 | | | |
| |
| Principal | | Interest | Maturity | |
| Amount | Long-Term Fixed Income (99.3%) | Rate | Date | Value |
|
| Texas — continued | | | |
| $4,315,000 | Texas State Veterans Land Board General | | | |
| | Obligation Bonds ÷ | 0.050% | 7/1/2010 | $3,932,389 |
| 315,000 | Westlake, Texas General Obligation Bonds | 6.500 | 5/1/2013 | 347,269 |
| 350,000 | Westlake, Texas General Obligation Bonds | 6.500 | 5/1/2015 | 387,356 |
| 335,000 | Westlake, Texas General Obligation Bonds ÷ | 6.500 | 5/1/2017 | 389,089 |
| 1,650,000 | Westlake, Texas General Obligation Bonds | 5.750 | 5/1/2024 | 1,753,504 |
| 2,000,000 | Westlake, Texas General Obligation Bonds ÷ | 5.800 | 5/1/2032 | 2,242,760 |
| 745,000 | Wylie, Texas Independent School District General | | | |
| | Obligation Bonds (PSF/GTD Insured) ÷! | 6.875 | 8/15/2014 | 831,524 |
| 430,000 | Wylie, Texas Independent School District General | | | |
| | Obligation Bonds (PSF/GTD Insured) ! | 6.875 | 8/15/2014 | 479,459 |
| 3,280,000 | Wylie, Texas Independent School District Unrefunded | | | |
| | General Obligation Bonds (PSF/GTD Insured) ! | 7.000 | 8/15/2024 | 3,666,679 |
|
|
| | Total Texas | | | 99,690,728 |
|
|
| |
| Virginia (0.9%) | | | |
| 2,500,000 | Fairfax County, Virginia Industrial Development | | | |
| | Authority Revenue Bonds (Inova Health | | | |
| | Systems Project) | 5.250 | 8/15/2019 | 2,695,400 |
| 3,625,000 | Fairfax County, Virginia Water Authority Water | | | |
| | Revenue Bonds | 5.000 | 4/1/2021 | 3,939,179 |
| 3,240,000 | Tobacco Settlement Authority, Virginia Tobacco | | | |
| | Settlement Revenue Bonds ÷ | 5.250 | 6/1/2019 | 3,375,270 |
|
|
| | Total Virginia | | | 10,009,849 |
|
|
| |
| Washington (4.9%) | | | |
| 1,000,000 | Energy Northwest, Washington Electric Revenue | | | |
| | Bonds (Columbia Generating) (Series A) | | | |
| | (MBIA Insured) ! | 5.750 | 7/1/2018 | 1,085,100 |
| 6,000,000 | Franklin County, Washington School District Bonds | | | |
| | (MBIA Insured) ! | 5.250 | 12/1/2022 | 6,431,580 |
| 10,000,000 | King County, Washington Sewer Revenue Bonds | | | |
| | (Series B) (FSA Insured) ! | 5.500 | 1/1/2013 | 10,698,900 |
| 8,330,000 | Tobacco Settlement Authority, Washington Tobacco | | | |
| | Settlement Revenue Bonds | 6.500 | 6/1/2026 | 8,730,590 |
| 5,620,000 | Washington State Economic Development Finance | | | |
| | Authority Lease Revenue Bonds (MBIA Insured) ! | 5.000 | 6/1/2030 | 5,808,270 |
| 2,955,000 | Washington State General Obligation Bonds | | | |
| | (Series 93A) | 5.750 | 10/1/2012 | 3,111,260 |
| 45,000 | Washington State General Obligation Bonds | | | |
| | (Series 93A) ÷ | 5.750 | 10/1/2012 | 47,458 |
| 1,235,000 | Washington State General Obligation Bonds | | | |
| | (Series A and AT-6) | 6.250 | 2/1/2011 | 1,287,846 |
| 5,000,000 | Washington State General Obligation Bonds | | | |
| | (Series A) | 6.750 | 2/1/2015 | 5,672,950 |
|
| The accompanying Notes to Financial Statements are an integral part of this schedule. |
|
| 181 |
| | | | |
| Municipal Bond Fund | | | |
| Schedule of Investments as of October 31, 2007 | | | |
| |
| Principal | | Interest | Maturity | |
| Amount | Long-Term Fixed Income (99.3%) | Rate | Date | Value |
|
| Washington — continued | | | |
| $5,000,000 | Washington State General Obligation Bonds | | | |
| | (Series A) (FSA Insured) ! | 5.000% | 7/1/2021 | $5,287,500 |
| 2,500,000 | Washington State General Obligation Bonds | | | |
| | (Series B and AT-7) | 6.250 | 6/1/2010 | 2,667,000 |
| 2,000,000 | Washington State General Obligation Bonds | | | |
| | (Series B and AT-7) | 6.000 | 6/1/2012 | 2,198,860 |
| 1,000,000 | Washington State Health Care Facilities Authority | | | |
| | Revenue Bonds (Series A) | 5.000 | 12/1/2030 | 1,021,920 |
| 2,000,000 | Washington State Health Care Facilities Authority | | | |
| | Revenue Bonds (Swedish Health Services) | | | |
| | (AMBAC Insured) ! | 5.125 | 11/15/2018 | 2,044,260 |
| 1,000,000 | Washington State Housing Finance Commission | | | |
| | Nonprofit Housing Revenue Bonds (Crista Ministries | | | |
| | Projects) (Series A) | 5.350 | 7/1/2014 | 1,005,370 |
|
|
| | Total Washington | | | 57,098,864 |
|
|
| |
| West Virginia (0.3%) | | | |
| 3,465,000 | West Virginia State Water Development Authority | | | |
| | Revenue Bonds (Series B-II) (FGIC Insured) ! | 5.000 | 11/1/2033 | 3,575,464 |
|
|
| | Total West Virginia | | | 3,575,464 |
|
|
| |
| Wisconsin (1.2%) | | | |
| 1,500,000 | Wisconsin State Health and Educational Facilities | | | |
| | Authority Revenue Bonds (Aurora Health Care) | | | |
| | (Series B) | 5.500 | 2/15/2015 | 1,530,390 |
| 1,000,000 | Wisconsin State Health and Educational Facilities | | | |
| | Authority Revenue Bonds (Eagle River Memorial | | | |
| | Hospital, Inc. Project) | 5.750 | 8/15/2020 | 1,045,060 |
| 1,000,000 | Wisconsin State Health and Educational Facilities | | | |
| | Authority Revenue Bonds (Franciscan Sisters | | | |
| | Christian) (Series A) ÷ | 5.500 | 2/15/2018 | 1,015,490 |
| 2,000,000 | Wisconsin State Health and Educational Facilities | | | |
| | Authority Revenue Bonds (Marshfield Clinic) | | | |
| | (Series B) | 6.000 | 2/15/2025 | 2,058,160 |
| 2,000,000 | Wisconsin State Health and Educational Facilities | | | |
| | Authority Revenue Bonds (Watertown Memorial | | | |
| | Hospital, Inc.) | 5.500 | 8/15/2029 | 2,049,540 |
| 6,000,000 | Wisconsin State Health and Educational Facilities | | | |
| | Authority Revenue Bonds (Wheaton | | | |
| | Franciscan Services) ÷ | 5.750 | 8/15/2025 | 6,555,840 |
|
|
| | Total Wisconsin | | | 14,254,480 |
|
|
|
| The accompanying Notes to Financial Statements are an integral part of this schedule. |
|
| 182 |
| | | | |
| Municipal Bond Fund | | | |
| Schedule of Investments as of October 31, 2007 | | | |
| |
| Principal | | Interest | Maturity | |
| Amount | Long-Term Fixed Income (99.3%) | Rate | Date | Value |
|
| Wyoming (0.6%) | | | |
| $270,000 | Lincoln County, Wyoming Pollution Control | | | |
| | Revenue Bonds † | 3.520% | 11/1/2007 | $270,000 |
| 5,825,000 | Wyoming State Farm Loan Board Capital Facilities | | | |
| | Revenue Bonds | 5.750 | 10/1/2020 | 6,332,649 |
|
|
| | Total Wyoming | | | 6,602,649 |
|
|
| | Total Long-Term Fixed Income | | |
| | (cost $1,102,700,446) | | | 1,167,391,735 |
|
|
| | Total Investments (cost $1,102,700,446) 99.3% | $1,167,391,735 |
|
|
| | Other Assets and Liabilities, Net 0.7% | | 8,187,798 |
|
|
| | Total Net Assets 100.0% | | | $1,175,579,533 |
|
|
> Denotes step coupon bonds for which the current interest rate and next scheduled reset date are shown.
† Denotes variable rate obligations for which the current yield and next scheduled reset date are shown.
§ Denotes investments purchased on a when-issued or delayed delivery basis.
± Designated as cover for long settling trades as discussed in the Notes to Financial Statements.
÷ Denotes securities that have been pre-refunded or escrowed to maturity. Under such an arrangement, money is deposited into an irrevocable escrow account and is used to purchase U.S. Treasury securities or government agency securities with maturing principals and interest earnings sufficient to pay all debt service requirements of the pre-refunded bonds.
! To reduce certain risks associated with securities issued by municipalities, which may include but are not limited to economic development in a specific industry or municipality, the principal and/or interest payments are guaranteed by the bond insurance company or Government agency identified.
Gross unrealized appreciation and depreciation of investments, based on cost for federal income tax purposes, were as follows:
| | |
| Gross unrealized appreciation | $67,070,244 | |
| Gross unrealized depreciation | (2,408,838) | |
|
| |
| Net unrealized appreciation (depreciation) | $64,661,406 | |
| Cost for federal income tax purposes | $1,102,730,329 | |
|
| The accompanying Notes to Financial Statements are an integral part of this schedule. |
|
| 183 |
| | | | |
| Income Fund |
| Schedule of Investments as of October 31, 2007 |
| Principal | | Interest | Maturity | |
| Amount | Long-Term Fixed Income (106.2%) | Rate | Date | Value |
|
| Asset-Backed Securities (8.6%) | | | |
| $2,419,857 | Bear Stearns Mortgage Funding Trust †~ | 5.012% | 11/25/2007 | $1,761,944 |
| 3,039,380 | Capitalsource Commercial Loan Trust †~ | 5.127 | 11/20/2007 | 3,040,563 |
| 5,000,000 | Countrywide Asset-Backed Certificates ~« | 5.549 | 4/25/2036 | 4,948,585 |
| 3,000,000 | Credit Based Asset Servicing and Securitization, LLC †~ | 4.982 | 11/25/2007 | 2,964,096 |
| 6,000,000 | DaimlerChrysler Master Owner Trust ±† | 5.141 | 11/15/2007 | 5,994,876 |
| 5,000,000 | Discover Card Master Trust | 5.650 | 3/16/2020 | 5,005,170 |
| 3,000,000 | First Franklin Mortgage Loan Asset-Backed Certificates †‡ | 4.962 | 11/25/2007 | 2,895,879 |
| 2,000,790 | First Horizon ABS Trust †‡« | 5.032 | 11/25/2007 | 1,880,869 |
| 5,000,000 | Ford Credit Floor Plan Master Owner Trust †‡ | 5.271 | 11/15/2007 | 4,971,440 |
| 6,000,000 | GE Dealer Floorplan Master Note Trust ±†‡ | 5.037 | 11/20/2007 | 5,995,374 |
| 6,500,000 | GMAC Mortgage Corporation Loan Trust †‡« | 4.943 | 11/25/2007 | 6,463,327 |
| 6,000,000 | GMAC Mortgage Corporation Loan Trust ±†« | 4.962 | 11/25/2007 | 5,977,386 |
| 2,139,546 | GMAC Mortgage Corporation Loan Trust †~« | 4.972 | 11/25/2007 | 2,112,751 |
| 4,961,886 | IndyMac Seconds Asset-Backed Trust ±†« | 5.042 | 11/25/2007 | 4,761,064 |
| 7,250,000 | Merna Re, Ltd. †‡≤ | 6.980 | 12/31/2007 | 7,239,850 |
| 3,957,567 | Residential Funding Mortgage Securities II †‡« | 5.002 | 11/25/2007 | 3,907,195 |
|
|
| | Total Asset-Backed Securities | | 69,920,369 |
|
|
| |
| Basic Materials (2.0%) | | | |
| 2,970,000 | Alcan, Inc. ‡ | 5.000 | 6/1/2015 | 2,856,668 |
| 2,500,000 | BHP Billiton Finance, Ltd. ~ | 5.400 | 3/29/2017 | 2,456,448 |
| 1,000,000 | Freeport-McMoRan Copper & Gold, Inc. †‡ | 8.394 | 4/1/2008 | 1,032,500 |
| 4,700,000 | Glencore Funding, LLC ±≤ | 6.000 | 4/15/2014 | 4,718,053 |
| 2,980,000 | Lubrizol Corporation | 5.500 | 10/1/2014 | 2,922,605 |
| 2,000,000 | Precision Castparts Corporation ‡ | 5.600 | 12/15/2013 | 2,049,452 |
|
|
| | Total Basic Materials | | | 16,035,726 |
|
|
| |
| Capital Goods (2.4%) | | | |
| 4,050,000 | Caterpillar Financial Services Corporation ~ | 5.850 | 9/1/2017 | 4,127,720 |
| 1,600,000 | CRH America, Inc. ‡ | 6.000 | 9/30/2016 | 1,576,098 |
| 2,219,000 | Goodrich Corporation ~ | 6.800 | 7/1/2036 | 2,421,488 |
| 1,170,000 | Lockheed Martin Corporation | 6.150 | 9/1/2036 | 1,203,588 |
| 3,250,000 | Oakmont Asset Trust ≤ | 4.514 | 12/22/2008 | 3,230,480 |
| 1,200,000 | Owens Corning, Inc. ± | 7.000 | 12/1/2036 | 1,121,293 |
| 2,513,021 | Systems 2001 Asset Trust, LLC ≤ | 6.664 | 9/15/2013 | 2,588,412 |
| 3,000,000 | United Technologies Corporation | 4.875 | 5/1/2015 | 2,902,353 |
|
|
| | Total Capital Goods | | | 19,171,432 |
|
|
| |
| Collateralized Mortgage Obligations (5.2%) | | | |
| 6,386,550 | Banc of America Mortgage Securities, Inc. ~ | 4.802 | 9/25/2035 | 6,298,173 |
| 3,000,000 | Citigroup Mortgage Loan Trust, Inc. ~ | 5.536 | 3/25/2036 | 2,996,820 |
| 2,655,828 | HomeBanc Mortgage Trust ~ | 5.987 | 4/25/2037 | 2,694,540 |
| 5,437,738 | J.P. Morgan Mortgage Trust ~ | 5.010 | 7/25/2035 | 5,419,794 |
| 4,245,630 | Merrill Lynch Mortgage Investors, Inc. ~ | 4.874 | 6/25/2035 | 4,229,624 |
| 3,854,623 | Thornburg Mortgage Securities Trust † | 4.963 | 11/25/2007 | 3,830,436 |
| 3,850,466 | Wachovia Mortgage Loan Trust, LLC | 5.575 | 5/20/2036 | 3,886,803 |
|
| The accompanying Notes to Financial Statements are an integral part of this schedule. |
|
| 184 |
| | | | |
| Income Fund | | | | |
| Schedule of Investments as of October 31, 2007 | | | |
| |
| Principal | | Interest | Maturity | |
| Amount | Long-Term Fixed Income (106.2%) | Rate | Date | Value |
|
| Collateralized Mortgage Obligations — continued | | | |
| $4,572,919 | Washington Mutual Alternative Loan Trust † | 5.683% | 11/25/2007 | $4,430,015 |
| 2,193,570 | Washington Mutual Mortgage Pass-Through Certificates † | 5.162 | 11/25/2007 | 2,154,933 |
| 3,290,293 | Washington Mutual Mortgage Pass-Through Certificates | 4.835 | 9/25/2035 | 3,261,013 |
| 2,870,700 | Zuni Mortgage Loan Trust ±† | 5.003 | 11/25/2007 | 2,851,636 |
|
|
| | Total Collateralized Mortgage Obligations | 42,053,787 |
|
|
| |
| Commercial Mortgage-Backed Securities (12.3%) | | | |
| 6,000,000 | Banc of America Commercial Mortgage, Inc. ‡~ | 5.001 | 9/10/2010 | 5,968,968 |
| 2,588,997 | Banc of America Commercial Mortgage, Inc. ~ | 4.037 | 11/10/2039 | 2,554,156 |
| 2,000,000 | Banc of America Commercial Mortgage, Inc. ~ | 5.118 | 7/11/2043 | 1,988,528 |
| 4,000,000 | Banc of America Large Loan Trust †~≤ | 5.201 | 11/15/2007 | 3,989,628 |
| 4,000,000 | Banc of America Large Loan Trust †~≤ | 5.301 | 11/15/2007 | 3,982,200 |
| 3,000,000 | Bear Stearns Commercial Mortgage Securities, Inc. †‡ | 5.241 | 11/15/2007 | 2,978,733 |
| 3,000,000 | Bear Stearns Commercial Mortgage Securities, Inc. ± | 5.835 | 9/11/2042 | 3,006,993 |
| 7,500,000 | Citigroup Commercial Mortgage Trust †~≤ | 5.231 | 11/15/2007 | 7,449,825 |
| 7,000,000 | Commercial Mortgage Pass-Through Certificates †‡≤ | 5.053 | 11/15/2007 | 6,927,319 |
| 201,057 | Commercial Mortgage Pass-Through Certificates †≤ | 5.191 | 11/15/2007 | 200,762 |
| 4,000,000 | Commercial Mortgage Pass-Through Certificates †‡≤ | 5.221 | 11/15/2007 | 3,952,988 |
| 4,000,000 | Credit Suisse Mortgage Capital Certificates †‡≤ | 5.261 | 11/15/2007 | 3,980,024 |
| 6,500,000 | Crown Castle International Corporation ±≤ | 5.245 | 11/15/2036 | 6,477,770 |
| 6,000,000 | Greenwich Capital Commercial Funding Corporation ~ | 6.111 | 7/10/2038 | 6,147,744 |
| 2,750,000 | J.P. Morgan Chase Commercial Mortgage | | | |
| | Securities Corporation ‡ | 4.302 | 1/15/2038 | 2,672,997 |
| 5,978,488 | J.P. Morgan Chase Commercial Mortgage | | | |
| | Securities Corporation ‡ | 5.284 | 5/15/2047 | 5,958,317 |
| 5,000,000 | J.P. Morgan Chase Commercial Mortgage | | | |
| | Securities Corporation ‡ | 6.007 | 6/15/2049 | 5,067,580 |
| 2,311,943 | Lehman Brothers “CALSTRS” Mortgage Trust ±≤ | 3.988 | 11/20/2012 | 2,309,906 |
| 6,500,000 | Merrill Lynch Mortgage Trust | 4.747 | 5/12/2043 | 6,156,820 |
| 5,500,000 | Merrill Lynch Mortgage Trust | 5.442 | 1/12/2044 | 5,385,567 |
| 10,000,000 | Wachovia Bank Commercial Mortgage Trust †≤ | 5.211 | 11/15/2007 | 9,949,090 |
| 2,025,994 | Washington Mutual Asset Securities Corporation ≤ | 3.830 | 1/25/2035 | 1,982,001 |
|
|
| | Total Commercial Mortgage-Backed Securities | 99,087,916 |
|
|
| |
| Communications Services (6.4%) | | | |
| 775,000 | AT&T Corporation | 8.000 | 11/15/2031 | 961,905 |
| 1,225,000 | AT&T, Inc. ~ | 6.500 | 9/1/2037 | 1,292,154 |
| 1,925,000 | British Telecom plc ~ | 9.125 | 12/15/2030 | 2,603,195 |
| 1,300,000 | Comcast Corporation ~ | 5.900 | 3/15/2016 | 1,306,783 |
| 1,400,000 | Comcast Corporation ± | 6.300 | 11/15/2017 | 1,444,146 |
| 3,520,000 | Comcast Corporation ~ | 5.875 | 2/15/2018 | 3,513,189 |
| 4,000,000 | Cox Communications, Inc. ~ | 4.625 | 6/1/2013 | 3,810,288 |
| 770,000 | Cox Communications, Inc. ~ | 5.450 | 12/15/2014 | 756,079 |
| 3,300,000 | Intelsat Intermediate, Inc. >‡ | Zero Coupon | 2/1/2010 | 2,714,250 |
| 2,500,000 | New Cingular Wireless Services, Inc. ‡~ | 8.125 | 5/1/2012 | 2,788,130 |
| 765,000 | New Cingular Wireless Services, Inc. ‡ | 8.750 | 3/1/2031 | 989,201 |
|
| The accompanying Notes to Financial Statements are an integral part of this schedule. |
|
| 185 |
| | | | |
| Income Fund | | | | |
| Schedule of Investments as of October 31, 2007 | | | |
| |
| Principal | | Interest | Maturity | |
| Amount | Long-Term Fixed Income (106.2%) | Rate | Date | Value |
|
| Communications Services — continued | | | |
| $1,350,000 | News America, Inc. | 6.400% | 12/15/2035 | $1,341,172 |
| 2,960,000 | Rogers Cable, Inc. ‡ | 5.500 | 3/15/2014 | 2,893,279 |
| 2,200,000 | Rogers Cable, Inc. ± | 6.750 | 3/15/2015 | 2,295,612 |
| 320,000 | Rogers Cable, Inc. ± | 8.750 | 5/1/2032 | 391,345 |
| 2,000,000 | Rogers Wireless Communications, Inc. ‡ | 6.375 | 3/1/2014 | 2,043,086 |
| 1,800,000 | Rogers Wireless Communications, Inc. ~ | 7.500 | 3/15/2015 | 1,950,903 |
| 2,900,000 | Sprint Capital Corporation | 6.900 | 5/1/2019 | 2,900,191 |
| 3,550,000 | Telecom Italia Capital SA ± | 5.250 | 11/15/2013 | 3,485,507 |
| 1,750,000 | Telecom Italia Capital SA | 5.250 | 10/1/2015 | 1,686,440 |
| 2,600,000 | Telefonica Emisones SAU | 6.221 | 7/3/2017 | 2,689,757 |
| 2,000,000 | Time Warner Cable, Inc. | 5.850 | 5/1/2017 | 1,982,928 |
| 1,150,000 | Time Warner Entertainment Company, LP | 8.375 | 3/15/2023 | 1,356,403 |
| 3,000,000 | Verizon Communications, Inc. ± | 5.550 | 2/15/2016 | 3,017,712 |
| 1,165,000 | Verizon Communications, Inc. | 5.500 | 4/1/2017 | 1,165,019 |
|
|
| | Total Communications Services | | 51,378,674 |
|
|
| |
| Consumer Cyclical (2.6%) | | | |
| 4,100,000 | D.R. Horton, Inc. ‡ | 6.500 | 4/15/2016 | 3,722,698 |
| 1,450,000 | Federated Retail Holdings, Inc. ± | 5.350 | 3/15/2012 | 1,413,644 |
| 1,850,000 | Ford Motor Credit Company ‡ | 6.625 | 6/16/2008 | 1,841,734 |
| 700,000 | JC Penney Corporation, Inc. | 7.950 | 4/1/2017 | 781,495 |
| 310,000 | JC Penney Corporation, Inc. | 5.750 | 2/15/2018 | 300,165 |
| 1,360,000 | JC Penney Corporation, Inc. ± | 6.375 | 10/15/2036 | 1,297,090 |
| 2,300,000 | McDonald’s Corporation | 5.800 | 10/15/2017 | 2,322,427 |
| 2,650,000 | Nissan Motor Acceptance Corporation ≤ | 5.625 | 3/14/2011 | 2,692,138 |
| 1,400,000 | Rite Aid Corporation ≤ | 9.500 | 6/15/2017 | 1,295,000 |
| 2,631,762 | SLM Private Credit Student Loan Trust † | 5.704 | 12/15/2007 | 2,619,695 |
| 1,400,000 | Station Casinos, Inc. | 6.875 | 3/1/2016 | 1,158,500 |
| 1,930,000 | Walmart Stores, Inc. | 5.875 | 4/5/2027 | 1,891,605 |
|
|
| | Total Consumer Cyclical | | 21,336,191 |
|
|
| |
| Consumer Non-Cyclical (4.4%) | | | |
| 800,000 | AmerisourceBergen Corporation | 5.625 | 9/15/2012 | 802,059 |
| 2,000,000 | AmerisourceBergen Corporation ~ | 5.875 | 9/15/2015 | 1,979,536 |
| 4,700,000 | AstraZeneca plc ~ | 5.400 | 9/15/2012 | 4,745,219 |
| 2,215,000 | Baxter International, Inc. ~ | 5.900 | 9/1/2016 | 2,265,201 |
| 3,800,000 | Bunge Limited Finance Corporation ~ | 5.350 | 4/15/2014 | 3,665,476 |
| 2,700,000 | Cardinal Health, Inc. ಠ| 6.000 | 6/15/2017 | 2,755,085 |
| 3,500,000 | Cargill, Inc. ಠ| 5.600 | 9/15/2012 | 3,535,231 |
| 2,400,000 | Community Health Systems, Inc. ~≤ | 8.875 | 7/15/2015 | 2,430,000 |
| 1,000,000 | General Mills, Inc. ‡ | 5.650 | 9/10/2012 | 1,015,534 |
| 2,200,000 | Johnson & Johnson Company ‡ | 5.950 | 8/15/2037 | 2,300,890 |
| 1,500,000 | Kroger Company ‡ | 6.400 | 8/15/2017 | 1,560,604 |
| 1,315,000 | Procter & Gamble Company | 5.550 | 3/5/2037 | 1,290,611 |
| 900,000 | Safeway, Inc. | 6.350 | 8/15/2017 | 931,698 |
|
| The accompanying Notes to Financial Statements are an integral part of this schedule. |
|
| 186 |
| | | | |
| Income Fund | | | | |
| Schedule of Investments as of October 31, 2007 | | | |
| |
| Principal | | Interest | Maturity | |
| Amount | Long-Term Fixed Income (106.2%) | Rate | Date | Value |
|
| Consumer Non-Cyclical — continued | | | |
| $2,000,000 | Schering-Plough Corporation | 6.000% | 9/15/2017 | $2,034,206 |
| 3,500,000 | Tesco plc §≤ | 5.500 | 11/15/2017 | 3,460,418 |
| 910,000 | Wyeth ± | 5.950 | 4/1/2037 | 899,970 |
|
|
| | Total Consumer Non-Cyclical | | 35,671,738 |
|
|
| |
| Energy (6.6%) | | | |
| 2,200,000 | Apache Corporation ‡ | 5.250 | 4/15/2013 | 2,203,670 |
| 3,650,000 | CenterPoint Energy Resources Corporation ~ | 6.125 | 11/1/2017 | 3,659,691 |
| 1,100,000 | Consolidated Natural Gas Company ‡ | 5.000 | 12/1/2014 | 1,054,472 |
| 3,100,000 | Enterprise Products Operating, LP ‡ | 5.600 | 10/15/2014 | 3,065,599 |
| 2,250,000 | Enterprise Products Operating, LP ‡ | 6.300 | 9/15/2017 | 2,291,018 |
| 1,500,000 | EOG Resources, Inc. | 5.875 | 9/15/2017 | 1,530,926 |
| 1,800,000 | Magellan Midstream Partners, LP | 6.450 | 6/1/2014 | 1,871,201 |
| 1,600,000 | Marathon Oil Corporation | 6.000 | 10/1/2017 | 1,626,138 |
| 1,750,000 | Mariner Energy, Inc. | 8.000 | 5/15/2017 | 1,728,125 |
| 735,000 | Nexen, Inc. ‡ | 5.650 | 5/15/2017 | 720,742 |
| 1,925,000 | Nexen, Inc. ± | 6.400 | 5/15/2037 | 1,915,336 |
| 1,750,000 | Oneok Partners, LP | 6.850 | 10/15/2037 | 1,828,356 |
| 2,000,000 | Plains All American Pipeline, LP/PAA | | | |
| | Finance Corporation ± | 6.650 | 1/15/2037 | 2,038,770 |
| 1,500,000 | Premcor Refining Group, Inc. | 6.125 | 5/1/2011 | 1,541,360 |
| 1,850,000 | Premcor Refining Group, Inc. | 6.750 | 5/1/2014 | 1,924,971 |
| 5,175,000 | Ras Laffan Liquefied Natural Gas Company, Ltd. II ≤ | 5.298 | 9/30/2020 | 4,997,394 |
| 2,000,000 | Southern Natural Gas Company ≤ | 5.900 | 4/1/2017 | 1,959,114 |
| 2,400,000 | Southern Star Central Corporation | 6.750 | 3/1/2016 | 2,268,000 |
| 2,000,000 | Transcontinental Gas Pipe Corporation | 8.875 | 7/15/2012 | 2,245,000 |
| 600,000 | Transcontinental Gas Pipe Corporation ± | 6.400 | 4/15/2016 | 610,500 |
| 2,250,000 | Valero Energy Corporation | 6.125 | 6/15/2017 | 2,283,676 |
| 800,000 | Valero Energy Corporation ± | 6.625 | 6/15/2037 | 823,691 |
| 4,600,000 | Western Oil Sands, Inc. | 8.375 | 5/1/2012 | 5,111,750 |
| 1,900,000 | XTO Energy, Inc. | 5.300 | 6/30/2015 | 1,869,473 |
| 1,900,000 | XTO Energy, Inc. | 6.250 | 8/1/2017 | 1,969,831 |
|
|
| | Total Energy | | | 53,138,804 |
|
|
| |
| Financials (24.1%) | | | |
| 1,250,000 | American Express Bank FSB | 6.000 | 9/13/2017 | 1,261,715 |
| 1,450,000 | American Express Centurion Bank | 5.550 | 10/17/2012 | 1,464,014 |
| 2,500,000 | American Express Company ~ | 6.150 | 8/28/2017 | 2,549,615 |
| 2,400,000 | American International Group, Inc. ‡ | 6.250 | 3/15/2037 | 2,233,457 |
| 1,900,000 | Archstone-Smith Operating Trust ~ | 5.625 | 8/15/2014 | 2,008,100 |
| 2,600,000 | AXA SA ಠ| 6.463 | 12/14/2018 | 2,417,568 |
| 720,000 | BAC Capital Trust XI | 6.625 | 5/23/2036 | 730,830 |
| 2,400,000 | BAC Capital Trust XIV ~ | 5.630 | 3/15/2012 | 2,264,098 |
| 500,000 | Bank of America Corporation ~ | 6.000 | 9/1/2017 | 509,714 |
| 2,200,000 | Bear Stearns Companies, Inc. ~ | 6.400 | 10/2/2017 | 2,192,863 |
| 2,100,000 | BNP Paribas SA ~≤ | 5.186 | 6/29/2015 | 1,945,211 |
|
| The accompanying Notes to Financial Statements are an integral part of this schedule. |
|
| 187 |
| | | | |
| Income Fund | | | | |
| Schedule of Investments as of October 31, 2007 | | | |
| |
| Principal | | Interest | Maturity | |
| Amount | Long-Term Fixed Income (106.2%) | Rate | Date | Value |
|
| Financials — continued | | | |
| $715,000 | Capital One Capital III | 7.686% | 8/15/2036 | $693,019 |
| 1,540,000 | Capital One Financial Corporation ‡ | 5.250 | 2/21/2017 | 1,420,636 |
| 3,500,000 | Capmark Financial Group, Inc. ಠ| 6.300 | 5/10/2017 | 2,862,300 |
| 2,350,000 | Citigroup, Inc. | 5.300 | 10/17/2012 | 2,356,925 |
| 2,200,000 | Citigroup, Inc. ~ | 6.000 | 8/15/2017 | 2,242,275 |
| 1,000,000 | Corestates Capital Trust I ≤ | 8.000 | 12/15/2026 | 1,035,799 |
| 4,500,000 | Countrywide Financial Corporation ~ | 5.800 | 6/7/2012 | 3,874,576 |
| 8,600,000 | Countrywide Financial Corporation, Convertible †‡≤ | 1.743 | 1/15/2008 | 7,612,720 |
| 1,200,000 | Coventry Health Care, Inc. ‡ | 5.875 | 1/15/2012 | 1,208,508 |
| 1,000,000 | Coventry Health Care, Inc. ‡ | 6.125 | 1/15/2015 | 996,872 |
| 1,000,000 | Coventry Health Care, Inc. ‡ | 5.950 | 3/15/2017 | 973,374 |
| 3,200,000 | Credit Agricole SA £ | 6.637 | 5/31/2017 | 3,041,190 |
| 1,900,000 | Deluxe Corporation ‡ | 7.375 | 6/1/2015 | 1,881,000 |
| 2,800,000 | Endurance Specialty Holdings, Ltd. ± | 6.150 | 10/15/2015 | 2,741,726 |
| 1,500,000 | ERP Operating, LP ~ | 5.125 | 3/15/2016 | 1,406,262 |
| 1,625,000 | General Electric Capital Corporation | 5.720 | 8/22/2011 | 1,632,171 |
| 3,200,000 | General Electric Capital Corporation | 4.375 | 3/3/2012 | 3,108,122 |
| 1,630,000 | General Electric Capital Corporation | 5.625 | 9/15/2017 | 1,645,886 |
| 700,000 | General Electric Capital Corporation ~ | 6.150 | 8/7/2037 | 725,329 |
| 3,295,000 | General Motors Acceptance Corporation | 6.875 | 9/15/2011 | 3,036,712 |
| 4,600,000 | General Motors Acceptance Corporation, LLC ‡ | 6.000 | 12/15/2011 | 4,081,378 |
| 3,500,000 | Goldman Sachs Group, Inc. | 6.600 | 1/15/2012 | 3,666,820 |
| 3,500,000 | Goldman Sachs Group, Inc. ± | 5.125 | 1/15/2015 | 3,383,681 |
| 700,000 | Goldman Sachs Group, Inc. | 6.750 | 10/1/2037 | 702,640 |
| 2,500,000 | HSBC Capital Funding, LP/Jersey Channel Islands ±≤ | 9.547 | 6/30/2010 | 2,727,635 |
| 815,000 | HSBC Holdings plc ‡ | 6.500 | 5/2/2036 | 804,586 |
| 2,095,000 | International Lease Finance Corporation ‡ | 5.750 | 6/15/2011 | 2,115,896 |
| 3,350,000 | iStar Financial, Inc. ‡ | 5.850 | 3/15/2017 | 2,988,800 |
| 1,700,000 | J.P. Morgan Chase & Company ‡ | 5.750 | 1/2/2013 | 1,730,163 |
| 2,940,000 | J.P. Morgan Chase Bank NA ‡ | 5.875 | 6/13/2016 | 2,974,410 |
| 5,000,000 | Keybank National Association | 5.500 | 9/17/2012 | 4,974,805 |
| 2,000,000 | Lehman Brothers Holdings, Inc. | 5.250 | 2/6/2012 | 1,973,072 |
| 3,500,000 | Lehman Brothers Holdings, Inc. ‡ | 6.000 | 7/19/2012 | 3,548,492 |
| 1,550,000 | Lehman Brothers Holdings, Inc. | 7.000 | 9/27/2027 | 1,582,942 |
| 1,830,000 | Liberty Property, LP | 5.500 | 12/15/2016 | 1,722,588 |
| 3,795,000 | Lincoln National Corporation ‡ | 7.000 | 5/17/2016 | 3,897,936 |
| 950,000 | Merrill Lynch & Company, Inc. ~ | 6.050 | 8/15/2012 | 964,063 |
| 1,500,000 | Merrill Lynch & Company, Inc. * | 6.050 | 5/16/2016 | 1,487,181 |
| 850,000 | Merrill Lynch & Company, Inc. ± | 6.110 | 1/29/2037 | 781,633 |
| 4,420,000 | Mitsubishi UFG Capital Finance, Ltd. ± | 6.346 | 7/25/2016 | 4,214,218 |
| 1,600,000 | Morgan Stanley | 4.000 | 1/15/2010 | 1,563,645 |
| 1,000,000 | Morgan Stanley ~ | 6.250 | 8/28/2017 | 1,023,868 |
| 2,280,000 | Morgan Stanley *~ | 6.250 | 8/9/2026 | 2,247,182 |
| 3,850,000 | Nationwide Health Properties, Inc. | 6.250 | 2/1/2013 | 3,875,814 |
| 3,318,137 | Preferred Term Securities XXIII, Ltd. ±†≤ | 5.894 | 12/24/2007 | 3,168,821 |
| 2,050,000 | ProLogis ~ | 5.500 | 4/1/2012 | 2,024,156 |
|
| The accompanying Notes to Financial Statements are an integral part of this schedule. |
|
| 188 |
| | | | |
| Income Fund | | | | |
| Schedule of Investments as of October 31, 2007 | | | |
| |
| Principal | | Interest | Maturity | |
| Amount | Long-Term Fixed Income (106.2%) | Rate | Date | Value |
|
| Financials — continued | | | |
| $1,400,000 | ProLogis ± | 5.625% | 11/15/2015 | $1,360,414 |
| 725,000 | Prudential Financial, Inc. ± | 5.900 | 3/17/2036 | 683,184 |
| 725,000 | Prudential Financial, Inc. ± | 5.700 | 12/14/2036 | 672,696 |
| 1,600,000 | QBE Capital Funding II, LP ~≤ | 6.797 | 6/1/2017 | 1,564,797 |
| 2,250,000 | RBS Capital Trust I ± | 5.512 | 9/30/2014 | 2,107,683 |
| 1,500,000 | Regency Centers, LP | 5.875 | 6/15/2017 | 1,459,816 |
| 3,100,000 | Reinsurance Group of America, Inc. | 5.625 | 3/15/2017 | 3,019,865 |
| 3,120,000 | Residential Capital Corporation †‡ | 7.314 | 11/2/2007 | 2,433,600 |
| 2,200,000 | Residential Capital Corporation †‡≤ | 8.044 | 1/17/2008 | 1,364,000 |
| 4,340,000 | Residential Capital Corporation | 7.500 | 4/17/2013 | 3,168,200 |
| 4,900,000 | Residential Capital, LLC ‡ | 7.500 | 6/1/2012 | 3,577,000 |
| 4,000,000 | Resona Bank, Ltd. ಠ| 5.850 | 4/15/2016 | 3,705,704 |
| 700,000 | Santander Perpetual SA Unipersonal ≤ | 6.671 | 10/24/2017 | 697,050 |
| 2,250,000 | Simon Property Group, LP ± | 4.600 | 6/15/2010 | 2,209,131 |
| 1,400,000 | Simon Property Group, LP | 5.375 | 6/1/2011 | 1,397,553 |
| 1,485,000 | Simon Property Group, LP | 5.750 | 12/1/2015 | 1,455,872 |
| 2,875,000 | SLM Corporation | 5.400 | 10/25/2011 | 2,660,401 |
| 2,340,000 | SMFG Preferred Capital GBP 1, Ltd. ≤ | 6.078 | 1/25/2017 | 2,188,859 |
| 4,190,000 | Student Loan Marketing Corporation ‡ | 4.500 | 7/26/2010 | 3,923,051 |
| 2,600,000 | Swiss RE Capital I, LP ≤ | 6.854 | 5/25/2016 | 2,622,378 |
| 550,000 | Travelers Companies, Inc. ± | 6.250 | 6/15/2037 | 542,642 |
| 2,000,000 | Travelers Property Casualty Corporation | 5.000 | 3/15/2013 | 1,958,846 |
| 1,500,000 | United Health Group ≤ | 6.500 | 6/15/2037 | 1,537,870 |
| 2,420,000 | Wachovia Bank NA | 4.875 | 2/1/2015 | 2,308,090 |
| 2,225,000 | Wachovia Capital Trust III | 5.800 | 3/15/2011 | 2,207,318 |
| 2,350,000 | Wachovia Corporation * | 5.300 | 10/15/2011 | 2,348,743 |
| 1,030,000 | Washington Mutual Bank FA | 5.125 | 1/15/2015 | 923,921 |
| 800,000 | Washington Mutual Preferred Funding ≤ | 6.665 | 12/15/2016 | 608,000 |
| 4,600,000 | Washington Mutual Preferred Funding II ≤ | 6.895 | 6/15/2012 | 3,496,000 |
| 4,000,000 | WellPoint, Inc. ‡ | 5.000 | 12/15/2014 | 3,846,436 |
| 2,940,000 | Willis North America, Inc. | 6.200 | 3/28/2017 | 2,966,845 |
| 1,925,000 | XL Capital, Ltd. ± | 6.250 | 5/15/2027 | 1,780,192 |
|
|
| | Total Financials | | | 195,095,169 |
|
|
| |
| Foreign (0.4%) | | | |
| 2,800,000 | Pemex Finance, Ltd. ‡ | 9.030 | 2/15/2011 | 2,972,200 |
|
|
| | Total Foreign | | | 2,972,200 |
|
|
| |
| Mortgage-Backed Securities (9.5%) | | | |
| 3,000,000 | Federal National Mortgage Association Conventional | | | |
| | 30-Yr. Pass Through § | 5.500 | 11/1/2037 | 2,955,936 |
| 57,000,000 | Federal National Mortgage Association Conventional | | | |
| | 30-Yr. Pass Through §~ | 6.000 | 11/1/2037 | 57,409,710 |
| 16,000,000 | Federal National Mortgage Association Conventional | | | |
| | 30-Yr. Pass Through § | 6.500 | 11/1/2037 | 16,375,008 |
|
|
| | Total Mortgage-Backed Securities | | 76,740,654 |
|
|
|
| The accompanying Notes to Financial Statements are an integral part of this schedule. |
|
| 189 |
| | | | |
| Income Fund | | | | |
| Schedule of Investments as of October 31, 2007 | | | |
| |
| Principal | | Interest | Maturity | |
| Amount | Long-Term Fixed Income (106.2%) | Rate | Date | Value |
|
| Technology (0.6%) | | | |
| $3,500,000 | IBM International Group Capital, LLC | 5.050% | 10/22/2012 | $3,498,408 |
| 1,250,000 | International Business Machines Corporation | 5.700 | 9/14/2017 | 1,268,732 |
|
|
| | Total Technology | | | 4,767,140 |
|
|
| |
| Transportation (5.3%) | | | |
| 1,800,000 | Burlington Northern Santa Fe Corporation ~ | 7.000 | 12/15/2025 | 1,944,976 |
| 2,192,159 | Continental Airlines, Inc. ‡ | 7.875 | 7/2/2018 | 2,131,875 |
| 2,250,000 | Continental Airlines, Inc. ‡ | 5.983 | 4/19/2022 | 2,211,908 |
| 4,500,000 | Delta Air Lines, Inc. ‡ | 7.111 | 9/18/2011 | 4,595,625 |
| 1,000,000 | FedEx Corporation | 3.500 | 4/1/2009 | 976,465 |
| 4,438,963 | FedEx Corporation | 6.720 | 1/15/2022 | 4,652,034 |
| 1,750,000 | Hertz Corporation ‡ | 8.875 | 1/1/2014 | 1,802,500 |
| 3,650,000 | Kansas City Southern de Mexico SA de CV ~≤ | 7.375 | 6/1/2014 | 3,650,000 |
| 2,260,000 | Norfolk Southern Corporation | 5.640 | 5/17/2029 | 2,099,126 |
| 9,250,000 | Northwest Airlines, Inc. | 6.841 | 4/1/2011 | 9,330,938 |
| 3,015,136 | Piper Jaffray Equipment Trust Securities ~≤ | 6.750 | 4/1/2011 | 2,939,758 |
| 6,500,000 | Union Pacific Corporation | 5.450 | 1/31/2013 | 6,501,092 |
|
|
| | Total Transportation | | 42,836,297 |
|
|
| |
| U.S. Government (9.1%) | | | |
| 3,250,000 | Federal Home Loan Mortgage Corporation ~ | 5.000 | 12/14/2018 | 3,185,757 |
| 7,500,000 | Federal National Mortgage Association * | 5.300 | 2/22/2011 | 7,514,505 |
| 800,000 | U.S. Treasury Bonds * | 6.250 | 8/15/2023 | 928,500 |
| 1,020,000 | U.S. Treasury Bonds ‡ | 7.625 | 2/15/2025 | 1,356,680 |
| 1,500,000 | U.S. Treasury Bonds * | 4.750 | 2/15/2037 | 1,499,180 |
| 7,500,000 | U.S. Treasury Notes | 4.500 | 5/15/2017 | 7,521,682 |
| 5,100,000 | U.S. Treasury Notes * | 4.750 | 8/15/2017 | 5,212,358 |
| 30,334,975 | U.S. Treasury Notes, TIPS * | 2.000 | 7/15/2014 | 30,325,510 |
| 10,250,000 | U.S. Treasury Principal Strips * | Zero Coupon | 2/15/2013 | 8,239,985 |
| 17,000,000 | U.S. Treasury Principal Strips ‡ | Zero Coupon | 11/15/2022 | 8,172,597 |
|
|
| | Total U.S. Government | | 73,956,754 |
|
|
| |
| U.S. Municipal (0.9%) | | | |
| 945,000 | California Infrastructure & Economic Bank | | | |
| | Revenue Bonds ÷~ | 5.000 | 7/1/2036 | 1,028,169 |
| 2,500,000 | Little Rock, Arkansas Sewer Revenue Bonds | 5.000 | 10/1/2037 | 2,598,925 |
| 3,500,000 | Missouri Joint Municipal Electric Utility | | | |
| | Commission Revenue Bonds (Power Project) | 5.000 | 1/1/2032 | 3,621,975 |
|
|
| | Total U.S. Municipal | | 7,249,069 |
|
|
|
| The accompanying Notes to Financial Statements are an integral part of this schedule. |
|
| 190 |
| | | | |
| Income Fund | | | | |
| Schedule of Investments as of October 31, 2007 | | | |
| |
| Principal | | Interest | Maturity | |
| Amount | Long-Term Fixed Income (106.2%) | Rate | Date | Value |
|
| Utilities (5.8%) | | | |
| $2,000,000 | Baltimore Gas & Electric Company ~ | 5.900% | 10/1/2016 | $2,004,122 |
| 1,250,000 | Carolina Power & Light, Inc. | 5.150 | 4/1/2015 | 1,231,141 |
| 2,635,000 | Cleveland Electric Illuminating Company ~≤ | 7.430 | 11/1/2009 | 2,743,391 |
| 1,065,000 | Cleveland Electric Illuminating Company ‡ | 5.700 | 4/1/2017 | 1,040,801 |
| 1,885,000 | Commonwealth Edison Company ~ | 5.400 | 12/15/2011 | 1,890,940 |
| 2,170,000 | Commonwealth Edison Company ~ | 7.500 | 7/1/2013 | 2,316,534 |
| 1,000,000 | Commonwealth Edison Company | 6.150 | 9/15/2017 | 1,020,724 |
| 1,500,000 | DTE Energy Company ‡ | 6.375 | 4/15/2033 | 1,512,579 |
| 2,000,000 | Exelon Corporation | 4.900 | 6/15/2015 | 1,876,436 |
| 2,000,000 | ITC Holdings Corporation ಠ| 5.875 | 9/30/2016 | 2,000,690 |
| 1,600,000 | MidAmerican Energy Holdings Company ~ | 6.125 | 4/1/2036 | 1,582,261 |
| 2,200,000 | MidAmerican Energy Holdings Company | 6.500 | 9/15/2037 | 2,256,258 |
| 1,700,000 | Nevada Power Company ‡ | 6.750 | 7/1/2037 | 1,776,560 |
| 4,100,000 | NiSource Finance Corporation ~ | 7.875 | 11/15/2010 | 4,387,927 |
| 1,700,000 | Nisource Finance Corporation ± | 6.400 | 3/15/2018 | 1,727,608 |
| 1,500,000 | NRG Energy, Inc. | 7.250 | 2/1/2014 | 1,500,000 |
| 1,000,000 | NRG Energy, Inc. ‡ | 7.375 | 2/1/2016 | 997,500 |
| 950,000 | Ohio Edison Company ± | 6.875 | 7/15/2036 | 994,920 |
| 1,108,314 | Power Contract Financing, LLC ~≤ | 6.256 | 2/1/2010 | 1,125,127 |
| 1,880,473 | Power Receivables Finance, LLC ≤ | 6.290 | 1/1/2012 | 1,937,451 |
| 725,000 | Progress Energy, Inc. | 7.000 | 10/30/2031 | 791,345 |
| 3,200,000 | PSEG Power, LLC ‡ | 5.000 | 4/1/2014 | 3,077,866 |
| 1,360,000 | PSI Energy, Inc. ± | 5.000 | 9/15/2013 | 1,324,968 |
| 1,730,000 | Southwestern Public Service Company | 6.000 | 10/1/2036 | 1,670,568 |
| 750,000 | TXU Corporation | 5.550 | 11/15/2014 | 585,004 |
| 1,600,000 | Union Electric Company ± | 6.400 | 6/15/2017 | 1,685,634 |
| 1,585,000 | Virginia Electric & Power Company | 6.000 | 1/15/2036 | 1,557,759 |
| 700,000 | Virginia Electric and Power Company | 5.950 | 9/15/2017 | 714,645 |
|
|
| | Total Utilities | | | 47,330,759 |
|
|
| | Total Long-Term Fixed Income (cost $867,319,158) | 858,742,679 |
|
|
| |
| |
| | | Strike | Expiration | |
| Contracts | Options Purchased (0.2%) | Price | Date | Value |
|
| 1,275 | Call on U.S. Treasury Bond Futures | $110 | 11/20/2007 | $757,031 |
| 350 | Put on Crude Oil Futures | 85 | 12/13/2007 | 511,000 |
|
|
| | Total Options Purchased (cost $1,940,191) | 1,268,031 |
|
|
| |
| |
| | | Interest | Maturity | |
| Shares | Collateral Held for Securities Loaned (7.3%) | Rate (+) | Date | Value |
|
| 58,963,653 | Thrivent Financial Securities Lending Trust | 5.050% | N/A | $58,963,653 |
|
|
| | Total Collateral Held for Securities Loaned | |
| | (cost $58,963,653) | | | 58,963,653 |
|
|
|
| The accompanying Notes to Financial Statements are an integral part of this schedule. |
|
| 191 |
| | | | |
| Income Fund | | | | |
| Schedule of Investments as of October 31, 2007 | | | |
| |
| Shares or | | | | |
| Principal | | Interest | Maturity | |
| Amount | Short-Term Investments (3.5%) | Rate (+) | Date | Value |
|
| $8,275,000 | GOVCO, Inc. | 4.900% | 11/1/2007 | $8,275,000 |
| 3,180,000 | Kitty Hawk Funding Corporation | 4.980 | 11/19/2007 | 3,172,082 |
| 17,265,511 | Thrivent Money Market Fund | 5.020 | N/A | 17,265,511 |
|
|
| | Total Short-Term Investments (at amortized cost) | 28,712,593 |
|
|
| | Total Investments (cost $956,935,595) 117.2% | $947,686,956 |
|
|
| | Other Assets and Liabilities, Net (17.2%) | (139,271,181) |
|
|
| | Total Net Assets 100.0% | | | $808,415,775 |
|
|
| | | | | |
| | Number of | | Notional | | |
| | Contracts | Expiration | Principal | | Unrealized |
| Futures | Long/(Short) | Date | Amount | Value | Gain/(Loss) |
|
| 5-Yr. U.S. Treasury Bond Futures | 755 | December 2007 | $80,610,353 | $81,044,531 | $434,178 |
| 10-Yr. U.S. Treasury Bond Futures | (775) | December 2007 | (85,065,482) | (85,262,113) | (196,631) |
| 20-Yr. U.S. Treasury Bond Futures | (205) | December 2007 | (23,010,627) | (23,081,719) | (71,092) |
| Total Futures | | | | | $166,455 |
| |
| | Number of | Exercise | Expiration | | Unrealized |
| Call Options Written | Contracts | Price | Date | Value | Gain/(Loss) |
|
| Federal National Mortgage Association | | | | | |
| Conventional 30-Yr. Pass Through | 37 | $101.08 | November 2007 | ($46,250) | $34,688 |
| Total Call Options Written | | | | | $34,688 |
* All or a portion of the security is on loan as discussed in item 2(M) of the Notes to Financial Statements.
+ The interest rate shown reflects the yield, coupon rate or, for securities purchased at a discount, the discount rate at the date of purchase.
> Denotes step coupon bonds for which the current interest rate and next scheduled reset date are shown.
† Denotes variable rate obligations for which the current yield and next scheduled reset date are shown.
§ Denotes investments purchased on a when-issued or delayed delivery basis.
± Designated as cover for long settling trades as discussed in the Notes to Financial Statements.
‡ At October 31, 2007, $1,588,053 of investments were held on deposit with the counterparty and pledged as the initial margin deposit for open financial futures contracts. In addition, $194,869,114 of investments were earmarked as collateral to cover open financial futures contracts.
~ All or a portion of the security was earmarked as collateral to cover options.
÷ Denotes securities that have been pre-refunded or escrowed to maturity. Under such an arrangement, money is deposited into an irrevocable escrow account and is used to purchase U.S. Treasury securities or government agency securities with maturing principals and interest earnings sufficient to pay all debt service requirements of the pre-refunded bonds.
≤ Denotes securities sold under Rule 144A of the Securities Act of 1933, which exempts them from registration. These securities have been determined to be liquid under the guidelines established by the Fund’s Board of Trustees and may be resold to other dealers in the program or to other qualified institutional buyers. As of October 31, 2007, the value of these investments was $149,095,010 or 18.4% of total net assets.
« All or a portion of the security is insured or guaranteed.
Definitions:
TIPS — Treasury Inflation Protected Security.
Gross unrealized appreciation and depreciation of investments, based on cost for federal income tax purposes, were as follows:
| | |
| Gross unrealized appreciation | $7,647,139 | |
| Gross unrealized depreciation | (16,983,972) | |
|
| |
| Net unrealized appreciation (depreciation) | ($9,336,833) | |
| Cost for federal income tax purposes | $957,023,789 | |
|
| The accompanying Notes to Financial Statements are an integral part of this schedule. |
|
| 192 |
| | | | |
| Core Bond Fund |
| Schedule of Investments as of October 31, 2007 |
| Principal | | Interest | Maturity | |
| Amount | Long-Term Fixed Income (118.8%) | Rate | Date | Value |
|
| Asset-Backed Securities (21.5%) | | | |
| $5,000,000 | AmeriCredit Automobile Receivables Trust †‡« | 5.202% | 11/6/2007 | $4,984,690 |
| 2,096,676 | Associates Manufactured Housing Contract | | | |
| | Pass-Through Certificates ‡ | 7.900 | 3/15/2027 | 2,140,429 |
| 2,110,616 | Bear Stearns Asset-Backed Securities, Inc. †~ | 5.112 | 11/25/2007 | 2,105,941 |
| 2,419,857 | Bear Stearns Mortgage Funding Trust ±†~ | 5.012 | 11/25/2007 | 1,761,944 |
| 935,901 | CIT Equipment Collateral ~ | 4.420 | 5/20/2009 | 934,711 |
| 3,000,000 | Citibank Credit Card Issuance Trust | 5.650 | 9/20/2019 | 3,021,618 |
| 3,500,000 | Countrywide Asset-Backed Certificates ±‡« | 5.549 | 4/25/2036 | 3,464,010 |
| 4,000,000 | Credit Based Asset Servicing and Securitization, LLC †‡ | 4.982 | 11/25/2007 | 3,952,128 |
| 2,500,000 | Credit Based Asset Servicing and Securitization, LLC ±‡ | 5.501 | 12/25/2036 | 2,470,652 |
| 5,000,000 | DaimlerChrysler Master Owner Trust ±†~ | 5.141 | 11/15/2007 | 4,995,730 |
| 3,500,000 | Discover Card Master Trust ~ | 5.650 | 3/16/2020 | 3,503,619 |
| 2,500,000 | First Franklin Mortgage Loan Asset-Backed Certificates ±† | 4.962 | 11/25/2007 | 2,413,232 |
| 3,219,925 | First Horizon ABS Trust †‡« | 5.002 | 11/25/2007 | 3,022,495 |
| 2,667,721 | First Horizon ABS Trust †‡« | 5.032 | 11/25/2007 | 2,507,826 |
| 5,000,000 | GE Dealer Floorplan Master Note Trust ±† | 5.037 | 11/20/2007 | 4,996,145 |
| 4,000,000 | GMAC Mortgage Corporation Loan Trust ±†« | 4.943 | 11/25/2007 | 3,977,432 |
| 5,000,000 | GMAC Mortgage Corporation Loan Trust †‡« | 4.962 | 11/25/2007 | 4,981,155 |
| 1,283,728 | GMAC Mortgage Corporation Loan Trust †‡« | 4.972 | 11/25/2007 | 1,267,650 |
| 1,137,926 | Green Tree Financial Corporation ± | 7.650 | 10/15/2027 | 1,181,306 |
| 423,971 | Master Asset-Backed Securities Trust † | 4.952 | 11/25/2007 | 423,344 |
| 2,300,000 | Merna Re, Ltd. †≤ | 6.980 | 12/31/2007 | 2,296,780 |
| 1,940,102 | National Collegiate Student Loan Trust † | 4.932 | 11/25/2007 | 1,941,569 |
| 668,887 | PG&E Energy Recovery Funding, LLC ~ | 3.870 | 6/25/2011 | 662,683 |
| 403,401 | Popular ABS Mortgage Pass-Through Trust †~ | 5.002 | 11/25/2007 | 402,841 |
| 628,290 | Popular ABS Mortgage Pass-Through Trust ± | 4.000 | 12/25/2034 | 619,495 |
| 5,000,000 | Renaissance Home Equity Loan Trust ± | 5.608 | 5/25/2036 | 4,944,865 |
| 585,433 | Residential Asset Securities Corporation ~ | 4.160 | 7/25/2030 | 578,641 |
| 3,166,054 | Residential Funding Mortgage Securities II †‡« | 5.002 | 11/25/2007 | 3,125,756 |
| 1,206,532 | SLM Student Loan Trust †‡ | 5.094 | 1/25/2008 | 1,204,138 |
| 5,000,000 | Textron Financial Floorplan Master Note Trust ±†≤ | 5.211 | 11/13/2007 | 4,997,525 |
| 3,686,453 | Wachovia Asset Securitization, Inc. †‡≤« | 5.013 | 11/25/2007 | 3,610,479 |
|
|
| | Total Asset-Backed Securities | | 82,490,829 |
|
|
| |
| Basic Materials (0.8%) | | | |
| 1,020,000 | Alcan, Inc. ~ | 5.000 | 6/1/2015 | 981,078 |
| 2,000,000 | Precision Castparts Corporation ± | 5.600 | 12/15/2013 | 2,049,452 |
|
|
| | Total Basic Materials | | | 3,030,530 |
|
|
|
| The accompanying Notes to Financial Statements are an integral part of this schedule. |
|
| 193 |
| | | | |
| Core Bond Fund | | | |
| Schedule of Investments as of October 31, 2007 | | | |
| |
| Principal | | Interest | Maturity | |
| Amount | Long-Term Fixed Income (118.8%) | Rate | Date | Value |
|
| Capital Goods (2.0%) | | | |
| $940,000 | Caterpillar Financial Services Corporation ± | 5.850% | 9/1/2017 | $958,039 |
| 890,000 | Goodrich Corporation ± | 6.290 | 7/1/2016 | 924,171 |
| 1,500,000 | John Deere Capital Corporation ‡ | 5.350 | 1/17/2012 | 1,508,763 |
| 410,000 | Lockheed Martin Corporation ± | 6.150 | 9/1/2036 | 421,770 |
| 2,750,000 | Oakmont Asset Trust ±≤ | 4.514 | 12/22/2008 | 2,733,484 |
| 1,150,000 | United Technologies Corporation ‡ | 4.875 | 5/1/2015 | 1,112,569 |
|
|
| | Total Capital Goods | | | 7,658,796 |
|
|
| |
| Collateralized Mortgage Obligations (6.9%) | | | |
| 3,991,594 | Banc of America Mortgage Securities, Inc. ±‡ | 4.802 | 9/25/2035 | 3,936,358 |
| 2,655,828 | HomeBanc Mortgage Trust ± | 5.987 | 4/25/2037 | 2,694,540 |
| 3,837,823 | J.P. Morgan Alternative Loan Trust ± | 5.796 | 3/25/2036 | 3,868,099 |
| 3,538,025 | Merrill Lynch Mortgage Investors, Inc. ±‡ | 4.874 | 6/25/2035 | 3,524,687 |
| 986,660 | National Collegiate Student Loan Trust †~ | 4.942 | 11/25/2007 | 986,608 |
| 3,083,699 | Thornburg Mortgage Securities Trust †~ | 4.963 | 11/25/2007 | 3,064,348 |
| 3,193,343 | Thornburg Mortgage Securities Trust ±† | 4.983 | 11/25/2007 | 3,154,531 |
| 3,290,293 | Washington Mutual Mortgage Pass-Through Certificates ‡ | 4.835 | 9/25/2035 | 3,261,013 |
| 1,913,800 | Zuni Mortgage Loan Trust †~ | 5.003 | 11/25/2007 | 1,901,091 |
|
|
| | Total Collateralized Mortgage Obligations | 26,391,275 |
|
|
| |
| Commercial Mortgage-Backed Securities (17.1%) | | | |
| 5,000,000 | Banc of America Commercial Mortgage, Inc. ±‡~ | 6.085 | 6/11/2035 | 5,060,670 |
| 5,000,000 | Bear Stearns Commercial Mortgage Securities, Inc. †~ | 5.241 | 11/15/2007 | 4,964,555 |
| 1,750,000 | Bear Stearns Commercial Mortgage Securities, Inc. ± | 5.835 | 9/11/2042 | 1,754,079 |
| 711,449 | Citigroup Commercial Mortgage Trust ±†≤ | 5.161 | 11/15/2007 | 710,031 |
| 167,548 | Commercial Mortgage Pass-Through Certificates ±†≤ | 5.191 | 11/15/2007 | 167,302 |
| 4,000,000 | Commercial Mortgage Pass-Through Certificates †‡≤ | 5.221 | 11/15/2007 | 3,952,988 |
| 4,000,000 | Credit Suisse Mortgage Capital Certificates †~≤ | 5.261 | 11/15/2007 | 3,980,024 |
| 4,000,000 | Crown Castle International Corporation ಠ| 5.245 | 11/15/2036 | 3,986,320 |
| 3,778,026 | First Union National Bank Commercial Mortgage Trust ± | 7.390 | 12/15/2031 | 3,919,766 |
| 5,000,000 | Goldman Sachs Mortgage Securities Corporation ± | 5.560 | 11/10/2039 | 4,974,780 |
| 3,000,000 | GS Mortgage Securities Corporation II ±† | 5.252 | 11/6/2007 | 2,975,268 |
| 4,700,000 | J.P. Morgan Chase Commercial Mortgage | | | |
| | Securities Corporation ~ | 5.198 | 12/15/2044 | 4,694,778 |
| 3,686,734 | J.P. Morgan Chase Commercial Mortgage | | | |
| | Securities Corporation ‡ | 5.284 | 5/15/2047 | 3,674,295 |
| 2,500,000 | J.P. Morgan Chase Commercial Mortgage | | | |
| | Securities Corporation ‡ | 6.007 | 6/15/2049 | 2,533,790 |
| 5,500,000 | LB-UBS Commercial Mortgage Trust ± | 4.187 | 8/15/2029 | 5,422,698 |
| 3,500,000 | Merrill Lynch Mortgage Trust | 4.747 | 5/12/2043 | 3,315,210 |
| 3,250,000 | Merrill Lynch Mortgage Trust ± | 5.442 | 1/12/2044 | 3,182,380 |
| 3,500,000 | TIAA Real Estate CDO, Ltd. ± | 5.823 | 8/15/2039 | 3,545,143 |
| 3,038,991 | Washington Mutual Asset Securities Corporation ~≤ | 3.830 | 1/25/2035 | 2,973,002 |
|
|
| | Total Commercial Mortgage-Backed Securities | 65,787,079 |
|
|
|
| The accompanying Notes to Financial Statements are an integral part of this schedule. |
|
| 194 |
| | | | |
| Core Bond Fund | | | |
| Schedule of Investments as of October 31, 2007 | | | |
| |
| Principal | | Interest | Maturity | |
| Amount | Long-Term Fixed Income (118.8%) | Rate | Date | Value |
|
| Communications Services (2.2%) | | | |
| $300,000 | AT&T, Inc. ± | 6.500% | 9/1/2037 | $316,446 |
| 500,000 | British Telecom plc ‡ | 9.125 | 12/15/2030 | 676,154 |
| 1,300,000 | Comcast Corporation ‡ | 5.875 | 2/15/2018 | 1,297,484 |
| 520,000 | New Cingular Wireless Services, Inc. ~ | 8.750 | 3/1/2031 | 672,398 |
| 510,000 | News America, Inc. ± | 6.400 | 12/15/2035 | 506,665 |
| 705,000 | Rogers Cable, Inc. ~ | 5.500 | 3/15/2014 | 689,109 |
| 975,000 | Rogers Cable, Inc. ± | 6.750 | 3/15/2015 | 1,017,374 |
| 130,000 | Rogers Cable, Inc. ‡ | 8.750 | 5/1/2032 | 158,984 |
| 775,000 | Sprint Capital Corporation ~ | 6.900 | 5/1/2019 | 775,051 |
| 1,175,000 | Telecom Italia Capital SA ‡ | 5.250 | 10/1/2015 | 1,132,324 |
| 990,000 | Verizon Communications, Inc. ± | 5.550 | 2/15/2016 | 995,845 |
|
|
| | Total Communications Services | | 8,237,834 |
|
|
| |
| Consumer Cyclical (1.5%) | | | |
| 1,080,000 | D.R. Horton, Inc. ± | 6.500 | 4/15/2016 | 980,613 |
| 1,250,000 | Ford Motor Credit Company ± | 6.625 | 6/16/2008 | 1,244,415 |
| 925,000 | JC Penney Corporation, Inc. ~ | 5.750 | 2/15/2018 | 895,653 |
| 750,000 | Nissan Motor Acceptance Corporation ~ | 4.625 | 3/8/2010 | 743,455 |
| 1,110,000 | Nissan Motor Acceptance Corporation ±≤ | 5.625 | 3/14/2011 | 1,127,650 |
| 800,000 | Walmart Stores, Inc. ~ | 5.875 | 4/5/2027 | 784,085 |
|
|
| | Total Consumer Cyclical | | 5,775,871 |
|
|
| |
| Consumer Non-Cyclical (1.7%) | | | |
| 765,000 | Baxter International, Inc. ±‡ | 5.900 | 9/1/2016 | 782,338 |
| 750,000 | Johnson & Johnson Company ± | 5.950 | 8/15/2037 | 784,394 |
| 800,000 | Kroger Company | 6.400 | 8/15/2017 | 832,322 |
| 575,000 | Procter & Gamble Company ~ | 5.550 | 3/5/2037 | 564,335 |
| 1,200,000 | Schering-Plough Corporation | 6.000 | 9/15/2017 | 1,220,524 |
| 800,000 | Tesco plc §≤ | 5.500 | 11/15/2017 | 790,953 |
| 1,000,000 | Wyeth ‡ | 6.950 | 3/15/2011 | 1,058,812 |
| 340,000 | Wyeth ‡ | 5.950 | 4/1/2037 | 336,253 |
|
|
| | Total Consumer Non-Cyclical | | 6,369,931 |
|
|
| |
| Energy (1.7%) | | | |
| 1,400,000 | Apache Corporation ‡ | 5.250 | 4/15/2013 | 1,402,335 |
| 1,150,000 | CenterPoint Energy Resources Corporation | 6.125 | 11/1/2017 | 1,153,053 |
| 1,000,000 | EOG Resources, Inc. ~ | 5.875 | 9/15/2017 | 1,020,617 |
| 900,000 | Nexen, Inc. ± | 5.650 | 5/15/2017 | 882,541 |
| 575,000 | Plains All American Pipeline, LP/PAA | | | |
| | Finance Corporation ± | 6.650 | 1/15/2037 | 586,146 |
| 1,500,000 | Ras Laffan Liquefied Natural Gas Company, Ltd. II ±≤ | 5.298 | 9/30/2020 | 1,448,520 |
|
|
| | Total Energy | | | 6,493,212 |
|
|
|
| The accompanying Notes to Financial Statements are an integral part of this schedule. |
|
| 195 |
| | | | |
| Core Bond Fund | | | |
| Schedule of Investments as of October 31, 2007 | | | |
| |
| Principal | | Interest | Maturity | |
| Amount | Long-Term Fixed Income (118.8%) | Rate | Date | Value |
|
| Financials (14.1%) | | | |
| $500,000 | American Express Bank FSB ‡ | 6.000% | 9/13/2017 | $504,686 |
| 750,000 | American Express Company ~ | 6.150 | 8/28/2017 | 764,884 |
| 1,005,000 | American International Group, Inc. ~ | 6.250 | 3/15/2037 | 935,260 |
| 125,000 | BAC Capital Trust XI ‡ | 6.625 | 5/23/2036 | 126,880 |
| 1,000,000 | BAC Capital Trust XIV | 5.630 | 3/15/2012 | 943,374 |
| 1,000,000 | Bank of America Corporation ‡ | 6.000 | 9/1/2017 | 1,019,429 |
| 800,000 | Bear Stearns Companies, Inc. ~ | 6.400 | 10/2/2017 | 797,405 |
| 440,000 | Capital One Capital III ± | 7.686 | 8/15/2036 | 426,473 |
| 1,150,000 | Capmark Financial Group, Inc. ಠ| 5.875 | 5/10/2012 | 1,032,432 |
| 400,000 | Capmark Financial Group, Inc. ±≤ | 6.300 | 5/10/2017 | 327,120 |
| 1,750,000 | Citigroup, Inc. ‡ | 5.300 | 10/17/2012 | 1,755,157 |
| 1,250,000 | Corestates Capital Trust I ±≤ | 8.000 | 12/15/2026 | 1,294,749 |
| 1,145,000 | Countrywide Financial Corporation ± | 5.800 | 6/7/2012 | 985,864 |
| 2,100,000 | Countrywide Financial Corporation, Convertible †≤ | 1.743 | 1/15/2008 | 1,858,920 |
| 355,000 | General Electric Capital Corporation ± | 5.720 | 8/22/2011 | 356,567 |
| 2,225,000 | General Electric Capital Corporation ±‡ | 4.375 | 3/3/2012 | 2,161,116 |
| 450,000 | General Electric Capital Corporation ± | 5.625 | 9/15/2017 | 454,386 |
| 500,000 | General Motors Acceptance Corporation ‡ | 6.875 | 9/15/2011 | 460,806 |
| 1,700,000 | General Motors Acceptance Corporation, LLC ± | 6.000 | 12/15/2011 | 1,508,335 |
| 1,500,000 | Goldman Sachs Group, Inc. ± | 5.125 | 1/15/2015 | 1,450,149 |
| 550,000 | Goldman Sachs Group, Inc. | 6.750 | 10/1/2037 | 552,074 |
| 575,000 | HSBC Holdings plc ± | 6.500 | 5/2/2036 | 567,653 |
| 765,000 | International Lease Finance Corporation ± | 5.750 | 6/15/2011 | 772,630 |
| 985,000 | iStar Financial, Inc. ~ | 5.850 | 3/15/2017 | 878,796 |
| 850,000 | J.P. Morgan Chase Bank NA ‡ | 5.875 | 6/13/2016 | 859,948 |
| 1,325,000 | Keybank National Association | 5.500 | 9/17/2012 | 1,318,323 |
| 1,500,000 | Lehman Brothers Holdings, Inc. | 5.250 | 2/6/2012 | 1,479,804 |
| 515,000 | Lehman Brothers Holdings, Inc. | 7.000 | 9/27/2027 | 525,945 |
| 630,000 | Liberty Property, LP ‡ | 5.500 | 12/15/2016 | 593,022 |
| 850,000 | Lincoln National Corporation ‡ | 7.000 | 5/17/2016 | 873,055 |
| 1,250,000 | Merrill Lynch & Company, Inc. ‡ | 6.050 | 8/15/2012 | 1,268,504 |
| 600,000 | Merrill Lynch & Company, Inc. ± | 6.050 | 5/16/2016 | 594,872 |
| 1,595,000 | Mitsubishi UFG Capital Finance, Ltd. ‡ | 6.346 | 7/25/2016 | 1,520,742 |
| 720,000 | Morgan Stanley ± | 6.250 | 8/9/2026 | 709,636 |
| 1,375,000 | Nationwide Health Properties, Inc. | 6.250 | 2/1/2013 | 1,384,219 |
| 2,000,000 | ProLogis ± | 5.500 | 4/1/2012 | 1,974,786 |
| 775,000 | Prudential Financial, Inc. ~ | 6.100 | 6/15/2017 | 782,941 |
| 390,000 | Prudential Financial, Inc. ±‡ | 5.700 | 12/14/2036 | 361,864 |
| 950,000 | Reinsurance Group of America, Inc. ~ | 5.625 | 3/15/2017 | 925,442 |
| 2,040,000 | Residential Capital Corporation ±† | 7.314 | 11/2/2007 | 1,591,200 |
| 1,445,000 | Residential Capital Corporation ‡ | 7.500 | 4/17/2013 | 1,054,850 |
| 1,295,000 | Residential Capital, LLC ‡~ | 7.500 | 6/1/2012 | 945,350 |
| 1,325,000 | Royal Bank of Scotland Group plc *≤ | 6.990 | 10/5/2017 | 1,339,174 |
|
| The accompanying Notes to Financial Statements are an integral part of this schedule. |
|
| 196 |
| | | | |
| Core Bond Fund | | | |
| Schedule of Investments as of October 31, 2007 | | | |
| |
| Principal | | Interest | Maturity | |
| Amount | Long-Term Fixed Income (118.8%) | Rate | Date | Value |
|
| Financials — continued | | | |
| $900,000 | Santander Perpetual SA Unipersonal ≤ | 6.671% | 10/24/2017 | $896,207 |
| 1,750,000 | Simon Property Group, LP ± | 4.600 | 6/15/2010 | 1,718,213 |
| 1,240,000 | Simon Property Group, LP ± | 5.375 | 6/1/2011 | 1,237,832 |
| 1,375,000 | Student Loan Marketing Corporation ‡ | 4.500 | 7/26/2010 | 1,287,397 |
| 850,000 | Swiss RE Capital I, LP ±≤ | 6.854 | 5/25/2016 | 857,316 |
| 350,000 | Travelers Companies, Inc. ~ | 6.250 | 6/15/2037 | 345,318 |
| 550,000 | United Health Group ~≤ | 6.500 | 6/15/2037 | 563,886 |
| 770,000 | Wachovia Bank NA ~ | 4.875 | 2/1/2015 | 734,392 |
| 1,895,000 | Wachovia Capital Trust III ~ | 5.800 | 3/15/2011 | 1,879,940 |
| 205,000 | Washington Mutual Preferred Funding ±≤ | 6.665 | 12/15/2016 | 155,800 |
| 1,900,000 | Washington Mutual Preferred Funding II ಠ| 6.895 | 6/15/2012 | 1,444,000 |
| 760,000 | Willis North America, Inc. ‡ | 6.200 | 3/28/2017 | 766,940 |
|
|
| | Total Financials | | | 53,926,063 |
|
|
| |
| Mortgage-Backed Securities (28.0%) | | | |
| 53,000,000 | Federal National Mortgage Association Conventional | | | |
| | 30-Yr. Pass Through §~ | 5.500 | 11/1/2037 | 52,221,536 |
| 42,500,000 | Federal National Mortgage Association Conventional | | | |
| | 30-Yr. Pass Through § | 6.000 | 11/1/2037 | 42,805,490 |
| 12,000,000 | Federal National Mortgage Association Conventional | | | |
| | 30-Yr. Pass Through § | 6.500 | 11/1/2037 | 12,281,256 |
|
|
| | Total Mortgage-Backed Securities | | 107,308,282 |
|
|
| |
| Technology (0.5%) | | | |
| 2,000,000 | International Business Machines Corporation | 5.700 | 9/14/2017 | 2,029,972 |
|
|
| | Total Technology | | | 2,029,972 |
|
|
| |
| Transportation (3.2%) | | | |
| 575,000 | Burlington Northern Santa Fe Corporation ±‡ | 7.000 | 12/15/2025 | 621,312 |
| 1,150,000 | Continental Airlines, Inc. ‡ | 5.983 | 4/19/2022 | 1,130,530 |
| 1,550,000 | Delta Air Lines, Inc. ‡ | 7.111 | 9/18/2011 | 1,582,938 |
| 1,178,149 | FedEx Corporation ± | 6.720 | 1/15/2022 | 1,234,701 |
| 650,000 | Norfolk Southern Corporation ± | 5.640 | 5/17/2029 | 603,731 |
| 3,500,000 | Northwest Airlines, Inc. ± | 6.841 | 4/1/2011 | 3,530,625 |
| 1,875,000 | Southwest Airlines Company | 6.150 | 8/1/2022 | 1,898,508 |
| 1,550,000 | Union Pacific Corporation ‡ | 6.125 | 1/15/2012 | 1,587,225 |
|
|
| | Total Transportation | | | 12,189,570 |
|
|
|
| The accompanying Notes to Financial Statements are an integral part of this schedule. |
|
| 197 |
| | | | |
| Core Bond Fund | | | |
| Schedule of Investments as of October 31, 2007 | | | |
| |
| Principal | | Interest | Maturity | |
| Amount | Long-Term Fixed Income (118.8%) | Rate | Date | Value |
|
| U.S. Government (13.1%) | | | |
| $5,000,000 | Federal Home Loan Bank ‡ | 5.330% | 3/6/2012 | $5,044,800 |
| 5,000,000 | Federal Home Loan Mortgage Corporation ~ | 5.400 | 2/2/2012 | 5,050,360 |
| 2,000,000 | Federal Home Loan Mortgage Corporation ~ | 5.000 | 12/14/2018 | 1,960,466 |
| 2,500,000 | Federal National Mortgage Association * | 5.300 | 2/22/2011 | 2,504,835 |
| 400,000 | U.S. Treasury Bonds * | 4.750 | 2/15/2037 | 399,781 |
| 6,550,000 | U.S. Treasury Notes * | 4.000 | 2/15/2015 | 6,413,884 |
| 9,270,000 | U.S. Treasury Notes ‡ | 4.125 | 5/15/2015 | 9,138,913 |
| 620,000 | U.S. Treasury Notes * | 4.625 | 11/15/2016 | 628,332 |
| 2,085,000 | U.S. Treasury Notes * | 4.500 | 5/15/2017 | 2,091,028 |
| 17,097,895 | U.S. Treasury Notes, TIPS * | 2.000 | 7/15/2014 | 17,092,566 |
|
|
| | Total U.S. Government | | | 50,324,965 |
|
|
| |
| U.S. Municipal (2.5%) | | | |
| 3,000,000 | California Infrastructure & Economic Bank | | | |
| | Revenue Bonds ÷~ | 5.000 | 7/1/2036 | 3,264,030 |
| 3,000,000 | Little Rock, Arkansas Sewer Revenue Bonds | 5.000 | 10/1/2037 | 3,118,710 |
| 3,000,000 | Missouri Joint Municipal Electric Utility Commission | | | |
| | Revenue Bonds (Power Project) | 5.000 | 1/1/2032 | 3,104,550 |
|
|
| | Total U.S. Municipal | | | 9,487,290 |
|
|
| |
| Utilities (2.0%) | | | |
| 825,000 | Cleveland Electric Illuminating Company ‡ | 5.700 | 4/1/2017 | 806,254 |
| 965,000 | Commonwealth Edison Company ± | 5.400 | 12/15/2011 | 968,041 |
| 1,500,000 | Exelon Corporation ± | 6.750 | 5/1/2011 | 1,563,022 |
| 775,000 | MidAmerican Energy Holdings Company | 6.500 | 9/15/2037 | 794,818 |
| 940,236 | Power Receivables Finance, LLC ±~≤ | 6.290 | 1/1/2012 | 968,725 |
| 800,000 | PSI Energy, Inc. ± | 5.000 | 9/15/2013 | 779,393 |
| 1,150,000 | Union Electric Company ‡ | 6.400 | 6/15/2017 | 1,211,549 |
| 700,000 | Virginia Electric & Power Company ± | 6.000 | 1/15/2036 | 687,969 |
|
|
| | Total Utilities | | | 7,779,771 |
|
|
| | Total Long-Term Fixed Income (cost $457,619,364) | 455,281,270 |
|
|
| |
| |
| | | Strike | Expiration | |
| Contracts | Options Purchased (0.1%) | Price | Date | Value |
|
| 510 | Call on U.S. Treasury Bond Futures | $110 | 11/21/2007 | $302,812 |
| 90 | Put on Crude Oil Futures | 85 | 12/7/2007 | 131,400 |
|
|
| | Total Options Purchased (cost $695,826) | 434,212 |
|
|
| |
| |
| | | Interest | Maturity | |
| Shares | Collateral Held for Securities Loaned (7.5%) | Rate (+) | Date | Value |
|
| 28,870,709 | Thrivent Financial Securities Lending Trust | 5.050% | N/A | $28,870,709 |
|
|
| | Total Collateral Held for Securities Loaned | |
| | (cost $28,870,709) | | | 28,870,709 |
|
|
|
| The accompanying Notes to Financial Statements are an integral part of this schedule. |
|
| 198 |
| | | | |
| Core Bond Fund | | | |
| Schedule of Investments as of October 31, 2007 | | | |
| |
| | | Interest | Maturity | |
| Shares | Short-Term Investments (8.6%) | Rate (+) | Date | Value |
|
| 32,927,527 | Thrivent Money Market Fund | 5.020% | N/A | $32,927,527 |
|
|
| | Total Short-Term Investments (at amortized cost) | 32,927,527 |
|
|
| | Total Investments (cost $520,113,426) 135.0% | $517,513,718 |
|
|
| | Other Assets and Liabilities, Net (35.0%) | | (134,180,607) |
|
|
| | Total Net Assets 100.0% | | | $383,333,111 |
|
|
| | | | | |
| | Number of | | Notional | | |
| | Contracts | Expiration | Principal | | Unrealized |
| Futures | Long/(Short) | Date | Amount | Value | Gain/(Loss) |
|
| 5-Yr. U.S. Treasury Bond Futures | 270 | December 2007 | $28,838,168 | $28,982,813 | $144,645 |
| 10-Yr. U.S. Treasury Bond Futures | (455) | December 2007 | (49,947,443) | (50,057,112) | (109,669) |
| 20-Yr. U.S. Treasury Bond Futures | (85) | December 2007 | (9,596,147) | (9,570,469) | 25,678 |
| Total Futures | | | | | $60,654 |
| |
| | Number of | Exercise | Expiration | | Unrealized |
| Call Options Written | Contracts | Price | Date | Value | Gain/(Loss) |
|
| Federal National Mortgage Association | | | | | |
| Conventional 30-Yr. Pass Through | 24 | $99.19 | November 2007 | ($37,500) | $37,500 |
| Total Call Options Written | | | | | $37,500 |
* All or a portion of the security is on loan as discussed in item 2(M) of the Notes to Financial Statements.
+ The interest rate shown reflects the yield, coupon rate or, for securities purchased at a discount, the discount rate at the date of purchase.
† Denotes variable rate obligations for which the current yield and next scheduled reset date are shown.
^ Security is fair valued as discussed in item 2(A) of the Notes to Financial Statements.
§ Denotes investments purchased on a when-issued or delayed delivery basis.
± Designated as cover for long settling trades as discussed in the Notes to Financial Statements.
‡ At October 31, 2007, $1,971,718 of investments were held on deposit with the counterparty and pledged as the initial margin deposit for open financial futures contracts. In addition, $93,890,546 of investments were earmarked as collateral to cover open financial futures contracts.
~ All or a portion of the security was earmarked as collateral to cover options.
÷ Denotes securities that have been pre-refunded or escrowed to maturity. Under such an arrangement, money is deposited into an irrevocable escrow account and is used to purchase U.S. Treasury securities or government agency securities with maturing principals and interest earnings sufficient to pay all debt service requirements of the pre-refunded bonds.
≤ Denotes securities sold under Rule 144A of the Securities Act of 1933, which exempts them from registration. These securities have been determined to be liquid under the guidelines established by the Fund’s Board of Trustees and may be resold to other dealers in the program or to other qualified institutional buyers. As of October 31, 2007, the value of these investments was $43,513,386 or 11.4% of total net assets.
« All or a portion of the security is insured or guaranteed.
Definitions:
TIPS — Treasury Inflation Protected Security.
Gross unrealized appreciation and depreciation of investments, based on cost for federal income tax purposes, were as follows:
| | |
| Gross unrealized appreciation | $2,949,607 | |
| Gross unrealized depreciation | (5,817,253) | |
|
| |
| Net unrealized appreciation (depreciation) | ($2,867,646) | |
| Cost for federal income tax purposes | $520,381,364 | |
|
| The accompanying Notes to Financial Statements are an integral part of this schedule. |
|
| 199 |
| | | | |
| Limited Maturity Bond Fund |
| Schedule of Investments as of October 31, 2007 |
| Principal | | Interest | Maturity | |
| Amount | Long-Term Fixed Income (99.8%) | Rate | Date | Value |
|
| Asset-Backed Securities (25.1%) | | | |
| $1,500,000 | AmeriCredit Automobile Receivables Trust †‡« | 5.202% | 11/6/2007 | $1,495,407 |
| 3,904,569 | AmeriCredit Automobile Receivables Trust ±« | 3.430 | 7/6/2011 | 3,859,011 |
| 3,000,000 | Capital Auto Receivables Asset Trust ~ | 5.380 | 7/15/2010 | 3,022,875 |
| 3,750,000 | Carmax Auto Owner Trust † | 5.491 | 11/15/2007 | 3,761,269 |
| 86,559 | Caterpillar Financial Asset Trust | 3.900 | 2/25/2009 | 86,488 |
| 3,750,000 | Chase Funding Issuance Trust | 4.960 | 9/17/2012 | 3,756,251 |
| 993,249 | Chase Manhattan Auto Owner Trust ‡ | 4.840 | 7/15/2009 | 992,458 |
| 467,950 | CIT Equipment Collateral ± | 4.420 | 5/20/2009 | 467,356 |
| 3,475,000 | Citibank Credit Card Issuance Trust | 4.850 | 2/10/2011 | 3,476,797 |
| 3,000,000 | CNH Equipment Trust † | 5.691 | 11/15/2007 | 3,001,023 |
| 3,500,000 | CNH Equipment Trust | 4.400 | 5/16/2011 | 3,466,844 |
| 2,000,000 | Countrywide Asset-Backed Certificates ‡« | 5.549 | 4/25/2036 | 1,979,434 |
| 2,269,000 | Countrywide Asset-Backed Certificates ‡ | 5.683 | 10/25/2036 | 2,235,709 |
| 2,000,000 | Countrywide Home Loans Asset-Backed Securities« | 6.085 | 6/25/2021 | 1,929,268 |
| 1,500,000 | CPL Transition Funding, LLC | 5.560 | 1/15/2012 | 1,519,504 |
| 220,117 | CPS Auto Trust ‡« | 4.520 | 3/15/2010 | 219,882 |
| 2,500,000 | Credit Acceptance Auto Dealer Loan Trust ~≤« | 5.320 | 10/15/2012 | 2,479,625 |
| 2,000,000 | Credit Based Asset Servicing and Securitization, LLC ‡ | 5.501 | 12/25/2036 | 1,976,522 |
| 2,740,967 | DaimlerChrysler Auto Trust ‡ | 5.330 | 8/8/2010 | 2,745,767 |
| 1,500,000 | DaimlerChrysler Master Owner Trust †‡ | 5.141 | 11/15/2007 | 1,498,719 |
| 2,500,000 | Drive Auto Receivables Trust ‡≤« | 5.300 | 7/15/2011 | 2,505,948 |
| 3,130,235 | Federal Home Loan Mortgage Corporation ±† | 4.913 | 11/25/2007 | 3,114,584 |
| 86,028 | First Franklin Mortgage Loan Asset-Backed Certificates ≤ | 5.500 | 3/25/2036 | 69,341 |
| 1,500,000 | Ford Credit Auto Owner Trust | 5.150 | 11/15/2011 | 1,510,312 |
| 624,144 | GE Commercial Loan Trust †≤ | 5.259 | 1/19/2008 | 622,609 |
| 1,500,000 | GE Dealer Floorplan Master Note Trust †~ | 5.037 | 11/20/2007 | 1,498,844 |
| 701,991 | GE Equipment Small Ticket, LLC ಠ| 4.380 | 7/22/2009 | 700,700 |
| 3,000,000 | GMAC Mortgage Corporation Loan Trust †~« | 4.943 | 11/25/2007 | 2,983,074 |
| 1,500,000 | GMAC Mortgage Corporation Loan Trust ±†‡« | 4.962 | 11/25/2007 | 1,494,346 |
| 1,069,773 | GMAC Mortgage Corporation Loan Trust †~« | 4.972 | 11/25/2007 | 1,056,375 |
| 2,500,000 | GMAC Mortgage Corporation Loan Trust ±« | 5.750 | 10/25/2036 | 2,444,090 |
| 3,500,000 | Harley Davidson Motorcycle Trust ±† | 5.441 | 11/15/2007 | 3,500,770 |
| 1,500,000 | Harley Davidson Motorcycle Trust ± | 5.240 | 1/15/2012 | 1,504,244 |
| 704,430 | Harley Davidson Motorcycle Trust ‡ | 3.200 | 5/15/2012 | 693,591 |
| 33,589 | Honda Auto Receivables Owner Trust | 2.910 | 10/20/2008 | 33,552 |
| 3,500,000 | Household Home Equity Loan Trust ‡ | 5.320 | 3/20/2036 | 3,429,160 |
| 2,000,000 | Household Home Equity Loan Trust ‡ | 5.660 | 3/20/2036 | 1,976,142 |
| 325,156 | John Deere Owner Trust ~ | 3.980 | 6/15/2009 | 324,505 |
| 3,500,000 | Merna Re, Ltd. †≤ | 6.980 | 12/31/2007 | 3,495,100 |
| 3,000,000 | Mortgage Equity Conversion Asset Trust †≤ | 4.660 | 11/25/2007 | 2,903,438 |
| 3,000,000 | Mortgage Equity Conversion Asset Trust †≤ | 4.680 | 11/25/2007 | 2,912,812 |
| 810,388 | Nissan Auto Receivables Owner Trust | 4.740 | 9/15/2009 | 808,347 |
| 3,000,000 | Nissan Auto Receivables Owner Trust | 5.030 | 5/16/2011 | 3,017,610 |
| 215,676 | Nomura Asset Acceptance Corporation †‡ | 5.012 | 11/25/2007 | 206,868 |
| 743,207 | PG&E Energy Recovery Funding, LLC | 3.870 | 6/25/2011 | 736,314 |
| 157,073 | Popular ABS Mortgage Pass-Through Trust | 4.000 | 12/25/2034 | 154,874 |
|
| The accompanying Notes to Financial Statements are an integral part of this schedule. |
|
| 200 |
| | | | |
| Limited Maturity Bond Fund | | | |
| Schedule of Investments as of October 31, 2007 | | | |
| |
| Principal | | Interest | Maturity | |
| Amount | Long-Term Fixed Income (99.8%) | Rate | Date | Value |
|
| Asset-Backed Securities — continued | | | |
| $2,000,000 | Renaissance Home Equity Loan Trust | 5.608% | 5/25/2036 | $1,977,946 |
| 579,012 | Residential Asset Securities Corporation | 5.010 | 4/25/2033 | 549,116 |
| 3,000,000 | Santander Drive Auto Receivables Trust « | 5.050 | 9/15/2011 | 3,006,015 |
| 361,960 | SLM Student Loan Trust † | 5.094 | 1/25/2008 | 361,242 |
| 1,500,000 | Textron Financial Floorplan Master Note Trust †≤ | 5.211 | 11/13/2007 | 1,499,258 |
| 1,324,228 | USAA Auto Owner Trust | 4.830 | 4/15/2010 | 1,322,955 |
| 1,382,420 | Wachovia Asset Securitization, Inc. †≤« | 5.013 | 11/25/2007 | 1,353,930 |
| 3,000,000 | Wachovia Auto Loan Owner Trust ≤ | 5.230 | 8/22/2011 | 3,010,173 |
| 4,000,000 | Washington Mutual Master Note Trust †≤ | 5.121 | 11/15/2007 | 3,982,492 |
|
|
| | Total Asset-Backed Securities | | 104,730,886 |
|
|
| |
| Basic Materials (0.8%) | | | |
| 400,000 | Equistar Chemicals, LP ~ | 10.125 | 9/1/2008 | 413,000 |
| 1,000,000 | Lubrizol Corporation ‡ | 4.625 | 10/1/2009 | 991,945 |
| 500,000 | Monsanto Company | 4.000 | 5/15/2008 | 497,482 |
| 1,500,000 | Precision Castparts Corporation | 6.750 | 12/15/2007 | 1,501,956 |
|
|
| | Total Basic Materials | | | 3,404,383 |
|
|
| |
| Capital Goods (1.4%) | | | |
| 1,450,000 | Goodrich Corporation ‡ | 7.500 | 4/15/2008 | 1,464,061 |
| 1,000,000 | John Deere Capital Corporation ± | 4.400 | 7/15/2009 | 992,372 |
| 800,000 | John Deere Capital Corporation ~ | 5.350 | 1/17/2012 | 804,674 |
| 1,000,000 | Oakmont Asset Trust ಠ| 4.514 | 12/22/2008 | 993,994 |
| 1,600,000 | Textron Financial Corporation | 5.125 | 11/1/2010 | 1,595,725 |
|
|
| | Total Capital Goods | | | 5,850,826 |
|
|
| |
| Collateralized Mortgage Obligations (11.7%) | | | |
| 2,206,760 | American Home Mortgage Assets †‡ | 5.853 | 11/25/2007 | 2,154,005 |
| 1,197,478 | Banc of America Mortgage Securities, Inc. ‡ | 4.802 | 9/25/2035 | 1,180,907 |
| 1,592,897 | Bear Stearns Adjustable Rate Mortgage Trust >‡ | 4.625 | 8/25/2010 | 1,566,380 |
| 1,839,199 | Chase Mortgage Finance Corporation ‡ | 4.580 | 2/25/2037 | 1,804,258 |
| 92,067 | Citigroup Mortgage Loan Trust, Inc. | 4.922 | 8/25/2035 | 91,786 |
| 2,000,000 | Citigroup Mortgage Loan Trust, Inc. ~ | 5.536 | 3/25/2036 | 1,997,880 |
| 1,762,451 | Countrywide Home Loans, Inc. ‡ | 5.358 | 3/20/2036 | 1,757,516 |
| 1,841,097 | Countrywide Home Loans, Inc. ‡ | 5.852 | 9/20/2036 | 1,864,280 |
| 2,711,710 | Deutsche Alt-A Securities, Inc. †~ | 5.703 | 11/25/2007 | 2,648,155 |
| 1,517,616 | HomeBanc Mortgage Trust ± | 5.987 | 4/25/2037 | 1,539,737 |
| 599,481 | Impac CMB Trust ±† | 5.192 | 11/25/2007 | 591,729 |
| 2,874,529 | J.P. Morgan Alternative Loan Trust | 5.796 | 3/25/2036 | 2,897,206 |
| 2,718,869 | J.P. Morgan Mortgage Trust ± | 5.010 | 7/25/2035 | 2,709,897 |
| 2,518,366 | Merrill Lynch Mortgage Investors, Inc. | 4.874 | 6/25/2035 | 2,508,872 |
| 1,401,370 | Residential Accredit Loans, Inc. | 5.603 | 9/25/2035 | 1,404,628 |
| 1,197,503 | Thornburg Mortgage Securities Trust † | 4.983 | 11/25/2007 | 1,182,949 |
| 1,466,844 | Wachovia Mortgage Loan Trust, LLC | 5.575 | 5/20/2036 | 1,480,687 |
| 3,018,126 | Washington Mutual Alternative Loan Trust † | 5.683 | 11/25/2007 | 2,923,810 |
| 2,134,293 | Washington Mutual Alternative Loan Trust † | 5.853 | 11/25/2007 | 2,080,435 |
|
| The accompanying Notes to Financial Statements are an integral part of this schedule. |
|
| 201 |
| | | | |
| Limited Maturity Bond Fund | | | |
| Schedule of Investments as of October 31, 2007 | | | |
| |
| Principal | | Interest | Maturity | |
| Amount | Long-Term Fixed Income (99.8%) | Rate | Date | Value |
|
| Collateralized Mortgage Obligations — continued | | | |
| $997,077 | Washington Mutual Mortgage Pass-Through Certificates † | 5.162% | 11/25/2007 | $979,515 |
| 2,328,781 | Washington Mutual Mortgage Pass-Through Certificates † | 5.813 | 11/25/2007 | 2,278,658 |
| 987,088 | Washington Mutual Mortgage Pass-Through Certificates | 4.835 | 9/25/2035 | 978,304 |
| 2,745,141 | Washington Mutual, Inc. † | 5.673 | 11/25/2007 | 2,682,947 |
| 2,806,132 | Washington Mutual, Inc. † | 5.753 | 11/25/2007 | 2,748,913 |
| 3,500,000 | Wells Fargo Mortgage Backed Securities Trust | 3.539 | 9/25/2034 | 3,431,932 |
| 612,836 | Wells Fargo Mortgage Backed Securities Trust | 4.950 | 3/25/2036 | 606,492 |
| 750,701 | Wells Fargo Mortgage Backed Securities Trust | 5.094 | 3/25/2036 | 749,257 |
|
|
| | Total Collateralized Mortgage Obligations | 48,841,135 |
|
|
| |
| Commercial Mortgage-Backed Securities (12.7%) | | | |
| 2,600,000 | Banc of America Commercial Mortgage, Inc. | 5.001 | 9/10/2010 | 2,586,553 |
| 597,461 | Banc of America Commercial Mortgage, Inc. ‡ | 4.037 | 11/10/2039 | 589,421 |
| 3,000,000 | Banc of America Large Loan Trust †~≤ | 5.201 | 11/15/2007 | 2,992,221 |
| 3,000,000 | Banc of America Large Loan Trust †‡≤ | 5.301 | 11/15/2007 | 2,986,650 |
| 2,000,000 | Bear Stearns Commercial Mortgage Securities, Inc. †‡ | 5.241 | 11/15/2007 | 1,985,822 |
| 4,190,000 | Bear Stearns Commercial Mortgage Securities, Inc. | 3.869 | 2/11/2041 | 4,128,042 |
| 3,750,000 | Bear Stearns Commercial Mortgage Securities, Inc. | 5.422 | 9/11/2042 | 3,763,200 |
| 3,000,000 | Commercial Mortgage Pass-Through Certificates †‡≤ | 5.053 | 11/15/2007 | 2,968,851 |
| 50,264 | Commercial Mortgage Pass-Through Certificates †≤ | 5.191 | 11/15/2007 | 50,191 |
| 1,000,000 | Commercial Mortgage Pass-Through Certificates †~≤ | 5.221 | 11/15/2007 | 988,247 |
| 1,500,000 | Credit Suisse Mortgage Capital Certificates †‡≤ | 5.261 | 11/15/2007 | 1,492,509 |
| 2,500,000 | Crown Castle International Corporation ~≤ | 5.245 | 11/15/2036 | 2,491,450 |
| 902,964 | Federal Home Loan Mortgage Corporation | | | |
| | Multifamily Structured Pass Through ‡ | 5.487 | 4/25/2010 | 902,159 |
| 1,150,411 | General Electric Commercial Mortgage Corporation ‡ | 4.591 | 7/10/2045 | 1,139,480 |
| 1,500,000 | J.P. Morgan Chase Commercial Mortgage | | | |
| | Securities Corporation | 4.302 | 1/15/2038 | 1,457,998 |
| 780,583 | J.P. Morgan Chase Commercial Mortgage | | | |
| | Securities Corporation ~ | 2.790 | 1/12/2039 | 762,319 |
| 4,000,000 | J.P. Morgan Chase Commercial Mortgage | | | |
| | Securities Corporation ~ | 5.198 | 12/15/2044 | 3,995,556 |
| 250,000 | LB-UBS Commercial Mortgage Trust ± | 3.323 | 3/15/2027 | 248,286 |
| 3,500,000 | LB-UBS Commercial Mortgage Trust | 4.567 | 6/15/2029 | 3,477,446 |
| 750,000 | LB-UBS Commercial Mortgage Trust | 4.187 | 8/15/2029 | 739,459 |
| 1,075,536 | LB-UBS Commercial Mortgage Trust ~ | 4.741 | 9/15/2040 | 1,069,908 |
| 346,791 | Lehman Brothers “CALSTRS” Mortgage Trust ≤ | 3.988 | 11/20/2012 | 346,486 |
| 4,000,000 | TIAA Real Estate CDO, Ltd. | 5.823 | 8/15/2039 | 4,051,592 |
| 3,750,000 | Wachovia Bank Commercial Mortgage Trust | 3.894 | 11/15/2035 | 3,702,368 |
| 2,750,000 | Wachovia Bank Commercial Mortgage Trust | 3.958 | 12/15/2035 | 2,715,510 |
| 1,458,716 | Washington Mutual Asset Securities Corporation ≤ | 3.830 | 1/25/2035 | 1,427,041 |
|
|
| | Total Commercial Mortgage-Backed Securities | 53,058,765 |
|
|
|
| The accompanying Notes to Financial Statements are an integral part of this schedule. |
|
| 202 |
| | | | |
| Limited Maturity Bond Fund | | | |
| Schedule of Investments as of October 31, 2007 | | | |
| |
| Principal | | Interest | Maturity | |
| Amount | Long-Term Fixed Income (99.8%) | Rate | Date | Value |
|
| Communications Services (3.8%) | | | |
| $1,200,000 | Ameritech Capital Funding Corporation | 6.250% | 5/18/2009 | $1,228,026 |
| 1,000,000 | British Telecom plc ‡ | 8.625 | 12/15/2010 | 1,100,171 |
| 1,400,000 | Comcast Cable Communications, Inc. ‡ | 6.200 | 11/15/2008 | 1,412,901 |
| 900,000 | Comcast Cable Communications, LLC ‡ | 6.875 | 6/15/2009 | 922,874 |
| 750,000 | Cox Communications, Inc. ‡ | 7.875 | 8/15/2009 | 783,697 |
| 600,000 | Cox Communications, Inc. ‡ | 4.625 | 1/15/2010 | 593,378 |
| 1,050,000 | GTE Corporation ‡ | 7.510 | 4/1/2009 | 1,084,912 |
| 845,000 | News America Holdings, Inc. | 7.375 | 10/17/2008 | 859,411 |
| 500,000 | Qwest Corporation | 5.625 | 11/15/2008 | 497,500 |
| 1,120,000 | Rogers Cable, Inc. | 7.875 | 5/1/2012 | 1,217,037 |
| 1,000,000 | SBC Communications, Inc. | 4.125 | 9/15/2009 | 985,017 |
| 1,000,000 | Sprint Capital Corporation | 6.125 | 11/15/2008 | 1,005,597 |
| 1,000,000 | Telecom Italia Capital SA | 4.000 | 11/15/2008 | 987,881 |
| 600,000 | Telecom Italia Capital SA | 6.200 | 7/18/2011 | 617,639 |
| 500,000 | Telefonos de Mexico SA de CV | 4.500 | 11/19/2008 | 496,000 |
| 1,100,000 | Time Warner Cable, Inc. | 5.400 | 7/2/2012 | 1,097,141 |
| 1,000,000 | Time Warner Entertainment Company, LP | 7.250 | 9/1/2008 | 1,013,569 |
|
|
| | Total Communications Services | | 15,902,751 |
|
|
| |
| Consumer Cyclical (4.7%) | | | |
| 4,000,000 | BMW Vehicle Lease Trust § | 4.590 | 8/15/2013 | 4,000,000 |
| 750,000 | Carnival Corporation ‡ | 3.750 | 11/15/2007 | 749,365 |
| 1,460,000 | Centex Corporation ‡ | 4.750 | 1/15/2008 | 1,450,323 |
| 1,300,000 | CVS Caremark Corporation †‡ | 5.921 | 12/3/2007 | 1,289,974 |
| 1,200,000 | CVS Corporation ‡ | 4.000 | 9/15/2009 | 1,178,293 |
| 900,000 | D.R. Horton, Inc. ± | 8.000 | 2/1/2009 | 887,866 |
| 1,000,000 | DaimlerChrysler North American | | | |
| | Holdings Corporation †‡ | 5.886 | 11/1/2007 | 999,801 |
| 750,000 | Ford Motor Credit Company ~ | 6.625 | 6/16/2008 | 746,649 |
| 900,000 | May Department Stores Company | 4.800 | 7/15/2009 | 890,423 |
| 1,200,000 | Nissan Motor Acceptance Corporation | 4.625 | 3/8/2010 | 1,189,528 |
| 950,000 | Ryland Group, Inc. | 5.375 | 6/1/2008 | 939,122 |
| 1,754,508 | SLM Private Credit Student Loan Trust † | 5.704 | 12/15/2007 | 1,746,464 |
| 1,000,000 | Walmart Stores, Inc. | 5.000 | 4/5/2012 | 996,892 |
| 2,600,000 | Walt Disney Company †~ | 5.294 | 1/16/2008 | 2,591,035 |
|
|
| | Total Consumer Cyclical | | 19,655,735 |
|
|
| |
| Consumer Non-Cyclical (2.5%) | | | |
| 625,000 | AstraZeneca plc | 5.400 | 9/15/2012 | 631,013 |
| 1,000,000 | Baxter International, Inc. ± | 5.196 | 2/16/2008 | 1,000,343 |
| 1,600,000 | Bunge Limited Finance Corporation | 4.375 | 12/15/2008 | 1,586,998 |
| 1,500,000 | Cadbury Schweppes plc ±‡≤ | 3.875 | 10/1/2008 | 1,485,591 |
| 890,000 | Fortune Brands, Inc. ±‡ | 5.125 | 1/15/2011 | 885,705 |
| 1,500,000 | General Mills, Inc. ‡ | 6.378 | 10/15/2008 | 1,515,176 |
| 825,000 | Kroger Company | 6.375 | 3/1/2008 | 827,786 |
| 1,200,000 | Miller Brewing Company ಠ| 4.250 | 8/15/2008 | 1,191,562 |
|
| The accompanying Notes to Financial Statements are an integral part of this schedule. |
|
| 203 |
| | | | |
| Limited Maturity Bond Fund | | | |
| Schedule of Investments as of October 31, 2007 | | | |
| |
| Principal | | Interest | Maturity | |
| Amount | Long-Term Fixed Income (99.8%) | Rate | Date | Value |
|
| Consumer Non-Cyclical — continued | | | |
| $400,000 | Safeway, Inc. | 6.500% | 11/15/2008 | $405,004 |
| 700,000 | Wyeth | 4.375 | 3/1/2008 | 698,772 |
|
|
| | Total Consumer Non-Cyclical | | 10,227,950 |
|
|
| |
| Energy (1.5%) | | | |
| 500,000 | Enterprise Products Operating, LP ~ | 4.625 | 10/15/2009 | 495,860 |
| 1,175,000 | KeySpan Corporation ± | 4.900 | 5/16/2008 | 1,173,309 |
| 1,000,000 | Oneok, Inc. | 5.510 | 2/16/2008 | 999,534 |
| 900,000 | Premcor Refining Group, Inc. | 6.125 | 5/1/2011 | 924,816 |
| 1,600,000 | Sempra Energy | 7.950 | 3/1/2010 | 1,696,378 |
| 650,000 | Western Oil Sands, Inc. | 8.375 | 5/1/2012 | 722,312 |
|
|
| | Total Energy | | | 6,012,209 |
|
|
| |
| Financials (15.6%) | | | |
| 750,000 | Abbey National plc ±> | 6.700 | 6/15/2008 | 757,650 |
| 1,300,000 | American Express Credit Corporation † | 5.304 | 11/2/2007 | 1,289,542 |
| 1,700,000 | American Express Credit Corporation †‡ | 5.276 | 11/5/2007 | 1,684,081 |
| 1,000,000 | American General Finance Corporation † | 5.329 | 1/18/2008 | 1,000,536 |
| 600,000 | BAC Capital Trust XIV ‡ | 5.630 | 3/15/2012 | 566,024 |
| 1,600,000 | Bank of New York Mellon Corporation | 4.950 | 11/1/2012 | 1,585,355 |
| 1,000,000 | Capital One Bank ± | 4.875 | 5/15/2008 | 998,691 |
| 850,000 | Capmark Financial Group, Inc. ≤ | 5.875 | 5/10/2012 | 763,102 |
| 1,000,000 | Chubb Corporation ±‡ | 4.934 | 11/16/2007 | 999,962 |
| 1,100,000 | CIT Group, Inc. ‡ | 5.200 | 11/3/2010 | 1,064,816 |
| 300,000 | Corestates Capital Trust I ಠ| 8.000 | 12/15/2026 | 310,740 |
| 3,050,000 | Countrywide Financial Corporation, Convertible †~≤ | 1.743 | 1/15/2008 | 2,699,860 |
| 1,100,000 | Countrywide Home Loans, Inc. ‡ | 4.125 | 9/15/2009 | 961,408 |
| 900,000 | Credit Suisse First Boston USA, Inc. †‡ | 5.854 | 12/10/2007 | 899,610 |
| 600,000 | Developers Diversified Realty Corporation ~ | 4.625 | 8/1/2010 | 591,028 |
| 1,000,000 | Donaldson, Lufkin & Jenrette, Inc. ‡ | 6.500 | 4/1/2008 | 1,006,406 |
| 500,000 | First Chicago Corporation ~ | 6.375 | 1/30/2009 | 508,790 |
| 1,600,000 | First Union Corporation ± | 6.300 | 4/15/2008 | 1,611,558 |
| 900,000 | General Electric Capital Corporation ‡ | 5.200 | 2/1/2011 | 907,099 |
| 1,200,000 | General Motors Acceptance Corporation ‡ | 6.875 | 8/28/2012 | 1,081,793 |
| 3,500,000 | Goldman Sachs Group, Inc. †~ | 5.290 | 12/24/2007 | 3,481,496 |
| 900,000 | Goldman Sachs Group, Inc. ‡ | 4.500 | 6/15/2010 | 887,893 |
| 900,000 | Hartford Financial Services Group, Inc. ± | 5.550 | 8/16/2008 | 903,212 |
| 1,200,000 | International Lease Finance Corporation ± | 3.300 | 1/23/2008 | 1,194,546 |
| 950,000 | International Lease Finance Corporation ± | 5.750 | 6/15/2011 | 959,475 |
| 750,000 | iSTAR Financial, Inc. ± | 4.875 | 1/15/2009 | 734,574 |
| 600,000 | iSTAR Financial, Inc. ± | 5.125 | 4/1/2011 | 560,914 |
| 705,000 | J.P. Morgan Chase & Company | 5.600 | 6/1/2011 | 715,655 |
| 900,000 | John Hancock Global Funding II ‡ | 3.750 | 9/30/2008 | 890,158 |
| 1,000,000 | KeyCorp ± | 4.700 | 5/21/2009 | 993,879 |
| 1,500,000 | Lehman Brothers Holdings E-Capital Trust I ±† | 6.290 | 11/19/2007 | 1,404,806 |
| 1,000,000 | Lehman Brothers Holdings, Inc. ‡ | 3.500 | 8/7/2008 | 990,100 |
|
| The accompanying Notes to Financial Statements are an integral part of this schedule. |
|
| 204 |
| | | | |
| Limited Maturity Bond Fund | | | |
| Schedule of Investments as of October 31, 2007 | | | |
| |
| Principal | | Interest | Maturity | |
| Amount | Long-Term Fixed Income (99.8%) | Rate | Date | Value |
|
| Financials — continued | | | |
| $800,000 | Lehman Brothers Holdings, Inc. | 5.250% | 2/6/2012 | $789,229 |
| 550,000 | Lincoln National Corporation | 5.650 | 8/27/2012 | 552,920 |
| 3,500,000 | Merrill Lynch & Company, Inc. †~ | 5.580 | 11/5/2007 | 3,458,780 |
| 1,200,000 | Merrill Lynch & Company, Inc. ‡ | 4.000 | 11/15/2007 | 1,199,344 |
| 1,500,000 | Mizuho Preferred Capital Company, LLC ±≤ | 8.790 | 6/30/2008 | 1,532,991 |
| 500,000 | Monumental Global Funding II ~≤ | 3.850 | 3/3/2008 | 497,724 |
| 3,500,000 | Morgan Stanley †~ | 5.523 | 1/15/2008 | 3,472,984 |
| 650,000 | Morgan Stanley | 5.250 | 11/2/2012 | 644,664 |
| 600,000 | Morgan Stanley Dean Witter & Company ~ | 6.750 | 4/15/2011 | 626,980 |
| 2,700,000 | Nations Bank Capital Trust IV ~ | 8.250 | 4/15/2027 | 2,811,923 |
| 1,100,000 | Pacific Life Global Funding ≤ | 3.750 | 1/15/2009 | 1,083,042 |
| 900,000 | Popular North America, Inc. | 5.200 | 12/12/2007 | 899,612 |
| 1,000,000 | Premium Asset Trust †≤ | 5.393 | 1/15/2008 | 1,000,230 |
| 600,000 | Pricoa Global Funding I ≤ | 4.350 | 6/15/2008 | 595,597 |
| 1,000,000 | Protective Life Secured Trust | 4.000 | 10/7/2009 | 988,453 |
| 1,200,000 | Residential Capital Corporation †≤ | 8.044 | 1/17/2008 | 744,000 |
| 1,000,000 | Residential Capital Corporation | 7.125 | 11/21/2008 | 842,500 |
| 450,000 | Residential Capital Corporation | 7.000 | 2/22/2011 | 328,500 |
| 1,800,000 | Simon Property Group, LP ± | 6.375 | 11/15/2007 | 1,800,703 |
| 1,000,000 | SLM Corporation | 4.000 | 1/15/2009 | 966,932 |
| 775,000 | Tokai Preferred Capital Company, LLC ≤ | 9.980 | 12/31/2007 | 799,512 |
| 600,000 | UnumProvident Corporation | 5.997 | 5/15/2008 | 599,924 |
| 300,000 | Wachovia Capital Trust III | 5.800 | 3/15/2011 | 297,616 |
| 600,000 | Wachovia Corporation | 6.375 | 2/1/2009 | 607,242 |
| 700,000 | Wachovia Corporation | 6.150 | 3/15/2009 | 706,590 |
| 600,000 | Washington Mutual Preferred Funding II ≤ | 6.895 | 6/15/2012 | 456,000 |
| 1,000,000 | Washington Mutual, Inc. | 4.000 | 1/15/2009 | 979,705 |
| 1,000,000 | Wells Fargo & Company *† | 5.794 | 12/17/2007 | 999,207 |
|
|
| | Total Financials | | | 65,287,663 |
|
|
| |
| Mortgage-Backed Securities (7.6%) | | | |
| 4,163,066 | Federal National Mortgage Association ‡ | 6.000 | 8/1/2024 | 4,220,428 |
| 7,000,000 | Federal National Mortgage Association Conventional | | | |
| | 30-Yr. Pass Through §~ | 6.000 | 11/1/2037 | 7,050,316 |
| 20,000,000 | Federal National Mortgage Association Conventional | | | |
| | 30-Yr. Pass Through § | 6.500 | 11/1/2037 | 20,468,751 |
|
|
| | Total Mortgage-Backed Securities | | 31,739,495 |
|
|
| |
| Technology (0.5%) | | | |
| 1,000,000 | International Business Machines Corporation ± | 4.950 | 3/22/2011 | 998,129 |
| 300,000 | Sun Microsystems, Inc. | 7.650 | 8/15/2009 | 313,938 |
| 900,000 | Xerox Corporation | 5.500 | 5/15/2012 | 900,267 |
|
|
| | Total Technology | | | 2,212,334 |
|
|
|
| The accompanying Notes to Financial Statements are an integral part of this schedule. |
|
| 205 |
| | | | |
| Limited Maturity Bond Fund | | | |
| Schedule of Investments as of October 31, 2007 | | | |
| |
| Principal | | Interest | Maturity | |
| Amount | Long-Term Fixed Income (99.8%) | Rate | Date | Value |
|
| Transportation (1.7%) | | | |
| $625,000 | Delta Air Lines, Inc. ‡ | 7.111% | 9/18/2011 | $638,281 |
| 700,000 | FedEx Corporation ‡ | 3.500 | 4/1/2009 | 683,526 |
| 1,400,000 | Norfolk Southern Corporation ‡ | 6.200 | 4/15/2009 | 1,420,387 |
| 1,085,000 | Northwest Airlines, Inc. ‡ | 6.841 | 4/1/2011 | 1,094,494 |
| 2,200,000 | Petro Stopping Centers, LP/Petro Financial Corporation | 9.000 | 2/15/2012 | 2,299,000 |
| 500,000 | Union Pacific Corporation | 6.125 | 1/15/2012 | 512,008 |
| 400,000 | Union Pacific Corporation | 5.450 | 1/31/2013 | 400,067 |
|
|
| | Total Transportation | | | 7,047,763 |
|
|
| |
| U.S. Government (7.0%) | | | |
| 3,000,000 | Federal Home Loan Bank ‡ | 4.100 | 6/13/2008 | 2,990,727 |
| 3,000,000 | Federal Home Loan Bank ‡ | 4.875 | 2/9/2010 | 3,033,675 |
| 1,000,000 | Federal Home Loan Mortgage Corporation ‡ | 4.625 | 8/15/2008 | 1,000,511 |
| 2,000,000 | Federal Home Loan Mortgage Corporation ‡ | 4.750 | 11/3/2009 | 2,016,312 |
| 1,000,000 | Federal National Mortgage Association ‡ | 3.875 | 7/15/2008 | 996,439 |
| 1,500,000 | Federal National Mortgage Association ‡ | 4.000 | 9/2/2008 | 1,493,385 |
| 2,000,000 | Federal National Mortgage Association *‡ | 5.300 | 2/22/2011 | 2,003,868 |
| 2,500,000 | Federal National Mortgage Association ‡ | 5.125 | 4/15/2011 | 2,553,732 |
| 13,237,080 | U.S. Treasury Notes, TIPS * | 2.000 | 7/15/2014 | 13,232,950 |
|
|
| | Total U.S. Government | | | 29,321,599 |
|
|
| |
| Utilities (3.2%) | | | |
| 1,300,000 | Carolina Power & Light, Inc. ±‡ | 5.950 | 3/1/2009 | 1,312,605 |
| 1,000,000 | CenterPoint Energy, Inc. ±‡ | 5.875 | 6/1/2008 | 1,000,503 |
| 375,000 | Cleveland Electric Illuminating Company ಠ| 7.430 | 11/1/2009 | 390,426 |
| 1,500,000 | Commonwealth Edison Company | 3.700 | 2/1/2008 | 1,493,712 |
| 1,400,000 | Dominion Resources, Inc. ‡ | 4.125 | 2/15/2008 | 1,395,215 |
| 325,000 | DPL, Inc. ~≤ | 6.250 | 5/15/2008 | 325,951 |
| 900,000 | Niagara Mohawk Power Corporation | 7.750 | 10/1/2008 | 920,179 |
| 500,000 | Pacific Gas & Electric Company | 3.600 | 3/1/2009 | 491,281 |
| 313,412 | Power Receivables Finance, LLC ≤ | 6.290 | 1/1/2012 | 322,909 |
| 2,500,000 | PSEG Funding Trust | 5.381 | 11/16/2007 | 2,499,878 |
| 239,000 | Texas-New Mexico Power Company | 6.125 | 6/1/2008 | 238,585 |
| 1,000,000 | Virginia Electric & Power Company | 4.500 | 12/15/2010 | 986,869 |
| 2,100,000 | Yorkshire Power Finance, Ltd. | 6.496 | 2/25/2008 | 2,105,265 |
|
|
| | Total Utilities | | | 13,483,378 |
|
|
| | Total Long-Term Fixed Income (cost $418,776,996) | 416,776,872 |
|
|
|
| The accompanying Notes to Financial Statements are an integral part of this schedule. |
|
| 206 |
| | | | |
| Limited Maturity Bond Fund | | | |
| Schedule of Investments as of October 31, 2007 | | | |
| |
| | | Strike | Expiration | |
| Contracts | Options Purchased (0.1%) | Price | Date | Value |
|
| 410 | Call on U.S. Treasury Bond Futures | $110 | 11/20/2007 | $243,438 |
| 50 | Put on Crude Oil Futures | 85 | 12/13/2007 | 73,000 |
|
|
| | Total Options Purchased (cost $523,513) | 316,438 |
|
|
| |
| |
| | | Interest | Maturity | |
| Shares | Collateral Held for Securities Loaned (3.5%) | Rate (+) | Date | Value |
|
| 14,722,625 | Thrivent Financial Securities Lending Trust | 5.050% | N/A | $14,722,625 |
|
|
| | Total Collateral Held for Securities Loaned | |
| | (cost $14,722,625) | | | 14,722,625 |
|
|
| |
| |
| | | Interest | Maturity | |
| Shares | Short-Term Investments (6.8%) | Rate (+) | Date | Value |
|
| 28,229,455 | Thrivent Money Market Fund | 5.020% | N/A | $28,229,455 |
|
|
| | Total Short-Term Investments (at amortized cost) | 28,229,455 |
|
|
| | Total Investments (cost $462,252,589) 110.2% | $460,045,390 |
|
|
| | Other Assets and Liabilities, Net (10.2%) | (42,589,854) |
|
|
| | Total Net Assets 100.0% | | | $417,455,536 |
|
|
| | | | | |
| | Number of | | Notional | | |
| | Contracts | Expiration | Principal | | Unrealized |
| Futures | Long/(Short) | Date | Amount | Value | Gain/(Loss) |
|
| 2-Yr. U.S. Treasury Bond Futures | 60 | December 2007 | $12,387,527 | $12,426,562 | $39,035 |
| 5-Yr. U.S. Treasury Bond Futures | 30 | December 2007 | 3,200,717 | 3,220,313 | 19,596 |
| 10-Yr. U.S. Treasury Bond Futures | (300) | December 2007 | (32,938,149) | (33,004,689) | (66,540) |
| Total Futures | | | | | ($7,909) |
| |
| | Number of | Exercise | Expiration | | Unrealized |
| Call Options Written | Contracts | Price | Date | Value | Gain/(Loss) |
|
| Federal National Mortgage Association | | | | | |
| Conventional 30-Yr. Pass Through | 7 | $101.08 | November 2007 | ($8,750) | $6,563 |
| Total Call Options Written | | | | | $6,563 |
|
| The accompanying Notes to Financial Statements are an integral part of this schedule. |
|
| 207 |
| | | | | | |
| Limited Maturity Bond Fund | | | | | | |
| Schedule of Investments as of October 31, 2007 | | | | | |
| |
| | | | | | Notional | |
| | Fund | Fund | Buy/Sell | Termination | Principal | Unrealized |
| Swaps and Counterparty | Receives | Pays | Protection | Date | Amount | Gain/(Loss) |
|
| Credit Default Swaps | | | | | | |
| LCDX, N.A. Index Series 8, | N/A | N/A | Sell | June 2012 | $1,666,000 | ($73,621) |
| 5 Year, at 1.20%; | | | | | | |
| Bank of America, N.A. | | | | | | |
| LCDX, N.A. Index Series 8, | N/A | N/A | Sell | June 2012 | 1,666,000 | (72,196) |
| 5 Year, at 1.20%; | | | | | | |
| J.P. Morgan Chase and Co. | | | | | | |
| Interest Rate Swaps | | | | | | |
| Bank of America, N.A., 2 Year | 5.275% | 3 Month LIBOR | N/A | May 2009 | 11,000,000 | 112,006 |
| Bank of America, N.A., 2 Year | 5.306 | 3 Month LIBOR | N/A | June 2009 | 15,000,000 | 171,674 |
| Total Swaps | | | | | | $137,863 |
* All or a portion of the security is on loan as discussed in item 2(M) of the Notes to Financial Statements.
+ The interest rate shown reflects the yield, coupon rate or, for securities purchased at a discount, the discount rate at the date of purchase.
> Denotes step coupon bonds for which the current interest rate and next scheduled reset date are shown.
† Denotes variable rate obligations for which the current yield and next scheduled reset date are shown.
§ Denotes investments purchased on a when-issued or delayed delivery basis.
± Designated as cover for long settling trades as discussed in the Notes to Financial Statements.
‡ At October 31, 2007, $1,006,406 of investments were held on deposit with the counterparty and pledged as the initial margin deposit for open financial futures contracts. In addition, $69,620,296 and $33,253,437 of investments were earmarked as collateral to cover open financial futures contracts and swap contracts, respectively.
~ All or a portion of the security was earmarked as collateral to cover options.
≤ Denotes securities sold under Rule 144A of the Securities Act of 1933, which exempts them from registration. These securities have been determined to be liquid under the guidelines established by the Fund’s Board of Trustees and may be resold to other dealers in the program or to other qualified institutional buyers. As of October 31, 2007, the value of these investments was $56,472,299 or 13.5% of total net assets.
« All or a portion of the security is insured or guaranteed.
Definitions:
TIPS — Treasury Inflation Protected Security.
Gross unrealized appreciation and depreciation of investments, based on cost for federal income tax purposes, were as follows:
| | |
| Gross unrealized appreciation | $1,541,364 | |
| Gross unrealized depreciation | (3,722,359) | |
|
| |
| Net unrealized appreciation (depreciation) | ($2,180,995) | |
| Cost for federal income tax purposes | $462,226,385 | |
|
| The accompanying Notes to Financial Statements are an integral part of this schedule. |
|
| 208 |
| | | | |
| Money Market Fund |
| Schedule of Investments as of October 31, 2007 |
| Principal | | Interest | Maturity | |
| Amount | Certificates of Deposit (0.3%) | Rate (+) | Date | Value |
|
| $5,500,000 | Deutsche Bank AG | 5.410% | 6/9/2008 | $5,500,000 |
|
|
| | Total Certificates of Deposit | | 5,500,000 |
|
|
| |
| |
| Principal | | Interest | Maturity | |
| Amount | Commercial Paper (67.9%) | Rate (+) | Date | Value |
|
| Asset-Backed Commercial Paper (2.1%) | | | |
| $13,140,000 | GOVCO, Inc. « | 5.400% | 11/7/2007 | $13,128,174 |
| 16,825,000 | GOVCO, Inc. « | 5.900 | 12/12/2007 | 16,711,945 |
| 3,440,000 | GOVCO, Inc. « | 5.220 | 12/20/2007 | 3,415,559 |
|
|
| | Total Asset-Backed Commercial Paper | | 33,255,678 |
|
|
| |
| Banking — Domestic (4.8%) | | | |
| 9,850,000 | Bank of America Corporation | 5.308 | 11/16/2007 | 9,828,215 |
| 1,540,000 | Bank of America Corporation | 5.250 | 11/20/2007 | 1,535,733 |
| 10,572,000 | Bank of America Corporation | 5.400 | 12/3/2007 | 10,521,254 |
| 1,485,000 | Societe Generale NA | 5.280 | 11/13/2007 | 1,482,386 |
| 4,220,000 | Societe Generale NA | 5.319 | 11/26/2007 | 4,204,413 |
| 1,200,000 | UBS Finance Corporation | 5.240 | 12/17/2007 | 1,191,966 |
| 10,200,000 | UBS Finance Corporation | 5.460 | 2/6/2008 | 10,049,941 |
| 10,150,000 | UBS Finance Corporation | 5.335 | 2/19/2008 | 9,984,541 |
| 10,070,000 | UBS Finance Corporation | 5.295 | 2/27/2008 | 9,895,227 |
| 10,100,000 | UBS Finance Corporation | 5.315 | 2/29/2008 | 9,921,061 |
| 6,770,000 | UBS Finance Corporation | 5.250 | 3/17/2008 | 6,634,741 |
| 1,898,000 | UBS Finance Delaware, LLC | 5.210 | 1/30/2008 | 1,873,278 |
|
|
| | Total Banking — Domestic | | 77,122,756 |
|
|
| |
| Banking — Foreign (1.0%) | | | |
| 5,450,000 | DnB NORBank ASA | 4.850 | 1/4/2008 | 5,403,009 |
| 10,130,000 | ICICI Bank, Ltd. « | 4.950 | 7/7/2008 | 9,783,174 |
| 1,870,000 | Royal Bank of Scotland | 5.250 | 11/16/2007 | 1,865,910 |
|
|
| | Total Banking — Foreign | | 17,052,093 |
|
|
| |
| Basic Industry (0.3%) | | | |
| 4,720,000 | BASF AG | 5.205 | 12/28/2007 | 4,681,101 |
|
|
| | Total Basic Industry | | | 4,681,101 |
|
|
| |
| Brokerage (2.1%) | | | |
| 16,820,000 | Citigroup Funding, Inc. | 5.220 | 12/18/2007 | 16,705,372 |
| 16,870,000 | Morgan Stanley | 5.410 | 3/17/2008 | 16,522,680 |
|
|
| | Total Brokerage | | | 33,228,052 |
|
|
|
| The accompanying Notes to Financial Statements are an integral part of this schedule. |
|
| 209 |
| | | | |
| Money Market Fund | | | |
| Schedule of Investments as of October 31, 2007 | | | |
| |
| Principal | | Interest | Maturity | |
| Amount | Commercial Paper (67.9%) | Rate (+) | Date | Value |
|
| Consumer Non-Cyclical (4.3%) | | | |
| $16,770,000 | Nestle Capital Corporation | 5.240% | 1/17/2008 | $16,582,046 |
| 10,060,000 | Nestle Capital Corporation | 5.230 | 1/25/2008 | 9,935,773 |
| 13,410,000 | Nestle Capital Corporation | 5.140 | 2/14/2008 | 13,208,962 |
| 16,825,000 | Nestle Finance France SA | 5.220 | 12/7/2007 | 16,737,173 |
| 13,440,000 | Nestle Finance France SA | 5.180 | 1/7/2008 | 13,310,431 |
|
|
| | Total Consumer Non-Cyclical | | 69,774,385 |
|
|
| |
| Education (1.3%) | | | |
| 4,619,000 | Northwestern University | 5.260 | 12/5/2007 | 4,596,054 |
| 3,450,000 | Northwestern University | 5.300 | 12/7/2007 | 3,431,715 |
| 13,475,000 | Yale University | 5.310 | 11/6/2007 | 13,465,062 |
|
|
| | Total Education | | | 21,492,831 |
|
|
| |
| Finance (32.3%) | | | |
| 16,920,000 | Amsterdam Funding Corporation « | 5.180 | 11/28/2007 | 16,854,266 |
| 8,700,000 | Cooperative Association of Tractor Dealers, Inc. « | 5.290 | 11/5/2007 | 8,694,887 |
| 2,046,000 | Cooperative Association of Tractor Dealers, Inc. « | 5.270 | 11/16/2007 | 2,041,507 |
| 1,053,000 | Cooperative Association of Tractor Dealers, Inc. « | 5.280 | 11/21/2007 | 1,049,911 |
| 1,931,000 | Cooperative Association of Tractor Dealers, Inc. « | 5.300 | 11/26/2007 | 1,923,893 |
| 2,710,000 | Cooperative Association of Tractor Dealers, Inc. « | 5.300 | 11/27/2007 | 2,699,627 |
| 5,500,000 | Cooperative Association of Tractor Dealers, Inc. « | 5.240 | 12/28/2007 | 5,454,369 |
| 5,510,000 | Cooperative Association of Tractor Dealers, Inc. « | 5.210 | 1/29/2008 | 5,439,030 |
| 5,480,000 | Cooperative Association of Tractor Dealers, Inc. « | 5.210 | 1/30/2008 | 5,408,623 |
| 2,000,000 | Cooperative Association of Tractor Dealers, Inc. « | 5.400 | 2/6/2008 | 1,970,900 |
| 2,070,000 | Cooperative Association of Tractor Dealers, Inc. « | 5.200 | 2/8/2008 | 2,040,399 |
| 7,570,000 | Cooperative Association of Tractor Dealers, Inc. « | 5.200 | 2/12/2008 | 7,457,375 |
| 6,755,000 | Cooperative Association of Tractor Dealers, Inc. « | 5.200 | 3/19/2008 | 6,619,375 |
| 5,699,000 | Cooperative Association of Tractor Dealers, Inc. « | 5.150 | 3/28/2008 | 5,578,339 |
| 16,800,000 | Corporate Receivables Corporation « | 5.300 | 11/15/2007 | 16,765,373 |
| 15,525,000 | Corporate Receivables Corporation « | 5.300 | 11/16/2007 | 15,490,715 |
| 13,400,000 | Fountain Square Commercial Funding, Inc. « | 5.235 | 11/28/2007 | 13,347,388 |
| 16,900,000 | Galaxy Funding, Inc. « | 5.170 | 12/26/2007 | 16,766,514 |
| 16,900,000 | Galaxy Funding, Inc. « | 5.170 | 12/28/2007 | 16,761,659 |
| 1,455,000 | General Electric Capital Corporation | 5.230 | 12/18/2007 | 1,445,065 |
| 13,800,000 | Grampian Funding, LLC « | 5.185 | 11/19/2007 | 13,764,223 |
| 2,015,000 | Grampian Funding, LLC « | 5.250 | 12/14/2007 | 2,002,364 |
| 3,375,000 | Grampian Funding, LLC « | 5.250 | 1/11/2008 | 3,340,055 |
| 20,250,000 | Grampian Funding, LLC « | 5.100 | 2/11/2008 | 19,957,388 |
| 13,520,000 | Grampian Funding, LLC « | 5.120 | 4/7/2008 | 13,216,190 |
| 13,817,000 | Kitty Hawk Funding Corporation « | 5.760 | 12/21/2007 | 13,706,464 |
| 6,755,000 | NATC California, LLC « | 5.100 | 1/10/2008 | 6,688,013 |
| 8,110,000 | Nieuw Amsterdam Receivables Corporation « | 5.235 | 1/11/2008 | 8,026,268 |
| 8,100,000 | Nieuw Amsterdam Receivables Corporation « | 5.140 | 1/15/2008 | 8,013,262 |
| 3,485,000 | North Sea Funding, LLC « | 5.250 | 11/15/2007 | 3,477,885 |
| 16,870,000 | Old Line Funding Corporation « | 6.100 | 12/20/2007 | 16,729,932 |
| 16,920,000 | Old Line Funding Corporation « | 5.150 | 12/27/2007 | 16,784,452 |
|
| The accompanying Notes to Financial Statements are an integral part of this schedule. |
|
| 210 |
| | | | |
| Money Market Fund | | | |
| Schedule of Investments as of October 31, 2007 | | | |
| |
| Principal | | Interest | Maturity | |
| Amount | Commercial Paper (67.9%) | Rate (+) | Date | Value |
|
| Finance — continued | | | |
| $9,275,000 | Old Line Funding Corporation « | 4.830% | 1/10/2008 | $9,187,892 |
| 6,750,000 | Old Line Funding Corporation « | 5.200 | 1/18/2008 | 6,673,950 |
| 16,900,000 | Regency Markets No.1, LLC « | 5.180 | 1/15/2008 | 16,717,621 |
| 22,101,000 | Regency Markets No.1, LLC « | 5.067 | 1/22/2008 | 21,845,906 |
| 16,920,000 | Solitaire Funding, LLC « | 5.220 | 12/10/2007 | 16,824,317 |
| 16,880,000 | Solitaire Funding, LLC « | 5.200 | 12/28/2007 | 16,741,021 |
| 20,300,000 | Solitaire Funding, LLC « | 4.910 | 1/29/2008 | 20,053,586 |
| 16,990,000 | Thames Asset Global Securitization, Inc. « | 5.250 | 11/14/2007 | 16,957,790 |
| 13,550,000 | Thames Asset Global Securitization, Inc. « | 5.150 | 3/14/2008 | 13,290,254 |
| 11,072,000 | Three Pillars, Inc. « | 5.180 | 1/17/2008 | 10,949,328 |
| 20,300,000 | Thunder Bay Funding, Inc. « | 5.600 | 12/17/2007 | 20,154,742 |
| 10,150,000 | Thunder Bay Funding, Inc. « | 5.250 | 12/27/2007 | 10,067,108 |
| 16,973,000 | Triple A-1 Funding Corporation « | 5.750 | 11/14/2007 | 16,937,758 |
| 13,500,000 | Triple A-1 Funding Corporation « | 5.300 | 11/26/2007 | 13,450,312 |
| 6,000,000 | Triple A-1 Funding Corporation « | 5.050 | 12/6/2007 | 5,970,542 |
| 4,150,000 | Triple A-1 Funding Corporation « | 5.250 | 12/10/2007 | 4,126,397 |
| 20,220,000 | Windmill Funding Corporation « | 5.180 | 11/29/2007 | 20,138,536 |
|
|
| | Total Finance | | | 519,602,771 |
|
|
| |
| Insurance (19.7%) | | | |
| 6,500,000 | Aquinas Funding, LLC « | 5.200 | 1/30/2008 | 6,415,500 |
| 12,180,000 | Aquinas Funding, LLC « | 5.120 | 4/4/2008 | 11,911,499 |
| 4,810,000 | Curzon Funding, LLC « | 5.190 | 11/9/2007 | 4,804,452 |
| 20,255,000 | Curzon Funding, LLC « | 5.150 | 1/22/2008 | 20,017,398 |
| 10,200,000 | Curzon Funding, LLC « | 4.850 | 4/24/2008 | 9,959,521 |
| 16,900,000 | Monument Gardens, LLC « | 5.215 | 12/11/2007 | 16,802,074 |
| 20,255,000 | Monument Gardens, LLC « | 5.130 | 1/22/2008 | 20,018,320 |
| 10,120,000 | Monument Gardens, LLC « | 5.100 | 3/18/2008 | 9,922,154 |
| 10,138,000 | Monument Gardens, LLC « | 4.780 | 4/28/2008 | 9,897,048 |
| 16,700,000 | Nyala Funding, LLC « | 5.580 | 11/21/2007 | 16,648,230 |
| 20,280,000 | Nyala Funding, LLC « | 5.200 | 1/15/2008 | 20,060,300 |
| 10,150,000 | Nyala Funding, LLC « | 5.100 | 3/25/2008 | 9,941,502 |
| 13,515,000 | Nyala Funding, LLC « | 5.100 | 4/15/2008 | 13,197,172 |
| 10,200,000 | Perry III Funding « | 5.020 | 11/13/2007 | 10,182,932 |
| 19,250,000 | Perry III Funding « | 5.020 | 11/13/2007 | 19,217,788 |
| 19,883,000 | Perry III Funding « | 5.120 | 1/29/2008 | 19,631,325 |
| 6,770,000 | Swiss RE Financial Products Company | 5.500 | 12/13/2007 | 6,726,559 |
| 16,785,000 | Swiss RE Financial Products Company | 5.300 | 1/28/2008 | 16,567,541 |
| 16,910,000 | Swiss RE Financial Products Company | 5.250 | 3/11/2008 | 16,586,948 |
| 20,130,000 | Swiss Reinsurance Company | 5.310 | 11/21/2007 | 20,070,617 |
| 10,133,000 | United Healthcare Corporation | 5.170 | 12/3/2007 | 10,086,433 |
| 12,030,000 | United Healthcare Corporation | 5.160 | 12/10/2007 | 11,962,752 |
| 16,882,000 | United Healthcare Corporation | 5.200 | 12/20/2007 | 16,762,513 |
|
|
| | Total Insurance | | | 317,390,578 |
|
|
| | Total Commercial Paper | | 1,093,600,245 |
|
|
|
| The accompanying Notes to Financial Statements are an integral part of this schedule. |
|
| 211 |
| | | | |
| Money Market Fund | | | |
| Schedule of Investments as of October 31, 2007 | | | |
| |
| | | Interest | Maturity | |
| Shares | Other (4.8%) | Rate (+) | Date | Value |
|
| 16,743,000 | Barclays Prime Money Market Fund | 5.100% | N/A | $16,743,000 |
| 60,675,000 | Primary Fund Institutional Class | 5.200 | N/A | 60,675,000 |
|
|
| | Total Other | | | 77,418,000 |
|
|
| |
| |
| Principal | | Interest | Maturity | |
| Amount | Variable Rate Notes (26.4%) † | Rate (+) | Date | Value |
|
| Banking — Domestic (6.2%) | | | |
| $9,250,000 | Bank of New York Company, Inc. | 5.120% | 11/13/2007 | $9,250,000 |
| 7,400,000 | Bank of New York Company, Inc. | 4.879 | 11/27/2007 | 7,400,653 |
| 18,500,000 | Fifth Third Bancorp | 4.950 | 11/23/2007 | 18,500,000 |
| 8,830,000 | HSBC USA, Inc. | 5.091 | 11/15/2007 | 8,830,000 |
| 13,690,000 | Rabobank Nederland NV/NY | 5.518 | 11/15/2007 | 13,690,000 |
| 9,300,000 | Royal Bank of Canada NY | 5.118 | 11/1/2007 | 9,300,000 |
| 13,800,000 | Svenska Handelsbanken AB | 4.967 | 11/21/2007 | 13,800,000 |
| 19,225,000 | Wells Fargo & Company | 5.171 | 11/15/2007 | 19,225,000 |
|
|
| | Total Banking — Domestic | | 99,995,653 |
|
|
| |
| Banking — Foreign (6.2%) | | | |
| 9,600,000 | Bank of Ireland | 5.008 | 11/20/2007 | 9,600,000 |
| 17,190,000 | BNP Paribas SA | 5.330 | 11/7/2007 | 17,190,000 |
| 10,950,000 | BNP Paribas SA | 4.846 | 11/26/2007 | 10,950,000 |
| 9,000,000 | DnB NORBank ASA | 4.872 | 11/26/2007 | 9,000,000 |
| 20,480,000 | HBOS Treasury Services plc | 5.092 | 11/7/2007 | 20,480,000 |
| 6,860,000 | Royal Bank of Canada | 5.092 | 11/6/2007 | 6,860,000 |
| 11,500,000 | Royal Bank of Scotland plc | 5.007 | 11/21/2007 | 11,500,000 |
| 13,680,000 | Svenska Handelsbanken AB | 5.061 | 11/13/2007 | 13,680,000 |
|
|
| | Total Banking — Foreign | | 99,260,000 |
|
|
| |
| Basic Industry (1.3%) | | | |
| 20,620,000 | BASF Finance Europe NV | 5.170 | 1/22/2008 | 20,620,000 |
|
|
| | Total Basic Industry | | | 20,620,000 |
|
|
| |
| Brokerage (2.2%) | | | |
| 19,000,000 | Goldman Sachs Group, Inc. | 5.084 | 1/25/2008 | 19,000,000 |
| 6,000,000 | Lehman Brothers Holdings, Inc. | 5.260 | 1/3/2008 | 5,998,206 |
| 10,000,000 | Merrill Lynch & Company, Inc. | 5.033 | 11/26/2007 | 10,000,000 |
|
|
| | Total Brokerage | | | 34,998,206 |
|
|
| |
| Consumer Cyclical (0.8%) | | | |
| 13,760,000 | American Honda Finance Corporation | 5.695 | 12/11/2007 | 13,760,000 |
|
|
| | Total Consumer Cyclical | | 13,760,000 |
|
|
|
| The accompanying Notes to Financial Statements are an integral part of this schedule. |
|
| 212 |
| | | | |
| Money Market Fund | | | |
| Schedule of Investments as of October 31, 2007 | | | |
| |
| Principal | | Interest | Maturity | |
| Amount | Variable Rate Notes (26.4%) † | Rate (+) | Date | Value |
|
| Finance (5.2%) | | | |
| $6,370,000 | Kordsa, Inc. « | 4.850% | 11/1/2007 | $6,370,000 |
| 19,100,000 | Merrill Lynch & Company, Inc. | 5.340 | 11/23/2007 | 19,100,000 |
| 24,500,000 | Union Hamilton Special Funding, LLC « | 5.238 | 12/21/2007 | 24,500,000 |
| 33,730,000 | Union Hamilton Special Funding, LLC « | 5.498 | 12/28/2007 | 33,730,000 |
|
|
| | Total Finance | | | 83,700,000 |
|
|
| |
| Insurance (4.5%) | | | |
| 19,325,000 | Allstate Life Global Funding II « | 5.192 | 11/8/2007 | 19,325,000 |
| 19,225,000 | Allstate Life Global Funding II « | 5.151 | 11/15/2007 | 19,225,000 |
| 20,560,000 | ING Verzekeringen NV | 5.096 | 11/5/2007 | 20,560,000 |
| 13,500,000 | MBIA Global Funding, LLC « | 5.321 | 1/23/2008 | 13,500,000 |
|
|
| | Total Insurance | | | 72,610,000 |
|
|
| | Total Variable Rate Notes | | 424,943,859 |
|
|
| | Total Investments (at amortized cost) 99.4% | $1,601,462,104 |
|
|
| | Other Assets and Liabilities, Net 0.6% | | 8,955,705 |
|
|
| | Total Net Assets 100.0% | | | $1,610,417,809 |
|
|
+ The interest rate shown reflects the yield, coupon rate or, for securities purchased at a discount, the discount rate at the date of purchase.
† Denotes variable rate obligations for which the current yield and next scheduled reset date are shown.
« Denotes investments that benefit from credit enhancements or liquidity support provided by a third party bank or institution.
Cost for federal income tax purposes is $1,601,462,104.
|
| The accompanying Notes to Financial Statements are an integral part of this schedule. |
|
| 213 |
Thrivent Mutual Funds
Statement of Assets and Liabilities
| | | | | | | | |
|
| | | | |
| | | Aggressive | | Moderately | | Moderate | | Moderately |
| | | Allocation | | Aggressive | | Allocation | | Conservative |
| As of October 31, 2007 | | Fund | | Allocation Fund | | Fund | | Allocation Fund |
|
| Assets | | | | |
| Investments at cost | $336,842,955 | $827,332,094 | $800,513,498 | $298,562,623 |
| Investments in securities at market value | — | — | — | — |
| Investments in affiliates at market value | 390,908,511 | 928,482,977 | 871,526,429 | 315,366,833 |
| Investments at Market Value | 390,908,511 | 928,482,977 | 871,526,429 | 315,366,833 |
|
| Cash | — | — | — | — |
| Dividends and interest receivable | — | — | — | — |
| Prepaid expenses | 2,281 | 3,243 | 3,150 | 2,092 |
| Receivable for investments sold | — | — | — | — |
| Receivable for written options | — | — | — | — |
| Receivable for fund shares sold | 612,545 | 1,486,247 | 1,527,602 | 851,012 |
| Receivable for variation margin | — | — | — | — |
| Total Assets | 391,523,337 | 929,972,467 | 873,057,181 | 316,219,937 |
|
| Liabilities | | | | |
| Accrued expenses | 66,693 | 107,711 | 79,644 | 32,720 |
| Payable for investments purchased | 531,817 | 926,533 | 1,223,218 | 454,600 |
| Payable upon return of collateral for securities loaned | — | — | — | — |
| Payable for fund shares redeemed | 219,550 | 550,296 | 292,064 | 391,827 |
| Open options written, at value | — | — | — | — |
| Payable to affiliate | 124,830 | 321,492 | 319,867 | 104,769 |
| Total Liabilities | 942,890 | 1,906,032 | 1,914,793 | 983,916 |
|
| Net Assets | | | | |
| Capital stock (beneficial interest) | 330,485,837 | 810,082,919 | 788,637,482 | 295,113,914 |
| Accumulated undistributed net investment income/(loss) | 312,008 | 5,131,439 | 1,123,489 | 671,806 |
| Accumulated undistributed net realized gain/(loss) on | | | | |
| investments and foreign currency transactions | 5,717,046 | 11,701,194 | 10,368,486 | 2,646,091 |
| Net unrealized appreciation/(depreciation) on: | | | | |
| Investments | — | — | — | — |
| Affiliated investments | 54,065,556 | 101,150,883 | 71,012,931 | 16,804,210 |
| Written option contracts | — | — | — | — |
| Futures contracts | — | — | — | — |
| | | | | |
| Total Net Assets | $390,580,447 | $928,066,435 | $871,142,388 | $315,236,021 |
|
| Class A Share Capital | $332,742,643 | $859,173,115 | $843,224,600 | $305,469,984 |
| Shares of beneficial interest outstanding (Class A) | 24,121,367 | 64,943,274 | 68,469,137 | 26,478,754 |
| Net asset value per share | $13.79 | $13.23 | $12.32 | $11.54 |
| Maximum public offering price | $14.59 | $14.00 | $13.04 | $12.21 |
| | | | | |
| Class B Share Capital | $— | $— | $— | $— |
| Shares of beneficial interest outstanding (Class B) | — | — | — | — |
| Net asset value per share | $— | $— | $— | $— |
| | | | | |
| Institutional Class Share Capital | $57,837,804 | $68,893,320 | $27,917,788 | $9,766,037 |
| Shares of beneficial interest outstanding (Institutional Class) | 4,172,623 | 5,181,783 | 2,262,976 | 844,941 |
| Net asset value per share | $13.86 | $13.30 | $12.34 | $11.56 |
|
| The accompanying Notes to Financial Statements are an integral part of this statement. |
|
| 214 |
Thrivent Mutual Funds
Statement of Assets and Liabilities – continued
| | | | | | | | | | | | | |
| | | | | | |
| | | Partner | | Partner | | | | | Partner |
| Technology | | Small Cap | | Small Cap | | Small Cap | | Small Cap | | Mid Cap | | Mid Cap |
| Fund | | Growth Fund | | Value Fund | | Stock Fund | | Index Fund | | Growth Fund | | Value Fund |
|
| |
| $42,953,662 | $95,388,732 | $158,408,952 | $627,380,122 | $39,012,518 | $376,115,454 | $46,138,539 |
| 44,741,911 | 78,679,896 | 139,413,286 | 538,403,634 | 46,095,849 | 344,606,473 | 43,407,529 |
| 4,252,366 | 26,852,089 | 43,066,831 | 193,186,792 | 7,919,626 | 109,259,522 | 6,358,651 |
| 48,994,277 | 105,531,985 | 182,480,117 | 731,590,426 | 54,015,475 | 453,865,995 | 49,766,180 |
|
| — | 17,858 | 558,000 | — | 131,684 | 906,362 | — |
| 5,504 | 19,969 | 79,300 | 238,232 | 28,481 | 168,141 | 20,955 |
| 1,649 | 1,674 | 1,928 | 2,996 | 1,666 | 2,391 | 1,643 |
| 3,763,907 | 895,820 | 40,383 | 13,604,217 | 5,567 | 856,863 | 721,614 |
| — | — | — | — | — | 7,985 | — |
| 16,302 | 82,573 | 81,066 | 140,845 | 5,219 | 182,548 | 44,733 |
| — | — | — | — | 8,160 | — | — |
| 52,781,639 | 106,549,879 | 183,240,794 | 745,576,716 | 54,196,252 | 455,990,285 | 50,555,125 |
|
| 40,682 | 16,363 | 41,423 | 171,913 | 29,249 | 136,385 | 15,516 |
| 2,966,047 | 823,356 | 141,755 | 19,990,012 | 92,742 | 1,429,674 | 515,059 |
| 3,005,900 | 25,651,383 | 38,943,138 | 158,510,727 | 7,664,789 | 89,916,284 | 4,022,546 |
| 13,329 | — | 266,845 | 502,424 | 13,473 | 197,848 | — |
| — | — | — | — | — | 6,758 | — |
| 39,199 | 69,007 | 120,627 | 520,826 | 28,098 | 276,119 | 32,695 |
| 6,065,157 | 26,560,109 | 39,513,788 | 179,695,902 | 7,828,351 | 91,963,068 | 4,585,816 |
|
| 64,982,241 | 66,836,824 | 108,397,410 | 395,453,102 | 26,397,932 | 265,227,409 | 39,675,722 |
| (11,283) | (3,971) | 372,278 | (285,181) | 135,998 | (25,814) | 270,895 |
| |
| (24,295,091) | 3,013,664 | 10,886,153 | 66,502,589 | 4,830,691 | 21,073,855 | 2,395,051 |
| |
| 6,040,615 | 10,143,253 | 24,071,165 | 104,210,304 | 15,002,957 | 77,750,541 | 3,627,641 |
| — | — | — | — | — | — | — |
| — | — | — | — | — | 1,226 | — |
| — | — | — | — | 323 | — | — |
| $46,716,482 | $79,989,770 | $143,727,006 | $565,880,814 | $46,367,901 | $364,027,217 | $45,969,309 |
|
| $42,399,041 | $15,509,766 | $82,489,576 | $448,936,836 | $46,367,901 | $302,662,551 | $12,026,118 |
| 9,069,091 | 1,113,805 | 5,026,678 | 23,647,543 | 2,804,578 | 15,560,926 | 929,778 |
| $4.68 | $13.93 | $16.41 | $18.98 | $16.53 | $19.45 | $12.93 |
| $4.95 | $14.74 | $17.37 | $20.08 | $17.49 | $20.58 | $13.68 |
| | | | | | | |
| $1,692,666 | $— | $3,554,482 | $10,348,783 | $— | $19,268,143 | $— |
| 381,591 | — | 230,155 | 628,832 | — | 1,090,094 | — |
| $4.44 | $— | $15.44 | $16.46 | $— | $17.68 | $— |
| | | | | | | |
| $2,624,775 | $64,480,004 | $57,682,948 | $106,595,195 | $— | $42,096,523 | $33,943,191 |
| 530,364 | 4,605,969 | 3,373,701 | 5,168,361 | — | 2,006,548 | 2,617,859 |
| $4.95 | $14.00 | $17.10 | $20.62 | $— | $20.98 | $12.97 |
|
| The accompanying Notes to Financial Statements are an integral part of this statement. |
|
| 215 |
Thrivent Mutual Funds
Statement of Assets and Liabilities – continued
| | | | | | | | |
| | | | |
| | | | | | Partner |
| | | Mid Cap | | Mid Cap | | Mid Cap | | International |
| As of October 31, 2007 | | Stock Fund | | Index Fund | | Index Fund-I | | Stock Fund |
|
| Assets | | | | |
| Investments at cost | $1,327,942,267 | $48,677,540 | $9,490,661 | $602,539,797 |
| Investments in securities at market value | 1,154,544,392 | 60,327,505 | 13,509,283 | 714,381,594 |
| Investments in affiliates at market value | 281,960,424 | 6,090,225 | 1,127,674 | 31,486,793 |
| Investments at Market Value | 1,436,504,816 | 66,417,730 | 14,636,957 | 745,868,387 |
|
| Cash | 2,103,185 | 46,800 | 10,800 | 25,596(a) |
| Dividends and interest receivable | 580,698 | 33,527 | 7,038 | 1,648,429 |
| Prepaid expenses | 4,582 | 1,702 | 1,597 | 3,215 |
| Receivable for investments sold | 2,202,404 | — | — | 17,055,856 |
| Receivable for written options | — | — | — | — |
| Receivable for fund shares sold | 579,441 | 7,376 | — | 512,020 |
| Swap agreements, at value | — | — | — | — |
| Receivable for forward contracts | — | — | — | 2,505,708 |
| Receivable for variation margin | — | 14,415 | 18,240 | — |
| Total Assets | 1,441,975,126 | 66,521,550 | 14,674,632 | 767,619,211 |
|
| Liabilities | | | | |
| Distributions payable | — | — | — | — |
| Accrued expenses | 262,646 | 29,858 | 16,564 | 135,749 |
| Payable for investments purchased | 3,143,044 | 27,250 | 5,450 | 12,949,772 |
| Payable upon return of collateral for securities loaned | 263,325,754 | 5,297,773 | 323,882 | 27,736,142 |
| Payable for fund shares redeemed | 1,279,402 | 114,333 | 179,688 | 266,348 |
| Payable for forward contracts | — | — | — | 2,506,033 |
| Open options written, at value | — | — | — | — |
| Payable to affiliate | 1,059,438 | 37,797 | 3,361 | 558,582 |
| Mortgage dollar roll deferred revenue | — | — | — | — |
| Total Liabilities | 269,070,284 | 5,507,011 | 528,945 | 44,152,626 |
|
| Net Assets | | | | |
| Capital stock (beneficial interest) | 913,617,333 | 37,174,910 | 5,053,484 | 518,134,496 |
| Accumulated undistributed net investment income/(loss) | 1,113,984 | 290,005 | 151,881 | 10,070,184 |
| Accumulated undistributed net realized gain/(loss) on | | | | |
| investments and foreign currency transactions | 149,610,976 | 5,813,769 | 3,787,215 | 51,921,025 |
| Net unrealized appreciation/(depreciation) on: | | | | |
| Investments | 108,562,549 | 17,740,190 | 5,146,296 | 143,328,590 |
| Written option contracts | — | — | — | — |
| Futures contracts | — | (4,335) | 6,811 | — |
| Swap agreements | — | — | — | — |
| Foreign currency forward contracts | — | — | — | (325) |
| Foreign currency transactions | — | — | — | 12,615 |
| Total Net Assets | $1,172,904,842 | $61,014,539 | $14,145,687 | $723,466,585 |
|
| Class A Share Capital | $988,917,187 | $61,014,539 | $— | $382,101,413 |
| Shares of beneficial interest outstanding (Class A) | 54,987,218 | 3,837,941 | — | 24,031,488 |
| Net asset value per share | $17.98 | $15.90 | $— | $15.90 |
| Maximum public offering price | $19.03 | $16.83 | $— | $16.83 |
| | | | | |
| Class B Share Capital | $11,914,074 | $— | $— | $10,769,992 |
| Shares of beneficial interest outstanding (Class B) | 780,964 | — | — | 705,599 |
| Net asset value per share | $15.26 | $— | $— | $15.26 |
| | | | | |
| Institutional Class Share Capital | $172,073,581 | $— | $14,145,687 | $330,595,180 |
| Shares of beneficial interest outstanding (Institutional Class) | 8,987,991 | — | 924,471 | 20,388,751 |
| Net asset value per share | $19.14 | $— | $15.30 | $16.21 |
a) Includes foreign currency holdings of $27,864 (cost $27,124).
|
| The accompanying Notes to Financial Statements are an integral part of this statement. |
|
| 216 |
Thrivent Mutual Funds
Statement of Assets and Liabilities – continued
| | | | | | | | | | | | | |
| | | | | | |
| Large Cap | | Large Cap | | Large Cap | | Large Cap | | Large Cap | | Balanced | | High Yield |
| Growth Fund | | Value Fund | | Stock Fund | | Index Fund | | Index Fund-I | | Fund | | Fund |
|
| |
| $562,902,669 | $629,216,710 | $2,885,008,974 | $70,796,839 | $29,315,774 | $357,530,030 | $639,129,959 |
| 568,977,992 | 647,453,314 | 3,423,968,559 | 91,446,976 | 34,344,062 | 346,427,313 | 553,888,868 |
| 66,767,549 | 103,121,481 | 422,051,901 | 6,809,258 | 1,751,786 | 53,941,063 | 79,566,094 |
| 635,745,541 | 750,574,795 | 3,846,020,460 | 98,256,234 | 36,095,848 | 400,368,376 | 633,454,962 |
|
| — | — | 12,143 | — | — | 1,687 | 2,485 |
| 326,900 | 804,435 | 3,087,147 | 86,822 | 31,678 | 940,389 | 11,977,247 |
| 2,653 | 3,007 | 10,259 | 1,781 | 1,630 | 2,406 | 3,225 |
| 8,821,865 | 5,132,480 | 23,729,077 | 13,242 | 5,736 | 1,689,212 | 766,111 |
| 90,450 | — | — | — | — | — | — |
| 617,806 | 412,499 | 443,492 | 10,213 | — | 63,419 | 211,729 |
| — | — | — | — | — | — | 413,908 |
| — | — | — | — | — | — | — |
| — | — | 431,750 | 29,295 | 13,702 | 56,985 | — |
| 645,605,215 | 756,927,216 | 3,873,734,328 | 98,397,587 | 36,148,594 | 403,122,474 | 646,829,667 |
|
| — | — | — | — | — | — | 1,000,189 |
| 71,140 | 111,047 | 791,531 | 32,031 | 17,184 | 94,507 | 111,943 |
| 17,338,387 | 20,568,474 | 7,078,422 | — | — | 34,296,114 | 17,556,950 |
| 43,016,898 | 75,833,378 | 417,436,171 | 4,630,568 | 911,167 | 39,692,963 | 69,283,020 |
| 181,312 | 411,451 | 2,073,358 | 62,247 | 210,154 | 410,348 | 306,576 |
| — | — | — | — | — | — | — |
| 107,822 | — | — | — | — | 9,375 | — |
| 423,822 | 405,372 | 2,641,604 | 38,286 | 8,537 | 253,691 | 359,982 |
| — | — | — | — | — | 7,977 | — |
| 61,139,381 | 97,329,722 | 430,021,086 | 4,763,132 | 1,147,042 | 74,764,975 | 88,618,660 |
|
| 480,572,126 | 500,691,007 | 2,170,726,471 | 67,803,922 | 29,698,048 | 266,117,438 | 1,034,114,141 |
| 1,265,857 | 6,762,407 | 22,687,776 | 986,277 | 421,215 | 698,307 | (123,871) |
| |
| 29,783,509 | 30,785,995 | 288,798,422 | (2,629,649) | (1,911,097) | 18,707,282 | (469,891,548) |
| |
| 72,842,872 | 121,358,085 | 961,011,486 | 27,459,395 | 6,780,074 | 42,838,346 | (5,674,997) |
| 1,470 | — | — | — | — | 9,375 | — |
| — | — | 489,087 | 14,510 | 13,312 | (13,249) | — |
| — | — | — | — | — | — | (212,718) |
| — | — | — | — | — | — | — |
| — | — | — | — | — | — | — |
| $584,465,834 | $659,597,494 | $3,443,713,242 | $93,634,455 | $35,001,552 | $328,357,499 | $558,211,007 |
|
| $157,277,223 | $336,944,824 | $3,028,996,060 | $93,634,455 | $— | $236,988,711 | $486,165,052 |
| 24,125,067 | 18,802,380 | 96,667,827 | 8,748,632 | — | 17,375,368 | 96,565,217 |
| $6.52 | $17.92 | $31.33 | $10.70 | $— | $13.64 | $5.03 |
| $6.90 | $18.96 | $33.15 | $11.32 | $— | $14.43 | $5.27 |
| | | | | | | |
| $8,899,632 | $9,766,862 | $45,390,368 | $— | $— | $7,579,519 | $9,927,898 |
| 1,469,606 | 555,255 | 1,575,277 | — | — | 558,060 | 1,972,528 |
| $6.06 | $17.59 | $28.81 | $— | $— | $13.58 | $5.03 |
| | | | | | | |
| $418,288,979 | $312,885,808 | $369,326,814 | $— | $35,001,552 | $83,789,269 | $62,118,057 |
| 60,334,421 | 17,315,390 | 11,689,691 | — | 3,284,972 | 6,149,262 | 12,324,082 |
| $6.93 | $18.07 | $31.59 | $— | $10.66 | $13.63 | $5.04 |
|
| The accompanying Notes to Financial Statements are an integral part of this statement. |
|
| 217 |
Thrivent Mutual Funds
Statement of Assets and Liabilities – continued
| | | | | | |
| | | |
| | | Municipal | | Income | | Core Bond |
| As of October 31, 2007 | | Bond Fund | | Fund | | Fund |
|
| Assets | | | |
| Investments at cost | $1,102,700,446 | $956,935,595 | $520,113,426 |
| Investments in securities at market value | 1,167,391,735 | 871,457,792 | 455,715,482 |
| Investments in affiliates at market value | — | 76,229,164 | 61,798,236 |
| Investments at Market Value | 1,167,391,735 | 947,686,956 | 517,513,718 |
|
| Cash | 9,662 | 18,266 | 5,213 |
| Dividends and interest receivable | 18,013,412 | 8,296,185 | 2,667,125 |
| Prepaid expenses | 4,687 | 3,379 | 2,516 |
| Receivable for investments sold | — | 6,497,444 | 713,783 |
| Receivable for fund shares sold | 140,046 | 422,709 | 14,903 |
| Swap agreements, at value | — | — | — |
| Receivable for variation margin | — | 335,774 | 233,332 |
| Total Assets | 1,185,559,542 | 963,260,713 | 521,150,590 |
|
| Liabilities | | | |
| Distributions payable | 911,440 | 362,307 | 150,007 |
| Accrued expenses | 182,397 | 106,272 | 108,203 |
| Payable for investments purchased | 7,652,808 | 94,689,279 | 107,633,895 |
| Payable upon return of collateral for securities loaned | — | 58,963,653 | 28,870,709 |
| Payable for fund shares redeemed | 462,230 | 255,905 | 737,617 |
| Open options written, at value | — | 46,250 | 37,500 |
| Swap agreements, at value | — | — | — |
| Payable to affiliate | 771,134 | 396,373 | 255,752 |
| Mortgage dollar roll deferred revenue | — | 24,899 | 23,796 |
| Total Liabilities | 9,980,009 | 154,844,938 | 137,817,479 |
|
| Net Assets | | | |
| Capital stock (beneficial interest) | 1,113,028,052 | 846,332,748 | 399,400,011 |
| Accumulated undistributed net investment income/(loss) | (14,027) | 306,064 | 264,248 |
| Accumulated undistributed net realized gain/(loss) on | | | |
| investments and foreign currency transactions | (2,125,781) | (29,175,541) | (13,829,594) |
| Net unrealized appreciation/(depreciation) on: | | | |
| Investments | 64,691,289 | (9,248,639) | (2,599,708) |
| Written option contracts | — | 34,688 | 37,500 |
| Futures contracts | — | 166,455 | 60,654 |
| Swap agreements | — | — | — |
| Total Net Assets | $1,175,579,533 | $808,415,775 | $383,333,111 |
|
| Class A Share Capital | $1,145,816,509 | $432,983,200 | $295,055,621 |
| Shares of beneficial interest outstanding (Class A) | 102,630,824 | 50,936,281 | 30,185,570 |
| Net asset value per share | $11.16 | $8.50 | $9.77 |
| Maximum public offering price | $11.69 | $8.90 | $10.23 |
| | | | |
| Class B Share Capital | $12,386,127 | $6,525,418 | $4,515,363 |
| Shares of beneficial interest outstanding (Class B) | 1,109,818 | 769,429 | 461,693 |
| Net asset value per share | $11.16 | $8.48 | $9.78 |
| | | | |
| Institutional Class Share Capital | $17,376,897 | $368,907,157 | $83,762,127 |
| Shares of beneficial interest outstanding (Institutional Class) | 1,556,475 | 43,437,154 | 8,566,073 |
| Net asset value per share | $11.16 | $8.49 | $9.78 |
|
| The accompanying Notes to Financial Statements are an integral part of this statement. |
|
| 218 |
Thrivent Mutual Funds
Statement of Assets and Liabilities – continued
| | | | | | | | |
| | | | | | |
| Limited | | Money | | | | | |
| Maturity | | Market | | | | | |
| Bond Fund | | Fund | | | | | |
| | | | | |
| | | | | | |
| $462,252,589 | $1,601,462,104 | | | | | |
| 417,093,310 | 1,601,462,104 | | | | | |
| 42,952,080 | — | | | | | |
| 460,045,390 | 1,601,462,104 | | | | | |
| | | | | |
| 3,067 | 110,348 | | | | | |
| 3,165,653 | 2,215,238 | | | | | |
| 2,397 | 5,006 | | | | | |
| 3,746,062 | — | | | | | |
| 948,498 | 15,115,534 | | | | | |
| 283,680 | — | | | | | |
| 150,467 | — | | | | | |
| 468,345,214 | 1,618,908,230 | | | | | |
| | | | | |
| 31,863 | 58,798 | | | | | |
| 42,008 | 255,272 | | | | | |
| 35,285,985 | — | | | | | |
| 14,722,625 | — | | | | | |
| 521,603 | 7,605,446 | | | | | |
| 8,750 | — | | | | | |
| 124,446 | — | | | | | |
| 137,605 | 570,905 | | | | | |
| 14,793 | — | | | | | |
| 50,889,678 | 8,490,421 | | | | | |
| | | | | |
| 420,800,109 | 1,610,426,798 | | | | | |
| 98,402 | 10,547 | | | | | |
| | | | | | |
| (1,372,293) | (19,536) | | | | | |
| | | | | | |
| (2,207,199) | — | | | | | |
| 6,563 | — | | | | | |
| (7,909) | — | | | | | |
| 137,863 | — | | | | | |
| $417,455,536 | $1,610,417,809 | | | | | |
| | | | | |
| $111,953,804 | $1,183,862,159 | | | | | |
| 8,931,711 | 1,183,862,161 | | | | | |
| $12.53 | $1.00 | | | | | |
| $12.53 | $1.00 | | | | | |
| | | | | | | |
| $1,813,276 | $1,529,322 | | | | | |
| 144,547 | 1,529,322 | | | | | |
| $12.54 | $1.00 | | | | | |
| | | | | | | |
| $303,688,456 | $425,026,328 | | | | | |
| 24,234,537 | 425,026,328 | | | | | |
| $12.53 | $1.00 | | | | | |
|
| The accompanying Notes to Financial Statements are an integral part of this statement. |
|
| 219 |
Thrivent Mutual Funds
Statement of Operations
| | | | | | | | |
| | | | |
| | | Aggressive | | Moderately | | Moderate | | Moderately |
| | | Allocation | | Aggressive | | Allocation | | Conservative |
| For the year ended October 31, 2007 | | Fund | | Allocation Fund | | Fund | | Allocation Fund |
|
| Investment Income | | | | |
| Dividends | $— | $— | $— | $— |
| Taxable interest | — | — | — | — |
| Income from securities loaned | — | — | — | — |
| Income from affiliated investments | 3,526,489 | 13,097,488 | 17,917,368 | 7,929,789 |
| Foreign dividend tax withholding | — | — | — | — |
| Total Investment Income | 3,526,489 | 13,097,488 | 17,917,368 | 7,929,789 |
|
| Expenses | | | | |
| Adviser fees | 450,214 | 989,424 | 942,914 | 340,585 |
| Sub-Adviser fees | — | — | — | — |
| Accounting and pricing fees | 22,334 | 30,674 | 30,674 | 20,674 |
| Administrative service fees | 60,028 | 138,373 | 130,957 | 45,411 |
| Audit and legal fees | 17,413 | 21,393 | 21,345 | 16,648 |
| Custody fees | 4,030 | 4,030 | 4,030 | 4,030 |
| Distribution expenses Class A | 632,197 | 1,590,388 | 1,581,785 | 545,242 |
| Distribution expenses Class B | — | — | — | — |
| Insurance expenses | 5,443 | 7,527 | 7,402 | 5,030 |
| Printing and postage expenses Class A | 200,612 | 332,859 | 228,033 | 67,266 |
| Printing and postage expenses Class B | — | — | — | — |
| Printing and postage expenses Institutional Class | 794 | 893 | 609 | 338 |
| SEC and state registration expenses | 57,450 | 105,289 | 109,806 | 56,718 |
| Transfer agent fees Class A | 447,111 | 761,889 | 527,804 | 152,577 |
| Transfer agent fees Class B | — | — | — | — |
| Transfer agent fees Institutional Class | 153 | 230 | 258 | 200 |
| Trustees’ fees | 3,816 | 3,816 | 3,816 | 3,816 |
| Other expenses | 7,199 | 7,720 | 7,812 | 7,337 |
| Total Expenses Before Reimbursement | 1,908,794 | 3,994,505 | 3,597,245 | 1,265,872 |
|
| Less: | | | | |
| Reimbursement from adviser | (902,092) | (1,617,974) | (1,223,278) | (527,951) |
| Custody earnings credit | — | — | — | — |
| Total Net Expenses | 1,006,702 | 2,376,531 | 2,373,967 | 737,921 |
|
| Net Investment Income/(Loss) | 2,519,787 | 10,720,957 | 15,543,401 | 7,191,868 |
|
| Realized and Unrealized Gains/(Losses) | | | | |
| Net realized gains/(losses) on: | | | | |
| Investments | — | — | — | — |
| Affiliated investments | 560,630 | 396,118 | (528,492) | 17,646 |
| Distributions of realized capital gains from | | | | |
| affiliated investments | 6,375,994 | 13,449,093 | 13,399,482 | 3,217,535 |
| Written option contracts | — | — | — | — |
| Futures contracts | — | — | — | — |
| Change in net unrealized appreciation/(depreciation) on: | | | | |
| Investments | — | — | — | — |
| Affiliated investments | 41,239,805 | 75,005,268 | 49,052,561 | 10,872,839 |
| Written option contracts | — | — | — | — |
| Futures contracts | — | — | — | — |
|
| |
| Net Realized and Unrealized Gains/(Losses) | 48,176,429 | 88,850,479 | 61,923,551 | 14,108,020 |
| |
| Net Increase/(Decrease) in Net Assets Resulting | | | | |
| From Operations | $50,696,216 | $99,571,436 | $77,466,952 | $21,299,888 |
|
| The accompanying Notes to Financial Statements are an integral part of this statement. |
|
| 220 |
Thrivent Mutual Funds
Statement of Operations – continued
| | | | | | | | | | | | | |
| | | | | | |
| | | Partner | | Partner | | | | | Partner |
| Technology | | Small Cap | | Small Cap | | Small Cap | | Small Cap | | Mid Cap | | Mid Cap |
| Fund | | Growth Fund | | Value Fund | | Stock Fund | | Index Fund | | Growth Fund | | Value Fund |
|
| |
| $175,645 | $175,535 | $1,732,485 | $4,812,039 | $537,688 | $1,683,566 | $689,679 |
| 4,503 | 73,970 | 12,753 | 590,983 | 6,463 | 84,425 | 5,859 |
| 13,022 | 84,459 | 104,723 | 412,971 | 49,415 | 396,423 | 9,078 |
| 39,897 | 58,020 | 252,375 | 1,409,829 | 39,128 | 677,293 | 71,581 |
| (4,838) | — | — | — | (192) | (3,833) | (101) |
| 228,229 | 391,984 | 2,102,336 | 7,225,822 | 632,502 | 2,837,874 | 776,096 |
|
| |
| 323,667 | 187,160 | 145,387 | 3,721,147 | 120,317 | 1,357,280 | 99,807 |
| — | 332,646 | 872,321 | — | — | — | 199,615 |
| 18,727 | 22,542 | 25,594 | 49,014 | 23,847 | 37,206 | 19,554 |
| 8,631 | 11,551 | 29,078 | 111,420 | 9,625 | 67,559 | 7,985 |
| 14,764 | 14,710 | 16,125 | 22,958 | 14,818 | 19,208 | 14,553 |
| 4,546 | 38,683 | 12,124 | 48,945 | 12,996 | 19,217 | 37,248 |
| 97,354 | 34,146 | 213,863 | 1,129,010 | 120,317 | 690,676 | 25,974 |
| 19,293 | — | 47,530 | 131,625 | — | 222,697 | — |
| 4,069 | 4,079 | 4,736 | 7,718 | 4,105 | 6,081 | 4,002 |
| 90,848 | 3,143 | 91,997 | 415,391 | 50,245 | 396,181 | 4,106 |
| 4,672 | — | 6,510 | 16,193 | — | 33,613 | — |
| 190 | 1,449 | 1,259 | 2,225 | — | 1,232 | 840 |
| 31,062 | 26,244 | 43,155 | 66,431 | 16,544 | 54,392 | 25,667 |
| 206,699 | 7,410 | 229,864 | 995,509 | 134,835 | 870,185 | 14,379 |
| 16,268 | — | 21,534 | 72,069 | — | 156,234 | — |
| 170 | 263 | 552 | 1,299 | — | 1,114 | 153 |
| 4,870 | 3,816 | 5,543 | 24,338 | 4,613 | 14,536 | 3,816 |
| 8,530 | 7,547 | 8,598 | 11,429 | 7,895 | 10,036 | 7,481 |
| 854,360 | 695,389 | 1,775,770 | 6,826,721 | 520,157 | 3,957,447 | 465,180 |
|
| |
| (212,676) | (124,322) | (255,846) | (112,770) | (62,063) | (54,024) | (155,129) |
| (13) | (251) | (1,670) | (2,640) | (888) | (111) | (67) |
| 641,671 | 570,816 | 1,518,254 | 6,711,311 | 457,206 | 3,903,312 | 309,984 |
|
| |
| (413,442) | (178,832) | 584,082 | 514,511 | 175,296 | (1,065,438) | 466,112 |
|
| |
| |
| 3,589,799 | 3,385,615 | 11,865,792 | 72,130,551 | 5,057,671 | 49,813,660 | 2,404,520 |
| — | — | — | — | — | — | — |
| |
| — | — | — | — | — | — | — |
| — | — | — | — | — | 35,600 | — |
| — | — | — | (87,969) | 16,514 | — | — |
| |
| 6,649,095 | 7,179,543 | 874,667 | 3,069,598 | (427,726) | 38,117,703 | 1,040,494 |
| — | — | — | — | — | — | — |
| — | — | — | — | — | 1,467 | — |
| — | — | — | — | (20,462) | — | — |
|
| |
| 10,238,894 | 10,565,158 | 12,740,459 | 75,112,180 | 4,625,997 | 87,968,430 | 3,445,014 |
|
| |
| $9,825,452 | $10,386,326 | $13,324,541 | $75,626,691 | $4,801,293 | $86,902,992 | $3,911,126 |
|
| The accompanying Notes to Financial Statements are an integral part of this statement. |
|
| 221 |
Thrivent Mutual Funds
Statement of Operations – continued
| | | | | | | | |
| | | | |
| | | | | | Partner |
| | | Mid Cap | | Mid Cap | | Mid Cap | | International |
| For the year ended October 31, 2007 | | Stock Fund | | Index Fund | | Index Fund-I | | Stock Fund |
|
| Investment Income | | | | |
| Dividends | $18,138,131 | $930,060 | $311,007 | $18,974,319 |
| Taxable interest | 1,589,332 | 6,463 | 9,666 | 826,118 |
| Income from mortgage dollar rolls | — | — | — | — |
| Income from securities loaned | 481,750 | 32,386 | 9,435 | 52,036 |
| Income from affiliated investments | 1,603,830 | 74,334 | 30,153 | 309,552 |
| Foreign dividend tax withholding | — | — | — | (1,278,916) |
| Total Investment Income | 21,813,043 | 1,043,243 | 360,261 | 18,883,109 |
|
| Expenses | | | | |
| Adviser fees | 7,602,198 | 155,913 | 51,736 | 1,545,330 |
| Sub-Adviser fees | — | — | — | 2,331,217 |
| Accounting and pricing fees | 81,749 | 22,599 | 19,434 | 99,899 |
| Administrative service fees | 233,409 | 12,473 | 4,139 | 128,385 |
| Audit and legal fees | 31,759 | 15,034 | 14,415 | 24,536 |
| Custody fees | 50,220 | 12,505 | 12,417 | 236,232 |
| Distribution expenses Class A | 2,509,536 | 155,913 | — | 896,684 |
| Distribution expenses Class B | 156,651 | — | — | 125,734 |
| Insurance expenses | 11,889 | 4,205 | 3,921 | 7,988 |
| Printing and postage expenses Class A | 553,133 | 45,030 | — | 257,886 |
| Printing and postage expenses Class B | 14,965 | — | — | 15,010 |
| Printing and postage expenses Institutional Class | 3,579 | — | 1,171 | 5,456 |
| SEC and state registration expenses | 114,394 | 18,240 | 14,378 | 75,336 |
| Transfer agent fees Class A | 1,628,355 | 164,893 | — | 919,039 |
| Transfer agent fees Class B | 77,957 | — | — | 72,164 |
| Transfer agent fees Institutional Class | 5,805 | — | 561 | 986 |
| Trustees’ fees | 45,949 | 4,718 | 4,377 | 24,727 |
| Other expenses | 14,315 | 7,834 | 7,635 | 10,470 |
| Total Expenses Before Reimbursement | 13,135,863 | 619,357 | 134,184 | 6,777,079 |
|
| Less: | | | | |
| Reimbursement from adviser | (130,045) | (57,027) | (1,467) | (24,819) |
| Custody earnings credit | (2,823) | (456) | (137) | (758) |
| Total Net Expenses | 13,002,995 | 561,874 | 132,580 | 6,751,502 |
|
| Net Investment Income/(Loss) | 8,810,048 | 481,369 | 227,681 | 12,131,607 |
|
| Realized and Unrealized Gains/(Losses) | | | | |
| Net realized gains/(losses) on: | | | | |
| Investments | 155,586,048 | 6,276,922 | 4,186,819 | 84,124,936 |
| Written option contracts | — | — | — | — |
| Futures contracts | — | 63,803 | 36,336 | — |
| Foreign currency transactions | — | — | — | (265,530) |
| Swap agreements | — | — | — | — |
| Change in net unrealized appreciation/(depreciation) on: | | | | |
| Investments | 4,549,641 | 2,403,082 | (1,498,105) | 44,646,551 |
| Written option contracts | — | — | — | — |
| Futures contracts | — | (10,272) | (12,463) | — |
| Foreign currency forward contracts | — | — | — | 1,226 |
| Foreign currency transactions | — | — | — | 8,435 |
| Swap agreements | — | — | — | — |
|
| |
| Net Realized and Unrealized Gains/(Losses) | 160,135,689 | 8,733,535 | 2,712,587 | 128,515,618 |
|
| |
| Net Increase/(Decrease) in Net Assets Resulting | | | | |
| From Operations | $168,945,737 | $9,214,904 | $2,940,268 | $140,647,225 |
|
| The accompanying Notes to Financial Statements are an integral part of this statement. |
|
| 222 |
Thrivent Mutual Funds
Statement of Operations – continued
| | | | | | | | | | | | | |
| | | | | | |
| Large Cap | | Large Cap | | Large Cap | | Large Cap | | Large Cap | | Balanced | | High Yield |
| Growth Fund | | Value Fund | | Stock Fund | | Index Fund | | Index Fund-I | | Fund | | Fund |
|
| |
| $4,277,881 | $12,190,882 | $64,017,764 | $1,777,092 | $647,041 | $3,614,068 | $477,869 |
| 21,800 | 74,172 | 5,586,936 | 12,924 | 12,047 | 5,268,123 | 48,646,943 |
| — | — | — | — | — | 125,488 | — |
| 64,705 | 108,902 | 440,117 | 11,165 | 4,091 | 102,276 | 275,826 |
| 651,377 | 830,090 | 1,289,923 | 54,170 | 38,418 | 668,539 | 1,281,612 |
| (31,150) | (70,941) | (274,818) | — | — | (22,127) | — |
|
| 4,984,613 | 13,133,105 | 71,059,922 | 1,855,351 | 701,597 | 9,756,367 | 50,682,250 |
| |
| |
| 3,448,259 | 2,630,202 | 17,581,084 | 233,991 | 86,253 | 1,847,137 | 2,372,244 |
| — | — | — | — | — | — | — |
| 33,745 | 44,032 | 225,395 | 25,482 | 21,816 | 55,238 | 71,038 |
| 92,129 | 116,898 | 681,382 | 18,719 | 6,900 | 67,169 | 121,271 |
| 19,619 | 22,180 | 68,601 | 15,523 | 14,573 | 19,603 | 24,079 |
| 49,253 | 24,925 | 98,605 | 12,373 | 7,671 | 36,212 | 21,621 |
| 351,649 | 847,543 | 7,608,711 | 233,991 | — | 605,018 | 1,290,455 |
| 101,937 | 121,771 | 561,568 | — | — | 86,856 | 129,553 |
| 6,443 | 7,524 | 28,042 | 4,420 | 3,999 | 6,224 | 8,344 |
| 128,465 | 172,909 | 1,576,842 | 50,814 | — | 121,759 | 234,197 |
| 13,631 | 12,908 | 62,621 | — | — | 7,314 | 11,107 |
| 4,659 | 4,048 | 5,577 | — | 1,787 | 2,042 | 2,792 |
| 63,797 | 68,675 | 248,786 | 21,319 | 16,236 | 49,008 | 77,291 |
| 461,710 | 630,467 | 4,293,471 | 192,816 | — | 393,151 | 656,314 |
| 71,015 | 62,506 | 331,072 | — | — | 34,018 | 50,078 |
| 1,395 | 2,798 | 2,681 | — | 468 | 342 | 2,668 |
| 17,104 | 24,160 | 137,274 | 4,848 | 4,632 | 18,670 | 23,081 |
| 9,763 | 10,709 | 27,809 | 8,042 | 7,746 | 10,480 | 10,160 |
| 4,874,573 | 4,804,255 | 33,539,521 | 822,338 | 172,081 | 3,360,241 | 5,106,293 |
|
| |
| (1,411,276) | (67,280) | (311,372) | (260,452) | (1,890) | (56,317) | (122,224) |
| (312) | (1,153) | (2,855) | (309) | (125) | (1,209) | (10,073) |
| 3,462,985 | 4,735,822 | 33,225,294 | 561,577 | 170,066 | 3,302,715 | 4,973,996 |
|
| |
| 1,521,628 | 8,397,283 | 37,834,628 | 1,293,774 | 531,531 | 6,453,652 | 45,708,254 |
|
| |
| 41,425,459 | 32,852,973 | 415,585,611 | 1,145,541 | 350,967 | 20,176,944 | 11,966,939 |
| 218,149 | — | — | — | — | 31,055 | — |
| — | — | 4,993,760 | 46,725 | 108,978 | (235,890) | 88,902 |
| — | — | — | — | — | (474) | — |
| — | — | — | — | — | (146,865) | (302,259) |
| |
| 58,213,896 | 33,582,411 | 25,852,485 | 9,708,107 | 3,620,349 | 13,303,029 | (15,683,538) |
| (2,642) | — | — | — | — | 9,375 | — |
| — | — | 489,087 | (417) | (15,816) | (15,180) | — |
| — | — | — | — | — | — | — |
| — | — | — | — | — | — | — |
| — | — | — | — | — | — | (212,718) |
|
| |
| 99,854,862 | 66,435,384 | 446,920,943 | 10,899,956 | 4,064,478 | 33,121,994 | (4,142,674) |
| |
| $101,376,490 | $74,832,667 | $484,755,571 | $12,193,730 | $4,596,009 | $39,575,646 | $41,565,580 |
|
| The accompanying Notes to Financial Statements are an integral part of this statement. |
|
| 223 |
Thrivent Mutual Funds
Statement of Operations – continued
| | | | | | |
| | | |
| | | Municipal | | Income | | Core Bond |
| For the year ended October 31, 2007 | | Bond Fund | | Fund | | Fund |
|
| Investment Income | | | |
| Dividends | $— | $— | $— |
| Taxable interest | 4,481,572 | 40,977,541 | 19,169,679 |
| Tax exempt interest | 57,614,752 | — | — |
| Income from mortgage dollar rolls | — | 393,235 | 435,108 |
| Income from securities loaned | — | 104,975 | 65,333 |
| Income from affiliated investments | — | 1,338,206 | 964,407 |
| Total Investment Income | 62,096,324 | 42,813,957 | 20,634,527 |
|
| Expenses | | | |
| Adviser fees | 4,944,427 | 2,494,561 | 1,674,364 |
| Accounting and pricing fees | 158,358 | 74,233 | 58,031 |
| Administrative service fees | 239,681 | 145,819 | 74,416 |
| Audit and legal fees | 33,677 | 24,365 | 20,413 |
| Custody fees | 28,919 | 28,964 | 20,697 |
| Distribution expenses Class A | 2,919,747 | 1,122,295 | 790,996 |
| Distribution expenses Class B | 167,518 | 91,153 | 62,209 |
| Insurance expenses | 12,591 | 8,610 | 6,586 |
| Printing and postage expenses Class A | 208,651 | 187,213 | 118,997 |
| Printing and postage expenses Class B | 6,057 | 10,021 | 5,274 |
| Printing and postage expenses Institutional Class | 679 | 4,845 | 1,604 |
| SEC and state registration expenses | 116,641 | 85,908 | 53,609 |
| Transfer agent fees Class A | 536,662 | 546,117 | 452,334 |
| Transfer agent fees Class B | 18,693 | 47,085 | 23,876 |
| Transfer agent fees Institutional Class | 2,215 | 2,079 | 2,029 |
| Trustees’ fees | 47,684 | 25,764 | 21,729 |
| Other expenses | 13,214 | 10,029 | 8,832 |
| Total Expenses Before Reimbursement | 9,455,414 | 4,909,061 | 3,395,996 |
|
| Less: | | | |
| Reimbursement from adviser | (24,117) | (126,177) | (78,099) |
| Custody earnings credit | (1,538) | (5,812) | (3,157) |
|
| Total Net Expenses | 9,429,759 | 4,777,072 | 3,314,740 |
|
| Net Investment Income/(Loss) | 52,666,565 | 38,036,885 | 17,319,787 |
|
| Realized and Unrealized Gains/(Losses) | | | |
| Net realized gains/(losses) on: | | | |
| Investments | 3,170,363 | 6,180,692 | (280,437) |
| Written option contracts | — | 217,383 | 124,218 |
| Futures contracts | — | (98,792) | (651,102) |
| Foreign currency transactions | — | (3,810) | (1,471) |
| Swap agreements | — | (1,104,661) | (620,342) |
| Change in net unrealized appreciation/(depreciation) on: | | | |
| Investments | (26,962,462) | (14,287,866) | (3,728,475) |
| Written option contracts | — | 34,688 | 37,500 |
| Futures contracts | — | 340,145 | 11,798 |
| Swap agreements | — | — | — |
|
| |
| Net Realized and Unrealized Gains/(Losses) | (23,792,099) | (8,722,221) | (5,108,311) |
|
| |
| Net Increase/(Decrease) in Net Assets Resulting | | | |
| From Operations | $28,874,466 | $29,314,664 | $12,211,476 |
|
| The accompanying Notes to Financial Statements are an integral part of this statement. |
|
| 224 |
Thrivent Mutual Funds
Statement of Operations – continued
| | | | | | | |
| | | | | |
| Limited | | | | | |
| Maturity | | Money Market | | | | |
| Bond Fund | | Fund | | | | |
| | | | |
| | | | | |
| $— | $399,545 | | | | |
| 16,949,098 | 74,960,441 | | | | |
| — | — | | | | |
| 120,066 | — | | | | |
| 21,595 | — | | | | |
| 768,037 | — | | | | |
| 17,858,796 | 75,359,986 | | | | |
| | | | |
| | | | | |
| 1,018,425 | 5,652,340 | | | | |
| 42,435 | 85,412 | | | | |
| 67,895 | 278,605 | | | | |
| 18,248 | 32,627 | | | | |
| 15,731 | 41,456 | | | | |
| 164,439 | 1,264,910 | | | | |
| 4,572 | 13,796 | | | | |
| 5,860 | 12,686 | | | | |
| 50,516 | 601,458 | | | | |
| 1,040 | 1,599 | | | | |
| 4,155 | 9,166 | | | | |
| 73,719 | 192,763 | | | | |
| 198,932 | 1,431,666 | | | | |
| 4,260 | 6,047 | | | | |
| 6,749 | 2,095 | | | | |
| 13,247 | 48,667 | | | | |
| 7,470 | 12,336 | | | | |
| 1,697,693 | 9,687,629 | | | | |
| | | | |
| | | | | |
| (45,175) | (2,416,101) | | | | |
| (7,538) | (3,339) | | | | |
| 1,644,980 | 7,268,189 | | | | |
| | | | |
| | | | | |
| 16,213,816 | 68,091,797 | | | | |
| | | | |
| | | | | |
| | | | | |
| 613,427 | (19,536) | | | | |
| 62,695 | — | | | | |
| (671,032) | — | | | | |
| (915) | — | | | | |
| (343,502) | — | | | | |
| | | | | |
| (1,598,391) | — | | | | |
| 6,563 | — | | | | |
| 29,663 | — | | | | |
| 137,863 | — | | | | |
| | | | |
| | | | | |
| (1,763,629) | (19,536) | | | | |
| | | | |
| | | | | |
| $14,450,187 | $68,072,261 | | | | |
|
| The accompanying Notes to Financial Statements are an integral part of this statement. |
|
| 225 |
Thrivent Mutual Funds
Statement of Changes in Net Assets
| | | | | |
| | Aggressive Allocation | | Moderately Aggressive |
| | Fund | | Allocation Fund |
| |
| |
|
| For the periods ended | 10/31/2007 | 10/31/2006 | | 10/31/2007 | 10/31/2006 |
|
| Operations | | | | | |
| Net investment income/(loss) | $2,519,787 | $1,050,214 | | $10,720,957 | $4,244,421 |
| Net realized gains/(losses) on: | | | | | |
| Investments | — | — | | — | — |
| Affiliated investments | 560,630 | (72,206) | | 396,118 | 83,912 |
| Distributions of realized capital gains from | | | | | |
| affiliated investments | 6,375,994 | 706,204 | | 13,449,093 | 1,134,486 |
| Change in net unrealized appreciation/(depreciation) on: | | | | | |
| Investments | — | — | | — | — |
| Affiliated investments | 41,239,805 | 12,627,314 | | 75,005,268 | 25,971,422 |
| |
| Net Change in Net Assets Resulting | | | | | |
| From Operations | 50,696,216 | 14,311,526 | | 99,571,436 | 31,434,241 |
|
| Distributions to Shareholders | | | | | |
| From net investment income | (3,897,772) | (593,507) | | (10,860,937) | (1,360,298) |
| From net realized gains | (632,879) | — | | (1,030,546) | — |
| |
| Total Distributions to Shareholders | (4,530,651) | (593,507) | | (11,891,483) | (1,360,298) |
| |
| Capital Stock Transactions | 132,564,581 | 168,727,654 | | 377,275,483 | 367,144,669 |
|
| Net Increase/(Decrease) in Net Assets | 178,730,146 | 182,445,673 | | 464,955,436 | 397,218,612 |
| |
| Net Assets, Beginning of Period | 211,850,301 | 29,404,628 | | 463,110,999 | 65,892,387 |
| |
| Net Assets, End of Period | $390,580,447 | $211,850,301 | | $928,066,435 | $463,110,999 |
|
| | | | |
| | Partner Small Cap | | Small Cap |
| | Value Fund | | Stock Fund |
| |
| |
|
| For the periods ended | 10/31/2007 | 10/31/2006 | | 10/31/2007 | 10/31/2006 |
|
| Operations | | | | | |
| Net investment income/(loss) | $584,082 | $696,961 | | $514,511 | $(1,396,328) |
| Net realized gains/(losses) on: | | | | | |
| Investments | 11,865,792 | 6,053,843 | | 72,130,551 | 58,639,765 |
| Written option contracts | — | — | | — | — |
| Futures contracts | — | — | | (87,969) | 1,062,631 |
| Change in net unrealized appreciation/(depreciation) on: | | | | | |
| Investments | 874,667 | 12,466,684 | | 3,069,598 | 18,907,527 |
| Written option contracts | — | — | | — | — |
| Futures contracts | — | — | | — | — |
| |
| Net Change in Net Assets Resulting | | | | | |
| From Operations | 13,324,541 | 19,217,488 | | 75,626,691 | 77,213,595 |
|
| Distributions to Shareholders | | | | | |
| From net investment income | (366,586) | (381,590) | | — | — |
| From net realized gains | (5,916,750) | (6,086,458) | | (56,856,098) | (52,593,044) |
| |
| Total Distributions to Shareholders | (6,283,336) | (6,468,048) | | (56,856,098) | (52,593,044) |
|
| Capital Stock Transactions | 6,441,160 | 21,175,487 | | (11,764,255) | 52,051,493 |
|
| Net Increase/(Decrease) in Net Assets | 13,482,365 | 33,924,927 | | 7,006,338 | 76,672,044 |
|
| Net Assets, Beginning of Period | 130,244,641 | 96,319,714 | | 558,874,476 | 482,202,432 |
|
| Net Assets, End of Period | $143,727,006 | $130,244,641 | | $565,880,814 | $558,874,476 |
|
|
| The accompanying Notes to Financial Statements are an integral part of this statement. |
|
| 226 |
Thrivent Mutual Funds
Statement of Changes in Net Assets – continued
| | | | | | | | | | |
| Moderate Allocation | | Moderately Conservative | | Technology | | Partner Small |
| Fund | | Allocation Fund | | Fund | | Cap Growth Fund |
| |
| |
| |
|
| 10/31/2007 | 10/31/2006 | | 10/31/2007 | 10/31/2006 | | 10/31/2007 | 10/31/2006 | | 10/31/2007 | 10/31/2006 |
|
| |
| $15,543,401 | $6,426,432 | | $7,191,868 | $3,055,979 | | $(413,442) | $(376,343) | | $(178,832) | $(9,774) |
| |
| — | — | | — | — | | 3,589,799 | 521,497 | | 3,385,615 | 14,342 |
| (528,492) | 48,262 | | 17,646 | 56,329 | | — | — | | — | — |
| |
| 13,399,482 | 1,733,913 | | 3,217,535 | 448,617 | | — | — | | — | — |
| |
| — | — | | — | — | | 6,649,095 | 3,162,485 | | 7,179,543 | 2,480,981 |
| 49,052,561 | 21,925,117 | | 10,872,839 | 5,976,528 | | — | — | | — | — |
|
| |
| 77,466,952 | 30,133,724 | | 21,299,888 | 9,537,453 | | 9,825,452 | 3,307,639 | | 10,386,326 | 2,485,549 |
|
| (17,495,259) | (6,007,876) | | (7,495,708) | (2,786,155) | | — | — | | (53,994) | — |
| (1,698,236) | — | | (463,260) | — | | — | — | | — | — |
| | | | | | | | | | | |
| (19,193,495) | (6,007,876) | | (7,958,968) | (2,786,155) | | — | — | | (53,994) | — |
|
| 352,922,702 | 356,782,599 | | 138,462,681 | 123,006,090 | | (7,715,199) | (7,466,749) | | 28,364,510 | 25,157,829 |
|
| 411,196,159 | 380,908,447 | | 151,803,601 | 129,757,388 | | 2,110,253 | (4,159,110) | | 38,696,842 | 27,643,378 |
|
| 459,946,229 | 79,037,782 | | 163,432,420 | 33,675,032 | | 44,606,229 | 48,765,339 | | 41,292,928 | 13,649,550 |
|
| $871,142,388 | $459,946,229 | | $315,236,021 | $163,432,420 | | $46,716,482 | $44,606,229 | | $79,989,770 | $41,292,928 |
|
| | | | | | | |
| | | | | | | |
| Small Cap | | Mid Cap | | Partner Mid Cap | | Mid Cap |
| Index Fund | | Growth Fund | | Value Fund | | Stock Fund |
| |
| |
| |
|
| 10/31/2007 | 10/31/2006 | | 10/31/2007 | 10/31/2006 | | 10/31/2007 | 10/31/2006 | | 10/31/2007 | 10/31/2006 |
|
| |
| $175,296 | $104,305 | | $(1,065,438) | $(1,395,786) | | $466,112 | $391,298 | | $8,810,048 | $1,440,535 |
| |
| 5,057,671 | 3,191,987 | | 49,813,660 | 29,662,260 | | 2,404,520 | 148,545 | | 155,586,048 | 192,483,986 |
| — | — | | 35,600 | 32,638 | | — | — | | — | — |
| 16,514 | 82,381 | | — | — | | — | — | | — | — |
| |
| (427,726) | 3,389,584 | | 38,117,703 | 5,014,198 | | 1,040,494 | 2,530,385 | | 4,549,641 | (42,034,620) |
| — | — | | 1,467 | (241) | | — | — | | — | — |
| (20,462) | 57,733 | | — | — | | — | — | | — | — |
|
| |
| 4,801,293 | 6,825,990 | | 86,902,992 | 33,313,069 | | 3,911,126 | 3,070,228 | | 168,945,737 | 151,889,901 |
|
| (70,526) | (73,001) | | — | — | | (506,983) | (48,599) | | (1,531,416) | — |
| (3,380,175) | (879,437) | | (22,856,197) | — | | (198,154) | — | | (185,489,976) | (101,541,373) |
|
| (3,450,701) | (952,438) | | (22,856,197) | — | | (705,137) | (48,599) | | (187,021,392) | (101,541,373) |
|
| (3,009,803) | (4,779,018) | | (23,321,712) | (26,887,487) | | 11,310,615 | 19,683,701 | | 79,741,104 | 58,174,368 |
|
| (1,659,211) | 1,094,534 | | 40,725,083 | 6,425,582 | | 14,516,604 | 22,705,330 | | 61,665,449 | 108,522,896 |
|
| 48,027,112 | 46,932,578 | | 323,302,134 | 316,876,552 | | 31,452,705 | 8,747,375 | | 1,111,239,393 | 1,002,716,497 |
|
| $46,367,901 | $48,027,112 | | $364,027,217 | $323,302,134 | | $45,969,309 | $31,452,705 | | $1,172,904,842 | $1,111,239,393 |
|
|
| The accompanying Notes to Financial Statements are an integral part of this statement. |
|
| 227 |
Thrivent Mutual Funds
Statement of Changes in Net Assets – continued
| | | | | |
| | Mid Cap | | Mid Cap |
| | Index Fund | | Index Fund-I |
| |
| |
|
| For the periods ended | 10/31/2007 | 10/31/2006 | | 10/31/2007 | 10/31/2006 |
|
| Operations | | | | | |
| Net investment income/(loss) | $481,369 | $367,048 | | $227,681 | $220,660 |
| Net realized gains/(losses) on: | | | | | |
| Investments | 6,276,922 | 2,626,545 | | 4,186,819 | 1,190,366 |
| Written option contracts | — | — | | — | — |
| Futures contracts | 63,803 | 107,698 | | 36,336 | 1,656 |
| Foreign currency transactions | — | — | | — | — |
| Change in net unrealized appreciation/(depreciation) on: | | | | | |
| Investments | 2,403,082 | 4,349,791 | | (1,498,105) | 1,388,618 |
| Written option contracts | — | — | | — | — |
| Futures contracts | (10,272) | 34,483 | | (12,463) | 16,137 |
| Foreign currency forward contracts | — | — | | — | — |
| Foreign currency transactions | — | — | | — | — |
|
| |
| Net Change in Net Assets Resulting | | | | | |
|
| From Operations | 9,214,904 | 7,485,565 | | 2,940,268 | 2,817,437 |
| |
| Distributions to Shareholders | | | | | |
| From net investment income | (435,746) | (289,668) | | (251,521) | (125,860) |
| From net realized gains | (2,837,634) | (3,962,434) | | (1,100,875) | (1,541,630) |
|
| Total Distributions to Shareholders | (3,273,380) | (4,252,102) | | (1,352,396) | (1,667,490) |
| Capital Stock Transactions | (6,488,708) | (4,117,833) | | (10,068,002) | (1,606,129) |
|
| Net Increase/(Decrease) in Net Assets | (547,184) | (884,370) | | (8,480,130) | (456,182) |
|
| Net Assets, Beginning of Period | 61,561,723 | 62,446,093 | | 22,625,817 | 23,081,999 |
|
| Net Assets, End of Period | $61,014,539 | $61,561,723 | | $14,145,687 | $22,625,817 |
|
| | | |
| | | |
| | Large Cap | | Large Cap |
| | Index Fund | | Index Fund-I |
| |
| |
|
| For the periods ended | 10/31/2007 | 10/31/2006 | | 10/31/2007 | 10/31/2006 |
|
| Operations | | | | | |
| Net investment income/(loss) | $1,293,774 | $1,271,625 | | $531,531 | $472,992 |
| Net realized gains/(losses) on: | | | | | |
| Investments | 1,145,541 | (3,510,264) | | 350,967 | 1,915,957 |
| Written option contracts | — | — | | — | — |
| Futures contracts | 46,725 | 42,682 | | 108,978 | 52,035 |
| Foreign currency transactions | — | — | | — | — |
| Swap agreements | — | — | | — | — |
| Change in net unrealized appreciation/(depreciation) on: | | | | | |
| Investments | 9,708,107 | 15,696,987 | | 3,620,349 | 2,156,990 |
| Written option contracts | — | — | | — | — |
| Futures contracts | (417) | 27,251 | | (15,816) | 30,941 |
| Swap agreements | — | — | | — | — |
|
| |
| Net Change in Net Assets Resulting | | | | | |
| From Operations | 12,193,730 | 13,528,281 | | 4,596,009 | 4,628,915 |
| |
| Distributions to Shareholders | | | | | |
| From net investment income | (1,253,298) | (1,207,200) | | (475,130) | (431,528) |
| From net realized gains | — | (88,425) | | — | — |
|
| Total Distributions to Shareholders | (1,253,298) | (1,295,625) | | (475,130) | (431,528) |
| | | | | |
| Capital Stock Transactions | (9,634,208) | (14,249,954) | | (1,697,446) | (3,099,630) |
|
| Net Increase/(Decrease) in Net Assets | 1,306,224 | (2,017,298) | | 2,423,433 | 1,097,757 |
|
| Net Assets, Beginning of Period | 92,328,231 | 94,345,529 | | 32,578,119 | 31,480,362 |
|
| Net Assets, End of Period | $93,634,455 | $92,328,231 | | $35,001,552 | $32,578,119 |
|
| The accompanying Notes to Financial Statements are an integral part of this statement. |
|
| 228 |
Thrivent Mutual Funds
Statement of Changes in Net Assets – continued
| | | | | | | | | | |
| Partner International | | Large Cap | | Large Cap | | Large Cap |
| Stock Fund | | Growth Fund | | Value Fund | | Stock Fund |
| |
| |
| |
|
| 10/31/2007 | 10/31/2006 | | 10/31/2007 | 10/31/2006 | | 10/31/2007 | 10/31/2006 | | 10/31/2007 | 10/31/2006 |
|
| |
| $12,131,607 | $5,780,574 | | $1,521,628 | $1,367,402 | | $8,397,283 | $5,979,238 | | $37,834,628 | $31,056,261 |
| |
| 84,124,936 | 36,402,780 | | 41,425,459 | 10,835,555 | | 32,852,973 | 31,208,693 | | 415,585,611 | 187,512,948 |
| — | — | | 218,149 | 129,165 | | — | — | | — | — |
| — | — | | — | — | | — | — | | 4,993,760 | 1,353,863 |
| (265,530) | (153,895) | | — | — | | — | — | | — | — |
| |
| 44,646,551 | 54,711,850 | | 58,213,896 | 8,313,147 | | 33,582,411 | 41,101,693 | | 25,852,485 | 183,089,416 |
| — | — | | (2,642) | 2,613 | | — | — | | — | — |
| — | — | | — | — | | — | — | | 489,087 | — |
| 1,226 | (1,120) | | — | — | | — | — | | — | — |
| 8,435 | 18,868 | | — | — | | — | — | | — | — |
|
| |
| |
| 140,647,225 | 96,759,057 | | 101,376,490 | 20,647,882 | | 74,832,667 | 78,289,624 | | 484,755,571 | 403,012,488 |
|
| |
| (7,072,912) | (4,550,020) | | (1,611,639) | (362,403) | | (6,247,252) | (4,838,129) | | (32,993,037) | (22,969,707) |
| — | — | | — | — | | (28,918,515) | (5,697,959) | | (142,672,537) | (37,619,468) |
|
| (7,072,912) | (4,550,020) | | (1,611,639) | (362,403) | | (35,165,767) | (10,536,088) | | (175,665,574) | (60,589,175) |
|
| 33,719,126 | 82,007,857 | | 133,792,532 | 152,600,841 | | 109,429,872 | 56,572,510 | | (287,296,107) | (490,294,712) |
|
| 167,293,439 | 174,216,894 | | 233,557,383 | 172,886,320 | | 149,096,772 | 124,326,046 | | 21,793,890 | (147,871,399) |
|
| 556,173,146 | 381,956,252 | | 350,908,451 | 178,022,131 | | 510,500,722 | 386,174,676 | | 3,421,919,352 | 3,569,790,751 |
|
| $723,466,585 | $556,173,146 | | $584,465,834 | $350,908,451 | | $659,597,494 | $510,500,722 | | $3,443,713,242 | $3,421,919,352 |
|
|
| |
| Balanced | | High Yield | | Municipal | | Income |
| Fund | | Fund | | Bond Fund | | Fund |
| |
| |
| |
|
| 10/31/2007 | 10/31/2006 | | 10/31/2007 | 10/31/2006 | | 10/31/2007 | 10/31/2006 | | 10/31/2007 | 10/31/2006 |
|
| |
| $6,453,652 | $6,505,919 | | $45,708,254 | $47,156,259 | | $52,666,565 | $55,724,400 | | $38,036,885 | $29,996,005 |
| |
| 20,176,944 | 16,727,101 | | 11,966,939 | (1,518,841) | | 3,170,363 | 5,573,334 | | 6,180,692 | (11,781,005) |
| 31,055 | 42,184 | | — | — | | — | — | | 217,383 | 222,888 |
| (235,890) | 142,181 | | 88,902 | 225,995 | | — | (145,731) | | (98,792) | 1,521,559 |
| (474) | 1,112 | | — | — | | — | — | | (3,810) | 245 |
| (146,865) | — | | (302,259) | — | | — | — | | (1,104,661) | — |
| |
| 13,303,029 | 15,502,008 | | (15,683,538) | 8,047,938 | | (26,962,462) | 2,986,542 | | (14,287,866) | 13,051,491 |
| 9,375 | — | | — | — | | — | — | | 34,688 | — |
| (15,180) | (28,387) | | — | — | | — | — | | 340,145 | (455,076) |
| — | — | | (212,718) | — | | — | — | | — | — |
|
| |
| |
| 39,575,646 | 38,892,118 | | 41,565,580 | 53,911,351 | | 28,874,466 | 64,138,545 | | 29,314,664 | 32,556,107 |
| |
| |
| (5,969,912) | (6,542,752) | | (45,718,586) | (47,156,259) | | (52,705,357) | (55,685,609) | | (36,677,821) | (29,934,835) |
| (16,231,550) | (10,044,905) | | — | — | | — | — | | — | — |
|
| (22,201,462) | (16,587,657) | | (45,718,586) | (47,156,259) | | (52,705,357) | (55,685,609) | | (36,677,821) | (29,934,835) |
|
| (36,980,557) | (62,160,657) | | (70,116,128) | 24,092,606 | | (35,656,399) | (53,031,771) | | 165,746,225 | 49,235,437 |
|
| (19,606,373) | (39,856,196) | | (74,269,134) | 30,847,698 | | (59,487,290) | (44,578,835) | | 158,383,068 | 51,856,709 |
|
| 347,963,872 | 387,820,068 | | 632,480,141 | 601,632,443 | | 1,235,066,823 | 1,279,645,658 | | 650,032,707 | 598,175,998 |
|
| $328,357,499 | $347,963,872 | | $558,211,007 | $632,480,141 | | $1,175,579,533 | $1,235,066,823 | | $808,415,775 | $650,032,707 |
|
|
| The accompanying Notes to Financial Statements are an integral part of this statement. |
|
| 229 |
Thrivent Mutual Funds
Statement of Changes in Net Assets – continued
| | | | | |
| | Core Bond | | Limited Maturity |
| | Fund | | Bond Fund |
| |
| |
|
| For the periods ended | 10/31/2007 | 10/31/2006 | | 10/31/2007 | 10/31/2006 |
|
| Operations | | | | | |
| Net investment income/(loss) | $17,319,787 | $19,369,310 | | $16,213,816 | $9,265,799 |
| Net realized gains/(losses) on: | | | | | |
| Investments | (280,437) | (9,424,786) | | 613,427 | (901,553) |
| Written option contracts | 124,218 | 167,842 | | 62,695 | 19,800 |
| Futures contracts | (651,102) | 235,593 | | (671,032) | 277,931 |
| Foreign currency transactions | (1,471) | (134) | | (915) | — |
| Swap agreements | (620,342) | — | | (343,502) | — |
| Change in net unrealized appreciation/(depreciation) on: | | | | | |
| Investments | (3,728,475) | 8,918,695 | | (1,598,391) | 1,253,361 |
| Written option contracts | 37,500 | — | | 6,563 | — |
| Futures contracts | 11,798 | 404,359 | | 29,663 | (332,123) |
| Swap agreements | — | — | | 137,863 | — |
|
| |
| Net Change in Net Assets Resulting | | | | | |
| From Operations | 12,211,476 | 19,670,879 | | 14,450,187 | 9,583,215 |
|
| Distributions to Shareholders | | | | | |
| From net investment income | (16,966,618) | (19,829,282) | | (15,855,497) | (9,229,771) |
|
| Total Distributions to Shareholders | (16,966,618) | (19,829,282) | | (15,855,497) | (9,229,771) |
|
| Capital Stock Transactions | (12,092,710) | (84,590,679) | | 153,860,055 | 93,899,531 |
|
| Net Increase/(Decrease) in Net Assets | (16,847,852) | (84,749,082) | | 152,454,745 | 94,252,975 |
|
| Net Assets, Beginning of Period | 400,180,963 | 484,930,045 | | 265,000,791 | 170,747,816 |
|
| Net Assets, End of Period | $383,333,111 | $400,180,963 | | $417,455,536 | $265,000,791 |
|
|
| |
| | Money Market | | | |
| | Fund | | | |
| |
| | | |
| For the periods ended | 10/31/2007 | 10/31/2006 | | | |
|
| Operations | | | | | |
| Net investment income/(loss) | $68,091,797 | $45,741,062 | | | |
| Net realized gains/(losses) on: | | | | | |
| Investments | (19,536) | — | | | |
|
| |
| Net Change in Net Assets Resulting | | | | | |
|
| From Operations | 68,072,261 | 45,741,062 | | | |
| |
| Distributions to Shareholders | | | | | |
| From net investment income | (68,072,261) | (45,741,062) | | | |
|
| Total Distributions to Shareholders | (68,072,261) | (45,741,062) | | | |
|
| Capital Stock Transactions | 403,220,392 | 261,005,791 | | | |
|
| Net Increase/(Decrease) in Net Assets | 403,220,392 | 261,005,791 | | | |
|
| Net Assets, Beginning of Period | 1,207,197,417 | 946,191,626 | | | |
|
| Net Assets, End of Period | $1,610,417,809 | $1,207,197,417 | | | |
|
|
| The accompanying Notes to Financial Statements are an integral part of this statement. |
|
| 230 |
THRIVENT MUTUAL FUNDS
NOTES TO FINANCIAL STATEMENTS
October 31, 2007
(1) ORGANIZATION
Thrivent Mutual Funds (the “Trust”) was organized as a Massachusetts Business Trust on March 10, 1987, and is registered as an open-end management investment company under the Investment Company Act of 1940. The Trust is divided into twenty-nine separate series (each a “Fund” and, collectively, the “Funds”), each with its own investment objective and policies. The Trust currently consists of four allocation funds, seventeen equity funds, two hybrid funds, five fixed-income funds, and one money market fund. Thrivent Diversified Income Plus Fund and Thrivent Real Estate Securities Fund have a fiscal year end on a calendar year basis and are presented under a separate annual report.
The Trust consists of three classes of shares: Class A, Class B and Institutional Class. The three classes of shares differ principally in their respective distribution expenses and arrangements. Class A shares have a 0.25% annual 12b-1 fee (0.125% for Limited Maturity Bond Fund and Money Market Fund) and a maximum front-end sales load of 5.50% for allocation funds, equity funds, and hybrid funds and 4.50% for fixed-income funds, excluding Limited Maturity Bond Fund and Money Market Fund, which have no front-end sales load. Class B shares were offered at net asset value and have a 1.00% annual 12b-1 fee (0.25% for Limited Maturity Bond Fund and 0.875% for Money Market Fund). In addition, Class B shares have a maximum contingent deferred sales charge of 5.00% . The contingent deferred sales charge declines by 1.00% per year through the fifth year. Class B shares convert to Class A shares at the end of the fifth year. Institutional Class shares are offered at net asset val ue and have no annual 12b-1 fees. All three classes of shares have identical rights to earnings, assets and voting privileges, except for class specific expenses and exclusive rights to vote on matters affecting only individual classes. Effective October 16, 2004, the Trust no longer offers Class B shares for sale.
The following Funds have all three classes of shares: Technology Fund, Partner Small Cap Value Fund, Small Cap Stock Fund, Mid Cap Growth Fund, Mid Cap Stock Fund, Partner International Stock Fund, Large Cap Growth Fund, Large Cap Value Fund, Large Cap Stock Fund, Balanced Fund, High Yield Fund, Municipal Bond Fund, Income Fund, Core Bond Fund, Limited Maturity Bond Fund and Money Market Fund. Aggressive Allocation Fund, Moderately Aggressive Allocation Fund, Moderate Allocation Fund, Moderately Conservative Allocation Fund, Partner Small Cap Growth Fund and Partner Mid Cap Value Fund offer Class A and Institutional Class shares. Small Cap Index Fund, Mid Cap Index Fund and Large Cap Index Fund offer Class A shares only. Mid Cap Index Fund-I and Large Cap Index Fund-I offer only Institutional Class shares.
Under the Trust’s organizational documents, its officers and trustees are indemnified against certain liabilities arising out of the performance of their duties to the Trust. In addition, in the normal course of business, the Trust enters into contracts with vendors and others that provide general damage clauses. The Trust’s maximum exposure under these contracts is unknown, as this would involve future claims that may be made against the Trust. However, based on experience, the Trust expects the risk of loss to be remote.
(2) SIGNIFICANT ACCOUNTING POLICIES
(A) Valuation of Investments — Securities traded on U.S. or foreign securities exchanges or included in a national market system are valued at the official closing price at the close of each business day unless otherwise stated below. Over-the-counter securities and listed securities for which no price is readily available are valued at the current bid price considered best to represent the value at that time. Security prices are based on quotes that are obtained from an independent pricing service approved by the Board of Trustees. The pricing service, in determining values of fixed-income securities, takes into consideration such factors as current quotations by broker/dealers, coupon, maturity, quality, type of issue, trading characteristics, and other yield and risk factors it deems relevant in determining valuations. Securities which cannot be valued by the approved pricing service are valued using valuations obtained from dealers that make markets in the securities. Exchange listed options and futures contracts are valued at the last quoted sales price. Mutual funds are valued at the net asset value at the close of each business day.
For all Funds, other than Money Market Fund, short-term securities with maturities of 60 days or less are valued at amortized cost. Securities held by Money Market Fund are valued on the basis of amortized cost (which approximates market value), whereby a portfolio security is valued at its cost initially, and thereafter valued to reflect a constant amortization to maturity of any discount or premium. The market values of the securities held in Money Market Fund are determined once per week using prices supplied by the Funds’ independent pricing service. Money Market Fund and the Funds’ investment adviser follow procedures necessary to maintain a constant net asset value of $1.00 per share.
All securities for which market values are not readily available or deemed unreliable are appraised at fair value as
THRIVENT MUTUAL FUNDS
Notes to Financial Statements
As of October 31, 2007
(2) SIGNIFICANT ACCOUNTING
POLICIES — continued
determined in good faith under the direction of the Board of Trustees. As of October 31, 2007, one security each in Small Cap Stock Fund, Mid Cap Growth Fund, Large Cap Growth Fund, Large Cap Stock Fund and High Yield Fund were valued at fair value, which represented less than 0.01% of each Fund’s net assets. Additionally, one security each in Balanced Fund and Core Bond Fund were valued at fair value, which represented 0.19% and 0.50%, respectively, of each Fund’s net assets.
Fair Valuation of International Securities — Because many foreign markets close before the U.S. markets, events may occur between the close of the foreign market and the close of the U.S. markets that could have a material impact on the valuation of foreign securities. The Funds, under the supervision of the Board of Trustees, evaluates the impacts of these events and may adjust the valuation of foreign securities to reflect the fair value as of the close of the U.S. markets. The Board of Trustees has authorized the investment adviser to make fair valuation determinations pursuant to policies approved by the Board of Trustees.
(B) Foreign Currency Translation — The accounting records of each Fund are maintained in U.S. dollars. Securities and other assets and liabilities that are denominated in foreign currencies are translated into U.S. dollars at the daily closing rates of exchange.
Foreign currency amounts related to the purchase or sale of securities and income and expenses are translated at the exchange rate on the transaction date. Net realized and unrealized currency gains and losses are recorded from sales of foreign currency, exchange gains or losses between the trade date and settlement dates on securities transactions, and other translation gains or losses on dividends, interest income and foreign withholding taxes. The Funds do not separately report the effect of changes in foreign exchange rates from changes in market prices on securities held. Such changes are included in net realized and unrealized gain or loss from investments.
For federal income tax purposes, the Funds treat the effect of changes in foreign exchange rates arising from actual foreign currency transactions and the changes in foreign exchange rates between the trade date and settlement date as ordinary income.
(C) Foreign Currency Contracts — In connection with purchases and sales of securities denominated in foreign currencies, all Funds except the Money Market Fund may enter into forward currency contracts. Additionally, the Funds may enter into such contracts to hedge certain other foreign currency denominated investments. These contracts are recorded at market value and the related realized and unrealized foreign exchange gains and losses are included in the Statement of Operations. In the event that counterparties fail to settle these forward contracts, the Funds could be exposed to foreign currency fluctuations. Foreign currency contracts are valued daily and unrealized appreciation or depreciation is recorded daily as the difference between the contract exchange rate and the closing forward rate applied to the face amount of the contract. A realized gain or loss is recorded at the time a forward c ontract is closed. During the year ended October 31, 2007, Partner International Stock Fund, Balanced Fund, Income Fund, Core Bond Fund and Limited Maturity Bond Fund engaged in this type of investment.
(D) Foreign Denominated Investments — Foreign denominated assets and currency contracts may involve more risks than domestic transactions including currency risk, political and economic risk, regulatory risk, and market risk. Certain Funds may also invest in securities of companies located in emerging markets. Future economic or political developments could adversely affect the liquidity or value, or both, of such securities.
(E) Federal Income Taxes — No provision has been made for income taxes because each Funds’ policy is to qualify as regulated investment companies under the Internal Revenue Code and distribute substantially all investment company taxable income and net capital gain on a timely basis. It is also the intention of each Fund to distribute an amount suf-ficient to avoid imposition of any federal excise tax. The Funds, accordingly, anticipate paying no federal taxes and no federal tax provision was recorded. Each Fund is treated as a separate taxable entity for federal income tax purposes. Certain Funds may utilize earnings and profits distributed to shareholders on the redemption of shares as part of the dividends paid deduction.
(F) Income and Expenses — Estimated expenses are accrued daily. The Funds are charged for those expenses that are directly attributable to them. Expenses that are not directly attributable to a Fund are allocated among all appropriate Funds in proportion to their respective net assets, number of shareholder accounts or other reasonable basis. Net investment income, expenses which are not class-spe-cific, and realized and unrealized gains and losses are allocated directly to each class based upon the relative net asset value of outstanding shares.
THRIVENT MUTUAL FUNDS
Notes to Financial Statements
As of October 31, 2007
Interest income is accrued daily and is determined on the basis of interest or discount earned on all debt securities, including accretion of market discount and original issue discount and amortization of premium. Paydown gains and losses on mortgage- and asset-backed securities are recorded as components of interest income. Dividend income is recorded on the ex-dividend date. For preferred stock payment-in-kind securities, income is recorded on the ex-dividend date in the amount of the value received.
(G) Custody Earnings Credit — The Funds have a deposit arrangement with the custodian whereby interest earned on uninvested cash balances is used to pay a portion of custodian fees. This deposit arrangement is an alternative to overnight investments.
(H) Distributions to Shareholders — Dividend and capital gain distributions are recorded on the ex-dividend date. With the exception of Money Market Fund, net realized gains from securities transactions, if any, are paid at least annually after the close of the fiscal year.
Dividends from High Yield Fund, Municipal Bond Fund, Income Fund, Core Bond Fund, Limited Maturity Bond Fund and Money Market Fund are declared daily and paid monthly. Dividends from Money Market Fund also include any short-term net realized gains or losses on the sale of securities. Dividends from Moderate Allocation Fund, Moderately Conservative Allocation Fund and Balanced Fund are declared and paid quarterly. Dividends from the following funds are declared and paid annually: Aggressive Allocation Fund, Moderately Aggressive Allocation Fund, Technology Fund, Partner Small Cap Growth Fund, Partner Small Cap Value Fund, Small Cap Stock Fund, Small Cap Index Fund, Mid Cap Growth Fund, Partner Mid Cap Value Fund, Mid Cap Stock Fund, Mid Cap Index Fund, Mid Cap Index Fund-I, Partner International Stock Fund, Large Cap Growth Fund, Large Cap Value Fund, Large Cap Stock Fund, Large Cap Index Fund and Large Cap Index Fund-I.
(I) Options — All Funds, with the exception of Money Market Fund, may buy put and call options and write put and covered call options. The Funds intend to use such derivative instruments as hedges to facilitate buying or selling securities or to provide protection against adverse movements in security prices or interest rates. The Funds may also enter into options contracts to protect against adverse foreign exchange rate fluctuations. Option contracts are valued daily and unrealized appreciation or depreciation is recorded. A Fund will realize a gain or loss upon expiration or closing of the option transaction. When an option is exercised, the proceeds upon sale for a written call option or the cost of a security for purchased put and call options is adjusted by the amount of premium received or paid. The writer of an option bears the market risk of an unfavorable change in the price of the securi ty underlying the written option. Risks of loss may exceed amounts recognized on the Statement of Assets and Liabilities. During the year ended October 31, 2007, Mid Cap Growth Fund, Large Cap Growth Fund, Balanced Fund, Income Fund, Core Bond Fund, and Limited Maturity Bond Fund engaged in this type of investment.
(J) Financial Futures Contracts — Certain Funds use futures contracts to manage the exposure to interest rate and market fluctuations. Gains or losses on futures contracts can offset changes in the yield of securities. When a futures contract is opened, cash or other investments equal to the required “initial margin deposit” are held on deposit with and pledged to the broker. Additional securities held by the Funds may be earmarked as collateral for open futures contracts. The futures contract’s daily change in value (“variation margin”) is either paid to or received from the broker, and is recorded as an unrealized gain or loss. When the contract is closed, the realized gain or loss is recorded equal to the difference between the value of the contract when opened and the value of the contract when closed. Futures contracts involve, to varying degrees, risk of loss in excess of the variation margin discl osed in the Statement of Assets and Liabilities. During the year ended October 31, 2007, Small Cap Stock Fund, Small Cap Index Fund, Mid Cap Index Fund, Mid Cap Index Fund-I, Large Cap Stock Fund, Large Cap Index Fund, Large Cap Index Fund-I, Balanced Fund, High Yield Fund, Income Fund, Core Bond Fund and Limited Maturity Bond Fund engaged in this type of investment.
(K) Swap Agreements — Certain Funds enter into swap transactions, which involve swapping one or more investment characteristics of a security or a basket of securities with another party. Such transactions include market risk, risk of default by the other party to the transaction, risk of imperfect correlation and manager risk and may involve commissions or other costs. Swap transactions generally do not involve delivery of securities, other underlying assets or principal. Accordingly, the risk of loss with respect to swap transactions is generally limited to the net amount of payments that the Fund is contractually obligated to make, or in the case of the counterparty defaulting, the net amount of payments that the Fund is contractually entitled to receive. Risks of loss may exceed amounts recognized on the Statement of Assets and Liabilities. If there is a default by the counterparty, the Fund may have contractual remedies pur suant to the agreements
THRIVENT MUTUAL FUNDS
Notes to Financial Statements
As of October 31, 2007
(2) SIGNIFICANT ACCOUNTING POLICIES — continued
related to the transaction. Periodic payments are recorded as realized gains or losses on the Statement of Operations. The contracts are valued daily and unrealized appreciation or depreciation is recorded. Periodic payments and receipts and payments received or made as a result of a credit event or termination of the contract are recognized as realized gains or losses on the Statement of Operations. Collateral, in the form of cash or securities, may be required to be held with the Trust’s custodian, or third party, in connection with these agreements.
Credit Default Swaps — A credit default swap is an agreement between two parties to exchange the credit risk of a particular issuer or reference entity. In a credit default swap transaction, a buyer pays periodic fees in return for payment by the seller which is contingent upon an adverse credit event occurring in the underlying issuer or referenced entity. The seller collects periodic fees from the buyer and profits if the credit of the underlying issuer or reference entity remains stable or improves while the swap is outstanding, but the seller in a credit default swap contract would be required to pay the amount of credit loss, determined as specified in the agreement, to the buyer in the event of an adverse credit event in the reference entity. A buyer of a credit default swap is said to buy protection whereas a seller of a credit default swap is said to sell protection. The Funds may be either the protection seller or the p rotection buyer. During the year ended October 31, 2007, Balanced Fund, High Yield Fund, Income Fund, Core Bond Fund and Limited Maturity Bond Fund engaged in this type of investment.
Total Rate of Return Swaps — A total rate of return swap is an agreement in which one party makes payments based on a set rate, either fixed or variable, while the other party makes payments based on the return of an underlying asset plus any capital gains and losses over the payment period. The underlying asset is typically an index, loan or a basket of assets. Total rate of return swaps provide the Funds with the additional flexibility of gaining exposure to a market or securities index by using the most cost-effective vehicle available. During the year ended October 31, 2007, Balanced Fund, Income Fund, Core Bond Fund and Limited Maturity Bond Fund engaged in this type of investment.
Interest Rate Swaps — An interest rate swap is an agreement between two parties to exchange cash flows based on the difference between two interest rates. Typically, one party pays a fixed-rate for a specific period while the other pays a variable-rate based on an underlying index for the same period. Interest rate swaps allow the Funds to manage exposure to interest rate fluctuations. During the year ended October 31, 2007, Limited Maturity Bond Fund engaged in this type of investment.
(L) Mortgage Dollar Roll Transactions — Certain Funds enter into dollar roll transactions on securities issued or to be issued by the Government National Mortgage Association, Federal National Mortgage Association and Federal Home Loan Mortgage Corporation, in which the Funds sell mortgage securities and simultaneously agree to repurchase similar (same type, coupon and maturity) securities at a later date at an agreed upon price. During the period between the sale and repurchase, the Funds forgo principal and interest paid on the mortgage securities sold. The Funds are compensated from negotiated fees paid by brokers offered as an inducement to the Funds to “roll over” their purchase commitments. These fees are recognized over the roll period and are included in Income from mortgage dollar rolls in the Statement of Operations. During the year ended October 31, 2007, Balanced Fund, Income Fund, Core Bond Fund and Limite d Maturity Bond Fund engaged in this type of transaction.
(M) Securities Lending — The Trust had previously entered into a Securities Lending Agreement (the “Agreement”) with State Street Bank and Trust Company (“State Street Bank”) and, as of April 27, 2007, entered into a similar agreement with Dresdner Bank AG (each, an “Agreement”). Each Agreement authorizes the applicable lender to lend securities to authorized borrowers on behalf of the Funds. Pursuant to each Agreement, all loaned securities are collateralized by cash equal to at least 102% of the value of the loaned securities. All cash collateral received is invested in Thrivent Financial Securities Lending Trust. Amounts earned on investments in Thrivent Financial Securities Lending Trust, net of rebates and other securities lending expenses, are included in Income from securities loaned on the Statement of Operations. As payment for its services, each lender receives a portion of the fee income and earnings on the collateral. By investing any cash collateral it receives in these transactions, a Fund could realize additional gains or losses. If the borrower fails to return the securities and the invested collateral has declined in value, the Fund could lose money. The Agreement with State Street Bank granted and transferred to State Street Bank a lien upon collateralized assets in the possession of State Street Bank.
As of October 31, 2007, all Funds except Aggressive Allocation Fund, Moderately Aggressive Allocation Fund, Moderate Allocation Fund, Moderately Conservative
THRIVENT MUTUAL FUNDS
Notes to Financial Statements
As of October 31, 2007
Allocation Fund, Municipal Bond Fund and Money Market Fund had securities on loan with Dresdner Bank AG. The value of securities on loan is as follows:
| |
| | Securities |
| Fund | on Loan |
|
| Technology | $ 2,212,283 |
| Partner Small Cap Growth | 25,153,038 |
| Partner Small Cap Value | 38,032,344 |
| Small Cap Stock | 153,707,072 |
| Small Cap Index | 7,507,672 |
| Mid Cap Growth | 87,221,745 |
| Partner Mid Cap Value | 3,905,709 |
| Mid Cap Stock | 258,093,621 |
| Mid Cap Index | 5,154,800 |
| Mid Cap Index-I | 309,826 |
| Partner International Stock | 25,296,355 |
| Large Cap Growth | 42,122,950 |
| Large Cap Value | 74,583,034 |
| Large Cap Stock | 412,451,844 |
| Large Cap Index | 4,538,794 |
| Large Cap Index-I | 895,969 |
| Balanced | 38,175,865 |
| High Yield | 66,156,006 |
| Income | 54,311,234 |
| Core Bond | 26,340,435 |
| Limited Maturity Bond | 13,098,111 |
(N) When-Issued and Delayed Delivery Transactions— Certain Funds may purchase or sell securities on a when-issued or delayed delivery basis. These transactions involve a commitment by a Fund to purchase or sell securities for a predetermined price or yield, with payment and delivery taking place beyond the customary settlement period. When delayed delivery purchases are outstanding, a Fund will designate liquid assets in an amount sufficient to meet the purchase price. When purchasing a security on a delayed delivery basis, a Fund assumes the rights and risks of ownership of the security, including the risk of price and yield fluctuations, and takes such fluctuations into account when determining its net asset value. A Fund may dispose of a delayed delivery transaction after it is entered into, and may sell when-issued securities before they are delivered, which may result in a capital gain or loss. When a Fund has sold a securi ty on a delayed delivery basis, a Fund does not participate in future gains and losses with respect to the security.
(O) Treasury Inflation Protected Securities — Certain Funds may invest in treasury inflation protected securities (TIPS). These securities are fixed income securities whose principal value is periodically adjusted to the rate of inflation. The interest rate is generally fixed at issuance. Interest is paid based on the principal value, which is adjusted for inflation. Any increase in the principal amount will be included as taxable interest in the Statement of Operations and received upon maturity or sale of the security. During the year ended October 31, 2007, Balanced Fund, Income Fund, Core Bond Fund and Limited Maturity Bond Fund engaged in this type of investment.
(P) Repurchase Agreements — Each Fund may engage in repurchase agreement transactions in pursuit of its investment objective. A repurchase agreement consists of a purchase and a simultaneous agreement to resell an investment for later delivery at an agreed upon price and rate of interest. The Fund must take possession of collateral either directly or through a third-party custodian. If the original seller of a security subject to a repurchase agreement fails to repurchase the security at the agreed upon time, the Fund could incur a loss due to a drop in the market value of the security during the time it takes the Fund to either sell the security or take action to enforce the original seller’s agreement to repurchase the security. Also, if a defaulting original seller filed for bankruptcy or became insolvent, disposition of such security might be delayed by pending legal action. The Fund may only enter into repurchase agree ments with banks and other recognized financial institutions such as broker/dealers that are found by the Funds’ investment adviser Thrivent Asset Management, LLC (“Thrivent Asset Mgt.” or the “Adviser”) (or subadviser) to be creditworthy. During the year ended October 31, 2007, Mid Cap Stock Fund, Partner International Stock Fund, Large Cap Stock Fund and High Yield Fund engaged in these types of investments.
(Q) Equity-Linked Structured Securities — Certain funds may invest in equity-linked structured notes. Equity-linked structured notes are debt securities which combine the characteristics of common stock and the sale of an option. The return component is based upon the performance of a single equity security, a basket of equity securities, or an equity index and the sale of an option which is recognized as income. There is no guaranteed return of principal with these securities. The appreciation potential of these securities may be limited by a maximum payment or call right and can be influenced by many unpredictable factors. During the year ended October 31, 2007, High Yield Fund engaged in this type of investment.
(R) Credit Risk — The Funds may be susceptible to credit risk to the extent an issuer or counter party defaults on its payment obligation. The Funds’ policy is to monitor the creditworthiness of issuers. Interest receivables on defaulted securities are monitored for ability to collect payments in default and are adjusted accordingly.
THRIVENT MUTUAL FUNDS
Notes to Financial Statements
As of October 31, 2007
(2) SIGNIFICANT ACCOUNTING POLICIES — continued
(S) Accounting Estimates — The preparation of financial statements in conformity with accounting principles generally accepted in the United States of America require management to make estimates and assumptions that affect the reported amounts of assets and liabilities and disclosure of contingent assets and liabilities at the date of the financial statements and the reported amounts of income and expenses during the reporting period. Actual results could differ from those estimates.
(T) Loss Contingencies — High Yield Fund received a dividend in the amount of $37,188 from Global Crossings on November 1, 2001, within 90 days of Global Crossings’ filing for bankruptcy. A preference action was filed on June 24, 2005, and it is possible that the Fund will be required to surrender the dividend back to the bankruptcy estate. This loss contingency has not been accrued as a liability because the amount to be surrendered and the likelihood of the loss can not be reasonably estimated.
(U) Unfunded Loan Commitments — Certain Funds may enter into loan commitments, all or a portion of which may be unfunded. The Fund is obligated to fund these commitments at the borrower’s discretion.
(V) Recent Accounting Pronouncements — In June 2006, the Financial Accounting Standards Board (FASB) issued FASB Interpretation No. 48 — Accounting for Uncertainty in Income Taxes (FIN 48) that requires additional tax disclosures and the tax effects of certain tax positions to be recognized.
These tax positions must meet a “more likely than not” standard that based on their technical merits, they have a more than 50 percent likelihood of being sustained upon examination. FIN 48 is effective for fiscal periods beginning after December 15, 2006. At adoption, the financial statements must be adjusted to reflect only those tax positions in any open tax years that are more likely than not of being sustained. Management of the Fund is currently evaluating the impact that FIN 48 will have on the Fund’s financial statements. Effective December 22, 2006, the U.S. Securities and Exchange Commission delayed implementation of FIN 48 for mutual funds with fiscal years beginning after December 15, 2006. As a result, the implementation of FIN 48 is delayed until April 30, 2008, for the Trust.
Additionally, in September 2006, the FASB issued FASB Statement No. 157 — Fair Value Measurements (FAS 157). The objective of the statement is to improve the consistency and comparability of fair value measurements used in finan-cial reporting. FAS 157 defines fair value, establishes a framework for measuring fair value in generally accepted accounting principles, and expands disclosures about fair value measurements. FAS 157 is effective for fiscal years beginning after November 15, 2007. Management of the Fund is currently evaluating the impact that FAS 157 will have on the Fund’s financial statements.
(W) Other — For financial statement purposes, investment security transactions are accounted for on the trade date. Realized gains and losses from investment transactions are determined on a specific cost identification basis, which is the same basis used for federal income tax purposes.
(3) FEES AND COMPENSATION PAID TO AFFILIATES
(A) Investment Advisory Fees — The Trust has entered into an Investment Advisory Agreement with Thrivent Asset Mgt., a wholly owned subsidiary of Thrivent Life Insurance Company. Under the Investment Advisory Agreement, each Fund pays a fee for investment advisory services. The fees are accrued daily and paid monthly. The annual rates of fees as a percent of average daily net assets under the Investment Advisory Agreement were as follows:
| | | | | | | | | | | |
| | $0 to | $50 to | $100 to | $200 to | $250 to | $500 to | $750 to | $1,000 to | $2,000 to | $2,500 to | Over |
| Fund (M - Millions) | $50M | $100M | $200M | $250M | $500M | $750M | $1,000M | $2,000M | $2,500M | $5,000M | $5,000M |
| | |
|
| Aggressive Allocation | 0.15% | 0.15% | 0.15% | 0.15% | 0.15% | 0.125% | 0.125% | 0.125% | 0.125% | 0.125% | 0.125% |
| Moderately Aggressive | | | | | | | | | | | |
| Allocation | 0.15% | 0.15% | 0.15% | 0.15% | 0.15% | 0.125% | 0.125% | 0.125% | 0.125% | 0.125% | 0.125% |
| Moderate Allocation | 0.15% | 0.15% | 0.15% | 0.15% | 0.15% | 0.125% | 0.125% | 0.125% | 0.125% | 0.125% | 0.125% |
| Moderately Conservative | | | | | | | | | | | |
| Allocation | 0.15% | 0.15% | 0.15% | 0.15% | 0.15% | 0.125% | 0.125% | 0.125% | 0.125% | 0.125% | 0.125% |
| Technology | 0.75% | 0.75% | 0.75% | 0.75% | 0.75% | 0.75% | 0.75% | 0.75% | 0.75% | 0.75% | 0.75% |
| Partner Small Cap Growth | 0.90% | 0.90% | 0.90% | 0.90% | 0.90% | 0.80% | 0.80% | 0.80% | 0.80% | 0.80% | 0.80% |
| Partner Small Cap Value | 0.70% | 0.70% | 0.70% | 0.70% | 0.70% | 0.70% | 0.70% | 0.70% | 0.70% | 0.70% | 0.70% |
| Small Cap Stock | 0.70% | 0.70% | 0.70% | 0.65% | 0.65% | 0.65% | 0.65% | 0.60% | 0.60% | 0.55% | 0.525% |
| Small Cap Index | 0.25% | 0.25% | 0.25% | 0.25% | 0.25% | 0.25% | 0.25% | 0.25% | 0.25% | 0.25% | 0.25% |
THRIVENT MUTUAL FUNDS
Notes to Financial Statements
As of October 31, 2007
| | $0 to | $50 to | $100 to | $200 to | $200 to | $200 to | $750 to | $1,000 to | $2,000 to | $2,500 to | Over |
| | $50M | $100M | $200M | $250M | $500M | $750M | $1,000M | $2,000M | $2,500M | $5,000M | $5,000M |
| Fund (M - Millions) | | |
|
| Mid Cap Growth | | 0.45% | 0.45% | 0.40% | 0.40% | 0.35% | 0.30% | 0.30% | 0.25% | 0.25% | 0.25% | 0.25% |
| Partner Mid Cap Value | | 0.75% | 0.75% | 0.75% | 0.75% | 0.70% | 0.70% | 0.70% | 0.70% | 0.70% | 0.70% | 0.70% |
| Mid Cap Stock | | 0.70% | 0.70% | 0.70% | 0.65% | 0.65% | 0.65% | 0.65% | 0.60% | 0.60% | 0.55% | 0.525% |
| Mid Cap Index | | 0.25% | 0.25% | 0.25% | 0.25% | 0.25% | 0.25% | 0.25% | 0.25% | 0.25% | 0.25% | 0.25% |
| Mid Cap Index-I | | 0.25% | 0.20% | 0.20% | 0.20% | 0.20% | 0.20% | 0.20% | 0.20% | 0.20% | 0.20% | 0.20% |
| Partner International Stock | | 0.65% | 0.60% | 0.60% | 0.60% | 0.60% | 0.60% | 0.60% | 0.60% | 0.60% | 0.60% | 0.60% |
| Large Cap Growth | | 0.75% | 0.75% | 0.75% | 0.75% | 0.75% | 0.70% | 0.70% | 0.65% | 0.65% | 0.60% | 0.575% |
| Large Cap Value | | 0.45% | 0.45% | 0.45% | 0.45% | 0.45% | 0.45% | 0.45% | 0.45% | 0.45% | 0.45% | 0.45% |
| Large Cap Stock | | 0.65% | 0.65% | 0.65% | 0.65% | 0.65% | 0.575% | 0.575% | 0.50% | 0.475% | 0.45% | 0.425% |
| Large Cap Index | | 0.25% | 0.25% | 0.25% | 0.25% | 0.25% | 0.25% | 0.25% | 0.25% | 0.25% | 0.25% | 0.25% |
| Large Cap Index-I | | 0.25% | 0.175% | 0.175% | 0.175% | 0.175% | 0.175% | 0.175% | 0.175% | 0.175% | 0.175% | 0.175% |
| Balanced | | 0.55% | 0.55% | 0.55% | 0.55% | 0.55% | 0.50% | 0.50% | 0.475% | 0.475% | 0.45% | 0.425% |
| High Yield | | 0.40% | 0.40% | 0.40% | 0.40% | 0.40% | 0.35% | 0.35% | 0.30% | 0.30% | 0.30% | 0.30% |
| Municipal Bond | | 0.45% | 0.45% | 0.45% | 0.45% | 0.45% | 0.40% | 0.40% | 0.35% | 0.35% | 0.325% | 0.30% |
| Income | | 0.35% | 0.35% | 0.35% | 0.35% | 0.35% | 0.325% | 0.325% | 0.30% | 0.30% | 0.30% | 0.30% |
| Core Bond | | 0.45% | 0.45% | 0.45% | 0.45% | 0.45% | 0.40% | 0.40% | 0.375% | 0.375% | 0.35% | 0.325% |
| Limited Maturity Bond | | 0.30% | 0.30% | 0.30% | 0.30% | 0.30% | 0.275% | 0.275% | 0.25% | 0.25% | 0.25% | 0.25% |
| Money Market | | 0.50% | 0.50% | 0.50% | 0.50% | 0.50% | 0.40% | 0.35% | 0.325% | 0.325% | 0.30% | 0.275% |
The following subadvisory fees are charged as part of the total investment advisory fees stated in the table above. The subadvisory fees are borne directly by the Adviser and do not increase the overall fees paid by the Fund.
The Adviser has entered into subadvisory agreements with Turner Investment Partners, Inc. (“Turner”) and Transamerica Investment Management, LLC (“Transamerica”) for the performance of subadvisory services for Partner Small Cap Growth Fund. The fee payable is equal to 0.65% and 0.50% of average daily net assets subadvised by Turner and Transamerica, respectively.
The Adviser has entered into a subadvisory agreement with T. Rowe Price Associates, Inc. for performance of sub-advisory services for Partner Small Cap Value Fund. The sub-advisory fee, which is paid by the Adviser from its advisory fee, is 0.60% of average daily net assets.
The Adviser has entered into a subadvisory agreement with Goldman Sachs Asset Management, LP (“Goldman Sachs”) for the performance of subadvisory services for Partner Mid Cap Value Fund. The fee payable is equal to 0.50% of average daily net assets for the first $250 million and 0.45% for assets over $250 million. Thrivent Partner Mid Cap Value Portfolio will be included in determining breakpoints for the assets managed by Goldman Sachs.
The Adviser paid T. Rowe Price International, Inc. (“Price International”) an annual subadvisory fee for the performance of subadvisory services for Partner International Stock Fund until the termination of the subadvisory agreement on February 28, 2007. The fee payable was equal to 0.75% of the first $20 million, 0.60% of the next $30 million, 0.50% of the next $150 million of average daily net assets, with the fee for all of the assets subadvised by Price International 0.50% and 0.45% when the assets exceed $200 million and $500 million, respectively. Thrivent Partner International Stock Portfolio was included in determining breakpoints for the assets managed by Price International.
Effective February 28, 2007, the Adviser entered into a subadvisory agreement with Principal Global Investors, LLC (“Principal”), in addition to the existing subadvisory agreement with Mercator Asset Management, LP (“Mercator”) for the performance of subadvisory services for Partner International Stock Fund. The fee payable is equal to 0.35% of the first $500 million of average daily net assets subadvised by Principal, 0.30% of the next $500 million and 0.25% when assets exceed $1.0 billion. For average daily net assets subadvised by Mercator, the fee payable is equal to 0.75% of the first $25 million of, 0.60% of the next $25 million, 0.55% of the next $25 million, 0.50% of the next $225 million, 0.40% of the next $200 million and 0.20% when assets exceed $500 million. Thrivent Partner International Stock Portfolio is included in determining breakpoints for the assets managed by Mercator and Principal.
THRIVENT MUTUAL FUNDS
Notes to Financial Statements
As of October 31, 2007
(3) FEES AND COMPENSATION PAID TO AFFILIATES — continued
| | | | | | | | |
| | | | |
| As of October 31, 2007, the following voluntary expense reimbursements, as a percentage of net assets, were in effect: |
| |
| | | | | Institutional | | Expiration |
| Fund | | Class A | | Class B | | Class | | Date |
|
| Technology | — | 1.00% | — | N/A |
| Partner Small Cap Value | 0.10% | 0.10% | 0.10% | N/A |
| Large Cap Growth | — | 0.80% | — | N/A |
| Money Market | 0.20% | 0.10% | 0.10% | N/A |
These voluntary reimbursements may be discontinued at any time.
As of October 31, 2007, contractual expense reimbursements to limit expenses to the following percentages were in effect:
| | | | | | | | |
| | | | | | |
| | | | |
| | | | | Institutional | | Expiration |
| Fund | | Class A | | Class B | | Class | | Date |
|
| Aggressive Allocation | 0.50% | N/A | — | 2/28/08 |
| Moderately Aggressive Allocation | 0.48% | N/A | — | 2/28/08 |
| Moderate Allocation | 0.48% | N/A | — | 2/28/08 |
| Moderately Conservative Allocation | 0.45% | N/A | — | 2/28/08 |
| Technology | 1.47% | — | 0.97% | 2/28/08 |
| Partner Small Cap Growth | 1.45% | N/A | 1.18% | 2/28/08 |
| Small Cap Index | 0.95% | N/A | N/A | 2/28/08 |
| Partner Mid Cap Value | 1.25% | N/A | 1.08% | 2/28/08 |
| Mid Cap Index | 0.90% | N/A | N/A | 2/28/08 |
| Large Cap Growth | 1.17% | — | 0.84% | 2/28/08 |
| Large Cap Index | 0.60% | N/A | N/A | 2/28/08 |
As of October 15, 2004, all Class B shares net operating expenses are limited to the following percentage of daily net assets of Class B shares: Technology Fund, 3.34%; Partner Small Cap Value Fund, 2.63%; Small Cap Stock Fund, 2.43%; Mid Cap Growth Fund, 2.31%; Mid Cap Stock Fund, 2.39%; Partner International Stock Fund, 2.79%; Large Cap Growth Fund, 2.55%; Large Cap Value Fund, 2.21%; Large Cap Stock Fund, 2.24%; Balanced Fund, 2.06%; High Yield Fund, 1.73%; Municipal Bond Fund, 1.50%; Income Fund, 1.63%; Core Bond Fund, 1.95%; Limited Maturity Bond Fund, 0.89%; and Money Market Fund, 1.95% . These reimbursements will be in effect as long as assets remain in the B shares.
Class B share expenses were voluntarily reimbursed to limit expenses to 2.75% of average daily net assets for Technology Fund and Partner International Stock Fund. Additionally, Class B share expenses were voluntarily reimbursed to limit expenses to 1.01% of average daily net assets for Money Market Fund. These voluntary expense reimbursements may be discontinued at any time.
Each equity, hybrid and fixed income fund may invest cash in Money Market Fund, subject to certain limitations. During the year ended October 31, 2007, all funds, with the exception of Municipal Bond Fund, invested in Money Market Fund. These related-party transactions are subject to the same termsas non-related party transactions except that, to avoid duplicate investment advisory fees, Thrivent Asset Mgt. reimburses an amount equal to the smaller of the amount of the advisory fee for that Fund or the amount of the advisory fee which is charged to the Fund for its investment in Money Market Fund.
(B) Distribution Plan — Thrivent Investment Management Inc. (“Thrivent Investment Mgt.”) is the Trust’s distributor. The Trust has adopted a Distribution Plan (“the Plan”) pursuant to Rule 12b-1 under the Investment Company Act of 1940. Class A shares have a Rule 12b-1 fee of 0.25% (0.125% for Limited Maturity Bond Fund and Money Market Fund) of average net assets. Class B shares have a Rule 12b-1 fee of 1.00% (0.25% for Limited Maturity Bond Fund and 0.875% for Money Market Fund) of average net assets.
(C) Sales Charges and Other Fees — For the year ended October 31, 2007, Thrivent Investment Mgt. received $15,290,410 of aggregate underwriting concessions from the sales of the Trust’s Class A and Class B shares and aggregate deferred sales charges of $227,415 from redemptions of Class A and Class B shares. Sales charges are not an expense of the Trust and are not reflected in the financial statement of any of the Funds.
THRIVENT MUTUAL FUNDS
Notes to Financial Statements
As of October 31, 2007
The Trust has entered into an accounting services agreement with Thrivent Asset Mgt. pursuant to which Thrivent Asset Mgt. provides certain accounting personnel and services. For the year ended October 31, 2007, Thrivent Asset Mgt. received aggregate fees for accounting personnel and services of $1,213,498 from the Trust.
The Trust has entered into an agreement with Thrivent Asset Mgt. to provide certain administrative personnel and services to the Funds. For the year ended October 31, 2007, Thrivent Asset Mgt. received aggregate fees for administrative personnel and services of $2,909,908 from the Trust.
The Trust has entered into an agreement with Thrivent Financial Investor Services, Inc. (“Thrivent Investor Services”) to provide the Funds with transfer agent services. For the year ended October 31, 2007, Thrivent Investor Services received $18,689,384 for transfer agent services from the Trust.
Each Trustee is eligible to participate in a deferred compensation plan with respect to fees received from the Funds. Participants in the plan may designate their deferred Trustee’s fees as if invested in any one of the portfolios of Thrivent Mutual Funds. The value of each Trustee’s deferred compensation account will increase or decrease as if it were invested in shares of the selected portfolio of Thrivent Mutual Funds. The deferred fees remain in the appropriate fund until distribution in accordance with the plan. The deferred fee liability is an unsecured liability.
Those Trustees not participating in the above plan received $188,993 in fees from the Trust for the year ended October 31, 2007. No remuneration has been paid by the Trust to any of the officers or affiliated Trustees of the Trust. In addition, the Trust reimbursed unaffiliated Trustees for reasonable expenses incurred in relation to attendance of meetings and industry conferences.
Certain officers and non-independent trustees of the Funds are officers and directors of Thrivent Asset Mgt., Thrivent Investment Mgt., and Thrivent Investor Services; however, they receive no compensation from the Funds.
(D) Indirect Expenses — Some Funds invest in other mutual funds. Fees and expenses of those underlying funds are not included in the Fund’s expense ratio. The Fund indirectly bears its proportionate share of the annualized weighted average expense ratio for the underlying funds in which it invests.
(4) TAX INFORMATION
Distributions are based on amounts calculated in accordance with the applicable federal income tax regulations, which may differ from accounting principles generally accepted in the United States of America. To the extent that these differences are permanent in nature, such amounts are reclassified within the capital accounts based on their federal tax-basis treatment; temporary differences do not require reclassifications.
On the Statement of Assets and Liabilities, as a result of permanent book-to-tax differences, reclassification adjustments were made as follows [Increase/(Decrease)]:
| | | | | | | | | | |
| | | | | | | |
| | | | Accumulated | | | Accumulated | | | |
| | | | Net Investment | | | Net Realized | | | Trust | |
| Fund | | | Income/(Loss) | | | Gain/(Loss) | | | Capital | |
| |
| | |
| Aggressive Allocation | | $1,035,538 | | $(1,044,070) | | $8,532 | |
| Moderately Aggressive | | | | | | | |
| Allocation | | 2,020,578 | | (2,037,526) | | 16,948 | |
| Moderate Allocation | | 2,253,596 | | (2,276,895) | | 23,299 | |
| Moderately Conservative | | | | | |
| Allocation | | 545,474 | | (550,633) | | 5,159 | |
| Technology | | 410,215 | | — | | (410,215) | |
| Partner Small Cap | | | | | | | |
| Growth | | 219,254 | | (219,254) | | — | |
| Partner Small Cap | | | | | | | |
| Value | | 84,273 | | (926,915) | | 842,642 | |
| Small Cap Stock | | (475,544) | | (113,399) | | 588,943 | |
| Small Cap Index | | (32,736) | | 32,736 | | — | |
| Mid Cap Growth | | 1,057,435 | | (1,046,894) | | (10,541) | |
| Partner Mid Cap | | | | | | | |
| Value | | (53,392) | | 53,392 | | — | |
| Mid Cap Stock | | (5,648,784) | | (4,088,300) | | 9,737,084 | |
| Mid Cap Index | | (59,835) | | 59,835 | | — | |
| Mid Cap Index-I | | (21,358) | | 21,358 | | — | |
| Partner International | | | | | | | |
| Stock | | 1,011,501 | | (1,011,501) | | — | |
| Large Cap Growth | | 2,025 | | 234 | | (2,259) | |
| Large Cap Value | | (27,574) | | 27,574 | | — | |
| Large Cap Stock | | (4,320,020) | | (15,679,980) | | 20,000,000 | |
| Large Cap Index | | (18,225) | | 18,225 | | — | |
| Large Cap Index-I | | (6,275) | | 6,275 | | — | |
| Balanced | | (110,342) | | 110,342 | | — | |
| High Yield | | (115,169) | | 10,368,123 | | (10,252,954) | |
| Income | | (1,146,317) | | 1,146,317 | | — | |
| Core Bond | | (248,323) | | 248,323 | | — | |
| Limited Maturity Bond | | (274,351) | | 326,521 | | (52,170) | |
THRIVENT MUTUAL FUNDS
Notes to Financial Statements
As of October 31, 2007
(4) TAX INFORMATION — continued
At October 31, 2007, the components of distributable earnings on a tax basis were as follows:
| | | | | | | |
| | | | | |
| | | | Undistributed | | | Undistributed | |
| | | | Ordinary | | | Long-Term | |
| Fund | | | Income | | | Capital Gain | |
| |
| Aggressive Allocation | $ | 615,432 | $ | 5,853,879 | |
| Moderately Aggressive | | | | | |
| Allocation | | 6,086,196 | | 11,819,586 | |
| Moderate Allocation | | 2,559,646 | | 11,280,690 | |
| Moderately Conservative | | | | | |
| Allocation | | 997,755 | | 2,607,293 | |
| Partner Small Cap Growth | | 413,465 | | 2,960,025 | |
| Partner Small Cap Value | | 2,077,727 | | 9,502,293 | |
| Small Cap Stock | | — | | 68,049,282 | |
| Small Cap Index | | 276,389 | | 4,941,956 | |
| Mid Cap Growth | | 16,106,048 | | 25,350,520 | |
| Partner Mid Cap Value | | 1,377,805 | | 1,518,830 | |
| Mid Cap Stock | | 48,347,903 | | 104,996,790 | |
| Mid Cap Index | | 370,468 | | 6,264,704 | |
| Mid Cap Index-I | | 195,260 | | 4,040,796 | |
| Partner International Stock | | 12,970,471 | | 59,327,108 | |
| Large Cap Growth | | 25,086,857 | | 14,207,157 | |
| Large Cap Value | | 8,864,938 | | 29,158,301 | |
| Large Cap Stock | | 94,487,115 | | 296,709,408 | |
| Large Cap Index | | 997,415 | | — | |
| Large Cap Index-I | | 430,846 | | — | |
| Balanced | | 7,928,921 | | 12,680,271 | |
| High Yield | | (296,026) | | — | |
| Municipal Bond * | | 52,321 | | — | |
| Income | | 347,930 | | — | |
| Core Bond | | 331,097 | | — | |
| Limited Maturity Bond | | (31,863) | | — | |
| Money Market | | 105,253 | | — | |
* Municipal Bond Fund undistributed ordinary income is primarily exempt from federal income taxes.
At October 31, 2007, the following Funds had accumulated net realized capital loss carryovers expiring as follows:
| | | | | |
| | | Capital Loss | | | |
| Fund | | Carryover | | Expiration Year | |
| |
| Technology | | 7,552,067 | | 2009 | |
| | | 13,695,973 | | 2010 | |
| | | 1,279,762 | | 2011 | |
| | | 1,471,537 | | 2012 | |
| | |
| | | |
| | $ | 23,999,339 | | | |
| | |
| | | |
| Mid Cap Growth | $ | 13,252,548 | | 2009 | |
| | | 6,613,531 | | 2010 | |
| | |
| | | |
| | $ | 19,866,079 | | | |
| | |
| | | |
| | | | | |
| | | Capital Loss | | | |
| Fund | | Carryover | | Expiration Year | |
| |
| Partner International Stock | $ | 5,685,578 | | 2010 | |
| | |
| | | |
| Large Cap Growth | $ | 4,358,032 | | 2009 | |
| | | 2,179,015 | | 2010 | |
| | |
| | | |
| | $ | 6,537,047 | | | |
| | |
| | | |
| Large Cap Stock | $ 24,992,067 | | 2009 | |
| | | 45,072,180 | | 2010 | |
| | |
| | | |
| | $ 70,064,247 | | | |
| | |
| | | |
| Large Cap Index | $ | 2,328,392 | | 2014 | |
| | |
| | | |
| Large Cap Index-I | $ | 1,691,423 | | 2011 | |
| | |
| | | |
| High Yield | $ 15,133,980 | | 2008 | |
| | | 125,418,013 | | 2009 | |
| | | 223,628,596 | | 2010 | |
| | | 90,973,334 | | 2011 | |
| | | 11,792,481 | | 2012 | |
| | | 1,037,644 | | 2013 | |
| | | 1,574,393 | | 2014 | |
| | |
| | | |
| | $469,558,441 | | | |
| | |
| | | |
| Municipal Bond | $ | 85,762 | | 2009 | |
| | | 545,473 | | 2012 | |
| | |
| | | |
| | $ | 631,235 | | | |
| | |
| | | |
| Income | $ | 531,597 | | 2008 | |
| | | 17,362,752 | | 2010 | |
| | | 9,939,596 | | 2014 | |
| | |
| | | |
| | $ 27,833,945 | | | |
| | |
| | | |
| Core Bond | $ | 1,246,299 | | 2012 | |
| | | 1,300,054 | | 2013 | |
| | | 9,402,862 | | 2014 | |
| | | 1,199,140 | | 2015 | |
| | |
| | | |
| | $ 13,148,355 | | | |
| | |
| | | |
| Limited Maturity Bond | $ | 413,501 | | 2013 | |
| | | 602,582 | | 2014 | |
| | |
| | | |
| | $ | 1,016,083 | | | |
| | |
| | | |
| Money Market | $ | 19,536 | | 2015 | |
| | |
| | | |
To the extent that these Funds realize future net capital gains, taxable distributions will be reduced by any unused capital loss carryovers as permitted by the Internal Revenue Code.
THRIVENT MUTUAL FUNDS
Notes to Financial Statements
As of October 31, 2007
Capital loss carryovers of $3,579,296, $6,613,531, $24,362,328, $3,600,676, $1,776,066, $38,456,766, $1,202,364, $426,179, $8,746,021, $2,737,990, $6,505,093, and $277,981 were utilized by Technology Fund, Mid Cap Growth Fund, Partner International Stock Fund, Large Cap Growth Fund, Large Cap Value Fund, Large Cap Stock Fund, Large Cap Index Fund, Large Cap Index Fund-I, High Yield Fund, Municipal Bond Fund, Income Fund, and Limited Maturity Bond Fund. In addition, the following capital loss carryover expired during 2007: High Yield Fund; $10,252,954.
The tax character of distributions paid during the years ended October 31, 2007 and 2006 was as follows:
| | | | | | | | | | | | |
| | | Tax-Exempt Income | | Ordinary Income | | Long-Term Capital Gain |
| Fund | 10/31/2007 | 10/31/2006 | | 10/31/2007 | | 10/31/2006 | | 10/31/2007 | | 10/31/2006 |
|
| Aggressive Allocation | $ | — | $ | — | $ | 4,045,342 | $ | 593,507 | $ | 485,309 | $ | — |
| Moderately Aggressive Allocation | | — | | — | | 11,046,128 | | 1,360,298 | | 845,355 | | — |
| Moderate Allocation | | — | | — | | 17,864,622 | | 6,007,876 | | 1,328,873 | | — |
| Moderately Conservative Allocation | | — | | — | | 7,591,127 | | 2,786,155 | | 367,841 | | — |
| Partner Small Cap Growth | | — | | — | | 50,532 | | — | | 3,462 | | — |
| Partner Small Cap Value | | — | | — | | 1,651,146 | | 4,448,423 | | 4,632,190 | | 2,019,625 |
| Small Cap Stock | | — | | — | | 32,327 | | 4,771,807 | | 56,823,771 | | 47,821,237 |
| Small Cap Index | | — | | — | | 147,024 | | 243,253 | | 3,303,677 | | 709,185 |
| Mid Cap Growth | | — | | — | | — | | — | | 22,856,197 | | — |
| Partner Mid Cap Value | | — | | — | | 582,204 | | 48,599 | | 122,933 | | — |
| Mid Cap Stock | | — | | — | | 65,331,719 | | 25,737,749 | | 121,689,673 | | 75,803,624 |
| Mid Cap Index | | — | | — | | 465,453 | | 625,306 | | 2,807,927 | | 3,626,796 |
| Mid Cap Index-I | | — | | — | | 283,367 | | 242,831 | | 1,069,029 | | 1,424,659 |
| Partner International Stock | | — | | — | | 7,072,912 | | 4,550,020 | | — | | — |
| Large Cap Growth | | — | | — | | 1,611,639 | | 362,403 | | — | | — |
| Large Cap Value | | — | | — | | 11,311,021 | | 4,838,129 | | 23,854,746 | | 5,697,959 |
| Large Cap Stock | | — | | — | | 32,993,037 | | 37,690,959 | | 142,672,537 | | 22,898,216 |
| Large Cap Index | | — | | — | | 1,253,298 | | 1,207,208 | | — | | 88,417 |
| Large Cap Index-I | | — | | — | | 475,130 | | 431,528 | | — | | — |
| Balanced | | — | | — | | 14,616,287 | | 15,177,996 | | 7,585,175 | | 1,409,661 |
| High Yield | | — | | — | | 45,718,586 | | 47,156,259 | | — | | — |
| Municipal Bond | | 52,400,219 | | 55,230,913 | | 305,138 | | 454,696 | | — | | — |
| Income | | — | | — | | 36,677,821 | | 29,934,835 | | — | | — |
| Core Bond | | — | | — | | 16,966,618 | | 19,829,282 | | — | | — |
| Limited Maturity Bond | | — | | — | | 15,855,497 | | 9,229,771 | | — | | — |
| Money Market | | — | | — | | 68,072,261 | | 45,741,062 | | — | | — |
THRIVENT MUTUAL FUNDS
Notes to Financial Statements
As of October 31, 2007
(5) DISTRIBUTIONS BY CLASS
Distributions to shareholders, by class, for the year ended October 31, 2007, and the year ended October 31, 2006, were as follows:
| | | | | | | | | | | | | | | | |
| | | Net Investment Income |
| | |
|
| | | For the year ended, | | For the year ended, |
| | | October 31, 2007 | | October 31, 2006 |
| | |
| |
|
| | | | | | | Institutional | | | | | | Institutional |
| Fund | | Class A | | Class B | | Class | | Class A | | Class B | | Class |
| |
| |
| |
| |
| |
| |
|
| Aggressive Allocation | $ | 3,146,988 | | $ | N/A | $ | 750,784 | | $ | 499,413 | | $ | N/A | | $ | 94,094 |
| Moderately Aggressive Allocation | | 9,799,040 | | | N/A | | 1,061,897 | | | 1,225,560 | | | N/A | | | 134,738 |
| Moderate Allocation | | 16,844,414 | | | N/A | | 650,845 | | | 5,750,817 | | | N/A | | | 257,059 |
| Moderately Conservative Allocation | | 7,172,710 | | | N/A | | 322,998 | | | 2,682,736 | | | N/A | | | 103,419 |
| Partner Small Cap Growth | | — | | | N/A | | 53,994 | | | — | | | N/A | | | — |
| Partner Small Cap Value | | 82,693 | | | — | | 283,893 | | | 218,412 | | | — | | | 163,178 |
| Small Cap Index | | 70,526 | | | N/A | | N/A | | | 73,001 | | | N/A | | | N/A |
| Partner Mid Cap Value | | 114,566 | | | N/A | | 392,417 | | | 19,273 | | | N/A | | | 29,326 |
| Mid Cap Stock | | 934,770 | | | — | | 596,646 | | | — | | | — | | | — |
| Mid Cap Index | | 435,746 | | | N/A | | N/A | | | 289,668 | | | N/A | | | N/A |
| Mid Cap Index-I | | N/A | | | N/A | | 251,521 | | | N/A | | | N/A | | | 125,860 |
| Partner International Stock | | 3,564,945 | | | — | | 3,507,967 | | | 3,199,167 | | | — | | | 1,350,853 |
| Large Cap Growth | | 79,128 | | | — | | 1,532,511 | | | 122,283 | | | — | | | 240,120 |
| Large Cap Value | | 3,510,097 | | | — | | 2,737,155 | | | 3,831,080 | | | — | | | 1,007,049 |
| Large Cap Stock | | 29,416,377 | | | — | | 3,576,660 | | | 21,262,576 | | | — | | | 1,707,131 |
| Large Cap Index | | 1,253,298 | | | N/A | | N/A | | | 1,207,200 | | | N/A | | | N/A |
| Large Cap Index-I | | N/A | | | N/A | | 475,130 | | | N/A | | | N/A | | | 431,528 |
| Balanced | | 4,080,959 | | | 58,987 | | 1,829,966 | | | 4,474,474 | | | 81,473 | | | 1,986,805 |
| High Yield | | 38,730,328 | | | 858,863 | | 6,129,395 | | | 41,475,295 | | | 1,328,620 | | | 4,352,344 |
| Municipal Bond | | 51,437,720 | | | 620,903 | | 646,734 | | 54,232,768 | | | 973,846 | | | 478,995 |
| Income | | 21,947,436 | | | 369,410 | | 14,360,975 | | 23,681,428 | | | 624,352 | | | 5,629,055 |
| Core Bond | | 14,288,518 | | | 217,178 | | 2,460,922 | | 17,088,041 | | | 329,212 | | | 2,412,029 |
| Limited Maturity Bond | | 4,974,929 | | | 77,823 | | 10,802,745 | | | 4,956,801 | | | 75,563 | | | 4,197,407 |
| Money Market | | 48,853,618 | | | 69,182 | | 19,149,461 | | 31,013,880 | | | 62,635 | | 14,664,547 |
| |
| | | Net Realized Gains |
| | |
|
| | | For the year ended, | | For the year ended, |
| | | October 31, 2007 | | October 31, 2006 |
| | |
| |
|
| | | | | | | Institutional | | | | | | Institutional |
| Fund | | Class A | | Class B | | Class | | Class A | | Class B | | Class |
| |
| |
| |
| |
| |
| |
|
| Aggressive Allocation | $ | 528,141 | | $ | N/A | $ | 104,738 | | $ | — | | $ | N/A | | $ | — |
| Moderately Aggressive Allocation | | 939,117 | | | N/A | | 91,429 | | | — | | | N/A | | | — |
| Moderate Allocation | | 1,638,900 | | | N/A | | 59,336 | | | — | | | N/A | | | — |
| Moderately Conservative Allocation | | 441,585 | | | N/A | | 21,675 | | | — | | | N/A | | | — |
| Partner Small Cap Value | | 3,597,545 | | | 244,365 | | 2,074,840 | | | 4,655,087 | | | 358,184 | | | 1,073,187 |
| Small Cap Stock | | 46,362,450 | | | 1,765,313 | | 8,728,335 | | | 47,662,131 | | | 2,332,355 | | | 2,598,558 |
| Small Cap Index | | 3,380,175 | | | N/A | | N/A | | | 879,437 | | | N/A | | | N/A |
| Mid Cap Growth | | 18,640,285 | | 1,923,145 | | 2,292,767 | | | — | | | — | | | — |
| Partner Mid Cap Value | | 46,696 | | | N/A | | 151,458 | | | — | | | N/A | | | — |
| Mid Cap Stock | | 162,402,109 | | | 3,354,680 | | 19,733,187 | | | 93,424,844 | | | 2,559,861 | | | 5,556,668 |
| Mid Cap Index | | 2,837,634 | | | N/A | | N/A | | | 3,962,434 | | | N/A | | | N/A |
| Mid Cap Index-I | | N/A | | | N/A | | 1,100,875 | | | N/A | | | N/A | | | 1,541,630 |
| Large Cap Value | | 18,379,765 | | | 781,553 | | 9,757,197 | | | 4,623,401 | | | 241,078 | | | 833,480 |
| Large Cap Stock | | 129,024,404 | | 2,960,678 | | 10,687,455 | | 34,978,181 | | 1,011,454 | | | 1,629,833 |
| Large Cap Index | | — | | | N/A | | N/A | | | 88,425 | | | N/A | | | N/A |
| Balanced | | 11,718,521 | | | 454,631 | | 4,058,398 | | | 7,173,390 | | | 339,341 | | | 2,532,174 |
THRIVENT MUTUAL FUNDS
Notes to Financial Statements
As of October 31, 2007
(6) SECURITY TRANSACTIONS
(A) Purchases and Sales of Investment Securities —
For the year ended October 31, 2007, the cost of purchases and the proceeds from sales of investment securities other than U.S. Government and short-term securities were as follows:
| | | | |
| | In thousands | |
|
| |
| Fund | Purchases | | Sales | |
| |
| Aggressive Allocation | $ 179,919 | | $ 43,761 | |
| Moderately Aggressive Allocation | 491,895 | | 123,325 | |
| Moderate Allocation | 465,360 | | 138,862 | |
| Moderately Conservative Allocation | 162,725 | | 37,908 | |
| Technology | 47,409 | | 56,141 | |
| Partner Small Cap Growth | 81,151 | | 54,355 | |
| Partner Small Cap Value | 50,375 | | 47,663 | |
| Small Cap Stock | 585,535 | | 658,160 | |
| Small Cap Index | 8,108 | | 14,106 | |
| Mid Cap Growth | 271,186 | | 316,561 | |
| Partner Mid Cap Value | 46,691 | | 36,800 | |
| Mid Cap Stock | 2,070,830 | | 2,165,516 | |
| Mid Cap Index | 9,975 | | 17,736 | |
| Mid Cap Index-I | 3,185 | | 14,697 | |
| Partner International Stock | 728,413 | | 688,071 | |
| Large Cap Growth | 882,538 | | 751,741 | |
| Large Cap Value | 300,465 | | 210,947 | |
| Large Cap Stock | 3,359,794 | | 3,665,603 | |
| Large Cap Index | 4,678 | | 14,344 | |
| Large Cap Index-I | 3,241 | | 4,439 | |
| Balanced | 186,133 | | 233,445 | |
| High Yield | 407,309 | | 462,233 | |
| Municipal Bond | 85,440 | | 114,343 | |
| Income | 617,335 | | 413,015 | |
| Core Bond | 223,855 | | 209,937 | |
| Limited Maturity Bond | 271,693 | | 125,533 | |
Purchases and sales of U.S. Government securities were:
| | | | |
| | In thousands | |
|
| |
| Fund | Purchases | | Sales | |
| |
| Balanced | $ 434,158 | | $ 442,383 | |
| Income | 1,388,698 | | 1,413,966 | |
| Core Bond | 1,514,663 | | 1,558,863 | |
| Limited Maturity Bond | 323,689 | | 308,211 | |
(B) Investments in Restricted Securities — Certain Funds may own restricted securities that were purchased in private placement transactions without registration under the Securities Act of 1933. Unless such securities subsequently become registered, they generally may be resold only in privately negotiated transactions with a limited number of purchasers. Currently no Funds hold such securities. The Funds have no right to require registration of unregistered securities.
(C) Investments in High-Yielding Securities — High Yield Fund invests primarily in high-yielding fixed-income securities. Each of the other Funds, except Money Market Fund, may also invest in high-yielding securities. These securities will typically be in the lower rating categories or will be non-rated and generally will involve more risk than securities in the higher rating categories. Lower rated or unrated securities are more likely to react to developments affecting market risk and credit risk than are more highly rated securities, which react primarily to movements in the general level of interest rates.
(D) Investments in Options and Futures Contracts —The movement in the price of the security underlying an option or futures contract may not correlate perfectly with the movement in the prices of the portfolio securities being hedged. A lack of correlation could render the Fund’s hedging strategy unsuccessful and could result in a loss to the Fund. In the event that a liquid secondary market would not exist, the Fund could be prevented from entering into a closing transaction, which could result in additional losses to the Fund.
(E) Written Option Contracts — The number of contracts and premium amounts associated with call option contracts written during the year ended October 31, 2007, were as follows:
| | | | |
| | Mid Cap Growth | |
|
| |
| | Number of | | Premium | |
| | Contracts | | Amount | |
| |
| Balance at October 31, 2006 | 169 | | $ 67,259 | |
| Opened | 81 | | 50,921 | |
| Closed | (149) | | (26,762) | |
| Expired | — | | — | |
| Exercised | (70) | | (83,434) | |
| |
| |
| |
| Balance at October 31, 2007 | 31 | | $ 7,984 | |
| |
| |
| |
| | |
| | |
| | Large Cap Growth | |
|
| |
| | Number of | | Premium | |
| | Contracts | | Amount | |
| |
| Balance at October 31, 2006 | 77 | | $ 18,542 | |
| Opened | 5,553 | | 898,689 | |
| Closed | (2,833) | | (547,871) | |
| Expired | (1,453) | | (143,845) | |
| Exercised | (511) | | (116,223) | |
| |
| |
| |
| Balance at October 31, 2007 | 833 | | $ 109,292 | |
| |
| |
| |
THRIVENT MUTUAL FUNDS
Notes to Financial Statements
As of October 31, 2007
(6) SECURITY TRANSACTIONS — continued
| | | | |
| | Balanced | |
|
| |
| | Number of | | Premium | |
| | Contracts | | Amount | |
| |
| Balance at October 31, 2006 | — | | $ — | |
| Opened | 35 | | 85,663 | |
| Closed | (5) | | (10,156) | |
| Expired | (10) | | (21,484) | |
| Exercised | (14) | | (35,273) | |
| |
| |
| |
| Balance at October 31, 2007 | 6 | | $ 18,750 | |
| |
| |
| |
| | | | |
| | Income | |
|
| |
| | Number of | | Premium | |
| | Contracts | | Amount | |
| |
| Balance at October 31, 2006 | — | | $ — | |
| Opened | 193 | | 431,056 | |
| Closed | (35) | | (71,094) | |
| Expired | (70) | | (150,391) | |
| Exercised | (51) | | (128,633) | |
| |
| |
| |
| Balance at October 31, 2007 | 37 | | $ 80,938 | |
| |
| |
| |
| | | | |
| | Core Bond | |
|
| |
| | Number of | | Premium | |
| | Contracts | | Amount | |
| |
| Balance at October 31, 2006 | — | | $ — | |
| Opened | 134 | | 325,040 | |
| Closed | (20) | | (40,625) | |
| Expired | (40) | | (85,938) | |
| Exercised | (50) | | (123,477) | |
| |
| |
| |
| Balance at October 31, 2007 | 24 | | $ 75,000 | |
| |
| |
| |
| | |
| | Limited Maturity Bond | |
|
| |
| | Number of | | Premium | |
| | Contracts | | Amount | |
| |
| Balance at October 31, 2006 | — | | $ — | |
| Opened | 87 | | 142,071 | |
| Closed | (15) | | (16,992) | |
| Expired | (30) | | (47,461) | |
| Exercised | (35) | | (62,305) | |
| |
| |
| |
| Balance at October 31, 2007 | 7 | | $ 15,313 | |
| |
| |
| |
(7) INVESTMENTS IN AFFILIATES
Affiliated issuers, as defined under the Investment Company Act of 1940, include those in which the Fund’s holdings of an issuer represent 5% or more of the outstanding voting securities of an issuer, or any affiliated mutual fund. A summary of transactions for the year ended October 31, 2007, in the Money Market Fund, is as follows:
| | | | | | | | | | | |
| | | Gross | | Gross | | Balance of | | | | Dividend Income | |
| | | Purchases and | | Sales and | | Shares Held at | | Value | | November 1, 2006 – | |
| Fund | | Additions | | Reductions | | October 31, 2007 | | October 31, 2007 | | October 31, 2007 | |
| |
| Aggressive Allocation | | $ 7,161,006 | | $ 6,081,104 | | 5,177,999 | | $ 5,177,999 | | $ 220,072 | |
| Moderately Aggressive Allocation | | 43,222,317 | | 21,853,833 | | 34,776,744 | | 34,776,744 | | 982,846 | |
| Moderate Allocation | | 50,906,613 | | 14,387,610 | | 67,606,196 | | 67,606,196 | | 2,492,233 | |
| Moderately Conservative Allocation | | 24,372,285 | | 8,140,745 | | 32,162,304 | | 32,162,304 | | 1,231,721 | |
| Technology | | 15,223,014 | | 15,309,650 | | 1,246,466 | | 1,246,466 | | 39,897 | |
| Partner Small Cap Growth | | 16,985,396 | | 17,045,027 | | 1,200,706 | | 1,200,706 | | 58,020 | |
| Partner Small Cap Value | | 29,182,642 | | 30,582,022 | | 4,123,694 | | 4,123,694 | | 252,375 | |
| Small Cap Stock | | 171,905,585 | | 151,148,426 | | 34,676,065 | | 34,676,065 | | 1,409,829 | |
| Small Cap Index | | 7,898,191 | | 8,229,420 | | 254,837 | | 254,837 | | 39,128 | |
| Mid Cap Growth | | 91,018,688 | | 85,942,916 | | 19,343,238 | | 19,343,238 | | 677,293 | |
| Partner Mid Cap Value | | 23,046,542 | | 21,873,455 | | 2,336,105 | | 2,336,105 | | 71,581 | |
| Mid Cap Stock | | 172,294,170 | | 189,186,408 | | 18,634,670 | | 18,634,670 | | 1,603,830 | |
| Mid Cap Index | | 11,234,424 | | 12,403,165 | | 792,453 | | 792,453 | | 74,334 | |
| Mid Cap Index-I | | 8,952,315 | | 8,589,010 | | 803,792 | | 803,792 | | 30,153 | |
| Partner International Stock | | 134,421,624 | | 141,466,042 | | 3,750,651 | | 3,750,651 | | 309,552 | |
| Large Cap Growth | | 182,462,483 | | 171,849,061 | | 23,750,652 | | 23,750,652 | | 651,377 | |
| Large Cap Value | | 126,490,591 | | 113,744,072 | | 27,288,103 | | 27,288,103 | | 830,090 | |
| Large Cap Stock | | 113,748,282 | | 143,210,223 | | 4,615,730 | | 4,615,730 | | 1,289,923 | |
| Large Cap Index | | 13,370,930 | | 13,277,723 | | 2,178,690 | | 2,178,690 | | 54,170 | |
| Large Cap Index-I | | 8,464,516 | | 8,597,397 | | 840,619 | | 840,619 | | 38,418 | |
| Balanced | | 77,474,524 | | 80,112,943 | | 14,248,100 | | 14,248,100 | | 668,539 | |
| High Yield | | 158,022,071 | | 169,128,889 | | 10,283,074 | | 10,283,074 | | 1,281,612 | |
| Income | | 153,232,062 | | 163,510,193 | | 17,265,511 | | 17,265,511 | | 1,338,205 | |
| Core Bond | | 101,377,962 | | 86,399,419 | | 32,927,528 | | 32,927,528 | | 964,407 | |
| Limited Maturity Bond | | 150,074,346 | | 127,292,477 | | 28,229,455 | | 28,229,455 | | 768,037 | |
| Total Value and Dividend Income | | | | | | | | $388,513,382 | | $17,377,643 | |
| |
THRIVENT MUTUAL FUNDS
Notes to Financial Statements
As of October 31, 2007
A summary of transactions for the year ended October 31, 2007, in the Thrivent Financial Securities Lending Trust, is as follows:
| | | | | | | | | | |
| | | Gross | | Gross | | Balance of | | | | |
| | | Purchases and | | Sales and | | Shares Held | | Value | | |
| Fund | | Additions | | Reductions | | October 31, 2007 | | October 31, 2007 | | |
| | |
| Technology | | $ 67,349,945 | | $ 75,286,997 | | 3,005,900 | | $ 3,005,900 | | |
| Partner Small Cap Growth | | 62,752,180 | | 47,735,563 | | 25,651,383 | | 25,651,383 | | |
| Partner Small Cap Value | | 118,004,225 | | 112,752,422 | | 38,943,138 | | 38,943,138 | | |
| Small Cap Stock | | 414,699,600 | | 401,037,148 | | 158,510,727 | | 158,510,727 | | |
| Small Cap Index | | 27,161,597 | | 31,968,078 | | 7,664,789 | | 7,664,789 | | |
| Mid Cap Growth | | 271,084,401 | | 264,894,483 | | 89,916,284 | | 89,916,284 | | |
| Partner Mid Cap Value | | 57,925,405 | | 59,985,457 | | 4,022,546 | | 4,022,546 | | |
| Mid Cap Stock | | 1,553,190,316 | | 1,490,390,080 | | 263,325,754 | | 263,325,754 | | |
| Mid Cap Index | | 26,146,027 | | 36,626,875 | | 5,297,773 | | 5,297,773 | | |
| Mid Cap Index-I | | 7,723,286 | | 13,280,146 | | 323,882 | | 323,882 | | |
| Partner International Stock | | 85,720,780 | | 57,984,638 | | 27,736,142 | | 27,736,142 | | |
| Large Cap Growth | | 358,081,192 | | 324,166,943 | | 43,016,898 | | 43,016,898 | | |
| Large Cap Value | | 509,627,416 | | 450,863,390 | | 75,833,378 | | 75,833,378 | | |
| Large Cap Stock | | 3,119,490,481 | | 2,831,520,071 | | 417,436,171 | | 417,436,171 | | |
| Large Cap Index | | 50,266,288 | | 48,446,995 | | 4,630,568 | | 4,630,568 | | |
| Large Cap Index-I | | 39,001,966 | | 40,690,032 | | 911,167 | | 911,167 | | |
| Balanced | | 209,411,015 | | 222,691,669 | | 39,692,963 | | 39,692,963 | | |
| High Yield | | 389,242,400 | | 406,237,572 | | 69,283,020 | | 69,283,020 | | |
| Income | | 302,792,487 | | 315,677,846 | | 58,963,653 | | 58,963,653 | | |
| Core Bond | | 147,056,821 | | 169,638,237 | | 28,870,709 | | 28,870,709 | | |
| Limited Maturity Bond | | 106,890,879 | | 107,243,254 | | 14,722,625 | | 14,722,625 | | |
| Total Value | | | | | | | | $1,377,759,470 | | |
A summary of transactions for the Thrivent Allocation Funds for the year ended October 31, 2007, in the following Thrivent Mutual Funds, is as follows:
| | | | | | | | | | |
| | | Gross | | Gross | | Balance of | | | | Dividend Income |
| | | Purchases and | | Sales and | | Shares Held at | | Value | | November 1, 2006 – |
| Fund | | Additions | | Reductions | | October 31, 2007 | | October 31, 2007 | | October 31, 2007 |
|
| Aggressive Allocation | | | | | | | | | | |
| Partner Small Cap Growth | | $ 9,024,731 | | $2,007,376 | | 1,689,719 | | $ 23,656,063 | | $ 26,449 |
| Partner Small Cap Value | | 8,432,928 | | 6,920,928 | | 958,340 | | 16,387,607 | | 94,117 |
| Small Cap Stock | | 16,034,155 | | 3,415,990 | | 1,396,962 | | 28,805,358 | | — |
| Mid Cap Growth | | 6,533,790 | | 3,994,448 | | 684,364 | | 14,357,962 | | — |
| Partner Mid Cap Value | | 5,741,170 | | 3,734,907 | | 985,802 | | 12,785,858 | | 175,235 |
| Mid Cap Stock | | 17,229,222 | | 178,365 | | 1,470,972 | | 28,154,410 | | 61,732 |
| Partner International Stock | | 29,331,531 | | 7,647,707 | | 5,149,652 | | 83,475,862 | | 834,073 |
| Large Cap Growth | | 31,593,382 | | 2,332,889 | | 12,112,728 | | 83,941,207 | | 298,326 |
| Large Cap Value | | 10,489,057 | | 944,858 | | 1,472,237 | | 26,603,332 | | 249,509 |
| Large Cap Stock | | 17,455,584 | | 420,230 | | 1,172,303 | | 37,033,043 | | 260,177 |
| Real Estate Securities | | 284,917 | | 561,099 | | — | | — | | 3,494 |
| High Yield | | 8,331,795 | | 8,394,402 | | 1,219,523 | | 6,146,398 | | 554,212 |
| Income | | 16,878,872 | | 204,436 | | 2,443,505 | | 20,745,356 | | 528,788 |
| Limited Maturity Bond | | 2,558,338 | | 3,002,983 | | 290,348 | | 3,638,056 | | 220,305 |
| Money Market | | 7,161,006 | | 6,081,104 | | 5,177,999 | | 5,177,999 | | 220,072 |
| Total Value and Dividend Income | | | | | | | | $390,908,511 | | $3,526,489 |
THRIVENT MUTUAL FUNDS
Notes to Financial Statements
As of October 31, 2007
(7) INVESTMENTS IN AFFILIATES — continued
| | | | | | | | | | |
| | | Gross | | Gross | | Balance of | | | | Dividend Income |
| | | Purchases and | | Sales and | | Shares Held at | | Value | | November 1, 2006 – |
| Fund | | Additions | | Reductions | | October 31, 2007 | | October 31, 2007 | | October 31, 2007 |
|
| Moderately Aggressive Allocation | | | | | | | | | | |
| Partner Small Cap Growth | | $11,040,655 | | $ 2,556,945 | | 2,001,571 | | $ 28,021,999 | | $ 27,256 |
| Partner Small Cap Value | | 10,795,914 | | 10,905,374 | | 1,014,385 | | 17,345,977 | | 97,049 |
| Small Cap Stock | | 24,064,127 | | 8,064,462 | | 1,762,476 | | 36,342,259 | | — |
| Mid Cap Growth | | 7,062,324 | | 8,067,351 | | 691,927 | | 14,516,628 | | — |
| Partner Mid Cap Value | | 6,151,458 | | 8,291,887 | | 997,962 | | 12,943,571 | | 217,180 |
| Mid Cap Stock | | 30,892,379 | | 14,708,776 | | 1,868,758 | | 35,768,035 | | 87,663 |
| Partner International Stock | | 54,212,934 | | 15,618,796 | | 8,134,917 | | 131,867,007 | | 1,282,220 |
| Large Cap Growth | | 70,955,166 | | 7,333,842 | | 22,556,473 | | 156,316,355 | | 529,219 |
| Large Cap Value | | 61,991,406 | | 704 | | 6,977,289 | | 126,079,605 | | 1,034,154 |
| Large Cap Stock | | 66,849,709 | | 3,282,907 | | 4,260,200 | | 134,579,715 | | 1,016,131 |
| Real Estate Securities | | 19,939,573 | | 4,119,320 | | 2,108,912 | | 26,888,622 | | 510,729 |
| High Yield | | 23,914,109 | | 33,544,033 | | 3,460,948 | | 17,443,177 | | 1,945,125 |
| Income | | 85,171,982 | | 666,649 | | 14,184,621 | | 120,427,429 | | 3,899,398 |
| Limited Maturity Bond | | 18,852,770 | | 6,163,969 | | 2,806,533 | | 35,165,854 | | 1,468,518 |
| Money Market | | 43,222,317 | | 21,853,833 | | 34,776,744 | | 34,776,744 | | 982,846 |
| Total Value and Dividend Income | | | | | | | | $928,482,977 | | $13,097,488 |
| |
| Moderate Allocation | | | | | | | | | | |
| Partner Small Cap Growth | | 11,967,544 | | — | | 909,883 | | 12,738,369 | | — |
| Partner Small Cap Value | | 7,978,363 | | — | | 460,466 | | 7,873,970 | | — |
| Small Cap Stock | | 16,958,782 | | 35,519,066 | | 663,859 | | 13,688,783 | | — |
| Mid Cap Growth | | 7,973,844 | | 518,333 | | 435,773 | | 9,142,524 | | — |
| Partner Mid Cap Value | | 7,973,850 | | 269,438 | | 629,362 | | 8,162,829 | | — |
| Mid Cap Stock | | 17,550,873 | | 18,769,550 | | 1,325,260 | | 25,365,467 | | 146,345 |
| Partner International Stock | | 35,291,834 | | 13,583,481 | | 5,492,884 | | 89,039,652 | | 886,081 |
| Large Cap Growth | | 52,766,702 | | 6,449,457 | | 18,073,384 | | 125,248,551 | | 448,866 |
| Large Cap Value | | 39,673,644 | | 1,956,835 | | 4,711,521 | | 85,137,182 | | 697,132 |
| Large Cap Stock | | 46,550,492 | | 7,710,202 | | 3,239,275 | | 102,328,711 | | 777,349 |
| Real Estate Securities | | 22,243,859 | | 10,835,747 | | 2,156,704 | | 27,497,973 | | 619,835 |
| High Yield | | 22,066,239 | | 32,155,837 | | 3,357,053 | | 16,919,546 | | 1,868,843 |
| Income | | 111,278,096 | | 8,434,293 | | 19,441,934 | | 165,062,022 | | 5,953,461 |
| Limited Maturity Bond | | 65,086,177 | | 2,659,951 | | 9,235,008 | | 115,714,654 | | 4,027,223 |
| Money Market | | 50,906,613 | | 14,387,610 | | 67,606,196 | | 67,606,196 | | 2,492,233 |
| Total Value and Dividend Income | | | | | | | | $871,526,429 | | $17,917,368 |
| |
| Moderately Conservative Allocation | | | | | | | | | | |
| Small Cap Stock | | 4,707,763 | | 2,187,574 | | 458,799 | | 9,460,435 | | — |
| Mid Cap Stock | | 5,098,535 | | 5,502,118 | | 321,973 | | 6,162,563 | | 34,353 |
| Partner International Stock | | 7,934,800 | | 3,580,844 | | 1,199,354 | | 19,441,529 | | 170,131 |
| Large Cap Growth | | 12,755,786 | | 2,922,054 | | 4,474,339 | | 31,007,166 | | 111,198 |
| Large Cap Value | | 9,792,607 | | 2,598,302 | | 1,114,662 | | 20,141,951 | | 163,605 |
| Large Cap Stock | | 12,380,410 | | 3,077,229 | | 773,314 | | 24,428,984 | | 174,165 |
| Real Estate Securities | | 8,239,592 | | 4,014,727 | | 779,481 | | 9,938,388 | | 216,683 |
| High Yield | | 7,270,800 | | 8,737,784 | | 1,276,026 | | 6,431,169 | | 551,159 |
| Income | | 29,521,821 | | 3,760,948 | | 5,510,716 | | 46,785,979 | | 1,623,922 |
| Limited Maturity Bond | | 65,022,788 | | 1,526,797 | | 8,731,554 | | 109,406,365 | | 3,652,656 |
| Money Market | | 24,372,285 | | 8,140,745 | | 32,162,304 | | 32,162,304 | | 1,231,917 |
| Total Value and Dividend Income | | | | | | | | $315,366,833 | | $7,929,789 |
THRIVENT MUTUAL FUNDS
Notes to Financial Statements
As of October 31, 2007
(8) SECURITY TRANSACTIONS WITH AFFILIATED FUNDS
The Funds are permitted to purchase or sell securities from or to certain other Funds under specified conditions outlined in procedures adopted by the Board of Trustees of the Trust. The procedures have been designed to ensure that any purchase or sale of securities by the Fund from or to another fund or portfolio that is or could be considered an affiliate by virtue of having a common investment adviser (or affiliated investment advisers), common Trustees and/or common officers complies with Rule 17a-7 of the 1940 Act. Further, as defined under the procedures, each transaction is effected at the current market price. Pursuant to these procedures, during the year ended October 31, 2007, the Funds engaged in purchases and sales of securities of $20,948,645 and $23,351,219, respectively.
(9) RELATED PARTY TRANSACTIONS
As of October 31, 2007, related parties held the following shares of Thrivent Mutual Funds:
| | |
| | | Percent of Fund’s |
| Fund | Shares | Outstanding Shares |
|
| Partner Small Cap Growth | 900,000 | 15.7% |
| Partner Mid Cap Value | 460,450 | 13.0% |
| Mid Cap Stock | 3,861,233 | 6.0% |
| Mid Cap Index-I | 52,321 | 5.7% |
| Large Cap Index-I | 388,648 | 11.8% |
| Core Bond | 4,433,981 | 11.3% |
| Limited Maturity Bond | 4,937,075 | 14.8% |
As of October 31, 2007, retirement plans sponsored by Thrivent Financial for Lutherans held the following shares of Thrivent Mutual Funds:
| | |
| | | Percent of Fund’s |
| Fund | Shares | Outstanding Shares |
|
| Aggressive Allocation | 4,142,096 | 14.6% |
| Moderately Aggressive Allocation | 5,016,861 | 7.2% |
| Partner Small Cap Value | 809,728 | 9.4% |
| Mid Cap Index-I | 762,259 | 82.5% |
| Large Cap Index-I | 2,613,293 | 79.6% |
| Balanced | 5,881,810 | 24.4% |
| Core Bond | 2,761,596 | 7.0% |
(10) SHARES OF BENEFICIAL INTEREST
The Declaration of Trust permits the Trust to issue an unlimited number of full and fractional shares of beneficial interest of all of the Funds. Automated conversions of Class B shares to Class A shares are included in the shares redeemed and sold amount. Transactions in Fund shares were as follows:
| | | | | | |
| | | | Aggressive Allocation Fund | |
| | |
|
| | | Class A | | Institutional Class |
| | |
| |
|
| Year Ended October 31, 2007 | | Shares | Amount | | Shares | Amount |
| |
|
| |
|
|
| Sold | | 11,145,392 | $ 141,612,846 | | 1,979,500 | $ 25,221,287 |
| |
| Dividends and distributions reinvested | | 303,204 | 3,665,237 | | 70,543 | 855,522 |
| |
| Redeemed | | (2,149,549) | (27,540,811) | | (879,192) | (11,249,500) |
| | |
|
| |
|
|
| Net Change | | 9,299,047 | $ 117,737,272 | | 1,170,851 | $ 14,827,309 |
| | |
|
| |
|
|
| |
| Year Ended October 31, 2006 | | | | | | |
| | | | | | |
| Sold | | 13,075,418 | $ 147,328,456 | | 3,128,872 | $ 35,198,189 |
| |
| Dividends and distributions reinvested | | 46,370 | 499,873 | | 8,720 | 94,094 |
| |
| Redeemed | | (732,893) | (8,298,776) | | (536,681) | (6,094,182) |
| | |
|
| |
|
|
| Net Change | | 12,388,895 | $ 139,529,553 | | 2,600,911 | $ 29,198,101 |
| | |
|
| |
|
|
THRIVENT MUTUAL FUNDS
Notes to Financial Statements
As of October 31, 2007
| | | | | | |
| (10) SHARES OF BENEFICIAL INTEREST — continued | | | |
| |
| | | Moderately Aggressive Allocation Fund |
| | |
|
| | | Class A | | Institutional Class |
| | |
| |
|
| Year Ended October 31, 2007 | | Shares | Amount | | Shares | Amount |
| |
|
| |
|
|
| Sold | | 32,827,844 | $ 405,451,968 | | 2,408,374 | $ 29,828,380 |
| |
| Dividends and distributions reinvested | | 903,871 | 10,702,312 | | 97,155 | 1,153,325 |
| |
| Redeemed | | (4,890,773) | (60,789,521) | | (727,993) | (9,070,981) |
| | |
|
| |
|
|
| Net Change | | 28,840,942 | $ 355,364,759 | | 1,777,536 | $ 21,910,724 |
| | |
|
| |
|
|
| |
| Year Ended October 31, 2006 | | | | | | |
| | | | | | |
| Sold | | 31,560,635 | $ 350,109,841 | | 3,471,588 | $ 38,408,189 |
| |
| Dividends and distributions reinvested | | 114,602 | 1,221,703 | | 12,628 | 134,737 |
| |
| Redeemed | | (1,696,994) | (18,900,089) | | (344,328) | (3,829,712) |
| | |
|
| |
|
|
| Net Change | | 29,978,243 | $ 332,431,455 | | 3,139,888 | $ 34,713,214 |
| | |
|
| |
|
|
| |
| | | | Moderate Allocation Fund | |
| | |
|
| | | Class A | | Institutional Class |
| | |
| |
|
| Year Ended October 31, 2007 | | Shares | Amount | | Shares | Amount |
| |
|
| |
|
|
| Sold | | 33,473,526 | $ 393,578,244 | | 1,206,409 | $ 14,190,666 |
| |
| Dividends and distributions reinvested | | 1,577,026 | 18,327,726 | | 60,742 | 706,921 |
| |
| Redeemed | | (5,753,418) | (67,815,953) | | (515,341) | (6,064,902) |
| | |
|
| |
|
|
| Net Change | | 29,297,134 | $ 344,090,017 | | 751,810 | $ 8,832,685 |
| | |
|
| |
|
|
| |
| Year Ended October 31, 2006 | | | | | | |
| | | | | | |
| Sold | | 33,438,724 | $ 362,112,798 | | 1,470,239 | $ 15,968,817 |
| |
| Dividends and distributions reinvested | | 526,632 | 5,698,786 | | 23,465 | 254,335 |
| |
| Redeemed | | (2,245,064) | (24,370,495) | | (264,002) | (2,881,642) |
| | |
|
| |
|
|
| Net Change | | 31,720,292 | $ 343,441,089 | | 1,229,702 | $ 13,341,510 |
| | |
|
| |
|
|
| |
| | | Moderately Conservative Allocation Fund |
| | |
|
| | | Class A | | Institutional Class |
| | |
| |
|
| Year Ended October 31, 2007 | | Shares | Amount | | Shares | Amount |
| |
|
| |
|
|
| Sold | | 14,097,689 | $ 158,211,117 | | 797,525 | $ 8,905,753 |
| |
| Dividends and distributions reinvested | | 675,328 | 7,522,058 | | 28,867 | 321,484 |
| |
| Redeemed | | (2,678,590) | (30,042,629) | | (576,060) | (6,455,102) |
| | |
|
| |
|
|
| Net Change | | 12,094,427 | $ 135,690,546 | | 250,332 | $ 2,772,135 |
| | |
|
| |
|
|
| |
| Year Ended October 31, 2006 | | | | | | |
| | | | | | |
| Sold | | 12,261,652 | $ 129,400,033 | | 664,580 | $ 7,047,732 |
| |
| Dividends and distributions reinvested | | 250,577 | 2,645,161 | | 9,531 | 100,909 |
| |
| Redeemed | | (1,375,509) | (14,531,407) | | (154,930) | (1,656,338) |
| | |
|
| |
|
|
| Net Change | | 11,136,720 | $ 117,513,787 | | 519,181 | $ 5,492,303 |
| | |
|
| |
|
|
THRIVENT MUTUAL FUNDS
Notes to Financial Statements
As of October 31, 2007
| | | | | | | | | |
| | | | | | Technology Fund | | | |
| | |
|
| | | Class A | | Class B | | Institutional Class |
| | |
| |
| |
|
| Year Ended October 31, 2007 | | Shares | Amount | | Shares | Amount | | Shares | Amount |
| |
|
| |
|
| |
|
|
| Sold | | 1,146,815 | $ 4,607,775 | | 2,428 | $ 9,130 | | 11,922 | $ 53,217 |
| |
| Dividends and distributions reinvested | | — | — | | — | — | | — | — |
| |
| Redeemed | | (2,827,104) | (11,179,185) | | (288,947) | (1,092,074) | | (26,208) | (114,062) |
| | |
|
| |
|
| |
|
|
| Net Change | | (1,680,289) | $ (6,571,410) | | (286,519) | $ (1,082,944) | | (14,286) | $ (60,845) |
| | |
|
| |
|
| |
|
|
| |
| Year Ended October 31, 2006 | | | | | | | | | |
| | | | | | | | | |
| Sold | | 1,575,576 | $ 5,840,342 | | 2,386 | $ 8,647 | | 40,689 | $ 161,546 |
| |
| Dividends and distributions reinvested | | — | — | | — | — | | — | — |
| |
| Redeemed | | (3,073,377) | (11,306,964) | | (384,866) | (1,362,959) | | (201,063) | (807,361) |
| | |
|
| |
|
| |
|
|
| Net Change | | (1,497,801) | $ (5,466,622) | | (382,480) | $ (1,354,312) | | (160,374) | $ (645,815) |
| | |
|
| |
|
| |
|
|
| |
| | | Partner Small Cap Growth Fund | | | |
| | |
| | | |
| | | Class A | | Institutional Class | | | |
| | |
| |
| | | |
| Year Ended October 31, 2007 | | Shares | Amount | | Shares | Amount | | | |
| |
|
| |
|
| | | |
| Sold | | 128,058 | $ 1,624,901 | | 2,488,996 | $ 32,039,224 | | | |
| |
| Dividends and distributions reinvested | | — | — | | 4,414 | 53,894 | | | |
| |
| Redeemed | | (39,443) | (497,747) | | (384,916) | (4,855,762) | | | |
| | |
|
| |
|
| | | |
| Net Change | | 88,615 | $ 1,127,154 | | 2,108,494 | $ 27,237,356 | | | |
| | |
|
| |
|
| | | |
| |
| Year Ended October 31, 2006 | | | | | | | | | |
| | | | | | | | | |
| Sold | | 149,939 | $ 1,731,354 | | 2,204,481 | $ 25,203,271 | | | |
| |
| Dividends and distributions reinvested | | — | — | | — | — | | | |
| |
| Redeemed | | (48,537) | (540,910) | | (111,243) | (1,235,886) | | | |
| | |
|
| |
|
| | | |
| Net Change | | 101,402 | $ 1,190,444 | | 2,093,238 | $ 23,967,385 | | | |
| | |
|
| |
|
| | | |
| |
| | | | | | Partner Small Cap Value Fund | | | |
| | |
|
| | | Class A | | Class B | | Institutional Class |
| | |
| |
| |
|
| Year Ended October 31, 2007 | | Shares | Amount | | Shares | Amount | | Shares | Amount |
| |
|
| |
|
| |
|
|
| Sold | | 968,005 | $ 15,747,777 | | 6,664 | $ 102,992 | | 1,947,958 | $ 33,076,549 |
| |
| Dividends and distributions reinvested | | 236,169 | 3,652,846 | | 16,612 | 243,530 | | 145,712 | 2,350,278 |
| |
| Redeemed | | (1,278,190) | (20,814,723) | | (161,479) | (2,497,225) | | (1,484,075) | (25,420,864) |
| | |
|
| |
|
| |
|
|
| Net Change | | (74,016) | $ (1,414,100) | | (138,203) | $ (2,150,703) | | 609,595 | $ 10,005,963 |
| | |
|
| |
|
| |
|
|
| |
| Year Ended October 31, 2006 | | | | | | | | | |
| | | | | | | | | |
| Sold | | 789,494 | $ 11,717,794 | | 13,752 | $ 195,259 | | 1,928,137 | $ 29,480,789 |
| |
| Dividends and distributions reinvested | | 360,245 | 4,839,610 | | 27,743 | 356,497 | | 88,388 | 1,234,013 |
| |
| Redeemed | | (1,344,105) | (19,806,868) | | (79,761) | (1,125,979) | | (376,799) | (5,715,628) |
| | |
|
| |
|
| |
|
|
| Net Change | | (194,366) | $ (3,249,464) | | (38,266) | $ (574,223) | | 1,639,726 | $ 24,999,174 |
| | |
|
| |
|
| |
|
|
THRIVENT MUTUAL FUNDS
Notes to Financial Statements
As of October 31, 2007
| | | | | | | | | |
| (10) SHARES OF BENEFICIAL INTEREST — continued | | | | | | |
| |
| | | | | | Small Cap Stock Fund | | | |
| | |
|
| | | Class A | | Class B | | Institutional Class |
| | |
| |
| |
|
| Year Ended October 31, 2007 | | Shares | Amount | | Shares | Amount | | Shares | Amount |
| |
|
| |
|
| |
|
|
| Sold | | 1,528,313 | $ 27,270,640 | | 5,394 | $ 86,399 | | 3,359,223 | $ 64,910,432 |
| |
| Dividends and distributions reinvested | | 2,727,091 | 46,060,560 | | 119,003 | 1,758,869 | | 466,152 | 8,511,934 |
| |
| Redeemed | | (5,355,767) | (95,829,947) | | (485,003) | (7,585,929) | | (2,953,241) | (56,947,213) |
| | |
|
| |
|
| |
|
|
| Net Change | | (1,100,363) | $ (22,498,747) | | (360,606) | $ (5,740,661) | | 872,134 | $ 16,475,153 |
| | |
|
| |
|
| |
|
|
| |
| Year Ended October 31, 2006 | | | | | | | | | |
| | | | | | | | | |
| Sold | | 2,538,144 | $ 45,530,084 | | 20,683 | $ 333,420 | | 3,185,306 | $ 60,806,535 |
| |
| Dividends and distributions reinvested | | 2,854,211 | 47,380,770 | | 156,278 | 2,326,978 | | 136,717 | 2,421,260 |
| |
| Redeemed | | (5,404,823) | (96,654,667) | | (457,190) | (7,322,618) | | (146,207) | (2,770,269) |
| | |
|
| |
|
| |
|
|
| Net Change | | (12,468) | $ (3,743,813) | | (280,229) | $ (4,662,220) | | 3,175,816 | $ 60,457,526 |
| | |
|
| |
|
| |
|
|
| |
| | | Small Cap Index Fund | | | | | | |
| | |
| | | | | | |
| | | Class A | | | | | | |
| | |
| | | | | | |
| Year Ended October 31, 2007 | | Shares | Amount | | | | | | |
| |
|
| | | | | | |
| Sold | | 260,961 | $ 4,199,158 | | | | | | |
| |
| Dividends and distributions reinvested | | 221,916 | 3,398,452 | | | | | | |
| |
| Redeemed | | (658,792) | (10,607,413) | | | | | | |
| | |
|
| | | | | | |
| Net Change | | (175,915) | $ (3,009,803) | | | | | | |
| | |
|
| | | | | | |
| |
| Year Ended October 31, 2006 | | | | | | | | | |
| | | | | | | | | |
| Sold | | 427,563 | $ 6,576,606 | | | | | | |
| |
| Dividends and distributions reinvested | | 64,987 | 942,691 | | | | | | |
| |
| Redeemed | | (799,487) | (12,298,315) | | | | | | |
| | |
|
| | | | | | |
| Net Change | | (306,937) | $ (4,779,018) | | | | | | |
| | |
|
| | | | | | |
| |
| | | | | | Mid Cap Growth Fund | | | |
| | |
|
| | | Class A | | Class B | | Institutional Class |
| | |
| |
| |
|
| Year Ended October 31, 2007 | | Shares | Amount | | Shares | Amount | | Shares | Amount |
| |
|
| |
|
| |
|
|
| Sold | | 1,499,540 | $ 25,689,155 | | 5,002 | $ 81,533 | | 1,187,378 | $ 21,125,779 |
| |
| Dividends and distributions reinvested | | 1,179,730 | 18,439,231 | | 133,760 | 1,919,476 | | 134,846 | 2,260,015 |
| |
| Redeemed | | (3,480,249) | (58,829,380) | | (814,726) | (12,583,879) | | (1,187,980) | (21,423,642) |
| | |
|
| |
|
| |
|
|
| Net Change | | (800,979) | $ (14,700,994) | | (675,964) | $ (10,582,870) | | 134,244 | $ 1,962,152 |
| | |
|
| |
|
| |
|
|
| |
| Year Ended October 31, 2006 | | | | | | | | | |
| | | | | | | | | |
| Sold | | 1,696,141 | $ 26,951,615 | | 10,638 | $ 159,589 | | 1,194,522 | $ 20,150,089 |
| |
| Dividends and distributions reinvested | | — | — | | — | — | | — | — |
| |
| Redeemed | | (3,776,345) | (59,668,750) | | (893,515) | (13,144,985) | | (80,530) | (1,335,045) |
| | |
|
| |
|
| |
|
|
| Net Change | | (2,080,204) | $ (32,717,135) | | (882,877) | $ (12,985,396) | | 1,113,992 | $ 18,815,044 |
| | |
|
| |
|
| |
|
|
THRIVENT MUTUAL FUNDS
Notes to Financial Statements
As of October 31, 2007
| | | | | | | | | |
| | | | Partner Mid Cap Value Fund | | | | |
| | |
| | | |
| | | Class A | | Institutional Class | | | |
| | |
| |
| | | |
| Year Ended October 31, 2007 | | Shares | Amount | | Shares | Amount | | | |
| |
|
| |
|
| | | |
| Sold | | 365,176 | $ 4,658,869 | | 1,553,427 | $ 19,409,359 | | | |
| |
| Dividends and distributions reinvested | | 13,192 | 160,156 | | 44,738 | 543,873 | | | |
| |
| Redeemed | | (89,498) | (1,137,851) | | (992,229) | (12,323,791) | | | |
| | |
|
| |
|
| | | |
| Net Change | | 288,870 | $ 3,681,174 | | 605,936 | $ 7,629,441 | | | |
| | |
|
| |
|
| | | |
| |
| Year Ended October 31, 2006 | | | | | | | | | |
| | | | | | | | | |
| Sold | | 152,647 | $ 1,676,515 | | 1,713,309 | $ 18,850,083 | | | |
| |
| Dividends and distributions reinvested | | 1,820 | 19,259 | | 2,772 | 29,325 | | | |
| |
| Redeemed | | (17,102) | (190,153) | | (63,360) | (701,328) | | | |
| | |
|
| |
|
| | | |
| Net Change | | 137,365 | $ 1,505,621 | | 1,652,721 | $ 18,178,080 | | | |
| | |
|
| |
|
| | | |
| |
| |
| | | | | | Mid Cap Stock Fund | | | |
| | |
|
| | | Class A | | Class B | | Institutional Class |
| | |
| |
| |
|
| Year Ended October 31, 2007 | | Shares | Amount | | Shares | Amount | | Shares | Amount |
| |
|
| |
|
| |
|
|
| Sold | | 3,888,821 | $ 67,807,186 | | 13,710 | $ 209,008 | | 4,919,725 | $ 90,057,227 |
| |
| Dividends and distributions reinvested | | 10,027,387 | 161,645,118 | | 242,752 | 3,349,973 | | 1,162,098 | 19,941,268 |
| |
| Redeemed | | (11,395,657) | (198,642,538) | | (608,710) | (9,091,254) | | (3,034,787) | (55,534,884) |
| | |
|
| |
|
| |
|
|
| Net Change | | 2,520,551 | $ 30,809,766 | | (352,248) | $ (5,532,273) | | 3,047,036 | $ 54,463,611 |
| | |
|
| |
|
| |
|
|
| |
| Year Ended October 31, 2006 | | | | | | | | | |
| | | | | | | | | |
| Sold | | 4,939,835 | $ 88,864,839 | | 44,431 | $ 712,655 | | 3,685,704 | $ 69,379,972 |
| |
| Dividends and distributions reinvested | | 5,464,459 | 92,680,703 | | 169,303 | 2,553,082 | | 304,504 | 5,417,124 |
| |
| Redeemed | | (9,926,843) | (177,890,193) | | (572,630) | (9,122,694) | | (771,657) | (14,421,120) |
| | |
|
| |
|
| |
|
|
| Net Change | | 477,451 | $ 3,655,349 | | (358,896) | $ (5,856,957) | | 3,218,551 | $ 60,375,976 |
| | |
|
| |
|
| |
|
|
| |
| |
| | | Mid Cap Index Fund | | Mid Cap Index Fund-I | | | |
| | |
| |
| | | |
| | | Class A | | Institutional Class | | | |
| | |
| |
| | | |
| Year Ended October 31, 2007 | | Shares | Amount | | Shares | Amount | | | |
| |
|
| |
|
| | | |
| Sold | | 375,877 | $ 5,674,544 | | 237,294 | $ 3,473,328 | | | |
| |
| Dividends and distributions reinvested | | 227,674 | 3,235,987 | | 97,308 | 1,331,116 | | | |
| |
| Redeemed | | (1,020,279) | (15,399,239) | | (1,027,200) | (14,872,446) | | | |
| | |
|
| |
|
| | | |
| Net Change | | (416,728) | $ (6,488,708) | | (692,598) | $ (10,068,002) | | | |
| | |
|
| |
|
| | | |
| |
| Year Ended October 31, 2006 | | | | | | | | | |
| | | | | | | | | |
| Sold | | 595,026 | $ 8,406,505 | | 292,085 | $ 3,993,921 | | | |
| |
| Dividends and distributions reinvested | | 310,443 | 4,211,597 | | 123,741 | 1,619,275 | | | |
| |
| Redeemed | | (1,185,347) | (16,735,935) | | (528,724) | (7,219,325) | | | |
| | |
|
| |
|
| | | |
| Net Change | | (279,878) | $ (4,117,833) | | (112,898) | $ (1,606,129) | | | |
| | |
|
| |
|
| | | |
THRIVENT MUTUAL FUNDS
Notes to Financial Statements
As of October 31, 2007
| | | | | | | | | |
| (10) SHARES OF BENEFICIAL INTEREST — continued | | | | | | |
| |
| | | | | | Partner International Stock Fund | | | |
| | |
|
| | | Class A | | Class B | | Institutional Class |
| | |
| |
| |
|
| Year Ended October 31, 2007 | | Shares | Amount | | Shares | Amount | | Shares | Amount |
| |
|
| |
|
| |
|
|
| Sold | | 2,688,054 | $ 38,314,231 | | 27,944 | $ 381,838 | | 8,691,362 | $ 125,824,841 |
| |
| Dividends and distributions reinvested | | 260,818 | 3,528,854 | | — | — | | 253,305 | 3,477,872 |
| |
| Redeemed | | (5,005,095) | (71,310,619) | | (483,004) | (6,607,820) | | (4,039,225) | (59,890,071) |
| | |
|
| |
|
| |
|
|
| Net Change | | (2,056,223) | $ (29,467,534) | | (455,060) | $ (6,225,982) | | 4,905,442 | $ 69,412,642 |
| | |
|
| |
|
| |
|
|
| |
| Year Ended October 31, 2006 | | | | | | | | | |
| | | | | | | | | |
| Sold | | 3,242,267 | $ 38,631,787 | | 55,694 | $ 639,937 | | 12,599,508 | $ 152,916,149 |
| |
| Dividends and distributions reinvested | | 278,655 | 3,165,499 | | — | — | | 114,683 | 1,321,143 |
| |
| Redeemed | | (6,278,166) | (75,182,696) | | (477,656) | (5,490,671) | | (2,906,204) | (33,993,291) |
| | |
|
| |
|
| |
|
|
| Net Change | | (2,757,244) | $ (33,385,410) | | (421,962) | $ (4,850,734) | | 9,807,987 | $ 120,244,001 |
| | |
|
| |
|
| |
|
|
| |
| | | | | | Large Cap Growth Fund | | | |
| | |
|
| | | Class A | | Class B | | Institutional Class |
| | |
| |
| |
|
| Year Ended October 31, 2007 | | Shares | Amount | | Shares | Amount | | Shares | Amount |
| |
|
| |
|
| |
|
|
| Sold | | 4,578,531 | $ 26,413,730 | | 35,799 | $ 196,211 | | 29,124,791 | $ 177,863,280 |
| |
| Dividends and distributions reinvested | | 14,253 | 77,678 | | — | — | | 264,904 | 1,528,495 |
| |
| Redeemed | | (5,709,169) | (32,676,336) | | (992,259) | (5,287,685) | | (5,285,186) | (34,322,841) |
| | |
|
| |
|
| |
|
|
| Net Change | | (1,116,385) | $ (6,184,928) | | (956,460) | $ (5,091,474) | | 24,104,509 | $ 145,068,934 |
| | |
|
| |
|
| |
|
|
| |
| Year Ended October 31, 2006 | | | | | | | | | |
| | | | | | | | | |
| Sold | | 5,705,035 | $ 29,361,687 | | 66,396 | $ 323,093 | | 30,963,196 | $ 168,846,450 |
| |
| Dividends and distributions reinvested | | 23,292 | 119,718 | | — | — | | 44,016 | 239,449 |
| |
| Redeemed | | (7,194,318) | (36,867,630) | | (1,042,666) | (5,024,700) | | (800,340) | (4,397,226) |
| | |
|
| |
|
| |
|
|
| Net Change | | (1,465,991) | $ (7,386,225) | | (976,270) | $ (4,701,607) | | 30,206,872 | $ 164,688,673 |
| | |
|
| |
|
| |
|
|
| |
| | | Large Cap Value Fund |
| | |
|
| | | Class A | | Class B | | Institutional Class |
| | |
| |
| |
|
| Year Ended October 31, 2007 | | Shares | Amount | | Shares | Amount | | Shares | Amount |
| |
|
| |
|
| |
|
|
| Sold | | 1,766,298 | $ 30,050,071 | | 18,259 | $ 303,308 | | 7,888,623 | $ 135,673,675 |
| |
| Dividends and distributions reinvested | | 1,303,412 | 21,452,553 | | 48,006 | 775,782 | | 751,450 | 12,464,266 |
| |
| Redeemed | | (3,981,337) | (68,090,102) | | (384,831) | (6,463,643) | | (979,936) | (16,736,038) |
| | |
|
| |
|
| |
|
|
| Net Change | | (911,627) | $ (16,587,478) | | (318,566) | $ (5,384,553) | | 7,660,137 | $ 131,401,903 |
| | |
|
| |
|
| |
|
|
| |
| Year Ended October 31, 2006 | | | | | | | | | |
| | | | | | | | | |
| Sold | | 2,027,404 | $ 31,651,188 | | 24,560 | $ 380,262 | | 7,067,224 | $ 110,974,959 |
| |
| Dividends and distributions reinvested | | 556,278 | 8,268,344 | | 16,314 | 239,486 | | 122,590 | 1,831,095 |
| |
| Redeemed | | (5,040,104) | (78,519,471) | | (353,683) | (5,446,939) | | (828,908) | (12,806,414) |
| | |
|
| |
|
| |
|
|
| Net Change | | (2,456,422) | $ (38,599,939) | | (312,809) | $ (4,827,191) | | 6,360,906 | $ 99,999,640 |
| | |
|
| |
|
| |
|
|
THRIVENT MUTUAL FUNDS
Notes to Financial Statements
As of October 31, 2007
| | | | | | | | | |
| | | | | | Large Cap Stock Fund | | | |
| | |
|
| | | Class A | | Class B | | Institutional Class |
| | |
| |
| |
|
| Year Ended October 31, 2007 | | Shares | Amount | | Shares | Amount | | Shares | Amount |
| |
|
| |
|
| |
|
|
| Sold | | 3,660,513 | $ 106,554,516 | | 3,681 | $ 98,022 | | 4,942,079 | $ 145,637,966 |
| |
| Dividends and distributions reinvested | | 5,520,112 | 155,979,217 | | 113,706 | 2,952,941 | | 490,129 | 13,951,238 |
| |
| Redeemed | | (21,101,121) | (614,890,225) | | (1,155,704) | (30,987,096) | | (2,261,086) | (66,592,686) |
| | |
|
| |
|
| |
|
|
| Net Change | | (11,920,496) | $ (352,356,492) | | (1,038,317) | $ (27,936,133) | | 3,171,122 | $ 92,996,518 |
| | |
|
| |
|
| |
|
|
| |
| Year Ended October 31, 2006 | | | | | | | | | |
| | | | | | | | | |
| Sold | | 4,462,863 | $ 120,738,121 | | 9,189 | $ 229,471 | | 4,720,185 | $ 128,445,765 |
| |
| Dividends and distributions reinvested | | 2,077,603 | 55,394,923 | | 40,804 | 1,008,349 | | 119,662 | 3,207,017 |
| |
| Redeemed | | (26,453,828) | (715,804,335) | | (1,264,335) | (31,648,461) | | (1,905,974) | (51,865,562) |
| | |
|
| |
|
| |
|
|
| Net Change | | (19,913,362) | $ (539,671,291) | | (1,214,342) | $ (30,410,641) | | 2,933,873 | $ 79,787,220 |
| | |
|
| |
|
| |
|
|
| |
| | | Large Cap Index Fund | | Large Cap Index Fund-I | | | |
| | |
| |
| | | |
| | | Class A | | Institutional Class | | | |
| | |
| |
| | | |
| Year Ended October 31, 2007 | | Shares | Amount | | Shares | Amount | | | |
| |
|
| |
|
| | | |
| Sold | | 1,058,165 | $ 10,620,328 | | 610,475 | $ 6,049,996 | | | |
| |
| Dividends and distributions reinvested | | 126,539 | 1,233,896 | | 44,964 | 435,248 | | | |
| |
| Redeemed | | (2,130,985) | (21,488,432) | | (815,472) | (8,182,690) | | | |
| | |
|
| |
|
| | | |
| Net Change | | (946,281) | $ (9,634,208) | | (160,033) | $ (1,697,446) | | | |
| | |
|
| |
|
| | | |
| |
| Year Ended October 31, 2006 | | | | | | | | | |
| | | | | | | | | |
| Sold | | 1,212,651 | $ 10,702,889 | | 691,604 | $ 6,083,284 | | | |
| |
| Dividends and distributions reinvested | | 149,126 | 1,280,887 | | 48,463 | 412,908 | | | |
| |
| Redeemed | | (2,970,026) | (26,233,730) | | (1,094,387) | (9,595,822) | | | |
| | |
|
| |
|
| | | |
| Net Change | | (1,608,249) | $ (14,249,954) | | (354,320) | $ (3,099,630) | | | |
| | |
|
| |
|
| | | |
| |
| | | | | | Balanced Fund | | | |
| | |
|
| | | Class A | | Class B | | Institutional Class |
| | |
| |
| |
|
| Year Ended October 31, 2007 | | Shares | Amount | | Shares | Amount | | Shares | Amount |
| |
|
| |
|
| |
|
|
| Sold | | 1,112,754 | $ 14,474,672 | | 7,379 | $ 96,953 | | 197,312 | $ 2,587,000 |
| |
| Dividends and distributions reinvested | | 1,224,913 | 15,538,875 | | 40,172 | 504,830 | | 463,340 | 5,884,861 |
| |
| Redeemed | | (4,397,809) | (57,170,898) | | (268,020) | (3,464,158) | | (1,183,861) | (15,432,692) |
| | |
|
| |
|
| |
|
|
| Net Change | | (2,060,142) | $ (27,157,351) | | (220,469) | $ (2,862,375) | | (523,209) | $ (6,960,831) |
| | |
|
| |
|
| |
|
|
| |
| Year Ended October 31, 2006 | | | | | | | | | |
| | | | | | | | | |
| Sold | | 1,503,534 | $ 18,783,943 | | 17,860 | $ 222,453 | | 155,282 | $ 1,931,549 |
| |
| Dividends and distributions reinvested | | 923,755 | 11,441,804 | | 33,814 | 415,972 | | 364,545 | 4,515,013 |
| |
| Redeemed | | (5,654,941) | (70,689,156) | | (371,363) | (4,606,196) | | (1,933,121) | (24,176,039) |
| | |
|
| |
|
| |
|
|
| Net Change | | (3,227,652) | $ (40,463,409) | | (319,689) | $ (3,967,771) | | (1,413,294) | $ (17,729,477) |
| | |
|
| |
|
| |
|
|
THRIVENT MUTUAL FUNDS
Notes to Financial Statements
As of October 31, 2007
| | | | | | | | | |
| (10) SHARES OF BENEFICIAL INTEREST — continued | | | | | | |
| |
| | | | | | High Yield Fund | | | |
| | |
|
| | | Class A | | Class B | | Institutional Class |
| | |
| |
| |
|
| Year Ended October 31, 2007 | | Shares | Amount | | Shares | Amount | | Shares | Amount |
| |
|
| |
|
| |
|
|
| Sold | | 7,232,910 | $ 37,047,669 | | 21,907 | $ 114,126 | | 11,794,211 | $ 60,386,929 |
| |
| Dividends and distributions reinvested | | 5,246,263 | 26,801,268 | | 123,011 | 629,179 | | 1,113,882 | 5,734,298 |
| |
| Redeemed | | (20,950,030) | (107,048,650) | | (1,421,027) | (7,286,182) | | (16,761,322) | (86,494,765) |
| | |
|
| |
|
| |
|
|
| Net Change | | (8,470,857) | $ (43,199,713) | | (1,276,109) | $ (6,542,877) | | (3,853,229) | $ (20,373,538) |
| | |
|
| |
|
| |
|
|
| |
| Year Ended October 31, 2006 | | | | | | | | | |
| | | | | | | | | |
| Sold | | 10,539,834 | $ 53,007,415 | | 84,971 | $ 425,746 | | 15,871,254 | $ 80,202,875 |
| |
| Dividends and distributions reinvested | | 5,791,921 | 29,188,525 | | 193,224 | 973,714 | | 785,290 | 3,957,887 |
| |
| Redeemed | | (23,329,587) | (117,459,897) | | (1,686,376) | (8,497,294) | | (3,501,294) | (17,706,365) |
| | |
|
| |
|
| |
|
|
| Net Change | | (6,997,832) | $ (35,263,957) | | (1,408,181) | $ (7,097,834) | | 13,155,250 | $ 66,454,397 |
| | |
|
| |
|
| |
|
|
| |
| | | | | | Municipal Bond Fund | | | |
| | |
|
| | | Class A | | Class B | | Institutional Class |
| | |
| |
| |
|
| Year Ended October 31, 2007 | | Shares | Amount | | Shares | Amount | | Shares | Amount |
| |
|
| |
|
| |
|
|
| Sold | | 7,183,715 | $ 80,703,622 | | 8,760 | $ 98,125 | | 833,046 | $ 9,310,700 |
| |
| Dividends and distributions reinvested | | 3,658,394 | 41,098,057 | | 47,292 | 531,637 | | 41,561 | 466,278 |
| |
| Redeemed | | (13,707,985) | (153,979,933) | | (849,791) | (9,550,832) | | (386,267) | (4,334,053) |
| | |
|
| |
|
| |
|
|
| Net Change | | (2,865,876) | $ (32,178,254) | | (793,739) | $ (8,921,070) | | 488,340 | $ 5,442,925 |
| | |
|
| |
|
| |
|
|
| |
| Year Ended October 31, 2006 | | | | | | | | | |
| | | | | | | | | |
| Sold | | 7,272,232 | $ 82,058,835 | | 19,033 | $ 214,594 | | 596,280 | $ 6,719,776 |
| |
| Dividends and distributions reinvested | | 3,835,932 | 43,308,906 | | 74,081 | 836,120 | | 28,913 | 326,346 |
| |
| Redeemed | | (15,492,085) | (174,708,654) | | (747,886) | (8,421,000) | | (298,232) | (3,366,694) |
| | |
|
| |
|
| |
|
|
| Net Change | | (4,383,921) | $ (49,340,913) | | (654,772) | $ (7,370,286) | | 326,961 | $ 3,679,428 |
| | |
|
| |
|
| |
|
|
| |
| | | | | | Income Fund | | | |
| | |
|
| | | Class A | | Class B | | Institutional Class |
| | |
| |
| |
|
| Year Ended October 31, 2007 | | Shares | Amount | | Shares | Amount | | Shares | Amount |
| |
|
| |
|
| |
|
|
| Sold | | 3,308,668 | $ 28,354,222 | | 16,670 | $ 142,484 | | 29,247,235 | $ 249,293,219 |
| |
| Dividends and distributions reinvested | | 2,101,548 | 18,003,759 | | 38,942 | 333,352 | | 1,632,272 | 13,937,636 |
| |
| Redeemed | | (9,245,559) | (79,239,954) | | (750,889) | (6,426,020) | | (6,903,824) | (58,652,473) |
| | |
|
| |
|
| |
|
|
| Net Change | | (3,835,343) | $ (32,881,973) | | (695,277) | $ (5,950,184) | | 23,975,683 | $ 204,578,382 |
| | |
|
| |
|
| |
|
|
| |
| Year Ended October 31, 2006 | | | | | | | | | |
| | | | | | | | | |
| Sold | | 3,056,959 | $ 25,955,319 | | 25,440 | $ 217,189 | | 14,980,955 | $ 127,041,110 |
| |
| Dividends and distributions reinvested | | 2,269,958 | 19,292,564 | | 66,628 | 565,078 | | 630,512 | 5,347,248 |
| |
| Redeemed | | (12,756,451) | (108,230,155) | | (871,989) | (7,377,170) | | (1,609,551) | (13,575,746) |
| | |
|
| |
|
| |
|
|
| Net Change | | (7,429,534) | $ (62,982,272) | | (779,921) | $ (6,594,903) | | 14,001,916 | $ 118,812,612 |
| | |
|
| |
|
| |
|
|
THRIVENT MUTUAL FUNDS
Notes to Financial Statements
As of October 31, 2007
| | | | | | | | | |
| | | | | | Core Bond Fund | | | |
| | |
|
| | | Class A | | Class B | | Institutional Class |
| | |
| |
| |
|
| Year Ended October 31, 2007 | | Shares | Amount | | Shares | Amount | | Shares | Amount |
| |
|
| |
|
| |
|
|
| Sold | | 2,079,081 | $ 20,448,256 | | 2,888 | $ 28,540 | | 5,195,639 | $ 50,755,835 |
| |
| Dividends and distributions reinvested | | 1,278,083 | 12,571,874 | | 20,800 | 204,880 | | 220,036 | 2,163,228 |
| |
| Redeemed | | (7,809,430) | (76,855,231) | | (375,012) | (3,688,696) | | (1,799,757) | (17,721,396) |
| | |
|
| |
|
| |
|
|
| Net Change | | (4,452,266) | $ (43,835,101) | | (351,324) | $ (3,455,276) | | 3,615,918 | $ 35,197,667 |
| | |
|
| |
|
| |
|
|
| |
| Year Ended October 31, 2006 | | | | | | | | | |
| | | | | | | | | |
| Sold | | 2,110,737 | $ 20,723,629 | | 14,315 | $ 140,843 | | 707,477 | $ 6,939,118 |
| |
| Dividends and distributions reinvested | | 1,516,826 | 14,895,141 | | 31,482 | 309,310 | | 198,870 | 1,953,261 |
| |
| Redeemed | | (11,570,007) | (113,497,276) | | (323,834) | (3,176,985) | | (1,304,709) | (12,877,720) |
| | |
|
| |
|
| |
|
|
| Net Change | | (7,942,444) | $ (77,878,506) | | (278,037) | $ (2,726,832) | | (398,362) | $ (3,985,341) |
| | |
|
| |
|
| |
|
|
| |
| | | | | | Limited Maturity Bond Fund | | | |
| | |
|
| | | Class A | | Class B | | Institutional Class |
| | |
| |
| |
|
| Year Ended October 31, 2007 | | Shares | Amount | | Shares | Amount | | Shares | Amount |
| |
|
| |
|
| |
|
|
| Sold | | 2,375,503 | $ 29,853,399 | | 6,321 | $ 79,420 | | 13,414,475 | $ 168,536,157 |
| |
| Dividends and distributions reinvested | | 374,035 | 4,699,357 | | 3,297 | 41,463 | | 849,457 | 10,665,647 |
| |
| Redeemed | | (2,942,069) | (36,972,850) | | (15,827) | (199,188) | | (1,818,204) | (22,843,350) |
| | |
|
| |
|
| |
|
|
| Net Change | | (192,531) | $ (2,420,094) | | (6,209) | $ (78,305) | | 12,445,728 | $ 156,358,454 |
| | |
|
| |
|
| |
|
|
| |
| Year Ended October 31, 2006 | | | | | | | | | |
| | | | | | | | | |
| Sold | | 2,934,035 | $ 36,800,045 | | 16,790 | $ 210,746 | | 9,931,652 | $ 124,519,949 |
| |
| Dividends and distributions reinvested | | 370,015 | 4,641,350 | | 3,350 | 42,050 | | 320,331 | 4,016,603 |
| |
| Redeemed | | (4,618,489) | (57,906,212) | | (30,151) | (378,631) | | (1,435,668) | (18,046,369) |
| | |
|
| |
|
| |
|
|
| Net Change | | (1,314,439) | $ (16,464,817) | | (10,011) | $ (125,835) | | 8,816,315 | $ 110,490,183 |
| | |
|
| |
|
| |
|
|
| |
| | | | | | Money Market Fund | | | |
| | |
|
| | | Class A | | Class B | | Institutional Class |
| | |
| |
| |
|
| Year Ended October 31, 2007 | | Shares | Amount | | Shares | Amount | | Shares | Amount |
| |
|
| |
|
| |
|
|
| Sold | | 1,394,460,205 | $1,394,460,225 | | 665,684 | $ 665,684 | | 1,980,415,531 | $1,980,415,531 |
| |
| Dividends and distributions reinvested | | 47,936,624 | 47,936,624 | | 67,358 | 67,358 | | 19,135,374 | 19,135,374 |
| |
| Redeemed | | (1,122,834,737) | (1,122,834,757) | | (1,000,594) | (1,000,594) | | (1,915,625,053) | (1,915,625,053) |
| | |
|
| |
|
| |
|
|
| Net Change | | 319,562,092 | $ 319,562,092 | | (267,552) | $ (267,552) | | 83,925,852 | $ 83,925,852 |
| | |
|
| |
|
| |
|
|
| |
| Year Ended October 31, 2006 | | | | | | | | | |
| | | | | | | | | |
| Sold | | 1,057,197,836 | $1,057,197,838 | | 1,348,662 | $ 1,348,662 | | 1,215,084,908 | $1,215,084,908 |
| |
| Dividends and distributions reinvested | | 30,553,980 | 30,553,980 | | 60,874 | 60,874 | | 13,967,308 | 13,967,308 |
| |
| Redeemed | | (884,770,696) | (884,770,698) | | (1,360,539) | (1,360,540) | | (1,171,076,541) | (1,171,076,541) |
| | |
|
| |
|
| |
|
|
| Net Change | | 202,981,120 | $ 202,981,120 | | 48,997 | $ 48,996 | | 57,975,675 | $ 57,975,675 |
| | |
|
| |
|
| |
|
|
Thrivent Mutual Funds
Financial Highlights
| | | | | | | | |
|
| | | F O R A S H A R E O U T S T A N D I N G T H R O U G H O U T E A C H P E R I O D(a) |
| | |
|
| |
| |
| | | | | | | Less Distributions | |
| | | | Income from Investment Operations | from | |
| | |
|
| |
| | | Net Asset | | Net Realized | | | Net | |
| | | Value, | Net | and Unrealized | Total from | Net | Realized | |
| | | Beginning | Investment | Gain/(Loss) on | Investment | Investment | Gain on | Total |
| | | of Period | Income/(Loss) | Investments(b) | Operations | Income | Investments | Distributions |
|
| AGGRESSIVE ALLOCATION FUND | | | | | | |
| Class A Shares | | | | | | | | |
| Year Ended 10/31/2007 | | $11.88 | $0.14 | $1.99 | $2.13 | $(0.19) | $(0.03) | $(0.22) |
| Year Ended 10/31/2006 | | 10.37 | 0.15 | 1.49 | 1.64 | (0.13) | — | (0.13) |
| Year Ended 10/31/2005 (e) | | 10.00 | (0.01) | 0.38 | 0.37 | — | — | — |
| Institutional Class Shares | | | | | | | | |
| Year Ended 10/31/2007 | | 11.94 | 0.16 | 2.02 | 2.18 | (0.23) | (0.03) | (0.26) |
| Year Ended 10/31/2006 | | 10.39 | 0.20 | 1.49 | 1.69 | (0.14) | — | (0.14) |
| Year Ended 10/31/2005 (e) | | 10.00 | — | 0.39 | 0.39 | — | — | — |
|
| MODERATELY AGGRESSIVE ALLOCATION FUND | | | | | |
| Class A Shares | | | | | | | | |
| Year Ended 10/31/2007 | | 11.72 | 0.21 | 1.56 | 1.77 | (0.24) | (0.02) | (0.26) |
| Year Ended 10/31/2006 | | 10.31 | 0.19 | 1.35 | 1.54 | (0.13) | — | (0.13) |
| Year Ended 10/31/2005 (e) | | 10.00 | 0.01 | 0.30 | 0.31 | — | — | — |
| Institutional Class Shares | | | | | | | | |
| Year Ended 10/31/2007 | | 11.77 | 0.23 | 1.60 | 1.83 | (0.28) | (0.02) | (0.30) |
| Year Ended 10/31/2006 | | 10.33 | 0.23 | 1.35 | 1.58 | (0.14) | — | (0.14) |
| Year Ended 10/31/2005 (e) | | 10.00 | 0.01 | 0.32 | 0.33 | — | — | — |
|
| MODERATE ALLOCATION FUND | | | | | | | | |
| Class A Shares | | | | | | | | |
| Year Ended 10/31/2007 | | 11.30 | 0.30 | 1.10 | 1.40 | (0.34) | (0.04) | (0.38) |
| Year Ended 10/31/2006 | | 10.22 | 0.27 | 1.08 | 1.35 | (0.27) | — | (0.27) |
| Year Ended 10/31/2005 (e) | | 10.00 | 0.02 | 0.22 | 0.24 | (0.02) | — | (0.02) |
| Institutional Class Shares | | | | | | | | |
| Year Ended 10/31/2007 | | 11.32 | 0.33 | 1.09 | 1.42 | (0.36) | (0.04) | (0.40) |
| Year Ended 10/31/2006 | | 10.23 | 0.31 | 1.09 | 1.40 | (0.31) | — | (0.31) |
| Year Ended 10/31/2005 (e) | | 10.00 | 0.03 | 0.22 | 0.25 | (0.02) | — | (0.02) |
|
| MODERATELY CONSERVATIVE ALLOCATION FUND | | | | | |
| Class A Shares | | | | | | | | |
| Year Ended 10/31/2007 | | 10.91 | 0.36 | 0.68 | 1.04 | (0.38) | (0.03) | (0.41) |
| Year Ended 10/31/2006 | | 10.13 | 0.32 | 0.77 | 1.09 | (0.31) | — | (0.31) |
| Year Ended 10/31/2005 (e) | | 10.00 | 0.04 | 0.11 | 0.15 | (0.02) | — | (0.02) |
| Institutional Class Shares | | | | | | | | |
| Year Ended 10/31/2007 | | 10.93 | 0.37 | 0.69 | 1.06 | (0.40) | (0.03) | (0.43) |
| Year Ended 10/31/2006 | | 10.14 | 0.34 | 0.79 | 1.13 | (0.34) | — | (0.34) |
| Year Ended 10/31/2005 (e) | | 10.00 | 0.05 | 0.12 | 0.17 | (0.03) | — | (0.03) |
|
(a) All per share amounts have been rounded to the nearest cent.
(b) The amount shown may not correlate with the change in aggregate gains and losses of portfolio securities due to the timing of sales and redemptions of fund shares.
|
| The accompanying Notes to the Financial Statements are an integral part of this schedule. |
|
| 256 |
Thrivent Mutual Funds
Financial Highlights – continued
| | | | | | | |
|
| | | | R A T I O S / S U P P L E M E N T A L D A T A | | |
|
|
| | | | | | Ratios to Average | |
| | | | | | Net Assets Before Expenses | |
| | | | Ratio to Average Net | Waived, Credited or Paid | |
| | | | Assets(d) | Indirectly(d) | |
| | | |
|
| |
| Net Asset | | | | | | | |
| Value, | | Net Assets | | Net | | Net | Portfolio |
| End of | Total | End of Period | | Investment | | Investment | Turnover |
| Period | Return(c) | (in millions) | Expenses | Income/(Loss) | Expenses | Income/(Loss) | Rate |
|
| |
| |
| |
| $13.79 | 18.27% | $332.7 | 0.38% | 0.79% | 0.72% | 0.45% | 15% |
| 11.88 | 15.95% | 176.0 | 0.10% | 0.78% | 0.81% | 0.07% | 8% |
| 10.37 | 3.70% | 25.2 | 0.89% | (0.60)% | 1.62% | (1.34)% | 3% |
|
| |
| 13.86 | 18.64% | 57.8 | 0.10% | 1.11% | 0.21% | 1.00% | 15% |
| 11.94 | 16.45% | 35.8 | (0.44)% | 1.25% | 0.27% | 0.53% | 8% |
| 10.39 | 3.90% | 4.2 | 0.10% | 0.08% | 0.87% | (0.69)% | 3% |
|
| |
| |
| |
| 13.23 | 15.45% | 859.2 | 0.37% | 1.52% | 0.61% | 1.28% | 18% |
| 11.72 | 15.05% | 423.0 | 0.08% | 1.60% | 0.67% | 1.01% | 10% |
| 10.31 | 3.10% | 63.2 | 0.44% | 0.45% | 1.03% | (0.14)% | 4% |
| |
| |
| 13.30 | 15.85% | 68.9 | 0.09% | 1.86% | 0.19% | 1.76% | 18% |
| 11.77 | 15.43% | 40.1 | (0.36)% | 2.05% | 0.23% | 1.46% | 10% |
| 10.33 | 3.30% | 2.7 | (0.04)% | 0.88% | 0.57% | 0.28% | 4% |
|
| |
| |
| |
| 12.32 | 12.60% | 843.2 | 0.37% | 2.36% | 0.56% | 2.17% | 23% |
| 11.30 | 13.40% | 442.8 | 0.04% | 2.44% | 0.61% | 1.88% | 10% |
| 10.22 | 2.36% | 76.2 | 0.27% | 1.30% | 0.90% | 0.67% | 3% |
| |
| |
| 12.34 | 12.84% | 27.9 | 0.11% | 2.66% | 0.20% | 2.57% | 23% |
| 11.32 | 13.83% | 17.1 | (0.33)% | 2.82% | 0.24% | 2.25% | 10% |
| 10.23 | 2.49% | 2.9 | (0.13)% | 1.67% | 0.51% | 1.03% | 3% |
|
| |
| |
| |
| 11.54 | 9.72% | 305.5 | 0.33% | 3.16% | 0.57% | 2.92% | 19% |
| 10.91 | 10.94% | 156.9 | 0.01% | 3.19% | 0.65% | 2.55% | 5% |
| 10.13 | 1.53% | 32.9 | 0.34% | 2.04% | 1.21% | 1.17% | 4% |
| |
| |
| 11.56 | 9.91% | 9.8 | 0.12% | 3.41% | 0.23% | 3.31% | 19% |
| 10.93 | 11.35% | 6.5 | (0.34)% | 3.50% | 0.30% | 2.86% | 5% |
| 10.14 | 1.66% | 0.8 | 0.18% | 2.14% | 1.03% | 1.29% | 4% |
|
(c) Total investment return assumes dividend reinvestment and does not reflect any deduction for sales charges. Not annualized for periods less than one year.
(d) Computed on an annualized basis for periods less than one year.
(e) Since fund inception, June 30, 2005.
|
| The accompanying Notes to the Financial Statements are an integral part of this schedule. |
|
| 257 |
Thrivent Mutual Funds
Financial Highlights – continued
| | | | | | | | |
|
| | | F O R A S H A R E O U T S T A N D I N G T H R O U G H O U T E A C H P E R I O D(a) |
| | |
|
| |
| |
| | | | | | | Less Distributions | |
| | | | Income from Investment Operations | from | |
| | |
|
| |
| | | Net Asset | | Net Realized | | | Net | |
| | | Value, | Net | and Unrealized | Total from | Net | Realized | |
| | | Beginning | Investment | Gain/(Loss) on | Investment | Investment | Gain on | Total |
| | | of Period | Income/(Loss) | Investments(b) | Operations | Income | Investments | Distributions |
|
| TECHNOLOGY FUND | | | | | | | | |
| Class A Shares | | | | | | | | |
| Year Ended 10/31/2007 | | $3.73 | $(0.04) | $0.99 | $0.95 | $— | $— | $— |
| Year Ended 10/31/2006 | | 3.48 | (0.03) | 0.28 | 0.25 | — | — | — |
| Year Ended 10/31/2005 | | 3.28 | (0.01) | 0.21 | 0.20 | — | — | — |
| Period Ended 10/31/2004 (e) | | 3.20 | (0.02) | 0.10 | 0.08 | — | — | — |
| Year Ended 4/30/2004 | | 2.50 | (0.03) | 0.73 | 0.70 | — | — | — |
| Year Ended 4/30/2003 | | 3.15 | (0.05) | (0.60) | (0.65) | — | — | — |
| Class B Shares | | | | | | | | |
| Year Ended 10/31/2007 | | 3.56 | (0.12) | 1.00 | 0.88 | — | — | — |
| Year Ended 10/31/2006 | | 3.34 | (0.07) | 0.29 | 0.22 | — | — | — |
| Year Ended 10/31/2005 | | 3.16 | (0.03) | 0.21 | 0.18 | — | — | — |
| Period Ended 10/31/2004 (e) | | 3.09 | (0.03) | 0.10 | 0.07 | — | — | — |
| Year Ended 4/30/2004 | | 2.43 | (0.04) | 0.70 | 0.66 | — | — | — |
| Year Ended 4/30/2003 | | 3.09 | (0.06) | (0.60) | (0.66) | — | — | — |
| Institutional Class Shares | | | | | | | | |
| Year Ended 10/31/2007 | | 3.93 | (0.02) | 1.04 | 1.02 | — | — | — |
| Year Ended 10/31/2006 | | 3.65 | (0.01) | 0.29 | 0.28 | — | — | — |
| Year Ended 10/31/2005 | | 3.42 | 0.01 | 0.22 | 0.23 | — | — | — |
| Period Ended 10/31/2004 (e) | | 3.32 | (0.01) | 0.11 | 0.10 | — | — | — |
| Year Ended 4/30/2004 | | 2.59 | (0.02) | 0.75 | 0.73 | — | — | — |
| Year Ended 4/30/2003 | | 3.22 | (0.02) | (0.61) | (0.63) | — | — | — |
|
| PARTNER SMALL CAP GROWTH FUND | | | | | | |
| Class A Shares | | | | | | | | |
| Year Ended 10/31/2007 | | 11.69 | (0.06) | 2.30 | 2.24 | — | — | — |
| Year Ended 10/31/2006 | | 10.28 | (0.03) | 1.44 | 1.41 | — | — | — |
| Year Ended 10/31/2005 (f) | | 10.00 | (0.04) | 0.32 | 0.28 | — | — | — |
| Institutional Class Shares | | | | | | | | |
| Year Ended 10/31/2007 | | 11.73 | (0.02) | 2.31 | 2.29 | (0.02) | — | (0.02) |
| Year Ended 10/31/2006 | | 10.28 | — | 1.45 | 1.45 | — | — | — |
| Year Ended 10/31/2005 (f) | | 10.00 | (0.02) | 0.30 | 0.28 | — | — | — |
|
(a) All per share amounts have been rounded to the nearest cent.
(b) The amount shown may not correlate with the change in aggregate gains and losses of portfolio securities due to the timing of sales and redemptions of fund shares.
(c) Total investment return assumes dividend reinvestment and does not reflect any deduction for sales charges. Not annualized for periods less than one year.
|
| The accompanying Notes to the Financial Statements are an integral part of this schedule. |
|
| 258 |
Thrivent Mutual Funds
Financial Highlights – continued
| | | | | | | |
|
| | | | R A T I O S / S U P P L E M E N T A L D A T A | | |
|
|
| | | | | | Ratios to Average | |
| | | | | | Net Assets Before Expenses | |
| | | | Ratio to Average Net | Waived, Credited or Paid | |
| | | | Assets(d) | Indirectly(d) | |
| | | |
|
| |
| Net Asset | | | | | | | |
| Value, | | Net Assets | | Net | | Net | Portfolio |
| End of | Total | End of Period | | Investment | | Investment | Turnover |
| Period | Return(c) | (in millions) | Expenses | Income/(Loss) | Expenses | Income/(Loss) | Rate |
|
| |
| |
| |
| $4.68 | 25.47% | $42.4 | 1.49% | (0.96)% | 1.98% | (1.46)% | 112% |
| 3.73 | 7.18% | 40.1 | 1.45% | (0.78)% | 1.97% | (1.30)% | 126% |
| 3.48 | 6.10% | 42.7 | 1.52% | (0.40)% | 2.04% | (0.92)% | 37% |
| 3.28 | 2.50% | 42.5 | 1.70% | (1.32)% | 2.22% | (1.84)% | 23% |
| 3.20 | 28.00% | 41.5 | 1.36% | (1.02)% | 2.19% | (1.85)% | 67% |
| 2.50 | (20.63)% | 29.3 | 2.39% | (2.09)% | 2.75% | (2.45)% | 67% |
| |
| |
| 4.44 | 24.72% | 1.7 | 2.05% | (1.51)% | 3.06% | (2.52)% | 112% |
| 3.56 | 6.59% | 2.4 | 1.94% | (1.27)% | 2.95% | (2.28)% | 126% |
| 3.34 | 5.70% | 3.5 | 2.07% | (0.91)% | 3.08% | (1.93)% | 37% |
| 3.16 | 2.27% | 4.0 | 2.32% | (1.94)% | 3.34% | (2.96)% | 23% |
| 3.09 | 27.16% | 3.9 | 1.85% | (1.51)% | 3.36% | (3.02)% | 67% |
| 2.43 | (21.36)% | 2.6 | 3.50% | (3.20)% | 4.12% | (3.82)% | 67% |
| |
| |
| 4.95 | 25.95% | 2.6 | 0.98% | (0.45)% | 0.99% | (0.46)% | 112% |
| 3.93 | 7.67% | 2.1 | 0.96% | (0.30)% | 0.97% | (0.31)% | 126% |
| 3.65 | 6.73% | 2.6 | 0.94% | 0.24% | 0.95% | 0.22% | 37% |
| 3.42 | 3.01% | 3.0 | 1.00% | (0.62)% | 1.02% | (0.64)% | 23% |
| 3.32 | 28.19% | 2.9 | 1.00% | (0.66)% | 1.02% | (0.68)% | 67% |
| 2.59 | (19.57)% | 2.2 | 1.06% | (0.76)% | 1.08% | (0.78)% | 67% |
|
| |
| |
| 13.93 | 19.16% | 15.5 | 1.20% | (0.52)% | 1.46% | (0.77)% | 98% |
| 11.69 | 13.72% | 12.0 | 0.91% | (0.31)% | 1.72% | (1.12)% | 109% |
| 10.28 | 2.80% | 9.5 | 1.61% | (1.16)% | 2.42% | (1.97)% | 37% |
| |
| |
| 14.00 | 19.55% | 64.5 | 0.92% | (0.25)% | 1.13% | (0.45)% | 98% |
| 11.73 | 14.11% | 29.3 | 0.53% | 0.10% | 1.35% | (0.71)% | 109% |
| 10.28 | 2.80% | 4.2 | 1.39% | (0.99)% | 2.21% | (1.81)% | 37% |
|
(d) Computed on an annualized basis for periods less than one year.
(e) For the period from May 1, 2004 to October 31, 2004.
(f) Since fund inception, June 30, 2005.
|
| The accompanying Notes to the Financial Statements are an integral part of this schedule. |
|
| 259 |
Thrivent Mutual Funds
Financial Highlights – continued
| | | | | | | | |
|
| | | F O R A S H A R E O U T S T A N D I N G T H R O U G H O U T E A C H P E R I O D(a) |
| | |
|
| |
| |
| | | | | | | Less Distributions | |
| | | | Income from Investment Operations | from | |
| | |
|
| |
| | | Net Asset | | Net Realized | | | Net | |
| | | Value, | Net | and Unrealized | Total from | Net | Realized | |
| | | Beginning | Investment | Gain/(Loss) on | Investment | Investment | Gain on | Total |
| | | of Period | Income/(Loss) | Investments(b) | Operations | Income | Investments | Distributions |
|
| PARTNER SMALL CAP VALUE FUND | | | | | | |
| Class A Shares | | | | | | | | |
| Year Ended 10/31/2007 | | $15.65 | $0.04 | $1.45 | $1.49 | $(0.02) | $(0.71) | $(0.73) |
| Year Ended 10/31/2006 | | 14.06 | 0.07 | 2.46 | 2.53 | (0.04) | (0.90) | (0.94) |
| Year Ended 10/31/2005 | | 14.27 | 0.04 | 1.61 | 1.65 | (0.01) | (1.85) | (1.86) |
| Period Ended 10/31/2004 (e) | | 13.58 | 0.01 | 1.02 | 1.03 | — | (0.34) | (0.34) |
| Year Ended 4/30/2004 | | 9.33 | (0.05) | 4.30 | 4.25 | — | — | — |
| Year Ended 4/30/2003 | | 11.65 | (0.07) | (2.18) | (2.25) | — | (0.07) | (0.07) |
| Class B Shares | | | | | | | | |
| Year Ended 10/31/2007 | | 14.89 | (0.33) | 1.59 | 1.26 | — | (0.71) | (0.71) |
| Year Ended 10/31/2006 | | 13.50 | (0.08) | 2.37 | 2.29 | — | (0.90) | (0.90) |
| Year Ended 10/31/2005 | | 13.88 | (0.10) | 1.57 | 1.47 | — | (1.85) | (1.85) |
| Period Ended 10/31/2004 (e) | | 13.29 | (0.06) | 0.99 | 0.93 | — | (0.34) | (0.34) |
| Year Ended 4/30/2004 | | 9.21 | (0.14) | 4.22 | 4.08 | — | — | — |
| Year Ended 4/30/2003 | | 11.59 | (0.12) | (2.19) | (2.31) | — | (0.07) | (0.07) |
| Institutional Class Shares | | | | | | | | |
| Year Ended 10/31/2007 | | 16.26 | 0.13 | 1.52 | 1.65 | (0.10) | (0.71) | (0.81) |
| Year Ended 10/31/2006 | | 14.57 | 0.12 | 2.60 | 2.72 | (0.13) | (0.90) | (1.03) |
| Year Ended 10/31/2005 | | 14.67 | 0.13 | 1.67 | 1.80 | (0.05) | (1.85) | (1.90) |
| Period Ended 10/31/2004 (e) | | 13.90 | 0.05 | 1.06 | 1.11 | — | (0.34) | (0.34) |
| Year Ended 4/30/2004 | | 9.47 | 0.03 | 4.40 | 4.43 | — | — | — |
| Year Ended 4/30/2003 | | 11.71 | — | (2.17) | (2.17) | — | (0.07) | (0.07) |
|
(a) All per share amounts have been rounded to the nearest cent.
(b) The amount shown may not correlate with the change in aggregate gains and losses of portfolio securities due to the timing of sales and redemptions of fund shares.
|
| The accompanying Notes to the Financial Statements are an integral part of this schedule. |
|
| 260 |
Thrivent Mutual Funds
Financial Highlights – continued
| | | | | | | |
|
| | | | R A T I O S / S U P P L E M E N T A L D A T A | | |
|
|
| | | | | | Ratios to Average | |
| | | | | | Net Assets Before Expenses | |
| | | | Ratio to Average Net | Waived, Credited or Paid | |
| | | | Assets(d) | Indirectly(d) | |
| | | |
|
| |
| Net Asset | | | | | | | |
| Value, | | Net Assets | | Net | | Net | Portfolio |
| End of | Total | End of Period | | Investment | | Investment | Turnover |
| Period | Return(c) | (in millions) | Expenses | Income/(Loss) | Expenses | Income/(Loss) | Rate |
|
| $16.41 | 9.77% | $82.5 | 1.25% | 0.21% | 1.43% | 0.03% | 34% |
| 15.65 | 19.08% | 79.8 | 0.95% | 0.51% | 1.46% | (0.01)% | 22% |
| 14.06 | 12.13% | 74.5 | 1.04% | 0.26% | 1.55% | (0.25)% | 53% |
| 14.27 | 7.60% | 61.4 | 1.10% | 0.61% | 1.61% | 0.10% | 100% |
| 13.58 | 45.55% | 50.6 | 1.32% | (0.46)% | 1.84% | (0.98)% | 80% |
| 9.33 | (19.38)% | 27.7 | 1.86% | (0.88)% | 2.05% | (1.07)% | 147% |
| |
| |
| 15.44 | 8.70% | 3.6 | 2.20% | (0.71)% | 2.39% | (0.91)% | 34% |
| 14.89 | 17.99% | 5.5 | 1.88% | (0.42)% | 2.40% | (0.93)% | 22% |
| 13.50 | 11.03% | 5.5 | 2.02% | (0.72)% | 2.53% | (1.23)% | 53% |
| 13.88 | 7.01% | 5.4 | 2.10% | (0.41)% | 2.61% | (0.92)% | 100% |
| 13.29 | 44.30% | 5.7 | 2.20% | (1.33)% | 2.73% | (1.86)% | 80% |
| 9.21 | (20.00)% | 2.9 | 2.71% | (1.73)% | 2.91% | (1.93)% | 147% |
| |
| |
| 17.10 | 10.45% | 57.7 | 0.63% | 0.79% | 0.80% | 0.62% | 34% |
| 16.26 | 19.85% | 44.9 | 0.30% | 1.06% | 0.82% | 0.54% | 22% |
| 14.57 | 12.92% | 16.4 | 0.33% | 0.97% | 0.84% | 0.46% | 53% |
| 14.67 | 8.01% | 13.3 | 0.40% | 1.32% | 0.91% | 0.81% | 100% |
| 13.90 | 46.78% | 10.3 | 0.52% | 0.34% | 1.04% | (0.18)% | 80% |
| 9.47 | (18.59)% | 3.8 | 0.87% | 0.10% | 1.07% | (0.10)% | 147% |
|
(c) Total investment return assumes dividend reinvestment and does not reflect any deduction for sales charges. Not annualized for periods less than one year.
(d) Computed on an annualized basis for periods less than one year.
(e) For the period from May 1, 2004 to October 31, 2004.
|
| The accompanying Notes to the Financial Statements are an integral part of this schedule. |
|
| 261 |
Thrivent Mutual Funds
Financial Highlights – continued
| | | | | | | |
|
| | F O R A S H A R E O U T S T A N D I N G T H R O U G H O U T E A C H P E R I O D(a) |
| |
|
| |
| |
| | | | | | Less Distributions | |
| | | Income from Investment Operations | from | |
| |
|
| |
| | Net Asset | | Net Realized | | | Net | |
| | Value, | Net | and Unrealized | Total from | Net | Realized | |
| | Beginning | Investment | Gain/(Loss) on | Investment | Investment | Gain on | Total |
| | of Period | Income/(Loss) | Investments(b) | Operations | Income | Investments | Distributions |
|
| SMALL CAP STOCK FUND | | | | | | | |
| Class A Shares | | | | | | | |
| Year Ended 10/31/2007 | $18.48 | $0.01 | $2.40 | $2.41 | $— | $(1.91) | $(1.91) |
| Year Ended 10/31/2006 | 17.79 | (0.05) | 2.68 | 2.63 | — | (1.94) | (1.94) |
| Year Ended 10/31/2005 | 16.39 | (0.08) | 2.30 | 2.22 | — | (0.82) | (0.82) |
| Period Ended 10/31/2004 (e) | 16.39 | (0.04) | 0.99 | 0.95 | — | (0.95) | (0.95) |
| Year Ended 4/30/2004 | 11.55 | (0.11) | 4.95 | 4.84 | — | — | — |
| Year Ended 4/30/2003 | 14.82 | (0.09) | (3.18) | (3.27) | — | — | — |
| Class B Shares | | | | | | | |
| Year Ended 10/31/2007 | 16.44 | (0.48) | 2.41 | 1.93 | — | (1.91) | (1.91) |
| Year Ended 10/31/2006 | 16.18 | (0.30) | 2.50 | 2.20 | — | (1.94) | (1.94) |
| Year Ended 10/31/2005 | 15.11 | (0.27) | 2.16 | 1.89 | — | (0.82) | (0.82) |
| Period Ended 10/31/2004 (e) | 15.26 | (0.11) | 0.91 | 0.80 | — | (0.95) | (0.95) |
| Year Ended 4/30/2004 | 10.86 | (0.26) | 4.66 | 4.40 | — | — | — |
| Year Ended 4/30/2003 | 14.08 | (0.26) | (2.96) | (3.22) | — | — | — |
| Institutional Class Shares | | | | | | | |
| Year Ended 10/31/2007 | 19.82 | 0.08 | 2.63 | 2.71 | — | (1.91) | (1.91) |
| Year Ended 10/31/2006 | 18.85 | (0.04) | 2.95 | 2.91 | — | (1.94) | (1.94) |
| Year Ended 10/31/2005 | 17.21 | 0.02 | 2.44 | 2.46 | — | (0.82) | (0.82) |
| Period Ended 10/31/2004 (e) | 17.12 | (0.02) | 1.06 | 1.04 | — | (0.95) | (0.95) |
| Year Ended 4/30/2004 | 11.98 | (0.01) | 5.15 | 5.14 | — | — | — |
| Year Ended 4/30/2003 | 15.26 | (0.06) | (3.22) | (3.28) | — | — | — |
|
| SMALL CAP INDEX FUND | | | | | | | |
| Class A Shares | | | | | | | |
| Year Ended 10/31/2007 | 16.11 | 0.06 | 1.53 | 1.59 | (0.02) | (1.15) | (1.17) |
| Year Ended 10/31/2006 | 14.28 | 0.03 | 2.09 | 2.12 | (0.02) | (0.27) | (0.29) |
| Year Ended 10/31/2005 | 12.63 | 0.03 | 1.74 | 1.77 | (0.02) | (0.10) | (0.12) |
| Period Ended 10/31/2004 (e) | 12.26 | 0.02 | 0.85 | 0.87 | — | (0.50) | (0.50) |
| Year Ended 4/30/2004 | 8.89 | (0.01) | 3.42 | 3.41 | — | (0.04) | (0.04) |
| Year Ended 4/30/2003 | 11.42 | (0.04) | (2.43) | (2.47) | — | (0.06) | (0.06) |
|
(a) All per share amounts have been rounded to the nearest cent.
(b) The amount shown may not correlate with the change in aggregate gains and losses of portfolio securities due to the timing of sales and redemptions of fund shares.
|
| The accompanying Notes to the Financial Statements are an integral part of this schedule. |
|
| 262 |
Thrivent Mutual Funds
Financial Highlights – continued
| | | | | | | |
|
| | | | R A T I O S / S U P P L E M E N T A L D A T A | | |
|
|
| | | | | | Ratios to Average | |
| | | | | | Net Assets Before Expenses | |
| | | | Ratio to Average Net | Waived, Credited or Paid | |
| | | | Assets(d) | Indirectly(d) | |
| | | |
|
| |
| Net Asset | | | | | | | |
| Value, | | Net Assets | | Net | | Net | Portfolio |
| End of | Total | End of Period | | Investment | | Investment | Turnover |
| Period | Return(c) | (in millions) | Expenses | Income/(Loss) | Expenses | Income/(Loss) | Rate |
|
| |
| |
| |
| $18.98 | 14.32% | $448.9 | 1.27% | 0.03% | 1.29% | 0.01% | 112% |
| 18.48 | 16.04% | 457.5 | 1.27% | (0.28)% | 1.29% | (0.30)% | 92% |
| 17.79 | 13.81% | 440.6 | 1.32% | (0.45)% | 1.33% | (0.47)% | 114% |
| 16.39 | 5.88% | 397.3 | 1.36% | (0.49)% | 1.38% | (0.51)% | 52% |
| 16.39 | 41.90% | 379.5 | 1.38% | (0.71)% | 1.40% | (0.73)% | 106% |
| 11.55 | (22.06)% | 266.7 | 1.47% | (0.78)% | 1.49% | (0.80)% | 97% |
| |
| |
| 16.46 | 13.06% | 10.3 | 2.38% | (1.06)% | 2.40% | (1.08)% | 112% |
| 16.44 | 14.86% | 16.3 | 2.30% | (1.29)% | 2.32% | (1.31)% | 92% |
| 16.18 | 12.75% | 20.5 | 2.32% | (1.47)% | 2.34% | (1.49)% | 114% |
| 15.11 | 5.31% | 25.1 | 2.39% | (1.52)% | 2.41% | (1.54)% | 52% |
| 15.26 | 40.52% | 25.3 | 2.42% | (1.75)% | 2.44% | (1.77)% | 106% |
| 10.86 | (22.87)% | 21.1 | 2.45% | (1.75)% | 2.47% | (1.77)% | 97% |
| |
| |
| 20.62 | 14.92% | 106.6 | 0.71% | 0.56% | 0.73% | 0.54% | 112% |
| 19.82 | 16.68% | 85.1 | 0.72% | 0.27% | 0.74% | 0.26% | 92% |
| 18.85 | 14.58% | 21.1 | 0.72% | 0.15% | 0.74% | 0.13% | 114% |
| 17.21 | 6.17% | 11.6 | 0.73% | (0.24)% | 0.75% | (0.26)% | 52% |
| 17.12 | 42.90% | 11.0 | 0.73% | (0.06)% | 0.75% | (0.08)% | 106% |
| 11.98 | (21.49)% | 6.8 | 0.73% | (0.03)% | 0.75% | (0.05)% | 97% |
|
| |
| |
| |
| 16.53 | 10.44% | 46.4 | 0.95% | 0.36% | 1.08% | 0.23% | 17% |
| 16.11 | 15.08% | 48.0 | 0.95% | 0.21% | 1.09% | 0.07% | 16% |
| 14.28 | 14.05% | 46.9 | 0.95% | 0.21% | 1.18% | (0.02)% | 17% |
| 12.63 | 7.11% | 35.4 | 0.95% | 0.43% | 1.37% | 0.01% | 17% |
| 12.26 | 38.37% | 34.4 | 1.04% | (0.13)% | 1.25% | (0.34)% | 18% |
| 8.89 | (21.69)% | 20.5 | 1.35% | (0.44)% | 1.40% | (0.49)% | 18% |
|
(c) Total investment return assumes dividend reinvestment and does not reflect any deduction for sales charges. Not annualized for periods less than one year.
(d) Computed on an annualized basis for periods less than one year.
(e) For the period from May 1, 2004 to October 31, 2004.
|
| The accompanying Notes to the Financial Statements are an integral part of this schedule. |
|
| 263 |
Thrivent Mutual Funds
Financial Highlights – continued
| | | | | | | | |
|
| | | F O R A S H A R E O U T S T A N D I N G T H R O U G H O U T E A C H P E R I O D(a) |
| | |
|
| |
| |
| | | | | | | Less Distributions | |
| | | Income from Investment Operations | from | |
| | |
|
| |
| | | Net Asset | | Net Realized | | | Net | |
| | | Value, | Net | and Unrealized | Total from | Net | Realized | |
| | | Beginning | Investment | Gain/(Loss) on | Investment | Investment | Gain on | Total |
| | | of Period | Income/(Loss) | Investments(b) | Operations | Income | Investments | Distributions |
|
| MID CAP GROWTH FUND | | | | | | | | |
| Class A Shares | | | | | | | | |
| Year Ended 10/31/2007 | | $16.17 | $(0.06) | $4.50 | $4.44 | $— | $(1.16) | $(1.16) |
| Year Ended 10/31/2006 | | 14.59 | (0.06) | 1.64 | 1.58 | — | — | — |
| Year Ended 10/31/2005 | | 12.75 | (0.10) | 1.94 | 1.84 | — | — | — |
| Year Ended 10/31/2004 | | 12.35 | (0.02) | 0.42 | 0.40 | — | — | — |
| Year Ended 10/31/2003 | | 9.50 | (0.15) | 3.00 | 2.85 | — | — | — |
| Class B Shares | | | | | | | | |
| Year Ended 10/31/2007 | | 14.96 | (0.56) | 4.44 | 3.88 | — | (1.16) | (1.16) |
| Year Ended 10/31/2006 | | 13.64 | (0.34) | 1.66 | 1.32 | — | — | — |
| Year Ended 10/31/2005 | | 12.05 | (0.27) | 1.86 | 1.59 | — | — | — |
| Year Ended 10/31/2004 | | 11.78 | (0.19) | 0.46 | 0.27 | — | — | — |
| Year Ended 10/31/2003 | | 9.13 | (0.24) | 2.89 | 2.65 | — | — | — |
| Institutional Class Shares | | | | | | | | |
| Year Ended 10/31/2007 | | 17.24 | 0.06 | 4.84 | 4.90 | — | (1.16) | (1.16) |
| Year Ended 10/31/2006 | | 15.44 | (0.04) | 1.84 | 1.80 | — | — | — |
| Year Ended 10/31/2005 | | 13.39 | 0.01 | 2.04 | 2.05 | — | — | — |
| Year Ended 10/31/2004 | | 12.87 | (0.01) | 0.53 | 0.52 | — | — | — |
| Year Ended 10/31/2003 | | 9.79 | (0.04) | 3.12 | 3.08 | — | — | — |
|
| PARTNER MID CAP VALUE FUND | | | | | | |
| Class A Shares | | | | | | | | |
| Year Ended 10/31/2007 | | 11.83 | 0.11 | 1.23 | 1.34 | (0.17) | (0.07) | (0.24) |
| Year Ended 10/31/2006 | | 10.13 | 0.17 | 1.57 | 1.74 | (0.04) | — | (0.04) |
| Year Ended 10/31/2005 (e) | | 10.00 | — | 0.13 | 0.13 | — | — | — |
| Institutional Class Shares | | | | | | | | |
| Year Ended 10/31/2007 | | 11.87 | 0.16 | 1.21 | 1.37 | (0.20) | (0.07) | (0.27) |
| Year Ended 10/31/2006 | | 10.14 | 0.17 | 1.61 | 1.78 | (0.05) | — | (0.05) |
| Year Ended 10/31/2005 (e) | | 10.00 | 0.01 | 0.13 | 0.14 | — | — | — |
|
(a) All per share amounts have been rounded to the nearest cent.
(b) The amount shown may not correlate with the change in aggregate gains and losses of portfolio securities due to the timing of sales and redemptions of fund shares.
|
| The accompanying Notes to the Financial Statements are an integral part of this schedule. |
|
| 264 |
Thrivent Mutual Funds
Financial Highlights – continued
| | | | | | | |
|
| | | | R A T I O S / S U P P L E M E N T A L D A T A | | |
|
|
| | | | | | Ratios to Average | |
| | | | | | Net Assets Before Expenses | |
| | | | Ratio to Average Net | Waived, Credited or Paid | |
| | | | Assets(d) | Indirectly(d) | |
| | | |
|
| |
| Net Asset | | | | | | | |
| Value, | | Net Assets | | Net | | Net | Portfolio |
| End of | Total | End of Period | | Investment | | Investment | Turnover |
| Period | Return(c) | (in millions) | Expenses | Income/(Loss) | Expenses | Income/(Loss) | Rate |
|
| |
| |
| |
| $19.45 | 29.25% | $302.7 | 1.16% | (0.32)% | 1.18% | (0.34)% | 84% |
| 16.17 | 10.83% | 264.6 | 1.19% | (0.37)% | 1.21% | (0.38)% | 156% |
| 14.59 | 14.43% | 269.0 | 1.26% | (0.71)% | 1.28% | (0.72)% | 146% |
| 12.75 | 3.24% | 250.7 | 1.36% | (0.95)% | 1.36% | (0.95)% | 154% |
| 12.35 | 29.86% | 113.1 | 1.88% | (1.51)% | 1.94% | (1.57)% | 76% |
| |
| |
| 17.68 | 27.77% | 19.3 | 2.31% | (1.45)% | 2.32% | (1.47)% | 84% |
| 14.96 | 9.68% | 26.4 | 2.27% | (1.43)% | 2.28% | (1.45)% | 156% |
| 13.64 | 13.20% | 36.1 | 2.31% | (1.75)% | 2.44% | (1.88)% | 146% |
| 12.05 | 2.29% | 45.0 | 2.32% | (1.91)% | 2.32% | (1.91)% | 154% |
| 11.78 | 29.03% | 37.2 | 2.63% | (2.27)% | 2.69% | (2.33)% | 76% |
| |
| |
| 20.98 | 30.15% | 42.1 | 0.46% | 0.37% | 0.48% | 0.36% | 84% |
| 17.24 | 11.66% | 32.3 | 0.47% | 0.34% | 0.49% | 0.32% | 156% |
| 15.44 | 15.31% | 11.7 | 0.49% | 0.07% | 0.50% | 0.06% | 146% |
| 13.39 | 4.04% | 10.1 | 0.62% | (0.21)% | 0.73% | (0.32)% | 154% |
| 12.87 | 31.46% | 7.3 | 0.74% | (0.37)% | 0.95% | (0.58)% | 76% |
|
| |
| |
| |
| 12.93 | 11.45% | 12.0 | 0.95% | 0.99% | 1.48% | 0.46% | 96% |
| 11.83 | 17.19% | 7.6 | 0.31% | 1.67% | 1.86% | 0.12% | 43% |
| 10.13 | 1.30% | 5.1 | 1.61% | 0.08% | 3.10% | (1.41)% | 15% |
| |
| |
| 12.97 | 11.73% | 33.9 | 0.72% | 1.23% | 1.06% | 0.89% | 96% |
| 11.87 | 17.65% | 23.9 | (0.14)% | 2.08% | 1.37% | 0.57% | 43% |
| 10.14 | 1.40% | 3.7 | 1.17% | 0.43% | 2.81% | (1.21)% | 15% |
|
(c) Total investment return assumes dividend reinvestment and does not reflect any deduction for sales charges. Not annualized for periods less than one year.
(d) Computed on an annualized basis for periods less than one year.
(e) Since fund inception, June 30, 2005.
|
| The accompanying Notes to the Financial Statements are an integral part of this schedule. |
|
| 265 |
Thrivent Mutual Funds
Financial Highlights – continued
| | | | | | | |
|
| | F O R A S H A R E O U T S T A N D I N G T H R O U G H O U T E A C H P E R I O D(a) |
| |
|
| |
| |
| | | | | | Less Distributions | |
| | | Income from Investment Operations | from | |
| |
|
| |
| | Net Asset | | Net Realized | | | Net | |
| | Value, | Net | and Unrealized | Total from | Net | Realized | |
| | Beginning | Investment | Gain/(Loss) on | Investment | Investment | Gain on | Total |
| | of Period | Income/(Loss) | Investments(b) | Operations | Income | Investments | Distributions |
|
| MID CAP STOCK FUND | | | | | | | |
| Class A Shares | | | | | | | |
| Year Ended 10/31/2007 | $18.61 | $0.13 | $2.40 | $2.53 | $(0.02) | $(3.14) | $(3.16) |
| Year Ended 10/31/2006 | 17.85 | 0.02 | 2.55 | 2.57 | — | (1.81) | (1.81) |
| Year Ended 10/31/2005 | 14.74 | — | 3.11 | 3.11 | — | — | — |
| Period Ended 10/31/2004 (e) | 13.96 | (0.02) | 0.80 | 0.78 | — | — | — |
| Year Ended 4/30/2004 | 10.74 | (0.05) | 3.27 | 3.22 | — | — | — |
| Year Ended 4/30/2003 | 13.01 | (0.02) | (2.25) | (2.27) | — | — | — |
| Class B Shares | | | | | | | |
| Year Ended 10/31/2007 | 16.39 | (0.27) | 2.28 | 2.01 | — | (3.14) | (3.14) |
| Year Ended 10/31/2006 | 16.08 | (0.24) | 2.36 | 2.12 | — | (1.81) | (1.81) |
| Year Ended 10/31/2005 | 13.42 | (0.19) | 2.85 | 2.66 | — | — | — |
| Period Ended 10/31/2004 (e) | 12.78 | (0.09) | 0.73 | 0.64 | — | — | — |
| Year Ended 4/30/2004 | 9.95 | (0.19) | 3.02 | 2.83 | — | — | — |
| Year Ended 4/30/2003 | 12.20 | (0.18) | (2.07) | (2.25) | — | — | — |
| Institutional Class Shares | | | | | | | |
| Year Ended 10/31/2007 | 19.60 | 0.16 | 2.60 | 2.76 | (0.08) | (3.14) | (3.22) |
| Year Ended 10/31/2006 | 18.63 | 0.04 | 2.74 | 2.78 | — | (1.81) | (1.81) |
| Year Ended 10/31/2005 | 15.30 | 0.07 | 3.26 | 3.33 | — | — | — |
| Period Ended 10/31/2004 (e) | 14.46 | 0.02 | 0.82 | 0.84 | — | — | — |
| Year Ended 4/30/2004 | 11.06 | 0.03 | 3.37 | 3.40 | — | — | — |
| Year Ended 4/30/2003 | 13.31 | 0.05 | (2.30) | (2.25) | — | — | — |
|
| MID CAP INDEX FUND | | | | | | | |
| Class A Shares | | | | | | | |
| Year Ended 10/31/2007 | 14.47 | 0.12 | 2.09 | 2.21 | (0.10) | (0.68) | (0.78) |
| Year Ended 10/31/2006 | 13.77 | 0.08 | 1.56 | 1.64 | (0.06) | (0.88) | (0.94) |
| Year Ended 10/31/2005 | 11.86 | 0.08 | 1.91 | 1.99 | (0.03) | (0.05) | (0.08) |
| Period Ended 10/31/2004 (e) | 11.48 | 0.01 | 0.37 | 0.38 | — | — | — |
| Year Ended 4/30/2004 | 8.65 | 0.01 | 2.82 | 2.83 | — | — | — |
| Year Ended 4/30/2003 | 10.71 | — | (1.97) | (1.97) | — | (0.09) | (0.09) |
|
| MID CAP INDEX FUND-I | | | | | | | |
| Institutional Class Shares | | | | | | | |
| Year Ended 10/31/2007 | 13.99 | 0.22 | 1.96 | 2.18 | (0.16) | (0.71) | (0.87) |
| Year Ended 10/31/2006 | 13.34 | 0.13 | 1.49 | 1.62 | (0.07) | (0.90) | (0.97) |
| Year Ended 10/31/2005 | 11.85 | 0.10 | 1.88 | 1.98 | (0.10) | (0.39) | (0.49) |
| Period Ended 10/31/2004 (e) | 11.79 | 0.05 | 0.33 | 0.38 | — | (0.32) | (0.32) |
| Year Ended 4/30/2004 | 8.91 | 0.07 | 2.93 | 3.00 | (0.06) | (0.06) | (0.12) |
| Year Ended 4/30/2003 | 11.23 | 0.08 | (2.07) | (1.99) | (0.08) | (0.25) | (0.33) |
|
(a) All per share amounts have been rounded to the nearest cent.
(b) The amount shown may not correlate with the change in aggregate gains and losses of portfolio securities due to the timing of sales and redemptions of fund shares.
|
| The accompanying Notes to the Financial Statements are an integral part of this schedule. |
|
| 266 |
Thrivent Mutual Funds
Financial Highlights – continued
| | | | | | | |
|
| | | | R A T I O S / S U P P L E M E N T A L D A T A | | |
|
|
| | | | | | Ratios to Average | |
| | | | | | Net Assets Before Expenses | |
| | | | Ratio to Average Net | Waived, Credited or Paid | |
| | | | Assets(d) | Indirectly(d) | |
| | | |
|
| |
| Net Asset | | | | | | | |
| Value, | | Net Assets | | Net | | Net | Portfolio |
| End of | Total | End of Period | | Investment | | Investment | Turnover |
| Period | Return(c) | (in millions) | Expenses | Income/(Loss) | Expenses | Income/(Loss) | Rate |
|
| |
| |
| |
| $17.98 | 15.56% | $988.9 | 1.16% | 0.72% | 1.17% | 0.71% | 188% |
| 18.61 | 15.37% | 976.3 | 1.17% | 0.12% | 1.18% | 0.11% | 193% |
| 17.85 | 21.10% | 928.0 | 1.21% | (0.02)% | 1.22% | (0.03)% | 96% |
| 14.74 | 5.59% | 808.8 | 1.24% | (0.30)% | 1.25% | (0.31)% | 46% |
| 13.96 | 29.98% | 789.9 | 1.26% | (0.36)% | 1.27% | (0.37)% | 123% |
| 10.74 | (17.45)% | 643.8 | 1.30% | (0.18)% | 1.31% | (0.19)% | 48% |
| |
| |
| 15.26 | 14.31% | 11.9 | 2.28% | (0.29)% | 2.29% | (0.30)% | 188% |
| 16.39 | 14.15% | 18.6 | 2.24% | (0.93)% | 2.25% | (0.94)% | 193% |
| 16.08 | 19.82% | 24.0 | 2.28% | (1.10)% | 2.29% | (1.12)% | 96% |
| 13.42 | 5.01% | 27.0 | 2.35% | (1.41)% | 2.36% | (1.42)% | 46% |
| 12.78 | 28.44% | 26.8 | 2.44% | (1.55)% | 2.45% | (1.56)% | 123% |
| 9.95 | (18.44)% | 22.8 | 2.50% | (1.38)% | 2.51% | (1.39)% | 48% |
| |
| |
| 19.14 | 16.09% | 172.1 | 0.70% | 1.08% | 0.71% | 1.07% | 188% |
| 19.60 | 15.90% | 116.4 | 0.70% | 0.57% | 0.71% | 0.56% | 193% |
| 18.63 | 21.76% | 50.7 | 0.70% | 0.51% | 0.71% | 0.49% | 96% |
| 15.30 | 5.81% | 29.8 | 0.71% | 0.23% | 0.72% | 0.22% | 46% |
| 14.46 | 30.74% | 28.4 | 0.70% | 0.20% | 0.71% | 0.19% | 123% |
| 11.06 | (16.90)% | 20.7 | 0.68% | 0.44% | 0.69% | 0.43% | 48% |
|
| |
| |
| |
| 15.90 | 15.97% | 61.0 | 0.90% | 0.77% | 0.99% | 0.68% | 16% |
| 14.47 | 12.37% | 61.6 | 0.90% | 0.57% | 1.00% | 0.46% | 12% |
| 13.77 | 16.80% | 62.5 | 0.90% | 0.62% | 1.07% | 0.45% | 23% |
| 11.86 | 3.33% | 49.2 | 0.92% | (0.10)% | 1.23% | (0.41)% | 8% |
| 11.48 | 32.72% | 38.5 | 1.12% | 0.09% | 1.24% | (0.03)% | 30% |
| 8.65 | (18.36)% | 29.0 | 1.21% | (0.03)% | 1.21% | (0.03)% | 16% |
|
| |
| |
| |
| 15.30 | 16.35% | 14.1 | 0.64% | 1.10% | 0.65% | 1.09% | 16% |
| 13.99 | 12.68% | 22.6 | 0.57% | 0.94% | 0.58% | 0.93% | 22% |
| 13.34 | 17.00% | 23.1 | 0.70% | 0.80% | 0.71% | 0.80% | 42% |
| 11.85 | 3.22% | 17.3 | 0.75% | 0.46% | 0.76% | 0.45% | 8% |
| 11.79 | 33.71% | 31.7 | 0.54% | 0.68% | 0.55% | 0.67% | 13% |
| 8.91 | (17.68)% | 20.8 | 0.28% | 0.89% | 0.57% | 0.60% | 22% |
|
(c) Total investment return assumes dividend reinvestment and does not reflect any deduction for sales charges. Not annualized for periods less than one year.
(d) Computed on an annualized basis for periods less than one year.
(e) For the period from May 1, 2004 to October 31, 2004.
|
| The accompanying Notes to the Financial Statements are an integral part of this schedule. |
|
| 267 |
Thrivent Mutual Funds
Financial Highlights – continued
| | | | | | | |
|
| | F O R A S H A R E O U T S T A N D I N G T H R O U G H O U T E A C H P E R I O D(a) |
| |
|
| |
| |
| | | | | | Less Distributions | |
| | | Income from Investment Operations | from | |
| |
|
| |
| | Net Asset | | Net Realized | | | Net | |
| | Value, | Net | and Unrealized | Total from | Net | Realized | |
| | Beginning | Investment | Gain/(Loss) on | Investment | Investment | Gain on | Total |
| | of Period | Income/(Loss) | Investments(b) | Operations | Income | Investments | Distributions |
|
| PARTNER INTERNATIONAL STOCK FUND | | | | | | |
| Class A Shares | | | | | | | |
| Year Ended 10/31/2007 | $12.94 | $0.24 | $2.86 | $3.10 | $(0.14) | $— | $(0.14) |
| Year Ended 10/31/2006 | 10.57 | 0.14 | 2.34 | 2.48 | (0.11) | — | (0.11) |
| Year Ended 10/31/2005 | 9.10 | 0.11 | 1.36 | 1.47 | — | — | — |
| Year Ended 10/31/2004 | 8.19 | 0.02 | 0.93 | 0.95 | (0.04) | — | (0.04) |
| Year Ended 10/31/2003 | 6.84 | (0.02) | 1.37 | 1.35 | — | — | — |
| Class B Shares | | | | | | | |
| Year Ended 10/31/2007 | 12.43 | 0.04 | 2.79 | 2.83 | — | — | — |
| Year Ended 10/31/2006 | 10.16 | (0.01) | 2.28 | 2.27 | — | — | — |
| Year Ended 10/31/2005 | 8.86 | (0.02) | 1.32 | 1.30 | — | — | — |
| Year Ended 10/31/2004 | 8.00 | (0.11) | 0.97 | 0.86 | — | — | — |
| Year Ended 10/31/2003 | 6.74 | (0.08) | 1.34 | 1.26 | — | — | — |
| Institutional Class Shares | | | | | | | |
| Year Ended 10/31/2007 | 13.19 | 0.34 | 2.90 | 3.24 | (0.22) | — | (0.22) |
| Year Ended 10/31/2006 | 10.77 | 0.20 | 2.40 | 2.60 | (0.18) | — | (0.18) |
| Year Ended 10/31/2005 | 9.23 | 0.07 | 1.48 | 1.55 | (0.01) | — | (0.01) |
| Year Ended 10/31/2004 | 8.31 | (0.02) | 1.07 | 1.05 | (0.13) | — | (0.13) |
| Year Ended 10/31/2003 | 6.85 | 0.09 | 1.37 | 1.46 | — | — | — |
|
| LARGE CAP GROWTH FUND | | | | | | | |
| Class A Shares | | | | | | | |
| Year Ended 10/31/2007 | 5.31 | 0.01 | 1.20 | 1.21 | — | — | — |
| Year Ended 10/31/2006 | 4.90 | 0.01 | 0.40 | 0.41 | — | — | — |
| Year Ended 10/31/2005 | 4.45 | 0.02 | 0.43 | 0.45 | — | — | — |
| Year Ended 10/31/2004 | 4.30 | 0.06 | 0.11 | 0.17 | (0.02) | — | (0.02) |
| Year Ended 10/31/2003 | 3.58 | (0.02) | 0.74 | 0.72 | — | — | — |
| Class B Shares | | | | | | | |
| Year Ended 10/31/2007 | 4.97 | (0.11) | 1.20 | 1.09 | — | — | — |
| Year Ended 10/31/2006 | 4.64 | (0.06) | 0.39 | 0.33 | — | — | — |
| Year Ended 10/31/2005 | 4.25 | (0.04) | 0.43 | 0.39 | — | — | — |
| Year Ended 10/31/2004 | 4.13 | — | 0.12 | 0.12 | — | — | — |
| Year Ended 10/31/2003 | 3.46 | (0.04) | 0.71 | 0.67 | — | — | — |
| Institutional Class Shares | | | | | | | |
| Year Ended 10/31/2007 | 5.65 | 0.03 | 1.29 | 1.32 | (0.04) | — | (0.04) |
| Year Ended 10/31/2006 | 5.20 | 0.04 | 0.44 | 0.48 | (0.03) | — | (0.03) |
| Year Ended 10/31/2005 | 4.69 | 0.02 | 0.50 | 0.52 | (0.01) | — | (0.01) |
| Year Ended 10/31/2004 | 4.51 | 0.08 | 0.13 | 0.21 | (0.03) | — | (0.03) |
| Year Ended 10/31/2003 | 3.69 | 0.04 | 0.78 | 0.82 | — | — | — |
|
(a) All per share amounts have been rounded to the nearest cent.
(b) The amount shown may not correlate with the change in aggregate gains and losses of portfolio securities due to the timing of sales and redemptions of fund shares.
|
| The accompanying Notes to the Financial Statements are an integral part of this schedule. |
|
| 268 |
Thrivent Mutual Funds
Financial Highlights – continued
| | | | | | | |
|
| | | | R A T I O S / S U P P L E M E N T A L D A T A | | |
|
|
| | | | | | Ratios to Average | |
| | | | | | Net Assets Before Expenses | |
| | | | Ratio to Average Net | Waived, Credited or Paid | |
| | | | Assets(d) | Indirectly(d) | |
| | | |
|
| |
| Net Asset | | | | | | | |
| Value, | | Net Assets | | Net | | Net | Portfolio |
| End of | Total | End of Period | | Investment | | Investment | Turnover |
| Period | Return(c) | (in millions) | Expenses | Income/(Loss) | Expenses | Income/(Loss) | Rate |
|
| |
| |
| |
| $15.90 | 24.13% | $382.1 | 1.27% | 1.61% | 1.28% | 1.60% | 111% |
| 12.94 | 23.63% | 337.5 | 1.33% | 1.08% | 1.34% | 1.07% | 50% |
| 10.57 | 16.18% | 304.8 | 1.44% | 1.10% | 1.45% | 1.09% | 43% |
| 9.10 | 11.65% | 243.7 | 1.70% | 0.33% | 1.70% | 0.33% | 126% |
| 8.19 | 19.69% | 59.8 | 2.46% | (0.27)% | 2.58% | (0.39)% | 27% |
| |
| |
| 15.26 | 22.77% | 10.8 | 2.39% | 0.36% | 2.39% | 0.36% | 111% |
| 12.43 | 22.34% | 14.4 | 2.42% | (0.03)% | 2.43% | (0.03)% | 50% |
| 10.16 | 14.67% | 16.1 | 2.62% | (0.13)% | 2.63% | (0.14)% | 43% |
| 8.86 | 10.72% | 19.5 | 2.79% | (0.76)% | 2.79% | (0.76)% | 126% |
| 8.00 | 18.81% | 10.8 | 3.21% | (1.01)% | 3.33% | (1.13)% | 27% |
| |
| |
| 16.21 | 24.84% | 330.6 | 0.70% | 2.33% | 0.70% | 2.33% | 111% |
| 13.19 | 24.40% | 204.2 | 0.71% | 1.74% | 0.72% | 1.73% | 50% |
| 10.77 | 16.82% | 61.1 | 0.76% | 1.48% | 0.77% | 1.47% | 43% |
| 9.23 | 12.69% | 13.1 | 1.08% | 0.95% | 1.18% | 0.85% | 126% |
| 8.31 | 21.22% | 10.3 | 1.24% | 0.96% | 1.49% | 0.71% | 27% |
|
| |
| |
| |
| 6.52 | 22.86% | 157.3 | 1.01% | 0.09% | 1.48% | (0.39)% | 168% |
| 5.31 | 8.46% | 134.0 | 0.76% | 0.26% | 1.57% | (0.55)% | 138% |
| 4.90 | 10.16% | 130.9 | 0.87% | 0.37% | 1.68% | (0.44)% | 106% |
| 4.45 | 3.90% | 83.6 | 0.51% | 0.35% | 1.68% | (0.82)% | 100% |
| 4.30 | 20.25% | 28.0 | 1.40% | (0.41)% | 2.56% | (1.57)% | 111% |
| |
| |
| 6.06 | 21.93% | 8.9 | 1.83% | (0.72)% | 2.64% | (1.53)% | 168% |
| 4.97 | 7.11% | 12.1 | 1.87% | (0.84)% | 2.67% | (1.65)% | 138% |
| 4.64 | 9.18% | 15.8 | 2.05% | (0.69)% | 2.86% | (1.50)% | 106% |
| 4.25 | 2.84% | 17.7 | 1.39% | (0.53)% | 2.60% | (1.74)% | 100% |
| 4.13 | 19.34% | 10.6 | 2.15% | (1.16)% | 3.31% | (2.32)% | 111% |
| |
| |
| 6.93 | 23.45% | 418.3 | 0.60% | 0.48% | 0.81% | 0.26% | 168% |
| 5.65 | 9.21% | 204.8 | 0.03% | 0.97% | 0.84% | 0.16% | 138% |
| 5.20 | 11.01% | 31.3 | 0.07% | 1.21% | 0.89% | 0.39% | 106% |
| 4.69 | 4.65% | 8.9 | (0.26)% | 1.12% | 0.90% | (0.04)% | 100% |
| 4.51 | 22.02% | 3.1 | 0.03% | 0.96% | 1.24% | (0.25)% | 111% |
|
(c) Total investment return assumes dividend reinvestment and does not reflect any deduction for sales charges. Not annualized for periods less than one year.
(d) Computed on an annualized basis for periods less than one year.
|
| The accompanying Notes to the Financial Statements are an integral part of this schedule. |
|
| 269 |
Thrivent Mutual Funds
Financial Highlights – continued
| | | | | | | |
|
| | F O R A S H A R E O U T S T A N D I N G T H R O U G H O U T E A C H P E R I O D(a) |
| |
|
| |
| |
| | | | | | Less Distributions | |
| | Income from Investment Operations | from | |
| |
|
| |
| | Net Asset | | Net Realized | | | Net | |
| | Value, | Net | and Unrealized | Total from | Net | Realized | |
| | Beginning | Investment | Gain/(Loss) on | Investment | Investment | Gain on | Total |
| | of Period | Income/(Loss) | Investments(b) | Operations | Income | Investments | Distributions |
|
| LARGE CAP VALUE FUND | | | | | | | |
| Class A Shares | | | | | | | |
| Year Ended 10/31/2007 | $16.85 | $0.22 | $1.97 | $2.19 | $(0.17) | $(0.95) | $(1.12) |
| Year Ended 10/31/2006 | 14.49 | 0.21 | 2.53 | 2.74 | (0.17) | (0.21) | (0.38) |
| Year Ended 10/31/2005 | 13.15 | 0.17 | 1.23 | 1.40 | (0.06) | — | (0.06) |
| Year Ended 10/31/2004 | 11.79 | 0.20 | 1.34 | 1.54 | (0.18) | — | (0.18) |
| Year Ended 10/31/2003 | 10.07 | 0.08 | 1.69 | 1.77 | (0.05) | — | (0.05) |
| Class B Shares | | | | | | | |
| Year Ended 10/31/2007 | 16.57 | 0.07 | 1.90 | 1.97 | — | (0.95) | (0.95) |
| Year Ended 10/31/2006 | 14.25 | 0.04 | 2.49 | 2.53 | — | (0.21) | (0.21) |
| Year Ended 10/31/2005 | 13.03 | — | 1.22 | 1.22 | — | — | — |
| Year Ended 10/31/2004 | 11.66 | (0.02) | 1.43 | 1.41 | (0.04) | — | (0.04) |
| Year Ended 10/31/2003 | 9.98 | (0.01) | 1.69 | 1.68 | — | — | — |
| Institutional Class Shares | | | | | | | |
| Year Ended 10/31/2007 | 16.98 | 0.28 | 2.01 | 2.29 | (0.25) | (0.95) | (1.20) |
| Year Ended 10/31/2006 | 14.60 | 0.25 | 2.59 | 2.84 | (0.25) | (0.21) | (0.46) |
| Year Ended 10/31/2005 | 13.20 | 0.17 | 1.32 | 1.49 | (0.09) | — | (0.09) |
| Year Ended 10/31/2004 | 11.92 | 0.34 | 1.28 | 1.62 | (0.34) | — | (0.34) |
| Year Ended 10/31/2003 | 10.15 | 0.16 | 1.74 | 1.90 | (0.13) | — | (0.13) |
|
| LARGE CAP STOCK FUND | | | | | | | |
| Class A Shares | | | | | | | |
| Year Ended 10/31/2007 | 28.61 | 0.33 | 3.87 | 4.20 | (0.27) | (1.21) | (1.48) |
| Year Ended 10/31/2006 | 25.93 | 0.25 | 2.88 | 3.13 | (0.17) | (0.28) | (0.45) |
| Year Ended 10/31/2005 | 23.93 | 0.24 | 1.91 | 2.15 | (0.15) | — | (0.15) |
| Period Ended 10/31/2004 (e) | 29.15 | 0.04 | 0.21 | 0.25 | (0.03) | (5.44) | (5.47) |
| Year Ended 4/30/2004 | 25.39 | 0.11 | 3.75 | 3.86 | (0.10) | — | (0.10) |
| Year Ended 4/30/2003 | 29.84 | 0.10 | (4.48) | (4.38) | (0.07) | — | (0.07) |
| Class B Shares | | | | | | | |
| Year Ended 10/31/2007 | 26.40 | 0.12 | 3.50 | 3.62 | — | (1.21) | (1.21) |
| Year Ended 10/31/2006 | 24.00 | 0.01 | 2.67 | 2.68 | — | (0.28) | (0.28) |
| Year Ended 10/31/2005 | 22.21 | 0.03 | 1.76 | 1.79 | — | — | — |
| Period Ended 10/31/2004 (e) | 27.55 | (0.08) | 0.18 | 0.10 | — | (5.44) | (5.44) |
| Year Ended 4/30/2004 | 24.19 | (0.23) | 3.59 | 3.36 | — | — | — |
| Year Ended 4/30/2003 | 28.67 | (0.28) | (4.20) | (4.48) | — | — | — |
| Institutional Class Shares | | | | | | | |
| Year Ended 10/31/2007 | 28.84 | 0.42 | 3.93 | 4.35 | (0.39) | (1.21) | (1.60) |
| Year Ended 10/31/2006 | 26.13 | 0.33 | 2.95 | 3.28 | (0.29) | (0.28) | (0.57) |
| Year Ended 10/31/2005 | 24.06 | 0.33 | 1.95 | 2.28 | (0.21) | — | (0.21) |
| Period Ended 10/31/2004 (e) | 29.24 | 0.07 | 0.24 | 0.31 | (0.05) | (5.44) | (5.49) |
| Year Ended 4/30/2004 | 25.46 | 0.23 | 3.77 | 4.00 | (0.22) | — | (0.22) |
| Year Ended 4/30/2003 | 29.90 | 0.21 | (4.47) | (4.26) | (0.18) | — | (0.18) |
|
(a) All per share amounts have been rounded to the nearest cent.
(b) The amount shown may not correlate with the change in aggregate gains and losses of portfolio securities due to the timing of sales and redemptions of fund shares.
|
| The accompanying Notes to the Financial Statements are an integral part of this schedule. |
|
| 270 |
Thrivent Mutual Funds
Financial Highlights – continued
| | | | | | | |
|
| | | | R A T I O S / S U P P L E M E N T A L D A T A | | |
|
|
| | | | | | Ratios to Average | |
| | | | | | Net Assets Before Expenses | |
| | | | Ratio to Average Net | Waived, Credited or Paid | |
| | | | Assets(d) | Indirectly(d) | |
| | | |
|
| |
| Net Asset | | | | | | | |
| Value, | | Net Assets | | Net | | Net | Portfolio |
| End of | Total | End of Period | | Investment | | Investment | Turnover |
| Period | Return(c) | (in millions) | Expenses | Income/(Loss) | Expenses | Income/(Loss) | Rate |
|
| |
| |
| |
| $17.92 | 13.63% | $336.9 | 0.98% | 1.28% | 0.99% | 1.27% | 37% |
| 16.85 | 19.32% | 332.1 | 1.00% | 1.28% | 1.02% | 1.26% | 45% |
| 14.49 | 10.64% | 321.2 | 1.03% | 1.15% | 1.04% | 1.14% | 53% |
| 13.15 | 13.12% | 290.0 | 0.88% | 1.05% | 1.09% | 0.84% | 51% |
| 11.79 | 17.72% | 28.4 | 1.28% | 0.71% | 2.06% | (0.07)% | 64% |
| |
| |
| 17.59 | 12.37% | 9.8 | 2.11% | 0.17% | 2.12% | 0.16% | 37% |
| 16.57 | 17.96% | 14.5 | 2.12% | 0.17% | 2.14% | 0.15% | 45% |
| 14.25 | 9.36% | 16.9 | 2.21% | 0.00% | 2.23% | (0.02)% | 53% |
| 13.03 | 12.10% | 19.3 | 1.70% | 0.22% | 2.23% | (0.31)% | 51% |
| 11.66 | 16.78% | 9.1 | 2.03% | (0.05)% | 2.81% | (0.83)% | 64% |
| |
| |
| 18.07 | 14.19% | 312.9 | 0.50% | 1.73% | 0.51% | 1.72% | 37% |
| 16.98 | 19.92% | 163.9 | 0.50% | 1.72% | 0.52% | 1.70% | 45% |
| 14.60 | 11.29% | 48.1 | 0.51% | 1.60% | 0.53% | 1.59% | 53% |
| 13.20 | 13.71% | 19.8 | 0.33% | 1.59% | 0.61% | 1.31% | 51% |
| 11.92 | 18.99% | 3.1 | 0.21% | 1.77% | 1.09% | 0.89% | 64% |
|
| |
| |
| |
| 31.33 | 15.29% | 3,029.0 | 1.00% | 1.09% | 1.00% | 1.09% | 103% |
| 28.61 | 12.18% | 3,107.2 | 1.00% | 0.88% | 1.00% | 0.88% | 67% |
| 25.93 | 9.00% | 3,332.0 | 1.00% | 0.93% | 1.01% | 0.92% | 46% |
| 23.93 | 1.27% | 3,435.1 | 1.02% | 0.41% | 1.02% | 0.41% | 43% |
| 29.15 | 15.23% | 2,807.4 | 1.01% | 0.37% | 1.01% | 0.37% | 22% |
| 25.39 | (14.66)% | 2,598.2 | 1.02% | 0.38% | 1.02% | 0.38% | 5% |
| |
| |
| 28.81 | 14.23% | 45.4 | 1.89% | 0.27% | 2.26% | (0.10)% | 103% |
| 26.40 | 11.23% | 69.0 | 1.89% | 0.01% | 2.21% | (0.31)% | 67% |
| 24.00 | 8.06% | 91.9 | 1.89% | 0.11% | 2.22% | (0.22)% | 46% |
| 22.21 | 0.72% | 122.9 | 2.00% | (0.57)% | 2.23% | (0.80)% | 43% |
| 27.55 | 13.89% | 75.3 | 2.17% | (0.79)% | 2.17% | (0.79)% | 22% |
| 24.19 | (15.63)% | 81.2 | 2.16% | (0.75)% | 2.16% | (0.75)% | 5% |
| |
| |
| 31.59 | 15.78% | 369.3 | 0.56% | 1.46% | 0.56% | 1.46% | 103% |
| 28.84 | 12.72% | 245.7 | 0.56% | 1.31% | 0.56% | 1.31% | 67% |
| 26.13 | 9.47% | 146.0 | 0.55% | 1.33% | 0.56% | 1.33% | 46% |
| 24.06 | 1.50% | 112.3 | 0.57% | 0.65% | 0.57% | 0.65% | 43% |
| 29.24 | 15.76% | 84.9 | 0.57% | 0.82% | 0.57% | 0.82% | 22% |
| 25.46 | (14.24)% | 68.2 | 0.55% | 0.85% | 0.55% | 0.85% | 5% |
|
(c) Total investment return assumes dividend reinvestment and does not reflect any deduction for sales charges. Not annualized for periods less than one year.
(d) Computed on an annualized basis for periods less than one year.
(e) For the period from May 1, 2004 to October 31, 2004.
|
| The accompanying Notes to the Financial Statements are an integral part of this schedule. |
|
| 271 |
Thrivent Mutual Funds
Financial Highlights – continued
| | | | | | | |
|
| | F O R A S H A R E O U T S T A N D I N G T H R O U G H O U T E A C H P E R I O D(a) |
| |
|
| |
| |
| | | | | | Less Distributions | |
| | | Income from Investment Operations | from | |
| |
|
| |
| | Net Asset | | Net Realized | | | Net | |
| | Value, | Net | and Unrealized | Total from | Net | Realized | |
| | Beginning | Investment | Gain/(Loss) on | Investment | Investment | Gain on | Total |
| | of Period | Income/(Loss) | Investments(b) | Operations | Income | Investments | Distributions |
|
| LARGE CAP INDEX FUND | | | | | | | |
| Class A Shares | | | | | | | |
| Year Ended 10/31/2007 | $9.52 | $0.15 | $1.16 | $1.31 | $(0.13) | $— | $(0.13) |
| Year Ended 10/31/2006 | 8.35 | 0.13 | 1.16 | 1.29 | (0.11) | (0.01) | (0.12) |
| Year Ended 10/31/2005 | 7.78 | 0.12 | 0.53 | 0.65 | (0.08) | — | (0.08) |
| Period Ended 10/31/2004 (e) | 7.61 | 0.04 | 0.16 | 0.20 | (0.03) | — | (0.03) |
| Year Ended 4/30/2004 | 6.30 | 0.08 | 1.31 | 1.39 | (0.08) | — | (0.08) |
| Year Ended 10/31/2003 | 7.32 | 0.05 | (1.05) | (1.00) | (0.02) | — | (0.02) |
|
| LARGE CAP INDEX FUND-I | | | | | | | |
| Institutional Class Shares | | | | | | | |
| Year Ended 10/31/2007 | 9.46 | 0.16 | 1.18 | 1.34 | (0.14) | — | (0.14) |
| Year Ended 10/31/2006 | 8.29 | 0.14 | 1.15 | 1.29 | (0.12) | — | (0.12) |
| Year Ended 10/31/2005 | 7.76 | 0.13 | 0.52 | 0.65 | (0.12) | — | (0.12) |
| Period Ended 10/31/2004 (e) | 7.55 | 0.05 | 0.16 | 0.21 | — | — | — |
| Year Ended 4/30/2004 | 6.31 | 0.15 | 1.24 | 1.39 | (0.15) | — | (0.15) |
| Year Ended 4/30/2003 | 7.38 | 0.08 | (1.07) | (0.99) | (0.08) | — | (0.08) |
|
| BALANCED FUND | | | | | | | |
| Class A Shares | | | | | | | |
| Year Ended 10/31/2007 | 12.95 | 0.24 | 1.29 | 1.53 | (0.22) | (0.62) | (0.84) |
| Year Ended 10/31/2006 | 12.18 | 0.21 | 1.09 | 1.30 | (0.21) | (0.32) | (0.53) |
| Year Ended 10/31/2005 | 11.81 | 0.20 | 0.57 | 0.77 | (0.22) | (0.18) | (0.40) |
| Period Ended 10/31/2004 (e) | 11.65 | 0.09 | 0.17 | 0.26 | (0.10) | — | (0.10) |
| Year Ended 4/30/2004 | 10.75 | 0.17 | 0.92 | 1.09 | (0.19) | — | (0.19) |
| Year Ended 4/30/2003 | 11.52 | 0.19 | (0.76) | (0.57) | (0.20) | — | (0.20) |
| Class B Shares | | | | | | | |
| Year Ended 10/31/2007 | 12.89 | 0.14 | 1.26 | 1.40 | (0.09) | (0.62) | (0.71) |
| Year Ended 10/31/2006 | 12.13 | 0.10 | 1.07 | 1.17 | (0.09) | (0.32) | (0.41) |
| Year Ended 10/31/2005 | 11.76 | 0.09 | 0.56 | 0.65 | (0.10) | (0.18) | (0.28) |
| Period Ended 10/31/2004 (e) | 11.60 | 0.03 | 0.17 | 0.20 | (0.04) | — | (0.04) |
| Year Ended 4/30/2004 | 10.70 | 0.06 | 0.92 | 0.98 | (0.08) | — | (0.08) |
| Year Ended 4/30/2003 | 11.47 | 0.11 | (0.76) | (0.65) | (0.12) | — | (0.12) |
| Institutional Class Shares | | | | | | | |
| Year Ended 10/31/2007 | 12.93 | 0.30 | 1.30 | 1.60 | (0.28) | (0.62) | (0.90) |
| Year Ended 10/31/2006 | 12.17 | 0.27 | 1.08 | 1.35 | (0.27) | (0.32) | (0.59) |
| Year Ended 10/31/2005 | 11.80 | 0.26 | 0.56 | 0.82 | (0.27) | (0.18) | (0.45) |
| Period Ended 10/31/2004 (e) | 11.64 | 0.12 | 0.17 | 0.29 | (0.13) | — | (0.13) |
| Year Ended 4/30/2004 | 10.74 | 0.22 | 0.93 | 1.15 | (0.25) | — | (0.25) |
| Year Ended 4/30/2003 | 11.51 | 0.21 | (0.73) | (0.52) | (0.25) | — | (0.25) |
|
(a) All per share amounts have been rounded to the nearest cent.
(b) The amount shown may not correlate with the change in aggregate gains and losses of portfolio securities due to the timing of sales and redemptions of fund shares.
|
| The accompanying Notes to the Financial Statements are an integral part of this schedule. |
|
| 272 |
Thrivent Mutual Funds
Financial Highlights – continued
| | | | | | | |
|
| | | | R A T I O S / S U P P L E M E N T A L D A T A | | |
|
|
| | | | | | Ratios to Average | |
| | | | | | Net Assets Before Expenses | |
| | | | Ratio to Average Net | Waived, Credited or Paid | |
| | | | Assets(d) | Indirectly(d) | |
| | | |
|
| |
| Net Asset | | | | | | | |
| Value, | | Net Assets | | Net | | Net | Portfolio |
| End of | Total | End of Period | | Investment | | Investment | Turnover |
| Period | Return(c) | (in millions) | Expenses | Income/(Loss) | Expenses | Income/(Loss) | Rate |
|
| |
| |
| |
| $10.70 | 13.90% | $93.6 | 0.60% | 1.38% | 0.88% | 1.10% | 5% |
| 9.52 | 15.56% | 92.3 | 0.60% | 1.37% | 0.91% | 1.05% | 7% |
| 8.35 | 8.33% | 94.3 | 0.60% | 1.49% | 0.94% | 1.15% | 9% |
| 7.78 | 2.62% | 76.3 | 0.57% | 0.64% | 1.08% | 0.13% | 5% |
| 7.61 | 22.09% | 51.2 | 0.41% | 1.28% | 1.17% | 0.52% | 6% |
| 6.30 | (13.58)% | 27.8 | 0.93% | 0.86% | 1.18% | 0.61% | 16% |
|
| |
| |
| |
| 10.66 | 14.27% | 35.0 | 0.49% | 1.54% | 0.50% | 1.53% | 10% |
| 9.46 | 15.69% | 32.6 | 0.52% | 1.50% | 0.52% | 1.49% | 14% |
| 8.29 | 8.39% | 31.5 | 0.50% | 1.61% | 0.51% | 1.61% | 11% |
| 7.76 | 2.78% | 29.4 | 0.54% | 1.19% | 0.55% | 1.18% | 4% |
| 7.55 | 22.00% | 28.7 | 0.54% | 1.21% | 0.55% | 1.20% | 27% |
| 6.31 | (13.36)% | 62.1 | 0.24% | 1.55% | 0.36% | 1.43% | 23% |
|
| |
| |
| |
| 13.64 | 12.39% | 237.0 | 1.07% | 1.83% | 1.09% | 1.81% | 176% |
| 12.95 | 10.97% | 251.6 | 1.07% | 1.67% | 1.09% | 1.65% | 215% |
| 12.18 | 6.56% | 276.1 | 1.07% | 1.62% | 1.09% | 1.60% | 231% |
| 11.81 | 2.21% | 278.5 | 1.07% | 1.49% | 1.08% | 1.48% | 114% |
| 11.65 | 10.22% | 278.0 | 1.06% | 1.48% | 1.07% | 1.47% | 194% |
| 10.75 | (4.90)% | 260.8 | 1.05% | 1.77% | 1.07% | 1.75% | 69% |
| |
| |
| 13.58 | 11.31% | 7.6 | 2.06% | 0.86% | 2.10% | 0.82% | 176% |
| 12.89 | 9.83% | 10.0 | 2.04% | 0.71% | 2.05% | 0.70% | 215% |
| 12.13 | 5.54% | 13.3 | 2.02% | 0.72% | 2.04% | 0.70% | 231% |
| 11.76 | 1.71% | 17.6 | 2.03% | 0.53% | 2.04% | 0.52% | 114% |
| 11.60 | 9.22% | 18.6 | 2.02% | 0.52% | 2.03% | 0.51% | 194% |
| 10.70 | (5.68)% | 19.3 | 1.84% | 0.97% | 1.86% | 0.95% | 60% |
| |
| |
| 13.63 | 13.00% | 83.8 | 0.61% | 2.29% | 0.63% | 2.27% | 176% |
| 12.93 | 11.41% | 86.3 | 0.61% | 2.13% | 0.63% | 2.12% | 215% |
| 12.17 | 7.07% | 98.4 | 0.59% | 2.11% | 0.62% | 2.09% | 231% |
| 11.80 | 2.47% | 108.5 | 0.60% | 1.97% | 0.61% | 1.96% | 114% |
| 11.64 | 10.75% | 111.2 | 0.59% | 1.96% | 0.60% | 1.95% | 194% |
| 10.74 | (4.45)% | 107.8 | 0.56% | 2.26% | 0.57% | 2.25% | 69% |
|
(c) Total investment return assumes dividend reinvestment and does not reflect any deduction for sales charges. Not annualized for periods less than one year.
(d) Computed on an annualized basis for periods less than one year.
(e) For the period from May 1, 2004 to October 31, 2004.
|
| The accompanying Notes to the Financial Statements are an integral part of this schedule. |
|
| 273 |
Thrivent Mutual Funds
Financial Highlights – continued
| | | | | | | |
|
| | F O R A S H A R E O U T S T A N D I N G T H R O U G H O U T E A C H P E R I O D(a) |
| |
|
| |
| |
| | | | | | Less Distributions | |
| | | Income from Investment Operations | from | |
| |
|
| |
| | Net Asset | | Net Realized | | | Net | |
| | Value, | Net | and Unrealized | Total from | Net | Realized | |
| | Beginning | Investment | Gain/(Loss) on | Investment | Investment | Gain on | Total |
| | of Period | Income/(Loss) | Investments(b) | Operations | Income | Investments | Distributions |
|
| HIGH YIELD FUND | | | | | | | |
| Class A Shares | | | | | | | |
| Year Ended 10/31/2007 | $5.08 | $0.38 | $(0.05) | $0.33 | $(0.38) | $— | $(0.38) |
| Year Ended 10/31/2006 | 5.03 | 0.38 | 0.05 | 0.43 | (0.38) | — | (0.38) |
| Year Ended 10/31/2005 | 5.24 | 0.38 | (0.20) | 0.18 | (0.39) | — | (0.39) |
| Year Ended 10/31/2004 | 5.07 | 0.40 | 0.16 | 0.56 | (0.39) | — | (0.39) |
| Year Ended 10/31/2003 | 4.23 | 0.41 | 0.82 | 1.23 | (0.39) | — | (0.39) |
| Class B Shares | | | | | | | |
| Year Ended 10/31/2007 | 5.08 | 0.34 | (0.05) | 0.29 | (0.34) | — | (0.34) |
| Year Ended 10/31/2006 | 5.02 | 0.34 | 0.06 | 0.40 | (0.34) | — | (0.34) |
| Year Ended 10/31/2005 | 5.24 | 0.34 | (0.21) | 0.13 | (0.35) | — | (0.35) |
| Year Ended 10/31/2004 | 5.07 | 0.36 | 0.16 | 0.52 | (0.35) | — | (0.35) |
| Year Ended 10/31/2003 | 4.23 | 0.37 | 0.82 | 1.19 | (0.35) | — | (0.35) |
| Institutional Class Shares | | | | | | | |
| Year Ended 10/31/2007 | 5.09 | 0.40 | (0.04) | 0.36 | (0.41) | — | (0.41) |
| Year Ended 10/31/2006 | 5.03 | 0.41 | 0.06 | 0.47 | (0.41) | — | (0.41) |
| Year Ended 10/31/2005 | 5.24 | 0.41 | (0.21) | 0.20 | (0.41) | — | (0.41) |
| Year Ended 10/31/2004 | 5.07 | 0.42 | 0.16 | 0.58 | (0.41) | — | (0.41) |
| Year Ended 10/31/2003 | 4.23 | 0.42 | 0.83 | 1.25 | (0.41) | — | (0.41) |
|
| MUNICIPAL BOND FUND | | | | | | | |
| Class A Shares | | | | | | | |
| Year Ended 10/31/2007 | 11.39 | 0.49 | (0.23) | 0.26 | (0.49) | — | (0.49) |
| Year Ended 10/31/2006 | 11.31 | 0.50 | 0.08 | 0.58 | (0.50) | — | (0.50) |
| Year Ended 10/31/2005 | 11.56 | 0.50 | (0.25) | 0.25 | (0.50) | — | (0.50) |
| Year Ended 10/31/2004 | 11.53 | 0.50 | 0.12 | 0.62 | (0.53) | (0.06) | (0.59) |
| Year Ended 10/31/2003 | 11.61 | 0.54 | (0.05) | 0.49 | (0.56) | (0.01) | (0.57) |
| Class B Shares | | | | | | | |
| Year Ended 10/31/2007 | 11.38 | 0.42 | (0.22) | 0.20 | (0.42) | — | (0.42) |
| Year Ended 10/31/2006 | 11.30 | 0.43 | 0.07 | 0.50 | (0.42) | — | (0.42) |
| Year Ended 10/31/2005 | 11.55 | 0.42 | (0.25) | 0.17 | (0.42) | — | (0.42) |
| Year Ended 10/31/2004 | 11.52 | 0.44 | 0.09 | 0.53 | (0.44) | (0.06) | (0.50) |
| Year Ended 10/31/2003 | 11.61 | 0.45 | (0.06) | 0.39 | (0.47) | (0.01) | (0.48) |
| Institutional Class Shares | | | | | | | |
| Year Ended 10/31/2007 | 11.39 | 0.53 | (0.23) | 0.30 | (0.53) | — | (0.53) |
| Year Ended 10/31/2006 | 11.31 | 0.54 | 0.08 | 0.62 | (0.54) | — | (0.54) |
| Year Ended 10/31/2005 | 11.55 | 0.53 | (0.24) | 0.29 | (0.53) | — | (0.53) |
| Year Ended 10/31/2004 | 11.53 | 0.53 | 0.11 | 0.64 | (0.56) | (0.06) | (0.62) |
| Year Ended 10/31/2003 | 11.61 | 0.58 | (0.05) | 0.53 | (0.60) | (0.01) | (0.61) |
|
(a) All per share amounts have been rounded to the nearest cent.
(b) The amount shown may not correlate with the change in aggregate gains and losses of portfolio securities due to the timing of sales and redemptions of fund shares.
|
| The accompanying Notes to the Financial Statements are an integral part of this schedule. |
|
| 274 |
Thrivent Mutual Funds
Financial Highlights – continued
| | | | | | | |
|
| | | | R A T I O S / S U P P L E M E N T A L D A T A | | |
|
|
| | | | | | Ratios to Average | |
| | | | | | Net Assets Before Expenses | |
| | | | Ratio to Average Net | Waived, Credited or Paid | |
| | | | Assets(d) | Indirectly(d) | |
| | | |
|
| |
| Net Asset | | | | | | | |
| Value, | | Net Assets | | Net | | Net | Portfolio |
| End of | Total | End of Period | | Investment | | Investment | Turnover |
| Period | Return(c) | (in millions) | Expenses | Income/(Loss) | Expenses | Income/(Loss) | Rate |
|
| |
| |
| |
| $5.03 | 6.72% | $486.2 | 0.86% | 7.50% | 0.87% | 7.49% | 72% |
| 5.08 | 8.96% | 533.7 | 0.88% | 7.62% | 0.89% | 7.60% | 63% |
| 5.03 | 3.54% | 563.0 | 0.87% | 7.45% | 0.88% | 7.43% | 54% |
| 5.24 | 11.53% | 603.1 | 0.89% | 7.80% | 0.89% | 7.80% | 73% |
| 5.07 | 30.00% | 579.8 | 1.02% | 8.70% | 1.02% | 8.70% | 96% |
| |
| |
| 5.03 | 5.79% | 9.9 | 1.73% | 6.62% | 1.92% | 6.42% | 72% |
| 5.08 | 8.25% | 16.5 | 1.73% | 6.75% | 1.92% | 6.57% | 63% |
| 5.02 | 2.45% | 23.4 | 1.73% | 6.57% | 1.91% | 6.39% | 54% |
| 5.24 | 10.66% | 33.1 | 1.70% | 7.00% | 1.74% | 6.96% | 73% |
| 5.07 | 29.03% | 36.3 | 1.77% | 7.95% | 1.77% | 7.95% | 96% |
| |
| |
| 5.04 | 7.16% | 62.1 | 0.44% | 7.92% | 0.46% | 7.90% | 72% |
| 5.09 | 9.63% | 82.3 | 0.45% | 8.07% | 0.46% | 8.06% | 63% |
| 5.03 | 3.97% | 15.2 | 0.46% | 7.88% | 0.47% | 7.87% | 54% |
| 5.24 | 11.98% | 10.1 | 0.49% | 8.21% | 0.60% | 8.10% | 73% |
| 5.07 | 30.57% | 10.8 | 0.57% | 9.15% | 0.69% | 9.03% | 96% |
|
| |
| |
| |
| 11.16 | 2.39% | 1,145.8 | 0.78% | 4.40% | 0.78% | 4.40% | 7% |
| 11.39 | 5.28% | 1,201.2 | 0.78% | 4.46% | 0.78% | 4.46% | 14% |
| 11.31 | 2.17% | 1,242.4 | 0.78% | 4.31% | 0.78% | 4.31% | 8% |
| 11.56 | 5.47% | 1,264.1 | 0.73% | 4.53% | 0.73% | 4.53% | 12% |
| 11.53 | 4.37% | 641.7 | 0.72% | 4.62% | 0.72% | 4.62% | 6% |
| |
| |
| 11.16 | 1.77% | 12.4 | 1.47% | 3.70% | 1.61% | 3.56% | 7% |
| 11.38 | 4.56% | 21.7 | 1.47% | 3.77% | 1.60% | 3.64% | 14% |
| 11.30 | 1.46% | 28.9 | 1.47% | 3.61% | 1.60% | 3.48% | 8% |
| 11.55 | 4.72% | 34.0 | 1.46% | 3.81% | 1.51% | 3.76% | 12% |
| 11.52 | 3.48% | 24.2 | 1.47% | 3.88% | 1.47% | 3.88% | 6% |
| |
| |
| 11.16 | 2.68% | 17.4 | 0.49% | 4.70% | 0.49% | 4.70% | 7% |
| 11.39 | 5.59% | 12.2 | 0.49% | 4.75% | 0.49% | 4.75% | 14% |
| 11.31 | 2.56% | 8.4 | 0.48% | 4.64% | 0.48% | 4.64% | 8% |
| 11.55 | 5.70% | 5.1 | 0.44% | 4.83% | 0.52% | 4.75% | 12% |
| 11.53 | 4.67% | 2.6 | 0.44% | 4.90% | 0.56% | 4.78% | 6% |
|
(c) Total investment return assumes dividend reinvestment and does not reflect any deduction for sales charges. Not annualized for periods less than one year.
(d) Computed on an annualized basis for periods less than one year.
|
| The accompanying Notes to the Financial Statements are an integral part of this schedule. |
|
| 275 |
Thrivent Mutual Funds
Financial Highlights – continued
| | | | | | | |
|
| | F O R A S H A R E O U T S T A N D I N G T H R O U G H O U T E A C H P E R I O D(a) |
| |
|
| |
| |
| | | | | | Less Distributions | |
| | | Income from Investment Operations | from | |
| |
|
| |
| | Net Asset | | Net Realized | | | Net | |
| | Value, | Net | and Unrealized | Total from | Net | Realized | |
| | Beginning | Investment | Gain/(Loss) on | Investment | Investment | Gain on | Total |
| | of Period | Income/(Loss) | Investments(b) | Operations | Income | Investments | Distributions |
|
| INCOME FUND | | | | | | | |
| Class A Shares | | | | | | | |
| Year Ended 10/31/2007 | $8.59 | $0.43 | $(0.10) | $0.33 | $(0.42) | $— | $(0.42) |
| Year Ended 10/31/2006 | 8.56 | 0.41 | 0.03 | 0.44 | (0.41) | — | (0.41) |
| Year Ended 10/31/2005 | 8.86 | 0.37 | (0.30) | 0.07 | (0.37) | — | (0.37) |
| Year Ended 10/31/2004 | 8.73 | 0.35 | 0.13 | 0.48 | (0.35) | — | (0.35) |
| Year Ended 10/31/2003 | 8.34 | 0.34 | 0.40 | 0.74 | (0.35) | — | (0.35) |
| Class B Shares | | | | | | | |
| Year Ended 10/31/2007 | 8.57 | 0.37 | (0.11) | 0.26 | (0.35) | — | (0.35) |
| Year Ended 10/31/2006 | 8.54 | 0.34 | 0.03 | 0.37 | (0.34) | — | (0.34) |
| Year Ended 10/31/2005 | 8.84 | 0.30 | (0.30) | — | (0.30) | — | (0.30) |
| Year Ended 10/31/2004 | 8.71 | 0.29 | 0.12 | 0.41 | (0.28) | — | (0.28) |
| Year Ended 10/31/2003 | 8.32 | 0.27 | 0.41 | 0.68 | (0.29) | — | (0.29) |
| Institutional Class Shares | | | | | | | |
| Year Ended 10/31/2007 | 8.58 | 0.47 | (0.11) | 0.36 | (0.45) | — | (0.45) |
| Year Ended 10/31/2006 | 8.55 | 0.44 | 0.03 | 0.47 | (0.44) | — | (0.44) |
| Year Ended 10/31/2005 | 8.85 | 0.40 | (0.29) | 0.11 | (0.41) | — | (0.41) |
| Year Ended 10/31/2004 | 8.75 | 0.39 | 0.10 | 0.49 | (0.39) | — | (0.39) |
| Year Ended 10/31/2003 | 8.34 | 0.37 | 0.43 | 0.80 | (0.39) | — | (0.39) |
|
| CORE BOND FUND | | | | | | | |
| Class A Shares | | | | | | | |
| Year Ended 10/31/2007 | 9.90 | 0.46 | (0.15) | 0.31 | (0.44) | — | (0.44) |
| Year Ended 10/31/2006 | 9.89 | 0.44 | 0.02 | 0.46 | (0.45) | — | (0.45) |
| Year Ended 10/31/2005 | 10.27 | 0.39 | (0.36) | 0.03 | (0.41) | — | (0.41) |
| Period Ended 10/31/2004 (e) | 10.14 | 0.20 | 0.16 | 0.36 | (0.22) | (0.01) | (0.23) |
| Year Ended 4/30/2004 | 10.31 | 0.40 | (0.12) | 0.28 | (0.45) | — | (0.45) |
| Year Ended 4/30/2003 | 9.82 | 0.42 | 0.52 | 0.94 | (0.45) | — | (0.45) |
| Class B Shares | | | | | | | |
| Year Ended 10/31/2007 | 9.91 | 0.36 | (0.15) | 0.21 | (0.34) | — | (0.34) |
| Year Ended 10/31/2006 | 9.90 | 0.34 | 0.02 | 0.36 | (0.35) | — | (0.35) |
| Year Ended 10/31/2005 | 10.27 | 0.29 | (0.35) | (0.06) | (0.31) | — | (0.31) |
| Period Ended 10/31/2004 (e) | 10.15 | 0.15 | 0.15 | 0.30 | (0.17) | (0.01) | (0.18) |
| Year Ended 4/30/2004 | 10.32 | 0.30 | (0.12) | 0.18 | (0.35) | — | (0.35) |
| Year Ended 4/30/2003 | 9.82 | 0.33 | 0.53 | 0.86 | (0.36) | — | (0.36) |
| Institutional Class Shares | | | | | | | |
| Year Ended 10/31/2007 | 9.91 | 0.49 | (0.13) | 0.36 | (0.49) | — | (0.49) |
| Year Ended 10/31/2006 | 9.90 | 0.48 | 0.02 | 0.50 | (0.49) | — | (0.49) |
| Year Ended 10/31/2005 | 10.27 | 0.43 | (0.34) | 0.09 | (0.46) | — | (0.46) |
| Period Ended 10/31/2004 (e) | 10.15 | 0.22 | 0.15 | 0.37 | (0.24) | (0.01) | (0.25) |
| Year Ended 4/30/2004 | 10.31 | 0.44 | (0.11) | 0.33 | (0.49) | — | (0.49) |
| Year Ended 4/30/2003 | 9.82 | 0.46 | 0.52 | 0.98 | (0.49) | — | (0.49) |
|
(a) All per share amounts have been rounded to the nearest cent.
(b) The amount shown may not correlate with the change in aggregate gains and losses of portfolio securities due to the timing of sales and redemptions of fund shares.
|
| The accompanying Notes to the Financial Statements are an integral part of this schedule. |
|
| 276 |
Thrivent Mutual Funds
Financial Highlights – continued
| | | | | | | |
|
| | | | R A T I O S / S U P P L E M E N T A L D A T A | | |
|
|
| | | | | | Ratios to Average | |
| | | | | | Net Assets Before Expenses | |
| | | | Ratio to Average Net | Waived, Credited or Paid | |
| | | | Assets(d) | Indirectly(d) | |
| | | |
|
| |
| Net Asset | | | | | | | |
| Value, | | Net Assets | | Net | | Net | Portfolio |
| End of | Total | End of Period | | Investment | | Investment | Turnover |
| Period | Return(c) | (in millions) | Expenses | Income/(Loss) | Expenses | Income/(Loss) | Rate |
|
| |
| |
| |
| $8.50 | 3.90% | $433.0 | 0.80% | 5.06% | 0.81% | 5.05% | 236% |
| 8.59 | 5.25% | 470.5 | 0.81% | 4.78% | 0.82% | 4.76% | 303% |
| 8.56 | 0.82% | 532.3 | 0.80% | 4.22% | 0.81% | 4.20% | 245% |
| 8.86 | 5.64% | 575.2 | 0.82% | 4.04% | 0.82% | 4.04% | 203% |
| 8.73 | 9.05% | 608.7 | 0.87% | 3.88% | 0.88% | 3.87% | 312% |
| |
| |
| 8.48 | 3.03% | 6.5 | 1.63% | 4.21% | 2.02% | 3.81% | 236% |
| 8.57 | 4.39% | 12.6 | 1.63% | 3.93% | 1.96% | 3.60% | 303% |
| 8.54 | (0.02)% | 19.2 | 1.63% | 3.38% | 1.94% | 3.07% | 245% |
| 8.84 | 4.83% | 25.4 | 1.60% | 3.25% | 1.68% | 3.17% | 203% |
| 8.71 | 8.25% | 30.3 | 1.62% | 3.13% | 1.63% | 3.12% | 312% |
| |
| |
| 8.49 | 4.32% | 368.9 | 0.39% | 5.51% | 0.40% | 5.50% | 236% |
| 8.58 | 5.68% | 167.0 | 0.40% | 5.30% | 0.41% | 5.29% | 303% |
| 8.55 | 1.22% | 46.7 | 0.40% | 4.64% | 0.41% | 4.62% | 245% |
| 8.85 | 5.94% | 29.0 | 0.43% | 4.43% | 0.54% | 4.32% | 203% |
| 8.75 | 9.49% | 25.2 | 0.47% | 4.28% | 0.60% | 4.15% | 312% |
|
| |
| |
| |
| 9.77 | 3.24% | 295.1 | 0.93% | 4.62% | 0.95% | 4.60% | 381% |
| 9.90 | 4.75% | 343.1 | 0.93% | 4.44% | 0.95% | 4.42% | 394% |
| 9.89 | 0.31% | 421.2 | 0.91% | 3.84% | 0.94% | 3.82% | 368% |
| 10.27 | 3.58% | 457.1 | 0.92% | 3.84% | 0.93% | 3.83% | 167% |
| 10.14 | 2.74% | 460.5 | 0.88% | 3.86% | 0.89% | 3.85% | 463% |
| 10.31 | 9.79% | 526.5 | 0.85% | 4.19% | 0.86% | 4.18% | 149% |
| |
| |
| 9.78 | 2.19% | 4.5 | 1.95% | 3.60% | 1.99% | 3.56% | 381% |
| 9.91 | 3.71% | 8.1 | 1.94% | 3.43% | 1.96% | 3.41% | 394% |
| 9.90 | (0.58)% | 10.8 | 1.91% | 2.86% | 1.93% | 2.84% | 368% |
| 10.27 | 2.97% | 13.3 | 1.91% | 2.84% | 1.92% | 2.83% | 167% |
| 10.15 | 1.75% | 13.4 | 1.86% | 2.89% | 1.87% | 2.88% | 463% |
| 10.32 | 8.91% | 13.2 | 1.77% | 3.28% | 1.78% | 3.27% | 149% |
| |
| |
| 9.78 | 3.68% | 83.8 | 0.51% | 5.00% | 0.53% | 4.98% | 381% |
| 9.91 | 5.20% | 49.0 | 0.51% | 4.86% | 0.53% | 4.85% | 394% |
| 9.90 | 0.84% | 52.9 | 0.49% | 4.17% | 0.51% | 4.15% | 368% |
| 10.27 | 3.69% | 36.3 | 0.50% | 4.25% | 0.51% | 4.24% | 167% |
| 10.15 | 3.25% | 34.5 | 0.49% | 4.26% | 0.50% | 4.25% | 463% |
| 10.31 | 10.20% | 29.2 | 0.47% | 4.57% | 0.48% | 4.56% | 149% |
|
(c) Total investment return assumes dividend reinvestment and does not reflect any deduction for sales charges. Not annualized for periods less than one year.
(d) Computed on an annualized basis for periods less than one year.
(e) For the period from May 1, 2004 to October 31, 2004.
|
| The accompanying Notes to the Financial Statements are an integral part of this schedule. |
|
| 277 |
Thrivent Mutual Funds
Financial Highlights – continued
| | | | | | | | |
|
| | | F O R A S H A R E O U T S T A N D I N G T H R O U G H O U T E A C H P E R I O D |
| | |
|
| |
| |
| | | | | | | Less Distributions | |
| | | | Income from Investment Operations | from | |
| | |
|
| |
| | | Net Asset | | Net Realized | | | Net | |
| | | Value, | Net | and Unrealized | Total from | Net | Realized | |
| | | Beginning | Investment | Gain/(Loss) on | Investment | Investment | Gain on | Total |
| | | of Period | Income/(Loss) | Investments(a) | Operations | Income | Investments | Distributions |
|
| LIMITED MATURITY BOND FUND | | | | | | |
| Class A Shares | | | | | | | | |
| Year Ended 10/31/2007 | | $12.58 | $0.57 | $(0.06) | $0.51 | $(0.56) | $— | $(0.56) |
| Year Ended 10/31/2006 | | 12.58 | 0.50 | — | 0.50 | (0.50) | — | (0.50) |
| Year Ended 10/31/2005 | | 12.91 | 0.41 | (0.30) | 0.11 | (0.41) | (0.03) | (0.44) |
| Year Ended 10/31/2004 | | 13.06 | 0.35 | (0.03) | 0.32 | (0.35) | (0.12) | (0.47) |
| Year Ended 10/31/2003 | | 12.75 | 0.36 | 0.31 | 0.67 | (0.36) | — | (0.36) |
| Class B Shares | | | | | | | | |
| Year Ended 10/31/2007 | | 12.59 | 0.55 | (0.06) | 0.49 | (0.54) | — | (0.54) |
| Year Ended 10/31/2006 | | 12.59 | 0.50 | — | 0.50 | (0.50) | — | (0.50) |
| Year Ended 10/31/2005 | | 12.92 | 0.41 | (0.30) | 0.11 | (0.41) | (0.03) | (0.44) |
| Year Ended 10/31/2004 | | 13.06 | 0.33 | (0.02) | 0.31 | (0.33) | (0.12) | (0.45) |
| Year Ended 10/31/2003 | | 12.75 | 0.34 | 0.31 | 0.65 | (0.34) | — | (0.34) |
| Institutional Class Shares | | | | | | | | |
| Year Ended 10/31/2007 | | 12.58 | 0.61 | (0.06) | 0.55 | (0.60) | — | (0.60) |
| Year Ended 10/31/2006 | | 12.58 | 0.56 | — | 0.56 | (0.56) | — | (0.56) |
| Year Ended 10/31/2005 | | 12.91 | 0.47 | (0.30) | 0.17 | (0.47) | (0.03) | (0.50) |
| Year Ended 10/31/2004 | | 13.05 | 0.39 | (0.02) | 0.37 | (0.39) | (0.12) | (0.51) |
| Year Ended 10/31/2003 | | 12.74 | 0.40 | 0.31 | 0.71 | (0.40) | — | (0.40) |
|
| MONEY MARKET FUND | | | | | | | | |
| Class A Shares | | | | | | | | |
| Year Ended 10/31/2007 | | 1.00 | 0.05 | — | 0.05 | (0.05) | — | (0.05) |
| Year Ended 10/31/2006 | | 1.00 | 0.04 | — | 0.04 | (0.04) | — | (0.04) |
| Year Ended 10/31/2005 | | 1.00 | 0.02 | — | 0.02 | (0.02) | — | (0.02) |
| Period Ended 10/31/2004 (d) | | 1.00 | (0.001) | 0.004 | 0.003 | (0.003) | — | (0.003) |
| Year Ended 4/30/2004 | | 1.00 | 0.003 | — | 0.003 | (0.003) | — | (0.003) |
| Year Ended 4/30/2003 | | 1.00 | 0.01 | — | 0.01 | (0.01) | — | (0.01) |
| Class B Shares | | | | | | | | |
| Year Ended 10/31/2007 | | 1.00 | 0.04 | — | 0.04 | (0.04) | — | (0.04) |
| Year Ended 10/31/2006 | | 1.00 | 0.04 | — | 0.04 | (0.04) | — | (0.04) |
| Year Ended 10/31/2005 | | 1.00 | 0.02 | — | 0.02 | (0.02) | — | (0.02) |
| Period Ended 10/31/2004 (d) | | 1.00 | 0.002 | — | 0.002 | (0.002) | — | (0.002) |
| Year Ended 4/30/2004 | | 1.00 | 0.001 | — | 0.001 | (0.001) | — | (0.001) |
| Year Ended 4/30/2003 | | 1.00 | 0.003 | — | 0.003 | (0.003) | — | (0.003) |
| Institutional Class Shares | | | | | | | | |
| Year Ended 10/31/2007 | | 1.00 | 0.05 | — | 0.05 | (0.05) | — | (0.05) |
| Year Ended 10/31/2006 | | 1.00 | 0.04 | — | 0.04 | (0.04) | — | (0.04) |
| Year Ended 10/31/2005 | | 1.00 | 0.03 | — | 0.03 | (0.03) | — | (0.03) |
| Period Ended 10/31/2004 (d) | | 1.00 | 0.005 | — | 0.005 | (0.005) | — | (0.005) |
| Year Ended 4/30/2004 | | 1.00 | 0.01 | — | 0.01 | (0.01) | — | (0.01) |
| Year Ended 4/30/2003 | | 1.00 | 0.01 | — | 0.01 | (0.01) | — | (0.01) |
(a) The amount shown may not correlate with the change in aggregate gains and losses of portfolio securities due to the timing of sales and redemptions of fund shares.
(b) Total investment return assumes dividend reinvestment and does not reflect any deduction for sales charges. Not annualized for periods less than one year.
|
| The accompanying Notes to the Financial Statements are an integral part of this schedule. |
|
| 278 |
Thrivent Mutual Funds
Financial Highlights – continued
| | | | | | | |
|
| | | | R A T I O S / S U P P L E M E N T A L D A T A | | |
|
|
| | | | | | Ratios to Average | |
| | | | | | Net Assets Before Expenses | |
| | | | Ratio to Average Net | Waived, Credited or Paid | |
| | | | Assets(c) | Indirectly(c) | |
| | | |
|
| |
| Net Asset | | | | | | | |
| Value, | | Net Assets | | Net | | Net | Portfolio |
| End of | Total | End of Period | | Investment | | Investment | Turnover |
| Period | Return(b) | (in millions) | Expenses | Income/(Loss) | Expenses | Income/(Loss) | Rate |
|
| |
| |
| |
| $12.53 | 4.10% | $112.0 | 0.73% | 4.52% | 0.74% | 4.50% | 130% |
| 12.58 | 4.07% | 114.8 | 0.85% | 3.99% | 0.86% | 3.98% | 145% |
| 12.58 | 0.89% | 131.3 | 0.86% | 3.25% | 0.88% | 3.24% | 295% |
| 12.91 | 2.52% | 119.4 | 0.75% | 2.71% | 0.89% | 2.57% | 230% |
| 13.06 | 5.30% | 90.4 | 0.74% | 2.78% | 0.96% | 2.56% | 297% |
| |
| |
| 12.54 | 3.93% | 1.8 | 0.89% | 4.35% | 0.91% | 4.33% | 130% |
| 12.59 | 4.02% | 1.9 | 0.89% | 3.96% | 0.94% | 3.91% | 145% |
| 12.59 | 0.87% | 2.0 | 0.89% | 3.21% | 0.93% | 3.17% | 295% |
| 12.92 | 2.45% | 2.1 | 0.88% | 2.59% | 0.88% | 2.59% | 230% |
| 13.06 | 5.14% | 6.2 | 0.91% | 2.61% | 0.96% | 2.56% | 297% |
| |
| |
| 12.53 | 4.47% | 303.7 | 0.36% | 4.91% | 0.38% | 4.89% | 130% |
| 12.58 | 4.55% | 148.3 | 0.38% | 4.58% | 0.39% | 4.57% | 145% |
| 12.58 | 1.36% | 37.4 | 0.41% | 3.78% | 0.42% | 3.77% | 295% |
| 12.91 | 2.90% | 9.8 | 0.45% | 3.01% | 0.57% | 2.89% | 230% |
| 13.05 | 5.62% | 14.7 | 0.46% | 3.07% | 0.64% | 2.89% | 297% |
|
| |
| |
| |
| 1.00 | 4.92% | 1,183.9 | 0.58% | 4.83% | 0.78% | 4.63% | N/A |
| 1.00 | 4.26% | 864.3 | 0.71% | 4.22% | 0.89% | 4.04% | N/A |
| 1.00 | 2.12% | 661.3 | 0.84% | 2.08% | 0.94% | 1.98% | N/A |
| 1.00 | 0.26% | 686.8 | 0.90% | 0.61% | 1.00% | 0.51% | N/A |
| 1.00 | 0.32% | 262.2 | 0.83% | 0.32% | 0.93% | 0.22% | N/A |
| 1.00 | 0.88% | 349.6 | 0.77% | 0.89% | 0.92% | 0.74% | N/A |
| |
| |
| 1.00 | 4.48% | 1.5 | 1.01% | 4.39% | 1.82% | 3.58% | N/A |
| 1.00 | 3.94% | 1.8 | 1.01% | 3.88% | 1.97% | 2.92% | N/A |
| 1.00 | 1.94% | 1.7 | 1.01% | 1.84% | 1.93% | 0.91% | N/A |
| 1.00 | 0.18% | 2.9 | 1.04% | 0.47% | 1.95% | (0.44)% | N/A |
| 1.00 | 0.07% | 1.8 | 1.08% | 0.07% | 1.84% | (0.69)% | N/A |
| 1.00 | 0.42% | 2.8 | 1.38% | 0.27% | 1.62% | 0.03% | N/A |
| |
| |
| 1.00 | 5.16% | 425.0 | 0.36% | 5.05% | 0.46% | 4.95% | N/A |
| 1.00 | 4.59% | 341.1 | 0.39% | 4.51% | 0.49% | 4.42% | N/A |
| 1.00 | 2.56% | 283.1 | 0.40% | 2.56% | 0.50% | 2.46% | N/A |
| 1.00 | 0.47% | 245.7 | 0.47% | 1.05% | 0.54% | 0.98% | N/A |
| 1.00 | 0.59% | 114.6 | 0.56% | 0.59% | 0.56% | 0.59% | N/A |
| 1.00 | 1.17% | 91.4 | 0.48% | 1.18% | 0.53% | 1.13% | N/A |
(c) Computed on an annualized basis for periods less than one year.
(d) For the period from May 1, 2004 to October 31, 2004.
|
| The accompanying Notes to the Financial Statements are an integral part of this schedule. |
|
| 279 |
Additional Information
(unaudited)
Shareholder Notification of Federal Tax
Information (unaudited)
The following information is provided solely to satisfy the requirements set forth by the Internal Revenue Code. Shareholders will be provided information regarding their distributions in January 2008.
The Funds designate the following percentages of dividends declared from net investment income as dividends qualifying for the 70% dividends received deduction for corporations or as qualified dividend income for individuals under the Jobs and Growth Tax Relief Reconciliation Act of 2003 for the tax period ending October 31, 2007:
| | | |
| | Dividends | Qualified |
| | | Received | Dividend |
| | Deduction for | Income for |
| Fund | Corporations | Individuals |
|
| Aggressive Allocation | | 24% | 44% |
| Moderately Aggressive Allocation | | 17% | 26% |
| Moderate Allocation | | 11% | 16% |
| Moderately Conservative Allocation | 6% | 8% |
| Partner Small Cap Growth | | 40% | 41% |
| Partner Small Cap Value | | 33% | 33% |
| Small Cap Stock | | 43% | 44% |
| Small Cap Index | | 100% | 100% |
| Mid Cap Growth | | 5% | 6% |
| Partner Mid Cap Value | | 34% | 35% |
| Mid Cap Stock | | 9% | 9% |
| Mid Cap Index | | 100% | 100% |
| Mid Cap Index-I | | 59% | 59% |
| Partner International Stock | | 0% | 100% |
| Large Cap Growth | | 87% | 87% |
| Large Cap Value | | 75% | 77% |
| Large Cap Stock | | 84% | 85% |
| Large Cap Index | | 100% | 100% |
| Large Cap Index-I | | 100% | 100% |
| Balanced | | 19% | 20% |
The Municipal Bond Fund designates 99.42% of the dividends declared from net investment income as exempt from federal income tax for the tax period ended October 31, 2007.
The Funds designate the following amounts as distributions of long-term capital gains: Aggressive Allocation Fund, $485,309; Moderately Aggressive Allocation Fund, $845,355; Moderate Allocation Fund, $1,328,873; Moderately Conservative Allocation Fund, $367,841; Partner Small Cap Growth Fund, $3,462; Partner Small Cap Value Fund, $5,442,190; Small Cap Stock Fund, $56,923,771; Small Cap Index Fund, $3,303,677; Mid Cap Growth Fund, $22,856,197; Partner Mid Cap Value Fund, $122,933; Mid Cap Stock Fund, $125,689,673; Mid Cap Index Fund, $2,807,927; Mid Cap Index Fund-I, $1,069,029; Large Cap Value Fund, $23,854,746; Large Cap Stock Fund, $157,672,537; and Balanced Fund, $7,585,175. These amounts may include earnings and profits distributed to shareholders on the redemption of shares as part of the dividend paid deduction.
Proxy Voting
The policies and procedures that the Trust uses to determine how to vote proxies relating to portfolio securities are attached to the Trust’s Statement of Additional Information. You may request a free copy of the Statement of Additional Information or the report of how the Trust voted proxies relating to portfolio securities during the most recent 12-month period ended June 30 by calling 1-800-847-4836. You also may review the Statement of Additional Information or the report of how the Trust voted proxies relating to portfolio securities during the most recent 12-month period ended June 30 at the Thrivent Financial web site (www.thrivent.com) or the SEC web site (www.sec.gov).
Quarterly Schedule of Portfolio Holdings
The Trust files its Schedule of Portfolio Holdings on Form N-Q with the SEC for the first and third quarters of each fiscal year. You may request a free copy of the Trust’s Forms N-Q by calling 1-800-847-4836. The Trust’s Forms N-Q also are available on the Thrivent Financial web site (www.thrivent.com) or the SEC web site (www.sec.gov). You also may review and copy the Forms N-Q for the Trust at the SEC’s Public Reference Room in Washington, DC. You may get information about the operation of the Public Reference Room by calling 1-800-SEC-0330.
Board of Trustees and Officers
The following table provides information about the Trustees and Officers of the Trust. Each Trustee oversees each of 29 series of the Trust and also serves as:
• Director of Thrivent Series Fund, Inc., a registered investment company consisting of 31 portfolios that serve as underlying funds for variable contracts issued by Thrivent Financial for Lutherans (“Thrivent Financial”) and Thrivent Life Insurance Company and investment options in the retirement plan offered by Thrivent Financial; and
• Trustee of Thrivent Financial Securities Lending Trust, a registered investment company consisting of one portfolio that serves as a cash collateral fund for a securities lending program sponsored by Thrivent Financial.
The 29 series of the Trust, 31 portfolios of the Thrivent Series Fund, Inc. and Thrivent Financial Securities Lending Trust are referred to herein as the “Fund Complex.” The Statement of Additional Information includes additional information about the Trustees and is available, without charge, by calling 1-800-847-4836.
| | | | | |
| Interested Trustee1 | | | | | |
| | | | Number of | | |
| | | Position | Portfolios in | Principal | |
| | | with Trust | Fund Complex | Occupation | Other |
| Name, Address, | | and Length | Overseen | During the | Directorships |
| and Age | | of Service2 | by Trustee | Past 5 Years | Held by Trustee |
|
| Pamela J. Moret | | President since 2002 | 61 | Executive Vice President, | Director, Minnesota |
| 625 Fourth Avenue South | | and Trustee since 2004 | | Marketing and Products, | Public Radio; Director, |
| Minneapolis, MN | | | | Thrivent Financial | Luther Seminary |
| Age 51 | | | | since 2002 | |
| |
| Independent Trustees3 | | | | | |
| | | | Number of | | |
| | | Position | Portfolios in | Principal | |
| | | with Trust | Fund Complex | Occupation | Other |
| Name, Address, | | and Length | Overseen | During the | Directorships |
| and Age | | of Service2 | by Trustee | Past 5 Years | Held by Trustee |
|
| F. Gregory Campbell | | Trustee since 1992 | 61 | President, Carthage | Director, Johnson Family |
| 625 Fourth Avenue South | | | | College | Funds, Inc., an investment |
| Minneapolis, MN | | | | | company consisting of four |
| Age 67 | | | | | portfolios; Director, |
| | | | | | Kenosha Hospital and |
| | | | | | Medical Center Board; |
| | | | | | Director, Prairie School |
| | | | | | Board; Director, United |
| | | | | | Health Systems Board |
| |
| Herbert F. Eggerding, Jr. | | Lead Trustee since 2003 | 61 | Management consultant | None |
| 625 Fourth Avenue South | | | | to several privately | |
| Minneapolis, MN | | | | owned companies | |
| Age 70 | | | | | |
| |
| Noel K. Estenson | | Trustee since 2004 | 61 | Retired | None |
| 625 Fourth Avenue South | | | | | |
| Minneapolis, MN | | | | | |
| Age 68 | | | | | |
Board of Trustees and Officers
| | | | | |
| Independent Trustees3 — continued | | | |
| | | | Number of | | |
| | | Position | Portfolios in | Principal | |
| | | with Trust | Fund Complex | Occupation | Other |
| Name, Address, | | and Length | Overseen | During the | Directorships |
| and Age | | of Service2 | by Trustee | Past 5 Years | Held by Trustee |
|
| Richard L. Gady | | Trustee since 1987 | 61 | Retired; previously Vice | None |
| 625 Fourth Avenue South | | | | President, Public Affairs | |
| Minneapolis, MN | | | | and Chief Economist, | |
| Age 64 | | | | ConAgra, Inc. | |
| | | | (agribusiness) | |
| | | | | | |
| Richard A. Hauser | | Trustee since 2004 | 61 | Vice President and | Director, The Washington |
| 625 Fourth Avenue South | | | | Assistant General | Hospital Center |
| Minneapolis, MN | | | | Counsel, Boeing | |
| Age 64 | | | | Company since | |
| | | | | 2007; President, | |
| | | | | National Legal Center | |
| | | | | for the Public Interest | |
| | | | | from 2004 to 2007; | |
| | | | | General Counsel U.S. | |
| | | | | Department of Housing | |
| | | | | and Urban Development | |
| | | | | from 2001 to 2004; | |
| | | | | Partner, Baker & | |
| | | | | Hosteller, from 1986 | |
| | | | | to 2001 | |
| | | | | | |
| Connie M. Levi | | Trustee since 2004 | 61 | Retired | None |
| 625 Fourth Avenue South | | | | | |
| Minneapolis, MN | | | | | |
| Age 68 | | | | | |
| | | | | | |
| Douglas D. Sims | | Trustee since 2006 | 61 | Retired; previously | Director, Keystone |
| 625 Fourth Avenue South | | | | Chief Executive Officer | Neighborhood Company; |
| Minneapolis, MN | | | | of CoBank from 1994 | Director, Center for |
| Age 61 | | | | to June 30, 2006 | Corporate Excellence |
| | | | | |
| Edward W. Smeds | | Chairman and Trustee 61 | Retired | Chairman of Carthage |
| 625 Fourth Avenue South | | since 1999 | | | College Board |
| Minneapolis, MN | | | | | |
| Age 71 | | | | | |
Board of Trustees and Officers
| | |
| Executive Officers | | |
| | Position with Trust | |
| Name, Address, | and Length | |
| and Age | of Service2 | Principal Occupation During the Past 5 Years |
|
| Pamela J. Moret | President since 2002 | Executive Vice President, Marketing and Products, Thrivent |
| 625 Fourth Avenue South | | Financial since 2002 |
| Minneapolis, MN | | |
| Age 51 | | |
| |
| David S. Royal | Secretary and Chief Legal | Vice President — Asset Management, Thrivent Financial since |
| 625 Fourth Avenue South | Officer since 2006 | 2006; Partner, Kirkland & Ellis LLP from 2004 to 2006; |
| Minneapolis, MN | | Associate, Skadden, Arps, Slate, Meagher & Flom LLP |
| Age 36 | | from 1997 to 2004 |
| |
| Katie S. Kloster | Vice President Investment | Vice President and IC and IA Chief Compliance Officer, |
| 625 Fourth Avenue South | Company and Investment | Thrivent Financial since 2004; Vice President and Controller, |
| Minneapolis, MN | Adviser Chief Compliance | Thrivent Financial from 2001 to 2004 |
| Age 42 | Officer since 2004 | |
| |
| Gerard V. Vaillancourt | Treasurer and Principal | Vice President, Mutual Fund Accounting since 2006; Head |
| 625 Fourth Avenue South | Financial Officer since 2005 | of Mutual Fund Accounting, Thrivent Financial from 2005 |
| Minneapolis, MN | | to 2006; Director, Fund Accounting Administration, |
| Age 40 | | Thrivent Financial from 2002 to 2005 |
| |
| Russell W. Swansen | Vice President since 2004 | Senior Vice President and Chief Investment Officer, Thrivent |
| 625 Fourth Avenue South | | Financial since 2004; Managing Director, Colonnade Advisors |
| Minneapolis, MN | | LLC from 2001 to 2003 |
| Age 50 | | |
| |
| Janice M. Guimond | Vice President since 2005 | Vice President, Investment Operations, Thrivent Financial |
| 625 Fourth Avenue South | | since 2003; Manager of Portfolio Reporting, Thrivent |
| Minneapolis, MN | | Financial from 2003 to 2004; Independent Consultant from |
| Age 43 | | 2001 to 2003 |
| |
| Karl D. Anderson | Vice President since 2006 | Vice President, Products, Thrivent Financial |
| 625 Fourth Avenue South | | |
| Minneapolis, MN | | |
| Age 46 | | |
| |
| Brian W. Picard | Vice President and | Director, FSO Compliance Corp. BCM, Thrivent Financial |
| 4321 North Ballard Road | Anti-Money Laundering | since 2006; Manager, Field and Securities Compliance, |
| Appleton, WI | Officer since 2006 | Thrivent Financial from 2002 to 2006 |
| Age 37 | | |
Board of Trustees and Officers
| | |
| Executive Officers — continued | |
| | Position with Trust | |
| Name, Address, | and Length | |
| and Age | of Service2 | Principal Occupation(s) During the Past 5 Years |
|
| Kenneth L. Kirchner | Assistant Vice President | Director, Mutual Funds Operations, Thrivent Financial since |
| 4321 North Ballard Road | since 2004 | 2004; Manager, Shareholder Services, Thrivent Financial |
| Appleton, WI | | from 2003 to 2004 |
| Age 41 | | |
| |
| Mark D. Anema | Assistant Vice President | Vice President, Accumulation and Retirement Income |
| 625 Fourth Avenue South | since 2007 | Solutions, Thrivent Financial since 2007; Vice President, |
| Minneapolis, MN | | Strategic Planning, Thrivent Financial from 2004 to 2007; |
| Age 46 | | Insurance Practice Engagement Manager, McKinsey and |
| | | Company from 1999 to 2004 |
| |
| James M. Odland | Assistant Secretary | Vice President, Office of the General Counsel, Thrivent |
| 625 Fourth Avenue South | since 2006 | Financial since 2005; Senior Securities Counsel, Allianz Life |
| Minneapolis, MN | | Insurance Company from January 2005 to August 2005; Vice |
| Age 52 | | President and Chief Legal Officer, Woodbury Financial |
| | | Services, Inc. from September 2003 to January 2005; Vice |
| | | President and Group Counsel, Corporate Practice Group, |
| | | American Express Financial Advisors, Inc. from 2001 to 2003 |
| |
| John L. Sullivan | Assistant Secretary | Senior Counsel, Thrivent Financial since 2007; Senior |
| 625 Fourth Avenue South | since 2007 | Counsel, Division of Investment Management of the |
| Minneapolis, MN | | Securities and Exchange Commission from 2000 to 2007 |
| Age 36 | | |
| |
| Todd J. Kelly | Assistant Treasurer | Director, Fund Accounting Operations, Thrivent Financial |
| 4321 North Ballard Road | since 1999 | |
| Appleton, WI | | |
| Age 38 | | |
| |
| Sarah L. Bergstrom | Assistant Treasurer | Director, Fund Accounting Administration, Thrivent Financial |
| 625 Fourth Avenue South | since 2007 | since 2007; Manager, Fund Accounting Administration, |
| Minneapolis, MN | | Thrivent Financial from 2005 to 2007; Manager, Mutual Fund |
| Age 30 | | Tax Reporting, Thrivent Financial from 2004 to 2005; |
| | | Supervisor, Mutual Fund Tax Reporting, Thrivent Financial |
| | | from 2002 to 2004 |
1 “Interested person” of the Trust as defined in 1940 Act by virtue of positions with Thrivent Financial. Ms. Moret is considered an interested person because of her principal occupation with Thrivent Financial.
2 Each Trustee serves an indefinite term until her or his successor is duly elected and qualified. Officers serve at the discretion of the board until their successors are duly appointed and qualified.
3 The Trustees other than Ms. Moret are not “interested persons” of the Trust and are referred to as “Independent Trustees.”
Item 2. Code of Ethics
As of the end of the period covered by this report, registrant has adopted a code of ethics (as defined in Item 2 of Form N-CSR) applicable to registrant’s Principal Executive Officer, Principal Financial Officer and Principal Accounting Officer. No waivers were granted to such code of ethics during the period covered by this report. A copy of this code of ethics is filed as an exhibit to this Form N-CSR.
Item 3. Audit Committee Financial Expert
Registrant’s Board of Trustees has determined that Herbert F. Eggerding, Jr., an independent trustee, is the Audit Committee Financial Expert.
Item 4. Principal Accountant Fees and Services
(a) Audit Fees
The aggregate fees billed by registrant’s independent public accountants, PricewaterhouseCoopers LLP (“PwC”), for the fiscal year ended October 31, 2006 and the fiscal year ended October 31, 2007, for professional services rendered in connection with the audit of registrant’s annual financial statements or services that are normally provided by the accountant in connection with statutory and regulatory filings or engagements were $394,409 and $364,656, respectively.
(b) Audit-Related Fees
The aggregate fees PwC billed to registrant for the fiscal year ended October 31, 2006 and the fiscal year ended October 31, 2007, for assurance and other services that are reasonably related to the performance of registrant’s audit and are not reported under Item 4(a), were $0 for each respective period. The aggregate fees PwC billed to registrant’s investment adviser and any entity controlling, controlled by, or under common control with registrant’s investment adviser for the fiscal year ended October 31, 2006 and the fiscal year ended October 31, 2007, for assurance and other services directly related to the operations and financial reporting of registrant, were $0 for each respective period.
(c) Tax Fees
The aggregate tax fees PwC billed to registrant for the fiscal year ended October 31, 2006 and the fiscal year ended October 31, 2007, for tax compliance, tax advice and tax planning services, were $124,065 and $117,935, respectively. The aggregate tax fees PwC billed to registrant’s investment adviser and any entity controlling, controlled by, or under common control with registrant’s investment adviser for the fiscal year ended October 31, 2006 and the fiscal year ended October 31, 2007, for services directly related to the operations and financial reporting of registrant, were $0 for each respective period.
(d) All Other Fees
The aggregate fees PwC billed to registrant for the fiscal year ended October 31, 2005 and the fiscal year ended October 31, 2007 for products and services provided, other than the services reported in paragraphs (a) through (c) of this item, were $0 for each respective period. The aggregate fees PwC billed to registrant’s investment adviser and any entity controlling, controlled by, or under common control with registrant’s investment adviser for the fiscal year ended October 31, 2006 and the
fiscal year ended October 31, 2007, for products and services provided, other than the services reported in paragraphs (a) through (c) of this item, were $0 and $0, respectively.
(e) Registrant’s audit committee charter, adopted in August 2004, provides that the audit committee (comprised of the independent directors of registrant) is responsible for pre-approval of all auditing services performed for the registrant. The audit committee reports to the Board of Directors (“Board”) regarding its approval of the engagement of the auditor and the proposed fees for the engagement, and a majority of the Board is required for the approval. The audit committee also is responsible for pre-approval (subject to the de minimis exceptions for non-audit services described in Section 10A(i)(1)(B) of the Securities Exchange Act of 1934) of all non-auditing services performed for the registrant or for any service affiliate of registrant. Registrant’s audit committee charter also permits a designated member of the audit committee to pre-approve, between meetings, one or more non-audit service projects, subject to an expense limit and ratification by the audit committee at the next audit committee meeting. Registrant’s audit committee pre-approved all fees described above which PwC billed to registrant.
(f) Less than 50% of the hours billed by PwC for auditing services to registrant for the fiscal year ended October 31, 2007 were for work performed by persons other than full-time permanent employees of PwC.
(g) The aggregate non-audit fees billed by PwC to registrant and to registrant’s investment adviser and any entity controlling, controlled by, or under common control with registrant’s investment adviser for the fiscal year ended October 31, 2006 and the fiscal year ended October 31, 2007 were $15,645 and $1,582 for each respective period.
(h) Registrant’s audit committee has considered the non-audit services provided to the registrant and registrant’s investment adviser and any entity controlling, controlled by, or under common control with registrant’s investment adviser as described above and determined that these services do not compromise PwC’s independence.
Item 5. Audit Committee of Listed Registrants
Not applicable.
Item 6. Schedule of Investments
Registrant’s Schedule of Investments is included in the report to shareholders filed under Item 1.
Item 7. Disclosure of Proxy Voting Policies and Procedures for Closed-End Management Investment Companies
Not applicable.
Item 8. Portfolio Managers of Closed-End Management Investment Companies
Not applicable.
Item 9. Purchases of Equity Securities by Closed-End Management Investment Company and Affiliated Purchasers.
Not applicable.
Item 10. Submission of Matters to a Vote of Security Holders
There have been no material changes to the procedures by which shareholders may recommend nominees to registrant’s board of trustees.
Item 11. Controls and Procedures
(a)(i) Registrant’s President and Treasurer have concluded that registrant’s disclosure controls and procedures (as defined in Rule 30a-3(c) under the Investment Company Act of 1940) are effective, based on their evaluation of these controls and procedures as of a date within 90 days of the filing date of this report.
(a)(ii) Registrant’s President and Treasurer are aware of no change in registrant’s internal control over financial reporting (as defined in Rule 30a-3(d) under the Investment Company Act of 1940) that occurred during registrant’s most recent fiscal quarter that has materially affected, or is reasonably likely to materially affect, registrant’s internal control over financial reporting.
Item 12. Exhibits
(a) The code of ethics pursuant to Item 2 is attached hereto.
(b) Certifications pursuant to Rules 30a-2(a) and 30a-2(b) under the Investment Company Act of 1940 are attached hereto.
SIGNATURES
Pursuant to the requirements of the Securities Exchange Act of 1934 and the Investment Company Act of 1940, the registrant has duly caused this report to be signed on its behalf by the undersigned, thereunto duly authorized.
| | |
| | THRIVENT MUTUAL FUNDS |
| |
| | | |
| |
| Date: December 27, 2007 | By: | /s/ Pamela J. Moret |
| |
|
| | | Pamela J. Moret |
| | | President |
Pursuant to the requirements of the Securities Exchange Act of 1934 and the Investment Company Act of 1940, this report has been signed below by the following persons on behalf of the registrant and in the capacities and on the dates indicated.
| | |
| | |
| |
| Date: December 27, 2007 | By: | /s/ Pamela J. Moret |
| |
|
| | | Pamela J. Moret |
| | | President |
| |
| |
| | |
| |
| Date: December 27, 2007 | By: | /s/ Gerard V. Vaillancourt |
| |
|
| | | Gerard V. Vaillancourt |
| | | Treasurer |