UNITED STATES
SECURITIES AND EXCHANGE COMMISSION
Washington, D.C. 20549
FORM N-CSR
CERTIFIED SHAREHOLDER REPORT OF REGISTERED MANAGEMENT
INVESTMENT COMPANIES
Investment Company Act file number: 811-05075
Thrivent Mutual Funds
(Exact name of registrant as specified in charter)
625 Fourth Avenue South
Minneapolis, Minnesota 55415
(Address of principal executive offices) (Zip code)
John L. Sullivan
625 Fourth Avenue South
Minneapolis, Minnesota 55415
(Name and address of agent for service)
Registrant’s telephone number, including area code: (612) 844-5704
Date of fiscal year end: December 31
Date of reporting period: December 31, 2007
Item 1. Report to Stockholders
| | |
| President’s Letter | 1 | |
| Economic and Market Overview | 2 | |
| Portfolio Perspective | | |
| Thrivent Real Estate Securities Fund | 4 | |
| Thrivent Diversified Income Plus Fund | 6 | |
| Shareholder Expense Example | 8 | |
| Report of Independent Registered Public | | |
| Accounting Firm | 9 | |
| Schedules of Investments | | |
| Thrivent Real Estate Securities Fund | 10 | |
| Thrivent Diversified Income Plus Fund | 13 | |
| Statement of Assets and Liabilities | 25 | |
| Statement of Operations | 26 | |
| Statement of Changes in Net Assets | 27 | |
| Notes to Financial Statements | 28 | |
| Financial Highlights | 38 | |
| Additional Information | 40 | |
| Board of Trustees and Officers | 43 | |

Dear Shareholder:
We are pleased to provide you with the annual report for the 12-month period ended December 31, 2007. In this report, you will find detailed information about the Thrivent Diversified Income Plus Fund and the Thrivent Real Estate Securities Fund, including summaries prepared by the portfolio managers on their performance and management strategies for the applicable fund and period. In addition, Russ Swansen, Thrivent Financial’s Chief Investment Officer, summarizes the overall market and economic environment over the past year.
Market Ride Grows Bumpier
Our nation’s financial markets ended 2007 on a sour note, with a weak 4th quarter for the stock market. Continued fallout from the sub-prime loan crisis combined with fears of much slower economic growth injected a healthy bout of long-dormant volatility back into stock prices. As it has been several years since we have endured a strong market correction, it may be helpful to review some age-old nuggets of wisdom for market uncertainty.
* Avoid trying to “time” the market. Pulling out of stocks in favor of the money market may help ease some of the anxiety you feel when the market is volatile, but consider the consequences of such action. When, and by what signal, will you put the money back into the stock market? Does a short-term flight to cash really align with your long-term investment goals? Have you weighed the potential gains you may miss out on if the market moves up?
Investors generally have little success in moving in and out of the stock market. If the nation’s very best hedge fund managers struggle in this regard, other investors are unlikely to do any better.
* Keep a long-term perspective. Investors generally enjoyed a favorable stock market from 2003 through 2007 — a historically lengthy bull market. If we see a pullback now and again, it’s important to recognize that volatility is an inherent part of overall investing. Periodic corrections can allow new investors and money to enter into the market and even set the stage for the next expansion.
There is no “free lunch” when it comes to investing. The relatively high returns investors have historically earned on stock investments typically occurred over longer time frames and have and will likely, continue to, come with periodic downturns and volatility.
* Consult with your Thrivent Financial representative. Talk with your representative to get the advice and reassurance you need to stay on track with your financial goals. The media is prone to saturating the airwaves and publications with sensational coverage of market ups and downs.
It’s imperative to get grounded, honest, and dispassionate advice at these times-your Thrivent Financial representative is always willing to address any questions or concerns. Please don’t hesitate to get in touch.
Our Ongoing Commitment to You
Many of you have one thing foremost on your minds at this point in your life — retirement. Our investment management philosophy is squarely focused on sound asset allocation strategies, striving for strong investment performance and meaningful advice that can provide a clear roadmap to your retirement — regardless of current market conditions. Whether saving for that retirement, sharing your success with your church or community, or leaving a legacy to the next generation, we stand ready to assist you each step of the way.
I want to personally wish you the best in 2008. Thank you for continuing to turn to us for your financial solutions. We very much value your business.
Sincerely,

Pamela J. Moret
President and Trustee
Thrivent Mutual Funds

Stocks and bonds posted mixed returns for the 12-month period ended December 31, 2007. In the first half, moderating economic growth appeared to ease inflation concerns, creating a positive backdrop for the financial markets but also an environment in which high risk categories of financial assets appeared extended. Beginning in early summer there was an increase in investment uncertainty, as an unexpected deterioration in the value of mortgage and asset-backed fixed-income securities roiled the credit markets and ultimately resulted in a significant withdrawal of credit availability from the financial system. This led to significant policy adjustments by central bankers around the globe as they attempted to facilitate the availability of credit and liquidity to the markets. Ultimately, a reduction in targeted short-term rates in the United States was warranted as heightened risks in both the real economy and the financial markets became apparent.
U.S. Economy
The nation’s gross domestic product fell from a 2.1% annual growth rate in the fourth quarter of 2006 to a 0.6% annual rate in the first quarter of 2007, the weakest rate of expansion in four years. Growth rebounded to 3.8% in the second quarter, however, thanks to strong spending by consumers, who were encouraged by employment and income gains and undeterred by high energy prices and deterioration in the housing market. Growth in the third quarter accelerated to a 4.9% annual rate, buttressed by exports and business investment. Current estimates for the fourth quarter 2007 suggest a significant moderation to around a 1% rate of growth.
Housing was a significant drag on the economy during the year. Weak sales, rising inventories, falling prices and much tighter lending standards caused the imbalances in the housing market to worsen over the period. Housing starts have fallen more than 50% since their highs in the beginning of 2006 and reached levels in November 2007 last seen in early 1991.
Increased business spending offset much of the negative impact of the housing slowdown. Global demand also remained strong, particularly from developing economies, and the low valuation of the dollar enhanced the attractiveness of U.S. goods and services in world markets, lifting U.S. exports and moderately improving the U.S. trade position.
Inflation & Monetary Policy
Inflation indicators were mixed during the period. The Consumer Price Index (CPI) rose at a 4.1% annual rate for 2007, compared with a 2.5% rate for all of 2006. The index for energy, which rose 2.9% in all of 2006, advanced at a 17.4% annual rate for 2007. Excluding the volatile prices of food and energy, the core CPI advanced at a 2.4% annual rate in 2007, following a 2.6% rise in all of 2006.
For the Federal Reserve Open Market Committee (FOMC), inflation concerns eventually were trumped by worries that the housing slump and expanding credit crunch might dampen economic growth. On September 18, policymakers cut the federal funds rate by a more-than-expected half-percent to 4.75%, and on October 31 and December 11 they followed with widely anticipated quarter-percent cuts. At their December meeting, policymakers noted that economic growth was slowing due mainly to the housing downturn and some softening in business and consumer spending.
Equity Performance
Stocks gained steadily through late in the first half of 2007, spurred by good corporate profits, a flurry of merger and acquisition activity prompted by low cost and relatively easy credit conditions, and diminishing concerns about higher inflation and interest rates. Price volatility jumped dramatically over the summer and fall of 2007 in response to credit market deterioration and the withdrawal of liquidity from the system. A number of reductions in the fed funds rate in the latter part of the year pushed many investment indexes to or near record highs, but those prices were not held as evidence of widespread consumer and business uncertainty called into question sustained economic growth.
Large-company stocks outperformed small-company issues during the period. The S&P 500 Index of large-company stocks posted a 5.49% total return, while the Russell 2000® Index of small-company stocks recorded a –1.57% return.
Growth stocks outperformed value stocks. During the period, the Russell 3000® Growth Index returned 11.55%, while the Russell 3000® Value Index posted a return of –.94%.
Real estate investment trusts (REITs) lost ground during the period, with the FTSE NAREIT Equity REIT Index declining by –15.69% . Foreign stocks generally continued to outperform most domestic issues. The Morgan Stanley Capital International Europe, Australasia, Far East (EAFE) Index, boosted by a weakening dollar, posted an 11.63% total return in dollar terms.
Fixed Income Performance
Treasury yields were relatively stable until mid-April, when they spiked as bond investors began to worry about a reacceleration in economic growth and, consequently, started to suspect that the Federal Reserve would not begin cutting rates any time soon. An investor flight to safety, spurred by concerns about sub-prime mortgages and liquidity problems at several large financial institutions, pushed down Treasury yields in the third quarter. The Federal Reserve eased both the federal funds and discount rates later in the period.
A substantial drop in the yields of shorter-maturity Treasury securities helped eliminate the yield curve inversion — an unusual situation in which shorter-term bonds actually pay higher yields than longer-term bonds — that had persisted for much of the last year. A general decline in yields, with a corresponding increase in prices, boosted bonds’ total returns for the period. The Lehman Brothers Aggregate Bond Index of the broad U.S. bond market posted a 6.97% total return, while the Lehman Brothers Government/Corporate 1-3 Year Bond Index registered a 6.84% total return. Below-investment-grade corporate bonds were weaker performers, with the Lehman Brothers U.S. Corporate High Yield Bond Index registering a 1.87% total return.
Outlook
We expect economic growth to remain below average over the next few months, with inflation moderating. Gross domestic product growth should continue at around a 1-2% annual rate, but risks to the forecast are high. We expect energy and commodities prices to moderate and the housing market to begin to stabilize in the second half of 2008. These factors suggest that consumer spending, while not robust, will be sufficient to maintain growth. We expect business spending on new plants and equipment to continue, after a number of years of below-average investing in productive resources.
Dislocations unfolding in the credit markets that began with the unwinding of the housing boom of the last five years have the potential to spill over into the rest of the economy. The risks to the economy are not directly a function of the softness in housing but rather how consumer spending or financial lending behaviors may change in reaction to what is happening in the housing market. With policymakers concerned about both an economic slowdown and the potential for higher inflation, it is uncertain whether the Federal Reserve intends to ease interest rates any time soon, but it is our view that the days of policy-driven tightening are past for the near term.
As always, your best strategy is to work with your Thrivent Financial registered representative to create a plan based on your goals, diversify your portfolio and remain focused on the long term.

How did Thrivent Real Estate Securities Fund perform for the 12-month period ended December 31, 2007?
For the 12-month period ended December 31, 2007, Thrivent Real Estate Securities Fund had a return of –16.92%, net of expenses. This return was below the –15.69% return of the FTSE NAREIT Equity REIT Index. The median return of the Fund’s peer group, the Lipper Real Estate Mutual Fund category, was –16.46%
What factors affected the Fund’s performance?
After seven straight years of outperforming the S&P 500 Index, U.S. real estate investment trusts (REITs) were due for a correction. Significant redemption activity from the mutual fund industry negatively impacted the group as it created selling pressure on REIT stocks in general, and in particular for large-capitalization companies that had provided the best returns and liquidity over the last several years.
The best-performing sectors in the Fund were health care and industrial property REITs, which provided positive returns for the year. The Fund’s international real estate exposure also benefited performance, with a modest decline relative to the more significant decline for U.S. REIT stocks. Property sectors that most significantly detracted from performance were multifamily apartments, office buildings, and lodging properties. The Fund had virtually no exposure to homebuilding stocks and mortgage REITs, which both underperformed equity REITs in 2007. The Fund’s two largest positive contributors to performance were ProLogis, a U.S. based global REIT that develops and manages warehouse distribution properties worldwide, and Ventas, a U.S. REIT that owns long-term acute care hospitals, skilled nur sing centers, assisted living facilities, and healthcare office properties.
What is your outlook?
As a result of mutual fund outflows and a weakening U.S. economy, downward pressure on REIT stock prices may continue in 2008. With a slowing U.S. economy, demand for most types of commercial real estate space will be negatively impacted. At the margin, fundamental factors are beginning to deteriorate, as evidenced by modestly increasing vacancy rates for office buildings and retail properties. Multifamily apartments are also being impacted by the oversupply of single family housing for sale, and the lodging sector may deteriorate as a result of consumer spending weakness and more stringent corporate travel expenditures. Regional malls are still enjoying high occupancy rates and rising rents, particularly in dominant centers located in
|
| Quoted Fund performance is for Class A shares and does not reflect a sales charge. |
| The returns shown do not reflect taxes a shareholder would pay on distributions or redemptions. |
| Quoted Major Market Sectors, Portfolio Composition and Top 10 Holdings are subject to change. |
| The lists of Major Market Sectors and Top 10 Holdings exclude short-term investments and collateral held for securities loaned. |
| The Portfolio Composition chart excludes collateral held for securities loaned. |
| |
| 4 |
major metropolitan markets. Health care properties appear to be somewhat insulated from the slowing economy as a result of their stable demand despite economic conditions.
We have positioned the Fund more defensively, in light of the weakening outlook for the U.S. economy. We believe that large-capitalization REITs with high-quality real estate and experienced management teams are best positioned to weather the difficult market conditions that are likely to persist through most of 2008.
We also plan to increase the Fund’s exposure in the more defensive property sectors. Property sectors that are generally considered to be more defensive are health care REITs, net-leased properties, and high-quality regional malls. Property sectors that are less defensive — in which we intend to reduce exposure-are multifamily apartments and lodging, which have the greatest immediate sensitivity to weakening economic conditions. In summary, we expect 2008 to be a challenging year for the U.S. economy, with slower economic growth and reduced leasing demand for commercial real estate. This may provide an attractive buying opportunity for investors willing to look beyond the current weak performance period in order to capture attractive current yield and long-term appreciation potential.
1 Class A performance has been restated to reflect the maximum sales charge of 5.5% . Institutional Class shares have no sales load and are for institutional shareholders only.
2 Past performance is not an indication of future results. Annualized total returns represent past performance and reflect changes in share prices, the reinvestment of all dividends and capital gains, and the effects of compounding. Periods of less than one year are not annualized. Investing in a mutual fund involves risks, including the possible loss of principal. The prospectus contains more complete information on the investment objectives, risks, charges and expenses of the investment company which investors should read and consider carefully before investing. To obtain a prospectus, contact a registered representative or visit www.thrivent.com. The Fund primarily invests in real estate-related industries; as a consequence, the Fund may be subject to greater price volatility than a fund investing in a broad range of industries. At various times, the Fund’s adviser waived its management fee and/or reimbursed Fund expenses. Had the adviser not done so, the Fund’s total returns would have been lower. The returns shown do not reflect taxes a shareholder would pay on distributions or redemptions.
3 Performance of other classes will be greater or less than the line shown based on the differences in fees paid by shareholders in the different classes.
* As you compare performance, please note that the Fund’s performance reflects the maximum 5.5% sales charge, while the Consumer Price Index and FTSE NAREIT Equity REIT Index do not reflect any such charges. If you were to purchase any of the above individual stocks or funds represented in these Indexes, any charges you would pay would reduce your total return as well.
** The FTSE NAREIT Equity REIT Index is an unmanaged capitalization-weighted index of all equity real estate investment trusts. It is not possible to invest directly in this Index. The performance of this Index does not reflect deductions for fees, expanses or taxes.
*** The Consumer Price Index is an inflationary indicator that measures the change in the cost of a fixed basket of products and services, including housing, electricity, food and transportation. It is not possible to invest directly in the Index.

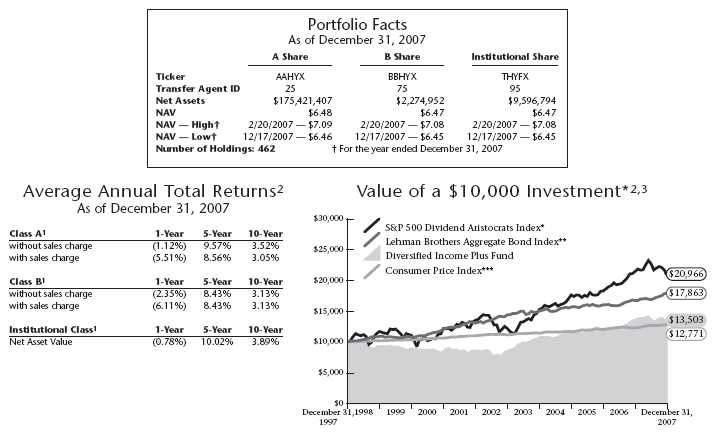
How did the Fund perform during the 12-month period ended December 31, 2007?
Thrivent Diversified Income Plus Fund returned –1.12% for the period. This compares with the Fund’s primary benchmarks, including the S&P 500 Dividend Aristocrats Index, which returned –2.07%; the Lehman Brothers Aggregate Bond Index, which returned 6.97%; and the Lehman Brothers High Yield Bond Index, which returned 1.87% for the same time frame.
What factors affected the Fund’s performance?
Detracting from the Fund’s performance during the period was the fact that most yield-oriented investments — our main investment focus — provided relatively poor performance.
In the equity portion, our allocation to real estate investment trusts (REITs) was a substantial detractor from the Fund’s performance. REIT share prices fell sharply during the period as they corrected from the high valuations reached due to the Equity Office Property acquisition in the first quarter of 2007. Although we meaningfully reduced our position in REITs from the Fund’s long-term strategic 11% allocation, having any exposure to these securities was problematic.
Also hurting the Fund’s performance was the relatively high allocation to financial stocks, which sharply underperformed the market due to ongoing troubles in the credit markets.
Positive contributors to the Fund’s performance were our weightings in investment-grade bonds and convertibles. Our position in Treasury securities performed particularly well as investors flocked to their safety when concerns about sub-prime mortgage market fallout grew later in the period. The investment-grade bond portion of the Fund is designed to add diversification and support if higher-yield securities falter, and that’s how it worked this period.
Among the Fund’s other fixed-income holdings, our high-yield bonds performed substantially better than the Lehman Brothers High Yield Index, one of our primary benchmarks, due to our focus on higher-quality securities within this segment.
What is your outlook?
We think economic growth will continue to slow in 2008, but we don’t expect a recession. It will take several months for the economy to work off the effects of the credit crunch.
|
| Quoted Fund performance is for Class A shares and does not reflect a sales charge. |
| The returns shown do not reflect taxes a shareholder would pay on distributions or redemptions. |
| Quoted Major Market Sectors, Portfolio Composition and Top 10 Holdings are subject to change. |
| Major Market Sectors represent long-term non-government holdings. |
| The list of Top 10 Holdings excludes short-term investments and collateral held for securities loaned. |
| The Portfolio Composition chart excludes collateral held for securities loaned. |
| |
| 6 |
The slowdown and continued challenges in the housing and mortgage markets will likely prompt the Federal Reserve to continue easing interest rates, perhaps more aggressively than initially thought. European and other central banks should continue to support the Fed’s efforts.
Considering our outlook, there could be some near-term weakness in REIT and financial stocks and other investments that involve risk. We expect the performance of these investments to turn around by the second or third quarter of 2008, as credit market problems are resolved and value hunters begin buying. In the meantime, we’ll continue to underweight our position in the REIT sector and carefully monitor our financial stock holdings.
The high-yield market has been dramatically re-priced, yet credit problems, higher defaults and possible supply pressures may inhibit this market in the coming year. We’ll continue to be cautious in this sector as well by upgrading quality and assuming a generally defensive posture.
1 Class A performance reflects the maximum sales charge of 4.5% . Class B performance reflects the maximum deferred sales charge of 5%, declining 1% each year during the first five years and then converting to Class A shares after the fifth year. Institutional Class shares have no sales load and are for institutional shareholders only.
2 Past performance is not an indication of future results. Annualized total returns represent past performance and reflect changes in share prices, the reinvestment of all dividends and capital gains, and the effects of compounding. Investing in a mutual fund involves risks, including the possible loss of principal. The prospectus contains more complete information on the investment objectives, risks, charges and expenses of the investment company which investors should read and consider carefully before investing. To obtain a prospectus, contact a registered representative or visit www.thrivent.com. At various times, the Fund’s adviser waived its management fee and/or reimbursed Fund expenses. Had the adviser not done so, the Fund’s total returns would have been lower. The returns shown do not reflect taxes a shareholder wou ld pay on distributions or redemptions.
3 Performance of other classes will be greater or less than the line shown based on the differences in loads and fees paid by shareholders investing in the different classes.
* As you compare performance, please note that the Fund’s performance reflects the maximum 4.5% sales charge, while the S&P 500 Dividend Aristocrats Index, the Lehman Brothers Aggregate Bond Index, the Lehman Brothers U.S. Corporate High Yield Bond Index and the Consumer Price Index do not reflect any such charges. If you were to purchase any of the above individual stocks or funds represented in these Indexes, any charges you would pay would reduce your total return as well.
** The S&P 500 Dividend Aristocrats Index is an index which measures the performance of large-capitalization companies within the S&P 500 that have followed a managed dividends policy of consistently increasing dividends every year for at least 25 years. The index portfolio has both capital growth and dividend income characteristics, is equal-weighted and is broadly diversified across sectors. It is not possible to invest directly in the Index. The performance of the Index does not reflect deductions for fees, expenses or taxes. The composition of the S&P 500 Dividend Aristocrats Index serves as a better reflection of the Fund’s current strategy than does the Lehman Brothers U.S. Corporate High Yield Bond Index.
*** The Lehman Brothers Aggregate Bond Index is an index that measures the performance of U.S. investment grade bonds. It is not possible to invest directly in the Index. The performance of the Index does not reflect deductions for fees, expenses or taxes.
**** The Consumer Price Index is an inflationary indicator that measures the change in the cost of a fixed basket of products and services, including housing, electricity, food and transportation. It is not possible to invest directly in the Index.
| | |
| Shareholder Expense Example |
| (unaudited) |
As a shareholder of the fund, you incur two types of costs: (1) transaction costs, including sales charges (loads) on purchase payments; and (2) ongoing costs, including management fees; distribution (12b-1) fees and other Fund expenses. This Shareholder Expense Example is intended to help you understand your ongoing costs (in dollars) of investing in the fund and to compare these costs with the ongoing costs of investing in other mutual funds. The Example is based on an investment of $1,000 invested at the beginning of the period and held for the entire period from June 30, 2007 through December 31, 2007.
Actual Expenses
In the table below, the first section, labeled “Actual,” provides information about actual account values and actual expenses. You may use the information in this section, together with the amount you invested, to estimate the expenses that you paid over the period. Simply divide your account value by $1,000 (for example, an $8,600 account value divided by $1,000 = 8.6), then multiply the result by the number from the appropriate Class line under the heading entitled “Expenses Paid During Period” to estimate the expenses you paid. A small account fee of $12 is charged to Class A and Class B shareholder accounts if the value falls below the stated account minimum of $1,000. This fee is not included in the table below. If it were, the expenses you paid during the period would have been higher and the ending account value would have been lower.
Hypothetical Example for Comparison Purposes
In the table below, the second section, labeled “Hypothetical,” provides information about hypothetical account values and hypothetical expenses based on the Fund’s actual expense ratio and an assumed rate of return of 5% per year before expenses, which is not the Fund’s actual return. The hypothetical account values and expenses may not be used to estimate the actual ending account balance or expenses you paid for the period. You may use this information to compare the ongoing costs of investing in the Fund and other funds. To do so, compare this 5% hypothetical example with the 5% hypothetical examples that appear in the shareholder reports of the other funds. A small account fee of $12 is charged to Class A and Class B shareholder accounts if the value falls below the stated account minimum of $1,000. This fee is not included in the table below. If it were, the expenses you paid during the period would have been higher and the ending account value would have been lower.
Please note that the expenses shown in the table are meant to highlight your ongoing costs only and do not reflect any transactional costs, such as sales charges (loads). Therefore, the second section of the table is useful in comparing ongoing costs only, and will not help you determine the relative total costs of owning different funds. In addition, if these transactional costs were included, your costs would have been higher.
| | | | |
| | Beginning | Ending | Expenses | |
| | Account | Account | Paid During | Annualized |
| | Value | Value | Period * | Expense |
| | 6/30/2007 | 12/31/2007 | 6/30/2007 — 12/31/2007 | Ratio |
|
| Thrivent Real Estate Securities Fund | | | | |
| Actual | | | | |
| Class A | $1,000 | $885 | $5.97 | 1.25% |
| Institutional Class | $1,000 | $887 | $4.49 | 0.94% |
| Hypothetical ** | | | | |
| Class A | $1,000 | $1,019 | $6.40 | 1.25% |
| Institutional Class | $1,000 | $1,021 | $4.81 | 0.94% |
| |
| Thrivent Diversified Income Plus Fund | | | | |
| Actual | | | | |
| Class A | $1,000 | $979 | $4.46 | 0.89% |
| Class B | $1,000 | $972 | $10.15 | 2.03% |
| Institutional Class | $1,000 | $980 | $2.46 | 0.49% |
| Hypothetical ** | | | | |
| Class A | $1,000 | $1,021 | $4.56 | 0.89% |
| Class B | $1,000 | $1,015 | $10.37 | 2.03% |
| Institutional Class | $1,000 | $1,023 | $2.51 | 0.49% |
* Expenses are equal to the Fund’s annualized expense ratio, multiplied by the average account value over the period, multiplied by 185/365 to reflect the one-half year period.
** Assuming 5% total return before expenses.

|
| Report of Independent Registered Public Accounting Firm |
To the Shareholders and Trustees of
the Thrivent Mutual Funds:
In our opinion, the accompanying statements of assets and liabilities, including the schedules of investments, and the related statements of operations and of changes in net assets and the financial highlights present fairly, in all material respects, the financial position of the Thrivent Real Estate Securities Fund and the Thrivent Diversified Income Plus Fund (the “Funds”) at December 31, 2007, the results of each of their operations, changes in each of their net assets and their financial highlights for each of the periods presented, in conformity with accounting principles generally accepted in the United States of America. These financial statements and financial highlights (hereafter referred to as “financial statements”) are the responsibility of the Funds’ management; our responsibility is to express an opinion on these financial statements based on our audits. We conducted our audits of these financial statements in accordance with the standards of the Public Company Accounting Oversight Board (United States). Those standards require that we plan and perform the audit to obtain reasonable assurance about whether the financial statements are free of material misstatement. An audit includes examining, on a test basis, evidence supporting the amounts and disclosures in the financial statements, assessing the accounting principles used and significant estimates made by management, and evaluating the overall financial statement presentation. We believe that our audits, which included confirmation of securities at December 31, 2007 by correspondence with the custodian and brokers, provide a reasonable basis for our opinion.

February 15, 2008
| | | | | | | |
| Real Estate Securities Fund |
| Schedule of Investments as of December 31, 2007 |
| |
| Shares | Common Stock (94.9%) | Value | | Shares | Common Stock (94.9%) | Value |
|
| Diversified REITS (5.4%) | | | Mortgage REITS (0.4%) | |
| 4,000 | Colonial Properties Trust | $90,520 | | 13,500 | iSTAR Financial, Inc. * | $351,675 |
|
|
| 17,827 | Liberty Property Trust | 513,596 | | | Total Mortgage REITS | 351,675 |
|
|
| 5,000 | PS Business Parks, Inc. | 262,750 | | | | |
| 43,500 | Vornado Realty Trust | 3,825,825 | | Office REITS (14.9%) | |
| 4,200 | Washington Real Estate | | | 13,200 | Alexandria Real Estate | |
| | Investment Trust * | 131,922 | | | Equities, Inc. | 1,342,044 |
|
| | |
| | Total Diversified REITS | 4,824,613 | | 20,500 | BioMed Realty Trust, Inc. * | 474,985 |
|
| | |
| | | | | 38,500 | Boston Properties, Inc. | 3,534,685 |
| Financials (6.4%) | | | 33,976 | Brandywine Realty Trust | 609,190 |
| 10,200 | iShares Cohen & Steers Realty | | | 23,000 | Corporate Office Properties Trust * | 724,500 |
| | Majors Index Fund * | 808,044 | | 23,400 | Digital Realty Trust, Inc. * | 897,858 |
| 15,000 | iShares Dow Jones U.S. Real Estate | | | 24,900 | Douglas Emmett, Inc. | 562,989 |
| | Index Fund * | 988,500 | | 21,100 | Duke Realty Corporation | 550,288 |
| 68,884 | SPDR DJ Wilshire International | | | 17,031 | Highwoods Properties, Inc. * | 500,371 |
| | Real Estate ETF * | 3,922,944 | | 13,100 | Kilroy Realty Corporation | 719,976 |
|
| | |
| | Total Financials | 5,719,488 | | 10,000 | Lexington Corporate | |
|
| | |
| | | | | | Properties Trust | 145,400 |
| | | | | 19,600 | Mack-Cali Realty Corporation | 666,400 |
| Foreign (3.6%) | | | | | |
| | | | | 15,225 | Maguire Properties, Inc. * | 448,681 |
| 10,300 | British Land Company plc | 193,135 | | | | |
| | | | | 23,787 | SL Green Realty Corporation * | 2,223,111 |
|
|
| 68,800 | Brookfield Properties Corporation * | 1,324,400 | | | | |
| | | | | | Total Office REITS | 13,400,478 |
|
|
| 9,600 | Henderson Land Development | | | | | |
| | Company, Ltd. | 89,156 | | | | |
| 20,000 | Hongkong Land Holdings, Ltd. | 97,954 | | Real Estate Management & Development (0.4%) |
| 23,000 | Hopson Development Holdings, Ltd. | 62,730 | | 7,668 | Forest City Enterprises | 340,766 |
|
|
| 7,500 | Land Securities Group plc | 224,737 | | | Total Real Estate | |
| 5,000 | Lend Lease Corporation, Ltd. | 75,499 | | | Management & Development | 340,766 |
|
|
| 8,900 | Mitsubishi Estate Company, Ltd. | 212,042 | | | | |
| 10,000 | Mitsui Fudosan Company, Ltd. | 215,665 | | Residential REITS (13.1%) | |
| 20,000 | Stockland | 146,794 | | 7,600 | American Campus Communities, Inc. | 204,060 |
| 8,000 | Sun Hung Kai Properties, Ltd. | 168,028 | | 23,210 | Apartment Investment & | |
| 1,035 | Unibail-Rodamco | 226,472 | | | Management Company * | 806,083 |
| 10,678 | Westfield Group | 195,218 | | 28,700 | Avalonbay Communities, Inc. * | 2,701,818 |
|
| | |
| | Total Foreign | 3,231,830 | | 17,700 | BRE Properties, Inc. * | 717,381 |
|
| | |
| | | | | 19,000 | Camden Property Trust | 914,850 |
| Hotels, Resorts & Cruise Lines (1.2%) | | | 7,700 | Equity Lifestyle Properties, Inc. | 351,659 |
| 25,300 | Starwood Hotels & Resorts | | | 68,000 | Equity Residential REIT | 2,479,960 |
| | Worldwide, Inc. | 1,113,959 | | 14,000 | Essex Property Trust, Inc. * | 1,364,860 |
|
| | |
| | Total Hotels, Resorts & | | | 14,105 | Home Properties, Inc. * | 632,609 |
| | Cruise Lines | 1,113,959 | | 10,300 | Mid-America Apartment | |
|
| | |
| | | | | | Communities, Inc. * | 440,325 |
| | | | | 12,500 | Post Properties, Inc. * | 439,000 |
| Industrial REITS (8.3%) | | | | | |
| | | | | 37,300 | UDR, Inc. * | 740,405 |
|
|
| 30,500 | AMB Property Corporation * | 1,755,580 | | | | |
| | | | | | Total Residential REITS | 11,793,010 |
|
|
| 31,000 | DCT Industrial Trust, Inc. * | 288,610 | | | | |
| 7,300 | EastGroup Properties, Inc. | 305,505 | | | | |
| 80,858 | ProLogis Trust * | 5,124,780 | | | | |
|
| | |
| | Total Industrial REITS | 7,474,475 | | | | |
|
| | |
|
| The accompanying Notes to Financial Statements are an integral part of this schedule. |
|
| 10 |
| | | | | | |
| Real Estate Securities Fund | | | | | |
| Schedule of Investments as of December 31, 2007 | | | | | |
| |
|
| Shares | Common Stock (94.9%) | Value | | Shares | Common Stock (94.9%) | Value |
|
| |
| Retail REITS (24.4%) | | | Specialized REITS (16.8%) | |
| 8,100 | Acadia Realty Trust | $207,441 | | 37,500 | Ashford Hospitality Trust | $269,625 |
| 16,200 | CBL & Associates Properties, Inc. | 387,342 | | 33,294 | DiamondRock Hospitality Company | 498,744 |
| 36,700 | Developers Diversified Realty | | | 5,800 | Entertainment Properties Trust | 272,600 |
| | Corporation | 1,405,243 | | 27,000 | Extra Space Storage, Inc. | 385,830 |
| 5,500 | Equity One, Inc. * | 126,665 | | 9,200 | FelCor Lodging Trust, Inc. | 143,428 |
| 21,600 | Federal Realty Investment Trust * | 1,774,440 | | 32,200 | Health Care Property Investors, Inc. | 1,119,916 |
| 62,000 | General Growth Properties, Inc. | 2,553,160 | | 20,500 | Health Care REIT, Inc. * | 916,145 |
| 8,400 | Glimcher Realty Trust * | 120,036 | | 9,000 | Healthcare Realty Trust, Inc. | 228,510 |
| 16,900 | Inland Real Estate Corporation * | 239,304 | | 5,000 | Hersha Hospitality Trust | 47,500 |
| 60,667 | Kimco Realty Corporation * | 2,208,279 | | 15,200 | Hospitality Properties Trust | 489,744 |
| 6,954 | Kite Realty Group Trust | 106,188 | | 149,683 | Host Marriott Corporation * | 2,550,598 |
| 24,500 | Macerich Company | 1,740,970 | | 17,000 | LaSalle Hotel Properties * | 542,300 |
| 18,000 | National Retail Properties, Inc. | 420,840 | | 26,000 | Nationwide Health Properties, Inc. * | 816,400 |
| 3,300 | Pennsylvania Real Estate | | | 5,000 | Omega Healthcare Investors, Inc. | 80,250 |
| | Investment Trust | 97,944 | | 9,100 | Plum Creek Timber Company, Inc. | 418,964 |
| 2,500 | Ramco-Gershenson Properties Trust | 53,425 | | 42,100 | Public Storage, Inc. | 3,090,561 |
| 7,000 | Realty Income Corporation * | 189,140 | | 19,900 | Senior Housing Property Trust | 451,332 |
| 23,000 | Regency Centers Corporation | 1,483,270 | | 1,000 | Sovran Self Storage, Inc. | 40,100 |
| 78,800 | Simon Property Group, Inc. * | 6,844,569 | | 23,600 | Strategic Hotel Capital, Inc. * | 394,828 |
| 13,700 | Tanger Factory Outlet Centers, Inc. * | 516,627 | | 13,000 | Sunstone Hotel Investors, Inc. * | 237,770 |
| 20,500 | Taubman Centers, Inc. | 1,008,395 | | 8,500 | U-Store-It Trust | 77,860 |
| 14,300 | Weingarten Realty Investors | 449,592 | | 43,741 | Ventas, Inc. * | 1,979,280 |
|
| | |
|
| | Total Retail REITS | 21,932,870 | | | Total Specialized REITS | 15,052,285 |
|
| | |
|
| |
| | | | | | Total Common Stock | |
| | | | | | (cost $90,298,074) | 85,235,449 |
|
|
|
| The accompanying Notes to Financial Statements are an integral part of this schedule. |
|
| 11 |
| | | | |
| Real Estate Securities Fund | | | |
| Schedule of Investments as of December 31, 2007 | | | |
| | | Interest | Maturity | |
| Shares | Collateral Held for Securities Loaned (42.0%) | Rate (+) | Date | Value |
|
| 37,685,177 | Thrivent Financial Securities Lending Trust | 5.000% | N/A | $37,685,177 |
|
|
| | Total Collateral Held for Securities Loaned | | |
| | (cost $37,685,177) | | | 37,685,177 |
|
|
| |
| Principal | | Interest | Maturity | |
| Amount | Short-Term Investments (4.7%) | Rate (+) | Date | Value |
|
| $4,195,000 | Federal Home Loan Mortgage Corporation | 3.150% | 1/2/2008 | $4,194,633 |
|
|
| | Total Short-Term Investments (at amortized cost) | 4,194,633 |
|
|
| | Total Investments (cost $132,177,884) 141.6% | | $127,115,259 |
|
|
| | Other Assets and Liabilities, Net (41.6%) | | (37,339,539) |
|
|
| | Total Net Assets 100.0% | | | $89,775,720 |
|
|
* All or a portion of the security is on loan as discussed in item 2(M) of the Notes to Financial Statements.
+ The interest rate shown reflects the yield, coupon rate or, for securities purchased at a discount, the discount rate at the date of purchase.
Definitions:
ETF — Exchange Traded Fund
REIT — Real Estate Investment Trust, is a company that buys, develops, manages and/or sells real estate assets.
Gross unrealized appreciation and depreciation of investments, based on cost for federal income tax purposes, were as follows:
| | |
| Gross unrealized appreciation | $617,419 | |
| Gross unrealized depreciation | (7,661,902) | |
|
| |
| Net unrealized appreciation (depreciation) | ($7,044,483) | |
| Cost for federal income tax purposes | $134,159,742 | |
|
| The accompanying Notes to Financial Statements are an integral part of this schedule. |
|
| 12 |
| | | | | | |
| Diversified Income Plus Fund |
| Schedule of Investments as of December 31, 2007 |
| |
| Shares | Common Stock (37.7%) | Value | | Shares | Common Stock (37.7%) | Value |
|
| Consumer Discretionary (1.9%) | | | 10,900 | Astoria Financial Corporation | $253,643 |
| 12,900 | Genuine Parts Company | $597,270 | | 4,000 | Avalonbay Communities, Inc. | 376,560 |
| 9,300 | Home Depot, Inc. | 250,542 | | 36,100 | Bank of America Corporation ± | 1,489,486 |
| 15,200 | Leggett & Platt, Inc. | 265,088 | | 14,000 | BB&T Corporation | 429,380 |
| 17,100 | McDonald’s Corporation | 1,007,361 | | 3,400 | BioMed Realty Trust, Inc. | 78,778 |
| 6,300 | Nordstrom, Inc. | 231,399 | | 6,000 | Boston Properties, Inc. | 550,860 |
| 4,100 | Polaris Industries, Inc. * | 195,857 | | 5,700 | Brandywine Realty Trust | 102,201 |
| 14,000 | Stanley Works | 678,720 | | 2,500 | BRE Properties, Inc. | 101,325 |
| 3,800 | VF Corporation | 260,908 | | 2,900 | Camden Property Trust | 139,635 |
|
| | |
| | Total Consumer Discretionary | 3,487,145 | | 4,100 | Capital Lease Funding, Inc. | 34,522 |
|
| | |
| | | | | 4,000 | CBL & Associates Properties, Inc. | 95,640 |
| Consumer Staples (5.4%) | | | 3,100 | Cedar Shopping Centers, Inc. | 31,713 |
| 21,400 | Altria Group, Inc. ‡ | 1,617,412 | | 15,900 | Citigroup, Inc. | 468,096 |
| 4,000 | Brown-Forman Corporation | 296,440 | | 1,200 | Cogdell Spencer, Inc. | 19,116 |
| 17,900 | Clorox Company | 1,166,543 | | 2,400 | Colonial Properties Trust * | 54,312 |
| 19,600 | Coca-Cola Company | 1,202,852 | | 13,300 | Comerica, Inc. | 578,949 |
| 1,600 | Imperial Tobacco Group plc ADR | 171,648 | | 15,100 | Commerce Group, Inc. | 543,298 |
| 13,800 | Kimberly-Clark Corporation | 956,892 | | 1,900 | Corporate Office Properties Trust | 59,850 |
| 20,000 | Kraft Foods, Inc. | 652,600 | | 2,200 | Cousins Properties, Inc. | 48,620 |
| 5,800 | PepsiCo, Inc. | 440,220 | | 5,600 | Credicorp, Ltd. | 427,280 |
| 21,200 | Procter & Gamble Company | 1,556,504 | | 10,800 | DCT Industrial Trust, Inc. * | 100,548 |
| 11,500 | SUPERVALU, Inc. | 431,480 | | 7,000 | Developers Diversified Realty | |
| 10,400 | Universal Corporation | 532,688 | | | Corporation | 268,030 |
| 23,200 | Wal-Mart Stores, Inc. | 1,102,696 | | 5,400 | DiamondRock Hospitality Company | 80,892 |
|
| | |
| | Total Consumer Staples | 10,127,975 | | 3,000 | Digital Realty Trust, Inc. * | 115,110 |
|
| | |
| | | | | 1,200 | Douglas Emmett, Inc. | 27,132 |
| Energy (3.6%) | | | | 7,900 | Duke Realty Corporation | 206,032 |
| 11,800 | BP plc | 863,406 | | 1,000 | EastGroup Properties, Inc. | 41,850 |
| 15,900 | Chevron Corporation | 1,483,947 | | 1,700 | Education Realty Trust, Inc. | 19,108 |
| 29,625 | Energy Income and Growth Fund | 727,294 | | 1,700 | Entertainment Properties Trust | 79,900 |
| 15,900 | Exxon Mobil Corporation ‡ | 1,489,671 | | 500 | Equity Lifestyle Properties, Inc. | 22,835 |
| 7,900 | Holly Corporation | 402,031 | | 2,100 | Equity One, Inc. | 48,363 |
| 48,455 | Kayne Anderson MLP | | | 14,900 | Equity Residential REIT | 543,403 |
| | Investment Company | 1,421,670 | | 1,200 | Essex Property Trust, Inc. | 116,988 |
| 7,500 | Sasol, Ltd. ADR | 371,025 | | 3,900 | Extra Space Storage, Inc. | 55,731 |
|
| | |
| | Total Energy | 6,759,044 | | 14,000 | Federal Home Loan Mortgage | |
|
| | |
| | | | | | Corporation | 476,980 |
| Financials (16.4%) | | | 2,900 | Federal Realty Investment Trust | 238,235 |
| 800 | Acadia Realty Trust | 20,488 | | 3,600 | FelCor Lodging Trust, Inc. | 56,124 |
| 700 | Agree Realty Corporation | 21,070 | | 66,252 | Fiduciary/Claymore MLP | |
| 1,200 | Alexandria Real Estate Equities, Inc. | 122,004 | | | Opportunity Fund | 1,383,342 |
| 5,000 | AMB Property Corporation | 287,800 | | 3,300 | First Industrial Realty Trust, Inc. * | 114,180 |
| 1,200 | American Campus Communities, Inc. | 32,220 | | 1,300 | First Potomac Realty Trust | 22,477 |
| 7,900 | American Financial Realty Trust | 63,358 | | 4,300 | Franklin Street Properties Corporation * | 63,640 |
| 3,200 | American International Group, Inc. | 186,560 | | 13,000 | General Growth Properties, Inc. | 535,340 |
| 1,000 | American Land Lease, Inc. | 19,830 | | 2,000 | Getty Realty Corporation | 53,360 |
| 4,900 | Apartment Investment & | | | 1,300 | Gladstone Commercial Corporation | 22,802 |
| | Management Company | 170,177 | | 4,700 | Glimcher Realty Trust * | 67,163 |
| 47,200 | Arthur J. Gallagher & Company ‡ | 1,141,768 | | 2,900 | GMH Communities Trust | 16,008 |
| 9,400 | Ashford Hospitality Trust | 67,586 | | 2,900 | Hartford Financial Services | |
| 1,900 | Associated Estates Realty Corporation | 17,936 | | | Group, Inc. | 252,851 |
|
| The accompanying Notes to Financial Statements are an integral part of this schedule. |
|
| 13 |
| | | | | | | |
| Diversified Income Plus Fund | | | | | |
| Schedule of Investments as of December 31, 2007 | | | | | |
|
| |
| Shares | Common Stock (37.7%) | Value | | Shares | Common Stock (37.7%) | Value |
|
| Financials — continued | | | 500 | Saul Centers, Inc. | $26,715 |
| 11,500 | Health Care Property Investors, Inc. | $399,970 | | 5,200 | Senior Housing Property Trust | 117,936 |
| 4,800 | Health Care REIT, Inc. * | 214,512 | | 11,900 | Simon Property Group, Inc. | 1,033,634 |
| 1,500 | Healthcare Realty Trust, Inc. | 38,085 | | 2,966 | SL Green Realty Corporation * | 277,202 |
| 2,800 | Hersha Hospitality Trust | 26,600 | | 1,200 | Sovran Self Storage, Inc. | 48,120 |
| 3,000 | Highwoods Properties, Inc. | 88,140 | | 3,600 | Strategic Hotel Capital, Inc. * | 60,228 |
| 2,100 | Home Properties, Inc. * | 94,185 | | 2,100 | Sun Communities, Inc. * | 44,247 |
| 8,300 | Hospitality Properties Trust | 267,426 | | 3,300 | Sunstone Hotel Investors, Inc. | 60,357 |
| 27,400 | Host Marriott Corporation | 466,896 | | 1,300 | Tanger Factory Outlet Centers, Inc. | 49,023 |
| 19,100 | HRPT Properties Trust * | 147,643 | | 1,600 | Taubman Centers, Inc. | 78,704 |
| 10,900 | HSBC Holdings plc ADR | 912,439 | | 29,997 | Tortoise Energy | |
| 3,400 | Inland Real Estate Corporation * | 48,144 | | | Infrastructure Corporation | 999,194 |
| 3,774 | Investors Real Estate Trust * | 33,853 | | 23,895 | Tortoise North American | |
| 4,200 | J.P. Morgan Chase & Company | 183,330 | | | Energy Corporation | 593,787 |
| 1,400 | Kilroy Realty Corporation | 76,944 | | 52,700 | U.S. Bancorp * | 1,672,698 |
| 13,545 | Kimco Realty Corporation * | 493,038 | | 7,400 | UDR, Inc. * | 146,890 |
| 1,500 | Kite Realty Group Trust | 22,905 | | 900 | Universal Health Realty | |
| 1,700 | LaSalle Hotel Properties | 54,230 | | | Income Trust | 31,896 |
| 6,200 | Lexington Corporate Properties Trust * | 90,148 | | 1,200 | Urstadt Biddle Properties | 18,600 |
| 5,900 | Liberty Property Trust | 169,979 | | 4,400 | U-Store-It Trust | 40,304 |
| 4,100 | Lincoln National Corporation | 238,702 | | 7,300 | Ventas, Inc. | 330,325 |
| 900 | LTC Properties, Inc. | 22,545 | | 8,000 | Vornado Realty Trust * | 703,600 |
| 3,700 | Macerich Company | 262,922 | | 2,700 | Washington Real Estate | |
| 4,700 | Mack-Cali Realty Corporation | 159,800 | | | Investment Trust * | 84,807 |
| 2,100 | Maguire Properties, Inc. * | 61,887 | | 4,800 | Weingarten Realty Investors | 150,912 |
| 4,900 | Medical Properties Trust, Inc. * | 49,931 | | 38,100 | Wells Fargo & Company | 1,150,239 |
|
|
| 24,300 | Mercury General Corporation | 1,210,383 | | | Total Financials | 30,727,048 |
|
|
| 1,300 | Mid-America Apartment | | | | | |
| | Communities, Inc. | 55,575 | | Health Care (3.4%) | |
| 1,700 | Mission West Properties, Inc. | 16,167 | | 16,700 | Abbott Laboratories ‡ | 937,705 |
| 2,400 | Monmouth Real Estate Investment | | | 10,000 | Bristol-Myers Squibb Company | 265,200 |
| | Corporation | 19,440 | | 20,000 | Eli Lilly and Company | 1,067,800 |
| 12,000 | National City Corporation | 197,520 | | 22,900 | Johnson & Johnson | 1,527,430 |
| 4,500 | National Retail Properties, Inc. | 105,210 | | 3,900 | Medtronic, Inc. | 196,053 |
| 5,300 | Nationwide Health Properties, Inc. * | 166,420 | | 15,000 | Merck & Company, Inc. | 871,650 |
| 4,500 | Omega Healthcare Investors, Inc. | 72,225 | | 5,000 | Meridian Bioscience, Inc. | 150,400 |
| 1,000 | One Liberty Properties, Inc. * | 18,370 | | 52,700 | Pfizer, Inc. | 1,197,871 |
| 900 | Parkway Properties, Inc. | 33,282 | | 4,600 | Teva Pharmaceutical Industries, | |
| 2,800 | Pennsylvania Real Estate | | | | Ltd. ADR | 213,808 |
|
|
| | Investment Trust | 83,104 | | | Total Health Care | 6,427,917 |
|
|
| 9,400 | Plum Creek Timber Company, Inc. | 432,776 | | | | |
| 2,000 | Post Properties, Inc. * | 70,240 | | Industrials (3.5%) | |
| 1,900 | Potlatch Corporation | 84,436 | | 5,000 | 3M Company | 421,600 |
| 13,600 | ProLogis Trust | 861,968 | | 6,300 | Avery Dennison Corporation | 334,782 |
| 500 | PS Business Parks, Inc. | 26,275 | | 9,000 | Briggs & Stratton Corporation * | 203,940 |
| 6,402 | Public Storage, Inc. | 469,971 | | 19,100 | Caterpillar, Inc. | 1,385,896 |
| 1,000 | Ramco-Gershenson Properties Trust | 21,370 | | 2,700 | Expeditors International of | |
| 4,400 | Rayonier, Inc. REIT | 207,856 | | | Washington, Inc. | 120,636 |
| 6,300 | Realty Income Corporation * | 170,226 | | 10,900 | General Dynamics Corporation | 969,991 |
| 3,500 | Regency Centers Corporation | 225,715 | | 41,400 | General Electric Company | 1,534,698 |
| 32,658 | Regions Financial Corporation * | 772,362 | | 38,300 | Masco Corporation | 827,663 |
|
| The accompanying Notes to Financial Statements are an integral part of this schedule. |
|
| 14 |
| | | | | | | |
| Diversified Income Plus Fund | | | | | |
| Schedule of Investments as of December 31, 2007 | | | | | |
|
| |
| Shares | Common Stock (37.7%) | Value | | Shares | Preferred Stock (2.1%) | Value |
|
| |
| Industrials — continued | | | Financials (1.2%) | |
| 4,000 | Raytheon Company | $242,800 | | 21,700 | Bank of America Corporation | $513,639 |
| 13,500 | Tomkins plc ADR | 188,325 | | 20,000 | Citigroup Capital VIII | 421,000 |
| 3,400 | United Technologies Corporation | 260,236 | | 19,000 | HSBC USA, Inc. | 418,190 |
|
| | |
| | Total Industrials | 6,490,567 | | 20,000 | MetLife, Inc. | 436,800 |
|
| | |
| | | | | 21,000 | Santander Finance Preferred SA | |
| Information Technology (0.8%) | | | | Unipersonal # | 463,050 |
|
|
| 7,200 | International Business Machines | | | | Total Financials | 2,252,679 |
|
|
| | Corporation | 778,320 | | | | |
| 12,500 | Linear Technology Corporation * | 397,875 | | U.S. Government (0.5%) | |
| 7,700 | Paychex, Inc. | 278,894 | | 14,300 | Federal Home Loan Mortgage | |
|
| | |
| | Total Information Technology | 1,455,089 | | | Corporation # | 373,945 |
|
| | |
| | | | | 18,100 | Federal National Mortgage | |
| Materials (1.0%) | | | | Association # | 466,075 |
|
|
| 1,700 | Broken Hill Proprietary, Ltd. | $119,068 | | | Total U.S. Government | 840,020 |
|
|
| 2,700 | Martin Marietta Materials, Inc. * | 358,020 | | | | |
| 6,600 | Nucor Corporation | 390,852 | | Utilities (0.4%) | |
| 8,700 | PPG Industries, Inc. | 611,001 | | 15,600 | CenterPoint Energy, Inc., | |
| 5,700 | Sonoco Products Company | 186,276 | | | Convertible ± | 500,448 |
| 3,100 | Vulcan Materials Company | 245,179 | | 720 | NRG Energy, Inc., Convertible | 270,504 |
|
| | |
|
| | Total Materials | 1,910,396 | | | Total Utilities | 770,952 |
|
| | |
|
| |
| Telecommunications Services (1.2%) | | | | Total Preferred Stock | |
| 12,200 | America Movil SA de CV ADR | 748,958 | | | (cost $3,967,165) | 3,863,651 |
|
|
| 37,200 | AT&T, Inc. ±‡ | 1,546,033 | | | | |
|
| | |
| | Total Telecommunications | | | | | |
| | Services | 2,294,991 | | | | |
|
| | |
| |
| Utilities (0.5%) | | | | | |
| 14,300 | Atmos Energy Corporation | 400,972 | | | | |
| 5,400 | Huaneng Power International, | | | | | |
| | Inc. ADR | 223,020 | | | | |
| 7,800 | Progress Energy, Inc. | 377,754 | | | | |
|
| | |
| | Total Utilities | 1,001,746 | | | | |
|
| | |
| |
| | Total Common Stock | | | | | |
| | (cost $76,053,272) | 70,681,918 | | | | |
|
| | |
|
| The accompanying Notes to Financial Statements are an integral part of this schedule. |
|
| 15 |
| | | | |
| Diversified Income Plus Fund | | | |
| Schedule of Investments as of December 31, 2007 | | | |
| |
| Principal | | Interest | Maturity | |
| Amount | Bank Loans (3.7%)!! | Rate | Date | Value |
|
| Basic Materials (0.2%) | | | |
| $491,181 | Domtar Corporation, Term Loan | 6.403% | 3/7/2014 | $470,458 |
|
|
| | Total Basic Materials | | | 470,458 |
|
|
| |
| Capital Goods (0.3%) | | | |
| 318,803 | Allied Waste North America, Inc., Term Loan §≠ | 6.358 | 3/28/2014 | 304,125 |
| 191,676 | Allied Waste North America, Inc., Term Loan §≠ | 6.621 | 3/28/2014 | 182,851 |
|
|
| | Total Capital Goods | | | 486,976 |
|
|
| |
| Communications Services (0.6%) | | | |
| 547,236 | Idearc, Inc., Term Loan §≠ | 6.830 | 11/17/2014 | 520,082 |
| 547,250 | Windstream Corporation, Term Loan | 6.714 | 7/17/2013 | 536,491 |
|
|
| | Total Communications Services | | 1,056,573 |
|
|
| |
| Consumer Cyclical (0.3%) | | | |
| 83,688 | Hertz Corporation, Term Loan | 6.660 | 12/21/2012 | 81,847 |
| 463,984 | Hertz Corporation, Term Loan | 6.894 | 12/21/2012 | 453,609 |
|
|
| | Total Consumer Cyclical | | | 535,456 |
|
|
| |
| Consumer Non-Cyclical (1.2%) | | | |
| 548,625 | Biomet, Inc., Term Loan | 7.858 | 3/25/2015 | 542,524 |
| 550,000 | BSC International Holdings, Ltd., Term Loan §≠ | 5.830 | 4/21/2011 | 523,875 |
| 5,964 | CHS/Community Health Systems, Inc., Term Loan §≠ | 7.331 | 7/25/2014 | 5,736 |
| 533,110 | CHS/Community Health Systems, Inc., Term Loan | 7.331 | 7/25/2014 | 512,729 |
| 596,962 | SUPERVALU, Inc., Term Loan | 6.396 | 6/2/2012 | 583,011 |
|
|
| | Total Consumer Non-Cyclical | | 2,167,875 |
|
|
| |
| Financials (0.3%) | | | |
| 547,236 | Solar Capital Corporation, Term Loan | 6.898 | 2/28/2014 | 527,552 |
|
|
| | Total Financials | | | 527,552 |
|
|
| |
| Technology (0.3%) | | | |
| 441,728 | Flextronics Semiconductor, Ltd., Term Loan | 7.394 | 10/1/2014 | 429,581 |
| 126,914 | Flextronics Semiconductor, Ltd., Term Loan | 7.455 | 10/1/2014 | 123,741 |
|
|
| | Total Technology | | | 553,322 |
|
|
| |
| Utilities (0.5%) | | | |
| 568,575 | Energy Future Holdings, Term Loan | 8.396 | 10/10/2014 | 557,602 |
| 161,348 | NRG Energy, Inc., Term Loan | 6.480 | 2/1/2013 | 152,810 |
| 349,469 | NRG Energy, Inc., Term Loan | 6.580 | 2/1/2013 | 332,607 |
|
|
| | Total Utilities | | | 1,043,019 |
|
|
| | Total Bank Loans (cost $6,958,939) | | 6,841,231 |
|
|
|
| The accompanying Notes to Financial Statements are an integral part of this schedule. |
|
| 16 |
| | | | |
| Diversified Income Plus Fund | | | |
| Schedule of Investments as of December 31, 2007 | | | |
| |
| Principal | | Interest | Maturity | |
| Amount | Long-Term Fixed Income (53.3%) | Rate | Date | Value |
|
| Asset-Backed Securities (2.6%) | | | |
| $1,500,000 | Citibank Credit Card Issuance Trust | 5.650% | 9/20/2019 | $1,501,502 |
| 1,000,000 | Discover Card Master Trust | 5.650 | 3/16/2020 | 998,737 |
| 850,000 | GAMUT Reinsurance, Ltd. †≤ | 11.960 | 1/31/2008 | 855,355 |
| 250,000 | GAMUT Reinsurance, Ltd. †≤ | 19.960 | 1/31/2008 | 249,725 |
| 600,000 | Merna Re, Ltd. †≤ | 6.580 | 3/31/2008 | 592,740 |
| 600,000 | Merna Re, Ltd. †≤ | 7.580 | 3/31/2008 | 595,020 |
|
|
| | Total Asset-Backed Securities | | 4,793,079 |
|
|
| |
| Basic Materials (4.2%) | | | |
| 150,000 | Aleris International, Inc. | 9.000 | 12/15/2014 | 125,250 |
| 110,000 | Aleris International, Inc. | 10.000 | 12/15/2016 | 89,100 |
| 220,000 | Arch Western Finance, LLC | 6.750 | 7/1/2013 | 213,400 |
| 104,000 | Buckeye Technologies, Inc. | 8.000 | 10/15/2010 | 102,960 |
| 570,000 | Chemtura Corporation | 6.875 | 6/1/2016 | 535,800 |
| 280,000 | Domtar, Inc. | 7.875 | 10/15/2011 | 285,950 |
| 280,000 | Domtar, Inc. | 5.375 | 12/1/2013 | 252,700 |
| 190,000 | Domtar, Inc. | 7.125 | 8/15/2015 | 186,200 |
| 190,000 | Drummond Company, Inc. ≤ | 7.375 | 2/15/2016 | 176,225 |
| 600,000 | FMG Finance, Pty., Ltd. ≤ | 10.625 | 9/1/2016 | 687,000 |
| 670,000 | Freeport-McMoRan Copper & Gold, Inc. ± | 8.375 | 4/1/2017 | 718,575 |
| 120,000 | Georgia-Pacific Corporation * | 8.125 | 5/15/2011 | 121,800 |
| 760,000 | Georgia-Pacific Corporation ≤ | 7.125 | 1/15/2017 | 739,100 |
| 300,000 | Glencore Funding, LLC ≤ | 6.000 | 4/15/2014 | 301,756 |
| 300,000 | Graphic Packaging International Corporation * | 9.500 | 8/15/2013 | 296,250 |
| 320,000 | Griffin Coal Mining Company, Pty., Ltd. ≤ | 9.500 | 12/1/2016 | 284,800 |
| 220,000 | Huntsman International, LLC | 7.875 | 11/13/2014 | 233,200 |
| 100,000 | Jefferson Smurfit Corporation | 8.250 | 10/1/2012 | 98,500 |
| 440,000 | Mosaic Global Holdings, Inc., Convertible ≤ | 7.375 | 12/1/2014 | 470,800 |
| 570,000 | Novelis, Inc. | 7.250 | 2/15/2015 | 535,800 |
| 550,000 | Peabody Energy Corporation | 5.875 | 4/15/2016 | 517,000 |
| 570,000 | Smurfit-Stone Container Enterprises, Inc. * | 8.000 | 3/15/2017 | 550,762 |
| 340,000 | Terra Capital, Inc. | 7.000 | 2/1/2017 | 332,350 |
|
|
| | Total Basic Materials | | | 7,855,278 |
|
|
| |
| Capital Goods (3.2%) | | | |
| 620,000 | Allied Waste North America, Inc. ‡ | 6.875 | 6/1/2017 | 604,500 |
| 100,000 | Ashtead Capital, Inc. ಠ| 9.000 | 8/15/2016 | 88,500 |
| 190,000 | Ball Corporation ‡ | 6.625 | 3/15/2018 | 188,575 |
| 210,000 | Berry Plastics Holding Corporation | 8.875 | 9/15/2014 | 199,500 |
| 550,000 | Bombardier, Inc. ಠ| 6.750 | 5/1/2012 | 556,875 |
| 490,000 | Case New Holland, Inc. ± | 7.125 | 3/1/2014 | 488,775 |
| 150,000 | Crown Americas, Inc. | 7.625 | 11/15/2013 | 153,375 |
| 150,000 | Crown Americas, Inc. | 7.750 | 11/15/2015 | 154,500 |
| 520,000 | Da-Lite Screen Company, Inc. | 9.500 | 5/15/2011 | 517,400 |
| 105,000 | Invensys plc ≤ | 9.875 | 3/15/2011 | 110,900 |
| 850,000 | L-3 Communications Corporation | 5.875 | 1/15/2015 | 820,250 |
| 600,000 | L-3 Communications Corporation, Convertible ‡ | 3.000 | 8/1/2035 | 725,250 |
| 190,000 | Mueller Water Products, Inc. | 7.375 | 6/1/2017 | 169,812 |
| 100,000 | Owens-Brockway Glass Container, Inc. | 8.250 | 5/15/2013 | 103,750 |
| 320,000 | Owens-Illinois, Inc. * | 7.500 | 5/15/2010 | 324,000 |
|
| The accompanying Notes to Financial Statements are an integral part of this schedule. |
|
| 17 |
| | | | |
| Diversified Income Plus Fund | | | |
| Schedule of Investments as of December 31, 2007 | | | |
| |
| Principal | | Interest | Maturity | |
| Amount | Long-Term Fixed Income (53.3%) | Rate | Date | Value |
|
| |
| Capital Goods — continued | | | |
| $260,000 | Plastipak Holdings, Inc. ≤ | 8.500% | 12/15/2015 | $260,000 |
| 180,000 | Rental Services Corporation * | 9.500 | 12/1/2014 | 161,100 |
| 150,000 | TransDigm, Inc. | 7.750 | 7/15/2014 | 152,250 |
| 350,000 | United Rentals North America, Inc. | 7.000 | 2/15/2014 | 293,125 |
|
|
| | Total Capital Goods | | | 6,072,437 |
|
|
| |
| Collateralized Mortgage Obligations (2.5%) | | | |
| 2,672,956 | Deutsche Alt-A Securities, Inc. † | 5.633 | 1/25/2008 | 2,552,020 |
| 2,276,559 | Washington Mutual Alternative Loan Trust † | 5.538 | 1/25/2008 | 2,150,992 |
|
|
| | Total Collateralized Mortgage Obligations | | 4,703,012 |
|
|
| |
| Commercial Mortgage-Backed Securities (3.1%) | | | |
| 2,000,000 | Banc of America Large Loan Trust ±†≤ | 5.138 | 1/15/2008 | 1,932,918 |
| 2,000,000 | Commercial Mortgage Pass-Through Certificates †≤ | 5.208 | 1/15/2008 | 1,912,804 |
| 2,000,000 | Wachovia Bank Commercial Mortgage Trust †≤ | 5.148 | 1/15/2008 | 1,951,734 |
|
|
| | Total Commercial Mortgage-Backed Securities | 5,797,456 |
|
|
| |
| Communications Services (7.6%) | | | |
| 660,000 | American Tower Corporation ‡ | 7.125 | 10/15/2012 | 678,150 |
| 480,000 | American Tower Corporation ≤ | 7.000 | 10/15/2017 | 482,400 |
| 180,000 | Centennial Communications Corporation * | 8.125 | 2/1/2014 | 177,300 |
| 290,000 | Charter Communications Operating, LLC ≤ | 8.000 | 4/30/2012 | 279,850 |
| 240,000 | Citizens Communications Company | 9.250 | 5/15/2011 | 259,800 |
| 570,000 | Citizens Communications Company ± | 6.250 | 1/15/2013 | 552,188 |
| 550,000 | CSC Holdings, Inc. | 7.625 | 4/1/2011 | 548,625 |
| 99,000 | Dex Media West, LLC/Dex Media West Finance Company | 9.875 | 8/15/2013 | 102,960 |
| 550,000 | DIRECTV Holdings, LLC | 6.375 | 6/15/2015 | 528,000 |
| 1,140,000 | Echostar DBS Corporation ± | 6.625 | 10/1/2014 | 1,134,300 |
| 700,000 | Idearc, Inc. | 8.000 | 11/15/2016 | 642,250 |
| 90,000 | Intelsat Bermuda, Ltd. | 9.250 | 6/15/2016 | 90,450 |
| 570,000 | Intelsat Intermediate, Inc. > | Zero Coupon | 2/1/2010 | 465,975 |
| 200,000 | Intelsat Subsidiary Holding Company, Ltd. | 8.625 | 1/15/2015 | 201,000 |
| 570,000 | Interpublic Group of Companies, Inc. | 6.250 | 11/15/2014 | 484,500 |
| 120,000 | Lamar Media Corporation | 6.625 | 8/15/2015 | 116,700 |
| 570,000 | Level 3 Financing, Inc. | 9.250 | 11/1/2014 | 515,850 |
| 570,000 | Liberty Media Corporation * | 5.700 | 5/15/2013 | 528,055 |
| 140,000 | Morris Publishing Group, LLC | 7.000 | 8/1/2013 | 101,675 |
| 300,000 | News America, Inc. ≤ | 6.650 | 11/15/2037 | 309,443 |
| 380,000 | NTL Cable plc | 9.125 | 8/15/2016 | 376,200 |
| 320,000 | Quebecor Media, Inc. ≤ | 7.750 | 3/15/2016 | 307,200 |
| 280,000 | Qwest Communications International, Inc. | 7.250 | 2/15/2011 | 280,000 |
| 90,000 | Qwest Communications International, Inc. | 7.500 | 2/15/2014 | 89,775 |
| 640,000 | Qwest Corporation | 7.875 | 9/1/2011 | 665,600 |
| 280,000 | R.H. Donnelley Corporation * | 6.875 | 1/15/2013 | 250,600 |
| 420,000 | R.H. Donnelley Corporation | 6.875 | 1/15/2013 | 375,900 |
| 160,000 | R.H. Donnelley Corporation | 8.875 | 1/15/2016 | 149,600 |
| 600,000 | Rogers Cable, Inc. | 6.750 | 3/15/2015 | 631,139 |
| 775,000 | Rogers Wireless Communications, Inc. | 7.500 | 3/15/2015 | 847,528 |
| 120,000 | Rural Cellular Corporation | 9.875 | 2/1/2010 | 124,500 |
| 300,000 | Time Warner Cable, Inc. | 5.850 | 5/1/2017 | 300,740 |
|
| The accompanying Notes to Financial Statements are an integral part of this schedule. |
|
| 18 |
| | | | |
| Diversified Income Plus Fund | | | |
| Schedule of Investments as of December 31, 2007 | | | |
| |
| Principal | | Interest | Maturity | |
| Amount | Long-Term Fixed Income (53.3%) | Rate | Date | Value |
|
| |
| Communications Services — continued | | | |
| $280,000 | Time Warner Telecom Holdings, Inc. | 9.250% | 2/15/2014 | $286,300 |
| 200,000 | Valor Telecommunications Enterprises, LLC | 7.750 | 2/15/2015 | 211,162 |
| 580,000 | Videotron Ltee | 6.875 | 1/15/2014 | 567,675 |
| 350,000 | Windstream Corporation | 8.625 | 8/1/2016 | 367,500 |
| 170,000 | Windstream Corporation | 7.000 | 3/15/2019 | 161,925 |
|
|
| | Total Communications Services | | 14,192,815 |
|
|
| |
| Consumer Cyclical (6.1%) | | | |
| 270,000 | American Casino & Entertainment Properties, LLC ± | 7.850 | 2/1/2012 | 278,302 |
| 350,000 | Beazer Homes USA, Inc. * | 8.625 | 5/15/2011 | 269,500 |
| 490,000 | Buhrmann U.S., Inc. | 7.875 | 3/1/2015 | 461,825 |
| 250,000 | Circus & Eldorado Joint Venture/ | | | |
| | Silver Legacy Capital Corporation | 10.125 | 3/1/2012 | 258,125 |
| 570,000 | Corrections Corporation of America | 6.250 | 3/15/2013 | 561,450 |
| 139,000 | Dollarama Group, LP †≤ | 10.599 | 6/16/2008 | 139,000 |
| 260,000 | Dollarama Group, LP | 8.875 | 8/15/2012 | 265,200 |
| 230,000 | Ford Motor Credit Company † | 9.693 | 1/15/2008 | 226,176 |
| 80,000 | Ford Motor Credit Company | 9.750 | 9/15/2010 | 76,336 |
| 170,000 | Ford Motor Credit Company | 7.000 | 10/1/2013 | 142,016 |
| 120,000 | Ford Motor Credit Company | 8.000 | 12/15/2016 | 101,929 |
| 310,000 | Gaylord Entertainment Company | 6.750 | 11/15/2014 | 292,175 |
| 570,000 | General Motors Corporation * | 7.200 | 1/15/2011 | 524,400 |
| 260,000 | Hanesbrands, Inc. *† | 8.204 | 6/16/2008 | 257,400 |
| 240,000 | Harrah’s Operating Company, Inc. | 5.625 | 6/1/2015 | 175,200 |
| 570,000 | Host Marriott, LP | 6.375 | 3/15/2015 | 555,750 |
| 250,000 | K. Hovnanian Enterprises, Inc. | 7.500 | 5/15/2016 | 175,000 |
| 570,000 | Lear Corporation | 8.500 | 12/1/2013 | 530,100 |
| 250,000 | Majestic Star Casino, LLC | 9.500 | 10/15/2010 | 236,250 |
| 390,000 | MGM MIRAGE | 5.875 | 2/27/2014 | 356,850 |
| 570,000 | MGM MIRAGE * | 7.625 | 1/15/2017 | 562,875 |
| 290,000 | Pokagon Gaming Authority ≤ | 10.375 | 6/15/2014 | 311,750 |
| 570,000 | Rite Aid Corporation | 7.500 | 3/1/2017 | 502,312 |
| 850,000 | Royal Caribbean Cruises, Ltd. * | 7.250 | 6/15/2016 | 835,579 |
| 305,000 | Seminole Hard Rock Entertainment †≤ | 7.491 | 3/15/2008 | 291,275 |
| 170,000 | Service Corporation International | 6.750 | 4/1/2015 | 167,875 |
| 440,000 | Station Casinos, Inc. | 6.875 | 3/1/2016 | 321,200 |
| 280,000 | Tenneco, Inc. ≤ | 8.125 | 11/15/2015 | 277,200 |
| 120,000 | TRW Automotive, Inc. *≤ | 7.000 | 3/15/2014 | 110,400 |
| 360,000 | Tunica Biloxi Gaming Authority ≤ | 9.000 | 11/15/2015 | 368,100 |
| 300,000 | Turning Stone Resort Casino Enterprise ≤ | 9.125 | 12/15/2010 | 303,000 |
| 180,000 | Turning Stone Resort Casino Enterprise ≤ | 9.125 | 9/15/2014 | 183,600 |
| 242,000 | Universal City Florida Holding Company I/II † | 9.661 | 2/1/2008 | 242,000 |
| 210,000 | Warnaco, Inc. | 8.875 | 6/15/2013 | 213,675 |
| 323,000 | WMG Holdings Corporation > | Zero Coupon | 12/15/2009 | 206,720 |
| 570,000 | Wynn Las Vegas, LLC ≤ | 6.625 | 12/1/2014 | 560,025 |
|
|
| | Total Consumer Cyclical | | 11,340,570 |
|
|
|
| The accompanying Notes to Financial Statements are an integral part of this schedule. |
|
| 19 |
| | | | |
| Diversified Income Plus Fund | | | |
| Schedule of Investments as of December 31, 2007 | | | |
| |
| Principal | | Interest | Maturity | |
| Amount | Long-Term Fixed Income (53.3%) | Rate | Date | Value |
|
| |
| Consumer Non-Cyclical (4.4%) | | | |
| $600,000 | Archer-Daniels-Midland Company, Convertible ಠ| 0.875% | 2/15/2014 | $723,750 |
| 910,000 | Boston Scientific Corporation ‡ | 5.450 | 6/15/2014 | 837,200 |
| 480,000 | Community Health Systems, Inc. | 8.875 | 7/15/2015 | 489,000 |
| 680,000 | Constellation Brands, Inc. ± | 7.250 | 9/1/2016 | 637,500 |
| 300,000 | Coventry Health Care, Inc. | 5.950 | 3/15/2017 | 294,153 |
| 570,000 | Delhaize Group, Inc. | 6.500 | 6/15/2017 | 583,125 |
| 300,000 | Fisher Scientific International, Inc., Convertible | 3.250 | 3/1/2024 | 469,125 |
| 285,000 | Genzyme Corporation, Convertible | 1.250 | 12/1/2023 | 328,462 |
| 660,000 | HCA, Inc. | 9.250 | 11/15/2016 | 693,000 |
| 250,000 | Jarden Corporation | 7.500 | 5/1/2017 | 215,000 |
| 230,000 | Michael Foods, Inc. | 8.000 | 11/15/2013 | 227,700 |
| 600,000 | Smithfield Foods, Inc. | 8.000 | 10/15/2009 | 606,000 |
| 450,000 | Stater Brothers Holdings, Inc. | 8.125 | 6/15/2012 | 444,375 |
| 740,000 | SUPERVALU, Inc. | 7.500 | 11/15/2014 | 758,500 |
| 315,000 | Teva Pharmaceutical Finance Company, Convertible | 1.750 | 2/1/2026 | 349,650 |
| 600,000 | Ventas Realty, LP/Ventas Capital Corporation | 6.500 | 6/1/2016 | 588,000 |
|
|
| | Total Consumer Non-Cyclical | | 8,244,540 |
|
|
| |
| Energy (3.1%) | | | |
| 220,000 | CHC Helicopter Corporation | 7.375 | 5/1/2014 | 207,900 |
| 680,000 | Chesapeake Energy Corporation ± | 6.375 | 6/15/2015 | 657,900 |
| 200,000 | Chesapeake Energy Corporation | 6.250 | 1/15/2018 | 192,000 |
| 600,000 | Chesapeake Energy Corporation, Convertible | 2.750 | 11/15/2035 | 702,000 |
| 280,000 | Connacher Oil and Gas, Ltd. ≤ | 10.250 | 12/15/2015 | 279,650 |
| 220,000 | Denbury Resources, Inc. | 7.500 | 12/15/2015 | 222,200 |
| 270,000 | Forest Oil Corporation *≤ | 7.250 | 6/15/2019 | 271,350 |
| 170,000 | Hornbeck Offshore Services, Inc. | 6.125 | 12/1/2014 | 161,500 |
| 400,000 | Newfield Exploration Company | 6.625 | 4/15/2016 | 392,000 |
| 650,000 | Ocean Rig Norway AS ≤ | 8.375 | 7/1/2013 | 690,625 |
| 260,000 | OPTI Canada, Inc. ≤ | 8.250 | 12/15/2014 | 257,400 |
| 270,000 | PetroHawk Energy Corporation | 9.125 | 7/15/2013 | 284,175 |
| 390,000 | Petroplus Finance, Ltd. ≤ | 7.000 | 5/1/2017 | 356,850 |
| 280,000 | Plains Exploration & Production Company | 7.750 | 6/15/2015 | 280,000 |
| 560,000 | Tesoro Corporation | 6.500 | 6/1/2017 | 554,400 |
| 210,000 | Western Oil Sands, Inc. | 8.375 | 5/1/2012 | 234,214 |
|
|
| | Total Energy | | | 5,744,164 |
|
|
| |
| Financials (5.6%) | | | |
| 600,000 | American International Group, Inc. ‡ | 6.250 | 3/15/2037 | 536,651 |
| 300,000 | AXA SA ಠ| 6.463 | 12/14/2018 | 270,142 |
| 300,000 | BBVA Bancomer SA ಠ| 6.008 | 5/17/2022 | 288,841 |
| 290,000 | Capital One Capital III ‡ | 7.686 | 8/15/2036 | 235,817 |
| 290,000 | Capital One Capital IV ‡ | 6.745 | 2/17/2037 | 215,652 |
| 600,000 | Countrywide Financial Corporation, Convertible ±†≤ | 1.743 | 1/15/2008 | 467,880 |
| 570,000 | Deluxe Corporation | 5.125 | 10/1/2014 | 483,075 |
| 400,000 | FTI Consulting, Inc. | 7.625 | 6/15/2013 | 410,000 |
| 870,000 | General Motors Acceptance Corporation, LLC | 6.875 | 9/15/2011 | 744,280 |
| 280,000 | Goldman Sachs Group, Inc., Convertible | 1.000 | 3/7/2012 | 310,649 |
| 560,000 | J.P. Morgan Chase Capital XX | 6.550 | 9/29/2036 | 505,280 |
| 600,000 | Lehman Brothers Holdings, Inc. | 7.000 | 9/27/2027 | 608,972 |
|
| The accompanying Notes to Financial Statements are an integral part of this schedule. |
|
| 20 |
| | | | |
| Diversified Income Plus Fund | | | |
| Schedule of Investments as of December 31, 2007 | | | |
| |
| Principal | | Interest | Maturity | |
| Amount | Long-Term Fixed Income (53.3%) | Rate | Date | Value |
|
| |
| Financials (5.6%) | | | |
| $470,000 | Leucadia National Corporation | 7.125% | 3/15/2017 | $434,750 |
| 870,000 | Lincoln National Corporation | 7.000 | 5/17/2016 | 873,500 |
| 300,000 | Mitsubishi UFG Capital Finance, Ltd. | 6.346 | 7/25/2016 | 284,140 |
| 290,000 | ProLogis Trust | 5.625 | 11/15/2016 | 268,928 |
| 580,000 | Rabobank Capital Funding Trust ≤ | 5.254 | 10/21/2016 | 519,117 |
| 600,000 | Residential Capital Corporation | 8.000 | 4/17/2013 | 369,000 |
| 580,000 | Royal Bank of Scotland Group plc ≤ | 6.990 | 10/5/2017 | 578,255 |
| 580,000 | Student Loan Marketing Corporation | 4.500 | 7/26/2010 | 531,975 |
| 580,000 | Swiss RE Capital I, LP ≤ | 6.854 | 5/25/2016 | 569,898 |
| 580,000 | Wachovia Capital Trust III | 5.800 | 3/15/2011 | 518,259 |
| 905,000 | Washington Mutual Preferred Funding ≤ | 6.665 | 12/15/2016 | 533,950 |
|
|
| | Total Financials | | | 10,559,011 |
|
|
| |
| Mortgage-Backed Securities (0.5%) | | | |
| 1,000,000 | Federal National Mortgage Association | | | |
| | Conventional 30-Yr. Pass Through § | 6.500 | 1/1/2038 | 1,027,812 |
|
|
| | Total Mortgage-Backed Securities | | 1,027,812 |
|
|
| |
| Technology (1.6%) | | | |
| 36,000 | Avago Technologies Finance Pte † | 10.624 | 3/3/2008 | 36,495 |
| 180,000 | Avago Technologies Finance Pte | 10.125 | 12/1/2013 | 188,325 |
| 570,000 | First Data Corporation ≤ | 9.875 | 9/24/2015 | 530,100 |
| 570,000 | Flextronics International, Ltd. | 6.250 | 11/15/2014 | 542,925 |
| 110,000 | NXP BV/NXP Funding, LLC † | 7.993 | 1/15/2008 | 101,200 |
| 190,000 | NXP BV/NXP Funding, LLC * | 9.500 | 10/15/2015 | 174,088 |
| 570,000 | Sanmina-SCI Corporation * | 6.750 | 3/1/2013 | 495,900 |
| 490,000 | Seagate Technology HDD Holdings | 6.800 | 10/1/2016 | 477,750 |
| 570,000 | Sungard Data Systems, Inc. | 4.875 | 1/15/2014 | 500,175 |
|
|
| | Total Technology | | | 3,046,958 |
|
|
| |
| Transportation (1.0%) | | | |
| 288,021 | Continental Airlines, Inc. | 7.875 | 7/2/2018 | 274,340 |
| 600,000 | Continental Airlines, Inc. ± | 6.903 | 4/19/2022 | 540,000 |
| 180,000 | Delta Air Lines, Inc. | 7.920 | 11/18/2010 | 175,500 |
| 80,000 | Hertz Corporation | 8.875 | 1/1/2014 | 81,100 |
| 140,000 | Hertz Corporation | 10.500 | 1/1/2016 | 144,900 |
| 210,000 | Kansas City Southern de Mexico SA de CV | 7.625 | 12/1/2013 | 207,112 |
| 502,523 | Piper Jaffray Equipment Trust Securities ≤ | 6.750 | 4/1/2011 | 482,422 |
|
|
| | Total Transportation | | | 1,905,374 |
|
|
| |
| U.S. Government (1.8%) | | | |
| 3,269,662 | U.S. Treasury Notes, TIPS * | 2.000 | 7/15/2014 | 3,378,225 |
|
|
| | Total U.S. Government | | | 3,378,225 |
|
|
|
| The accompanying Notes to Financial Statements are an integral part of this schedule. |
|
| 21 |
| | | | |
| Diversified Income Plus Fund | | | |
| Schedule of Investments as of December 31, 2007 | | | |
| |
| Principal | | Interest | Maturity | |
| Amount | Long-Term Fixed Income (53.3%) | Rate | Date | Value |
|
| |
| Utilities (6.0%) | | | |
| $105,000 | AES Corporation * | 8.875% | 2/15/2011 | $109,462 |
| 399,000 | AES Corporation ಠ| 8.750 | 5/15/2013 | 416,456 |
| 570,000 | AES Corporation ಠ| 7.750 | 10/15/2015 | 578,550 |
| 480,000 | CMS Energy Corporation, Convertible ‡ | 2.875 | 12/1/2024 | 642,000 |
| 490,000 | Colorado Interstate Gas Company | 6.800 | 11/15/2015 | 510,071 |
| 100,000 | Consumers Energy Company | 6.300 | 2/1/2012 | 100,889 |
| 290,000 | Copano Energy, LLC | 8.125 | 3/1/2016 | 292,175 |
| 150,000 | Dynegy Holdings, Inc. | 6.875 | 4/1/2011 | 144,750 |
| 130,000 | Dynegy Holdings, Inc. | 7.500 | 6/1/2015 | 121,550 |
| 170,000 | Dynegy Holdings, Inc. | 8.375 | 5/1/2016 | 166,175 |
| 50,000 | Dynegy Holdings, Inc. | 7.750 | 6/1/2019 | 46,125 |
| 170,000 | Edison Mission Energy | 7.500 | 6/15/2013 | 174,250 |
| 180,000 | Edison Mission Energy | 7.750 | 6/15/2016 | 185,400 |
| 270,000 | Edison Mission Energy | 7.000 | 5/15/2017 | 265,275 |
| 270,000 | Edison Mission Energy | 7.200 | 5/15/2019 | 265,275 |
| 320,000 | El Paso Corporation ± | 6.875 | 6/15/2014 | 322,312 |
| 320,000 | El Paso Corporation ± | 7.000 | 6/15/2017 | 320,332 |
| 880,000 | Enterprise Products Operating, LP | 8.375 | 8/1/2016 | 900,980 |
| 240,000 | Illinois Power Company ≤ | 6.125 | 11/15/2017 | 242,472 |
| 570,000 | Intergen NV ≤ | 9.000 | 6/30/2017 | 599,925 |
| 570,000 | Kinder Morgan Finance Company ulc | 5.700 | 1/5/2016 | 515,965 |
| 100,000 | Mirant North America, LLC | 7.375 | 12/31/2013 | 100,250 |
| 755,000 | NRG Energy, Inc. * | 7.375 | 2/1/2016 | 736,125 |
| 170,000 | Pacific Energy Partners, LP/Pacific Energy | | | |
| | Finance Corporation | 7.125 | 6/15/2014 | 176,908 |
| 200,000 | Pacific Energy Partners, LP/Pacific Energy | | | |
| | Finance Corporation | 6.250 | 9/15/2015 | 200,350 |
| 570,000 | Regency Energy Partners, LP | 8.375 | 12/15/2013 | 587,100 |
| 145,000 | Reliant Energy Resources Corporation | 6.750 | 12/15/2014 | 145,362 |
| 570,000 | Sabine Pass LNG, LP | 7.500 | 11/30/2016 | 544,350 |
| 500,000 | SemGroup, LP ≤ | 8.750 | 11/15/2015 | 475,000 |
| 570,000 | Sierra Pacific Power Company ≤ | 6.000 | 5/15/2016 | 565,010 |
| 110,000 | Southern Natural Gas Company | 7.350 | 2/15/2031 | 114,858 |
| 150,000 | Southern Star Central Corporation | 6.750 | 3/1/2016 | 143,625 |
| 270,000 | Williams Companies, Inc. | 8.125 | 3/15/2012 | 293,962 |
| 170,000 | Williams Partners, LP | 7.250 | 2/1/2017 | 175,100 |
|
|
| | Total Utilities | | | 11,178,389 |
|
|
| | Total Long-Term Fixed Income (cost $102,983,359) | 99,839,120 |
|
|
| |
| |
| | | Interest | Maturity | |
| Shares | Collateral Held for Securities Loaned (8.2%) | Rate (+) | Date | Value |
|
| 15,434,201 | Thrivent Financial Securities Lending Trust | 5.000% | N/A | $15,434,201 |
|
|
| | Total Collateral Held for Securities Loaned | | |
| | (cost $15,434,201) | | | 15,434,201 |
|
|
|
| The accompanying Notes to Financial Statements are an integral part of this schedule. |
|
| 22 |
| | | | |
| Diversified Income Plus Fund | | | |
| Schedule of Investments as of December 31, 2007 | | | |
| |
| Shares or | | | | |
| Principal | | Interest | Maturity | |
| Amount | Short-Term Investments (3.8%) | Rate (+) | Date | Value |
|
| $1,015,000 | Federal Home Loan Mortgage Corporation | 3.150% | 1/2/2008 | $1,014,911 |
| 650,000 | Federal National Mortgage Association ‡ | 4.030 | 5/16/2008 | 640,055 |
| 5,391,261 | Thrivent Money Market Fund | 4.940 | N/A | 5,391,261 |
|
|
| | Total Short-Term Investments (cost $7,046,340) | 7,046,227 |
|
|
| | Total Investments (cost $212,443,276) 108.8% | | $203,706,348 |
|
|
| | Other Assets and Liabilities, Net (8.8%) | | (16,413,195) |
|
|
| | Total Net Assets 100.0% | | | $187,293,153 |
|
|
| | | | | |
| | | | | |
| | Number of | | Notional | | |
| | Contracts | Expiration | Principal | | Unrealized |
| Futures | Long/(Short) | Date | Amount | Value | Gain/(Loss) |
|
| 5-Yr. U.S. Treasury Bond Futures | 42 | March 2008 | $4,591,253 | $4,631,813 | $40,560 |
| 10-Yr. U.S. Treasury Bond Futures | (10) | March 2008 | (1,126,807) | (1,133,906) | (7,099) |
| S&P 500 Mini-Futures | 19 | March 2008 | 1,403,600 | 1,403,340 | (260) |
| Total Futures | | | | | $33,201 |
|
| The accompanying Notes to Financial Statements are an integral part of this schedule. |
|
| 23 |
| | | | | |
| Diversified Income Plus Fund | | | | | |
| Schedule of Investments as of December 31, 2007 | | | | |
| |
| | | | Notional | | |
| | Buy/Sell | Termination | Principal | | Unrealized |
| Swaps and Counterparty | Protection | Date | Amount | Value | Gain/(Loss) |
|
| Credit Default Swaps | | | | | |
| LCDX, N.A. Index Series 9, | Sell | December 2012 | $3,000,000 | ($94,294) | ($53,682) |
| 5 Year, at 2.25%; | | | | | |
| J.P. Morgan Chase and Co. | | | | | |
| Ford Motor Company, 5 Year, at 6.90% | Sell | September 2012 | 480,000 | (12,577) | (12,577) |
| Banc of America | | | | | |
| Total Swaps | | | | ($106,871) | ($66,259) |
# Non-income producing security.
* All or a portion of the security is on loan as discussed in item 2(M) of the Notes to Financial Statements.
+ The interest rate shown reflects the yield, coupon rate or, for securities purchased at a discount, the discount rate at the date of purchase.
> Denotes step coupon bonds for which the current interest rate and next scheduled reset date are shown.
† Denotes variable rate obligations for which the current yield and next scheduled reset date are shown.
§ Denotes investments purchased on a when-issued or delayed delivery basis.
± Designated as cover for long settling trades as discussed in the Notes to Financial Statements.
‡ At December 31, 2007, $640,055 of investments were held on deposit with the counterparty and pledged as the initial margin deposit for open financial futures contracts. In addition, $9,677,446 and $3,840,463 of investments were earmarked as collateral to cover open financial futures contracts and swap contracts, respectively.
≤ Denotes securities sold under Rule 144A of the Securities Act of 1933, which exempts them from registration. These securities have been determined to be liquid under the guidelines established by the Fund’s Board of Trustees and may be resold to other dealers in the program or to other qualified institutional buyers. As of December 31, 2007, the value of these investments was $25,387,138 or 13.6% of total net assets.
≠ All or a portion of the loan is unfunded as discussed in item 2(T) of the Notes to Financial Statements.
!! The stated interest rate represents the weighted average of all contracts within the bank loan facility. Bank loans generally have rates of interest which are reset either daily, monthly, quarterly or semi-annually by reference to a base lending rate, plus a premium. These base lending rates are primarily the London-Interbank Offered Rate (“LIBOR”), and secondarily the prime rate offered by one or more major United States banks (the “Prime Rate”) and the certificate of deposit (“CD”) rate or other base lending rates used by commercial lenders. Bank loans often require prepayments from excess cash flows or allow the borrower to repay at its election. The rate at which the borrower repays cannot be predicted with accuracy. Therefore, the remaining maturity may be considerably less than the stated maturities shown.
Definitions:
ADR — American Depository Receipts, which are certificates for shares of an underlying foreign security’s shares held by an issuing U.S. depository bank.
REIT — Real Estate Investment Trust, is a company that buys, develops, manages and/or sells real estate assets.
TIPS — Treasury Inflation Protected Security.
Gross unrealized appreciation and depreciation of investments, based on cost for federal income tax purposes, were as follows:
| | |
| Gross unrealized appreciation | $1,700,877 | |
| Gross unrealized depreciation | (11,038,505) | |
|
| |
| Net unrealized appreciation (depreciation) | ($9,337,628) | |
| Cost for federal income tax purposes | $213,043,976 | |
|
| The accompanying Notes to Financial Statements are an integral part of this schedule. |
|
| 24 |
| | |
| Thrivent Mutual Funds |
| Statement of Assets and Liabilities |
| |
| |
| | | Diversified |
| | Real Estate | Income |
| As of December 31, 2007 | Securities Fund | Plus Fund |
|
| Assets | | |
| Investments at cost | $132,177,884 | $212,443,276 |
| Investments in securities at market value | 89,430,082 | 182,880,886 |
| Investments in affiliates at market value | 37,685,177 | 20,825,462 |
| |
| Investments at Market Value | 127,115,259 | 203,706,348 |
|
| Cash | 1,020 | — |
| Dividends and interest receivable | 789,515 | 1,811,135 |
| Prepaid expenses | 1,042 | 1,202 |
| Receivable for investments sold | 421,433 | 7,803,576 |
| Receivable for fund shares sold | 111,023 | 137,127 |
| Receivable for forward contracts | 79,050 | — |
| Receivable for variation margin | — | 8,937 |
| |
| Total Assets | 128,518,342 | 213,468,325 |
|
| Liabilities | | |
| Accrued expenses | 20,465 | 59,700 |
| Notes payable and other debt | — | 25,388 |
| Payable for investments purchased | 834,213 | 10,297,586 |
| Payable upon return of collateral for securities loaned | 37,685,177 | 15,434,201 |
| Payable for fund shares redeemed | 58,063 | 118,855 |
| Payable for variation margin | — | 8,113 |
| Payable for forward contracts | 79,533 | — |
| Swap agreements, at value | — | 106,871 |
| Payable to affiliate | 65,171 | 123,115 |
| Mortgage dollar roll deferred revenue | — | 1,343 |
| |
| Total Liabilities | 38,742,622 | 26,175,172 |
|
| Net Assets | | |
| Capital stock (beneficial interest) | 96,824,236 | 223,401,078 |
| Accumulated undistributed net investment income/(loss) | (12,199) | 234,705 |
| Accumulated undistributed net realized gain/(loss) | (1,973,538) | (27,572,644) |
| Net unrealized appreciation/(depreciation) on: | | |
| Investments | (5,062,625) | (8,736,928) |
| Futures contracts | — | 33,201 |
| Swap agreements | — | (66,259) |
| Foreign currency forward contracts | (484) | — |
| Foreign currency transactions | 330 | — |
| |
| Total Net Assets | $89,775,720 | $187,293,153 |
|
| Class A Share Capital | $14,597,344 | $175,421,407 |
| Shares of beneficial interest outstanding (Class A) | 1,382,878 | 27,090,409 |
| Net asset value per share | $10.56 | $6.48 |
| Maximum public offering price | $11.17 | $6.79 |
| |
| Class B Share Capital | $— | $2,274,952 |
| Shares of beneficial interest outstanding (Class B) | — | 351,573 |
| Net asset value per share | $— | $6.47 |
| |
| Institutional Class Share Capital | $75,178,376 | $9,596,794 |
| Shares of beneficial interest outstanding (Institutional Class Shares) | 7,120,415 | 1,484,311 |
| Net asset value per share | $10.56 | $6.47 |
|
| The accompanying Notes to Financial Statements are an integral part of this schedule. |
|
| 25 |
| | |
| Thrivent Mutual Funds |
| Statement of Operations |
| |
| |
| | | Diversified |
| | Real Estate | Income |
| For the year ended December 31, 2007 | Securities Fund | Plus Fund |
|
| Investment Income | | |
| Dividends | $1,973,060 | $2,765,135 |
| Taxable interest | 68,292 | 7,201,935 |
| Income from mortgage dollar rolls | — | 25,493 |
| Income from securities loaned | 51,655 | 120,198 |
| Income from affiliated investments | 71,784 | 523,341 |
| Foreign dividend tax withholding | (10,658) | (437) |
| |
| Total Investment Income | 2,154,133 | 10,635,665 |
|
| Expenses | | |
| Adviser fees | 659,948 | 1,022,485 |
| Accounting and pricing fees | 21,798 | 42,689 |
| Administrative service fees | 16,499 | 37,181 |
| Audit and legal fees | 16,497 | 18,802 |
| Custody fees | 24,089 | 27,834 |
| Distribution expenses Class A | 64,117 | 430,027 |
| Distribution expenses Class B | — | 27,723 |
| Insurance expenses | 4,208 | 4,832 |
| Printing and postage expenses Class A | 20,732 | 74,797 |
| Printing and postage expenses Class B | — | 4,493 |
| Printing and postage expenses Institutional Class Shares | 1,153 | 1,195 |
| SEC and state registration expenses | 27,574 | 55,747 |
| Transfer agent fees Class A | 63,086 | 224,922 |
| Transfer agent fees Class B | — | 11,318 |
| Transfer agent fees Institutional Class Shares | 249 | 2,142 |
| Trustees’ fees | 3,777 | 9,055 |
| Other expenses | 10,879 | 9,139 |
| |
| Total Expenses Before Reimbursement | 934,606 | 2,004,381 |
|
| Less: | | |
| Reimbursement from adviser | (187,836) | (337,904) |
| Custody earnings credit | (789) | (4,681) |
| |
| Total Net Expenses | 745,981 | 1,661,796 |
|
| |
| Net Investment Income/(Loss) | 1,408,152 | 8,973,869 |
|
| Realized and Unrealized Gains/(Losses) | | |
| Net realized gains/(losses) on: | | |
| Investments | 1,241,297 | 1,744,098 |
| Written option contracts | — | 12,188 |
| Futures contracts | — | 241,288 |
| Foreign currency transactions | (14,431) | — |
| Swap agreements | — | (346,030) |
| Change in net unrealized appreciation/(depreciation) on: | | |
| Investments | (16,989,308) | (13,867,703) |
| Futures contracts | — | (2,670) |
| Foreign currency forward contracts | (484) | — |
| Foreign currency transactions | 330 | — |
| Swap agreements | — | (66,259) |
|
| |
| Net Realized and Unrealized Gains/(Losses) | (15,762,596) | (12,285,088) |
|
| |
| Net Increase/(Decrease) in Net Assets Resulting | | |
| From Operations | $(14,354,444) | $(3,311,219) |
|
|
| The accompanying Notes to Financial Statements are an integral part of this schedule. |
|
| 26 |
| | | |
| Thrivent Mutual Funds |
| Statement of Changes in Net Assets |
| |
| |
| | Real Estate | |
| | Securities Fund | |
| |
| |
| For the periods ended | 12/31/2007 | 12/31/2006 | |
|
| Operations | | | |
| Net investment income/(loss) | $1,408,152 | $1,097,026 | |
| Net realized gains/(losses) on: | | | |
| Investments | 1,241,297 | 1,557,584 | |
| Foreign currency transactions | (14,431) | (6,328) | |
| Change in net unrealized appreciation/(depreciation) on: | | | |
| Investments | (16,989,308) | 11,225,103 | |
| Foreign currency forward contracts | (484) | — | |
| Foreign currency transactions | 330 | — | |
|
| |
| Net Change in Net Assets Resulting | | | |
| From Operations | (14,354,444) | 13,873,385 | |
|
| Distributions to Shareholders | | | |
| From net investment income | (1,566,394) | (1,178,158) | |
| From net realized gains | (2,841,093) | (1,630,889) | |
| From return of capital | (57,298) | (195,501) | |
| |
| Total Distributions to Shareholders | (4,464,785) | (3,004,548) | |
| |
| Capital Stock Transactions | 37,013,257 | 35,814,716 | |
|
| Net Increase/(Decrease) in Net Assets | 18,194,028 | 46,683,553 | |
| |
| Net Assets, Beginning of Period | 71,581,692 | 24,898,139 | |
| |
| Net Assets, End of Period | $89,775,720 | $71,581,692 | |
|
| | Diversified Income |
| | Plus Fund |
| |
|
| For the periods ended | 12/31/2007 | 12/31/2006(a) | 10/31/2006 |
|
| Operations | | | |
| Net investment income/(loss) | $8,973,869 | $1,126,327 | $8,231,672 |
| Net realized gains/(losses) on: | | | |
| Investments | 1,744,098 | 1,683,435 | 2,948,783 |
| Written option contracts | 12,188 | — | — |
| Futures contracts | 241,288 | 11,487 | 65,497 |
| Swap agreements | (346,030) | — | — |
| Change in net unrealized appreciation/(depreciation) on: | | | |
| Investments | (13,867,703) | 2,052,092 | 2,568,745 |
| Futures contracts | (2,670) | 51,632 | (15,761) |
| Swap agreements | (66,259) | — | — |
|
| |
| Net Change in Net Assets Resulting | | | |
| From Operations | (3,211,219) | 4,924,973 | 13,798,936 |
|
| Distributions to Shareholders | | | |
| From net investment income | (9,156,389) | (1,138,483) | (8,376,527) |
| |
| Total Distributions to Shareholders | (9,156,389) | (1,138,483) | (8,376,527) |
| |
| Capital Stock Transactions | 50,986,029 | 12,800,379 | (5,873,154) |
|
| Net Increase/(Decrease) in Net Assets | 38,518,421 | 16,586,869 | (450,745) |
| |
| Net Assets, Beginning of Period | 148,774,732 | 132,187,863 | 132,638,608 |
| |
| Net Assets, End of Period | $187,293,153 | $148,774,732 | $132,187,863 |
|
(a) For the period from November 1, 2006 through December 31, 2006.
|
| The accompanying Notes to Financial Statements are an integral part of this schedule. |
|
| 27 |
|
| NOTES TO FINANCIAL STATEMENTS |
| As of December 31, 2007 |
(1) ORGANIZATION
Thrivent Mutual Funds (the “Trust”) was organized as a Massachusetts Business Trust on March 10, 1987 and is registered as an open-end management investment company under the Investment Company Act of 1940. The Trust is divided into twenty-nine separate series (the “Fund(s)”), each with its own investment objective and policies. The Trust currently consists of four allocation funds, seventeen equity funds, two hybrid funds, five fixed-income funds, and one money market fund. The Trust commenced operations on July 16, 1987.
This annual report includes Thrivent Real Estate Securities Fund and Thrivent Diversified Income Plus Fund, two of the Trust’s twenty-nine Funds. The other Funds of the Trust are presented under a separate annual report.
The Trust consists of three classes of shares: Class A, Class B and Institutional Class. The three classes of shares differ principally in their respective distribution expenses and arrangements. Class A shares generally have a 0.25% annual 12b-1 fee and a maximum front-end sales load of 5.50% for equity funds and 4.50% for fixed-income funds. Class B shares were offered at net asset value and generally have a 1.00% annual 12b-1 fee. In addition, Class B shares have a maximum deferred sales charge of 5.00% . The deferred sales charge declines by 1.00% per year through the fifth year. Class B shares convert to Class A shares at the end of the fifth year. Institutional Class shares are offered at net asset value and have no annual 12b-1 fees. All three classes of shares have identical rights to earnings, assets and voting privileges, except for class specific expenses and exclusive rights to vote on matters affecting only individual classes. Effective October 16, 2004, the Trust no longer offers Class B shares for sale. Diversified Income Plus Fund has all three classes of shares. Real Estate Securities Fund offers Class A and Institutional Class shares.
Under the Trust’s organizational documents, its officers and trustees are indemnified against certain liabilities arising out of the performance of their duties to the Trust. In addition, in the normal course of business, the Trust enters into contracts with vendors and others that provide general damage clauses. The Trust’s maximum exposure under these contracts is unknown, as this would involve future claims that may be made against the Trust. However, based on experience, the Trust expects the risk of loss to be remote.
(2) SIGNIFICANT ACCOUNTING POLICIES
(A) Valuation of Investments — Securities traded on U.S. or foreign securities exchanges or included in a national market system are valued at the official closing price at the close of each business day unless otherwise stated below. Over-the-counter securities and listed securities for which no price is readily available are valued at the current bid price considered best to represent the value at that time. Security prices are based on quotes that are obtained from an independent pricing service approved by the Board of Trustees. The pricing service, in determining values of fixed-income securities, takes into consideration such factors as current quotations by broker/dealers, coupon, maturity, quality, type of issue, trading characteristics, and other yield and risk factors it deems relevant in determining valuations. Securities which cannot be valued by the approved pricing service are valued using valuations obtained from dealers that make markets in the securities. Exchange listed options and futures contracts are valued at the last quoted sales price. Short-term securities with maturities of 60 days or less are valued at amortized cost. Mutual Funds are valued at the net asset value at the close of each business day.
All securities for which market values are not readily available or deemed unreliable are appraised at fair value as determined in good faith under the direction of the Board of Trustees. As of December 31, 2007, there were no securities valued at fair value in either of the Real Estate or Diversified Income Plus Funds’ net assets.
Fair Valuation of International Securities — Because many foreign markets close before the U.S. markets, events may occur between the close of the foreign market and the close of the U.S. market that could have a material impact on the valuation of foreign securities. The Funds, under the supervision of the Board of Trustees, evaluates the impacts of these events and may adjust the valuation of foreign securities to reflect the fair value as of the close of the U.S. markets. The Board of Trustees has authorized the investment adviser to make fair valuation determinations pursuant to policies approved by the Board of Trustees.
(B) Foreign Currency Translation — The accounting records of each Fund are maintained in U.S. dollars. Securities and other assets and liabilities that are denominated in foreign currencies are translated into U.S. dollars at the daily closing rates of exchange.
|
| Notes to Financial Statements |
| December 31, 2007 |
Foreign currency amounts related to the purchase or sale of securities and income and expenses are translated at the exchange rate on the transaction date. Net realized and unrealized currency gains and losses are recorded from sales of foreign currency, exchange gains or losses between the trade date and settlement dates on securities transactions, and other translation gains or losses on dividends, interest income and foreign withholding taxes. The Funds do not separately report the effect of changes in foreign exchange rates from changes in market prices on securities held. Such changes are included in net realized and unrealized gain or loss from investments.
For federal income tax purposes, the Funds treat the effect of changes in foreign exchange rates arising from actual foreign currency transactions and the changes in foreign exchange rates between the trade date and settlement date as ordinary income.
(C) Foreign Currency Contracts — In connection with purchases and sales of securities denominated in foreign currencies, the Funds may enter into forward currency contracts. Additionally, the Funds may enter into such contracts to hedge certain other foreign currency denominated investments. These contracts are recorded at market value and the related realized and unrealized foreign exchange gains and losses are included in the Statement of Operations. In the event that counterparties fail to settle these forward contracts, the Funds could be exposed to foreign currency fluctuations. Foreign currency contracts are valued daily and unrealized appreciation or depreciation is recorded daily as the difference between the contract exchange rate and the closing forward rate applied to the face amount of the contract. A realized gain or loss is recorded at the time a forward contract is closed. During the year ended December 31, 2007, Real Estate Securities Fund engaged in this type of investment.
(D) Foreign Denominated Investments — Foreign denominated assets and currency contracts may involve more risks than domestic transactions including currency risk, political and economic risk, regulatory risk, and market risk. Certain Funds may also invest in securities of companies located in emerging markets. Future economic or political developments could adversely affect the liquidity or value, or both, of such securities.
(E) Federal Income Taxes — No provision has been made for federal income taxes because each Fund’s policy is to qualify as regulated investment companies under the Internal Revenue Code and distribute substantially all taxable income on a timely basis. It is also the intention of the Funds to distribute an amount sufficient to avoid imposition of any federal excise tax. The Funds, accordingly, anticipate paying no federal taxes and no federal tax provision was recorded. Each Fund is treated as a separate taxable entity for federal income tax purposes. Certain Funds may utilize earnings and profits distributed to shareholders on the redemption of shares as part of the dividend paid deduction.
(F) Income and Expenses — Estimated expenses are accrued daily. The Funds are charged for those expenses that are directly attributable to them. Expenses that are not directly attributable to a Fund are allocated among all appropriate Funds in proportion to their respective net assets, number of shareholder accounts or other reasonable basis. Net investment income, expenses which are not class-specific, and realized and unrealized gains and losses are allocated directly to each class based upon the relative net asset value of outstanding shares.
Interest income is accrued daily and is determined on the basis of interest or discount earned on all debt securities, including accretion of market discount and original issue discount and amortization of premium. Dividend income is recorded on the ex-dividend date. For preferred stock payment-in-kind securities, income is recorded on the ex-dividend date in the amount of the value received.
(G) Custody Earnings Credit — The Funds have a deposit arrangement with the custodian whereby interest earned on uninvested cash balances is used to pay a portion of custodian fees. This deposit arrangement is an alternative to overnight investments.
(H) Distributions to Shareholders — Net investment income is distributed to each shareholder as a dividend. Dividends from Real Estate Securities Fund are declared and paid quarterly. Dividends from Diversified Income Plus Fund are declared and paid monthly. Additionally, it is possible that such dividends may be reclassified as return of capital or capital gains after year end. Such determination cannot be made until tax information is received from the real estate investments of the Fund. Net realized gains from securities transactions, if any, are distributed at least annually.
|
| Notes to Financial Statements |
| December 31, 2007 |
(I) Options — The Funds may buy put and call options and write put and covered call options. The Funds intend to use such derivative instruments as hedges to facilitate buying or selling securities or to provide protection against adverse movements in security prices or interest rates. Option contracts are valued daily and unrealized appreciation or depreciation is recorded. The Funds will realize a gain or loss upon expiration or closing of the option transaction. When an option is exercised, the proceeds upon sale for a written call option or the cost of a security for purchased put and call options is adjusted by the amount of premium received or paid. The writer of an option bears the market risk of an unfavorable change in the price of the security underlying the written option. Risks of loss may exceed amounts recognized on the Statements of Assets and Liabilities. During the year ended December 31, 2007, Diversified Incom e Plus Fund engaged in this type of investment.
(J) Financial Futures Contracts — The Funds may use futures contracts to manage the exposure to interest rate and market fluctuations. Gains or losses on futures contracts can offset changes in the yield of securities. When a futures contract is opened, cash or other investments equal to the required “initial margin deposit” are held on deposit with and pledged to the broker. Additional securities held by the Funds may be earmarked as collateral for open futures contracts. The futures contract’s daily change in value (“variation margin”) is either paid to or received from the broker, and is recorded as an unrealized gain or loss. When the contract is closed, the realized gain or loss is recorded equal to the difference between the value of the contract when opened and the value of the contract when closed. Futures contracts involve, to varying degrees, risk of loss in excess of the variation margin discl osed in the Statement of Assets and Liabilities. During the year ended December 31, 2007, Diversified Income Plus Fund engaged in this type of investment.
(K) Swap Agreements — Certain Funds enter into swap transactions, which involve swapping one or more investment characteristics of a security or a basket of securities with another party. Such transactions include market risk, risk of default by the other party to the transaction, risk of imperfect correlation and manager risk and may involve commissions or other costs. Swaps generally do not involve delivery of securities, other underlying assets or principal. Accordingly, the risk of loss with respect to swaps is generally limited to the net amount of payments that the Fund is contractually obligated to make, or in the case of the counterparty defaulting, the net amount of payments that the Fund is contractually entitled to receive. Risks of loss may exceed amounts recognized on the Statement of Assets and Liabilities. If there is a default by the counterparty, the Fund may have contractual remed ies pursuant to the agreements related to the transaction. The contracts are valued daily and unrealized appreciation or depreciation is recorded. Periodic payments and receipts and payments received or made as a result of a credit event or termination of the contract are recognized as realized gains or losses on the Statement of Operations. Collateral, in the form of cash or securities, may be required to be held with the Trust’s custodian, or third party, in connection with these agreements.
Credit Default Swaps — A credit default swap is an agreement between two parties to exchange the credit risk of a particular issuer, basket of securities or reference entity. In a credit default swap transaction, a buyer pays periodic fees in return for payment by the seller which is contingent upon an adverse credit event occurring in the underlying issuer or reference entity. The seller collects periodic fees from the buyer and profits if the credit of the underlying issuer or reference entity remains stable or improves while the swap is outstanding, but the seller in a credit default swap contract would be required to pay the amount of credit loss, determined as specified in the agreement, to the buyer in the event of an adverse credit event in the reference entity. A buyer of a credit default swap is said to buy protection whereas a seller of a credit default swap is said to sell protection. The Funds may be either the prote ction seller or the protection buyer. During the year ended December 31, 2007, Diversified Income Plus Fund engaged in this type of investment.
Total Rate of Return Swaps — A total rate of return swap is an agreement in which one party makes payments based on a set rate, either fixed or variable, while the other party makes payments based on the return of an underlying asset plus any capital gains and losses over the payment period. The underlying asset is typically an index, loan or a basket of assets. Total rate of return swaps provide the Funds with the additional flexibility of gaining exposure to a market or securities index by using the most cost-effective vehicle available. During the year ended December 31, 2007, Diversified Income Plus Fund engaged in this type of investment.
Interest Rate Swaps — An interest rate swap is an agreement between two parties to exchange cash flows based on the difference between two interest rates. Typically, one party pays
|
| Notes to Financial Statements |
| December 31, 2007 |
(2) SIGNIFICANT ACCOUNTING
POLICIES — continued
a fixed-rate for a specific period while the other pays a variable-rate based on an underlying index for the same period. Interest rate swaps allow the Funds to manage exposure to interest rate fluctuations. During the year ended December 31, 2007, neither Fund engaged in this type of investment.
(L) Mortgage Dollar Roll Transactions — Certain Funds enter into dollar roll transactions on securities issued or to be issued by the Government National Mortgage Association, Federal National Mortgage Association and Federal Home Loan Mortgage Corporation, in which the Funds sell mortgage securities and simultaneously agree to repurchase similar (same type, coupon, and maturity) securities at a later date at an agreed upon price. During the period between the sale and repurchase, the Funds forgo principal and interest paid on the mortgage securities sold. The Funds are compensated from negotiated fees paid by brokers offered as an inducement to the Funds to “roll over” their purchase commitments. These fees are recognized over the roll period and are included in Income from mortgage dollar rolls in the Statement of Operations. During the year ended December 31, 2007, Diversified Income Plus Fund engaged in this type o f transaction.
(M) Securities Lending — The Trust had previously entered into a Securities Lending Agreement with State Street Bank and Trust Company (“State Street Bank”) and, as of April 27, 2007, entered into a similar agreement with Dresdner Bank AG (each, an “Agreement”). Each Agreement authorizes the applicable lender to lend securities to authorized borrowers on behalf of the Funds. Pursuant to each Agreement, all loaned securities are collateralized by cash equal to at least 102% of the value of the loaned securities. All cash collateral received is invested in Thrivent Financial Securities Lending Trust. Amounts earned on investments in Thrivent Financial Securities Lending Trust, net of rebates and other securities lending expenses, are included in Income from securities loaned on the Statement of Operations. As payment for its services, each lender receives a portion of the fee income and earnings on the collater al. By investing any cash collateral it receives in these transactions, a Fund could realize additional gains or losses. If the borrower fails to return the securities and the invested collateral has declined in value, the Fund could lose money. The Agreement with State Street Bank granted and transferred to State Street Bank a lien upon collateralized assets in the possession of State Street Bank.
As of December 31, 2007, Real Estate Securities Fund and Diversified Income Plus Fund had $36,927,306 and $14,574,254 of securities on loan with Dresdner Bank AG, respectively.
(N) When-Issued and Delayed Delivery Transactions — The Funds may purchase or sell securities on a when-issued or delayed delivery basis. These transactions involve a commitment by a Fund to purchase or sell securities for a predetermined price or yield, with payment and delivery taking place beyond the customary settlement period. When delayed delivery purchases are outstanding, a Fund will designate liquid assets in an amount sufficient to meet the purchase price. When purchasing a security on a delayed delivery basis, a Fund assumes the rights and risks of ownership of the security, including the risk of price and yield fluctuations, and takes such fluctuations into account when determining its net asset value. A Fund may dispose of a delayed delivery transaction after it is entered into, and may sell when-issued securities before they are delivered, which may result in a capital gain or loss. When a Fund has sold a security on a delayed delivery basis, a Fund does not participate in future gains and losses with respect to the security.
(O) Treasury Inflation Protected Securities — Certain Funds may invest in treasury inflation protected securities (TIPS). These securities are fixed income securities whose principal value is periodically adjusted to the rate of inflation. The interest rate is generally fixed at issuance. Interest is paid based on the principal value, which is adjusted for inflation. Any increase in the principal amount will be included as taxable interest in the Statement of Operations and received upon maturity or sale of the security. During the year ended December 31, 2007, Diversified Income Plus Fund engaged in this type of transaction.
(P) Equity-Linked Structured Securities — Certain Funds may invest in equity-linked structured notes. Equity-linked structured notes are debt securities which combine the characteristics of common stock and the sale of an option. The return component is based upon the performance of a single equity security, a basket of equity securities, or an equity index and the sale of an option which is recognized as income. There is no guaranteed return of principal with these securities. The appreciation potential of these securities may be limited by a maximum payment or call right and can be influenced by many unpredictable factors. During the year ended December 31, 2007, Diversified Income Plus Fund engaged in this type of transaction.
|
| Notes to Financial Statements |
| December 31, 2007 |
(Q) Credit Risk — The Funds may be susceptible to credit risk to the extent an issuer or counter party defaults on its payment obligation. The Funds’ policy is to monitor the creditworthiness of issuers. Interest receivables on defaulted securities are monitored for ability to collect payments in default and are adjusted accordingly.
(R) Accounting Estimates — The preparation of financial statements in conformity with accounting principles generally accepted in the United States of America require management to make estimates and assumptions that affect the reported amounts of assets and liabilities and disclosure of contingent assets and liabilities at the date of the financial statements and the reported amounts of income and expenses during the reporting period. Actual results could differ from those estimates.
(S) Loss Contingencies — Thrivent Diversified Income Plus Fund is a defendant in an adversary action filed on July 7, 2004, by the Official Committee of Asbestos Claimants of G-I Holdings Inc. (G-I) against prior and current holders of secured debt of Building Materials Corp. of America (BMCA), a wholly owned subsidiary of G-I. The suit seeks to recover the value of assets G-I transferred to BMCA that later served as collateral for BMCA’s Debt. The Fund at one time held secured notes in the amount of $1,650,000 and, if the plaintiffs are successful, it is reasonably possible that the Fund will be required to pay damages in some amount. This loss contingency has not been accrued as a liability because the amount of potential damages and the likelihood of loss cannot be reasonably estimated.
(T) Unfunded Loan Commitment — Certain Funds may enter into loan commitments, all or a portion of which may be unfunded. The Fund is obligated to fund these commitments at the borrower’s discretion.
(U) Recent Accounting Pronouncements — In June 2006, the Financial Accounting Standards Board (FASB) issued FASB Interpretation No. 48 — Accounting for Uncertainty in Income Taxes (FIN 48), an interpretation of FASB Statement 109 that requires additional tax disclosures and the tax effects of certain income tax positions, whether on previously filed tax returns or those expected to be taken on future returns. These positions must meet a “more likely than not” standard that, based on the technical merits, they have a more than 50 percent likelihood of being sustained upon examination. In evaluating whether a tax position has met the more-likely-than-not recognition threshold, management of the Trust must presume that the position will be examined by the appropriate taxing authority that has full knowledge of all relevant information. The Funds adopted the provisions of FIN 48 on June 29, 2007, the extended required implementation date set by the U.S. Securities and Exchange Commission for mutual funds.
FIN 48 requires management of the Trust to analyze all open tax years, as defined by statute of limitations, for all major jurisdictions. Open tax years are those that are open for exam by taxing authorities. Major jurisdictions for the Fund’s include Federal, Minnesota, Wisconsin as well as certain foreign countries. As of December 31, 2007, open Federal and Minnesota tax years include the tax years ended December 31, 2004 through 2007. Additionally, as of December 31, 2007, the December 31, 2003 tax year is open for Wisconsin. The Funds have no examinations in progress and none are expected at this time.
As of December 31, 2007, management of the Trust has reviewed all open tax years and major jurisdictions and concluded that the adoption of FIN 48 resulted in no effect to the Fund’s tax liability, financial position or results of operations. There is no tax liability resulting from unrecognized tax benefits related to uncertain income tax positions taken or expected to be taken in future tax returns. The Funds are also not aware of any tax positions for which it is reasonably possible that the total amounts of unrecognized tax benefits will significantly change in the next 12 months.
Additionally, in September 2006, the FASB issued FASB Statement No. 157 — Fair Value Measurements (FAS 157). The objective of the statement is to improve the consistency and comparability of fair value measurements used in financial reporting. FAS 157 defines fair value, establishes a framework for measuring fair value in generally accepted accounting principles, and expands disclosures about fair value measurements. FAS 157 is effective for fiscal years beginning after November 15, 2007. Management of the Trust is currently evaluating the impact that FAS 157 will have on the Trust’s financial statements.
(V) Other — For financial statement purposes, investment security transactions are accounted for on the trade date. Realized gains and losses from investment transactions are determined on a specific cost identification basis, which is the same basis used for federal income tax purposes.
|
| Notes to Financial Statements |
| December 31, 2007 |
(3) FEES AND COMPENSATION PAID TO AFFILIATES
(A) Investment Advisory Fees — The Trust has entered into an Investment Advisory Agreement with Thrivent Asset Management, LLC (“Thrivent Asset Mgt.” or the “Adviser”). Thrivent Asset Mgt. is a wholly owned subsidiary of Thrivent Life Insurance Company. Under the Investment Advisory Agreement, each of the Funds pays a fee for investment advisory services. The fees are accrued daily and paid monthly. The annual rates of fees as a percent of average daily net assets under the Investment Advisory Agreement were as follows:
| | |
| Real Estate Securities Fund | | |
| First $500 million | 0.80% | |
| Over $500 million | 0.75% | |
| | |
| Diversified Income Plus Fund | 0.55% | |
The Adviser has contractually agreed, through at least February 28, 2008, to reimburse expenses to limit expenses to 1.25% and 1.06% of the average daily net assets of the Real Estate Securities Fund Class A and Institutional Class shares, respectively.
The Adviser has contractually agreed, through at least February 28, 2008, to reimburse expenses by 0.16% of the average daily net assets of Diversified Income Plus Fund.
As of October 15, 2004, Diversified Income Plus Fund Class B shares net operating expenses are limited to 2.30% of daily net assets of Class B shares. The reimbursement will be in effect as long as assets remain in the Class B shares.
The Funds may invest cash in Thrivent Money Market Fund, subject to certain limitations. These related-party transactions are subject to the same terms as non-related party transactions except that, to avoid duplicate investment advisory fees, Thrivent Asset Mgt. reimburses an amount equal to the smaller of the amount of the advisory fee for the Fund or the amount of the advisory fee, which is charged to the Fund for its investment in Thrivent Money Market Fund.
(B) Distribution Plan — Thrivent Investment Management, Inc. (“Thrivent Investment Mgt.”) is also the Trust’s distributor. The Trust has adopted a Distribution Plan (“the Plan”) pursuant to Rule 12b-1 under the Investment Company Act of 1940. Class A shares generally have a Rule 12b-1 fee of 0.25% of average net assets. Class B shares generally have a Rule 12b-1 fee of 1.00% of average net assets.
(C) Sales Charges and Other Fees — For the year ended December 31, 2007, Thrivent Investment Mgt. received $920,302 of aggregate underwriting concessions from the sales of the Trust’s Class A and Class B shares and aggregate deferred sales charges of $939 from redemptions of Class A and Class B shares. Sales charges are not an expense of the Trust and are not reflected in the financial statement of any of the Funds.
The Trust has entered into an accounting services agreement with Thrivent Asset Mgt. pursuant to which Thrivent Asset Mgt. provides certain accounting personnel and services. For the year ended December 31, 2007, Thrivent Asset Mgt. received aggregate fees for accounting personnel and services of $47,004 from the Funds.
The Trust has entered into an agreement with Thrivent Asset Mgt. to provide certain administrative personnel and services to the Funds. For the year ended December 31, 2007, Thrivent Asset Mgt. received aggregate fees for administrative services of $53,680 from the Funds.
The Trust has entered into an agreement with Thrivent Financial Investor Services, Inc. (“Thrivent Investor Services”) to provide the Funds with transfer agent services. For the year ended December 31, 2007, Thrivent Investor Services received aggregate fees for transfer agent services of $304,496 from the Funds.
Each Trustee is eligible to participate in a deferred compensation plan with respect to fees received from the Funds. Participants in the plan may designate their deferred Trustee’s fees as if invested in any one of the portfolios of Thrivent Mutual Funds. The value of each Trustee’s deferred compensation account will increase or decrease as if it were invested in shares of the selected portfolio of Thrivent Mutual Funds. The deferred fees remain in the appropriate fund until distribution in accordance with the plan. The deferred fee liability is an unsecured liability.
Those Trustees not participating in the above plan received $4,940 in fees from the Funds for the year ended December 31, 2007. No remuneration has been paid by the Trust to any of the officers or affiliated Trustees of the Trust. In addition, the Trust reimbursed unaffiliated Trustees for reasonable expenses incurred in relation to attendance of meetings and industry conferences.
Certain officers and non-independent trustees of the Fund are officers and directors of Thrivent Asset Mgt., Thrivent Investment Mgt. and Thrivent Investor Services; however, they receive no compensation from the Funds.
|
| Notes to Financial Statements |
| December 31, 2007 |
(D) Indirect Expenses — Some Funds invest in other mutual funds. Fees and expenses of those underlying funds are not included in the Fund’s expense ratio. The Fund indirectly bears its proportionate share of the annualized weighted average expense ratio for the underlying funds in which it invests.
(4) TAX INFORMATION
Distributions are based on amounts calculated in accordance with the applicable federal income tax regulations, which may differ from accounting principles generally accepted in the United States of America. To the extent that these differences are permanent in nature, such amounts are reclassified within the capital accounts based on their federal tax-basis treatment; temporary differences do not require reclassifications.
On the Statement of Assets and Liabilities, as a result of permanent book-to-tax differences, reclassification adjustments were made as follows [Increase (Decrease)]:
| | | | |
| | Accumulated | Accumulated | | |
| Net Investment | Net Realized | Capital | |
| Fund | Gain/(Loss) | Income/(Loss) | Stock | |
| |
| Real Estate Securities | $147,935 | $ (147,935) | $ — | |
| Diversified Income Plus | (74,181) | 31,967,799 | (31,893,618) | |
At December 31, 2007, the components of distributable earnings on a tax basis were as follows:
| | | | |
| | Undistributed | Undistributed | | |
| | Ordinary | Long-Term | | |
| Fund | Income | Capital Gain | | |
| | |
| Diversified Income Plus | $286,096 | $— | | |
At December 31, 2007, Thrivent Diversified Income Plus Fund had accumulated net realized capital loss carryovers expiring as follows:
| | | | |
| | Capital Loss | Expiration | | |
| Fund | Carryover | Year | | |
| | |
| Diversified Income Plus | $14,003,544 | 2008 | | |
| | 12,668,032 | 2009 | | |
| | 324,797 | 2011 | | |
| | ———————— | | | |
| | $26,996,373 | | | |
| | ============== | | | |
To the extent that this Fund realizes future net capital gains, taxable distributions will be reduced by any unused capital loss carryovers as permitted by the Internal Revenue Code.
The following capital loss carryover was utilized during 2007: Thrivent Diversified Income Plus Fund, $2,071,732. In addition, the following capital loss carryover expired during 2007: Thrivent Diversified Income Plus Fund, $31,893,618.
The tax character of distributions paid during the years ended December 31, 2007, and December 31, 2006, was as follows:
| | | | | | |
| | Ordinary Income | Long-Term Capital Gain | Return of Capital |
| Fund | 12/31/07 | 12/31/06 | 12/31/07 | 12/31/06 | 12/31/07 | 12/31/06 |
|
| Real Estate Securities | $1,917,994 | $1,881,430 | $2,489,493 | $927,617 | $57,298 | $195,501 |
| | | | | | |
| | | Ordinary Income | | | | |
| | 12/31/07 | 12/31/06(a) | 10/31/06 | | | |
| | | |
| Diversified Income Plus | $9,156,389 | $1,138,483 | $8,376,527 | | | |
(a) From November 1, 2006 through December 31, 2006.
(5) DISTRIBUTIONS BY CLASS
Net investment income and net realized gain distributions by class for the Funds were as follows:
| | | | |
| | Net Investment | Net Realized | | |
| | Income | Gains | | |
| | |
| Real Estate Securities Fund | | | | |
| Class A Shares | | | | |
| Year ended December 31, 2007 | $438,619 | $466,993 | | |
| Year ended December 31, 2006 | 355,518 | 553,751 | | |
| | | | | |
| Institutional Class Shares | | | | |
| Year ended December 31, 2007 | 1,127,775 | 2,374,100 | | |
| Year ended December 31, 2006 | 822,640 | 1,077,138 | | |
| | | | |
| | Net Investment | Net Realized | | |
| | Income | Gains | | |
| | |
| Diversified Income Plus Fund | | | | |
| Class A Shares | | | | |
| Year ended December 31, 2007 | $8,453,093 | $— | | |
| Period ended December 31, 2006 (a) | 1,061,942 | — | | |
| Year ended October 31, 2006 | 7,897,336 | — | | |
| | | | | |
| Class B Shares | | | | |
| Year ended December 31, 2007 | 102,833 | — | | |
| Period ended December 31, 2006 (a) | 18,633 | — | | |
| Year ended October 31, 2006 | 207,527 | — | | |
| | | | | |
| Institutional Class Shares | | | | |
| Year ended December 31, 2007 | 600,463 | — | | |
| Period ended December 31, 2006 (a) | 57,908 | — | | |
| Year ended October 31, 2006 | 271,664 | — | | |
(a) For the period from November 1, 2006, to December 31, 2006.
|
| Notes to Financial Statements |
| December 31, 2007 |
(5) DISTRIBUTIONS BY CLASS — continued
Distributions from Real Estate Securities Fund to shareholders, by class, for the year ended December 31, 2007, were $12,542 and $44,756 from return of capital for Class A and Institutional Class, respectively, and for the year ended December 31, 2006, were $66,807 and $128,694 from return of capital for Class A and Institutional Class, respectively.
(6) SECURITY TRANSACTIONS
(A) Purchases and Sales of Investment Securities — For the year ended December 31, 2007, the cost of purchases and the proceeds from sales of investment securities other than U.S. Government and short-term securities were as follows:
| | | | |
| | In thousands | | |
|
| | |
| Fund | Purchases | Sales | | |
| | |
| Real Estate Securities | $ 94,846 | $ 61,350 | | |
| Diversified Income Plus | 271,450 | 219,913 | | |
Purchases and sales of U.S. Government securities were:
| | | | |
| | In thousands | | |
|
| | |
| Fund | Purchases | Sales | | |
| | |
| Diversified Income Plus | $78,752 | $76,520 | | |
(B) Investments in Restricted Securities — Certain Funds may own restricted securities that were purchased in private placement transactions without registration under the Securities Act of 1933 and are not liquid. Unless such securities subsequently become registered, they generally may be resold only in privately negotiated transactions with a limited number of purchasers. Currently no Funds hold such securities. The Funds have no right to require registration of unregistered securities.
(C) Investments in High-Yielding Securities — The Funds may invest in high-yielding securities. These securities will typically be in the lower rating categories or will be non-rated and generally will involve more risk than securities in the higher rating categories. Lower rated or unrated securities are more likely to react to developments affecting market risk and credit risk than are more highly rated securities, which react primarily to movements in the general level of interest rates.
(D) Investments in Options and Futures Contracts — The movement in the price of the security underlying an option or futures contract may not correlate perfectly with the movement in the prices of the portfolio securities being hedged. A lack of correlation could render the Fund’s hedging strategy unsuccessful and could result in a loss to the Fund. In the event that a liquid secondary market would not exist, the Fund could be prevented from entering into a closing transaction, which could result in additional losses to the Fund.
(E) Written Option Contracts — The number of contracts and premium amounts associated with call option contracts written during the year ended December 31, 2007, were as follows:
| | | | |
| | Diversified Income Plus | | |
|
| | |
| | Number of | Premium | | |
| | Contracts | Amount | | |
| | |
| Balance at January 1, 2007 | — | $ — | | |
| Opened | 20 | 35,293 | | |
| Closed | — | — | | |
| Expired | (7) | (12,188) | | |
| Exercised | (13) | (23,105) | | |
| | ———————— | ———————— | | |
| Balance at December 31, 2007 | — | $ — | | |
| | ============== | ============== | | |
(7) INVESTMENTS IN AFFILIATES
Affiliated issuers, as defined under the Investment Company Act of 1940, include those in which the Fund’s holdings of an issuer represent 5% or more of the outstanding voting securities of an issuer, or any affiliated mutual fund. A summary of transactions for the year ended December 31, 2007, in Thrivent Money Market Fund, is as follows:
| | | | | |
| | Gross | Gross | Balance of | | Dividend Income |
| | Purchases and | Sales and | Shares Held | Value | Year Ending |
| Fund | Additions | Reductions | December 31, 2007 | December 31, 2007 | December 31, 2007 |
|
| Real Estate Securities | $31,223,305 | $33,724,879 | — | $ — | $ 71,784 |
| Diversified Income Plus | 46,554,317 | 45,078,234 | 5,391,261 | 5,391,261 | 523,341 |
| Total Value and Dividend Income | | | | $5,391,261 | $595,125 |
|
| Notes to Financial Statements |
| December 31, 2007 |
A summary of transactions for the year ended December 31, 2007, in Thrivent Financial Securities Lending Trust, is as follows:
| | | | |
| | Gross | Gross | Balance of | |
| | Purchases and | Sales and | Shares Held | Value |
| Fund | Additions | Reductions | December 31, 2007 | December 31, 2007 |
|
| Real Estate Securities | $158,633,738 | $131,344,536 | 37,685,177 | $ 37,685,177 |
| Diversified Income Plus | 138,570,571 | 161,288,154 | 15,434,201 | 15,434,201 |
| Total Value | | | | $53,119,378 |
(8) SECURITY TRANSACTIONS WITH AFFILIATED FUNDS
The Funds are permitted to purchase or sell securities from or to certain other Funds under specified conditions outlined in procedures adopted by the Board of Trustees of the Trust. The procedures have been designed to ensure that any purchase or sale of securities by the Fund from or to another fund or portfolio that is or could be considered an affiliate by virtue of having a common investment adviser (or affiliated investment advisers), common Trustees and/or common officers complies with Rule 17a-7 of the 1940 Act. Further, as defined under the procedures, each transaction is effected at the current market price. Pursuant to these procedures, during the year ended December 31, 2007, Diversified Income Plus Fund engaged in purchases and sales of securities of $3,134,013 and $150,150, respectively.
(9) RELATED PARTY TRANSACTIONS
As of December 31, 2007, related parties held 582,724, or 6.9%, of Real Estate Securities Fund’s outstanding shares and 1,873,010, or 6.5%, of Diversified Income Plus Fund’s outstanding shares.
(10) SHARES OF BENEFICIAL INTEREST
The Declaration of Trust permits the Trust to issue an unlimited number of full and fractional shares of beneficial interest of the Fund. Transactions in Fund shares for the periods indicated below were as follows:
| | | | | | | | |
| | | | | | | | |
| | | | | | | |
| | | | | | |
| | | Real Estate Securities Fund | | | |
| |
| | |
| | Class A | Institutional Class | | |
| |
|
| | |
| Year Ended December 31, 2007 | Shares | Amount | Shares | Amount | | |
| | ———————— | ———————— | ———————— | ———————— | | |
| Sold | 827,738 | $ 11,356,417 | 4,900,974 | $ 58,649,632 | | |
| Dividends and distributions reinvested | 78,581 | 905,901 | 319,092 | 3,533,685 | | |
| Redeemed | (1,344,756) | (16,507,557) | (1,641,498) | (20,924,821) | | |
| | ———————— | ———————— | ———————— | ———————— | | |
| Net Change | (438,437) | $ (4,245,239) | 3,578,568 | $ 41,258,496 | | |
| | ============== | ============== | ============== | ============== | | |
| | | |
| Year Ended December 31, 2006 | | | | | | |
| | | | | | | |
| Sold | 936,037 | $ 11,367,812 | 3,125,197 | $ 37,459,765 | | |
| Dividends and distributions reinvested | 75,048 | 963,216 | 158,329 | 2,028,641 | | |
| Capital contribution from adviser | — | 31,439 | — | 49,849 | | |
| Redeemed | (145,707) | (1,797,728) | (1,175,056) | (14,288,278) | | |
| | ———————— | ———————— | ———————— | ———————— | | |
| Net Change | 865,378 | $ 10,564,739 | 2,108,470 | $ 25,249,977 | | |
| | ============== | ============== | ============== | ============== | | |
|
| Notes to Financial Statements |
| December 31, 2007 |
(10) SHARES OF BENEFICIAL INTEREST — continued
| | | | | | | |
| | | | | | |
| | | | Diversified Income Plus Fund | | |
| |
|
| | Class A | Class B | Institutional Class |
| |
|
|
|
| Year Ended December 31, 2007 | Shares | Amount | Shares | Amount | Shares | Amount |
| | ———————— | ———————— | ———————— | ———————— | ———————— | ———————— |
| Sold | 11,447,788 | $ 78,737,275 | 37,737 | $ 260,532 | 1,303,372 | $ 8,959,691 |
| Dividends and distributions reinvested | 989,643 | 6,685,573 | 13,215 | 89,448 | 75,520 | 508,716 |
| Redeemed | (5,502,709) | (37,226,260) | (140,980) | (956,300) | (907,488) | (6,072,646) |
| | ———————— | ———————— | ———————— | ———————— | ———————— | ———————— |
| Net Change | 6,934,722 | $ 48,196,588 | (90,028) | $ (606,320) | 471,404 | $ 3,395,761 |
| | ============== | ============== | ============== | ============== | ============== | ============== |
| |
| |
| Period Ended December 31, 2006 (a) | | | | | | |
| | | | | | | |
| Sold | 2,202,970 | $ 15,030,302 | 12,953 | $ 87,907 | 169,013 | $ 1,152,549 |
| Dividends and distributions reinvested | 117,547 | 806,470 | 2,263 | 15,526 | 5,788 | 39,714 |
| Redeemed | (584,365) | (3,987,392) | (26,614) | (181,048) | (24,148) | (163,649) |
| | ———————— | ———————— | ———————— | ———————— | ———————— | ———————— |
| Net Change | 1,736,152 | $ 11,849,380 | (11,398) | $ (77,615) | 150,653 | $ 1,028,614 |
| | ============== | ============== | ============== | ============== | ============== | ============== |
| |
| Year Ended October 31, 2006 | | | | | | |
| | | | | | | |
| Sold | 4,306,685 | $ 28,014,839 | 17,526 | $ 113,372 | 610,182 | $ 3,981,168 |
| Dividends and distributions reinvested | 857,313 | 5,538,631 | 24,164 | 155,968 | 24,610 | 159,237 |
| Redeemed | (6,139,059) | (39,536,691) | (227,488) | (1,463,782) | (437,305) | (2,835,896) |
| | ———————— | ———————— | ———————— | ———————— | ———————— | ———————— |
| Net Change | (975,061) | $ (5,983,221) | (185,798) | $ (1,194,442) | 197,487 | $ 1,304,509 |
| | ============== | ============== | ============== | ============== | ============== | ============== |
(a) For the period from November 1, 2006 through December 31, 2006.
| | | | | | | | | | | | | | | | | | |
| | Thrivent Mutual Funds | | | | | | | | | Thrivent Mutual Funds | | |
| | Financial Highlights | | | | | | | | | Financial Highlights — continued | | |
| |
| |
| |
|
| | F O R A S H A R E O U T S T A N D I N G T H R O U G H O U T E A C H P E R I O D(a) | | | | | | | R A T I O S / S U P P L E M E N T A L D A T A | | |
| |
| |
|
| | | | | | | | | | | | | | | | Ratios to Average | |
| | | | | | | | | | | | | | | | | Net Assets Before Expenses | |
| | | | | | | Less Distributions | | | | | | | | Ratios to Average Net | Waived, Credited or Paid | |
| | | Income from Investment Operations | | from | | | | | | | | Assets(d) | Indirectly(d) | |
| |
|
| | | | | |
|
| |
| | Net Asset | | Net Realized | | | Net | | | | Net Asset | | | | | | |
| | Value, | Net | and Unrealized | Total from | Net | Realized | | | | Value, | | | Net Assets | | Net | | Net | Portfolio |
| | Beginning | Investment | Gain/(Loss) on | Investment | Investment | Gain on | Return of | | Total | End of | | Total | End of Period | | Investment | | Investment | Turnover |
| | of Period | Income/(Loss) | Investments(b) | Operations | Income | Investments | Capital | | Distributions | Period | | Return(c) | (in millions) | Expenses | Income/(Loss) | Expenses | Income (Loss) | Rate |
|
| REAL ESTATE SECURITIES FUND | | | | | | | | | | | | | | | | | |
| Class A Shares | | | | | | | | | | | | | | | | | | |
| Year Ended 12/31/2007 | $13.34 | $0.12 | $(2.34) | $(2.22) | $(0.20) | $(0.35) | $(0.01) | | $(0.56) | $10.56 | | (16.84)% | $14.6 | 1.10% | 1.24% | 1.53% | 0.81% | 77% |
| Year Ended 12/31/2006 | 10.42 | 0.23 | 3.30 | 3.53 | (0.26) | (0.31) | (0.04) | | (0.61) | 13.34 | | 34.27% | 24.3 | 0.48% | 2.01% | 1.60% | 0.89% | 70% |
| Period Ended 12/31/2005 (e) | 10.00 | 0.11 | 0.48 | 0.59 | (0.11) | (0.04) | (0.02) | | (0.17) | 10.42 | | 5.90% | 10.0 | 1.06% | 2.30% | 2.30% | 1.07% | 16% |
| Institutional Class Shares | | | | | | | | | | | | | | | | | | |
| Year Ended 12/31/2007 | 13.35 | 0.25 | (2.43) | (2.18) | (0.25) | (0.35) | (0.01) | | (0.61) | 10.56 | | (16.59)% | 75.2 | 0.82% | 1.92% | 0.95% | 1.78% | 77% |
| Year Ended 12/31/2006 | 10.42 | 0.31 | 3.29 | 3.60 | (0.32) | (0.31) | (0.04) | | (0.67) | 13.35 | | 34.96% | 47.3 | 0.00% | 2.51% | 1.06% | 1.45% | 70% |
| Period Ended 12/31/2005 (e) | 10.00 | 0.12 | 0.49 | 0.61 | (0.13) | (0.04) | (0.02) | | (0.19) | 10.42 | | 6.11% | 14.9 | 0.31% | 3.34% | 1.61% | 2.04% | 16% |
|
| DIVERSIFIED INCOME PLUS FUND | | | | | | | | | | | | | | | | | |
| Class A Shares | | | | | | | | | | | | | | | | | | |
| Year Ended 12/31/2007 | 6.88 | 0.32 | (0.39) | (0.07) | (0.33) | — | — | | (0.33) | 6.48 | | (1.12)% | 175.4 | 0.90% | 4.82% | 1.08% | 4.64% | 171% |
| Period Ended 12/31/2006 (f) | 6.70 | 0.05 | 0.18 | 0.23 | (0.05) | — | — | | (0.05) | 6.88 | | 3.50% | 138.8 | 1.08% | 4.80% | 1.25% | 4.63% | 16% |
| Year Ended 10/31/2006 | 6.41 | 0.43 | 0.29 | 0.72 | (0.43) | — | — | | (0.43) | 6.70 | | 11.77% | 123.4 | 0.98% | 6.66% | 1.15% | 6.49% | 170% |
| Year Ended 10/31/2005 | 6.71 | 0.46 | (0.27) | 0.19 | (0.49) | — | — | | (0.49) | 6.41 | | 2.91% | 124.3 | 0.95% | 6.99% | 1.13% | 6.82% | 57% |
| Period Ended 10/31/2004 (g) | 6.54 | 0.22 | 0.18 | 0.40 | (0.23) | — | — | | (0.23) | 6.71 | | 6.32% | 138.9 | 1.07% | 6.82% | 1.14% | 6.75% | 55% |
| Year Ended 4/30/2004 | 6.27 | 0.46 | 0.28 | 0.74 | (0.47) | — | — | | (0.47) | 6.54 | | 12.08% | 135.1 | 1.10% | 6.98% | 1.10% | 6.98% | 91% |
| Year Ended 4/30/2003 | 6.19 | 0.50 | 0.08 | 0.58 | (0.50) | — | — | | (0.50) | 6.27 | | 10.59% | 117.4 | 0.93% | 8.72% | 1.03% | 8.62% | 103% |
| Class B Shares | | | | | | | | | | | | | | | | | | |
| Year Ended 12/31/2007 | 6.88 | 0.26 | (0.41) | (0.15) | (0.26) | — | — | | (0.26) | 6.47 | | (2.35)% | 2.3 | 2.05% | 3.67% | 2.23% | 3.49% | 171% |
| Period Ended 12/31/2006 (f) | 6.70 | 0.04 | 0.18 | 0.22 | (0.04) | — | — | | (0.04) | 6.88 | | 3.32% | 3.0 | 2.17% | 3.77% | 2.34% | 3.60% | 16% |
| Year Ended 10/31/2006 | 6.41 | 0.37 | 0.29 | 0.66 | (0.37) | — | — | | (0.37) | 6.70 | | 10.64% | 3.0 | 2.01% | 5.75% | 2.18% | 5.58% | 170% |
| Year Ended 10/31/2005 | 6.72 | 0.40 | (0.28) | 0.12 | (0.43) | — | — | | (0.43) | 6.41 | | 1.74% | 4.1 | 1.95% | 6.02% | 2.12% | 5.85% | 57% |
| Period Ended 10/31/2004 (g) | 6.54 | 0.19 | 0.19 | 0.38 | (0.20) | — | — | | (0.20) | 6.72 | | 5.95% | 5.9 | 2.05% | 5.84% | 2.11% | 5.78% | 55% |
| Year Ended 4/30/2004 | 6.27 | 0.40 | 0.28 | 0.68 | (0.41) | — | — | | (0.41) | 6.54 | | 11.06% | 6.1 | 2.01% | 6.07% | 2.01% | 6.07% | 91% |
| Year Ended 4/30/2003 | 6.19 | 0.45 | 0.08 | 0.53 | (0.45) | — | — | | (0.45) | 6.27 | | 9.61% | 6.0 | 1.84% | 7.81% | 2.01% | 7.64% | 103% |
| Institutional Class Shares | | | | | | | | | | | | | | | | | | |
| Year Ended 12/31/2007 | 6.88 | 0.35 | (0.40) | (0.05) | (0.36) | — | — | | (0.36) | 6.47 | | (0.78)% | 9.6 | 0.51% | 5.22% | 0.69% | 5.04% | 171% |
| Period Ended 12/31/2006 (f) | 6.70 | 0.05 | 0.19 | 0.24 | (0.06) | — | — | | (0.06) | 6.88 | | 3.59% | 7.0 | 0.66% | 5.15% | 0.83% | 4.98% | 16% |
| Year Ended 10/31/2006 | 6.41 | 0.45 | 0.30 | 0.75 | (0.46) | — | — | | (0.46) | 6.70 | | 12.29% | 5.8 | 0.54% | 6.84% | 0.72% | 6.66% | 170% |
| Year Ended 10/31/2005 | 6.71 | 0.49 | (0.27) | 0.22 | (0.52) | — | — | | (0.52) | 6.41 | | 3.36% | 4.3 | 0.50% | 7.42% | 0.67% | 7.25% | 57% |
| Period Ended 10/31/2004 (g) | 6.54 | 0.24 | 0.18 | 0.42 | (0.25) | — | — | | (0.25) | 6.71 | | 6.56% | 4.3 | 0.61% | 7.28% | 0.68% | 7.21% | 55% |
| Year Ended 4/30/2004 | 6.27 | 0.48 | 0.29 | 0.77 | (0.50) | — | — | | (0.50) | 6.54 | | 12.56% | 3.8 | 0.67% | 7.41% | 0.67% | 7.41% | 91% |
| Year Ended 4/30/2003 | 6.19 | 0.51 | 0.09 | 0.60 | (0.52) | — | — | | (0.52) | 6.27 | | 10.88% | 3.3 | 0.67% | 8.98% | 0.67% | 8.98% | 103% |
|
| | | | | |
| (a) | All per share amounts have been rounded to the nearest cent. | | | (d) | Computed on an annualized basis for periods less than one year. |
| (b) | The amount shown may not correlate with the change in aggregate gains and losses of portfolio securities due to the timing of sales and redemptions of | | | (e) | Since inception, June 30, 2005. |
| | fund shares. | | | (f) | For the period from November 1, 2006 to December 31, 2006. |
| (c) | Total investment return assumes dividend reinvestment and does not reflect any deduction for sales charges. Not annualized for periods less than one year. | | | (g) | For the period from May 1, 2004 to October 31, 2004. |
| |
| The accompanying Notes to Financial Statements are an integral part of this schedule. | The accompanying Notes to Financial Statements are an integral part of this schedule. |
|
| 38 | 39 |
|
| Additional Information |
| (unaudited) |
Shareholder Notification of Federal Tax Information (unaudited)
The following information is provided solely to satisfy the requirements set forth by the Internal Revenue Code. Shareholders will be provided information regarding their distributions in February 2008.
The Funds designate the percentage of dividends declared from net investment income as dividends qualifying for the 70% dividends received deduction for corporations and the percentage as qualified dividend income for individuals under the Jobs and Growth Tax Relief Reconciliation Act of 2003 as follows:
| | | | |
| | Dividends | Qualified | | |
| | Received | Dividend | | |
| | Deduction for | Income for | | |
| Fund | Corporations | Individuals | | |
| | |
| Real Estate Securities | 7% | 7% | | |
| Diversified Income Plus | 16% | 17% | | |
Thrivent Real Estate Securities Fund designates $2,489,493 as distributions of long-term capital gains.
Proxy Voting
The policies and procedures that the Trust uses to determine how to vote proxies relating to portfolio securities are attached to the Trust’s Statement of Additional Information. You may request a free copy of the Statement of Additional Information or the report of how the Trust voted proxies relating to portfolio securities during the most recent 12-month period ended June 30 by calling 1-800-847-4836. You also may review the Statement of Additional Information or the report of how the Trust voted proxies relating to portfolio securities during the most recent 12-month period ended June 30 at the Thrivent Financial web site (www.thrivent.com) or the SEC web site (www.sec.gov).
Quarterly Schedule of Portfolio Holdings
The Trust files its Schedule of Portfolio Holdings on Form N-Q with the SEC for the first and third quarters of each fiscal year. You may request a free copy of the Trust’s Forms N-Q by calling 1-800-847-4836. The Trust’s Forms N-Q also are available on the Thrivent Financial web site (www.thrivent.com) or the SEC web site (www.sec.gov). You also may review and copy the Forms N-Q for the Trust at the SEC’s Public Reference Room in Washington, DC. You may get information about the operation of the Public Reference Room by calling 1-800-SEC-0330.
Board Approval of Investment Advisory Agreements and Subadvisory Agreements
Both the Investment Company Act of 1940 and the terms of the Advisory Agreement of the Thrivent Mutual Funds (the “Trust”) require that the agreement be approved annually by a majority of the Board of Trustees, including a majority of the Independent Trustees.
At its meeting on November 6, 2007, the Board of Trustees of the Trust voted unanimously to renew the existing Advisory Agreement between the Trust and Thrivent Asset Management, LLC (the “Adviser”) for each series (each a “Fund”) of the Trust. The Board also unanimously approved the Subadvisory Agreements for each of the Funds for which there is an investment subadviser (each a “Subadviser”). The Adviser and Subadvisers are referred to, collectively, as the “Advisory Organizations.” In connection with its reapproval of the agreements with the Advisory Organizations, the Board considered the following factors:
1. The nature, extent and quality of the services provided by the Advisory Organizations;
2. The performance of the Funds;
3. The costs of services provided and profits realized by the Adviser;
4. The extent to which economies of scale may be realized as the Funds grow; and
5. Whether the breakpoint levels reflect these economies of scale for the benefit of shareholders.
In connection with the renewal process, the Contracts Committee of the Board (consisting of each of the Independent Trustees of the Trust) met on July 10, August 28, and November 6, 2007, to consider information relevant to the renewal process. The Independent Trustees also retained the services of Management Practice, Inc. (“MPI”) as an independent consultant to assist them in the compilation, organization and evaluation of relevant information. This information included statistical comparisons of the advisory fees, total operating expenses, and performance of each of the Funds in comparison to
|
| Additional Information |
| (unaudited) |
a peer group of comparable investment companies; detailed information prepared by management with respect to the cost of services provided to the Funds and fees charged, including effective advisory fees that take into account breakpoints and fee waivers by the Adviser; profit realized by the Adviser and its affiliates that provide services to the Funds; and information regarding the types of services furnished to the Funds, the personnel providing the services, staff additions, systems improvements and plans for further hiring. The Board also received reports from the Adviser’s investment management staff with respect to the performance of the Funds. In addition to its review of the information presented to the Board during the contract renewal process and throughout the year, the Board also considered knowledge gained from discussions with management.
The Independent Trustees were represented by independent counsel throughout the review process and during private sessions of the Independent Trustees to consider reapproval of the agreements. The Trustees also received a memorandum from independent counsel summarizing their responsibilities under the Investment Company Act of 1940 in reviewing and approving the Advisory Agreement and the Subadvisory Agreements. The Contract Committee’s and Board’s consideration of the factors listed above and the information provided to it are discussed below.
Nature, Extent and Quality of Services
At each of the Board’s regular quarterly meetings during 2007, management presented information describing the services furnished to the Funds by the Adviser and, as appropriate, the Subadvisers. During these meetings, management reported on the investment management, portfolio trading, and compliance functions provided to the Funds under the Advisory and Subadvisory Agreements. During the renewal process, the Board considered the specific services provided under the Advisory Agreement as compared to the services provided by other mutual fund investment advisers under similar investment advisory agreements. The Board also considered information relating to the investment experience and educational backgrounds of the Adviser’s portfolio managers and those of the Subadvisers.
The Board received reports at each of its quarterly meetings from the Adviser’s Chief Investment Officer and from the Directors of Equity and Fixed Income Investments. In addition, the Board had, over the past year, met with a majority of the portfolio managers of both the Adviser and each of the Subadvisers, which gave the Board an opportunity to evaluate the managers’ abilities, experience, and the quality of services they provide to the Funds. Information was also presented to the Board describing the portfolio compliance functions performed by the Adviser and the Adviser’s oversight of Subadvisers to the Trust. The Independent Trustees also received quarterly reports from the Trust’s Chief Compliance Officer.
The Board also considered other benefits to the Adviser and its affiliates derived from its relationship with the Funds. These benefits include, among other things, fees for transfer agency services provided to the Funds, research received by the Adviser generated from commission dollars spent on Funds’ portfolio trading, and in certain cases distribution or service related fees related to Funds’ sales. The Board reviewed with the Adviser each of these arrangements and the reasonableness of the costs relative to the services performed.
The Adviser also reviewed with the Board the Adviser’s ongoing program to enhance portfolio management capabilities, including recruitment of personnel, the addition of several research analysts, and investment in systems technology to improve trading, portfolio compliance, and investment reporting functions. The Board viewed these actions as a significant factor in approving the current Advisory Agreement as they demonstrated the Adviser’s commitment to provide the Funds with quality service and competitive investment performance.
Performance of the Funds
The Board received regular monthly performance reports, which included both the absolute and relative investment performance of each Fund. In addition, in connection with each of its regular quarterly meetings, the Board received more extensive information on the performance of each Fund, including absolute performance, relative performance rankings within each Fund’s Lipper peer group and performance as compared to benchmark index returns. The Board considered investment performance for each Fund over the one-, three- and five-year periods. When evaluating investment performance the Board placed emphasis on longer term performance and on the trend of performance, focusing particularly upon the three-year performance record.
|
| Additional Information |
| (unaudited) |
For the three-year period ended September 28, 2007, 57% of the internally managed Funds and 60% of the subadvised Funds performed at or above the median of their respective Lipper peer groups. For the one-year period ending September 28, 2007, 43% of the internally managed Funds and 67% of the subadvised Funds performed at or above the median of their respective Lipper peer groups. No Fund ranked in the bottom quartile of its Lipper peer group for the three-year period, although one Fund was in the bottom quartile for the one-year period ended September 28, 2007. The Board concluded that the performance of the individual Funds was either satisfactory compared to their peer groups of funds or that the Adviser had taken appropriate actions to improve performance.
Cost of Services and Profitability to the Advisory Organization
The Board considered both the contractual and effective advisory fees for each of the Funds. They noted that 83% of the Funds, representing 66% of total Trust assets, had contractual advisory fees at or below the medians of their peer groups. The Board also considered advisory fees after the voluntary and contractual fee waivers and expense reimbursements provided by the Adviser for several of the Funds, noting that 92% of the Funds, representing 69% of total Trust assets, had effective advisory fees at or below the medians of their peer groups and that no Fund had effective advisory fees in the highest quartile of fees. In addition, the Board reviewed information prepared by MPI comparing each Fund’s overall expense ratio with the expense ratio of its peer group of funds. The Board also considered the profitability of the Adviser both overall and on a Fund-by-Fund basis.
The Board considered the allocations of the Adviser’s costs to the Funds. The internal audit department of the Adviser conducted a review of such allocations and reported to the Board regarding the reasonableness and consistency of these allocations. The Board was satisfied with the results of this review.
From its review of the MPI data and expense and profit information provided by the Adviser, the Board concluded that the profits earned by the Adviser from the Advisory Agreements were reasonable, particularly in light of the expense reimbursements and waivers in effect. On the basis of this information and review, the Board concluded that the advisory fees charged to the Funds for investment management services were reasonable.
With respect to fees paid to Subadvisers under the Subadvisory Agreements, the Trustees considered that those contracts had been negotiated at arm’s length between the Adviser and each Subadviser and that the markup for additional services provided by the Adviser was reasonable. The Board also was informed of any separate arrangements for unrelated services between a Subadviser and the Adviser or its affiliates.
Economies of Scale and Breakpoints
The Trustees considered whether economies of scale might be realized as a Fund’s assets increase. Because of differences between Funds as to management style and cost, it is difficult to generalize as to whether or to what extent economies in the advisory function may be realized as a Fund’s assets increase. Typically, expected economies of scale, where they exist, are shared through the use of fee breakpoints and/or fee waivers by the Adviser.
The Trustees considered information provided by the Adviser related to the breakpoints in the Advisory Agreement and fee waivers provided by the Adviser. The Adviser explained that its general goal with respect to fee waivers, expense reimbursements and breakpoints was that the overall expense ratio for each Fund should be at or below the median expense ratio of its peer group. In connection with their review of fee breakpoints and economies of scale, the Trustees noted that all of the Funds had net operating expenses at or below the medians of their peer groups. The Board also noted that while some Funds were increasing in assets and other were decreasing in assets, the Funds overall were not experiencing significant asset growth.
Based on the factors discussed above, the Contracts Committee unanimously recommended approval of the Advisory Agreement and the Subadvisory Agreements and the Board, including all of the Independent Trustees voting separately, approved each of the agreements.
|
| Board of Trustees and Officers |
The following table provides information about the Trustees and Officers of the Trust. Each Trustee oversees each of 29 series of the Trust and also serves as:
• Director of Thrivent Series Fund, Inc., a registered investment company consisting of 31 portfolios that serve as underlying funds for variable contracts issued by Thrivent Financial for Lutherans (“Thrivent Financial”) and Thrivent Life Insurance Company and investment options in the retirement plan offered by Thrivent Financial
• Trustee of Thrivent Financial Securities Lending Trust, a registered investment company consisting of one portfolio that serves as a cash collateral fund for a securities lending program sponsored by Thrivent Financial.
The 29 series of the Trust, 31 portfolios of Thrivent Series Fund, Inc., and Thrivent Financial Securities Lending Trust are referred to herein as the “Fund Complex.” The Statement of Additional Information includes additional information about the Trustees and is available, without charge, by calling 1-800-847-4836.
| | | | | | | | |
| | | | |
| Interested Trustee1 | | | | |
| | | Number of | | | |
| | Position | | Portfolios in | | Principal | | |
| | with Trust | | Fund Complex | | Occupation | | Other | |
| Name, Address, | and Length | | Overseen | | During the | | Directorships | |
| and Age | of Service2 | | by Trustee | | Past 5 Years | | Held by Trustee | |
|
| Pamela J. Moret | President since 2002 | 61 | | Executive Vice President, | Director, Minnesota |
| 625 Fourth Avenue South | and Trustee since 2004 | Marketing and Products, | Public Radio; Director, |
| Minneapolis, MN | | | Thrivent Financial | Luther Seminary |
| Age 51 | | | since 2002 | |
| |
| Independent Trustees3 | | | | |
| | | Number of | | | |
| | Position | | Portfolios in | | Principal | | |
| | with Trust | | Fund Complex | | Occupation | | Other | |
| Name, Address, | and Length | | Overseen | | During the | | Directorships | |
| and Age | of Service2 | | by Trustee | | Past 5 Years | | Held by Trustee | |
|
| F. Gregory Campbell | Trustee since 1992 | 61 | | President, Carthage | Director, JohnsonFamily |
| 625 Fourth Avenue South | | | College | Funds, Inc., an investment |
| Minneapolis, MN | | | | company consisting of four |
| Age 68 | | | | portfolios; Director, |
| | | | | Kenosha Hospital and |
| | | | | Medical Center Board; |
| | | | | Director, Prairie School |
| | | | | Board; Director United |
| | | | | Health Systems Board |
| |
| Herbert F. Eggerding, Jr. | Lead Trustee | 61 | | Management consultant | None |
| 625 Fourth Avenue South | since 2003 | | to several privately | |
| Minneapolis, MN | | | owned companies | |
| Age 70 | | | | |
| |
| Noel K. Estenson | Trustee since 2004 | 61 | | Retired | None |
| 625 Fourth Avenue South | | | | |
| Minneapolis, MN | | | | |
| Age 69 | | | | |
| | | | | | | | |
| | | | |
| Board of Trustees and Officers |
| |
| |
| Independent Trustees3 — continued | | | |
| | | Number of | | | |
| | Position | | Portfolios in | | Principal | | |
| | with Trust | | Fund Complex | | Occupation | | Other | |
| Name, Address, | and Length | | Overseen | | During the | | Directorships | |
| and Age | of Service2 | | by Trustee | | Past 5 Years | | Held by Trustee | |
|
| Richard L. Gady | Trustee since 1987 | 61 | | Retired; previously Vice | None |
| 625 Fourth Avenue South | | | President, Public Affairs | |
| Minneapolis, MN | | | and Chief Economist, | |
| Age 64 | | | ConAgra, Inc. | |
| | | | (agribusiness) | |
| Richard A. Hauser | Trustee since 2004 | 61 | | Vice President, and | Director, The Washington |
| 625 Fourth Avenue South | | | Assistant General | Hospital Center |
| Minneapolis, MN | | | Counsel, Boeing | |
| Age 64 | | | Company since 2007; | |
| | | | President, National | |
| | | | Legal Center for the | |
| | | | Public Interest from 2004 | |
| | | | to 2007; General Counsel, | |
| | | | U.S. Department of | |
| | | | Housing and Urban | |
| | | | Development from 2001 | |
| | | | to 2004; Partner, Baker | |
| | | | & Hosteller from 1986 | |
| | | | to 2001 | |
| Connie M. Levi | Trustee since 2004 | 61 | | Retired | None |
| 625 Fourth Avenue South | | | | |
| Minneapolis, MN | | | | |
| Age 68 | | | | |
| | | | | | |
| Douglas D. Sims | Trustee since 2006 | 61 | | Retired; previously Chief | Director, Keystone |
| 625 Fourth Avenue South | | | Executive Officer of | Neighborhood Company; |
| Minneapolis, MN | | | CoBank from 1994 | Director, Center for |
| Age 61 | | | to 2006 | Corporate Excellence |
| | | | |
| Edward W. Smeds | Chairman and Trustee | 61 | | Retired | Chairman, Carthage |
| 625 Fourth Avenue South | since 1999 | | | College Board |
| Minneapolis, MN | | | | |
| Age 71 | | | | |
| | | | | | | | |
| | | | |
| | Board of Trustees and Officers | |
| |
| |
| Independent Trustees3 — continued | | | |
| | Number of | | | | |
| | Position | | Portfolios in | | Principal | | |
| | with Trust | | Fund Complex | | Occupation | | Other | |
| Name, Address, | and Length | | Overseen | | During the | | Directorships | |
| and Age | of Service2 | | by Trustee | | Past 5 Years | | Held by Trustee | |
|
| Constance L. Souders | Trustee since 2007 | 61 | | Retired; previously | None |
| 625 Fourth Avenue South | | | Director from 1983 to | |
| 2007, Minneapolis, MN | | | Executive Vice President | |
| Age 57 | | | from 2001 to 2007, AML | |
| | | | Compliance Officer from | |
| | | | 2003 to 2007, Chief | |
| | | | Financial Officer from | |
| | | | 2000 to 2005, Chief | |
| | | | Administrative Officer | |
| | | | from 2000 to 2005 and | |
| | | | Treasurer from 1992 to | |
| | | | 2005 of Harbor Capital | |
| | | | Advisors, Inc.; Director | |
| | | | from 1992 to 2007, | |
| | | | President from 2000 | |
| | | | to 2007 and AML | |
| | | | Compliance Officer from | |
| | | | 2003 to 2007 of Harbor | |
| | | | Services Group, Inc.; | |
| | | | Director from 1992 to | |
| | | | 2007, Executive Vice | |
| | | | President from 2001 to | |
| | | | 2007, Chief Compliance | |
| | | | Officer from 2004 to | |
| | | | 2007, AML Compliance | |
| | | | Officer from 2003 to | |
| | | | 2007, Supervisory | |
| | | | Registered Principal from | |
| | | | 2000 to 2007, Interim | |
| | | | President from 2002 to | |
| | | | 2003, Treasurer from | |
| | | | 2000 to 2005 and | |
| | | | Secretary from 2000 to | |
| | | | 2005 of Harbor Funds | |
| | | | Distributors, Inc.; Vice | |
| | | | President from 2000 to | |
| | | | 2007, Chief Financial | |
| | | | Officer from 2000 to | |
| | | | 2005 and Treasurer from | |
| | | | 1992 to 2005 of | |
| | | | Harbor Funds | |
| | | | |
| | |
| Board of Trustees and Officers |
| |
| |
| Executive Officers | | |
| | Position with Trust | | |
| Name, Address, | and Length | | |
| and Age | of Service2 | | Principal Occupation During the Past 5 Years | |
|
| Pamela J. Moret | President since 2002 | Executive Vice President, Marketing and Products, Thrivent |
| 625 Fourth Avenue South | | Financial since 2002 |
| Minneapolis, MN | | |
| Age 51 | | |
| |
| David S. Royal | Secretary and Chief | Vice President — Asset Management, Thrivent Financial |
| 625 Fourth Avenue South | Legal Officer since 2006 | since 2006; Partner, Kirkland & Ellis LLP from 2004 to |
| Minneapolis, MN | | 2006; Associate, Skadden, Arps, Slate, Meagher & Flom |
| Age 36 | | LLP from 1997 to 2004 |
| |
| Katie S. Kloster | Vice President and | Vice President and Controller, Thrivent Financial |
| 625 Fourth Avenue South | Investment Company and | from 2001 to 2004 |
| Minneapolis, MN | Investment Adviser | |
| Age 42 | Chief Compliance Officer | |
| | since 2004 | |
| |
| Gerard V. Vaillancourt | Treasurer and Principal | Vice President, Mutual Fund Accounting since 2006; Head of |
| 625 Fourth Avenue South | Financial Officer | Mutual Fund Accounting, Thrivent Financial from 2005 to |
| Minneapolis, MN | since 2005 | 2006; Director, Fund Accounting Administration, Thrivent |
| Age 40 | | Financial from 2002 to 2005 |
| |
| Russell W. Swansen | Vice President since 2004 | Senior Vice President and Chief Investment Officer, Thrivent |
| 625 Fourth Avenue South | | Financial since 2004; Managing Director, Colonade Advisors, |
| Minneapolis, MN | | LLC from 2001 to 2003 |
| Age 50 | | |
| |
| Janice M. Guimond | Vice President since 2005 | Vice President, Investment Operations, Thrivent Financial |
| 625 Fourth Avenue South | | since 2004; Manager of Portfolio Reporting, Thrivent Financial |
| Minneapolis, MN | | from 2003 to 2004; Independent Consultant 2001 to 2003 |
| Age 43 | | |
| |
| Karl D. Anderson | Vice President since 2006 | Vice President, Products, Thrivent Financial |
| 625 Fourth Avenue South | | |
| Minneapolis, MN | | |
| Age 46 | | |
| |
| Brian W. Picard | Vice President | Director, FSO Compliance Corp. BCM, Thrivent Financial |
| 4321 North Ballard Road | Anti-Money Laundering | since 2006; Manager, Field and Securities Compliance, |
| Appleton, WI | Officer since 2006 | Thrivent Financial from 2002 to 2006 |
| Age 37 | | |
| |
| Kenneth L. Kirchner | Assistant Vice President | Director, Mutual Fund Operations, Thrivent Financial |
| 4321 North Ballard Road | since 2004 | since 2004; Manager, Shareholder Services, Thrivent Financial |
| Appleton, WI | | from 2003 to 2004 |
| Age 41 | | |
| | | | |
| | |
| Board of Trustees and Officers |
| |
| |
| Executive Officers — continued | |
| | | |
| | Position with Trust | | |
| Name, Address, | and Length | | |
| and Age | of Service2 | | Principal Occupation(s) During the Past 5 Years | |
|
| Mark D. Anema | Assistant Vice President | Vice President, Accumulation and Retirement Income |
| 625 Fourth Avenue South | since 2007 | Solutions, Thrivent Financial since 2007; Vice President, |
| Minneapolis, MN | | Strategic Planning, Thrivent Financial from 2004 to 2007; |
| Age 46 | | Insurance Practice Engagement Manager, McKinsey and |
| | | Company from 1999 to 2004 |
| |
| James M. Odland | Assistant Secretary | Vice President, Office of the General Counsel, Thrivent |
| 625 Fourth Avenue South | since 2006 | Financial since 2005; Senior Securities Counsel, |
| Minneapolis, MN | | Allianz Life Insurance Company from January 2005 to |
| Age 52 | | August 2005; Vice President and Chief Legal Officer, |
| | | Woodbury Financial Services, Inc. from 2003 to 2005; Vice |
| | | President and Group Counsel, Corporate Practice Group, |
| | | American Express Financial Advisors, Inc., from 2001 to 2003 |
| |
| John L. Sullivan | Assistant Secretary | Senior Counsel, Thrivent Financial since 2007; Senior |
| 625 Fourth Avenue South | since 2007 | Counsel, Division of Investment Management of the |
| Minneapolis, MN | | SEC from 2000 to 2007 |
| Age 37 | | |
| |
| Todd J. Kelly | Assistant Treasurer | Director, Fund Accounting Operations, Thrivent Financial |
| 4321 North Ballard Road | since 1999 | |
| Appleton, WI | | |
| Age 38 | | |
| |
| Sarah L. Bergstrom | Assistant Treasurer | Director, Fund Accounting Administration, Thrivent |
| 625 Fourth Avenue South | since 2007 | Financial since 2007; Manager, Fund Accounting |
| Minneapolis, MN | | Administration, Thrivent Financial from 2005 to 2007; |
| Age 30 | | Manager, Mutual Fund Tax Reporting, Thrivent Financial |
| | | from 2004 to 2005; Supervisor, Mutual Fund Tax Reporting, |
| | | Thrivent Financial from 2002 to 2004 |
1 “Interested person” of the Trust as defined in 1940 Act by virtue of positions with Thrivent Financial. Ms. Moret is considered an interested person because of her principal occupation with Thrivent Financial.
2 Each Trustee serves an indefinite term until her or his successor is duly elected and qualified. Officers serve at the discretion of the board until their successors are duly appointed and qualified.
3 The Trustees other than Ms. Moret are not “interested persons” of the Trust and are referred to as “Independent Trustees.”
|
| This page intentionally left blank. |
Item 2. Code of Ethics
As of the end of the period covered by this report, registrant has adopted a code of ethics (as defined in Item 2 of Form N-CSR) applicable to registrant’s Principal Executive Officer, Principal Financial Officer, and Principal Accounting Officer. No waivers were granted to such code of ethics during the period covered by this report. A copy of this code of ethics is filed as an exhibit to this Form N-CSR.
Item 3. Audit Committee Financial Expert
Registrant’s Board of Trustees has determined that Herbert F. Eggerding, Jr., an independent trustee, is the Audit Committee Financial Expert.
Item 4. Principal Accountant Fees and Services
(a) through (d)
Thrivent Real Estate Securities Fund and Thrivent Diversified Income Plus Fund (each, a “Fund”) are each a series of Thrivent Mutual Funds, a Massachusetts business trust (the “Trust”). The Trust contains a total of 29 series (the “Series”), which include the Funds. This Form N-CSR relates to the annual report of each Fund.
The following table presents the aggregate fees billed to the Thrivent Real Estate Securities Fund for the Fund’s respective fiscal years ended December 31, 2006 and December 31, 2007 by the Fund’s independent public accountants, PricewaterhouseCoopers LLP (“PwC”), for professional services rendered for the audit of the Fund’s annual financial statements and fees billed for other services rendered by PwC during those periods.
| | | | | | | |
| | | | | | |
| Fiscal Years Ended | | 12/31/06 | | 12/31/07 | | |
| |
| |
| | |
| Audit Fees | | $8,500 | | $7,784 | | |
| | | |
| Audit-Related Fees(1) | | $0 | | $0 | | |
| | | |
| Tax Fees(2) | | $6,535 | | $5,865 | | |
| | | |
| All Other Fees(3) | | $0 | | $681 | | |
| |
| |
| | |
| Total | | $15,035 | | $14,330 | | |
| |
| |
| | |
(1) Audit-related fees consist of the aggregate fees billed for assurance and related services that are reasonably related to the performance of the audit of financial statements and are not reported under the category of audit fees.
(2) Tax fees consist of the aggregate fees billed for professional services rendered by the principal accountant relating to tax compliance, tax advice, and tax planning and specifically include fees for tax return preparation.
(3) All other fees consist of the aggregate fees billed for products and services provided by the principal accountant other than audit, audit-related, and tax services.
The following table presents the aggregate fees billed to the Thrivent Diversified Income Plus Fund for the Fund’s fiscal year ended October 31, 2006, the two-month period ended December 31, 2006 and the fiscal year ended December 31, 2007 by PwC for
professional services rendered for the audit of the Fund’s annual financial statements and fees billed for other services rendered by PwC during those periods. In 2006, the Fund changed its fiscal year end from October 31 to December 31; accordingly, an additional column is shown.
| | | | | | | | |
| | | | | | |
| Fiscal Years Ended | | 10/31/06 | | 12/31/06 | | 12/31/07 |
| |
| |
| |
|
| Audit Fees | | $9,250 | | $11,830 | | $8,892 |
| | | | | | | |
| Audit-Related Fees(1) | | $0 | | $0 | | $0 |
| | | | | |
| Tax Fees(2) | | $4,575 | | $1,800 | | $7,305 |
| | | | | |
| All Other Fees(3) | | $0 | | $0 | | $662 |
| |
| |
| |
|
| Total | | $13,825 | | $13,630 | | $16,859 |
| |
| |
| |
|
(1) Audit-related fees consist of the aggregate fees billed for assurance and related services that are reasonably related to the performance of the audit of financial statements and are not reported under the category of audit fees.
(2) Tax fees consist of the aggregate fees billed for professional services rendered by the principal accountant relating to tax compliance, tax advice, and tax planning and specifically include fees for tax return preparation.
(3) All other fees consist of the aggregate fees billed for products and services provided by the principal accountant other than audit, audit-related, and tax services.
The following table presents the aggregate fees billed to all Series of the Trust with fiscal years ending on October 31 for the fiscal years ended October 31, 2006 and October 31, 2007 by PwC for professional services rendered for the audit of the annual financial statements of the applicable Series and fees billed for other services rendered by PwC during those periods.
| | | | | | | | |
| Fiscal Years Ended | | 10/31/06 | | 10/31/07 | | |
| |
| |
| | |
| Audit Fees | | $394,409 | | $364,656 | | |
| | | |
| Audit-Related Fees(1) | | $0 | | $0 | | |
| | | |
| Tax Fees(2) | | $124,065 | | $117,935 | | |
| | | | | | | |
| All Other Fees(3) | | $0 | | $0 | | |
| |
| |
| | |
| Total | | $518,474 | | $482,591 | | |
| |
| |
| | |
(1) Audit-related fees consist of the aggregate fees billed for assurance and related services that are reasonably related to the performance of the audit of financial statements and are not reported under the category of audit fees.
(2) Tax fees consist of the aggregate fees billed for professional services rendered by the principal accountant relating to tax compliance, tax advice, and tax planning and specifically include fees for tax return preparation.
(3) All other fees consist of the aggregate fees billed for products and services provided by the principal accountant other than audit, audit-related and tax services.
(e) Registrant’s audit committee charter, adopted in August 2004, provides that the audit committee (comprised of the independent trustees of registrant) is responsible for pre-approval of all auditing services performed for the registrant. The audit committee reports to the Board of Trustees (“Board”) regarding its approval of the engagement of the auditor and the proposed fees for the engagement, and the majority of the Board (including the members of the Board who are independent trustees) must approve the auditor at an in-person meeting. The audit committee also is responsible for pre-approval (subject to the de minimis exceptions for non-audit services described in Section 10A(i)(1)(B) of the Securities Exchange Act of 1934, as amended) of all non-auditing services performed for the registrant or for any service affiliate of registrant. Registrant’s audit committee chart er also permits a designated member of the audit committee to pre-approve, between meetings, one or more non-audit service projects, subject to ratification by the audit committee at the next meeting of the audit committee. Registrant’s audit committee pre-approved all fees described above which PwC billed to registrant.
(f) Less than 50% of the hours billed by PwC for auditing services to each Fund and to the registrant for the fiscal year ended December 31, 2007 were for work performed by persons other than full-time, permanent employees of PwC.
(g) The aggregate non-audit fees billed by PwC to registrant and to registrant’s investment adviser and any entity controlling, controlled by, or under common control with registrant’s investment adviser for the fiscal years set forth below were as follows:
| | | | |
| Fiscal Year Ended | 10/31/06 | 12/31/06 | 10/31/07 | 12/31/07 |
|
| Registrant(1) | $0 | $0 | $0 | $0 |
|
| Adviser | $15,645 | $6,500 | $1,582 | $1,582 |
|
(1) Includes all Series of the Trust
(h) Registrant’s audit committee has considered the non-audit services provided to the registrant and registrant’s investment adviser and any entity controlling, controlled by, or under common control with registrant’s investment adviser as described above and determined that these services do not compromise PwC’s independence.
Item 5. Audit Committee of Listed Registrants
Not applicable.
Item 6. Schedule of Investments
Registrant’s Schedule of Investments is included in the report to shareholders filed under Item 1.
Item 7. Disclosure of Proxy Voting Policies and Procedures for Closed-End Management Investment Companies
Not applicable.
Item 8. Portfolio Managers of Closed-End Management Investment Companies
Not applicable.
Item 9. Purchases of Equity Securities by Closed-End Management Investment Company and Affiliated Purchasers
Not applicable.
Item 10. Submission of Matters to a Vote of Security Holders
There have been no material changes to the procedures by which shareholders may recommend nominees to registrant’s board of trustees.
Item 11. Controls and Procedures
(a)(i) Registrant’s President and Treasurer have concluded that registrant’s disclosure controls and procedures (as defined in Rule 30a-3(c) under the Investment Company Act) are effective, based on their evaluation of these controls and procedures as of a date within 90 days of the filing date of this report.
(a)(ii) Registrant’s President and Treasurer are aware of no change in registrant’s internal control over financial reporting (as defined in Rule 30a-3(d) under the Investment Company Act) that occurred during registrant’s most recent fiscal quarter that has materially affected, or is reasonably likely to materially affect, registrant’s internal control over financial reporting.
Item 12. Exhibits
(a) The code of ethics pursuant to Item 2 is attached hereto.
(b) Certifications pursuant to Rules 30a-2(a) and 30a-2(b) under the Investment Company Act of 1940 are attached hereto.
SIGNATURES
Pursuant to the requirements of the Securities Exchange Act of 1934 and the Investment Company Act of 1940, the registrant has duly caused this report to be signed on its behalf by the undersigned, thereunto duly authorized.
| | | |
| |
| THRIVENT MUTUAL FUNDS |
| | | |
| | | |
| Date: February 28, 2008 | By: | /s/ Pamela J. Moret |
| |
| |
| | | Pamela J. Moret |
| | | President |
Pursuant to the requirements of the Securities Exchange Act of 1934 and the Investment Company Act of 1940, this report has been signed below by the following persons on behalf of the registrant and in the capacities and on the dates indicated.
| | | | |
| | | |
| Date: February 28, 2008 | By: | /s/ Pamela J. Moret |
|
| |
| | | Pamela J. Moret |
| | | President |
| |
| |
| |
| Date: February 28, 2008 | By: | /s/ Gerard V. Vaillancourt |
|
| |
| | | Gerard V. Vaillancourt |
| | | Treasurer |