UNITED STATES
SECURITIES AND EXCHANGE COMMISSION
Washington, D.C. 20549
FORM N-CSR
CERTIFIED SHAREHOLDER REPORT OF REGISTERED MANAGEMENT
INVESTMENT COMPANIES
Investment Company Act file number: 811-5075
Thrivent Mutual Funds
(Exact name of registrant as specified in charter)
625 Fourth Avenue South
Minneapolis, Minnesota 55415
(Address of principal executive offices) (Zip code)
David S. Royal, Secretary
625 Fourth Avenue South
Minneapolis, Minnesota 55415
(Name and address of agent for service)
Registrant's telephone number, including area code: (612) 340-4249
Date of fiscal year end: October 31
Date of reporting period: October 31, 2006
Item 1. Report to Stockholders
Table of Contents
| President’s Letter | 1 | Thrivent Partner International Stock Fund | 116 |
| | | Thrivent Large Cap Growth Fund | 120 |
| Economic and Market Review | 2 | Thrivent Large Cap Value Fund | 124 |
| | | Thrivent Large Cap Stock Fund | 127 |
| Portfolio Perspectives | | Thrivent Large Cap Index Fund | 131 |
| Thrivent Aggressive Allocation Fund | 4 | Thrivent Large Cap Index Fund-I | 138 |
| Thrivent Moderately Aggressive Allocation Fund | 6 | Thrivent Balanced Fund | 145 |
| Thrivent Moderate Allocation Fund | 8 | Thrivent High Yield Fund | 155 |
| Thrivent Moderately Conservative Allocation Fund | 10 | Thrivent Diversified Income Plus Fund | 163 |
| Thrivent Technology Fund | 12 | Thrivent Municipal Bond Fund | 172 |
| Thrivent Partner Small Cap Growth Fund | 14 | Thrivent Income Fund | 198 |
| Thrivent Partner Small Cap Value Fund | 16 | Thrivent Core Bond Fund | 205 |
| Thrivent Small Cap Stock Fund | 18 | Thrivent Limited Maturity Bond Fund | 211 |
| Thrivent Small Cap Index Fund | 20 | Thrivent Money Market Fund | 218 |
| Thrivent Mid Cap Growth Fund | 22 | | |
| Thrivent Partner Mid Cap Value Fund | 24 | Statement of Assets and Liabilities | 224 |
| Thrivent Mid Cap Stock Fund | 26 | | |
| Thrivent Mid Cap Index Fund | 28 | Statement of Operations | 230 |
| Thrivent Mid Cap Index Fund-I | 30 | | |
| Thrivent Partner International Stock Fund | 32 | Statement of Changes in Net Assets | 236 |
| Thrivent Large Cap Growth Fund | 34 | | |
| Thrivent Large Cap Value Fund | 36 | Notes to Financial Statements | 241 |
| Thrivent Large Cap Stock Fund | 38 | | |
| Thrivent Large Cap Index Fund | 40 | Financial Highlights | |
| Thrivent Large Cap Index Fund-I | 42 | Thrivent Aggressive Allocation Fund | 268 |
| Thrivent Balanced Fund | 44 | Thrivent Moderately Aggressive Allocation Fund | 268 |
| Thrivent High Yield Fund | 46 | Thrivent Moderate Allocation Fund | 268 |
| Thrivent Diversified Income Plus Fund | 48 | Thrivent Moderately Conservative Allocation Fund | 268 |
| Thrivent Municipal Bond Fund | 50 | Thrivent Technology Fund | 270 |
| Thrivent Income Fund | 52 | Thrivent Partner Small Cap Growth Fund | 270 |
| Thrivent Core Bond Fund | 54 | Thrivent Partner Small Cap Value Fund | 272 |
| Thrivent Limited Maturity Bond Fund | 56 | Thrivent Small Cap Stock Fund | 272 |
| Thrivent Money Market Fund | 58 | Thrivent Small Cap Index Fund | 274 |
| | Thrivent Mid Cap Growth Fund | 274 |
| Shareholder Expense Example | 60 | Thrivent Partner Mid Cap Value Fund | 274 |
| | Thrivent Mid Cap Stock Fund | 276 |
| Report of Independent Registered | | Thrivent Mid Cap Index Fund | 276 |
| Public Accounting Firm | 65 | Thrivent Mid Cap Index Fund-I | 276 |
| | | Thrivent Partner International Stock Fund | 278 |
| Schedules of Investments | | Thrivent Large Cap Growth Fund | 278 |
| Thrivent Aggressive Allocation Fund | 66 | Thrivent Large Cap Value Fund | 280 |
| Thrivent Moderately Aggressive Allocation Fund | 67 | Thrivent Large Cap Stock Fund | 280 |
| Thrivent Moderate Allocation Fund | 68 | Thrivent Large Cap Index Fund | 282 |
| Thrivent Moderately Conservative Allocation Fund | 69 | Thrivent Large Cap Index Fund-I | 282 |
| Thrivent Technology Fund | 70 | Thrivent Balanced Fund | 282 |
| Thrivent Partner Small Cap Growth Fund | 73 | Thrivent High Yield Fund | 284 |
| Thrivent Partner Small Cap Value Fund | 77 | Thrivent Diversified Income Plus Fund | 284 |
| Thrivent Small Cap Stock Fund | 80 | Thrivent Municipal Bond Fund | 286 |
| Thrivent Small Cap Index Fund | 84 | Thrivent Income Fund | 286 |
| Thrivent Mid Cap Growth Fund | 93 | Thrivent Core Bond Fund | 288 |
| Thrivent Partner Mid Cap Value Fund | 97 | Thrivent Limited Maturity Bond Fund | 288 |
| Thrivent Mid Cap Stock Fund | 100 | Thrivent Money Market Fund | 290 |
| Thrivent Mid Cap Index Fund | 104 | Additional Information | 292 |
| Thrivent Mid Cap Index Fund-I | 110 | | |
| | | Board of Trustees and Officers | 293 |

Dear Member:
We are pleased to provide you with the annual report for the twelve months ended Oct. 31, 2006, for the Thrivent Mutual Funds. In this report, you will find detailed information about the Thrivent Mutual Funds, including performance highlights, overall market conditions and management strategies during the 12-month period. In addition, Thrivent Financial’s chief investment officer, Russ Swansen, reviews the larger economic environment in his Economic and Market Overview.
The 12-month period was truly a tale of three markets. The opening months featured an environment where more aggressive asset classes such as small company stocks and international investments performed well. In May this trend quickly reversed with investor concerns over slowing global economic growth, higher interest rates and continued unrest in the Middle East. As a result, large company stocks and bonds held up better than more aggressive asset classes. In the final months of the period, a strong bull market emerged as a result of lower interest rates and oil prices with all major asset classes benefiting. These quick market shifts illustrate the value of diversifying a portfolio and avoiding the temptation to buy what’s hot and sell what’s not. Good advice, a well thought out long-term plan and a disciplined approach can make all the difference. Be sure to contact your Thrivent Financial representative if you have any questions or concerns with your portfo lio.
Supporting Your Most Important Financial
Goal: Retirement
Whether saving for retirement or structuring accumulated assets for income generation in retirement, proper advice and guidance for this important goal is critical. At Thrivent Financial, we seek to provide our members with the financial confidence and security you need to live the life you want in retirement. Our asset management capabilities position us well to structure and monitor an investment course that can help you reach your retirement goals. Whether you seek an aggressive approach for long-term growth or a conservative plan for near-term income, Thrivent Financial has the resources to help. Relevant, honest financial advice with the products and services that can deliver the retirement you’ve worked so hard for — that’s our goal.
A Strategy that Fits Your Retirement Needs
We have the investment solutions and a money management philosophy uniquely tailored to supporting our members. Critical among these solutions is our strong belief in asset allocation and overall portfolio balance. Studies have shown that strategic asset allocation (the mix of investments in an overall portfolio) can be the major determinant of how well your portfolio will fare over the long term. Furthermore, success in investing or making retirement assets last longer is often dependent on achieving growth by investing in stocks.
A sound asset allocation strategy can reduce the risk of investing in more volatile stocks by diversifying among different types of stocks (large and small, international and domestic, value style and growth style, etc.), as well as bonds and real estate securities.
Consider the following:
• Thrivent Financial representatives are equipped with leading edge tools and advice to build and support ongoing asset allocation strategies.
• Our funds are strictly managed to their individual investment objective to best support asset allocation.
• Finally, our Thrivent Asset Allocation Funds are customized to your specific risk tolerance levels to provide a simple and smart method of investing.
Introducing Thrivent Diversified Income Plus
Thrivent is proud to offer a new dividend-oriented Fund to our valued investors. The Thrivent Diversified Income Plus Fund seeks a high current yield for income and, secondarily, potential growth in the form of capital appreciation through an optimized asset allocation mix of high-yield bonds, real estate equities, dividend-producing stocks and high-quality, fixed-income investments.
With life spans growing ever longer, and the specter of infla-tion taking a bite out of fixed-income portfolios, the Thrivent Diversified Income Plus Fund can provide valuable equity exposure and potential growth your portfolio needs in retirement, without the level of volatility that comes with many stock funds. Generating total return primarily from reinvesting dividends can provide a smoother growth track for your investment than sole reliance on more volatile security price gains. Contact your Thrivent Financial representative for more information.
Our Commitment to You
We remain committed to providing our members with the guidance and solutions they need to prepare for retirement and achieve their goals. Thank you for continuing to turn to us for your financial solutions. We very much value you and your business.
Sincerely,

Pamela J. Moret
President and Trustee
Thrivent Mutual Funds |
1

Most major stock indices posted double-digit returns during the 12-month period ended October. 31, 2006, as a cooling economy and falling commodities prices brightened investors’ outlook for inflation and interest rates. Although bond returns were pressured by further Federal Reserve (Fed) interest rate hikes during much of the period, most types of bonds provided positive returns due to an easing of inflation worries and a pause in Fed tightening late in the period.
U.S. Economy
The nation’s gross domestic product (GDP) jumped from a 1.8% annual growth rate in the fourth quarter of 2005 to 5.6% in the first quarter of 2006. The economy moderated to a 2.6% GDP growth rate in the second quarter and slowed further to a 1.6% rate in the third quarter (the weakest showing in three years). One of the most visible signs of the slowdown was an increasingly sharp pullback in the nation’s housing market, which could affect consumer spending in the months to come.
The high cost of oil and other commodities was an intermittent concern for investors, weighing on stock prices particularly during mid-summer. However, an easing in energy prices both early and late in the period shifted inflation sentiment dramatically and provided a strong boost to stock and bond markets.
Although economic growth slowed during the period, the labor market continued to add jobs. The unemployment rate sank to a five-year low of 4.4% in October, falling from 4.9% a year earlier.
Inflation & Monetary Policy
Overall inflation declined during the period, largely due to a pullback in energy prices. The Consumer Price Index (CPI) rose at a rate of 1.3% for the 12 months ended Oct. 31, 2006, compared with an increase of 3.4% for all of 2005. However, “core” inflation — excluding the more volatile prices of food and energy — rose 2.7% for the year ended Oct. 31, compared with a 2.2% core rate for all of 2005. The index for energy, which rose 17.1% in 2005, declined 11.3% during the 12-month period ended Oct. 31.
With inflation still a concern, the Federal Reserve’s Federal Reserve Open Market Committee (FOMC) continued raising its target for the federal funds rate through June 29, bringing the rate to 5.25% . But in the face of a slowing economy and an accelerating pullback in housing, policymakers left rates steady at their August, September and October meetings. The Fed continued to indicate its wariness of infla-tion, however, a possible sign that it may not begin cutting rates any time soon.
Equity Performance
Stocks surged in the first months of the period as investors cheered strong economic and corporate profit growth and declining energy prices. But a broad pullback occurred in the second quarter in response to renewed concerns about infla-tion, interest rates, expensive energy and a slumping housing market. Investors’ mood reversed yet again in July as worries about inflation and interest rates fell with the prices of commodities and dwindling prospects of further Fed rate hikes. In fact, the Dow Jones Industrials set several all-time highs in September and October, and other equity indices set multi-year highs.
Small-company stocks outperformed large-company issues during the period. The Russell 2000 Index of small-company stocks posted a 19.98% total return, while the S&P 500 Index of large-company stocks recorded a 16.35% return. Value stocks outperformed growth stocks. During the period, the Russell 1000 Value Index returned 21.46%, while the Russell 1000 Growth Index posted a return of 10.84% .
Sectors that performed best during the period included telecommunications services, energy, utilities and consumer discretionary, while health care, information technology, industrials, and consumer staples advanced at a more moderate rate. Real estate investment trusts (REITs), which are not the same as the residential housing market, performed well during the period, with the MSCI U.S. REIT Index posting a 37.77% return.
Foreign stocks generally continued to outperform most domestic issues. The Morgan Stanley Capital International Europe, Australasia, Far East (EAFE) Index posted a 28.04% total return in dollar terms.
2
Fixed Income Performance
Bond returns were pressured by continued Federal Reserve interest rate hikes during much of the period. But in August — after 17 consecutive rate increases — policymakers moved to the sidelines. The pause brightened investors’ inflation and interest rate outlook dramatically, boosting the prices of most types of bonds.
During the 12 months, yields on shorter-term securities rose, while yields on longer-term bonds remained relatively stable or even declined. The result was a substantially inverted yield curve (the differences among the yields of different maturities of similar credit quality) as of Oct. 31, an atypical situation in which shorter-term bonds provided higher yields than longer-term bonds. The six-month Treasury yield rose from 4.26% to 5.13% during the period, the 10-year Treasury yield increased from 4.57% to 4.61%, and the 20-year Treasury yield fell from 4.84% to 4.81% .
Despite the headwind of rising rates during much of the period, most bond sectors provided positive returns. The Lehman Brothers Aggregate Bond Index of the broad U.S. bond market posted a 5.19% total return for the 12 months ended Oct. 31, 2006. Municipal bonds fared better in this environment, with the Lehman Brothers Municipal Bond Index posting a total return of 5.75% during the period. The Lehman Brothers Government/Corporate 1-3 Year Bond Index registered a 4.38% total return.
Below-investment-grade corporate bonds were stronger U.S. market performers during the 12-month period. The Lehman Brothers U.S. Corporate High Yield Bond Index registered a 10.31% total return.
Outlook
We think economic growth will remain slow over the next few months, with inflation continuing to ease from the higher levels of earlier this year. This will provide the “soft landing” sought by the Federal Reserve after more than two years of consecutive interest rate hikes.
Gross domestic product growth should continue at a 2% to 2.5% annual rate, keeping the economy out of the recession that concerns some market watchers. Energy and commodities prices should continue to ease, and the housing pull-back should moderate. Both of these factors will support consumer spending. Businesses, with plenty of cash on their balance sheets, are investing in productive resources.
Although we don’t expect more Fed interest rate increases in the near future, we don’t expect policymakers to ease rates any time soon, either. The stock and bond markets have priced in expectations of lower rates in the first half of 2007, and, in the absence of an unexpected slowdown in the economy, we don’t agree.
The potential for the markets to be surprised by a lack of lower rates early next year makes us cautious on more volatile segments of the stock and bond markets in the near-term. Also, with the potential for further weakness in energy and commodities prices, and uncertainty in the housing market, there is a possibility that the economy could slow more than we expect or even enter a recession.
As always, your best strategy is to work with your Thrivent Investment Management registered representative to create an investment plan based on your goals, diversify your portfolio and remain focused on the long term.
3

The Fund’s performance depends upon how its assets are allocated across broad asset categories and applicable sub-classes within such categories. Some broad asset categories and sub-classes may perform below expectations or below the securities markets generally over short or extended periods. In particular, underperformance in the equity markets would have material adverse effect on the Fund’s total return, given its allocation to equity securities. Therefore a principal risk of investing in the Fund is heavily dependent upon the performance of the underlying funds in which the Fund invests. As a result, the Fund is subject to the same risks as those faced by the underlying funds. Those risks include, but are not limited to, allocation risk, non-diversified risk, underlying fund risk, market risk, equity investment and issuer risk, volatility risk, foreign securities risk, real estate industry risk, credit, interest rate and high yield risk, and investment adv iser risk. These and other risks are described in the Fund’s prospectus.
How did the Fund perform during the 12-month
period ended Oct. 31, 2006?
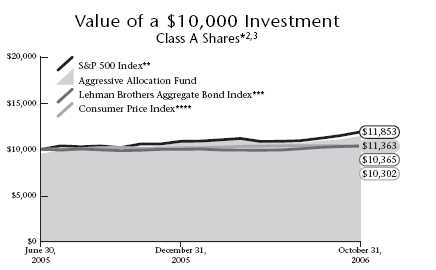
Thrivent Aggressive Allocation Fund earned a total return of 15.95% as compared to the median return to its peer group, the Lipper Inc. Multicap Core Funds, of 14.65% . The Fund’s market benchmarks, the S&P 500 Index and the Lehman Brothers Aggregate Bond Index, earned total returns of 16.35% and 5.19%, respectively.
What factors affected the Fund’s performance?
The Fund’s good return versus its peer group and its benchmark was the result of good diversification across a broad range of equity asset classes, many providing higher returns than the S&P 500 Index during the reporting period. Allocation to fixed income securities was minimal, which also aided results, as returns to stocks generally exceeded returns to bonds in the last year.
Early in the reporting period, we applied a tactical bias in the Fund, indicating our preference to be overweighted in risk assets, compared to long-term targets. This caused us to favor small- and mid-cap domestic portfolios, as well as emphasize allocations to non-U.S. portfolios — all accomplished by reducing exposure to large-cap U.S. holdings. Following a strong rally in stock prices late in 2005, particularly in the more speculative segments of the equity market, our work indicated that an overweighted position in risk assets was no longer supported, and a reallocation away from more volatile equity categories was implemented in January 2006.
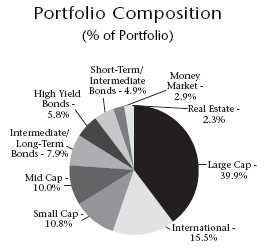
This reallocation resulted in a reduced exposure to small-and mid-cap categories, in favor of large-cap categories. Additionally, international exposure was reduced from a sig-nificant overweighting of our long-term target allocation. These decisions aided Fund returns over the period. In addition, we had a modest tilt in the portfolios toward growth-oriented, domestic-asset categories. This factor did not add to results, as value-oriented stocks generally outperformed their growth counterparts. Late in the reporting period, we began to see indications that investors’ strong preference for value-style portfolios was beginning to diminish. Finally, long-term targets indicated a modest allocation to real estate investment trusts (REITs) in aggressive portfolios. We did not have direct exposure to this segment during the period, which limited our advance, as REIT portfolios performed quite well in the period. Within other Thrivent Allocation Fund portfolios, we had lim ited exposure to REIT stocks, mitigating some of the opportunity cost.

| Top 10 Holdings | |
| (% of Portfolio) | |
| |
| Thrivent Partner International | |
| Stock Fund | 22.6% |
| Thrivent Large Cap Growth Fund | 19.5% |
| Thrivent Large Cap Stock Fund | 8.1% |
| Thrivent Large Cap Value Fund | 7.3% |
| Thrivent Small Cap Stock Fund | 6.9% |
| Thrivent Partner Small Cap Value Fund | 6.6% |
| Thrivent Partner Small Cap Growth Fund | 6.3% |
| Thrivent Mid Cap Stock Fund | 5.0% |
| Thrivent Partner Mid Cap Value Fund | 4.6% |
| Thrivent Mid Cap Growth Fund | 4.3% |
| |
| These common stocks represent 91.2% of the total |
| investment portfolio. | |
Quoted Fund performance is for Class A shares and does not reflect a sales charge. The returns shown do not reflect taxes a shareholder would pay on distributions or redemptions. Quoted Portfolio Composition and Top 10 Holdings are subject to change.
4
What is your outlook?
We are in the maturing stage of the economic cycle and the stock market advance that coincided with the onset of the 2001-2002 economic recovery. That fact does not preclude a continuation of the economic recovery or the stock market advance, but it does suggest that risks to both are higher, and a heightened level of attentiveness is appropriate. As is often the case, inflation pressures have taken hold domestically in an environment of tighter labor markets and increased factory utilization. Policy actions have been initiated to contain inflation risk, specifically, higher short-term interest rates, and while we expect those actions to be successful, they bring with them some risk of policy error.
These cyclical trends are exacerbated by the extraordinary demands related to the emerging economies of China, India and other former “third world” economies, particularly in those segments most sensitive to developing economies, such as raw materials, energy and capital goods. We have a bias to large-cap equity portfolios, as they appear to offer good valuations at acceptable levels of volatility given our risk preferences at this point. Allocations to fixed income are limited.
| | | Portfolio Facts |
| | | As of October 31, 2006 | |
| | | A Share | Institutional Share |
| | | ————————— | ————————— |
| Ticker | | TAAAX | TAAIX |
| Transfer Agent ID | 038 | 468 |
| Net Assets | | $176,017,015 | $35,833,286 |
| NAV | | $11.88 | $11.94 |
| NAV — High† | | 10/26/2006 — $11.98 | 10/26/2006 — $12.04 |
| NAV — Low† | | 11/1/2005 — $10.37 | 11/1/2005 — $10.38 |
| Number of Holdings: 15 | | † For the year ended October 31, 2006 |
| Average Annual Total Returns2 |
| As of October 31, 2006 | |
| |
| | | From |
| | | Inception |
| Class A1 | 1-Year | 6/30/2005 |
|
| without sales charge | 15.95% | 14.78% |
| with sales charge | 9.61% | 10.04% |
| |
| | | From |
| | | Inception |
| Institutional Class1 | 1-Year | 6/30/2005 |
|
| Net Asset Value | 16.45% | 15.32% |
1 Class A performance reflects the maximum sales charge of 5.5% . Institutional Class shares have no sales load and are for institutional shareholders only.
2 Past performance is not an indication of future results. Annualized total returns represent past performance and reflect changes in share prices, the reinvestment of all dividends and capital gains, and the effects of compounding. Periods of less than one year are not annualized. Investing in a mutual fund involves risks, including the possible loss of principal. The prospectus contains more complete information on the investment objectives, risks, charges and expenses of the investment company which investors should read and consider carefully before investing. To obtain a prospectus, contact a registered representative or visit www.thrivent.com. At various times, the Fund’s adviser waived its management fee and/or reimbursed Fund expenses. Had the adviser not done so, the Fund’s total returns would have been lower. The re turns shown do not reflect taxes a shareholder would pay on distributions or redemptions. Please read your prospectus carefully.
3 Performance of other classes will be greater or less than the line shown based on the differences in loads and fees paid by shareholders investing in the different classes.
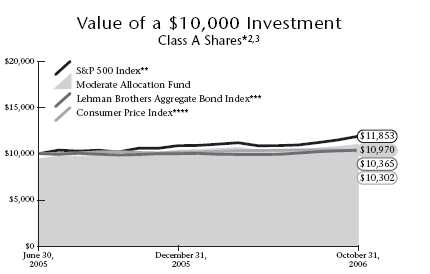
* As you compare performance, please note that the Fund’s performance reflects the maximum 5.5% sales charge, while the Consumer Price Index, the S&P 500 Index and the Lehman Brothers Aggregate Bond Index do not reflect any such charges. If you were to purchase any of the above individual stocks or funds represented in these Indexes, any charges you would pay would reduce your total return as well.
** The S&P 500 Index is an index that represents the average performance of a group of 500 large-capitalization stocks. It is not possible to invest directly in the Index. The performance of the Index does not reflect deductions for fees, expenses or taxes.
*** The Lehman Brothers Aggregate Bond Index is an index that measures the performance of U.S. investment grade bonds. It is not possible to invest directly in the Index. The performance of the Index does not reflect deductions for fees, expenses or taxes.
**** The Consumer Price Index is an inflationary indicator that measures the change in the cost of a fixed basket of products and services, including housing, electricity, food and transportation. It is not possible to invest directly in the Index.
5

The Fund’s performance depends upon how its assets are allocated across broad asset categories and applicable sub-classes within such categories. Some broad asset categories and sub-classes may perform below expectations or below the securities markets generally over short or extended periods. In particular, underperformance in the equity markets would have material adverse effect on the Fund’s total return, given its allocation to equity securities. Therefore a principal risk of investing in the Fund is heavily dependent upon the performance of the underlying funds in which the Fund invests. As a result, the Fund is subject to the same risks as those faced by the underlying funds. Those risks include, but are not limited to, allocation risk, non-diversified risk, underlying fund risk, market risk, equity investment and issuer risk, volatility risk, foreign securities risk, real estate industry risk, credit, interest rate and high yield risk, and investment adv iser risk. These and other risks are described in the Fund’s prospectus.
How did the Fund perform during the 12-month
period ended Oct. 31, 2006?
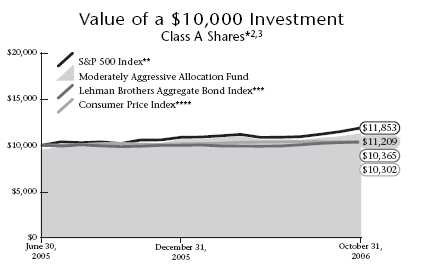
Thrivent Moderately Aggressive Allocation Fund earned a total return of 15.05% as compared to the median return to its peer group, the Lipper Inc. Mixed Asset Target Allocation Growth Funds, of 12.10% . The Fund’s market benchmarks, the S&P 500 Index and the Lehman Brothers Aggregate Bond Index, earned total returns of 16.35% and 5.19%, respectively.
What factors affected the Fund’s performance?
The Fund’s return versus its peer group and its benchmark was the result of a strong allocation to equity portfolios, thoughtful and timely portfolio reallocations and diversifica-tion across a broad range of equity asset classes. Fixed-income returns were less than equity returns, but the lower risk inherent in fixed-income portfolios, compared to equity accounts, reduced overall Fund volatility in an environment that saw increasing levels of speculation in certain asset segments.
We began the period with an overweighted position in higher-risk asset portfolios, as we expected an ongoing recovery. In equities, a bias toward small- to mid-cap and international portfolios was evident, while in fixed-income, our bias was to high-yield and corporate bonds. In January 2006, return premiums available on the more volatile equity asset classes became quite low, compared with historical returns, suggesting we take a more conservative stance. Because of this, we reduced our overweighting in equities to long-term targets, repositioned within the equity funds to higher-quality segments and allocated assets to high-yield, fixed-income securities, as they appeared to offer returns competitive with equity portfolios, but at lower levels of volatility. These strategies were rewarded in the spring, as equity markets corrected some of the excesses of the first half and lower-risk asset classes provided returns competitive with their h igher-volatility counterparts. Late in the period, a more conservative tilt was applied to fixed-income portfolios, as risk premiums in low-quality portfolios were not sufficient to compensate for higher-volatility levels apparent on the horizon.
During most of the period there was an evident tilt toward growth portfolios in the Fund’s equity segments that limited our advance, as value-style stocks provided a return premium compared to their growth counterparts. In addition, an underexposure to the real estate investment trust (REIT) segment also limited results, as that market segment continued to provide premium returns.
What is your outlook?
In addition to the stock market advance that coincided with the onset of the 2001-2002 economic recovery, we are in the maturing stage of the economic cycle. This does not preclude
| Top 10 Holdings | |
| (% of Portfolio) | |
| |
| Thrivent Partner International | |
| Stock Fund | 15.5% |
| Thrivent Large Cap Growth Fund | 14.6% |
| Thrivent Large Cap Stock Fund | 13.0% |
| Thrivent Large Cap Value Fund | 12.3% |
| Thrivent Income Fund | 7.9% |
| Thrivent High Yield Fund | 5.8% |
| Thrivent Limited Maturity Bond Fund | 4.9% |
| Thrivent Mid Cap Stock Fund | 4.0% |
| Thrivent Small Cap Stock Fund | 3.9% |
| Thrivent Partner Small Cap Value Fund | 3.5% |
| |
| These common stocks represent 85.4% of the total |
| investment portfolio | |
Quoted Fund performance is for Class A shares and does not reflect a sales charge. The returns shown do not reflect taxes a shareholder would pay on distributions or redemptions. Quoted Portfolio Composition and Top 10 Holdings are subject to change.
6
a continuation of the stock market advance or economic recovery, but it does suggest that risks to both are higher, and a heightened level of attentiveness is appropriate. As often happens, inflation pressures have taken hold domestically in an environment of tighter labor markets and increased factory utilization. Policy actions have been initiated to contain inflation risk, specifically higher short-term interest rates, and while we expect those actions to be successful, they bring with them some risk of policy error.
These cyclical trends are exacerbated by the extraordinary demands related to the emerging economies of China, India and other former “third world” economies, particularly in those segments most sensitive to developing economies, such as raw materials, energy and capital goods. At present, we are maintaining our stock/bond allocation at long-term targets. We have a bias to large-cap equity portfolios, as they appear to offer good valuations at acceptable levels of volatility given our risk preferences at this point. Within fixed-income, we reduced maturities and improved credit quality within corporate portfolios, as risk premiums are not at levels consistent with overweighting toward low-quality.
| | | Portfolio Facts |
| | | As of October 31, 2006 | |
| | | A Share | Institutional Share |
| | | ————————— | ————————— |
| Ticker | | TMAAX | TMAFX |
| Transfer Agent ID | 037 | 467 |
| Net Assets | | $423,026,328 | $40,084,671 |
| NAV | | $11.72 | $11.77 |
| NAV — High† | | 10/26/2006 — $11.79 | 10/26/2006 — $11.85 |
| NAV — Low† | | 11/1/2005 — $10.31 | 11/1/2005 — $10.32 |
| Number of Holdings: 15 | | † For the year ended October 31, 2006 |
| Average Annual Total Returns2 |
| As of October 31, 2006 | |
| |
| | | From |
| | | Inception |
| Class A1 | 1-Year | 6/30/2005 |
|
| without sales charge | 15.05% | 13.62% |
| with sales charge | 8.72% | 8.93% |
| |
| | | From |
| | | Inception |
| Institutional Class1 | 1-Year | 6/30/2005 |
|
| Net Asset Value | 15.43% | 14.07% |
1 Class A performance reflects the maximum sales charge of 5.5% . Institutional Class shares have no sales load and are for institutional shareholders only.
2 Past performance is not an indication of future results. Annualized total returns represent past performance and reflect changes in share prices, the reinvestment of all dividends and capital gains, and the effects of compounding. Periods of less than one year are not annualized. Investing in a mutual fund involves risks, including the possible loss of principal. The prospectus contains more complete information on the investment objectives, risks, charges and expenses of the investment company which investors should read and consider carefully before investing. To obtain a prospectus, contact a registered representative or visit www.thrivent.com. At various times, the Fund’s adviser waived its management fee and/or reimbursed Fund expenses. Had the adviser not done so, the Fund’s total returns would have been lower. The re turns shown do not reflect taxes a shareholder would pay on distributions or redemptions. Please read your prospectus carefully.
3 Performance of other classes will be greater or less than the line shown based on the differences in loads and fees paid by shareholders investing in the different classes.
* As you compare performance, please note that the Fund’s performance reflects the maximum 5.5% sales charge, while the Consumer Price Index, the S&P 500 Index and the Lehman Brothers Aggregate Bond Index do not reflect any such charges. If you were to purchase any of the above individual stocks or funds represented in these Indexes, any charges you would pay would reduce your total return as well.
** The S&P 500 Index is an index that represents the average performance of a group of 500 large-capitalization stocks. It is not possible to invest directly in the Index. The performance of the Index does not reflect deductions for fees, expenses or taxes.
*** The Lehman Brothers Aggregate Bond Index is an index that measures the performance of U.S. investment grade bonds. It is not possible to invest directly in the Index. The performance of the Index does not reflect deductions for fees, expenses or taxes.
**** The Consumer Price Index is an inflationary indicator that measures the change in the cost of a fixed basket of products and services, including housing, electricity, food and transportation. It is not possible to invest directly in the Index.
7

The Fund’s performance depends upon how its assets are allocated across broad asset categories and applicable sub-classes within such categories. Some broad asset categories and sub-classes may perform below expectations or below the securities markets generally over short or extended periods. In particular, underperformance in the equity markets would have material adverse effect on the Fund’s total return, given its allocation to equity securities. Therefore a principal risk of investing in the Fund is heavily dependent upon the performance of the underlying funds in which the Fund invests. As a result, the Fund is subject to the same risks as those faced by the underlying funds. Those risks include, but are not limited to, allocation risk, non-diversified risk, underlying fund risk, market risk, equity investment and issuer risk, volatility risk, foreign securities risk, real estate industry risk, credit, interest rate and high yield risk, and investment adv iser risk. These and other risks are described in the Fund’s prospectus.
How did the Fund perform during the 12-month period ended Oct. 31, 2006?
Thrivent Moderate Allocation Fund earned a total return of 13.40% as compared to the median return to its peer group, the Lipper Mixed Asset Target Allocation Growth Funds, of 12.10% . The Fund’s market benchmarks, the S&P 500 Index and the Lehman Brothers Aggregate Bond Index, earned total returns of 16.35% and 5.19%, respectively.
What factors affected the Fund’s performance?
The Fund’s return versus its peer group and its benchmark was the result of thoughtful and timely reallocations and diversification across a broad range of equity asset classes, many providing higher returns than the S&P 500 Index during the reporting period. Fixed-income returns were less than equity returns, but the lower risk inherent in fixed-income portfolios, compared to equity accounts, reduced overall Fund volatility in an environment that saw increasing levels of speculation in certain asset segments and increased preferences for lower-risk assets.
We began the period with an overweighted position in higher-risk asset portfolios, as we expected an ongoing recovery. In equities, a bias toward small- to mid-cap and international portfolios was evident, while in fixed-income, our bias was to high-yield and corporate bonds. Early in 2006, return premiums available on the more volatile equity asset classes came quite low, compared with historical returns, suggesting we take a more conservative stance. As such, we reduced our overweighting in equities to long-term targets, repositioned equity funds to higher-quality segments and allocated assets to high-yield, fixed-income securities, as they appeared to offer returns competitive with equity portfolios, but at lower levels of volatility. These strategies were rewarded in the spring, as equity markets corrected some of the excesses of the first half and lower-risk asset classes provided returns competitive with their higher-volatility counte rparts. Late in the period, a more conservative tilt was applied to fixed-income portfolios as risk premiums in low-quality portfolios were not sufficient to compensate for higher volatility levels apparent on the horizon.
A tilt toward the growth portfolios in the Fund’s equity segments was evident during most of the period. This limited our advance, as value-style stocks provided a return premium, versus their growth counterparts.
What is your outlook?
We are in the maturing stage of the economic cycle, in addition to the stock market advance that coincided with the onset of the 2001-2002 economic recovery. That fact does not preclude a continuation of the economic recovery or the
| Top 10 Holdings | |
| (% of Portfolio) | |
| |
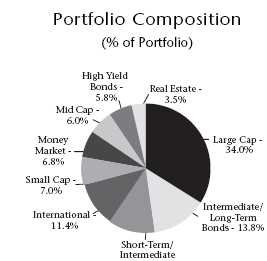
| Thrivent Income Fund | 13.8% |
| Thrivent Large Cap Growth Fund | 12.7% |
| Thrivent Large Cap Stock Fund | 12.0% |
| Thrivent Limited Maturity Bond Fund | 11.7% |
| Thrivent Partner International Stock Fund | 11.4% |
| Thrivent Large Cap Value Fund | 9.3% |
| Thrivent Small Cap Stock Fund | 7.0% |
| Thrivent Money Market Fund | 6.8% |
| Thrivent Mid Cap Stock Fund | 6.0% |
| Thrivent High Yield Fund | 5.8% |
| |
| |
| |
| These common stocks represent 96.5% of the total |
| investment portfolio. | |
Bonds - 11.7%
Quoted Fund performance is for Class A shares and does not reflect a sales charge. The returns shown do not reflect taxes a shareholder would pay on distributions or redemptions. Quoted Portfolio Composition and Top 10 Holdings are subject to change.
8
stock market advance, but it suggests that risks to both are higher, and a heightened level of attentiveness is appropriate. As is often the case, inflation pressures have taken hold domestically in an environment of tighter labor markets and increased factory utilization. Policy actions have been initiated to contain inflation risk, specifically higher short-term interest rates, and while we expect those actions to be successful, they bring with them some risk of policy error.
Within this cycle, trends are exacerbated by the extraordinary demands related to the emerging economies of China, India and other former “third world” economies, particularly in those segments most sensitive to developing economies, such as raw materials, energy and capital goods. At present, we are maintaining our stock/bond allocation at long-term targets. We have a bias to large-cap equity portfolios, which appear to offer good valuations at acceptable levels of volatility, given our risk preferences. Within fixed-income, we have reduced maturities and improved credit quality within the corporate portfolios, as risk premiums are not at levels consistent with overweighting toward low-quality.
| | | Portfolio Facts |
| | | As of October 31, 2006 | |
| | | A Share | Institutional Share |
| | | ————————— | ————————— |
| Ticker | | THMAX | TMAIX |
| Transfer Agent ID | 036 | 466 |
| Net Assets | | $442,836,523 | $17,109,706 |
| NAV | | $11.30 | $11.32 |
| NAV — High† | | 10/26/2006 — $11.35 | 10/26/2006 — $11.37 |
| NAV — Low† | | 11/1/2005 — $10.21 | 11/1/2005 — $10.22 |
| Number of Holdings: 11 | | † For the year ended October 31, 2006 |
| Average Annual Total Returns2 |
| As of October 31, 2006 | |
| |
| | | From |
| | | Inception |
| Class A1 | 1-Year | 6/30/2005 |
|
| without sales charge | 13.40% | 11.80% |
| with sales charge | 7.21% | 7.18% |
| |
| | | From |
| | | Inception |
| Institutional Class1 | 1-Year | 6/30/2005 |
|
| Net Asset Value | 13.83% | 12.22% |
1 Class A performance reflects the maximum sales charge of 5.5% . Institutional Class shares have no sales load and are for institutional shareholders only.
2 Past performance is not an indication of future results. Annualized total returns represent past performance and reflect changes in share prices, the reinvestment of all dividends and capital gains, and the effects of compounding. Periods of less than one year are not annualized. Investing in a mutual fund involves risks, including the possible loss of principal. The prospectus contains more complete information on the investment objectives, risks, charges and expenses of the investment company which investors should read and consider carefully before investing. To obtain a prospectus, contact a registered representative or visit www.thrivent.com. At various times, the Fund’s adviser waived its management fee and/or reimbursed Fund expenses. Had the adviser not done so, the Fund’s total returns would have been lower. The re turns shown do not reflect taxes a shareholder would pay on distributions or redemptions. Please read your prospectus carefully.
3 Performance of other classes will be greater or less than the line shown based on the differences in loads and fees paid by shareholders investing in the different classes.
* As you compare performance, please note that the Fund’s performance reflects the maximum 5.5% sales charge, while the Consumer Price Index, the S&P 500 Index and the Lehman Brothers Aggregate Bond Index do not reflect any such charges. If you were to purchase any of the above individual stocks or funds represented in these Indexes, any charges you would pay would reduce your total return as well.
** The S&P 500 Index is an index that represents the average performance of a group of 500 large-capitalization stocks. It is not possible to invest directly in the Index. The performance of the Index does not reflect deductions for fees, expenses or taxes.
*** The Lehman Brothers Aggregate Bond Index is an index that measures the performance of U.S. investment grade bonds. It is not possible to invest directly in the Index. The performance of the Index does not reflect deductions for fees, expenses or taxes.
**** The Consumer Price Index is an inflationary indicator that measures the change in the cost of a fixed basket of products and services, including housing, electricity, food and transportation. It is not possible to invest directly in the Index.
9

The Fund’s performance depends upon how its assets are allocated across broad asset categories and applicable sub-classes within such categories. Some broad asset categories and sub-classes may perform below expectations or below the securities markets generally over short or extended periods. In particular, underperformance in the equity markets would have material adverse effect on the Fund’s total return, given its allocation to equity securities. Therefore a principal risk of investing in the Fund is heavily dependent upon the performance of the underlying funds in which the Fund invests. As a result, the Fund is subject to the same risks as those faced by the underlying funds. Those risks include, but are not limited to, allocation risk, non-diversified risk, underlying fund risk, market risk, equity investment and issuer risk, volatility risk, foreign securities risk, real estate industry risk, credit, interest rate and high yield risk, and investment adv iser risk. These and other risks are described in the Fund’s prospectus.
How did the Fund perform during the 12-month period ended Oct. 31, 2006?
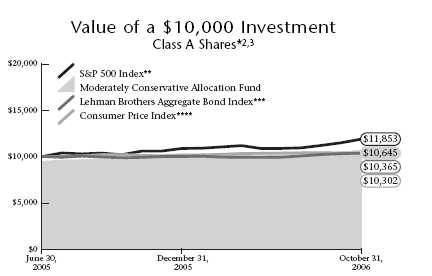
Thrivent Moderately Conservative Allocation Fund earned a total return of 10.94% as compared to the median return to its peer group, the Lipper Mixed Asset Target Allocation Conservative Funds, of 11.15% . The Fund’s market benchmarks, the S&P 500 Index and the Lehman Brothers Aggregate Bond Index, earned total returns of 16.35% and 5.19%, respectively.
What factors affected the Fund’s performance?
Our overweighted position in risk asset classes aided Fund returns early in the reporting season. Investors determined the volatile weather season of 2005 would not have a long-term harmful effect on the economy, and equity and fixed-income groups staged a strong rally. Early in 2006, we determined that equity return expectations in higher-risk equity categories were no longer sufficient to justify an overweighting of those groups.
We reduced equity exposure to our long-term target levels and biased assets within the equity portfolios to large-cap stocks, a group providing a reasonable expectation of return at lower levels of volatility and good valuation support. We increased allocations to the fixed-income portfolios of the Fund, as groups within that segment appeared to offer attractive and competitive returns, but at more reasonable valuations than some of the more speculative groups.
Our allocation mix benefited the Fund during the period of equity market weakness that ensued in the spring. The subsequent recovery in late summer and to the end of the reporting period continued to favor better-quality segments of the market. A limited exposure to Treasury bonds in the summer moderated the returns to the fixed-income portfolios, as long-maturity Treasury notes and bonds provided the best returns in fixed-income in the third quarter. We modestly reduced maturities late in the period, as interest rates on the highest-quality segments of the fixed-income market declined to levels we feel are unlikely to be sustained. In equities, we remain biased toward the large-cap segment and at long-term target allocations for the overall Fund.
What is your outlook?
We are in the maturing stage of the economic cycle, in addition to the stock market advance that coincided with the onset of the 2001-2002 economic recovery. That fact does not preclude a continuation of the economic recovery or the
| Top 10 Holdings | |
| (% of Portfolio) | |
| |
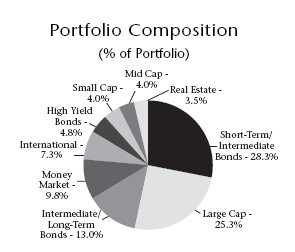
| Thrivent Limited Maturity Bond Fund | 28.3% |
| Thrivent Income Fund | 13.0% |
| Thrivent Large Cap Growth Fund | 9.9% |
| Thrivent Money Market Fund | 9.8% |
| Thrivent Large Cap Stock Fund | 8.1% |
| Thrivent Partner International Stock Fund | 7.3% |
| Thrivent Large Cap Value Fund | 7.3% |
| Thrivent High Yield Fund | 4.8% |
| Thrivent Small Cap Stock Fund | 4.0% |
| Thrivent Mid Cap Stock Fund | 4.0% |
| |
| |
| |
| These common stocks represent 96.5% of the total |
| investment portfolio. | |
Quoted Fund performance is for Class A shares and does not reflect a sales charge. The returns shown do not reflect taxes a shareholder would pay on distributions or redemptions. Quoted Portfolio Composition and Top 10 Holdings are subject to change.
10
stock market advance, but it suggests that risks to both are higher, and a heightened level of attentiveness is appropriate. As is often the case, inflation pressures have taken hold domestically in an environment of tighter labor markets and increased factory utilization. Policy actions have been initiated to contain inflation risk, specifically higher short-term interest rates, and while we expect those actions to be successful, they bring with them some risk of policy error.
Within this cycle, trends are exacerbated by the extraordinary demands related to the emerging economies of China, India and other former “third world” economies, particularly in those segments most sensitive to developing economies, such as raw materials, energy and capital goods. At present, we are maintaining our stock/bond allocation at long-term targets. We have a bias to large-cap equity portfolios, which appear to offer good valuations at acceptable levels of volatility, given our risk preferences. Within fixed-income, we have reduced maturities and improved credit quality within the corporate portfolios, as risk premiums are not at levels consistent with overweighting toward low-quality.
| | | Portfolio Facts |
| | | As of October 31, 2006 | |
| | | A Share | Institutional Share |
| | | ————————— | ————————— |
| Ticker | | TCAAX | TCAIX |
| Transfer Agent ID | 035 | 465 |
| Net Assets | | $156,934,114 | $6,498,306 |
| NAV | | $10.91 | $10.93 |
| NAV — High† | | 10/26/2006 — $10.93 | 10/26/2006 — $10.95 |
| NAV — Low† | | 11/1/2005 — $10.13 | 11/1/2005 — $10.14 |
| Number of Holdings: 11 | | † For the year ended October 31, 2006 |
| Average Annual Total Returns2 |
| As of October 31, 2006 | |
| |
| | | From |
| | | Inception |
| Class A1 | 1-Year | 6/30/2005 |
|
| without sales charge | 10.94% | 9.31% |
| with sales charge | 4.83% | 4.80% |
| |
| | | From |
| | | Inception |
| Institutional Class1 | 1-Year | 6/30/2005 |
|
| Net Asset Value | 11.35% | 9.72% |
1 Class A performance reflects the maximum sales charge of 5.5% . Institutional Class shares have no sales load and are for institutional shareholders only.
2 Past performance is not an indication of future results. Annualized total returns represent past performance and reflect changes in share prices, the reinvestment of all dividends and capital gains, and the effects of compounding. Periods of less than one year are not annualized. Investing in a mutual fund involves risks, including the possible loss of principal. The prospectus contains more complete information on the investment objectives, risks, charges and expenses of the investment company which investors should read and consider carefully before investing. To obtain a prospectus, contact a registered representative or visit www.thrivent.com. At various times, the Fund’s adviser waived its management fee and/or reimbursed Fund expenses. Had the adviser not done so, the Fund’s total returns would have been lower. The re turns shown do not reflect taxes a shareholder would pay on distributions or redemptions. Please read your prospectus carefully.
3 Performance of other classes will be greater or less than the line shown based on the differences in loads and fees paid by shareholders investing in the different classes.
* As you compare performance, please note that the Fund’s performance reflects the maximum 5.5% sales charge, while the Consumer Price Index, the S&P 500 Index and the Lehman Brothers Aggregate Bond Index do not reflect any such charges. If you were to purchase any of the above individual stocks or funds represented in these Indexes, any charges you would pay would reduce your total return as well.
** The S&P 500 Index is an index that represents the average performance of a group of 500 large-capitalization stocks. It is not possible to invest directly in the Index. The performance of the Index does not reflect deductions for fees, expenses or taxes.
*** The Lehman Brothers Aggregate Bond Index is an index that measures the performance of U.S. investment grade bonds. It is not possible to invest directly in the Index. The performance of the Index does not reflect deductions for fees, expenses or taxes.
**** The Consumer Price Index is an inflationary indicator that measures the change in the cost of a fixed basket of products and services, including housing, electricity, food and transportation. It is not possible to invest directly in the Index.
11

How did the Fund perform during the 12-month
period ended Oct. 31, 2006?
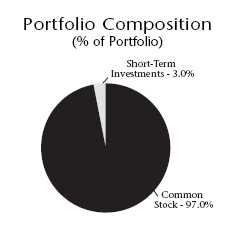
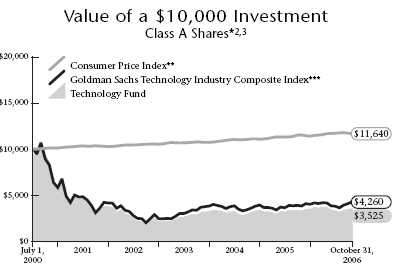
Thrivent Technology Fund earned a total return of 7.18% as compared to the median return of its peer group, the Lipper Inc. Science and Technology Funds, of 9.91% . The Fund’s market benchmark, the Goldman Sachs Technology Industry Composite Index, earned a total return of 10.84% .
What factors affected the Fund’s performance?
Underperformance was driven primarily by our broader allocations to segments outside the traditional information technology sectors, such as health care and telecommunications. Asset selection was also a negative overall contributor, with Fund performance falling short as a function of insufficient exposure to the better-performing companies in certain segments, as well as sub-par returns in select Fund holdings.
Our underweighted holdings in top-performing technology hardware names Hewlett-Packard and Cisco Systems more than offset our successful positions in Apple Computer, Symbol Technologies and Network Appliances. In communications equipment, poor performance from our holding in Juniper Networks and below average exposure to the strong returns realized by Research in Motion limited our advance. Within software, we were not sufficiently exposed to the recovery in operating results and subsequent better performance achieved in Oracle. The underperformance of our open-source bets in Red Hat and Novell offset our successful holdings in infrastructure, security and content like BEA Systems, RSA Security and Adobe Systems.
Our semiconductor holdings were positive contributors to relative performance, as our emphasis on application-specific and specialty companies like NVIDIA, Freescale Semiconductor and FormFactor achieved excellent results, relative to our holdings in bellwethers like Texas Instruments and Applied Materials, which achieved positive returns but not as strong as the Index.
What is your outlook?
Solid capital spending trends sustain our optimism regarding steady technology expenditure growth at the enterprise level of 6-8% — especially within communications, storage and software. Thus, our enthusiasm for consumer-oriented

| Top 10 Holdings | |
| (% of Portfolio) | |
| |
| Google, Inc. | 3.9% |
| Cisco Systems, Inc. | 3.8% |
| Intel Corporation | 3.5% |
| Apple Computer, Inc. | 3.2% |
| Texas Instruments, Inc. | 3.1% |
| Applied Materials, Inc. | 3.1% |
| Yahoo!, Inc. | 2.7% |
| Integrated Device Technology, Inc. | 2.4% |
| Adobe Systems, Inc. | 2.3% |
| EMC Corporation | 2.2% |
| |
| |
| |
| |
| These common stocks represent 30.2% of the total | |
| investment portfolio. | |
Quoted Fund performance is for Class A shares and does not reflect a sales charge.
The returns shown do not reflect taxes a shareholder would pay on distributions or redemptions.
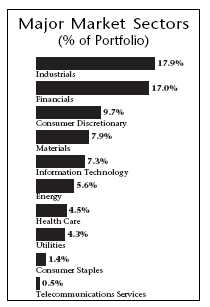
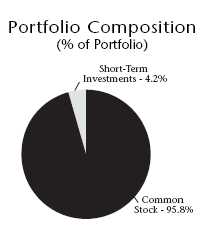
Quoted Major Market Sectors, Portfolio Composition and Top 10 Holdings are subject to change.
The lists of Major Market Sectors and Top 10 Holdings exclude short-term investments and collateral held for securities loaned.
The Portfolio Composition chart excludes collateral held for securities loaned.
12
Apple, Google and Yahoo! is complemented by storage plays EMC Corp and Network Appliances; business intelligence software makers Hyperion Solutions and Informatica Corp; service-oriented architecture companies Red Hat and BEA Systems; as well as enterprise-level infrastructure providers Cisco Systems, Citrix Systems and TIBCO Software Inc.
We think regulatory concerns and exaggerated risk premiums have created significant opportunities within the biotechnology and medical device sectors, as well, and we have above-average exposure to concentrated, higher-growth companies in both categories.
| | | Portfolio Facts | |
| | | As of October 31, 2006 | |
| | A Share | B Share | Institutional Share |
| | ————————— | ————————— | ————————— |
| Ticker | AATSX | | BBTSX | THTIX |
| Transfer Agent ID | 028 | | 078 | 098 |
| Net Assets | $40,089,692 | | $2,377,404 | $2,139,133 |
| NAV | $3.73 | | $3.56 | $3.93 |
| NAV — High† | 4/20/2006 — $3.97 | 4/20/2006 — $3.80 | 4/20/2006 — $4.17 |
| NAV — Low† | 7/21/2006 — $3.21 | 7/21/2006 — $3.07 | 7/21/2006 — $3.38 |
| Number of Holdings: 107 | | † For the year ended October 31, 2006 | |
| Average Annual Total Returns2 |
| As of October 31, 2006 | |
| |
| | | | From |
| | | | Inception |
| Class A1 | 1-Year | 5 Years | 7/1/2000 |
|
| without sales charge | 7.18% | 1.46% | (14.42%) |
| with sales charge | 1.36% | 0.32% | (15.18%) |
| |
| | | | From |
| | | | Inception |
| Class B1 | 1-Year | 5 Years | 7/1/2000 |
|
| without sales charge | 6.59% | 0.81% | (14.98%) |
| with sales charge | 2.59% | 0.81% | (14.98%) |
| |
| | | | From |
| | | | Inception |
| Institutional Class1 | 1-Year | 5 Years | 7/1/2000 |
|
| Net Asset Value | 7.67% | 2.23% | (13.71%) |
1 Class A performance reflects the maximum sales charge of 5.5% . Class B performance reflects the maximum contingent deferred sales charge (CDSC) of 5%, declining 1% each year during the first five years and then converting to Class A shares after the fifth year. Institutional Class shares have no sales load and are for institutional shareholders only.
2 Past performance is not an indication of future results. Annualized total returns represent past performance and reflect changes in share prices, the reinvestment of all dividends and capital gains, and the effects of compounding. Investing in a mutual fund involves risks, including the possible loss of principal. The prospectus contains more complete information on the investment objectives, risks, charges and expenses of the investment company which investors should read and consider carefully before investing. To obtain a prospectus, contact a registered representative or visit www.thrivent.com. The Fund primarily invests in technology-related industries; as a consequence, the Fund may be subject to greater price volatility than a fund investing in a broad range of industries. At various times, the Fund’s adviser waived its m anagement fee and/or reimbursed Fund expenses. Had the adviser not done so, the Fund’s total returns would have been lower. The returns shown do not reflect taxes a shareholder would pay on distributions or redemptions. Please read your prospectus carefully.
3 Performance of other classes will be greater or less than the line shown based on the differences in loads and fees paid by shareholders investing in the different classes.
* As you compare performance, please note that the Fund’s performance reflects the maximum 5.5% sales charge, while the Consumer Price Index and Goldman Sachs Technology Industry Composite Index do not reflect any such charges. If you were to purchase any of the above individual stocks or funds represented in these Indexes, any charges you would pay would reduce your total return as well.
** The Consumer Price Index is an inflationary indicator that measures the change in the cost of a fixed basket of products and services, including housing, electricity, food and transportation. It is not possible to invest directly in the Index.
*** The Goldman Sachs Technology Industry Composite Index is a modified capitalization-weighted index of selected technology stocks. It is not possible to invest directly in the Index. The performance of the Index does not reflect deductions for fees, expenses or taxes.
13

How did the Fund perform during the 12-month
period ended Oct. 31, 2006?
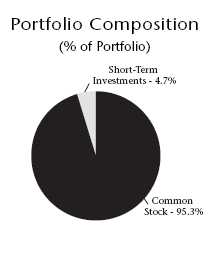
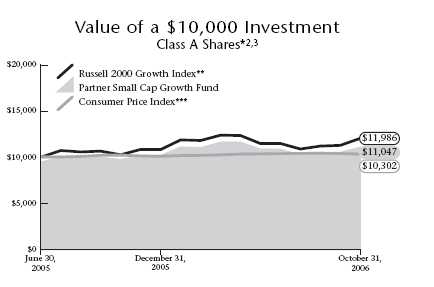
Thrivent Partner Small Cap Growth Fund earned a total return of 13.72% as compared to the median return to its peer group, the Lipper Inc. Small Cap Growth Funds, of 12.93% . The Fund’s market benchmark, the Russell 2000 Growth Index, earned a total return of 17.07% .
What factors affected the Fund’s performance?
The Fund’s less-than-Index performance was in large part due to stock selection within the information technology and industrials segments of the Fund. Counterbalancing those results to some extent was stock selection within other sectors of the Fund, such as health care, financials and consumer staples, but those results were not sufficient enough to offset the drag created in groups previously highlighted.
Software companies within the information technology group were the main source of sub-par returns. As a group, information technology stocks did not advance as much as the broader small-cap growth indices, and within this sector, companies in the Internet software industry faired even more poorly. Stock values in software companies owned in the Fund, such as Jupitermedia Cos. and Websense Inc., declined during a period of good returns to other segments, and we did not own positions in a timely fashion in stocks that advanced over the year. Our holdings in semiconductor industry stocks, like Atheros Communications and PMC-Sierra Inc., also detracted from our results, as did our position in Intermec Inc. in the information technology equipment industry. Some holdings in the technology segment of the Fund did perform well, such as Global Imaging Systems and Trimble Navigation Ltd. in the electronic technology and equipment industry, but those situations were not sufficient in terms of magnitude or frequency to offset weaker segments of the Fund.
The health care sector of the Fund provided the most value over the reporting period, driven by strong stock selection in the life sciences segment and health care equipment industry. Illumina Inc., a provider of equipment and analysis equipment to the genomics industry, realized excellent returns. Serologicals Corp. provides technologies and services in support of research in the biological research industry and also experienced a strong advance in price in the Fund. Companies in the managed care industry, such as our holdings in WellCare Group Inc. and Sierra Health also provided excellent returns. The financial segment of the Fund also contributed nicely to returns, as holdings in the asset manage ment industry or real estate management industry like Cohen & Steers advanced with the move-up in the equity

| Top 10 Holdings | |
| (% of Portfolio) | |
| |
| Digital Insight Corporation | 2.0% |
| Dril-Quip, Inc. | 1.8% |
| ValueClick, Inc. | 1.7% |
| American Medical Systems Holdings, Inc. | 1.4% |
| Inverness Medical Innovations, Inc. | 1.3% |
| Mentor Corporation | 1.3% |
| IBRD Discount Note | 1.3% |
| Gardner Denver, Inc. | 1.2% |
| Shuffle Master, Inc. | 1.2% |
| CRA International, Inc. | 1.1% |
| |
| |
| |
| |
| These common stocks represent 14.3% of the total | |
| investment portfolio. | |
Quoted Fund performance is for Class A shares and does not reflect a sales charge.
The returns shown do not reflect taxes a shareholder would pay on distributions or redemptions.
Quoted Major Market Sectors, Portfolio Composition and Top 10 Holdings are subject to change.
The lists of Major Market Sectors and Top 10 Holdings exclude short-term investments and collateral held for securities loaned.
The Portfolio Composition chart excludes collateral held for securities loaned. |
14
and commercial real estate markets. Investment banking companies performed well in an environment that saw increased takeover activity.
What is your outlook?
There has been a steady reduction in the market’s price/earnings multiple since 2002. During that time, corporate profits are up more than 120%, but the market is up only about 70%. Despite the general compression in valuations for equities, small-cap stocks have provided a leadership position for over five years now, and a shift to the larger-cap segments of the market is possibly at hand.
We believe the Fund is well positioned for the coming months. We have anticipated since the beginning of the year that a slowing economy would arrive, easing the upward pressure on interest rates and inflation, and favoring companies that can generate growth independent of the U.S. economic cycle. As of now, it appears the Federal Reserve has engineered that slowdown without precipitating a recession, and consumer spending, though weaker, is not declining dramatically.
| | | Portfolio Facts |
| | | As of October 31, 2006 | |
| | A Share | Institutional Share |
| | ————————— | ————————— |
| Ticker | TPSAX | | TPGIX |
| Transfer Agent ID | 063 | | 463 |
| Net Assets | $11,985,224 | | $29,307,704 |
| NAV | $11.69 | | $11.73 |
| NAV — High† | 5/8/2006 — $12.56 | 5/8/2006 — $12.59 |
| NAV — Low† | 11/1/2005 — $10.18 | 11/1/200 — $10.18 |
| Number of Holdings: 178 | | † For the year ended October 31, 2006 |
| Average Annual Total Returns2 |
| As of October 31, 2006 | |
| |
| | | From |
| | | Inception |
| Class A1 | 1-Year | 6/30/2005 |
|
| without sales charge | 13.72% | 12.39% |
| with sales charge | 7.44% | 7.75% |
| |
| | | From |
| | | Inception |
| Institutional Class1 | 1-Year | 6/30/2005 |
|
| Net Asset Value | 14.11% | 12.68% |
1 Class A performance reflects the maximum sales charge of 5.5% . Institutional Class shares have no sales load and are for institutional shareholders only.
2 Past performance is not an indication of future results. Annualized total returns represent past performance and reflect changes in share prices, the reinvestment of all dividends and capital gains, and the effects of compounding. Periods of less than one year are not annualized. Investing in a mutual fund involves risks, including the possible loss of principal. The prospectus contains more complete information on the investment objectives, risks, charges and expenses of the investment company which investors should read and consider carefully before investing. To obtain a prospectus, contact a registered representative or visit www.thrivent.com. At various times, the Fund’s adviser waived its management fee and/or reimbursed Fund expenses. Had the adviser not done so, the Fund’s total returns would have been lower. The re turns shown do not reflect taxes a shareholder would pay on distributions or redemptions. Please read your prospectus carefully.
3 Performance of other classes will be greater or less than the line shown based on the differences in loads and fees paid by shareholders investing in the different classes.
* As you compare performance, please note that the Fund’s performance reflects the maximum 5.5% sales charge, while the Consumer Price Index, and the Russell 2000 Growth Index do not reflect any such charges. If you were to purchase any of the above individual stocks or funds represented in these Indexes, any charges you would pay would reduce your total return as well.
** The Russell 2000 Growth Index is an index comprised of companies with a greater than average growth orientation within the Russell 2000 Index. The Russell 2000 Index is comprised of the 2,000 smaller companies in the Russell 3000 Index, which represents the 3,000 largest companies based on market capitalization and is designed to represent the performance of about 98% of the U.S. equity market. It is not possible to invest directly in the Index. The performance of the Index does not reflect deductions for fees, expenses or taxes.
*** The Consumer Price Index is an inflationary indicator that measures the change in the cost of a fixed basket of products and services, including housing, electricity, food and transportation. It is not possible to invest directly in the Index.
15

How did the Fund perform during the 12-month
period ended Oct. 31, 2006?
Thrivent Partner Small Cap Value Fund earned a total return of 19.08% as compared to the median return to its peer group, the Lipper Inc. Small Cap Value Funds, of 16.73% . The Fund’s market benchmark, the Russell 2000 Value Index, earned a total return of 22.90% .
What factors affected the Fund’s performance?
Performance in the period was excellent on an absolute basis but was moderately below the Index, primarily due to stock selection within the materials and consumer discretionary sectors. Stocks in the energy, health care, financial and information technology segments provided good returns versus their respective sectors, but we did not have sufficient exposure to those segments to fully offset the effect of the other groups.
Within the consumer discretionary group, our holding in Ruby Tuesday within the restaurant industry did not fully participate in the advance seen by other stocks within the group. We experienced weakness in Cutter and Buck Inc. in the apparel industry and CSS Industries Inc. in the retail segment. Other holdings in retail that held back overall results were Hancock Fabrics and Stein Mart Inc. We held small positions in the homebuilding sector, a group that did not help performance over the full period, although we were encouraged to see the stocks stabilize in the second half.
Our holdings in the financial sector performed well, but we limited our representation in the group versus the benchmark, as we do not have the conviction to carry the signifi-cant weights that would be indicated in this segment —almost one-third of the Fund. Within the group, our holdings in REITs and real estate management company Trammel Crow Co. performed very well. Regional broker Piper Jaffray also achieved excellent results for the Fund. In health care, holdings in West Pharmaceutical Services and Arrow International achieved solid returns, as did our position in National Healthcare Corp. An overweighted position in the energy equipment and services industry and strong performance from our holdings in the group Tetra Technology and W-H Energy Services both added to our results.
| Top 10 Holdings | |
| (% of Portfolio) | |
| |
| Texas Regional Bancshares, Inc. | 1.4% |
| ProAssurance Corporation | 1.3% |
| Whiting Petroleum Corporation | 1.1% |
| Hub Group, Inc. | 1.1% |
| Kirby Corporation | 1.1% |
| First Republic Bank | 1.0% |
| Owens & Minor, Inc. | 1.0% |
| Southwest Gas Corporation | 0.9% |
| Glenborough Realty Trust, Inc. | 0.9% |
| Genesee & Wyoming, Inc. | 0.9% |
| |
| |
| |
| |
| These common stocks represent 10.7% of the total | |
| investment portfolio. | |
Quoted Fund performance is for Class A shares and does not reflect a sales charge.
The returns shown do not reflect taxes a shareholder would pay on distributions or redemptions.
Quoted Major Market Sectors, Portfolio Composition and Top 10 Holdings are subject to change.
The lists of Major Market Sectors and Top 10 Holdings exclude short-term investments and collateral held for securities loaned.
The Portfolio Composition chart excludes collateral held for securities loaned. |
16
What is your outlook?
Despite evidence of a general slowdown in the economy, we continue to hold a positive outlook. Falling gasoline prices should help support consumer spending and reduce costs for businesses. Equity valuations look attractive, compared to bonds, and corporate profits should continue to rise, albeit at a slower rate. The cycle of outperformance by small-cap stocks over large-cap ended in the spring, and large-cap stocks remain more attractive from a valuation perspective, even though they have outperformed small-cap issues over the last six months. Nonetheless, we continue to find attractive opportunities among small-cap value stocks.
| | | | Portfolio Facts | |
| | | | As of October 31, 2006 | |
| | | A Share | B Share | Institutional Share |
| | | ————————— | | ————————— | ————————— |
| Ticker | | AALVX | BBSVX | TPSIX |
| Transfer Agent ID | 032 | | 082 | 099 |
| Net Assets | | $79,823,328 | $5,485,375 | $44,935,938 |
| NAV | | $15.65 | | $14.89 | $16.26 |
| NAV — High† | | 5/9/2006 — $16.08 | | 5/9/2006 — $15.37 | 5/9/2006 — $16.65 |
| NAV — Low† | | 12/19/2005 — $13.43 | | 12/20/2005 — $12.85 | 12/30/2005 — $13.92 |
| Number of Holdings: 142 | | † For the year ended October 31, 2006 | |
| Average Annual Total Returns2 |
| As of October 31, 2006 | |
| |
| | | | From |
| | | | Inception |
| Class A1 | 1-Year | 5 Years | 7/17/2001 |
|
| without sales charge | 19.08% | 15.71% | 13.60% |
| with sales charge | 12.52% | 14.41% | 12.40% |
| |
| | | | From |
| | | | Inception |
| Class B1 | 1-Year | 5 Years | 7/17/2001 |
|
| without sales charge | 17.99% | 14.67% | 12.66% |
| with sales charge | 13.99% | 14.67% | 12.66% |
| |
| | | | From |
| | | | Inception |
| Institutional Class1 | 1-Year | 5 Years | 7/17/2001 |
|
| Net Asset Value | 19.85% | 16.60% | 14.47% |

1 Class A performance reflects the maximum sales charge of 5.5% . Class B performance reflects the maximum contingent deferred sales charge (CDSC) of 5%, declining 1% each year during the first five years and then converting to Class A shares after the fifth year. Institutional Class shares have no sales load and are for institutional shareholders only.
2 Past performance is not an indication of future results. Annualized total returns represent past performance and reflect changes in share prices, the reinvestment of all dividends and capital gains, and the effects of compounding. Investing in a mutual fund involves risks, including the possible loss of principal. The prospectus contains more complete information on the investment objectives, risks, charges and expenses of the investment company which investors should read and consider carefully before investing. To obtain a prospectus, contact a registered representative or visit www.thrivent.com. At various times, the Fund’s adviser waived its management fee and/or reimbursed Fund expenses. Had the adviser not done so, the Fund’s total returns would have been lower. The returns shown do not reflect taxes a shareholder wou ld pay on distributions or redemptions. Please read your prospectus carefully.
3 Performance of other classes will be greater or less than the line shown based on the differences in loads and fees paid by shareholders investing in the different classes.
* As you compare performance, please note that the Fund’s performance reflects the maximum 5.5% sales charge, while the Russell 2000 Value Index and the Consumer Price Index do not reflect any such charges. If you were to purchase any of the above individual stocks or funds represented in these Indexes, any charges you would pay would reduce your total return as well.
** The Russell 2000 Value Index is an index comprised of companies with a greater than average value orientation within the Russell 2000 Index. It is not possible to invest directly in these Indexes. The performance of these Indexes does not reflect deductions for fees, expenses or taxes.
*** The Consumer Price Index is an inflationary indicator that measures the change in the cost of a fixed basket of products and services, including housing, electricity, food and transportation. It is not possible to invest directly in the Index.
17

How did the Fund perform during the 12-month
period ended Oct. 31, 2006?
Thrivent Small Cap Stock Fund’s total return of 16.04% equaled the median return of its peer group, the Lipper Inc. Small Cap Core Funds, also 16.04% . The Fund’s market benchmark, the Russell 2000 Index, earned a total return of 19.98% .
What factors affected the Fund’s performance?
Much of the increase of the Russell 2000 was driven by a sig-nificant rally of what we would evaluate and measure as lower-quality stocks. Stocks with no earnings, very low returns on equity and high valuations performed very well during the time period. Given that we generally invest in companies that generate meaningful cash flow and high returns on capital, we did not fully participate in this low-quality rally. In time, we believe that the stocks of these “lower-quality” companies will return to appropriate levels and that the better-quality companies within the group will be afforded the suitable valuations.
Stock selection within the health care segment had the most limiting impact on performance during the time period. Several of our holdings in medical equipment stocks declined significantly. These positions included DexCom, a glucose monitoring company, and Cyberonics, which manufactures devices for the treatment of epilepsy, depression and other diseases. In addition, we did not participate in the many large gains within the sector during the year.
Our industrial holdings added to the Fund’s relative performance during the time period. As a result of our belief that the economy would remain healthy, we maintained a significant overweighted stance. Within the industrial sector, several of our machinery and commercial services holding performed particularly well. Manitowoc Company, a manufacturer of cranes and food service equipment, more than doubled, while Standard Parking, which manages parking lots and garages, increased by more than 80%.

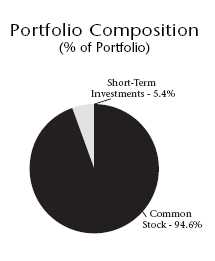
| Top 10 Holdings | |
| (% of Portfolio) | |
| |
| HCC Insurance Holdings, Inc. | 0.8% |
| URS Corporation | 0.8% |
| Affiliated Managers Group, Inc. | 0.7% |
| Genlyte Group, Inc. | 0.7% |
| Baldor Electric Company | 0.6% |
| Casey's General Stores, Inc. | 0.6% |
| Watson Wyatt Worldwide, Inc. | 0.6% |
| Roper Industries, Inc. | 0.6% |
| Pacer International, Inc. | 0.6% |
| Waste Connections, Inc. | 0.6% |
| |
| |
| |
| |
| These common stocks represent 6.6% of the total | |
| investment portfolio. | |
Quoted Fund performance is for Class A shares and does not reflect a sales charge.
The returns shown do not reflect taxes a shareholder would pay on distributions or redemptions.
Quoted Major Market Sectors, Portfolio Composition and Top 10 Holdings are subject to change.
The lists of Major Market Sectors and Top 10 Holdings exclude short-term investments and collateral held for securities loaned.
The Portfolio Composition chart excludes collateral held for securities loaned.
18
What is your outlook?
As result of slowing economic growth, relatively full valuation levels and a wide breadth of stock ownership, we do not expect the small-cap sector as a whole to offer the premium return levels achieved over the last few years. That said, we continue to find opportunities. Due to our belief that corporations have underinvested in plant and equipment over the last nine years, we still like the industrial sector. Also, we like particular niches within technology, particularly businesses that help companies operate more efficiently. While we are cautious about the consumer sector, we think continued job stability and potential wage gains may allow consumer spending to hang on for another year or two. In addition, while we believe that the slowdown in housing will have a significant negative impact on certain industries and regions, we do not believe the housing slowdown will be the specific cause of a recession or economic crisis. Subsequently , we are beginning to make selective investments in the consumer sector.
| | | | Portfolio Facts | |
| | | | As of October 31, 2006 | |
| | | A Share | B Share | Institutional Share |
| | | ————————— | | ————————— | ————————— |
| Ticker | | AASMX | BBSMX | TSCSX |
| Transfer Agent ID | 024 | | 074 | 094 |
| Net Assets | | $457,563,835 | $16,264,995 | $85,145,646 |
| NAV | | $18.48 | | $16.44 | $19.82 |
| NAV — High† | | 5/9/2006 — $19.20 | | 5/9/2006 — $17.17 | 5/9/2006 — $20.54 |
| NAV — Low† | | 12/19/2005 — $16.60 | | 12/19/2005 — $14.89 | 12/19/2005 — $17.71 |
| Number of Holdings: 244 | | † For the year ended October 31, 2006 | |
| Average Annual Total Returns2 |
| As of October 31, 2006 | |
| |
| Class A1 | 1-Year | 5 Years | 10 Years |
|
| without sales charge | 16.04% | 12.51% | 10.69% |
| with sales charge | 9.63% | 11.25% | 10.07% |
| |
| | | | From |
| | | | Inception |
| Class B1 | 1-Year | 5 Years | 1/8/1997 |
|
| without sales charge | 14.86% | 11.40% | 9.78% |
| with sales charge | 10.86% | 11.40% | 9.78% |
| |
| | | | From |
| | | | Inception |
| Institutional Class1 | 1-Year | 5 Years | 12/29/1997 |
|
| Net Asset Value | 16.68% | 13.22% | 10.66% |
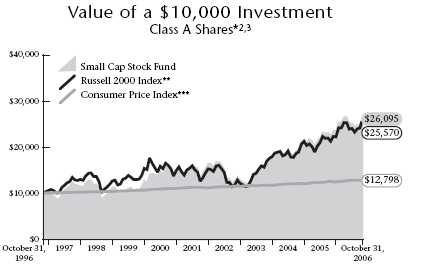
1 Class A performance reflects the maximum sales charge of 5.5% . Class B performance reflects the maximum contingent deferred sales charge (CDSC) of 5%, declining 1% each year during the first five years and then converting to Class A shares after the fifth year. Institutional Class shares have no sales load and are for institutional shareholders only.
2 Past performance is not an indication of future results. Annualized total returns represent past performance and reflect changes in share prices, the reinvestment of all dividends and capital gains, and the effects of compounding. Investing in a mutual fund involves risks, including the possible loss of principal. The prospectus contains more complete information on the investment objectives, risks, charges and expenses of the investment company which investors should read and consider carefully before investing. To obtain a prospectus, contact a registered representative or visit www.thrivent.com. At various times, the Fund’s adviser waived its management fee and/or reimbursed Fund expenses. Had the adviser not done so, the Fund’s total returns would have been lower. The returns shown do not reflect taxes a shareholder wou ld pay on distributions or redemptions. Please read your prospectus carefully.
3 Performance of other classes will be greater or less than the line shown based on the differences in loads and fees paid by shareholders investing in the different classes.
* As you compare performance, please note that the Fund’s performance reflects the maximum 5.5% sales charge, while the Russell 2000 Index and the Consumer Price Index do not reflect any such charges. If you were to purchase any of the above individual stocks or funds represented in these Indexes, any charges you would pay would reduce your total return as well.
** The Russell 2000 Index is an index comprised of the 2,000 smaller companies in the Russell 3000 index. It is not possible to invest directly in these Indexes. The performance of these Indexes does not reflect deductions for fees, expenses or taxes.
*** The Consumer Price Index is an inflationary indicator that measures the change in the cost of a fixed basket of products and services, including housing, electricity, food and transportation. It is not possible to invest directly in the Index.
19

How did the Fund perform during the 12-month
period ended Oct. 31, 2006?
Thrivent Small Cap Index Fund earned a total return of 15.08% as compared to the median return to its peer group, the Lipper Inc. Small Cap Core Funds, of 16.04% . The Fund’s market benchmark, the S&P SmallCap 600 Index, earned a total return of 16.11% .
What factors affected the Fund’s performance?
The Fund is managed to align with the performance of the S&P SmallCap 600 Index, a benchmark for small-stock performance. We seek to maintain a fully invested position with limited transactions to minimize costs. As typically occurs with an index fund, the difference in performance between the benchmark index and the fund itself can be largely attributed to expenses and minor differences in portfolio composition often related to managing cash flows of the fund.
Small-cap stocks outperformed mid-cap stocks, but slightly underperformed large-cap stocks for the last twelve months. Fund segment returns were varied, with groups like industrials, materials, financial, consumer staples and energy besting the average for the Index. Consumer discretionary, health care and information technology segments provided attractive absolute returns but below the level of the overall Index. Volatility was high in this segment during the reporting period, with particularly strong returns in the first six months, followed by a sharp correction in May and June. Investors appear to have adjusted their preferences for risky assets in light of a more aggressive policy stance toward inflation risks on the part of central bankers around the world. Small-cap stocks tend to be more leveraged to changes in the momentum of the economy, and concerns about an economic slowdown weighed on this group over the summer. Returns improv ed late in the period but were more in line with other market segments.
What is your outlook?
The Fund will remain fully invested in stocks designed to track the performance of the S&P SmallCap 600 Index. This offers individuals an attractive way to take advantage of the growth potential of the broad, diversified marketplace of small-cap stocks.
Small-cap stocks have enjoyed a return premium over larger-cap issues in recent years. With uncertainty growing over the strength of the U.S. economy and an ongoing inflation
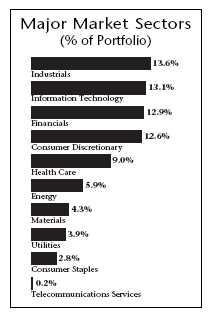

| Top 10 Holdings | |
| (% of Portfolio) | |
| |
| Manitowoc Company, Inc. | 0.5% |
| Frontier Oil Corporation | 0.4% |
| Cerner Corporation | 0.4% |
| Energen Corporation | 0.4% |
| Essex Property Trust, Inc. | 0.4% |
| Global Payments, Inc. | 0.4% |
| Cimarex Energy Company | 0.4% |
| JLG Industries, Inc. | 0.4% |
| Helix Energy Solutions Group, Inc. | 0.4% |
| NVR, Inc. | 0.4% |
| |
| |
| |
| |
| These common stocks represent 4.1% of the total | |
| investment portfolio. | |
Quoted Fund performance is for Class A shares and does not reflect a sales charge.
The returns shown do not reflect taxes a shareholder would pay on distributions or redemptions.
Quoted Major Market Sectors, Portfolio Composition and Top 10 Holdings are subject to change.
The lists of Major Market Sectors and Top 10 Holdings exclude short-term investments and collateral held for securities loaned.
The Portfolio Composition chart excludes collateral held for securities loaned. |
20
threat, investors adjusted their preferences away from riskier aspects of the equity markets. Large-cap stocks rallied, relative to small-cap issues, in the second half of the period. Whether this marks a period of rotation in the markets and a sustained shift to more blue chip names remains to be seen. Often the maturing stages of an economic cycle tend to favor large-cap stocks in the equity marketplace. We still believe there is solid opportunity in the small-cap arena, but the premium returns earned in the small-cap segment are likely to be more in line with long-term averages going forward.
| | Portfolio Facts |
| | As of October 31, 2006 |
| | A Share |
| | ————————— |
| Ticker | AALSX |
| Transfer Agent ID | 029 |
| Net Assets | $48,027,112 |
| NAV | $16.11 |
| NAV — High† | 5/8/2006 — $16.72 |
| NAV — Low† | 11/1/2005 — $14.24 |
| Number of Holdings: 603 | † For the year ended October 31, 2006 |
| Average Annual Total Returns2 |
| As of October 31, 2006 | |
| |
| | | | From |
| | | | Inception |
| Class A1 | 1-Year | 5 Years | 7/1/2000 |
|
| without sales charge | 15.08% | 13.71% | 9.43% |
| with sales charge | 8.76% | 12.44% | 8.46% |

1 Class A performance reflects the maximum sales charge of 5.5% .
2 Past performance is not an indication of future results. Annualized total returns represent past performance and reflect changes in share prices, the reinvestment of all dividends and capital gains, and the effects of compounding. Investing in a mutual fund involves risks, including the possible loss of principal. The prospectus contains more complete information on the investment objectives, risks, charges and expenses of the investment company which investors should read and consider carefully before investing. To obtain a prospectus, contact a registered representative or visit www.thrivent.com. At various times, the Fund’s adviser waived its management fee and/or reimbursed Fund expenses. Had the adviser not done so, the Fund’s total returns would have been lower. The returns shown do not reflect taxes a shareholder wou ld pay on distributions or redemptions. Please read your prospectus carefully.
* As you compare performance, please note that the Fund’s performance reflects the maximum 5.5% sales charge, while the S&P SmallCap 600 Index and the Consumer Price Index do not reflect any such charges. If you were to purchase any of the above individual stocks or funds represented in these Indexes, any charges you would pay would reduce your total return as well.
** The S&P SmallCap 600 Index is an index that represents the average performance of a group of 600 small capitalization stocks. “S&P SmallCap 600 Index” is a trademark of The McGraw-Hill Companies, Inc. and has been licensed for use by Thrivent Financial for Lutherans. The product is not sponsored, endorsed or promoted by Standard & Poor’s and Standard & Poor’s makes no representation regarding the advisability of investing in the product. Index funds are subject to the same market risks associated with the stocks in their respective indexes. It is not possible to invest directly in the Index. The performance of the Index does not reflect deductions for fees, expenses or taxes.
*** The Consumer Price Index is an inflationary indicator that measures the change in the cost of a fixed basket of products and services, including housing, electricity, food and transportation. It is not possible to invest directly in the Index.
21

How did the Fund perform during the 12-month
period ended Oct. 31, 2006?
Thrivent Mid Cap Growth Fund earned a total return of 10.83% as compared to the median return to its peer group, the Lipper Inc. Mid Cap Growth Funds, of 11.27% . The Fund’s market benchmark, the Russell MidCap Growth Index, earned a total return of 14.51% .
What factors affected the Fund’s performance?
The Fund did not fully participate in the advance in the Russell MidCap Growth Index. Stock selection in the health care segment of the Fund was the primary factor restraining the Fund’s progress this year. In the early months of 2006, lack of exposure to small-cap medical products companies that performed well in the benchmark hurt performance. Later in the year, poor operating performance on the part of two companies owned in the medical products industry, St. Jude Medical and Advanced Medical Optics, resulted in poor stock performance and limited the Fund’s advance. Our lack of exposure to better performing stocks in the pharmaceutical industry was another contributing factor.
On the other hand, companies owned in the basic material industries, particularly metals and mining stocks, were extremely strong in the reporting period. Allegheny Technologies, a company that produces specialty metals such as stainless steel, was an excellent performer in the Fund.
The Fund’s position in NuCor Steel also added nicely to performance. Telecommunication services, although a small part of the Fund, also provided very attractive returns, due primarily to strength in the wireless services industry. Two of the strongest performers in this segment of the Fund,
SBAC Communications and Crown Castle International, operate and lease towers for wireless communications. The Fund’s exposure to this industry, as well as the performance of our holdings in this segment, aided overall Fund results.
What is your outlook?
The consumer has been a key factor in maintaining economic momentum through the current economic cycle. We believe it will be difficult for consumers to sustain above-trend spending and growth as the economic cycle matures. An economic wildcard will be the impact of the anticipated weakness in the housing sector. As such, we have reduced our exposure to those industries and companies that could be seriously affected by an impaired consumer or from the housing recession. We have taken profits in several retail and restaurant stocks. We have an underweighted stance in financial stocks that may suffer adverse effects from impaired consumer credit.
We have also taken profits in many industrial names, as we believe the slowdown anticipated in the consumer sector will ultimately manifest itself in reduced demand for other
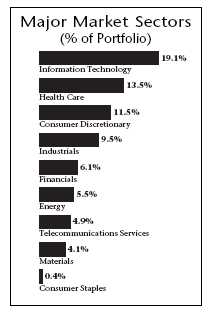
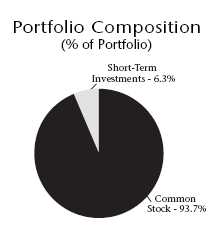
| Top 10 Holdings | |
| (% of Portfolio) | |
| |
| Praxair, Inc. | 1.0% |
| Precision Castparts Corporation | 1.0% |
| Adobe Systems, Inc. | 0.9% |
| Monster Worldwide, Inc. | 0.8% |
| International Game Technology | 0.8% |
| Gen-Probe, Inc. | 0.8% |
| Cameron International Corporation | 0.8% |
| St. Jude Medical, Inc. | 0.8% |
| NII Holdings, Inc. | 0.8% |
| KLA-Tencor Corporation | 0.8% |
| |
| |
| |
| |
| These common stocks represent 8.5% of the total | |
| investment portfolio. | |
Quoted Fund performance is for Class A shares and does not reflect a sales charge.
The returns shown do not reflect taxes a shareholder would pay on distributions or redemptions.
Quoted Major Market Sectors, Portfolio Composition and Top 10 Holdings are subject to change.
The lists of Major Market Sectors and Top 10 Holdings exclude short-term investments and collateral held for securities loaned.
The Portfolio Composition chart excludes collateral held for securities loaned. |
22
goods. We continue to favor technology names that have growth drivers that will be less affected by a slowdown in the economy. A key theme in the Fund is the continued increase in Web traffic and the resulting build-out of the Internet that must take place to service that traffic. We also continue to favor technology companies that provide productivity-enhancing goods and services to companies.
Over the last six months, we have refined our investment process to reduce the breadth of Fund’s holdings and focus the Fund’s resources on those investments that have strong business fundamentals and a sound plan for continuing to deliver above-average operating results. We believe those adjustments are consistent with your objectives of realizing the full potential of the opportunities offered by mid-cap growth companies.
| | | Portfolio Facts | |
| | | As of October 31, 2006 | |
| | A Share�� | B Share | Institutional Share |
| | ————————— | ————————— | ————————— |
| Ticker | LBMGX | LUGBX | LBMIX |
| Transfer Agent ID | 058 | | 358 | 458 |
| Net Assets | $264,605,392 | $26,417,246 | $32,279,496 |
| NAV | $16.17 | | $14.96 | $17.24 |
| NAV — High† | 4/20/2006 — $17.12 | 4/20/2006 — $15.93 | 4/20/206 — $18.18 |
| NAV — Low† | 7/21/2006 — $14.45 | 7/21/2006 — $13.40 | 7/21/2006 — $15.37 |
| Number of Holdings: 170 | | † For the year ended October 31, 2006 | |
| Average Annual Total Returns2 |
| As of October 31, 2006 | |
| |
| | | | From |
| | | | Inception |
| Class A1 | 1-Year | 5 Years | 5/30/1997 |
|
| without sales charge | 10.83% | 7.18% | 8.13% |
| with sales charge | 4.73% | 5.97% | 7.48% |
| |
| | | | From |
| | | | Inception |
| Class B1 | 1-Year | 5 Years | 10/31/1997 |
|
| without sales charge | 9.68% | 6.23% | 6.75% |
| with sales charge | 5.68% | 6.23% | 6.75% |
| |
| | | | From |
| | | | Inception |
| Institutional Class1 | 1-Year | 5 Years | 10/31/1997 |
|
| Net Asset Value | 11.66% | 8.14% | 7.95% |
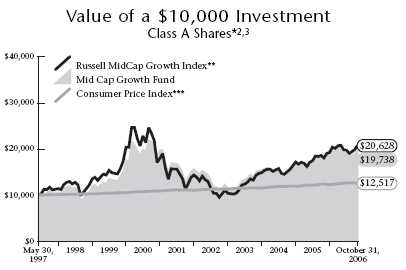
1 Class A performance reflects the maximum sales charge of 5.5% . Class B performance reflects the maximum contingent deferred sales charge (CDSC) of 5%, declining 1% each year during the first five years and then converting to Class A shares after the fifth year. Institutional Class shares have no sales load and are for institutional shareholders only.
2 Past performance is not an indication of future results. Annualized total returns represent past performance and reflect changes in share prices, the reinvestment of all dividends and capital gains, and the effects of compounding. Investing in a mutual fund involves risks, including the possible loss of principal. The prospectus contains more complete information on the investment objectives, risks, charges and expenses of the investment company which investors should read and consider carefully before investing. To obtain a prospectus, contact a registered representative or visit www.thrivent.com. At various times, the Fund’s adviser waived its management fee and/or reimbursed Fund expenses. Had the adviser not done so, the Fund’s total returns would have been lower. The returns shown do not reflect taxes a shareholder wou ld pay on distributions or redemptions. Please read your prospectus carefully.
3 Performance of other classes will be greater or less than the line shown based on the differences in loads and fees paid by shareholders investing in the different classes.
* As you compare performance, please note that the Fund’s performance reflects the maximum 5.5% sales charge, while the Russell MidCap Growth Index and the Consumer Price Index do not reflect any such charges. If you were to purchase any of the above individual stocks or funds represented in these Indexes, any charges you would pay would reduce your total return as well.
** The Russell MidCap Growth Index is an index comprised of companies with higher than average price-to-book ratios and higher forecasted growth values, within the Russell Midcap Index. It is not possible to invest directly in the Index.
*** The Consumer Price Index is an inflationary indicator that measures the change in the cost of a fixed basket of products and services, including housing, electricity, food and transportation. It is not possible to invest directly in these Indexes. The performance of these Indexes does not reflect deductions for fees, expenses, or taxes.
23

How did the Fund perform during the 12-month
period ended Oct. 31, 2006?
Thrivent Partner Mid Cap Value Fund earned a total return of 17.19% as compared to the median return to its peer group, the Lipper Inc. Mid Cap Value Funds, of 17.06% . The Fund’s market benchmark, the Russell MidCap Value Index, earned a total return of 20.51% .
What factors affected the Fund’s performance?
Thrivent Partner Mid Cap Value Fund results were moderately less than the benchmark Index. The key limiting factors causing the difference in returns were an overexposure to the energy sector, stock selection in the health care segment and modest holdings in cash for liquidity and transaction purposes. Stocks owned in the consumer staples and financial sectors performed well but were not held in sufficient quantities to fully offset the factors listed above.
We had an emphasis in the Fund on stocks in the energy group, particularly industries and companies sensitive to the dynamics of the natural gas markets, such as Noble Energy and Range Resources. This segment came under pressure, as natural gas prices declined in the face of increasing supplies from stepped-up exploration. Additionally, demand moderated due to unusually warm weather in last winter’s heating season and a reduction in industrial demand for natural gas as a chemical feedstock. We remain confident in our long-term view of improving North American natural gas fundamentals. Our investments are centered on companies with a mix of low-cost structures, quality assets and disciplined management teams. Managed care companies in the health care sector, such as C oventry Healthcare and Health Net Inc. provided disappointing returns during the period, as did our holdings in the health care equipment companies Charles River Laboratories and PerkinElmer, Inc.
In the consumer staples sector, we realized good returns from our holdings in Safeway Inc. and Reynolds American Inc. and in the agricultural area with Archer Daniels Midland Inc., a primary beneficiary of investor interest in alternative fuel producers. Stock selection in the financial sector contributed to returns with holdings in insurance stocks like Assurant, Inc. and Bear Stearns in the investment banking industry and Apartment Investment and Management Co., a real estate investment trust specializing in apartment properties, all providing competitive returns .
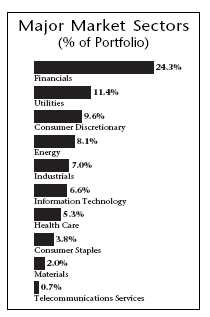
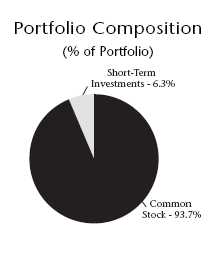
| Top 10 Holdings | |
| (% of Portfolio) | |
| |
| Entergy Corporation | 2.4% |
| Range Resources Corporation | 2.3% |
| J.C. Penney Company, Inc. | |
| (Holding Company) | 2.2% |
| Equity Office Properties Trust | 2.0% |
| Ambac Financial Group, Inc. | 1.9% |
| PG&E Corporation | 1.8% |
| Ultra Petroleum Corporation | 1.7% |
| Edison International, Inc. | 1.7% |
| EOG Resources, Inc. | 1.7% |
| PPL Corporation | 1.7% |
| |
| |
| |
| These common stocks represent 19.4% of the total | |
| investment portfolio. | |
Quoted Fund performance is for Class A shares and does not reflect a sales charge.
The returns shown do not reflect taxes a shareholder would pay on distributions or redemptions.
Quoted Major Market Sectors, Portfolio Composition and Top 10 Holdings are subject to change.
The lists of Major Market Sectors and Top 10 Holdings exclude short-term investments and collateral held for securities loaned.
The Portfolio Composition chart excludes collateral held for securities loaned. |
24
What is your outlook?
As we near the end of 2006, we remain firmly committed to our quality-focused investment style. We continue to think that management teams will experience varying degrees of success as they attempt to contain rising commodity, regulatory and operating costs. As such, security selection, as opposed to a thematic approach, is likely to be a critical differentiating factor for performance success. The merger and acquisition environment should also remain strong, as private equity firms and corporate buyers compete for attractive assets. Over time, we believe our strict attention to fundamental analysis and disciplined valuation will serve our shareholders well, despite short-term swings in market trends.
| | | Portfolio Facts |
| | | As of October 31, 2006 |
| | A Share | | Institutional Share |
| | ————————— | | ————————— |
| Ticker | TPMAX | | TPMIX |
| Transfer Agent ID | 086 | | 486 |
| Net Assets | $7,580,825 | | $23,871,880 |
| NAV | $11.83 | | $11.87 |
| NAV — High† | 10/26/2006 — $11.93 | | 10/26/2006 — $11.97 |
| NAV — Low† | 11/1/2005 — $10.11 | | 11/1/2005 — $10.12 |
| Number of Holdings: 94 | | † For the year ended October 31, 2006 |
| Average Annual Total Returns2 |
| As of October 31, 2006 | |
| |
| | | From |
| | | Inception |
| Class A1 | 1-Year | 6/30/2005 |
|
| without sales charge | 17.19% | 13.69% |
| with sales charge | 10.74% | 9.00% |
| |
| | | From |
| | | Inception |
| Institutional Class1 | 1-Year | 6/30/2005 |
|
| Net Asset Value | 17.65% | 14.11% |

1 Class A performance reflects the maximum sales charge of 5.5% . Institutional Class shares have no sales load and are for institutional shareholders only.
2 Past performance is not an indication of future results. Annualized total returns represent past performance and reflect changes in share prices, the reinvestment of all dividends and capital gains, and the effects of compounding. Periods of less than one year are not annualized. Investing in a mutual fund involves risks, including the possible loss of principal. The prospectus contains more complete information on the investment objectives, risks, charges and expenses of the investment company which investors should read and consider carefully before investing. To obtain a prospectus, contact a registered representative or visit www.thrivent.com. At various times, the Fund’s adviser waived its management fee and/or reimbursed Fund expenses. Had the adviser not done so, the Fund’s total returns would have been lower. The re turns shown do not reflect taxes a shareholder would pay on distributions or redemptions. Please read your prospectus carefully.
3 Performance of other classes will be greater or less than the line shown based on the differences in loads and fees paid by shareholders investing in the different classes.
* As you compare performance, please note that the Fund’s performance reflects the maximum 5.5% sales charge, while the Consumer Price Index, and the Russell MidCap Value Index do not reflect any such charges. If you were to purchase any of the above individual stocks or funds represented in these Indexes, any charges you would pay would reduce your total return as well.
** The Russell MidCap Value Index is an index comprised of companies with lower than average price-to-book ratios and lower forecasted growth values within the Russell MidCap Index. It is not possible to invest directly in the Index. The performance of the Index does not reflect deductions for fees, expenses or taxes.
*** The Consumer Price Index is an inflationary indicator that measures the change in the cost of a fixed basket of products and services, including housing, electricity, food and transportation. It is not possible to invest directly in the Index.
25

How did the Fund perform during the 12-month
period ended Oct. 31, 2006?
Thrivent Mid Cap Stock Fund earned a total return of 15.37% as compared to the median return to its peer group, the Lipper Inc. Mid Cap Core Funds, of 14.06% . The Fund’s previous market benchmark, the S&P MidCap 400 Index, returned 13.42%, and the current benchmark, the Russell MidCap Index, earned a total return of 17.41% . Because the Russell MidCap Index is more representative of the companies in which the Fund invests, it will be used to compare performance in the future.
What factors affected the Fund’s performance?
Thrivent Mid Cap Stock Fund delivered excellent returns during the year ending Oct. 31, 2006. Stock selection was the key differentiating factor in the Fund’s strong performance, with particularly good results achieved by our holdings in the energy, industrial and consumer discretionary sectors. Sector and industry allocation decisions across the energy segment also contributed positively to overall Fund results. Within the energy segment of the Fund, investments in exploration and production companies provided the largest contribution to performance.
Stock selection within the industrial sector contributed significantly to the Fund’s returns. Investments in Manitowoc Company and Oshkosh Truck Corporation provided a significant increment, as these firms benefited from increased global construction spending and growing domestic defense expenditures for new and replacement equipment.
In the consumer discretionary sector, good returns were achieved by investments in the media and hotel, restaurant and leisure industries. Outperformance was broad-based across these industries. Returns to our holdings in the media group were strong, as investors were drawn to the attractive valuations and improved operating performance after many years of sub-par results. Investments in companies within the hotel, restaurant and leisure segments, as well as suppliers to those segments, also aided Fund returns. The hotel industry benefited from high operating rates and strong pricing, and our holdings in companies such as Hilton Hotels Corp., Harrahs Entertainment Inc. and Wynn Resorts Ltd. were lifted, as this translated into good earnings performance.
Two sectors detracting from performance were information technology and consumer staples. Stock selection in the software industry was the main reason for underperfor-mance in information technology. Disappointing execution of the business model from Wind River Systems Inc. and increasing competition for Novell Inc. and Red Hat Inc., combined with poor operating performance, resulted in signifi-cant stock price declines. Finally, poor performance in the Fund’s holdings in food products companies like Bunge Ltd. was behind the shortfall in the consumer staples sector.
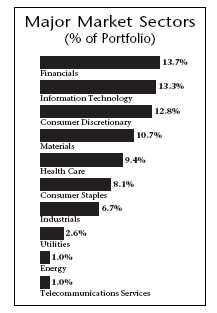
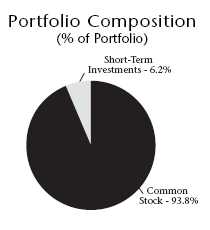
| Top 10 Holdings | |
| (% of Portfolio) | |
| |
| Owens-Illinois, Inc. | 1.7% |
| HCC Insurance Holdings, Inc. | 1.5% |
| Pactiv Corporation | 1.5% |
| Lubrizol Corporation | 1.4% |
| Ball Corporation | 1.4% |
| Hershey Company | 1.3% |
| Clorox Company | 1.3% |
| Crown Holdings, Inc. | 1.3% |
| Harman International Industries, Inc. | 1.3% |
| Bemis Company, Inc. | 1.3% |
| |
| |
| |
| |
| These common stocks represent 14.0% of the total | |
| investment portfolio. | |
Quoted Fund performance is for Class A shares and does not reflect a sales charge.
The returns shown do not reflect taxes a shareholder would pay on distributions or redemptions.
Quoted Major Market Sectors, Portfolio Composition and Top 10 Holdings are subject to change.
The lists of Major Market Sectors and Top 10 Holdings exclude short-term investments and collateral held for securities loaned.
The Portfolio Composition chart excludes collateral held for securities loaned. |
26
What is your outlook?
The Fund is currently underweighted in industries that are highly dependent on continued strong economic growth and/or a strong pricing environment. We believe policymakers will continue to act in a manner to slow the economy to bring inflation down to their long-term target, and that environment is not favorable for more cyclical industries. Specifically, energy remains the Fund’s largest underweighted sector, as excess inventories are expected to limit further significant price increases and increasing production capacity is coming online (new drilling rigs). This particularly affects companies in the exploration industry, as it will result in lower day rates. The declining day rates will result in lower earnings versus expectations, ultimately affecting stock prices. Offsetting the energy underweighting is the Fund’s overweighting in the materials sector. This overweighted position is concentrated in packaging and specialty che micals, which are historically defensive, non-cyclical industries. The Fund is also overweighted in the semiconductor industry. Capital spending has been restrained in the sector, and this should lead to improved operating rates and better earnings for a group with strong balance sheets selling at attractive valuations.
| | | | Portfolio Facts | |
| | | | As of October 31, 2006 | |
| | | A Share | B Share | Institutional Share |
| | | ————————— | | ————————— | ————————— |
| Ticker | | AASCX | BBSCX | TMSIX |
| Transfer Agent ID | 021 | | 083 | 051 |
| Net Assets | | $976,253,499 | $18,568,911 | $116,416,983 |
| NAV | | $18.61 | | $16.39 | $19.60 |
| NAV — High† | | 12/14/2005 — $19.21 | | 12/14/2005 — $17.28 | 12/14/2005 — $20.06 |
| NAV — Low† | | 7/21/2005 — $16.96 | | 7/21/2005 — $14.80 | 7/21/2005 — $17.62 |
| Number of Holdings: 166 | | † For the year ended October 31, 2006 | |
| Average Annual Total Returns2 |
| As of October 31, 2006 | |
| |
| |
| |
| Class A1 | 1-Year | 5 Years | 10 Years |
|
| without sales charge | 15.37% | 12.20% | 9.33% |
| with sales charge | 9.02% | 10.95% | 8.71% |
| |
| | | | From |
| | | | Inception |
| Class B1 | 1-Year | 5 Years | 1/8/1997 |
|
| without sales charge | 14.15% | 10.96% | 8.39% |
| with sales charge | 10.15% | 10.96% | 8.39% |
| |
| | | | From |
| | | | Inception |
| Institutional Class1 | 1-Year | 5 Years | 12/29/1997 |
|
| Net Asset Value | 15.90% | 12.81% | 9.03% |
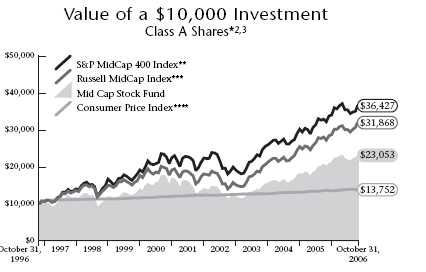
1 Class A performance reflects the maximum sales charge of 5.5% . Class B performance reflects the maximum contingent deferred sales charge (CDSC) of 5%, declining 1% each year during the first five years and then converting to Class A shares after the fifth year. Institutional Class shares have no sales load and are for institutional shareholders only.
2 Past performance is not an indication of future results. Annualized total returns represent past performance and reflect changes in share prices, the reinvestment of all dividends and capital gains, and the effects of compounding. Investing in a mutual fund involves risks, including the possible loss of principal. The prospectus contains more complete information on the investment objectives, risks, charges and expenses of the investment company which investors should read and consider carefully before investing. To obtain a prospectus, contact a registered representative or visit www.thrivent.com. At various times, the Fund’s adviser waived its management fee and/or reimbursed Fund expenses. Had the adviser not done so, the Fund’s total returns would have been lower. The returns shown do not reflect taxes a shareholder wou ld pay on distributions or redemptions. Please read your prospectus carefully.
3 Performance of other classes will be greater or less than the line shown based on the differences in loads and fees paid by shareholders investing in the different classes.
* As you compare performance, please note that the Fund’s performance reflects the maximum 5.5% sales charge, while the S&P MidCap 400 Index, the Russell MidCap Index and the Consumer Price Index do not reflect any such charges. If you were to purchase any of the above individual stocks or funds represented in these Indexes, any charges you would pay would reduce your total return as well.
** The S&P MidCap 400 Index is an index that represents the average performance of a group of 400 medium capitalization stocks. It is not possible to invest directly in the Index. The performance of the Index does not reflect deductions for fees, expenses or taxes.
*** The Russell MidCap Index is an unmanaged index that measures the performance of the smallest 800 securities in the Russell 1000 Index, as ranked by total market capitalization. It is not possible to invest directly in the index. The performance of the Index does not reflect deductions for fees, expenses or taxes. The composition of the Russell MidCap Index serves as a better reflection of the Fund’s current strategy than does the S&P MidCap 400 Index.
****The Consumer Price Index is an inflationary indicator that measures the change in the cost of a fixed basket of products and services, including housing, electricity, food and transportation. It is not possible to invest directly in the Index.
27

How did the Fund perform during the 12-month
period ended Oct. 31, 2006?
Thrivent Mid Cap Index Fund earned a total return of 12.37% as compared to the median return to its peer group, the Lipper Inc. Mid Cap Core Funds, of 14.06% . The Fund’s market benchmark, the S&P MidCap 400 Index, earned a total return of 13.42% .
What factors affected the Fund’s performance?
The Fund is managed using a process to best reflect its benchmark Index, the S&P MidCap 400. The only changes made to holdings in the Fund are done to reconcile alterations in the composition of the Index or as a result of cash flows in or out of the Fund. As typically occurs with an index fund, the difference in performance between the benchmark index and the fund itself is largely attributed to expenses and minor differences in fund composition.
Mid-cap companies as reflected in the S&P 400 Index achieved a solid return for the recent fiscal year, but results were moderately below that of the large- and small-cap companies. Mid-cap telecommunication services and information technology companies were leading contributors within this segment. By contrast, energy stocks in the mid-cap group performed significantly below that of large- and small-cap energy companies, reflecting greater exposure to the natural gas prices and the volatility of the exploration and equipment segments of the industry. Also within the mid-cap group, the consumer discretionary sector did not achieve the levels of results seen in the large-cap group, owing to less exposure to the strong performance in media stocks and greater exposure to the weakening housing sector.
What is your outlook?
The Fund will remain fully invested in a way that tracks the performance of the S&P MidCap 400 Index. This is an attractive way for individuals to take advantage of the investment potential of the broad, diversified marketplace for mid-cap stocks.
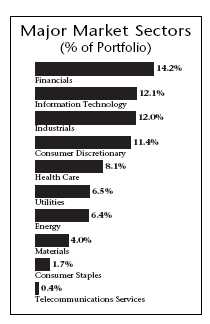
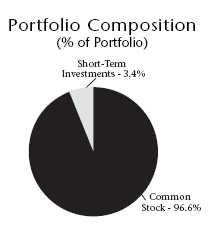
| Top 10 Holdings | |
| (% of Portfolio) | |
| |
| Peabody Energy Corporation | 0.8% |
| Cognizant Technology Solutions | |
| Corporation | 0.7% |
| Expeditors International of | |
| Washington, Inc. | 0.7% |
| Precision Castparts Corporation | 0.6% |
| Noble Energy, Inc. | 0.6% |
| ENSCO International, Inc. | 0.5% |
| C.H. Robinson Worldwide, Inc. | 0.5% |
| Varian Medical Systems, Inc. | 0.5% |
| Microchip Technology, Inc. | 0.5% |
| Lam Research Corporation | 0.5% |
| |
| These common stocks represent 5.9% of the total | |
| investment portfolio. | |
Quoted Fund performance is for Class A shares and does not reflect a sales charge.
The returns shown do not reflect taxes a shareholder would pay on distributions or redemptions.
Quoted Major Market Sectors, Portfolio Composition and Top 10 Holdings are subject to change.
The lists of Major Market Sectors and Top 10 Holdings exclude short-term investments and collateral held for securities loaned.
The Portfolio Composition chart excludes collateral held for securities loaned.
28
For the first time since early 2000, mid-cap stocks have underperformed their large-cap counterparts. Collectively, this group tends to offer more leveraged exposure to changes in economic growth, hence, the strong performance over the last few years. With a moderation in economic growth appearing to unfold, and particular weakness in segments like housing and related industries, such as furniture and construction equipment, this group may not experience the return premiums it has over the last few years. Attractive opportunities remain in this segment, but our estimate is that returns will be more in line with long-term averages.
| | Portfolio Facts |
| | As of October 31, 2006 |
| | A Share |
| | ————————— |
| Ticker | AAMIX |
| Transfer Agent ID | 030 |
| Net Assets | $61,561,723 |
| NAV | $14.47 |
| NAV — High† | 5/8/2006 — $15.05 |
| NAV — Low† | 7/21/2006 — $13.13 |
| Number of Holdings: 403 | † For the year ended October 31, 2006 |
| Average Annual Total Returns2 |
| As of October 31, 2006 | |
| |
| | | | From |
| | | | Inception |
| Class A1 | 1-Year | 5 Years | 7/1/2000 |
|
| without sales charge | 12.37% | 11.83% | 7.54% |
| with sales charge | 6.20% | 10.56% | 6.58% |

1 Class A performance reflects the maximum sales charge of 5.5% .
2 Past performance is not an indication of future results. Annualized total returns represent past performance and reflect changes in share prices, the reinvestment of all dividends and capital gains, and the effects of compounding. Investing in a mutual fund involves risks, including the possible loss of principal. The prospectus contains more complete information on the investment objectives, risks, charges and expenses of the investment company which investors should read and consider carefully before investing. To obtain a prospectus, contact a registered representative or visit www.thrivent.com. At various times, the Fund’s adviser waived its management fee and/or reimbursed Fund expenses. Had the adviser not done so, the Fund’s total returns would have been lower. The returns shown do not reflect taxes a shareholder wou ld pay on distributions or redemptions. Please read your prospectus carefully.
* As you compare performance, please note that the Fund’s performance reflects the maximum 5.5% sales charge, while the S&P MidCap 400 Index and the Consumer Price Index do not reflect any such charges. If you were to purchase any of the above individual stocks or funds represented in these Indexes, any charges you would pay would reduce your total return as well.
** The S&P MidCap 400 Index is an index that represents the average performance of a group of 400 medium capitalization stocks. “S&P MidCap 400 Index” is a trademark of The McGraw-Hill Companies, Inc. and has been licensed for use by Thrivent Financial for Lutherans. The product is not sponsored, endorsed or promoted by Standard & Poor’s and Standard & Poor’s makes no representation regarding the advisability of investing in the product. Index funds are subject to the same market risks associated with the stocks in their respective indexes. It is not possible to invest directly in the Index. The performance of the Index does not reflect deductions for fees, expenses or taxes.
*** The Consumer Price Index is an inflationary indicator that measures the change in the cost of a fixed basket of products and services, including housing, electricity, food and transportation. It is not possible to invest directly in the Index.
29

How did the Fund perform during the 12-month
period ended Oct. 31, 2006?
Thrivent Mid Cap Index Fund-I earned a total return of 12.68% as compared to the median return to its peer group, the Lipper Inc. Mid Cap Core Funds, of 14.06% . The Fund’s market benchmark, the S&P MidCap 400 Index, earned a total return of 13.42% .
What factors affected the Fund’s performance?
The Fund is managed using a process to best reflect its benchmark Index, the S&P MidCap 400. The only changes made to holdings in the Fund are done to reconcile alterations in the composition of the Index or as a result of cash flows in or out of the Fund. As typically occurs with an index fund, the difference in performance between the benchmark index and the fund itself is largely attributed to expenses and minor differences in fund composition.
Mid-cap companies as reflected in the S&P 400 Index achieved a solid return for the recent fiscal year, but results were moderately below that of the large- and small-cap companies. Mid-cap telecommunication services and information technology companies were leading contributors within this segment. By contrast, energy stocks in the mid-cap group performed significantly below that of large- and small-cap energy companies, reflecting greater exposure to the natural gas prices and the volatility of the exploration and equipment segments of the industry. Also within the mid-cap group, the consumer discretionary sector did not achieve the levels of results seen in the large-cap group, owing to less exposure to the strong performance in media stocks and greater exposure to the weakening housing sector.
What is your outlook?
The Fund will remain fully invested in a way that tracks the performance of the S&P MidCap 400 Index. This is an attractive way for individuals to take advantage of the investment potential of the broad, diversified marketplace for mid-cap stocks.
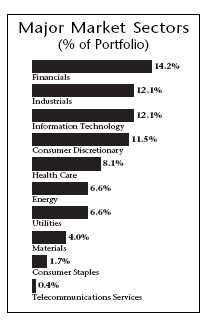

| Top 10 Holdings | |
| (% of Portfolio) | |
| |
| Peabody Energy Corporation | 0.8% |
| Cognizant Technology Solutions | |
| Corporation | 0.7% |
| Expeditors International of | |
| Washington, Inc. | 0.7% |
| Precision Castparts Corporation | 0.6% |
| Noble Energy, Inc. | 0.6% |
| ENSCO International, Inc. | 0.5% |
| C.H. Robinson Worldwide, Inc. | 0.5% |
| Questar Corporation | 0.5% |
| Lam Research Corporation | 0.5% |
| Varian Medical Systems, Inc. | 0.5% |
| |
| These common stocks represent 5.9% of the total | |
| investment portfolio | |
The returns shown do not reflect taxes a shareholder would pay on distributions or redemptions.
Quoted Major Market Sectors, Portfolio Composition and Top 10 Holdings are subject to change.
The lists of Major Market Sectors and Top 10 Holdings exclude short-term investments and collateral held for securities loaned.
The Portfolio Composition chart excludes collateral held for securities loaned.
30
For the first time since early 2000, mid-cap stocks have underperformed their large-cap counterparts. Collectively, this group tends to offer more leveraged exposure to changes in economic growth, hence, the strong performance over the last few years. With a moderation in economic growth appearing to unfold, and particular weakness in segments like housing and related industries, such as furniture and construction equipment, this group may not experience the return premiums it has over the last few years. Attractive opportunities remain in this segment, but our estimate is that returns will be more in line with long-term averages.
| | Portfolio Facts |
| | As of October 31, 2006 |
| | Institutional Share |
| | ————————— |
| Ticker | AALMX |
| Transfer Agent ID | 097 |
| Net Assets | $22,625,817 |
| NAV | $13.99 |
| NAV — High† | 5/8/2006 — $14.51 |
| NAV — Low† | 7/21/2006 — $12.68 |
| Number of Holdings: 403 | † For the year ended October 31, 2006 |
| Average Annual Total Returns2 |
| As of October 31, 2006 | |
| |
| | | | From |
| | | | Inception |
| Institutional Class1 | 1-Year | 5 Years | 12/31/1999 |
|
| Net Asset Value | 12.68% | 12.38% | 9.33% |
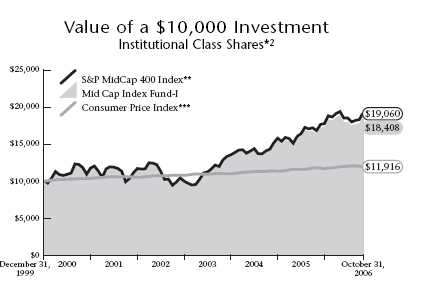
1 Institutional Class shares have no sales load and are for institutional shareholders only.
2 Past performance is not an indication of future results. Annualized total returns represent past performance and reflect changes in share prices, the reinvestment of all dividends and capital gains, and the effects of compounding. Investing in a mutual fund involves risks, including the possible loss of principal. The prospectus contains more complete information on the investment objectives, risks, charges and expenses of the investment company which investors should read and consider carefully before investing. To obtain a prospectus, contact a registered representative or visit www.thrivent.com. At various times, the Fund’s adviser waived its management fee and/or reimbursed Fund expenses. Had the adviser not done so, the Fund’s total returns would have been lower. The returns shown do not reflect taxes a shareholder wou ld pay on distributions or redemptions. Please read your prospectus carefully.
* As you compare performance, please note that the Fund’s performance reflects Fund expenses, net of any reimbursements, while the S&P MidCap 400 Index and the Consumer Price Index do not reflect such charges. If you were to purchase any of the above individual stocks or funds represented in these Indexes, any charges you would pay would reduce your total return as well.
** The S&P MidCap 400 Index is an index that represents the average performance of a group of 400 medium capitalization stocks. "S&P MidCap 400 Index" is a trademark of The McGraw-Hill Companies, Inc. and has been licensed for use by Thrivent Financial for Lutherans. The product is not sponsored, endorsed or promoted by Standard & Poor’s and Standard & Poor’s makes no representation regarding the advisability of investing in the product. Index funds are subject to the same market risks associated with the stocks in their respective indexes. It is not possible to invest directly in the Index. The performance of the Index does not reflect deductions for fees, expenses or taxes.
*** The Consumer Price Index is an inflationary indicator that measures the change in the cost of a fixed basket of products and services, including housing, electricity, food and transportation. It is not possible to invest directly in the Index.
31

How did the Fund perform during the 12-month
period ended Oct. 31, 2006?
Thrivent Partner International Stock Fund earned a total return of 23.63% as compared to the median return to its peer group, the Lipper Inc. International Large Cap Core Funds, of 25.69% . The Fund’s market benchmark, the MSCI Europe, Australasia and Far East (EAFE) Index, earned a total return of 28.04% .
What factors affected the Fund’s performance?
Thrivent Partner International Stock Fund achieved good absolute returns, as well as providing an attractive return versus most domestic equity indices over the reporting period, but it did not participate fully in the strong advance achieved by the international Index. The primary factor constraining the Fund’s return was sub-par returns from the segment of the Fund managed in the growth style, with most of the performance shortfall from that allocation occurring in the first six months of 2006.
Country allocations and stock selection were both factors in limiting the return to the growth segment of the Fund. Over the course of the reporting period, the growth component of the Fund maintained an overweighted position in the Japanese stock market, and that market underperformed the EAFE benchmark. As a corollary, the account was underweighted in the better performing markets in Western Europe. Additionally, the account’s holdings in Japanese banks and consumer finance companies did not perform well, as investors began to discount an increased likelihood of interest rate increases in the face of more sustained growth on the part of the Japanese economy. An exposure to financial companies in other countries was also a factor in limiting the Fund’s advance.
Counterbalancing some of the previously indicated shortfalls were good results achieved in the valuation-based segments of the accounts, with good returns to energy-related shares like Saipem and Keppel. Capital goods companies Atlas Copco and Schneider also performed well, in expectation of an improving economic backdrop and increases in corporate spending. European retailers were another contributing group for the valuation segment of the account, with good returns realized in Marks and Spencer, Metro and Carrefour. Pharmaceutical companies performed well, as inv estors sought more defensive positions in companies like Takeda in Japan and Glaxo from the UK. Increased takeover activity also aided the Fund in Europe, as private equity capital sought to be placed advantageously, lifting our holding in companies like Iberdrola in the Spanish utility sector.
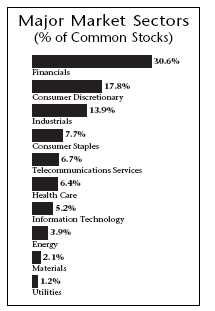
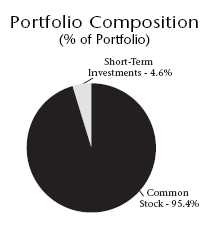
| Top 10 Countries | |
| (% of Portfolio) | |
| |
| Japan | 22.0% |
| United Kingdom | 15.8% |
| France | 8.4% |
| Switzerland | 8.0% |
| Spain | 6.3% |
| Italy | 6.0% |
| Germany | 5.4% |
| Singapore | 3.0% |
| Sweden | 2.7% |
| Netherlands | 2.3% |
| |
| |
| |
| |
| These common stocks represent 79.9% of the total |
| investment portfolio. | |
*International investing has special risks including currency fluctuation and political volatility.
Quoted Fund performance is for Class A shares and does not reflect a sales charge.
The returns shown do not reflect taxes a shareholder would pay on distributions or redemptions.
Quoted Major Market Sectors, Portfolio Composition and Top 10 Countries are subject to change.
The lists of Major Market Sectors and Top 10 Countries exclude short-term investments and collateral held for securities loaned.
The Portfolio Composition chart excludes collateral held for securities loaned. |
32
What is your outlook?
Central banks are struggling to determine the level of interest rates that will allow a continuation of economic growth while keeping inflation at bay. We expect confirmation in the next year that inflation and the global interest rate tightening cycle have peaked, presenting a reasonable environment for international investing. In addition, we believe a weaker dollar will enhance returns on overseas markets for U.S. investors over the medium- and long-term.
We believe risk spreads widen in this environment. Strong corporate balance sheets and plentiful liquidity from private equity funds should help create a floor for asset values despite the more uncertain macro environment. Our valuation work has led us to invest in high-quality companies. Investors should once again recognize the benefits of strong balance sheets, healthy profit margins, good growth prospects and attractive valuations in a more uncertain period.
Emerging market shares have rebounded strongly from their recent correction, and their economies continue to offer attractive growth prospects. However, we currently favor developed markets over emerging markets based on relative valuations after a sustained period of outperformance by emerging market shares.
| | | | Portfolio Facts | |
| | | | As of October 31, 2006 | |
| | | A Share | B Share | Institutional Share |
| | | ————————— | | ————————— | ————————— |
| Ticker | | AAITX | BBITX | TISFX |
| Transfer Agent ID | 023 | | 084 | 093 |
| Net Assets | | $337,514,761 | $14,429,151 | $204,229,234 |
| NAV | | $12.94 | | $12.43 | $13.19 |
| NAV — High† | | 5/9/2006 — $13.20 | | 5/9/2006 — $12.76 | 5/9/2006 — $13.42 |
| NAV — Low† | | 11/16/2005 — $10.60 | | 11/16/2005 — $10.19 | 11/16/2005 — $10.81 |
| Number of Holdings: 169 | | † For the year ended October 31, 2006 | |
| Average Annual Total Returns2 |
| As of October 31, 2006 | |
| |
| |
| |
| Class A1 | 1-Year | 5 Years | 10 Years |
|
| without sales charge | 23.63% | 10.41% | 5.13% |
| with sales charge | 16.78% | 9.16% | 4.53% |
| |
| | | | From |
| | | | Inception |
| Class B1 | 1-Year | 5 Years | 10/31/1997 |
|
| without sales charge | 22.34% | 9.37% | 4.43% |
| with sales charge | 18.34% | 9.37% | 4.43% |
| |
| | | | From |
| | | | Inception |
| Institutional Class1 | 1-Year | 5 Years | 10/31/1997 |
|
| Net Asset Value | 24.40% | 11.35% | 5.61% |
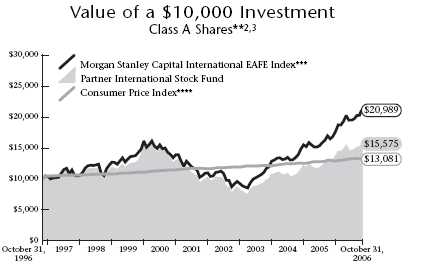
1 Class A performance reflects the maximum sales charge of 5.5% . Class B performance reflects the maximum contingent deferred sales charge (CDSC) of 5%, declining 1% each year during the first five years and then converting to Class A shares after the fifth year. Institutional Class shares have no sales load and are for institutional shareholders only.
2 Past performance is not an indication of future results. Annualized total returns represent past performance and reflect changes in share prices, the reinvestment of all dividends and capital gains, and the effects of compounding. Investing in a mutual fund involves risks, including the possible loss of principal. The prospectus contains more complete information on the investment objectives, risks, charges and expenses of the investment company which investors should read and consider carefully before investing. To obtain a prospectus, contact a registered representative or visit www.thrivent.com. At various times, the Fund’s adviser waived its management fee and/or reimbursed Fund expenses. Had the adviser not done so, the Fund’s total returns would have been lower. The returns shown do not reflect taxes a shareholder wou ld pay on distributions or redemptions. Please read your prospectus carefully.
3 Performance of other classes will be greater or less than the line shown based on the differences in loads and fees paid by shareholders investing in the different classes.
** As you compare performance, please note that the Fund’s performance reflects the maximum 5.5% sales charge, while the MSCI EAFE Index and the Consumer Price Index do not reflect any such charges. If you were to purchase any of the above individual stocks or funds represented in these Indexes, any charges you would pay would reduce your total return as well.
*** The Morgan Stanley Capital International Europe, Australasia, Far East Index (MSCI EAFE Index) is a stock index designed to measure the equity performance of developed countries outside of North America. It is not possible to invest directly in the Index. The performance of the Index does not reflect deductions for fees, expenses or taxes.
**** The Consumer Price Index is an inflationary indicator that measures the change in the cost of a fixed basket of products and services, including housing, electricity, food and transportation. It is not possible to invest directly in the Index.
33

How did the Fund perform during the 12-month
period ended Oct. 31, 2006?
Thrivent Large Cap Growth Fund earned a total return of 8.46% as compared to the median return to its peer group, the Lipper Inc. Large Cap Growth Funds, of 7.61% . The Fund’s market benchmark, the Russell 1000 Growth Index, earned a total return of 10.84% .
What factors affected the Fund’s performance?
Large-cap growth stocks, while posting positive returns, did not provide the higher levels of returns achieved in the value- and smaller-cap indices. The traditional key large-cap growth sectors, health care and information technology, did not achieve the results seen in the more cyclically sensitive industrials and materials segments. Strong earnings and price momentum was more evident in cyclical industries, and the performance over the last twelve months highlighted the continued shift away from the more customary beneficiaries of large-cap growth investing.
Looking at a sector-based analysis, the majority of our performance versus the benchmark was achieved in the finan-cials, materials and telecommunication services sectors. Within the financial services sector, our performance within the investment banking subsector contributed the most performance, highlighted by our ownership of stocks such as Goldman Sachs and Merrill Lynch. Stock selection also drove performance in the materials sectors, with overweighted positions in Monsanto and Newmont Mining. Both sector allocation and security selection equally contributed to performance in telecommunications services, where our bullish stance on emerging wireless markets was re warded with positions in America Movil and NII Holdings.
Two sectors detracting the most from performance for the year were health care and information technology. In health care, the pharmaceutical and medical technology subsec-tors both underperformed, primarily due to stock selection. A representative holding that highlighted the slowdown in medical devices was St. Jude Medical, while increased generic drug competition was the factor for Teva Pharmaceuticals. In the technology sector, the communications equipment and systems software subsectors had the most negative impact on performance, highlighted by our lack of significant exposure to Microsoft, which performed well, and negative returns on ADC Telecommunications, which had execution issues during t he year.
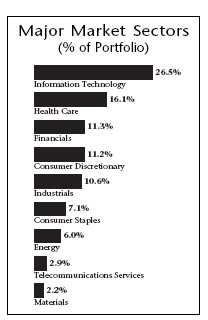
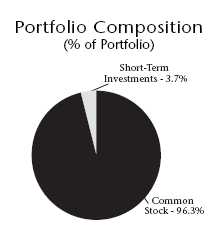
| Top 10 Holdings | |
| (% of Portfolio) | |
| |
| Google, Inc. | 2.7% |
| Cisco Systems, Inc. | 2.2% |
| Apple Computer, Inc. | 1.8% |
| QUALCOMM, Inc. | 1.6% |
| General Electric Company | 1.6% |
| PepsiCo, Inc. | 1.6% |
| Procter & Gamble Company | 1.6% |
| Amgen, Inc. | 1.6% |
| Goldman Sachs Group, Inc. | 1.5% |
| Schlumberger, Ltd. | 1.4% |
| |
| |
| |
| |
| These common stocks represent 17.6% of the total | |
| investment portfolio. | |
Quoted Fund performance is for Class A shares and does not reflect a sales charge.
The returns shown do not reflect taxes a shareholder would pay on distributions or redemptions.
Quoted Major Market Sectors, Portfolio Composition and Top 10 Holdings are subject to change.
The lists of Major Market Sectors and Top 10 Holdings exclude short-term investments and collateral held for securities loaned.
The Portfolio Composition chart excludes collateral held for securities loaned.
34
What is your outlook?
A slowing economy and relatively attractive valuations for many large-cap growth companies may provide relative outperformance for this asset class in the coming year. We will keep a close watch on potential inflationary pressures, such as energy costs and the actions of the Federal Reserve with regard to further interest rate changes, as it relates to our industry allocation. A large influx of private equity into the market via leveraged buy-outs, as well as merger and acquisition activity, shows the intrinsic value of equities and should help buoy the market. Currently, we believe the technology sector will provide superior returns and have a sizeable overweighted position that emphasizes software and communication equipment. The emerging telecommunication services companies continue to look attractive, and we maintain our overweighted position. With concerns regarding a slowing economy, we have underweighted our position in the consumer discretionary sector, highlighted by underexposure in household durables, autos and media-related companies.
| | | Portfolio Facts | |
| | | As of October 31, 2006 | |
| | A Share | B Share | Institutional Share |
| | ————————— | ————————— | ————————— |
| Ticker | AAAGX | | BBAGX | THLCX |
| Transfer Agent ID | 027 | | 077 | 060 |
| Net Assets | $134,020,822 | $12,057,865 | $204,829,764 |
| NAV | $5.31 | | $4.97 | $5.65 |
| NAV — High† | 10/26/2006 — $5.37 | 1/11/2006 — $5.04 | 10/26/2006 — $5.71 |
| NAV — Low† | 7/21/2006 — $4.74 | 7/21/2006 — $4.45 | 6/13/2006 — $5.04 |
| Number of Holdings: 186 | | † For the year ended October 31, 2006 | |
| Average Annual Total Returns2 |
| As of October 31, 2006 | |
| |
| | | | From |
| | | | Inception |
| Class A1 | 1-Year | 5 Years | 10/29/1999 |
|
| without sales charge | 8.46% | 3.29% | (2.98%) |
| with sales charge | 2.40% | 2.13% | (3.76%) |
| |
| | | | From |
| | | | Inception |
| Class B1 | 1-Year | 5 Years | 10/29/1999 |
|
| without sales charge | 7.11% | 2.33% | (3.55%) |
| with sales charge | 3.11% | 2.33% | (3.55%) |
| |
| | | | From |
| | | | Inception |
| Institutional Class1 | 1-Year | 5 Years | 10/29/1999 |
|
| Net Asset Value | 9.21% | 4.32% | (2.05%) |
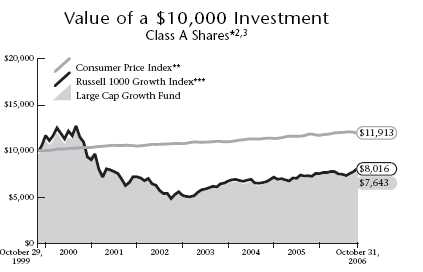
1 Class A performance reflects the maximum sales charge of 5.5% . Class B performance reflects the maximum contingent deferred sales charge (CDSC) of 5%, declining 1% each year during the first five years and then converting to Class A shares after the fifth year. Institutional Class shares have no sales load and are for institutional shareholders only.
2 Past performance is not an indication of future results. Annualized total returns represent past performance and reflect changes in share prices, the reinvestment of all dividends and capital gains, and the effects of compounding. Investing in a mutual fund involves risks, including the possible loss of principal. The prospectus contains more complete information on the investment objectives, risks, charges and expenses of the investment company which investors should read and consider carefully before investing. To obtain a prospectus, contact a registered representative or visit www.thrivent.com. At various times, the Fund’s adviser waived its management fee and/or reimbursed Fund expenses. Had the adviser not done so, the Fund’s total returns would have been lower. The returns shown do not reflect taxes a shareholder wou ld pay on distributions or redemptions. Please read your prospectus carefully.
3 Performance of other classes will be greater or less than the line shown based on the differences in loads and fees paid by shareholders investing in the different classes.
* As you compare performance, please note that the Fund’s performance reflects the maximum 5.5% sales charge, while the Consumer Price Index, and the Russell 1000 Growth Index do not reflect any such charges. If you were to purchase any of the above individual stocks or funds represented in these Indexes, any charges you would pay would reduce your total return as well.
** The Consumer Price Index is an inflationary indicator that measures the change in the cost of a fixed basket of products and services, including housing, electricity, food and transportation. It is not possible to invest directly in the Index.
*** The Russell 1000 Growth Index is an index comprised of those Russell 1000 Index companies with higher than average price-to-book ratios and higher forecasted growth values. It is not possible to invest directly in these Indexes. The performance of these Indexes does not reflect deductions for fees, expenses or taxes.
35

How did the Fund perform during the 12-month period ended Oct. 31, 2006?
Thrivent Large Cap Value Fund earned a total return of 19.32% as compared to the median return to its peer group, the Lipper Inc. Large Cap Value Funds, of 17.90% . The Fund’s market benchmark, the Russell 1000 Value Index, earned a total return of 21.46% .
What factors affected the Fund’s performance?
The Fund was helped by performance from the industrials, energy, consumer staples, consumer discretionary and utilities sectors. In each of these sectors stock selection was the primary source of Fund performance. A modest liquidity position in the Fund accounted for most of the moderate return shortfall, versus the benchmark Index.
Highlights in the industrial sector included American Airlines, which was up over 100%, and construction equipment company Terex, which advanced more than 85%. The industrials sector was one of the strongest areas of the market during the period. The Fund has been, and continues to be, overweighted in this area. However, the weighting has come down and a number of positions have been sold, because peak operating performance was reflected in the share prices. Positions that were sold include Terex and Caterpillar.
Energy was another strong area of the market. Security selection in the oil and gas equipment and oil and gas exploration industries helped performance the most in this sector. Energy positions were cut back this summer, as the best-case scenario for these companies became reflected in share prices.
In the consumer staples sector Conagra-Food was the largest positive contributor. The position was purchased on the day the company cut the dividend and initiated a restructuring plan under new management. The share price subsequently appreciated in anticipation of a successful implementation of that program. While we agreed the new agenda was likely to take the company in the proper direction, we felt the improvement in share price reflected much of the opportunity, and the position was sold when there appeared to be limited further upside. In the consumer staples sector, it’s what we didn’t own that had the largest benefit on the Fund’s performance. The housing industry sector was one of the weakest areas of the market during the period.
Areas that hurt performance included health care, telecommunications services, materials and financials. Stock selection was the primary source of poor performance in these areas. Not owning Merck, a stock that experienced a surge in price, in spite of ongoing product liability issues and


| Top 10 Holdings | |
| (% of Portfolio) | |
| |
| Exxon Mobil Corporation | 3.2% |
| J.P. Morgan Chase & Company | 2.9% |
| Citigroup, Inc. | 2.5% |
| Pfizer, Inc. | 2.3% |
| Bank of America Corporation | 2.3% |
| International Business Machines Corporation | 2.2% |
| Altria Group, Inc. | 2.1% |
| Chevron Corporation | 2.0% |
| Verizon Communications, Inc. | 1.7% |
| AT&T, Inc. | 1.7% |
| |
| These common stocks represent 22.9% of the total | |
| investment portfolio. | |
Quoted Fund performance is for Class A shares and does not reflect a sales charge.
The returns shown do not reflect taxes a shareholder would pay on distributions or redemptions.
Quoted Major Market Sectors, Portfolio Composition and Top 10 Holdings are subject to change.
The lists of Major Market Sectors and Top 10 Holdings exclude short-term investments and collateral held for securities loaned.
The Portfolio Composition chart excludes collateral held for securities loaned.
36
meaningful exposure to generic product competition, hurt the Fund in the health care sector. Not owning steel stocks hurt the Fund in materials. In the financial sector, an underweighted stance in the real estate investment trust (REIT) industry was a negative.
What is your outlook?
Our focus is on investing in good companies that are undervalued versus their long-term normal earnings power and growth potential. We are finding value in selected technology and industrial companies, and to a lesser degree in market-sensitive financials other than brokers. In addition, certain pharmaceutical companies remain attractive.
| | Portfolio Facts | |
| | As of October 31, 2006 | |
| | A Share | B Share | Institutional Share |
| | ————————— | ————————— | ————————— |
| Ticker | AAUTX | BBEIX | TLVIX |
| Transfer Agent ID | 022 | 072 | 092 |
| Net Assets | $332,110,822 | $14,478,335 | $163,911,565 |
| NAV | $16.85 | $16.57 | $16.98 |
| NAV — High† | 10/26/2006 — $17.01 | 10/26/2006 — $16.73 | 10/26/2006 — $17.14 |
| NAV — Low† | 11/1/2005 — $14.45 | 11/1/2005 — $14.21 | 11/1/2005 — $14.56 |
| Number of Holdings: 108 | | † For the year ended October 31, 2006 | |
| Average Annual Total Returns2 |
| As of October 31, 2006 | |
| |
| | | | From |
| | | | Inception |
| Class A1 | 1-Year | 5 Years | 10/29/1999 |
|
| without sales charge | 19.32% | 7.79% | 3.81% |
| with sales charge | 12.78% | 6.58% | 2.98% |
| |
| | | | From |
| | | | Inception |
| Class B1 | 1-Year | 5 Years | 10/29/1999 |
|
| without sales charge | 17.96% | 6.78% | 3.23% |
| with sales charge | 13.96% | 6.78% | 3.23% |
| |
| | | | From |
| | | | Inception |
| Institutional Class1 | 1-Year | 5 Years | 10/29/1999 |
|
| Net Asset Value | 19.92% | 8.56% | 4.55% |
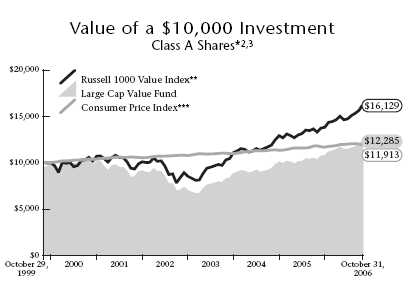
1 Class A performance reflects the maximum sales charge of 5.5% . Class B performance reflects the maximum contingent deferred sales charge (CDSC) of 5%, declining 1% each year during the first five years and then converting to Class A shares after the fifth year. Institutional Class shares have no sales load and are for institutional shareholders only.
2 Past performance is not an indication of future results. Annualized total returns represent past performance and reflect changes in share prices, the reinvestment of all dividends and capital gains, and the effects of compounding. Investing in a mutual fund involves risks, including the possible loss of principal. The prospectus contains more complete information on the investment objectives, risks, charges and expenses of the investment company which investors should read and consider carefully before investing. To obtain a prospectus, contact a registered representative or visit www.thrivent.com. At various times, the Fund’s adviser waived its management fee and/or reimbursed Fund expenses. Had the adviser not done so, the Fund’s total returns would have been lower. The returns shown do not reflect taxes a shareholder wou ld pay on distributions or redemptions. Please read your prospectus carefully.
3 Performance of other classes will be greater or less than the line shown based on the differences in loads and fees paid by shareholders investing in the different classes.
* As you compare performance, please note that the Fund’s performance reflects the maximum 5.5% sales charge, while the Russell 1000 Value Index and the Consumer Price Index do not reflect any such charges. If you were to purchase any of the above individual stocks or funds represented in these Indexes, any charges you would pay would reduce your total return as well.
** The Russell 1000 Value Index is an index comprised of companies with lower price-to-book ratios and lower forecasted growth rates within the Russell 1000 Index. It is not possible to invest directly in these Indexes. The performance of these Indexes does not reflect deductions for fees, expenses or taxes.
*** The Consumer Price Index is an inflationary indicator that measures the change in the cost of a fixed basket of products and services, including housing, electricity, food and transportation. It is not possible to invest directly in the Index.
37

How did the Fund perform during the 12-month period ended Oct. 31, 2006?
Thrivent Large Cap Stock Fund earned a total return of 12.18% as compared to the median return to its peer group, the Lipper Large Inc. Cap Core Funds, of 14.36% . The Fund’s market benchmark, the S&P 500 Index, earned a total return of 16.35% .
What factors affected the Fund’s performance?
The most significant factor limiting the Fund’s performance was stock selection in the health care sector. For a sector that traditionally provides reasonably consistent growth, 2006 was a year of major negative surprises for the group. The experience in pharmaceuticals was representative. An underweighting in Merck was a critical factor, as a longer-term concern about several of its largest drugs coming off of patent protection was more than offset by optimism about a near-term improvement in profitability and some new product introductions. Other company recovery stories in the sector were missed, and many of the companies that were held did not advance in line with the group. Other sources of sub-par performance included an overweighted stance in several managed care stocks that declined in price and poor stock selection in health care equipment, where the outlook for heart device stocks deterio rated quickly and unexpectedly.
A moderate position in cash reserves was held through most of the later part of the fiscal year in anticipation of a major slowdown in consumer spending and its anticipated negative effect on economic growth and corporate profits. This factor limited our advance in the face of unexpected strength in stocks late in the period. Consumer spending was anticipated to decline due to a falloff in confidence, as home values began to decline, coupled with a decrease in the mortgage equity withdrawals that had been used to support spending over the past several years.
A third area limiting performance was stock selection in the consumer discretionary sector. Examples include Harrah’s Entertainment, which was sold after announcing an earnings disappointment and a poor outlook as the result of a step-up in spending on property improvements. An overweighted position in Home Depot proved to be a poor decision, as a reasonably strong profit outlook and very cheap valuation were overcome by concerns over the impact of the slowdown in the home building industry. Some relative performance was missed, due to a lack of a position in News Corporation early in the year.
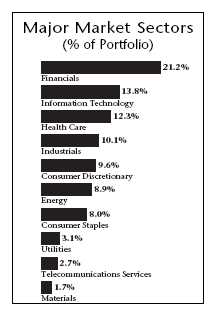
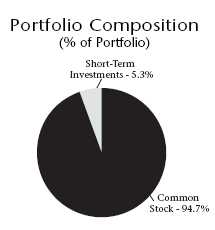
| Top 10 Holdings | |
| (% of Portfolio) | |
| |
| Exxon Mobil Corporation | 3.6% |
| General Electric Company | 2.9% |
| Bank of America Corporation | 2.1% |
| Citigroup, Inc. | 1.9% |
| Microsoft Corporation | 1.9% |
| Procter & Gamble Company | 1.7% |
| Johnson & Johnson | 1.5% |
| Pfizer, Inc. | 1.5% |
| J.P. Morgan Chase & Company | 1.4% |
| Cisco Systems, Inc. | 1.4% |
| |
| These common stocks represent 19.9% of the total | |
| investment portfolio. | |
Quoted Fund performance is for Class A shares and does not reflect a sales charge.
The returns shown do not reflect taxes a shareholder would pay on distributions or redemptions.
Quoted Major Market Sectors, Portfolio Composition and Top 10 Holdings are subject to change.
The lists of Major Market Sectors and Top 10 Holdings exclude short-term investments and collateral held for securities loaned.
The Portfolio Composition chart excludes collateral held for securities loaned.
38
What is your outlook?
A moderate cash position is being held in the Fund, as the outlook for the consumer continues to be uncertain, and we expect the market to retrace some of its recent advance and provide better opportunities to invest. Sector bets are small, as no sector appears to be inappropriately priced in a meaningful way, with the possible exceptions of several retail industries and select technology groups that may have run up too far in the recent rally. Stock selection is favoring higher-quality companies and companies that have a history of strong dividend growth, two factors that have worked well recently and should continue to do so in an economic environment where the prospects for near-term growth are relatively uncertain. Stock selection also has a bias toward higher-growth companies, particularly ones that have fairly consistent growth, regardless of the economic environment. Higher-growth companies appear to have better valuations relat ive to value names after an extended period of outperformance by value stock over the past several years.
| | Portfolio Facts | |
| | As of October 31, 2006 | |
| | | |
| | A Share | B Share | Institutional Share |
| | ————————— | ————————— | ————————— |
| Ticker | AALGX | BBLGX | IILGX |
| Transfer Agent ID | 017 | 067 | 090 |
| Net Assets | $3,107,248,432 | $68,988,835 | $245,682,085 |
| NAV | $28.61 | $26.40 | $28.84 |
| NAV — High† | 10/26/2006 — $28.87 | 10/26/2006 — $26.64 | 10/26/2006 — $29.10 |
| NAV — Low† | 6/13/2005 — $25.72 | 6/13/2005 — $23.81 | 6/13/2005 — $25.88 |
| Number of Holdings: 198 | | † For the year ended October 31, 2006 | |
| Average Annual Total Returns2 |
| As of October 31, 2006 | |
| |
| |
| |
| Class A1 | 1-Year | 5 Years | 10 Years |
|
| without sales charge | 12.18% | 4.49% | 8.12% |
| with sales charge | 6.01% | 3.31% | 7.51% |
| |
| | | | From |
| | | | Inception |
| Class B1 | 1-Year | 5 Years | 1/8/1997 |
|
| without sales charge | 11.23% | 3.44% | 6.97% |
| with sales charge | 7.23% | 3.44% | 6.97% |
| |
| | | | From |
| | | | Inception |
| Institutional Class1 | 1-Year | 5 Years | 12/29/1997 |
|
| Net Asset Value | 12.72% | 4.97% | 5.70% |
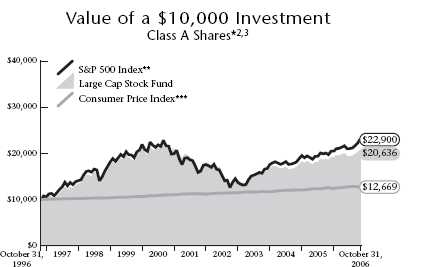
1 Class A performance reflects the maximum sales charge of 5.5% . Class B performance reflects the maximum contingent deferred sales charge (CDSC) of 5%, declining 1% each year during the first five years and then converting to Class A shares after the fifth year. Institutional Class shares have no sales load and are for institutional shareholders only.
2 Past performance is not an indication of future results. Annualized total returns represent past performance and reflect changes in share prices, the reinvestment of all dividends and capital gains, and the effects of compounding. Investing in a mutual fund involves risks, including the possible loss of principal. The prospectus contains more complete information on the investment objectives, risks, charges and expenses of the investment company which investors should read and consider carefully before investing. To obtain a prospectus, contact a registered representative or visit www.thrivent.com. At various times, the Fund’s adviser waived its management fee and/or reimbursed Fund expenses. Had the adviser not done so, the Fund’s total returns would have been lower. The returns shown do not reflect taxes a shareholder wou ld pay on distributions or redemptions. Please read your prospectus carefully.
3 Performance of other classes will be greater or less than the line shown based on the differences in loads and fees paid by shareholders investing in the different classes.
* As you compare performance, please note that the Fund’s performance reflects the maximum 5.5% sales charge, while the S&P 500 Index and the Consumer Price Index do not reflect any such charges. If you were to purchase any of the above individual stocks or funds represented in these Indexes, any charges you would pay would reduce your total return as well.
** The S&P 500 Index is an index that represents the average performance of a group of 500 large-capitalization stocks. It is not possible to invest directly in the Index. The performance of the Index does not reflect deductions for fees, expenses or taxes.
*** The Consumer Price Index is an inflationary indicator that measures the change in the cost of a fixed basket of products and services, including housing, electricity, food and transportation. It is not possible to invest directly in the Index.
39

How did the Fund perform during the 12-month period ended Oct. 31, 2006?
Thrivent Large Cap Index Fund earned a total return of 15.56% as compared to the median return to its peer group, the Lipper Inc. S&P 500 Index Objective Funds, of 15.86% . The Fund’s market benchmark, the S&P 500 Index, earned a total return of 16.35% .
What factors affected the Fund’s performance?
The Fund’s holdings are aligned with those of the S&P 500 Index. As typically occurs in an index fund, the difference in performance between the benchmark index and the fund itself can largely be attributed to expenses and minor differences in fund composition related to cash flow investing.
Large-company stocks modestly outperformed mid- and small-cap companies over the reporting period. Within the large-cap segments, the telecommunication services, materials, and financial and energy sectors provided the best returns. The information technology, health care and consumer staples sectors achieved positive returns, but their segment returns were less than that of the S&P 500 Index over the fiscal year.
Large-cap performance was largely a function of better returns in the second six months of the period. A disturbing level of speculation was evident in the first half, with unusually high returns achieved in commodity-related companies in the energy, industrial and precious metal sectors. This was particularly evident in the mid- and small-cap segments of the market, as those groups tended to be more leveraged to higher prices for commodities. In the spring, policymakers across both industrialized and emerging countries indicated a more active approach to bringing inflation risk under control, primarily by raising interest rates and moderating economic growth. This caused investors to reevaluate their preferences for risk and led to improved results for the large-capitalization, higher-quality segments of the market in the second half of the period.
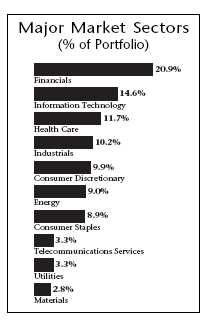

| Top 10 Holdings | |
| (% of Portfolio) | |
| |
| Exxon Mobil Corporation | 3.2% |
| General Electric Company | 2.8% |
| Microsoft Corporation | 1.9% |
| Citigroup, Inc. | 1.9% |
| Bank of America Corporation | 1.9% |
| Procter & Gamble Company | 1.5% |
| Johnson & Johnson | 1.5% |
| Pfizer, Inc. | 1.5% |
| American International Group, Inc. | 1.3% |
| Altria Group, Inc. | 1.3% |
| |
| These common stocks represent 18.8% of the total | |
| investment portfolio. | |
Quoted Fund performance is for Class A shares and does not reflect a sales charge.
The returns shown do not reflect taxes a shareholder would pay on distributions or redemptions.
Quoted Major Market Sectors, Portfolio Composition and Top 10 Holdings are subject to change.
The lists of Major Market Sectors and Top 10 Holdings exclude short-term investments and collateral held for securities loaned.
The Portfolio Composition chart excludes collateral held for securities loaned.
40
What is your outlook?
There is an attempt on the part of policymakers to slow economic growth and lower inflationary risks that appear to be taking root in the economy. With that shift in policy, economic and market risks increase, as the opportunity for policy errors is not insignificant. We believe the economy will respond and growth will moderate, allowing inflation risk to subside. This would provide a constructive environment for financial assets in general and common stocks in particular.
Large-cap companies, while providing attractive returns over the last few years, have not provided the levels of results achieved in the small- and mid-cap segments of the equity market, in spite of very impressive operating performance and earnings growth. We believe that returns to this segment are likely to be more in line with their counterparts, as investors consider the attractive valuations in this group, along with the higher level of operating stability and seasoned business models. It appears that the largest companies may be best positioned from a valuation perspective, and with the increased risk evident in the current policy environment, provide a relatively attractive combination of opportunity and stability.
| | Portfolio Facts |
| | As of October 31, 2006 |
| | A Share |
| | ————————— |
| Ticker | AALCX |
| Transfer Agent ID | 031 |
| Net Assets | $92,328,231 |
| NAV | $9.52 |
| NAV — High† | 10/26/2006 — $9.60 |
| NAV — Low† | 11/1/2005 — $8.32 |
| Number of Holdings: 503 | † For the year ended October 31, 2006 |
| Average Annual Total Returns2 |
| As of October 31, 2006 | |
| |
| | | | From |
| | | | Inception |
| Class A1 | 1-Year | 5 Years | 7/1/2000 |
|
| without sales charge | 15.56% | 6.62% | (0.12%) |
| with sales charge | 9.15% | 5.42% | (1.01%) |
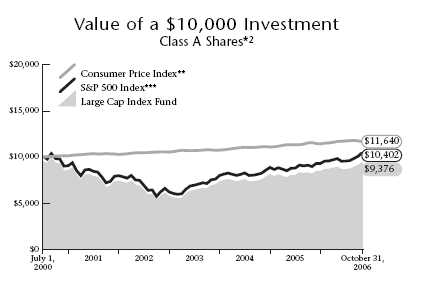
1 Class A performance reflects the maximum sales charge of 5.5% .
2 Past performance is not an indication of future results. Annualized total returns represent past performance and reflect changes in share prices, the reinvestment of all dividends and capital gains, and the effects of compounding. Investing in a mutual fund involves risks, including the possible loss of principal. The prospectus contains more complete information on the investment objectives, risks, charges and expenses of the investment company which investors should read and consider carefully before investing. To obtain a prospectus, contact a registered representative or visit www.thrivent.com. At various times, the Fund’s adviser waived its management fee and/or reimbursed Fund expenses. Had the adviser not done so, the Fund’s total returns would have been lower. The returns shown do not reflect taxes a shareholder wou ld pay on distributions or redemptions. Please read your prospectus carefully.
* As you compare performance, please note that the Fund’s performance reflects the maximum 5.5% sales charge, while the Consumer Price Index and the S&P 500 Index do not reflect any such charges. If you were to purchase any of the above individual stocks or funds represented in these Indexes, any charges you would pay would reduce your total return as well.
** The Consumer Price Index is an inflationary indicator that measures the change in the cost of a fixed basket of products and services, including housing, electricity, food and transportation. It is not possible to invest directly in the Index.
*** The S&P 500 Index is an index that represents the average performance of a group of 500 large-capitalization stocks. “S&P 500®” is a trademark of The McGraw-Hill Companies, Inc. and has been licensed for use by Thrivent Financial for Lutherans. The product is not sponsored, endorsed or promoted by Standard & Poor’s and Standard & Poor’s makes no representation regarding the advisability of investing in the product. Index funds are subject to the same market risks associated with the stocks in their respective indexes. It is not possible to invest directly in the Index. The performance of the Index does not reflect deductions for fees, expenses or taxes.
41

How did the Fund perform during the 12-month period ended Oct. 31, 2006?
Thrivent Large Cap Index Fund-I earned a total return of 15.69% as compared to the median return to its peer group, the Lipper Inc. S&P 500 Index Objective Funds, of 15.86% . The Fund’s market benchmark, the S&P 500 Index, earned a total return of 16.35% .
What factors affected the Fund’s performance?
The Fund’s holdings are aligned with those of the S&P 500 Index. As typically occurs in an index fund, the difference in performance between the benchmark index and the fund itself can largely be attributed to expenses and minor differences in fund composition related to cash flow investing.
Large-company stocks modestly outperformed mid- and small-cap companies over the reporting period. Within the large-cap segments, the telecommunication services, materials, and financial and energy sectors provided the best returns. The information technology, health care and consumer staples sectors achieved positive returns, but their segment returns were less than that of the S&P 500 Index over the fiscal year.
Large-cap performance was largely a function of better returns in the second six months of the period. A disturbing level of speculation was evident in the first half, with unusually high returns achieved in commodity-related companies in the energy, industrial and precious metal sectors. This was particularly evident in the mid- and small-cap segments of the market, as those groups tended to be more leveraged to higher prices for commodities. In the spring, policymakers across both industrialized and emerging countries indicated a more active approach to bringing inflation risk under control, primarily by raising interest rates and moderating economic growth. This caused investors to reevaluate their preferences for risk and led to improved results for the large-capitalization, higher-quality segments of the market in the second half of the period.

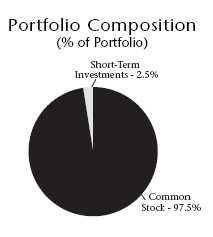
| Top 10 Holdings | |
| (% of Portfolio) | |
| |
| Exxon Mobil Corporation | 3.0% |
| General Electric Company | 2.6% |
| Citigroup, Inc. | 1.8% |
| Microsoft Corporation | 1.8% |
| Bank of America Corporation | 1.8% |
| Procter & Gamble Company | 1.4% |
| Johnson & Johnson | 1.4% |
| Pfizer, Inc. | 1.4% |
| American International Group, Inc. | 1.2% |
| Altria Group, Inc. | 1.2% |
| |
| These common stocks represent 17.6% of the total | |
| investment portfolio. | |
The returns shown do not reflect taxes a shareholder would pay on distributions or redemptions.
Quoted Major Market Sectors, Portfolio Composition and Top 10 Holdings are subject to change.
The lists of Major Market Sectors and Top 10 Holdings exclude short-term investments and collateral held for securities loaned.
The Portfolio Composition chart excludes collateral held for securities loaned.
42
What is your outlook?
There is an attempt on the part of policymakers to slow economic growth and lower inflationary risks that appear to be taking root in the economy. With that shift in policy, economic and market risks increase, as the opportunity for policy errors is not insignificant. We believe the economy will respond and growth will moderate, allowing inflation risk to subside. This would provide a constructive environment for financial assets in general and common stocks in particular.
Large-cap companies, while providing attractive returns over the last few years, have not provided the levels of results achieved in the small- and mid-cap segments of the equity market, in spite of very impressive operating performance and earnings growth. We believe that returns to this segment are likely to be more in line with their counterparts, as investors consider the attractive valuations in this group, along with the higher level of operating stability and seasoned business models. It appears that the largest companies may be best positioned from a valuation perspective, and with the increased risk evident in the current policy environment, provide a relatively attractive combination of opportunity and stability.
| | Portfolio Facts |
| | As of October 31, 2006 |
| | Institutional Share |
| | ————————— |
| Ticker | IILCX |
| Transfer Agent ID | 096 |
| Net Assets | $32,578,119 |
| NAV | $9.46 |
| NAV — High† | 10/26/2006 — $9.53 |
| NAV — Low† | 11/1/2005 — $8.26 |
| Number of Holdings: 503 | † For the year ended October 31, 2006 |
| Average Annual Total Returns2 |
| As of October 31, 2006 | |
| |
| | | | From |
| | | | Inception |
| Institutional Class1 | 1-Year | 5 Years | 12/31/1999 |
|
| Net Asset Value | 15.69% | 6.81% | 0.31% |
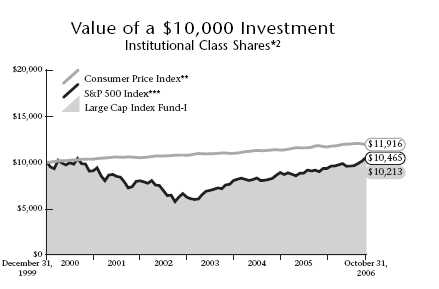
1 Institutional Class shares have no sales load and are for institutional shareholders only.
2 Past performance is not an indication of future results. Annualized total returns represent past performance and reflect changes in share prices, the reinvestment of all dividends and capital gains, and the effects of compounding. Investing in a mutual fund involves risks, including the possible loss of principal. The prospectus contains more complete information on the investment objectives, risks, charges and expenses of the investment company which investors should read and consider carefully before investing. To obtain a prospectus, contact a registered representative or visit www.thrivent.com. At various times, the Fund’s adviser waived its management fee and/or reimbursed Fund expenses. Had the adviser not done so, the Fund’s total returns would have been lower. The returns shown do not reflect taxes a shareholder wou ld pay on distributions or redemptions. Please read your prospectus carefully.
* As you compare performance, please note that the Fund’s performance reflects Fund expenses, net of any reimbursements, while the Consumer Price Index and the S&P 500 Index do not reflect such charges. If you were to purchase any of the above individual stocks or funds represented in these Indexes, any charges you would pay would reduce your total return as well.
** The Consumer Price Index is an inflationary indicator that measures the change in the cost of a fixed basket of products and services, including housing, electricity, food and transportation. It is not possible to invest directly in the Index.
*** The S&P 500 Index is an index that represents the average performance of a group of 500 large-capitalization stocks. “S&P 500®” is a trademark of The McGraw-Hill Companies, Inc. and has been licensed for use by Thrivent Financial for Lutherans. The product is not sponsored, endorsed or promoted by Standard & Poor’s and Standard & Poor’s makes no representation regarding the advisability of investing in the product. Index funds are subject to the same market risks associated with the stocks in their respective indexes. It is not possible to invest directly in the Index. The performance of the Index does not reflect deductions for fees, expenses or taxes.
43

THRIVENT MUTUAL FUNDS 625 Fourth Avenue South Minneapolis, MN 55415 December 29, 2006 Securities and Exchange Commission Branch of Document Control Room 1004 450 Fifth Street, N.W. Washington, DC 20549 RE: Thrivent Mutual Funds Annual Report on Form N-SAR 1940 Act File No. 811-5075 Dear Sir or Madam: On behalf of Thrivent Mutual Funds (the "Registrant"), enclosed herewith for filing via the EDGAR system of electronic filing is the Registrant's annual report on Form N-SAR for the Registrant's fiscal period ended October 31, 2006, including the report on internal control by Independent Public Accountants (Item 77.B.), the results of special shareholder meetings (Item 77.C.), as well as transactions effected pursuant to Rule 10f-3 (Item 77.O.). If you have any questions, please feel free to contact me at (612) 340-4249. Sincerely yours, /s/ David S. Royal David S. Royal Secretary Enclosures THRIVENT MUTUAL FUNDS 625 Fourth Avenue South Minneapolis, MN 55415 December 29, 2006 Securities and Exchange Commission Branch of Document Control Room 1004 450 Fifth Street, N.W. Washington, DC 20549 RE: Thrivent Mutual Funds Annual Report on Form N-SAR 1940 Act File No. 811-5075 Dear Sir or Madam: On behalf of Thrivent Mutual Funds (the "Registrant"), enclosed herewith for filing via the EDGAR system of electronic filing is the Registrant's annual report on Form N-SAR for the Registrant's fiscal period ended October 31, 2006, including the report on internal control by Independent Public Accountants (Item 77.B.), the results of special shareholder meetings (Item 77.C.), as well as transactions effected pursuant to Rule 10f-3 (Item 77.O.). If you have any questions, please feel free to contact me at (612) 340-4249. Sincerely yours, /s/ David S. Royal David S. Royal Secretary Enclosures THRIVENT MUTUAL FUNDS 625 Fourth Avenue South Minneapolis, MN 55415 December 29, 2006 Securities and Exchange Commission Branch of Document Control Room 1004 450 Fifth Street, N.W. Washington, DC 20549 RE: Thrivent Mutual Funds Annual Report on Form N-SAR 1940 Act File No. 811-5075 Dear Sir or Madam: On behalf of Thrivent Mutual Funds (the "Registrant"), enclosed herewith for filing via the EDGAR system of electronic filing is the Registrant's annual report on Form N-SAR for the Registrant's fiscal period ended October 31, 2006, including the report on internal control by Independent Public Accountants (Item 77.B.), the results of special shareholder meetings (Item 77.C.), as well as transactions effected pursuant to Rule 10f-3 (Item 77.O.). If you have any questions, please feel free to contact me at (612) 340-4249. Sincerely yours, /s/ David S. Royal David S. Royal Secretary Enclosures THRIVENT MUTUAL FUNDS 625 Fourth Avenue South Minneapolis, MN 55415 December 29, 2006 Securities and Exchange Commission Branch of Document Control Room 1004 450 Fifth Street, N.W. Washington, DC 20549 RE: Thrivent Mutual Funds Annual Report on Form N-SAR 1940 Act File No. 811-5075 Dear Sir or Madam: On behalf of Thrivent Mutual Funds (the "Registrant"), enclosed herewith for filing via the EDGAR system of electronic filing is the Registrant's annual report on Form N-SAR for the Registrant's fiscal period ended October 31, 2006, including the report on internal control by Independent Public Accountants (Item 77.B.), the results of special shareholder meetings (Item 77.C.), as well as transactions effected pursuant to Rule 10f-3 (Item 77.O.). If you have any questions, please feel free to contact me at (612) 340-4249. Sincerely yours, /s/ David S. Royal David S. Royal Secretary Enclosures THRIVENT MUTUAL FUNDS 625 Fourth Avenue South Minneapolis, MN 55415 December 29, 2006 Securities and Exchange Commission Branch of Document Control Room 1004 450 Fifth Street, N.W. Washington, DC 20549 RE: Thrivent Mutual Funds Annual Report on Form N-SAR 1940 Act File No. 811-5075 Dear Sir or Madam: On behalf of Thrivent Mutual Funds (the "Registrant"), enclosed herewith for filing via the EDGAR system of electronic filing is the Registrant's annual report on Form N-SAR for the Registrant's fiscal period ended October 31, 2006, including the report on internal control by Independent Public Accountants (Item 77.B.), the results of special shareholder meetings (Item 77.C.), as well as transactions effected pursuant to Rule 10f-3 (Item 77.O.). If you have any questions, please feel free to contact me at (612) 340-4249. Sincerely yours, /s/ David S. Royal David S. Royal Secretary Enclosures THRIVENT MUTUAL FUNDS 625 Fourth Avenue South Minneapolis, MN 55415 December 29, 2006 Securities and Exchange Commission Branch of Document Control Room 1004 450 Fifth Street, N.W. Washington, DC 20549 RE: Thrivent Mutual Funds Annual Report on Form N-SAR 1940 Act File No. 811-5075 Dear Sir or Madam: On behalf of Thrivent Mutual Funds (the "Registrant"), enclosed herewith for filing via the EDGAR system of electronic filing is the Registrant's annual report on Form N-SAR for the Registrant's fiscal period ended October 31, 2006, including the report on internal control by Independent Public Accountants (Item 77.B.), the results of special shareholder meetings (Item 77.C.), as well as transactions effected pursuant to Rule 10f-3 (Item 77.O.). If you have any questions, please feel free to contact me at (612) 340-4249. Sincerely yours, /s/ David S. Royal David S. Royal Secretary Enclosures THRIVENT MUTUAL FUNDS 625 Fourth Avenue South Minneapolis, MN 55415 December 29, 2006 Securities and Exchange Commission Branch of Document Control Room 1004 450 Fifth Street, N.W. Washington, DC 20549 RE: Thrivent Mutual Funds Annual Report on Form N-SAR 1940 Act File No. 811-5075 Dear Sir or Madam: On behalf of Thrivent Mutual Funds (the "Registrant"), enclosed herewith for filing via the EDGAR system of electronic filing is the Registrant's annual report on Form N-SAR for the Registrant's fiscal period ended October 31, 2006, including the report on internal control by Independent Public Accountants (Item 77.B.), the results of special shareholder meetings (Item 77.C.), as well as transactions effected pursuant to Rule 10f-3 (Item 77.O.). If you have any questions, please feel free to contact me at (612) 340-4249. Sincerely yours, /s/ David S. Royal David S. Royal Secretary Enclosures THRIVENT MUTUAL FUNDS 625 Fourth Avenue South Minneapolis, MN 55415 December 29, 2006 Securities and Exchange Commission Branch of Document Control Room 1004 450 Fifth Street, N.W. Washington, DC 20549 RE: Thrivent Mutual Funds Annual Report on Form N-SAR 1940 Act File No. 811-5075 Dear Sir or Madam: On behalf of Thrivent Mutual Funds (the "Registrant"), enclosed herewith for filing via the EDGAR system of electronic filing is the Registrant's annual report on Form N-SAR for the Registrant's fiscal period ended October 31, 2006, including the report on internal control by Independent Public Accountants (Item 77.B.), the results of special shareholder meetings (Item 77.C.), as well as transactions effected pursuant to Rule 10f-3 (Item 77.O.). If you have any questions, please feel free to contact me at (612) 340-4249. Sincerely yours, /s/ David S. Royal David S. Royal Secretary Enclosures THRIVENT MUTUAL FUNDS 625 Fourth Avenue South Minneapolis, MN 55415 December 29, 2006 Securities and Exchange Commission Branch of Document Control Room 1004 450 Fifth Street, N.W. Washington, DC 20549 RE: Thrivent Mutual Funds Annual Report on Form N-SAR 1940 Act File No. 811-5075 Dear Sir or Madam: On behalf of Thrivent Mutual Funds (the "Registrant"), enclosed herewith for filing via the EDGAR system of electronic filing is the Registrant's annual report on Form N-SAR for the Registrant's fiscal period ended October 31, 2006, including the report on internal control by Independent Public Accountants (Item 77.B.), the results of special shareholder meetings (Item 77.C.), as well as transactions effected pursuant to Rule 10f-3 (Item 77.O.). If you have any questions, please feel free to contact me at (612) 340-4249. Sincerely yours, /s/ David S. Royal David S. Royal Secretary Enclosures THRIVENT MUTUAL FUNDS 625 Fourth Avenue South Minneapolis, MN 55415 December 29, 2006 Securities and Exchange Commission Branch of Document Control Room 1004 450 Fifth Street, N.W. Washington, DC 20549 RE: Thrivent Mutual Funds Annual Report on Form N-SAR 1940 Act File No. 811-5075 Dear Sir or Madam: On behalf of Thrivent Mutual Funds (the "Registrant"), enclosed herewith for filing via the EDGAR system of electronic filing is the Registrant's annual report on Form N-SAR for the Registrant's fiscal period ended October 31, 2006, including the report on internal control by Independent Public Accountants (Item 77.B.), the results of special shareholder meetings (Item 77.C.), as well as transactions effected pursuant to Rule 10f-3 (Item 77.O.). If you have any questions, please feel free to contact me at (612) 340-4249. Sincerely yours, /s/ David S. Royal David S. Royal Secretary Enclosures THRIVENT MUTUAL FUNDS 625 Fourth Avenue South Minneapolis, MN 55415 December 29, 2006 Securities and Exchange Commission Branch of Document Control Room 1004 450 Fifth Street, N.W. Washington, DC 20549 RE: Thrivent Mutual Funds Annual Report on Form N-SAR 1940 Act File No. 811-5075 Dear Sir or Madam: On behalf of Thrivent Mutual Funds (the "Registrant"), enclosed herewith for filing via the EDGAR system of electronic filing is the Registrant's annual report on Form N-SAR for the Registrant's fiscal period ended October 31, 2006, including the report on internal control by Independent Public Accountants (Item 77.B.), the results of special shareholder meetings (Item 77.C.), as well as transactions effected pursuant to Rule 10f-3 (Item 77.O.). If you have any questions, please feel free to contact me at (612) 340-4249. Sincerely yours, /s/ David S. Royal David S. Royal Secretary Enclosures THRIVENT MUTUAL FUNDS 625 Fourth Avenue South Minneapolis, MN 55415 December 29, 2006 Securities and Exchange Commission Branch of Document Control Room 1004 450 Fifth Street, N.W. Washington, DC 20549 RE: Thrivent Mutual Funds Annual Report on Form N-SAR 1940 Act File No. 811-5075 Dear Sir or Madam: On behalf of Thrivent Mutual Funds (the "Registrant"), enclosed herewith for filing via the EDGAR system of electronic filing is the Registrant's annual report on Form N-SAR for the Registrant's fiscal period ended October 31, 2006, including the report on internal control by Independent Public Accountants (Item 77.B.), the results of special shareholder meetings (Item 77.C.), as well as transactions effected pursuant to Rule 10f-3 (Item 77.O.). If you have any questions, please feel free to contact me at (612) 340-4249. Sincerely yours, /s/ David S. Royal David S. Royal Secretary Enclosures THRIVENT MUTUAL FUNDS 625 Fourth Avenue South Minneapolis, MN 55415 December 29, 2006 Securities and Exchange Commission Branch of Document Control Room 1004 450 Fifth Street, N.W. Washington, DC 20549 RE: Thrivent Mutual Funds Annual Report on Form N-SAR 1940 Act File No. 811-5075 Dear Sir or Madam: On behalf of Thrivent Mutual Funds (the "Registrant"), enclosed herewith for filing via the EDGAR system of electronic filing is the Registrant's annual report on Form N-SAR for the Registrant's fiscal period ended October 31, 2006, including the report on internal control by Independent Public Accountants (Item 77.B.), the results of special shareholder meetings (Item 77.C.), as well as transactions effected pursuant to Rule 10f-3 (Item 77.O.). If you have any questions, please feel free to contact me at (612) 340-4249. Sincerely yours, /s/ David S. Royal David S. Royal Secretary Enclosures THRIVENT MUTUAL FUNDS 625 Fourth Avenue South Minneapolis, MN 55415 December 29, 2006 Securities and Exchange Commission Branch of Document Control Room 1004 450 Fifth Street, N.W. Washington, DC 20549 RE: Thrivent Mutual Funds Annual Report on Form N-SAR 1940 Act File No. 811-5075 Dear Sir or Madam: On behalf of Thrivent Mutual Funds (the "Registrant"), enclosed herewith for filing via the EDGAR system of electronic filing is the Registrant's annual report on Form N-SAR for the Registrant's fiscal period ended October 31, 2006, including the report on internal control by Independent Public Accountants (Item 77.B.), the results of special shareholder meetings (Item 77.C.), as well as transactions effected pursuant to Rule 10f-3 (Item 77.O.). If you have any questions, please feel free to contact me at (612) 340-4249. Sincerely yours, /s/ David S. Royal David S. Royal Secretary Enclosures THRIVENT MUTUAL FUNDS 625 Fourth Avenue South Minneapolis, MN 55415 December 29, 2006 Securities and Exchange Commission Branch of Document Control Room 1004 450 Fifth Street, N.W. Washington, DC 20549 RE: Thrivent Mutual Funds Annual Report on Form N-SAR 1940 Act File No. 811-5075 Dear Sir or Madam: On behalf of Thrivent Mutual Funds (the "Registrant"), enclosed herewith for filing via the EDGAR system of electronic filing is the Registrant's annual report on Form N-SAR for the Registrant's fiscal period ended October 31, 2006, including the report on internal control by Independent Public Accountants (Item 77.B.), the results of special shareholder meetings (Item 77.C.), as well as transactions effected pursuant to Rule 10f-3 (Item 77.O.). If you have any questions, please feel free to contact me at (612) 340-4249. Sincerely yours, /s/ David S. Royal David S. Royal Secretary Enclosures THRIVENT MUTUAL FUNDS 625 Fourth Avenue South Minneapolis, MN 55415 December 29, 2006 Securities and Exchange Commission Branch of Document Control Room 1004 450 Fifth Street, N.W. Washington, DC 20549 RE: Thrivent Mutual Funds Annual Report on Form N-SAR 1940 Act File No. 811-5075 Dear Sir or Madam: On behalf of Thrivent Mutual Funds (the "Registrant"), enclosed herewith for filing via the EDGAR system of electronic filing is the Registrant's annual report on Form N-SAR for the Registrant's fiscal period ended October 31, 2006, including the report on internal control by Independent Public Accountants (Item 77.B.), the results of special shareholder meetings (Item 77.C.), as well as transactions effected pursuant to Rule 10f-3 (Item 77.O.). If you have any questions, please feel free to contact me at (612) 340-4249. Sincerely yours, /s/ David S. Royal David S. Royal Secretary Enclosures THRIVENT MUTUAL FUNDS 625 Fourth Avenue South Minneapolis, MN 55415 December 29, 2006 Securities and Exchange Commission Branch of Document Control Room 1004 450 Fifth Street, N.W. Washington, DC 20549 RE: Thrivent Mutual Funds Annual Report on Form N-SAR 1940 Act File No. 811-5075 Dear Sir or Madam: On behalf of Thrivent Mutual Funds (the "Registrant"), enclosed herewith for filing via the EDGAR system of electronic filing is the Registrant's annual report on Form N-SAR for the Registrant's fiscal period ended October 31, 2006, including the report on internal control by Independent Public Accountants (Item 77.B.), the results of special shareholder meetings (Item 77.C.), as well as transactions effected pursuant to Rule 10f-3 (Item 77.O.). If you have any questions, please feel free to contact me at (612) 340-4249. Sincerely yours, /s/ David S. Royal David S. Royal Secretary Enclosures " border=0>
How did the Fund perform during the 12-month period ended Oct. 31, 2006?
Thrivent Balanced Fund gained 10.97% during the annual reporting period. The Fund’s equity and fixed income benchmarks, the S&P Supercomposite 1500 Index and the Lehman Brothers Aggregate Bond Index, advanced 16.16% and 5.19% for the period, respectively.
What factors affected the Fund’s performance?
In a bond market environment characterized by low volatility, relatively low returns and tight credit spreads, it was dif-ficult to find opportunities for the Fund. We focused our efforts on taking an appropriate amount of risk to gain some incremental yield in the bond portfolio. The corporate bond segment, particularly high-yield, was the best-performing area of the market. Mortgage-backed securities also performed well, led by commercial mortgage-backed securities (CMBS). Our bond portfolio was able to outpace the Lehman Index because of its overweighted position in high-yield bonds and CMBS.
In the equity portfolio, several of our retail holdings aided performance as U.S. consumer spending continued to be strong. In particular, GameStop, Kohl’s, Coldwater Creek and The Children’s Place added to the Fund’s return. Three industrial holdings contributed positively to performance as well. These included Manitowoc, the largest crane producer in the world; Rockwell Automation, a producer of equipment to help automate businesses; and Harley-Davidson. In technology, a number of software and Internet-related holdings performed well, including Google, BEA Software, Cisco Systems and Symbol Technologies.
On the negative side, holdings in the health care sector hindered the Fund’s equity returns. We did not own large-capitalization pharmaceutical companies due to our pessimism surrounding a number of issues. These stocks performed quite well during the period. Conversely, our Fund was overweighted in medical device stocks like St. Jude Medical and Medtronic. Product issues and slow market growth in the industry hampered these holdings’ results during the period. Also, concerns about sales and inventories in the personal computing market dragged down several of our technology holdings including Intel and Texas Instruments. Finally, the Fund’s returns were negatively affected by our reluc tance to chase momentum-driven metal stocks.
What is your outlook?
Our outlook calls for continued U.S. economic growth; however, it will most likely be at a slower pace than we experienced in 2006. We believe the Federal Reserve is likely done with its recent two-year tightening campaign. However, with inflation figures still at elevated levels, we don’t foresee
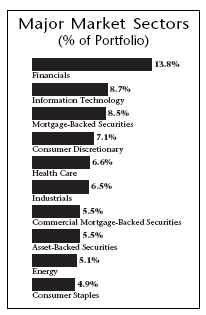

| Top 10 Holdings | |
| (% of Portfolio) | |
| |
| Federal National Mortgage Association | |
| Conventional 30-Yr. Pass Through | 8.5% |
| U.S. Treasury Notes | 4.5% |
| Exxon Mobil Corporation | 1.3% |
| Bank of America Corporation | 1.1% |
| Apple Computer, Inc. | 0.9% |
| Citigroup, Inc. | 0.9% |
| Cisco Systems, Inc. | 0.8% |
| Altria Group, Inc. | 0.8% |
| Wachovia Bank Commercial | |
| Mortgage Trust | 0.7% |
| Wells Fargo & Company | 0.6% |
| |
| |
| These common stocks and long-term fixed income |
| securities represent 20.1% of the total investment portfolio. |
Quoted Fund performance is for Class A shares and does not reflect a sales charge.
The returns shown do not reflect taxes a shareholder would pay on distributions or redemptions.
Quoted Major Market Sectors, Portfolio Composition and Top 10 Holdings are subject to change.
Major Market Sectors represent long-term non-government holdings.
The list of Top 10 Holdings excludes short-term investments and collateral held for securities loaned.
The Portfolio Composition chart excludes collateral held for securities loaned.
44
any rate cuts in the near future. In the fixed income market, we anticipate that the yield curve will remain flat with little difference between rates for shorter- and longer-term securities. Because it is currently not beneficial to take on more risk by owning longer-term bonds, we plan on maintaining a shorter duration in the Fund. We have moved to a lower-than-Index weighting in high-yield corporate bonds based on their valuations. Also, we are continuing to increase the Fund’s CMBS weighting. Finally, after a period of poor performance, we believe Treasury Inflation Protected Securities (TIPS) are attractive.
On the equity side, we anticipate a continued positive backdrop for stocks. We believe corporate earnings will be slower than the phenomenal pace set in 2006, but still favorable. Our outlook for industrial stocks is cautious, based on their outperformance over the past year and the outlook for a somewhat slower economic environment. We are also notably more guarded about the retail industry as we anticipate a slowdown in consumer spending. However, we are favoring technology companies in areas such as open source software solutions, network infrastructure, semi-conductors, and web-based solution providers. We are maintaining our overweighted position in biotechnology and medical devices and are continuing to avoid large-cap pharmaceutical stocks.
| | | | Portfolio Facts | |
| | | | As of October 31, 2006 | |
| | | | A Share | B Share | Institutional Share |
| | | ————————— | ————————— | ————————— |
| Ticker | | | AABFX | BBBFX | IBBFX |
| Transfer Agent ID | | 026 | 085 | 056 |
| Net Assets | | | $251,623,387 | $10,036,849 | $86,303,636 |
| NAV | | | $12.95 | $12.89 | $12.93 |
| NAV — High† | | 10/26/2006 — $13.00 | 10/26/2006 — $12.95 | 10/26/2006 — $12.99 |
| NAV — Low† | | 7/17/2006 — $11.99 | 6/13/2006 — $11.93 | 7/17/2006 — $11.98 |
| Number of Holdings: 451 | | † For the year ended October 31, 2006 | |
| Average Annual Total Returns2 |
| As of October 31, 2006 | |
| |
| | | | From |
| | | | Inception |
| Class A1 | 1-Year | 5 Years | 12/29/1997 |
|
| without sales charge | 10.97% | 5.01% | 5.55% |
| with sales charge | 4.86% | 3.83% | 4.88% |
| |
| | | | From |
| | | | Inception |
| Class B1 | 1-Year | 5 Years | 12/29/1997 |
|
| without sales charge | 9.83% | 4.07% | 5.02% |
| with sales charge | 5.83% | 4.07% | 5.02% |
| |
| | | | From |
| | | | Inception |
| Institutional Class1 | 1-Year | 5 Years | 12/29/1997 |
|
| Net Asset Value | 11.41% | 5.49% | 5.96% |
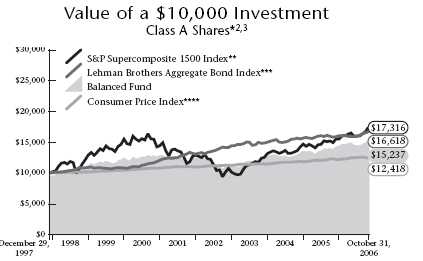
1 Class A performance reflects the maximum sales charge of 5.5% . Class B performance reflects the maximum contingent deferred sales charge (CDSC) of 5%, declining 1% each year during the first five years and then converting to Class A shares after the fifth year. Institutional Class shares have no sales load and are for institutional shareholders only.
2 Past performance is not an indication of future results. Annualized total returns represent past performance and reflect changes in share prices, the reinvestment of all dividends and capital gains, and the effects of compounding. Investing in a mutual fund involves risks, including the possible loss of principal. The prospectus contains more complete information on the investment objectives, risks, charges and expenses of the investment company which investors should read and consider carefully before investing. To obtain a prospectus, contact a registered representative or visit www.thrivent.com. At various times, the Fund’s adviser waived its management fee and/or reimbursed Fund expenses. Had the adviser not done so, the Fund’s total returns would have been lower. The returns shown do not reflect taxes a shareholder wou ld pay on distributions or redemptions. Please read your prospectus carefully.
3 Performance of other classes will be greater or less than the line shown based on the differences in loads and fees paid by shareholders investing in the different classes.
* As you compare performance, please note that the Fund’s performance reflects the maximum 5.5% sales charge, while the Lehman Brothers Aggregate Bond Index, the S&P Supercomposite 1500 Index and the Consumer Price Index do not reflect any such charges. If you were to purchase any of the above individual stocks or funds represented in these Indexes, any charges you would pay would reduce your total return as well.
** The S&P Supercomposite 1500 Index is an index that represents the performance of a group of 1500 publicly traded stocks. It is not possible to invest directly in the Index. The performance of the Index does not reflect deductions for fees, expenses or taxes.
*** The Lehman Brothers Aggregate Bond Index is an index that measures the performance of U.S. investment grade bonds. It is not possible to invest directly in the Index. The performance of the Index does not reflect deductions for fees, expenses or taxes.
**** The Consumer Price Index is an inflationary indicator that measures the change in the cost of a fixed basket of products and services, including housing, electricity, food and transportation. It is not possible to invest directly in the Index.
45

How did the Fund perform during the 12-month period ended Oct. 31, 2006?
For the 12-month period under review, Thrivent High Yield Fund returned 8.96%, in line with its peer group, the Lipper Inc. High Current Yield Funds category, which returned 9.08% . The Fund’s benchmark, the Lehman Brothers U.S. Corporate High Yield Bond Index, returned 10.31% for the same time frame.
What factors affected the Fund’s performance?
The fact that we held less lower-quality and distressed credits both hurt and helped us over the course of the fiscal year. When the period began, strong economic growth, increased appetite for risk among investors and low default rates helped fuel investors’ quest for yield, thereby propelling the lowest-quality, high-yield bonds to outperform. As such, our decision to take an underweighted position in the lowest-rated high-yield credits — CCC-rated and distressed/defaulted credits —detracted from the Fund’s performance over the first half of the period and held back fiscal-year returns for the Fund, relative to the Index.
In May, however, when conditions shifted, the very same defensive positioning that hurt us in the first half of the period substantially added to performance through the rest of the period. A general sense among investors that high-yield valuations had become richly valued, along with growing concerns about a slowdown in economic growth caused yields in the high-yield segment to back up considerably, thereby compressing bond prices. As investors became less comfortable with risk, the lowest-quality credits suffered, and as such, our relative underweighting in this area added to our returns versus the Index.
Another positive contributor to performance was our decision to reduce our previous emphasis, or overweighting, in energy-related names to an underweighted position. Based on our belief that many energy credits had peaked in value and offered minimal room for further appreciation, we sold off many of our energy holdings, enabling us to reap formidable gains for the Fund. Likewise, trimming our exposure to gaming-related bonds, which performed well in the first half of the period, helped us reap profits for the Fund and add to its total return for the year.
On the negative side, our underweighted stance in auto-related bonds, which performed strongly in the first half of the period, detracted from returns through May versus the Index. In addition, like most of our peers, in order to remain sufficiently diversified, we typically don’t invest more than

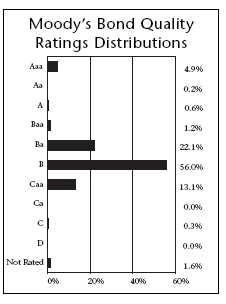
| Top 10 Holdings by Issuer |
| (% of Portfolio) | |
| |
| General Motors Acceptance Corporation | 2.3% |
| International Telecom Satellite | 2.0% |
| R.H. Donnelley Corporation | 1.7% |
| Qwest Corporation | 1.5% |
| Williams Companies, Inc. | 1.4% |
| CCH I, LLC | 1.4% |
| NRG Energy, Inc. | 1.1% |
| Qwest Communications International | 1.1% |
| Ford Motor Credit Company | 1.0% |
| Lyondell Chemical Company | 1.0% |
| |
| |
| These long-term fixed income securities represent 14.5% |
| of the total investment portfolio. | |
*High-yield bonds carry greater volatility and risk than investment-grade bonds.
Quoted Fund performance is for Class A shares and does not reflect a sales charge.
The returns shown do not reflect taxes a shareholder would pay on distributions or redemptions.
Quoted Major Market Sectors, Moody's Bond Quality Ratings Distributions and Top 10 Holdings by Issuer are subject to change.
The lists of Major Market Sectors and Top 10 Holdings by Issuer exclude short-term investments and collateral held for securities loaned.
46
2% to 3% of the Fund’s assets in a single issue. Since both GM and Ford each represent more than 5% of the Lehman Index and outperformed strongly during the first half of the period, we (like most other high-yield funds) lost ground versus the benchmark.
What is your outlook?
Our outlook for high-yield bonds is generally positive, given our expectations for only a mild slowdown in U.S. economic growth as opposed to an outright recession, which we believe is unlikely, given the strength of current economic fundamentals. The combination of steady but slower growth and continued low default rates should enable the high-yield market to deliver a total return in line with its coupon, while favoring the higher-quality tiers of the high-yield market. All in all, we are convinced that the Fund’s current composition and structure position it well for the macro environment we expect over the months ahead.
| | | Portfolio Facts | |
| | | As of October 31, 2006 | |
| | | | |
| | | A Share | B Share | Institutional Share |
| | | ————————— | ————————— | ————————— |
| Ticker | | LBHYX | LUHBX | LBHIX |
| Transfer Agent ID | | 073 | 373 | 473 |
| Net Assets | | $533,711,065 | $16,500,810 | $82,268,266 |
| NAV | | $5.08 | $5.08 | $5.09 |
| NAV — High† | | 2/28/2006 — $5.09 | 2/28/2006 — $5.09 | 10/31/2006 — $5.09 |
| NAV — Low† | | 6/26/2006 — $4.93 | 6/26/2006 — $4.93 | 6/26/2006 — $4.93 |
| Number of Holdings: 258 | | † For the year ended October 31, 2006 | |
| Average Annual Total Returns2 |
| As of October 31, 2006 | |
| |
| |
| |
| Class A1 | 1-Year | 5 Years | 10 Years |
|
| without sales charge | 8.96% | 8.06% | 3.71% |
| with sales charge | 3.99% | 7.06% | 3.23% |
| |
| | | | From |
| | | | Inception |
| Class B1 | 1-Year | 5 Years | 10/31/1997 |
|
| without sales charge | 8.25% | 7.20% | 2.15% |
| with sales charge | 4.25% | 7.20% | 2.15% |
| |
| | | | From |
| | | | Inception |
| Institutional Class1 | 1-Year | 5 Years | 10/31/1997 |
|
| Net Asset Value | 9.63% | 8.54% | 2.95% |

1 Class A performance reflects the maximum sales charge of 4.5% . Class B performance reflects the maximum contingent deferred sales charge (CDSC) of 5%, declining 1% each year during the first five years and then converting to Class A shares after the fifth year. Institutional Class shares have no sales load and are for institutional shareholders only.
2 Past performance is not an indication of future results. Annualized total returns represent past performance and reflect changes in share prices, the reinvestment of all dividends and capital gains, and the effects of compounding. Investing in a mutual fund involves risks, including the possible loss of principal. The prospectus contains more complete information on the investment objectives, risks, charges and expenses of the investment company which investors should read and consider carefully before investing. To obtain a prospectus, contact a registered representative or visit www.thrivent.com. At various times, the Fund’s adviser waived its management fee and/or reimbursed Fund expenses. Had the adviser not done so, the Fund’s total returns would have been lower. The returns shown do not reflect taxes a shareholder wou ld pay on distributions or redemptions. Please read your prospectus carefully.
3 Performance of other classes will be greater or less than the line shown based on the differences in loads and fees paid by shareholders investing in the different classes.
** As you compare performance, please note that the Fund’s performance reflects the maximum 4.5% sales charge, while the Lehman Brothers U.S. Corporate High Yield Bond Index and the Consumer Price Index do not reflect any such charges. If you were to purchase any of the above individual stocks or funds represented in these Indexes, any charges you would pay would reduce your total return as well.
*** The Lehman Brothers U.S. Corporate High Yield Bond Index is an index which measures the performance of fixed-rate non-investment grade bonds. It is not possible to invest directly in the Index. The performance of the Index does not reflect deductions for fees, expenses or taxes.
**** The Consumer Price Index is an inflationary indicator that measures the change in the cost of a fixed basket of products and services, including housing, electricity, food and transportation. It is not possible to invest directly in the Index.
47

Thrivent Diversified Income Plus Fund (formerly known as Thrivent High Yield Fund II) seeks to maximize income, while maintaining prospects for capital appreciation by investing primarily in a diversified portfolio of income-producing securities. All historical performance information on these pages prior to June 30, 2006 pertains to the predecessor Thrivent High Yield Fund II.
Prior to June 30, 2006, the Fund was named Thrivent High Yield Fund II and invested primarily (i.e., at least 80% of its net assets) in high-risk, high-yield bonds commonly referred to as “junk bonds.*” On June 30, 2006, the Fund adopted its current name and its current strategy, which includes the ability to invest in a more diversified portfolio of income-producing securities, such as dividend-producing equities, REIT stocks and other income-producing securities.
How did the Fund perform during the 12-month period ended Oct. 31, 2006?
For the 12-month period under review, Thrivent Diversified Income Plus Fund returned 11.77% . This compares with the Fund’s primary benchmarks, including the S&P 500 Dividend Aristocrats Index, which returned 19.18%; the Lehman Brothers Aggregate Bond Index, which returned 5.19%; and the Lehman Brothers U.S. Corporate High Yield Bond Index, which returned 10.31% for the same one-year time frame.
Since transitioning to its current investment strategy, in the three-month period ended Oct. 31, 2006, the Fund returned 5.81%, compared to the median of its peer group, the Lipper Inc. Mixed Asset Target Allocation Moderate Fund, which delivered 5.24% for the same three-month timeframe.
What factors affected the Fund’s performance?
In the equity portion, both a large relative allocation to real estate investment trust (REIT) equities and stock selection within that sector contributed to returns. This proved to be the best-performing element in the equity component for the period. REITs continued their surprisingly strong run due to robust demand from investors who value the favorable incremental dividend yield the sector typically provides.
Next, the equity component’s focus on traditionally high dividend-paying stocks issued by companies in the utilities and financial services sectors significantly supported performance. At the time of the Fund’s transition to its new mandate, the Federal Reserve had halted its series of interest rate increases. Since utilities and financial services stocks tend to exhibit a greater sensitivity to interest rate fluctuations, they performed well as interest rates stabilized.
The one detractor to performance on the equity side was our decision not to take on more risk within our REIT position when the Fund transitioned to its new structure. Based on our analysis in July, we perceived REIT stocks to be fairly valued, and as such, did not reach the maximum allowable allocation to REIT permitted by the Fund’s prospectus.
The fixed-income component, which is comprised primarily of high-yield, or non-investment grade bonds, delivered strong
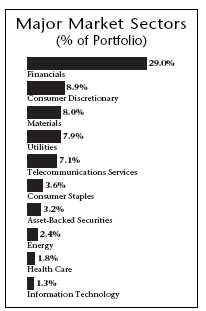
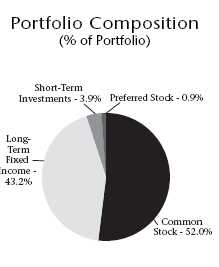
| Top 10 Holdings | |
| (% of Portfolio) | |
| |
| Dow Jones CDX | 3.2% |
| AT&T, Inc. | 1.4% |
| F.N.B. Corporation | 1.4% |
| McDonald's Corporation | 1.4% |
| First Commonwealth Financial | |
| Corporation | 1.3% |
| Pfizer, Inc. | 1.3% |
| Washington Mutual, Inc. | 1.2% |
| Progress Energy, Inc. | 1.2% |
| FirstMerit Corporation | 1.2% |
| Atmos Energy Corporation | 1.1% |
| |
| These common stocks and long term fixed income securities |
| represent 14.7% of the total investment portfolio. | |
*High-yield bonds carry greater volatility and risk than investment-grade bonds.
Quoted Fund performance is for Class A shares and does not reflect a sales charge.
The returns shown do not reflect taxes a shareholder would pay on distributions or redemptions.
Quoted Major Market Sectors, Portfolio Composition and Top 10 Holdings are subject to change.
Major Market Sectors represent long-term non-government holdings.
The list of Top 10 Holdings excludes short-term investments and collateral held for securities loaned.
The Portfolio Composition chart excludes collateral held for securities loaned.
48
performance, thanks to good security selection and an allocation to hybrid securities, a new sector of the fixed-income market that is similar in structure to preferred stock.
Based on our belief that many energy credits had peaked in value and offered minimal room for further appreciation, we sold off many of our energy bonds, enabling us to reap solid gains for the Fund. Finally, deliberately de-emphasizing both health care and utilities-related bonds added to return.
Our underweighting in the lowest-rated high-yield credits —CCC-rated and distressed/defaulted credits — detracted from performance during the first half of the period.
What is your outlook?
Our outlook for the Fund is quite positive, particularly given its strong start and favorable performance versus its peer group median. In general, we believe that higher-dividend-paying securities will remain in favor among investors, particularly as interest rates stabilize. On the fixed-income side, our outlook for high-yield bonds is somewhat cautious, given our expectations for only a mild slowdown in U.S. economic growth, as opposed to an outright recession, which we believe is unlikely given the strength of current economic fundamentals. Our active management of the Fund’s portfolio, coupled with the generally favorable macro conditions we anticipate, should bode well for the Fund, given its highly diversified composition and pursuit of attractive, steady income.
| | | Portfolio Facts | |
| | | As of October 31, 2006 | |
| | | | |
| | | A Share | B Share | Institutional Share |
| | | ————————— | ————————— | ————————— |
| Ticker | | AAHYX | BBHYX | THYFX |
| Transfer Agent ID | | 025 | 075 | 095 |
| Net Assets | | $123,380,401 | $3,033,909 | $5,773,553 |
| NAV | | $6.70 | $6.70 | $6.70 |
| NAV — High† | | 10/26/2006 — $6.74 | 10/26/2006 — $6.73 | 10/26/2006 — $6.74 |
| NAV — Low† | | 6/26/2006 — $6.28 | 6/26/2006 — $6.27 | 6/26/2006 — $6.27 |
| |
| Number of Holdings: 376 | † For the year ended October 31, 2006 |
| Average Annual Total Returns2 |
| As of October 31, 2006 | |
| |
| | | | From |
| | | | Inception |
| Class A1 | 1-Year | 5 Years | 1/8/1997 |
|
| without sales charge | 11.77% | 9.27% | 4.66% |
| with sales charge | 6.77% | 8.25% | 4.18% |
| |
| | | | From |
| | | | Inception |
| Class B1 | 1-Year | 5 Years | 1/8/1997 |
|
| without sales charge | 10.64% | 8.25% | 4.28% |
| with sales charge | 6.64% | 8.25% | 4.28% |
| |
| | | | From |
| | | | Inception |
| Institutional Class1 | 1-Year | 5 Years | 12/29/1997 |
|
| Net Asset Value | 12.29% | 9.70% | 4.09% |
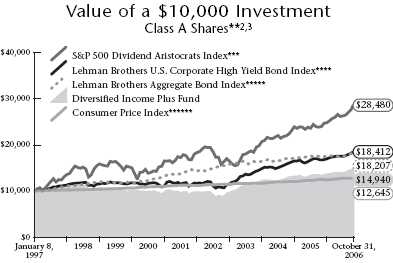
1 Class A performance reflects the maximum sales charge of 4.5% . Class B performance reflects the maximum contingent deferred sales charge (CDSC) of 5%, declining 1% each year during the first five years and then converting to Class A shares after the fifth year. Institutional Class shares have no sales load and are for institutional shareholders only.
2 Past performance is not an indication of future results. Annualized total returns represent past performance and reflect changes in share prices, the reinvestment of all dividends and capital gains, and the effects of compounding. Investing in a mutual fund involves risks, including the possible loss of principal. The prospectus contains more complete information on the investment objectives, risks, charges and expenses of the investment company which investors should read and consider carefully before investing. To obtain a prospectus, contact a registered representative or visit www.thrivent.com. At various times, the Fund’s adviser waived its management fee and/or reimbursed Fund expenses. Had the adviser not done so, the Fund’s total returns would have been lower. The returns shown do not reflect taxes a shareholder wou ld pay on distributions or redemptions. Please read your prospectus carefully.
3 Performance of other classes will be greater or less than the line shown based on the differences in loads and fees paid by shareholders investing in the different classes.
** As you compare performance, please note that the Fund’s performance reflects the maximum 4.5% sales charge, while the S&P 500 Dividend Aristocrats Index, the Lehman Brothers Aggregate Bond Index, the Lehman Brothers U.S. Corporate High Yield Bond Index and the Consumer Price Index do not reflect any such charges. If you were to purchase any of the above individual stocks or funds represented in these Indexes, any charges you would pay would reduce your total return as well.
*** The S&P 500 Dividend Aristocrats Index is an index which measures the performance of large-capitalization companies within the S&P 500 that have followed a managed dividends policy of consistently increasing dividends every year for at least 25 years. The index portfolio has both capital growth and dividend income characteristics, is equal-weighted and is broadly diversified across sectors. It is not possible to invest directly in the Index. The performance of the Index does not reflect deductions for fees, expenses or taxes. The composition of the S&P 500 Dividend Aristocrats Index serves as a better reflection of the Fund’s current strategy than does the Lehman Brothers U.S. Corporate High Yield Bond Index.
**** The Lehman Brothers U.S. Corporate High Yield Bond Index is an index which measures the performance of fixed-rate non-investment grade bonds. It is not possible to invest directly in the Index. The performance of the Index does not reflect deductions for fees, expenses or taxes.
***** The Lehman Brothers Aggregate Bond Index is an index that measures the performance of U.S. investment grade bonds. It is not possible to invest directly in the Index. The performance of the Index does not reflect deductions for fees, expenses or taxes. The composition of the Lehman Brothers Aggregate Bond Index serves as a better reflection of the Fund’s current strategy than does the Lehman Brothers High Yield Bond Index.
******The Consumer Price Index is an inflationary indicator that measures the change in the cost of a fixed basket of products and services, including housing, electricity, food and transportation. It is not possible to invest directly in the Index.
49

How did the Fund perform during the 12-month period ended Oct. 31, 2006?
Thrivent Municipal Bond Fund gained 5.28% during the annual reporting period. The Fund’s peer group, as represented by the Lipper Inc. General Municipal Debt Funds Category, reported a median return of 5.41% . The Fund’s market benchmark, the Lehman Brothers Municipal Bond Index, returned 5.75% over the same time frame.
What factors affected the Fund’s performance?
The Fund’s returns fell slightly short of the Lipper peer group and Lehman Index due to a few factors. First, our results were hindered by the Fund’s lower weighting in high-yield municipal bonds. This was the top-performing segment during the period as investors’ demand for yield drove up prices. The Fund had very limited exposure to high yield, whereas some members of its peer group had a considerable percentage of their portfolios invested in this segment. Second, we held onto the Fund’s five- and 10-year bonds, believing they would outperform longer maturities. Unfortunately, the demand for longer maturity bonds caused rates at the long end of the yield curve to come down, while shorter rates continued to increase. Finally, we made a conscious decision to keep the Fund’s weighting in bonds subject to the alternative minimum tax (AMT) below 5%. While we believed our investors would appreciate the lower AMT exposu re at tax time, this decision hurt our relative results, as these bonds offered higher yields.
On the other hand, we made several moves in the Fund that offset most of these negative factors. Our Fund had a larger-than-Index weighting in hospital bonds, an area that performed well during the period. In addition, we benefited from a number of our health care and higher education bonds that were pre-refunded during the year, which increased their value. Also, we took advantage of higher rates in mid-summer to improve the Fund’s call protection. To accomplish this goal, we sold approximately 3% of the Fund’s holdings that were callable in 2011-2014 and bought bonds with later call dates. This move enhanced performance, as the new bonds were priced to their call dates and longer-term bonds outperformed. Additionally, the Fund was rewarded for its position in long-maturity, non-callable bonds and zero-coupon bonds.
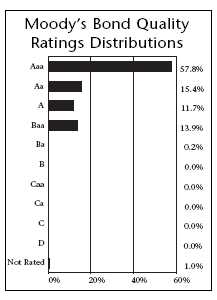
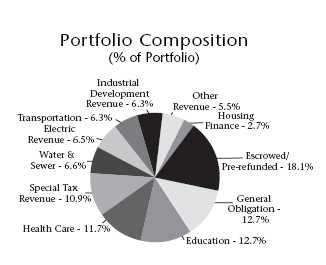
| Top 10 |
| States |
| (% of Portfolio) |
| |
| California | 10.1% |
| Texas | 9.4% |
| Illinois | 9.3% |
| New York | 9.2% |
| Colorado | 6.0% |
| Washington | 4.9% |
| Minnesota | 3.8% |
| Georgia | 3.1% |
| Massachusetts | 3.0% |
| Michigan | 2.7% |
| |
| These long-term fixed |
| income securities repre- |
| sent 61.5% of the total |
| investment portfolio. |
*Investors may be subject to state taxes and federal alternative minimum tax.
Quoted Fund performance is for Class A shares and does not reflect a sales charge.
The returns shown do not reflect taxes a shareholder would pay on distributions or redemptions.
Quoted Moody's Bond Quality Ratings Distributions, Portfolio Composition and Top 10 States are subject to change.
The list of Top 10 States excludes short-term investments.
50
What is your outlook?
Our forecast calls for continued economic growth in the United States, albeit slightly slower than we experienced in 2006. We believe the Federal Reserve (the Fed) is done with its recent rate tightening campaign but won’t be in a hurry to lower rates. Inflation appears to be receding; however, it is still high enough to keep the Fed vigilant. We believe the outlook in general for municipal bonds is very favorable, considering they are one of the few tax-exempt investments available. Given the recent election results and the challenges facing the federal government as baby boomers enter retirement, the municipal market has begun to question the prospects for continued low tax rates. Higher tax rates would improve the relative value of municipal bonds, compared to taxable alternatives. Municipal bond issuance is likely to remain strong next year, as voters approved the majority of the $78.6 billion in bond issues placed on the bal lots in November.
We’re continuing to upgrade the credit quality in the Fund’s portfolio. The current tight credit spreads in the municipal market mean that it doesn’t pay for us to take on more risk by buying lower-quality bonds. We are also lowering our weighting to hospital bonds because we believe several federal issues surrounding Medicare could trickle down and affect hospitals. Conversely, we are favoring higher education bonds. As always, we will continue to search for value in the municipal bond marketplace to help enhance the Fund’s total return.
| | | Portfolio Facts | |
| | | As of October 31, 2006 | |
| | | | |
| | | A Share | B Share | Institutional Share |
| | | ————————— | ————————— | ————————— |
| Ticker | | AAMBX | TMBBX | TMBIX |
| Transfer Agent ID | | 015 | 065 | 088 |
| Net Assets | | $1,201,237,475 | $21,667,214 | $12,162,134 |
| NAV | | $11.39 | $11.38 | $11.39 |
| NAV — High† | | 1/18/2006 — $11.42 | 1/24/2006 — $11.41 | 1/18/2006 — $11.42 |
| NAV — Low† | | 7/5/2006 — $11.09 | 7/5/2006 — $11.09 | 7/5/2006 — $11.09 |
| Number of Holdings: 446 | | † For the year ended October 31, 2006 | |
| Average Annual Total Returns2 |
| As of October 31, 2006 | |
| |
| |
| |
| Class A1 | 1-Year | 5 Years | 10 Years |
|
| without sales charge | 5.28% | 4.44% | 5.43% |
| with sales charge | 0.57% | 3.48% | 4.94% |
| |
| | | | From |
| | | | Inception |
| Class B1 | 1-Year | 5 Years | 10/31/1997 |
|
| without sales charge | 4.56% | 3.67% | 4.66% |
| with sales charge | 0.56% | 3.67% | 4.66% |
| |
| | | | From |
| | | | Inception |
| Institutional Class1 | 1-Year | 5 Years | 10/31/1997 |
|
| Net Asset Value | 5.59% | 4.71% | 5.36% |
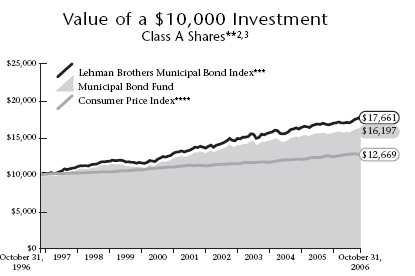
1 Class A performance reflects the maximum sales charge of 4.5% . Class B performance reflects the maximum contingent deferred sales charge (CDSC) of 5%, declining 1% each year during the first five years and then converting to Class A shares after the fifth year. Institutional Class shares have no sales load and are for institutional shareholders only.
2 Past performance is not an indication of future results. Annualized total returns represent past performance and reflect changes in share prices, the reinvestment of all dividends and capital gains, and the effects of compounding. Investing in a mutual fund involves risks, including the possible loss of principal. The prospectus contains more complete information on the investment objectives, risks, charges and expenses of the investment company which investors should read and consider carefully before investing. To obtain a prospectus, contact a registered representative or visit www.thrivent.com. At various times, the Fund’s adviser waived its management fee and/or reimbursed Fund expenses. Had the adviser not done so, the Fund’s total returns would have been lower. The returns shown do not reflect taxes a sharehold er would pay on distributions or redemptions. Please read your prospectus carefully.
3 Performance of other classes will be greater or less than the line shown based on the differences in loads and fees paid by shareholders investing in the different classes.
** As you compare performance, please note that the Fund’s performance reflects the maximum 4.5% sales charge, while the Lehman Brothers Municipal Bond Index and the Consumer Price Index do not reflect any such charges. If you were to purchase any of the above individual stocks or funds represented in these Indexes, any charges you would pay would reduce your total return as well.
*** The Lehman Brothers Municipal Bond Index is a market value-weighted index of investment grade municipal bonds with maturities of one year or more. It is not possible to invest directly in the Index. The performance of the Index does not reflect deductions for fees, expenses or taxes.
**** The Consumer Price Index is an inflationary indicator that measures the change in the cost of a fixed basket of products and services, including housing, electricity, food and transportation. It is not possible to invest directly in the Index.
51

How did the Fund perform during the 12-month period ended Oct. 31, 2006?
Thrivent Income Fund returned 5.25% over the 12-month period. The Fund’s return outpaced that of its peer group, the Lipper Inc. Corporate Debt Funds BBB-Rated Funds Index, which gained 5.06%, and its market benchmark, the Lehman Brothers Aggregate Bond Index, which returned 5.19% .
What factors affected the Fund’s performance?
As many expected, the early months of the 12-month period were challenging for bond investors. The Federal Reserve (the Fed) was in the midst of a money-tightening policy and continued to raise the short-term interest rates it controls. The Fed was clearly focused on stemming a growing inflation risk, one that was exacerbated by a spike in oil prices. By mid-summer, interest rates on one of the bond market’s bellwether measures, the 10-year U.S. Treasury note, had risen from 4.56% at the end of October 2005 to 5.25% near the end of June 2006 (bond values decline when interest rates rise).
In this environment, with Treasury securities offering limited opportunities, we put increasing emphasis on corporate bond issues. Bonds from financial firms, such as banks and insurance companies performed particularly well for the Fund. Our focus on higher-quality issues within this market segment proved to be beneficial. Other areas of the bond market that boosted the Fund’s return included utility issues and hybrid debt securities (similar to preferred stock). In addition, our exposure to high-yield (junk) bonds contributed to the Fund’s return. Another category of interest was in commercial mortgage-backed securities. These issues underwrite the development of commercial properties, a market that has performed well in 2006, in contrast to the residential housing market.
In the final four months of the fiscal year, yields on 10-year Treasury bonds began to drift lower. When yields peaked in June, we focused on bonds with longer maturities, and they enjoyed solid performance when rates again began to decline. The yield on 10-year Treasury issues dropped to 4.61% by Oct. 31, 2006, almost the same point where they stood 12 months earlier.
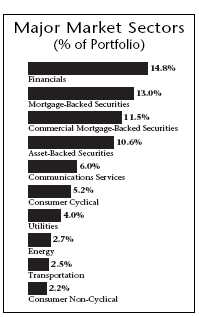
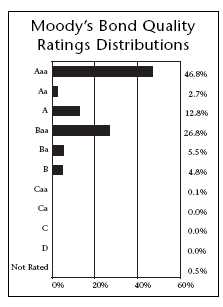
| Top 10 Holdings | |
| (% of Portfolio) | |
| |
| Federal National Mortgage Association | |
| Conventional 30-Yr. Pass Through | 13.0% |
| U.S. Treasury Notes | 2.7% |
| U.S. Treasury Bonds | 2.1% |
| Merrill Lynch Mortgage Trust | 1.8% |
| Dow Jones CDX | 1.8% |
| GMAC Mortgage Corporation Loan Trust | 1.7% |
| Residential Capital Corporation | 1.5% |
| Banc of America Commercial | |
| Mortgage, Inc. | 1.4% |
| General Motors Acceptance Corporation | 1.3% |
| Washington Mutual Mortgage | |
| Pass-Through Certificates | 1.0% |
| |
| These long-term fixed income securities represent 28.3% |
| of the total investment portfolio. | |
Quoted Fund performance is for Class A shares and does not reflect a sales charge.
The returns shown do not reflect taxes a shareholder would pay on distributions or redemptions.
Quoted Major Market Sectors, Moody's Bond Quality Ratings Distributions and Top 10 Holdings are subject to change.
Major Market Sectors represent long-term non-government holdings.
The list of Top 10 Holdings excludes short-term investments and collateral held for securities loaned.
52
What is your outlook?
The Federal Reserve put itself in a holding pattern in the late summer and early fall, as the risk of higher inflation appeared to subside. Many in the bond market seem to anticipate that the Fed will change course and reduce short-term interest rates sometime in early 2007, a move that would generally be welcomed by the bond market. We are not as optimistic that the Fed will be ready to make such a dramatic decision that quickly. Some inflation risks continue, particularly as the U.S. job market improves, which could result in a degree of wage inflation. Rather, we anticipate that the unusual trend where yields on shorter-term debt securities are higher than those of longer-term securities may actually remain in place for the near term.
We are likely to maintain a relatively high level of quality in the Fund’s holdings. This is particularly true given that lower-quality, high-yield bonds appear to be somewhat over-priced in the current market. We will use a very selective approach in adding bonds from this segment of the market. Commercial mortgage-backed securities are likely to continue playing an important role in the Fund, as commercial property development appears poised to enjoy an ongoing recovery.
| | | Portfolio Facts | |
| | | As of October 31, 2006 | |
| | | | |
| | | A Share | B Share | Institutional Share |
| | | ————————— | ————————— | ————————— |
| Ticker | | LUBIX | LUIBX | LBIIX |
| Transfer Agent ID | | 055 | 355 | 455 |
| Net Assets | | $470,456,145 | $12,552,723 | $167,023,839 |
| NAV | | $8.59 | $8.57 | $8.58 |
| NAV — High† | | 1/23/2006 — $8.64 | 1/23/2006 — $8.62 | 1/23/2006 — $8.63 |
| NAV — Low† | | 6/26/2006 — $8.28 | 6/26/2006 — $8.26 | 6/28/2006 — $8.27 |
| Number of Holdings: 230 | | † For the year ended October 31, 2006 | |
| Average Annual Total Returns2 |
| As of October 31, 2006 | |
| |
| |
| Class A1 | 1-Year | 5 Years | 10 Years |
|
| without sales charge | 5.25% | 4.15% | 5.52% |
| with sales charge | 0.55% | 3.20% | 5.04% |
| |
| | | | From |
| | | | Inception |
| Class B1 | 1-Year | 5 Years | 10/31/1997 |
|
| without sales charge | 4.39% | 3.34% | 4.79% |
| with sales charge | 0.39% | 3.34% | 4.79% |
| |
| | | | From |
| | | | Inception |
| Institutional Class1 | 1-Year | 5 Years | 10/31/1997 |
|
| Net Asset Value | 5.68% | 4.55% | 5.58% |
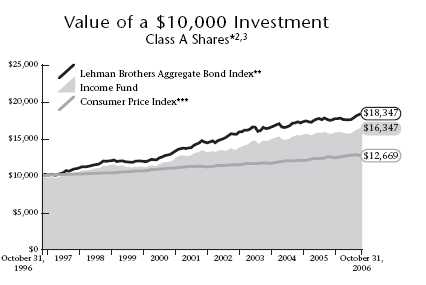
1 Class A performance reflects the maximum sales charge of 4.5% . Class B performance reflects the maximum contingent deferred sales charge (CDSC) of 5%, declining 1% each year during the first five years and then converting to Class A shares after the fifth year. Institutional Class shares have no sales load and are for institutional shareholders only.
2 Past performance is not an indication of future results. Annualized total returns represent past performance and reflect changes in share prices, the reinvestment of all dividends and capital gains, and the effects of compounding. Investing in a mutual fund involves risks, including the possible loss of principal. The prospectus contains more complete information on the investment objectives, risks, charges and expenses of the investment company which investors should read and consider carefully before investing. To obtain a prospectus, contact a registered representative or visit www.thrivent.com. At various times, the Fund’s adviser waived its management fee and/or reimbursed Fund expenses. Had the adviser not done so, the Fund’s total returns would have been lower. The returns shown do not reflect taxes a shareholder wou ld pay on distributions or redemptions. Please read your prospectus carefully.
3 Performance of other classes will be greater or less than the line shown based on the differences in loads and fees paid by shareholders investing in the different classes.
* As you compare performance, please note that the Fund’s performance reflects the maximum 4.5% sales charge, while the Lehman Brothers Aggregate Bond Index and the Consumer Price Index do not reflect any such charges. If you were to purchase any of the above individual stocks or funds represented in these Indexes, any charges you would pay would reduce your total return as well.
** The Lehman Brothers Aggregate Bond Index is an index that measures the performance of U.S. investment grade bonds. It is not possible to invest directly in the Index. The performance of the Index does not reflect deductions for fees, expenses or taxes.
*** The Consumer Price Index is an inflationary indicator that measures the change in the cost of a fixed basket of products and services, including housing, electricity, food and transportation. It is not possible to invest directly in the Index.
53

How did the Fund perform during the 12-month period ended Oct. 31, 2006?
Thrivent Core Bond Fund generated a return of 4.75%, while its peer group, the Lipper Inc. Intermediate Investment Grade Debt Fund Index, gained 4.64% . The Fund’s market benchmark, the Lehman Brothers Aggregate Bond Index, rose 5.19% for the 12-month period.
What factors affected the Fund’s performance?
In the first eight months of the fiscal year, interest rates generally moved in an upward direction, as investors showed increasing concern over the risk of higher inflation. This concern was driven by a dramatic jump in oil prices. Through most of this time, the Federal Reserve (the Fed) raised short-term interest rates consistently, maintaining a policy of rate increases that began in mid-2004. The yield on the 10-year Treasury bond, a bellwether measure of the bond market, rose from 4.56% at the end of October 2005 to a peak of 5.25% in late June 2006. This had a negative impact on much of the market, as bond values decline when interest rates move higher. Through that time, the Fund’s performance was relatively flat.
By early July, market sentiment began to shift. A late-summer decline in oil prices helped stem the inflation threat, at least temporarily. The yield on 10-year Treasury notes drifted lower and ended the 12-month period at 4.61%, only slightly higher than where it stood a year earlier. The result was a fairly flat (and even somewhat inverted) yield curve, where investors could earn higher yields on short-term securities, compared to those paid by longer-term bonds.
The period from late June through October proved to be the most productive for the Fund. With limited opportunities to generate superior performance in this type of environment, we took a meaningful position in mortgage-backed securities that underwrite the development of commercial properties. While the housing market struggled in recent months, the market for commercial properties has moved in a positive direction, and our holdings in this segment of the market helped the Fund outperform its peer group. In the corporate bond arena, we focused on higher-quality securities. This included an overweight position in debt issued by financial companies, such as banks and insurance firms.

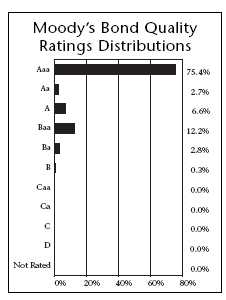
| Top 10 Holdings | |
| (% of Portfolio) | |
| |
| Federal National Mortgage Association | |
| Conventional 30-Yr. Pass Through | 22.9% |
| U.S. Treasury Notes | 8.3% |
| GMAC Mortgage Corporation Loan Trust | 1.8% |
| Banc of America Commercial | |
| Mortgage, Inc. | 1.8% |
| National Collegiate Student Loan Trust | 1.6% |
| Wachovia Bank Commercial | |
| Mortgage Trust | 1.6% |
| Federal National Mortgage Association | 1.3% |
| Credit Based Asset Servicing | |
| and Securitization, LLC | 1.1% |
| Popular ABS Mortgage | |
| Pass-Through Trust | 1.0% |
| U.S. Treasury Bonds | 0.9% |
| These long-term fixed income securities represent 42.3% |
| of the total investment portfolio. | |
Quoted Fund performance is for Class A shares and does not reflect a sales charge.
The returns shown do not reflect taxes a shareholder would pay on distributions or redemptions.
Quoted Major Market Sectors, Moody's Bond Quality Ratings Distributions and Top 10 Holdings are subject to change.
Major Market Sectors represent long-term non-government holdings.
The list of Top 10 Holdings excludes short-term investments and collateral held for securities loaned.
54
What is your outlook?
With the inflation risk appearing to have subsided, at least for the time being, it seems likely that the Federal Reserve will hold off on any further interest rate increases in the current cycle. But the Fed may be in a holding pattern for some time, as concerns about rising labor costs and the continued risk that oil prices could again move significantly higher don’t necessarily rule out a decision by the Fed to again raise interest rates. The bond market appears to assume that the Fed not only won’t raise rates, but in fact will cut short-term rates sometime in early 2007. We are more skeptical, and expect little to change in terms of bond yields in the near term.
Corporate bonds have enjoyed solid performance, but don’t offer compelling value in the current market. We will continue to emphasize commercial mortgage-backed securities and even add to our position as new issues become available. Another area of interest is the market for Treasury Inflation Protected Securities (TIPS). They performed poorly over the past year but look to offer more attractive value in the current environment.
| | | Portfolio Facts | |
| | | As of October 31, 2006 | |
| | | | |
| | | A Share | B Share | Institutional Share |
| | | ————————— | ————————— | ————————— |
| Ticker | | AAINX | BBFBX | IIINX |
| Transfer Agent ID | | 016 | 066 | 089 |
| Net Assets | | $343,076,210 | $8,057,013 | $49,047,740 |
| NAV | | $9.90 | $9.91 | $9.91 |
| NAV — High† | | 1/23/2006 — $9.97 | 1/17/2006 — $9.98 | 1/23/2006 — $9.97 |
| NAV — Low† | | 6/26/2006 — $9.60 | 6/26/2006 — $9.60 | 6/26/2006 — $9.60 |
| Number of Holdings: 174 | | † For the year ended October 31, 2006 | |
| Average Annual Total Returns2 |
| As of October 31, 2006 | |
| |
| |
| |
| Class A1 | 1-Year | 5 Years | 10 Years |
|
| without sales charge | 4.75% | 3.89% | 5.44% |
| with sales charge | 0.00% | 2.94% | 4.96% |
| |
| | | | From |
| | | | Inception |
| Class B1 | 1-Year | 5 Years | 1/8/1997 |
|
| without sales charge | 3.71% | 2.89% | 5.00% |
| with sales charge | (0.29%) | 2.89% | 5.00% |
| |
| | | | From |
| | | | Inception |
| Institutional Class1 | 1-Year | 5 Years 12/29/1997 |
|
| Net Asset Value | 5.20% | 4.33% | 5.49% |
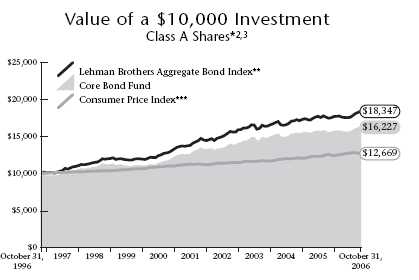
1 Class A performance reflects the maximum sales charge of 4.5% . Class B performance reflects the maximum contingent deferred sales charge (CDSC) of 5%, declining 1% each year during the first five years and then converting to Class A shares after the fifth year. Institutional Class shares have no sales load and are for institutional shareholders only.
2 Past performance is not an indication of future results. Annualized total returns represent past performance and reflect changes in share prices, the reinvestment of all dividends and capital gains, and the effects of compounding. Investing in a mutual fund involves risks, including the possible loss of principal. The prospectus contains more complete information on the investment objectives, risks, charges and expenses of the investment company which investors should read and consider carefully before investing. To obtain a prospectus, contact a registered representative or visit www.thrivent.com. At various times, the Fund’s adviser waived its management fee and/or reimbursed Fund expenses. Had the adviser not done so, the Fund’s total returns would have been lower. The returns shown do not reflect taxes a sharehold er would pay on distributions or redemptions. Please read your prospectus carefully.
3 Performance of other classes will be greater or less than the line shown based on the differences in loads and fees paid by shareholders investing in the different classes.
* As you compare performance, please note that the Fund’s performance reflects the maximum 4.5% sales charge, while the Lehman Brothers Aggregate Bond Index and the Consumer Price Index do not reflect any such charges. If you were to purchase any of the above individual stocks or funds represented in these Indexes, any charges you would pay would reduce your total return as well.
** The Lehman Brothers Aggregate Bond Index is an index that measures the performance of U.S. investment grade bonds. It is not possible to invest directly in the Index. The performance of the Index does not reflect deductions for fees, expenses or taxes.
*** The Consumer Price Index is an inflationary indicator that measures the change in the cost of a fixed basket of products and services, including housing, electricity, food and transportation. It is not possible to invest directly in the Index.
55

How did the Fund perform during the 12-month period ended Oct. 31, 2006?
Thrivent Limited Maturity Bond Fund returned 4.07% for the period, narrowly outpacing the median return of 4.06% for its Lipper Inc. Short Investment Grade Debt Funds peer group. During the same period, the Fund’s market benchmark, the Lehman Brothers Government/Credit 1-3 Year Bond Index, generated a return of 4.38% .
What factors affected the Fund’s performance?
With signs of strong economic growth, particularly in the first months of 2006, interest rates began to move higher, putting some pressure on the Fund. The move was more dramatic on the shorter end of the yield curve, with continued interest rate hikes by the Federal Reserve having much to do with that. Initially, yields on longer-term securities also rose, particularly given the rising inflation threat caused by higher oil prices.
We were prepared for the upward trend in interest rates. Early in 2006, we had positioned the Fund in a defensive manner. Much of our focus was on floating rate securities and money market securities, which tend to perform better as interest rates rise. The coupon rates paid by floating-rate securities is adjusted monthly or quarterly, based on market conditions, so rising rates result in better yields for the Fund. This type of positioning proved to be beneficial to the Fund in the first half of 2006.
However, the economy then showed signs of a fairly dramatic slowdown in the rate of growth by mid-year, and our short duration position proved to be less effective. While yields on short-term securities continued to rise or stabilize, yields on longer-term issues declined. The Fund was not positioned initially to capitalize on this trend. Late in the 12-month period, we did extend the Fund’s duration a bit in an effort to capture some of the benefit of the ongoing decline in long-term rates. Even through the ups and downs, the overall movement of the interest rate market was not dramatic over the past 12 months.
What is your outlook?
We anticipate the trend toward slower growth in the economy will continue into the early months of 2007. As a result, inflation concerns should diminish. While the bond market seems to already be pricing in the likelihood of an
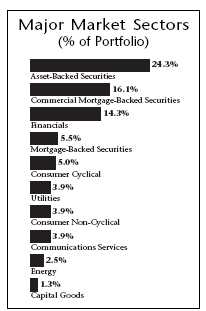
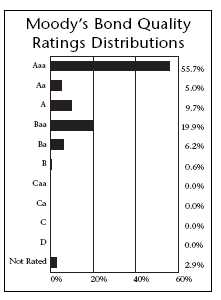
| Top 10 Holdings | |
| (% of Portfolio) | |
| |
| Federal National Mortgage Association | |
| Conventional 30-Yr. Pass Through | 5.5% |
| Federal Home Loan Mortgage Corporation | 3.5% |
| Federal Home Loan Bank | 3.3% |
| Federal National Mortgage Association | 2.4% |
| GMAC Mortgage Corporation Loan Trust | 2.1% |
| Washington Mutual Mortgage | |
| Pass-Through Certificates | 2.0% |
| Countrywide Home Loans, Inc. | 1.9% |
| Countrywide Asset-Backed Certificates | 1.6% |
| Washington Mutual, Inc. | 1.5% |
| General Motors Acceptance Corporation | 1.2% |
| |
| These long-term fixed income securities represent 25.0% |
| of the total investment portfolio. | |
Quoted Fund performance is for Class A shares.
The returns shown do not reflect taxes a shareholder would pay on distributions or redemptions.
Quoted Major Market Sectors, Moody's Bond Quality Ratings Distributions and Top 10 Holdings are subject to change.
Major Market Sectors represent long-term non-government holdings.
The list of Top 10 Holdings excludes short-term investments and collateral held for securities loaned.
56
interest rate cut by the Federal Reserve (the Fed) in late 2006 or early 2007, we do not expect it to happen any time soon. More likely is that interest rates controlled by the investment markets will continue to move in a fairly narrow range, at least in the early months of the new fiscal year.
The biggest wild card that could play into the Fed’s plans is the housing market. If housing activity continues to slow dramatically, as it began to do in the summer of 2006, the Fed may feel more compelled to jump-start the market by cutting short-term rates.
In the current environment, we will look for opportunities to extend the average life of our Fund’s holdings, taking a slightly more aggressive posture and increasing our emphasis on fixed-rate securities. We continue to prefer a focus on mortgage-backed and asset-backed securities, which tend to perform better than government securities in a low interest rate environment. Corporate bonds also remain part of the mix.
| | | Portfolio Facts | |
| | | As of October 31, 2006 | |
| | | | |
| | | A Share | B Share | Institutional Share |
| | | ————————— | ————————— | ————————— |
| Ticker | | LBLAX | TLMBX | THLIX |
| Transfer Agent ID | | 076 | 376 | 476 |
| Net Assets | | $114,807,526 | $1,898,444 | $148,294,821 |
| NAV | | $12.58 | $12.59 | $12.58 |
| NAV — High† | | 1/24/2006 — $12.60 | 1/24/2006 — $12.61 | 1/23/2006 — $12.60 |
| NAV — Low† | | 6/28/2006 — $12.45 | 6/28/2006 — $12.46 | 6/23/2006 — $12.45 |
| Number of Holdings: 226 | | † For the year ended October 31, 2006 | |
| Average Annual Total Returns2 |
| As of October 31, 2006 | |
| |
| | | | From |
| | | | Inception |
| Class A1 | 1-Year | 5 Years | 10/29/1999 |
|
| Net Asset Value | 4.07% | 3.05% | 4.56% |
| |
| | | | From |
| | | | Inception |
| Class B1 | 1-Year | 5 Years | 10/29/1999 |
|
| New Asset Value | 4.02% | 2.99% | 4.52% |
| |
| | | | From |
| | | | Inception |
| Institutional Class1 | 1-Year | 5 Years | 10/29/1999 |
|
| Net Asset Value | 4.55% | 3.43% | 4.91% |
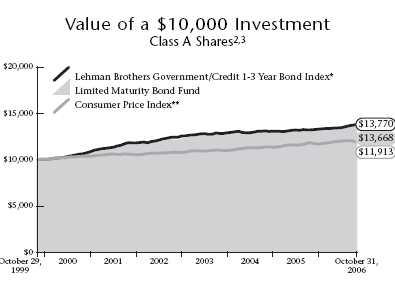
1 Class A, Class B, and Institutional Class shares have no sales loads.
2 Past performance is not an indication of future results. Annualized total returns represent past performance and reflect changes in share prices, the reinvestment of all dividends and capital gains, and the effects of compounding. Investing in a mutual fund involves risks, including the possible loss of principal. The prospectus contains more complete information on the investment objectives, risks, charges and expenses of the investment company which investors should read and consider carefully before investing. To obtain a prospectus, contact a registered representative or visit www.thrivent.com. At various times, the Fund’s adviser waived its management fee and/or reimbursed Fund expenses. Had the adviser not done so, the Fund’s total returns would have been lower. The returns shown do not reflect taxes a sharehold er would pay on distributions or redemptions. Please read your prospectus carefully.
3 Performance of other classes will be greater or less than the line shown based on the differences in fees paid by shareholders in the different classes.
* The Lehman Brothers Government/Credit 1-3 Year Bond Index is an unmanaged market value weighted performance benchmark for government and corporate fixed-rate debt issues with maturities between one and three years. It is not possible to invest directly in the Index. The performance of the Index does not reflect deductions for fees, expenses or taxes.
** The Consumer Price Index is an inflationary indicator that measures the change in the cost of a fixed basket of products and services, including housing, electricity, food and transportation. It is not possible to invest directly in the Index.
57

How did the Fund perform during the 12-month period ended Oct. 31, 2006?
Thrivent Money Market Fund produced a 4.26% return during the period, while its Lipper Money Market Funds Category reported a median net return of 4.13% over the same time frame.
What factors affected the Fund’s performance?
While many factors helped the Fund’s performance during the period, the most significant factor was proper structuring of the Fund to best capitalize on changes in short-term interest rates. We maintained a relatively short weighted average maturity — avoiding longer-dated securities most of the year, and only buying longer-dated securities when the market had fully priced in our expectations for higher interest rates.
Also helping our performance was our high exposure to floating rate securities. The yields on these securities reset weekly, monthly or quarterly with changes in prevailing interest rates.
One factor detracting from our performance was that we didn’t extend the Fund’s average maturity in June and July, when the market anticipated more Federal Reserve (the Fed) rate tightening than actually occurred. In that case, we missed some opportunities.
Our primary objectives of safety and liquidity also detracted from performance. While there is generally some sacrifice in yield for increased safety and liquidity, it remains a small cost, compared with the benefits of providing a conservative fund that meets investors’ objectives of safety and liquidity in all types of market conditions.
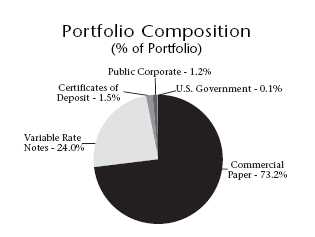
*To the extent practicable, the Fund intends to maintain a stable net asset value of $1.00 per share. An investment in Thrivent Money Market Fund is not insured or guaranteed by the FDIC or any other government agency. Although the Fund seeks to preserve the value of your investment at $1.00 per share, it is possible to lose money by investing in the fund.
Quoted Fund performance is for Class A shares.
The returns shown do not reflect taxes a shareholder would pay on distributions or redemptions.
Quoted Portfolio Composition is subject to change.
58
What is your outlook?
The Fed kept interest rates steady at its last three meetings, and we expect policymakers will continue to stay on hold at least through the first quarter of 2007. The third and fourth quarters of 2006 will probably be the softest of the cycle, with the economy likely firming over the course of next year. We think the risk of the Fed either raising or lowering rates next is about equal.
Our strategy going forward is to extend the Fund’s weighted average maturity as the Fed remains on hold but also keeping the Fund flexible in case the economy regains strength in the second half of 2007 and the market begins to anticipate higher interest rates. As in any interest rate environment, we will continue to focus on our primary objectives of safety and liquidity, while pursuing the optimum risk-adjusted yield.
| | | Portfolio Facts | |
| | | As of October 31, 2006 | |
| | | | |
| | | A Share | B Share | Institutional Share |
| | | ————————— | ————————— | ————————— |
| Ticker | | AMMXX | TMBXX | AALXX |
| Transfer Agent ID | | 018 | 068 | 091 |
| Net Assets | | $864,300,068 | $1,796,873 | $341,100,476 |
| NAV | | $1.00 | $1.00 | $1.00 |
| Number of Holdings: 118 | | † For the year ended October 31, 2006 | |
| Average Annual Total Returns2 |
| As of October 31, 2006 | |
| |
| Class A1 | 1-Year | 5 Years | 10 Years |
|
| without sales charge | 4.26% | 1.69% | 3.30% |
| with sales charge | 4.26% | 1.69% | 3.30% |
| |
| | | | From |
| | | | Inception |
| Class B1 | 1-Year | 5 Years | 1/8/1997 |
|
| without sales charge | 3.94% | 1.35% | 2.76% |
| with sales charge | (0.06%) | 1.35% | 2.76% |
| |
| | | | From |
| | | | Inception |
| Institutional Class1 | 1-Year | 5 Years | 12/29/1997 |
|
| Net Asset Value | 4.59% | 2.03% | 3.37% |
| | Yields | | |
| | As of October 31, 2006** | |
| |
| | Class A | Class B | Institutional |
|
| 7-Day | 4.77% | 4.40% | 4.98% |
| 7-Day Effective | 4.88% | 4.49% | 5.11% |
1 Class A shares have no sales load. Class B performance reflects the maximum contingent deferred sales charge (CDSC) of 5%, declining 1% each year during the first five years and then converting to Class A shares after the fifth year. Institutional Class shares have no sales load and are for institutional shareholders only.
2 Past performance is not an indication of future results. Annualized total returns represent past performance and reflect changes in share prices, the reinvestment of all dividends and capital gains, and the effects of compounding. Investing in a mutual fund involves risks, including the possible loss of principal. The prospectus contains more complete information on the investment objectives, risks, charges and expenses of the investment company which investors should read and consider carefully before investing. To obtain a prospectus, contact a registered representative or visit www.thrivent.com. At various times, the Fund’s adviser waived its management fee and/or reimbursed Fund expenses. Had the adviser not done so, the Fund’s total returns would have been lower. The returns shown do not reflect taxes a shareholder wou ld pay on distributions or redemptions. Please read your prospectus carefully.
** Seven-day yields of Thrivent Money Market Fund refer to the income generated by an investment in the Fund over a specified seven-day period. Effective yields reflect the reinvestment of income. Yields are subject to daily fluctuation and should not be considered an indication of future results.
59
Shareholder Expense Example
(Unaudited) |
As a shareholder of the Fund, you incur two types of costs: (1) transaction costs, including sales charges (loads) on purchase payments, reinvested dividends, or other distributions; redemption fees; and exchange fees; and (2) ongoing costs, including management fees; distribution (12b-1) fees and other Fund expenses. This Example is intended to help you understand your ongoing costs (in dollars) of investing in the Fund and to compare these costs with the ongoing costs of investing in other mutual funds. The Example is based on an investment of $1,000 invested at the beginning of the period and held for the entire period from April 29, 2006 through October 31, 2006.
Actual Expenses
The first line of the table below provides information about actual account values and actual expenses. You may use the information in this line, together with the amount you invested, to estimate the expenses that you paid over the period. Simply divide your account value by $1,000 (for example, an $8,600 account value divided by $1,000 = 8.6), then multiply the result by the number in the first line under the heading entitled "Expenses Paid During Period" to estimate the expenses you paid. A small account fee of $12 is charged to Class A and Class B shareholder accounts if the value falls below stated account minimums ($2,500 for Thrivent Limited Maturity Bond Fund, $1,500 for Thrivent Money Market Fund and $1,000 for all other Funds). This fee is not included in the table below. If it were, the expenses you paid during the period would have been higher and the ending account value would have been lower.
Hypothetical Example for Comparison Purposes
The second line of the table below provides information about hypothetical account values and hypothetical expenses based on the Fund's actual expense ratio and an assumed rate of return of 5% per year before expenses, which is not the Fund's actual return. The hypothetical account values and expenses may not be used to estimate the actual ending account balance or expenses you paid for the period. You may use this information to compare the ongoing costs of investing in the Fund and other funds. To do so, compare this 5% hypothetical example with the 5% hypothetical examples that appear in the shareholder reports of the other funds. A small account fee of $12 is charged to Class A and Class B shareholder accounts if the value falls below stated account minimums ($2,500 for Thrivent Limited Maturity Bond Fund, $1,500 for Thrivent Money Market Fund and $1,000 for all other Funds). This fee is not included in the table below. If it were, the expenses you paid during the pe riod would have been higher and the ending account value would have been lower.
Please note that the expenses shown in the table are meant to highlight your ongoing costs only and do not reflect any transactional costs, such as sales charges (loads), redemption fees, or exchange fees. Therefore, the second line of the table is useful in comparing ongoing costs only, and will not help you determine the relative total costs of owning different funds. In addition, if these transactional costs were included, your costs would have been higher.
| | Beginning | Ending | Expenses | |
| | Account | Account | Paid During | Annualized |
| | Value | Value | Period * | Expense |
| | 4/29/2006 | 10/31/2006 | 4/29/2006 — 10/31/2006 | Ratio |
|
| Thrivent Aggressive Allocation Fund | | | |
| Actual | | | | |
| Class A | $1,000 | $1,014 | $0.46 | 0.09% |
| Institutional Class | $1,000 | $1,016 | ($2.25) | (0.44%) |
| Hypothetical ** | | | | |
| Class A | $1,000 | $1,025 | $0.46 | 0.09% |
| Institutional Class | $1,000 | $1,028 | ($2.26) | (0.44%) |
| |
| Thrivent Moderately Aggressive Allocation Fund | | | |
| Actual | | | | |
| Class A | $1,000 | $1,028 | $0.31 | 0.06% |
| Institutional Class | $1,000 | $1,030 | ($1.90) | (0.37%) |
| Hypothetical ** | | | | |
| Class A | $1,000 | $1,025 | $0.31 | 0.06% |
| Institutional Class | $1,000 | $1,027 | ($1.90) | (0.37%) |
60
| | Beginning | Ending | Expenses | |
| | Account | Account | Paid During | Annualized |
| | Value | Value | Period * | Expense |
| | 4/29/2006 | 10/31/2006 | 4/29/2006 — 10/31/2006 | Ratio |
|
| Thrivent Moderate Allocation Fund | | | |
| Actual | | | | |
| Class A | $1,000 | $1,033 | $0.26 | 0.05% |
| Institutional Class | $1,000 | $1,035 | ($1.65) | (0.32%) |
| Hypothetical ** | | | | |
| Class A | $1,000 | $1,025 | $0.26 | 0.05% |
| Institutional Class | $1,000 | $1,027 | ($1.64) | (0.32%) |
| |
| Thrivent Moderately Conservative Allocation Fund | | | |
| Actual | | | | |
| Class A | $1,000 | $1,034 | $0.05 | 0.01% |
| Institutional Class | $1,000 | $1,035 | ($1.70) | (0.33%) |
| Hypothetical ** | | | | |
| Class A | $1,000 | $1,025 | $0.05 | 0.01% |
| Institutional Class | $1,000 | $1,027 | ($1.70) | (0.33%) |
| |
| Thrivent Technology Fund | | | | |
| Actual | | | | |
| Class A | $1,000 | $956 | $7.29 | 1.47% |
| Class B | $1,000 | $954 | $9.66 | 1.95% |
| Institutional Class | $1,000 | $961 | $4.87 | 0.98% |
| Hypothetical ** | | | | |
| Class A | $1,000 | $1,018 | $7.52 | 1.47% |
| Class B | $1,000 | $1,015 | $9.96 | 1.95% |
| Institutional Class | $1,000 | $1,020 | $5.02 | 0.98% |
| |
| Thrivent Partner Small Cap Growth Fund | | | |
| Actual | | | | |
| Class A | $1,000 | $953 | $3.86 | 0.78% |
| Institutional Class | $1,000 | $954 | $2.23 | 0.45% |
| Hypothetical ** | | | | |
| Class A | $1,000 | $1,021 | $4.00 | 0.78% |
| Institutional Class | $1,000 | $1,023 | $2.31 | 0.45% |
| |
| Thrivent Partner Small Cap Value Fund | | | |
| Actual | | | | |
| Class A | $1,000 | $1,005 | $4.67 | 0.92% |
| Class B | $1,000 | $1,000 | $9.43 | 1.86% |
| Institutional Class | $1,000 | $1,008 | $1.48 | 0.29% |
| Hypothetical ** | | | | |
| Class A | $1,000 | $1,021 | $4.71 | 0.92% |
| Class B | $1,000 | $1,016 | $9.50 | 1.86% |
| Institutional Class | $1,000 | $1,024 | $1.49 | 0.29% |
| |
| Thrivent Small Cap Stock Fund | | | | |
| Actual | | | | |
| Class A | $1,000 | $982 | $6.38 | 1.27% |
| Class B | $1,000 | $977 | $11.68 | 2.33% |
| Institutional Class | $1,000 | $985 | $3.62 | 0.72% |
| Hypothetical ** | | | | |
| Class A | $1,000 | $1,019 | $6.50 | 1.27% |
| Class B | $1,000 | $1,014 | $11.89 | 2.33% |
| Institutional Class | $1,000 | $1,022 | $3.69 | 0.72% |
| |
| Thrivent Small Cap Index Fund | | | | |
| Actual | | | | |
| Class A | $1,000 | $988 | $4.79 | 0.95% |
| Hypothetical ** | | | | |
| Class A | $1,000 | $1,021 | $4.86 | 0.95% |
61
| | Beginning | Ending | Expenses | |
| | Account | Account | Paid During | Annualized |
| | Value | Value | Period * | Expense |
| | 4/29/2006 | 10/31/2006 | 4/29/2006 — 10/31/2006 | Ratio |
|
| Thrivent Mid Cap Growth Fund | | | | |
| Actual | | | | |
| Class A | $1,000 | $963 | $5.97 | 1.20% |
| Class B | $1,000 | $958 | $11.36 | 2.29% |
| Institutional Class | $1,000 | $966 | $2.34 | 0.47% |
| Hypothetical ** | | | | |
| Class A | $1,000 | $1,019 | $6.14 | 1.20% |
| Class B | $1,000 | $1,014 | $11.69 | 2.29% |
| Institutional Class | $1,000 | $1,023 | $2.41 | 0.47% |
| |
| Thrivent Partner Mid Cap Value Fund | | | |
| Actual | | | | |
| Class A | $1,000 | $1,048 | $0.88 | 0.17% |
| Institutional Class | $1,000 | $1,050 | ($1.09) | (0.21%) |
| Hypothetical ** | | | | |
| Class A | $1,000 | $1,024 | $0.87 | 0.17% |
| Institutional Class | $1,000 | $1,026 | ($1.08) | (0.21%) |
| |
| Thrivent Mid Cap Stock Fund | | | | |
| Actual | | | | |
| Class A | $1,000 | $1,000 | $5.93 | 1.17% |
| Class B | $1,000 | $995 | $11.47 | 2.27% |
| Institutional Class | $1,000 | $1,003 | $3.55 | 0.70% |
| Hypothetical ** | | | | |
| Class A | $1,000 | $1,019 | $5.99 | 1.17% |
| Class B | $1,000 | $1,014 | $11.59 | 2.27% |
| Institutional Class | $1,000 | $1,022 | $3.59 | 0.70% |
| |
| Thrivent Mid Cap Index Fund | | | | |
| Actual | | | | |
| Class A | $1,000 | $980 | $4.52 | 0.90% |
| Hypothetical ** | | | | |
| Class A | $1,000 | $1,021 | $4.61 | 0.90% |
| |
| Thrivent Mid Cap Index Fund-I | | | | |
| Actual | | | | |
| Institutional Class | $1,000 | $982 | $2.56 | 0.51% |
| Hypothetical ** | | | | |
| Institutional Class | $1,000 | $1,023 | $2.61 | 0.51% |
| |
| Thrivent Partner International Stock Fund | | | |
| Actual | | | | |
| Class A | $1,000 | $1,014 | $6.74 | 1.32% |
| Class B | $1,000 | $1,008 | $12.32 | 2.42% |
| Institutional Class | $1,000 | $1,017 | $3.58 | 0.70% |
| Hypothetical ** | | | | |
| Class A | $1,000 | $1,019 | $6.75 | 1.32% |
| Class B | $1,000 | $1,013 | $12.35 | 2.42% |
| Institutional Class | $1,000 | $1,022 | $3.59 | 0.70% |
| |
| Thrivent Large Cap Growth Fund | | | | |
| Actual | | | | |
| Class A | $1,000 | $1,010 | $3.92 | 0.77% |
| Class B | $1,000 | $1,004 | $9.65 | 1.90% |
| Institutional Class | $1,000 | $1,013 | $0.10 | 0.02% |
| Hypothetical ** | | | | |
| Class A | $1,000 | $1,021 | $3.94 | 0.77% |
| Class B | $1,000 | $1,016 | $9.71 | 1.90% |
| Institutional Class | $1,000 | $1,025 | $0.10 | 0.02% |
62
| | Beginning | Ending | Expenses | |
| | Account | Account | Paid During | Annualized |
| | Value | Value | Period * | Expense |
| | 4/29/2006 | 10/31/2006 | 4/29/2006 — 10/31/2006 | Ratio |
|
| Thrivent Large Cap Value Fund | | | | |
| Actual | | | | |
| Class A | $1,000 | $1,054 | $5.15 | 0.99% |
| Class B | $1,000 | $1,047 | $11.05 | 2.13% |
| Institutional Class | $1,000 | $1,057 | $2.55 | 0.49% |
| Hypothetical ** | | | | |
| Class A | $1,000 | $1,020 | $5.07 | 0.99% |
| Class B | $1,000 | $1,015 | $10.87 | 2.13% |
| Institutional Class | $1,000 | $1,023 | $2.51 | 0.49% |
| |
| Thrivent Large Cap Stock Fund | | | | |
| Actual | | | | |
| Class A | $1,000 | $1,040 | $5.22 | 1.01% |
| Class B | $1,000 | $1,035 | $9.75 | 1.89% |
| Institutional Class | $1,000 | $1,042 | $2.90 | 0.56% |
| Hypothetical ** | | | | |
| Class A | $1,000 | $1,020 | $5.17 | 1.01% |
| Class B | $1,000 | $1,016 | $9.65 | 1.89% |
| Institutional Class | $1,000 | $1,023 | $2.87 | 0.56% |
| |
| Thrivent Large Cap Index Fund | | | | |
| Actual | | | | |
| Class A | $1,000 | $1,058 | $3.13 | 0.60% |
| Hypothetical ** | | | | |
| Class A | $1,000 | $1,022 | $3.08 | 0.60% |
| |
| Thrivent Large Cap Index Fund-I | | | | |
| Actual | | | | |
| Institutional Class | $1,000 | $1,059 | $2.51 | 0.48% |
| Hypothetical ** | | | | |
| Institutional Class | $1,000 | $1,023 | $2.46 | 0.48% |
| |
| Thrivent Balanced Fund | | | | |
| Actual | | | | |
| Class A | $1,000 | $1,027 | $5.50 | 1.07% |
| Class B | $1,000 | $1,021 | $10.50 | 2.05% |
| Institutional Class | $1,000 | $1,029 | $3.08 | 0.60% |
| Hypothetical ** | | | | |
| Class A | $1,000 | $1,020 | $5.48 | 1.07% |
| Class B | $1,000 | $1,015 | $10.47 | 2.05% |
| Institutional Class | $1,000 | $1,022 | $3.08 | 0.60% |
| |
| Thrivent High Yield Fund | | | | |
| Actual | | | | |
| Class A | $1,000 | $1,044 | $4.51 | 0.87% |
| Class B | $1,000 | $1,039 | $8.94 | 1.73% |
| Institutional Class | $1,000 | $1,048 | $2.28 | 0.44% |
| Hypothetical ** | | | | |
| Class A | $1,000 | $1,021 | $4.46 | 0.87% |
| Class B | $1,000 | $1,017 | $8.84 | 1.73% |
| Institutional Class | $1,000 | $1,023 | $2.26 | 0.44% |
| |
| Thrivent Diversified Income Plus Fund | | | |
| Actual | | | | |
| Class A | $1,000 | $1,072 | $5.14 | 0.98% |
| Class B | $1,000 | $1,066 | $10.58 | 2.02% |
| Institutional Class | $1,000 | $1,074 | $2.84 | 0.54% |
| Hypothetical ** | | | | |
| Class A | $1,000 | $1,020 | $5.02 | 0.98% |
| Class B | $1,000 | $1,015 | $10.32 | 2.02% |
| Institutional Class | $1,000 | $1,023 | $2.77 | 0.54% |
63
| | Beginning | Ending | Expenses | |
| | Account | Account | Paid During | Annualized |
| | Value | Value | Period * | Expense |
| | 4/29/2006 | 10/31/2006 | 4/29/2006 — 10/31/2006 | Ratio |
|
| Thrivent Municipal Bond Fund | | | | |
| Actual | | | | |
| Class A | $1,000 | $1,039 | $4.03 | 0.78% |
| Class B | $1,000 | $1,034 | $7.58 | 1.47% |
| Institutional Class | $1,000 | $1,040 | $2.53 | 0.49% |
| Hypothetical ** | | | | |
| Class A | $1,000 | $1,021 | $4.00 | 0.78% |
| Class B | $1,000 | $1,018 | $7.52 | 1.47% |
| Institutional Class | $1,000 | $1,023 | $2.51 | 0.49% |
| |
| Thrivent Income Fund | | | | |
| Actual | | | | |
| Class A | $1,000 | $1,047 | $4.20 | 0.81% |
| Class B | $1,000 | $1,043 | $8.44 | 1.63% |
| Institutional Class | $1,000 | $1,048 | $2.02 | 0.39% |
| Hypothetical ** | | | | |
| Class A | $1,000 | $1,021 | $4.15 | 0.81% |
| Class B | $1,000 | $1,017 | $8.33 | 1.63% |
| Institutional Class | $1,000 | $1,023 | $2.00 | 0.39% |
| |
| Thrivent Core Bond Fund | | | | |
| Actual | | | | |
| Class A | $1,000 | $1,042 | $4.86 | 0.94% |
| Class B | $1,000 | $1,038 | $10.12 | 1.96% |
| Institutional Class | $1,000 | $1,045 | $2.64 | 0.51% |
| Hypothetical ** | | | | |
| Class A | $1,000 | $1,021 | $4.81 | 0.94% |
| Class B | $1,000 | $1,015 | $10.01 | 1.96% |
| Institutional Class | $1,000 | $1,023 | $2.61 | 0.51% |
| |
| Thrivent Limited Maturity Bond Fund | | | |
| Actual | | | | |
| Class A | $1,000 | $1,026 | $4.37 | 0.85% |
| Class B | $1,000 | $1,026 | $4.57 | 0.89% |
| Institutional Class | $1,000 | $1,029 | $1.95 | 0.38% |
| Hypothetical ** | | | | |
| Class A | $1,000 | $1,021 | $4.35 | 0.85% |
| Class B | $1,000 | $1,021 | $4.56 | 0.89% |
| Institutional Class | $1,000 | $1,023 | $1.95 | 0.38% |
| |
| Thrivent Money Market Fund | | | | |
| Actual | | | | |
| Class A | $1,000 | $1,024 | $3.44 | 0.67% |
| Class B | $1,000 | $1,022 | $5.18 | 1.01% |
| Institutional Class | $1,000 | $1,025 | $1.95 | 0.38% |
| Hypothetical ** | | | | |
| Class A | $1,000 | $1,022 | $3.43 | 0.67% |
| Class B | $1,000 | $1,020 | $5.17 | 1.01% |
| Institutional Class | $1,000 | $1,023 | $1.95 | 0.38% |
* Expenses are equal to the Fund's annualized expense ratio, multiplied by the average account value over the period, multiplied by 186/365 to reflect the one-half year period.
** Assuming 5% total return before expenses.
64

Report of Independent Registered Public Accounting Firm
To the Shareholders and Trustees of
the Thrivent Mutual Funds: |
In our opinion, the accompanying statements of assets and liabilities, including the schedules of investments, and the related statements of operations and of changes in net assets and the financial highlights present fairly, in all material respects, the financial position of the Thrivent Aggressive Allocation Fund, Thrivent Moderately Aggressive Allocation Fund, Thrivent Moderate Allocation Fund, Thrivent Moderately Conservative Allocation Fund, Thrivent Technology Fund, Thrivent Partner Small Cap Growth Fund, Thrivent Partner Small Cap Value Fund, Thrivent Small Cap Stock Fund, Thrivent Small Cap Index Fund, Thrivent Mid Cap Growth Fund, Thrivent Partner Mid Cap Value Fund, Thrivent Mid Cap Stock Fund, Thrivent Mid Cap Index Fund, Thrivent Mid Cap Index Fund-I, Thrivent Partner International Stock Fund, Thrivent Large Cap Growth Fund, Thrivent Large Cap Value Fund, Thrivent Large Cap Stock Fund, Thrivent Large Cap Index Fund, Thrivent Large Cap Index Fund-I, Thrivent Balanced Fund, Thrivent High Yield Fund, Thrivent Diversified Income Plus Fund, Thrivent Municipal Bond Fund, Thrivent Income Fund, Thrivent Core Bond Fund, Thrivent Limited Maturity Bond Fund, and Thrivent Money Market Fund (the “Funds”) at October 31, 2006, the results of each of their operations, changes in each of their net assets and their financial highlights for each of the periods presented, in conformity with accounting principles generally accepted in the United States of America. These financial statements and financial highlights (hereafter referred to as “financial statements”) are the responsibility of the Funds’ management; our responsibility is to express an opinion on these financial statements based on our audits. We conducted our audits of these financial statements in accordance with the standards of the Public Company Accounting Oversight Board (United States). Those standards require that we plan and perform the audit to obtain reasonable assurance about whether the financial statements are free of material misstatement. An audit includes examining, on a test basis, evidence supporting the amounts and disclosures in the financial statements, assessing the accounting principles used and significant estimates made by management, and evaluating the overall financial statement presentation. We believe that our audits, which included confirmation of securities at October 31, 2006 by correspondence with the custodian and brokers, provide a reasonable basis for our opinion.

December 21, 2006
65
Aggressive Allocation Fund
Schedule of Investments as of October 31, 2006 |
| Shares | | Value | Percentage |
|
| |
| Equity Funds (91.3%) | | |
| 1,131,509 | Thrivent Partner Small Cap Growth Fund # | $13,272,602 | 6.3% |
| 855,578 | Thrivent Partner Small Cap Value Fund | 13,911,704 | 6.6 |
| 737,232 | Thrivent Small Cap Stock Fund # | 14,611,931 | 6.9 |
| 531,925 | Thrivent Mid Cap Growth Fund # | 9,170,382 | 4.3 |
| 818,692 | Thrivent Partner Mid Cap Value Fund | 9,717,876 | 4.6 |
| 539,315 | Thrivent Mid Cap Stock Fund # | 10,570,581 | 5.0 |
| 3,635,801 | Thrivent Partner International Stock Fund | 47,956,218 | 22.6 |
| 7,292,981 | Thrivent Large Cap Growth Fund | 41,205,345 | 19.5 |
| 915,094 | Thrivent Large Cap Value Fund | 15,538,293 | 7.3 |
| 594,985 | Thrivent Large Cap Stock Fund | 17,159,380 | 8.1 |
| 19,974 | Thrivent Real Estate Securities Fund | 266,652 | 0.1 |
|
|
| | Total Equity Funds | | |
| | (cost $180,645,581) | 193,380,964 | |
|
|
| |
| Debt Funds (6.8%) | | |
| 1,219,467 | Thrivent High Yield Fund | 6,207,086 | 2.9 |
| 475,260 | Thrivent Income Fund | 4,077,727 | 1.9 |
| 326,347 | Thrivent Limited Maturity Bond Fund | 4,105,443 | 2.0 |
|
|
| | Total Debt Funds | | |
| | (cost $14,299,888) | 14,390,256 | |
|
|
| |
| Short-Term Investments (1.9%) | | |
| 4,098,097 | Thrivent Money Market Fund | 4,098,097 | 1.9 |
|
|
| | Total Short-Term Investments | | |
| | (cost $4,098,097) | 4,098,097 | |
|
|
| | Total Investments | | |
| | (cost $199,043,566) 100.0% | $211,869,317 | |
|
|
| | Other Assets and Liabilities, | | |
| | Net (0.0%) | (19,016) | |
|
|
| | Total Net Assets 100.0% | $211,850,301 | |
|
|
# Non-income producing security.
| Gross unrealized appreciation and depreciation of investments, based on cost for federal income tax purposes, were as follows: |
| Gross unrealized appreciation | $12,650,396 | |
| Gross unrealized depreciation | 0 | |
|
| Net unrealized appreciation (depreciation) | $12,650,396 | |
| Cost for federal income tax purposes | $199,218,921 | |
| The accompanying Notes to Financial Statements are an integral part of this schedule. |
|
| 66 |
Moderately Aggressive Allocation Fund
Schedule of Investments as of October 31, 2006 |
| Shares | | Value | Percentage |
|
| |
| Equity Funds (78.5%) | | |
| 1,342,314 | Thrivent Partner Small Cap Growth Fund # | $15,745,345 | 3.4% |
| 1,012,315 | Thrivent Partner Small Cap Value Fund | 16,460,240 | 3.5 |
| 922,237 | Thrivent Small Cap Stock Fund # | 18,278,731 | 3.9 |
| 777,392 | Thrivent Mid Cap Growth Fund # | 13,402,242 | 2.9 |
| 1,193,224 | Thrivent Partner Mid Cap Value Fund | 14,163,563 | 3.1 |
| 937,639 | Thrivent Mid Cap Stock Fund # | 18,377,715 | 4.0 |
| 5,427,522 | Thrivent Partner International Stock Fund | 71,589,010 | 15.5 |
| 11,987,816 | Thrivent Large Cap Growth Fund | 67,731,158 | 14.6 |
| 3,361,947 | Thrivent Large Cap Value Fund | 57,085,861 | 12.3 |
| 2,084,084 | Thrivent Large Cap Stock Fund | 60,104,985 | 13.0 |
| 803,861 | Thrivent Real Estate Securities Fund | 10,731,539 | 2.3 |
|
|
| | Total Equity Funds | | |
| | (cost $338,252,146) | 363,670,389 | |
|
|
| |
| Debt Funds (18.6%) | | |
| 5,292,707 | Thrivent High Yield Fund | 26,939,881 | 5.8 |
| 4,254,811 | Thrivent Income Fund | 36,506,278 | 7.9 |
| 1,797,997 | Thrivent Limited Maturity Bond Fund | 22,618,806 | 4.9 |
|
|
| | Total Debt Funds | | |
| | (cost $85,337,593) | 86,064,965 | |
|
|
| |
| Short-Term Investments (2.9%) | | |
| 13,408,260 | Thrivent Money Market Fund | 13,408,260 | 2.9 |
|
|
| | Total Short-Term Investments | | |
| | (cost $13,408,260) | $13,408,260 | |
|
|
| | Total Investments | | |
| | (cost $436,997,999) 100.0% | $463,143,614 | |
|
|
| | Other Assets and Liabilities, | | |
| | Net (0.0%) | (32,615) | |
|
|
| | Total Net Assets 100.0% | $463,110,999 | |
|
|
# Non-income producing security.
| Gross unrealized appreciation and depreciation of investments, based on cost for federal income tax purposes, were as follows: |
| Gross unrealized appreciation | $26,039,877 |
| Gross unrealized depreciation | 0 |
| |
|
| Net unrealized appreciation (depreciation) | $26,039,877 |
| Cost for federal income tax purposes | $437,103,737 |
| The accompanying Notes to Financial Statements are an integral part of this schedule. |
|
| 67 |
Moderate Allocation Fund
Schedule of Investments as of October 31, 2006 |
| Shares | | Value | Percentage |
|
| |
| Equity Funds (61.9%) | | |
| 1,616,023 | Thrivent Small Cap Stock Fund # | $32,029,569 | 7.0% |
| 1,408,623 | Thrivent Mid Cap Stock Fund # | 27,609,019 | 6.0 |
| 3,979,098 | Thrivent Partner International Stock Fund | 52,484,302 | 11.4 |
| 10,378,483 | Thrivent Large Cap Growth Fund | 58,638,428 | 12.7 |
| 2,523,938 | Thrivent Large Cap Value Fund | 42,856,460 | 9.3 |
| 1,920,813 | Thrivent Large Cap Stock Fund | 55,396,256 | 12.0 |
| 1,196,410 | Thrivent Real Estate Securities Fund | 15,972,072 | 3.5 |
|
|
| | Total Equity Funds | | |
| | (cost $264,035,476) | 284,986,106 | |
|
|
| |
| Debt Funds (31.3%) | | |
| 5,274,643 | Thrivent High Yield Fund | 26,847,932 | 5.8 |
| 7,390,369 | Thrivent Income Fund | 63,409,364 | 13.8 |
| 4,265,076 | Thrivent Limited Maturity Bond Fund | 53,654,652 | 11.7 |
|
|
| | Total Debt Funds | | |
| | (cost $142,902,208) | 143,911,948 | |
|
|
| |
| Short-Term Investments (6.8%) | | |
| 31,087,193 | Thrivent Money Market Fund | 31,087,193 | 6.8 |
|
|
| | Total Short-Term Investments | | |
| | (cost $31,087,193) | 31,087,193 | |
|
|
| | Total Investments | | |
| | (cost $438,024,877) 100.0% | $459,985,247 | |
|
|
| | Other Assets and Liabilities, | | |
| | Net (0.0%) | (39,018) | |
|
|
| | Total Net Assets 100.0% | $459,946,229 | |
|
|
# Non-income producing security.
| Gross unrealized appreciation and depreciation of investments, based on cost for federal income tax purposes, were as follows: | |
| Gross unrealized appreciation | $21,735,365 | |
| Gross unrealized depreciation | 0 | |
|
| |
| Net unrealized appreciation (depreciation) | $21,735,365 | |
| Cost for federal income tax purposes | $438,249,882 | |
| The accompanying Notes to Financial Statements are an integral part of this schedule. |
|
| 68 |
Moderately Conservative Allocation Fund
Schedule of Investments as of October 31, 2006 |
| Shares | | Value | Percentage |
|
| |
| Equity Funds (44.1%) | | |
| 332,254 | Thrivent Small Cap Stock Fund # | $6,585,264 | 4.0% |
| 335,765 | Thrivent Mid Cap Stock Fund # | 6,580,997 | 4.0 |
| 909,042 | Thrivent Partner International Stock Fund | 11,990,265 | 7.3 |
| 2,858,854 | Thrivent Large Cap Growth Fund | 16,152,526 | 9.9 |
| 702,407 | Thrivent Large Cap Value Fund | 11,926,867 | 7.3 |
| 459,024 | Thrivent Large Cap Stock Fund | 13,238,260 | 8.1 |
| 422,959 | Thrivent Real Estate Securities Fund | 5,646,503 | 3.5 |
|
|
| | Total Equity Funds | | |
| | (cost $66,522,089) | 72,120,682 | |
|
|
| |
| Debt Funds (46.1%) | | |
| 1,541,813 | Thrivent High Yield Fund | 7,847,826 | 4.8 |
| 2,480,584 | Thrivent Income Fund | 21,283,407 | 13.0 |
| 3,676,121 | Thrivent Limited Maturity Bond Fund | 46,245,604 | 28.3 |
|
|
| | Total Debt Funds | | |
| | (cost $75,044,059) | 75,376,837 | |
|
|
| |
| Short-Term Investments (9.8%) | | |
| 15,930,764 | Thrivent Money Market Fund | 15,930,764 | 9.8 |
|
|
| | Total Short-Term Investments | | |
| | (cost $15,930,764) | 15,930,764 | |
|
|
| | Total Investments | | |
| | (cost $157,496,912) 100.0% | $163,428,283 | |
|
|
| | Other Assets and Liabilities, | | |
| | Net (0.0%) | 4,137 | |
|
|
| | Total Net Assets 100.0% | $163,432,420 | |
|
|
# Non-income producing security.
| Gross unrealized appreciation and depreciation of investments, based on cost for federal income tax purposes, were as follows: | |
| Gross unrealized appreciation | $5,893,141 | |
| Gross unrealized depreciation | 0 | |
|
| |
| Net unrealized appreciation (depreciation) | $5,893,141 | |
| Cost for federal income tax purposes | $157,535,142 | |
| The accompanying Notes to Financial Statements are an integral part of this schedule. |
|
| 69 |
Technology Fund
Schedule of Investments as of October 31, 2006 |
| Shares | Common Stock (97.2%) | Value | | Shares | Common Stock (97.2%) | Value |
|
| |
| Consumer Discretionary (3.9%) | | | 700 | Medco Health Solutions, Inc. # | $37,450 |
| 1,900 | Best Buy Company, Inc. | $104,975 | | 3,600 | Medtronic, Inc. | 175,248 |
| 1,800 | Children’s Place Retail | | | 1,100 | Millipore Corporation #* | 70,983 |
| | Stores, Inc. #* | 126,342 | | 24,800 | NeoPharm, Inc. #* | 179,552 |
| 4,900 | Coldwater Creek, Inc. #* | 149,401 | | 2,400 | Novartis AG ADR | 145,752 |
| 2,000 | E.W. Scripps Company | 98,920 | | 12,100 | NuVasive, Inc. #* | 284,471 |
| 1,000 | Harley-Davidson, Inc. * | 68,630 | | 700 | Quest Diagnostics, Inc. | 34,818 |
| 1,100 | Kohl’s Corporation # | 77,660 | | 3,500 | Sanofi-Aventis ADR | 149,415 |
| 2,200 | McGraw-Hill Companies, Inc. | 141,174 | | 4,100 | St. Jude Medical, Inc. # | 140,835 |
| 2,200 | Penn National Gaming, Inc. #* | 80,454 | | 900 | UnitedHealth Group, Inc. | 43,902 |
| 3,100 | Royal Caribbean Cruises, Ltd. * | 125,550 | | 9,500 | Vertex Pharmaceuticals, Inc. #* | 385,700 |
| 3,500 | Scientific Games Corporation #* | 98,105 | | 600 | WellPoint, Inc. # | 45,792 |
|
|
| 4,999 | Shuffle Master, Inc. #* | 139,872 | | | Total Health Care | 3,998,955 |
|
|
| 3,200 | Staples, Inc. | 82,528 | | | | |
| 1,700 | Starwood Hotels & Resorts | | | Industrials (6.0%) | |
| | Worldwide, Inc. | 101,558 | | 4,000 | American Commercial | |
| 1,500 | Target Corporation * | 88,770 | | | Lines, Inc. #* | 256,600 |
| 3,500 | Viacom, Inc. # | 136,220 | | 5,400 | American Reprographics | |
| 4,200 | Walt Disney Company | 132,132 | | | Company #* | 191,700 |
|
| | |
| | Total Consumer | | | 2,500 | American Standard | |
| | Discretionary | 1,752,291 | | | Companies, Inc. * | 110,725 |
|
| | |
| | | | | 2,000 | Burlington Northern | |
| Consumer Staples (0.4%) | | | | Santa Fe Corporation | 155,060 |
| 3,000 | CVS Corporation | 94,140 | | 900 | Emerson Electric Company | 75,960 |
| 1,500 | Wal-Mart Stores, Inc. | 73,920 | | 2,000 | GATX Corporation * | 87,140 |
|
| | |
| | Total Consumer Staples | 168,060 | | 4,500 | Gol Linhas Aereas Inteligentes | |
|
| | |
| | | | | | SA ADR * | 140,175 |
| Health Care (9.0%) | | | 10,700 | Hub Group, Inc. # | 290,612 |
| 6,700 | Abbott Laboratories | 318,317 | | 4,400 | Interline Brands, Inc. #* | 105,336 |
| 2,800 | Advanced Medical Optics, Inc. #* | 114,380 | | 9,200 | Labor Ready, Inc. # | 161,092 |
| 1,100 | Aetna, Inc. | 45,342 | | 4,600 | Laidlaw International, Inc. | 133,446 |
| 1,000 | AmerisourceBergen Corporation | 47,200 | | 3,100 | MSC Industrial | |
| 3,600 | Amgen, Inc. # | 273,276 | | | Direct Company, Inc. | 126,852 |
| 8,900 | Aspect Medical Systems, Inc. #* | 159,043 | | 1,400 | Rockwell Collins, Inc. * | 81,312 |
| 10,200 | BioMarin Pharmaceutical, Inc. # | 163,506 | | 7,000 | Roper Industries, Inc. | 334,950 |
| 800 | Caremark Rx, Inc. | 39,384 | | 300 | SAIC, Inc. # | 6,000 |
| 400 | CIGNA Corporation | 46,792 | | 3,100 | URS Corporation # | 125,271 |
| 8,800 | Conor Medsystems, Inc. #* | 216,128 | | 8,100 | Waste Management, Inc. | 303,588 |
|
|
| 700 | Covance, Inc. # | 40,950 | | | Total Industrials | 2,685,819 |
|
|
| 10,700 | Cubist Pharmaceuticals, Inc. # | 238,289 | | | | |
| 3,300 | Cytyc Corporation # | 87,186 | | Information Technology (73.6%) | |
| 17,500 | Dexcom, Inc. #* | 154,000 | | 18,200 | Accenture, Ltd. | 598,962 |
| 600 | Express Scripts, Inc. #* | 38,232 | | 33,636 | Adobe Systems, Inc. # | 1,286,577 |
| 800 | Fisher Scientific International, Inc. # 68,496 | | 15,500 | ADTRAN, Inc. | 358,670 |
| 1,600 | IMS Health, Inc. * | 44,560 | | 14,700 | Agilent Technologies, Inc. # | 523,320 |
| 12,100 | Keryx BioPharmaceuticals, Inc. #* | 169,884 | | 41,300 | Alcatel SA ADR * | 524,510 |
| 800 | McKesson Corporation | 40,072 | | | | |
| The accompanying Notes to Financial Statements are an integral part of this schedule. |
|
| 70 |
| Technology Fund | | | | | | | |
| Schedule of Investments as of October 31, 2006 | | | | | | | |
| |
| Shares | Common Stock (97.2%) | Value | | Shares | Common Stock (97.2%) | Value |
|
| Information Technology — continued | | | | 42,600 | Powerwave Technologies, Inc. #* | $277,326 |
| 22,100 | Apple Computer, Inc. # | $1,791,868 | | | 33,900 | QUALCOMM, Inc. | 1,233,621 |
| 98,900 | Applied Materials, Inc. | 1,719,871 | | | 38,800 | Red Hat, Inc. #* | 635,544 |
| 21,100 | aQuantive, Inc. #* | 573,498 | | | 1 | Taiwan Semiconductor | |
| 18,800 | Autodesk, Inc. #* | 690,900 | | | | Manufacturing Company, Ltd. | 5 |
| 6,700 | Automatic Data Processing, Inc. | 331,248 | | | 39,300 | Tellabs, Inc. # | | 414,222 |
| 12,200 | Avocent Corporation #* | 447,862 | | | 57,300 | Texas Instruments, Inc. * | 1,729,314 |
| 64,300 | BEA Systems, Inc. # | 1,046,161 | | | 82,900 | TIBCO Software, Inc. #* | 766,825 |
| 87,300 | Cisco Systems, Inc. # | 2,106,549 | | | 44,700 | Wind River Systems, Inc. # | 490,806 |
| 21,200 | Citrix Systems, Inc. # | 626,036 | | | 56,300 | Yahoo!, Inc. #* | 1,482,942 |
|
|
| 24,200 | ECI Telecom, Ltd. # | 179,564 | | | | Total Information | |
| 101,200 | EMC Corporation # | 1,239,700 | | | | Technology | | 32,845,311 |
|
|
| 4,600 | Google, Inc. # | 2,191,394 | | | | | | |
| 26,600 | Hyperion Solutions Corporation # | 994,840 | | Telecommunications Services (4.3%) | |
| 44,500 | Informatica Corporation #* | 551,355 | | | 10,700 | America Movil SA de CV ADR | 458,709 |
| 84,700 | Integrated Device | | | | 15,300 | AT&T, Inc. | | 524,025 |
| | Technology, Inc. # | 1,342,495 | | | 15,700 | Verizon Communications, Inc. | 580,900 |
| 90,700 | Intel Corporation | 1,935,538 | | | 24,400 | Windstream Corporation | 334,768 |
|
|
| 34,700 | Motorola, Inc. | 800,182 | | | | Total Telecommunications | |
| 26,300 | Network Appliance, Inc. # | 959,950 | | | | Services | | 1,898,402 |
|
|
| 46,500 | Nokia Oyj ADR | 924,420 | | | | | | |
|
|
| 67,800 | Novell, Inc. # | 406,800 | | | | Total Common Stock | |
| 52,200 | Nuance Communications, Inc. #* | 602,388 | | | | (cost $43,957,318) | 43,348,838 |
|
|
| 30,400 | NVIDIA Corporation #* | 1,060,048 | | | | | | |
| |
| | | | | | Interest | Maturity | |
| Shares | Collateral Held for Securities Loaned (24.5%) | Rate (+) | Date | Value |
|
| 10,942,952 | Thrivent Financial Securities Lending Trust | | | 5.300% | N/A | $10,942,952 |
|
|
| | Total Collateral Held for Securities Loaned | |
| | (cost $10,942,952) | | | | 10,942,952 |
|
|
| The accompanying Notes to Financial Statements are an integral part of this schedule. |
|
| 71 |
| Technology Fund | | | |
| Schedule of Investments as of October 31, 2006 | | | |
| |
| | | Interest | Maturity | |
| Shares | Short-Term Investments (3.0%) | Rate (+) | Date | Value |
|
| 1,333,102 | Thrivent Money Market Fund | 4.600% | N/A | $1,333,102 |
|
|
| | Total Short-Term Investments (at amortized cost) | 1,333,102 |
|
|
| | Total Investments (cost $56,233,372) 124.7% | $55,624,892 |
|
|
| | Other Assets and Liabilities, Net (24.7%) | | (11,018,663) |
|
|
| | Total Net Assets 100.0% | | | $44,606,229 |
|
|
# Non-income producing security.
* All or a portion of the security is on loan as discussed in item 2(L) of the Notes to Financial Statements.
+ The interest rate shown reflects the yield, coupon rate or, for securities purchased at a discount, the discount rate at the date of purchase.
Definitions:
ADR — American Depository Receipts, which are certificates for shares of an underlying foreign security’s shares held by an issuing U.S. depository bank.
| Gross unrealized appreciation and depreciation of investments, based on cost for federal income tax purposes, were as follows: | |
| Gross unrealized appreciation | $3,126,846 | |
| Gross unrealized depreciation | (4,041,581) | |
| |
| |
| Net unrealized appreciation (depreciation) | ($914,735) | |
| Cost for federal income tax purposes | $56,539,627 | |
| The accompanying Notes to Financial Statements are an integral part of this schedule. |
|
| 72 |
Partner Small Cap Growth Fund
Schedule of Investments as of October 31, 2006
| Shares | Common Stock (95.7%) | | Value | | Shares | Common Stock (95.7%) | Value |
|
| |
| Consumer Discretionary (10.8%) | | | | 4,480 | Parallel Petroleum Corporation #* | $90,720 |
| 13,640 | Casual Male Retail Group, Inc. #* | $202,008 | | 1,750 | Penn Virginia Corporation | 125,212 |
| 2,490 | Children’s Place Retail Stores, Inc. # | 174,773 | | 15,984 | Superior Energy Services, Inc. # | 500,299 |
|
|
| 2,550 | Crocs, Inc. #* | | 101,031 | | | Total Energy | 3,111,060 |
|
|
| 3,020 | Ctrip.com International, Ltd. ADR * | 147,980 | | | | |
| 4,350 | DSW, Inc. #* | | 150,510 | | Financials (9.0%) | |
| 3,890 | Guess ?, Inc. #* | | 221,536 | | 3,890 | Argonaut Group, Inc. # | 132,299 |
| 11,070 | Iconix Brand Group, Inc. #* | | 206,345 | | 14,690 | Cohen & Steers, Inc. * | 512,387 |
| 3,940 | Life Time Fitness, Inc. #* | | 203,028 | | 2,040 | Corporate Office Properties Trust | 97,492 |
| 7,090 | McCormick & Schmick’s Seafood | | | 4,610 | Digital Realty Trust, Inc. | 153,928 |
| | Restaurants, Inc. # | | 186,396 | | 13,959 | Financial Federal Corporation * | 384,152 |
| 1,240 | Nutri/System, Inc. #* | | 76,483 | | 2,670 | Greenhill & Company, Inc. * | 181,400 |
| 1,880 | Pantry, Inc. # | | 102,610 | | 5,440 | Hanmi Financial Corporation * | 116,253 |
| 3,470 | Phillips-Van Heusen Corporation | 158,787 | | 34,771 | Highland Hospitality Corporation * 480,535 |
| 3,220 | Pinnacle Entertainment, Inc. # | | 97,437 | | 1,620 | Home Properties, Inc. | 102,335 |
| 3,970 | Priceline.com, Inc. # | | 159,951 | | 5,370 | optionsXpress Holdings, Inc. | 166,900 |
| 3,590 | Red Robin Gourmet Burgers, Inc. #* | 173,182 | | 3,220 | Penson Worldwide, Inc. # | 78,310 |
| 21,863 | Shuffle Master, Inc. #* | | 611,727 | | 1,500 | PrivateBancorp, Inc. * | 61,605 |
| 1,090 | Strayer Education, Inc. | | 123,301 | | 3,650 | Sunstone Hotel Investors, Inc. * | 107,529 |
| 11,428 | Tractor Supply Company #* | | 553,344 | | 25,571 | Texas Capital Bancshares, Inc. # | 512,443 |
| 4,670 | Under Armour, Inc. #* | | 216,454 | | 3,490 | United Community Banks, Inc. * | 109,726 |
| 6,620 | VistaPrint, Ltd. #* | | 207,074 | | 5,480 | Waddell & Reed Financial, Inc. | 139,740 |
| 7,030 | WMS Industries, Inc. #* | | 248,370 | | 8,223 | Wintrust Financial Corporation * | 396,842 |
|
|
| 3,810 | Zumiez, Inc. #* | | 125,197 | | | Total Financials | 3,733,876 |
|
| | |
|
| | Total Consumer | | | | | | |
| | Discretionary | | 4,447,524 | | Health Care (20.3%) | | |
|
| | | | |
| | | | | | 2,050 | Adams Respiratory | |
| Consumer Staples (1.0%) | | | | | Therapeutics, Inc. # | 88,355 |
| 2,950 | Central Garden & Pet Company #* | 147,412 | | 3,640 | Alexion Pharmaceuticals, Inc. #* | 135,990 |
| 4,470 | United Natural Foods, Inc. #* | | 156,003 | | 40,568 | American Medical Systems | |
| 6,500 | Wild Oats Markets, Inc. #* | | 116,870 | | | Holdings, Inc. #* | 722,516 |
|
| | |
| | Total Consumer Staples | | 420,285 | | 4,480 | AMN Healthcare Services, Inc. #* | 113,299 |
|
| | |
| | | | | | 7,740 | Array Biopharma, Inc. # | 76,007 |
| Energy (7.5%) | | | | 20,089 | Cambrex Corporation | 470,083 |
| 2,640 | Arena Resources, Inc. #* | | 94,301 | | 3,670 | Conor Medsystems, Inc. #* | 90,135 |
| 4,640 | Basic Energy Services, Inc. # | | 113,402 | | 3,640 | Cubist Pharmaceuticals, Inc. #* | 81,063 |
| 2,120 | Core Laboratories NV # | | 154,527 | | 3,520 | Haemonetics Corporation # | 160,512 |
| 1,050 | Crosstex Energy, Inc. * | | 100,779 | | 16,145 | HealthExtras, Inc. #* | 371,819 |
| 23,418 | Dril-Quip, Inc. #* | | 922,201 | | 3,680 | Hologic, Inc. #* | 177,192 |
| 1,850 | Goodrich Petroleum Corporation #* | 63,288 | | 2,580 | ICON plc #* | 92,570 |
| 4,680 | Hornbeck Offshore Services, Inc. #* | 168,901 | | 11,319 | Illumina, Inc. #* | 497,583 |
| 7,114 | Hydril Company #* | | 427,196 | | 13,475 | Integra LifeSciences Holdings | |
| 3,980 | Mariner Energy, Inc. # | | 78,884 | | | Corporation #* | 497,632 |
| 9,344 | Oil States International, Inc. #* | | 271,350 | | 18,418 | Inverness Medical | |
| | | | | | | Innovations, Inc. #* | 694,174 |
| | | | | | 11,793 | Kensey Nash Corporation #* | 358,625 |
| | | | | | 5,410 | K-V Pharmaceutical Company #* | 120,751 |
| The accompanying Notes to Financial Statements are an integral part of this schedule. |
|
| 73 |
Partner Small Cap Growth Fund
Schedule of Investments as of October 31, 2006 |
| Shares | Common Stock (95.7%) | | Value | | Shares | Common Stock (95.7%) | Value |
|
| |
| Health Care — continued | | | | 2,070 | Teledyne Technologies, Inc. # | $86,360 |
| 2,360 | Kyphon, Inc. # | | $93,220 | | 3,200 | Valmont Industries, Inc. | 178,560 |
| 4,520 | Medicis Pharmaceutical | | | | 1,880 | Washington Group | |
| | Corporation * | | 158,381 | | | International, Inc. # | 106,446 |
| 14,789 | Mentor Corporation * | | 692,125 | | 3,360 | Waste Connections, Inc. # | 136,718 |
|
|
| 5,480 | Myogen, Inc. #* | | 286,604 | | | Total Industrials | 6,235,657 |
|
|
| 5,340 | New River | | | | | | |
| | Pharmaceuticals, Inc. #* | | 271,592 | | Information Technology (27.9%) | |
| 8,729 | NuVasive, Inc. #* | | 205,219 | | 10,620 | 24/7 Real Media, Inc. #* | 105,138 |
| 6,790 | Nuvelo, Inc. # | | 125,208 | | 4,540 | Acme Packet, Inc. # | 78,088 |
| 7,300 | Onyx Pharmaceuticals, Inc. #* | | 137,094 | | 3,240 | Advent Software, Inc. #* | 119,945 |
| 5,620 | PAREXEL International | | | | 47,142 | Aeroflex, Inc. # | 509,134 |
| | Corporation # | | 166,352 | | 4,090 | Altiris, Inc. # | 92,066 |
| 3,320 | Progenics Pharmaceuticals, Inc. # | 86,718 | | 12,410 | Anadigics, Inc. #* | 100,273 |
| 15,052 | PSS World Medical, Inc. #* | | 302,846 | | 8,640 | aQuantive, Inc. #* | 234,835 |
| 9,320 | Psychiatric Solutions, Inc. #* | | 309,424 | | 4,860 | Atheros Communications, Inc. # | 105,608 |
| 4,250 | Sunrise Senior Living, Inc. # | | 132,642 | | 12,841 | Avocent Corporation #* | 471,393 |
| 1,720 | United Therapeutics Corporation # | 102,942 | | 6,930 | Benchmark Electronics, Inc. # | 183,992 |
| 2,270 | Ventana Medical Systems, Inc. # | 91,685 | | 8,190 | Blackbaud, Inc. * | 204,750 |
| 3,220 | Wellcare Health Plans, Inc. # | | 189,175 | | 9,510 | Brightpoint, Inc. # | 115,071 |
| 6,430 | West Pharmaceutical Services, Inc. * | 270,317 | | 14,822 | Coherent, Inc. # | 477,713 |
|
| | |
| | Total Health Care | 8,369,850 | | 13,190 | Comtech Group, Inc. #* | 222,647 |
|
| | |
| | | | | | 4,270 | Cymer, Inc. #* | 197,829 |
| Industrials (15.1%) | | | | 34,450 | Digital Insight Corporation # | 1,060,373 |
| 24,376 | A.S.V., Inc. #* | | 356,133 | | 4,510 | Digital River, Inc. #* | 260,904 |
| 17,860 | AAR Corporation #* | | 465,074 | | 4,870 | Diodes, Inc. #* | 214,475 |
| 4,340 | Acuity Brands, Inc. | | 215,004 | | 2,900 | Equinix, Inc. #* | 198,360 |
| 5,480 | Administaff, Inc. | | 188,786 | | 28,650 | Finisar Corporation #* | 99,702 |
| 3,240 | American Commercial Lines, Inc. #* | 207,846 | | 3,770 | FormFactor, Inc. #* | 143,939 |
| 4,320 | Barnes Group, Inc. * | | 86,616 | | 8,700 | Foundry Networks, Inc. # | 110,142 |
| 8,880 | Cenveo, Inc. #* | | 176,179 | | 22,166 | Global Imaging Systems, Inc. #* | 482,554 |
| 11,021 | CRA International, Inc. #* | | 560,197 | | 5,220 | Heartland Payment Systems, Inc. * | 139,478 |
| 1,940 | EGL, Inc. # | | 65,941 | | 10,786 | Hyperion Solutions Corporation # | 403,396 |
| 2,380 | Energy Conversion Devices, Inc. #* | 87,560 | | 32,382 | Informatica Corporation #* | 401,213 |
| 12,012 | Forward Air Corporation | | 390,030 | | 21,986 | Intermec, Inc. #* | 496,884 |
| 18,800 | Gardner Denver, Inc. # | | 639,012 | | 1,820 | Itron, Inc. #* | 99,081 |
| 4,580 | General Cable Corporation # | | 172,208 | | 4,700 | Kanbay International, Inc. #* | 133,480 |
| 2,630 | Genlyte Group, Inc. # | | 203,194 | | 2,830 | MICROS Systems, Inc. # | 140,594 |
| 5,400 | Hub Group, Inc. #* | | 146,664 | | 2,390 | MoneyGram International, Inc. | 81,762 |
| 5,582 | ICT Group, Inc. #* | | 176,949 | | 4,720 | Net 1 UEPS Technology, Inc. # | 116,254 |
| 6,465 | IDEX Corporation | | 303,208 | | 4,230 | Nice Systems, Ltd. # | 130,157 |
| 5,980 | Infrasource Services, Inc. # | | 117,029 | | 11,310 | Opsware, Inc. #* | 102,808 |
| 7,203 | Kennametal, Inc. | | 444,497 | | 9,200 | Par Technology Corporation #* | 74,888 |
| 5,650 | Knoll, Inc. | | 111,870 | | 7,230 | Polycom, Inc. # | 198,102 |
| 2,360 | Ladish Company, Inc. # | | 73,679 | | 3,110 | Quality Systems, Inc. | 131,988 |
| 15,409 | Shaw Group, Inc. #* | | 409,263 | | 6,720 | Riverbed Technology, Inc. #* | 161,078 |
| 4,900 | SkyWest, Inc. | | 130,634 | | 6,110 | Rogers Corporation #* | 427,517 |
| The accompanying Notes to Financial Statements are an integral part of this schedule. |
|
| 74 |
Partner Small Cap Growth Fund
Schedule of Investments as of October 31, 2006 |
| Shares | Common Stock (95.7%) | Value | | Shares | Common Stock (95.7%) | Value |
|
| |
| Information Technology — continued | | | | 6,190 | Pan American Silver | |
| 2,260 | Silicon Laboratories, Inc. #* | $73,744 | | | | Corporation #* | | $137,170 |
| 23,670 | Sonus Networks, Inc. #* | 123,794 | | | 3,250 | Rockwood Holdings, Inc. # | 75,758 |
| 6,240 | Tessera Technologies, Inc. #* | 217,838 | | | 1,820 | RTI International Metals, Inc. #* | 111,602 |
| 4,870 | THQ, Inc. #* | 146,441 | | | 2,590 | Silgan Holdings, Inc. | 107,148 |
|
|
| 15,250 | TIBCO Software, Inc. # | 141,062 | | | | Total Materials | 777,090 |
|
|
| 3,320 | Transaction Systems | | | | | | | |
| | Architects, Inc. # | 111,917 | | Telecommunications Services (2.2%) | |
| 9,697 | Trimble Navigation, Ltd. # | 448,195 | | | 8,940 | Cogent Communications Group, | |
| 45,800 | ValueClick, Inc. #* | 861,040 | | | | Inc. #* | | 126,590 |
| 5,295 | Varian Semiconductor Equipment | | | 13,012 | NeuStar, Inc. #* | | 380,211 |
| | Associates, Inc. #* | 193,215 | | | 3,810 | SBA Communications | |
| 4,940 | WebEx Communications, Inc. #* | 189,943 | | | | Corporation #* | | 101,765 |
|
| | |
| | Total Information | | | | 14,700 | Time Warner Telecom, Inc. # | 293,118 |
|
|
| | Technology | 11,534,800 | | | | Total Telecommunications | |
|
| | |
| | | | | | | Services | | 901,684 |
|
|
| Materials (1.9%) | | | | | | | |
|
|
| 3,600 | H.B. Fuller Company | 89,244 | | | | Total Common Stock | |
| 7,320 | Hercules, Inc. # | 133,224 | | | | (cost $36,568,116) | 39,531,826 |
|
|
| 2,260 | Oregon Steel Mills, Inc. # | 122,944 | | | | | | |
| | | | | | Interest | Maturity | |
| Shares | Collateral Held for Securities Loaned (25.8%) | Rate (+) | Date | Value |
|
| 10,634,766 | Thrivent Financial Securities Lending Trust | | | 5.300% | N/A | $10,634,766 |
|
|
| | Total Collateral Held for Securities Loaned | |
| | (cost $10,634,766) | | | | 10,634,766 |
|
|
| The accompanying Notes to Financial Statements are an integral part of this schedule. |
|
| 75 |
Partner Small Cap Growth Fund
Schedule of Investments as of October 31, 2006 |
| Shares or | | | | |
| Principal | | Interest | Maturity | |
| Amount | Short-Term Investments (4.7%) | Rate (+) | Date | Value |
|
| $670,000 | IBRD Discount Note | 5.000% | 11/1/2006 | $670,000 |
| 1,260,337 | Thrivent Money Market Fund | 4.600 | N/A | 1,260,337 |
|
|
| | Total Short-Term Investments (at amortized cost) | 1,930,337 |
|
|
| | Total Investments (cost $49,133,219) 126.2% | $52,096,929 |
|
|
| | Other Assets and Liabilities, Net (26.2%) | | (10,804,001) |
|
|
| | Total Net Assets 100.0% | | | $41,292,928 |
|
|
# Non-income producing security.
* All or a portion of the security is on loan as discussed in item 2(L) of the Notes to Financial Statements.
+ The interest rate shown reflects the yield, coupon rate or, for securities purchased at a discount, the discount rate at the date of purchase.
Definitions:
ADR — American Depository Receipts, which are certificates for shares of an underlying foreign security’s shares held by an issuing U.S. depository bank.
| Gross unrealized appreciation and depreciation of investments, based on cost for federal income tax purposes, were as follows: | |
| Gross unrealized appreciation | $4,009,142 | |
| Gross unrealized depreciation | (1,203,799) | |
| |
| |
| Net unrealized appreciation (depreciation) | $2,805,343 | |
| Cost for federal income tax purposes | $49,291,586 | |
| The accompanying Notes to Financial Statements are an integral part of this schedule. |
|
| 76 |
Partner Small Cap Value Fund
Schedule of Investments as of October 31, 2006 |
| Shares | Common Stock (95.8%) | Value | | Shares | Common Stock (95.8%) | Value |
|
| |
| Consumer Discretionary (12.2%) | | | 25,500 | W-H Energy Services, Inc. # | $1,194,165 |
| 54,000 | Aaron Rents, Inc. | $1,343,520 | | 40,000 | Whiting Petroleum | |
| 25,200 | Building Materials Holding | | | | Corporation #* | 1,784,400 |
|
|
| | Corporation * | 656,712 | | | Total Energy | 9,149,390 |
|
|
| 25,300 | Cavco Industries, Inc. # | 849,574 | | | | |
| 26,500 | CSS Industries, Inc. | 832,365 | | Financials (21.4%) | |
| 40,000 | Cutter & Buck, Inc. | 452,000 | | 28,000 | Allied Capital Corporation * | 882,840 |
| 51,000 | Dixie Group, Inc. # | 687,480 | | 23,100 | Boston Private Financial | |
| 36,700 | Fred’s, Inc. * | 480,036 | | | Holdings, Inc. * | 638,484 |
| 54,500 | Fuel Systems Solutions, Inc. #* | 715,040 | | 33,100 | Bristol West Holdings, Inc. | 460,752 |
| 44,000 | Hancock Fabrics, Inc. #* | 146,080 | | 33,500 | East West Bancorp, Inc. * | 1,223,085 |
| 71,100 | Haverty Furniture | | | 50,401 | First Financial Fund, Inc. * | 896,123 |
| | Companies, Inc. * | 1,123,380 | | 43,400 | First Republic Bank * | 1,689,996 |
| 39,500 | Journal Register Company * | 311,260 | | 58,000 | Glenborough Realty Trust, Inc. | 1,506,840 |
| 12,400 | M/I Homes, Inc. * | 445,408 | | 36,100 | Hercules Technology Growth | |
| 23,400 | Matthews International | | | | Capital, Inc. * | 500,707 |
| | Corporation * | 899,028 | | 11,700 | Home Bancshares, Inc. * | 258,102 |
| 16,700 | Orient Express Hotels, Ltd. * | 658,815 | | 6,000 | iShares Russell 2000 Value | 464,700 |
| 33,300 | RARE Hospitality | | | 8,000 | Kilroy Realty Corporation | 602,640 |
| | International, Inc. # | 1,049,283 | | 18,000 | Kite Realty Group Trust * | 330,120 |
| 21,900 | Ruby Tuesday, Inc. * | 607,725 | | 29,300 | LaSalle Hotel Properties | 1,237,925 |
| 41,400 | Saga Communications, Inc. # | 347,760 | | 2,400 | Markel Corporation #* | 958,800 |
| 38,800 | Shiloh Industries, Inc. #* | 575,792 | | 18,000 | Max Re Capital, Ltd. * | 419,040 |
| 31,600 | Stanley Furniture Company, Inc. * 698,676 | | 25,000 | Midland Company | 1,168,500 |
| 31,600 | Steak n Shake Company #* | 587,444 | | 32,000 | National Health Realty, Inc. | 659,200 |
| 77,000 | Stein Mart, Inc. | 1,260,490 | | 46,500 | Net Bank, Inc. * | 246,915 |
| 12,600 | WCI Communities, Inc. #* | 203,112 | | 32,400 | Ohio Casualty Corporation | 888,732 |
| 29,600 | Winnebago Industries, Inc. * | 985,384 | | 10,800 | Piper Jaffray Companies # | 746,820 |
|
| | |
| | Total Consumer | | | 25,000 | Potlatch Corporation * | 1,015,000 |
| | Discretionary | 15,916,364 | | 42,500 | ProAssurance Corporation # | 2,069,750 |
|
| | |
| | | | | 32,500 | Sandy Spring Bancorp, Inc. | 1,191,450 |
| Consumer Staples (1.7%) | | | 31,500 | Seabright Insurance Holdings #* | 516,915 |
| 109,000 | Alliance One International, Inc. * | 525,380 | | 38,100 | Strategic Hotel Capital, Inc. | 810,387 |
| 26,000 | Casey’s General Stores, Inc. * | 631,020 | | 25,900 | SVB Financial Group #* | 1,191,918 |
| 31,000 | Nash Finch Company * | 804,450 | | 57,000 | Texas Regional Bancshares, Inc. * | 2,214,450 |
| 14,200 | Wild Oats Markets, Inc. #* | 255,316 | | 25,000 | Trammell Crow Company #* | 1,218,750 |
|
| | |
| | Total Consumer Staples | 2,216,166 | | 26,000 | Washington Real Estate | |
|
| | |
| | | | | | Investment Trust * | 1,095,900 |
| Energy (7.0%) | | | 15,500 | Wintrust Financial Corporation * | 748,030 |
|
|
| 15,400 | Atwood Oceanics, Inc. # | 711,480 | | | Total Financials | 27,852,871 |
|
|
| 10,000 | Cimarex Energy Company * | 360,200 | | | | |
| 34,400 | Forest Oil Corporation #* | 1,122,816 | | Health Care (5.7%) | |
| 13,300 | Lone Star Technologies, Inc. # | 642,124 | | 8,600 | Analogic Corporation | 479,966 |
| 55,000 | Mariner Energy, Inc. # | 1,090,100 | | 11,700 | Arrow International, Inc. | 418,275 |
| 42,500 | TETRA Technologies, Inc. # | 1,100,750 | | 49,400 | Capital Senior Living | |
| 33,500 | Todco #* | 1,143,355 | | | Corporation #* | 471,770 |
| | | | | 52,500 | Diversa Corporation #* | 488,775 |
| The accompanying Notes to Financial Statements are an integral part of this schedule. |
|
| 77 |
Partner Small Cap Value Fund
Schedule of Investments as of October 31, 2006 |
| Shares | Common Stock (95.8%) | Value | | Shares | Common Stock (95.8%) | Value |
|
| |
| Health Care — continued | | | 55,000 | Catapult Communications | |
| 44,000 | Myriad Genetics, Inc. #* | $1,183,160 | | | Corporation #* | $480,150 |
| 17,500 | National Healthcare | | | 66,800 | Digitas, Inc. #* | 705,408 |
| | Corporation * | 970,375 | | 76,000 | Entegris, Inc. #* | 851,960 |
| 49,500 | Owens & Minor, Inc. | 1,559,745 | | 66,500 | GSI Group, Inc. #* | 608,475 |
| 26,000 | Pharmion Corporation #* | 635,700 | | 153,000 | Lattice Semiconductor | |
| 27,900 | West Pharmaceutical | | | | Corporation #* | 950,130 |
| | Services, Inc. | 1,172,916 | | 8,500 | Littelfuse, Inc. # | 287,810 |
|
| | |
| | Total Health Care | 7,380,682 | | 146,000 | LookSmart, Ltd. #* | 532,900 |
|
| | |
| | | | | 47,000 | Methode Electronics, Inc. * | 520,290 |
| Industrials (22.6%) | | | 97,800 | MPS Group, Inc. #* | 1,491,450 |
| 44,000 | Accuride Corporation #* | 541,200 | | 46,300 | Progress Software Corporation # | 1,332,977 |
| 14,700 | Ameron International Corporation 1,076,775 | | 122,000 | S1 Corporation #* | 602,680 |
| 38,000 | Belden CDT, Inc. * | 1,375,600 | | 13,200 | Safeguard Scientifics, Inc. #* | 32,208 |
| 40,800 | Builders Firstsource, Inc. #* | 645,456 | | 35,400 | SPSS, Inc. # | 979,518 |
| 44,000 | C&D Technologies, Inc. * | 218,240 | | 35,000 | StarTek, Inc. * | 477,400 |
|
|
| 31,200 | Circor International, Inc. | 1,028,664 | | | Total Information | |
| 34,100 | Dollar Thrifty Automotive | | | | Technology | 11,994,901 |
|
|
| | Group, Inc. #* | 1,369,456 | | | | |
| 17,000 | EDO Corporation * | 406,470 | | Materials (10.0%) | |
| 46,300 | Electro Rent Corporation # | 765,339 | | 33,500 | Airgas, Inc. | 1,266,635 |
| 18,700 | ElkCorp * | 469,744 | | 24,200 | AptarGroup, Inc. * | 1,328,822 |
| 23,500 | Franklin Electric Company, Inc. * | 1,267,590 | | 36,500 | Arch Chemicals, Inc. | 1,221,290 |
| 42,200 | FTI Consulting, Inc. #* | 1,198,902 | | 14,000 | Carpenter Technology | |
| 28,900 | G & K Services, Inc. * | 1,101,379 | | | Corporation * | 1,497,860 |
| 53,500 | Genesee & Wyoming, Inc. #* | 1,502,815 | | 14,500 | Chesapeake Corporation * | 224,895 |
| 17,500 | Genlyte Group, Inc. # | 1,352,050 | | 8,700 | Deltic Timber Corporation | 442,917 |
| 64,500 | Hub Group, Inc. # | 1,751,820 | | 17,100 | Florida Rock Industries, Inc. * | 733,590 |
| 26,200 | IDEX Corporation | 1,228,780 | | 48,700 | Gibraltar Industries, Inc. * | 1,028,057 |
| 47,500 | Insituform Technologies, Inc. #* | 1,110,075 | | 27,400 | Innospec, Inc. | 917,352 |
| 50,700 | JLG Industries, Inc. | 1,401,855 | | 11,500 | MacDermid, Inc. | 384,675 |
| 49,500 | Kirby Corporation #* | 1,733,985 | | 35,700 | Metal Management, Inc. * | 981,036 |
| 30,400 | LSI Industries, Inc. | 545,680 | | 10,600 | Minerals Technologies, Inc. | 584,696 |
| 23,800 | Macquarie Infrastructure | | | 51,200 | Myers Industries, Inc. | 927,744 |
| | Company Trust * | 709,954 | | 71,500 | Stillwater Mining Company #* | 768,625 |
| 48,400 | McGrath Rentcorp * | 1,306,800 | | 51,600 | Wausau-Mosinee Paper | |
| 31,200 | Nordson Corporation | 1,436,760 | | | Corporation * | 699,696 |
|
|
| 56,800 | Synagro Technologies, Inc. * | 245,376 | | | Total Materials | 13,007,890 |
|
|
| 79,200 | Vitran Corporation, Inc. # | 1,330,560 | | | | |
| 23,500 | Waste Connections, Inc. #* | 956,215 | | Telecommunications Services (0.6%) | |
| 37,300 | Woodward Governor Company | 1,331,983 | | 91,500 | Premiere Global Services, Inc. #* | 761,280 |
|
| | |
|
| | Total Industrials | 29,409,523 | | | Total Telecommunications | |
|
| | |
| | | | | | Services | 761,280 |
|
|
| Information Technology (9.2%) | | | | | |
| 22,500 | ATMI, Inc. #* | 713,025 | | | | |
| 100,600 | Brooks Automation, Inc. # | 1,428,520 | | | | |
| The accompanying Notes to Financial Statements are an integral part of this schedule. |
|
| 78 |
Partner Small Cap Value Fund
Schedule of Investments as of October 31, 2006 |
| Shares | Common Stock (95.8%) | Value |
|
| |
| Utilities (5.4%) | |
| 29,900 | Black Hills Corporation * | $1,031,849 |
| 56,000 | Cleco Corporation * | 1,439,200 |
| 40,000 | El Paso Electric Company # | 934,400 |
| 42,700 | Southwest Gas Corporation | 1,532,076 |
| 32,700 | UniSource Energy Corporation * | 1,163,466 |
| 34,400 | Vectren Corporation | 999,664 |
|
|
| | Total Utilities | 7,100,655 |
|
|
| |
| | Total Common Stock | |
| | (cost $101,593,224) | 124,789,722 |
|
|
| | | Interest | Maturity | |
| Shares | Collateral Held for Securities Loaned (25.9%) | Rate (+) | Date | Value |
|
| 33,691,335 | Thrivent Financial Securities Lending Trust | 5.300% | N/A | $33,691,335 |
|
|
| | Total Collateral Held for Securities Loaned | |
| | (cost $33,691,335) | | | 33,691,335 |
|
|
| |
| |
| | | Interest | Maturity | |
| Shares | Short-Term Investments (4.2%) | Rate (+) | Date | Value |
|
| 5,523,074 | Thrivent Money Market Fund | 4.600% | N/A | $5,523,074 |
|
|
| | Total Short-Term Investments (at amortized cost) | 5,523,074 |
|
|
| | Total Investments (cost $140,807,633) 125.9% | $164,004,131 |
|
|
| | Other Assets and Liabilities, Net (25.9%) | | (33,759,490) |
|
|
| | Total Net Assets 100.0% | | | $130,244,641 |
|
|
# Non-income producing security.
* All or a portion of the security is on loan as discussed in item 2(L) of the Notes to Financial Statements.
+ The interest rate shown reflects the yield, coupon rate or, for securities purchased at a discount, the discount rate at the date of purchase.
| Gross unrealized appreciation and depreciation of investments, based on cost for federal income tax purposes, were as follows: | |
| Gross unrealized appreciation | $27,828,891 | |
| Gross unrealized depreciation | (4,776,997) | |
|
| |
| Net unrealized appreciation (depreciation) | $23,051,894 | |
| Cost for federal income tax purposes | $140,952,237 | |
| The accompanying Notes to Financial Statements are an integral part of this schedule. |
|
| 79 |
Small Cap Stock Fund
Schedule of Investments as of October 31, 2006 |
| Shares | Common Stock (95.9%) | Value | | Shares | Common Stock (95.9%) | Value |
|
| |
| Consumer Discretionary (13.0%) | | | 64,100 | Performance Food Group | |
| 48,300 | AnnTaylor Stores Corporation # | $2,126,166 | | | Company #* | $1,863,387 |
| 32,200 | Autoliv, Inc. | 1,831,214 | | 87,100 | Reddy Ice Holdings, Inc. | 2,090,400 |
|
|
| 26,000 | Children’s Place Retail | | | | Total Consumer Staples | 14,343,417 |
|
|
| | Stores, Inc. #* | 1,824,940 | | | | |
| 49,000 | Coldwater Creek, Inc. #* | 1,494,010 | | Energy (4.7%) | |
| 50,500 | Desarrolladora Homex ADR # | 2,216,950 | | 38,200 | Cimarex Energy Company | 1,375,964 |
| 58,400 | DreamWorks Animation | | | 80,900 | Denbury Resources, Inc. # | 2,325,066 |
| | SKG, Inc. #* | 1,544,680 | | 44,200 | Energy Transfer Partners, LP | 2,163,148 |
| 59,100 | DSW, Inc. #* | 2,044,860 | | 76,500 | Frontier Oil Corporation | 2,249,100 |
| 49,600 | GameStop Corporation #* | 2,532,576 | | 117,700 | Global Industries, Ltd. #* | 1,953,820 |
| 73,200 | Genesco, Inc. #* | 2,750,124 | | 94,300 | Key Energy Services, Inc. # | 1,320,200 |
| 125,200 | Gentex Corporation * | 1,991,932 | | 32,600 | Lufkin Industries, Inc. | 1,967,084 |
| 97,881 | Golf Galaxy, Inc. #* | 1,519,113 | | 42,800 | Oil States International, Inc. # | 1,242,912 |
| 152,500 | Imax Corporation #* | 745,725 | | 26,700 | Overseas Shipholding | |
| 161,400 | Interface, Inc. # | 2,348,370 | | | Group, Inc. * | 1,670,085 |
| 61,200 | Jackson Hewitt Tax Service, Inc. | 2,117,520 | | 12,300 | Penn Virginia Corporation * | 880,065 |
| 70,050 | Joseph A. Bank Clothiers, Inc. #* | 2,079,784 | | 75,662 | Petrohawk Energy Corporation # | 857,250 |
| 32,800 | Laureate Education, Inc. #* | 1,729,216 | | 24,600 | Petroleum Development | |
| 50,900 | Life Time Fitness, Inc. #* | 2,622,877 | | | Corporation # | 1,135,290 |
| 45,800 | Meredith Corporation | 2,404,500 | | 67,828 | Range Resources Corporation | 1,841,530 |
| 53,500 | Modine Manufacturing | | | 87,300 | Superior Energy Services, Inc. # | 2,732,490 |
| | Company * | 1,273,835 | | 38,700 | Teekay Shipping Corporation * | 1,590,957 |
| 91,000 | Penn National Gaming, Inc. #* | 3,327,870 | | 33,300 | Todco #* | 1,136,529 |
|
|
| 78,025 | Pool Corporation * | 3,197,464 | | | Total Energy | 26,441,490 |
|
|
| 156,400 | Quiksilver, Inc. #* | 2,181,780 | | | | |
| 57,400 | R.H. Donnelley Corporation #* | 3,456,628 | | Financials (20.2%) | |
| 62,700 | Red Robin Gourmet | | | 49,950 | Affiliated Managers | |
| | Burgers, Inc. #* | 3,024,648 | | | Group, Inc. #* | 5,001,993 |
| 105,800 | Scientific Games Corporation #* | 2,965,574 | | 30,100 | Alabama National | |
| 88,050 | Shuffle Master, Inc. #* | 2,463,639 | | | BanCorporation | 2,042,285 |
| 139,100 | Sonic Corporation # | 3,164,525 | | 31,400 | Alexandria Real Estate | |
| 58,500 | Steiner Leisure, Ltd. #* | 2,669,940 | | | Equities, Inc. * | 3,130,580 |
| 219,600 | Texas Roadhouse, Inc. #* | 3,173,220 | | 22,700 | Apartment Investment & | |
| 41,900 | Tractor Supply Company #* | 2,028,798 | | | Management Company | 1,301,164 |
| 130,200 | Wolverine World Wide, Inc. | 3,692,472 | | 89,700 | Argonaut Group, Inc. # | 3,050,697 |
|
| | |
| | Total Consumer | | | 196,500 | Ashford Hospitality Trust | 2,530,920 |
| | Discretionary | 72,544,950 | | 140,000 | Assured Guaranty, Ltd. | 3,523,800 |
|
| | |
| | | | | 109,600 | BioMed Realty Trust, Inc. | 3,532,408 |
| Consumer Staples (2.6%) | | | 61,711 | BOK Financial Corporation | 3,171,945 |
| 176,500 | Casey’s General Stores, Inc. | 4,283,655 | | 59,600 | Cardinal Financial Corporation * | 613,880 |
| 60,600 | Central Garden & Pet | | | 94,000 | Center Financial Corporation * | 2,271,040 |
| | Company #* | 3,028,182 | | 52,400 | Cullen/Frost Bankers, Inc. | 2,837,984 |
| 40,500 | Dean Foods Company #* | 1,696,545 | | 58,200 | Delphi Financial Group, Inc. | 2,284,350 |
| 79,200 | Elizabeth Arden, Inc. # | 1,381,248 | | 113,200 | Dollar Financial Corporation # | 2,628,504 |
| | | | | 56,100 | EastGroup Properties, Inc. * | 2,986,203 |
| The accompanying Notes to Financial Statements are an integral part of this schedule. |
|
| 80 |
Small Cap Stock Fund
Schedule of Investments as of October 31, 2006 |
| Shares | Common Stock (95.9%) | | Value | | Shares | Common Stock (95.9%) | Value |
|
| |
| Financials — continued | | | | 42,800 | Dade Behring Holdings, Inc. | $1,559,204 |
| 54,100 | Endurance Specialty | | | | 130,800 | Dexcom, Inc. #* | 1,151,040 |
| | Holdings, Ltd. | | $1,928,665 | | 48,700 | Digene Corporation # | 2,261,141 |
| 103,100 | FelCor Lodging Trust, Inc. | | 2,140,356 | | 57,600 | Endo Pharmaceutical | |
| 32,700 | First Community Bancorp, Inc. | 1,748,469 | | | Holdings, Inc. # | 1,643,904 |
| 57,500 | Greenhill & Company, Inc. * | 3,906,550 | | 39,200 | Genesis Healthcare Corporation # | 1,898,456 |
| 177,050 | HCC Insurance Holdings, Inc. * | 5,959,505 | | 22,300 | Henry Schein, Inc. #* | 1,108,087 |
| 55,800 | Home Properties, Inc. | | 3,524,886 | | 30,700 | Hologic, Inc. # | 1,478,205 |
| 52,700 | iShares Russell Microcap | | | | 201,200 | Indevus Pharmaceuticals, Inc. #* | 1,374,196 |
| | Index Fund * | | 2,979,131 | | 30,100 | Integra LifeSciences Holdings | |
| 54,184 | Mercantile Bank Corporation | 2,149,479 | | | Corporation #* | 1,111,593 |
| 61,000 | Mid-America Apartment | | | | 14,400 | Intuitive Surgical, Inc. #* | 1,428,192 |
| | Communities, Inc. | | 3,882,650 | | 51,300 | inVentiv Health, Inc. # | 1,467,180 |
| 105,400 | Nationwide Health | | | | 40,700 | LifePoint Hospitals, Inc. # | 1,444,850 |
| | Properties, Inc. | | 3,029,196 | | 204,600 | NeoPharm, Inc. #* | 1,481,304 |
| 145,610 | Nexity Financial Corporation # | 1,923,508 | | 70,300 | NuVasive, Inc. #* | 1,652,753 |
| 96,300 | Philadelphia Consolidated | | | | 12,500 | Orthofix International NV # | 556,750 |
| | Holding Corporation # | | 3,767,256 | | 57,300 | Pediatrix Medical Group, Inc. # | 2,574,489 |
| 27,700 | Piper Jaffray Companies # | | 1,915,455 | | 55,900 | Pharmaceutical Product | |
| 117,700 | Platinum Underwriters | | | | | Development, Inc. | 1,769,235 |
| | Holdings, Ltd. | | 3,514,522 | | 146,400 | PSS World Medical, Inc. # | 2,945,568 |
| 39,300 | Portfolio Recovery | | | | 74,600 | Psychiatric Solutions, Inc. #* | 2,476,720 |
| | Associates, Inc. #* | | 1,832,166 | | 42,500 | ResMed, Inc. #* | 1,869,575 |
| 140,200 | PowerShares Zacks Micro | | | | 48,700 | Respironics, Inc. # | 1,720,084 |
| | Cap Portfolio | | 2,403,028 | | 203,875 | Savient Pharmaceuticals, Inc. #* | 1,551,489 |
| 70,300 | ProAssurance Corporation # | | 3,423,610 | | 33,600 | Triad Hospitals, Inc. #* | 1,244,208 |
| 21,900 | Selective Insurance Group, Inc. | 1,209,975 | | 16,000 | Universal Health Services, Inc. | 847,200 |
| 56,800 | Senior Housing Property Trust * | 1,302,424 | | 42,900 | Varian, Inc. # | 2,011,581 |
| 22,100 | SL Green Realty Corporation | 2,675,205 | | 89,900 | VCA Antech, Inc. #* | 2,910,063 |
| 50,400 | Sovran Self Storage, Inc. | | 2,972,592 | | 30,200 | Ventana Medical Systems, Inc. #* | 1,219,778 |
| 139,200 | Sterling Bancshares, Inc. | | 2,548,752 | | 40,200 | Vertex Pharmaceuticals, Inc. #* | 1,632,120 |
| 113,700 | Strategic Hotel Capital, Inc. * | 2,418,399 | | 36,450 | Wellcare Health Plans, Inc. #* | 2,141,438 |
|
|
| 61,200 | Tower Group, Inc. * | | 2,163,420 | | | Total Health Care | 56,968,843 |
|
|
| 88,600 | U-Store-It Trust * | | 1,945,656 | | | | |
| 63,350 | Virginia Commerce | | | | Industrials (18.1%) | |
| | Bancorp, Inc. #* | | 1,289,806 | | 34,400 | American Commercial | |
| 82,877 | Washington Federal, Inc. * | | 1,926,061 | | | Lines, Inc. #* | 2,206,760 |
| 27,600 | Westamerica Bancorporation * | 1,375,860 | | 142,500 | Baldor Electric Company * | 4,571,400 |
|
| | |
| | Total Financials | 112,764,335 | | 150,600 | Beacon Roofing Supply, Inc. #* | 2,981,880 |
|
| | |
| | | | | | 74,800 | CLARCOR, Inc. | 2,436,984 |
| Health Care (10.2%) | | | | 74,000 | DRS Technologies, Inc. * | 3,272,280 |
| 24,100 | ArthroCare Corporation #* | | 973,881 | | 70,300 | ElkCorp * | 1,765,936 |
| 122,600 | BioMarin Pharmaceutical, Inc. #* | 1,965,278 | | 110,900 | Gardner Denver, Inc. # | 3,769,491 |
| 36,700 | Conor Medsystems, Inc. #* | | 901,352 | | 75,000 | GATX Corporation * | 3,267,750 |
| 31,800 | Cooper Companies, Inc. * | | 1,832,634 | | 135,806 | Genesee & Wyoming, Inc. #* | 3,814,791 |
| 25,000 | Covance, Inc. #* | | 1,462,500 | | 59,900 | Genlyte Group, Inc. # | 4,627,874 |
| 58,500 | Cubist Pharmaceuticals, Inc. #* | 1,302,795 | | 118,100 | Hub Group, Inc. # | 3,207,596 |
| The accompanying Notes to Financial Statements are an integral part of this schedule. |
|
| 81 |
Small Cap Stock Fund
Schedule of Investments as of October 31, 2006 |
| Shares | Common Stock (95.9%) | | Value | | Shares | Common Stock (95.9%) | | Value |
|
| |
| Industrials — continued | | | | 69,900 | Global Payments, Inc. | | $3,055,329 |
| 88,400 | Huron Consulting Group, Inc. # | $3,532,464 | | 82,500 | Hyperion Solutions Corporation # | 3,085,500 |
| 80,750 | IDEX Corporation | | 3,787,175 | | 117,600 | Informatica Corporation #* | | 1,457,064 |
| 158,500 | Interline Brands, Inc. # | | 3,794,490 | | 151,000 | Insight Enterprises, Inc. # | | 3,244,990 |
| 26,800 | Jacobs Engineering Group, Inc. # | 2,024,472 | | 162,400 | Integrated Device | | |
| 87,600 | JB Hunt Transport Services, Inc. * | 1,895,664 | | | Technology, Inc. # | | 2,574,040 |
| 115,600 | JetBlue Airways Corporation #* | 1,451,936 | | 171,300 | Ixia #* | | 1,567,395 |
| 69,200 | Kirby Corporation #* | | 2,424,076 | | 106,400 | J2 Global Communication, Inc. #* | 2,919,616 |
| 156,100 | Labor Ready, Inc. # | | 2,733,311 | | 69,150 | Kronos, Inc. #* | | 2,344,185 |
| 47,500 | Landstar System, Inc. | | 2,205,900 | | 153,500 | Micrel, Inc. #* | | 1,713,060 |
| 60,800 | Manitowoc Company, Inc. | | 3,336,704 | | 79,864 | MoneyGram International, Inc. | 2,732,147 |
| 87,200 | McGrath Rentcorp * | | 2,354,400 | | 198,700 | MPS Group, Inc. # | | 3,030,175 |
| 50,700 | MSC Industrial Direct | | | | 60,559 | Nanometrics, Inc. # | | 627,391 |
| | Company, Inc. | | 2,074,644 | | 111,200 | Packeteer, Inc. # | | 1,246,552 |
| 129,500 | Pacer International, Inc. | | 3,974,355 | | 122,440 | Parametric Technology | | |
| 72,100 | Pall Corporation * | | 2,299,990 | | | Corporation # | | 2,392,478 |
| 85,400 | Roper Industries, Inc. * | | 4,086,390 | | 152,700 | Photronics, Inc. #* | | 2,136,273 |
| 119,300 | SkyWest, Inc. * | | 3,180,538 | | 40,000 | Polycom, Inc. # | | 1,096,000 |
| 100,050 | Standard Parking Corporation #* | 3,478,738 | | 222,400 | Powerwave Technologies, Inc. #* | 1,447,824 |
| 133,700 | URS Corporation # | | 5,402,817 | | 77,900 | Progress Software Corporation # | 2,242,741 |
| 97,550 | Waste Connections, Inc. # | | 3,969,310 | | 107,300 | QLogic Corporation # | | 2,208,234 |
| 94,100 | Watson Wyatt Worldwide, Inc. | 4,248,615 | | 27,000 | Red Hat, Inc. #* | | 442,260 |
| 44,000 | WESCO International, Inc. # | 2,871,880 | | 181,200 | Sapient Corporation #* | | 987,540 |
|
| | |
| | Total Industrials | 101,050,611 | | 80,200 | ScanSource, Inc. #* | | 2,517,478 |
|
| | |
| | | | | | 106,100 | Silicon Image, Inc. # | | 1,255,163 |
| Information Technology (18.4%) | | | | 274,600 | STATS ChipPAC, Ltd. #* | | 1,729,980 |
| 47,300 | ADTRAN, Inc. | | 1,094,522 | | 166,100 | Stellent, Inc. | | 1,855,337 |
| 83,958 | Avnet, Inc. #* | | 1,988,125 | | 45,400 | Sybase, Inc. # | | 1,105,490 |
| 80,000 | Avocent Corporation #* | | 2,936,800 | | 251,100 | TIBCO Software, Inc. #* | | 2,322,675 |
| 178,100 | Axcelis Technologies, Inc. #* | 1,228,890 | | 72,800 | Trimble Navigation, Ltd. # | | 3,364,816 |
| 145,600 | BEA Systems, Inc. # | | 2,368,912 | | 75,150 | Varian Semiconductor Equipment | |
| 113,500 | Benchmark Electronics, Inc. # | 3,013,425 | | | Associates, Inc. # | | 2,742,224 |
| 359,800 | Brocade Communications #* | 2,917,978 | | 75,600 | ViaSat, Inc. # | | 2,051,784 |
| 62,600 | Business Objects SA ADR #* | | 2,318,704 | | 337,900 | Vitria Technology, Inc. #* | | 905,572 |
| 31,500 | CACI International, Inc. #* | | 1,812,510 | | 122,800 | webMethods, Inc. #* | | 923,456 |
| 149,400 | CNET Networks, Inc. #* | | 1,335,636 | | 199,500 | Wind River Systems, Inc. #* | | 2,190,510 |
| 41,813 | Cymer, Inc. #* | | 1,937,196 | | 59,300 | Zebra Technologies Corporation #* | 2,210,111 |
|
|
| 59,600 | Cypress Semiconductor | | | | | Total Information | | |
| | Corporation #* | | 1,000,684 | | | Technology | | 102,996,750 |
|
|
| 31,750 | Diodes, Inc. #* | | 1,398,270 | | | | | |
| 198,300 | ECI Telecom, Ltd. # | | 1,471,386 | | Materials (6.0%) | | |
| 281,700 | Entrust, Inc. # | | 1,059,192 | | 100,500 | Airgas, Inc. | | 3,799,905 |
| 74,373 | Euronet Worldwide, Inc. #* | | 2,210,366 | | 55,600 | Albemarle Corporation | | 3,615,668 |
| 26,400 | F5 Networks, Inc. #* | | 1,747,416 | | 84,106 | Bemis Company, Inc. * | | 2,827,644 |
| 76,900 | Fairchild Semiconductor | | | | 28,257 | Century Aluminum Company #* | 1,099,762 |
| | International, Inc. # | | 1,238,859 | | 78,700 | Commercial Metals Company | 2,094,207 |
| 68,644 | FLIR Systems, Inc. #* | | 2,192,489 | | 36,300 | Eagle Materials, Inc. * | | 1,332,210 |
| The accompanying Notes to Financial Statements are an integral part of this schedule. |
|
| 82 |
Small Cap Stock Fund
Schedule of Investments as of October 31, 2006 |
| Shares | Common Stock (95.9%) | Value | | Shares | Common Stock (95.9%) | Value |
|
| Materials — continued | | | Utilities (2.2%) | | |
| 39,500 | FMC Corporation | $2,707,725 | | | 45,400 | AGL Resources, Inc. * | $1,702,500 |
| 71,100 | Lubrizol Corporation | 3,199,500 | | | 75,961 | Aqua America, Inc. * | 1,842,054 |
| 60,600 | Pactiv Corporation # | 1,868,904 | | | 80,100 | Piedmont Natural Gas | |
| 157,200 | RPM International, Inc. * | 3,010,380 | | | | Company, Inc. * | 2,162,700 |
| 26,900 | RTI International Metals, Inc. #* | 1,649,508 | | | 71,800 | PNM Resources, Inc. | 2,021,888 |
| 71,100 | Silgan Holdings, Inc. | 2,941,407 | | | 84,100 | Vectren Corporation | 2,443,946 |
| 55,400 | Steel Dynamics, Inc. * | 3,330,094 | | | 87,400 | Westar Energy, Inc. | 2,212,968 |
|
| | |
|
| | Total Materials | 33,476,914 | | | | Total Utilities | 12,386,056 |
|
| | |
|
| |
| Telecommunications Services (0.5%) | | | | | Total Common Stock | |
| 146,450 | Iowa Telecommunications | | | | | (cost $434,753,066) | 535,893,579 |
|
|
| | Services, Inc. * | 2,920,213 | | | | | | |
|
| | |
| | Total Telecommunications | | | | | | | |
| | Services | 2,920,213 | | | | | | |
|
| | |
| |
| | | | | | Interest | Maturity | |
| Shares | Collateral Held for Securities Loaned (25.9%) | Rate (+) | Date | Value |
|
| 144,848,275 | Thrivent Financial Securities Lending Trust | | | 5.300% | N/A | $144,848,275 |
|
|
| | Total Collateral Held for Securities Loaned | |
| | (cost $144,848,275) | | | | 144,848,275 |
|
|
| |
| Shares or | | | | | | | | |
| Principal | | | | | Interest | Maturity | |
| Amount | Short-Term Investments (5.5%) | | | Rate (+) | Date | Value |
|
| $6,000,000 | Cintas Corporation | | | | 5.300% | 11/1/2006 | $6,000,000 |
| 1,000,000 | Federal National Mortgage Association | | | 5.200 | 2/7/2007 | 986,171 |
| 2,125,000 | GOVCO, Inc. | | | | 5.260 | 11/14/2006 | 2,120,964 |
| 3,000,000 | Jupiter Securitization Company, LLC | | | 5.300 | 11/17/2006 | 2,992,987 |
| 2,000,000 | Jupiter Securitization Company, LLC | | | 5.260 | 11/27/2006 | 1,992,402 |
| 801,000 | Preferred Receivables Funding Corporation | | | 5.300 | 11/3/2006 | 800,764 |
| 2,000,000 | Preferred Receivables Funding Corporation | | | 5.265 | 11/13/2006 | 1,996,490 |
| 13,918,906 | Thrivent Money Market Fund | | | | 4.600 | N/A | 13,918,906 |
|
|
| | Total Short-Term Investments (cost $30,808,491) | 30,808,684 |
|
|
| | Total Investments (cost $610,409,832) 127.3% | $711,550,538 |
|
|
| | Other Assets and Liabilities, Net (27.3%) | (152,676,062) |
|
|
| | Total Net Assets 100.0% | | | $558,874,476 |
|
|
# Non-income producing security.
* All or a portion of the security is on loan as discussed in item 2(L) of the Notes to Financial Statements.
+ The interest rate shown reflects the yield, coupon rate or, for securities purchased at a discount, the discount rate at the date of purchase.
Definitions:
ADR — American Depository Receipts, which are certificates for shares of an underlying foreign security’s shares held by an issuing U.S. depository bank.
| Gross unrealized appreciation and depreciation of investments, based on cost for federal income tax purposes, were as follows: | |
| Gross unrealized appreciation | $108,407,771 | |
| Gross unrealized depreciation | (9,337,206) | |
|
| |
| Net unrealized appreciation (depreciation) | $99,070,565 | |
| Cost for federal income tax purposes | $612,479,973 | |
| The accompanying Notes to Financial Statements are an integral part of this schedule. |
|
| 83 |
Small Cap Index Fund
Schedule of Investments as of October 31, 2006 |
| Shares | Common Stock (98.6%) | Value | | Shares | Common Stock (98.6%) | Value |
|
| |
| Consumer Discretionary (15.9%) | | | 3,900 | K2, Inc. #* | $53,274 |
| 1,100 | 4Kids Entertainment, Inc. #* | $19,987 | | 2,200 | Kellwood Company * | 67,320 |
| 3,975 | Aaron Rents, Inc. | 98,898 | | 1,400 | Keystone Automotive | |
| 2,550 | ADVO, Inc. ∈ | 74,868 | | | Industries, Inc. # | 53,844 |
| 2,500 | Arbitron, Inc. * | 105,000 | | 2,200 | K-Swiss, Inc. | 77,704 |
| 1,100 | Arctic Cat, Inc. * | 19,701 | | 1,500 | Landry’s Restaurants, Inc. * | 43,950 |
| 1,400 | Ashworth, Inc. # | 9,828 | | 4,300 | La-Z-Boy, Inc. * | 52,675 |
| 1,600 | Audiovox Corporation # | 20,992 | | 1,200 | Lenox Group, Inc. # | 7,212 |
| 3,100 | Aztar Corporation # | 166,067 | | 1,200 | Libbey, Inc. * | 13,800 |
| 1,000 | Bassett Furniture Industries, Inc. | 16,520 | | 5,400 | Live Nation, Inc. # | 114,804 |
| 2,800 | Bright Horizons Family | | | 3,700 | LKQ Corporation #* | 85,618 |
| | Solutions, Inc. # | 107,576 | | 1,600 | Lone Star Steakhouse & Saloon, Inc. | 43,680 |
| 2,300 | Brown Shoe Company, Inc. | 89,608 | | 1,100 | M/I Homes, Inc. * | 39,512 |
| 2,500 | Building Materials Holding | | | 1,700 | Marcus Corporation * | 42,483 |
| | Corporation * | 65,150 | | 1,500 | MarineMax, Inc. #* | 42,765 |
| 2,650 | Cato Corporation | 60,658 | | 4,500 | Men’s Wearhouse, Inc. * | 179,325 |
| 2,850 | CEC Entertainment, Inc. # | 98,240 | | 1,800 | Meritage Homes Corporation #* | 82,404 |
| 6,400 | Champion Enterprises, Inc. #* | 59,264 | | 900 | Midas, Inc. # | 18,567 |
| 1,900 | Children’s Place Retail | | | 2,200 | Monaco Coach Corporation * | 26,268 |
| | Stores, Inc. #* | 133,361 | | 2,300 | Multimedia Games, Inc. #* | 21,597 |
| 3,100 | Christopher & Banks Corporation * | 83,669 | | 400 | National Presto Industries, Inc. * | 24,492 |
| 1,200 | Coachmen Industries, Inc. * | 13,416 | | 2,700 | Nautilus Group, Inc. * | 38,151 |
| 1,900 | Cost Plus, Inc. #* | 22,705 | | 420 | NVR, Inc. #* | 235,830 |
| 400 | CPI Corporation | 18,884 | | 1,900 | O’Charley’s, Inc. # | 37,791 |
| 2,800 | Crocs, Inc. #* | 110,936 | | 1,200 | Oxford Industries, Inc. * | 63,336 |
| 900 | Deckers Outdoor Corporation #* | 47,853 | | 2,300 | P.F. Chang’s China Bistro, Inc. #* | 96,186 |
| 3,700 | Dress Barn, Inc. #* | 80,364 | | 2,600 | Panera Bread Company #* | 160,680 |
| 1,500 | Drew Industries, Inc. # | 40,725 | | 2,000 | Papa John’s International, Inc. #* | 73,400 |
| 2,700 | Ethan Allen Interiors, Inc. * | 96,174 | | 4,500 | Pep Boys — Manny, Moe & Jack * | 63,810 |
| 3,500 | Finish Line, Inc. * | 45,360 | | 2,000 | PetMed Express, Inc. #* | 25,000 |
| 5,200 | Fleetwood Enterprises, Inc. #* | 37,128 | | 4,500 | Phillips-Van Heusen Corporation | 205,920 |
| 3,800 | Fossil, Inc. #* | 82,992 | | 4,000 | Pinnacle Entertainment, Inc. # | 121,040 |
| 3,300 | Fred’s, Inc. * | 43,164 | | 3,400 | Polaris Industries, Inc. * | 145,588 |
| 1,800 | Genesco, Inc. #* | 67,626 | | 4,375 | Pool Corporation * | 179,288 |
| 2,000 | Group 1 Automotive, Inc. * | 114,620 | | 800 | Pre-Paid Legal Services, Inc. * | 33,960 |
| 2,500 | Guitar Center, Inc. #* | 108,425 | | 9,900 | Quiksilver, Inc. #* | 138,105 |
| 2,700 | Gymboree Corporation #* | 125,442 | | 6,400 | Radio One, Inc. #* | 43,456 |
| 1,700 | Hancock Fabrics, Inc. #* | 5,644 | | 2,800 | RARE Hospitality | |
| 1,800 | Haverty Furniture Companies, Inc. * | 28,440 | | | International, Inc. # | 88,228 |
| 2,650 | Hibbett Sporting Goods, Inc. #* | 77,486 | | 1,800 | RC2 Corporation # | 81,324 |
| 3,575 | Hot Topic, Inc. #* | 36,143 | | 1,300 | Red Robin Gourmet Burgers, Inc. #* | 62,712 |
| 1,300 | IHOP Corporation | 67,821 | | 1,000 | Russ Berrie and Company, Inc. # | 15,160 |
| 3,900 | Interface, Inc. # | 56,745 | | 3,600 | Ryan’s Restaurant Group, Inc. # | 58,356 |
| 2,900 | Jack in the Box, Inc. # | 162,719 | | 4,450 | Select Comfort Corporation #* | 95,141 |
| 2,200 | JAKKS Pacific, Inc. #* | 47,718 | | 2,875 | Shuffle Master, Inc. #* | 80,442 |
| 2,010 | Jo-Ann Stores, Inc. #* | 36,582 | | 2,000 | Skechers USA, Inc. #* | 59,780 |
| 1,450 | Joseph A. Bank Clothiers, Inc. #* | 43,050 | | 600 | Skyline Corporation | 23,694 |
| The accompanying Notes to Financial Statements are an integral part of this schedule. |
|
| 84 |
Small Cap Index Fund
Schedule of Investments as of October 31, 2006 |
| Shares | Common Stock (98.6%) | | Value | | Shares | Common Stock (98.6%) | Value |
|
| |
| Consumer Discretionary — continued | | | | 1,300 | Sanderson Farms, Inc. * | $34,489 |
| 2,400 | Sonic Automotive, Inc. | | $63,120 | | 3,100 | Spectrum Brands, Inc. #* | 30,132 |
| 5,875 | Sonic Corporation # | | 133,656 | | 2,500 | TreeHouse Foods, Inc. #* | 63,400 |
| 2,200 | Stage Stores, Inc. * | | 71,302 | | 3,500 | United Natural Foods, Inc. #* | 122,150 |
| 1,700 | Stamps.com, Inc. #* | | 27,285 | | 700 | USANA Health Sciences, Inc. #* | 31,444 |
| 900 | Standard Motor Products, Inc. | | 9,972 | | 1,400 | WD-40 Company | 47,586 |
|
|
| 5,400 | Standard Pacific Corporation * | | 130,842 | | | Total Consumer Staples | 1,688,895 |
|
|
| 2,400 | Steak n Shake Company # | | 44,616 | | | | |
| 2,300 | Stein Mart, Inc. | | 37,651 | | Energy (7.4%) | |
| 3,000 | Stride Rite Corporation * | | 44,250 | | 2,300 | Atwood Oceanics, Inc. #* | 106,260 |
| 1,900 | Sturm, Ruger & Company, Inc. #* | 15,827 | | 1,900 | Bristow Group, Inc. # | 63,080 |
| 1,900 | Superior Industries | | | | 4,100 | Cabot Oil & Gas Corporation ∈ | 216,931 |
| | International, Inc. * | | 32,110 | | 1,700 | Carbo Ceramics, Inc. * | 57,290 |
| 2,900 | Tractor Supply Company #* | | 140,418 | | 6,800 | Cimarex Energy Company * | 244,936 |
| 5,100 | Triarc Companies, Inc. * | | 85,629 | | 2,000 | Dril-Quip, Inc. #* | 78,760 |
| 2,400 | Tuesday Morning Corporation * | 39,600 | | 9,200 | Frontier Oil Corporation | 270,480 |
| 2,700 | Tween Brands, Inc. # | | 112,914 | | 7,516 | Helix Energy Solutions | |
| 2,000 | Universal Technical | | | | | Group, Inc. #* | 242,754 |
| | Institute, Inc. #* | | 39,960 | | 1,700 | Hydril Company #* | 102,085 |
| 900 | Vertrue, Inc. #* | | 40,473 | | 5,700 | Input/Output, Inc. #* | 63,897 |
| 2,500 | Winnebago Industries, Inc. * | | 83,225 | | 2,500 | Lone Star Technologies, Inc. # | 120,700 |
| 2,000 | WMS Industries, Inc. #* | | 70,660 | | 1,300 | Lufkin Industries, Inc. | 78,442 |
| 4,550 | Wolverine World Wide, Inc. * | | 129,038 | | 6,600 | Massey Energy Company * | 166,650 |
| 3,900 | Zale Corporation #* | | 112,476 | | 1,800 | NS Group, Inc. # | 117,648 |
|
| | |
| | Total Consumer | | | | 4,400 | Oceaneering International, Inc. #∈ | 158,356 |
| | Discretionary | 7,630,245 | 1,600 | Penn Virginia Corporation | 114,480 |
|
| | | |
| | | | | | 1,400 | Petroleum Development | |
| Consumer Staples (3.5%) | | | | | Corporation # | 64,610 |
| 7,200 | Alliance One International, Inc. * | 34,704 | | 1,800 | SEACOR Holdings, Inc. # | 161,064 |
| 1,500 | American Italian Pasta Company #* | 11,235 | | 4,600 | St. Mary Land & Exploration | |
| 4,100 | Casey’s General Stores, Inc. | | 99,507 | | | Company * | 171,534 |
| 6,000 | Corn Products International, Inc. * | 217,140 | | 2,400 | Stone Energy Corporation # | 93,528 |
| 2,900 | Delta & Pine Land Company * | | 117,479 | | 2,500 | Swift Energy Company # | 116,800 |
| 4,275 | Flowers Foods, Inc. | | 116,152 | | 5,900 | TETRA Technologies, Inc. #* | 152,810 |
| 1,600 | Great Atlantic & Pacific Tea | | | | 3,900 | Unit Corporation # | 180,921 |
| | Company, Inc. * | | 44,272 | | 2,900 | Veritas DGC, Inc. # | 208,829 |
| 3,100 | Hain Celestial Group, Inc. # | | 87,513 | | 2,400 | W-H Energy Services, Inc. #* | 112,392 |
| 1,100 | J & J Snack Foods Corporation | | 36,751 | | 2,400 | World Fuel Services Corporation | 103,248 |
|
|
| 2,600 | Lance, Inc. * | | 50,752 | | | Total Energy | 3,568,485 |
|
|
| 2,300 | Longs Drug Stores Corporation * | 98,992 | | | | |
| 1,100 | Nash Finch Company * | | 28,545 | | Financials (16.2%) | |
| 4,600 | NBTY, Inc. # | | 127,972 | | 2,600 | Acadia Realty Trust ∈ | 66,430 |
| 1,100 | Peet’s Coffee & Tea, Inc. #* | | 29,425 | | 1,700 | Anchor BanCorp Wisconsin, Inc. | 49,368 |
| 2,800 | Performance Food Group | | | | 5,000 | Bank Mutual Corporation ∈ | 60,600 |
| | Company #* | | 81,396 | | 3,900 | BankAtlantic Bancorp, Inc. * | 51,090 |
| 4,600 | Playtex Products, Inc. #* | | 64,124 | | 2,700 | BankUnited Financial Corporation * | 72,819 |
| 2,300 | Ralcorp Holdings, Inc. # | | 113,735 | | | | |
| The accompanying Notes to Financial Statements are an integral part of this schedule. |
|
| 85 |
Small Cap Index Fund
Schedule of Investments as of October 31, 2006 |
| Shares | Common Stock (98.6%) | Value | | Shares | Common Stock (98.6%) | Value |
|
| |
| Financials — continued | | | 1,900 | LTC Properties, Inc. | $51,490 |
| 3,000 | Boston Private Financial | | | 2,300 | MAF Bancorp, Inc. | 99,107 |
| | Holdings, Inc. * | $82,920 | | 2,000 | Mid-America Apartment | |
| 5,100 | Brookline Bancorp, Inc. * | 67,983 | | | Communities, Inc. | 127,300 |
| 2,400 | Cash America International, Inc. * | 99,192 | | 1,800 | Nara Bancorp, Inc. | 34,200 |
| 2,600 | Central Pacific Financial | | | 4,800 | National Retail Properties, Inc. * | 107,856 |
| | Corporation * | 95,654 | | 3,750 | New Century Financial | |
| 3,875 | Chittenden Corporation | 114,274 | | | Corporation * | 147,675 |
| 3,800 | Colonial Properties Trust | 191,482 | | 1,100 | Parkway Properties, Inc. * | 54,274 |
| 2,400 | Community Bank System, Inc. * | 59,640 | | 4,800 | Philadelphia Consolidated | |
| 3,500 | Delphi Financial Group, Inc. * | 137,375 | | | Holding Corporation # | 187,776 |
| 2,350 | Dime Community Bancshares | 32,782 | | 1,800 | Piper Jaffray Companies # | 124,470 |
| 1,600 | Downey Financial Corporation * | 110,208 | | 1,400 | Portfolio Recovery | |
| 5,100 | East West Bancorp, Inc. | 186,201 | | | Associates, Inc. #* | 65,268 |
| 1,900 | EastGroup Properties, Inc. | 101,137 | | 1,800 | Presidential Life Corporation * | 42,480 |
| 2,200 | Entertainment Properties Trust | 121,000 | | 1,400 | PrivateBancorp, Inc. * | 57,498 |
| 1,900 | Essex Property Trust, Inc. * | 253,232 | | 2,700 | ProAssurance Corporation # | 131,490 |
| 1,800 | Fidelity Bankshares, Inc. * | 71,424 | | 2,200 | Prosperity Bancshares, Inc. * | 76,318 |
| 2,300 | Financial Federal Corporation * | 63,296 | | 2,755 | Provident Bankshares Corporation | 99,566 |
| 6,600 | First BanCorp | 65,340 | | 1,300 | PS Business Parks, Inc. | 85,605 |
| 5,100 | First Commonwealth Financial | | | 6,225 | Republic Bancorp, Inc. * | 83,290 |
| | Corporation * | 68,187 | | 2,200 | Rewards Network, Inc. #* | 12,452 |
| 1,200 | First Indiana Corporation | 30,624 | | 1,800 | RLI Corporation | 97,578 |
| 4,100 | First Midwest Bancorp, Inc. | 155,923 | | 1,200 | Safety Insurance Group, Inc. * | 60,012 |
| 2,600 | First Republic Bank | 101,244 | | 800 | SCPIE Holdings, Inc. # | 22,440 |
| 1,300 | FirstFed Financial Corporation #* | 80,301 | | 2,500 | Selective Insurance Group, Inc. | 138,125 |
| 3,300 | Flagstar Bancorp, Inc. * | 49,599 | | 5,200 | Senior Housing Property Trust | 119,236 |
| 1,900 | Franklin Bank Corporation #* | 38,399 | | 6,300 | South Financial Group, Inc. * | 167,139 |
| 5,600 | Fremont General Corporation * | 81,368 | | 1,500 | Sovran Self Storage, Inc. | 88,470 |
| 2,600 | Glacier Bancorp, Inc. | 90,792 | | 1,600 | Sterling Bancorp | 31,168 |
| 2,600 | Glenborough Realty Trust, Inc. * | 67,548 | | 3,750 | Sterling Bancshares, Inc. | 68,662 |
| 3,400 | Hanmi Financial Corporation | 72,658 | | 3,120 | Sterling Financial Corporation | 103,771 |
| 1,600 | Harbor Florida Bancshares, Inc. * | 72,656 | | 1,500 | Stewart Information Services | |
| 3,000 | Hilb, Rogal and Hobbs Company | 119,760 | | | Corporation * | 55,590 |
| 1,785 | Independent Bank Corporation | 42,662 | | 4,300 | Susquehanna Bancshares, Inc. | 107,457 |
| 1,600 | Infinity Property & Casualty | | | 1,393 | SWS Group, Inc. | 38,711 |
| | Corporation | 68,832 | | 2,100 | Tradestation Group, Inc. #* | 32,865 |
| 5,800 | Inland Real Estate Corporation | 108,402 | | 6,133 | TrustCo Bank Corporation NY * | 67,770 |
| 3,500 | Investment Technology | | | 7,900 | UCBH Holdings, Inc. * | 135,406 |
| | Group, Inc. # | 163,450 | | 4,800 | Umpqua Holdings Corporation * | 135,552 |
| 1,500 | Irwin Financial Corporation * | 33,255 | | 3,100 | United Bankshares, Inc. | 118,389 |
| 2,700 | Kilroy Realty Corporation | 203,391 | | 1,700 | United Fire & Casual Company * | 60,146 |
| 4,300 | LaBranche & Company, Inc. #* | 38,141 | | 5,375 | Whitney Holding Corporation | 175,548 |
| 1,400 | LandAmerica Financial | | | 1,300 | Wilshire Bancorp, Inc. * | 25,714 |
| | Group, Inc. * | 88,326 | | 2,200 | Wintrust Financial Corporation * | 106,172 |
| 4,400 | Lexington Corporate | | | | | |
| | Properties Trust * | 93,720 | | | | |
| The accompanying Notes to Financial Statements are an integral part of this schedule. |
|
| 86 |
Small Cap Index Fund
Schedule of Investments as of October 31, 2006 |
| Shares | Common Stock (98.6%) | Value | | Shares | Common Stock (98.6%) | Value |
|
| |
| Financials — continued | | | 1,600 | Integra LifeSciences Holdings | |
| 1,494 | World Acceptance Corporation #* | $74,685 | | | Corporation #* | $59,088 |
| 3,000 | Zenith National Insurance | | | 3,226 | Intermagnetics General | |
| | Corporation | 139,560 | | | Corporation # | 88,231 |
|
| | |
| | Total Financials | 7,780,966 | | 2,600 | Invacare Corporation | 56,758 |
|
| | |
| | | | | 2,500 | inVentiv Health, Inc. # | 71,500 |
| Health Care (11.3%) | | | 1,000 | Kendle International, Inc. #* | 34,620 |
| 3,500 | Alpharma, Inc. ∈ | 77,245 | | 900 | Kensey Nash Corporation #* | 27,369 |
| 1,400 | Amedisys, Inc. #* | 56,798 | | 1,800 | LCA-Vision, Inc. * | 63,234 |
| 5,800 | American Medical Systems | | | 1,800 | Matria Healthcare, Inc. #* | 50,760 |
| | Holdings, Inc. #* | 103,298 | | 3,400 | Mentor Corporation * | 159,120 |
| 4,300 | AMERIGROUP Corporation #* | 128,828 | | 1,700 | Meridian Bioscience, Inc. | 39,185 |
| 3,500 | AMN Healthcare Services, Inc. # | 88,515 | | 2,300 | Merit Medical Systems, Inc. #* | 36,363 |
| 2,400 | AmSurg Corporation #* | 50,448 | | 6,500 | MGI Pharma, Inc. #* | 123,695 |
| 1,100 | Analogic Corporation * | 61,391 | | 1,900 | Noven Pharmaceuticals, Inc. #* | 42,199 |
| 2,400 | ArQule, Inc. # | 9,648 | | 2,850 | Odyssey Healthcare, Inc. #* | 37,762 |
| 2,100 | ArthroCare Corporation #* | 84,861 | | 1,500 | Osteotech, Inc. # | 7,830 |
| 2,000 | BioLase Technology, Inc. #* | 13,000 | | 3,300 | Owens & Minor, Inc. | 103,983 |
| 1,500 | Biosite, Inc. #* | 68,895 | | 1,500 | Palomar Medical | |
| 1,400 | Bradley Pharmaceuticals, Inc. #* | 24,360 | | | Technologies, Inc. #* | 70,635 |
| 2,200 | Cambrex Corporation * | 51,480 | | 2,200 | PAREXEL International | |
| 3,600 | Centene Corporation #* | 84,924 | | | Corporation # | 65,120 |
| 5,400 | Cerner Corporation #* | 260,874 | | 4,000 | Pediatrix Medical Group, Inc. # | 179,720 |
| 2,100 | Chemed Corporation * | 74,529 | | 2,820 | Per-Se Technologies, Inc. #* | 69,034 |
| 1,200 | CNS, Inc. | 44,460 | | 1,600 | Pharmnet Development Group #* | 29,920 |
| 2,400 | CONMED Corporation # | 53,256 | | 1,900 | PolyMedica Corporation | 78,945 |
| 2,900 | Connetics Corporation # | 49,416 | | 1,400 | Possis Medical, Inc. # | 15,288 |
| 3,700 | Cooper Companies, Inc. * | 213,231 | | 4,700 | Regeneron Pharmaceuticals, Inc. #* | 94,235 |
| 1,800 | Cross Country Healthcare, Inc. #* | 34,848 | | 1,400 | RehabCare Group, Inc. #* | 18,004 |
| 1,850 | CryoLife, Inc. #* | 11,026 | | 6,100 | Respironics, Inc. # | 215,452 |
| 1,700 | Cyberonics, Inc. #* | 30,651 | | 3,800 | Savient Pharmaceuticals, Inc. #* | 28,918 |
| 1,000 | Datascope Corporation | 35,870 | | 2,400 | Sciele Pharma, Inc. #* | 52,344 |
| 3,600 | Dendrite International, Inc. #* | 37,620 | | 4,700 | Sierra Health Services, Inc. # | 160,928 |
| 1,600 | Dionex Corporation # | 87,040 | | 3,700 | Sunrise Senior Living, Inc. #* | 115,477 |
| 2,000 | DJO, Inc. # | 80,460 | | 1,300 | SurModics, Inc. # | 45,370 |
| 2,322 | Enzo Biochem, Inc. #* | 33,205 | | 2,700 | Theragenics Corporation #* | 8,478 |
| 1,700 | Genesis Healthcare Corporation # | 82,331 | | 3,700 | United Surgical Partners | |
| 2,300 | Gentiva Health Services, Inc. # | 42,665 | | | International, Inc. #* | 91,834 |
| 1,900 | Greatbatch Technologies, Inc. #* | 42,731 | | 2,600 | Viasys Healthcare, Inc. # | 74,490 |
| 2,300 | Haemonetics Corporation # | 104,880 | | 700 | Vital Signs, Inc. | 39,452 |
|
|
| 2,900 | Healthways, Inc. #* | 122,815 | | | Total Health Care | 5,446,576 |
|
|
| 4,300 | Hologic, Inc. # | 207,045 | | | | |
| 5,500 | Hooper Holmes, Inc. * | 19,800 | | Industrials (17.1%) | |
| 1,200 | ICU Medical, Inc. #* | 50,700 | | 1,900 | A.O. Smith Corporation | 66,804 |
| 2,600 | IDEXX Laboratories, Inc. # | 216,346 | | 1,700 | A.S.V., Inc. #* | 24,837 |
| 5,512 | Immucor, Inc. # | 151,745 | | 3,000 | AAR Corporation #* | 78,120 |
| The accompanying Notes to Financial Statements are an integral part of this schedule. |
|
| 87 |
Small Cap Index Fund
Schedule of Investments as of October 31, 2006 |
| Shares | Common Stock (98.6%) | Value | | Shares | Common Stock (98.6%) | Value |
|
| |
| Industrials — continued | | | 2,200 | Insituform Technologies, Inc. #* | $51,414 |
| 3,600 | ABM Industries, Inc. * | $71,496 | | 8,800 | JLG Industries, Inc. | 243,320 |
| 3,700 | Acuity Brands, Inc. * | 183,298 | | 2,200 | John H. Harland Company * | 89,958 |
| 2,000 | Administaff, Inc. ∈ | 68,900 | | 1,900 | Kaman Corporation | 38,741 |
| 2,400 | Albany International Corporation | 80,664 | | 6,200 | Kansas City Southern, Inc. #* | 176,018 |
| 800 | Angelica Corporation * | 16,752 | | 2,400 | Kaydon Corporation | 100,320 |
| 2,400 | Apogee Enterprises, Inc. * | 38,616 | | 4,400 | Kirby Corporation # | 154,132 |
| 3,175 | Applied Industrial | | | 4,725 | Knight Transportation, Inc. * | 86,090 |
| | Technologies, Inc. * | 91,250 | | 4,300 | Labor Ready, Inc. # | 75,293 |
| 1,000 | Applied Signal Technology, Inc. * | 14,840 | | 4,700 | Landstar System, Inc. * | 218,268 |
| 2,000 | Arkansas Best Corporation * | 81,960 | | 400 | Lawson Products, Inc. | 19,364 |
| 2,600 | Armor Holdings, Inc. #* | 133,796 | | 5,000 | Lennox International, Inc. | 134,800 |
| 1,600 | Astec Industries, Inc. #* | 51,024 | | 900 | Lindsay Manufacturing Company * | 29,601 |
| 2,400 | Baldor Electric Company * | 76,992 | | 1,400 | Lydall, Inc. # | 12,698 |
| 3,200 | Barnes Group, Inc. * | 64,160 | | 2,500 | MagneTek, Inc. # | 11,900 |
| 3,625 | Belden CDT, Inc. * | 131,225 | | 5,200 | Manitowoc Company, Inc. | 285,375 |
| 2,400 | Bowne & Company, Inc. | 37,512 | | 3,100 | Mesa Air Group, Inc. #* | 27,590 |
| 4,300 | Brady Corporation * | 159,100 | | 2,900 | Mobile Mini, Inc. #* | 93,293 |
| 4,200 | Briggs & Stratton Corporation * | 107,058 | | 3,425 | Moog, Inc. # | 127,752 |
| 2,200 | C&D Technologies, Inc. * | 10,912 | | 3,000 | Mueller Industries, Inc. * | 110,010 |
| 1,100 | CDI Corporation * | 26,004 | | 1,800 | NCI Building Systems, Inc. #* | 107,730 |
| 1,300 | Central Parking Corporation * | 22,295 | | 2,600 | NCO Group, Inc. # | 70,096 |
| 2,150 | Ceradyne, Inc. #* | 88,688 | | 2,400 | Old Dominion Freight Line #* | 66,384 |
| 4,400 | CLARCOR, Inc. | 143,352 | | 2,200 | On Assignment, Inc. # | 24,970 |
| 2,200 | Coinstar, Inc. #* | 66,836 | | 2,500 | Regal-Beloit Corporation | 123,625 |
| 1,000 | Consolidated Graphics, Inc. # | 62,170 | | 1,300 | Robbins & Myers, Inc. | 50,037 |
| 1,200 | Cubic Corporation | 25,092 | | 1,600 | School Specialty, Inc. #* | 62,656 |
| 3,600 | Curtiss-Wright Corporation | 121,824 | | 6,600 | Shaw Group, Inc. #* | 175,296 |
| 1,400 | EDO Corporation * | 33,474 | | 3,000 | Simpson Manufacturing | |
| 2,600 | EGL, Inc. # | 88,374 | | | Company, Inc. * | 85,170 |
| 1,700 | ElkCorp * | 42,704 | | 5,200 | SkyWest, Inc. | 138,632 |
| 2,600 | EMCOR Group, Inc. #* | 153,790 | | 4,600 | Spherion Corporation # | 33,350 |
| 1,700 | EnPro Industries, Inc. #* | 54,400 | | 1,200 | Standard Register Company * | 16,236 |
| 2,100 | Esterline Technologies | | | 1,100 | Standex International Corporation | 32,032 |
| | Corporation #* | 79,170 | | 2,800 | Teledyne Technologies, Inc. # | 116,816 |
| 2,500 | Forward Air Corporation | 81,175 | | 4,800 | Tetra Tech, Inc. #* | 87,264 |
| 3,000 | Frontier Airlines Holdings, Inc. #* | 24,120 | | 3,400 | Toro Company * | 146,744 |
| 1,700 | G & K Services, Inc. * | 64,787 | | 2,400 | Tredegar Corporation * | 41,856 |
| 4,300 | Gardner Denver, Inc. # | 146,157 | | 1,400 | Triumph Group, Inc. * | 67,410 |
| 4,600 | GenCorp, Inc. #* | 60,260 | | 2,500 | United Stationers, Inc. # | 119,375 |
| 2,220 | Griffon Corporation #* | 54,590 | | 1,500 | Universal Forest Products, Inc. * | 68,070 |
| 2,350 | Healthcare Services Group, Inc. | 63,873 | | 4,300 | URS Corporation #* | 173,763 |
| 4,801 | Heartland Express, Inc. * | 78,400 | | 1,400 | Valmont Industries, Inc. | 78,120 |
| 1,500 | Heidrick & Struggles | | | 1,700 | Viad Corporation | 62,815 |
| | International, Inc. # | 61,305 | | 1,600 | Vicor Corporation * | 19,040 |
| 3,500 | Hub Group, Inc. # | 95,060 | | 700 | Volt Information | |
| 4,450 | IDEX Corporation | 208,705 | | | Sciences, Inc. #* | 27,650 |
| The accompanying Notes to Financial Statements are an integral part of this schedule. |
|
| 88 |
Small Cap Index Fund
Schedule of Investments as of October 31, 2006 |
| Shares | Common Stock (98.6%) | Value | | Shares | Common Stock (98.6%) | Value |
|
| |
| Industrials — continued | | | 2,600 | Daktronics, Inc. * | $61,646 |
| 2,500 | Wabash National Corporation | $35,075 | | 2,000 | Digi International, Inc. # | 28,040 |
| 3,850 | Waste Connections, Inc. #* | 156,656 | | 2,900 | Digital Insight Corporation # | 89,262 |
| 2,100 | Watsco, Inc. * | 104,580 | | 7,700 | Digitas, Inc. # | 81,312 |
| 3,500 | Watson Wyatt Worldwide, Inc. | 158,025 | | 1,600 | Diodes, Inc. #* | 70,464 |
| 2,000 | Watts Water Technologies, Inc. * | 74,440 | | 2,700 | Ditech Networks, Inc. #* | 21,303 |
| 1,300 | Wolverine Tube, Inc. #* | 3,731 | | 2,500 | DSP Group, Inc. # | 54,300 |
| 2,400 | Woodward Governor Company | 85,704 | | 3,900 | eFunds Corporation # | 96,720 |
|
| | |
| | Total Industrials | 8,235,206 | | 2,400 | Electro Scientific Industries, Inc. # | 47,880 |
|
| | |
| | | | | 4,600 | Epicor Software Corporation #* | 64,538 |
| Information Technology (16.5%) | | | 1,100 | EPIQ Systems, Inc. #* | 16,808 |
| 2,200 | Actel Corporation # | 36,058 | | 2,900 | Exar Corporation #* | 37,613 |
| 9,700 | Adaptec, Inc. #* | 43,941 | | 3,100 | FactSet Research Systems, Inc. | 157,790 |
| 2,900 | Advanced Energy Industries, Inc. # | 45,588 | | 2,000 | FEI Company #* | 45,720 |
| 6,300 | Aeroflex, Inc. #- | 68,040 | | 5,600 | FLIR Systems, Inc. #* | 178,864 |
| 2,600 | Agilysys, Inc. | 38,558 | | 1,800 | Gerber Scientific, Inc. # | 26,298 |
| 2,000 | Altiris, Inc. # | 45,020 | | 2,300 | Gevity HR, Inc. * | 51,980 |
| 2,700 | Anixter International, Inc. #* | 161,352 | | 4,300 | Global Imaging Systems, Inc. #* | 93,611 |
| 3,100 | ANSYS, Inc. #* | 142,600 | | 5,680 | Global Payments, Inc. | 248,273 |
| 3,000 | ATMI, Inc. #- | 95,070 | | 6,100 | Harmonic, Inc. #* | 49,471 |
| 3,547 | Avid Technology, Inc. #* | 128,118 | | 2,200 | Hutchinson Technology, Inc. #* | 50,930 |
| 8,300 | Axcelis Technologies, Inc. #* | 57,270 | | 4,700 | Hyperion Solutions Corporation # | 175,780 |
| 900 | Bankrate, Inc. #* | 28,755 | | 2,500 | InfoSpace, Inc. # | 50,525 |
| 900 | Bel Fuse, Inc. * | 32,058 | | 3,950 | Insight Enterprises, Inc. # | 84,886 |
| 2,700 | Bell Microproducts, Inc. #* | 18,198 | | 1,700 | Inter-Tel, Inc. * | 35,173 |
| 5,450 | Benchmark Electronics, Inc. #- | 144,698 | | 2,100 | Itron, Inc. #* | 114,324 |
| 1,500 | Black Box Corporation | 66,885 | | 4,100 | J2 Global Communication, Inc. #* | 112,504 |
| 1,100 | Blue Coat Systems, Inc. #* | 24,530 | | 2,500 | JDA Software Group, Inc. # | 36,775 |
| 4,120 | Brightpoint, Inc. #* | 49,852 | | 3,700 | Keane, Inc. #* | 42,883 |
| 6,253 | Brooks Automation, Inc. #* | 88,793 | | 1,200 | Keithley Instruments, Inc. | 16,320 |
| 2,100 | Cabot Microelectronics | | | 2,600 | Komag, Inc. #* | 99,450 |
| | Corporation # | 59,955 | | 5,600 | Kopin Corporation #* | 19,992 |
| 2,600 | CACI International, Inc. #* | 149,604 | | 2,650 | Kronos, Inc. # | 89,835 |
| 2,300 | Captaris, Inc. # | 13,547 | | 4,700 | Kulicke and Soffa Industries, Inc. #* | 42,206 |
| 1,700 | Carreker Corporation # | 12,444 | | 1,900 | Littelfuse, Inc. #* | 64,334 |
| 800 | Catapult Communications | | | 1,500 | LoJack Corporation #* | 29,940 |
| | Corporation # | 6,984 | | 2,300 | Manhattan Associates, Inc. # | 67,919 |
| 3,900 | C-COR, Inc. #* | 38,961 | | 1,500 | ManTech International | |
| 3,200 | Checkpoint Systems, Inc. # | 58,272 | | | Corporation # | 51,090 |
| 4,600 | CIBER, Inc. #* | 31,510 | | 1,800 | MapInfo Corporation # | 24,174 |
| 3,800 | Cognex Corporation | 87,514 | | 1,800 | MAXIMUS, Inc. | 50,238 |
| 2,500 | Coherent, Inc. #* | 80,575 | | 1,700 | Mercury Computer Systems, Inc. #* | 20,944 |
| 1,800 | Cohu, Inc. * | 35,604 | | 3,100 | Methode Electronics, Inc. * | 34,317 |
| 1,900 | Comtech Telecommunications | | | 3,200 | MICROS Systems, Inc. # | 158,976 |
| | Corporation # | 67,735 | | 5,900 | Microsemi Corporation #* | 115,640 |
| 2,900 | CTS Corporation * | 40,948 | | 2,500 | MIVA, Inc. #* | 7,975 |
| 3,200 | Cymer, Inc. #* | 148,256 | | 1,600 | MTS Systems Corporation | 53,264 |
| The accompanying Notes to Financial Statements are an integral part of this schedule. |
|
| 89 |
Small Cap Index Fund
Schedule of Investments as of October 31, 2006 |
| Shares | Common Stock (98.6%) | Value | | Shares | Common Stock (98.6%) | | Value |
|
| |
| Information Technology — continued | | | 2,000 | ViaSat, Inc. # | | $54,280 |
| 3,700 | Napster, Inc. #* | $17,538 | | 3,500 | WebEx Communications, Inc. #* | 134,575 |
| 1,700 | Neoware Systems, Inc. #* | 20,349 | | 4,000 | Websense, Inc. # | | 109,480 |
| 2,800 | NETGEAR, Inc. #* | 75,040 | | 2,300 | X-Rite, Inc. * | | 26,013 |
|
|
| 2,100 | Network Equipment | | | | Total Information | | |
| | Technologies, Inc. # | 11,865 | | | Technology | 7,921,184 |
|
|
| 2,400 | Novatel Wireless, Inc. #* | 20,208 | | | | | |
| 1,800 | Open Solutions, Inc. #* | 67,266 | | Materials (5.4%) | | |
| 1,600 | Park Electrochemical Corporation | 49,152 | | 2,100 | A. Schulman, Inc. * | | 50,841 |
| 3,400 | Paxar Corporation #* | 68,068 | | 1,000 | A.M. Castle & Company | | 33,440 |
| 1,900 | PC TEL, Inc. # | 20,425 | | 2,696 | Aleris International, Inc. # | | 138,871 |
| 2,200 | Pericom Semiconductor | | | 1,900 | AMCOL International Corporation * | 49,989 |
| | Corporation # | 21,142 | | 2,900 | AptarGroup, Inc. * | | 159,239 |
| 2,200 | Phoenix Technologies, Ltd. #* | 9,658 | | 2,000 | Arch Chemicals, Inc. * | | 66,920 |
| 1,400 | Photon Dynamics, Inc. # | 16,618 | | 1,600 | Brush Engineered Materials, Inc. #* | 53,856 |
| 3,500 | Photronics, Inc. #* | 48,965 | | 3,200 | Buckeye Technologies, Inc. # | | 33,248 |
| 1,400 | Planar Systems, Inc. #* | 16,870 | | 2,400 | Caraustar Industries, Inc. #* | | 25,992 |
| 3,400 | Progress Software Corporation # | 97,886 | | 2,100 | Carpenter Technology Corporation * | 224,679 |
| 1,400 | Quality Systems, Inc. * | 59,416 | | 2,000 | Century Aluminum Company #* | 77,840 |
| 2,200 | Radiant Systems, Inc. # | 24,222 | | 3,800 | Chaparral Steel Company | | 158,042 |
| 1,800 | RadiSys Corporation #* | 32,994 | | 1,600 | Chesapeake Corporation * | | 24,816 |
| 1,400 | Rogers Corporation # | 97,958 | | 3,400 | Cleveland-Cliffs, Inc. * | | 143,786 |
| 2,100 | Rudolph Technologies, Inc. #* | 37,086 | | 800 | Deltic Timber Corporation | | 40,728 |
| 2,200 | ScanSource, Inc. #* | 69,058 | | 2,800 | Georgia Gulf Corporation * | | 59,892 |
| 5,300 | Secure Computing Corporation #* | 38,054 | | 5,000 | H.B. Fuller Company | | 123,950 |
| 13,300 | Skyworks Solutions, Inc. #* | 88,179 | | 3,500 | Headwaters, Inc. #* | | 86,625 |
| 2,200 | Sonic Solutions, Inc. #* | 35,508 | | 2,100 | MacDermid, Inc. | | 70,245 |
| 1,600 | SPSS, Inc. # | 44,272 | | 1,100 | Material Sciences Corporation # | 13,068 |
| 1,900 | Standard Microsystems | | | 2,198 | Myers Industries, Inc. | | 39,828 |
| | Corporation # | 58,577 | | 1,300 | Neenah Paper, Inc. * | | 47,879 |
| 1,000 | StarTek, Inc. * | 13,640 | | 2,500 | OM Group, Inc. # | | 142,500 |
| 1,100 | Supertex, Inc. # | 48,851 | | 3,500 | OMNOVA Solutions, Inc. #* | | 15,330 |
| 2,400 | Sykes Enterprises, Inc. # | 48,696 | | 800 | Penford Corporation | | 13,000 |
| 3,850 | Symmetricom, Inc. #* | 32,610 | | 7,600 | PolyOne Corporation # | | 62,320 |
| 2,100 | Synaptics, Inc. #* | 59,556 | | 1,400 | Pope & Talbot, Inc. #* | | 7,630 |
| 5,950 | Take-Two Interactive | | | 900 | Quaker Chemical Corporation | | 17,127 |
| | Software, Inc. #* | 83,240 | | 2,975 | Quanex Corporation * | | 99,692 |
| 2,650 | TALX Corporation * | 64,448 | | 2,700 | Rock-Tenn Company | | 55,728 |
| 3,400 | Technitrol, Inc. | 85,748 | | 1,800 | RTI International Metals, Inc. #* | 110,376 |
| 5,400 | THQ, Inc. # | 162,378 | | 2,200 | Ryerson, Inc. * | | 53,020 |
| 1,200 | Tollgrade Communications, Inc. # | 9,852 | | 1,200 | Schweitzer-Mauduit | | |
| 4,550 | Trimble Navigation, Ltd. #* | 210,301 | | | International, Inc. | | 27,672 |
| 1,900 | Ultratech, Inc. #* | 27,151 | | 900 | Steel Technologies, Inc. | | 17,271 |
| 5,300 | United Online, Inc. * | 71,656 | | 2,000 | Texas Industries, Inc. * | | 124,200 |
| 4,550 | Varian Semiconductor Equipment | | | 3,400 | Tronox, Inc. * | | 44,472 |
| | Associates, Inc. #* | 166,030 | | | | | |
| 2,500 | Veeco Instruments, Inc. #* | 46,725 | | | | | |
| The accompanying Notes to Financial Statements are an integral part of this schedule. |
|
| 90 |
Small Cap Index Fund
Schedule of Investments as of October 31, 2006 |
| Shares | Common Stock (98.6%) | Value | | Shares | Common Stock (98.6%) | Value |
|
| |
| Materials — continued | | | 1,200 | CH Energy Group, Inc. * | $62,424 |
| 3,800 | Wausau-Mosinee Paper Corporation | $51,528 | | 4,600 | Cleco Corporation | 118,220 |
| 2,700 | Wellman, Inc. * | 10,179 | | 4,000 | El Paso Electric Company # | 93,440 |
|
| | |
| | Total Materials | 2,575,819 | | 6,000 | Energen Corporation | 256,920 |
|
| | | |
| | | | | 600 | Green Mountain Power Corporation | 20,178 |
| Telecommunications Services (0.3%) | | | 1,900 | Laclede Group, Inc. * | 67,697 |
| 1,800 | Commonwealth Telephone | | | 2,300 | New Jersey Resources Corporation | 119,278 |
| | Enterprises, Inc. | 75,348 | | 2,400 | Northwest Natural Gas Company * | 99,288 |
| 3,700 | General Communication, Inc. #* | 48,507 | | 6,300 | Piedmont Natural Gas | |
|
| | |
| | Total Telecommunications | | | | Company, Inc. * | 170,100 |
| | Services | 123,855 | | 2,500 | South Jersey Industries, Inc. | 77,325 |
|
| | |
| | | | | 8,356 | Southern Union Company ∈ | 231,294 |
| Utilities (5.0%) | | | 3,400 | Southwest Gas Corporation * | 121,992 |
| 2,500 | ALLETE, Inc. * | 112,750 | | 8,800 | UGI Corporation | 233,200 |
| 1,400 | American States Water Company | 58,800 | | 1,999 | UIL Holdings Corporation | 79,460 |
| 6,800 | Atmos Energy Corporation * | 208,964 | | 3,000 | UniSource Energy Corporation | 106,740 |
|
|
| 4,000 | Avista Corporation | 102,960 | | | Total Utilities | 2,387,083 |
|
|
| 1,000 | Cascade Natural Gas Corporation * | 25,740 | | | | |
|
|
| 900 | Central Vermont Public Service | | | | Total Common Stock | |
| | Corporation | 20,313 | | | (cost $31,927,655) | 47,358,314 |
|
|
| The accompanying Notes to Financial Statements are an integral part of this schedule. |
|
| 91 |
Small Cap Index Fund
Schedule of Investments as of October 31, 2006 |
| | | | | Interest | Maturity | |
| Shares | Collateral Held for Securities Loaned (26.0%) | Rate (+) | Date | Value |
|
| 12,471,270 | Thrivent Financial Securities Lending Trust | 5.300% | N/A | $12,471,270 |
| |
|
| | | Total Collateral Held for Securities Loaned | |
| | | (cost $12,471,270) | | | 12,471,270 |
| |
|
| |
| |
| Shares or | | | | | | |
| Principal | | | | Interest | Maturity | |
| Amount | Short-Term Investments (1.5%) | | Rate (+) | Date | Value |
|
| $125,000 | Federal National Mortgage Association ∈ | 5.200% | 2/7/2007 | $123,271 |
| 586,066 | Thrivent Money Market Fund | | 4.600 | N/A | 586,066 |
|
|
| | | Total Short-Term Investments (cost $709,313) | 709,337 |
|
|
| | | Total Investments (cost $45,108,238) 126.1% | $60,538,921 |
|
|
| | | Other Assets and Liabilities, Net (26.1%) | (12,511,809) |
|
|
| | | Total Net Assets 100.0% | | | $48,027,112 |
|
|
| |
| |
| | | Number of | | Notional | | |
| | | Contracts | Expiration | Principal | | Unrealized |
| Futures | | Long/(Short) | Date | Amount | Value | Gain/(Loss) |
|
| Russell 2000 Index Mini-Futures | 9 | December 2006 | $673,115 | $693,900 | $20,785 |
# Non-income producing security.
* All or a portion of the security is on loan as discussed in item 2(L) of the Notes to Financial Statements.
+ The interest rate shown reflects the yield, coupon rate or, for securities purchased at a discount, the discount rate at the date of purchase.
∈ At October 31, 2006, $123,271 of investments were held on deposit with the counterparty and pledged as the initial margin deposit for open financial futures contracts. In addition, $1,122,071 of investments were earmarked as collateral to cover open financial futures contracts.
| Gross unrealized appreciation and depreciation of investments, based on cost for federal income tax purposes, were as follows: | |
| Gross unrealized appreciation | $17,163,867 | |
| Gross unrealized depreciation | (1,988,562) | |
|
| |
| Net unrealized appreciation (depreciation) | $15,175,305 | |
| Cost for federal income tax purposes | $45,363,616 | |
| The accompanying Notes to Financial Statements are an integral part of this schedule. |
|
| 92 |
Mid Cap Growth Fund
Schedule of Investments as of October 31, 2006 |
| Shares | Common Stock (93.6%) | | Value | | Shares | Common Stock (93.6%) | | Value |
|
| |
| Consumer Discretionary (14.5%) | | | | 38,900 | Toreador Resources Corporation #* | $844,130 |
| 8,900 | Abercrombie & Fitch Company | $682,185 | | 32,400 | Ultra Petroleum Corporation #* | 1,729,188 |
| 22,100 | Aeropostale, Inc. # | | 647,751 | | 41,800 | Weatherford International, Ltd. # | 1,717,144 |
| 16,800 | Children’s Place Retail | | | | 51,742 | XTO Energy, Inc. | | 2,414,282 |
|
|
| | Stores, Inc. # | | 1,179,192 | | | Total Energy | | 22,196,659 |
|
|
| 44,500 | Chipotle Mexican Grill, Inc. #* | 2,665,550 | | | | | |
| 88,100 | Circuit City Stores, Inc. | | 2,376,938 | | Financials (7.6%) | | |
| 86,050 | Coldwater Creek, Inc. #* | | 2,623,664 | | 16,399 | Affiliated Managers | | |
| 21,515 | Crocs, Inc. #*~ | | 852,424 | | | Group, Inc. #* | | 1,642,196 |
| 86,100 | DeVry, Inc. #* | | 2,096,535 | | 27,200 | AllianceBernstein Holding, LP * | 2,113,440 |
| 50,846 | DSW, Inc. #* | | 1,759,272 | | 51,900 | Assurant, Inc. | | 2,733,054 |
| 1 | Expedia, Inc. # | | 10 | | 5,200 | Chicago Mercantile Exchange | | |
| 66,600 | Federated Department Stores, Inc. | 2,924,406 | | | Holdings, Inc. | | 2,605,200 |
| 33,200 | Harrah’s Entertainment, Inc. | | 2,467,756 | | 126,700 | E*TRADE Financial Corporation # | 2,949,576 |
| 57,500 | Hilton Hotels Corporation | | 1,662,900 | | 47,600 | East West Bancorp, Inc. | | 1,737,876 |
| 78,600 | International Game Technology | 3,341,286 | | 39,300 | Lazard, Ltd. * | | 1,666,320 |
| 44,700 | ITT Educational Services, Inc. #* | 3,082,065 | | 29,850 | Legg Mason, Inc. * | | 2,687,097 |
| 45,100 | McCormick & Schmick’s Seafood | | | 64,400 | Nasdaq Stock Market, Inc. #* | | 2,301,012 |
| | Restaurants, Inc. # | | 1,185,679 | | 42,200 | PartnerRe, Ltd. * | | 2,950,624 |
| 63,500 | PETsMART, Inc. | | 1,827,530 | | 3,328 | Portfolio Recovery Associates, Inc. # | 155,151 |
| 107,600 | Staples, Inc. | | 2,775,004 | | 65,900 | TD Ameritrade | | |
| 11,400 | Starwood Hotels & Resorts | | | | | Holding Corporation * | | 1,085,373 |
|
|
| | Worldwide, Inc. | | 681,036 | | | Total Financials | 24,626,919 |
|
|
| 120,400 | Texas Roadhouse, Inc. #* | | 1,739,780 | | | | | |
| 43,100 | Tween Brands, Inc. # | | 1,802,442 | | Health Care (16.9%) | | |
| 24,600 | Under Armour, Inc. #* | | 1,140,210 | | 59,500 | Advanced Medical Optics, Inc. #* | 2,430,575 |
| 130,800 | Urban Outfitters, Inc. #* | | 2,289,000 | | 73,400 | Affymetrix, Inc. #* | | 1,871,700 |
| 71,400 | VistaPrint, Ltd. #* | | 2,233,392 | | 9,100 | Allergan, Inc. | | 1,051,050 |
| 38,800 | Volcom, Inc. # | | 1,271,088 | | 24,900 | Amylin Pharmaceuticals, Inc. #* | 1,094,604 |
| 22,200 | Wynn Resorts, Ltd. #* | | 1,632,588 | | 82,500 | BioMarin Pharmaceutical, Inc. # | 1,322,475 |
|
| | |
| | Total Consumer | | | | 34,900 | Conor Medsystems, Inc. #* | | 857,144 |
| | Discretionary | | 46,939,683 | | 20,600 | Covance, Inc. # | | 1,205,100 |
|
| | | |
| | | | | | 44,375 | Coventry Health Care, Inc. # | | 2,083,406 |
| Consumer Staples (0.5%) | | | | 72,200 | Cubist Pharmaceuticals, Inc. #* | 1,607,894 |
| 75,900 | Coca-Cola Enterprises, Inc. | | 1,520,277 | | 41,200 | Dade Behring Holdings, Inc. | | 1,500,916 |
|
| | |
| | Total Consumer Staples | | 1,520,277 | | 41,150 | DaVita, Inc. # | | 2,289,174 |
|
| | |
| | | | | | 46,000 | Dentsply International, Inc. * | | 1,438,880 |
| Energy (6.9%) | | | | 55,100 | Endo Pharmaceutical | | |
| 62,500 | Cameron International | | | | | Holdings, Inc. # | | 1,572,554 |
| | Corporation # | | 3,131,250 | | 34,400 | Fisher Scientific | | |
| 36,400 | Diamond Offshore Drilling, Inc. * | 2,519,972 | | | International, Inc. # | | 2,945,328 |
| 24,200 | Grant Prideco, Inc. # | | 914,034 | | 28,100 | Forest Laboratories, Inc. # | | 1,375,214 |
| 24,100 | National Oilwell Varco, Inc. # | | 1,455,640 | | 68,000 | Gen-Probe, Inc. # | | 3,255,160 |
| 44,300 | Peabody Energy Corporation * | 1,859,271 | | 26,800 | Genzyme Corporation # | | 1,809,268 |
| 91,200 | Range Resources Corporation | | 2,476,080 | | 13,400 | Gilead Sciences, Inc. # | | 923,260 |
| 73,700 | Southwestern Energy Company #* | 2,622,246 | | 19,900 | Haemonetics Corporation #* | | 907,440 |
| 16,900 | Teekay LNG Partners, LP * | | 513,422 | | 11,100 | Henry Schein, Inc. # | | 551,559 |
| The accompanying Notes to Financial Statements are an integral part of this schedule. |
|
| 93 |
Mid Cap Growth Fund
Schedule of Investments as of October 31, 2006 |
| Shares | Common Stock (93.6%) | Value | | Shares | Common Stock (93.6%) | Value |
|
| |
| Health Care — continued | | | Information Technology (24.0%) | |
| 26,800 | Intuitive Surgical, Inc. #* | $2,658,024 | | 52,200 | Accenture, Ltd. | $1,717,902 |
| 24,500 | Kyphon, Inc. #* | 967,750 | | 194,600 | Activision, Inc. #* | 3,000,732 |
| 30,800 | Manor Care, Inc. * | 1,478,092 | | 92,934 | Adobe Systems, Inc. # | 3,554,726 |
| 23,200 | Medco Health Solutions, Inc. # | 1,241,200 | | 42,300 | Akamai Technologies, Inc. #* | 1,982,178 |
| 69,500 | NuVasive, Inc. #* | 1,633,945 | | 21,100 | Alliance Data | |
| 63,300 | PDL BioPharma, Inc. #* | 1,337,529 | | | Systems Corporation # | 1,281,192 |
| 67,500 | Pharmaceutical Product | | | 43,400 | Amdocs, Ltd. # | 1,682,184 |
| | Development, Inc. | 2,136,375 | | 41,600 | Amphenol Corporation * | 2,824,640 |
| 18,400 | Psychiatric Solutions, Inc. # | 610,880 | | 94,100 | aQuantive, Inc. #* | 2,557,638 |
| 13,700 | Quest Diagnostics, Inc. | 681,438 | | 42,000 | Autodesk, Inc. #* | 1,543,500 |
| 28,000 | ResMed, Inc. #* | 1,231,720 | | 19,550 | Baidu.com, Inc. #*~ | 1,706,324 |
| 90,400 | St. Jude Medical, Inc. # | 3,105,240 | | 186,100 | BEA Systems, Inc. # | 3,027,847 |
| 30,600 | Thermo Electron Corporation #* | 1,311,822 | | 21,250 | Broadcom Corporation #* | 643,238 |
| 16,500 | Varian Medical Systems, Inc. # | 905,190 | | 144,600 | Cadence Design Systems, Inc. #* | 2,582,556 |
| 67,400 | VCA Antech, Inc. # | 2,181,738 | | 46,400 | CIENA Corporation # | 1,090,864 |
| 30,700 | Vertex Pharmaceuticals, Inc. #* | 1,246,420 | | 33,100 | Citrix Systems, Inc. # | 977,443 |
|
| | |
| | Total Health Care | 54,820,064 | | 135,200 | CNET Networks, Inc. #* | 1,208,688 |
|
| | |
| | | | | 42,600 | Cogent, Inc. #* | 489,900 |
| Industrials (11.9%) | | | 36,076 | Cognizant Technology | |
| 62,500 | American Reprographics | | | | Solutions Corporation # | 2,715,801 |
| | Company #* | 2,218,750 | | 237,300 | Compuware Corporation # | 1,907,892 |
| 22,900 | C.H. Robinson Worldwide, Inc. | 955,846 | | 43,100 | F5 Networks, Inc. #* | 2,852,789 |
| 16,700 | Corporate Executive | | | 41,800 | FormFactor, Inc. # | 1,595,924 |
| | Board Company | 1,499,994 | | 39,800 | Hyperion Solutions Corporation # | 1,488,520 |
| 24,440 | Expeditors International of | | | 160,400 | Integrated Device | |
| | Washington, Inc. | 1,158,700 | | | Technology, Inc. # | 2,542,340 |
| 24,200 | Flowserve Corporation # | 1,282,600 | | 106,400 | Intersil Corporation * | 2,495,080 |
| 48,200 | Foster Wheeler, Ltd. #* | 2,166,590 | | 104,963 | JDS Uniphase Corporation #* | 1,525,105 |
| 42,800 | Huron Consulting Group, Inc. # | 1,710,288 | | 133,436 | Juniper Networks, Inc. #* | 2,297,768 |
| 37,600 | ITT Corporation | 2,045,064 | | 62,880 | KLA-Tencor Corporation | 3,091,810 |
| 20,100 | Jacobs Engineering Group, Inc. # | 1,518,354 | | 62,800 | L-1 Identity Solutions, Inc. #* | 898,668 |
| 26,700 | Joy Global, Inc. | 1,044,237 | | 116,500 | Marvell Technology Group, Ltd. # | 2,129,620 |
| 39,200 | Mobile Mini, Inc. #* | 1,261,064 | | 71,610 | Microchip Technology, Inc. * | 2,358,117 |
| 84,900 | Monster Worldwide, Inc. # | 3,439,299 | | 62,200 | NAVTEQ Corporation #* | 2,065,040 |
| 58,700 | Precision Castparts Corporation | 3,995,123 | | 52,100 | Network Appliance, Inc. # | 1,901,650 |
| 29,200 | Robert Half International, Inc. | 1,067,260 | | 42,800 | NVIDIA Corporation # | 1,492,436 |
| 17,900 | Rockwell Automation, Inc. | 1,109,800 | | 57,300 | Oplink Communications, Inc. #* | 1,134,540 |
| 26,300 | Roper Industries, Inc. * | 1,258,455 | | 1,500 | Optium Corporation # | 30,375 |
| 34,700 | Stericycle, Inc. #* | 2,453,637 | | 207,300 | Powerwave Technologies, Inc. #* | 1,349,523 |
| 29,300 | Textron, Inc. | 2,664,249 | | 31,300 | SunPower Corporation # | 1,053,245 |
| 40,700 | URS Corporation # | 1,644,687 | | 140,100 | Tellabs, Inc. # | 1,476,654 |
| 61,100 | US Airways Group, Inc. #* | 3,046,446 | | 59,200 | Tessera Technologies, Inc. #* | 2,066,672 |
| 38,000 | UTI Worldwide, Inc. * | 982,300 | | 41,100 | Varian Semiconductor Equipment | |
| | | | Associates, Inc. # | 1,499,739 |
|
| | | | |
| | Total Industrials | 38,522,743 | | | | |
|
| | |
| The accompanying Notes to Financial Statements are an integral part of this schedule. |
|
| 94 |
Mid Cap Growth Fund
Schedule of Investments as of October 31, 2006 |
| Shares | Common Stock (93.6%) | Value | | Shares | Common Stock (93.6%) | Value |
|
| |
| Information Technology — continued | | | Telecommunications Services (6.2%) | |
| 107,600 | Western Digital Corporation # | $1,966,928 | | | 33,010 | American Tower Corporation # | $1,189,020 |
| 67,800 | Xilinx, Inc. | 1,729,578 | | | 123,200 | Broadwing Corporation #* | 1,845,536 |
|
| | |
| | Total Information | | | | 35,500 | Crown Castle | | |
| | Technology | 77,537,366 | | | | International Corporation #* | 1,194,575 |
|
| | |
| | | | | | 118,700 | Dobson Communications | |
| Materials (5.1%) | | | | | Corporation #* | 921,112 |
| 32,500 | Allegheny Technologies, Inc. * | 2,558,725 | | | 19,900 | Embarq Corporation | 962,165 |
| 68,700 | Ball Corporation | 2,857,233 | | | 326,500 | Level 3 Communications, Inc. #* | 1,727,185 |
| 73,800 | Bemis Company, Inc. | 2,481,156 | | | 54,400 | NeuStar, Inc. #* | 1,589,568 |
| 48,300 | Freeport-McMoRan | | | | 47,700 | NII Holdings, Inc. #* | 3,101,931 |
| | Copper & Gold, Inc. | 2,921,184 | | | 39,800 | Rogers Communications, Inc. | 2,380,836 |
| 86,100 | Mosaic Company #* | 1,611,792 | | | 97,600 | SBA Communications | |
| 67,500 | Praxair, Inc. | 4,066,875 | | | | Corporation # | 2,606,896 |
|
| | |
| | Total Materials | 16,496,965 | | | 121,400 | Time Warner Telecom, Inc. #* | 2,420,716 |
|
| | |
|
| | | | | | | Total Telecommunications | |
| | | | | | | Services | | 19,939,540 |
|
|
| |
| | | | | | | Total Common Stock | |
| | | | | | | (cost $262,967,378) | 302,600,216 |
|
|
| |
| | | | | | Interest | Maturity | |
| Shares | Collateral Held for Securities Loaned (25.9%) | Rate (+) | Date | Value |
|
| 83,726,366 | Thrivent Financial Securities Lending Trust | | | 5.300% | N/A | $83,726,366 |
|
|
| | | Total Collateral Held for Securities Loaned | |
| | | (cost $83,726,366) | | | | 83,726,366 |
|
|
| The accompanying Notes to Financial Statements are an integral part of this schedule. |
|
| 95 |
Mid Cap Growth Fund
Schedule of Investments as of October 31, 2006 |
| Shares or | | | | | | |
| Principal | | | | Interest | Maturity | |
| Amount | Short-Term Investments (6.3%) | | Rate (+) | Date | Value |
|
| $6,000,000 | DnB NORBank ASA | | | 5.310% | 11/1/2006 | $6,000,000 |
| 14,267,466 | Thrivent Money Market Fund | | 4.600 | N/A | 14,267,466 |
|
|
| | | Total Short-Term Investments (at amortized cost) | 20,267,466 |
|
|
| | | Total Investments (cost $366,961,210) 125.8% | $406,594,048 |
|
|
| | | Other Assets and Liabilities, Net (25.8%) | (83,291,914) |
|
|
| | | Total Net Assets 100.0% | | $323,302,134 |
|
|
| |
| | | Number of | Exercise | Expiration | | Unrealized |
| Call Options Written | Contracts | Price | Date | Value | Gain/(Loss) |
|
| Baidu.com, Inc. | 59 | $90.00 | November 2006 | ($38,350) | $1,975 |
| Crocs, Inc. | | 110 | $40.00 | November 2006 | ($29,150) | ($2,216) |
# Non-income producing security.
* All or a portion of the security is on loan as discussed in item 2(L) of the Notes to Financial Statements.
+ The interest rate shown reflects the yield, coupon rate or, for securities purchased at a discount, the discount rate at the date of purchase.
~ All or a portion of the security was earmarked as collateral to cover options.
| Gross unrealized appreciation and depreciation of investments, based on cost for federal income tax purposes, were as follows: | |
| Gross unrealized appreciation | $44,060,120 | |
| Gross unrealized depreciation | (5,676,074) | |
| |
| |
| Net unrealized appreciation (depreciation) | $38,384,046 | |
| Cost for federal income tax purposes | $368,210,002 | |
| The accompanying Notes to Financial Statements are an integral part of this schedule. |
|
| 96 |
Partner Mid Cap Value Fund
Schedule of Investments as of October 31, 2006 |
| Shares | Common Stock (95.7%) | Value | | Shares | Common Stock (95.7%) | Value |
|
| |
| Consumer Discretionary (11.6%) | | | 5,048 | Equity Residential REIT | $275,671 |
| 6,854 | Autoliv, Inc. | $389,787 | | 4,189 | Everest Re Group, Ltd. | 415,465 |
| 3,525 | Boyd Gaming Corporation | 139,132 | | 2,114 | Healthcare Realty Trust, Inc. | 85,617 |
| 6,394 | Dow Jones & Company, Inc. * | 224,365 | | 3,530 | Home Properties, Inc. | 222,990 |
| 8,014 | Harrah’s Entertainment, Inc. | 595,681 | | 19,994 | Hudson City Bancorp, Inc. * | 274,518 |
| 10,970 | J.C. Penney Company, Inc. | | | 6,396 | iStar Financial, Inc. | 296,327 |
| | (Holding Company) | 825,273 | | 15,140 | KeyCorp | 562,300 |
| 4,508 | Lamar Advertising Company #* | 260,021 | | 6,192 | Liberty Property Trust | 298,454 |
| 8,838 | Lennar Corporation * | 419,628 | | 3,909 | Lincoln National Corporation | 247,479 |
| 17,276 | Newell Rubbermaid, Inc. * | 497,203 | | 2,450 | M&T Bank Corporation * | 298,434 |
| 4,761 | Ross Stores, Inc. | 140,116 | | 2,525 | MGIC Investment Corporation * | 148,369 |
| 4,825 | Williams-Sonoma, Inc. * | 164,098 | | 5,975 | Northern Trust Corporation | 350,852 |
|
| | |
| | Total Consumer | | | 5,329 | PartnerRe, Ltd. * | 372,604 |
| | Discretionary | 3,655,304 | | 5,608 | PMI Group, Inc. * | 239,181 |
|
| | |
| | | | | 2,764 | RenaissanceRe Holdings, Ltd. * | 150,362 |
| Consumer Staples (4.7%) | | | 2,737 | Torchmark Corporation * | 168,818 |
| 6,031 | Clorox Company | 389,361 | | 4,950 | Zions Bancorporation | 397,980 |
|
|
| 2,545 | Pepsi Bottling Group, Inc. | 80,473 | | | Total Financials | 9,283,140 |
|
|
| 9,068 | Safeway, Inc. | 266,236 | | | | |
| 10,432 | Smithfield Foods, Inc. #* | 280,412 | | Health Care (6.4%) | |
| 13,513 | SUPERVALU, Inc. | 451,334 | | 8,639 | Apria Healthcare Group, Inc. #* | 201,202 |
|
| | |
| | Total Consumer Staples | 1,467,816 | | 8,306 | Charles River Laboratories | |
|
| | |
| | | | | | International, Inc. #* | 356,494 |
| Energy (9.9%) | | | 5,100 | Coventry Health Care, Inc. # | 239,445 |
| 12,611 | BJ Services Company | 380,348 | | 6,722 | Health Net, Inc. # | 279,030 |
| 9,623 | EOG Resources, Inc. | 640,218 | | 14,493 | IMS Health, Inc. * | 403,630 |
| 31,829 | Range Resources Corporation | 864,157 | | 10,020 | MedImmune, Inc. #* | 321,041 |
| 12,490 | Ultra Petroleum Corporation # | 666,591 | | 9,771 | PerkinElmer, Inc. | 208,709 |
|
|
| 22,900 | Williams Companies, Inc. | 559,447 | | | Total Health Care | 2,009,551 |
|
| | |
|
| | Total Energy | 3,110,761 | | | | |
|
| | |
| | | | | Industrials (8.5%) | |
| Financials (29.5%) | | | 3,228 | Alliant Techsystems, Inc. #* | 249,234 |
| 8,730 | Ambac Financial Group, Inc. | 728,868 | | 32,228 | Allied Waste Industries, Inc. # | 391,570 |
| 3,774 | American Capital Strategies, Ltd. * | 162,886 | | 5,609 | American Standard Companies, Inc. | 248,423 |
| 7,691 | Apartment Investment & | | | 2,435 | Carlisle Companies, Inc. | 203,785 |
| | Management Company * | 440,848 | | 4,368 | Cooper Industries, Ltd. | 390,718 |
| 3,348 | Assurant, Inc. | 176,306 | | 8,761 | Norfolk Southern Corporation | 460,566 |
| 3,327 | Bear Stearns Companies, Inc. | 503,541 | | 5,593 | Republic Services, Inc. | 229,369 |
| 3,306 | Brandywine Realty Trust * | 110,288 | | 5,537 | Rockwell Collins, Inc. | 321,589 |
| 11,123 | CIT Group, Inc. | 578,952 | | 7,051 | Swift Transportation | |
| 3,015 | City National Corporation * | 200,678 | | | Company, Inc. #* | 177,333 |
|
|
| 2,225 | Commerce Bancshares, Inc. | 110,160 | | | Total Industrials | 2,672,587 |
|
|
| 5,757 | Developers Diversified Realty | | | | | |
| | Corporation * | 350,601 | | Information Technology (8.0%) | |
| 3,418 | E*TRADE Financial Corporation # | 79,571 | | 36,766 | Activision, Inc. # | 566,932 |
| 8,250 | Eaton Vance Corporation | 256,080 | | 5,884 | Amphenol Corporation | 399,524 |
| 18,328 | Equity Office Properties Trust | 778,940 | | 6,536 | Arrow Electronics, Inc. # | 195,100 |
| The accompanying Notes to Financial Statements are an integral part of this schedule. |
|
| 97 |
Partner Mid Cap Value Fund
Schedule of Investments as of October 31, 2006 |
| Shares | Common Stock (95.7%) | Value | | Shares | Common Stock (95.7%) | Value |
|
| |
| Information Technolog — continued | | | Utilities (13.8%) | | |
| 6,842 | Avnet, Inc. # | $162,019 | | | 6,497 | AGL Resources, Inc. | $243,638 |
| 30,895 | BearingPoint, Inc. #* | 257,355 | | | 5,674 | CMS Energy Corporation #* | 84,486 |
| 8,242 | National Semiconductor | | | | 16,054 | DPL, Inc. * | | 461,071 |
| | Corporation * | 200,198 | | | 14,459 | Edison International, Inc. | 642,558 |
| 15,350 | Seagate Technology * | 346,603 | | | 10,708 | Entergy Corporation | 919,067 |
| 4,793 | Tessera Technologies, Inc. #* | 167,324 | | | 3,632 | FirstEnergy Corporation | 213,743 |
| 16,684 | Unisys Corporation # | 109,113 | | | 6,144 | Northeast Utilities | |
| 3,462 | Zebra Technologies Corporation # | 129,029 | | | | Service Company | 153,661 |
|
| | |
| | Total Information | | | | 16,034 | PG&E Corporation | 691,707 |
| | Technology | 2,533,197 | | | 18,428 | PPL Corporation | | 636,135 |
|
| | |
| | | | | | 1,470 | Sierra Pacific Resources # | 22,285 |
| Materials (2.4%) | | | | 5,941 | Wisconsin Energy Corporation | 272,930 |
|
|
| 10,805 | Commercial Metals Company | 287,521 | | | | Total Utilities | | 4,341,281 |
|
|
| 8,434 | MeadWestvaco Corporation * | 232,104 | | | | | | |
|
|
| 9,954 | Packaging Corporation of America | 228,643 | | | | Total Common Stock | |
|
| | |
| | Total Materials | 748,268 | | | | (cost $27,504,116) | 30,091,263 |
|
| | |
|
| |
| Telecommunications Services (0.9%) | | | | | | | |
| 5,571 | Embarq Corporation | 269,358 | | | | | | |
|
| | |
| | Total Telecommunications | | | | | | | |
| | Services | 269,358 | | | | | | |
|
| | |
| |
| | | | | | Interest | Maturity | |
| Shares | Collateral Held for Securities Loaned (19.3%) | Rate (+) | Date | Value |
|
| 6,082,598 | Thrivent Financial Securities Lending Trust | | | 5.300% | N/A | $6,082,598 |
|
|
| | Total Collateral Held for Securities Loaned | |
| | (cost $6,082,598) | | | | 6,082,598 |
|
|
| The accompanying Notes to Financial Statements are an integral part of this schedule. |
|
| 98 |
Partner Mid Cap Value Fund
Schedule of Investments as of October 31, 2006 |
| Shares or | | | | |
| Principal | | Interest | Maturity | |
| Amount | Short-Term Investments (6.4%) | Rate (+) | Date | Value |
|
| $400,000 | Three Pillars, Inc. | 5.270% | 11/3/2006 | $399,883 |
| 1,163,018 | Thrivent Money Market Fund | 4.600 | N/A | 1,163,018 |
| 450,000 | Thunder Bay Funding, Inc. | 5.290 | 11/7/2006 | 449,603 |
|
|
| | Total Short-Term Investments (at amortized cost) | 2,012,504 |
|
|
| | Total Investments (cost $35,599,218) 121.4% | $38,186,365 |
|
|
| | Other Assets and Liabilities, Net (21.4%) | | (6,733,660) |
|
|
| | Total Net Assets 100.0% | | | $31,452,705 |
|
|
# Non-income producing security.
* All or a portion of the security is on loan as discussed in item 2(L) of the Notes to Financial Statements.
+ The interest rate shown reflects the yield, coupon rate or, for securities purchased at a discount, the discount rate at the date of purchase.
Definitions:
REIT — Real Estate Investment Trust, is a company that buys, develops, manages and/or sells real estate assets.
| Gross unrealized appreciation and depreciation of investments, based on cost for federal tax income purposes, were as follows: | |
| Gross unrealized appreciation | $2,822,923 | |
| Gross unrealized depreciation | (297,217) | |
|
| |
| Net unrealized appreciation (depreciation) | $2,525,706 | |
| Cost for federal income tax purposes | $35,660,659 | |
| The accompanying Notes to Financial Statements are an integral part of this schedule. |
|
| 99 |
Mid Cap Stock Fund
Schedule of Investments as of October 31, 2006 |
| Shares | Common Stock (94.4%) | Value | | Shares | Common Stock (94.4%) | | Value |
|
| |
| Consumer Discretionary (15.3%) | | | Financials (16.3%) | | |
| 163,900 | Belo Corporation | $2,871,528 | | 130,700 | A.G. Edwards, Inc. | | $7,456,435 |
| 154,300 | CBS Corporation | 4,465,442 | | 44,550 | Affiliated Managers | | |
| 280,400 | Clear Channel | | | | Group, Inc. #* | | 4,461,237 |
| | Communications, Inc. | 9,771,940 | | 147,800 | American Capital | | |
| 226,400 | E.W. Scripps Company * | 11,197,744 | | | Strategies, Ltd. * | | 6,379,048 |
| 547,700 | Foot Locker, Inc. | 12,701,163 | | 126,400 | Assurant, Inc. * | | 6,656,224 |
| 304,800 | Goodyear Tire & Rubber | | | 43,300 | Bear Stearns Companies, Inc. | 6,553,455 |
| | Company #* | 4,672,584 | | 99,300 | Brown & Brown, Inc. | | 2,905,518 |
| 169,600 | Harman International | | | 232,066 | CapitalSource, Inc. * | | 6,437,511 |
| | Industries, Inc. | 17,358,560 | | 38,900 | City National Corporation | | 2,589,184 |
| 252,900 | International Game Technology | 10,750,779 | | 232,700 | Colonial BancGroup, Inc. | | 5,547,568 |
| 485,500 | Newell Rubbermaid, Inc. * | 13,972,690 | | 82,700 | Commerce Bancorp, Inc. * | | 2,887,884 |
| 341,800 | Royal Caribbean Cruises, Ltd. * | 13,842,900 | | 105,200 | Cullen/Frost Bankers, Inc. | | 5,697,632 |
| 576,300 | Service Corporation | | | 183,400 | E*TRADE Financial Corporation # | 4,269,552 |
| | International * | 5,255,856 | | 234,500 | Endurance Specialty | | |
| 244,500 | Tupperware Corporation * | 5,190,735 | | | Holdings, Ltd. | | 8,359,925 |
| 319,300 | Viacom, Inc. # | 12,427,156 | | 86,000 | Everest Re Group, Ltd. | | 8,529,480 |
| 14,400 | Washington Post Company | 10,844,640 | | 198,382 | Fidelity National Financial, Inc. | 4,423,919 |
| 262,400 | WMS Industries, Inc. #* | 9,270,592 | | 207,851 | Fidelity National Title | | |
| 169,300 | Wynn Resorts, Ltd. #* | 12,450,322 | | | Group, Inc. | | 4,574,804 |
| 210,700 | Yum! Brands, Inc. | 12,528,222 | | 106,800 | General Growth Properties, Inc. | 5,542,920 |
|
| | |
| | Total Consumer | | | 589,250 | HCC Insurance Holdings, Inc. * | 19,834,155 |
| | Discretionary | 169,572,853 | | 73,900 | Investors Financial Services | | |
|
| | |
| | | | | | Corporation * | | 2,905,748 |
| Consumer Staples (9.7%) | | | 87,900 | Leucadia National Corporation * | 2,317,923 |
| 164,100 | Alberto-Culver Company | 8,337,921 | | 137,800 | Mellon Financial Corporation | 5,346,640 |
| 147,500 | Avon Products, Inc. | 4,485,475 | | 249,400 | Nationwide Health | | |
| 272,000 | Clorox Company | 17,560,320 | | | Properties, Inc. | | 7,167,756 |
| 264,700 | Coca-Cola Enterprises, Inc. | 5,301,941 | | 387,300 | New York Community | | |
| 560,700 | Constellation Brands, Inc. # | 15,413,643 | | | Bancorp, Inc. * | | 6,332,355 |
| 502,200 | Flowers Foods, Inc. * | 13,644,774 | | 122,100 | PartnerRe, Ltd. * | | 8,537,232 |
| 334,000 | Hershey Company * | 17,671,940 | | 77,600 | Philadelphia Consolidated | | |
| 230,200 | Hormel Foods Corporation | 8,312,522 | | | Holding Corporation # | | 3,035,712 |
| 371,900 | Kroger Company | 8,364,031 | | 62,000 | PMI Group, Inc. | | 2,644,300 |
| 259,000 | Pepsi Bottling Group, Inc. | 8,189,580 | | 43,200 | Radian Group, Inc. | | 2,302,560 |
|
| | |
| | Total Consumer Staples | 107,282,147 | | 136,600 | Rayonier, Inc. REIT | | 5,599,234 |
|
| | |
| | | | | 51,800 | SEI Investments Company | | 2,915,304 |
| Energy (1.2%) | | | 379,000 | U-Store-It Trust * | | 8,322,840 |
| 50,800 | Cameron International | | | 147,750 | W.R. Berkley Corporation | | 5,446,065 |
| | Corporation # | 2,545,080 | | 109,100 | Westamerica Bancorporation * | 5,438,635 |
|
|
| 35,900 | Devon Energy Corporation | 2,399,556 | | | Total Financials | | 181,418,755 |
|
|
| 64,200 | Noble Corporation | 4,500,420 | | | | | |
| 79,700 | Range Resources Corporation | 2,163,855 | | Health Care (11.1%) | | |
| 47,100 | XTO Energy, Inc. | 2,197,686 | | 136,100 | Advanced Medical Optics, Inc. #* | 5,559,685 |
|
| | |
| | Total Energy | 13,806,597 | | 84,000 | Aetna, Inc. | | 3,462,480 |
|
| | |
| | | | | 122,600 | Affymetrix, Inc. # | | 3,126,300 |
| The accompanying Notes to Financial Statements are an integral part of this schedule. |
|
| 100 |
Mid Cap Stock Fund
Schedule of Investments as of October 31, 2006 |
| Shares | Common Stock (94.4%) | Value | | Shares | Common Stock (94.4%) | | Value |
|
| |
| Health Care — continued | | | Information Technology (15.8%) | | |
| 59,900 | Amylin Pharmaceuticals, Inc. #* | $2,633,204 | | 205,800 | ADTRAN, Inc. | | $4,762,212 |
| 211,100 | Applera Corporation (Celera | | | 277,100 | Advanced Micro Devices, Inc. # | 5,893,917 |
| | Genomics Group) # | 3,276,272 | | 410,100 | Alcatel SA ADR * | | 5,208,270 |
| 92,800 | Beckman Coulter, Inc. | 5,342,496 | | 61,400 | Alliance Data Systems | | |
| 82,700 | C.R. Bard, Inc. | 6,778,092�� | | | Corporation # | | 3,728,208 |
| 55,000 | Cephalon, Inc. #* | 3,859,900 | | 90,000 | Amphenol Corporation | | 6,111,000 |
| 121,200 | Cooper Companies, Inc. * | 6,984,756 | | 107,500 | Analog Devices, Inc. | | 3,420,650 |
| 117,900 | Cytyc Corporation # | 3,114,918 | | 177,200 | BEA Systems, Inc. # | | 2,883,044 |
| 132,894 | Dade Behring Holdings, Inc. | 4,841,328 | | 962,000 | Brocade Communications #* | 7,801,820 |
| 107,000 | Dentsply International, Inc. | 3,346,960 | | 60,400 | CACI International, Inc. # | | 3,475,416 |
| 60,600 | Edwards Lifesciences | | | 220,300 | Cadence Design Systems, Inc. #* | 3,934,558 |
| | Corporation #* | 2,601,558 | | 88,600 | CDW Corporation | | 5,818,362 |
| 114,000 | Endo Pharmaceutical | | | 134,900 | CheckFree Corporation # | | 5,325,852 |
| | Holdings, Inc. # | 3,253,560 | | 60,600 | Cognizant Technology Solutions | |
| 66,000 | Express Scripts, Inc. # | 4,205,520 | | | Corporation # | | 4,561,968 |
| 96,500 | Henry Schein, Inc. #* | 4,795,085 | | 801,100 | Compuware Corporation # | | 6,440,844 |
| 224,000 | IMS Health, Inc. | 6,238,400 | | 72,700 | Diebold, Inc. * | | 3,175,536 |
| 39,100 | Intuitive Surgical, Inc. #* | 3,877,938 | | 122,700 | eFunds Corporation #* | | 3,042,960 |
| 54,000 | Invitrogen Corporation #* | 3,132,540 | | 216,600 | Electronic Data Systems | | |
| 162,400 | LifePoint Hospitals, Inc. # | 5,765,200 | | | Corporation | | 5,486,478 |
| 99,600 | Omnicare, Inc. * | 3,772,848 | | 75,700 | FormFactor, Inc. # | | 2,890,226 |
| 150,800 | PDL BioPharma, Inc. #* | 3,186,404 | | 241,100 | Integrated Device | | |
| 165,400 | Quest Diagnostics, Inc. * | 8,226,996 | | | Technology, Inc. # | | 3,821,435 |
| 88,600 | ResMed, Inc. # | 3,897,514 | | 100,000 | International Rectifier | | |
| 60,900 | Sierra Health Services, Inc. # | 2,085,216 | | | Corporation #* | | 3,597,000 |
| 192,600 | St. Jude Medical, Inc. # | 6,615,810 | | 243,900 | Intersil Corporation | | 5,719,455 |
| 165,200 | Vertex Pharmaceuticals, Inc. # | 6,707,120 | | 349,200 | Juniper Networks, Inc. # | | 6,013,224 |
| 81,100 | WebMD Health Corporation #* | 2,956,906 | | 85,500 | MEMC Electronic Materials, Inc. # | 3,035,250 |
|
| | |
| | Total Health Care | 123,645,006 | | 93,200 | Microchip Technology, Inc. | | 3,069,076 |
|
| | |
| | | | | 108,600 | MoneyGram International, Inc. | 3,715,206 |
| Industrials (8.0%) | | | 134,400 | NAVTEQ Corporation # | | 4,462,080 |
| 911,100 | Allied Waste Industries, Inc. #* | 11,069,865 | | 249,000 | NVIDIA Corporation # | | 8,682,630 |
| 53,000 | Avery Dennison Corporation | 3,346,420 | | 112,500 | Paychex, Inc. | | 4,441,500 |
| 184,000 | ChoicePoint, Inc. # | 6,695,760 | | 111,100 | Salesforce.com, Inc. #* | | 4,335,122 |
| 243,000 | Cintas Corporation | 10,060,200 | | 763,600 | STATS ChipPAC, Ltd. #* | | 4,810,680 |
| 93,600 | Expeditors International of | | | 107,700 | Sybase, Inc. # | | 2,622,495 |
| | Washington, Inc. | 4,437,576 | | 149,800 | Synopsys, Inc. # | | 3,371,998 |
| 303,800 | Laidlaw International, Inc. | 8,813,238 | | 541,300 | Tellabs, Inc. # | | 5,705,302 |
| 404,800 | Republic Services, Inc. | 16,600,848 | | 218,400 | Varian Semiconductor | | |
| 17,368 | Roper Industries, Inc. | 831,059 | | | Equipment Associates, Inc. # | 7,969,416 |
| 10,250 | SAIC, Inc. # | 205,000 | | 250,200 | Vishay Intertechnology, Inc. #* | 3,375,198 |
| 357,900 | Southwest Airlines Company | 5,379,237 | | 240,000 | Western Digital Corporation # | 4,387,200 |
| 67,200 | Stericycle, Inc. #* | 4,751,712 | | 726,900 | Wind River Systems, Inc. #* | | 7,981,362 |
|
|
| 446,600 | Waste Management, Inc. | 16,738,568 | | | Total Information | | |
|
| | |
| | Total Industrials | 88,929,483 | | | Technology | 175,076,950 |
|
| | |
|
| The accompanying Notes to Financial Statements are an integral part of this schedule. |
|
| 101 |
Mid Cap Stock Fund
Schedule of Investments as of October 31, 2006 |
| Shares | Common Stock (94.4%) | Value | | Shares | Common Stock (94.4%) | Value |
|
| |
| Materials (12.7%) | | | Utilities (3.1%) | |
| 430,200 | Ball Corporation | $17,892,018 | | 150,900 | Aqua America, Inc. * | $3,659,325 |
| 498,200 | Bemis Company, Inc. | 16,749,484 | | 760,400 | CMS Energy Corporation # | 11,322,356 |
| 893,000 | Crown Holdings, Inc. # | 17,359,920 | | 133,200 | Northeast Utilities Service | |
| 417,600 | Lubrizol Corporation | 18,792,000 | | | Company | 3,331,332 |
| 1,388,500 | Owens-Illinois, Inc. # | 23,049,100 | | 91,100 | Pepco Holdings, Inc. | 2,315,762 |
| 621,700 | Pactiv Corporation # | 19,173,228 | | 198,900 | PPL Corporation | 6,866,028 |
| 127,800 | Rohm and Haas Company | 6,622,596 | | 23,800 | Questar Corporation * | 1,939,224 |
| 371,100 | RPM International, Inc. * | 7,106,565 | | 79,600 | SCANA Corporation | 3,180,816 |
| 183,000 | Sealed Air Corporation * | 10,892,160 | | 50,100 | Wisconsin Energy Corporation | 2,301,594 |
|
|
| 90,800 | Silgan Holdings, Inc. | 3,756,396 | | | Total Utilities | 34,916,437 |
|
| | |
|
| | Total Materials | 141,393,467 | | | | |
|
| | |
|
| | | | | | Total Common Stock | |
| Telecommunications Services (1.2%) | | | | (cost $945,302,397) | 1,049,315,305 |
|
|
| 981,900 | Cincinnati Bell, Inc. # | 4,605,111 | | | | |
| 133,300 | NII Holdings, Inc. # | 8,668,499 | | | | |
|
| | |
| | Total Telecommunications | | | | | |
| | Services | 13,273,610 | | | | |
|
| | |
| The accompanying Notes to Financial Statements are an integral part of this schedule. |
|
| 102 |
Mid Cap Stock Fund
Schedule of Investments as of October 31, 2006 |
| | | Interest | Maturity | |
| Shares | Collateral Held for Securities Loaned (18.1%) | Rate (+) | Date | Value |
|
| 200,525,518 | Thrivent Financial Securities Lending Trust | 5.300% | N/A | $200,525,518 |
|
|
| | Total Collateral Held for Securities Loaned | |
| | (cost $200,525,518) | | | 200,525,518 |
|
|
| |
| |
| Shares or | | | | |
| Principal | | Interest | Maturity | |
| Amount | Short-Term Investments (6.3%) | Rate (+) | Date | Value |
|
| $21,390,000 | Corporate Asset Finance Company, LLC | 5.310% | 11/1/2006 | $21,390,000 |
| 5,000,000 | GOVCO, Inc. | 5.250 | 12/20/2006 | 4,964,271 |
| 3,000,000 | Jupiter Securitization Company, LLC | 5.260 | 11/27/2006 | 2,988,603 |
| 5,000,000 | Kitty Hawk Funding Corporation | 5.260 | 11/1/2006 | 5,000,000 |
| 35,526,908 | Thrivent Money Market Fund | 4.600 | N/A | 35,526,908 |
|
|
| | Total Short-Term Investments (at amortized cost) | 69,869,782 |
|
|
| | Total Investments (cost $1,215,697,697) 118.8% | $1,319,710,605 |
|
|
| | Other Assets and Liabilities, Net (18.8%) | (208,471,212) |
|
|
| | Total Net Assets 100.0% | | | $1,111,239,393 |
|
|
# Non-income producing security.
* All or a portion of the security is on loan as discussed in item 2(L) of the Notes to Financial Statements.
+ The interest rate shown reflects the yield, coupon rate or, for securities purchased at a discount, the discount rate at the date of purchase.
Definitions:
ADR — American Depository Receipts, which are certificates for shares of an underlying foreign security’s shares held by an issuing U.S. depository bank.
REIT — Real Estate Investment Trust, is a company that buys, develops, manages and/or sells real estate assets.
| Gross unrealized appreciation and depreciation of investments, based on cost for federal income tax purposes, were as follows: | |
| Gross unrealized appreciation | $118,685,366 | |
| Gross unrealized depreciation | (16,998,790) | |
|
| |
| Net unrealized appreciation (depreciation) | $101,686,576 | |
| Cost for federal income tax purposes | $1,218,024,029 | |
| The accompanying Notes to Financial Statements are an integral part of this schedule. |
|
| 103 |
| Mid Cap Index Fund |
| Schedule of Investments as of October 31, 2006 |
| Shares | Common Stock (96.4%) | Value | | Shares | Common Stock (96.4%) | Value |
|
| |
| Consumer Discretionary (14.3%) | | | 2,470 | Lee Enterprises, Inc. | $70,469 |
| 2,500 | 99 Cents Only Stores #* | $29,975 | | 1,900 | M.D.C. Holdings, Inc. * | 94,734 |
| 4,770 | Abercrombie & Fitch Company ∈ | 365,620 | | 1,210 | Media General, Inc. * | 44,891 |
| 5,500 | Advance Auto Parts, Inc. | 192,610 | | 1,850 | Modine Manufacturing Company | 44,048 |
| 2,800 | Aeropostale, Inc. #* | 82,068 | | 2,860 | Mohawk Industries, Inc. #* | 207,922 |
| 7,100 | American Eagle Outfitters, Inc. ∈ | 325,180 | | 6,100 | O’Reilly Automotive, Inc. # | 196,969 |
| 3,100 | American Greetings Corporation * | 74,121 | | 4,060 | OSI Restaurant Partners, Inc. | 135,076 |
| 3,900 | AnnTaylor Stores Corporation # | 171,678 | | 3,600 | Pacific Sunwear of California, Inc. #* | 63,432 |
| 3,950 | Applebee’s International, Inc. | 90,139 | | 3,470 | Payless ShoeSource, Inc. # | 92,822 |
| 3,817 | ArvinMeritor, Inc. * | 57,331 | | 7,400 | PETsMART, Inc. | 212,972 |
| 780 | Bandag, Inc. * | 34,234 | | 4,600 | Pier 1 Imports, Inc. * | 30,084 |
| 2,660 | Barnes & Noble, Inc. | 109,885 | | 3,200 | Polo Ralph Lauren Corporation | 227,200 |
| 2,000 | Beazer Homes USA, Inc. * | 86,680 | | 5,090 | Reader’s Digest Association, Inc. * | 73,194 |
| 4,610 | Belo Corporation | 80,767 | | 2,400 | Regis Corporation * | 90,120 |
| 1,510 | Blyth, Inc. | 36,119 | | 3,700 | Rent-A-Center, Inc. # | 106,412 |
| 2,110 | Bob Evans Farms, Inc. | 71,550 | | 7,500 | Ross Stores, Inc. | 220,725 |
| 3,260 | Borders Group, Inc. * | 67,123 | | 3,200 | Ruby Tuesday, Inc. * | 88,800 |
| 3,140 | BorgWarner, Inc. * | 180,550 | | 2,300 | Ryland Group, Inc. * | 105,639 |
| 2,200 | Boyd Gaming Corporation * | 86,834 | | 7,210 | Saks, Inc. * | 139,441 |
| 4,375 | Brinker International, Inc. | 203,131 | | 1,380 | Scholastic Corporation # | 43,360 |
| 3,250 | Callaway Golf Company * | 43,648 | | 3,600 | Scientific Games Corporation # | 100,908 |
| 5,000 | Career Education Corporation # | 111,400 | | 3,000 | Sotheby’s Holdings, Inc. | 114,000 |
| 5,600 | CarMax, Inc. #* | 248,080 | | 800 | Strayer Education, Inc. | 90,496 |
| 1,900 | Catalina Marketing Corporation | 48,165 | | 2,000 | Thor Industries, Inc. * | 87,640 |
| 1,700 | CBRL Group, Inc. * | 74,647 | | 2,800 | Timberland Company # | 80,780 |
| 6,600 | Charming Shoppes, Inc. # | 97,680 | | 6,800 | Toll Brothers, Inc. #* | 196,588 |
| 4,200 | Cheesecake Factory, Inc. #* | 118,650 | | 3,200 | Tupperware Corporation * | 67,936 |
| 9,300 | Chico’s FAS, Inc. #* | 222,549 | | 6,000 | Urban Outfitters, Inc. #* | 105,000 |
| 5,060 | Claire’s Stores, Inc. | 143,451 | | 2,460 | Valassis Communications, Inc. # | 36,925 |
| 3,100 | Coldwater Creek, Inc. #* | 94,519 | | 300 | Washington Post Company | 225,930 |
| 4,500 | Corinthian Colleges, Inc. #* | 55,125 | | 3,750 | Westwood One, Inc. | 29,662 |
| 3,090 | DeVry, Inc. #* | 75,242 | | 6,060 | Williams-Sonoma, Inc. * | 206,101 |
|
|
| 5,470 | Dollar Tree Stores, Inc. # | 170,062 | | | Total Consumer | |
| 1,500 | Entercom Communications | | | | Discretionary | 8,820,220 |
|
|
| | Corporation * | 41,505 | | | | |
| 8,200 | Foot Locker, Inc. | 190,158 | | Consumer Staples (2.1%) | |
| 2,520 | Furniture Brands International, Inc. * | 46,872 | | 3,420 | BJ’s Wholesale Club, Inc. # | 97,983 |
| 4,100 | GameStop Corporation #* | 209,346 | | 3,380 | Church & Dwight Company, Inc. | 137,127 |
| 7,800 | Gentex Corporation * | 124,098 | | 3,050 | Energizer Holdings, Inc. # | 238,358 |
| 5,000 | Hanesbrands, Inc. # | 118,000 | | 3,300 | Hansen Natural Corporation # | 104,775 |
| 2,820 | Harte-Hanks, Inc. | 71,205 | | 3,800 | Hormel Foods Corporation | 137,218 |
| 2,000 | Hovnanian Enterprises, Inc. #* | 61,700 | | 2,988 | J.M. Smucker Company | 146,412 |
| 1,950 | International Speedway | | | 1,430 | Lancaster Colony Corporation | 57,986 |
| | Corporation | 101,224 | | 3,260 | PepsiAmericas, Inc. | 66,667 |
| 1,800 | ITT Educational Services, Inc. # | 124,110 | | 1,990 | Ruddick Corporation | 56,118 |
| 2,700 | Laureate Education, Inc. #* | 142,344 | | 5,200 | Smithfield Foods, Inc. # | 139,776 |
| 3,660 | Lear Corporation * | 110,569 | | | | |
| The accompanying Notes to Financial Statements are an integral part of this schedule. |
|
| 104 |
Mid Cap Index Fund
Schedule of Investments as of October 31, 2006 |
| Shares | Common Stock (96.4%) | Value | | Shares | Common Stock (96.4%) | Value |
|
| |
| Consumer Staples — continued | | | 5,800 | Developers Diversified Realty | |
| 1,610 | Tootsie Roll Industries, Inc. * | $51,166 | | | Corporation | $353,220 |
| 1,440 | Universal Corporation * | 53,021 | | 6,700 | Eaton Vance Corporation | 207,968 |
|
| | |
| | Total Consumer Staples | 1,286,607 | | 3,490 | Everest Re Group, Ltd. | 346,138 |
|
| | |
| | | | | 9,327 | Fidelity National Financial, Inc. | 207,992 |
| Energy (8.0%) | | | 11,472 | Fidelity National Title Group, Inc. | 252,503 |
| 7,600 | Arch Coal, Inc. * | 263,188 | | 5,200 | First American Corporation | 212,316 |
| 5,900 | Cameron International | | | 5,900 | First Niagara Financial Group, Inc. | 84,488 |
| | Corporation # | 295,590 | | 4,350 | FirstMerit Corporation * | 101,007 |
| 6,300 | Denbury Resources, Inc. # | 181,062 | | 2,800 | Greater Bay Bancorp | 72,100 |
| 8,170 | ENSCO International, Inc. | 400,085 | | 2,760 | Hanover Insurance Group, Inc. | 125,166 |
| 3,600 | FMC Technologies, Inc. # | 217,620 | | 5,900 | HCC Insurance Holdings, Inc. | 198,594 |
| 2,900 | Forest Oil Corporation #* | 94,656 | | 3,000 | Highwoods Properties, Inc. | 114,600 |
| 6,920 | Grant Prideco, Inc. # | 261,368 | | 2,450 | Horace Mann Educators Corporation | 49,343 |
| 5,490 | Hanover Compressor Company #* | 101,675 | | 4,000 | Hospitality Properties Trust | 193,840 |
| 5,540 | Helmerich & Payne, Inc. | 132,683 | | 3,700 | IndyMac Bancorp, Inc. * | 168,165 |
| 6,900 | Newfield Exploration Company # | 281,451 | | 3,500 | Investors Financial Services | |
| 9,340 | Noble Energy, Inc. | 454,204 | | | Corporation * | 137,620 |
| 1,490 | Overseas Shipholding Group, Inc. | 93,200 | | 5,400 | Jefferies Group, Inc. | 155,142 |
| 8,800 | Patterson-UTI Energy, Inc. | 204,160 | | 8,600 | Leucadia National Corporation * | 226,782 |
| 14,000 | Peabody Energy Corporation * | 587,575 | | 4,800 | Liberty Property Trust | 231,360 |
| 6,550 | Pioneer Natural Resources | | | 3,578 | Longview Fibre Company | 75,353 |
| | Company * | 266,782 | | 3,900 | Macerich Company | 313,365 |
| 4,000 | Plains Exploration & Production | | | 3,400 | Mack-Cali Realty Corporation | 179,860 |
| | Company # | 169,160 | | 6,670 | Mercantile Bankshares Corporation | 300,684 |
| 3,000 | Pogo Producing Company * | 134,250 | | 1,900 | Mercury General Corporation | 98,363 |
| 8,600 | Pride International, Inc. # | 237,446 | | 5,600 | New Plan Excel Realty Trust, Inc. * | 161,280 |
| 2,900 | Quicksilver Resources, Inc. #* | 99,412 | | 13,810 | New York Community | |
| 8,900 | Southwestern Energy Company #* | 316,662 | | | Bancorp, Inc. * | 225,794 |
| 3,010 | Tidewater, Inc. | 149,687 | | 3,210 | Ohio Casualty Corporation | 88,050 |
|
| | |
| | Total Energy | 4,941,916 | | 12,206 | Old Republic International | |
|
| | |
| | | | | | Corporation | 275,001 |
| Financials (17.8%) | | | 4,640 | PMI Group, Inc. | 197,896 |
| 4,160 | A.G. Edwards, Inc. | 237,328 | | 2,055 | Potlatch Corporation * | 83,433 |
| 4,700 | AMB Property Corporation ∈ | 274,527 | | 3,650 | Protective Life Corporation | 161,512 |
| 2,500 | American Financial Group, Inc. | 119,650 | | 4,400 | Radian Group, Inc. * | 234,520 |
| 6,700 | AmeriCredit Corporation #* | 171,319 | | 4,725 | Raymond James Financial, Inc. | 150,538 |
| 2,200 | AmerUs Group Company | 150,656 | | 4,028 | Rayonier, Inc. REIT | 165,108 |
| 5,100 | Arthur J. Gallagher & Company * | 142,035 | | 3,600 | Regency Centers Corporation | 259,776 |
| 6,978 | Associated Banc-Corp | 229,158 | | 3,400 | SEI Investments Company | 191,352 |
| 4,620 | Astoria Financial Corporation | 134,026 | | 2,800 | StanCorp Financial Group, Inc. | 127,932 |
| 2,870 | Bank of Hawaii Corporation | 149,728 | | 2,000 | SVB Financial Group #* | 92,040 |
| 6,000 | Brown & Brown, Inc. | 175,560 | | 6,080 | TCF Financial Corporation * | 158,262 |
| 2,800 | Cathay General Bancorp * | 96,460 | | 2,550 | Texas Regional Bancshares, Inc. | 99,068 |
| 2,200 | City National Corporation * | 146,432 | | 7,200 | United Dominion Realty | |
| 8,200 | Colonial BancGroup, Inc. | 195,488 | | | Trust, Inc. * | 233,064 |
| 3,000 | Cullen/Frost Bankers, Inc. | 162,480 | | 2,190 | Unitrin, Inc. | 94,017 |
| The accompanying Notes to Financial Statements are an integral part of this schedule. |
|
| 105 |
Mid Cap Index Fund
Schedule of Investments as of October 31, 2006 |
| Shares | Common Stock (96.4%) | | Value | | Shares | Common Stock (96.4%) | Value |
|
| |
| Financials — continued | | | | 4,600 | Triad Hospitals, Inc. # | $170,338 |
| 8,950 | W.R. Berkley Corporation | | $329,897 | | 3,100 | Universal Health Services, Inc. | 164,145 |
| 4,500 | Waddell & Reed Financial, Inc. | 114,750 | | 4,870 | Valeant Pharmaceuticals | |
| 4,696 | Washington Federal, Inc. | | 109,135 | | | International * | 90,972 |
| 3,150 | Webster Financial Corporation | 152,208 | | 6,900 | Varian Medical Systems, Inc. # | 378,534 |
| 4,200 | Weingarten Realty Investors * | | 195,300 | | 1,600 | Varian, Inc. # | 75,024 |
| 1,710 | Westamerica Bancorporation * | 85,244 | | 4,400 | VCA Antech, Inc. # | 142,428 |
| 3,740 | Wilmington Trust Corporation | 155,509 | | 6,400 | Vertex Pharmaceuticals, Inc. # | 259,840 |
|
| | |
|
| | Total Financials | 10,931,502 | | | Total Health Care | 6,260,125 |
|
| | |
|
| |
| Health Care (10.2%) | | | | Industrials (15.1%) | |
| 3,256 | Advanced Medical Optics, Inc. #* | 133,008 | | 4,830 | Adesa, Inc. ∈ | 121,426 |
| 3,700 | Affymetrix, Inc. #* | | 94,350 | | 4,810 | AGCO Corporation #∈ | 128,668 |
| 2,340 | Apria Healthcare Group, Inc. #* | 54,499 | | 4,900 | AirTran Holdings, Inc. #* | 48,853 |
| 3,300 | Beckman Coulter, Inc.∈ | | 189,981 | | 2,120 | Alaska Air Group, Inc. # | 85,118 |
| 3,300 | Cephalon, Inc. #* | | 231,594 | | 2,350 | Alexander & Baldwin, Inc. * | 108,170 |
| 3,600 | Charles River Laboratories | | | | 1,800 | Alliant Techsystems, Inc. #* | 138,978 |
| | International, Inc. #* | | 154,512 | | 3,840 | AMETEK, Inc. | 179,251 |
| 5,000 | Community Health Systems, Inc. # | 162,250 | | 5,300 | Avis Budget Group, Inc. | 104,887 |
| 3,490 | Covance, Inc. # | | 204,165 | | 1,310 | Banta Corporation | 58,007 |
| 5,900 | Cytyc Corporation # | | 155,878 | | 2,440 | Brink’s Company * | 128,076 |
| 8,120 | Dentsply International, Inc. | | 253,994 | | 9,140 | C.H. Robinson Worldwide, Inc. | 381,504 |
| 3,090 | Edwards Lifesciences Corporation # | 132,654 | | 1,560 | Carlisle Companies, Inc. | 130,556 |
| 2,700 | Gen-Probe, Inc. # | | 129,249 | | 4,433 | ChoicePoint, Inc. # | 161,317 |
| 6,140 | Health Net, Inc. # | | 254,871 | | 2,610 | Con-way, Inc. | 123,114 |
| 4,600 | Henry Schein, Inc. # | | 228,574 | | 3,700 | Copart, Inc. # | 107,041 |
| 3,330 | Hillenbrand Industries, Inc. | | 195,404 | | 2,100 | Corporate Executive Board | |
| 2,000 | Intuitive Surgical, Inc. #* | | 198,360 | | | Company | 188,622 |
| 2,900 | Invitrogen Corporation # | | 168,229 | | 2,800 | Crane Company | 109,032 |
| 3,100 | LifePoint Hospitals, Inc. # | | 110,050 | | 2,700 | Deluxe Corporation * | 61,209 |
| 4,900 | Lincare Holdings, Inc. # | | 164,444 | | 3,880 | Donaldson Company, Inc. * | 145,694 |
| 1,800 | Martek Biosciences Corporation #* | 42,696 | | 2,100 | DRS Technologies, Inc. * | 92,862 |
| 3,000 | Medicis Pharmaceutical | | | | 3,400 | Dun & Bradstreet Corporation # | 262,616 |
| | Corporation * | | 105,120 | | 11,300 | Expeditors International of | |
| 16,738 | Millennium Pharmaceuticals, Inc. # | 195,835 | | | Washington, Inc. | 535,733 |
| 6,380 | Omnicare, Inc. * | | 241,674 | | 6,580 | Fastenal Company * | 264,779 |
| 1,800 | Par Pharmaceutical Companies, | | | 2,580 | Federal Signal Corporation | 39,371 |
| | Inc. #* | | 35,082 | | 3,020 | Flowserve Corporation # | 160,060 |
| 6,100 | PDL BioPharma, Inc. #* | | 128,893 | | 2,800 | GATX Corporation * | 121,996 |
| 4,120 | Perrigo Company | | 73,707 | | 3,650 | Graco, Inc. | 148,774 |
| 5,400 | Pharmaceutical Product | | | | 1,845 | Granite Construction, Inc. | 96,124 |
| | Development, Inc. | | 170,910 | | 2,240 | Harsco Corporation | 182,851 |
| 2,800 | Psychiatric Solutions, Inc. # | | 92,960 | | 3,470 | Herman Miller, Inc. | 118,952 |
| 4,100 | ResMed, Inc. #* | | 180,359 | | 2,610 | HNI Corporation * | 117,372 |
| 5,720 | Sepracor, Inc. #* | | 296,067 | | 3,230 | Hubbell, Inc. * | 159,950 |
| 3,370 | STERIS Corporation | | 82,127 | | 3,040 | Jacobs Engineering Group, Inc. # | 229,642 |
| 2,100 | Techne Corporation # | | 117,348 | | 5,600 | JB Hunt Transport Services, Inc. * | 121,184 |
| The accompanying Notes to Financial Statements are an integral part of this schedule. |
|
| 106 |
Mid Cap Index Fund
Schedule of Investments as of October 31, 2006 |
| Shares | Common Stock (96.4%) | Value | Shares | Common Stock (96.4%) | Value |
|
| |
| Industrials — continued | | 2,660 | Avocent Corporation # | $97,649 |
| 9,400 | JetBlue Airways Corporation #* | $118,064 | 6,400 | BISYS Group, Inc. # | 70,656 |
| 6,250 | Joy Global, Inc. | 244,438 | 14,880 | Cadence Design Systems, Inc. # | 265,757 |
| 1,200 | Kelly Services, Inc. | 34,536 | 3,240 | CDW Corporation | 212,771 |
| 2,060 | Kennametal, Inc. | 127,123 | 7,400 | Ceridian Corporation # | 174,418 |
| 2,400 | Korn/Ferry International # | 53,064 | 4,690 | CheckFree Corporation # | 185,161 |
| 2,200 | Lincoln Electric Holdings, Inc. | 135,278 | 7,500 | Cognizant Technology Solutions | |
| 4,540 | Manpower, Inc. | 307,676 | | Corporation #∈- | 564,600 |
| 1,700 | Mine Safety Appliances Company * | 64,294 | 3,230 | CommScope, Inc. #* | 103,069 |
| 2,900 | MSC Industrial Direct | | 4,200 | Cree, Inc. #* | 92,358 |
| | Company, Inc. | 118,668 | 2,540 | CSG Systems International, Inc. # | 68,529 |
| 2,900 | Navigant Consulting, Inc. #* | 51,649 | 7,510 | Cypress Semiconductor | |
| 1,880 | Nordson Corporation | 86,574 | | Corporation #* | 126,093 |
| 4,000 | Oshkosh Truck Corporation | 180,840 | 3,500 | Diebold, Inc. | 152,880 |
| 5,320 | Pentair, Inc. | 175,241 | 3,060 | DST Systems, Inc. #* | 189,077 |
| 7,140 | Precision Castparts Corporation | 485,948 | 2,200 | Dycom Industries, Inc. #* | 51,282 |
| 6,290 | Quanta Services, Inc. #* | 115,107 | 2,100 | F5 Networks, Inc. # | 138,999 |
| 6,200 | Republic Services, Inc. | 254,262 | 3,350 | Fair Isaac Corporation * | 122,710 |
| 1,662 | Rollins, Inc. | 35,966 | 6,500 | Fairchild Semiconductor | |
| 4,700 | Roper Industries, Inc. | 224,895 | | International, Inc. # | 104,715 |
| 490 | Sequa Corporation #* | 51,994 | 3,500 | Fidelity National Information | |
| 3,040 | SPX Corporation | 174,861 | | Services, Inc. * | 145,495 |
| 2,400 | Stericycle, Inc. #* | 169,704 | 3,100 | Gartner Group, Inc. #* | 57,660 |
| 2,830 | Swift Transportation | | 7,080 | Harris Corporation | 301,608 |
| | Company, Inc. #* | 71,174 | 1,800 | Imation Corporation | 82,386 |
| 2,120 | Teleflex, Inc. | 131,864 | 7,300 | Ingram Micro, Inc. # | 150,453 |
| 2,700 | Thomas & Betts Corporation # | 139,131 | 10,590 | Integrated Device Technology, Inc. # | 167,852 |
| 5,000 | Timken Company | 150,250 | 3,900 | International Rectifier | |
| 4,195 | Trinity Industries, Inc. * | 151,272 | | Corporation # | 140,283 |
| 3,500 | United Rentals, Inc. #* | 82,915 | 7,400 | Intersil Corporation | 173,530 |
| 2,800 | Werner Enterprises, Inc. * | 51,380 | 4,200 | Jack Henry & Associates, Inc. * | 91,518 |
| 3,100 | YRC Worldwide, Inc. #* | 120,094 | 4,600 | KEMET Corporation #* | 33,810 |
|
| |
| | Total Industrials | 9,270,051 | 7,500 | Lam Research Corporation # | 370,875 |
|
| |
| | | | 6,000 | Lattice Semiconductor | |
| Information Technology (15.2%) | | | Corporation # | 37,260 |
| 20,900 | 3Com Corporation # | 101,574 | 2,900 | Macrovision Corporation #* | 77,169 |
| 13,200 | Activision, Inc. #* | 203,544 | 8,480 | McAfee, Inc. #* | 245,326 |
| 3,530 | Acxiom Corporation | 87,368 | 8,400 | McDATA Corporation #* | 47,628 |
| 3,360 | ADTRAN, Inc. | 77,750 | 8,800 | MEMC Electronic Materials, Inc. # | 312,400 |
| 1,100 | Advent Software, Inc. #* | 40,722 | 4,240 | Mentor Graphics Corporation #* | 71,529 |
| 3,500 | Alliance Data Systems | | 3,110 | Micrel, Inc. #* | 34,708 |
| | Corporation #* | 212,520 | 11,435 | Microchip Technology, Inc. | 376,555 |
| 4,800 | Amphenol Corporation ∈ | 325,920 | 4,500 | MoneyGram International, Inc. | 153,945 |
| 8,500 | Andrew Corporation # | 78,710 | 5,420 | MPS Group, Inc. # | 82,655 |
| 6,420 | Arrow Electronics, Inc. #∈ | 191,637 | 3,050 | National Instruments Corporation | 95,099 |
| 22,760 | Atmel Corporation # | 130,870 | 2,100 | Newport Corporation # | 45,402 |
| 6,840 | Avnet, Inc. # | 161,971 | 5,500 | Palm, Inc. #* | 84,425 |
| The accompanying Notes to Financial Statements are an integral part of this schedule. |
|
| 107 |
Mid Cap Index Fund
Schedule of Investments as of October 31, 2006 |
| Shares | Common Stock (96.4%) | | Value | | Shares | Common Stock (96.4%) | | Value |
|
| |
| Information Technology — continued | | | | 5,320 | Valspar Corporation | | $142,523 |
| 2,500 | Plantronics, Inc. * | | $52,775 | | 3,800 | Worthington Industries, Inc. * | 65,664 |
|
|
| 2,400 | Plexus Corporation # | | 52,608 | | | Total Materials | | 3,082,086 |
|
|
| 4,600 | Polycom, Inc. # | | 126,040 | | | | | |
| 6,920 | Powerwave Technologies, Inc. #* | 45,049 | | Telecommunications Services (0.5%) | | |
| 10,200 | RF Micro Devices, Inc. #* | | 74,460 | | 13,110 | Cincinnati Bell, Inc. # | | 61,486 |
| 3,960 | Semtech Corporation # | | 51,599 | | 5,510 | Telephone and Data Systems, Inc. | 269,164 |
|
|
| 2,900 | Silicon Laboratories, Inc. # | | 94,627 | | | Total Telecommunications | |
| 2,200 | SRA International, Inc. #* | | 70,510 | | | Services | | 330,650 |
|
|
| 4,860 | Sybase, Inc. # | | 118,341 | | | | | |
| 7,580 | Synopsys, Inc. # | | 170,626 | | Utilities (8.2%) | | |
| 2,840 | Tech Data Corporation # | | 111,754 | | 4,160 | AGL Resources, Inc. | | 156,000 |
| 2,080 | Transaction Systems Architects, Inc. # | 70,117 | | 6,370 | Alliant Energy Corporation | | 244,290 |
| 7,479 | TriQuint Semiconductor, Inc. #* | 33,656 | | 6,966 | Aqua America, Inc. * | | 168,926 |
| 5,600 | UTStarcom, Inc. #* | | 60,312 | | 19,890 | Aquila, Inc. # | | 91,295 |
| 9,870 | Vishay Intertechnology, Inc. # | | 133,146 | | 1,780 | Black Hills Corporation * | | 61,428 |
| 11,700 | Western Digital Corporation # | | 213,876 | | 6,020 | DPL, Inc. * | | 172,894 |
| 4,100 | Wind River Systems, Inc. # | | 45,018 | | 4,270 | Duquesne Light Holdings, Inc. * | 84,674 |
| 3,700 | Zebra Technologies Corporation #* | 137,899 | | 7,950 | Energy East Corporation * | | 193,264 |
|
| | |
| | Total Information | | | | 6,400 | Equitable Resources, Inc. | | 259,328 |
| | Technology | | 9,375,294 | | 4,330 | Great Plains Energy, Inc. * | | 140,898 |
|
| |
| | | | | | 4,340 | Hawaiian Electric Industries, Inc. * | 121,607 |
| Materials (5.0%) | | | | 2,320 | IDACORP, Inc. * | | 91,478 |
| 4,190 | Airgas, Inc. | | 158,424 | | 9,525 | MDU Resources Group, Inc. | | 244,602 |
| 2,090 | Albemarle Corporation | | 135,913 | | 4,460 | National Fuel Gas Company * | 166,804 |
| 3,040 | Bowater, Inc. * | | 63,566 | | 8,160 | Northeast Utilities Service Company | 204,082 |
| 3,470 | Cabot Corporation * | | 137,238 | | 5,640 | NSTAR | | 196,216 |
| 12,770 | Chemtura Corporation | | 109,567 | | 4,760 | OGE Energy Corporation * | | 183,641 |
| 6,300 | Commercial Metals Company | | 167,643 | | 5,800 | ONEOK, Inc. | | 241,454 |
| 2,150 | Cytec Industries, Inc. | | 119,088 | | 10,055 | Pepco Holdings, Inc. | | 255,598 |
| 2,290 | Ferro Corporation | | 45,159 | | 3,660 | PNM Resources, Inc. | | 103,066 |
| 2,700 | Florida Rock Industries, Inc. * | | 115,830 | | 6,220 | Puget Energy, Inc. | | 148,534 |
| 2,000 | FMC Corporation | | 137,100 | | 4,480 | Questar Corporation * | | 365,030 |
| 2,460 | Glatfelter Company * | | 36,014 | | 6,090 | SCANA Corporation | | 243,356 |
| 3,560 | Lubrizol Corporation | | 160,200 | | 11,670 | Sierra Pacific Resources # | | 176,917 |
| 11,200 | Lyondell Chemical Company * | | 287,504 | | 4,120 | Vectren Corporation | | 119,727 |
| 2,500 | Martin Marietta Materials, Inc. * | 220,000 | | 4,600 | Westar Energy, Inc. | | 116,472 |
| 1,070 | Minerals Technologies, Inc. * | | 59,021 | | 2,690 | WGL Holdings, Inc. * | | 87,290 |
| 3,780 | Olin Corporation | | 65,394 | | 6,220 | Wisconsin Energy Corporation | 285,747 |
| 4,400 | Packaging Corporation of America | 101,068 | | 2,300 | WPS Resources Corporation * | | 122,383 |
|
|
| 3,400 | Reliance Steel & Aluminum | | | | | Total Utilities | | 5,047,001 |
|
|
| | Company | | 116,790 | | | | | |
|
|
| 6,290 | RPM International, Inc. * | | 120,454 | | | Total Common Stock | | |
| 2,500 | Scotts Company * | | 123,650 | | | (cost $44,008,368) | | 59,345,452 |
|
|
| 2,520 | Sensient Technologies Corporation | 58,086 | | | | | |
| 5,240 | Sonoco Products Company | | 185,915 | | | | | |
| 2,500 | Steel Dynamics, Inc. | | 150,275 | | | | | |
| The accompanying Notes to Financial Statements are an integral part of this schedule. |
|
| 108 |
Mid Cap Index Fund
Schedule of Investments as of October 31, 2006 |
| | | | | Interest | Maturity | |
| Shares | Collateral Held for Securities Loaned (25.6%) | Rate (+) | Date | Value |
|
| 15,778,621 | Thrivent Financial Securities Lending Trust | 5.300% | N/A | $15,778,621 |
| |
|
| | | Total Collateral Held for Securities Loaned | |
| | | (cost $15,778,621) | | | 15,778,621 |
|
|
| |
| |
| Shares or | | | | | | |
| Principal | | | | Interest | Maturity | |
| Amount | Short-Term Investments (3.4%) | | Rate (+) | Date | Value |
|
| $125,000 | Federal National Mortgage Association ∈ | 5.200% | 2/7/2007 | $123,271 |
| 1,961,194 | Thrivent Money Market Fund | | 4.600 | N/A | 1,961,194 |
|
|
| | | Total Short-Term Investments (cost $2,084,441) | 2,084,465 |
|
|
| | | Total Investments (cost $61,871,430) 125.4% | $77,208,538 |
|
|
| | | Other Assets and Liabilities, Net (25.4%) | (15,646,815) |
|
|
| | | Total Net Assets 100.0% | | | $61,561,723 |
|
|
| |
| | | Number of | | Notional | | |
| | | Contracts | Expiration | Principal | | Unrealized |
| Futures | | Long/(Short) | Date | Amount | Value | Gain/(Loss) |
|
| S&P 400 Index Mini-Futures | 26 | December 2006 | $2,044,683 | $2,050,620 | $5,937 |
# Non-income producing security.
* All or a portion of the security is on loan as discussed in item 2(L) of the Notes to Financial Statements.
+ The interest rate shown reflects the yield, coupon rate or, for securities purchased at a discount, the discount rate at the date of purchase.
∈ At October 31, 2006, $123,271 of investments were held on deposit with the counterparty and pledged as the initial margin deposit for open financial futures contracts. In addition, $2,487,559 of investments were earmarked as collateral to cover open financial futures contracts.
Definitions:
REIT — Real Estate Investment Trust, is a company that buys, develops, manages and/or sells real estate assets.
| Gross unrealized appreciation and depreciation of investments, based on cost for federal income tax purposes, were as follows: | |
| Gross unrealized appreciation | $17,147,526 | |
| Gross unrealized depreciation | (2,391,189) | |
|
| |
| Net unrealized appreciation (depreciation) | $14,756,337 | |
| Cost for federal income tax purposes | $62,452,201 | |
| The accompanying Notes to Financial Statements are an integral part of this schedule. |
|
| 109 |
Mid Cap Index Fund-I
Schedule of Investments as of October 31, 2006 |
| Shares | Common Stock (97.4%) | Value | | Shares | Common Stock (97.4%) | Value |
|
| |
| Consumer Discretionary (14.5%) | | | 1,275 | Lear Corporation * | $38,518 |
| 866 | 99 Cents Only Stores #* | $10,383 | | 960 | Lee Enterprises, Inc. * | 27,389 |
| 1,775 | Abercrombie & Fitch Company | 136,054 | | 600 | M.D.C. Holdings, Inc. * | 29,916 |
| 2,150 | Advance Auto Parts, Inc. | 75,293 | | 435 | Media General, Inc. * | 16,138 |
| 1,100 | Aeropostale, Inc. # | 32,241 | | 640 | Modine Manufacturing Company | 15,238 |
| 2,614 | American Eagle Outfitters, Inc. ∈ | 119,721 | | 1,020 | Mohawk Industries, Inc. #* | 74,154 |
| 1,100 | American Greetings Corporation * | 26,301 | | 2,300 | O’Reilly Automotive, Inc. # | 74,267 |
| 1,500 | AnnTaylor Stores Corporation # | 66,030 | | 1,445 | OSI Restaurant Partners, Inc. * | 48,075 |
| 1,500 | Applebee’s International, Inc. | 34,230 | | 1,300 | Pacific Sunwear of | |
| 1,486 | ArvinMeritor, Inc. * | 22,320 | | | California, Inc. #* | 22,906 |
| 280 | Bandag, Inc. * | 12,289 | | 1,325 | Payless ShoeSource, Inc. # | 35,444 |
| 995 | Barnes & Noble, Inc. * | 41,103 | | 2,800 | PETsMART, Inc. | 80,584 |
| 800 | Beazer Homes USA, Inc. * | 34,672 | | 1,700 | Pier 1 Imports, Inc. * | 11,118 |
| 1,715 | Belo Corporation | 30,047 | | 1,300 | Polo Ralph Lauren Corporation | 92,300 |
| 415 | Blyth, Inc. | 9,927 | | 1,815 | Reader’s Digest | |
| 720 | Bob Evans Farms, Inc. | 24,415 | | | Association, Inc. * | 26,100 |
| 1,265 | Borders Group, Inc. * | 26,046 | | 900 | Regis Corporation * | 33,795 |
| 1,140 | BorgWarner, Inc. | 65,550 | | 1,400 | Rent-A-Center, Inc. # | 40,264 |
| 900 | Boyd Gaming Corporation * | 35,523 | | 2,620 | Ross Stores, Inc. | 77,107 |
| 1,690 | Brinker International, Inc. | 78,467 | | 1,200 | Ruby Tuesday, Inc. * | 33,300 |
| 1,250 | Callaway Golf Company * | 16,788 | | 900 | Ryland Group, Inc. * | 41,337 |
| 1,800 | Career Education Corporation #* | 40,104 | | 2,735 | Saks, Inc. * | 52,895 |
| 2,100 | CarMax, Inc. #* | 93,030 | | 510 | Scholastic Corporation # | 16,024 |
| 700 | Catalina Marketing Corporation * | 17,745 | | 1,300 | Scientific Games Corporation # | 36,439 |
| 680 | CBRL Group, Inc. * | 29,859 | | 1,005 | Sotheby’s Holdings, Inc. | 38,190 |
| 2,300 | Charming Shoppes, Inc. # | 34,040 | | 300 | Strayer Education, Inc. | 33,936 |
| 1,550 | Cheesecake Factory, Inc. #* | 43,788 | | 700 | Thor Industries, Inc. * | 30,674 |
| 3,400 | Chico’s FAS, Inc. #* | 81,362 | | 1,100 | Timberland Company # | 31,735 |
| 1,780 | Claire’s Stores, Inc. | 50,463 | | 2,400 | Toll Brothers, Inc. #* | 69,384 |
| 1,200 | Coldwater Creek, Inc. #* | 36,588 | | 1,100 | Tupperware Corporation * | 23,353 |
| 1,700 | Corinthian Colleges, Inc. #* | 20,825 | | 2,200 | Urban Outfitters, Inc. #* | 38,500 |
| 1,195 | DeVry, Inc. #* | 29,098 | | 975 | Valassis Communications, Inc. # | 14,635 |
| 1,902 | Dollar Tree Stores, Inc. # | 59,133 | | 120 | Washington Post Company | 90,372 |
| 600 | Entercom Communications | | | 1,460 | Westwood One, Inc. | 11,549 |
| | Corporation * | 16,602 | | 2,170 | Williams-Sonoma, Inc. * | 73,802 |
|
|
| 3,100 | Foot Locker, Inc. | 71,889 | | | Total Consumer | |
| 1,000 | Furniture Brands | | | | Discretionary | 3,275,439 |
|
|
| | International, Inc. * | 18,600 | | | | |
| 1,500 | GameStop Corporation #* | 76,590 | | Consumer Staples (2.2%) | |
| 2,900 | Gentex Corporation * | 46,139 | | 1,330 | BJ’s Wholesale Club, Inc. #* | 38,104 |
| 1,900 | Hanesbrands, Inc. #* | 44,840 | | 1,265 | Church & Dwight Company, Inc. | 51,321 |
| 1,035 | Harte-Hanks, Inc. | 26,134 | | 1,200 | Energizer Holdings, Inc. # | 93,780 |
| 700 | Hovnanian Enterprises, Inc. #* | 21,595 | | 1,200 | Hansen Natural Corporation # | 38,100 |
| 755 | International Speedway | | | 1,525 | Hormel Foods Corporation | 55,068 |
| | Corporation | 39,192 | | 1,195 | J.M. Smucker Company | 58,555 |
| 700 | ITT Educational Services, Inc. # | 48,265 | | 445 | Lancaster Colony Corporation | 18,045 |
| 1,000 | Laureate Education, Inc. #* | 52,720 | | 1,110 | PepsiAmericas, Inc. | 22,700 |
| The accompanying Notes to Financial Statements are an integral part of this schedule. |
|
| 110 |
Mid Cap Index Fund-I
Schedule of Investments as of October 31, 2006 |
| Shares | Common Stock (97.4%) | Value | | Shares | Common Stock (97.4%) | Value |
|
| |
| Consumer Staples — continued | | | 3,100 | Colonial BancGroup, Inc. | $73,904 |
| 780 | Ruddick Corporation | $21,996 | | 1,000 | Cullen/Frost Bankers, Inc. | 54,160 |
| 2,000 | Smithfield Foods, Inc. #* | 53,760 | | 2,200 | Developers Diversified | |
| 684 | Tootsie Roll Industries, Inc. * | 21,738 | | | Realty Corporation * | 133,980 |
| 550 | Universal Corporation * | 20,251 | | 2,400 | Eaton Vance Corporation | 74,496 |
|
| | |
| | Total Consumer Staples | 493,418 | | 1,305 | Everest Re Group, Ltd. | 129,430 |
|
| | |
| | | | | 3,518 | Fidelity National Financial, Inc. | 78,451 |
| Energy (8.4%) | | | 4,286 | Fidelity National Title Group, Inc. | 94,333 |
| 3,000 | Arch Coal, Inc. * | 103,890 | | 1,900 | First American Corporation | 77,577 |
| 2,300 | Cameron International | | | 2,200 | First Niagara Financial Group, Inc. * | 31,504 |
| | Corporation #* | 115,230 | | 1,670 | FirstMerit Corporation | 38,777 |
| 2,400 | Denbury Resources, Inc. # | 68,976 | | 1,000 | Greater Bay Bancorp * | 25,750 |
| 3,080 | ENSCO International, Inc. * | 150,828 | | 1,065 | Hanover Insurance Group, Inc. | 48,298 |
| 1,300 | FMC Technologies, Inc. # | 78,585 | | 2,150 | HCC Insurance Holdings, Inc. | 72,369 |
| 1,100 | Forest Oil Corporation #* | 35,904 | | 1,200 | Highwoods Properties, Inc. | 45,840 |
| 2,630 | Grant Prideco, Inc. # | 99,335 | | 930 | Horace Mann Educators Corporation | 18,730 |
| 2,010 | Hanover Compressor Company #* | 37,225 | | 1,500 | Hospitality Properties Trust | 72,690 |
| 2,050 | Helmerich & Payne, Inc. | 49,098 | | 1,300 | IndyMac Bancorp, Inc. * | 59,085 |
| 2,600 | Newfield Exploration Company # | 106,054 | | 1,300 | Investors Financial | |
| 3,580 | Noble Energy, Inc. | 174,095 | | | Services Corporation * | 51,116 |
| 570 | Overseas Shipholding Group, Inc. * | 35,654 | | 2,000 | Jefferies Group, Inc. * | 57,460 |
| 3,300 | Patterson-UTI Energy, Inc. * | 76,560 | | 3,300 | Leucadia National Corporation * | 87,021 |
| 5,300 | Peabody Energy Corporation * | 222,439 | | 1,700 | Liberty Property Trust | 81,940 |
| 2,560 | Pioneer Natural | | | 1,285 | Longview Fibre Company | 27,069 |
| | Resources Company | 104,269 | | 1,400 | Macerich Company | 112,490 |
| 1,600 | Plains Exploration & | | | 1,300 | Mack-Cali Realty Corporation | 68,770 |
| | Production Company #* | 67,664 | | 2,385 | Mercantile Bankshares Corporation | 107,516 |
| 1,200 | Pogo Producing Company | 53,700 | | 700 | Mercury General Corporation * | 36,239 |
| 3,300 | Pride International, Inc. #* | 91,113 | | 2,100 | New Plan Excel Realty Trust, Inc. * | 60,480 |
| 1,100 | Quicksilver Resources, Inc. #* | 37,708 | | 5,100 | New York Community Bancorp, Inc. * | 83,385 |
| 3,500 | Southwestern Energy Company #* | 124,530 | | 1,315 | Ohio Casualty Corporation | 36,070 |
| 1,180 | Tidewater, Inc. | 58,681 | | 4,621 | Old Republic | |
|
| | |
| | Total Energy | 1,891,538 | | | International Corporation | 104,111 |
|
| | |
| | | | | 1,770 | PMI Group, Inc. * | 75,490 |
| Financials (17.8%) | | | 718 | Potlatch Corporation * | 29,167 |
| 1,475 | A.G. Edwards, Inc. | 84,149 | | 1,455 | Protective Life Corporation | 64,384 |
| 1,800 | AMB Property Corporation∈ | 105,138 | | 1,700 | Radian Group, Inc. * | 90,610 |
| 1,000 | American Financial Group, Inc. | 47,860 | | 1,850 | Raymond James Financial, Inc. | 58,941 |
| 2,400 | AmeriCredit Corporation #* | 61,368 | | 1,483 | Rayonier, Inc. REIT | 60,788 |
| 800 | AmerUs Group Company | 54,784 | | 1,300 | Regency Centers Corporation | 93,808 |
| 2,000 | Arthur J. Gallagher & Company * | 55,700 | | 1,300 | SEI Investments Company | 73,164 |
| 2,644 | Associated Banc-Corp ∈ | 86,829 | | 1,000 | StanCorp Financial Group, Inc. | 45,690 |
| 1,745 | Astoria Financial Corporation | 50,622 | | 700 | SVB Financial Group #* | 32,214 |
| 1,085 | Bank of Hawaii Corporation | 56,604 | | 2,120 | TCF Financial Corporation * | 55,184 |
| 2,200 | Brown & Brown, Inc. * | 64,372 | | 900 | Texas Regional Bancshares, Inc. | 34,965 |
| 1,100 | Cathay General Bancorp * | 37,895 | | 2,600 | United Dominion Realty Trust, Inc. * | 84,162 |
| 710 | City National Corporation * | 47,258 | | 815 | Unitrin, Inc. | 34,988 |
| The accompanying Notes to Financial Statements are an integral part of this schedule. |
|
| 111 |
Mid Cap Index Fund-I
Schedule of Investments as of October 31, 2006 |
| Shares | Common Stock (97.4%) | | Value | | Shares | Common Stock (97.4%) | | Value |
|
| |
| Financials — continued | | | | 1,800 | Triad Hospitals, Inc. #* | | $66,654 |
| 3,250 | W.R. Berkley Corporation ∈ | | $119,795 | | 1,200 | Universal Health Services, Inc. | | 63,540 |
| 1,600 | Waddell & Reed Financial, Inc. | | 40,800 | | 1,870 | Valeant Pharmaceuticals | | |
| 1,773 | Washington Federal, Inc. * | | 41,205 | | | International * | | 34,932 |
| 1,070 | Webster Financial Corporation | | 51,702 | | 2,500 | Varian Medical Systems, Inc. # | | 137,150 |
| 1,500 | Weingarten Realty Investors | | 69,750 | | 600 | Varian, Inc. # | | 28,134 |
| 625 | Westamerica Bancorporation * | | 31,156 | | 1,700 | VCA Antech, Inc. # | | 55,029 |
| 1,370 | Wilmington Trust Corporation | | 56,965 | | 2,400 | Vertex Pharmaceuticals, Inc. #* | | 97,440 |
|
| | |
|
| | Total Financials | | 4,040,548 | | | Total Health Care | | 2,315,261 |
|
| | |
|
| |
| Health Care (10.2%) | | | | Industrials (15.3%) | | |
| 1,124 | Advanced Medical Optics, Inc. #* | 45,915 | | 1,830 | Adesa, Inc. | | 46,006 |
| 1,300 | Affymetrix, Inc. #* | | 33,150 | | 1,810 | AGCO Corporation #* | | 48,418 |
| 845 | Apria Healthcare Group, Inc. #* | 19,680 | | 1,700 | AirTran Holdings, Inc. #* | | 16,949 |
| 1,210 | Beckman Coulter, Inc. | | 69,660 | | 835 | Alaska Air Group, Inc. #* | | 33,525 |
| 1,200 | Cephalon, Inc. #* | | 84,216 | | 950 | Alexander & Baldwin, Inc. * | | 43,728 |
| 1,400 | Charles River Laboratories | | | | 700 | Alliant Techsystems, Inc. #* | | 54,047 |
| | International, Inc. # | | 60,088 | | 1,420 | AMETEK, Inc. | | 66,286 |
| 1,800 | Community Health Systems, Inc. # | 58,410 | | 1,910 | Avis Budget Group, Inc. | | 37,799 |
| 1,270 | Covance, Inc. # | | 74,295 | | 510 | Banta Corporation | | 22,583 |
| 2,300 | Cytyc Corporation #* | | 60,766 | | 1,005 | Brink’s Company | | 52,752 |
| 3,064 | Dentsply International, Inc. | | 95,842 | | 3,420 | C.H. Robinson Worldwide, Inc. ∈ | | 142,751 |
| 1,200 | Edwards Lifesciences Corporation # | 51,516 | | 565 | Carlisle Companies, Inc. | | 47,285 |
| 1,000 | Gen-Probe, Inc. # | | 47,870 | | 1,600 | ChoicePoint, Inc. # | | 58,224 |
| 2,350 | Health Net, Inc. # | | 97,548 | | 1,015 | Con-way, Inc. | | 47,878 |
| 1,800 | Henry Schein, Inc. # | | 89,442 | | 1,400 | Copart, Inc. # | | 40,502 |
| 1,130 | Hillenbrand Industries, Inc. | | 66,308 | | 800 | Corporate Executive Board Company | 71,856 |
| 700 | Intuitive Surgical, Inc. #* | | 69,426 | | 1,000 | Crane Company | | 38,940 |
| 1,000 | Invitrogen Corporation #* | | 58,010 | | 1,000 | Deluxe Corporation * | | 22,670 |
| 1,100 | LifePoint Hospitals, Inc. # | | 39,050 | | 1,390 | Donaldson Company, Inc. * | | 52,194 |
| 1,930 | Lincare Holdings, Inc. # | | 64,771 | | 800 | DRS Technologies, Inc. | | 35,376 |
| 600 | Martek Biosciences Corporation #* | 14,232 | | 1,300 | Dun & Bradstreet Corporation # | | 100,412 |
| 1,100 | Medicis Pharmaceutical | | | | 4,200 | Expeditors International of | | |
| | Corporation * | | 38,544 | | | Washington, Inc. | | 199,122 |
| 6,222 | Millennium Pharmaceuticals, Inc. #* | 72,797 | | 2,340 | Fastenal Company * | | 94,162 |
| 2,385 | Omnicare, Inc. * | | 90,344 | | 995 | Federal Signal Corporation * | | 15,184 |
| 700 | Par Pharmaceutical | | | | 1,100 | Flowserve Corporation # | | 58,300 |
| | Companies, Inc. #* | | 13,643 | | 925 | GATX Corporation * | | 40,302 |
| 2,300 | PDL BioPharma, Inc. #* | | 48,599 | | 1,400 | Graco, Inc. | | 57,064 |
| 1,430 | Perrigo Company | | 25,583 | | 630 | Granite Construction, Inc. | | 32,823 |
| 2,000 | Pharmaceutical Product | | | | 730 | Harsco Corporation | | 59,590 |
| | Development, Inc. | | 63,300 | | 1,380 | Herman Miller, Inc. | | 47,306 |
| 1,000 | Psychiatric Solutions, Inc. # | | 33,200 | | 1,015 | HNI Corporation * | | 45,645 |
| 1,500 | ResMed, Inc. #* | | 65,985 | | 1,255 | Hubbell, Inc. | | 62,148 |
| 2,170 | Sepracor, Inc. #* | | 112,319 | | 1,120 | Jacobs Engineering Group, Inc. # | | 84,605 |
| 1,180 | STERIS Corporation | | 28,757 | | 2,060 | JB Hunt Transport Services, Inc. * | | 44,578 |
| 700 | Techne Corporation # | | 39,116 | | 3,300 | JetBlue Airways Corporation #* | | 41,448 |
| The accompanying Notes to Financial Statements are an integral part of this schedule. |
|
| 112 |
Mid Cap Index Fund-I
Schedule of Investments as of October 31, 2006 |
| Shares | Common Stock (97.4%) | | Value | | Shares | Common Stock (97.4%) | Value |
|
| |
| Industrials — continued | | | | 1,250 | CDW Corporation | $82,088 |
| 2,450 | Joy Global, Inc. | | $95,820 | | 2,700 | Ceridian Corporation # | 63,639 |
| 490 | Kelly Services, Inc. * | | 14,102 | | 1,770 | CheckFree Corporation #* | 69,880 |
| 765 | Kennametal, Inc. | | 47,208 | | 2,700 | Cognizant Technology | |
| 800 | Korn/Ferry International # | | 17,688 | | | Solutions Corporation # ∈ | 203,256 |
| 800 | Lincoln Electric Holdings, Inc. * | 49,192 | | 1,100 | CommScope, Inc. #* | 35,101 |
| 1,750 | Manpower, Inc. | | 118,598 | | 1,500 | Cree, Inc. #* | 32,985 |
| 600 | Mine Safety Appliances Company * | 22,692 | | 945 | CSG Systems International, Inc. #* | 25,496 |
| 1,000 | MSC Industrial Direct Company, Inc. | 40,920 | | 2,840 | Cypress Semiconductor | |
| 1,000 | Navigant Consulting, Inc. #* | | 17,810 | | | Corporation #* | 47,684 |
| 660 | Nordson Corporation * | | 30,393 | | 1,390 | Diebold, Inc. | 60,715 |
| 1,500 | Oshkosh Truck Corporation | | 67,815 | | 1,090 | DST Systems, Inc. #* | 67,351 |
| 2,030 | Pentair, Inc. | | 66,868 | | 700 | Dycom Industries, Inc. #* | 16,317 |
| 2,700 | Precision Castparts Corporation | 183,762 | | 800 | F5 Networks, Inc. #* | 52,952 |
| 2,300 | Quanta Services, Inc. #* | | 42,090 | | 1,200 | Fair Isaac Corporation * | 43,956 |
| 2,300 | Republic Services, Inc. | | 94,323 | | 2,300 | Fairchild Semiconductor | |
| 740 | Rollins, Inc. | | 16,014 | | | International, Inc. # | 37,053 |
| 1,800 | Roper Industries, Inc. * | | 86,130 | | 1,200 | Fidelity National Information | |
| 175 | Sequa Corporation # | | 18,569 | | | Services, Inc. * | 49,884 |
| 1,040 | SPX Corporation * | | 59,821 | | 1,200 | Gartner Group, Inc. #* | 22,320 |
| 900 | Stericycle, Inc. #* | | 63,639 | | 2,690 | Harris Corporation | 114,594 |
| 1,050 | Swift Transportation | | | | 600 | Imation Corporation * | 27,462 |
| | Company, Inc. #* | | 26,408 | | 2,700 | Ingram Micro, Inc. # | 55,647 |
| 735 | Teleflex, Inc. | | 45,717 | | 3,755 | Integrated Device Technology, Inc. # | 59,517 |
| 1,100 | Thomas & Betts Corporation # | | 56,683 | | 1,400 | International Rectifier | |
| 1,800 | Timken Company | | 54,090 | | | Corporation #* | 50,358 |
| 1,580 | Trinity Industries, Inc. * | | 56,975 | | 2,700 | Intersil Corporation * | 63,315 |
| 1,400 | United Rentals, Inc. #* | | 33,166 | | 1,500 | Jack Henry & Associates, Inc. * | 32,685 |
| 1,175 | Werner Enterprises, Inc. * | | 21,561 | | 1,700 | KEMET Corporation # | 12,495 |
| 1,200 | YRC Worldwide, Inc. #* | | 46,488 | | 2,800 | Lam Research Corporation #* | 138,460 |
|
| | |
| | Total Industrials | 3,457,000 | | 2,300 | Lattice Semiconductor | |
|
| | |
| | | | | | | Corporation #* | 14,283 |
| Information Technology (15.2%) | | | | 1,000 | Macrovision Corporation # | 26,610 |
| 7,800 | 3Com Corporation # | | 37,908 | | 3,195 | McAfee, Inc. #* | 92,431 |
| 4,677 | Activision, Inc. #* | | 72,119 | | 3,200 | McDATA Corporation #* | 18,144 |
| 1,345 | Acxiom Corporation | | 33,289 | | 3,300 | MEMC Electronic Materials, Inc. # | 117,150 |
| 1,190 | ADTRAN, Inc. * | | 27,537 | | 1,550 | Mentor Graphics Corporation #* | 26,148 |
| 300 | Advent Software, Inc. #* | | 11,106 | | 1,100 | Micrel, Inc. #* | 12,276 |
| 1,300 | Alliance Data Systems Corporation # | 78,936 | | 4,160 | Microchip Technology, Inc. * | 136,989 |
| 1,800 | Amphenol Corporation | | 122,220 | | 1,700 | MoneyGram International, Inc. | 58,157 |
| 3,200 | Andrew Corporation #- | | 29,632 | | 2,125 | MPS Group, Inc. # | 32,406 |
| 2,425 | Arrow Electronics, Inc. # * | | 72,386 | | 1,050 | National Instruments Corporation | 32,739 |
| 8,290 | Atmel Corporation # | | 47,668 | | 800 | Newport Corporation # | 17,296 |
| 2,460 | Avnet, Inc. #* | | 58,253 | | 2,000 | Palm, Inc. #* | 30,700 |
| 1,000 | Avocent Corporation #* | | 36,710 | | 900 | Plantronics, Inc. * | 18,999 |
| 2,400 | BISYS Group, Inc. #* | | 26,496 | | 900 | Plexus Corporation #* | 19,728 |
| 5,580 | Cadence Design Systems, Inc. #∈ | 99,659 | | 1,790 | Polycom, Inc. # | 49,046 |
| The accompanying Notes to Financial Statements are an integral part of this schedule. |
|
| 113 |
Mid Cap Index Fund-I
Schedule of Investments as of October 31, 2006 |
| Shares | Common Stock (97.4%) | Value | | Shares | Common Stock (97.4%) | Value |
|
| |
| Information Technology — continued | | | Telecommunications Services (0.5%) | |
| 2,700 | Powerwave Technologies, Inc. #* | $17,577 | | 4,960 | Cincinnati Bell, Inc. # | $23,262 |
| 3,700 | RF Micro Devices, Inc. #* | 27,010 | | 2,035 | Telephone and Data Systems, Inc. | 99,410 |
|
|
| 1,500 | Semtech Corporation # | 19,545 | | | Total Telecommunications | |
| 1,100 | Silicon Laboratories, Inc. # | 35,893 | | | Services | 122,672 |
|
|
| 800 | SRA International, Inc. #* | 25,640 | | | | |
| 1,700 | Sybase, Inc. #* | 41,395 | | Utilities (8.3%) | |
| 2,700 | Synopsys, Inc. # | 60,777 | | 1,485 | AGL Resources, Inc. * | 55,688 |
| 1,045 | Tech Data Corporation # | 41,121 | | 2,375 | Alliant Energy Corporation | 91,081 |
| 685 | Transaction Systems | | | 2,500 | Aqua America, Inc. * | 60,625 |
| | Architects, Inc. # | 23,091 | | 7,495 | Aquila, Inc. #∈ | 34,402 |
| 2,615 | TriQuint Semiconductor, Inc. #* | 11,768 | | 670 | Black Hills Corporation * | 23,122 |
| 2,100 | UTStarcom, Inc. #* | 22,617 | | 2,245 | DPL, Inc. * | 64,476 |
| 3,495 | Vishay Intertechnology, Inc. #* | 47,148 | | 1,450 | Duquesne Light Holdings, Inc. * | 28,754 |
| 4,300 | Western Digital Corporation # | 78,604 | | 2,865 | Energy East Corporation | 69,648 |
| 1,500 | Wind River Systems, Inc. #* | 16,470 | | 2,300 | Equitable Resources, Inc. * | 93,196 |
| 1,400 | Zebra Technologies Corporation # | 52,178 | | 1,630 | Great Plains Energy, Inc. * | 53,040 |
|
| | |
| | Total Information | | | 1,670 | Hawaiian Electric Industries, Inc. * | 46,793 |
| | Technology | 3,443,065 | | 925 | IDACORP, Inc. * | 36,473 |
|
| | |
| | | | | 3,550 | MDU Resources Group, Inc. | 91,164 |
| Materials (5.0%) | | | 1,670 | National Fuel Gas Company * | 62,458 |
| 1,495 | Airgas, Inc. | 56,526 | | 3,125 | Northeast Utilities Service Company | 78,156 |
| 780 | Albemarle Corporation | 50,723 | | 2,030 | NSTAR | 70,624 |
| 1,045 | Bowater, Inc. * | 21,851 | | 1,765 | OGE Energy Corporation * | 68,094 |
| 1,175 | Cabot Corporation * | 46,471 | | 2,100 | ONEOK, Inc. | 87,423 |
| 4,720 | Chemtura Corporation | 40,498 | | 3,832 | Pepco Holdings, Inc. * | 97,409 |
| 2,400 | Commercial Metals Company | 63,864 | | 1,295 | PNM Resources, Inc. | 36,467 |
| 765 | Cytec Industries, Inc. | 42,373 | | 2,325 | Puget Energy, Inc. | 55,521 |
| 890 | Ferro Corporation | 17,551 | | 1,705 | Questar Corporation | 138,923 |
| 900 | Florida Rock Industries, Inc. * | 38,610 | | 2,190 | SCANA Corporation | 87,512 |
| 700 | FMC Corporation | 47,985 | | 4,370 | Sierra Pacific Resources # | 66,249 |
| 1,040 | Glatfelter Company * | 15,226 | | 1,540 | Vectren Corporation | 44,752 |
| 1,370 | Lubrizol Corporation | 61,650 | | 1,700 | Westar Energy, Inc. | 43,044 |
| 4,110 | Lyondell Chemical Company * | 105,504 | | 1,080 | WGL Holdings, Inc. * | 35,046 |
| 905 | Martin Marietta Materials, Inc. * | 79,640 | | 2,210 | Wisconsin Energy Corporation | 101,527 |
| 470 | Minerals Technologies, Inc. | 25,925 | | 1,000 | WPS Resources Corporation | 53,210 |
|
|
| 1,485 | Olin Corporation | 25,690 | | | Total Utilities | 1,874,877 |
|
|
| 1,600 | Packaging Corporation of America | 36,752 | | | | |
|
|
| 1,200 | Reliance Steel & Aluminum Company | 41,220 | | | Total Common Stock | |
| 2,415 | RPM International, Inc. * | 46,247 | | | (cost $15,406,158) | 22,050,541 |
|
|
| 900 | Scotts Company * | 44,514 | | | | |
| 1,010 | Sensient Technologies Corporation | 23,280 | | | | |
| 1,975 | Sonoco Products Company | 70,073 | | | | |
| 900 | Steel Dynamics, Inc. | 54,099 | | | | |
| 2,100 | Valspar Corporation | 56,259 | | | | |
| 1,400 | Worthington Industries, Inc. * | 24,192 | | | | |
|
| | |
| | Total Materials | 1,136,723 | | | | |
|
| | |
| The accompanying Notes to Financial Statements are an integral part of this schedule. |
|
| 114 |
| Mid Cap Index Fund-I | | | | | |
| Schedule of Investments as of October 31, 2006 | | | | |
| |
| | | | | Interest | Maturity | |
| Shares | Collateral Held for Securities Loaned (26.0%) | Rate (+) | Date | Value |
|
| 5,880,742 | Thrivent Financial Securities Lending Trust | 5.300% | N/A | $5,880,742 |
| |
|
| | | Total Collateral Held for Securities Loaned | |
| | | (cost $5,880,742) | | | 5,880,742 |
|
|
| |
| |
| Shares or | | | | | | |
| Principal | | | | Interest | Maturity | |
| Amount | Short-Term Investments (2.4%) | | Rate (+) | Date | Value |
|
| $100,000 | Federal National Mortgage Association ∈ | 5.200% | 2/7/2007 | $98,617 |
| 440,487 | Thrivent Money Market Fund | | 4.600 | N/A | 440,487 |
|
|
| | | Total Short-Term Investments (cost $539,086) | 539,104 |
|
|
| | | Total Investments (cost $21,825,986) 125.8% | $28,470,387 |
|
|
| | | Other Assets and Liabilities, Net (25.8%) | (5,844,570) |
|
|
| | | Total Net Assets 100.0% | | | $22,625,817 |
|
|
| |
| | | Number of | | Notional | | |
| | | Contracts | Expiration | Principal | | Unrealized |
| Futures | | Long/(Short) | Date | Amount | Value | Gain/(Loss) |
|
| S&P 400 Index Mini-Futures | 7 | December 2006 | $532,816 | $552,090 | $19,274 |
# Non-income producing security.
* All or a portion of the security is on loan as discussed in item 2(L) of the Notes to Financial Statements.
+ The interest rate shown reflects the yield, coupon rate or, for securities purchased at a discount, the discount rate at the date of purchase.
∈ At October 31, 2006, $98,617 of investments were held on deposit with the counterparty and pledged as the initial margin deposit for open financial futures contracts. In addition, $737,927 of investments were earmarked as collateral to cover open financial futures contracts.
Definitions:
REIT — Real Estate Investment Trust, is a company that buys, develops, manages and/or sells real estate assets.
| Gross unrealized appreciation and depreciation of investments, based on cost for federal income tax purposes, were as follows: | |
| Gross unrealized appreciation | $6,890,680 | |
| Gross unrealized depreciation | (684,278) | |
| |
| |
| Net unrealized appreciation (depreciation) | $6,206,402 | |
| Cost for federal income tax purposes | $22,263,985 | |
| The accompanying Notes to Financial Statements are an integral part of this schedule. |
|
| 115 |
Partner International Stock Fund
Schedule of Investments as of October 31, 2006 |
| Shares | Common Stock (95.3%) | Value (^) | | Shares | Common Stock (95.3%) | Value (^) |
|
| |
| Australia (2.0%) | | | 41,410 | LVMH Moet Hennessy | |
| 150,600 | AMP, Ltd. | $1,105,815 | | | Louis Vuitton SA | $4,313,151 |
| 139,400 | Brambles Industries, Ltd. | 1,348,285 | | 17,539 | Pernod Ricard SA | 3,511,151 |
| 197,800 | Lend Lease Corporation, Ltd. | 2,581,432 | | 8,986 | Pinault-Printemps-Redoute SA | 1,340,056 |
| 651,900 | Macquarie Infrastructure Group | 1,705,622 | | 63,600 | Safran SA | 1,437,214 |
| 91,700 | Rinker Group, Ltd. | 1,311,997 | | 59,900 | Schneider Electric SA | 6,221,695 |
| 26,000 | Rio Tinto, Ltd. | 1,580,892 | | 15,429 | Societe Generale | 2,561,470 |
| 218,600 | Transurban Group | 1,223,578 | | 45,145 | Societe Television Francaise 1 | 1,531,617 |
|
| | |
| | Total Australia | 10,857,621 | | 49,020 | Total SA | 3,316,036 |
|
| | |
| | | | | 43,600 | Veolia Environnement | 2,668,175 |
|
|
| Austria (1.0%) | | | | Total France | 46,852,666 |
|
|
| 58,060 | Erste Bank der oesterreichischen | | | | | |
| | Sparkassen AG | 3,949,762 | | Germany (5.5%) | |
| 22,400 | Wiener Staedtische Allgemeine | | | 114,200 | Adidas AG | 5,727,957 |
| | Versicherung AG | 1,440,670 | | 8,500 | Deutsche Boerse AG | 1,373,107 |
|
| | |
| | Total Austria | 5,390,432 | | 194,200 | Deutsche Post AG-REG | 5,382,252 |
|
| | |
| | | | | 21,600 | Fresenius Medical Care AG & | |
| Belgium (1.0%) | | | | Company | 2,882,716 |
| 48,400 | InBev NV | 2,724,954 | | 22,789 | Hypo Real Estate Holding AG | 1,435,847 |
| 24,050 | KBC Groep NV | 2,626,192 | | 84,200 | Metro AG | 5,011,098 |
| 4,777 | UCB SA | 295,458 | | 82,400 | Praktiker Bau- und | |
|
| | |
| | Total Belgium | 5,646,604 | | | Heimwerkermaerkte Holding AG | 2,625,841 |
|
| | |
| | | | | 64,600 | Siemens AG | 5,827,613 |
|
|
| Brazil (1.2%) | | | | Total Germany | 30,266,431 |
|
|
| 22,800 | Banco Itau Holding Financeira SA 750,595 | | | | |
| 76,800 | Companhia Vale do Rio Doce | | | Greece (1.5%) | |
| | SP ADR | 1,668,096 | | 33,846 | Cosmote Mobile | |
| 52,590 | Petroleo Brasileiro SA ADR | 4,257,686 | | | Telecommunications SA | 834,245 |
|
| | |
| | Total Brazil | 6,676,377 | | 148,180 | Hellenic Telecommunication | |
|
| | |
| | | | | | Organization SA # | 3,835,810 |
| Canada (0.2%) | | | 81,170 | National Bank of Greece SA | 3,679,451 |
|
|
| 19,300 | Telus Corporation | 1,107,048 | | | Total Greece | 8,349,506 |
|
| | |
|
| | Total Canada | 1,107,048 | | | | |
|
| | |
| | | | | Hong Kong (1.3%) | |
| Denmark (0.5%) | | | 920,000 | China Overseas Land & | |
| 36,422 | Novo Nordisk AS | 2,743,276 | | | Investment, Ltd. | 836,378 |
|
| | |
| | Total Denmark | 2,743,276 | | 1,220,000 | China Petroleum & Chemical | |
|
| | |
| | | | | | Corporation | 846,103 |
| Finland (0.4%) | | | 406,000 | Shangri-La Asia, Ltd. | 880,502 |
| 95,682 | Nokia Oyj | 1,901,880 | | 462,200 | Swire Pacific, Ltd. | 4,879,398 |
|
| | |
|
| | Total Finland | 1,901,880 | | | Total Hong Kong | 7,442,381 |
|
| | |
|
| |
| France (8.4%) | | | Ireland (0.7%) | |
| 50,191 | Accor SA | 3,481,577 | | 171,300 | Anglo Irish Bank Corporation plc | 3,074,698 |
| 308,055 | Axa SA | 11,719,543 | | 25,200 | CRH plc | 888,294 |
|
|
| 78,000 | Carrefour SA | 4,750,981 | | | Total Ireland | 3,962,992 |
|
|
| The accompanying Notes to Financial Statements are an integral part of this schedule. |
|
| 116 |
Partner International Stock Fund
Schedule of Investments as of October 31, 2006 |
| Shares | Common Stock (95.3%) | Value (^) | | Shares | Common Stock (95.3%) | Value (^) |
|
| |
| Italy (6.0%) | | | 51,200 | Sony Corporation | $2,092,553 |
| 673,900 | AEM SPA | $1,851,311 | | 411,100 | Sumitomo Corporation | 5,401,927 |
| 468,400 | Banca Intesa SPA | 3,103,337 | | 492 | Sumitomo Mitsui Financial | |
| 262,680 | Banca Intesa SPA | 1,794,438 | | | Group, Inc. | 5,376,714 |
| 264,311 | Eni SPA | 7,995,450 | | 635,700 | Sumitomo Trust and Banking | |
| 50,900 | Lottomatica SPA | 1,852,058 | | | Company, Ltd. | 6,819,605 |
| 71,400 | Mediobanca SPA | 1,656,963 | | 19,400 | T&D Holdings, Inc. | 1,415,763 |
| 202,600 | Saipem SPA | 4,772,413 | | 106,600 | Takeda Pharmaceutical | |
| 1,275,780 | UniCredito Italiano SPA | 10,572,121 | | | Company, Ltd. | 6,843,870 |
|
| | |
| | Total Italy | 33,598,091 | | 155,700 | Toyota Motor Corporation | 9,193,383 |
|
| | |
| | | | | 50,500 | Ushio, Inc. | 1,050,574 |
|
|
| Japan (21.9%) | | | | Total Japan | 121,962,734 |
|
|
| 37,650 | Aiful Corporation | 1,297,808 | | | | |
| 18,100 | Astellas Pharmaceutical, Inc. | 815,202 | | Luxembourg (0.6%) | |
| 297,300 | Bridgestone Corporation | 6,192,277 | | 19,100 | Tenaris SA ADR | 737,069 |
| 26,500 | Canon, Inc. | 1,415,266 | | 177,000 | SES Global SA | 2,711,545 |
|
|
| 32,300 | Credit Saison Company, Ltd. | 1,167,951 | | | Total Luxembourg | 3,448,614 |
|
|
| 100,300 | Daito Trust Construction | | | | | |
| | Company, Ltd. | 5,289,364 | | Mexico (1.9%) | |
| 18,500 | Fanuc, Ltd. | 1,604,925 | | 71,000 | America Movil SA de CV ADR | 3,043,770 |
| 113,500 | Fuji Film Holdings Corporation | 4,217,050 | | 635,900 | Grupo Financiero Banorte SA | |
| 40,100 | Honda Motor Company | 1,415,363 | | | de CV | 2,305,935 |
| 49,000 | Hoya Corporation | 1,893,311 | | 48,600 | Grupo Televisia SA ADR | 1,199,448 |
| 44,200 | IBIDEN Company, Ltd. | 2,311,237 | | 108,100 | Telefonos de Mexico SA | |
| 40,000 | JSR Corporation | 1,004,535 | | | de CV ADR | 2,852,759 |
| 9,600 | Keyence Corporation | 2,122,704 | | 303,322 | Wal-Mart de Mexico SA de CV | 1,054,798 |
|
|
| 61,300 | Kyocera Corporation | 5,493,320 | | | Total Mexico | 10,456,710 |
|
|
| 28,400 | Leopalace21 Corporation | 1,066,495 | | | | |
| 155,800 | MARUI Company, Ltd. | 2,095,184 | | Netherlands (2.3%) | |
| 116,200 | Mitsubishi Corporation | 2,243,324 | | 142,000 | ABN AMRO Holding NV | 4,137,701 |
| 57,000 | Mitsubishi Estate Company, Ltd. | 1,363,259 | | 149,500 | ING Groep NV | 6,621,161 |
| 710 | Mitsubishi UFJ Financial | | | 47,828 | Royal Numico NV | 2,136,437 |
|
|
| | Group, Inc. | 9,005,763 | | | Total Netherlands | 12,895,299 |
|
|
| 155,000 | Mitsui Fudosan Company, Ltd. | 3,813,305 | | | | |
| 174,000 | Mitsui Trust Holdings, Inc. | 2,041,293 | | Norway (0.5%) | |
| 24,200 | Nidec Corporation | 1,851,020 | | 172,600 | Telenor ASA | 2,730,272 |
|
|
| 286,700 | Nikon Corporation | 5,885,336 | | | Total Norway | 2,730,272 |
|
|
| 18,300 | Nitto Denko Corporation | 1,041,348 | | | | |
| 10,470 | ORIX Corporation | 2,944,523 | | Portugal (0.3%) | |
| 16,800 | Otsuka Corporation | 1,842,125 | | 114,900 | Portugal Telecom SGPS SA | 1,433,676 |
|
|
| 3,307 | Rakuten, Inc. | 1,467,486 | | | Total Portugal | 1,433,676 |
|
|
| 631 | Resona Holdings, Inc. | 1,915,200 | | | | |
| 43,100 | Secom Company, Ltd. | 2,154,491 | | Russia (0.1%) | |
| 52,100 | Sega Sammy Holdings, Inc. | 1,307,287 | | 13,900 | OAO TMK GDR # | 356,257 |
|
|
| 46,400 | Seven & I Holdings Company, Ltd. 1,488,596 | | | Total Russia | 356,257 |
|
|
| 30,250 | Shin-Etsu Chemical Company, Ltd. 1,982,997 | | | | |
| 14,800 | SMC Corporation | 2,019,000 | | | | |
| The accompanying Notes to Financial Statements are an integral part of this schedule. |
|
| 117 |
Partner International Stock Fund
Schedule of Investments as of October 31, 2006 |
| Shares | Common Stock (95.3%) | Value (^) | | Shares | Common Stock (95.3%) | | Value (^) |
|
| |
| Singapore | (3.0%) | | | 16,750 | Holcim, Ltd. | | $1,442,301 |
| 222,600 | Keppel Corporation, Ltd. | $2,260,417 | | 19,200 | Nestle SA | | 6,560,667 |
| 3,417,490 | Singapore | | | 9,359 | Nobel Biocare Holding AG | | 2,560,536 |
| | Telecommunications, Ltd. | 5,821,236 | | 79,979 | Novartis AG | | 4,854,586 |
| 623,150 | StarHub, Ltd. | 893,176 | | 30,900 | Swatch Group AG | | 6,096,872 |
| 557,500 | United Overseas Bank, Ltd. | 6,332,252 | | 18,100 | Swiss Life Holding # | | 4,263,683 |
| 162,000 | Venture Corporation, Ltd. | 1,486,814 | | 68,300 | Swiss Reinsurance Company | | 5,603,043 |
|
| | |
| | Total Singapore | 16,793,895 | | 68,081 | UBS AG | | 4,065,116 |
|
| | |
|
| | | | | | Total Switzerland | | 44,497,262 |
|
|
| South Africa (0.3%) | | | | | | |
| 83,400 | Naspers, Ltd. | 1,507,410 | | Taiwan (0.7%) | | |
|
| | |
| | Total South Africa | 1,507,410 | | 396,000 | Cathay Financial Holding | | |
|
| | |
| | | | | | Company, Ltd. | | 767,562 |
| South Korea (1.3%) | | | 200,800 | Hon Hai Precision Industry | | |
| 18,520 | Kookmin Bank | 1,468,431 | | | Company, LTD. (Foxconn) | | 1,298,782 |
| 56,150 | LG Electronics, Inc. | 3,392,226 | | 100,000 | Media Tek, Inc. | | 973,468 |
| 2,606 | Lotte Shopping Company, Ltd. | 987,032 | | 77,608 | Taiwan Semiconductor | | |
| 2,050 | Samsung Electronics | | | | Manufacturing Company, Ltd. ADR | 752,798 |
|
|
| | Company, Ltd. | 1,327,441 | | | Total Taiwan | | 3,792,610 |
|
| | |
|
| | Total South Korea | 7,175,130 | | | | | |
|
| | |
| | | | | United Kingdom (15.7%) | | |
| Spain (6.3%) | | | 300,500 | Amvescap plc | | 3,433,565 |
| 16,619 | Acciona SA | 2,925,905 | | 84,600 | AstraZeneca plc | | 4,985,977 |
| 63,600 | Actividades de Construccion y | | | 190,300 | Aviva plc | | 2,811,118 |
| | Servicios SA | 3,192,355 | | 144,522 | BP Amoco plc | | 1,615,713 |
| 232,300 | Banco Bilbao Vizcaya | | | 542,600 | British Sky Broadcasting | | |
| | Argentaria SA | 5,606,806 | | | Group plc | | 5,626,189 |
| 63,500 | Cintra Concesiones de | | | 297,500 | Capita Group plc | | 3,055,533 |
| | Infraestructuras de | | | 574,640 | Friends Provident plc | | 2,268,743 |
| | Transporte SA | 972,802 | | 355,013 | GlaxoSmithKline plc | | 9,461,821 |
| 90,100 | Enagas | 2,183,536 | | 1,229,700 | Group 4 Securicor plc | | 4,092,588 |
| 22,900 | Grupo Ferrovial SA | 2,116,258 | | 90,100 | Johnson Matthey plc | | 2,466,939 |
| 125,600 | Iberdrola SA | 5,756,488 | | 1,245,000 | Kingfisher plc | | 6,245,425 |
| 84,100 | Repsol YPF SA | 2,795,855 | | 571,100 | Lloyds TSB Group plc | | 6,100,485 |
| 504,732 | Telefonica SA | 9,717,202 | | 77,200 | Next plc | | 2,766,962 |
|
| | |
| | Total Spain | 35,267,207 | | 413,500 | Pearson plc | | 6,102,320 |
|
| | |
| | | | | 70,464 | Reckitt Benckiser plc | | 3,063,477 |
| Sweden (2.7%) | | | 162,800 | Reuters Group plc | | 1,388,148 |
| 209,000 | Assa Abloy AB | 4,016,201 | | 148,200 | Royal Bank of Scotland Group plc | 5,275,943 |
| 108,500 | Atlas Copco AB | 3,161,312 | | 238,725 | Unilever plc | | 5,928,550 |
| 78,900 | Skandinaviska Enskilda Banken | 2,201,853 | | 1,944,688 | Vodafone Group plc | | 5,011,224 |
| 1,510,700 | Telefonaktiebolaget LM Ericsson | 5,710,222 | | 454,500 | WPP Group plc | | 5,822,057 |
|
| | |
|
| | Total Sweden | 15,089,588 | | | Total United Kingdom | | 87,522,777 |
|
| | |
|
| |
| Switzerland (8.0%) | | | | Total Common Stock | | |
| 31,280 | Credit Suisse Group | 1,885,512 | | | (cost $431,042,707) | | 529,724,746 |
|
|
| 8,650 | Givaudan SA | 7,164,946 | | | | | |
| The accompanying Notes to Financial Statements are an integral part of this schedule. |
|
| 118 |
Partner International Stock Fund
Schedule of Investments as of October 31, 2006 |
| Shares or | | | | |
| Principal | Interest | | | |
| Amount | Short-Term Investments (4.6%) | Rate (+) | Date | Value |
|
| $3,000,000 | Amsterdam Funding Corporation | 5.260% | 11/3/2006 | $2,999,123 |
| 12,005,000 | Falcon Asset Securitization Corporation | 5.300 | 11/1/2006 | 12,005,000 |
| 10,795,069 | Thrivent Money Market Fund | 4.600 | N/A | 10,795,069 |
|
|
| | Total Short-Term Investments (at amortized cost) | 25,799,192 |
|
|
| | Total Investments (cost $456,841,899) 99.9% | $555,523,938 |
|
|
| | Other Assets and Liabilities, Net 0.1% | | 649,208 |
|
|
| | Total Net Assets 100.0% | | | $556,173,146 |
|
|
# Non-income producing security.
+ The interest rate shown reflects the yield, coupon rate or, for securities purchased at a discount, the discount rate at the date of purchase.
^ Securities are fair valued as discussed in item 2(A) of the Notes to Financial Statements.
Definitions:
ADR — American Depository Receipts, which are certificates for shares of an underlying foreign security’s shares held by an issuing U.S. depository bank.
GDR — Global Depository Receipts, which are certificates for shares of an underlying foreign security’s shares held by an issuing depository bank from more than one country.
| Gross unrealized appreciation and depreciation of investments, based on cost for federal income tax purposes, were as follows: | |
| | |
| Gross unrealized appreciation | $101,209,812 | |
| Gross unrealized depreciation | (6,268,489) | |
| |
| |
| Net unrealized appreciation (depreciation) | $94,941,323 | |
| Cost for federal income tax purposes | $460,582,615 | |
| The accompanying Notes to Financial Statements are an integral part of this schedule. |
|
| 119 |
Large Cap Growth Fund
Schedule of Investments as of October 31, 2006 |
| Shares | Common Stock (96.6%) | Value | | Shares | Common Stock (96.6%) | Value |
|
| |
| Consumer Discretionary (11.6%) | | | 27,400 | Cameron International | |
| 36,250 | Aeropostale, Inc. # | $1,062,488 | | | Corporation # | $1,372,740 |
| 44,812 | Best Buy Company, Inc. | 2,475,863 | | 22,550 | ConocoPhillips | 1,358,412 |
| 1 | Chipotle Mexican Grill, Inc. # | 22 | | 33,650 | Devon Energy Corporation | 2,249,166 |
| 29,500 | Circuit City Stores, Inc. | 795,910 | | 21,850 | Diamond Offshore Drilling, Inc. * | 1,512,676 |
| 37,850 | Coach, Inc. # | 1,500,374 | | 13,050 | Exxon Mobil Corporation | 932,031 |
| 34,850 | Federated Department Stores, Inc. | 1,530,264 | | 9,300 | National Oilwell Varco, Inc. # | 561,720 |
| 9,900 | Harrah’s Entertainment, Inc. | 735,867 | | 31,950 | Occidental Petroleum Corporation | 1,499,733 |
| 48,900 | International Game Technology | 2,078,739 | | 39,350 | Range Resources Corporation * | 1,068,352 |
| 37,750 | Kohl’s Corporation # | 2,665,150 | | 78,360 | Schlumberger, Ltd. | 4,942,949 |
| 22,250 | Las Vegas Sands Corporation # | 1,695,450 | | 37,700 | Valero Energy Corporation | 1,972,841 |
| 130,750 | Lowe’s Companies, Inc. | 3,940,805 | | 39,950 | XTO Energy, Inc. | 1,864,067 |
|
|
| 48,800 | Marriott International, Inc. | 2,038,376 | | | Total Energy | 21,554,016 |
|
|
| 16,239 | McDonald’s Corporation | 680,739 | | | | |
| 38,800 | McGraw-Hill Companies, Inc. | 2,489,796 | | Financials (11.7%) | |
| 32,300 | MGM MIRAGE #* | 1,389,546 | | 20,610 | ACE, Ltd. | 1,179,922 |
| 68,400 | News Corporation ADR * | 1,487,016 | | 16,650 | AllianceBernstein Holding, LP * | 1,293,705 |
| 15,550 | OSI Restaurant Partners, Inc. | 517,348 | | 43,950 | American Express Company | 2,540,750 |
| 17,300 | Royal Caribbean Cruises, Ltd. | 700,650 | | 37,900 | American International | |
| 105,575 | Staples, Inc. | 2,722,779 | | | Group, Inc. | 2,545,743 |
| 71,600 | Starbucks Corporation # | 2,702,900 | | 92,150 | Charles Schwab Corporation | 1,678,973 |
| 17,100 | Starwood Hotels & Resorts | | | 8,150 | Chicago Mercantile Exchange | |
| | Worldwide, Inc. | 1,021,554 | | | Holdings, Inc. | 4,083,150 |
| 31,800 | Target Corporation | 1,881,924 | | 30,096 | Citigroup, Inc. | 1,509,615 |
| 24,700 | Toll Brothers, Inc. #* | 714,077 | | 18,100 | Franklin Resources, Inc. | 2,062,676 |
| 26,900 | Viacom, Inc. # | 1,046,948 | | 29,450 | Goldman Sachs Group, Inc. | 5,589,316 |
| 55,535 | Walt Disney Company | 1,747,131 | | 11,500 | Hartford Financial Services | |
| 13,500 | Wynn Resorts, Ltd. # | 992,790 | | | Group, Inc. | 1,002,455 |
|
| | |
| | Total Consumer | | | 40,000 | J.P. Morgan Chase & Company | 1,897,600 |
| | Discretionary | 40,614,506 | | 17,450 | Legg Mason, Inc. | 1,570,849 |
|
| | |
| | | | | 23,310 | Lehman Brothers Holdings, Inc. | 1,814,450 |
| Consumer Staples (7.3%) | | | 11,750 | Marsh & McLennan | |
| 30,200 | Altria Group, Inc. | 2,456,166 | | | Companies, Inc. | 345,920 |
| 14,300 | Anheuser-Busch Companies, Inc. | 678,106 | | 21,650 | Merrill Lynch & Company, Inc. | 1,892,643 |
| 23,150 | Archer-Daniels-Midland Company | 891,275 | | 17,200 | Moody’s Corporation | 1,140,360 |
| 23,350 | Coca-Cola Company | 1,090,912 | | 24,150 | Morgan Stanley | 1,845,784 |
| 39,450 | Colgate-Palmolive Company | 2,523,616 | | 43,900 | Nasdaq Stock Market, Inc. # | 1,568,547 |
| 10,050 | Costco Wholesale Corporation | 536,469 | | 25,000 | State Street Corporation | 1,605,750 |
| 97,050 | CVS Corporation | 3,045,429 | | 29,900 | UBS AG | 1,789,216 |
| 90,300 | PepsiCo, Inc. | 5,728,632 | | 55,600 | Wells Fargo & Company | 2,017,724 |
|
|
| 89,039 | Procter & Gamble Company | 5,644,182 | | | Total Financials | 40,975,148 |
|
|
| 17,850 | Walgreen Company | 779,688 | | | | |
| 45,700 | Wal-Mart Stores, Inc. | 2,252,096 | | Health Care (16.6%) | |
|
| | |
| | Total Consumer Staples | 25,626,571 | | 48,800 | Abbott Laboratories | 2,318,488 |
|
| | |
| | | | | 17,750 | Allergan, Inc. | 2,050,125 |
| Energy (6.1%) | | | 74,350 | Amgen, Inc. # | 5,643,908 |
| 10,450 | Arch Coal, Inc. * | 361,884 | | 20,800 | Amylin Pharmaceuticals, Inc. # | 914,368 |
| 26,900 | Baker Hughes, Inc. | 1,857,445 | | 14,600 | AstraZeneca plc | 857,020 |
| The accompanying Notes to Financial Statements are an integral part of this schedule. |
|
| 120 |
Large Cap Growth Fund
Schedule of Investments as of October 31, 2006 |
| Shares | Common Stock (96.6%) | Value | | Shares | Common Stock (96.6%) | Value |
|
| |
| Health Care — continued | | | 15,500 | General Dynamics Corporation | $1,102,050 |
| 39,429 | Caremark Rx, Inc. | $1,941,090 | | 165,320 | General Electric Company | 5,804,385 |
| 26,000 | Celgene Corporation #* | 1,389,440 | | 17,500 | Illinois Tool Works, Inc. | 838,775 |
| 4,250 | CIGNA Corporation | 497,165 | | 13,050 | ITT Corporation | 709,790 |
| 19,850 | DaVita, Inc. # | 1,104,256 | | 14,500 | L-3 Communications | |
| 18,450 | Fisher Scientific | | | | Holdings, Inc. | 1,167,540 |
| | International, Inc. # | 1,579,689 | | 13,650 | Lockheed Martin Corporation | 1,186,594 |
| 57,400 | Genentech, Inc. # | 4,781,420 | | 21,950 | Manitowoc Company, Inc. | 1,204,616 |
| 31,655 | Genzyme Corporation # | 2,137,029 | | 12,300 | Monster Worldwide, Inc. # | 498,273 |
| 48,200 | Gilead Sciences, Inc. # | 3,320,980 | | 23,100 | Precision Castparts Corporation | 1,572,186 |
| 8,250 | Intuitive Surgical, Inc. #* | 818,235 | | 56,530 | United Technologies Corporation | 3,715,152 |
| 47,608 | Johnson & Johnson | 3,208,779 | | 10,900 | US Airways Group, Inc. # | 543,474 |
| 28,050 | McKesson Corporation | 1,405,024 | | 31,800 | Waste Management, Inc. | 1,191,864 |
|
|
| 30,800 | Medco Health Solutions, Inc. # | 1,647,800 | | | Total Industrials | 38,261,978 |
|
|
| 34,350 | MedImmune, Inc. # | 1,100,574 | | | | |
| 59,680 | Medtronic, Inc. | 2,905,222 | | Information Technology (27.2%) | |
| 32,950 | Novartis AG ADR | 2,001,054 | | 52,593 | Accenture, Ltd. | 1,730,836 |
| 37,250 | Pfizer, Inc. | 992,712 | | 80,750 | Adobe Systems, Inc. # | 3,088,688 |
| 24,300 | Pharmaceutical Product | | | 35,100 | Advanced Micro Devices, Inc. # | 746,577 |
| | Development, Inc. | 769,095 | | 33,400 | Agilent Technologies, Inc. # | 1,189,040 |
| 21,350 | Quest Diagnostics, Inc. | 1,061,949 | | 34,450 | Amdocs, Ltd. # | 1,335,282 |
| 22,000 | Schering-Plough Corporation | 487,080 | | 79,900 | Apple Computer, Inc. # | 6,478,292 |
| 48,950 | St. Jude Medical, Inc. # | 1,681,432 | | 33,100 | aQuantive, Inc. #* | 899,658 |
| 47,150 | Teva Pharmaceutical | | | 31,400 | Autodesk, Inc. # | 1,153,950 |
| | Industries, Ltd. | 1,554,536 | | 21,450 | Automatic Data Processing, Inc. | 1,060,488 |
| 71,250 | UnitedHealth Group, Inc. | 3,475,575 | | 87,650 | BEA Systems, Inc. # | 1,426,066 |
| 9,000 | Varian Medical Systems, Inc. # | 493,740 | | 39,525 | Broadcom Corporation # | 1,196,422 |
| 16,600 | Vertex Pharmaceuticals, Inc. # | 673,960 | | 48,300 | Cadence Design Systems, Inc. # | 862,638 |
| 27,450 | WellPoint, Inc. # | 2,094,984 | | 322,600 | Cisco Systems, Inc. # | 7,784,338 |
| 28,610 | Wyeth | 1,459,968 | | 29,693 | Citrix Systems, Inc. # | 876,834 |
| 23,750 | Zimmer Holdings, Inc. # | 1,710,238 | | 33,850 | Cognizant Technology | |
|
| | |
| | Total Health Care | 58,076,935 | | | Solutions Corporation #~ | 2,548,228 |
|
| | |
| | | | | 38,100 | Comverse Technology, Inc. # | 829,437 |
| Industrials (10.9%) | | | 141,050 | Corning, Inc. # | 2,881,652 |
| 33,550 | AMR Corporation #* | 950,807 | | 71,550 | Dell, Inc. # | 1,740,812 |
| 45,300 | Boeing Company | 3,617,658 | | 98,550 | eBay, Inc. # | 3,166,412 |
| 12,650 | Burlington Northern | | | 49,570 | Electronic Arts, Inc. # | 2,621,757 |
| | Santa Fe Corporation | 980,754 | | 80,430 | EMC Corporation # | 985,268 |
| 22,350 | Caterpillar, Inc. | 1,356,868 | | 43,291 | Entegris, Inc. # | 485,292 |
| 65,600 | CSX Corporation | 2,339,952 | | 22,250 | Fidelity National Information | |
| 32,100 | Danaher Corporation | 2,303,817 | | | Services, Inc. | 924,932 |
| 26,650 | Emerson Electric Company | 2,249,260 | | 51,600 | First Data Corporation | 1,251,300 |
| 17,650 | Expeditors International of | | | 20,700 | Google, Inc. #~ | 9,861,271 |
| | Washington, Inc. | 836,786 | | 77,700 | Hewlett-Packard Company | 3,010,098 |
| 22,550 | FedEx Corporation | 2,582,877 | | 14,150 | Infosys Technologies, Ltd. ADR * | 737,215 |
| 11,500 | Flowserve Corporation # | 609,500 | | 118,150 | Intel Corporation | 2,521,321 |
| 20,000 | Foster Wheeler, Ltd. #* | 899,000 | | 88,450 | Juniper Networks, Inc. # | 1,523,109 |
| The accompanying Notes to Financial Statements are an integral part of this schedule. |
|
| 121 |
Large Cap Growth Fund
Schedule of Investments as of October 31, 2006 |
| Shares | Common Stock (96.6%) | | Value | | | Shares | Common Stock (96.6%) | Value |
|
| |
| Information Technology — continued | | | Materials (2.2%) | | |
| 16,550 | Lam Research Corporation # | | $818,398 | | | 18,350 | Allegheny Technologies, Inc. * | $1,444,696 |
| 98,645 | Lawson Software, Inc. # | | 751,675 | | | 19,600 | Freeport-McMoRan | |
| 22,550 | Linear Technology Corporation | 701,756 | | | | Copper & Gold, Inc. | 1,185,408 |
| 100,100 | Marvell Technology Group, Ltd. # | 1,829,828 | | | 52,700 | Monsanto Company | 2,330,394 |
| 19,900 | MEMC Electronic Materials, Inc. # | 706,450 | | | 13,850 | Nucor Corporation | 808,978 |
| 11,550 | Microchip Technology, Inc. | | 380,342 | | | 33,250 | Praxair, Inc. | | 2,003,312 |
|
|
| 146,700 | Microsoft Corporation | | 4,211,757 | | | | Total Materials | 7,772,788 |
|
|
| 108,600 | Motorola, Inc. | | 2,504,316 | | | | | | |
| 53,150 | Network Appliance, Inc. # | | 1,939,975 | | Telecommunications Services (3.0%) | | |
| 23,800 | NVIDIA Corporation # | | 829,906 | | | 75,250 | America Movil SA de CV ADR | 3,225,968 |
| 129,795 | Oracle Corporation # | | 2,397,314 | | | 50,400 | AT&T, Inc. | | 1,726,200 |
| 163,200 | QUALCOMM, Inc. | | 5,938,848 | | | 70,550 | Crown Castle | | |
| 17,500 | SanDisk Corporation # | | 841,750 | | | | International Corporation # | 2,374,008 |
| 30,800 | Symantec Corporation # | | 611,072 | | | 33,000 | NII Holdings, Inc. #* | 2,145,990 |
| 65,250 | Texas Instruments, Inc. | | 1,969,245 | | | 50,150 | Sprint Nextel Corporation | 937,304 |
|
|
| 17,300 | Varian Semiconductor Equipment | | | | | Total Telecommunications | |
| | Associates, Inc. # | | 631,277 | | | | Services | | 10,409,470 |
|
|
| 42,900 | Xilinx, Inc. | | 1,094,379 | | | | | | |
|
|
| 93,900 | Yahoo!, Inc. # | | 2,473,326 | | | | Total Common Stock | |
|
| | |
| | Total Information | | | | | | (cost $324,211,263) | 338,840,239 |
|
|
| | Technology | 95,548,827 | | | | |
|
| | | |
| | | | | Interest | Maturity | |
| Shares | Collateral Held for Securities Loaned (2.6%) | Rate (+) | Date | Value |
|
| 9,102,649 | Thrivent Financial Securities Lending Trust | | | 5.300% | N/A | $9,102,649 |
| |
|
| | | Total Collateral Held for Securities Loaned | |
| | | (cost $9,102,649) | | | | 9,102,649 |
|
|
| The accompanying Notes to Financial Statements are an integral part of this schedule. |
|
| 122 |
Large Cap Growth Fund
Schedule of Investments as of October 31, 2006 |
| | | | | Interest | Maturity | |
| Shares | Short-Term Investments (3.7%) | | Rate (+) | Date | Value |
|
| 13,137,230 | Thrivent Money Market Fund | | 4.600% | N/A | $13,137,230 |
|
|
| | | Total Short-Term Investments (at amortized cost) | 13,137,230 |
|
|
| | | Total Investments (cost $346,451,142) 102.9% | $361,080,118 |
|
|
| | | Other Assets and Liabilities, Net (2.9%) | | (10,171,667) |
|
|
| | | Total Net Assets 100.0% | | $350,908,451 |
|
|
| |
| | | Number of | Exercise | Expiration | | Unrealized |
| Call Options Written | Contracts | Price | Date | Value | Gain/(Loss) |
|
| Cognizant Technology | | | | | |
| Solutions Corporation | 65 | $80.00 | November 2006 | ($9,750) | $2,516 |
| Google, Inc. | | 12 | $500.00 | November 2006 | ($4,680) | $1,596 |
# Non-income producing security.
* All or a portion of the security is on loan as discussed in item 2(L) of the Notes to Financial Statements.
+ The interest rate shown reflects the yield, coupon rate or, for securities purchased at a discount, the discount rate at the date of purchase.
~ All or a portion of the security was earmarked as collateral to cover options.
Definitions:
ADR — American Depository Receipts, which are certificates for shares of an underlying foreign security’s shares held by an issuing U.S. depository bank.
| Gross unrealized appreciation and depreciation of investments, based on cost for federal income tax purposes, were as follows: | |
| | |
| Gross unrealized appreciation | $23,388,389 | |
| Gross unrealized depreciation | (10,255,206) | |
|
| |
| Net unrealized appreciation (depreciation) | $13,133,183 | |
| Cost for federal income tax purposes | $347,946,935 | |
| The accompanying Notes to Financial Statements are an integral part of this schedule. |
|
| 123 |
Large Cap Value Fund
Schedule of Investments as of October 31, 2006 |
| Shares | Common Stock (96.3%) | Value | | Shares | Common Stock (96.3%) | Value |
|
| |
| Consumer Discretionary (7.2%) | | | 222,280 | Bank of America Corporation | $11,974,224 |
| 64,600 | BorgWarner, Inc. | $3,714,500 | | 65,100 | Chubb Corporation | 3,460,065 |
| 14,050 | CBS Corporation | 406,607 | | 259,432 | Citigroup, Inc. | 13,013,109 |
| 60,800 | Clear Channel | | | 35,300 | City National Corporation | 2,349,568 |
| | Communications, Inc. | 2,118,880 | | 68,300 | Countrywide Financial | |
| 188,200 | Comcast Corporation #* | 7,654,094 | | | Corporation | 2,603,596 |
| 68,700 | Federated Department Stores, Inc. | 3,016,617 | | 40,500 | Equity Office Properties Trust | 1,721,250 |
| 64,200 | J.C. Penney Company, Inc. | | | 12,900 | Everest Re Group, Ltd. | 1,279,422 |
| | (Holding Company) | 4,829,766 | | 66,240 | Federal Home Loan Mortgage | |
| 58,185 | Liberty Media Holding | | | | Corporation | 4,569,898 |
| | Corporation # | 5,181,956 | | 43,000 | Federal National Mortgage | |
| 66,125 | Liberty Media Holding | | | | Association | 2,548,180 |
| | Corporation # | 1,459,379 | | 15,900 | Goldman Sachs Group, Inc. | 3,017,661 |
| 7,375 | Live Nation, Inc. # | 156,792 | | 33,880 | Hartford Financial Services | |
| 46,200 | Office Depot, Inc. # | 1,939,938 | | | Group, Inc. | 2,953,320 |
| 144,500 | Visteon Corporation # | 1,066,410 | | 322,500 | J.P. Morgan Chase & Company | 15,299,400 |
| 172,400 | Walt Disney Company | 5,423,704 | | 53,700 | Lehman Brothers Holdings, Inc. | 4,180,008 |
|
| | |
| | Total Consumer | | | 86,700 | Mellon Financial Corporation | 3,363,960 |
| | Discretionary | 36,968,643 | | 72,800 | Morgan Stanley | 5,564,104 |
|
| | |
| | | | | 23,300 | PMI Group, Inc. * | 993,745 |
| Consumer Staples (7.6%) | | | 86,400 | PNC Financial Services Group, Inc. | 6,050,592 |
| 134,500 | Altria Group, Inc. | 10,938,885 | | 99,200 | Principal Financial Group, Inc. | 5,603,808 |
| 60,500 | Anheuser-Busch Companies, Inc. | 2,868,910 | | 74,000 | Prudential Financial, Inc. | 5,692,820 |
| 91,100 | Estee Lauder Companies, Inc. | 3,679,529 | | 12,900 | Simon Property Group, Inc. | 1,252,590 |
| 81,500 | General Mills, Inc. | 4,630,830 | | 105,700 | St. Paul Travelers Companies, Inc. | 5,404,441 |
| 50,100 | Kellogg Company | 2,520,531 | | 92,100 | State Street Corporation | 5,915,583 |
| 53,310 | Kimberly-Clark Corporation | 3,546,181 | | 87,800 | U.S. Bancorp | 2,971,152 |
| 92,200 | Kroger Company | 2,073,578 | | 106,514 | Wachovia Corporation | 5,911,527 |
| 73,100 | Reynolds American, Inc. * | 4,616,996 | | 94,062 | Washington Mutual, Inc. * | 3,978,823 |
| 78,700 | Wal-Mart Stores, Inc. | 3,878,336 | | 193,700 | Wells Fargo & Company | 7,029,373 |
|
| | |
|
| | Total Consumer Staples | 38,753,776 | | | Total Financials | 146,098,526 |
|
| | |
|
| |
| Energy (9.5%) | | | Health Care (9.7%) | |
| 58,950 | Apache Corporation | 3,850,614 | | 162,700 | Abbott Laboratories | 7,729,877 |
| 152,614 | Chevron Corporation | 10,255,661 | | 65,100 | Baxter International, Inc. | 2,992,647 |
| 84,612 | ConocoPhillips | 5,097,027 | | 7,200 | Biotech HOLDRS Trust | 1,380,528 |
| 235,200 | Exxon Mobil Corporation | 16,797,983 | | 27,500 | Eli Lilly and Company | 1,540,275 |
| 45,900 | Marathon Oil Corporation | 3,965,760 | | 31,000 | GlaxoSmithKline plc | 1,650,750 |
| 62,700 | Occidental Petroleum | | | 69,700 | HCA, Inc. | 3,521,244 |
| | Corporation | 2,943,138 | | 52,060 | Johnson & Johnson | 3,508,844 |
| 87,700 | Schlumberger, Ltd. | 5,532,116 | | 79,600 | McKesson Corporation | 3,987,164 |
|
| | |
| | Total Energy | 48,442,299 | | 31,100 | Novartis AG ADR | 1,888,703 |
|
| | |
| | | | | 451,800 | Pfizer, Inc. | 12,040,470 |
| Financials (28.6%) | | | 144,600 | Sanofi-Aventis ADR | 6,172,974 |
| 55,900 | ACE, Ltd. | 3,200,275 | | 58,000 | Wyeth | 2,959,740 |
|
|
| 107,000 | Allstate Corporation | 6,565,520 | | | Total Health Care | 49,373,216 |
|
|
| 113,600 | American International | | | | | |
| | Group, Inc. | 7,630,512 | | | | |
| The accompanying Notes to Financial Statements are an integral part of this schedule. |
|
| 124 |
Large Cap Value Fund
Schedule of Investments as of October 31, 2006 |
| Shares | Common Stock (96.3%) | Value | | Shares | Common Stock (96.3%) | Value |
|
| |
| Industrials (12.0%) | | | Materials (3.7%) | |
| 92,100 | AMR Corporation #* | $2,610,114 | | 85,450 | Alcoa, Inc. | $2,470,360 |
| 68,000 | CSX Corporation | 2,425,560 | | 107,400 | E.I. du Pont de Nemours and | |
| 18,200 | Deere & Company | 1,549,366 | | | Company | 4,918,920 |
| 65,200 | Emerson Electric Company | 5,502,880 | | 156,740 | International Paper Company | 5,227,279 |
| 153,300 | Flowserve Corporation # | 8,124,900 | | 79,600 | MeadWestvaco Corporation * | 2,190,592 |
| 204,300 | General Electric Company | 7,172,973 | | 67,800 | Praxair, Inc. | 4,084,950 |
|
|
| 87,300 | Lockheed Martin Corporation | 7,588,989 | | | Total Materials | 18,892,101 |
|
|
| 49,400 | Parker-Hannifin Corporation | 4,131,322 | | | | |
| 127,900 | Republic Services, Inc. | 5,245,179 | | Telecommunications Services (5.7%) | |
| 183,300 | Steelcase, Inc. * | 3,037,281 | | 37,500 | ALLTEL Corporation | 1,999,125 |
| 62,800 | Union Pacific Corporation | 5,691,564 | | 259,487 | AT&T, Inc. | 8,887,430 |
| 126,500 | United Technologies Corporation | 8,313,580 | | 100,820 | BellSouth Corporation | 4,546,982 |
|
| | |
| | Total Industrials | 61,393,708 | | 238,392 | Sprint Nextel Corporation | 4,455,546 |
|
| | |
| | | | | 246,464 | Verizon Communications, Inc. | 9,119,168 |
|
|
| Information Technology (9.9%) | | | | Total Telecommunications | |
| 99,200 | Accenture, Ltd. | 3,264,672 | | | Services | 29,008,251 |
|
|
| 93,200 | Amdocs, Ltd. # | 3,612,432 | | | | |
| 55,920 | Applied Materials, Inc. | 972,449 | | Utilities (2.4%) | |
| 46,300 | Comverse Technology, Inc. #* | 1,007,951 | | 37,100 | Entergy Corporation | 3,184,293 |
| 131,300 | Hewlett-Packard Company | 5,086,562 | | 85,600 | Exelon Corporation | 5,305,488 |
| 181,750 | Hyperion Solutions Corporation # 6,797,450 | | 66,300 | FirstEnergy Corporation | 3,901,755 |
|
|
| 122,450 | International Business Machines | | | | Total Utilities | 12,391,536 |
|
|
| | Corporation | 11,305,808 | | | | |
|
|
| 200,500 | Microsoft Corporation | 5,756,355 | | | Total Common Stock | |
| 96,400 | Molex, Inc. * | 3,364,360 | | | (cost $403,826,945) | 491,602,619 |
|
|
| 89,000 | Motorola, Inc. | 2,052,340 | | | | |
| 102,850 | Nokia Oyj ADR | 2,044,658 | | | | |
| 87,000 | Oracle Corporation # | 1,606,890 | | | | |
| 323,400 | Tellabs, Inc. # | 3,408,636 | | | | |
|
| | |
| | Total Information | | | | | |
| | Technology | 50,280,563 | | | | |
|
| | |
| The accompanying Notes to Financial Statements are an integral part of this schedule. |
|
| 125 |
| Large Cap Value Fund | | | |
| Schedule of Investments as of October 31, 2006 | | | |
| |
| | | Interest | Maturity | |
| Shares | Collateral Held for Securities Loaned (3.3%) | Rate (+) | Date | Value |
|
| 17,069,352 | Thrivent Financial Securities Lending Trust | 5.300% | N/A | $17,069,352 |
|
|
| | Total Collateral Held for Securities Loaned | |
| | (cost $17,069,352) | | | 17,069,352 |
|
|
| |
| |
| | | Interest | Maturity | |
| Shares | Short-Term Investments (2.9%) | Rate (+) | Date | Value |
|
| 14,541,584 | Thrivent Money Market Fund | 4.600% | N/A | $14,541,584 |
|
|
| | Total Short-Term Investments (at amortized cost) | 14,541,584 |
|
|
| | Total Investments (cost $435,437,881) 102.5% | $523,213,555 |
|
|
| | Other Assets and Liabilities, Net (2.5%) | | (12,712,833) |
|
|
| | Total Net Assets 100.0% | | | $510,500,722 |
|
|
# Non-income producing security.
* All or a portion of the security is on loan as discussed in item 2(L) of the Notes to Financial Statements.
+ The interest rate shown reflects the yield, coupon rate or, for securities purchased at a discount, the discount rate at the date of purchase.
Definitions:
ADR — American Depository Receipts, which are certificates for shares of an underlying foreign security’s shares held by an issuing U.S. depository bank.
| Gross unrealized appreciation and depreciation of investments, based on cost for federal income tax purposes, were as follows: | |
| Gross unrealized appreciation | $91,366,752 | |
| Gross unrealized depreciation | (3,906,612) | |
| |
| |
| Net unrealized appreciation (depreciation) | $87,460,140 | |
| Cost for federal income tax purposes | $435,753,415 | |
| The accompanying Notes to Financial Statements are an integral part of this schedule. |
|
| 126 |
Large Cap Stock Fund
Schedule of Investments as of October 31, 2006 |
| Shares | Common Stock (94.5%) | Value | | Shares | Common Stock (94.5%) | Value |
|
| |
| Consumer Discretionary (9.9%) | | | Energy (9.2%) | |
| 256,300 | Best Buy Company, Inc. | $14,160,575 | | 212,600 | Apache Corporation | $13,887,032 |
| 199,800 | CBS Corporation | 5,782,212 | | 240,800 | BJ Services Company | 7,262,528 |
| 272,500 | Circuit City Stores, Inc. * | 7,352,050 | | 718,551 | Chevron Corporation | 48,286,627 |
| 785,600 | Comcast Corporation #* | 31,801,088 | | 548,929 | ConocoPhillips | 33,067,483 |
| 167,500 | Fortune Brands, Inc. * | 12,889,125 | | 102,100 | Diamond Offshore Drilling, Inc. * | 7,068,383 |
| 187,800 | Genuine Parts Company * | 8,548,656 | | 1,763,746 | Exxon Mobil Corporation | 125,966,740 |
| 186,300 | Harley-Davidson, Inc. * | 12,785,769 | | 125,700 | National Oilwell Varco, Inc. # | 7,592,280 |
| 163,900 | J.C. Penney Company, Inc. | | | 370,000 | Occidental Petroleum | |
| | (Holding Company) * | 12,330,197 | | | Corporation | 17,367,800 |
| 129,000 | Johnson Controls, Inc. * | 10,518,660 | | 375,800 | Schlumberger, Ltd. * | 23,705,464 |
| 131,200 | Kohl’s Corporation # | 9,262,720 | | 98,700 | Total SA ADR | 6,725,418 |
| 318,800 | Limited Brands, Inc. | 9,395,036 | | 81,100 | Transocean, Inc. # | 5,882,994 |
| 478,600 | Lowe’s Companies, Inc. | 14,425,004 | | 188,100 | Valero Energy Corporation | 9,843,273 |
| 655,400 | McDonald’s Corporation | 27,474,368 | | 185,700 | XTO Energy, Inc. | 8,664,762 |
|
|
| 263,100 | McGraw-Hill Companies, Inc. | 16,883,127 | | | Total Energy | 315,320,784 |
|
|
| 433,400 | Newell Rubbermaid, Inc. * | 12,473,252 | | | | |
| 958,000 | News Corporation | 19,974,300 | | Financials (21.9%) | |
| 223,200 | Nordstrom, Inc. * | 10,568,520 | | 204,500 | ACE, Ltd. | 11,707,625 |
| 237,000 | Office Depot, Inc. # | 9,951,630 | | 99,900 | Allstate Corporation | 6,129,864 |
| 148,700 | Omnicom Group, Inc. | 15,085,615 | | 48,200 | Ambac Financial Group, Inc. * | 4,024,218 |
| 631,700 | Staples, Inc. | 16,291,543 | | 261,000 | American Capital Strategies, Ltd. * | 11,264,760 |
| 168,400 | Starwood Hotels & Resorts | | | 450,300 | American Express Company | 26,031,843 |
| | Worldwide, Inc. | 10,060,216 | | 704,952 | American International | |
| 118,200 | Target Corporation | 6,995,076 | | | Group, Inc. | 47,351,626 |
| 714,500 | Time Warner, Inc. | 14,297,145 | | 158,280 | Ameriprise Financial, Inc. | 8,151,420 |
| 948,700 | Walt Disney Company | 29,846,102 | | 150,100 | Archstone-Smith Trust | 9,037,521 |
|
| | |
| | Total Consumer | | | 158,400 | Assurant, Inc. * | 8,341,344 |
| | Discretionary | 339,151,986 | | 1,393,382 | Bank of America Corporation | 75,061,488 |
|
| | |
| | | | | 315,300 | Chubb Corporation | 16,758,195 |
| Consumer Staples (8.3%) | | | 260,100 | CIT Group, Inc. | 13,538,205 |
| 159,400 | Alberto-Culver Company | 8,099,114 | | 1,318,248 | Citigroup, Inc. | 66,123,320 |
| 516,100 | Altria Group, Inc. | 41,974,413 | | 189,700 | Federal Home Loan Mortgage | |
| 205,000 | Anheuser-Busch Companies, Inc. 9,721,100 | | | Corporation | 13,087,403 |
| 692,200 | Coca-Cola Company | 32,339,584 | | 256,300 | Federal National Mortgage | |
| 245,000 | Colgate-Palmolive Company | 15,672,650 | | | Association | 15,188,338 |
| 256,300 | CVS Corporation | 8,042,694 | | 74,300 | Franklin Resources, Inc. | 8,467,228 |
| 91,800 | Diageo plc | 6,836,346 | | 207,900 | Genworth Financial, Inc. | 6,952,176 |
| 246,300 | General Mills, Inc. | 13,994,766 | | 114,900 | Goldman Sachs Group, Inc. | 21,806,871 |
| 37,400 | Kraft Foods, Inc. * | 1,286,560 | | 212,100 | Hartford Financial Services | |
| 136,900 | Pepsi Bottling Group, Inc. | 4,328,778 | | | Group, Inc. | 18,488,757 |
| 536,400 | PepsiCo, Inc. | 34,029,216 | | 1,068,084 | J.P. Morgan Chase & Company | 50,669,905 |
| 977,700 | Procter & Gamble Company | 61,976,403 | | 270,400 | KeyCorp | 10,042,656 |
| 126,100 | Reynolds American, Inc. * | 7,964,476 | | 90,700 | Kimco Realty Corporation * | 4,029,801 |
| 384,000 | Safeway, Inc. | 11,274,240 | | 266,400 | Lehman Brothers Holdings, Inc. | 20,736,576 |
| 519,100 | Wal-Mart Stores, Inc. | 25,581,248 | | 253,300 | Lincoln National Corporation * | 16,036,423 |
|
| | |
| | Total Consumer Staples | 283,121,588 | | 163,600 | Loews Corporation * | 6,367,312 |
|
| | |
| The accompanying Notes to Financial Statements are an integral part of this schedule. |
|
| 127 |
Large Cap Stock Fund
Schedule of Investments as of October 31, 2006 |
| Shares | Common Stock (94.5%) | | Value | | Shares | Common Stock (94.5%) | | Value |
|
| |
| Financials — continued | | | | Industrials (10.5%) | | |
| 195,600 | Marshall & Ilsley Corporation * | | $9,377,064 | | 106,800 | 3M Company | | $8,420,112 |
| 139,300 | MBIA, Inc. * | | 8,639,386 | | 137,500 | Avery Dennison Corporation * | | 8,681,750 |
| 160,500 | Merrill Lynch & Company, Inc. | | 14,030,910 | | 186,300 | Boeing Company | | 14,877,918 |
| 427,400 | MetLife, Inc. | | 24,417,362 | | 191,100 | Burlington Northern Santa Fe | | |
| 370,950 | Morgan Stanley | | 28,351,708 | | | Corporation | | 14,815,983 |
| 123,300 | PNC Financial Services Group, Inc. | 8,634,699 | | 180,700 | Caterpillar, Inc. | | 10,970,297 |
| 177,000 | Principal Financial Group, Inc. | | 9,998,730 | | 97,800 | Cooper Industries, Ltd. | | 8,748,210 |
| 178,600 | ProLogis Trust | | 11,300,022 | | 197,700 | CSX Corporation | | 7,051,959 |
| 211,808 | Prudential Financial, Inc. * | | 16,294,389 | | 66,400 | Deere & Company * | | 5,652,632 |
| 59,900 | SAFECO Corporation * | | 3,485,581 | | 185,000 | Dover Corporation | | 8,787,500 |
| 94,700 | Simon Property Group, Inc. | | 9,195,370 | | 115,600 | Emerson Electric Company | | 9,756,640 |
| 440,200 | St. Paul Travelers Companies, Inc. | 22,507,426 | | 83,500 | FedEx Corporation | | 9,564,090 |
| 494,600 | U.S. Bancorp | | 16,737,264 | | 205,800 | General Dynamics Corporation | | 14,632,380 |
| 182,500 | W.R. Berkley Corporation | | 6,726,950 | | 2,944,100 | General Electric Company | | 103,367,351 |
| 458,844 | Wachovia Corporation | | 25,465,842 | | 187,200 | Goodrich Corporation | | 8,253,648 |
| 1,091,200 | Wells Fargo & Company | | 39,599,648 | | 244,200 | Honeywell International, Inc. | | 10,285,704 |
|
| | |
| | Total Financials | | 750,157,226 | | 104,000 | Illinois Tool Works, Inc. | | 4,984,720 |
|
| | |
| | | | | | 126,900 | Lockheed Martin Corporation | | 11,031,417 |
| Health Care (12.7%) | | | | 101,400 | Manpower, Inc. * | | 6,871,878 |
| 565,600 | Abbott Laboratories | | 26,871,656 | | 78,900 | Norfolk Southern Corporation | | 4,147,773 |
| 270,600 | AmerisourceBergen Corporation | | 12,772,320 | | 11,600 | Parker-Hannifin Corporation | | 970,108 |
| 409,400 | Amgen, Inc. # | | 31,077,554 | | 131,900 | Precision Castparts Corporation * | 8,977,114 |
| 99,100 | AstraZeneca plc * | | 5,817,170 | | 253,200 | Raytheon Company | | 12,647,340 |
| 318,700 | Baxter International, Inc. | | 14,650,639 | | 87,700 | Rockwell Automation, Inc. | | 5,437,400 |
| 268,300 | Cardinal Health, Inc. | | 17,560,235 | | 73,400 | Union Pacific Corporation | | 6,652,242 |
| 314,100 | Caremark Rx, Inc. | | 15,463,143 | | 161,400 | United Parcel Service, Inc. | | 12,161,490 |
| 150,000 | Eli Lilly and Company | | 8,401,500 | | 420,400 | United Technologies Corporation | 27,628,688 |
| 166,000 | GlaxoSmithKline plc | | 8,839,500 | | 327,600 | Waste Management, Inc. | | 12,278,448 |
|
|
| 124,800 | Henry Schein, Inc. #* | | 6,201,312 | | | Total Industrials | 357,654,792 |
|
|
| 804,800 | Johnson & Johnson | | 54,243,520 | | | | | |
| 139,600 | Laboratory Corporation of | | | | Information Technology (14.3%) | | |
| | America Holdings #* | | 9,561,204 | | 236,200 | Accenture, Ltd. | | 7,773,342 |
| 319,900 | McKesson Corporation | | 16,023,791 | | 217,800 | Adobe Systems, Inc. # | | 8,330,850 |
| 258,400 | Medco Health Solutions, Inc. # | | 13,824,400 | | 137,100 | Agilent Technologies, Inc. # | | 4,880,760 |
| 304,900 | Medtronic, Inc. * | | 14,842,532 | | 124,600 | Alliance Data Systems | | |
| 578,800 | Merck & Company, Inc. | | 26,289,096 | | | Corporation #* | | 7,565,712 |
| 162,000 | Novartis AG ADR | | 9,838,260 | | 302,200 | Apple Computer, Inc. # | | 24,502,376 |
| 1,929,375 | Pfizer, Inc. | | 51,417,844 | | 400,700 | Applied Materials, Inc. | | 6,968,173 |
| 150,200 | Quest Diagnostics, Inc. | | 7,470,948 | | 261,200 | Arrow Electronics, Inc. # | | 7,796,820 |
| 833,300 | Schering-Plough Corporation | | 18,449,262 | | 355,300 | BEA Systems, Inc. # | | 5,780,731 |
| 366,900 | UnitedHealth Group, Inc. | | 17,897,382 | | 2,044,200 | Cisco Systems, Inc. # | | 49,326,546 |
| 298,300 | WellPoint, Inc. # | | 22,766,256 | | 258,800 | Citrix Systems, Inc. # | | 7,642,364 |
| 480,000 | Wyeth * | | 24,494,400 | | 319,992 | First Data Corporation | | 7,759,806 |
|
| | |
| | Total Health Care | 434,773,924 | | 261,400 | Freescale Semiconductor, Inc. # | | 10,280,862 |
|
| | |
| | | | | | 154,700 | Global Payments, Inc. | | 6,761,937 |
| | | | | | 47,800 | Google, Inc. # | | 22,771,442 |
| The accompanying Notes to Financial Statements are an integral part of this schedule. |
|
| 128 |
| Large Cap Stock Fund | | | | | | | |
| Schedule of Investments as of October 31, 2006 | | | | | | |
| |
| Shares | Common Stock (94.5%) | | Value | | Shares | Common Stock (94.5%) | Value |
|
| |
| Information Technology — continued | | | 138,200 | PPG Industries, Inc. * | | $9,452,880 |
| 145,000 | Harris Corporation * | | $6,177,000 | | 287,500 | Praxair, Inc. * | | 17,321,875 |
| 1,057,900 | Hewlett-Packard Company | | 40,983,046 | | 103,200 | Sigma-Aldrich Corporation * | 7,751,352 |
|
|
| 328,400 | Integrated Device | | | | | Total Materials | | 59,079,106 |
|
|
| | Technology, Inc. # | | 5,205,140 | | | | | |
| 1,514,400 | Intel Corporation | | 32,317,296 | | Telecommunications Services (2.8%) | |
| 378,400 | International Business Machines | | | 1,283,771 | AT&T, Inc. | | 43,969,157 |
| | Corporation | | 34,937,672 | | 490,700 | BellSouth Corporation | | 22,130,570 |
| 217,000 | Jabil Circuit, Inc. * | | 6,230,070 | | 782,200 | Verizon Communications, Inc. | 28,941,400 |
|
|
| 117,600 | Lam Research Corporation # | 5,815,320 | | | Total Telecommunications | |
| 2,284,600 | Microsoft Corporation | | 65,590,866 | | | Services | | 95,041,127 |
|
|
| 949,100 | Motorola, Inc. | | 21,886,246 | | | | | |
| 184,200 | NCR Corporation # | | 7,647,984 | | Utilities (3.2%) | | |
| 221,700 | Network Appliance, Inc. # | | 8,092,050 | | 279,700 | American Electric Power | | |
| 1,491,100 | Oracle Corporation # | | 27,540,617 | | | Company, Inc. | | 11,587,971 |
| 261,400 | Paychex, Inc. | | 10,320,072 | | 192,800 | Exelon Corporation | | 11,949,744 |
| 436,300 | QUALCOMM, Inc. | | 15,876,957 | | 305,500 | FirstEnergy Corporation * | | 17,978,675 |
| 473,500 | Texas Instruments, Inc. | | 14,290,230 | | 257,800 | FPL Group, Inc. * | | 13,147,800 |
| 319,992 | Western Union Company # | | 7,055,824 | | 123,400 | ONEOK, Inc. | | 5,137,142 |
|
| | |
| | Total Information | | | | 245,500 | PG&E Corporation | | 10,590,870 |
| | Technology | | 488,108,111 | | 400,200 | PPL Corporation | | 13,814,904 |
|
| | | |
| | | | | | 203,500 | Sempra Energy * | | 10,793,640 |
| Materials (1.7%) | | | | 250,000 | TXU Corporation | | 15,782,500 |
|
|
| 179,000 | Air Products and Chemicals, Inc. | 12,470,930 | | | Total Utilities | | 110,783,246 |
|
|
| 149,500 | Ball Corporation | | 6,217,705 | | | | | |
|
|
| 100,400 | Nucor Corporation | | 5,864,364 | | | Total Common Stock | | |
| | | | | | | (cost $2,298,034,482) | | 3,233,191,890 |
|
|
| The accompanying Notes to Financial Statements are an integral part of this schedule. |
|
| 129 |
Large Cap Stock Fund
Schedule of Investments as of October 31, 2006 |
| | | Interest | Maturity | |
| Shares | Collateral Held for Securities Loaned (3.8%) | Rate (+) | Date | Value |
|
| 129,465,761 | Thrivent Financial Securities Lending Trust | 5.300% | N/A | $129,465,761 |
|
|
| | Total Collateral Held for Securities Loaned | |
| | (cost $129,465,761) | | | 129,465,761 |
|
|
| |
| |
| Shares or | | | | |
| Principal | | Interest | Maturity | |
| Amount | Short-Term Investments (5.3%) | Rate (+) | Date | Value |
|
| $99,980,000 | Barclays Bank plc Repurchase Agreement ▪ | 5.280% | 11/1/2006 | $99,980,000 |
| 8,300,000 | Federal National Mortgage Association | 5.200 | 2/7/2007 | 8,185,219 |
| 10,000,000 | Jupiter Securitization Company, LLC | 5.300 | 11/17/2006 | 9,976,622 |
| 10,000,000 | Jupiter Securitization Company, LLC | 5.260 | 11/27/2006 | 9,962,011 |
| 10,000,000 | Kitty Hawk Funding Corporation | 5.260 | 11/1/2006 | 10,000,000 |
| 10,000,000 | Preferred Receivables Funding Corporation | 5.265 | 11/13/2006 | 9,982,450 |
| 34,077,671 | Thrivent Money Market Fund | 4.600 | N/A | 34,077,671 |
|
|
| | Total Short-Term Investments (cost $182,162,380) | 182,163,973 |
|
|
| | Total Investments (cost $2,609,662,623) 103.6% | $3,544,821,624 |
|
|
| | Other Assets and Liabilities, Net (3.6%) | | (122,902,272) |
|
|
| | Total Net Assets 100.000 | | | $3,421,919,352 |
|
|
# Non-income producing security.
* All or a portion of the security is on loan as discussed in item 2(L) of the Notes to Financial Statements.
+ The interest rate shown reflects the yield, coupon rate or, for securities purchased at a discount, the discount rate at the date of purchase.
▪ Repurchase agreement dated October 31, 2006, $99,980,432 maturing November 1, 2006, collateralized by $101,980,040 of Federal Home Loan Mortgage Corporation Notes, 4.240% due February 22, 2010.
Definitions:
ADR — American Depository Receipts, which are certificates for shares of an underlying foreign security’s shares held by an issuing U.S. depository bank.
| Gross unrealized appreciation and depreciation of investments, based on cost for federal income tax purposes, were as follows: | |
| Gross unrealized appreciation | $938,625,557 | |
| Gross unrealized depreciation | (11,045,590) | |
| |
| |
| Net unrealized appreciation (depreciation) | $927,579,967 | |
| Cost for federal income tax purposes | $2,617,241,657 | |
The accompanying Notes to Financial Statements are an integral part of this schedule.
130
Large Cap Index Fund
Schedule of Investments as of October 31, 2006 |
| Shares | Common Stock (97.5%) | Value | | Shares | Common Stock (97.5%) | Value |
|
| |
| Consumer Discretionary (10.2%) | | | 600 | KB Home * | $26,964 |
| 2,300 | Amazon.com, Inc. #* | $87,607 | | 2,400 | Kohl’s Corporation # | 169,440 |
| 1,000 | Apollo Group, Inc. # | 36,960 | | 1,300 | Leggett & Platt, Inc. | 30,355 |
| 1,200 | AutoNation, Inc. # | 24,060 | | 1,000 | Lennar Corporation | 47,480 |
| 400 | AutoZone, Inc. # | 44,800 | | 2,400 | Limited Brands, Inc. | 70,728 |
| 2,100 | Bed Bath & Beyond, Inc. # | 84,609 | | 800 | Liz Claiborne, Inc. | 33,736 |
| 2,975 | Best Buy Company, Inc. | 164,369 | | 11,100 | Lowe’s Companies, Inc. | 334,554 |
| 700 | Big Lots, Inc. #* | 14,756 | | 2,500 | Marriott International, Inc. | 104,425 |
| 500 | Black & Decker Corporation | 41,940 | | 2,800 | Mattel, Inc. | 63,364 |
| 700 | Brunswick Corporation | 22,050 | | 8,900 | McDonald’s Corporation | 373,088 |
| 3,300 | Carnival Corporation | 161,106 | | 2,600 | McGraw-Hill Companies, Inc. | 166,842 |
| 5,750 | CBS Corporation | 166,405 | | 300 | Meredith Corporation | 15,750 |
| 900 | Centex Corporation | 47,070 | | 1,100 | New York Times Company * | 26,587 |
| 1,000 | Circuit City Stores, Inc. | 26,980 | | 2,000 | Newell Rubbermaid, Inc. | 57,560 |
| 3,700 | Clear Channel Communications, Inc. | 128,945 | | 16,900 | News Corporation | 352,365 |
| 2,600 | Coach, Inc. # | 103,064 | | 1,400 | NIKE, Inc. | 128,632 |
| 15,187 | Comcast Corporation # | 617,655 | | 1,700 | Nordstrom, Inc. | 80,495 |
| 1,900 | D.R. Horton, Inc. | 44,517 | | 2,100 | Office Depot, Inc. # | 88,179 |
| 1,000 | Darden Restaurants, Inc. | 41,900 | | 500 | OfficeMax, Inc. | 23,790 |
| 400 | Dillard’s, Inc. | 12,068 | | 1,300 | Omnicom Group, Inc. | 131,885 |
| 2,200 | Dollar General Corporation | 30,866 | | 1,600 | Pulte Homes, Inc. | 49,584 |
| 500 | Dow Jones & Company, Inc. * | 17,545 | | 1,000 | RadioShack Corporation * | 17,840 |
| 700 | E.W. Scripps Company | 34,622 | | 672 | Sears Holdings Corporation #* | 117,244 |
| 2,000 | Eastman Kodak Company * | 48,800 | | 900 | Sherwin-Williams Company | 53,307 |
| 1,100 | Family Dollar Stores, Inc. | 32,395 | | 400 | Snap-On, Inc. | 18,812 |
| 3,956 | Federated Department Stores, Inc. | 173,708 | | 500 | Stanley Works | 23,825 |
| 13,600 | Ford Motor Company * | 112,608 | | 5,250 | Staples, Inc. | 135,398 |
| 1,100 | Fortune Brands, Inc. | 84,645 | | 5,400 | Starbucks Corporation # | 203,850 |
| 1,700 | Gannett Company, Inc. | 100,538 | | 1,600 | Starwood Hotels & Resorts | |
| 4,000 | Gap, Inc. | 84,080 | | | Worldwide, Inc. | 95,584 |
| 4,200 | General Motors Corporation * | 146,664 | | 6,300 | Target Corporation | 372,834 |
| 1,200 | Genuine Parts Company | 54,624 | | 1,000 | Tiffany & Company | 35,720 |
| 1,200 | Goodyear Tire & Rubber Company #* | 18,396 | | 29,450 | Time Warner, Inc. | 589,294 |
| 2,400 | H&R Block, Inc. | 52,464 | | 3,300 | TJX Companies, Inc. | 95,535 |
| 2,000 | Harley-Davidson, Inc. * | 137,260 | | 1,400 | Tribune Company * | 46,662 |
| 500 | Harman International Industries, Inc. | 51,175 | | 1,800 | Univision Communications, Inc. # | 63,108 |
| 1,300 | Harrah’s Entertainment, Inc. | 96,629 | | 600 | VF Corporation | 45,606 |
| 1,100 | Hasbro, Inc. | 28,512 | | 5,250 | Viacom, Inc. # | 204,330 |
| 2,800 | Hilton Hotels Corporation | 80,976 | | 15,100 | Walt Disney Company | 475,046 |
| 14,900 | Home Depot, Inc. | 556,217 | | 800 | Wendy’s International, Inc. | 27,680 |
| 2,400 | International Game Technology | 102,024 | | 484 | Whirlpool Corporation * | 42,050 |
| 3,300 | Interpublic Group of | | | 1,500 | Wyndham Worldwide Corporation # | 44,250 |
| | Companies, Inc. #* | 36,003 | | 2,000 | Yum! Brands, Inc. | 118,920 |
|
|
| 1,600 | J.C. Penney Company, Inc. | | | | Total Consumer | |
| | (Holding Company) | 120,368 | | | Discretionary | 9,427,048 |
|
|
| 1,500 | Johnson Controls, Inc. | 122,310 | | | | |
| 900 | Jones Apparel Group, Inc. | 30,060 | | | | |
| The accompanying Notes to Financial Statements are an integral part of this schedule. |
|
| 131 |
Large Cap Index Fund
Schedule of Investments as of October 31, 2006 |
| Shares | Common Stock (97.5%) | Value | | Shares | Common Stock (97.5%) | Value |
|
| |
| Consumer Staples (9.2%) | | | 2,800 | Chesapeake Energy Corporation * | $90,832 |
| 650 | Alberto-Culver Company | $33,026 | | 15,903 | Chevron Corporation | 1,068,682 |
| 15,200 | Altria Group, Inc. ∈ | 1,236,216 | | 11,888 | ConocoPhillips | 716,133 |
| 5,500 | Anheuser-Busch Companies, Inc. | 260,810 | | 1,400 | CONSOL Energy, Inc. | 49,546 |
| 4,796 | Archer-Daniels-Midland Company | 184,646 | | 3,300 | Devon Energy Corporation | 220,572 |
| 3,300 | Avon Products, Inc. | 100,353 | | 4,992 | El Paso Corporation | 68,390 |
| 600 | Brown-Forman Corporation | 43,314 | | 1,800 | EOG Resources, Inc. | 119,754 |
| 1,700 | Campbell Soup Company | 63,546 | | 43,100 | Exxon Mobil Corporation | 3,078,201 |
| 1,100 | Clorox Company | 71,016 | | 7,400 | Halliburton Company | 239,390 |
| 14,700 | Coca-Cola Company | 686,784 | | 1,800 | Hess Corporation | 76,320 |
| 2,100 | Coca-Cola Enterprises, Inc. * | 42,063 | | 800 | Kinder Morgan, Inc. | 84,080 |
| 3,800 | Colgate-Palmolive Company | 243,086 | | 2,665 | Marathon Oil Corporation | 230,256 |
| 3,800 | ConAgra Foods, Inc. | 99,370 | | 1,400 | Murphy Oil Corporation | 66,024 |
| 1,500 | Constellation Brands, Inc. # | 41,235 | | 2,200 | Nabors Industries, Ltd. # | 67,936 |
| 3,400 | Costco Wholesale Corporation | 181,492 | | 1,300 | National Oilwell Varco, Inc. # | 78,520 |
| 5,900 | CVS Corporation | 185,142 | | 900 | Noble Corporation | 63,090 |
| 1,000 | Dean Foods Company # | 41,890 | | 6,200 | Occidental Petroleum Corporation | 291,028 |
| 900 | Estee Lauder Companies, Inc. | 36,351 | | 900 | Rowan Companies, Inc. | 30,042 |
| 2,500 | General Mills, Inc. | 142,050 | | 8,500 | Schlumberger, Ltd. | 536,180 |
| 2,400 | H.J. Heinz Company | 101,184 | | 1,500 | Smith International, Inc. | 59,220 |
| 1,200 | Hershey Company * | 63,492 | | 900 | Sunoco, Inc. | 59,517 |
| 1,800 | Kellogg Company | 90,558 | | 2,200 | Transocean, Inc. # | 159,588 |
| 3,400 | Kimberly-Clark Corporation | 226,168 | | 4,400 | Valero Energy Corporation | 230,252 |
| 5,300 | Kroger Company | 119,197 | | 2,600 | Weatherford International, Ltd. # | 106,808 |
| 900 | McCormick & Company, Inc. | 33,660 | | 4,300 | Williams Companies, Inc. | 105,049 |
| 400 | Molson Coors Brewing Company | 28,472 | | 2,700 | XTO Energy, Inc. | 125,982 |
|
|
| 900 | Pepsi Bottling Group, Inc. | 28,458 | | | Total Energy | 8,547,938 |
|
|
| 11,890 | PepsiCo, Inc. | 754,302 | | | | |
| 23,010 | Procter & Gamble Company | 1,458,604 | | Financials (21.5%) | |
| 1,200 | Reynolds American, Inc. * | 75,792 | | 2,300 | ACE, Ltd. | 131,675 |
| 3,300 | Safeway, Inc. | 96,888 | | 3,500 | AFLAC, Inc. | 157,220 |
| 5,500 | Sara Lee Corporation | 94,050 | | 4,600 | Allstate Corporation | 282,256 |
| 1,610 | SUPERVALU, Inc. | 53,761 | | 850 | Ambac Financial Group, Inc. | 70,966 |
| 4,400 | SYSCO Corporation | 153,912 | | 8,800 | American Express Company | 508,728 |
| 1,800 | Tyson Foods, Inc. | 26,010 | | 18,844 | American International | |
| 1,200 | UST, Inc. | 64,272 | | | Group, Inc. | 1,265,751 |
| 7,400 | Walgreen Company | 323,232 | | 1,800 | Ameriprise Financial, Inc. | 92,700 |
| 17,800 | Wal-Mart Stores, Inc. | 877,184 | | 2,400 | AmSouth Bancorporation | 72,528 |
| 1,000 | Whole Foods Market, Inc. | 63,840 | | 2,300 | Aon Corporation | 80,017 |
| 1,675 | William Wrigley Jr. Company | 87,016 | | 800 | Apartment Investment & | |
|
| | |
| | Total Consumer Staples | 8,512,442 | | | Management Company | 45,856 |
|
| | |
| | | | | 1,600 | Archstone-Smith Trust | 96,336 |
| Energy (9.3%) | | | 32,803 | Bank of America Corporation | 1,767,098 |
| 3,290 | Anadarko Petroleum Corporation | 152,722 | | 5,600 | Bank of New York Company, Inc. | 192,472 |
| 2,322 | Apache Corporation | 151,673 | | 3,800 | BB&T Corporation | 165,376 |
| 2,300 | Baker Hughes, Inc. | 158,815 | | 900 | Bear Stearns Companies, Inc. | 136,215 |
| 2,100 | BJ Services Company | 63,336 | | 900 | Boston Properties, Inc. | 96,147 |
| The accompanying Notes to Financial Statements are an integral part of this schedule. |
|
| 132 |
Large Cap Index Fund
Schedule of Investments as of October 31, 2006 |
| Shares | Common Stock (97.5%) | Value | | Shares | Common Stock (97.5%) | Value |
|
| |
| Financials — continued | | | 7,700 | Morgan Stanley | $588,511 |
| 2,300 | Capital One Financial Corporation | $182,459 | | 4,400 | National City Corporation | 163,900 |
| 7,600 | Charles Schwab Corporation | 138,472 | | 3,300 | North Fork Bancorporation, Inc. | 94,314 |
| 300 | Chicago Mercantile Exchange | | | 1,300 | Northern Trust Corporation | 76,336 |
| | Holdings, Inc. | 150,300 | | 1,400 | Plum Creek Timber Company, Inc. | 50,316 |
| 2,900 | Chubb Corporation | 154,135 | | 2,200 | PNC Financial Services Group, Inc. | 154,066 |
| 1,307 | Cincinnati Financial Corporation | 59,665 | | 1,900 | Principal Financial Group, Inc. | 107,331 |
| 1,500 | CIT Group, Inc. | 78,075 | | 5,700 | Progressive Corporation | 137,769 |
| 35,806 | Citigroup, Inc. | 1,796,029 | | 1,800 | ProLogis Trust | 113,886 |
| 1,100 | Comerica, Inc. | 64,009 | | 3,600 | Prudential Financial, Inc. | 276,948 |
| 1,400 | Commerce Bancorp, Inc. * | 48,888 | | 900 | Public Storage, Inc. | 80,739 |
| 900 | Compass Bancshares, Inc. | 50,634 | | 1,575 | Realogy Corporation # | 40,604 |
| 4,500 | Countrywide Financial Corporation | 171,540 | | 3,301 | Regions Financial Corporation | 125,273 |
| 3,100 | E*TRADE Financial Corporation # | 72,168 | | 800 | SAFECO Corporation | 46,552 |
| 2,500 | Equity Office Properties Trust | 106,250 | | 1,600 | Simon Property Group, Inc. | 155,360 |
| 2,100 | Equity Residential REIT | 114,681 | | 3,000 | SLM Corporation | 146,040 |
| 5,000 | Federal Home Loan Mortgage | | | 2,635 | Sovereign Bancorp, Inc. * | 62,871 |
| | Corporation | 344,950 | | 5,064 | St. Paul Travelers Companies, Inc. | 258,922 |
| 7,100 | Federal National Mortgage | | | 2,400 | State Street Corporation | 154,152 |
| | Association | 420,746 | | 2,700 | SunTrust Banks, Inc. | 213,273 |
| 600 | Federated Investors, Inc. | 20,574 | | 2,300 | Synovus Financial Corporation | 67,574 |
| 4,122 | Fifth Third Bancorp * | 164,262 | | 2,000 | T. Rowe Price Group, Inc. | 94,620 |
| 1,000 | First Horizon National | | | 700 | Torchmark Corporation | 43,176 |
| | Corporation * | 39,320 | | 12,818 | U.S. Bancorp | 433,761 |
| 1,200 | Franklin Resources, Inc. | 136,752 | | 2,500 | UnumProvident Corporation * | 49,450 |
| 3,300 | Genworth Financial, Inc. | 110,352 | | 900 | Vornado Realty Trust | 107,325 |
| 3,100 | Goldman Sachs Group, Inc. | 588,349 | | 13,832 | Wachovia Corporation | 767,676 |
| 2,300 | Hartford Financial Services | | | 6,901 | Washington Mutual, Inc. * | 291,912 |
| | Group, Inc. | 200,491 | | 24,400 | Wells Fargo & Company | 885,476 |
| 1,810 | Huntington Bancshares, Inc. | 44,182 | | 1,400 | XL Capital, Ltd. | 98,770 |
| 25,158 | J.P. Morgan Chase & Company | 1,193,496 | | 700 | Zions Bancorporation | 56,280 |
|
|
| 1,500 | Janus Capital Group, Inc. | 30,120 | | | Total Financials | 19,888,997 |
|
|
| 2,900 | KeyCorp | 107,706 | | | | |
| 1,500 | Kimco Realty Corporation | 66,645 | | Health Care (12.0%) | |
| 1,000 | Legg Mason, Inc. | 90,020 | | 10,900 | Abbott Laboratories ∈ | 517,859 |
| 3,900 | Lehman Brothers Holdings, Inc. | 303,576 | | 3,900 | Aetna, Inc. | 160,758 |
| 2,043 | Lincoln National Corporation | 129,342 | | 1,000 | Allergan, Inc. | 115,500 |
| 3,400 | Loews Corporation | 132,328 | | 1,400 | AmerisourceBergen Corporation | 66,080 |
| 600 | M&T Bank Corporation | 73,086 | | 8,436 | Amgen, Inc. # | 640,377 |
| 3,900 | Marsh & McLennan Companies, Inc. | 114,816 | | 1,300 | Applera Corporation (Applied | |
| 1,800 | Marshall & Ilsley Corporation | 86,292 | | | Biosystems Group) | 48,490 |
| 900 | MBIA, Inc. | 55,818 | | 800 | Barr Pharmaceuticals, Inc. # | 41,896 |
| 3,000 | Mellon Financial Corporation | 116,400 | | 300 | Bausch & Lomb, Inc. * | 16,062 |
| 6,400 | Merrill Lynch & Company, Inc. | 559,488 | | 4,800 | Baxter International, Inc. | 220,656 |
| 5,500 | MetLife, Inc. | 314,215 | | 1,700 | Becton, Dickinson and Company | 119,051 |
| 700 | MGIC Investment Corporation | 41,132 | | 2,590 | Biogen Idec, Inc. # | 123,284 |
| 1,700 | Moody’s Corporation | 112,710 | | 1,775 | Biomet, Inc. | 67,166 |
| The accompanying Notes to Financial Statements are an integral part of this schedule. |
|
| 133 |
Large Cap Index Fund
Schedule of Investments as of October 31, 2006 |
| Shares | Common Stock (97.5%) | Value | | Shares | Common Stock (97.5%) | Value |
|
| |
| Health Care — continued | | | Industrials (10.6%) | |
| 8,635 | Boston Scientific Corporation # | $137,383 | | 5,500 | 3M Company | $433,620 |
| 14,200 | Bristol-Myers Squibb Company | 351,450 | | 1,900 | Allied Waste Industries, Inc. # | 23,085 |
| 700 | C.R. Bard, Inc. | 57,372 | | 1,300 | American Power Conversion | |
| 3,000 | Cardinal Health, Inc. | 196,350 | | | Corporation * | 39,299 |
| 3,200 | Caremark Rx, Inc. | 157,536 | | 1,200 | American Standard Companies, Inc. | 53,148 |
| 800 | CIGNA Corporation | 93,584 | | 600 | Avery Dennison Corporation | 37,884 |
| 1,250 | Coventry Health Care, Inc. # | 58,688 | | 5,700 | Boeing Company | 455,202 |
| 7,100 | Eli Lilly and Company | 397,671 | | 2,600 | Burlington Northern Santa Fe | |
| 1,000 | Express Scripts, Inc. # | 63,720 | | | Corporation | 201,578 |
| 1,000 | Fisher Scientific International, Inc. # | 85,620 | | 4,700 | Caterpillar, Inc. | 285,337 |
| 2,400 | Forest Laboratories, Inc. # | 117,456 | | 900 | Cintas Corporation | 37,260 |
| 1,800 | Genzyme Corporation # | 121,518 | | 700 | Cooper Industries, Ltd. | 62,615 |
| 3,300 | Gilead Sciences, Inc. # | 227,370 | | 3,200 | CSX Corporation | 114,144 |
| 3,100 | HCA, Inc. | 156,612 | | 400 | Cummins, Inc. * | 50,792 |
| 1,800 | Health Management Associates, Inc. | 35,460 | | 1,800 | Danaher Corporation | 129,186 |
| 1,150 | Hospira, Inc. # | 41,802 | | 1,700 | Deere & Company | 144,721 |
| 1,200 | Humana, Inc. # | 72,000 | | 1,400 | Dover Corporation | 66,500 |
| 1,500 | IMS Health, Inc. | 41,775 | | 1,000 | Eaton Corporation | 72,430 |
| 21,190 | Johnson & Johnson | 1,428,206 | | 2,900 | Emerson Electric Company | 244,760 |
| 1,733 | King Pharmaceuticals, Inc. # | 28,993 | | 1,000 | Equifax, Inc. | 38,030 |
| 900 | Laboratory Corporation of | | | 2,300 | FedEx Corporation | 263,442 |
| | America Holdings # | 61,641 | | 600 | Fluor Corporation | 47,058 |
| 600 | Manor Care, Inc. * | 28,794 | | 2,900 | General Dynamics Corporation | 206,190 |
| 2,200 | McKesson Corporation | 110,198 | | 74,900 | General Electric Company | 2,629,739 |
| 2,225 | Medco Health Solutions, Inc. # | 119,038 | | 1,000 | Goodrich Corporation | 44,090 |
| 1,800 | MedImmune, Inc. #* | 57,672 | | 5,900 | Honeywell International, Inc. | 248,508 |
| 8,300 | Medtronic, Inc. | 404,044 | | 3,100 | Illinois Tool Works, Inc. | 148,583 |
| 15,800 | Merck & Company, Inc. | 717,636 | | 2,300 | Ingersoll-Rand Company | 84,433 |
| 400 | Millipore Corporation # | 25,812 | | 1,400 | ITT Corporation | 76,146 |
| 1,500 | Mylan Laboratories, Inc. | 30,750 | | 800 | L-3 Communications Holdings, Inc. | 64,416 |
| 1,100 | Patterson Companies, Inc. #* | 36,135 | | 2,500 | Lockheed Martin Corporation | 217,325 |
| 1,000 | PerkinElmer, Inc. | 21,360 | | 2,800 | Masco Corporation | 77,420 |
| 52,940 | Pfizer, Inc. | 1,410,851 | | 1,000 | Monster Worldwide, Inc. # | 40,510 |
| 1,200 | Quest Diagnostics, Inc. | 59,688 | | 400 | Navistar International | |
| 10,700 | Schering-Plough Corporation | 236,898 | | | Corporation # | 11,092 |
| 2,500 | St. Jude Medical, Inc. # | 85,875 | | 3,100 | Norfolk Southern Corporation | 162,967 |
| 2,200 | Stryker Corporation | 115,038 | | 2,534 | Northrop Grumman Corporation | 168,232 |
| 3,500 | Tenet Healthcare Corporation # | 24,710 | | 1,838 | PACCAR, Inc. | 108,798 |
| 1,100 | Thermo Electron Corporation # | 47,157 | | 1,000 | Pall Corporation | 31,900 |
| 9,700 | UnitedHealth Group, Inc. | 473,166 | | 900 | Parker-Hannifin Corporation | 75,267 |
| 800 | Waters Corporation # | 39,840 | | 1,700 | Pitney Bowes, Inc. | 79,407 |
| 700 | Watson Pharmaceuticals, Inc. # | 18,837 | | 1,600 | R.R. Donnelley & Sons Company | 54,176 |
| 4,600 | WellPoint, Inc. # | 351,072 | | 3,300 | Raytheon Company | 164,835 |
| 9,700 | Wyeth | 494,991 | | 1,200 | Robert Half International, Inc. | 43,860 |
| 1,840 | Zimmer Holdings, Inc. # | 132,498 | | 1,300 | Rockwell Automation, Inc. | 80,600 |
|
| | |
| | Total Health Care | 11,111,446 | | 1,300 | Rockwell Collins, Inc. * | 75,504 |
|
| | |
| The accompanying Notes to Financial Statements are an integral part of this schedule. |
|
| 134 |
Large Cap Index Fund
Schedule of Investments as of October 31, 2006 |
| Shares | Common Stock (97.5%) | Value | | Shares | Common Stock (97.5%) | Value |
|
| |
| Industrials — continued | | | 41,800 | Intel Corporation | $892,012 |
| 500 | Ryder System, Inc. | $26,325 | | 11,000 | International Business Machines | |
| 5,800 | Southwest Airlines Company | 87,174 | | | Corporation | 1,015,630 |
| 900 | Textron, Inc. | 81,837 | | 2,400 | Intuit, Inc. # | 84,720 |
| 14,538 | Tyco International, Ltd. | 427,853 | | 1,400 | Jabil Circuit, Inc. | 40,194 |
| 2,000 | Union Pacific Corporation | 181,260 | | 1,575 | JDS Uniphase Corporation #* | 22,885 |
| 7,800 | United Parcel Service, Inc. | 587,730 | | 4,200 | Juniper Networks, Inc. # | 72,324 |
| 7,300 | United Technologies Corporation | 479,756 | | 1,400 | KLA-Tencor Corporation | 68,838 |
| 600 | W.W. Grainger, Inc. | 43,668 | | 800 | Lexmark International, Inc. # | 50,872 |
| 3,900 | Waste Management, Inc. | 146,172 | | 2,100 | Linear Technology Corporation | 65,352 |
|
| | |
| | Total Industrials | 9,755,864 | | 2,900 | LSI Logic Corporation #* | 29,145 |
|
| | |
| | | | | 32,500 | Lucent Technologies, Inc. # | 78,975 |
| Information Technology (15.0%) | | | 2,400 | Maxim Integrated Products, Inc. | 72,024 |
| 914 | ADC Telecommunications, Inc. #* | 13,079 | | 5,400 | Micron Technology, Inc. # | 78,030 |
| 4,100 | Adobe Systems, Inc. # | 156,825 | | 62,700 | Microsoft Corporation | 1,800,117 |
| 4,100 | Advanced Micro Devices, Inc. # | 87,207 | | 1,100 | Molex, Inc. | 38,390 |
| 700 | Affiliated Computer Services, Inc. #* | 37,436 | | 17,800 | Motorola, Inc. | 410,468 |
| 2,900 | Agilent Technologies, Inc. # | 103,240 | | 2,100 | National Semiconductor | |
| 2,600 | Altera Corporation # | 47,944 | | | Corporation | 51,009 |
| 2,600 | Analog Devices, Inc. | 82,732 | | 1,400 | NCR Corporation # | 58,128 |
| 6,100 | Apple Computer, Inc. # | 494,588 | | 2,800 | Network Appliance, Inc. # | 102,200 |
| 10,000 | Applied Materials, Inc. | 173,900 | | 2,400 | Novell, Inc. # | 14,400 |
| 1,600 | Autodesk, Inc. # | 58,800 | | 800 | Novellus Systems, Inc. # | 22,120 |
| 4,100 | Automatic Data Processing, Inc. | 202,704 | | 2,600 | NVIDIA Corporation # | 90,662 |
| 3,325 | Avaya, Inc. #* | 42,593 | | 29,191 | Oracle Corporation # | 539,158 |
| 1,500 | BMC Software, Inc. # | 45,465 | | 780 | Parametric Technology | |
| 3,400 | Broadcom Corporation # | 102,918 | | | Corporation # | 15,241 |
| 3,000 | CA, Inc. | 74,280 | | 2,500 | Paychex, Inc. | 98,700 |
| 585 | CIENA Corporation #* | 13,753 | | 1,600 | PMC-Sierra, Inc. #* | 10,608 |
| 44,300 | Cisco Systems, Inc. # | 1,068,959 | | 1,100 | QLogic Corporation # | 22,638 |
| 1,400 | Citrix Systems, Inc. # | 41,342 | | 11,900 | QUALCOMM, Inc. | 433,041 |
| 1,300 | Computer Sciences Corporation # | 68,705 | | 1,000 | Sabre Holdings Corporation | 25,420 |
| 2,800 | Compuware Corporation # | 22,512 | | 1,500 | SanDisk Corporation # | 72,150 |
| 1,500 | Comverse Technology, Inc. # | 32,655 | | 3,800 | Sanmina-SCI Corporation # | 15,010 |
| 1,100 | Convergys Corporation # | 23,331 | | 6,700 | Solectron Corporation #* | 22,378 |
| 11,300 | Corning, Inc. # | 230,859 | | 25,400 | Sun Microsystems, Inc. # | 137,922 |
| 16,400 | Dell, Inc. # | 399,012 | | 7,247 | Symantec Corporation # | 143,780 |
| 8,600 | eBay, Inc. # | 276,318 | | 1,784 | Symbol Technologies, Inc. | 26,635 |
| 2,300 | Electronic Arts, Inc. # | 121,647 | | 600 | Tektronix, Inc. | 18,222 |
| 3,800 | Electronic Data Systems | | | 3,300 | Tellabs, Inc. # | 34,782 |
| | Corporation | 96,254 | | 1,400 | Teradyne, Inc. # | 19,628 |
| 16,600 | EMC Corporation # | 203,350 | | 11,100 | Texas Instruments, Inc. | 334,998 |
| 5,503 | First Data Corporation | 133,448 | | 2,400 | Unisys Corporation #* | 15,696 |
| 1,250 | Fiserv, Inc. # | 61,750 | | 1,700 | VeriSign, Inc. # | 35,156 |
| 2,899 | Freescale Semiconductor, Inc. # | 114,018 | | 5,503 | Western Union Company # | 121,341 |
| 1,600 | Google, Inc. # | 762,224 | | | | |
| 19,841 | Hewlett-Packard Company | 768,640 | | | | |
| The accompanying Notes to Financial Statements are an integral part of this schedule. |
|
| 135 |
Large Cap Index Fund
Schedule of Investments as of October 31, 2006 |
| Shares | Common Stock (97.5%) | Value | | Shares | Common Stock (97.5%) | Value |
|
| |
| Information Technology — continued | | | 2,300 | Citizens Communications Company | $33,718 |
| 7,100 | Xerox Corporation # | $120,700 | | 1,143 | Embarq Corporation | 55,264 |
| 2,400 | Xilinx, Inc. | 61,224 | | 11,600 | Qwest Communications | |
| 9,000 | Yahoo!, Inc. # | 237,060 | | | International, Inc. #* | 100,108 |
|
| | |
| | Total Information | | | 21,668 | Sprint Nextel Corporation | 404,975 |
| | Technology | 13,882,471 | | 21,000 | Verizon Communications, Inc. | 777,000 |
|
| | |
| | | | | 3,401 | Windstream Corporation | 46,662 |
|
|
| Materials (2.9%) | | | | Total Telecommunications | |
| 1,500 | Air Products and Chemicals, Inc. | 104,505 | | | Services | 3,150,573 |
|
|
| 6,200 | Alcoa, Inc. | 179,242 | | | | |
| 700 | Allegheny Technologies, Inc. | 55,111 | | Utilities (3.4%) | |
| 500 | Ashland, Inc. | 29,550 | | 4,800 | AES Corporation # | 105,552 |
| 700 | Ball Corporation | 29,113 | | 1,100 | Allegheny Energy, Inc. # | 47,333 |
| 700 | Bemis Company, Inc. * | 23,534 | | 1,400 | Ameren Corporation * | 75,740 |
| 6,983 | Dow Chemical Company | 284,837 | | 2,900 | American Electric Power | |
| 6,600 | E.I. du Pont de Nemours and | | | | Company, Inc. | 120,147 |
| | Company | 302,280 | | 2,200 | CenterPoint Energy, Inc. * | 34,056 |
| 500 | Eastman Chemical Company * | 30,460 | | 1,700 | CMS Energy Corporation #* | 25,313 |
| 1,300 | Ecolab, Inc. | 58,955 | | 1,700 | Consolidated Edison, Inc. * | 82,195 |
| 1,500 | Freeport-McMoRan Copper & | | | 1,300 | Constellation Energy Group, Inc. | 81,120 |
| | Gold, Inc. | 90,720 | | 2,600 | Dominion Resources, Inc. | 210,574 |
| 900 | Hercules, Inc. # | 16,380 | | 1,200 | DTE Energy Company | 54,516 |
| 500 | International Flavors & | | | 9,040 | Duke Energy Corporation | 286,026 |
| | Fragrances, Inc. | 21,240 | | 2,800 | Dynegy, Inc. # | 17,024 |
| 3,300 | International Paper Company | 110,055 | | 2,300 | Edison International, Inc. | 102,212 |
| 700 | Louisiana-Pacific Corporation | 13,846 | | 1,500 | Entergy Corporation | 128,745 |
| 1,291 | MeadWestvaco Corporation | 35,528 | | 4,950 | Exelon Corporation | 306,801 |
| 3,968 | Monsanto Company | 175,465 | | 2,400 | FirstEnergy Corporation | 141,240 |
| 3,200 | Newmont Mining Corporation | 144,864 | | 3,000 | FPL Group, Inc. * | 153,000 |
| 2,300 | Nucor Corporation | 134,343 | | 1,200 | KeySpan Corporation | 48,696 |
| 1,100 | Pactiv Corporation # | 33,924 | | 400 | Nicor, Inc. * | 18,384 |
| 1,400 | Phelps Dodge Corporation | 140,532 | | 2,037 | NiSource, Inc. | 47,401 |
| 1,200 | PPG Industries, Inc. | 82,080 | | 200 | Peoples Energy Corporation | 8,738 |
| 2,400 | Praxair, Inc. | 144,600 | | 2,600 | PG&E Corporation | 112,164 |
| 1,100 | Rohm and Haas Company | 57,002 | | 800 | Pinnacle West Capital Corporation * | 38,248 |
| 500 | Sealed Air Corporation * | 29,760 | | 2,800 | PPL Corporation | 96,656 |
| 400 | Sigma-Aldrich Corporation * | 30,044 | | 1,927 | Progress Energy, Inc. * | 88,642 |
| 700 | Temple-Inland, Inc. | 27,608 | | 1,900 | Public Service Enterprise Group, Inc. | 115,995 |
| 900 | United States Steel Corporation | 60,840 | | 1,800 | Sempra Energy | 95,472 |
| 800 | Vulcan Materials Company | 65,184 | | 5,300 | Southern Company * | 192,920 |
| 1,800 | Weyerhaeuser Company | 114,462 | | 1,600 | TECO Energy, Inc. | 26,384 |
|
| | |
| | Total Materials | 2,626,064 | | 3,400 | TXU Corporation | 214,642 |
|
| | |
| | | | | 2,855 | Xcel Energy, Inc. * | 63,010 |
|
|
| Telecommunications Services (3.4%) | | | | Total Utilities | 3,138,946 |
|
|
| 2,800 | ALLTEL Corporation | 149,268 | | | | |
|
|
| 28,046 | AT&T, Inc. ∈ | 960,576 | | | Total Common Stock | |
| 13,100 | BellSouth Corporation | 590,810 | | | (cost $72,290,550) | 90,041,789 |
|
|
| 800 | CenturyTel, Inc. | 32,192 | | | | |
| The accompanying Notes to Financial Statements are an integral part of this schedule. |
|
| 136 |
Large Cap Index Fund
Schedule of Investments as of October 31, 2006 |
| | | | | Interest | Maturity | |
| Shares | Collateral Held for Securities Loaned (3.1%) | Rate (+) | Date | Value |
|
| 2,811,275 | Thrivent Financial Securities Lending Trust | 5.300% | N/A | $2,811,275 |
| |
|
| | | Total Collateral Held for Securities Loaned | |
| | | (cost $2,811,275) | | | 2,811,275 |
|
|
| |
| |
| Shares or | | | | | | |
| Principal | | | | Interest | Maturity | |
| Amount | Short-Term Investments (2.5%) | | Rate (+) | Date | Value |
|
| $250,000 | Federal National Mortgage Association ∈ | 5.200% | 2/7/2007 | $246,543 |
| 2,085,483 | Thrivent Money Market Fund | | 4.600 | N/A | 2,085,483 |
|
|
| | | Total Short-Term Investments (cost $2,331,977) | 2,332,026 |
|
|
| | | Total Investments (cost $77,433,802) 103.1% | $95,185,090 |
|
|
| | | Other Assets and Liabilities, Net (3.1%) | | (2,856,859) |
|
|
| | | Total Net Assets 100.0% | | | $92,328,231 |
|
|
| |
| | | Number of | | Notional | | |
| | | Contracts | Expiration | Principal | | Unrealized |
| Futures | | Long/(Short) | Date | Amount | Value | Gain/(Loss) |
|
| S&P 500 Index Mini-Futures | 33 | December 2006 | $2,267,353 | $2,282,280 | $14,927 |
# Non-income producing security.
* All or a portion of the security is on loan as discussed in item 2(L) of the Notes to Financial Statements.
+ The interest rate shown reflects the yield, coupon rate or, for securities purchased at a discount, the discount rate at the date of purchase.
∈ At October 31, 2006, $246,543 of investments were held on deposit with the counterparty and pledged as the initial margin deposit for open
financial futures contracts. In addition, $2,714,651 of investments were earmarked as collateral to cover open financial futures contracts.
Definitions:
REIT — Real Estate Investment Trust, is a company that buys, develops, manages and/or sells real estate assets. |
| Gross unrealized appreciation and depreciation of investments, based on cost for federal income tax purposes, were as follows: | |
| | |
| Gross unrealized appreciation �� | $20,670,329 | |
| Gross unrealized depreciation | (3,213,498) | |
|
| |
| Net unrealized appreciation (depreciation) | $17,456,831 | |
| Cost for federal income tax purposes | $77,728,259 | |
| The accompanying Notes to Financial Statements are an integral part of this schedule. |
|
| 137 |
Large Cap Index Fund-I
Schedule of Investments as of October 31, 2006 |
| Shares | Common Stock (96.3%) | Value | | Shares | Common Stock (96.3%) | Value |
|
| |
| Consumer Discretionary (10.0%) | | | 200 | KB Home * | $8,988 |
| 800 | Amazon.com, Inc. #* | $30,472 | | 858 | Kohl’s Corporation # | 60,575 |
| 355 | Apollo Group, Inc. # | 13,121 | | 604 | Leggett & Platt, Inc. | 14,103 |
| 408 | AutoNation, Inc. #* | 8,180 | | 300 | Lennar Corporation * | 14,244 |
| 152 | AutoZone, Inc. # | 17,024 | | 864 | Limited Brands, Inc. | 25,462 |
| 657 | Bed Bath & Beyond, Inc. # | 26,471 | | 303 | Liz Claiborne, Inc. * | 12,778 |
| 941 | Best Buy Company, Inc. | 51,990 | | 3,748 | Lowe’s Companies, Inc. | 112,965 |
| 302 | Big Lots, Inc. #* | 6,366 | | 810 | Marriott International, Inc. | 33,834 |
| 201 | Black & Decker Corporation * | 16,860 | | 862 | Mattel, Inc. | 19,507 |
| 302 | Brunswick Corporation * | 9,513 | | 3,085 | McDonald’s Corporation | 129,323 |
| 1,165 | Carnival Corporation | 56,875 | | 908 | McGraw-Hill Companies, Inc. | 58,266 |
| 2,011 | CBS Corporation | 58,198 | | 200 | Meredith Corporation | 10,500 |
| 302 | Centex Corporation * | 15,795 | | 454 | New York Times Company * | 10,973 |
| 354 | Circuit City Stores, Inc. | 9,551 | | 756 | Newell Rubbermaid, Inc. | 21,758 |
| 1,315 | Clear Channel Communications, Inc. | 45,828 | | 5,800 | News Corporation | 120,930 |
| 900 | Coach, Inc. # | 35,676 | | 457 | NIKE, Inc. | 41,989 |
| 5,316 | Comcast Corporation # | 216,202 | | 604 | Nordstrom, Inc. | 28,599 |
| 700 | D.R. Horton, Inc. | 16,401 | | 707 | Office Depot, Inc. # | 29,687 |
| 380 | Darden Restaurants, Inc. | 15,922 | | 201 | OfficeMax, Inc. | 9,564 |
| 201 | Dillard’s, Inc. * | 6,064 | | 403 | Omnicom Group, Inc. | 40,884 |
| 671 | Dollar General Corporation * | 9,414 | | 604 | Pulte Homes, Inc. * | 18,718 |
| 200 | Dow Jones & Company, Inc. * | 7,018 | | 403 | RadioShack Corporation * | 7,190 |
| 300 | E.W. Scripps Company | 14,838 | | 175 | Sears Holdings Corporation #* | 30,532 |
| 758 | Eastman Kodak Company * | 18,495 | | 353 | Sherwin-Williams Company | 20,908 |
| 505 | Family Dollar Stores, Inc. | 14,872 | | 200 | Snap-On, Inc. | 9,406 |
| 1,338 | Federated Department Stores, Inc. | 58,752 | | 301 | Stanley Works * | 14,343 |
| 4,754 | Ford Motor Company * | 39,363 | | 1,918 | Staples, Inc. | 49,465 |
| 354 | Fortune Brands, Inc. | 27,240 | | 1,820 | Starbucks Corporation # | 68,705 |
| 604 | Gannett Company, Inc. | 35,721 | | 506 | Starwood Hotels & Resorts | |
| 1,274 | Gap, Inc. | 26,779 | | | Worldwide, Inc. | 30,228 |
| 1,365 | General Motors Corporation | 47,666 | | 2,128 | Target Corporation | 125,935 |
| 554 | Genuine Parts Company | 25,218 | | 304 | Tiffany & Company * | 10,859 |
| 503 | Goodyear Tire & Rubber Company #* | 7,711 | | 10,286 | Time Warner, Inc. | 205,823 |
| 910 | H&R Block, Inc. * | 19,893 | | 1,216 | TJX Companies, Inc. | 35,203 |
| 608 | Harley-Davidson, Inc. | 41,727 | | 406 | Tribune Company * | 13,532 |
| 100 | Harman International Industries, Inc. | 10,235 | | 606 | Univision Communications, Inc. # | 21,246 |
| 402 | Harrah’s Entertainment, Inc. | 29,881 | | 302 | VF Corporation | 22,955 |
| 504 | Hasbro, Inc. * | 13,064 | | 1,811 | Viacom, Inc. # | 70,484 |
| 961 | Hilton Hotels Corporation | 27,792 | | 5,211 | Walt Disney Company | 163,938 |
| 5,167 | Home Depot, Inc. | 192,884 | | 402 | Wendy’s International, Inc. | 13,909 |
| 808 | International Game Technology | 34,348 | | 181 | Whirlpool Corporation * | 15,726 |
| 1,060 | Interpublic Group of | | | 525 | Wyndham Worldwide Corporation # | 15,488 |
| | Companies, Inc. #* | 11,565 | | 659 | Yum! Brands, Inc. | 39,184 |
|
|
| 556 | J.C. Penney Company, Inc. | | | | Total Consumer | |
| | (Holding Company) | 41,828 | | | Discretionary | 3,277,779 |
|
|
| 504 | Johnson Controls, Inc. | 41,096 | | | | |
| 454 | Jones Apparel Group, Inc. * | 15,164 | | | | |
| The accompanying Notes to Financial Statements are an integral part of this schedule. |
|
| 138 |
Large Cap Index Fund-I
Schedule of Investments as of October 31, 2006 |
| Shares | Common Stock (96.3%) | Value | | Shares | Common Stock (96.3%) | Value |
|
| |
| Consumer Staples (9.1%) | | | 1,000 | Chesapeake Energy Corporation * | $32,440 |
| 301 | Alberto-Culver Company | $15,294 | | 5,614 | Chevron Corporation | 377,261 |
| 5,309 | Altria Group, Inc. ∈ | 431,781 | | 4,180 | ConocoPhillips | 251,803 |
| 2,025 | Anheuser-Busch Companies, Inc. | 96,026 | | 400 | CONSOL Energy, Inc. | 14,156 |
| 1,638 | Archer-Daniels-Midland Company | 63,063 | | 1,112 | Devon Energy Corporation | 74,326 |
| 1,212 | Avon Products, Inc. | 36,857 | | 1,775 | El Paso Corporation * | 24,318 |
| 300 | Brown-Forman Corporation | 21,657 | | 606 | EOG Resources, Inc. | 40,317 |
| 560 | Campbell Soup Company * | 20,933 | | 15,005 | Exxon Mobil Corporation | 1,071,657 |
| 305 | Clorox Company | 19,691 | | 2,624 | Halliburton Company | 84,886 |
| 5,123 | Coca-Cola Company | 239,347 | | 553 | Hess Corporation | 23,447 |
| 611 | Coca-Cola Enterprises, Inc. | 12,238 | | 253 | Kinder Morgan, Inc. * | 26,590 |
| 1,365 | Colgate-Palmolive Company | 87,319 | | 866 | Marathon Oil Corporation | 74,822 |
| 1,312 | ConAgra Foods, Inc. | 34,309 | | 400 | Murphy Oil Corporation | 18,864 |
| 500 | Constellation Brands, Inc. # | 13,745 | | 806 | Nabors Industries, Ltd. #* | 24,889 |
| 1,161 | Costco Wholesale Corporation | 61,974 | | 500 | National Oilwell Varco, Inc. # | 30,200 |
| 2,020 | CVS Corporation | 63,388 | | 304 | Noble Corporation | 21,310 |
| 300 | Dean Foods Company #* | 12,567 | | 2,222 | Occidental Petroleum Corporation | 104,301 |
| 300 | Estee Lauder Companies, Inc. | 12,117 | | 301 | Rowan Companies, Inc. | 10,047 |
| 860 | General Mills, Inc. | 48,865 | | 3,030 | Schlumberger, Ltd. | 191,132 |
| 859 | H.J. Heinz Company | 36,215 | | 500 | Smith International, Inc. * | 19,740 |
| 504 | Hershey Company * | 26,667 | | 302 | Sunoco, Inc. * | 19,971 |
| 660 | Kellogg Company * | 33,205 | | 757 | Transocean, Inc. # | 54,913 |
| 1,164 | Kimberly-Clark Corporation | 77,429 | | 1,600 | Valero Energy Corporation | 83,728 |
| 1,872 | Kroger Company | 42,101 | | 1,000 | Weatherford International, Ltd. # | 41,080 |
| 404 | McCormick & Company, Inc. | 15,110 | | 1,563 | Williams Companies, Inc. | 38,184 |
| 150 | Molson Coors Brewing Company * | 10,677 | | 933 | XTO Energy, Inc. | 43,534 |
|
|
| 408 | Pepsi Bottling Group, Inc. | 12,901 | | | Total Energy | 2,989,334 |
|
|
| 4,197 | PepsiCo, Inc. | 266,258 | | | | |
| 7,992 | Procter & Gamble Company | 506,613 | | Financials (21.4%) | |
| 404 | Reynolds American, Inc. * | 25,517 | | 757 | ACE, Ltd. | 43,338 |
| 1,161 | Safeway, Inc. | 34,087 | | 1,263 | AFLAC, Inc. | 56,734 |
| 1,822 | Sara Lee Corporation | 31,156 | | 1,670 | Allstate Corporation | 102,471 |
| 608 | SUPERVALU, Inc. | 20,318 | | 303 | Ambac Financial Group, Inc. | 25,297 |
| 1,568 | SYSCO Corporation * | 54,849 | | 3,088 | American Express Company ∈ | 178,517 |
| 700 | Tyson Foods, Inc. | 10,115 | | 6,527 | American International | |
| 403 | UST, Inc. * | 21,585 | | | Group, Inc. ∈ | 438,419 |
| 2,529 | Walgreen Company | 110,467 | | 677 | Ameriprise Financial, Inc. | 34,866 |
| 6,182 | Wal-Mart Stores, Inc. | 304,649 | | 959 | AmSouth Bancorporation | 28,981 |
| 300 | Whole Foods Market, Inc. * | 19,152 | | 807 | Aon Corporation * | 28,076 |
| 531 | William Wrigley Jr. Company | 27,585 | | 353 | Apartment Investment & | |
|
| | |
| | Total Consumer Staples | 2,977,827 | | | Management Company | 20,234 |
|
| | |
| | | | | 700 | Archstone-Smith Trust | 42,147 |
| Energy (9.2%) | | | 11,444 | Bank of America Corporation | 616,488 |
| 1,140 | Anadarko Petroleum Corporation | 52,919 | | 1,972 | Bank of New York Company, Inc. | 67,778 |
| 846 | Apache Corporation | 55,261 | | 1,412 | BB&T Corporation * | 61,450 |
| 808 | Baker Hughes, Inc. | 55,792 | | 252 | Bear Stearns Companies, Inc. | 38,140 |
| 910 | BJ Services Company | 27,446 | | 300 | Boston Properties, Inc. | 32,049 |
| The accompanying Notes to Financial Statements are an integral part of this schedule. |
|
| 139 |
Large Cap Index Fund-I
Schedule of Investments as of October 31, 2006 |
| Shares | Common Stock (96.3%) | Value | | Shares | Common Stock (96.3%) | Value |
|
| |
| Financials — continued | | | 2,631 | Morgan Stanley | $201,087 |
| 705 | Capital One Financial Corporation | $55,928 | | 1,416 | National City Corporation * | 52,746 |
| 2,587 | Charles Schwab Corporation | 47,135 | | 1,257 | North Fork Bancorporation, Inc. | 35,925 |
| 90 | Chicago Mercantile Exchange | | | 504 | Northern Trust Corporation | 29,595 |
| | Holdings, Inc. | 45,090 | | 556 | Plum Creek Timber Company, Inc. | 19,983 |
| 1,106 | Chubb Corporation | 58,784 | | 755 | PNC Financial Services Group, Inc. | 52,873 |
| 550 | Cincinnati Financial Corporation * | 25,108 | | 660 | Principal Financial Group, Inc. | 37,283 |
| 500 | CIT Group, Inc. | 26,025 | | 2,024 | Progressive Corporation | 48,920 |
| 12,460 | Citigroup, Inc. | 624,994 | | 600 | ProLogis Trust | 37,962 |
| 553 | Comerica, Inc. | 32,179 | | 1,267 | Prudential Financial, Inc. | 97,470 |
| 500 | Commerce Bancorp, Inc. * | 17,460 | | 400 | Public Storage, Inc. | 35,884 |
| 400 | Compass Bancshares, Inc. | 22,504 | | 557 | Realogy Corporation # | 14,359 |
| 1,606 | Countrywide Financial Corporation | 61,221 | | 1,223 | Regions Financial Corporation * | 46,413 |
| 1,100 | E*TRADE Financial Corporation # | 25,608 | | 402 | SAFECO Corporation | 23,392 |
| 812 | Equity Office Properties Trust | 34,510 | | 555 | Simon Property Group, Inc. | 53,890 |
| 758 | Equity Residential REIT | 41,394 | | 1,062 | SLM Corporation | 51,698 |
| 1,719 | Federal Home Loan Mortgage | | | 950 | Sovereign Bancorp, Inc. * | 22,667 |
| | Corporation | 118,594 | | 1,753 | St. Paul Travelers Companies, Inc. | 89,631 |
| 2,428 | Federal National Mortgage | | | 808 | State Street Corporation | 51,898 |
| | Association | 143,883 | | 956 | SunTrust Banks, Inc. | 75,514 |
| 303 | Federated Investors, Inc. | 10,390 | | 908 | Synovus Financial Corporation * | 26,677 |
| 1,407 | Fifth Third Bancorp * | 56,069 | | 602 | T. Rowe Price Group, Inc. * | 28,481 |
| 454 | First Horizon National | | | 352 | Torchmark Corporation | 21,711 |
| | Corporation * | 17,851 | | 4,469 | U.S. Bancorp | 151,231 |
| 355 | Franklin Resources, Inc. | 40,456 | | 857 | UnumProvident Corporation * | 16,951 |
| 1,100 | Genworth Financial, Inc. | 36,784 | | 300 | Vornado Realty Trust | 35,775 |
| 1,013 | Goldman Sachs Group, Inc. | 192,257 | | 4,827 | Wachovia Corporation | 267,898 |
| 756 | Hartford Financial Services | | | 2,400 | Washington Mutual, Inc. * | 101,520 |
| | Group, Inc. | 65,901 | | 8,396 | Wells Fargo & Company | 304,691 |
| 726 | Huntington Bancshares, Inc. * | 17,722 | | 404 | XL Capital, Ltd. | 28,502 |
| 8,678 | J.P. Morgan Chase & Company | 411,684 | | 352 | Zions Bancorporation | 28,301 |
|
|
| 606 | Janus Capital Group, Inc. * | 12,168 | | | Total Financials | 6,973,429 |
|
|
| 1,110 | KeyCorp | 41,225 | | | | |
| 600 | Kimco Realty Corporation * | 26,658 | | Health Care (11.8%) | |
| 300 | Legg Mason, Inc. * | 27,006 | | 3,896 | Abbott Laboratories | 185,099 |
| 1,310 | Lehman Brothers Holdings, Inc. | 101,970 | | 1,312 | Aetna, Inc. | 54,081 |
| 739 | Lincoln National Corporation | 46,791 | | 303 | Allergan, Inc. | 34,996 |
| 1,162 | Loews Corporation | 45,225 | | 504 | AmerisourceBergen Corporation | 23,789 |
| 300 | M&T Bank Corporation | 36,543 | | 3,007 | Amgen, Inc. #∈ | 228,261 |
| 1,466 | Marsh & McLennan Companies, Inc. | 43,159 | | 454 | Applera Corporation (Applied | |
| 606 | Marshall & Ilsley Corporation | 29,052 | | | Biosystems Group) | 16,934 |
| 329 | MBIA, Inc. | 20,405 | | 200 | Barr Pharmaceuticals, Inc. # | 10,474 |
| 1,061 | Mellon Financial Corporation | 41,167 | | 101 | Bausch & Lomb, Inc. * | 5,408 |
| 2,278 | Merrill Lynch & Company, Inc. | 199,143 | | 1,669 | Baxter International, Inc. | 76,724 |
| 1,970 | MetLife, Inc. | 112,546 | | 606 | Becton, Dickinson and Company | 42,438 |
| 251 | MGIC Investment Corporation * | 14,749 | | 805 | Biogen Idec, Inc. # | 38,318 |
| 606 | Moody’s Corporation | 40,178 | | 644 | Biomet, Inc. * | 24,369 |
| The accompanying Notes to Financial Statements are an integral part of this schedule. |
|
| 140 |
Large Cap Index Fund-I
Schedule of Investments as of October 31, 2006 |
| Shares | Common Stock (96.3%) | | Value | | Shares | Common Stock (96.3%) | Value |
|
| |
| Health Care — continued | | | | Industrials (10.4%) | |
| 2,943 | Boston Scientific Corporation # | $46,823 | | 1,824 | 3M Company | $143,804 |
| 4,956 | Bristol-Myers Squibb Company | | 122,661 | | 654 | Allied Waste Industries, Inc. # | 7,946 |
| 202 | C.R. Bard, Inc. | | 16,556 | | 505 | American Power Conversion | |
| 1,037 | Cardinal Health, Inc. | | 67,872 | | | Corporation * | 15,266 |
| 1,100 | Caremark Rx, Inc. | | 54,153 | | 456 | American Standard Companies, Inc. | 20,196 |
| 204 | CIGNA Corporation | | 23,864 | | 402 | Avery Dennison Corporation * | 25,382 |
| 350 | Coventry Health Care, Inc. # | | 16,432 | | 1,974 | Boeing Company | 157,644 |
| 2,483 | Eli Lilly and Company | | 139,073 | | 858 | Burlington Northern Santa Fe | |
| 300 | Express Scripts, Inc. #* | | 19,116 | | | Corporation | 66,521 |
| 300 | Fisher Scientific International, Inc. # | 25,686 | | 1,618 | Caterpillar, Inc. | 98,229 |
| 812 | Forest Laboratories, Inc. # | | 39,739 | | 405 | Cintas Corporation | 16,767 |
| 606 | Genzyme Corporation # | | 40,911 | | 252 | Cooper Industries, Ltd. | 22,541 |
| 1,100 | Gilead Sciences, Inc. # | | 75,790 | | 1,108 | CSX Corporation | 39,522 |
| 1,063 | HCA, Inc. * | | 53,703 | | 50 | Cummins, Inc. | 6,349 |
| 657 | Health Management Associates, Inc. | 12,943 | | 604 | Danaher Corporation | 43,349 |
| 409 | Hospira, Inc. # | | 14,867 | | 555 | Deere & Company | 47,247 |
| 354 | Humana, Inc. # | | 21,240 | | 654 | Dover Corporation | 31,065 |
| 554 | IMS Health, Inc. | | 15,429 | | 304 | Eaton Corporation | 22,019 |
| 7,335 | Johnson & Johnson | | 494,379 | | 1,061 | Emerson Electric Company | 89,548 |
| 673 | King Pharmaceuticals, Inc. # | | 11,259 | | 403 | Equifax, Inc. | 15,326 |
| 300 | Laboratory Corporation of | | | | 707 | FedEx Corporation | 80,980 |
| | America Holdings # | | 20,547 | | 202 | Fluor Corporation * | 15,843 |
| 251 | Manor Care, Inc. * | | 12,045 | | 1,008 | General Dynamics Corporation | 71,669 |
| 756 | McKesson Corporation | | 37,868 | | 26,150 | General Electric Company | 918,126 |
| 741 | Medco Health Solutions, Inc. # | | 39,644 | | 401 | Goodrich Corporation | 17,680 |
| 707 | MedImmune, Inc. #* | | 22,652 | | 2,124 | Honeywell International, Inc. | 89,463 |
| 2,834 | Medtronic, Inc. | | 137,959 | | 1,014 | Illinois Tool Works, Inc. | 48,601 |
| 5,417 | Merck & Company, Inc. | | 246,040 | | 808 | Ingersoll-Rand Company | 29,662 |
| 250 | Millipore Corporation #* | | 16,132 | | 404 | ITT Corporation | 21,974 |
| 600 | Mylan Laboratories, Inc. | | 12,300 | | 300 | L-3 Communications Holdings, Inc. | 24,156 |
| 400 | Patterson Companies, Inc. #* | | 13,140 | | 862 | Lockheed Martin Corporation | 74,934 |
| 452 | PerkinElmer, Inc. | | 9,655 | | 1,061 | Masco Corporation | 29,337 |
| 18,381 | Pfizer, Inc. | | 489,854 | | 301 | Monster Worldwide, Inc. # | 12,194 |
| 406 | Quest Diagnostics, Inc. | | 20,194 | | 350 | Navistar International | |
| 3,743 | Schering-Plough Corporation | | 82,870 | | | Corporation # | 9,706 |
| 912 | St. Jude Medical, Inc. # | | 31,327 | | 1,010 | Norfolk Southern Corporation | 53,096 |
| 708 | Stryker Corporation | | 37,021 | | 846 | Northrop Grumman Corporation | 56,166 |
| 1,190 | Tenet Healthcare Corporation #* | 8,401 | | 665 | PACCAR, Inc. | 39,345 |
| 454 | Thermo Electron Corporation #* | 19,463 | | 351 | Pall Corporation | 11,197 |
| 3,332 | UnitedHealth Group, Inc. | | 162,535 | | 352 | Parker-Hannifin Corporation | 29,438 |
| 254 | Waters Corporation # | | 12,649 | | 655 | Pitney Bowes, Inc. * | 30,595 |
| 301 | Watson Pharmaceuticals, Inc. #* | 8,100 | | 601 | R.R. Donnelley & Sons Company | 20,350 |
| 1,620 | WellPoint, Inc. # | | 123,638 | | 1,159 | Raytheon Company | 57,892 |
| 3,339 | Wyeth | | 170,389 | | 405 | Robert Half International, Inc. | 14,803 |
| 639 | Zimmer Holdings, Inc. # | | 46,014 | | 454 | Rockwell Automation, Inc. * | 28,148 |
|
| | |
| | Total Health Care | 3,833,824 | | 354 | Rockwell Collins, Inc. * | 20,560 |
|
| | |
| The accompanying Notes to Financial Statements are an integral part of this schedule. |
|
| 141 |
Large Cap Index Fund-I
Schedule of Investments as of October 31, 2006 |
| Shares | Common Stock (96.3%) | | Value | | Shares | Common Stock (96.3%) | Value |
|
| |
| Industrials — continued | | | | 14,649 | Intel Corporation | $312,610 |
| 200 | Ryder System, Inc. | | $10,530 | | 3,748 | International Business Machines | |
| 1,895 | Southwest Airlines Company | | 28,482 | | | Corporation | 346,053 |
| 302 | Textron, Inc. | | 27,461 | | 810 | Intuit, Inc. # | 28,593 |
| 5,061 | Tyco International, Ltd. | | 148,945 | | 405 | Jabil Circuit, Inc. | 11,628 |
| 656 | Union Pacific Corporation | | 59,453 | | 530 | JDS Uniphase Corporation #* | 7,703 |
| 2,684 | United Parcel Service, Inc. | | 202,239 | | 1,500 | Juniper Networks, Inc. # | 25,830 |
| 2,522 | United Technologies Corporation | | 165,746 | | 504 | KLA-Tencor Corporation * | 24,782 |
| 252 | W.W. Grainger, Inc. | | 18,341 | | 251 | Lexmark International, Inc. # | 15,961 |
| 1,264 | Waste Management, Inc. | | 47,375 | | 757 | Linear Technology Corporation | 23,558 |
|
| | |
| | Total Industrials | 3,383,208 | | 1,108 | LSI Logic Corporation #* | 11,135 |
|
| | |
| | | | | | 11,416 | Lucent Technologies, Inc. #* | 27,741 |
| Information Technology (14.7%) | | | | 859 | Maxim Integrated Products, Inc. | 25,779 |
| 338 | ADC Telecommunications, Inc. #* | | 4,837 | | 1,866 | Micron Technology, Inc. # | 26,964 |
| 1,510 | Adobe Systems, Inc. # | | 57,758 | | 21,725 | Microsoft Corporation | 623,725 |
| 1,407 | Advanced Micro Devices, Inc. #* | | 29,927 | | 467 | Molex, Inc. * | 16,298 |
| 300 | Affiliated Computer Services, Inc. #* | 16,044 | | 6,051 | Motorola, Inc. | 139,536 |
| 951 | Agilent Technologies, Inc. # | | 33,856 | | 808 | National Semiconductor | |
| 859 | Altera Corporation # | | 15,840 | | | Corporation | 19,626 |
| 910 | Analog Devices, Inc. | | 28,956 | | 502 | NCR Corporation # | 20,843 |
| 2,120 | Apple Computer, Inc. # | | 171,890 | | 908 | Network Appliance, Inc. # | 33,142 |
| 3,602 | Applied Materials, Inc. * | | 62,639 | | 909 | Novell, Inc. # | 5,454 |
| 604 | Autodesk, Inc. #* | | 22,197 | | 353 | Novellus Systems, Inc. #* | 9,760 |
| 1,465 | Automatic Data Processing, Inc. | | 72,430 | | 910 | NVIDIA Corporation # | 31,732 |
| 1,118 | Avaya, Inc. # | | 14,322 | | 10,110 | Oracle Corporation # | 186,732 |
| 507 | BMC Software, Inc. # | | 15,367 | | 382 | Parametric Technology | |
| 1,132 | Broadcom Corporation #* | | 34,266 | | | Corporation # | 7,464 |
| 965 | CA, Inc. * | | 23,893 | | 785 | Paychex, Inc. | 30,992 |
| 194 | CIENA Corporation #* | | 4,561 | | 704 | PMC-Sierra, Inc. #* | 4,668 |
| 15,314 | Cisco Systems, Inc. # | | 369,527 | | 502 | QLogic Corporation # | 10,331 |
| 403 | Citrix Systems, Inc. # | | 11,901 | | 4,242 | QUALCOMM, Inc. | 154,366 |
| 404 | Computer Sciences Corporation # | | 21,351 | | 389 | Sabre Holdings Corporation | 9,888 |
| 1,059 | Compuware Corporation # | | 8,514 | | 500 | SanDisk Corporation #* | 24,050 |
| 454 | Comverse Technology, Inc. # | | 9,884 | | 1,313 | Sanmina-SCI Corporation # | 5,186 |
| 404 | Convergys Corporation # | | 8,569 | | 2,372 | Solectron Corporation #* | 7,922 |
| 3,933 | Corning, Inc. # | | 80,351 | | 8,796 | Sun Microsystems, Inc. #* | 47,762 |
| 5,676 | Dell, Inc. # | | 138,097 | | 2,436 | Symantec Corporation # | 48,330 |
| 2,932 | eBay, Inc. # | | 94,205 | | 686 | Symbol Technologies, Inc. | 10,242 |
| 708 | Electronic Arts, Inc. # | | 37,446 | | 301 | Tektronix, Inc. | 9,141 |
| 1,312 | Electronic Data Systems | | | | 1,160 | Tellabs, Inc. # | 12,226 |
| | Corporation | | 33,233 | | 554 | Teradyne, Inc. #* | 7,767 |
| 5,815 | EMC Corporation # | | 71,234 | | 3,898 | Texas Instruments, Inc. | 117,642 |
| 1,865 | First Data Corporation | | 45,226 | | 1,057 | Unisys Corporation #* | 6,913 |
| 380 | Fiserv, Inc. # | | 18,772 | | 700 | VeriSign, Inc. #* | 14,476 |
| 923 | Freescale Semiconductor, Inc. # | | 36,302 | | 1,865 | Western Union Company # | 41,123 |
| 500 | Google, Inc. # | | 238,195 | | 2,571 | Xerox Corporation # | 43,707 |
| 6,907 | Hewlett-Packard Company | | 267,577 | | | | |
| The accompanying Notes to Financial Statements are an integral part of this schedule. |
|
| 142 |
Large Cap Index Fund-I
Schedule of Investments as of October 31, 2006
| Shares | Common Stock (96.3%) | Value | | Shares | Common Stock (96.3%) | | Value |
|
| |
| Information Technology — continued | | | 1,007 | Citizens Communications Company | $14,763 |
| 806 | Xilinx, Inc. | $20,561 | | 387 | Embarq Corporation * | | 18,711 |
| 3,128 | Yahoo!, Inc. # | 82,392 | | 4,136 | Qwest Communications | | |
|
| | |
| | Total Information | | | | International, Inc. #* | | 35,694 |
| | Technology | 4,791,501 | | 7,441 | Sprint Nextel Corporation | | 139,072 |
|
| | |
| | | | | 7,274 | Verizon Communications, Inc. | | 269,138 |
| Materials (2.9%) | | | 1,189 | Windstream Corporation | | 16,313 |
|
|
| 456 | Air Products and Chemicals, Inc. | 31,770 | | | Total Telecommunications | | |
| 2,186 | Alcoa, Inc. | 63,197 | | | Services | | 1,091,463 |
|
|
| 251 | Allegheny Technologies, Inc. * | 19,761 | | | | | |
| 251 | Ashland, Inc. * | 14,834 | | Utilities (3.5%) | | |
| 302 | Ball Corporation | 12,560 | | 1,664 | AES Corporation #* | | 36,591 |
| 402 | Bemis Company, Inc. | 13,515 | | 352 | Allegheny Energy, Inc. # | | 15,147 |
| 2,418 | Dow Chemical Company | 98,630 | | 503 | Ameren Corporation * | | 27,212 |
| 2,329 | E.I. du Pont de Nemours and | | | 929 | American Electric Power | | |
| | Company | 106,668 | | | Company, Inc. | | 38,488 |
| 301 | Eastman Chemical Company * | 18,337 | | 906 | CenterPoint Energy, Inc. * | | 14,025 |
| 504 | Ecolab, Inc. | 22,856 | | 702 | CMS Energy Corporation #* | | 10,453 |
| 503 | Freeport-McMoRan Copper & | | | 557 | Consolidated Edison, Inc. * | | 26,931 |
| | Gold, Inc. | 30,421 | | 503 | Constellation Energy Group, Inc. | | 31,387 |
| 352 | Hercules, Inc. # | 6,406 | | 929 | Dominion Resources, Inc. | | 75,240 |
| 251 | International Flavors & | | | 603 | DTE Energy Company | | 27,394 |
| | Fragrances, Inc. * | 10,662 | | 3,264 | Duke Energy Corporation | | 103,273 |
| 1,019 | International Paper Company | 33,984 | | 1,009 | Dynegy, Inc. # | | 6,135 |
| 351 | Louisiana-Pacific Corporation | 6,943 | | 758 | Edison International, Inc. | | 33,686 |
| 496 | MeadWestvaco Corporation * | 13,650 | | 506 | Entergy Corporation | | 43,430 |
| 1,346 | Monsanto Company | 59,520 | | 1,664 | Exelon Corporation | | 103,135 |
| 1,160 | Newmont Mining Corporation | 52,513 | | 858 | FirstEnergy Corporation | | 50,493 |
| 804 | Nucor Corporation | 46,962 | | 1,106 | FPL Group, Inc. * | | 56,406 |
| 354 | Pactiv Corporation # | 10,917 | | 554 | KeySpan Corporation | | 22,481 |
| 502 | Phelps Dodge Corporation | 50,391 | | 250 | Nicor, Inc. * | | 11,490 |
| 404 | PPG Industries, Inc. | 27,634 | | 875 | NiSource, Inc. | | 20,361 |
| 808 | Praxair, Inc. | 48,682 | | 150 | Peoples Energy Corporation * | | 6,554 |
| 406 | Rohm and Haas Company | 21,039 | | 860 | PG&E Corporation | | 37,100 |
| 201 | Sealed Air Corporation * | 11,964 | | 401 | Pinnacle West Capital Corporation * | 19,172 |
| 251 | Sigma-Aldrich Corporation | 18,853 | | 1,006 | PPL Corporation | | 34,727 |
| 402 | Temple-Inland, Inc. | 15,855 | | 682 | Progress Energy, Inc. | | 31,372 |
| 251 | United States Steel Corporation * | 16,968 | | 606 | Public Service Enterprise Group, Inc. | 36,996 |
| 251 | Vulcan Materials Company * | 20,451 | | 659 | Sempra Energy | | 34,953 |
| 605 | Weyerhaeuser Company * | 38,472 | | 1,970 | Southern Company * | | 71,708 |
|
| | |
| | Total Materials | 944,415 | | 704 | TECO Energy, Inc. | | 11,609 |
|
| | |
| | | | | 1,114 | TXU Corporation | | 70,327 |
| Telecommunications Services (3.3%) | | | 1,214 | Xcel Energy, Inc. * | | 26,793 |
|
|
| 957 | ALLTEL Corporation | 51,018 | | | Total Utilities | | 1,135,069 |
|
|
| 9,624 | AT&T, Inc. ∈ | 329,622 | | | | | |
|
|
| 4,454 | BellSouth Corporation | 200,875 | | | Total Common Stock | | |
| 404 | CenturyTel, Inc. | 16,257 | | | (cost $28,238,167) | | 31,397,849 |
|
|
| The accompanying Notes to Financial Statements are an integral part of this schedule. |
|
| 143 |
Large Cap Index Fund-I
Schedule of Investments as of October 31, 2006 |
| | | | | Interest | Maturity | |
| Shares | Collateral Held for Securities Loaned (8.0%) | Rate (+) | Date | Value |
|
| 2,599,233 | Thrivent Financial Securities Lending Trust | 5.300% | N/A | $2,599,233 |
| |
|
| | | Total Collateral Held for Securities Loaned | |
| | | (cost $2,599,233) | | | 2,599,233 |
|
|
| |
| |
| Shares or | | | | | | |
| Principal | | | | Interest | Maturity | |
| Amount | Short-Term Investments (3.7%) | | Rate (+) | Date | Value |
|
| $225,000 | Federal National Mortgage Association ∈ | 5.200% | 2/7/2007 | $221,888 |
| 973,500 | Thrivent Money Market Fund | | 4.600 | N/A | 973,500 |
|
|
| | | Total Short-Term Investments (cost $1,195,345) | 1,195,388 |
|
|
| | | Total Investments (cost $32,032,745) 108.0% | $35,192,470 |
|
|
| | | Other Assets and Liabilities, Net (8.0%) | | (2,614,351) |
|
|
| | | Total Net Assets 100.0% | | | $32,578,119 |
|
|
| |
| | | Number of | | Notional | | |
| | | Contracts | Expiration | Principal | | Unrealized |
| Futures | | Long/(Short) | Date | Amount | Value | Gain/(Loss) |
|
| S&P 500 Index Mini-Futures | 17 | December 2006 | $1,146,592 | $1,175,720 | $29,128 |
# Non-income producing security.
* All or a portion of the security is on loan as discussed in item 2(L) of the Notes to Financial Statements.
+ The interest rate shown reflects the yield, coupon rate or, for securities purchased at a discount, the discount rate at the date of purchase.
∈ At October 31, 2006, $221,888 of investments were held on deposit with the counterparty and pledged as the initial margin deposit for open financial futures contracts. In addition, $1,606,600 of investments were earmarked as collateral to cover open financial futures contracts.
Definitions:
REIT — Real Estate Investment Trust, is a company that buys, develops, manages and/or sells real estate assets.
| Gross unrealized appreciation and depreciation of investments, based on cost for federal income tax purposes, were as follows: | |
| | |
| Gross unrealized appreciation | $6,099,366 | |
| Gross unrealized depreciation | (3,170,228) | |
| |
| |
| Net unrealized appreciation (depreciation) | $2,929,138 | |
| Cost for federal income tax purposes | $32,263,332 | |
| The accompanying Notes to Financial Statements are an integral part of this schedule. |
|
| 144 |
Balanced Fund
Schedule of Investments as of October 31, 2006
| Shares | Common Stock (67.2%) | Value | | Shares | Common Stock (67.2%) | Value |
|
| |
| Consumer Discretionary (7.7%) | | | 60,200 | Viacom, Inc. #±∈ | $2,342,984 |
| 8,600 | Advance Auto Parts, Inc. ± | $301,172 | | 48,500 | Visteon Corporation # | 357,930 |
| 17,700 | Best Buy Company, Inc. ∈ | 977,925 | | 52,900 | Walt Disney Company | 1,664,234 |
|
|
| 3,000 | Black & Decker Corporation | 251,640 | | | Total Consumer | |
| 7,200 | Brunswick Corporation * | 226,800 | | | Discretionary | 27,025,629 |
|
|
| 4,500 | Centex Corporation * | 235,350 | | | | |
| 5,900 | Children’s Place Retail | | | Consumer Staples (5.8%) | |
| | Stores, Inc. #* | 414,121 | | 12,900 | Alberto-Culver Company ± | 655,449 |
| 16,900 | Coldwater Creek, Inc. #* | 515,281 | | 41,800 | Altria Group, Inc. | 3,399,594 |
| 10,400 | D.R. Horton, Inc. | 243,672 | | 11,300 | Cadbury Schweppes plc * | 458,667 |
| 13,900 | DreamWorks Animation | | | 19,200 | Colgate-Palmolive Company ± | 1,228,224 |
| | SKG, Inc. #* | 367,655 | | 27,700 | Constellation Brands, Inc. # | 761,473 |
| 12,300 | DSW, Inc. #* | 425,580 | | 16,100 | Corn Products International, Inc. * | 582,659 |
| 27,300 | E.W. Scripps Company | 1,350,258 | | 9,200 | Costco Wholesale Corporation | 491,096 |
| 10,400 | Federated Department Stores, Inc. | 456,664 | | 27,700 | CVS Corporation ± | 869,226 |
| 7,800 | Fortune Brands, Inc. | 600,210 | | 9,600 | Diageo plc | 714,912 |
| 7,800 | GameStop Corporation #* | 398,268 | | 15,700 | Elizabeth Arden, Inc. # | 273,808 |
| 11,800 | Gap, Inc. | 248,036 | | 12,300 | Flowers Foods, Inc. ± | 334,191 |
| 11,600 | Genesco, Inc. #* | 435,812 | | 11,900 | Hormel Foods Corporation | 429,709 |
| 48,500 | Gentex Corporation * | 771,635 | | 10,600 | Kellogg Company | 533,286 |
| 16,150 | Golf Galaxy, Inc. #* | 250,648 | | 19,400 | Kroger Company | 436,306 |
| 20,100 | Harley-Davidson, Inc. | 1,379,463 | | 10,300 | Loews Corporation — | |
| 2,700 | Harman International | | | | Carolina Group | 595,546 |
| | Industries, Inc. | 276,345 | | 23,400 | Nu Skin Enterprises, Inc. * | 447,408 |
| 33,500 | Home Depot, Inc. | 1,250,555 | | 23,900 | Pepsi Bottling Group, Inc. | 755,718 |
| 13,700 | Kohl’s Corporation # | 967,220 | | 42,712 | Procter & Gamble Company ± | 2,707,514 |
| 4,900 | Lennar Corporation * | 232,652 | | 14,429 | Reckitt Benckiser plc | 627,312 |
| 11,800 | Lowe’s Companies, Inc. | 355,652 | | 9,500 | Reynolds American, Inc. * | 600,020 |
| 18,100 | McGraw-Hill Companies, Inc. | 1,161,477 | | 14,800 | Smithfield Foods, Inc. # | 397,824 |
| 9,700 | MGM MIRAGE #* | 417,294 | | 13,500 | SYSCO Corporation | 472,230 |
| 2,200 | Mohawk Industries, Inc. #* | 159,940 | | 10,200 | Walgreen Company | 445,536 |
| 6,400 | Newell Rubbermaid, Inc. | 184,192 | | 38,200 | Wal-Mart Stores, Inc. | 1,882,496 |
|
|
| 9,900 | Nordstrom, Inc. | 468,765 | | | Total Consumer Staples | 20,100,204 |
|
|
| 4,400 | Office Depot, Inc. # | 184,756 | | | | |
| 16,100 | Penn National Gaming, Inc. # | 588,777 | | Energy (6.3%) | |
| 7,600 | Pulte Homes, Inc. | 235,524 | | 23,300 | Apache Corporation ∈ | 1,521,956 |
| 25,700 | Royal Caribbean Cruises, Ltd. | 1,040,850 | | 30,700 | Chevron Corporation ∈ | 2,063,040 |
| 15,600 | Scientific Games Corporation # | 437,268 | | 26,500 | ConocoPhillips | 1,596,360 |
| 18,200 | Shuffle Master, Inc. #* | 509,236 | | 25,400 | Denbury Resources, Inc. # | 729,996 |
| 30,800 | Staples, Inc. ∈ | 794,332 | | 10,600 | Dril-Quip, Inc. # | 417,428 |
| 15,500 | Starwood Hotels & Resorts | | | 12,800 | ENSCO International, Inc. | 626,816 |
| | Worldwide, Inc. | 925,970 | | 78,386 | Exxon Mobil Corporation | 5,598,328 |
| 8,400 | Station Casinos, Inc. * | 506,520 | | 28,300 | Halliburton Company ± | 915,505 |
| 23,000 | Target Corporation | 1,361,140 | | 36,800 | Key Energy Services, Inc. # | 515,200 |
| 4,500 | Tiffany & Company * | 160,740 | | 11,800 | Lufkin Industries, Inc. | 712,012 |
| 11,900 | TJX Companies, Inc. | 344,505 | | 41,800 | Occidental Petroleum Corporation | 1,962,092 |
| 19,100 | ValueVision Media, Inc. # | 246,581 | | 9,600 | Peabody Energy Corporation ± | 402,912 |
| The accompanying Notes to Financial Statements are an integral part of this schedule. |
|
| 145 |
Balanced Fund
Schedule of Investments as of October 31, 2006 |
| Shares | Common Stock (67.2%) | Value | | Shares | Common Stock (67.2%) | Value |
|
| |
| Energy — continued | | | 27,100 | Federal Home Loan Mortgage | |
| 22,250 | Range Resources Corporation | $604,088 | | | Corporation | $1,869,629 |
| 14,400 | Total SA ADR | 981,216 | | 10,100 | Franklin Resources, Inc. | 1,150,996 |
| 20,400 | Transocean, Inc. #± | 1,479,816 | | 100 | Glenborough Realty Trust, Inc. | 2,598 |
| 22,200 | Valero Energy Corporation | 1,161,726 | | 11,600 | Goldman Sachs Group, Inc. | 2,201,564 |
| 14,000 | Weatherford | | | 9,900 | Hartford Financial Services | |
| | International, Ltd. #± | 575,120 | | | Group, Inc. ∈ | 862,983 |
|
| | |
| | Total Energy | 21,863,611 | | 23,800 | HCC Insurance Holdings, Inc. | 801,108 |
|
| | |
| | | | | 3,900 | Hospitality Properties Trust | 188,994 |
| Financials (14.1%) | | | 400 | Kilroy Realty Corporation | 30,132 |
| 8,600 | Affiliated Managers | | | 1 | Lincoln National Corporation | 62 |
| | Group, Inc. #* | 861,204 | | 2,500 | Mack-Cali Realty Corporation | 132,250 |
| 24,300 | AFLAC, Inc. ± | 1,091,556 | | 18,000 | Mellon Financial Corporation | 698,400 |
| 17,500 | Allstate Corporation | 1,073,800 | | 20,600 | Merrill Lynch & Company, Inc. | 1,800,852 |
| 2,400 | AMB Property Corporation | 140,184 | | 1,900 | Mills Corporation * | 34,713 |
| 31,300 | American Express Company ±∈ | 1,809,453 | | 2,600 | New Century | |
| 6,700 | American Financial Realty Trust * | 78,189 | | | Financial Corporation * | 102,388 |
| 10,462 | American International | | | 4,200 | New Plan Excel Realty Trust, Inc. | 120,960 |
| | Group, Inc. ∈ | 702,733 | | 53,100 | Nexity Financial Corporation # | 701,451 |
| 2,600 | Apartment Investment & | | | 15,200 | Northern Trust Corporation | 892,544 |
| | Management Company | 149,032 | | 100 | Parkway Properties, Inc. * | 4,934 |
| 2,700 | Archstone-Smith Trust | 162,567 | | 2,900 | Plum Creek Timber Company, Inc. | 104,226 |
| 27,900 | Associated Banc-Corp * | 916,236 | | 26,200 | PMI Group, Inc. ∈ | 1,117,430 |
| 24,000 | Axis Capital Holdings, Ltd. | 788,400 | | 25,200 | PNC Financial Services | |
| 93,500 | Bank of America Corporation | 5,036,845 | | | Group, Inc. | 1,764,756 |
| 16,700 | Capital One Financial | | | 13,200 | Portfolio Recovery | |
| | Corporation ± | 1,324,811 | | | Associates, Inc. #* | 615,384 |
| 2,763 | CapitalSource, Inc. * | 76,646 | | 3,200 | ProLogis Trust | 202,464 |
| 31,500 | Center Financial Corporation * | 761,040 | | 10,500 | Prudential Financial, Inc. ∈ | 807,765 |
| 1,400 | Chicago Mercantile Exchange | | | 3,440 | Public Storage, Inc. | 308,602 |
| | Holdings, Inc. | 701,400 | | 2,800 | Rayonier, Inc. REIT | 114,772 |
| 21,900 | Chubb Corporation * | 1,163,985 | | 3,500 | Simon Property Group, Inc. | 339,850 |
| 76,145 | Citigroup, Inc. | 3,819,433 | | 100 | Sovran Self Storage, Inc. | 5,898 |
| 17,200 | City National Corporation * | 1,144,832 | | 30,800 | TD Ameritrade | |
| 30,300 | Countrywide Financial | | | | Holding Corporation | 507,276 |
| | Corporation | 1,155,036 | | 24,900 | Texas Capital Bancshares, Inc. # | 498,996 |
| 1,800 | Developers Diversified | | | 4,500 | United Dominion Realty | |
| | Realty Corporation | 109,620 | | | Trust, Inc. * | 145,665 |
| 32,000 | E*TRADE Financial | | | 29,586 | Wachovia Corporation | 1,642,023 |
| | Corporation #∈ | 744,960 | | 2,600 | Weingarten Realty Investors * | 120,900 |
| 18,000 | Endurance Specialty | | | 76,900 | Wells Fargo & Company ~ | 2,790,701 |
| | Holdings, Ltd. | 641,700 | | 15,600 | Zions Bancorporation * | 1,254,240 |
|
|
| 300 | Entertainment Properties Trust * | 16,500 | | | Total Financials | 48,957,216 |
|
|
| 3,200 | Equity Office Properties Trust | 136,000 | | | | |
| 4,400 | Equity Residential REIT | 240,284 | | Health Care (8.4%) | |
| 1,300 | Essex Property Trust, Inc. | 173,264 | | 49,000 | Abbott Laboratories ~ | 2,327,990 |
| | | | | 15,200 | Advanced Medical Optics, Inc. #* | 620,920 |
| The accompanying Notes to Financial Statements are an integral part of this schedule. |
|
| 146 |
Balanced Fund
Schedule of Investments as of October 31, 2006 |
| Shares | Common Stock (67.2%) | Value | Shares | Common Stock (67.2%) | Value |
|
| |
| Health Care — continued | | Industrials (8.1%) | |
| 12,200 | Aetna, Inc. ± | $502,884 | 16,000 | American Commercial | |
| 400 | Amedisys, Inc. #* | 16,228 | | Lines, Inc. #* | $1,026,400 |
| 4,100 | AmerisourceBergen Corporation | 193,520 | 23,500 | American Reprographics | |
| 36,100 | Amgen, Inc. #± | 2,740,351 | | Company # | 834,250 |
| 10,300 | Amylin Pharmaceuticals, Inc. #* | 452,788 | 17,600 | Burlington Northern Santa Fe | |
| 42,000 | Aspect Medical Systems, Inc. #* | 750,540 | | Corporation ± | 1,364,528 |
| 31,500 | BioMarin Pharmaceutical, Inc. # | 504,945 | 17,100 | Cooper Industries, Ltd. | 1,529,595 |
| 7,300 | Cardinal Health, Inc. | 477,785 | 37,200 | CSX Corporation | 1,326,924 |
| 9,200 | Caremark Rx, Inc. ± | 452,916 | 20,800 | Emerson Electric Company ± | 1,755,520 |
| 2,900 | CIGNA Corporation | 339,242 | 30,100 | GATX Corporation ∈ | 1,311,457 |
| 41,300 | Conor Medsystems, Inc. #* | 1,014,328 | 36,600 | General Electric Company | 1,285,026 |
| 1,400 | Covance, Inc. #∈ | 81,900 | 7,100 | Genlyte Group, Inc. #* | 548,546 |
| 6,800 | Coventry Health Care, Inc. # | 319,260 | 13,500 | Gol Linhas Aereas Inteligentes | |
| 37,000 | Cubist Pharmaceuticals, Inc. # | 823,990 | | SA ADR * | 420,525 |
| 17,400 | Cytyc Corporation # | 459,708 | 39,000 | Hub Group, Inc. # | 1,059,240 |
| 53,300 | Dexcom, Inc. #* | 469,040 | 25,500 | Illinois Tool Works, Inc. | 1,222,215 |
| 4,800 | Express Scripts, Inc. # | 305,856 | 45,300 | Interline Brands, Inc. # | 1,084,482 |
| 5,200 | Fisher Scientific | | 30,400 | Labor Ready, Inc. # | 532,304 |
| | International, Inc. # | 445,224 | 24,700 | Laidlaw International, Inc. ± | 716,547 |
| 3,700 | HCA, Inc. * | 186,924 | 12,400 | Manitowoc Company, Inc. | 680,512 |
| 2,200 | Health Net, Inc. # | 91,322 | 49,800 | MSC Industrial Direct | |
| 1,700 | Henry Schein, Inc. # | 84,473 | | Company, Inc. | 2,037,816 |
| 3,700 | Humana, Inc. # | 222,000 | 25,900 | Rockwell Automation, Inc. ± | 1,605,800 |
| 9,700 | IMS Health, Inc. | 270,145 | 10,100 | Rockwell Collins, Inc. * | 586,608 |
| 107,300 | Keryx BioPharmaceuticals, Inc. #* | 1,506,492 | 27,800 | Roper Industries, Inc. * | 1,330,230 |
| 2,600 | Laboratory Corporation of | | 900 | SAIC, Inc. # | 18,000 |
| | America Holdings # | 178,074 | 30,800 | United Technologies | |
| 2,900 | Manor Care, Inc. * | 139,171 | | Corporation ± | 2,024,176 |
| 5,900 | McKesson Corporation | 295,531 | 29,500 | URS Corporation # | 1,192,095 |
| 5,978 | Medco Health Solutions, Inc. # | 319,823 | 39,200 | Waste Management, Inc. | 1,469,216 |
| 36,300 | Medtronic, Inc. | 1,767,084 | 21,500 | WESCO International, Inc. # | 1,403,305 |
|
|
| 4,300 | Millipore Corporation #* | 277,479 | | Total Industrials | 28,365,317 |
|
|
| 53,600 | NeoPharm, Inc. #* | 388,064 | | | |
| 24,500 | Novartis AG ADR | 1,487,885 | Information Technology (10.7%) | |
| 66,800 | NuVasive, Inc. #* | 1,570,468 | 22,400 | Accenture, Ltd. | 737,184 |
| 2,400 | Omnicare, Inc. * | 90,912 | 21,500 | Adobe Systems, Inc. #± | 822,375 |
| 2,600 | Patterson Companies, Inc. #± | 85,410 | 20,100 | ADTRAN, Inc. | 465,114 |
| 100 | Psychiatric Solutions, Inc. # | 3,320 | 23,500 | Agilent Technologies, Inc. #±∈ | 836,600 |
| 3,300 | Quest Diagnostics, Inc. | 164,142 | 49,800 | Alcatel SA ADR * | 632,460 |
| 30,400 | Sanofi-Aventis ADR | 1,297,776 | 49,900 | Apple Computer, Inc. #± | 4,045,892 |
| 34,200 | St. Jude Medical, Inc. # | 1,174,770 | 67,100 | Applied Materials, Inc. * | 1,166,869 |
| 20,440 | UnitedHealth Group, Inc. | 997,063 | 13,800 | aQuantive, Inc. #* | 375,084 |
| 13,600 | Varian Medical Systems, Inc. # | 746,096 | 13,600 | Autodesk, Inc. # | 499,800 |
| 36,200 | Vertex Pharmaceuticals, Inc. #* | 1,469,720 | 24,800 | Automatic Data Processing, Inc. | 1,226,112 |
| 13,600 | WellPoint, Inc. # | 1,037,952 | 17,000 | Avocent Corporation # | 624,070 |
|
| |
| | Total Health Care | 29,151,511 | 52,600 | BEA Systems, Inc. # | 855,802 |
|
| |
| The accompanying Notes to Financial Statements are an integral part of this schedule. |
|
| 147 |
Balanced Fund
Schedule of Investments as of October 31, 2006 |
| Shares | Common Stock (67.2%) | Value | | Shares | Common Stock (67.2%) | Value |
|
| |
| Information Technology — continued | | | Telecommunications Services (1.2%) | |
| 146,300 | Cisco Systems, Inc. #± | $3,530,219 | | 17,300 | America Movil SA de CV ADR | $741,651 |
| 15,000 | Citrix Systems, Inc. # | 442,950 | | 53,900 | AT&T, Inc. ∈ | 1,846,075 |
| 43,000 | ECI Telecom, Ltd. # | 319,060 | | 33,400 | Verizon Communications, Inc. | 1,235,800 |
| 70,600 | EMC Corporation # | 864,850 | | 42,050 | Windstream Corporation | 576,926 |
|
|
| 3,845 | Google, Inc. # | 1,831,720 | | | Total Telecommunications | |
| 11,500 | Hyperion Solutions Corporation # | 430,100 | | | Services | 4,400,452 |
|
|
| 25,800 | Informatica Corporation # | 319,662 | | | | |
| 55,500 | Integrated Device | | | Utilities (2.7%) | |
| | Technology, Inc. # | 879,675 | | 16,100 | AES Corporation # | 354,039 |
| 121,100 | Intel Corporation ± | 2,584,274 | | 5,200 | Ameren Corporation * | 281,320 |
| 51,300 | Microsoft Corporation ± | 1,472,823 | | 10,600 | American Electric Power | |
| 59,900 | Motorola, Inc. | 1,381,294 | | | Company, Inc. | 439,158 |
| 15,600 | NAVTEQ Corporation # | 517,920 | | 6,300 | Consolidated Edison, Inc. * | 304,605 |
| 23,000 | Network Appliance, Inc. # | 839,500 | | 4,700 | Constellation Energy | |
| 39,700 | Nokia Oyj ADR ± | 789,236 | | | Group, Inc. ∈ | 293,280 |
| 84,600 | Novell, Inc. # | 507,600 | | 9,400 | Dominion Resources, Inc. ∈ | 761,306 |
| 33,400 | Nuance Communications, Inc. #* | 385,436 | | 4,600 | DTE Energy Company * | 208,978 |
| 43,700 | NVIDIA Corporation #* | 1,523,819 | | 25,716 | Duke Energy Corporation | 813,654 |
| 41,600 | Packeteer, Inc. # | 466,336 | | 8,700 | Edison International, Inc. | 386,628 |
| 53,200 | Powerwave Technologies, Inc. #* | 346,332 | | 5,500 | Entergy Corporation | 472,065 |
| 28,700 | QUALCOMM, Inc. | 1,044,393 | | 17,700 | Exelon Corporation ~ | 1,097,046 |
| 44,000 | Tellabs, Inc. # | 463,760 | | 8,700 | FirstEnergy Corporation | 511,995 |
| 74,500 | Texas Instruments, Inc. | 2,248,410 | | 4,300 | KeySpan Corporation | 174,494 |
| 49,800 | TIBCO Software, Inc. # | 460,650 | | 8,900 | PG&E Corporation | 383,946 |
| 28,800 | Wind River Systems, Inc. # | 316,224 | | 9,700 | PPL Corporation | 334,844 |
| 36,500 | Yahoo!, Inc. # | 961,410 | | 6,800 | Progress Energy, Inc. | 312,800 |
|
| | |
| | Total Information | | | 6,500 | Public Service Enterprise | |
| | Technology | 37,215,015 | | | Group, Inc. | 396,825 |
|
| | | |
| | | | | 2,400 | Questar Corporation * | 195,552 |
| Materials (2.2%) | | | 6,800 | Sempra Energy | 360,672 |
| 12,500 | Air Products and | | | 13,100 | TXU Corporation ± | 827,003 |
| | Chemicals, Inc. ± | 870,875 | | 3,000 | Wisconsin Energy Corporation | 137,820 |
| 375 | Arkema # | 18,308 | | 10,900 | Xcel Energy, Inc. ± | 240,563 |
|
|
| 22,300 | Bemis Company, Inc. | 749,726 | | | Total Utilities | 9,288,593 |
|
|
| 20,600 | Dow Chemical Company ± | 840,274 | | | | |
|
|
| 19,200 | E.I. du Pont de Nemours and | | | | Total Common Stock | |
| | Company | 879,360 | | | (cost $204,940,049) | 233,924,199 |
|
|
| 5,400 | FMC Corporation ± | 370,170 | | | | |
| 19,300 | Freeport-McMoRan Copper & | | | | | |
| | Gold, Inc. | 1,167,264 | | | | |
| 11,100 | Lubrizol Corporation | 499,500 | | | | |
| 22,000 | Praxair, Inc. * | 1,325,500 | | | | |
| 20,200 | Silgan Holdings, Inc. | 835,674 | | | | |
|
| | |
| | Total Materials | 7,556,651 | | | | |
|
| | |
| The accompanying Notes to Financial Statements are an integral part of this schedule. |
|
| 148 |
Balanced Fund
Schedule of Investments as of October 31, 2006 |
| Principal | | Interest | Maturity | |
| Amount | Long-Term Fixed Income (38.7%) | Rate | Date | Value |
|
| Asset-Backed Securities (7.0%) | | | |
| $1,000,000 | Americredit Automobile Receivables Trust ∞∈ | 5.400% | 11/6/2006 | $1,000,325 |
| 1,500,000 | Bear Stearns Asset-Backed Securities, Inc. ∞ | 5.560 | 11/25/2006 | 1,501,282 |
| 905,483 | Bear Stearns Mortgage Funding Trust ∞ | 5.460 | 11/25/2006 | 905,479 |
| 853,111 | Countrywide Asset-Backed Certificates ∞ | 5.400 | 11/25/2006 | 852,945 |
| 240,739 | Countrywide Asset-Backed Certificates | 3.903 | 1/25/2031 | 239,223 |
| 1,150,000 | Countrywide Asset-Backed Certificates | 5.549 | 4/25/2036 | 1,147,843 |
| 53,394 | Credit Based Asset Servicing and Securitization | 3.887 | 10/25/2034 | 53,145 |
| 1,000,000 | DaimlerChrysler Master Owner Trust ∞ | 5.370 | 11/15/2006 | 1,000,137 |
| 56,904 | Encore Credit Receivables Trust ∞ | 5.440 | 11/25/2006 | 56,906 |
| 441,892 | FBR Securitization Trust, LLC ∞ | 5.440 | 11/25/2006 | 441,925 |
| 365,743 | First Franklin Mortgage Loan Asset-Backed Certificates ∞ | 5.420 | 11/25/2006 | 365,803 |
| 1,000,000 | First Franklin Mortgage Loan Asset-Backed Certificates ∞ | 5.430 | 11/25/2006 | 1,000,137 |
| 1,000,000 | Ford Credit Floor Plan Master Owner Trust ±∞ | 5.500 | 11/15/2006 | 1,000,517 |
| 527,782 | Fremont Home Loan Trust ∞ | 5.480 | 11/25/2006 | 527,878 |
| 1,000,000 | GE Dealer Floorplan Master Note Trust ∞ | 5.360 | 11/20/2006 | 1,000,283 |
| 1,000,000 | GMAC Mortgage Corporation Loan Trust ∞ | 5.390 | 11/25/2006 | 1,001,250 |
| 1,100,000 | GMAC Mortgage Corporation Loan Trust ∞ | 5.410 | 11/25/2006 | 1,100,145 |
| 649,371 | Green Tree Financial Corporation | 6.330 | 11/1/2029 | 660,898 |
| 500,000 | Harley Davidson Motorcycle Trust | 3.200 | 5/15/2012 | 488,578 |
| 838,811 | Master Asset-Backed Securities Trust ∞ | 5.400 | 11/25/2006 | 838,975 |
| 859,169 | National Collegiate Student Loan Trust ∞ | 5.380 | 11/25/2006 | 859,845 |
| 592,198 | Option One Mortgage Loan Trust ∞ | 5.480 | 11/25/2006 | 592,476 |
| 452,245 | Popular ABS Mortgage Pass-Through Trust ∞ | 5.430 | 11/25/2006 | 452,243 |
| 795,847 | Popular ABS Mortgage Pass-Through Trust ∞ | 5.450 | 11/25/2006 | 796,051 |
| 500,000 | Popular ABS Mortgage Pass-Through Trust | 4.000 | 12/25/2034 | 493,450 |
| 1,500,000 | Renaissance Home Equity Loan Trust | 5.608 | 5/25/2036 | 1,500,696 |
| 768,227 | Residential Asset Securities Corporation ∞ | 5.400 | 11/25/2006 | 768,355 |
| 397,885 | Residential Asset Securities Corporation ∞ | 5.430 | 11/25/2006 | 397,935 |
| 1,100,173 | Residential Asset Securities Corporation | 4.160 | 7/25/2030 | 1,085,209 |
| 430,589 | SLM Student Loan Trust ∞ | 5.387 | 1/25/2007 | 430,788 |
| 482,125 | Specialty Underwriting and Residential Finance Trust ∞ | 5.440 | 11/25/2006 | 482,190 |
| 1,000,000 | Textron Financial Floorplan Master Note Trust ∞∈ | 5.440 | 11/13/2006 | 1,001,783 |
| 150,455 | Wachovia Mortgage Loan Trust, LLC ∞ | 5.430 | 11/25/2006 | 150,465 |
|
|
| | Total Asset-Backed Securities | | 24,195,160 |
|
|
| |
| Basic Materials (0.1%) | | | |
| 500,000 | Precision Castparts Corporation ± | 5.600 | 12/15/2013 | 498,120 |
|
|
| | Total Basic Materials | | | 498,120 |
|
|
| |
| Capital Goods (0.4%) | | | |
| 275,000 | Goodrich Corporation * | 6.290 | 7/1/2016 | 284,213 |
| 270,000 | Lockheed Martin Corporation | 6.150 | 9/1/2036 | 286,898 |
| 750,000 | Oakmont Asset Trust | 4.514 | 12/22/2008 | 732,741 |
|
|
| | Total Capital Goods | | | 1,303,852 |
|
|
| The accompanying Notes to Financial Statements are an integral part of this schedule. |
|
| 149 |
Balanced Fund
Schedule of Investments as of October 31, 2006 |
| Principal | | Interest | Maturity | |
| Amount | Long-Term Fixed Income (38.7%) | Rate | Date | Value |
|
| Commercial Mortgage-Backed Securities (7.0%) | | | |
| $750,000 | Banc of America Commercial Mortgage, Inc. ± | 4.037% | 11/10/2039 | $726,162 |
| 500,000 | Banc of America Commercial Mortgage, Inc. | 5.118 | 7/11/2043 | 499,174 |
| 1,346,205 | Banc of America Mortgage Securities, Inc. | 4.817 | 9/25/2035 | 1,328,319 |
| 1,000,000 | Bear Stearns Commercial Mortgage Securities, Inc. | 3.869 | 2/11/2041 | 974,763 |
| 1,000,000 | Bear Stearns Commercial Mortgage Securities, Inc. | 4.487 | 2/11/2041 | 970,602 |
| 1,000,000 | Citigroup Commercial Mortgage Trust Ω | 5.438 | 11/15/2018 | 1,000,000 |
| 269,925 | Commercial Mortgage Pass-Through Certificates ∞ | 5.420 | 11/15/2006 | 269,947 |
| 1,000,000 | Commercial Mortgage Pass-Through Certificates ∞ | 5.450 | 11/15/2006 | 1,000,000 |
| 1,000,000 | First Union National Bank Commercial Mortgage Trust | 7.390 | 12/15/2031 | 1,055,667 |
| 1,500,000 | GS Mortgage Securities Corporation | 5.588 | 11/10/2039 | 1,528,290 |
| 899,630 | HomeBanc Mortgage Trust | 6.078 | 4/25/2037 | 911,347 |
| 908,715 | J.P. Morgan Alternative Loan Trust | 5.804 | 3/25/2036 | 916,096 |
| 1,000,000 | LB-UBS Commercial Mortgage Trust | 3.086 | 5/15/2027 | 969,839 |
| 1,213,648 | Merrill Lynch Mortgage Investors, Inc. | 4.881 | 6/25/2035 | 1,202,905 |
| 1,250,000 | Merrill Lynch Mortgage Trust ∈ | 4.099 | 11/15/2010 | 1,235,198 |
| 1,000,000 | Merrill Lynch Mortgage Trust ∈ | 5.264 | 1/12/2044 | 1,001,178 |
| 1,361,350 | Morgan Stanley Capital I, Inc. ± | 6.210 | 11/15/2031 | F1,379,975 |
| 1,497,154 | National Collegiate Student Loan Trust ±∞ | 5.390 | 11/25/2006 | 1,497,738 |
| 976,236 | Thornburg Mortgage Securities Trust ∞ | 5.410 | 11/25/2006 | 973,449 |
| 608,044 | Wachovia Bank Commercial Mortgage Trust ∞ | 5.520 | 11/15/2006 | 608,176 |
| 1,000,000 | Wachovia Bank Commercial Mortgage Trust | 4.390 | 2/15/2036 | 966,051 |
F| 1,500,000 | Wachovia Bank Commercial Mortgage Trust | 4.516 | 5/15/2044 | 1,469,996 |
| 894,445 | Washington Mutual Asset Securities Corporation | 3.830 | 1/25/2035 | 865,636 |
| 889,344 | Zuni Mortgage Loan Trust ∈ | 5.450 | 11/25/2006 | 888,151 |
|
|
| | Total Commercial Mortgage-Backed Securities | 24,238,659 |
|
|
| |
| Communications Services (1.2%) | | | |
| 375,000 | AT&T Broadband Corporation ∈ | 8.375 | 3/15/2013 | 428,367 |
| 225,000 | AT&T Corporation ± | 8.000 | 11/15/2031 | 281,886 |
| 500,000 | British Telecom plc ~ | 8.375 | 12/15/2010 | 561,567 |
| 270,000 | Comcast Corporation ~ | 5.900 | 3/15/2016 | 271,753 |
| 180,000 | Comcast Corporation ~ | 6.500 | 1/15/2017 | 188,760 |
| 340,000 | Cox Communications, Inc. ~ | 5.450 | 12/15/2014 | 332,144 |
| 140,000 | New Cingular Wireless Services, Inc. ∈ | 8.750 | 3/1/2031 | 183,449 |
| 125,000 | News America, Inc. * | 6.400 | 12/15/2035 | 125,338 |
| 570,000 | Nextel Communications, Inc. ∈ | 7.375 | 8/1/2015 | 588,642 |
| 375,000 | Nextel Partners, Inc. ± | 8.125 | 7/1/2011 | 393,750 |
| 500,000 | Telecom Italia Capital SA * | 5.250 | 11/15/2013 | 478,230 |
| 245,000 | Verizon Communications, Inc. | 5.550 | 2/15/2016 | 243,959 |
|
|
| | Total Communications Services | | 4,077,845 |
|
|
| |
| Consumer Cyclical (1.2%) | | | |
| 750,000 | Caesars Entertainment, Inc. ∈ | 8.500 | 11/15/2006 | 751,080 |
| 245,000 | CVS Corporation ~ | 5.750 | 8/15/2011 | 248,756 |
| 115,000 | CVS Corporation ~ | 6.125 | 8/15/2016 | 118,528 |
| The accompanying Notes to Financial Statements are an integral part of this schedule. |
|
| 150 |
Balanced Fund
Schedule of Investments as of October 31, 2006 |
| Principal | | Interest | Maturity | |
| Amount | Long-Term Fixed Income (38.7%) | Rate | Date | Value |
|
| Consumer Cyclical — continued | | | |
| $335,000 | DaimlerChrysler North American | | | |
| | Holdings Corporation | 5.750% | 9/8/2011 | $335,251 |
| 375,000 | Ford Motor Credit Company | 6.625 | 6/16/2008 | 367,920 |
| 1,280,000 | General Motors Acceptance Corporation | 6.875 | 9/15/2011 | 1,288,786 |
| 235,000 | General Motors Acceptance Corporation * | 8.000 | 11/1/2031 | 251,795 |
| 210,000 | Home Depot, Inc. * | 5.400 | 3/1/2016 | 209,678 |
| 475,000 | Nissan Motor Acceptance Corporation | 5.625 | 3/14/2011 | 477,538 |
| 155,000 | Walt Disney Company * | 5.625 | 9/15/2016 | 156,800 |
|
|
| | Total Consumer Cyclical | | | 4,206,132 |
|
|
| |
| Consumer Non-Cyclical (0.3%) | | | |
| 425,000 | Abbott Laboratories ∈ | 5.600 | 5/15/2011 | 433,151 |
| 230,000 | Baxter International, Inc. ~ | 5.900 | 9/1/2016 | 237,230 |
| 225,000 | Fortune Brands, Inc. ~ | 5.875 | 1/15/2036 | 205,590 |
| 325,000 | Wyeth ± | 6.950 | 3/15/2011 | 346,284 |
|
|
| | Total Consumer Non-Cyclical | | 1,222,255 |
|
|
| |
| Energy (0.1%) | | | |
| 160,000 | Anadarko Petroleum Corporation ~ | 5.950 | 9/15/2016 | 162,494 |
| 375,000 | Ras Laffan Liquefied Natural Gas Company, Ltd. II | 5.298 | 9/30/2020 | 361,852 |
|
|
| | Total Energy | | | 524,346 |
|
|
| |
| Financials (3.3%) | | | |
| 150,000 | American International Group, Inc. * | 6.250 | 5/1/2036 | 160,481 |
| 475,000 | Archstone-Smith Trust | 5.250 | 12/1/2010 | 473,742 |
| 130,000 | BAC Capital Trust XI | 6.625 | 5/23/2036 | 140,038 |
| 375,000 | Barnett Capital I | 8.060 | 12/1/2026 | 390,645 |
| 200,000 | Capital One Capital III | 7.686 | 8/15/2036 | 220,548 |
| 240,000 | CIT Group, Inc. * | 5.850 | 9/15/2016 | 243,503 |
| 375,000 | Corestates Capital Trust I | 8.000 | 12/15/2026 | 390,141 |
| 200,000 | General Electric Capital Corporation ~ | 5.720 | 8/22/2011 | 201,850 |
| 555,000 | General Electric Capital Corporation ~ | 4.375 | 3/3/2012 | 534,037 |
| 450,000 | Goldman Sachs Group, Inc. | 5.125 | 1/15/2015 | 439,923 |
| 265,000 | HSBC Holdings plc | 6.500 | 5/2/2036 | 287,099 |
| 80,000 | International Lease Finance Corporation | 4.875 | 9/1/2010 | 79,050 |
| 310,000 | International Lease Finance Corporation * | 5.750 | 6/15/2011 | 316,502 |
| 365,000 | iStar Financial, Inc. | 5.950 | 10/15/2013 | 367,493 |
| 450,000 | J.P. Morgan Chase Bank NA | 5.875 | 6/13/2016 | 462,228 |
| 500,000 | KeyCorp ± | 4.700 | 5/21/2009 | 493,604 |
| 105,000 | Lincoln National Corporation * | 7.000 | 5/17/2016 | 110,529 |
| 185,000 | Merrill Lynch & Company, Inc. | 6.050 | 5/16/2016 | 192,114 |
| 215,000 | Mitsubishi UFG Capital Finance, Ltd. * | 6.346 | 7/25/2016 | 217,127 |
| 325,000 | Montpelier Re Holdings, Ltd. * | 6.125 | 8/15/2013 | 315,519 |
| 415,000 | Monumental Global Funding II | 4.625 | 3/15/2010 | 407,469 |
| 210,000 | Morgan Stanley | 6.250 | 8/9/2026 | 219,971 |
| 525,000 | ProLogis ± | 5.500 | 4/1/2012 | 525,391 |
| The accompanying Notes to Financial Statements are an integral part of this schedule. |
|
| 151 |
Balanced Fund
Schedule of Investments as of October 31, 2006 |
| Principal | | Interest | Maturity | |
| Amount | Long-Term Fixed Income (38.7%) | Rate | Date | Value |
|
| Financials — continued | | | |
| $375,000 | Prudential Financial, Inc. ± | 5.500% | 3/15/2016 | $375,454 |
| 550,000 | RBS Capital Trust I | 5.512 | 9/30/2014 | 541,127 |
| FTIPS | Residential Capital Corporation ±∞ | 6.474 | 1/17/2007 | 665,592 |
| 870,000 | Residential Capital Corporation ± | 6.500 | 4/17/2013 | 885,349 |
| 500,000 | Simon Property Group, LP ± | 4.600 | 6/15/2010 | 489,586 |
| 275,000 | Simon Property Group, LP | 5.375 | 6/1/2011 | 275,295 |
| 275,000 | Swiss RE Capital I, LP | 6.854 | 5/25/2016 | 287,245 |
| 285,000 | Wachovia Bank NA * | 4.875 | 2/1/2015 | 274,392 |
| 495,000 | Wachovia Capital Trust III | 5.800 | 3/15/2011 | 499,359 |
| 210,000 | Washington Mutual Bank FA * | 5.125 | 1/15/2015 | 203,093 |
|
|
| | Total Financials | | | 11,685,496 |
|
|
| |
| Mortgage-Backed Securities (10.7%) | | | |
| 7,000,000 | Federal National Mortgage Association | | | |
| | Conventional 30-Yr. Pass Through Ω | 5.000 | 11/1/2036 | 6,757,184 |
| 16,000,000 | Federal National Mortgage Association | | | |
| | Conventional 30-Yr. Pass Through Ω | 5.500 | 11/1/2036 | 15,810,000 |
| 14,375,000 | Federal National Mortgage Association | | | |
| | Conventional 30-Yr. Pass Through Ω | 6.500 | 11/1/2036 | 14,649,016 |
|
|
| | Total Mortgage-Backed Securities | | 37,216,200 |
|
|
| |
| Technology (0.2%) | | | |
| 750,000 | Deluxe Corporation * | 3.500 | 10/1/2007 | 731,250 |
|
|
| | Total Technology | | | 731,250 |
|
|
| |
| Transportation (0.2%) | | | |
| 372,309 | FedEx Corporation | 6.720 | 1/15/2022 | 401,387 |
| 300,000 | Northwest Airlines, Inc. ±√ | 6.841 | 4/1/2011 | 297,375 |
|
|
| | Total Transportation | | | 698,762 |
|
|
| |
| U.S. Government (6.2%) | | | |
| 750,000 | Federal Home Loan Bank ∈ | 5.625 | 6/13/2016 | 774,408 |
| 650,000 | U.S. Treasury Bonds * | 7.625 | 2/15/2025 | 870,035 |
| 165,000 | U.S. Treasury Bonds * | 4.500 | 2/15/2036 | 159,251 |
| 320,000 | U.S. Treasury Notes * | 4.750 | 3/31/2011 | 322,163 |
| 2,190,000 | U.S. Treasury Notes * | 4.875 | 4/30/2011 | 2,216,092 |
| 315,000 | U.S. Treasury Notes * | 4.875 | 7/31/2011 | 318,913 |
| 590,000 | U.S. Treasury Notes * | 4.500 | 9/30/2011 | 587,949 |
| 7,500,000 | U.S. Treasury Notes * | 4.875 | 2/15/2012 | 7,612,208 |
| 800,000 | U.S. Treasury Notes * | 4.375 | 8/15/2012 | 792,718 |
| 450,000 | U.S. Treasury Notes * | 4.250 | 8/15/2013 | 441,281 |
| 800,000 | U.S. Treasury Notes * | 4.000 | 2/15/2015 | 767,218 |
| 3,400,000 | U.S. Treasury Notes *∈ | 4.125 | 5/15/2015 | 3,287,508 |
| 100,000 | U.S. Treasury Notes * | 4.250 | 8/15/2015 | 97,484 |
| The accompanying Notes to Financial Statements are an integral part of this schedule. |
|
| 152 |
Balanced Fund
Schedule of Investments as of October 31, 2006 |
| Principal | | Interest | Maturity | |
| Amount | Long-Term Fixed Income (38.7%) | Rate | Date | Value |
|
| U.S. Government — continued | | | |
| $1,135,000 | U.S. Treasury Notes * | 5.125% | 5/15/2016 | $1,179,868 |
| 1,050,000 | U.S. Treasury Notes * | 4.875 | 8/15/2016 | 1,071,820 |
| 1,081,650 | U.S. Treasury Notes, TIPS * | 2.000 | 7/15/2014 | 1,053,594 |
|
|
| | Total U.S. Government | | | 21,552,510 |
|
|
| |
| Utilities (0.8%) | | | |
| $250,000 | Boardwalk Pipelines, LLC ± | 5.500 | 2/1/2017 | 243,116 |
| 270,000 | Cincinnati Gas & Electric Company ~ | 5.700 | 9/15/2012 | 273,088 |
| 190,000 | Energy Transfer Partners, LP | 6.125 | 2/15/2017 | 192,984 |
| 300,000 | Exelon Corporation ~ | 6.750 | 5/1/2011 | 314,656 |
| 563,705 | Power Receivables Finance, LLC | 6.290 | 1/1/2012 | 568,440 |
| 235,000 | Progress Energy, Inc. | 7.000 | 10/30/2031 | 264,565 |
| 230,000 | PSI Energy, Inc. ± | 5.000 | 9/15/2013 | 222,741 |
| 250,000 | Southern California Gas Company | 5.750 | 11/15/2035 | 252,825 |
| 295,000 | Virginia Electric & Power Company | 6.000 | 1/15/2036 | 297,409 |
|
|
| | Total Utilities | | | 2,629,824 |
|
|
| | Total Long-Term Fixed Income | | |
| | (cost $134,189,031) | | | 134,780,411 |
|
|
| |
| |
| | | | Expiration | |
| Contracts | Options Purchased (<0.1%) | Price | Date | Value |
|
| 55 | 10-Yr. U.S. Treasury Note Futures | $106 | 11/21/2006 | $859 |
| 25 | 20-Yr. U.S. Treasury Bond Futures | 110 | 11/21/2006 | 1,172 |
|
|
| | Total Options Purchased (cost $42,244) | | 2,031 |
|
|
| |
| |
| | | Interest | Maturity | |
| Shares | Collateral Held for Securities Loaned (15.2%) | Rate (+) | Date | Value |
|
| 52,973,617 | Thrivent Financial Securities Lending Trust | 5.300% | N/A | $52,973,617 |
|
|
| | Total Collateral Held for Securities Loaned | |
| | (cost $52,973,617) | | | 52,973,617 |
|
|
| The accompanying Notes to Financial Statements are an integral part of this schedule. |
|
| 153 |
Balanced Fund
Schedule of Investments as of October 31, 2006 |
| | | | | Interest | Maturity | |
| Shares | Short-Term Investments (4.9%) | | Rate (+) | Date | Value |
|
| 16,886,519 | Thrivent Money Market Fund | | 4.600% | N/A | $16,886,519 |
|
|
| | | Total Short-Term Investments (at amortized cost) | 16,886,519 |
|
|
| | | Total Investments (cost $409,031,460) 126.0% | $438,566,777 |
|
|
| | | Other Assets and Liabilities, Net (26.0%) | (90,602,905) |
|
|
| | | Total Net Assets 100.0% | | | $347,963,872 |
|
|
| |
| | | Number of | | Notional | | |
| | | Contracts | Expiration | Principal | | Unrealized |
| Futures | | Long/(Short) | Date | Amount | Value | Gain/(Loss) |
|
| 5-Yr. U.S. Treasury Bond Futures | (65) | December 2006 | ($6,835,805) | ($6,861,563) | ($25,758) |
| 10-Yr. U.S. Treasury Bond Futures | (60) | December 2006 | ($6,442,789) | ($6,493,125) | ($50,336) |
| 20-Yr. U.S. Treasury Bond Futures | 40 | December 2006 | $4,428,225 | $4,506,250 | $78,025 |
# Non-income producing security.
* All or a portion of the security is on loan as discussed in item 2(L) of the Notes to Financial Statements.
+ The interest rate shown reflects the yield, coupon rate or, for securities purchased at a discount, the discount rate at the date of purchase.
∞ Denotes variable rate obligations for which the current yield and next scheduled reset date are shown.
Ω Denotes investments purchased on a when-issued basis.
± Designated as cover for long settling trades as discussed in the Notes to Financial Statements.
∈ At October 31, 2006, $676,840 of investments were held on deposit with the counterparty and pledged as the initial margin deposit for open financial futures contracts. In addition, $20,071,751 of investments were earmarked as collateral to cover open financial futures contracts.
~ All or a portion of the security was earmarked as collateral to cover options.
√ In bankruptcy.
Definitions:
ADR — American Depository Receipts, which are certificates for shares of an underlying foreign security’s shares held by an issuing U.S. depository bank.
REIT — Real Estate Investment Trust, is a company that buys, develops, manages and/or sells real estate assets.
TIPS — Treasury Inflation Protected Security.
| Gross unrealized appreciation and depreciation of investments, based on cost for federal income tax purposes, were as follows: | |
| | |
| Gross unrealized appreciation | $34,310,223 | |
| Gross unrealized depreciation | (5,857,975) | |
|
| |
| Net unrealized appreciation (depreciation) | $28,452,248 | |
| Cost for federal income tax purposes | $410,114,529 | |
| The accompanying Notes to Financial Statements are an integral part of this schedule. |
|
| 154 |
High Yield Fund
Schedule of Investments as of October 31, 2006 |
| Principal | | Interest | Maturity | |
| Amount | Long-Term Fixed Income (92.3%) | Rate | Date | Value |
|
| Asset-Backed Securities (0.6%) | | | |
| $4,000,000 | Dow Jones CDX | 8.375% | 12/29/2011 | $4,060,000 |
|
|
| | Total Asset-Backed Securities | | 4,060,000 |
|
|
| |
| Basic Materials (10.6%) | | | |
| 2,205,000 | Abitibi-Consolidated, Inc. * | 8.550 | 8/1/2010 | 2,119,556 |
| 1,220,000 | Abitibi-Consolidated, Inc. | 7.750 | 6/15/2011 | 1,088,850 |
| 1,100,000 | Ainsworth Lumber Company, Ltd. *∞ | 9.117 | 12/30/2006 | 874,500 |
| 2,440,000 | Ainsworth Lumber Company, Ltd. ± | 6.750 | 3/15/2014 | 1,732,400 |
| 1,600,000 | AK Steel Corporation * | 7.750 | 6/15/2012 | 1,600,000 |
| 1,310,000 | Appleton Papers, Inc. | 8.125 | 6/15/2011 | 1,303,450 |
| 1,600,000 | Appleton Papers, Inc. | 9.750 | 6/15/2014 | 1,584,000 |
| 2,820,000 | Arch Western Finance, LLC | 6.750 | 7/1/2013 | 2,721,300 |
| 1,925,000 | BCP Caylux Holdings Luxembourg SCA | 9.625 | 6/15/2014 | 2,112,688 |
| 1,750,000 | Buckeye Technologies, Inc. | 8.000 | 10/15/2010 | 1,710,625 |
| 2,830,000 | Chaparral Steel Company | 10.000 | 7/15/2013 | 3,169,600 |
| 2,840,000 | Crystal US Holdings 3, LLC/Crystal | | | |
| | US Sub 3 Corporation > | Zero Coupon | 10/1/2009 | 2,350,100 |
| 2,580,000 | Domtar, Inc. | 7.125 | 8/1/2015 | 2,463,900 |
| 2,410,000 | Drummond Company, Inc. | 7.375 | 2/15/2016 | 2,301,550 |
| 1,800,000 | Equistar Chemicals, LP | 10.625 | 5/1/2011 | 1,926,000 |
| 3,180,000 | FMG Finance, Pty. Ltd. * | 10.625 | 9/1/2016 | 3,132,300 |
| 1,640,000 | Georgia-Pacific Corporation | 8.125 | 5/15/2011 | 1,697,400 |
| 3,920,000 | Graphic Packaging International Corporation * | 9.500 | 8/15/2013 | 4,027,800 |
| 2,606,000 | Huntsman International, LLC | 10.125 | 7/1/2009 | 2,645,090 |
| 2,620,000 | Huntsman International, LLC Ω | 7.875 | 11/13/2014 | 2,633,100 |
| 4,270,000 | Ineos Group Holdings plc * | 8.500 | 2/15/2016 | 4,109,875 |
| 1,400,000 | Jefferson Smurfit Corporation | 8.250 | 10/1/2012 | 1,358,000 |
| 2,590,000 | Lyondell Chemical Company | 10.500 | 6/1/2013 | 2,849,000 |
| 3,030,000 | Lyondell Chemical Company | 8.250 | 9/15/2016 | 3,120,900 |
| 3,050,000 | MacDermid, Inc. | 9.125 | 7/15/2011 | 3,187,250 |
| 1,010,000 | Novelis, Inc. | 8.250 | 2/15/2015 | 964,550 |
| 2,040,000 | PNA Group, Inc. | 10.750 | 9/1/2016 | 2,101,200 |
| 1,567,000 | Rockwood Specialties, Inc. | 10.625 | 5/15/2011 | 1,680,608 |
| 2,830,000 | Ryerson, Inc. | 8.250 | 12/15/2011 | 2,815,850 |
| 1,460,000 | Southern Copper Corporation * | 7.500 | 7/27/2035 | 1,560,987 |
|
|
| | Total Basic Materials | | 66,942,429 |
|
|
| |
| Capital Goods (10.6%) | | | |
| 1,650,000 | Ahern Rentals, Inc. ± | 9.250 | 8/15/2013 | 1,695,375 |
| 3,610,000 | Allied Waste North America, Inc. * | 7.875 | 4/15/2013 | 3,709,275 |
| 2,170,000 | Amsted Industries, Inc. | 10.250 | 10/15/2011 | 2,332,750 |
| 1,420,000 | Ashtead Capital, Inc. | 9.000 | 8/15/2016 | 1,494,550 |
| 2,400,000 | Ball Corporation | 6.625 | 3/15/2018 | 2,355,000 |
| 2,420,000 | Berry Plastics Holding Corporation | 8.875 | 9/15/2014 | 2,444,200 |
| 740,000 | Browning-Ferris Industries, Inc. | 9.250 | 5/1/2021 | 777,000 |
| The accompanying Notes to Financial Statements are an integral part of this schedule. |
|
| 155 |
High Yield Fund
Schedule of Investments as of October 31, 2006 |
| Principal | | Interest | Maturity | |
| Amount | Long-Term Fixed Income (92.3%) | Rate | Date | Value |
|
| Capital Goods — continued | | | |
| $740,000 | Browning-Ferris Industries, Inc. | 7.400% | 9/15/2035 | $680,800 |
| 1,480,000 | Builders Firstsource, Inc. ∞ | 9.655 | 11/15/2006 | 1,454,100 |
| 3,900,000 | Case New Holland, Inc. | 9.250 | 8/1/2011 | 4,138,875 |
| 2,920,000 | Consolidated Container Company, LLC *> | Zero Coupon | 6/15/2007 | 2,861,600 |
| 2,210,000 | Covalence Specialty Materials Corporation | 10.250 | 3/1/2016 | 2,132,650 |
| 2,020,000 | Crown Americas, Inc. | 7.625 | 11/15/2013 | 2,070,500 |
| 2,020,000 | Crown Americas, Inc. | 7.750 | 11/15/2015 | 2,073,025 |
| 2,600,000 | Da-Lite Screen Company, Inc. | 9.500 | 5/15/2011 | 2,743,000 |
| 3,000,000 | DRS Technologies, Inc. | 7.625 | 2/1/2018 | 3,067,500 |
| 2,150,000 | Erico International Corporation | 8.875 | 3/1/2012 | 2,241,375 |
| 2,150,000 | Fastentech, Inc. | 11.500 | 5/1/2011 | 2,225,250 |
| 1,825,000 | Graham Packaging Company, Inc. * | 9.875 | 10/15/2014 | 1,829,562 |
| 810,000 | K&F Acquisition, Inc. * | 7.750 | 11/15/2014 | 820,125 |
| 850,000 | Legrand SA | 8.500 | 2/15/2025 | 969,000 |
| 1,015,000 | Mueller Group, Inc. | 10.000 | 5/1/2012 | 1,106,350 |
| 2,379,000 | Mueller Holdings, Inc. > | Zero Coupon | 4/15/2009 | 2,093,520 |
| 3,000,000 | Norcraft Companies, LP/Norcraft | | | |
| | Finance Corporation | 9.000 | 11/1/2011 | 3,075,000 |
| 1,723,000 | Owens-Brockway Glass Container, Inc. | 8.875 | 2/15/2009 | 1,766,075 |
| 1,230,000 | Owens-Brockway Glass Container, Inc. | 8.250 | 5/15/2013 | 1,266,900 |
| 2,320,000 | Owens-Illinois, Inc. | 7.500 | 5/15/2010 | 2,354,800 |
| 3,340,000 | Plastipak Holdings, Inc. | 8.500 | 12/15/2015 | 3,456,900 |
| 2,550,000 | Ply Gem Industries, Inc. * | 9.000 | 2/15/2012 | 2,129,250 |
| 1,610,000 | RBS Global, Inc./Rexnord Corporation | 9.500 | 8/1/2014 | 1,666,350 |
| 820,000 | RBS Global, Inc./Rexnord Corporation | 11.750 | 8/1/2016 | 852,800 |
| 2,250,000 | United Rentals North America, Inc. | 6.500 | 2/15/2012 | 2,193,750 |
| 1,210,000 | United Rentals North America, Inc. * | 7.000 | 2/15/2014 | 1,158,575 |
|
|
| | Total Capital Goods | | | 67,235,782 |
|
|
| |
| Communications Services (20.2%) | | | |
| 3,000,000 | Alamosa Delaware, Inc. | 8.500 | 1/31/2012 | 3,190,350 |
| 2,020,000 | American Cellular Corporation * | 10.000 | 8/1/2011 | 2,121,000 |
| 2,920,000 | American Tower Corporation * | 7.125 | 10/15/2012 | 2,978,400 |
| 1,700,000 | American Towers, Inc. | 7.250 | 12/1/2011 | 1,746,750 |
| 1,290,000 | Block Communications, Inc. | 8.250 | 12/15/2015 | 1,270,650 |
| 2,010,000 | Cablevision Systems Corporation | 8.000 | 4/15/2012 | 1,952,212 |
| 9,054,027 | CCH I, LLC | 11.000 | 10/1/2015 | 8,725,819 |
| 2,430,000 | Centennial Communications Corporation * | 8.125 | 2/1/2014 | 2,433,038 |
| 2,290,000 | Charter Communications Holdings, LLC * | 8.750 | 11/15/2013 | 2,330,075 |
| 2,200,000 | Charter Communications Operating, LLC | 8.000 | 4/30/2012 | 2,244,000 |
| 3,240,000 | Citizens Communications Company | 9.250 | 5/15/2011 | 3,592,350 |
| 2,030,000 | Cricket Communications, Inc. * | 9.375 | 11/1/2014 | 2,070,600 |
| 1,270,000 | Dex Media West, LLC/Dex Media West Finance Company | 9.875 | 8/15/2013 | 1,379,538 |
| 850,000 | Digicel, Ltd. | 9.250 | 9/1/2012 | 881,875 |
| 3,230,000 | Dobson Cellular Systems * | 9.875 | 11/1/2012 | 3,488,400 |
| 2,020,000 | Houghton Mifflin Company | 8.250 | 2/1/2011 | 2,080,600 |
| The accompanying Notes to Financial Statements are an integral part of this schedule. |
|
| 156 |
High Yield Fund
Schedule of Investments as of October 31, 2006 |
| Principal | | Interest | Maturity | |
| Amount | Long-Term Fixed Income (92.3%) | Rate | Date | Value |
|
| Communications Services — continued | | | |
| $3,250,000 | Insight Midwest, LP/Insight Capital, Inc. | 10.500% | 11/1/2010 | $3,363,750 |
| 1,210,000 | Intelsat Bermuda, Ltd. | 9.250 | 6/15/2016 | 1,291,675 |
| 5,840,000 | Intelsat Bermuda, Ltd. | 11.250 | 6/15/2016 | 6,358,300 |
| 3,200,000 | Intelsat Intermediate, Inc. *> | Zero Coupon | 2/1/2010 | 2,424,000 |
| 2,400,000 | Intelsat Subsidiary Holding Company, Ltd. * | 8.625 | 1/15/2015 | 2,490,000 |
| 3,100,000 | Kabel Deutschland GmbH | 10.625 | 7/1/2014 | 3,351,875 |
| 1,620,000 | Lamar Media Corporation | 6.625 | 8/15/2015 | 1,559,250 |
| 2,440,000 | Mediacom Broadband, LLC | 8.500 | 10/15/2015 | 2,436,950 |
| 605,000 | Medianews Group, Inc. | 6.375 | 4/1/2014 | 533,156 |
| 2,020,000 | MetroPCS Wireless, Inc. Ω | 9.250 | 11/1/2014 | 2,037,675 |
| 2,830,000 | Morris Publishing Group, LLC | 7.000 | 8/1/2013 | 2,692,038 |
| 3,270,000 | NTL Cable plc | 9.125 | 8/15/2016 | 3,437,588 |
| 2,390,000 | PRIMEDIA, Inc. *∞ | 10.780 | 11/15/2006 | 2,473,650 |
| 2,050,000 | Qwest Communications International, Inc. ∞ | 8.905 | 11/15/2006 | 2,083,312 |
| 3,640,000 | Qwest Communications International, Inc. | 7.250 | 2/15/2011 | 3,694,600 |
| 1,220,000 | Qwest Communications International, Inc. * | 7.500 | 2/15/2014 | 1,244,400 |
| 820,000 | Qwest Corporation ∞ | 8.640 | 12/15/2006 | 883,550 |
| 6,570,000 | Qwest Corporation | 7.875 | 9/1/2011 | 6,955,988 |
| 1,230,000 | Qwest Corporation | 7.625 | 6/15/2015 | 1,294,575 |
| 4,830,000 | R.H. Donnelley Corporation | 6.875 | 1/15/2013 | 4,546,238 |
| 4,060,000 | R.H. Donnelley Corporation | 6.875 | 1/15/2013 | 3,821,475 |
| 2,460,000 | R.H. Donnelley Corporation | 8.875 | 1/15/2016 | 2,536,875 |
| 2,830,000 | Rogers Wireless Communications, Inc. * | 7.500 | 3/15/2015 | 3,021,025 |
| 1,620,000 | Rural Cellular Corporation * | 9.750 | 1/15/2010 | 1,640,250 |
| 1,615,000 | Rural Cellular Corporation * | 9.875 | 2/1/2010 | 1,695,750 |
| 3,220,000 | Time Warner Telecom Holdings, Inc. | 9.250 | 2/15/2014 | 3,397,100 |
| 2,420,000 | UbiquiTel Operating Company | 9.875 | 3/1/2011 | 2,619,650 |
| 2,210,000 | US Unwired, Inc. | 10.000 | 6/15/2012 | 2,431,000 |
| 3,690,000 | Valor Telecommunications Enterprises, LLC | 7.750 | 2/15/2015 | 3,934,462 |
| 3,200,000 | Videotron Ltee | 6.875 | 1/15/2014 | 3,176,000 |
| 400,000 | Windstream Corporation | 8.125 | 8/1/2013 | 427,000 |
| 1,280,000 | Windstream Corporation | 8.625 | 8/1/2016 | 1,380,800 |
|
|
| | Total Communications Services | | 127,719,614 |
|
|
| |
| Consumer Cyclical (19.9%) | | | |
| 1,470,000 | Allied Security Escrow Corporation | 11.375 | 7/15/2011 | 1,477,350 |
| 3,520,000 | American Casino & Entertainment Properties, LLC ± | 7.850 | 2/1/2012 | 3,581,600 |
| 3,250,000 | Beazer Homes USA, Inc. * | 8.625 | 5/15/2011 | 3,315,000 |
| 1,490,000 | Beazer Homes USA, Inc. * | 8.125 | 6/15/2016 | 1,516,075 |
| 860,000 | Blockbuster, Inc. * | 9.000 | 9/1/2012 | 774,000 |
| 4,650,000 | Bon-Ton Stores, Inc. * | 10.250 | 3/15/2014 | 4,713,938 |
| 2,430,000 | Buffets, Inc. | 12.500 | 11/1/2014 | 2,442,150 |
| 2,190,000 | Buhrmann U.S., Inc. | 7.875 | 3/1/2015 | 2,080,500 |
| 1,700,000 | Circus & Eldorado Joint Venture/Silver Legacy | | | |
| | Capital Corporation | 10.125 | 3/1/2012 | 1,785,000 |
| 4,650,000 | Dollarama Group, LP * | 8.875 | 8/15/2012 | 4,801,125 |
| The accompanying Notes to Financial Statements are an integral part of this schedule. |
|
| 157 |
High Yield Fund
Schedule of Investments as of October 31, 2006 |
| Principal | | Interest | Maturity | |
| Amount | Long-Term Fixed Income (92.3%) | Rate | Date | Value |
|
| Consumer Cyclical — continued | | | |
| $2,960,000 | Ford Motor Credit Company ∞ | 9.824% | 1/16/2007 | $3,087,215 |
| 1,000,000 | Ford Motor Credit Company | 9.750 | 9/15/2010 | 1,031,210 |
| 2,020,000 | Ford Motor Credit Company | 7.000 | 10/1/2013 | 1,877,838 |
| 3,680,000 | Gaylord Entertainment Company | 6.750 | 11/15/2014 | 3,523,600 |
| 11,830,000 | General Motors Acceptance Corporation | 6.875 | 9/15/2011 | 11,911,203 |
| 2,140,000 | General Motors Acceptance Corporation * | 8.000 | 11/1/2031 | 2,292,946 |
| 3,630,000 | General Motors Corporation * | 8.250 | 7/15/2023 | 3,221,625 |
| 4,460,000 | Group 1 Automotive, Inc. | 8.250 | 8/15/2013 | 4,588,225 |
| 2,020,000 | Harrah’s Operating Company, Inc. | 6.500 | 6/1/2016 | 1,777,947 |
| 3,660,000 | IAAI Finance Corporation | 11.000 | 4/1/2013 | 3,678,300 |
| 2,410,000 | Jean Coutu Group (PJC), Inc. | 7.625 | 8/1/2012 | 2,530,500 |
| 2,750,000 | K. Hovnanian Enterprises, Inc. * | 7.500 | 5/15/2016 | 2,667,500 |
| 2,930,000 | KB Home * | 6.250 | 6/15/2015 | 2,751,847 |
| 1,620,000 | Majestic Star Casino, LLC | 9.500 | 10/15/2010 | 1,636,200 |
| 6,030,000 | MGM MIRAGE * | 5.875 | 2/27/2014 | 5,524,988 |
| 3,450,000 | Mohegan Tribal Gaming Authority | 6.375 | 7/15/2009 | 3,441,375 |
| 1,280,000 | Morgan Stanley, Convertible ¿ | 16.500 | 1/18/2007 | 1,286,912 |
| 4,230,000 | NCL Corporation | 10.625 | 7/15/2014 | 4,124,250 |
| 2,200,000 | Perry Ellis International, Inc. * | 8.875 | 9/15/2013 | 2,205,500 |
| 2,700,000 | Pokagon Gaming Authority | 10.375 | 6/15/2014 | 2,895,750 |
| 3,520,000 | Poster Financial Group, Inc. * | 8.750 | 12/1/2011 | 3,669,600 |
| 4,580,000 | Rent-Way, Inc. | 11.875 | 6/15/2010 | 5,358,211 |
| 3,240,000 | Station Casinos, Inc. | 6.875 | 3/1/2016 | 2,972,700 |
| 1,300,000 | TRW Automotive, Inc. | 9.375 | 2/15/2013 | 1,392,625 |
| 4,870,000 | Tunica Biloxi Gaming Authority | 9.000 | 11/15/2015 | 5,028,275 |
| 2,010,000 | Turning Stone Resort Casino Enterprise | 9.125 | 9/15/2014 | 2,045,175 |
| 3,195,000 | Universal City Florida Holding Company I/II ∞ | 10.239 | 11/1/2006 | 3,286,856 |
| 2,440,000 | VICORP Restaurants, Inc. | 10.500 | 4/15/2011 | 2,330,200 |
| 2,830,000 | Warnaco, Inc. | 8.875 | 6/15/2013 | 2,957,350 |
| 1,420,000 | West Corporation | 9.500 | 10/15/2014 | 1,416,450 |
| 3,705,000 | WMG Holdings Corporation *> | Zero Coupon | 12/15/2009 | 2,834,325 |
|
|
| | Total Consumer Cyclical | | 125,833,436 |
|
|
| |
| Consumer Non-Cyclical (7.0%) | | | |
| 1,460,000 | DaVita, Inc. | 7.250 | 3/15/2015 | 1,452,700 |
| 1,610,000 | Elan Finance Corporation, Ltd. | 7.750 | 11/15/2011 | 1,581,825 |
| 1,620,000 | Elan Finance plc/Elan Finance Corporation *∞ | 9.405 | 11/15/2006 | 1,634,175 |
| 2,190,000 | Fisher Scientific International, Inc. | 6.125 | 7/1/2015 | 2,173,575 |
| 2,010,000 | HCA, Inc. * | 6.950 | 5/1/2012 | 1,776,338 |
| 3,240,000 | IASIS Healthcare, LLC (IASIS Capital Corporation) | 8.750 | 6/15/2014 | 3,130,650 |
| 1,596,000 | Jafra Cosmetics | 10.750 | 5/15/2011 | 1,713,705 |
| 3,940,000 | Jostens Holding Corporation *> | Zero Coupon | 10/1/2008 | 3,329,300 |
| 3,050,000 | Michael Foods, Inc. | 8.000 | 11/15/2013 | 3,149,125 |
| 1,110,000 | Multiplan, Inc. | 10.375 | 4/15/2016 | 1,110,000 |
| 2,020,000 | Smithfield Foods, Inc. | 8.000 | 10/15/2009 | 2,113,425 |
| 2,015,000 | Stater Brothers Holdings, Inc. | 8.125 | 6/15/2012 | 2,030,112 |
| The accompanying Notes to Financial Statements are an integral part of this schedule. |
|
| 158 |
High Yield Fund
Schedule of Investments as of October 31, 2006 |
| Principal | | Interest | Maturity | |
| Amount | Long-Term Fixed Income (92.3%) | Rate | Date | Value |
|
| Consumer Non-Cyclical — continued | | | |
| $2,020,000 | Supervalu, Inc. | 7.500% | 11/15/2014 | $2,054,679 |
| 3,440,000 | Triad Hospitals, Inc. | 7.000 | 5/15/2012 | 3,414,200 |
| 2,010,000 | Triad Hospitals, Inc. | 7.000 | 11/15/2013 | 1,954,725 |
| 3,030,000 | US Oncology Holdings, Inc. ∞ | 10.675 | 3/15/2007 | 3,098,175 |
| 1,640,000 | US Oncology, Inc. | 9.000 | 8/15/2012 | 1,699,450 |
| 2,810,000 | Vanguard Health Holding Company II, LLC | 9.000 | 10/1/2014 | 2,718,675 |
| 3,240,000 | Ventas Realty, LP/Ventas Capital Corporation * | 6.500 | 6/1/2016 | 3,231,900 |
| 1,111,000 | Warner Chilcott Corporation | 8.750 | 2/1/2015 | 1,147,108 |
|
|
| | Total Consumer Non-Cyclical | | 44,513,842 |
|
|
| |
| Energy (3.7%) | | | |
| 1,460,000 | Chesapeake Energy Corporation | 6.375 | 6/15/2015 | 1,408,900 |
| 2,550,000 | Chesapeake Energy Corporation | 6.250 | 1/15/2018 | 2,416,125 |
| 2,820,000 | Denbury Resources, Inc. | 7.500 | 12/15/2015 | 2,820,000 |
| 2,010,000 | Hornbeck Offshore Services, Inc. | 6.125 | 12/1/2014 | 1,871,812 |
| 1,332,000 | Magnum Hunter Resources, Inc. | 9.600 | 3/15/2012 | 1,405,260 |
| 3,365,000 | Ocean Rig Norway AS | 8.375 | 7/1/2013 | 3,545,869 |
| 2,210,000 | Pioneer Natural Resources Company * | 5.875 | 7/15/2016 | 2,056,182 |
| 1,070,000 | Range Resources Corporation | 7.500 | 5/15/2016 | 1,080,700 |
| 2,700,000 | Western Oil Sands, Inc. | 8.375 | 5/1/2012 | 2,902,500 |
| 2,770,000 | Whiting Petroleum Corporation | 7.250 | 5/1/2012 | 2,742,300 |
| 810,000 | Whiting Petroleum Corporation | 7.250 | 5/1/2013 | 799,875 |
|
|
| | Total Energy | | | 23,049,523 |
|
|
| |
| Financials (1.3%) | | | |
| 1,620,000 | ACE Cash Express, Inc. ± | 10.250 | 10/1/2014 | 1,628,100 |
| 1,830,000 | FTI Consulting, Inc. | 7.625 | 6/15/2013 | 1,871,175 |
| 3,220,000 | Residential Capital Corporation ∞ | 7.204 | 1/17/2007 | 3,227,206 |
| 1,210,000 | Wells Fargo & Company, Convertible ∞ | 5.239 | 11/1/2006 | 1,219,438 |
|
|
| | Total Financials | | | 7,945,919 |
|
|
| |
| Technology (5.2%) | | | |
| 2,440,000 | Avago Technologies Finance Pte *∞ | 10.900 | 12/1/2006 | 2,549,800 |
| 1,285,000 | Electronic Data Systems Corporation, Convertible * | 3.875 | 7/15/2023 | 1,313,912 |
| 1,470,000 | Freescale Semiconductor, Inc. | 6.875 | 7/15/2011 | 1,543,500 |
| 1,470,000 | Freescale Semiconductor, Inc. | 7.125 | 7/15/2014 | 1,576,575 |
| 1,630,000 | Intel Corporation, Convertible | 2.950 | 12/15/2035 | 1,479,225 |
| 2,120,000 | Itron, Inc. | 7.750 | 5/15/2012 | 2,167,700 |
| 3,040,000 | MagnaChip Semiconductor SA/MagnaChip | | | |
| | Semiconductor Finance Company ∞ | 8.640 | 12/15/2006 | 2,614,400 |
| 1,710,000 | Nortel Networks, Ltd. ∞ | 9.624 | 1/16/2007 | 1,765,575 |
| 1,210,000 | NXP BV/NXP Funding, LLC *∞ | 8.124 | 1/15/2007 | 1,220,588 |
| 3,620,000 | Seagate Technology HDD Holdings | 6.800 | 10/1/2016 | 3,574,750 |
| 1,620,000 | SunGard Data Systems, Inc. | 9.125 | 8/15/2013 | 1,680,750 |
| 1,600,000 | SunGard Data Systems, Inc. * | 10.250 | 8/15/2015 | 1,676,000 |
| 1,070,000 | UGS Capital Corporation II ∞ | 10.380 | 12/1/2006 | 1,104,775 |
| The accompanying Notes to Financial Statements are an integral part of this schedule. |
|
| 159 |
High Yield Fund
Schedule of Investments as of October 31, 2006 |
| Principal | | Interest | Maturity | |
| Amount | Long-Term Fixed Income (92.3%) | Rate | Date | Value |
|
| Technology — continued | | | |
| $3,750,000 | UGS Corporation | 10.000% | 6/1/2012 | $4,050,000 |
| 2,010,000 | Unisys Corporation * | 6.875 | 3/15/2010 | 1,934,625 |
| 2,590,000 | Xerox Corporation | 7.625 | 6/15/2013 | 2,706,550 |
|
|
| | Total Technology | | | 32,958,725 |
|
|
| |
| Transportation (2.6%) | | | |
| 2,390,000 | CHC Helicopter Corporation | 7.375 | 5/1/2014 | 2,282,450 |
| 2,380,000 | Delta Air Lines, Inc. √ | 7.111 | 9/18/2011 | 2,385,950 |
| 1,660,000 | Hertz Corporation | 8.875 | 1/1/2014 | 1,734,700 |
| 2,770,000 | Hertz Corporation | 10.500 | 1/1/2016 | 3,040,075 |
| 949,000 | H-Lines Finance Holding Corporation > | Zero Coupon | 4/1/2008 | 856,472 |
| 1,813,000 | Horizon Lines, LLC | 9.000 | 11/1/2012 | 1,894,585 |
| 4,050,000 | Windsor Petroleum Transport Corporation | 7.840 | 1/15/2021 | 4,206,589 |
|
|
| | Total Transportation | | 16,400,821 |
|
|
| |
| Utilities (10.6%) | | | |
| 1,300,000 | AES Corporation | 8.875 | 2/15/2011 | 1,397,500 |
| 3,230,000 | AES Corporation | 8.750 | 5/15/2013 | 3,468,212 |
| 2,635,000 | AmeriGas Partners, LP | 7.250 | 5/20/2015 | 2,628,412 |
| 2,840,000 | Calpine Generating Company, LLC ∞√ | 11.073 | 11/1/2006 | 2,989,100 |
| 1,990,000 | Calpine Generating Company, LLC *∞√ | 14.370 | 4/1/2007 | 2,124,325 |
| 2,210,000 | Colorado Interstate Gas Company | 6.800 | 11/15/2015 | 2,245,948 |
| 1,360,000 | Consumers Energy Company * | 6.300 | 2/1/2012 | 1,349,800 |
| 1,700,000 | Copano Energy, LLC | 8.125 | 3/1/2016 | 1,729,750 |
| 2,020,000 | Dynegy Holdings, Inc. * | 6.875 | 4/1/2011 | 1,989,700 |
| 2,020,000 | Dynegy Holdings, Inc. * | 8.375 | 5/1/2016 | 2,075,550 |
| 1,670,000 | Edison Mission Energy | 7.500 | 6/15/2013 | 1,715,925 |
| 1,870,000 | Edison Mission Energy | 7.750 | 6/15/2016 | 1,930,775 |
| 4,150,000 | El Paso Corporation | 7.000 | 5/15/2011 | 4,212,250 |
| 3,250,000 | El Paso Production Holding Company | 7.750 | 6/1/2013 | 3,331,250 |
| 1,650,000 | Midwest Generation, LLC | 8.750 | 5/1/2034 | 1,784,062 |
| 1,420,000 | Mirant North America, LLC | 7.375 | 12/31/2013 | 1,435,975 |
| 3,130,000 | Mission Energy Holding Company | 13.500 | 7/15/2008 | 3,489,950 |
| 6,050,000 | NRG Energy, Inc. | 7.375 | 2/1/2016 | 6,118,062 |
| 1,470,000 | Pacific Energy Partners, LP/Pacific Energy | | | |
| | Finance Corporation | 7.125 | 6/15/2014 | 1,486,538 |
| 2,025,000 | Reliant Energy Resources Corporation | 6.750 | 12/15/2014 | 1,931,344 |
| 2,780,000 | SemGroup, LP | 8.750 | 11/15/2015 | 2,800,850 |
| 1,500,000 | Southern Natural Gas Company | 8.875 | 3/15/2010 | 1,575,740 |
| 3,130,000 | Southern Natural Gas Company * | 7.350 | 2/15/2031 | 3,286,735 |
| 1,060,000 | Southern Star Central Corporation | 6.750 | 3/1/2016 | 1,052,050 |
| 6,500,000 | Williams Companies, Inc. * | 8.125 | 3/15/2012 | 6,971,250 |
| 1,830,000 | Williams Companies, Inc. | 8.750 | 3/15/2032 | 2,031,300 |
|
|
| | Total Utilities | | | 67,152,353 |
|
|
| | Total Long-Term Fixed Income (cost $573,670,073) | 583,812,444 |
|
|
| The accompanying Notes to Financial Statements are an integral part of this schedule. |
|
| 160 |
High Yield Fund
Schedule of Investments as of October 31, 2006 |
| Shares | Preferred Stock (2.0%) | | | Value |
|
| 43,000 | CenterPoint Energy, Inc., Convertible | | | $1,565,200 |
| 65,000 | Chevy Chase Preferred Capital Corporation, Convertible* | | | 3,445,000 |
| 29,200 | Goldman Sachs Group, Inc., Convertible #¿ | | | 866,130 |
| 13,100 | Goldman Sachs Group, Inc., Convertible #¿ | | | 1,307,943 |
| 14,250 | Lehman Brothers Holdings, Inc., Convertible #¿ | | | 857,992 |
| 3,720 | NRG Energy, Inc., Convertible* | | | 922,374 |
| 2,600 | Sovereign Real Estate Investment Corporation | | | 3,640,000 |
|
|
| | Total Preferred Stock (cost $11,049,049) | | 12,604,639 |
|
|
| |
| |
| Shares | Common Stock (0.2%) | | | Value |
|
| 2,900 | ASAT Finance, LLC, Stock Warrants #^Ф | | | $0 |
| 15 | Pliant Corporation # | | | 0 |
| 3,000 | RailAmerica, Inc., Stock Warrants #- | | | 165,000 |
| 13,500 | TravelCenters of America, Inc., Stock Warrants #^Ф | | | 618,840 |
| 4,500 | TravelCenters of America, Inc., Stock Warrants #^ | | | 206,280 |
| 36,330 | TVMAX Holdings, Inc. # | | | 36,330 |
| 6,054 | XO Communications, Inc., Stock Warrants # | | | 3,753 |
| 4,540 | XO Communications, Inc., Stock Warrants # | | | 1,634 |
| 4,540 | XO Communications, Inc., Stock Warrants # | | | 908 |
| 3,026 | XO Holdings, Inc., Stock Warrants #* | | | 11,801 |
|
|
| | Total Common Stock (cost $2,733,966) | | 1,044,546 |
|
|
| |
| |
| | | Interest | Maturity | |
| Shares | Collateral Held for Securities Loaned (13.6%) | Rate (+) | Date | Value |
|
| 86,278,192 | Thrivent Financial Securities Lending Trust | 5.300% | N/A | $86,278,192 |
|
|
| | Total Collateral Held for Securities Loaned | |
| | (cost $86,278,192) | | | 86,278,192 |
|
|
| The accompanying Notes to Financial Statements are an integral part of this schedule. |
|
| 161 |
High Yield Fund
Schedule of Investments as of October 31, 2006 |
| Shares or | | | | |
| Principal | | Interest | Maturity | |
| Amount | Short-Term Investments (4.3%) | Rate (+) | Date | Value |
|
| $5,500,000 | DnB NORBank ASA | 5.310% | 11/1/2006 | $5,500,000 |
| 21,389,892 | Thrivent Money Market Fund | 4.600 | N/A | 21,389,892 |
|
|
| | Total Short-Term Investments (at amortized cost) | 26,889,892 |
|
|
| | Total Investments (cost $700,621,172) 112.4% | $710,629,713 |
|
|
| | Other Assets and Liabilities, Net (12.4%) | | (78,149,572) |
|
|
| | Total Net Assets 100.0% | | | $632,480,141 |
|
|
# Non-income producing security.
* All or a portion of the security is on loan as discussed in item 2(L) of the Notes to Financial Statements.
+ The interest rate shown reflects the yield, coupon rate or, for securities purchased at a discount, the discount rate at the date of purchase.
^ Security is fair valued as discussed in item 2(A) of the Notes to Financial Statements.
> Denotes step coupon bonds for which the current interest rate and next scheduled reset date are shown.
∞ Denotes variable rate obligations for which the current yield and next scheduled reset date are shown.
Ω Denotes investments purchased on a when-issued basis.
± Designated as cover for long settling trades as discussed in the Notes to Financial Statements.
√ In bankruptcy.
Ф Denotes restricted securities. Restricted securities are investment securities which cannot be offered for public sale without first being registered under the Securities Act of 1933. The following table indicates the acquisition date and cost of restricted securities Thrivent High Yield Fund owned as of October 31, 2006.
| | Acquisition | |
| Security | Date | Cost |
|
| ASAT Finance, LLC, Stock Warrants | 10/20/1999 | $64,123 |
| RailAmerica, Inc., Stock Warrants | 8/9/2000 | $117,000 |
| TravelCenters of America, Inc., Stock Warrants | 11/9/2000 | $156,200 |
| |
| ¿ These securities are Equity-Linked Structured Securities as discussed in item 2(P) of the Notes to Financial Statements. | |
| Gross unrealized appreciation and depreciation of investments, based on cost for federal income tax purposes, were as follows: | |
| | |
| Gross unrealized appreciation | $14,230,177 | |
| Gross unrealized depreciation | (8,423,286) | |
|
| |
| Net unrealized appreciation (depreciation) | $5,806,891 | |
| Cost for federal income tax purposes | $704,822,822 | |
| The accompanying Notes to Financial Statements are an integral part of this schedule. |
|
| 162 |
Diversified Income Plus Fund
Schedule of Investments as of October 31, 2006 |
| Shares | Common Stock (51.7%) | Value | | Shares | Common Stock (51.7%) | Value |
|
| |
| Consumer Discretionary (3.6%) | | | 7,200 | Colonial Properties Trust | $362,808 |
| 5,400 | Bandag, Inc. * | $237,006 | | 14,900 | Comerica, Inc. | 867,031 |
| 5,000 | Genuine Parts Company * | 227,600 | | 14,400 | Commerce Group, Inc. | 426,240 |
| 12,900 | La-Z-Boy, Inc. * | 158,025 | | 7,400 | Community Bank System, Inc. * | 183,890 |
| 54,000 | McDonald’s Corporation * | 2,263,680 | | 2,600 | Community Banks, Inc. * | 69,862 |
| 4,200 | Polaris Industries, Inc. * | 179,844 | | 100 | Corporate Office Properties Trust | 4,779 |
| 38,800 | ServiceMaster Company * | 439,604 | | 10,100 | Corus Bankshares, Inc. * | 207,353 |
| 4,700 | Stanley Works * | 223,955 | | 800 | Cousins Properties, Inc. * | 28,616 |
| 42,500 | Superior Industries | | | 23,000 | Crescent Real Estate | |
| | International, Inc. * | 718,250 | | | Equities Company * | 501,400 |
| 1,700 | Talbots, Inc. * | 47,668 | | 6,300 | Developers Diversified Realty | |
| 3,100 | VF Corporation * | 235,631 | | | Corporation * | 383,670 |
|
| | |
| | Total Consumer | | | 8,400 | DiamondRock | |
| | Discretionary | 4,731,263 | | | Hospitality Company | 141,708 |
|
| | |
| | | | | 4,300 | Digital Realty Trust, Inc. | 143,577 |
| Consumer Staples (1.9%) | | | 25,500 | Duke Realty Corporation * | 1,021,530 |
| 12,800 | Altria Group, Inc. | 1,041,024 | | 700 | Entertainment Properties Trust | 38,500 |
| 11,400 | ConAgra Foods, Inc. | 298,110 | | 12,500 | Equity Office Properties Trust * | 531,250 |
| 33,200 | Universal Corporation | 1,222,424 | | 3,500 | Equity One, Inc. * | 87,920 |
|
| | |
| | Total Consumer Staples | 2,561,558 | | 10,400 | Equity Residential REIT * | 567,944 |
|
| | |
| | | | | 100 | Essex Property Trust, Inc. * | 13,328 |
| Energy (1.2%) | | | 6,800 | Extra Space Storage, Inc. | 125,392 |
| 12,900 | Chevron Corporation ∈ | 866,880 | | 134,000 | F.N.B. Corporation * | 2,268,620 |
| 23,300 | Kayne Anderson MLP | | | 1,100 | Federal Realty Investment Trust | 88,165 |
| | Investment Company * | 673,137 | | 29,000 | Fiduciary/Claymore MLP | |
|
| | |
| | Total Energy | 1,540,017 | | | Opportunity Fund | 574,490 |
|
| | |
| | | | | 23,200 | Fifth Third Bancorp * | 924,520 |
| Financials (32.9%) | | | 161,300 | First Commonwealth | |
| 100 | AMB Property Corporation | 5,841 | | | Financial Corporation * | 2,156,581 |
| 13,500 | American Financial Realty Trust * | 157,545 | | 13,900 | First Industrial Realty Trust, Inc. * | 638,983 |
| 16,000 | AmSouth Bancorporation | 483,520 | | 83,500 | FirstMerit Corporation * | 1,938,870 |
| 5,000 | Apartment Investment & | | | 7,700 | Franklin Street | |
| | Management Company | 286,600 | | | Properties Corporation * | 158,235 |
| 750 | Arcadia Financial, Ltd., | | | 8,000 | General Growth Properties, Inc. * | 415,200 |
| | StockWarrants #^ | 0 | | 13,700 | Glimcher Realty Trust * | 352,912 |
| 8,000 | Archstone-Smith Trust * | 481,680 | | 1,700 | Global Signal, Inc. | 92,310 |
| 54,300 | Arthur J. Gallagher & Company * | 1,512,255 | | 12,915 | Harleysville National | |
| 600 | Avalonbay Communities, Inc. | 78,636 | | | Corporation * | 275,864 |
| 27,800 | Bank of America Corporation | 1,497,586 | | 30,400 | Health Care Property | |
| 8,500 | BB&T Corporation * | 369,920 | | | Investors, Inc. | 954,560 |
| 4,100 | BioMed Realty Trust, Inc. | 132,143 | | 21,000 | Health Care REIT, Inc. * | 866,880 |
| 4,700 | Boston Properties, Inc. | 502,101 | | 11,000 | Healthcare Realty Trust, Inc. | 445,500 |
| 5,700 | Brandywine Realty Trust * | 190,152 | | 4,500 | Highwoods Properties, Inc. | 171,900 |
| 800 | BRE Properties, Inc. * | 53,040 | | 4,800 | Home Properties, Inc. | 303,216 |
| 800 | Camden Property Trust | 64,576 | | 15,600 | Hospitality Properties Trust * | 755,976 |
| 800 | CBL & Associates Properties, Inc. * | 34,984 | | 21,900 | Host Marriott Corporation * | 505,014 |
| 12,800 | Citigroup, Inc. | 642,048 | | 38,100 | HRPT Properties Trust * | 453,390 |
| The accompanying Notes to Financial Statements are an integral part of this schedule. |
|
| 163 |
Diversified Income Plus Fund
Schedule of Investments as of October 31, 2006 |
| Shares | Common Stock (51.7%) | Value | Shares | Common Stock (51.7%) | Value |
|
| |
| Financials — continued | | 3,000 | Sunstone Hotel Investors, Inc. * | $88,380 |
| 8,400 | Independent Bank Corporation | $200,760 | 25,900 | Susquehanna Bancshares, Inc. * | 647,241 |
| 3,600 | Inland Real Estate Corporation * | 67,284 | 3,200 | Tanger Factory Outlet | |
| 800 | iShares Cohen & Steers Realty | | | Centers, Inc. * | 119,360 |
| | Majors Index Fund | 78,296 | 100 | Taubman Centers, Inc. | 4,690 |
| 1,600 | iShares Dow Jones U.S. Real | | 16,830 | Tortoise Energy Infrastructure | |
| | Estate Index Fund | 131,488 | | Corporation * | 549,668 |
| 4,445 | Kimco Realty Corporation | 197,494 | 9,000 | United Dominion Realty | |
| 900 | LaSalle Hotel Properties | 38,025 | | Trust, Inc. * | 291,330 |
| 40,400 | Lexington Corporate | | 6,800 | U-Store-It Trust * | 149,328 |
| | Properties Trust * | 860,520 | 5,000 | Valley National Bancorp * | 130,300 |
| 7,900 | Liberty Property Trust | 380,780 | 6,100 | Ventas, Inc. | 237,778 |
| 1,500 | Macerich Company | 120,525 | 6,600 | Vornado Realty Trust | 787,050 |
| 5,600 | Mack-Cali Realty Corporation * | 296,240 | 31,100 | Washington Federal, Inc. * | 722,764 |
| 3,600 | Maguire Properties, Inc. | 153,936 | 48,700 | Washington Mutual, Inc. * | 2,060,010 |
| 1,600 | Mercury General Corporation * | 82,832 | 1,700 | Washington Real Estate | |
| 1,600 | Mid-America Apartment | | | Investment Trust * | 71,655 |
| | Communities, Inc. | 101,840 | 3,100 | Weingarten Realty Investors * | 144,150 |
| 21,700 | National City Corporation * | 808,325 | 7,100 | WesBanco, Inc. * | 232,525 |
|
|
| 4,223 | National penn Bancshares, Inc. * | 86,529 | | Total Financials | 43,484,841 |
|
|
| 12,300 | National Retail Properties, Inc. * | 276,381 | | | |
| 13,300 | Nationwide Health Properties, Inc. | 382,242 | Health Care (2.2%) | |
| 8,800 | New Plan Excel Realty Trust, Inc. * | 253,440 | 13,600 | Merck & Company, Inc. | 617,712 |
| 45,500 | North Fork Bancorporation, Inc. | 1,300,390 | 6,000 | Meridian Bioscience, Inc. | 138,300 |
| 26,300 | Old National Bancorp * | 499,174 | 80,700 | Pfizer, Inc. | 2,150,655 |
|
|
| 4,900 | Old Republic International | | | Total Health Care | 2,906,667 |
|
|
| | Corporation * | 110,397 | | | |
| 900 | Park National Corporation * | 91,251 | Industrials (1.3%) | |
| 4,100 | Pennsylvania Real Estate | | 4,800 | Avery Dennison Corporation * | 303,072 |
| | Investment Trust * | 176,710 | 12,800 | Briggs & Stratton Corporation * | 326,272 |
| 2,000 | Plum Creek Timber Company, Inc. | 71,880 | 13,200 | General Electric Company | 463,452 |
| 800 | Post Properties, Inc. | 39,184 | 16,800 | Masco Corporation * | 464,520 |
| 7,700 | ProLogis Trust | 487,179 | 4,700 | McGrath Rentcorp * | 126,900 |
| 902 | Public Storage, Inc. | 80,918 | 300 | Quixote Corporation | 5,517 |
| 2,800 | Rayonier, Inc. REIT * | 114,772 | 2,800 | Tennant Company | 77,420 |
|
|
| 12,800 | Realty Income Corporation * | 337,920 | | Total Industrials | 1,767,153 |
|
|
| 2,500 | Reckson Associates | | | | |
| | Realty Corporation * | 110,300 | Materials (1.5%) | |
| 700 | Regency Centers Corporation | 50,512 | 2,200 | Bemis Company, Inc. * | 73,964 |
| 18,100 | Senior Housing Property Trust * | 415,033 | 52,000 | RPM International, Inc. * | 995,800 |
| 10,300 | Simon Property Group, Inc. | 1,000,130 | 24,700 | Sonoco Products Company * | 876,356 |
|
|
| 6,500 | Sky Financial Group, Inc. | 162,825 | | Total Materials | 1,946,120 |
|
|
| 600 | SL Green Realty Corporation | 72,630 | | | |
| 2,800 | Sovran Self Storage, Inc. | 165,144 | | | |
| 33,300 | Spirit Finance Corporation | 396,603 | | | |
| 23,900 | Sterling Bancorp * | 465,572 | | | |
| 2,000 | Strategic Hotel Capital, Inc. | 42,540 | | | |
| The accompanying Notes to Financial Statements are an integral part of this schedule. |
|
| 164 |
Diversified Income Plus Fund
Schedule of Investments as of October 31, 2006 |
| Shares | Common Stock (51.7%) | Value | | Shares | Preferred Stock (0.9%) | Value |
|
| |
| Telecommunications Services (1.7%) | | | Energy (0.4%) | | |
| 67,700 | AT&T, Inc. | $2,318,723 | | 10,000 | Goldman Sachs Group, Inc., | |
| 500 | Unifi Communications, Inc., | | | | Convertible # | | $296,620 |
| | Stock Warrants # ΦФ | 0 | | 2,750 | Lehman Brothers Holdings, Inc., | |
|
| | |
| | Total Telecommunications | | | | Convertible # | | 165,578 |
|
|
| | Services | 2,318,723 | | | Total Energy | 462,198 |
|
| | |
|
| |
| Utilities (5.4%) | | | Financials (0.3%) | | |
| 61,700 | Atmos Energy Corporation | 1,896,041 | | 2,500 | Goldman Sachs Group, Inc., | |
| 11,500 | Consolidated Edison, Inc. * | 556,025 | | | Convertible #¿ | 249,608 |
| 20,100 | Otter Tail Corporation * | 601,794 | | 98 | Sovereign Real Estate Investment | |
| 21,500 | Peoples Energy Corporation | 939,335 | | | Corporation | | 137,200 |
|
|
| 43,200 | Progress Energy, Inc. * | 1,987,200 | | | Total Financials | 386,808 |
|
|
| 28,600 | Vectren Corporation * | 831,116 | | | | | |
| 6,100 | WPS Resources Corporation | 324,581 | | Utilities (0.2%) | | |
|
| | |
| | Total Utilities | 7,136,092 | | 3,505 | CenterPoint Energy, Inc., | |
|
| | |
| | | | | | Convertible | | 127,582 |
|
| | |
| | Total Common Stock | | | 720 | NRG Energy, Inc., Convertible * | 178,524 |
|
|
| | (cost $65,694,173) | 68,392,434 | | | Total Utilities | 306,106 |
|
| | |
|
| |
| | | | | | Total Preferred Stock | |
| | | | | | (cost $1,171,522) | 1,155,112 |
|
|
| |
| |
| |
| Principal | | | | | Interest | Maturity | |
| Amount | Long-Term Fixed Income (43.0%) | | | Rate | Date | Value |
|
| |
| Asset-Backed Securities (4.0%) | | | | | | |
| $5,200,000 | Dow Jones CDX * | | | | 8.375% | 12/29/2011 | $5,278,000 |
|
|
| | | Total Asset-Backed Securities | | 5,278,000 |
|
|
| |
| Basic Materials (3.8%) | | | | | | |
| 180,000 | Abitibi-Consolidated, Inc. * | | | 8.550 | 8/1/2010 | 173,025 |
| 100,000 | Abitibi-Consolidated, Inc. | | | 7.750 | 6/15/2011 | 89,250 |
| 250,000 | Ainsworth Lumber Company, Ltd. *∞ | | 9.117 | 12/30/2006 | 198,750 |
| 120,000 | AK Steel Corporation ± | | | 7.750 | 6/15/2012 | 120,000 |
| 130,000 | Appleton Papers, Inc. | | | 8.125 | 6/15/2011 | 129,350 |
| 150,000 | Appleton Papers, Inc. | | | 9.750 | 6/15/2014 | 148,500 |
| 220,000 | Arch Western Finance, LLC | | | 6.750 | 7/1/2013 | 212,300 |
| 143,000 | BCP Caylux Holdings Luxembourg SCA | | 9.625 | 6/15/2014 | 156,942 |
| 120,000 | Buckeye Technologies, Inc. | | | 8.000 | 10/15/2010 | 117,300 |
| 210,000 | Chaparral Steel Company ∈ | | | 10.000 | 7/15/2013 | 235,200 |
| 220,000 | Crystal US Holdings 3, LLC/Crystal | | | | | |
| | US Sub 3 Corporation *> | | | Zero Coupon | 10/1/2009 | 182,050 |
| 190,000 | Domtar, Inc. | | | 7.125 | 8/1/2015 | 181,450 |
| 190,000 | Drummond Company, Inc. | | | 7.375 | 2/15/2016 | 181,450 |
| The accompanying Notes to Financial Statements are an integral part of this schedule. |
|
| 165 |
Diversified Income Plus Fund
Schedule of Investments as of October 31, 2006 |
| Principal | | Interest | Maturity | |
| Amount | Long-Term Fixed Income (43.0%) | Rate | Date | Value |
|
| Basic Materials — continued | | | |
| $145,000 | Equistar Chemicals, LP | 10.625% | 5/1/2011 | $155,150 |
| 320,000 | FMG Finance, Pty. Ltd. * | 10.625 | 9/1/2016 | 315,200 |
| 120,000 | Georgia-Pacific Corporation | 8.125 | 5/15/2011 | 124,200 |
| 300,000 | Graphic Packaging International Corporation * | 9.500 | 8/15/2013 | 308,250 |
| 190,000 | Huntsman International, LLC * | 10.125 | 7/1/2009 | 192,850 |
| 220,000 | Huntsman International, LLC Ω | 7.875 | 11/13/2014 | 221,100 |
| 330,000 | Ineos Group Holdings plc | 8.500 | 2/15/2016 | 317,625 |
| 100,000 | Jefferson Smurfit Corporation | 8.250 | 10/1/2012 | 97,000 |
| 200,000 | Lyondell Chemical Company | 10.500 | 6/1/2013 | 220,000 |
| 260,000 | Lyondell Chemical Company | 8.250 | 9/15/2016 | 267,800 |
| 200,000 | MacDermid, Inc. | 9.125 | 7/15/2011 | 209,000 |
| 80,000 | Novelis, Inc. | 8.250 | 2/15/2015 | 76,400 |
| 140,000 | PNA Group, Inc. | 10.750 | 9/1/2016 | 144,200 |
| 220,000 | Ryerson, Inc. | 8.250 | 12/15/2011 | 218,900 |
|
|
| | Total Basic Materials | | 4,993,242 |
|
|
| |
| Capital Goods (4.7%) | | | |
| 80,000 | Ahern Rentals, Inc. ± | 9.250 | 8/15/2013 | 82,200 |
| 340,000 | Allied Waste North America, Inc. | 7.875 | 4/15/2013 | 349,350 |
| 490,000 | Amsted Industries, Inc. | 10.250 | 10/15/2011 | 526,750 |
| 100,000 | Ashtead Capital, Inc. | 9.000 | 8/15/2016 | 105,250 |
| 190,000 | Ball Corporation | 6.625 | 3/15/2018 | 186,438 |
| 210,000 | Berry Plastics Holding Corporation | 8.875 | 9/15/2014 | 212,100 |
| 150,000 | Browning-Ferris Industries, Inc. | 9.250 | 5/1/2021 | 157,500 |
| 150,000 | Browning-Ferris Industries, Inc. | 7.400 | 9/15/2035 | 138,000 |
| 290,000 | Builders Firstsource, Inc. ∞ | 9.655 | 11/15/2006 | 284,925 |
| 210,000 | Case New Holland, Inc. | 9.250 | 8/1/2011 | 222,862 |
| 220,000 | Consolidated Container Company, LLC *> | Zero Coupon | 6/15/2007 | 215,600 |
| 170,000 | Covalence Specialty Materials Corporation | 10.250 | 3/1/2016 | 164,050 |
| 150,000 | Crown Americas, Inc. | 7.625 | 11/15/2013 | 153,750 |
| 150,000 | Crown Americas, Inc. | 7.750 | 11/15/2015 | 153,938 |
| 520,000 | Da-Lite Screen Company, Inc. ∈ | 9.500 | 5/15/2011 | 548,600 |
| 230,000 | DRS Technologies, Inc. | 7.625 | 2/1/2018 | 235,175 |
| 610,000 | Fastentech, Inc. | 11.500 | 5/1/2011 | 631,350 |
| 130,000 | Graham Packaging Company, Inc. * | 9.875 | 10/15/2014 | 130,325 |
| 350,000 | Invensys plc * | 9.875 | 3/15/2011 | 381,500 |
| 60,000 | K&F Acquisition, Inc. * | 7.750 | 11/15/2014 | 60,750 |
| 49,000 | Mueller Group, Inc. | 10.000 | 5/1/2012 | 53,410 |
| 143,000 | Mueller Holdings, Inc. > | Zero Coupon | 4/15/2009 | 125,840 |
| 100,000 | Owens-Brockway Glass Container, Inc. | 8.250 | 5/15/2013 | 103,000 |
| 320,000 | Owens-Illinois, Inc. * | 7.500 | 5/15/2010 | 324,800 |
| 260,000 | Plastipak Holdings, Inc. | 8.500 | 12/15/2015 | 269,100 |
| 120,000 | RBS Global, Inc./Rexnord Corporation | 9.500 | 8/1/2014 | 124,200 |
| 40,000 | RBS Global, Inc./Rexnord Corporation | 11.750 | 8/1/2016 | 41,600 |
| 120,000 | United Rentals North America, Inc. | 6.500 | 2/15/2012 | 117,000 |
| 100,000 | United Rentals North America, Inc. * | 7.000 | 2/15/2014 | 95,750 |
|
|
| | Total Capital Goods | | 6,195,113 |
|
|
| The accompanying Notes to Financial Statements are an integral part of this schedule. |
|
| 166 |
Diversified Income Plus Fund
Schedule of Investments as of October 31, 2006 |
| Principal | | | Interest | Maturity | |
| Amount | Long-Term Fixed Income (43.0%) | | Rate | Date | Value |
|
| Communications Services (7.1%) | | | | |
| $150,000 | American Cellular Corporation ± | | 10.000% | 8/1/2011 | $157,500 |
| 660,000 | American Tower Corporation ∈ | | 7.125 | 10/15/2012 | 673,200 |
| 380,000 | American Towers, Inc. ∈ | | 7.250 | 12/1/2011 | 390,450 |
| 150,000 | Cablevision Systems Corporation | | 8.000 | 4/15/2012 | 145,688 |
| 669,788 | CCH I, LLC | | 11.000 | 10/1/2015 | 645,508 |
| 180,000 | Centennial Communications Corporation * | | 8.125 | 2/1/2014 | 180,225 |
| 170,000 | Charter Communications Holdings, LLC | | 8.750 | 11/15/2013 | 172,975 |
| 175,000 | Charter Communications Operating, LLC * | | 8.000 | 4/30/2012 | 178,500 |
| 240,000 | Citizens Communications Company | | 9.250 | 5/15/2011 | 266,100 |
| 160,000 | Cricket Communications, Inc. * | | 9.375 | 11/1/2014 | 163,200 |
| 99,000 | Dex Media West, LLC/Dex Media West Finance Company | 9.875 | 8/15/2013 | 107,539 |
| 240,000 | Dobson Cellular Systems * | | 9.875 | 11/1/2012 | 259,200 |
| 150,000 | Houghton Mifflin Company | | 8.250 | 2/1/2011 | 154,500 |
| 240,000 | Insight Midwest, LP/Insight Capital, Inc. * | | 10.500 | 11/1/2010 | 248,400 |
| 90,000 | Intelsat Bermuda, Ltd. | | 9.250 | 6/15/2016 | 96,075 |
| 510,000 | Intelsat Bermuda, Ltd. | | 11.250 | 6/15/2016 | 555,262 |
| 280,000 | Intelsat Intermediate, Inc. *> | | Zero Coupon | 2/1/2010 | 212,100 |
| 200,000 | Intelsat Subsidiary Holding Company, Ltd. | | 8.625 | 1/15/2015 | 207,500 |
| 240,000 | Kabel Deutschland GmbH | | 10.625 | 7/1/2014 | 259,500 |
| 120,000 | Lamar Media Corporation | | 6.625 | 8/15/2015 | 115,500 |
| 190,000 | Mediacom Broadband, LLC * | | 8.500 | 10/15/2015 | 189,762 |
| 170,000 | MetroPCS Wireless, Inc. Ω | | 9.250 | 11/1/2014 | 171,488 |
| 220,000 | Morris Publishing Group, LLC | | 7.000 | 8/1/2013 | 209,275 |
| 210,000 | NTL Cable plc | | 9.125 | 8/15/2016 | 220,762 |
| 190,000 | PRIMEDIA, Inc. ∞ | | 10.780 | 11/15/2006 | 196,650 |
| 110,000 | Qwest Communications International, Inc. ∞ | | 8.905 | 11/15/2006 | 111,788 |
| 280,000 | Qwest Communications International, Inc. | | 7.250 | 2/15/2011 | 284,200 |
| 90,000 | Qwest Communications International, Inc. | | 7.500 | 2/15/2014 | 91,800 |
| 40,000 | Qwest Corporation ∞ | | 8.640 | 12/15/2006 | 43,100 |
| 360,000 | Qwest Corporation | | 7.875 | 9/1/2011 | 381,150 |
| 70,000 | Qwest Corporation | | 7.625 | 6/15/2015 | 73,675 |
| 280,000 | R.H. Donnelley Corporation | | 6.875 | 1/15/2013 | 263,550 |
| 420,000 | R.H. Donnelley Corporation | | 6.875 | 1/15/2013 | 395,325 |
| 160,000 | R.H. Donnelley Corporation | | 8.875 | 1/15/2016 | 165,000 |
| 205,000 | Rogers Wireless Communications, Inc. * | | 7.500 | 3/15/2015 | 218,838 |
| 120,000 | Rural Cellular Corporation * | | 9.750 | 1/15/2010 | 121,500 |
| 120,000 | Rural Cellular Corporation * | | 9.875 | 2/1/2010 | 126,000 |
| 280,000 | Time Warner Telecom Holdings, Inc. | | 9.250 | 2/15/2014 | 295,400 |
| 175,000 | UbiquiTel Operating Company | | 9.875 | 3/1/2011 | 189,438 |
| 200,000 | Valor Telecommunications Enterprises, LLC | | 7.750 | 2/15/2015 | 213,250 |
| 290,000 | Videotron Ltee * | | 6.875 | 1/15/2014 | 287,825 |
|
|
| | Total Communications Services | | 9,438,698 |
|
|
| |
| Consumer Cyclical (7.8%) | | | | |
| 330,000 | Allied Security Escrow Corporation | | 11.375 | 7/15/2011 | 331,650 |
| 270,000 | American Casino & Entertainment Properties, LLC | | 7.850 | 2/1/2012 | 274,725 |
| The accompanying Notes to Financial Statements are an integral part of this schedule. |
|
| 167 |
Diversified Income Plus Fund
Schedule of Investments as of October 31, 2006 |
| Principal | | Interest | Maturity | |
| Amount | Long-Term Fixed Income (43.0%) | Rate | Date | Value |
|
| Consumer Cyclical — continued | | | |
| $180,000 | Beazer Homes USA, Inc. | 8.625% | 5/15/2011 | $183,600 |
| 350,000 | Bon-Ton Stores, Inc. * | 10.250 | 3/15/2014 | 354,812 |
| 190,000 | Buffets, Inc. | 12.500 | 11/1/2014 | 190,950 |
| 490,000 | Buhrmann U.S., Inc. ∈ | 7.875 | 3/1/2015 | 465,500 |
| 130,000 | Circus & Eldorado Joint Venture/Silver | | | |
| | Legacy Capital Corporation | 10.125 | 3/1/2012 | 136,500 |
| 360,000 | Dollarama Group, LP * | 8.875 | 8/15/2012 | 371,700 |
| 230,000 | Ford Motor Credit Company ∞ | 9.824 | 1/16/2007 | 239,885 |
| 80,000 | Ford Motor Credit Company | 9.750 | 9/15/2010 | 82,497 |
| 170,000 | Ford Motor Credit Company | 7.000 | 10/1/2013 | 158,036 |
| 310,000 | Gaylord Entertainment Company ∈ | 6.750 | 11/15/2014 | 296,825 |
| 860,000 | General Motors Acceptance Corporation ∈ | 6.875 | 9/15/2011 | 865,903 |
| 310,000 | General Motors Corporation | 8.250 | 7/15/2023 | 275,125 |
| 340,000 | Group 1 Automotive, Inc. | 8.250 | 8/15/2013 | 349,775 |
| 170,000 | Harrah’s Operating Company, Inc. | 6.500 | 6/1/2016 | 149,629 |
| 820,000 | IAAI Finance Corporation | 11.000 | 4/1/2013 | 824,100 |
| 220,000 | Jean Coutu Group (PJC), Inc. | 7.625 | 8/1/2012 | 231,000 |
| 150,000 | K. Hovnanian Enterprises, Inc. * | 7.500 | 5/15/2016 | 145,500 |
| 160,000 | KB Home * | 6.250 | 6/15/2015 | 150,272 |
| 130,000 | Majestic Star Casino, LLC | 9.500 | 10/15/2010 | 131,300 |
| 280,000 | MGM MIRAGE * | 5.875 | 2/27/2014 | 256,550 |
| 295,000 | Morgan Stanley, Convertible ¿ | 16.500 | 1/18/2007 | 296,593 |
| 330,000 | NCL Corporation | 10.625 | 7/15/2014 | 321,750 |
| 260,000 | Poster Financial Group, Inc. | 8.750 | 12/1/2011 | 271,050 |
| 900,000 | Rent-Way, Inc. | 11.875 | 6/15/2010 | 1,052,924 |
| 270,000 | Station Casinos, Inc. * | 6.875 | 3/1/2016 | 247,725 |
| 115,000 | TRW Automotive, Inc. | 9.375 | 2/15/2013 | 123,194 |
| 360,000 | Tunica Biloxi Gaming Authority | 9.000 | 11/15/2015 | 371,700 |
| 180,000 | Turning Stone Resort Casino Enterprise | 9.125 | 9/15/2014 | 183,150 |
| 242,000 | Universal City Florida Holding Company I/II ∞ | 10.239 | 11/1/2006 | 248,958 |
| 180,000 | VICORP Restaurants, Inc. | 10.500 | 4/15/2011 | 171,900 |
| 210,000 | Warnaco, Inc. | 8.875 | 6/15/2013 | 219,450 |
| 120,000 | West Corporation | 9.500 | 10/15/2014 | 119,700 |
| 323,000 | WMG Holdings Corporation > | Zero Coupon | 12/15/2009 | 247,095 |
|
|
| | Total Consumer Cyclical | | 10,341,023 |
|
|
| |
| Consumer Non-Cyclical (2.6%) | | | |
| 110,000 | DaVita, Inc. | 7.250 | 3/15/2015 | 109,450 |
| 130,000 | Elan Finance Corporation, Ltd. | 7.750 | 11/15/2011 | 127,725 |
| 120,000 | Elan Finance plc/Elan Finance Corporation ∞ | 9.405 | 11/15/2006 | 121,050 |
| 170,000 | Fisher Scientific International, Inc. | 6.125 | 7/1/2015 | 168,725 |
| 180,000 | HCA, Inc. | 6.950 | 5/1/2012 | 159,075 |
| 240,000 | IASIS Healthcare, LLC (IASIS Capital Corporation) * | 8.750 | 6/15/2014 | 231,900 |
| 315,000 | Jostens Holding Corporation *> | Zero Coupon | 10/1/2008 | 266,175 |
| 230,000 | Michael Foods, Inc. | 8.000 | 11/15/2013 | 237,475 |
| 210,000 | Multiplan, Inc. | 10.375 | 4/15/2016 | 210,000 |
| The accompanying Notes to Financial Statements are an integral part of this schedule. |
|
| 168 |
Diversified Income Plus Fund
Schedule of Investments as of October 31, 2006 |
| Principal | | Interest | Maturity | |
| Amount | Long-Term Fixed Income (43.0%) | Rate | Date | Value |
|
| Consumer Non-Cyclical — continued | | | |
| $150,000 | Smithfield Foods, Inc. | 8.000% | 10/15/2009 | $156,938 |
| 160,000 | Stater Brothers Holdings, Inc. | 8.125 | 6/15/2012 | 161,200 |
| 170,000 | Supervalu, Inc. | 7.500 | 11/15/2014 | 172,919 |
| 260,000 | Triad Hospitals, Inc. | 7.000 | 5/15/2012 | 258,050 |
| 180,000 | Triad Hospitals, Inc. | 7.000 | 11/15/2013 | 175,050 |
| 230,000 | US Oncology Holdings, Inc. ∞ | 10.675 | 3/15/2007 | 235,175 |
| 120,000 | US Oncology, Inc. | 9.000 | 8/15/2012 | 124,350 |
| 220,000 | Vanguard Health Holding Company II, LLC | 9.000 | 10/1/2014 | 212,850 |
| 250,000 | Ventas Realty, LP/Ventas Capital Corporation | 6.500 | 6/1/2016 | 249,375 |
| 85,000 | Warner Chilcott Corporation | 8.750 | 2/1/2015 | 87,762 |
|
|
| | Total Consumer Non-Cyclical | | 3,465,244 |
|
|
| |
| Energy (1.5%) | | | |
| 110,000 | Chesapeake Energy Corporation * | 6.375 | 6/15/2015 | 106,150 |
| 200,000 | Chesapeake Energy Corporation ∈ | 6.250 | 1/15/2018 | 189,500 |
| 220,000 | Denbury Resources, Inc. | 7.500 | 12/15/2015 | 220,000 |
| 170,000 | Hornbeck Offshore Services, Inc. | 6.125 | 12/1/2014 | 158,312 |
| 650,000 | Ocean Rig Norway AS | 8.375 | 7/1/2013 | 684,938 |
| 90,000 | Pioneer Natural Resources Company * | 5.875 | 7/15/2016 | 83,736 |
| 210,000 | Western Oil Sands, Inc. | 8.375 | 5/1/2012 | 225,750 |
| 280,000 | Whiting Petroleum Corporation * | 7.250 | 5/1/2012 | 277,200 |
| 60,000 | Whiting Petroleum Corporation | 7.250 | 5/1/2013 | 59,250 |
|
|
| | Total Energy | | | 2,004,836 |
|
|
| |
| Financials (2.9%) | | | |
| 130,000 | ACE Cash Express, Inc. ± | 10.250 | 10/1/2014 | 130,650 |
| 400,000 | FTI Consulting, Inc. | 7.625 | 6/15/2013 | 409,000 |
| 580,000 | J.P. Morgan Chase Capital XX | 6.550 | 9/29/2036 | 600,541 |
| 580,000 | Lincoln National Corporation * | 7.000 | 5/17/2016 | 610,542 |
| 580,000 | Rabobank Capital Funding Trust | 5.254 | 10/21/2016 | 563,177 |
| 580,000 | RBS Capital Trust I | 5.512 | 9/30/2014 | 570,643 |
| 250,000 | Residential Capital Corporation ∞ | 7.204 | 1/17/2007 | 250,560 |
| 580,000 | Wachovia Capital Trust III | 5.800 | 3/15/2011 | 585,108 |
| 100,000 | Wells Fargo & Company, Convertible ∞ | 5.239 | 11/1/2006 | 100,780 |
|
|
| | Total Financials | | | 3,821,001 |
|
|
| |
| Technology (1.7%) | | | |
| 180,000 | Avago Technologies Finance Pte ∞ | 10.900 | 12/1/2006 | 188,100 |
| 110,000 | Electronic Data Systems Corporation, Convertible | 3.875 | 7/15/2023 | 112,475 |
| 120,000 | Freescale Semiconductor, Inc. | 6.875 | 7/15/2011 | 126,000 |
| 120,000 | Freescale Semiconductor, Inc. | 7.125 | 7/15/2014 | 128,700 |
| 117,000 | Intel Corporation, Convertible | 2.950 | 12/15/2035 | 106,178 |
| 230,000 | MagnaChip Semiconductor SA/MagnaChip | | | |
| | Semiconductor Finance Company ∞ | 8.640 | 12/15/2006 | 197,800 |
| 110,000 | NXP BV/NXP Funding, LLC ∞ | 8.124 | 1/15/2007 | 110,962 |
| 320,000 | Seagate Technology HDD Holdings | 6.800 | 10/1/2016 | 316,000 |
| 130,000 | SunGard Data Systems, Inc. | 9.125 | 8/15/2013 | 134,875 |
| The accompanying Notes to Financial Statements are an integral part of this schedule. |
|
| 169 |
Diversified Income Plus Fund
Schedule of Investments as of October 31, 2006 |
| Principal | | Interest | Maturity | |
| Amount | Long-Term Fixed Income (43.0%) | Rate | Date | Value |
|
| Technology — continued | | | |
| $130,000 | SunGard Data Systems, Inc. * | 10.250% | 8/15/2015 | $136,175 |
| 280,000 | UGS Corporation | 10.000 | 6/1/2012 | 302,400 |
| 150,000 | Unisys Corporation | 6.875 | 3/15/2010 | 144,375 |
| 190,000 | Xerox Corporation | 7.625 | 6/15/2013 | 198,550 |
|
|
| | Total Technology | | | 2,202,590 |
|
|
| |
| Transportation (1.4%) | | | |
| 220,000 | CHC Helicopter Corporation | 7.375 | 5/1/2014 | 210,100 |
| 240,000 | Delta Air Lines, Inc. ∈√ | 7.111 | 9/18/2011 | 240,600 |
| 80,000 | Hertz Corporation | 8.875 | 1/1/2014 | 83,600 |
| 140,000 | Hertz Corporation | 10.500 | 1/1/2016 | 153,650 |
| 214,000 | H-Lines Finance Holding Corporation > | Zero Coupon | 4/1/2008 | 193,135 |
| 410,000 | Horizon Lines, LLC ∈ | 9.000 | 11/1/2012 | 428,450 |
| 556,931 | Piper Jaffray Equipment Trust Securities | 6.750 | 4/1/2011 | 554,147 |
|
|
| | Total Transportation | | 1,863,682 |
|
|
| |
| U.S. Government (1.2%) | | | |
| 1,622,475 | U.S. Treasury Notes, TIPS * | 2.000 | 7/15/2014 | 1,580,391 |
|
|
| | Total U.S. Government | | 1,580,391 |
|
|
| |
| Utilities (4.3%) | | | |
| 105,000 | AES Corporation ∈ | 8.875 | 2/15/2011 | 112,875 |
| 240,000 | AES Corporation ∈ | 8.750 | 5/15/2013 | 257,700 |
| 260,000 | AmeriGas Partners, LP | 7.250 | 5/20/2015 | 259,350 |
| 210,000 | Calpine Generating Company, LLC ∞√ | 11.073 | 11/1/2006 | 221,025 |
| 190,000 | Calpine Generating Company, LLC ∞√ | 14.370 | 4/1/2007 | 202,825 |
| 490,000 | Colorado Interstate Gas Company ∈ | 6.800 | 11/15/2015 | 497,970 |
| 100,000 | Consumers Energy Company | 6.300 | 2/1/2012 | 99,250 |
| 150,000 | Dynegy Holdings, Inc. | 6.875 | 4/1/2011 | 147,750 |
| 170,000 | Dynegy Holdings, Inc. * | 8.375 | 5/1/2016 | 174,675 |
| 170,000 | Edison Mission Energy | 7.500 | 6/15/2013 | 174,675 |
| 180,000 | Edison Mission Energy | 7.750 | 6/15/2016 | 185,850 |
| 290,000 | Energy Transfer Partners, LP * | 6.625 | 10/15/2036 | 297,863 |
| 590,000 | Enterprise Products Operating, LP ∈ | 8.375 | 8/1/2016 | 634,081 |
| 140,000 | Midwest Generation, LLC | 8.750 | 5/1/2034 | 151,375 |
| 100,000 | Mirant North America, LLC | 7.375 | 12/31/2013 | 101,125 |
| 260,000 | Mission Energy Holding Company | 13.500 | 7/15/2008 | 289,900 |
| 460,000 | NRG Energy, Inc. | 7.375 | 2/1/2016 | 465,175 |
| 170,000 | Pacific Energy Partners, LP/Pacific Energy | | | |
| | Finance Corporation | 7.125 | 6/15/2014 | 171,912 |
| 200,000 | Pacific Energy Partners, LP/Pacific Energy | | | |
| | Finance Corporation | 6.250 | 9/15/2015 | 196,750 |
| 145,000 | Reliant Energy Resources Corporation | 6.750 | 12/15/2014 | 138,294 |
| 210,000 | SemGroup, LP | 8.750 | 11/15/2015 | 211,575 |
| 230,000 | Southern Natural Gas Company | 7.350 | 2/15/2031 | 241,517 |
| 410,000 | Williams Companies, Inc. | 8.750 | 3/15/2032 | 455,100 |
|
|
| | Total Utilities | | | 5,688,612 |
|
|
| | Total Long-Term Fixed Income (cost $56,475,619) | 56,872,432 |
|
|
| The accompanying Notes to Financial Statements are an integral part of this schedule. |
|
| 170 |
Diversified Income Plus Fund
Schedule of Investments as of October 31, 2006 |
| | | | | Interest | Maturity | |
| Shares | Collateral Held for Securities Loaned (25.5%) | Rate (+) | Date | Value |
|
| 33,647,182 | Thrivent Financial Securities Lending Trust | 5.300% | N/A | $33,647,182 |
| |
|
| | | Total Collateral Held for Securities Loaned | |
| | | (cost $33,647,182) | | | 33,647,182 |
|
|
| |
| |
| Shares or | | | | | | |
| Principal | | | | Interest | Maturity | |
| Amount | Short-Term Investments (3.9%) | | Rate (+) | Date | Value |
|
| $100,000 | Federal National Mortgage Association ∈ | 5.200% | 2/7/2007 | $98,617 |
| 2,420,000 | IBRD Discount Note | | 5.000 | 11/1/2006 | 2,420,000 |
| 2,618,010 | Thrivent Money Market Fund | | 4.600 | N/A | 2,618,010 |
|
|
| | | Total Short-Term Investments (cost $5,136,608) | 5,136,627 |
|
|
| | | Total Investments (cost $162,125,104) 125.0% | $165,203,787 |
|
|
| | | Other Assets and Liabilities, Net (25.0%) | (33,015,924) |
|
|
| | | Total Net Assets 100.0% | | | $132,187,863 |
|
|
| |
| | | Number of | | Notional | | |
| | | Contracts | Expiration | Principal | | Unrealized |
| Futures | | Long/(Short) | Date | Amount | Value | Gain/(Loss) |
|
| 10-Yr. U.S. Treasury Bond Futures | (28) | December 2006 | ($3,008,353) | ($3,030,125) | ($21,772) |
| S&P 500 Index Mini-Futures | 17 | December 2006 | $1,169,709 | $1,175,720 | $6,011 |
# Non-income producing security.
* All or a portion of the security is on loan as discussed in item 2(L) of the Notes to Financial Statements.
+ The interest rate shown reflects the yield, coupon rate or, for securities purchased at a discount, the discount rate at the date of purchase.
^ Security is fair valued as discussed in item 2(A) of the Notes to Financial Statements.
> Denotes step coupon bonds for which the current interest rate and next scheduled reset date are shown.
∞ Denotes variable rate obligations for which the current yield and next scheduled reset date are shown.
Ω Denotes investments purchased on a when-issued basis.
± Designated as cover for long settling trades as discussed in the Notes to Financial Statements.
∈ At October 31, 2006, $356,317 of investments were held on deposit with the counterparty and pledged as the initial margin deposit for open financial futures contracts. In addition, $6,433,138 of investments were earmarked as collateral to cover open financial futures contracts.
Φ Denotes restricted securities. Restricted securities are investment securities which cannot be offered for public sale without first being registered under the Securities Act of 1933. The following table indicates the acquisition date and cost of restricted securities Thrivent Diversified Income Plus Fund owned as of October 31, 2006.
| | Acquisition | |
| Security | Date | Cost |
|
| Unifi Communications, Inc., Stock Warrants | 2/14/1997 | $6,525 |
√ In bankruptcy.
¿ These securities are Equity-Linked Structured Securities as discussed in item 2(P) of the Notes to Financial Statements.
Definitions:
REIT — Real Estate Investment Trust, is a company that buys, develops, manages and/or sells real estate assets.
TIPS — Treasury Inflation Protected Security.
| Gross unrealized appreciation and depreciation of investments, based on cost for federal income tax purposes, were as follows: | |
| | |
| Gross unrealized appreciation | $3,935,729 | |
| Gross unrealized depreciation | (1,230,178) | |
|
| |
| Net unrealized appreciation (depreciation) | $2,705,551 | |
| Cost for federal income tax purposes | $162,498,236 | |
| The accompanying Notes to Financial Statements are an integral part of this schedule. |
|
| 171 |
Municipal Bond Fund
Schedule of Investments as of October 31, 2006 |
| Principal | | Interest | Maturity | |
| Amount | Long-Term Fixed Income (98.5%) | Rate | Date | Value |
|
| |
| Alabama (0.1%) | | | |
| $1,000,000 | Alabama 21st Century Authority Tobacco Settlement | | | |
| | Revenue Bonds | 5.750% | 12/1/2020 | $1,053,140 |
|
|
| | Total Alabama | | | 1,053,140 |
|
|
| |
| Alaska (0.7%) | | | |
| 3,155,000 | Alaska Energy Authority Power Revenue Refunding Bonds | | | |
| | (Bradley Lake) (Series 5) (FSA Insured) | 5.000 | 7/1/2021 | 3,256,465 |
| 2,000,000 | Northern Tobacco Securitization Corporation Tobacco | | | |
| | Settlement Asset Backed Revenue Bonds (Series A) | 5.000 | 6/1/2032 | 2,015,000 |
| 2,870,000 | Northern Tobacco Securitization Corporation, Alaska | | | |
| | Tobacco Settlement Revenue Bonds ÷ | 6.200 | 6/1/2022 | 3,056,234 |
|
|
| | Total Alaska | | | 8,327,699 |
|
|
| |
| Arizona (0.7%) | | | |
| 975,000 | Arizona Health Facilities Authority Revenue Bonds | | | |
| | (Arizona Healthcare Pooled Financing) (FGIC Insured) | 5.000 | 6/1/2011 | 1,029,580 |
| 1,020,000 | Arizona Health Facilities Authority Revenue Bonds | | | |
| | (Arizona Healthcare Pooled Financing) (FGIC Insured) | 5.000 | 6/1/2012 | 1,081,496 |
| 1,000,000 | Arizona Health Facilities Authority Revenue Bonds | | | |
| | (Blood Systems, Inc.) | 5.000 | 4/1/2017 | 1,069,480 |
| 1,200,000 | Arizona Health Facilities Authority Revenue Bonds | | | |
| | (Blood Systems, Inc.) | 5.000 | 4/1/2018 | 1,256,664 |
| 500,000 | Glendale, Arizona Industrial Development Authority | | | |
| | Revenue Bonds (Midwestern University) (Series A) | 5.750 | 5/15/2021 | 544,025 |
| 2,000,000 | Phoenix, Arizona Industrial Development Authority | | | |
| | Government Office Lease Revenue Bonds | | | |
| | (Capital Mall Project) (AMBAC Insured) ÷ | 5.375 | 9/15/2020 | 2,128,480 |
| 15,000 | Phoenix, Arizona Industrial Development Authority | | | |
| | Single Family Mortgage Revenue Bonds (Series 1A) | | | |
| | (GNMA/FNMA/FHLMC Insured) | 5.875 | 6/1/2016 | 15,013 |
| 1,285,000 | Pima County, Arizona Industrial Development Authority | | | |
| | Multifamily Bonds (La Hacienda Project) | | | |
| | (GNMA/FHA Insured) ÷ | 7.000 | 12/20/2031 | 1,392,118 |
| 500,000 | Yavapai County, Arizona Hospital Revenue Bonds | | | |
| | (Yavapai Regional Medical Center) (Series A) | 6.000 | 8/1/2033 | 540,755 |
|
|
| | Total Arizona | | | 9,057,611 |
|
|
| The accompanying Notes to Financial Statements are an integral part of this schedule. |
|
| 172 |
Municipal Bond Fund
Schedule of Investments as of October 31, 2006 |
| Principal | | Interest | Maturity | |
| Amount | Long-Term Fixed Income (98.5%) | Rate | Date | Value |
|
| Arkansas (1.0%) | | | |
| $460,000 | Arkansas Housing Development Agency Single Family | | | |
| | Mortgage Revenue Bonds (FHA Insured) ÷ | 8.375% | 7/1/2010 | $501,635 |
| 2,400,000 | Arkansas State Community Water System Public Water | | | |
| | Authority Revenue Bonds (Series B) (MBIA Insured) | 5.000 | 10/1/2023 | 2,514,840 |
| 5,000,000 | Arkansas State Development Finance Authority Revenue | | | |
| | Bonds (Series B) (FSA insured) | 5.000 | 11/1/2025 | 5,366,800 |
| 3,000,000 | Jonesboro, Arkansas Residential Housing and Health | | | |
| | Care Facilities Revenue Bonds (St. Bernards Regional | | | |
| | Medical Center) (AMBAC Insured) | 5.800 | 7/1/2011 | 3,063,420 |
| 875,000 | Pope County, Arkansas Pollution Control Revenue Bonds | | | |
| | (Arkansas Power and Light Company Project) (FSA Insured) | 6.300 | 12/1/2016 | 875,752 |
|
|
| | Total Arkansas | | | 12,322,447 |
|
|
| |
| California (10.0%) | | | |
| 3,950,000 | Anaheim, California Public Financing Authority Lease | | | |
| | Revenue Bonds (Public Improvements Project) (Series A) | | | |
| | (FSA Insured) | 6.000 | 9/1/2024 | 4,791,903 |
| 5,000,000 | California Infrastructure & Economic Bank Revenue | | | |
| | Bonds (Bay Area Toll Bridges) (1st Lien-A) ÷ | 5.000 | 7/1/2025 | 5,702,550 |
| 95,000 | California Rural Home Mortgage Finance Authority | | | |
| | Single Family Mortgage Revenue Bonds (Series D) | | | |
| | (GNMA/FNMA Insured) (Subject to ‘AMT’) | 7.100 | 6/1/2031 | 98,863 |
| 2,000,000 | California State General Obligation Bonds | | | |
| | (AMBAC Insured) | 6.300 | 9/1/2010 | 2,198,120 |
| 3,000,000 | California State Public Works Board Lease Revenue | | | |
| | Bonds (Department of Corrections State Prison) | 7.400 | 9/1/2010 | 3,397,140 |
| 4,000,000 | California State Public Works Board Lease Revenue | | | |
| | Bonds (UCLA Replacement Hospital) (Series A) | | | |
| | (FSA Insured) | 5.375 | 10/1/2015 | 4,390,520 |
| 2,000,000 | California State Revenue General Obligation Bonds | 5.250 | 11/1/2021 | 2,160,080 |
| 10,000,000 | California State Revenue General Obligation Bonds | 5.250 | 4/1/2029 | 10,721,600 |
| 1,000,000 | California State Unrefunded Balance General | | | |
| | Obligation Bonds | 5.250 | 12/1/2019 | 1,058,920 |
| 300,000 | California State Unrefunded General Obligation Bonds | | | |
| | (MBIA Insured) | 6.000 | 8/1/2016 | 301,830 |
| 2,000,000 | California State Veterans General Obligation | | | |
| | Revenue Bonds (FGIC) (Series AT) | 9.500 | 2/1/2010 | 2,344,020 |
| 4,030,000 | Contra Costa County, California Home Mortgage | | | |
| | Revenue Bonds (GNMA Insured) (Escrowed to Maturity) ÷ | 7.500 | 5/1/2014 | 4,982,692 |
| 5,000,000 | Foothill/Eastern Transportation Corridor Agency, | | | |
| | California Toll Road Revenue Bonds (Series A) ÷ | 7.050 | 1/1/2009 | 5,374,700 |
| 5,000,000 | Foothill/Eastern Transportation Corridor Agency, | | | |
| | California Toll Road Revenue Bonds (Series A) ÷ | 7.100 | 1/1/2011 | 5,634,800 |
| 6,000,000 | Foothill/Eastern Transportation Corridor Agency, | | | |
| | California Toll Road Revenue Bonds (Series A) ÷ | 7.150 | 1/1/2013 | 6,770,640 |
| The accompanying Notes to Financial Statements are an integral part of this schedule. |
|
| 173 |
Municipal Bond Fund
Schedule of Investments as of October 31, 2006 |
| Principal | | | Interest | Maturity | |
| Amount | Long-Term Fixed Income (98.5%) | | Rate | Date | Value |
|
| California — continued | | | | |
| $7,145,000 | Foothill/Eastern Transportation Corridor Agency, | | | | |
| | California Toll Road Revenue Bonds (Series A) ÷ | | 7.150% | 1/1/2014 | $8,062,704 |
| 420,000 | Golden West Schools Financing Authority, California | | | |
| | Revenue Bonds (Series A) (MBIA Insured) | | 5.800 | 2/1/2022 | 508,859 |
| 3,000,000 | Los Angeles, California Unified School District | | | | |
| | Revenue Bonds | | 5.000 | 7/1/2023 | 3,238,290 |
| 5,000,000 | Pittsburg, California Redevelopment Agency Tax | | | | |
| | Allocation Bonds (Los Medanos Community | | | | |
| | Development Project) (AMBAC Insured) | | Zero Coupon | 8/1/2024 | 2,297,750 |
| 4,140,000 | Pomona, California Single Family Mortgage | | | | |
| | Revenue Bonds (Series A) (GNMA/FNMA Insured) ÷ | 7.600 | 5/1/2023 | 5,332,693 |
| 10,000,000 | Sacramento County, California Sanitary District | | | | |
| | Authority Revenue Bonds | | 5.000 | 12/1/2036 | 10,657,700 |
| 1,480,000 | San Bernardino County, California Single Family | | | | |
| | Mortgage Revenue Bonds (Series A) (GNMA Insured) ÷ | 7.500 | 5/1/2023 | 1,889,427 |
| 10,000,000 | San Diego Community College District (FSA guaranteed) | 5.000 | 5/1/2030 | 10,619,400 |
| 1,500,000 | San Francisco, California Bay Area Rapid Transit District | | | |
| | Sales Tax Revenue Bonds (AMBAC Insured) | | 6.750 | 7/1/2010 | 1,672,620 |
| 15,000,000 | San Joaquin Hills Transportation Corridor Agency, | | | |
| | California Toll Road Revenue Bonds ÷ | | 7.650 | 1/1/2013 | 16,007,250 |
| 2,760,000 | San Jose, California Redevelopment Agency Tax | | | | |
| | Allocation Bonds (Series A) (MBIA Insured) | | 5.000 | 8/1/2025 | 2,932,472 |
|
|
| | Total California | | | 123,147,543 |
|
|
| |
| Colorado (5.9%) | | | | |
| 2,000,000 | Colorado Educational and Cultural Facilities Authority | | | |
| | Revenue Bonds (Bromley East Project) (Series A) ÷ | 7.250 | 9/15/2030 | 2,320,200 |
| 570,000 | Colorado Educational and Cultural Facilities Authority | | | |
| | Revenue Bonds (Cherry Creek Academy Facility, Inc.) | 6.000 | 4/1/2021 | 588,126 |
| 1,280,000 | Colorado Educational and Cultural Facilities Authority | | | |
| | Revenue Bonds (Cherry Creek Academy Facility, Inc.) | 6.000 | 4/1/2030 | 1,315,110 |
| 2,825,000 | Colorado Educational and Cultural Facilities Authority | | | |
| | Revenue Bonds (Classical Academy) ÷ | | 7.250 | 12/1/2030 | 3,309,516 |
| 660,000 | Colorado Educational and Cultural Facilities Authority | | | |
| | Revenue Bonds (Pinnacle Charter School Project) ÷ | 5.250 | 12/1/2011 | 682,090 |
| 1,000,000 | Colorado Educational and Cultural Facilities Authority | | | |
| | Revenue Bonds (University Lab School Project) ÷ | | 5.750 | 6/1/2016 | 1,090,840 |
| 750,000 | Colorado Educational and Cultural Facilities Authority | | | |
| | Revenue Bonds (University Lab School Project) ÷ | | 6.125 | 6/1/2021 | 829,912 |
| 6,250,000 | Colorado Educational and Cultural Facilities Authority | | | |
| | Revenue Bonds (University Lab School Project) ÷ | | 6.250 | 6/1/2031 | 6,948,625 |
| 1,000,000 | Colorado Health Facilities Authority Revenue Bonds | | | |
| | (Evangelical Lutheran Good Samaritan) ÷ | | 6.250 | 12/1/2010 | 1,079,940 |
| 5,000,000 | Colorado Health Facilities Authority Revenue Bonds | | | |
| | (Evangelical Lutheran Good Samaritan) ÷ | | 6.800 | 12/1/2020 | 5,645,250 |
| The accompanying Notes to Financial Statements are an integral part of this schedule. |
|
| 174 |
Municipal Bond Fund
Schedule of Investments as of October 31, 2006 |
| Principal | | Interest | Maturity | |
| Amount | Long-Term Fixed Income (98.5%) | Rate | Date | Value |
|
| Colorado — continued | | | |
| $1,000,000 | Colorado Health Facilities Authority Revenue Bonds | | | |
| | (Parkview Medical Center Project) | 6.500% | 9/1/2020 | $1,099,030 |
| 500,000 | Colorado Health Facilities Authority Revenue Bonds | | | |
| | (Parkview Medical Center Project) | 6.600 | 9/1/2025 | 549,390 |
| 160,000 | Colorado Housing and Finance Authority Revenue Bonds | | | |
| | (Single Family Program) (Series A-2) (Subject to ‘AMT’) | 7.450 | 10/1/2016 | 161,440 |
| 100,000 | Colorado Housing and Finance Authority Revenue Bonds | | | |
| | (Single Family Program) (Series A-3) | 7.250 | 4/1/2010 | 100,999 |
| 585,000 | Colorado Housing and Finance Authority Revenue Bonds | | | |
| | (Single Family Program) (Series B-3) | 6.700 | 8/1/2017 | 603,153 |
| 70,000 | Colorado Housing and Finance Authority Revenue Bonds | | | |
| | (Single Family Program) (Series C-3) (FHA/VA Insured) | 7.150 | 10/1/2030 | 71,492 |
| 55,000 | Colorado Housing and Finance Authority Single Family | | | |
| | Revenue Bonds (Series A-3) | 7.000 | 11/1/2016 | 55,732 |
| 770,000 | Colorado Housing and Finance Authority Single Family | | | |
| | Revenue Bonds (Series D-2) (Subject to ‘AMT’) | 6.350 | 11/1/2029 | 814,044 |
| 70,000 | Colorado Water Resources and Power Development | | | |
| | Authority Clean Water Revenue Unrefunded Bonds | | | |
| | (Series A) (FSA Insured) | 6.250 | 9/1/2013 | 70,580 |
| 3,525,000 | Colorado Water Resources and Power Development | | | |
| | Authority Small Water Resources Revenue Bonds | | | |
| | (Series A) (FGIC Insured) | 5.250 | 11/1/2021 | 3,792,794 |
| 5,000,000 | Denver, Colorado City and County Airport Revenue | | | |
| | Bonds (Series A) | 5.000 | 11/15/2022 | 5,352,400 |
| 6,000,000 | Denver, Colorado City and County Bonds | 5.600 | 10/1/2029 | 6,707,640 |
| 200,000 | Denver, Colorado Health and Hospital Authority | | | |
| | Healthcare Revenue Bonds (Series A) | 5.250 | 12/1/2010 | 205,900 |
| 200,000 | Denver, Colorado Health and Hospital Authority | | | |
| | Healthcare Revenue Bonds (Series A) | 5.250 | 12/1/2011 | 206,368 |
| 2,000,000 | Denver, Colorado Health and Hospital Authority | | | |
| | Healthcare Revenue Bonds (Series A) (ACA/CBI Insured) | 6.250 | 12/1/2016 | 2,169,480 |
| 1,890,000 | Goldsmith, Colorado Metropolitan District Capital | | | |
| | Appreciation General Obligation Bonds | | | |
| | (MBIA Insured) | Zero Coupon | 6/1/2007 | 1,851,217 |
| 1,890,000 | Goldsmith, Colorado Metropolitan District | | | |
| | Capital Appreciation General Obligation Bonds | | | |
| | (MBIA Insured) | Zero Coupon | 6/1/2008 | 1,785,426 |
| 1,885,000 | Goldsmith, Colorado Metropolitan District Capital | | | |
| | Appreciation General Obligation Bonds | | | |
| | (MBIA Insured) | Zero Coupon | 12/1/2008 | 1,748,884 |
| 10,000,000 | Jefferson County Colorado School District | | | |
| | (FSA Guaranteed) | 5.000 | 12/15/2016 | 10,957,300 |
| 3,000,000 | Larimer County, Colorado School District #R1 | | | |
| | Poudre Valley (MBIA/IBC Insured) | 7.000 | 12/15/2016 | 3,794,130 |
| The accompanying Notes to Financial Statements are an integral part of this schedule. |
|
| 175 |
Municipal Bond Fund
Schedule of Investments as of October 31, 2006 |
| Principal | | | Interest | Maturity | |
| Amount | Long-Term Fixed Income (98.5%) | | Rate | Date | Value |
|
| Colorado — continued | | | | |
| $4,000,000 | Northwest Parkway Public Highway Authority, Colorado | | | |
| | Capital Appreciation Revenue Bonds (Series C) | | | | |
| | (AMBAC Insured) > | | Zero Coupon | 6/15/2011 | $3,598,720 |
| 3,500,000 | Regional Transportation District, Colorado, | | | | |
| | Sales Tax Revenue Bonds (Series B) (AMBAC Insured) ÷ | 5.500% | 11/1/2021 | 3,863,615 |
|
|
| | Total Colorado | | | | 73,369,343 |
|
|
| |
| Connecticut (0.5%) | | | | |
| 2,000,000 | Connecticut State Health and Educational Facilities | | | |
| | Authority Revenue Bonds (Yale University) (Series W) | 5.125 | 7/1/2027 | 2,071,500 |
| 4,000,000 | Connecticut State Special Tax Obligation Revenue | | | |
| | Bonds (Transportation Infrastructure) (Series B) | | 6.500 | 10/1/2010 | 4,411,840 |
|
|
| | Total Connecticut | | | 6,483,340 |
|
|
| |
| District of Columbia (0.6%) | | | | |
| 7,185,000 | District of Columbia Tobacco Settlement Financing | | | |
| | Corporation Revenue Bonds | | 6.250 | 5/15/2024 | 7,696,213 |
|
|
| | Total District of Columbia | | 7,696,213 |
|
|
| |
| Florida (1.3%) | | | | |
| 428,000 | Brevard County, Florida Housing Finance Authority | | | |
| | Homeowner Mortgage Revenue Bonds (Series B) | | | | |
| | (GNMA Insured) | | 6.500 | 9/1/2022 | 440,515 |
| 1,040,000 | Clay County, Florida Housing Finance Authority | | | | |
| | Single Family Mortgage Revenue Bonds | | | | |
| | (GNMA/FNMA Insured) (Subject to ‘AMT’) | | 6.000 | 4/1/2029 | 1,076,119 |
| 400,000 | Dade County, Florida Industrial Development | | | | |
| | Authority Exempt Facilities Revenue Bonds | | | | |
| | (Florida Power & Light Company) ∞ | | 3.650 | 11/1/2006 | 400,000 |
| 620,000 | Florida State Board of Education Capital Outlay | | | | |
| | Unrefunded General Obligation Bonds (MBIA Insured) | 9.125 | 6/1/2014 | 761,596 |
| 1,520,000 | Florida State Revenue Bonds (Jacksonville Transportation) | 5.000 | 7/1/2019 | 1,547,147 |
| 2,000,000 | Highlands County, Florida Health Facilities Authority | | | |
| | Revenue Bonds (Adventist Health System/Sunbelt, Inc.) | | | |
| | (Series A) ÷ | | 6.000 | 11/15/2031 | 2,237,820 |
| 1,500,000 | Jacksonville, Florida Health Facilities Authority Revenue | | | |
| | Bonds (Series C) ÷ | | 5.750 | 8/15/2015 | 1,596,945 |
| 1,145,000 | Leon County, Florida Educational Facilities Authority | | | |
| | Certificates of Participation ÷ | | 8.500 | 9/1/2017 | 1,603,996 |
| 85,000 | Manatee County, Florida Housing Finance Authority Single | | | |
| | Family Mortgage Revenue Bonds (Series 1) (GNMA/FNMA/ | | | |
| | FHLMC Insured) (Subject to ‘AMT’) | | 7.200 | 5/1/2028 | 90,662 |
| 1,000,000 | Orange County, Florida Health Facilities Authority | | | |
| | Revenue Bonds (Adventist Health Systems) ÷ | | 5.850 | 11/15/2010 | 1,084,540 |
| The accompanying Notes to Financial Statements are an integral part of this schedule. |
|
| 176 |
Municipal Bond Fund
Schedule of Investments as of October 31, 2006 |
| Principal | | Interest | Maturity | |
| Amount | Long-Term Fixed Income (98.5%) | Rate | Date | Value |
|
| Florida — continued | | | |
| $2,000,000 | Orange County, Florida Health Facilities Authority | | | |
| | Revenue Bonds (Orlando Regional Healthcare System) | | | |
| | (Series A) (MBIA Insured) | 6.250% | 10/1/2018 | $2,406,880 |
| 345,000 | Orange County, Florida Housing Finance Authority | | | |
| | Homeowner Revenue Bonds (Series B-1) | | | |
| | (GNMA/FNMA Insured) (Subject to ‘AMT’) | 5.900 | 9/1/2028 | 346,508 |
| 2,500,000 | Orlando, Florida Utilities Community Water & | | | |
| | Electric Revenue Bonds ~ | 5.250 | 10/1/2019 | 2,687,525 |
| 105,000 | Palm Beach County, Florida Housing Finance Authority | | | |
| | Single Family Homeowner Revenue Bonds (Series A-1) | | | |
| | (GNMA/FNMA Insured) (Subject to ‘AMT’) | 5.900 | 10/1/2027 | 105,476 |
|
|
| | Total Florida | | | 16,385,729 |
|
|
| |
| Georgia (3.0%) | | | |
| 6,900,000 | Bibb County, Georgia Authority Environmental | | | |
| | Improvement Revenue Bonds | 4.850 | 12/1/2009 | 6,980,247 |
| 2,000,000 | Brunswick, Georgia Water and Sewer Revenue Refunding | | | |
| | Bonds (MBIA Insured) | 6.000 | 10/1/2011 | 2,121,660 |
| 1,500,000 | Brunswick, Georgia Water and Sewer Revenue Refunding | | | |
| | Bonds (MBIA Insured) | 6.100 | 10/1/2019 | 1,790,205 |
| 1,560,000 | Chatham County, Georgia Hospital Authority Revenue | | | |
| | Bonds (C/O Memorial Medical Center) | 5.750 | 1/1/2029 | 1,698,044 |
| 1,000,000 | Chatham County, Georgia Hospital Authority Revenue | | | |
| | Bonds (Memorial Health University Medical Center) | 6.125 | 1/1/2024 | 1,087,570 |
| 5,000,000 | Cherokee County, Georgia Water and Sewer Authority | | | |
| | Revenue Refunding Bonds (MBIA Insured) | 5.500 | 8/1/2018 | 5,684,550 |
| 1,000,000 | Georgia State General Obligation Bonds (Series B) | 6.300 | 3/1/2009 | 1,062,010 |
| 1,000,000 | Georgia State General Obligation Bonds (Series B) | 6.300 | 3/1/2010 | 1,087,500 |
| 2,000,000 | Georgia State General Obligation Bonds (Series B) | 5.650 | 3/1/2012 | 2,206,220 |
| 3,500,000 | Georgia State General Obligation Bonds (Series D) | 5.000 | 8/1/2012 | 3,767,085 |
| 2,500,000 | Milledgeville-Balswin County, Georgia Development | | | |
| | Authority Revenue Bonds | 5.500 | 9/1/2024 | 2,681,500 |
| 5,000,000 | Rockdale County, Georgia Water and Sewer Authority | | | |
| | Revenue Bonds (Series A) (MBIA Insured) ~ | 5.500 | 7/1/2025 | 5,341,350 |
| 1,500,000 | Savannah, Georgia Economic Development Authority | | | |
| | Student Housing Revenue Bonds (State University Project) | | | |
| | (Series A) (ACA Insured) | 6.750 | 11/15/2020 | 1,663,530 |
|
|
| | Total Georgia | | | 37,171,471 |
|
|
| The accompanying Notes to Financial Statements are an integral part of this schedule. |
|
| 177 |
Municipal Bond Fund
Schedule of Investments as of October 31, 2006 |
| Principal | | | Interest | Maturity | |
| Amount | Long-Term Fixed Income (98.5%) | | Rate | Date | Value |
|
| Hawaii (2.2%) | | | | |
| $7,330,000 | Hawaii State Highway Revenue Bonds | | 5.500% | 7/1/2018 | $8,472,234 |
| 5,000,000 | Honolulu, Hawaii City & County Board of Water Supply | | |
| | Water System Revenue Bonds (Series A) | | 5.000 | 7/1/2036 | 5,290,250 |
| 10,000,000 | Honolulu, Hawaii City & County Revenue Bonds (Series A) | | |
| | (FSA Insured) | | 5.250 | 3/1/2027 | 10,703,700 |
| 2,555,000 | Honolulu, Hawaii City & County Revenue Bonds | | | | |
| | (Unrefunded Balance) (Series A) (FGIC Insured) | | 6.250 | 4/1/2014 | 2,977,444 |
|
|
| | Total Hawaii | | | | 27,443,628 |
|
|
| |
| Idaho (0.4%) | | | | |
| 1,000,000 | Idaho Falls, Idaho General Obligation Bonds | | | | |
| | (FGIC Insured) | | Zero Coupon | 4/1/2007 | 985,220 |
| 3,115,000 | Idaho Falls, Idaho General Obligation Bonds | | | | |
| | (FGIC Insured) | | Zero Coupon | 4/1/2010 | 2,729,550 |
| 2,000,000 | Idaho Falls, Idaho General Obligation Bonds | | | | |
| | (FGIC Insured) | | Zero Coupon | 4/1/2011 | 1,685,240 |
|
|
| | Total Idaho | | | | 5,400,010 |
|
|
| |
| Illinois (9.2%) | | | | |
| 2,000,000 | Broadview, Illinois Tax Increment Tax Allocation | | | | |
| | Revenue Bonds | | 5.250 | 7/1/2012 | 2,056,300 |
| 1,000,000 | Broadview, Illinois Tax Increment Tax Allocation | | | | |
| | Revenue Bonds | | 5.375 | 7/1/2015 | 1,027,960 |
| 10,000,000 | Chicago, Illinois Capital Appreciation City Colleges | | | | |
| | General Obligation Bonds (FGIC Insured) | | Zero Coupon | 1/1/2024 | 4,778,300 |
| 3,000,000 | Chicago, Illinois Lakefront Millennium Project | | | | |
| | General Obligation Bonds (MBIA Insured) | | 5.750 | 1/1/2029 | 3,288,420 |
| 2,500,000 | Chicago, Illinois O’hare International Airport Revenue | | |
| | Bonds (Series A) (FGIC Insured) | | 5.000 | 1/1/2033 | 2,646,750 |
| 20,000 | Chicago, Illinois Single Family Mortgage Revenue Bonds | | |
| | (Series A) (GNMA/FNMA/FHLMC Insured) | | | | |
| | (Subject to ‘AMT’) | | 7.250 | 9/1/2028 | 20,040 |
| 235,000 | Chicago, Illinois Single Family Mortgage Revenue Bonds | | |
| | (Series C) (GNMA/FNMA/FHLMC Insured) | | | | |
| | (Subject to ‘AMT’) | | 7.050 | 10/1/2030 | 239,902 |
| 155,000 | Chicago, Illinois Single Family Mortgage Revenue Bonds | | |
| | (Series C) (GNMA/FNMA/FHLMC Insured) | | | | |
| | (Subject to ‘AMT’) | | 7.000 | 3/1/2032 | 157,708 |
| 7,200,000 | Chicago, Illinois Tax Increment Capital Appreciation | | | | |
| | Tax Allocation Bonds (Series A) (ACA Insured) | | Zero Coupon | 11/15/2014 | 4,918,680 |
| 1,000,000 | Cook County, Illinois Community Consolidated | | | | |
| | School District #15 Palatine Capital Appreciation | | | | |
| | General Obligation Bonds (FGIC Insured) ÷ | | Zero Coupon | 12/1/2014 | 729,660 |
| 2,500,000 | Cook County, Illinois General Obligation Bonds | | | | |
| | (Series A) (MBIA Insured) | | 6.250 | 11/15/2011 | 2,800,025 |
| The accompanying Notes to Financial Statements are an integral part of this schedule. |
|
| 178 |
Municipal Bond Fund
Schedule of Investments as of October 31, 2006 |
| Principal | | Interest | Maturity | |
| Amount | Long-Term Fixed Income (98.5%) | Rate | Date | Value |
|
| Illinois — continued | | | |
| $1,250,000 | Cook County, Illinois School District #99 Cicero | | | |
| | General Obligation Bonds (FGIC Insured) | 8.500% | 12/1/2011 | $1,524,088 |
| 1,565,000 | Cook County, Illinois School District #99 Cicero General | | | |
| | Obligation Bonds (FGIC Insured) | 8.500 | 12/1/2014 | 2,068,586 |
| 1,815,000 | Cook County, Illinois School District #99 Cicero General | | | |
| | Obligation Bonds (FGIC Insured) | 8.500 | 12/1/2016 | 2,505,154 |
| 1,000,000 | Du Page County, Illinois General Obligation Bonds | | | |
| | (Stormwater Project) | 5.600 | 1/1/2021 | 1,139,420 |
| 1,710,000 | Du Page, Cook & Will Counties, Illinois Community | | | |
| | College District Number 502 | 5.000 | 1/1/2017 | 1,822,655 |
| 1,000,000 | Illinois Development Finance Authority Revenue Bonds | | | |
| | (Midwestern University) (Series B) | 6.000 | 5/15/2021 | 1,094,430 |
| 1,000,000 | Illinois Development Finance Authority Revenue Bonds | | | |
| | (Midwestern University) (Series B) | 6.000 | 5/15/2026 | 1,091,380 |
| 4,900,000 | Illinois Educational Facilities Authority Revenue Bonds | | | |
| | (Northwestern University) ÷ | 5.250 | 11/1/2032 | 5,374,418 |
| 1,000,000 | Illinois Educational Facilities Authority Student Housing | | | |
| | Revenue Bonds (University Center Project) ÷ | 6.625 | 5/1/2017 | 1,154,560 |
| 1,600,000 | Illinois Health Facilities Authority Revenue Bonds | | | |
| | (Bethesda Home and Retirement) (Series A) | 6.250 | 9/1/2014 | 1,681,024 |
| 2,000,000 | Illinois Health Facilities Authority Revenue Bonds | | | |
| | (Centegra Health Systems) | 5.250 | 9/1/2018 | 2,040,460 |
| 2,000,000 | Illinois Health Facilities Authority Revenue Bonds | | | |
| | (Lutheran General Health Care Facilities) (FSA Insured) | 6.000 | 4/1/2018 | 2,311,380 |
| 2,500,000 | Illinois Health Facilities Authority Revenue Bonds | | | |
| | (Passavant Memorial Area Hospital Association) | 6.000 | 10/1/2024 | 2,703,500 |
| 1,000,000 | Illinois Health Facilities Authority Revenue Bonds | | | |
| | (Riverside Health System) ÷ | 6.850 | 11/15/2029 | 1,130,450 |
| 4,180,000 | Illinois Health Facilities Authority Revenue Bonds | | | |
| | (Rush-Presbyterian-St. Lukes) (Series A) (MBIA Insured) | 5.250 | 11/15/2014 | 4,332,863 |
| 3,980,000 | Illinois Health Facilities Authority Revenue Bonds | | | |
| | (Swedish American Hospital) ÷ | 6.875 | 11/15/2030 | 4,401,402 |
| 4,655,000 | Illinois Health Facilities Authority Revenue Bonds | | | |
| | (Thorek Hospital and Medical Center) | 5.250 | 8/15/2018 | 4,774,866 |
| 2,120,000 | Illinois Health Facilities Authority Unrefunded Revenue | | | |
| | Bonds (Series B) (MBIA/IBC Insured) | 5.250 | 8/15/2018 | 2,187,013 |
| 7,900,000 | Illinois State Sales Tax Revenue Bonds (Second Series) | 5.750 | 6/15/2018 | 9,278,708 |
| 3,065,000 | Illinois State Sales Tax Revenue Bonds (Series L) | 7.450 | 6/15/2012 | 3,644,622 |
| 3,035,000 | McHenry County, Illinois Community High School | | | |
| | District #157 General Obligation Bonds (FSA Insured) | 9.000 | 12/1/2017 | 4,416,411 |
| 4,000,000 | McLean County, Illinois Bloomington — Normal Airport | | | |
| | Central Illinois Regional Authority Revenue Bonds | | | |
| | (Subject to ‘AMT’) | 6.050 | 12/15/2019 | 4,208,640 |
| 1,410,000 | Metropolitan Pier and Exposition Authority, Illinois State | | | |
| | Tax Revenue Bonds (McCormick Place Exposition Project) | | | |
| | (FGIC Insured) | 5.250 | 12/15/2028 | 1,470,193 |
| The accompanying Notes to Financial Statements are an integral part of this schedule. |
|
| 179 |
Municipal Bond Fund
Schedule of Investments as of October 31, 2006 |
| Principal | | Interest | Maturity | |
| Amount | Long-Term Fixed Income (98.5%) | Rate | Date | Value |
|
| Illinois — continued | | | |
| $1,115,000 | Metropolitan Pier and Exposition Authority, Illinois | | | |
| | State Tax Revenue Bonds (McCormick Place Exposition | | |
| | Project) (Series A) ÷ | 5.500% | 6/15/2015 | $1,264,522 |
| 885,000 | Metropolitan Pier and Exposition Authority, Illinois | | | |
| | State Tax Revenue Bonds (McCormick Place | | | |
| | Exposition Project) (Series A) (FGIC Insured) | 5.500 | 6/15/2015 | 1,000,882 |
| 17,505,000 | Metropolitan Pier and Exposition Authority, Illinois | | | |
| | State Tax Revenue Bonds (McCormick Place | | | |
| | Exposition Project) (Series A) (FGIC Insured) | Zero Coupon | 6/15/2020 | 9,886,474 |
| 3,100,000 | Metropolitan Pier and Exposition Authority, Illinois | | | |
| | State Tax Revenue Bonds (McCormick Place | | | |
| | Exposition Project) (Series A) (MBIA Insured) | Zero Coupon | 6/15/2024 | 1,457,527 |
| 2,000,000 | Metropolitan Pier and Exposition Authority, Illinois | | | |
| | State Tax Revenue Bonds (McCormick Place | | | |
| | Exposition Project) (Series A) (MBIA Insured) | Zero Coupon | 12/15/2024 | 920,420 |
| 7,000,000 | Metropolitan Pier and Exposition Authority, | | | |
| | Illinois State Tax Revenue Bonds (McCormick | | | |
| | Place Exposition Project) (Series B) | | | |
| | (MBIA Insured) > | Zero Coupon | 6/15/2012 | 5,886,230 |
| 3,000,000 | Regional Transportation Authority, Illinois | | | |
| | Revenue Bonds (Series A) (FGIC Insured) | 6.700 | 11/1/2021 | 3,709,620 |
|
|
| | Total Illinois | | | 113,145,643 |
|
|
| |
| Indiana (0.9%) | | | |
| 700,000 | Ball State University, Indiana University Student Fee | | | |
| | Revenue Bonds (Series K) (FGIC Insured) | 5.750 | 7/1/2020 | 760,991 |
| 1,250,000 | East Chicago, Indiana Elementary School Building | | | |
| | Corporation Revenue Bonds | 6.250 | 1/5/2016 | 1,398,250 |
| 175,000 | Indiana State Housing Authority Single Family Mortgage | | |
| | Revenue Bonds (Series C-2) (GNMA Insured) | 5.250 | 7/1/2017 | 178,495 |
| 250,000 | Indiana Transportation Finance Authority Highway | | | |
| | Revenue Bonds (Series A) | 6.800 | 12/1/2016 | 293,635 |
| 570,000 | Indiana Transportation Finance Authority Highway | | | |
| | Revenue Bonds (Series A) (AMBAC Insured) ÷ | 5.750 | 6/1/2012 | 623,038 |
| 985,000 | Indiana Transportation Finance Authority Highway | | | |
| | Revenue Bonds (Series A) (MBIA/IBC Insured) ÷ | 7.250 | 6/1/2015 | 1,100,087 |
| 3,565,000 | Indiana Transportation Finance Authority Highway | | | |
| | Unrefunded Revenue Bonds (Series A) (MBIA/IBC Insured) | 7.250 | 6/1/2015 | 4,242,956 |
| 2,120,000 | Purdue University, Indiana Revenue Bonds (Student Fees) | | |
| | (Series L) | 5.000 | 7/1/2020 | 2,224,919 |
|
|
| | Total Indiana | | | 10,822,371 |
|
|
| The accompanying Notes to Financial Statements are an integral part of this schedule. |
|
| 180 |
Municipal Bond Fund
Schedule of Investments as of October 31, 2006
| Principal | | | Interest | Maturity | |
| Amount | Long-Term Fixed Income (98.5%) | | Rate | Date | Value |
|
| Iowa (1.0%) | | | | |
| $2,085,000 | Coralville, Iowa Urban Renewal Annual Appropriation | | | |
| | Revenue Bonds (Tax Increment-H2) | | 5.000% | 6/1/2011 | $2,142,379 |
| 3,125,000 | Coralville, Iowa Urban Renewal Annual Appropriation | | | |
| | Revenue Bonds (Tax Increment-H2) | | 5.000 | 6/1/2021 | 3,214,906 |
| 4,500,000 | Iowa Finance Authority Health Care Facilities Revenue | | | |
| | Bonds (Genesis Medical Center) | | 6.250 | 7/1/2025 | 4,855,680 |
| 2,000,000 | Iowa Finance Authority Single Family Revenue Bonds | | | |
| | (Series E) | | 5.000 | 1/1/2037 | 2,046,160 |
|
|
| | Total Iowa | | | | 12,259,125 |
|
|
| |
| Kansas (1.1%) | | | | |
| 1,255,000 | Kansas City, Kansas Utility System Capital | | | | |
| | Appreciation Revenue Bonds (AMBAC Insured) ÷ | | Zero Coupon | 3/1/2007 | 1,240,568 |
| 920,000 | Kansas City, Kansas Utility System Capital | | | | |
| | Appreciation Unrefunded Revenue Bonds | | | | |
| | (AMBAC Insured) | | Zero Coupon | 3/1/2007 | 909,245 |
| 1,000,000 | Kansas State Development Finance Authority Health | | | | |
| | Facilities Revenue Bonds (Stormont Vail Healthcare) | | | | |
| | (Series K) | | 5.375 | 11/15/2024 | 1,065,860 |
| 2,000,000 | Olathe, Kansas Health Facilities Revenue Bonds (Olathe | | | |
| | Medical Center Project) (Series A) (AMBAC Insured) | | 5.500 | 9/1/2025 | 2,109,000 |
| 825,000 | Salina, Kansas Hospital Revenue Bonds | | 5.000 | 10/1/2036 | 857,612 |
| 340,000 | Sedgwick and Shawnee Counties, Kansas Single Family | | | |
| | Mortgage Revenue Bonds (Series A-2) (GNMA Insured) | 6.700 | 6/1/2029 | 345,831 |
| 2,300,000 | University of Kansas Hospital Authority Health Facilities | | | |
| | Revenue Bonds | | 5.500 | 9/1/2022 | 2,472,684 |
| 4,350,000 | Wyandotte County/Kansas City, Kansas Unified | | | | |
| | Government Special Obligation Revenue Bonds | | | | |
| | (2nd Lien-B) | | 5.000 | 12/1/2020 | 4,541,878 |
|
|
| | Total Kansas | | | | 13,542,678 |
|
|
| |
| Kentucky (0.4%) | | | | |
| 5,345,000 | Kentucky State Turnpike Authority Economic | | | | |
| | Development Revenue Bonds (Revitalization Project) | | | | |
| | (FGIC Insured) | | Zero Coupon | 1/1/2010 | 4,736,525 |
|
|
| | Total Kentucky | | | | 4,736,525 |
|
|
| |
| Louisiana (2.2%) | | | | |
| 750,000 | Jefferson Parish, Louisiana Home Mortgage Authority | | | |
| | Single Family Mortgage Revenue Bonds (Series A-2) | | | | |
| | (GNMA/FNMA Insured) (Subject to ‘AMT’) | | 7.500 | 12/1/2030 | 792,818 |
| 305,000 | Jefferson Parish, Louisiana Home Mortgage Authority | | | |
| | Single Family Mortgage Revenue Bonds (Series D-1) | | | | |
| | (GNMA/FNMA Insured) (Subject to ‘AMT’) | | 7.500 | 6/1/2026 | 305,586 |
| The accompanying Notes to Financial Statements are an integral part of this schedule. |
|
| 181 |
Municipal Bond Fund
Schedule of Investments as of October 31, 2006 |
| Principal | | | Interest | Maturity | |
| Amount | Long-Term Fixed Income (98.5%) | | Rate | Date | Value |
|
| Louisiana — continued | | | | |
| $240,000 | Louisiana Housing Finance Agency Single Family | | | | |
| | Mortgage Revenue Bonds (Series D-2) (GNMA/FNMA | | | |
| | Insured) (Subject to ‘AMT’) | | 7.050% | 6/1/2031 | $242,758 |
| 3,000,000 | Louisiana Public Facilities Authority Hospital | | | | |
| | Revenue Bonds (Lake Charles Memorial) | | | | |
| | (AMBAC/TCRS Insured) | | 8.625 | 12/1/2030 | 3,584,520 |
| 500,000 | Louisiana Public Facilities Authority Revenue Bonds | 5.000 | 7/1/2031 | 519,780 |
| 4,745,000 | Louisiana Public Facilities Authority Revenue Bonds | | | |
| | (MBIA Insured) | | 5.250 | 3/1/2031 | 5,158,432 |
| 6,500,000 | New Orleans, Louisiana General Obligation Bonds | | | |
| | (AMBAC Insured) | | Zero Coupon | 9/1/2012 | 5,130,905 |
| 3,000,000 | Orleans Parish, Louisiana School Board Administration | | | |
| | Offices Revenue Bonds (MBIA Insured) ÷ | | 8.950 | 2/1/2008 | 3,193,320 |
| 2,605,000 | Regional Transportation Authority, Louisiana Sales Tax | | | |
| | Revenue Bonds (Series A) (FGIC Insured) | | 8.000 | 12/1/2012 | 3,198,445 |
| 4,200,000 | Tobacco Settlement Financing Corporation, Louisiana | | | |
| | Revenue Bonds (Series 2001-B) | | 5.500 | 5/15/2030 | 4,404,666 |
|
|
| | Total Louisiana | | | 26,531,230 |
|
|
| |
| Maryland (0.9%) | | | | |
| 1,250,000 | Frederick County, Maryland Educational Facilities | | | |
| | Revenue Bonds (Mount Saint Mary’s College) (Series A) | 5.750 | 9/1/2025 | 1,307,300 |
| 1,865,000 | Maryland State Economic Development Corporation | | | |
| | Revenue Bonds (Lutheran World Relief) | | 7.200 | 4/1/2025 | 2,023,003 |
| 1,550,000 | Maryland State Economic Development Corporation | | | |
| | Student Housing Revenue Bonds (Sheppard Pratt) | | | |
| | (ACA Insured) | | 6.000 | 7/1/2033 | 1,655,230 |
| 1,000,000 | Maryland State Health and Higher Educational Facilities | | | |
| | Authority Revenue Bonds (University of Maryland | | | |
| | Medical System) | | 6.000 | 7/1/2022 | 1,096,650 |
| 4,500,000 | Morgan State University, Maryland Academic and | | | |
| | Auxiliary Facilities Fees Revenue Bonds (MBIA Insured) | 6.050 | 7/1/2015 | 5,074,875 |
| 20,000 | Prince George’s County, Maryland Housing Authority | | | |
| | Single Family Mortgage Revenue Bonds (Series A) | | | | |
| | (GNMA/FNMA/FHLMC Insured) (Subject to ‘AMT’) | 7.400 | 8/1/2032 | 20,350 |
| 425,000 | Westminster, Maryland Education Facilities Revenue | | | |
| | Bonds (McDaniel College) ÷ | | 5.500 | 4/1/2027 | 448,630 |
|
|
| | Total Maryland | | | 11,626,038 |
|
|
| |
| Massachusetts (2.9%) | | | | |
| 5,000,000 | Massachusetts Bay Transportation Authority Sales | | | |
| | Tax Revenue Bonds (Series B) (MBIA Insured) | | 5.500 | 7/1/2025 | 5,935,450 |
| 4,935,000 | Massachusetts State Construction Lien General Obligation | | | |
| | Bonds (Series A) (FGIC-TCRS) | | 5.250 | 1/1/2013 | 5,372,586 |
| The accompanying Notes to Financial Statements are an integral part of this schedule. |
|
| 182 |
Municipal Bond Fund
Schedule of Investments as of October 31, 2006
| Principal | | | Interest | Maturity | |
| Amount | Long-Term Fixed Income (98.5%) | | Rate | Date | Value |
|
| Massachusetts — continued | | | | |
| $725,000 | Massachusetts State Development Finance Agency | | | |
| | Revenue Bonds (Devens Electric Systems) | | 5.625% | 12/1/2016 | $773,923 |
| 1,980,000 | Massachusetts State General Obligation Bonds | | | | |
| | (Series B) ÷ | | 6.500 | 8/1/2008 | 2,074,486 |
| 15,000,000 | Massachusetts State Health and Educational Facilities | | | |
| | Authority Revenue Bonds | | 5.250 | 7/1/2033 | 17,835,150 |
| 1,000,000 | Massachusetts State Health and Educational Facilities | | | |
| | Authority Revenue Bonds (Partners Healthcare System) | | | |
| | (Series C) | | 6.000 | 7/1/2016 | 1,107,370 |
| 3,000,000 | Massachusetts State School Building Authority Dedicated | | | |
| | Sales Tax Revenue Bonds (Series A) (MBIA Insured) | 5.000 | 8/15/2027 | 3,192,720 |
|
|
| | Total Massachusetts | | | 36,291,685 |
|
|
| |
| Michigan (2.7%) | | | | |
| 545,000 | Chelsea, Michigan Economic Development Corporation | | | |
| | Obligation Revenue Bonds (United Methodist Retirement) | 4.900 | 11/15/2006 | 544,475 |
| 2,000,000 | East Lansing, Michigan Building Authority General | | | |
| | Obligation Bonds | | 5.700 | 4/1/2020 | 2,373,100 |
| 1,500,000 | Livonia, Michigan Public Schools School District | | | | |
| | General Obligation Bonds (FGIC Insured) ÷ | | Zero Coupon | 5/1/2009 | 1,364,895 |
| 1,380,000 | Michigan Public Power Agency Revenue Bonds | | | | |
| | (Combustion Turbine #1 Project) (Series A) | | | | |
| | (AMBAC Insured) | | 5.250 | 1/1/2016 | 1,484,963 |
| 45,000 | Michigan State Hospital Finance Authority Revenue | | | |
| | Bonds (Detroit Medical Center) | | 8.125 | 8/15/2012 | 45,086 |
| 2,825,000 | Michigan State Hospital Finance Authority Revenue | | | |
| | Bonds (MBIA Insured) ÷ | | 5.375 | 8/15/2014 | 3,001,421 |
| 175,000 | Michigan State Hospital Finance Authority Revenue | | | |
| | Bonds (Series P) (MBIA Insured) ÷ | | 5.375 | 8/15/2014 | 186,700 |
| 2,750,000 | Michigan State Hospital Finance Authority Revenue | | | |
| | Refunding Bonds (Crittenton Hospital) (Series A) | | 5.500 | 3/1/2022 | 2,951,850 |
| 5,000,000 | Michigan State Trunk Line Fund Revenue Bonds | | | | |
| | (FSA Insured) | | 5.000 | 11/1/2022 | 5,378,500 |
| 4,500,000 | Rochester, Michigan Community School District | | | | |
| | (MBIA Insured) | | 5.000 | 5/1/2019 | 4,985,865 |
| 3,320,000 | Sault Ste. Marie, Michigan Chippewa Indians Housing | | | |
| | Authority Revenue Bonds (Tribal Health and Human | | | |
| | Services Center) | | 7.750 | 9/1/2012 | 3,340,883 |
| 2,000,000 | St. Clair County, Michigan Economic Development | | | |
| | Corporation Revenue Bonds (Detroit Edison) (Series AA) | | | |
| | (AMBAC Insured) | | 6.400 | 8/1/2024 | 2,129,200 |
| 990,000 | Summit Academy North, Michigan Public School | | | | |
| | Academy Certificates of Participation ÷ | | 6.550 | 7/1/2014 | 1,088,208 |
| The accompanying Notes to Financial Statements are an integral part of this schedule. |
|
| 183 |
Municipal Bond Fund
Schedule of Investments as of October 31, 2006 |
| Principal | | | Interest | Maturity | |
| Amount | Long-Term Fixed Income (98.5%) | | Rate | Date | Value |
|
| Michigan — continued | | | | |
| $690,000 | Summit Academy North, Michigan Public School | | | | |
| | Academy Certificates of Participation ÷ | | 8.375% | 7/1/2030 | $799,958 |
| 3,560,000 | Wayne State University, Michigan University | | | | |
| | Revenue Bonds (FGIC Insured) | | 5.125 | 11/15/2029 | 3,716,284 |
|
|
| | Total Michigan | | | | 33,391,388 |
|
|
| |
| Minnesota (3.8%) | | | | |
| 800,000 | Minneapolis and St. Paul, Minnesota Housing & | | | | |
| | Redevelopment Authority Healthcare System Bonds | | | | |
| | (Healthpartners Obligation Group Project) | | 6.000 | 12/1/2021 | 885,288 |
| 2,030,000 | Minneapolis and St. Paul, Minnesota Metropolitan | | | | |
| | Airports Commission Airport Revenue Bonds | | 5.000 | 1/1/2022 | 2,138,240 |
| 5,000,000 | Minneapolis and St. Paul, Minnesota Metropolitan | | | | |
| | Airports Commission Airport Revenue Bonds (Series A) | | |
| | (AMBAC Insured) | | 5.000 | 1/1/2035 | 5,256,050 |
| 1,000,000 | Minneapolis and St. Paul, Minnesota Metropolitan | | | | |
| | Airports Commission Airport Revenue Bonds (Series C) | | |
| | (FGIC Insured) | | 5.125 | 1/1/2020 | 1,055,230 |
| 5,000,000 | Minneapolis and St. Paul, Minnesota Metropolitan | | | | |
| | Airports Commission Airport Revenue Bonds (Series C) | | |
| | (FGIC Insured) | | 5.000 | 1/1/2031 | 5,270,150 |
| 7,685,000 | Minneapolis, Minnesota Community Development | | | | |
| | Agency Tax Increment Revenue Bonds | | | | |
| | (MBIA Insured) | | Zero Coupon | 3/1/2009 | 7,021,016 |
| 4,915,000 | Minnesota Agricultural and Economic Development | | | | |
| | Board Health Care System Pre-refunded Revenue Bonds | | |
| | (Fairview Hospital) (Series A) (MBIA Insured) ÷ | | 5.750 | 11/15/2026 | 5,123,593 |
| 85,000 | Minnesota Agricultural and Economic Development | | | | |
| | Board Health Care System Unrefunded Balance Revenue | | |
| | Bonds (Fairview Hospital) (Series A) (MBIA Insured) | | 5.750 | 11/15/2026 | 88,404 |
| 1,000,000 | Minnesota Higher Education Facilities Authority Revenue | | |
| | Bonds (College of Art and Design) (Series 5-D) ÷ | | 6.625 | 5/1/2020 | 1,097,460 |
| 530,000 | Minnesota Higher Education Facilities Authority Revenue | | |
| | Bonds (University of St. Thomas) (Series 5-Y) | | 5.250 | 10/1/2019 | 575,278 |
| 3,620,000 | Minnesota State General Obligation Bonds | | 5.250 | 8/1/2017 | 3,776,493 |
| 1,000,000 | Northfield, Minnesota Hospital Revenue Bonds | | | | |
| | (Series C) ÷ | | 6.000 | 11/1/2021 | 1,107,370 |
| 1,300,000 | Northfield, Minnesota Hospital Revenue Bonds | | | | |
| | (Series C) ÷ | | 6.000 | 11/1/2026 | 1,439,581 |
| 2,040,000 | Northfield, Minnesota Hospital Revenue Bonds | | | | |
| | (Series C) ÷ | | 6.000 | 11/1/2031 | 2,259,035 |
| 2,000,000 | St. Louis Park, Minnesota Health Care Facilities | | | | |
| | Revenue Bonds | | 5.250 | 7/1/2030 | 2,117,420 |
| The accompanying Notes to Financial Statements are an integral part of this schedule. |
|
| 184 |
Municipal Bond Fund
Schedule of Investments as of October 31, 2006
| Principal | | Interest | Maturity | |
| Amount | Long-Term Fixed Income (98.5%) | Rate | Date | Value |
|
| Minnesota — continued | | | |
| $1,690,000 | St. Paul, Minnesota Housing and Redevelopment Authority | | | |
| | Lease Parking Facilities Revenue Bonds | | | |
| | (Rivercentre Parking Ramp) | 6.000% | 5/1/2013 | $1,782,223 |
| 5,000,000 | White Earth Band of Chippewa Indians, Minnesota | | | |
| | Revenue Bonds (Series A) (ACA Insured) | 7.000 | 12/1/2011 | 5,273,050 |
|
|
| | Total Minnesota | | | 46,265,881 |
|
|
| |
| Missouri (1.8%) | | | |
| 7,500,000 | Jackson County, Missouri Special Obligation Harry S. | | | |
| | Truman Sports Complex Revenue Bonds (AMBAC Insured) | 5.000 | 12/1/2027 | 8,071,650 |
| 785,000 | Missouri State Development Finance Board Infrastructure | | | |
| | Facilities Revenue Bonds (Eastland Center Project Phase II) | | | |
| | (Series B) | 5.875 | 4/1/2017 | 819,030 |
| 500,000 | Missouri State Development Finance Board Infrastructure | | | |
| | Facilities Revenue Bonds (Eastland Center Project Phase II) | | | |
| | (Series B) | 6.000 | 4/1/2021 | 524,270 |
| 1,000,000 | Missouri State Environmental Improvement and Energy | | | |
| | Resources Authority Water Pollution Revenue Bonds | | | |
| | (Series A) | 5.250 | 1/1/2018 | 1,084,070 |
| 2,500,000 | Missouri State Health and Educational Facilities Authority | | | |
| | Health Facilities Revenue Bonds | 5.000 | 5/15/2020 | 2,660,600 |
| 3,000,000 | Missouri State Health and Educational Facilities Authority | | | |
| | Health Facilities Revenue Bonds (Barnes Jewish, Inc. | | | |
| | Christian) (Series A) | 5.250 | 5/15/2014 | 3,275,340 |
| 1,500,000 | Missouri State Health and Educational Facilities Authority | | | |
| | Health Facilities Revenue Bonds (Lake Regional Health | | | |
| | Securities Project) | 5.600 | 2/15/2025 | 1,588,980 |
| 1,000,000 | Missouri State Health and Educational Facilities Authority | | | |
| | Health Facilities Revenue Bonds | | | |
| | (Saint Anthony’s Medical Center) ÷ | 6.250 | 12/1/2030 | 1,109,090 |
| 655,000 | Missouri State Health and Educational Facilities Authority | | | |
| | Revenue Bonds (Lake of the Ozarks) | 6.500 | 2/15/2021 | 664,360 |
| 185,000 | Missouri State Housing Development Commission Single | | | |
| | Family Mortgage Revenue Bonds (Series B-1) (GNMA/FNMA | | | |
| | Insured) (Subject to ‘AMT’) | 7.450 | 9/1/2031 | 192,814 |
| 175,000 | Missouri State Housing Development Commission Single | | | |
| | Family Mortgage Revenue Bonds (Series C-1) | | | |
| | (GNMA/FNMA Insured) | 6.550 | 9/1/2028 | 183,622 |
| 320,000 | Missouri State Housing Development Commission Single | | | |
| | Family Mortgage Revenue Bonds (Series C-1) | | | |
| | (GNMA/FNMA Insured) (Subject to ‘AMT’) | 7.150 | 3/1/2032 | 326,368 |
| 2,000,000 | St. Charles County, Missouri Francis Howell School District | | | |
| | General Obligation Bonds (Series A) | 5.250 | 3/1/2018 | 2,253,040 |
|
|
| | Total Missouri | | | 22,753,234 |
|
|
| The accompanying Notes to Financial Statements are an integral part of this schedule. |
|
| 185 |
Municipal Bond Fund
Schedule of Investments as of October 31, 2006 |
| Principal | | Interest | Maturity | |
| Amount | Long-Term Fixed Income (98.5%) | Rate | Date | Value |
|
| Montana (1.4%) | | | |
| $2,830,000 | Montana Facility Finance Authority Revenue Providence | | | |
| | Health and Services Revenue Bonds | 5.000% | 10/1/2024 | $3,009,535 |
| 45,000 | Montana State Board of Housing Single Family Mortgage | | | |
| | Revenue Bonds (Series A-1) | 6.000 | 6/1/2016 | 45,041 |
| 165,000 | Montana State Board of Housing Single Family Mortgage | | | |
| | Revenue Bonds (Series A-2) (Subject to ‘AMT’) | 6.250 | 6/1/2019 | 165,183 |
| 2,385,000 | Montana State Board of Investment Refunded Balance | | | |
| | 1996 Payroll Tax Revenue Bonds (MBIA Insured) ÷ | 6.875 | 6/1/2020 | 2,560,464 |
| 775,000 | Montana State Board of Investment Refunded Revenue | | | |
| | Bonds (1996 Payroll Tax) (MBIA Insured) ÷ | 6.875 | 6/1/2020 | 832,017 |
| 1,240,000 | Montana State Board of Investment Refunded Revenue | | | |
| | Bonds (Payroll Tax) (MBIA Insured) ÷ | 6.875 | 6/1/2020 | 1,331,103 |
| 1,165,000 | Montana State Board of Regents Revenue Bonds (Higher | | | |
| | Education-University of Montana) (Series F) (MBIA Insured) | 5.750 | 5/15/2016 | 1,264,281 |
| 3,000,000 | Montana State Health Facilities Authority Revenue Bonds | | | |
| | (Hillcrest Senior Living Project) ÷ | 7.375 | 6/1/2030 | 3,400,020 |
| 3,860,000 | Montana State Hospital Finance Authority Revenue | | | |
| | Refunding Bonds | 5.250 | 6/1/2018 | 4,141,317 |
|
|
| | Total Montana | | | 16,748,961 |
|
|
| |
| Nebraska (1.7%) | | | |
| 2,500,000 | Nebraska Public Power District Revenue Bonds (Series B) | | | |
| | (AMBAC Insured) | 5.000 | 1/1/2013 | 2,684,600 |
| 5,780,000 | Omaha, Nebraska Public Power District Electric Revenue | | | |
| | Bonds (Series A) | 5.000 | 2/1/2046 | 6,007,270 |
| 3,455,000 | Omaha, Nebraska Public Power District Revenue Bonds | | | |
| | (Series B) ÷ | 6.150 | 2/1/2012 | 3,748,779 |
| 1,675,000 | Omaha, Nebraska Special Assessment Bonds | | | |
| | (Riverfront Redevelopment Project) (Series A) | 5.500 | 2/1/2015 | 1,835,448 |
| 6,000,000 | University of Nebraska Revenue Bonds (Lincoln Student | | | |
| | Fees & Facilities) (Series B) | 5.000 | 7/1/2023 | 6,361,980 |
|
|
| | Total Nebraska | | | 20,638,077 |
|
|
| |
| New Hampshire (0.1%) | | | |
| 1,100,000 | New Hampshire State Turnpike System Revenue Bonds | | | |
| | (Series C) (FGIC Insured) ∞ | 10.206 | 11/24/2006 | 1,147,806 |
|
|
| | Total New Hampshire | | | 1,147,806 |
|
|
| |
| New Jersey (1.9%) | | | |
| 2,000,000 | Hudson County, New Jersey Certificate Of Participation | | | |
| | Department of Finance and Administration | | | |
| | (MBIA Insured) | 6.250 | 12/1/2015 | 2,353,000 |
| 4,000,000 | New Jersey State Highway Authority Revenue Bonds | | | |
| | (Series L) | 5.250 | 7/15/2017 | 4,502,040 |
| 1,000,000 | New Jersey State Highway Authority Revenue Bonds | | | |
| | (Series L) | 5.250 | 7/15/2018 | 1,131,830 |
| The accompanying Notes to Financial Statements are an integral part of this schedule. |
|
| 186 |
Municipal Bond Fund
Schedule of Investments as of October 31, 2006 |
| Principal | | Interest | Maturity | |
| Amount | Long-Term Fixed Income (98.5%) | Rate | Date | Value |
|
| New Jersey — continued | | | |
| $260,000 | New Jersey State Turnpike Authority Revenue Bonds | | | |
| | (Series C) (AMBAC-TCRS Insured) ÷ | 6.500% | 1/1/2016 | $304,556 |
| 745,000 | New Jersey State Turnpike Authority Revenue Bonds | | | |
| | (Series C) (AMBAC-TCRS Insured) | 6.500 | 1/1/2016 | 869,475 |
| 3,695,000 | New Jersey State Turnpike Authority Revenue Bonds | | | |
| | (Series C) (AMBAC-TCRS Insured) ÷ | 6.500 | 1/1/2016 | 4,328,212 |
| 5,000,000 | New Jersey Transportation Trust Fund Authority Revenue | | | |
| | Bonds (Transportation System) (Series A) (FSA Insured) | 5.500 | 12/15/2016 | 5,703,650 |
| 2,195,000 | West New York, New Jersey Municipal Utilities | | | |
| | Authority Revenue Bonds (FGIC Insured) ÷ | Zero Coupon | 12/15/2007 | 2,110,427 |
| 2,595,000 | West New York, New Jersey Municipal Utilities | | | |
| | Authority Revenue Bonds (FGIC Insured) ÷ | Zero Coupon | 12/15/2009 | 2,316,920 |
|
|
| | Total New Jersey | | | 23,620,110 |
|
|
| |
| New Mexico (1.5%) | | | |
| 3,315,000 | Alamogordo, New Mexico Hospital Revenue Bonds | | | |
| | (Gerald Champion Memorial Hospital Project) | 5.300% | 1/1/2013 | 3,377,587 |
| 1,300,000 | Farmington, New Mexico Utility System Revenue | | | |
| | Bonds (AMBAC Insured) ÷ | 9.875 | 1/1/2008 | 1,339,611 |
| 3,500,000 | Jicarilla, New Mexico Apache Nation Revenue Bonds | | | |
| | (Series A) | 5.500 | 9/1/2023 | 3,793,790 |
| 1,085,000 | New Mexico Mortgage Finance Authority Revenue Bonds | | | |
| | (Series F) (GNMA/FNMA Insured) | 7.000 | 1/1/2026 | 1,101,600 |
| 210,000 | New Mexico Mortgage Finance Authority Single Family | | | |
| | Mortgage Capital Appreciation Revenue Bonds | | | |
| | (Series D-2) (Subject to ‘AMT’) | Zero Coupon | 9/1/2019 | 183,387 |
| 660,000 | New Mexico Mortgage Finance Authority Single Family | | | |
| | Mortgage Revenue Bonds (Series C-2) (GNMA/FNMA | | | |
| | Insured) (Subject to ‘AMT’) | 6.950 | 9/1/2031 | 671,266 |
| 7,500,000 | Sandoval County, New Mexico Incentive Payment | | | |
| | Revenue Bonds | 5.000 | 6/1/2020 | 7,978,200 |
|
|
| | Total New Mexico | | | 18,445,441 |
|
|
| |
| New York (9.1%) | | | |
| 5,000,000 | Metropolitan Transportation Authority, New York | | | |
| | Transportation Facilities Revenue Bonds (Series A) | 5.500 | 7/1/2017 | 5,682,750 |
| 4,225,000 | Metropolitan Transportation Authority, New York | | | |
| | Transportation Facilities Revenue Bonds (Series O) ÷ | 5.750 | 7/1/2013 | 4,581,928 |
| 35,000 | New York Counties Tobacco Trust Settlement | | | |
| | Revenue Bonds | 5.800 | 6/1/2023 | 36,378 |
| 155,000 | New York Counties Tobacco Trust Settlement | | | |
| | Revenue Bonds ÷ | 5.800 | 6/1/2023 | 168,091 |
| 4,000,000 | New York State Dormitory Authority Revenue | | | |
| | Bonds (Series B) > | 5.250 | 5/15/2012 | 4,305,520 |
| 2,000,000 | New York State Dormitory Authority Revenue Bonds | | | |
| | (State University Educational Facilities) (Series A) | 7.500 | 5/15/2013 | 2,411,700 |
| The accompanying Notes to Financial Statements are an integral part of this schedule. |
|
| 187 |
Municipal Bond Fund
Schedule of Investments as of October 31, 2006 |
| Principal | | Interest | Maturity | |
| Amount | Long-Term Fixed Income (98.5%) | Rate | Date | Value |
|
| New York — continued | | | |
| $5,000,000 | New York State Dormitory Authority Revenue Bonds | | | |
| | (State University Educational Facilities) (Series A) | 5.875% | 5/15/2017 | $5,836,850 |
| 2,000,000 | New York State Local Government Assistance Corporation | | | |
| | Revenue Bonds (Series E) (MBIA/IBC Insured) | 5.250 | 4/1/2016 | 2,227,260 |
| 1,060,000 | New York State Mortgage Agency Revenue Bonds | | | |
| | (Series 26) | 5.350 | 10/1/2016 | 1,080,946 |
| 2,605,000 | New York State Thruway Authority General Unrefunded | | | |
| | Balance Revenue Bonds (Series E) | 5.000 | 1/1/2016 | 2,674,293 |
| 2,500,000 | New York State Thruway Authority Revenue Bonds | | | |
| | (Series B) (FSA Insured) | 5.000 | 4/1/2015 | 2,736,775 |
| 20,000,000 | New York State Urban Development Corporation | | | |
| | Revenue Bonds (Correctional and Youth Facilities) | | | |
| | (Series A) | 5.000 | 1/1/2017 | 21,016,799 |
| 1,620,000 | New York State Urban Development Corporation | | | |
| | Revenue Bonds (Syracuse University Center) | 6.000 | 1/1/2009 | 1,701,778 |
| 1,720,000 | New York State Urban Development Corporation | | | |
| | Revenue Bonds (Syracuse University Center) | 6.000 | 1/1/2010 | 1,839,540 |
| 8,940,000 | New York, New York City Municipal Transitional Finance | | | |
| | Authority Revenue Bonds (Series A) > | 5.500 | 11/1/2011 | 9,671,918 |
| 2,000,000 | New York, New York City Municipal Water and Sewer | | | |
| | System Revenue Bonds (Series A) (AMBAC Insured) ÷ | 5.875 | 6/15/2012 | 2,239,140 |
| 2,540,000 | New York, New York City Transitional Finance Authority | | | |
| | Revenue Bonds | 5.375 | 11/15/2021 | 2,758,135 |
| 13,000,000 | New York, New York City Transitional Finance Authority | | | |
| | Revenue Bonds (Future Tax Secured) (Series B) > | 5.250 | 2/1/2011 | 13,794,560 |
| 1,750,000 | New York, New York General Obligation Bonds (Series A) | 5.500 | 8/1/2022 | 1,912,365 |
| 12,000,000 | New York, New York General Obligation Bonds (Series B) | 5.250 | 8/1/2017 | 13,089,960 |
| 655,000 | New York, New York General Obligation Bonds (Series H) | | | |
| | (FSA/CR Insured) ÷ | 5.250 | 3/15/2016 | 687,278 |
| 5,000,000 | New York, New York General Obligation Bonds (Series I) | 5.000 | 8/1/2016 | 5,371,200 |
| 5,000,000 | New York, New York General Obligation Bonds (Series I-1) | 5.000 | 4/1/2023 | 5,328,150 |
| 825,000 | Triborough, New York Bridge and Tunnel Authority | | | |
| | Revenue Bonds (Series Q) ÷ | 6.750 | 1/1/2009 | 856,820 |
|
|
| | Total New York | | | 112,010,134 |
|
|
| |
| North Carolina (1.8%) | | | |
| 1,475,000 | North Carolina Eastern Municipal Power Agency | | | |
| | Power System Prerefunded Revenue Bonds (Series A) ÷ | 6.000 | 1/1/2026 | 1,825,091 |
| 4,000,000 | North Carolina Eastern Municipal Power Agency | | | |
| | Power System Revenue Bonds | 5.375 | 1/1/2017 | 4,270,480 |
| 2,375,000 | North Carolina Eastern Municipal Power Agency | | | |
| | Power System Revenue Bonds (Series B) | 5.500 | 1/1/2021 | 2,393,668 |
| 5,000,000 | North Carolina Eastern Municipal Power Agency | | | |
| | Power System Revenue Bonds (Series D) | 5.500 | 1/1/2014 | 5,459,450 |
| 2,000,000 | North Carolina Eastern Municipal Power Agency | | | |
| | Power System Revenue Bonds (Series D) | 6.750 | 1/1/2026 | 2,189,300 |
| The accompanying Notes to Financial Statements are an integral part of this schedule. |
|
| 188 |
Municipal Bond Fund
Schedule of Investments as of October 31, 2006 |
| Principal | | Interest | Maturity | |
| Amount | Long-Term Fixed Income (98.5%) | Rate | Date | Value |
|
| North Carolina — continued | | | |
| $250,000 | North Carolina Municipal Power Agency #1 Catawba | | | |
| | Electric Revenue Bonds (Series B) | 6.500% | 1/1/2009 | $263,118 |
| 610,000 | North Carolina Municipal Power Agency #1 Catawba | | | |
| | Electric Revenue Bonds (Series B) | 6.375 | 1/1/2013 | 662,698 |
| 4,000,000 | North Carolina Municipal Power Agency #1 Catawba | | | |
| | Electric Revenue Bonds (Series B) (MBIA Insured) | 6.000 | 1/1/2011 | 4,366,080 |
| 1,000,000 | Wake County, North Carolina Industrial, Facilities, and | | | |
| | Pollution Control Revenue Bonds (Carolina Power and | | | |
| | Light Company Project) | 5.375 | 2/1/2017 | 1,066,170 |
|
|
| | Total North Carolina | | | 22,496,055 |
|
|
| |
| North Dakota (1.0%) | | | |
| 3,500,000 | Grand Forks, North Dakota Health Care System | | | |
| | Revenue Bonds (Altru Health Systems Group) | 7.125 | 8/15/2024 | 3,884,265 |
| 1,340,000 | North Dakota State Water Commission Revenue Bonds | | | |
| | (Southwest Pipeline) (Series A) (AMBAC Insured) | 5.750 | 7/1/2027 | 1,358,050 |
| 2,945,000 | South Central Regional Water District, North Dakota | | | |
| | Utility System Revenue Bonds (Northern Burleigh County) | | | |
| | (Series A) | 5.650 | 10/1/2029 | 3,123,938 |
| 3,250,000 | Ward County, North Dakota Health Care Facilities Revenue | | | |
| | Bonds (Trinity Medical Center) (Series B) | 6.250 | 7/1/2021 | 3,336,808 |
|
|
| | Total North Dakota | | | 11,703,061 |
|
|
| |
| Ohio (2.5%) | | | |
| 2,500,000 | Akron, Ohio Certificates of Participation (Akron Municipal | | | |
| | Baseball Stadium Project) ÷ | 6.900 | 12/1/2016 | 2,556,250 |
| 875,000 | Akron, Ohio Economic Development Revenue Bonds | | | |
| | (MBIA Insured) | 6.000 | 12/1/2012 | 986,659 |
| 1,700,000 | Cincinnati, Ohio General Obligation Bonds | 5.375 | 12/1/2019 | 1,819,442 |
| 2,000,000 | Lorain County, Ohio Hospital Revenue Bonds (Catholic | | | |
| | Healthcare Partners) | 5.400 | 10/1/2021 | 2,130,900 |
| 2,000,000 | Lucas County, Ohio Health Care Facilities Revenue Bonds | | | |
| | (Sunset Retirement) (Series A) | 6.550 | 8/15/2024 | 2,158,620 |
| 2,000,000 | Montgomery County, Ohio Hospital Revenue Bonds | | | |
| | (Kettering Medical Center) ÷ | 6.750 | 4/1/2018 | 2,219,520 |
| 2,500,000 | Montgomery County, Ohio Hospital Revenue Bonds | | | |
| | (Kettering Medical Center) ÷ | 6.750 | 4/1/2022 | 2,774,400 |
| 2,000,000 | Ohio State Higher Education Faculty Revenue Bonds | | | |
| | (Case Western Reserve University) | 6.500 | 10/1/2020 | 2,462,240 |
| 4,000,000 | Ohio State Infrastructure Improvement Revenue Bonds | | | |
| | (Series B) ÷ | 5.250 | 3/1/2014 | 4,315,160 |
| 2,000,000 | Ohio State Turnpike Commission Turnpike Revenue Bonds | | | |
| | (Series A) (FGIC Insured) | 5.500 | 2/15/2024 | 2,345,920 |
| 750,000 | Port of Greater Cincinnati Development Authority | | | |
| | Revenue Bonds | 5.000 | 10/1/2025 | 787,650 |
| The accompanying Notes to Financial Statements are an integral part of this schedule. |
|
| 189 |
Municipal Bond Fund
Schedule of Investments as of October 31, 2006
| Principal | | | Interest | Maturity | |
| Amount | Long-Term Fixed Income (98.5%) | | Rate | Date | Value |
|
| Ohio — continued | | | | |
| $1,610,000 | Reynoldsburg, Ohio City School District (FSA Insured) | 5.000% | 12/1/2028 | $1,709,868 |
| 2,115,000 | University of Akron, Ohio General Receipts Revenue Bonds | | |
| | (FGIC Insured) ÷ | | 5.500 | 1/1/2020 | 2,257,424 |
| 2,545,000 | University of Cincinnati, Ohio General Receipts | | | | |
| | Revenue Bonds (Series D) (AMBAC insured) | | 5.000 | 6/1/2016 | 2,753,079 |
|
|
| | Total Ohio | | | | 31,277,132 |
|
|
| |
| Oklahoma (0.7%) | | | | |
| 2,020,000 | Bass, Oklahoma Memorial Baptist Hospital Authority | | | | |
| | Hospital Revenue Bonds (Bass Memorial Hospital | | | | |
| | Project) ÷ | | 8.350 | 5/1/2009 | 2,154,896 |
| 1,040,000 | Oklahoma Development Finance Authority Hospital | | | | |
| | Revenue Bonds (Unity Health Center Project) | | 5.000 | 10/1/2011 | 1,087,809 |
| 155,000 | Oklahoma Housing Finance Agency Single Family Mortgage | | |
| | Revenue Bonds (Series C-2) (Subject to ‘AMT’) | | 7.550 | 9/1/2028 | 159,642 |
| 210,000 | Oklahoma Housing Finance Agency Single Family Mortgage | | |
| | Revenue Bonds (Series D-2) (GNMA/FNMA Insured) | | | | |
| | (Subject to ‘AMT’) | | 7.100 | 9/1/2028 | 216,138 |
| 1,500,000 | Oklahoma State Municipal Power Authority Revenue | | | | |
| | Bonds (Series B) (MBIA Insured) | | 5.875 | 1/1/2012 | 1,617,735 |
| 2,900,000 | Payne County, Oklahoma Economic Development Authority | | |
| | Student Housing Revenue Bonds (Collegiate Housing | | |
| | Foundation) (Series A) ÷ | | 6.375 | 6/1/2030 | 3,219,957 |
|
|
| | Total Oklahoma | | | | 8,456,177 |
|
|
| |
| Pennsylvania (1.6%) | | | | |
| 1,460,000 | Allegheny County, Pennsylvania Redevelopment | | | | |
| | Authority Tax Increment Tax Allocation Bonds | | | | |
| | (Waterfront Project) (Series B) | | 6.000 | 12/15/2010 | 1,527,978 |
| 2,145,000 | Allegheny County, Pennsylvania Redevelopment | | | | |
| | Authority Tax Increment Tax Allocation Bonds | | | | |
| | (Waterfront Project) (Series C) | | 6.550 | 12/15/2017 | 2,352,550 |
| 2,575,000 | Allegheny County, Pennsylvania Sanitation | | | | |
| | Authority Sewer Interest Compensatory Revenue | | | | |
| | Bonds (Series A) (FGIC Insured) | | Zero Coupon | 6/1/2008 | 2,433,298 |
| 2,780,000 | Carbon County, Pennsylvania Industrial | | | | |
| | Development Authority Revenue Bonds (Panther | | | | |
| | Creek Partners Project) (Subject to ‘AMT’) | | 6.650 | 5/1/2010 | 2,901,375 |
| 2,000,000 | Cornwall Lebanon, Pennsylvania School District | | | | |
| | Capital Appreciation General Obligation Bonds | | | | |
| | (FSA Insured) | | Zero Coupon | 3/15/2016 | 1,371,280 |
| 1,520,000 | Cornwall Lebanon, Pennsylvania School District | | | | |
| | Capital Appreciation General Obligation Bonds | | | | |
| | (FSA Insured) | | Zero Coupon | 3/15/2017 | 994,946 |
| 2,000,000 | Lancaster County, Pennsylvania Hospital Authority | | | | |
| | Revenue Bonds | | 5.500 | 3/15/2026 | 2,146,200 |
| The accompanying Notes to Financial Statements are an integral part of this schedule. |
|
| 190 |
Municipal Bond Fund
Schedule of Investments as of October 31, 2006 |
| Principal | | | Interest | Maturity | |
| Amount | Long-Term Fixed Income (98.5%) | | Rate | Date | Value |
|
| Pennsylvania — continued | | | | |
| $3,170,000 | Millcreek Township, Pennsylvania School District | | | |
| | General Obligation Bonds (FGIC Insured) ÷ | | Zero Coupon | 8/15/2009 | $2,864,824 |
| 435,000 | Montgomery County, Pennsylvania Higher Education | | | |
| | and Health Authority Revenue Bonds (Foulkeways at | | | |
| | Gwynedd Project) ÷ | | 6.750% | 11/15/2024 | $477,678 |
| 1,880,000 | Montgomery County, Pennsylvania Higher Education | | | |
| | and Health Authority Revenue Bonds (Foulkeways at | | | |
| | Gwynedd Project) ÷ | | 6.750 | 11/15/2030 | 2,064,447 |
| 1,000,000 | York County, Pennsylvania Solid Waste & Refuse Authority | | | |
| | Solid Waste System Revenue Bonds (FGIC Insured) | 5.500 | 12/1/2012 | 1,103,430 |
|
|
| | Total Pennsylvania | | | 20,238,006 |
|
|
| |
| Puerto Rico (0.4%) | | | | |
| 4,955,000 | Puerto Rico Industrial Tourist Educational Medical and | | | |
| | Environmental Central Facilities Revenue Bonds | | | | |
| | (AES Cogen Facilities Project) (Subject to ‘AMT’) | | 6.625 | 6/1/2026 | 5,427,410 |
|
|
| | Total Puerto Rico | | | 5,427,410 |
|
|
| |
| South Carolina (1.6%) | | | | |
| 1,000,000 | Greenwood County, South Carolina Hospital Revenue | | | |
| | Bonds (Self Memorial Hospital) | | 5.500 | 10/1/2026 | 1,058,930 |
| 4,000,000 | Piedmont, South Carolina Municipal Power Agency | | | |
| | Electric Revenue Bonds (FGIC Insured) | | 6.250 | 1/1/2021 | 4,960,680 |
| 5,000,000 | Piedmont, South Carolina Municipal Power Agency | | | |
| | Electric Revenue Bonds (FGIC Insured) | | 5.000 | 1/1/2022 | 5,009,650 |
| 605,000 | South Carolina Jobs Economic Development Authority | | | |
| | Hospital Facilities Prerefunded Revenue Bonds (Palmetto | | | |
| | Health Alliance) (Series C) | | 6.875 | 8/1/2027 | 703,391 |
| 4,895,000 | South Carolina Jobs Economic Development Authority | | | |
| | Hospital Facilities Prerefunded Revenue Bonds (Palmetto | | | |
| | Health Alliance) (Series C) ÷ | | 6.875 | 8/1/2027 | 5,814,770 |
| 2,000,000 | Spartanburg, South Carolina Waterworks Revenue Bonds | | | |
| | (FGIC Insured) | | 5.250 | 6/1/2028 | 2,163,340 |
|
|
| | Total South Carolina | | | 19,710,761 |
|
|
| |
| South Dakota (0.7%) | | | | |
| 5,000,000 | South Dakota Educational Enhancement Funding | | | |
| | Corporation Tobacco Settlement Revenue Bonds (Series B) | 6.500 | 6/1/2032 | 5,500,200 |
| 1,170,000 | South Dakota State Health and Educational Facilities | | | |
| | Authority Revenue Bonds (Prairie Lakes Health Care | | | |
| | System, Inc.) | | 5.625 | 4/1/2032 | 1,228,594 |
| 2,000,000 | South Dakota State Health and Educational Facilities | | | |
| | Authority Revenue Bonds (Prairie Lakes Health Care | | | |
| | System, Inc.) (ACA/CBI Insured) | | 5.650 | 4/1/2022 | 2,066,640 |
|
|
| | Total South Dakota | | | 8,795,434 |
|
|
| The accompanying Notes to Financial Statements are an integral part of this schedule. |
|
| 191 |
Municipal Bond Fund
Schedule of Investments as of October 31, 2006 |
| Principal | | | Interest | Maturity | |
| Amount | Long-Term Fixed Income (98.5%) | | Rate | Date | Value |
|
| Tennessee (1.5%) | | | | |
| $2,000,000 | Carter County, Tennessee Industrial Development Board | | |
| | Revenue Bonds | | 4.150% | 10/1/2007 | $2,004,200 |
| 2,000,000 | Memphis-Shelby County, Tennessee Airport Authority | | |
| | Special Facilities and Project Revenue Bonds (Federal | | | | |
| | Express Corporation) | | 5.350 | 9/1/2012 | 2,146,520 |
| 4,500,000 | Memphis-Shelby County, Tennessee Airport Authority | | |
| | Special Facilities Revenue Bonds | | | | |
| | (Federal Express Corporation) | | 5.050 | 9/1/2012 | 4,764,780 |
| 4,155,000 | Metropolitan Government, Nashville and Davidson County, | | |
| | Tennessee Industrial Development Board Revenue Bonds | | |
| | (Series A) (GNMA Insured) | | 6.625 | 3/20/2036 | 4,582,009 |
| 5,000,000 | Shelby County, Tennessee Health Educational and Housing | | |
| | Facilities Board Revenue Bonds (St. Jude Children’s | | | | |
| | Research Project) | | 5.375 | 7/1/2024 | 5,283,800 |
|
|
| | Total Tennessee | | | | 18,781,309 |
|
|
| |
| Texas (9.3%) | | | | |
| 7,000,000 | Alliance Airport Authority Income Texas Facilities | | | | |
| | Revenue Bonds | | 4.850 | 4/1/2021 | 7,132,160 |
| 2,000,000 | Amarillo, Texas Health Facilities Corporation | | | | |
| | Revenue Bonds (Baptist St. Anthony’s Hospital Corporation) | | |
| | (FSA Insured) | | 5.500 | 1/1/2017 | 2,257,280 |
| 750,000 | Arlington, Texas General Obligation Bonds ÷ | | 5.375 | 8/15/2016 | 797,745 |
| 1,055,000 | Arlington, Texas General Obligation Bonds ÷ | | 5.500 | 8/15/2019 | 1,126,782 |
| 2,165,000 | Arlington, Texas Independent School District Capital | | | | |
| | Appreciation Refunding General Obligation Bonds | | | | |
| | (PSF/GTD Insured) | | Zero Coupon | 2/15/2009 | 1,984,915 |
| 2,500,000 | Austin, Texas Higher Education Authority, Inc. | | | | |
| | University Revenue Bonds (St. Edwards | | | | |
| | University Project) | | 5.750 | 8/1/2031 | 2,607,275 |
| 2,250,000 | Austin, Texas Utility System Revenue Bonds | | | | |
| | (FGIC Insured) | | 6.000 | 11/15/2013 | 2,502,742 |
| 7,000,000 | Austin, Texas Utility System Revenue | | | | |
| | Capital Appreciation Refunding Bonds (Financial | | | | |
| | Services Department) (Series A) (MBIA Insured) | | Zero Coupon | 11/15/2008 | 6,506,220 |
| 8,100,000 | Austin, Texas Utility System Revenue Capital | | | | |
| | Appreciation Refunding Bonds (Financial | | | | |
| | Services Department) (Series A) (MBIA Insured) | | Zero Coupon | 11/15/2009 | 7,232,409 |
| 1,930,000 | Bexar County, Texas Housing Finance Corporation | | | | |
| | Multi-Family Housing Revenue Bonds (Dymaxion and | | |
| | Marrach Park Apartments) (Series A) (MBIA Insured) | | 6.000 | 8/1/2023 | 2,050,239 |
| 1,720,000 | Bexar County, Texas Housing Finance Corporation | | | | |
| | Multi-Family Housing Revenue Bonds (Pan American | | |
| | Apartments) (Series A-1) (GNMA Insured) | | 7.000 | 3/20/2031 | 1,938,371 |
| 1,000,000 | Bluebonnet Trails Community Mental Health and Mental | | |
| | Retardation Revenue Bonds | | 6.125 | 12/1/2016 | 1,054,890 |
| The accompanying Notes to Financial Statements are an integral part of this schedule. |
|
| 192 |
Municipal Bond Fund
Schedule of Investments as of October 31, 2006
| Principal | | Interest | Maturity | |
| Amount | Long-Term Fixed Income (98.5%) | Rate | Date | Value |
|
| Texas — continued | | | |
| $3,950,000 | Colorado River, Texas Municipal Water District | | | |
| | Revenue Bonds (MBIA Insured) | 5.000% | 1/1/2014 | $3,958,414 |
| 500,000 | Corpus Christi, Texas General Obligation Bonds | | | |
| | (Series A) (FSA Insured) | 5.000 | 3/1/2012 | 533,385 |
| 1,000,000 | Dallas-Fort Worth, Texas International Airport Revenue | | | |
| | Bonds (Series A) (MBIA Insured) (Subject to ‘AMT’) | 5.500 | 11/1/2016 | 1,083,680 |
| 500,000 | Dallas-Fort Worth, Texas International Airport Revenue | | | |
| | Bonds (Series A) (Subject to ‘AMT’) | 5.500 | 11/1/2017 | 540,730 |
| 1,375,000 | Deer Park, Texas Independent School District General | | | |
| | Obligation Bonds (PSF/GTD Insured) | 5.000 | 2/15/2013 | 1,477,520 |
| 2,285,000 | Denton, Texas Independent School District General | | | |
| | Obligation Bonds (PSF/GTD Insured) | 6.250 | 2/15/2009 | 2,417,987 |
| 3,210,000 | Denton, Texas Utility System Revenue Bonds (Series A) | | | |
| | (FSA Insured) | 5.250 | 12/1/2015 | 3,487,601 |
| 1,445,000 | Frisco, Texas Independent School District General | | | |
| | Obligation Bonds (PSF/GTD Insured) | 6.250 | 8/15/2017 | 1,577,073 |
| 1,805,000 | Gulf Coast Waste Disposal Authority, Texas Pollution | | | |
| | Control Revenue Bonds | 3.560 | 10/1/2024 | 1,805,000 |
| 7,000,000 | Harris County, Houston, Texas General Obligation | | | |
| | Bonds (MBIA Insured) | Zero Coupon | 8/15/2024 | 3,233,860 |
| 2,000,000 | Harris County, Texas Health Facilities Development | | | |
| | Authority Hospital Revenue Bonds (Memorial | | | |
| | Hermann Healthcare Project) (Series A) ÷ | 6.375 | 6/1/2029 | 2,248,320 |
| 2,000,000 | Houston, Texas Airport System Revenue Bonds | | | |
| | (Series A) (FSA Insured) (Subject to ‘AMT’) | 5.625 | 7/1/2030 | 2,106,060 |
| 5,000,000 | Houston, Texas Water and Sewer System Revenue | | | |
| | Bonds (Series A) (FSA Insured) ÷ | 5.750 | 12/1/2032 | 6,267,050 |
| 5,315,000 | Lewisville, Texas Independent School District | | | |
| | General Obligation Bonds (PSF/GTD Insured) | Zero Coupon | 8/15/2019 | 3,120,330 |
| 1,000,000 | Lower Colorado River Authority, Texas Revenue | | | |
| | Unrefunded Balance Revenue Bonds (Series A) | 5.875 | 5/15/2015 | 1,061,480 |
| 370,000 | Mesquite, Texas Independent School District General | | | |
| | Obligation Bonds (Series A) (PSF/GTD Insured) | 6.000 | 2/15/2020 | 380,734 |
| 2,600,000 | North Texas Health Facilities Development Corporation | | | |
| | Hospital Revenue Bonds (United Regional Healthcare | | | |
| | System, Inc.) | 6.000 | 9/1/2023 | 2,830,074 |
| 475,000 | Nueces County, Texas Housing Finance Corporation | | | |
| | Multi-Family Housing Revenue Bonds (Dolphins | | | |
| | Landing Apartments Project) (Series A) | 6.250 | 7/1/2010 | 482,386 |
| 1,000,000 | Ridge Parc Development Corporation, Texas | | | |
| | Multifamily Revenue Bonds (GNMA Insured) | 6.100 | 6/20/2033 | 1,110,340 |
| 2,795,000 | Ridge Parc Development Corporation, Texas | | | |
| | Multifamily Revenue Bonds (GNMA Insured) | 6.150 | 11/20/2041 | 3,069,832 |
| 1,365,000 | San Antonio, Texas General Obligation Bonds | | | |
| | (General Improvement) | 5.250 | 2/1/2014 | 1,450,626 |
| 1,000,000 | San Antonio, Texas Water Revenue Bonds (FSA Insured) | 5.500 | 5/15/2018 | 1,094,020 |
| The accompanying Notes to Financial Statements are an integral part of this schedule. |
|
| 193 |
Municipal Bond Fund
Schedule of Investments as of October 31, 2006
| Principal | | | Interest | Maturity | |
| Amount | Long-Term Fixed Income (98.5%) | | Rate | Date | Value |
|
| Texas — continued | | | | |
| $1,000,000 | San Antonio, Texas Water Revenue Bonds (FSA Insured) | 5.500% | 5/15/2019 | $1,091,920 |
| 1,000,000 | San Antonio, Texas Water Revenue Bonds (FSA Insured) | 5.500 | 5/15/2020 | 1,089,830 |
| 85,000 | South San Antonio, Texas Independent School District | | | |
| | General Obligation Bonds (PSF/GTD Insured) | | 6.000 | 8/15/2017 | 90,444 |
| 1,095,000 | South San Antonio, Texas Independent School District | | | |
| | General Obligation Bonds (PSF/GTD Insured) ÷ | | 6.000 | 8/15/2017 | 1,165,430 |
| 1,160,000 | South San Antonio, Texas Independent School District | | | |
| | General Obligation Bonds (PSF/GTD Insured) ÷ | | 6.000 | 8/15/2018 | 1,234,611 |
| 90,000 | South San Antonio, Texas Independent School District | | | |
| | General Obligation Bonds (PSF/GTD Insured) | | 6.000 | 8/15/2018 | 95,740 |
| 95,000 | South San Antonio, Texas Independent School District | | | |
| | General Obligation Bonds (PSF/GTD Insured) | | 6.000 | 8/15/2019 | 101,032 |
| 1,180,000 | South San Antonio, Texas Independent School District | | | |
| | General Obligation Bonds (PSF/GTD Insured) ÷ | | 6.000 | 8/15/2019 | 1,255,898 |
| 11,615,000 | Southeast Texas Housing Finance Corporation Revenue | | | |
| | Bonds (MBIA Insured) ÷ | | Zero Coupon | 9/1/2017 | 7,366,465 |
| 1,410,000 | Tarrant County, Texas College District General | | | | |
| | Obligation Bonds | | 5.375 | 2/15/2013 | 1,544,556 |
| 4,315,000 | Texas State Veterans Land Board General | | | | |
| | Obligation Bonds ÷ | | 0.050 | 7/1/2010 | 3,765,442 |
| 1,000,000 | Texas State Water Development Board Revenue Bonds | | | |
| | (State Revolving) (Series A) | | 5.250 | 7/15/2017 | 1,001,080 |
| 2,000,000 | Travis County, Texas Health Facilities Development | | | |
| | Corporation Revenue Bonds (Ascension Health Credit) | | | |
| | (Series A) (MBIA Insured) ÷ | | 6.250 | 11/15/2017 | 2,168,940 |
| 315,000 | Westlake, Texas General Obligation Bonds | | 6.500 | 5/1/2013 | 352,583 |
| 350,000 | Westlake, Texas General Obligation Bonds | | 6.500 | 5/1/2015 | 393,404 |
| 335,000 | Westlake, Texas General Obligation Bonds | | 6.500 | 5/1/2017 | 377,903 |
| 1,650,000 | Westlake, Texas General Obligation Bonds | | 5.750 | 5/1/2024 | 1,793,088 |
| 2,000,000 | Westlake, Texas General Obligation Bonds | | 5.800 | 5/1/2032 | 2,169,140 |
| 745,000 | Wylie, Texas Independent School District General | | | |
| | Obligation Bonds (PSF/GTD Insured) ÷ | | 6.875 | 8/15/2014 | 849,173 |
| 430,000 | Wylie, Texas Independent School District General | | | |
| | Obligation Bonds (PSF/GTD Insured) | | 6.875 | 8/15/2014 | 490,531 |
| 3,280,000 | Wylie, Texas Independent School District Unrefunded | | | |
| | General Obligation Bonds (PSF/GTD Insured) | | 7.000 | 8/15/2024 | 3,744,120 |
|
|
| | Total Texas | | | | 114,668,860 |
|
|
| |
| Utah (0.3%) | | | | |
| 3,345,000 | Intermountain Power Agency, Utah Power Supply | | | |
| | Revenue Bonds (Series B) (MBIA insured) | | 5.750 | 7/1/2019 | 3,456,489 |
|
|
| | Total Utah | | | | 3,456,489 |
|
|
| The accompanying Notes to Financial Statements are an integral part of this schedule. |
|
| 194 |
Municipal Bond Fund
Schedule of Investments as of October 31, 2006 |
| Principal | | Interest | Maturity | |
| Amount | Long-Term Fixed Income (98.5%) | Rate | Date | Value |
|
| Vermont (0.3%) | | | |
| $3,500,000 | Vermont Educational and Health Buildings Financing | | | |
| | Agency Revenue Bonds (Norwich University Project) ÷ | 5.500% | 7/1/2021 | $3,639,090 |
|
|
| | Total Vermont | | | 3,639,090 |
|
|
| |
| Virginia (0.8%) | | | |
| 2,500,000 | Fairfax County, Virginia Industrial Development | | | |
| | Authority Revenue Bonds (Inova Health Systems Project) | 5.250 | 8/15/2019 | 2,734,025 |
| 3,625,000 | Fairfax County, Virginia Water Authority Water | | | |
| | Revenue Bonds | 5.000 | 4/1/2021 | 4,065,582 |
| 3,240,000 | Tobacco Settlement Authority, Virginia Tobacco | | | |
| | Settlement Revenue Bonds | 5.250 | 6/1/2019 | 3,379,676 |
|
|
| | Total Virginia | | | 10,179,283 |
|
|
| |
| Washington (4.9%) | | | |
| 1,000,000 | Energy Northwest, Washington Electric Revenue | | | |
| | Bonds (Columbia Generating) (Series A) (MBIA Insured) | 5.750 | 7/1/2018 | 1,101,640 |
| 6,000,000 | Franklin County, Washington School District Bonds | | | |
| | (MBIA Insured) | 5.250 | 12/1/2022 | 6,591,720 |
| 10,000,000 | King County, Washington Sewer Revenue Bonds (Series B) | | | |
| | (FSA Insured) | 5.500 | 1/1/2013 | 10,855,000 |
| 8,575,000 | Tobacco Settlement Authority, Washington Tobacco | | | |
| | Settlement Revenue Bonds | 6.500 | 6/1/2026 | 9,505,302 |
| 5,620,000 | Washington State Economic Development Finance | | | |
| | Authority Lease Revenue Bonds (MBIA Insured) | 5.000 | 6/1/2030 | 5,934,551 |
| 45,000 | Washington State General Obligation Bonds | | | |
| | (Series 93A) ÷ | 5.750 | 10/1/2012 | 47,969 |
| 2,955,000 | Washington State General Obligation Bonds (Series 93A) | 5.750 | 10/1/2012 | 3,153,340 |
| 1,500,000 | Washington State General Obligation Bonds | | | |
| | (Series A and AT-6) | 6.250 | 2/1/2011 | 1,584,285 |
| 5,000,000 | Washington State General Obligation Bonds (Series A) | 6.750 | 2/1/2015 | 5,772,000 |
| 5,000,000 | Washington State General Obligation Bonds (Series A) | | | |
| | (FSA Insured) | 5.000 | 7/1/2021 | 5,405,500 |
| 2,500,000 | Washington State General Obligation Bonds | | | |
| | (Series B and AT-7) | 6.250 | 6/1/2010 | 2,721,325 |
| 2,000,000 | Washington State General Obligation Bonds | | | |
| | (Series B and AT-7) | 6.000 | 6/1/2012 | 2,236,260 |
| 1,000,000 | Washington State Health Care Facilities Authority | | | |
| | Revenue Bonds (Series A) | 5.000 | 12/1/2030 | 1,048,380 |
| 2,000,000 | Washington State Health Care Facilities Authority | | | |
| | Revenue Bonds (Swedish Health Services) (AMBAC | | | |
| | Insured) | 5.125 | 11/15/2018 | 2,073,060 |
| The accompanying Notes to Financial Statements are an integral part of this schedule. |
|
| 195 |
Municipal Bond Fund
Schedule of Investments as of October 31, 2006 |
| Principal | | Interest | Maturity | |
| Amount | Long-Term Fixed Income (98.5%) | Rate | Date | Value |
|
| Washington — continued | | | |
| $1,000,000 | Washington State Higher Education Facilities Authority | | | |
| | Revenue Bonds (Whitman College) ÷ | 5.875% | 10/1/2029 | $1,064,590 |
| 1,000,000 | Washington State Housing Finance Commission Nonprofit | | | |
| | Housing Revenue Bonds (Crista Ministries Projects) | | | |
| | (Series A) | 5.350 | 7/1/2014 | 1,016,600 |
|
|
| | Total Washington | | | 60,111,522 |
|
|
| |
| West Virginia (0.3%) | | | |
| 3,465,000 | West Virginia State Water Development Authority | | | |
| | Revenue Bonds (Series B-II) (FGIC Insured) | 5.000 | 11/1/2033 | 3,676,192 |
|
|
| | Total West Virginia | | | 3,676,192 |
|
|
| |
| Wisconsin (1.2%) | | | |
| 1,500,000 | Wisconsin State Health and Educational Facilities | | | |
| | Authority Revenue Bonds (Aurora Health Care) (Series B) | 5.500 | 2/15/2015 | 1,558,905 |
| 1,000,000 | Wisconsin State Health and Educational Facilities | | | |
| | Authority Revenue Bonds (Eagle River Memorial | | | |
| | Hospital, Inc. Project) | 5.750 | 8/15/2020 | 1,072,700 |
| 1,000,000 | Wisconsin State Health and Educational Facilities | | | |
| | Authority Revenue Bonds (Franciscan Sisters Christian) | | | |
| | (Series A) | 5.500 | 2/15/2018 | 1,019,440 |
| 2,000,000 | Wisconsin State Health and Educational Facilities | | | |
| | Authority Revenue Bonds (Marshfield Clinic) (Series B) | 6.000 | 2/15/2025 | 2,155,100 |
| 2,000,000 | Wisconsin State Health and Educational Facilities | | | |
| | Authority Revenue Bonds (Watertown Memorial | | | |
| | Hospital, Inc.) | 5.500 | 8/15/2029 | 2,126,980 |
| 6,000,000 | Wisconsin State Health and Educational Facilities | | | |
| | Authority Revenue Bonds (Wheaton Franciscan Services) | 5.750 | 8/15/2025 | 6,502,080 |
|
|
| | Total Wisconsin | | | 14,435,205 |
|
|
| |
| Wyoming (0.6%) | | | |
| 600,000 | Kemmerer, Wyoming Pollution Control Term | | | |
| | Revenue Bonds | 3.560 | 11/1/2014 | 600,000 |
| 785,000 | Lincoln County, Wyoming Pollution Control | | | |
| | Revenue Bonds ∞ | 3.560 | 11/1/2006 | 785,000 |
| 5,825,000 | Wyoming State Farm Loan Board Capital Facilities | | | |
| | Revenue Bonds | 5.750 | 10/1/2020 | 6,498,545 |
|
|
| | Total Wyoming | | | 7,883,545 |
|
|
| | Total Long-Term Fixed Income | | |
| | (cost $1,125,116,281) | | | 1,216,770,032 |
|
|
| The accompanying Notes to Financial Statements are an integral part of this schedule |
|
| 196 |
Municipal Bond Fund
Schedule of Investments as of October 31, 2006 |
| Shares or | | | | |
| Principal | | Interest | Maturity | |
| Amount | Short-Term Investments (0.2%) | Rate (+) | Date | Value |
|
| $1,885,000 | Kansas State Department of Transportation Highway | | | |
| | Revenue Bonds (Series B-1) | 3.600% | 11/1/2006 | $1,885,000 |
|
|
| | Total Short-Term Investments (at amortized cost) | 1,885,000 |
|
|
| | Total Investments (cost $1,127,001,281) 98.7% | $1,218,655,032 |
|
|
| | Other Assets and Liabilities, Net (1.3%) | | 16,411,791 |
|
|
| | Total Net Assets 100.0% | | | $1,235,066,823 |
|
|
+ The interest rate shown reflects the yield, coupon rate or, for securities purchased at a discount, the discount rate at the date of purchase.
> Denotes step coupon bonds for which the current interest rate and next scheduled reset date are shown.
∞ Denotes variable rate obligations for which the current yield and next scheduled reset date are shown.
÷ Denotes securities that have been pre-refunded or escrowed to maturity. Under such an arrangement, money is deposited into an irrevocable escrow account and is used to purchase U.S. Treasury securities or government agency securities with maturing principals and interest earnings sufficient to pay all debt service requirements of the pre-refunded bonds.
| Gross unrealized appreciation and depreciation of investments, based on cost for federal income tax purposes, were as follows: | |
| | |
| Gross unrealized appreciation | $92,035,309 | |
| Gross unrealized depreciation | (411,441) | |
|
| |
| Net unrealized appreciation (depreciation) | $91,623,868 | |
| Cost for federal income tax purposes | $1,127,031,164 | |
| The accompanying Notes to Financial Statements are an integral part of this schedule. |
|
| 197 |
Income Fund
Schedule of Investments as of October 31, 2006 |
| Principal | | | Interest | Maturity | |
| Amount | Long-Term Fixed Income (106.9%) | | Rate | Date | Value |
|
| Asset-Backed Securities (13.3%) | | | | |
| $3,621,931 | Bear Stearns Mortgage Funding Trust ∞ | | 5.460% | 11/25/2006 | $3,621,916 |
| 7,000,000 | Chase Funding Issuance Trust ∞- | | 5.310 | 11/15/2006 | 7,001,631 |
| 1,203,696 | Countrywide Asset-Backed Certificates | | 3.903 | 1/25/2031 | 1,196,115 |
| 5,000,000 | Countrywide Asset-Backed Certificates | | 5.549 | 4/25/2036 | 4,990,620 |
| 3,000,000 | Credit Based Asset Servicing and Securitization, LLC ∞ | 5.430 | 11/25/2006 | 3,000,381 |
| 6,000,000 | DaimlerChrysler Master Owner Trust ±∞ | | 5.370 | 11/15/2006 | 6,000,822 |
| 4,000,000 | Dow Jones CDX | | 8.125 | 6/29/2011 | 4,090,000 |
| 7,060,000 | Dow Jones CDX | | 8.000 | 12/29/2011 | 7,060,000 |
| 3,410,000 | Dow Jones CDX * | | 8.375 | 12/29/2011 | 3,461,150 |
| 3,000,000 | First Franklin Mortgage Loan Asset-Backed Certificates ∞ | 5.410 | 11/25/2006 | 2,999,985 |
| 2,547,852 | First Horizon ABS Trust ∞ | | 5.480 | 11/25/2006 | 2,547,839 |
| 5,000,000 | Ford Credit Floor Plan Master Owner Trust ∞ | | 5.500 | 11/15/2006 | 5,002,585 |
| 2,111,128 | Fremont Home Loan Trust ∞ | | 5.480 | 11/25/2006 | 2,111,512 |
| 6,000,000 | GE Dealer Floorplan Master Note Trust ±∞ | | 5.360 | 11/20/2006 | 6,001,698 |
| 3,000,000 | GMAC Mortgage Corporation Loan Trust ∞ | | 5.390 | 11/25/2006 | 3,003,750 |
| 6,000,000 | GMAC Mortgage Corporation Loan Trust ±∞ | | 5.410 | 11/25/2006 | 6,000,792 |
| 4,759,187 | GMAC Mortgage Corporation Loan Trust ∞ | | 5.420 | 11/25/2006 | 4,759,173 |
| 3,000,000 | Household Automotive Trust | | 5.400 | 6/17/2009 | 3,000,663 |
| 5,912,861 | IndyMac Seconds Asset-Backed Trust ∞ | | 5.490 | 11/25/2006 | 5,912,826 |
| 888,296 | Option One Mortgage Loan Trust ∞ | | 5.480 | 11/25/2006 | 888,714 |
| 1,205,986 | Popular ABS Mortgage Pass-Through Trust ∞ | | 5.430 | 11/25/2006 | 1,205,982 |
| 2,826,506 | Residential Asset Mortgage Products, Inc. ∞ | | 5.430 | 11/25/2006 | 2,827,004 |
|
|
| | Total Asset-Backed Securities | | 86,685,158 |
|
|
| |
| Basic Materials (1.8%) | | | | |
| 1,200,000 | Crystal US Holdings 3, LLC/Crystal US | | | | |
| | Sub 3 Corporation *> | Zero Coupon | 10/1/2009 | 1,008,000 |
| 3,500,000 | Glencore Funding, LLC ~ | | 6.000 | 4/15/2014 | 3,399,781 |
| 2,980,000 | Lubrizol Corporation ~ | | 5.500 | 10/1/2014 | 2,918,663 |
| 2,000,000 | Lyondell Chemical Company ~ | | 8.000 | 9/15/2014 | 2,045,000 |
| 2,000,000 | Precision Castparts Corporation ± | | 5.600 | 12/15/2013 | 1,992,480 |
|
|
| | Total Basic Materials | | | 11,363,924 |
|
|
| |
| Capital Goods (2.6%) | | | | |
| 2,500,000 | Boeing Capital Corporation * | | 6.500 | 2/15/2012 | 2,653,790 |
| 1,600,000 | CRH America, Inc. ~ | | 6.000 | 9/30/2016 | 1,611,672 |
| 2,219,000 | Goodrich Corporation * | | 6.800 | 7/1/2036 | 2,366,843 |
| 2,020,000 | Lockheed Martin Corporation ± | | 6.150 | 9/1/2036 | 2,146,424 |
| 3,250,000 | Oakmont Asset Trust ∈ | | 4.514 | 12/22/2008 | 3,175,211 |
| 800,000 | Owens Corning, Inc. | | 6.500 | 12/1/2016 | 813,509 |
| 1,200,000 | Owens Corning, Inc. | | 7.000 | 12/1/2036 | 1,213,453 |
| 2,770,500 | Systems 2001 Asset Trust, LLC | | 6.664 | 9/15/2013 | 2,916,533 |
|
|
| | Total Capital Goods | | | 16,897,435 |
|
|
| |
| Commercial Mortgage-Backed Securities (14.6%) | | | | |
| 6,000,000 | Banc of America Commercial Mortgage, Inc. ± | | 5.001 | 9/10/2010 | 5,969,856 |
| 3,250,000 | Banc of America Commercial Mortgage, Inc. ± | | 4.037 | 11/10/2039 | 3,146,702 |
| The accompanying Notes to Financial Statements are an integral part of this schedule. |
|
| 198 |
Income Fund
Schedule of Investments as of October 31, 2006 |
| Principal | | | Interest | Maturity | |
| Amount | Long-Term Fixed Income (106.9%) | | Rate | Date | Value |
|
| Commercial Mortgage-Backed Securities — continued | | | | |
| $270,228 | Banc of America Commercial Mortgage, Inc. | | 3.366% | 7/11/2043 | $267,907 |
| 2,000,000 | Banc of America Commercial Mortgage, Inc. ± | | 5.118 | 7/11/2043 | 1,996,698 |
| 7,179,758 | Banc of America Mortgage Securities, Inc. | | 4.817 | 9/25/2035 | 7,084,368 |
| 3,000,000 | Citigroup Mortgage Loan Trust, Inc. | | 5.536 | 3/25/2036 | 2,993,295 |
| 1,619,552 | Commercial Mortgage Pass-Through Certificates ∞ | 5.420 | 11/15/2006 | 1,619,680 |
| 4,000,000 | Commercial Mortgage Pass-Through Certificates ∞ | 5.450 | 11/15/2006 | 4,000,000 |
| 6,000,000 | Greenwich Capital Commercial Funding Corporation | 5.912 | 7/10/2038 | 6,301,140 |
| 3,148,703 | HomeBanc Mortgage Trust | | 6.078 | 4/25/2037 | 3,189,715 |
| 2,750,000 | J.P. Morgan Chase Commercial Mortgage | | | | |
| | Securities Corporation | | 4.302 | 1/15/2038 | 2,654,468 |
| 4,000,000 | LB-UBS Commercial Mortgage Trust | | 3.323 | 3/15/2027 | 3,901,240 |
| 3,679,409 | Lehman Brothers “CALSTRS” Mortgage Trust ± | | 3.988 | 11/20/2012 | 3,629,913 |
| 4,854,593 | Merrill Lynch Mortgage Investors, Inc. | | 4.881 | 6/25/2035 | 4,811,620 |
| 10,000,000 | Merrill Lynch Mortgage Trust ~ | | 4.747 | 5/12/2043 | 9,634,260 |
| 5,500,000 | Merrill Lynch Mortgage Trust | | 5.264 | 1/12/2044 | 5,506,479 |
| 4,881,181 | Thornburg Mortgage Securities Trust ∞ | | 5.410 | 11/25/2006 | 4,867,246 |
| 4,866,892 | Wachovia Bank Commercial Mortgage Loan Trust | 5.600 | 5/20/2036 | 4,890,404 |
| 2,432,177 | Wachovia Bank Commercial Mortgage Trust ∞∈ | | 5.520 | 11/15/2006 | 2,432,704 |
| 2,555,557 | Washington Mutual Asset Securities Corporation | | 3.830 | 1/25/2035 | 2,473,245 |
| 3,879,855 | Washington Mutual Mortgage Pass-Through Certificates ∞ | 5.610 | 11/25/2006 | 3,901,373 |
| 3,998,331 | Washington Mutual Mortgage Pass-Through Certificates | 4.837 | 9/25/2035 | 3,945,701 |
| 5,336,066 | Zuni Mortgage Loan Trust ∞∈ | | 5.450 | 11/25/2006 | 5,328,905 |
|
|
| | Total Commercial Mortgage-Backed Securities | 94,546,919 |
|
|
| |
| Communications Services (7.6%) | | | | |
| 1,795,000 | AT&T Corporation ~ | | 8.000 | 11/15/2031 | 2,248,824 |
| 4,000,000 | British Telecom plc ± | | 8.375 | 12/15/2010 | 4,492,536 |
| 2,500,000 | Citizens Communications Company ± | | 9.250 | 5/15/2011 | 2,771,875 |
| 1,330,000 | Comcast Corporation ± | | 5.900 | 3/15/2016 | 1,338,634 |
| 1,920,000 | Comcast Corporation ~ | | 6.500 | 1/15/2017 | 2,013,437 |
| 4,000,000 | Cox Communications, Inc. ∈~ | | 4.625 | 6/1/2013 | 3,733,876 |
| 845,000 | Cox Communications, Inc. | | 5.450 | 12/15/2014 | 825,475 |
| 1,200,000 | Embarq Corporation | | 7.082 | 6/1/2016 | 1,227,847 |
| 700,000 | Embarq Corporation | | 7.995 | 6/1/2036 | 744,381 |
| 3,300,000 | Intelsat Intermediate, Inc. > | | Zero Coupon | 2/1/2010 | 2,499,750 |
| 2,500,000 | New Cingular Wireless Services, Inc. ± | | 8.125 | 5/1/2012 | 2,821,695 |
| 765,000 | New Cingular Wireless Services, Inc. ± | | 8.750 | 3/1/2031 | 1,002,415 |
| 1,350,000 | News America, Inc. ∈ | | 6.400 | 12/15/2035 | 1,353,649 |
| 3,260,000 | Nextel Communications, Inc. ± | | 7.375 | 8/1/2015 | 3,366,622 |
| 1,650,000 | Nextel Partners, Inc. ~ | | 8.125 | 7/1/2011 | 1,732,500 |
| 3,200,000 | Qwest Corporation ∈ | | 8.875 | 3/15/2012 | 3,520,000 |
| 2,000,000 | Rogers Wireless Communications, Inc. ~ | | 6.375 | 3/1/2014 | 2,000,000 |
| 3,000,000 | TCI Communications, Inc. ± | | 8.750 | 8/1/2015 | 3,553,428 |
| 2,000,000 | Telecom Italia Capital SA ± | | 5.250 | 11/15/2013 | 1,912,918 |
| The accompanying Notes to Financial Statements are an integral part of this schedule. |
|
| 199 |
Income Fund
Schedule of Investments as of October 31, 2006 |
| Principal | | Interest | Maturity | |
| Amount | Long-Term Fixed Income (106.9%) | Rate | Date | Value |
|
| Communications Services — continued | | | |
| $2,250,000 | Telecom Italia Capital SA | 5.250% | 10/1/2015 | $2,104,027 |
| 1,150,000 | Time Warner Entertainment Company, LP | 8.375 | 3/15/2023 | 1,357,397 |
| 3,000,000 | Verizon Communications, Inc. ± | 5.550 | 2/15/2016 | 2,987,259 |
|
|
| | Total Communications Services | | 49,608,545 |
|
|
| |
| Consumer Cyclical (6.5%) | | | |
| 1,200,000 | Caesars Entertainment, Inc. | 7.500 | 9/1/2009 | 1,244,784 |
| 2,400,000 | Centex Corporation ± | 6.500 | 5/1/2016 | 2,459,724 |
| 2,030,000 | CVS Corporation ~ | 5.750 | 8/15/2011 | 2,061,120 |
| 900,000 | CVS Corporation ~ | 6.125 | 8/15/2016 | 927,608 |
| 3,440,000 | DaimlerChrysler North American Holdings Corporation | 5.750 | 9/8/2011 | 3,442,580 |
| 1,850,000 | Ford Motor Credit Company | 6.625 | 6/16/2008 | 1,815,074 |
| 7,985,000 | General Motors Acceptance Corporation ±∈ | 6.875 | 9/15/2011 | 8,039,809 |
| 2,090,000 | General Motors Acceptance Corporation | 8.000 | 11/1/2031 | 2,239,372 |
| 625,000 | General Motors Corporation * | 8.250 | 7/15/2023 | 554,688 |
| 1,300,000 | Home Depot, Inc. ~ | 5.400 | 3/1/2016 | 1,298,010 |
| 2,000,000 | Marriott International, Inc. ∈ | 7.000 | 1/15/2008 | 2,030,442 |
| 2,800,000 | May Department Stores Company ± | 4.800 | 7/15/2009 | 2,756,348 |
| 1,700,000 | May Department Stores Company *∈ | 5.750 | 7/15/2014 | 1,679,982 |
| 400,000 | MGM MIRAGE ~ | 6.750 | 4/1/2013 | 388,000 |
| 2,650,000 | Nissan Motor Acceptance Corporation | 5.625 | 3/14/2011 | 2,664,162 |
| 2,000,000 | Royal Caribbean Cruises, Ltd. * | 7.250 | 6/15/2016 | 2,026,258 |
| 2,939,937 | SLM Private Credit Student Loan Trust ∞ | 5.400 | 12/15/2006 | 2,940,542 |
| 1,400,000 | Viacom, Inc. | 5.750 | 4/30/2011 | 1,401,743 |
| 1,540,000 | Walt Disney Company ~ | 5.625 | 9/15/2016 | 1,557,882 |
| 800,000 | Yum! Brands, Inc. | 6.250 | 4/15/2016 | 825,878 |
|
|
| | Total Consumer Cyclical | | | 42,354,006 |
|
|
| |
| Consumer Non-Cyclical (2.8%) | | | |
| 3,600,000 | Abbott Laboratories ~ | 5.600 | 5/15/2011 | 3,669,044 |
| 800,000 | AmerisourceBergen Corporation | 5.625 | 9/15/2012 | 785,901 |
| 800,000 | AmerisourceBergen Corporation | 5.875 | 9/15/2015 | 785,707 |
| 2,215,000 | Baxter International, Inc. ± | 5.900 | 9/1/2016 | 2,284,624 |
| 1,670,000 | Fortune Brands, Inc. * | 5.875 | 1/15/2036 | 1,525,936 |
| 2,075,000 | Quest Diagnostic, Inc. ∈ | 5.450 | 11/1/2015 | 2,016,168 |
| 2,800,000 | Triad Hospitals, Inc. | 7.000 | 5/15/2012 | 2,779,000 |
| 4,025,000 | Wyeth ± | 6.950 | 3/15/2011 | 4,288,593 |
|
|
| | Total Consumer Non-Cyclical | | 18,134,973 |
|
|
| |
| Energy (3.4%) | | | |
| 1,260,000 | Anadarko Petroleum Corporation ± | 5.950 | 9/15/2016 | 1,279,637 |
| 800,000 | Anadarko Petroleum Corporation | 6.450 | 9/15/2036 | 829,212 |
| 1,325,000 | Boardwalk Pipelines, LLC ∈ | 5.500 | 2/1/2017 | 1,288,515 |
| 1,100,000 | Consolidated Natural Gas Company | 5.000 | 12/1/2014 | 1,050,106 |
| 1,740,000 | Energy Transfer Partners, LP | 6.125 | 2/15/2017 | 1,767,323 |
| 600,000 | Energy Transfer Partners, LP | 6.625 | 10/15/2036 | 616,268 |
| The accompanying Notes to Financial Statements are an integral part of this schedule. |
|
| 200 |
Income Fund
Schedule of Investments as of October 31, 2006 |
| Principal | | Interest | Maturity | |
| Amount | Long-Term Fixed Income (106.9%) | Rate | Date | Value |
|
| Energy — continued | | | |
| $3,100,000 | Enterprise Products Operating, LP ±∈ | 5.600% | 10/15/2014 | $3,059,161 |
| 1,800,000 | Magellan Midstream Partners, LP | 6.450 | 6/1/2014 | 1,865,518 |
| 1,500,000 | Premcor Refining Group, Inc. | 6.125 | 5/1/2011 | 1,532,691 |
| 1,850,000 | Premcor Refining Group, Inc. ∈ | 6.750 | 5/1/2014 | 1,895,321 |
| 3,375,000 | Ras Laffan Liquefied Natural Gas Company, Ltd. II | 5.298 | 9/30/2020 | 3,256,672 |
| 1,100,000 | Southern California Gas Company | 5.750 | 11/15/2035 | 1,112,431 |
| 2,000,000 | Transcontinental Gas Pipe Corporation | 8.875 | 7/15/2012 | 2,245,000 |
| 600,000 | Transcontinental Gas Pipe Corporation | 6.400 | 4/15/2016 | 597,000 |
|
|
| | Total Energy | | | 22,394,855 |
|
|
| |
| Financials (18.7%) | | | |
| 1,600,000 | Ace INA Holdings, Inc. ± | 6.700 | 5/15/2036 | 1,737,618 |
| 1,400,000 | American International Group, Inc. ± | 6.250 | 5/1/2036 | 1,497,819 |
| 1,900,000 | Archstone-Smith Operating Trust ± | 5.625 | 8/15/2014 | 1,916,701 |
| 1,590,000 | BAC Capital Trust XI | 6.625 | 5/23/2036 | 1,712,773 |
| 1,500,000 | Barnett Capital I | 8.060 | 12/1/2026 | 1,562,580 |
| 2,100,000 | BNP Paribas SA ∈ | 5.186 | 6/29/2015 | 2,002,749 |
| 1,950,000 | Capital One Capital III ~ | 7.686 | 8/15/2036 | 2,150,339 |
| 1,500,000 | Capital One Financial Corporation ± | 6.250 | 11/15/2013 | 1,562,228 |
| 1,795,000 | CIT Group, Inc. * | 5.850 | 9/15/2016 | 1,821,202 |
| 1,000,000 | Corestates Capital Trust I | 8.000 | 12/15/2026 | 1,040,377 |
| 4,000,000 | Credit Suisse USA, Inc. ± | 5.250 | 3/2/2011 | 4,009,904 |
| 2,800,000 | Endurance Specialty Holdings, Ltd. * | 6.150 | 10/15/2015 | 2,788,985 |
| 1,600,000 | EOP Operating, LP | 4.650 | 10/1/2010 | 1,556,584 |
| 2,800,000 | EOP Operating, LP | 5.875 | 1/15/2013 | 2,850,364 |
| 1,500,000 | ERP Operating, LP ± | 5.125 | 3/15/2016 | 1,455,213 |
| 1,625,000 | General Electric Capital Corporation | 5.720 | 8/22/2011 | 1,640,033 |
| 3,200,000 | General Electric Capital Corporation | 4.375 | 3/3/2012 | 3,079,133 |
| 3,500,000 | Goldman Sachs Group, Inc. ± | 5.125 | 1/15/2015 | 3,421,621 |
| 4,500,000 | HSBC Capital Funding, LP/Jersey Channel Islands ± | 9.547 | 6/30/2010 | 5,108,562 |
| 1,345,000 | HSBC Holdings plc ∈ | 6.500 | 5/2/2036 | 1,457,165 |
| 495,000 | International Lease Finance Corporation | 4.875 | 9/1/2010 | 489,123 |
| 1,600,000 | International Lease Finance Corporation * | 5.750 | 6/15/2011 | 1,633,560 |
| 2,970,000 | iStar Financial, Inc. ∈ | 5.950 | 10/15/2013 | 2,990,288 |
| 2,940,000 | J.P. Morgan Chase Bank NA | 5.875 | 6/13/2016 | 3,019,889 |
| 755,000 | Lincoln National Corporation | 7.000 | 5/17/2016 | 794,758 |
| 2,000,000 | Marsh & McLennan Companies, Inc. | 5.750 | 9/15/2015 | 1,927,276 |
| 1,500,000 | Merrill Lynch & Company, Inc. | 6.050 | 5/16/2016 | 1,557,682 |
| 2,475,000 | Mitsubishi UFG Capital Finance, Ltd. | 6.346 | 7/25/2016 | 2,499,488 |
| 2,080,000 | Montpelier Re Holdings, Ltd. ∈ | 6.125 | 8/15/2013 | 2,019,322 |
| 2,000,000 | Monumental Global Funding II | 4.625 | 3/15/2010 | 1,963,708 |
| 1,600,000 | Morgan Stanley ∈ | 3.875 | 1/15/2009 | 1,559,102 |
| 2,280,000 | Morgan Stanley | 6.250 | 8/9/2026 | 2,388,261 |
| 4,000,000 | Preferred Term Securities XXIII, Ltd. ∞ | 5.590 | 12/22/2006 | 4,002,500 |
| 2,050,000 | ProLogis | 5.500 | 4/1/2012 | 2,051,527 |
| 1,400,000 | ProLogis | 5.625 | 11/15/2015 | 1,401,240 |
| The accompanying Notes to Financial Statements are an integral part of this schedule. |
|
| 201 |
Income Fund
Schedule of Investments as of October 31, 2006 |
| Principal | | Interest | Maturity | |
| Amount | Long-Term Fixed Income (106.9%) | Rate | Date | Value |
|
| Financials — continued | | | |
| $2,000,000 | Protective Life Secured Trust | 4.850% | 8/16/2010 | $1,982,096 |
| 1,500,000 | Prudential Financial, Inc. | 4.750 | 6/13/2015 | 1,421,518 |
| 725,000 | Prudential Financial, Inc. | 5.900 | 3/17/2036 | 734,083 |
| 2,250,000 | RBS Capital Trust I * | 5.512 | 9/30/2014 | 2,213,701 |
| 3,120,000 | Residential Capital Corporation ∞~ | 6.474 | 1/17/2007 | 3,146,433 |
| 2,200,000 | Residential Capital Corporation ∞ | 7.204 | 1/17/2007 | 2,204,924 |
| 6,460,000 | Residential Capital Corporation | 6.500 | 4/17/2013 | 6,573,974 |
| 2,000,000 | Resona Bank, Ltd. | 5.850 | 4/15/2016 | 1,959,090 |
| 2,250,000 | Simon Property Group, LP ± | 4.600 | 6/15/2010 | 2,203,137 |
| 1,400,000 | Simon Property Group, LP | 5.375 | 6/1/2011 | 1,401,501 |
| 1,485,000 | Simon Property Group, LP | 5.750 | 12/1/2015 | 1,511,433 |
| 850,000 | St. Paul Companies, Inc. | 6.250 | 6/20/2016 | 898,757 |
| 2,600,000 | Swiss RE Capital I, LP | 6.854 | 5/25/2016 | 2,715,768 |
| 2,000,000 | Travelers Property Casualty Corporation | 5.000 | 3/15/2013 | 1,959,610 |
| 2,420,000 | Wachovia Bank NA ∈ | 4.875 | 2/1/2015 | 2,329,928 |
| 2,225,000 | Wachovia Capital Trust III | 5.800 | 3/15/2011 | 2,244,596 |
| 2,350,000 | Wachovia Corporation | 5.300 | 10/15/2011 | 2,362,213 |
| 2,170,000 | Washington Mutual Bank FA | 5.125 | 1/15/2015 | 2,098,627 |
| 4,500,000 | Wells Fargo Capital | 7.730 | 12/1/2026 | 4,683,478 |
| 2,200,000 | Willis Group North America, Inc. ∈ | 5.625 | 7/15/2015 | 2,102,883 |
|
|
| | Total Financials | | | 121,417,424 |
|
|
| |
| Foreign (0.6%) | | | |
| 166,667 | Pemex Finance, Ltd. | 8.450 | 2/15/2007 | 167,493 |
| 3,600,000 | Pemex Finance, Ltd. ∈ | 9.030 | 2/15/2011 | 3,862,152 |
|
|
| | Total Foreign | | | 4,029,645 |
|
|
| |
| Mortgage-Backed Securities (16.4%) | | | |
| 19,000,000 | Federal National Mortgage Association Conventional | | | |
| | 30-Yr. Pass Through Ω | 5.000 | 11/1/2036 | 18,340,928 |
| 50,000,000 | Federal National Mortgage Association Conventional | | | |
| | 30-Yr. Pass Through Ω | 5.500 | 11/1/2036 | 49,406,252 |
| 38,000,000 | Federal National Mortgage Association Conventional | | | |
| | 30-Yr. Pass Through Ω | 6.500 | 11/1/2036 | 38,724,356 |
|
|
| | Total Mortgage-Backed Securities | | 106,471,536 |
|
|
| |
| Transportation (3.2%) | | | |
| 1,000,000 | FedEx Corporation | 3.500 | 4/1/2009 | 960,998 |
| 4,626,141 | FedEx Corporation | 6.720 | 1/15/2022 | 4,987,443 |
| 1,750,000 | Hertz Corporation ± | 8.875 | 1/1/2014 | 1,828,750 |
| 5,800,000 | Northwest Airlines, Inc. ∈~√ | 6.841 | 4/1/2011 | 5,749,250 |
| 3,341,588 | Piper Jaffray Equipment Trust Securities | 6.750 | 4/1/2011 | 3,324,880 |
| 4,000,000 | Southwest Airlines Company | 5.496 | 11/1/2006 | 4,000,000 |
|
|
| | Total Transportation | | | 20,851,321 |
|
|
| The accompanying Notes to Financial Statements are an integral part of this schedule. |
|
| 202 |
Income Fund
Schedule of Investments as of October 31, 2006 |
| Principal | | Interest | Maturity | |
| Amount | Long-Term Fixed Income (106.9%) | Rate | Date | Value |
|
| U.S. Government (10.3%) | | | |
| $3,250,000 | Federal Home Loan Bank | 5.625% | 6/13/2016 | $3,355,768 |
| 1,500,000 | Federal Home Loan Mortgage Corporation | 5.400 | 2/28/2011 | 1,499,610 |
| 7,500,000 | Federal National Mortgage Association ∈ | 5.300 | 2/22/2011 | 7,466,085 |
| 1,020,000 | U.S. Treasury Bonds *∈ | 7.625 | 2/15/2025 | 1,365,286 |
| 12,910,000 | U.S. Treasury Bonds * | 6.125 | 8/15/2029 | 15,287,260 |
| 210,000 | U.S. Treasury Bonds * | 5.375 | 2/15/2031 | 227,998 |
| 130,000 | U.S. Treasury Bonds * | 4.500 | 2/15/2036 | 125,470 |
| 15,140,000 | U.S. Treasury Notes * | 4.500 | 9/30/2011 | 15,087,358 |
| 7,030,725 | U.S. Treasury Notes, TIPS * | 2.000 | 7/15/2014 | 6,848,362 |
| 17,000,000 | U.S. Treasury Principal Strips *∈ | Zero Coupon | 11/15/2022 | 7,833,005 |
| 10,250,000 | U.S. Treasury Strips * | Zero Coupon | 2/15/2013 | 7,709,824 |
|
|
| | Total U.S. Government | | 66,806,026 |
|
|
| |
| Utilities (5.1%) | | | |
| 2,000,000 | Baltimore Gas & Electric Company ± | 5.900 | 10/1/2016 | 2,031,666 |
| 1,250,000 | Carolina Power & Light, Inc. ± | 5.150 | 4/1/2015 | 1,228,372 |
| 1,640,000 | Cincinnati Gas & Electric Company ~ | 5.700 | 9/15/2012 | 1,658,755 |
| 2,635,000 | Cleveland Electric Illuminating Company ± | 7.430 | 11/1/2009 | 2,782,412 |
| 2,000,000 | Dynegy Holdings, Inc. ~ | 8.750 | 2/15/2012 | 2,090,000 |
| 1,000,000 | Exelon Corporation ± | 6.750 | 5/1/2011 | 1,048,853 |
| 2,000,000 | Exelon Corporation ~ | 4.900 | 6/15/2015 | 1,891,084 |
| 1,200,000 | Florida Power & Light Company ∈ | 6.200 | 6/1/2036 | 1,296,085 |
| 1,475,000 | MidAmerican Energy Holdings Company | 3.500 | 5/15/2008 | 1,436,432 |
| 4,100,000 | NiSource Finance Corporation ± | 7.875 | 11/15/2010 | 4,432,539 |
| 1,500,000 | NRG Energy, Inc. ± | 7.250 | 2/1/2014 | 1,516,875 |
| 1,000,000 | NRG Energy, Inc. ± | 7.375 | 2/1/2016 | 1,011,250 |
| 1,662,807 | Power Contract Financing, LLC ± | 6.256 | 2/1/2010 | 1,675,028 |
| 2,254,818 | Power Receivables Finance, LLC | 6.290 | 1/1/2012 | 2,273,758 |
| 790,000 | Progress Energy, Inc. | 7.000 | 10/30/2031 | 889,390 |
| 3,200,000 | PSEG Power, LLC ∈ | 5.000 | 4/1/2014 | 3,055,168 |
| 1,360,000 | PSI Energy, Inc. | 5.000 | 9/15/2013 | 1,317,077 |
| 1,585,000 | Virginia Electric & Power Company | 6.000 | 1/15/2036 | 1,597,945 |
|
|
| | Total Utilities | | | 33,232,689 |
|
|
| | Total Long-Term Fixed Income (cost $689,519,450) | 694,794,456 |
|
|
| |
| |
| | | | Expiration | |
| Contracts | Options Purchased (<0.1%) | Price | Date | Value |
|
| 325 | 10-Yr. U.S. Treasury Note Futures | $106 | 11/21/2006 | $5,078 |
| 145 | 20-Yr. U.S. Treasury Bond Futures | 110 | 11/21/2006 | 6,797 |
|
|
| | Total Options Purchased (cost $247,654) | 11,875 |
|
|
| The accompanying Notes to Financial Statements are an integral part of this schedule. |
|
| 203 |
Income Fund
Schedule of Investments as of October 31, 2006 |
| | | | | Interest | Maturity | |
| Shares | Collateral Held for Securities Loaned (11.1%) | Rate (+) | Date | Value |
|
| 71,849,012 | Thrivent Financial Securities Lending Trust | 5.300% | N/A | $71,849,012 |
|
|
| | | Total Collateral Held for Securities Loaned | |
| | | (cost $71,849,012) | | | 71,849,012 |
|
|
| |
| |
| Shares or | | | | | | |
| Principal | | | | Interest | Maturity | |
| Amount | Short-Term Investments (8.3%) | | Rate (+) | Date | Value |
|
| $10,500,000 | DnB NORBank ASA | | | 5.310% | 11/1/2006 | $10,500,000 |
| 763,000 | Falcon Asset Securitization Corporation | 5.300 | 11/13/2006 | 761,652 |
| 5,000,000 | Falcon Asset Securitization Corporation | 5.260 | 11/20/2006 | 4,986,119 |
| 5,000,000 | Jupiter Securitization Company, LLC | | 5.300 | 11/17/2006 | 4,988,311 |
| 2,000,000 | Jupiter Securitization Company, LLC | | 5.260 | 11/27/2006 | 1,992,402 |
| 27,543,642 | Thrivent Money Market Fund | | 4.600 | N/A | 27,543,642 |
| 3,500,000 | Windmill Funding Corporation | | 5.280 | 11/8/2006 | 3,496,407 |
|
|
| | | Total Short-Term Investments (at amortized cost) | 54,268,533 |
|
|
| | | Total Investments (cost $815,884,649) 126.3% | $820,923,876 |
|
|
| | | Other Assets and Liabilities, Net (26.3%) | (170,891,169) |
|
|
| | | Total Net Assets 100.0% | | $650,032,707 |
|
|
| |
| | | Number of | | Notional | | |
| | | Contracts | Expiration | Principal | | Unrealized |
| Futures | | Long/(Short) | Date | Amount | Value | Gain/(Loss) |
|
| 5-Yr. U.S. Treasury Bond Futures | 5 | December 2006 | $525,013 | $527,813 | $2,800 |
| 10-Yr. U.S. Treasury Bond Futures | (460) | December 2006 | ($49,389,566) | ($49,780,625) | ($391,059) |
| 20-Yr. U.S. Treasury Bond Futures | 110 | December 2006 | $12,177,620 | $12,392,189 | $214,569 |
* All or a portion of the security is on loan as discussed in item 2(L) of the Notes to Financial Statements.
+ The interest rate shown reflects the yield, coupon rate or, for securities purchased at a discount, the discount rate at the date of purchase.
> Denotes step coupon bonds for which the current interest rate and next scheduled reset date are shown.
∞ Denotes variable rate obligations for which the current yield and next scheduled reset date are shown.
Ω Denotes investments purchased on a when-issued basis.
± Designated as cover for long settling trades as discussed in the Notes to Financial Statements.
∈ At October 31, 2006, $1,074,042 of investments were held on deposit with the counterparty and pledged as the initial margin deposit for open financial futures contracts. In addition, $64,955,606 of investments were earmarked as collateral to cover open financial futures contracts.
~ All or a portion of the security was earmarked as collateral to cover options.
√ In bankruptcy.
Definitions:
TIPS — Treasury Inflation Protected Security.
| Gross unrealized appreciation and depreciation of investments, based on cost for federal income tax purposes, were as follows: | |
| | |
| Gross unrealized appreciation | $8,019,968 | |
| Gross unrealized depreciation | (3,435,987) | |
| |
| |
| Net unrealized appreciation (depreciation) | $4,583,981 | |
|
| |
| Cost for federal income tax purposes | $816,339,895 | |
| The accompanying Notes to Financial Statements are an integral part of this schedule. |
|
| 204 |
Core Bond Fund
Schedule of Investments as of October 31, 2006 |
| Principal | | Interest | Maturity | |
| Amount | Long-Term Fixed Income (122.5%) | Rate | Date | Value |
|
| Asset-Backed Securities (27.1%) | | | |
| $5,000,000 | Americredit Automobile Receivables Trust ±∞ | 5.400% | 11/6/2006 | $5,001,625 |
| 3,000,000 | Associates Manufactured Housing Contract | | | |
| | Pass-Through Certificates ± | 7.900 | 3/15/2027 | 3,067,539 |
| 5,000,000 | Bear Stearns Asset-Backed Securities, Inc. ±∞ | 5.560 | 11/25/2006 | 5,004,275 |
| 3,621,931 | Bear Stearns Mortgage Funding Trust ±∞ | 5.460 | 11/25/2006 | 3,621,916 |
| 3,000,000 | CIT Equipment Collateral ± | 4.420 | 5/20/2009 | 2,976,957 |
| 962,957 | Countrywide Asset-Backed Certificates | 3.903 | 1/25/2031 | 956,892 |
| 3,500,000 | Countrywide Asset-Backed Certificates ± | 5.549 | 4/25/2036 | 3,493,434 |
| 123,554 | Credit Based Asset Servicing and Securitization ± | 3.887 | 10/25/2034 | 122,979 |
| 4,000,000 | Credit Based Asset Servicing and Securitization, LLC ∞ | 5.430 | 11/25/2006 | 4,000,508 |
| 2,500,000 | Credit Based Asset Servicing and Securitization, LLC ± | 5.501 | 12/25/2036 | 2,497,418 |
| 5,000,000 | DaimlerChrysler Master Owner Trust ±∞∈ | 5.370 | 11/15/2006 | 5,000,685 |
| 189,680 | Encore Credit Receivables Trust ±∞ | 5.440 | 11/25/2006 | 189,688 |
| 1,472,973 | FBR Securitization Trust, LLC ∞ | 5.440 | 11/25/2006 | 1,473,083 |
| 2,500,000 | First Franklin Mortgage Loan Asset-Backed Certificates ∞ | 5.410 | 11/25/2006 | 2,499,988 |
| 1,828,713 | First Franklin Mortgage Loan Asset-Backed Certificates ∞ | 5.420 | 11/25/2006 | 1,829,015 |
| 3,397,136 | First Horizon ABS Trust ∞ | 5.480 | 11/25/2006 | 3,397,119 |
| 2,638,910 | Fremont Home Loan Trust ∞ | 5.480 | 11/25/2006 | 2,639,390 |
| 5,000,000 | GE Dealer Floorplan Master Note Trust ±∞ | 5.360 | 11/20/2006 | 5,001,415 |
| 3,000,000 | GMAC Mortgage Corporation Loan Trust ±∞ | 5.390 | 11/25/2006 | 3,003,750 |
| 5,000,000 | GMAC Mortgage Corporation Loan Trust ∞∈ | 5.410 | 11/25/2006 | 5,000,660 |
| 2,855,512 | GMAC Mortgage Corporation Loan Trust ∞ | 5.420 | 11/25/2006 | 2,855,504 |
| 1,523,687 | Green Tree Financial Corporation ±∈ | 7.650 | 10/15/2027 | 1,578,837 |
| 5,000,000 | Harley Davidson Motorcycle Trust ±∈ | 3.200 | 5/15/2012 | 4,885,780 |
| 2,796,037 | Master Asset-Backed Securities Trust ∞ | 5.400 | 11/25/2006 | 2,796,582 |
| 4,295,846 | National Collegiate Student Loan Trust ∞ | 5.380 | 11/25/2006 | 4,299,223 |
| 2,960,988 | Option One Mortgage Loan Trust ±∞ | 5.480 | 11/25/2006 | 2,962,380 |
| 1,061,797 | PG&E Energy Recovery Funding, LLC | 3.870 | 6/25/2011 | 1,044,645 |
| 1,507,482 | Popular ABS Mortgage Pass-Through Trust ∞ | 5.430 | 11/25/2006 | 1,507,478 |
| 2,652,822 | Popular ABS Mortgage Pass-Through Trust ∞∈ | 5.450 | 11/25/2006 | 2,653,504 |
| 2,000,000 | Popular ABS Mortgage Pass-Through Trust ± | 4.000 | 12/25/2034 | 1,973,802 |
| 5,000,000 | Renaissance Home Equity Loan Trust ~ | 5.608 | 5/25/2036 | 5,002,320 |
| 1,326,282 | Residential Asset Securities Corporation ∞∈ | 5.430 | 11/25/2006 | 1,326,450 |
| 1,466,898 | Residential Asset Securities Corporation | 4.160 | 7/25/2030 | 1,446,945 |
| 2,152,943 | SLM Student Loan Trust ±∞ | 5.387 | 1/25/2007 | 2,153,942 |
| 1,607,082 | Specialty Underwriting and Residential Finance Trust ∞ | 5.440 | 11/25/2006 | 1,607,299 |
| 5,000,000 | Textron Financial Floorplan Master Note Trust ±∞ | 5.440 | 11/13/2006 | 5,008,915 |
| 4,000,000 | Wachovia Auto Loan Owner Trust | 5.210 | 8/22/2011 | 4,012,031 |
| 501,518 | Wachovia Mortgage Loan Trust, LLC ∞∈ | 5.430 | 11/25/2006 | 501,549 |
|
|
| | Total Asset-Backed Securities | | 108,395,522 |
|
|
| |
| Basic Materials (0.5%) | | | |
| 2,000,000 | Precision Castparts Corporation ± | 5.600 | 12/15/2013 | 1,992,480 |
|
|
| | Total Basic Materials | | | 1,992,480 |
|
|
| The accompanying Notes to Financial Statements are an integral part of this schedule. |
|
| 205 |
Core Bond Fund
Schedule of Investments as of October 31, 2006 |
| Principal | | Interest | Maturity | |
| Amount | Long-Term Fixed Income (122.5%) | Rate | Date | Value |
|
| Capital Goods (1.7%) | | | |
| $2,000,000 | Boeing Capital Corporation * | 6.500% | 2/15/2012 | $2,123,032 |
| 890,000 | Goodrich Corporation ∈ | 6.290 | 7/1/2016 | 919,817 |
| 935,000 | Lockheed Martin Corporation ± | 6.150 | 9/1/2036 | 993,518 |
| 2,750,000 | Oakmont Asset Trust ± | 4.514 | 12/22/2008 | 2,686,717 |
|
|
| | Total Capital Goods | | | 6,723,084 |
|
|
| |
| Commercial Mortgage-Backed Securities (21.6%) | | | |
| 5,000,000 | Banc of America Commercial Mortgage, Inc. ±∈ | 6.085 | 6/11/2035 | 5,115,025 |
| 2,750,000 | Banc of America Commercial Mortgage, Inc. | 4.037 | 11/10/2039 | 2,662,594 |
| 3,000,000 | Banc of America Commercial Mortgage, Inc. ± | 5.118 | 7/11/2043 | 2,995,047 |
| 4,487,349 | Banc of America Mortgage Securities, Inc. ± | 4.817 | 9/25/2035 | 4,427,730 |
| 3,000,000 | Bear Stearns Commercial Mortgage Securities, Inc. ± | 3.869 | 2/11/2041 | 2,924,289 |
| 4,000,000 | Citigroup Commercial Mortgage Trust Ω | 5.438 | 11/15/2018 | 4,000,000 |
| 1,349,627 | Commercial Mortgage Pass-Through Certificates ±∞ | 5.420 | 11/15/2006 | 1,349,734 |
| 4,000,000 | Commercial Mortgage Pass-Through Certificates ∞ | 5.450 | 11/15/2006 | 4,000,000 |
| 4,100,000 | First Union National Bank Commercial Mortgage Trust ± | 7.390 | 12/15/2031 | 4,328,235 |
| 5,000,000 | GS Mortgage Securities Corporation | 5.588 | 11/10/2039 | 5,094,300 |
| 3,148,703 | HomeBanc Mortgage Trust ±∈ | 6.078 | 4/25/2037 | 3,189,715 |
| 4,543,575 | J.P. Morgan Alternative Loan Trust ±∈ | 5.804 | 3/25/2036 | 4,580,478 |
| 5,500,000 | LB-UBS Commercial Mortgage Trust ± | 4.187 | 8/15/2029 | 5,377,614 |
| 4,045,494 | Merrill Lynch Mortgage Investors, Inc. ±∈ | 4.881 | 6/25/2035 | 4,009,684 |
| 3,250,000 | Merrill Lynch Mortgage Trust ± | 5.264 | 1/12/2044 | 3,253,828 |
| 4,990,512 | National Collegiate Student Loan Trust~ | 5.390 | 11/25/2006 | 4,992,459 |
| 3,904,945 | Thornburg Mortgage Securities Trust ∞~ | 5.410 | 11/25/2006 | 3,893,797 |
| 1,824,133 | Wachovia Bank Commercial Mortgage Trust ∞ | 5.520 | 11/15/2006 | 1,824,528 |
| 3,000,000 | Wachovia Bank Commercial Mortgage Trust ±∈ | 4.390 | 2/15/2036 | 2,898,153 |
| 4,500,000 | Wachovia Bank Commercial Mortgage Trust ∈ | 4.516 | 5/15/2044 | 4,409,986 |
| 3,833,335 | Washington Mutual Asset Securities Corporation ~ | 3.830 | 1/25/2035 | 3,709,867 |
| 3,998,331 | Washington Mutual Mortgage Pass-Through Certificates ~ | 4.837 | 9/25/2035 | 3,945,701 |
| 3,557,377 | Zuni Mortgage Loan Trust ∞∈ | 5.450 | 11/25/2006 | 3,552,603 |
|
|
| | Total Commercial Mortgage-Backed Securities | 86,535,367 |
|
|
| |
| Communications Services (3.6%) | | | |
| 1,750,000 | AT&T Broadband Corporation ±~ | 8.375 | 3/15/2013 | 1,999,046 |
| 755,000 | AT&T Corporation ± | 8.000 | 11/15/2031 | 945,884 |
| 2,000,000 | British Telecom plc ± | 8.375 | 12/15/2010 | 2,246,268 |
| 475,000 | Comcast Corporation ± | 5.900 | 3/15/2016 | 478,084 |
| 600,000 | Comcast Corporation ~ | 6.500 | 1/15/2017 | 629,199 |
| 1,325,000 | Cox Communications, Inc. ± | 5.450 | 12/15/2014 | 1,294,385 |
| 520,000 | New Cingular Wireless Services, Inc. ± | 8.750 | 3/1/2031 | 681,380 |
| 510,000 | News America, Inc. ± | 6.400 | 12/15/2035 | 511,379 |
| 1,600,000 | Nextel Communications, Inc. ± | 7.375 | 8/1/2015 | 1,652,330 |
| 1,300,000 | Nextel Partners, Inc. ∈ | 8.125 | 7/1/2011 | 1,365,000 |
| 1,500,000 | Telecom Italia Capital SA ± | 5.250 | 10/1/2015 | 1,402,684 |
| 990,000 | Verizon Communications, Inc. ∈ | 5.550 | 2/15/2016 | 985,795 |
|
|
| | Total Communications Services | | 14,191,434 |
|
|
| The accompanying Notes to Financial Statements are an integral part of this schedule. |
|
| 206 |
Core Bond Fund
Schedule of Investments as of October 31, 2006 |
| Principal | | Interest | Maturity | |
| Amount | Long-Term Fixed Income (122.5%) | Rate | Date | Value |
|
| Consumer Cyclical (3.3%) | | | |
| $1,500,000 | Caesars Entertainment, Inc. ∈ | 8.500% | 11/15/2006 | $1,502,160 |
| 825,000 | CVS Corporation ~ | 5.750 | 8/15/2011 | 837,647 |
| 390,000 | CVS Corporation ± | 6.125 | 8/15/2016 | 401,963 |
| 1,150,000 | DaimlerChrysler North American Holdings Corporation ± | 5.750 | 9/8/2011 | 1,150,862 |
| 1,250,000 | Ford Motor Credit Company ± | 6.625 | 6/16/2008 | 1,226,401 |
| 4,205,000 | General Motors Acceptance Corporation ~ | 6.875 | 9/15/2011 | 4,233,863 |
| 770,000 | General Motors Acceptance Corporation ± | 8.000 | 11/1/2031 | 825,032 |
| 650,000 | Home Depot, Inc. ∈ | 5.400 | 3/1/2016 | 649,005 |
| 1,950,000 | Nissan Motor Acceptance Corporation ∈ | 5.625 | 3/14/2011 | 1,960,421 |
| 530,000 | Walt Disney Company ∈ | 5.625 | 9/15/2016 | 536,154 |
|
|
| | Total Consumer Cyclical | | | 13,323,508 |
|
|
| |
| Consumer Non-Cyclical (1.2%) | | | |
| 1,845,000 | Abbott Laboratories ±∈ | 5.600 | 5/15/2011 | 1,880,385 |
| 765,000 | Baxter International, Inc. ~ | 5.900 | 9/1/2016 | 789,046 |
| 810,000 | Fortune Brands, Inc. ± | 5.875 | 1/15/2036 | 740,125 |
| 1,325,000 | Wyeth ∈ | 6.950 | 3/15/2011 | 1,411,773 |
|
|
| | Total Consumer Non-Cyclical | | 4,821,329 |
|
|
| |
| Energy (0.9%) | | | |
| 545,000 | Anadarko Petroleum Corporation ~ | 5.950 | 9/15/2016 | 553,494 |
| 815,000 | Boardwalk Pipelines, LLC ± | 5.500 | 2/1/2017 | 792,558 |
| 630,000 | Energy Transfer Partners, LP | 6.125 | 2/15/2017 | 639,893 |
| 1,500,000 | Ras Laffan Liquefied Natural Gas Company, Ltd. II ± | 5.298 | 9/30/2020 | 1,447,410 |
|
|
| | Total Energy | | | 3,433,355 |
|
|
| |
| Financials (9.5%) | | | |
| 600,000 | American International Group, Inc. ~ | 6.250 | 5/1/2036 | 641,923 |
| 1,825,000 | Archstone-Smith Trust ± | 5.250 | 12/1/2010 | 1,820,166 |
| 550,000 | BAC Capital Trust XI ± | 6.625 | 5/23/2036 | 592,469 |
| 1,250,000 | Barnett Capital I ± | 8.060 | 12/1/2026 | 1,302,150 |
| 650,000 | Capital One Capital III ± | 7.686 | 8/15/2036 | 716,780 |
| 825,000 | CIT Group, Inc. ~ | 5.850 | 9/15/2016 | 837,043 |
| 1,250,000 | Corestates Capital Trust I ± | 8.000 | 12/15/2026 | 1,300,471 |
| 355,000 | General Electric Capital Corporation ∈ | 5.720 | 8/22/2011 | 358,284 |
| 2,225,000 | General Electric Capital Corporation ∈ | 4.375 | 3/3/2012 | 2,140,960 |
| 1,500,000 | Goldman Sachs Group, Inc. ± | 5.125 | 1/15/2015 | 1,466,409 |
| 950,000 | HSBC Holdings plc ± | 6.500 | 5/2/2036 | 1,029,224 |
| 175,000 | International Lease Finance Corporation ∈ | 4.875 | 9/1/2010 | 172,922 |
| 590,000 | International Lease Finance Corporation * | 5.750 | 6/15/2011 | 602,375 |
| 1,260,000 | iStar Financial, Inc. ± | 5.950 | 10/15/2013 | 1,268,607 |
| 1,500,000 | J.P. Morgan Chase Bank NA ±∈ | 5.875 | 6/13/2016 | 1,540,760 |
| 355,000 | Lincoln National Corporation ∈ | 7.000 | 5/17/2016 | 373,694 |
| 600,000 | Merrill Lynch & Company, Inc. ± | 6.050 | 5/16/2016 | 623,073 |
| 800,000 | Mitsubishi UFG Capital Finance, Ltd. ∈ | 6.346 | 7/25/2016 | 807,915 |
| 1,350,000 | Montpelier Re Holdings, Ltd. ± | 6.125 | 8/15/2013 | 1,310,618 |
| The accompanying Notes to Financial Statements are an integral part of this schedule. |
|
| 207 |
Core Bond Fund
Schedule of Investments as of October 31, 2006 |
| Principal | | Interest | Maturity | |
| Amount | Long-Term Fixed Income (122.5%) | Rate | Date | Value |
|
| Financials — continued | | | |
| $1,500,000 | Monumental Global Funding II ± | 4.625% | 3/15/2010 | $1,472,781 |
| 720,000 | Morgan Stanley ± | 6.250 | 8/9/2026 | 754,188 |
| 2,000,000 | ProLogis ± | 5.500 | 4/1/2012 | 2,001,490 |
| 1,000,000 | Prudential Financial, Inc. ∈ | 5.500 | 3/15/2016 | 1,001,211 |
| 1,875,000 | RBS Capital Trust I | 5.512 | 9/30/2014 | 1,844,751 |
| 2,040,000 | Residential Capital Corporation ±∞ | 6.474 | 1/17/2007 | 2,057,283 |
| 2,890,000 | Residential Capital Corporation ± | 6.500 | 4/17/2013 | 2,940,988 |
| 1,750,000 | Simon Property Group, LP ± | 4.600 | 6/15/2010 | 1,713,551 |
| 1,240,000 | Simon Property Group, LP ± | 5.375 | 6/1/2011 | 1,241,329 |
| 850,000 | Swiss RE Capital I, LP ∈ | 6.854 | 5/25/2016 | 887,847 |
| 770,000 | Wachovia Bank NA ∈ | 4.875 | 2/1/2015 | 741,341 |
| 1,895,000 | Wachovia Capital Trust III ∈ | 5.800 | 3/15/2011 | 1,911,689 |
| 725,000 | Washington Mutual Bank FA | 5.125 | 1/15/2015 | 701,154 |
|
|
| | Total Financials | | | 38,175,446 |
|
|
| |
| Mortgage-Backed Securities (33.7%) | | | |
| 25,000,000 | Federal National Mortgage Association | | | |
| | Conventional 30-Yr. Pass Through Ω | 5.000 | 11/1/2036 | 24,132,800 |
| 60,500,000 | Federal National Mortgage Association | | | |
| | Conventional 30-Yr. Pass Through Ω | 5.500 | 11/1/2036 | 59,781,557 |
| 50,000,000 | Federal National Mortgage Association | | | |
| | Conventional 30-Yr. Pass Through Ω | 6.500 | 11/1/2036 | 50,953,100 |
|
|
| | Total Mortgage-Backed Securities | | 134,867,457 |
|
|
| |
| Technology (0.6%) | | | |
| 2,500,000 | Deluxe Corporation ± | 3.500 | 10/1/2007 | 2,437,500 |
|
|
| | Total Technology | | | 2,437,500 |
|
|
| |
| Transportation (0.6%) | | | |
| 1,227,829 | FedEx Corporation ± | 6.720 | 1/15/2022 | 1,323,722 |
| 990,000 | Northwest Airlines, Inc. ∈√ | 6.841 | 4/1/2011 | 981,338 |
|
|
| | Total Transportation | | | 2,305,060 |
|
|
| |
| U.S. Government (16.6%) | | | |
| 2,000,000 | Federal Home Loan Bank ∈ | 5.625 | 6/13/2016 | 2,065,088 |
| 2,500,000 | Federal Home Loan Mortgage Corporation | 5.400 | 2/28/2011 | 2,499,350 |
| 2,500,000 | Federal National Mortgage Association | 5.300 | 2/22/2011 | 2,488,695 |
| 5,000,000 | Federal National Mortgage Association ± | 5.500 | 3/15/2011 | 5,120,425 |
| 3,600,000 | U.S. Treasury Bonds | 7.625 | 2/15/2025 | 4,818,658 |
| 340,000 | U.S. Treasury Bonds * | 6.125 | 8/15/2029 | 402,608 |
| 155,000 | U.S. Treasury Bonds * | 5.375 | 2/15/2031 | 168,284 |
| 50,000 | U.S. Treasury Notes | 4.250 | 10/15/2010 | 49,416 |
| 1,600,000 | U.S. Treasury Notes * | 4.375 | 12/15/2010 | 1,588,062 |
| 2,500,000 | U.S. Treasury Notes * | 4.250 | 1/15/2011 | 2,468,360 |
| 10,105,000 | U.S. Treasury Notes * | 4.875 | 4/30/2011 | 10,225,391 |
| The accompanying Notes to Financial Statements are an integral part of this schedule. |
|
| 208 |
Core Bond Fund
Schedule of Investments as of October 31, 2006 |
| Principal | | Interest | Maturity | |
| Amount | Long-Term Fixed Income (122.5%) | Rate | Date | Value |
|
| U.S. Government — continued | | | |
| $2,125,000 | U.S. Treasury Notes * | 4.500% | 9/30/2011 | $2,117,611 |
| 3,125,000 | U.S. Treasury Notes * | 4.375 | 8/15/2012 | 3,096,556 |
| 1,100,000 | U.S. Treasury Notes * | 4.250 | 8/15/2013 | 1,078,688 |
| 8,980,000 | U.S. Treasury Notes * | 4.000 | 2/15/2015 | 8,612,027 |
| 10,685,000 | U.S. Treasury Notes *∈ | 4.125 | 5/15/2015 | 10,331,476 |
| 3,230,000 | U.S. Treasury Notes * | 5.125 | 5/15/2016 | 3,357,685 |
| 1,800,000 | U.S. Treasury Notes * | 4.875 | 8/15/2016 | 1,837,406 |
| 4,326,600 | U.S. Treasury Notes, TIPS * | 2.000 | 7/15/2014 | 4,214,377 |
|
|
| | Total U.S. Government | | | 66,540,163 |
|
|
| |
| Utilities (1.6%) | | | |
| 950,000 | Cincinnati Gas & Electric Company ~ | 5.700 | 9/15/2012 | 960,864 |
| 1,500,000 | Exelon Corporation ± | 6.750 | 5/1/2011 | 1,573,280 |
| 1,127,409 | Power Receivables Finance, LLC | 6.290 | 1/1/2012 | 1,136,879 |
| 800,000 | Progress Energy, Inc. ± | 7.000 | 10/30/2031 | 900,648 |
| 800,000 | PSI Energy, Inc. ± | 5.000 | 9/15/2013 | 774,751 |
| 1,060,000 | Virginia Electric & Power Company ± | 6.000 | 1/15/2036 | 1,068,657 |
|
|
| | Total Utilities | | | 6,415,079 |
|
|
| | Total Long-Term Fixed Income (cost $488,878,159) | 490,156,784 |
|
|
| |
| |
| | | | Expiration | |
| Contracts | Options Purchased (<0.1%) | Price | Date | Value |
|
| 210 | 10-Yr. U.S. Treasury Note Futures | $106 | 11/21/2006 | $3,281 |
| 90 | 20-Yr. U.S. Treasury Bond Futures | 110 | 11/21/2006 | 4,219 |
|
|
| | Total U.S. Government | | | 7,500 |
|
|
| | Total Options Purchased (cost $157,358) | 7,500 |
|
|
| |
| |
| | | Interest | Maturity | |
| Shares | Collateral Held for Securities Loaned (12.9%) | Rate (+) | Date | Value |
|
| 51,452,125 | Thrivent Financial Securities Lending Trust | 5.300% | N/A | $51,452,125 |
|
|
| | Total Collateral Held for Securities Loaned | |
| | (cost $51,452,125) | | | 51,452,125 |
|
|
| The accompanying Notes to Financial Statements are an integral part of this schedule. |
|
| 209 |
Core Bond Fund
Schedule of Investments as of October 31, 2006 |
| Shares or | | | | |
| Principal | | Interest | Maturity | |
| Amount | Short-Term Investments (11.5%) | Rate (+) | Date | Value |
|
| $7,155,000 | Amsterdam Funding Corporation | 5.330% | 11/1/2006 | $7,155,000 |
| 4,500,000 | Edison Asset Securitization, LLC ± | 5.260 | 11/14/2006 | 4,491,452 |
| 3,000,000 | Falcon Asset Securitization Corporation ∈ | 5.260 | 11/20/2006 | 2,991,672 |
| 3,000,000 | GOVCO, Inc. | 5.260 | 11/14/2006 | 2,994,302 |
| 3,000,000 | Jupiter Securitization Company, LLC ± | 5.260 | 11/27/2006 | 2,988,603 |
| 2,000,000 | Preferred Receivables Funding Corporation ± | 5.265 | 11/13/2006 | 1,996,490 |
| 2,500,000 | Three Pillars, Inc. | 5.270 | 11/3/2006 | 2,499,268 |
| 17,948,985 | Thrivent Money Market Fund | 4.600 | N/A | 17,948,985 |
| 3,000,000 | Windmill Funding Corporation | 5.260 | 11/10/2006 | 2,996,055 |
|
|
| | Total Short-Term Investments (at amortized cost) | 46,061,827 |
|
|
| | Total Investments (cost $586,549,469) 146.9% | $587,678,236 |
|
|
| | Other Assets and Liabilities, Net (46.9%) | (187,497,273) |
|
|
| | Total Net Assets 100.0% | | | $400,180,963 |
|
|
| | Number of | | Notional | | |
| | Contracts | Expiration | Principal | | Unrealized |
| Futures | Long/(Short) | Date | Amount | Value | Gain/(Loss) |
|
| 5-Yr. U.S. Treasury Bond Futures | (145) | December 2006 | ($15,249,488) | ($15,306,563) | ($57,075) |
| 10-Yr. U.S. Treasury Bond Futures | (175) | December 2006 | ($18,751,619) | ($18,938,282) | ($186,663) |
| 20-Yr. U.S. Treasury Bond Futures | 150 | December 2006 | $16,605,845 | $16,898,439 | $292,594 |
* All or a portion of the security is on loan as discussed in item 2(L) of the Notes to Financial Statements.
+ The interest rate shown reflects the yield, coupon rate or, for securities purchased at a discount, the discount rate at the date of purchase.
∞ Denotes variable rate obligations for which the current yield and next scheduled reset date are shown.
Ω Denotes investments purchased on a when-issued basis.
± Designated as cover for long settling trades as discussed in the Notes to Financial Statements.
∈ At October 31, 2006, $966,914 of investments were held on deposit with the counterparty and pledged as the initial margin deposit for open financial futures contracts. In addition, $53,474,054 of investments were earmarked as collateral to cover open financial futures contracts.
~ All or a portion of the security was earmarked as collateral to cover options.
√ In bankruptcy.
Definitions:
TIPS — Treasury Inflation Protected Security.
| Gross unrealized appreciation and depreciation of investments, based on cost for federal income tax purposes, were as follows: | |
| | |
| Gross unrealized appreciation | $2,737,158 | |
| Gross unrealized depreciation | (2,222,299) | |
|
| |
| Net unrealized appreciation (depreciation) | $514,859 | |
| Cost for federal income tax purposes | $587,163,377 | |
| The accompanying Notes to Financial Statements are an integral part of this schedule. |
|
| 210 |
Limited Maturity Bond Fund
Schedule of Investments as of October 31, 2006 |
| Principal | | Interest | Maturity | |
| Amount | Long-Term Fixed Income (104.6%) | Rate | Date | Value |
|
| |
| Asset-Backed Securities (27.3%) | | | |
| $1,500,000 | Americredit Automobile Receivables Trust ∞ | 5.400% | 11/6/2006 | $1,500,488 |
| 1,000,000 | Americredit Automobile Receivables Trust | 3.430 | 7/6/2011 | 975,717 |
| 382,168 | Banc of America Securities Auto Trust | 3.890 | 6/18/2008 | 381,382 |
| 728,373 | Capital Auto Receivables Asset Trust | 3.350 | 2/15/2008 | 724,914 |
| 1,486,296 | Caterpillar Financial Asset Trust | 3.900 | 2/25/2009 | 1,474,042 |
| 2,500,000 | Chase Funding Issuance Trust ∞ | 5.310 | 11/15/2006 | 2,500,582 |
| 2,000,000 | Chase Manhattan Auto Owner Trust | 4.840 | 7/15/2009 | 1,993,044 |
| 1,500,000 | CIT Equipment Collateral | 4.420 | 5/20/2009 | 1,488,478 |
| 481,479 | Countrywide Asset-Backed Certificates | 3.903 | 1/25/2031 | 478,446 |
| 2,000,000 | Countrywide Asset-Backed Certificates | 5.549 | 4/25/2036 | 1,996,248 |
| 2,269,000 | Countrywide Asset-Backed Certificates | 5.683 | 10/25/2036 | 2,277,831 |
| 2,000,000 | Countrywide Home Loans Asset-Backed Securities | 6.085 | 6/25/2021 | 2,025,184 |
| 972,770 | CPS Auto Trust | 4.520 | 3/15/2010 | 967,939 |
| 106,788 | Credit Based Asset Servicing and Securitization | 3.887 | 10/25/2034 | 106,291 |
| 2,000,000 | Credit Based Asset Servicing and Securitization, LLC | 5.501 | 12/25/2036 | 1,997,934 |
| 3,000,000 | DaimlerChrysler Auto Trust | 5.330 | 8/8/2010 | 3,011,142 |
| 1,500,000 | DaimlerChrysler Master Owner Trust ∞ | 5.370 | 11/15/2006 | 1,500,206 |
| 2,500,000 | Drive Auto Receivables Trust | 5.300 | 7/15/2011 | 2,505,469 |
| 37,936 | Encore Credit Receivables Trust ∞ | 5.440 | 11/25/2006 | 37,938 |
| 498,728 | First Franklin Mortgage Loan Asset-Backed Certificates | 5.500 | 3/25/2036 | 497,802 |
| 527,782 | Fremont Home Loan Trust ∞ | 5.480 | 11/25/2006 | 527,878 |
| 1,677,574 | GE Commercial Loan Trust ∞ | 5.434 | 1/19/2007 | 1,677,574 |
| 1,500,000 | GE Dealer Floorplan Master Note Trust - | 5.360 | 11/20/2006 | 1,500,424 |
| 1,500,000 | GE Equipment Small Ticket, LLC | 4.380 | 7/22/2009 | 1,487,571 |
| 1,500,000 | GMAC Mortgage Corporation Loan Trust ±∞ | 5.410 | 11/25/2006 | 1,500,198 |
| 2,379,593 | GMAC Mortgage Corporation Loan Trust ∞ | 5.420 | 11/25/2006 | 2,379,586 |
| 2,500,000 | GMAC Mortgage Corporation Loan Trust | 5.750 | 10/25/2036 | 2,505,710 |
| 671,516 | Goldman Sachs Asset Management Products Trust | 5.500 | 4/25/2036 | 670,507 |
| 1,500,000 | Harley Davidson Motorcycle Trust | 5.240 | 1/15/2012 | 1,504,988 |
| 1,000,000 | Harley Davidson Motorcycle Trust | 3.200 | 5/15/2012 | 977,156 |
| 651,452 | Honda Auto Receivables Owner Trust ± | 2.910 | 10/20/2008 | 644,021 |
| 699,220 | Honda Auto Receivables Owner Trust | 2.790 | 3/16/2009 | 690,923 |
| 992,664 | Honda Auto Receivables Owner Trust | 2.960 | 4/20/2009 | 979,662 |
| 1,750,000 | Household Automotive Trust | 5.400 | 6/17/2009 | 1,750,387 |
| 2,000,000 | Household Home Equity Loan Trust | 5.660 | 3/20/2036 | 2,005,912 |
| 501,239 | Hyundai Auto Receivables Trust | 3.880 | 6/16/2008 | 499,596 |
| 1,000,000 | John Deere Owner Trust | 3.980 | 6/15/2009 | 990,176 |
| 351,827 | Long Beach Asset Holdings Corporation | 5.780 | 5/25/2046 | 351,345 |
| 1,040,322 | Long Beach Asset Holdings Corporation | 5.877 | 6/25/2046 | 1,039,146 |
| 750,000 | MBNA Credit Card Master Note Trust | 4.950 | 6/15/2009 | 749,608 |
| 579,377 | Navistar Financial Corporation | 4.090 | 7/15/2008 | 577,876 |
| 1,321,495 | Nissan Auto Lease Trust | 3.180 | 6/15/2010 | 1,308,215 |
| 1,000,000 | Nissan Auto Receivables Owner Trust | 4.740 | 9/15/2009 | 994,785 |
| 758,116 | Nomura Asset Acceptance Corporation ∞ | 5.460 | 11/25/2006 | 758,198 |
| 1,179,774 | PG&E Energy Recovery Funding, LLC | 3.870 | 6/25/2011 | 1,160,716 |
| The accompanying Notes to Financial Statements are an integral part of this schedule. |
|
| 211 |
Limited Maturity Bond Fund
Schedule of Investments as of October 31, 2006 |
| Principal | | Interest | Maturity | |
| Amount | Long-Term Fixed Income (104.6%) | Rate | Date | Value |
|
| Asset-Backed Securities — continued | | | |
| $500,000 | Popular ABS Mortgage Pass-Through Trust | 4.000% | 12/25/2034 | $493,450 |
| 311,772 | Renaissance Home Equity Loan Trust | 3.856 | 1/25/2035 | 310,399 |
| 2,000,000 | Renaissance Home Equity Loan Trust | 5.608 | 5/25/2036 | 2,000,928 |
| 820,112 | Residential Asset Securities Corporation | 5.010 | 4/25/2033 | 813,865 |
| 645,883 | SLM Student Loan Trust ∞ | 5.387 | 1/25/2007 | 646,183 |
| 1,500,000 | Textron Financial Floorplan Master Note Trust ∞ | 5.440 | 11/13/2006 | 1,502,674 |
| 2,000,000 | USAA Auto Owner Trust | 4.830 | 4/15/2010 | 1,991,782 |
| 3,000,000 | Wachovia Auto Loan Owner Trust | 5.210 | 8/22/2011 | 3,009,023 |
| 3,500,000 | Washington Mutual, Inc. Ω | Zero Coupon | 12/25/2046 | 3,500,000 |
| 431,965 | World Omni Auto Receivables Trust | 4.300 | 3/20/2008 | 431,240 |
|
|
| | Total Asset-Backed Securities | | 72,372,779 |
|
|
| |
| Basic Materials (1.0%) | | | |
| 700,000 | Equistar Chemicals, LP | 10.125 | 9/1/2008 | 742,000 |
| 500,000 | ICI North America | 8.875 | 11/15/2006 | 500,816 |
| 1,000,000 | Lubrizol Corporation * | 4.625 | 10/1/2009 | 981,709 |
| 500,000 | Monsanto Company | 4.000 | 5/15/2008 | 490,170 |
|
|
| | Total Basic Materials | | 2,714,695 |
|
|
| |
| Capital Goods (1.5%) | | | |
| 1,000,000 | John Deere Capital Corporation | 4.400 | 7/15/2009 | 982,079 |
| 1,000,000 | Oakmont Asset Trust | 4.514 | 12/22/2008 | 976,988 |
| 500,000 | Raytheon Company | 6.750 | 8/15/2007 | 504,652 |
| 1,500,000 | Tyco International Group SA Participation | | | |
| | Certificate Trust | 4.436 | 6/15/2007 | 1,489,608 |
|
|
| | Total Capital Goods | | 3,953,327 |
|
|
| |
| Commercial Mortgage-Backed Securities (18.1%) | | | |
| 2,507,974 | American Home Mortgage Assets Trust ∞ | 5.678 | 11/25/2006 | 2,507,977 |
| 600,000 | Banc of America Commercial Mortgage, Inc. | 5.001 | 9/10/2010 | 596,986 |
| 750,000 | Banc of America Commercial Mortgage, Inc. | 4.037 | 11/10/2039 | 726,162 |
| 72,061 | Banc of America Commercial Mortgage, Inc. | 3.366 | 7/11/2043 | 71,442 |
| 1,346,205 | Banc of America Mortgage Securities, Inc. | 4.817 | 9/25/2035 | 1,328,319 |
| 1,807,917 | Bear Stearns Adjustable Rate Mortgage Trust > | 4.625 | 8/25/2010 | 1,761,121 |
| 700,000 | Bear Stearns Commercial Mortgage Securities, Inc. | 3.869 | 2/11/2041 | 682,334 |
| 730,912 | Citigroup Mortgage Loan Trust, Inc. | 4.922 | 8/25/2035 | 723,298 |
| 2,000,000 | Citigroup Mortgage Loan Trust, Inc. | 5.536 | 3/25/2036 | 1,995,530 |
| 404,888 | Commercial Mortgage Pass-Through Certificates ∞ | 5.420 | 11/15/2006 | 404,920 |
| 1,000,000 | Commercial Mortgage Pass-Through Certificates ∞ | 5.450 | 11/15/2006 | 1,000,000 |
| 2,184,095 | Countrywide Home Loans, Inc. | 5.398 | 3/20/2036 | 2,178,799 |
| 2,417,313 | Countrywide Home Loans, Inc. | 5.924 | 9/20/2036 | 2,440,089 |
| 2,549,350 | Federal Home Loan Mortgage Corporation | | | |
| | Multifamily Structured Pass Through | 5.487 | 4/25/2010 | 2,557,136 |
| 1,330,296 | General Electric Commercial Mortgage Corporation | 4.591 | 7/10/2045 | 1,314,287 |
| 1,799,259 | HomeBanc Mortgage Trust | 6.078 | 4/25/2037 | 1,822,694 |
| 892,213 | Impac CMB Trust ∞ | 5.640 | 11/25/2006 | 893,082 |
| The accompanying Notes to Financial Statements are an integral part of this schedule. |
|
| 212 |
Limited Maturity Bond Fund
Schedule of Investments as of October 31, 2006 |
| Principal | | Interest | Maturity | |
| Amount | Long-Term Fixed Income (104.6%) | Rate | Date | Value |
|
| Commercial Mortgage-Backed Securities — continued | | | |
| $1,817,430 | J.P. Morgan Alternative Loan Trust | 5.804% | 3/25/2036 | $1,832,191 |
| 1,042,535 | J.P. Morgan Chase Commercial Mortgage | | | |
| | Securities Corporation | 2.790 | 1/12/2039 | 1,004,179 |
| 250,000 | LB-UBS Commercial Mortgage Trust ± | 3.323 | 3/15/2027 | 243,828 |
| 750,000 | LB-UBS Commercial Mortgage Trust | 4.187 | 8/15/2029 | 733,311 |
| 1,294,409 | LB-UBS Commercial Mortgage Trust | 4.741 | 9/15/2040 | 1,285,421 |
| 551,911 | Lehman Brothers “CALSTRS” Mortgage Trust | 3.988 | 11/20/2012 | 544,487 |
| 1,618,198 | Merrill Lynch Mortgage Investors, Inc. | 4.881 | 6/25/2035 | 1,603,874 |
| 1,666,154 | Residential Accredit Loans, Inc. | 5.625 | 9/25/2035 | 1,673,214 |
| 1,854,054 | Wachovia Bank Commercial Mortgage Loan Trust | 5.600 | 5/20/2036 | 1,863,011 |
| 608,044 | Wachovia Bank Commercial Mortgage Trust ∞ | 5.520 | 11/15/2006 | 608,176 |
| 2,841,328 | Washington Mutual Alternative Loan Trust ∞ | 5.678 | 11/25/2006 | 2,845,212 |
| 1,533,334 | Washington Mutual Asset Securities Corporation | 3.830 | 1/25/2035 | 1,483,947 |
| 1,763,570 | Washington Mutual Mortgage Pass-Through Certificates ∞ | 5.610 | 11/25/2006 | 1,773,351 |
| 2,921,017 | Washington Mutual Mortgage Pass-Through Certificates ∞ | 5.638 | 11/25/2006 | 2,919,990 |
| 1,199,499 | Washington Mutual Mortgage Pass-Through Certificates | 4.837 | 9/25/2035 | 1,183,710 |
| 2,000,000 | Wells Fargo Mortgage Backed Securities Trust | 3.539 | 9/25/2034 | 1,934,590 |
| 695,222 | Wells Fargo Mortgage Backed Securities Trust | 4.950 | 3/25/2036 | 689,700 |
| 845,792 | Wells Fargo Mortgage Backed Securities Trust | 5.095 | 3/25/2036 | 836,145 |
|
|
| | Total Commercial Mortgage-Backed Securities | 48,062,513 |
|
|
| |
| Communications Services (4.3%) | | | |
| 600,000 | CenturyTel, Inc. ± | 4.628 | 5/15/2007 | 597,428 |
| 1,400,000 | Comcast Cable Communications, Inc. ± | 6.200 | 11/15/2008 | 1,426,867 |
| 750,000 | Cox Communications, Inc. | 7.875 | 8/15/2009 | 796,384 |
| 1,050,000 | GTE Corporation | 7.510 | 4/1/2009 | 1,100,064 |
| 1,000,000 | Nextel Partners, Inc. | 8.125 | 7/1/2011 | 1,050,000 |
| 500,000 | Qwest Corporation | 5.625 | 11/15/2008 | 498,125 |
| 1,000,000 | SBC Communications, Inc. | 4.125 | 9/15/2009 | 970,572 |
| 1,000,000 | Sprint Capital Corporation | 6.125 | 11/15/2008 | 1,015,355 |
| 1,000,000 | Telecom Italia Capital SA | 4.000 | 11/15/2008 | 972,858 |
| 500,000 | Telefonos de Mexico SA de CV | 4.500 | 11/19/2008 | 490,660 |
| 1,000,000 | Time Warner Entertainment Company, LP | 7.250 | 9/1/2008 | 1,032,087 |
| 1,525,000 | Viacom, Inc. ± | 5.625 | 5/1/2007 | 1,526,130 |
|
|
| | Total Communications Services | | 11,476,530 |
|
|
| |
| Consumer Cyclical (5.6%) | | | |
| 750,000 | Carnival Corporation ± | 3.750 | 11/15/2007 | 736,484 |
| 900,000 | D.R. Horton, Inc. ± | 8.000 | 2/1/2009 | 945,926 |
| 1,000,000 | DaimlerChrysler North American Holdings Corporation ∞ | 6.019 | 11/1/2006 | 1,003,172 |
| 750,000 | Ford Motor Credit Company | 6.625 | 6/16/2008 | 735,841 |
| 3,600,000 | General Motors Acceptance Corporation | 4.375 | 12/10/2007 | 3,531,514 |
| 1,700,000 | Harrah’s Operating Company, Inc. | 7.125 | 6/1/2007 | 1,707,905 |
| 3,000,000 | Host Marriott, LP | 9.500 | 1/15/2007 | 3,018,750 |
| 900,000 | May Department Stores Company | 4.800 | 7/15/2009 | 885,969 |
| The accompanying Notes to Financial Statements are an integral part of this schedule. |
|
| 213 |
Limited Maturity Bond Fund
Schedule of Investments as of October 31, 2006 |
| Principal | | Interest | Maturity | |
| Amount | Long-Term Fixed Income (104.6%) | Rate | Date | Value |
|
| Consumer Cyclical — continued | | | |
| $1,959,958 | SLM Private Credit Student Loan Trust ∞ | 5.400% | 12/15/2006 | $1,960,361 |
| 250,000 | Starwood Hotels & Resorts Worldwide, Inc. > | 7.375 | 5/1/2007 | 251,562 |
|
|
| | Total Consumer Cyclical | | | 14,777,484 |
|
|
| |
| Consumer Non-Cyclical (4.3%) | | | |
| 1,500,000 | Abbott Laboratories ± | 5.375 | 5/15/2009 | 1,512,650 |
| 1,000,000 | Baxter International, Inc. ± | 5.196 | 2/16/2008 | 995,288 |
| 900,000 | Beckman Coulter, Inc. ± | 7.450 | 3/4/2008 | 919,329 |
| 1,500,000 | Cadbury Schweppes plc ± | 3.875 | 10/1/2008 | 1,460,312 |
| 1,500,000 | General Mills, Inc. | 6.378 | 10/15/2008 | 1,528,678 |
| 750,000 | Harvard University ± | 8.125 | 4/15/2007 | 759,172 |
| 825,000 | Kroger Company | 6.375 | 3/1/2008 | 833,237 |
| 1,200,000 | Maytag Corporation | 6.875 | 12/1/2006 | 1,201,067 |
| 1,200,000 | Miller Brewing Company | 4.250 | 8/15/2008 | 1,177,228 |
| 400,000 | Safeway, Inc. | 6.500 | 11/15/2008 | 408,625 |
| 700,000 | Wyeth | 4.375 | 3/1/2008 | 691,523 |
|
|
| | Total Consumer Non-Cyclical | | 11,487,109 |
|
|
| |
| Energy (2.8%) | | | |
| 1,100,000 | Duke Capital, LLC ± | 4.331 | 11/16/2006 | 1,099,390 |
| 1,075,000 | Enterprise Products Operating, LP | 4.000 | 10/15/2007 | 1,059,319 |
| 500,000 | Enterprise Products Operating, LP | 4.625 | 10/15/2009 | 489,612 |
| 1,000,000 | KeySpan Corporation ± | 4.900 | 5/16/2008 | 994,901 |
| 1,281,000 | Marathon Oil Corporation | 5.375 | 6/1/2007 | 1,281,552 |
| 1,000,000 | Oneok, Inc. | 5.510 | 2/16/2008 | 1,000,766 |
| 1,500,000 | Panhandle Eastern Pipe Line Company ∈ | 2.750 | 3/15/2007 | 1,484,546 |
|
|
| | Total Energy | | | 7,410,086 |
|
|
| |
| Financials (16.1%) | | | |
| 750,000 | Abbey National plc ±> | 6.700 | 6/15/2008 | 764,365 |
| 1,000,000 | American General Finance Corporation ±∞ | 5.494 | 1/18/2007 | 1,001,553 |
| 300,000 | Barnett Capital I ± | 8.060 | 12/1/2026 | 312,516 |
| 500,000 | Capital One Bank | 4.875 | 5/15/2008 | 497,162 |
| 1,000,000 | Capital One Financial Corporation ∈ | 4.738 | 5/17/2007 | 995,577 |
| 1,000,000 | Chubb Corporation ± | 4.934 | 11/16/2007 | 996,454 |
| 1,000,000 | CIT Group, Inc. ∈ | 4.750 | 8/15/2008 | 992,171 |
| 1,500,000 | CNA Financial Corporation ± | 6.750 | 11/15/2006 | 1,500,508 |
| 300,000 | Corestates Capital Trust I | 8.000 | 12/15/2026 | 312,113 |
| 1,100,000 | Countrywide Home Loans, Inc. | 4.125 | 9/15/2009 | 1,067,404 |
| 900,000 | Credit Suisse First Boston USA, Inc. ∞ | 5.520 | 12/11/2006 | 901,460 |
| 1,000,000 | Donaldson, Lufkin & Jenrette, Inc. ∈ | 6.500 | 4/1/2008 | 1,017,535 |
| 750,000 | EOP Operating, LP | 6.800 | 1/15/2009 | 772,687 |
| 500,000 | First Chicago Corporation | 6.375 | 1/30/2009 | 512,816 |
| 900,000 | Goldman Sachs Group, Inc. | 4.500 | 6/15/2010 | 880,724 |
| 900,000 | Hartford Financial Services Group, Inc. | 5.550 | 8/16/2008 | 904,860 |
| 1,200,000 | International Lease Finance Corporation | 3.300 | 1/23/2008 | 1,168,938 |
| The accompanying Notes to Financial Statements are an integral part of this schedule. |
|
| 214 |
Limited Maturity Bond Fund
Schedule of Investments as of October 31, 2006 |
| Principal | | Interest | Maturity | |
| Amount | Long-Term Fixed Income (104.6%) | Rate | Date | Value |
|
| Financials — continued | | | |
| $750,000 | iSTAR Financial, Inc. | 4.875% | 1/15/2009 | $740,596 |
| 900,000 | John Hancock Global Funding II * | 3.750 | 9/30/2008 | 876,018 |
| 1,000,000 | KeyCorp | 4.700 | 5/21/2009 | 987,208 |
| 1,500,000 | Lehman Brothers Holdings E-Capital Trust I ∞ | 6.173 | 11/20/2006 | 1,510,136 |
| 1,000,000 | Lehman Brothers Holdings, Inc. ∈ | 3.500 | 8/7/2008 | 972,057 |
| 650,000 | Liberty Property, LP | 6.950 | 12/1/2006 | 650,617 |
| 1,000,000 | Marsh & McLennan Companies, Inc. | 5.375 | 3/15/2007 | 999,285 |
| 1,000,000 | MBNA Europe Funding plc ∞ | 5.490 | 12/7/2006 | 1,000,725 |
| 1,000,000 | Merrill Lynch & Company, Inc. ∞ | 5.704 | 1/22/2007 | 1,002,990 |
| 1,200,000 | Merrill Lynch & Company, Inc. * | 4.000 | 11/15/2007 | 1,183,229 |
| 1,500,000 | Mizuho Preferred Capital Company, LLC | 8.790 | 6/30/2008 | 1,577,094 |
| 500,000 | Monumental Global Funding II | 3.850 | 3/3/2008 | 490,688 |
| 700,000 | Pacific Life Global Funding | 3.750 | 1/15/2009 | 680,939 |
| 900,000 | Popular North America, Inc. | 5.200 | 12/12/2007 | 896,542 |
| 1,000,000 | Premium Asset Trust ∞ | 5.524 | 1/16/2007 | 1,001,062 |
| 600,000 | Pricoa Global Funding I | 4.350 | 6/15/2008 | 590,599 |
| 1,000,000 | Protective Life Secured Trust | 4.000 | 10/7/2009 | 970,448 |
| 300,000 | Residential Capital Corporation ∞ | 7.204 | 1/17/2007 | 300,671 |
| 1,000,000 | Residential Capital Corporation | 6.125 | 11/21/2008 | 1,005,550 |
| 1,200,000 | Simon Property Group, LP ± | 6.375 | 11/15/2007 | 1,210,208 |
| 1,000,000 | SLM Corporation | 4.000 | 1/15/2009 | 975,078 |
| 1,500,000 | St. Paul Travelers Companies, Inc. ± | 5.750 | 3/15/2007 | 1,502,392 |
| 775,000 | Tokai Preferred Capital Company, LLC | 9.980 | 6/30/2008 | 828,609 |
| 750,000 | Union Planters Bank | 5.125 | 6/15/2007 | 749,054 |
| 600,000 | UnumProvident Corporation | 5.997 | 5/15/2008 | 604,147 |
| 700,000 | Wachovia Corporation | 6.150 | 3/15/2009 | 714,758 |
| 1,000,000 | Washington Mutual, Inc. | 4.000 | 1/15/2009 | 976,089 |
| 1,000,000 | Wells Fargo & Company ∞ | 5.490 | 12/15/2006 | 1,001,682 |
| 1,000,000 | Westpac Banking Corporation *∞ | 5.460 | 11/27/2006 | 1,000,529 |
| 1,000,000 | World Savings Bank FSB ∞ | 5.460 | 12/1/2006 | 1,000,707 |
|
|
| | Total Financials | | | 42,598,550 |
|
|
| |
| Foreign (<0.1%) | | | |
| 41,667 | Pemex Finance, Ltd. | 8.450 | 2/15/2007 | 41,873 |
|
|
| | Total Foreign | | | 41,873 |
|
|
| |
| Industrials (0.6%) | | | |
| 1,500,000 | Precision Castparts Corporation | 6.750 | 12/15/2007 | 1,520,727 |
|
|
| | Total Industrials | | | 1,520,727 |
|
|
| |
| Mortgage-Backed Securities (6.1%) | | | |
| 16,000,000 | Federal National Mortgage Association | | | |
| | Conventional 30-Yr. Pass Through Ω | 6.500 | 11/1/2036 | 16,304,992 |
|
|
| | Total Mortgage-Backed Securities | | 16,304,992 |
|
|
| The accompanying Notes to Financial Statements are an integral part of this schedule. |
|
| 215 |
Limited Maturity Bond Fund
Schedule of Investments as of October 31, 2006 |
| Principal | | Interest | Maturity | |
| Amount | Long-Term Fixed Income (104.6%) | Rate | Date | Value |
|
| Technology (0.4%) | | | |
| $1,000,000 | Deluxe Corporation ± | 3.500% | 10/1/2007 | $975,000 |
|
|
| | Total Technology | | | 975,000 |
|
|
| |
| Transportation (0.4%) | | | |
| 700,000 | FedEx Corporation | 3.500 | 4/1/2009 | 672,699 |
| 500,000 | Southwest Airlines Company | 5.496 | 11/1/2006 | 500,000 |
|
|
| | Total Transportation | | | 1,172,699 |
|
|
| |
| U.S. Government (11.4%) | | | |
| 1,000,000 | Federal Home Loan Bank | 4.250 | 4/16/2007 | 995,189 |
| 2,000,000 | Federal Home Loan Bank | 4.625 | 7/18/2007 | 1,991,494 |
| 1,500,000 | Federal Home Loan Bank | 4.625 | 10/24/2007 | 1,492,056 |
| 3,000,000 | Federal Home Loan Bank | 4.100 | 6/13/2008 | 2,962,056 |
| 2,500,000 | Federal Home Loan Bank * | 5.125 | 6/13/2008 | 2,507,630 |
| 1,500,000 | Federal Home Loan Mortgage Corporation | 4.125 | 4/2/2007 | 1,492,455 |
| 3,500,000 | Federal Home Loan Mortgage Corporation * | 5.125 | 4/18/2008 | 3,508,204 |
| 2,500,000 | Federal Home Loan Mortgage Corporation * | 3.875 | 6/15/2008 | 2,459,245 |
| 1,000,000 | Federal Home Loan Mortgage Corporation | 4.625 | 8/15/2008 | 994,993 |
| 2,000,000 | Federal Home Loan Mortgage Corporation | 4.000 | 9/22/2009 | 1,954,148 |
| 1,500,000 | Federal National Mortgage Association | 4.375 | 9/7/2007 | 1,489,191 |
| 1,200,000 | Federal National Mortgage Association | 5.400 | 2/1/2008 | 1,204,950 |
| 1,000,000 | Federal National Mortgage Association | 3.875 | 7/15/2008 | 982,923 |
| 1,500,000 | Federal National Mortgage Association * | 4.000 | 9/2/2008 | 1,473,152 |
| 2,000,000 | Federal National Mortgage Association | 5.300 | 2/22/2011 | 1,990,956 |
| 2,704,125 | U.S. Treasury Notes, TIPS * | 2.000 | 7/15/2014 | 2,633,985 |
|
|
| | Total U.S. Government | | | 30,132,627 |
|
|
| |
| U.S. Municipals (0.3%) | | | |
| 750,000 | Washington State Office of the State Treasurer | 4.500 | 7/1/2007 | 745,912 |
|
|
| | Total U.S. Municipals | | | 745,912 |
|
|
| |
| Utilities (4.4%) | | | |
| 1,000,000 | Carolina Power & Light, Inc. ∈ | 5.950 | 3/1/2009 | 1,015,678 |
| 1,000,000 | CenterPoint Energy, Inc. ± | 5.875 | 6/1/2008 | 1,005,586 |
| 375,000 | Cleveland Electric Illuminating Company | 7.430 | 11/1/2009 | 395,979 |
| 750,000 | Dominion Resources, Inc. ∞ | 5.664 | 12/28/2006 | 750,233 |
| 325,000 | DPL, Inc. | 6.250 | 5/15/2008 | 326,970 |
| 500,000 | DTE Energy Company | 5.630 | 8/16/2007 | 500,502 |
| 420,000 | FirstEnergy Corporation | 5.500 | 11/15/2006 | 420,205 |
| 500,000 | Indiana Michigan Power Company ∈ | 6.125 | 12/15/2006 | 499,948 |
| 1,000,000 | MidAmerican Energy Holdings Company | 3.500 | 5/15/2008 | 973,852 |
| 500,000 | Pacific Gas & Electric Company * | 3.600 | 3/1/2009 | 482,624 |
| 375,803 | Power Receivables Finance, LLC | 6.290 | 1/1/2012 | 378,960 |
| 1,000,000 | PSEG Funding Trust �� | 5.381 | 11/16/2007 | 998,822 |
| The accompanying Notes to Financial Statements are an integral part of this schedule. |
|
| 216 |
Limited Maturity Bond Fund
Schedule of Investments as of October 31, 2006 |
| Principal | | | | Interest | Maturity | |
| Amount | Long-Term Fixed Income (104.6%) | Rate | Date | Value |
|
| Utilities — continued | | | | | |
| $1,950,000 | Southwestern Public Service Company | 5.125% | 11/1/2006 | $1,950,000 |
| 1,500,000 | Teco Energy, Inc. | | | 6.125 | 5/1/2007 | 1,500,000 |
| 400,000 | Texas-New Mexico Power Company | | 6.125 | 6/1/2008 | 402,526 |
|
|
| | | Total Utilities | | | 11,601,885 |
|
|
| | | Total Long-Term Fixed Income (cost $277,957,596) | 277,348,788 |
|
|
| |
| |
| | | | | Interest | Maturity | |
| Shares | Collateral Held for Securities Loaned (5.7%) | Rate (+) | Date | Value |
|
| 15,075,000 | Thrivent Financial Securities Lending Trust | 5.300% | N/A | $15,075,000 |
| |
|
| | | Total Collateral Held for Securities Loaned | |
| | | (cost $15,075,000) | | | 15,075,000 |
|
|
| |
| |
| | | | | Interest | Maturity | |
| Shares | Short-Term Investments (2.1%) | | Rate (+) | Date | Value |
|
| 5,447,586 | Thrivent Money Market Fund | | 4.600% | N/A | $5,447,586 |
|
|
| | | Total Short-Term Investments (at amortized cost) | 5,447,586 |
|
|
| | | Total Investments (cost $298,480,182) 112.4% | $297,871,374 |
|
|
| | | Other Assets and Liabilities, Net (12.4%) | (32,870,583) |
|
|
| | | Total Net Assets 100.0% | | | $265,000,791 |
|
|
| |
| |
| |
| | | Number of | | Notional | | |
| | | Contracts | Expiration | Principal | | Unrealized |
| Futures | | Long/(Short) | Date | Amount | Value | Gain/(Loss) |
|
| 5-Yr. U.S. Treasury Bond Futures | (10) | December 2006 | ($1,051,611) | ($1,055,625) | ($4,014) |
| 10-Yr. U.S. Treasury Bond Futures | (40) | December 2006 | ($4,295,192) | ($4,328,750) | ($33,558) |
* All or a portion of the security is on loan as discussed in item 2(L) of the Notes to Financial Statements.
+ The interest rate shown reflects the yield, coupon rate or, for securities purchased at a discount, the discount rate at the date of purchase.
> Denotes step coupon bonds for which the current interest rate and next scheduled reset date are shown.
∞ Denotes variable rate obligations for which the current yield and next scheduled reset date are shown.
Ω Denotes investments purchased on a when-issued basis.
± Designated as cover for long settling trades as discussed in the Notes to Financial Statements.
∈ At October 31, 2006, $1,017,535 of investments were held on deposit with the counterparty and pledged as the initial margin deposit for open financial futures contracts. In addition, $6,958,798 of investments were earmarked as collateral to cover open financial futures contracts.
Definitions:
TIPS — Treasury Inflation Protected Security.
| Gross unrealized appreciation and depreciation of investments, based on cost for federal income tax purposes, were as follows: | |
| | |
| Gross unrealized appreciation | $531,349 | |
| Gross unrealized depreciation | (1,145,118) | |
|
| |
| Net unrealized appreciation (depreciation) | ($613,769) | |
| Cost for federal income tax purposes | $298,485,143 | |
| The accompanying Notes to Financial Statements are an integral part of this schedule. |
|
| 217 |
Money Market Fund
Schedule of Investments as of October 31, 2006 |
| Principal | | | Maturity | |
| Amount | Certificates of Deposit (1.5%) | Yield (+) | Date | Value |
|
| |
| Banking — Domestic (0.9%) | | | |
| $3,375,000 | BNP Paribas Chicago | 4.790% | 12/27/2006 | $3,375,000 |
| 4,091,000 | Dexia Bank NY | 4.525 | 11/17/2006 | 4,087,042 |
| 3,380,000 | Royal Bank of Canada NY | 4.750 | 12/4/2006 | 3,380,000 |
|
|
| | Total Banking — Domestic | | 10,842,042 |
|
|
| |
| Banking — Foreign (0.6%) | | | |
| 2,200,000 | Deutsche Bank AG | 5.000 | 2/12/2007 | 2,200,000 |
| 3,000,000 | Deutsche Bank NY | 5.510 | 8/31/2007 | 3,000,000 |
| 2,170,000 | Svenska Handelsbanken NY | 5.055 | 2/20/2007 | 2,170,000 |
|
|
| | Total Banking — Foreign | | 7,370,000 |
|
|
| | Total Certificates of Deposit | | 18,212,042 |
|
|
| |
| |
| Principal | | | Maturity | |
| Amount | Commercial Paper (74.7%) | Yield (+) | Date | Value |
|
| Asset-Backed Commercial Paper (0.9%) | | | |
| $10,300,000 | Corporate Asset Finance Company, LLC | 5.301% | 12/5/2006 | $10,248,832 |
|
|
| | Total Asset-Backed Commercial Paper | | 10,248,832 |
|
|
| |
| Banking — Domestic (9.7%) | | | |
| 17,200,000 | Acts Retirement — Life Communities, Inc. | 5.300 | 11/7/2006 | 17,184,807 |
| 2,500,000 | Bank of America Corporation | 5.300 | 11/20/2006 | 2,493,007 |
| 2,840,000 | Barclays Bank plc NY | 5.200 | 4/3/2007 | 2,840,000 |
| 5,175,000 | Blue Spice, LLC | 5.260 | 1/23/2007 | 5,112,242 |
| 20,700,000 | Depfa Bank plc NY | 5.350 | 11/30/2006 | 20,700,000 |
| 3,435,000 | MLTC Funding, Inc. | 5.300 | 11/30/2006 | 3,420,334 |
| 15,461,000 | River Fuel Company No. 2, Inc. | 5.250 | 1/31/2007 | 15,255,820 |
| 14,000,000 | Society of New York | 5.280 | 11/1/2006 | 14,000,000 |
| 11,644,000 | Stadshypotek Delaware, Inc. | 5.270 | 11/16/2006 | 11,618,432 |
| 20,700,000 | Stadshypotek Delaware, Inc. | 5.270 | 11/27/2006 | 20,621,214 |
| 3,520,000 | UBS Finance Corporation | 5.270 | 11/16/2006 | 3,512,271 |
|
|
| | Total Banking — Domestic | | 116,758,127 |
|
|
| |
| Banking — Foreign (0.7%) | | | |
| 2,150,000 | Deutsche Bank AG | 5.120 | 3/27/2007 | 2,150,000 |
| 6,400,000 | HBOS Treasury Services plc | 5.270 | 12/15/2006 | 6,358,777 |
|
|
| | Total Banking — Foreign | | 8,508,777 |
|
|
| |
| Consumer Cyclical (4.5%) | | | |
| 13,800,000 | Golden Funding Corporation | 5.275 | 11/13/2006 | 13,775,735 |
| 10,662,000 | Golden Funding Corporation | 5.280 | 11/27/2006 | 10,621,342 |
| 18,520,000 | Golden Funding Corporation | 5.270 | 12/13/2006 | 18,406,133 |
| 11,545,000 | Golden Funding Corporation | 5.260 | 1/12/2007 | 11,423,547 |
|
|
| | Total Consumer Cyclical | | 54,226,757 |
|
|
| The accompanying Notes to Financial Statements are an integral part of this schedule. |
|
| 218 |
Money Market Fund
Schedule of Investments as of October 31, 2006 |
| Principal | | | Maturity | |
| Amount | Commercial Paper (74.7%) | Yield (+) | Date | Value |
|
| Consumer Non-Cyclical (1.0%) | | | |
| $10,275,000 | Nestle Capital Corporation | 5.275% | 7/18/2007 | $9,885,056 |
| 2,070,000 | Nestle Capital Corporation | 5.225 | 8/10/2007 | 1,985,277 |
|
|
| | Total Consumer Non-Cyclical | | 11,870,333 |
|
|
| |
| Education (11.2%) | | | |
| 16,525,000 | Duke University | 5.450 | 12/1/2006 | 16,449,948 |
| 10,660,000 | Duke University | 5.560 | 12/6/2006 | 10,602,378 |
| 15,525,000 | Northwestern University | 5.320 | 11/1/2006 | 15,525,000 |
| 31,440,000 | Northwestern University | 5.510 | 12/6/2006 | 31,272,420 |
| 9,640,000 | Northwestern University | 5.350 | 1/5/2007 | 9,546,880 |
| 10,300,000 | University of Washington | 5.400 | 4/3/2007 | 10,300,000 |
| 3,450,000 | Yale University | 5.300 | 11/1/2006 | 3,450,000 |
| 4,570,000 | Yale University | 5.440 | 12/4/2006 | 4,547,254 |
| 34,250,000 | Yale University | 5.510 | 12/6/2006 | 34,066,520 |
|
|
| | Total Education | | | 135,760,400 |
|
|
| |
| Finance (36.7%) | | | |
| 8,995,000 | Amsterdam Funding Corporation | 5.330 | 11/1/2006 | 8,995,000 |
| 20,700,000 | Aspen Funding Corporation ± | 5.270 | 12/19/2006 | 20,554,548 |
| 18,614,000 | Bryant Park Funding, LLC | 5.270 | 12/15/2006 | 18,494,105 |
| 6,957,000 | Bryant Park Funding, LLC | 5.250 | 12/26/2006 | 6,901,199 |
| 20,535,000 | Chariot Funding, LLC | 5.270 | 12/18/2006 | 20,393,714 |
| 2,620,000 | Corporate Receivables Corporation Funding, LLC | 5.270 | 11/3/2006 | 2,619,233 |
| 17,250,000 | Corporate Receivables Corporation Funding, LLC | 5.280 | 11/21/2006 | 17,199,400 |
| 20,570,000 | Corporate Receivables Corporation Funding, LLC | 5.260 | 12/19/2006 | 20,425,736 |
| 5,510,000 | Edison Asset Securitization, LLC | 5.230 | 3/14/2007 | 5,403,536 |
| 17,150,000 | Falcon Asset Securitization Corporation | 5.260 | 12/12/2006 | 17,047,262 |
| 13,800,000 | Fountain Square Commercial Funding Corporation | 5.280 | 12/18/2006 | 13,704,872 |
| 6,900,000 | Galaxy Funding, Inc. | 5.330 | 11/6/2006 | 6,894,892 |
| 5,860,000 | Galaxy Funding, Inc. | 5.270 | 12/19/2006 | 5,818,824 |
| 3,510,000 | Grampian Funding, LLC | 5.090 | 11/1/2006 | 3,510,000 |
| 5,540,000 | Grampian Funding, LLC | 5.260 | 11/17/2006 | 5,527,320 |
| 3,425,000 | Grampian Funding, LLC | 5.380 | 12/18/2006 | 3,400,944 |
| 10,300,000 | Grampian Funding, LLC | 5.230 | 2/2/2007 | 10,160,838 |
| 17,130,000 | Greyhawk Funding, LLC | 5.260 | 2/1/2007 | 16,899,735 |
| 17,100,000 | Greyhawk Funding, LLC | 5.240 | 2/26/2007 | 16,808,787 |
| 4,700,000 | Greyhawk Funding, LLC | 5.240 | 4/12/2007 | 4,589,174 |
| 20,570,000 | Liberty Harbour CDO, Inc. | 5.290 | 11/8/2006 | 20,548,842 |
| 13,700,000 | Liberty Harbour CDO, Inc. | 5.280 | 11/10/2006 | 13,681,916 |
| 13,710,000 | Liberty Harbour CDO, Inc. | 5.280 | 11/15/2006 | 13,681,849 |
| 20,580,000 | NATC California, LLC | 5.270 | 1/12/2007 | 20,363,087 |
| 13,700,000 | Nieuw Amsterdam Receivables Corporation | 5.270 | 11/10/2006 | 13,681,950 |
| 1,000,000 | Nieuw Amsterdam Receivables Corporation | 5.270 | 12/19/2006 | 992,973 |
| 5,920,000 | North Sea Funding, LLC | 5.270 | 11/20/2006 | 5,903,534 |
| 17,135,000 | North Sea Funding, LLC | 5.270 | 1/23/2007 | 16,926,805 |
| 3,660,000 | North Sea Funding, LLC | 5.230 | 4/18/2007 | 3,570,672 |
| The accompanying Notes to Financial Statements are an integral part of this schedule. |
|
| 219 |
Money Market Fund
Schedule of Investments as of October 31, 2006 |
| Principal | | | Maturity | |
| Amount | Commercial Paper (74.7%) | Yield (+) | Date | Value |
|
| Finance — continued | | | |
| $6,500,000 | Old Line Funding, LLC | 5.260% | 12/20/2006 | $6,453,464 |
| 14,179,000 | Paradigm Funding, LLC | 5.270 | 12/11/2006 | 14,095,974 |
| 4,450,000 | Paradigm Funding, LLC | 5.250 | 12/28/2006 | 4,413,009 |
| 6,860,000 | Paradigm Funding, LLC | 5.230 | 1/31/2007 | 6,769,309 |
| 12,000,000 | Paradigm Funding, LLC | 5.250 | 3/2/2007 | 11,788,250 |
| 12,750,000 | Solitaire Funding, LLC | 5.280 | 12/1/2006 | 12,693,900 |
| 6,900,000 | Solitaire Funding, LLC | 5.250 | 2/22/2007 | 6,786,294 |
| 20,570,000 | Thames Asset Global Securitization, Inc. | 5.270 | 11/20/2006 | 20,512,787 |
| 3,450,000 | Thames Asset Global Securitization, Inc. | 5.270 | 11/27/2006 | 3,436,869 |
| 6,975,000 | Three Pillars, Inc. | 5.140 | 11/27/2006 | 6,949,106 |
| 6,900,000 | Thunder Bay Funding, Inc. | 5.270 | 11/9/2006 | 6,891,919 |
| 7,930,000 | Tulip Funding Corporation | 5.270 | 11/20/2006 | 7,907,944 |
|
|
| | Total Finance | | | 443,399,572 |
|
|
| |
| Insurance (4.8%) | | | |
| 3,590,000 | Aquinas Funding, LLC | 5.130 | 11/22/2006 | 3,579,256 |
| 5,520,000 | Aquinas Funding, LLC | 5.350 | 12/15/2006 | 5,483,905 |
| 4,125,000 | Aquinas Funding, LLC | 5.450 | 12/26/2006 | 4,090,654 |
| 10,300,000 | Aquinas Funding, LLC | 5.250 | 12/27/2006 | 10,215,883 |
| 13,700,000 | Curzon Funding, LLC | 5.380 | 11/3/2006 | 13,695,905 |
| 4,830,000 | Curzon Funding, LLC | 5.270 | 11/15/2006 | 4,820,101 |
| 3,500,000 | Curzon Funding, LLC | 5.240 | 3/13/2007 | 3,432,753 |
| 12,400,000 | Nyala Funding, LLC | 5.310 | 11/15/2006 | 12,374,394 |
|
|
| | Total Insurance | | | 57,692,851 |
|
|
| |
| U.S. Municipal (5.2%) | | | |
| 27,060,000 | Alaska Housing Financing Corporation | 5.310 | 11/7/2006 | 27,036,053 |
| 7,912,000 | Alaska Housing Financing Corporation | 5.340 | 12/1/2006 | 7,876,791 |
| 20,655,000 | Alaska Housing Financing Corporation | 5.340 | 12/4/2006 | 20,553,891 |
| 6,860,000 | State of Michigan Industry Regional Authority | | | |
| | General Obligation Bonds | 5.410 | 10/4/2007 | 6,860,000 |
|
|
| | Total U.S. Municipal | | | 62,326,735 |
|
|
| | Total Commercial Paper | | 900,792,384 |
|
|
| |
| |
| Shares | Other (<0.1%) | Yield (+) | Date | Value |
|
| 8,000 | Barclays Prime Money Market Fund | 3.900% | N/A | $8,000 |
|
|
| | Total Other | | | 8,000 |
|
|
| |
| |
| Principal | | | Maturity | |
| Amount | Public Corporate (1.2%) | Yield (+) | Date | Value |
|
| Banking — Domestic (0.8%) | | | |
| $2,720,000 | HSBC USA, Inc. | 7.000% | 11/1/2006 | $2,720,000 |
| 7,290,000 | J.P. Morgan Chase & Company | 3.125 | 12/11/2006 | 7,277,119 |
|
|
| | Total Banking — Domestic | | 9,997,119 |
|
|
| The accompanying Notes to Financial Statements are an integral part of this schedule. |
|
| 220 |
Money Market Fund
Schedule of Investments as of October 31, 2006 |
| Principal | | | Maturity | |
| Amount | Public Corporate (1.2%) | Yield (+) | Date | Value |
|
| Brokerage (0.1%) | | | |
| $1,215,000 | Goldman Sachs Group, Inc. | 7.200% | 11/1/2006 | $1,215,000 |
|
|
| | Total Brokerage | | | 1,215,000 |
|
|
| |
| Finance (0.3%) | | | |
| 3,540,000 | General Electric Capital Corporation | 5.375 | 3/15/2007 | 3,542,459 |
|
|
| | Total Finance | | | 3,542,459 |
|
|
| | Total Public Corporate | | | 14,754,578 |
|
|
| |
| |
| Principal | | | Maturity | |
| Amount | U.S. Government (0.1%) | Yield (+) | Date | Value |
|
| $1,390,000 | Federal Home Loan Mortgage Corporation | 4.875% | 2/26/2007 | $1,390,000 |
|
|
| | Total U.S. Government | | | 1,390,000 |
|
|
| |
| |
| Principal | | | Maturity | |
| Amount | Variable Rate Notes (24.4%) ∞ | Yield (+) | Date | Value |
|
| Banking — Domestic (10.0%) | | | |
| $9,250,000 | Bank of New York Company, Inc. | 5.310% | 11/10/2006 | $9,250,000 |
| 7,400,000 | Bank of New York Company, Inc. | 5.380 | 11/27/2006 | 7,401,799 |
| 13,690,000 | Cooperatieve Centrale Raiffeisen Boerenleen Bank | 5.365 | 11/15/2006 | 13,690,000 |
| 18,500,000 | Fifth Third Bancorp | 5.300 | 11/24/2006 | 18,500,000 |
| 8,830,000 | HSBC USA, Inc. | 5.300 | 11/15/2006 | 8,830,000 |
| 9,300,000 | Royal Bank of Canada NY | 5.293 | 11/1/2006 | 9,300,000 |
| 20,570,000 | Royal Bank of Scotland plc | 5.410 | 11/24/2006 | 20,571,008 |
| 13,800,000 | Svenska Handelsbanken AB Ω | 5.290 | 11/21/2006 | 13,800,000 |
| 19,225,000 | Wells Fargo & Company | 5.330 | 11/15/2006 | 19,225,000 |
|
|
| | Total Banking — Domestic | | 120,567,807 |
|
|
| |
| Banking — Foreign (3.4%) | | | |
| 9,600,000 | Bank of Ireland | 5.290 | 11/20/2006 | 9,600,000 |
| 10,950,000 | BNP Paribas SA | 5.310 | 11/27/2006 | 10,950,000 |
| 9,000,000 | DNB NOR ASA | 5.310 | 11/27/2006 | 9,000,000 |
| 11,500,000 | Royal Bank of Scotland plc | 5.310 | 11/21/2006 | 11,500,000 |
|
|
| | Total Banking — Foreign | | 41,050,000 |
|
|
| |
| Brokerage (1.3%) | | | |
| 6,000,000 | Merrill Lynch & Company, Inc. | 5.570 | 11/13/2006 | 6,002,935 |
| 10,000,000 | Merrill Lynch & Company, Inc. | 5.300 | 11/24/2006 | 10,000,000 |
|
|
| | Total Brokerage | | | 16,002,935 |
|
|
| The accompanying Notes to Financial Statements are an integral part of this schedule. |
|
| 221 |
Money Market Fund
Schedule of Investments as of October 31, 2006 |
| Principal | | | Maturity | |
| Amount | Variable Rate Notes (24.4%) ∞ | Yield (+) | Date | Value |
|
| Finance (4.3%) | | | |
| $4,140,000 | HSBC Finance Corporation | 5.440% | 12/1/2006 | $4,141,636 |
| 7,070,000 | Kordsa, Inc. | 5.330 | 11/2/2006 | 7,070,000 |
| 20,100,000 | Union Hamilton Special Funding, LLC | 5.390 | 12/21/2006 | 20,100,000 |
| 20,600,000 | Union Hamilton Special Funding, LLC | 5.364 | 12/28/2006 | 20,600,000 |
|
|
| | Total Finance | | | 51,911,636 |
|
|
| |
| Insurance (3.2%) | | | |
| 19,325,000 | Allstate Life Global Funding II | 5.370 | 11/8/2006 | 19,325,000 |
| 19,225,000 | Allstate Life Global Funding II | 5.360 | 11/15/2006 | 19,225,000 |
|
|
| | Total Insurance | | | 38,550,000 |
|
|
| |
| U.S. Municipal (2.2%) | | | |
| 8,000,000 | Illinois Student Assistance Commission Student Loan | | | |
| | Revenue Bonds | 5.300 | 11/1/2006 | 8,000,000 |
| 8,600,000 | Michigan State Housing Development Authority Revenue | | | |
| | Bonds (Series D) | 5.360 | 11/2/2006 | 8,600,000 |
| 10,000,000 | Ohio State Air Quality Development Authority Revenue | | | |
| | Bonds (Columbus and Southern) (Series B) | 5.360 | 11/1/2006 | 10,000,000 |
|
|
| | Total U.S. Municipal | | | 26,600,000 |
|
|
| | Total Variable Rate Notes | | 294,682,378 |
|
|
| | Total Investments (at amortized cost) 101.9% | $1,229,839,382 |
|
|
| | Other Assets and Liabilities, Net (1.9%) | | (22,641,965) |
|
|
| | Total Net Assets 100.0% | | | $1,207,197,417 |
|
|
+ The interest rate shown reflects the yield, coupon rate or, for securities purchased at a discount, the discount rate at the date of purchase.
∞ Denotes variable rate obligations for which the current yield and next scheduled reset date are shown.
Ω Denotes investments purchased on a when-issued basis.
± Designated as cover for long settling trades as discussed in the Notes to Financial Statements. Cost for federal income tax purposes is $1,229,839,382.
| The accompanying Notes to Financial Statements are an integral part of this schedule. |
|
| 222 |
This page intentionally left blank.
Thrivent Mutual Funds
Statement of Assets and Liabilities |
| | Aggressive | Moderately | Moderate | Moderately |
| | Allocation | Aggressive | Allocation | Conservative |
| As of October 31, 2006 | Fund | Allocation Fund | Fund | Allocation Fund |
|
| Assets | | | | |
| Investments at cost | $199,043,566 | $436,997,999 | $438,024,877 | $157,496,912 |
| Investments in securities at market value | — | — | — | — |
| Investments in affiliates at market value | 211,869,317 | 463,143,614 | 459,985,247 | 163,428,283 |
|
| Investments at Market Value | 211,869,317 | 463,143,614 | 459,985,247 | 163,428,283 |
| |
| Cash | — | — | — | — |
| Dividends and interest receivable | — | — | — | — |
| Prepaid expenses | 6,456 | 9,842 | 11,338 | 7,619 |
| Receivable for investments sold | — | — | — | — |
| Receivable for written options | — | — | — | — |
| Receivable for fund shares sold | 621,515 | 1,554,023 | 1,299,575 | 291,801 |
| Receivable from affiliate | 25,820 | 35,022 | 6,126 | 14,817 |
|
| Total Assets | 212,523,108 | 464,742,501 | 461,302,286 | 163,742,520 |
| |
| Liabilities | | | | |
| Accrued expenses | 51,295 | 79,584 | 65,440 | 27,637 |
| Payable for investments purchased | 542,991 | 1,413,837 | 1,223,345 | 252,093 |
| Payable upon return of collateral for securities loaned | — | — | — | — |
| Payable for fund shares redeemed | 78,521 | 138,081 | 67,272 | 30,370 |
| Open options written, at value | — | — | — | — |
| Payable for variation margin | — | — | — | — |
| Payable to affiliate | — | — | — | — |
|
| Total Liabilities | 672,807 | 1,631,502 | 1,356,057 | 310,100 |
| |
| Net Assets | | | | |
| Capital stock (beneficial interest) | 197,912,724 | 432,790,488 | 435,691,481 | 156,646,074 |
| Accumulated undistributed net investment income/(loss) | 654,455 | 3,250,841 | 821,751 | 430,172 |
| Accumulated undistributed net realized gain/(loss) on | | | | |
| investments and foreign currency transactions | 457,371 | 924,055 | 1,472,627 | 424,803 |
| Net unrealized appreciation/(depreciation) on: | | | | |
| Investments | — | — | — | — |
| Affiliated investments | 12,825,751 | 26,145,615 | 21,960,370 | 5,931,371 |
| Written option contracts | — | — | — | — |
| Futures contracts | — | — | — | — |
|
| Total Net Assets | $211,850,301 | $463,110,999 | $459,946,229 | $163,432,420 |
| |
| Class A Share Capital | $176,017,015 | $423,026,328 | $442,836,523 | $156,934,114 |
| Shares of beneficial interest outstanding (Class A) | 14,822,320 | 36,102,332 | 39,172,003 | 14,384,327 |
| Net asset value per share | $11.88 | $11.72 | $11.30 | $10.91 |
| Maximum public offering price | $12.57 | $12.40 | $11.96 | $11.54 |
| Class B Share Capital | $— | $— | $— | $— |
| Shares of beneficial interest outstanding (Class B) | — | — | — | — |
| Net asset value per share | $— | $— | $— | $— |
| Class I Share Capital | $35,833,286 | $40,084,671 | $17,109,706 | $6,498,306 |
| Shares of beneficial interest outstanding (Class I) | 3,001,772 | 3,404,247 | 1,511,166 | 594,609 |
| Net asset value per share | $11.94 | $11.77 | $11.32 | $10.93 |
| The accompanying Notes to Financial Statements are an integral part of this statement. |
|
| 224 |
Thrivent Mutual Funds
Statement of Assets and Liabilities – continued
| | Partner | Partner | | | | Partner |
| Technology | Small Cap | Small Cap | Small Cap | Small Cap | Mid Cap | Mid Cap |
| Fund | Growth Fund | Value Fund | Stock Fund | Index Fund | Growth Fund | Value Fund |
|
| |
| $56,233,372 | $49,133,219 | $140,807,633 | $610,409,832 | $45,108,238 | $366,961,210 | $35,599,218 |
| 43,348,838 | 40,201,826 | 124,789,722 | 552,783,357 | 47,481,585 | 308,600,216 | 30,940,749 |
| 12,276,054 | 11,895,103 | 39,214,409 | 158,767,181 | 13,057,336 | 97,993,832 | 7,245,616 |
|
| 55,624,892 | 52,096,929 | 164,004,131 | 711,550,538 | 60,538,921 | 406,594,048 | 38,186,365 |
| |
| — | 2,767 | — | 883 | — | 883 | 463 |
| 25,405 | 6,112 | 57,000 | 89,960 | 23,233 | 64,103 | 8,766 |
| 8,338 | 6,341 | 9,146 | 13,913 | 4,647 | 11,523 | 6,252 |
| 150,349 | 74,007 | 13,789 | 4,057,819 | — | 2,878,177 | 19,057 |
| — | — | — | — | — | 40,325 | — |
| 26,280 | 89,004 | 129,848 | 325,730 | 14,539 | 91,693 | 71,827 |
| — | — | — | — | — | — | 6,756 |
|
| 55,835,264 | 52,275,160 | 164,213,914 | 716,038,843 | 60,581,340 | 409,680,752 | 38,299,486 |
| |
| |
| 47,144 | 15,068 | 44,235 | 187,900 | 31,431 | 148,698 | 13,706 |
| 152,260 | 325,543 | — | 11,123,081 | — | 1,675,390 | 750,077 |
| 10,942,953 | 10,634,767 | 33,691,335 | 144,848,275 | 12,471,270 | 83,726,366 | 6,082,598 |
| 46,667 | — | 169,214 | 475,910 | 23,785 | 472,818 | 400 |
| — | — | — | — | — | 67,500 | — |
| — | — | — | — | 2,340 | — | — |
| 40,011 | 6,854 | 64,489 | 529,201 | 25,402 | 287,846 | — |
|
| 11,229,035 | 10,982,232 | 33,969,273 | 157,164,367 | 12,554,228 | 86,378,618 | 6,846,781 |
| |
| |
| 73,107,655 | 38,472,314 | 101,113,608 | 406,628,414 | 29,407,735 | 288,559,662 | 28,365,107 |
| (8,056) | 9,601 | 70,509 | (324,148) | 63,964 | (17,811) | 365,158 |
| |
| (27,884,890) | (152,697) | 5,864,026 | 51,429,504 | 3,103,945 | (4,872,314) | 135,293 |
| |
| (608,480) | 2,963,710 | 23,196,498 | 101,140,706 | 15,430,683 | 39,632,838 | 2,587,147 |
| — | — | — | — | — | — | — |
| — | — | — | — | — | (241) | — |
| — | — | — | — | 20,785 | — | — |
|
| $44,606,229 | $41,292,928 | $130,244,641 | $558,874,476 | $48,027,112 | $323,302,134 | $31,452,705 |
| |
| $40,089,692 | $11,985,224 | $79,823,328 | $457,463,835 | $48,027,112 | $264,605,392 | $7,580,825 |
| 10,749,380 | 1,025,190 | 5,100,694 | 24,747,906 | 2,980,493 | 16,361,905 | 640,908 |
| $3.73 | $11.69 | $15.65 | $18.48 | $16.11 | $16.17 | $11.83 |
| $3.95 | $12.37 | $16.56 | $19.56 | $17.05 | $17.11 | $12.52 |
| $2,377,404 | $— | $5,485,375 | $16,264,995 | $— | $26,417,246 | $— |
| 668,110 | — | 368,358 | 989,438 | — | 1,766,058 | — |
| $3.56 | $— | $14.89 | $16.44 | $— | $14.96 | $— |
| $2,139,133 | $29,307,704 | $44,935,938 | $85,145,646 | $— | $32,279,496 | $23,871,880 |
| 544,650 | 2,497,475 | 2,764,106 | 4,296,227 | — | 1,872,304 | 2,011,923 |
| $3.93 | $11.73 | $16.26 | $19.82 | $— | $17.24 | $11.87 |
| The accompanying Notes to Financial Statements are an integral part of this statement. |
|
| 225 |
Thrivent Mutual Funds
Statement of Assets and Liabilities – continued
| | | | | Partner |
| | Mid Cap | Mid Cap | Mid Cap | International |
| As of October 31, 2006 | Stock Fund | Index Fund | Index Fund-I | Stock Fund |
|
| Assets | | | | |
| Investments at cost | $1,215,697,697 | $61,871,430 | $21,825,986 | $456,841,899 |
| Investments in securities at market value | 1,083,658,179 | 59,468,723 | 22,149,158 | 544,728,869 |
| Investments in affiliates at market value | 236,052,426 | 17,739,815 | 6,321,229 | 10,795,069 |
|
| Investments at Market Value | 1,319,710,605 | 77,208,538 | 28,470,387 | 555,523,938 |
| |
| Cash | 3,756 | — | — | 463,920(a) |
| Dividends and interest receivable | 384,992 | 30,757 | 11,186 | 928,351 |
| Prepaid expenses | 20,245 | 4,751 | 10,159 | 13,501 |
| Receivable for investments sold | 13,281,633 | 307,921 | 118,769 | 3,784,809 |
| Receivable for written options | — | — | — | — |
| Receivable for fund shares sold | 788,789 | 11,324 | — | 533,054 |
| Receivable for forward contracts | — | — | — | 607,166 |
|
| Total Assets | 1,334,190,020 | 77,563,291 | 28,610,501 | 561,854,739 |
| |
| Liabilities | | | | |
| Distributions payable | — | — | — | — |
| Accrued expenses | 262,246 | 29,594 | 13,565 | 132,069 |
| Payable for investments purchased | 20,337,096 | 90,480 | 33,930 | 4,082,420 |
| Payable upon return of collateral for securities loaned | 200,525,518 | 15,778,622 | 5,880,742 | — |
| Payable for fund shares redeemed | 811,972 | 54,896 | 48,531 | 395,759 |
| Payable for forward contracts | — | — | — | 608,717 |
| Open options written, at value | — | — | — | — |
| Payable for variation margin | — | 9,620 | 2,653 | — |
| Payable to affiliate | 1,013,795 | 38,356 | 5,263 | 462,628 |
| Mortgage dollar roll deferred revenue | — | — | — | — |
|
| Total Liabilities | 222,950,627 | 16,001,568 | 5,984,684 | 5,681,593 |
| |
| Net Assets | | | | |
| Capital stock (beneficial interest) | 824,139,145 | 43,663,618 | 15,121,486 | 484,415,370 |
| Accumulated undistributed net investment income/(loss) | (515,864) | 304,217 | 197,079 | 3,999,988 |
| Accumulated undistributed net realized gain/(loss) on | | | | |
| investments and foreign currency transactions | 183,603,204 | 2,250,843 | 643,577 | (30,926,880) |
| Net unrealized appreciation/(depreciation) on: | | | | |
| Investments | 104,012,908 | 15,337,108 | 6,644,401 | 98,682,039 |
| Written option contracts | — | — | — | — |
| Futures contracts | — | 5,937 | 19,274 | — |
| Foreign currency forward contracts | — | — | — | (1,551) |
| Foreign currency transactions | — | — | — | 4,180 |
|
| Total Net Assets | $1,111,239,393 | $61,561,723 | $22,625,817 | $556,173,146 |
| |
| Class A Share Capital | $976,253,499 | $61,561,723 | $— | $337,514,761 |
| Shares of beneficial interest outstanding (Class A) | 52,466,667 | 4,254,669 | — | 26,087,711 |
| Net asset value per share | $18.61 | $14.47 | $— | $12.94 |
| Maximum public offering price | $19.69 | $15.31 | $— | $13.69 |
| Class B Share Capital | $18,568,911 | $— | $— | $14,429,151 |
| Shares of beneficial interest outstanding (Class B) | 1,133,212 | — | — | 1,160,659 |
| Net asset value per share | $16.39 | $— | $— | $12.43 |
| Class I Share Capital | $116,416,983 | $— | $22,625,817 | $204,229,234 |
| Shares of beneficial interest outstanding (Class I) | 5,940,955 | — | 1,617,069 | 15,483,309 |
| Net asset value per share | $19.60 | $— | $13.99 | $13.19 |
| (a) Includes foreign currency holdings of $460,877. | | | | |
| The accompanying Notes to Financial Statements are an integral part of this statement. |
|
| 226 |
Thrivent Mutual Funds
Statement of Assets and Liabilities – continued
| Large Cap | Large Cap | Large Cap | Large Cap | Large Cap | Balanced | High Yield |
| Growth Fund | Value Fund | Stock Fund | Index Fund | Index Fund-I | Fund | Fund |
|
| |
| $346,451,142 | $435,437,881 | $2,609,662,623 | $77,433,802 | $32,032,745 | $409,031,460 | $700,621,172 |
| 338,840,239 | 491,602,619 | 3,381,278,192 | 90,288,332 | 31,619,737 | 368,706,641 | 602,961,629 |
| 22,239,879 | 31,610,936 | 163,543,432 | 4,896,758 | 3,572,733 | 69,860,136 | 107,668,084 |
|
| 361,080,118 | 523,213,555 | 3,544,821,624 | 95,185,090 | 35,192,470 | 438,566,777 | 710,629,713 |
| |
| — | — | 4,001 | — | — | — | 810 |
| 131,261 | 446,624 | 2,561,571 | 79,087 | 27,333 | 934,912 | 12,712,826 |
| 10,741 | 11,642 | 44,690 | 5,060 | 11,361 | 24,219 | 14,735 |
| 5,903,641 | 4,117,492 | 10,503,158 | — | — | 977,288 | 4,133,474 |
| 12,266 | — | — | — | — | — | — |
| 927,157 | 583,518 | 574,507 | 27,120 | 27 | 25,864 | 331,262 |
| — | — | — | — | — | — | — |
|
| 368,065,184 | 528,372,831 | 3,558,509,551 | 95,296,357 | 35,231,191 | 440,529,060 | 727,822,820 |
| |
| |
| — | — | — | — | — | — | 1,148,728 |
| 72,677 | 103,310 | 789,368 | 32,120 | 15,483 | 88,724 | 110,853 |
| 7,780,664 | — | 707,654 | — | — | 38,927,483 | 7,092,988 |
| 9,102,649 | 17,069,353 | 129,465,761 | 2,811,275 | 2,599,233 | 52,973,617 | 86,278,192 |
| 113,595 | 358,081 | 2,904,613 | 87,867 | 30,541 | 285,679 | 296,134 |
| — | — | — | — | — | — | — |
| 14,430 | — | — | — | — | — | — |
| — | — | — | 541 | 361 | 17,422 | — |
| 72,718 | 341,365 | 2,722,803 | 36,323 | 7,454 | 268,880 | 415,784 |
| — | — | — | — | — | 3,383 | — |
|
| 17,156,733 | 17,872,109 | 136,590,199 | 2,968,126 | 2,653,072 | 92,565,188 | 95,342,679 |
| |
| |
| 346,781,853 | 391,261,135 | 2,438,022,578 | 77,438,130 | 31,395,494 | 303,097,995 | 1,114,483,223 |
| 1,353,843 | 4,639,950 | 22,166,205 | 964,026 | 371,089 | 324,909 | 1,630 |
| |
| (11,860,333) | 26,823,963 | 26,571,568 | (3,840,140) | (2,377,317) | 15,003,720 | (492,013,253) |
| |
| 14,628,976 | 87,775,674 | 935,159,001 | 17,751,288 | 3,159,725 | 29,535,317 | 10,008,541 |
| 4,112 | — | — | — | — | — | — |
| — | — | — | 14,927 | 29,128 | 1,931 | — |
| — | — | — | — | — | — | — |
| — | — | — | — | — | — | — |
|
| $350,908,451 | $510,500,722 | $3,421,919,352 | $92,328,231 | $32,578,119 | $347,963,872 | $632,480,141 |
| |
| $134,020,822 | $332,110,822 | $3,107,248,432 | $92,328,231 | $— | $251,623,387 | $533,711,065 |
| 25,241,452 | 19,714,007 | 108,588,323 | 9,694,913 | — | 19,435,510 | 105,036,074 |
| $5.31 | $16.85 | $28.61 | $9.52 | $— | $12.95 | $5.08 |
| $5.62 | $17.83 | $30.28 | $10.07 | $— | $13.70 | $5.32 |
| $12,057,865 | $14,478,335 | $68,988,835 | $— | $— | $10,036,849 | $16,500,810 |
| 2,426,066 | 873,821 | 2,613,594 | — | — | 778,529 | 3,248,637 |
| $4.97 | $16.57 | $26.40 | $— | $— | $12.89 | $5.08 |
| $204,829,764 | $163,911,565 | $245,682,085 | $— | $32,578,119 | $86,303,636 | $82,268,266 |
| 36,229,912 | 9,655,253 | 8,518,569 | — | 3,445,005 | 6,672,471 | 16,177,311 |
| $5.65 | $16.98 | $28.84 | $— | $9.46 | $12.93 | $5.09 |
| The accompanying Notes to Financial Statements are an integral part of this statement. |
|
| 227 |
Thrivent Mutual Funds
Statement of Assets and Liabilities – continued
| | Diversified | | | |
| | Income | Municipal | Income | Core Bond |
| As of October 31, 2006 | Plus Fund | Bond Fund | Fund | Fund |
|
| Assets | | | | |
| Investments at cost | $162,125,104 | $1,127,001,281 | $815,884,649 | $586,549,469 |
| Investments in securities at market value | 128,938,595 | 1,218,655,032 | 721,531,222 | 518,277,126 |
| Investments in affiliates at market value | 36,265,192 | — | 99,392,654 | 69,401,110 |
|
| Investments at Market Value | 165,203,787 | 1,218,655,032 | 820,923,876 | 587,678,236 |
| |
| Cash | 178,988 | 5,899 | 5,653 | 1,404 |
| Dividends and interest receivable | 1,291,032 | 18,584,170 | 6,374,871 | 2,583,658 |
| Prepaid expenses | 6,276 | 21,924 | 15,561 | 12,387 |
| Receivable for investments sold | 882,642 | — | 2,740,795 | 589,426 |
| Receivable for fund shares sold | 736,484 | 301,523 | 396,695 | 26,085 |
|
| Total Assets | 168,299,209 | 1,237,568,548 | 830,457,451 | 590,891,196 |
| |
| Liabilities | | | | |
| Distributions payable | 133,921 | 907,191 | 388,764 | 200,677 |
| Accrued expenses | 45,621 | 158,605 | 99,054 | 98,825 |
| Payable for investments purchased | 1,968,567 | — | 107,367,657 | 138,405,820 |
| Payable upon return of collateral for securities loaned | 33,647,183 | — | 71,849,013 | 51,452,125 |
| Payable for fund shares redeemed | 211,358 | 642,933 | 215,185 | 242,615 |
| Payable for variation margin | 13,666 | — | 131,641 | 12,577 |
| Payable to affiliate | 91,030 | 792,996 | 364,612 | 285,546 |
| Mortgage dollar roll deferred revenue | — | — | 8,818 | 12,048 |
|
| Total Liabilities | 36,111,346 | 2,501,725 | 180,424,744 | 190,710,233 |
| |
| Net Assets | | | | |
| Capital stock (beneficial interest) | 191,508,288 | 1,148,684,451 | 680,586,523 | 411,492,721 |
| Accumulated undistributed net investment income/(loss) | 505,125 | 24,765 | 93,317 | 159,402 |
| Accumulated undistributed net realized gain/(loss) on | | | | |
| investments and foreign currency transactions | (62,888,472) | (5,296,144) | (35,512,670) | (12,648,783) |
| Net unrealized appreciation/(depreciation) on: | | | | |
| Investments | 3,078,683 | 91,653,751 | 5,039,227 | 1,128,767 |
| Futures contracts | (15,761) | — | (173,690) | 48,856 |
|
| Total Net Assets | $132,187,863 | $1,235,066,823 | $650,032,707 | $400,180,963 |
| |
| Class A Share Capital | $123,380,401 | $1,201,237,475 | $470,456,145 | $343,076,210 |
| Shares of beneficial interest outstanding (Class A) | 18,419,535 | 105,496,700 | 54,771,624 | 34,637,836 |
| Net asset value per share | $6.70 | $11.39 | $8.59 | $9.90 |
| Maximum public offering price | $7.02 | $11.93 | $8.99 | $10.37 |
| Class B Share Capital | $3,033,909 | $21,667,214 | $12,552,723 | $8,057,013 |
| Shares of beneficial interest outstanding (Class B) | 452,999 | 1,903,557 | 1,464,706 | 813,017 |
| Net asset value per share | $6.70 | $11.38 | $8.57 | $9.91 |
| Class I Share Capital | $5,773,553 | $12,162,134 | $167,023,839 | $49,047,740 |
| Shares of beneficial interest outstanding (Class I) | 862,254 | 1,068,135 | 19,461,471 | 4,950,155 |
| Net asset value per share | $6.70 | $11.39 | $8.58 | $9.91 |
| The accompanying Notes to Financial Statements are an integral part of this statement. |
|
| 228 |
Thrivent Mutual Funds
Statement of Assets and Liabilities – continued |
| Limited | Money |
| Maturity | Market |
| Bond Fund | Fund |
|
| |
| $298,480,182 | $1,229,839,382 |
| 277,348,788 | 1,229,839,382 |
| 20,522,586 | — |
|
| 297,871,374 | 1,229,839,382 |
| |
| 101 | 5,729 |
| 2,354,059 | 2,530,430 |
| 10,124 | 22,637 |
| — | — |
| 1,013,104 | 10,608,510 |
|
| 301,248,762 | 1,243,006,688 |
| |
| |
| 33,115 | 39,204 |
| 37,824 | 223,445 |
| 20,643,345 | 25,588,250 |
| 15,075,000 | — |
| 318,274 | 9,452,249 |
| 21,719 | — |
| 115,045 | 506,123 |
| 3,649 | — |
|
| 36,247,971 | 35,809,271 |
| |
| |
| 266,992,224 | 1,207,206,406 |
| 14,434 | (8,989) |
| |
| (1,359,487) | — |
| |
| (608,808) | — |
| (37,572) | — |
|
| $265,000,791 | $1,207,197,417 |
| |
| $114,807,526 | $864,300,068 |
| 9,124,242 | 864,300,069 |
| $12.58 | $1.00 |
| $12.58 | $1.00 |
| $1,898,444 | $1,796,873 |
| 150,756 | 1,796,874 |
| $12.59 | $1.00 |
| $148,294,821 | $341,100,476 |
| 11,788,809 | 341,100,476 |
| $12.58 | $1.00 |
| The accompanying Notes to Financial Statements are an integral part of this statement. |
|
| 229 |
Thrivent Mutual Funds
Statement of Operations |
| | Aggressive | Moderately | Moderate | Moderately |
| | Allocation | Aggressive | Allocation | Conservative |
| For the Year Ended October 31, 2006 | Fund | Allocation Fund | Fund | Allocation Fund |
|
| Investment Income | | | | |
| Dividends | $— | $— | $— | $— |
| Taxable interest | — | — | — | — |
| Income from securities loaned | — | — | — | — |
| Income from affiliated investments | 1,050,214 | 4,343,247 | 6,500,268 | 3,055,979 |
| Foreign dividend tax withholding | — | — | — | — |
|
| Total Investment Income | 1,050,214 | 4,343,247 | 6,500,268 | 3,055,979 |
| |
| Expenses | | | | |
| Adviser fees | 182,283 | 388,254 | 392,560 | 143,391 |
| Sub-Adviser fees | — | — | — | — |
| Accounting and pricing fees | 14,336 | 14,336 | 14,336 | 14,336 |
| Administrative service fees | 24,305 | 51,767 | 52,341 | 19,119 |
| Amortization of offering costs | 22,472 | 21,192 | 21,278 | 19,528 |
| Audit and legal fees | 16,715 | 16,715 | 16,715 | 16,715 |
| Custody fees | 4,490 | 4,598 | 4,598 | 4,598 |
| Distribution expenses Class A | 249,790 | 588,293 | 629,516 | 230,662 |
| Distribution expenses Class B | — | — | — | — |
| Insurance expenses | 4,105 | 4,555 | 4,611 | 4,077 |
| Printing and postage expenses Class A | 92,587 | 141,272 | 103,343 | 32,635 |
| Printing and postage expenses Class B | — | — | — | — |
| Printing and postage expenses Class I | 455 | 488 | 342 | 179 |
| SEC and state registration expenses | 54,542 | 84,670 | 82,644 | 49,344 |
| Transfer agent fees Class A | 191,089 | 300,981 | 220,797 | 67,687 |
| Transfer agent fees Class B | — | — | — | — |
| Transfer agent fees Class I | 97 | 136 | 193 | 148 |
| Trustees’ fees | 2,965 | 2,965 | 2,965 | 2,965 |
| Other expenses | 5,308 | 5,736 | 5,754 | 5,231 |
|
| Total Expenses Before Reimbursement | 865,539 | 1,625,958 | 1,551,993 | 610,615 |
| |
| Less: | | | | |
| Reimbursement from adviser | (865,539) | (1,527,132) | (1,478,157) | (610,615) |
| Custody earnings credit | — | — | — | — |
|
| Total Net Expenses | — | 98,826 | 73,836 | — |
|
| |
| Net Investment Income/(Loss) | 1,050,214 | 4,244,421 | 6,426,432 | 3,055,979 |
| |
| Realized and Unrealized Gains/(Losses) on | | | | |
| Investments and Foreign Currency Transactions | | | | |
| Net realized gains/(losses) on: | | | | |
| Investments | — | — | — | — |
| Affiliated investments | (72,206) | 83,912 | 48,262 | 56,329 |
| Distributions of realized capital gains from | | | | |
| affiliated investments | 706,204 | 1,134,486 | 1,733,913 | 448,617 |
| Written option contracts | — | — | — | — |
| Futures contracts | — | — | — | — |
| Change in net unrealized appreciation/(depreciation) on: | | | | |
| Investments | — | — | — | — |
| Affiliated investments | 12,627,314 | 25,971,422 | 21,925,117 | 5,976,528 |
| Written option contracts | — | — | — | — |
| Futures contracts | — | — | — | — |
|
| |
| Net Realized and Unrealized Gains/(Losses) on | | | | |
|
| Investments and Foreign Currency Transactions | 13,261,312 | 27,189,820 | 23,707,292 | 6,481,474 |
|
| |
| Net Increase/(Decrease) in Net Assets Resulting | | | | |
|
| From Operations | $14,311,526 | $31,434,241 | $30,133,724 | $9,537,453 |
| The accompanying Notes to Financial Statements are an integral part of this statement. |
|
| 230 |
Thrivent Mutual Funds
Statement of Operations – continued |
| | Partner | Partner | | | | Partner |
| Technology | Small Cap | Small Cap | Small Cap | Small Cap | Mid Cap | Mid Cap |
| Fund | Growth Fund | Value Fund | Stock Fund | Index Fund | Growth Fund | Value Fund |
|
| |
| $221,036 | $68,558 | $1,342,253 | $3,788,369 | $486,045 | $1,931,926 | $336,465 |
| 9,006 | 45,506 | 15,139 | 221,213 | 4,241 | 45,681 | 25,253 |
| 27,883 | 24,363 | 57,280 | 316,611 | 26,388 | 198,160 | 2,441 |
| 69,639 | 39,076 | 215,745 | 1,018,688 | 55,036 | 566,160 | 27,162 |
| (7,201) | — | — | (4,124) | (195) | (3,403) | (23) |
|
| 320,363 | 177,503 | 1,630,417 | 5,340,757 | 571,515 | 2,738,524 | 391,298 |
| |
| |
| 357,908 | 92,413 | 113,966 | 3,592,513 | 122,950 | 1,334,134 | 50,683 |
| — | 163,837 | 683,793 | — | — | — | 99,468 |
| 17,612 | 16,942 | 19,541 | 44,387 | 20,026 | 43,880 | 16,135 |
| 9,544 | 5,694 | 22,793 | 107,462 | 9,836 | 66,236 | 4,004 |
| — | 19,942 | — | — | — | — | 19,720 |
| 16,550 | 15,988 | 16,585 | 23,257 | 16,550 | 20,751 | 16,715 |
| 10,405 | 38,284 | 13,744 | 43,711 | 16,449 | 25,966 | 38,150 |
| 106,221 | 27,836 | 194,557 | 1,164,283 | 122,950 | 691,680 | 15,702 |
| 29,115 | — | 56,892 | 188,017 | — | 320,155 | — |
| 4,217 | 3,883 | 4,710 | 8,490 | 4,205 | 6,800 | 3,832 |
| 92,684 | 1,840 | 87,285 | 412,998 | 53,453 | 376,838 | 1,752 |
| 6,762 | — | 8,032 | 23,230 | — | 51,958 | — |
| 136 | 929 | 818 | 1,538 | — | 906 | 518 |
| 33,354 | 25,131 | 41,964 | 74,874 | 19,235 | 56,705 | 24,114 |
| 228,226 | 3,959 | 222,663 | 1,035,780 | 142,803 | 961,429 | 5,604 |
| 21,976 | — | 24,988 | 87,085 | — | 206,567 | — |
| 141 | 164 | 350 | 1,167 | — | 1,292 | 128 |
| 3,500 | 2,965 | 4,697 | 18,311 | 3,369 | 11,542 | 2,965 |
| 6,744 | 5,606 | 6,918 | 9,985 | 5,962 | 8,565 | 5,578 |
|
| 945,095 | 425,413 | 1,524,296 | 6,837,088 | 537,788 | 4,185,404 | 305,068 |
| |
| |
| (248,362) | (231,376) | (590,106) | (98,186) | (69,934) | (50,992) | (304,513) |
| (27) | (6,760) | (734) | (1,817) | (644) | (102) | (555) |
|
| 696,706 | 187,277 | 933,456 | 6,737,085 | 467,210 | 4,134,310 | — |
|
| |
| (376,343) | (9,774) | 696,961 | (1,396,328) | 104,305 | (1,395,786) | 391,298 |
| |
| |
| |
| |
| 521,497 | 14,342 | 6,053,843 | 58,639,765 | 3,191,987 | 29,662,260 | 148,545 |
| — | — | — | — | — | — | — |
| |
| — | — | — | — | — | — | — |
| — | — | — | — | — | 32,638 | — |
| — | — | — | 1,062,631 | 82,381 | — | — |
| |
| 3,162,485 | 2,480,981 | 12,466,684 | 18,907,527 | 3,389,584 | 5,014,198 | 2,530,385 |
| — | — | — | — | — | — | — |
| — | — | — | — | — | (241) | — |
| — | — | — | — | 57,733 | — | — |
|
| |
| |
| 3,683,982 | 2,495,323 | 18,520,527 | 78,609,923 | 6,721,685 | 34,708,855 | 2,678,930 |
|
| |
| |
| $3,307,639 | $2,485,549 | $19,217,488 | $77,213,595 | $6,825,990 | $33,313,069 | $3,070,228 |
| The accompanying Notes to Financial Statements are an integral part of this statement. |
|
| 231 |
Thrivent Mutual Funds
Statement of Operations – continued |
| | | | | Partner |
| | Mid Cap | Mid Cap | Mid Cap | International |
| For the Year Ended October 31, 2006 | Stock Fund | Index Fund | Index Fund-I | Stock Fund |
|
| Investment Income | | | | |
| Dividends | $11,399,495 | $870,789 | $314,743 | $11,337,451 |
| Taxable interest | 1,022,284 | 4,242 | 3,538 | 517,931 |
| Income from mortgage dollar rolls | — | — | — | — |
| Income from securities loaned | 418,852 | 15,215 | 5,892 | 124,024 |
| Income from affiliated investments | 1,208,071 | 57,895 | 30,685 | 391,337 |
| Foreign dividend tax withholding | (20,579) | — | — | (902,866) |
|
| Total Investment Income | 14,028,123 | 948,141 | 354,858 | 11,467,877 |
| |
| Expenses | | | | |
| Adviser fees | 7,124,935 | 161,415 | 58,787 | 709,067 |
| Sub-Adviser fees | — | — | — | 2,155,731 |
| Accounting and pricing fees | 90,818 | 18,109 | 14,101 | 89,984 |
| Administrative service fees | 217,500 | 12,913 | 4,703 | 94,660 |
| Audit and legal fees | 30,466 | 16,550 | 16,585 | 22,175 |
| Custody fees | 43,632 | 13,717 | 11,642 | 235,027 |
| Distribution expenses Class A | 2,455,859 | 161,415 | — | 827,422 |
| Distribution expenses Class B | 217,266 | — | — | 155,659 |
| Insurance expenses | 13,399 | 4,349 | 3,968 | 7,438 |
| Printing and postage expenses Class A | 585,396 | 53,840 | — | 275,397 |
| Printing and postage expenses Class B | 24,015 | — | — | 20,218 |
| Printing and postage expenses Class I | 2,301 | — | 1,000 | 2,541 |
| SEC and state registration expenses | 115,036 | 20,693 | 15,664 | 67,409 |
| Transfer agent fees Class A | 1,638,630 | 175,788 | — | 946,739 |
| Transfer agent fees Class B | 94,137 | — | — | 89,949 |
| Transfer agent fees Class I | 3,070 | — | 575 | 873 |
| Trustees’ fees | 33,967 | 3,423 | 3,249 | 15,712 |
| Other expenses | 13,656 | 6,059 | 5,808 | 8,597 |
|
| Total Expenses Before Reimbursement | 12,704,083 | 648,271 | 136,082 | 5,724,598 |
| |
| Less: | | | | |
| Reimbursement from adviser | (116,255) | (66,709) | (1,688) | (36,846) |
| Custody earnings credit | (240) | (469) | (196) | (449) |
|
| Total Net Expenses | 12,587,588 | 581,093 | 134,198 | 5,687,303 |
|
| |
| Net Investment Income/(Loss) | 1,440,535 | 367,048 | 220,660 | 5,780,574 |
| |
| Realized and Unrealized Gains/(Losses) on | | | | |
| Investments and Foreign Currency Transactions | | | | |
| Net realized gains/(losses) on: | | | | |
| Investments | 192,483,986 | 2,626,545 | 1,190,366 | 36,402,780 |
| Written option contracts | — | — | — | — |
| Futures contracts | — | 107,698 | 1,656 | — |
| Foreign currency transactions | — | — | — | (153,895) |
| Change in net unrealized appreciation/(depreciation) on: | | | | |
| Investments | (42,034,620) | 4,349,791 | 1,388,618 | 54,711,850 |
| Written option contracts | — | — | — | — |
| Futures contracts | — | 34,483 | 16,137 | — |
| Foreign currency forward contracts | — | — | — | (1,120) |
| Foreign currency transactions | — | — | — | 18,868 |
|
| |
| Net Realized and Unrealized Gains/(Losses) on | | | | |
|
| Investments and Foreign Currency Transactions | 150,449,366 | 7,118,517 | 2,596,777 | 90,978,483 |
|
| |
| Net Increase/(Decrease) in Net Assets Resulting | | | | |
|
| From Operations | $151,889,901 | $7,485,565 | $2,817,437 | $96,759,057 |
|
| The accompanying Notes to Financial Statements are an integral part of this statement. |
|
| 232 |
Thrivent Mutual Funds Statement of Operations – continued
| Large Cap | Large Cap | Large Cap | Large Cap | Large Cap | Balanced | High Yield |
| Growth Fund | Value Fund | Stock Fund | Index Fund | Index Fund-I | Fund | Fund |
|
| |
| $2,349,075 | $9,053,292 | $58,418,011 | $1,769,833 | $592,364 | $3,609,941 | $970,677 |
| 3,280 | 144,594 | 6,244,219 | 8,484 | 8,012 | 5,449,981 | 50,323,893 |
| — | — | — | — | — | 353,287 | — |
| 24,955 | 30,485 | 173,909 | 5,362 | 1,982 | 85,451 | 241,681 |
| 311,976 | 904,777 | 1,296,635 | 46,713 | 33,442 | 679,262 | 956,976 |
| (15,571) | (26,331) | (140,467) | — | — | (13,726) | — |
|
| 2,673,715 | 10,106,817 | 65,992,307 | 1,830,392 | 635,800 | 10,164,196 | 52,493,227 |
| |
| |
| 1,986,703 | 2,011,008 | 18,007,504 | 232,820 | 79,020 | 2,038,524 | 2,413,104 |
| — | — | — | — | — | — | — |
| 32,277 | 46,458 | 298,366 | 25,077 | 18,069 | 54,065 | 94,473 |
| 52,979 | 89,378 | 700,334 | 18,625 | 6,322 | 74,128 | 123,606 |
| 16,585 | 21,951 | 66,057 | 16,550 | 16,585 | 22,275 | 26,195 |
| 45,244 | 18,356 | 75,843 | 19,173 | 13,148 | 29,740 | 17,225 |
| 334,908 | 822,119 | 8,078,368 | 232,820 | — | 665,684 | 1,361,168 |
| 139,241 | 159,454 | 801,624 | — | — | 118,002 | 196,735 |
| 5,512 | 7,504 | 37,883 | 4,653 | 4,059 | 7,482 | 9,608 |
| 146,818 | 200,512 | 1,620,436 | 61,569 | — | 141,617 | 247,970 |
| 22,505 | 20,413 | 99,483 | — | — | 10,409 | 17,674 |
| 2,451 | 2,301 | 4,205 | — | 1,444 | 1,912 | 2,306 |
| 63,562 | 70,619 | 260,321 | 23,110 | 16,346 | 62,640 | 75,524 |
| 493,010 | 636,347 | 4,700,539 | 204,600 | — | 432,920 | 773,503 |
| 93,901 | 80,217 | 418,670 | — | — | 40,234 | 73,662 |
| 1,257 | 1,847 | 2,799 | — | 447 | 315 | 2,680 |
| 9,438 | 15,696 | 106,659 | 4,019 | 3,379 | 14,745 | 18,756 |
| 7,748 | 9,385 | 32,618 | 6,256 | 5,875 | 9,411 | 8,987 |
|
| 3,454,139 | 4,213,565 | 35,311,709 | 849,272 | 164,694 | 3,724,103 | 5,463,176 |
| |
| |
| (2,147,728) | (85,912) | (374,227) | (290,389) | (1,852) | (64,984) | (116,942) |
| (98) | (74) | (1,436) | (116) | (34) | (842) | (9,266) |
|
| 1,306,313 | 4,127,579 | 34,936,046 | 558,767 | 162,808 | 3,658,277 | 5,336,968 |
|
| |
| 1,367,402 | 5,979,238 | 31,056,261 | 1,271,625 | 472,992 | 6,505,919 | 47,156,259 |
| |
| |
| |
| |
| 10,835,555 | 31,208,693 | 187,512,948 | (3,510,264) | 1,915,957 | 16,727,101 | (1,518,841) |
| 129,165 | — | — | — | — | 42,184 | — |
| — | — | 1,353,863 | 42,682 | 52,035 | 142,181 | 225,995 |
| — | — | — | — | — | 1,112 | — |
| |
| 8,313,147 | 41,101,693 | 183,089,416 | 15,696,987 | 2,156,990 | 15,502,008 | 8,047,938 |
| 2,613 | — | — | — | — | — | — |
| — | — | — | 27,251 | 30,941 | (28,387) | — |
| — | — | — | — | — | — | — |
| — | — | — | — | — | — | — |
|
| |
| |
| 19,280,480 | 72,310,386 | 371,956,227 | 12,256,656 | 4,155,923 | 32,386,199 | 6,755,092 |
|
| |
| |
| $20,647,882 | $78,289,624 | $403,012,488 | $13,528,281 | $4,628,915 | $38,892,118 | $53,911,351 |
|
| The accompanying Notes to Financial Statements are an integral part of this statement. |
|
| 233 |
Thrivent Mutual Funds
Statement of Operations – continued |
| | Diversified | | | |
| | Income | Municipal | Income | Core Bond |
| For the Year Ended October 31, 2006 | Plus Fund | Bond Fund | Fund | Fund |
|
| Investment Income | | | | |
| Dividends | $813,662 | $— | $45,687 | $40,313 |
| Taxable interest | 8,423,335 | 532,074 | 32,527,337 | 21,002,196 |
| Tax exempt interest | — | 65,096,565 | — | — |
| Income from mortgage dollar rolls | 4,531 | — | 803,968 | 1,262,213 |
| Income from securities loaned | 49,831 | — | 121,364 | 115,365 |
| Income from affiliated investments | 173,701 | — | 1,189,863 | 884,497 |
|
| Total Investment Income | 9,465,060 | 65,628,639 | 34,688,219 | 23,304,584 |
| |
| Expenses | | | | |
| Adviser fees | 681,504 | 5,134,080 | 2,136,287 | 1,952,267 |
| Accounting and pricing fees | 45,677 | 184,309 | 84,132 | 67,173 |
| Administrative service fees | 24,782 | 250,519 | 123,771 | 86,767 |
| Audit and legal fees | 17,659 | 34,614 | 24,619 | 23,542 |
| Custody fees | 17,229 | 24,745 | 26,011 | 19,874 |
| Distribution expenses Class A | 291,366 | 3,041,608 | 1,241,132 | 940,259 |
| Distribution expenses Class B | 35,775 | 258,514 | 159,055 | 93,171 |
| Insurance expenses | 5,028 | 15,913 | 9,564 | 8,360 |
| Printing and postage expenses Class A | 55,487 | 196,484 | 199,561 | 145,741 |
| Printing and postage expenses Class B | 3,527 | 7,692 | 16,588 | 7,740 |
| Printing and postage expenses Class I | 334 | 569 | 2,998 | 1,544 |
| SEC and state registration expenses | 46,575 | 118,826 | 77,698 | 62,296 |
| Transfer agent fees Class A | 197,706 | 589,092 | 634,591 | 554,053 |
| Transfer agent fees Class B | 14,181 | 26,802 | 72,072 | 33,437 |
| Transfer agent fees Class I | 685 | 2,155 | 2,232 | 2,300 |
| Trustees’ fees | 6,262 | 38,210 | 18,665 | 17,417 |
| Other expenses | 5,838 | 13,490 | 8,817 | 7,825 |
|
| Total Expenses Before Reimbursement | 1,449,615 | 9,937,622 | 4,837,793 | 4,023,766 |
| |
| Less: | | | | |
| Reimbursement from adviser | (212,977) | (32,936) | (142,481) | (85,736) |
| Custody earnings credit | (3,250) | (447) | (3,098) | (2,756) |
|
| Total Net Expenses | 1,233,388 | 9,904,239 | 4,692,214 | 3,935,274 |
|
| |
| Net Investment Income/(Loss) | 8,231,672 | 55,724,400 | 29,996,005 | 19,369,310 |
| |
| Realized and Unrealized Gains/(Losses) on | | | | |
| Investments and Foreign Currency Transactions | | | | |
| Net realized gains/(losses) on: | | | | |
| Investments | 2,948,783 | 5,573,334 | (11,781,005) | (9,424,786) |
| Written option contracts | — | — | 222,888 | 167,842 |
| Futures contracts | 65,497 | (145,731) | 1,521,559 | 235,593 |
| Foreign currency transactions | — | — | 245 | (134) |
| Change in net unrealized appreciation/(depreciation) on: | | | | |
| Investments | 2,568,745 | 2,986,542 | 13,051,491 | 8,918,695 |
| Futures contracts | (15,761) | — | (455,076) | 404,359 |
|
| |
| Net Realized and Unrealized Gains/(Losses) on | | | | |
|
| Investments and Foreign Currency Transactions | 5,567,264 | 8,414,145 | 2,560,102 | 301,569 |
|
| |
| Net Increase/(Decrease) in Net Assets Resulting | | | | |
|
| From Operations | $13,798,936 | $64,138,545 | $32,556,107 | $19,670,879 |
| The accompanying Notes to Financial Statements are an integral part of this statement. |
|
| 234 |
Thrivent Mutual Funds
Statement of Operations – continued |
| Limited | |
| Maturity | Money Market |
| Bond Fund | Fund |
|
| |
| $— | $378 |
| 10,103,570 | 52,205,365 |
| — | — |
| 166,051 | — |
| 15,913 | — |
| 400,479 | — |
|
| 10,686,013 | 52,205,743 |
| |
| |
| 655,263 | 4,571,049 |
| 33,015 | 87,154 |
| 43,684 | 212,150 |
| 16,635 | 29,279 |
| 11,650 | 29,995 |
| 311,226 | 917,932 |
| 4,789 | 14,109 |
| 5,380 | 12,812 |
| 57,655 | 517,145 |
| 1,188 | 1,914 |
| 2,311 | 8,502 |
| 60,856 | 175,771 |
| 222,781 | 1,531,898 |
| 4,604 | 7,943 |
| 4,185 | 2,189 |
| 8,124 | 31,582 |
| 5,409 | 11,416 |
|
| 1,448,755 | 8,162,840 |
| |
| |
| (27,048) | (1,697,072) |
| (1,493) | (1,087) |
|
| 1,420,214 | 6,464,681 |
|
| |
| 9,265,799 | 45,741,062 |
| |
| |
| |
| |
| (901,553) | — |
| 19,800 | — |
| 277,931 | — |
| — | — |
| |
| 1,253,361 | — |
| (332,123) | — |
|
| |
| |
| 317,416 | — |
|
| |
| |
| $9,583,215 | $45,741,062 |
| The accompanying Notes to Financial Statements are an integral part of this statement. |
|
| 235 |
Thrivent Mutual Funds
Statement of Changes in Net Assets |
| | Aggressive Allocation | Moderately Aggressive |
| | Fund | Allocation Fund |
| ———————————————————— | ———————————————————— |
| For the periods ended | 10/31/2006 | 10/31/2005 (a) | 10/31/2006 | 10/31/2005 (a) |
|
| Operations | | | | |
| Net investment income/(loss) | $1,050,214 | $(23,129) | $4,244,421 | $43,934 |
| Net realized gains/(losses) on: | | | | |
| Investments | — | — | — | — |
| Affiliated investments | (72,206) | (843) | 83,912 | (3,347) |
| Distributions of realized capital gains from | | | | |
| affiliated investments | 706,204 | — | 1,134,486 | — |
| Change in net unrealized appreciation/(depreciation) on: | | | | |
| Investments | — | — | — | — |
| Affiliated investments | 12,627,314 | 198,437 | 25,971,422 | 174,193 |
|
| |
| Net Change in Net Assets Resulting | | | | |
|
| From Operations | 14,311,526 | 174,465 | 31,434,241 | 214,780 |
| |
| Distributions to Shareholders | | | | |
| From net investment income | (593,507) | — | (1,360,298) | — |
|
| Total Distributions to Shareholders | (593,507) | — | (1,360,298) | — |
|
| Capital Stock Transactions | 168,727,654 | 29,230,163 | 367,144,669 | 65,677,607 |
|
| Net Increase/(Decrease) in Net Assets | 182,445,673 | 29,404,628 | 397,218,612 | 65,892,387 |
|
| Net Assets, Beginning of Period | 29,404,628 | — | 65,892,387 | — |
|
| Net Assets, End of Period | $211,850,301 | $29,404,628 | $463,110,999 | $65,892,387 |
| |
| | Partner Small Cap | Small Cap |
| | Value Fund | Stock Fund |
| | ———————————————————— | ———————————————————— |
| For the periods ended | 10/31/2006 | 10/31/2005 | 10/31/2006 | 10/31/2005 |
|
| Operations | | | | |
| Net investment income/(loss) | $696,961 | $304,230 | $(1,396,328) | $(2,306,044) |
| Net realized gains/(losses) on: | | | | |
| Investments | 6,053,843 | 5,903,646 | 58,639,765 | 57,043,987 |
| Written option contracts | — | — | — | — |
| Futures contracts | — | — | 1,062,631 | — |
| Change in net unrealized appreciation/(depreciation) on: | | | | |
| Investments | 12,466,684 | 3,886,120 | 18,907,527 | 5,093,689 |
| Written option contracts | — | — | — | — |
| Futures contracts | — | — | — | — |
|
| |
| Net Change in Net Assets Resulting | | | | |
|
| From Operations | 19,217,488 | 10,093,996 | 77,213,595 | 59,831,632 |
| |
| Distributions to Shareholders | | | | |
| From net investment income | (381,590) | (121,714) | — | — |
| From net realized gains | (6,086,458) | (10,871,080) | (52,593,044) | (21,956,221) |
|
| Total Distributions to Shareholders | (6,468,048) | (10,992,794) | (52,593,044) | (21,956,221) |
|
| Capital Stock Transactions | 21,175,487 | 17,168,894 | 52,051,493 | 10,272,248 |
|
| Net Increase/(Decrease) in Net Assets | 33,924,927 | 16,270,096 | 76,672,044 | 48,147,659 |
|
| Net Assets, Beginning of Period | 96,319,714 | 80,049,618 | 482,202,432 | 434,054,773 |
|
| Net Assets, End of Period | $130,244,641 | $96,319,714 | $558,874,476 | $482,202,432 |
(a) For the period from June 30, 2005 (inception) through October 31, 2005
| The accompanying Notes to Financial Statements are an integral part of this statement. |
|
| 236 |
Thrivent Mutual Funds
Statement of Changes in Net Assets – continued |
| Moderate Allocation | Moderately Conservative | Technology | Partner Small |
| Fund | Allocation Fund | Fund | Cap Growth Fund |
| ———————————————————— | ———————————————————— | ———————————————————— |
| 10/31/2006 | 10/31/2005 (a) | 10/31/2006 | 10/31/2005 (a) | 10/31/2006 | 10/31/2005 | 10/31/2006 | 10/31/2005 (a) |
|
| $6,426,432 | $151,115 | $3,055,979 | $106,576 | $(376,343) | $(204,142) | $(9,774) | $(42,607) |
| — | — | — | — | 521,497 | 3,037,134 | 14,342 | (167,307) |
| 48,262 | (4,288) | 56,329 | (855) | — | — | — | — |
| 1,733,913 | — | 448,617 | — | — | — | — | — |
| — | — | — | — | 3,162,485 | 220,131 | 2,480,981 | 482,729 |
| 21,925,117 | 35,253 | 5,976,528 | (45,157) | — | — | — | — |
|
| |
| 30,133,724 | 182,080 | 9,537,453 | 60,564 | 3,307,639 | 3,053,123 | 2,485,549 | 272,815 |
| |
| (6,007,876) | (85,097) | (2,786,155) | (54,808) | — | — | — | — |
|
| (6,007,876) | (85,097) | (2,786,155) | (54,808) | — | — | — | — |
|
| 356,782,599 | 78,940,799 | 123,006,090 | 33,669,276 | (7,466,749) | (3,765,081) | 25,157,829 | 13,376,735 |
|
| 380,908,447 | 79,037,782 | 129,757,388 | 33,675,032 | (4,159,110) | (711,958) | 27,643,378 | 13,649,550 |
|
| 79,037,782 | — | 33,675,032 | — | 48,765,339 | 49,477,297 | 13,649,550 | — |
|
| $459,946,229 | $79,037,782 | $163,432,420 | $33,675,032 | $44,606,229 | $48,765,339 | $41,292,928 | $13,649,550 |
| | | |
| | | |
| Small Cap | Mid Cap | Partner Mid Cap | Mid Cap |
| Index Fund | Growth Fund | Value Fund | Stock Fund |
| ———————————————————— | ———————————————————— | ———————————————————— | ———————————————————— |
| 10/31/2006 | 10/31/2005 | 10/31/2006 | 10/31/2005 | 10/31/2006 | 10/31/2005 (a) | 10/31/2006 | 10/31/2005 |
|
| |
| $104,305 | $91,474 | $(1,395,786) | $(2,600,471) | $391,298 | $4,367 | $1,440,535 | $(274,356) |
| 3,191,987 | 672,186 | 29,662,260 | 31,965,595 | 148,545 | (24,740) | 192,483,986 | 134,136,943 |
| — | — | 32,638 | — | — | — | — | — |
| 82,381 | 192,869 | — | — | — | — | — | — |
| 3,389,584 | 4,472,524 | 5,014,198 | 12,770,569 | 2,530,385 | 56,762 | (42,034,620) | 45,435,232 |
| — | — | (241) | — | — | — | — | — |
| 57,733 | (48,603) | — | — | — | — | — | — |
|
| |
| 6,825,990 | 5,380,450 | 33,313,069 | 42,135,693 | 3,070,228 | 36,389 | 151,889,901 | 179,297,819 |
| |
| (73,001) | (69,683) | — | — | (48,599) | — | — | — |
| (879,437) | (276,597) | — | — | — | — | (101,541,373) | — |
|
| (952,438) | (346,280) | — | — | (48,599) | — | (101,541,373) | — |
|
| (4,779,018) | 6,517,175 | (26,887,487) | (31,100,335) | 19,683,701 | 8,710,986 | 58,174,368 | (42,263,790) |
|
| 1,094,534 | 11,551,345 | 6,425,582 | 11,035,358 | 22,705,330 | 8,747,375 | 108,522,896 | 137,034,029 |
|
| 46,932,578 | 35,381,233 | 316,876,552 | 305,841,194 | 8,747,375 | — | 1,002,716,497 | 865,682,468 |
|
| $48,027,112 | $46,932,578 | $323,302,134 | $316,876,552 | $31,452,705 | $8,747,375 | $1,111,239,393 | $1,002,716,497 |
| The accompanying Notes to Financial Statements are an integral part of this statement. |
|
| 237 |
Thrivent Mutual Funds
Statement of Changes in Net Assets – continued |
| | Mid Cap | Mid Cap |
| | Index Fund | Index Fund-I |
| ———————————————————— | ———————————————————— |
| For the periods ended | 10/31/2006 | 10/31/2005 | 10/31/2006 | 10/31/2005 |
|
| Operations | | | | |
| Net investment income/(loss) | $367,048 | $360,456 | $220,660 | $158,446 |
| Net realized gains/(losses) on: | | | | |
| Investments | 2,626,545 | 3,732,411 | 1,190,366 | 1,338,176 |
| Written option contracts | — | — | — | — |
| Futures contracts | 107,698 | 232,117 | 1,656 | 120,758 |
| Foreign currency transactions | — | — | — | — |
| Change in net unrealized appreciation/(depreciation) on: | | | | |
| Investments | 4,349,791 | 4,391,973 | 1,388,618 | 1,360,348 |
| Written option contracts | — | — | — | — |
| Futures contracts | 34,483 | (42,681) | 16,137 | (12,031) |
| Foreign currency forward contracts | — | — | — | — |
| Foreign currency transactions | — | — | — | — |
|
| |
| Net Change in Net Assets Resulting | | | | |
|
| From Operations | 7,485,565 | 8,674,276 | 2,817,437 | 2,965,697 |
| |
| Distributions to Shareholders | | | | |
| From net investment income | (289,668) | (108,546) | (125,860) | (141,843) |
| From net realized gains | (3,962,434) | (213,705) | (1,541,630) | (571,863) |
|
| Total Distributions to Shareholders | (4,252,102) | (322,251) | (1,667,490) | (713,706) |
|
| Capital Stock Transactions | (4,117,833) | 4,892,420 | (1,606,129) | 3,525,917 |
|
| Net Increase/(Decrease) in Net Assets | (884,370) | 13,244,445 | (456,182) | 5,777,908 |
|
| Net Assets, Beginning of Period | 62,446,093 | 49,201,648 | 23,081,999 | 17,304,091 |
|
| Net Assets, End of Period | $61,561,723 | $62,446,093 | $22,625,817 | $23,081,999 |
| |
| | Large Cap | Large Cap |
| | Index Fund | Index Fund-I |
| | ———————————————————— | ———————————————————— |
| For the periods ended | 10/31/2006 | 10/31/2005 | 10/31/2006 | 10/31/2005 |
|
| Operations | | | | |
| Net investment income/(loss) | $1,271,625 | $1,347,905 | $472,992 | $512,038 |
| Net realized gains/(losses) on: | | | | |
| Investments | (3,510,264) | 877,706 | 1,915,957 | 911,105 |
| Written option contracts | — | — | — | — |
| Futures contracts | 42,682 | 89,515 | 52,035 | 11,100 |
| Foreign currency transactions | — | — | — | — |
| Change in net unrealized appreciation/(depreciation) on: | | | | |
| Investments | 15,696,987 | 4,418,451 | 2,156,990 | 1,069,786 |
| Futures contracts | 27,251 | (41,943) | 30,941 | (7,996) |
|
| |
| Net Change in Net Assets Resulting | | | | |
|
| From Operations | 13,528,281 | 6,691,634 | 4,628,915 | 2,496,033 |
| |
| Distributions to Shareholders | | | | |
| From net investment income | (1,207,200) | (794,013) | (431,528) | (457,553) |
| From net realized gains | (88,425) | — | — | — |
|
| Total Distributions to Shareholders | (1,295,625) | (794,013) | (431,528) | (457,553) |
|
| Capital Stock Transactions | (14,249,954) | 12,105,671 | (3,099,630) | 10,348 |
|
| Net Increase/(Decrease) in Net Assets | (2,017,298) | 18,003,292 | 1,097,757 | 2,048,828 |
|
| Net Assets, Beginning of Period | 94,345,529 | 76,342,237 | 31,480,362 | 29,431,534 |
|
| Net Assets, End of Period | $92,328,231 | $94,345,529 | $32,578,119 | $31,480,362 |
| The accompanying Notes to Financial Statements are an integral part of this statement. |
|
| 238 |
Thrivent Mutual Funds
Statement of Changes in Net Assets – continued |
| Partner International | Large Cap | Large Cap | Large Cap |
| Stock Fund | Growth Fund | Value Fund | Stock Fund |
| | ———————————————————— | ———————————————————— | ———————————————————— |
| 10/31/2006 | 10/31/2005 | 10/31/2006 | 10/31/2005 | 10/31/2006 | 10/31/2005 | 10/31/2006 | 10/31/2005 |
|
| |
| $5,780,574 | $3,439,989 | $1,367,402 | $413,585 | $5,979,238 | $4,144,561 | $31,056,261 | $34,129,181 |
| |
| 36,402,780 | 13,023,132 | 10,835,555 | 9,003,137 | 31,208,693 | 22,216,587 | 187,512,948 | 123,150,939 |
| — | — | 129,165 | 24,309 | — | — | — | — |
| — | — | — | — | — | — | 1,353,863 | — |
| (153,895) | (193,395) | — | — | — | — | — | — |
| |
| 54,711,850 | 30,276,003 | 8,313,147 | 3,510,871 | 41,101,693 | 9,200,693 | 183,089,416 | 165,489,675 |
| — | — | 2,613 | 1,717 | — | — | — | — |
| — | — | — | — | — | — | — | — |
| (1,120) | (463) | — | — | — | — | — | — |
| 18,868 | (37,928) | — | — | — | — | — | — |
|
| |
| 96,759,057 | 46,507,338 | 20,647,882 | 12,953,619 | 78,289,624 | 35,561,841 | 403,012,488 | 322,769,795 |
| |
| (4,550,020) | (70,182) | (362,403) | (48,823) | (4,838,129) | (1,412,596) | (22,969,707) | (22,365,685) |
| — | — | — | — | (5,697,959) | — | (37,619,468) | — |
|
| (4,550,020) | (70,182) | (362,403) | (48,823) | (10,536,088) | (1,412,596) | (60,589,175) | (22,365,685) |
|
| 82,007,857 | 59,168,144 | 152,600,841 | 54,917,459 | 56,572,510 | 22,956,913 | (490,294,712) | (400,968,665) |
|
| 174,216,894 | 105,605,300 | 172,886,320 | 67,822,255 | 124,326,046 | 57,106,158 | (147,871,399) | (100,564,555) |
|
| 381,956,252 | 276,350,952 | 178,022,131 | 110,199,876 | 386,174,676 | 329,068,518 | 3,569,790,751 | 3,670,355,306 |
|
| $556,173,146 | $381,956,252 | $350,908,451 | $178,022,131 | $510,500,722 | $386,174,676 | $3,421,919,352 | $3,569,790,751 |
| | | |
| Balanced | High Yield | Diversified Income | Municipal |
| Fund | Fund | Plus Fund | Bond Fund |
| ———————————————————— | ———————————————————— | ———————————————————— | ———————————————————— |
| 10/31/2006 | 10/31/2005 | 10/31/2006 | 10/31/2005 | 10/31/2006 | 10/31/2005 | 10/31/2006 | 10/31/2005 |
|
| |
| $6,505,919 | $6,973,082 | $47,156,259 | $46,798,750 | $8,231,672 | $9,920,829 | $55,724,400 | $55,654,717 |
| |
| 16,727,101 | 8,810,635 | (1,518,841) | 7,625,983 | 2,948,783 | 1,009,632 | 5,573,334 | 1,725,755 |
| 42,184 | 64,682 | — | — | — | — | — | — |
| 142,181 | 317,695 | 225,995 | — | 65,497 | — | (145,731) | 187,077 |
| 1,112 | — | — | — | — | — | — | — |
| |
| 15,502,008 | 10,223,472 | 8,047,938 | (32,637,681) | 2,568,745 | (6,912,651) | 2,986,542 | (30,369,797) |
| (28,387) | 30,318 | — | — | (15,761) | — | — | 602,136 |
|
| |
| 38,892,118 | 26,419,884 | 53,911,351 | 21,787,052 | 13,798,936 | 4,017,810 | 64,138,545 | 27,799,888 |
| |
| (6,542,752) | (7,582,902) | (47,156,259) | (47,618,361) | (8,376,527) | (10,545,623) | (55,685,609) | (55,956,597) |
| (10,044,905) | (6,139,893) | — | — | — | — | — | — |
|
| (16,587,657) | (13,722,795) | (47,156,259) | (47,618,361) | (8,376,527) | (10,545,623) | (55,685,609) | (55,956,597) |
|
| (62,160,657) | (29,421,278) | 24,092,606 | (18,775,270) | (5,873,154) | (9,880,322) | (53,031,771) | 4,526,315 |
|
| (39,856,196) | (16,724,189) | 30,847,698 | (44,606,579) | (450,745) | (16,408,135) | (44,578,835) | (23,630,394) |
|
| 387,820,068 | 404,544,257 | 601,632,443 | 646,239,022 | 132,638,608 | 149,046,743 | 1,279,645,658 | 1,303,276,052 |
|
| $347,963,872 | $387,820,068 | $632,480,141 | $601,632,443 | $132,187,863 | $132,638,608 | $1,235,066,823 | $1,279,645,658 |
| The accompanying Notes to Financial Statements are an integral part of this statement. |
|
| 239 |
Thrivent Mutual Funds
Statement of Changes in Net Assets – continued |
| | Income | Core Bond |
| | Fund | Fund |
| ———————————————————— | ———————————————————— |
| For the periods ended | 10/31/2006 | 10/31/2005 | 10/31/2006 | 10/31/2005 |
|
| Operations | | | | |
| Net investment income/(loss) | $29,996,005 | $25,879,473 | $19,369,310 | $19,010,872 |
| Net realized gains/(losses) on: | | | | |
| Investments | (11,781,005) | 4,958,463 | (9,424,786) | 36,223 |
| Written option contracts | 222,888 | 193,543 | 167,842 | 237,429 |
| Futures contracts | 1,521,559 | 459,013 | 235,593 | 1,318,169 |
| Foreign currency transactions | 245 | — | (134) | — |
| Change in net unrealized appreciation/(depreciation) on: | | | | |
| Investments | 13,051,491 | (26,850,225) | 8,918,695 | (18,539,668) |
| Futures contracts | (455,076) | 281,386 | 404,359 | (355,503) |
|
| |
| Net Change in Net Assets Resulting | | | | |
|
| From Operations | 32,556,107 | 4,921,653 | 19,670,879 | 1,707,522 |
| |
| Distributions to Shareholders | | | | |
| From net investment income | (29,934,835) | (26,177,235) | (19,829,282) | (20,255,052) |
|
| |
| Total Distributions to Shareholders | (29,934,835) | (26,177,235) | (19,829,282) | (20,255,052) |
|
| Capital Stock Transactions | 49,235,437 | (10,180,362) | (84,590,679) | (3,241,410) |
|
| |
| Net Increase/(Decrease) in Net Assets | 51,856,709 | (31,435,944) | (84,749,082) | (21,788,940) |
|
| |
| Net Assets, Beginning of Period | 598,175,998 | 629,611,942 | 484,930,045 | 506,718,985 |
|
| Net Assets, End of Period | $650,032,707 | $598,175,998 | $400,180,963 | $484,930,045 |
| |
| | Limited Maturity | Money Market |
| | Bond Fund | Fund |
| | ———————————————————— | ———————————————————— |
| For the periods ended | 10/31/2006 | 10/31/2005 | 10/31/2006 | 10/31/2005 |
|
| Operations | | | | |
| Net investment income/(loss) | $9,265,799 | $4,762,411 | $45,741,062 | $20,514,325 |
| Net realized gains/(losses) on: | | | | |
| Investments | (901,553) | (919,586) | — | — |
| Written option contracts | 19,800 | 28,995 | — | — |
| Futures contracts | 277,931 | 144,455 | — | — |
| Change in net unrealized appreciation/(depreciation) on: | | | | |
| Investments | 1,253,361 | (2,998,476) | — | — |
| Futures contracts | (332,123) | 294,551 | — | — |
|
| |
| Net Change in Net Assets Resulting | | | | |
|
| From Operations | 9,583,215 | 1,312,350 | 45,741,062 | 20,514,325 |
| |
| Distributions to Shareholders | | | | |
| From net investment income | (9,229,771) | (4,768,571) | (45,741,062) | (20,563,557) |
| From net realized gains | — | (309,277) | — | — |
|
| |
| Total Distributions to Shareholders | (9,229,771) | (5,077,848) | (45,741,062) | (20,563,557) |
|
| Capital Stock Transactions | 93,899,531 | 43,175,754 | 261,005,791 | 10,868,079 |
|
| |
| Net Increase/(Decrease) in Net Assets | 94,252,975 | 39,410,256 | 261,005,791 | 10,818,847 |
|
| |
| Net Assets, Beginning of Period | 170,747,816 | 131,337,560 | 946,191,626 | 935,372,779 |
|
| Net Assets, End of Period | $265,000,791 | $170,747,816 | $1,207,197,417 | $946,191,626 |
| The accompanying Notes to Financial Statements are an integral part of this statement. |
|
| 240 |
THRIVENT MUTUAL FUNDS
NOTES TO FINANCIAL STATEMENTS
October 31, 2006
(1) ORGANIZATION
Thrivent Mutual Funds (the “Trust”) was organized as a Massachusetts Business Trust on March 10, 1987, and is registered as an open-end management investment company under the Investment Company Act of 1940. The Trust is divided into twenty-nine separate series (the “Fund(s)”), each with its own investment objective and policies. The Trust currently consists of four allocation funds, seventeen equity funds, two hybrid funds, five fixed-income funds, and one money market fund. Effective June 30, 2006, Thrivent High Yield Fund II changed its name to Thrivent Diversified Income Plus Fund. The Trust commenced operations on July 16, 1987.
Thrivent Diversified Income Plus Fund will be changing its fiscal year end to a calendar year basis beginning December 31, 2006, and will be presented with Thrivent Real Estate Securities Fund under a separate annual report. Thrivent U.S. Government Zero Coupon Target Fund, Series 2006 was liquidated on October 19, 2006.
The Trust offers three classes of shares: Class A, Class B and Institutional Class. The three classes of shares differ principally in their respective distribution expenses and arrangements. Class A shares have a 0.25% annual 12b-1 fee (0.125% for the Money Market Fund) and a maximum front-end sales load of 5.50% for equity funds and 4.50% for fixed-income funds, excluding the Limited Maturity Bond Fund and the Money Market Fund. Class B shares were offered at net asset value and have a 1.00% annual 12b-1 fee (0.25% for the Limited Maturity Bond Fund and 0.875% for the Money Market Fund). In addition, Class B shares have a maximum contingent deferred sales charge of 5.00% . The contingent deferred sales charge declines by 1.00% per year through the fifth year. Class B shares convert to Class A shares at the end of the fifth year. Institutional Class shares are offered at net asset value and have no annual 12b-1 fees. All three classes of shares have identical rights to e arnings, assets and voting privileges, except for class specific expenses and exclusive rights to vote on matters affecting only individual classes. Effective October 16, 2004, the Trust no longer offers Class B shares for sale.
The following Funds have all three classes of shares: Technology Fund, Partner Small Cap Value Fund, Small Cap Stock Fund, Mid Cap Growth Fund, Mid Cap Stock Fund, Partner International Stock Fund, Large Cap Growth Fund, Large Cap Value Fund, Large Cap Stock Fund, Balanced Fund, High Yield Fund, Diversified Income Plus Fund, Municipal Bond Fund, Income Fund, Core Bond Fund, Limited Maturity Bond Fund and Money Market Fund. Aggressive Allocation Fund, Moderately Aggressive Allocation Fund, Moderate Allocation Fund, Moderately Conservative Allocation Fund, Partner Small Cap Growth Fund and Partner Mid Cap Value Fund offer Class A and Institutional Class shares. Small Cap Index Fund, Mid Cap Index Fund and Large Cap Index Fund offer Class A shares only. Mid Cap Index Fund-I and Large Cap Index Fund-I offer only Institutional Class shares.
Under the Trust’s organizational documents, its officers and trustees are indemnified against certain liabilities arising out of the performance of their duties to the Trust. In addition, in the normal course of business, the Trust enters into contracts with vendors and others that provide general damage clauses. The Trust’s maximum exposure under these contracts is unknown, as this would involve future claims that may be made against the Trust. However, based on experience, the Trust expects the risk of loss to be remote.
(2) SIGNIFICANT ACCOUNTING POLICIES
(A) Valuation of Investments — Securities traded on U.S. or foreign securities exchanges or included in a national market system are valued at the official closing price at the close of each business day unless otherwise stated below. Over-the-counter securities and listed securities for which no price is readily available are valued at the current bid price considered best to represent the value at that time. Security prices are based on quotes that are obtained from an independent pricing service approved by the Board of Trustees. The pricing service, in determining values of fixed-income securities, takes into consideration such factors as current quotations by broker/dealers, coupon, maturity, quality, type of issue, trading characteristics, and other yield and risk factors it deems relevant in determining valuations. Securities which cannot be valued by the approved pricing service are valued using valuations obtained from dealers that make markets in the securities. Exchange listed options and futures contracts are valued at the last quoted sales price. Mutual funds are valued at the net asset value at the close of each business day.
For all Funds, other than the Money Market Fund, short-term securities with maturities of 60 days or less are valued at amortized cost. Securities held by the Money Market Fund are valued on the basis of amortized cost (which approximates market value), whereby a portfolio security is valued at its cost initially, and thereafter valued to reflect a constant amortization to maturity of any discount or premium. The Money Market Fund and the Funds’ investment adviser follow procedures necessary to maintain a constant net asset value of $1.00 per share.
THRIVENT MUTUAL FUNDS
NOTES TO FINANCIAL STATEMENTS
As of October 31, 2006 |
(2) SIGNIFICANT ACCOUNTING POLICIES — continued
All securities for which market values are not readily available or deemed unreliable are appraised at fair value as determined in good faith under the direction of the Board of Trustees. As of October 31, 2006, three securities in the High Yield Fund and two securities in the Diversified Income Plus Fund were valued at fair value, which represented 0.13% and 0.00%, respectively, of each Fund’s net assets.
Fair Valuation of International Securities — Because many foreign markets close before the U.S. markets, events may occur between the close of the foreign market and the close of the U.S. markets that could have a material impact on the valuation of foreign securities. The Funds, under the supervision of the Board of Trustees, evaluates the impacts of these events and may adjust the valuation of foreign securities to reflect the fair value as of the close of the U.S. markets. The Board of Trustees has authorized the investment adviser to make fair valuation determinations pursuant to policies approved by the Board of Trustees.
(B) Foreign Currency Translation — The accounting records of each Fund are maintained in U.S. dollars. Securities and other assets and liabilities that are denominated in foreign currencies are translated into U.S. dollars at the daily closing rates of exchange.
Foreign currency amounts related to the purchase or sale of securities and income and expenses are translated at the exchange rate on the transaction date. Net realized and unrealized currency gains and losses are recorded from sales of foreign currency, exchange gains or losses between the trade date and settlement dates on securities transactions, and other translation gains or losses on dividends, interest income and foreign withholding taxes. The Funds do not separately report the effect of changes in foreign exchange rates from changes in market prices on securities held. Such changes are included in net realized and unrealized gain or loss from investments.
For federal income tax purposes, the Funds treat the effect of changes in foreign exchange rates arising from actual foreign currency transactions and the changes in foreign exchange rates between the trade date and settlement date as ordinary income.
(C) Foreign Currency Contracts — In connection with purchases and sales of securities denominated in foreign currencies, all Funds except the Money Market Fund may enter into forward currency contracts. Additionally, the Funds may enter into such contracts to hedge certain other foreign currency denominated investments. These contracts are recorded at market value and the related realized and unrealized foreign exchange gains and losses are included in the Statement of Operations. In the event that counterpar-ties fail to settle these forward contracts, the Funds could be exposed to foreign currency fluctuations. Foreign currency contracts are valued daily and unrealized appreciation or depreciation is recorded daily as the difference between the contract exchange rate and the closing forward rate applied to the face amount of the contract. A realized gain or loss is recorded at the time a forward contract is closed. During the year ended October 31, 2006, the Partner International Stock Fund, Balanced Fund, Income Fund and Core Bond Fund engaged in this type of investment.
(D) Foreign Denominated Investments — Foreign denominated assets and currency contracts may involve more risks than domestic transactions including currency risk, political and economic risk, regulatory risk, and market risk. Certain Funds may also invest in securities of companies located in emerging markets. Future economic or political developments could adversely affect the liquidity or value, or both, of such securities.
(E) Federal Income Taxes — No provision has been made for income taxes because each Funds’ policy is to qualify as regulated investment companies under the Internal Revenue Code and distribute substantially all taxable income on a timely basis. It is also the intention of the Funds to distribute an amount sufficient to avoid imposition of any federal excise tax. The Funds, accordingly, anticipate paying no federal taxes and no federal tax provision was recorded. Each Fund is treated as a separate taxable entity for federal income tax purposes. Certain Funds may utilize earnings and profits distributed to shareholders on the redemption of shares as part of the dividend paid deduction.
(F) Income and Expenses — Estimated expenses are accrued daily. The Funds are charged for those expenses that are directly attributable to them. Expenses that are not directly attributable to a Fund are allocated among all appropriate Funds in proportion to their respective net assets, number of shareholder accounts or other reasonable basis. Net investment income, expenses which are not class-specific, and realized and unrealized gains and losses are allocated directly to each class based upon the relative net asset value of outstanding shares.
THRIVENT MUTUAL FUNDS
NOTES TO FINANCIAL STATEMENTS
As of October 31, 2006
Interest income is accrued daily and is determined on the basis of interest or discount earned on all debt securities, including accretion of market discount and original issue discount and amortization of premium. Paydown gains and losses on mortgage- and asset-backed securities are recorded as components of interest income. Dividend income is recorded on the ex-dividend date. For preferred stock payment-in-kind securities, income is recorded on the ex-dividend date in the amount of the value received.
(G) Custody Earnings Credit — The Funds have a deposit arrangement with the custodian whereby interest earned on uninvested cash balances is used to pay a portion of custodian fees. This deposit arrangement is an alternative to overnight investments.
(H) Distributions to Shareholders — Dividend and capital gain distributions are recorded on the ex-dividend date. With the exception of the Money Market Fund, net realized gains from securities transactions, if any, are paid at least annually after the close of the fiscal year.
Dividends from the High Yield Fund, Municipal Bond Fund, Income Fund, Core Bond Fund, Limited Maturity Bond Fund and Money Market Fund are declared daily and paid monthly. Dividends from the Money Market Fund also include any short-term net realized gains or losses on the sale of securities. Dividends from the Diversified Income Plus Fund are declared and paid monthly. Dividends from the Moderate Allocation Fund, Moderately Conservative Allocation Fund and Balanced Fund are declared and paid quarterly. Dividends from the following funds are declared and paid annually: Aggressive Allocation Fund, Moderately Aggressive Allocation Fund, Technology Fund, Partner Small Cap Growth Fund, Partner Small Cap Value Fund, Small Cap Stock Fund, Small Cap Index Fund, Mid Cap Growth Fund, Partner Mid Cap Value Fund, Mid Cap Stock Fund, Mid Cap Index Fund, Mid Cap Index Fund-I, Partner International Stock Fund, Large Cap Growth Fund, Large Cap Value Fund, Large Cap Stock Fund, Large Cap Index Fund and Large Cap Index Fund-I.
(I) Options — All Funds, with the exception of the Money Market Fund, may buy put and call options and write put and covered call options. The Funds intend to use such derivative instruments as hedges to facilitate buying or selling securities or to provide protection against adverse movements in security prices or interest rates. The Funds may also enter into options contracts to protect against adverse foreign exchange rate fluctuations. Option contracts are valued daily and unrealized appreciation or depreciation is recorded. A Fund will realize a gain or loss upon expiration or closing of the option transaction. When an option is exercised, the proceeds upon sale for a written call option or the cost of a security for purchased put and call options is adjusted by the amount of premium received or paid. The writer of an option bears the market risk of an unfavorable change in the price of the se curity underlying the written option. During the year ended October 31, 2006, the Mid Cap Growth Fund, Large Cap Growth Fund, Balanced Fund, Income Fund, Core Bond Fund, and Limited Maturity Bond Fund engaged in this type of investment.
(J) Financial Futures Contracts — Certain Funds may use futures contracts to manage the exposure to interest rate and market fluctuations. Gains or losses on futures contracts can offset changes in the yield of securities. When a futures contract is opened, cash or other investments equal to the required “initial margin deposit” are held on deposit with and pledged to the broker. Additional securities held by the Funds may be earmarked as collateral for open futures contracts. The futures contract’s daily change in value (“variation margin”) is either paid to or received from the broker, and is recorded as an unrealized gain or loss. When the contract is closed, the realized gain or loss is recorded equal to the difference between the value of the contract when opened and the value of the contract when closed. Future contracts involve, to varying degrees, risk of loss in excess of the variation margin di sclosed in the Statement of Assets and Liabilities. During the year ended October 31, 2006, the Small Cap Stock Fund, Small Cap Index Fund, Mid Cap Index Fund, Mid Cap Index Fund-I, Large Cap Stock Fund, Large Cap Index Fund, Large Cap Index Fund-I, Balanced Fund, High Yield Fund, Diversified Income Plus Fund, Municipal Bond Fund, Income Fund, Core Bond Fund and Limited Maturity Bond Fund engaged in this type of investment.
(K) Mortgage Dollar Roll Transactions — Certain Funds enter into dollar roll transactions on securities issued or to be issued by the Government National Mortgage Association, Federal National Mortgage Association and Federal Home Loan Mortgage Corporation, in which the Funds sell mortgage securities and simultaneously agree to repurchase similar (same type, coupon and maturity) securities at a later date at an agreed upon price. During the period between the sale and repurchase, the Funds forgo principal and interest paid on the mortgage securities sold. The Funds are compensated from negotiated fees paid by brokers offered as an inducement to the Funds to “roll over” their purchase commitments. These fees are recognized over the roll period and are included in Income from mortgage dollar rolls in the Statement of Operations.
THRIVENT MUTUAL FUNDS
NOTES TO FINANCIAL STATEMENTS
As of October 31, 2006 |
(2) SIGNIFICANT ACCOUNTING POLICIES — continued
(L) Securities Lending — The Trust has entered into a Securities Lending Agreement (the “Agreement”) with State Street Bank and Trust Company (“State Street Bank”). The Agreement authorizes State Street Bank to lend securities to authorized borrowers on behalf of the Funds. Pursuant to the Agreement, all loaned securities are collateralized by cash equal to at least 102% of the value of the loaned securities. All cash collateral received is invested in Thrivent Financial Securities Lending Trust. Amounts earned on investments in Thrivent Financial Securities Lending Trust, net of rebates and other securities lending expenses, are included in Income from securities loaned on the Statement of Operations. As payment for its services, State Street Bank receives a portion of the fee income and earnings on the collateral. By investing any cash collateral it receives in these transactions, a Fund could realize addit ional gains or losses. If the borrower fails to return the securities and the invested collateral has declined in value, the Fund could lose money. The Agreement grants and transfers to State Street Bank a lien upon collateralized assets in the possession of State Street Bank. As of October 31, 2006, all Funds except Aggressive Allocation Fund, Moderately Aggressive Allocation Fund, Moderate Allocation Fund, Moderately Conservative Allocation Fund, Partner International Stock Fund, Municipal Bond Fund and Money Market Fund had securities on loan. The value of securities on loan is as follows:
| | | Securities |
| Fund | | on Loan |
|
| Technology | $ | 10,800,067 |
| Partner Small Cap Growth | | 10,386,951 |
| Partner Small Cap Value | | 32,629,447 |
| Small Cap Stock | | 141,067,394 |
| Small Cap Index | | 12,111,632 |
| Mid Cap Growth | | 81,701,428 |
| Partner Mid Cap Value | | 5,932,492 |
| Mid Cap Stock | | 195,958,359 |
| Mid Cap Index | | 15,311,450 |
| Mid Cap Index-I | | 5,711,699 |
| Large Cap Growth | | 8,462,524 |
| Large Cap Value | | 16,667,629 |
| Large Cap Stock | | 126,325,111 |
| Large Cap Index | | 2,749,292 |
| Large Cap Index-I | | 2,539,855 |
| Balanced | | 51,721,912 |
| High Yield | | 83,129,872 |
| Diversified Income Plus | | 32,521,019 |
| Income | | 69,840,374 |
| Core Bond | | 49,665,538 |
| Limited Maturity Bond | | 14,497,054 |
(M) When-Issued and Delayed Delivery Transactions — Certain Funds may purchase or sell securities on a when-issued or delayed delivery basis. These transactions involve a commitment by a Fund to purchase or sell securities for a predetermined price or yield, with payment and delivery taking place beyond the customary settlement period. When delayed delivery purchases are outstanding, a Fund will designate liquid assets in an amount sufficient to meet the purchase price. When purchasing a security on a delayed delivery basis, a Fund assumes the rights and risks of ownership of the security, including the risk of price and yield fluctuations, and takes such fluctuations into account when determining its net asset value. A Fund may dispose of a delayed delivery transaction after it is entered into, and may sell when-issued securities before they are delivered, which may result in a capital gain or loss. When a Fund has sold a secur ity on a delayed delivery basis, a Fund does not participate in future gains and losses with respect to the security.
(N) Treasury Inflation Protected Securities — Certain funds may invest in treasury inflation protected securities (TIPS). These securities are fixed income securities whose principal value is periodically adjusted to the rate of infla-tion. The interest rate is generally fixed at issuance. Interest is paid based on the principal value, which is adjusted for inflation. Any increase in the principal amount will be included as taxable interest in the Statement of Operations and received upon maturity of the security.
(O) Repurchase Agreements — Each Fund may engage in repurchase agreement transactions in pursuit of its investment objective. A repurchase agreement consists of a purchase and a simultaneous agreement to resell an investment for later delivery at an agreed upon price and rate of interest. The Fund must take possession of collateral either directly or through a third-party custodian. If the original seller of a security subject to a repurchase agreement fails to repurchase the security at the agreed upon time, the Fund could incur a loss due to a drop in the market value of the security during the time it takes the Fund to either sell the security or take action to enforce the original seller’s agreement to repurchase the security. Also, if a defaulting original seller filed for bankruptcy or became insolvent, disposition of such security might be delayed by pending court action. The Fund may only enter into repurchase agree ments with banks and other recognized financial institutions such as broker/dealers that are found by the Funds’ investment advisor Thrivent Asset Management, LLC (“Thrivent Asset Mgt.”) (or a subadviser) to be creditworthy.
THRIVENT MUTUAL FUNDS
NOTES TO FINANCIAL STATEMENTS
As of October 31, 2006 |
(P) Equity-Linked Structured Securities — Certain funds may invest in equity-linked structured notes. Equity-linked structured notes are debt securities which combine the characteristics of common stock and the sale of an option. The return component is based upon the performance of a single equity security, a basket of equity securities, or an equity index and the sale of an option which is recognized as income. There is no guaranteed return of principal with these securities. The appreciation potential of these securities may be limited by a maximum payment or call right and can be influenced by many unpredictable factors.
(Q) Credit Risk — The Funds may be susceptible to credit risk to the extent an issuer or counterparty defaults on its payment obligation. The Funds’ policy is to monitor the creditworthiness of issuers. Interest receivables on defaulted securities are monitored for ability to collect payments in default and are adjusted accordingly.
(R) Accounting Estimates — The preparation of finan-cial statements in conformity with accounting principles generally accepted in the United States of America require management to make estimates and assumptions that affect the reported amounts of assets and liabilities and disclosure of contingent assets and liabilities at the date of the finan-cial statements and the reported amounts of income and expenses during the reporting period. Actual results could differ from those estimates.
(S) Loss Contingencies — Thrivent High Yield Fund received a dividend in the amount of $37,188 from Global Crossings within 90 days of Global Crossings’ filing for bankruptcy. A preference action has been filed and it is possible that the Fund will be required to surrender the dividend back to the bankruptcy estate. This loss contingency has not been accrued as a liability because the amount to be surrendered and the likelihood of the loss can not be reasonably estimated.
Thrivent Diversified Income Plus is a defendant in an adversary action brought by the Official Committee of Asbestos Claimants of G-I Holdings Inc. (G-I) against prior and current holders of secured debt of Building Materials Corp. of America (BMCA), a wholly owned subsidiary of G-I. The suit seeks to recover the value of assets G-I transferred to BMCA that later served as collateral for BMCA’s Debt. The Fund at one time held secured notes in the amount of $1,650,000 and, if the plaintiffs are successful, it is possible that the Fund will be required to pay damages in some amount. This loss contingency has not been accrued as a liability because the amount of potential damages and the likelihood of loss can not be reasonably estimated.
(T) Unfunded Loan Commitments — The following funds entered into a loan commitment with HCA, Inc. Maturity of the loan commitment is one year from closing. The coupon rate will be determined at time of settlement. The funds are obligated to fund these loan commitments at the borrower’s discretion. A commitment fee is paid to the funds at the close of the loan commitment.
| Fund | Unfunded Commitment |
|
| High Yield Fund | $4,020,000 |
| Diversified Income Plus Fund | 350,000 |
Subsequent to October 31, 2006, the borrower issued other Notes in lieu of the above loan. As such, the Funds will not be obligated to fund these loan commitments.
(U) Recent Accounting Pronouncements — In June 2006, the Financial Accounting Standards Board (FASB) issued FASB Interpretation No. 48 — Accounting for Uncertainty in Income Taxes (FIN 48), that requires additional tax disclosures and the tax effects of certain tax positions to be recognized. These tax positions must meet a “more likely than not” standard that based on their technical merits, have a more than 50 percent likelihood of being sustained upon examination. FIN 48 is effective for fiscal periods beginning after December 15, 2006. At adoption, the financial statements must be adjusted to reflect only those tax positions in any open tax years that are more likely than not of being sustained. Management of the Fund is currently evaluating the impact that FIN 48 will have on the Fund’s financial statements.
Additionally, in September 2006, the FASB issued FASB Interpretation No. 157 — Fair Value Measurements (FAS 157). The objective of the statement is to improve the consistency and comparability of fair value measurements used in financial reporting. FAS 157 defines fair value, establishes a framework for measuring fair value in generally accepted accounting principles, and expands disclosures about fair value measurements. FAS 157 is effective for fiscal years beginning after November 15, 2007. Management of the fund is currently evaluating the impact that FAS 157 will have on the Fund’s financial statements.
(V) Other — For financial statement purposes, investment security transactions are accounted for on the trade date. Realized gains and losses from investment transactions are determined on a specific cost identification basis, which is the same basis used for federal income tax purposes.
THRIVENT MUTUAL FUNDS
NOTES TO FINANCIAL STATEMENTS
As of October 31, 2006 |
(3) FEES AND COMPENSATION PAID TO AFFILIATES
(A) Investment Advisory Fees — Effective January 1, 2006, the Trust has entered into an Investment Advisory Agreement with Thrivent Asset Mgt., (“the Adviser”). Thrivent Asset Mgt. is a wholly owned subsidiary of Thrivent Life Insurance Company (Thrivent Life). Prior to January 1, 2006, the Trust’s Adviser was Thrivent Investment Management, Inc. (Thrivent Investment Mgt.). There was no change in the investment management fees and Thrivent Asset Mgt. provides the same investment advisory services using the same investment personnel as previously provided by Thrivent Investment Mgt. Under the Investment Advisory Agreement, each of the Funds pays a fee for investment advisory services. The fees are accrued daily and paid monthly. The annual rates of fees as a percent of average daily net assets under the Investment Advisory Agreement were as follows:
| (M - Millions) | $0 to | $50 to | $100 to | $200 to | $250 to | $500 to | $750 to | $1,000 to | $2,000 to | $2,500 to | Over |
| Fund | $50M | $100M | $200M | $250M | $500M | $750M | $1,000M | $2,000M | $2,500M | $5,000M | $5,000M |
|
| Aggressive Allocation | | | | | | | | | | | |
| Fund | 0.15% | 0.15% | 0.15% | 0.15% | 0.15% | 0.125% | 0.125% | 0.125% | 0.125% | 0.125% | 0.125% |
| Moderately Aggressive | | | | | | | | | | | |
| Allocation Fund | 0.15% | 0.15% | 0.15% | 0.15% | 0.15% | 0.125% | 0.125% | 0.125% | 0.125% | 0.125% | 0.125% |
| Moderate Allocation | | | | | | | | | | | |
| Fund | 0.15% | 0.15% | 0.15% | 0.15% | 0.15% | 0.125% | 0.125% | 0.125% | 0.125% | 0.125% | 0.125% |
| Moderately Conservative | | | | | | | | | | |
| Allocation Fund | 0.15% | 0.15% | 0.15% | 0.15% | 0.15% | 0.125% | 0.125% | 0.125% | 0.125% | 0.125% | 0.125% |
| Technology Fund | 0.75% | 0.75% | 0.75% | 0.75% | 0.75% | 0.75% | 0.75% | 0.75% | 0.75% | 0.75% | 0.75% |
| Partner Small Cap | | | | | | | | | | | |
| Growth Fund | 0.90% | 0.90% | 0.90% | 0.90% | 0.90% | 0.80% | 0.80% | 0.80% | 0.80% | 0.80% | 0.80% |
| Partner Small Cap | | | | | | | | | | | |
| Value Fund | 0.70% | 0.70% | 0.70% | 0.70% | 0.70% | 0.70% | 0.70% | 0.70% | 0.70% | 0.70% | 0.70% |
| Small Cap Stock Fund | 0.70% | 0.70% | 0.70% | 0.65% | 0.65% | 0.65% | 0.65% | 0.60% | 0.60% | 0.55% | 0.525% |
| Small Cap Index Fund | 0.25% | 0.25% | 0.25% | 0.25% | 0.25% | 0.25% | 0.25% | 0.25% | 0.25% | 0.25% | 0.25% |
| Mid Cap Growth Fund | 0.45% | 0.45% | 0.40% | 0.40% | 0.35% | 0.30% | 0.30% | 0.25% | 0.25% | 0.25% | 0.25% |
| Partner Mid Cap | | | | | | | | | | | |
| Value Fund | 0.75% | 0.75% | 0.75% | 0.75% | 0.70% | 0.70% | 0.70% | 0.70% | 0.70% | 0.70% | 0.70% |
| Mid Cap Stock Fund | 0.70% | 0.70% | 0.70% | 0.65% | 0.65% | 0.65% | 0.65% | 0.60% | 0.60% | 0.55% | 0.525% |
| Mid Cap Index Fund | 0.25% | 0.25% | 0.25% | 0.25% | 0.25% | 0.25% | 0.25% | 0.25% | 0.25% | 0.25% | 0.25% |
| Mid Cap Index Fund-I | 0.25% | 0.20% | 0.20% | 0.20% | 0.20% | 0.20% | 0.20% | 0.20% | 0.20% | 0.20% | 0.20% |
| Partner International | | | | | | | | | | | |
| Stock Fund | 0.65% | 0.60% | 0.60% | 0.60% | 0.60% | 0.60% | 0.60% | 0.60% | 0.60% | 0.60% | 0.60% |
| Large Cap Growth Fund | 0.75% | 0.75% | 0.75% | 0.75% | 0.75% | 0.70% | 0.70% | 0.65% | 0.65% | 0.60% | 0.575% |
| Large Cap Value Fund | 0.45% | 0.45% | 0.45% | 0.45% | 0.45% | 0.45% | 0.45% | 0.45% | 0.45% | 0.45% | 0.45% |
| Large Cap Stock Fund | 0.65% | 0.65% | 0.65% | 0.65% | 0.65% | 0.575% | 0.575% | 0.50% | 0.475% | 0.45% | 0.425% |
| Large Cap Index Fund | 0.25% | 0.25% | 0.25% | 0.25% | 0.25% | 0.25% | 0.25% | 0.25% | 0.25% | 0.25% | 0.25% |
| Large Cap Index Fund-I | 0.25% | 0.175% | 0.175% | 0.175% | 0.175% | 0.175% | 0.175% | 0.175% | 0.175% | 0.175% | 0.175% |
| Balanced Fund | 0.55% | 0.55% | 0.55% | 0.55% | 0.55% | 0.50% | 0.50% | 0.475% | 0.475% | 0.45% | 0.425% |
| High Yield Fund | 0.40% | 0.40% | 0.40% | 0.40% | 0.40% | 0.35% | 0.35% | 0.30% | 0.30% | 0.30% | 0.30% |
| Diversified Income | | | | | | | | | | | |
| Plus Fund | 0.55% | 0.55% | 0.55% | 0.55% | 0.55% | 0.55% | 0.55% | 0.55% | 0.55% | 0.55% | 0.55% |
| Municipal Bond Fund | 0.45% | 0.45% | 0.45% | 0.45% | 0.45% | 0.40% | 0.40% | 0.35% | 0.35% | 0.325% | 0.30% |
| Income Fund | 0.35% | 0.35% | 0.35% | 0.35% | 0.35% | 0.325% | 0.325% | 0.30% | 0.30% | 0.30% | 0.30% |
| Core Bond Fund | 0.45% | 0.45% | 0.45% | 0.45% | 0.45% | 0.40% | 0.40% | 0.375% | 0.375% | 0.35% | 0.325% |
| Limited Maturity | | | | | | | | | | | |
| Bond Fund | 0.30% | 0.30% | 0.30% | 0.30% | 0.30% | 0.275% | 0.275% | 0.25% | 0.25% | 0.25% | 0.25% |
| Money Market Fund | 0.50% | 0.50% | 0.50% | 0.50% | 0.50% | 0.40% | 0.35% | 0.325% | 0.325% | 0.30% | 0.275% |
THRIVENT MUTUAL FUNDS
NOTES TO FINANCIAL STATEMENTS
As of October 31, 2006 |
The following subadvisory fees are charged as part of the total investment advisory fees in the table above. The sub-advisory fees are borne directly by the Adviser and do not increase the overall fees paid by the Fund.
The Adviser has entered into subadvisory agreements with Turner Investment Partners, Inc. (“Turner”) and Transamerica Investment Management LLC (“Transamerica”) for the performance of subadvisory services for the Partner Small Cap Growth Fund. The fee payable is equal to 0.65% and 0.50% of average daily net assets subadvised by Turner and Transamerica, respectively.
The Adviser has entered into a subadvisory agreement with T. Rowe Price Associates, Inc. for performance of subadvisory services for the Partner Small Cap Value Fund. The subadvisory fee, which is paid by the Adviser from its advisory fee, is 0.60% of average daily net assets.
The Adviser has entered into a subadvisory agreement with Goldman Sachs Asset Management, LP (“Goldman Sachs”) for the performance of subadvisory services for the Partner Mid Cap Value Fund. The fee payable is equal to 0.50% of average daily net assets for the first $250 million and 0.45% for assets over $250 million. Thrivent Partner Mid Cap Value Portfolio will be included in determining breakpoints for the assets managed by Goldman Sachs.
The Adviser has entered into a subadvisory agreement with Mercator Asset Management, LP (“Mercator”) and T. Rowe Price International, Inc. (“Price International”) for the performance of subadvisory services for the Partner International Stock Fund. The fee payable is equal to 0.47% of average daily net assets subadvised by Mercator. As of June 1, 2006, Mercator has agreed to temporarily waive, through at least December 31, 2006, subadviser fees equal in aggregate to 0.02% of average daily net assets. For assets subadvised by Price International, the fee payable is equal to 0.75% of the first $20 million, 0.60% of the next $30 million, and 0.50% of the next $150 million of average daily net assets, with the fee for all of the assets subadvised by Price International 0.50% and 0.45% when assets exceed $200 million and $500 million, respectively. Thrivent Partner International Stock Portfolio will be included in determining breakpoints for the assets man aged by Price International.
As of October 31, 2006, the following voluntary and contractual expense reimbursements were in effect:
| | Voluntary/ | | | Institutional | Expiration |
| Fund | Contractual | Class A | Class B | Class | Date |
|
| Aggressive Allocation | Contractual | 1.24% | N/A | 1.24% | 2/28/07 |
| Moderately Aggressive Allocation | Contractual | 0.59% | N/A | 0.59% | 2/28/07 |
| Moderate Allocation | Contractual | 0.50% | N/A | 0.50% | 2/28/07 |
| Moderately Conservative Allocation | Contractual | 0.77% | N/A | 0.77% | 2/28/07 |
| Technology | Contractual | 0.25% | — | — | 2/28/07 |
| Technology | Voluntary | 0.25% | 1.00% | — | N/A |
| Partner Small Cap Growth | Contractual | 0.80% | N/A | 0.80% | 2/28/07 |
| Partner Small Cap Value | Voluntary | 0.50% | 0.50% | 0.50% | N/A |
| Partner Mid Cap Value | Contractual | 1.70% | N/A | 1.70% | 2/28/07 |
| Large Cap Growth | Contractual | 0.40% | 0.40% | 0.40% | 2/28/07 |
| Large Cap Growth | Voluntary | 0.40% | 0.40% | 0.40% | N/A |
| Diversified Income Plus | Voluntary | 0.16% | 0.16% | 0.16% | N/A |
| Money Market | Voluntary | 0.20% | 0.10% | 0.10% | N/A |
As of October 31, 2006, the following contractual expense reimbursements to limit expenses to the following percentages were in effect:
| | Voluntary/ | | | Institutional | Expiration |
| Fund | Contractual | Class A | Class B | Class | Date |
|
| Small Cap Index | Contractual | 0.95% | N/A | N/A | 2/28/07 |
| Mid Cap Index | Contractual | 0.90% | N/A | N/A | 2/28/07 |
| Large Cap Index | Contractual | 0.60% | N/A | N/A | 2/28/07 |
THRIVENT MUTUAL FUNDS
NOTES TO FINANCIAL STATEMENTS
As of October 31, 2006 |
(3) FEES AND COMPENSATION PAID TO AFFILIATES — continued
As of October 15, 2004, all Class B shares net operating expenses are limited to the following percentage of daily net assets of Class B shares: Technology Fund, 3.34%; Partner Small Cap Value Fund, 2.63%; Small Cap Stock Fund, 2.43%; Mid Cap Growth Fund, 2.31%; Mid Cap Stock Fund, 2.39%; Partner International Stock Fund, 2.79%; Large Cap Growth Fund, 2.55%; Large Cap Value Fund, 2.21%; Large Cap Stock Fund, 2.24%; Balanced Fund, 2.06%; High Yield Fund, 1.73%; Diversified Income Plus Fund, 2.30%; Municipal Bond Fund, 1.50%; Income Fund, 1.67%; Core Bond Fund, 1.95%; Limited Maturity Bond Fund, 0.89%; and Money Market Fund, 1.95% . These reimbursements will be in effect as long as assets remain in the B shares.
Class B share expenses were voluntarily reimbursed to limit expenses to 2.75% of average daily net assets for Technology Fund and Partner International Stock Fund. Additionally, Class B share expenses were voluntarily reimbursed to limit expenses to 1.01% of average daily net assets for Money Market Fund. These voluntary expense reimbursements may be discontinued at any time.
Each equity, hybrid and fixed income fund may invest cash in the Money Market Fund, subject to certain limitations. During the year ended October 31, 2006, all funds, with the exception of the Municipal Bond Fund, invested in the Money Market Fund. These related-party transactions are subject to the same terms as non-related party transactions except that, to avoid duplicate investment advisory fees, Thrivent Asset Mgt. reimburses an amount equal to the smaller of the amount of the advisory fee for that Fund or the amount of the advisory fee which is charged to the Fund for its investment in Thrivent Money Market Fund.
(B) Distribution Plan — Thrivent Investment Mgt. is the Trust’s distributor. The Trust has adopted a Distribution Plan (“the Plan”) pursuant to Rule 12b-1 under the Investment Company Act of 1940. Class A shares have a Rule 12b-1 fee of 0.25% (0.125% for the Money Market Fund) of average net assets. Class B shares have a Rule 12b-1 fee of 1.00% (0.25% for the Limited Maturity Bond Fund and 0.875% for the Money Market Fund) of average net assets.
(C) Sales Charges and Other Fees — For the year ended October 31, 2006, Thrivent Investment Mgt. received $14,514,633 of aggregate underwriting concessions from the sales of the Trust’s Class A and Class B shares and aggregate contingent deferred sales charges of $398,138 from redemptions of Class A and Class B shares. Sales charges are not an expense of the Trust and are not reflected in the financial statement of any of the Funds.
The Trust has entered into an accounting services agreement with Thrivent Asset Mgt. pursuant to which Thrivent Asset Mgt. provides certain accounting personnel and services. For the year ended October 31, 2006, Thrivent Asset Mgt. received aggregate fees for accounting personnel and services of $1,312,508 from the Trust.
The Trust has entered into an agreement with Thrivent Asset Mgt. to provide certain administrative personnel and services to the Funds. For the year ended October 31, 2006, Thrivent Asset Mgt. received aggregate fees for administrative personnel and services of $2,509,923 from the Trust.
The Trust has entered into an agreement with Thrivent Financial Investor Services Inc. (Thrivent Investor Services) to provide the Funds with transfer agent services. For the year ended October 31, 2006, Thrivent Investor Services received $18,714,301 for transfer agent services from the Trust.
Each Trustee is eligible to participate in a deferred compensation plan with respect to fees received from the Funds. Participants in the plan may designate their deferred Trustee’s fees as if invested in any one of the Thrivent Mutual Funds. The value of each Trustee’s deferred compensation account will increase or decrease as if it were invested in shares of the selected Thrivent Mutual Funds. The deferred fees remain in the appropriate Fund until distribution in accordance with the plan. The deferred fee liability is an unsecured liability.
Those Trustees not participating in the above plan received $175,809 in fees from the Trust for the year ended October 31, 2006. No remuneration has been paid by the Trust to any of the officers or affiliated Trustees of the Trust. In addition, the Trust reimbursed unaffiliated Trustees for reasonable expenses incurred in relation to attendance at the meetings and industry conferences.
Certain officers and non-independent trustees of the Funds are officers and directors of Thrivent Asset Mgt., Thrivent Investment Mgt., and Thrivent Investor Services; however, they receive no compensation from the Funds.
THRIVENT MUTUAL FUNDS
NOTES TO FINANCIAL STATEMENTS
As of October 31, 2006 |
(4) TAX INFORMATION
Distributions are based on amounts calculated in accordance with the applicable federal income tax regulations, which may differ from accounting principles generally accepted in the United States of America. To the extent that these differences are permanent in nature, such amounts are reclassified within the capital accounts based on their federal tax-basis treatment; temporary differences do not require reclassifications.
On the Statement of Assets and Liabilities, as a result of permanent book-to-tax differences, reclassification adjustments were made as follows [Increase/(Decrease)]:
| | Accumulated Accumulated |
| Net Investment | Net Realized | Trust |
| Fund | Income/(Loss) | Gain/(Loss) | Capital |
|
| |
| Aggressive Allocation | $198,047 | $(175,575) | $(22,472) |
| Moderately Aggressive | | | |
| Allocation | 312,188 | (290,996) | (21,192) |
| Moderate Allocation | 326,538 | (305,260) | (21,278) |
| Moderately Conservative | | |
| Allocation | 98,816 | (79,288) | (19,528) |
| Technology | 374,309 | — | (374,309) |
| Partner Small Cap | | | |
| Growth | 19,674 | 268 | (19,942) |
| Partner Small Cap | | | |
| Value | (337,787) | (96,916) | 434,703 |
| Small Cap Stock | 1,345,845 | (3,273,655) | 1,927,810 |
| Small Cap Index | (35,704) | 35,704 | — |
| Mid Cap Growth | 1,390,677 | 10,425 | (1,401,102) |
| Partner Mid Cap Value | 8,232 | 11,488 | (19,720) |
| Mid Cap Stock | (1,500,145) | (8,086,525) | 9,586,670 |
| Mid Cap Index | (57,607) | 57,607 | — |
| Mid Cap Index - I | (20,224) | 20,224 | — |
| Partner International | | | |
| Stock | (146,580) | 146,580 | — |
| Large Cap Growth | (4,863) | 5,686 | (823) |
| Large Cap Value | (78,554) | 78,554 | — |
| Large Cap Stock | (36,038) | 30,609 | 5,429 |
| Large Cap Index | (12,238) | 12,238 | — |
| Large Cap Index - I | (4,193) | 4,193 | — |
| Balanced | 73,165 | (73,165) | — |
| High Yield | 209,636 | (209,636) | — |
| Diversified Income Plus | 336,101 | (336,101) | — |
| Income | 52,475 | (52,475) | — |
| Core Bond | 523,039 | (523,039) | — |
| Limited Maturity Bond | (36,028) | 36,028 | — |
At October 31, 2006, the components of distributable earnings on a tax basis were as follows:
| | Undistributed | Undistributed |
| | Ordinary | Long-Term |
| Fund | Income | Capital Gain |
|
| Aggressive Allocation | $ 803,763 | $485,217 |
| Moderately Aggressive | | |
| Allocation | 3,437,585 | 844,848 |
| Moderate Allocation | 1,192,529 | 1,328,653 |
| Moderately Conservative | | |
| Allocation | 527,235 | 367,769 |
| Partner Small Cap Growth | 16,999 | 70 |
| Partner Small Cap Value | 1,453,060 | 4,632,137 |
| Small Cap Stock | 49,260 | 53,118,657 |
| Small Cap Index | 146,965 | 3,303,639 |
| Mid Cap Growth | — | 22,856,088 |
| Partner Mid Cap Value | 440,806 | 122,885 |
| Mid Cap Stock | 63,800,423 | 121,689,111 |
| Mid Cap Index | 341,054 | 2,807,868 |
| Mid Cap Index - I | 234,049 | 1,069,007 |
| Partner International Stock | 6,893,862 | — |
| Large Cap Growth | 1,367,452 | — |
| Large Cap Value | 9,736,546 | 23,854.507 |
| Large Cap Stock | 22,446,311 | 142,671,616 |
| Large Cap Index | 971,959 | — |
| Large Cap Index - I | 377,732 | — |
| Balanced | 9,002,856 | 7,585,007 |
| High Yield | 775,187 | — |
| Diversified Income Plus | 646,627 | — |
| Municipal Bond* | 60,820 | — |
| Income | 120,916 | — |
| Core Bond | 210,653 | — |
| Limited Maturity Bond | 22,284 | — |
| Money Market | 55,550 | — |
* Municipal Bond Fund undistributed ordinary income is primarily exempt from federal income taxes.
THRIVENT MUTUAL FUNDS
NOTES TO FINANCIAL
STATEMENTS As of October 31, 2006
(4) TAX INFORMATION — continued
At October 31, 2006, the following Funds had accumulated net realized capital loss carryovers expiring as follows:
| | | Capital Loss | | |
| Fund | | Carryover | | Expiration Year |
|
| Technology | $ | 11,131,363 | | 2009 |
| | | 13,695,973 | | 2010 |
| | | 1,279,762 | | 2011 |
| | | 1,471,537 | | 2012 |
| | |
| | |
| | $ | 27,578,635 | | |
| | |
| | |
| Mid Cap Growth | $ | 19,866,079 | | 2009 |
| | | 6,613,531 | | 2010 |
| | |
| | |
| | $ | 26,479,610 | | |
| | |
| | |
| Partner International Stock | $ | 943,210 | | 2009 |
| | | 29,104,696 | | 2010 |
| | |
| | |
| | $ | 30,047,906 | | |
| | |
| | |
| Large Cap Growth | $ | 6,537,047�� | | 2009 |
| | | 3,809,590 | | 2010 |
| | |
| | |
| | $ | 10,346,637 | | |
| | |
| | |
| Large Cap Value | $ | 1,776,066 | | 2010 |
| | |
| | |
| Large Cap Stock | $ | 63,448,833 | | 2009 |
| | | 45,072,180 | | 2010 |
| | |
| | |
| | | $108,521,013 | | |
| | |
| | |
| Large Cap Index | $ | 3,530,756 | | 2014 |
| | |
| | |
| Large Cap Index - I | $ | 387,177 | | 2010 |
| | | 1,730,425 | | 2011 |
| | |
| | |
| | $ | 2,117,602 | | |
| | |
| | |
| High Yield | $ | 18,998,975 | | 2007 |
| | | 15,133,980 | | 2008 |
| | | 125,418,013 | | 2009 |
| | | 223,628,596 | | 2010 |
| | | 90,973,334 | | 2011 |
| | | 11,792,481 | | 2012 |
| | | 1,037,644 | | 2013 |
| | | 1,574,393 | | 2014 |
| | |
| | |
| | | $488,557,416 | | |
| | |
| | |
| | | Capital Loss | | |
| Fund | | Carryover | | Expiration Year |
|
| Diversified Income Plus | $ | 35,624,749 | | 2008 |
| | | 14,003,544 | | 2009 |
| | | 12,668,032 | | 2010 |
| | | 324,797 | | 2012 |
| | |
| | |
| | $ | 62,621,122 | | |
| | |
| | |
| Municipal Bond | $ | 2,495,262 | | 2007 |
| | | 328,490 | | 2009 |
| | | 545,473 | | 2012 |
| | |
| | |
| | $ | 3,369,225 | | |
| | |
| | |
| Income | $ | 7,036,690 | | 2008 |
| | | 17,362,752 | | 2010 |
| | | 9,939,596 | | 2014 |
| | |
| | |
| | $ | 34,339,038 | | |
| | |
| | |
| Core Bond | $ | 1,246,299 | | 2012 |
| | | 1,300,054 | | 2013 |
| | | 9,402,862 | | 2014 |
| | |
| | |
| | $ | 11,949,215 | | |
| | |
| | |
| Limited Maturity Bond | $ | 691,482 | | 2013 |
| | | 602,582 | | 2014 |
| | |
| | |
| | $ | 1,294,064 | | |
| | |
| | |
To the extent that these Funds realize future net capital gains, taxable distributions will be reduced by any unused capital loss carryovers as permitted by the Internal Revenue Code.
Capital loss carryovers of $452,083, $148,783, $7,356,869, $13,966, $36,763,759, $10,579,248, $2,364,925, $38,456,766, $1,930,614, $2,318,869 and $4,996,540 were utilized by Technology Fund, Partner Small Cap Growth Fund, Mid Cap Growth Fund, Partner Mid Cap Value Fund, Partner International Stock Fund, Large Cap Growth Fund, Large Cap Value Fund, Large Cap Stock Fund, Large Cap Index Fund - I, Diversified Income Plus Fund, and Municipal Bond Fund.
THRIVENT MUTUAL FUNDS
NOTES TO FINANCIAL STATEMENTS
As of October 31, 2006 |
The tax character of distributions paid during the years ended October 31, 2006 and 2005 was as follows:
| | Tax-Exempt Income | Ordinary Income | Long-Term Capital Gain |
| Fund | 10/31/2006 | 10/31/2005 | 10/31/2006 | 10/31/2005 | 10/31/2006 | 10/31/2005 |
|
| Aggressive Allocation | $ — | $ — | $ 593,507 | $ — | $ — | $— |
| Moderately Aggressive Allocation | — | — | 1,360,298 | — | — | — |
| Moderate Allocation | — | — | 6,007,876 | 85,097 | — | — |
| Moderately Conservative Allocation | — | — | 2,786,155 | 54,808 | — | — |
| Partner Small Cap Value | — | — | 4,448,423 | 2,449.833 | 2,019,625 | 8,542,961 |
| Small Cap Stock | — | — | 4,771,807 | 4,506,150 | 47,821,237 | 17,450,071 |
| Small Cap Index | — | — | 243,253 | 69,683 | 709,185 | 276,597 |
| Partner Mid Cap Value | — | — | 48,599 | — | — | — |
| Mid Cap Stock | — | — | 25,737,749 | — | 75,803,624 | — |
| Mid Cap Index | — | — | 625,306 | 108,546 | 3,626,796 | 213,705 |
| Mid Cap Index - I | — | — | 242,831 | 141,843 | 1,424,659 | 571,863 |
| Partner International Stock | — | — | 4,550,020 | 70,182 | — | — |
| Large Cap Growth | — | — | 362,403 | 48,823 | — | — |
| Large Cap Value | — | — | 4,838,129 | 1,412,596 | 5,697,959 | — |
| Large Cap Stock | — | — | 37,690,959 | 22,365,685 | 22,898,216 | — |
| Large Cap Index | — | — | 1,207,208 | 794,013 | 88,417 | — |
| Large Cap Index - I | — | — | 431,528 | 457,553 | — | — |
| Balanced | — | — | 15,177,996 | 7,582,902 | 1,409,661 | 6,139,893 |
| High Yield | — | — | 47,156,259 | 47,618,361 | — | — |
| Diversified Income Plus | — | — | 8,376,527 | 10,545,623 | — | — |
| Municipal Bond | 55,230,913 | 55,585,203 | 454,696 | 371,394 | — | — |
| Income | — | — | 29,934,835 | 26,177,235 | — | — |
| Core Bond | — | — | 19,829,282 | 20,255,052 | — | — |
| Limited Maturity Bond | — | — | 9,229,771 | 4,768,519 | —- | 309,329 |
| Money Market | — | — | 45,741,062 | 20,563,557 | —- | — |
(5) DISTRIBUTIONS BY CLASS
Distributions to shareholders, by class, for the year ended October 31, 2006, and the year ended October 31, 2005, were as follows:
| | | | Net Investment Income | | |
| |
|
| | For the year ended, | For the year ended, | |
| | October 31, 2006 | | | October 31, 2005 | |
| |
|
|
| | | | Institutional | | | Institutional |
| Fund | Class A | Class B | Class | Class A | Class B | Class |
|
|
|
|
|
|
|
| Aggressive Allocation Fund | $ 499,413 | $ N/A | $ 94,094 | $ — | $ N/A | $ — |
| Moderately Aggressive Allocation Fund | 1,225,560 | N/A | 134,738 | — | N/A | — |
| Moderate Allocation Fund | 5,750,817 | N/A | 257,059 | 84,047 | N/A | 1,050 |
| Moderately Conservative Allocation Fund | 2,682,736 | N/A | 103,419 | 53,752 | N/A | 1,056 |
| Partner Small Cap Value Fund | 218,412 | — | 163,178 | 60,956 | — | 60,758 |
| Small Cap Index Fund | 73,001 | N/A | N/A | 69,683 | N/A | N/A |
| Partner Mid Cap Value Fund | 19,273 | N/A | 29,326 | — | N/A | — |
| Mid Cap Index Fund | 289,668 | N/A | N/A | 108,546 | N/A | N/A |
| Mid Cap Index Fund-I | N/A | N/A | 125,860 | N/A | N/A | 141,843 |
| Partner International Stock Fund | 3,199,167 | — | 1,350,853 | 52,742 | — | 17,440 |
| Large Cap Growth Fund | 122,283 | — | 240,120 | 41,063 | — | 7,760 |
| Large Cap Value Fund | 3,831,080 | — | 1,007,049 | 1,266,086 | — | 146,510 |
| Large Cap Stock Fund | 21,262,576 | — | 1,707,131 | 21,399,610 | — | 966,075 |
| Large Cap Index Fund | 1,207,200 | N/A | N/A | 794,013 | N/A | N/A |
THRIVENT MUTUAL FUNDS
NOTES TO FINANCIAL STATEMENTS
As of October 31, 2006 |
(5) DISTRIBUTIONS BY CLASS — continued
| | | | Net Investment Income | | |
| |
|
| | For the year ended, | For the year ended, |
| | October 31, 2006 | | | October 31, 2005 | | |
| |
|
|
| | | | Institutional | | | Institutional |
| Fund | Class A | Class B | Class | Class A | Class B | Class |
|
|
|
|
|
|
|
| Large Cap Index Fund-I | $ N/A | $ N/A | $ 431,528 | $ N/A | $ N/A | $ 457,553 |
| Balanced Fund | 4,474,474 | 81,473 | 1,986,805 | 5,092,320 | 126,181 | 2,364,401 |
| High Yield Fund | 41,475,295 | 1,328,620 | 4,352,344 | 44,855,146 | 1,884,350 | 878,865 |
| Diversified Income Plus Fund | 7,897,336 | 207,527 | 271,664 | 9,905,335 | 313,008 | 327,280 |
| Municipal Bond Fund | 54,232,768 | 973,846 | 478,995 | 54,576,418 | 1,139,478 | 240,701 |
| Income Fund | 23,681,428 | 624,352 | 5,629,055 | 23,801,098 | 757,982 | 1,618,155 |
| Core Bond Fund | 17,088,041 | 329,212 | 2,412,029 | 18,189,070 | 370,854 | 1,695,128 |
| Limited Maturity Bond Fund | 4,956,801 | 75,563 | 4,197,407 | 4,214,827 | 66,216 | 487,528 |
| Money Market Fund | 31,013,880 | 62,635 | 14,664,547 | 13,834,725 | 39,585 | 6,689,247 |
| |
| | | | Net Realized Gains | | |
| |
|
| | For the year ended, | For the year ended, |
| | October 31, 2006 | | | October 31, 2005 | | |
| |
|
|
| | | | Institutional | | | Institutional |
| Fund | Class A | Class B | Class | Class A | Class B | Class |
|
|
|
|
|
|
|
| Partner Small Cap Value Fund | $ 4,655,087 | $ 358,184 | $1,073,187 | $ 8,343,475 | $ 713,424 | $1,814,181 |
| Small Cap Stock Fund | 47,662,131 | 2,332,355 | 2,598,558 | 20,078,791 | 1,326,981 | 550,449 |
| Small Cap Index Fund | 879,437 | N/A | N/A | 276,597 | N/A | N/A |
| Mid Cap Stock Fund | 93,424,844 | 2,559,861 | 5,556,668 | — | — | — |
| Mid Cap Index Fund | 3,962,434 | N/A | N/A | 213,705 | N/A | N/A |
| Mid Cap Index Fund-I | N/A | N/A | 1,541,630 | N/A | N/A | 571,863 |
| Large Cap Value Fund | 4,623,401 | 241,078 | 833,480 | — | — | — |
| Large Cap Stock Fund | 34,978,181 | 1,011,454 | 1,629,833 | — | — | — |
| Large Cap Index Fund | 88,425 | N/A | N/A | — | N/A | N/A |
| Balanced Fund | 7,173,390 | 339,341 | 2,532,174 | 4,255,139 | 257,863 | 1,626,891 |
| Limited Maturity Bond Fund | — | — | — | 282,527 | 4,817 | 21,933 |
THRIVENT MUTUAL FUNDS
NOTES TO FINANCIAL STATEMENTS
As of October 31, 2006 |
(6) SECURITY TRANSACTIONS
(A) Purchases and Sales of Investment Securities —
For the year ended October 31, 2006, the cost of purchases and the proceeds from sales of investment securities other than U.S. Government and short-term securities were as follows:
| | In thousands | |
|
|
| Fund | Purchases | Sales |
|
| Aggressive Allocation Fund | $ 176,186 | $ 9,768 |
| Moderately Aggressive | | |
| Allocation Fund | 384,035 | 24,235 |
| Moderate Allocation Fund | 356,386 | 24,511 |
| Moderately Conservative | | |
| Allocation Fund | 115,836 | 4,643 |
| Technology Fund | 57,953 | 64,767 |
| Partner Small Cap Growth Fund | 53,936 | 29,375 |
| Partner Small Cap Value Fund | 36,242 | 23,578 |
| Small Cap Stock Fund | 471,325 | 476,117 |
| Small Cap Index Fund | 7,429 | 12,001 |
| Mid Cap Growth Fund | 495,080 | 533,742 |
| Partner Mid Cap Value Fund | 27,302 | 8,189 |
| Mid Cap Stock Fund | 1,994,558 | 2,051,652 |
| Mid Cap Index Fund | 7,307 | 15,393 |
| Mid Cap Index Fund-I | 4,974 | 7,439 |
| Partner International Stock Fund | 301,866 | 228,016 |
| Large Cap Growth Fund | 503,220 | 359,898 |
| Large Cap Value Fund | 240,920 | 192,847 |
| Large Cap Stock Fund | 2,233,994 | 2,570,436 |
| Large Cap Index Fund | 6,579 | 22,188 |
| Large Cap Index Fund-I | 4,139 | 7,238 |
| Balanced Fund | 309,768 | 387,060 |
| High Yield Fund | 389,549 | 368,773 |
| Diversified Income Plus Fund | 181,423 | 189,589 |
| Municipal Bond Fund | 167,049 | 217,978 |
| Income Fund | 534,013 | 529,592 |
| Core Bond Fund | 230,628 | 325,718 |
| Limited Maturity Bond Fund | 143,883 | 62,148 |
Purchases and sales of U.S. Government securities were:
| | In thousands |
| |
|
| Fund | Purchases | Sales |
|
| Balanced Fund | $ 529,045 | $ 527,535 |
| Diversified Income Plus Fund | 19,360 | 17,810 |
| Income Fund | 1,482,162 | 1,440,479 |
| Core Bond Fund | 1,854,191 | 1,858,261 |
| Limited Maturity Bond Fund | 276,131 | 263,176 |
(B) Investments in Restricted Securities — The High Yield Fund and Diversified Income Plus Fund own restricted securities that were purchased in private placement transactions without registration under the Securities Act of 1933. Unless such securities subsequently become registered, they generally may be resold only in privately negotiated transactions with a limited number of purchasers. The aggregate value of restricted securities at October 31, 2006, was $783,840 and $0, which represented 0.12% and 0.00% of the net assets of the High Yield Fund and Diversified Income Plus Fund, respectively. The Funds have no right to require registration of unregistered securities.
(C) Investments in High-Yielding Securities — The High Yield Fund invests primarily in high-yielding fixed-income securities. Each of the other Funds, except the Money Market Fund, may also invest in high-yielding securities. These securities will typically be in the lower rating categories or will be non-rated and generally will involve more risk than securities in the higher rating categories. Lower rated or unrated securities are more likely to react to developments affecting market risk and credit risk than are more highly rated securities, which react primarily to movements in the general level of interest rates.
(D) Investments in Options and Futures Contracts — The movement in the price of the security underlying an option or futures contract may not correlate perfectly with the movement in the prices of the portfolio securities being hedged. A lack of correlation could render the Fund’s hedging strategy unsuccessful and could result in a loss to the Fund. In the event that a liquid secondary market would not exist, the Fund could be prevented from entering into a closing transaction, which could result in additional losses to the Fund.
THRIVENT MUTUAL FUNDS
NOTES TO FINANCIAL STATEMENTS
As of October 31, 2006 |
(E) Written Option Contracts — The number of contracts and premium amounts associated with call option contracts written during the year ended October 31, 2006, were as follows:
| | Thrivent Mid Cap Growth Fund |
|
|
| | Number of | | Premium |
| | Contracts | | Amount |
|
| Balance at October 31, 2005 | — | | $ — |
| Opened | 279 | | 102,600 |
| Closed | (110) | | (35,341) |
| Expired | — | | — |
| Exercised | — | | — |
| |
| |
|
| Balance at October 31, 2006 | 169 | | $ 67,259 |
| |
| |
|
| | Thrivent Large Cap Growth Fund |
|
|
| | Number of | | Premium |
| | Contracts | | Amount |
|
| Balance at October 31, 2005 | 19 | | $ 4,254 |
| Opened | 2,992 | | 379,939 |
| Closed | (2,322) | | (322,791) |
| Expired | (466) | | (30,753) |
| Exercised | (146) | | (12,106) |
| |
| |
|
| Balance at October 31, 2006 | 77 | | $ 18,543 |
| |
| |
|
| | Thrivent Balanced Fund |
|
|
| | Number of | | Premium |
| | Contracts | | Amount |
|
| Balance at October 31, 2005 | — | | $ — |
| Opened | 105 | | 46,913 |
| Closed | (105) | | (46,913) |
| Expired | — | | — |
| Exercised | — | | — |
| |
| |
|
| Balance at October 31, 2006 | — | | $ — |
| |
| |
|
| | Thrivent Income Fund |
|
|
| | Number of | | Premium |
| | Contracts | | Amount |
|
| Balance at October 31, 2005 | — | | $ — |
| Opened | 565 | | 245,391 |
| Closed | (565) | | (245,391) |
| Expired | — | | — |
| Exercised | — | | — |
| |
| |
|
| Balance at October 31, 2006 | — | | $ — |
| |
| |
|
| | Thrivent Core Bond Fund |
|
|
| | Number of | | Premium |
| | Contracts | | Amount |
|
| Balance at October 31, 2005 | — | | $ — |
| Opened | 425 | | 184,977 |
| Closed | (425) | | (184,977) |
| Expired | — | | — |
| Exercised | — | | — |
| |
| |
|
| Balance at October 31, 2006 | — | | $ — |
| |
| |
|
| | Thrivent Limited Maturity |
| | Bond Fund | | |
|
|
| | Number of | | Premium |
| | Contracts | | Amount |
|
| Balance at October 31, 2005 | — | | $ — |
| Opened | 40 | | 24,275 |
| Closed | (40) | | (24,275) |
| Expired | — | | — |
| Exercised | — | | — |
| |
| |
|
| Balance at October 31, 2006 | — | | $ — |
| |
| |
|
(7) INVESTMENTS IN AFFILIATES
Affiliated issuers, as defined under the Investment Company Act of 1940, include those in which the Fund’s holdings of an issuer represent 5% or more of the outstanding voting securities of an issuer, or any affiliated mutual fund. A summary of transactions for the year ended October 31, 2006, in the Money Market Fund, is as follows:
| | Gross | Gross | Balance of | | Dividend Income |
| | Purchases and | Sales and | Shares Held at | Value | Year Ended |
| Fund | Additions | Reductions | October 31, 2006 | October 31, 2006 | October 31, 2006 |
|
| Aggressive Allocation Fund | $ 3,538,943 | $ 29,512 | 4,098,097 | $ 4,098,097 | $ 114,228 |
| Moderately Aggressive Allocation Fund | 11,425,178 | — | 13,408,260 | 13,408,260 | 363,857 |
| Moderate Allocation Fund | 27,118,787 | — | 31,087,193 | 31,087,193 | 835,477 |
| Moderately Conservative Allocation Fund | 12,549,577 | 1,106 | 15,930,764 | 15,930,764 | 445,992 |
| Technology Fund | 14,686,198 | 15,557,562 | 1,333,102 | 1,333,102 | 69,639 |
| Partner Small Cap Growth Fund | 13,169,120 | 12,556,721 | 1,260,337 | 1,260,337 | 39,076 |
| Partner Small Cap Value Fund | 25,823,650 | 22,980,817 | 5,523,074 | 5,523,074 | 215,745 |
| Small Cap Stock Fund | 88,886,693 | 96,168,287 | 13,918,906 | 13,918,906 | 1,018,688 |
THRIVENT MUTUAL FUNDS
NOTES TO FINANCIAL STATEMENTS
As of October 31, 2006 |
| | Gross | Gross | Balance of | | | Dividend Income |
| | Purchases and | Sales and | Shares Held at | | Value | Year Ended |
| Fund | Additions | Reductions | October 31, 2006 | October 31, 2006 | October 31, 2006 |
|
| Small Cap Index Fund | $ 7,982,568 | $ 8,948,639 | 586,066 | $ | 586,066 | $ 55,036 |
| Mid Cap Growth Fund | 96,681,438 | 94,675,574 | 14,267,466 | | 14,267,466 | 566,160 |
| Partner Mid Cap Value Fund | 12,973,659 | 11,819,692 | 1,163,018 | | 1,163,018 | 27,162 |
| Mid Cap Stock Fund | 94,755,219 | 87,226,414 | 35,526,908 | | 35,526,908 | 1,208,071 |
| Mid Cap Index Fund | 10,487,039 | 10,579,927 | 1,961,194 | | 1,961,194 | 57,895 |
| Mid Cap Index Fund-I | 7,701,046 | 8,377,417 | 440,487 | | 440,487 | 30,685 |
| Partner International Stock Fund | 86,179,728 | 80,396,379 | 10,795,069 | | 10,795,069 | 391,337 |
| Large Cap Growth Fund | 99,065,072 | 89,770,143 | 13,137,230 | | 13,137,230 | 311,976 |
| Large Cap Value Fund | 51,482,950 | 49,184,351 | 14,541,584 | | 14,541,584 | 904,777 |
| Large Cap Stock Fund | 31,355,230 | 24,935,155 | 34,077,671 | | 34,077,671 | 1,296,635 |
| Large Cap Index Fund | 17,983,773 | 16,640,746 | 2,085,483 | | 2,085,483 | 46,713 |
| Large Cap Index Fund-I | 9,135,498 | 9,174,150 | 973,500 | | 973,500 | 33,442 |
| Balanced Fund | 71,541,934 | 67,841,055 | 16,886,519 | | 16,886,519 | 679,262 |
| High Yield Fund | 148,559,520 | 152,934,097 | 21,389,892 | | 21,389,892 | 956,976 |
| Diversified Income Plus Fund | 38,948,778 | 40,718,121 | 2,618,010 | | 2,618,010 | 173,701 |
| Income Fund | 32,125,600 | 28,880,373 | 27,543,642 | | 27,543,642 | 1,189,863 |
| Core Bond Fund | 43,160,403 | 49,356,268 | 17,948,985 | | 17,948,985 | 884,497 |
| Limited Maturity Bond Fund | 59,938,650 | 59,060,578 | 5,447,586 | | 5,447,586 | 400,479 |
A summary of transactions for the year ended October 31, 2006, in the Thrivent Financial Securities Lending Trust, is as follows:
| | Gross | Gross | Balance of Shares | | |
| | Purchases and | Sales and | Held October 31, | | Value |
| Fund | Additions | Reductions | 2006 | October 31, 2006 |
|
| Technology Fund | $ 72,541,210 | $ 67,245,500 | 10,942,952 | $ | 10,942,952 |
| Partner Small Cap Growth Fund | 17,857,900 | 9,558,078 | 10,634,766 | | 10,634,766 |
| Partner Small Cap Value Fund | 93,509,395 | 75,988,890 | 33,691,335 | | 33,691,335 |
| Small Cap Stock Fund | 417,954,751 | 361,519,570 | 144,848,275 | | 144,848,275 |
| Small Cap Index Fund | 18,566,862 | 17,711,384 | 12,471,270 | | 12,471,270 |
| Mid Cap Growth Fund | 250,667,380 | 220,095,331 | 83,726,366 | | 83,726,366 |
| Partner Mid Cap Value | 30,222,741 | 24,669,690 | 6,082,598 | | 6,082,598 |
| Mid Cap Stock Fund | 1,289,464,051 | 1,261,050,174 | 200,525,518 | | 200,525,518 |
| Mid Cap Index Fund | 50,538,668 | 45,822,869 | 15,778,621 | | 15,778,621 |
| Mid Cap Index Fund-I | 20,004,078 | 18,121,588 | 5,880,742 | | 5,880,742 |
| Partner International Stock Fund | 173,126,547 | 231,745,824 | — | | — |
| Large Cap Growth Fund | 150,111,139 | 148,348,188 | 9,102,649 | | 9,102,649 |
| Large Cap Value Fund | 264,359,273 | 261,298,495 | 17,069,352 | | 17,069,352 |
| Large Cap Stock Fund | 2,684,668,041 | 2,629,567,936 | 129,465,761 | | 129,465,761 |
| Large Cap Index Fund | 32,101,349 | 34,134,613 | 2,811,275 | | 2,811,275 |
| Large Cap Index Fund-I | 14,317,324 | 12,156,567 | 2,599,233 | | 2,599,233 |
| Balanced Fund | 186,779,025 | 179,044,139 | 52,973,617 | | 52,973,617 |
| High Yield Fund | 348,251,365 | 344,433,991 | 86,278,192 | | 86,278,192 |
| Diversified Income Plus Fund | 103,309,021 | 92,010,514 | 33,647,182 | | 33,647,182 |
| Income Fund | 381,928,399 | 370,966,801 | 71,849,012 | | 71,849,012 |
| Core Bond Fund | 301,350,980 | 298,611,664 | 51,452,125 | | 51,452,125 |
| Limited Maturity Bond Fund | 117,504,818 | 113,293,418 | 15,075,000 | | 15,075,000 |
THRIVENT MUTUAL FUNDS
NOTES TO FINANCIAL STATEMENTS
As of October 31, 2006 |
(7) INVESTMENTS IN AFFILIATES — continued
A summary of transactions for the Thrivent Allocation Funds for the year ended October 31, 2006, in the following Thrivent Mutual Funds, is as follows:
| | Gross | Gross | Balance of | | Dividend Income |
| | Purchases and | Sales and | Shares Held at | Value | November 1, 2005 – |
| Fund | Additions | Reductions | October 31, 2006 | October 31, 2006 | October 31, 2006 |
|
| Aggressive Allocation Fund | | | | | |
| Partner Small Cap Growth | $11,755,522 | $ 95,915 | 1,131,509 | $13,272,602 | $ — |
| Partner Small Cap Value | 11,905,966 | 95,915 | 855,578 | 13,911,704 | 17,132 |
| Small Cap Stock | 12,684,907 | 103,293 | 737,232 | 14,611,931 | — |
| Mid Cap Growth | 7,772,955 | 66,403 | 531,925 | 9,170,382 | — |
| Partner Mid Cap Value | 7,808,400 | 66,403 | 818,692 | 9,717,876 | 9,577 |
| Mid Cap Stock | 8,898,661 | 535,341 | 539,315 | 10,570,581 | — |
| Partner International Stock | 37,936,959 | 2,007,978 | 3,635,801 | 47,956,218 | 194,645 |
| Large Cap Growth | 35,159,138 | 295,123 | 7,292,981 | 41,205,345 | 39,045 |
| Large Cap Value | 13,066,372 | 2,481,509 | 915,094 | 15,538,293 | 95,508 |
| Large Cap Stock | 14,478,559 | 1,942,086 | 594,985 | 17,159,380 | 61,505 |
| Real Estate Securities | 903,457 | 1,975,168 | 19,974 | 266,652 | 26,392 |
| High Yield | 6,203,794 | 44,269 | 1,219,467 | 6,207,086 | 265,855 |
| Income | 4,074,516 | 29,512 | 475,260 | 4,077,727 | 115,910 |
| Limited Maturity Bond | 3,536,528 | 29,512 | 326,347 | 4,105,443 | 110,417 |
| Money Market | 3,538,943 | 29,512 | 4,098,097 | 4,098,097 | 114,228 |
| |
| Moderately Aggressive Allocation Fund | | | | | |
| Partner Small Cap Growth | 13,153,221 | — | 1,342,314 | 15,745,345 | — |
| Partner Small Cap Value | 13,410,143 | — | 1,012,315 | 16,460,240 | 29,913 |
| Small Cap Stock | 15,607,973 | — | 922,237 | 18,278,731 | — |
| Mid Cap Growth | 10,955,444 | — | 777,392 | 13,402,242 | — |
| Partner Mid Cap Value | 11,017,651 | — | 1,193,224 | 14,163,563 | 16,706 |
| Mid Cap Stock | 14,974,445 | — | 937,639 | 18,377,715 | — |
| Partner International Stock | 58,931,355 | 9,898,347 | 5,427,522 | 71,589,010 | 416,815 |
| Large Cap Growth | 55,652,915 | — | 11,987,816 | 67,731,158 | 79,507 |
| Large Cap Value | 44,979,727 | — | 3,361,947 | 57,085,861 | 203,666 |
| Large Cap Stock | 49,261,534 | — | 2,084,084 | 60,104,985 | 131,206 |
| Real Estate Securities | 8,479,832 | 2,185,158 | 803,861 | 10,731,539 | 229,007 |
| High Yield | 33,602,650 | 6,849,039 | 5,292,707 | 26,939,881 | 1,278,084 |
| Income | 32,745,653 | — | 4,254,811 | 36,506,278 | 959,106 |
| Limited Maturity Bond | 21,262,445 | 5,302,549 | 1,797,997 | 22,618,806 | 635,380 |
| Money Market | 11,425,178 | — | 13,408,260 | 13,408,260 | 363,857 |
| |
| Moderate Allocation Fund | | | | | |
| Small Cap Stock | 26,046,527 | — | 1,616,023 | 32,029,569 | — |
| Mid Cap Stock | 22,180,690 | 1,284,458 | 1,408,623 | 27,609,019 | — |
| Partner International Stock | 41,969,300 | 9,563,289 | 3,979,098 | 52,484,302 | 359,987 |
| Large Cap Growth | 45,655,564 | — | 10,378,483 | 58,638,428 | 81,433 |
| Large Cap Value | 32,272,078 | 1,113,233 | 2,523,938 | 42,856,460 | 204,125 |
| Large Cap Stock | 43,270,852 | — | 1,920,813 | 55,396,256 | 144,638 |
| Real Estate Securities | 11,724,919 | 2,392,921 | 1,196,410 | 15,972,072 | 335,812 |
| High Yield | 30,535,701 | 7,048,594 | 5,274,643 | 26,847,932 | 1,360,628 |
| Income | 57,982,233 | — | 7,390,369 | 63,409,364 | 1,725,390 |
| Limited Maturity Bond | 44,748,088 | 3,108,916 | 4,265,076 | 53,654,652 | 1,452,778 |
| Money Market | 27,118,787 | — | 31,087,193 | 31,087,193 | 835,477 |
THRIVENT MUTUAL FUNDS
NOTES TO FINANCIAL STATEMENTS
As of October 31, 2006 |
| | Gross | Gross | Balance of | | Dividend Income |
| | Purchases and | Sales and | Shares Held at | Value | November 1, 2005 – |
| Fund | Additions | Reductions | October 31, 2006 | October 31, 2006 | October 31, 2006 |
|
| Moderately Conservative Allocation Fund | | | | | |
| Small Cap Stock | $ 4,990,920 | $ 7,243 | 332,254 | $ 6,585,264 | $ — |
| Mid Cap Stock | 4,982,315 | 41,353 | 335,765 | 6,580,997 | — |
| Partner International Stock | 9,333,977 | 2,824,802 | 909,042 | 11,990,265 | 98,475 |
| Large Cap Growth | 12,037,585 | 40,018 | 2,858,854 | 16,152,526 | 25,680 |
| Large Cap Value | 8,513,150 | 15,268 | 702,407 | 11,926,867 | 58,540 |
| Large Cap Stock | 9,703,504 | 885 | 459,024 | 13,238,260 | 43,085 |
| Real Estate Securities | 3,722,881 | 332 | 422,959 | 5,646,503 | 111,574 |
| High Yield | 8,150,285 | 1,708,728 | 1,541,813 | 7,847,826 | 407,170 |
| Income | 17,369,107 | 1,549 | 2,480,584 | 21,283,407 | 620,413 |
| Limited Maturity Bond | 37,032,036 | 3,208 | 3,676,121 | 46,245,604 | 1,245,050 |
| Money Market | 12,549,577 | 1,106 | 15,930,764 | 15,930,764 | 445,992 |
(8) SECURITY TRANSACTIONS WITH AFFILIATED FUNDS
The Funds are permitted to purchase or sell securities from or to certain other Funds under specified conditions outlined in procedures adopted by the Board of Trustees of the Trust. The procedures have been designed to ensure that any purchase or sale of securities by the Fund from or to another fund or portfolio that is or could be considered an affiliate by virtue of having a common investment adviser (or affiliated investment advisers), common Trustees and/or common officers complies with Rule 17a-7 of the 1940 Act. Further, as defined under the procedures, each transaction is effected at the current market price. Pursuant to these procedures, during the year ended October 31, 2006, the Funds engaged in purchases and sales of securities of $21,750,112 and $31,855,772, respectively.
(9) RELATED PARTY TRANSACTIONS
As of October 31, 2006, related parties held the following shares of Thrivent Mutual Funds:
| | | Percent of Fund’s |
| Fund | Shares | Outstanding Shares |
|
| Partner Small Cap Growth | 900,000 | 25.6% |
| Partner Mid Cap Value | 451,578 | 17.1% |
| Mid Cap Index-I | 473,231 | 29.2% |
| Large Cap Index-I | 221,894 | 6.4% |
| Limited Maturity Bond | 1,494,396 | 7.1% |
As of October 31, 2006, retirement plans sponsored by Thrivent Financial for Lutherans held the following shares of Thrivent Mutual Funds:
| | | Percent of Fund’s |
| Fund | Shares | Outstanding Shares |
|
| Aggressive Allocation | 2,984,503 | 16.8% |
| Moderately Aggressive Allocation | 3,290,701 | 8.3% |
| Partner Small Cap Value | 850,261 | 10.3% |
| Mid Cap Index-I | 863,618 | 53.3% |
| Large Cap Value | 1,590,420 | 5.3% |
| Large Cap Index-I | 2,677,662 | 77.7% |
| Balanced | 6,399,087 | 23.8% |
| Core Bond | 2,817,079 | 7.0% |
THRIVENT MUTUAL FUNDS
NOTES TO FINANCIAL STATEMENTS
As of October 31, 2006
(10) SHARES OF BENEFICIAL INTEREST
The Declaration of Trust permits the Trust to issue an unlimited number of full and fractional shares of beneficial interest of all of the Funds. Automated conversions of Class B shares to Class A shares are included in the shares redeemed and sold amount. Transactions in Fund shares were as follows:
| | | Aggressive Allocation Fund | |
| | ———————————————————————————————————————————————————— |
| | Class A | Institutional Class |
| | ————————————————————————— | ————————————————————————— |
| Year Ended October 31, 2006 | Shares | Amount | Shares | Amount |
| ————————————————————————— | ———————— | ————————— | ———————— | ———————— |
| Sold | 13,075,418 | $ 147,328,456 | 3,128,872 | $ 35,198,189 |
| |
| Dividends and distributions reinvested | 46,370 | 499,873 | 8,720 | 94,094 |
| |
| Redeemed | (732,893) | (8,298,776) | (536,681) | (6,094,182) |
| | ———————— | ————————— | ———————— | ———————— |
| Net Change | 12,388,895 | $ 139,529,553 | 2,600,911 | $ 29,198,101 |
| | ———————— | ———————— | ———————— | ———————— |
| |
| Year Ended October 31, 2005 (a) | | | | |
| ————————————————————————— | | | | |
| Sold | 2,539,432 | $ 26,218,740 | 400,862 | $ 4,121,513 |
| |
| Dividends and distributions reinvested | — | — | — | — |
| |
| Redeemed | (106,007) | (1,110,080) | (1) | (10) |
| | ———————— | ————————— | ———————— | ———————— |
| Net Change | 2,433,425 | $ 25,108,660 | 400,861 | $ 4,121,503 |
| | ———————— | ———————— | ———————— | ———————— |
| |
| | Moderately Aggressive Allocation Fund |
| | ———————————————————————————————————————————————————— |
| | Class A | Institutional Class |
| | ———————————————————— | ——————————————————— |
| Year Ended October 31, 2006 | Shares | Amount | Shares | Amount |
| ————————————————————————— | ———————— | ————————— | ———————— | ———————— |
| Sold | 31,560,635 | $ 350,109,841 | 3,471,588 | $ 38,408,189 |
| |
| Dividends and distributions reinvested | 114,602 | 1,221,703 | 12,628 | 134,737 |
| |
| Redeemed | (1,696,994) | (18,900,089) | (344,328) | (3,829,712) |
| | ———————— | ————————— | ———————— | ———————— |
| Net Change | 29,978,243 | $ 332,431,455 | 3,139,888 | $ 34,713,214 |
| | ———————— | ———————— | ———————— | ———————— |
| |
| Year Ended October 31, 2005 (a) | | | | |
| ————————————————————————— | | | | |
| Sold | 6,318,180 | $ 64,978,054 | 264,360 | $ 2,705,003 |
| |
| Dividends and distributions reinvested | — | — | — | — |
| |
| Redeemed | (194,091) | (2,005,440) | (1) | (10) |
| | ———————— | ————————— | ———————— | ———————— |
| Net Change | 6,124,089 | $ 62,972,614 | 264,359 | $ 2,704,993 |
| | ———————— | ———————— | ———————— | ———————— |
| |
| | | Moderate Allocation Fund | |
| | ———————————————————————————————————————————————————— |
| | Class A | Institutional Class |
| | ———————————————————— | ——————————————————— |
| Year Ended October 31, 2006 | Shares | Amount | Shares | Amount |
| ————————————————————————— | ———————— | ————————— | ———————— | ———————— |
| Sold | 33,438,724 | $ 362,112,798 | 1,470,239 | $ 15,968,817 |
| |
| Dividends and distributions reinvested | 526,632 | 5,698,786 | 23,465 | 254,335 |
| |
| Redeemed | (2,245,064) | (24,370,495) | (264,002) | (2,881,642) |
| | ———————— | ————————— | ———————— | ———————— |
| Net Change | 31,720,292 | $ 343,441,089 | 1,229,702 | $ 13,341,510 |
| | ———————— | ———————— | ———————— | ———————— |
| |
| Year Ended October 31, 2005 (a) | | | | |
| ————————————————————————— | | | | |
| Sold | 7,597,586 | $ 77,579,096 | 281,371 | $ 2,860,982 |
| |
| Dividends and distributions reinvested | 8,054 | 83,525 | 101 | 1,050 |
| |
| Redeemed | (153,929) | (1,583,773) | (8) | (81) |
| | ———————— | ————————— | ———————— | ———————— |
| Net Change | 7,451,711 | $ 76,078,848 | 281,464 | $ 2,861,951 |
| | ———————— | ———————— | ———————— | ———————— |
| (a) For the period from June 30, 2005 (inception) through October 31, 2005. |
|
| 258 |
THRIVENT MUTUAL FUNDS
NOTES TO FINANCIAL STATEMENTS
As of October 31, 2006 |
| | Moderately Conservative Allocation Fund | | |
| | ———————————————————————————————————————————————————— | | |
| | Class A | Institutional Class | | |
| | ———————————————————— | ——————————————————— | | |
| Year Ended October 31, 2006 | Shares | Amount | Shares | Amount | | |
| ————————————————————————— | ———————— | ————————— | ———————— | ———————— | | |
| Sold | 12,261,652 | $ 129,400,033 | 664,580 | $ 7,047,732 | | |
| |
| Dividends and distributions reinvested | 250,577 | 2,645,161 | 9,531 | 100,909 | | |
| |
| Redeemed | (1,375,509) | (14,531,407) | (154,930) | (1,656,338) | | |
| | ———————— | ————————— | ———————— | ———————— | | |
| Net Change | 11,136,720 | $ 117,513,787 | 519,181 | $ 5,492,303 | | |
| | ———————— | ———————— | ———————— | ———————— | | |
| |
| Year Ended October 31, 2005 (a) | | | | | | |
| ————————————————————————— | | | | | | |
| Sold | 3,376,617 | $ 34,227,042 | 75,332 | $ 755,613 | | |
| |
| Dividends and distributions reinvested | 5,184 | 53,085 | 103 | 1,056 | | |
| |
| Redeemed | (134,194) | (1,367,449) | (7) | (71) | | |
| | ———————— | ————————— | ———————— | ———————— | | |
| Net Change | 3,247,607 | $ 32,912,678 | 75,428 | $ 756,598 | | |
| | ———————— | ———————— | ———————— | ———————— | | |
| |
| | | | Technology Fund | | |
| | ——————————————————————————————————————— —————————————————————— |
| | Class A | Class B | Institutional Class |
| | ———————————————————— | ——————————————————— | ——————————————————— |
| Year Ended October 31, 2006 | Shares | Amount | Shares | Amount | Shares | Amount |
| ————————————————————————— | ———————— | ————————— | ———————— | ———————— | ———————— | ———————— |
| Sold | 1,575,576 | $ 5,840,342 | 2,386 | $ 8,647 | 40,689 | $ 161,546 |
| |
| Dividends and distributions reinvested | — | — | — | — | — | — |
| |
| Redeemed | (3,073,377) | (11,306,964) | (384,866) | (1,362,959) | (201,063) | (807,361) |
| | ———————— | ————————— | ———————— | ———————— | ———————— | ———————— |
| Net Change | (1,497,801) | $ (5,466,622) | (382,480) | $ (1,354,312) | (160,374) | $ (645,815) |
| | ———————— | ———————— | ———————— | ———————— | ———————— | ———————— |
| |
| Year Ended October 31, 2005 | | | | | | |
| ————————————————————————— | | | | | | |
| Sold | 2,413,463 | $ 8,199,817 | 61,398 | $ 199,867 | 3,449 | $12,581 |
| |
| Dividends and distributions reinvested | — | — | — | — | — | — |
| |
| Redeemed | (3,128,503) | (10,679,889) | (279,898) | (923,848) | (164,088) | (573,609) |
| | ———————— | ————————— | ———————— | ———————— | ———————— | ———————— |
| Net Change | (715,040) | $ (2,480,072) | (218,500) | $ (723,981) | (160,639) | $ (561,028) |
| | ———————— | ———————— | ———————— | ———————— | ———————— | ———————— |
| |
| | | Partner Small Cap Growth Fund | | | |
| | ———————————————————————————————————————————————————— | | |
| | Class A | Institutional Class | | |
| | ———————————————————— | ——————————————————— | | |
| Year Ended October 31, 2006 | Shares | Amount | Shares | Amount | | |
| ————————————————————————— | ———————— | ————————— | ———————— | ———————— | | |
| Sold | 149,939 | $ 1,731,354 | 2,204,481 | $ 25,203,271 | | |
| |
| Dividends and distributions reinvested | — | — | — | — | | |
| |
| Redeemed | (48,537) | (540,910) | (111,243) | (1,235,886) | | |
| | ———————— | ————————— | ———————— | ———————— | | |
| Net Change | 101,402 | $ 1,190,444 | 2,093,238 | $ 23,967,385 | | |
| | ———————— | ———————— | ———————— | ———————— | | |
| |
| Year Ended October 31, 2005 (a) | | | | | | |
| ————————————————————————— | | | | | | |
| Sold | 923,858 | $ 9,244,828 | 404,238 | $ 4,132,659 | | |
| |
| Dividends and distributions reinvested | — | — | — | — | | |
| |
| Redeemed | (70) | (742) | (1) | (10) | | |
| | ———————— | ————————— | ———————— | ———————— | | |
| Net Change | 923,788 | $ 9,244,086 | 404,237 | $ 4,132,649 | | |
| | ———————— | ———————— | ———————— | ———————— | | |
| (a) For the period from June 30, 2005 (inception) through October 31, 2005. |
|
| 259 |
THRIVENT MUTUAL FUNDS
NOTES TO FINANCIAL STATEMENTS
As of October 31, 2006 |
(10) SHARES OF BENEFICIAL INTEREST — continued
| | | | Partner Small Cap Value Fund | | |
| | —————————————————————————————————————————————————————————————— |
| | Class A | Class B | Institutional Class |
| | ———————————————————— | ——————————————————— | ——————————————————— |
| Year Ended October 31, 2006 | Shares | Amount | Shares | Amount | Shares | Amount |
| ————————————————————————— | ———————— | ————————— | ———————— | ———————— | ———————— | ———————— |
| Sold | 789,494 | $ 11,717,794 | 13,752 | $ 195,259 | 1,928,137 | $ 29,480,789 |
| |
| Dividends and distributions reinvested | 360,245 | 4,839,610 | 27,743 | 356,497 | 88,388 | 1,234,013 |
| |
| Redeemed | (1,344,105) | (19,806,868) | (79,761) | (1,125,979) | (376,799) | (5,715,628) |
| | ———————— | ————————— | ———————— | ———————— | ———————— | ———————— |
| Net Change | (194,366) | $ (3,249,464) | (38,266) | $ (574,223) | 1,639,726 | $ 24,999,174 |
| | ———————— | ———————— | ———————— | ———————— | ———————— | ———————— |
| |
| Year Ended October 31, 2005 | | | | | | |
| ————————————————————————— | | | | | | |
| Sold | 1,517,333 | $ 20,881,363 | 24,491 | $ 330,888 | 687,886 | $ 9,913,887 |
| |
| Dividends and distributions reinvested | 619,617 | 8,353,675 | 54,502 | 711,264 | 134,623 | 1,874,939 |
| |
| Redeemed | (1,142,359) | (15,657,893) | (58,263) | (774,977) | (606,729) | (8,464,252) |
| | ———————— | ————————— | ———————— | ———————— | ———————— | ———————— |
| Net Change | 994,591 | $ 13,577,145 | 20,730 | $ 267,175 | 215,780 | $ 3,324,574 |
| | ———————— | ———————— | ———————— | ———————— | ———————— | ———————— |
| |
| | | | Small Cap Stock Fund | | |
| | —————————————————————————————————————————————————————————————— |
| | Class A | Class B | Institutional Class |
| | ———————————————————— | ——————————————————— | ——————————————————— |
| Year Ended October 31, 2006 | Shares | Amount | Shares | Amount | Shares | Amount |
| ————————————————————————— | ———————— | ————————— | ———————— | ———————— | ———————— | ———————— |
| Sold | 2,538,144 | $ 45,530,084 | 20,683 | $ 333,420 | 3,185,306 | $ 60,806,535 |
| |
| Dividends and distributions reinvested | 2,854,211 | 47,380,770 | 156,278 | 2,326,978 | 136,717 | 2,421,260 |
| |
| Redeemed | (5,404,823) | (96,654,667) | (457,190) | (7,322,618) | (146,207) | (2,770,269) |
| | ———————— | ————————— | ———————— | ———————— | ———————— | ———————— |
| Net Change | (12,468) | $ (3,743,813) | (280,229) | $ (4,662,220) | 3,175,816 | $ 60,457,526 |
| | ———————— | ———————— | ———————— | ———————— | ———————— | ———————— |
| |
| Year Ended October 31, 2005 | | | | | | |
| ————————————————————————— | | | | | | |
| Sold | 3,177,885 | $ 54,691,472 | 41,762 | $ 655,185 | 576,981 | $ 10,908,320 |
| |
| Dividends and distributions reinvested | 1,169,439 | 19,952,382 | 84,625 | 1,324,943 | 27,428 | 493,053 |
| |
| Redeemed | (3,837,097) | (66,584,361) | (518,871) | (8,208,131) | (157,397) | (2,960,615) |
| | ———————— | ————————— | ———————— | ———————— | ———————— | ———————— |
| Net Change | 510,227 | $ 8,059,493 | (392,484) | $ (6,228,003) | 447,012 | $ 8,440,758 |
| | ———————— | ———————— | ———————— | ———————— | ———————— | ———————— |
| |
| | Small Cap Index Fund | | | | |
| | ———————————————————— | | | | |
| | Class A | | | | |
| | ———————————————————— | | | | |
| Year Ended October 31, 2006 | Shares | Amount | | | | |
| ————————————————————————— | ———————— | ————————— | | | | |
| Sold | 427,563 | $ 6,576,606 | | | | |
| |
| Dividends and distributions reinvested | 64,987 | 942,691 | | | | |
| |
| Redeemed | (799,487) | (12,298,315) | | | | |
| | ———————— | ————————— | | | | |
| Net Change | (306,937) | $ (4,779,018) | | | | |
| | ———————— | ———————— | | | | |
| |
| Year Ended October 31, 2005 | | | | | | |
| ————————————————————————— | | | | | | |
| Sold | 1,016,689 | $ 13,900,371 | | | | |
| |
| Dividends and distributions reinvested | 25,112 | 342,666 | | | | |
| |
| Redeemed | (555,929) | (7,725,862) | | | | |
| | ———————— | ————————— | | | | |
| Net Change | 485,872 | $ 6,517,175 | | | | |
| | ———————— | ———————— | | | | |
THRIVENT MUTUAL FUNDS
NOTES TO FINANCIAL STATEMENTS
As of October 31, 2006 |
| | | | Mid Cap Growth Fund | | |
| | ————————————————————————————————————————————————————————————— |
| | Class A | Class B | Institutional Class |
| | ———————————————————— | ——————————————————— | ——————————————————— |
| Year Ended October 31, 2006 | Shares | Amount | Shares | Amount | Shares | Amount |
| ————————————————————————— | ———————— | ————————— | ———————— | ———————— | ———————— | ———————— |
| Sold | 1,696,141 | $ 26,951,615 | 10,638 | $ 159,589 | 1,194,522 | $ 20,150,089 |
| |
| Dividends and distributions reinvested | — | — | — | — | — | — |
| |
| Redeemed | (3,776,345) | (59,668,750) | (893,515) | (13,144,985) | (80,530) | (1,335,045) |
| | ———————— | ————————— | ———————— | ———————— | ———————— | ———————— |
| Net Change | (2,080,204) | $ (32,717,135) | (882,877) | $ (12,985,396) | 1,113,992 | $ 18,815,044 |
| | ———————— | ———————— | ———————— | ———————— | ———————— | ———————— |
| |
| Year Ended October 31, 2005 | | | | | | |
| ————————————————————————— | | | | | | |
| Sold | 2,537,539 | $ 35,036,716 | 30,434 | $ 393,259 | 272,971 | $ 4,152,199 |
| |
| Dividends and distributions reinvested | — | — | — | — | — | — |
| |
| Redeemed | (3,757,363) | (52,189,301) | (1,116,546) | (14,519,624) | (270,037) | (3,973,584) |
| | ———————— | ————————— | ———————— | ———————— | ———————— | ———————— |
| Net Change | (1,219,824) | $ (17,152,585) | (1,086,112) | $ (14,126,365) | 2,934 | $ 178,615 |
| | ———————— | ———————— | ———————— | ———————— | ———————— | ———————— |
| |
| | | Partner Mid Cap Value Fund | | | |
| | ————————————————————————————————————————— | | |
| | Class A | Institutional Class | | |
| | ———————————————————— | ——————————————————— | | |
| Year Ended October 31, 2006 | Shares | Amount | Shares | Amount | | |
| ————————————————————————— | ———————— | ————————— | ———————— | ———————— | | |
| Sold | 152,647 | $ 1,676,515 | 1,713,309 | $ 18,850,083 | | |
| |
| Dividends and distributions reinvested | 1,820 | 19,259 | 2,772 | 29,325 | | |
| |
| Redeemed | (17,102) | (190,153) | (63,360) | (701,328) | | |
| | ———————— | ————————— | ———————— | ———————— | | |
| Net Change | 137,365 | $ 1,505,621 | 1,652,721 | $ 18,178,080 | | |
| | ———————— | ———————— | ———————— | ———————— | | |
| |
| Year Ended October 31, 2005 (a) | | | | | | |
| ————————————————————————— | | | | | | |
| Sold | 503,544 | $ 5,050,647 | 359,203 | $ 3,660,359 | | |
| |
| Dividends and distributions reinvested | — | — | — | — | | |
| |
| Redeemed | (1) | (10) | (1) | (10) | | |
| | ———————— | ————————— | ———————— | ———————— | | |
| Net Change | 503,543 | $ 5,050,637 | 359,202 | $ 3,660,349 | | |
| | ———————— | ———————— | ———————— | ———————— | | |
| |
| | | | Mid Cap Stock Fund | | |
| | ————————————————————————————————————————————————————————————— |
| | Class A | Class B | Institutional Class |
| | ———————————————————— | ——————————————————— | ——————————————————— |
| Year Ended October 31, 2006 | Shares | Amount | Shares | Amount | Shares | Amount |
| ————————————————————————— | ———————— | ————————— | ———————— | ———————— | ———————— | ———————— |
| Sold | 4,939,835 | $ 88,864,839 | 44,431 | $ 712,655 | 3,685,704 | $ 69,379,972 |
| |
| Dividends and distributions reinvested | 5,464,459 | 92,680,703 | 169,303 | 2,553,082 | 304,504 | 5,417,124 |
| |
| Redeemed | (9,926,843) | (177,890,193) | (572,630) | (9,122,694) | (771,657) | (14,421,120) |
| | ———————— | ————————— | ———————— | ———————— | ———————— | ———————— |
| Net Change | 477,451 | $ 3,655,349 | (358,896) | $ (5,856,957) | 3,218,551 | $ 60,375,976 |
| | ———————— | ———————— | ———————— | ———————— | ———————— | ———————— |
| |
| Year Ended October 31, 2005 | | | | | | |
| ————————————————————————— | | | | | | |
| Sold | 4,460,836 | $ 73,983,970 | 66,435 | $ 992,529 | 1,096,974 | $ 19,788,180 |
| |
| Dividends and distributions reinvested | — | — | — | — | — | — |
| |
| Redeemed | (7,360,779) | (122,554,586) | (586,322) | (8,805,799) | (325,759) | (5,668,084) |
| | ———————— | ————————— | ———————— | ———————— | ———————— | ———————— |
| Net Change | (2,899,943) | $ (48,570,616) | (519,887) | $ (7,813,270) | 771,215 | $ 14,120,096 |
| | ———————— | ———————— | ———————— | ———————— | ———————— | ———————— |
| (a) For the period from June 30, 2005 (inception) through October 31, 2005. |
|
| 261 |
THRIVENT MUTUAL FUNDS
NOTES TO FINANCIAL STATEMENTS As of October 31, 2006
(10) SHARES OF BENEFICIAL INTEREST — continued
| | Mid Cap Index Fund | Mid Cap Index Fund-I | | |
| | ———————————————————— | ———————————————————— | |
| | Class A | Institutional Class | | |
| | ———————————————————— | ———————————————————— | | |
| Year Ended October 31, 2006 | Shares | Amount | Shares | Amount | | |
| ————————————————————————— | ———————— | ————————— | ———————— | ———————— | | |
| Sold | 595,026 | $ 8,406,505 | 292,085 | $ 3,993,921 | | |
| |
| Dividends and distributions reinvested | 310,443 | 4,211,597 | 123,741 | 1,619,275 | | |
| |
| Redeemed | (1,185,347) | (16,735,935) | (528,724) | (7,219,325) | | |
| | ———————— | ————————— | ———————— | ———————— | | |
| Net Change | (279,878) | $ (4,117,833) | (112,898) | $ (1,606,129) | | |
| | ———————— | ———————— | ———————— | ———————— | | |
| |
| Year Ended October 31, 2005 | | | | | | |
| ————————————————————————— | | | | | | |
| Sold | 1,114,612 | $ 14,521,029 | 701,761 | $ 9,027,007 | | |
| |
| Dividends and distributions reinvested | 24,930 | 319,594 | 55,097 | 684,234 | | |
| |
| Redeemed | (754,081) | (9,948,203) | (486,586) | (6,185,324) | | |
| | ———————— | ————————— | ———————— | ———————— | | |
| Net Change | 385,461 | $ 4,892,420 | 270,272 | $ 3,525,917 | | |
| | ———————— | ———————— | ———————— | ———————— | | |
| |
| | | Partner International Stock Fund | |
| | ————————————————————————————————————————————————————————————— |
| | Class A | Class B | Institutional Class |
| | ———————————————————— | ——————————————————— | ——————————————————— |
| Year Ended October 31, 2006 | Shares | Amount | Shares | Amount | Shares | Amount |
| ————————————————————————— | ———————— | ————————— | ———————— | ———————— | ———————— | ———————— |
| Sold | 3,242,267 | $ 38,631,787 | 55,694 | $ 639,937 | 12,599,508 | $152,916,149 |
| |
| Dividends and distributions reinvested | 278,655 | 3,165,499 | — | — | 114,683 | 1,321,143 |
| |
| Redeemed | (6,278,166) | (75,182,696) | (477,656) | (5,490,671) | (2,906,204) | (33,993,291) |
| | ———————— | ————————— | ———————— | ———————— | ———————— | ———————— |
| Net Change | (2,757,244) | $ (33,385,410) | (421,962) | $ (4,850,734) | 9,807,987 | $120,244,001 |
| | ———————— | ———————— | ———————— | ———————— | ———————— | ———————— |
| |
| Year Ended October 31, 2005 | | | | | | |
| ————————————————————————— | | | | | | |
| Sold | 6,327,274 | $ 63,200,783 | 83,665 | $ 808,246 | 4,287,992 | $ 45,266,449 |
| |
| Dividends and distributions reinvested | 5,184 | 52,212 | — | — | 1,557 | 15,897 |
| |
| Redeemed | (4,260,381) | (43,002,707) | (702,098) | (6,815,411) | (35,291) | (357,325) |
| | ———————— | ————————— | ———————— | ———————— | ———————— | ———————— |
| Net Change | 2,072,077 | $ 20,250,288 | (618,433) | $ (6,007,165) | 4,254,258 | $ 44,925,021 |
| | ———————— | ———————— | ———————— | ———————— | ———————— | ———————— |
| |
| | | | Large Cap Growth Fund | | |
| | ————————————————————————————————————————————————————————————— |
| | Class A | Class B | Institutional Class |
| | ———————————————————— | ——————————————————— | ——————————————————— |
| Year Ended October 31, 2006 | Shares | Amount | Shares | Amount | Shares | Amount |
| ————————————————————————— | ———————— | ————————— | ———————— | ———————— | ———————— | ———————— |
| Sold | 5,705,035 | $ 29,361,687 | 66,396 | $ 323,093 | 30,963,196 | $168,846,450 |
| |
| Dividends and distributions reinvested | 23,292 | 119,718 | — | — | 44,016 | 239,449 |
| |
| Redeemed | (7,194,318) | (36,867,630) | (1,042,666) | (5,024,700) | (800,340) | (4,397,226) |
| | ———————— | ————————— | ———————— | ———————— | ———————— | ———————— |
| Net Change | (1,465,991) | $ (7,386,225) | (976,270) | $ (4,701,607) | 30,206,872 | $164,688,673 |
| | ———————— | ———————— | ———————— | ———————— | ———————— | ———————— |
| |
| Year Ended October 31, 2005 | | | | | | |
| ————————————————————————— | | | | | | |
| Sold | 12,171,994 | $ 57,010,739 | 180,129 | $ 800,578 | 5,501,581 | $ 28,433,153 |
| |
| Dividends and distributions reinvested | 8,451 | 40,650 | — | — | 1,389 | 7,042 |
| |
| Redeemed | (4,266,894) | (20,309,601) | (928,944) | (4,171,992) | (1,386,103) | (6,893,110) |
| | ———————— | ————————— | ———————— | ———————— | ———————— | ———————— |
| Net Change | 7,913,551 | $ 36,741,788 | (748,815) | $ (3,371,414) | 4,116,867 | $ 21,547,085 |
| | ———————— | ———————— | ———————— | ———————— | ———————— | ———————— |
THRIVENT MUTUAL FUNDS
NOTES TO FINANCIAL STATEMENTS As of October 31, 2006
| | | | Large Cap Value Fund | | |
| | ————————————————————————————————————————————————————————————— |
| | Class A | Class B | Institutional Class |
| | ———————————————————— | ——————————————————— | ——————————————————— |
| Year Ended October 31, 2006 | Shares | Amount | Shares | Amount | Shares | Amount |
| ————————————————————————— | ———————— | ————————— | ———————— | ———————— | ———————— | ———————— |
| Sold | 2,027,404 | $ 31,651,188 | 24,560 | $ 380,262 | 7,067,224 | $110,974,959 |
| |
| Dividends and distributions reinvested | 556,278 | 8,268,344 | 16,314 | 239,486 | 122,590 | 1,831,095 |
| |
| Redeemed | (5,040,104) | (78,519,471) | (353,683) | (5,446,939) | (828,908) | (12,806,414) |
| | ———————— | ————————— | ———————— | ———————— | ———————— | ———————— |
| Net Change | (2,456,422) | $ (38,599,939) | (312,809) | $ (4,827,191) | 6,360,906 | $ 99,999,640 |
| | ———————— | ———————— | ———————— | ———————— | ———————— | ———————— |
| |
| Year Ended October 31, 2005 | | | | | | |
| ————————————————————————— | | | | | | |
| Sold | 3,673,689 | $ 51,883,546 | 59,489 | $ 829,196 | 2,420,261 | $ 34,854,535 |
| |
| Dividends and distributions reinvested | 86,770 | 1,230,393 | — | — | 8,810 | 125,280 |
| |
| Redeemed | (3,651,149) | (51,917,884) | (350,803) | (4,904,147) | (634,417) | (9,144,006) |
| | ———————— | ————————— | ———————— | ———————— | ———————— | ———————— |
| Net Change | 109,310 | $ 1,196,055 | (291,314) | $ (4,074,951) | 1,794,654 | $ 25,835,809 |
| | ———————— | ———————— | ———————— | ———————— | ———————— | ———————— |
| |
| | | | Large Cap Stock Fund | | |
| | —————————————————————————————————————————————————————————————— |
| | Class A | Class B | Institutional Class |
| | ———————————————————— | ——————————————————— | ——————————————————— |
| Year Ended October 31, 2006 | Shares | Amount | Shares | Amount | Shares | Amount |
| ————————————————————————— | ———————— | ————————— | ———————— | ———————— | ———————— | ———————— |
| Sold | 4,462,863 | $ 120,738,121 | 9,189 | $ 229,471 | 4,720,185 | $128,445,765 |
| |
| Dividends and distributions reinvested | 2,077,603 | 55,394,923 | 40,804 | 1,008,349 | 119,662 | 3,207,017 |
| |
| Redeemed | (26,453,828) | (715,804,335) | (1,264,335) | (31,648,461) | (1,905,974) | (51,865,562) |
| | ———————— | ————————— | ———————— | ———————— | ———————— | ———————— |
| Net Change | (19,913,362) | $ (539,671,291) | (1,214,342) | $ (30,410,641) | 2,933,873 | $ 79,787,220 |
| | ———————— | ———————— | ———————— | ———————— | ———————— | ———————— |
| |
| Year Ended October 31, 2005 | | | | | | |
| ————————————————————————— | | | | | | |
| Sold | 6,847,339 | $ 173,588,211 | 40,093 | $ 937,446 | 1,719,267 | $ 44,559,132 |
| |
| Dividends and distributions reinvested | 825,490 | 21,106,807 | 62 | 1,351 | 35,618 | 914,310 |
| |
| Redeemed | (22,742,851) | (579,282,313) | (1,746,412) | (41,233,194) | (840,455) | (21,560,415) |
| | ———————— | ————————— | ———————— | ———————— | ———————— | ———————— |
| Net Change | (15,070,022) | $ (384,587,295) | (1,706,257) | $ (40,294,397) | 914,430 | $ 23,913,027 |
| | ———————— | ———————— | ———————— | ———————— | ———————— | ———————— |
| |
| | Large Cap Index Fund | Large Cap Index Fund-I | | |
| | ———————————————————— | ———————————————————— | | |
| | Class A | Institutional Class | | |
| | ———————————————————— | ———————————————————— | |
| Year Ended October 31, 2006 | Shares | Amount | Shares | Amount | | |
| ————————————————————————— | ———————— | ————————— | ———————— | ———————— | | |
| Sold | 1,212,651 | $ 10,702,889 | 691,604 | $ 6,083,284 | | |
| |
| Dividends and distributions reinvested | 149,126 | 1,280,887 | 48,463 | 412,908 | | |
| |
| Redeemed | (2,970,026) | (26,233,730) | (1,094,387) | (9,595,822) | | |
| | ———————— | ————————— | ———————— | ———————— | | |
| Net Change | (1,608,249) | $ (14,249,954) | (354,320) | $ (3,099,630) | | |
| | ———————— | ———————— | ———————— | ———————— | | |
| |
| Year Ended October 31, 2005 | | | | | | |
| ————————————————————————— | | | | | | |
| Sold | 3,307,347 | $ 27,090,444 | 884,376 | $ 7,236,775 | | |
| |
| Dividends and distributions reinvested | 95,005 | 788,538 | 54,311 | 446,980 | | |
| |
| Redeemed | (1,908,815) | (15,773,311) | (934,372) | (7,673,407) | | |
| | ———————— | ————————— | ———————— | ———————— | | |
| Net Change | 1,493,537 | $ 12,105,671 | 4,315 | $ 10,348 | | |
| | ———————— | ———————— | ———————— | ———————— | | |
THRIVENT MUTUAL FUNDS
NOTES TO FINANCIAL STATEMENTS
As of October 31, 2006 |
(10) SHARES OF BENEFICIAL INTEREST — continued
| | | | Balanced Fund | | |
| | ————————————————————————————————————————————————————————————— |
| | Class A | Class B | Institutional Class |
| | ———————————————————— | ——————————————————— | ——————————————————— |
| Year Ended October 31, 2006 | Shares | Amount | Shares | Amount | Shares | Amount |
| ————————————————————————— | ———————— | ————————— | ———————— | ———————— | ———————— | ———————— |
| Sold | 1,503,534 | $ 18,783,943 | 17,860 | $ 222,453 | 155,282 | $ 1,931,549 |
| |
| Dividends and distributions reinvested | 923,755 | 11,441,804 | 33,814 | 415,972 | 364,545 | 4,515,013 |
| |
| Redeemed | (5,654,941) | (70,689,156) | (371,363) | (4,606,196) | (1,933,121) | (24,176,039) |
| | ———————— | ————————— | ———————— | ———————— | ———————— | ———————— |
| Net Change | (3,227,652) | $ (40,463,409) | (319,689) | $ (3,967,771) | (1,413,294) | $ (17,729,477) |
| | ———————— | ———————— | ———————— | ———————— | ———————— | ———————— |
| |
| Year Ended October 31, 2005 | | | | | | |
| ————————————————————————— | | | | | | |
| Sold | 3,195,298 | $ 38,470,275 | 14,849 | $ 179,001 | 161,848 | $ 1,956,455 |
| |
| Dividends and distributions reinvested | 758,679 | 9,156,247 | 31,721 | 380,639 | 330,563 | 3,986,774 |
| |
| Redeemed | (4,871,001) | (58,885,348) | (446,249) | (5,356,650) | (1,600,278) | (19,308,671) |
| | ———————— | ————————— | ———————— | ———————— | ———————— | ———————— |
| Net Change | (917,024) | $ (11,258,826) | (399,679) | $ (4,797,010) | (1,107,867) | $ (13,365,442) |
| | ———————— | ———————— | ———————— | ———————— | ———————— | ———————— |
| |
| | | | High Yield Fund | | |
| | ————————————————————————————————————————————————————————————— |
| | Class A | Class B | Institutional Class |
| | ———————————————————— | ——————————————————— | ——————————————————— |
| Year Ended October 31, 2006 | Shares | Amount | Shares | Amount | Shares | Amount |
| ————————————————————————— | ———————— | ————————— | ———————— | ———————— | ———————— | ———————— |
| Sold | 10,539,834 | $ 53,007,415 | 84,971 | $ 425,746 | 15,871,254 | $ 80,202,875 |
| |
| Dividends and distributions reinvested | 5,791,921 | 29,188,525 | 193,224 | 973,714 | 785,290 | 3,957,887 |
| |
| Redeemed | (23,329,587) | (117,459,897) | (1,686,376) | (8,497,294) | (3,501,294) | (17,706,365) |
| | ———————— | ————————— | ———————— | ———————— | ———————— | ———————— |
| Net Change | (6,997,832) | $ (35,263,957) | (1,408,181) | $ (7,097,834) | 13,155,250 | $ 66,454,397 |
| | ———————— | ———————— | ———————— | ———————— | ———————— | ———————— |
| |
| Year Ended October 31, 2005 | | | | | | |
| ————————————————————————— | | | | | | |
| Sold | 11,380,648 | $ 58,997,559 | 78,981 | $ 410,492 | 1,274,897 | $ 6,551,599 |
| |
| Dividends and distributions reinvested | 6,193,332 | 31,927,680 | 271,884 | 1,402,509 | 101,401 | 522,045 |
| |
| Redeemed | (20,693,498) | (106,752,495) | (2,012,945) | (10,408,639) | (275,736) | (1,426,020) |
| | ———————— | ————————— | ———————— | ———————— | ———————— | ———————— |
| Net Change | (3,119,518) | $ (15,827,256) | (1,662,080) | $ (8,595,638) | 1,100,562 | $ 5,647,624 |
| | ———————— | ———————— | ———————— | ———————— | ———————— | ———————— |
| |
| | | | Diversified Income Plus Fund | | |
| | ————————————————————————————————————————————————————————————— |
| | Class A | Class B | Institutional Class |
| | ———————————————————— | ——————————————————— | ——————————————————— |
| Year Ended October 31, 2006 | Shares | Amount | Shares | Amount | Shares | Amount |
| ————————————————————————— | ———————— | ————————— | ———————— | ———————— | ———————— | ———————— |
| Sold | 4,306,685 | $ 28,014,839 | 17,526 | $ 113,372 | 610,182 | $ 3,981,168 |
| |
| Dividends and distributions reinvested | 857,313 | 5,538,631 | 24,164 | 155,968 | 24,610 | 159,237 |
| |
| Redeemed | (6,139,059) | (39,536,691) | (227,488) | (1,463,782) | (437,305) | (2,835,896) |
| | ———————— | ————————— | ———————— | ———————— | ———————— | ———————— |
| Net Change | (975,061) | $ (5,983,221) | (185,798) | $ (1,194,442) | 197,487 | $ 1,304,509 |
| | ———————— | ———————— | ———————— | ———————— | ———————— | ———————— |
| |
| Year Ended October 31, 2005 | | | | | | |
| ————————————————————————— | | | | | | |
| Sold | 1,645,098 | $ 10,909,037 | 13,662 | $ 89,576 | 59,725 | $ 397,171 |
| |
| Dividends and distributions reinvested | 1,057,002 | 6,959,351 | 35,298 | 232,596 | 35,874 | 235,946 |
| |
| Redeemed | (3,988,894) | (26,331,604) | (284,341) | (1,885,441) | (72,353) | (486,954) |
| | ———————— | ————————— | ———————— | ———————— | ———————— | ———————— |
| Net Change | (1,286,794) | $ (8,463,216) | (235,381) | $ (1,563,269) | 23,246 | $ 146,163 |
| | ———————— | ———————— | ———————— | ———————— | ———————— | ———————— |
THRIVENT MUTUAL FUNDS
NOTES TO FINANCIAL STATEMENTS
As of October 31, 2006 |
| | | | Municipal Bond Fund | | |
| | ——————————————————————————————————————— —————————————————————— |
| | Class A | Class B | Institutional Class |
| | ———————————————————— | ——————————————————— | ——————————————————— |
| Year Ended October 31, 2006 | Shares | Amount | Shares | Amount | Shares | Amount |
| ————————————————————————— | ———————— | ————————— | ———————— | ———————— | ———————— | ———————— |
| Sold | 7,272,232 | $ 82,058,835 | 19,033 | $ 214,594 | 596,280 | $ 6,719,776 |
| |
| Dividends and distributions reinvested | 3,835,932 | 43,308,906 | 74,081 | 836,120 | 28,913 | 326,346 |
| |
| Redeemed | (15,492,085) | (174,708,654) | (747,886) | (8,421,000) | (298,232) | (3,366,694) |
| | ———————— | ————————— | ———————— | ———————— | ———————— | ———————— |
| Net Change | (4,383,921) | $ (49,340,913) | (654,772) | $ (7,370,286) | 326,961 | $ 3,679,428 |
| | ———————— | ———————— | ———————— | ———————— | ———————— | ———————— |
| |
| Year Ended October 31, 2005 | | | | | | |
| ————————————————————————— | | | | | | |
| Sold | 9,170,851 | $ 105,337,442 | 17,696 | $ 203,078 | 433,972 | $ 4,973,247 |
| |
| Dividends and distributions reinvested | 3,790,971 | 43,498,716 | 85,950 | 986,057 | 12,542 | 143,719 |
| |
| Redeemed | (12,477,891) | (143,266,278) | (492,658) | (5,658,362) | (148,135) | (1,691,304) |
| | ———————— | ————————— | ———————— | ———————— | ———————— | ———————— |
| Net Change | 483,931 | $ 5,569,880 | (389,012) | $ (4,469,227) | 298,379 | $ 3,425,662 |
| | ———————— | ———————— | ———————— | ———————— | ———————— | ———————— |
| |
| | | | Income Fund | | |
| | ————————————————————————————————————————————————————————————— |
| | Class A | Class B | Institutional Class |
| | ———————————————————— | ——————————————————— | ——————————————————— |
| Year Ended October 31, 2006 | Shares | Amount | Shares | Amount | Shares | Amount |
| ————————————————————————— | ———————— | ————————— | ———————— | ———————— | ———————— | ———————— |
| Sold | 3,056,959 | $ 25,955,319 | 25,440 | $ 217,189 | 14,980,955 | $127,041,110 |
| |
| Dividends and distributions reinvested | 2,269,958 | 19,292,564 | 66,628 | 565,078 | 630,512 | 5,347,248 |
| |
| Redeemed | (12,756,451) | (108,230,155) | (871,989) | (7,377,170) | (1,609,551) | (13,575,746) |
| | ———————— | ————————— | ———————— | ———————— | ———————— | ———————— |
| Net Change | (7,429,534) | $ (62,982,272) | (779,921) | $ (6,594,903) | 14,001,916 | $118,812,612 |
| | ———————— | ———————— | ———————— | ———————— | ———————— | ———————— |
| |
| Year Ended October 31, 2005 | | | | | | |
| ————————————————————————— | | | | | | |
| Sold | 4,570,109 | $ 40,024,825 | 33,360 | $ 292,484 | 2,812,041 | $ 24,523,996 |
| |
| Dividends and distributions reinvested | 2,212,878 | 19,346,299 | 78,094 | 681,374 | 156,192 | 1,363,273 |
| |
| Redeemed | (9,502,313) | (83,136,647) | (739,002) | (6,453,543) | (780,965) | (6,822,423) |
| | ———————— | ————————— | ———————— | ———————— | ———————— | ———————— |
| Net Change | (2,719,326) | $ (23,765,523) | (627,548) | $ (5,479,685) | 2,187,268 | $ 19,064,846 |
| | ———————— | ———————— | ———————— | ———————— | ———————— | ———————— |
| |
| | | | Core Bond Fund | | |
| | ——————————————————————————————————————————————————————————————— |
| | Class A | Class B | Institutional Class |
| | ———————————————————— | ——————————————————— | ——————————————————— |
| Year Ended October 31, 2006 | Shares | Amount | Shares | Amount | Shares | Amount |
| ————————————————————————— | ———————— | ————————— | ———————— | ———————— | ———————— | ———————— |
| Sold | 2,110,737 | $ 20,723,629 | 14,315 | $ 140,843 | 707,477 | $ 6,939,118 |
| |
| Dividends and distributions reinvested | 1,516,826 | 14,895,141 | 31,482 | 309,310 | 198,870 | 1,953,261 |
| |
| Redeemed | (11,570,007) | (113,497,276) | (323,834) | (3,176,985) | (1,304,709) | (12,877,720) |
| | ———————— | ————————— | ———————— | ———————— | ———————— | ———————— |
| Net Change | (7,942,444) | $ (77,878,506) | (278,037) | $ (2,726,832) | (398,362) | $ (3,985,341) |
| | ———————— | ———————— | ———————— | ———————— | ———————— | ———————— |
| |
| Year Ended October 31, 2005 | | | | | | |
| ————————————————————————— | | | | | | |
| Sold | 5,126,034 | $ 51,935,614 | 24,978 | $ 253,247 | 2,424,776 | $ 24,573,803 |
| |
| Dividends and distributions reinvested | 1,580,139 | 15,973,123 | 34,282 | 346,831 | 133,347 | 1,346,119 |
| |
| Redeemed | (8,646,568) | (87,413,887) | (263,007) | (2,662,091) | (748,571) | (7,594,169) |
| | ———————— | ————————— | ———————— | ———————— | ———————— | ———————— |
| Net Change | (1,940,395) | $ (19,505,150) | (203,747) | $ (2,062,013) | 1,809,552 | $ 18,325,753 |
| | ———————— | ———————— | ———————— | ———————— | ———————— | ———————— |
THRIVENT MUTUAL FUNDS
NOTES TO FINANCIAL STATEMENTS
As of October 31, 2006 |
(10) SHARES OF BENEFICIAL INTEREST — continued
| | | | Limited Maturity Bond Fund | | |
| | ———————————————————————————————————————————————————————————————— |
| | Class A | Class B | Institutional Class |
| | ———————————————————— | ——————————————————— | ——————————————————— |
| Year Ended October 31, 2006 | Shares | Amount | Shares | Amount | Shares | Amount |
| ————————————————————————— | ———————— | ————————— | ———————— | ———————— | ———————— | ———————— |
| Sold | 2,934,035 | $ 36,800,045 | 16,790 | $ 210,746 | 9,931,652 | $124,519,949 |
| |
| Dividends and distributions reinvested | 370,015 | 4,641,350 | 3,350 | 42,050 | 320,331 | 4,016,603 |
| |
| Redeemed | (4,618,489) | (57,906,212) | (30,151) | (378,631) | (1,435,668) | (18,046,369) |
| | ———————— | ————————— | ———————— | ———————— | ———————— | ———————— |
| Net Change | (1,314,439) | $ (16,464,817) | (10,011) | $ (125,835) | 8,816,315 | $110,490,183 |
| | ———————— | ———————— | ———————— | ———————— | ———————— | ———————— |
| |
| Year Ended October 31, 2005 | | | | | | |
| ————————————————————————— | | | | | | |
| Sold | 4,788,604 | $ 60,965,787 | 19,048 | $ 240,851 | 2,562,863 | $ 32,414,317 |
| |
| Dividends and distributions reinvested | 337,414 | 4,287,517 | 3,022 | 38,414 | 26,630 | 337,062 |
| |
| Redeemed | (3,937,777) | (50,049,978) | (24,936) | (316,529) | (374,113) | (4,741,687) |
| | ———————— | ————————— | ———————— | ———————— | ———————— | ———————— |
| Net Change | 1,188,241 | $ 15,203,326 | (2,866) | $ (37,264) | 2,215,380 | $ 28,009,692 |
| | ———————— | ———————— | ———————— | ———————— | ———————— | ———————— |
| |
| | | | Money Market Fund | | |
| | ————————————————————————————————————————————————————————————— |
| | Class A | Class B | Institutional Class |
| | ———————————————————— | ——————————————————— | ———————————————————— |
| Year Ended October 31, 2006 | Shares | Amount | Shares | Amount | Shares | Amount |
| ————————————————————————— | ———————— | ————————— | ———————— | ———————— | ————————— | ————————— |
| Sold | 1,057,197,836 | $1,057,197,838 | 1,348,662 | $ 1,348,662 | 1,215,084,908 | $1,215,084,908 |
| |
| Dividends and distributions reinvested | 30,553,980 | 30,553,980 | 60,874 | 60,874 | 13,967,308 | 13,967,308 |
| |
| Redeemed | (884,770,696) | (884,770,698) | (1,360,539) | (1,360,540) | (1,171,076,541) | (1,171,076,541) |
| | ———————— | ————————— | ———————— | ———————— | ————————— | ————————— |
| Net Change | 202,981,120 | $ 202,981,120 | 48,997 | $ 48,996 | 57,975,675 | $ 57,975,675 |
| | ———————— | ———————— | ———————— | ———————— | ———————— | ———————— |
| |
| Year Ended October 31, 2005 | | | | | | |
| ————————————————————————— | | | | | | |
| Sold | 795,205,175 | $ 795,205,174 | 684,330 | $ 684,330 | 939,281,015 | $ 939,281,015 |
| |
| Dividends and distributions reinvested | 13,622,558 | 13,622,558 | 38,863 | 38,863 | 6,325,425 | 6,325,425 |
| |
| Redeemed | (834,313,997) | (834,313,997) | (1,844,399) | (1,844,399) | (908,130,890) | (908,130,890) |
| | ———————— | ————————— | ———————— | ———————— | ————————— | ————————— |
| Net Change | (25,486,264) | $ (25,486,265) | (1,121,206) | $ (1,121,206) | 37,475,550 | $ 37,475,550 |
| | ———————— | ———————— | ———————— | ———————— | ———————— | ———————— |
This page intentionally left blank.
Thrivent Mutual Funds
Financial Highlights |
|
| | F O R A S H A R E O U T S T A N D I N G T H R O U G H O U T E A C H P E R I O D(a) |
| |
|
| |
| | | | | | Less Distributions | |
| | | Income from Investment Operations | from | | |
| |
|
| |
| | Net Asset | | Net Realized | | | Net | |
| | Value, | Net | and Unrealized | Total from | Net | Realized | |
| | Beginning | Investment | Gain/(Loss) on | Investment | Investment | Gain on | Total |
| of Period | Income/(Loss) | Investments(b) | Operations | Income | Investments | Distributions |
|
| AGGRESSIVE ALLOCATION FUND | | | | | | |
| Class A Share | | | | | | | |
| Year Ended 10/31/2006 | $10.37 | $0.15 | $1.49 | $1.64 | $(0.13) | $— | $(0.13) |
| Year Ended 10/31/2005 (e) | 10.00 | (0.01) | 0.38 | 0.37 | — | — | — |
| Class I Shares | | | | | | | |
| Year Ended 10/31/2006 | 10.39 | 0.20 | 1.49 | 1.69 | (0.14) | — | (0.14) |
| Year Ended 10/31/2005 (e) | 10.00 | — | 0.39 | 0.39 | — | — | — |
|
| MODERATELY AGGRESSIVE ALLOCATION FUND | | | | | |
| Class A Share | | | | | | | |
| Year Ended 10/31/2006 | 10.31 | 0.19 | 1.35 | 1.54 | (0.13) | — | (0.13) |
| Year Ended 10/31/2005 (e) | 10.00 | 0.01 | 0.30 | 0.31 | — | — | — |
| Class I Shares | | | | | | | |
| Year Ended 10/31/2006 | 10.33 | 0.23 | 1.35 | 1.58 | (0.14) | — | (0.14) |
| Year Ended 10/31/2005 (e) | 10.00 | 0.01 | 0.32 | 0.33 | — | — | — |
|
| MODERATE ALLOCATION FUND | | | | | | | |
| Class A Share | | | | | | | |
| Year Ended 10/31/2006 | 10.22 | 0.27 | 1.08 | 1.35 | (0.27) | — | (0.27) |
| Year Ended 10/31/2005 (e) | 10.00 | 0.02 | 0.22 | 0.24 | (0.02) | — | (0.02) |
| Class I Shares | | | | | | | |
| Year Ended 10/31/2006 | 10.23 | 0.31 | 1.09 | 1.40 | (0.31) | — | (0.31) |
| Year Ended 10/31/2005 (e) | 10.00 | 0.03 | 0.22 | 0.25 | (0.02) | — | (0.02) |
|
| MODERATELY CONSERVATIVE ALLOCATION FUND | | | | | |
| Class A Share | | | | | | | |
| Year Ended 10/31/2006 | 10.13 | 0.32 | 0.77 | 1.09 | (0.31) | — | (0.31) |
| Year Ended 10/31/2005 (e) | 10.00 | 0.04 | 0.11 | 0.15 | (0.02) | — | (0.02) |
| Class I Shares | | | | | | | |
| Year Ended 10/31/2006 | 10.14 | 0.34 | 0.79 | 1.13 | (0.34) | — | (0.34) |
| Year Ended 10/31/2005 (e) | 10.00 | 0.05 | 0.12 | 0.17 | (0.03) | — | (0.03) |
(a) All per share amounts have been rounded to the nearest cent.
(b) The amount shown may not correlate with the change in aggregate gains and losses of portfolio securities due to the timing of sales and redemptions of fund shares.
| The accompanying notes to the financial statements are an integral part of this schedule. |
|
| 268 |
Thrivent Mutual Funds
Financial Highlights – continued |
|
| | | | R A T I O S / S U P P L E M E N T A L D A T A | | |
|
|
| | | | | | Ratios to Average | |
| | | | | | Net Assets Before Expenses | |
| | | | Ratio to Average Net | Waived, Credited or Paid | |
| | | | Assets(d) | Indirectly(d) | |
| | | |
|
| |
| Net Asset | | | | | | | |
| Value, | | Net Assets | | Net | | Net | Portfolio |
| End of | Total | End of Period | | Investment | | Investment | Turnover |
| Period | Return(c) | (in millions) | Expenses | Income/(Loss) | Expenses | Income/(Loss) | Rate |
|
| $11.88 | 15.95% | $176.0 | 0.10% | 0.78% | 0.81% | 0.07% | 8% |
| 10.37 | 3.70% | 25.2 | 0.89% | (0.60)% | 1.62% | (1.34)% | 3% |
| |
| 11.94 | 16.45% | 35.8 | (0.44)%(f) | 1.25% | 0.27% | 0.53% | 8% |
| 10.39 | 3.90% | 4.2 | 0.10% | 0.08% | 0.87% | (0.69)% | 3% |
|
| 11.72 | 15.05% | 423.0 | 0.08% | 1.60% | 0.67% | 1.01% | 10% |
| 10.31 | 3.10% | 63.2 | 0.44% | 0.45% | 1.03% | (0.14)% | 4% |
| |
| 11.77 | 15.43% | 40.1 | (0.36)%(f) | 2.05% | 0.23% | 1.46% | 10% |
| 10.33 | 3.30% | 2.7 | (0.04)% | 0.88% | 0.57% | 0.28% | 4% |
|
| 11.30 | 13.40% | 442.8 | 0.04% | 2.44% | 0.61% | 1.88% | 10% |
| 10.22 | 2.36% | 76.2 | 0.27% | 1.30% | 0.90% | 0.67% | 3% |
| |
| |
| 11.32 | 13.83% | 17.1 | (0.33)%(f) | 2.82% | 0.24% | 2.25% | 10% |
| 10.23 | 2.49% | 2.9 | (0.13)% | 1.67% | 0.51% | 1.03% | 3% |
|
| 10.91 | 10.94% | 156.9 | 0.01% | 3.19% | 0.65% | 2.55% | 5% |
| 10.13 | 1.53% | 32.9 | 0.34% | 2.04% | 1.21% | 1.17% | 4% |
| |
| 10.93 | 11.35% | 6.5 | (0.34)%(f) | 3.50% | 0.30% | 2.86% | 5% |
| 10.14 | 1.66% | 0.8 | 0.18% | 2.14% | 1.03% | 1.29% | 4% |
(c) Total investment return assumes dividend reinvestment and does not reflect any deduction for sales charges. Not annualized for periods less than one year.
(d) Computed on an annualized basis for periods less than one year.
(e) Since fund inception, June 30, 2005.
(f) Eхpense ratio is negative because the adviser has agreed, through at least February 28,2007, to reimburse certain eхpenses associated with operating the Fund.
| The accompanying notes to the financial statements are an integral part of this schedule. |
|
| 269 |
Thrivent Mutual Funds
Financial Highlights – continued |
|
| | F O R A S H A R E O U T S T A N D I N G T H R O U G H O U T E A C H P E R I O D(a) | |
| |
|
| |
| |
| | | | | | Less Distributions | |
| | | Income from Investment Operations | from | | |
| |
|
| |
| | Net Asset | | Net Realized | | | Net | |
| | Value, | Net | and Unrealized | Total from | Net | Realized | |
| | Beginning | Investment | Gain/(Loss) on | Investment | Investment | Gain on | Total |
| | of Period | Income/(Loss) | Investments(b) | Operations | Income | Investments | Distributions |
|
| TECHNOLOGY FUND | | | | | | | |
| Class A Share | | | | | | | |
| Year Ended 10/31/2006 | $3.48 | $(0.03) | $0.28 | $0.25 | $— | $— | $— |
| Year Ended 10/31/2005 | 3.28 | (0.01) | 0.21 | 0.20 | — | — | — |
| Period Ended 10/31/2004 (f) | 3.20 | (0.02) | 0.10 | 0.08 | — | — | — |
| Year Ended 4/30/2004 | 2.50 | (0.03) | 0.73 | 0.70 | — | — | — |
| Year Ended 4/30/2003 | 3.15 | (0.05) | (0.60) | (0.65) | — | — | — |
| Year Ended 4/30/2002 | 5.13 | (0.06) | (1.92) | (1.98) | — | — | — |
| Class B Shares | | | | | | | |
| Year Ended 10/31/2006 | 3.34 | (0.07) | 0.29 | 0.22 | — | — | — |
| Year Ended 10/31/2005 | 3.16 | (0.03) | 0.21 | 0.18 | — | — | — |
| Period Ended 10/31/2004 (f) | 3.09 | (0.03) | 0.10 | 0.07 | — | — | — |
| Year Ended 4/30/2004 | 2.43 | (0.04) | 0.70 | 0.66 | — | — | — |
| Year Ended 4/30/2003 | 3.09 | (0.06) | (0.60) | (0.66) | — | — | — |
| Year Ended 4/30/2002 | 5.10 | (0.09) | (1.92) | (2.01) | — | — | — |
| Class I Shares | | | | | | | |
| Year Ended 10/31/2006 | 3.65 | (0.01) | 0.29 | 0.28 | — | — | — |
| Year Ended 10/31/2005 | 3.42 | 0.01 | 0.22 | 0.23 | — | — | — |
| Period Ended 10/31/2004 (f) | 3.32 | (0.01) | 0.11 | 0.10 | — | — | — |
| Year Ended 4/30/2004 | 2.59 | (0.02) | 0.75 | 0.73 | — | — | — |
| Year Ended 4/30/2003 | 3.22 | (0.02) | (0.61) | (0.63) | — | — | — |
| Year Ended 4/30/2002 | 5.19 | (0.03) | (1.94) | (1.97) | — | — | — |
|
| PARTNER SMALL CAP GROWTH FUND | | | | | | |
| Class A Share | | | | | | | |
| Year Ended 10/31/2006 | 10.28 | (0.03) | 1.44 | 1.41 | — | — | — |
| Year Ended 10/31/2005 (e) | 10.00 | (0.04) | 0.32 | 0.28 | — | — | — |
| Class I Shares | | | | | | | |
| Year Ended 10/31/2006 | 10.28 | — | 1.45 | 1.45 | — | — | — |
| Year Ended 10/31/2005 (e) | 10.00 | (0.02) | 0.30 | 0.28 | — | — | — |
(a) All per share amounts have been rounded to the nearest cent.
(b) The amount shown may not correlate with the change in aggregate gains and losses of portfolio securities due to the timing of sales and redemptions of fund shares.
(c) Total investment return assumes dividend reinvestment and does not reflect any deduction for sales charges. Not annualized for periods less than one year.
| The accompanying notes to the financial statements are an integral part of this schedule. |
|
| 270 |
Thrivent Mutual Funds
Financial Highlights – continued |
|
| | | | R A T I O S / S U P P L E M E N T A L D A T A | | |
|
|
| | | | | | Ratios to Average | |
| | | | | | Net Assets Before Expenses | |
| | | | Ratio to Average Net | Waived, Credited or Paid | |
| | | | Assets(d) | Indirectly(d) | |
| | | |
|
| |
| Net Asset | | | | | | | |
| Value, | | Net Assets | | Net | | Net | Portfolio |
| End of | Total | End of Period | | Investment | | Investment | Turnover |
| Period | Return(c) | (in millions) | Expenses | Income/(Loss) | Expenses | Income/(Loss) | Rate |
|
| $3.73 | 7.18% | $40.1 | 1.45% | (0.78)% | 1.97% | (1.30)% | 126% |
| 3.48 | 6.10% | 42.7 | 1.52% | (0.40)% | 2.04% | (0.92)% | 37% |
| 3.28 | 2.50% | 42.5 | 1.70% | (1.32)% | 2.22% | (1.84)% | 23% |
| 3.20 | 28.00% | 41.5 | 1.36% | (1.02)% | 2.19% | (1.85)% | 67% |
| 2.50 | (20.63)% | 29.3 | 2.39% | (2.09)% | 2.75% | (2.45)% | 67% |
| 3.15 | (38.60)% | 31.4 | 2.29% | (2.05)% | 2.33% | (2.09)% | 57% |
| |
| 3.56 | 6.59% | 2.4 | 1.94% | (1.27)% | 2.95% | (2.28)% | 126% |
| 3.34 | 5.70% | 3.5 | 2.07% | (0.91)% | 3.08% | (1.93)% | 37% |
| 3.16 | 2.27% | 4.0 | 2.32% | (1.94)% | 3.34% | (2.96)% | 23% |
| 3.09 | 27.16% | 3.9 | 1.85% | (1.51)% | 3.36% | (3.02)% | 67% |
| 2.43 | (21.36)% | 2.6 | 3.50% | (3.20)% | 4.12% | (3.82)% | 67% |
| 3.09 | (39.41)% | 2.6 | 3.25% | (3.01)% | 3.29% | (3.05)% | 57% |
| |
| 3.93 | 7.67% | 2.1 | 0.96% | (0.30)% | 0.97% | (0.31)% | 126% |
| 3.65 | 6.73% | 2.6 | 0.94% | 0.24% | 0.95% | 0.22% | 37% |
| 3.42 | 3.01% | 3.0 | 1.00% | (0.62)% | 1.02% | (0.64)% | 23% |
| 3.32 | 28.19% | 2.9 | 1.00% | (0.66)% | 1.02% | (0.68)% | 67% |
| 2.59 | (19.57)% | 2.2 | 1.06% | (0.76)% | 1.08% | (0.78)% | 67% |
| 3.22 | (37.96)% | 7.9 | 1.10% | (0.86)% | 1.14% | (0.90)% | 57% |
|
| 11.69 | 13.72% | 12.0 | 0.91% | (0.31)% | 1.72% | (1.12)% | 109% |
| 10.28 | 2.80% | 9.5 | 1.61% | (1.16)% | 2.42% | (1.97)% | 37% |
| |
| 11.73 | 14.11% | 29.3 | 0.53% | 0.10% | 1.35% | (0.71)% | 109% |
| 10.28 | 2.80% | 4.2 | 1.39% | (0.99)% | 2.21% | (1.81)% | 37% |
(d) Computed on an annualized basis for periods less than one year.
(e) Since fund inception, June 30, 2005.
(f) For the period from May 1, 2004 to October 31, 2004. |
| The accompanying notes to the financial statements are an integral part of this schedule. |
|
| 271 |
Thrivent Mutual Funds
Financial Highlights – continued |
|
| | F O R A S H A R E O U T S T A N D I N G T H R O U G H O U T E A C H P E R I O D(a) |
| |
|
| | | | | | Less Distributions | |
| | | Income from Investment Operations | from | | |
| |
|
| |
| | Net Asset | | Net Realized | | | Net | |
| | Value, | Net | and Unrealized | Total from | Net | Realized | |
| | Beginning | Investment | Gain/(Loss) on | Investment | Investment | Gain on | Total |
| | of Period | Income/(Loss) | Investments(b) | Operations | Income | Investments | Distributions |
|
| PARTNER SMALL CAP VALUE FUND | | | | | | |
| Class A Share | | | | | | | |
| Year Ended 10/31/2006 | $14.06 | $0.07 | $2.46 | $2.53 | $(0.04) | $(0.90) | $(0.94) |
| Year Ended 10/31/2005 | 14.27 | 0.04 | 1.61 | 1.65 | (0.01) | (1.85) | (1.86) |
| Period Ended 10/31/2004 (f) | 13.58 | 0.01 | 1.02 | 1.03 | — | (0.34) | (0.34) |
| Year Ended 4/30/2004 | 9.33 | (0.05) | 4.30 | 4.25 | — | — | — |
| Year Ended 4/30/2003 | 11.65 | (0.07) | (2.18) | (2.25) | — | (0.07) | (0.07) |
| Year Ended 4/30/2002 (g) | 10.00 | (0.05) | 1.70 | 1.65 | — | — | — |
| Class B Shares | | | | | | | |
| Year Ended 10/31/2006 | 13.50 | (0.08) | 2.37 | 2.29 | — | (0.90) | (0.90) |
| Year Ended 10/31/2005 | 13.88 | (0.10) | 1.57 | 1.47 | — | (1.85) | (1.85) |
| Period Ended 10/31/2004 (f) | 13.29 | (0.06) | 0.99 | 0.93 | — | (0.34) | (0.34) |
| Year Ended 4/30/2004 | 9.21 | (0.14) | 4.22 | 4.08 | — | — | — |
| Year Ended 4/30/2003 | 11.59 | (0.12) | (2.19) | (2.31) | — | (0.07) | (0.07) |
| Year Ended 4/30/2002 (g) | 10.00 | (0.11) | 1.70 | 1.59 | — | — | — |
| Class I Shares | | | | | | | |
| Year Ended 10/31/2006 | 14.57 | 0.12 | 2.60 | 2.72 | (0.13) | (0.90) | (1.03) |
| Year Ended 10/31/2005 | 14.67 | 0.13 | 1.67 | 1.80 | (0.05) | (1.85) | (1.90) |
| Period Ended 10/31/2004 (f) | 13.90 | 0.05 | 1.06 | 1.11 | — | (0.34) | (0.34) |
| Year Ended 4/30/2004 | 9.47 | 0.03 | 4.40 | 4.43 | — | — | — |
| Year Ended 4/30/2003 | 11.71 | — | (2.17) | (2.17) | — | (0.07) | (0.07) |
| Year Ended 4/30/2002 (g) | 10.00 | (0.05) | 1.76 | 1.71 | — | — | — |
|
| SMALL CAP STOCK FUND | | | | | | | |
| Class A Share | | | | | | | |
| Year Ended 10/31/2006 | 17.79 | (0.05) | 2.68 | 2.63 | — | (1.94) | (1.94) |
| Year Ended 10/31/2005 | 16.39 | (0.08) | 2.30 | 2.22 | — | (0.82) | (0.82) |
| Period Ended 10/31/2004 (f) | 16.39 | (0.04) | 0.99 | 0.95 | — | (0.95) | (0.95) |
| Year Ended 4/30/2004 | 11.55 | (0.11) | 4.95 | 4.84 | — | — | — |
| Year Ended 4/30/2003 | 14.82 | (0.09) | (3.18) | (3.27) | — | — | — |
| Year Ended 4/30/2002 | 13.39 | (0.09) | 1.60 | 1.51 | — | (0.08) | (0.08) |
| Class B Shares | | | | | | | |
| Year Ended 10/31/2006 | 16.18 | (0.30) | 2.50 | 2.20 | — | (1.94) | (1.94) |
| Year Ended 10/31/2005 | 15.11 | (0.27) | 2.16 | 1.89 | — | (0.82) | (0.82) |
| Period Ended 10/31/2004 (f) | 15.26 | (0.11) | 0.91 | 0.80 | — | (0.95) | (0.95) |
| Year Ended 4/30/2004 | 10.86 | (0.26) | 4.66 | 4.40 | — | — | — |
| Year Ended 4/30/2003 | 14.08 | (0.26) | (2.96) | (3.22) | — | — | — |
| Year Ended 4/30/2002 | 12.86 | (0.24) | 1.54 | 1.30 | — | (0.08) | (0.08) |
| Class I Shares | | | | | | | |
| Year Ended 10/31/2006 | 18.85 | (0.04) | 2.95 | 2.91 | — | (1.94) | (1.94) |
| Year Ended 10/31/2005 | 17.21 | 0.02 | 2.44 | 2.46 | — | (0.82) | (0.82) |
| Period Ended 10/31/2004 (f) | 17.12 | (0.02) | 1.06 | 1.04 | — | (0.95) | (0.95) |
| Year Ended 4/30/2004 | 11.98 | (0.01) | 5.15 | 5.14 | — | — | — |
| Year Ended 4/30/2003 | 15.26 | (0.06) | (3.22) | (3.28) | — | — | — |
| Year Ended 4/30/2002 | 13.71 | (0.01) | 1.64 | 1.63 | — | (0.08) | (0.08) |
(a) All per share amounts have been rounded to the nearest cent.
(b) The amount shown may not correlate with the change in aggregate gains and losses of portfolio securities due to the timing of sales and redemptions of fund shares.
(c) Total investment return assumes dividend reinvestment and does not reflect any deduction for sales charges. Not annualized for periods less than one year.
| The accompanying notes to the financial statements are an integral part of this schedule. |
|
| 272 |
Thrivent Mutual Funds
Financial Highlights – continued |
|
| | | | R A T I O S / S U P P L E M E N T A L D A T A | | |
|
|
| | | | | | Ratios to Average | |
| | | | | | Net Assets Before Expenses | |
| | | | Ratio to Average Net | Waived, Credited or Paid | |
| | | | Assets(d) | Indirectly(d) | |
| | | |
|
| |
| Net Asset | | | | | | | |
| Value, | | Net Assets | | Net | | Net | Portfolio |
| End of | Total | End of Period | | Investment | | Investment | Turnover |
| Period | Return(c) | (in millions) | Expenses | Income/(Loss) | Expenses | Income/(Loss) | Rate |
|
| $15.65 | 19.08% | $79.8 | 0.95% | 0.51% | 1.46% | (0.01)% | 22% |
| 14.06 | 12.13% | 74.5 | 1.04% | 0.26% | 1.55% | (0.25)% | 53% |
| 14.27 | 7.60% | 61.4 | 1.10% | 0.61% | 1.61% | 0.10% | 100% |
| 13.58 | 45.55% | 50.6 | 1.32% | (0.46)% | 1.84% | (0.98)% | 80% |
| 9.33 | (19.38)% | 27.7 | 1.86% | (0.88)% | 2.05% | (1.07)% | 147% |
| 11.65 | 16.50% | 22.3 | 2.12% | (1.19)% | 2.16% | (1.23)% | 50% |
| |
| 14.89 | 17.99% | 5.5 | 1.88% | (0.42)% | 2.40% | (0.93)% | 22% |
| 13.50 | 11.03% | 5.5 | 2.02% | (0.72)% | 2.53% | (1.23)% | 53% |
| 13.88 | 7.01% | 5.4 | 2.10% | (0.41)% | 2.61% | (0.92)% | 100% |
| 13.29 | 44.30% | 5.7 | 2.20% | (1.33)% | 2.73% | (1.86)% | 80% |
| 9.21 | (20.00)% | 2.9 | 2.71% | (1.73)% | 2.91% | (1.93)% | 147% |
| 11.59 | 15.90% | 2.3 | 2.86% | (1.93)% | 2.90% | (1.97)% | 50% |
| |
| 16.26 | 19.85% | 44.9 | 0.30% | 1.06% | 0.82% | 0.54% | 22% |
| 14.57 | 12.92% | 16.4 | 0.33% | 0.97% | 0.84% | 0.46% | 53% |
| 14.67 | 8.01% | 13.3 | 0.40% | 1.32% | 0.91% | 0.81% | 100% |
| 13.90 | 46.78% | 10.3 | 0.52% | 0.34% | 1.04% | (0.18)% | 80% |
| 9.47 | (18.59)% | 3.8 | 0.87% | 0.10% | 1.07% | (0.10)% | 147% |
| 11.71 | 17.10% | 3.5 | 1.59% | (0.66)% | 1.63% | (0.70)% | 50% |
|
| 18.48 | 16.04% | 457.5 | 1.27% | (0.28)% | 1.29% | (0.30)% | 92% |
| 17.79 | 13.81% | 440.6 | 1.32% | (0.45)% | 1.33% | (0.47)% | 114% |
| 16.39 | 5.88% | 397.3 | 1.36% | (0.49)% | 1.38% | (0.51)% | 52% |
| 16.39 | 41.90% | 379.5 | 1.38% | (0.71)% | 1.40% | (0.73)% | 106% |
| 11.55 | (22.06)% | 266.7 | 1.47% | (0.78)% | 1.49% | (0.80)% | 97% |
| 14.82 | 11.29% | 344.3 | 1.36% | (0.69)% | 1.37% | (0.70)% | 59% |
| |
| 16.44 | 14.86% | 16.3 | 2.30% | (1.29)% | 2.32% | (1.31)% | 92% |
| 16.18 | 12.75% | 20.5 | 2.32% | (1.47)% | 2.34% | (1.49)% | 114% |
| 15.11 | 5.31% | 25.1 | 2.39% | (1.52)% | 2.41% | (1.54)% | 52% |
| 15.26 | 40.52% | 25.3 | 2.42% | (1.75)% | 2.44% | (1.77)% | 106% |
| 10.86 | (22.87)% | 21.1 | 2.45% | (1.75)% | 2.47% | (1.77)% | 97% |
| 14.08 | 10.11% | 33.8 | 2.39% | (1.72)% | 2.41% | (1.74)% | 59% |
| |
| 19.82 | 16.68% | 85.1 | 0.72% | 0.27% | 0.74% | 0.26% | 92% |
| 18.85 | 14.58% | 21.1 | 0.72% | 0.15% | 0.74% | 0.13% | 114% |
| 17.21 | 6.17% | 11.6 | 0.73% | (0.24)% | 0.75% | (0.26)% | 52% |
| 17.12 | 42.90% | 11.0 | 0.73% | (0.06)% | 0.75% | (0.08)% | 106% |
| 11.98 | (21.49)% | 6.8 | 0.73% | (0.03)% | 0.75% | (0.05)% | 97% |
| 15.26 | 11.90% | 5.3 | 0.74% | (0.07)% | 0.75% | (0.08)% | 59% |
(d) Computed on an annualized basis for periods less than one year.
(f) For the period from May 1, 2004 to October 31, 2004.
(g) Since fund inception, July 17, 2001.
| The accompanying notes to the financial statements are an integral part of this schedule. |
|
| 273 |
Thrivent Mutual Funds
Financial Highlights – continued |
|
| | F O R A S H A R E O U T S T A N D I N G T H R O U G H O U T E A C H P E R I O D(a) |
| |
|
| |
| |
| | | | | | Less Distributions | |
| | | Income from Investment Operations | from | | |
| |
|
| |
| | Net Asset | | Net Realized | | | Net | |
| | Value, | Net | and Unrealized | Total from | Net | Realized | |
| | Beginning | Investment | Gain/(Loss) on | Investment | Investment | Gain on | Total |
| | of Period | Income/(Loss) | Investments(b) | Operations | Income | Investments | Distributions |
|
| SMALL CAP INDEX FUND | | | | | | | |
| Class A Share | | | | | | | |
| Year Ended 10/31/2006 | $14.28 | $0.03 | $2.09 | $2.12 | $(0.02) | $(0.27) | $(0.29) |
| Year Ended 10/31/2005 | 12.63 | 0.03 | 1.74 | 1.77 | (0.02) | (0.10) | (0.12) |
| Period Ended 10/31/2004 (e) | 12.26 | 0.02 | 0.85 | 0.87 | — | (0.50) | (0.50) |
| Year Ended 4/30/2004 | 8.89 | (0.01) | 3.42 | 3.41 | — | (0.04) | (0.04) |
| Year Ended 4/30/2003 | 11.42 | (0.04) | (2.43) | (2.47) | — | (0.06) | (0.06) |
| Year Ended 4/30/2002 | 10.03 | (0.07) | 1.52 | 1.45 | — | (0.06) | (0.06) |
|
| MID CAP GROWTH FUND | | | | | | | |
| Class A Share | | | | | | | |
| Year Ended 10/31/2006 | 14.59 | (0.06) | 1.64 | 1.58 | — | — | — |
| Year Ended 10/31/2005 | 12.75 | (0.10) | 1.94 | 1.84 | — | — | — |
| Year Ended 10/31/2004 | 12.35 | (0.02) | 0.42 | 0.40 | — | — | — |
| Year Ended 10/31/2003 | 9.50 | (0.15) | 3.00 | 2.85 | — | — | — |
| Year Ended 10/31/2002 | 11.43 | (0.13) | (1.80) | (1.93) | — | — | — |
| Class B Shares | | | | | | | |
| Year Ended 10/31/2006 | 13.64 | (0.34) | 1.66 | 1.32 | — | — | — |
| Year Ended 10/31/2005 | 12.05 | (0.27) | 1.86 | 1.59 | — | — | — |
| Year Ended 10/31/2004 | 11.78 | (0.19) | 0.46 | 0.27 | — | — | — |
| Year Ended 10/31/2003 | 9.13 | (0.24) | 2.89 | 2.65 | — | — | — |
| Year Ended 10/31/2002 | 11.06 | (0.13) | (1.80) | (1.93) | — | — | — |
| Class I Shares | | | | | | | |
| Year Ended 10/31/2006 | 15.44 | (0.04) | 1.84 | 1.80 | — | — | — |
| Year Ended 10/31/2005 | 13.39 | 0.01 | 2.04 | 2.05 | — | — | — |
| Year Ended 10/31/2004 | 12.87 | (0.01) | 0.53 | 0.52 | — | — | — |
| Year Ended 10/31/2003 | 9.79 | (0.04) | 3.12 | 3.08 | — | — | — |
| Year Ended 10/31/2002 | 11.66 | (0.01) | (1.86) | (1.87) | — | — | — |
|
| PARTNER MID CAP VALUE FUND | | | | | | |
| Class A Share | | | | | | | |
| Year Ended 10/31/2006 | 10.13 | 0.17 | 1.57 | 1.74 | (0.04) | — | (0.04) |
| Year Ended 10/31/2005 (f) | 10.00 | — | 0.13 | 0.13 | — | — | — |
| Class I Shares | | | | | | | |
| Year Ended 10/31/2006 | 10.14 | 0.17 | 1.61 | 1.78 | (0.05) | — | (0.05) |
| Year Ended 10/31/2005 (f) | 10.00 | 0.01 | 0.13 | 0.14 | — | — | — |
(a) All per share amounts have been rounded to the nearest cent.
(b) The amount shown may not correlate with the change in aggregate gains and losses of portfolio securities due to the timing of sales and redemptions of fund shares.
(c) Total investment return assumes dividend reinvestment and does not reflect any deduction for sales charges. Not annualized for periods less than one year.
| The accompanying notes to the financial statements are an integral part of this schedule. |
|
| 274 |
Thrivent Mutual Funds
Financial Highlights – continued |
|
| | | | R A T I O S / S U P P L E M E N T A L D A T A | | |
|
|
| | | | | | Ratios to Average | |
| | | | | | Net Assets Before Expenses | |
| | | | Ratio to Average Net | Waived, Credited or Paid | |
| | | | Assets(d) | Indirectly(d) | |
| | | |
|
| |
| Net Asset | | | | | | | |
| Value, | | Net Assets | | Net | | Net | Portfolio |
| End of | Total | End of Period | | Investment | | Investment | Turnover |
| Period | Return(c) | (in millions) | Expenses | Income/(Loss) | Expenses | Income/(Loss) | Rate |
|
| $16.11 | 15.08% | $48.0 | 0.95% | 0.21% | 1.09% | 0.07% | 16% |
| 14.28 | 14.05% | 46.9 | 0.95% | 0.21% | 1.18% | (0.02)% | 17% |
| 12.63 | 7.11% | 35.4 | 0.95% | 0.43% | 1.37% | 0.01% | 17% |
| 12.26 | 38.37% | 34.4 | 1.04% | (0.13)% | 1.25% | (0.34)% | 18% |
| 8.89 | (21.69)% | 20.5 | 1.35% | (0.44)% | 1.40% | (0.49)% | 18% |
| 11.42 | 14.53% | 21.6 | 1.51% | (0.77)% | 1.51% | (0.77)% | 18% |
|
| 16.17 | 10.83% | 264.6 | 1.19% | (0.37)% | 1.21% | (0.38)% | 156% |
| 14.59 | 14.43% | 269.0 | 1.26% | (0.71)% | 1.28% | (0.72)% | 146% |
| 12.75 | 3.24% | 250.7 | 1.36% | (0.95)% | 1.36% | (0.95)% | 154% |
| 12.35 | 29.86% | 113.1 | 1.88% | (1.51)% | 1.94% | (1.57)% | 76% |
| 9.50 | (16.80)% | 86.2 | 1.54% | (1.17)% | 1.89% | (1.52)% | 55% |
| |
| 14.96 | 9.68% | 26.4 | 2.27% | (1.43)% | 2.28% | (1.45)% | 156% |
| 13.64 | 13.20% | 36.1 | 2.31% | (1.75)% | 2.44% | (1.88)% | 146% |
| 12.05 | 2.29% | 45.0 | 2.32% | (1.91)% | 2.32% | (1.91)% | 154% |
| 11.78 | 29.03% | 37.2 | 2.63% | (2.27)% | 2.69% | (2.33)% | 76% |
| 9.13 | (17.45)% | 31.1 | 2.29% | (1.92)% | 2.64% | (2.27)% | 55% |
| |
| 17.24 | 11.66% | 32.3 | 0.47% | 0.34% | 0.49% | 0.32% | 156% |
| 15.44 | 15.31% | 11.7 | 0.49% | 0.07% | 0.50% | 0.06% | 146% |
| 13.39 | 4.04% | 10.1 | 0.62% | (0.21)% | 0.73% | (0.32)% | 154% |
| 12.87 | 31.46% | 7.3 | 0.74% | (0.37)% | 0.95% | (0.58)% | 76% |
| 9.79 | (16.04)% | 12.6 | 0.58% | (0.21)% | 0.93% | (0.56)% | 55% |
|
| 11.83 | 17.19% | 7.6 | 0.31% | 1.67% | 1.86% | 0.12% | 43% |
| 10.13 | 1.30% | 5.1 | 1.61% | 0.08% | 3.10% | (1.41)% | 15% |
| |
| |
| 11.87 | 17.65% | 23.9 | (0.14)%(g) | 2.08% | 1.37% | 0.57% | 43% |
| 10.14 | 1.40% | 3.7 | 1.17% | 0.43% | 2.81% | (1.21)% | 15% |
(d) Computed on an annualized basis for periods less than one year.
(e) For the period from May 1, 2004, to October 31, 2004.
(f) Since fund inception, June 30, 2005.
(g) Expense ratio is negative because the adviser has agreed, through at least February 28, 2007, to reimburse certain expenses accociated with operating the Fund.
| The accompanying notes to the financial statements are an integral part of this schedule. |
|
| 275 |
Thrivent Mutual Funds
Financial Highlights – continued |
|
| | F O R A S H A R E O U T S T A N D I N G T H R O U G H O U T E A C H P E R I O D(a) |
| |
|
| |
| |
| | | | | | Less Distributions | |
| | | Income from Investment Operations | from | | |
| |
|
| |
| | Net Asset | | Net Realized | | | Net | |
| | Value, | Net | and Unrealized | Total from | Net | Realized | |
| | Beginning | Investment | Gain/(Loss) on | Investment | Investment | Gain on | Total |
| | of Period | Income/(Loss) | Investments(b) | Operations | Income | Investments | Distributions |
|
| MID CAP STOCK FUND | | | | | | | |
| Class A Share | | | | | | | |
| Year Ended 10/31/2006 | $17.85 | $0.02 | $2.55 | $2.57 | $— | $(1.81) | $(1.81) |
| Year Ended 10/31/2005 | 14.74 | — | 3.11 | 3.11 | — | — | — |
| Period Ended 10/31/2004 (e) | 13.96 | (0.02) | 0.80 | 0.78 | — | — | — |
| Year Ended 4/30/2004 | 10.74 | (0.05) | 3.27 | 3.22 | — | — | — |
| Year Ended 4/30/2003 | 13.01 | (0.02) | (2.25) | (2.27) | — | — | — |
| Year Ended 4/30/2002 | 14.73 | (0.03) | (1.31) | (1.34) | — | (0.38) | (0.38) |
| Class B Shares | | | | | | | |
| Year Ended 10/31/2006 | 16.08 | (0.24) | 2.36 | 2.12 | — | (1.81) | (1.81) |
| Year Ended 10/31/2005 | 13.42 | (0.19) | 2.85 | 2.66 | — | — | — |
| Period Ended 10/31/2004 (e) | 12.78 | (0.09) | 0.73 | 0.64 | — | — | — |
| Year Ended 4/30/2004 | 9.95 | (0.19) | 3.02 | 2.83 | — | — | — |
| Year Ended 4/30/2003 | 12.20 | (0.18) | (2.07) | (2.25) | — | — | — |
| Year Ended 4/30/2002 | 14.00 | (0.17) | (1.25) | (1.42) | — | (0.38) | (0.38) |
| Class I Shares | | | | | | | |
| Year Ended 10/31/2006 | 18.63 | 0.04 | 2.74 | 2.78 | — | (1.81) | (1.81) |
| Year Ended 10/31/2005 | 15.30 | 0.07 | 3.26 | 3.33 | — | — | — |
| Period Ended 10/31/2004 (e) | 14.46 | 0.02 | 0.82 | 0.84 | — | — | — |
| Year Ended 4/30/2004 | 11.06 | 0.03 | 3.37 | 3.40 | — | — | — |
| Year Ended 4/30/2003 | 13.31 | 0.05 | (2.30) | (2.25) | — | — | — |
| Year Ended 4/30/2002 | 14.98 | 0.03 | (1.32) | (1.29) | — | (0.38) | (0.38) |
|
| MID CAP INDEX FUND | | | | | | | |
| Class A Share | | | | | | | |
| Year Ended 10/31/2006 | 13.77 | 0.08 | 1.56 | 1.64 | (0.06) | (0.88) | (0.94) |
| Year Ended 10/31/2005 | 11.86 | 0.08 | 1.91 | 1.99 | (0.03) | (0.05) | (0.08) |
| Period Ended 10/31/2004 (e) | 11.48 | 0.01 | 0.37 | 0.38 | — | — | — |
| Year Ended 4/30/2004 | 8.65 | 0.01 | 2.82 | 2.83 | — | — | — |
| Year Ended 4/30/2003 | 10.71 | — | (1.97) | (1.97) | — | (0.09) | (0.09) |
| Year Ended 4/30/2002 | 10.24 | (0.03) | 0.53 | 0.50 | — | (0.03) | (0.03) |
|
| MID CAP INDEX FUND—I | | | | | | | |
| Class I Shares | | | | | | | |
| Year Ended 10/31/2006 | 13.34 | 0.13 | 1.49 | 1.62 | (0.07) | (0.90) | (0.97) |
| Year Ended 10/31/2005 | 11.85 | 0.10 | 1.88 | 1.98 | (0.10) | (0.39) | (0.49) |
| Period Ended 10/31/2004 (e) | 11.79 | 0.05 | 0.33 | 0.38 | — | (0.32) | (0.32) |
| Year Ended 4/30/2004 | 8.91 | 0.07 | 2.93 | 3.00 | (0.06) | (0.06) | (0.12) |
| Year Ended 4/30/2003 | 11.23 | 0.08 | (2.07) | (1.99) | (0.08) | (0.25) | (0.33) |
| Year Ended 4/30/2002 | 10.80 | 0.06 | 0.60 | 0.66 | (0.07) | (0.16) | (0.23) |
(a) All per share amounts have been rounded to the nearest cent.
(b) The amount shown may not correlate with the change in aggregate gains and losses of portfolio securities due to the timing of sales and redemptions of fund shares.
(c) Total investment return assumes dividend reinvestment and does not reflect any deduction for sales charges. Not annualized for periods less than one year.
| The accompanying notes to the financial statements are an integral part of this schedule. |
|
| 276 |
Thrivent Mutual Funds
Financial Highlights – continued |
|
| | | | R A T I O S / S U P P L E M E N T A L D A T A | | |
|
|
| | | | | | Ratios to Average | |
| | | | | | Net Assets Before Expenses | |
| | | | Ratio to Average Net | Waived, Credited or Paid | |
| | | | Assets(d) | Indirectly(d) | |
| | | |
|
| |
| Net Asset | | | | | | | |
| Value, | | Net Assets | | Net | | Net | Portfolio |
| End of | Total | End of Period | | Investment | | Investment | Turnover |
| Period | Return(c) | (in millions) | Expenses | Income/(Loss) | Expenses | Income/(Loss) | Rate |
|
| $18.61 | 15.37% | $976.3 | 1.17% | 0.12% | 1.18% | 0.11% | 193% |
| 17.85 | 21.10% | 928.0 | 1.21% | (0.02)% | 1.22% | (0.03)% | 96% |
| 14.74 | 5.59% | 808.8 | 1.24% | (0.30)% | 1.25% | (0.31)% | 46% |
| 13.96 | 29.98% | 789.9 | 1.26% | (0.36)% | 1.27% | (0.37)% | 123% |
| 10.74 | (17.45)% | 643.8 | 1.30% | (0.18)% | 1.31% | (0.19)% | 48% |
| 13.01 | (9.36)% | 836.5 | 1.22% | (0.25)% | 1.23% | (0.26)% | 97% |
| |
| 16.39 | 14.15% | 18.6 | 2.24% | (0.93)% | 2.25% | (0.94)% | 193% |
| 16.08 | 19.82% | 24.0 | 2.28% | (1.10)% | 2.29% | (1.12)% | 96% |
| 13.42 | 5.01% | 27.0 | 2.35% | (1.41)% | 2.36% | (1.42)% | 46% |
| 12.78 | 28.44% | 26.8 | 2.44% | (1.55)% | 2.45% | (1.56)% | 123% |
| 9.95 | (18.44)% | 22.8 | 2.50% | (1.38)% | 2.51% | (1.39)% | 48% |
| 12.20 | (10.44)% | 33.1 | 2.38% | (1.41)% | 2.39% | (1.42)% | 97% |
| |
| 19.60 | 15.90% | 116.4 | 0.70% | 0.57% | 0.71% | 0.56% | 193% |
| 18.63 | 21.76% | 50.7 | 0.70% | 0.51% | 0.71% | 0.49% | 96% |
| 15.30 | 5.81% | 29.8 | 0.71% | 0.23% | 0.72% | 0.22% | 46% |
| 14.46 | 30.74% | 28.4 | 0.70% | 0.20% | 0.71% | 0.19% | 123% |
| 11.06 | (16.90)% | 20.7 | 0.68% | 0.44% | 0.69% | 0.43% | 48% |
| 13.31 | (8.86)% | 24.8 | 0.69% | 0.28% | 0.70% | 0.27% | 97% |
|
| 14.47 | 12.37% | 61.6 | 0.90% | 0.57% | 1.00% | 0.46% | 12% |
| 13.77 | 16.80% | 62.5 | 0.90% | 0.62% | 1.07% | 0.45% | 23% |
| 11.86 | 3.33% | 49.2 | 0.92% | (0.10)% | 1.23% | (0.41)% | 8% |
| 11.48 | 32.72% | 38.5 | 1.12% | 0.09% | 1.24% | (0.03)% | 30% |
| 8.65 | (18.36)% | 29.0 | 1.21% | (0.03)% | 1.21% | (0.03)% | 16% |
| 10.71 | 4.94% | 29.2 | 1.36% | (0.31)% | 1.36% | (0.31)% | 15% |
|
| 13.99 | 12.68% | 22.6 | 0.57% | 0.94% | 0.58% | 0.93% | 22% |
| 13.34 | 17.00% | 23.1 | 0.70% | 0.80% | 0.71% | 0.80% | 42% |
| 11.85 | 3.22% | 17.3 | 0.75% | 0.46% | 0.76% | 0.45% | 8% |
| 11.79 | 33.71% | 31.7 | 0.54% | 0.68% | 0.55% | 0.67% | 13% |
| 8.91 | (17.68)% | 20.8 | 0.28% | 0.89% | 0.57% | 0.60% | 22% |
| 11.23 | 6.23% | 24.3 | 0.20% | 0.84% | 0.88% | 0.16% | 21% |
(d) Computed on an annualized basis for periods less than one year.
(e) For the period from May 1, 2004, to October 31, 2004. |
| The accompanying notes to the financial statements are an integral part of this schedule. |
|
| 277 |
Thrivent Mutual Funds
Financial Highlights – continued |
|
| | F O R A S H A R E O U T S T A N D I N G T H R O U G H O U T E A C H P E R I O D(a) |
| |
|
| |
| | | | | | Less Distributions | |
| | | Income from Investment Operations | from | | |
| |
|
| |
| | Net Asset | | Net Realized | | | Net | |
| | Value, | Net | and Unrealized | Total from | Net | Realized | |
| | Beginning | Investment | Gain/(Loss) on | Investment | Investment | Gain on | Total |
| | of Period | Income/(Loss) | Investments(b) | Operations | Income | Investments | Distributions |
|
| PARTNER INTERNATIONAL STOCK FUND | | | | | | |
| Class A Share | | | | | | | |
| Year Ended 10/31/2006 | $10.57 | $0.14 | $2.34 | $2.48 | $(0.11) | $— | $(0.11) |
| Year Ended 10/31/2005 | 9.10 | 0.11 | 1.36 | 1.47 | — | — | — |
| Year Ended 10/31/2004 | 8.19 | 0.02 | 0.93 | 0.95 | (0.04) | — | (0.04) |
| Year Ended 10/31/2003 | 6.84 | (0.02) | 1.37 | 1.35 | — | — | — |
| Year Ended 10/31/2002 | 8.00 | (0.03) | (1.13) | (1.16) | — | — | — |
| Class B Shares | | | | | | | |
| Year Ended 10/31/2006 | 10.16 | (0.01) | 2.28 | 2.27 | — | — | — |
| Year Ended 10/31/2005 | 8.86 | (0.02) | 1.32 | 1.30 | — | — | — |
| Year Ended 10/31/2004 | 8.00 | (0.11) | 0.97 | 0.86 | — | — | — |
| Year Ended 10/31/2003 | 6.74 | (0.08) | 1.34 | 1.26 | — | — | — |
| Year Ended 10/31/2002 | 7.94 | (0.05) | (1.15) | (1.20) | — | — | — |
| Class I Shares | | | | | | | |
| Year Ended 10/31/2006 | 10.77 | 0.20 | 2.40 | 2.60 | (0.18) | — | (0.18) |
| Year Ended 10/31/2005 | 9.23 | 0.07 | 1.48 | 1.55 | (0.01) | — | (0.01) |
| Year Ended 10/31/2004 | 8.31 | (0.02) | 1.07 | 1.05 | (0.13) | — | (0.13) |
| Year Ended 10/31/2003 | 6.85 | 0.09 | 1.37 | 1.46 | — | — | — |
| Year Ended 10/31/2002 | 7.95 | 0.05 | (1.15) | (1.10) | — | — | — |
|
| LARGE CAP GROWTH FUND | | | | | | | |
| Class A Share | | | | | | | |
| Year Ended 10/31/2006 | 4.90 | 0.01 | 0.40 | 0.41 | — | — | — |
| Year Ended 10/31/2005 | 4.45 | 0.02 | 0.43 | 0.45 | — | — | — |
| Year Ended 10/31/2004 | 4.30 | 0.06 | 0.11 | 0.17 | (0.02) | — | (0.02) |
| Year Ended 10/31/2003 | 3.58 | (0.02) | 0.74 | 0.72 | — | — | — |
| Year Ended 10/31/2002 | 4.54 | — | (0.96) | (0.96) | — | — | — |
| Class B Shares | | | | | | | |
| Year Ended 10/31/2006 | 4.64 | (0.06) | 0.39 | 0.33 | — | — | — |
| Year Ended 10/31/2005 | 4.25 | (0.04) | 0.43 | 0.39 | — | — | — |
| Year Ended 10/31/2004 | 4.13 | — | 0.12 | 0.12 | — | — | — |
| Year Ended 10/31/2003 | 3.46 | (0.04) | 0.71 | 0.67 | — | — | — |
| Year Ended 10/31/2002 | 4.43 | (0.04) | (0.93) | (0.97) | — | — | — |
| Class I Shares | | | | | | | |
| Year Ended 10/31/2006 | 5.20 | 0.04 | 0.44 | 0.48 | (0.03) | — | (0.03) |
| Year Ended 10/31/2005 | 4.69 | 0.02 | 0.50 | 0.52 | (0.01) | — | (0.01) |
| Year Ended 10/31/2004 | 4.51 | 0.08 | 0.13 | 0.21 | (0.03) | — | (0.03) |
| Year Ended 10/31/2003 | 3.69 | 0.04 | 0.78 | 0.82 | — | — | — |
| Year Ended 10/31/2002 | 4.63 | (0.01) | (0.93) | (0.94) | — | — | — |
(a) All per share amounts have been rounded to the nearest cent.
(b) The amount shown may not correlate with the change in aggregate gains and losses of portfolio securities due to the timing of sales and redemptions of fund shares.
| The accompanying notes to the financial statements are an integral part of this schedule. |
|
| 278 |
Thrivent Mutual Funds
Financial Highlights – continued |
|
| | | | R A T I O S / S U P P L E M E N T A L D A T A | | |
|
|
| | | | | | Ratios to Average | |
| | | | | | Net Assets Before Expenses | |
| | | | Ratio to Average Net | Waived, Credited or Paid | |
| | | | Assets(d) | Indirectly(d) | |
| | | |
|
| |
| Net Asset | | | | | | | |
| Value, | | Net Assets | | Net | | Net | Portfolio |
| End of | Total | End of Period | | Investment | | Investment | Turnover |
| Period | Return(c) | (in millions) | Expenses | Income/(Loss) | Expenses | Income/(Loss) | Rate |
|
| $12.94 | 23.63% | $337.5 | 1.33% | 1.08% | 1.34% | 1.07% | 50% |
| 10.57 | 16.18% | 304.8 | 1.44% | 1.10% | 1.45% | 1.09% | 43% |
| 9.10 | 11.65% | 243.7 | 1.70% | 0.33% | 1.70% | 0.33% | 126% |
| 8.19 | 19.69% | 59.8 | 2.46% | (0.27)% | 2.58% | (0.39)% | 27% |
| 6.84 | (14.51)% | 54.6 | 2.15% | (0.39)% | 2.38% | (0.62)% | 22% |
| |
| 12.43 | 22.34% | 14.4 | 2.42% | (0.03)% | 2.43% | (0.03)% | 50% |
| 10.16 | 14.67% | 16.1 | 2.62% | (0.13)% | 2.63% | (0.14)% | 43% |
| 8.86 | 10.72% | 19.5 | 2.79% | (0.76)% | 2.79% | (0.76)% | 126% |
| 8.00 | 18.81% | 10.8 | 3.21% | (1.01)% | 3.33% | (1.13)% | 27% |
| 6.74 | (15.20)% | 10.3 | 2.90% | (1.14)% | 3.23% | (1.37)% | 22% |
| |
| 13.19 | 24.40% | 204.2 | 0.71% | 1.74% | 0.72% | 1.73% | 50% |
| 10.77 | 16.82% | 61.1 | 0.76% | 1.48% | 0.77% | 1.47% | 43% |
| 9.23 | 12.69% | 13.1 | 1.08% | 0.95% | 1.18% | 0.85% | 126% |
| 8.31 | 21.22% | 10.3 | 1.24% | 0.96% | 1.49% | 0.71% | 27% |
| 6.85 | (13.76)% | 13.2 | 1.16% | 0.60% | 1.39% | 0.37% | 22% |
|
| 5.31 | 8.46% | 134.0 | 0.76% | 0.26% | 1.57% | (0.55)% | 138% |
| 4.90 | 10.16% | 130.9 | 0.87% | 0.37% | 1.68% | (0.44)% | 106% |
| 4.45 | 3.90% | 83.6 | 0.51% | 0.35% | 1.68% | (0.82)% | 100% |
| 4.30 | 20.25% | 28.0 | 1.40% | (0.41)% | 2.56% | (1.57)% | 111% |
| 3.58 | (21.23)% | 21.6 | 1.89% | (1.02)% | 2.54% | (1.67)% | 59% |
| |
| |
| 4.97 | 7.11% | 12.1 | 1.87% | (0.84)% | 2.67% | (1.65)% | 138% |
| 4.64 | 9.18% | 15.8 | 2.05% | (0.69)% | 2.86% | (1.50)% | 106% |
| 4.25 | 2.84% | 17.7 | 1.39% | (0.53)% | 2.60% | (1.74)% | 100% |
| 4.13 | 19.34% | 10.6 | 2.15% | (1.16)% | 3.31% | (2.32)% | 111% |
| 3.46 | (21.82)% | 7.9 | 2.64% | (1.77)% | 3.29% | (2.42)% | 59% |
| |
| |
| 5.65 | 9.21% | 204.8 | 0.03% | 0.97% | 0.84% | 0.16% | 138% |
| 5.20 | 11.01% | 31.3 | 0.07% | 1.21% | 0.89% | 0.39% | 106% |
| 4.69 | 4.65% | 8.9 | (0.26)% | 1.12% | 0.90% | (0.04)% | 100% |
| 4.51 | 22.02% | 3.1 | 0.03% | 0.96% | 1.24% | (0.25)% | 111% |
| 3.69 | (20.17)% | 4.6 | 0.62% | 0.24% | 1.27% | (0.41)% | 59% |
(c) Total investment return assumes dividend reinvestment and does not reflect any deduction for sales charges. Not annualized for periods less than one year.
(d) Computed on an annualized basis for periods less than one year.
| The accompanying notes to the financial statements are an integral part of this schedule. |
|
| 279 |
Thrivent Mutual Funds
Financial Highlights – continued |
|
| | F O R A S H A R E O U T S T A N D I N G T H R O U G H O U T E A C H P E R I O D(a) |
| |
|
| |
| |
| | | | | | Less Distributions | |
| | | Income from Investment Operations | from | | |
| |
|
| |
| | Net Asset | | Net Realized | | | Net | |
| | Value, | Net | and Unrealized | Total from | Net | Realized | |
| | Beginning | Investment | Gain/(Loss) on | Investment | Investment | Gain on | Total |
| | of Period | Income/(Loss) | Investments(b) | Operations | Income | Investments | Distributions |
|
| LARGE CAP VALUE FUND | | | | | | | |
| Class A Share | | | | | | | |
| Year Ended 10/31/2006 | $14.49 | $0.21 | $2.53 | $2.74 | $(0.17) | $(0.21) | $(0.38) |
| Year Ended 10/31/2005 | 13.15 | 0.17 | 1.23 | 1.40 | (0.06) | — | (0.06) |
| Year Ended 10/31/2004 | 11.79 | 0.20 | 1.34 | 1.54 | (0.18) | — | (0.18) |
| Year Ended 10/31/2003 | 10.07 | 0.08 | 1.69 | 1.77 | (0.05) | — | (0.05) |
| Year Ended 10/31/2002 | 12.20 | 0.05 | (2.13) | (2.08) | (0.05) | — | (0.05) |
| Class B Shares | | | | | | | |
| Year Ended 10/31/2006 | 14.25 | 0.04 | 2.49 | 2.53 | — | (0.21) | (0.21) |
| Year Ended 10/31/2005 | 13.03 | — | 1.22 | 1.22 | — | — | — |
| Year Ended 10/31/2004 | 11.66 | (0.02) | 1.43 | 1.41 | (0.04) | — | (0.04) |
| Year Ended 10/31/2003 | 9.98 | (0.01) | 1.69 | 1.68 | — | — | — |
| Year Ended 10/31/2002 | 12.14 | — | (2.16) | (2.16) | — | — | — |
| Class I Shares | | | | | | | |
| Year Ended 10/31/2006 | 14.60 | 0.25 | 2.59 | 2.84 | (0.25) | (0.21) | (0.46) |
| Year Ended 10/31/2005 | 13.20 | 0.17 | 1.32 | 1.49 | (0.09) | — | (0.09) |
| Year Ended 10/31/2004 | 11.92 | 0.34 | 1.28 | 1.62 | (0.34) | — | (0.34) |
| Year Ended 10/31/2003 | 10.15 | 0.16 | 1.74 | 1.90 | (0.13) | — | (0.13) |
| Year Ended 10/31/2002 | 12.28 | 0.11 | (2.12) | (2.01) | (0.12) | — | (0.12) |
|
| LARGE CAP STOCK FUND | | | | | | | |
| Class A Share | | | | | | | |
| Year Ended 10/31/2006 | 25.93 | 0.25 | 2.88 | 3.13 | (0.17) | (0.28) | (0.45) |
| Year Ended 10/31/2005 | 23.93 | 0.24 | 1.91 | 2.15 | (0.15) | — | (0.15) |
| Period Ended 10/31/2004 (e) | 29.15 | 0.04 | 0.21 | 0.25 | (0.03) | (5.44) | (5.47) |
| Year Ended 4/30/2004 | 25.39 | 0.11 | 3.75 | 3.86 | (0.10) | — | (0.10) |
| Year Ended 4/30/2003 | 29.84 | 0.10 | (4.48) | (4.38) | (0.07) | — | (0.07) |
| Year Ended 4/30/2002 | 34.82 | 0.05 | (4.86) | (4.81) | (0.09) | (0.08) | (0.17) |
| Class B Shares | | | | | | | |
| Year Ended 10/31/2006 | 24.00 | 0.01 | 2.67 | 2.68 | — | (0.28) | (0.28) |
| Year Ended 10/31/2005 | 22.21 | 0.03 | 1.76 | 1.79 | — | — | — |
| Period Ended 10/31/2004 (e) | 27.55 | (0.08) | 0.18 | 0.10 | — | (5.44) | (5.44) |
| Year Ended 4/30/2004 | 24.19 | (0.23) | 3.59 | 3.36 | — | — | — |
| Year Ended 4/30/2003 | 28.67 | (0.28) | (4.20) | (4.48) | — | — | — |
| Year Ended 4/30/2002 | 33.71 | (0.27) | (4.69) | (4.96) | — | (0.08) | (0.08) |
| Class I Shares | | | | | | | |
| Year Ended 10/31/2006 | 26.13 | 0.33 | 2.95 | 3.28 | (0.29) | (0.28) | (0.57) |
| Year Ended 10/31/2005 | 24.06 | 0.33 | 1.95 | 2.28 | (0.21) | — | (0.21) |
| Period Ended 10/31/2004 (e) | 29.24 | 0.07 | 0.24 | 0.31 | (0.05) | (5.44) | (5.49) |
| Year Ended 4/30/2004 | 25.46 | 0.23 | 3.77 | 4.00 | (0.22) | — | (0.22) |
| Year Ended 4/30/2003 | 29.90 | 0.21 | (4.47) | (4.26) | (0.18) | — | (0.18) |
| Year Ended 4/30/2002 | 34.88 | 0.18 | (4.88) | (4.70) | (0.20) | (0.08) | (0.28) |
(a) All per share amounts have been rounded to the nearest cent.
(b) The amount shown may not correlate with the change in aggregate gains and losses of portfolio securities due to the timing of sales and redemptions of fund shares.
| The accompanying notes to the financial statements are an integral part of this schedule. |
|
| 280 |
Thrivent Mutual Funds
Financial Highlights – continued |
|
| | | | R A T I O S / S U P P L E M E N T A L D A T A | | |
|
|
| | | | | | Ratios to Average | |
| | | | | | Net Assets Before Expenses | |
| | | | Ratio to Average Net | Waived, Credited or Paid | |
| | | | Assets(d) | Indirectly(d) | |
| | | |
|
| |
| Net Asset | | | | | | | |
| Value, | | Net Assets | | Net | | Net | Portfolio |
| End of | Total | End of Period | | Investment | | Investment | Turnover |
| Period | Return(c) | (in millions) | Expenses | Income/(Loss) | Expenses | Income/(Loss) | Rate |
|
| $16.85 | 19.32% | $332.1 | 1.00% | 1.28% | 1.02% | 1.26% | 45% |
| 14.49 | 10.64% | 321.2 | 1.03% | 1.15% | 1.04% | 1.14% | 53% |
| 13.15 | 13.12% | 290.0 | 0.88% | 1.05% | 1.09% | 0.84% | 51% |
| 11.79 | 17.72% | 28.4 | 1.28% | 0.71% | 2.06% | (0.07)% | 64% |
| 10.07 | (17.22)% | 22.9 | 1.37% | 0.48% | 2.02% | (0.17)% | 109% |
| |
| 16.57 | 17.96% | 14.5 | 2.12% | 0.17% | 2.14% | 0.15% | 45% |
| 14.25 | 9.36% | 16.9 | 2.21% | 0.00% | 2.23% | (0.02)% | 53% |
| 13.03 | 12.10% | 19.3 | 1.70% | 0.22% | 2.23% | (0.31)% | 51% |
| 11.66 | 16.78% | 9.1 | 2.03% | (0.05)% | 2.81% | (0.83)% | 64% |
| 9.98 | (17.79)% | 7.0 | 2.12% | (0.27)% | 2.77% | (0.92)% | 109% |
| |
| 16.98 | 19.92% | 163.9 | 0.50% | 1.72% | 0.52% | 1.70% | 45% |
| 14.60 | 11.29% | 48.1 | 0.51% | 1.60% | 0.53% | 1.59% | 53% |
| 13.20 | 13.71% | 19.8 | 0.33% | 1.59% | 0.61% | 1.31% | 51% |
| 11.92 | 18.99% | 3.1 | 0.21% | 1.77% | 1.09% | 0.89% | 64% |
| 10.15 | (16.51)% | 4.1 | 0.50% | 1.35% | 1.15% | 0.70% | 109% |
|
| 28.61 | 12.18% | 3,107.2 | 1.00% | 0.88% | 1.00% | 0.88% | 67% |
| 25.93 | 9.00% | 3,332.0 | 1.00% | 0.93% | 1.01% | 0.92% | 46% |
| 23.93 | 1.27% | 3,435.1 | 1.02% | 0.41% | 1.02% | 0.41% | 43% |
| 29.15 | 15.23% | 2,807.4 | 1.01% | 0.37% | 1.01% | 0.37% | 22% |
| 25.39 | (14.66)% | 2,598.2 | 1.02% | 0.38% | 1.02% | 0.38% | 5% |
| 29.84 | (13.86)% | 3,385.5 | 0.95% | 0.16% | 0.95% | 0.16% | 3% |
| |
| 26.40 | 11.23% | 69.0 | 1.89% | 0.01% | 2.21% | (0.31)% | 67% |
| 24.00 | 8.06% | 91.9 | 1.89% | 0.11% | 2.22% | (0.22)% | 46% |
| 22.21 | 0.72% | 122.9 | 2.00% | (0.57)% | 2.23% | (0.80)% | 43% |
| 27.55 | 13.89% | 75.3 | 2.17% | (0.79)% | 2.17% | (0.79)% | 22% |
| 24.19 | (15.63)% | 81.2 | 2.16% | (0.75)% | 2.16% | (0.75)% | 5% |
| 28.67 | (14.73)% | 126.4 | 1.97% | (0.86)% | 1.97% | (0.86)% | 3% |
| |
| 28.84 | 12.72% | 245.7 | 0.56% | 1.31% | 0.56% | 1.31% | 67% |
| 26.13 | 9.47% | 146.0 | 0.55% | 1.33% | 0.56% | 1.33% | 46% |
| 24.06 | 1.50% | 112.3 | 0.57% | 0.65% | 0.57% | 0.65% | 43% |
| 29.24 | 15.76% | 84.9 | 0.57% | 0.82% | 0.57% | 0.82% | 22% |
| 25.46 | (14.24)% | 68.2 | 0.55% | 0.85% | 0.55% | 0.85% | 5% |
| 29.90 | (13.53)% | 65.9 | 0.55% | 0.56% | 0.55% | 0.56% | 3% |
(c) Total investment return assumes dividend reinvestment and does not reflect any deduction for sales charges. Not annualized for periods less than one year.
(d) Computed on an annualized basis for periods less than one year.
(e) For the period from May 1, 2004, to October 31, 2004.
| The accompanying notes to the financial statements are an integral part of this schedule. |
|
| 281 |
Thrivent Mutual Funds
Financial Highlights – continued |
|
| | |
| |
|
| |
| |
| | | | | | Less Distributions | |
| | | Income from Investment Operations | from | | |
| |
|
| |
| | Net Asset | | Net Realized | | | Net | |
| | Value, | Net | and Unrealized | Total from | Net | Realized | |
| | Beginning | Investment | Gain/(Loss) on | Investment | Investment | Gain on | Total |
| | of Period | Income/(Loss) | Investments(b) | Operations | Income | Investments | Distributions |
|
| LARGE CAP INDEX FUND | | | | | | | |
| Class A Share | | | | | | | |
| Year Ended 10/31/2006 | $8.35 | $0.13 | $1.16 | $1.29 | $(0.11) | $(0.01) | $(0.12) |
| Year Ended 10/31/2005 | 7.78 | 0.12 | 0.53 | 0.65 | (0.08) | — | (0.08) |
| Period Ended 10/31/2004 (e) | 7.61 | 0.04 | 0.16 | 0.20 | (0.03) | — | (0.03) |
| Year Ended 4/30/2004 | 6.30 | 0.08 | 1.31 | 1.39 | (0.08) | — | (0.08) |
| Year Ended 10/31/2003 | 7.32 | 0.05 | (1.05) | (1.00) | (0.02) | — | (0.02) |
| Year Ended 10/31/2002 | 8.49 | — | (1.17) | (1.17) | — | — | — |
|
| LARGE CAP INDEX FUND—I | | | | | | | |
| Class I Shares | | | | | | | |
| Year Ended 10/31/2006 | 8.29 | 0.14 | 1.15 | 1.29 | (0.12) | — | (0.12) |
| Year Ended 10/31/2005 | 7.76 | 0.13 | 0.52 | 0.65 | (0.12) | — | (0.12) |
| Period Ended 10/31/2004 (e) | 7.55 | 0.05 | 0.16 | 0.21 | — | — | — |
| Year Ended 4/30/2004 | 6.31 | 0.15 | 1.24 | 1.39 | (0.15) | — | (0.15) |
| Year Ended 4/30/2003 | 7.38 | 0.08 | (1.07) | (0.99) | (0.08) | — | (0.08) |
| Year Ended 4/30/2002 | 8.56 | 0.05 | (1.18) | (1.13) | (0.05) | — | (0.05) |
|
| BALANCED FUND | | | | | | | |
| Class A Share | | | | | | | |
| Year Ended 10/31/2006 | 12.18 | 0.21 | 1.09 | 1.30 | (0.21) | (0.32) | (0.53) |
| Year Ended 10/31/2005 | 11.81 | 0.20 | 0.57 | 0.77 | (0.22) | (0.18) | (0.40) |
| Period Ended 10/31/2004 (e) | 11.65 | 0.09 | 0.17 | 0.26 | (0.10) | — | (0.10) |
| Year Ended 4/30/2004 | 10.75 | 0.17 | 0.92 | 1.09 | (0.19) | — | (0.19) |
| Year Ended 4/30/2003 | 11.52 | 0.19 | (0.76) | (0.57) | (0.20) | — | (0.20) |
| Year Ended 4/30/2002 | 12.41 | 0.26 | (0.88) | (0.62) | (0.27) | — | (0.27) |
| Class B Shares | | | | | | | |
| Year Ended 10/31/2006 | 12.13 | 0.10 | 1.07 | 1.17 | (0.09) | (0.32) | (0.41) |
| Year Ended 10/31/2005 | 11.76 | 0.09 | 0.56 | 0.65 | (0.10) | (0.18) | (0.28) |
| Period Ended 10/31/2004 (e) | 11.60 | 0.03 | 0.17 | 0.20 | (0.04) | — | (0.04) |
| Year Ended 4/30/2004 | 10.70 | 0.06 | 0.92 | 0.98 | (0.08) | — | (0.08) |
| Year Ended 4/30/2003 | 11.47 | 0.11 | (0.76) | (0.65) | (0.12) | — | (0.12) |
| Year Ended 4/30/2002 | 12.35 | 0.15 | (0.87) | (0.72) | (0.16) | — | (0.16) |
| Class I Shares | | | | | | | |
| Year Ended 10/31/2006 | 12.17 | 0.27 | 1.08 | 1.35 | (0.27) | (0.32) | (0.59) |
| Year Ended 10/31/2005 | 11.80 | 0.26 | 0.56 | 0.82 | (0.27) | (0.18) | (0.45) |
| Period Ended 10/31/2004 (e) | 11.64 | 0.12 | 0.17 | 0.29 | (0.13) | — | (0.13) |
| Year Ended 4/30/2004 | 10.74 | 0.22 | 0.93 | 1.15 | (0.25) | — | (0.25) |
| Year Ended 4/30/2003 | 11.51 | 0.21 | (0.73) | (0.52) | (0.25) | — | (0.25) |
| Year Ended 4/30/2002 | 12.39 | 0.30 | (0.86) | (0.56) | (0.32) | — | (0.32) |
(a) All per share amounts have been rounded to the nearest cent.
(b) The amount shown may not correlate with the change in aggregate gains and losses of portfolio securities due to the timing of sales and redemptions of fund shares.
| The accompanying notes to the financial statements are an integral part of this schedule. |
|
| 282 |
Thrivent Mutual Funds
Financial Highlights – continued |
|
| | | | R A T I O S / | S U P P L E M E N T A L D A T A | | |
|
|
| | | | | | Ratios to Average | |
| | | | | | Net Assets Before Expenses | |
| | | | Ratio to Average Net | Waived, Credited or Paid | |
| | | | Assets(d) | Indirectly(d) | |
| | | |
|
| |
| Net Asset | | | | | | | |
| Value, | | Net Assets | | Net | | Net | Portfolio |
| End of | Total | End of Period | | Investment | | Investment | Turnover |
| Period | Return(c) | (in millions) | Expenses | Income/(Loss) | Expenses | Income/(Loss) | Rate |
|
| $9.52 | 15.56% | $92.3 | 0.60% | 1.37% | 0.91% | 1.05% | 7% |
| 8.35 | 8.33% | 94.3 | 0.60% | 1.49% | 0.94% | 1.15% | 9% |
| 7.78 | 2.62% | 76.3 | 0.57% | 0.64% | 1.08% | 0.13% | 5% |
| 7.61 | 22.09% | 51.2 | 0.41% | 1.28% | 1.17% | 0.52% | 6% |
| 6.30 | (13.58)% | 27.8 | 0.93% | 0.86% | 1.18% | 0.61% | 16% |
| 7.32 | (13.78)% | 30.2 | 1.29% | 0.08% | 1.29% | 0.08% | 4% |
|
| 9.46 | 15.69% | 32.6 | 0.52% | 1.50% | 0.52% | 1.49% | 14% |
| 8.29 | 8.39% | 31.5 | 0.50% | 1.61% | 0.51% | 1.61% | 11% |
| 7.76 | 2.78% | 29.4 | 0.54% | 1.19% | 0.55% | 1.18% | 4% |
| 7.55 | 22.00% | 28.7 | 0.54% | 1.21% | 0.55% | 1.20% | 27% |
| 6.31 | (13.36)% | 62.1 | 0.24% | 1.55% | 0.36% | 1.43% | 23% |
| 7.38 | (13.22)% | 63.0 | 0.20% | 1.17% | 0.49% | 0.88% | 3% |
|
| |
| 12.95 | 10.97% | 251.6 | 1.07% | 1.67% | 1.09% | 1.65% | 215% |
| 12.18 | 6.56% | 276.1 | 1.07% | 1.62% | 1.09% | 1.60% | 231% |
| 11.81 | 2.21% | 278.5 | 1.07% | 1.49% | 1.08% | 1.48% | 114% |
| 11.65 | 10.22% | 278.0 | 1.06% | 1.48% | 1.07% | 1.47% | 194% |
| 10.75 | (4.90)% | 260.8 | 1.05% | 1.77% | 1.07% | 1.75% | 69% |
| 11.52 | (5.02)% | 305.6 | 0.99% | 2.19% | 1.02% | 2.16% | 76% |
| |
| 12.89 | 9.83% | 10.0 | 2.04% | 0.71% | 2.05% | 0.70% | 215% |
| 12.13 | 5.54% | 13.3 | 2.02% | 0.72% | 2.04% | 0.70% | 231% |
| 11.76 | 1.71% | 17.6 | 2.03% | 0.53% | 2.04% | 0.52% | 114% |
| 11.60 | 9.22% | 18.6 | 2.02% | 0.52% | 2.03% | 0.51% | 194% |
| 10.70 | (5.68)% | 19.3 | 1.84% | 0.97% | 1.86% | 0.95% | 60% |
| 11.47 | (5.83)% | 22.3 | 1.89% | 1.29% | 1.92% | 1.26% | 76% |
| |
| 12.93 | 11.41% | 86.3 | 0.61% | 2.13% | 0.63% | 2.12% | 215% |
| 12.17 | 7.07% | 98.4 | 0.59% | 2.11% | 0.62% | 2.09% | 231% |
| 11.80 | 2.47% | 108.5 | 0.60% | 1.97% | 0.61% | 1.96% | 114% |
| 11.64 | 10.75% | 111.2 | 0.59% | 1.96% | 0.60% | 1.95% | 194% |
| 10.74 | (4.45)% | 107.8 | 0.56% | 2.26% | 0.57% | 2.25% | 69% |
| 11.51 | (4.65)% | 3.7 | 0.58% | 2.60% | 0.62% | 2.56% | 76% |
(c) Total investment return assumes dividend reinvestment and does not reflect any deduction for sales charges. Not annualized for periods less than one year.
(d) Computed on an annualized basis for periods less than one year.
(e) For the period from May 1, 2004, to October 31, 2004.
| The accompanying notes to the financial statements are an integral part of this schedule. |
|
| 283 |
Thrivent Mutual Funds
Financial Highlights – continued |
|
| | F O R A S H A R E O U T S T A N D I N G T H R O U G H O U T E A C H P E R I O D(a) |
| |
|
| |
| |
| | | | | | Less Distributions | |
| | | Income from Investment Operations | from | | |
| |
|
| |
| | Net Asset | | Net Realized | | | Net | |
| | Value, | Net | and Unrealized | Total from | Net | Realized | |
| | Beginning | Investment | Gain/(Loss) on | Investment | Investment | Gain on | Total |
| | of Period | Income/(Loss) | Investments(b) | Operations | Income | Investments | Distributions |
|
| HIGH YIELD FUND | | | | | | | |
| Class A Share | | | | | | | |
| Year Ended 10/31/2006 | $5.03 | $0.38 | $0.05 | $0.43 | $(0.38) | $— | $(0.38) |
| Year Ended 10/31/2005 | 5.24 | 0.38 | (0.20) | 0.18 | (0.39) | — | (0.39) |
| Year Ended 10/31/2004 | 5.07 | 0.40 | 0.16 | 0.56 | (0.39) | — | (0.39) |
| Year Ended 10/31/2003 | 4.23 | 0.41 | 0.82 | 1.23 | (0.39) | — | (0.39) |
| Year Ended 10/31/2002 | 5.22 | 0.53 | (1.00) | (0.47) | (0.52) | — | (0.52) |
| Class B Shares | | | | | | | |
| Year Ended 10/31/2006 | 5.02 | 0.34 | 0.06 | 0.40 | (0.34) | — | (0.34) |
| Year Ended 10/31/2005 | 5.24 | 0.34 | (0.21) | 0.13 | (0.35) | — | (0.35) |
| Year Ended 10/31/2004 | 5.07 | 0.36 | 0.16 | 0.52 | (0.35) | — | (0.35) |
| Year Ended 10/31/2003 | 4.23 | 0.37 | 0.82 | 1.19 | (0.35) | — | (0.35) |
| Year Ended 10/31/2002 | 5.22 | 0.50 | (1.01) | (0.51) | (0.48) | — | (0.48) |
| Class I Shares | | | | | | | |
| Year Ended 10/31/2006 | 5.03 | 0.41 | 0.06 | 0.47 | (0.41) | — | (0.41) |
| Year Ended 10/31/2005 | 5.24 | 0.41 | (0.21) | 0.20 | (0.41) | — | (0.41) |
| Year Ended 10/31/2004 | 5.07 | 0.42 | 0.16 | 0.58 | (0.41) | — | (0.41) |
| Year Ended 10/31/2003 | 4.23 | 0.42 | 0.83 | 1.25 | (0.41) | — | (0.41) |
| Year Ended 10/31/2002 | 5.22 | 0.55 | (1.01) | (0.46) | (0.53) | — | (0.53) |
|
| DIVERSIFIED INCOME PLUS FUND | | | | | | |
| Class A Share | | | | | | | |
| Year Ended 10/31/2006 | 6.41 | 0.43 | 0.29 | 0.72 | (0.43) | — | (0.43) |
| Year Ended 10/31/2005 | 6.71 | 0.46 | (0.27) | 0.19 | (0.49) | — | (0.49) |
| Period Ended 10/31/2004 (e) | 6.54 | 0.22 | 0.18 | 0.40 | (0.23) | — | (0.23) |
| Year Ended 4/30/2004 | 6.27 | 0.46 | 0.28 | 0.74 | (0.47) | — | (0.47) |
| Year Ended 4/30/2003 | 6.19 | 0.50 | 0.08 | 0.58 | (0.50) | — | (0.50) |
| Year Ended 4/30/2002 | 6.76 | 0.54 | (0.56) | (0.02) | (0.55) | — | (0.55) |
| Class B Shares | | | | | | | |
| Year Ended 10/31/2006 | 6.41 | 0.37 | 0.29 | 0.66 | (0.37) | — | (0.37) |
| Year Ended 10/31/2005 | 6.72 | 0.40 | (0.28) | 0.12 | (0.43) | — | (0.43) |
| Period Ended 10/31/2004 (e) | 6.54 | 0.19 | 0.19 | 0.38 | (0.20) | — | (0.20) |
| Year Ended 4/30/2004 | 6.27 | 0.40 | 0.28 | 0.68 | (0.41) | — | (0.41) |
| Year Ended 4/30/2003 | 6.19 | 0.45 | 0.08 | 0.53 | (0.45) | — | (0.45) |
| Year Ended 4/30/2002 | 6.76 | 0.49 | (0.56) | (0.07) | (0.50) | — | (0.50) |
| Class I Shares | | | | | | | |
| Year Ended 10/31/2006 | 6.41 | 0.45 | 0.30 | 0.75 | (0.46) | — | (0.46) |
| Year Ended 10/31/2005 | 6.71 | 0.49 | (0.27) | 0.22 | (0.52) | — | (0.52) |
| Period Ended 10/31/2004 (e) | 6.54 | 0.24 | 0.18 | 0.42 | (0.25) | — | (0.25) |
| Year Ended 4/30/2004 | 6.27 | 0.48 | 0.29 | 0.77 | (0.50) | — | (0.50) |
| Year Ended 4/30/2003 | 6.19 | 0.51 | 0.09 | 0.60 | (0.52) | — | (0.52) |
| Year Ended 4/30/2002 | 6.76 | 0.56 | (0.57) | (0.01) | (0.56) | — | (0.56) |
(a) All per share amounts have been rounded to the nearest cent.
(b) The amount shown may not correlate with the change in aggregate gains and losses of portfolio securities due to the timing of sales and redemptions of fund shares.
| The accompanying notes to the financial statements are an integral part of this schedule. |
|
| 284 |
Thrivent Mutual Funds
Financial Highlights – continued |
|
| | | | R A T I O S / S U P P L E M E N T A L D A T A | | |
|
|
| | | | | | Ratios to Average | |
| | | | | | Net Assets Before Expenses | |
| | | | Ratio to Average Net | Waived, Credited or Paid | |
| | | | Assets(d) | Indirectly(d) | |
| | | |
|
| |
| Net Asset | | | | | | | |
| Value, | | Net Assets | | Net | | Net | Portfolio |
| End of | Total | End of Period | | Investment | | Investment | Turnover |
| Period | Return(c) | (in millions) | Expenses | Income/(Loss) | Expenses | Income/(Loss) | Rate |
|
| $5.08 | 8.96% | $533.7 | 0.88% | 7.62% | 0.89% | 7.60% | 63% |
| 5.03 | 3.54% | 563.0 | 0.87% | 7.45% | 0.88% | 7.43% | 54% |
| 5.24 | 11.53% | 603.1 | 0.89% | 7.80% | 0.89% | 7.80% | 73% |
| 5.07 | 30.00% | 579.8 | 1.02% | 8.70% | 1.02% | 8.70% | 96% |
| 4.23 | (9.91)% | 488.8 | 1.03% | 10.49% | 1.03% | 10.49% | 77% |
| |
| 5.08 | 8.25% | 16.5 | 1.73% | 6.75% | 1.92% | 6.57% | 63% |
| 5.02 | 2.45% | 23.4 | 1.73% | 6.57% | 1.91% | 6.39% | 54% |
| 5.24 | 10.66% | 33.1 | 1.70% | 7.00% | 1.74% | 6.96% | 73% |
| 5.07 | 29.03% | 36.3 | 1.77% | 7.95% | 1.77% | 7.95% | 96% |
| 4.23 | (10.58)% | 34.9 | 1.78% | 9.74% | 1.78% | 9.74% | 77% |
| |
| 5.09 | 9.63% | 82.3 | 0.45% | 8.07% | 0.46% | 8.06% | 63% |
| 5.03 | 3.97% | 15.2 | 0.46% | 7.88% | 0.47% | 7.87% | 54% |
| 5.24 | 11.98% | 10.1 | 0.49% | 8.21% | 0.60% | 8.10% | 73% |
| 5.07 | 30.57% | 10.8 | 0.57% | 9.15% | 0.69% | 9.03% | 96% |
| 4.23 | (9.60)% | 10.9 | 0.69% | 10.83% | 0.69% | 10.83% | 77% |
|
| 6.70 | 11.77% | 123.4 | 0.98% | 6.66% | 1.15% | 6.49% | 170% |
| 6.41 | 2.91% | 124.3 | 0.95% | 6.99% | 1.13% | 6.82% | 57% |
| 6.71 | 6.32% | 138.9 | 1.07% | 6.82% | 1.14% | 6.75% | 55% |
| 6.54 | 12.08% | 135.1 | 1.10% | 6.98% | 1.10% | 6.98% | 91% |
| 6.27 | 10.59% | 117.4 | 0.93% | 8.72% | 1.03% | 8.62% | 103% |
| 6.19 | (0.26)% | 118.6 | 1.00% | 8.41% | 1.17% | 8.24% | 72% |
| |
| 6.70 | 10.64% | 3.0 | 2.01% | 5.75% | 2.18% | 5.58% | 170% |
| 6.41 | 1.74% | 4.1 | 1.95% | 6.02% | 2.12% | 5.85% | 57% |
| 6.72 | 5.95% | 5.9 | 2.05% | 5.84% | 2.11% | 5.78% | 55% |
| 6.54 | 11.06% | 6.1 | 2.01% | 6.07% | 2.01% | 6.07% | 91% |
| 6.27 | 9.61% | 6.0 | 1.84% | 7.81% | 2.01% | 7.64% | 103% |
| 6.19 | (1.02)% | 8.2 | 1.74% | 7.67% | 1.93% | 7.48% | 72% |
| |
| 6.70 | 12.29% | 5.8 | 0.54% | 6.84% | 0.72% | 6.66% | 170% |
| 6.41 | 3.36% | 4.3 | 0.50% | 7.42% | 0.67% | 7.25% | 57% |
| 6.71 | 6.56% | 4.3 | 0.61% | 7.28% | 0.68% | 7.21% | 55% |
| 6.54 | 12.56% | 3.8 | 0.67% | 7.41% | 0.67% | 7.41% | 91% |
| 6.27 | 10.88% | 3.3 | 0.67% | 8.98% | 0.67% | 8.98% | 103% |
| 6.19 | 0.05% | 2.7 | 0.68% | 8.73% | 0.68% | 8.73% | 72% |
(c) Total investment return assumes dividend reinvestment and does not reflect any deduction for sales charges. Not annualized for periods less than one year.
(d) Computed on an annualized basis for periods less than one year.
(e) For the period from May 1, 2004, to October 31, 2004.
| The accompanying notes to the financial statements are an integral part of this schedule. |
|
| 285 |
Thrivent Mutual Funds
Financial Highlights – continued |
|
| | F O R A S H A R E O U T S T A N D I N G T H R O U G H O U T E A C H P E R I O D(a) |
| |
|
| |
| |
| | | | | | Less Distributions | |
| | | Income from Investment Operations | from | | |
| |
|
| |
| | Net Asset | | Net Realized | | | Net | |
| | Value, | Net | and Unrealized | Total from | Net | Realized | |
| | Beginning | Investment | Gain/(Loss) on | Investment | Investment | Gain on | Total |
| | of Period | Income/(Loss) | Investments(b) | Operations | Income | Investments | Distributions |
|
| MUNICIPAL BOND FUND | | | | | | | |
| Class A Share | | | | | | | |
| Year Ended 10/31/2006 | $11.31 | $0.50 | $0.08 | $0.58 | $(0.50) | $— | $(0.50) |
| Year Ended 10/31/2005 | 11.56 | 0.50 | (0.25) | 0.25 | (0.50) | — | (0.50) |
| Year Ended 10/31/2004 | 11.53 | 0.50 | 0.12 | 0.62 | (0.53) | (0.06) | (0.59) |
| Year Ended 10/31/2003 | 11.61 | 0.54 | (0.05) | 0.49 | (0.56) | (0.01) | (0.57) |
| Year Ended 10/31/2002 | 11.58 | 0.54 | 0.01 | 0.55 | (0.52) | — | (0.52) |
| Class B Shares | | | | | | | |
| Year Ended 10/31/2006 | 11.30 | 0.43 | 0.07 | 0.50 | (0.42) | — | (0.42) |
| Year Ended 10/31/2005 | 11.55 | 0.42 | (0.25) | 0.17 | (0.42) | — | (0.42) |
| Year Ended 10/31/2004 | 11.52 | 0.44 | 0.09 | 0.53 | (0.44) | (0.06) | (0.50) |
| Year Ended 10/31/2003 | 11.61 | 0.45 | (0.06) | 0.39 | (0.47) | (0.01) | (0.48) |
| Year Ended 10/31/2002 | 11.59 | 0.46 | 0.01 | 0.47 | (0.45) | — | (0.45) |
| Class I Shares | | | | | | | |
| Year Ended 10/31/2006 | 11.31 | 0.54 | 0.08 | 0.62 | (0.54) | — | (0.54) |
| Year Ended 10/31/2005 | 11.55 | 0.53 | (0.24) | 0.29 | (0.53) | — | (0.53) |
| Year Ended 10/31/2004 | 11.53 | 0.53 | 0.11 | 0.64 | (0.56) | (0.06) | (0.62) |
| Year Ended 10/31/2003 | 11.61 | 0.58 | (0.05) | 0.53 | (0.60) | (0.01) | (0.61) |
| Year Ended 10/31/2002 | 11.58 | 0.57 | 0.01 | 0.58 | (0.55) | — | (0.55) |
|
| INCOME FUND | | | | | | | |
| Class A Share | | | | | | | |
| Year Ended 10/31/2006 | 8.56 | 0.41 | 0.03 | 0.44 | (0.41) | — | (0.41) |
| Year Ended 10/31/2005 | 8.86 | 0.37 | (0.30) | 0.07 | (0.37) | — | (0.37) |
| Year Ended 10/31/2004 | 8.73 | 0.35 | 0.13 | 0.48 | (0.35) | — | (0.35) |
| Year Ended 10/31/2003 | 8.34 | 0.34 | 0.40 | 0.74 | (0.35) | — | (0.35) |
| Year Ended 10/31/2002 | 8.71 | 0.41 | (0.38) | 0.03 | (0.40) | — | (0.40) |
| Class B Shares | | | | | | | |
| Year Ended 10/31/2006 | 8.54 | 0.34 | 0.03 | 0.37 | (0.34) | — | (0.34) |
| Year Ended 10/31/2005 | 8.84 | 0.30 | (0.30) | — | (0.30) | — | (0.30) |
| Year Ended 10/31/2004 | 8.71 | 0.29 | 0.12 | 0.41 | (0.28) | — | (0.28) |
| Year Ended 10/31/2003 | 8.32 | 0.27 | 0.41 | 0.68 | (0.29) | — | (0.29) |
| Year Ended 10/31/2002 | 8.70 | 0.35 | (0.40) | (0.05) | (0.33) | — | (0.33) |
| Class I Shares | | | | | | | |
| Year Ended 10/31/2006 | 8.55 | 0.44 | 0.03 | 0.47 | (0.44) | — | (0.44) |
| Year Ended 10/31/2005 | 8.85 | 0.40 | (0.29) | 0.11 | (0.41) | — | (0.41) |
| Year Ended 10/31/2004 | 8.75 | 0.39 | 0.10 | 0.49 | (0.39) | — | (0.39) |
| Year Ended 10/31/2003 | 8.34 | 0.37 | 0.43 | 0.80 | (0.39) | — | (0.39) |
| Year Ended 10/31/2002 | 8.71 | 0.44 | (0.39) | 0.05 | (0.42) | — | (0.42) |
(a) All per share amounts have been rounded to the nearest cent.
(b) The amount shown may not correlate with the change in aggregate gains and losses of portfolio securities due to the timing of sales and redemptions of fund shares.
| The accompanying notes to the financial statements are an integral part of this schedule. |
|
| 286 |
Thrivent Mutual Funds
Financial Highlights – continued |
|
| | | | R A T I O S / S U P P L E M E N T A L D A T A | | |
|
|
| | | | | | Ratios to Average | |
| | | | | | Net Assets Before Expenses | |
| | | | Ratio to Average Net | Waived, Credited or Paid | |
| | | | Assets(d) | Indirectly(d) | |
| | | |
|
| |
| Net Asset | | | | | | | |
| Value, | | Net Assets | | Net | | Net | Portfolio |
| End of | Total | End of Period | | Investment | | Investment | Turnover |
| Period | Return(c) | (in millions) | Expenses | Income/(Loss) | Expenses | Income/(Loss) | Rate |
|
| $11.39 | 5.28% | $1,201.2 | 0.78% | 4.46% | 0.78% | 4.46% | 14% |
| 11.31 | 2.17% | 1,242.4 | 0.78% | 4.31% | 0.78% | 4.31% | 8% |
| 11.56 | 5.47% | 1,264.1 | 0.73% | 4.53% | 0.73% | 4.53% | 12% |
| 11.53 | 4.37% | 641.7 | 0.72% | 4.62% | 0.72% | 4.62% | 6% |
| 11.61 | 4.91% | 645.4 | 0.73% | 4.69% | 0.73% | 4.69% | 13% |
| |
| 11.38 | 4.56% | 21.7 | 1.47% | 3.77% | 1.60% | 3.64% | 14% |
| 11.30 | 1.46% | 28.9 | 1.47% | 3.61% | 1.60% | 3.48% | 8% |
| 11.55 | 4.72% | 34.0 | 1.46% | 3.81% | 1.51% | 3.76% | 12% |
| 11.52 | 3.48% | 24.2 | 1.47% | 3.88% | 1.47% | 3.88% | 6% |
| 11.61 | 4.15% | 22.3 | 1.48% | 3.94% | 1.48% | 3.94% | 13% |
| |
| 11.39 | 5.59% | 12.2 | 0.49% | 4.75% | 0.49% | 4.75% | 14% |
| 11.31 | 2.56% | 8.4 | 0.48% | 4.64% | 0.48% | 4.64% | 8% |
| 11.55 | 5.70% | 5.1 | 0.44% | 4.83% | 0.52% | 4.75% | 12% |
| 11.53 | 4.67% | 2.6 | 0.44% | 4.90% | 0.56% | 4.78% | 6% |
| 11.61 | 5.08% | 3.2 | 0.57% | 4.85% | 0.57% | 4.85% | 13% |
|
| 8.59 | 5.25% | 470.5 | 0.81% | 4.78% | 0.82% | 4.76% | 303% |
| 8.56 | 0.82% | 532.3 | 0.80% | 4.22% | 0.81% | 4.20% | 245% |
| 8.86 | 5.64% | 575.2 | 0.82% | 4.04% | 0.82% | 4.04% | 203% |
| 8.73 | 9.05% | 608.7 | 0.87% | 3.88% | 0.88% | 3.87% | 312% |
| 8.34 | 0.25% | 629.3 | 0.84% | 4.87% | 0.89% | 4.82% | 170% |
| |
| 8.57 | 4.39% | 12.6 | 1.63% | 3.93% | 1.96% | 3.60% | 303% |
| 8.54 | (0.02)% | 19.2 | 1.63% | 3.38% | 1.94% | 3.07% | 245% |
| 8.84 | 4.83% | 25.4 | 1.60% | 3.25% | 1.68% | 3.17% | 203% |
| 8.71 | 8.25% | 30.3 | 1.62% | 3.13% | 1.63% | 3.12% | 312% |
| 8.32 | (0.49)% | 31.7 | 1.59% | 4.12% | 1.64% | 4.07% | 170% |
| |
| 8.58 | 5.68% | 167.0 | 0.40% | 5.30% | 0.41% | 5.29% | 303% |
| 8.55 | 1.22% | 46.7 | 0.40% | 4.64% | 0.41% | 4.62% | 245% |
| 8.85 | 5.94% | 29.0 | 0.43% | 4.43% | 0.54% | 4.32% | 203% |
| 8.75 | 9.49% | 25.2 | 0.47% | 4.28% | 0.60% | 4.15% | 312% |
| 8.34 | 0.65% | 40.1 | 0.55% | 5.15% | 0.60% | 5.10% | 170% |
(c) Total investment return assumes dividend reinvestment and does not reflect any deduction for sales charges. Not annualized for periods less than one year.
(d) Computed on an annualized basis for periods less than one year.
The accompanying notes to the financial statements are an integral part of this schedule.
Thrivent Mutual Funds
Financial Highlights – continued |
|
| | F O R A S H A R E O U T S T A N D I N G T H R O U G H O U T E A C H P E R I O D(a) |
| |
|
| | | | | | Less Distributions | |
| | | Income from Investment Operations | from | | |
| |
|
| |
| | Net Asset | | Net Realized | | | Net | |
| | Value, | Net | and Unrealized | Total from | Net | Realized | |
| | Beginning | Investment | Gain/(Loss) on | Investment | Investment | Gain on | Total |
| | of Period | Income/(Loss) | Investments(b) | Operations | Income | Investments | Distributions |
|
| CORE BOND FUND | | | | | | | |
| Class A Share | | | | | | | |
| Year Ended 10/31/2006 | $9.89 | $0.44 | $0.02 | $0.46 | $(0.45) | $— | $(0.45) |
| Year Ended 10/31/2005 | 10.27 | 0.39 | (0.36) | 0.03 | (0.41) | — | (0.41) |
| Period Ended 10/31/2004 (e) | 10.14 | 0.20 | 0.16 | 0.36 | (0.22) | (0.01) | (0.23) |
| Year Ended 4/30/2004 | 10.31 | 0.40 | (0.12) | 0.28 | (0.45) | — | (0.45) |
| Year Ended 4/30/2003 | 9.82 | 0.42 | 0.52 | 0.94 | (0.45) | — | (0.45) |
| Year Ended 4/30/2002 | 9.80 | 0.56 | 0.02 | 0.58 | (0.56) | — | (0.56) |
| Class B Shares | | | | | | | |
| Year Ended 10/31/2006 | 9.90 | 0.34 | 0.02 | 0.36 | (0.35) | — | (0.35) |
| Year Ended 10/31/2005 | 10.27 | 0.29 | (0.35) | (0.06) | (0.31) | — | (0.31) |
| Period Ended 10/31/2004 (e) | 10.15 | 0.15 | 0.15 | 0.30 | (0.17) | (0.01) | (0.18) |
| Year Ended 4/30/2004 | 10.32 | 0.30 | (0.12) | 0.18 | (0.35) | — | (0.35) |
| Year Ended 4/30/2003 | 9.82 | 0.33 | 0.53 | 0.86 | (0.36) | — | (0.36) |
| Year Ended 4/30/2002 | 9.80 | 0.47 | 0.02 | 0.49 | (0.47) | — | (0.47) |
| Class I Shares | | | | | | | |
| Year Ended 10/31/2006 | 9.90 | 0.48 | 0.02 | 0.50 | (0.49) | — | (0.49) |
| Year Ended 10/31/2005 | 10.27 | 0.43 | (0.34) | 0.09 | (0.46) | — | (0.46) |
| Period Ended 10/31/2004 (e) | 10.15 | 0.22 | 0.15 | 0.37 | (0.24) | (0.01) | (0.25) |
| Year Ended 4/30/2004 | 10.31 | 0.44 | (0.11) | 0.33 | (0.49) | — | (0.49) |
| Year Ended 4/30/2003 | 9.82 | 0.46 | 0.52 | 0.98 | (0.49) | — | (0.49) |
| Year Ended 4/30/2002 | 9.80 | 0.60 | 0.02 | 0.62 | (0.60) | — | (0.60) |
|
| LIMITED MATURITY BOND FUND | | | | | | |
| Class A Share | | | | | | | |
| Year Ended 10/31/2006 | 12.58 | 0.50 | — | 0.50 | (0.50) | — | (0.50) |
| Year Ended 10/31/2005 | 12.91 | 0.41 | (0.30) | 0.11 | (0.41) | (0.03) | (0.44) |
| Year Ended 10/31/2004 | 13.06 | 0.35 | (0.03) | 0.32 | (0.35) | (0.12) | (0.47) |
| Year Ended 10/31/2003 | 12.75 | 0.36 | 0.31 | 0.67 | (0.36) | — | (0.36) |
| Year Ended 10/31/2002 | 13.14 | 0.46 | (0.14) | 0.32 | (0.46) | (0.25) | (0.71) |
| Class B Shares | | | | | | | |
| Year Ended 10/31/2006 | 12.59 | 0.50 | — | 0.50 | (0.50) | — | (0.50) |
| Year Ended 10/31/2005 | 12.92 | 0.41 | (0.30) | 0.11 | (0.41) | (0.03) | (0.44) |
| Year Ended 10/31/2004 | 13.06 | 0.33 | (0.02) | 0.31 | (0.33) | (0.12) | (0.45) |
| Year Ended 10/31/2003 | 12.75 | 0.34 | 0.31 | 0.65 | (0.34) | — | (0.34) |
| Year Ended 10/31/2002 | 13.14 | 0.46 | (0.14) | 0.32 | (0.46) | (0.25) | (0.71) |
| Class I Shares | | | | | | | |
| Year Ended 10/31/2006 | 12.58 | 0.56 | — | 0.56 | (0.56) | — | (0.56) |
| Year Ended 10/31/2005 | 12.91 | 0.47 | (0.30) | 0.17 | (0.47) | (0.03) | (0.50) |
| Year Ended 10/31/2004 | 13.05 | 0.39 | (0.02) | 0.37 | (0.39) | (0.12) | (0.51) |
| Year Ended 10/31/2003 | 12.74 | 0.40 | 0.31 | 0.71 | (0.40) | — | (0.40) |
| Year Ended 10/31/2002 | 13.14 | 0.50 | (0.15) | 0.35 | (0.50) | (0.25) | (0.75) |
(a) All per share amounts have been rounded to the nearest cent.
(b) The amount shown may not correlate with the change in aggregate gains and losses of portfolio securities due to the timing of sales and redemptions of fund shares.
| The accompanying notes to the financial statements are an integral part of this schedule. |
|
| 288 |
Thrivent Mutual Funds
Financial Highlights – continued |
|
| | | | R A T I O S / S U P P L E M E N T A L D A T A | | |
|
|
| | | | | | Ratios to Average | |
| | | | | | Net Assets Before Expenses | |
| | | | Ratio to Average Net | Waived, Credited or Paid | |
| | | | Assets(d) | Indirectly(d) | |
| | | |
|
| |
| Net Asset | | | | | | | |
| Value, | | Net Assets | | Net | | Net | Portfolio |
| End of | Total | End of Period | | Investment | | Investment | Turnover |
| Period | Return(c) | (in millions) | Expenses | Income/(Loss) | Expenses | Income/(Loss) | Rate |
|
| $9.90 | 4.75% | $343.1 | 0.93% | 4.44% | 0.95% | 4.42% | 394% |
| 9.89 | 0.31% | 421.2 | 0.91% | 3.84% | 0.94% | 3.82% | 368% |
| 10.27 | 3.58% | 457.1 | 0.92% | 3.84% | 0.93% | 3.83% | 167% |
| 10.14 | 2.74% | 460.5 | 0.88% | 3.86% | 0.89% | 3.85% | 463% |
| 10.31 | 9.79% | 526.5 | 0.85% | 4.19% | 0.86% | 4.18% | 149% |
| 9.82 | 6.01% | 451.5 | 0.81% | 5.54% | 0.88% | 5.47% | 160% |
| |
| 9.91 | 3.71% | 8.1 | 1.94% | 3.43% | 1.96% | 3.41% | 394% |
| 9.90 | (0.58)% | 10.8 | 1.91%�� | 2.86% | 1.93% | 2.84% | 368% |
| 10.27 | 2.97% | 13.3 | 1.91% | 2.84% | 1.92% | 2.83% | 167% |
| 10.15 | 1.75% | 13.4 | 1.86% | 2.89% | 1.87% | 2.88% | 463% |
| 10.32 | 8.91% | 13.2 | 1.77% | 3.28% | 1.78% | 3.27% | 149% |
| 9.82 | 5.03% | 7.9 | 1.73% | 4.64% | 1.80% | 4.57% | 160% |
| |
| 9.91 | 5.20% | 49.0 | 0.51% | 4.86% | 0.53% | 4.85% | 394% |
| 9.90 | 0.84% | 52.9 | 0.49% | 4.17% | 0.51% | 4.15% | 368% |
| 10.27 | 3.69% | 36.3 | 0.50% | 4.25% | 0.51% | 4.24% | 167% |
| 10.15 | 3.25% | 34.5 | 0.49% | 4.26% | 0.50% | 4.25% | 463% |
| 10.31 | 10.20% | 29.2 | 0.47% | 4.57% | 0.48% | 4.56% | 149% |
| 9.82 | 6.42% | 22.9 | 0.39% | 5.93% | 0.46% | 5.86% | 160% |
|
| 12.58 | 4.07% | 114.8 | 0.85% | 3.99% | 0.86% | 3.98% | 145% |
| 12.58 | 0.89% | 131.3 | 0.86% | 3.25% | 0.88% | 3.24% | 295% |
| 12.91 | 2.52% | 119.4 | 0.75% | 2.71% | 0.89% | 2.57% | 230% |
| 13.06 | 5.30% | 90.4 | 0.74% | 2.78% | 0.96% | 2.56% | 297% |
| 12.75 | 2.51% | 73.9 | 0.75% | 3.56% | 1.05% | 3.26% | 288% |
| |
| 12.59 | 4.02% | 1.9 | 0.89% | 3.96% | 0.94% | 3.91% | 145% |
| 12.59 | 0.87% | 2.0 | 0.89% | 3.21% | 0.93% | 3.17% | 295% |
| 12.92 | 2.45% | 2.1 | 0.88% | 2.59% | 0.88% | 2.59% | 230% |
| 13.06 | 5.14% | 6.2 | 0.91% | 2.61% | 0.96% | 2.56% | 297% |
| 12.75 | 2.51% | 5.8 | 0.75% | 3.56% | 1.05% | 3.26% | 288% |
| |
| 12.58 | 4.55% | 148.3 | 0.38% | 4.58% | 0.39% | 4.57% | 145% |
| 12.58 | 1.36% | 37.4 | 0.41% | 3.78% | 0.42% | 3.77% | 295% |
| 12.91 | 2.90% | 9.8 | 0.45% | 3.01% | 0.57% | 2.89% | 230% |
| 13.05 | 5.62% | 14.7 | 0.46% | 3.07% | 0.64% | 2.89% | 297% |
| 12.74 | 2.77% | 14.0 | 0.42% | 3.89% | 0.72% | 3.59% | 288% |
(c) Total investment return assumes dividend reinvestment and does not reflect any deduction for sales charges. Not annualized for periods less than one year.
(d) Computed on an annualized basis for periods less than one year.
(e) For the period from May 1, 2004, to October 31, 2004.
| The accompanying notes to the financial statements are an integral part of this schedule. |
|
| 289 |
Thrivent Mutual Funds
Financial Highlights – continued |
|
| | F O R A S H A R E O U T S T A N D I N G T H R O U G H O U T E A C H P E R I O D(a) |
| |
|
| |
| | | | | | Less Distributions | |
| | | Income from Investment Operations | from | | |
| |
|
| |
| | Net Asset | | Net Realized | | | Net | |
| | Value, | Net | and Unrealized | Total from | Net | Realized | |
| | Beginning | Investment | Gain/(Loss) on | Investment | Investment | Gain on | Total |
| | of Period | Income/(Loss) | Investments(a) | Operations | Income | Investments | Distributions |
|
| MONEY MARKET FUND | | | | | | | |
| Class A Share | | | | | | | |
| Year Ended 10/31/2006 | $1.00 | $0.04 | $— | $0.04 | $(0.04) | $— | $(0.04) |
| Year Ended 10/31/2005 | 1.00 | 0.02 | — | 0.02 | (0.02) | — | (0.02) |
| Period Ended 10/31/2004 (d) | 1.00 | (0.001) | 0.004 | 0.003 | (0.003) | — | (0.003) |
| Year Ended 4/30/2004 | 1.00 | 0.003 | — | 0.003 | (0.003) | — | (0.003) |
| Year Ended 4/30/2003 | 1.00 | 0.01 | — | 0.01 | (0.01) | — | (0.01) |
| Year Ended 4/30/2002 | 1.00 | 0.02 | — | 0.02 | (0.02) | — | (0.02) |
| Class B Shares | | | | | | | |
| Year Ended 10/31/2006 | 1.00 | 0.04 | — | 0.04 | (0.04) | — | (0.04) |
| Year Ended 10/31/2005 | 1.00 | 0.02 | — | 0.02 | (0.02) | — | (0.02) |
| Period Ended 10/31/2004 (d) | 1.00 | 0.002 | — | 0.002 | (0.002) | — | (0.002) |
| Year Ended 4/30/2004 | 1.00 | 0.001 | — | 0.001 | (0.001) | — | (0.001) |
| Year Ended 4/30/2003 | 1.00 | 0.003 | — | 0.003 | (0.003) | — | (0.003) |
| Year Ended 4/30/2002 | 1.00 | 0.01 | — | 0.01 | (0.01) | — | (0.01) |
| Class I Shares | | | | | | | |
| Year Ended 10/31/2006 | 1.00 | 0.04 | — | 0.04 | (0.04) | — | (0.04) |
| Year Ended 10/31/2005 | 1.00 | 0.03 | — | 0.03 | (0.03) | — | (0.03) |
| Period Ended 10/31/2004 (d) | 1.00 | 0.005 | — | 0.005 | (0.005) | — | (0.005) |
| Year Ended 4/30/2004 | 1.00 | 0.01 | — | 0.01 | (0.01) | — | (0.01) |
| Year Ended 4/30/2003 | 1.00 | 0.01 | — | 0.01 | (0.01) | — | (0.01) |
| Year Ended 4/30/2002 | 1.00 | 0.03 | — | 0.03 | (0.03) | — | (0.03) |
(a) The amount shown may not correlate with the change in aggregate gains and losses of portfolio securities due to the timing of sales and redemptions of fund shares.
| The accompanying notes to the financial statements are an integral part of this schedule. |
|
| 290 |
Thrivent Mutual Funds
Financial Highlights – continued |
|
| | | | R A T I O S / S U P P L E M E N T A L D A T A | | |
|
|
| | | | | | Ratios to Average | |
| | | | | | Net Assets Before Expenses | |
| | | | Ratio to Average Net | Waived, Credited or Paid | |
| | | | Assets(c) | Indirectly(c) | |
| | | |
|
| |
| Net Asset | | | | | | | |
| Value, | | Net Assets | | Net | | Net | Portfolio |
| End of | Total | End of Period | | Investment | | Investment | Turnover |
| Period | Return(b) | (in millions) | Expenses | Income/(Loss) | Expenses | Income/(Loss) | Rate |
|
| $1.00 | 4.26% | $864.3 | 0.71% | 4.22% | 0.89% | 4.04% | N/A |
| 1.00 | 2.12% | 661.3 | 0.84% | 2.08% | 0.94% | 1.98% | N/A |
| 1.00 | 0.26% | 686.8 | 0.90% | 0.61% | 1.00% | 0.51% | N/A |
| 1.00 | 0.32% | 262.2 | 0.83% | 0.32% | 0.93% | 0.22% | N/A |
| 1.00 | 0.88% | 349.6 | 0.77% | 0.89% | 0.92% | 0.74% | N/A |
| 1.00 | 2.28% | 399.8 | 0.72% | 2.19% | 0.90% | 2.01% | N/A |
| |
| 1.00 | 3.94% | 1.8 | 1.01% | 3.88% | 1.97% | 2.92% | N/A |
| 1.00 | 1.94% | 1.7 | 1.01% | 1.84% | 1.93% | 0.91% | N/A |
| 1.00 | 0.18% | 2.9 | 1.04% | 0.47% | 1.95% | (0.44)% | N/A |
| 1.00 | 0.07% | 1.8 | 1.08% | 0.07% | 1.84% | (0.69)% | N/A |
| 1.00 | 0.42% | 2.8 | 1.38% | 0.27% | 1.62% | 0.03% | N/A |
| 1.00 | 1.34% | 2.8 | 1.52% | 1.39% | 1.70% | 1.21% | N/A |
| |
| 1.00 | 4.59% | 341.1 | 0.39% | 4.51% | 0.49% | 4.42% | N/A |
| 1.00 | 2.56% | 283.1 | 0.40% | 2.56% | 0.50% | 2.46% | N/A |
| 1.00 | 0.47% | 245.7 | 0.47% | 1.05% | 0.54% | 0.98% | N/A |
| 1.00 | 0.59% | 114.6 | 0.56% | 0.59% | 0.56% | 0.59% | N/A |
| 1.00 | 1.17% | 91.4 | 0.48% | 1.18% | 0.53% | 1.13% | N/A |
| 1.00 | 2.54% | 117.8 | 0.46% | 2.45% | 0.54% | 2.37% | N/A |
(b) Total investment return assumes dividend reinvestment and does not reflect any deduction for sales charges. Not annualized for periods less than one year.
(c) Computed on an annualized basis for periods less than one year.
(d) For the period from May 1, 2004 to October 31, 2004.
| The accompanying notes to the financial statements are an integral part of this schedule. |
|
| 291 |
Additional Information
(unaudited) |
Shareholder Notification of Federal Tax Information (unaudited)
The following information is provided solely to satisfy the requirements set forth by the Internal Revenue Code. Shareholders will be provided information regarding their distributions in January 2007.
The Funds designate the following percentages of dividends declared from net investment income as dividends qualifying for the 70% dividends received deduction for corporations or as qualified dividend income for individuals under the Jobs and Growth Tax Relief Reconciliation Act of 2003 for the tax period ending October 31, 2006:
| | Dividends | Qualified |
| | Received | Dividend |
| | Deduction for | Income for |
| Fund | Corporations | Individuals |
|
| Aggressive Allocation | 13% | 26% |
| Moderately Aggressive Allocation | 9% | 15% |
| Moderate Allocation | 6% | 10% |
| Moderately Conservative Allocation | 4% | 6% |
| Partner Small Cap Value | 9% | 9% |
| Small Cap Stock | 38% | 39% |
| Small Cap Index | 87% | 87% |
| Partner Mid Cap Value | 56% | 56% |
| Mid Cap Stock | 25% | 26% |
| Mid Cap Index | 72% | 72% |
| Mid Cap Index - I | 67% | 67% |
| Partner International Stock | 0% | 100% |
| Large Cap Growth | 100% | 100% |
| Large Cap Value | 93% | 93% |
| Large Cap Stock | 100% | 100% |
| Large Cap Index | 100% | 100% |
| Large Cap Index - I | 100% | 100% |
| Balanced | 22% | 22% |
| Diversified Income Plus | 5% | 5% |
The Municipal Bond Fund designates 99.18% of the dividends declared from net investment income as exempt from federal income tax for the tax period ended October 31, 2006.
The Funds designate the following amounts as distributions of long-term capital gains: Partner Small Cap Value Fund, $2,069,625; Small Cap Stock Fund, $49,421,237; Small Cap Index Fund, $709,185; Mid Cap Stock Fund, $81,148,075; Mid Cap Index Fund, $3,626,796; Mid Cap Index Fund - I, $1,424,659; Large Cap Value Fund, $5,697,959; Large Cap Stock Fund, $22,898,216; Large Cap Index Fund, $88,417; Balanced Fund, $1,409,661. These amounts may include earnings and profits distributed to shareholders on the redemption of shares as part of the dividend paid deduction.
Proxy Voting
The policies and procedures that the Trust uses to determine how to vote proxies relating to portfolio securities are attached to the Trust’s Statement of Additional Information. You may request a free copy of the Statement of Additional Information or the report of how the Trust voted proxies relating to portfolio securities during the most recent 12-month period ended June 30 by calling 800-847-4836. You also may review the Statement of Additional Information or the report of how the Trust voted proxies relating to portfolio securities during the most recent 12-month period ended June 30 at the Thrivent Financial web site (www.thrivent.com) or the SEC web site (www.sec.gov).
Quarterly Schedule of Portfolio Holdings
The Trust files its Schedule of Portfolio Holdings on Form N-Q with the SEC for the first and third quarters of each fiscal year. You may request a free copy of the Trust’s Forms N-Q by calling 1-800-847-4836. The Trust’s Forms N-Q also are available on the Thrivent Financial web site (www.thrivent.com) or the SEC web site (www.sec.gov). You also may review and copy the Forms N-Q for the Trust at the SEC’s Public Reference Room in Washington, DC. You may get information about the operation of the Public Reference Room by calling 1-202-551-8090.
Results of Special Shareholder Meetings Thrivent Mutual Funds
A special meeting of the shareholders of the Diversified Income Plus Fund, formerly know as the Thrivent High Yield Fund II, for the Thrivent Mutual Funds was held on June 23, 2006. The matter voted upon at the meeting and the shares cast for, against, or to abstain are set forth as follows.
A. To change the investment objective of Thrivent High Yield Fund II.
For: 10,060,047.476
Against: 366,020.566
Abstain: 248,974.522
Board of Trustees and Officers
The following table provides information about the Trustees and Officers of the Funds. Each Trustee oversees each of 29 series of the Trust and also serves as:
• Director of Thrivent Series Fund, Inc., a registered investment company consisting of 31 Portfolios that serve as underlying funds for variable contracts issued by Thrivent Financial for Lutherans (“Thrivent Financial”) and Thrivent Life Insurance Company (“TLIC”) and investment options in the retirement plan offered by Thrivent Financial
• Trustee of Thrivent Financial Securities Lending Trust, a registered investment company consisting of one Portfolio that serves as a cash collateral fund for a securities lending program sponsored by Thrivent Financial.
The 29 series of the Trust, 31 Portfolios of Thrivent Series Fund, Inc., and Thrivent Financial Securities Lending Trust are referred to herein as the “Fund Complex.” The Statement of Additional Information includes additional information about the Trustees and is available, without charge, by calling 1-800-847-4836.
| Interested Trustee1 | | | | |
| | | Number of | | |
| | Position | Portfolios in | Principal | |
| | with Trust | Fund Complex | Occupation | Other |
| Name, Address, | and Length | Overseen | During the | Directorships |
| and Age | of Service2 | by Trustee | Past 5 Years | Held by Trustee |
|
| Pamela J. Moret | President since 2002 | 61 | Executive Vice President, | Director, Banta |
| 625 Fourth Avenue South | and Trustee since 2004 | Marketing and Products, | Corporation; Director, |
| Minneapolis, MN | | | Thrivent Financial since | Minnesota Public Radio |
| Age 50 | | | 2002; Senior Vice | |
| | | | President, Products, | |
| | | | American Express | |
| | | | Financial Advisors from | |
| | | | 2000 to 2001 | |
| |
| Independent Trustees3 | | | | |
| | | Number of | | |
| | Position | Portfolios in | Principal | |
| | with Trust | Fund Complex | Occupation | Other |
| Name, Address, | and Length | Overseen | During the | Directorships |
| and Age | of Service2 | by Trustee | Past 5 Years | Held by Trustee |
|
| F. Gregory Campbell | Trustee since 1992 | 61 | President, Carthage | Director, National |
| 625 Fourth Avenue South | | | College | Association of Independent |
| Minneapolis, MN | | | | Colleges and Universities; |
| Age 67 | | | | Director, Johnson Family |
| | | | | Funds, Inc., an investment |
| | | | | company consisting of four |
| | | | | portfolios; Director, |
| | | | | Kenosha Hospital and |
| | | | | Medical Center Board; |
| | | | | Prairie School Board; United |
| | | | | Health Systems Board |
Board of Trustees and Officers
| Independent Trustees3 — continued | | | |
| | | | Number of | | |
| | | Position | Portfolios in | Principal | |
| | | with Trust | Fund Complex | Occupation | Other |
| Name, Address, | and Length | Overseen | During the | Directorships |
| and Age | of Service2 | by Trustee | Past 5 Years | Held by Trustee |
|
| Herbert F. Eggerding, Jr. | Lead Trustee | 61 | Management consultant | None |
| 625 | Fourth Avenue South | since 2003 | | to several privately | |
| Minneapolis, MN | | | owned companies | |
| Age | 69 | | | | |
| |
| Noel K. Estenson | Trustee since 2004 | 61 | Retired | None |
| 625 | Fourth Avenue South | | | | |
| Minneapolis, MN | | | | |
| Age | 68 | | | | |
| |
| Richard L. Gady | Trustee since 1987 | 61 | Retired; previously Vice | Director, International |
| 625 | Fourth Avenue South | | | President, Public | Agricultural Marketing |
| Minneapolis, MN | | | Affairs and Chief | Association |
| Age | 63 | | | Economist, ConAgra, | |
| | | | | Inc. (agribusiness) | |
| |
| Richard A. Hauser | Trustee since 2004 | 61 | President, National Legal | Director, The Washington |
| 625 | Fourth Avenue South | | | Center for the Public | Hospital Center |
| Minneapolis, MN | | | Interest since 2004; | |
| Age | 63 | | | General Counsel, U.S. | |
| | | | | Department of Housing | |
| | | | | and Urban Development, | |
| | | | | 2001 to 2004; Partner, | |
| | | | | Baker & Hosteller, | |
| | | | | 1986 to 2001 | |
| |
| Connie M. Levi | Trustee since 2004 | 61 | Retired | None |
| 625 | Fourth Avenue South | | | | |
| Minneapolis, MN | | | | |
| Age | 67 | | | | |
| |
| Edward W. Smeds | Chairman and Trustee 61 | Retired | Chairman of Carthage |
| 625 | Fourth Avenue South | since 1999 | | | College Board |
| Minneapolis, MN | | | | |
| Age | 70 | | | | |
| |
| Douglas D. Sims | Trustee since 2006 | 61 | Retired; previously Chief | Director, Keystone |
| 625 | Fourth Avenue South | | | Executive Officer of | Neighborhood Company; |
| Minneapolis, MN | | | CoBank from 1994 to | Director, Center for |
| Age | 60 | | | June 30, 2006 | Corporate Excellence |
Board of Trustees and Officers
| Executive Officers | | |
| | | Position with Trust | |
| Name, Address, | and Length | |
| and Age | of Service2 | Principal Occupation During the Past 5 Years |
|
| Pamela J. Moret | President since 2002 | Executive Vice President, Marketing and Products, Thrivent |
| 625 | Fourth Avenue South | | Financial since 2002; Senior Vice President, Products, |
| Minneapolis, MN | | American Express Financial Advisors from 2000 to 2001 |
| Age | 50 | | |
| |
| David S. Royal | Secretary and Chief | Vice President — Asset Management, Thrivent Financial |
| 625 | Fourth Avenue South | Legal Officer since 2006 | since 2006; Partner, Kirkland & Ellis LLP from April 2004 to |
| Minneapolis, MN | | June 2006; Associate, Skadden, Arps, Slate, Meagher & Flom |
| Age | 35 | | LLP from 1997 to 2004 |
| |
| Katie S. Kloster | Vice President and | Vice President and IC and IA Chief Compliance Officer, |
| 625 | Fourth Avenue South | Investment Company and | since 2004; previously Vice President and Comptroller of |
| Minneapolis, MN | Investment Adviser | Thrivent Financial |
| Age | 41 | Chief Compliance Officer | |
| | | since 2004 | |
| |
| Gerard V. Vaillancourt | Treasurer and Principal | Vice President, Mutual Fund Accounting since 2006; Head of |
| 625 | Fourth Avenue South | Accounting Officer | Mutual Fund Accounting, Thrivent Financial from 2005 to |
| Minneapolis, MN | since 2005 | 2006; Director, Fund Accounting Administration, Thrivent |
| Age | 39 | | Financial from 2002 to 2005; Manager, Portfolio Compliance, |
| | | | Lutheran Brotherhood from 2001 to 2002; Manager, Fund |
| | | | Accounting, Minnesota Life from 2000 to 2001 |
| |
| Russell W. Swansen | Vice President since 2004 | Senior Vice President and Chief Investment Officer, Thrivent |
| 625 | Fourth Avenue South | | Financial, since 2004; Managing Director, Colonade Advisors, |
| Minneapolis, MN | | LLC, from 2001 to 2003; President and Chief Investment |
| Age | 49 | | Officer of PPM America from 1999 to 2000 |
| |
| Janice M. Guimond | Vice President since 2005 | Vice President, Investment Operations, Thrivent Financial |
| 625 | Fourth Avenue South | | since 2003; Manager of Portfolio Reporting, Thrivent Financial |
| Minneapolis, MN | | 2003 to 2004; Independent Consultant 2001 to 2003; Vice |
| Age | 42 | | President, Director of Technology, Investment Advisers, Inc. |
| | | | 1999 to 2000; Vice President, Investment Systems & Services, |
| | | | Investment Advisers, Inc. from 1997 to 1999 |
| |
| Marnie L. Loomans-Thuecks | Vice President since 2004 | Vice President, Annuity & Settlement Option Product Services |
| 4321 North Ballard Road | | Operations, Thrivent Financial |
| Appleton, WI | | |
| Age | 43 | | |
| |
| Brian W. Picard | Vice President | Director of FSO Compliance Corp. BCM, since 2006; Manager |
| 4321 North Ballard Road | Anti-Money Laundering | of Field and Securities Compliance from 2002 to 2006, |
| Appleton, WI | Officer since 2006 | Thrivent Financial |
| Age | 36 | | |
Board of Trustees and Officers
| Executive Officers — continued | |
| | |
| | Position with Trust | |
| Name, Address, | and Length | |
| and Age | of Service2 | Principal Occupation(s) During the Past 5 Years |
|
| Kenneth L. Kirchner | Assistant Vice President | Director, Mutual Fund Operations, Thrivent Financial |
| 4321 North Ballard Road | since 2004 | |
| Appleton, WI | | |
| Age 40 | | |
| |
| James M. Odland | Assistant Secretary | Vice President, Office of the General Counsel, Thrivent |
| 625 Fourth Avenue South | since 2006 | Financial for Lutherans, since 2005; Senior Securities Counsel, |
| Minneapolis, MN | | Allianz Life Insurance Company from January 2005 to |
| Age 50 | | August 2005; Vice President and Chief Legal Officer, |
| | | Woodbury Financial Services, Inc., from September 2003 to |
| | | January 2005; Vice President and Group Counsel, Corporate |
| | | Practice Group, American Express Financial Advisors, Inc., |
| | | from 2001 to 2003 |
| |
| Marlene J. Nogle | Assistant Secretary | Senior Counsel, Thrivent Financial |
| 625 Fourth Avenue South | since 2003 | |
| Minneapolis, MN | | |
| Age 59 | | |
| |
| Todd J. Kelly | Assistant Treasurer | Director, Fund Accounting Operations, Thrivent Financial |
| 4321 North Ballard Road | since 1999 | |
| Appleton, WI | | |
| Age 37 | | |
1 “Interested person” of the Trust as defined in 1940 Act by virtue of positions with Thrivent Financial. Ms. Moret is considered an interested person because of her principal occupation with Thrivent Financial.
2 Each Trustee serves an indefinite term until her or his successor is duly elected and qualified. Officers serve at the discretion of the board until their successors are duly appointed and qualified.
3 The Trustees other than Ms. Moret are not “interested persons” of the Trust and are referred to as “Independent Trustees.”
This page intentionally left blank.
This page intentionally left blank.
| This page intentionally left blank. |

Item 2. Code of Ethics
As of the end of the period covered by this report, registrant has adopted a code of ethics (as defined in Item 2 of Form N-CSR) applicable to registrant's Principal Executive Officer, Principal Financial Officer, and Principal Accounting Officer. No waivers were granted to such code of ethics during the period covered by this report. However, during the period covered by this report, such code of ethics was amended to (a) reflect the new names of registrant and its affiliated investment company; (b) add the name of a newly-created affiliated investment company as being covered by such code: and (c) permit the Chief Legal Officer to keep copies of the records required to be kept under such code. A copy of this code of ethics is filed as an exhibit to this Form N-CSR.
Item 3. Audit Committee Financial Expert
Registrant's Board of Trustees has determined that Herbert F. Eggerding, Jr., an independent trustee, is the Audit Committee Financial Expert.
Item 4. Principal Accountant Fees and Services
(a) Audit Fees
The aggregate fees billed by registrant's independent public accountants, PricewaterhouseCoopers LLP ("PwC"), for the fiscal year ended October 31, 2005 and the fiscal year ended October 31, 2006, for professional services rendered in connection with the audit of registrant's annual financial statements or services that are normally provided by the accountant in connection with statutory and regulatory filings or engagements were $417,660 and $394,409, respectively.
(b) Audit-Related Fees
The aggregate fees PwC billed to registrant for the fiscal year ended October 31, 2005 and the fiscal year ended October 31, 2006, for assurance and other services which are reasonably related to the performance of registrant's audit and are not reported under Item 4(a) were $0 each of the respective periods. The aggregate fees PwC billed to registrant's investment adviser and any entity controlling, controlled by, or under common control with registrant's investment adviser for the fiscal year ended October 31, 2005 and the fiscal year ended October 31, 2006, for assurance and other services directly related to the operations and financial reporting of registrant were $0 for each of the respective periods.
(c) Tax Fees
The aggregate tax fees PwC billed to registrant for the fiscal year ended October 31, 2005 and the fiscal year ended October 31, 2006, for tax compliance, tax advice, and tax planning services were $135,325 and $124,065, respectively. The aggregate tax fees PwC billed to registrant's investment adviser and any entity controlling, controlled by, or under common control with registrant's investment adviser for the fiscal year ended October 31, 2005 and the fiscal year ended October 31, 2006, for services directly related to the operations and financial reporting of registrant were $0 for each of the respective periods.
(d) All Other Fees
The aggregate fees PwC billed to registrant for the fiscal year ended October 31, 2005 and the fiscal year ended October 31, 2006, for products and services provided other than the services reported in paragraphs (a) through (c) of this item were $0 for each of the respective periods. The aggregate fees PwC billed to registrant's investment adviser and any entity controlling, controlled by, or under common control with registrant's investment adviser for the fiscal year ended October 31, 2005 and the fiscal year ended October 31, 2006, for products and services provided other than the services reported in paragraphs (a) through (c) of this item were $44,431 and $14,145, respectively.
(e) Registrant's audit committee charter, adopted in August 2004, provides that the audit committee (comprised of the independent directors of registrant) is responsible for pre-approval of all auditing services performed for the registrant. The audit committee reports to the Board of Directors ("Board") regarding its approval of the engagement of the auditor and the proposed fees for the engagement, and a majority of the Board is required for the approval. The audit committee also is responsible for pre-approval (subject to the de minimus exceptions for non-audit services described in Section 10A(i)(1)(B) of the Securities Exchange Act of 1934, as amended) of all non-auditing services performed for the registrant or for any service affiliate of registrant. Registrant's audit committee charter also permits a designated member of the audit committee to pre-approve, between meetings, one or more non-audit service projects, subject to ratification by the audit committee at the next meeting of the audit committee. Registrant's audit committee pre-approved all fees described above which PwC billed to registrant.
(f) Less than 50% of the hours billed by PwC for auditing services to registrant for the fiscal year ended October 31, 2006, were for work performed by persons other than full-time, permanent employees of PwC.
(g) The aggregate non-audit fees billed by PwC to registrant and to registrant's investment adviser and any entity controlling, controlled by, or under common control with registrant's investment adviser for the fiscal year ended October 31, 2005 and the fiscal year ended October 31, 2006 were $0 for each of the respective periods.
(h) Registrant's audit and compliance committee has considered the non-audit services provided to the registrant and registrant's investment adviser and any entity controlling, controlled by, or under common control with registrant's investment adviser as described above and determined that these services do not compromise PwC's independence.
Item 5. Audit Committee of Listed Registrants
Not applicable.
Item 6. Schedule of Investments
Registrant's Schedule of Investments is included in the report to shareholders filed under
Item 1.
Item 7. Disclosure of Proxy Voting Policies and Procedures for Closed-End Management
Investment Companies
Not applicable.
Item 8. Portfolio Managers of Closed-End Management Investment Companies
Not applicable.
Item 9. Purchases of Equity Securities by Closed-End Management Investment Company and
Affiliated Purchasers.
Not applicable.
Item 10. Submission of Matters to a Vote of Security Holders
There have been no material changes to the procedures by which shareholders may recommend nominees to registrant's board of trustees.
Item 11. Controls and Procedures
(a)(i) Registrant's President and Treasurer have concluded that registrant's disclosure controls and procedures (as defined in Rule 30a-3(c) under the Investment Company Act) are effective, based on their evaluation of these controls and procedures as of a date within 90 days of the filing date of this report.
(a)(ii) There has been no change in registrant's internal controls over financial reporting (as defined in Rule 30a-3(d) under the Investment Company Act) that occurred during registrant’s most recent fiscal quarter that has materially affected, or is reasonably likely to materially affect, registrant's internal control over financial reporting.
Item 12. Exhibits
(a) The code of ethics pursuant to Item 2 is attached hereto.
(b) Certifications pursuant to Rules 30a-2(a) and 30a-2(b) under the Investment Company Act of 1940 are attached hereto.
SIGNATURES
| Pursuant to the requirements of the Securities Exchange Act of 1934 and the Investment |
| Company Act of 1940, the registrant has duly caused this report to be signed on its behalf by the |
| undersigned, thereunto duly authorized. | | |
| |
| Date: December 29, 2006 | THRIVENT MUTUAL FUNDS |
| |
| |
| |
| | By: | /s/ Pamela J. Moret |
|
|
| | | Pamela J. Moret |
| | | President |
| |
| Pursuant to the requirements of the Securities Exchange Act of 1934 and the Investment |
| Company Act of 1940, this report has been signed below by the following persons on behalf of |
| the registrant and in the capacities and on the dates indicated. | | |
| |
| |
| |
| Date: December 29, 2006 | By: | /s/ Pamela J. Moret |
|
|
| | | Pamela J. Moret |
| | | President |
| |
| |
| |
| |
| Date: December 29, 2006 | By: | /s/ Gerard V. Vaillancourt |
|
|
| | | Gerard V. Vaillancourt |
| | | Treasurer |